
First Quarter 2017 Earnings Presentation May 4, 2017

Disclaimer: This presentation contains “forward-looking statements” within the meaning of the Private Securities Litigation Reform Act of 1995. Such forward looking statements generally include the words “may,” “could,” “should,” “believes,” “plans,” “intends,” “targets,” “will,” “expects,” “suggests,” “anticipates,” “outlook,” “continues,” “forecast,” “prospect,” “potential” or similar expressions. Forward-looking statements may include, without limitation, expected financial positions, results of operations and cash flows; financing plans; business strategies and expectations; operating plans; capital and other expenditures; competitive positions; growth opportunities for existing products; benefits from new technology and cost-reduction initiatives, plans and objectives; and markets for securities. Like other businesses, Ingevity is subject to risks and uncertainties that could cause its actual results to differ materially from its expectations or that could cause other forward-looking statements to prove incorrect. Factors that could cause actual results to materially differ from those contained in the forward-looking statements, or that could cause other forward-looking statements to prove incorrect, include, without limitation, general economic and financial conditions; international sales and operations; currency exchange rates and currency devaluation; compliance with U.S. and foreign regulations; attracting and retaining key personnel; adverse conditions in the automotive market; worldwide air quality standards; a decrease in government infrastructure spending; declining volumes in the printing inks market; the limited supply of crude tall oil (“CTO”); lack of access to sufficient CTO; access to and pricing of raw materials; competition from producers of substitute products; a prolonged period of low energy prices; the provision of services by third parties at several facilities; natural disasters, such as hurricanes, winter or tropical storms, earthquakes, floods, fires; other unanticipated problems such as labor difficulties including renewal of collective bargaining agreements, equipment failure or unscheduled maintenance and repair; protection of intellectual property and proprietary information; information technology security risks; government policies and regulations, including, but not limited to, those affecting the environment, climate change, tax policies and the chemicals industry; and lawsuits arising out of environmental damage or personal injuries associated with chemical or other manufacturing processes. These and other important factors that could cause actual results or events to differ materially from those expressed in forward- looking statements that may have been made in this document are and will be more particularly described in our filings with the U.S. Securities and Exchange Commission, including our Form 10 Registration Statement and periodic filings. Readers are cautioned not to place undue reliance on Ingevity’s projections and forward-looking statements, which speak only as the date thereof. Ingevity undertakes no obligation to publicly release any revision to the projections and forward-looking statements contained in this presentation, or to update them to reflect events or circumstances occurring after the date of this presentation. 2
Agenda •First Quarter Highlights •Segment Performance •Financial Review •2017 Guidance •Q&A 3
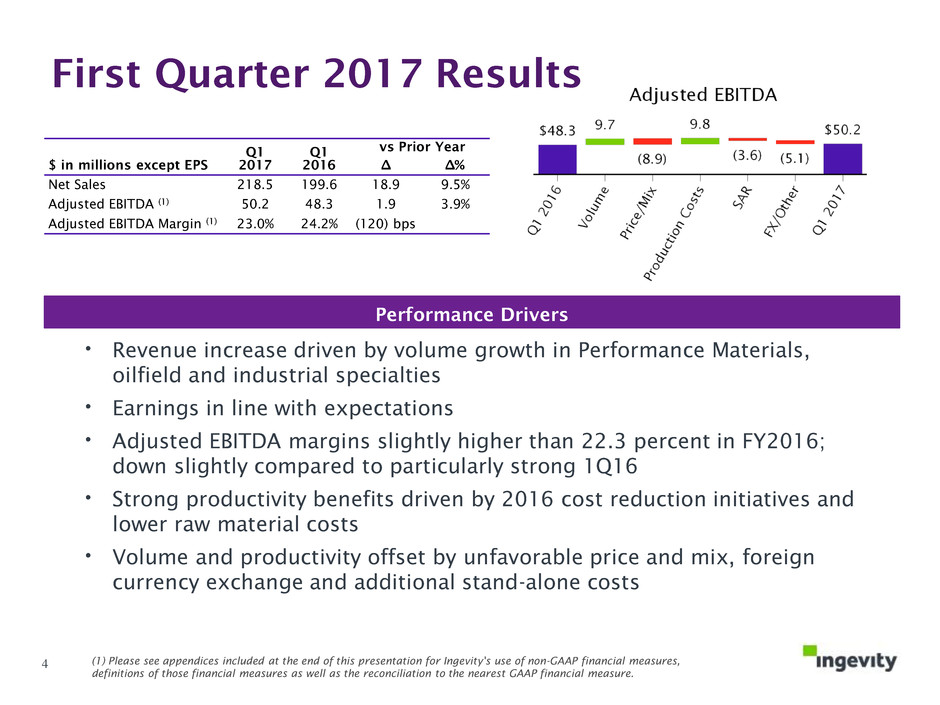
First Quarter 2017 Results • Revenue increase driven by volume growth in Performance Materials, oilfield and industrial specialties • Earnings in line with expectations • Adjusted EBITDA margins slightly higher than 22.3 percent in FY2016; down slightly compared to particularly strong 1Q16 • Strong productivity benefits driven by 2016 cost reduction initiatives and lower raw material costs • Volume and productivity offset by unfavorable price and mix, foreign currency exchange and additional stand-alone costs Performance Drivers (1) Please see appendices included at the end of this presentation for Ingevity's use of non-GAAP financial measures, definitions of those financial measures as well as the reconciliation to the nearest GAAP financial measure. 4 $ in millions except EPS Q1 2017 Q1 2016 vs Prior Year ∆ ∆% Net Sales 218.5 199.6 18.9 9.5% Adjusted EBITDA (1) 50.2 48.3 1.9 3.9% Adjusted EBITDA Margin (1) 23.0% 24.2% (120) bps
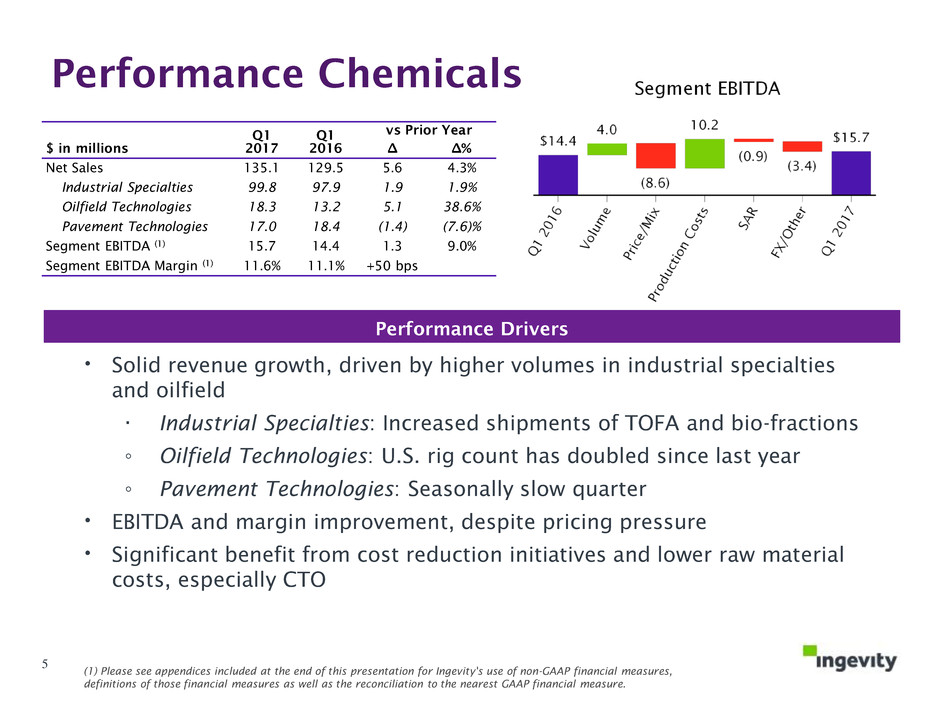
Performance Chemicals • Solid revenue growth, driven by higher volumes in industrial specialties and oilfield · Industrial Specialties: Increased shipments of TOFA and bio-fractions ◦ Oilfield Technologies: U.S. rig count has doubled since last year ◦ Pavement Technologies: Seasonally slow quarter • EBITDA and margin improvement, despite pricing pressure • Significant benefit from cost reduction initiatives and lower raw material costs, especially CTO Performance Drivers (1) Please see appendices included at the end of this presentation for Ingevity's use of non-GAAP financial measures, definitions of those financial measures as well as the reconciliation to the nearest GAAP financial measure. 5 $ in millions Q1 2017 Q1 2016 vs Prior Year ∆ ∆% Net Sales 135.1 129.5 5.6 4.3% Industrial Specialties 99.8 97.9 1.9 1.9% Oilfield Technologies 18.3 13.2 5.1 38.6% Pavement Technologies 17.0 18.4 (1.4) (7.6)% Segment EBITDA (1) 15.7 14.4 1.3 9.0% Segment EBITDA Margin (1) 11.6% 11.1% +50 bps
Bio-Refinery Competitive Conditions
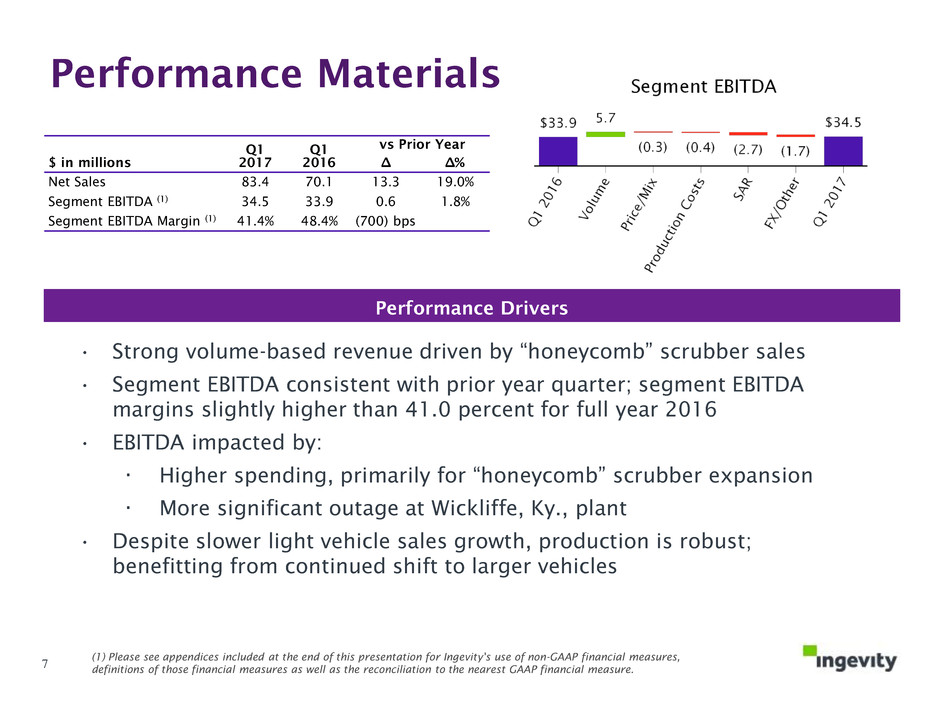
Performance Materials • Strong volume-based revenue driven by “honeycomb” scrubber sales • Segment EBITDA consistent with prior year quarter; segment EBITDA margins slightly higher than 41.0 percent for full year 2016 • EBITDA impacted by: · Higher spending, primarily for “honeycomb” scrubber expansion · More significant outage at Wickliffe, Ky., plant • Despite slower light vehicle sales growth, production is robust; benefitting from continued shift to larger vehicles Performance Drivers (1) Please see appendices included at the end of this presentation for Ingevity's use of non-GAAP financial measures, definitions of those financial measures as well as the reconciliation to the nearest GAAP financial measure. 7 $ in millions Q1 2017 Q1 2016 vs Prior Year ∆ ∆% Net Sales 83.4 70.1 13.3 19.0% Segment EBITDA (1) 34.5 33.9 0.6 1.8% Segment EBITDA Margin (1) 41.4% 48.4% (700) bps
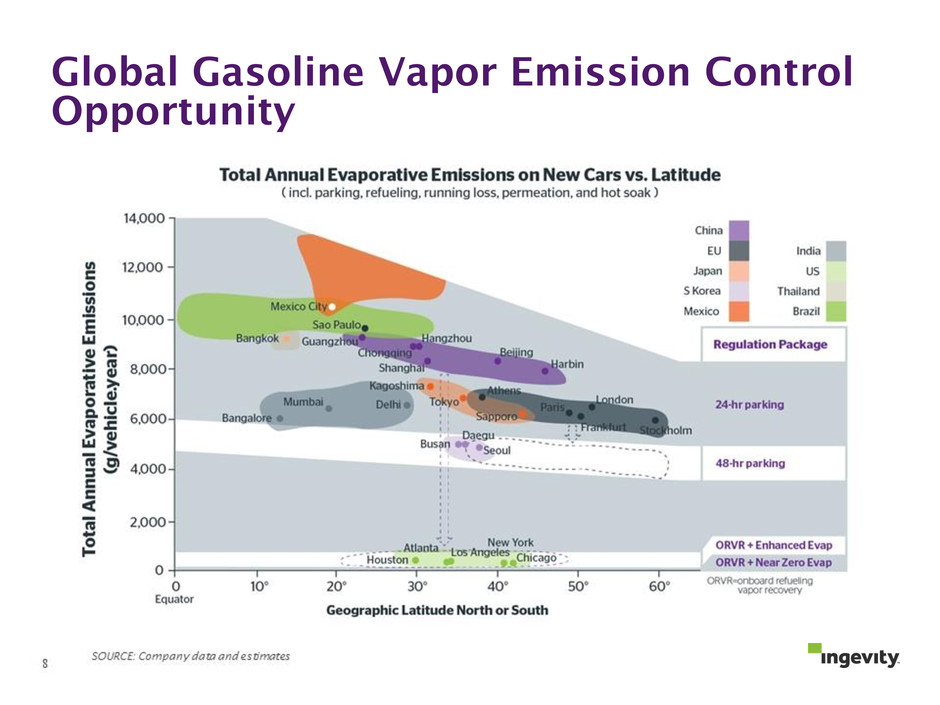
Global Gasoline Vapor Emission Control Opportunity
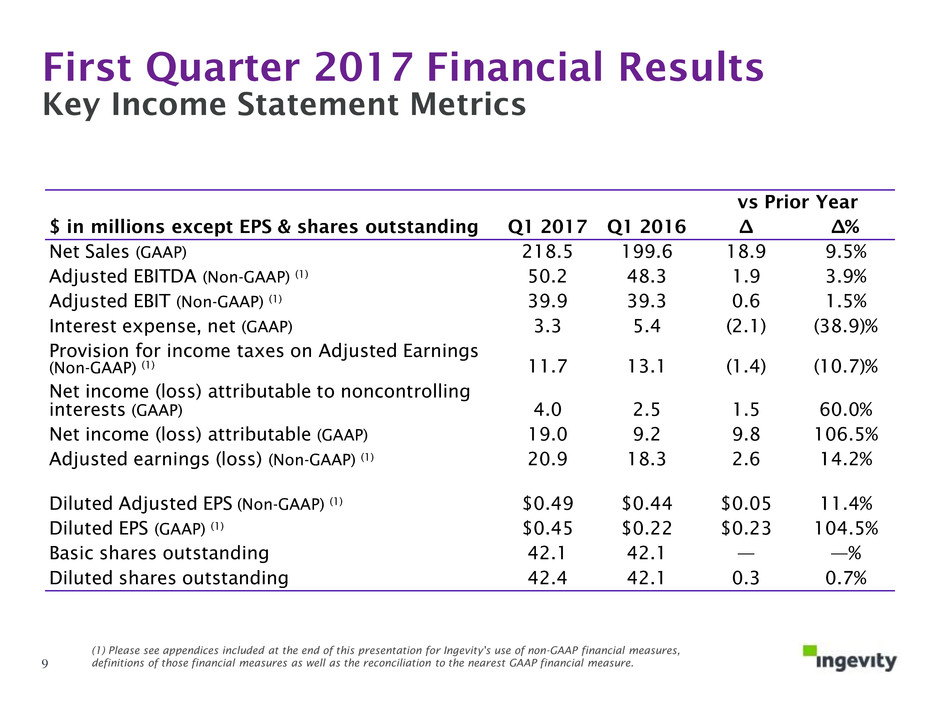
First Quarter 2017 Financial Results Key Income Statement Metrics (1) Please see appendices included at the end of this presentation for Ingevity's use of non-GAAP financial measures, definitions of those financial measures as well as the reconciliation to the nearest GAAP financial measure. 9 $ in millions except EPS & shares outstanding Q1 2017 Q1 2016 vs Prior Year ∆ ∆% Net Sales (GAAP) 218.5 199.6 18.9 9.5% Adjusted EBITDA (Non-GAAP) (1) 50.2 48.3 1.9 3.9% Adjusted EBIT (Non-GAAP) (1) 39.9 39.3 0.6 1.5% Interest expense, net (GAAP) 3.3 5.4 (2.1) (38.9)% Provision for income taxes on Adjusted Earnings (Non-GAAP) (1) 11.7 13.1 (1.4) (10.7)% Net income (loss) attributable to noncontrolling interests (GAAP) 4.0 2.5 1.5 60.0% Net income (loss) attributable (GAAP) 19.0 9.2 9.8 106.5% Adjusted earnings (loss) (Non-GAAP) (1) 20.9 18.3 2.6 14.2% Diluted Adjusted EPS (Non-GAAP) (1) $0.49 $0.44 $0.05 11.4% Diluted EPS (GAAP) (1) $0.45 $0.22 $0.23 104.5% Basic shares outstanding 42.1 42.1 — —% Diluted shares outstanding 42.4 42.1 0.3 0.7%
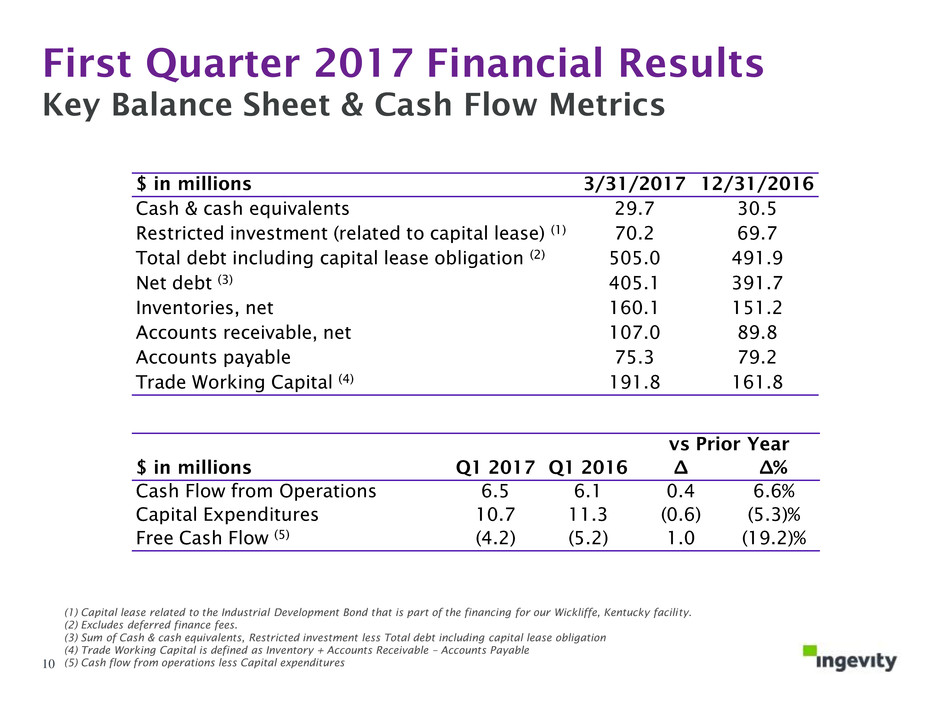
First Quarter 2017 Financial Results Key Balance Sheet & Cash Flow Metrics (1) Capital lease related to the Industrial Development Bond that is part of the financing for our Wickliffe, Kentucky facility. (2) Excludes deferred finance fees. (3) Sum of Cash & cash equivalents, Restricted investment less Total debt including capital lease obligation (4) Trade Working Capital is defined as Inventory + Accounts Receivable – Accounts Payable (5) Cash flow from operations less Capital expenditures 10 $ in millions 3/31/2017 12/31/2016 Cash & cash equivalents 29.7 30.5 Restricted investment (related to capital lease) (1) 70.2 69.7 Total debt including capital lease obligation (2) 505.0 491.9 Net debt (3) 405.1 391.7 Inventories, net 160.1 151.2 Accounts receivable, net 107.0 89.8 Accounts payable 75.3 79.2 Trade Working Capital (4) 191.8 161.8 $ in millions Q1 2017 Q1 2016 vs Prior Year ∆ ∆% Cash Flow from Operations 6.5 6.1 0.4 6.6% Capital Expenditures 10.7 11.3 (0.6) (5.3)% Free Cash Flow (5) (4.2) (5.2) 1.0 (19.2)%
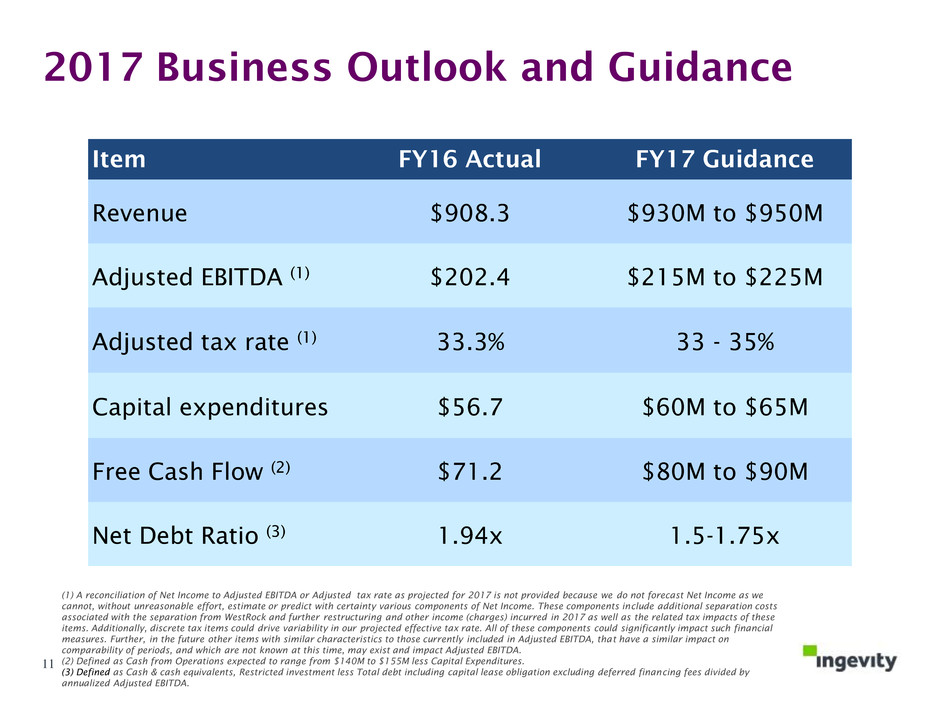
2017 Business Outlook and Guidance Item FY16 Actual FY17 Guidance Revenue $908.3 $930M to $950M Adjusted EBITDA (1) $202.4 $215M to $225M Adjusted tax rate (1) 33.3% 33 - 35% Capital expenditures $56.7 $60M to $65M Free Cash Flow (2) $71.2 $80M to $90M Net Debt Ratio (3) 1.94x 1.5-1.75x (1) A reconciliation of Net Income to Adjusted EBITDA or Adjusted tax rate as projected for 2017 is not provided because we do not forecast Net Income as we cannot, without unreasonable effort, estimate or predict with certainty various components of Net Income. These components include additional separation costs associated with the separation from WestRock and further restructuring and other income (charges) incurred in 2017 as well as the related tax impacts of these items. Additionally, discrete tax items could drive variability in our projected effective tax rate. All of these components could significantly impact such financial measures. Further, in the future other items with similar characteristics to those currently included in Adjusted EBITDA, that have a similar impact on comparability of periods, and which are not known at this time, may exist and impact Adjusted EBITDA. (2) Defined as Cash from Operations expected to range from $140M to $155M less Capital Expenditures. (3) Defined as Cash & cash equivalents, Restricted investment less Total debt including capital lease obligation excluding deferred financing fees divided by annualized Adjusted EBITDA. 11

For More Information Thank you for your interest in Ingevity! Investors Dan Gallagher (843) 740-2126 Media Jack Maurer (843) 746-8242 12
Appendix 13
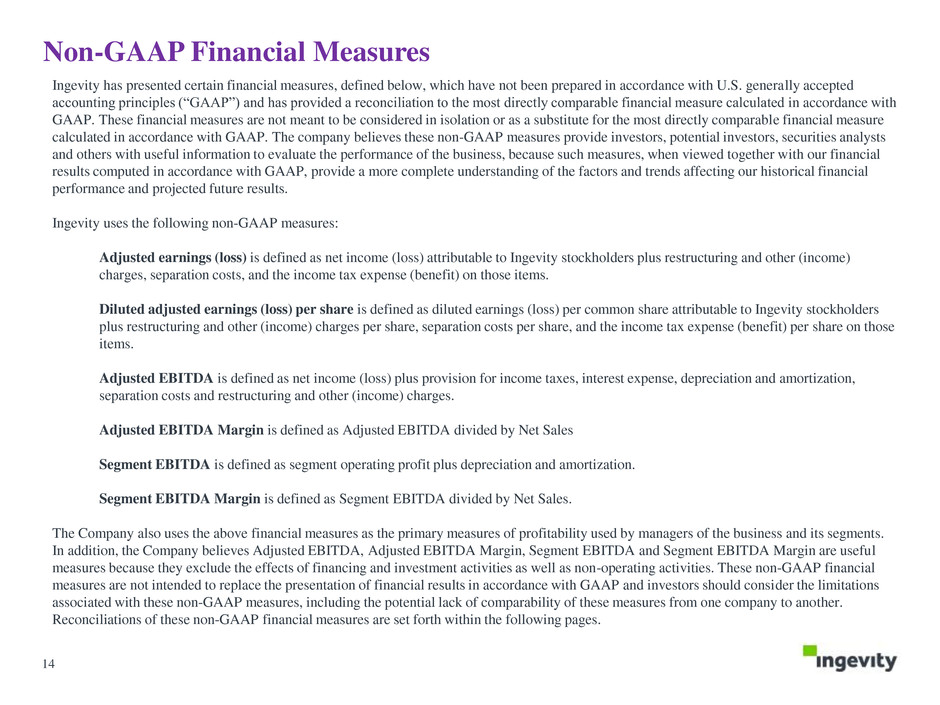
Non-GAAP Financial Measures Ingevity has presented certain financial measures, defined below, which have not been prepared in accordance with U.S. generally accepted accounting principles (“GAAP”) and has provided a reconciliation to the most directly comparable financial measure calculated in accordance with GAAP. These financial measures are not meant to be considered in isolation or as a substitute for the most directly comparable financial measure calculated in accordance with GAAP. The company believes these non-GAAP measures provide investors, potential investors, securities analysts and others with useful information to evaluate the performance of the business, because such measures, when viewed together with our financial results computed in accordance with GAAP, provide a more complete understanding of the factors and trends affecting our historical financial performance and projected future results. Ingevity uses the following non-GAAP measures: Adjusted earnings (loss) is defined as net income (loss) attributable to Ingevity stockholders plus restructuring and other (income) charges, separation costs, and the income tax expense (benefit) on those items. Diluted adjusted earnings (loss) per share is defined as diluted earnings (loss) per common share attributable to Ingevity stockholders plus restructuring and other (income) charges per share, separation costs per share, and the income tax expense (benefit) per share on those items. Adjusted EBITDA is defined as net income (loss) plus provision for income taxes, interest expense, depreciation and amortization, separation costs and restructuring and other (income) charges. Adjusted EBITDA Margin is defined as Adjusted EBITDA divided by Net Sales Segment EBITDA is defined as segment operating profit plus depreciation and amortization. Segment EBITDA Margin is defined as Segment EBITDA divided by Net Sales. The Company also uses the above financial measures as the primary measures of profitability used by managers of the business and its segments. In addition, the Company believes Adjusted EBITDA, Adjusted EBITDA Margin, Segment EBITDA and Segment EBITDA Margin are useful measures because they exclude the effects of financing and investment activities as well as non-operating activities. These non-GAAP financial measures are not intended to replace the presentation of financial results in accordance with GAAP and investors should consider the limitations associated with these non-GAAP measures, including the potential lack of comparability of these measures from one company to another. Reconciliations of these non-GAAP financial measures are set forth within the following pages. 14
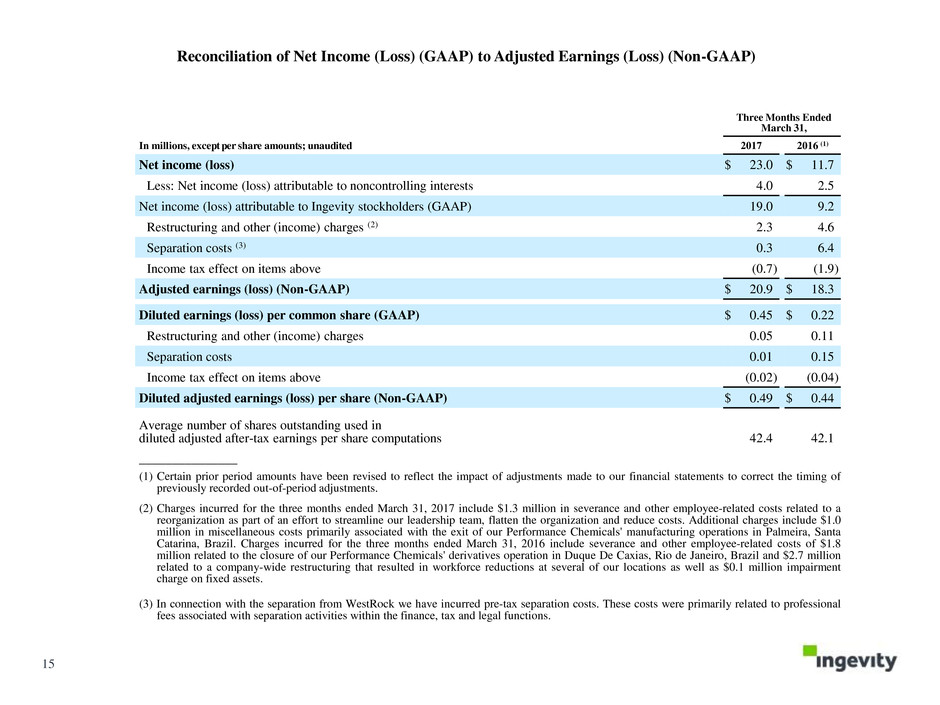
Three Months Ended March 31, In millions, except per share amounts; unaudited 2017 2016 (1) Net income (loss) $ 23.0 $ 11.7 Less: Net income (loss) attributable to noncontrolling interests 4.0 2.5 Net income (loss) attributable to Ingevity stockholders (GAAP) 19.0 9.2 Restructuring and other (income) charges (2) 2.3 4.6 Separation costs (3) 0.3 6.4 Income tax effect on items above (0.7 ) (1.9 ) Adjusted earnings (loss) (Non-GAAP) $ 20.9 $ 18.3 Diluted earnings (loss) per common share (GAAP) $ 0.45 $ 0.22 Restructuring and other (income) charges 0.05 0.11 Separation costs 0.01 0.15 Income tax effect on items above (0.02 ) (0.04 ) Diluted adjusted earnings (loss) per share (Non-GAAP) $ 0.49 $ 0.44 Average number of shares outstanding used in diluted adjusted after-tax earnings per share computations 42.4 42.1 _______________ (1) Certain prior period amounts have been revised to reflect the impact of adjustments made to our financial statements to correct the timing of previously recorded out-of-period adjustments. (2) Charges incurred for the three months ended March 31, 2017 include $1.3 million in severance and other employee-related costs related to a reorganization as part of an effort to streamline our leadership team, flatten the organization and reduce costs. Additional charges include $1.0 million in miscellaneous costs primarily associated with the exit of our Performance Chemicals' manufacturing operations in Palmeira, Santa Catarina, Brazil. Charges incurred for the three months ended March 31, 2016 include severance and other employee-related costs of $1.8 million related to the closure of our Performance Chemicals' derivatives operation in Duque De Caxias, Rio de Janeiro, Brazil and $2.7 million related to a company-wide restructuring that resulted in workforce reductions at several of our locations as well as $0.1 million impairment charge on fixed assets. (3) In connection with the separation from WestRock we have incurred pre-tax separation costs. These costs were primarily related to professional fees associated with separation activities within the finance, tax and legal functions. Reconciliation of Net Income (Loss) (GAAP) to Adjusted Earnings (Loss) (Non-GAAP) 15
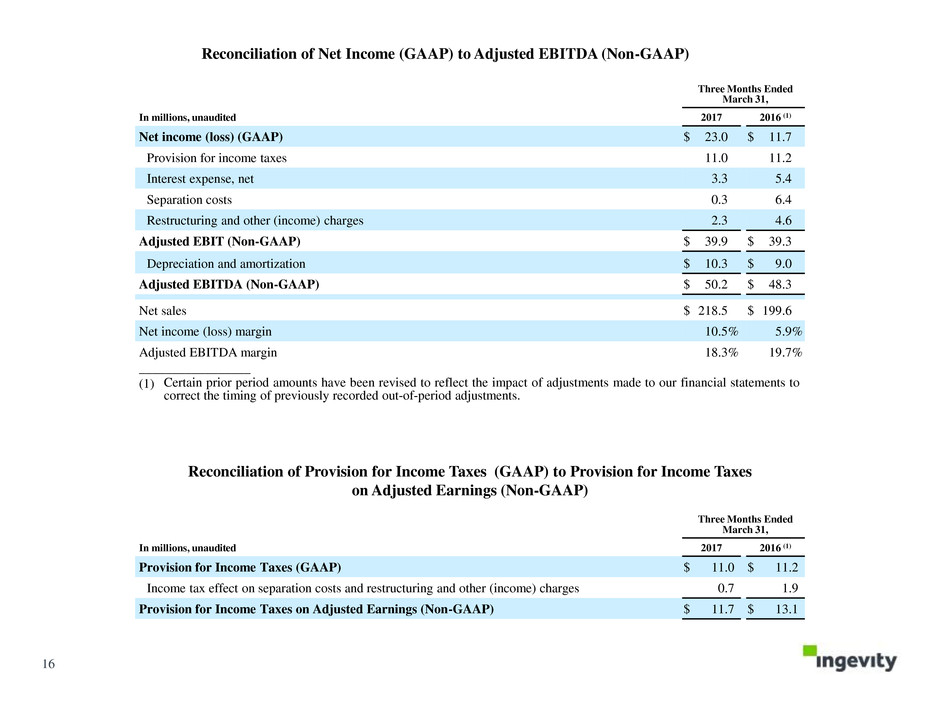
Three Months Ended March 31, In millions, unaudited 2017 2016 (1) Net income (loss) (GAAP) $ 23.0 $ 11.7 Provision for income taxes 11.0 11.2 Interest expense, net 3.3 5.4 Separation costs 0.3 6.4 Restructuring and other (income) charges 2.3 4.6 Adjusted EBIT (Non-GAAP) $ 39.9 $ 39.3 Depreciation and amortization $ 10.3 $ 9.0 Adjusted EBITDA (Non-GAAP) $ 50.2 $ 48.3 Net sales $ 218.5 $ 199.6 Net income (loss) margin 10.5 % 5.9 % Adjusted EBITDA margin 18.3 % 19.7 % _________________ (1) Certain prior period amounts have been revised to reflect the impact of adjustments made to our financial statements to correct the timing of previously recorded out-of-period adjustments. Reconciliation of Net Income (GAAP) to Adjusted EBITDA (Non-GAAP) 16 Reconciliation of Provision for Income Taxes (GAAP) to Provision for Income Taxes on Adjusted Earnings (Non-GAAP) Three Months Ended March 31, In millions, unaudited 2017 2016 (1) Provision for Income Taxes (GAAP) $ 11.0 $ 11.2 Income tax effect on separation costs and restructuring and other (income) charges 0.7 1.9 Provision for Income Taxes on Adjusted Earnings (Non-GAAP) $ 11.7 $ 13.1
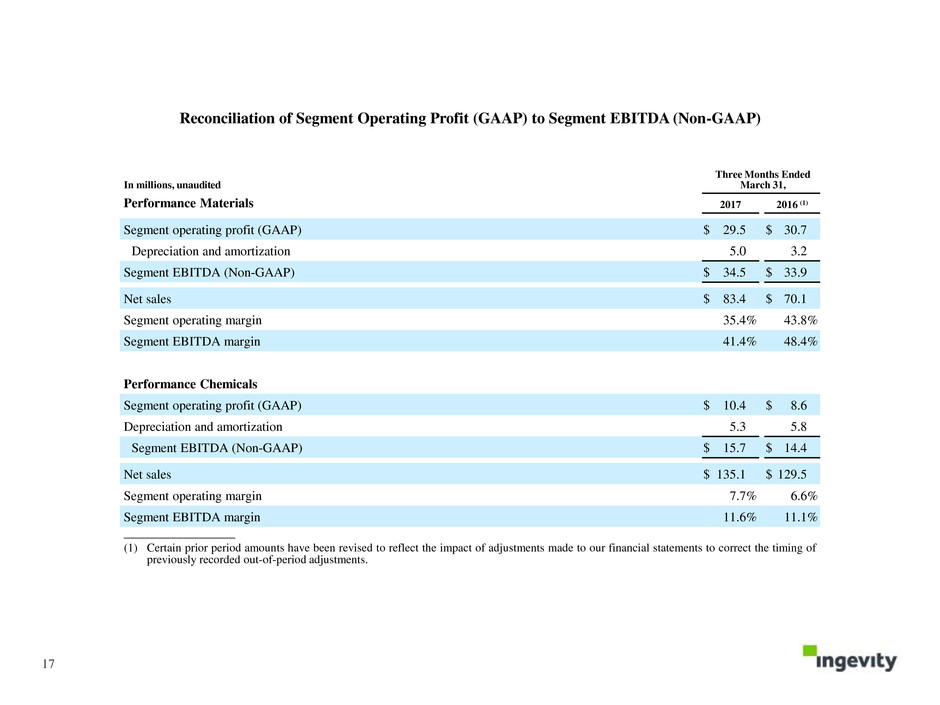
In millions, unaudited Three Months Ended March 31, Performance Materials 2017 2016 (1) Segment operating profit (GAAP) $ 29.5 $ 30.7 Depreciation and amortization 5.0 3.2 Segment EBITDA (Non-GAAP) $ 34.5 $ 33.9 Net sales $ 83.4 $ 70.1 Segment operating margin 35.4 % 43.8 % Segment EBITDA margin 41.4 % 48.4 % Performance Chemicals Segment operating profit (GAAP) $ 10.4 $ 8.6 Depreciation and amortization 5.3 5.8 Segment EBITDA (Non-GAAP) $ 15.7 $ 14.4 Net sales $ 135.1 $ 129.5 Segment operating margin 7.7 % 6.6 % Segment EBITDA margin 11.6 % 11.1 % _________________ (1) Certain prior period amounts have been revised to reflect the impact of adjustments made to our financial statements to correct the timing of previously recorded out-of-period adjustments. Reconciliation of Segment Operating Profit (GAAP) to Segment EBITDA (Non-GAAP) 17


