Priority Technology Holdings, Inc. Supplemental Slides for the Second Quarter 2021 Earnings Call August 9, 2021
Forward-Looking Statements 1 The press release and this presentation contain “forward-looking statements” within the meaning of the Private Securities Litigation Reform Act of 1995. Such statements include, but are not limited to, statements about future financial and operating results, our plans, objectives, expectations and intentions with respect to future operations, products and services, and other statements identified by words such as “may,” “will,” “should,” “anticipates,” “believes,” “expects,” “plans,” “future,” “intends,” “could,” “estimate,” “predict,” “projects,” “targeting,” “potential” or “contingent,” “guidance,” “outlook” or words of similar meaning. These forward-looking statements include, but are not limited to, expected timing of the closing of Priority Technology Holdings, Inc.'s ("Priority", "we", "our", or "us") merger with Finxera Holdings, Inc. ("Finxera") and our 2021 outlook and statements regarding our market and growth opportunities. Such forward-looking statements are based upon the current beliefs and expectations of our management and are inherently subject to significant business, economic and competitive risks, trends and uncertainties that could cause actual results to differ materially from those projected, expressed, or implied by such forward-looking statements. These forward-looking statements may include, but are not limited to, statements about the effects of the COVID-19 pandemic on our revenues and financial operating results. Our actual results could differ materially, and potentially adversely, from those discussed or implied herein. We caution that it is very difficult to predict the impact of known factors, and it is impossible for us to anticipate all factors that could affect our actual results. All forward-looking statements are expressly qualified in their entirety by these cautionary statements. You should evaluate all forward-looking statements made in this press release in the context of the risks and uncertainties disclosed in our SEC filings, including our most recent Annual Report on Form 10-K filed with the SEC on March 31, 2021. These filings are available online at www.sec.gov or www.PRTH.com. We caution you that the important factors referenced above may not contain all of the factors that are important to you. In addition, we cannot assure you that we will realize the results or developments we expect or anticipate or, even if substantially realized, that they will result in the consequences we anticipate or affect us or our operations in the way we expect. You are cautioned not to place undue reliance on forward-looking statements as a predictor of future performance. The forward-looking statements included in the press release and this presentation are made only as of the date hereof. We undertake no obligation to publicly update or revise any forward- looking statement as a result of new information, future events or otherwise, except as otherwise required by law. If we do update one or more forward-looking statements, no inference should be made that we will make additional updates with respect to those or other forward-looking statements. We qualify all of our forward-looking statements by these cautionary statements.

Revenue, Gross Profit and Adjusted EBITDA Second Quarter Highlights 2 • Revenue of $125.0 million increased 35.4% from $92.4 million in 2020 • Gross profit of $35.2 million increased 17.4% from $30.0 million in 2020 • Gross profit margin of 28.1% decreased 429 basis points from 32.4% in 2020 • Income from operations of $7.4 million increased 83.7% from $4.0 million in 2020 • Adjusted EBITDA of $21.0 million increased 26.1% from $16.7 million in 2020 • Net debt of $318.9 million decreased $60.2 million from $379.1 million at end of Q1 2021 • Net leverage ratio of 3.43x decreased from 5.85x at December 31, 2020 and 5.44x at March 31, 2021 (dollars in millions)
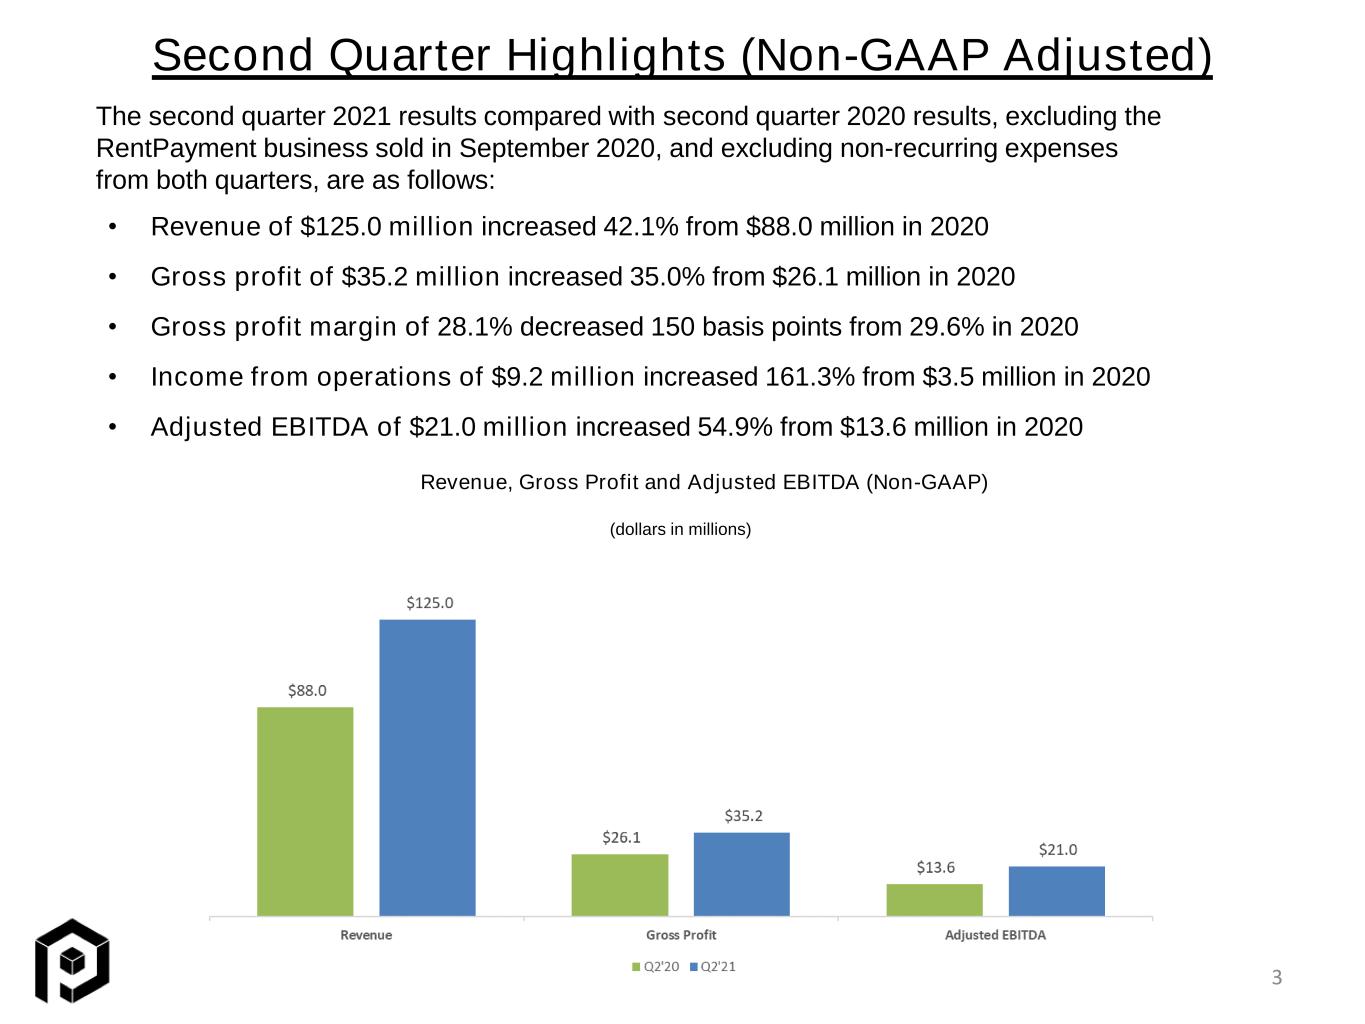
Second Quarter Highlights (Non-GAAP Adjusted) 3 • Revenue of $125.0 million increased 42.1% from $88.0 million in 2020 • Gross profit of $35.2 million increased 35.0% from $26.1 million in 2020 • Gross profit margin of 28.1% decreased 150 basis points from 29.6% in 2020 • Income from operations of $9.2 million increased 161.3% from $3.5 million in 2020 • Adjusted EBITDA of $21.0 million increased 54.9% from $13.6 million in 2020 Revenue, Gross Profit and Adjusted EBITDA (Non-GAAP) (dollars in millions) The second quarter 2021 results compared with second quarter 2020 results, excluding the RentPayment business sold in September 2020, and excluding non-recurring expenses from both quarters, are as follows:
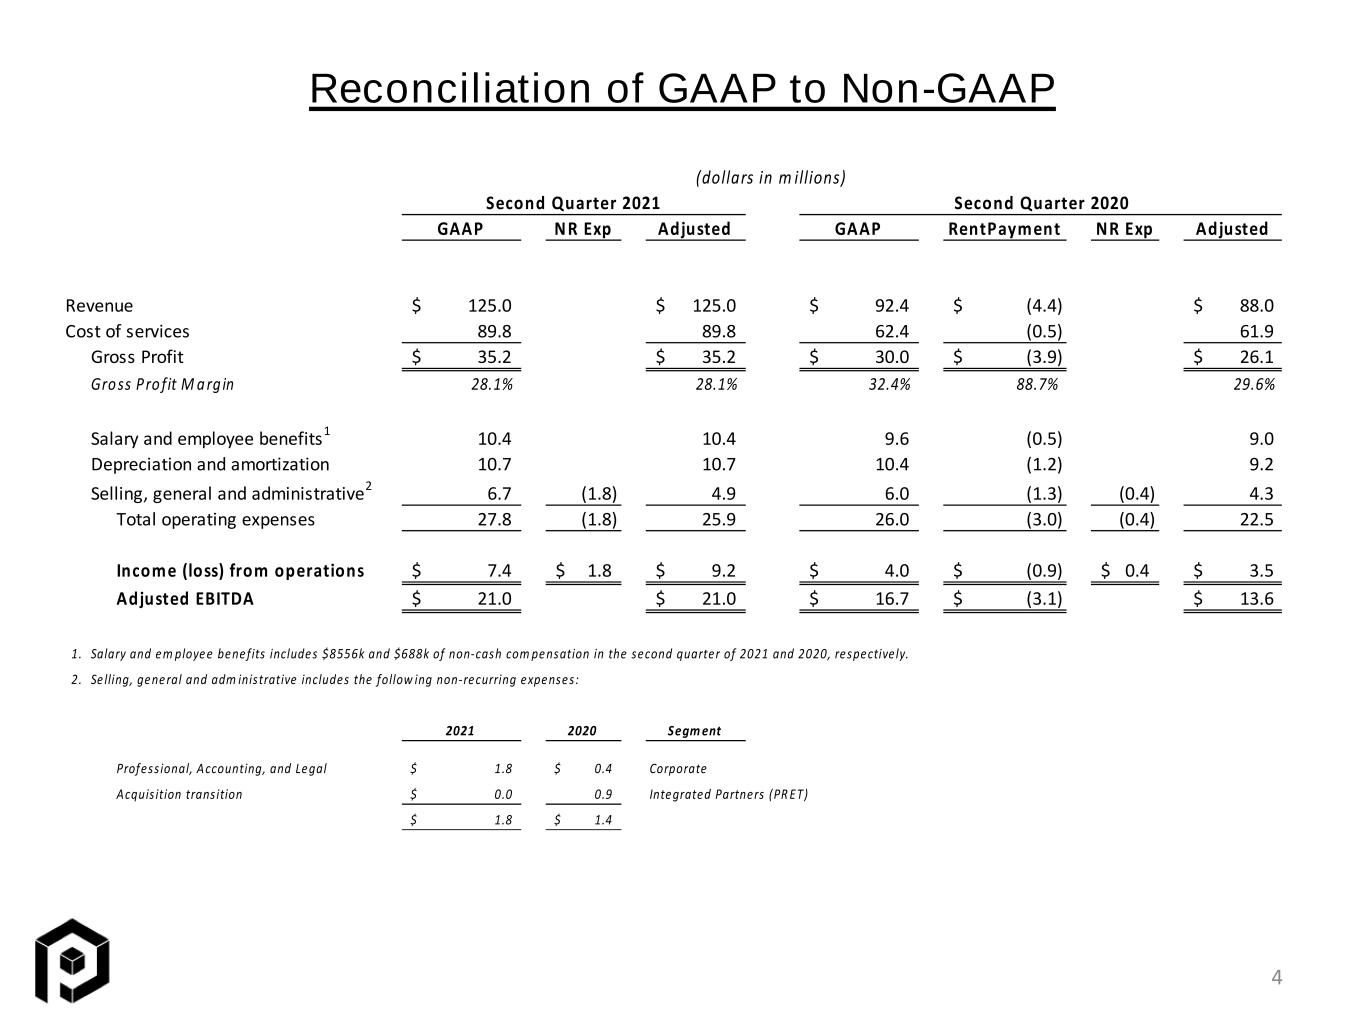
Reconciliation of GAAP to Non-GAAP 4 (dollars in m illions) Second Quarter 2021 Second Quarter 2020 GAAP N R Exp Adjusted GAAP RentPayment NR Exp Adjusted Revenue 125.0$ 125.0$ 92.4$ (4.4)$ 88.0$ Cost of services 89.8 89.8 62.4 (0.5) 61.9 Gross Profit 35.2$ 35.2$ 30.0$ (3.9)$ 26.1$ Gro ss P ro fit M a rg in 28.1% 28.1% 32.4% 88.7% 29.6% Salary and employee benefits1 10.4 10.4 9.6 (0.5) 9.0 Depreciation and amortization 10.7 10.7 10.4 (1.2) 9.2 Selling, general and administrative 2 6.7 (1.8) 4.9 6.0 (1.3) (0.4) 4.3 Total operating expenses 27.8 (1.8) 25.9 26.0 (3.0) (0.4) 22.5 Income (loss) from operations 7.4$ 1.8$ 9.2$ 4.0$ (0.9)$ 0.4$ 3.5$ Adjusted EBITDA 21.0$ 21.0$ 16.7$ (3.1)$ 13.6$ 1. Salary and em ploye e benefits include s $8556k and $688k of non-cash com pe nsation in the second quarter of 2021 and 2020, respective ly. 2. Se lling, general and adm inistrative includes the follow ing non-recurring expenses: 2021 2020 Segment Profess ional, Accounting, and Legal 1.8$ 0.4$ Corporate Acquis ition trans ition 0.0$ 0.9 Integrated Partners (PR ET) 1.8$ 1.4$
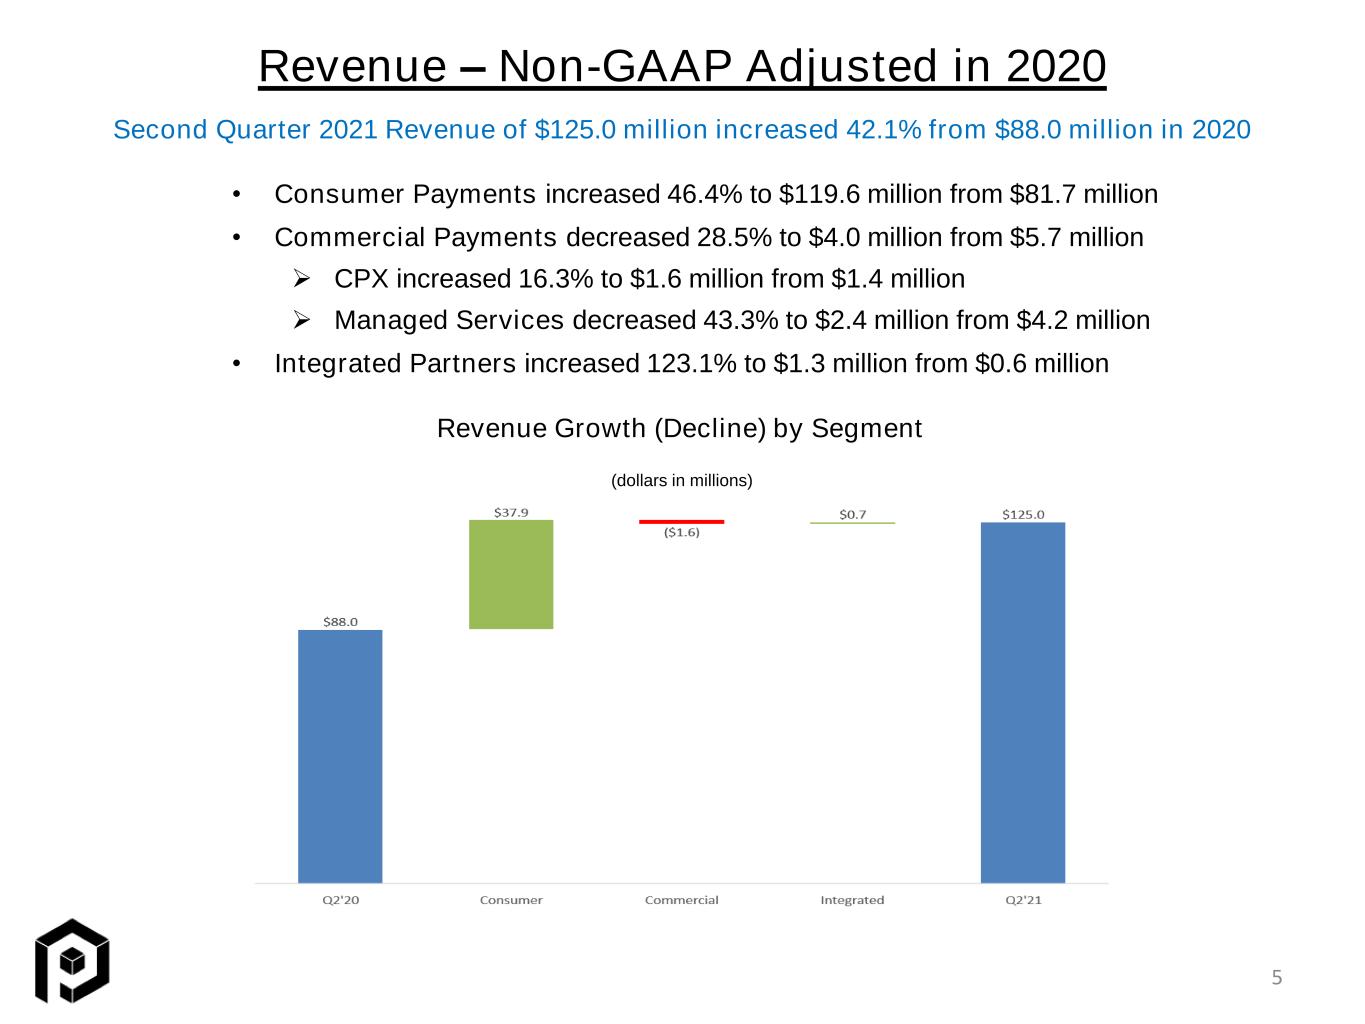
Revenue – Non-GAAP Adjusted in 2020 • Consumer Payments increased 46.4% to $119.6 million from $81.7 million • Commercial Payments decreased 28.5% to $4.0 million from $5.7 million ➢ CPX increased 16.3% to $1.6 million from $1.4 million ➢ Managed Services decreased 43.3% to $2.4 million from $4.2 million • Integrated Partners increased 123.1% to $1.3 million from $0.6 million Revenue Growth (Decline) by Segment Second Quarter 2021 Revenue of $125.0 million increased 42.1% from $88.0 million in 2020 (dollars in millions) 5
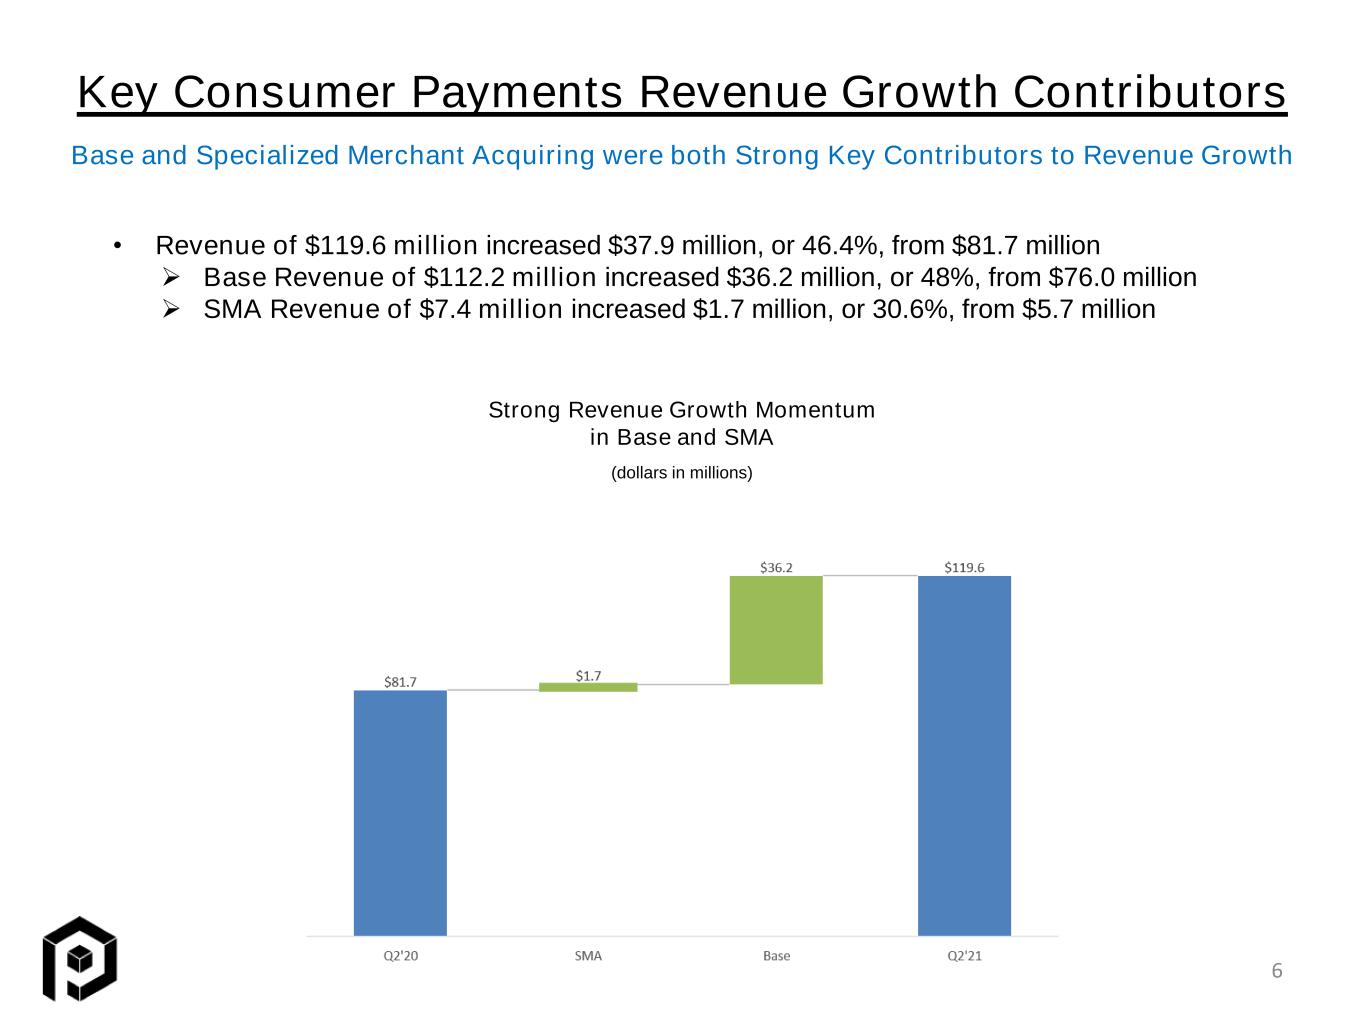
Key Consumer Payments Revenue Growth Contributors Base and Specialized Merchant Acquiring were both Strong Key Contributors to Revenue Growth Strong Revenue Growth Momentum in Base and SMA (dollars in millions) • Revenue of $119.6 million increased $37.9 million, or 46.4%, from $81.7 million ➢ Base Revenue of $112.2 million increased $36.2 million, or 48%, from $76.0 million ➢ SMA Revenue of $7.4 million increased $1.7 million, or 30.6%, from $5.7 million 6
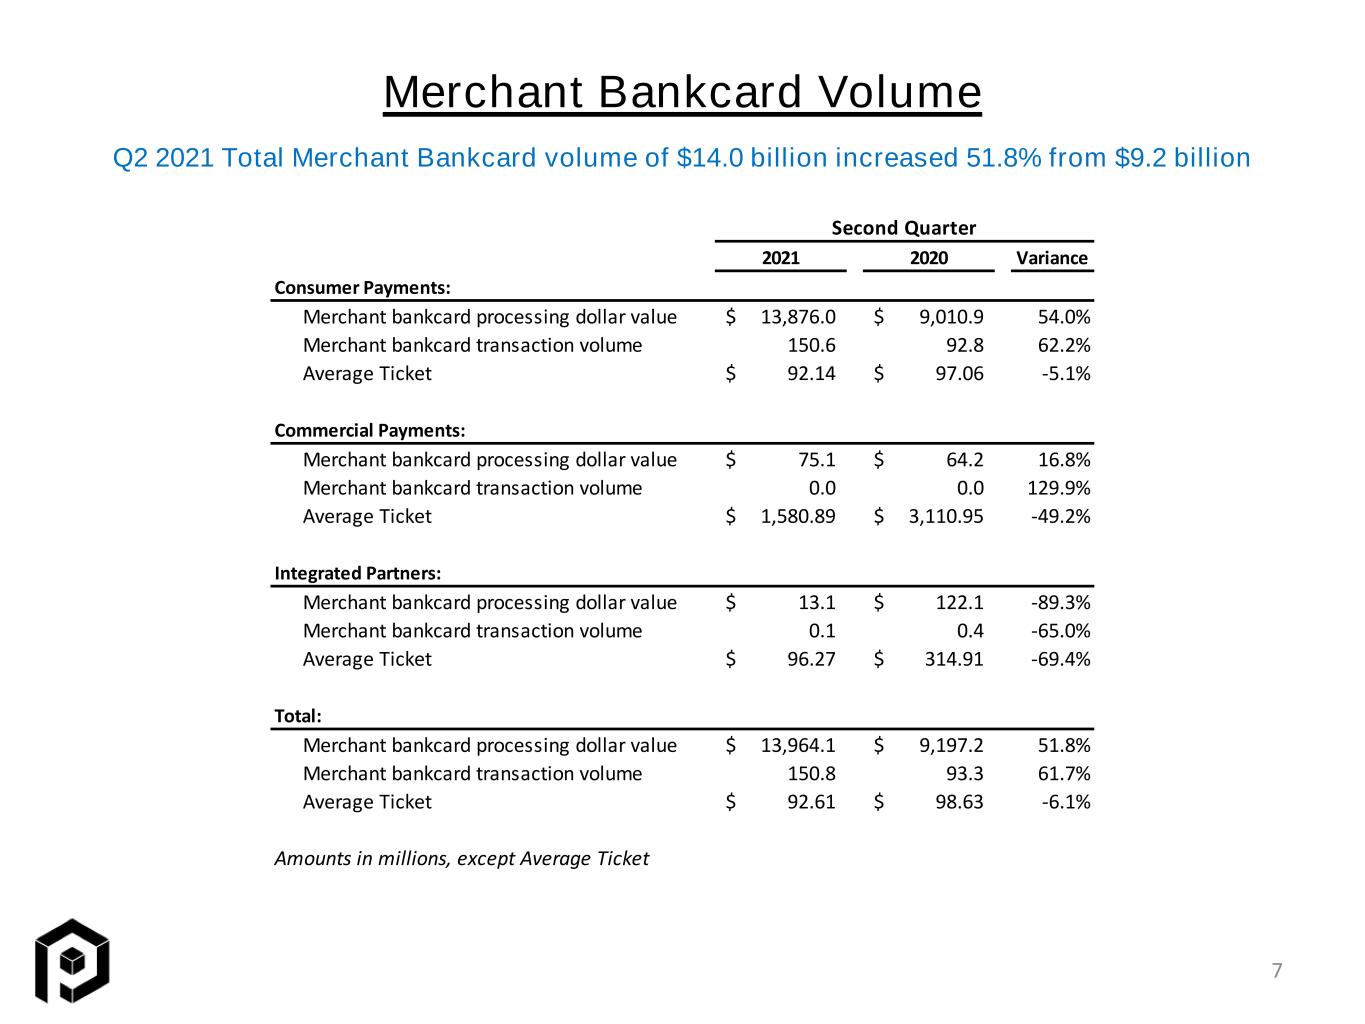
Merchant Bankcard Volume Q2 2021 Total Merchant Bankcard volume of $14.0 billion increased 51.8% from $9.2 billion 7 Second Quarter 2021 2020 Variance Consumer Payments: Merchant bankcard processing dollar value 13,876.0$ 9,010.9$ 54.0% Merchant bankcard transaction volume 150.6 92.8 62.2% Average Ticket 92.14$ 97.06$ -5.1% Commercial Payments: Merchant bankcard processing dollar value 75.1$ 64.2$ 16.8% Merchant bankcard transaction volume 0.0 0.0 129.9% Average Ticket 1,580.89$ 3,110.95$ -49.2% Integrated Partners: Merchant bankcard processing dollar value 13.1$ 122.1$ -89.3% Merchant bankcard transaction volume 0.1 0.4 -65.0% Average Ticket 96.27$ 314.91$ -69.4% Total: Merchant bankcard processing dollar value 13,964.1$ 9,197.2$ 51.8% Merchant bankcard transaction volume 150.8 93.3 61.7% Average Ticket 92.61$ 98.63$ -6.1% Amounts in millions, except Average Ticket
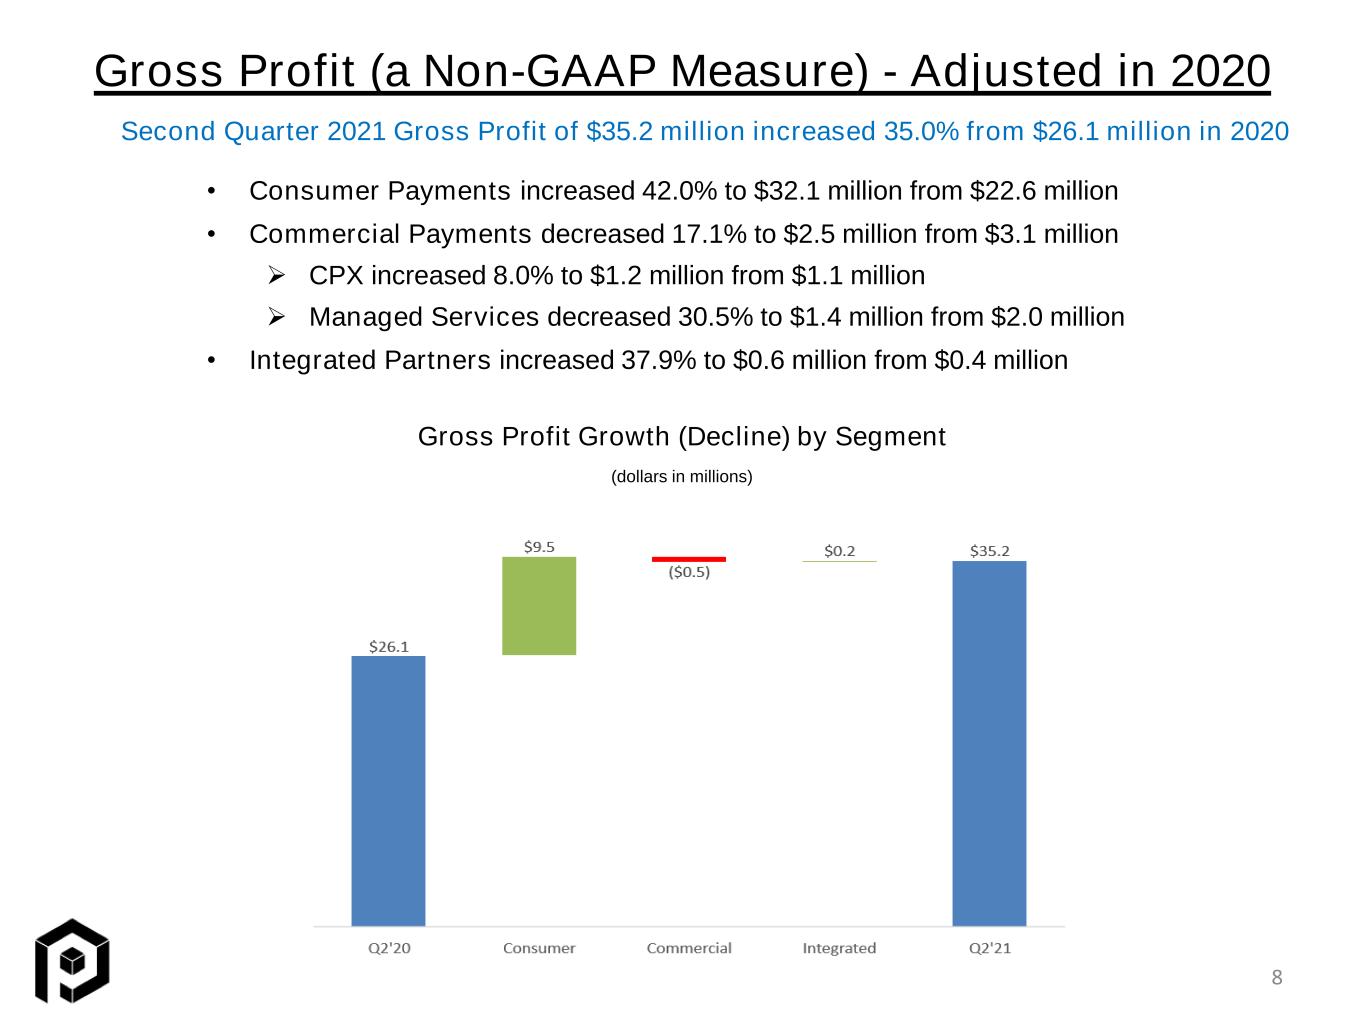
Gross Profit (a Non-GAAP Measure) - Adjusted in 2020 • Consumer Payments increased 42.0% to $32.1 million from $22.6 million • Commercial Payments decreased 17.1% to $2.5 million from $3.1 million ➢ CPX increased 8.0% to $1.2 million from $1.1 million ➢ Managed Services decreased 30.5% to $1.4 million from $2.0 million • Integrated Partners increased 37.9% to $0.6 million from $0.4 million Gross Profit Growth (Decline) by Segment Second Quarter 2021 Gross Profit of $35.2 million increased 35.0% from $26.1 million in 2020 (dollars in millions) 8
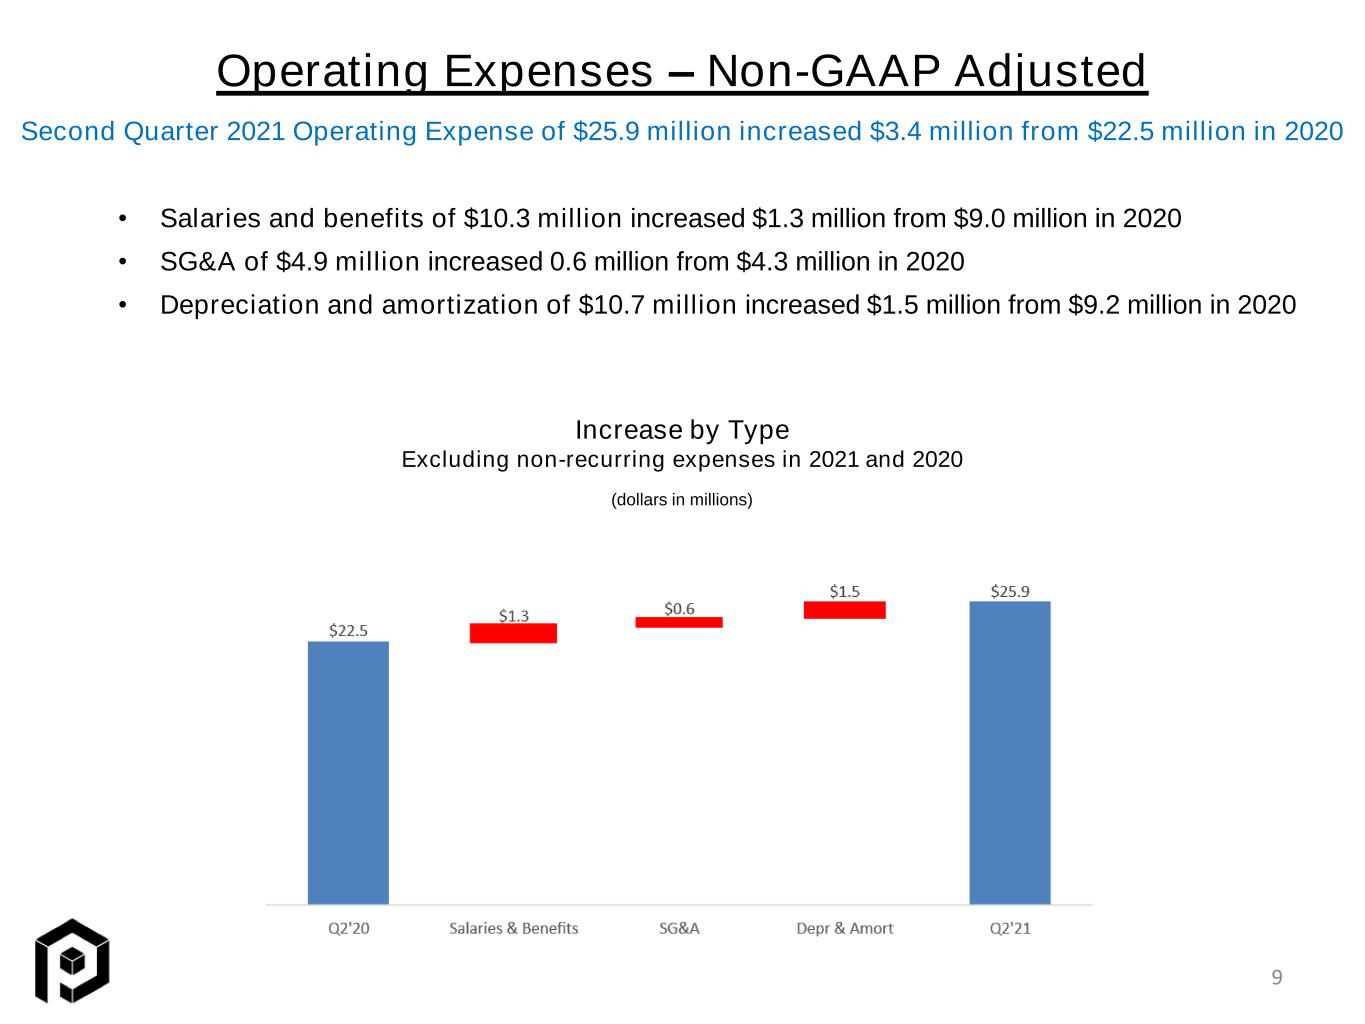
Operating Expenses – Non-GAAP Adjusted • Salaries and benefits of $10.3 million increased $1.3 million from $9.0 million in 2020 • SG&A of $4.9 million increased 0.6 million from $4.3 million in 2020 • Depreciation and amortization of $10.7 million increased $1.5 million from $9.2 million in 2020 Increase by Type Excluding non-recurring expenses in 2021 and 2020 Second Quarter 2021 Operating Expense of $25.9 million increased $3.4 million from $22.5 million in 2020 (dollars in millions) 9
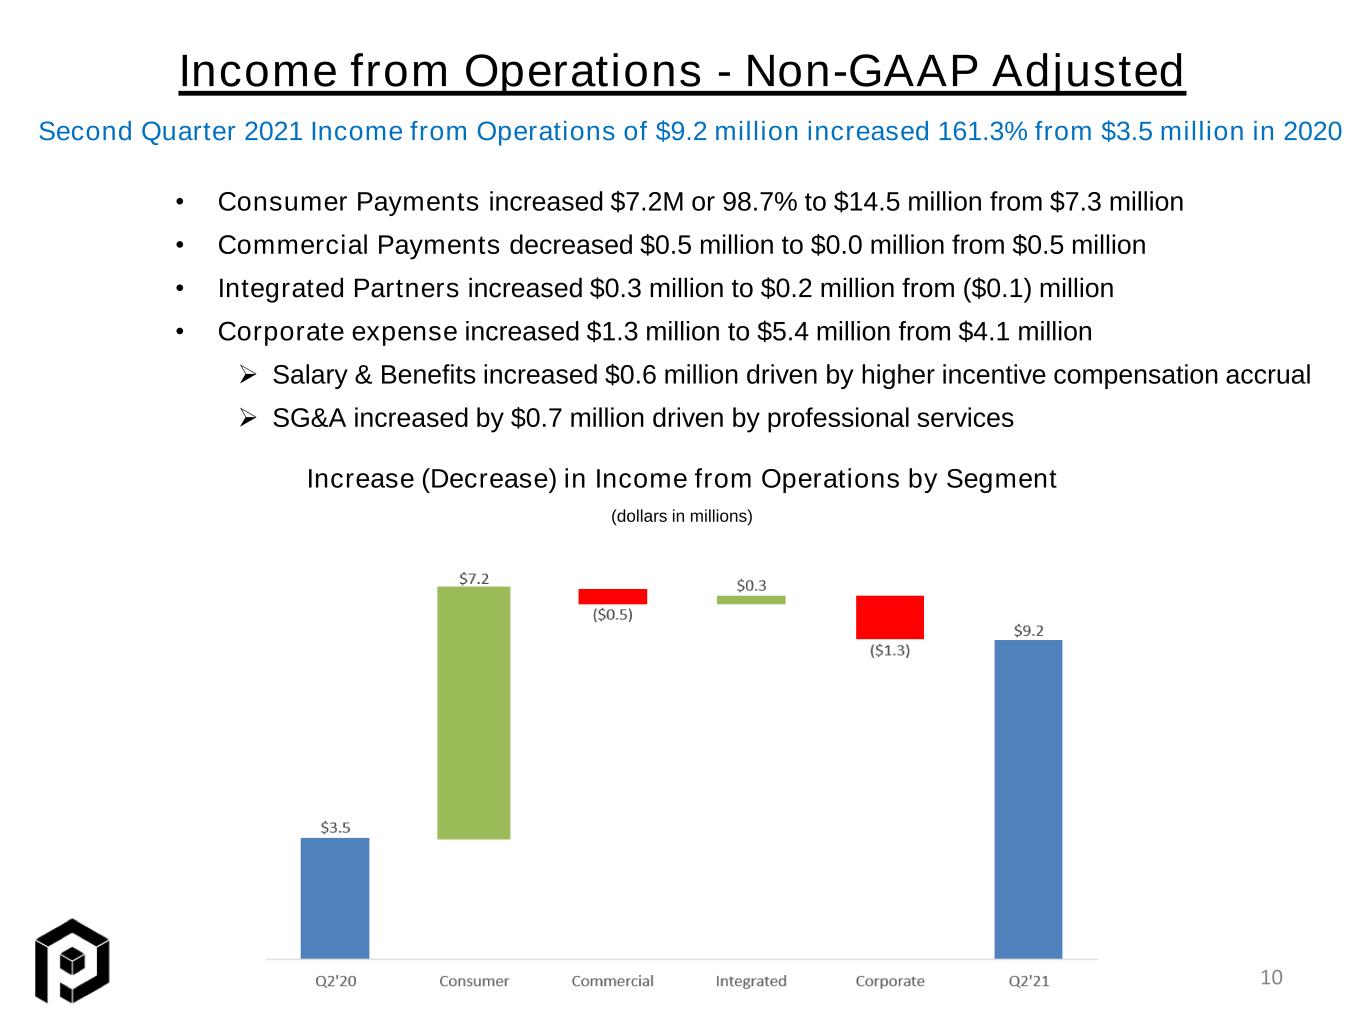
Income from Operations - Non-GAAP Adjusted • Consumer Payments increased $7.2M or 98.7% to $14.5 million from $7.3 million • Commercial Payments decreased $0.5 million to $0.0 million from $0.5 million • Integrated Partners increased $0.3 million to $0.2 million from ($0.1) million • Corporate expense increased $1.3 million to $5.4 million from $4.1 million ➢ Salary & Benefits increased $0.6 million driven by higher incentive compensation accrual ➢ SG&A increased by $0.7 million driven by professional services Second Quarter 2021 Income from Operations of $9.2 million increased 161.3% from $3.5 million in 2020 Increase (Decrease) in Income from Operations by Segment (dollars in millions) 10
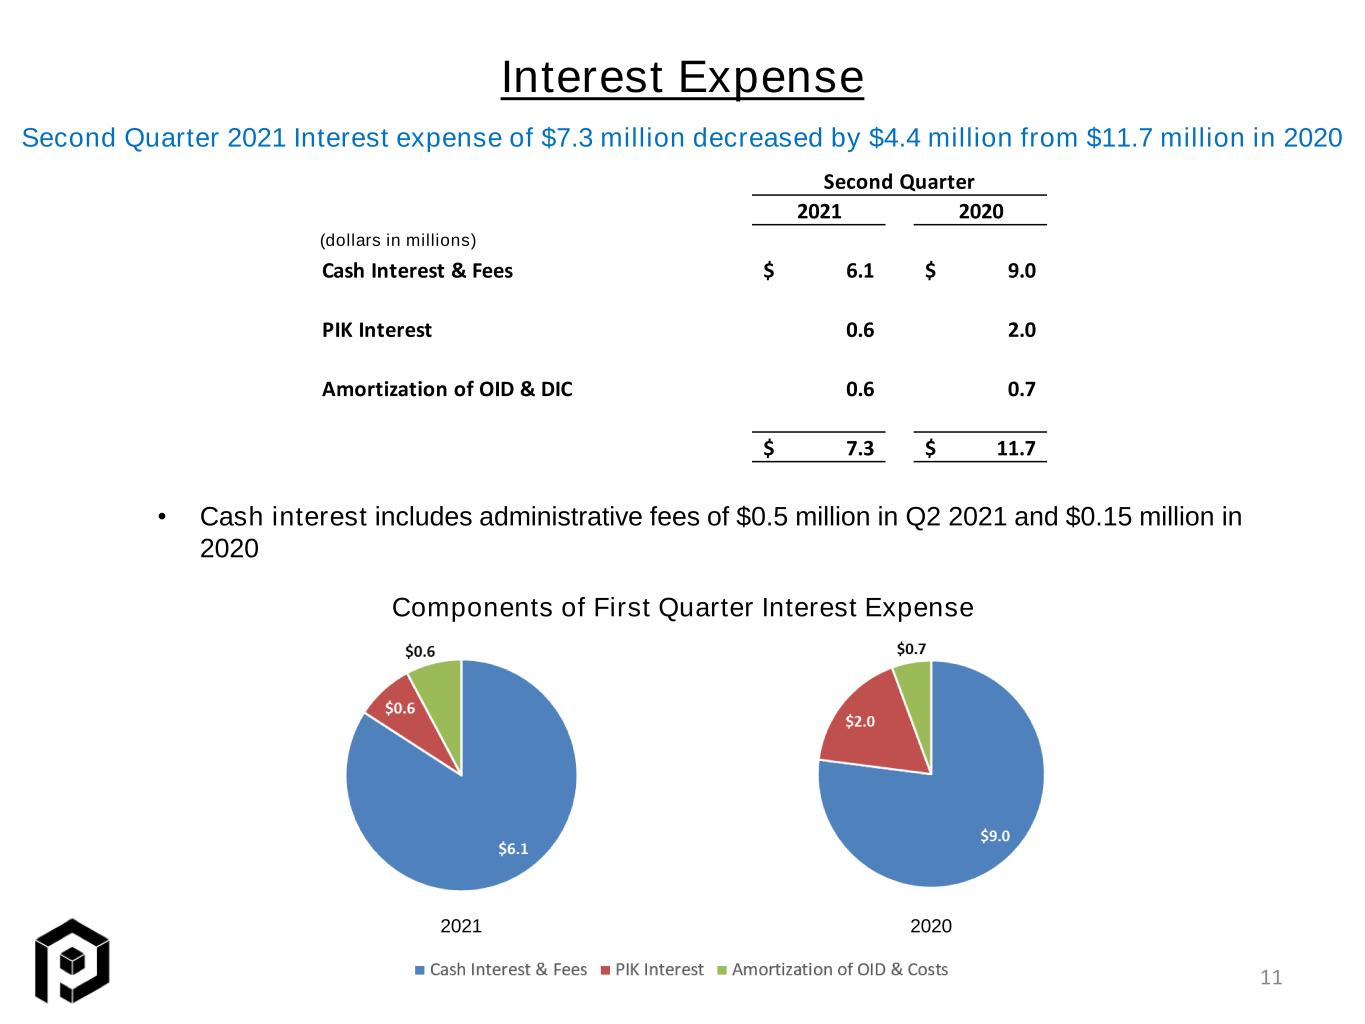
Second Quarter 2021 2020 Cash Interest & Fees 6.1$ 9.0$ PIK Interest 0.6 2.0 Amortization of OID & DIC 0.6 0.7 7.3$ 11.7$ • Cash interest includes administrative fees of $0.5 million in Q2 2021 and $0.15 million in 2020 Interest Expense Second Quarter 2021 Interest expense of $7.3 million decreased by $4.4 million from $11.7 million in 2020 2021 2020 (dollars in millions) Components of First Quarter Interest Expense 11
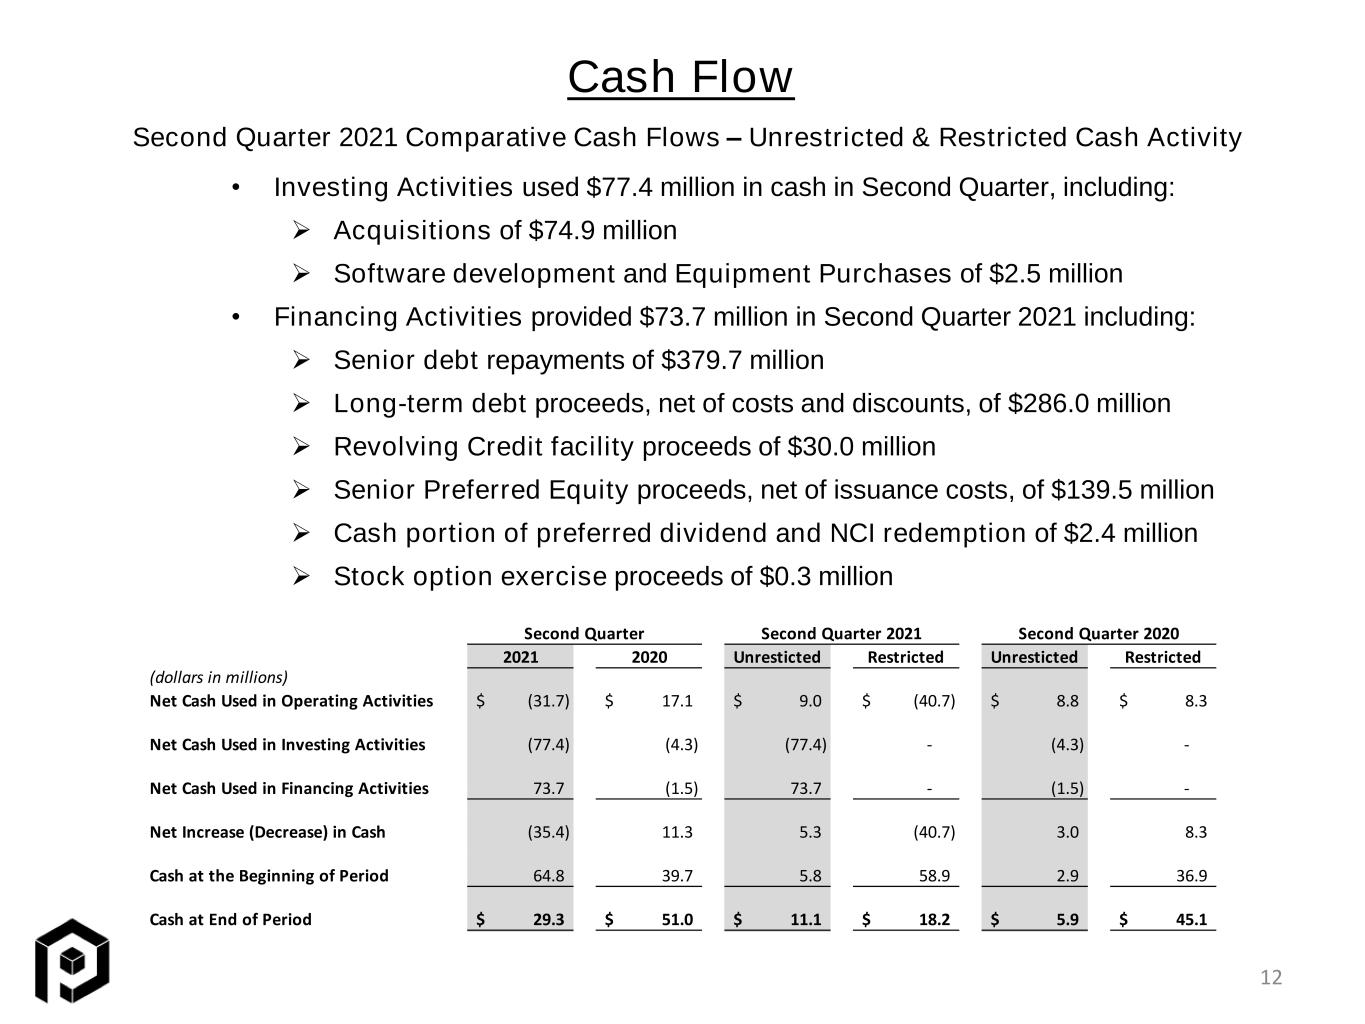
Cash Flow Second Quarter 2021 Comparative Cash Flows – Unrestricted & Restricted Cash Activity • Investing Activities used $77.4 million in cash in Second Quarter, including: ➢ Acquisitions of $74.9 million ➢ Software development and Equipment Purchases of $2.5 million • Financing Activities provided $73.7 million in Second Quarter 2021 including: ➢ Senior debt repayments of $379.7 million ➢ Long-term debt proceeds, net of costs and discounts, of $286.0 million ➢ Revolving Credit facility proceeds of $30.0 million ➢ Senior Preferred Equity proceeds, net of issuance costs, of $139.5 million ➢ Cash portion of preferred dividend and NCI redemption of $2.4 million ➢ Stock option exercise proceeds of $0.3 million 12 2021 2020 Unresticted Restricted Unresticted Restricted (dollars in millions) Net Cash Used in Operating Activities (31.7)$ 17.1$ 9.0$ (40.7)$ 8.8$ 8.3$ Net Cash Used in Investing Activities (77.4) (4.3) (77.4) - (4.3) - Net Cash Used in Financing Activities 73.7 (1.5) 73.7 - (1.5) - Net Increase (Decrease) in Cash (35.4) 11.3 5.3 (40.7) 3.0 8.3 Cash at the Beginning of Period 64.8 39.7 5.8 58.9 2.9 36.9 Cash at End of Period 29.3$ 51.0$ 11.1$ 18.2$ 5.9$ 45.1$ Second Quarter Second Quarter 2021 Second Quarter 2020
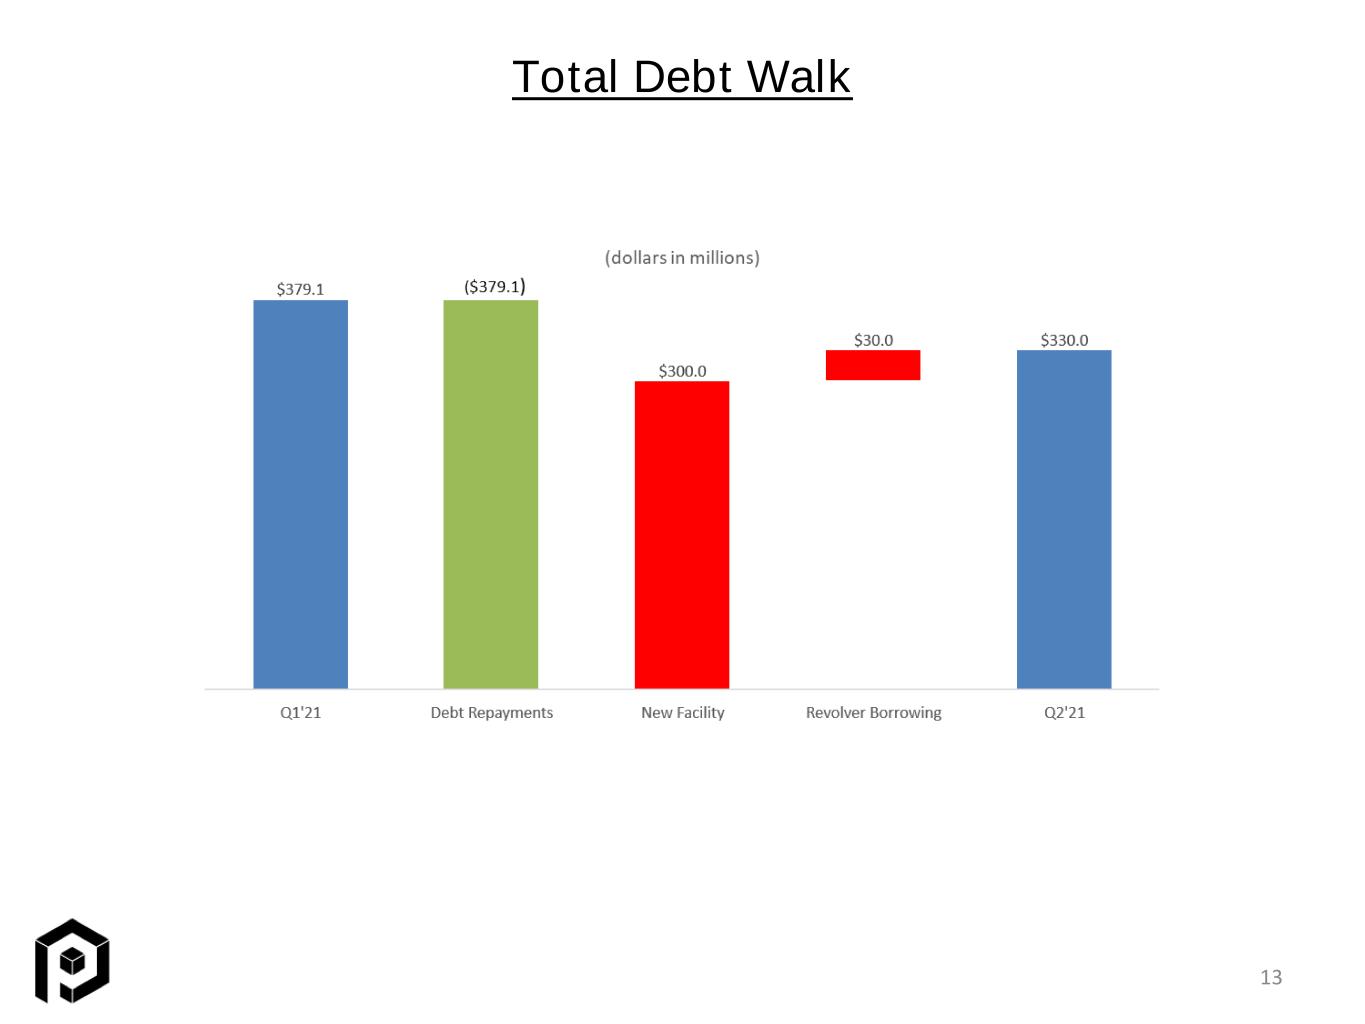
13 Total Debt Walk
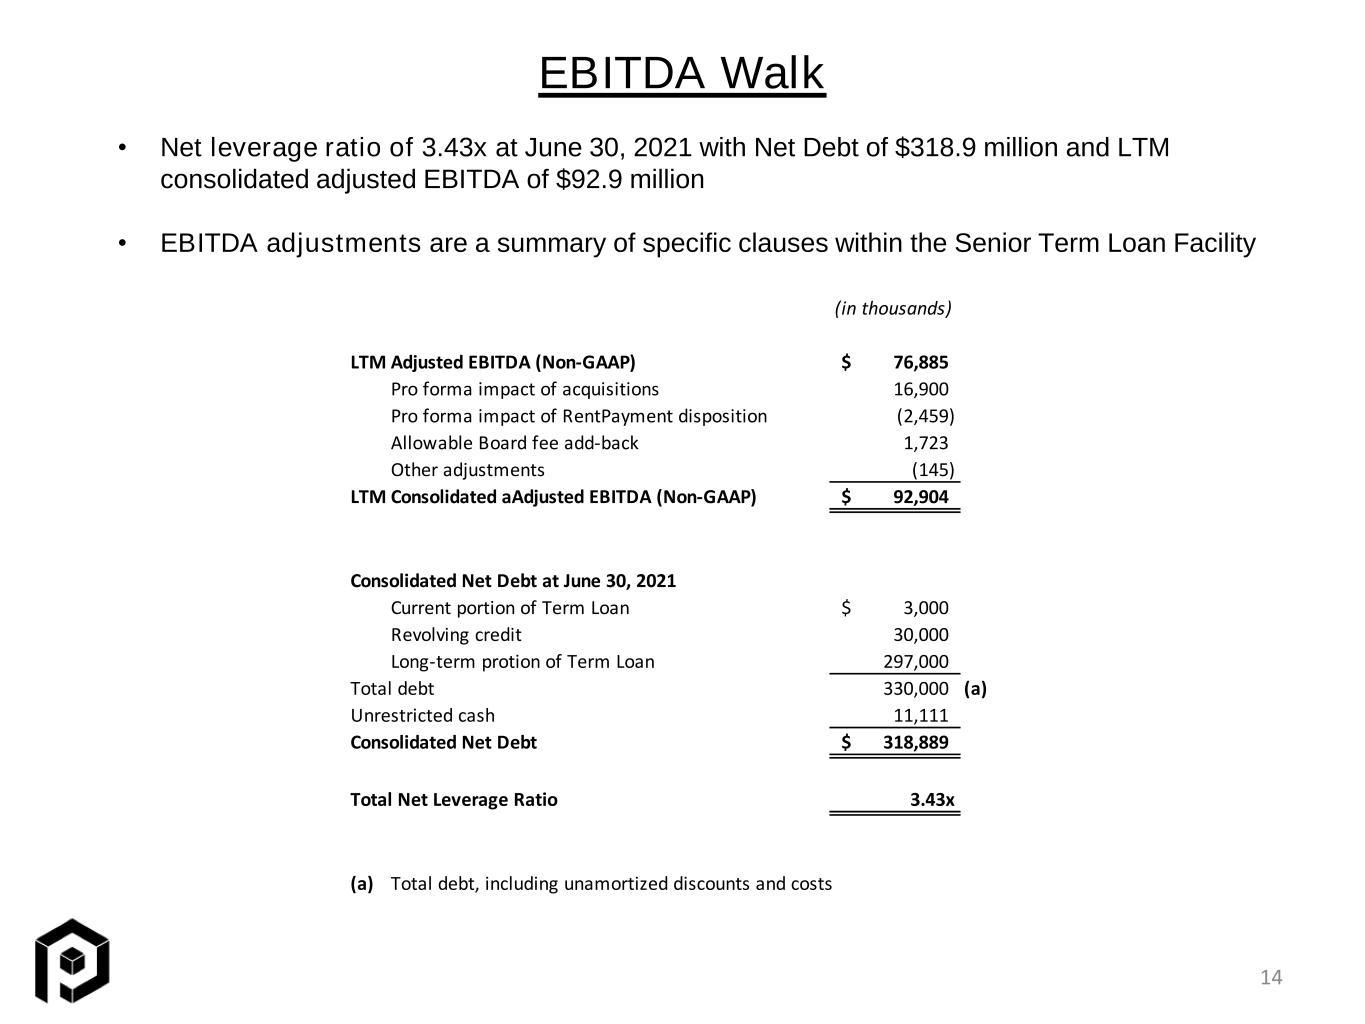
EBITDA Walk 14 • Net leverage ratio of 3.43x at June 30, 2021 with Net Debt of $318.9 million and LTM consolidated adjusted EBITDA of $92.9 million • EBITDA adjustments are a summary of specific clauses within the Senior Term Loan Facility (in thousands) LTM Adjusted EBITDA (Non-GAAP) 76,885$ Pro forma impact of acquisitions 16,900 Pro forma impact of RentPayment disposition (2,459) Allowable Board fee add-back 1,723 Other adjustments (145) LTM Consolidated aAdjusted EBITDA (Non-GAAP) 92,904$ Consolidated Net Debt at June 30, 2021 Current portion of Term Loan 3,000$ Revolving credit 30,000 Long-term protion of Term Loan 297,000 Total debt 330,000 (a) Unrestricted cash 11,111 Consolidated Net Debt 318,889$ Total Net Leverage Ratio 3.43x (a) Total debt, including unamortized discounts and costs
Senior Preferred Stock Dividend 15 The Senior Preferred Stock has a quarterly cumulative preferred dividend at LIBOR plus 12.0%, with a cash portion at the discretion of the Company at LIBOR (1.0% floor) plus 5.0% and payment-in-kind (“PIK”) portion at 7.0%. The dividend is subject to a 2.0% increase if the Company elects the cash portion to be added to PIK. There are scheduled dividend rate increases after the fifth anniversary of issuance. In June 2021, the Company’s Board of Directors declared and authorized the second quarter 2021 dividend with a 6.0% cash portion of $1.6 million and a 7.0% PIK portion of $1.8 million. The Company paid the dividend on June 30, 2021.
Preferred Unit Redemption 16 $10.8 million Distribution to Non-Controlling Interests in a Subsidiary In February 2019, a subsidiary of the Company, Priority Hospitality Technology (“PHOT”), received a contribution of substantially all of the operating assets of eTab, LLC (“eTab”) and CUMULUS POS, LLC (“Cumulus”) under asset contribution agreements. PHOT is a part of the Company’s Integrated Partners reportable segment. These contributed assets were composed substantially of technology-related assets. No cash consideration was paid to the contributors of the eTab or Cumulus assets on the date of the transactions. As consideration for these contributed assets, the contributors were issued redeemable non- controlling preferred equity interests (“NCIs”) in PHOT. Under these redeemable NCIs, the contributors were eligible to receive up to $4.5 million of profits earned by PHOT, plus a preferred yield (6.0% per annum) on any undistributed preferred equity interest (“Total Preferred Equity Interest”). In November 2020, the Company agreed with the contributors to an exchange of shares of common stock of the Company and/or cash for the remaining undistributed Total Preferred Equity Interest. This established an agreed valuation as of November 12, 2020 for the Company’s common stock to be exchanged at the prior 20-day volume weighted average price of $2.78. The agreement was contingent upon lender approval. The binding agreements for the exchange, therefore, were not entered into until the lender approval was received. Subsequent to receipt of lender approval in April 2021, the Company completed the exchange of 1,428,358 shares of common stock and $814,219 of cash for the Total Preferred Equity Interests. Between the time of the November 2020 agreement and the date of exchange, the Company’s common stock price appreciated to $7.75 per share; therefore, the Company’s financial statements for the three- months ended June 30, 2021 reflect this exchange as a distribution to non-controlling interests at the common stock value of $7.75 reduced by a 10% liquidity discount of $0.775 due to Rule 144 trading restrictions. The total distribution amounted to $10.8 million, comprised of $10.0 million of common stock and $0.8 million of cash.


