
Priority (Nasdaq: PRTH) S u p p l e m e n t a l S l i d e s : F i r s t Q u a r t e r 2 0 2 2 E a r n i n g s C a l l May 11, 2022 P R IO R IT Y T E C H N O L O G Y H O L D IN G S
P R IO R IT Y T E C H N O L O G Y H O L D IN G S DISCLAIMER Important Notice Regarding Forward-Looking Statements and Non-GAAP Measures This presentation contains “forward-looking statements” within the meaning of the Private Securities Litigation Reform Act of 1995. Such statements include, but are not limited to, statements about future financial and operating results, our plans, objectives, expectations and intentions with respect to future operations, products and services, and other statements identified by words such as “may,” “will,” “should,” “anticipates,” “believes,” “expects,” “plans,” “future,” “intends,” “could,” “estimate,” “predict,” “projects,” “targeting,” “potential” or “contingent,” “guidance,” “anticipates,” “outlook” or words of similar meaning. These forward-looking statements include, but are not limited to, the expected returns and other benefits of the merger of Priority Technology Holdings, Inc.’s (“Priority”, “we”, “our” or “us”) with Finxera Holdings, Inc. (“Finxera”) to shareholders, expected improvement in operating efficiency resulting from the merger, estimated expense reductions resulting from the transactions and the timing of achievement of such reductions, and our 2022 outlook and statements regarding our market and growth opportunities,. Such forward-looking statements are based upon the current beliefs and expectations of our management and are inherently subject to significant business, economic and competitive risks, trends and uncertainties that could cause actual results to differ materially from those projected, expressed, or implied by such forward-looking statements. These forward-looking statements may include, but are not limited to, statements about the effects of the COVID-19 pandemic on our revenues and financial operating results. Our actual results could differ materially, and potentially adversely, from those discussed or implied herein. We caution that it is very difficult to predict the impact of known factors, and it is impossible for us to anticipate all factors that could affect our actual results. All forward-looking statements are expressly qualified in their entirety by these cautionary statements. You should evaluate all forward-looking statements made in this presentation in the context of the risks and uncertainties disclosed in our Securities and Exchange Commission (“SEC”) filings, including our Annual Report on Form 10-K filed with the SEC on March 17, 2022. This filing is available online at www.sec.gov or www.PRTH.com. We caution you that the important factors referenced above may not contain all of the factors that are important to you. In addition, we cannot assure you that we will realize the results or developments we expect or anticipate or, even if substantially realized, that they will result in the consequences we anticipate or affect us or our operations in the way we expect. You are cautioned not to place undue reliance on forward-looking statements as a predictor of future performance. The forward-looking statements included in this presentation are made only as of the date hereof. We undertake no obligation to publicly update or revise any forward-looking statement as a result of new information, future events or otherwise, except as otherwise required by law. If we do update one or more forward-looking statements, no inference should be made that we will make additional updates with respect to those or other forward-looking statements. We qualify all of our forward-looking statements by these cautionary statements. Statements included in this presentation include non-GAAP financial measures, including: (i) Revenue Growth, (ii) EBITDA Growth Acceleration, (iii) Run-Rate PF Net Revenue, (iv) Run-Rate Organic PF Net Revenue Growth, (v) Integrated Revenue, (vi) Run-Rate PF Adj. EBITDA, (vii) PF Adj. EBITDA Growth, (viii) PF Adj. EBITDA Margins, (ix) PF Annual Free Cash Flow. Priority does not provide a reconciliation for projected non-GAAP financial measures to their comparable GAAP financial measures because it could not do so without unreasonable effort due to the unavailability of the information needed to calculate reconciling items. Priority does not believe that a GAAP reconciliation would provide meaningful supplemental information about the Priority’s outlook. Management believes that non-GAAP financial measures provide a greater understanding of ongoing performance and operations, and enhance comparability with prior periods. Non-GAAP financial measures should not be considered as an alternative to any measure of performance or financial condition as determined in accordance with GAAP, and investors should consider Priority’s performance and financial condition as reported under GAAP and all other relevant information when assessing its performance or financial condition. Non-GAAP financial measures have limitations as analytical tools, and investors should not consider them in isolation or as a substitute for analysis of the results or financial condition as reported under GAAP. Non-GAAP financial measures may not be comparable to non-GAAP financial measures presented by other companies. 2

P R IO R IT Y T E C H N O L O G Y H O L D IN G S 3 First Quarter 2022 Highlights • Revenue of $153.2 million increased 35.2% from $113.3 million in Q1 2021 • Gross profit of $51.8 million increased 65.0% from $31.4 million in Q1 2021 • Gross profit margin of 33.8% increased 610 basis points from 27.7% in Q1 2021 • Operating income of $10.8 million increased 140.0% from $4.5 million in Q1 2021 • Adjusted EBITDA of $30.3 million increased 68.3% from $18.0 million in Q1 2021 Revenue, Gross Profit and Adjusted EBITDA (dollars in millions)
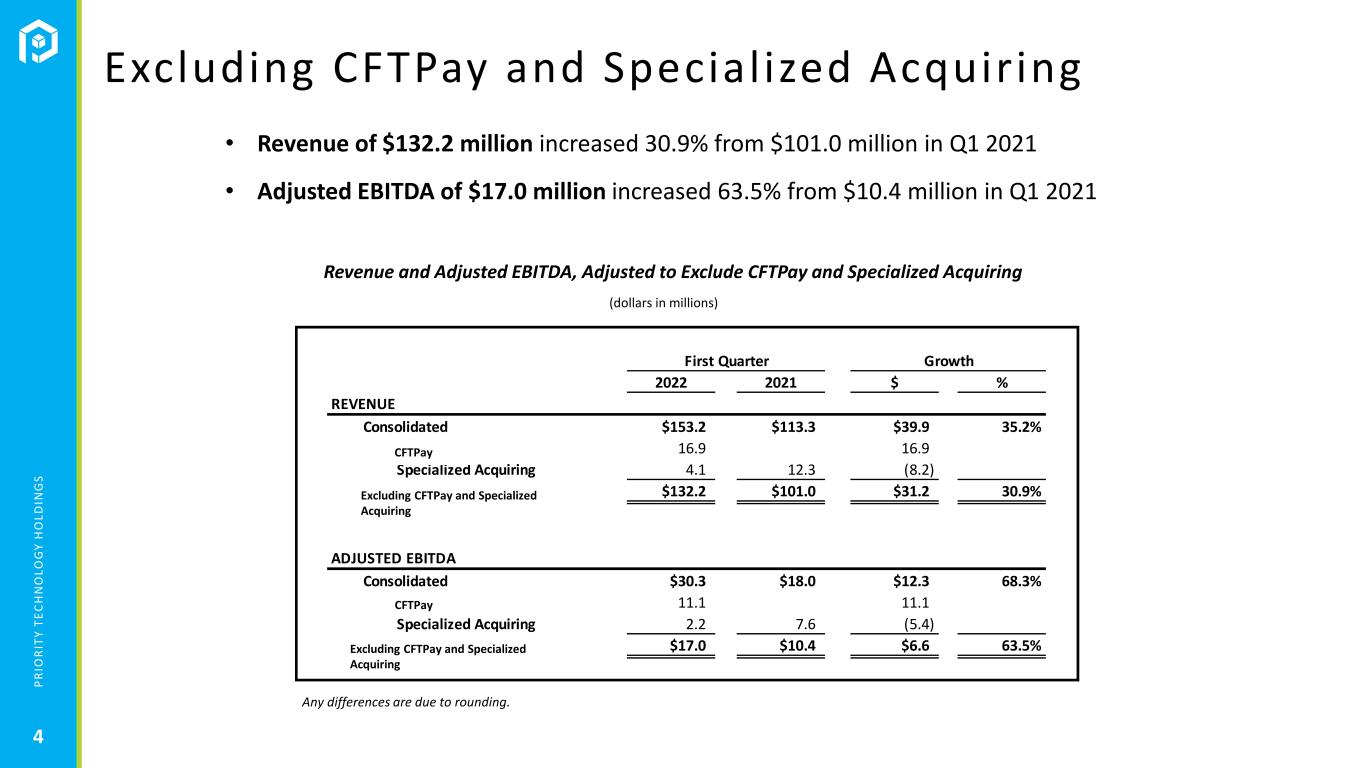
P R IO R IT Y T E C H N O L O G Y H O L D IN G S 4 Excluding CFTPay and Specialized Acquiring • Revenue of $132.2 million increased 30.9% from $101.0 million in Q1 2021 • Adjusted EBITDA of $17.0 million increased 63.5% from $10.4 million in Q1 2021 Revenue and Adjusted EBITDA, Adjusted to Exclude CFTPay and Specialized Acquiring (dollars in millions) First Quarter Growth 2022 2021 $ % REVENUE Consolidated $153.2 $113.3 $39.9 35.2% CFT Pay 16.9 16.9 Specialized Acquiring 4.1 12.3 (8.2) Excluding CFT Pay and Specialized $132.2 $101.0 $31.2 30.9% ADJUSTED EBITDA Consolidated $30.3 $18.0 $12.3 68.3% CFT Pay 11.1 11.1 Specialized Acquiring 2.2 7.6 (5.4) Excluding CFT Pay and Specialized $17.0 $10.4 $6.6 63.5% Any differences are due to rounding. CFTPay FTPay Excluding CFTPay and Specialized Acquiring Excluding CFTPay and Specialized Acquiring
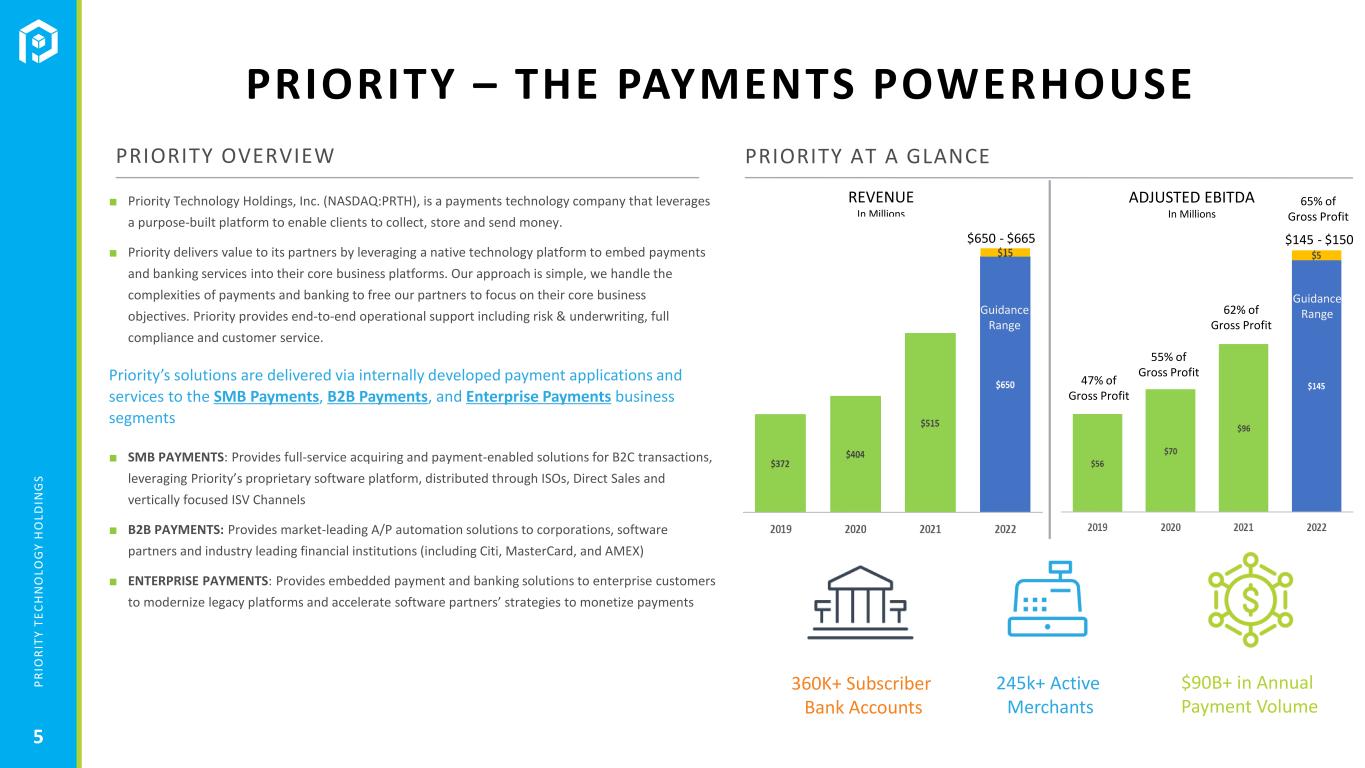
P R IO R IT Y T E C H N O L O G Y H O L D IN G S 245k+ Active Merchants $90B+ in Annual Payment Volume ■ Priority Technology Holdings, Inc. (NASDAQ:PRTH), is a payments technology company that leverages a purpose-built platform to enable clients to collect, store and send money. ■ Priority delivers value to its partners by leveraging a native technology platform to embed payments and banking services into their core business platforms. Our approach is simple, we handle the complexities of payments and banking to free our partners to focus on their core business objectives. Priority provides end-to-end operational support including risk & underwriting, full compliance and customer service. Priority’s solutions are delivered via internally developed payment applications and services to the SMB Payments, B2B Payments, and Enterprise Payments business segments ■ SMB PAYMENTS: Provides full-service acquiring and payment-enabled solutions for B2C transactions, leveraging Priority’s proprietary software platform, distributed through ISOs, Direct Sales and vertically focused ISV Channels ■ B2B PAYMENTS: Provides market-leading A/P automation solutions to corporations, software partners and industry leading financial institutions (including Citi, MasterCard, and AMEX) ■ ENTERPRISE PAYMENTS: Provides embedded payment and banking solutions to enterprise customers to modernize legacy platforms and accelerate software partners’ strategies to monetize payments PRIORITY OVERVIEW 5 PRIORITY AT A GLANCE 360K+ Subscriber Bank Accounts PRIORITY – THE PAYMENTS POWERHOUSE REVENUE In Millions ADJUSTED EBITDA In Millions 55% of Gross Profit 47% of Gross Profit 62% of Gross Profit 65% of Gross Profit Guidance Range Guidance Range $650 - $665 $145 - $150

P R IO R IT Y T E C H N O L O G Y H O L D IN G S MISSION: Build innovative payment solutions that collect, store & send money to power modern commerce PRIORITY SMB PAYMENTS B2B PAYMENTS ENTERPRISE PAYMENTS PASSPORT – API / UI + UX “ YOUR TICKET TO MODERN COMMERCE” A N ATIVE PLATFORM OF SHARED SERVICES DEPLOYED AS S IMPLE SET OF API ’S TO COLLEC T, STOR E & SEN D MON EY MX Merchant e|tab PayRight MX Connect LandlordStation Cumulus CPX FI’s (ACH.com) Managed Services CFTPay CFTConnect Passport Enterprise PASSPORT PLATFORM ARCHITECTURE (SHARED MACRO/MICRO SERVICES) C O M M E R C E B A N K I N G D ATA S C I E N C E Card Processing • Compliance Card Issuing • Pay Fac Virtual Accounts • Ledger • ACH/ACH+ • Compliance Check Processing /Recon • Bill Payments Data Warehouse • Business Intelligence Data Science • Visualization Direct | ISV | Reseller Direct | ISV | Reseller Direct | ISV 6
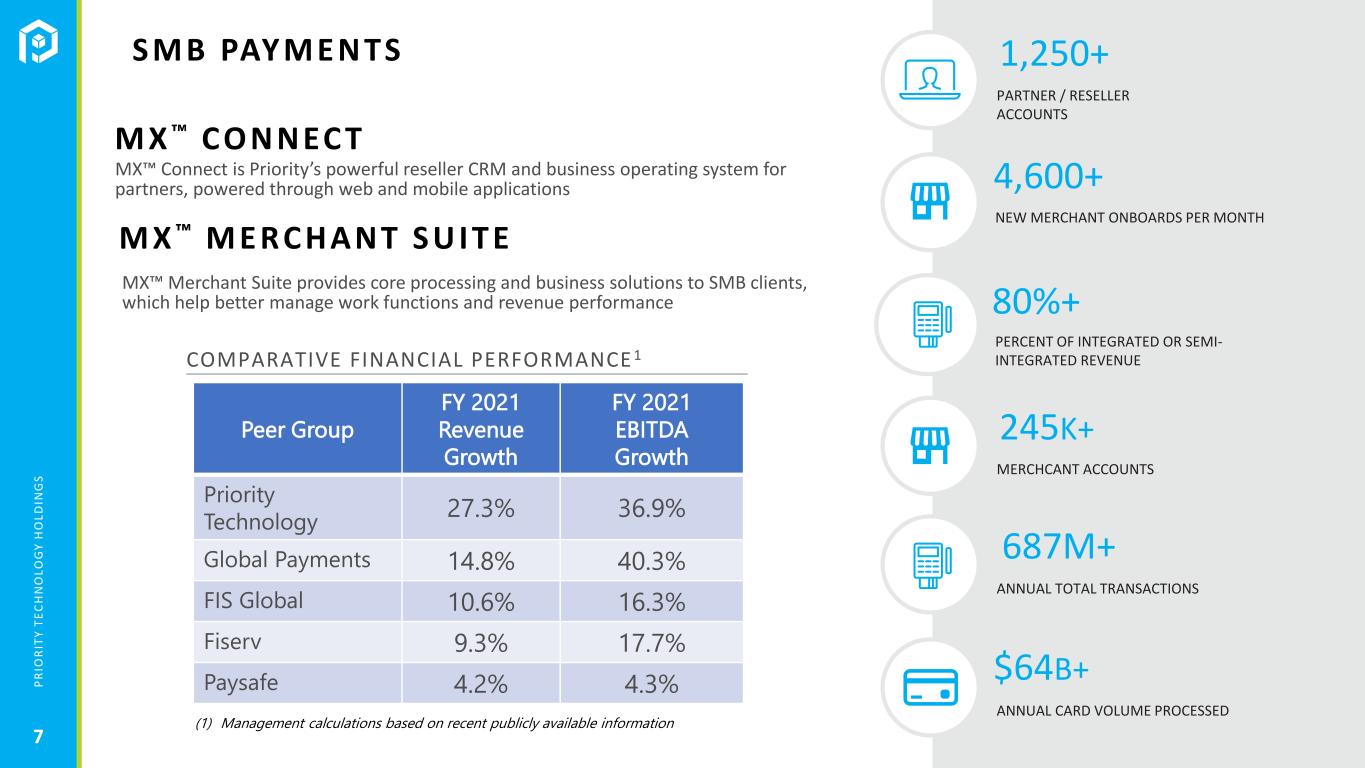
P R IO R IT Y T E C H N O L O G Y H O L D IN G S M X ™ CON NEC T PARTNER / RESELLER ACCOUNTS NEW MERCHANT ONBOARDS PER MONTH MX™ Connect is Priority’s powerful reseller CRM and business operating system for partners, powered through web and mobile applications 1,250+ 4,600+ 7 80%+ PERCENT OF INTEGRATED OR SEMI- INTEGRATED REVENUE MERCHCANT ACCOUNTS ANNUAL TOTAL TRANSACTIONS ANNUAL CARD VOLUME PROCESSED 245K+ 687M+ $64B+ M X ™ M E RC HANT S U IT E MX™ Merchant Suite provides core processing and business solutions to SMB clients, which help better manage work functions and revenue performance S M B PAYM E N TS Peer Group FY 2021 Revenue Growth FY 2021 EBITDA Growth Priority Technology 27.3% 36.9% Global Payments 14.8% 40.3% FIS Global 10.6% 16.3% Fiserv 9.3% 17.7% Paysafe 4.2% 4.3% COMPARATIVE FINANCIAL PERFORMANCE 1 (1) Management calculations based on recent publicly available information

P R IO R IT Y T E C H N O L O G Y H O L D IN G S SUPPLIERS ENROLLED ISSUING VOLUME (ANNUAL) ENROLLED FINANCIAL INSTITUTIONS SUPPORTED CPX provides market-leading A/P automation solutions to corporations, software partners and industry leading financial institutions 75K $26B 46 Overview CPX offers a robust suite of payments solutions which helps to ease reconciliation, reporting and payments for buyers and suppliers • Named as CFO Tech Outlook Top 10 Accounts Payable Solution • Minimal to no upfront investment required • Purpose-built to automate and integrate every payment method including cards, check and ACH • Generate interchange from issuing virtual and physical credit cards; and managed service fees • Integration into any ERP system • Direct Fed terminal • Supplier wallet 8 B2B PAYM E NTS

P R IO R IT Y T E C H N O L O G Y H O L D IN G S PASSPORT APIs E N TE RPRIS E PAYM E N TS P R I O R I T Y VA LU E P R O P O S I T I O N Priority is a payments powerhouse driving the convergence of payments and banking with a single platform to collect, store & send money INNOVATIVE PAYMENT SOLUTIONS DONE WITH EASE… Simple APIs to Solve Complex Workflows (Collect, Store & Send) Simple Rest APIs that are powerful to design any complex funds movement workflow supported by nationwide MTLs Single Virtual Ledger for Having One View of Customer Eases reconciliation to allow ‘closing your books daily or even more frequent’ Automated reconciliation so you build your workflow with confidence Built for Future … Modular architecture allows for adding new payment rails quickly. Co-innovate with external ecosystems. Time Tested & Improving Continuously PRTH existing products utilize Passport and are thriving and stays at par with changing regulatory requirements Talented & Matured Fintech Operations Resource Pool to Support Your Journey SUB ACCOUNTS Customer Integrate with Existing Financial Solutions or with In-House Products CARD MANAGEMENT & PAYMENTS CORE BANKING LENDING MORE… CHECKING FUTURE INVEST LOANSAVE 1. Create ‘Customer’ in Passport 2. Open sub-accounts 3. Execute your workflow for funds movement Customer PASSPORT PLATFORM SOLUTIONS • Passport provides a simple and integrated banking and payments infrastructure for the merchants’ ecosystem. It features banking service APIs and a complete, end-to-end solution to collect, store and send money at scale with full regulatory compliance. • It provides an agile and a secure platform to onboard individual and business customers and supports them in conducting and managing financial transactions, using various major payment instruments such as ACH, Checks and Wires. • The platform caters to the needs of individuals or businesses that look for a robust system supporting: • Efficient and automated disbursement of funds • Fee collection and split payment capabilities • Virtual account setup and KYC • Smooth ledgering and reconciliation • Operations infrastructure for compliance, payments & customer support • And much more 9
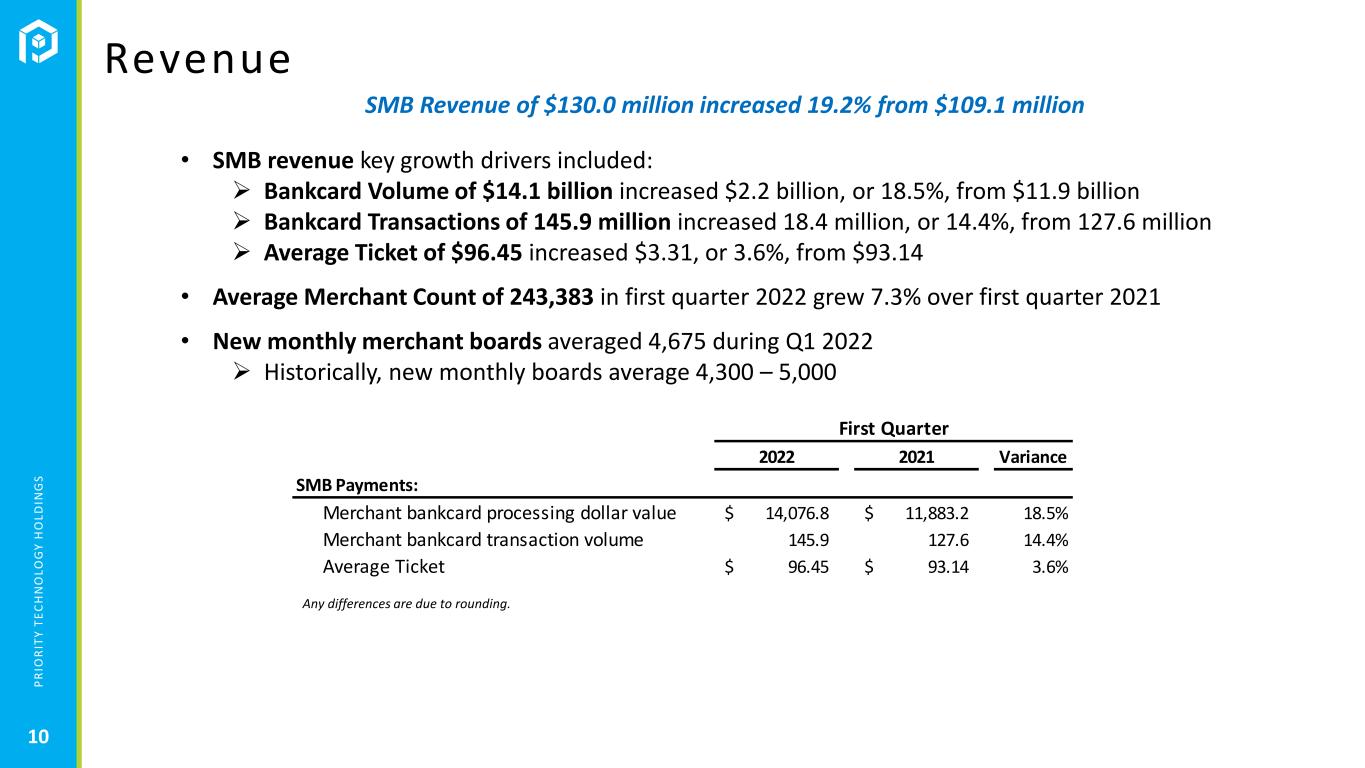
P R IO R IT Y T E C H N O L O G Y H O L D IN G S 10 Revenue • SMB revenue key growth drivers included: ➢ Bankcard Volume of $14.1 billion increased $2.2 billion, or 18.5%, from $11.9 billion ➢ Bankcard Transactions of 145.9 million increased 18.4 million, or 14.4%, from 127.6 million ➢ Average Ticket of $96.45 increased $3.31, or 3.6%, from $93.14 • Average Merchant Count of 243,383 in first quarter 2022 grew 7.3% over first quarter 2021 • New monthly merchant boards averaged 4,675 during Q1 2022 ➢ Historically, new monthly boards average 4,300 – 5,000 SMB Revenue of $130.0 million increased 19.2% from $109.1 million First Quarter 2022 2021 Variance SMB Payments: Merchant bankcard processing dollar value 14,076.8$ 11,883.2$ 18.5% Merchant bankcard transaction volume 145.9 127.6 14.4% Average Ticket 96.45$ 93.14$ 3.6% Any differences are due to rounding.

P R IO R IT Y T E C H N O L O G Y H O L D IN G S 11 Revenue • B2B revenue key growth drivers included: ➢ Managed Services increased 44.4% to $2.6 million from $1.8 million, driven by program growth ➢ CPX increased 94.1% to $3.3 million from $1.7 million driven by new customer additions, volume increases within existing customers, and a minimum revenue recovery from a 2020 contract termination. The growth rate was 41.2% excluding the recovery. • Enterprise revenue increased $16.7 million from $0.7 million. CFTPay (Finxera), acquired in September 2021, drove the growth. B2B Revenue of $5.9 million increased 68.6% from $3.5 million Enterprise Revenue of $17.4 million increased $16.7 million from $0.7 million Revenue Growth by Segment (dollars in millions)
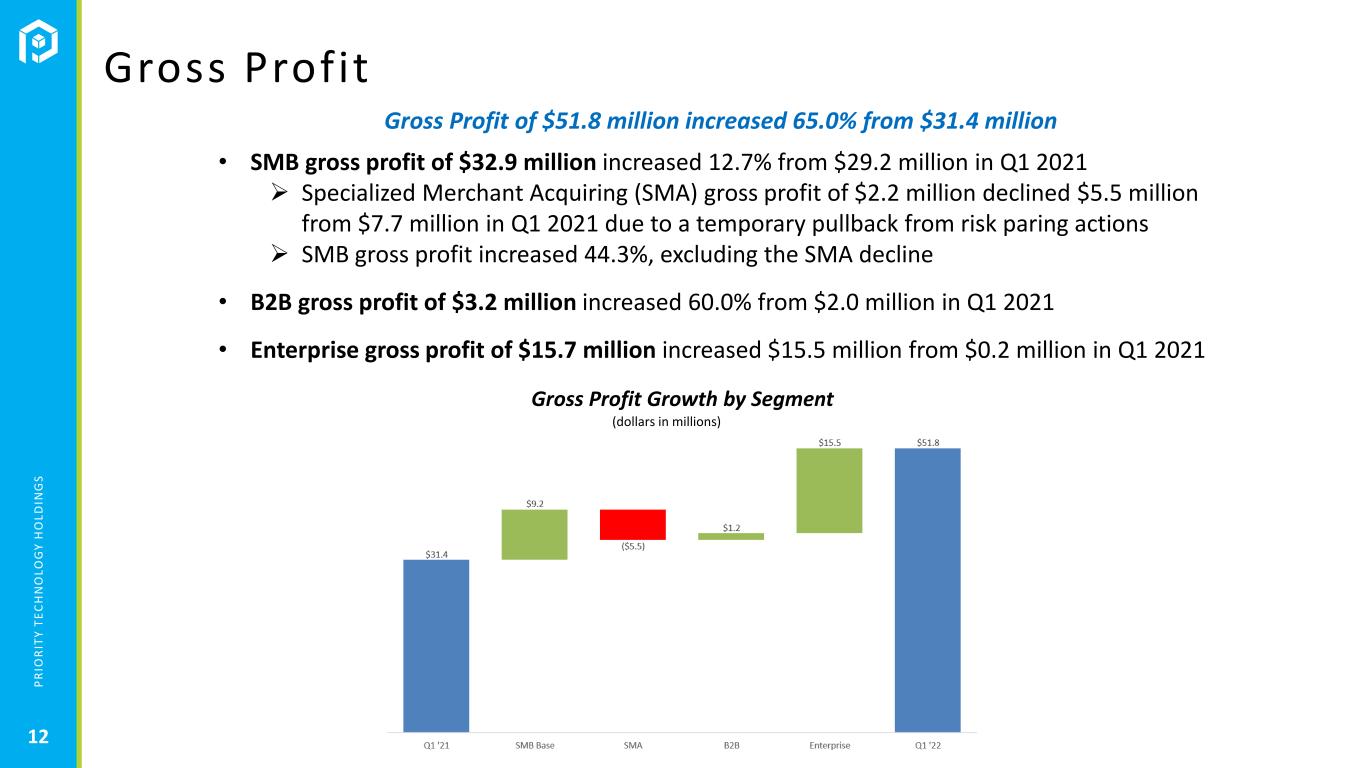
P R IO R IT Y T E C H N O L O G Y H O L D IN G S 12 Gross Profit • SMB gross profit of $32.9 million increased 12.7% from $29.2 million in Q1 2021 ➢ Specialized Merchant Acquiring (SMA) gross profit of $2.2 million declined $5.5 million from $7.7 million in Q1 2021 due to a temporary pullback from risk paring actions ➢ SMB gross profit increased 44.3%, excluding the SMA decline • B2B gross profit of $3.2 million increased 60.0% from $2.0 million in Q1 2021 • Enterprise gross profit of $15.7 million increased $15.5 million from $0.2 million in Q1 2021 Gross Profit of $51.8 million increased 65.0% from $31.4 million Gross Profit Growth by Segment (dollars in millions)
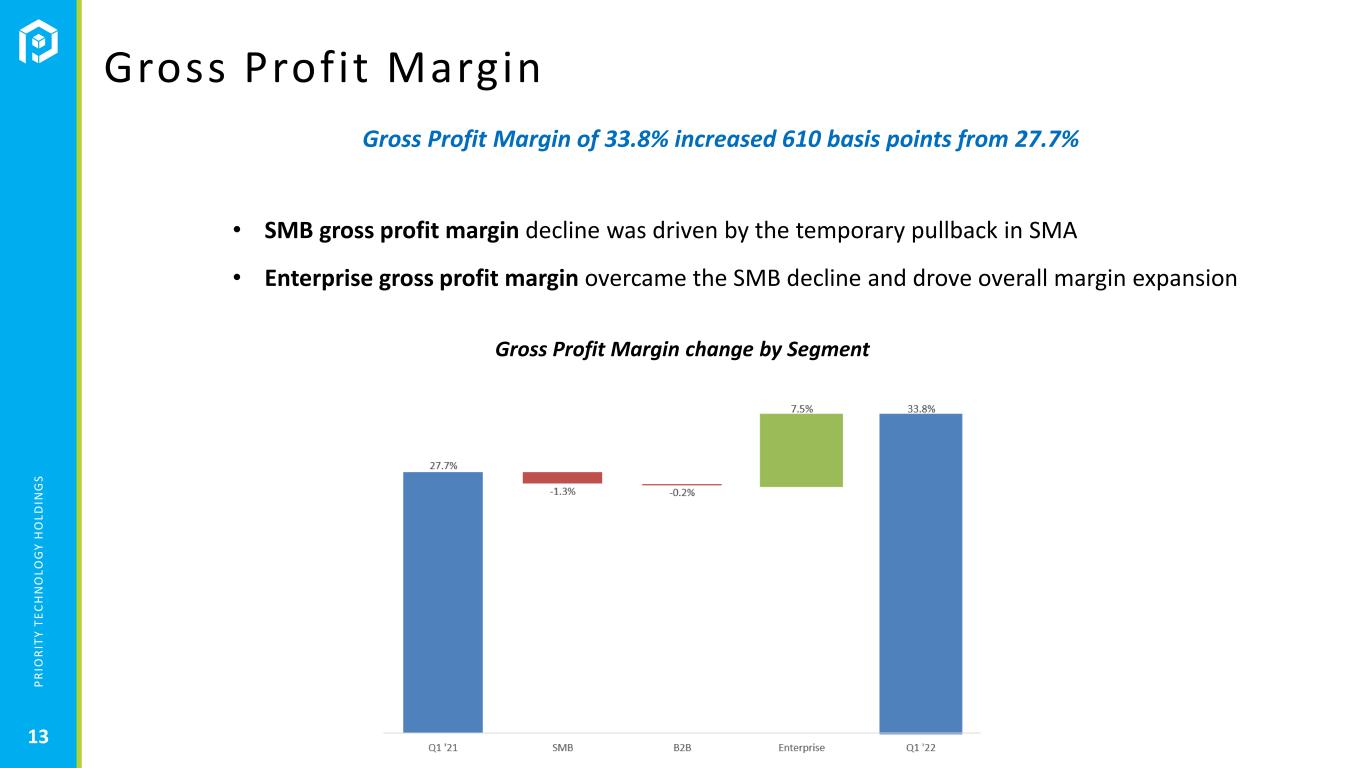
P R IO R IT Y T E C H N O L O G Y H O L D IN G S 13 Gross Profit Margin • SMB gross profit margin decline was driven by the temporary pullback in SMA • Enterprise gross profit margin overcame the SMB decline and drove overall margin expansion Gross Profit Margin of 33.8% increased 610 basis points from 27.7% Gross Profit Margin change by Segment

P R IO R IT Y T E C H N O L O G Y H O L D IN G S 14 Other Operating Expenses • Salaries and Benefits of $16.1 million increased 67.8% from $9.6 million in Q1 2021 ➢ Growth driven by the CFTPay (Finxera) acquisition, other headcount growth and $1.0 million of higher non-cash, stock-based compensation • SG&A of $7.5 million decreased 9.6% from $8.3 million in Q1 2021 ➢ Includes non-recurring expenses of $4.1 million in Q1 2021 and $0.5M in Q1 2022 ➢ Recurring growth is largely the result of the significant increase in size of the Company • Depreciation & Amortization of $17.4 million increased $8.3 million from $9.1 million in Q1 2021, driven by acquisitions Other Operating Expenses of $40.9 million increased 52.0% from $26.9 million (dollars in millions)
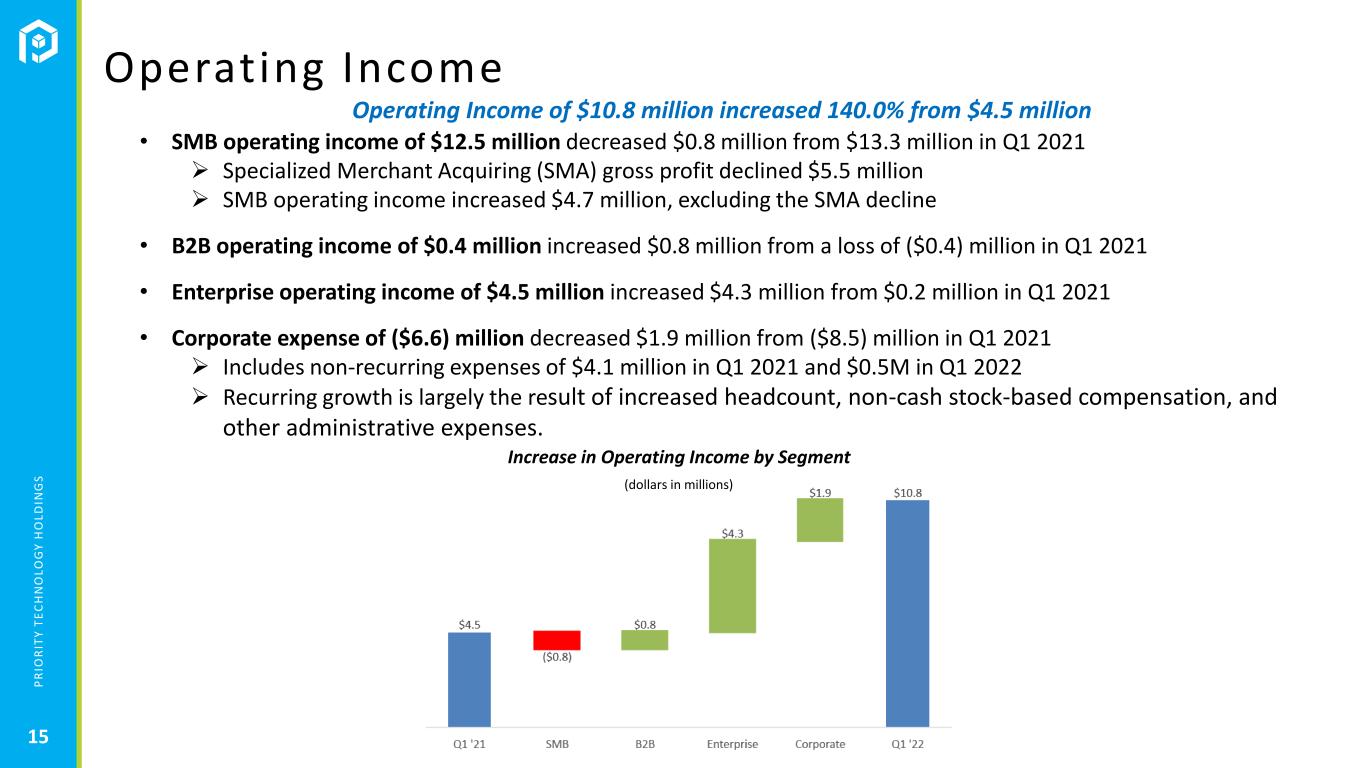
P R IO R IT Y T E C H N O L O G Y H O L D IN G S 15 Operating Income • SMB operating income of $12.5 million decreased $0.8 million from $13.3 million in Q1 2021 ➢ Specialized Merchant Acquiring (SMA) gross profit declined $5.5 million ➢ SMB operating income increased $4.7 million, excluding the SMA decline • B2B operating income of $0.4 million increased $0.8 million from a loss of ($0.4) million in Q1 2021 • Enterprise operating income of $4.5 million increased $4.3 million from $0.2 million in Q1 2021 • Corporate expense of ($6.6) million decreased $1.9 million from ($8.5) million in Q1 2021 ➢ Includes non-recurring expenses of $4.1 million in Q1 2021 and $0.5M in Q1 2022 ➢ Recurring growth is largely the result of increased headcount, non-cash stock-based compensation, and other administrative expenses. Operating Income of $10.8 million increased 140.0% from $4.5 million Increase in Operating Income by Segment (dollars in millions)

P R IO R IT Y T E C H N O L O G Y H O L D IN G S 16 Adjusted EBITDA Strong Adjusted EBITDA Growth in Q1 • Q1 2022 Adjusted EBITDA of $30.3 million increased 68.3% from $18.0 million in Q1 2021 (dollars in millions) 2022 2021 Q1 Q1 Consolidated net income (loss) (GAAP) (0.3)$ (2.7)$ Add: Interest expense 11.5 9.2 Add: Depreciation and amortization 17.4 9.1 Add: Income tax expense (benefit) (0.3) (2.2) EBITDA (non-GAAP) 28.2 13.3 Further adjusted by: Add: Non-cash stock-based compensation 1.6 0.6 Add: Non-recurring expenses: - - Debt extinguishment and modification costs - - (Gain) on Investment - - Legal, professional, accounting and other SG&A 0.5 4.1 Adjusted EBITDA (non-GAAP) 30.3$ 18.0$ EBITDA Walk

P R IO R IT Y T E C H N O L O G Y H O L D IN G S 17 Interest Expense • Interest expense of $11.5 million increased $2.3 million from $9.2 million in Q1 2021 ➢ Total outstanding debt of $625.4 million at March 31, 2022 increased $246.3 million from $379.1 million at March 31, 2021 due to acquisition financing ➢ Lower interest rates on borrowing in Q1 2022 compared with Q1 2021 o Term loan interest rate of 6.75% in Q1 2022 is 75 bps below 7.5% in Q1 2021 o Subordinated loan, fully repaid in April 2021, carried an interest rate of 12.5% Components of Q1 2022 and 2021 Interest Expense 2022 2021 First Quarter First Quarter (dollars in Millions) 2022 2021 Cash Interest & Fees 10.7$ 6.7$ PIK Interest - 1.9 Amortization of OID & DIC 0.8 0.6 11.5$ 9.2$
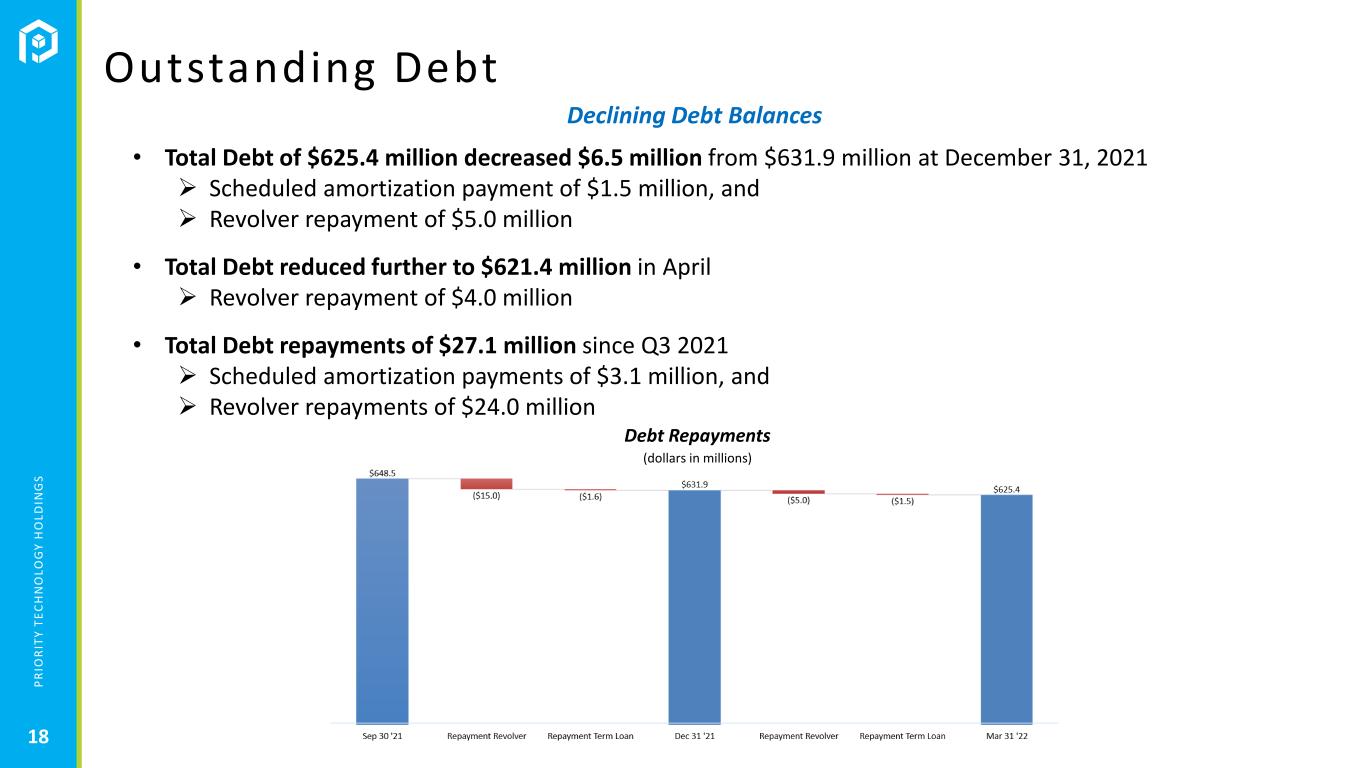
P R IO R IT Y T E C H N O L O G Y H O L D IN G S 18 Outstanding Debt • Total Debt of $625.4 million decreased $6.5 million from $631.9 million at December 31, 2021 ➢ Scheduled amortization payment of $1.5 million, and ➢ Revolver repayment of $5.0 million • Total Debt reduced further to $621.4 million in April ➢ Revolver repayment of $4.0 million • Total Debt repayments of $27.1 million since Q3 2021 ➢ Scheduled amortization payments of $3.1 million, and ➢ Revolver repayments of $24.0 million Declining Debt Balances Debt Repayments (dollars in millions)
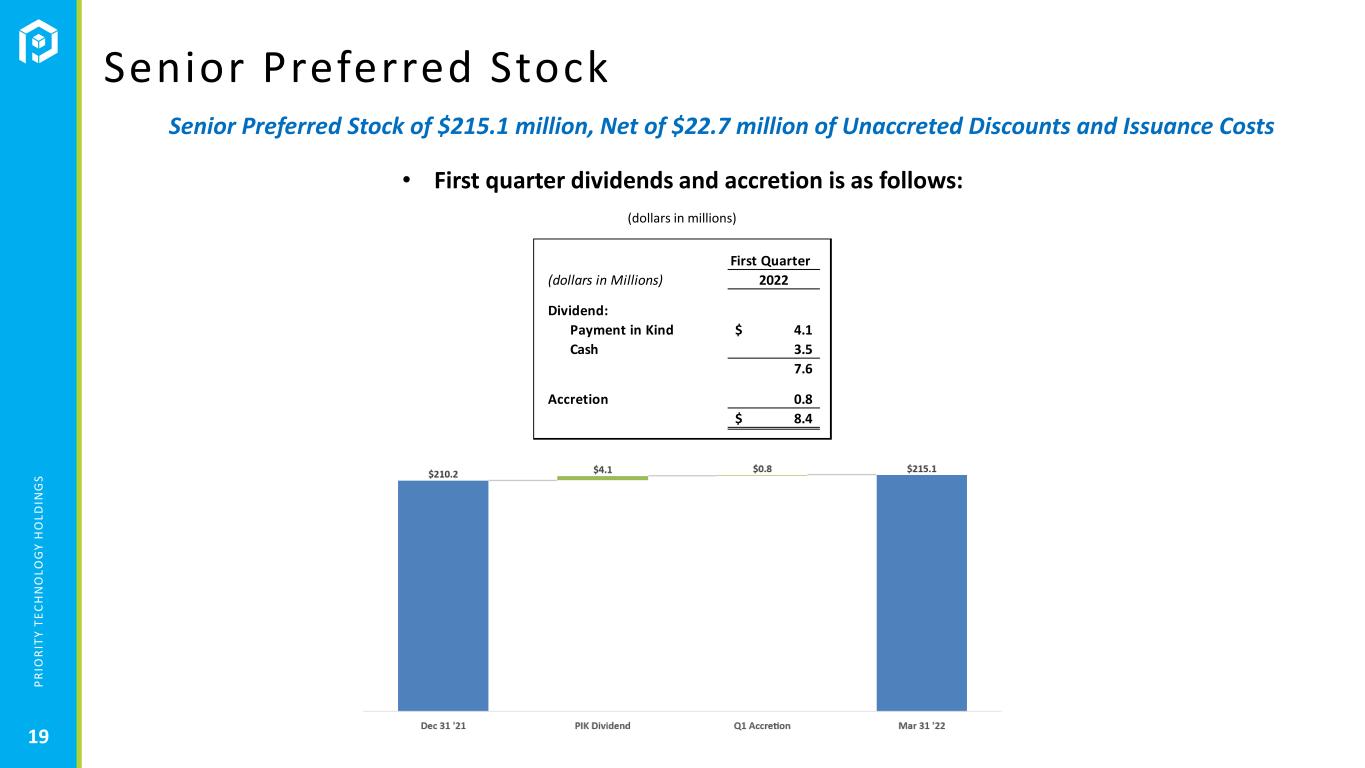
P R IO R IT Y T E C H N O L O G Y H O L D IN G S 19 Senior Preferred Stock Senior Preferred Stock of $215.1 million, Net of $22.7 million of Unaccreted Discounts and Issuance Costs • First quarter dividends and accretion is as follows: (dollars in millions) First Quarter (dollars in Millions) 2022 Dividend: Payment in Kind 4.1$ Cash 3.5 7.6 Accretion 0.8 8.4$

P R IO R IT Y T E C H N O L O G Y H O L D IN G S 20 STRONG FINANCIAL PERFORMANCE with PEER VALUATION DISCOUNT ENTERPRISE VALUE MULTIPLE 1 (1) Recent Enterprise Values divided by twelve-month Adjusted EBITDA (Management calculations based on recent publicly available information). ■ Revenue CAGR2: 18% ■ Adj. EBITDA CAGR2: 31% ■ Adj. EBITDA as % of Gross Profit: 62% ■ Gross Profit Margin: 30.1% ■ Free Cash Flow Conversion4 ~55% ■ Recurring Net Revenue: ~94% PRTH KEY PERFORMANCE METRICS 3 (2) 2-year CAGR (3) Performance Metrics based on GAAP 2021, 2020 and 2019 (4) Free cash flow as a percentage of Adjusted EBITDA. Free cash flow is Adjusted EBITDA less cash interest, cash dividends, cash taxes, and scheduled debt repayment

P R IO R IT Y T E C H N O L O G Y H O L D IN G S BUILT TO POWER MODERN COMMERCE P R IO R IT Y T E C H N O L O G Y H O L D IN G S 21 ■ Built for the Future of Payments – Large Global Market Opportunity ■ Scalable, Innovative Technology Platform – Low Capital Spending Needs ■ Strong Revenue Growth & Significant Operating Leverage ■ Diversified Payment Revenue Sources Balanced with Countercyclical and Early Cycle Assets ■ Strong Financial Performance with Peer Valuation Discount ■ Leadership Well Aligned with Shareholders – with Proven Track-Record Overcoming Challenges, Identifying Opportunities Ahead of Peers, and Driving Results


