| FREE WRITING PROSPECTUS | ||
| FILED PURSUANT TO RULE 433 | ||
| REGISTRATION FILE NO.: 333-207361-01 | ||
 | January 19, 2016 |

CSAIL 2016-C5
Commercial Mortgage Trust
Free Writing Prospectus
Structural and Collateral Term Sheet
Credit Suisse Commercial Mortgage Securities Corp.
as Depositor
Commercial Mortgage Pass-Through Certificates Series 2016-C5
Column Financial, Inc.
Silverpeak Real Estate Finance LLC
Rialto Mortgage Finance, LLC
The Bank of New York Mellon
Jefferies LoanCore LLC
as Sponsors and Mortgage Loan Sellers
Credit Suisse
Lead Manager and Sole Bookrunner
| Drexel Hamilton | Jefferies | Mischler Financial Group, Inc. |
| Co-Manager | Co-Manager | Co-Manager |
| THE DEPOSITOR HAS FILED A REGISTRATION STATEMENT (INCLUDING A PROSPECTUS) WITH THE SEC (SEC FILE NO. 333-207361) FOR THE OFFERING TO WHICH THIS COMMUNICATION RELATES. BEFORE YOU INVEST, YOU SHOULD READ THE PROSPECTUS IN THAT REGISTRATION STATEMENT AND OTHER DOCUMENTS THE ISSUER HAS FILED WITH THE SEC FOR MORE COMPLETE INFORMATION ABOUT THE ISSUER AND THIS OFFERING. YOU MAY GET THESE DOCUMENTS FOR FREE BY VISITING EDGAR ON THE SEC WEB SITE ATWWW.SEC.GOV. ALTERNATIVELY, CREDIT SUISSE WILL ARRANGE TO SEND YOU THE PROSPECTUS IF YOU REQUEST IT BY CALLING TOLL FREE 1-800-221-1037. |
STATEMENT REGARDING ASSUMPTIONS AS TO
SECURITIES, PRICING ESTIMATES AND OTHER INFORMATION
This material is for your information, and none of Credit Suisse Securities (USA) LLC and the other underwriters (collectively, the “Underwriters”) are soliciting any action based upon it. This material is not to be construed as an offer to sell or the solicitation of any offer to buy any security in any jurisdiction where such an offer or solicitation would be illegal.
Neither this document nor anything contained herein shall form the basis for any contract or commitment whatsoever. The information contained herein is preliminary as of the date hereof. These materials are subject to change, completion or amendment from time to time. The information contained herein will be superseded by similar information delivered to you prior to the time of sale as part of the Preliminary Prospectus referred to herein relating to the CSAIL 2016-C5 Commercial Mortgage Trust, Commercial Mortgage Pass-Through Certificates (the “Offering Document”). The information supersedes any such information previously delivered. The information should be reviewed only in conjunction with the entire Offering Document. All of the information contained herein is subject to the same limitations and qualifications contained in the Offering Document. The information contained herein does not contain all relevant information relating to the underlying mortgage loans or mortgaged properties. Such information is described elsewhere in the Offering Document. The information contained herein will be more fully described elsewhere in the Offering Document. The information contained herein should not be viewed as projections, forecasts, predictions or opinions with respect to value. Prior to making any investment decision, prospective investors are strongly urged to read the Offering Document in its entirety. Neither the Securities and Exchange Commission nor any state securities commission has approved or disapproved of these securities or determined if this Free Writing Prospectus is truthful or complete. Any representation to the contrary is a criminal offense.
The attached information contains certain tables and other statistical analyses (the “Computational Materials”) which have been prepared in reliance upon information furnished by the Mortgage Loan Sellers. Numerous assumptions were used in preparing the Computational Materials, which may or may not be reflected herein. As such, no assurance can be given as to the appropriateness of the assumptions used in preparing the Computational Materials; or as to whether the Computational Materials and/or the assumptions upon which they are based reflect present market conditions or future market performance. The Computational Materials should not be construed as either projections or predictions or as legal, tax, financial or accounting advice. You should consult your own counsel, accountant and other advisors as to the legal, tax, business, financial and related aspects of a purchase of these securities. Any weighted average lives, yields and principal payment periods shown in the Computational Materials are based on prepayment and/or loss assumptions, and changes in such prepayment and/or loss assumptions may dramatically affect such weighted average lives, yields and principal payment periods. In addition, it is possible that prepayments or losses on the underlying assets will occur at rates higher or lower than the rates shown in the attached Computational Materials. The specific characteristics of the securities may differ from those shown in the Computational Materials due to differences between the final underlying assets and the preliminary underlying assets used in preparing the Computational Materials. The principal amount and designation of any security described in the Computational Materials are subject to change prior to issuance. None of the Underwriters or any of their respective affiliates makes any representation or warranty as to the actual rate or timing of payments or losses on any of the underlying assets or the payments or yield on the securities.
This document contains forward-looking statements. Those statements are subject to certain risks and uncertainties that could cause the success of collections and the actual cash flow generated to differ materially from the information set forth herein. While such information reflects projections prepared in good faith based upon methods and data that are believed to be reasonable and accurate as of the dates thereof, the depositor undertakes no obligation to revise these forward-looking statements to reflect subsequent events or circumstances. Individuals should not place undue reliance on forward-looking statements and are advised to make their own independent analysis and determination with respect to the forecasted periods, which reflect the issuer’s view only as of the date hereof.
IMPORTANT NOTICE RELATING TO AUTOMATICALLY GENERATED EMAIL DISCLAIMERS
Any legends, disclaimers or other notices that may appear at the bottom of the email communication to which this Free Writing Prospectus is attached relating to (1) these materials not constituting an offer (or a solicitation of an offer), (2) no representation being made that these materials are accurate or complete and may not be updated or (3) these materials possibly being confidential, are not applicable to these materials and should be disregarded. Such legends, disclaimers or other notices have been automatically generated as a result of these materials having been sent via Bloomberg or another system.

Indicative Capital Structure
Publicly Offered Certificates
| Class | Expected Ratings (Moody’s/Fitch/Morningstar) | Approximate Initial Certificate Principal Balance or Notional Amount(1) | Approximate Initial Credit Support | Expected Weighted Avg. Life (years)(3) | Expected Principal Window(3) | Certificate Principal to Value Ratio(4) | Underwritten NOI Debt Yield(5) |
| A-1 | Aaa(sf)/AAAsf/AAA | $28,557,000 | 30.000%(2) | 2.67 | 1-53 | 45.1% | 16.1% |
| A-2 | Aaa(sf)/AAAsf/AAA | $121,570,000 | 30.000%(2) | 4.52 | 53-56 | 45.1% | 16.1% |
| A-3 | Aaa(sf)/AAAsf/AAA | $19,780,000 | 30.000%(2) | 6.77 | 81-81 | 45.1% | 16.1% |
| A-4 | Aaa(sf)/AAAsf/AAA | $170,000,000 | 30.000%(2) | 9.64 | 112-116 | 45.1% | 16.1% |
| A-5 | Aaa(sf)/AAAsf/AAA | $267,448,000 | 30.000%(2) | 9.73 | 116-117 | 45.1% | 16.1% |
| A-SB | Aaa(sf)/AAAsf/AAA | $48,139,000 | 30.000%(2) | 7.14 | 56-112 | 45.1% | 16.1% |
| X-A | Aa1(sf)/AAAsf/AAA | $723,385,000(6) | N/A | N/A | N/A | N/A | N/A |
| X-B | NR/AA-sf/AAA | $51,503,000(6) | N/A | N/A | N/A | N/A | N/A |
| A-S | Aa2(sf)/AAAsf/AAA | $67,891,000 | 22.750% | 9.77 | 117-117 | 49.7% | 14.6% |
| B | NR/AA-sf/AA | $51,503,000 | 17.250% | 9.77 | 117-117 | 53.3% | 13.6% |
| C | NR/A-sf/A- | $42,139,000 | 12.750% | 9.77 | 117-117 | 56.2% | 12.9% |
Privately Offered Certificates(7)
| Class | Expected Ratings (Moody’s/Fitch/Morningstar) | Approximate Initial Certificate Principal Balance or Notional Amount(1) | Approximate Initial Credit Support | Expected Weighted Avg. Life (years)(3) | Expected Principal Window(3) | Certificate Principal to Value Ratio(4) | Underwritten NOI Debt Yield(5) |
| X-E | NR/BB-sf/AAA | $23,410,000(6) | N/A | N/A | N/A | N/A | N/A |
| X-F | NR/B-sf/AAA | $9,365,000(6) | N/A | N/A | N/A | N/A | N/A |
| X-NR | NR/NR/AAA | $39,797,933(6) | N/A | N/A | N/A | N/A | N/A |
| D | NR/BBB-sf/BBB | $46,821,000 | 7.750% | 9.77 | 117-117 | 59.4% | 12.2% |
| X-D | NR/BBB-sf/BBB | $46,821,000(6) | N/A | N/A | N/A | N/A | N/A |
| E | NR/BB-sf/BB- | $23,410,000 | 5.250% | 9.77 | 117-117 | 61.0% | 11.9% |
| F | NR/B-sf/B | $9,365,000 | 4.250% | 9.77 | 117-117 | 61.7% | 11.8% |
| NR | NR/NR/NR | $39,797,933 | 0.000% | 9.77 | 117-117 | 64.4% | 11.3% |
| (1) | Approximate, subject to a variance of plus or minus 5%. |
| (2) | The credit support percentages set forth for the Class A-1, Class A-2, Class A-3, Class A-4, Class A-5 and Class A-SB certificates are represented in the aggregate. |
| (3) | Assumes 0% CPR / 0% CDR and a February 9, 2016 closing date. Based on “Modeling Assumptions” as described in the Preliminary Prospectus relating to the Publicly Offered Certificates, dated January 19, 2016 (the “Preliminary Prospectus”). Capitalized terms used but not defined herein have the meanings ascribed to them in the Preliminary Prospectus. |
| (4) | The “Certificate Principal to Value Ratio” for any Class (other than the Class A-1, Class A-2, Class A-3, Class A-4, Class A-5 and Class A-SB certificates) is calculated as the product of (a) the weighted average Cut-off Date LTV Ratio for the mortgage loans, multiplied by (b) a fraction, the numerator of which is the total initial Certificate Principal Balance of such Class of Certificates and all Classes of Principal Balance Certificates senior to such Class of Certificates and the denominator of which is the total initial Certificate Principal Balance of all of the Principal Balance Certificates. The Class A-1, Class A-2, Class A-3, Class A-4, Class A-5 and Class A-SB Certificate Principal to Value Ratios are calculated in the aggregate for those Classes as if they were a single Class. Investors should note, however, that excess mortgaged property value associated with a mortgage loan will not be available to offset losses on any other mortgage loan. |
| (5) | The “Underwritten NOI Debt Yield” for any Class (other than the Class A-1, Class A-2, Class A-3, Class A-4, Class A-5 and Class A-SB certificates) is calculated as the product of (a) the weighted average UW NOI Debt Yield for the mortgage loans and (b) the total initial Certificate Principal Balance of all of the Classes of Principal Balance Certificates divided by the total initial Certificate Principal Balance for such Class and all Classes of Principal Balance Certificates senior to such Class of Certificates. The Underwritten NOI Debt Yield for each Class of the Class A-1, Class A-2, Class A-3, Class A-4, Class A-5 and Class A-SB certificates is calculated in the aggregate for those Classes as if they were a single Class. Investors should note, however, that net operating income from any mortgaged property supports only the related mortgage loan and will not be available to support any other mortgage loan. |
| (6) | The notional amounts of the Class X-A, Class X-B, Class X-E, Class X-F, Class X-NR and Class X-D certificates (collectively, the “Class X Certificates”) are defined in the Preliminary Prospectus. |
| (7) | The Class Z and Class R certificates are not shown above. |
THE INFORMATION IN THIS COLLATERAL TERM SHEET IS NOT COMPLETE AND MAY BE AMENDED PRIOR TO THE TIME OF SALE. THIS TERM SHEET IS NOT AN OFFER TO SELL THESE SECURITIES AND IT IS NOT A SOLICITATION OF AN OFFER TO BUY THESE SECURITIES IN ANY JURISDICTION WHERE THE OFFER OR SALE IS NOT PERMITTED.
| 1 |
Summary of Transaction Terms
| Securities Offered: | $936,420,933 monthly pay, multi-class, commercial mortgage REMIC Pass-Through Certificates. |
| Lead Manager and Sole Bookrunner: | Credit Suisse Securities (USA) LLC. |
| Co-Managers: | Drexel Hamilton, LLC, Mischler Financial Group, Inc. and Jefferies LLC. |
| Mortgage Loan Sellers: | Column Financial, Inc. (“Column”) (36.7%), Rialto Mortgage Finance, LLC (“RMF”) (16.3%), The Bank of New York Mellon (“BNY Mellon”) (16.0%), Silverpeak Real Estate Finance LLC (“SPREF”) (15.9%) and Jefferies LoanCore LLC (“JLC”) (15.2%). |
| Master Servicer: | KeyBank National Association (“KeyBank”). |
| Special Servicer: | Rialto Capital Advisors, LLC (“Rialto”). |
| Directing Certificateholder: | Rialto CMBS VII, LLC (or its affiliate). |
| Trustee: | Wells Fargo Bank, National Association (“Wells Fargo”). |
| Certificate Administrator: | Wells Fargo. |
| Operating Advisor: | Pentalpha Surveillance LLC (“Pentalpha”). |
| Asset Representations Reviewer: | Pentalpha. |
| Rating Agencies: | Fitch Ratings, Inc. (“Fitch”), Moody’s Investors Service, Inc. (“Moody’s”) and Morningstar Credit Ratings, LLC (“Morningstar”). |
| Closing Date: | On or about February 9, 2016. |
| Cut-off Date: | With respect to each mortgage loan, the respective due date for the monthly debt service payment that is due in February 2016, (or, in the case of any mortgage loan that has its first due date in March 2016, the date that would have been its due date in February 2016 under the terms of that mortgage loan if a monthly payment were scheduled to be due in that month.) |
| Distribution Date: | The 4th business day following each Determination Date, commencing in March 2016. |
| Determination Date: | 11th day of each month, or if the 11th day is not a business day, then the business day immediately following such 11thday, commencing in March 2016. |
| Rated Final Distribution Date: | The Distribution Date in November 2048. |
| Tax Treatment: | The Publicly Offered Certificates are expected to be treated as REMIC regular interests for U.S. federal income tax purposes. |
| Form of Offering: | The Class A-1, Class A-2, Class A-3, Class A-4, Class A-5, Class A-SB, Class X-A, Class X-B, Class A-S, Class B and Class C certificates will be offered publicly (the “Publicly Offered Certificates”). The Class X-E, Class X-F, Class X-NR, Class D, Class X-D, Class E, Class F, Class NR, Class Z and Class R certificates (the “Privately Offered Certificates”) will be offered domestically to Qualified Institutional Buyers and to Institutional Accredited Investors and to institutions that are not U.S. Persons pursuant to Regulation S. |
| SMMEA Status: | The Certificates willnot constitute “mortgage related securities” for purposes of SMMEA. |
| ERISA: | The Publicly Offered Certificates are expected to be ERISA eligible. |
| Optional Termination: | 1% clean-up call. |
| Minimum Denominations: | The Publicly Offered Certificates (other than the Class X-A and Class X-B certificates) will be issued in minimum denominations of $10,000 and integral multiples of $1 in excess of $10,000. The Class X-A and Class X-B certificates will be issued in minimum denominations of $1,000,000 and in integral multiples of $1 in excess of $1,000,000. |
| Settlement Terms: | DTC, Euroclear and Clearstream Banking. |
| Analytics: | The transaction is expected to be available on Intex Solutions, Inc., Trepp, LLC, Bloomberg Financial Markets, L.P. and BlackRock Financial Management Inc. |
THE INFORMATION IN THIS COLLATERAL TERM SHEET IS NOT COMPLETE AND MAY BE AMENDED PRIOR TO THE TIME OF SALE. THIS TERM SHEET IS NOT AN OFFER TO SELL THESE SECURITIES AND IT IS NOT A SOLICITATION OF AN OFFER TO BUY THESE SECURITIES IN ANY JURISDICTION WHERE THE OFFER OR SALE IS NOT PERMITTED.
| 2 |
Collateral Characteristics
| Loan Pool | |
| Initial Pool Balance (“IPB”)(1): | $936,420,933 |
| Number of Mortgage Loans: | 59 |
| Number of Mortgaged Properties: | 241 |
| Average Cut-off Date Balance per Mortgage Loan: | $15,871,541 |
| Weighted Average Current Mortgage Rate: | 4.5545% |
| 10 Largest Mortgage Loans as % of IPB: | 53.3% |
| Weighted Average Remaining Term to Maturity(2): | 107 |
| Weighted Average Seasoning: | 4 |
| Credit Statistics | |
| Weighted Average UW NCF DSCR(3)(4): | 1.92x |
| Weighted Average UW NOI Debt Yield(3): | 11.3% |
| Weighted Average Cut-off Date Loan-to-Value Ratio (“LTV”)(3)(5): | 64.4% |
| Weighted Average Maturity Date LTV(2)(3)(5): | 58.4% |
| Other Statistics | |
| % of Mortgage Loans with Additional Debt: | 21.8% |
| % of Mortgaged Properties with Single Tenants: | 18.2% |
| Amortization | |
| Weighted Average Original Amortization Term(6): | 356 |
| Weighted Average Remaining Amortization Term(6): | 355 |
| % of Mortgage Loans with Partial Interest-Only followed by Amortizing Balloon: | 49.6% |
| % of Mortgage Loans with Amortizing Balloon: | 22.9% |
| % of Mortgage Loans with Interest-Only: | 18.2% |
| % of Mortgage Loans with Interest Only followed by ARD Structure: | 9.3% |
| Cash Management(7) | |
| % of Mortgage Loans with In-Place, Hard Lockboxes: | 53.4% |
| % of Mortgage Loans with Springing Lockboxes: | 36.8% |
| % of Mortgage Loans with In-Place, Soft Lockboxes: | 9.3% |
| % of Mortgage Loans with No Lockbox: | 0.5% |
| Reserves | |
| % of Mortgage Loans Requiring Upfront or Ongoing Tax Reserves: | 75.1% |
| % of Mortgage Loans Requiring Upfront or Ongoing Insurance Reserves: | 67.7% |
| % of Mortgage Loans Requiring Upfront or Ongoing CapEx Reserves(8): | 76.7% |
| % of Mortgage Loans Requiring Upfront or Ongoing TI/LC Reserves(9): | 58.5% |
| (1) | Subject to a permitted variance of plus or minus 5%. |
| (2) | In the case of Loan No. 2 with an anticipated repayment date, calculated through or as of, as applicable, the related anticipated repayment date. |
| (3) | In the case of Loan Nos. 1, 2, 3 and 12, the UW NCF DSCR, UW NOI Debt Yield, Cut-off Date LTV and Maturity Date LTV calculations include the relatedpari passu companion loan. In the case of Loan Nos. 1, 3, 9, and 21, the UW NCF DSCR, UW NOI Debt Yield, Cut-off Date LTV and Maturity Date LTV calculations exclude the mezzanine loan. In the case of Loan Nos. 1 and 46, the UW NCF DSCR, UW NOI Debt Yield, Cut-off Date LTV and Maturity Date LTV calculations exclude the subordinate companion loan(s). |
| (4) | For each partial interest-only mortgage loan, the UW NCF DSCR is calculated using the first principal and interest payment to be made into the trust during the term of the mortgage loan once amortization has commenced. |
| (5) | In the case of Loan Nos. 9, 11, 17 and 18, the Cut-off Date LTV and Maturity Date LTV are calculated based upon an “as-stabilized” or “as-complete” appraised value based on certain assumptions. Refer to “Description of the Mortgage Pool—Certain Calculations and Definitions” in the Preliminary Prospectus for additional details. |
| (6) | Excludes four mortgage loans that are interest-only for the entire term. In the case of Loan No. 3, the related loan will amortize based on the assumed principal payment schedule set forth on Annex F to the Preliminary Prospectus. |
| (7) | For a detailed description of Cash Management, refer to “Description of the Mortgage Pool—Certain Terms of the Mortgage Loans—Mortgaged Property Accounts—Lockbox Accounts” in the Preliminary Prospectus. |
| (8) | CapEx Reserves include FF&E reserves for hospitality properties. |
| (9) | Calculated only with respect to Cut-off Date Balance of mortgage loans secured by industrial, office and retail properties. |
THE INFORMATION IN THIS COLLATERAL TERM SHEET IS NOT COMPLETE AND MAY BE AMENDED PRIOR TO THE TIME OF SALE. THIS TERM SHEET IS NOT AN OFFER TO SELL THESE SECURITIES AND IT IS NOT A SOLICITATION OF AN OFFER TO BUY THESE SECURITIES IN ANY JURISDICTION WHERE THE OFFER OR SALE IS NOT PERMITTED.
| 3 |
Collateral Characteristics
| Originator | Sponsor | Number of Mortgage Loans | Number of Mortgaged Properties | Aggregate Cut-off Date Balance | % of IPB | ||||
| Column(1)(2) | Column | 17 | 179 | $343,808,574 | 36.7 | % | |||
| RMF | RMF | 20 | 36 | 152,472,674 | 16.3 | ||||
| BNY Mellon(3) | BNY Mellon | 9 | 9 | 149,632,243 | 16.0 | ||||
| SPREF | SPREF | 7 | 11 | 148,495,218 | 15.9 | ||||
| JLC | JLC | 6 | 6 | 142,012,224 | 15.2 | ||||
| Total: | 59 | 241 | $936,420,933 | 100.0 | % | ||||
| (1) | Certain of the Column mortgage loans were originated by Pillar Funding II LLC and acquired by Column. Column has re-underwritten such mortgage loans in accordance with the procedures described under “Transaction Parties—The Sponsors and Mortgage Loan Sellers—Column Financial, Inc.” in the Preliminary Prospectus. |
| (2) | One (1) of the Column mortgage loans was co-originated with Morgan Stanley Bank, N. A. |
| (3) | One (1) of the BNY Mellon mortgage loans was originated by Arbor Commercial Mortgage, LLC and acquired by BNY Mellon. BNY Mellon has reunderwritten such mortgage loan in accordance with the procedures described under “Transaction Parties—The Sponsors and Mortgage Loan Sellers—The Bank of New York Mellon” in the Preliminary Prospectus. |
Ten Largest Mortgage Loans
| No. | Loan Name | Mortgage Loan Seller | No. of Properties | Cut-off Date Balance | % of IPB | SF/ Rooms/ Units | Property Type | UW NCF DSCR(1)(2) | UW NOI Debt Yield(1) | Cut-off Date LTV(1) | Maturity Date LTV(1)(3) | |
| 1 | GLP Industrial Portfolio A | Column | 114 | $87,100,000 | 9.3 | % | 26,878,777 | Industrial | 3.97x | 18.2% | 30.5% | 30.5% |
| 2 | FedEx Brooklyn | JLC | 1 | 87,000,000 | 9.3 | 278,721 | Industrial | 1.97x | 8.6% | 66.7% | 66.7% | |
| 3 | Starwood Capital Extended Stay Portfolio | Column | 50 | 75,000,000 | 8.0 | 6,106 | Hotel | 2.26x | 14.0% | 64.3% | 61.3% | |
| 4 | Ellicott House | SPREF | 1 | 57,500,000 | 6.1 | 327 | Multifamily | 1.64x | 7.2% | 70.6% | 70.6% | |
| 5 | 401 Market | BNY Mellon | 1 | 56,000,000 | 6.0 | 484,643 | Office | 1.29x | 8.9% | 72.0% | 66.1% | |
| 6 | Baldwin Hills Center | SPREF | 1 | 33,000,000 | 3.5 | 127,054 | Retail | 1.42x | 9.5% | 64.2% | 58.9% | |
| 7 | Embassy Suites and Claypool Court | Column | 1 | 30,000,000 | 3.2 | 360 | Hotel | 2.42x | 17.3% | 58.0% | 50.4% | |
| 8 | Rosecroft Mews Apartments | Column | 1 | 27,865,000 | 3.0 | 304 | Multifamily | 1.26x | 8.3% | 79.4% | 73.1% | |
| 9 | Triple Net Acquisitions Portfolio - Pool 1 | SPREF | 4 | 23,244,278 | 2.5 | 339,405 | Various | 1.45x | 11.1% | 66.7% | 50.2% | |
| 10 | San Diego HHSA Building | JLC | 1 | 22,292,174 | 2.4 | 111,285 | Office | 1.57x | 10.4% | 71.2% | 58.1% | |
| Top 3 Total/Weighted Average | 165 | $249,100,000 | 26.6 | % | 2.76x | 13.6% | 53.3% | 52.4% | ||||
| Top 5 Total/Weighted Average | 167 | $362,600,000 | 38.7 | % | 2.35x | 11.8% | 58.9% | 57.4% | ||||
| Top 10 Total/Weighted Average | 175 | $499,001,453 | 53.3 | % | 2.16x | 11.7% | 61.3% | 57.6% | ||||
| (1) | In the case of Loan Nos. 1, 2 and 3, the UW NCF DSCR, UW NOI Debt Yield, Cut-off Date LTV and Maturity Date LTV calculations include the relatedpari passu companion loan. In the case of Loan Nos. 1, 3, and 9, the UW NCF DSCR, UW NOI Debt Yield, Cut-off Date LTV and Maturity Date LTV calculations exclude the mezzanine loan. In the case of Loan No. 1, the UW NCF DSCR, UW NOI Debt Yield, Cut-off Date LTV and Maturity Date LTV calculations exclude the subordinate companion loan(s). |
| (2) | For each partial interest-only mortgage loan, the UW NCF DSCR is calculated using the first principal and interest payment to be made into the trust during the term of the mortgage loan once amortization has commenced. |
| (3) | In the case of Loan No. 2 with an anticipated repayment date, calculated through or as of, as applicable, the related anticipated repayment date. |
THE INFORMATION IN THIS COLLATERAL TERM SHEET IS NOT COMPLETE AND MAY BE AMENDED PRIOR TO THE TIME OF SALE. THIS TERM SHEET IS NOT AN OFFER TO SELL THESE SECURITIES AND IT IS NOT A SOLICITATION OF AN OFFER TO BUY THESE SECURITIES IN ANY JURISDICTION WHERE THE OFFER OR SALE IS NOT PERMITTED.
| 4 |
Pari Passu Loan Summary
| No. | Loan Name | Trust Cut-off Date Balance | Pari Passu Companion Loan Cut-off Date Balance | Whole Loan Cut-off Date Balance(1) | Controlling Pooling and Servicing Agreement | Master Servicer | Special Servicer |
| 1 | GLP Industrial Portfolio A | $87,100,000 | $550,500,000 | $966,500,000 | CSMC 2015-GLPA | KeyBank | AEGON |
| 2 | FedEx Brooklyn | $87,000,000 | $43,000,000 | $130,000,000 | CSAIL 2016-C5 | KeyBank | Rialto |
| 3 | Starwood Capital Extended Stay Portfolio | $75,000,000 | $125,000,000 | $200,000,000 | CSAIL 2015-C3 | Midland Loan Services, a Division of PNC Bank, National Association | Rialto |
| 12 | Sheraton Lincoln Harbor Hotel | $20,000,000 | $60,000,000 | $80,000,000 | WFCM 2015-C31
| Wells Fargo
| Midland Loan Services, a Division of PNC Bank, National Association |
| (1) | In the case of Loan Nos. 1 and 3, excludes one or more mezzanine loans. |
Additional Debt Summary
| No. | Loan Name | Trust Cut-off Date Balance | Subordinate Debt Cut-off Date Balance(1) | Total Debt Cut- off Date Balance(2) | Mortgage Loan UW NCF DSCR | Total Debt UW NCF DSCR | Mortgage Loan Cut- off Date LTV | Total Debt Cut-off Date LTV | Mortgage Loan UW NOI Debt Yield | Total Debt UW NOI Debt Yield |
| 1 | GLP Industrial Portfolio A | $87,100,000 | $658,900,000 | $1,296,500,000 | 3.97x | 1.84x | 30.5% | 62.0% | 18.2% | 8.9% |
| 3 | Starwood Capital Extended Stay Portfolio | $75,000,000 | $25,000,000 | $225,000,000 | 2.26x | 1.83x | 64.3% | 72.3% | 14.0% | 12.4% |
| 9 | Triple Net Acquisitions Portfolio - Pool 1 | $23,244,278 | $5,100,000 | $28,344,278 | 1.45x | 1.02x | 66.7% | 81.3% | 11.1% | 9.1% |
| 21 | Holiday Inn Austin | $14,000,000 | $3,500,000 | $17,500,000 | 2.16x | 1.43x | 65.4% | 81.8% | 15.6% | 12.5% |
| 46 | Avalon Apartments | $4,850,000 | $1,500,000 | $6,350,000 | 1.83x | 1.40x | 54.5% | 71.3% | 12.4% | 9.4% |
| (1) | In the case of Loan Nos. 1, 3, 9 and 21, the subordinate debt includes one or more mezzanine loans. In the case of Loan Nos. 1 and 46, the subordinate debt includes one or more B notes. |
| (2) | In the case of Loan Nos. 1 and 3, the total debt includes one or morepari passu loans. |
THE INFORMATION IN THIS COLLATERAL TERM SHEET IS NOT COMPLETE AND MAY BE AMENDED PRIOR TO THE TIME OF SALE. THIS TERM SHEET IS NOT AN OFFER TO SELL THESE SECURITIES AND IT IS NOT A SOLICITATION OF AN OFFER TO BUY THESE SECURITIES IN ANY JURISDICTION WHERE THE OFFER OR SALE IS NOT PERMITTED.
| 5 |
Mortgaged Properties by Type(1)
| Weighted Average | |||||||||||
| Property Type | Property Subtype | Number of Properties | Cut-off Date Principal Balance | % of IPB | Occupancy | UW NCF DSCR(2)(3) | UW NOI Debt Yield(2) | Cut-off Date LTV(2)4) | Maturity Date LTV(2)(4)(5) | ||
| Multifamily | |||||||||||
| Garden | 10 | $132,593,942 | 14.2 | % | 95.2% | 1.34x | 8.9% | 73.6% | 65.1% | ||
| High Rise | 1 | 57,500,000 | 6.1 | 97.6% | 1.64x | 7.2% | 70.6% | 70.6% | |||
| Student Housing | 3 | 27,780,000 | 3.0 | 99.4% | 1.43x | 9.3% | 70.4% | 64.3% | |||
| Multifamily/Retail | 1 | 14,181,318 | 1.5 | 100.0% | 1.22x | 7.6% | 70.6% | 57.5% | |||
| Independent Living | 1 | 9,306,002 | 1.0 | 91.5% | 1.47x | 9.5% | 66.0% | 54.0% | |||
| Subtotal | 16 | $241,361,262 | 25.8 | % | 96.4% | 1.42x | 8.5% | 72.0% | 65.4% | ||
| Industrial | |||||||||||
| Distribution Warehouse | 60 | $142,263,418 | 15.2 | % | 98.2% | 2.75x | 12.3% | 52.6% | 52.6% | ||
| Warehouse | 46 | 29,977,448 | 3.2 | 96.0% | 3.97x | 18.2% | 30.5% | 30.5% | |||
| Flex | 10 | 12,508,262 | 1.3 | 89.3% | 1.88x | 11.7% | 66.4% | 55.1% | |||
| Recycling Center | 1 | 8,436,812 | 0.9 | 100.0% | 1.45x | 11.1% | 66.7% | 50.2% | |||
| Manufacturing | 2 | 8,137,239 | 0.9 | 100.0% | 1.45x | 11.1% | 66.7% | 50.2% | |||
| Subtotal | 119 | $201,323,179 | 21.5 | % | 97.5% | 2.77x | 13.0% | 51.3% | 49.3% | ||
| Hotel | |||||||||||
| Full Service | 5 | $97,600,000 | 10.4 | % | 79.3% | 2.51x | 16.2% | 60.1% | 55.5% | ||
| Extended Stay | 51 | 83,881,476 | 9.0 | 79.8% | 2.23x | 14.1% | 63.7% | 59.5% | |||
| Limited Service | 4 | 16,783,908 | 1.8 | 65.5% | 1.74x | 13.2% | 65.1% | 52.9% | |||
| Subtotal | 60 | $198,265,384 | 21.2 | % | 78.4% | 2.32x | 15.0% | 62.0% | 57.0% | ||
| Office | |||||||||||
| CBD | 1 | $56,000,000 | 6.0 | % | 100.0% | 1.29x | 8.9% | 72.0% | 66.1% | ||
| Suburban | 8 | 51,441,841 | 5.5 | 91.0% | 1.61x | 11.4% | 66.9% | 54.2% | |||
| Office/Retail | 1 | 17,900,000 | 1.9 | 95.7% | 1.59x | 9.9% | 66.3% | 56.9% | |||
| Medical | 1 | 3,750,000 | 0.4 | 100.0% | 1.39x | 8.7% | 75.0% | 66.1% | |||
| Subtotal | 11 | $129,091,841 | 13.8 | % | 95.8% | 1.46x | 10.0% | 69.2% | 60.1% | ||
| Retail | |||||||||||
| Unanchored | 6 | $60,656,674 | 6.5 | % | 90.7% | 1.39x | 9.4% | 66.0% | 59.5% | ||
| Anchored | 4 | 19,952,346 | 2.1 | 87.3% | 1.37x | 10.3% | 71.4% | 57.6% | |||
| Shadow Anchored | 3 | 19,268,526 | 2.1 | 92.4% | 2.22x | 11.0% | 62.5% | 59.5% | |||
| Retail/Multifamily | 1 | 5,850,000 | 0.6 | 99.0% | 1.25x | 8.4% | 72.0% | 63.6% | |||
| Single Tenant | 1 | 5,300,000 | 0.6 | 100.0% | 1.33x | 8.2% | 61.6% | 56.5% | |||
| Subtotal | 15 | $111,027,546 | 11.9 | % | 91.2% | 1.52x | 9.7% | 66.5% | 59.2% | ||
| Manufactured Housing | |||||||||||
| Manufactured Housing | 17 | $50,151,722 | 5.4% | 84.9% | 1.52x | 9.9% | 72.9% | 60.6% | |||
| Subtotal | 17 | $50,151,722 | 5.4% | 84.9% | 1.52x | 9.9% | 72.9% | 60.6% | |||
| Self Storage | |||||||||||
| Self Storage | 3 | $5,200,000 | 0.6% | 93.2% | 1.51x | 9.6% | 67.1% | 59.0% | |||
| Subtotal | 3 | $5,200,000 | 0.6% | 93.2% | 1.51x | 9.6% | 67.1% | 59.0% | |||
| Total / Wtd. Avg.: | 241 | $936,420,933 | 100.0% | 91.5% | 1.92x | 11.3% | 64.4% | 58.4% | |||
| (1) | Because this table presents information relating to the mortgaged properties and not mortgage loans, the information for mortgage loans secured by more than one mortgaged property is based on allocated loan amounts. |
| (2) | In the case of Loan Nos. 1, 2, 3 and 12, the UW NCF DSCR, UW NOI Debt Yield, Cut-off Date LTV and Maturity Date LTV calculations include the relatedpari passu companion loan. In the case of Loan Nos. 1, 3, 9 and 21, the UW NCF DSCR, UW NOI Debt Yield, Cut-off Date LTV and Maturity Date LTV calculations exclude the mezzanine loan. In the case of Loan Nos. 1 and 46, the UW NCF DSCR, UW NOI Debt Yield, Cut-off Date LTV and Maturity Date LTV calculations exclude the subordinate companion loan(s). |
| (3) | For each partial interest-only mortgage loan, the UW NCF DSCR is calculated using the first principal and interest payment to be made into the trust during the term of the mortgage loan once amortization has commenced. |
| (4) | In the case of Loan Nos. 9, 11, 17 and 18, the Cut-off Date LTV and Maturity Date LTV are calculated based upon an “as-stabilized” or “as-complete” appraised value based on certain assumptions. Refer to “Description of the Mortgage Pool—Certain Calculations and Definitions” in the Preliminary Prospectus for additional details. |
| (5) | In the case of Loan No. 2 with an anticipated repayment date, the Maturity Date LTV is as of the related anticipated repayment date. |
THE INFORMATION IN THIS COLLATERAL TERM SHEET IS NOT COMPLETE AND MAY BE AMENDED PRIOR TO THE TIME OF SALE. THIS TERM SHEET IS NOT AN OFFER TO SELL THESE SECURITIES AND IT IS NOT A SOLICITATION OF AN OFFER TO BUY THESE SECURITIES IN ANY JURISDICTION WHERE THE OFFER OR SALE IS NOT PERMITTED.
| 6 |
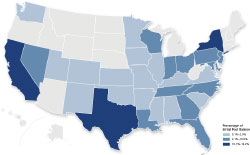
Mortgaged Properties by Location(1)
| State | Number of Properties | Cut-off Date Principal Balance | % of IPB | Occupancy | UW NCF DSCR(2)(3) | UW NOI Debt Yield(2) | Cut-off Date LTV(2)(4) | Maturity Date LTV(2)(4)(5) | |
| CA | 22 | $123,515,543 | 13.2 | % | 92.4% | 2.07x | 12.2% | 60.0% | 53.4% |
| NY | 2 | 95,436,812 | 10.2 | 100.0% | 1.92x | 8.8% | 66.7% | 65.2% | |
| TX | 49 | 94,375,462 | 10.1 | 89.1% | 2.02x | 12.5% | 62.6% | 56.8% | |
| PA | 3 | 69,272,742 | 7.4 | 98.8% | 1.31x | 9.0% | 70.6% | 64.1% | |
| DC | 2 | 58,303,006 | 6.2 | 97.6% | 1.67x | 7.3% | 70.0% | 70.0% | |
| GA | 13 | 45,384,916 | 4.8 | 88.2% | 1.82x | 12.3% | 65.4% | 58.6% | |
| NC | 11 | 44,690,867 | 4.8 | 88.6% | 1.56x | 10.1% | 72.5% | 63.4% | |
| MD | 23 | 43,554,172 | 4.7 | 94.5% | 2.24x | 11.8% | 61.8% | 57.7% | |
| IN | 9 | 40,785,610 | 4.4 | 76.4% | 2.44x | 16.2% | 57.3% | 50.1% | |
| OH | 9 | 40,203,665 | 4.3 | 85.9% | 1.57x | 11.4% | 67.4% | 55.1% | |
| LA | 7 | 30,844,984 | 3.3 | 85.8% | 1.65x | 10.7% | 69.2% | 60.7% | |
| FL | 6 | 28,437,575 | 3.0 | 90.3% | 1.59x | 10.4% | 68.8% | 61.7% | |
| NJ | 10 | 26,541,883 | 2.8 | 87.9% | 2.18x | 13.2% | 54.6% | 53.3% | |
| TN | 10 | 24,778,985 | 2.6 | 97.5% | 2.11x | 11.4% | 59.2% | 51.2% | |
| WI | 3 | 23,750,102 | 2.5 | 90.6% | 1.45x | 9.3% | 70.0% | 57.2% | |
| NV | 4 | 23,475,200 | 2.5 | 90.3% | 2.06x | 10.6% | 64.0% | 59.8% | |
| IL | 20 | 18,733,014 | 2.0 | 94.6% | 3.12x | 15.1% | 43.5% | 40.9% | |
| IA | 1 | 16,800,000 | 1.8 | 99.3% | 1.36x | 8.8% | 73.4% | 67.4% | |
| WA | 2 | 13,816,632 | 1.5 | 75.0% | 5.00x | 22.7% | 43.7% | 42.1% | |
| VA | 8 | 13,512,555 | 1.4 | 72.6% | 1.89x | 12.8% | 66.4% | 54.6% | |
| UT | 2 | 11,520,227 | 1.2 | 99.6% | 1.61x | 11.6% | 61.6% | 49.4% | |
| CO | 5 | 10,451,048 | 1.1 | 85.8% | 2.38x | 13.6% | 60.7% | 54.6% | |
| OK | 2 | 8,137,239 | 0.9 | 100.0% | 1.45x | 11.1% | 66.7% | 50.2% | |
| SC | 2 | 7,173,738 | 0.8 | 94.9% | 1.45x | 9.1% | 73.2% | 67.5% | |
| KS | 3 | 5,202,660 | 0.6 | 80.2% | 1.56x | 10.4% | 72.7% | 60.0% | |
| AL | 5 | 4,995,030 | 0.5 | 65.8% | 2.26x | 14.0% | 64.3% | 61.3% | |
| MO | 2 | 3,851,131 | 0.4 | 93.2% | 1.56x | 10.4% | 72.7% | 60.0% | |
| AR | 1 | 3,150,000 | 0.3 | 100.0% | 1.54x | 9.8% | 73.3% | 61.8% | |
| MN | 1 | 2,485,069 | 0.3 | 86.8% | 1.56x | 10.4% | 72.7% | 60.0% | |
| NM | 1 | 1,700,311 | 0.2 | 97.2% | 1.56x | 10.4% | 72.7% | 60.0% | |
| MS | 2 | 1,018,887 | 0.1 | 59.0% | 2.26x | 14.0% | 64.3% | 61.3% | |
| KY | 1 | 521,869 | 0.1 | 56.2% | 2.26x | 14.0% | 64.3% | 61.3% | |
| Total / Wtd. Avg.: | 241 | $936,420,933 | 100.0 | % | 91.5% | 1.92x | 11.3% | 64.4% | 58.4% |
| (1) | Because this table presents information relating to the mortgaged properties and not mortgage loans, the information for mortgage loans secured by more than one mortgaged property is based on allocated loan amounts. |
| (2) | In the case of Loan Nos. 1, 2, 3 and 12, the UW NCF DSCR, UW NOI Debt Yield, Cut-off Date LTV and Maturity Date LTV calculations include the relatedpari passu companion loan. In the case of Loan Nos. 1, 3, 9 and 21, the UW NCF DSCR, UW NOI Debt Yield, Cut-off Date LTV and Maturity Date LTV calculations exclude the mezzanine loan. In the case of Loan Nos. 1 and 46, the UW NCF DSCR, UW NOI Debt Yield, Cut-off Date LTV and Maturity Date LTV calculations exclude the subordinate companion loan. |
| (3) | For each partial interest-only mortgage loan, the UW NCF DSCR is calculated using the first principal and interest payment to be made into the trust during the term of the mortgage loan once amortization has commenced. |
| (4) | In the case of Loan Nos. 9, 11, 17 and 18, the Cut-off Date LTV and Maturity Date LTV are calculated based upon an “as-stabilized” or “as-complete” appraised value based on certain assumptions. Refer to “Description of the Mortgage Pool—Certain Calculations and Definitions” in the Preliminary Prospectus for additional details. |
| (5) | In the case of Loan No. 2 with an anticipated repayment date, the Maturity Date LTV is as of the related anticipated repayment date. |
THE INFORMATION IN THIS COLLATERAL TERM SHEET IS NOT COMPLETE AND MAY BE AMENDED PRIOR TO THE TIME OF SALE. THIS TERM SHEET IS NOT AN OFFER TO SELL THESE SECURITIES AND IT IS NOT A SOLICITATION OF AN OFFER TO BUY THESE SECURITIES IN ANY JURISDICTION WHERE THE OFFER OR SALE IS NOT PERMITTED.
| 7 |
Cut-off Date Principal Balance
| Weighted Average | |||||||||
| Range of Principal Balances | Number of Loans | Cut-off Date Principal Balance | % of IPB | Mortgage Rate | Remaining Loan Term(1) | UW NCF DSCR(2)(3) | UW NOI Debt Yield(2) | Cut-off Date LTV(2)(4) | Maturity Date LTV(1)(2)(4) |
| 1,816,632 to 4,999,999 | 15 | $57,757,576 | 6.2% | 4.8966% | 116 | 1.45x | 10.0% | 69.1% | 58.1% |
| 5,000,000 to 9,999,999 | 16 | 109,465,067 | 11.7 | 4.8262% | 111 | 1.50x | 10.4% | 67.7% | 58.1% |
| 10,000,000 to 19,999,999 | 16 | 228,596,837 | 24.4 | 4.7230% | 105 | 1.76x | 10.8% | 68.4% | 59.6% |
| 20,000,000 to 24,999,999 | 4 | 87,136,453 | 9.3 | 4.7982% | 108 | 1.65x | 11.8% | 67.3% | 57.7% |
| 25,000,000 to 49,999,999 | 3 | 90,865,000 | 9.7 | 4.5569% | 116 | 1.70x | 11.7% | 66.8% | 60.4% |
| 50,000,000 to 87,100,000 | 5 | 362,600,000 | 38.7 | 4.2525% | 104 | 2.35x | 11.8% | 58.9% | 57.4% |
| Total / Wtd. Avg.: | 59 | $936,420,933 | 100.0% | 4.5545% | 107 | 1.92x | 11.3% | 64.4% | 58.4% |
Mortgage Interest Rates
| Weighted Average | |||||||||
| Range of Mortgage Interest Rates | Number of Loans | Cut-off Date Principal Balance | % of IPB | Mortgage Rate | Remaining Loan Term(1) | UW NCF DSCR(2)(3) | UW NOI Debt Yield(2) | Cut-off Date LTV(2)(4) | Maturity Date LTV(1)(2)(4) |
| 3.5500% to 3.9999% | 1 | $12,000,000 | 1.3% | 3.5500% | 56 | 5.55x | 24.7% | 40.0% | 40.0% |
| 4.0000% to 4.2499% | 4 | 249,600,000 | 26.7 | 4.1231% | 98 | 2.74x | 14.3% | 53.2% | 51.4% |
| 4.2500% to 4.4999% | 3 | 110,400,000 | 11.8 | 4.2918% | 111 | 1.99x | 9.0% | 66.8% | 66.4% |
| 4.5000% to 4.7499% | 20 | 277,787,145 | 29.7 | 4.6672% | 110 | 1.49x | 10.0% | 69.4% | 61.2% |
| 4.7500% to 4.9999% | 21 | 198,305,504 | 21.2 | 4.8846% | 111 | 1.46x | 10.1% | 70.5% | 61.3% |
| 5.0000% to 5.5000% | 10 | 88,328,284 | 9.4 | 5.1422% | 117 | 1.47x | 10.7% | 67.5% | 55.5% |
| Total / Wtd. Avg.: | 59 | $936,420,933 | 100.0% | 4.5545% | 107 | 1.92x | 11.3% | 64.4% | 58.4% |
Original Term to Maturity/ARD in Months(1)
| Weighted Average | |||||||||
| Original Term to Maturity/ARD in Months | Number of Loans | Cut-off Date Principal Balance | % of IPB | Mortgage Rate | Remaining Loan Term | UW NCF DSCR(2)(3) | UW NOI Debt Yield(2) | Cut-off Date LTV(2)(4) | Maturity Date LTV(2)(4) |
| 60 | 5 | $125,665,000 | 13.4% | 4.1672% | 54 | 2.38x | 14.1% | 64.2% | 61.0% |
| 84 | 1 | 21,600,000 | 2.3 | 4.5500% | 81 | 2.00x | 14.5% | 68.4% | 62.6% |
| 120 | 53 | 789,155,933 | 84.3 | 4.6162% | 116 | 1.85x | 10.7% | 64.4% | 57.9% |
| Total / Wtd. Avg.: | 59 | $936,420,933 | 100.0% | 4.5545% | 107 | 1.92x | 11.3% | 64.4% | 58.4% |
| (1) | In the case of Loan No. 2 with an anticipated repayment date, the Original Term to Maturity/ARD, Remaining Loan Term and Maturity Date LTV are as of the related anticipated repayment date. |
| (2) | In the case of Loan Nos. 1, 2, 3 and 12, the UW NCF DSCR, UW NOI Debt Yield, Cut-off Date LTV and Maturity Date LTV calculations include the relatedpari passu companion loan. In the case of Loan Nos. 1, 3, 9, and 21, the UW NCF DSCR, UW NOI Debt Yield, Cut-off Date LTV and Maturity Date LTV calculations exclude the mezzanine loan. In the case of Loan Nos. 1 and 46, the UW NCF DSCR, UW NOI Debt Yield, Cut-off Date LTV and Maturity Date LTV calculations exclude the subordinate companion loan(s). |
| (3) | For each partial interest-only mortgage loan, the UW NCF DSCR is calculated using the first principal and interest payment to be made into the trust during the term of the mortgage loan once amortization has commenced. |
| (4) | In the case of Loan Nos. 9, 11, 17 and 18, the Cut-off Date LTV and Maturity Date LTV are calculated based upon an “as-stabilized” or “as-complete” appraised value based on certain assumptions. Refer to “Description of the Mortgage Pool—Certain Calculations and Definitions” in the Preliminary Prospectus for additional details. |
THE INFORMATION IN THIS COLLATERAL TERM SHEET IS NOT COMPLETE AND MAY BE AMENDED PRIOR TO THE TIME OF SALE. THIS TERM SHEET IS NOT AN OFFER TO SELL THESE SECURITIES AND IT IS NOT A SOLICITATION OF AN OFFER TO BUY THESE SECURITIES IN ANY JURISDICTION WHERE THE OFFER OR SALE IS NOT PERMITTED.
| 8 |
Remaining Term to Maturity/ARD in Months(1)
| Weighted Average | |||||||||
| Remaining Term to Maturity/ARD in Months | Number of Loans | Cut-off Date Principal Balance | % of IPB | Mortgage Rate | Remaining Loan Term | UW NCF DSCR(2)(3) | UW NOI Debt Yield(2) | Cut-off Date LTV(2)(4) | Maturity Date LTV(2)(4) |
| 53 to 60 | 5 | $125,665,000 | 13.4% | 4.1672% | 54 | 2.38x | 14.1% | 64.2% | 61.0% |
| 61 to 117 | 54 | 810,755,933 | 86.6 | 4.6145% | 115 | 1.85x | 10.8% | 64.5% | 58.0% |
| Total / Wtd. Avg.: | 59 | $936,420,933 | 100.0% | 4.5545% | 107 | 1.92x | 11.3% | 64.4% | 58.4% |
Original Amortization Term in Months
| Weighted Average | |||||||||
| Original Amortization Term in Months | Number of Loans | Cut-off Date Principal Balance | % of IPB | Mortgage Rate | Remaining Loan Term(1) | UW NCF DSCR(2)(3) | UW NOI Debt Yield(2) | Cut-off Date LTV(2)(4) | Maturity Date LTV(1)(2)(4) |
| Interest Only | 5 | $257,100,000 | 27.5% | 4.1919% | 114 | 2.77x | 12.4% | 53.7% | 53.7% |
| 300 | 5 | 44,087,804 | 4.7 | 5.0335% | 116 | 1.54x | 11.9% | 66.5% | 50.3% |
| 360 | 49 | 635,233,129 | 67.8 | 4.6680% | 104 | 1.61x | 10.8% | 68.7% | 60.9% |
| Total / Wtd. Avg.: | 59 | $936,420,933 | 100.0% | 4.5545% | 107 | 1.92x | 11.3% | 64.4% | 58.4% |
Remaining Amortization Term in Months
| Weighted Average | |||||||||
| Remaining Amortization Term in Months | Number of Loans | Cut-off Date Principal Balance | % of IPB | Mortgage Rate | Remaining Loan Term(1) | UW NCF DSCR(2)(3) | UW NOI Debt Yield(2) | Cut-off Date LTV(2)(4) | Maturity Date LTV(1)(2)(4) |
| Interest Only | 5 | $257,100,000 | 27.5% | 4.1919% | 114 | 2.77x | 12.4% | 53.7% | 53.7% |
| 292 to 298 | 4 | 40,247,804 | 4.3 | 5.0386% | 116 | 1.56x | 12.1% | 65.7% | 49.5% |
| 299 to 337 | 1 | 3,840,000 | 0.4 | 4.9800% | 116 | 1.25x | 9.7% | 74.9% | 58.3% |
| 338 to 360 | 49 | 635,233,129 | 67.8 | 4.6680% | 104 | 1.61x | 10.8% | 68.7% | 60.9% |
| Total / Wtd. Avg.: | 59 | $936,420,933 | 100.0% | 4.5545% | 107 | 1.92x | 11.3% | 64.4% | 58.4% |
| (1) | In the case of Loan No. 2 with an anticipated repayment date, the Remaining Term to Maturity/ARD, Remaining Loan Term and Maturity Date LTV are as of the related anticipated repayment date. |
| (2) | In the case of Loan Nos. 1, 2, 3 and 12, the UW NCF DSCR, UW NOI Debt Yield, Cut-off Date LTV and Maturity Date LTV calculations include the relatedpari passu companion loan. In the case of Loan Nos. 1, 3, 9 and 21, the UW NCF DSCR, UW NOI Debt Yield, Cut-off Date LTV and Maturity Date LTV calculations exclude the mezzanine loan. In the case of Loan Nos. 1 and 46, the UW NCF DSCR, UW NOI Debt Yield, Cut-off Date LTV and Maturity Date LTV calculations exclude the subordinate companion loan(s). |
| (3) | For each partial interest-only mortgage loan, the UW NCF DSCR is calculated using the first principal and interest payment to be made into the trust during the term of the mortgage loan once amortization has commenced. |
| (4) | In the case of Loan Nos. 9, 11, 17 and 18, the Cut-off Date LTV and Maturity Date LTV are calculated based upon an “as-stabilized” or “as-complete” appraised value based on certain assumptions. Refer to “Description of the Mortgage Pool—Certain Calculations and Definitions” in the Preliminary Prospectus for additional details. |
THE INFORMATION IN THIS COLLATERAL TERM SHEET IS NOT COMPLETE AND MAY BE AMENDED PRIOR TO THE TIME OF SALE. THIS TERM SHEET IS NOT AN OFFER TO SELL THESE SECURITIES AND IT IS NOT A SOLICITATION OF AN OFFER TO BUY THESE SECURITIES IN ANY JURISDICTION WHERE THE OFFER OR SALE IS NOT PERMITTED.
| 9 |
Amortization Types
| Weighted Average | |||||||||
| Amortization Types | Number of Loans | Cut-off Date Principal Balance | % of IPB | Mortgage Rate | Remaining Loan Term(1) | UW NCF DSCR(2)(3) | UW NOI Debt Yield(2) | Cut-off Date LTV(2)(4) | Maturity Date LTV(1)(2)(4) |
| IO-Balloon | 32 | $464,612,500 | 49.6% | 4.6084% | 99 | 1.65x | 11.0% | 68.2% | 62.1% |
| Balloon | 22 | 214,708,433 | 22.9 | 4.8718% | 116 | 1.51x | 10.5% | 69.3% | 56.0% |
| Interest Only | 4 | 170,100,000 | 18.2 | 4.1468% | 113 | 3.18x | 14.4% | 47.0% | 47.0% |
| Interest Only, ARD | 1 | 87,000,000 | 9.3 | 4.2800% | 117 | 1.97x | 8.6% | 66.7% | 66.7% |
| Total / Wtd. Avg.: | 59 | $936,420,933 | 100.0% | 4.5545% | 107 | 1.92x | 11.3% | 64.4% | 58.4% |
Interest Only Periods(5)
| Weighted Average | |||||||||
| Interest Only Periods | Number of Loans | Cut-off Date Principal Balance | % of IPB | Mortgage Rate | Remaining Loan Term(1) | UW NCF DSCR(2)(3) | UW NOI Debt Yield(2) | Cut-off Date LTV(2)(4) | Maturity Date LTV(1)(2)(4) |
| 12 to 24 | 14 | $200,267,500 | 21.4% | 4.4832% | 77 | 1.85x | 12.1% | 67.8% | 62.0% |
| 25 to 48 | 10 | 94,800,000 | 10.1 | 4.5807% | 117 | 1.74x | 11.9% | 65.3% | 57.3% |
| 49 to 60 | 8 | 161,545,000 | 17.3 | 4.6541% | 112 | 1.64x | 10.0% | 69.0% | 63.6% |
| 61 to 120 | 5 | 265,100,000 | 28.3 | 4.2811% | 117 | 2.56x | 11.8% | 54.9% | 54.8% |
| Total / Wtd. Avg.: | 37 | $721,712,500 | 77.1% | 4.4600% | 105 | 2.05x | 11.5% | 63.0% | 59.1% |
Underwritten Net Cash Flow Debt Service Coverage Ratios(2)(3)
| Weighted Average | |||||||||
| Underwritten Net Cash Flow Debt Service Coverage Ratios | Number of Loans | Cut-off Date Principal Balance | % of IPB | Mortgage Rate | Remaining Loan Term(1) | UW NCF DSCR | UW NOI Debt Yield | Cut-off Date LTV(4) | Maturity Date LTV(1)(4) |
| 1.22 to 1.24 | 3 | $23,871,318 | 2.5% | 4.7482% | 116 | 1.23x | 8.1% | 71.6% | 59.1% |
| 1.25 to 1.49 | 30 | 348,805,430 | 37.2 | 4.8128% | 112 | 1.36x | 9.2% | 70.6% | 62.1% |
| 1.50 to 1.74 | 13 | 182,777,509 | 19.5 | 4.6386% | 116 | 1.59x | 9.6% | 69.6% | 62.6% |
| 1.75 to 1.99 | 6 | 127,766,676 | 13.6 | 4.4901% | 116 | 1.93x | 10.1% | 65.6% | 61.9% |
| 2.00 to 2.24 | 2 | 35,600,000 | 3.8 | 4.6051% | 71 | 2.07x | 14.9% | 67.2% | 62.1% |
| 2.25 to 2.49 | 2 | 105,000,000 | 11.2 | 4.0485% | 71 | 2.31x | 14.9% | 62.5% | 58.2% |
| 2.50 to 2.74 | 1 | 13,500,000 | 1.4 | 4.3500% | 116 | 2.53x | 11.6% | 59.5% | 59.5% |
| 2.75 to 3.99 | 1 | 87,100,000 | 9.3 | 4.1439% | 117 | 3.97x | 18.2% | 30.5% | 30.5% |
| 4.00 to 5.55 | 1 | 12,000,000 | 1.3 | 3.5500% | 56 | 5.55x | 24.7% | 40.0% | 40.0% |
| Total / Wtd. Avg.: | 59 | $936,420,933 | 100.0% | 4.5545% | 107 | 1.92x | 11.3% | 64.4% | 58.4% |
| (1) | In the case of Loan No. 2 with an anticipated repayment date, the Remaining Loan Term and Maturity Date LTV are as of the related anticipated repayment date. |
| (2) | In the case of Loan Nos. 1, 2, 3 and 12, the UW NCF DSCR, UW NOI Debt Yield, Cut-off Date LTV and Maturity Date LTV calculations include the relatedpari passu companion loan. In the case of Loan Nos. 1, 3, 9 and 21, the UW NCF DSCR, UW NOI Debt Yield, Cut-off Date LTV and Maturity Date LTV calculations exclude the mezzanine loan. In the case of Loan Nos. 1 and 46, the UW NCF DSCR, UW NOI Debt Yield, Cut-off Date LTV and Maturity Date LTV calculations exclude the subordinate companion loan. |
| (3) | For each partial interest-only mortgage loan, the UW NCF DSCR is calculated using the first principal and interest payment to be made into the trust during the term of the mortgage loan once amortization has commenced. |
| (4) | In the case of Loan Nos. 9, 11, 17 and 18, the Cut-off Date LTV and Maturity Date LTV are calculated based upon an “as-stabilized” or “as-complete” appraised value based on certain assumptions. Refer to “Description of the Mortgage Pool—Certain Calculations and Definitions” in the Preliminary Prospectus for additional details. |
| (5) | Excluding twenty-two (22) loans that have no interest-only period for during the loan term. |
THE INFORMATION IN THIS COLLATERAL TERM SHEET IS NOT COMPLETE AND MAY BE AMENDED PRIOR TO THE TIME OF SALE. THIS TERM SHEET IS NOT AN OFFER TO SELL THESE SECURITIES AND IT IS NOT A SOLICITATION OF AN OFFER TO BUY THESE SECURITIES IN ANY JURISDICTION WHERE THE OFFER OR SALE IS NOT PERMITTED.
| 10 |
LTV Ratios as of the Cut-off Date(1)(2)
| Weighted Average | |||||||||
| Range of Cut-off Date LTVs | Number of Loans | Cut-off Date Principal Balance | % of IPB | Mortgage Rate | Remaining Loan Term(3) | UW NCF DSCR(4) | UW NOI Debt Yield | Cut-off Date LTV | Maturity Date LTV(3) |
| 30.5% to 34.9% | 1 | $87,100,000 | 9.3% | 4.1439% | 117 | 3.97x | 18.2% | 30.5% | 30.5% |
| 35.0% to 44.9% | 1 | 12,000,000 | 1.3 | 3.5500% | 56 | 5.55x | 24.7% | 40.0% | 40.0% |
| 45.0% to 49.9% | 1 | 5,307,511 | 0.6 | 5.0800% | 117 | 1.45x | 11.9% | 46.2% | 38.2% |
| 50.0% to 54.9% | 1 | 4,850,000 | 0.5 | 4.9900% | 116 | 1.83x | 12.4% | 54.5% | 48.2% |
| 55.0% to 59.9% | 3 | 52,381,476 | 5.6 | 4.3150% | 115 | 2.37x | 15.5% | 58.5% | 51.7% |
| 60.0% to 64.9% | 7 | 147,829,096 | 15.8 | 4.4231% | 84 | 1.89x | 12.2% | 63.8% | 59.9% |
| 65.0% to 69.9% | 17 | 255,213,316 | 27.3 | 4.6517% | 110 | 1.74x | 10.4% | 67.0% | 60.3% |
| 70.0% to 74.9% | 25 | 330,224,534 | 35.3 | 4.6847% | 114 | 1.42x | 8.9% | 72.2% | 64.0% |
| 75.0% to 79.4% | 3 | 41,515,000 | 4.4 | 4.7243% | 101 | 1.31x | 8.5% | 78.7% | 72.5% |
| Total / Wtd. Avg.: | 59 | $936,420,933 | 100.0% | 4.5545% | 107 | 1.92x | 11.3% | 64.4% | 58.4% |
LTV Ratios as of the Maturity Date(1)(2)(3)
| Weighted Average | |||||||||
| Range of Maturity/ARD Date LTVs | Number of Loans | Cut-off Date Principal Balance | % of IPB | Mortgage Rate | Remaining Loan Term | UW NCF DSCR(4) | UW NOI Debt Yield | Cut-off Date LTV | Maturity Date LTV |
| 30.5% to 34.9% | 1 | $87,100,000 | 9.3% | 4.1439% | 117 | 3.97x | 18.2% | 30.5% | 30.5% |
| 35.0% to 39.9% | 1 | 5,307,511 | 0.6 | 5.0800% | 117 | 1.45x | 11.9% | 46.2% | 38.2% |
| 40.0% to 44.9% | 2 | 20,881,476 | 2.2 | 4.1199% | 80 | 4.01x | 20.6% | 48.0% | 41.9% |
| 45.0% to 49.9% | 1 | 4,850,000 | 0.5 | 4.9900% | 116 | 1.83x | 12.4% | 54.5% | 48.2% |
| 50.0% to 54.9% | 5 | 73,161,822 | 7.8 | 4.6744% | 116 | 1.90x | 13.8% | 62.5% | 50.8% |
| 55.0% to 59.9% | 22 | 212,426,915 | 22.7 | 4.7083% | 116 | 1.54x | 10.0% | 67.6% | 57.9% |
| 60.0% to 64.9% | 18 | 252,983,209 | 27.0 | 4.6212% | 91 | 1.77x | 11.7% | 68.5% | 61.6% |
| 65.0% to 69.9% | 6 | 184,445,000 | 19.7 | 4.5229% | 112 | 1.62x | 8.7% | 69.8% | 66.7% |
| 70.0% to 73.5% | 3 | 95,265,000 | 10.2 | 4.4220% | 110 | 1.50x | 7.7% | 73.9% | 71.6% |
| Total / Wtd. Avg.: | 59 | $936,420,933 | 100.0% | 4.5545% | 107 | 1.92x | 11.3% | 64.4% | 58.4% |
Prepayment Protection
| Weighted Average | |||||||||
| Prepayment Protection | Number of Loans | Cut-off Date Principal Balance | % of IPB | Mortgage Rate | Remaining Loan Term(3) | UW NCF DSCR(1)(4) | UW NOI Debt Yield(1) | Cut-off Date LTV(1)(2) | Maturity Date LTV(1)(2)(3) |
| Defeasance | 52 | $692,206,830 | 73.9% | 4.6439% | 111 | 1.68x | 10.2% | 68.4% | 61.6% |
| Yield Maintenance | 6 | 169,214,103 | 18.1 | 4.4272% | 117 | 2.79x | 14.4% | 48.2% | 43.9% |
| Defeasance or Yield Maintenance | 1 | 75,000,000 | 8.0 | 4.0163% | 53 | 2.26x | 14.0% | 64.3% | 61.3% |
| Total / Wtd. Avg.: | 59 | $936,420,933 | 100.0% | 4.5545% | 107 | 1.92x | 11.3% | 64.4% | 58.4% |
| (1) | In the case of Loan Nos. 1, 2, 3 and 12, the UW NCF DSCR, UW NOI Debt Yield, Cut-off Date LTV and Maturity Date LTV calculations include the relatedpari passu companion loan. In the case of Loan Nos. 1, 3, 9 and 21, the UW NCF DSCR, UW NOI Debt Yield, Cut-off Date LTV and Maturity Date LTV calculations exclude the mezzanine loan. In the case of Loan Nos. 1 and 46, the UW NCF DSCR, UW NOI Debt Yield, Cut-off Date LTV and Maturity Date LTV calculations exclude the subordinate companion loan(s). |
| (2) | In the case of Loan Nos. 9, 11, 17 and 18, the Cut-off Date LTV and Maturity Date LTV are calculated based upon an “as-stabilized” or “as-complete” appraised value based on certain assumptions. Refer to “Description of the Mortgage Pool—Certain Calculations and Definitions” in the Preliminary Prospectus for additional details. |
| (3) | In the case of Loan No. 2 with an anticipated repayment date, Remaining Loan Term and Maturity Date LTV are as of the related anticipated repayment date. |
| (4) | For each partial interest-only mortgage loan, the UW NCF DSCR is calculated using the first principal and interest payment to be made into the trust during the term of the mortgage loan once amortization has commenced. |
THE INFORMATION IN THIS COLLATERAL TERM SHEET IS NOT COMPLETE AND MAY BE AMENDED PRIOR TO THE TIME OF SALE. THIS TERM SHEET IS NOT AN OFFER TO SELL THESE SECURITIES AND IT IS NOT A SOLICITATION OF AN OFFER TO BUY THESE SECURITIES IN ANY JURISDICTION WHERE THE OFFER OR SALE IS NOT PERMITTED.
| 11 |
Loan Purpose
| Weighted Average | |||||||||
| Loan Purpose | Number of Loans | Cut-off Date Principal Balance | % of IPB | Mortgage Rate | Remaining Loan Term(1) | UW NCF DSCR(2)(3) | UW NOI Debt Yield(2) | Cut-off Date LTV(2)(4) | Maturity Date LTV(1)(2)(4) |
| Refinance | 37 | $474,392,512 | 50.7% | 4.6597% | 115 | 1.74x | 10.7% | 67.2% | 59.1% |
| Acquisition | 22 | 462,028,421 | 49.3 | 4.4464% | 99 | 2.12x | 11.9% | 61.7% | 57.7% |
| Total / Wtd. Avg.: | 59 | $936,420,933 | 100.0% | 4.5545% | 107 | 1.92x | 11.3% | 64.4% | 58.4% |
| (1) | In the case of Loan No. 2 with an anticipated repayment date, Remaining Loan Term and Maturity Date LTV are as of the related anticipated repayment date. |
| (2) | In the case of Loan Nos. 1, 2, 3 and 12, the UW NCF DSCR, UW NOI Debt Yield, Cut-off Date LTV and Maturity Date LTV calculations include the relatedpari passu companion loan. In the case of Loan Nos. 1, 3, 9 and 21, the UW NCF DSCR, UW NOI Debt Yield, Cut-off Date LTV and Maturity Date LTV calculations exclude the mezzanine loan. In the case of Loan Nos. 1 and 46, the UW NCF DSCR, UW NOI Debt Yield, Cut-off Date LTV and Maturity Date LTV calculations exclude the subordinate companion loan(s). |
| (3) | For each partial interest-only mortgage loan, the UW NCF DSCR is calculated using the first principal and interest payment to be made into the trust during the term of the mortgage loan once amortization has commenced. |
| (4) | In the case of Loan Nos. 9, 11, 17 and 18, the Cut-off Date LTV and Maturity Date LTV are calculated based upon an “as-stabilized” or “as-complete” appraised value based on certain assumptions. Refer to “Description of the Mortgage Pool—Certain Calculations and Definitions” in the Preliminary Prospectus for additional details. |
THE INFORMATION IN THIS COLLATERAL TERM SHEET IS NOT COMPLETE AND MAY BE AMENDED PRIOR TO THE TIME OF SALE. THIS TERM SHEET IS NOT AN OFFER TO SELL THESE SECURITIES AND IT IS NOT A SOLICITATION OF AN OFFER TO BUY THESE SECURITIES IN ANY JURISDICTION WHERE THE OFFER OR SALE IS NOT PERMITTED.
| 12 |
Previous Securitization History(1)
| No. | Loan / Property Name | Location | Property Type | Previous Securitization |
| 1.001 | Inland Empire Indian Ave DC | Perris, CA | Industrial | WFRBS 2011-C2 |
| 1.022 | Champagne DC | Ontario, CA | Industrial | MSDWC 2001-IQA |
| 1.027 | Brandon Woods DC | Baltimore, MD | Industrial | WFRBS 2011-C3 |
| 1.031 | Franklin Square IC I | Rossville, MD | Industrial | GFCM 2003-1 |
| 1.060 | 10th Street Business Park 2 | Plano, TX | Industrial | GFCM 2003-1 |
| 1.061 | Park 55 | Bolingbrook, IL | Industrial | WBCMT 2006-C27 |
| 1.063 | Baltimore IC | Baltimore, MD | Industrial | GMACC 2001-C2 |
| 1.083 | Maple Point 2 | Woodridge, IL | Industrial | BSCMS 2007-PW17 |
| 1.092 | 10th Street Business Park 1 | Plano, TX | Industrial | GFCM 2003-1 |
| 1.098 | Park 88 | Aurora, IL | Industrial | WBCMT 2007-C31 |
| 6 | Baldwin Hills Center | Los Angeles, CA | Retail | JPMCC 2005-LDP5 |
| 7 | Embassy Suites and Claypool Court | Indianapolis, IN | Hotel | CSFB 2000-C1 |
| 8 | Rosecroft Mews Apartments | Fort Washington, MD | Multifamily | BACM 2005-5 |
| 11 | DoubleTree Commerce | Commerce, CA | Hotel | LBFRC 2007-LLFA; JPMCC 2011-FL1; CSFB 2004-TF2A |
| 12 | Sheraton Lincoln Harbor Hotel | Weehawken, NJ | Hotel | MSC 2007-T25; CSFB 1997-C2 |
| 15 | Madison Park | Torrance, CA | Office | BACM 2005-5 |
| 19.06 | Mobile Lodge | Lecompton, KS | Manufactured Housing | CSFB 2004-C3 |
| 23 | Frisco Plaza | Frisco, TX | Retail | JPMCC 2005-CB13 |
| 24 | DoubleTree Spokane | Spokane, WA | Hotel | GSMS 2010-C2; BALL 2010-HLTN |
| 25.01 | Pinecrest Village | Shreveport, LA | Manufactured Housing | BACM 2006-5 |
| 25.02 | Stonegate MHC | Shreveport, LA | Manufactured Housing | LBUBS 2006-C6 |
| 25.03 | The Vineyards | Clifton, CO | Manufactured Housing | LBUBS 2006-C6 |
| 28 | 579 Executive Campus | Westerville, OH | Industrial | JPMCC 2005-CB12 |
| 32 | Cape Horn Square | Red Lion, PA | Retail | CSFB 2005-C6 |
| 40 | Heritage Square | Saint Charles, IL | Retail | CD 2006-CD2 |
| 44 | Cypress Gardens MHC | Las Vegas, NV | Manufactured Housing | PSSF 1999-C2 |
| 45.01 | Tropicana Centre | Las Vegas, NV | Retail | CSMC 2006-C1 |
| 45.02 | Flamingo Jones Plaza | Las Vegas, NV | Retail | CSMC 2006-C1 |
| 48 | The Plazas at Lakewood Forest | Houston, TX | Retail | JPMCC 2005-LDP1 |
| 49 | Magnolia Lane MHC | Fullerton, CA | Manufactured Housing | GMACC 1998-C2 |
| 50 | Dominion Market Plaza | Chesapeake, VA | Retail | BACM 2006-1 |
| 53 | New Lebanon Plaza | New Lebanon, OH | Retail | BSCMS 2005-PWR8 |
| 56 | Springfield Meadows | Springfield, OH | Manufactured Housing | GECMC 2006-C1 |
| 58 | Hot Springs | Hot Springs, AR | Retail | CSMC 2006-C2 |
| 59 | Woodland MHC/RV Resort | Woodland, WA | Manufactured Housing | CLNY 2014-MF1 |
| (1) | The table above represents the properties for which the previously existing debt was most recently securitized, based on information provided by the related borrower or obtained through searches of a third-party database. |
THE INFORMATION IN THIS COLLATERAL TERM SHEET IS NOT COMPLETE AND MAY BE AMENDED PRIOR TO THE TIME OF SALE. THIS TERM SHEET IS NOT AN OFFER TO SELL THESE SECURITIES AND IT IS NOT A SOLICITATION OF AN OFFER TO BUY THESE SECURITIES IN ANY JURISDICTION WHERE THE OFFER OR SALE IS NOT PERMITTED.
| 13 |
Class A-2(1)
| No. | Loan Name | Location | Cut-off Date Balance | % of IPB | Maturity/ARD Balance | % of Certificate Class(2) | Original Loan Term | Remaining Loan Term | UW NCF DSCR(3) | UW NOI Debt Yield(3) | Cut-off Date LTV Ratio(3) | Maturity Date/ARD LTV Ratio(3) |
| 3 | Starwood Capital Extended Stay Portfolio | Various | $75,000,000 | 8.0% | $71,515,809 | 58.8% | 60 | 53 | 2.26x | 14.0% | 64.3% | 61.3% |
| 18 | Ivy Ridge Apartments | Marietta, GA | 14,765,000 | 1.6 | 13,843,870 | 11.4% | 60 | 54 | 1.29x | 8.5% | 72.7% | 68.2% |
| 21 | Holiday Inn Austin | Austin, TX | 14,000,000 | 1.5 | 13,102,375 | 10.8% | 60 | 56 | 2.16x | 15.6% | 65.4% | 61.2% |
| 24 | DoubleTree Spokane | Spokane, WA | 12,000,000 | 1.3 | 12,000,000 | 9.9% | 60 | 56 | 5.55x | 24.7% | 40.0% | 40.0% |
| 29 | Savannah Place Apartments | Winston-Salem, NC | 9,900,000 | 1.1 | 9,313,687 | 7.7% | 60 | 56 | 1.42x | 8.9% | 78.1% | 73.5% |
| Total/Wtd. Avg.: | $125,665,000 | 13.4% | $119,775,741 | 98.5% | 2.38x | 14.1% | 64.2% | 61.0% | ||||
| (1) | The table above presents the mortgage loans whose balloon payments would be applied to pay down the majority of the principal balance of the Class A-2 certificates, assuming a 0% CPR and applying the “Modeling Assumptions” described in the Preliminary Prospectus, including the assumptions that (i) none of the mortgage loans in the pool experience prepayments prior to the maturity date or anticipated repayment date, as applicable, defaults or losses; (ii) there are no extensions of maturity dates of any mortgage loans in the pool; and (iii) each mortgage loan in the pool is paid in full on its stated maturity date or anticipated repayment date, as applicable. Each class of Certificates, including the Class A-2 certificates, evidences undivided ownership interests in the entire pool of mortgage loans. Debt service coverage ratio, debt yield and loan-to-value ratio information does not take into account subordinate debt (whether or not secured by the mortgaged property), if any, that is allowed under the terms of any mortgage loan. See Annex A-1 to the Preliminary Prospectus. |
| (2) | Reflects the percentage equal to the Maturity/ARD Balance divided by the initial Class A-2 certificate principal balance. The sum presented does not equal the total due to rounding. |
| (3) | In the case of Loan No. 3 the UW NCF DSCR, UW NOI Debt Yield, Cut-off Date LTV Ratio and Maturity Date/ARD LTV Ratio calculations include the relatedpari passu companion loan. In the case of Loan No. 21 the UW NCF DSCR, UW NOI Debt Yield, Cut-off Date LTV and Maturity Date LTV calculations exclude the mezzanine loan. In the case of Loan No. 18, the Cut-off Date LTV Ratio and Maturity Date/ARD LTV Ratio was calculated based upon an “as-stabilized” appraised value. |
THE INFORMATION IN THIS COLLATERAL TERM SHEET IS NOT COMPLETE AND MAY BE AMENDED PRIOR TO THE TIME OF SALE. THIS TERM SHEET IS NOT AN OFFER TO SELL THESE SECURITIES AND IT IS NOT A SOLICITATION OF AN OFFER TO BUY THESE SECURITIES IN ANY JURISDICTION WHERE THE OFFER OR SALE IS NOT PERMITTED.
| 14 |
Structural Overview
Order of Distribution:
| On each Distribution Date, funds available for distribution from the mortgage loans, net of specified trust expenses, yield maintenance charges, prepayment premiums and excess interest, will be distributed in the following amounts and order of priority (in each case to the extent of remaining available funds):
First:To interest on the Class A-1, Class A-2, Class A-3, Class A-4, Class A-5, Class A-SB, Class X-A, Class X-B, Class X-E, Class X-F and Class X-NR certificates, up to, andpro rata, in accordance with their respective interest entitlements.
Second:To the extent of funds allocated to principal and available for distribution: (i)first,to principal on the Class A-SB certificates, until the certificate balance of the Class A-SB certificates is reduced to the scheduled principal balance for the related distribution date set forth in Annex E to the Preliminary Prospectus, (ii)second,to principal on the Class A-1 certificates, until the certificate balance of the Class A-1 certificates has been reduced to zero, (iii)third,to principal on the Class A-2 certificates, until the certificate balance of the Class A-2 certificates has been reduced to zero, (iv)fourth,to principal on the Class A-3 certificates, until the certificate balance of the Class A-3 certificates has been reduced to zero, (v)fifth, to principal on the Class A-4 certificates until the certificate balance of the Class A-4 certificates has been reduced to zero, (vi)sixth, to principal on the Class A-5 certificates until the certificate balance of the Class A-5 has been reduced to zero and (vii)seventh, to principal on the Class A-SB certificates, until the certificate balance of the Class A-SB certificates has been reduced to zero. If the certificate balance of each and every class of certificates other than the Class A-1, Class A-2, Class A-3, Class A-4, Class A-5 and Class A-SB certificates has been reduced to zero as a result of the allocation of mortgage loan losses to those certificates, funds available for distributions of principal will be distributed to the Class A-1, Class A-2, Class A-3, Class A-4, Class A-5 and Class A-SB certificates,pro rata, based on their respective certificate balances, without regard to the distribution priorities described above or the planned principal balance of the Class A-SB certificates.
Third:To reimburse the Class A-1, Class A-2, Class A-3, Class A-4, Class A-5 and Class A-SB certificates,pro rata, for any previously unreimbursed losses on the mortgage loans allocable to principal that were previously borne by those classes, together with interest at their respective pass-through rates.
Fourth:(i)first, to interest on the Class A-S certificates in the amount of their interest entitlement; (ii)second, to the extent of funds allocated to principal remaining after any distributions in respect of principal to each class of certificates with a higher payment priority (in this case, the Class A-1, Class A-2, Class A-3, Class A-4, Class A-5 and Class A-SB certificates), to principal on the Class A-S certificates until their certificate balance is reduced to zero; and (iii)third, to reimburse the Class A-S certificates for any previously unreimbursed losses on the mortgage loans allocable to principal that were previously borne by that class, together with interest at its pass-through rate.
|
THE INFORMATION IN THIS COLLATERAL TERM SHEET IS NOT COMPLETE AND MAY BE AMENDED PRIOR TO THE TIME OF SALE. THIS TERM SHEET IS NOT AN OFFER TO SELL THESE SECURITIES AND IT IS NOT A SOLICITATION OF AN OFFER TO BUY THESE SECURITIES IN ANY JURISDICTION WHERE THE OFFER OR SALE IS NOT PERMITTED.
| 15 |
| Order of Distribution (continued): | Fifth:After the Class A-1, Class A-2, Class A-3, Class A-4, Class A-5, Class A-SB, Class A-S, Class X-A, Class X-B, Class X-E, Class X-F and Class X-NR certificates are paid all amounts to which they are entitled, the remaining funds available for distribution will be used to pay interest and principal and to reimburse any unreimbursed losses to the Class B, Class C, Class D (or, in the case of distributions of interest, Class D and Class X-Dpro rata), Class E, Class F and Class NR certificates sequentially in that order in a manner analogous to that described in clausefourth above with respect to the Class A-S certificates, until the certificate balance of each such class is reduced to zero. |
| Realized Losses: | The certificate balances of the Class A-1, Class A-2, Class A-3, Class A-4, Class A-5, Class A-SB, Class A-S, Class B, Class C, Class D, Class E, Class F and Class NR certificates will each be reduced without distribution on any Distribution Date as a write-off to the extent of any loss realized on the mortgage loans allocated to such class of certificates on such Distribution Date. On each Distribution Date, any such write-offs will be applied to such classes of certificates in the following order, in each case until the related certificate balance is reduced to zero:first, to the Class NR certificates;second, to the Class F certificates;third, to the Class E certificates;fourth, to the Class D certificates;fifth, to the Class C certificates;sixth, to the Class B certificates;seventh, to the Class A-S certificates; and,finally,pro rata, to the Class A-1, Class A-2, Class A-3, Class A-4, Class A-5 and Class A-SB certificates, based on their then-current respective certificate balances. The notional amount of the Class X-A certificates will be reduced to reflect reductions in the certificate balances of the Class A-1, Class A-2, Class A-3, Class A-4, Class A-5, Class A-SB and Class A-S certificates resulting from allocations of losses realized on the mortgage loans. The notional amount of the Class X-B certificates will be reduced to reflect reductions in the certificate balance of the Class B certificates resulting from allocations of losses realized on the mortgage loans. The notional amount of the Class X-D certificates will be reduced to reflect reductions in the certificate balance of the Class D certificates resulting from allocations of losses realized on the mortgage loans. The notional amount of the Class X-E certificates will be reduced to reflect reductions in the certificate balance of the Class E certificates resulting from allocations of losses realized on the mortgage loans. The notional amount of the Class X-F certificates will be reduced to reflect reductions in the certificate balance of the Class F certificates resulting from allocations of losses realized on the mortgage loans. The notional amount of the Class X-NR certificates will be reduced to reflect reductions in the certificate balance of the Class NR certificates resulting from allocations of losses realized on the mortgage loans. |
| Prepayment Premiums and Yield Maintenance Charges: | On each Distribution Date, each yield maintenance charge collected on the mortgage loans during the one-month period ending on the related Determination Date is required to be distributed to certificateholders (excluding the Class X-E, Class X-F, Class X-NR, Class E, Class F, Class NR, Class R and Class Z certificates) as follows: (1)pro rata, between (x) the group (the “YM Group A”) of Class A-1, Class A-2, Class A-3, Class A-4,Class A-5, Class A-SB, Class X-A and Class A-S certificates, and (y) the group (the “YM Group B” and collectively with the YM Group A, the “YM Groups”) of the Class X-B, Class B, Class C, Class D and Class X-D certificates, based upon the aggregate amount of principal distributed to the classes of certificates in each YM Group on such Distribution Date, and (2) as among the |
THE INFORMATION IN THIS COLLATERAL TERM SHEET IS NOT COMPLETE AND MAY BE AMENDED PRIOR TO THE TIME OF SALE. THIS TERM SHEET IS NOT AN OFFER TO SELL THESE SECURITIES AND IT IS NOT A SOLICITATION OF AN OFFER TO BUY THESE SECURITIES IN ANY JURISDICTION WHERE THE OFFER OR SALE IS NOT PERMITTED.
| 16 |
Prepayment Premiums and Yield Maintenance Charges (continued):
|
respective classes of certificates in each YM Group in the following manner: (A) on apro rata basis in accordance with their respective entitlements in those yield maintenance charges, to each class of certificates in such YM Group in an amount equal to the product of (x) a fraction whose numerator is the amount of principal distributed to such class of certificates on such Distribution Date and whose denominator is the total amount of principal distributed to all of the certificates in such YM Group on such Distribution Date, (y) the Base Interest Fraction for the related principal prepayment with respect to such class of certificates, and (z) the aggregate amount of such yield maintenance charge allocated to such YM Group; and (B) the portion of such yield maintenance charge allocated to such YM Group remaining after such distributions to the applicable class(es) of principal balance certificates in such YM Group, to the class(es) of Class X Certificates in such YM Group, and in the case of the YM Group B, on apro rata basis in accordance with their respective reductions in their notional amounts on such Distribution Date, to the Class X-B and Class X-D Certificates.
The “Base Interest Fraction” with respect to any principal prepayment on any mortgage loan and with respect to any class of Class A-1, Class A-2, Class A-3, Class A-4, Class A-5, Class A-SB, Class A-S, Class B, Class C and Class D certificates is a fraction (a) whose numerator is the amount, if any, by which (i) the pass-through rate on such class of certificates exceeds (ii) the discount rate used in accordance with the related mortgage loan documents in calculating the yield maintenance charge with respect to such principal prepayment and (b) whose denominator is the amount, if any, by which (i) the mortgage loan rate on such mortgage loan exceeds (ii) the discount rate used in accordance with the related mortgage loan documents in calculating the yield maintenance charge with respect to such principal prepayment; provided, however, that under no circumstances will the Base Interest Fraction be greater than one. If such discount rate is greater than or equal to the lesser of (x) the mortgage loan rate on the related mortgage loan and (y) the pass-through rate described in the preceding sentence, then the Base Interest Fraction will equal zero; provided, however, that if such discount rate is greater than or equal to the mortgage loan rate, but less than the pass-through rate, the fraction will be one.
If a prepayment premium (calculated as a fixed percentage of the amount prepaid) is imposed in connection with a prepayment rather than a yield maintenance charge, then the prepayment premium so collected will be allocated as described above. For this purpose, the discount rate used to calculate the Base Interest Fraction will be the discount rate used to determine the yield maintenance charge for mortgage loans that require payment at the greater of a yield maintenance charge or a minimum amount equal to a fixed percentage of the principal balance of the mortgage loan or, for mortgage loans that only have a prepayment premium based on a fixed percentage of the principal balance of the mortgage loan, such other discount rate as may be specified in the related loan documents.
No prepayment premiums or yield maintenance charges will be distributed to holders of the Class X-E, Class X-F, Class X-NR, Class E, Class F, Class NR, Class Z or Class R certificates. Instead, after the notional amounts of the Class X-A, Class X-B and Class X-D certificates and the certificate balances of the Class A-1, Class A-2, Class A-3, Class A-4, Class A-5, Class A-SB, Class A-S, Class B, Class C and Class D certificates have been reduced to zero, all prepayment premiums and yield |
THE INFORMATION IN THIS COLLATERAL TERM SHEET IS NOT COMPLETE AND MAY BE AMENDED PRIOR TO THE TIME OF SALE. THIS TERM SHEET IS NOT AN OFFER TO SELL THESE SECURITIES AND IT IS NOT A SOLICITATION OF AN OFFER TO BUY THESE SECURITIES IN ANY JURISDICTION WHERE THE OFFER OR SALE IS NOT PERMITTED.
| 17 |
| Prepayment Premiums and Yield Maintenance Charges (continued): | maintenance charges with respect to the mortgage loans will be distributed to holders of the Class X-D certificates, regardless of whether the notional amount of the Class X-D certificates has been reduced to zero. For a description of prepayment premiums and yield maintenance charges required on the mortgage loans, see Annex A-1 to the Preliminary Prospectus. See also“Certain Legal Aspects of the Mortgage Loans—Default Interest and Limitations on Prepayments”in the Preliminary Prospectus. Prepayment premiums and yield maintenance charges will be distributed on any Distribution Date only to the extent they are received in respect of the mortgage loans as of the related Determination Date. See also“Description of the Certificates—Distributions” in the Preliminary Prospectus. |
| Non-Serviced Mortgage Loans: | Each of the GLP Industrial Portfolio A mortgage loan, the Starwood Capital Extended Stay Portfolio mortgage loan and the Sheraton Lincoln Harbor Hotel mortgage loan is referred to in this Term Sheet as, individually, a “non-serviced mortgage loan” and, collectively, the “non-serviced mortgage loans”. Each non-serviced mortgage loan and the related companion loan(s) are being serviced and administered in accordance with, and all decisions, consents, waivers, approvals and other actions on the part of the holders of the non-serviced mortgage loan and the related companion loan(s) will be effected in accordance with, the Controlling Pooling and Servicing Agreement set forth in the “Pari Passu Note Loan Summary” table above and the related co-lender agreement. Consequently, the servicing provisions set forth in this Term Sheet will generally not be applicable to the non-serviced mortgage loans, but instead such servicing and administration of the non-serviced mortgage loans will, in each case, be governed by the related Controlling Pooling and Servicing Agreement. Each Controlling Pooling and Servicing Agreement provides for servicing in a manner acceptable for rated transactions similar in nature to this securitization. The non-serviced mortgage loans are discussed further under“—Whole Loans” below. |
Advances:
| The master servicer and, if it fails to do so, the trustee, will be obligated to make (i) P&I advances with respect to each mortgage loan in the issuing entity and, (ii) with respect to each mortgage loan (other than the non-serviced mortgage loans) and serviced whole loan, servicing advances, including paying delinquent real estate taxes, assessments and hazard insurance premiums, but only to the extent that those advances are not deemed non-recoverable from collections on the related mortgage loan (or, if applicable, serviced whole loan) and, in the case of P&I advances, subject to reduction in connection with any appraisal reduction amounts that may occur. The special servicer will have no obligation to make property advances;providedthat with respect to a specially serviced loan, the special servicer will be entitled to make a property advance in an urgent or emergency situation, and the master servicer will be required to reimburse the special servicer for such advance, with interest;provided that the advance is not determined by the master servicer to be nonrecoverable. Notwithstanding the foregoing, servicing advances for the non-serviced mortgage loans will be made by the parties to, and pursuant to, the applicable Controlling Pooling and Servicing Agreement. |
| Appraisal Reduction Amounts: | An appraisal reduction amount generally will be created with respect to a required appraisal loan (which is a serviced mortgage loan (or serviced whole loan, if applicable)) as to which certain defaults, modifications or insolvency events have occurred (as further described in the Preliminary Prospectus) in the amount, if any, |
THE INFORMATION IN THIS COLLATERAL TERM SHEET IS NOT COMPLETE AND MAY BE AMENDED PRIOR TO THE TIME OF SALE. THIS TERM SHEET IS NOT AN OFFER TO SELL THESE SECURITIES AND IT IS NOT A SOLICITATION OF AN OFFER TO BUY THESE SECURITIES IN ANY JURISDICTION WHERE THE OFFER OR SALE IS NOT PERMITTED.
| 18 |
Appraisal Reduction
| by which the principal balance of such required appraisal loan, exceeds 90% of the appraised value of the related mortgaged property (as determined by one or more appraisals obtained by the special servicer) plus certain escrows and reserves (including letters of credit) held with respect to such required appraisal loan (net of other amounts overdue or advanced in connection with such required appraisal loan). In general, subject to the discussion in the next paragraphs, any appraisal reduction amount calculated with respect to a whole loan will be allocated to the related mortgage loan andpari passucompanion loan(s) on apro rata basis in accordance with their respective outstanding principal balances. In the case of the non-serviced mortgage loans, any appraisal reduction amounts will be calculated pursuant to, and by a party to, the related Controlling Pooling and Servicing Agreement (as discussed under “—Whole Loans” below). As a result of an appraisal reduction amount being calculated for and/or allocated to a given mortgage loan, the interest portion of any P&I advance for such mortgage loan will be reduced, which will have the effect of reducing the amount of interest available for distribution to the most subordinate class(es) of certificates (exclusive of the Class Z and Class R certificates) then outstanding (i.e., first to the Class NR certificates, then to the Class F certificates, then to the Class E certificates, then to the Class X-D and Class D certificatespro rata based on their respective interest entitlements, then to the Class C certificates, then to the Class B certificates, then to the Class A-S certificates, and then,pro rata based on their respective interest entitlements, to the Class A-1, Class A-2, Class A-3, Class A-4, Class A-5, Class A-SB, Class X-A, Class X-B, Class X-E, Class X-F and Class X-NR certificates). In general, a mortgage loan (or whole loan, if applicable) serviced under the pooling and servicing agreement for this transaction will cease to be a required appraisal loan, and no longer be subject to an appraisal reduction amount, when the same has ceased to be a specially serviced loan (if applicable), has been brought current for at least three consecutive months and no other circumstances exist that would cause such serviced loan to be a required appraisal loan.
Appraisal reductions with respect to GLP Industrial Portfolio A whole loan will be allocated to notionally reduce the outstanding principal balance of the related subordinate companion loans prior topro rata allocation to the related mortgage loan andpari passucompanion loans.
Appraisal reductions with respect to the Avalon Apartments whole loan will be allocated to notionally reduce the outstanding principal balance of the related subordinate companion loan prior to any allocation to the related mortgage loan.
At any time an appraisal is ordered under the pooling and servicing agreement with respect to a property that would result in an appraisal reduction amount with respect to a mortgage loan that would result in a change in the controlling class, certain certificate holders will have a right to request a new appraisal as described in the Preliminary Prospectus. |
Age of Appraisals:
| Appraisals (which can be an update of a prior appraisal) with respect to a mortgage loan serviced under the pooling and servicing agreement are required to be no older than 9 months for purposes of determining appraisal reductions, market value, and other calculations as described in the Preliminary Prospectus. |
| Sale of Defaulted Loans: | There will be no “Fair Market Value Purchase Option”, instead defaulted loans will be sold in a process similar to the sale process for REO property. |
THE INFORMATION IN THIS COLLATERAL TERM SHEET IS NOT COMPLETE AND MAY BE AMENDED PRIOR TO THE TIME OF SALE. THIS TERM SHEET IS NOT AN OFFER TO SELL THESE SECURITIES AND IT IS NOT A SOLICITATION OF AN OFFER TO BUY THESE SECURITIES IN ANY JURISDICTION WHERE THE OFFER OR SALE IS NOT PERMITTED.
| 19 |
Cleanup Call:
| On any distribution date on which the aggregate unpaid principal balance of the mortgage loans remaining in the issuing entity is less than 1% of the aggregate principal balance of the pool of mortgage loans as of the Cut-off Date, certain specified persons will have the option to purchase all of the remaining mortgage loans (and all property acquired through exercise of remedies in respect of any mortgage loan) at the price specified in the Preliminary Prospectus. Exercise of the option will terminate the issuing entity and retire the then outstanding certificates.
If the aggregate certificate balances of all certificates (exclusive of the Class X Certificates) senior to the Class E certificates, and the notional amounts of the Class X-A, Class X-B and Class X-D certificates have been reduced to zero, and if the master servicer has received from the remaining certificateholders the payment specified in the pooling and servicing agreement, the issuing entity could also be terminated in connection with a voluntary exchange of all the then-outstanding certificates (excluding the Class Z and Class R certificates), for the mortgage loans remaining in the issuing entity, but all of the holders of those classes of outstanding certificates would have to voluntarily participate in the exchange. |
| Directing Certificateholder: | The “Directing Certificateholder” will generally be the controlling class certificateholder or other representative designated by the holder(s) of at least a majority of the voting rights of the controlling class. The controlling class is the most subordinate class of the Class F and Class NR certificates that has an aggregate certificate balance as notionally reduced by any appraisal reductions allocated to such class, that is equal to or greater than 25% of the initial certificate balance of such class of certificates, or if neither the Class F certificates nor the Class NR certificates meets the preceding requirements, the Class F certificates. At any time when Class F is the controlling class, the majority Class F certificateholders may elect under certain circumstances to opt-out from its rights under the pooling and servicing agreement. See “The Pooling and Servicing Agreement—The Directing Certificateholder” in the Preliminary Prospectus. No other class of certificates will be eligible to act as the controlling class or appoint a Directing Certificateholder.
Rialto CMBS VII, LLC (or its affiliate) is expected to purchase the Class F, Class NR and Class Z certificates (and may also purchase certain other classes of certificates, including the Class E, Class X-E, Class X-F and Class X-NR certificates) and, on the Closing Date, is expected to appoint Rialto CMBS VII, LLC (or its affiliate) to be the initial Directing Certificateholder. |
| Control/Consultation Rights: | The Directing Certificateholder will be entitled to have consultation and approval rights with respect to certain major decisions (including with respect to assumptions, waivers, loan modifications and workouts) unless no class of the Class F and Class NR certificates has an outstanding certificate balance, as notionally reduced by any appraisal reductions allocated to such class, that is equal to or greater than 25% of the initial certificate balance of that class of certificates (a “Control Termination Event”).
So long as a Control Termination Event does not exist, the Directing Certificateholder will be entitled to direct the special servicer to take, or refrain from taking, certain actions that would constitute major decisions with respect to a mortgage loan or whole loan serviced under the pooling and servicing agreement and will also have the right to notice and to consent to certain material actions that would constitute |
THE INFORMATION IN THIS COLLATERAL TERM SHEET IS NOT COMPLETE AND MAY BE AMENDED PRIOR TO THE TIME OF SALE. THIS TERM SHEET IS NOT AN OFFER TO SELL THESE SECURITIES AND IT IS NOT A SOLICITATION OF AN OFFER TO BUY THESE SECURITIES IN ANY JURISDICTION WHERE THE OFFER OR SALE IS NOT PERMITTED.
| 20 |
Control/Consultation Rights (continued):
| major decisions that the master servicer or the special servicer plan on taking with respect to any such mortgage loan or serviced whole loan subject to the servicing standard and other restrictions as described in the Preliminary Prospectus.
Following the occurrence and during the continuation of a Control Termination Event until such time as no class of the Class F and Class NR certificates has an outstanding certificate balance, without regard to the application of any appraisal reductions, that is at least equal to 25% of the initial certificate balance of such class of certificates (a “Consultation Termination Event”), all of the rights of the Directing Certificateholder will terminate other than a right to consult with respect to the major decisions and other matters as to which it previously had approval rights. After the occurrence and during the continuation of a Control Termination Event, the operating advisor will be entitled to consult with the special servicer with respect to certain major decisions on behalf of the issuing entity and in the best interest of, and for the benefit of, the certificateholders, as if those certificateholders and, with respect to a servicedpari passu companion loan, the relatedpari passu companion loan holder(s) constituted a single lender.
With respect to each non-serviced whole loan, the Directing Certificateholder for this transaction will have limited consultation rights, and the applicable directing certificateholder (or equivalent entity) pursuant to the related Controlling Pooling and Servicing Agreement will have consultation, approval and direction rights, with respect to certain major decisions (including with respect to assumptions, waivers, loan modifications and workouts) regarding such non-serviced whole loan, as provided for in the related co-lender agreement and in the related Controlling Pooling and Servicing Agreement, and as described under “Description of the Mortgage Pool—The Whole Loans” in the Preliminary Prospectus.
Notwithstanding any contrary description set forth above, in the event that, with respect to any mortgage loan, the Directing Certificateholder or any controlling class certificateholder is a Borrower Party (any of the above, as applicable, an “Excluded Controlling Class Holder”), such Excluded Controlling Class Holder will not have any consultation or approval rights with respect to such mortgage loan and will have no right to receive asset status reports or such other information as may be specified in the pooling and servicing agreement. A “Borrower Party” is a borrower, a mortgagor, a manager of a mortgaged property or the holder of a mezzanine loan that has accelerated the related mezzanine loan (unless (i) acceleration was automatic under such mezzanine loan, (ii) the event directly giving rise to the automatic acceleration under such mezzanine loan was not initiated by such mezzanine lender or an affiliate of such mezzanine lender, and (iii) such mezzanine lender is stayed from exercising and has not commenced the exercise of remedies associated with foreclosure of the equity collateral under such mezzanine loan) or commenced foreclosure or enforcement proceedings against the equity collateral pledged to secure the related mezzanine loan, a person controlling or controlled by or under common control with the foregoing or any other such person owning, directly or indirectly, 25% or more of the beneficial interests in such borrower, mortgagor, manager of a mortgaged property or mezzanine lender. |
| Whole Loans: | The GLP Industrial Portfolio A mortgage loan, which will be contributed to the issuing entity and has an outstanding principal balance as of the Cut-off Date of $87,100,000, represents approximately 9.3% of the Initial Pool Balance and has |
THE INFORMATION IN THIS COLLATERAL TERM SHEET IS NOT COMPLETE AND MAY BE AMENDED PRIOR TO THE TIME OF SALE. THIS TERM SHEET IS NOT AN OFFER TO SELL THESE SECURITIES AND IT IS NOT A SOLICITATION OF AN OFFER TO BUY THESE SECURITIES IN ANY JURISDICTION WHERE THE OFFER OR SALE IS NOT PERMITTED.
| 21 |
Whole Loans (continued):
| (i) four related companion loans that arepari passu in right of payment with the GLP Industrial Portfolio A mortgage loan, of which (a) two notes were included in CSMC Trust 2015-GLPA (“CSMC 2015-GLPA transaction”), (b) one note is currently held by Column, a sponsor and originator, and is expected to be contributed to one or more future securitization trusts and (c) one note is currently held by Morgan Stanley Mortgage Capital Holdings LLC and is expected to be contributed to one or more future securitization trusts and (ii) two related companion loans that are generally subordinate in right of payment with the GLP Industrial Portfolio A mortgage loan and which were included in the CSMC 2015-GLPA transaction. Eachpari passu companion loan described above is referred to in this Term Sheet as a “pari passu companion loan”, a “non-serviced companion loan” and a “companion loan”. Each subordinate companion loan is referred to in this Term Sheet as a “subordinate companion loan”, a “non-serviced companion loan” and a “companion loan”. The GLP Industrial Portfolio A mortgage loan and the related companion loans are collectively referred to in this Term Sheet as the “GLP Industrial Portfolio A whole loan”, a “non-serviced whole loan” and a “whole loan”. The GLP Industrial Portfolio A whole loan will be serviced by the CSMC 2015-GLPA transaction master servicer and, if and to the extent necessary, the CSMC 2015-GLPA transaction special servicer under the CSMC 2015-GLPA transaction trust and servicing agreement (referred to as the “CSMC 2015-GLPA TSA” in this Term Sheet). Wells Fargo, as the CSMC 2015-GLPA transaction trustee, or a custodian on its behalf, will hold the mortgage file for the GLP Industrial Portfolio A whole loan pursuant to the CSMC 2015-GLPA TSA (other than the promissory note for the related mortgage loan, which will be held by the custodian under the pooling and servicing agreement for this securitization).
The FedEx Brooklyn mortgage loan, which will be contributed to the issuing entity, has an outstanding principal balance as of the Cut-off Date of $87,000,000, represents approximately 9.3% of the Initial Pool Balance, and has a related companion loan that (i) ispari passu in right of payment with the FedEx Brooklyn mortgage loan and (ii) is currently held by JLC, a sponsor and originator, or an affiliate and is expected to be contributed to one or more future securitization trusts. Thepari passu companion loan described above is referred to in this Term Sheet as a “pari passucompanion loan”, a “serviced companion loan” and a “companion loan”. The FedEx Brooklyn mortgage loan and the related companion loan are collectively referred to in this Term Sheet as the “FedEx Brooklyn whole loan”, the “serviced whole loan” and a “whole loan”.
The Starwood Capital Extended Stay Portfolio mortgage loan, which will be contributed to the issuing entity, has an outstanding principal balance as of the Cut-off Date of $75,000,000, represents approximately 8.0% of the Initial Pool Balance, and has two related companion loans that arepari passu in right of payment with the Starwood Capital Extended Stay Portfolio mortgage loan, (i) one of which was included in the CSAIL 2015-C3 Commercial Mortgage Trust (the “CSAIL 2015-C3 transaction”) and (ii) one of which is currently held by Column, a sponsor and originator, and is expected to be contributed to one or more future securitization trusts . Eachpari passu companion loan described above is referred to in this Term Sheet as a “pari passu companion loan”, a “non-serviced companion loan” and a “companion loan”. The Starwood Capital Extended Stay Portfolio mortgage loan and the related companion loans are collectively referred to in this Term Sheet as the
|
THE INFORMATION IN THIS COLLATERAL TERM SHEET IS NOT COMPLETE AND MAY BE AMENDED PRIOR TO THE TIME OF SALE. THIS TERM SHEET IS NOT AN OFFER TO SELL THESE SECURITIES AND IT IS NOT A SOLICITATION OF AN OFFER TO BUY THESE SECURITIES IN ANY JURISDICTION WHERE THE OFFER OR SALE IS NOT PERMITTED.
| 22 |
| Whole Loans (continued): | “Starwood Capital Extended Stay Portfolio whole loan”, a “non-serviced whole loan” and a “whole loan”. The Starwood Capital Extended Stay Portfolio whole loan will be serviced by the CSAIL 2015-C3 transaction master servicer and, if and to the extent necessary, the CSAIL 2015-C3 transaction special servicer under the CSAIL 2015-C3 transaction pooling and servicing agreement (referred to as the “CSAIL 2015-C3 PSA” in this Term Sheet). Wells Fargo, as the CSAIL 2015-C3 transaction trustee, or a custodian on its behalf, will hold the mortgage file for the Starwood Capital Extended Stay Portfolio whole loan pursuant to the CSAIL 2015-C3 PSA (other than the promissory note for the related mortgage loan, which will be held by the custodian under the pooling and servicing agreement for this securitization).
The Sheraton Lincoln Harbor Hotel mortgage loan, which will be contributed to the issuing entity, has an outstanding principal balance as of the Cut-off Date of $20,000,000, represents approximately 2.1% of the Initial Pool Balance, and has a related companion loan that ispari passu in right of payment with the Sheraton Lincoln Harbor Hotel mortgage loan and was included in the WFCM 2015-C31 Commercial Mortgage Trust (the “WFCM 2015-C31 transaction”). Thepari passu companion loan described above is referred to in this Term Sheet as a “pari passu companion loan”, a “non-serviced companion loan” and a “companion loan”. The Sheraton Lincoln Harbor Hotel mortgage loan and the related companion loan are collectively referred to in this Term Sheet as the “Sheraton Lincoln Harbor Hotel whole loan”, a “non-serviced whole loan” and a “whole loan”. The Sheraton Lincoln Harbor Hotel whole loan will be serviced by the WFCM 2015-C31 transaction master servicer and, if and to the extent necessary, the WFCM 2015-C31 transaction special servicer under the WFCM 2015-C31 transaction pooling and servicing agreement (referred to as the “WFCM 2015-C31 PSA” in this Term Sheet). Wilmington Trust, National Association, as the WFCM 2015-C31 transaction trustee, or a custodian on its behalf, will hold the mortgage file for the Sheraton Lincoln Harbor Hotel whole loan pursuant to the WFCM 2015-C31 PSA (other than the promissory note for the related mortgage loan, which will be held by the custodian under the pooling and servicing agreement for this securitization).
The Avalon Apartments mortgage loan, which will be contributed to the issuing entity, has an outstanding principal balance as of the Cut-off Date of $4,850,000, represents approximately 0.5% of the Initial Pool Balance, and has a related companion loan that is generally subordinate in right of payment with the Avalon Apartments mortgage loan, which is currently held by an affiliate of Rialto Mortgage Finance, LLC. The subordinate companion loan is referred to in this Term Sheet as a “subordinate companion loan”, a “serviced companion loan” and a “companion loan”. The Avalon Apartments mortgage loan and the related subordinate companion loan are collectively referred to in this Term Sheet as the “Avalon Apartments whole loan”, a “serviced whole loan” and a “whole loan”.
In the case of the Avalon Apartments whole loan, the related co-lender agreement provides, among other things, that (i) the holder of the related subordinate companion loan will have the right to cure certain defaults affecting the Avalon Apartments mortgage loan and the right to purchase the Avalon Apartments mortgage loan following a material default, and (ii) the Directing Certificateholder will be the directing holder with the right to advise and direct the special servicer with respect to material servicing actions and replace the special servicer.
|
THE INFORMATION IN THIS COLLATERAL TERM SHEET IS NOT COMPLETE AND MAY BE AMENDED PRIOR TO THE TIME OF SALE. THIS TERM SHEET IS NOT AN OFFER TO SELL THESE SECURITIES AND IT IS NOT A SOLICITATION OF AN OFFER TO BUY THESE SECURITIES IN ANY JURISDICTION WHERE THE OFFER OR SALE IS NOT PERMITTED.
| 23 |
| Whole Loans (continued): | Each of the CSMC 2015-GLPA TSA, CSAIL 2015-C3 PSA and the WFCM 2015-C31 PSA is also referred to in this Term Sheet as a “Controlling Pooling and Servicing Agreement” insofar as it relates to the non-serviced whole loan serviced thereunder.
In the case of the non-serviced whole loans, the related mortgage loans are referred to as “non-serviced mortgage loans”.
The FedEx Brooklyn whole loan and the Avalon Apartments whole loan will each be serviced by KeyBank, as the CSAIL 2016-C5 master servicer, and special serviced by Rialto, as the CSAIL 2016-C5 special servicer pursuant to the terms of the CSAIL 2016-C5 PSA. Wells Fargo, as the CSAIL 2016-C5 trustee, or a custodian on its behalf, will hold the mortgage file for each of the FedEx Brooklyn whole loan and the Avalon Apartments whole loan pursuant to the CSAIL 2016-C5 PSA (other than the promissory note for the related companion loan that is not an asset of the CSAIL 2016-C5 securitization).
For more information regarding the whole loan, see “Description of the Mortgage Pool—The Whole Loans” in the Preliminary Prospectus. |
Servicing Standard:
| Each of the mortgage loans (other than the non-serviced mortgage loans) and serviced whole loans will be serviced by the master servicer and the applicable special servicer pursuant to the terms of the pooling and servicing agreement. In all circumstances, each of the master servicer and the applicable special servicer are obligated to act in the best interests of the certificateholders (and, in the case of a serviced whole loan, the holder of the related serviced companion loan) as a collective whole as if such certificateholders (and, if applicable, such companion loan holder), constituted a single lender. The applicable special servicer is required to determine the effect on net present value of various courses of action (including workout or foreclosure), using the Calculation Rate as the discount rate, and pursue the course of action that it determines would maximize recovery on a net present value basis.
“Calculation Rate” means:
(a) for principal and interest payments on a mortgage loan or proceeds from the sale of a defaulted loan, the highest of (i) the rate determined by the master servicer or the special servicer, as applicable, that approximates the market rate that would be obtainable by borrowers on similar debt of the borrowers as of such date of determination, (ii) the mortgage loan rate and (iii) the yield on 10-year US treasuries; and
(b) for all other cash flows, including property cash flow, the “discount rate” set forth in the most recent appraisal (or update of such appraisal). |
| Termination of Special Servicer: | If a Control Termination Event has not occurred (or has occurred, but is no longer continuing), the special servicer may be replaced with respect to the mortgage loans and the serviced whole loans at the direction of the Directing Certificateholder upon satisfaction of certain conditions specified in the pooling and servicing agreement.
After the occurrence and during the continuance of a Control Termination Event, the holders of at least 25% of the voting rights of the certificates (other than the Class Z and Class R certificates) may request a vote to replace the special servicer. The |
THE INFORMATION IN THIS COLLATERAL TERM SHEET IS NOT COMPLETE AND MAY BE AMENDED PRIOR TO THE TIME OF SALE. THIS TERM SHEET IS NOT AN OFFER TO SELL THESE SECURITIES AND IT IS NOT A SOLICITATION OF AN OFFER TO BUY THESE SECURITIES IN ANY JURISDICTION WHERE THE OFFER OR SALE IS NOT PERMITTED.
| 24 |
Termination of Special Servicer: (continued):
| subsequent vote may result in the termination and replacement of such special servicer if, within 180 days of the initial request for that vote, the holders of (a) at least 66 2/3% of a “certificateholder quorum” (holders of certificates evidencing at least 50% of the aggregate voting rights of the certificates (other than the Class X, Class Z and Class R certificates)), or (b) more than 50% of the voting rights of each class of certificates other than any Class X, Class Z and Class R certificates (but in the case of this clause (b) only such classes of certificates that, in each case, have an outstanding certificate balance, as notionally reduced by any appraisal reduction amount allocated to such class, equal to or greater than 25% of the initial certificate balance of such class, minus all payments of principal made on such class of certificates), vote affirmatively to so replace such special servicer.
At any time after the occurrence of a Consultation Termination Event, if the operating advisor determines that the special servicer is not performing its duties as required under the pooling and servicing agreement or is otherwise not acting in accordance with the servicing standard, the operating advisor may recommend the replacement of the special servicer resulting in a solicitation of a certificateholder vote. The operating advisor’s recommendation to replace the special servicer must be confirmed by an affirmative vote of holders of certificates (other than Class X, Class Z and Class R certificates) evidencing at least a majority of the voting rights (taking into account the application of any appraisal reduction amounts to notionally reduce the certificate balances of the classes to which such appraisal reduction amounts are allocable) of all certificates (other than Class X, Class Z and Class R certificates). In the event the holders of such certificates elect to remove and replace the special servicer, the certificate administrator will be required to obtain a rating agency confirmation from each of the rating agencies at that time. |
| Excluded Special Servicer: | In the event that, with respect to any mortgage loan, the special servicer has obtained knowledge that it is a Borrower Party with respect to a mortgage loan, the special servicer will be required to resign as special servicer of such mortgage loan (an “Excluded Special Servicer Loan”), and, prior to the occurrence and continuance of a Control Termination Event, the Directing Certificateholder will be required to appoint (and may replace with or without cause) a successor special servicer that is not a Borrower Party (an “Excluded Special Servicer”) with respect to such Excluded Special Servicer Loan unless such Excluded Special Servicer Loan is also an excluded loan with respect to such Directing Certificateholder, in which case the resigning special servicer will be required to use reasonable efforts to appoint the Excluded Special Servicer. |
| Servicing Compensation: | Modification Fees: Certain fees resulting from modifications, amendments, waivers or other changes to the terms of the loan documents, as more fully described in the Preliminary Prospectus, will be used to offset expenses on the related serviced mortgage loan (i.e., a mortgage loan other than a non-serviced mortgage loan) or serviced whole loan, if applicable (i.e.,reimburse the trust for certain expenses including unreimbursed advances and interest on unreimbursed advances previously incurred (other than special servicing fees, workout fees and liquidation fees) on the related mortgage loan (other than a non-serviced mortgage loan) or serviced whole loan, if applicable, but not yet reimbursed to the trust or servicers), or to pay expenses (other than special servicing fees, workout fees and liquidation fees) that are still outstanding, in each case unless as part of the written modification the related |
THE INFORMATION IN THIS COLLATERAL TERM SHEET IS NOT COMPLETE AND MAY BE AMENDED PRIOR TO THE TIME OF SALE. THIS TERM SHEET IS NOT AN OFFER TO SELL THESE SECURITIES AND IT IS NOT A SOLICITATION OF AN OFFER TO BUY THESE SECURITIES IN ANY JURISDICTION WHERE THE OFFER OR SALE IS NOT PERMITTED.
| 25 |
Servicing Compensation (continued):
| borrower is required to pay these amounts on a going forward basis or in the future). Any excess modification fees not so applied to offset expenses will be available as compensation to the master servicer and/or applicable special servicer. Within any prior 12-month period, all excess modification fees earned by the master servicer or by the applicable special servicer (after taking into account the offset described below applied during such 12-month period) with respect to any mortgage loan (other than a non-serviced mortgage loan) or serviced whole loan, if applicable, will be subject to a cap equal to the greater of (i) 1.0% of the outstanding principal balance of such mortgage loan after giving effect to such transaction and (ii) $25,000.
All excess modification fees earned by either special servicer will be required to offset any future workout fees or liquidation fees payable with respect to the related mortgage loan (other than a non-serviced mortgage loan) or serviced whole loan, if applicable, or related REO property; provided that if the mortgage loan (other than a non-serviced mortgage loan) or serviced whole loan, if applicable, ceases being a corrected loan, and is subject to a subsequent modification, any excess modification fees earned by the applicable special servicer prior to such mortgage loan (other than a non-serviced mortgage loan) or serviced whole loan, if applicable, ceasing to be a corrected loan will no longer be offset against future liquidation fees and workout fees unless such mortgage loan (other than a non-serviced mortgage loan) or serviced whole loan, if applicable, ceased to be a corrected loan within 12 months of it becoming a modified mortgage loan (or modified whole loan, if applicable).
Penalty Charges: All late fees and default interest will first be used to reimburse certain expenses previously incurred with respect to the related mortgage loan (other than a non-serviced mortgage loan) or serviced whole loan, if applicable (other than special servicing fees, workout fees and liquidation fees) but not yet reimbursed to the trust, the master servicer or the applicable special servicer or to pay certain expenses (other than special servicing fees, workout fees and liquidation fees) that are still outstanding on the related mortgage loan (other than a non-serviced mortgage loan) or serviced whole loan, if applicable, and any excess received with respect to a serviced loan will be paid to the master servicer (for penalty charges accrued while a non-specially serviced loan), and the applicable special servicer (for penalty charges accrued while a specially serviced loan). To the extent any amounts reimbursed out of penalty charges are subsequently recovered on a related serviced loan, they will be paid to the master servicer or applicable special servicer who would have been entitled to the related penalty charges that were previously used to reimburse such expense.
Liquidation / Workout Fees: Liquidation fees will be calculated at the lesser of (a) 1.0% and (b) such lower rate as would result in a liquidation fee of $1,000,000, for each mortgage loan (other than a non-serviced mortgage loan) or serviced whole loan that is a specially serviced loan and any REO property, subject in any case to a minimum liquidation fee of $25,000, except that the liquidation fee will be zero with respect to certain liquidation events set forth in the pooling and servicing agreement, and the liquidation fee with respect to each mortgage loan or REO mortgage loan repurchased or substituted for after more than 180 days following the Mortgage Loan Seller’s receipt of notice or discovery of a material breach or material defect will be in an amount equal to the liquidation fee rate described above of the outstanding principal balance of such mortgage loan or REO loan. For any mortgage loan (other |
THE INFORMATION IN THIS COLLATERAL TERM SHEET IS NOT COMPLETE AND MAY BE AMENDED PRIOR TO THE TIME OF SALE. THIS TERM SHEET IS NOT AN OFFER TO SELL THESE SECURITIES AND IT IS NOT A SOLICITATION OF AN OFFER TO BUY THESE SECURITIES IN ANY JURISDICTION WHERE THE OFFER OR SALE IS NOT PERMITTED.
| 26 |
| Servicing Compensation (continued): | than a non-serviced loan) or serviced whole loan that is a corrected loan, workout fees will be calculated at the lesser of (a) 1.0% and (b) such lower rate as would result in a workout fee of $1,000,000 when applied to each expected payment of principal and interest (other than default interest) on the related mortgage loan (other than a non-serviced mortgage loan) or serviced whole loan, if applicable, from the date such serviced loan becomes a corrected loan through and including the then related maturity date; or in any case such higher rate as would result in a workout fee of $25,000 when applied to each expected payment of principal and interest (other than default interest) on any mortgage loan from the date such serviced loan becomes a corrected loan through and including the then related maturity date.
Notwithstanding the foregoing, in connection with a maturity default, no liquidation or workout fee will be payable in connection with a payoff or refinancing of the related serviced loan within 90 days of the maturity default. |
Operating Advisor:
| Prior to the occurrence and continuance of a Control Termination Event, the operating advisor will review certain information on the certificate administrator’s website, and will have access to any final asset status report but will not have any approval or consultation rights. After the occurrence and during the continuance of a Control Termination Event, the operating advisor will be entitled to consult with the special servicer in respect of the asset status report with respect to certain major decisions on behalf of the issuing entity and in the best interest of, and for the benefit of, the certificateholders, as if those certificateholders (and, with respect to a servicedpari passu companion loan, the relatedpari passucompanion loan holder(s)) constituted a single lender. Additionally, the operating advisor will be required to prepare an annual report to be provided to the trustee, the master servicer, the rating agencies, the certificate administrator and the 17g-5 information provider and to recalculate and verify the accuracy of certain calculations and their corresponding application.
After the occurrence of a Consultation Termination Event, the operating advisor may be removed without cause upon (i) the written direction of certificateholders evidencing not less than 15% of the voting rights (taking into account the application of appraisal reduction amounts to notionally reduce the certificate balances of classes to which such appraisal reduction amounts are allocable) requesting a vote to replace the operating advisor, (ii) payment by such requesting holders to the certificate administrator of all reasonable fees and expenses to be incurred by the certificate administrator in connection with administering such vote and (iii) receipt by the trustee of the rating agency confirmation with respect to such removal. Upon the vote or written direction of holders of at least 75% of the voting rights (taking into account the application of appraisal reduction amounts to notionally reduce the certificate balances of classes to which such appraisal reduction amounts are allocable), the trustee will immediately replace the operating advisor with the replacement operating advisor. In the event there are no classes of certificates outstanding (other than the Class X-F, Class X-NR, Class F, Class NR, Class Z and Class R certificates), then all of the rights and obligations of the operating advisor under the pooling and servicing agreement will terminate. |
Asset Representations Reviewer: | The asset representations reviewer will be required to review certain delinquent mortgage loans after a specified delinquency threshold has been exceeded and the required percentage of certificateholders vote to direct a review of such delinquent |
THE INFORMATION IN THIS COLLATERAL TERM SHEET IS NOT COMPLETE AND MAY BE AMENDED PRIOR TO THE TIME OF SALE. THIS TERM SHEET IS NOT AN OFFER TO SELL THESE SECURITIES AND IT IS NOT A SOLICITATION OF AN OFFER TO BUY THESE SECURITIES IN ANY JURISDICTION WHERE THE OFFER OR SALE IS NOT PERMITTED.
| 27 |
| Asset Representations Reviewer (continued): | mortgage loans. An asset review will occur when either (1) mortgage loans with an aggregate outstanding principal balance of 25.0% or more of the aggregate outstanding principal balance of all of the mortgage loans (including any REO loans (or a portion of any REO loan in the case of a whole loan)) held by the issuing entity as of the end of the applicable collection period are delinquent loans or (2) at least 15 mortgage loans are delinquent loans as of the end of the applicable collection period and the outstanding principal balance of such delinquent loans in the aggregate constitutes at least 20.0% of the aggregate outstanding principal balance of all of the mortgage loans (including any REO loans (or a portion of any REO loan in the case of a whole loan)) held by the issuing entity as of the end of the applicable collection period. |
| Replacement of the Asset Representations Reviewer: | The asset representations reviewer may be terminated and replaced without cause. Upon (i) the written direction of certificateholders evidencing not less than 25% of the voting rights (without regard to the application of any appraisal reduction amounts) requesting a vote to terminate and replace the asset representations reviewer with a proposed successor asset representations reviewer that is an eligible asset representations reviewer, and (ii) payment by such holders to the certificate administrator of the reasonable fees and expenses to be incurred by the certificate administrator in connection with administering such vote, the certificate administrator will promptly provide notice to all certificateholders and the asset representations reviewer of such request. Upon the written direction of certificateholders evidencing at least 75% of a certificateholder quorum (without regard to the application of any appraisal reduction amounts), the trustee will terminate all of the rights and obligations of the asset representations reviewer under the pooling and servicing agreement, and the proposed successor asset representations reviewer will be appointed. |
Dispute Resolution Provisions:
| Each Mortgage Loan Seller will be subject to the dispute resolution provisions set forth in the pooling and servicing agreement to the extent those provisions are triggered with respect to any mortgage loan sold to the depositor by a Mortgage Loan Seller and such Mortgage Loan Seller will be obligated under the related mortgage loan purchase agreement to comply with all applicable provisions and to take part in any mediation or arbitration proceedings that may result.
Generally, in the event that a repurchase request is not “Resolved” (as defined below) within 180 days after the related Mortgage Loan Seller receives such repurchase request, then the enforcing servicer will be required to send a notice to the “initial requesting certificateholder” (if any) and to the certificate administrator who will make such notice available to all other certificateholders and certificate owners indicating the enforcing servicer’s intended course of action with respect to the repurchase request. Such notice will notify all certificateholders and certificate owners that in the event any certificateholder disagrees with the enforcing servicer’s intended course of action, the enforcing servicer will be required to follow the course of action agreed to and/or proposed by the majority of the responding certificateholders that involves referring the matter to mediation or arbitration, as the case may be. If (a) the enforcing servicer’s intended course of action with respect to the repurchase request does not involve pursuing further action to exercise rights against the related Mortgage Loan Seller with respect to the repurchase request and the initial requesting certificateholder, if any, or any other certificateholder or |
THE INFORMATION IN THIS COLLATERAL TERM SHEET IS NOT COMPLETE AND MAY BE AMENDED PRIOR TO THE TIME OF SALE. THIS TERM SHEET IS NOT AN OFFER TO SELL THESE SECURITIES AND IT IS NOT A SOLICITATION OF AN OFFER TO BUY THESE SECURITIES IN ANY JURISDICTION WHERE THE OFFER OR SALE IS NOT PERMITTED.
| 28 |
| Dispute Resolution Provisions (continued): | certificate owner wishes to exercise its right to refer the matter to mediation (including nonbinding arbitration) or arbitration, or (b) the enforcing servicer’s intended course of action is to pursue further action to exercise rights against the related Mortgage Loan Seller with respect to the repurchase request but the initial requesting certificateholder, if any, or any other certificateholder or certificate owner does not agree with the dispute resolution method selected by the enforcing servicer, then the initial requesting certificateholder, if any, or such other certificateholder or certificate owner may deliver a written notice to the enforcing servicer indicating its intent to exercise its right to refer the matter to either mediation or arbitration.
“Resolved” means, with respect to a repurchase request, (i) that related material defect has been cured, (ii) the related mortgage loan has been repurchased in accordance with the related mortgage loan purchase agreement, (iii) a mortgage loan has been substituted for the related mortgage loan in accordance with the related mortgage loan purchase agreement, (iv) the applicable Mortgage Loan Seller has paid a loss of value payment, (v) a contractually binding agreement is entered into between the enforcing servicer, on behalf of the issuing entity, and the related Mortgage Loan Seller that settles the related Mortgage Loan Seller’s obligations under the related mortgage loan purchase agreement, or (vi) the related mortgage loan is no longer property of the issuing entity as a result of a sale or other disposition in accordance with the pooling and servicing agreement. |
| Deal Website: | The Certificate Administrator will maintain a deal website including, but not limited to:
■ all special notices delivered
■ summaries of final asset status reports
■ all appraisals in connection with appraisal reductions plus any subsequent appraisal updates
■ an “Investor Q&A Forum” and a voluntary investor registry
|
THE INFORMATION IN THIS COLLATERAL TERM SHEET IS NOT COMPLETE AND MAY BE AMENDED PRIOR TO THE TIME OF SALE. THIS TERM SHEET IS NOT AN OFFER TO SELL THESE SECURITIES AND IT IS NOT A SOLICITATION OF AN OFFER TO BUY THESE SECURITIES IN ANY JURISDICTION WHERE THE OFFER OR SALE IS NOT PERMITTED.
| 29 |
(THIS PAGE INTENTIONALLY LEFT BLANK)
| 30 |
Mortgage Loan No. 1 — GLP Industrial Portfolio A
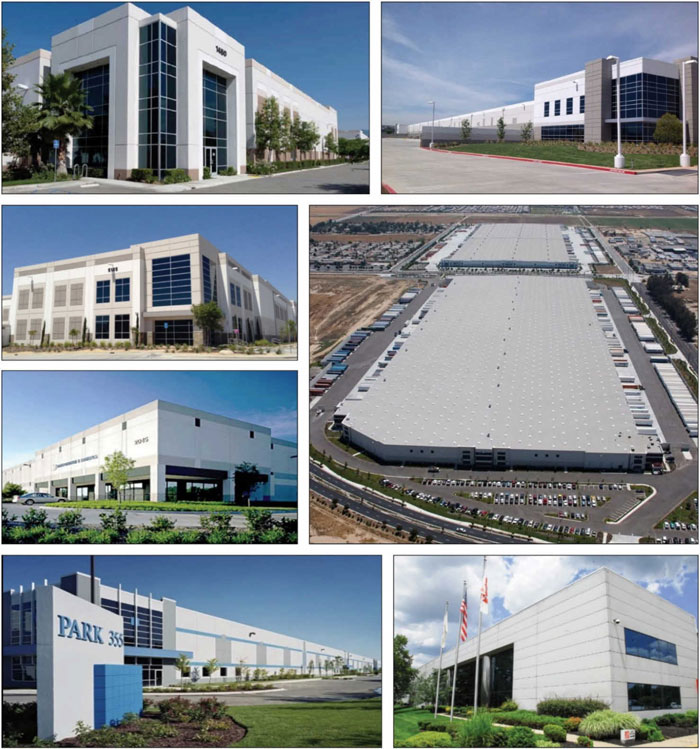
THE INFORMATION IN THIS COLLATERAL TERM SHEET IS NOT COMPLETE AND MAY BE AMENDED PRIOR TO THE TIME OF SALE. THIS TERM SHEET IS NOT AN OFFER TO SELL THESE SECURITIES AND IT IS NOT A SOLICITATION OF AN OFFER TO BUY THESE SECURITIES IN ANY JURISDICTION WHERE THE OFFER OR SALE IS NOT PERMITTED.
| 31 |
Mortgage Loan No. 1 — GLP Industrial Portfolio A
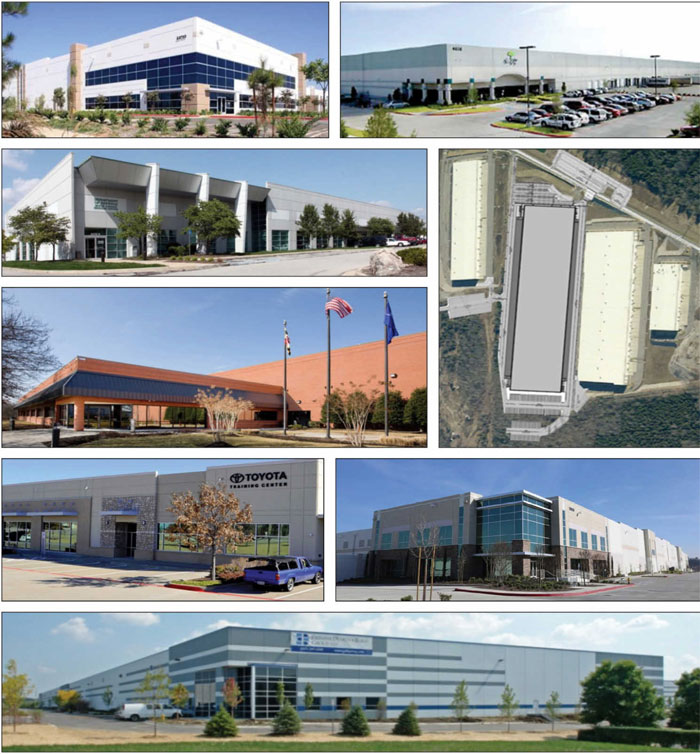
THE INFORMATION IN THIS COLLATERAL TERM SHEET IS NOT COMPLETE AND MAY BE AMENDED PRIOR TO THE TIME OF SALE. THIS TERM SHEET IS NOT AN OFFER TO SELL THESE SECURITIES AND IT IS NOT A SOLICITATION OF AN OFFER TO BUY THESE SECURITIES IN ANY JURISDICTION WHERE THE OFFER OR SALE IS NOT PERMITTED.
| 32 |
Mortgage Loan No. 1 — GLP Industrial Portfolio A
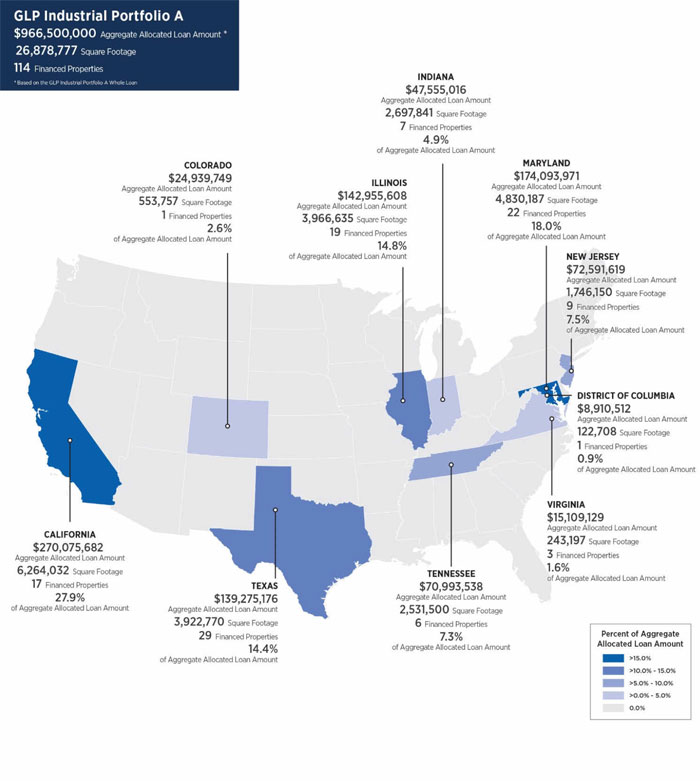
THE INFORMATION IN THIS COLLATERAL TERM SHEET IS NOT COMPLETE AND MAY BE AMENDED PRIOR TO THE TIME OF SALE. THIS TERM SHEET IS NOT AN OFFER TO SELL THESE SECURITIES AND IT IS NOT A SOLICITATION OF AN OFFER TO BUY THESE SECURITIES IN ANY JURISDICTION WHERE THE OFFER OR SALE IS NOT PERMITTED.
| 33 |
Mortgage Loan No. 1 — GLP Industrial Portfolio A
| Mortgage Loan Information | Property Information | |||
| Mortgage Loan Seller: | Column | Single Asset/Portfolio: | Portfolio of 114 Properties | |
| Original Principal Balance(1): | $87,100,000 | Title: | Fee | |
| Cut-off Date Principal Balance(1): | $87,100,000 | Property Type - Subtype: | Industrial – Various | |
| % of Pool by IPB: | 9.3% | Net Rentable Area (SF): | 26,878,777 | |
| Loan Purpose: | Acquisition | Location: | Various | |
| Credit Assessment (Fitch, Moody’s, Morningstar)(2): | AAA/Aaa/AAA | Year Built/Renovated: | Various | |
| Borrowers(3): | Various | Occupancy: | 94.4% | |
| Sponsors(4): | Global Logistic Properties Limited | Occupancy Date: | 10/1/2015 | |
| Interest Rate: | 4.1439213% | Number of Tenants: | 193 | |
| Note Date: | 11/4/2015 | 2013 NOI: | $70,564,730 | |
| Maturity Date: | 11/6/2025 | 2014 NOI: | $98,621,458 | |
| Interest-only Period: | 120 months | TTM NOI(6)(7): | $102,686,288 | |
| Original Term: | 120 months | UW Economic Occupancy: | 94.0% | |
| Original Amortization: | None | UW Revenues: | $156,891,953 | |
| Amortization Type: | Interest Only | UW Expenses: | $41,005,138 | |
| Call Protection: | YM1(113),O(7) | UW NOI(7): | $115,886,815 | |
| Lockbox(5): | Hard | UW NCF: | $106,479,243 | |
| Additional Debt(1): | Yes | Appraised Value / Per SF: | $2,090,000,000 / $78 | |
| Additional Debt Balance(1): | $1,209,400,000 | Appraisal Date(8): | Various | |
| Additional Debt Type(1): | Pari Passu, B-Note, Mezzanine | |||
| Additional Future Debt Permitted: | No |
| Escrows and Reserves(9) | Financial Information(1) | |||||
| Initial | Monthly | Initial Cap | Cut-off Date Loan / SF: | $24 | ||
| Taxes: | $0 | Springing | N/A | Maturity Date Loan / SF: | $24 | |
| Insurance: | $0 | Springing | N/A | Cut-off Date LTV(8): | 30.5% | |
| Replacement Reserves: | $0 | Springing | (9) | Maturity Date LTV(8): | 30.5% | |
| TI/LC: | $0 | Springing | (9) | UW NCF DSCR: | 3.97x | |
| Engineering: | $1,177,541 | N/A | N/A | UW NOI Debt Yield: | 18.2% |
Sources and Uses
| Sources | Proceeds | % of Total | Uses | Proceeds | % of Total | |
| Mortgage Loan (A Notes) | $637,600,000 | 29.6% | Purchase Price | $2,026,347,948 | 94.0% | |
| Mortgage Loan (B Notes) | 328,900,000 | 15.3 | Closing Costs | 127,911,757 | 5.9 | |
| Mezzanine Loans | 330,000,000 | 15.3 | Upfront Reserves | 1,177,541 | 0.1 | |
| Sponsor Equity | 858,937,246 | 39.8 | ||||
| Total Sources | $2,155,437,246 | 100.0% | Total Uses | $2,155,437,246 | 100.0% |
| (1) | The GLP Industrial Portfolio A loan is part of a larger split whole loan evidenced by 5pari passu senior notes (collectively, “A Notes”) and two subordinate notes (collectively, “B Notes”) with an aggregate original principal balance of $966.5 million. The financial information presented in the chart above and herein reflects the cut-off date balance of the $637.6 million of A Notes, but not the $330.0 million of mezzanine loans or the $328.9 million of B Notes. The additional debt consists of 4pari passu companion loans with an outstanding principal balance of $550.5 million, $328.9 million of B Notes and $330.0 million of mezzanine loans. For more description of the additional debt, please refer to“Additional Debt”below. |
| (2) | Fitch, Moody’s and Morningstar have confirmed that the GLP Industrial Portfolio A Loan has, in the context of its inclusion in the Initial Pool Balance, credit characteristics consistent with an AAA-rated obligation. |
| (3) | The loan has 33 borrowers, which are each special purpose entities. |
| (4) | The GLP Industrial Portfolio A loan’s sponsor and non-recourse carveout guarantors are eleven subsidiaries of Global Logistic Properties Limited. |
| (5) | For a more detailed description of Lockbox, please refer to“Lockbox / Cash Management”below. |
| (6) | Represents trailing twelve months ending June 30, 2015. |
THE INFORMATION IN THIS COLLATERAL TERM SHEET IS NOT COMPLETE AND MAY BE AMENDED PRIOR TO THE TIME OF SALE. THIS TERM SHEET IS NOT AN OFFER TO SELL THESE SECURITIES AND IT IS NOT A SOLICITATION OF AN OFFER TO BUY THESE SECURITIES IN ANY JURISDICTION WHERE THE OFFER OR SALE IS NOT PERMITTED.
| 34 |
Mortgage Loan No. 1 — GLP Industrial Portfolio A
| (7) | UW NOI exceeds TTM NOI due to increases in rents on the October 2015 rent roll and the inclusion of approximately $5.5 million for rent steps. |
| (8) | The appraised value of $2,090.0 million is reflective of the value of the portfolio if sold in its entirety to a single buyer. The appraisal determined an appraised value on both a portfolio and an individual basis. The concluded aggregate appraised value of the individual properties was $1,995.8 million, which would result in a Cut-off Date LTV of 31.9% and a Maturity Date LTV of 31.9%. The dates of the appraised values ranged from August 10, 2015 to September 24, 2015. |
| (9) | For a more detailed description of Escrows and Reserves, please refer to “Escrows and Reserves” below. |
The Loan. The GLP Industrial Portfolio A loan which is part of a larger split whole loan, is a first mortgage loan secured by the borrower’s fee interest in a cross-collateralized pool of 114 industrial properties located in nine states and the District of Columbia. The whole loan has an outstanding principal balance of $966.5 million (“GLP Industrial Portfolio A Whole Loan”) as of the cut-off date, which is comprised of five pari passu notes, Note A-1, Note A-2, Note A-3-1, Note A-3-2 and Note A-4 and $328.9 million of subordinate B Notes. Note A-1 and Note A-2, which have an aggregate outstanding principal balance as of the cut-off date of $437.6 million, were previously contributed with the B Notes to the CSMC Trust 2015-GLPA securitization. Note A-3-1 has an outstanding principal balance as of the cut-off date of $87.1 million and is being contributed to the CSAIL 2016-C5 Commercial Mortgage Trust. Note A-3-2 and Note A-4 have an aggregate principal balance of $112.9 million, are currently held by Column Financial, Inc. and Morgan Stanley Mortgage Capital Holdings LLC, respectively, and are expected to be contributed to future securitization trusts.
Whole Loan Note Summary
| Original Balance | Cut-off Date Balance | Note Holder | Note in Controlling Securitization | |
| Notes A-1, A-2 | $437,600,000 | $437,600,000 | CSMC 2015-GLPA | Yes |
| Note A-3-1 | 87,100,000 | 87,100,000 | CSAIL 2016-C5 | No |
| Note A-3-2 | 42,900,000 | 42,900,000 | Future Securitization | No |
| Note A-4 | 70,000,000 | 70,000,000 | Future Securitization | No |
| Notes B-1, B-2 | 328,900,000 | 328,900,000 | CSMC 2015-GLPA | Yes |
| Total | $966,500,000 | $966,500,000 |
The Borrowers. There are 33 borrowing entities for the loan, each a special-purpose entity.
The Sponsors. The loan’s sponsors and nonrecourse carve-out guarantors are eleven subsidiaries of Global Logistic Properties Limited (“GLP”). GLP (SGX: MC0.SI; Moody’s: Baa2; Fitch: BBB+) is a public, Singapore-based investment holding company that owns, leases, manages, and develops logistics facilities. GLP began operations in 2003 and is one of the largest logistics operators by square footage globally with total assets under management valued at approximately $33 billion. GLP’s portfolio comprises approximately 2,300 properties and 521 million SF throughout 111 markets and 4,000 customers globally. GLP had a market capitalization of approximately $7.1 billion as of November 20, 2015.
The Global Logistic Properties Portfolio A Whole Loan is part of a larger $2.85 billion financing completed in November 2015 to facilitate the sponsor’s $4.8 billion acquisition (the “Acquisition”) of Industrial Income Trust Inc. (“IIT”), a public, non-traded REIT. The sponsor acquired IIT for a total cost of $4.8 billion (which includes closing costs and working capital) and invested approximately $2.0 billion of cash equity to facilitate the transaction. The financing consisted of financing three separate non-crossed pools. On a pro rata basis, approximately $858.9 million of invested equity was contributed for the acquisition of the Portfolio.
The Properties. The GLP Industrial Portfolio A consists of 114 properties (the “Portfolio”) totaling approximately 26.9 million SF across nine states and the District of Columbia and 11 different markets. The top three markets in the Portfolio, by allocated loan amount, are Inland Empire (27.9%), Chicago(14.8%) and Baltimore (11.8%). The top 10 properties in the Portfolio account for 28.0% of GLA and 31.5% of UW NOI and the top 10 tenants in the Portfolio account for 32.1% of GLA and 32.4% of UW Base Rent. The top 3 tenants in the Portfolio by UW Base Rent are HanesBrands, Inc. (5.4%), CEVA (4.4%) and Harbor Freight Tools (4.3%). The properties comprising the Portfolio have a weighted average age of 14 years (2001), weighted average clear heights of 29.5 feet and primary truck court depth of 155.5 feet, with weighted averages of 67 dock high doors, 4 grade level doors, 67
THE INFORMATION IN THIS COLLATERAL TERM SHEET IS NOT COMPLETE AND MAY BE AMENDED PRIOR TO THE TIME OF SALE. THIS TERM SHEET IS NOT AN OFFER TO SELL THESE SECURITIES AND IT IS NOT A SOLICITATION OF AN OFFER TO BUY THESE SECURITIES IN ANY JURISDICTION WHERE THE OFFER OR SALE IS NOT PERMITTED.
| 35 |
Mortgage Loan No. 1 — GLP Industrial Portfolio A
trailer spaces and 7.1% (GLA) office space. As of October 1, 2015, the Portfolio was 94.4% occupied by 193 tenants with a weighted average base rent of $4.86 PSF and weighted average remaining lease term of 5.1 years.
Top Twenty Properties(1)
| Property | Market | GLA (SF) | Year Built | Occupancy | UW NOI | % of NOI | Allocated Loan Amount(2) | % of Allocated Loan Amount | Appraised Value(3) |
| Inland Empire Indian Ave DC | Inland Empire | 1,309,754 | 2009 | 100.0% | $6,541,590 | 5.6% | $57,627,769 | 6.0% | $119,000,000 |
| Centerpointe 4 | Inland Empire | 1,280,446 | 2007 | 100.0% | 4,790,530 | 4.1 | 49,927,924 | 5.2 | 103,100,000 |
| Hofer Ranch IC Bldg 1 | Inland Empire | 612,104 | 2012 | 100.0% | 3,159,936 | 2.7 | 28,378,044 | 2.9 | 58,600,000 |
| Denver DC | Denver | 553,757 | 2013 | 100.0% | 3,282,162 | 2.8 | 24,939,749 | 2.6 | 51,500,000 |
| Freeport DC Bldg 4 | Dallas/Ft Worth | 727,508 | 1980 | 100.0% | 4,056,956 | 3.5 | 24,891,322 | 2.6 | 51,400,000 |
| Ontario Mills DC | Inland Empire | 520,161 | 2013 | 100.0% | 2,749,881 | 2.4 | 23,486,944 | 2.4 | 48,500,000 |
| Hagerstown Distribution Center | Washington, DC | 824,298 | 1998 | 100.0% | 3,398,847 | 2.9 | 22,276,280 | 2.3 | 46,000,000 |
| Beckwith Farms DC | Nashville | 706,500 | 2013 | 100.0% | 3,289,262 | 2.8 | 21,792,014 | 2.3 | 45,000,000 |
| Crossroads DC I | Baltimore | 456,500 | 2007 | 100.0% | 2,896,195 | 2.5 | 21,259,320 | 2.2 | 43,900,000 |
| Centerpointe 6 | Inland Empire | 532,926 | 2007 | 100.0% | 2,314,762 | 2.0 | 20,968,759 | 2.2 | 43,300,000 |
| I-95 DC | Baltimore | 449,299 | 2014 | 100.0% | 2,297,443 | 2.0 | 19,564,385 | 2.0 | 40,400,000 |
| Chino Spec Forward | Inland Empire | 409,930 | 2014 | 100.0% | 2,050,199 | 1.8 | 19,176,972 | 2.0 | 39,600,000 |
| Bedford Park II | Chicago | 470,160 | 2006 | 100.0% | 2,273,176 | 2.0 | 18,644,278 | 1.9 | 38,500,000 |
| Landover DC | Washington, DC | 507,072 | 1963 | 100.0% | 2,268,578 | 2.0 | 16,222,943 | 1.7 | 33,500,000 |
| North Plainfield 8 | Indianapolis | 798,096 | 1997 | 100.0% | 1,987,922 | 1.7 | 14,189,022 | 1.5 | 29,300,000 |
| Sterling DC | Inland Empire | 300,172 | 1990 | 100.0% | 1,804,632 | 1.6 | 13,946,889 | 1.4 | 28,800,000 |
| Beckwith Farms 3 | Nashville | 480,000 | 2009 | 100.0% | 1,396,650 | 1.2 | 13,462,621 | 1.4 | 27,800,000 |
| Clifton DC | Northern New Jersey | 230,953 | 2004 | 100.0% | 1,447,645 | 1.2 | 13,462,621 | 1.4 | 27,800,000 |
| Collington Commerce Center | Washington, DC | 239,742 | 1990 | 100.0% | 1,732,560 | 1.5 | 12,542,515 | 1.3 | 25,900,000 |
| Bedford Park IB | Chicago | 272,446 | 2006 | 100.0% | 1,322,491 | 1.1 | 12,397,234 | 1.3 | 25,600,000 |
| Subtotal - Top 20 Properties | 11,681,824 | 2003 | 100.0% | $55,061,417 | 47.5% | $449,157,605 | 46.5% | $927,500,000 | |
| Total/Wtd. Avg.: | 26,878,777 | 2001 | 94.4% | $115,886,815 | 100.0% | $966,500,000 | 100.0% | $1,995,800,000 |
| (1) | Based on the underwritten rent roll dated October 1, 2015. |
| (2) | Based on the GLP Industrial Portfolio A Whole Loan. |
| (3) | Source: Appraisal. The appraised value of $2,090.0 million is reflective of the value of the Portfolio if sold in its entirety to a single buyer. The appraisal determined an appraised value on both a portfolio and individual basis. The concluded aggregate appraised value of the individual properties was $1,995.8 million. |
Market Concentration(1)
| Property | Property Count | GLA (SF) | Year Built(2) |
Occupancy | UW NOI | % of NOI | Allocated Loan Amount(3) | % of Allocated Loan Amount | Appraised Value(4) | |
| Inland Empire | 17 | 6,264,032 | 2008 | 98.4% | $28,741,404 | 24.8% | $270,075,682 | 27.9% | $557,700,000 | |
| Chicago | 19 | 3,966,635 | 2004 | 91.4% | 16,240,694 | 14.0 | 142,955,608 | 14.8 | 295,200,000 | |
| Baltimore | 17 | 2,974,705 | 1995 | 87.9% | 13,240,795 | 11.4 | 114,238,574 | 11.8 | 235,900,000 | |
| Dallas/Ft Worth | 22 | 3,175,184 | 1999 | 97.5% | 14,335,584 | 12.4 | 105,763,903 | 10.9 | 218,400,000 | |
| Washington, DC | 9 | 2,221,387 | 1985 | 99.3% | 11,942,326 | 10.3 | 83,875,038 | 8.7 | 173,200,000 | |
| Nashville | 6 | 2,531,500 | 2009 | 100.0% | 9,347,699 | 8.1 | 70,993,538 | 7.3 | 146,600,000 | |
| Indianapolis | 7 | 2,697,841 | 1998 | 82.1% | 5,320,687 | 4.6 | 47,555,016 | 4.9 | 98,200,000 | |
| Northern New Jersey | 6 | 956,250 | 1986 | 100.0% | 5,802,524 | 5.0 | 46,005,363 | 4.8 | 95,000,000 | |
| Austin | 7 | 747,586 | 2008 | 84.6% | 3,766,724 | 3.3 | 33,511,273 | 3.5 | 69,200,000 | |
| Philadelphia | 3 | 789,900 | 1989 | 100.0% | 3,866,216 | 3.3 | 26,586,256 | 2.8 | 54,900,000 | |
| Denver | 1 | 553,757 | 2013 | 100.0% | 3,282,162 | 2.8 | 24,939,749 | 2.6 | 51,500,000 | |
| Total/Wtd. Avg.: | 114 | 26,878,777 | 2001 | 94.4% | $115,886,815 | 100.0% | $966,500,000 | 100.0% | $1,995,800,000 |
| (1) | Based on the underwritten rent roll dated October 1, 2015. |
| (2) | Weighted Average. |
| (3) | Based on the GLP Industrial Portfolio A Whole Loan. |
| (4) | Source: Appraisal. The appraised value of $2,090.0 million is reflective of the value of the Portfolio if sold in its entirety to a single buyer. The appraisal determined an appraised value on both a portfolio and individual basis. The concluded aggregate appraised value of the individual properties was $1,995.8 million. |
THE INFORMATION IN THIS COLLATERAL TERM SHEET IS NOT COMPLETE AND MAY BE AMENDED PRIOR TO THE TIME OF SALE. THIS TERM SHEET IS NOT AN OFFER TO SELL THESE SECURITIES AND IT IS NOT A SOLICITATION OF AN OFFER TO BUY THESE SECURITIES IN ANY JURISDICTION WHERE THE OFFER OR SALE IS NOT PERMITTED.
| 36 |
Mortgage Loan No. 1 — GLP Industrial Portfolio A
Property Sub-Type(1)
| Property Sub-Type | Property Count | GLA (SF) | Year Built(2) | Occupancy | UW NOI | % of NOI | Allocated Loan Amount(3) | % of Allocated Loan Amount | Appraised Value(4) | |
| Distribution Warehouse | 59 | 17,518,251 | 2006 | 94.0% | $69,300,394 | 59.8% | $613,227,253 | 63.4% | $1,266,300,000 | |
| Warehouse | 46 | 8,950,487 | 1991 | 95.5% | 43,763,774 | 37.8 | 332,642,976 | 34.4 | 686,900,000 | |
| Flex | 9 | 410,039 | 2000 | 87.8% | 2,822,647 | 2.4 | 20,629,771 | 2.1 | 42,600,000 | |
| Total/Wtd. Avg.: | 114 | 26,878,777 | 2001 | 94.4% | $115,886,815 | 100.0% | $966,500,000 | 100.0% | $1,995,800,000 |
| (1) | Based on the underwritten rent roll dated October 1, 2015. |
| (2) | Weighted Average. |
| (3) | Based on the GLP Industrial Portfolio A Whole Loan. |
| (4) | Source: Appraisal. The appraised value of $2,090.0 million is reflective of the value of the Portfolio if sold in its entirety to a single buyer. The appraisal determined an appraised value on both a Portfolio and individual basis. The concluded aggregate appraised value of the individual properties was $1,995.8 million. |
Tenant Summary(1)
| Tenant | Credit | % of UW | UW | |||||
| Rating | Property | UW | Base | Base | Original | Lease | ||
| (Fitch/MIS/S&P)(2) | Count | GLA | Base Rent | Rent | Rent PSF | Start | Expiration | |
| HanesBrands, Inc. | NR/Ba2/BB | 1 | 1,309,754 | $6,638,881 | 5.4% | $5.07 | 1/1/2011 | 10/31/2018 |
| CEVA | NR/NR/NR | 3 | 1,434,000 | 5,459,745 | 4.4 | $3.81 | Various | Various |
| Harbor Freight Tools | NR/Ba3/BB- | 2 | 1,280,446 | 5,321,841 | 4.3 | $4.16 | Various | Various |
| Home Depot USA Inc | A/A2/A | 2 | 1,123,818 | 5,173,796 | 4.2 | $4.60 | Various | Various |
| United Natural Foods, Inc. | NR/NR/NR | 1 | 553,757 | 3,433,293 | 2.8 | $6.20 | 5/1/2013 | 10/31/2028 |
| Owens & Minor Distribution, Inc | BBB-/Ba1/BBB | 2 | 604,161 | 3,236,710 | 2.6 | $5.36 | Various | Various |
| Samsung Electronics | A+/A1/A+ | 1 | 612,104 | 3,202,528 | 2.6 | $5.23 | 6/1/2013 | 9/30/2019 |
| Belkin Corporation | NR/NR/NR | 1 | 798,096 | 2,793,336 | 2.3 | $3.50 | 4/1/2001 | 11/30/2019 |
| Reliable Churchill | NR/NR/NR | 1 | 449,299 | 2,407,371 | 2.0 | $5.36 | 8/1/2014 | 8/31/2029 |
| Packaging Corp of America | NR/Baa3/BBB | 1 | 470,160 | 2,320,080 | 1.9 | $4.93 | 2/1/2013 | 9/30/2025 |
| Ten Largest Tenants | 8,635,595 | $39,987,581 | 32.5% | $4.63 | ||||
| Remaining Tenants | 16,745,912 | 83,402,096 | 67.5 | $4.98 | ||||
| Vacant | 1,497,270 | 0 | 0.0 | $0.00 | ||||
| Total/Wtd. Avg.: | 26,878,777 | $123,389,677 | 100.0% | $4.59 |
| (1) | Based on the underwritten rent roll dated October 1, 2015. |
| (2) | Ratings provided are for the parent company of the entity listed in the “Tenant” field whether or not the parent company guarantees the lease. |
Lease Rollover Schedule(1)
| Year | % of | Cumulative | |||||||
| Number | % of | UW Base | Cumulative | Cumulative | Cumulative | % of UW | |||
| of Leases | GLA | GLA | UW Base | Rent | GLA | % of GLA | UW Base | Base Rent | |
| Expiring(2) | Expiring | Expiring | Rent Expiring | Expiring | Expiring | Expiring | Rent Expiring | Expiring | |
| Vacant | NAP | 1,497,270 | 5.6% | NAP | NAP | 1,497,270 | 5.6% | NAP | NAP |
| MTM | 5 | 179,354 | 0.7 | $1,542,653 | 1.3% | 1,676,624 | 6.2% | $1,542,653 | 1.3% |
| 2016 | 37 | 2,574,488 | 9.6 | 13,237,578 | 10.7 | 4,251,112 | 15.8% | $14,780,231 | 12.0% |
| 2017 | 32 | 2,461,727 | 9.2 | 11,426,667 | 9.3 | 6,712,839 | 25.0% | $26,206,898 | 21.2% |
| 2018 | 35 | 4,737,391 | 17.6 | 21,311,824 | 17.3 | 11,450,230 | 42.6% | $47,518,722 | 38.5% |
| 2019 | 34 | 4,329,613 | 16.1 | 19,805,396 | 16.1 | 15,779,843 | 58.7% | $67,324,118 | 54.6% |
| 2020 | 27 | 2,546,095 | 9.5 | 12,743,662 | 10.3 | 18,325,938 | 68.2% | $80,067,780 | 64.9% |
| 2021 | 12 | 1,179,561 | 4.4 | 6,624,473 | 5.4 | 19,505,499 | 72.6% | $86,692,253 | 70.3% |
| 2022 | 13 | 1,336,256 | 5.0 | 5,955,616 | 4.8 | 20,841,755 | 77.5% | $92,647,869 | 75.1% |
| 2023 | 3 | 243,225 | 0.9 | 1,275,260 | 1.0 | 21,084,980 | 78.4% | $93,923,129 | 76.1% |
| 2024 | 8 | 1,152,305 | 4.3 | 5,854,352 | 4.7 | 22,237,285 | 82.7% | $99,777,481 | 80.9% |
| 2025 | 5 | 1,270,190 | 4.7 | 7,418,711 | 6.0 | 23,507,475 | 87.5% | $107,196,192 | 86.9% |
| 2026 & Beyond | 9 | 3,371,302 | 12.5 | 16,193,483 | 13.1 | 26,878,777 | 100.0% | $123,389,677 | 100.0% |
| Total | 220 | 26,878,777 | 100.0% | $123,389,677 | 100.0% |
| (1) | Based on the underwritten rent roll dated October 1, 2015. |
| (2) | Certain tenants have more than one lease. |
THE INFORMATION IN THIS COLLATERAL TERM SHEET IS NOT COMPLETE AND MAY BE AMENDED PRIOR TO THE TIME OF SALE. THIS TERM SHEET IS NOT AN OFFER TO SELL THESE SECURITIES AND IT IS NOT A SOLICITATION OF AN OFFER TO BUY THESE SECURITIES IN ANY JURISDICTION WHERE THE OFFER OR SALE IS NOT PERMITTED.
| 37 |
Mortgage Loan No. 1 — GLP Industrial Portfolio A
Operating History and Underwritten Net Cash Flow(1)
| Yr1 Budget | |||||||
| 2013 | 2014 | TTM(2) | (10/2015 - 9/2016) | Underwritten(3) | PSF(3) | %(4) | |
| Rents in Place(3) | $79,931,143 | $107,113,582 | $112,598,033 | $126,908,982 | $123,389,677 | $4.59 | 73.9% |
| Vacant Income | 0 | 0 | 0 | 0 | 8,256,110 | 0.31 | 4.9% |
| Gross Potential Rent | $79,931,143 | $107,113,582 | $112,598,033 | $126,908,982 | $131,645,787 | $4.90 | 78.8% |
| Total Reimbursements | 20,337,584 | 30,188,389 | 31,444,105 | 35,562,338 | 35,361,718 | 1.32 | 21.2% |
| Net Rental Income | $100,268,727 | $137,301,971 | $144,042,137 | $162,471,320 | $167,007,505 | $6.21 | 100.0% |
| (Vacancy/Collection Loss) | (3,893,316) | (3,207,494) | (5,010,206) | (9,239,767) | (10,841,311) | (0.40) | (6.5%) |
| Other Income | 363,625 | 1,683,391 | 1,365,188 | 725,759 | 725,759 | 0.03 | 0.4% |
| Effective Gross Income | $96,739,036 | $135,777,869 | $140,397,120 | $153,957,312 | $156,891,953 | $5.84 | 93.9% |
| Total Expenses | $26,174,307 | $37,156,412 | $37,710,832 | $40,905,654 | $41,005,138 | $1.53 | 26.1% |
| Net Operating Income | $70,564,730 | $98,621,458 | $102,686,288 | $113,051,658 | $115,886,815 | $4.31 | 73.9% |
| Total TI/LC, Capex/RR | 0 | 0 | 0 | 10,265,392 | 9,407,572 | 0.35 | 6.0% |
| Net Cash Flow | $70,564,730 | $98,621,458 | $102,686,288 | $102,786,266 | $106,479,243 | $3.96 | 67.9% |
| (1) | Not all of the properties in the Portfolio were the same in each of the historical periods. “Same Store” analysis, representing 91 properties, of net operating income and occupancy for 2013, 2014, TTM and Yr1 Budget was approximately $62.6 million, $78.4 million, $79.5 million and $84.8 million, respectively, and 91.2%, 94.0%, 93.2% and 97.2%, respectively. |
| (2) | The TTM column represents the trailing twelve month period ending June 30, 2015. |
| (3) | Underwritten Rents in Place are based on the October 2015 rent roll and includes approximately $4.5 million for rent steps and approximately $1.0 million for credit tenant rent steps. Rent steps reflects the difference between in-place rent and annualized contractual base rent steps through December 1, 2016. Credit tenant rent steps reflects the difference between in-place rent plus annualized contractual base rent steps through December 1, 2016 and credit tenants’ average rent from October 1, 2015 through the maturity date. |
| (4) | % column represents the percentage of Net Rental Income for all revenue lines and represents the percentage of Effective Gross Income for the remainder of fields. |
Property Management. The GLP Industrial Portfolio A properties are managed by GLP US Management LLC, an affiliate of the sponsor. Following the acquisition of IIT, GLP ranks as the 2nd largest logistics space owner in the U.S. after Prologis, Inc. (NYSE: PLD), with approximately 173 million SF. GLP entered the U.S. logistics market in February 2015 with its $8.1 billion acquisition of IndCor Properties, Inc. from the Blackstone Group, LP (NYSE: BX).
Escrows and Reserves. At origination, the borrower deposited into escrow approximately $1.2 million into the deferred maintenance escrow.
Tax & Insurance Escrows – The requirement of the borrower to make monthly deposits to the basic carrying costs reserve account is waived so long as a Trigger Period is not continuing.
TI/LC Reserves – The requirement of the borrower to make monthly deposits to the TI/LC reserve account is waived so long as a Trigger Period is not continuing. During a Trigger Period, 1/12th of $0.25 PSF (with accumulation in the reserve capped at $0.25 PSF) is required to be deposited into the TI/LC reserve account on a monthly basis.
Capital Expenditure Reserve – The requirement of the borrower to make monthly deposits to the capital expenditure reserve account is waived so long as a Trigger Period is not continuing. During a Trigger Period, 1/12th of $0.10 PSF (with accumulation in the reserve capped at $0.10 PSF) is required to be deposited into the capital expenditure reserves on a monthly basis.
Lockbox / Cash Management. The GLP Industrial Portfolio A Whole Loan is structured with a hard lockbox and springing cash management. Tenants have been directed to remit all payments due under their respective leases directly into the lockbox account controlled by the lender. During the continuance of a Trigger Period, all funds in the lockbox account are swept daily to a cash management account under the control of the lender and disbursed during each interest period of the term of the loan in accordance with the loan documents. During the continuance of a Trigger Period, all excess cash flow, after payments made in accordance with the loan documents for, amongst other things, debt service, required reserves and operating expenses, will be held as additional collateral for the loan.
THE INFORMATION IN THIS COLLATERAL TERM SHEET IS NOT COMPLETE AND MAY BE AMENDED PRIOR TO THE TIME OF SALE. THIS TERM SHEET IS NOT AN OFFER TO SELL THESE SECURITIES AND IT IS NOT A SOLICITATION OF AN OFFER TO BUY THESE SECURITIES IN ANY JURISDICTION WHERE THE OFFER OR SALE IS NOT PERMITTED.
| 38 |
Mortgage Loan No. 1 — GLP Industrial Portfolio A
“Trigger Period” means, (i) any period where the net operating income debt yield (for the total debt inclusive of the mezzanine loans) for the trailing twelve month period, falls below 6.75% for two consecutive fiscal quarters until the net operating income debt yield for the trailing twelve month period is at least 6.75% for two consecutive quarters and (ii) any period during the continuance of an event of default under any related mezzanine loan. The first test period will be the 12-month period ending March 30, 2016.
Property Releases.The applicable borrowers may release a related property from the mortgage by prepaying a portion of GLP Industrial Portfolio A Whole Loan in an amount equal to the applicable allocated loan amount times (i) 105% until the first 10% of GLP Industrial Portfolio A Whole Loan has been repaid; then (ii) 110% until 20% in aggregate of GLP Industrial Portfolio A Whole Loan has been repaid; and (iii) thereafter 115%. All principal repayments under the GLP Industrial Portfolio A Whole Loan prior to the open prepayment date in connection with such property releases are subject to yield maintenance.
In addition, property releases (other than releases that occur as a result of the application of loss proceeds from a casualty or condemnation at any related property) are further subject to a debt yield test (based on the total debt inclusive of the mezzanine loans) under the GLP Industrial Portfolio A Whole Loan, such that the aggregate portfolio debt yield (for the total debt inclusive of the mezzanine loans) of GLP Industrial Portfolio A Whole Loan after giving effect to such release is at least the lesser of (x) the debt yield immediately prior to such release and (y) 10.5%.
In addition, if no event of default under the GLP Industrial Portfolio A Whole Loan is continuing, the related borrowers may obtain a release of certain related excess parcels from the lien of the GLP Industrial Portfolio A mortgage without the related lender’s consent or approval or any requirement to prepay any portion of the GLP Industrial Portfolio A Whole Loan upon the satisfaction of certain conditions as described in the prospectus.
Additional Debt.The mortgaged properties are also security for thepari passu Note A-1, Note A-2, Note A-3-2, and Note A-4 and two subordinate B Notes. The B Notes have an outstanding principal balance as of the cut-off date of $328.9 million. The GLP Industrial Portfolio A Whole Loan (inclusive of B Notes) has a Cut-off Date LTV of 46.2%, and UW NCF DSCR of 2.62x and an UW NOI debt yield of 12.0%. In addition, $330.0 million of mezzanine loans were provided in connection with the financing of the portfolio that are secured by a pledge of the direct equity interests in the borrowers and are coterminous with the mortgage loan. The mezzanine loans have a weighted average coupon of 5.1500%. Including the mezzanine loans and the B Notes, the Cut-off Date LTV is 62.0%, the UW NCF DSCR is 1.84x and the UW NOI debt yield is 8.9%. The mezzanine loans are owned by TIAA-CREF.
THE INFORMATION IN THIS COLLATERAL TERM SHEET IS NOT COMPLETE AND MAY BE AMENDED PRIOR TO THE TIME OF SALE. THIS TERM SHEET IS NOT AN OFFER TO SELL THESE SECURITIES AND IT IS NOT A SOLICITATION OF AN OFFER TO BUY THESE SECURITIES IN ANY JURISDICTION WHERE THE OFFER OR SALE IS NOT PERMITTED.
| 39 |
(THIS PAGE INTENTIONALLY LEFT BLANK)
| 40 |
Mortgage Loan No. 2 — FedEx Brooklyn
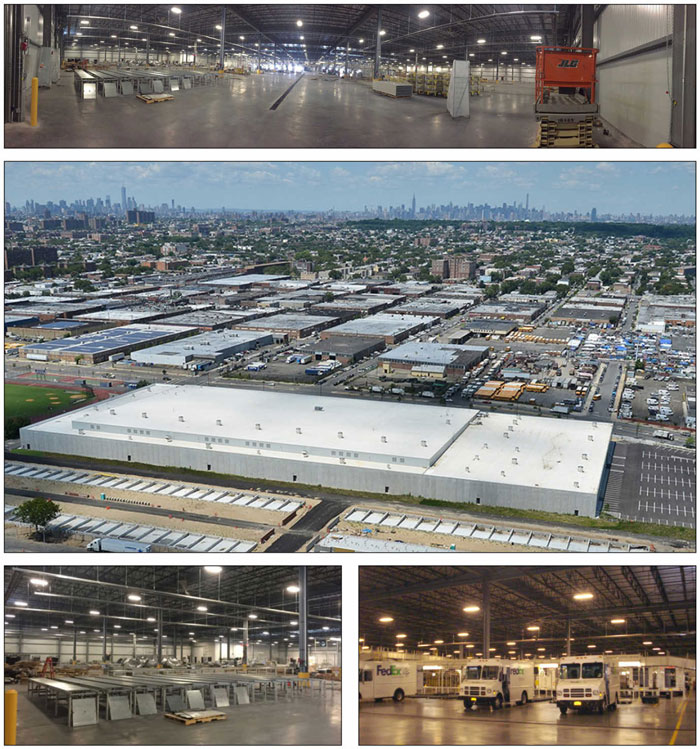
THE INFORMATION IN THIS COLLATERAL TERM SHEET IS NOT COMPLETE AND MAY BE AMENDED PRIOR TO THE TIME OF SALE. THIS TERM SHEET IS NOT AN OFFER TO SELL THESE SECURITIES AND IT IS NOT A SOLICITATION OF AN OFFER TO BUY THESE SECURITIES IN ANY JURISDICTION WHERE THE OFFER OR SALE IS NOT PERMITTED.
| 41 |
Mortgage Loan No. 2 — FedEx Brooklyn
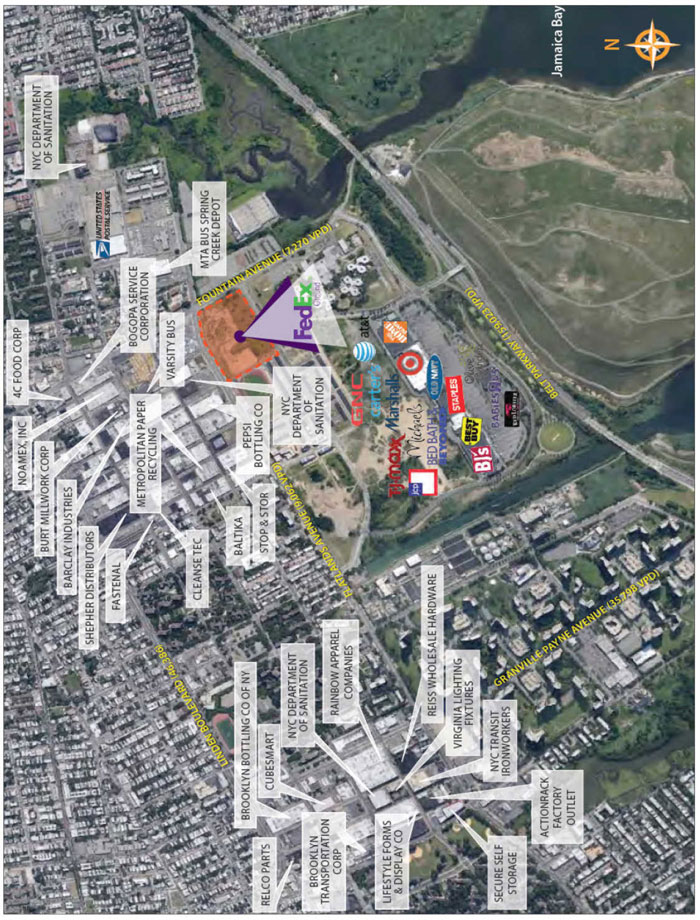
THE INFORMATION IN THIS COLLATERAL TERM SHEET IS NOT COMPLETE AND MAY BE AMENDED PRIOR TO THE TIME OF SALE. THIS TERM SHEET IS NOT AN OFFER TO SELL THESE SECURITIES AND IT IS NOT A SOLICITATION OF AN OFFER TO BUY THESE SECURITIES IN ANY JURISDICTION WHERE THE OFFER OR SALE IS NOT PERMITTED.
| 42 |
Mortgage Loan No. 2 — FedEx Brooklyn
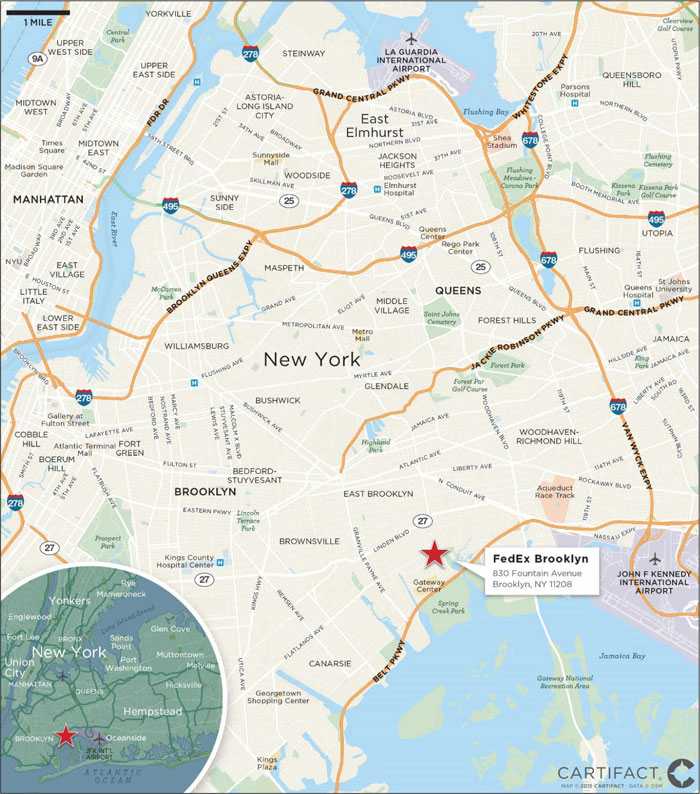
THE INFORMATION IN THIS COLLATERAL TERM SHEET IS NOT COMPLETE AND MAY BE AMENDED PRIOR TO THE TIME OF SALE. THIS TERM SHEET IS NOT AN OFFER TO SELL THESE SECURITIES AND IT IS NOT A SOLICITATION OF AN OFFER TO BUY THESE SECURITIES IN ANY JURISDICTION WHERE THE OFFER OR SALE IS NOT PERMITTED.
| 43 |
Mortgage Loan No. 2 — FedEx Brooklyn
| Mortgage Loan Information | Property Information | |||
| Mortgage Loan Seller: | JLC | Single Asset/Portfolio: | Single Asset | |
| Original Principal Balance(1): | $87,000,000 | Title: | Fee | |
| Cut-off Date Principal Balance(1): | $87,000,000 | Property Type - Subtype: | Industrial – Distribution Warehouse | |
| % of Pool by IPB: | 9.3% | Net Rentable Area (SF): | 278,721 | |
| Loan Purpose: | Refinance | Location: | Brooklyn, NY | |
| Borrower: | Fountain Avenue Investments, LLC | Year Built / Renovated: | 2015 / N/A | |
| Sponsor: | Jacob Feldman | Occupancy: | 100.0% | |
| Interest Rate(2): | 4.2800% | Occupancy Date: | 2/6/2016 | |
| Note Date: | 10/22/2015 | Number of Tenants: | 1 | |
| Anticipated Repayment Date (2): | 11/6/2025 | 2012 NOI(5): | N/A | |
| Interest-only Period: | 120 months | 2013 NOI(5): | N/A | |
| Original Term: | 120 months (to ARD) | 2014 NOI(5): | N/A | |
| Original Amortization: | None | UW Economic Occupancy: | 100.0% | |
| Amortization Type: | Interest Only, ARD | UW Revenues: | $11,154,536 | |
| Call Protection(3): | L(27),Def(89),O(4) | UW Expenses: | $0 | |
| Lockbox(4): | Hard | UW NOI: | $11,154,536 | |
| Additional Debt(1): | Yes | UW NCF: | $11,112,728 | |
| Additional Debt Balance(1): | $43,000,000 | Appraised Value / Per SF: | $195,000,000 / $700 | |
| Additional Debt Type(1): | Pari Passu | Appraisal Date: | 8/26/2015 | |
| Additional Future Debt Permitted: | No |
| Escrows and Reserves(6) | Financial Information(1) | |||||
| Initial | Monthly | Initial Cap | Cut-off Date Loan / SF: | $466 | ||
| Taxes: | $0 | $10,433 | N/A | Maturity Date Loan / SF: | $466 | |
| Insurance: | $38,000 | $12,149 | N/A | Cut-off Date LTV: | 66.7% | |
| Replacement Reserves: | $0 | $3,484 | N/A | Maturity Date LTV: | 66.7% | |
| Special Rollover Reserve: | $0 | Springing | N/A | UW NCF DSCR: | 1.97x | |
| UW NOI Debt Yield: | 8.6% | |||||
Sources and Uses
| Sources | Proceeds | % of Total | Uses | Proceeds | % of Total | |
| Mortgage Loan(1) | $130,000,000 | 100.0% | Payoff Existing Debt | $32,696,312 | 25.2% | |
| Return of Equity | 93,055,196 | 71.6 | ||||
| Closing Costs | 4,210,492 | 3.2 | ||||
| Upfront Reserves | 38,000 | 0.0 | ||||
| Total Sources | $130,000,000 | 100.0% | Total Uses | $130,000,000 | 100.0% |
| (1) | The FedEx Brooklyn loan is part of a larger split whole loan evidenced by two notes with an aggregate principal balance of $130.0 million. Note A-1 has an outstanding principal balance as of the cut-off date of $87.0 million and is being contributed to the CSAIL 2016-C5 Commercial Mortgage Trust. Note A-2 has an outstanding principal balance as of the cut-off date of $43.0 million and it is expected to be contributed to a future securitization. |
| The financial information presented in the chart above reflects the cut-off date balance of the $130.0 million FedEx Brooklyn Whole Loan. |
| (2) | The loan is structured with an anticipated repayment date (“ARD”) of November 6, 2025 and a stated maturity date of May 6, 2030. From and after the ARD, (i) the interest rate will increase to 7.8800% (the “Adjusted Interest Rate”), (ii) the borrower will be required to make monthly payments equal to $641,807.09, which is based on the Initial Interest Rate and a 30-year amortization schedule, (iii) interest will accrue on the FedEx Brooklyn Whole Loan at the Adjusted Interest Rate and (iv) all excess cash flow from the FedEx Brooklyn property, after payment of reserves and operating expenses, will be applied to the outstanding principal balance of the FedEx Brooklyn Whole Loan. The portion of interest that is “Additional Interest” (which means the difference between the interest accrued at the Adjusted Interest Rate and the Initial Interest Rate) is not required to be paid current from and after the ARD, but will be deferred and will be required to be repaid on the maturity date. |
| (3) | The lockout period will be at least 27 payment dates. Defeasance of the Fedex Brooklyn loan is permitted following two years after the closing date of the securitization that includes the note last to be securitized. |
THE INFORMATION IN THIS COLLATERAL TERM SHEET IS NOT COMPLETE AND MAY BE AMENDED PRIOR TO THE TIME OF SALE. THIS TERM SHEET IS NOT AN OFFER TO SELL THESE SECURITIES AND IT IS NOT A SOLICITATION OF AN OFFER TO BUY THESE SECURITIES IN ANY JURISDICTION WHERE THE OFFER OR SALE IS NOT PERMITTED.
| 44 |
Mortgage Loan No. 2 — FedEx Brooklyn
| (4) | For a more detailed description of Lockbox, please refer to“Lockbox / Cash Management”below. |
| (5) | The property was newly constructed in 2015 and historical financials were not available. |
| (6) | For a more detailed description of Escrows and Reserves, please refer to “Escrows and Reserves” below. |
The Loan. The FedEx Brooklyn loan, which is part of a larger split whole loan, is a first mortgage loan secured by the fee interest in a newly constructed 278,721 SF single-tenant industrial property located in Brooklyn, New York. The whole loan has an outstanding principal balance of $130.0 million (the “FedEx Brooklyn Whole Loan”) as of the cut-off date, which is comprised of twopari passu notes, Note A-1 and Note A-2. Note A-1 has an outstanding principal balance as of the cut-off date of $87.0 million and is being contributed to the CSAIL 2016-C5 Commercial Mortgage Trust. Note A-2 has an outstanding principal balance as of the cut-off date of $43.0 million, is currently held by Jefferies LoanCore LLC or an affiliate, and is expected to be contributed to a future securitized trust. As the holder of Note A-1 (the “Controlling Noteholder”), the trustee of the CSAIL 2016-C5 Commercial Mortgage Trust (or, prior to the occurrence and continuance of a control termination event under the CSAIL 2016-C5 pooling and servicing agreement, the CSAIL 2016-C5 controlling class representative) will be entitled to exercise all of the rights of the Controlling Noteholder with respect to the FedEx Brooklyn Whole Loan; however, the holder of Note A-2 will be entitled, under certain circumstances, to consult with the Controlling Noteholder with respect to certain major decisions. The loan has a 10-year ARD and is interest-only for the term of the loan through the ARD.
Whole Loan Note Summary
| Original Balance | Cut-off Date Balance | Note Holder | Note in Controlling Securitization | |
| Note A-1 | $87,000,000 | $87,000,000 | CSAIL 2016-C5 | Yes |
| Note A-2 | 43,000,000 | 43,000,000 | Future Securitization | No |
| Total | $130,000,000 | $130,000,000 |
The Borrower. The borrowing entity for the loan is Fountain Avenue Investments, LLC, a Delaware limited liability company and special purpose entity.
The Sponsor. The loan’s sponsor and nonrecourse carve-out guarantor is Jacob Feldman. Jacob Feldman is the president of the Rector Hylan Corporation which owns and manages commercial and multifamily properties, four of which are located in the Brooklyn, New York market.
The Property. The property is a 278,721 SF, single-tenant industrial property located in Brooklyn, New York. The property was recently constructed as a “built-to-suit” in 2015 for FedEx Ground Package System, Inc. (“FedEx Ground”). The sponsor subsequently purchased the property for an all in cost of $192.5 million in June 2015 using approximately $160.0 million of equity and a $32.7 million bridge loan. The FedEx Brooklyn Whole Loan refinanced the aforementioned bridge loan. The property is situated on approximately 9.9 acres and consists of 153,354 SF of warehouse space (55.0% of NRA), 116,900 SF of distribution space (41.9% of NRA) and 8,467 SF of office space (3.0% of NRA). The property is 100.0% leased by FedEx Ground on a non-terminable NNN basis expiring on June 30, 2030 with two, 10-year extension options. FedEx Ground’s rent commenced on July 1, 2015 at a rental rate of $37.10 PSF NNN and the lease is structured with 7.5% base rent escalations every five years, including extension terms. Under the lease, FedEx Ground is responsible for all expenses (including reimbursing the landlord for 100% of the costs of real estate taxes and insurance premiums) except for structural repairs and capital replacements. FedEx Corporation (NYSE: FDX) guarantees the FedEx Ground lease. FedEx Ground took occupancy in October 2015 and is fully operational.
The property features 19 exterior dock doors, five drive-in doors, security systems that include access gates and perimeter fencing and 250 parking spaces providing a parking ratio of approximately 0.9 spaces per 1,000 SF of NRA. The property was built with internal distribution vehicle access and staging areas that will allow FedEx Ground distribution vehicles to enter the property and gain direct access to package conveyor systems.
FedEx Corporation is the world’s largest commerce provider, operating in more than 220 countries and territories. Founded in Little Rock, Arkansas in 1971, FedEx Corporation provides a range of transportation, logistics, e-commerce and business services through its four major operating segments: FedEx Ground, FedEx Express, FedEx Freight and FedEx Services. FedEx
THE INFORMATION IN THIS COLLATERAL TERM SHEET IS NOT COMPLETE AND MAY BE AMENDED PRIOR TO THE TIME OF SALE. THIS TERM SHEET IS NOT AN OFFER TO SELL THESE SECURITIES AND IT IS NOT A SOLICITATION OF AN OFFER TO BUY THESE SECURITIES IN ANY JURISDICTION WHERE THE OFFER OR SALE IS NOT PERMITTED.
| 45 |
Mortgage Loan No. 2 — FedEx Brooklyn
Corporation is headquartered in Memphis, Tennessee and has over 325,000 team members worldwide. FedEx Corporation makes an average of approximately 11.0 million shipments each business day. FedEx Ground is the most profitable operating subdivision of FedEx Corporation, yielding a 16.7% operating margin. For fiscal year 2014, FedEx Ground accounted for approximately 25.5% and 53.0% of FedEx Corporation’s revenue and operating income, respectively. FedEx Ground is headquartered in Pittsburgh, Pennsylvania.
The Market.The FedEx Brooklyn property is located at 830 Fountain Avenue between Flatlands Avenue and Old Vandalia Street within the East New York neighborhood of Brooklyn, approximately 15 miles southeast of Midtown Manhattan, five miles west of John F. Kennedy International Airport and 13 miles south of LaGuardia Airport. The East New York neighborhood of South Brooklyn is generally characterized as a mixed-use neighborhood primarily supporting residential, industrial and commercial uses. The property is located within close proximity to the Gateway Center retail power center which features over 1.24 million SF of gross leasable area. The Gateway Center features a combination of national and regional tenants and is anchored by JC Penney, Burlington Coat Factory, ShopRite, Home Depot, Target, and BJ’s Wholesale Club. Other notable tenants include a Marshall’s, Best Buy, Old Navy, Staples and a Bed Bath and Beyond. As of the third quarter 2015, the Brooklyn (Kings County) industrial market had a supply of 4,502 industrial properties totaling 91,295,326 SF. Vacancy rates have decreased from 5.8% in the fourth quarter 2011 to 4.6% as of the third quarter 2015.
Competitive Set Summary(1)
| Property Location | Tenant Name | Lease Commencement | Leased SF | Initial Rent PSF ($) | Term | Lease Type |
| FedEx Brooklyn | FedEx Ground | 7/2015(2) | 278,721(2) | $37.10(2) | 15(2) | Net |
| Bushwick, Brooklyn | Confidential | 7/2015 | 18,000 | $37.00 | 10 | Gross |
| Jamaica, Queens | Walmart | 6/2015 | 42,438 | $20.00 | 15 | Net |
| Flushing, Queens | All City Metal | 2/2014 | 45,000 | $38.40 | 15 | Net |
| Jamaica, Queens | DHL Express | 1/2014 | 45,051 | $23.00 | 15 | Net |
| Long Island City, Queens | FedEx Ground | 3/2013 | 143,000 | $65.61 | 15 | Net |
| Maspeth, Queens | Bimbo Bakery | 1/2013 | 56,966 | $42.48 | 15 | Net |
| Blauvelt, NY | FedEx Ground | 3/2012 | 142,139 | $24.97 | 15 | Net |
| Jamaica, Queens | Offering | 8/2015 | 27,308 | $40.00 | 15 | Net |
| Jamaica, Queens | Offering | 8/2015 | 40,000 | $38.00 | 15 | Net |
| (1) | Source: Appraisal. |
| (2) | Based on the underwritten rent roll. |
Historical and Current Occupancy(1)
| 2011 | 2012 | 2013 | 2014 | Current(2) |
| N/A | N/A | N/A | N/A | 100.0% |
| (1) | The property was newly constructed in 2015 and historical occupancies are not available. |
| (2) | Based on the underwritten rent roll. |
Tenant Summary(1)
| Tenant | Ratings Moody’s/S&P/Fitch(2) | Net Rentable Area (SF) | % of Total NRA | Base Rent PSF | Lease Expiration Date |
| FedEx Ground Package System, Inc. | Baa1 / BBB / NR | 278,721 | 100.0% | $37.10 | 6/30/2030 |
| (1) | Based on the underwritten rent roll. |
| (2) | Ratings provided are for FedEx Corporation, the parent company of the entity listed in the “Tenant” field and guarantor of the FedEx Ground lease. |
THE INFORMATION IN THIS COLLATERAL TERM SHEET IS NOT COMPLETE AND MAY BE AMENDED PRIOR TO THE TIME OF SALE. THIS TERM SHEET IS NOT AN OFFER TO SELL THESE SECURITIES AND IT IS NOT A SOLICITATION OF AN OFFER TO BUY THESE SECURITIES IN ANY JURISDICTION WHERE THE OFFER OR SALE IS NOT PERMITTED.
| 46 |
Mortgage Loan No. 2 — FedEx Brooklyn
Lease Rollover Schedule(1)
| Year | Number of Leases Expiring | NRA Expiring | % of NRA Expiring | Base Rent Expiring | % of Base Rent Expiring | Cumulative NRA Expiring | Cumulative % of NRA Expiring | Cumulative Base Rent Expiring | Cumulative % of Base Rent Expiring |
| Vacant | NAP | 0 | 0.0% | NAP | NAP | 0 | 0.0% | NAP | NAP |
| MTM | 0 | 0 | 0.0 | $0 | 0.0% | 0 | 0.0% | $0 | 0.0% |
| 2016 | 0 | 0 | 0.0 | 0 | 0.0 | 0 | 0.0% | $0 | 0.0% |
| 2017 | 0 | 0 | 0.0 | 0 | 0.0 | 0 | 0.0% | $0 | 0.0% |
| 2018 | 0 | 0 | 0.0 | 0 | 0.0 | 0 | 0.0% | $0 | 0.0% |
| 2019 | 0 | 0 | 0.0 | 0 | 0.0 | 0 | 0.0% | $0 | 0.0% |
| 2020 | 0 | 0 | 0.0 | 0 | 0.0 | 0 | 0.0% | $0 | 0.0% |
| 2021 | 0 | 0 | 0.0 | 0 | 0.0 | 0 | 0.0% | $0 | 0.0% |
| 2022 | 0 | 0 | 0.0 | 0 | 0.0 | 0 | 0.0% | $0 | 0.0% |
| 2023 | 0 | 0 | 0.0 | 0 | 0.0 | 0 | 0.0% | $0 | 0.0% |
| 2024 | 0 | 0 | 0.0 | 0 | 0.0 | 0 | 0.0% | $0 | 0.0% |
| 2025 | 0 | 0 | 0.0 | 0 | 0.0 | 0 | 0.0% | $0 | 0.0% |
| 2026 & Beyond | 1 | 278,721 | 100.0 | 11,154,536 | 100.0 | 278,721 | 100.0% | $11,154,536 | 100.0% |
| Total | 1 | 278,721 | 100.0% | $11,154,536 | 100.0% |
| (1) | Based on the underwritten rent roll. Rent represents straight-line average for the FedEx Ground lease through the final maturity date of the loan. |
Underwritten Net Cash Flow
| In-Place (7/1/2015) (1) | In-Place (7/1/2020) (1) | In-Place (7/1/2025) (1) | Underwritten(2) | PSF | %(3) | |
| Rents in Place | $10,341,468 | $11,117,076 | $11,950,860 | $10,341,468 | $37.10 | 92.7% |
| Straight-Line Average Rent | 0 | 0 | 0 | 813,068 | 2.92 | 7.3% |
| Gross Potential Rent | $10,341,468 | $11,117,076 | $11,950,860 | $11,154,536 | $40.02 | 100.0% |
| Total Reimbursements | 0 | 0 | 0 | 0 | 0.00 | 0.0% |
| Net Rental Income | $10,341,468 | $11,117,076 | $11,950,860 | $11,154,536 | $40.02 | 100.0% |
| (Vacancy/Collection Loss) | 0 | 0 | 0 | 0 | 0.00 | 0.0% |
| Other Income | 0 | 0 | 0 | 0 | 0.00 | 0.0% |
| Effective Gross Income | $10,341,468 | $11,117,076 | $11,950,860 | $11,154,536 | $40.02 | 100.0% |
| Total Expenses | 0 | 0 | 0 | 0 | 0.00 | 0.0% |
| Net Operating Income | $10,341,468 | $11,117,076 | $11,950,860 | $11,154,536 | $40.02 | 100.0% |
| Total TI/LC, Capex/RR | 41,808 | 41,808 | 41,808 | 41,808 | 0.15 | 0.4% |
| Net Cash Flow | $10,299,660 | $11,075,268 | $11,909,052 | $11,112,728 | $39.87 | 99.6% |
| (1) | Reflects annualized base rent payable under the FedEx Ground lease as of the specified date. |
| (2) | Rent includes Base Rent and the straight-line average for the FedEx Ground lease through the final maturity date of the loan. |
| (3) | % column represents percent of Net Rental Income for all revenue lines and represents percent of Effective Gross Income for the remainder of fields. |
Property Management. The property is self-managed.
Escrows and Reserves. At origination, the borrower deposited $38,000 into escrow for insurance.
Tax Escrows – The loan requires monthly escrows for real estate taxes, which currently equates to $10,433. Notwithstanding the foregoing, the loan documents provide that monthly tax escrows will not be required if the lease is modified such that taxes become the direct obligation of the tenant and (i) taxes are actually paid prior to the assessment of any penalty for late payment and prior to the date that such taxes are considered delinquent (and if requested by lender, the borrower or tenant provides reasonably satisfactory evidence to that effect) and (ii) no event of default has occurred and is continuing.
Insurance Escrows – The loan requires monthly escrows for insurance premiums, which currently equates to $12,149. Notwithstanding the foregoing, the loan documents provide that monthly insurance escrows will not be required if the lease is modified
THE INFORMATION IN THIS COLLATERAL TERM SHEET IS NOT COMPLETE AND MAY BE AMENDED PRIOR TO THE TIME OF SALE. THIS TERM SHEET IS NOT AN OFFER TO SELL THESE SECURITIES AND IT IS NOT A SOLICITATION OF AN OFFER TO BUY THESE SECURITIES IN ANY JURISDICTION WHERE THE OFFER OR SALE IS NOT PERMITTED.
| 47 |
Mortgage Loan No. 2 — FedEx Brooklyn
such that insurance premiums become the direct obligation of the tenant and (i) the borrower or tenant provides the lender with satisfactory evidence (as determined by the lender) that the property is insured in accordance with the loan documents and (ii) no default has occurred and is continuing.
Replacement Reserves – On a monthly basis, the borrower is required to escrow $3,484 for replacement reserves, which equates to $0.15 PSF annually.
Special Rollover Reserve – During the continuance of a Lease Sweep Period (defined below), the Applicable Percentage of Available Cash (defined below) (after payment of debt service, reserve payments and approved operating expenses) will be deposited into a reserve account for the purposes of paying leasing expenses in connection with re-tenanting the space under the lease that triggered the Lease Sweep Period. If the Lease Sweep Period is triggered in the first four years of the loan term, the Special Rollover Reserve will be subject to a cap of $20.0 million.
“Applicable Percentage of Available Cash” means (i) with respect to a Lease Sweep Period triggered by any of the matters described in clauses (i), (ii), (iii), (v) or (vi) of the definition of “Lease Sweep Period”, 100%, (ii) with respect to a Lease Sweep Period triggered by the matter described in clause (iv) of the definition of “Lease Sweep Period”, 90%, and (iii) with respect to a Lease Sweep Period triggered by the matter described in clause (vii) of the defined term “Lease Sweep Period”, (x) if the credit rating of the subject credit tenant has been downgraded below BB by S&P or Ba2 by Moody’s (or its functional equivalent by any other rating agency), but is equal to or higher than B+ by S&P or B1 by Moody’s (or its functional equivalent by any other rating agency), 50%, and (y) if the credit rating of the subject credit tenant has been downgraded below B+ by S&P or B1 by Moody’s (or its functional equivalent by any other rating agency), 90%.
Lockbox / Cash Management. The loan is structured with a hard lockbox and springing cash management. Unless a Cash Management Period (as defined below) has occurred, all amounts on deposit in the clearing account will be swept into the borrower’s account. From and after the commencement of a Cash Management Period, all amounts on deposit in the clearing account will be swept daily into a lender controlled account.
“Cash Management Period” means the period: (i) during the continuation of an event of default, (ii) following the ARD, (iii) during which the debt yield on the loan is less than 7.0%, until such time that the debt yield is at least 7.0% for two consecutive quarters or (iv) that is a Lease Sweep Period (defined below).
“Lease Sweep Period” means the period: (i) from the date that is 18 months prior to the end of the term of any Major Lease (defined below), (ii) commencing on the date required under a Major Lease by which the applicable Major Tenant (defined below) is required to give notice of its exercise of a renewal option (and such renewal option has not been so exercised), (iii) commencing when any Major Lease is surrendered, cancelled or terminated prior to its then-current expiration date, (iv) commencing when any Major Tenant goes dark or gives notice that it intends to discontinue its business, (v) commencing upon the occurrence of a material default under any Major Lease, (vi) commencing upon the occurrence of a Major Tenant insolvency proceeding or (vii) commencing when the credit rating of FedEx Corporation or any Major Tenant that has a credit rating as specified in the definition of Applicable Percentage of Available Cash above. A Lease Sweep Period may terminate as and when provided in the related loan documents.
“Major Lease” means: the lease with FedEx Ground, and any replacement lease which covers 30% or more of the rentable SF of the improvements or which represents 30% or more of the total annual rents at the property.
“Major Tenant” means: any tenant under a Major Lease, or under one or more leases which when taken together would constitute a Major Lease.
ICAP Program. The borrower has received preliminary approval for a 25-year tax abatement via the New York City Industrial & Commercial Abatement Program (“ICAP”). All requirements under the ICAP statute have been satisfied and it is anticipated that the benefit period will commence in the 2016 tax year. Following the commencement of the ICAP, the property will benefit from a real estate tax abatement on its improved value for 16 years and the abatement will then burn off in 10% increments for the following nine years (years 17-25).
THE INFORMATION IN THIS COLLATERAL TERM SHEET IS NOT COMPLETE AND MAY BE AMENDED PRIOR TO THE TIME OF SALE. THIS TERM SHEET IS NOT AN OFFER TO SELL THESE SECURITIES AND IT IS NOT A SOLICITATION OF AN OFFER TO BUY THESE SECURITIES IN ANY JURISDICTION WHERE THE OFFER OR SALE IS NOT PERMITTED.
| 48 |
Mortgage Loan No. 3 — Starwood Capital Extended Stay Portfolio
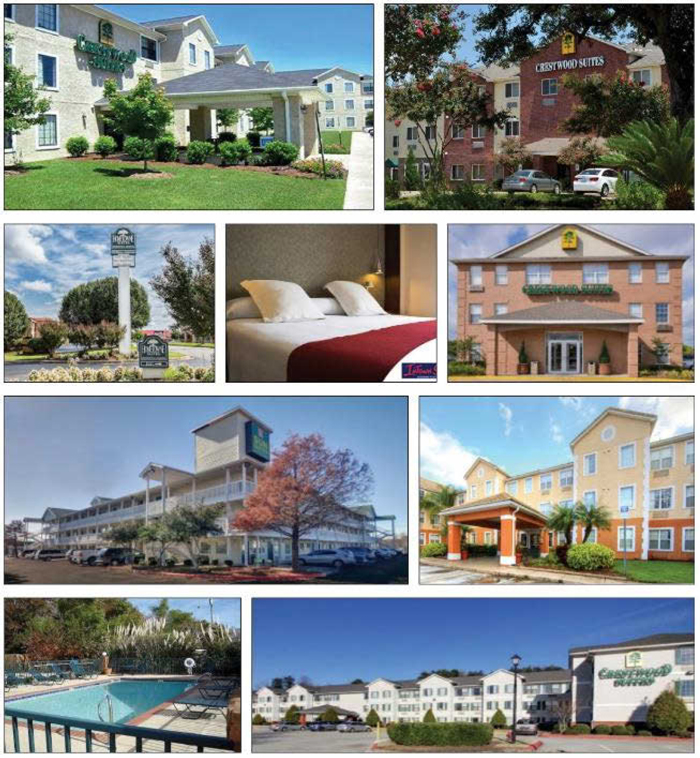
THE INFORMATION IN THIS COLLATERAL TERM SHEET IS NOT COMPLETE AND MAY BE AMENDED PRIOR TO THE TIME OF SALE. THIS TERM SHEET IS NOT AN OFFER TO SELL THESE SECURITIES AND IT IS NOT A SOLICITATION OF AN OFFER TO BUY THESE SECURITIES IN ANY JURISDICTION WHERE THE OFFER OR SALE IS NOT PERMITTED.
| 49 |
Mortgage Loan No. 3 — Starwood Capital Extended Stay Portfolio
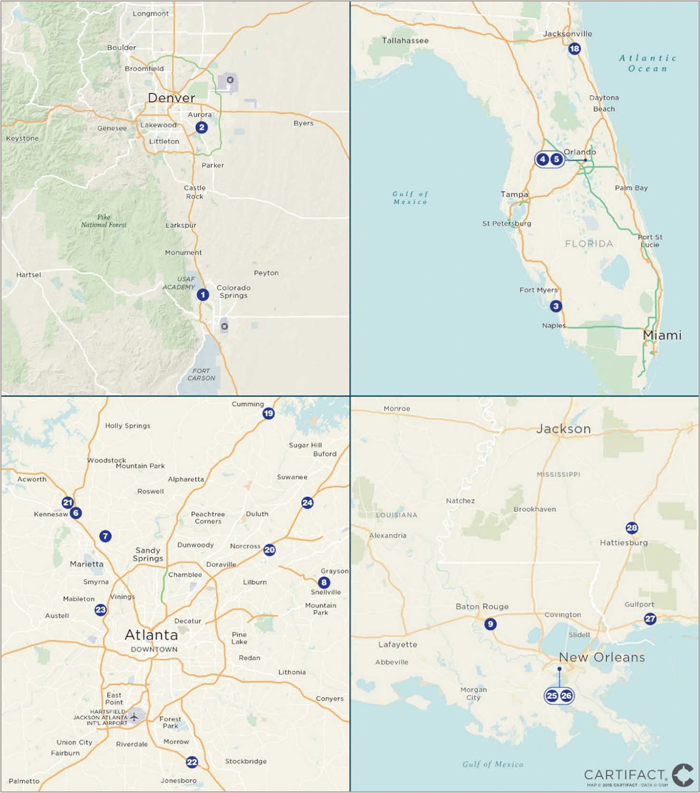
THE INFORMATION IN THIS COLLATERAL TERM SHEET IS NOT COMPLETE AND MAY BE AMENDED PRIOR TO THE TIME OF SALE. THIS TERM SHEET IS NOT AN OFFER TO SELL THESE SECURITIES AND IT IS NOT A SOLICITATION OF AN OFFER TO BUY THESE SECURITIES IN ANY JURISDICTION WHERE THE OFFER OR SALE IS NOT PERMITTED.
| 50 |
Mortgage Loan No. 3 — Starwood Capital Extended Stay Portfolio
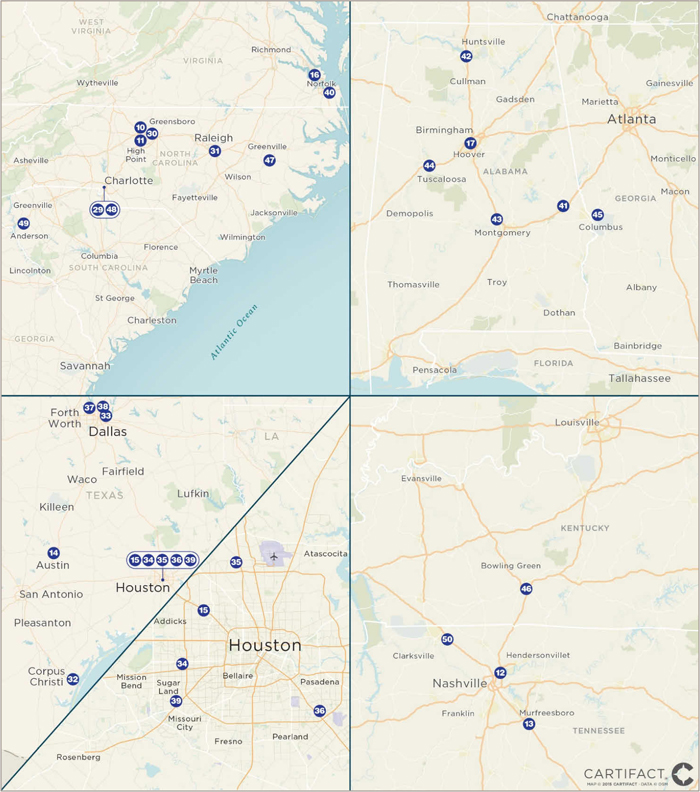
THE INFORMATION IN THIS COLLATERAL TERM SHEET IS NOT COMPLETE AND MAY BE AMENDED PRIOR TO THE TIME OF SALE. THIS TERM SHEET IS NOT AN OFFER TO SELL THESE SECURITIES AND IT IS NOT A SOLICITATION OF AN OFFER TO BUY THESE SECURITIES IN ANY JURISDICTION WHERE THE OFFER OR SALE IS NOT PERMITTED.
| 51 |
Mortgage Loan No. 3 — Starwood Capital Extended Stay Portfolio
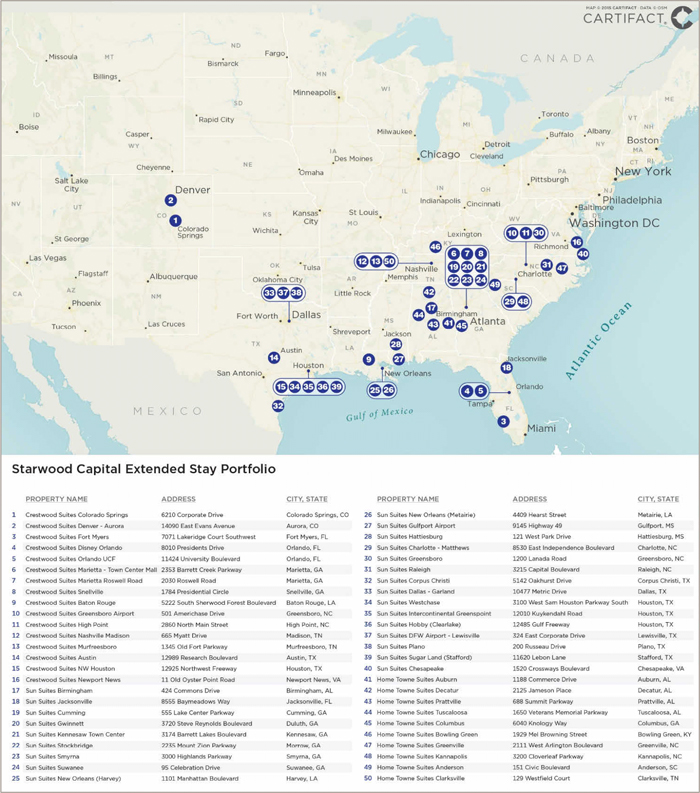
THE INFORMATION IN THIS COLLATERAL TERM SHEET IS NOT COMPLETE AND MAY BE AMENDED PRIOR TO THE TIME OF SALE. THIS TERM SHEET IS NOT AN OFFER TO SELL THESE SECURITIES AND IT IS NOT A SOLICITATION OF AN OFFER TO BUY THESE SECURITIES IN ANY JURISDICTION WHERE THE OFFER OR SALE IS NOT PERMITTED.
| 52 |
Mortgage Loan No. 3 — Starwood Capital Extended Stay Portfolio
| Mortgage Loan Information | Property Information | |||
| Mortgage Loan Seller: | Column | Single Asset/Portfolio: | Portfolio of 50 Properties | |
| Original Principal Balance(1): | $75,000,000 | Title: | Fee | |
| Cut-off Date Principal Balance(1): | $75,000,000 | Property Type - Subtype: | Hotel – Extended Stay | |
| % of Pool by IPB: | 8.0% | Net Rentable Area (Rooms): | 6,106 | |
| Loan Purpose: | Acquisition | Location: | Various | |
| Borrowers(2): | Various | Year Built / Renovated: | Various | |
| Sponsor: | SOF-IX U.S. Holdings, L.P. | Occupancy / ADR / RevPAR(7): | 76.3% / $39.81 / $30.38 | |
| Interest Rate: | 4.01625% | Occupancy / ADR / RevPAR Date(7): | 4/30/2015 | |
| Note Date: | 6/11/2015 | Number of Tenants: | N/A | |
| Maturity Date: | 7/6/2020 | 2012 NOI: | $15,986,386 | |
| Interest-only Period: | 24 months | 2013 NOI: | $15,645,926 | |
| Original Term: | 60 months | 2014 NOI: | $27,185,644 | |
| Original Amortization(3): | 360 months | TTM NOI(7): | $28,792,531 | |
| Amortization Type: | IO-Balloon | UW Occupancy / ADR / RevPAR: | 76.3% / $39.81 / $30.38 | |
| Call Protection(4): | L(31),Def or YM1(25),O(4) | UW Revenues: | $68,907,956 | |
| Lockbox(5): | Hard | UW Expenses: | $40,932,498 | |
| Additional Debt(1)(6): | Yes | UW NOI: | $27,975,458 | |
| Additional Debt Balance(1)(6): | $150,000,000 | UW NCF: | $25,219,140 | |
| Additional Debt Type(1)(6): | Pari Passu, Mezzanine | Appraised Value / Per Room(8): | $311,000,000 / $50,934 | |
| Additional Future Debt Permitted: | No | Appraisal Date(8): | 5/4/2015 |
| Escrows and Reserves(9) | Financial Information(1) | |||||
| Initial | Monthly | Initial Cap | Cut-off Date Loan / Room: | $32,755 | ||
| Taxes: | $0 | Springing | N/A | Maturity Date Loan / Room: | $31,233 | |
| Insurance: | $0 | Springing | N/A | Cut-off Date LTV(8): | 64.3% | |
| FF&E Reserve: | $244,725 | 4% of total gross monthly revenue | N/A | Maturity Date LTV(8): | 61.3% | |
| Capital Work Reserve: | $6,500,000 | N/A | N/A | UW NCF DSCR: | 2.26x | |
| Engineering Reserve: | $1,121,206 | N/A | N/A | UW NOI Debt Yield: | 14.0% | |
Sources and Uses
| Sources | Proceeds | % of Total | Uses | Proceeds | % of Total | |
| Mortgage Loan(1) | $200,000,000 | 63.7% | Purchase Price | $300,000,000 | 95.5% | |
| Mezzanine Loan | 25,000,000 | 8.0 | Upfront Reserves | 7,865,931 | 2.5 | |
| Borrower Equity | 89,019,273 | 28.3 | Closing Costs | 6,153,341 | 2.0 | |
| Total Sources | $314,019,273 | 100.0% | Total Uses | $314,019,273 | 100.0% |
| (1) | The Starwood Capital Extended Stay Portfolio loan is part of a larger split whole loan evidenced by fourpari passu notes with an aggregate principal balance of $200.0 million. The financial information presented in the chart above reflects the cut-off date balance of the $200.0 million Starwood Capital Extended Stay Portfolio Whole Loan. |
| (2) | The borrowing entities are 50 limited partnership, special purposes entities. |
| (3) | After the interest-only period, the loan will amortize on a fixed amortization schedule. For more information see Annex F to the Prospectus. |
| (4) | The lockout period will be at least 31 payment dates beginning with and including the first payment date of August 6, 2015. Defeasance or yield maintenance of the full Starwood Capital Extended Stay Portfolio Whole Loan is permitted following two years after the closing date of the securitization that includes the note last to be securitized. |
| (5) | For a more detailed description of lockbox, please refer to“Lockbox / Cash Management”below. |
| (6) | The additional debt balance includes $125.0 million ofpari passu debt and a $25.0 million mezzanine loan. |
| (7) | Represents trailing twelve months ending April 30, 2015. |
| (8) | The appraised value of $311.0 million is reflective of the value of the portfolio if sold in its entirety to a single buyer. The appraisal determined an appraised value on both a portfolio and individual basis. The concluded aggregate appraised value of the individual properties was $301.8 million, which would result in a Cut-off Date LTV of 66.3% and a Maturity Date LTV of 63.2%. |
| (9) | For a more detailed description of Escrows and Reserves, please refer to“Escrows and Reserves” below. |
THE INFORMATION IN THIS COLLATERAL TERM SHEET IS NOT COMPLETE AND MAY BE AMENDED PRIOR TO THE TIME OF SALE. THIS TERM SHEET IS NOT AN OFFER TO SELL THESE SECURITIES AND IT IS NOT A SOLICITATION OF AN OFFER TO BUY THESE SECURITIES IN ANY JURISDICTION WHERE THE OFFER OR SALE IS NOT PERMITTED.
| 53 |
Mortgage Loan No. 3 — Starwood Capital Extended Stay Portfolio
The Loan. The Starwood Capital Extended Stay Portfolio loan, which is part of a larger split whole loan, is a first mortgage loan secured by the fee interest in 50 extended stay properties located in 12 states. The whole loan has an outstanding principal balance of $200.0 million (the “Starwood Capital Extended Stay Portfolio Whole Loan”) as of the cut-off date, which is comprised of fourpari passu notes, Note A-1-A, Note A-1-B, Note A-2 and Note A-3. Notes A-2 and A-3, which have an aggregate outstanding principal balance as of the cut-off date of $75.0 million, are being contributed to the CSAIL 2016-C5 Commercial Mortgage Trust. Note A-1-B, which has a balance as of the cut-off date of $20.0 million, is currently held by Column Financial, Inc. and is expected to be contributed to a future securitization trust. Note A-1-A has an outstanding principal balance as of the cut-off date of approximately $105.0 million and was contributed to the CSAIL 2015-C3 Commercial Mortgage Trust. As the holder of Note A-1-A (the “Controlling Noteholder”), the trustee of the CSAIL 2015-C3 Commercial Mortgage Trust (or, prior to the occurrence and continuance of a control termination event under the CSAIL 2015-C3 pooling and servicing agreement, the CSAIL 2015-C3 controlling class representative) will be entitled to exercise all of the rights of the Controlling Noteholder with respect to the Starwood Capital Extended Stay Portfolio Whole Loan; however, the holders of Note A-1-B, A-2 and A-3 will be entitled, under certain circumstances, to consult with the Controlling Noteholder with respect to certain major decisions. The loan has a 5-year term and will amortize on a 30-year schedule after a two-year interest only period.
Whole Loan Note Summary
| Original Balance | Cut-off Date Balance | Note Holder | Note in Controlling Securitization | |
| Note A-1-A | $105,000,000 | $105,000,000 | CSAIL 2015-C3 | Yes |
| Notes A-2 and A-3 | 75,000,000 | 75,000,000 | CSAIL 2016-C5 | No |
| Notes A-1-B | 20,000,000 | 20,000,000 | Future Securitization | No |
| Total | $200,000,000 | $200,000,000 |
The Borrowers. The borrowing entities for the loan consist of 50 limited partnerships which are controlled by SCG LH GP, L.L.C. a Delaware limited liability corporation and special purpose entity.
The Sponsor. The loan’s sponsor and nonrecourse carve-out guarantor is SOF-IX U.S. Holdings, L.P. which is the U.S. holding company for Starwood Opportunity Fund IX and is managed and controlled by Starwood Capital Group. The guarantor’s liability in connection with bankruptcy is capped at 20.0% of the then outstanding principal amount plus incurred legal expenses. The Starwood Capital Group is a private investment firm with a primary focus on global real estate. Since its inception in 1991, the firm has raised over $31 billion of equity capital and currently has more than $44 billion of assets under management. Over the past 24 years, Starwood Capital Group has acquired approximately $65 billion of assets across virtually every real estate asset class.
The Properties. The portfolio consists of 50 extended stay properties totaling 6,106 rooms. The portfolio is geographically diverse in nature with properties located in 12 states including Texas, Georgia, North Carolina, Louisiana, Florida, Alabama, Colorado, Tennessee, Virginia, South Carolina, Mississippi and Kentucky. The properties were built between 1992 and 2007. The portfolio currently consist of 24 Sun Suites (3,112 rooms), 16 Crestwood Suites (2,188 rooms) and 10 Home-Towne Suites (806 rooms).
The sponsor acquired the properties in May 2015 from Mount Kellet Capital Management and Westmont Hospitality Group (“Seller”). The Seller acquired the Sun Suites and Crestwood Suites assets through the purchase of a mezzanine position and eventual foreclosure in December 2012 and acquired the Home Towne Suites in October 2013. The portfolio was underperforming when the Seller acquired it with 2013 NOI of approximately $15.6 million and RevPAR of $23.58. The Seller invested approximately $23.3 million ($3,819 per rooms) of capital to improve the assets in 2013 and 2014, which contributed to improved portfolio performance. NOI increased in 2014 to approximately $27.2 million and RevPAR to $29.36.
THE INFORMATION IN THIS COLLATERAL TERM SHEET IS NOT COMPLETE AND MAY BE AMENDED PRIOR TO THE TIME OF SALE. THIS TERM SHEET IS NOT AN OFFER TO SELL THESE SECURITIES AND IT IS NOT A SOLICITATION OF AN OFFER TO BUY THESE SECURITIES IN ANY JURISDICTION WHERE THE OFFER OR SALE IS NOT PERMITTED.
| 54 |
Mortgage Loan No. 3 — Starwood Capital Extended Stay Portfolio
Current Portfolio Overview
| Brand | Properties | # of Rooms | Allocated Whole Loan Amount | % | Average Occ.(1) | Average Daily Rate(1) | Average RevPAR(1) | NCF(1) |
| Sun Suites | 24 | 3,112 | $108,614,977 | 54.3% | 81.2% | $36.58 | $29.68 | $14,402,358 |
| Crestwood Suites | 16 | 2,188 | 65,672,631 | 32.8 | 74.0% | $40.47 | $29.96 | 8,862,003 |
| Home-Towne Suites | 10 | 806 | 25,712,392 | 12.9 | 63.9% | $53.54 | $34.21 | 2,771,852 |
| Total/Wtd. Avg.: | 50 | 6,106 | $200,000,000 | 100.0% | 76.3% | $39.81 | $30.38 | $26,036,213 |
| (1) | Based on the trailing twelve month period ended April 30, 2015. |
Portfolio Historical Capital Expenditures
| Brand | 2013 | 2014 | Total | Per Room |
| Sun Suites | $6,388,321 | $5,343,490 | $11,731,811 | $3,770 |
| Crestwood Suites | 4,427,551 | 5,251,186 | 9,678,737 | $4,424 |
| Home-Towne Suites | 30,261 | 1,877,683 | 1,907,944 | $2,367 |
| Total/Wtd. Avg.: | $10,846,133 | $12,472,359 | $23,318,492 | $3,819 |
The sponsor acquired the portfolio in May 2015 and plans to continue investing capital into the assets in an effort to improve the performance of the portfolio. The sponsor intends to convert the properties to InTown Suites in or before 2017. $6.5 million was escrowed into a Capital Work Reserve at closing to cover expected costs of approximately $2.1 million to convert the assets to InTown Suites and an additional $4.4 million for other capital improvements and renovations.
Through affiliated entities, the sponsor owns InTown Suites (“InTown”), which currently owns and manages a portfolio of 139 extended-stay properties, encompassing approximately 18,000 rooms, located in 21 states. The company has approximately 1,100 employees; of which approximately 66 serve a corporate function. Management is led by a group of professionals possessing both institutional leadership and hospitality industry experience at both the company and sponsorship level. The InTown team will provide management oversight of the properties.
InTown Suites will have over 180 locations across 22 states after the conversion of the portfolio. InTown Suites’ properties operate as long-term extended stay facilities with guestrooms rented on a weekly basis with an average guest stay of 84 days. Amenities include kitchens equipped with stovetops, microwaves and full-size refrigerators, dining areas, high speed internet access, flat-screen TVs, premium cable and guest laundry facilities.
InTown maximizes profitability by creating operating efficiencies by running a weekly pricing model (as opposed to a daily model), at a higher occupancy (80% or higher) level with a longer length of stay (average 84 days). Average staffing at InTown properties is five to six full time employees, housekeeping services are provided on a weekly basis rather than nightly, room supplies are provided at check in and are not replenished during a guest’s stay and operating hours are generally limited to 8 hours per day, 6 days per week. Compared to the hybrid model that offers weekly and nightly rooms (utilized at 37 of the 50 properties in this portfolio at acquisition), the InTown weekly-only business model with limited amenities result in lower costs and high occupancies on average. The sponsor anticipates these efficiencies will improve operating margins and increase the performance of the portfolio to be more in-line with InTown’s current portfolio that operates at a 57% EBITDA margin.
THE INFORMATION IN THIS COLLATERAL TERM SHEET IS NOT COMPLETE AND MAY BE AMENDED PRIOR TO THE TIME OF SALE. THIS TERM SHEET IS NOT AN OFFER TO SELL THESE SECURITIES AND IT IS NOT A SOLICITATION OF AN OFFER TO BUY THESE SECURITIES IN ANY JURISDICTION WHERE THE OFFER OR SALE IS NOT PERMITTED.
| 55 |
Mortgage Loan No. 3 — Starwood Capital Extended Stay Portfolio
Portfolio Geographic Summary
| State | # of Rooms | Allocated Whole Loan Amount | % | Average Occ.(1) | Average Daily Rate(1) | Average RevPAR(1) | NCF(1) | |
| Texas | 1,380 | $51,888,668 | 25.9 | % | 82.1% | $37.82 | $31.04 | $6,731,635 |
| Georgia | 1,178 | 40,291,584 | 20.1 | 85.8% | $36.05 | $30.93 | 5,498,658 | |
| North Carolina | 834 | 24,320,742 | 12.2 | 71.8% | $39.31 | $28.22 | 2,990,381 | |
| Louisiana | 395 | 19,019,218 | 9.5 | 82.2% | $45.72 | $37.57 | 2,406,569 | |
| Florida | 550 | 16,633,532 | 8.3 | 73.2% | $40.12 | $29.36 | 2,462,006 | |
| Alabama | 457 | 13,320,080 | 6.7 | 64.8% | $47.22 | $30.62 | 1,519,221 | |
| Colorado | 295 | 11,530,815 | 5.8 | 65.4% | $47.84 | $31.27 | 1,317,729 | |
| Tennessee | 343 | 11,199,470 | 5.6 | 82.4% | $39.44 | $32.49 | 1,501,679 | |
| Virginia | 244 | 4,903,910 | 2.5 | 66.7% | $40.79 | $27.20 | 660,748 | |
| South Carolina | 80 | 2,783,300 | 1.4 | 64.8% | $53.50 | $34.66 | 304,306 | |
| Mississippi | 244 | 2,717,031 | 1.4 | 59.6% | $34.72 | $20.69 | 434,123 | |
| Kentucky | 106 | 1,391,650 | 0.7 | 56.2% | $48.39 | $27.20 | 209,158 | |
| Total/Wtd. Avg. | 6,106 | $200,000,000 | 100.0 | % | 76.3% | $39.81 | $30.38 | $26,036,213 |
| (1) | Based on the trailing twelve month period ended April 30, 2015. |
Operating History and Underwritten Net Cash Flow
| 2012 | 2013 | 2014 | TTM(1)(2) | Underwritten | Per Room(3) | %(4) | |
| Occupancy | 56.7% | 60.5% | 76.0% | 76.3% | 76.3% | ||
| ADR | $39.98 | $38.98 | $38.63 | $39.81 | $39.81 | ||
| RevPAR | $22.68 | $23.58 | $29.36 | $30.38 | $30.38 | ||
| Room Revenue | $50,610,387 | $52,419,383 | $65,416,045 | $67,710,367 | $67,710,367 | $11,089 | 98.3% |
| Other Departmental Revenues | 559,555 | 872,100 | 1,194,449 | 1,197,589 | 1,197,589 | 196 | 1.7% |
| Total Revenue | $51,169,942 | $53,291,483 | $66,610,494 | $68,907,956 | $68,907,956 | $11,285 | 100.0% |
| Room Expense | 12,783,537 | 11,791,435 | 12,421,630 | 12,578,121 | 12,578,121 | 2,060 | 18.6% |
| Other Departmental Expenses | 825,147 | 761,913 | 564,933 | 543,307 | 543,307 | 89 | 45.4% |
| Departmental Expenses | $13,608,684 | $12,553,347 | $12,986,562 | $13,121,428 | $13,121,428 | $2,149 | 19.0% |
| Departmental Profit | $37,561,258 | $40,738,136 | $53,623,931 | $55,786,528 | $55,786,528 | $9,136 | 81.0% |
| Operating Expenses | $16,022,892 | $18,400,304 | $20,010,563 | $20,557,302 | $20,557,302 | $3,367 | 29.8% |
| Gross Operating Profit | $21,538,365 | $22,337,831 | $33,613,368 | $35,229,226 | $35,229,226 | $5,770 | 51.1% |
| Fixed Expenses | 5,551,980 | 6,691,905 | 6,427,724 | 6,436,694 | 7,253,768 | 1,188 | 10.5% |
| Net Operating Income | $15,986,386 | $15,645,926 | $27,185,644 | $28,792,531 | $27,975,458 | $4,582 | 40.6% |
| FF&E | 2,046,798 | 2,131,659 | 2,664,420 | 2,756,318 | 2,756,318 | 451 | 4.0% |
| Net Cash Flow | $13,939,588 | $13,514,267 | $24,521,224 | $26,036,213 | $25,219,140 | $4,130 | 36.6% |
| (1) | The TTM column represents the trailing twelve month period ending April 30, 2015. |
| (2) | As of September 30, 2015 the TTM NCF was $25,093,015 with an Occupancy, ADR and RevPAR of 72.0%, $40.65 and $29.28 respectively. The portfolio was acquired on May 5, 2015 and the financials do not include the revenue or expenses from May 1, 2015 through May 4, 2015 (4 days). If the revenue for the 27 days of May are used to estimate the first 4 days of the month, the 4 days would represent an additional $747,039 of revenue. |
| (3) | Per Room values are based on 6,106 rooms. |
| (4) | % column represents percent of Total Revenue except for Room Expense and Other Departmental Expenses which is based on the corresponding revenue line items. |
Property Management. The property is managed by Sleep Specialty Management, L.P., an affiliate of the sponsors.
THE INFORMATION IN THIS COLLATERAL TERM SHEET IS NOT COMPLETE AND MAY BE AMENDED PRIOR TO THE TIME OF SALE. THIS TERM SHEET IS NOT AN OFFER TO SELL THESE SECURITIES AND IT IS NOT A SOLICITATION OF AN OFFER TO BUY THESE SECURITIES IN ANY JURISDICTION WHERE THE OFFER OR SALE IS NOT PERMITTED.
| 56 |
Mortgage Loan No. 3 — Starwood Capital Extended Stay Portfolio
Escrows and Reserves. At origination, the borrower deposited into escrow $6.5 million for capital work, approximately $1.1 million for required repairs and $244,725 for FF&E reserve.
Tax Escrows – The requirement of the borrower to make monthly deposits to the tax reserve is waived so long as a Trigger Period is not in continuance or a third party manager approved by lender is adequately reserving and paying taxes.
Insurance Escrows – The requirement of the borrower to make monthly deposits to the insurance reserve is waived so long as a Trigger Period is not in continuance or the borrower provides satisfactory evidence that the property is insured as part of a blanket policy in accordance with the loan documents.
FF&E Reserves – On a monthly basis, the borrower is required to escrow an amount equal to 4.0% of gross monthly revenues.
Capital Work – The borrower deposited $6.5 million into escrow at origination. Of that amount it is estimated that approximately $2.1 million will be used for work related to the conversion of the properties to InTown Suites and $4.4 million will be used for additional renovations and improvements to the properties.
Lockbox / Cash Management. The Starwood Capital Extended Stay Portfolio Whole Loan is structured with a hard lockbox and springing cash management. The property manager will deposit all rental, credit card deposits and other income directly into the lockbox account controlled by the lender. Upon the continuance of a Trigger Period, all funds in the lockbox account are swept daily to a cash management account under the control of the lender and disbursed during each interest period of the term of the loan in accordance with the loan documents. During the continuance of a Trigger Period, all excess cash flow, after payments made in accordance with the loan documents for, amongst other things, debt service, required reserves and operating expenses, will be held as additional collateral for the loan.
“Trigger Period” means a period commencing on the earliest of (i) an event of default, (ii) any event of default on the mezzanine loan, or (iii) the combined debt yield on the mortgage and mezzanine loan is less than 8.0% through July 2018, 8.25% through July 2019 and 8.50% thereafter.
Property Release. Provided no event of default under the mortgage loan documents, the borrower may release individual properties from the loan subject to the satisfaction of certain conditions including, but not limited to, the following: (i) the debt yield for the remaining properties based on the mortgage and mezzanine loans either (a) exceeds the greater of the debt yield at closing or the debt yield prior to the release of the property or (b) is above 12.0%, (ii) payment of the Release Price for any conveyance of a property to a third party or the Affiliate Release Price for any conveyance of a property to an affiliate of the borrower, (iii) payment of any release price with respect to the mezzanine loan, and (iv) payment of any yield maintenance prior to the open period.
“Release Price” means: (i) if less than $20.0 million has been prepaid, 105% of the allocated loan amount, (ii) if $20.0 million or more, but less than $40.0 million, has been prepaid, 110% of the allocated loan amount, (iii) if $40.0 million or more, but less than $60.0 million, has been prepaid, 115% of the allocated loan amount, or (iv) otherwise, 120% of the allocated loan amount. If a prepayment of a property results in the aggregate prepayments exceeding a threshold, the Release Price will be applied pro rata to the respective amounts within each threshold.
“Affiliate Release Price” means: (i) if less than $20.0 million has been prepaid, 110% of the allocated loan amount, (ii) if $20.0 million or more, but less than $40.0 million has been prepaid, 115% of the allocated loan amount, (iii) if $40.0 million or more, but less than $60.0 million, has been prepaid, 120% of the allocated loan amount, or (iv) otherwise, 125% of the allocated loan amount. If a prepayment of a property results in the aggregate prepayments exceeding a threshold, the release price will be applied pro rata to the respective amounts within each threshold.
Additional Debt.A $25.0 million mezzanine loan was provided with the financing that is secured by a pledge of the direct equity interests in the mortgage borrowers and is coterminous with the mortgage loan. The mezzanine loan has a 9.0000% coupon. Including the mezzanine loan, the Cut-off Date LTV is 72.3%, the UW NCF DSCR is 1.83x and the UW NOI Debt Yield is 12.4%.
THE INFORMATION IN THIS COLLATERAL TERM SHEET IS NOT COMPLETE AND MAY BE AMENDED PRIOR TO THE TIME OF SALE. THIS TERM SHEET IS NOT AN OFFER TO SELL THESE SECURITIES AND IT IS NOT A SOLICITATION OF AN OFFER TO BUY THESE SECURITIES IN ANY JURISDICTION WHERE THE OFFER OR SALE IS NOT PERMITTED.
| 57 |
(THIS PAGE INTENTIONALLY LEFT BLANK)
| 58 |
Mortgage Loan No. 4 — Ellicott House
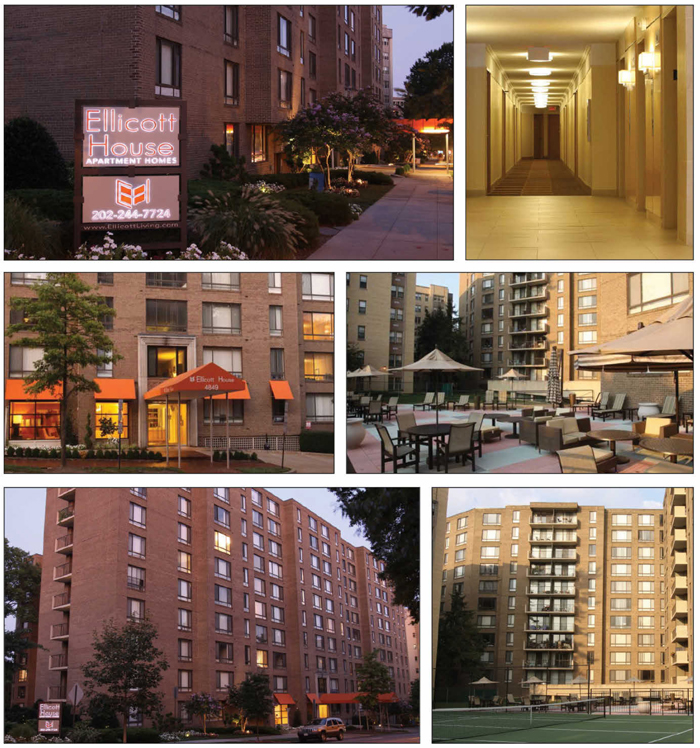
THE INFORMATION IN THIS COLLATERAL TERM SHEET IS NOT COMPLETE AND MAY BE AMENDED PRIOR TO THE TIME OF SALE. THIS TERM SHEET IS NOT AN OFFER TO SELL THESE SECURITIES AND IT IS NOT A SOLICITATION OF AN OFFER TO BUY THESE SECURITIES IN ANY JURISDICTION WHERE THE OFFER OR SALE IS NOT PERMITTED.
| 59 |
Mortgage Loan No. 4 — Ellicott House
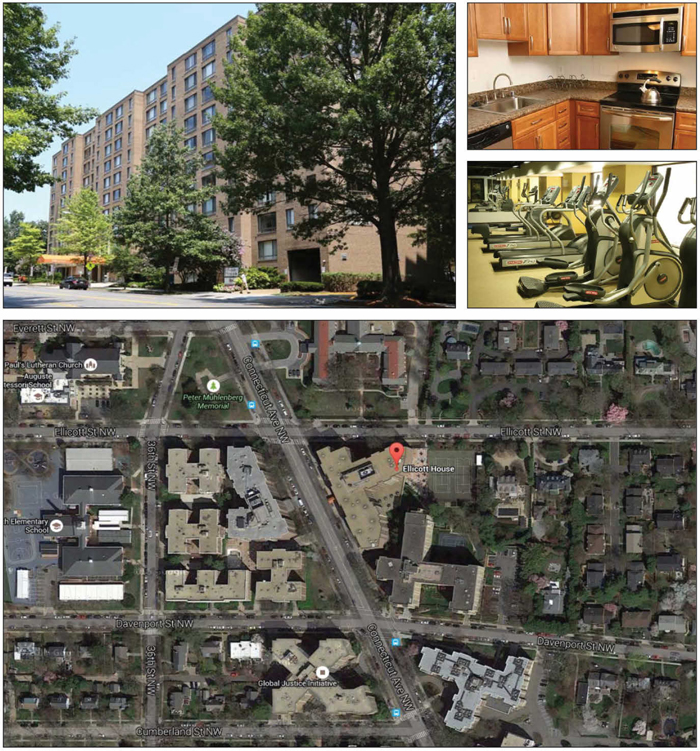
THE INFORMATION IN THIS COLLATERAL TERM SHEET IS NOT COMPLETE AND MAY BE AMENDED PRIOR TO THE TIME OF SALE. THIS TERM SHEET IS NOT AN OFFER TO SELL THESE SECURITIES AND IT IS NOT A SOLICITATION OF AN OFFER TO BUY THESE SECURITIES IN ANY JURISDICTION WHERE THE OFFER OR SALE IS NOT PERMITTED.
| 60 |
Mortgage Loan No. 4 — Ellicott House
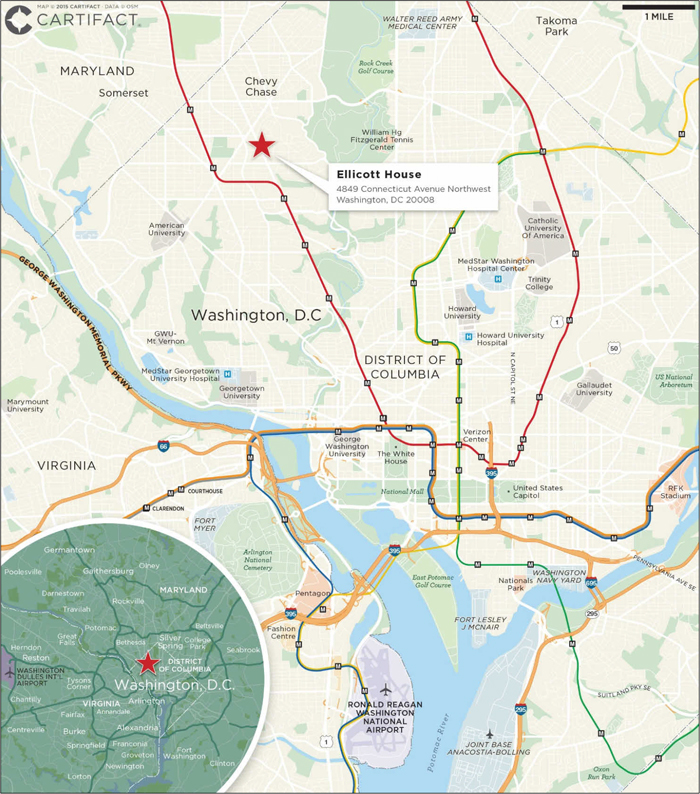
THE INFORMATION IN THIS COLLATERAL TERM SHEET IS NOT COMPLETE AND MAY BE AMENDED PRIOR TO THE TIME OF SALE. THIS TERM SHEET IS NOT AN OFFER TO SELL THESE SECURITIES AND IT IS NOT A SOLICITATION OF AN OFFER TO BUY THESE SECURITIES IN ANY JURISDICTION WHERE THE OFFER OR SALE IS NOT PERMITTED.
| 61 |
Mortgage Loan No. 4 — Ellicott House
Mortgage Loan Information | Property Information | |||
| Mortgage Loan Seller: | SPREF | Single Asset / Portfolio: | Single Asset | |
| Original Principal Balance: | $57,500,000 | Title: | Fee | |
| Cut-off Date Principal Balance: | $57,500,000 | Property Type - Subtype: | Multifamily – High Rise | |
| % of Pool by IPB: | 6.1% | Net Rentable Area (Units): | 327 | |
| Loan Purpose: | Acquisition | Location: | Washington, DC | |
| Borrower: | Ellicott Owner LLC | Year Built/Renovated: | 1974 / 2007-2015 | |
| Sponsor: | ACREG Investment Holdings LLC | Occupancy: | 97.6% | |
| Occupancy Date: | 10/7/2015 | |||
| Number of Tenants: | N/A | |||
| Interest Rate: | 4.2280% | 2012 NOI: | $4,147,566 | |
| Note Date: | 10/20/2015 | 2013 NOI: | $4,395,383 | |
| Maturity Date: | 11/6/2025 | 2014 NOI: | $3,950,970 | |
| Interest-only Period: | 120 months | TTM NOI(2): | $4,106,968 | |
| Original Term: | 120 months | UW Economic Occupancy: | 94.0% | |
| Original Amortization: | None | UW Revenues: | $6,640,892 | |
| Amortization Type: | Interest Only | UW Expenses: | $2,509,511 | |
| Call Protection: | L(27),Def(89),O(4) | UW NOI: | $4,131,381 | |
| Lockbox(1): | Springing | UW NCF: | $4,032,670 | |
| Additional Debt: | No | Appraised Value / Per Unit: | $81,500,000 / $249,235 | |
| Additional Debt Balance: | N/A | Appraisal Date: | 8/31/2015 | |
| Additional Debt Type: | N/A | |||
| Additional Future Debt Permitted: | No | |||
Escrows and Reserves(3) | Financial Information | |||||
| Initial | Monthly | Initial Cap | Cut-off Date Loan / Unit: | $175,841 | ||
| Taxes: | $219,523 | $54,881 | N/A | Maturity Date Loan / Unit: | $175,841 | |
| Insurance: | $40,726 | $4,525 | N/A | Cut-off Date LTV: | 70.6% | |
| Replacement Reserves: | $0 | Springing | $196,200 | Maturity Date LTV: | 70.6% | |
| UW NCF DSCR: | 1.64x | |||||
| UW NOI Debt Yield: | 7.2% | |||||
Sources and Uses
| Sources | Proceeds | % of Total | Uses | Proceeds | % of Total | |||
| Mortgage Loan | $57,500,000 | 73.3 | % | Purchase Price | $75,000,000 | 95.6 | % | |
| Sponsor Equity | 20,946,861 | 26.7 | Closing Costs | 3,186,612 | 4.1 | |||
| Upfront Reserves | 260,249 | 0.3 | ||||||
| Total Sources | $78,446,861 | 100.0 | % | Total Uses | $78,446,861 | 100.0 | % | |
| (1) | For a more detailed description of Lockbox, please refer to“Lockbox / Cash Management”below. |
| (2) | Represents trailing twelve months ending August 31, 2015. |
| (3) | For a more detailed description of Escrows and Reserves, please refer to “Escrows and Reserves” below. |
THE INFORMATION IN THIS COLLATERAL TERM SHEET IS NOT COMPLETE AND MAY BE AMENDED PRIOR TO THE TIME OF SALE. THIS TERM SHEET IS NOT AN OFFER TO SELL THESE SECURITIES AND IT IS NOT A SOLICITATION OF AN OFFER TO BUY THESE SECURITIES IN ANY JURISDICTION WHERE THE OFFER OR SALE IS NOT PERMITTED.
| 62 |
Mortgage Loan No. 4 — Ellicott House
The Loan. The Ellicott House loan is a $57.5 million first mortgage loan secured by the fee interest in a 327-unit high rise style multifamily property located in Washington, D.C. The loan has a 10-year term and is interest-only for the term of the loan.
The Borrower. The borrowing entity for the loan is Ellicott Owner LLC, a Delaware limited liability company and special purpose entity.
The Sponsor. The loan’s sponsor and nonrecourse carveout guarantor is ACREG Investment Holdings LLC.
ACREG Investment Holdings LLC is a wholly owned subsidiary of Annaly Capital Management, Inc. (NYSE: NLY). It was acquired by Annaly Capital Management, Inc. during the second quarter of 2013 and specializes in acquiring, financing, and managing commercial mortgage loans and other commercial real estate debt, commercial property and other commercial real estate-related assets.
The Property. The property is a 327-unit high rise multifamily property located in Washington, D.C. that was built in 1974 and renovated between 2007 and 2015. The property consists of one ten-story building located on approximately 1.43 acres. The property provides covered parking and has a total of 146 parking spaces, or 0.45 parking spaces per unit. As of October 7, 2015, the property was 97.6% leased.
The property contains 149 studio units (45.6%), 158 one-bedroom units (48.3%) and 20 two-bedroom units (6.1%). Studio units range from approximately 470 SF to 675 SF, one bedroom units range from 570 SF to 750 SF, and two bedrooms units range from 950 SF to 975 SF, with an overall average unit size of 669 SF.
Property amenities include an indoor swimming pool, fitness center, business center, tennis courts, outdoor seating areas, 24-hour front desk/concierge, laundry facilities and storage. Unit kitchens feature a refrigerator, electric range/oven, dishwasher, built-in microwave and garbage disposal. Most of the appliances are stainless steel. Interior amenities include laminate flooring in the kitchen and bathrooms feature ceramic tile flooring. Each unit includes a patio or balcony.
The property has frontage along Connecticut Avenue. Connecticut and Wisconsin Avenues are the primary roadways through the property’s local area. These thoroughfares connect the D.C. central business district to Chevy Chase in the south and to Kensington in the north, as well as to the Capital Beltway (I-495). The Van Ness-UDC Metrorail station is located approximately seven blocks south of the property at the intersection of Connecticut Avenue and Van Ness Street NW. Bus service (Metrobus) is also available throughout the area along the major roadways. There is a bus stop directly in front of the property on Connecticut Avenue.
The property is approximately 1.1 miles west of Rock Creek Park, a 1754-acre urban park which also contains the National Zoological Park, one of the oldest zoos in the United States which is operated by the Smithsonian Institution. The property is also near local retail and restaurant districts including the Shops at Wisconsin Place, approximately 1.6 miles from the property. The entrance to the property is located at the intersection of Ellicott Street NW and Connecticut Avenue NW. Regional access to the neighborhood is provided by Connecticut Avenue.
THE INFORMATION IN THIS COLLATERAL TERM SHEET IS NOT COMPLETE AND MAY BE AMENDED PRIOR TO THE TIME OF SALE. THIS TERM SHEET IS NOT AN OFFER TO SELL THESE SECURITIES AND IT IS NOT A SOLICITATION OF AN OFFER TO BUY THESE SECURITIES IN ANY JURISDICTION WHERE THE OFFER OR SALE IS NOT PERMITTED.
| 63 |
Mortgage Loan No. 4 — Ellicott House
Multifamily Unit Mix (1)
| Unit Type | No. of Units | % of Total | Occupied Units | Occupancy | Average Unit Size (SF) | Average Monthly Rental Rate(2) | Average Monthly Rental Rate PSF(2) | Monthly Market Rental Rate | Monthly Market Rental Rate PSF | |||||||||||
| Studio | 149 | 45.6 | % | 147 | 98.7% | 593 | $1,507 | $2.54 | $1,693 | $2.85 | ||||||||||
| One Bedroom, One Bathroom | 158 | 48.3 | 153 | 96.8% | 704 | $1,747 | $2.48 | $1,971 | $2.80 | |||||||||||
| Two Bedroom, Two Bath | 20 | 6.1 | 19 | 95.0% | 963 | $2,546 | $2.64 | $2,780 | $2.89 | |||||||||||
| Total/Wtd. Avg. | 327 | 100.0 | % | 319 | 97.6% | 669 | $1,684 | $2.52 | $1,894 | $2.83 | ||||||||||
| (1) | Based on the underwritten rent roll dated October 7, 2015. |
| (2) | The Ellicott House is subject to certain rental restrictions. The rent restrictions at the property limit the annual rent increases of tenants who were in occupancy in 2007 to increases in to the Consumer Price Index plus 2% subject to a maximum of 10%, or 5% for qualified occupants 62 years of age or older or disabled. Once those restricted units are vacated, rents may be increased to a pre-determined monthly rental level based on unit type and thereafter to annual increases based upon changes in the consumer price index plus 2% subject to a maximum of 10%, or 5% for qualified occupants 62 years of age of older or disabled. As of October 2015, the in-place weighted average monthly rental amount was approximately 55% below the pre-determined monthly rental level and 11% below market. |
The Market. The property is located at the southeast corner of Connecticut Avenue NW and Ellicott Street NW in the Forest Hills area of the District of Columbia. The general area is located in the northern portion of the District of Columbia within the Northwest quadrant. Northwest Washington includes the city’s major commercial office corridors in the Central Business District, the East End, West End, and Uptown. Georgetown University, George Washington University, American University, Howard University Law School, and the University of the District of Columbia are located in this area. The Mall, the National Zoo and Rock Creek Park are among the local recreational amenities. This Northwest section is also the home for the Washington Wizards professional basketball team and the Washington Capitals professional hockey team.
The appraiser identified five comparable rental properties, ranging from 119 units to 510 units, with average unit sizes ranging from 322 SF to 1,949 SF. The competitive set reported a weighted average occupancy of approximately 95%, with average rents ranging from $1,115 to $4,060 per unit. Average rents at the property are in line with the competitive set.
Competitive Set Summary(1)
| Property | Year Built / Renovated | No. of Units | Avg. Unit Size (SF) | Avg. $/ Unit | Occupancy | Distance from Property | |||||||||
| Ellicott House | 1974 / 2007-2015 | 327 | (2) | 470-975(2) | $1,429-$2,583(2) | 98% | (2) | ||||||||
| Connecticut Heights | 1925 & 1974 / 2013 | 510 | 396-1,083 | $1,375-$2,660 | 95% | Adjacent | |||||||||
| The Brandywine | 1954 / 1999-2012 | 305 | 771-1,550 | $1,844-$4,060 | 98% | 0.3 miles | |||||||||
| Connecticut House | 1958 / On-going | 119 | 350-1,500 | $1,400-$3,000 | 94% | 0.3 miles | |||||||||
| The Chesapeake | 1941 / 2001 | 184 | 322-965 | $1,115-$2,500 | 94% | 0.2 miles | |||||||||
| Albemarle | 1958 / 2010 | 235 | 602-1,949 | $1,519-$3,949 | 94% | 0.3 miles | |||||||||
| Total/Wtd. Avg.(3) | 1,353 | 322-1,949 | $1,115-$4,060 | 95% | |||||||||||
| (1) | Source: Appraisal. |
| (2) | Based on the underwritten rent roll dated October 7, 2015. |
| (3) | Excludes the subject property. |
THE INFORMATION IN THIS COLLATERAL TERM SHEET IS NOT COMPLETE AND MAY BE AMENDED PRIOR TO THE TIME OF SALE. THIS TERM SHEET IS NOT AN OFFER TO SELL THESE SECURITIES AND IT IS NOT A SOLICITATION OF AN OFFER TO BUY THESE SECURITIES IN ANY JURISDICTION WHERE THE OFFER OR SALE IS NOT PERMITTED.
| 64 |
Mortgage Loan No. 4 — Ellicott House
Historical and Current Occupancy(1)
| 2012 | 2013 | 2014 | Current(2) |
| 96.3% | 95.6% | 93.7% | 97.6% |
| (1) | Historical Occupancy reflects the average for each indicated year as provided by the sponsor. |
| (2) | Based on the underwritten rent roll dated October 7, 2015. |
Operating History and Underwritten Net Cash Flow
| 2012 | 2013 | 2014 | TTM(1) | Underwritten(2) | Per Unit | %(3) | |
| Rents in Place(2) | $6,539,512 | $6,691,235 | $6,583,757 | $6,584,922 | $6,613,332 | $20,224 | 100.0% |
| Vacant Income | 0 | 0 | 0 | 0 | 0 | 0 | 0.0% |
| Gross Potential Rent | $6,539,512 | $6,691,235 | $6,583,757 | $6,584,922 | $6,613,332 | $20,224 | 100.0% |
| Total Reimbursements | 0 | 0 | 0 | 0 | 0 | 0 | 0.0% |
| Net Rental Income | $6,539,512 | $6,691,235 | $6,583,757 | $6,584,922 | $6,613,332 | $20,224 | 100.0% |
| (Vacancy/Collection Loss) | (407,257) | (436,250) | (456,937) | (355,672) | (397,566) | (1,216) | (6.0%) |
| Other Income | 426,167 | 414,711 | 399,616 | 425,126 | 425,126 | 1,300 | 6.4% |
| Effective Gross Income | $6,558,422 | $6,669,696 | $6,526,436 | $6,654,376 | $6,640,892 | $20,309 | 100.4% |
| Total Expenses | $2,410,856 | $2,274,313 | $2,575,466 | $2,547,408 | $2,509,511 | $7,674 | 37.8% |
| Net Operating Income | $4,147,566 | $4,395,383 | $3,950,970 | $4,106,968 | $4,131,381 | $12,634 | 62.2% |
| Replacement Reserves | 0 | 0 | 0 | 0 | 98,711 | 302 | 1.5% |
| Net Cash Flow | $4,147,566 | $4,395,383 | $3,950,970 | $4,106,968 | $4,032,670 | $12,332 | 60.7% |
| (1) | The TTM column represents the trailing twelve months ending August 31, 2015. |
| (2) | Underwritten Rents in Place are based on the trailing three months operating statements ending August 31, 2015. |
| (3) | % column represents percent of Net Rental Income for all revenue lines and represents percent of Effective Gross Income for the remainder of fields. |
Property Management. The property is managed by Milestone Management TRS, Inc. (“Milestone Management”). Milestone Management is a nationwide residential property management firm. Currently, it manages approximately 35,000 units, including the property.
Escrows and Reserves. At origination, the borrower deposited into escrow $219,523 for real estate taxes and $40,726 for insurance.
Tax Escrows –On a monthly basis, the borrower is required to escrow 1/12th of the annual estimated tax payments, currently equal to $54,881.
Insurance Escrows – On a monthly basis, the borrower is required to escrow 1/12th of the annual estimated insurance premiums, currently equal to $4,525.
Replacement Reserves – The monthly replacement reserve is waived for the first 24 months, however the lender required an additional recourse carveout for the borrower’s failure to (i) pay any capital expense incurred by the borrower or (ii) perform any required repairs. Commencing on December 6, 2017 and monthly thereafter, the borrower is required to escrow 1/12th of the product of $300 per unit and the aggregate number of units at the property (currently equal to $8,175), subject to a cap of $196,200.
Lockbox / Cash Management. The loan is structured with a springing lockbox and springing cash management. During a Cash Management Period (defined below), the borrower is required to promptly establish and maintain a lockbox account (the “Lockbox Account”) with the lockbox bank in trust for the benefit of the lender into which rents are required to be deposited by the borrower and/or property manager. The related loan documents require the lender to have a first priority security interest in the Lockbox Account and the cash management account (the “Cash Management Account”). Upon the occurrence and during the continuance of a Cash Management Period, the borrower and the property manager are required to hold rents and other income from the property in trust for lender and deposit such amounts in the Lockbox Account within two business days of receipt. All funds deposited into the Lockbox Account will be swept daily into the Cash Management Account and so long as no event of default is
THE INFORMATION IN THIS COLLATERAL TERM SHEET IS NOT COMPLETE AND MAY BE AMENDED PRIOR TO THE TIME OF SALE. THIS TERM SHEET IS NOT AN OFFER TO SELL THESE SECURITIES AND IT IS NOT A SOLICITATION OF AN OFFER TO BUY THESE SECURITIES IN ANY JURISDICTION WHERE THE OFFER OR SALE IS NOT PERMITTED.
| 65 |
Mortgage Loan No. 4 — Ellicott House
continuing will be applied by the lender to the payment of tax and insurance (if applicable) escrows, debt service, replacement reserves, any other amounts then due to the lender and monthly cash expenses and extraordinary expenses. Any excess funds after deductions for these items are required to be deposited into the excess cash flow reserve account.
“Cash Management Period” means the period commencing on the earlier to occur of: (i) the stated maturity date of the loan or (ii) an event of default.
THE INFORMATION IN THIS COLLATERAL TERM SHEET IS NOT COMPLETE AND MAY BE AMENDED PRIOR TO THE TIME OF SALE. THIS TERM SHEET IS NOT AN OFFER TO SELL THESE SECURITIES AND IT IS NOT A SOLICITATION OF AN OFFER TO BUY THESE SECURITIES IN ANY JURISDICTION WHERE THE OFFER OR SALE IS NOT PERMITTED.
| 66 |
Mortgage Loan No. 5 — 401 Market
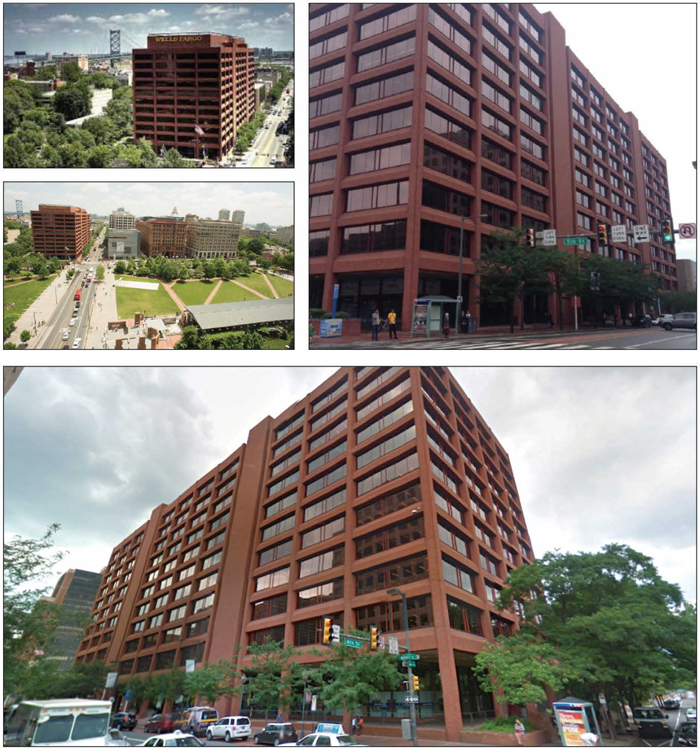
THE INFORMATION IN THIS COLLATERAL TERM SHEET IS NOT COMPLETE AND MAY BE AMENDED PRIOR TO THE TIME OF SALE. THIS TERM SHEET IS NOT AN OFFER TO SELL THESE SECURITIES AND IT IS NOT A SOLICITATION OF AN OFFER TO BUY THESE SECURITIES IN ANY JURISDICTION WHERE THE OFFER OR SALE IS NOT PERMITTED.
| 67 |
Mortgage Loan No. 5 — 401 Market
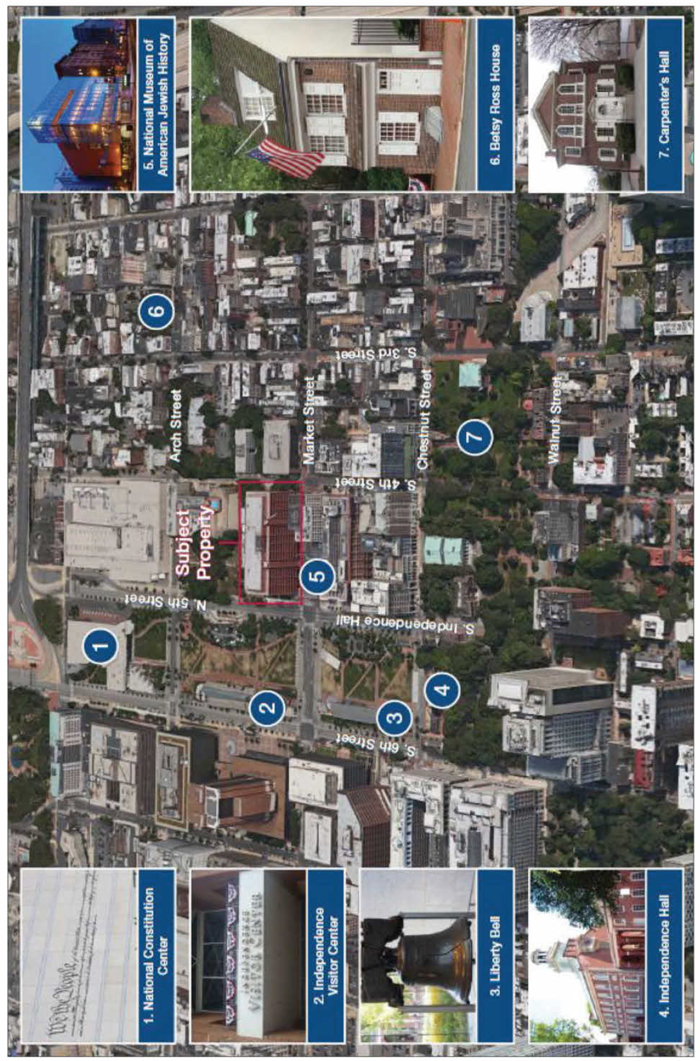
THE INFORMATION IN THIS COLLATERAL TERM SHEET IS NOT COMPLETE AND MAY BE AMENDED PRIOR TO THE TIME OF SALE. THIS TERM SHEET IS NOT AN OFFER TO SELL THESE SECURITIES AND IT IS NOT A SOLICITATION OF AN OFFER TO BUY THESE SECURITIES IN ANY JURISDICTION WHERE THE OFFER OR SALE IS NOT PERMITTED.
| 68 |
Mortgage Loan No. 5 — 401 Market
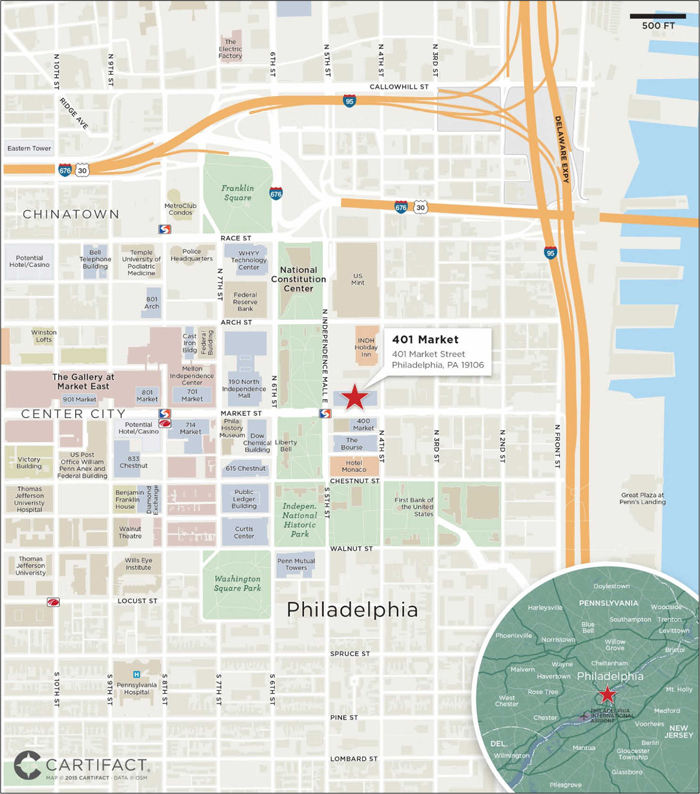
THE INFORMATION IN THIS COLLATERAL TERM SHEET IS NOT COMPLETE AND MAY BE AMENDED PRIOR TO THE TIME OF SALE. THIS TERM SHEET IS NOT AN OFFER TO SELL THESE SECURITIES AND IT IS NOT A SOLICITATION OF AN OFFER TO BUY THESE SECURITIES IN ANY JURISDICTION WHERE THE OFFER OR SALE IS NOT PERMITTED.
| 69 |
Mortgage Loan No. 5 — 401 Market
| Mortgage Loan Information | Property Information | |||
| Mortgage Loan Seller: | BNY Mellon | Single Asset/Portfolio: | Single Asset | |
| Original Principal Balance: | $56,000,000 | Title: | Fee | |
| Cut-off Date Principal Balance: | $56,000,000 | Property Type - Subtype: | Office–CBD | |
| % of Pool by IPB: | 6.0% | Net Rentable Area (SF): | 484,643 | |
| Loan Purpose: | Acquisition | Location: | Philadelphia, PA | |
| Borrower: | MREF 401 LP | Year Built/Renovated: | 1971/2015 | |
| Sponsor: | Miller Real Estate Fund II, LP | Occupancy: | 100.0% | |
| Interest Rate: | 4.7200% | Occupancy Date: | 7/1/2015 | |
| Note Date: | 9/22/2015 | Number of Tenants: | 2 | |
| Maturity Date: | 10/6/2025 | 2012 NOI(2): | N/A | |
| Interest-only Period: | 60 months | 2013 NOI(2): | N/A | |
| Original Term: | 120 months | 2014 NOI(2): | N/A | |
| Original Amortization: | 360 months | TTM NOI(2): | N/A | |
| Amortization Type: | IO-Balloon | UW Economic Occupancy: | 95.3% | |
| Call Protection: | L(28),Def(89),O(3) | UW Revenues: | $9,806,417 | |
| Lockbox(1): | Hard | UW Expenses: | $4,835,755 | |
| Additional Debt: | No | UW NOI(3): | $4,970,663 | |
| Additional Debt Balance: | N/A | UW NCF(3): | $4,510,252 | |
| Additional Debt Type: | N/A | Appraised Value / Per SF(4): | $77,800,00 / $161 | |
| Additional Future Debt Permitted: | No | Appraisal Date(4): | 7/8/2015 |
| Escrows and Reserves(5) | Financial Information | |||||
| Initial | Monthly | Initial Cap | Cut-off Date Loan / SF: | $116 | ||
| Taxes: | $133,619 | $14,847 | N/A | Maturity Date Loan / SF: | $106 | |
| Insurance: | $0 | $9,978 | N/A | Cut-off Date LTV(4): | 72.0% | |
| Replacement Reserves: | $0 | Springing | N/A | Maturity Date LTV(4): | 66.1% | |
| TI/LC: | $0 | $24,233 | N/A | UW NCF DSCR: | 1.29x | |
| Free Rent Reserve: | $3,439,949 | $0 | N/A | UW NOI Debt Yield: | 8.9% | |
| Immediate Repairs: | $150,000 | N/A | N/A | |||
| Tenant Cash Trap: | $0 | Springing | N/A | |||
Sources and Uses
| Sources | Proceeds | % of Total | Uses | Proceeds | % of Total | |
| Mortgage Loan | $56,000,000 | 65.9% | Purchase Price | $78,452,145 | 92.3% | |
| Sponsor Equity | 29,025,198 | 34.1 | Free Rent Reserve | 3,439,949 | 4.0 | |
| Closing Costs | 2,849,485 | 3.4 | ||||
| Upfront Reserves | 283,619 | 0.3 | ||||
| Total Sources | $85,025,198 | 100.0% | Total Uses | $85,025,198 | 100.0% |
| (1) | For a more detailed description of Lockbox, please refer to“Lockbox / Cash Management”below. |
| (2) | The property was acquired by the borrower in 2015. Historical financials were not available. |
| (3) | UW NOI and UW NCF includes the full unabated rent for tenant American Bible Society, which has a rent commencement date of July 1, 2016 for the office space and October 1, 2016 for the retail space. |
| (4) | The Cut-off Date LTV and Maturity Date LTV are calculated using the “as-is” appraised value of $77,800,000. The appraiser also estimated a prospective market value of the property as of its projected date of stabilization, November 1, 2016, of $82,900,000. The Cut-off Date LTV and Maturity Date LTV based on the “as-stabilized” appraised value are 67.6% and 62.0%, respectively. |
| (5) | For a more detailed description of Escrows and Reserves, please refer to “Escrows and Reserves” below. |
THE INFORMATION IN THIS COLLATERAL TERM SHEET IS NOT COMPLETE AND MAY BE AMENDED PRIOR TO THE TIME OF SALE. THIS TERM SHEET IS NOT AN OFFER TO SELL THESE SECURITIES AND IT IS NOT A SOLICITATION OF AN OFFER TO BUY THESE SECURITIES IN ANY JURISDICTION WHERE THE OFFER OR SALE IS NOT PERMITTED.
| 70 |
Mortgage Loan No. 5 — 401 Market
The Loan. The 401 Market loan is a $56.0 million first mortgage loan secured by the fee interest in a 484,643 SF class A office building located in Philadelphia, Pennsylvania, adjacent to the Independence Mall. The loan has a 10-year term and will amortize on a 30-year schedule after a five-year interest-only period.
The Borrower. The borrowing entity for the loan is MREF 401 LP, a Pennsylvania limited partnership and special-purpose entity.
The Sponsor. The loan’s sponsor and nonrecourse carve-out guarantor is Miller Real Estate Fund II, LP (“MREF II”). MREF II is an affiliate of Miller Investment Management, LP (“Miller”), a registered investment adviser with over $1.5 billion in assets under management spread across real estate, private equity and public securities. MREF II is Miller’s second investment fund and currently has a total of $80.0 million in capital commitments as of June 30, 2015. Miller’s first fund, MIM-Hayden Fund I, L.P., had a total of $108 million of capital commitments as of June 30, 2015 and owns 3.2 million SF of industrial flex assets and 1.1 million SF of office assets.
The Property.The property is an 11-story class A office building, constructed in 1971, located in Philadelphia, Pennsylvania. The property is situated on approximately 1.76 acres in the Philadelphia central business district, within the Center City submarket. The property consists of 452,750 SF of office space, 31,893 SF of retail space and a 148-car on-site parking garage.
The property is currently 100.0% occupied by 2 tenants, Wells Fargo and American Bible Society (“ABS”). Wells Fargo, the largest tenant at the property and a tenant since 1971, leases 349,770 SF (72.2% of the NRA, 38.2% of UW Base Rent) through September 30, 2024 and has six 5-year extension options remaining under a triple net lease. Since 2014, Wells Fargo has invested over $28.0 million to upgrade tenant spaces and improve systems at the property. Wells Fargo is a multinational banking and financial services holding company and is rated A2/A+/AA- by Moody’s/S&P/Fitch. ABS leases 134,873 SF (27.8% of the NRA, 61.8% of UW base Rent) through September 30, 2041. ABS was founded in 1816 in New York as a producer of bibles but over the course of almost 200 years transformed into an interconfessional, non-denominational, non-profit organization, which publishes, distributes and translates the Bible and provides study aids and other tools to help people engage with the Bible. As of June 2014, ABS had an endowment of approximately $528.4 million. ABS will use the ground floor and part of the basement as retail/museum space and the 8th and 9th floor office space as their global headquarters.
The property is located on the Independence Mall in the eastern part of the Center City area of Philadelphia, with access to public transportation, regional highways and the Philadelphia International Airport. The property is situated near some of the historic U.S. landmarks, including the Liberty Bell and Independence Hall, and overlooks the National Constitution Center, Benjamin Franklin Bridge and the Delaware River.
The Wells Fargo Master Lease.The Wells Fargo lease is governed by a master agreement (the “Master Lease”)between Wells Fargo, First States Investors 3300 B, L.P., and National Financial Realty – East Coast Portfolio I, LLC (“NFR”) covering a multi-property portfolio that includes the property (the “Wells Fargo Crossed Portfolio”). The Wells Fargo Crossed Portfolio consists of Wells Fargo leases at approximately 110 properties other than the property. The Wells Fargo lease at the property represents approximately 0.46% of the total square footage leased under the Master Lease. In March 2013, Oaktree Real Estate Opportunities Fund VI, L.P. (the “Oaktree Fund”) and National Financial Realty Inc. acquired a portion of the Wells Fargo Crossed Portfolio consisting of 40 office buildings and totaling 3.4 million SF of space, which are covered by the Master Lease.
Wells Fargo is permitted, upon nine (9) months’ notice to the lender, to terminate a portion of its leased premises without payment of a termination fee for a certain amount of rentable square footage across the Wells Fargo Crossed Portfolio (the “Available Termination Rights Area”), which square footage increases during the term of the Master Lease. Wells Fargo is permitted to terminate space in excess of the Available Termination Rights Area at any time subject to payment of a termination fee equal to the net present value of the annual base rent that would have been payable for the balance of the lease term if not so terminated (the “WF Termination Fee”). If Wells Fargo terminates space at the property using the Available Termination Rights Area and thus, no WF Termination Fee is due, the Oaktree Fund has agreed to either (a) make a payment to the borrower in the amount of the WF Termination Fee or (b) enter into (or cause an affiliate to enter into) a lease with the borrower for the space vacated by Wells Fargo (together, the “Oaktree Backstop”). In addition, the first $33.75 PSF paid to the borrower for the terminated space is required to be deposited into a lender-controlled reserve (the “Tenant Cash Trap Reserve”) to be used for the re-tenanting of
THE INFORMATION IN THIS COLLATERAL TERM SHEET IS NOT COMPLETE AND MAY BE AMENDED PRIOR TO THE TIME OF SALE. THIS TERM SHEET IS NOT AN OFFER TO SELL THESE SECURITIES AND IT IS NOT A SOLICITATION OF AN OFFER TO BUY THESE SECURITIES IN ANY JURISDICTION WHERE THE OFFER OR SALE IS NOT PERMITTED.
| 71 |
Mortgage Loan No. 5 — 401 Market
such space. Any amounts in excess of $33.75 PSF will be deposited into an operating expense reserve that will be available to the borrower to cover operating expense shortfalls at the property. See “Lockbox/Cash Management” below for additional information concerning the Wells Fargo lease.
As of December 31, 2014, the Oaktree Fund reported net assets of approximately $2.1 billion, liquidity of $73.3 million and a net income of approximately $401.4 million. The Oaktree Fund will expire on or about August 30, 2022 unless extended or terminated earlier in accordance with its partnership agreement. Prior to the Oaktree Fund’s release under the Oaktree Backstop, the Oaktree Fund must either (i) deposit sufficient funds into escrow with the borrower (which the borrower is required to deliver to the lender under the loan documents) to satisfy its obligations under the Oaktree Backstop or (ii) provide a replacement master tenant with a rating of not less than BBB- or its equivalent to perform its obligations under the Oaktree Backstop, pursuant to an acceptable assumption agreement.
The borrower is permitted to opt out of the Oaktree Backstop at any time if Wells Fargo terminates 21,000 SF or less of its space at the property to capitalize on higher market rents. If the borrower exercises this option, it will enter into a new master lease with MREF II as tenant on the same terms and conditions as those contained in the Wells Fargo lease. If Wells Fargo terminates more than 21,000 SF (4.3% of the NRA) of its space at any time, the borrower is not permitted to opt out of the Oaktree Backstop.
The borrower is also permitted to opt out of the Oaktree Backstop with respect to a Wells Fargo space being terminated if the borrower deposits with the lender an amount equal to the Oaktree Termination Payment (as defined in the Oaktree Backstop) with respect to such space, which amount will be determined by the lender in accordance with the terms of the Oaktree Backstop.
The Market.The property is located in Philadelphia, Pennsylvania in the central business district known as Center City, adjacent to the historic Independence Mall area, which is a 3-block section of the Independence National Historical Park. Center City is comprised of retail, office, residential and institutional and commercial developments, is situated at the center of a nine-county region of approximately 5.9 million residents, and offers 294,000 jobs, which account for 46% of all jobs in Philadelphia. Center City is accessible to mass transit, with a transit network carrying nearly 300,000 weekday passengers in 2014, and is in close proximity to major colleges and universities as well as arts, history and cultural institutions. According to the appraisal, as Philadelphia is the second largest city along the eastern coast of the U.S., Center City ranks second to Midtown Manhattan in population size among U.S. downtown districts.
According to the appraisal, as of the second quarter of 2015, the Center City office submarket contained 61.2 million SF of office space with a reported vacancy rate of 9.2% and the estimated market rent for the space was $28.3 PSF NNN. The appraisal identified the property’s competitive set to consist of the 6 properties detailed in the table below.
Competitive Set Summary(1)
| Property | Year Built / Renovated | Total GLA (SF) | Est. Sales PSF | Est. Occ. | Proximity (miles) | Anchor Tenants |
| 401 Market | 1971 / 2015 | 484,643(2) | $171 | 100%(2) | N/A | Wells Fargo, ABS |
| United Plaza | 1975 / 2002 | 617,476 | $165 | 94% | 1.2 | NAV |
| 1835 Market Street | 1986 / N/A | 686,503 | $146 | 70% | 1.4 | Klehr Harrison Harvey Branzburg LLP |
| 1515 Market | 1960/ 2007 | 504,975 | $168 | 86% | 1.0 | Temple University |
| 1818 Beneficial Bank Place | 1972 / 1991 | 988,031 | $195 | 88% | 1.3 | NAV |
| The Curtis Center | 1916 / 1986 | 873,904 | $143 | 85% | 0.3 | NAV |
| 100 Independence Mall West | 1965 / N/A | 340,324 | $167 | 100% | 0.5 | NAV |
| (1) | Source: Appraisal. |
| (2) | Based on the underwritten rent roll. |
THE INFORMATION IN THIS COLLATERAL TERM SHEET IS NOT COMPLETE AND MAY BE AMENDED PRIOR TO THE TIME OF SALE. THIS TERM SHEET IS NOT AN OFFER TO SELL THESE SECURITIES AND IT IS NOT A SOLICITATION OF AN OFFER TO BUY THESE SECURITIES IN ANY JURISDICTION WHERE THE OFFER OR SALE IS NOT PERMITTED.
| 72 |
Mortgage Loan No. 5 — 401 Market
Historical and Current Occupancy(1)
| 2011 | 2012 | 2013 | 2014 | Current(2) |
| N/A | N/A | N/A | N/A | 100.0% |
| (1) | The property was acquired by the borrower in 2015. Historical occupancies were not available. |
| (2) | Based on the underwritten rent roll. |
Tenant Summary(1)
| Tenant | Ratings Moody’s/S&P/Fitch(2) | Net Rentable Area (SF) | % of Total NRA | Base Rent PSF | Lease Expiration Date |
| Wells Fargo | A2 / A+ / AA- | 349,770 | 72.2% | $6.13 | 9/30/2024(3) |
| American Bible Society | NA / NA / NA | 134,873 | 27.8% | $25.69(4) | 9/30/2041 |
| (1) | Based on the underwritten rent roll. |
| (2) | Ratings provided are for the parent company of the entity listed in the “Tenant” field whether or not the parent company guarantees the lease. |
| (3) | For a more detailed description of the Wells Fargo Master Lease, including the ability of Wells Fargo to terminate all or a portion of its lease, please refer to“The Wells Fargo Master Lease”above. |
| (4) | ABS has two leases at the property, one for retail space (31,893 SF, $37.00 PSF), and one for office space (102,980 SF, $22.19 PSF). Base Rent PSF reflects the weighted average Base Rent PSF of the retail space and the office space. ABS is currently in a free rent period and will commence paying unabated rent on July 1, 2016 with respect to the office space and October 1, 2016 with respect to the retail space. At origination approximately $3.4 million was escrowed for the free rent period. |
Lease Rollover Schedule(1)
| Year | Number of Leases Expiring(2) | NRA Expiring(2) | % of NRA Expiring(2) | Base Rent Expiring | % of Base Rent Expiring | Cumulative NRA Expiring(2) | Cumulative % of NRA Expiring(2) | Cumulative Base Rent Expiring | Cumulative % of Base Rent Expiring |
| Vacant | NAP | 0 | 0.0% | NAP | NAP | 0 | 0.0% | NAP | NAP |
| 2016 | 0 | 0 | 0.0 | $0 | 0.0% | 0 | 0.0% | $0 | 0.0% |
| 2017 | 0 | 0 | 0.0 | 0 | 0.0 | 0 | 0.0% | $0 | 0.0% |
| 2018 | 0 | 0 | 0.0 | 0 | 0.0 | 0 | 0.0% | $0 | 0.0% |
| 2019 | 0 | 0 | 0.0 | 0 | 0.0 | 0 | 0.0% | $0 | 0.0% |
| 2020 | 0 | 0 | 0.0 | 0 | 0.0 | 0 | 0.0% | $0 | 0.0% |
| 2021 | 0 | 0 | 0.0 | 0 | 0.0 | 0 | 0.0% | $0 | 0.0% |
| 2022 | 0 | 0 | 0.0 | 0 | 0.0 | 0 | 0.0% | $0 | 0.0% |
| 2023 | 0 | 0 | 0.0 | 0 | 0.0 | 0 | 0.0% | $0 | 0.0% |
| 2024 | 1 | 349,770 | 72.2 | 2,144,090 | 38.2 | 349,770 | 72.2% | $2,144,090 | 38.2% |
| 2025 | 0 | 0 | 0.0 | 0 | 0.0 | 349,770 | 72.2% | $2,144,090 | 38.2% |
| 2026 & Beyond | 2 | 134,873 | 27.8 | 3,465,561 | 61.8 | 484,643 | 100.0% | $5,609,651 | 100.0% |
| Total | 3 | 484,643 | 100.0% | $5,609,651 | 100.0% |
| (1) | Based on the underwritten rent roll. |
| (2) | ABS has two leases at the property, one for retail space (31,893 SF, $37.00 PSF), and one for office space (102,980 SF, $22.19 PSF). |
THE INFORMATION IN THIS COLLATERAL TERM SHEET IS NOT COMPLETE AND MAY BE AMENDED PRIOR TO THE TIME OF SALE. THIS TERM SHEET IS NOT AN OFFER TO SELL THESE SECURITIES AND IT IS NOT A SOLICITATION OF AN OFFER TO BUY THESE SECURITIES IN ANY JURISDICTION WHERE THE OFFER OR SALE IS NOT PERMITTED.
| 73 |
Mortgage Loan No. 5 — 401 Market
Operating History and Underwritten Net Cash Flow
| Pro-forma 6/17 | Underwritten(1) | PSF | %(2) | |
| Rents in Place | $5,694,875 | $5,609,651 | $11.57 | 55.2% |
| Vacant Income | 0 | 0 | 0.00 | 0.0% |
| Gross Potential Rent | $5,694,875 | $5,609,651 | $11.57 | 55.2% |
| Total Reimbursements | 4,715,508 | 4,555,983 | 9.40 | 44.8% |
| Net Rental Income | $10,410,383 | $10,165,634 | $20.98 | 100.0% |
| (Vacancy/Collection Loss) | 0 | (483,490) | (1.00) | (4.8%) |
| Other Income | 2,895 | 124,273 | 0.26 | 1.2% |
| Effective Gross Income | $10,413,278 | $9,806,417 | $20.23 | 96.5% |
| Total Expenses | $5,310,355 | $4,835,755 | $9.98 | 49.3% |
| Net Operating Income | $5,102,923 | $4,970,663 | $10.26 | 50.7% |
| Total TI/LC, Capex/RR | 0 | 460,411 | 0.95 | 4.7% |
| Net Cash Flow | $5,102,923 | $4,510,252 | $9.31 | 46.0% |
| (1) | Underwritten rents in place includes unabated rent for tenant ABS, which is in a free rent period until July 1, 2016 with respect to the office space and October 1, 2016 with respect to the retail space. |
| (2) | % column represents percent of Net Rental Income for all revenue lines and represents percent of Effective Gross Income for the remainder of fields. |
Property Management. Tenant Wells Fargo has the right pursuant to its lease to operate and manage the property. Wells Fargo retained Jones Lang LaSalle (“JLL”), a third party manager, to manage the property pursuant to a management agreement expiring on September 30, 2024. At any time that Wells Fargo is not operating and managing the property, the borrower has the right to retain a property manager meeting the requirements specified in the loan documents.
Escrows and Reserves. At origination, the borrower deposited into escrow $3,439,949 for a free rent reserve relating to tenant ABS, $150,000 for immediate repairs (which represents 120% of the estimated costs) and $133,619 for real estate taxes.
Tax Escrows– On a monthly basis, the borrower is required to escrow 1/12th of the annual estimated tax payments, which currently equates to $14,847. However, so long as (i) (a) no Trigger Period (as defined below) or event of default under the 401 Market loan exists, and (b) the Wells Fargo lease is in full force and effect, and Wells Fargo is required under its lease to pay all taxes directly to the appropriate governmental authority, or (ii) (a) no Trigger Period or event of default under the 401 Market loan exists and (b) the borrower has paid all taxes relating to the Wells Fargo space directly to the appropriate governmental authority and the lender is provided with evidence of such payment, then the monthly deposits on account of that portion of taxes that are attributed to the Wells Fargo space will be suspended.
Insurance Escrows –On a monthly basis, the borrower is required to escrow 1/12thof the annual estimated insurance payments, which currently equates to $9,978. The borrower is not required to make monthly deposits to the insurance reserve so long as (i) no event of default exists, (ii) the property continues to be insured by an acceptable blanket policy, (iii) the borrower provides evidence of renewal of the blanket policy and (iv) the borrower provides evidence that all insurance premiums have been timely paid.
TI/LC Reserves– On a monthly basis, the borrower is required to make a deposit to a TI/LC reserve in an amount equal to $24,233 for the first 48 months of the loan term, which will increase to $60,581 on the payment date in November 2019.
Replacement Reserves – On a monthly basis beginning in October 2020, the borrower is required to deposit $14,135 to a replacement reserve.
Tenant Cash Trap Reserve– If tenant Wells Fargo terminates all or any portion of its lease, on a monthly basis beginning on the next payment date the borrower is required to deposit an amount equal to the product of (i) 33.75 times (ii) the square footage relinquished by Wells Fargo pursuant to early termination options divided by (iii) the number of remaining months in Wells Fargo’s lease term (without regard to such termination). The monthly deposits will cease upon the termination of a Tenant Cash Trap Period (as defined below), so long as no event of default or other Trigger Period exists.
THE INFORMATION IN THIS COLLATERAL TERM SHEET IS NOT COMPLETE AND MAY BE AMENDED PRIOR TO THE TIME OF SALE. THIS TERM SHEET IS NOT AN OFFER TO SELL THESE SECURITIES AND IT IS NOT A SOLICITATION OF AN OFFER TO BUY THESE SECURITIES IN ANY JURISDICTION WHERE THE OFFER OR SALE IS NOT PERMITTED.
| 74 |
Mortgage Loan No. 5 — 401 Market
Lockbox /Cash Management. The loan is structured with a hard lockbox and in-place cash management. At origination, the borrower and property manager were required to send direction letters to tenants instructing them to deposit all rents and payments into a lender-controlled lockbox account. Prior to the occurrence of a Trigger Period or a Tenant Cash Trap Period, all funds in the lockbox account are swept daily to a lender-controlled cash management account and applied on a monthly basis to, among other things, the payment of debt service, required reserves and operating expenses, and any excess funds are remitted to the borrower. During the continuance of a Trigger Period, all excess cash flow, after the payment of debt service, required reserves and operating expenses, among other things, will be held as additional collateral for the loan; provided, that if the Trigger Event arose solely as a result of a Wells Fargo Downgrade Event (as defined below), and the credit rating of Wells Fargo has been upgraded by Moody’s and/or S&P to one rating level below A2 and/or A+, as applicable, then 50% of the excess cash flow will be remitted to the borrower. During the continuance of a Tenant Cash Trap Period, all excess cash flow, after the payment of debt service, required reserves and operating expenses, among other things, will be held as additional collateral for the loan and applied to re-tenanting expenses in connection with the Wells Fargo space or the ABS space, as applicable.
A “Trigger Period” means the period commencing upon the earliest to occur of the following: (i) the occurrence and continuance of an event of default, (ii) the debt service coverage ratio is less than 1.15x for any calendar quarter or (iii) the date on which either or both of Moody’s and/or S&P downgrade Wells Fargo’s credit ratings by two or more rating levels below A2 and/or A+, as applicable (a “Wells Fargo Downgrade Event”).
A “Tenant Cash Trap Period” means a period commencing upon the earlier of (i) a Wells Fargo Trigger Period or (ii) certain events generally similar but not identical to those relating to tenant Wells Fargo occur with respect to tenant ABS (an “ABS Trigger Period”). Notwithstanding the foregoing, so long as no event of default exists, a Tenant Cash Trap Period will be temporarily suspended for so long as all of the following conditions are (and remain) satisfied: (i) the aggregate amount then on deposit in the Tenant Cash Trap Reserve and TI/LC reserve is at least equal to $11,800,000, and (ii) the property is not less than 80% occupied by tenants that are in occupancy, open for business and paying rent (after the expiration of any free rent or rent concession periods).
A “Wells Fargo Trigger Period” means a period commencing upon the earlier of (i) the date on which Wells Fargo goes “dark” or gives notice of the same with respect to at least 130,000 SF of its space (a “Wells Fargo Go-Dark Event”), (ii) the date on which the Wells Fargo lease expires or otherwise terminates such that the amount of the terminated Wells Fargo space which, when aggregated with all of the space at the property leased to in-place tenants, is less than 80%, or the date on which the Wells Fargo lease expires or otherwise terminates with respect to more than 20,000 SF or the date on which Wells Fargo gives notice of its intent to commence any of the foregoing (a “Wells Fargo Termination Event”), (iii) Wells Fargo failing to renew its lease by the date that is the earlier to occur of (A) eighteen (18) months prior to the expiration date of its lease or (B) the renewal notice period required under its lease, or (iv) the filing of a bankruptcy or a similar insolvency proceeding by or against Wells Fargo.
A Wells Fargo Trigger Period will terminate, provided that no other event would cause a Wells Fargo Trigger Period to exist, (a) with regard to clause (i) above, on the earlier to occur of (1) Wells Fargo has resumed operations and been open for business in all or substantially all of the Wells Fargo space for thirty (30) consecutive days, the Wells Fargo lease is in effect and no continuing default exists under the Wells Fargo lease or (2) the amount on deposit with the lender in respect of the event that caused such Wells Fargo Trigger Period is at least equal to the product of (x) 50 times (y) the square footage that is or will be “dark”; provided, that if ABS goes “dark” or gives notice of the same, clause (y) will be increased by the ABS square footage that is going “dark” (excluding any portion of the ABS space that was the subject of a cure in accordance with the loan documents) and the debt service coverage ratio will be at least 1.15x for the following calendar quarter (the “DSCR Test”); (b) with regard to clause (ii) above, the earlier to occur of (1) the lender receiving evidence that one or more leases with one or more replacement tenants reasonably satisfactory to the lender demising in the aggregate an amount of the terminated Wells Fargo space that, when aggregated with all of the space at the property leased to in-place tenants, results in occupancy at the property of not less than 80%, each replacement tenant is open for business and paying full unabated rent and the DSCR Test has been met (a “Wells Fargo Tenant Replacement Event”); (2) the date on which (i) the amount on deposit in the Tenant Cash Trap Reserve is at least equal to the product of (x) 33.75 times (y) the square footage that is being terminated by Wells Fargo space (excluding any portion
THE INFORMATION IN THIS COLLATERAL TERM SHEET IS NOT COMPLETE AND MAY BE AMENDED PRIOR TO THE TIME OF SALE. THIS TERM SHEET IS NOT AN OFFER TO SELL THESE SECURITIES AND IT IS NOT A SOLICITATION OF AN OFFER TO BUY THESE SECURITIES IN ANY JURISDICTION WHERE THE OFFER OR SALE IS NOT PERMITTED.
| 75 |
Mortgage Loan No. 5 — 401 Market
of the Wells Fargo space that was the subject of a Wells Fargo Tenant Replacement Event), provided, that if the ABS lease has expired or been terminated, clause (y) will be increased by the ABS square footage that is expiring or being terminated (excluding any portion of the ABS space that was the subject of a cure in accordance with the loan documents) and (ii) the DSCR Test has been met; or (3) the occurrence of an Oaktree Backstop Event Cure (as defined below); (c) with regard to clause (iii) above, the earlier to occur of (1) Wells Fargo renews or extends its lease upon terms reasonably acceptable to the lender for an amount of space that, when aggregated with all of the space at the property leased to in-place tenants, results in occupancy at the property of not less than 80%, and upon such renewal, the DSCR Test has been met, or (2) a Wells Fargo Tenant Replacement Event; and (d) with regard to clause (iv) above, the earlier to occur of (1) the date on which the Wells Fargo bankruptcy or insolvency proceeding has terminated and the Wells Fargo lease has been affirmed or assumed in a manner satisfactory to the lender or (2) a Wells Fargo Tenant Replacement Event.
An “Oaktree Backstop Event Cure” means, in the event that no payments are due under the Master Lease from Wells Fargo to NFR, the earlier to occur of (i) an election by the Oaktree Fund pursuant to the Oaktree Backstop to deliver a master lease with respect to the non-renewed Wells Fargo space, as to which the Oaktree Fund is paying full unabated rent, or (ii) an election by the Oaktree Fund pursuant to the Oaktree Backstop to make a termination payment, which has been paid by the borrower to the lender.
THE INFORMATION IN THIS COLLATERAL TERM SHEET IS NOT COMPLETE AND MAY BE AMENDED PRIOR TO THE TIME OF SALE. THIS TERM SHEET IS NOT AN OFFER TO SELL THESE SECURITIES AND IT IS NOT A SOLICITATION OF AN OFFER TO BUY THESE SECURITIES IN ANY JURISDICTION WHERE THE OFFER OR SALE IS NOT PERMITTED.
| 76 |
Mortgage Loan No. 6 — Baldwin Hills Center
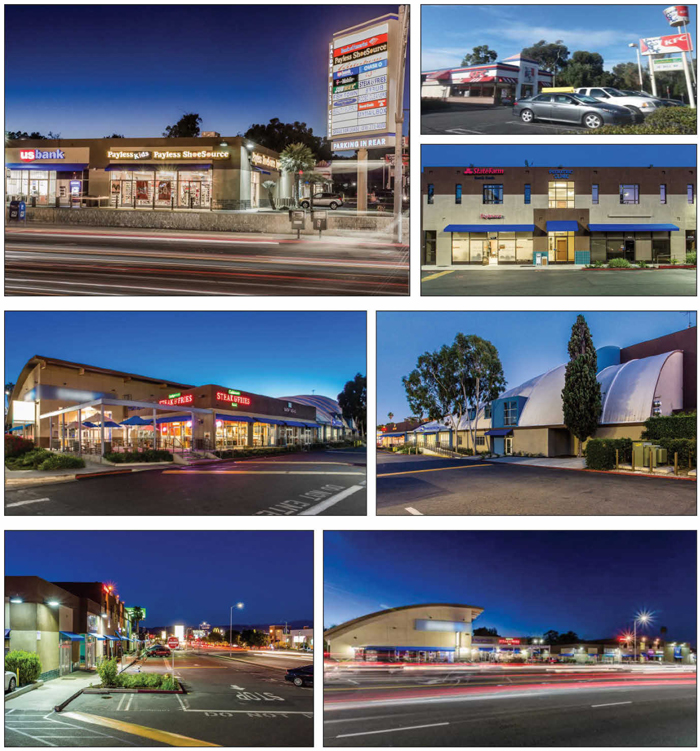
THE INFORMATION IN THIS COLLATERAL TERM SHEET IS NOT COMPLETE AND MAY BE AMENDED PRIOR TO THE TIME OF SALE. THIS TERM SHEET IS NOT AN OFFER TO SELL THESE SECURITIES AND IT IS NOT A SOLICITATION OF AN OFFER TO BUY THESE SECURITIES IN ANY JURISDICTION WHERE THE OFFER OR SALE IS NOT PERMITTED.
| 77 |
Mortgage Loan No. 6 — Baldwin Hills Center
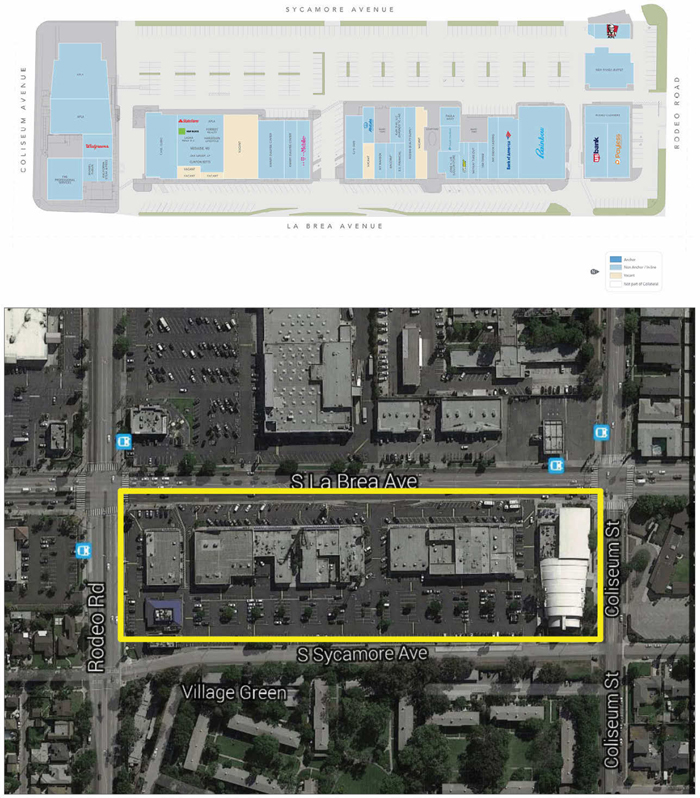
THE INFORMATION IN THIS COLLATERAL TERM SHEET IS NOT COMPLETE AND MAY BE AMENDED PRIOR TO THE TIME OF SALE. THIS TERM SHEET IS NOT AN OFFER TO SELL THESE SECURITIES AND IT IS NOT A SOLICITATION OF AN OFFER TO BUY THESE SECURITIES IN ANY JURISDICTION WHERE THE OFFER OR SALE IS NOT PERMITTED.
| 78 |
Mortgage Loan No. 6 — Baldwin Hills Center
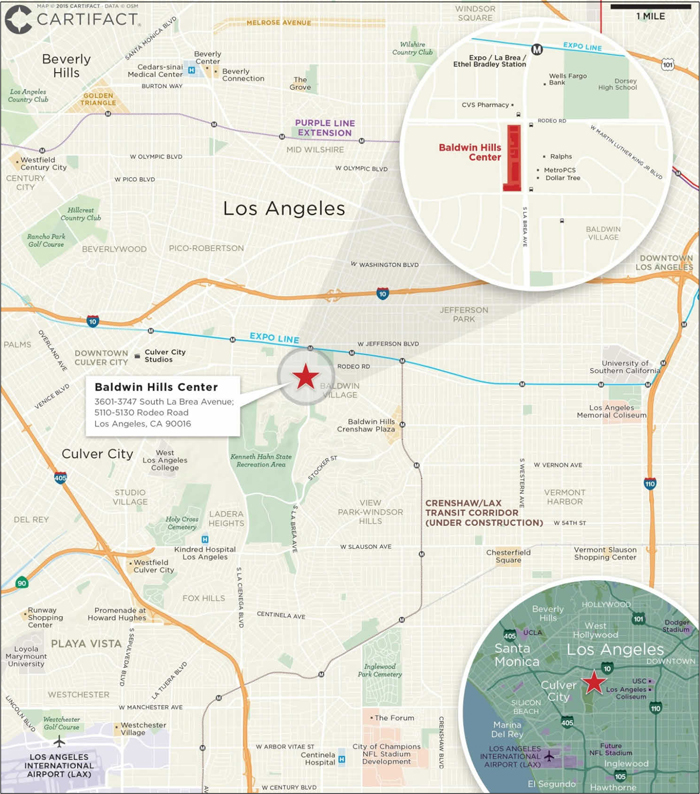
THE INFORMATION IN THIS COLLATERAL TERM SHEET IS NOT COMPLETE AND MAY BE AMENDED PRIOR TO THE TIME OF SALE. THIS TERM SHEET IS NOT AN OFFER TO SELL THESE SECURITIES AND IT IS NOT A SOLICITATION OF AN OFFER TO BUY THESE SECURITIES IN ANY JURISDICTION WHERE THE OFFER OR SALE IS NOT PERMITTED.
| 79 |
Mortgage Loan No. 6 — Baldwin Hills Center
| Mortgage Loan Information | Property Information |
| Mortgage Loan Seller: | SPREF | Single Asset/Portfolio: | Single Asset | |
| Original Principal Balance: | $33,000,000 | Title: | Fee | |
| Cut-off Date Principal Balance: | $33,000,000 | Property Type - Subtype: | Retail – Unanchored | |
| % of Pool by IPB: | 3.5% | Net Rentable Area (SF): | 127,054 | |
| Loan Purpose: | Refinance | Location: | Los Angeles, CA | |
| Borrower: | Baldwin Hills Investors, Ltd. | Year Built/Renovated: | 1955 / 1993, 2001, 2004, 2012-2014 | |
| Sponsor: | John F. Karubian | Occupancy: | 85.9% | |
| Interest Rate: | 4.6900% | Occupancy Date: | 10/16/2015 | |
| Note Date: | 11/2/2015 | Number of Tenants: | 38 | |
| Maturity Date: | 11/6/2025 | 2012 NOI: | $2,620,466 | |
| Interest-only Period: | 60 months | 2013 NOI: | $1,947,438 | |
| Original Term: | 120 months | 2014 NOI(2): | $2,328,067 | |
| Original Amortization: | 360 months | TTM NOI(2)(3): | $2,533,317 | |
| Amortization Type: | IO-Balloon | UW Economic Occupancy: | 85.9% | |
| Call Protection: | L(27),YM2(89),O(4) | UW Revenues: | $4,465,651 | |
| Lockbox(1): | Springing | UW Expenses: | $1,338,160 | |
| Additional Debt: | No | UW NOI(2): | $3,127,491 | |
| Additional Debt Balance: | N/A | UW NCF: | $2,920,393 | |
| Additional Debt Type: | N/A | Appraised Value / Per SF: | $51,400,000 / $405 | |
| Additional Future Debt Permitted: | No | Appraisal Date: | 10/10/2015 | |
| Escrows and Reserves(4) | Financial Information |
| Initial | Monthly | Initial Cap | Cut-off Date Loan / SF: | $260 | ||
| Taxes: | $85,374 | $17,075 | N/A | Maturity Date Loan / SF: | $238 | |
| Insurance: | $96,470 | $8,039 | N/A | Cut-off Date LTV: | 64.2% | |
| Replacement Reserves: | $0 | $2,118 | $76,233 | Maturity Date LTV: | 58.9% | |
| TI/LC: | $0 | $15,141 | $545,062 | UW NCF DSCR: | 1.42x | |
| Engineering Reserve: | $21,844 | N/A | N/A | UW NOI Debt Yield: | 9.5% | |
| Litigation Reserve: | $54,025 | N/A | N/A | |||
| Rent Reserve: | $258,016 | N/A | N/A | |||
| Special Rollover Reserve: | $0 | Springing | N/A |
Sources and Uses
| Sources | Proceeds | % of Total | Uses | Proceeds | % of Total | ||
| Mortgage Loan | $33,000,000 | 100.0% | Payoff Existing Debt | $24,094,941 | 73.0% | ||
| Return of Equity | 7,844,724 | 23.8 | |||||
| Closing Costs | 544,606 | 1.7 | |||||
| Upfront Reserves | 515,729 | 1.6 | |||||
| Total Sources | $33,000,000 | 100.0% | Total Uses | $33,000,000 | 100.0% |
| (1) | For a more detailed description of Lockbox, please refer to“Lockbox / Cash Management”below. |
| (2) | The increase in UW NOI compared to 2014 and TTM NOI is due in part to existing tenant APLA expanding into 15,266 SF of previously vacant space and PAE Professional Services executing a new lease for 6,940 SF. |
| (3) | Represents trailing twelve months ending August 31, 2015. |
| (4) | For a more detailed description of Escrows and Reserves, please refer to “Escrows and Reserves” below. |
THE INFORMATION IN THIS COLLATERAL TERM SHEET IS NOT COMPLETE AND MAY BE AMENDED PRIOR TO THE TIME OF SALE. THIS TERM SHEET IS NOT AN OFFER TO SELL THESE SECURITIES AND IT IS NOT A SOLICITATION OF AN OFFER TO BUY THESE SECURITIES IN ANY JURISDICTION WHERE THE OFFER OR SALE IS NOT PERMITTED.
| 80 |
Mortgage Loan No. 6 — Baldwin Hills Center
The Loan. The Baldwin Hills Center loan is a $33.0 million first mortgage loan secured by the fee interest in a 127,054 SF unanchored retail center located in Los Angeles, California. The loan has a 10-year term and will amortize on a 30-year schedule after a five-year interest only period.
The Borrower. The borrowing entity for the loan is Baldwin Hills Investors, Ltd., a California limited partnership and special purpose entity.
The Sponsor. The loan’s sponsor and nonrecourse carve-out guarantor is John F. Karubian. Mr. Karubian is a local real estate professional who has been investing, managing, and developing real estate in the Los Angeles area for over three decades. Throughout his career, Mr. Karubian has acquired approximately 900 residential units and nine commercial and storage properties with an estimated value of nearly $250 million.
The Property. The property is a 127,054 SF unanchored retail center located in Los Angeles, California. The property was constructed in 1955 and is situated on approximately 8.0 acres, in a residential area southwest of downtown Los Angeles. There are 433 surface parking spaces at the property which are included in the collateral, resulting in a parking ratio of 3.4 spaces per 1,000 SF of net rentable area. A 9,490 SF building that is part of the property is currently being renovated. The sponsor plans to add additional mezzanine space along the north side of the building connecting the current mezzanine areas on the east and west ends of the building and both open and raise the roof in the center of the building to create an atrium that provides natural light to the first and second floors. The sponsor executed a completion guarantee for the space at origination.
As of October 16, 2015, the property was approximately 85.9% leased by 38 tenants. The property’s tenancy caters to mid-price point customers with both national and local tenants that include APLA, Rainbow USA, Inc., and PAE Professional Services. The largest tenant at the property, APLA, leases 22,928 SF (18.0% of the net rentable area) pursuant to multiple leases which have expiration dates between August 2021 and September 2022. APLA is a non-profit organization dedicated to improving lives of people affected by HIV/AIDS, reducing the incidence of HIV infection, and advocating for fair and effective HIV-related public policy. The second largest tenant at the property, Rainbow USA, Inc., leases 10,150 SF (8.0% of the net rentable area) through January 2022. Rainbow USA, Inc. is a neighborhood boutique founded in 1935 in New York City. Rainbow USA, Inc. offers a wide assortment of clothing for juniors, plus sizes, and children, as well as a large shoe collection. Today, along with sister brands 579 and Marianne, the company operates over 1,000 locations within 37 states, Puerto Rico, and the U.S. Virgin Islands. The third largest tenant at the property, PAE Professional Services, leases 6,940 SF (5.5% of the net rentable area) through June 2021. PAE Professional Services provides support for the essential missions of a wide range of customers, including the U.S. government, its allied partners and international organizations. PAE Professional Services’ current portfolio includes capabilities in aviation, capacity building and stabilization, critical infrastructure, expeditionary logistics, identity and information management solutions, integrated security solutions, test and training ranges, and training solutions.
The property benefits from its location on the southwest corner of Rodeo Road and La Brea Avenue which provides good frontage. Primary access to the location is provided by Interstate 10.
The Market. The property is located in the Greater Los Angeles market, approximately 8.0 miles from downtown Los Angeles and approximately 7.0 miles from Los Angeles International Airport. The corner of Rodeo Road and La Brea Avenue contain two grocery anchored centers. A Ralphs anchored center is situated directly across from the property at the southeastern corner of the intersection, and a Superior Grocers and Rite Aid anchored center is situated at the northeastern corner of the intersection. A free standing CVS Drug store is located at the northwest corner of the intersection.
According to the appraisal, the 3-mile radius of the property contains approximately 331,199 people, with an average household income of $68,907 as of 2015. The appraisal concluded per square foot market rents of $30.60. According to the appraisal, the Culver City/Inglewood/El Segundo submarket reported an overall vacancy rate of 2.7% as of 2015. According to the appraisal, the property’s competitive set consists of the 8 properties detailed in the table below.
THE INFORMATION IN THIS COLLATERAL TERM SHEET IS NOT COMPLETE AND MAY BE AMENDED PRIOR TO THE TIME OF SALE. THIS TERM SHEET IS NOT AN OFFER TO SELL THESE SECURITIES AND IT IS NOT A SOLICITATION OF AN OFFER TO BUY THESE SECURITIES IN ANY JURISDICTION WHERE THE OFFER OR SALE IS NOT PERMITTED.
| 81 |
Mortgage Loan No. 6 — Baldwin Hills Center
Competitive Set Summary(1)
| Property | Year Built / Renovated | Total GLA (SF) | Est. Occ. | Proximity (miles) | Major Tenants |
| Baldwin Hills Center | 1955 / 2014 | 127,054(2) | 86%(2) | APLA, Rainbow USA, Inc., PAE Professional Services(2) | |
| Crenshaw Town Plaza | 1969 / 1994 | 138,083 | 90% | 3.6 | Ralphs Grocery |
| Chesterfield Square | 2002 / NAP | 215,755 | 98% | 4.6 | Home Depot, Food 4 Less, Walgreens |
| Gage Village Shopping Center | 2003 / NAP | 102,685 | 96% | 8.2 | El Super |
Crenshaw Imperial Shopping Center | 1958 / NAP | 222,690 | 73% | 7.8 | Dd’s Discount (Ross), General Discount, Fallas Paredes |
| Cheviot Hills Shopping Center | 1967 / NAP | 50,306 | 100% | 3.4 | Vons, Rite Aid |
Athens Westmont Shopping Center | 1967 / NAP | 183,173 | 97% | 8.8 | Food 4 Less |
| Northgate Slauson Marketplace | 2014 / NAP | 77,096 | 100% | 7.4 | Gonzalez Northgate Market, CVS |
| Superior Grocers Shopping Center | 1961 / 1993 | 93,535 | 80% | 9.0 | Superior Grocers |
| (1) | Source: Appraisal. |
| (2) | Based on underwritten rent roll. |
Historical and Current Occupancy(1)
| 2012 | 2013 | 2014 | TTM(2) | Current(3) |
| 74.5% | 76.6% | 74.8 % | 87.4 % | 85.9% |
| (1) | Source: Historical Occupancy is provided by the sponsor. |
| (2) | The TTM is based on the trailing-twelve month period ending August 31, 2015. |
| (3) | Based on the October 2015 underwritten rent roll. |
Tenant Summary(1)
| Tenant | Ratings Moody’s/S&P/Fitch(2) | Net Rentable Area (SF) | % of Total NRA | Base Rent PSF | Sales PSF(3) | Occupancy Costs(3) | Lease Expiration Date |
| APLA | NA / NA / NA | 22,928 | 18.0% | $23.55 | N/A | N/A | Various(4) |
| Rainbow USA, Inc. (5) | NA / NA / NA | 10,150 | 8.0% | $22.29 | $159 | 21.0% | 1/31/2022 |
| PAE Professional Services(6) | NA / NA / NA | 6,940 | 5.5% | $33.00 | N/A | N/A | 6/30/2021 |
| Kidney Dialysis Center | NA / NA / NA | 6,750 | 5.3% | $28.14 | N/A | N/A | 12/31/2022 |
| T.H.E. Clinic | NA / NA / NA | 5,700 | 4.5% | $50.36 | N/A | N/A | 11/30/2020 |
| New Panda Buffet | NA / NA / NA | 4,620 | 3.6% | $22.80 | N/A | N/A | 12/31/2020 |
| Bank of America | Baa1 / A- / A | 3,840 | 3.0% | $30.48 | N/A | N/A | 9/30/2019 |
| US Bank | A1 / A+ / AA | 3,640 | 2.9% | $40.01 | N/A | N/A | 6/30/2017 |
| Payless Shoes(7) | NA / NA / NA | 3,615 | 2.8% | $30.00 | N/A | N/A | 12/31/2017 |
| Jessica Padilla (CJ’s Café) | NA / NA / NA | 3,250 | 2.6% | $38.08 | N/A | N/A | 2/28/2022 |
| (1) | Based on the underwritten rent roll, including rent increases occurring through October 31, 2016. |
| (2) | Ratings provided are for the parent company of the entity listed in the “Tenant” field whether or not the parent company guarantees the lease. |
| (3) | Sales PSF and Occupancy Costs represent comparable tenant sales (tenants with 12 months reported sales) and occupancy costs for the twelve-month period ending on August 31, 2015 as provided by the sponsors for tenants that are required to report. |
| (4) | APLA occupies three spaces, with 15,266 SF expiring September 30, 2022, 6,712 SF expiring August 31, 2021, and 950 SF expiring August 31, 2021. |
| (5) | In the event, that more than 50% of the floor area of the shopping area is not open for business for a consecutive period of more than 30 days, Rainbow USA, Inc. will have the right to terminate the lease upon 60 days’ written notice to landlord, unless after 30 days after giving such notice the condition is satisfied. |
| (6) | If at any time prior to the 30th month of the initial term, PAE Professional Services receives instructions from the United States Federal Government to terminate the lease, the tenant will have a one-time option to terminate the lease effective on the last day of the 36th month of the initial term. |
| (7) | Payless Shoes may close its store when in its sole judgment the operation of the store cannot be economically justified. In the event the tenant should close for a period of more than ten calendar days, the borrower will have the right to terminate the lease with 30 days’ prior written notice to the tenant. |
THE INFORMATION IN THIS COLLATERAL TERM SHEET IS NOT COMPLETE AND MAY BE AMENDED PRIOR TO THE TIME OF SALE. THIS TERM SHEET IS NOT AN OFFER TO SELL THESE SECURITIES AND IT IS NOT A SOLICITATION OF AN OFFER TO BUY THESE SECURITIES IN ANY JURISDICTION WHERE THE OFFER OR SALE IS NOT PERMITTED.
| 82 |
Mortgage Loan No. 6 — Baldwin Hills Center
Lease Rollover Schedule(1)
| Year | Number of Leases Expiring(2) | NRA Expiring | % of NRA Expiring | Base Rent Expiring | % of Base Rent Expiring | Cumulative NRA Expiring | Cumulative % of NRA Expiring | Cumulative Base Rent Expiring | Cumulative % of Base Rent Expiring |
| Vacant | NAP | 17,956 | 14.1% | NAP | NAP | 17,956 | 14.1% | NAP | NAP |
| 2016 | 2 | 3,648 | 2.9 | $101,123 | 3.1% | 21,604 | 17.0% | $101,123 | 3.1% |
| 2017 | 6 | 12,857 | 10.1 | 358,494 | 11.1 | 34,461 | 27.1% | $459,616 | 14.2% |
| 2018 | 2 | 3,435 | 2.7 | 93,755 | 2.9 | 37,896 | 29.8% | $553,372 | 17.1% |
| 2019 | 6 | 9,753 | 7.7 | 321,334 | 9.9 | 47,649 | 37.5% | $874,705 | 27.0% |
| 2020 | 8 | 16,505 | 13.0 | 563,307 | 17.4 | 64,154 | 50.5% | $1,438,012 | 44.4% |
| 2021 | 4 | 16,701 | 13.1 | 439,167 | 13.6 | 80,855 | 63.6% | $1,877,179 | 57.9% |
| 2022 | 7 | 37,409 | 29.4 | 1,033,672 | 31.9 | 118,264 | 93.1% | $2,910,851 | 89.8% |
| 2023 | 2 | 2,400 | 1.9 | 92,096 | 2.8 | 120,664 | 95.0% | $3,002,947 | 92.7% |
| 2024 | 3 | 5,331 | 4.2 | 190,470 | 5.9 | 125,995 | 99.2% | $3,193,418 | 98.5% |
| 2025 | 1 | 1,059 | 0.8 | 47,652 | 1.5 | 127,054 | 100.0% | $3,241,070 | 100.0% |
| 2026 & Beyond | 0 | 0 | 0.0 | 0 | 0.0 | 127,054 | 100.0% | $3,241,070 | 100.0% |
| Total | 41 | 127,054 | 100.0% | $3,241,070 | 100.0% |
| (1) | Based on the underwritten rent roll. Rent includes base rent and rent increases occurring through October 31, 2016. |
| (2) | Certain tenants have more than one lease. |
Operating History and Underwritten Net Cash Flow
| 2012 | 2013 | 2014(1) | TTM(1)(2) | Underwritten(1)(3) | PSF | %(4) | |
| Rents in Place(3) | $2,759,358 | $2,297,735 | $2,621,345 | $2,736,507 | $3,241,070 | $25.51 | 65.4% |
| Vacant Income | 0 | 0 | 0 | 0 | 506,076 | 3.98 | 10.2% |
| Gross Potential Rent | $2,759,358 | $2,297,735 | $2,621,345 | $2,736,507 | $3,747,146 | $29.49 | 75.6% |
| Total Reimbursements | 941,654 | 761,495 | 811,339 | 872,627 | 1,209,185 | 9.52 | 24.4% |
| Net Rental Income | $3,701,012 | $3,059,229 | $3,432,683 | $3,609,134 | $4,956,331 | $39.01 | 100.0% |
| (Vacancy/Collection Loss) | 0 | 0 | 0 | 0 | (506,076) | (3.98) | (10.2%) |
| Other Income | (66) | 330 | 12,708 | 15,396 | 15,396 | 0.12 | 0.3% |
| Effective Gross Income | $3,700,946 | $3,059,559 | $3,445,392 | $3,624,530 | $4,465,651 | $35.15 | 90.1% |
| Total Expenses | $1,080,479 | $1,112,121 | $1,117,325 | $1,091,213 | $1,338,160 | $10.53 | 30.0% |
| Net Operating Income | $2,620,466 | $1,947,438 | $2,328,067 | $2,533,317 | $3,127,491 | $24.62 | 70.0% |
| Total TI/LC, Capex/RR | 0 | 0 | 0 | 0 | 207,098 | 1.63 | 4.6% |
| Net Cash Flow | $2,620,466 | $1,947,438 | $2,328,067 | $2,533,317 | $2,920,393 | $22.99 | 65.4% |
| (1) | The increase in UW NOI compared to 2014 and TTM NOI is due in part to existing tenant APLA expanding into 15,266 SF of previously vacant space and PAE Professional Services executing a new lease for 6,940 SF. |
| (2) | Represents trailing twelve months ending August 31, 2015. |
| (3) | Underwritten Rents in Place includes Base Rent and Rent Increases occurring through October 31, 2016. |
| (4) | % column represents percent of Net Rental Income for all revenue lines and represents percent of Effective Gross Income for the remainder of fields. |
Property Management. The property is managed by Forsat, Inc., an affiliate of the sponsor.
THE INFORMATION IN THIS COLLATERAL TERM SHEET IS NOT COMPLETE AND MAY BE AMENDED PRIOR TO THE TIME OF SALE. THIS TERM SHEET IS NOT AN OFFER TO SELL THESE SECURITIES AND IT IS NOT A SOLICITATION OF AN OFFER TO BUY THESE SECURITIES IN ANY JURISDICTION WHERE THE OFFER OR SALE IS NOT PERMITTED.
| 83 |
Mortgage Loan No. 6 — Baldwin Hills Center
Escrows and Reserves. At origination, the borrower deposited into escrow $258,016 for a rent reserve, $96,470 for insurance, $85,374 for real estate taxes, $54,025 for a litigation reserve and $21,844 for engineering reserves.
Tax Escrows – On a monthly basis, the borrower is required to escrow 1/12th of the annual estimated tax payments, currently equal to $17,075.
Insurance Escrows – On a monthly basis, the borrower is required to escrow 1/12th of the annual estimated insurance premiums due for the renewal of the coverage afforded by the policies, currently equal to $8,039.
TI/LC Reserve – On a monthly basis, the borrower is required to make a deposit with the lender in the amount of $15,141 for tenant improvements and leasing commissions, up to a cap of $545,062.
Replacement Reserve – On a monthly basis, the borrower is required to make a deposit with the lender in the amount of $2,118 for replacement reserves, up to a cap of $76,233.
Litigation Reserve – The litigation reserved for is regarding an outstanding dispute over a leasing commission. If the settlement exceeds the Litigation Reserve, the sponsor is required to deposit the shortfall within five business days.
Rent Reserve - The $258,016 rent reserve which is required to be disbursed to borrower upon confirmation that APLA (with reference to suite 3741) and PAE Professional Services have each begun paying full unabated rent pursuant to their leases.
Lockbox / Cash Management.The loan is structured with a springing lockbox and springing cash management. Upon written notification from the lender that the first Cash Management Period (defined below), if any, has occurred, the borrower is required to promptly establish and maintain a lockbox account (the “Lockbox Account”) with the lockbox bank in trust for the benefit of the lender into which rents will be deposited. The related loan documents require the lender to have a first priority security interest in the Lockbox Account and the cash management account (the “Cash Management Account”). Upon the occurrence and during the continuance of a Cash Management Period, the borrower and property manager are required to hold rents and other income from the property in trust for the lender and deposit such amounts in the Lockbox Account within one business day of receipt. During a Cash Management Period, all funds deposited into the Lockbox Account will be periodically swept into the Cash Management Account and will be applied by the lender to the payment of tax and insurance (if applicable) escrows, debt service, replacement reserves, any other amounts then due to the lender and monthly operating expenses and extraordinary expenses. Any excess funds after deductions for these items must be deposited into the excess cash flow reserve account.
“Cash Management Period” means a period commencing: (i) upon the occurrence of an event of default, or (ii) if the debt service coverage ratio is less than 1.30x at the end of any calendar quarter, or (iii) concurrently with the commencement of a Lease Sweep Period (defined below), or (iv) on the stated maturity date of the loan. A Cash Management Period will end with respect to clause (i) above, after the cure (if applicable) of such event of default (provided that no other Cash Management Period has occurred and is continuing), or with respect to clause (ii) above, upon the date that the debt service coverage ratio is equal to or greater than 1.35x at the end of any calendar quarter (provided that no event of default has occurred and is continuing), or with respect to clause (iii) above, when such Lease Sweep Period has ended.
A “Lease Sweep Period” commences (i) on the date that is six (6) months prior to the end of the term of any Major Lease (including any renewal terms); provided, however, that with reference to any Major Lease, the borrower will have the ability to reduce the six (6) month period to four (4) months if the borrower deposits $250,000 with the lender on or before the date that is twelve months prior to the end of the term of such Major Lease; (ii) on the date required under a Major Lease by which the tenant is required to give notice of its exercise of a renewal option (and such renewal has not been exercised), (iii) if any Major Lease is surrendered, cancelled or terminated prior to its expiration date, (iv) if any tenant under a Major Lease “goes dark” or gives notice that it intends to “go dark” or (v) upon the occurrence of an insolvency proceeding with respect to a tenant under a Major Lease. “Major Lease” is: any of the respective leases with APLA (suite 3741, only 15,266 square feet), Rainbow USA, Inc., and PAE Professional Services, together with any replacement lease which covers all or substantially all of the space demised under any of the foregoing.
THE INFORMATION IN THIS COLLATERAL TERM SHEET IS NOT COMPLETE AND MAY BE AMENDED PRIOR TO THE TIME OF SALE. THIS TERM SHEET IS NOT AN OFFER TO SELL THESE SECURITIES AND IT IS NOT A SOLICITATION OF AN OFFER TO BUY THESE SECURITIES IN ANY JURISDICTION WHERE THE OFFER OR SALE IS NOT PERMITTED.
| 84 |
Mortgage Loan No. 7 — Embassy Suites and Claypool Court

THE INFORMATION IN THIS COLLATERAL TERM SHEET IS NOT COMPLETE AND MAY BE AMENDED PRIOR TO THE TIME OF SALE. THIS TERM SHEET IS NOT AN OFFER TO SELL THESE SECURITIES AND IT IS NOT A SOLICITATION OF AN OFFER TO BUY THESE SECURITIES IN ANY JURISDICTION WHERE THE OFFER OR SALE IS NOT PERMITTED.
| 85 |
Mortgage Loan No. 7 — Embassy Suites and Claypool Court
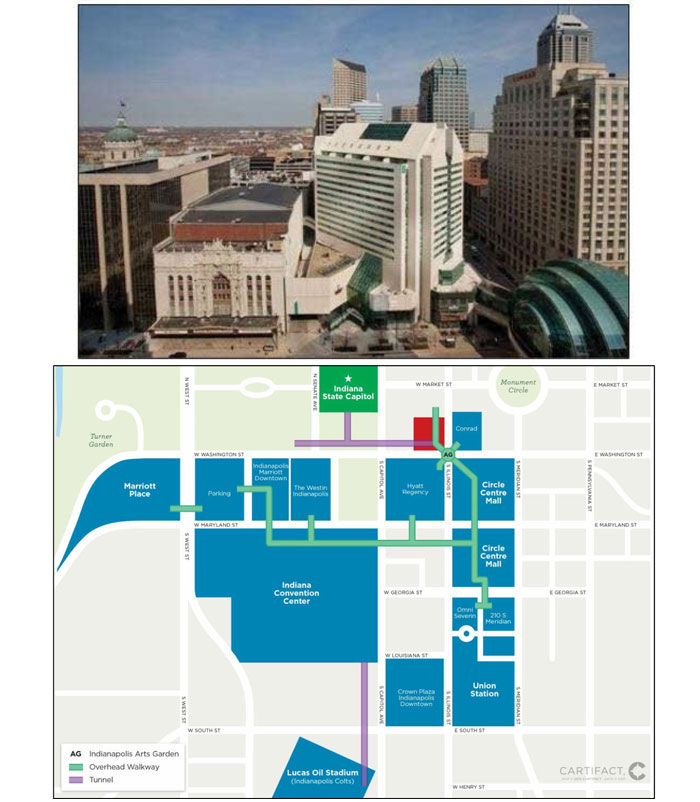
THE INFORMATION IN THIS COLLATERAL TERM SHEET IS NOT COMPLETE AND MAY BE AMENDED PRIOR TO THE TIME OF SALE. THIS TERM SHEET IS NOT AN OFFER TO SELL THESE SECURITIES AND IT IS NOT A SOLICITATION OF AN OFFER TO BUY THESE SECURITIES IN ANY JURISDICTION WHERE THE OFFER OR SALE IS NOT PERMITTED.
| 86 |
Mortgage Loan No. 7 — Embassy Suites and Claypool Court

THE INFORMATION IN THIS COLLATERAL TERM SHEET IS NOT COMPLETE AND MAY BE AMENDED PRIOR TO THE TIME OF SALE. THIS TERM SHEET IS NOT AN OFFER TO SELL THESE SECURITIES AND IT IS NOT A SOLICITATION OF AN OFFER TO BUY THESE SECURITIES IN ANY JURISDICTION WHERE THE OFFER OR SALE IS NOT PERMITTED.
| 87 |
Mortgage Loan No. 7 — Embassy Suites and Claypool Court
| Mortgage Loan Information | Property Information | |||
| Mortgage Loan Seller: | Column | Single Asset / Portfolio: | Single Asset | |
| Original Principal Balance: | $30,000,000 | Title(2): | Fee & Leasehold | |
| Cut-off Date Principal Balance: | $30,000,000 | Property Type - Subtype: | Hotel – Full Service | |
| % of Pool by IPB: | 3.2% | Net Rentable Area (Rooms)(2): | 360 | |
| Loan Purpose: | Refinance | Location: | Indianapolis, IN | |
| Borrower: | Claypool Court, LLC | Year Built / Renovated: | 1985 / 2011-2012 | |
| Sponsor: | Melvin Simon & Associates, Inc. | Occupancy / ADR / RevPAR: | 73.9% / $147.70 / $109.08 | |
| Interest Rate: | 4.1290% | Occupancy / ADR / RevPAR Date: | 8/31/2015 | |
| Note Date: | 9/29/2015 | Number of Tenants(3): | 7 | |
| Maturity Date: | 10/6/2025 | 2012 NOI: | $5,152,732 | |
| Interest-only Period: | 36 months | 2013 NOI: | $5,373,024 | |
| Original Term: | 120 months | 2014 NOI: | $5,308,304 | |
| Original Amortization: | 360 months | TTM NOI(4): | $5,372,975 | |
| Amortization Type: | IO-Balloon | UW Occupancy / ADR / RevPAR: | 73.9% / $147.70 / $109.08 | |
| Call Protection: | L(28),Def(88),O(4) | UW Revenues: | $18,873,495 | |
| Lockbox(1): | Hard | UW Expenses: | $13,668,564 | |
| Additional Debt: | No | UW NOI: | $5,204,931 | |
| Additional Debt Balance: | N/A | UW NCF: | $4,230,955 | |
| Additional Debt Type: | N/A | Appraised Value / Per Room: | $51,700,000 / $143,611 | |
| Additional Future Debt Permitted: | No | Appraisal Date: | 8/28/2015 | |
| Escrows and Reserves(5) | Financial Information | |||||
| Initial | Monthly | Initial Cap | Cut-off Date Loan / Room: | $83,333 | ||
| Taxes: | $0 | Springing | N/A | Maturity Date Loan / Room: | $72,313 | |
| Insurance: | $0 | Springing | N/A | Cut-off Date LTV: | 58.0% | |
| FF&E Reserve: | $0 | 5% of hotel gross revenue | N/A | Maturity Date LTV: | 50.4% | |
| PIP Reserve: | $11,000,000 | $185,333 | N/A | UW NCF DSCR: | 2.42x | |
| TI/LC Reserve: | $0 | Springing | $230,000 | UW NOI Debt Yield: | 17.3% | |
| Replacement Reserve: | $0 | Springing | $46,200 | |||
Sources and Uses
| Sources | Proceeds | % of Total | Uses | Proceeds | % of Total | |
| Mortgage Loan | $30,000,000 | 88.7% | Payoff Existing Debt | $22,247,609 | 65.8% | |
| Borrower Equity | 3,814,313 | 11.3 | Upfront Reserves | 11,000,000 | 32.5 | |
| Closing Costs | 566,704 | 1.7 | ||||
| Total Sources | $33,814,313 | 100.0% | Total Uses | $33,814,313 | 100.0% |
| (1) | For a more detailed description of Lockbox, please refer to“Lockbox / Cash Management”below. |
| (2) | The property is owned in fee by the borrower but the borrower leases parking spaces from an adjacent parking garage. For more information please refer to “Parking Lease” below. |
(3) The property contains approximately 78,000 SF of retail and office/exhibition space, located on floors 1 through 3. The net operating income from the space represents approximately 3.3% of the UW NOI.
| (4) | Represents trailing twelve months ending August 31, 2015. |
| (5) | For a more detailed description of Escrows and Reserves, please refer to “Escrows and Reserves” below. |
THE INFORMATION IN THIS COLLATERAL TERM SHEET IS NOT COMPLETE AND MAY BE AMENDED PRIOR TO THE TIME OF SALE. THIS TERM SHEET IS NOT AN OFFER TO SELL THESE SECURITIES AND IT IS NOT A SOLICITATION OF AN OFFER TO BUY THESE SECURITIES IN ANY JURISDICTION WHERE THE OFFER OR SALE IS NOT PERMITTED.
| 88 |
Mortgage Loan No. 7 — Embassy Suites and Claypool Court
The Loan. The Embassy Suites and Claypool Court loan is a $30.0 million first mortgage loan secured by the fee interest in a 360-room full-service hotel property located in Indianapolis, Indiana, together with a leasehold interest in certain parking spaces, pursuant to a parking agreement. The loan has a 10-year term and will amortize on a 30-year schedule after a three-year interest-only period.
The Borrower. The borrowing entity for the loan is Claypool Court, LLC, a Delaware limited liability company and special purpose entity.
The Sponsor. The loan’s sponsor and nonrecourse carve-out guarantor is Melvin Simon & Associates, Inc., an entity owned by various members of the Simon family, including David Simon, the current Chairman and CEO of the Simon Property Group (“Simon”). Simon is a leader in retail real estate ownership, management, investment and development across North America, Europe and Asia and is an S&P 100 company (NYSE: SPG).
The Property. The property consists of a full-service hotel known as the Embassy Suites Indianapolis Downtown located in Indianapolis, Indiana that offers 360 suites and additionally contains approximately 78,000 SF of retail and office space known as Claypool Court. The property was originally constructed in 1985. The sponsors have spent over $4.0 million (approximately $11,200 per room) on capital expenditures between 2010 and 2014. In addition, they are expected to undergo an approximately $19.8 million ($55,070 per room) property improvement plan between 2015 and 2017. The renovation is expected to upgrade the entire hotel including the entry, lobby, meeting rooms, guestrooms and other public spaces. The hotel has access to an adjacent, adjoining garage, which is owned by a third-party and charges guests a daily usage fee. The borrower has a leasehold interest in certain parking spaces pursuant to a parking agreement which grants rights to utilize such parking. The borrower’s leasehold interest is encumbered by the mortgage. See “Parking Lease” below.
The hotel’s lobby is located at the base of an open-air atrium with glass enclosed elevators providing views of the lobby and atrium as guests ascend to their rooms. Amenities at the property include the Claypool Grill Restaurant and Lounge, a breakfast/snack area, a fitness room, a business center and an indoor swimming pool. The property also provides approximately 12,500 SF of meeting space as well as providing guests direct access to the adjacent Indiana Roof Ballroom meeting facilities, a landmark facility and per the appraisal, one of the central business district’s higher-end meeting venues. The guestroom mix includes 210 king suites, 132 double/double suites, 11 penthouse suites, one penthouse double king suite and six ADA suites. Each guestroom includes a flat-screen television, refrigerator, sleeper sofa, desk with chairs and lounge chairs.
The property contains the approximately 78,000 SF Claypool Court which is located on the first three floors of the property and provided a mixture of retail and office/exhibition space. The larger tenants include Rhythm! Discovery Center, the Indianapolis Colts Bar, the Weber Grill, the Indianapolis Arts Counsel and Panera Bread. Based on the underwritten rent roll, Claypool Court was 74.0% leased to seven tenants and the net operating income attributed to the Claypool Court space represented approximately 3.3% of UW NOI. The retail space is managed by Simon.
The property’s demand mix is approximately 50% commercial, 30% leisure and 20% meeting & group. According to the appraisal, the largest generators of commercial demand in Indianapolis include Bank One, Clarion Health, Deloitte, Eli Lilly, JPMorgan Chase, the NCAA, Pricewaterhouse Coopers, Simon, Rolls Royce and United Technologies.
THE INFORMATION IN THIS COLLATERAL TERM SHEET IS NOT COMPLETE AND MAY BE AMENDED PRIOR TO THE TIME OF SALE. THIS TERM SHEET IS NOT AN OFFER TO SELL THESE SECURITIES AND IT IS NOT A SOLICITATION OF AN OFFER TO BUY THESE SECURITIES IN ANY JURISDICTION WHERE THE OFFER OR SALE IS NOT PERMITTED.
| 89 |
Mortgage Loan No. 7 — Embassy Suites and Claypool Court
The Market. The property is located in Indianapolis, Indiana on the north side of West Washington Street, which, according to the appraisal, is within Indianapolis’ primary entertainment, retail and convention venue in the heart of the Indianapolis central business district. According to the appraisal, the property is in walking distance to many of the area’s primary generators of lodging demand including Monument Circle, the Circle Centre Mall, Conseco Fieldhouse, Lucas Oil Stadium (the home of the Indianapolis Colts), Banker’s Life Fieldhouse (homes of the Indiana Pacers), Hilbert Circle Theatre (home of the Indianapolis Symphony Orchestra), Indianapolis Zoo various commercial and governmental developments, including the state capitol building, and the recently expanded Indiana Convention Center. The Indiana Convention Center offers approximately 566,600 SF of contiguous exhibit hall space, 11 exhibit halls ranging from 36,300 SF to 88,900 SF, 71 meeting rooms totaling 113,302 SF and three ballrooms of various sizes totaling 62,173 SF, with the largest one in excess of 33,000 SF. In addition, the property connects to the Circle Centre Mall through the city’s covered skywalk. The Circle Centre Mall, which was developed by Simon, consists of over 100 stores on four levels with a gross leasable area of 786,000 SF.
Historical Occupancy, ADR, RevPAR(1)
| Competitive Set | Embassy Suites and Claypool Court(2) | Penetration Factor | |||||||
| Year | Occupancy | ADR | RevPAR | Occupancy | ADR | RevPAR | Occupancy | ADR | RevPAR |
| 2012 | 70.3% | $132.69 | $93.32 | 72.5% | $146.05 | $105.87 | 103.1% | 110.1% | 113.4% |
| 2013 | 69.8% | $135.38 | $94.45 | 74.4% | $141.00 | $104.92 | 106.6% | 104.2% | 111.1% |
| 2014 | 71.7% | $140.85 | $101.03 | 75.1% | $143.24 | $107.51 | 104.7% | 101.7% | 106.4% |
| TTM(3) | 70.2% | $145.02 | $101.84 | 73.9% | $147.70 | $109.08 | 105.2% | 101.8% | 107.1% |
| (1) | Source: Third Party Data Provider. The competitive set consists of the following hotels: Hyatt Regency Indianapolis, Crowne Plaza Indianapolis Downtown Union Station, Omni Severin Hotel, and Hilton Indianapolis. |
| (2) | Source: Borrower financials. |
| (3) | Represents the trailing twelve month period ending August 31, 2015. |
Competitive Hotels Profile(1)
| Estimated Market Mix | |||||||
| Property | Rooms | Year Built | Meeting Space (SF) | Commercial | Meeting & Group | Leisure | |
| Embassy Suites Indianapolis Downtown | 360 | 1985 | 12,493 | 50% | 20% | 30% | |
| Hilton Indianapolis | 332 | 2000 | 28,000 | 40% | 35% | 25% | |
| Hyatt Regency Indianapolis | 499 | 1977 | 35,000 | 35% | 45% | 20% | |
| Crowne Plaza Indianapolis Downtown Union Station | 273 | 1986 | 50,000 | 35% | 35% | 30% | |
| Omni Severin Hotel | 424 | 1913 | 17,000 | 40% | 30% | 30% | |
| Total(2) | 1,528 | ||||||
| (1) | Source: Appraisal and borrower financials. |
| (2) | Excludes the subject property. |
THE INFORMATION IN THIS COLLATERAL TERM SHEET IS NOT COMPLETE AND MAY BE AMENDED PRIOR TO THE TIME OF SALE. THIS TERM SHEET IS NOT AN OFFER TO SELL THESE SECURITIES AND IT IS NOT A SOLICITATION OF AN OFFER TO BUY THESE SECURITIES IN ANY JURISDICTION WHERE THE OFFER OR SALE IS NOT PERMITTED.
| 90 |
Mortgage Loan No. 7 — Embassy Suites and Claypool Court
Operating History and Underwritten Net Cash Flow
| 2012 | 2013 | 2014 | TTM(1) | Underwritten | Per Room(2) | %(3) | |
| Occupancy | 72.5% | 74.4% | 75.1% | 73.9% | 73.9% | ||
| ADR | $146.05 | $141.00 | $143.24 | $147.70 | $147.70 | ||
| RevPAR | $105.87 | $104.92 | $107.51 | $109.08 | $109.08 | ||
| Room Revenue | $13,949,040 | $13,786,439 | $14,127,432 | $14,332,449 | $14,332,449 | $39,812 | 75.9% |
| Food and Beverage | 1,223,699 | 1,343,226 | 1,360,678 | 1,318,067 | 1,318,067 | 3,661 | 7.0% |
| Other Departmental Revenues | 3,191,350 | 3,045,522 | 3,147,585 | 3,222,979 | 3,222,979 | 8,953 | 17.1% |
| Total Revenue | $18,364,089 | $18,175,187 | $18,635,695 | $18,873,495 | $18,873,495 | $52,426 | 100.0% |
| Room Expense | 3,371,089 | 3,337,024 | 3,383,599 | 3,285,675 | 3,285,675 | 9,127 | 22.9% |
| Food and Beverage Expense | 923,173 | 1,039,106 | 1,021,564 | 992,480 | 992,480 | 2,757 | 75.3% |
| Other Departmental Expenses | 685,525 | 655,578 | 671,134 | 672,823 | 672,823 | 1,869 | 20.9% |
| Departmental Expenses | $4,979,787 | $5,031,708 | $5,076,297 | $4,950,978 | $4,950,978 | $13,753 | 26.2% |
| Departmental Profit | $13,384,302 | $13,143,479 | $13,559,398 | $13,922,517 | $13,922,517 | $38,674 | 73.8% |
| Operating Expenses | $7,085,050 | $6,827,143 | $7,223,003 | $7,473,556 | $7,740,210 | $21,501 | 41.0% |
| Gross Operating Profit | $6,299,252 | $6,316,336 | $6,336,395 | $6,448,961 | $6,182,307 | $17,173 | 32.8% |
| Fixed Expenses | 1,146,520 | 943,312 | 1,028,091 | 1,075,986 | 977,376 | 2,715 | 5.2% |
| Net Operating Income | $5,152,732 | $5,373,024 | $5,308,304 | $5,372,975 | $5,204,931 | $14,458 | 27.6% |
| FF&E | 0 | 0 | 0 | 0 | 973,975 | 2,705 | 5.2% |
| Net Cash Flow | $5,152,732 | $5,373,024 | $5,308,304 | $5,372,975 | $4,230,955 | $11,753 | 22.4% |
| (1) | The TTM column represents the trailing twelve month period ending August 31, 2015. |
| (2) | Per Room values are based on 360 rooms. |
| (3) | % column represents percent of Total Revenue except for Room Expense, Food and Beverage Expense and Other Departmental Expenses, which are based on their corresponding revenue line items. |
Property Management. The hotel is managed by Embassy Suites Management LLC, a subsidiary of Hilton Hotels Corporation, pursuant to a management agreement that expires in December 2024. The management agreement provides for a management fee of 3.0% of gross hotel revenues plus an incentive fee. In addition, the property has a co-terminus franchise agreement that provides for a program fee of 4.0% of gross hotel revenues and a royalty fee of 4.0% of gross hotel revenues (stepping up to 5.0% in 2016). The retail portion of the property is managed by M.S. Management Associates, Inc., an affiliate of the borrower.
Escrows and Reserves. At origination, the borrower deposited into escrow $11.0 million into the PIP reserve.
Tax Escrows – During a Lockbox Event, on a monthly basis, the borrower is required to escrow 1/12th of the annual estimated tax payments.
Insurance Escrows – The requirement of the borrower to make monthly deposits to the insurance reserve is waived so long as no Lockbox Event exists and the borrower provides satisfactory evidence that the property is insured as part of a blanket policy in accordance with the loan documents.
Replacement Reserves – During a Lockbox Event, on a monthly basis, the borrower is required to escrow $1,283 for replacement reserves. The replacement reserve is capped at $46,200.
TI/LC Reserves – During a Lockbox Event, on a monthly basis, the borrower is required to escrow $9,667 for TI/LC reserves. The TI/LC reserve is capped at $230,000.
FF&E Reserves – On a monthly basis, the borrower is required to escrow an amount equal to 1/12th of 5.0% of gross revenues from the hotel portion of the property, which currently equates to $70,238.
PIP Reserve – At origination, the borrower deposited into escrow $11.0 million to be held for the PIP work. In addition, the borrower is required to deposit an additional $5.0 million into the PIP reserve through nine quarterly payments of $556,000 commencing on January 6, 2016 and continuing consecutively for the next eight calendar quarters. Borrower’s failure to make any such deposits to the PIP Reserve on a timely basis shall constitute an event of default. In lieu of depositing the full amount of PIP reserve funds required hereunder in cash and at any time after depositing any PIP reserve funds, the borrower may deliver to
THE INFORMATION IN THIS COLLATERAL TERM SHEET IS NOT COMPLETE AND MAY BE AMENDED PRIOR TO THE TIME OF SALE. THIS TERM SHEET IS NOT AN OFFER TO SELL THESE SECURITIES AND IT IS NOT A SOLICITATION OF AN OFFER TO BUY THESE SECURITIES IN ANY JURISDICTION WHERE THE OFFER OR SALE IS NOT PERMITTED.
| 91 |
Mortgage Loan No. 7 — Embassy Suites and Claypool Court
lender one or more letters of credit as a substitute for all or any portion of such PIP reserve funds; provided however, that such letter, or letters of credit may not exceed $5.0 million, in aggregate, for the initial deposit or the quarterly installments.
Lockbox/Cash Management. The Embassy Suites and Claypool Court loan is structured with a hard lockbox and springing cash management. The borrower is required to send tenant direction letters to instruct tenants of the retail portion of the property to deposit all rental, or related deposits and other income directly into the lockbox account controlled by the lender. In addition, the borrower is required to, and is required to cause the applicable manager to, deposit all amounts received by borrower or manager constituting rents from the retail portion of the property and the net receipts or net income from the hotel portion of the property (after all expenses and capital expenditures with respect to the hotel portion of the property have been paid for by the hotel manager in compliance with the provisions of the hotel management agreement) into the lockbox account within two business days after receipt. During the continuance of a Lockbox Event, all funds in the lockbox account are swept weekly to a cash management account under the control of the lender and disbursed in accordance with the provisions of the loan documents. During the continuance of a Lockbox Event, all excess cash flow, after payments made in accordance with the loan documents for, amongst other things, debt service, required reserves and operating expenses, will be held as additional collateral for the loan.
“Lockbox Event” means: (i) an event of default, (ii) any bankruptcy action of the borrower, retail manager, or the hotel manager or (iii) the DSCR based on the trailing four calendar quarter period is less than 1.50x for two consecutive quarters.
Parking Lease. The borrower has a parking agreement in place with the adjacent parking garage owner which provides for the lease of up to 131 parking spaces per day which has a 2015 general daily rate of $12.47 per parking space. The lease has a current expiration date of October 31, 2035. The borrower’s leasehold interest in the parking agreement is encumbered by the lien of the mortgage.
THE INFORMATION IN THIS COLLATERAL TERM SHEET IS NOT COMPLETE AND MAY BE AMENDED PRIOR TO THE TIME OF SALE. THIS TERM SHEET IS NOT AN OFFER TO SELL THESE SECURITIES AND IT IS NOT A SOLICITATION OF AN OFFER TO BUY THESE SECURITIES IN ANY JURISDICTION WHERE THE OFFER OR SALE IS NOT PERMITTED.
| 92 |
Mortgage Loan No. 8 — Rosecroft Mews Apartments
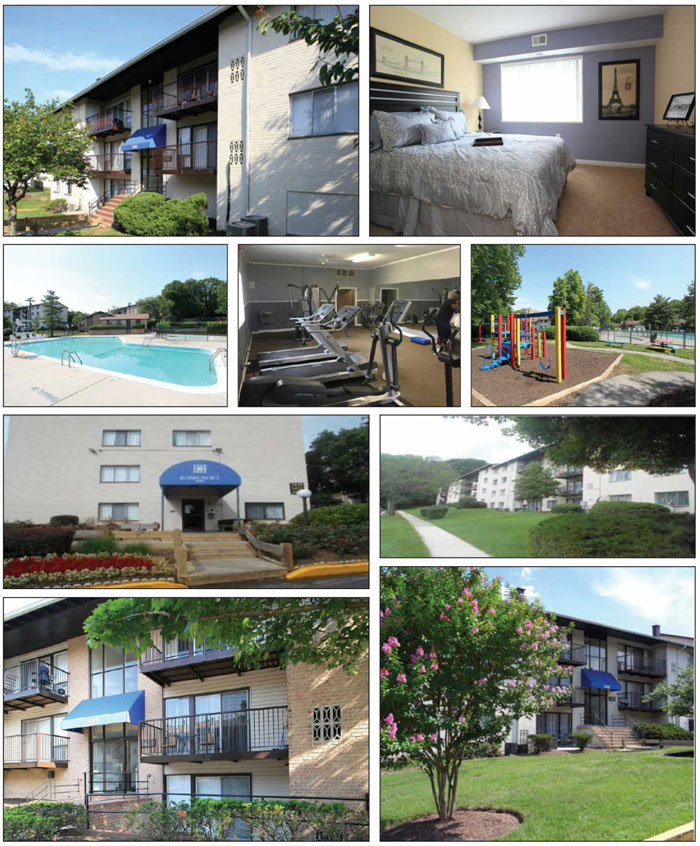
THE INFORMATION IN THIS COLLATERAL TERM SHEET IS NOT COMPLETE AND MAY BE AMENDED PRIOR TO THE TIME OF SALE. THIS TERM SHEET IS NOT AN OFFER TO SELL THESE SECURITIES AND IT IS NOT A SOLICITATION OF AN OFFER TO BUY THESE SECURITIES IN ANY JURISDICTION WHERE THE OFFER OR SALE IS NOT PERMITTED.
| 93 |
Mortgage Loan No. 8 — Rosecroft Mews Apartments

THE INFORMATION IN THIS COLLATERAL TERM SHEET IS NOT COMPLETE AND MAY BE AMENDED PRIOR TO THE TIME OF SALE. THIS TERM SHEET IS NOT AN OFFER TO SELL THESE SECURITIES AND IT IS NOT A SOLICITATION OF AN OFFER TO BUY THESE SECURITIES IN ANY JURISDICTION WHERE THE OFFER OR SALE IS NOT PERMITTED.
| 94 |
Mortgage Loan No. 8 — Rosecroft Mews Apartments
Mortgage Loan Information | Property Information | |||
| Mortgage Loan Seller: | Column | Single Asset / Portfolio: | Single Asset | |
| Original Principal Balance: | $27,865,000 | Title: | Fee | |
| Cut-off Date Principal Balance: | $27,865,000 | Property Type - Subtype: | Multifamily – Garden | |
| % of Pool by IPB: | 3.0% | Net Rentable Area (Units): | 304 | |
| Loan Purpose: | Acquisition | Location: | Fort Washington, MD | |
| Borrower: | Glen Rock Landing, LLC | Year Built / Renovated: | 1965 / 2005 | |
| Sponsor: | Alliant Capital, Ltd. | Occupancy: | 95.4% | |
| Interest Rate: | 4.8600% | Occupancy Date: | 10/30/2015 | |
| Note Date: | 8/27/2015 | Number of Tenants: | N/A | |
| Maturity Date: | 9/6/2025 | 2012 NOI: | $1,943,545 | |
| Interest-only Period: | 60 months | 2013 NOI: | $1,823,195 | |
| Original Term: | 120 months | 2014 NOI: | $1,984,433 | |
| Original Amortization: | 360 months | TTM NOI(2): | $2,086,194 | |
| Amortization Type: | IO-Balloon | UW Economic Occupancy: | 90.0% | |
| Call Protection: | L(29),Def(87),O(4) | UW Revenues: | $4,057,138 | |
| Lockbox(1): | Springing | UW Expenses: | $1,750,491 | |
| Additional Debt: | No | UW NOI(3): | $2,306,647 | |
| Additional Debt Balance: | N/A | UW NCF: | $2,230,647 | |
| Additional Debt Type: | N/A | Appraised Value / Per Unit(4): | $35,100,000 / $115,461 | |
| Additional Future Debt Permitted: | No | Appraisal Date: | 6/26/2015 | |
Escrows and Reserves(5) | Financial Information | |||||
| Initial | Monthly | Initial Cap | Cut-off Date Loan / Unit: | $91,661 | ||
| Taxes: | $0 | $28,194 | N/A | Maturity Date Loan / Unit: | $84,350 | |
| Insurance: | $10,105 | $10,105 | N/A | Cut-off Date LTV(4): | 79.4% | |
| Replacement Reserves: | $6,333 | $6,333 | N/A | Maturity Date LTV(4): | 73.1% | |
| Engineering Reserve: | $318,287 | N/A | N/A | UW NCF DSCR: | 1.26x | |
| Capital Improvement Reserve: | $2,258,500 | N/A | N/A | UW NOI Debt Yield: | 8.3% | |
Sources and Uses
| Sources | Proceeds | % of Total | Uses | Proceeds | % of Total | |||
| Mortgage Loan | $27,865,000 | 74.1 | % | Purchase Price | $34,150,000 | 90.8 | % | |
| Borrower Equity | 9,759,695 | 25.9 | Upfront Reserves | 2,593,225 | 6.9 | |||
| Closing Costs | 881,470 | 2.3 | ||||||
| Total Sources | $37,624,695 | 100.0 | % | Total Uses | $37,624,695 | 100.0 | % | |
| (1) | For a more detailed description of Lockbox, please refer to“Lockbox / Cash Management”below. |
| (2) | Represents trailing twelve months ending July 31, 2015. |
| (3) | UW NOI exceeds TTM NOI due to underwriting lower expenses in line with the borrower’s budget. The loan represents acquisition financing and the sponsor believes certain expenses related to managing the property and payroll were too high and plans to reduce those. The appraisal also underwrote lower expenses than the TTM related to management fees and payroll. |
| (4) | The property is currently undergoing renovation for which an approximately $2.3 million capital improvement reserve was escrowed at closing. The appraiser determined a $38.5 million “As Renovated” value. Based on the “As Renovated” value the loan would have a Cut-Off Date LTV and Maturity Date LTV of 72.4% and 66.6%, respectively. |
| (5) | For a more detailed description of Escrows and Reserves, please refer to “Escrows and Reserves” below. |
THE INFORMATION IN THIS COLLATERAL TERM SHEET IS NOT COMPLETE AND MAY BE AMENDED PRIOR TO THE TIME OF SALE. THIS TERM SHEET IS NOT AN OFFER TO SELL THESE SECURITIES AND IT IS NOT A SOLICITATION OF AN OFFER TO BUY THESE SECURITIES IN ANY JURISDICTION WHERE THE OFFER OR SALE IS NOT PERMITTED.
| 95 |
Mortgage Loan No. 8 — Rosecroft Mews Apartments
The Loan. The Rosecroft Mews Apartments loan is an approximately $27.9 million first mortgage loan secured by the fee interest in a 304-unit Class B garden-style multifamily property located in Fort Washington, Maryland. The loan has a 10-year term and will amortize on a 30-year schedule after a five-year interest-only period.
The Borrower. The borrowing entity for the loan is Glen Rock Landing, LLC, a Delaware limited liability company and special purpose entity.
The Sponsor. The loan’s sponsor and nonrecourse carve-out guarantor is Alliant Capital, Ltd. Alliant Capital, Ltd. was founded in 1997 and has offices nationwide with a team of commercial real estate, legal and tax professionals. It is actively involved in the multifamily real estate market and has been involved in partnerships with interests in approximately 770 properties in 47 states. Over its history, it has raised in excess of $5.65 billion in investor equity.
The Property. The property is a 304-unit garden-style multifamily property located in Fort Washington, Maryland that was built in 1965 and renovated in 2005. The property consists of 28 three-story and four-story walk-up apartment buildings located on approximately 12.6 acres. The property provides 362 parking spaces, or 1.2 parking spaces per unit, including open-air, carport and garage spaces. As of October 30, 2015, the property was 95.4% leased.
The property contains 139 one-bedroom units (45.8%), 152 two-bedroom units (50.0%) and 13 three-bedroom units (4.2%). One-bedroom units range from approximately 710 SF to 820 SF, two-bedroom units range from 862 SF to 960 SF, and three-bedroom units range from 972 SF to 1,070 SF with an overall average unit size of 826 SF. Property amenities include a clubhouse with a fitness center, a leasing center, a swimming pool and a spa. Units feature fully equipped kitchens including a refrigerator, a gas stove, a dishwasher and a garbage disposal. All units have washers and dryers inside the units. In addition, 199 of the property’s 304 total units have been fully renovated and feature new GE appliances, new cabinets, faux granite countertops, new vinyl flooring in the kitchen, bathroom and foyer, and upgraded lighting. The sponsor has plans to renovate the remainder of the units and additional interior and exterior renovations which are expected to involve capital investment of approximately $2.3 million, which was reserved at origination.
The property is located in Fort Washington in a neighborhood composed mainly of residential and retail properties. In addition, within a mile of the property are multiple supermarkets, schools, parks, restaurants and retail outlets including, Home Depot, Petsmart, Ross Dress for Less, Staples and Kmart. In addition, the property is located approximately three miles south of the St. Elizabeth’s Hospital and less than 15 miles from the White House. The property is located just off Interstate 495, which is the major transportation artery that encircles Washington, D.C.
Multifamily Unit Mix (1)
| Unit Type | No. of Units | % of Total | Occupied Units | Occupancy | Average Unit Size (SF) | Average Monthly Rental Rate | Average Monthly Rental Rate PSF | Monthly Market Rental Rate(2) | Monthly Market Rental Rate PSF(2) | |||||||||||
| One Bedroom, One Bath | 100 | 33.0 | % | 99 | 99.0 | % | 710 | $1,004 | $1.41 | $1,055 | $1.49 | |||||||||
| One Bedroom, One Bath - D | 39 | 12.8 | 36 | 92.3 | % | 820 | $1,038 | $1.27 | $1,100 | $1.34 | ||||||||||
| Two Bedroom, One Bath | 44 | 14.5 | 40 | 90.9 | % | 960 | $1,226 | $1.28 | $1,450 | $1.51 | ||||||||||
| Two Bedroom, One Bath - D | 108 | 35.5 | 105 | 97.2 | % | 862 | $1,362 | $1.58 | $1,270 | $1.49 | ||||||||||
| Three Bedroom, One Bath | 12 | 3.9 | 9 | 75.0 | % | 972 | $1,426 | $1.47 | $1,540 | $1.58 | ||||||||||
| Three Bedroom, One Bath - D | 1 | 0.3 | 1 | 100.0 | % | 1,070 | $1,665 | $1.56 | $1,660 | $1.55 | ||||||||||
| Total/Wtd. Avg. | 304 | 100.0 | % | 290 | 95.4 | % | 826 | $1,184 | $1.44 | $1,215 | $1.48 | |||||||||
| (1) | Based on the underwritten rent roll dated October 30, 2015. |
| (2) | Source: Appraisal. |
THE INFORMATION IN THIS COLLATERAL TERM SHEET IS NOT COMPLETE AND MAY BE AMENDED PRIOR TO THE TIME OF SALE. THIS TERM SHEET IS NOT AN OFFER TO SELL THESE SECURITIES AND IT IS NOT A SOLICITATION OF AN OFFER TO BUY THESE SECURITIES IN ANY JURISDICTION WHERE THE OFFER OR SALE IS NOT PERMITTED.
| 96 |
Mortgage Loan No. 8 — Rosecroft Mews Apartments
The Market. The property is located in suburban Fort Washington, Maryland just off Interstate 495 in the Washington, D.C.-Arlington-Alexandria Metropolitan Statistical Area (“MSA”). Fort Washington is located approximately 13.8 miles southeast of Washington, D.C. According to the appraisal, on an annual basis, the area sees over 17.9 million visitors, generating over $6.0 billion in visitor spending. The centers for all three branches of the federal government of the United States are in the Washington, D.C. area. Washington, D.C. is home to many national monuments and museums, 176 foreign embassies as well as the headquarters of many international organizations, trade unions, non-profit organizations, lobbying groups and professional associations. According to the appraisal the submarket reported an average vacancy of 3.3% as of March 2015 and is expected to be a center of robust economic activity.
The appraiser identified four comparable rental properties, ranging from 227 units to 841 units that were constructed between 1964 and 1967. The competitive set reported a weighted average occupancy of approximately 98%, with average rents ranging from $1,179 to $1,441 per unit. Average rents at the property are in-line with the competitive set. The properties in the appraisal’s competitive set are all located in Forest Heights, Maryland within 1.0 mile of the property and are shown in the below table.
Competitive Set Summary(1)
| Property | Year Built | No. of Units | Avg.Unit Size (SF) | Avg. $/ Unit | Occupancy |
| Rosecroft Mews Apartments | 1965 | 304(2) | 826(2) | $1,184(2) | 95%(2) |
| The Marconi | 1967 | 227 | 841 | $1,179 | 99% |
| Brinkley House | 1967 | 636 | 1,000 | $1,301 | 97% |
| Oxon Hill Village | 1964 | 841 | 803 | $1,441 | 99% |
| Heather Hill | 1965 | 459 | 915 | $1,390 | 98% |
| Total/Wtd. Avg.(3) | 2,163 | 889 | $1,362 | 98% |
| (1) | Source: Appraisal. |
| (2) | Based on rent roll dated October 30, 2015. |
| (3) | Excludes the subject property. |
Historical and Current Occupancy(1)
| 2012 | 2013 | 2014 | Current(2) |
| 94.3% | 93.4% | 94.6% | 95.4% |
| (1) | Source: Historical Occupancy is provided by the sponsor. Historical Occupancies are as of December 31 of each respective year. |
| (2) | Based on the October 2015 underwritten rent roll. |
THE INFORMATION IN THIS COLLATERAL TERM SHEET IS NOT COMPLETE AND MAY BE AMENDED PRIOR TO THE TIME OF SALE. THIS TERM SHEET IS NOT AN OFFER TO SELL THESE SECURITIES AND IT IS NOT A SOLICITATION OF AN OFFER TO BUY THESE SECURITIES IN ANY JURISDICTION WHERE THE OFFER OR SALE IS NOT PERMITTED.
| 97 |
Mortgage Loan No. 8 — Rosecroft Mews Apartments
Operating History and Underwritten Net Cash Flow
| 2012 | 2013 | 2014 | TTM(1) | Underwritten(2) | Per Unit | %(3) | |||||||||
| Rents in Place(4) | $3,878,744 | $3,962,092 | $3,986,717 | $4,173,849 | $4,248,036 | $13,974 | 100.0 | % | |||||||
| Vacant Income | 0 | 0 | 0 | 0 | 0 | 0 | 0.0 | ||||||||
| Gross Potential Rent | $3,878,744 | $3,962,092 | $3,986,717 | $4,173,849 | $4,248,036 | $13,974 | 100.0 | % | |||||||
| Total Reimbursements | 0 | 0 | 0 | 0 | 0 | 0 | 0.0 | ||||||||
| Net Rental Income | $3,878,744 | $3,962,092 | $3,986,717 | $4,173,849 | $4,248,036 | $13,974 | 100.0 | % | |||||||
| (Vacancy/Collection Loss) | (465,300) | (560,442) | (395,431) | (511,878) | (606,239) | (1,994) | (14.3 | %) | |||||||
| Other Income | 432,089 | 378,040 | 424,891 | 399,318 | 415,341 | 1,366 | 9.8 | % | |||||||
| Effective Gross Income | $3,845,533 | $3,779,690 | $4,016,177 | $4,061,289 | $4,057,138 | $13,346 | 95.5 | % | |||||||
| Total Expenses | $1,901,988 | $1,956,495 | $2,031,744 | $1,975,095 | $1,750,491 | $5,758 | 43.1 | % | |||||||
| Net Operating Income | $1,943,545 | $1,823,195 | $1,984,433 | $2,086,194 | $2,306,647 | $7,588 | 56.9 | % | |||||||
| Replacement Reserves | 0 | 0 | 0 | 0 | 76,000 | 250 | 1.9 | ||||||||
| Net Cash Flow | $1,943,545 | $1,823,195 | $1,984,433 | $2,086,194 | $2,230,647 | $7,338 | 55.0 | % | |||||||
| (1) | The TTM column represents the trailing twelve months ending July 31, 2015. |
| (2) | UW Net Operating Income exceeds TTM Net Operating Income due to underwriting lower expenses in line with the borrower’s budget. The loan represents acquisition financing and the sponsor believes certain expenses related to managing the property and payroll were too high and plans to reduce such expenses. The appraisal also underwrote lower expenses than the TTM related to management fees and payroll. |
| (3) | % column represents percent of Net Rental Income for all revenue lines and represents percent of Effective Gross Income for the remainder of fields. |
| (4) | Rents in Place are based on the October 30, 2015 rent roll. |
Property Management. The property is managed by E&G Property Services, Inc. (“E&G Group”), a third-party manager. E&G Group is a full service real estate development and consulting firm providing services to investors, for-profit and non-profit clients since 1982. It has expertise in redeveloping and repositioning real property in urban settings and has overseen the acquisition, redevelopment and disposition of approximately 9,000 apartment units in and around Washington, D.C.
Escrows and Reserves. At origination, the borrower deposited into escrow $2,258,500 for capital expenditures, $318,287 for immediate repairs, $10,105 for insurance and $6,333 for replacement reserves.
Tax Escrows – On a monthly basis, the borrower is required to escrow 1/12th of the annual estimated tax payments, which currently equates to $28,194.
Insurance Escrows – On a monthly basis, the borrower is required to escrow 1/12th of the annual insurance premiums, which currently equates to $10,105.
Replacement Reserves – On a monthly basis, the borrower is required to escrow $6,333 for replacement reserves which equates to $250 per unit, annually.
Capital Improvement Reserve – At origination, $2,258,000 was deposited into a capital expenditure holdback escrow. Provided no event of default is continuing, the lender is required to direct the servicer to disburse all or a portion, as applicable, of the capital expenditure holdback reserve to the borrower to be utilized solely for the purpose of performing renovations set forth in the borrower’s approved renovation budget.
Lockbox / Cash Management. The loan is structured with a springing lockbox and springing cash management. Upon written notification from the lender that the first Cash Sweep Event (defined below), if any, has occurred, the borrower is required to promptly establish and maintain a lockbox account (the “Lockbox Account”) with the lockbox bank in trust, for the benefit of the lender, into which rents will be deposited. The related loan documents require the lender to have a first priority security interest in the Lockbox Account and the cash management account (the “Cash Management Account”). Upon the occurrence and during the continuance of a Cash Sweep Event, the borrower and the property manager are required to hold rents and other income from the property in trust for the lender and deposit such amounts in the Lockbox Account within one business day of receipt. All funds deposited into the Lockbox Account will be swept into the Cash Management Account and will be applied by the lender to the payment of tax and insurance (if applicable) escrows, debt service, replacement reserves, any other amounts then due to the
THE INFORMATION IN THIS COLLATERAL TERM SHEET IS NOT COMPLETE AND MAY BE AMENDED PRIOR TO THE TIME OF SALE. THIS TERM SHEET IS NOT AN OFFER TO SELL THESE SECURITIES AND IT IS NOT A SOLICITATION OF AN OFFER TO BUY THESE SECURITIES IN ANY JURISDICTION WHERE THE OFFER OR SALE IS NOT PERMITTED.
| 98 |
Mortgage Loan No. 8 — Rosecroft Mews Apartments
lender and monthly cash expenses and extraordinary expenses. Any excess funds after deductions for these items will be deposited into the excess cash flow reserve account and held as collateral for the loan.
“Cash Sweep Event” means: (i) an event of default, or (ii) the DSCR is less than 1.10x.
THE INFORMATION IN THIS COLLATERAL TERM SHEET IS NOT COMPLETE AND MAY BE AMENDED PRIOR TO THE TIME OF SALE. THIS TERM SHEET IS NOT AN OFFER TO SELL THESE SECURITIES AND IT IS NOT A SOLICITATION OF AN OFFER TO BUY THESE SECURITIES IN ANY JURISDICTION WHERE THE OFFER OR SALE IS NOT PERMITTED.
| 99 |
(THIS PAGE INTENTIONALLY LEFT BLANK)
| 100 |
Mortgage Loan No. 9 — Triple Net Acquisitions Portfolio – Pool 1
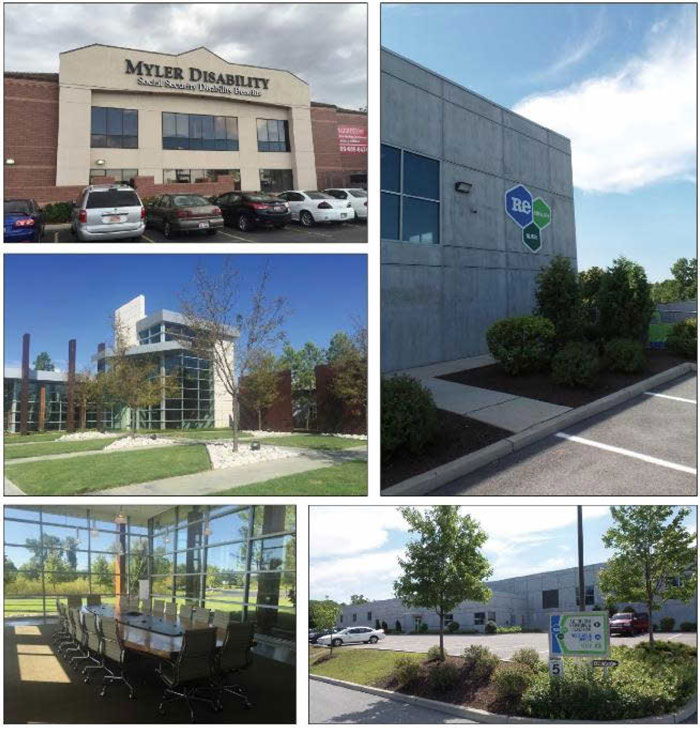
THE INFORMATION IN THIS COLLATERAL TERM SHEET IS NOT COMPLETE AND MAY BE AMENDED PRIOR TO THE TIME OF SALE. THIS TERM SHEET IS NOT AN OFFER TO SELL THESE SECURITIES AND IT IS NOT A SOLICITATION OF AN OFFER TO BUY THESE SECURITIES IN ANY JURISDICTION WHERE THE OFFER OR SALE IS NOT PERMITTED.
| 101 |
Mortgage Loan No. 9 — Triple Net Acquisitions Portfolio – Pool 1
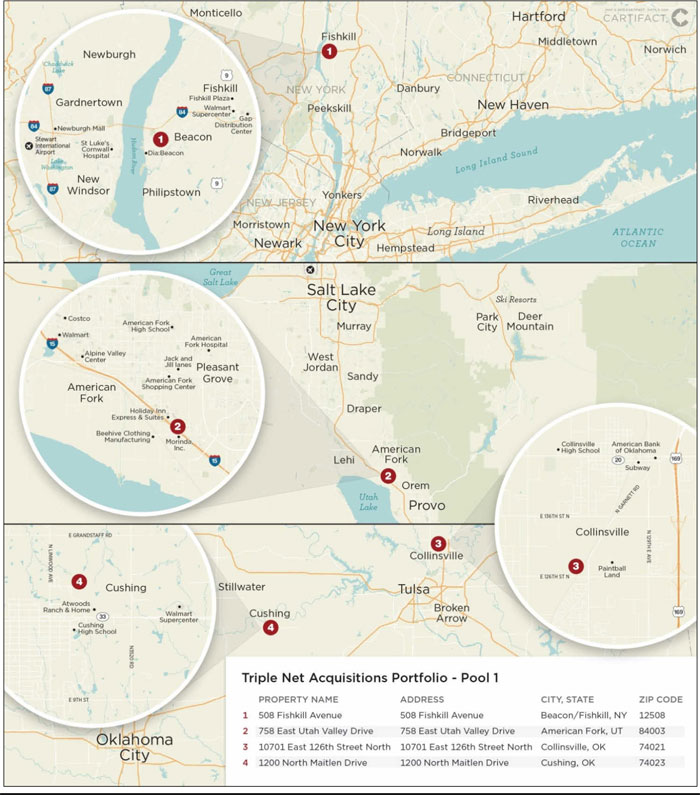
THE INFORMATION IN THIS COLLATERAL TERM SHEET IS NOT COMPLETE AND MAY BE AMENDED PRIOR TO THE TIME OF SALE. THIS TERM SHEET IS NOT AN OFFER TO SELL THESE SECURITIES AND IT IS NOT A SOLICITATION OF AN OFFER TO BUY THESE SECURITIES IN ANY JURISDICTION WHERE THE OFFER OR SALE IS NOT PERMITTED.
| 102 |
Mortgage Loan No. 9 — Triple Net Acquisitions Portfolio – Pool 1
| Mortgage Loan Information | Property Information |
| Mortgage Loan Seller: | SPREF | Single Asset / Portfolio: | Portfolio of Four Properties | |
| Original Principal Balance: | $23,355,000 | Title: | Fee | |
| Cut-off Date Principal Balance: | $23,244,278 | Property Type - Subtype: | Various | |
| % of Pool by IPB: | 2.5% | Net Rentable Area (SF): | 339,405 | |
| Loan Purpose: | Acquisition | Location: | Various | |
| Borrowers: | Maitlen Drive Cushing OK, LLC; 126th Street North Collinsville OK, LLC; Fishkill Avenue Beacon NY, LLC; Utah Valley Drive American Fork UT, LLC | Year Built / Renovated: | Various | |
| Occupancy: | 100.0% | |||
| Occupancy Date: | 2/6/2016 | |||
| Sponsor: | Mark Weber | Number of Tenants: | 4 | |
| Interest Rate: | 5.0500% | 2012 NOI(3): | N/A | |
| Note Date: | 10/13/2015 | 2013 NOI(3): | N/A | |
| Maturity Date: | 11/6/2025 | 2014 NOI(3): | N/A | |
| Interest-only Period: | 0 months | UW Economic Occupancy: | 94.3% | |
| Original Term: | 120 months | UW Revenues: | $2,651,607 | |
| Original Amortization: | 300 months | UW Expenses: | $79,548 | |
| Amortization Type: | Balloon | UW NOI: | $2,572,059 | |
| Call Protection: | L(27),Def(90),O(3) | UW NCF: | $2,385,386 | |
| Lockbox(1): | Hard | Appraised Value / Per SF(4): | $34,850,000 / $103 | |
| Additional Debt: | Yes | Appraisal Date(4): | Various | |
| Additional Debt Balance: | $5,100,000 | |||
| Additional Debt Type: | Mezzanine | |||
| Additional Future Debt Permitted(2): | Yes |
| Escrows and Reserves(5) | Financial Information |
| Initial | Monthly | Initial Cap | Cut-off Date Loan / SF: | $68 | ||
| Taxes: | $94,203 | Springing | N/A | Maturity Date Loan / SF: | $52 | |
| Insurance: | $35,097 | Springing | N/A | Cut-off Date LTV(4): | 66.7% | |
| Replacement Reserves: | $0 | $5,657 | $203,643 | Maturity Date LTV(5): | 50.2% | |
| TI/LC: | $0 | $9,899 | $593,959 | UW NCF DSCR: | 1.45x | |
| Victory Energy TI Reserve: | $2,200,000 | $0 | N/A | UW NOI Debt Yield: | 11.1% | |
| Special Rollover Reserve: | $0 | Springing | N/A |
Sources and Uses
| Sources | Proceeds | % of Total | Uses | Proceeds | % of Total | |
| Mortgage Loan | $23,355,000 | 66.7% | Purchase Price | $31,685,642 | 90.4% | |
| Mezzanine Loan | 5,100,000 | 14.6 | Upfront Reserves | 129,300 | 0.4 | |
| Sponsor Equity | 6,581,451 | 18.8 | Victory Energy TI Payment | 2,200,000 | 6.3 | |
| Closing Costs | 1,021,509 | 2.9 | ||||
| Total Sources | $35,036,451 | 100.0% | Total Uses | $35,036,451 | 100.0% |
| (1) | For a more detailed description of Lockbox, please refer to“Lockbox / Cash Management”below. |
| (2) | Future mezzanine debt is permitted subject to (i) the proceeds being used to pay off the existing mezzanine loan and preferred equity investment, (ii) the aggregate NOI DSCR is not less than 1.15x, (iii) the combined NOI debt yield is not less than 9.50% and (iv) the combined LTV is not greater than 80.0%. |
| (3) | The single tenant properties were acquired by the sponsor in 2015 and historical financial information is not available. |
| (4) | Based on the “as-complete” Appraised Value which takes into account a $2.2 million tenant improvement payment due to Victory Energy at the 10701 East 126th Street North property in Collinsville, Oklahoma for use in completing a 49,000 SF expansion. Victory Energy’s rental payment will increase by $192,000 per annum on the earlier of February 1, 2016 and upon completion of the 49,000 SF expansion. Please refer to the “Victory Energy Tenant Improvement Payment” below. The “as-is” Appraised Value, Cut-off Date LTV and Maturity Date LTV for the portfolio are $32,250,000, 72.1% and 54.2%, respectively. |
| (5) | For a more detailed description of Escrows and Reserves, please refer to“Escrows and Reserves” below. |
THE INFORMATION IN THIS COLLATERAL TERM SHEET IS NOT COMPLETE AND MAY BE AMENDED PRIOR TO THE TIME OF SALE. THIS TERM SHEET IS NOT AN OFFER TO SELL THESE SECURITIES AND IT IS NOT A SOLICITATION OF AN OFFER TO BUY THESE SECURITIES IN ANY JURISDICTION WHERE THE OFFER OR SALE IS NOT PERMITTED.
| 103 |
Mortgage Loan No. 9 — Triple Net Acquisitions Portfolio – Pool 1
The Loan. The Triple Net Acquisitions Portfolio - Pool 1 loan is an approximately $23.4 million first mortgage loan secured by the fee interest in four industrial and office properties located throughout the United States. The loan has a 10-year term and will amortize on a 25-year schedule.
The Borrowers. The borrowing entities for the loan are Maitlen Drive Cushing OK, LLC; 126th Street North Collinsville OK, LLC; Fishkill Avenue Beacon NY, LLC; and Utah Valley Drive American Fork UT, LLC. The borrowing entities are Delaware limited liability companies and single purpose entities.
The Sponsor. The loan’s sponsor and nonrecourse carve-out guarantor is Mark Weber. Mr. Weber has led the sourcing, structuring, due diligence, debt placement, and debt selection for private equity partnerships that have completed 22 equity/junior capital investments with transaction values exceeding $1.1 billion ($240 million in equity).
The Portfolio. The portfolio was acquired by the sponsor in October 2015 for a total cost of $36.7 million, which includes $2.2 million held back for a tenant improvement payment due to Victory Energy at the 10701 East 126th Street North property in Collinsville, Oklahoma (described below). The portfolio consists of three industrial properties and one office building totaling 339,405 SF, each 100.0% occupied by a single tenant under a NNN lease.
Portfolio Summary
| Property | Location | SF(1) | Year Built / Renovated(2) | Allocated Loan Amount | % of Portfolio Allocated Loan Amount | Appraised Value(2) | Underwritten Net Cash Flow |
| 508 Fishkill Avenue | Beacon/Fishkill, NY | 56,125 | 2011 / N/A | $8,477,000 | 36.3% | $12,650,000 | $940,802 |
| 758 East Utah Valley Drive | American Fork, UT | 53,480 | 1996 / N/A | 6,702,000 | 28.7 | 10,000,000 | 725,606 |
| 10701 East 126th Street North | Collinsville, OK | 150,750 | 2002 / Various | 6,434,000 | 27.5 | 9,600,000(3) | 564,312 |
| 1200 North Maitlen Drive | Cushing, OK | 79,050 | 1984 / 2006 | 1,742,000 | 7.5 | 2,600,000 | 154,666 |
| Total/Wtd. Avg. | 339,405 | $23,355,000 | 100.0% | $34,850,000 | $2,385,386 |
| (1) | Based on underwritten rent roll. |
| (2) | Source: Appraisal. |
| (3) | The 10701 East 126th Street North property has an “as-complete” Appraised Value of $9.6 million, which takes into account a $2.2 million tenant improvement payment due to Victory Energy at the 10701 East 126th Street North property in Collinsville, Oklahoma for use in completing a 49,000 SF expansion. Victory Energy’s rental payment will increase by $192,000 per annum on the earlier of February 1, 2016 and upon completion of the 49,000 SF expansion. The “as-is” appraised value was $7.0 million. Please refer to“Victory Energy Tenant Improvement Payment”below. |
508 Fishkill Avenue
The property is a single story, 56,125 SF industrial building that was constructed in 2011 and has 71 parking spaces on 17.12 acres. The property is 100.0% occupied by ReCommunity Recyling, for which it was built-to-suit in 2011. ReCommunity Recycling invested approximately $7.5 million to build out and install equipment at the property. The clear height at the property is 32 ft. with 4 grade-level overhead doors and 16 dock-high overhead doors. ReCommunity Recycling recovers and processes close to two million tons of reusable materials per year. ReCommunity Recycling is paid a fee for incoming products received as well as the bundled packages that are shipped out. The property is located approximately 40 miles north of New York City and serves communities within a 100 mile radius (excluding New York City). It is located less than three miles from I-84 and Route 9. As of year-end 2014, ReCommunity Recycling had total assets of $189.9 million and earnings before interest, tax, depreciation and amortization (“EBITDA”) of $10.9 million.
According to a third party research report, the property is located in the Westchester/So. Connecticut industrial market which contains approximately 181 million SF of space across 6,288 buildings. Industrial vacancy within the market is 9.3% as of third quarter 2015 with average quoted asking rents of $7.20 PSF. Furthermore, the property is located in the Fishkill industrial submarket market which contains approximately 2.1 million SF of industrial space across 245 buildings. Industrial vacancy within the submarket is 16.3%, with an average quoted rental rate of $6.11 PSF. The in-place rental rate at the property is $18.79 PSF.
The appraiser concluded an “as-is” value of $12,650,000 and a “Go Dark” value of $10,300,000, which result in an allocated Cut-off Date “as-is” LTV and a “Go Dark” LTV of 66.7% and 81.9%, respectively.
THE INFORMATION IN THIS COLLATERAL TERM SHEET IS NOT COMPLETE AND MAY BE AMENDED PRIOR TO THE TIME OF SALE. THIS TERM SHEET IS NOT AN OFFER TO SELL THESE SECURITIES AND IT IS NOT A SOLICITATION OF AN OFFER TO BUY THESE SECURITIES IN ANY JURISDICTION WHERE THE OFFER OR SALE IS NOT PERMITTED.
| 104 |
Mortgage Loan No. 9 — Triple Net Acquisitions Portfolio – Pool 1
758 East Utah Valley Drive
The property is a single, class B, 2-story, 53,480 SF office building on a 3.41-acre site with 260 parking spaces located throughout the property. The property was built in 1996 and is 100.0% occupied by Myler Disability, which utilizes this space as its corporate headquarters. The property is located approximately 30 miles south of the Salt Lake City International Airport with frontage on I-15, the only north/south highway in Utah.
According to a third party research report, the property is located in the Provo market which contains 16.2 million SF of office space across 1,072 buildings. Office vacancy within the market is 2.9%, with an average quoted rental rate of $16.41 PSF. Furthermore, the property is located in the Utah County office submarket, which contains 16.2 million SF of class B office space across 1,069 buildings. Office vacancy within the submarket is 2.9%, with an average quoted rental rate of $16.41 PSF. The in-place rental rate at the property is $15.50 PSF which is in line with class B market and submarket averages.
The appraiser concluded an as-is value of $10,000,000 and a “Go Dark” value of $6,750,000, which result in an allocated Cut-off Date “as-is” LTV and a “Go Dark” LTV of 66.7% and 98.8%, respectively.
10701 East 126th Street North
The property consists of four, single story buildings totaling 150,570 SF, inclusive of a 49,000 SF expansion, on a 29.9 acre site. The property was built in 2002 and consists of 13.9% office tenants and 86.1% industrial tenants. The clear heights at the property are 25-26 ft. with 19 grade-level overhead doors. The property is 100.0% leased to Victory Energy and is utilized as its headquarters. Founded in 1999, Victory Energy is a manufacturer of custom boilers and heat recovery steam generators for industrial users in the United States. In addition to boiler systems, Victory Energy offers a range of auxiliary equipment, including ductwork, main stack assemblies, economizers, de-aerators, control systems, and feed-water systems. Victory Energy services the utility, institutional, refining, food, chemical, biomass and pulp/paper industries. As of December 2014, Victory Energy reported approximately $55.4 million in total assets and shareholder’s equity of $19.8 million. They registered total revenues of $75.9 million with net income of $722,000 and EBITDA of $5.3 million for 2014.
According to the appraiser, the property is located in the Tulsa submarket which contains 72.4 million SF of industrial supply. Industrial vacancy within the market is 4.8% and average asking rent is $3.99 PSF. Furthermore, the property is located in the Owasso industrial submarket, which contains 1.1 million SF of industrial supply with a vacancy rate of 0.2%.
The appraiser concluded an as-is value of $7,000,000, an “as-complete” value of $9,600,000 and a “Go Dark” value of $8,600,000 (which assumes the completion of the expansion space), which result in an allocated Cut-off Date LTV for the “as-is” value, “as-complete” value and “Go Dark” value of 91.5%, 66.7% and 74.5%, respectively.
1200 North Maitlen Drive
The property consists of two, single story industrial buildings totaling 79,050 SF on a 15.1 acre site. The property was built in 1984, renovated in 2006 and consists of 6.2% office space and 93.8% industrial space. The clear heights at the property are 28 feet with 13 grade-level overhead doors. The property is 100.0% leased to Victory Energy. The appraiser concluded a market rent for the property of $3.75 PSF.
The appraiser concluded an as-is value of $2,600,000 and a “Go Dark” value of $1,950,000, which result in an allocated Cut-off Date “as-is” LTV and a “Go Dark” LTV of 66.7% and 88.9%, respectively.
THE INFORMATION IN THIS COLLATERAL TERM SHEET IS NOT COMPLETE AND MAY BE AMENDED PRIOR TO THE TIME OF SALE. THIS TERM SHEET IS NOT AN OFFER TO SELL THESE SECURITIES AND IT IS NOT A SOLICITATION OF AN OFFER TO BUY THESE SECURITIES IN ANY JURISDICTION WHERE THE OFFER OR SALE IS NOT PERMITTED.
| 105 |
Mortgage Loan No. 9 — Triple Net Acquisitions Portfolio – Pool 1
Historical and Current Occupancy(1)
| Property | 2012 | 2013 | 2014 | Current(2) |
| 508 Fishkill Avenue | 100.0% | 100.0% | 100.0% | 100.0% |
| 758 East Utah Valley Drive | 100.0% | 100.0% | 100.0% | 100.0% |
| 10701 East 126th Street North | 100.0% | 100.0% | 100.0% | 100.0% |
| 1200 North Maitlen Drive | 100.0% | 100.0% | 100.0% | 100.0% |
| (1) | Source: Historical occupancy is provided by the sponsor. Occupancies are as of December 31 of each respective year. |
| (2) | Based on the underwritten rent roll. |
Tenant Summary(1)
| Tenant | Property | Ratings Moody’s/S&P/Fitch | Net Rentable Area (SF) | % of Total NRA | Base Rent PSF | Lease Expiration Date |
| ReCommunity Recycling | 508 Fishkill Avenue | NA/NA/NA | 56,125 | 100.0% | $18.79 | 6/1/2027 |
| Myler Disability | 758 East Utah Valley Drive | NA/NA/NA | 53,480 | 100.0% | $15.50 | 4/1/2025 |
| Victory Energy | 10701 East 126th Street North | NA/NA/NA | 150,750 | 100.0% | $4.66(2) | 10/1/2035 |
| Victory Energy | 1200 North Maitlen Drive | NA/NA/NA | 79,050 | 100.0% | $2.87 | 7/31/2020 |
| (1) | Based on the underwritten rent roll, including rent increases through August 31, 2016. |
| (2) | Inclusive of Victory Energy’s rent increase at 10701 East 126th Street North of $192,000 per annum. The rental payment will increase upon the earlier of February 1, 2016 and completion of a 49,000 SF expansion. |
Lease Rollover Schedule(1)
| Year | Number of Leases Expiring(2) | NRA Expiring | % of NRA Expiring | Base Rent Expiring | % of Base Rent Expiring | Cumulative NRA Expiring(2) | Cumulative % of NRA Expiring | Cumulative Base Rent Expiring | Cumulative % of Base Rent Expiring |
| Vacant | NAP | 0 | 0.0% | NAP | NAP | 0 | 0.0% | NAP | NAP |
| 2016 | 0 | 0 | 0.0 | $0 | 0.0% | 0 | 0.0% | $0 | 0.0% |
| 2017 | 0 | 0 | 0.0 | 0 | 0.0 | 0 | 0.0% | $0 | 0.0% |
| 2018 | 0 | 0 | 0.0 | 0 | 0.0 | 0 | 0.0% | $0 | 0.0% |
| 2019 | 0 | 0 | 0.0 | 0 | 0.0 | 0 | 0.0% | $0 | 0.0% |
| 2020 | 1 | 79,050 | 23.3 | 226,968 | 8.1 | 79,050 | 23.3% | $226,968 | 8.1% |
| 2021 | 0 | 0 | 0.0 | 0 | 0.0 | 79,050 | 23.3% | $226,968 | 8.1% |
| 2022 | 0 | 0 | 0.0 | 0 | 0.0 | 79,050 | 23.3% | $226,968 | 8.1% |
| 2023 | 0 | 0 | 0.0 | 0 | 0.0 | 79,050 | 23.3% | $226,968 | 8.1% |
| 2024 | 0 | 0 | 0.0 | 0 | 0.0 | 79,050 | 23.3% | $226,968 | 8.1% |
| 2025 | 1 | 53,480 | 15.8 | 828,936 | 29.5 | 132,530 | 39.0% | $1,055,904 | 37.5% |
| 2026 & Beyond | 2 | 206,875 | 61.0 | 1,756,805 | 62.5 | 339,405 | 100.0% | $2,812,709 | 100.0% |
| Total | 4 | 339,405 | 100.0% | $2,812,709 | 100.0% |
| (1) | Based on the underwritten rent roll. Rent includes base rent and rent increases occurring through June, 2016 and the Victory Energy’s rent increase at 10701 East 126th Street North of $192,000 per annum, which will increase upon the earlier of February 1, 2016 and upon completion of a 49,000 SF expansion. |
| (2) | Victory Energy has two leases, one at 10701 East 126th Street North in Collinsville, Oklahoma for 150,750 SF expiring in October 2035 and a second at 1200 North Maitlen Drive in Cushing, Oklahoma, for 79,050 SF expiring in July 2020. |
THE INFORMATION IN THIS COLLATERAL TERM SHEET IS NOT COMPLETE AND MAY BE AMENDED PRIOR TO THE TIME OF SALE. THIS TERM SHEET IS NOT AN OFFER TO SELL THESE SECURITIES AND IT IS NOT A SOLICITATION OF AN OFFER TO BUY THESE SECURITIES IN ANY JURISDICTION WHERE THE OFFER OR SALE IS NOT PERMITTED.
| 106 |
Mortgage Loan No. 9 — Triple Net Acquisitions Portfolio – Pool 1
Operating History and Underwritten Net Cash Flow(1)
| Underwritten(2) | PSF | %(3) | |
| Rents in Place(2) | $2,812,709 | $8.29 | 100.0% |
| Vacant Income | 0 | 0.00 | 0.0% |
| Gross Potential Rent | $2,812,709 | $8.29 | 100.0% |
| Total Reimbursements | 0 | 0.00 | 0.0% |
| Net Rental Income | $2,812,709 | $8.29 | 100.0% |
| (Vacancy/Collection Loss) | (161,102) | (0.47) | (5.7%) |
| Other Income | 0 | 0.00 | 0.0% |
| Effective Gross Income | $2,651,607 | $7.81 | 94.3% |
| Total Expenses | $79,548 | $0.23 | 3.0% |
| Net Operating Income | $2,572,059 | $7.58 | 97.0% |
| Total TI/LC, Capex/RR | 186,673 | 0.55 | 7.0% |
| Net Cash Flow | $2,385,386 | $7.03 | 90.0% |
| (1) | The Triple Net Acquisitions Portfolio – Pool 1 consists of four single tenant properties, each on a NNN lease. The properties were acquired by the sponsor in 2015 and historical financial information is not available. |
| (2) | Underwritten Rents in Place includes base rent and rent increases occurring through June 2016. Base rent also includes a $192,000 rent increase that will occur on February 1, 2016 at the 10701 East 126th Street North property for Victory Energy. Please refer to the “Victory Energy Tenant Improvement Payment” section below. |
| (3) | % column represents percent of Net Rental Income for all revenue lines and represents percent of Effective Gross Income for the remainder of fields. |
Property Management. The property is managed by Norton Weber Property Management, LLC, an affiliate of the sponsor.
Escrows and Reserves. At origination, the borrower deposited into escrow $94,203 for real estate taxes and $35,097 for insurance.
Tax Escrows – On a monthly basis, the borrower is required to escrow 1/12th of the annual estimated tax payments. The requirement for the borrower to make monthly deposits into the tax escrow will be waived so long as (i) no Major Tenant (defined below) is in default (beyond any notice and cure period) under its obligations to pay taxes pursuant to such Major Tenant’s lease, (ii) the direct payment of all taxes is and continues to be the obligation of a Major Tenant at each property, and (iii) the Major Leases (defined below) continue to be in full force and effect at the applicable property.
Insurance Escrows - On a monthly basis, the borrower is required to escrow 1/12th of the annual estimated insurance payments. The requirement for the borrower to make monthly deposits into the insurance escrow will be waived so long as (i) no Major Tenant is in default (beyond any notice and cure period) under its obligations to pay insurance pursuant to such Major Tenant’s lease, (ii) the direct payment of all insurance is and continues to be the obligation of a Major Tenant at each property, and (iii) the Major Leases continue to be in full force and effect at the applicable property.
Replacement Reserves – On a monthly basis, the borrower is required to deposit $5,657 ($0.20 PSF annually) for monthly reserves subject to a cap of $203,643.
TI/LC Reserves – On a monthly basis, the borrower is required to deposit $9,899 ($0.35 PSF annually) for tenant improvements and leasing commissions subject to a cap of $593,959.
Victory Energy Tenant Improvement Payment.Pursuant to an escrow agreement between the borrower and the title company, entered into at closing of the borrower’s acquisition of the property, the borrower escrowed with the title company $2.2 million for a tenant improvement payment due to the Victory Energy tenant at 10701 East 126th Street North in Collinsville, Oklahoma. The $2.2 million escrow will be drawn upon by Victory Energy to complete and disburse as construction proceeds. The borrower assigned all of its rights in the deposit to the lender. Rent on the Victory Energy space will increase from $510,360 to $702,360 upon the earlier of February 1, 2016 and completion of the expansion.
THE INFORMATION IN THIS COLLATERAL TERM SHEET IS NOT COMPLETE AND MAY BE AMENDED PRIOR TO THE TIME OF SALE. THIS TERM SHEET IS NOT AN OFFER TO SELL THESE SECURITIES AND IT IS NOT A SOLICITATION OF AN OFFER TO BUY THESE SECURITIES IN ANY JURISDICTION WHERE THE OFFER OR SALE IS NOT PERMITTED.
| 107 |
Mortgage Loan No. 9 — Triple Net Acquisitions Portfolio – Pool 1
Lockbox / Cash Management.The loan is structured with a hard lockbox and springing cash management. All rents of the property are required to be directly deposited into a lockbox account controlled by the lender. Provided no Cash Management Period (defined below) is continuing, all funds are required to be remitted to the borrower on each business day. During a Cash Management Period, all funds in the lockbox account will be swept on each business day to a cash management account under the control of the lender and disbursed during the loan term in accordance with the loan documents. Any excess, if no Cash Management Period is in effect, will be disbursed to the borrower, or if a Cash Management Period is in effect (other than a Cash Management Period solely due to the existence of the mezzanine loan), held as additional collateral for the loan.
“Cash Management Period” means a period commencing: (i) upon the occurrence of an event of default, (ii) if the combined debt service coverage ratio for the Triple Net Acquisitions Portfolio – Pool 1 loan and the allocated portion of the related mezzanine loan is less than 1.10x at the end of any calendar quarter, or (iii) concurrently with the commencement of a Lease Sweep Period (defined below). A Cash Management Period will end with respect to clause (i) above, after the cure (if applicable) of such event of default (provided that no other event of default has occurred or is continuing), with respect to clause (ii) above, upon the combined debt service coverage ratio for the Triple Net Acquisitions Portfolio – Pool 1 loan and the allocated portion of the related mezzanine loan being at least equal to 1.10x for two consecutive calendar quarters and, with respect to clause (iii) above, when such Lease Sweep Period has ended. Additionally, so long as the mezzanine loan is outstanding, a Cash Management Period will be in effect.
A “Lease Sweep Period” will commence upon the occurrence of the earlier of (i) the date that is 18 months prior to the end of the term of the ReCommunity Recycling lease, Myler Disability lease, Victory Energy lease (Collinsville, Oklahoma) or Victory Energy lease (Cushing, Oklahoma), (each a “Major Tenant”) or any lease (inclusive of renewal terms) at the property that represents more than 50,000 SF (each, a “Major Lease”); (ii) the date required under a Major Lease by which the applicable tenant is required to give notice of its exercise of a renewal option thereunder (and such renewal has not been so exercised); (iii) the date any Major Lease is surrendered, cancelled or terminated prior to its then current expiration date (other than with the lender’s consent); (iv) the date any tenant under a Major Lease discontinues its business at its premises or gives notice that it intends to discontinue its business; (v) the occurrence and continuance (beyond any applicable notice and cure periods) of a default in the payment of rent or a material non-monetary obligation under any Major Lease by the applicable tenant thereunder; or (vi) an insolvency proceeding with respect to a tenant under a Major Lease.
Property Release.Provided no event of default exists under the mortgage loan documents, the borrower may release individual properties from the loan in connection with a bona fide sale on arms’ length terms to a third party subject to the satisfaction of certain conditions including, but not limited to, the following: (a) the debt service coverage ratio for the remaining properties based on the mortgage and allocated mezzanine loan proceeds exceeds the greater of (i) the debt service coverage ratio immediately preceding such release and (ii) 1.11x, provided however that with respect to the release of the 1200 North Maitlen Drive property, only subclause (ii) of this clause (a) will be required to be satisfied; (b) the debt yield for the remaining properties based on the mortgage and allocated mezzanine loan proceeds exceeds the greater of (i) the debt yield immediately preceding such release and (ii) 9.70%, provided however that with respect to the release of the 1200 North Maitlen Drive property, only subclause (ii) of this clause (b) will be required to be satisfied; (c) the LTV ratio for the remaining properties based on the mortgage and allocated mezzanine loan proceeds is not greater than the lesser of (i) the LTV immediately preceding such release and (ii) 81.6%, provided however that with respect to the release of the 1200 North Maitlen Drive property, only subclause (ii) of this clause (c) will be required to be satisfied; and (d) defeasance of the full Release Amount.
“Release Amount” means, with respect to any individual property: the greater of (i) 120% of the allocated loan amount and (ii) 100% of net sales proceeds.
Additional Debt. An $11,690,000 mezzanine loan was provided in connection with the Triple Net Acquisitions Portfolio-Pool 1 loan and two additional loans (which additional loans are not included in the CSAIL 2016-C5 transaction), of which $5,100,000 was allocated to the Triple Net Acquisitions Portfolio - Pool 1 properties. The $11,690,000 mezzanine loan is secured by (i) a pledge of the direct equity interest in the borrowers, (ii) a pledge of the direct equity interest in the borrowers under two other loans secured by an office property and a portfolio of three industrial properties (neither of which loans are included in the CSAIL
THE INFORMATION IN THIS COLLATERAL TERM SHEET IS NOT COMPLETE AND MAY BE AMENDED PRIOR TO THE TIME OF SALE. THIS TERM SHEET IS NOT AN OFFER TO SELL THESE SECURITIES AND IT IS NOT A SOLICITATION OF AN OFFER TO BUY THESE SECURITIES IN ANY JURISDICTION WHERE THE OFFER OR SALE IS NOT PERMITTED.
| 108 |
Mortgage Loan No. 9 — Triple Net Acquisitions Portfolio – Pool 1
2016-C5 transaction) and (iii) a pledge of a 49% non-controlling equity interest in the owners of another portfolio. The mezzanine loan is coterminous with the Triple Net Acquisitions Portfolio-Pool 1 mortgage loan, accrues interest at a fixed rate of 13.2500% per annum and is interest only. Taking into account the allocated portion of the mezzanine loan, the allocated combined Cutoff-Date LTV is 87.9% based on the “as-is” appraised value and 81.3% based on the “as-complete” value, the UW NCF DSCR is 1.02x and the UW NOI debt yield is 9.1%. Additionally, a preferred equity investment was also provided in the initial amount of $7,760,000 to an affiliate of the borrowers, with an additional preferred equity investment of $2,700,000 which may be made at a future date. The preferred equity return will be paid in kind and be payable only to the extent cash flow is available. The preferred equity investment and any unpaid return is required to be paid in full on or before the mandatory redemption date which is coterminous with the mortgage and mezzanine loan. However, a default on the preferred equity investment will not cause a default under the Triple Net Acquisitions Portfolio - Pool 1 loan or the related mezzanine loan, nor will it result in a change in control of the borrowers under the Triple Net Acquisitions Portfolio - Pool 1 loan.
THE INFORMATION IN THIS COLLATERAL TERM SHEET IS NOT COMPLETE AND MAY BE AMENDED PRIOR TO THE TIME OF SALE. THIS TERM SHEET IS NOT AN OFFER TO SELL THESE SECURITIES AND IT IS NOT A SOLICITATION OF AN OFFER TO BUY THESE SECURITIES IN ANY JURISDICTION WHERE THE OFFER OR SALE IS NOT PERMITTED.
| 109 |
(THIS PAGE INTENTIONALLY LEFT BLANK)
| 110 |
Mortgage Loan No. 10 — San Diego HHSA Building
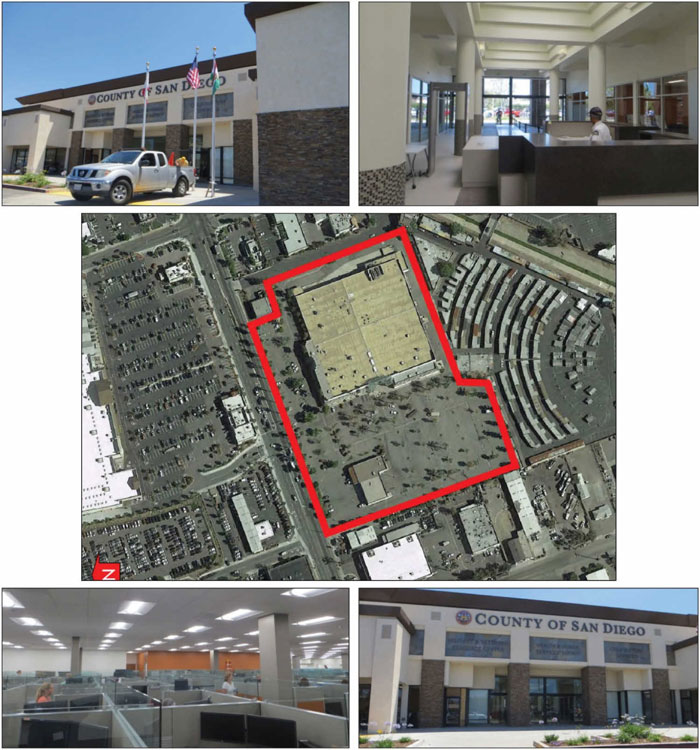
THE INFORMATION IN THIS COLLATERAL TERM SHEET IS NOT COMPLETE AND MAY BE AMENDED PRIOR TO THE TIME OF SALE. THIS TERM SHEET IS NOT AN OFFER TO SELL THESE SECURITIES AND IT IS NOT A SOLICITATION OF AN OFFER TO BUY THESE SECURITIES IN ANY JURISDICTION WHERE THE OFFER OR SALE IS NOT PERMITTED.
| 111 |
Mortgage Loan No. 10 — San Diego HHSA Building
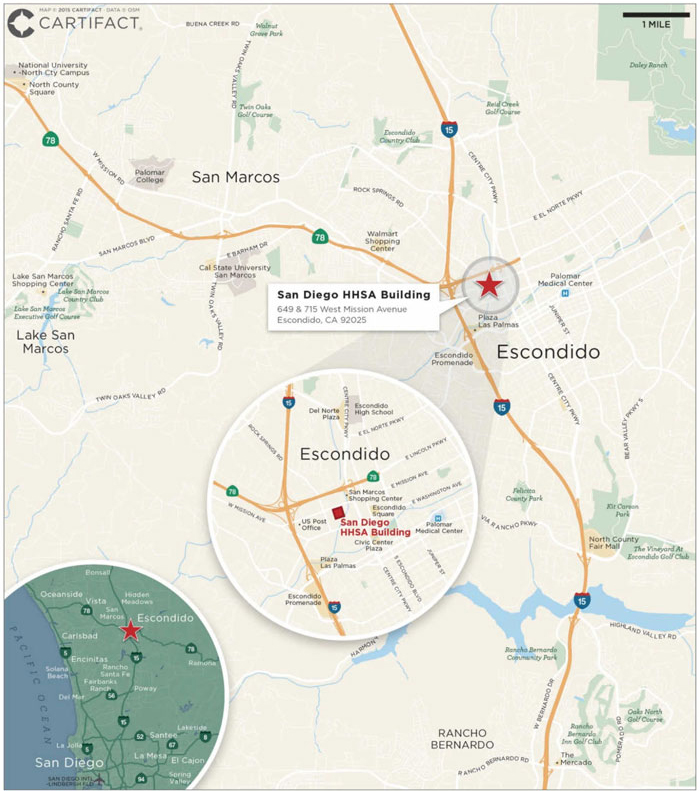
THE INFORMATION IN THIS COLLATERAL TERM SHEET IS NOT COMPLETE AND MAY BE AMENDED PRIOR TO THE TIME OF SALE. THIS TERM SHEET IS NOT AN OFFER TO SELL THESE SECURITIES AND IT IS NOT A SOLICITATION OF AN OFFER TO BUY THESE SECURITIES IN ANY JURISDICTION WHERE THE OFFER OR SALE IS NOT PERMITTED.
| 112 |
Mortgage Loan No. 10 — San Diego HHSA Building
| Mortgage Loan Information | Property Information | |||
| Mortgage Loan Seller: | JLC | Single Asset / Portfolio: | Single Asset | |
| Original Principal Balance: | $22,400,000 | Title: | Fee | |
| Cut-off Date Principal Balance: | $22,292,174 | Property Type - Subtype: | Office – Suburban | |
| % of Pool by IPB: | 2.4% | Net Rentable Area (SF): | 111,285 | |
| Loan Purpose: | Refinance | Location: | Escondido, CA | |
| Borrower: | MDA Mission Two, LLC | Year Built / Renovated: | 1977 / 2015 | |
| Sponsor: | Michael D. Abrams | Occupancy: | 95.7% | |
| Interest Rate: | 4.6040% | Occupancy Date: | 9/1/2015 | |
| Note Date: | 9/14/2015 | Number of Tenants: | 4 | |
| Maturity Date: | 10/6/2025 | 2012 NOI(1): | N/A | |
| Interest-only Period: | 0 months | 2013 NOI(1): | N/A | |
| Original Term: | 120 months | 2014 NOI(1): | N/A | |
| Original Amortization: | 360 months | TTM NOI(1): | N/A | |
| Amortization Type: | Balloon | UW Economic Occupancy: | 94.1% | |
| Call Protection: | L(28),YM1(88),O(4) | UW Revenues: | $3,087,494 | |
| Lockbox: | Hard | UW Expenses: | $777,629 | |
| Additional Debt: | No | UW NOI: | $2,309,865 | |
| Additional Debt Balance: | N/A | UW NCF: | $2,162,969 | |
| Additional Debt Type: | N/A | Appraised Value / Per SF: | $31,300,000 / $281 | |
| Additional Future Debt Permitted: | No | Appraisal Date: | 6/22/2015 |
| Escrows and Reserves | Financial Information | |||||
| Initial | Monthly | Initial Cap | Cut-off Date Loan / SF: | $200 | ||
| Taxes: | $64,520 | $9,218 | N/A | Maturity Date Loan / SF: | $163 | |
| Insurance: | $9,010 | $3,100 | N/A | Cut-off Date LTV: | 71.2% | |
| Replacement Reserves: | $0 | $2,318 | N/A | Maturity Date LTV: | 58.1% | |
| TI/LC: | $65,000 | $1,357 | N/A | UW NCF DSCR: | 1.57x | |
| UW NOI Debt Yield: | 10.4% |
Sources and Uses
| Sources | Proceeds | % of Total | Uses | Proceeds | % of Total | |
| Mortgage Loan | $22,400,000 | 97.7% | Payoff Existing Debt | $22,414,558 | 97.7% | |
| Sponsor Equity | 538,140 | 2.3 | Upfront Reserves | 138,530 | 0.6 | |
| Closing Costs | 385,052 | 1.7 | ||||
| Total Sources | $22,938,140 | 100.0% | Total Uses | $22,938,140 | 100.0% |
| (1) | The property was acquired by the sponsor in 2014 and subsequently underwent a full renovation and redevelopment which was completed in 2015. Therefore, historical cash flows were not available. |
THE INFORMATION IN THIS COLLATERAL TERM SHEET IS NOT COMPLETE AND MAY BE AMENDED PRIOR TO THE TIME OF SALE. THIS TERM SHEET IS NOT AN OFFER TO SELL THESE SECURITIES AND IT IS NOT A SOLICITATION OF AN OFFER TO BUY THESE SECURITIES IN ANY JURISDICTION WHERE THE OFFER OR SALE IS NOT PERMITTED.
| 113 |
Mortgage Loan No. 10 — San Diego HHSA Building
The Loan. The San Diego HHSA Building loan is a $22.4 million first mortgage loan secured by the fee interest in a 111,285 SF office property with retail space, consisting of two buildings located in Escondido, California. The loan has a 10-year term and will amortize on a 30-year schedule.
The Borrower. The borrowing entity for the loan is MDA Mission Two, LLC, a Delaware limited liability company and special purpose entity.
The Sponsor. The loan’s sponsor and non-recourse carve-out guarantor is Michael D. Abrams. Since 1982, Michael D. Abrams has developed 71 commercial properties in California with both Diamond Development and Park/Abrams Development Company. Currently Mr. Abrams owns five office and retail properties located in Southern California with a combined market value of approximately $85.1 million.
The Property. The property is an 111,285 SF of office property with retail located in Escondido, California. The property was originally constructed in 1977 but upon the sponsor’s acquisition in 2014, underwent a full renovation and redevelopment which was completed in 2015. The improvements consist of a single-story multi-tenant building totaling 102,510 SF and a retail pad building totaling 8,775 SF located on a 9.7 acre parcel directly off of the heavily trafficked West Mission Avenue.
As of September 2015, the property was 95.7% leased by four tenants. The largest tenant at the property, San Diego Health and Human Services Administration (“HHSA”), leases 95,000 SF of office space (85.4% of the net rentable area) through June 2025 with three, five-year extension options remaining. HHSA is a division of the San Diego County government that provides health and social services to promote wellness, self-sufficiency and a better quality of life for individuals and families in San Diego County. San Diego County has provided health services in Escondido at several other locations but recently consolidated into the subject property. Approximately seven HHSA programs are expected to be located at the property with an anticipated 400 employees.
The second largest tenant at the property, Good Nutrition, leases 4,500 SF of retail space (4.0% of the net rentable area) through June 2018 with one, two-year option remaining. Good Nutrition is a specialized nutritional store that is one of six stores in San Diego County that specializes in the state-sponsored Women Infants and Children (“WIC”) program. Good Nutrition carries fresh fruits and vegetables, certified Gerber baby foods, WIC certified dry cereals and WIC certified juices.
The third largest tenant at the property, Steak n’ Shake, leases 4,000 SF of retail space in the pad building (3.6% of the net rentable area) pursuant to a 10-year lease with two, five-year extension options. Steak N Shake is a wholly owned subsidiary of Biglari Holdings Inc. and is generally concentrated in the Midwest and Atlantic states but also has footprints in California, Arizona, Utah, Montana, Colorado and Texas. No other tenant represents more than 2.7% of net rentable area. Steak n’ Shake is not yet in occupancy as the lease was executed on September 11, 2015, and they are in the process of obtaining a conditional use permit (“CUP”) to operate a drive-thru at the property and other required construction/operation permits from the City of Escondido. Steak n’ Shake has until February 8, 2016 to obtain the CUP, at which time, if the CUP has not been obtained, the borrower may extend the CUP contingency expiration date for up to five additional 30 day periods. In the event the CUP has not been obtained by February 8, 2016 (or the end of the extension period), the tenant has the right to terminate the lease. Contemporaneously, Steak ‘n Shake has 90 days following borrower’s approval of the tenant’s plans for the premises to obtain all necessary permits for construction and operation of the premises, after which the tenant may terminate the lease if the required permits have not been issued. After expiration of both the CUP and other permit contingency periods, the borrower will have an additional 120 days within which to complete landlord’s required work under the lease and deliver the premises to the tenant. The term of the lease runs for 10 years following the rent commencement date, which is the earlier of (i) 150 days after the later of the date the tenant obtains the tenant permits or the borrower has completed its work at the property and (ii) the date tenant opens for business. It is estimated that the tenant will take occupancy by June 2016, assuming the CUP and other permits are timely granted by the City of Escondido; provided, however, that the 10-year term of the lease and rent commencement may not occur until late 2016 or early 2017 given the deadlines and grace periods discussed above.
The Market. The property is located at the intersection of Centre City Parkway and Mission Avenue in Escondido, California, approximately 29 miles north of the San Diego CBD. The property benefits from visibility and access along Mission Avenue, which per the City of Escondido has an estimated traffic count of 27,900 vehicles per day. The property’s immediate area is a mixture
THE INFORMATION IN THIS COLLATERAL TERM SHEET IS NOT COMPLETE AND MAY BE AMENDED PRIOR TO THE TIME OF SALE. THIS TERM SHEET IS NOT AN OFFER TO SELL THESE SECURITIES AND IT IS NOT A SOLICITATION OF AN OFFER TO BUY THESE SECURITIES IN ANY JURISDICTION WHERE THE OFFER OR SALE IS NOT PERMITTED.
| 114 |
Mortgage Loan No. 10 — San Diego HHSA Building
of commercial and residential developments. Per the appraiser, the current retail and office vacancy rates within the property’s trade area are equal to 5.4% and 5.8%, respectively. The appraiser concluded rental rates of $23.40 PSF modified gross for the office space, $27.00 PSF NNN for the inline retail and $33.00-$39.00 PSF NNN for the pad retail.
Historical and Current Occupancy(1)
| 2012 | 2013 | 2014 | Current(2) |
| N/A | N/A | N/A | 95.7% |
| (1) | The property was acquired by the sponsor in 2014 and subsequently underwent a full renovation and redevelopment which was completed in 2015. Therefore, historical occupancies are not available. |
| (2) | Based on the underwritten rent roll. |
Tenant Summary(1)
| Tenant | Ratings Moody’s/S&P/Fitch(2) | Net Rentable Area (SF) | % of Total NRA | Base Rent PSF | Lease Expiration Date |
| San Diego Health and Human Services Administration | Aaa / AAA / AAA | 95,000 | 85.4% | $26.88 | 6/18/2025 |
| Good Nutrition | NA / NA / NA | 4,500 | 4.0% | $14.83 | 6/3/2018 |
| Steak n’ Shake | NA / NA / NA | 4,000 | 3.6% | $39.00 | 8/31/2026 |
| WIC North County Office | NA / NA / NA | 3,010 | 2.7% | $16.15 | 10/31/2019 |
| (1) | Based on the underwritten rent roll. |
| (2) | Ratings provided are for the parent company of the entity listed in the “Tenant” field whether or not the parent company guarantees the lease. |
Lease Rollover Schedule(1)
| Year | Number of Leases Expiring | NRA Expiring | % of NRA Expiring | UW Base Rent Expiring | % of UW Base Rent Expiring | Cumulative NRA Expiring | Cumulative % of NRA Expiring | Cumulative UW Base Rent Expiring | Cumulative % of UW Base Rent Expiring |
| Vacant | NAP | 4,775 | 4.3% | NAP | NAP | 4,775 | 4.3% | NAP | NAP |
| 2016 | 0 | 0 | 0.0 | $0 | 0.0% | 4,775 | 4.3% | $0 | 0.0% |
| 2017 | 0 | 0 | 0.0 | 0 | 0.0 | 4,775 | 4.3% | $0 | 0.0% |
| 2018 | 1 | 4,500 | 4.0 | 66,744 | 2.4 | 9,275 | 8.3% | $66,744 | 2.4% |
| 2019 | 1 | 3,010 | 2.7 | 48,600 | 1.7 | 12,285 | 11.0% | $115,344 | 4.1% |
| 2020 | 0 | 0 | 0.0 | 0 | 0.0 | 12,285 | 11.0% | $115,344 | 4.1% |
| 2021 | 0 | 0 | 0.0 | 0 | 0.0 | 12,285 | 11.0% | $115,344 | 4.1% |
| 2022 | 0 | 0 | 0.0 | 0 | 0.0 | 12,285 | 11.0% | $115,344 | 4.1% |
| 2023 | 0 | 0 | 0.0 | 0 | 0.0 | 12,285 | 11.0% | $115,344 | 4.1% |
| 2024 | 0 | 0 | 0.0 | 0 | 0.0 | 12,285 | 11.0% | $115,344 | 4.1% |
| 2025 | 1 | 95,000 | 85.4 | 2,553,936 | 90.4 | 107,285 | 96.4% | $2,669,280 | 94.5% |
| 2026 & Beyond | 1 | 4,000 | 3.6 | 156,000 | 5.5 | 111,285 | 100.0% | $2,825,280 | 100.0% |
| Total | 4 | 111,285 | 100.0% | $2,825,280 | 100.0% |
| (1) | Based on the underwritten rent roll. |
THE INFORMATION IN THIS COLLATERAL TERM SHEET IS NOT COMPLETE AND MAY BE AMENDED PRIOR TO THE TIME OF SALE. THIS TERM SHEET IS NOT AN OFFER TO SELL THESE SECURITIES AND IT IS NOT A SOLICITATION OF AN OFFER TO BUY THESE SECURITIES IN ANY JURISDICTION WHERE THE OFFER OR SALE IS NOT PERMITTED.
| 115 |
Mortgage Loan No. 10 — San Diego HHSA Building
Operating History and Underwritten Net Cash Flow(1)
| Underwritten | PSF | %(2) | ||
| Rents in Place | $2,492,400 | $22.40 | 76.0% | |
| Rent Steps(3) | 1,944 | 0.02 | 0.1% | |
| Straight-Line Rent(4) | 330,936 | 2.97 | 10.1% | |
| Vacant Income | 157,575 | 1.42 | 4.8% | |
| Gross Potential Rent | $2,982,855 | $26.80 | 90.9% | |
| Total Reimbursements | $297,375 | 2.67 | 9.1% | |
| Net Rental Income | $3,280,230 | $29.48 | 100.0% | |
| (Vacancy/Collection Loss) | (192,736) | (1.73) | (5.9%) | |
| Effective Gross Income | $3,087,494 | $27.74 | 94.1% | |
| Total Expenses | $777,629 | $6.99 | 25.2% | |
| Net Operating Income | $2,309,865 | $20.76 | 74.8% | |
| Total TI/LC, Capex/RR | 146,896 | 1.32 | 4.8% | |
| Net Cash Flow | $2,162,969 | $19.44 | 70.1% | |
| (1) | The property was acquired by the sponsor in 2014 and subsequently underwent a full renovation and redevelopment which was completed in 2015. Therefore, historical cash flows are not available. |
| (2) | % column represents percent of Net Rental Income for all revenue lines and represents percent of Effective Gross Income for the remainder of fields |
| (3) | Rent Steps include rent increases occurring through November 1, 2016. |
| (4) | Straight-Line Rent based on the average rent for HHSA over the 10-year lease term. |
Property Management. The property is managed by Diamond Commercial Properties, LLC, an affiliate of the sponsor.
Escrows and Reserves. At origination, the borrower deposited into escrow $65,000 for outstanding tenant improvements and leasing commissions associated with the Good Nutrition space, $64,520 for real estate taxes and $9,010 for insurance premiums.
TI/LC Reserves – On a monthly basis, the borrower is required to escrow an amount equal to $1,357.
Tax Escrows – On a monthly basis, the borrower is required to escrow 1/12th of the annual estimated tax payments, currently equal to $9,218.
Insurance Escrows – On a monthly basis, the borrower is required to escrow 1/12th of the annual estimated insurance payments, currently equal to $3,100.
Replacement Reserves – On a monthly basis, the borrower is required to escrow an amount equal to $2,318.
Lockbox / Cash Management. The loan is structured with a hard lockbox and springing cash management. Unless a Cash Management Period (as defined below) has occurred, all amounts on deposit in the clearing account will be swept into the borrower’s account. During a Cash Management Period (other than during a Cash Management Period occurring solely as a result of the occurrence of a Partial HHSA Sweep Period (defined below)), all amounts on deposit in the clearing account will be swept daily into a lender controlled account. If a Partial HHSA Sweep Period commences, $23,750 per month will be swept into a lender controlled account and starting 12 months prior to the end of the term of the HHSA lease term (i.e. August 1, 2024) all amounts on deposit in the clearing account will be swept daily into a lender controlled account.
“Cash Management Period” means a period: (i) while an event of default exists, (ii) while the debt service coverage ratio is less than 1.05x, (iii) the continuance of a Lease Sweep Period (defined below), or (iv) the continuance of a Partial HHSA Lease Sweep Period (as defined below).
“Lease Sweep Period” means the period: (i) from the date that is 12 months prior to the end of the term of any Major Lease (defined below), (ii) commencing on the date required under a Major Lease by which the applicable Major Tenant (defined below) is required to give notice of its exercise of a renewal option thereunder (and such renewal has not been so exercised), (iii)
THE INFORMATION IN THIS COLLATERAL TERM SHEET IS NOT COMPLETE AND MAY BE AMENDED PRIOR TO THE TIME OF SALE. THIS TERM SHEET IS NOT AN OFFER TO SELL THESE SECURITIES AND IT IS NOT A SOLICITATION OF AN OFFER TO BUY THESE SECURITIES IN ANY JURISDICTION WHERE THE OFFER OR SALE IS NOT PERMITTED.
| 116 |
Mortgage Loan No. 10 — San Diego HHSA Building
commencing when any Major Lease is surrendered, cancelled or terminated prior to its then current expiration date, (iv) commencing when any Major Tenant goes dark or gives notice that it intends to discontinue its business, (v) commencing upon the occurrence of a material default under any Major Lease, or (vi) commencing upon the occurrence of a Major Tenant insolvency proceeding. A Lease Sweep Period may terminate as and when provided in the related loan documents.
“Major Lease” means: the lease with HHSA, and any lease which covers 20,000 or more of the rentable SF of the improvements.
“Major Tenant” means: any tenant under a Major Lease, or under one or more leases which when taken together would constitute a Major Lease.
“Partial HHSA Sweep Period” means the period commencing on the date that is 24 months prior to the end of the term of the HHSA lease (i.e., August 1, 2023).
THE INFORMATION IN THIS COLLATERAL TERM SHEET IS NOT COMPLETE AND MAY BE AMENDED PRIOR TO THE TIME OF SALE. THIS TERM SHEET IS NOT AN OFFER TO SELL THESE SECURITIES AND IT IS NOT A SOLICITATION OF AN OFFER TO BUY THESE SECURITIES IN ANY JURISDICTION WHERE THE OFFER OR SALE IS NOT PERMITTED.
| 117 |
(THIS PAGE INTENTIONALLY LEFT BLANK)
| 118 |
Mortgage Loan No. 11 — DoubleTree Commerce
| Mortgage Loan Information | Property Information | |||
| Mortgage Loan Seller: | Column | Single Asset / Portfolio: | Single Asset | |
| Original Principal Balance: | $21,600,000 | Title: | Leasehold | |
| Cut-off Date Principal Balance: | $21,600,000 | Property Type - Subtype: | Hotel – Full Service | |
| % of Pool by IPB: | 2.3% | Net Rentable Area (Rooms): | 201 | |
| Loan Purpose: | Acquisition | Location: | Commerce, CA | |
| Borrower: | TPG LA Commerce, LLC | Year Built / Renovated: | 1991 / 2007 | |
| Sponsor: | TH Investment Holdings II, LLC | Occupancy / ADR / RevPAR: | 88.5% / $146.04 / $129.27 | |
| Interest Rate: | 4.5500% | Occupancy / ADR / RevPAR Date: | 8/31/2015 | |
| Note Date: | 10/20/2015 | Number of Tenants: | N/A | |
| Maturity Date: | 11/6/2022 | 2012 NOI: | $2,314,107 | |
| Interest-only Period: | 24 months | 2013 NOI: | $2,974,850 | |
| Original Term: | 84 months | 2014 NOI: | $3,221,534 | |
| Original Amortization: | 360 months | TTM NOI(1): | $3,419,143 | |
| Amortization Type: | IO-Balloon | UW Occupancy / ADR / RevPAR: | 88.5% / $146.04 / $129.27 | |
| Call Protection: | L(27),Def(53),O(4) | UW Revenues: | $12,031,579 | |
| Lockbox: | Hard | UW Expenses: | $8,903,139 | |
| Additional Debt: | No | UW NOI: | $3,128,439 | |
| Additional Debt Balance: | N/A | UW NCF: | $2,647,176 | |
| Additional Debt Type: | N/A | Appraised Value / Per Room(2): | $31,600,000 / $157,214 | |
| Additional Future Debt Permitted: | No | Appraisal Date(2): | 9/1/2016 |
| Escrows and Reserves | Financial Information | |||||
| Initial | Monthly | Initial Cap | Cut-off Date Loan / Room: | $107,463 | ||
| Taxes: | $0 | $19,855 | N/A | Maturity Date Loan / Room: | $98,413 | |
| Insurance: | $90,731 | $15,122 | N/A | Cut-off Date LTV(2): | 68.4% | |
| FF&E Reserve: | $39,617 | 4% of gross monthly revenue(3) | N/A | Maturity Date LTV(2): | 62.6% | |
| PIP Reserve: | $3,000,000 | $0 | N/A | UW NCF DSCR: | 2.00x | |
| Engineering Reserve: | $16,813 | N/A | N/A | UW NOI Debt Yield: | 14.5% | |
Sources and Uses
| Sources | Proceeds | % of Total | Uses | Proceeds | % of Total | |
| Mortgage Loan | $21,600,000 | 71.3% | Payoff Existing Debt | $26,600,000 | 87.8% | |
| Borrower Equity | 8,711,514 | 28.7 | Upfront Reserves | 3,147,161 | 10.4 | |
| Closing Costs | 564,353 | 1.9 | ||||
| Total Sources | $30,311,514 | 100.0% | Total Uses | $30,311,514 | 100.0% |
(1) Represents trailing twelve months ending August 31, 2015.
| (2) | The value listed is the appraisal’s “When Complete” value, which is based on the completion of required PIP work, for which $3.0 million has been reserved in escrow. The “as-is” value was $27.3 million and equates to a Cut-Off Date LTV and Maturity LTV of 79.1% and 72.5%, respectively. The appraisal also concluded an “As-Stabilized” value of $32.7 million which would result in a Maturity Date LTV of 60.5%. |
(3) The borrower is required to make monthly FF&E deposits in an amount that is equal to the greater of (i) 1/12th of 4% times the annual rent of the property for the previous 12 month period as determined on the origination date and each anniversary thereof, or (ii) the monthly amount required to be reserved pursuant to the franchise agreement for the replacement of FF&E but excluding any amounts attributable to a PIP.
THE INFORMATION IN THIS COLLATERAL TERM SHEET IS NOT COMPLETE AND MAY BE AMENDED PRIOR TO THE TIME OF SALE. THIS TERM SHEET IS NOT AN OFFER TO SELL THESE SECURITIES AND IT IS NOT A SOLICITATION OF AN OFFER TO BUY THESE SECURITIES IN ANY JURISDICTION WHERE THE OFFER OR SALE IS NOT PERMITTED.
| 119 |
Mortgage Loan No. 11 — DoubleTree Commerce
The Loan. The DoubleTree Commerce loan is a $21.6 million first mortgage loan secured by the leasehold interest in a 201-room full-service hotel property located in Commerce, California. The loan has a 7-year term and will amortize on a 30-year schedule after a two-year interest-only period.
The Borrower. The borrowing entity for the loan is TPG LA Commerce, LLC, a Delaware limited liability company and special purpose entity.
The Sponsor. The loan’s sponsors and nonrecourse carve-out guarantor is TH Investment Holdings II, LLC, an entity owned by affiliates of the The Procaccianti Group. The Procaccianti Group, founded in 1964, is a second generation, privately-held real estate investment and management company with a broad national platform that spans various sectors of real estate. Throughout five decades, the company has owned or managed hundreds of real estate assets surpassing 50 million SF with a value over $5 billion.
The Property. The property is a full-service DoubleTree branded hotel located in Commerce, California that offers 201 guestrooms. The property is located on approximately 4.4 acres and is seven-stories tall. The hotel was originally constructed in 1991 and renovated in 2007. The sponsor is currently planning an approximately $3.0 million ($14,925 per room) property improvement plan that will include renovating the lobby, public area and guestrooms.
Amenities at the property include an outdoor pool and whirlpool, a fitness room, a business center, restaurant and lounge. The property also provides approximately 6,085 SF of meeting space that include the 5,760 SF Grand Tree Ballroom and a 325 SF boardroom. The guestroom mix includes 117 king rooms, 64 double/double rooms and 20 king suites. Each guestroom includes flat-panel televisions, desks with chairs and the suites include a separate living area with a sleeper sofa and second television.
The borrower holds its leasehold interest in the property pursuant to a ground lease that has an expiration date in November 2054 with a 34-year extension option to November 2088. Rent under the ground lease is equal to the greater of a percentage rent (with respect to hotel revenues) and base rent. The base rent is subject to adjustments every five years, with the next adjustment in January 2016. Adjustments are subject to a CPI calculation with a minimum increase of 15.9% and maximum increase of 33.8%. Base rent is subject to an additional adjustment in January 2021, as well as at the commencement of the renewal term in November 2054, based on an appraised value of the land (excluding improvements). New base annual rent will be equal to no less than 9.0% return on the subsequent appraised value of the land. The trailing twelve month payment ending November 2015 was $325,892.
The Market. The property is located in the City of Commerce, California in the county of Los Angeles. The Los Angeles area is one of the world’s major centers of business, entertainment, international trade, culture, media, fashion, science, technology, and education. The county is home to multiple Fortune 500 companies including the Walt Disney Company and Mattel, Inc. Regional access to the area is provided by Interstate 10, which extends from Palm Springs to Santa Monica, Interstate 405 and Interstate 5. The property is located approximately 14 miles east of the Los Angeles International Airport.
According to the appraisal, Commerce is located just two miles southeast of the Los Angeles city center, making it a convenient secondary lodging choice for demand generated by downtown Los Angeles events, conventions, and companies. Located in the center of Commerce, the Crowne Plaza Hotel and Commerce Casino represents the largest employer within the City of Commerce with over 2,500 employees. The casino also serves as a large attraction to the area, offering a well-established card casino that covers 92,000 SF of playing area. According to the appraisal, the LA Poker Classic and the World Poker Tournament are hosted annually during the months of January through March at the Commerce Casino.
THE INFORMATION IN THIS COLLATERAL TERM SHEET IS NOT COMPLETE AND MAY BE AMENDED PRIOR TO THE TIME OF SALE. THIS TERM SHEET IS NOT AN OFFER TO SELL THESE SECURITIES AND IT IS NOT A SOLICITATION OF AN OFFER TO BUY THESE SECURITIES IN ANY JURISDICTION WHERE THE OFFER OR SALE IS NOT PERMITTED.
| 120 |
Mortgage Loan No. 11 — DoubleTree Commerce
Historical Occupancy, ADR, RevPAR(1)
| Competitive Set | DoubleTree Commerce(2) | Penetration Factor | |||||||
| Year | Occupancy | ADR | RevPAR | Occupancy | ADR | RevPAR | Occupancy | ADR | RevPAR |
| 2012 | 80.3% | $99.84 | $80.21 | 90.1% | $124.74 | $112.38 | 112.2% | 124.9% | 140.1% |
| 2013 | 82.7% | $103.40 | $85.56 | 90.2% | $133.29 | $120.20 | 109.1% | 128.9% | 140.5% |
| 2014 | 82.0% | $109.48 | $89.82 | 89.9% | $140.70 | $126.44 | 109.6% | 128.5% | 140.8% |
| TTM(3) | 82.9% | $115.85 | $96.10 | 88.5% | $146.04 | $129.27 | 106.8% | 126.1% | 134.5% |
| (1) | Source: Third Party Data Provider. The competitive set consists of the following hotels: Quality Inn & Suites Montebello, Embassy Suites Los Angeles Downey, Ramada Commerce Los Angeles Area, Doubletree Hotel Los Angeles Norwalk, Doubletree Los Angeles Rosemead and Crowne Plaza Los Angeles Commerce Casino. |
| (2) | Source: Borrower financials. |
| (3) | Represents the trailing twelve month period ending August 31, 2015. |
Competitive Hotels Profile(1)
| Estimated Market Mix | 2014 Estimated Operating Statistics | |||||||||||
| Property | Rooms | Year Built | Meeting Space (SF) | Commercial | Meeting & Group | Leisure | Occupancy | ADR | RevPAR | |||
| DoubleTree Commerce | 201 | 1991 | 6,085 | 50% | 40% | 10% | 90% | $140.70 | $126.44 | |||
| Crowne Plaza at Commerce Casino | 194 | 2001 | 16,500 | 35% | 20% | 45% | 84% | $123.00 | $103.32 | |||
| DoubleTree Los Angeles Norwalk | 171 | 1990 | 18,044 | 50% | 35% | 15% | 77% | $121.00 | $93.17 | |||
| DoubleTree Los Angeles Rosemead | 147 | 1990 | 7,491 | 70% | 10% | 20% | 85% | $130.00 | $110.50 | |||
| Embassy Suites Los Angeles Downey | 219 | 1985 | 6,091 | 55% | 15% | 30% | 85% | $146.00 | $124.10 | |||
| Total(2) | 932 | |||||||||||
| (1) | Source: Appraisal and borrower financials. |
| (2) | Excludes the subject property. |
Operating History and Underwritten Net Cash Flow
| 2012 | 2013 | 2014 | TTM(1) | Underwritten | Per Room | %(2) | |
| Occupancy | 90.1% | 90.2% | 89.9% | 88.5% | 88.5% | ||
| ADR | $124.74 | $133.29 | $140.70 | $146.04 | $146.04 | ||
| RevPAR | $112.38 | $120.20 | $126.44 | $129.27 | $129.27 | ||
| Room Revenue | $8,267,249 | $8,818,523 | $9,276,563 | $9,484,221 | $9,484,232 | $47,185 | 78.8% |
| Food and Beverage | 1,934,081 | 2,036,842 | 2,279,372 | 2,427,578 | 2,427,578 | 12,078 | 20.2% |
| Other Departmental Revenues | 127,901 | 134,232 | 107,544 | 119,769 | 119,769 | 596 | 1.0% |
| Total Revenue | $10,329,231 | $10,989,597 | $11,663,479 | $12,031,568 | $12,031,579 | $59,859 | 100.0% |
| Room Expense | 1,894,802 | 1,904,982 | 1,921,279 | 1,844,424 | 1,844,399 | 9,176 | 19.4% |
| Food and Beverage Expense | 1,613,037 | 1,588,824 | 1,628,422 | 1,742,265 | 1,742,273 | 8,668 | 71.8% |
| Other Departmental Expenses | 91,900 | 65,690 | 71,967 | 172,329 | 172,467 | 858 | 144.0% |
| Departmental Expenses | $3,599,739 | $3,559,496 | $3,621,668 | $3,759,018 | $3,759,139 | $18,702 | 31.2% |
| Departmental Profit | $6,729,492 | $7,430,101 | $8,041,811 | $8,272,550 | $8,272,440 | $41,156 | 68.8% |
| Operating Expenses | $3,541,727 | $3,726,646 | $4,102,274 | $4,112,537 | $4,222,495 | $21,007 | 35.1% |
| Gross Operating Profit | $3,187,765 | $3,703,455 | $3,939,537 | $4,160,013 | $4,049,945 | $20,149 | 33.7% |
| Fixed Expenses | 873,658 | 728,605 | 718,003 | 740,870 | 921,506 | 4,585 | 7.7% |
| Net Operating Income | $2,314,107 | $2,974,850 | $3,221,534 | $3,419,143 | $3,128,439 | $15,564 | 26.0% |
| FF&E | 0 | 0 | 466,539 | 435,797 | 481,263 | 2,394 | 4.0% |
| Net Cash Flow | $2,314,107 | $2,974,850 | $2,754,995 | $2,983,346 | $2,647,176 | $13,170 | 22.0% |
| (1) | The TTM column represent the trailing twelve month period ending August 31, 2015. |
| (2) | % column represents percent of Total Revenue except for Room Expense, Food and Beverage Expense and Other Departmental Expenses, which are based on their corresponding revenue line items. |
THE INFORMATION IN THIS COLLATERAL TERM SHEET IS NOT COMPLETE AND MAY BE AMENDED PRIOR TO THE TIME OF SALE. THIS TERM SHEET IS NOT AN OFFER TO SELL THESE SECURITIES AND IT IS NOT A SOLICITATION OF AN OFFER TO BUY THESE SECURITIES IN ANY JURISDICTION WHERE THE OFFER OR SALE IS NOT PERMITTED.
| 121 |
(THIS PAGE INTENTIONALLY LEFT BLANK)
| 122 |
Mortgage Loan No. 12 — Sheraton Lincoln Harbor Hotel
| Mortgage Loan Information | Property Information | |||
| Mortgage Loan Seller: | RMF | Single Asset / Portfolio: | Single Asset | |
| Original Principal Balance(1): | $20,000,000 | Title: | Fee | |
| Cut-off Date Principal Balance(1): | $20,000,000 | Property Type - Subtype: | Hotel – Full Service | |
| % of Pool by IPB: | 2.1% | Net Rentable Area (Rooms)(2): | 358 | |
| Loan Purpose: | Refinance | Location: | Weehawken, NJ | |
| Borrower: | River-PW Hotel Limited Partnership | Year Built / Renovated: | 1991, 1999 / 2009-2010, 2015 | |
| Sponsor: | Hartz Financial Corp. | Occupancy / ADR / RevPAR: | 83.9% / $197.32 / $165.59 | |
| Occupancy / ADR / RevPAR Date: | 7/31/2015 | |||
| Number of Tenants: | N/A | |||
| Interest Rate: | 4.9900% | 2012 NOI: | $6,758,257 | |
| Note Date: | 10/1/2015 | 2013 NOI: | $7,517,525 | |
| Maturity Date: | 10/6/2025 | 2014 NOI: | $8,831,821 | |
| Interest-only Period: | 96 months | TTM NOI(3): | $8,649,021 | |
| Original Term: | 120 months | UW Occupancy / ADR / RevPAR: | 83.9% / $197.37 / $165.59 | |
| Original Amortization: | 360 months | UW Revenues(2): | $22,491,786 | |
| Amortization Type: | IO-Balloon | UW Expenses(2): | $13,268,309 | |
| Call Protection: | L(28),Def(88),O(4) | UW NOI(2): | $9,223,477 | |
| Lockbox: | Hard | UW NCF(2): | $8,211,347 | |
| Additional Debt(1): | Yes | Appraised Value / Per Room(4): | $128,000,000 / $357,542 | |
| Additional Debt Balance(1): | $60,000,000 | Appraisal Date: | 8/20/2015 | |
| Additional Debt Type(1): | Pari Passu | |||
| Additional Future Debt Permitted: | No |
| Escrows and Reserves | Financial Information(1) | |||||
| Initial | Monthly | Initial Cap | Cut-off Date Loan / Room(2): | $223,464 | ||
| Taxes: | $0 | Springing(5) | N/A | Maturity Date Loan / Room(2): | $217,043 | |
| Insurance: | $0 | Springing(5) | N/A | Cut-off Date LTV(4): | 62.5% | |
| FF&E: | $0 | $86,891(6) | N/A | Maturity Date LTV(4): | 60.7% | |
| Additional Room Reserve(7): | $1,700,000 | $0 | N/A | UW NCF DSCR(2): | 1.60x | |
| UW NOI Debt Yield(2): | 11.5% | |||||
Sources and Uses
| Sources | Proceeds | % of Total | Uses | Proceeds | % of Total | |
| Mortgage Loan(1) | $80,000,000 | 100.0% | Payoff Existing Debt | $58,865,158 | 73.6% | |
| Return of Equity | 18,740,653 | 23.4 | ||||
| Upfront Reserves | 1,700,000 | 2.1 | ||||
| Closing Costs | 694,189 | 0.9 | ||||
| Total Sources | $80,000,000 | 100.0% | Total Uses | $80,000,000 | 100.0% |
| (1) | The Sheraton Lincoln Harbor Hotel loan is part of a larger split whole loan evidenced by twopari passu notes, with an aggregate original principal balance of $80.0 million. The financial information presented in the chart above reflects the cut-off date balance of the $80.0 million Sheraton Lincoln Harbor Hotel Whole Loan. |
| (2) | The property currently has 343 rooms. During the first quarter of 2016, the borrower plans to reconfigure the administrative and meeting space and use that space to add an additional 15 rooms, bringing the room count of the property to 358 rooms. The per unit and underwritten metrics are based on 358 rooms. $1,700,000 was reserved for the additional rooms and renovations are expected to be complete in February 2016. The underwritten metrics include the additional fifteen guestrooms. |
| (3) | Represents trailing twelve months ending July 31, 2015. |
THE INFORMATION IN THIS COLLATERAL TERM SHEET IS NOT COMPLETE AND MAY BE AMENDED PRIOR TO THE TIME OF SALE. THIS TERM SHEET IS NOT AN OFFER TO SELL THESE SECURITIES AND IT IS NOT A SOLICITATION OF AN OFFER TO BUY THESE SECURITIES IN ANY JURISDICTION WHERE THE OFFER OR SALE IS NOT PERMITTED.
| 123 |
Mortgage Loan No. 12 — Sheraton Lincoln Harbor Hotel
| (4) | The appraiser concluded an “as-complete” appraised value of $130,000,000 with an “as-complete” date of August 20, 2015 (assuming the completion of the 15-room expansion) and an “as-stabilized” appraised value of $143,000,000 with an “as-stabilized” date of August 20, 2017. The Cut-Off Date LTV and Maturity Date LTV as based on the “as-stabilized” appraised value are 55.9% and 54.3%, respectively. |
| (5) | Monthly reserves for real estate taxes and insurance premiums are required only during the occurrence and continuation of a Cash Sweep Event. A “Cash Sweep Event” will commence upon the earliest of (i) the occurrence of an event of default; (ii) the occurrence of a bankruptcy action of the borrower, the guarantor or the property manager that has not been dismissed within 60 days; or (iii) a DSCR Trigger Event. A “DSCR Trigger Event” occurs upon any date the amortizing debt service coverage ratio based on the trailing 12-month period immediately preceding the date of such determination is less than 1.10x. |
| (6) | Monthly replacement reserves are required in an amount equal to 4.0% of operating income for the calendar month that is two months prior to when the deposit is to be made (initially estimated to be $86,891). |
| (7) | The upfront Additional Room Revenue Reserve in the amount of $1,700,000 will be used for the construction and addition of 15 rooms on the second floor of the Sheraton Lincoln Harbor Hotel property. Within one year of the origination date, the borrower is required to either (i) complete all additional rooms or (ii) restore the property to its original condition. |
The Loan. The Sheraton Lincoln Harbor Hotel loan, which is part of a larger split whole loan, is a first mortgage loan secured by the borrower’s fee interest in a 358-room full service hotel property located in Weehawken, New Jersey. The whole loan has an outstanding principal balance of $80.0 million (“Sheraton Lincoln Harbor Hotel Whole Loan”) as of the cut-off date, which is comprised of twopari passunotes, Note A-1 and Note A-2. Note A-2 has an outstanding principal balance as of the cut-off date of $20.0 million and is being contributed to the CSAIL 2016-C5 Commercial Mortgage Trust. Note A-1 has an outstanding principal balance as of the cut-off date of $60.0 million and was contributed to the WFCM 2015-C31 Commercial Mortgage Trust. The Sheraton Lincoln Harbor Hotel Whole Loan has a 10-year term and will amortize on a 30-year schedule, after an eight-year interest-only period.
Whole Loan Note Summary
| Original Balance | Cut-off Date Balance | Note Holder | Note in Controlling Securitization | |
| Note A-1 | $60,000,000 | $60,000,000 | WFCM 2015-C31 | Yes |
| Note A-2 | 20,000,000 | 20,000,000 | CSAIL 2016-C5 | No |
| Total | $80,000,000 | $80,000,000 |
The Borrower. The borrowing entity for the loan is River-PW Hotel Limited Partnership, a New Jersey limited partnership and special purpose entity.
The Sponsor. The loan’s sponsor and nonrecourse carve-out guarantor is Hartz Financial Corp. Hartz Financial Corp., is a New Jersey corporation formed in 1997 and is a wholly-owned subsidiary of Hartz Mountain Development Corp. (“HMDC”). HMDC is wholly-owned by Hartz Mountain Industries, Inc., which is indirectly wholly-owned by The Hartz Group, Inc. The Hartz Group, Inc., is a privately held enterprise with interests in real estate, oil, gas and financial management. The Hartz real estate portfolio includes approximately 185 properties comprised of over 35 million SF and 300 acres of land in the Northern New Jersey/New York area. The Hartz real estate portfolio is managed through its in-house property and asset management team and includes corporate offices, warehouse and distribution facilities, hotels, single and multi-family developments, retail centers, movie theaters, restaurants and land.
The Property. The property is a 10-story, 358-room full service, Sheraton hotel property located in Weehawken, New Jersey. The property was originally constructed in 1991. In 1999, the West Tower was constructed and the hotel was converted to the Sheraton flag. The buildings are interconnected, and the West Tower is accessible via an enclosed corridor from the south side of the Main Tower. The ground level of the Main Tower accommodates the lobby, registration desk, Sheraton Link (business center), a restaurant, lounge, kitchen, fitness center, indoor pool, meeting space, and administrative areas.
Guestrooms are located on levels two through ten of each building and are configured as suites that feature floor plans with sitting areas in addition to the bedroom. Guestrooms offer one or two beds, dressers, sleeper-sofa, coffee table, upholstered armchair, ottoman, desk and chair, end table, and lamps. In-room amenities include a built-in hair dryer, iron and ironing board, two-line phone, safe, microwave, mini-refrigerator, coffee maker, wireless high-speed Internet access, as well as a 32” or 37” flat panel television. The bathrooms feature a tub and shower combination with a separate vanity area. Prior to the completion of the current
THE INFORMATION IN THIS COLLATERAL TERM SHEET IS NOT COMPLETE AND MAY BE AMENDED PRIOR TO THE TIME OF SALE. THIS TERM SHEET IS NOT AN OFFER TO SELL THESE SECURITIES AND IT IS NOT A SOLICITATION OF AN OFFER TO BUY THESE SECURITIES IN ANY JURISDICTION WHERE THE OFFER OR SALE IS NOT PERMITTED.
| 124 |
Mortgage Loan No. 12 — Sheraton Lincoln Harbor Hotel
planned renovation, the guestroom mix includes 176 king bedrooms, 150 double/double bedrooms, nine executive suites and eight queen bedrooms. The Sheraton Lincoln Harbor Hotel features a Sheraton Club lounge – which extends exclusive access for complimentary breakfast, all-day snacks and beverages, free Wi-Fi, and personalized service to VIP and Club guests and is located on the top floor of the West Tower. Parking is provided on a parcel located adjacent to the property for which there are 202 surface parking spaces resulting in a parking ratio of 0.6 spaces per room. Parking is available to guests on an exclusive basis at the property between the hours of 6:00pm and 8:00am Monday through Friday and at all other times on a non-exclusive basis. The 20-year franchise agreement with The Sheraton, LLC expires on March 16, 2029, with no extension options.
From 2009 to 2010, the property underwent a $13.5 million ($39,359 per room, based on 343 room count) four-phase property improvement plan. The restaurant and lounge recently completed a $500,000 renovation which included the addition of an entrance from the exterior of the hotel as well as two private dining rooms that can seat 80 and 60 people, respectively. The restaurant and lounge is leased to a borrower affiliated entity, Harbor Boulevard Restaurant, L.L.C., with a 50-year lease term expiring on September 26, 2039, with six, eight-year renewal options remaining. In lieu of paying rent, the restaurant contributes $121,252 annually to debt service and also pays an additional charge equal to 4.0% of gross sales for room and banquet services.
A planned renovation budgeted at $1.7 million ($113,333 per room, based on the additional 15 room count) will increase the guestroom count to 358 rooms by converting the existing administrative and meeting rooms on the second floor into fifteen additional guestrooms. The second floor renovations will take place in January and February of 2016, and will include eliminating the second floor meeting space and relocating the administrative offices.
The Market.The property is located in Weehawken, New Jersey, within the greater New York-Newark-Jersey City, NY-NJ-PA metropolitan statistical area. The NY-NJ-PA metropolitan statistical area has an estimated population of approximately 20.1 million. According to the Bureau of Labor Statistics, the unemployment rate for the NY-NJ-PA metropolitan statistical area was 5.6% as of April 2015. In comparison, the unemployment rate in New Jersey was 6.2% and the national unemployment rate was 5.4% for the same period. More specifically, the property is part of the Northern New Jersey region which extends 45 to 55 miles west of Midtown Manhattan in Hudson County. Hudson County benefits from a diverse economic base and convenient accessibility to public transportation into New York City via bus, rail, and waterway services. NJ Transit provides bus and rail service throughout the region and into New York City, with additional rail service provided by Amtrak, Conrail, and the Port Authority Trans Hudson (PATH). The region is also supported by Newark-Liberty International Airport (13.0 miles southwest) which is the sixth largest airport in the world for passenger travel. Top employers within Hudson County primarily consist of financial services firms including UBS Financial Services, Bank of Tokyo Mitsubishi Trust, Insurance Service Office Inc., Goldman Sachs & Co. Inc., Mellon Bank, JP Morgan Chase Bank, and Citigroup Inc. Other top employers are positioned within the education, healthcare, government, distribution, and pharmaceutical sectors.
The property is located along the banks of the Hudson River at the southeast corner of 19th Street and Harbor Boulevard within the Lincoln Harbor neighborhood of Weehawken’s Waterfront district. The Lincoln Harbor neighborhood sits across the river from New York City and is accessible via the Lincoln Tunnel which leads into the city’s Hudson Yards and Garment District to the east. Lincoln Harbor serves as one of two major waterfront developments in Weehawken, which has experienced growth along the western shores of the Hudson River over the past decade. Lincoln Harbor is a 60.0-acre mixed use development opposite midtown Manhattan that contains five office buildings totaling 1.53 million SF completed from 1987 to 1989 and is occupied by UBS and Citigroup. One of the office buildings is being redeveloped as a 227-unit apartment building. Lincoln Harbor also accommodates more than 70,000 SF of retail shops and restaurants, a 245-unit condominium, as well as a public park, 250 slip marina, and a waterfront walkway.
THE INFORMATION IN THIS COLLATERAL TERM SHEET IS NOT COMPLETE AND MAY BE AMENDED PRIOR TO THE TIME OF SALE. THIS TERM SHEET IS NOT AN OFFER TO SELL THESE SECURITIES AND IT IS NOT A SOLICITATION OF AN OFFER TO BUY THESE SECURITIES IN ANY JURISDICTION WHERE THE OFFER OR SALE IS NOT PERMITTED.
| 125 |
Mortgage Loan No. 12 — Sheraton Lincoln Harbor Hotel
Historical Occupancy, ADR, RevPAR(1)
| Competitive Set | Sheraton Lincoln Harbor Hotel(2) | Penetration Factor | |||||||
| Year | Occupancy | ADR | RevPAR | Occupancy | ADR | RevPAR | Occupancy | ADR | RevPAR |
| 2013 | 79.6% | $192.61 | $153.28 | 82.7% | $187.35 | $154.98 | 103.9% | 97.3% | 101.1% |
| 2014 | 79.2% | $200.80 | $159.09 | 84.5% | $196.62 | $166.23 | 106.7% | 97.9% | 104.5% |
| TTM(3) | 77.2% | $203.70 | $157.29 | 83.9% | $197.32 | $165.59 | 108.7% | 96.9% | 105.3% |
| (1) | Source: Third Party Data Provider. The competitive set includes the following hotels: Hilton Meadowlands, Courtyard Jersey City Newport, Hyatt Regency Jersey City, Westin Jersey City, Renaissance Meadowlands Hotel and DoubleTree Hotel Jersey City. |
| (2) | Source: Borrower financials. |
| (3) | Represents the trailing twelve month period ending July 31, 2015. |
Operating History and Underwritten Net Cash Flow
| 2013 | 2014 | TTM(1) | Underwritten(2) | Per Room(2) | %(3) | |
| Occupancy | 82.7% | 84.5% | 83.9% | 83.9% | ||
| ADR | $187.35 | $196.62 | $197.32 | $197.37 | ||
| RevPAR | $154.98 | $166.23 | $165.59 | $165.59 | ||
| Room Revenue | $19,402,459 | $20,868,775 | $20,730,945 | $21,637,645 | $60,440 | 96.2% |
| Food and Beverage | 150,142 | 169,940 | 177,287 | 185,000 | 517 | 0.8% |
| Other Departmental Revenues | 572,799 | 600,566 | 537,619 | 561,010 | 1,567 | 2.5% |
| Restaurant Lease | 91,839 | 91,839 | 91,839 | 108,131 | 302 | 0.5% |
| Total Revenue | $20,217,239 | $21,731,120 | $21,537,690 | $22,491,786 | $62,826 | 100.0% |
| Room Expense | 4,700,785 | 4,695,894 | 4,654,481 | 4,858,052 | 13,570 | 22.5% |
| Food and Beverage Expense | 110,231 | 105,398 | 129,780 | 135,427 | 378 | 73.2% |
| Other Departmental Expenses | 16,861 | 18,093 | 18,864 | 19,685 | 55 | 3.5% |
| Departmental Expenses | $4,827,877 | $4,819,385 | $4,803,125 | $5,013,164 | $14,003 | 22.3% |
| Departmental Profit | $15,389,362 | $16,911,735 | $16,734,564 | $17,478,623 | $48,823 | 77.7% |
| Operating Expenses | $6,376,653 | $6,518,952 | $6,619,767 | $6,728,867 | $18,796 | 29.9% |
| Gross Operating Profit | $9,012,708 | $10,392,783 | $10,114,797 | $10,749,756 | $30,027 | 47.8% |
| Fixed Expenses | 1,495,183 | 1,560,962 | 1,465,777 | 1,526,279 | 4,263 | 6.8% |
| Net Operating Income | $7,517,525 | $8,831,821 | $8,649,021 | $9,223,477 | $25,764 | 41.0% |
| FF&E | 1,020,135 | 1,088,225 | 964,753 | 1,012,130 | 2,827 | 4.5% |
| Net Cash Flow | $6,497,390 | $7,743,596 | $7,684,268 | $8,211,347 | $22,937 | 36.5% |
| (1) | The TTM column represent the trailing twelve month period ending July 31, 2015. |
| (2) | Per room values are based on 358 rooms. During the 1st quarter of 2016, the borrower plans to reconfigure administrative and meeting space and use that space to add an additional 15 rooms bringing room count at the property to 358 rooms. The underwritten metrics are based on 358 rooms. $1,700,000 has been reserved for this renovation and renovations are expected to be complete in February 2016. The underwritten metrics include the additional fifteen guestrooms. |
| (3) | % column represents percent of Total Revenue except for Room Expense, Food and Beverage Expense and Other Departmental Expenses, which is based on their corresponding revenue line items. |
THE INFORMATION IN THIS COLLATERAL TERM SHEET IS NOT COMPLETE AND MAY BE AMENDED PRIOR TO THE TIME OF SALE. THIS TERM SHEET IS NOT AN OFFER TO SELL THESE SECURITIES AND IT IS NOT A SOLICITATION OF AN OFFER TO BUY THESE SECURITIES IN ANY JURISDICTION WHERE THE OFFER OR SALE IS NOT PERMITTED.
| 126 |
Mortgage Loan No. 13 — Windwood Oaks Apartments
| Mortgage Loan Information | Property Information | |||
| Mortgage Loan Seller: | Column | Single Asset / Portfolio: | Single Asset | |
| Original Principal Balance: | $18,750,000 | Title: | Fee | |
| Cut-off Date Principal Balance: | $18,750,000 | Property Type - Subtype: | Multifamily - Garden | |
| % of Pool by IPB: | 2.0% | Net Rentable Area (Units): | 352 | |
| Loan Purpose: | Refinance | Location: | Tampa, FL | |
| Borrower: | Windwood Oaks Tampa Apartments, Ltd. | Year Built / Renovated: | 1985 / N/A | |
| Sponsor: | Ronald I. Eisenberg | Occupancy: | 94.0% | |
| Interest Rate: | 4.8500% | Occupancy Date: | 10/9/2015 | |
| Note Date: | 10/30/2015 | Number of Tenants: | N/A | |
| Maturity Date: | 11/6/2025 | 2012 NOI: | $557,333 | |
| Interest-only Period: | 36 months | 2013 NOI: | $1,122,442 | |
| Original Term: | 120 months | 2014 NOI: | $1,402,990 | |
| Original Amortization: | 360 months | TTM NOI(1)(2): | $1,602,946 | |
| Amortization Type: | IO-Balloon | UW Economic Occupancy: | 94.0% | |
| Call Protection: | L(27),Def(89),O(4) | UW Revenues: | $3,199,024 | |
| Lockbox: | Soft | UW Expenses: | $1,468,555 | |
| Additional Debt: | No | UW NOI(2): | $1,730,469 | |
| Additional Debt Balance: | N/A | UW NCF: | $1,614,309 | |
| Additional Debt Type: | N/A | Appraised Value / Per Unit: | $26,400,000 / $75,000 | |
| Additional Future Debt Permitted: | No | Appraisal Date: | 9/10/2015 |
| Escrows and Reserves | Financial Information | |||||
| Initial | Monthly | Initial Cap | Cut-off Date Loan / Unit: | $53,267 | ||
| Taxes: | $236,367 | $18,684 | N/A | Maturity Date Loan / Unit: | $46,999 | |
| Insurance: | $0 | $11,487 | N/A | Cut-off Date LTV: | 71.0% | |
| Replacement Reserves: | $9,680 | $9,680 | N/A | Maturity Date LTV: | 62.7% | |
| Engineering Reserves: | $527,000 | N/A | N/A | UW NCF DSCR: | 1.36x | |
| UW NOI Debt Yield: | 9.2% |
Sources and Uses
| Sources | Proceeds | % of Total | Uses | Proceeds | % of Total | |
| Mortgage Loan | $18,750,000 | 100.0% | Payoff Existing Debt | $12,223,477 | 65.2% | |
| Return of Equity | 5,443,303 | 28.6 | ||||
| Upfront Reserves | 773,047 | 4.1 | ||||
| Closing Costs | 310,172 | 2.1 | ||||
| Total Sources | $18,750,000 | 100.0% | Total Uses | $18,750,000 | 100.0% |
| (1) | Represents trailing twelve months ending August 31, 2015. |
| (2) | The UW NOI exceeds the TTM NOI due to underwriting the October 2015 rent roll which has rents in place that exceed those of the TTM period. |
THE INFORMATION IN THIS COLLATERAL TERM SHEET IS NOT COMPLETE AND MAY BE AMENDED PRIOR TO THE TIME OF SALE. THIS TERM SHEET IS NOT AN OFFER TO SELL THESE SECURITIES AND IT IS NOT A SOLICITATION OF AN OFFER TO BUY THESE SECURITIES IN ANY JURISDICTION WHERE THE OFFER OR SALE IS NOT PERMITTED.
| 127 |
Mortgage Loan No. 13 — Windwood Oaks Apartments
The Loan. The Windwood Oaks Apartments loan, is an approximately $18.8 million first mortgage loan secured by the fee interest in a 352-unit garden style multifamily property located in Tampa, Florida. The loan has a 10-year term and will amortize on a 30-year schedule after an initial three-year interest-only period.
The Borrower. The borrowing entity for the loan is Windwood Oaks Tampa Apartments, Ltd., a Florida limited partnership and special purpose entity.
The Sponsor. The loan’s sponsor and nonrecourse carve-out guarantor is Ronald I. Eisenberg. Mr. Eisenberg is a real estate professional with over 20 years of real estate experience. Mr. Eisenberg is founder and owner of Ventron Realty Corporation and Ventron Management. The companies were founded in 1993 in Ottawa, Canada. Ventron’s corporate office and finance department is located in Boca Raton, Florida, with an office in Atlanta, Georgia. Ventron Management’s current portfolio consists of over 5,000 multifamily units, with the majority of the portfolio located in Atlanta, Georgia and two properties located in Tampa, Florida.
The Property. The property is a 352-unit garden style multifamily property located in Tampa, Florida that was built in 1985. The property consists of 22 apartment buildings and two clubhouse/office buildings located on approximately 27.9 acres. The property has a total of 615 surface parking spaces, or 1.75 parking spaces per unit. As of October 9, 2015, the property was 94.0% leased.
The property contains 32 studio units (9.1%), 160 one-bedroom units (45.5%) and 160 two-bedroom units (45.5%). Studios average 450 SF, one bedrooms average 650 SF, and two bedrooms average 975 SF, with an overall average unit size of 780 SF. The property’s common amenities include two swimming pools, a clubhouse, a fitness center, a tennis court, a laundry facility, and a business center with Wi-Fi. Each unit is equipped with a refrigerator/freezer, dishwasher, electric range, microwave and garbage disposal. Select units offer washer and dryer connections, screened in patios and balcony areas and extra storage rooms. Apartment units are individually metered for electrical and water/sewer usage. Residents also pay a monthly trash fee.
The property is located on Windwood Oaks Drive, west of North Florida Avenue. Route 41 is an arterial road providing access to Bearss Avenue which connects to I-275. Bearss Avenue and I-275 provides access to Tampa and the neighboring area. The property is located approximately two miles northeast of the University of South Florida and approximately 3.5 miles northeast of Busch Gardens amusement park. Regional access is provided by I-275 which provides access to I-75 and I-4, two major central Florida transportation arteries.
Multifamily Unit Mix (1)
| Unit Type | No. of Units | % of Total | Occupied Units | Occupancy | Average Unit Size (SF) | Average Monthly Rental Rate | Average Monthly Rental Rate PSF | Monthly Market Rental Rate(2) | Monthly Market Rental Rate PSF(2) |
| Studio | 32 | 9.1% | 32 | 100.0% | 450 | $591 | $1.31 | $685 | $1.52 |
| One Bedroom, One Bath | 160 | 45.5 | 152 | 95.0% | 650 | $677 | $1.04 | $792 | $1.22 |
| Two Bedroom, Two Bath | 160 | 45.5 | 147 | 91.9% | 975 | $815 | $0.84 | $928 | $0.95 |
| Total/Wtd. Avg. | 352 | 100.0% | 331 | 94.0% | 780 | $730 | $0.94 | $844 | $1.08 |
| (1) | Based on the underwritten rent roll dated October 9, 2015. |
| (2) | Source: Appraisal. |
THE INFORMATION IN THIS COLLATERAL TERM SHEET IS NOT COMPLETE AND MAY BE AMENDED PRIOR TO THE TIME OF SALE. THIS TERM SHEET IS NOT AN OFFER TO SELL THESE SECURITIES AND IT IS NOT A SOLICITATION OF AN OFFER TO BUY THESE SECURITIES IN ANY JURISDICTION WHERE THE OFFER OR SALE IS NOT PERMITTED.
| 128 |
Mortgage Loan No. 13 — Windwood Oaks Apartments
The Market. The property is located Tampa, Florida in the Tampa-St. Petersburg-Clearwater MSA. According to the appraisal, the neighborhood is projected to have modest population growth over the next five years and as of 2015 the neighborhood had a population of approximately 237,412. Downtown Tampa is located approximately nine miles south of the property. The University of South Florida is located approximately two miles from the property and Busch Gardens amusement park is located within 3.5 miles of the property. About 11% of the area’s private workforce is employed in leisure and hospitality. Tampa International Airport is located approximately 10 miles southwest of the property. Top employers in the area include Baycare Health System, Publix Super Markets, Home Shopping Network, University of South Florida and Tech Data Corp. According to the appraisal, the North Hillsborough submarket reported an average vacancy of 4.4%. According to the appraisal, the downward trend in vacancy is expected to continue and favorable rates of rent growth are expected for this year and after.
The appraiser identified three comparable rental properties, ranging from 192 units to 338 units that were constructed between 1976 and 1985. The competitive set reported a weighted average occupancy of approximately 97.3% with average rents ranging from $753 to $832. Average rents at the property are in-line with the competitive set. The properties in the appraisal’s competitive set are all located in Tampa, Florida within approximately 3.4 miles of the property and are shown in the below table.
Competitive Set Summary(1)
| Property | Year Built | No. of Units | Avg. Unit Size (SF) | Avg. $/ Unit | Occupancy | Distance from Property |
| Windwood Oaks Apartments | 1985 | 352(2) | 780(2) | $730(2) | 94.0%(2) | |
| Park at Lake Magdalene | 1976 | 338 | 792 | $832 | 99.0% | 3.4 miles |
| Park East | 1983 | 192 | 747 | $753 | 96.0% | 2.5 miles |
| The Villages at Turtle Creek | 1985 | 232 | 709 | $759 | 96.0% | 2.3 miles |
| Total/Wtd. Avg.(3) | 762 | 755 | $790 | 97.3% |
| (1) | Source: Appraisal. |
| (2) | Based on rent roll dated October 9, 2015. |
| (3) | Excludes the subject property. |
Historical and Current Occupancy(1)
| 2012 | 2013 | 2014 | Current(2) |
| 76.3% | 93.1% | 94.8% | 94.0% |
| (1) | Source: Historical Occupancy was provided by the sponsor. Occupancies are as of December 31 of each respective year. |
| (2) | Based on the October 2015 underwritten rent roll. |
THE INFORMATION IN THIS COLLATERAL TERM SHEET IS NOT COMPLETE AND MAY BE AMENDED PRIOR TO THE TIME OF SALE. THIS TERM SHEET IS NOT AN OFFER TO SELL THESE SECURITIES AND IT IS NOT A SOLICITATION OF AN OFFER TO BUY THESE SECURITIES IN ANY JURISDICTION WHERE THE OFFER OR SALE IS NOT PERMITTED.
| 129 |
Mortgage Loan No. 13 — Windwood Oaks Apartments
Operating History and Underwritten Net Cash Flow
| 2012 | 2013 | 2014 | TTM(1) | Underwritten | Per Unit | %(2) | |
| Rents in Place(3) | $2,744,020 | $2,701,571 | $2,829,120 | $2,963,828 | $3,104,851 | $8,821 | 90.5% |
| Vacant Income | 0 | 0 | 0 | 0 | 0 | 0 | 0.0% |
| Gross Potential Rent | $2,744,020 | $2,701,571 | $2,829,120 | $2,963,828 | $3,104,851 | $8,821 | 90.5% |
| Total Reimbursements | 204,902 | 231,449 | 266,521 | 333,571 | 325,699 | 925 | 9.5% |
| Net Rental Income | $2,948,922 | $2,933,020 | $3,095,641 | $3,297,399 | $3,430,549 | $9,746 | 100.0% |
| (Vacancy/Collection Loss) (4) | (978,752) | (360,241) | (235,179) | (242,436) | (231,525) | (658) | (6.7%) |
| Effective Gross Income | $1,970,170 | $2,572,779 | $2,860,462 | $3,054,963 | $3,199,024 | $9,088 | 93.3% |
| Total Expenses | $1,412,838 | $1,450,336 | $1,457,473 | $1,452,018 | $1,468,555 | $4,172 | 45.9% |
| Net Operating Income | $557,333 | $1,122,442 | $1,402,990 | $1,602,946 | $1,730,469 | $4,916 | 54.1% |
| Replacement Reserves | 0 | 0 | 0 | 0 | 116,160 | 330 | 3.6% |
| Net Cash Flow | $557,333 | $1,122,442 | $1,402,990 | $1,602,946 | $1,614,309 | $4,586 | 50.5% |
| (1) | The TTM column represents the trailing twelve month period ending August 31, 2015. |
| (2) | % column represents percent of Net Rental Income for all revenue lines and represents percent of Effective Gross Income for the remainder of fields. |
| (3) | Underwritten Rents in Place are based on the October 9, 2015 underwritten rent roll. |
| (4) | Includes vacancy and credit loss for underwriting. |
THE INFORMATION IN THIS COLLATERAL TERM SHEET IS NOT COMPLETE AND MAY BE AMENDED PRIOR TO THE TIME OF SALE. THIS TERM SHEET IS NOT AN OFFER TO SELL THESE SECURITIES AND IT IS NOT A SOLICITATION OF AN OFFER TO BUY THESE SECURITIES IN ANY JURISDICTION WHERE THE OFFER OR SALE IS NOT PERMITTED.
| 130 |
Mortgage Loan No. 14 — Stone Gables Apartments
| Mortgage Loan Information | Property Information | |||
| Mortgage Loan Seller: | BNY Mellon | Single Asset / Portfolio: | Single Asset | |
| Original Principal Balance: | $18,000,000 | Title: | Fee | |
| Cut-off Date Principal Balance: | $17,938,143 | Property Type - Subtype: | Multifamily – Garden | |
| % of Pool by IPB: | 1.9% | Net Rentable Area (Units): | 192 | |
| Loan Purpose: | Refinance | Location: | Raeford, NC | |
| Borrower: | Stone Gables North Carolina, LP | Year Built / Renovated: | 2013 / N/A | |
| Sponsor: | Benny Tenenbaum | Occupancy: | 95.8% | |
| Interest Rate: | 4.8700% | Occupancy Date: | 10/1/2015 | |
| Note Date: | 10/21/2015 | Number of Tenants: | N/A | |
| Maturity Date: | 11/6/2025 | 2012 NOI(2): | N/A | |
| Interest-only Period: | 0 months | 2013 NOI(2): | N/A | |
| Original Term: | 120 months | 2014 NOI: | $822,598 | |
| Original Amortization: | 360 months | T4 NOI(3): | $1,474,176 | |
| Amortization Type: | Balloon | UW Economic Occupancy: | 92.0% | |
| Call Protection: | L(27),Def(89),O(4) | UW Revenues: | $2,380,146 | |
| Lockbox(1): | Springing | UW Expenses: | $864,169 | |
| Additional Debt: | No | UW NOI: | $1,515,977 | |
| Additional Debt Balance: | N/A | UW NCF: | $1,477,577 | |
| Additional Debt Type: | N/A | Appraised Value / Per Unit: | $24,100,000 / $125,521 | |
| Additional Future Debt Permitted: | No | Appraisal Date: | 9/3/2015 |
| Escrows and Reserves | Financial Information | |||||
| Initial | Monthly | Initial Cap | Cut-off Date Loan / Unit: | $93,428 | ||
| Taxes: | $39,168 | $13,056 | N/A | Maturity Date Loan / Unit: | $76,752 | |
| Insurance: | $16,376 | $2,729 | N/A | Cut-off Date LTV: | 74.4% | |
| Replacement Reserve: | $0 | $3,200 | N/A | Maturity Date LTV: | 61.1% | |
| UW NCF DSCR: | 1.29x | |||||
| UW NOI Debt Yield: | 8.5% |
Sources and Uses
| Sources | Proceeds | % of Total | Uses | Proceeds | % of Total | |
| Mortgage Loan | $18,000,000 | 100.0% | Payoff Existing Debt | $17,003,370 | 94.5% | |
| Closing Costs | 120,352 | 0.7 | ||||
| Upfront Reserves | 55,544 | 0.3 | ||||
| Return of Equity | 820,734 | 4.6 | ||||
| Total Sources | $18,000,000 | 100.0% | Total Uses | $18,000,000 | 100.0% |
| (1) | Upon the occurrence of a trigger event, the borrower will be required to establish a lockbox account. A cash trap period will begin upon (i) the occurrence of an event of default or (ii) the debt service coverage ratio being less than 1.05x at the end of any quarter. |
| (2) | The property was newly constructed in 2013. Historical financials were not available. |
| (3) | Represents the trailing four month period ending July 31, 2015, annualized. |
THE INFORMATION IN THIS COLLATERAL TERM SHEET IS NOT COMPLETE AND MAY BE AMENDED PRIOR TO THE TIME OF SALE. THIS TERM SHEET IS NOT AN OFFER TO SELL THESE SECURITIES AND IT IS NOT A SOLICITATION OF AN OFFER TO BUY THESE SECURITIES IN ANY JURISDICTION WHERE THE OFFER OR SALE IS NOT PERMITTED.
| 131 |
Mortgage Loan No. 14 — Stone Gables Apartments
The Loan. The Stone Gables Apartments loan is an $18.0 million first mortgage loan secured by the fee interest in a 192-unit garden-style multifamily property located in Raeford, North Carolina. The loan has a 10-year term and will amortize on a 30-year schedule.
The Borrower.The borrowing entity for the loan is Stone Gables North Carolina, LP, a North Carolina limited partnership and special purpose entity.
The Sponsor. The loan’s sponsor and non-recourse carve-out guarantor is Benny Tenenbaum. The sponsor owns nine multifamily assets in New York, Texas, Georgia, North Carolina and Toronto, Canada containing more than 1,800 multifamily units.
The Property. The property is a class A garden-style apartment complex consisting of eight 3-story residential buildings, a leasing office, a pool house, and ten detached garage buildings. Stone Gables Apartments opened in October 2013 and as of October 1, 2015, was 95.8% occupied.
The property features 192 units including 48 one-bedrooms (25.0% of total units), 48 1,102 SF two-bedrooms (25.0% of total units), 48 1,137 SF two-bedrooms (25.0% of total units) and 48 three-bedrooms (25.0% of total units). Property amenities include a fitness center, a salt-water swimming pool with sundeck and cabana, a clubhouse, a business center, a tanning booth, a playground, a pet park, a grilling cabana, a volleyball court, and gated access. All unit kitchens include a full energy-efficient appliance package including an electric range and oven, a dishwasher and a built-in microwave oven. Additional unit amenities include granite countertops, walk-in closets, garden tubs, patios or balconies (all first floor units and select upper floor units), security alarms, washer and dryer connections, and pre-wiring for cable TV and internet. The property has a total of 365 parking spaces, or 1.9 spaces per unit.
Multifamily Unit Mix(1)
| Unit Type | No. of Units | % of Total | Occupied Units | Occupancy | Average Unit Size (SF) | Average Monthly Rental Rate | Average Monthly Rental Rate PSF | Monthly Market Rental Rate(2) | Monthly Market Rental Rate PSF(2) |
| 1 BD / 1 BA | 48 | 25.0% | 48 | 100.0% | 806 | $864 | $1.07 | $825 | $1.02 |
| 2 BD / 2 BA | 48 | 25.0 | 48 | 100.0 | 1,102 | $976 | $0.89 | $975 | $0.88 |
| 2 BD / 2 BA | 48 | 25.0 | 46 | 95.8 | 1,137 | $1,037 | $0.91 | $1,025 | $0.90 |
| 3 BD / 2 BA | 48 | 25.0 | 42 | 87.5 | 1,252 | $1,217 | $0.97 | $1,150 | $0.92 |
| Total/Wtd. Avg. | 192 | 100.0% | 184 | 95.8% | 1,074 | $1,017 | $0.96 | $1,006 | $0.95 |
| (1) | Based on the underwritten rent roll. |
| (2) | Source: Appraisal. |
The Market.The property is located in the northeastern portion of Raeford in the Fayetteville metropolitan statistical area (“MSA”), approximately 8 miles northwest of the Raeford central business district (“CBD”) and 13 miles southwest of the Fayetteville CBD. Raeford is located in close proximity to U.S. Highway 401 and U.S. Business Highway 401. The Fayetteville MSA’s economy is influenced by Fort Bragg and Pope Air Force Base— two large U.S. military installations with an aggregate acreage of more than 160,000. Fort Bragg houses the 82nd Airborne Division and the XVIII Airborne Corps of the U.S. Army. The two bases employ approximately 50,000 military personnel and 10,000 civilians. According to the appraisal, Pope Air Force Base will be terminating operations in Fayetteville but will become an Army airfield and functional part of local military operations. The appraiser noted that, for multifamily properties, the second quarter 2015 vacancy rate for the Fayetteville MSA was 10.4%, which represents a 1.1% improvement from the previous quarter, and the second quarter 2015 asking rent for the Fayetteville MSA represents 0.2% growth from the previous quarter.
THE INFORMATION IN THIS COLLATERAL TERM SHEET IS NOT COMPLETE AND MAY BE AMENDED PRIOR TO THE TIME OF SALE. THIS TERM SHEET IS NOT AN OFFER TO SELL THESE SECURITIES AND IT IS NOT A SOLICITATION OF AN OFFER TO BUY THESE SECURITIES IN ANY JURISDICTION WHERE THE OFFER OR SALE IS NOT PERMITTED.
| 132 |
Mortgage Loan No. 14 — Stone Gables Apartments
Competitive Set Summary(1)
| Property | Year Built | No. of Units | Avg. Unit Size (SF) | Avg. $/ Unit | Occupancy | Distance from Property |
| Stone Gables Apartments | 2013 | 192(2) | 1,074(2) | $1,017(2) | 96%(2) | |
| West Park | 2012 | 288 | 1,090 | $1,009 | 92% | 3.0 miles |
| Addison Ridge | 2014 | 211 | 1,110 | $1,139 | 94% | 9.0 miles |
| Raeford Crossing | 2012 | 291 | 1,051 | $815 | 92% | 7.0 miles |
| The Grove at Park Place | 2013 | 188 | 1,115 | $917 | 90% | 10.0 miles |
| Stone Ridge | 2008 | 216 | 1,147 | $859 | 93% | 7.0 miles |
| Total/Wtd. Avg.(3) | 1,194 | 1,098 | $943 | 92% |
| (1) | Source: Appraisal. |
| (2) | Based on the underwritten rent roll. |
| (3) | Excludes the subject property. |
Historical and Current Occupancy(1)
| 2013 | 2014(2) | Current(3) |
| N/A | 74.9% | 95.8% |
| (1) | The property was newly constructed in 2013. Historical occupancies were not available. |
| (2) | Source: 2014 occupancies reflect the average occupancy for the indicated year as provided by the borrower. |
| (3) | Based on the underwritten rent roll. |
Operating History and Underwritten Net Cash Flow(1)
| 2014 | T4 Annualized(2) | Underwritten | Per Unit | %(3) | |
| Rents in Place | $1,537,878 | $2,252,337 | $2,245,584 | $11,696 | 95.4% |
| Vacant Income | 731,048 | 100,209 | 107,400 | 559 | 4.6% |
| Gross Potential Rent | $2,268,926 | $2,352,546 | $2,352,984 | $12,255 | 100.0% |
| Total Reimbursements | 0 | 0 | 0 | 0 | 0.0% |
| Net Rental Income | $2,268,926 | $2,352,546 | $2,352,984 | $12,255 | 100.0% |
| (Vacancy/Collection Loss) | (789,803) | (158,265) | (188,337) | (981) | (8.0%) |
| Other Income | 114,511 | 176,598 | 215,499 | 1,122 | 9.2% |
| Effective Gross Income | $1,593,634 | $2,370,879 | $2,380,146 | $12,397 | 101.2% |
| Total Expenses | $771,036 | $896,703 | $864,169 | $4,501 | 36.3% |
| Net Operating Income | $822,598 | $1,474,176 | $1,515,977 | $7,896 | 63.7% |
| Replacement Reserves | 0 | 0 | 38,400 | 200 | 1.6% |
| Net Cash Flow | $822,598 | $1,474,176 | $1,477,577 | $7,696 | 62.1% |
| (1) | The property was newly constructed in 2013. Additional historical financials were not available. |
| (2) | Represents the trailing four month period ending July 31, 2015, annualized. |
| (3) | % column represents percent of Net Rental Income for all revenue lines and represents percent of Effective Gross Income for the remainder of fields. |
THE INFORMATION IN THIS COLLATERAL TERM SHEET IS NOT COMPLETE AND MAY BE AMENDED PRIOR TO THE TIME OF SALE. THIS TERM SHEET IS NOT AN OFFER TO SELL THESE SECURITIES AND IT IS NOT A SOLICITATION OF AN OFFER TO BUY THESE SECURITIES IN ANY JURISDICTION WHERE THE OFFER OR SALE IS NOT PERMITTED.
| 133 |
(THIS PAGE INTENTIONALLY LEFT BLANK)
| 134 |
Mortgage Loan No. 15 — Madison Park
| Mortgage Loan Information | Property Information | |||
| Mortgage Loan Seller: | BNY Mellon | Single Asset / Portfolio: | Single Asset | |
| Original Principal Balance: | $17,900,000 | Title(2): | Leasehold | |
| Cut-off Date Principal Balance: | $17,900,000 | Property Type - Subtype: | Office-Office/Retail | |
| % of Pool by IPB: | 1.9% | Net Rentable Area (SF): | 92,784 | |
| Loan Purpose: | Refinance | Location: | Torrance, CA | |
| Borrower: | JAS Madison I LLC | Year Built / Renovated: | 1988 / N/A | |
| Sponsor: | James A. Smith | Occupancy: | 95.7% | |
| Interest Rate: | 4.6800% | Occupancy Date: | 6/5/2015 | |
| Note Date: | 7/29/2015 | Number of Tenants: | 28 | |
| Maturity Date: | 8/6/2025 | 2012 NOI: | $1,775,474 | |
| Interest-only Period: | 24 months | 2013 NOI: | $1,653,546 | |
| Original Term: | 120 months | 2014 NOI: | $1,766,089 | |
| Original Amortization: | 360 months | TTM NOI(3): | $1,743,208 | |
| Amortization Type: | IO-Balloon | UW Economic Occupancy: | 93.0% | |
| Call Protection: | L(30),Def(86),O(4) | UW Revenues: | $3,245,844 | |
| Lockbox(1): | Springing | UW Expenses: | $1,473,321 | |
| Additional Debt: | No | UW NOI: | $1,772,523 | |
| Additional Debt Balance: | N/A | UW NCF: | $1,768,588 | |
| Additional Debt Type: | N/A | Appraised Value / Per SF: | $27,000,000 / $291 | |
| Additional Future Debt Permitted: | No | Appraisal Date: | 5/18/2015 | |
| Escrows and Reserves | Financial Information | |||||
| Initial | Monthly | Initial Cap | Cut-off Date Loan / SF: | $193 | ||
| Taxes: | $80,445 | $26,815 | N/A | Maturity Date Loan / SF: | $166 | |
| Insurance: | $3,077 | $3,077 | N/A | Cut-off Date LTV: | 66.3% | |
| Replacement Reserves(4): | $239,000 | Springing | $239,000 | Maturity Date LTV: | 56.9% | |
| TI/LC(5): | $650,000 | Springing | $400,000 | UW NCF DSCR(7): | 1.59x | |
| Environmental(6): | $31,250 | $0 | N/A | UW NOI Debt Yield: | 9.9% | |
| Ground Rent Reserve: | $46,667 | Springing | $46,667 | |||
| Engineering Reserve: | $11,000 | N/A | N/A | |||
Sources and Uses
| Sources | Proceeds | % of Total | Uses | Proceeds | % of Total | |
| Mortgage Loan | $17,900,000 | 100.0% | Payoff Existing Debt | $16,318,516 | 91.2% | |
| Upfront Reserves | 1,061,439 | 5.9 | ||||
| Closing Costs | 478,662 | 2.7 | ||||
| Return of Equity | 41,383 | 0.2 | ||||
| Total Sources | $17,900,000 | 100.0% | Total Uses | $17,900,000 | 100.0% |
| (1) | A hard lockbox and in place cash management will be triggered upon the occurrence of (i) an event of default, until the event of default is waived or cured or (ii) the failure by the borrower to maintain a debt service coverage ratio of at least 1.20x for two consecutive calendar quarters (based on amortizing debt service payments), until such time as the debt service coverage ratio is at least 1.20x for two consecutive calendar quarters. |
| (2) | The property is subject to a ground lease with the City of Torrance, which expires on February 8, 2054. |
| (3) | Represents the trailing twelve months ending May 31, 2015. |
| (4) | The borrower is required to make monthly deposits of $2,320 at any time that the balance in the replacement reserve is less than $50,000, until such time as the amount on deposit reaches a cap of $239,000. |
| (5) | The borrower is required to make monthly deposits of $10,000 at any time that the balance in the TI/LC reserve is less than $250,000, until such time as the amount on deposit reaches a cap of $400,000. |
THE INFORMATION IN THIS COLLATERAL TERM SHEET IS NOT COMPLETE AND MAY BE AMENDED PRIOR TO THE TIME OF SALE. THIS TERM SHEET IS NOT AN OFFER TO SELL THESE SECURITIES AND IT IS NOT A SOLICITATION OF AN OFFER TO BUY THESE SECURITIES IN ANY JURISDICTION WHERE THE OFFER OR SALE IS NOT PERMITTED.
| 135 |
Mortgage Loan No. 15 — Madison Park
| (6) | The upfront deposit of $31,250 is 125% of the estimated remediation costs, to be applied to (i) the installation of a vapor mitigation system at an estimated cost of $15,792; (ii) an annual operation and maintenance program to monitor the level of PERC at the property at an estimated cost of $5,000 ($500 per year for the entire loan term) and (iii) ongoing sampling and reporting on the levels of PERC at the property at an estimated cost of $4,200. |
| (7) | Based on amortizing debt service payments. Based on the current interest only payments, UW NOI DSCR and UW NCF DSCR are 2.09x and 2.08x, respectively. |
The Loan. The Madison Park loan is a $17.9 million first mortgage loan secured by the leasehold interest in a 92,784 SF office and retail center located in Torrance, California. The loan has a 10-year term and will amortize on a 30-year schedule after a two-year interest only period.
The Borrower.The borrowing entity for the loan is JAS Madison I LLC, a Delaware limited liability company and special purpose entity.
The Sponsor. The loan’s sponsor and nonrecourse carve-out guarantor is James A. Smith. James A Smith is the founder and director of Ultra Wheel Company (“Ultra Wheel”), a U.S. aftermarket wheel manufacturer that engineers, designs, produces, sells, and distributes its products. Ultra Wheel was founded in 1984 and in 2014 reported approximately $60 million in annual revenues.
The Property.The property is a 92,784 SF office and retail center located in Torrance, California. The collateral is comprised of a leasehold interest in a 46,601 SF retail center and a 46,183 SF medical office building. The property is located approximately 24 miles southwest of downtown Los Angeles. The property is located adjacent to Rancho Palos Verdes, Rolling Hills Estates, and Palos Verdes Estates within Los Angeles County.
The property’s tenancy consists of 28 distinct tenants at a weighted average in-place rent of $32.90 PSF. As of June 5, 2015, the property was 95.7% occupied by 12 medical office tenants, with a weighted average in-place rent of $38.12 PSF, and 15 retail tenants, with a weighted average in-place rent of $26.82 PSF (excluding Telecom Partners GP DBA ATS, which takes up no square footage but pays annual rent of $18,084). The largest tenant at the property, The Regents of the University of California, accounts for 12.3% of the net rentable area and has been a tenant at the property since 2012.
The Market. The property is located in Torrance, California within Los Angeles County. Torrance is considered to be suburban with commercial, industrial, office and residential uses. According to a third party market research firm, as of the end of 2014, there was 1.7 million SF of office space in the Torrance submarket, with no new construction completed in 2014. The office vacancy rate as of the first quarter 2015 was 7.4%, with no new construction completed in that same period. The Torrance submarket retail vacancy rate in the first quarter 2015 was 2.6%.
Medical Office Competitive Set Summary (1)
| Property | Year Built / Renovated | Total GLA (SF) | Est. Sales PSF | Est. Occ. | Proximity (miles) |
| Madison Park | 1988 | 46,183(2) | $215 | 100%(2) | |
| Los Angeles Medical Center | 1995 | 31,787 | $236 | 87% | 17.6 |
| Batavia Woods Medical Center | 1980 | 26,345 | $262 | 72% | 28.0 |
| Brookshire Medical Building | 1970 | 56,121 | $201 | 77% | 15.4 |
| Thatcher Medical Building | 1963 | 73,564 | $294 | 82% | 26.6 |
| Medical Building | 1941 | 10,500 | $207 | 100% | 17.9 |
| (1) | Source: Appraisal. |
| (2) | Based on the underwritten rent roll. |
THE INFORMATION IN THIS COLLATERAL TERM SHEET IS NOT COMPLETE AND MAY BE AMENDED PRIOR TO THE TIME OF SALE. THIS TERM SHEET IS NOT AN OFFER TO SELL THESE SECURITIES AND IT IS NOT A SOLICITATION OF AN OFFER TO BUY THESE SECURITIES IN ANY JURISDICTION WHERE THE OFFER OR SALE IS NOT PERMITTED.
| 136 |
Mortgage Loan No. 15 — Madison Park
Retail Competitive Set Summary (1)
| Property | Year Built / Renovated | Total GLA (SF) | Est. Sales PSF | Est. Occ. | Proximity (miles) | Anchor Tenants |
| Madison Park | 1988 | 46,601(2) | $350 | 92%(2) | NAP | |
| The Village Center | 1972 | 31,153 | $353 | 95% | 0.7 | NAP |
| 22929 Hawthorne Blvd | 1976 | 23,866 | $384 | 100% | 1.2 | NAP |
| Pacific Plaza | 1992 | 23,438 | $454 | 100% | 1.7 | Subway, H&R Block, The UPS Store |
| 20715-20725 Hawthorne Blvd | 1973 | 11,050 | $462 | 100% | 2.7 | NAP |
| The Carpenter Village | 1979 | 31,100 | $370 | 100% | 1.5 | American Red Cross |
| (1) | Source: Appraisal. |
| (2) | Based on the underwritten rent roll. |
Historical and Current Occupancy(1)
| 2011 | 2012 | 2013 | 2014 | Current(2) |
| 95.0% | 97.4% | 95.3% | 98.9% | 95.7% |
| (1) | Source: Historical Occupancies reflect the average occupancy for the indicated year as provided by the borrower. |
| (2) | Based on the underwritten rent roll. |
Tenant Summary (1)
| Tenant | Ratings Moody’s/S&P/Fitch | Net Rentable Area (SF) | % of Total NRA | Base Rent PSF | Lease Expiration Date |
| The Regents of the University of California | NA / NA / NA | 11,421 | 12.3% | $34.69 | Various(2) |
| KINECTA Federal Credit Union | NA / NA / NA | 8,424 | 9.1% | $33.04 | 4/30/2017 |
| CB Restaurant INC DBA China BF | NA / NA / NA | 6,756 | 7.3% | $20.47 | 5/2/2019 |
| Animal Emergency Referral Center | NA / NA / NA | 6,597 | 7.1% | $23.30 | 11/30/2025 |
| Lisa’s Bon Appetite, INC. | NA / NA / NA | 5,890 | 6.3% | $28.12 | 7/1/2020 |
| Urology Specialists of Southern California | NA / NA / NA | 5,132 | 5.5% | $37.56 | 4/30/2016 |
| Coast Surgery Center, LP | NA / NA / NA | 5,036 | 5.4% | $36.06 | 6/30/2021 |
| Pacific ENDO-Surgical CTR, LP | NA / NA / NA | 4,468 | 4.8% | $41.28 | 1/8/2019 |
| Tomoto, DMD & S Barney DDS | NA / NA / NA | 3,581 | 3.9% | $37.63 | 7/31/2018 |
| SIMIN HASHEMIZADEH | NA / NA / NA | 3,439 | 3.7% | $35.79 | 4/30/2021 |
| (1) | Based on the underwritten rent roll. |
| (2) | The Regents of the University of California leases two suites, with one lease covering 5,891 SF and expiring on November 30, 2022 and the other lease covering 5,530 SF and expiring on June 30, 2024. |
THE INFORMATION IN THIS COLLATERAL TERM SHEET IS NOT COMPLETE AND MAY BE AMENDED PRIOR TO THE TIME OF SALE. THIS TERM SHEET IS NOT AN OFFER TO SELL THESE SECURITIES AND IT IS NOT A SOLICITATION OF AN OFFER TO BUY THESE SECURITIES IN ANY JURISDICTION WHERE THE OFFER OR SALE IS NOT PERMITTED.
| 137 |
Mortgage Loan No. 15 — Madison Park
Lease Rollover Schedule(1)
| Year | Number of Leases Expiring | NRA Expiring | % of NRA Expiring | Base Rent Expiring | % of Base Rent Expiring | Cumulative NRA Expiring | Cumulative % of NRA Expiring | Cumulative Base Rent Expiring | Cumulative % of Base Rent Expiring |
| Vacant | NAP | 3,952 | 4.3% | NAP | NAP | 3,952 | 4.3% | NAP | NAP |
| MTM | 3 | 3,969 | 4.3 | $81,110 | 2.8% | 7,921 | 8.5% | $81,110 | 2.8% |
| 2016 | 2 | 6,436 | 6.9 | 243,203 | 8.3 | 14,357 | 15.5% | $324,313 | 11.1% |
| 2017 | 5 | 16,459 | 17.7 | 554,658 | 19.0 | 30,816 | 33.2% | $878,971 | 30.1% |
| 2018 | 6 | 11,797 | 12.7 | 451,150 | 15.4 | 42,613 | 45.9% | $1,330,121 | 45.5% |
| 2019 | 3 | 12,574 | 13.6 | 370,114 | 12.7 | 55,187 | 59.5% | $1,700,235 | 58.2% |
| 2020 | 5 | 11,104 | 12.0 | 346,720 | 11.9 | 66,291 | 71.4% | $2,046,955 | 70.0% |
| 2021 | 2 | 8,475 | 9.1 | 313,808 | 10.7 | 74,766 | 80.6% | $2,360,762 | 80.8% |
| 2022 | 1 | 5,891 | 6.3 | 220,154 | 7.5 | 80,657 | 86.9% | $2,580,917 | 88.3% |
| 2023 | 0 | 0 | 0.0 | 0 | 0.0 | 80,657 | 86.9% | $2,580,917 | 88.3% |
| 2024 | 1 | 5,530 | 6.0 | 187,965 | 6.4 | 86,187 | 92.9% | $2,768,881 | 94.7% |
| 2025 | 1 | 6,597 | 7.1 | 153,693 | 5.3 | 92,784 | 100.0% | $2,922,574 | 100.0% |
| 2026 & Beyond | 0 | 0 | 0.0 | 0 | 0.0 | 92,784 | 100.0% | $2,922,574 | 100.0% |
| Total | 29 | 92,784 | 100.0% | $2,922,574 | 100.0% |
| (1) | Based on the underwritten rent roll, including rent increases occurring through June 1, 2016. |
Operating History and Underwritten Net Cash Flow
| 2012 | 2013 | 2014 | TTM(1) | Underwritten(2) | PSF | %(3) | |
| Rents in Place | $2,575,952 | $2,661,088 | $2,745,032 | $2,789,030 | $2,922,574 | $31.50 | 84.0% |
| Vacant Income | 0 | 0 | 0 | 0 | 98,800 | 1.06 | 2.8% |
| Gross Potential Rent | $2,575,952 | $2,661,088 | $2,745,032 | $2,789,030 | $3,021,374 | $32.56 | 86.8% |
| Total Reimbursements | 474,908 | 344,835 | 447,558 | 451,520 | 458,667 | 4.94 | 13.2% |
| Net Rental Income | $3,050,860 | $3,005,923 | $3,192,589 | $3,240,550 | $3,480,041 | $37.51 | 100.0% |
| (Vacancy/Collection Loss) | 0 | 0 | 0 | 0 | (244,193) | (2.63) | (7.0%) |
| Other Income | 16,546 | 29,141 | 29,141 | 9,701 | 9,996 | 0.11 | 0.3% |
| Effective Gross Income | $3,067,406 | $3,035,064 | $3,221,730 | $3,250,251 | $3,245,844 | $34.98 | 93.3% |
| Total Expenses | $1,291,932 | $1,381,518 | $1,455,642 | $1,507,043 | $1,473,321 | $15.88 | 45.4% |
| Net Operating Income | $1,775,474 | $1,653,546 | $1,766,089 | $1,743,208 | $1,772,523 | $19.10 | 54.6% |
| Total TI/LC, Capex/RR | 0 | 0 | 0 | 0 | 3,935 | 0.04 | 0.1% |
| Net Cash Flow | $1,775,474 | $1,653,546 | $1,766,089 | $1,743,208 | $1,768,588 | $19.06 | 54.5% |
| (1) | The TTM column represents the trailing twelve month period ending May 31, 2015. |
| (2) | Based on the underwritten rent roll, including rent increases occurring through June 1, 2016. |
| (3) | % column represents percent of Net Rental Income for all revenue lines and represents percent of Effective Gross Income for the remainder of fields. |
THE INFORMATION IN THIS COLLATERAL TERM SHEET IS NOT COMPLETE AND MAY BE AMENDED PRIOR TO THE TIME OF SALE. THIS TERM SHEET IS NOT AN OFFER TO SELL THESE SECURITIES AND IT IS NOT A SOLICITATION OF AN OFFER TO BUY THESE SECURITIES IN ANY JURISDICTION WHERE THE OFFER OR SALE IS NOT PERMITTED.
| 138 |