| FREE WRITING PROSPECTUS | ||
| FILED PURSUANT TO RULE 433 | ||
| REGISTRATION FILE NO.: 333-207361-03 | ||
 | November 1, 2016 |

CSAIL 2016-C7 Commercial Mortgage Trust Free Writing Prospectus Structural and Collateral Term Sheet Credit Suisse Commercial Mortgage Securities Corp.as DepositorCommercial Mortgage Pass-Through Certificates Series 2016-C7 Column Financial, Inc. Benefit Street Partners CRE Finance LLC Silverpeak Real Estate Finance LLCas Sponsors and Mortgage Loan SellersCredit SuisseLead Manager and Sole Bookrunner
THE DEPOSITOR HAS FILED A REGISTRATION STATEMENT (INCLUDING A PROSPECTUS) WITH THE SEC (SEC FILE NO. 333-207361) FOR THE OFFERING TO WHICH THIS COMMUNICATION RELATES. BEFORE YOU INVEST, YOU SHOULD READ THE PROSPECTUS IN THAT REGISTRATION STATEMENT AND OTHER DOCUMENTS THE ISSUER HAS FILED WITH THE SEC FOR MORE COMPLETE INFORMATION ABOUT THE ISSUER AND THIS OFFERING. YOU MAY GET THESE DOCUMENTS FOR FREE BY VISITING EDGAR ON THE SEC WEB SITE ATWWW.SEC.GOV. ALTERNATIVELY, CREDIT SUISSE WILL ARRANGE TO SEND YOU THE PROSPECTUS IF YOU REQUEST IT BY CALLING TOLL FREE 1-800-221-1037.
STATEMENT REGARDING ASSUMPTIONS AS TO
SECURITIES, PRICING ESTIMATES AND OTHER INFORMATION
This material is for your information, and Credit Suisse Securities (USA) LLC (the “Underwriter”) is not soliciting any action based upon it. This material is not to be construed as an offer to sell or the solicitation of any offer to buy any security in any jurisdiction where such an offer or solicitation would be illegal.
Neither this document nor anything contained herein shall form the basis for any contract or commitment whatsoever. The information contained herein is preliminary as of the date hereof. These materials are subject to change, completion or amendment from time to time. The information contained herein will be superseded by similar information delivered to you prior to the time of sale, including as part of the Preliminary Prospectus referred to herein relating to the CSAIL 2016-C7 Commercial Mortgage Trust, Commercial Mortgage Pass-Through Certificates (the “Offering Document”). The information supersedes any such information previously delivered. The information should be reviewed only in conjunction with the entire Offering Document. All of the information contained herein is subject to the same limitations and qualifications contained in the Offering Document. The information contained herein does not contain all relevant information relating to the underlying mortgage loans or mortgaged properties. Such information is described elsewhere in the Offering Document. The information contained herein will be more fully described elsewhere in the Offering Document. The information contained herein should not be viewed as projections, forecasts, predictions or opinions with respect to value. Prior to making any investment decision, prospective investors are strongly urged to read the Offering Document in its entirety. Neither the Securities and Exchange Commission nor any state securities commission has approved or disapproved of these securities or determined if this Free Writing Prospectus is truthful or complete. Any representation to the contrary is a criminal offense.
The attached information contains certain tables and other statistical analyses (the “Computational Materials”) which have been prepared in reliance upon information furnished by the Mortgage Loan Sellers. Numerous assumptions were used in preparing the Computational Materials, which may or may not be reflected herein. As such, no assurance can be given as to the appropriateness of the assumptions used in preparing the Computational Materials; or as to whether the Computational Materials and/or the assumptions upon which they are based reflect present market conditions or future market performance. The Computational Materials should not be construed as either projections or predictions or as legal, tax, financial or accounting advice. You should consult your own counsel, accountant and other advisors as to the legal, tax, business, financial and related aspects of a purchase of these securities. Any weighted average lives, yields and principal payment periods shown in the Computational Materials are based on prepayment and/or loss assumptions, and changes in such prepayment and/or loss assumptions may dramatically affect such weighted average lives, yields and principal payment periods. In addition, it is possible that prepayments or losses on the underlying assets will occur at rates higher or lower than the rates shown in the attached Computational Materials. The specific characteristics of the securities may differ from those shown in the Computational Materials due to differences between the final underlying assets and the preliminary underlying assets used in preparing the Computational Materials. The principal amount and designation of any security described in the Computational Materials are subject to change prior to issuance. Neither the Underwriter nor any of its affiliates makes any representation or warranty as to the actual rate or timing of payments or losses on any of the underlying assets or the payments or yield on the securities.
This document contains forward-looking statements. Those statements are subject to certain risks and uncertainties that could cause the success of collections and the actual cash flow generated to differ materially from the information set forth herein. While such information reflects projections prepared in good faith based upon methods and data that are believed to be reasonable and accurate as of the dates thereof, the depositor undertakes no obligation to revise these forward-looking statements to reflect subsequent events or circumstances. Individuals should not place undue reliance on forward-looking statements and are advised to make their own independent analysis and determination with respect to the forecasted periods, which reflect the issuer’s view only as of the date hereof.
| IMPORTANT NOTICE RELATING TO AUTOMATICALLY GENERATED EMAIL DISCLAIMERS |
Any legends, disclaimers or other notices that may appear at the bottom of the email communication to which this Free Writing Prospectus is attached relating to (1) these materials not constituting an offer (or a solicitation of an offer), (2) no representation being made that these materials are accurate or complete and may not be updated or (3) these materials possibly being confidential, are not applicable to these materials and should be disregarded. Such legends, disclaimers or other notices have been automatically generated as a result of these materials having been sent via Bloomberg or another system.
- 2 -

Indicative Capital Structure
Publicly Offered Certificates
| Class | Expected Ratings (DBRS/Fitch/Moody’s) | Approximate Initial Certificate Principal Balance or Notional Amount(1) | Approximate Initial Credit Support | Expected Weighted Avg. Life (years)(2) | Expected Principal Window(2) | Certificate Principal to Value Ratio(3) | Underwritten NOI Debt Yield(4) |
| A-1 | AAA(sf)/AAAsf/Aaa(sf) | $40,491,000 | 30.000%(5) | 2.33 | 1-49 | 44.5% | 15.2% |
| A-2 | AAA(sf)/AAAsf/Aaa(sf) | $5,938,000 | 30.000%(5) | 4.06 | 49-49 | 44.5% | 15.2% |
| A-3 | AAA(sf)/AAAsf/Aaa(sf) | $15,900,000 | 30.000%(5) | 5.98 | 72-72 | 44.5% | 15.2% |
| A-4 | AAA(sf)/AAAsf/Aaa(sf) | $163,000,000 | 30.000%(5) | 9.10 | 103-116 | 44.5% | 15.2% |
| A-5 | AAA(sf)/AAAsf/Aaa(sf) | $246,354,000 | 30.000%(5) | 9.82 | 116-119 | 44.5% | 15.2% |
| A-SB | AAA(sf)/AAAsf/Aaa(sf) | $65,656,000 | 30.000%(5) | 6.44 | 49-103 | 44.5% | 15.2% |
| X-A | AAA(sf)/AAAsf/Aa1(sf) | $590,113,000(6) | N/A | N/A | N/A | N/A | N/A |
| X-B | AAA(sf)/AA-sf/NR | $29,746,000(6) | N/A | N/A | N/A | N/A | N/A |
| A-S | AAA(sf)/AAAsf/Aa3(sf) | $52,774,000 | 23.125% | 9.90 | 119-119 | 48.9% | 13.8% |
| B | AAA(sf)/AA-sf/NR | $29,746,000 | 19.250% | 9.90 | 119-119 | 51.3% | 13.2% |
| C | AA(low)(sf)/A-sf/NR | $37,422,000 | 14.375% | 9.91 | 119-120 | 54.4% | 12.4% |
Privately Offered Certificates(7)
| Class | Expected Ratings (DBRS/Fitch/Moody’s) | Approximate Initial Certificate Principal Balance or Notional Amount(1) | Approximate Initial Credit Support | Expected Weighted Avg. Life (years)(2) | Expected Principal Window(2) | Certificate Principal to Value Ratio(3) | Underwritten NOI Debt Yield(4) |
| X-E | AAA(sf)/BB-sf/NR | $23,029,000(6) | N/A | N/A | N/A | N/A | N/A |
| X-F | AAA(sf)/B-sf/NR | $9,595,000(6) | N/A | N/A | N/A | N/A | N/A |
| X-NR | AAA(sf)/NR/NR | $32,624,581(6) | N/A | N/A | N/A | N/A | N/A |
| D | BBB(high)(sf)/BBB-sf/NR | $45,098,000 | 8.500% | 9.98 | 120-120 | 58.2% | 11.6% |
| E | BB(high)(sf)/BB-sf/NR | $23,029,000 | 5.500% | 9.98 | 120-120 | 60.1% | 11.2% |
| F | BB(low)(sf)/B-sf/NR | $9,595,000 | 4.250% | 9.98 | 120-120 | 60.9% | 11.1% |
| NR | NR/NR/NR | $32,624,581 | 0.000% | 9.98 | 120-120 | 63.6% | 10.6% |
| (1) | Approximate, subject to a variance of plus or minus 5%. |
| (2) | Assumes 0% CPR / 0% CDR and a November 22, 2016 closing date. Based on “Modeling Assumptions” as described in the Preliminary Prospectus relating to the Publicly Offered Certificates, dated November 1, 2016 (the “Preliminary Prospectus”). Capitalized terms used but not defined herein have the meanings ascribed to them in the Preliminary Prospectus. |
| (3) | The “Certificate Principal to Value Ratio” for any class (other than the Class A-1, Class A-2, Class A-3, Class A-4, Class A-5 and Class A-SB certificates) is calculated as the product of (a) the weighted average Cut-off Date LTV Ratio for the mortgage loans, multiplied by (b) a fraction, the numerator of which is the total initial certificate principal balance of such class of certificates and all classes of principal balance certificates senior to such class of certificates and the denominator of which is the total initial certificate principal balance of all of the principal balance certificates. The Class A-1, Class A-2, Class A-3, Class A-4, Class A-5 and Class A-SB Certificate Principal to Value Ratios are calculated in the aggregate for those classes as if they were a single class. Investors should note, however, that excess mortgaged property value associated with a mortgage loan will not be available to offset losses on any other mortgage loan. |
| (4) | The “Underwritten NOI Debt Yield” for any class (other than the Class A-1, Class A-2, Class A-3, Class A-4, Class A-5 and Class A-SB certificates) is calculated as the product of (a) the weighted average UW NOI Debt Yield for the mortgage loans and (b) the total initial certificate principal balance of all of the classes of principal balance certificates divided by the total initial certificate principal balance for such class and all classes of principal balance certificates senior to such class of certificates. The Underwritten NOI Debt Yield for each class of the Class A-1, Class A-2, Class A-3, Class A-4, Class A-5 and Class A-SB certificates is calculated in the aggregate for those classes as if they were a single class. Investors should note, however, that net operating income from any mortgaged property supports only the related mortgage loan and will not be available to support any other mortgage loan. |
| (5) | The credit support percentages set forth for the Class A-1, Class A-2, Class A-3, Class A-4, Class A-5 and Class A-SB certificates are represented in the aggregate. |
| (6) | The notional amounts of the Class X-A, Class X-B, Class X-E, Class X-F and Class X-NR certificates (collectively, the “Class X Certificates”) are defined in the Preliminary Prospectus. |
| (7) | The Class R certificates are not shown above. |
THE INFORMATION IN THIS STRUCTURAL AND COLLATERAL TERM SHEET IS NOT COMPLETE AND MAY BE AMENDED PRIOR TO THE TIME OF SALE. THIS STRUCTURAL AND COLLATERAL TERM SHEET IS NOT AN OFFER TO SELL THESE SECURITIES AND IT IS NOT A SOLICITATION OF AN OFFER TO BUY THESE SECURITIES IN ANY JURISDICTION WHERE THE OFFER OR SALE IS NOT PERMITTED.
| 3 |
Summary of Transaction Terms
| Securities: | $767,627,581 monthly pay, multi-class, commercial mortgage REMIC Pass-Through Certificates. |
| Lead Manager and Sole Bookrunner: | Credit Suisse Securities (USA) LLC. |
| Mortgage Loan Sellers: | Column Financial, Inc. (“Column”) (52.2%), Benefit Street Partners CRE Finance LLC (“BSP”) (40.4%) and Silverpeak Real Estate Finance LLC (“Silverpeak”) (7.4%). |
| Master Servicer: | Wells Fargo Bank, National Association (“Wells Fargo”). |
| Special Servicer: | Rialto Capital Advisors, LLC (“Rialto”). |
| Directing Certificateholder: | RREF III Debt AIV, LP or another affiliate of Rialto. |
| Trustee: | Wilmington Trust National Association (“Wilmington”). |
| Certificate Administrator: | Wells Fargo. |
| Operating Advisor: | Park Bridge Lender Services LLC (“Park Bridge”). |
| Asset Representations Reviewer: | Park Bridge. |
| Closing Date: | On or about November 22, 2016. |
| Cut-off Date: | With respect to each mortgage loan, the respective due date for the monthly debt service payment that is due in November 2016 (or, in the case of any mortgage loan that has its first due date in December 2016, the date that would have been its due date in November 2016 under the terms of that mortgage loan if a monthly payment were scheduled to be due in that month.) |
| Distribution Date: | The 4th business day following each Determination Date, commencing in December 2016. |
| Determination Date: | 11th day of each month, or if the 11th day is not a business day, then the business day immediately following such 11th day, commencing in December 2016. |
| Rated Final Distribution Date: | The Distribution Date in November 2049. |
| Tax Treatment: | The Publicly Offered Certificates are expected to be treated as REMIC regular interests for U.S. federal income tax purposes. |
| Form of Offering: | The Class A-1, Class A-2, Class A-3, Class A-4, Class A-5, Class A-SB, Class X-A, Class X-B, Class A-S, Class B and Class C certificates will be offered publicly (the “Publicly Offered Certificates”). The Class X-E, Class X-F, Class X-NR, Class D, Class E, Class F, Class NR and Class R certificates (the “Privately Offered Certificates”) will be offered domestically to Qualified Institutional Buyers and to Institutional Accredited Investors and to institutions that are not U.S. Persons pursuant to Regulation S. |
| SMMEA Status: | The Certificates willnot constitute “mortgage related securities” for purposes of SMMEA. |
| ERISA: | The Publicly Offered Certificates are expected to be ERISA eligible. |
| Optional Termination: | 1% clean-up call. |
| Minimum Denominations: | The Publicly Offered Certificates (other than the Class X-A and Class X-B certificates) will be issued in minimum denominations of $10,000 and integral multiples of $1 in excess of $10,000. The Class X-A and Class X-B certificates will be issued in minimum denominations of $1,000,000 and in integral multiples of $1 in excess of $1,000,000. |
| Settlement Terms: | DTC, Euroclear and Clearstream Banking. |
| Analytics: | The transaction is expected to be available on Intex Solutions, Inc., Trepp, LLC, Bloomberg Financial Markets, L.P., CMBS.com, Inc. and BlackRock Financial Management Inc. |
THE INFORMATION IN THIS STRUCTURAL AND COLLATERAL TERM SHEET IS NOT COMPLETE AND MAY BE AMENDED PRIOR TO THE TIME OF SALE. THIS STRUCTURAL AND COLLATERAL TERM SHEET IS NOT AN OFFER TO SELL THESE SECURITIES AND IT IS NOT A SOLICITATION OF AN OFFER TO BUY THESE SECURITIES IN ANY JURISDICTION WHERE THE OFFER OR SALE IS NOT PERMITTED.
| 4 |
Collateral Characteristics
| Loan Pool | |
| Initial Pool Balance (“IPB”)(1): | $767,627,582 |
| Number of Mortgage Loans: | 53 |
| Number of Mortgaged Properties: | 199 |
| Average Cut-off Date Balance per Mortgage Loan: | $14,483,539 |
| Weighted Average Current Mortgage Rate: | 4.4122% |
| 10 Largest Mortgage Loans as % of IPB: | 52.8% |
| Weighted Average Remaining Term to Maturity: | 115 |
| Weighted Average Seasoning: | 4 |
| Credit Statistics | |
| Weighted Average UW NCF DSCR(2)(3): | 1.72x |
| Weighted Average UW NOI Debt Yield(2): | 10.6% |
| Weighted Average Cut-off Date Loan-to-Value Ratio (“LTV”)(2)(4): | 63.6% |
| Weighted Average Maturity Date LTV(2)(4): | 52.8% |
| Other Statistics | |
| % of Mortgage Loans with Additional Debt: | 11.1% |
| % of Mortgaged Properties with Single Tenants: | 7.5% |
| Amortization | |
| Weighted Average Original Amortization Term(5): | 350 |
| Weighted Average Remaining Amortization Term(5): | 347 |
| % of Mortgage Loans with Amortizing Balloon: | 51.6% |
| % of Mortgage Loans with Partial Interest-Only followed by Amortizing Balloon: | 39.8% |
| % of Mortgage Loans with Interest-Only: | 8.6% |
| Cash Management(6) | |
| % of Mortgage Loans with In-Place, Hard Lockboxes: | 60.1% |
| % of Mortgage Loans with Springing Lockboxes: | 25.9% |
| % of Mortgage Loans with In-Place, Soft Lockboxes: | 10.8% |
| % of Mortgage Loans with No Lockbox: | 3.1% |
| Reserves | |
| % of Mortgage Loans Requiring Upfront or Ongoing Tax Reserves: | 68.6% |
| % of Mortgage Loans Requiring Upfront or Ongoing Insurance Reserves: | 65.1% |
| % of Mortgage Loans Requiring Upfront or Ongoing CapEx Reserves(7): | 66.9% |
| % of Mortgage Loans Requiring Upfront or Ongoing TI/LC Reserves(8): | 59.2% |
| (1) | Subject to a permitted variance of plus or minus 5%. |
| (2) | In the case of Loan Nos. 1, 2, 3, 7 and 16, the UW NCF DSCR, UW NOI Debt Yield, Cut-off Date LTV and Maturity Date LTV calculations include the relatedpari passu companion loan(s). In the case of Loan Nos. 3, 16 and 24, the UW NCF DSCR, UW NOI Debt Yield, Cut-off Date LTV and Maturity Date LTV calculations exclude the subordinate companion loan(s). In the case of Loan Nos. 16 and 29, the UW NCF DSCR, UW NOI Debt Yield, Cut-off Date LTV and Maturity Date LTV calculations exclude the mezzanine loan. |
| (3) | For each partial interest-only mortgage loan, the UW NCF DSCR is calculated using the first principal and interest payment to be made into the trust during the term of the mortgage loan once amortization has commenced. |
| (4) | In the case of Loan Nos. 37 and 50, the Cut-off Date LTV and Maturity Date LTV are calculated based upon an “as-renovated”, “as-stabilized” or “when complete” appraised value based on certain assumptions. In the case of Loan No. 10, the Cut-off Date LTV and Maturity Date LTV are calculated with the incorporation of a PILOT value. Refer to “Description of the Mortgage Pool—Certain Calculations and Definitions” in the Preliminary Prospectus for additional details. |
| (5) | Excludes two mortgage loans that are interest-only for the entire term. |
| (6) | For a detailed description of cash management, refer to“Description of the Mortgage Pool—Certain Terms of the Mortgage Loans—Mortgaged Property Accounts—Lockbox Accounts” in the Preliminary Prospectus. |
| (7) | CapEx Reserves include FF&E reserves for hospitality properties. |
| (8) | Calculated only with respect to Cut-off Date Balance of mortgage loans secured by industrial, office, mixed use and retail properties. |
THE INFORMATION IN THIS STRUCTURAL AND COLLATERAL TERM SHEET IS NOT COMPLETE AND MAY BE AMENDED PRIOR TO THE TIME OF SALE. THIS STRUCTURAL AND COLLATERAL TERM SHEET IS NOT AN OFFER TO SELL THESE SECURITIES AND IT IS NOT A SOLICITATION OF AN OFFER TO BUY THESE SECURITIES IN ANY JURISDICTION WHERE THE OFFER OR SALE IS NOT PERMITTED.
| 5 |
Collateral Characteristics
| Originator | Sponsor | Number of Mortgage Loans | Number of Mortgaged Properties | Aggregate Cut-off Date Balance | % of IPB |
| Column Financial, Inc.(1)(2) | Column | 25 | 170 | $400,883,545 | 52.2% |
| BSP(3) | BSP | 22 | 23 | 310,312,888 | 40.4 |
| Silverpeak(4) | Silverpeak | 6 | 6 | 56,431,149 | 7.4 |
| Total: | 53 | 199 | $767,627,582 | 100.0% |
| (1) | Certain of the Column mortgage loans were originated by Regions Bank, Five Mile Capital Partners LLC, or MC-Five Mile Commercial Mortgage Finance LLC, and acquired by Column. Column has re-underwritten such mortgage loans in accordance with the procedures described under “Transaction Parties—The Sponsors and Mortgage Loan Sellers—Column Financial, Inc.” in the Preliminary Prospectus. |
| (2) | Two (2) of the Column mortgage loans was co-originated with Morgan Stanley Bank, N. A. One (1) of the Column mortgage loans was co-originated with Wells Fargo Bank, National Association and Regions Bank. |
| (3) | One (1) of the BSP mortgage loans was originated by JPMorgan Chase Bank, National Association and acquired by BSP. BSP has reunderwritten such mortgage loan in accordance with the procedures described under “Transaction Parties—The Sponsors and Mortgage Loan Sellers— Benefit Street Partners CRE Finance LLC” in the Preliminary Prospectus. |
| (4) | Two (2) of the Silverpeak mortgage loans were originated by Walker & Dunlop Commercial Property Funding, LLC. Silverpeak has reunderwritten such mortgage loans in accordance with the procedures described under “Transaction Parties—The Sponsors and Mortgage Loan Sellers—Silverpeak Real Estate Finance LLC” in the Preliminary Prospectus. |
Ten Largest Mortgage Loans
| No. | Loan Name | Mortgage Loan Seller | No. of Properties | Cut-off Date Balance | % of IPB | SF/ Rooms/ Units | Property Type | UW NCF DSCR(1)(2) | UW NOI Debt Yield(1) | Cut-off Date LTV(1)(3) | Maturity Date LTV(1)(3) | |
| 1 | Coconut Point | Column | 1 | $100,000,000 | 13.0% | 836,531 | Retail | 1.39x | 8.8% | 67.1% | 56.5% | |
| 2 | Gurnee Mills | Column | 1 | 74,900,058 | 9.8 | 1,683,915 | Retail | 1.60x | 9.7% | 65.9% | 52.4% | |
| 3 | 9 West 57th Street | BSP | 1 | 50,000,000 | 6.5 | 1,680,218 | Office | 3.64x | 10.6% | 29.8% | 29.8% | |
| 4 | Tampa Marriott Westshore | Column | 1 | 29,799,361 | 3.9 | 310 | Hotel | 1.92x | 15.5% | 57.9% | 43.1% | |
| 5 | Cypress Park West | BSP | 1 | 29,250,000 | 3.8 | 225,757 | Office | 1.48x | 10.3% | 67.7% | 59.4% | |
| 6 | CVS Office Centre Building | BSP | 1 | 28,500,000 | 3.7 | 226,501 | Office | 1.51x | 10.8% | 68.2% | 53.1% | |
| 7 | Peachtree Mall | Silverpeak | 1 | 24,761,505 | 3.2 | 536,202 | Retail | 1.83x | 12.6% | 56.8% | 42.2% | |
| 8 | Eastern Shore Plaza | BSP | 1 | 24,000,000 | 3.1 | 270,105 | Retail | 1.53x | 10.3% | 68.6% | 59.0% | |
| 9 | Robert Pitt Professional Plaza | BSP | 1 | 22,892,017 | 3.0 | 143,194 | Mixed Use | 1.38x | 9.2% | 66.4% | 54.3% | |
| 10 | Preserve at Autumn Ridge II | Column | 1 | 20,846,669 | 2.7 | 152 | Multifamily | 1.51x | 9.5% | 75.8% | 62.7% | |
| Top 3 Total/Weighted Average | 3 | $224,900,058 | 29.3% | 1.96x | 9.5% | 58.4% | 49.2% | |||||
| Top 5 Total/Weighted Average | 5 | $283,949,419 | 37.0% | 1.91x | 10.2% | 59.3% | 49.6% | |||||
| Top 10 Total/Weighted Average | 10 | $404,949,610 | 52.8% | 1.80x | 10.3% | 61.6% | 50.9% | |||||
| (1) | In the case of Loan Nos. 1, 2, 3, and 7, the UW NCF DSCR, UW NOI Debt Yield, Cut-off Date LTV and Maturity Date LTV calculations include the relatedpari passu companion loan(s). In the case of Loan No. 3 the UW NCF DSCR, UW NOI Debt Yield, Cut-off Date LTV and Maturity Date LTV calculations exclude the subordinate companion loan(s). |
| (2) | For each partial interest-only mortgage loan, the UW NCF DSCR is calculated using the first principal and interest payment to be made into the trust during the term of the mortgage loan once amortization has commenced . |
| (3) | In the case of Loan No. 10, the Cut-off Date LTV and Maturity Date LTV are calculated with the incorporation of a PILOT value. |
THE INFORMATION IN THIS STRUCTURAL AND COLLATERAL TERM SHEET IS NOT COMPLETE AND MAY BE AMENDED PRIOR TO THE TIME OF SALE. THIS STRUCTURAL AND COLLATERAL TERM SHEET IS NOT AN OFFER TO SELL THESE SECURITIES AND IT IS NOT A SOLICITATION OF AN OFFER TO BUY THESE SECURITIES IN ANY JURISDICTION WHERE THE OFFER OR SALE IS NOT PERMITTED.
| 6 |
Pari Passu Loan Summary
| No. | Loan Name | Trust Cut-off Date Balance | Pari Passu Companion Loan Cut-off Date Balance(1) | Whole Loan Cut-off Date Balance(1)(2) | Lead Pooling and Servicing Agreement | Master Servicer | Special Servicer |
| 1 | Coconut Point | $100,000,000 | $90,000,000 | $190,000,000 | CSAIL 2016-C7 | Wells Fargo | Rialto |
| 2 | Gurnee Mills | $74,900,058 | $199,733,489 | $274,633,547 | CSAIL 2016-C7 | Wells Fargo | Rialto |
| 3 | 9 West 57th Street | $50,000,000 | $1,150,000,000 | $1,200,000,000 | JPMCC 2016-NINE | Wells Fargo | Wells Fargo |
| 7 | Peachtree Mall | $24,761,505 | $54,777,956 | $79,539,460 | CSAIL 2016-C7 | Wells Fargo | Rialto |
| 16 | GLP Industrial Portfolio B | $15,900,000 | $948,100,000 | $964,000,000 | CSMC 2015-GLPB | KeyBank | AEGON USA Realty Advisors, LLC (“AEGON”) |
| (1) | In the case of Loan Nos. 3 and 16, includes subordinate debt of one or more B notes. |
| (2) | In the case of Loan 3, exclude one or more mezzanine loans. |
Additional Debt Summary
| No. | Loan Name | Trust Cut-off Date Balance | Subordinate Debt Cut-off Date Balance(1) | Total Debt Cut-off Date Balance(1)(2) | Mortgage Loan UW NCF DSCR | Total Debt UW NCF DSCR | Mortgage Loan Cut-off Date LTV | Total Debt Cut-off Date LTV | Mortgage Loan UW NOI Debt Yield | Total Debt UW NOI Debt Yield |
| 3 | 9 West 57th Street | $50,000,000 | $186,276,000 | $1,200,000,000 | 3.64 | 3.08x | 29.8% | 35.3% | 10.6% | 9.0% |
| 16 | GLP Industrial Portfolio B | $15,900,000 | $665,300,000 | $1,294,000,000 | 4.37 | 1.99x | 30.2% | 62.2% | 18.4% | 8.9% |
| 24 | Peacock Run Apartments | $10,000,000 | Subordinate Secured Debt ($699,825); Subordinate Unsecured Debt ($1,200,000) | $11,899,825 | 1.30 | 1.13x | 68.5% | 81.5% | 9.4% | 7.9% |
| 29 | Staybridge Suites - Indianapolis, IN | $8,957,700 | $1,399,525 | $10,357,225 | 1.62 | 1.23x | 67.4% | 77.9% | 13.3% | 11.5% |
| (1) | In the case of Loan Nos. 16 and 29, the subordinate debt includes one or more mezzanine loans. In the case of Loan Nos. 3, 16 and 24, the subordinate debt includes one or more B notes, secured debt and unsecured debt. |
| (2) | Includes the mortgage loan in this securitization and subordinate debt. In the case of Loan Nos. 3 and 16, the total debt also includes one or morepari passu loans. |
THE INFORMATION IN THIS STRUCTURAL AND COLLATERAL TERM SHEET IS NOT COMPLETE AND MAY BE AMENDED PRIOR TO THE TIME OF SALE. THIS STRUCTURAL AND COLLATERAL TERM SHEET IS NOT AN OFFER TO SELL THESE SECURITIES AND IT IS NOT A SOLICITATION OF AN OFFER TO BUY THESE SECURITIES IN ANY JURISDICTION WHERE THE OFFER OR SALE IS NOT PERMITTED.
| 7 |
Mortgaged Properties by Type(1)
| Weighted Average | |||||||||
| Property Type | Property Subtype | Number of Properties | Cut-off Date Principal Balance | % of IPB | Occupancy | UW NCF DSCR(2)(3) | UW NOI Debt Yield(2) | Cut-off Date LTV(2)(4) | Maturity Date LTV(2)(4) |
| Retail | |||||||||
| Anchored | 8 | $168,468,440 | 21.9% | 92.0% | 1.45x | 9.3% | 68.0% | 57.2% | |
| Regional Mall | 2 | 99,661,563 | 13.0 | 90.9% | 1.65x | 10.4% | 63.6% | 49.8% | |
| Single Tenant | 1 | 20,200,000 | 2.6 | 100.0% | 1.32x | 8.4% | 70.3% | 61.4% | |
| Shadow Anchored | 3 | 14,867,835 | 1.9 | 90.1% | 1.31x | 9.1% | 66.3% | 54.9% | |
| Unanchored | 1 | 3,797,044 | 0.5 | 100.0% | 1.31x | 9.5% | 72.3% | 57.8% | |
| Subtotal | 15 | $306,994,882 | 40.0% | 92.2% | 1.50x | 9.6% | 66.7% | 55.0% | |
| Office | |||||||||
| Suburban | 8 | $119,748,277 | 15.6% | 92.5% | 1.46x | 10.4% | 67.9% | 57.4% | |
| CBD | 3 | 61,000,000 | 7.9 | 70.1% | 3.23x | 10.5% | 36.8% | 35.2% | |
| Flex | 1 | 9,600,000 | 1.3 | 100.0% | 1.98x | 13.9% | 67.1% | 56.0% | |
| Subtotal | 12 | $190,348,277 | 24.8% | 85.7% | 2.06x | 10.6% | 57.9% | 50.2% | |
| Multifamily | |||||||||
| Garden | 15 | $124,496,891 | 16.2% | 95.9% | 1.45x | 9.9% | 69.8% | 58.1% | |
| Student Housing | 1 | 17,350,000 | 2.3 | 97.2% | 1.57x | 10.3% | 60.4% | 52.1% | |
| Subtotal | 16 | $141,846,891 | 18.5% | 96.0% | 1.47x | 9.9% | 68.7% | 57.3% | |
| Hotel | |||||||||
| Full Service | 1 | $29,799,361 | 3.9% | 68.7% | 1.92x | 15.5% | 57.9% | 43.1% | |
| Limited Service | 3 | 21,831,356 | 2.8 | 70.2% | 1.75x | 14.0% | 63.4% | 48.7% | |
| Extended Stay | 2 | 12,389,272 | 1.6 | 73.2% | 1.95x | 16.0% | 67.7% | 51.4% | |
| Select Service | 1 | 8,824,645 | 1.1 | 78.8% | 1.65x | 13.0% | 67.9% | 51.5% | |
| Subtotal | 7 | $72,844,634 | 9.5% | 71.1% | 1.84x | 14.8% | 62.4% | 47.2% | |
| Mixed Use | |||||||||
| Office/Warehouse | 1 | $22,892,017 | 3.0% | 100.0% | 1.38 | 9.2% | 66.4% | 54.3% | |
| Retail/Self Storage/Office | 1 | $5,475,705 | 0.7% | 82.6% | 1.68 | 11.7% | 59.5% | 49.1% | |
| Subtotal | 2 | $28,367,721 | 3.7% | 96.6% | 1.44 | 9.7% | 65.0% | 53.3% | |
| Industrial | |||||||||
| Distribution Warehouse | 68 | $10,529,621 | 1.4% | 94.5% | 4.37x | 18.4% | 30.2% | 30.2% | |
| Warehouse | 20 | 3,015,890 | 0.4 | 100.0% | 4.37x | 18.4% | 30.2% | 30.2% | |
| Light Industrial | 24 | 1,088,471 | 0.1 | 97.4% | 4.37x | 18.4% | 30.2% | 30.2% | |
| Flex | 19 | 720,582 | 0.1 | 90.5% | 4.37x | 18.4% | 30.2% | 30.2% | |
| Flex, light industrial, distribution | 11 | 545,435 | 0.1 | 88.1% | 4.37x | 18.4% | 30.2% | 30.2% | |
| Subtotal | 142 | $15,900,000 | 2.1% | 95.4% | 4.37x | 18.4% | 30.2% | 30.2% | |
| Manufactured Housing | |||||||||
| Manufactured Housing | 5 | $11,325,176 | 1.5% | 94.2% | 1.61x | 10.7% | 59.6% | 49.2% | |
| Subtotal | 5 | $11,325,176 | 1.5% | 94.2% | 1.61x | 10.7% | 59.6% | 49.2% | |
| Total / Wtd. Avg.: | 199 | $767,627,582 | 100.0% | 89.5% | 1.72x | 10.6% | 63.6% | 52.8% | |
| (1) | Because this table presents information relating to the mortgaged properties and not mortgage loans, the information for mortgage loans secured by more than one mortgaged property is based on allocated loan amounts. |
| (2) | In the case of Loan Nos. 1, 2, 3, 7 and 16, the UW NCF DSCR, UW NOI Debt Yield, Cut-off Date LTV and Maturity Date LTV calculations include the relatedpari passu companion loan(s). In the case of Loan Nos. 3, 16 and 24, the UW NCF DSCR, UW NOI Debt Yield, Cut-off Date LTV and Maturity Date LTV calculations exclude the subordinate companion loan(s) or other subordinate indebtedness. In the case of Loan Nos. 16 and 29, the UW NCF DSCR, UW NOI Debt Yield, Cut-off Date LTV and Maturity Date LTV calculations exclude the mezzanine loan. |
| (3) | For each partial interest-only mortgage loan, the UW NCF DSCR is calculated using the first principal and interest payment to be made into the trust during the term of the mortgage loan once amortization has commenced. |
| (4) | In the case of Loan Nos. 37 and 50, the Cut-off Date LTV and Maturity Date LTV are calculated based upon an “as-renovated”, “as-stabilized” or “when complete” appraised value based on certain assumptions. In the case of Loan No. 10, the Cut-off Date LTV and Maturity Date LTV are calculated with the incorporation of a PILOT value. Refer to “Description of the Mortgage Pool—Certain Calculations and Definitions” in the Preliminary Prospectus for additional details. |
THE INFORMATION IN THIS STRUCTURAL AND COLLATERAL TERM SHEET IS NOT COMPLETE AND MAY BE AMENDED PRIOR TO THE TIME OF SALE. THIS STRUCTURAL AND COLLATERAL TERM SHEET IS NOT AN OFFER TO SELL THESE SECURITIES AND IT IS NOT A SOLICITATION OF AN OFFER TO BUY THESE SECURITIES IN ANY JURISDICTION WHERE THE OFFER OR SALE IS NOT PERMITTED.
| 8 |
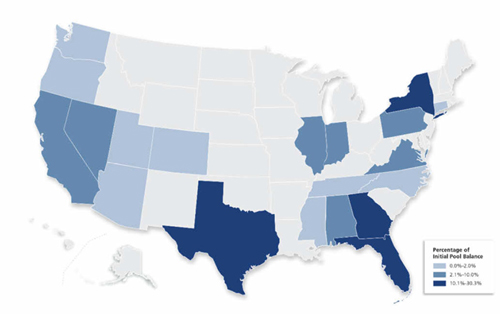
Mortgaged Properties by Location(1)
| State | Number of Properties | Cut-off Date Principal Balance | % of IPB | Occupancy | UW NCF DSCR(2)(3) | UW NOI Debt Yield(2) | Cut-off Date LTV(2)(4) | Maturity Date LTV(2)(4) |
| FL | 33 | $232,714,039 | 30.3% | 87.0% | 1.51x | 10.5% | 66.0% | 55.2% |
| GA | 31 | 109,202,543 | 14.2 | 91.6% | 1.64x | 11.0% | 64.6% | 52.8% |
| NY | 3 | 93,738,686 | 12.2 | 80.4% | 2.62x | 10.0% | 49.0% | 43.1% |
| TX | 42 | 77,445,202 | 10.1 | 94.6% | 1.63x | 10.7% | 64.9% | 54.5% |
| IL | 1 | 74,900,058 | 9.8 | 91.1% | 1.60x | 9.7% | 65.9% | 52.4% |
| PA | 21 | 40,585,650 | 5.3 | 100.0% | 1.80x | 12.0% | 65.6% | 52.4% |
| AL | 1 | 24,000,000 | 3.1 | 95.5% | 1.53x | 10.3% | 68.6% | 59.0% |
| CA | 17 | 23,586,095 | 3.1 | 93.7% | 1.71x | 10.5% | 61.2% | 52.0% |
| IN | 3 | 21,579,388 | 2.8 | 78.5% | 1.58x | 12.5% | 68.4% | 52.3% |
| VA | 2 | 17,387,134 | 2.3 | 84.5% | 1.50x | 11.1% | 69.2% | 59.6% |
| NV | 1 | 16,679,330 | 2.2 | 100.0% | 1.47x | 9.2% | 71.3% | 57.4% |
| UT | 5 | 12,286,193 | 1.6 | 100.0% | 1.70x | 11.1% | 58.6% | 53.5% |
| CT | 1 | 8,700,000 | 1.1 | 88.6% | 1.37x | 10.4% | 70.9% | 57.9% |
| CO | 1 | 5,498,277 | 0.7 | 100.0% | 1.34x | 10.3% | 65.1% | 49.5% |
| AZ | 17 | 3,819,692 | 0.5 | 88.4% | 2.93x | 14.1% | 51.7% | 45.7% |
| NC | 1 | 3,345,945 | 0.4 | 96.3% | 1.50x | 10.1% | 74.4% | 60.0% |
| WA | 9 | 1,110,065 | 0.1 | 100.0% | 4.37x | 18.4% | 30.2% | 30.2% |
| TN | 4 | 419,073 | 0.1 | 98.0% | 4.37x | 18.4% | 30.2% | 30.2% |
| OR | 4 | 351,094 | 0.0 | 100.0% | 4.37x | 18.4% | 30.2% | 30.2% |
| MS | 2 | 279,116 | 0.0 | 100.0% | 4.37x | 18.4% | 30.2% | 30.2% |
| Total/Wtd. Avg.: | 199 | $767,627,582 | 100.0% | 89.5% | 1.72x | 10.6% | 63.6% | 52.8% |
| (1) | Because this table presents information relating to the mortgaged properties and not mortgage loans, the information for mortgage loans secured by more than one mortgaged property is based on allocated loan amounts. |
| (2) | In the case of Loan Nos. 1, 2, 3, 7 and 16, the UW NCF DSCR, UW NOI Debt Yield, Cut-off Date LTV and Maturity Date LTV calculations include the relatedpari passu companion loan(s). In the case of Loan Nos. 3, 16 and 24, the UW NCF DSCR, UW NOI Debt Yield, Cut-off Date LTV and Maturity Date LTV calculations exclude the subordinate companion loan(s) or other subordinate indebtedness. In the case of Loan Nos. 16 and 29, the UW NCF DSCR, UW NOI Debt Yield, Cut-off Date LTV and Maturity Date LTV calculations exclude the mezzanine loan. |
| (3) | For each partial interest-only mortgage loan, the UW NCF DSCR is calculated using the first principal and interest payment to be made into the trust during the term of the mortgage loan once amortization has commenced. |
| (4) | In the case of Loan Nos. 37 and 50, the Cut-off Date LTV and Maturity Date LTV are calculated based upon an “as-renovated”, “as-stabilized” or “when complete” appraised value based on certain assumptions. Refer to “Description of the Mortgage Pool—Certain Calculations and Definitions” in the Preliminary Prospectus for additional details. |
THE INFORMATION IN THIS STRUCTURAL AND COLLATERAL TERM SHEET IS NOT COMPLETE AND MAY BE AMENDED PRIOR TO THE TIME OF SALE. THIS STRUCTURAL AND COLLATERAL TERM SHEET IS NOT AN OFFER TO SELL THESE SECURITIES AND IT IS NOT A SOLICITATION OF AN OFFER TO BUY THESE SECURITIES IN ANY JURISDICTION WHERE THE OFFER OR SALE IS NOT PERMITTED.
| 9 |
Cut-off Date Principal Balance
| Weighted Average | |||||||||
| Range of Principal Balances | Number of Loans | Cut-off Date Principal Balance | % of IPB | Mortgage Rate | Remaining Loan Term | UW NCF DSCR(1)(2) | UW NOI Debt Yield(1) | Cut-off Date LTV(1)(3) | Maturity Date LTV(1)(3) |
| 1,858,684 - 4,999,999 | 13 | $46,661,411 | 6.1% | 5.0143% | 114 | 1.60x | 11.8% | 64.0% | 51.2% |
| 5,000,000 - 9,999,999 | 16 | 120,071,912 | 15.6 | 4.8062% | 111 | 1.58x | 11.3% | 67.7% | 55.8% |
| 10,000,000 - 19,999,999 | 13 | 175,744,648 | 22.9 | 4.7606% | 113 | 1.72x | 10.9% | 64.4% | 54.7% |
| 20,000,000 - 24,999,999 | 5 | 112,700,191 | 14.7 | 4.4716% | 113 | 1.52x | 10.1% | 67.2% | 55.4% |
| 25,000,000 - 49,999,999 | 3 | 87,549,361 | 11.4 | 4.5472% | 118 | 1.64x | 12.2% | 64.5% | 51.8% |
| 50,000,000 - 100,000,000 | 3 | 224,900,058 | 29.3 | 3.7222% | 119 | 1.96x | 9.5% | 58.4% | 49.2% |
| Total/Wtd. Avg.: | 53 | $767,627,582 | 100.0% | 4.4122% | 115 | 1.72x | 10.6% | 63.6% | 52.8% |
Mortgage Interest Rates
| Weighted Average | |||||||||
| Range of Mortgage Interest Rates | Number of Loans | Cut-off Date Principal Balance | % of IPB | Mortgage Rate | Remaining Loan Term | UW NCF DSCR(1)(2) | UW NOI Debt Yield(1) | Cut-off Date LTV(1)(3) | Maturity Date LTV(1)(3) |
| 2.8595% - 3.9999% | 5 | $265,561,563 | 34.6% | 3.7485% | 115 | 2.09x | 10.3% | 56.6% | 47.4% |
| 4.0000% - 4.2499% | 1 | 11,600,000 | 1.5 | 4.2000% | 120 | 1.54x | 10.7% | 60.3% | 54.9% |
| 4.2500% - 4.4999% | 6 | 96,225,275 | 12.5 | 4.3714% | 119 | 1.47x | 9.9% | 69.9% | 57.7% |
| 4.5000% - 4.7499% | 13 | 173,630,690 | 22.6 | 4.6391% | 115 | 1.60x | 11.3% | 67.7% | 55.3% |
| 4.7500% - 4.9999% | 11 | 102,690,936 | 13.4 | 4.8496% | 114 | 1.50x | 10.3% | 65.8% | 55.0% |
| 5.0000% - 5.4500% | 17 | 117,919,118 | 15.4 | 5.2457% | 113 | 1.50x | 11.3% | 66.4% | 55.4% |
| Total/Wtd. Avg.: | 53 | $767,627,582 | 100.0% | 4.4122% | 115 | 1.72x | 10.6% | 63.6% | 52.8% |
Original Term to Maturity/ARD in Months
| Weighted Average | |||||||||
| Original Term to Maturity/ARD in Months | Number of Loans | Cut-off Date Principal Balance | % of IPB | Mortgage Rate | Remaining Loan Term | UW NCF DSCR(1)(2) | UW NOI Debt Yield(1) | Cut-off Date LTV(1)(3) | Maturity Date LTV(1)(3) |
| 60 | 1 | $6,300,000 | 0.8% | 5.2950% | 49 | 1.32x | 10.5% | 67.0% | 63.2% |
| 84 | 1 | 15,900,000 | 2.1 | 3.8164% | 72 | 4.37x | 18.4% | 30.2% | 30.2% |
| 114 | 1 | 24,761,505 | 3.2 | 3.9440% | 109 | 1.83x | 12.6% | 56.8% | 42.2% |
| 120 | 50 | 720,666,077 | 93.9 | 4.4337% | 117 | 1.66x | 10.4% | 64.5% | 53.6% |
| Total/Wtd. Avg.: | 53 | $767,627,582 | 100.0% | 4.4122% | 115 | 1.72x | 10.6% | 63.6% | 52.8% |
(1) | In the case of Loan Nos. 1, 2, 3, 7 and 16, the UW NCF DSCR, UW NOI Debt Yield, Cut-off Date LTV and Maturity Date LTV calculations include the relatedpari passu companion loan(s). In the case of Loan Nos. 3, 16 and 24, the UW NCF DSCR, UW NOI Debt Yield, Cut-off Date LTV and Maturity Date LTV calculations exclude the subordinate companion loan(s) or other subordinate indebtedness. In the case of Loan Nos. 16 and 29, the UW NCF DSCR, UW NOI Debt Yield, Cut-off Date LTV and Maturity Date LTV calculations exclude the mezzanine loan. |
| (2) | For each partial interest-only mortgage loan, the UW NCF DSCR is calculated using the first principal and interest payment to be made into the trust during the term of the mortgage loan once amortization has commenced. |
| (3) | In the case of Loan Nos. 37 and 50, the Cut-off Date LTV and Maturity Date LTV are calculated based upon an “as-renovated”, “as-stabilized” or “when complete” appraised value based on certain assumptions. In the case of Loan No. 10, the Cut-off Date LTV and Maturity Date LTV are calculated with the incorporation of a PILOT value. Refer to “Description of the Mortgage Pool—Certain Calculations and Definitions” in the Preliminary Prospectus for additional details. |
THE INFORMATION IN THIS STRUCTURAL AND COLLATERAL TERM SHEET IS NOT COMPLETE AND MAY BE AMENDED PRIOR TO THE TIME OF SALE. THIS STRUCTURAL AND COLLATERAL TERM SHEET IS NOT AN OFFER TO SELL THESE SECURITIES AND IT IS NOT A SOLICITATION OF AN OFFER TO BUY THESE SECURITIES IN ANY JURISDICTION WHERE THE OFFER OR SALE IS NOT PERMITTED.
| 10 |
Remaining Term to Maturity/ARD in Months
| Weighted Average | |||||||||
| Remaining Term to Maturity/ARD in Months | Number of Loans | Cut-off Date Principal Balance | % of IPB | Mortgage Rate | Remaining Loan Term | UW NCF DSCR(1)(2) | UW NOI Debt Yield(1) | Cut-off Date LTV(1)(3) | Maturity Date LTV(1)(3) |
| 49 - 60 | 1 | $6,300,000 | 0.8% | 5.2950% | 49 | 1.32x | 10.5% | 67.0% | 63.2% |
| 61 - 120 | 52 | 761,327,582 | 99.2 | 4.4049% | 116 | 1.73x | 10.6% | 63.5% | 52.7% |
| Total/Wtd. Avg.: | 53 | $767,627,582 | 100.0% | 4.4122% | 115 | 1.72x | 10.6% | 63.6% | 52.8% |
Original Amortization Term in Months
| Weighted Average | |||||||||
| Original Amortization Term in Months | Number of Loans | Cut-off Date Principal Balance | % of IPB | Mortgage Rate | Remaining Loan Term | UW NCF DSCR(1)(2) | UW NOI Debt Yield(1) | Cut-off Date LTV(1)(3) | Maturity Date LTV(1)(3) |
| Interest Only | 2 | $65,900,000 | 8.6% | 3.0904% | 107 | 3.82x | 12.5% | 29.9% | 29.9% |
| 270 | 1 | 3,244,222 | 0.4 | 5.3220% | 119 | 1.97x | 16.7% | 50.7% | 35.8% |
| 300 | 9 | 102,336,271 | 13.3 | 4.6786% | 113 | 1.77x | 13.7% | 61.6% | 46.2% |
| 330 | 1 | 3,797,044 | 0.5 | 4.9871% | 110 | 1.31x | 9.5% | 72.3% | 57.8% |
| 336 | 1 | 28,500,000 | 3.7 | 4.3900% | 120 | 1.51x | 10.8% | 68.2% | 53.1% |
| 360 | 39 | 563,850,046 | 73.5 | 4.5103% | 116 | 1.48x | 9.8% | 67.6% | 56.7% |
| Total/Wtd. Avg.: | 53 | $767,627,582 | 100.0% | 4.4122% | 115 | 1.72x | 10.6% | 63.6% | 52.8% |
Remaining Amortization Term in Months
| Weighted Average | ||||||||||
| Remaining Amortization Term in Months | Number of Loans | Cut-off Date Principal Balance | % of IPB | Mortgage Rate | Remaining Loan Term | UW NCF DSCR(1)(2) | UW NOI Debt Yield(1) | Cut-off Date LTV(1)(3) | Maturity Date LTV(1)(3) | |
| Interest Only | 2 | $65,900,000 | 8.6% | 3.0904% | 107 | 3.82x | 12.5% | 29.9% | 29.9% | |
| 269-300 | 10 | 105,580,492 | 13.8 | 4.6984% | 113 | 1.77x | 13.8% | 61.3% | 45.9% | |
| 301-330 | 1 | 3,797,044 | 0.5 | 4.9871% | 110 | 1.31x | 9.5% | 72.3% | 57.8% | |
| 331-360 | 40 | 592,350,046 | 77.2 | 4.5045% | 116 | 1.48x | 9.9% | 67.6% | 56.6% | |
| Total/Wtd. Avg.: | 53 | $767,627,582 | 100.0% | 4.4122% | 115 | 1.72x | 10.6% | 63.6% | 52.8% | |
| (1) | In the case of Loan Nos. 1, 2, 3, 7 and 16, the UW NCF DSCR, UW NOI Debt Yield, Cut-off Date LTV and Maturity Date LTV calculations include the relatedpari passu companion loan(s). In the case of Loan Nos. 3, 16 and 24, the UW NCF DSCR, UW NOI Debt Yield, Cut-off Date LTV and Maturity Date LTV calculations exclude the subordinate companion loan(s) or other subordinate indebtedness. In the case of Loan Nos. 16 and 29, the UW NCF DSCR, UW NOI Debt Yield, Cut-off Date LTV and Maturity Date LTV calculations exclude the mezzanine loan. |
| (2) | For each partial interest-only mortgage loan, the UW NCF DSCR is calculated using the first principal and interest payment to be made into the trust during the term of the mortgage loan once amortization has commenced. |
| (3) | In the case of Loan Nos. 37 and 50, the Cut-off Date LTV and Maturity Date LTV are calculated based upon an “as-renovated”, “as-stabilized” or “when complete” appraised value based on certain assumptions. In the case of Loan No. 10, the Cut-off Date LTV and Maturity Date LTV are calculated with the incorporation of a PILOT value. Refer to “Description of the Mortgage Pool—Certain Calculations and Definitions” in the Preliminary Prospectus for additional details. |
THE INFORMATION IN THIS STRUCTURAL AND COLLATERAL TERM SHEET IS NOT COMPLETE AND MAY BE AMENDED PRIOR TO THE TIME OF SALE. THIS STRUCTURAL AND COLLATERAL TERM SHEET IS NOT AN OFFER TO SELL THESE SECURITIES AND IT IS NOT A SOLICITATION OF AN OFFER TO BUY THESE SECURITIES IN ANY JURISDICTION WHERE THE OFFER OR SALE IS NOT PERMITTED.
| 11 |
Amortization Types
| Weighted Average | |||||||||
| Amortization Types | Number of Loans | Cut-off Date Principal Balance | % of IPB | Mortgage Rate | Remaining Loan Term | UW NCF DSCR(1)(2) | UW NOI Debt Yield(1) | Cut-off Date LTV(1)(3) | Maturity Date LTV(1)(3) |
| Balloon | 35 | $395,952,582 | 51.6% | 4.5701% | 115 | 1.59x | 11.0% | 66.0% | 52.4% |
| IO-Balloon | 16 | 305,775,000 | 39.8 | 4.4925% | 116 | 1.44x | 9.7% | 67.7% | 58.3% |
| Interest Only | 2 | 65,900,000 | 8.6 | 3.0904% | 107 | 3.82x | 12.5% | 29.9% | 29.9% |
| Total/Wtd. Avg.: | 53 | $767,627,582 | 100.0% | 4.4122% | 115 | 1.72x | 10.6% | 63.6% | 52.8% |
Interest Only Periods(4)
| Weighted Average | |||||||||
| Interest Only Periods | Number of Loans | Cut-off Date Principal Balance | % of IPB | Mortgage Rate | Remaining Loan Term | UW NCF DSCR(1)(2) | UW NOI Debt Yield(1) | Cut-off Date LTV(1)(3) | Maturity Date LTV(1)(3) |
| 12 - 24 | 12 | $234,725,000 | 30.6% | 4.4749% | 115 | 1.45x | 9.7% | 67.8% | 57.9% |
| 25 - 48 | 3 | 59,450,000 | 7.7 | 4.6188% | 119 | 1.39x | 9.5% | 68.7% | 60.3% |
| 49 - 60 | 1 | 11,600,000 | 1.5 | 4.2000% | 120 | 1.54x | 10.7% | 60.3% | 54.9% |
| 61 - 120 | 2 | 65,900,000 | 8.6 | 3.0904% | 107 | 3.82x | 12.5% | 29.9% | 29.9% |
| Total/Wtd. Avg.: | 18 | $371,675,000 | 48.4% | 4.2439% | 115 | 1.87x | 10.2% | 61.0% | 53.2% |
Underwritten Net Cash Flow Debt Service Coverage Ratios(1)(2)
| Weighted Average | |||||||||
| Underwritten Net Cash Flow Debt Service Coverage Ratios | Number of Loans | Cut-off Date Principal Balance | % of IPB | Mortgage Rate | Remaining Loan Term | UW NCF DSCR | UW NOI Debt Yield | Cut-off Date LTV(3) | Maturity Date LTV(1)(3) |
| 1.25-1.49 | 25 | $329,221,003 | 42.9% | 4.5718% | 116 | 1.38x | 9.3% | 68.5% | 57.7% |
| 1.50-1.74 | 18 | 286,723,128 | 37.4 | 4.4841% | 116 | 1.57x | 10.6% | 66.9% | 54.6% |
| 1.75-2.74 | 7 | 82,351,879 | 10.7 | 4.5393% | 115 | 1.89x | 14.1% | 58.9% | 45.3% |
| 2.75-3.99 | 2 | 53,431,572 | 7.0 | 3.0239% | 117 | 3.59x | 11.4% | 32.3% | 31.3% |
| 4.00-4.37 | 1 | 15,900,000 | 2.1 | 3.8164% | 72 | 4.37x | 18.4% | 30.2% | 30.2% |
| Total/Wtd. Avg.: | 53 | $767,627,582 | 100.0% | 4.4122% | 115 | 1.72x | 10.6% | 63.6% | 52.8% |
| (1) | In the case of Loan Nos. 1, 2, 3, 7 and 16, the UW NCF DSCR, UW NOI Debt Yield, Cut-off Date LTV and Maturity Date LTV calculations include the relatedpari passu companion loan(s). In the case of Loan Nos. 3, 16 and 24, the UW NCF DSCR, UW NOI Debt Yield, Cut-off Date LTV and Maturity Date LTV calculations exclude the subordinate companion loan(s) or other subordinate indebtedness. In the case of Loan Nos. 16 and 29, the UW NCF DSCR, UW NOI Debt Yield, Cut-off Date LTV and Maturity Date LTV calculations exclude the mezzanine loan. |
| (2) | For each partial interest-only mortgage loan, the UW NCF DSCR is calculated using the first principal and interest payment to be made into the trust during the term of the mortgage loan once amortization has commenced. |
| (3) | In the case of Loan Nos. 37 and 50, the Cut-off Date LTV and Maturity Date LTV are calculated based upon an “as-renovated”, “as-stabilized” or “when complete” appraised value based on certain assumptions. In the case of Loan No. 10, the Cut-off Date LTV and Maturity Date LTV are calculated with the incorporation of a PILOT value. Refer to “Description of the Mortgage Pool—Certain Calculations and Definitions” in the Preliminary Prospectus for additional details. |
| (4) | Excluding thirty-five (35) loans that have no interest-only period during the loan term. |
THE INFORMATION IN THIS STRUCTURAL AND COLLATERAL TERM SHEET IS NOT COMPLETE AND MAY BE AMENDED PRIOR TO THE TIME OF SALE. THIS STRUCTURAL AND COLLATERAL TERM SHEET IS NOT AN OFFER TO SELL THESE SECURITIES AND IT IS NOT A SOLICITATION OF AN OFFER TO BUY THESE SECURITIES IN ANY JURISDICTION WHERE THE OFFER OR SALE IS NOT PERMITTED.
| 12 |
LTV Ratios as of the Cut-off Date(1)(2)
| Weighted Average | |||||||||
| Range of Cut-off Date LTVs | Number of Loans | Cut-off Date Principal Balance | % of IPB | Mortgage Rate | Remaining Loan Term | UW NCF DSCR(3) | UW NOI Debt Yield | Cut-off Date LTV | Maturity Date LTV |
| 29.8% - 44.9% | 2 | $65,900,000 | 8.6% | 3.0904% | 107 | 3.82x | 12.5% | 29.9% | 29.9% |
| 45.0% - 54.9% | 3 | 9,690,191 | 1.3 | 5.3184% | 115 | 1.78x | 13.9% | 52.5% | 40.3% |
| 55.0% - 59.9% | 6 | 77,274,001 | 10.1 | 4.5517% | 114 | 1.81x | 13.4% | 57.6% | 44.2% |
| 60.0% - 64.9% | 6 | 58,312,786 | 7.6 | 4.6844% | 113 | 1.55x | 10.4% | 61.8% | 53.0% |
| 65.0% - 69.9% | 22 | 408,543,047 | 53.2 | 4.4327% | 117 | 1.50x | 10.2% | 67.2% | 55.4% |
| 70.0% - 78.7% | 14 | 147,907,557 | 19.3 | 4.7046% | 115 | 1.42x | 9.5% | 73.1% | 61.3% |
| Total/Wtd. Avg.: | 53 | $767,627,582 | 100.0% | 4.4122% | 115 | 1.72x | 10.6% | 63.6% | 52.8% |
LTV Ratios as of the Maturity Date(1)(2)
| Weighted Average | |||||||||
| Range of Maturity/ARD Date LTVs | Number of Loans | Cut-off Date Principal Balance | % of IPB | Mortgage Rate | Remaining Loan Term | UW NCF DSCR(3) | UW NOI Debt Yield | Cut-off Date LTV | Maturity Date LTV |
| 29.8% - 34.9% | 2 | $65,900,000 | 8.6% | 3.0904% | 107 | 3.82x | 12.5% | 29.9% | 29.9% |
| 35.0% - 44.9% | 4 | 61,284,564 | 8.0 | 4.4628% | 113 | 1.86x | 14.2% | 56.7% | 42.1% |
| 45.0% - 54.9% | 23 | 276,264,206 | 36.0 | 4.5825% | 116 | 1.57x | 10.7% | 64.8% | 52.2% |
| 55.0% - 59.9% | 12 | 245,129,485 | 31.9 | 4.3677% | 118 | 1.46x | 9.7% | 68.3% | 57.6% |
| 60.0% - 65.6% | 12 | 119,049,327 | 15.5 | 4.8140% | 110 | 1.40x | 9.5% | 73.0% | 62.6% |
| Total/Wtd. Avg.: | 53 | $767,627,582 | 100.0% | 4.4122% | 115 | 1.72x | 10.6% | 63.6% | 52.8% |
Prepayment Protection
| Weighted Average | |||||||||
| Prepayment Protection | Number of Loans | Cut-off Date Principal Balance | % of IPB | Mortgage Rate | Remaining Loan Term | UW NCF DSCR(3) | UW NOI Debt Yield(1) | Cut-off Date LTV(1)(2) | Maturity Date LTV(1)(2) |
| Defeasance | 50 | $724,580,912 | 94.4% | 4.4139% | 117 | 1.68x | 10.5% | 63.9% | 52.9% |
| Yield Maintenance | 2 | 22,200,000 | 2.9 | 4.2360% | 65 | 3.50x | 16.1% | 40.7% | 39.6% |
| Yield Maintenance/Defeasance | 1 | 20,846,669 | 2.7 | 4.5400% | 104 | 1.51x | 9.5% | 75.8% | 62.7% |
| Total/Wtd. Avg.: | 53 | $767,627,582 | 100.0% | 4.4122% | 115 | 1.72x | 10.6% | 63.6% | 52.8% |
| (1) | In the case of Loan Nos. 1, 2, 3, 7 and 16, the UW NCF DSCR, UW NOI Debt Yield, Cut-off Date LTV and Maturity Date LTV calculations include the relatedpari passu companion loan(s). In the case of Loan Nos. 3, 16 and 24, the UW NCF DSCR, UW NOI Debt Yield, Cut-off Date LTV and Maturity Date LTV calculations exclude the subordinate companion loan(s) or other subordinate indebtedness. In the case of Loan Nos. 16 and 29, the UW NCF DSCR, UW NOI Debt Yield, Cut-off Date LTV and Maturity Date LTV calculations exclude the mezzanine loan. |
| (2) | In the case of Loan Nos. 37 and 50, the Cut-off Date LTV and Maturity Date LTV are calculated based upon an “as-renovated”, “as-stabilized” or “when complete” appraised value based on certain assumptions. In the case of Loan No. 10, the Cut-off Date LTV and Maturity Date LTV are calculated with the incorporation of a PILOT value. Refer to “Description of the Mortgage Pool—Certain Calculations and Definitions” in the Preliminary Prospectus for additional details. |
| (3) | For each partial interest-only mortgage loan, the UW NCF DSCR is calculated using the first principal and interest payment to be made into the trust during the term of the mortgage loan once amortization has commenced. |
THE INFORMATION IN THIS STRUCTURAL AND COLLATERAL TERM SHEET IS NOT COMPLETE AND MAY BE AMENDED PRIOR TO THE TIME OF SALE. THIS STRUCTURAL AND COLLATERAL TERM SHEET IS NOT AN OFFER TO SELL THESE SECURITIES AND IT IS NOT A SOLICITATION OF AN OFFER TO BUY THESE SECURITIES IN ANY JURISDICTION WHERE THE OFFER OR SALE IS NOT PERMITTED.
| 13 |
Loan Purpose
| Weighted Average | |||||||||
| Loan Purpose | Number of Loans | Cut-off Date Principal Balance | % of IPB | Mortgage Rate | Remaining Loan Term | UW NCF DSCR(1)(2) | UW NOI Debt Yield(1) | Cut-off Date LTV(1)(3) | Maturity Date LTV(1)(3) |
| Refinance | 35 | $574,168,441 | 74.8% | 4.3207% | 117 | 1.72x | 10.4% | 63.0% | 51.8% |
| Acquisition | 17 | 187,159,140 | 24.4 | 4.6632% | 112 | 1.76x | 11.3% | 65.1% | 55.7% |
| Recapitalization | 1 | 6,300,000 | 0.8 | 5.2950% | 49 | 1.32x | 10.5% | 67.0% | 63.2% |
| Total / Wtd. Avg.: | 53 | $767,627,582 | 100.0% | 4.4122% | 115 | 1.72 | 10.6% | 63.6% | 52.8% |
| (1) | In the case of Loan Nos. 1, 2, 3, 7 and 16, the UW NCF DSCR, UW NOI Debt Yield, Cut-off Date LTV and Maturity Date LTV calculations include the relatedpari passu companion loan(s). In the case of Loan Nos. 3, 16 and 24, the UW NCF DSCR, UW NOI Debt Yield, Cut-off Date LTV and Maturity Date LTV calculations exclude the subordinate companion loan(s) or other subordinate indebtedness. In the case of Loan Nos. 16 and 29, the UW NCF DSCR, UW NOI Debt Yield, Cut-off Date LTV and Maturity Date LTV calculations exclude the mezzanine loan. |
| (2) | For each partial interest-only mortgage loan, the UW NCF DSCR is calculated using the first principal and interest payment to be made into the trust during the term of the mortgage loan once amortization has commenced. |
| (3) | In the case of Loan Nos. 37 and 50, the Cut-off Date LTV and Maturity Date LTV are calculated based upon an “as-renovated”, “as-stabilized” or “when complete” appraised value based on certain assumptions. In the case of Loan No. 10, the Cut-off Date LTV and Maturity Date LTV are calculated with the incorporation of a PILOT value. Refer to “Description of the Mortgage Pool—Certain Calculations and Definitions” in the Preliminary Prospectus for additional details. |
THE INFORMATION IN THIS STRUCTURAL AND COLLATERAL TERM SHEET IS NOT COMPLETE AND MAY BE AMENDED PRIOR TO THE TIME OF SALE. THIS STRUCTURAL AND COLLATERAL TERM SHEET IS NOT AN OFFER TO SELL THESE SECURITIES AND IT IS NOT A SOLICITATION OF AN OFFER TO BUY THESE SECURITIES IN ANY JURISDICTION WHERE THE OFFER OR SALE IS NOT PERMITTED.
| 14 |
Previous Securitization History(1)
| No. | Loan / Property Name | Location | Property Type | Previous Securitization |
| 1 | Coconut Point | Estero, FL | Retail | JPMCC 2007-LDPX |
| 2 | Gurnee Mills | Gurnee, IL | Retail | JPMCC 2007-C1, JPMCC 2007-CB20 |
| 3 | 9 West 57th Street | New York, NY | Office | COMM 2012-9W57 |
| 4 | Tampa Marriott Westshore | Tampa, FL | Hotel | WBCMT 2006-C26 |
| 7 | Peachtree Mall | Columbus, GA | Retail | BACM 2005-4 |
| 8 | Eastern Shore Plaza | Spanish Fort, AL | Retail | WBCMT 2006-C26 |
| 9 | Robert Pitt Professional Plaza | Monsey, NY | Mixed Use | JPMCC 2006-CB16 |
| 11 | BJ’s Wholesale Club - Miami | Miami, FL | Retail | WBCMT 2007-C30 |
| 13 | The Heights II | San Marcos, TX | Multifamily | MSC 2006-IQ12 |
| 14 | Beltway Marketplace | Las Vegas, NV | Retail | LBUBS 2006-C6 |
| 15 | Embarcadero Club Apartments | College Park, GA | Multifamily | COMM 2006-C8 |
| 18 | Wrigley Plaza | Long Beach, CA | Retail | WBCMT 2006-C27 |
| 21 | Pinehurst Centre | Virginia Beach, VA | Office | CGCMT 2006-C5 |
| 22 | Cherry Creek Apartments | Houston, TX | Multifamily | CSMC 2006-C2 |
| 33 | The Registry Apartments | Houston, TX | Multifamily | NASC 1998-D6 |
| 35 | Southwood One | Tallahassee, FL | Office | JPMCC 2007-LD12 |
| 39 | Hinesville Square | Hinesville, GA | Mixed Use | MSC 2006-IQ12 |
| 41 | Weatherbee Townhomes | Fort Pierce, FL | Multifamily | WBCMT 2006-C23 |
| 47 | Candlewood Suites - Fort Myers FL | Fort Myers, FL | Hotel | WFRBS 2013-C15 |
| 48 | Beaver Pond Center | Rocky Mount, NC | Retail | JPMCC 2006-LDP8 |
| 51 | Silsbee & Lumberton Retail | Various, TX | Retail | LBUBS 2006-C3 |
| (1) | The table above represents the properties for which the previously existing debt was most recently securitized, based on information provided by the related borrower or obtained through searches of a third-party database. While loans secured by the above mortgaged properties may have been securitized multiple times in prior transactions, mortgage loans in this securitization are only listed in the above chart if the mortgage loan in this securitization paid off a loan in another securitization. |
THE INFORMATION IN THIS STRUCTURAL AND COLLATERAL TERM SHEET IS NOT COMPLETE AND MAY BE AMENDED PRIOR TO THE TIME OF SALE. THIS STRUCTURAL AND COLLATERAL TERM SHEET IS NOT AN OFFER TO SELL THESE SECURITIES AND IT IS NOT A SOLICITATION OF AN OFFER TO BUY THESE SECURITIES IN ANY JURISDICTION WHERE THE OFFER OR SALE IS NOT PERMITTED.
| 15 |
Class A-2(1)
| No. | Loan Name | Location | Cut-off Date Balance | % of IPB | Maturity/ARD Balance | % of Certificate Class | Original Loan Term | Remaining Loan Term | UW NCF DSCR | UW NOI Debt Yield | Cut-off Date LTV Ratio | Maturity Date LTV Ratio |
| 35 | Southwood One | Tallahassee, FL | $6,300,000 | 0.8% | $5,938,749 | 100.0 | 60 | 49 | 1.32x | 10.5% | 67.0% | 63.2% |
| Total /Wtd. Avg.: | $6,300,000 | 0.8% | $5,938,749 | 1.32x | 10.5% | 67.0% | 63.2% | |||||
| (1) | The table above presents the mortgage loans whose balloon payments would be applied to pay down the majority of the principal balance of the Class A-2 certificates, assuming a 0% CPR and applying the “Modeling Assumptions” described in the Preliminary Prospectus, including the assumptions that (i) none of the mortgage loans in the pool experience prepayments prior to the maturity date, defaults or losses; (ii) there are no extensions of maturity dates of any mortgage loans in the pool; and (iii) each mortgage loan in the pool is paid in full on its stated maturity date. Each class of Certificates, including the Class A-2 certificates, evidences undivided ownership interests in the entire pool of mortgage loans. Debt service coverage ratio, debt yield and loan-to-value ratio information does not take into account subordinate debt (whether or not secured by the mortgaged property), if any, that is allowed under the terms of any mortgage loan. See Annex A-1 to the Preliminary Prospectus. |
THE INFORMATION IN THIS STRUCTURAL AND COLLATERAL TERM SHEET IS NOT COMPLETE AND MAY BE AMENDED PRIOR TO THE TIME OF SALE. THIS STRUCTURAL AND COLLATERAL TERM SHEET IS NOT AN OFFER TO SELL THESE SECURITIES AND IT IS NOT A SOLICITATION OF AN OFFER TO BUY THESE SECURITIES IN ANY JURISDICTION WHERE THE OFFER OR SALE IS NOT PERMITTED.
| 16 |
Structural Overview
Order of Distribution: | On each Distribution Date, funds available for distribution from the mortgage loans, net of specified trust expenses, yield maintenance charges, prepayment premiums and excess interest, will be distributed in the following amounts and order of priority (in each case to the extent of remaining available funds):
First:To interest on the Class A-1, Class A-2, Class A-3, Class A-4, Class A-5, Class A-SB, Class X-A, Class X-B, Class X-E, Class X-F and Class X-NR certificates, up to, andpro rata in accordance with, their respective interest entitlements.
Second:To the extent of funds allocated to principal and available for distribution: (i) first,to principal on the Class A-SB certificates, until the certificate balance of the Class A-SB certificates is reduced to the scheduled principal balance for the related distribution date set forth in Annex E to the Preliminary Prospectus, (ii) second,to principal on the Class A-1 certificates, until the certificate balance of the Class A-1 certificates has been reduced to zero, (iii)third,to principal on the Class A-2 certificates, until the certificate balance of the Class A-2 certificates has been reduced to zero, (iv) fourth,to principal on the Class A-3 certificates, until the certificate balance of the Class A-3 certificates has been reduced to zero, (v)fifth, to principal on the Class A-4 certificates until the certificate balance of the Class A-4 certificates has been reduced to zero, (vi)sixth, to principal on the Class A-5 certificates until the certificate balance of the Class A-5 has been reduced to zero and (vii)seventh, to principal on the Class A-SB certificates, until the certificate balance of the Class A-SB certificates has been reduced to zero. If the certificate balance of each and every class of certificates other than the Class A-1, Class A-2, Class A-3, Class A-4, Class A-5 and Class A-SB certificates has been reduced to zero as a result of the allocation of mortgage loan losses to those certificates, funds available for distributions of principal will be distributed to the Class A-1, Class A-2, Class A-3, Class A-4, Class A-5 and Class A-SB certificates,pro rata, based on their respective certificate balances, without regard to the distribution priorities described above or the planned principal balance of the Class A-SB certificates.
Third:To reimburse the Class A-1, Class A-2, Class A-3, Class A-4, Class A-5 and Class A-SB certificates,pro rata, for any previously unreimbursed losses on the mortgage loans allocable to principal that were previously borne by those classes, together with interest on that amount at the pass-through rate for such class.
Fourth:(i)first, to interest on the Class A-S certificates in the amount of their interest entitlement; (ii)second, to the extent of funds allocated to principal remaining after any distributions in respect of principal to each class of certificates with a higher payment priority (in this case, the Class A-1, Class A-2, Class A-3, Class A-4, Class A-5 and Class A-SB certificates), to principal on the Class A-S certificates until their certificate balance is reduced to zero; and (iii)third, to reimburse the Class A-S certificates for any previously unreimbursed losses on the mortgage loans allocable to principal that were previously borne by that class, together with interest at its pass-through rate.
Fifth:(i)first, to interest on the Class B certificates in the amount of their interest entitlement; (ii)second, to the extent of funds allocated to principal remaining after |
THE INFORMATION IN THIS STRUCTURAL AND COLLATERAL TERM SHEET IS NOT COMPLETE AND MAY BE AMENDED PRIOR TO THE TIME OF SALE. THIS STRUCTURAL AND COLLATERAL TERM SHEET IS NOT AN OFFER TO SELL THESE SECURITIES AND IT IS NOT A SOLICITATION OF AN OFFER TO BUY THESE SECURITIES IN ANY JURISDICTION WHERE THE OFFER OR SALE IS NOT PERMITTED.
| - 17 - |
| Order of Distribution (continued): | any distributions in respect of principal to each class of certificates with a higher payment priority (in this case, the Class A-1, Class A-2, Class A-3, Class A-4, Class A-5, Class A-SB and Class A-S certificates), to principal on the Class B certificates until their certificate balance is reduced to zero; and (iii)third, to reimburse the Class B certificates for any previously unreimbursed losses on the mortgage loans allocable to principal that were previously borne by that class, together with interest at its pass-through rate.
Sixth:(i)first, to interest on the Class C certificates in the amount of their interest entitlement; (ii)second, to the extent of funds allocated to principal remaining after any distributions in respect of principal to each class of certificates with a higher payment priority (in this case, the Class A-1, Class A-2, Class A-3, Class A-4, Class A-5, Class A-SB, Class A-S and Class B certificates), to principal on the Class C certificates until their certificate balance is reduced to zero; and (iii)third, to reimburse the Class C certificates for any previously unreimbursed losses on the mortgage loans allocable to principal that were previously borne by that class, together with interest at its pass-through rate.
Seventh:After the Class A-1, Class A-2, Class A-3, Class A-4, Class A-5, Class A-SB, Class X-A, Class X-B, Class X-E, Class X-F, Class X-NR, Class A-S, Class B and Class C certificates are paid all amounts to which they are entitled, the remaining funds available for distribution will be used to pay interest and principal and to reimburse any unreimbursed losses to the Class D, Class E, Class F and Class NR certificates sequentially in that order in a manner analogous to that described in clausesixthabove with respect to the Class C certificates, until the certificate balance of each such class is reduced to zero. |
Realized Losses: | The certificate balances of the Class A-1, Class A-2, Class A-3, Class A-4, Class A-5, Class A-SB, Class A-S, Class B, Class C, Class D, Class E, Class F and Class NR certificates will each be reduced without distribution on any Distribution Date as a write-off to the extent of any loss realized on the mortgage loans allocated to such class of certificates on such Distribution Date. On each Distribution Date, any such write-offs will be applied to such classes of certificates in the following order, in each case until the related certificate balance is reduced to zero:first, to the Class NR certificates;second, to the Class F certificates;third, to the Class E certificates;fourth, to the Class D certificates;fifth, to the Class C certificates;sixth, to the Class B certificates;seventh, to the Class A-S certificates; and,finally,pro rata, to the Class A-1, Class A-2, Class A-3, Class A-4, Class A-5 and Class A-SB certificates, based on their then-current respective certificate balances. The notional amount of the Class X-A certificates will be reduced to reflect reductions in the certificate balances of the Class A-1, Class A-2, Class A-3, Class A-4, Class A-5, Class A-SB and Class A-S certificates resulting from allocations of losses realized on the mortgage loans. The notional amount of the Class X-B certificates will be reduced to reflect reductions in the certificate balance of the Class B certificates resulting from allocations of losses realized on the mortgage loans. The notional amount of the Class X-E certificates will be reduced to reflect reductions in the certificate balance of the Class E certificates resulting from allocations of losses realized on the mortgage loans. The notional amount of the Class X-F certificates will be reduced to reflect reductions in the certificate balance of the Class F certificates resulting from allocations of losses realized on the mortgage loans. The notional amount of the |
THE INFORMATION IN THIS STRUCTURAL AND COLLATERAL TERM SHEET IS NOT COMPLETE AND MAY BE AMENDED PRIOR TO THE TIME OF SALE. THIS STRUCTURAL AND COLLATERAL TERM SHEET IS NOT AN OFFER TO SELL THESE SECURITIES AND IT IS NOT A SOLICITATION OF AN OFFER TO BUY THESE SECURITIES IN ANY JURISDICTION WHERE THE OFFER OR SALE IS NOT PERMITTED.
| - 18 - |
| Realized Losses (continued): | Class X-NR certificates will be reduced to reflect reductions in the certificate balance of the Class NR certificates resulting from allocations of losses realized on the mortgage loans. |
Prepayment Premiums and Yield Maintenance Charges: | On each Distribution Date, each yield maintenance charge collected on the mortgage loans during the one-month period ending on the related Determination Date is required to be distributed to certificateholders (excluding the Class X-E, Class X-F, Class X-NR, Class E, Class F, Class NR and Class R certificates) as follows: (1)pro rata, between (x) the group (the “YM Group A”) of Class A-1, Class A-2, Class A-3, Class A-4, Class A-5, Class A-SB, Class X-A and Class A-S certificates, and (y) the group (the “YM Group B” and collectively with the YM Group A, the “YM Groups”) of the Class X-B, Class B, Class C and Class D certificates, based upon the aggregate amount of principal distributed to the classes of certificates in each YM Group on such Distribution Date, and (2) as among the respective classes of certificates in each YM Group in the following manner: (A) on apro rata basis in accordance with their respective entitlements in those yield maintenance charges, to each class of certificates in such YM Group with a certificate balance in an amount equal to the product of (x) a fraction whose numerator is the amount of principal distributed to such class of certificates on such Distribution Date and whose denominator is the total amount of principal distributed to all of the certificates in such YM Group with certificate balances on such Distribution Date, (y) the Base Interest Fraction for the related principal prepayment with respect to such class of certificates, and (z) the aggregate amount of such yield maintenance charge allocated to such YM Group; and (B) the portion of such yield maintenance charge allocated to such YM Group remaining after such distributions to the applicable class(es) of principal balance certificates in such YM Group, to the class(es) of Class X Certificates in such YM Group.
The “Base Interest Fraction” with respect to any principal prepayment on any mortgage loan and with respect to any class of Class A-1, Class A-2, Class A-3, Class A-4, Class A-5, Class A-SB, Class A-S, Class B, Class C and Class D certificates is a fraction (a) whose numerator is the greater of (x) zero and (y) the difference between (i) the pass-through rate on such class of certificates and (ii) the discount rate used in accordance with the related mortgage loan documents in calculating the yield maintenance charge with respect to such principal prepayment and (b) whose denominator is the greater of zero and the difference between (i) the mortgage loan rate on such mortgage loan (or serviced whole loan) and (ii) the discount rate used in accordance with the related mortgage loan documents in calculating the yield maintenance charge with respect to such principal prepayment;provided, however, that under no circumstances will the Base Interest Fraction be greater than one or less than zero. If such discount rate is greater than or equal to the lesser of (x) the mortgage loan rate on the related mortgage loan and (y) the pass-through rate described in the preceding sentence, then the Base Interest Fraction will equal zero;provided,however, that if such discount rate is greater than or equal to the mortgage loan rate, but less than the pass-through rate, the fraction will be one.
If a prepayment premium (calculated as a fixed percentage of the amount prepaid) is |
THE INFORMATION IN THIS STRUCTURAL AND COLLATERAL TERM SHEET IS NOT COMPLETE AND MAY BE AMENDED PRIOR TO THE TIME OF SALE. THIS STRUCTURAL AND COLLATERAL TERM SHEET IS NOT AN OFFER TO SELL THESE SECURITIES AND IT IS NOT A SOLICITATION OF AN OFFER TO BUY THESE SECURITIES IN ANY JURISDICTION WHERE THE OFFER OR SALE IS NOT PERMITTED.
| - 19 - |
| Prepayment Premiums and Yield Maintenance Charges (continued): | imposed in connection with a prepayment rather than a yield maintenance charge, then the prepayment premium so collected will be allocated as described above. For this purpose, the discount rate used to calculate the Base Interest Fraction will be the discount rate used to determine the yield maintenance charge for mortgage loans that require payment at the greater of a yield maintenance charge or a minimum amount equal to a fixed percentage of the principal balance of the mortgage loan or, for mortgage loans that only have a prepayment premium based on a fixed percentage of the principal balance of the mortgage loan, such other discount rate as may be specified in the related loan documents.
No prepayment premiums or yield maintenance charges will be distributed to holders of the Class X-E, Class X-F, Class X-NR, Class E, Class F, Class NR or Class R certificates. Instead, after the notional amounts of the Class X-A and Class X-B certificates and the certificate balances of the Class A-1, Class A-2, Class A-3, Class A-4, Class A-5, Class A-SB, Class A-S, Class B, Class C and Class D certificates have been reduced to zero, all prepayment premiums and yield maintenance charges with respect to the mortgage loans will be distributed to holders of the Class X-B certificates, regardless of whether the notional amount of the Class X-B certificates has been reduced to zero. For a description of prepayment premiums and yield maintenance charges required on the mortgage loans, see Annex A-1 to the Preliminary Prospectus. See also“Certain Legal Aspects of the Mortgage Loans—Default Interest and Limitations on Prepayments” in the Preliminary Prospectus. Prepayment premiums and yield maintenance charges will be distributed on any Distribution Date only to the extent they are received in respect of the mortgage loans as of the related Determination Date. See also“Description of the Certificates—Distributions”in the Preliminary Prospectus. |
Non-Serviced Mortgage Loans: | Each of the 9 West 57th Street mortgage loan and the GLP Industrial Portfolio B mortgage loan is referred to in this Term Sheet as, individually, a “non-serviced mortgage loan” and, collectively, the “non-serviced mortgage loans”. Each non-serviced mortgage loan and the related companion loan(s) are being serviced and administered in accordance with, and all decisions, consents, waivers, approvals and other actions on the part of the holders of the non-serviced mortgage loan and the related companion loan(s) will be effected in accordance with, the Lead Pooling and Servicing Agreement set forth in the “Pari Passu Loan Summary” table above and the related co-lender agreement. Consequently, the servicing provisions set forth in this Term Sheet will generally not be applicable to the non-serviced mortgage loans, but instead such servicing and administration of the non-serviced mortgage loans will, in each case, be governed by the related Lead Pooling and Servicing Agreement. Each Lead Pooling and Servicing Agreement provides for servicing in a manner acceptable for rated transactions similar in nature to this securitization. The non-serviced mortgage loans are discussed further under“—Whole Loans” below. |
THE INFORMATION IN THIS STRUCTURAL AND COLLATERAL TERM SHEET IS NOT COMPLETE AND MAY BE AMENDED PRIOR TO THE TIME OF SALE. THIS STRUCTURAL AND COLLATERAL TERM SHEET IS NOT AN OFFER TO SELL THESE SECURITIES AND IT IS NOT A SOLICITATION OF AN OFFER TO BUY THESE SECURITIES IN ANY JURISDICTION WHERE THE OFFER OR SALE IS NOT PERMITTED.
| - 20 - |
Advances: | The master servicer and, if it fails to do so, the trustee, will be obligated to make (i) P&I advances with respect to each mortgage loan in the issuing entity and, (ii) with respect to each mortgage loan (other than the non-serviced mortgage loans) and serviced whole loan, servicing advances, including paying delinquent real estate taxes, assessments and hazard insurance premiums, but only to the extent that those advances are not deemed non-recoverable from collections on the related mortgage loan (or, if applicable, serviced whole loan) and, in the case of P&I advances, subject to reduction in connection with any appraisal reduction amounts that may occur. The special servicer will have no obligation to make property advances;providedthat with respect to a specially serviced loan, the special servicer will be entitled to make a property advance in an urgent or emergency situation, and the master servicer will be required to reimburse the special servicer for such advance, with interest;provided that the advance is not determined by the master servicer to be nonrecoverable. Notwithstanding the foregoing, servicing advances for the non-serviced mortgage loans will be made by the parties to, and pursuant to, the applicable Lead Pooling and Servicing Agreement. |
Appraisal Reduction Amounts: | An appraisal reduction amount generally will be created with respect to a required appraisal loan (which is a serviced mortgage loan (or serviced whole loan, if applicable)) as to which certain defaults, modifications or insolvency events have occurred (as further described in the Preliminary Prospectus) in the amount, if any, by which the principal balance of such required appraisal loan, exceeds 90% of the appraised value of the related mortgaged property (as determined by one or more appraisals obtained by the special servicer) plus certain escrows and reserves (including letters of credit) held with respect to such required appraisal loan (net of other amounts overdue or advanced in connection with such required appraisal loan). In general, subject to the discussion in the next paragraphs, any appraisal reduction amount calculated with respect to a whole loan will be allocated to the related mortgage loan andpari passu companion loan(s) on apro rata basis in accordance with their respective outstanding principal balances. In the case of the non-serviced mortgage loans, any appraisal reduction amounts will be calculated pursuant to, and by a party to, the related Lead Pooling and Servicing Agreement (as discussed under “—Whole Loans” below). As a result of an appraisal reduction amount being calculated for and/or allocated to a given mortgage loan, the interest portion of any P&I advance for such mortgage loan will be reduced, which will have the effect of reducing the amount of interest available for distribution to the most subordinate class(es) of certificates (exclusive of Class R certificates) then outstanding (i.e., first to the Class NR certificates, then to the Class F certificates, then to the Class E certificates, then to the Class D certificates, then to the Class C certificates, then to the Class B certificates, then to the Class A-S certificates, and then,pro rata based on their respective interest entitlements, to the Class A-1, Class A-2, Class A-3, Class A-4, Class A-5, Class A-SB, Class X-A, Class X-B, Class X-E, Class X-F and Class X-NR certificates). In general, a mortgage loan (or whole loan, if applicable) serviced under the pooling and servicing agreement for this transaction will cease to be a required appraisal loan, and no longer be subject to an appraisal reduction amount, when the same has ceased to be a specially serviced loan (if applicable), has been brought current for at least three consecutive months and no other circumstances exist that would cause such serviced loan to be a required appraisal |
THE INFORMATION IN THIS STRUCTURAL AND COLLATERAL TERM SHEET IS NOT COMPLETE AND MAY BE AMENDED PRIOR TO THE TIME OF SALE. THIS STRUCTURAL AND COLLATERAL TERM SHEET IS NOT AN OFFER TO SELL THESE SECURITIES AND IT IS NOT A SOLICITATION OF AN OFFER TO BUY THESE SECURITIES IN ANY JURISDICTION WHERE THE OFFER OR SALE IS NOT PERMITTED.
| - 21 - |
| Appraisal Reduction Amounts (continued): | loan.
Appraisal reduction amounts with respect to each of the 9 West 57th Street whole loan and the GLP Industrial Portfolio B whole loan will be allocated to notionally reduce the outstanding principal balance of the related subordinate companion loans prior topro rata allocation to the related mortgage loan andpari passu companion loans.
At any time an appraisal is ordered under the pooling and servicing agreement with respect to a property that would result in an appraisal reduction amount with respect to a mortgage loan that would result in a change in the controlling class, certain certificate holders will have a right to request a new appraisal as described in the Preliminary Prospectus. |
Age of Appraisals: | Appraisals (which can be an update of a prior appraisal) with respect to a mortgage loan serviced under the pooling and servicing agreement are required to be no older than 9 months for purposes of determining appraisal reduction amounts, market value, and other calculations as described in the Preliminary Prospectus. |
| Sale of Defaulted Loans: | There will be no “Fair Market Value Purchase Option”, instead defaulted loans will be sold in a process similar to the sale process for REO property. |
Cleanup Call: | On any distribution date on which the aggregate unpaid principal balance of the mortgage loans remaining in the issuing entity is less than 1% of the aggregate principal balance of the pool of mortgage loans as of the Cut-off Date, certain specified persons will have the option to purchase all of the remaining mortgage loans (and all property acquired through exercise of remedies in respect of any mortgage loan) at the price specified in the Preliminary Prospectus. Exercise of the option will terminate the issuing entity and retire the then outstanding certificates.
If the aggregate certificate balances of all certificates (exclusive of the Class X Certificates) senior to the Class E certificates, and the notional amounts of the Class X-A and Class X-B certificates have been reduced to zero, and if the master servicer has consented, the issuing entity could also be terminated in connection with a voluntary exchange of all the then-outstanding certificates (excluding Class R certificates), for the mortgage loans remaining in the issuing entity, but all of the holders of those classes of outstanding certificates would have to voluntarily participate in the exchange. |
Directing Certificateholder: | The “Directing Certificateholder” will generally be the controlling class certificateholder or other representative designated by the holder(s) of at least a majority of the voting rights of the controlling class. The controlling class is the most subordinate class of the Class F and Class NR certificates that has an aggregate certificate balance as notionally reduced by any Cumulative Appraisal Reduction Amounts allocated to such class, that is equal to or greater than 25% of the initial certificate balance of such class of certificates. At any time when Class F is the controlling class, the majority Class F certificateholders may elect under certain circumstances to opt-out from its rights under the pooling and servicing agreement. See“Pooling and Servicing Agreement—The Directing Certificateholder” in the Preliminary Prospectus. No other class of certificates will be eligible to act as the controlling class or appoint a Directing Certificateholder.
RREF III Debt AIV, LP or another affiliate of Rialto is expected to purchase the Class
|
THE INFORMATION IN THIS STRUCTURAL AND COLLATERAL TERM SHEET IS NOT COMPLETE AND MAY BE AMENDED PRIOR TO THE TIME OF SALE. THIS STRUCTURAL AND COLLATERAL TERM SHEET IS NOT AN OFFER TO SELL THESE SECURITIES AND IT IS NOT A SOLICITATION OF AN OFFER TO BUY THESE SECURITIES IN ANY JURISDICTION WHERE THE OFFER OR SALE IS NOT PERMITTED.
| - 22 - |
| Directing Certificateholder (continued): | F, Class NR certificates (and may also purchase certain other classes of certificates, including the Class X-E, Class X-F, Class X-NR and Class E Certificates) and, on the Closing Date, is expected to be the initial Directing Certificateholder. |
Control/Consultation Rights: | The Directing Certificateholder will be entitled to have consultation and approval rights with respect to certain major decisions (including with respect to assumptions, waivers, loan modifications and workouts) unless no class of the Class F and Class NR certificates (the “control eligible certificates”) has an outstanding certificate balance, as notionally reduced by any Cumulative Appraisal Reduction Amounts allocated to such class, that is equal to or greater than 25% of the initial certificate balance of that class of certificates (a “Control Termination Event”).
The “Cumulative Appraisal Reduction Amount” as of any date of determination for any mortgage loan, is equal to the sum of (i) all appraisal reduction amounts then in effect, and (ii) with respect to any AB Modified Loan, any Collateral Deficiency Amount then in effect.
“AB Modified Loan” means any corrected loan (1) that became a corrected loan (which includes for purposes of this definition any non-serviced mortgage loan that became a “corrected loan” (or any term substantially similar thereto) pursuant to the Lead Pooling and Servicing Agreement governing the servicing of such non-serviced mortgage loan) due to a modification thereto that resulted in the creation of an A/B note structure (or similar structure) and as to which the new junior note(s) did not previously exist or the principal amount of the new junior note(s) was previously part of either an A note held by the issuing entity or the original unmodified mortgage loan and (2) as to which an appraisal reduction amount is not in effect.
“Collateral Deficiency Amount” means, with respect to any AB Modified Loan as of any date of determination, the excess of (i) the principal balance of such AB Modified Loan (taking into account the related junior note(s) and any pari passu notes included therein), over (ii) the sum of (in the case of a Whole Loan, solely to the extent allocable to the subject mortgage loan) (x) the most recent Appraised Value for the related mortgaged property or mortgaged properties, plus (y) solely to the extent not reflected or taken into account in such Appraised Value (or in the calculation of any related appraisal reduction amount) and to the extent on deposit with, or otherwise under the control of, the lender as of the date of such determination, any capital or additional collateral contributed by the related borrower at the time the mortgage loan became (and as part of the modification related to) such AB Modified Loan for the benefit of the related mortgaged property or mortgaged properties (provided that in the case of a non-serviced mortgage loan, the amounts set forth in this clause (y) will be taken into account solely to the extent relevant information is received by the master servicer), plus (z) any other escrows or reserves (in addition to any amounts set forth in the immediately preceding clause (y) and solely to the extent not reflected or taken into account in the calculation of any related appraisal reduction amount) held by the lender in respect of such AB Modified Loan as of the date of such determination, which such excess, for the avoidance of doubt, will be determined separately from and exclude any related appraisal reduction amounts.
So long as a Control Termination Event does not exist, the Directing Certificateholder will be entitled to direct the special servicer to take, or refrain from taking, certain |
THE INFORMATION IN THIS STRUCTURAL AND COLLATERAL TERM SHEET IS NOT COMPLETE AND MAY BE AMENDED PRIOR TO THE TIME OF SALE. THIS STRUCTURAL AND COLLATERAL TERM SHEET IS NOT AN OFFER TO SELL THESE SECURITIES AND IT IS NOT A SOLICITATION OF AN OFFER TO BUY THESE SECURITIES IN ANY JURISDICTION WHERE THE OFFER OR SALE IS NOT PERMITTED.
| - 23 - |
| Control/Consultation Rights (continued): | actions that would constitute major decisions with respect to a mortgage loan or whole loan serviced under the pooling and servicing agreement and will also have the right to notice and to consent to certain material actions that would constitute major decisions that the master servicer or the special servicer plan on taking with respect to any such mortgage loan or serviced whole loan subject to the servicing standard and other restrictions as described in the Preliminary Prospectus.
Following the occurrence and during the continuation of a Control Termination Event until such time as no class of the Class F and Class NR certificates has an outstanding certificate balance, without regard to the application of any Cumulative Appraisal Reduction Amounts, that is at least equal to 25% of the initial certificate balance of such class of certificates (a “Consultation Termination Event”), all of the rights of the Directing Certificateholder will terminate other than a right to consult with respect to the major decisions and other matters as to which it previously had approval rights. After the occurrence and during the continuation of a Control Termination Event, the operating advisor will be entitled to consult with the special servicer with respect to certain major decisions on behalf of the issuing entity and in the best interest of, and for the benefit of, the certificateholders, as if those certificateholders and, with respect to a servicedpari passu companion loan, the relatedpari passu companion loan holder(s) constituted a single lender.
With respect to each non-serviced whole loan, the Directing Certificateholder for this transaction will have limited consultation rights, and the applicable directing certificateholder (or equivalent entity) pursuant to the related Lead Pooling and Servicing Agreement (other than with respect to the 9 West 57th Street whole loan) will have consultation, approval and direction rights, with respect to certain major decisions (including with respect to assumptions, waivers, loan modifications and workouts) regarding such non-serviced whole loan, as provided for in the related co-lender agreement and in the related Lead Pooling and Servicing Agreement, and as described under “Description of the Mortgage Pool—The Whole Loans” in the Preliminary Prospectus.
Notwithstanding any contrary description set forth above, in the event that, with respect to any mortgage loan, the Directing Certificateholder or any controlling class certificateholder is a Borrower Party (any of the above, as applicable, an “Excluded Controlling Class Holder”), such Excluded Controlling Class Holder will not have any consultation or approval rights with respect to such mortgage loan and will have no right to receive asset status reports or such other information as may be specified in the pooling and servicing agreement. A “Borrower Party” is a borrower, a mortgagor, a manager of a mortgaged property or the holder of a mezzanine loan that has been accelerated or as to which foreclosure or enforcement proceedings have been commenced against the equity collateral pledged to secure the related mezzanine loan, a person controlling or controlled by or under common control with the foregoing or any other such person owning, directly or indirectly, 25% or more of the beneficial interests in such borrower, mortgagor, manager of a mortgaged property or mezzanine lender.
|
Whole Loans: | The Coconut Point mortgage loan, which will be contributed to the issuing entity, has an outstanding principal balance as of the Cut-off Date of $100,000,000, represents |
THE INFORMATION IN THIS STRUCTURAL AND COLLATERAL TERM SHEET IS NOT COMPLETE AND MAY BE AMENDED PRIOR TO THE TIME OF SALE. THIS STRUCTURAL AND COLLATERAL TERM SHEET IS NOT AN OFFER TO SELL THESE SECURITIES AND IT IS NOT A SOLICITATION OF AN OFFER TO BUY THESE SECURITIES IN ANY JURISDICTION WHERE THE OFFER OR SALE IS NOT PERMITTED.
| - 24 - |
| Whole Loans (continued): | approximately 13.0% of the Initial Pool Balance, and has two related companion loans that arepari passu in right of payment with the Coconut Point mortgage loan, of which (a) one note was included in the MSBAM Trust 2016-C30, and (b) one note is currently held by Morgan Stanley Bank, N.A. or an affiliate and is expected to be contributed to one or more future securitization trusts. Eachpari passu companion loan described above is referred to in this Term Sheet as a “pari passu companion loan”, a “serviced companion loan” and a “companion loan”. The Coconut Point mortgage loan and the related companion loans are collectively referred to in this Term Sheet as the “Coconut Point whole loan”, a “serviced whole loan” and a “whole loan”.
The Gurnee Mills mortgage loan, which will be contributed to the issuing entity, has an outstanding principal balance as of the Cut-off Date of $74,900,058, represents approximately 9.8% of the Initial Pool Balance, and has five related companion loans that arepari passu in right of payment with the Gurnee Mills mortgage loan, of which (a) one note is currently held by Column or an affiliate and is expected to be contributed to one or more future securitization trusts, (b) one note is expected to be included in the WFCM Trust 2016-C36, (c) one note is currently held by Wells Fargo or an affiliate and is expected to be contributed to one or more future securitization trusts and (d) two notes are currently held by Regions Bank or an affiliate and are expected to be contributed to one or more future securitization trusts. Eachpari passu companion loan described above is referred to in this Term Sheet as a “pari passu companion loan”, a “serviced companion loan” and a “companion loan”. The Gurnee Mills mortgage loan and the related companion loans are collectively referred to in this Term Sheet as the “Gurnee Mills whole loan”, a “serviced whole loan” and a “whole loan”.
The 9 West 57th Street mortgage loan, which will be contributed to the issuing entity and has an outstanding principal balance as of the Cut-off Date of $50,000,000, represents approximately 6.5% of the Initial Pool Balance and has (i) five related companion loans that arepari passu in right of payment with the 9 West 57th Street mortgage loan, of which (a) one note was included in JPMCC Trust 2016-NINE (“JPMCC 2016-NINE transaction”), (b) one note was included in the JPMCC Trust 2016-JP3, (c) one note is currently held by a third party and is expected to be contributed to one or more future securitization trusts, (d) one note is expected to be included in the JPMDB Trust 2016-C4 and (e) one note is currently held by JPMorgan Chase Bank, National Association or an affiliate and is expected to be contributed to one or more future securitization trusts and (ii) one related companion loan that is generally subordinate in right of payment with the 9 West 57th Street mortgage loan and which was included in the JPMCC 2016-NINE transaction. Eachpari passu companion loan described above is referred to in this Term Sheet as a “pari passucompanion loan”, a “non-serviced companion loan” and a “companion loan”. The subordinate companion loan is referred to in this Term Sheet as a “subordinate companion loan”, a “non-serviced companion loan” and a “companion loan”. The 9 West 57th Street mortgage loan and the related companion loans are collectively referred to in this Term Sheet as the “9 West 57th Street whole loan”, a “non-serviced whole loan” and a “whole loan”. The 9 West 57th Street whole loan will be serviced by the JPMCC 2016-NINE transaction master servicer and, if and to the extent necessary, the JPMCC 2016-NINE transaction special servicer under the JPMCC 2016-NINE transaction trust and servicing agreement (referred to as the |
THE INFORMATION IN THIS STRUCTURAL AND COLLATERAL TERM SHEET IS NOT COMPLETE AND MAY BE AMENDED PRIOR TO THE TIME OF SALE. THIS STRUCTURAL AND COLLATERAL TERM SHEET IS NOT AN OFFER TO SELL THESE SECURITIES AND IT IS NOT A SOLICITATION OF AN OFFER TO BUY THESE SECURITIES IN ANY JURISDICTION WHERE THE OFFER OR SALE IS NOT PERMITTED.
| - 25 - |
| Whole Loans (continued): | “JPMCC 2016-NINE TSA” in this Term Sheet). Wilmington, as the JPMCC 2016-NINE transaction trustee, or a custodian on its behalf, will hold the mortgage file for the 9 West 57thStreet whole loan pursuant to the JPMCC 2016-NINE TSA (other than the promissory note for the related mortgage loan, which will be held by the custodian under the pooling and servicing agreement for this securitization).
The Peachtree Mall mortgage loan, which will be contributed to the issuing entity, has an outstanding principal balance as of the Cut-off Date of $24,761,505, represents approximately 3.2% of the Initial Pool Balance, and has three related companion loans that arepari passu in right of payment with the Peachtree Mall mortgage loan, of which (a) one note was included in the SGCMS Trust 2016-C5, (b) one note was included in the WFCM Trust 2016-NXS6 and (c) one note is currently held by Silverpeak or an affiliate and is expected to be contributed to one or more future securitization trusts. Eachpari passu companion loan described above is referred to in this Term Sheet as a “pari passu companion loan”, a “serviced companion loan” and a “companion loan”. The Peachtree Mall mortgage loan and the related companion loans are collectively referred to in this Term Sheet as the “Peachtree Mall whole loan”, a “serviced whole loan” and a “whole loan”.
The GLP Industrial Portfolio B mortgage loan, which will be contributed to the issuing entity and has an outstanding principal balance as of the Cut-off Date of $15,900,000, represents approximately 2.1% of the Initial Pool Balance and has (i) four related companion loans that arepari passu in right of payment with the GLP Industrial Portfolio B mortgage loan, of which (a) two notes were included in CSMC Trust 2015-GLPB (“CSMC 2015-GLPB transaction”), (b) one note was included in the CSAIL Trust 2016-C6 and (c) one note was included in the MSCI Trust 2016-UBS9 and (ii) two related companion loans that are generally subordinate in right of payment with the GLP Industrial Portfolio B mortgage loan and which were included in the CSMC 2015-GLPB transaction. Eachpari passu companion loan described above is referred to in this Term Sheet as a “pari passu companion loan”, a “non-serviced companion loan” and a “companion loan”. Each subordinate companion loan is referred to in this Term Sheet as a “subordinate companion loan”, a “non-serviced companion loan” and a “companion loan”. The GLP Industrial Portfolio B mortgage loan and the related companion loans are collectively referred to in this Term Sheet as the “GLP Industrial Portfolio B whole loan”, a “non-serviced whole loan” and a “whole loan”. The GLP Industrial Portfolio B whole loan will be serviced by the CSMC 2015-GLPB transaction master servicer and, if and to the extent necessary, the CSMC 2015-GLPB transaction special servicer under the CSMC 2015-GLPB transaction trust and servicing agreement (referred to as the “CSMC 2015-GLPB TSA” in this Term Sheet). Wells Fargo, as the CSMC 2015-GLPB transaction trustee, or a custodian on its behalf, will hold the mortgage file for the GLP Industrial Portfolio B whole loan pursuant to the CSMC 2015-GLPB TSA (other than the promissory note for the related mortgage loan, which will be held by the custodian under the pooling and servicing agreement for this securitization).
Each of the CSMC 2015-GLPB TSA and JPMCC 2016-NINE TSA is also referred to in this Term Sheet as a “Lead Pooling and Servicing Agreement” insofar as it relates to the non-serviced whole loan serviced thereunder.
In the case of the non-serviced whole loans, the related mortgage loans are referred |
THE INFORMATION IN THIS STRUCTURAL AND COLLATERAL TERM SHEET IS NOT COMPLETE AND MAY BE AMENDED PRIOR TO THE TIME OF SALE. THIS STRUCTURAL AND COLLATERAL TERM SHEET IS NOT AN OFFER TO SELL THESE SECURITIES AND IT IS NOT A SOLICITATION OF AN OFFER TO BUY THESE SECURITIES IN ANY JURISDICTION WHERE THE OFFER OR SALE IS NOT PERMITTED.
| - 26 - |
Whole Loans (continued): | to as “non-serviced mortgage loans”.
The Coconut Point whole loan, Gurnee Mills whole loan and Peachtree Mall whole loan will be serviced by Wells Fargo, as the CSAIL 2016-C7 master servicer, and special serviced by Rialto, as the CSAIL 2016-C7 special servicer pursuant to the terms of the CSAIL 2016-C7 PSA. Wilmington, as the CSAIL 2016-C7 trustee, or a custodian on its behalf, will hold the mortgage file for The Coconut Point whole loan, Gurnee Mills whole loan and Peachtree Mall whole loan pursuant to the CSAIL 2016-C7 PSA (other than the promissory note for the related companion loan that is not an asset of the CSAIL 2016-C7 securitization).
For more information regarding the whole loans, see “Description of the Mortgage Pool—The Whole Loans” in the Preliminary Prospectus. |
Servicing Standard: | Each of the mortgage loans (other than the non-serviced mortgage loans) and serviced whole loan(s) will be serviced by the master servicer and the special servicer pursuant to the terms of the pooling and servicing agreement. In all circumstances, each of the master servicer and the special servicer are obligated to act in the best interests of the certificateholders (and, in the case of a serviced whole loan, the holder of the related serviced companion loan) as a collective whole as if such certificateholders (and, if applicable, such companion loan holder), constituted a single lender. The applicable special servicer is required to determine the effect on net present value of various courses of action (including workout or foreclosure), using the Calculation Rate as the discount rate, and pursue the course of action that it determines would maximize recovery on a net present value basis.
“Calculation Rate” means:
(a) for principal and interest payments on a mortgage loan or proceeds from the sale of a defaulted loan, the highest of (i) the rate determined by the master servicer or the special servicer, as applicable, that approximates the market rate that would be obtainable by borrowers on similar debt of the borrowers as of such date of determination, (ii) the mortgage loan rate and (iii) the yield on 10-year US treasuries; and
(b) for all other cash flows, including property cash flow, the “discount rate” set forth in the most recent appraisal (or update of such appraisal). |
Termination of Special Servicer: | If a Control Termination Event has not occurred (or has occurred, but is no longer continuing), the special servicer may be replaced with respect to the mortgage loans and the serviced whole loans at the direction of the Directing Certificateholder upon satisfaction of certain conditions specified in the pooling and servicing agreement.
After the occurrence and during the continuance of a Control Termination Event, the holders of at least 25% of the voting rights of the certificates (other than Class R certificates) may request a vote to replace the special servicer. The subsequent vote may result in the termination and replacement of such special servicer if, within 180 days of the initial request for that vote, the holders of (a) at least 66-2/3% of a “certificateholder quorum” (holders of certificates evidencing at least 75% of the aggregate voting rights of the certificates (other than the Class X and Class R certificates)), or (b) more than 50% of the voting rights of each class of certificates other than any Class X and Class R certificates (but in the case of this clause (b) only |
THE INFORMATION IN THIS STRUCTURAL AND COLLATERAL TERM SHEET IS NOT COMPLETE AND MAY BE AMENDED PRIOR TO THE TIME OF SALE. THIS STRUCTURAL AND COLLATERAL TERM SHEET IS NOT AN OFFER TO SELL THESE SECURITIES AND IT IS NOT A SOLICITATION OF AN OFFER TO BUY THESE SECURITIES IN ANY JURISDICTION WHERE THE OFFER OR SALE IS NOT PERMITTED.
| - 27 - |
| Termination of Special Servicer (continued): | such classes of certificates that, in each case, have an outstanding certificate balance, as notionally reduced by any appraisal reduction amounts allocated to such class, equal to or greater than 25% of the initial certificate balance of such class, minus all payments of principal made on such class of certificates), vote affirmatively to so replace such special servicer.
At any time after the occurrence of a Consultation Termination Event, if the operating advisor determines that the special servicer is not performing its duties as required under the pooling and servicing agreement or is otherwise not acting in accordance with the servicing standard, the operating advisor may recommend the replacement of the special servicer resulting in a solicitation of a certificateholder vote. The operating advisor’s recommendation to replace the special servicer must be confirmed by an affirmative vote of holders of certificates (other than Class X and Class R certificates) evidencing at least a majority of the voting rights (taking into account the application of any appraisal reduction amounts to notionally reduce the certificate balances of the classes to which such appraisal reduction amounts are allocable) of all certificates (other than Class X and Class R certificates). In the event the holders of such certificates elect to remove and replace the special servicer, the certificate administrator will be required to obtain a rating agency confirmation from each of the rating agencies at that time.
|
| Excluded Special Servicer: | In the event that, with respect to any mortgage loan, the special servicer has obtained knowledge that it is a Borrower Party with respect to a mortgage loan, the special servicer will be required to resign as special servicer of such mortgage loan (an “Excluded Special Servicer Loan”), and, prior to the occurrence and continuance of a Control Termination Event, the Directing Certificateholder or the majority controlling class certificateholder on its behalf will be required to appoint (and may replace with or without cause) a successor special servicer that is not a Borrower Party (an “Excluded Special Servicer”) with respect to such Excluded Special Servicer Loan unless such Excluded Special Servicer Loan is also an excluded loan with respect to such Directing Certificateholder, in which case the resigning special servicer will be required to use reasonable efforts to appoint the Excluded Special Servicer. |
Servicing Compensation: | Modification Fees: Certain fees resulting from modifications, amendments, waivers or other changes to the terms of the loan documents, as more fully described in the Preliminary Prospectus, will be used to offset expenses on the related serviced mortgage loan (i.e., a mortgage loan other than a non-serviced mortgage loan) or serviced whole loan, if applicable (i.e.,reimburse the trust for certain expenses including unreimbursed advances and interest on unreimbursed advances previously incurred (other than special servicing fees, workout fees and liquidation fees) on the related mortgage loan (other than a non-serviced mortgage loan) or serviced whole loan, if applicable, but not yet reimbursed to the trust or servicers), or to pay expenses (other than special servicing fees, workout fees and liquidation fees) that are still outstanding, in each case unless as part of the written modification the related borrower is required to pay these amounts on a going forward basis or in the future). Any excess modification fees not so applied to offset expenses will be available as compensation to the master servicer and/or applicable special servicer. Within any prior 12-month period, all excess modification fees earned by the master servicer or by the applicable special servicer (after taking into account the offset |
THE INFORMATION IN THIS STRUCTURAL AND COLLATERAL TERM SHEET IS NOT COMPLETE AND MAY BE AMENDED PRIOR TO THE TIME OF SALE. THIS STRUCTURAL AND COLLATERAL TERM SHEET IS NOT AN OFFER TO SELL THESE SECURITIES AND IT IS NOT A SOLICITATION OF AN OFFER TO BUY THESE SECURITIES IN ANY JURISDICTION WHERE THE OFFER OR SALE IS NOT PERMITTED.
| - 28 - |
Servicing Compensation | described below applied during such 12-month period) with respect to any mortgage loan (other than a non-serviced mortgage loan) or serviced whole loan, if applicable, will be subject to a cap equal to the greater of (i) 1.0% of the outstanding principal balance of such mortgage loan after giving effect to such transaction and (ii) $25,000.
All excess modification fees earned by either special servicer will be required to offset any future workout fees or liquidation fees payable with respect to the related mortgage loan (other than a non-serviced mortgage loan) or serviced whole loan, if applicable, or related REO property;provided that if the mortgage loan (other than a non-serviced mortgage loan) or serviced whole loan, if applicable, ceases being a corrected loan, and is subject to a subsequent modification, any excess modification fees earned by the applicable special servicer prior to such mortgage loan (other than a non-serviced mortgage loan) or serviced whole loan, if applicable, ceasing to be a corrected loan will no longer be offset against future liquidation fees and workout fees unless such mortgage loan (other than a non-serviced mortgage loan) or serviced whole loan, if applicable, ceased to be a corrected loan within 12 months of it becoming a modified mortgage loan (or modified whole loan, if applicable).
Penalty Charges: All late fees and default interest will first be used to reimburse certain expenses previously incurred with respect to the related mortgage loan (other than a non-serviced mortgage loan) or serviced whole loan, if applicable (other than special servicing fees, workout fees and liquidation fees) but not yet reimbursed to the trust, the master servicer or the applicable special servicer or to pay certain expenses (other than special servicing fees, workout fees and liquidation fees) that are still outstanding on the related mortgage loan (other than a non-serviced mortgage loan) or serviced whole loan, if applicable, and any excess received with respect to a serviced loan will be paid to the master servicer (for penalty charges accrued while a non-specially serviced loan), and the applicable special servicer (for penalty charges accrued while a specially serviced loan). To the extent any amounts reimbursed out of penalty charges are subsequently recovered on a related serviced loan, they will be paid to the master servicer or applicable special servicer who would have been entitled to the related penalty charges that were previously used to reimburse such expense.
Liquidation / Workout Fees: Liquidation fees will be calculated at the lesser of (a) 1.0% and (b) such lower rate as would result in a liquidation fee of $1,000,000, for each mortgage loan (other than a non-serviced mortgage loan) or serviced whole loan that is a specially serviced loan and any REO property, subject in any case to a minimum liquidation fee of $25,000, except that the liquidation fee will be zero with respect to certain liquidation events set forth in the pooling and servicing agreement, and the liquidation fee with respect to each mortgage loan or REO mortgage loan repurchased or substituted for after more than 180 days following the Mortgage Loan Seller’s receipt of notice or discovery of a material breach or material defect will be in an amount equal to the liquidation fee rate described above of the outstanding principal balance of such mortgage loan or REO loan. For any mortgage loan (other than a non-serviced loan) or serviced whole loan that is a corrected loan, workout fees will be calculated at the lesser of (a) 1.0% and (b) such lower rate as would result in a workout fee of $1,000,000 when applied to each expected payment of principal and interest (other than default interest) on the related mortgage loan (other |
THE INFORMATION IN THIS STRUCTURAL AND COLLATERAL TERM SHEET IS NOT COMPLETE AND MAY BE AMENDED PRIOR TO THE TIME OF SALE. THIS STRUCTURAL AND COLLATERAL TERM SHEET IS NOT AN OFFER TO SELL THESE SECURITIES AND IT IS NOT A SOLICITATION OF AN OFFER TO BUY THESE SECURITIES IN ANY JURISDICTION WHERE THE OFFER OR SALE IS NOT PERMITTED.
| - 29 - |
Servicing Compensation | than a non-serviced mortgage loan) or serviced whole loan, if applicable, from the date such serviced loan becomes a corrected loan through and including the then related maturity date; or in any case such higher rate as would result in a workout fee of $25,000 when applied to each expected payment of principal and interest (other than default interest) on any mortgage loan from the date such serviced loan becomes a corrected loan through and including the then related maturity date.
Notwithstanding the foregoing, in connection with a maturity default, no liquidation or workout fee will be payable in connection with a payoff or refinancing of the related serviced loan within 90 days of the maturity default. |
Operating Advisor: | Prior to the occurrence and continuance of a Control Termination Event, the operating advisor will review certain information on the certificate administrator’s website, and will have access to any final asset status report but will not have any approval or consultation rights. After the occurrence and during the continuance of a Control Termination Event, the operating advisor will be entitled to consult with the special servicer in respect of the asset status report with respect to certain major decisions on behalf of the issuing entity and in the best interest of, and for the benefit of, the certificateholders, as if those certificateholders (and, with respect to a servicedpari passu companion loan, the relatedpari passucompanion loan holder(s)) constituted a single lender. Additionally, the operating advisor will be required to prepare an annual report to be provided to the trustee, the master servicer, the rating agencies, the certificate administrator and the 17g-5 information provider and to recalculate and verify the accuracy of certain calculations and their corresponding application.
After the occurrence of a Consultation Termination Event, the operating advisor may be removed without cause upon (i) the written direction of certificateholders evidencing not less than 15% of the voting rights (taking into account the application of appraisal reduction amounts to notionally reduce the certificate balances of classes to which such appraisal reduction amounts are allocable) requesting a vote to replace the operating advisor and (ii) payment by such requesting holders to the certificate administrator of all reasonable fees and expenses to be incurred by the certificate administrator in connection with administering such vote Upon the vote or written direction of holders of at least 75% of the voting rights (taking into account the application of appraisal reduction amounts to notionally reduce the certificate balances of classes to which such appraisal reduction amounts are allocable), the trustee will immediately replace the operating advisor with the replacement operating advisor. In the event there are no classes of certificates outstanding (other than the Class X-F, Class X-NR, Class F, Class NR and Class R certificates), then all of the rights and obligations of the operating advisor under the pooling and servicing agreement will terminate.
|
Asset Representations Reviewer | The asset representations reviewer will be required to review certain delinquent mortgage loans after a specified delinquency threshold has been exceeded and the required percentage of certificateholders vote to direct a review of such delinquent mortgage loans. An asset review will occur when either (1) mortgage loans with an aggregate outstanding principal balance of 25.0% or more of the aggregate |
THE INFORMATION IN THIS STRUCTURAL AND COLLATERAL TERM SHEET IS NOT COMPLETE AND MAY BE AMENDED PRIOR TO THE TIME OF SALE. THIS STRUCTURAL AND COLLATERAL TERM SHEET IS NOT AN OFFER TO SELL THESE SECURITIES AND IT IS NOT A SOLICITATION OF AN OFFER TO BUY THESE SECURITIES IN ANY JURISDICTION WHERE THE OFFER OR SALE IS NOT PERMITTED.
| - 30 - |
Asset Representations Reviewer | outstanding principal balance of all of the mortgage loans (including any REO loans (or a portion of any REO loan in the case of a whole loan)) held by the issuing entity as of the end of the applicable collection period are delinquent loans or (2) at least 15 mortgage loans are delinquent loans as of the end of the applicable collection period and the outstanding principal balance of such delinquent loans in the aggregate constitutes at least 20.0% of the aggregate outstanding principal balance of all of the mortgage loans (including any REO loans (or a portion of any REO loan in the case of a whole loan)) held by the issuing entity as of the end of the applicable collection period. |
Replacement of the Asset Representations Reviewer: | The asset representations reviewer may be terminated and replaced without cause. Upon (i) the written direction of certificateholders evidencing not less than 25% of the voting rights (without regard to the application of any appraisal reduction amounts) requesting a vote to terminate and replace the asset representations reviewer with a proposed successor asset representations reviewer that is an eligible asset representations reviewer, and (ii) payment by such holders to the certificate administrator of the reasonable fees and expenses to be incurred by the certificate administrator in connection with administering such vote, the certificate administrator will promptly provide notice to all certificateholders and the asset representations reviewer of such request. Upon the written direction of certificateholders evidencing at least 75% of a certificateholder quorum (without regard to the application of any appraisal reduction amounts), the trustee will terminate all of the rights and obligations of the asset representations reviewer under the pooling and servicing agreement, and the proposed successor asset representations reviewer will be appointed. |
Dispute Resolution Provisions: | Each Mortgage Loan Seller will be subject to the dispute resolution provisions set forth in the pooling and servicing agreement to the extent those provisions are triggered with respect to any mortgage loan sold to the depositor by a Mortgage Loan Seller and such Mortgage Loan Seller will be obligated under the related mortgage loan purchase agreement to comply with all applicable provisions and to take part in any mediation or arbitration proceedings that may result.
Generally, in the event that a repurchase request is not “Resolved” (as defined below) within 180 days after the related Mortgage Loan Seller receives such repurchase request, then the enforcing servicer will be required to send a notice to the “initial requesting certificateholder” (if any) and to the certificate administrator who will make such notice available to all other certificateholders and certificate owners indicating the enforcing servicer’s intended course of action with respect to the repurchase request. Such notice will notify all certificateholders and certificate owners that in the event any certificateholder disagrees with the enforcing servicer’s intended course of action, the enforcing servicer will be required to follow the course of action agreed to and/or proposed by the majority of the responding certificateholders that involves referring the matter to mediation or arbitration, as the case may be. If (a) the enforcing servicer’s intended course of action with respect to the repurchase request does not involve pursuing further action to exercise rights against the related Mortgage Loan Seller with respect to the repurchase request and the initial requesting certificateholder, if any, or any other certificateholder or certificate owner wishes to exercise its right to refer the matter to mediation (including nonbinding arbitration) or arbitration, or (b) the enforcing servicer’s |
THE INFORMATION IN THIS STRUCTURAL AND COLLATERAL TERM SHEET IS NOT COMPLETE AND MAY BE AMENDED PRIOR TO THE TIME OF SALE. THIS STRUCTURAL AND COLLATERAL TERM SHEET IS NOT AN OFFER TO SELL THESE SECURITIES AND IT IS NOT A SOLICITATION OF AN OFFER TO BUY THESE SECURITIES IN ANY JURISDICTION WHERE THE OFFER OR SALE IS NOT PERMITTED.
| - 31 - |
Dispute Resolution Provisions | intended course of action is to pursue further action to exercise rights against the related Mortgage Loan Seller with respect to the repurchase request but the initial requesting certificateholder, if any, or any other certificateholder or certificate owner does not agree with the dispute resolution method selected by the enforcing servicer, then the initial requesting certificateholder, if any, or such other certificateholder or certificate owner may deliver a written notice to the enforcing servicer indicating its intent to exercise its right to refer the matter to either mediation or arbitration.
“Resolved” means, with respect to a repurchase request, (i) that related material defect has been cured, (ii) the related mortgage loan has been repurchased in accordance with the related mortgage loan purchase agreement, (iii) a mortgage loan has been substituted for the related mortgage loan in accordance with the related mortgage loan purchase agreement, (iv) the applicable Mortgage Loan Seller has paid a loss of value payment, (v) a contractually binding agreement is entered into between the enforcing servicer, on behalf of the issuing entity, and the related Mortgage Loan Seller that settles the related Mortgage Loan Seller’s obligations under the related mortgage loan purchase agreement, or (vi) the related mortgage loan is no longer property of the issuing entity as a result of a sale or other disposition in accordance with the pooling and servicing agreement. |
| Deal Website: | The Certificate Administrator will maintain a deal website including, but not limited to:
■ all special notices delivered
■ summaries of final asset status reports
■ all appraisals in connection with appraisal reduction amounts plus any subsequent appraisal updates
■ an “Investor Q&A Forum” and a voluntary investor registry |
THE INFORMATION IN THIS STRUCTURAL AND COLLATERAL TERM SHEET IS NOT COMPLETE AND MAY BE AMENDED PRIOR TO THE TIME OF SALE. THIS STRUCTURAL AND COLLATERAL TERM SHEET IS NOT AN OFFER TO SELL THESE SECURITIES AND IT IS NOT A SOLICITATION OF AN OFFER TO BUY THESE SECURITIES IN ANY JURISDICTION WHERE THE OFFER OR SALE IS NOT PERMITTED.
| - 32 - |
(THIS PAGE INTENTIONALLY LEFT BLANK)
| - 33 - |
Mortgage Loan No. 1 — Coconut Point

THE INFORMATION IN THIS STRUCTURAL AND COLLATERAL TERM SHEET IS NOT COMPLETE AND MAY BE AMENDED PRIOR TO THE TIME OF SALE. THIS STRUCTURAL AND COLLATERAL TERM SHEET IS NOT AN OFFER TO SELL THESE SECURITIES AND IT IS NOT A SOLICITATION OF AN OFFER TO BUY THESE SECURITIES IN ANY JURISDICTION WHERE THE OFFER OR SALE IS NOT PERMITTED.
| - 34 - |
Mortgage Loan No. 1 — Coconut Point

THE INFORMATION IN THIS STRUCTURAL AND COLLATERAL TERM SHEET IS NOT COMPLETE AND MAY BE AMENDED PRIOR TO THE TIME OF SALE. THIS STRUCTURAL AND COLLATERAL TERM SHEET IS NOT AN OFFER TO SELL THESE SECURITIES AND IT IS NOT A SOLICITATION OF AN OFFER TO BUY THESE SECURITIES IN ANY JURISDICTION WHERE THE OFFER OR SALE IS NOT PERMITTED.
| - 35 - |
Mortgage Loan No. 1 — Coconut Point

THE INFORMATION IN THIS STRUCTURAL AND COLLATERAL TERM SHEET IS NOT COMPLETE AND MAY BE AMENDED PRIOR TO THE TIME OF SALE. THIS STRUCTURAL AND COLLATERAL TERM SHEET IS NOT AN OFFER TO SELL THESE SECURITIES AND IT IS NOT A SOLICITATION OF AN OFFER TO BUY THESE SECURITIES IN ANY JURISDICTION WHERE THE OFFER OR SALE IS NOT PERMITTED.
| - 36 - |
Mortgage Loan No. 1 — Coconut Point

THE INFORMATION IN THIS STRUCTURAL AND COLLATERAL TERM SHEET IS NOT COMPLETE AND MAY BE AMENDED PRIOR TO THE TIME OF SALE. THIS STRUCTURAL AND COLLATERAL TERM SHEET IS NOT AN OFFER TO SELL THESE SECURITIES AND IT IS NOT A SOLICITATION OF AN OFFER TO BUY THESE SECURITIES IN ANY JURISDICTION WHERE THE OFFER OR SALE IS NOT PERMITTED.
| - 37 - |
Mortgage Loan No. 1 — Coconut Point
| Mortgage Loan Information | Property Information | |||
| Mortgage Loan Seller(1): | Column | Single Asset / Portfolio: | Single Asset | |
| Original Principal Balance(2): | $100,000,000 | Title(3): | Fee | |
| Cut-off Date Principal Balance(2): | $100,000,000 | Property Type - Subtype: | Retail – Anchored | |
| % of Pool by IPB: | 13.0% | Net Rentable Area (SF)(4): | 836,531 | |
| Loan Purpose: | Refinance | Location: | Estero, FL | |
| Borrower: | Coconut Point Town Center, LLC | Year Built / Renovated(5): | 2006 / N/A | |
| Sponsors: | Simon Property Group, L.P.; Dillard’s Inc.; and Coconut Point Developers, LLC | Occupancy(6): | 88.4% | |
| Interest Rate: | 3.9530% | Occupancy Date: | 6/7/2016 | |
| Note Date: | 9/7/2016 | Number of Tenants: | 136 | |
| Maturity Date: | 10/1/2026 | 2013 NOI: | $16,474,389 | |
| Interest-only Period: | 24 months | 2014 NOI: | $16,983,407 | |
| Original Term: | 120 months | 2015 NOI: | $17,639,774 | |
| Original Amortization: | 360 months | TTM NOI(7): | $17,897,357 | |
| Amortization Type: | IO-Balloon | UW Economic Occupancy: | 88.4% | |
| Call Protection(8): | L(25),Def(88),O(7) | UW Revenues: | $25,908,550 | |
| Lockbox(9): | Hard | UW Expenses: | $9,273,941 | |
| Additional Debt: | Yes | UW NOI: | $16,634,609 | |
| Additional Debt Balance: | $90,000,000 | UW NCF: | $15,087,026 | |
| Additional Debt Type: | Pari Passu | Appraised Value / Per SF: | $283,000,000 / $338 | |
| Additional Future Debt Permitted: | No | Appraisal Date: | 7/19/2016 |
| Escrows and Reserves(10) | Financial Information(2) | |||||
| Initial | Monthly | Initial Cap | Cut-off Date Loan / SF(4): | $227 | ||
| Taxes: | $0 | Springing | N/A | Maturity Date Loan / SF(4): | $191 | |
| Insurance: | $0 | Springing | N/A | Cut-off Date LTV: | 67.1% | |
| Replacement Reserves: | $0 | Springing | N/A | Maturity Date LTV: | 56.5% | |
| TI/LC: | $0 | Springing | N/A | UW NCF DSCR: | 1.39x | |
| UW NOI Debt Yield: | 8.8% |
Sources and Uses
| Sources | Proceeds | % of Total | Uses | Proceeds | % of Total | |
| Mortgage Loan(2) | $190,000,000 | 82.1% | Payoff Existing Debt(11) | $231,155,064 | 99.8% | |
| Sponsor Equity(12) | 41,552,258 | 17.9 | Closing Costs(12) | 397,194 | 0.2 | |
| Total Sources | $231,552,258 | 100.0% | Total Uses | $231,552,258 | 100.0% |
| (1) | The Coconut Point Whole Loan was co-originated by Column Financial, Inc. and Morgan Stanley Bank, N.A. |
| (2) | The Coconut Point loan is part of a larger split whole loan evidenced by threepari passunotes with an aggregate original principal balance of $190.0 million. The Financial Information presented in the chart above reflects the Cut-off Date Balance of the $190.0 million Coconut Point Whole Loan. |
| (3) | The Coconut Point borrower owns a leasehold interest in the Coconut Point property and the 100% equity owner of the Coconut Point borrower owns a fee interest in the Coconut Point property, each of which is subject to a mortgage securing the Coconut Point Whole Loan. Accordingly, the Coconut Point property is being treated as a fee interest. |
| (4) | The property is part of a larger center with a total of 1,205,351 SF. Net Rentable Area (SF) is not inclusive of square footage associated with the non-collateral anchor tenants, Super Target (186,995 SF), and Dillard’s, Inc. (“Dillard’s”) (181,825 SF). Dillard’s is a 50% owner of the Coconut Point borrower. |
| (5) | As of origination, there were no plans for major renovations at the property. |
| (6) | Most recent occupancy information is calculated based on the collateral SF of 836,531. The occupancy including the non-collateral anchors is 92.0%. |
| (7) | Represents the trailing twelve-month period ending June 30, 2016. |
THE INFORMATION IN THIS STRUCTURAL AND COLLATERAL TERM SHEET IS NOT COMPLETE AND MAY BE AMENDED PRIOR TO THE TIME OF SALE. THIS STRUCTURAL AND COLLATERAL TERM SHEET IS NOT AN OFFER TO SELL THESE SECURITIES AND IT IS NOT A SOLICITATION OF AN OFFER TO BUY THESE SECURITIES IN ANY JURISDICTION WHERE THE OFFER OR SALE IS NOT PERMITTED.
| - 38 - |
Mortgage Loan No. 1 — Coconut Point
| (8) | The lockout period will be at least 25 payment dates beginning with and including the first payment date of November 1, 2016. Defeasance of the full $190.0 million Coconut Point Whole Loan is permitted after the earlier to occur of (i) November 1, 2019 and (ii) the date that is two years from the closing date of the securitization that includes the note to be last securitized (the “REMIC Prohibition Period”). |
| (9) | For a more detailed description of lockbox, please refer to “Lockbox / Cash Management” below. |
| (10) | For a full description of escrows and reserves, please refer to “Escrows and Reserves” below. |
| (11) | The Coconut Point property was previously securitized in JPMCC 2007-LDPX. |
| (12) | Including title related expenses, lender fees and stub interest, closing costs would be approximately $1.1 million and sponsor equity would be approximately $42.3 million. |
The Loan. The Coconut Point loan, which is part of a larger split loan, is a first mortgage loan secured by the fee interest in a 836,531 SF anchored retail center located in Estero, Florida. The whole loan was co-originated by Column Financial, Inc. and Morgan Stanley Bank, N.A. and has an outstanding principal balance as of the Cut-off Date of $190.0 million (the “Coconut Point Whole Loan”), and is comprised of threepari passusenior notes, Note A-1, Note A-2 and Note A-3. Note A-1, which is the controlling note and has an outstanding principal balance as of the Cut-off Date of $100.0 million, is being contributed to the CSAIL 2016-C7 Commercial Mortgage Trust. Note A-2, which has an outstanding principal balance as of the Cut-off Date of $60.0 million, was contributed to the MSBAM 2016-C30 Trust. Note A-3 is currently held by Morgan Stanley Bank, N.A. The Coconut Point Whole Loan is expected to be serviced pursuant to the CSAIL 2016-C7 pooling and servicing agreement. As the holder of Note A-1 (the “Controlling Noteholder”), the trustee of the CSAIL 2016-C7 Commercial Mortgage Trust (or, prior to the occurrence and continuance of a control termination event under the CSAIL 2016-C7 pooling and servicing agreement, the CSAIL 2016-C7 controlling class representative) is entitled to exercise all of the rights of the Controlling Noteholder with respect to the Coconut Point Whole Loan; however, the holders of Notes A-2 and A-3 are entitled, under certain circumstances, to consult with the Controlling Noteholder with respect to certain major decisions. The loan has a 10-year term and will amortize on 30-year schedule following an initial interest-only period of two years.
Whole Loan Note Summary
| Original Balance | Cut-off Date Balance | Note Holder | Note in Controlling Securitization | |
| Note A-1 | $100,000,000 | $100,000,000 | CSAIL 2016-C7 | Yes |
| Note A-2 | 60,000,000 | 60,000,000 | MSBAM 2016-C30 | No |
| Note A-3 | 30,000,000 | 30,000,000 | Morgan Stanley Bank, N.A. | No |
| Total | $190,000,000 | $190,000,000 |
The Borrower. The borrowing entity is Coconut Point Town Center, LLC, a Delaware limited liability company and special purpose entity.
The Sponsors. The loan’s sponsors are Simon Property Group, L.P. (“Simon”), Dillard’s Inc. (“Dillard’s”) and Coconut Point Developers, LLC. The Borrower is owned by Coconut Point Developers, LLC which is 50% owned by Simon and 50% owned by Dillard’s. Simon is a wholly-owned subsidiary of Simon Property Group, Inc., a publicly traded REIT (NYSE: SPG, S&P: A, Fitch: A, Moody’s: A3) that is focused on retail property ownership and management. Simon is the largest publicly traded owner, operator and developer of retail assets in the world. Dillard’s is a publicly traded company (NYSE: DDS, S&P: BBB-, Fitch: BBB-, Moody’s: Baa3) that operates as a fashion apparel, cosmetics and home furnishing retailer in the United States. Simon and Dillard’s serve as the nonrecourse carve-out guarantors for the Coconut Point Whole Loan, subject to the borrower’s right to replace the guarantor with a replacement guarantor in accordance with the loan documents. The liability of Simon (or any guarantor that replaces Simon in accordance with the loan agreement) under the nonrecourse carve-out guaranty is capped at $38.0 million plus reasonable collection costs.
The Property.Coconut Point is an open-air, one-story, regional shopping center, comprised of approximately 1,205,351 total SF, 836,531 SF of which serve as collateral for the Coconut Point Whole Loan. The center was built in 2006 by the sponsors. The property is located in Estero, Florida and consists of 22 buildings on an elongated, irregularly shaped site flanked by U.S. Route 41 (west), Via Coconut Point (east), Coconut Road (south), and a nature preserve buffer to the north. The Coconut Point property is part of a larger development. The northern portion of the development contains the Super Target anchor (non-collateral) and the majority of the “big box” retailers, configured in a semi-circle facing U.S. 41. The southern portion of the
THE INFORMATION IN THIS STRUCTURAL AND COLLATERAL TERM SHEET IS NOT COMPLETE AND MAY BE AMENDED PRIOR TO THE TIME OF SALE. THIS STRUCTURAL AND COLLATERAL TERM SHEET IS NOT AN OFFER TO SELL THESE SECURITIES AND IT IS NOT A SOLICITATION OF AN OFFER TO BUY THESE SECURITIES IN ANY JURISDICTION WHERE THE OFFER OR SALE IS NOT PERMITTED.
| - 39 - |
Mortgage Loan No. 1 — Coconut Point
development consists of buildings in a linear configuration set back from and facing U.S. 41, akin to a lifestyle center, which contains Dillard’s and most of the outparcels (Hyatt Regency Hotel, The Vitamin Shoppe, Ethan Allen, CNL Bank, Wells Fargo Bank, Verizon – none of which are collateral for the Coconut Point Whole Loan). The development also contains the two-story Residences at Coconut Point, which are condominiums and located on the southeast end near Dillard’s (non-collateral).
The property is anchored by Super Target (non-collateral), Dillard’s (non-collateral), Hollywood Theaters, Bed Bath & Beyond, T.J. Maxx, Ross Dress For Less and Best Buy. In addition to the anchors, the Coconut Point property is leased to 131 additional tenants including Barnes & Noble, DSW Shoe Warehouse, Office Max, PetsMart, Cost Plus World Market, and West Elm. As of June 7, 2016, the Coconut Point property had an occupancy rate of 92.0% (including non-collateral anchors) and 88.4% for the collateral SF.
Non-Owned Anchors
| Anchor | Ratings Moody’s/S&P/Fitch | Net Rentable Area SF |
| Super Target | A2/A/A- | 186,995 |
| Dillard’s | Baa3/BBB-/BBB- | 181,825 |
Major Tenants.
Hollywood Theaters (79,197 SF, 9.5% of NRA, 3.6% of underwritten base rent). Hollywood Theaters, Inc. (“Hollywood Theaters”) leases 79,197 SF at the Coconut Point property and operates the space as a 16-screen movie theater. The lease began in April 2009 and has a lease expiration date of April 30, 2024. Hollywood Theaters is now part of the Regal Entertainment Group. Regal Entertainment Group (NYSE: RGC) operates theatres in the United States, consisting of 7,307 screens in 564 theatres in 42 states along with Guam, Saipan, American Samoa and the District of Columbia as of June 30, 2016, with approximately 217 million attendees for the year ended December 31, 2015.
Bed Bath & Beyond (35,000 SF, 4.2% of NRA, 3.1% of underwritten base rent). Bed Bath & Beyond Inc. (“Bed Bath & Beyond”) leases 35,000 SF at the Coconut Point property. The lease began September 7, 2006 and has a lease expiration date of January 31, 2017. Bed, Bath & Beyond (NASDAQ:BBBY) is a domestic supplier and furnishing retailer with 1,530 stores throughout the United States, Puerto Rico, and Canada. The store specializes in domestic foods and home furnishings, and also operates three smaller specialty chains: Christmas Tree Shops, buybuy BABY stores, and Harmon discount health and beauty shops.
T.J. Maxx (32,311 SF, 3.9% of NRA, 2.1% of underwritten base rent). The TJX Companies, Inc. (“T.J. Maxx”) leases 32,311 SF at the Coconut Point property. The lease began May 21, 2006 and has a lease expiration date of May 31, 2021. T.J. Maxx (NYSE:TJX) is a leading American off-price retailer of apparel and home fashions. The company operates 2,587 stores in the United States and 808 stores in Canada and Europe. In the United States, TJX Companies, Inc. operates under four brands: T.J. Maxx, HomeGoods, Marshalls, and Sierra Trading Post.
Ross Dress For Less (30,173 SF, 3.6% of NRA, 2.6% of underwritten base rent). Ross Stores, Inc. (“Ross Dress For Less”) leases 30,173 SF at the Coconut Point property. The lease began September 20, 2006 and has a lease expiration date of January 31, 2022. Ross Dress For Less is headquartered in Pleasanton, California, and is a large national off-price retailer. The company operates two chains of off-price retail apparel and home accessories stores.
Best Buy (30,000 SF, 3.6% of NRA, 3.6% of underwritten base rent).Best Buy Stores Co., Inc. (“Best Buy”) leases 30,000 SF at the Coconut Point property. The lease began August 11, 2006 and has a lease expiration date of January 31, 2022. Best Buy (NYSE: BBY) is a specialty retailer of consumer electronics, home-office products, entertainment software, appliances, and related services. Worldwide, the company operates 1,731 stores and according to the appraisal, is currently the largest consumer electronics retailer in the United States accounting for approximately one-third of total electronics, appliance, and computer stores sales.
THE INFORMATION IN THIS STRUCTURAL AND COLLATERAL TERM SHEET IS NOT COMPLETE AND MAY BE AMENDED PRIOR TO THE TIME OF SALE. THIS STRUCTURAL AND COLLATERAL TERM SHEET IS NOT AN OFFER TO SELL THESE SECURITIES AND IT IS NOT A SOLICITATION OF AN OFFER TO BUY THESE SECURITIES IN ANY JURISDICTION WHERE THE OFFER OR SALE IS NOT PERMITTED.
| - 40 - |
Mortgage Loan No. 1 — Coconut Point
Historical and Current Occupancy(1)(2)(3)
| 2011 | 2012 | 2013 | 2014 | 2015 | Current(4)(5) |
| 94.3% | 94.6% | 94.8% | 92.8% | 93.7% | 88.4% |
| (1) | Includes collateral tenants only. |
| (2) | Historical Occupancy excludes temporary tenants. Including temporary tenants, occupancy would be 95.4%, 95.7%, 95.8%, 93.6% and 96.8% for the 2011, 2012, 2013, 2014 and 2015, respectively. |
| (3) | Historical occupancies are as of December 31 of each respective year. |
| (4) | Based on the underwritten rent roll as of June 7, 2016 |
| (5) | The Current occupancy is lower than 2015 occupancy mainly due to Sports Authority and T.J. Maxx vacating its space in 2016. |
Historical In-line Sales and Occupancy Costs(1)
| 2013 | 2014 | 2015 | TTM(2) | |
| In-line Sales PSF(3) | $446 | $463 | $460 | $457 |
| Occupancy Costs(4) | 11.2% | 10.8% | 10.8% | 10.9% |
| (1) | In-line Sales PSF and Occupancy Costs are for comparable tenants less than 10,000 SF that reported full year sales and have been in occupancy since 2013. |
| (2) | The TTM represents the trailing twelve-month period ending June 30, 2016. |
| (3) | In-line Sales PSF excluding Apple are $356, $369, $373 and $371 for 2013, 2014, 2015 and the TTM, respectively. |
| (4) | Occupancy Costs excluding Apple are 13.9%, 13.4%, 13.3% and 13.3% for 2013, 2014, 2015 and the TTM, respectively. |
The Market.Coconut Point is located within the Village of Estero, in the southern portion of the Fort Myers-Cape Coral CBSA, on the west coast of Florida. The Coconut Point property is situated in between Ft. Myers, FL and Naples, FL along U.S. Route 41 and is approximately 2.3 miles southwest of I-75, which provides regional access to the area. The property lies approximately mid-way between Fort Myers to the north and Naples to the south. According to the appraisal, the area surrounding Coconut Point is characterized by residential development, including several golf-oriented, country club subdivisions with upscale homes separated by numerous lakes. Over the period extending from 2000 through 2015, the compound annual growth rates for the population within a one, three, and five mile radius of the property have been 5.2%, 5.4% and 3.9%, respectively. Within a one, three, and five mile radius of the property, the 2015 annual average household income levels were estimated at $123,919, $103,065, and $92,110, respectively. These are above the corresponding average for the Fort Myers-Cape Coral CBSA, State of Florida and United States which are estimated at $70,514, $68,907 and $77,468, respectively.
According to the appraisal, the Coconut Point property is located in the Estero submarket of the Florida Southwest retail market, encompassing approximately 1.7% of the region’s retail inventory. As of the second quarter of 2016, the Florida Southwest retail market had a vacancy rate of 9.7% and the Estero submarket had a vacancy rate of 10.9%. In the same period, asking rents in the Florida Southwest retail market were $14.18 PSF and asking rents in the Estero submarket were $15.86 PSF.
THE INFORMATION IN THIS STRUCTURAL AND COLLATERAL TERM SHEET IS NOT COMPLETE AND MAY BE AMENDED PRIOR TO THE TIME OF SALE. THIS STRUCTURAL AND COLLATERAL TERM SHEET IS NOT AN OFFER TO SELL THESE SECURITIES AND IT IS NOT A SOLICITATION OF AN OFFER TO BUY THESE SECURITIES IN ANY JURISDICTION WHERE THE OFFER OR SALE IS NOT PERMITTED.
| - 41 - |
Mortgage Loan No. 1 — Coconut Point
Competitive Set Summary(1)
| Property | Center Type | Year Built / Renovated | Total GLA (SF) | Est. Occ. | Proximity (miles) | Anchor Tenants | |
| Coconut Point(2) | Regional | 2006 / N/A | 1,205,351 | 92% | N/A | Dillard’s, Hollywood Theaters, Barnes & Noble, West Elm, Super Target, Bed Bath & Beyond, T.J. Maxx, Ross Dress For Less, Best Buy | |
| Primary Competition | |||||||
| Miromar Outlets | Outlet | 1998 / 2013 | 954,900 | 99% | 4.3 | Bloomingdale’s Outlet, Nordstrom Last Call, Saks Off Fifth | |
| Gulf Coast Town Center | Regional | 2005 / N/A | 1,651,000 | 91% | 8.3 | Bass Pro, Belk, JC Penney, Target, Costco | |
| Coastland Center | Super Regional | 1977 / 2007 | 934,000 | 92% | 16.3 | Dillard’s, JC Penney, Macy’s, Sears | |
| Promenade at Bonita Bay | Fashion / Specialty | 1998 / N/A | 110,000 | 76% | 2.4 | None | |
| Bell Tower Shops | Lifestyle | 1982 / 2009 | 348,565 | 94% | 10.6 | Saks Fifth Ave., Regal Cinemas, Bed Bath & Beyond, Fresh Market | |
Secondary Competition | |||||||
Waterside Shops at Pelican Bay | Regional | 1992 / 2006 | 356,000 | 96% | 13.2 | Saks Fifth Ave., Nordstrom | |
| The Mercato | Lifestyle | 2008 / N/A | 454,300 | 91% | 10.4 | Whole Foods, Silverspot Cinema, Nordstrom Rack | |
| Edison Mall | Super Regional | 1965 / 1995 | 1,051,000 | 84% | 14.2 | Macy’s, Dillard’s, JC Penney, Sears, Macy’s | |
(1) | Based on the appraisal and the underwritten rent roll dated June 7, 2016. |
| (2) | Excluding the non-collateral anchors, the Coconut Point property has an occupancy rate of 88.4% based on the June 7, 2016 rent roll. |
Tenant Summary(1)
| Tenant | Ratings Moody’s/S&P/ Fitch(2) | Net Rentable Area (SF) | % of Total NRA | Base Rent PSF | % of Total Base Rent | Most Recent Sales PSF(3)(4) | Occ. Cost | Lease Expiration Date |
| Hollywood Theaters(4) | B3 / B+ / B+ | 79,197 | 9.5% | $7.20 | 3.6% | $268,626 | 20.2% | 4/30/2024 |
| Bed Bath & Beyond | Baa1 / BBB+ / NR | 35,000 | 4.2% | $14.07 | 3.1% | N/A | N/A | 1/31/2017 |
| T.J. Maxx | A2 / A+ / NR | 32,311 | 3.9% | $10.25 | 2.1% | $353 | 3.3% | 5/31/2021 |
| Ross Dress For Less | A3 / A- / NR | 30,173 | 3.6% | $13.50 | 2.6% | N/A | N/A | 1/31/2022 |
| Best Buy | Baa1 / BBB- / BBB- | 30,000 | 3.6% | $19.00 | 3.6% | N/A | N/A | 1/31/2022 |
| Barnes & Noble | NR / NR / NR | 27,544 | 3.3% | $14.00 | 2.4% | $142 | 11.6% | 2/28/2017 |
| DSW Shoe Warehouse | NR / NR / NR | 20,961 | 2.5% | $14.50 | 1.9% | N/A | N/A | 1/31/2022 |
| Office Max | NR / NR / NR | 19,899 | 2.4% | $16.33 | 2.1% | N/A | N/A | 7/31/2021 |
| PetsMart | B3 / B+ / NR | 19,624 | 2.3% | $14.75 | 1.8% | $258 | 6.4% | 9/30/2021 |
| Cost Plus World Market | Baa1 / BBB+ / NR | 18,300 | 2.2% | $19.50 | 2.3% | $129 | 17.3% | 1/31/2017 |
| West Elm | NR / NR / NR | 15,087 | 1.8% | $20.00 | 1.9% | $197 | 10.1% | 3/31/2019 |
| Michael’s | Ba2 / B+ / NR | 14,763 | 1.8% | $16.55 | 1.5% | $186 | 10.3% | 10/31/2023 |
| Party City(5) | NR / NR / NR | 12,000 | 1.4% | N/A | N/A | $93 | 19.3% | 1/31/2018 |
| Pier 1 Imports | NR / NR / NR | 11,030 | 1.3% | $19.75 | 1.4% | $199 | 11.6% | 10/31/2021 |
| (1) | Based on the underwritten rent roll. |
| (2) | Ratings provided are for the parent company of the entity listed in the “Tenant” field whether or not the parent company guarantees the lease. |
| (3) | Tenant sales for trailing twelve months ended June 30, 2016. |
| (4) | Sales PSF for Hollywood Theaters are based on 16 screens. |
| (5) | Party City pays percentage rent in lieu of base rent. |
THE INFORMATION IN THIS STRUCTURAL AND COLLATERAL TERM SHEET IS NOT COMPLETE AND MAY BE AMENDED PRIOR TO THE TIME OF SALE. THIS STRUCTURAL AND COLLATERAL TERM SHEET IS NOT AN OFFER TO SELL THESE SECURITIES AND IT IS NOT A SOLICITATION OF AN OFFER TO BUY THESE SECURITIES IN ANY JURISDICTION WHERE THE OFFER OR SALE IS NOT PERMITTED.
| - 42 - |
Mortgage Loan No. 1 — Coconut Point
Lease Rollover Schedule(1)(2)
| Year | Number of Leases Expiring | Net Rentable Area Expiring(3) | % of NRA Expiring | Base Rent Expiring | % of Base Rent Expiring | Cumulative Net Rentable Area Expiring | Cumulative % of NRA Expiring | Cumulative Base Rent Expiring | Cumulative % of Base Rent Expiring |
| Vacant | NAP | 96,756 | 11.6% | NAP | NAP | 96,756 | 11.6% | NAP | NAP |
| MTM | 0 | 0 | 0.0 | $0 | 0.0% | 96,756 | 11.6% | $0 | 0.0% |
| 2016 | 3 | 8,006 | 1.0 | 302,096 | 1.9 | 104,762 | 12.5% | $302,096 | 1.9% |
| 2017 | 39 | 203,794 | 24.4 | 4,677,370 | 29.6 | 308,556 | 36.9% | $4,979,466 | 31.5% |
| 2018 | 14 | 46,385 | 5.5 | 1,024,453 | 6.5 | 354,941 | 42.4% | $6,003,919 | 38.0% |
| 2019 | 7 | 37,944 | 4.5 | 910,232 | 5.8 | 392,885 | 47.0% | $6,914,151 | 43.8% |
| 2020 | 8 | 25,973 | 3.1 | 845,316 | 5.4 | 418,858 | 50.1% | $7,759,467 | 49.1% |
| 2021 | 22 | 141,918 | 17.0 | 3,026,863 | 19.2 | 560,776 | 67.0% | $10,786,330 | 68.3% |
| 2022 | 9 | 102,119 | 12.2 | 1,868,001 | 11.8 | 662,895 | 79.2% | $12,654,331 | 80.1% |
| 2023 | 3 | 20,191 | 2.4 | 469,213 | 3.0 | 683,086 | 81.7% | $13,123,544 | 83.1% |
| 2024 | 7 | 101,722 | 12.2 | 1,095,974 | 6.9 | 784,808 | 93.8% | $14,219,518 | 90.0% |
| 2025 | 3 | 13,351 | 1.6 | 335,079 | 2.1 | 798,159 | 95.4% | $14,554,597 | 92.2% |
| 2026 | 6 | 24,066 | 2.9 | 831,769 | 5.3 | 822,225 | 98.3% | $15,386,366 | 97.4% |
| 2027 & Beyond | 15 | 14,306 | 1.7 | 406,777 | 2.6 | 836,531 | 100.0% | $15,793,143 | 100.0% |
| Total | 136 | 836,531 | 100.0% | $15,793,143 | 100.0% |
| (1) | Based on the underwritten rent roll. |
| (2) | Lease Rollover Schedule is not inclusive of the square footage associated with the Super Target and Dillard’s. The Super Target and Dillard’s improvements are tenant-owned with no attributable base rent. |
| (3) | Certain tenants may have lease termination options that are exercisable prior to the originally stated expiration date of the subject and that are not considered in the lease rollover schedule. |
Operating History and Underwritten Net Cash Flow
| 2013 | 2014 | 2015 | TTM(1) | Underwritten | PSF | %(2) | |
| Base Rents In Place(3) | $15,532,917 | $15,947,060 | $16,109,374 | $16,396,941 | $15,793,143 | $18.88 | 53.9% |
| Vacant Income | 0 | 0 | 0 | 0 | 2,270,250 | 2.71 | 7.8 |
| Base Rental Revenue | $15,532,917 | $15,947,060 | $16,109,374 | $16,396,941 | $18,063,393 | $21.59 | 61.7% |
| Percentage Rent in Lieu | 335,758 | 446,310 | 578,523 | 506,967 | 380,739 | 0.46 | 1.3 |
| Overage Rent | 383,569 | 413,451 | 305,578 | 331,093 | 205,200 | 0.25 | 0.7 |
| Specialty Leasing Income(4) | 359,608 | 357,194 | 303,318 | 278,170 | 348,411 | 0.42 | 1.2 |
| Total Minimum Rent | $16,611,852 | $17,164,015 | $17,296,793 | $17,513,171 | $18,997,743 | $22.71 | 64.9% |
| Expense Reimbursement(5) | 8,399,018 | 8,605,619 | 9,180,668 | 9,151,647 | 10,057,802 | 12.02 | 34.4 |
| Other Income(6) | 226,438 | 179,055 | 231,581 | 220,992 | 220,992 | 0.26 | 0.8 |
| Total Gross Income | $25,237,308 | $25,948,689 | $26,709,042 | $26,885,810 | $29,276,537 | 35.00 | 100.0% |
| (Vacancy/Collection Loss) | 0 | 0 | 0 | 0 | (3,367,987) | (4.03) | (11.5) |
| Effective Gross Income | $25,237,308 | $25,948,689 | $26,709,042 | $26,885,810 | $25,908,550 | $30.97 | 88.5% |
| Total Expenses | $8,762,919 | $8,965,282 | $9,069,268 | $8,988,453 | $9,273,941 | $11.09 | 35.8% |
| Net Operating Income | $16,474,389 | $16,983,407 | $17,639,774 | $17,897,357 | $16,634,609 | $19.89 | 64.2% |
| Total TI/LC, Capex/RR | 0 | 0 | 0 | 0 | 1,547,582 | 1.85 | 6.0 |
| Net Cash Flow | $16,474,389 | $16,983,407 | $17,639,774 | $17,897,357 | $15,087,026 | $18.04 | 58.2% |
| Avg. Rents in Place (PSF) | $18.57 | $19.06 | $19.26 | $19.60 | $18.88 |
| (1) | TTM is of the trailing twelve-month period ending on June 30, 2016. |
| (2) | % column represents percent of Total Gross Income for all revenue lines and percent of Effective Gross Income for the remainder of fields. |
| (3) | UW Base Rents in Place is based on the rent roll as of June 7, 2016 and includes rent steps totaling $510,442 taken through June 30, 2017, $456,000 of rent associated with three tenants which have signed leases but are not yet in occupancy (Divieto, Tommy Bahama and Naples Soap Company). |
| (4) | Specialty Leasing Income includes income from events, temporary tenants, kiosk and other miscellaneous income. |
| (5) | Underwritten Expense Reimbursement includes $1,097,737 from reimbursements attributed to vacant space which is netted out in Vacancy/Collection Loss. |
| (6) | Other Income consists of storage, parking, sponsorship and other miscellaneous income. |
THE INFORMATION IN THIS STRUCTURAL AND COLLATERAL TERM SHEET IS NOT COMPLETE AND MAY BE AMENDED PRIOR TO THE TIME OF SALE. THIS STRUCTURAL AND COLLATERAL TERM SHEET IS NOT AN OFFER TO SELL THESE SECURITIES AND IT IS NOT A SOLICITATION OF AN OFFER TO BUY THESE SECURITIES IN ANY JURISDICTION WHERE THE OFFER OR SALE IS NOT PERMITTED.
| - 43 - |
Mortgage Loan No. 1 — Coconut Point
Property Management. The property is managed by Simon Management Associates, LLC, an affiliate of the loan sponsor.
Escrows and Reserves.
Tax Escrows -The requirement of the borrower to make monthly deposits into the tax escrow is waived so long as (i) a Lockbox Event (as defined below) is not in continuance and (ii) the borrower provides satisfactory evidence that all such taxes have been paid.
Insurance Escrows -The requirement for the borrower to make monthly deposits to the insurance escrow is waived so long as (i) a Lockbox Event is not in continuance and (ii) the borrower provides satisfactory evidence that the property is insured under an acceptable blanket policy in accordance with the loan documents.
Replacement Reserves -The requirement for the borrower to make monthly deposits to the replacement reserve account is waived so long as no Lockbox Event is in continuance and there is no event of default. Following the occurrence and during the continuance of a Lockbox Event or an event of default, the borrower is required to deposit $24,399 per month (approximately $0.35 PSF annually) for replacement reserves.
Rollover Reserves -The requirement for the borrower to make monthly deposits into the rollover reserve account is waived so long as no Lockbox Event is in continuance and there is no event of default. Following the occurrence and during the continuance of a Lockbox Event or an event of default, the borrower is required to deposit $104,566 per month (approximately $1.50 PSF annually).
A “Lockbox Event” means (a) the occurrence and continuance of an event of default; (b) any bankruptcy action of the borrower; (c) a bankruptcy action of the property manager if the manager is an affiliate of the borrower and provided the manager is not replaced within sixty days with a qualified manager; or (d) a DSCR Trigger Event.
A “DSCR Trigger Event” means the period commencing on the date when the debt service coverage ratio (as calculated in the loan documents) based on the trailing four calendar quarters falls below 1.20x for two consecutive calendar quarters.
Lockbox / Cash Management. The loan is structured with a hard lockbox and springing cash management. Tenant direction letters are required to be sent to all tenants within 30 days after the origination date instructing them to deposit all rents and payments into the lockbox account controlled by the lender. The funds are then transferred to an account controlled by the borrower until the occurrence of a Lockbox Event. During the continuance of a Lockbox Event, all rents will be swept weekly to a segregated cash management account and held in trust and for the benefit of the lender. The lender will have a first priority security interest in the cash management account. Upon the occurrence and during the continuance of a Lockbox Event, all excess cash after payment of debt service, required reserves and budgeted operating expenses will be held as additional security for the loan.
Release of Property. The Coconut Point borrower may make transfers of non-income producing portions of the Coconut Point property in accordance with the loan documents.
THE INFORMATION IN THIS STRUCTURAL AND COLLATERAL TERM SHEET IS NOT COMPLETE AND MAY BE AMENDED PRIOR TO THE TIME OF SALE. THIS STRUCTURAL AND COLLATERAL TERM SHEET IS NOT AN OFFER TO SELL THESE SECURITIES AND IT IS NOT A SOLICITATION OF AN OFFER TO BUY THESE SECURITIES IN ANY JURISDICTION WHERE THE OFFER OR SALE IS NOT PERMITTED.
| - 44 - |
Mortgage Loan No. 2 — Gurnee Mills

THE INFORMATION IN THIS STRUCTURAL AND COLLATERAL TERM SHEET IS NOT COMPLETE AND MAY BE AMENDED PRIOR TO THE TIME OF SALE. THIS STRUCTURAL AND COLLATERAL TERM SHEET IS NOT AN OFFER TO SELL THESE SECURITIES AND IT IS NOT A SOLICITATION OF AN OFFER TO BUY THESE SECURITIES IN ANY JURISDICTION WHERE THE OFFER OR SALE IS NOT PERMITTED.
| - 45 - |
Mortgage Loan No. 2 — Gurnee Mills

THE INFORMATION IN THIS STRUCTURAL AND COLLATERAL TERM SHEET IS NOT COMPLETE AND MAY BE AMENDED PRIOR TO THE TIME OF SALE. THIS STRUCTURAL AND COLLATERAL TERM SHEET IS NOT AN OFFER TO SELL THESE SECURITIES AND IT IS NOT A SOLICITATION OF AN OFFER TO BUY THESE SECURITIES IN ANY JURISDICTION WHERE THE OFFER OR SALE IS NOT PERMITTED.
| - 46 - |
Mortgage Loan No. 2 — Gurnee Mills

THE INFORMATION IN THIS STRUCTURAL AND COLLATERAL TERM SHEET IS NOT COMPLETE AND MAY BE AMENDED PRIOR TO THE TIME OF SALE. THIS STRUCTURAL AND COLLATERAL TERM SHEET IS NOT AN OFFER TO SELL THESE SECURITIES AND IT IS NOT A SOLICITATION OF AN OFFER TO BUY THESE SECURITIES IN ANY JURISDICTION WHERE THE OFFER OR SALE IS NOT PERMITTED.
| - 47 - |
Mortgage Loan No. 2 — Gurnee Mills
| Mortgage Loan Information | Property Information | |||
| Mortgage Loan Seller(1): | Column | Single Asset / Portfolio: | Single Asset | |
| Original Principal Balance(2): | $75,000,000 | Title: | Fee | |
| Cut-off Date Principal Balance(2): | $74,900,058 | Property Type - Subtype: | Retail – Super Regional Mall | |
| % of Pool by IPB: | 9.8% | Net Rentable Area (SF)(3): | 1,683,915 | |
| Loan Purpose: | Refinance | Location: | Gurnee, IL | |
| Borrower: | Mall at Gurnee Mills, LLC | Year Built / Renovated: | 1991 / 2014 | |
| Sponsor: | Simon Property Group, L.P. | Occupancy: | 91.1% | |
| Interest Rate: | 3.9900% | Occupancy Date: | 9/22/2016 | |
| Note Date: | 9/27/2016 | Number of Tenants: | 159 | |
| Maturity Date: | 10/1/2026 | 2013 NOI: | $25,964,013 | |
| Interest-only Period: | 0 months | 2014 NOI: | $27,475,772 | |
| Original Term: | 120 months | 2015 NOI: | $27,801,962 | |
| Original Amortization: | 360 months | TTM NOI(4): | $28,050,715 | |
| Amortization Type: | Balloon | UW Economic Occupancy(5): | 86.6% | |
| Call Protection(6): | L(25),Def(88),O(7) | UW Revenues: | $40,778,955 | |
| Lockbox(7): | Hard | UW Expenses: | $14,098,029 | |
| Additional Debt: | Yes | UW NOI: | $26,680,926 | |
| Additional Debt Balance: | $200,000,000 | UW NCF: | $25,099,266 | |
| Additional Debt Type: | Pari Passu | Appraised Value / Per SF: | $417,000,000 / $248 | |
| Additional Future Debt Permitted: | No | Appraisal Date: | 8/23/2016 |
| Escrows and Reserves(8) | Financial Information(2) | |||||
| Initial | Monthly | Initial Cap | Cut-off Date Loan / SF(3): | $163 | ||
| Taxes: | $0 | Springing | N/A | Maturity Date Loan / SF(3): | $130 | |
| Insurance: | $0 | Springing | N/A | Cut-off Date LTV: | 65.9% | |
| Replacement Reserves: | $0 | Springing | N/A | Maturity Date LTV: | 52.4% | |
| TI/LC: | $0 | Springing | N/A | UW NCF DSCR: | 1.60x | |
| UW NOI Debt Yield: | 9.7% |
| Sources and Uses | ||||||
| Sources | Proceeds | % of Total | Uses | Proceeds | % of Total | |
| Mortgage Loan(2) | $275,000,000 | 85.1% | Payoff Existing Debt(9) | $322,543,428 | 99.8% | |
| Sponsor Equity | 48,328,282 | 14.9 | Closing Costs | 784,854 | 0.2 | |
| Total Sources | $323,328,282 | 100.0% | Total Uses | $323,328,282 | 100.0% |
| (1) | The Gurnee Mills Whole Loan was co-originated by Column Financial, Inc., Wells Fargo Bank, National Association and Regions Bank. |
| (2) | The Gurnee Mills loan is part of a whole loan evidenced by sixpari passu senior notes, with an aggregate original principal balance of $275.0 million. The Financial Information presented in the chart above reflects the Cut-off Date balance of the approximately $274.6 million of the Gurnee Mills Whole Loan. |
| (3) | Net Rentable Area (SF) is not inclusive of square footage associated with the Marcus Cinema, Burlington Coat Factory or Value City Furniture which are not part of the collateral. |
| (4) | Represents trailing twelve months ending July 31, 2016. |
| (5) | As of September 22, 2016, the property was 91.1% leased and 81.9% occupied. The leased percentage includes the Simon Master Lease (as defined below) (2.8% of net rentable area), Floor & Décor and three other tenants who have not yet taken occupancy, all totaling 9.2% of the net rentable area. |
| (6) | The lockout period will be at least 25 payment dates beginning with and including the first payment date of November 1, 2016. Defeasance of the full $275.0 million Gurnee Mills Whole Loan is permitted after the earlier to occur of (i) November 1, 2019 and (ii) the date that is two years from the closing date of the securitization that includes the note to be last securitized (the “REMIC Prohibition Period”). If the REMIC Prohibition Period has not expired by November 1, 2019, the borrower is permitted to prepay the Gurnee Mills Whole Loan in whole, but not in part, with the payment of a yield maintenance premium. |
| (7) | For a more detailed description of lockbox, please refer to “Lockbox / Cash Management” below. |
THE INFORMATION IN THIS STRUCTURAL AND COLLATERAL TERM SHEET IS NOT COMPLETE AND MAY BE AMENDED PRIOR TO THE TIME OF SALE. THIS STRUCTURAL AND COLLATERAL TERM SHEET IS NOT AN OFFER TO SELL THESE SECURITIES AND IT IS NOT A SOLICITATION OF AN OFFER TO BUY THESE SECURITIES IN ANY JURISDICTION WHERE THE OFFER OR SALE IS NOT PERMITTED.
| - 48 - |
Mortgage Loan No. 2 — Gurnee Mills
| (8) | For a full description of escrows and reserves, please refer to “Escrows and Reserves” below. |
| (9) | The Gurnee Mills property was previously securitized in JPMCC 2007-CB20 and JPMCC 2007-C1. |
The Loan. The Gurnee Mills loan, which is part of a larger split whole loan, is a first mortgage loan secured by the fee interest in a 1,683,915 SF super regional mall located in Gurnee, Illinois. The loan has a 10-year term and amortizes on 30-year schedule. The whole loan was co-originated by Column Financial, Inc., Wells Fargo Bank, National Association and Regions Bank and has an outstanding principal balance as of the Cut-off Date of approximately $274.6 million (the “Gurnee Mills Whole Loan”), and is comprised sixpari passu senior notes, Note A-1-A, Note A-1-B, Note A-2-A, Note A-2-B, Note A-3 and Note A-4. Note A-1-A which has an outstanding principal balane as of the Cut-off Date of approximately $74.9 million, is being contributed to the CSAIL 2016-C7 Commercial Mortgage Trust. As the holder of the Note A-1-A (the “Controlling Noteholder”), the trustee of the CSAIL 2016-C7 Commercial Mortgage Trust (or, prior to the occurrence and continuance of a control termination event under the CSAIL 2015-C7 pooling and servicing agreement, the CSAIL 2015-C7 controlling class representative) is entitled to exercise all of the rights of the Controlling Noteholder with respect to the Gurnee Mills Whole Loan; however, the holders of the Notes A-1-B, A-2-A, A-2-B, A-3 and A-4 are entitled, under certain circumstances, to consult with the Controlling Noteholder with respect to certain major decisions.
Whole Loan Note Summary
| Original Balance | Note Holder | Note in Controlling Securitization | |
| Note A-1-A | $75,000,000 | CSAIL 2016-C7 | Yes |
| Note A-1-B | 35,000,000 | Column | No |
| Note A-2-A | 80,000,000 | Wells Fargo Bank, NA | No |
| Note A-2-B | 25,000,000 | Wells Fargo Bank, NA | No |
| Note A-3 | 30,000,000 | Regions Bank | No |
| Note A-4 | 30,000,000 | Regions Bank | No |
| Total | $275,000,000 |
The Borrower. The borrowing entity for the Gurnee Mills Whole Loan is Mall at Gurnee Mills, LLC, a Delaware limited liability company and special purpose entity.
The Sponsor. The loan’s sponsor is Simon Property Group, L.P. (“Simon”). Simon is a wholly-owned subsidiary of Simon Property Group Inc., a publicly traded REIT (NYSE: SPG, S&P: A, Moody’s: A3) that is focused on retail property ownership and management. Simon Property Group Inc. is the largest publicly traded real estate company in the world. Simon serves as the nonrecourse carve-out guarantor for the Gurnee Mills Whole Loan, subject to the borrower’s right to replace the guarantor with a replacement guarantor in accordance with the loan documents. The liability of Simon (or any guarantor that replaces Simon in accordance with the loan agreement) under the nonrecourse carve-out guaranty is capped at $55.0 million plus reasonable collection costs.
The Property.Gurnee Mills is an approximately 1.9 million SF, super regional mall located in Gurnee, Illinois. Approximately 1.7 million SF of the Gurnee Mills mall serves as collateral for the Gurnee Mills Whole Loan. The property is situated on a 233.5-acre parcel of land and was originally built in 1991 and later renovated in 2014. The Gurnee Mills property is anchored by Marcus Cinema (not part of the collateral), Burlington Coat Factory (not part of the collateral) and Value City Furniture (not part of the collateral), Bass Pro Shops Outdoor World, Sears Grand, Floor & Décor, Kohl’s and Macy’s. Junior anchors at the property include Forever 21, Marshalls HomeGoods, Rink Side, Last Call Neiman Marcus, Bed Bath & Beyond / Buy Buy Baby, Off Broadway Shoes, Rainforest Café and Saks Fifth Avenue Off 5th, among others.
As of September 22, 2016, the Gurnee Mills property was 91.1% leased and 81.9% occupied by 159 tenants, excluding temporary and non-collateral tenants. The leased percentage includes the Simon Master Lease (as defined below) (2.8% of net rentable area), Floor & Décor and three other tenants that have not yet taken occupancy, all totaling 9.2% of net rentable area combined. Sports Authority previously occupied 46,892 square feet (2.8% of net rentable area) but declared bankruptcy and vacated the Gurnee Mills property in 2016. Simon Property Group, Inc. has executed a 10-year master lease for this space, and
THE INFORMATION IN THIS STRUCTURAL AND COLLATERAL TERM SHEET IS NOT COMPLETE AND MAY BE AMENDED PRIOR TO THE TIME OF SALE. THIS STRUCTURAL AND COLLATERAL TERM SHEET IS NOT AN OFFER TO SELL THESE SECURITIES AND IT IS NOT A SOLICITATION OF AN OFFER TO BUY THESE SECURITIES IN ANY JURISDICTION WHERE THE OFFER OR SALE IS NOT PERMITTED.
| - 49 - |
Mortgage Loan No. 2 — Gurnee Mills
recently dark TJ Maxx space, at a rent of $700,000, which will burn off on a dollar-for-dollar basis once they have a signed lease or leases and a tenant (or tenants) is in occupancy and paying full, unabated rent for one or both of the spaces (the “Simon Master Lease”).
The Market.The Gurnee Mills property is located in the Village of Gurnee, approximately 40 miles north of Chicago’s central business district, in Lake County, Illinois. The community is best known for the Six Flags Great America, a major regional theme park. The property, together with Six Flags Great America, draw 26 million visitors annually. As of year-end 2015, the estimated population within a 5-, 10- and 15-mile radius of the property was 122,401, 454,466 and 739,314, respectively. As of year-end 2015, the average household incomes within a 5-, 10- and 15-mile radius were $102,298, $94,579, and $103,865, respectively. According to the appraisal, competitive properties in the area maintained a vacancy rate of 11.8%. The appraisal shows the property’s current Outlet Center and Traditional Mall Competition consists of seven properties detailed in the table below.
Competitive Set Summary(1)
| Property | Year Built / Renovated | Total GLA (SF) | Est. Occ. | Proximity (miles) | Anchor Tenants |
| Gurnee Mills(2) | 1991 / 2014 | 1,934,721 | 92.3% | Sears Grand, Bass Pro Shops Outdoor World, Macy’s, Kohl’s, Floor & Decor | |
| Outlet Center Competition | |||||
| Fashion Outlets of Chicago | 2013 | 528,112 | 98.0% | 29.0 | Bloomingdale’s Outlet, Forever 21, Last Call Neiman Marcus, Nike, Saks Fifth Avenue Off 5th |
| Chicago Premium Outlets | 2004 / 2015 | 690,000 | 97.0% | 44.0 | Nike, Polo, Ann Taylor, Adidas, Timberland, Eddie Bauer, Gap, Saks Fifth Avenue - Off 5th, J.Crew, Coach, Old Navy, Under Armour |
| Pleasant Prairie Premium Outlets | 1988 / 2006 | 776,000 | 98.0% | 8.7 | Nike, Gap, Hilfiger, Under Armour, Coach, Adidas, Timberland, Jockey, Bass, Polo, J.Crew, Banana |
| Huntley Outlet Center | 1994 / 2005 | 279,387 | 80.0% | 30.3 | Eddie Bauer, Reebok, Carters, Gap, Bose, Banana Republic, Aeropostale |
| Traditional Mall Competition | |||||
| Hawthorn Center | 1973 / 2014/15 | 1,329,555 | 93.0% | 10.0 | Sears, Macy’s, JCPenney, Carson Pirie Scott |
| Woodfield Mall | 1999 / 2016 | 2,208,000 | 95.0% | 24.0 | Nordstrom, Lord & Taylor, JCPenney, Sears, Macy’s |
| Old Orchard | 1956 / 1995 | 1,740,000 | 94.0% | 25.0 | Nordstrom, Lord & Taylor, Macy’s, Bloomingdale’s, Cinema, Barnes & Noble |
| (1) | Based on the appraisal and the underwritten rent roll dated September 22, 2016. |
| (2) | SF and Est. Occ. includes non-collateral anchors. |
Historical and Current Occupancy(1)(2)
| 2013(3) | 2014(3) | 2015(3) | Current(4) |
| 95.2% | 95.8% | 95.1% | 91.1% |
| (1) | Includes collateral tenants only. |
| (2) | The current occupancy does not include any temporary tenants or non-collateral tenants. Including temporary tenants, occupancy in 2013, 2014, 2015 and as of September 22, 2016 was 98.2%, 98.9%, 97.6% and 94.8%, respectively. |
| (3) | Historical occupancies are as of December 31 of each respective year. |
| (4) | Based on the underwritten rent roll. As of September 22, 2016, the Gurnee Mills property was 81.9% occupied and 91.1% leased. The leased percentage includes the Simon Master Lease, Floor & Décor and three other tenants that have signed leases but not yet taken occupancy, all totaling 9.2% of net rentable area combined. |
THE INFORMATION IN THIS STRUCTURAL AND COLLATERAL TERM SHEET IS NOT COMPLETE AND MAY BE AMENDED PRIOR TO THE TIME OF SALE. THIS STRUCTURAL AND COLLATERAL TERM SHEET IS NOT AN OFFER TO SELL THESE SECURITIES AND IT IS NOT A SOLICITATION OF AN OFFER TO BUY THESE SECURITIES IN ANY JURISDICTION WHERE THE OFFER OR SALE IS NOT PERMITTED.
| - 50 - |
Mortgage Loan No. 2 — Gurnee Mills
Historical In-line Sales and Occupancy Costs(1)
| 2013 | 2014 | 2015 | TTM | |
| In-line Sales PSF(2) | $332 | $337 | $353 | $347 |
| Occupancy Costs | 13.7% | 15.0% | 14.5% | 15.2% |
| (1) | In-line Sales PSF and Occupancy Costs are for comparable tenants less than 10,000 SF that reported full year sales. |
| (2) | TTM represents the trailing twelve-month period ending in July 31, 2016. |
Non-Owned Anchors
| Anchor | Ratings (M/S/F) | Net Rentable Area |
| Marcus Cinema | NR/NR/NR | 88,707 |
| Burlington Coat Factory | Ba3/NR/NR | 82,320 |
| Value City Furniture | NR/NR/NR | 79,779 |
Tenant Summary(1)
| Tenant | Ratings Moody’s/S&P/Fitch(2) | Net Rentable Area (SF) | % of Total NRA | Base Rent PSF | % of Total Base Rent | Most Recent Sales PSF(3) | Lease Expiration Date |
| Sears Grand | Caa1/ CCC+/CC | 201,439 | 12.0% | $5.00 | 4.6% | $71 | 4/30/2019 |
| Bass Pro Shops Outdoor World | Ba3/BB-/NR | 137,201 | 8.1% | $10.15 | 6.3% | $189 | 8/31/2018 |
| Macy’s(4) | Baa2/BBB/BBB | 130,000 | 7.7% | $0.00 | 0.0% | $134 | 1/31/2039 |
| Kohl’s(5) | Baa2/BBB/BBB | 111,675 | 6.6% | $5.95 | 3.0% | $176 | 9/2/2024 |
| Floor & Décor(6) | B2/NR/NR | 105,248 | 6.3% | $9.25 | 4.4% | N/A | 9/30/2026 |
| Bed Bath & Beyond | Baa1/BBB+/NR | 60,317 | 3.6% | $7.50 | 2.1% | $143 | 1/31/2023 |
| Marshalls HomeGoods | A2/A+/NR | 60,000 | 3.6% | $9.75 | 2.7% | $212 | 1/31/2022 |
| Rink Side(7) | NR/NR/NR | 55,970 | 3.3% | $8.58 | 2.2% | $32 | 12/31/2016 |
| Last Call Neiman Marcus | NR/NR/NR | 30,462 | 1.8% | $15.00 | 2.1% | $166 | 1/31/2020 |
| Saks Fifth Avenue Off 5th | NR/NR/NR | 28,108 | 1.7% | $9.10 | 1.2% | $105 | 6/30/2019 |
| Forever 21 | NR/NR/NR | 24,107 | 1.4% | $28.82 | 3.1% | $183 | 1/31/2024 |
| (1) | Based on the underwritten rent roll. |
| (2) | Ratings provided are for the parent company of the entity listed in the “Tenant” field whether or not the parent company guarantees the lease. |
| (3) | Most Recent Sales PSF are based on the trailing twelve-month period ending December 31, 2015. Occupancy cost for the tenants listed are as follows: Sear’s Grand (8.6%); Bass Pro Shops (5.4%); Bed Bath & Beyond (8.9%); Marshalls HomeGoods (5.2%); Rink Side (28.8%), Last Call Neiman Marcus (9.1%); Saks Fifth Avenue Off 5th (11.0%); Forever 21 (16.8%). |
| (4) | Macy’s owns its own improvements. Macy’s pays solely reimbursements currently. It is also required to pay percentage rent, which is calculated based on a percentage of sales above $26.0 million. |
| (5) | Kohl’s owns its own improvements; base rent is reflective of ground rent. |
| (6) | Floor & Décor is still completing its buildout and is not yet in occupancy but began paying rent on October 1, 2016. Its scheduled to open for business in January 2017. |
| (7) | Rink Side recently exercised its automatic five-year lease renewal option, extending their lease to December 2021. |
THE INFORMATION IN THIS STRUCTURAL AND COLLATERAL TERM SHEET IS NOT COMPLETE AND MAY BE AMENDED PRIOR TO THE TIME OF SALE. THIS STRUCTURAL AND COLLATERAL TERM SHEET IS NOT AN OFFER TO SELL THESE SECURITIES AND IT IS NOT A SOLICITATION OF AN OFFER TO BUY THESE SECURITIES IN ANY JURISDICTION WHERE THE OFFER OR SALE IS NOT PERMITTED.
| - 51 - |
Mortgage Loan No. 2 — Gurnee Mills
Lease Rollover Schedule(1)(2)
| Year | Number of Leases Expiring | Net Rentable Area Expiring | % of NRA Expiring | Base Rent Expiring | % of Base Rent Expiring | Cumulative Net Rentable Area Expiring | Cumulative % of NRA Expiring | Cumulative Base Rent Expiring | Cumulative % of Base Rent Expiring |
| Vacant | NAP | 149,764 | 8.9% | NAP | NAP | 149,764 | 8.9% | NAP | NAP |
| MTM | 3 | 11,475 | 0.7 | $311,601 | 1.4% | 161,239 | 9.6% | $311,601 | 1.4% |
| 2016 | 3 | 79,477 | 4.7 | 516,766 | 2.3 | 240,716 | 14.3% | $828,367 | 3.8% |
| 2017 | 26 | 69,784 | 4.1 | 2,515,793 | 11.4 | 310,500 | 18.4% | $3,344,160 | 15.2% |
| 2018 | 23 | 199,595 | 11.9 | 3,392,943 | 15.4 | 510,095 | 30.3% | $6,737,103 | 30.6% |
| 2019 | 16 | 278,979 | 16.6 | 2,716,434 | 12.3 | 789,074 | 46.9% | $9,453,537 | 42.9% |
| 2020 | 14 | 77,358 | 4.6 | 1,645,599 | 7.5 | 866,432 | 51.5% | $11,099,136 | 50.3% |
| 2021 | 15 | 73,185 | 4.3 | 1,957,735 | 8.9 | 939,617 | 55.8% | $13,056,871 | 59.2% |
| 2022 | 4 | 72,578 | 4.3 | 939,095 | 4.3 | 1,012,195 | 60.1% | $13,995,966 | 63.5% |
| 2023 | 15 | 107,168 | 6.4 | 1,853,045 | 8.4 | 1,119,363 | 66.5% | $15,849,011 | 71.9% |
| 2024 | 23 | 223,371 | 13.3 | 3,667,843 | 16.6 | 1,342,734 | 79.7% | $19,516,854 | 88.5% |
| 2025 | 8 | 20,126 | 1.2 | 522,412 | 2.4 | 1,362,860 | 80.9% | $20,039,266 | 90.9% |
| 2026 & Beyond | 9 | 321,055 | 19.1 | 2,017,088 | 9.2 | 1,683,915 | 100.0% | $22,056,354 | 100.0% |
| Total | 159 | 1,683,915 | 100.0% | $22,056,354 | 100.0% |
| (1) | Based on the underwritten rent roll. |
| (2) | Lease Rollover Schedule is not inclusive of the square footage associated with the Marcus Cinema, Burlington Coat Factory and Value City Furniture boxes. The Marcus Cinema, Burlington Coat Factory and Value City Furniture land and improvements are tenant owned with no significant attributable base rent. |
Operating History and Underwritten Net Cash Flow
| 2013 | 2014 | 2015 | TTM(1) | Underwritten | PSF | %(2) | |
| Rents in Place(3) | $20,520,014 | $22,641,489 | $22,716,688 | $22,207,409 | $22,056,354 | $13.10 | 48.1% |
| Vacant Income | 0 | 0 | 0 | 0 | 6,159,895 | 3.66 | 13.4 |
| Gross Potential Rent | $20,520,014 | $22,641,489 | $22,716,688 | $22,207,409 | $28,216,249 | $16.76 | 61.6% |
| Percentage/Overage Rent | 542,881 | 339,800 | 599,424 | 989,722 | 979,159 | 0.58 | 2.1 |
| Reimbursements | 12,522,737 | 13,642,927 | 13,955,041 | 14,065,465 | 13,088,291 | 7.77 | 28.6 |
| Specialty Leasing Income(4) | 4,339,492 | 3,638,788 | 3,421,783 | 3,392,678 | 3,523,393 | 2.09 | 7.7 |
| Net Rental Income | $37,925,124 | $40,263,004 | $40,692,936 | $40,655,274 | $45,807,093 | $27.20 | 100.0% |
| (Vacancy/Collection Loss)(5) | 0 | 0 | 0 | 0 | (6,159,895) | (3.66) | (13.4) |
| Other Income(6) | 1,200,144 | 1,201,801 | 1,068,511 | 1,111,763 | 1,131,757 | 0.67 | 2.5 |
| Effective Gross Income | $39,125,268 | $41,464,805 | $41,761,447 | $41,767,037 | $40,778,955 | $24.22 | 89.0% |
| Total Expenses | $13,161,255 | $13,989,033 | $13,959,485 | $13,716,322 | $14,098,029 | $8.37 | 34.6% |
| Net Operating Income | $25,964,013 | $27,475,772 | $27,801,962 | $28,050,715 | $26,680,926 | $15.84 | 65.4% |
| Total TI/LC, Capex/RR | 0 | 0 | 0 | 0 | 1,581,660 | 0.94 | 3.9 |
| Net Cash Flow | $25,964,013 | $27,475,772 | $27,801,962 | $28,050,715 | $25,099,266 | $14.91 | 61.5% |
| (1) | Represents the trailing twelve-month period ending July 31, 2016. |
| (2) | % column represents percent of Net Rental Income for all revenue lines and percent of Effective Gross Income for the remainder of fields. |
| (3) | Annual Underwritten Rents in Place PSF include contractual rent steps through August 2017 totaling $315,690. |
| (4) | Specialty Leasing Income includes income from temporary tenants, kiosks and signage at the Gurnee Mills property. |
| (5) | The underwritten economic vacancy is 13.4%. The Gurnee Mills property was 81.9% occupied and 91.1% leased as of September 22, 2016. The leased percentage includes the Simon Master Lease (2.8% of net rentable area), Floor & Décor and three other tenants who have not yet taken occupancy, all totaling 9.2% of net rentable area combined. |
| (6) | Underwritten Other Income includes storage income, sponsorship, local marketing and other miscellaneous income items. |
THE INFORMATION IN THIS STRUCTURAL AND COLLATERAL TERM SHEET IS NOT COMPLETE AND MAY BE AMENDED PRIOR TO THE TIME OF SALE. THIS STRUCTURAL AND COLLATERAL TERM SHEET IS NOT AN OFFER TO SELL THESE SECURITIES AND IT IS NOT A SOLICITATION OF AN OFFER TO BUY THESE SECURITIES IN ANY JURISDICTION WHERE THE OFFER OR SALE IS NOT PERMITTED.
| - 52 - |
Mortgage Loan No. 2 — Gurnee Mills
Property Management. The property is managed by Simon Management Associates II, LLC, an affiliate of the borrower.
Escrows and Reserves.
Tax Escrows -The requirement for the borrower to make monthly deposits into the tax escrow is waived so long as (i) no Lockbox Event (as defined below) has occurred and is continuing and (ii) the borrower does not (a) fail to pay all taxes prior to the assessment of any late payment penalty and the date that such taxes become delinquent or (b) fail to provide the lender with satisfactory evidence that taxes have been paid prior to the assessment of any late payment penalty and the date that such taxes become delinquent upon request.
Insurance Escrows -The requirement for the borrower to make monthly deposits to the insurance escrow is waived so long as (i) no Lockbox Event (as defined below) has occurred and is continuing and (ii) the borrower provides satisfactory evidence that the property is insured under an acceptable blanket policy in accordance with the loan documents.
Replacement Reserves -The requirement for the borrower to make monthly deposits to the replacement reserve account is waived so long as no Lockbox Event (as defined below) has occurred. Following the occurrence and during the continuance of a Lockbox Event, the borrower is required to deposit $29,926 per month (approximately $0.21 per square foot annually) for replacement reserves.
TI/LC Reserves -The requirement for the borrower to make monthly deposits to the TI/LC reserve account is waived so long as no Lockbox Event (as defined below) has occurred. Following the occurrence and during the continuance of a Lockbox Event, the borrower is required to deposit $94,204 per month (approximately $0.67 per square foot annually) for TI/LC reserves.
Lockbox / Cash Management. The loan is structured with a hard lockbox and springing cash management. Tenant direction letters are required to be sent to all tenants within 30 days after the origination date instructing them to deposit all rents and payments into the lockbox account controlled by the lender. The funds are then transferred to an account controlled by the borrower until the occurrence of a Cash Sweep Event (as defined below). During the continuance of a Cash Sweep Event, all rents will be swept weekly to a segregated cash management account and held in trust and for the benefit of the lender. The lender will have a first priority security interest in the cash management account. Upon the occurrence and during the continuance of a Cash Sweep Event until the occurrence of a Cash Sweep Event cure, all excess cash after payment of debt service, required reserves and budgeted operating expenses will be held as additional security for the Gurnee Mills Whole Loan.
A “Lockbox Event” means (i) the occurrence and continuance of an event of default, (ii) any bankruptcy action of the borrower or any affiliated property manager (provided that the property manager is not replaced with a qualified property manager in accordance with the loan documents within 60 days), or (iii) the occurrence of a DSCR Trigger Event (as defined below).
A “DSCR Trigger Event” means the period commencing on the date when the debt service coverage ratio (as calculated in the loan documents) based on the trailing four calendar quarters falls below 1.20x for two consecutive calendar quarters.
A “Cash Sweep Event” means the occurrence of (i) an event of default; (ii) any bankruptcy or insolvency action of the borrower; (iii) any bankruptcy or insolvency action of the property manager if the property manager is affiliated with the borrower (provided that the property manager is not replaced within 60 days with a qualified manager); or (iv) a DSCR Trigger Event.
THE INFORMATION IN THIS STRUCTURAL AND COLLATERAL TERM SHEET IS NOT COMPLETE AND MAY BE AMENDED PRIOR TO THE TIME OF SALE. THIS STRUCTURAL AND COLLATERAL TERM SHEET IS NOT AN OFFER TO SELL THESE SECURITIES AND IT IS NOT A SOLICITATION OF AN OFFER TO BUY THESE SECURITIES IN ANY JURISDICTION WHERE THE OFFER OR SALE IS NOT PERMITTED.
| - 53 - |
(THIS PAGE INTENTIONALLY LEFT BLANK)
| - 54 - |
Mortgage Loan No. 3 – 9 West 57th Street

THE INFORMATION IN THIS STRUCTURAL AND COLLATERAL TERM SHEET IS NOT COMPLETE AND MAY BE AMENDED PRIOR TO THE TIME OF SALE. THIS STRUCTURAL AND COLLATERAL TERM SHEET IS NOT AN OFFER TO SELL THESE SECURITIES AND IT IS NOT A SOLICITATION OF AN OFFER TO BUY THESE SECURITIES IN ANY JURISDICTION WHERE THE OFFER OR SALE IS NOT PERMITTED.
| - 55 - |
Mortgage Loan No. 3 – 9 West 57th Street
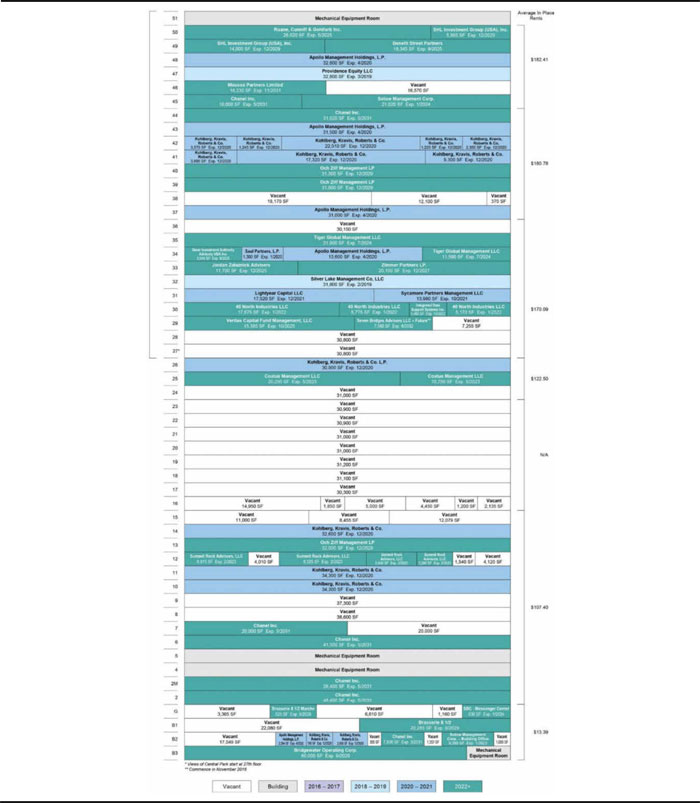
THE INFORMATION IN THIS STRUCTURAL AND COLLATERAL TERM SHEET IS NOT COMPLETE AND MAY BE AMENDED PRIOR TO THE TIME OF SALE. THIS STRUCTURAL AND COLLATERAL TERM SHEET IS NOT AN OFFER TO SELL THESE SECURITIES AND IT IS NOT A SOLICITATION OF AN OFFER TO BUY THESE SECURITIES IN ANY JURISDICTION WHERE THE OFFER OR SALE IS NOT PERMITTED.
| - 56 - |
Mortgage Loan No. 3 – 9 West 57th Street
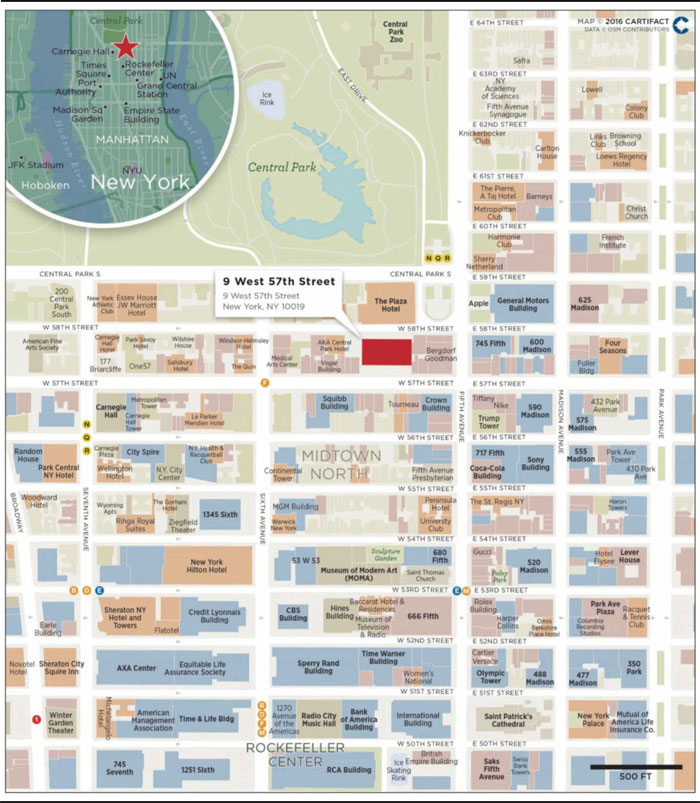
THE INFORMATION IN THIS STRUCTURAL AND COLLATERAL TERM SHEET IS NOT COMPLETE AND MAY BE AMENDED PRIOR TO THE TIME OF SALE. THIS STRUCTURAL AND COLLATERAL TERM SHEET IS NOT AN OFFER TO SELL THESE SECURITIES AND IT IS NOT A SOLICITATION OF AN OFFER TO BUY THESE SECURITIES IN ANY JURISDICTION WHERE THE OFFER OR SALE IS NOT PERMITTED.
| - 57 - |
Mortgage Loan No. 3 – 9 West 57th Street
| Mortgage Loan Information | Property Information | |||
| Mortgage Loan Seller: | BSP | Single Asset / Portfolio: | Single Asset | |
| Original Principal Balance(1): | $50,000,000 | Title: | Fee and Leasehold | |
| Cut-off Date Principal Balance(1): | $50,000,000 | Property Type - Subtype: | Office – CBD | |
| % of Pool by IPB: | 6.5% | Net Rentable Area (SF): | 1,680,218 | |
Credit Assessment (Fitch/Moody’s/DBRS)(2): | AAA/Aaa /AAA | Location: | New York, NY | |
| Loan Purpose: | Refinance | Year Built / Renovated: | 1972 / N/A | |
| Borrowers: | Solow Building Company II, L.L.C.; Solovieff Realty Co. II, L.L.C. | Occupancy: | 63.5% | |
| Sponsor: | Sheldon H. Solow | Occupancy Date: | 6/1/2016 | |
| Interest Rate: | 2.8595% | Number of Tenants: | 26 | |
| Note Date: | 8/30/2016 | 2013 NOI(3): | $60,972,979 | |
| Maturity Date: | 9/1/2026 | 2014 NOI(3): | $67,687,210 | |
| Interest-only Period: | 120 months | 2015 NOI(3): | $85,164,572 | |
| Original Term: | 120 months | TTM NOI(3): | $97,014,333 | |
| Original Amortization: | None | UW Economic Occupancy: | 66.9% | |
| Amortization Type: | Interest Only | UW Revenues: | $166,714,099 | |
| Call Protection(4): | L(26),Def(87),O(7) | UW Expenses: | $58,877,243 | |
| Lockbox(5): | Hard | UW NOI: | $107,836,855 | |
| Additional Debt(1): | Yes | UW NCF: | $107,098,067 | |
| Additional Debt Balance(1): | $1,150,000,000 | Appraised Value / Per SF: | $3,400,000,000 / $2,024 | |
| Additional Debt Type(1): | Pari Passu, B-Note | Appraisal Date: | 7/28/2016 | |
| Additional Future Debt Permitted(1): | Yes | |||
| Escrows and Reserves(6) | Financial Information(1) | |||||
| Initial | Monthly | Initial Cap | ||||
| Taxes: | $9,417,640 | $3,139,213 | N/A | Cut-off Date Loan / SF: | $603 | |
| Insurance: | $264,333 | $88,111 | N/A | Maturity Date Loan / SF: | $603 | |
| Replacement Reserves: | $0 | $61,615 | $2,500,000 | Cut-off Date LTV: | 29.8% | |
| TI/LC: | $25,000,000 | Springing | $25,000,000 | Maturity Date LTV: | 29.8% | |
| Free Rent Reserve: | $16,462,228 | $0 | N/A | UW NCF DSCR: | 3.64x | |
| Outstanding TI/LC Reserve: | $13,061,790 | $0 | N/A | UW NOI Debt Yield: | 10.6% | |
| Engineering Reserve: | $287,500 | N/A | N/A | |||
Sources and Uses
| Sources | Proceeds | % of Total | Uses | Proceeds | % of Total | |
| Mortgage Loan (A Notes) | $1,013,724,000 | 84.5% | Payoff Existing Debt(7) | $630,769,032 | 52.6% | |
| Mortgage Loan (B-Note) | 186,276,000 | 15.5 | Return of Equity | 484,972,507 | 40.4 | |
| Upfront Reserves | 64,493,490 | 5.4 | ||||
| Closing Costs | 19,764,970 | 1.6 | ||||
| Total Sources | $1,200,000,000 | 100.0% | Total Uses | $1,200,000,000 | 100.0% |
| (1) | The 9 West 57th Street loan is part of a larger split whole loan evidenced by sixpari passu notes (collectively, “A Notes”) and one subordinate note (“B-Note”) with an aggregate original principal balance of $1.2 billion. The financial information presented in the chart above and herein reflects the cut-off date balance of the approximately $1.0 billion of A Notes, not including the approximately $186.3 million B-Note. The additional debt consists of fivepari passu companion loans with an outstanding principal balance of approximately $963.7 million and a $186.3 million B-Note. For a more detailed description of the 9 West 57th Street Whole Loan, please refer to “The Loan” below. For more description of the additional debt, please refer to “Additional Debt” below. |
| (2) | Fitch, Moody’s and DBRS have confirmed that the 9 West 57th Street loan has, in the context of its inclusion in the Initial Pool Balance, credit characteristics consistent with an AAA-rated obligation. |
THE INFORMATION IN THIS STRUCTURAL AND COLLATERAL TERM SHEET IS NOT COMPLETE AND MAY BE AMENDED PRIOR TO THE TIME OF SALE. THIS STRUCTURAL AND COLLATERAL TERM SHEET IS NOT AN OFFER TO SELL THESE SECURITIES AND IT IS NOT A SOLICITATION OF AN OFFER TO BUY THESE SECURITIES IN ANY JURISDICTION WHERE THE OFFER OR SALE IS NOT PERMITTED.
| - 58 - |
Mortgage Loan No. 3 – 9 West 57th Street
| (3) | TTM NOI represents the trailing twelve months ending June 30, 2016. The increase in NOI from 2013 to 2014 is primarily due to an increase in occupancy from 50.9% to 63.5%. The increase in NOI from 2014 to 2015 is primarily due to an increase in occupancy from 63.5% to 67.3% and an increase in in-place weighted average base rent PSF from approximately $97.86 to approximately $113.98 PSF. The increase in NOI from 2015 to TTM is primarily due to an increase in in-place weighted average base rent from approximately $113.98 to approximately $127.10 PSF. The increase in NOI from TTM to UW is primarily due to the inclusion of tenants who have signed leases but have not begun paying rent including Zimmer Partners, LP (20,100 SF) and Seven Bridges Advisors LLC (7,560 SF). |
| (4) | The lockout period will be at least 26 payments beginning with and including the first payment date of October 1, 2016. Defeasance of the full $1.2 billion 9 West 57th Street Whole Loan is permitted at any time after the earlier to occur of (A) two years after the closing date of the final REMIC that holds any note evidencing the 9 West 57th Street Whole Loan or (B) the third anniversary of the origination date. |
| (5) | For a more detailed description of lockbox, please refer to“Lockbox / Cash Management”below. |
| (6) | For a more detailed description of Escrows and Reserves, please refer to “Escrows and Reserves” below. |
| (7) | The prior loan was securitized in the COMM 2012-9W57 securitization. |
The Loan. The 9 West 57th Street loan, which is part of a larger split whole loan, is a first mortgage loan secured by the borrowers’ fee and leasehold interests in a 50-story, 1,680,218 SF office building located on West 57th Street in Manhattan between 5th and 6th Avenues. The whole loan has an outstanding principal balance as of the cut-off date of $1.2 billion (the “9 West 57th Street Whole Loan”), and is comprised of six seniorpari passunotes, Note A-1, Note A-2, Note A-3-A, Note A-3-B, Note A-4 and Note A-5 with an aggregate outstanding principal balance as of the cut-off date of approximately $963.7 million, and one subordinate note with an outstanding principal balance as of the cut-off date of approximately $186.3 million. The senior Note A-1 and the subordinate B-1 Note, with an aggregate outstanding principal as of the cut-off date of $857.0 million, were previously contributed to the JPMCC 2016-NINE securitization trust, a private CMBS securitization pursuant to which the 9 West 57th Street Whole Loan is expected to be serviced and administered. The senior Note A-2, with an outstanding principal balance as of the cut-off date of $100.0 million, was previously contributed to the JPMCC 2016-JP3 securitization trust. The senior Note A-3-A, with an outstanding principal balance as of the cut-off date of $50.0 million, was sold to a third-party investor. The senior Note A-3-B has an outstanding principal balance as of the cut-off date of $50.0 million and is being contributed to the CSAIL 2016-C7 Commercial Mortgage Trust. Note A-4 and Note A-5, with an aggregate outstanding principal balance as of the cut-off date of $143.0 million, are currently held by JPMorgan Chase Bank, National Association and are expected to be contributed to future securitization trusts. The 9 West 57thStreet Whole Loan has a 10-year term and is interest-only for the entire term.
Whole Loan Note Summary
| Original Balance | Cut-off Date Balance | Note Holder | Controlling Piece | |
| Note A-1 | $670,724,000 | $670,724,000 | JPMCC 2016-NINE | No |
| Note A-2 | 100,000,000 | 100,000,000 | JPMCC 2016-JP3 | No |
| Note A-3-A | 50,000,000 | 50,000,000 | Privately Sold | No |
| Note A-3-B | 50,000,000 | 50,000,000 | CSAIL 2016-C7 | No |
| Note A-4 | 80,000,000 | 80,000,000 | JPMCB | No |
| Note A-5 | 63,000,000 | 63,000,000 | JPMCB | No |
| Note B-1 | 186,276,000 | 186,276,000 | JPMCC 2016-NINE | No |
| Total | $1,200,000,000 | $1,200,000,000 |
The Borrowers. The borrowing entities for the 9 West 57th Street Whole Loan are Solow Building Company II, L.L.C. and Solovieff Realty Co. II, L.L.C., each a Delaware limited liability company and special purpose entity.
The Sponsor. The loan sponsor of the borrowers is Sheldon H. Solow (“Solow”) who has been an owner and developer of commercial and residential properties in New York since 1950 and has owned the property since developing it in 1972. Solow has a real estate portfolio consisting of approximately 18 commercial and residential properties in New York City, including 265 East 66th Street, One East River Place and 420 East 61st. Solow has shown his commitment to the property by periodically upgrading and improving it for more than 40 years in order to attract top tier tenants.
THE INFORMATION IN THIS STRUCTURAL AND COLLATERAL TERM SHEET IS NOT COMPLETE AND MAY BE AMENDED PRIOR TO THE TIME OF SALE. THIS STRUCTURAL AND COLLATERAL TERM SHEET IS NOT AN OFFER TO SELL THESE SECURITIES AND IT IS NOT A SOLICITATION OF AN OFFER TO BUY THESE SECURITIES IN ANY JURISDICTION WHERE THE OFFER OR SALE IS NOT PERMITTED.
| - 59 - |
Mortgage Loan No. 3 – 9 West 57th Street
The Property.The 9 West 57th Street property consists of 50 stories with 47 office levels and three subterranean levels that contain a mix of retail, storage and service areas as well as a 285-space parking garage. The building is near the 5th Avenue retail corridor and across the street from the Plaza Hotel within the Plaza District submarket. The full-service restaurant, Brasserie 8 ½, is located on the first subterranean level. According to the appraisal, the property is an iconic trophy office property and is widely perceived as being one of the top three office buildings in New York City due to its excellent Plaza District location, quality tenancy and unobstructed Central Park views from the 27th floor and above. As of June 1, 2016, the property was leased to 26 tenants, including a number of institutional quality tenants. The 9 West 57th Street property serves as headquarters’ locations for Kohlberg, Kravis, Roberts & Co. (“KKR”), Chanel Inc. (“Chanel”), Apollo Management Holdings, L.P. (“Apollo”), Och Ziff Management LP, Tiger Global Management LLC and Ruane, Cunniff & Goldfarb Inc. The property commands some of the highest PSF office rents in Manhattan with certain higher floor in-place rents exceeding $200 PSF. The property was 63.5% occupied as of June 1, 2016, considerably below the Plaza District market occupancy of 89.9%, which presents an opportunity for improvement in debt yield and DSCR if the property’s occupancy increases during the loan term. The sponsor is marketing the approximately 600,000 SF of vacant space at the property.
The property’s largest tenant is KKR, an investment firm headquartered at the property, which leases 11.7% of the NRA through December 2020 across seven floors. KKR has over $131.0 billion of assets under management with over 800 employees. The second largest tenant, Chanel, leases 11.0% of the NRA through May 2031. Chanel is a French designer of women’s fashion items and is headquartered at the property. The Chanel brand had over $5.2 billion in revenues in 2016 and over 12,760 employees. The third largest tenant, Apollo, leases 6.6% of the NRA through April 2020. Apollo is an alternative asset manager with a value-oriented investment strategy in private equity, credit and real estate. As of 2016, Apollo had $173 billion of assets under management and is also headquartered at the property.
The Market. The property is located in the Plaza District in Midtown Manhattan and in close proximity to the Plaza Hotel, 5th Avenue, the Museum of Modern Art, Rockefeller Center, Carnegie Hall, Radio City Music Hall, Columbus Circle and Grand Central Terminal. Midtown Manhattan is home to numerous national and multinational corporations, such as the Blackstone Group, Bloomberg L.P., Estée Lauder, JPMorgan Chase and NBC. The surrounding area has a number of luxury hotels, including The Four Seasons, The Peninsula, The Plaza and The St. Regis. The property is located along “Billionaire’s Row” which includes several luxury supertall residential condominium developments such as One57, 432 Park, 220 Central Park South and 111 West 57th Street. Certain residential condominium units along “Billionaire’s Row” have sold for more than $9,000 PSF.
As of the second quarter of 2016, the Plaza District submarket reported an overall vacancy rate of 10.1% and overall average asking rents of $128.36 PSF. The appraisal identified four comparable Class A trophy office buildings including the Seagram Building (375 Park Avenue), 667 Madison Avenue, the GM Building (767 5th Avenue) and Lever House (390 Park Avenue) with current asking rents ranging from $110 PSF to $225 PSF which is in-line with the property.
Competitive Set Summary(1)
| Property | Year Built / Renovated | Total GLA (SF) | Est. Rent PSF | Est. Occ. | Proximity (miles) |
| 9 West 57th Street | 1972 / N/A | 1,680,218(2) | $105 - $218(2) | 63.5%(2) | N/A |
| Seagram Building | 1958 / N/A | 830,928 | $165 - $185 | 98.5% | 0.6 |
| 667 Madison Avenue | 1988 / N/A | 269,933 | $110 - $195 | 92.0% | 0.3 |
| GM Building | 1968 / 2005 | 1,835,080 | $225 | 95.6% | 0.0 |
| Lever House | 1952 / N/A | 261,619 | $175 | 87.0% | 0.5 |
| (1) | Source: Appraisal. The Est. Rent PSF shown are only for current listings and are not reflective of building-wide ranges. |
| (2) | Based on the June 1, 2016 underwritten rent roll. |
THE INFORMATION IN THIS STRUCTURAL AND COLLATERAL TERM SHEET IS NOT COMPLETE AND MAY BE AMENDED PRIOR TO THE TIME OF SALE. THIS STRUCTURAL AND COLLATERAL TERM SHEET IS NOT AN OFFER TO SELL THESE SECURITIES AND IT IS NOT A SOLICITATION OF AN OFFER TO BUY THESE SECURITIES IN ANY JURISDICTION WHERE THE OFFER OR SALE IS NOT PERMITTED.
| - 60 - |
Mortgage Loan No. 3 – 9 West 57th Street
Historical and Current Occupancy(1)
| 2013 | 2014(2) | 2015(2) | Current(3) |
| 50.9% | 63.5% | 67.3% | 63.5% |
| (1) | Source: Historical Occupancy is provided by the sponsor. Historical occupancies are as of December 31 of each respective year. |
| (2) | The increase in 2014 occupancy from 2013 is primarily driven by leases signed with SHL Investment Group (USA), Inc. and Benefit Street Partners LLC (an affiliate of the mortgage loan seller). The increase in 2015 occupancy from 2014 is primarily driven by leases signed with Tiger Global Management LLC, Qatar Investment Authority Advisory USA Inc. and Veritas Capital Fund Management, LLC. |
| (3) | Based on the June 1, 2016 underwritten rent roll. |
Tenant Summary(1)
| Tenant | Ratings Moody’s/S&P/ Fitch(2) | Net Rentable Area (SF) | % of Total NRA | Base Rent PSF | Lease Expiration Date |
| Kohlberg, Kravis, Roberts & Co.(3) | NR / A / A | 196,124 | 11.7% | $121.48 | 12/31/2020 |
| Chanel Inc.(4) | NR / NR / NR | 185,120 | 11.0% | $119.07 | 5/31/2031 |
| Apollo Management Holdings, L.P.(5) | NR / A / A- | 111,194 | 6.6% | $167.17 | 4/30/2020 |
| Och Ziff Management LP | NR / NR / NR | 95,200 | 5.7% | $180.18 | 12/31/2029 |
| Tiger Global Management LLC | NR / NR / NR | 43,490 | 2.6% | $171.20 | 7/31/2024 |
| Providence Equity LLC(6) | NR / NR / NR | 32,800 | 2.0% | $210.00 | 3/15/2019 |
| Silver Lake Management Co., LLC | NR / NR / NR | 31,800 | 1.9% | $195.00 | 2/9/2019 |
| Coatue Management LLC | NR / NR / NR | 31,000 | 1.8% | $125.00 | 5/31/2023 |
| 40 North Industries LLC | NR / NR / NR | 28,620 | 1.7% | $167.32 | 1/31/2022 |
| Ruane, Cunniff & Goldfarb Inc. | NR / NR / NR | 26,920 | 1.6% | $191.00 | 5/31/2025 |
| (1) | Based on the underwritten rent roll dated June 1, 2016. |
| (2) | Ratings provided are for the parent company of the entity listed in the “Tenant” field whether or not the parent company guarantees the lease. |
| (3) | Kohlberg, Kravis, Roberts & Co., has acquired an approximately 343,000 SF condominium at Hudson Yards, an office development in West Midtown, Manhattan. There can be no assurance that KKR will not vacate the property upon lease expiration in December 2020. Excluding KKR from the in-place underwritten base rent, the UW NCF DSCR based on UW NCF is equal to 2.30x. |
| (4) | Chanel Inc.’s storage lease for 7,800 SF expires March 31, 2031. |
| (5) | Apollo Management Holdings, L.P.’s lease on 13,600 SF of office space expires April 15, 2020. Apollo Management Holdings L.P.’s 2,294 SF storage lease also expires April 15, 2020. |
| (6) | The 32,800 SF space leased to Providence Equity LLC does not include the 18,345 SF of space leased to Benefit Street Partners LLC, an affiliate of Providence Equity LLC and an affiliate of the mortgage loan seller. Benefit Street Partners LLC pays a base rent of $195.00 PSF and its lease expires September 30, 2025. Benefit Street Partners LLC has the right to terminate its lease as of September 1, 2022, with at least 12 months’ notice and the payment of a termination fee approximately equal to the sum of (i) an amount equal to four months of base rent and (ii) any unamortized brokerage commissions paid by the landlord on account of the lease. |
THE INFORMATION IN THIS STRUCTURAL AND COLLATERAL TERM SHEET IS NOT COMPLETE AND MAY BE AMENDED PRIOR TO THE TIME OF SALE. THIS STRUCTURAL AND COLLATERAL TERM SHEET IS NOT AN OFFER TO SELL THESE SECURITIES AND IT IS NOT A SOLICITATION OF AN OFFER TO BUY THESE SECURITIES IN ANY JURISDICTION WHERE THE OFFER OR SALE IS NOT PERMITTED.
| - 61 - |
Mortgage Loan No. 3 – 9 West 57th Street
Lease Rollover Schedule(1)
| Year | Number of Leases Expiring(2) | NRA Expiring | % of NRA Expiring | Base Rent Expiring | % of Base Rent Expiring | Cumulative NRA Expiring | Cumulative % of NRA Expiring | Cumulative Base Rent Expiring | Cumulative % of Base Rent Expiring | |
| Vacant | NAP | 613,310 | 36.5% | NAP | NAP | 613,310 | 36.5% | NAP | NAP | |
| MTM | 0 | 0 | 0.0 | $0 | 0.0% | 613,310 | 36.5% | $0 | 0.0% | |
| 2016 | 0 | 0 | 0.0 | 0 | 0.0 | 613,310 | 36.5% | $0 | 0.0% | |
| 2017 | 0 | 0 | 0.0 | 0 | 0.0 | 613,310 | 36.5% | $0 | 0.0% | |
| 2018 | 0 | 0 | 0.0 | 0 | 0.0 | 613,310 | 36.5% | $0 | 0.0% | |
| 2019 | 2 | 64,600 | 3.8 | 13,089,000 | 8.8 | 677,910 | 40.3% | $13,089,000 | 8.8% | |
| 2020 | 3 | 308,618 | 18.4 | 42,632,981 | 28.8 | 986,528 | 58.7% | $55,721,981 | 37.7% | |
| 2021 | 2 | 31,500 | 1.9 | 5,109,900 | 3.5 | 1,018,028 | 60.6% | $60,831,881 | 41.1% | |
| 2022 | 2 | 30,020 | 1.8 | 5,204,730 | 3.5 | 1,048,048 | 62.4% | $66,036,611 | 44.6% | |
| 2023 | 2 | 64,730 | 3.9 | 6,827,514 | 4.6 | 1,112,778 | 66.2% | $72,864,125 | 49.2% | |
| 2024 | 3 | 65,140 | 3.9 | 10,046,735 | 6.8 | 1,177,918 | 70.1% | $82,910,860 | 56.0% | |
| 2025 | 5 | 77,395 | 4.6 | 14,301,223 | 9.7 | 1,255,313 | 74.7% | $97,212,083 | 65.7% | |
| 2026 & Beyond | 7 | 424,905 | 25.3 | 50,783,105 | 34.3 | 1,680,218 | 100.0% | $147,995,188 | 100.0% | |
| Total | 26 | 1,680,218 | 100.0% | $147,995,188 | 100.0% | |||||
| (1) | Based on the underwritten rent roll dated June 1, 2016 and includes rent steps through September 2017. |
| (2) | Certain tenants have more than one lease. |
Operating History and Underwritten Net Cash Flow
| 2013 | 2014 | 2015 | TTM(1) | Underwritten | PSF | %(2) | ||
| Rents in Place | $96,419,788 | $104,395,474 | $128,865,929 | $141,867,688 | $147,995,188 | $88.08 | 59.4% | |
| Vacant Income | 0 | 0 | 0 | 0 | 82,518,645 | 49.11 | 33.1 | |
| Gross Potential Rent | $96,419,788 | $104,395,474 | $128,865,929 | $141,867,688 | $230,513,833 | $137.19 | 92.5% | |
| Total Reimbursements | 18,367,753 | 20,686,585 | 18,213,824 | 17,863,714 | 16,775,136 | 9.98 | 6.7 | |
| Percentage Rent Income - Garage | 1,960,765 | 2,011,104 | 1,649,779 | 1,754,505 | 1,943,774 | 1.16 | 0.8 | |
| Net Rental Income | $116,748,306 | $127,093,163 | $148,729,532 | $161,485,907 | $249,232,744 | $148.33 | 100.0% | |
| (Vacancy/Collection Loss) | 0 | 0 | 0 | 0 | (82,518,645) | (49.11) | (33.1) | |
| Other Income | 0 | 0 | 0 | 0 | 0 | 0.00 | 0.0 | |
| Effective Gross Income | $116,748,306 | $127,093,163 | $148,729,532 | $161,485,907 | $166,714,099 | $99.22 | 66.9% | |
| Total Expenses | $55,775,327 | $59,405,953 | $63,564,960 | $64,471,574 | $58,877,243 | $35.04 | 35.3% | |
| Net Operating Income(3)(4)(5)(6) | $60,972,979 | $67,687,210 | $85,164,572 | $97,014,333 | $107,836,855 | $64.18 | 64.7% | |
| Total TI/LC, Capex/RR | 0 | 0 | 0 | 0 | 738,788 | 0.44 | 0.4 | |
| Net Cash Flow | $60,972,979 | $67,687,210 | $85,164,572 | $97,014,333 | $107,098,067 | $63.74 | 64.2% |
| (1) | TTM Column represents the trailing 12-month period ending June 30, 2016. |
| (2) | % column represents percent of Net Rental Income for all revenue lines and represents percent of Effective Gross Income for the remainder of fields. |
| (3) | The increase in Net Operating Income from 2013 to 2014 is primarily due to an increase in occupancy from 50.9% to 63.5%. |
| (4) | The increase in Net Operating Income from 2014 to 2015 is primarily due to an increase in occupancy from 63.5% to 67.3% and an increase in in-place weighted average base rent PSF from approximately $97.86 to approximately $113.98 PSF. |
| (5) | The increase in Net Operating Income from 2015 to TTM is primarily due to an increase in in-place weighted average base rent from approximately $113.98 to approximately $127.10 PSF. |
| (6) | The increase in Net Operating Income from TTM to Underwritten is primarily due to the inclusion of tenants who have signed leases but have not begun paying rent including Zimmer Partners, LP (20,100 SF) and Seven Bridges Advisors LLC (7,560 SF). |
THE INFORMATION IN THIS STRUCTURAL AND COLLATERAL TERM SHEET IS NOT COMPLETE AND MAY BE AMENDED PRIOR TO THE TIME OF SALE. THIS STRUCTURAL AND COLLATERAL TERM SHEET IS NOT AN OFFER TO SELL THESE SECURITIES AND IT IS NOT A SOLICITATION OF AN OFFER TO BUY THESE SECURITIES IN ANY JURISDICTION WHERE THE OFFER OR SALE IS NOT PERMITTED.
| - 62 - |
Mortgage Loan No. 3 – 9 West 57th Street
Property Management. The property is managed by Solow Management Corp., an affiliate of the borrowers, under a management agreement that is renewed annually.
Escrows and Reserves. At origination, the borrowers deposited $25,000,000 for future tenant improvements and leasing commissions, $16,462,228 for outstanding free rent related to seven tenants at the property, $13,061,790 for outstanding tenant improvements and leasing commissions related to 10 tenants at the property, $9,417,640 for real estate taxes, $287,500 for required repairs and $264,333 for insurance reserves.
Tax Escrows - On a monthly basis, the borrowers are required to escrow 1/12th of annual estimated tax payments, which currently equates to $3,139,213.
Insurance Escrows - On a monthly basis, the borrowers are required to escrow 1/12th of the annual insurance premiums, which currently equates to $88,111.
Replacement Reserves - On a monthly basis, the borrowers are required to escrow $61,615 ($0.44 PSF annually) for ongoing replacement reserves. The replacement reserve is subject to a cap of $2,500,000.
TI/LC Reserves - If the amount on deposit in the TI/LC reserve falls below the initial deposit of $25,000,000, on a monthly basis, the borrowers are required to escrow $420,055 for tenant improvements and leasing commissions, unless, (A) the debt service coverage ratio is equal to or greater than 2.50x, (B) the balance of the reserve account is equal to or greater than $15,000,000, and (C) the property is occupied by tenants under leases demising no less than 65.0% of the NRA. The TI/LC reserve is subject to a cap of $25,000,000.
Lockbox / Cash Management. The 9 West 57th Street Whole Loan is structured with a hard lockbox and springing cash management. The borrowers were required at origination to deliver tenant direction letters instructing all tenants to deposit rents into a lockbox account controlled by the lender. All funds in the lockbox account are swept daily into the borrowers’ operating account at the clearing bank, unless a Trigger Period (as defined below) is continuing, in which event such funds will be swept on a daily basis into the a cash management account controlled by the lender and disbursed on each payment date in accordance with the loan documents.
“Trigger Period” commences upon the occurrence of (a) an event of default, (b) the bankruptcy or insolvency of the borrowers, (c) the bankruptcy or insolvency of the property manager or (d) the debt service coverage ratio based on net cash flow (as calculated in the loan documents) falling below 2.50x based on a trailing three-month basis.
The borrowers will have the right two times (in the aggregate) in any 12-month period to cure a Trigger Period as follows: (A) if a Trigger Period exists solely by reason of an event of default, the curing and acceptance of such cure by the lender of the applicable event of default (in its sole and absolute discretion), (B) if a Trigger Period exists solely by reason of a bankruptcy or insolvency of a property manager, the replacement of such manager with a qualified manager pursuant to a management agreement acceptable to the lender within 60 days, (C) if a Trigger Period exists solely by reason of a the debt service coverage ratio falling below 2.50x for a trailing three-month period, the achievement of the debt service coverage ratio for two consecutive quarters of at least 2.50x on a trailing three month basis as determined by the lender. In no event will the borrowers have the right to cure a Trigger Period occurring by reason of a borrowers’ bankruptcy.
Additional Debt. In addition to Note A-3-B, the mortgaged property is also security for thepari passu Note A-1, Note A-2, Note A-3-A, Note A-4 and Note A-5, and one subordinate B-Note. The B-Note has an outstanding principal balance as of the cut-off date of approximately $186.3 million. The 9 West 57th Street Whole Loan (inclusive of the B-Note) has a cut-off date LTV of 35.3%, and UW NCF DSCR of 3.08x and an UW NOI Debt Yield of 9.0%.
In addition, the sole members of the borrowers are permitted to obtain a mezzanine loan secured by the ownership interests in the related borrower upon satisfaction of certain terms and conditions which include, without limitation, (i) the mezzanine lender meets a qualified lender provision in the loan documents, (ii) the combined loan-to-value ratio on the origination date of the mezzanine loan does not exceed 35.3%, (iii) the combined debt service coverage ratio (as calculated in the loan documents and based on the 12 months immediately preceding the origination date of the mezzanine loan) is not less than 3.08x, and (iv) the
THE INFORMATION IN THIS STRUCTURAL AND COLLATERAL TERM SHEET IS NOT COMPLETE AND MAY BE AMENDED PRIOR TO THE TIME OF SALE. THIS STRUCTURAL AND COLLATERAL TERM SHEET IS NOT AN OFFER TO SELL THESE SECURITIES AND IT IS NOT A SOLICITATION OF AN OFFER TO BUY THESE SECURITIES IN ANY JURISDICTION WHERE THE OFFER OR SALE IS NOT PERMITTED.
| - 63 - |
Mortgage Loan No. 3 – 9 West 57th Street
lenders enter into an intercreditor agreement in form and substance reasonably acceptable to the mortgage lender and the rating agencies.
Ground Lease.The borrowers have pledged both the fee interest in the 9 West 57th Street property and the leasehold estate. The borrowers are permitted to terminate the ground lease upon certain terms and conditions in the loan documents which include, without limitation, delivery of a new title policy or an endorsement to the existing title policy, confirmation that all space leases will remain in full force and effect and satisfaction of any REMIC requirements.
THE INFORMATION IN THIS STRUCTURAL AND COLLATERAL TERM SHEET IS NOT COMPLETE AND MAY BE AMENDED PRIOR TO THE TIME OF SALE. THIS STRUCTURAL AND COLLATERAL TERM SHEET IS NOT AN OFFER TO SELL THESE SECURITIES AND IT IS NOT A SOLICITATION OF AN OFFER TO BUY THESE SECURITIES IN ANY JURISDICTION WHERE THE OFFER OR SALE IS NOT PERMITTED.
| - 64 - |
(THIS PAGE INTENTIONALLY LEFT BLANK)
| - 65 - |
Mortgage Loan No. 4 — Tampa Marriott Westshore
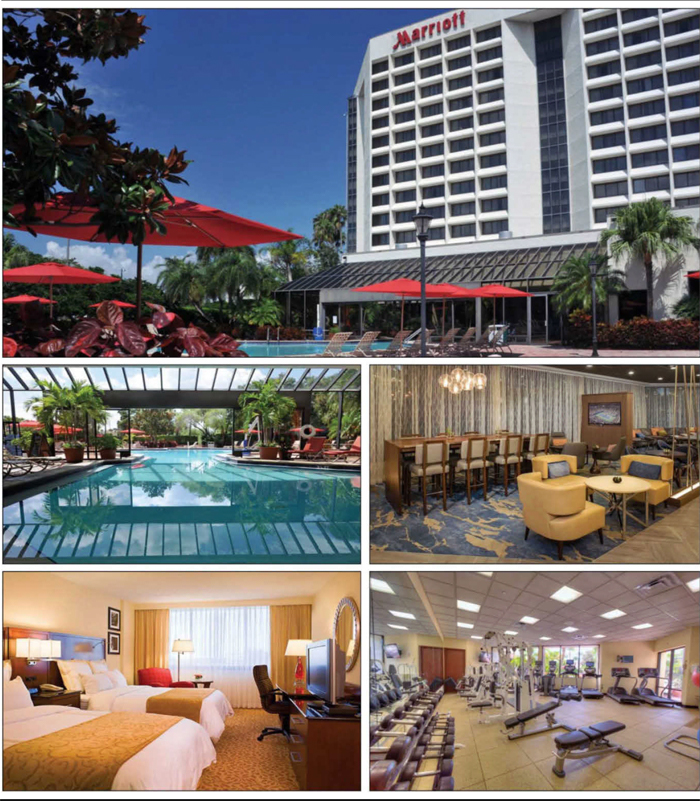
THE INFORMATION IN THIS STRUCTURAL AND COLLATERAL TERM SHEET IS NOT COMPLETE AND MAY BE AMENDED PRIOR TO THE TIME OF SALE. THIS STRUCTURAL AND COLLATERAL TERM SHEET IS NOT AN OFFER TO SELL THESE SECURITIES AND IT IS NOT A SOLICITATION OF AN OFFER TO BUY THESE SECURITIES IN ANY JURISDICTION WHERE THE OFFER OR SALE IS NOT PERMITTED.
| - 66 - |
Mortgage Loan No. 4 — Tampa Marriott Westshore

THE INFORMATION IN THIS STRUCTURAL AND COLLATERAL TERM SHEET IS NOT COMPLETE AND MAY BE AMENDED PRIOR TO THE TIME OF SALE. THIS STRUCTURAL AND COLLATERAL TERM SHEET IS NOT AN OFFER TO SELL THESE SECURITIES AND IT IS NOT A SOLICITATION OF AN OFFER TO BUY THESE SECURITIES IN ANY JURISDICTION WHERE THE OFFER OR SALE IS NOT PERMITTED.
| - 67 - |
Mortgage Loan No. 4 — Tampa Marriott Westshore
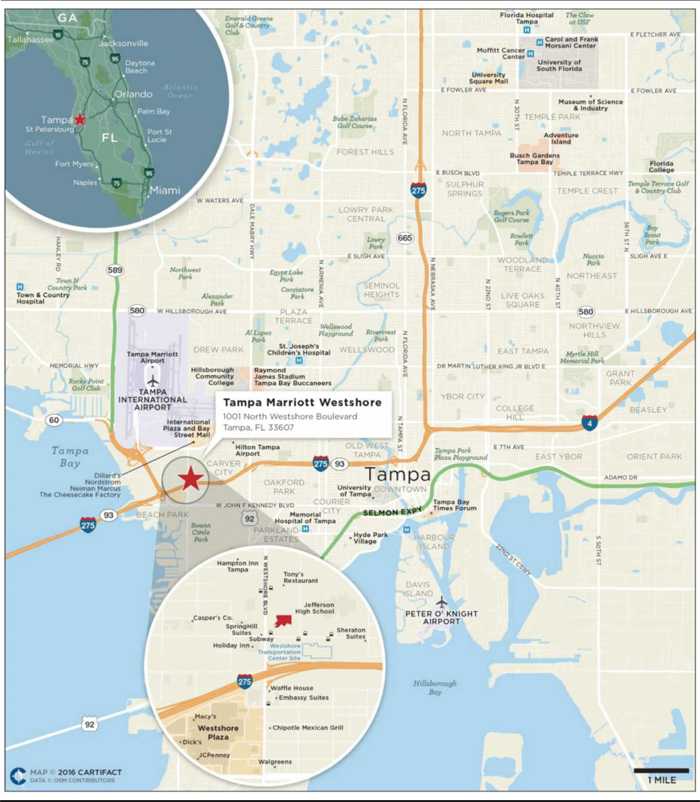
THE INFORMATION IN THIS STRUCTURAL AND COLLATERAL TERM SHEET IS NOT COMPLETE AND MAY BE AMENDED PRIOR TO THE TIME OF SALE. THIS STRUCTURAL AND COLLATERAL TERM SHEET IS NOT AN OFFER TO SELL THESE SECURITIES AND IT IS NOT A SOLICITATION OF AN OFFER TO BUY THESE SECURITIES IN ANY JURISDICTION WHERE THE OFFER OR SALE IS NOT PERMITTED.
| - 68 - |
Mortgage Loan No. 4 — Tampa Marriott Westshore
| Mortgage Loan Information | Property Information | |||
| Mortgage Loan Seller: | Column | Single Asset / Portfolio: | Single Asset | |
| Original Principal Balance: | $30,000,000 | Title: | Leasehold | |
| Cut-off Date Principal Balance: | $29,799,361 | Property Type - Subtype: | Hotel – Full Service | |
| % of Pool by IPB: | 3.9% | Net Rentable Area (Rooms): | 310 | |
| Loan Purpose: | Refinance | Location: | Tampa, FL | |
| Borrower: | Columbia Properties Westshore, LLC | Year Built / Renovated: | 1981 / 2005-2006 | |
| Sponsors: | Columbia Sussex Corporation and CSC Holdings LLC | Occupancy / ADR / RevPAR: | 68.7% / $140.39 / $96.48 | |
| Interest Rate: | 4.6850% | Occupancy / ADR / RevPAR Date: | 7/31/2016 | |
| Note Date: | 6/9/2016 | Number of Tenants: | N/A | |
| Maturity Date: | 7/1/2026 | 2013 NOI: | $3,167,832 | |
| Interest-only Period: | 0 months | 2014 NOI: | $4,013,540 | |
| Original Term: | 120 months | 2015 NOI: | $4,737,515 | |
| Original Amortization: | 300 months | TTM NOI(1): | $4,916,019 | |
| Amortization Type: | Balloon | UW Occupancy / ADR / RevPAR: | 67.6% / $135.82 / $91.79 | |
| Call Protection: | L(28),Def(88),O(4) | UW Revenues: | $13,769,377 | |
| Lockbox(2): | Hard | UW Expenses: | $9,157,750 | |
| Additional Debt: | No | UW NOI: | $4,611,627 | |
| Additional Debt Balance: | N/A | UW NCF: | $3,923,158 | |
| Additional Debt Type: | N/A | Appraised Value / Per Room: | $51,500,000 / $166,129 | |
| Additional Future Debt Permitted: | No | Appraisal Date: | 4/26/2016 | |
| Escrows and Reserves(3) | Financial Information | |||||
| Initial | Monthly | Initial Cap | Cut-off Date Loan / Room: | $96,127 | ||
| Taxes: | $347,220 | $38,580 | N/A | Maturity Date Loan / Room: | $71,520 | |
| Insurance: | $52,210 | Springing | N/A | Cut-off Date LTV: | 57.9% | |
| FF&E Reserve: | $0 | $58,088 | N/A | Maturity Date LTV: | 43.1% | |
| Ground Rent Reserve: | $90,450 | Springing | 3-months of ground rent | UW NCF DSCR: | 1.92x | |
| UW NOI Debt Yield: | 15.5% | |||||
Sources and Uses
| Sources | Proceeds | % of Total | Uses | Proceeds | % of Total | |
| Mortgage Loan | $30,000,000 | 89.8% | Payoff Existing Debt(4) | $32,644,091 | 97.7% | |
| Borrower Equity | 3,403,089 | 10.2 | Upfront Reserves | 489,880 | 1.5 | |
| Closing Costs | 269,118 | 0.8 | ||||
| Total Sources | $33,403,089 | 100.0% | Total Uses | $33,403,089 | 100.0% |
| (1) | Represents trailing twelve months ending July 31, 2016. |
| (2) | For a more detailed description of Lockbox, please refer to“Lockbox / Cash Management”below. |
| (3) | For a more detailed description of Escrows and Reserves, please refer to “Escrows and Reserves” below. |
| (4) | The property was previously securitized in WBCMT 2006-C26. |
THE INFORMATION IN THIS STRUCTURAL AND COLLATERAL TERM SHEET IS NOT COMPLETE AND MAY BE AMENDED PRIOR TO THE TIME OF SALE. THIS STRUCTURAL AND COLLATERAL TERM SHEET IS NOT AN OFFER TO SELL THESE SECURITIES AND IT IS NOT A SOLICITATION OF AN OFFER TO BUY THESE SECURITIES IN ANY JURISDICTION WHERE THE OFFER OR SALE IS NOT PERMITTED.
| - 69 - |
Mortgage Loan No. 4 — Tampa Marriott Westshore
The Loan. The Tampa Marriott Westshore loan is a $30.0 million first mortgage loan secured by the sub-leasehold interest in a 310-room full-service hotel property located in Tampa, Florida. The loan has a 10-year term and will amortize on a 25-year schedule.
The Borrower. The borrowing entity for the loan is Columbia Properties Westshore, LLC, a Delaware limited liability company and special purpose entity.
The Sponsors. The loan’s sponsors and nonrecourse carve-out guarantors are Columbia Sussex Corporation and CSC Holdings LLC. Columbia Sussex Corporation was founded in 1972 and has a portfolio of hotels that operate under various brands that include Hilton, Marriott and Starwood.
The Property. The property consists of a 310 room, full-service hotel known as the Tampa Marriott Westshore located in Tampa, Florida. The property is 13-stories tall and was originally constructed in 1981. The property underwent an approximately $9.8 million renovation between 2005 and 2006 and has subsequently had over $3.9 million of capital expenditures invested, including a full renovation of the lobby that was completed in July 2016. The property features the Tampa Bistro Blue and Lounge which is a 106-seat combination restaurant and lounge serving three meals per day, a Starbucks coffee bar, concierge lounge, an indoor/outdoor swimming pool, exercise room, gift shop, business center and 405 surface parking spaces. In addition, the property features 12,088 SF of meeting space with a 4,840 SF grand ballroom and a 1,848 SF junior ballroom.
The hotel has a unit mix of 165 king rooms, 127 double/double rooms, 16 handicap accessible rooms and two suites. Rooms feature flat-panel screen television, high-speed internet access, small refrigerators, and coffee makers. The property’s estimated 2015 demand mix was approximately 55% commercial, 18% group, 14% leisure and 13% airline crew. According to the appraisal, the largest corporate accounts include JPMorgan, PWC, CVS, Microsoft and IBM. The property operates under a franchise agreement with Marriott International, Inc. through January 6, 2025.
Tampa International Airport is located approximately 2.5 miles northwest of the property. According to the appraisal, a $953 million expansion of the airport was approved in 2013, and ground was broken on November 20, 2014. The project, to be completed in late 2017, will enable the airport to handle 35 million passengers annually.
The Market. The property is located in Tampa, Florida in the Westshore submarket, approximately 4.5 miles west of downtown Tampa. The property is located in the Tampa-St. Petersburg-Clearwater metropolitan statistical area (“MSA”), the second largest MSA in the state of Florida. According to the appraisal, the Tampa MSA’s leading employers reflect its focus on health care, government and education. According to the appraisal, tourism also plays a dominant role in the area’s economy, with visitors spending $3.5 billion annually. In addition to the beaches, attractions such as Busch Gardens, Ybor City, the Florida Aquarium, Adventure Island, the Tampa Bay Performing Arts Center, the Florida State Fair, the annual Gasparilla Pirate Fest and MacDill AirFest bring a substantial number of visitors to the area each year. According to the appraisal, the Tampa MSA has three major sport franchises: the National Hockey League’s Tampa Bay Lightning, Major League Baseball’s Tampa Bay Rays and the National Football League’s Tampa Bay Buccaneers. In addition, the city of Tampa features the 600,000 SF Tampa Convention Center facility, which offers a 200,000 SF exhibit hall and 125,000 SF of unobstructed space. With approximately 12.7 million SF of office space, Westshore is the center of commercial activity and the largest office market in the Tampa MSA. Through the first quarter of 2016, the Tampa Westshore office market had the highest asking rent in the MSA at $25.23 PSF and vacancy rate of 9.2%.
THE INFORMATION IN THIS STRUCTURAL AND COLLATERAL TERM SHEET IS NOT COMPLETE AND MAY BE AMENDED PRIOR TO THE TIME OF SALE. THIS STRUCTURAL AND COLLATERAL TERM SHEET IS NOT AN OFFER TO SELL THESE SECURITIES AND IT IS NOT A SOLICITATION OF AN OFFER TO BUY THESE SECURITIES IN ANY JURISDICTION WHERE THE OFFER OR SALE IS NOT PERMITTED.
| - 70 - |
Mortgage Loan No. 4 — Tampa Marriott Westshore
Historical Occupancy, ADR, RevPAR
| Competitive Set(1) | Tampa Marriott Westshore(2) | Penetration Factor | |||||||
| Year | Occupancy | ADR | RevPAR | Occupancy | ADR | RevPAR | Occupancy | ADR | RevPAR |
| 2013 | 75.6% | $110.01 | $83.12 | 64.3% | $119.39 | $76.82 | 85.1% | 108.5% | 92.4% |
| 2014 | 78.0% | $117.58 | $91.66 | 69.1% | $124.29 | $85.90 | 88.6% | 105.7% | 93.7% |
| 2015 | 79.3% | $125.62 | $99.67 | 68.9% | $135.82 | $93.58 | 86.9% | 108.1% | 93.9% |
| TTM(3) | 78.7% | $130.93 | $103.08 | 68.7% | $140.39 | $96.48 | 87.3% | 107.2% | 93.6% |
| (1) | Source: Third Party Data Provider. The competitive set consists of the following hotels: Tampa Marriott Airport, Renaissance Tampa International Plaza Hotel, Hilton Tampa Airport Westshore, Sheraton Suites Tampa Airport Westshore, DoubleTree by Hilton Hotel Tampa Airport-Westshore, Holiday Inn Tampa Westshore-Airport Area, Embassy Suites Tampa Airport Westshore. |
| (2) | Source: Borrower financials. |
| (3) | Represents the trailing twelve month period ending July 31, 2016. |
Competitive Hotels Profile(1)
| Estimated Market Mix | ||||||||||||
| Property | Rooms | Year Built | Meeting Space (SF) | Commercial | Meeting & Group | Leisure | Airline Crew | |||||
| Tampa Marriott Westshore | 310 | 1981 | 12,088 | 55% | 18% | 14% | 13% | |||||
| Tampa Marriott Airport | 298 | 1982 | 20,702 | 62% | 17% | 7% | 14% | |||||
| Renaissance Tampa International Plaza Hotel | 293 | 2004 | 12,416 | 45% | 35% | 20% | 0% | |||||
| Hilton Tampa Airport Westshore | 238 | 1982 | 15,792 | 46% | 20% | 20% | 14% | |||||
| Sheraton Suites Tampa Airport Westshore | 261 | 1986 | 10,020 | 48% | 15% | 20% | 17% | |||||
| DoubleTree by Hilton Hotel Tampa Airport-Westshore | 489 | 1974 | 13,601 | 30% | 25% | 15% | 30% | |||||
| Holiday Inn Tampa Westshore-Airport Area | 261 | 1986 | 12,441 | 32% | 24% | 17% | 27% | |||||
| Embassy Suites Tampa Airport Westshore | 243 | 1970 | 9,527 | 50% | 20% | 20% | 5% | |||||
| Total(2) | 2,083 | |||||||||||
| (1) | Source: Appraisal and borrower financials. |
| (2) | Excludes the subject property. |
THE INFORMATION IN THIS STRUCTURAL AND COLLATERAL TERM SHEET IS NOT COMPLETE AND MAY BE AMENDED PRIOR TO THE TIME OF SALE. THIS STRUCTURAL AND COLLATERAL TERM SHEET IS NOT AN OFFER TO SELL THESE SECURITIES AND IT IS NOT A SOLICITATION OF AN OFFER TO BUY THESE SECURITIES IN ANY JURISDICTION WHERE THE OFFER OR SALE IS NOT PERMITTED.
| - 71 - |
Mortgage Loan No. 4 — Tampa Marriott Westshore
Operating History and Underwritten Net Cash Flow
| 2013 | 2014 | 2015 | TTM(1) | Underwritten | Per Room(2) | %(3) | ||
| Occupancy | 64.3% | 69.1% | 68.9% | 68.7% | 67.6% | |||
| ADR | $119.39 | $124.29 | $135.82 | $140.39 | $135.82 | |||
| RevPAR | $76.82 | $85.90 | $93.58 | $96.48 | $91.79 | |||
| Room Revenue | $8,692,006 | $9,719,279 | $10,588,481 | $10,946,505 | $10,386,009 | $33,503 | 75.4% | |
| Food and Beverage | 2,771,847 | 3,203,409 | 3,249,513 | 3,235,871 | 3,249,513 | 10,482 | 23.6% | |
| Other Departmental Revenues | 185,140 | 147,076 | 136,855 | 141,072 | 133,855 | 432 | 1.0% | |
| Total Revenue | $11,648,993 | $13,069,764 | $13,974,849 | $14,323,448 | $13,769,377 | $44,417 | 100.0% | |
| Room Expense | 1,934,278 | 2,183,116 | 2,191,102 | 2,259,874 | 2,144,161 | 6,917 | 20.6% | |
| Food and Beverage Expense | 1,490,603 | 1,702,399 | 1,709,510 | 1,728,719 | 1,736,007 | 5,600 | 53.4% | |
| Other Departmental Expenses | 5,046 | 4,359 | 2,354 | 6,620 | 3,887 | 13 | 2.9% | |
| Departmental Expenses | $3,429,927 | $3,889,874 | $3,902,966 | $3,995,213 | $3,884,055 | $12,529 | 28.2% | |
| Departmental Profit | $8,219,066 | $9,179,890 | $10,071,883 | $10,328,235 | $9,885,322 | $31,888 | 71.8% | |
| Operating Expenses | $3,885,242 | 4,044,212 | $4,168,988 | $4,233,464 | $4,135,380 | $13,340 | 30.0% | |
| Gross Operating Profit | $4,333,824 | 5,135,678 | $5,902,895 | $6,094,771 | $5,749,942 | $18,548 | 41.8% | |
| Fixed Expenses | 1,165,992 | 1,122,138 | 1,165,380 | 1,178,752 | 1,138,315 | 3,672 | 8.3% | |
| Net Operating Income | $3,167,832 | $4,013,540 | $4,737,515 | $4,916,019 | $4,611,627 | $14,876 | 33.5% | |
| FF&E | 465,541 | 521,388 | 557,624 | 571,612 | 688,469 | 2,221 | 5.0% | |
| Net Cash Flow | $2,702,291 | $3,492,152 | $4,179,891 | $4,344,407 | $3,923,158 | $12,655 | 28.5% | |
| (1) | The TTM column represents the trailing twelve month period ending July 31, 2016. |
| (2) | Per Room values are based on 310 rooms. |
| (3) | % column represents percent of Total Revenue except for Room Expense, Food and Beverage Expense and Other Departmental Expenses, which are based on their corresponding revenue line items. |
Property Management. The hotel is managed by Columbia Sussex Management, LLC, an affiliate of the sponsor.
Escrows and Reserves. At origination, the borrower deposited into escrow $347,220 for taxes, $52,210 for insurance and $90,450 in the ground rent reserve.
Tax Escrows – On a monthly basis, the borrower is required to escrow 1/12th of the annual estimated tax payments.
Insurance Escrows – The requirement of the borrower to make monthly deposits to the insurance reserve is waived so long as no event of default exists and the borrower provides satisfactory evidence that the property is insured as part of a blanket policy in accordance with the loan documents.
FF&E Reserves – On a monthly basis, with respect to any payment date up to and including December 1, 2019, the borrower is required to escrow an amount equal to 1/12th of 5.0% of gross revenues from the property for the prior calendar year, respectively, which currently equates to $58,088. Thereafter, but before the replacement of the franchise agreement, the borrower is required to escrow an amount equal to 1/12th of 6.0% of gross revenues from the property for the prior calendar year, respectively (any such deposits, a “Second Period FF&E Monthly Deposit”). After the replacement of the franchise agreement the payment will be an amount equal to the greater of (i) 1/12th of 4.0% of gross revenues from the property and (ii) the amount required by the franchise agreement. Fifty percent of the Second Period FF&E Monthly Deposit will be deposited into the FF&E reserve account and fifty percent will be deposited into a PIP reserve account. Additionally, during a PIP Cash Sweep Period (defined below), excess cash flow will be deposited into the PIP Reserve account. Further, if the Franchise Agreement has not been renewed or replaced in accordance with the terms and conditions of the loan agreement before the date that is three months prior to the expiration date thereof, borrower shall be obligated to (i) deposit cash into the FF&E Reserve or (ii) deliver a letter of credit to lender, in each case, in an amount equal to 110% of the total amount required by the applicable property improvement plan less any amounts then on deposit in the PIP Reserve, (the “PIP Deposit”);provided,however, that borrower and lender agree that the PIP Deposit shall be equal to an aggregate amount of $5,270,000 until such time as the applicable property improvement plan is finalized.
THE INFORMATION IN THIS STRUCTURAL AND COLLATERAL TERM SHEET IS NOT COMPLETE AND MAY BE AMENDED PRIOR TO THE TIME OF SALE. THIS STRUCTURAL AND COLLATERAL TERM SHEET IS NOT AN OFFER TO SELL THESE SECURITIES AND IT IS NOT A SOLICITATION OF AN OFFER TO BUY THESE SECURITIES IN ANY JURISDICTION WHERE THE OFFER OR SALE IS NOT PERMITTED.
| - 72 - |
Mortgage Loan No. 4 — Tampa Marriott Westshore
PIP Reserve – 50% of the Second Period FF&E Monthly Deposit payment will be deposited into the PIP Reserve account.
Ground Rent Reserve – On a monthly basis, the borrower is required to escrow an amount equal to an amount that would make the amount of funds in the reserve equal to three months of the current ground rent owed under the ground lease.
Lockbox / Cash Management. The loan is structured with a hard lockbox and springing cash management. The borrower was required to send credit card direction letters to instruct credit card companies to deposit all receipts payable with respect to the property directly into the lockbox account controlled by the lender. During the continuance of a Cash Sweep Period (defined below), all funds in the lockbox account are swept daily to a cash management account under the control of the lender and disbursed during each interest period during the continuance of a Cash Sweep Period in accordance with the loan documents. During the continuance of a Cash Sweep Period other than a PIP Cash Sweep Period (during which, all excess cash is to be deposited into the PIP Reserve account as set forth above), all excess cash flow, after payments made in accordance with the loan documents for, amongst other things, debt service, required reserves and operating expenses, will be held as additional collateral for the loan.
“Cash Sweep Period” means amongst other things: (i) an event of default, (ii) the DSCR based on the most recent calendar quarter falls below 1.30x, (such Cash Sweep Period cured upon DSCR of 1.35x or greater for two consecutive quarters), (iii) a PIP Cash Sweep Period or (iv) the period commencing upon the occurrence of the guarantors’ failure to maintain an aggregate minimum net worth of $100.0 million and/or an aggregate liquidity of $10.0 million.
A “PIP Cash Sweep Period” begins upon the earliest of (i) twenty-four months prior to the expiration of the franchise agreement, (ii) borrower’s notification to lender that it is replacing the franchise agreement or (iii) the date on which (a) the franchise agreement is terminated, (b) borrower receives notice that the franchise agreement will be terminated and/or (c) the borrower defaults under the franchise agreement beyond any applicable notice and/or cure period.
Ground Lease.The property is subject to a ground lease and sub-ground lease. The ground lease has a current expiration date of December 31, 2017 and extension options extending until December 31, 2057. The sub-ground lease will expire one day prior to the ground lease. Extensions under the ground lease are automatic and self-operative and no expiration may occur without lender’s consent. Rent is three percent of annual gross room sales plus one percent of annual gross food sales plus one percent of annual gross alcoholic beverage sales, with a base minimum of $96,000.
THE INFORMATION IN THIS STRUCTURAL AND COLLATERAL TERM SHEET IS NOT COMPLETE AND MAY BE AMENDED PRIOR TO THE TIME OF SALE. THIS STRUCTURAL AND COLLATERAL TERM SHEET IS NOT AN OFFER TO SELL THESE SECURITIES AND IT IS NOT A SOLICITATION OF AN OFFER TO BUY THESE SECURITIES IN ANY JURISDICTION WHERE THE OFFER OR SALE IS NOT PERMITTED.
| - 73 - |
Mortgage Loan No. 5 – Cypress Park West
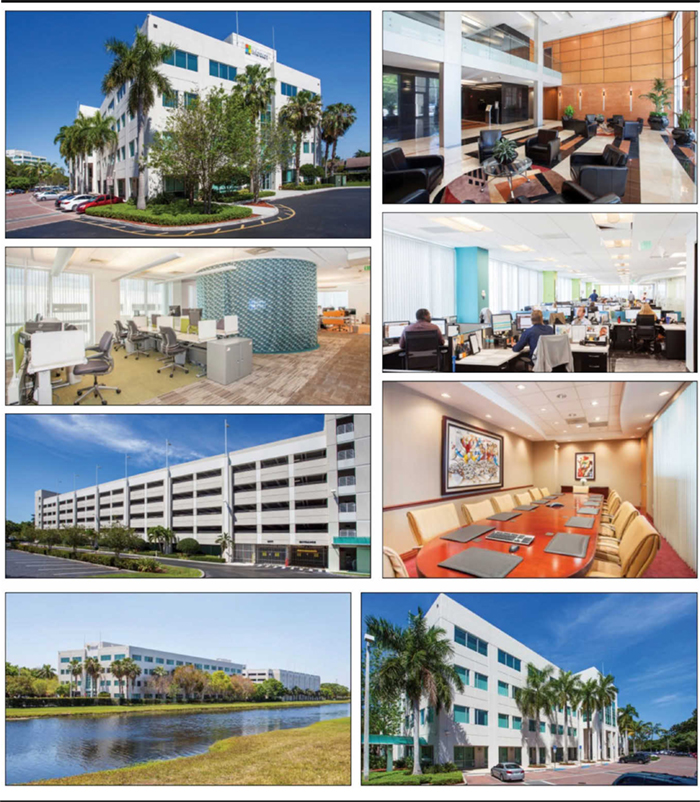
THE INFORMATION IN THIS STRUCTURAL AND COLLATERAL TERM SHEET IS NOT COMPLETE AND MAY BE AMENDED PRIOR TO THE TIME OF SALE. THIS STRUCTURAL AND COLLATERAL TERM SHEET IS NOT AN OFFER TO SELL THESE SECURITIES AND IT IS NOT A SOLICITATION OF AN OFFER TO BUY THESE SECURITIES IN ANY JURISDICTION WHERE THE OFFER OR SALE IS NOT PERMITTED.
| - 74 - |
Mortgage Loan No. 5 – Cypress Park West
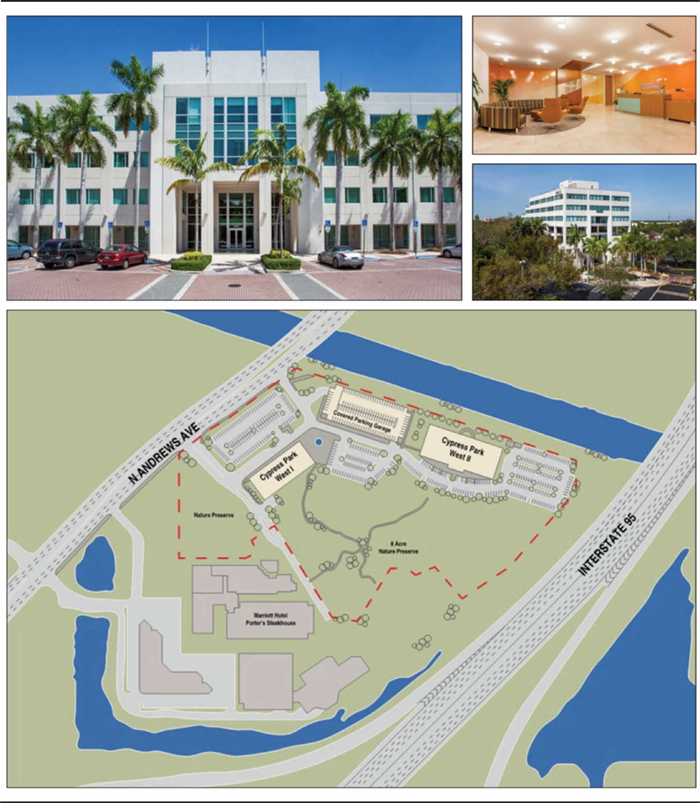
THE INFORMATION IN THIS STRUCTURAL AND COLLATERAL TERM SHEET IS NOT COMPLETE AND MAY BE AMENDED PRIOR TO THE TIME OF SALE. THIS STRUCTURAL AND COLLATERAL TERM SHEET IS NOT AN OFFER TO SELL THESE SECURITIES AND IT IS NOT A SOLICITATION OF AN OFFER TO BUY THESE SECURITIES IN ANY JURISDICTION WHERE THE OFFER OR SALE IS NOT PERMITTED.
| - 75 - |
Mortgage Loan No. 5 – Cypress Park West
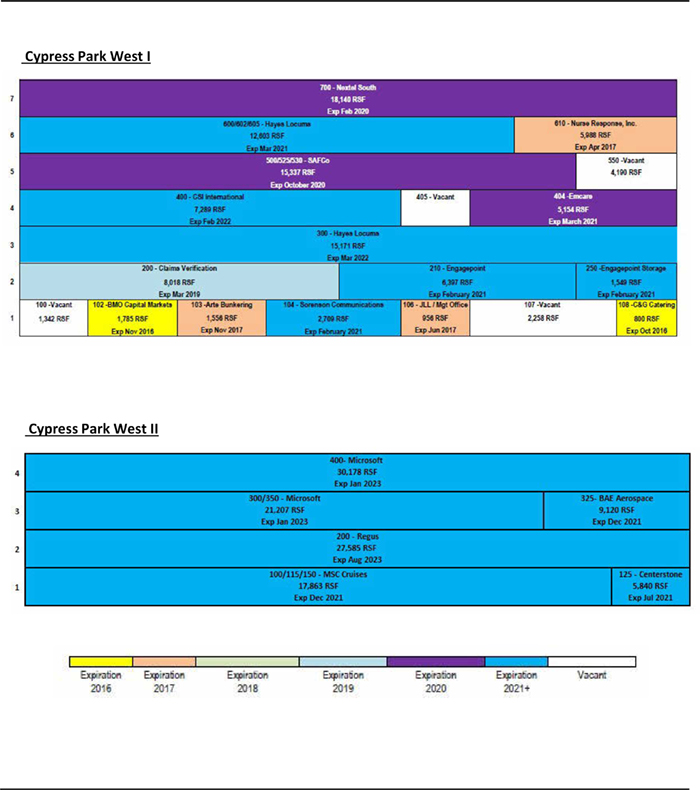
THE INFORMATION IN THIS STRUCTURAL AND COLLATERAL TERM SHEET IS NOT COMPLETE AND MAY BE AMENDED PRIOR TO THE TIME OF SALE. THIS STRUCTURAL AND COLLATERAL TERM SHEET IS NOT AN OFFER TO SELL THESE SECURITIES AND IT IS NOT A SOLICITATION OF AN OFFER TO BUY THESE SECURITIES IN ANY JURISDICTION WHERE THE OFFER OR SALE IS NOT PERMITTED.
| - 76 - |
Mortgage Loan No. 5 – Cypress Park West
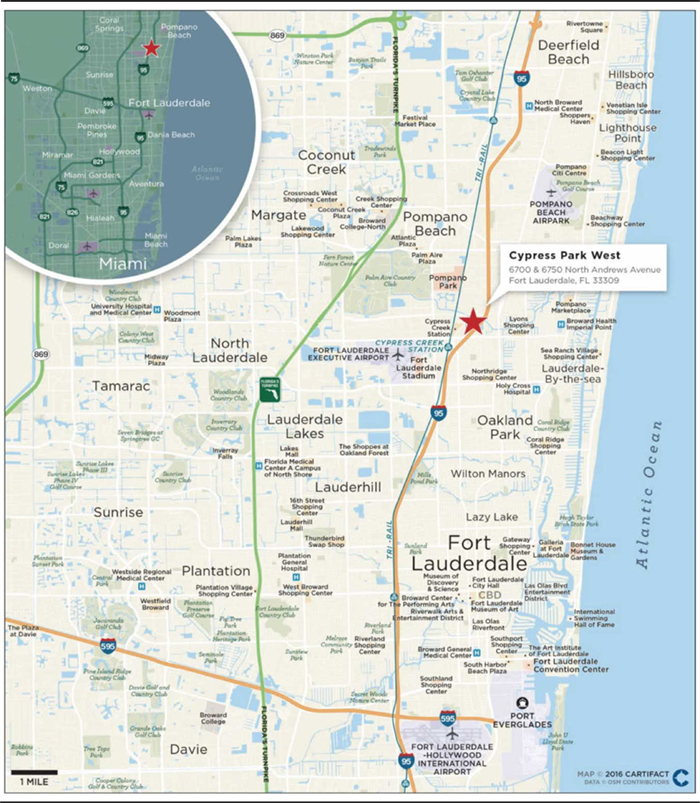
THE INFORMATION IN THIS STRUCTURAL AND COLLATERAL TERM SHEET IS NOT COMPLETE AND MAY BE AMENDED PRIOR TO THE TIME OF SALE. THIS STRUCTURAL AND COLLATERAL TERM SHEET IS NOT AN OFFER TO SELL THESE SECURITIES AND IT IS NOT A SOLICITATION OF AN OFFER TO BUY THESE SECURITIES IN ANY JURISDICTION WHERE THE OFFER OR SALE IS NOT PERMITTED.
| - 77 - |
Mortgage Loan No. 5 – Cypress Park West
Mortgage Loan Information | Property Information | |||
| Mortgage Loan Seller: | BSP | Single Asset / Portfolio: | Single Asset | |
| Original Principal Balance: | $29,250,000 | Title: | Fee | |
| Cut-off Date Principal Balance: | $29,250,000 | Property Type - Subtype: | Office – Suburban | |
| % of Pool by IPB: | 3.8% | Net Rentable Area (SF): | 225,757 | |
| Loan Purpose: | Acquisition | Location: | Fort Lauderdale, FL | |
| Borrower: | CPN West LLC | Year Built / Renovated: | 1986, 2003 / 2015 | |
| Sponsor: | Yoav Merary | Occupancy: | 84.8% | |
| Interest Rate: | 4.5600% | Occupancy Date: | 9/21/2016 | |
| Note Date: | 9/30/2016 | Number of Tenants: | 15 | |
| Maturity Date: | 10/6/2026 | 2013 NOI: | $2,065,882 | |
| Interest-only Period: | 36 months | 2014 NOI: | $2,341,729 | |
| Original Term: | 120 months | 2015 NOI(1): | $2,411,138 | |
| Original Amortization: | 360 months | TTM NOI(1)(2): | $2,846,953 | |
| Amortization Type: | IO-Balloon | UW Economic Occupancy: | 85.2% | |
| Call Protection: | L(25),Def(91),O(4) | UW Revenues: | $5,876,565 | |
| Lockbox(3): | Springing | UW Expenses: | $2,859,971 | |
| Additional Debt: | No | UW NOI(1): | $3,016,594 | |
| Additional Debt Balance: | N/A | UW NCF: | $2,652,807 | |
| Additional Debt Type: | N/A | Appraised Value / Per SF: | $43,200,000 / $191 | |
| Additional Future Debt Permitted: | No | Appraisal Date: | 8/3/2016 | |
| Escrows and Reserves(4) | Financial Information | |||||
| Initial | Monthly | Initial Cap | Cut-off Date Loan / SF: | $130 | ||
| Taxes: | $499,958 | $65,625 | N/A | Maturity Date Loan / SF: | $114 | |
| Insurance: | $29,408 | $14,704 | N/A | Cut-off Date LTV: | 67.7% | |
| Replacement Reserves: | $39,380 | $3,763 | N/A | Maturity Date LTV: | 59.4% | |
| TI/LC: | $200,000 | $28,220 | $1,500,000 | UW NCF DSCR: | 1.48x | |
| Tenant Leasing Reserve: | $1,483,934 | $0 | N/A | UW NOI Debt Yield: | 10.3% | |
| Free Rent Reserve: | $79,318 | $0 | N/A | |||
| Lease Sweep Reserve: | $0 | Springing | N/A | |||
Sources and Uses
| Sources | Proceeds | % of Total | Uses | Proceeds | % of Total | |
| Mortgage Loan | $29,250,000 | 63.6% | Purchase Price | $42,550,000 | 92.5% | |
| Sponsor Equity | 14,729,869 | 32.0 | Closing Costs | 1,134,836 | 2.5 | |
| Seller Funded Escrows | 2,036,966 | 4.4 | Upfront Reserves | 2,331,998 | 5.1 | |
| Total Sources | $46,016,834 | 100.0% | Total Uses | $46,016,834 | 100.0% |
| (1) | The increase in TTM NOI from 2015 NOI is largely due to increased occupancy from leasing activity with three new leases executed in the later part of 2015 and 2016 and certain lease extensions. The Underwritten NOI includes rent steps through September 2017, averaged rent for Microsoft Corporation through its termination option on August 31, 2020 and averaged rent for BAE Systems Applied through its lease expiration on December 31, 2021. |
| (2) | Represents trailing twelve months ending June 30, 2016. |
| (3) | For a more detailed description of lockbox, please refer to“Lockbox / Cash Management”below. |
| (4) | For a more detailed description of Escrows and Reserves, please refer to “Escrows and Reserves” below. |
THE INFORMATION IN THIS STRUCTURAL AND COLLATERAL TERM SHEET IS NOT COMPLETE AND MAY BE AMENDED PRIOR TO THE TIME OF SALE. THIS STRUCTURAL AND COLLATERAL TERM SHEET IS NOT AN OFFER TO SELL THESE SECURITIES AND IT IS NOT A SOLICITATION OF AN OFFER TO BUY THESE SECURITIES IN ANY JURISDICTION WHERE THE OFFER OR SALE IS NOT PERMITTED.
| - 78 - |
Mortgage Loan No. 5 – Cypress Park West
The Loan. The Cypress Park West loan is an approximately $29.3 million first mortgage loan secured by the fee simple interest in a 225,757 SF office complex located in Fort Lauderdale, Florida. The loan has a 10-year term and will amortize on a 30-year schedule after a three-year interest-only period.
The Borrower. The borrowing entity for the loan is CPN West LLC, a Florida limited liability company and special purpose entity.
The Sponsor. The loan’s sponsor and nonrecourse carve-out guarantor is Yoav Merary. Yoav Merary is an experienced real estate professional and the founder of NAYA USA Investment & Management (“NAYA”). NAYA is based in Hollywood, Florida and currently owns, manages and leases a portfolio of more than 800,000 SF of commercial and residential properties. The sponsor has ownership in 18 real estate assets valued at over $110 million, 12 of which are located in Florida and include 6 office buildings. As of July 2016, the sponsor reports a net worth of $7.0 million and a liquidity of $600,000. The sponsor has covenanted to maintain a minimum net worth of $5.0 million and minimum liquidity of $500,000 throughout the loan term.
The Property.The property is a two-building, 225,757 SF, Class A office complex located in Fort Lauderdale, Florida. The property is comprised of two office buildings: Cypress Park West I, a seven-story, 113,964 SF building, and Cypress Park West II, a four-story 111,793 SF building. Cypress Park West I was built in 1986 and renovated in 2003-2007, and Cypress Park West II was built in 2003. The property is situated on a 8.74-acre site that includes a six-story parking garage with 660 spaces and a surface lot with 339 spaces for a total parking ratio of 4.43 spaces per thousand SF. Additionally, the property includes 7.76 acres of nature preserve.
The previous ownership spent an estimated $2.2 million in capital improvements since 2013, including lobby and corridor renovations, window caulking, chiller replacements, lighting upgrades, and charging stations in the parking garage. The property was awarded an Energy Star label for operating efficiency. Additionally, the property’s nature preserve has wood-framed elevated walking paths that connect to the adjacent Marriott hotel and there are outdoor picnic areas located at each building. Site signage includes monument signs located near the entrance along North Andrews Avenue. The property includes an on-site cafe, a conference room facility, and 24/7 security. Adjacent to the property is a full-service Marriott hotel, which provides property tenants with special rates on guest rooms, event and meeting room space, and catering services.
As of September 21, 2016, the property was underwritten with an effective physical occupancy 84.8%. Cypress Park West I is on the east side of the site and Cypress Park West II is on northeast side of the site. Two tenants, representing 26.8% of NRA, have investment grade ratings including Microsoft Corporation (rated Aaa/AAA/AA+ by Moody’s/S&P/Fitch) and BAE Systems Applied (rated Baa2/BBB/BBB by Moody’s/S&P/Fitch).
The property’s location offers direct frontage and easy access to Interstate 95 and close proximity to Florida’s Turnpike, the two main north-south arterial highways. Interstate 95 provides regional access for the area with the nearest exit to the property at Cypress Creek Road (0.5 miles south of the property). Cypress Creek Road, McNab Road, and Commercial Boulevard provide localized east/west access in the area with Andrews Avenue and Powerline Road providing north/south access. The property is located approximately two miles from the Fort Lauderdale Executive Airport and the Cypress Creek Station (Tri-Rail system).
The Market. The property is located on the east side of North Andrews Avenue, just north of Cypress Creek Boulevard in Fort Lauderdale, near the eastern coast of Florida. The property is located along North Andrews Avenue, approximately seven miles from the Fort Lauderdale central business district and 10 miles from Boca Raton. The property has an on-site shuttle stop along the Sun Trolley’s Uptown Link route, connecting tenants from the property to area retail, restaurants and the Cypress Creek Tri-Rail Station. The 280,000 SF Cypress Creek Station Shopping Center is within two miles of the property and includes a Regal Cinemas, LA Fitness and multiple dining and shopping outlets. Other retail in the area includes the Promenade at Bay Colony (three miles) and the Coral Ridge Mall (four miles) featuring a Publix, Target, Old Navy, HomeGoods, and AMC Theater. Additionally, there is a number of hotels within close proximity of the property including the Fort Lauderdale Marriott North, the Westin Fort Lauderdale and the Sheraton Suites Fort Lauderdale at Cypress Creek. Other demand drivers for the area include the Broward Health Imperial Point Hospital, Pine Crest Preparatory School, Coral Ridge Country Club and Isle Casino Racing Pompano Park.
THE INFORMATION IN THIS STRUCTURAL AND COLLATERAL TERM SHEET IS NOT COMPLETE AND MAY BE AMENDED PRIOR TO THE TIME OF SALE. THIS STRUCTURAL AND COLLATERAL TERM SHEET IS NOT AN OFFER TO SELL THESE SECURITIES AND IT IS NOT A SOLICITATION OF AN OFFER TO BUY THESE SECURITIES IN ANY JURISDICTION WHERE THE OFFER OR SALE IS NOT PERMITTED.
| - 79 - |
Mortgage Loan No. 5 – Cypress Park West
The property is in the Broward County office market and the Cypress Creek submarket. According to the appraisal, the Class A segment in the Cypress Creek submarket exhibits an average rent of $17.30 PSF triple-net, and a vacancy rate of 11.0%, whereas the Class A segment in the Broward County market averages $20.19 PSF triple-net, with a vacancy rate of 12.7%. The appraiser concluded to $18.00 PSF for Cypress Park West I and $18.50 PSF for Cypress Park West II as well as 8.0% vacancy. According to the appraisal, the property’s competitive set consists of the five properties detailed in the table below.
Competitive Set Summary(1)
| Property | Year Built / Renovated | Total GLA (SF) | Est. Occ. | Proximity (miles) | ||
| Cypress Park West | 1986, 2003 / 2015 | 225,757 | (2) | 84.8% | (2) | N/A |
| Cypress Financial Center | 1988 / NA | 198,528 | 84.0% | 0.5 | ||
| Trade Center South | 1986 / NA | 215,049 | 60.0% | 0.5 | ||
| Pinnacle Corporate Park | 1986 / NA | 262,434 | 95.0% | 0.5 | ||
| Broward Trade Center Corporate Park | 1984 / NA | 99,740 | 100.0% | 0.5 | ||
| Cypress Center | 1985 / NA | 131,063 | 92.0% | 0.3 | ||
| (1) | Source: Appraisal. |
| (2) | Based on the September 21, 2016 underwritten rent roll. The increase in current occupancy from 2015 occupancy is due to three new leases executed in the later part of 2015 and 2016 and certain lease extensions. |
Historical and Current Occupancy(1)
| 2013 | 2014 | 2015 | Current(2) |
| 77.9% | 77.2% | 78.2% | 84.8% |
| (1) | Source: Historical Occupancy is provided by the sponsor. Occupancies are as of December 31 of each respective year. |
| (2) | Based on the September 21, 2016 underwritten rent roll. |
Tenant Summary(1)
| Tenant | Ratings Moody’s/S&P/Fitch(2) | Net Rentable Area (SF) | % of Total NRA | Base Rent PSF | Lease Expiration Date | |
| Microsoft Corporation | Aaa / AAA / AA+ | 51,385 | 22.8% | $18.16 | 1/31/2023 | |
| Regus-Fort Lauderdale | NR / NR / NR | 27,585 | 12.2% | $19.14 | 8/31/2023 | |
| Nextel South Corporation d/b/a Sprint | Caa1 / B / B+ | 18,140 | 8.0% | $16.70 | 2/29/2020 | |
| MSC Cruises (USA) Inc. | NR / NR / NR | 17,863 | 7.9% | $18.51 | 12/31/2021 | |
| Southern Auto Finance | NR / NR / NR | 15,337 | 6.8% | $15.97 | 10/31/2020 | |
| Hayes Locums, LLC | NR / NR / NR | 12,603 | 5.6% | $15.91 | 3/31/2021 | |
| BAE Systems Applied | Baa2 / BBB / BBB | 9,120 | 4.0% | $18.47 | 12/31/2021 | |
| Claims Verification | NR / NR / NR | 8,018 | 3.6% | $16.33 | 3/31/2019 | |
| CSI International, Inc. | NR / NR / NR | 7,289 | 3.2% | $17.35 | 2/28/2022 | |
| EngagePoint, Inc.(3) | NR / NR / NR | 6,397 | 2.8% | $18.04 | 2/28/2021 | |
| (1) | Based on the September 21, 2016 underwritten rent roll, including rent increases occurring through September, 2017. |
| (2) | Ratings provided are for the parent company of the entity listed in the “Tenant” field whether or not the parent company guarantees the lease. |
| (3) | EngagePoint, Inc. leases an additional 1,549 SF as a storage space (for a total of 7,946 SF) and is only responsible for reimbursements on this portion of its space. This portion of the tenant’s space has been excluded from the above table. |
THE INFORMATION IN THIS STRUCTURAL AND COLLATERAL TERM SHEET IS NOT COMPLETE AND MAY BE AMENDED PRIOR TO THE TIME OF SALE. THIS STRUCTURAL AND COLLATERAL TERM SHEET IS NOT AN OFFER TO SELL THESE SECURITIES AND IT IS NOT A SOLICITATION OF AN OFFER TO BUY THESE SECURITIES IN ANY JURISDICTION WHERE THE OFFER OR SALE IS NOT PERMITTED.
| - 80 - |
Mortgage Loan No. 5 – Cypress Park West
Lease Rollover Schedule(1)
| Year | Number of Leases Expiring(2) | NRA Expiring | % of NRA Expiring | Base Rent Expiring | % of Base Rent Expiring | Cumulative NRA Expiring | Cumulative % of NRA Expiring | Cumulative Base Rent Expiring | Cumulative % of Base Rent Expiring | |||||||||||||||||||
| Vacant | NAP | 34,412 | 15.2 | % | NAP | NAP | 34,412 | 15.2 | % | NAP | NAP | |||||||||||||||||
| MTM | 1 | 800 | 0.4 | $0 | 0.0 | % | 35,212 | 15.6 | % | $0 | 0.0% | |||||||||||||||||
| 2016 | 0 | 0 | 0.0 | 0 | 0.0 | 35,212 | 15.6 | % | $0 | 0.0% | ||||||||||||||||||
| 2017 | 1 | 1,556 | 0.7 | 29,128 | 0.9 | 36,768 | 16.3 | % | $29,128 | 0.9% | ||||||||||||||||||
| 2018 | 0 | 0 | 0.0 | 0 | 0.0 | 36,768 | 16.3 | % | $29,128 | 0.9% | ||||||||||||||||||
| 2019 | 1 | 8,018 | 3.6 | 130,934 | 3.9 | 44,786 | 19.8 | % | $160,062 | 4.8% | ||||||||||||||||||
| 2020 | 2 | 33,477 | 14.8 | 547,870 | 16.3 | 78,263 | 34.7 | % | $707,932 | 21.1% | ||||||||||||||||||
| 2021 | 7 | 61,235 | 27.1 | 1,058,386 | 31.6 | 139,498 | 61.8 | % | $1,766,318 | 52.7% | ||||||||||||||||||
| 2022 | 1 | 7,289 | 3.2 | 126,464 | 3.8 | 146,787 | 65.0 | % | $1,892,782 | 56.4% | ||||||||||||||||||
| 2023 | 2 | 78,970 | 35.0 | 1,461,129 | 43.6 | 225,757 | 100.0 | % | $3,353,911 | 100.0% | ||||||||||||||||||
| 2024 | 0 | 0 | 0.0 | 0 | 0.0 | 225,757 | 100.0 | % | $3,353,911 | 100.0% | ||||||||||||||||||
| 2025 | 0 | 0 | 0.0 | 0 | 0.0 | 225,757 | 100.0 | % | $3,353,911 | 100.0% | ||||||||||||||||||
| 2026 & Beyond | 0 | 0 | 0.0 | 0 | 0.0 | 225,757 | 100.0 | % | $3,353,911 | 100.0% | ||||||||||||||||||
| Total | 15 | 225,757 | 100.0 | % | $3,353,911 | 100.0 | % | |||||||||||||||||||||
| (1) | Based on the September 21, 2016 underwritten rent roll. Rent includes base rent and rent increases occurring through September, 2017. |
| (2) | Certain tenants may have more than one lease. |
Operating History and Underwritten Net Cash Flow
| 2013 | 2014 | 2015 | TTM(1) | Underwritten(2) | PSF | %(3) | |||||||||||||||
| Rents in Place | $2,851,645 | $2,944,584 | $2,946,642 | $3,129,441 | $3,353,911 | $14.86 | 49.2 | % | |||||||||||||
| Vacant Income | 0 | 0 | 0 | 0 | 587,709 | 2.60 | 8.6 | ||||||||||||||
| Gross Potential Rent | $2,851,645 | $2,944,584 | $2,946,642 | $3,129,441 | $3,941,619 | $17.46 | 57.8 | % | |||||||||||||
| Total Reimbursements | 1,838,171 | 2,006,986 | 2,117,227 | 2,307,443 | 2,876,734 | 12.74 | 42.2 | ||||||||||||||
| Net Rental Income | $4,689,817 | $4,951,569 | $5,063,868 | $5,436,884 | $6,818,354 | $30.20 | 100.0 | % | |||||||||||||
| (Vacancy/Collection Loss) | 0 | 0 | 0 | 0 | (1,022,817 | ) | (4.53 | ) | (15.0 | ) | |||||||||||
| Other Income(4) | 70,240 | 95,204 | 97,940 | 81,029 | 81,029 | 0.36 | 1.2 | ||||||||||||||
| Effective Gross Income | $4,760,057 | $5,046,774 | $5,161,809 | $5,517,913 | $5,876,565 | $26.03 | 86.2 | % | |||||||||||||
| Total Expenses | $2,694,174 | $2,705,045 | $2,750,671 | $2,670,960 | $2,859,971 | $12.67 | 48.7 | % | |||||||||||||
| Net Operating Income(5) | $2,065,882 | $2,341,729 | $2,411,138 | $2,846,953 | $3,016,594 | $13.36 | 51.3 | % | |||||||||||||
| Total TI/LC, Capex/RR | 0 | 0 | 0 | 0 | 363,787 | 1.61 | 6.2 | ||||||||||||||
| Net Cash Flow | $2,065,882 | $2,341,729 | $2,411,138 | $2,846,953 | $2,652,807 | $11.75 | 45.1 | % | |||||||||||||
| (1) | TTM Column represents the trailing twelve month period ending June 30, 2016. |
| (2) | Rent includes Base Rent and Rent Increases occurring through September 2017. |
| (3) | % column represents percent of Net Rental Income for all revenue lines and represents percent of Effective Gross Income for the remainder of fields. |
| (4) | Underwritten Other Income primarily includes after hours HVAC and parking income. |
| (5) | The increase in TTM Net Operating Income from 2015 is largely due to increased occupancy from leasing activity with three new leases executed in the later part of 2015, 2016 and certain lease extensions. The Underwritten Net Operating Income includes rent steps through September 2017, averaged rent for Microsoft Corporation through its termination option on August 31, 2020 and averaged rent for BAE Systems Applied through its lease expiration on December 31, 2021. |
THE INFORMATION IN THIS STRUCTURAL AND COLLATERAL TERM SHEET IS NOT COMPLETE AND MAY BE AMENDED PRIOR TO THE TIME OF SALE. THIS STRUCTURAL AND COLLATERAL TERM SHEET IS NOT AN OFFER TO SELL THESE SECURITIES AND IT IS NOT A SOLICITATION OF AN OFFER TO BUY THESE SECURITIES IN ANY JURISDICTION WHERE THE OFFER OR SALE IS NOT PERMITTED.
| - 81 - |
Mortgage Loan No. 5 – Cypress Park West
Property Management. The property is managed by Jones Lang LaSalle Americas, Inc. (“JLL”) (NYSE: JLL). JLL is a financial and professional services firm specializing in commercial real estate services and investment management. As of 2016, JLL had more than 280 corporate offices, operated in more than 80 countries and had a global workforce of more than 60,000. JLL provides management and real estate outsourcing services for a property portfolio of 4.0 billion square feet. JLL’s property management group currently manages over 350 million SF of space across the Americas.
Escrows and Reserves. At origination, the borrower deposited into escrow $1,483,934 for specified tenant leasing reserve, $499,958 for real estate taxes, $200,000 for tenant improvement and leasing commissions reserve, $79,318 for free rent reserve, $39,380 for replacement reserve and $29,408 for insurance.
Tax Escrows – On a monthly basis, the borrower is required to escrow 1/12th of annual tax payments, currently equal to $65,625.
Insurance Escrows – On a monthly basis, the borrower is required to escrow 1/12th of annual insurance payments equal to $14,704.
Replacement Reserves – On a monthly basis, the borrower is required to escrow $3,763 for replacement reserves.
TI/LC Reserve– On a monthly basis, the borrower is required to escrow $28,220 for tenant improvements and leasing commissions, subject to a cap of $1,500,000.
Lease Sweep Reserve– On each monthly payment date during a Cash Sweep Period (as defined below) that was caused and exists solely due to a Specified Tenant Sweep Event (as defined below), the borrower is required to deposit all excess cash flow generated by the property, after the payment of debt service, required reserves and operating expenses, among other things, for the immediately preceding interest period into a lease sweep reserve.
Lockbox / Cash Management. The Cypress Park West loan is structured with a springing lockbox and springing cash management structure. Upon the occurrence of a Cash Sweep Event (as defined below), tenants will be directed to remit all payments directly to the lockbox account controlled by the lender. During the continuance of a Cash Sweep Event, all funds received into the lockbox account will be swept immediately into the cash management account and used to pay monthly reserve balances, debt service payments and outstanding expense balances. The lockbox account was established at closing and tenant direction letters for all existing tenants are being held by lender in escrow.
A “Cash Sweep Event” commences upon (i) an event of default, (ii) the debt service coverage ratio being less than 1.25x or (iii) the occurrence of a Specified Tenant Sweep Event. A Cash Sweep Event expires upon, with regard to clause (i) above, the cure of such event of default, with regard to clause (ii) above, the date that the debt service coverage ratio is equal to or greater than 1.30x for two consecutive calendar quarters and with regard to clause (iii) above, the expiration of all Specified Tenant Sweep Events.
A “Specified Tenant Sweep Event” is triggered if Microsoft Corporation, any other tenant occupying at least 25,000 SF of NRA at the property or any replacement tenant, (i) defaults on its lease beyond notice and cure periods, (ii) goes dark or vacates its space, (iii) files for bankruptcy, (iv) terminates its lease, or (v) Microsoft Corporation does not renew its lease at least nine months prior to the scheduled lease expiration or any other specified tenant does not renew its lease at least 12 months prior to the scheduled lease expiration.
THE INFORMATION IN THIS STRUCTURAL AND COLLATERAL TERM SHEET IS NOT COMPLETE AND MAY BE AMENDED PRIOR TO THE TIME OF SALE. THIS STRUCTURAL AND COLLATERAL TERM SHEET IS NOT AN OFFER TO SELL THESE SECURITIES AND IT IS NOT A SOLICITATION OF AN OFFER TO BUY THESE SECURITIES IN ANY JURISDICTION WHERE THE OFFER OR SALE IS NOT PERMITTED.
| - 82 - |
(THIS PAGE INTENTIONALLY LEFT BLANK)
| - 83 - |
Mortgage Loan No. 6 — CVS Office Centre Building

THE INFORMATION IN THIS STRUCTURAL AND COLLATERAL TERM SHEET IS NOT COMPLETE AND MAY BE AMENDED PRIOR TO THE TIME OF SALE. THIS STRUCTURAL AND COLLATERAL TERM SHEET IS NOT AN OFFER TO SELL THESE SECURITIES AND IT IS NOT A SOLICITATION OF AN OFFER TO BUY THESE SECURITIES IN ANY JURISDICTION WHERE THE OFFER OR SALE IS NOT PERMITTED.
| - 84 - |
Mortgage Loan No. 6 — CVS Office Centre Building

THE INFORMATION IN THIS STRUCTURAL AND COLLATERAL TERM SHEET IS NOT COMPLETE AND MAY BE AMENDED PRIOR TO THE TIME OF SALE. THIS STRUCTURAL AND COLLATERAL TERM SHEET IS NOT AN OFFER TO SELL THESE SECURITIES AND IT IS NOT A SOLICITATION OF AN OFFER TO BUY THESE SECURITIES IN ANY JURISDICTION WHERE THE OFFER OR SALE IS NOT PERMITTED.
| - 85 - |
Mortgage Loan No. 6 — CVS Office Centre Building
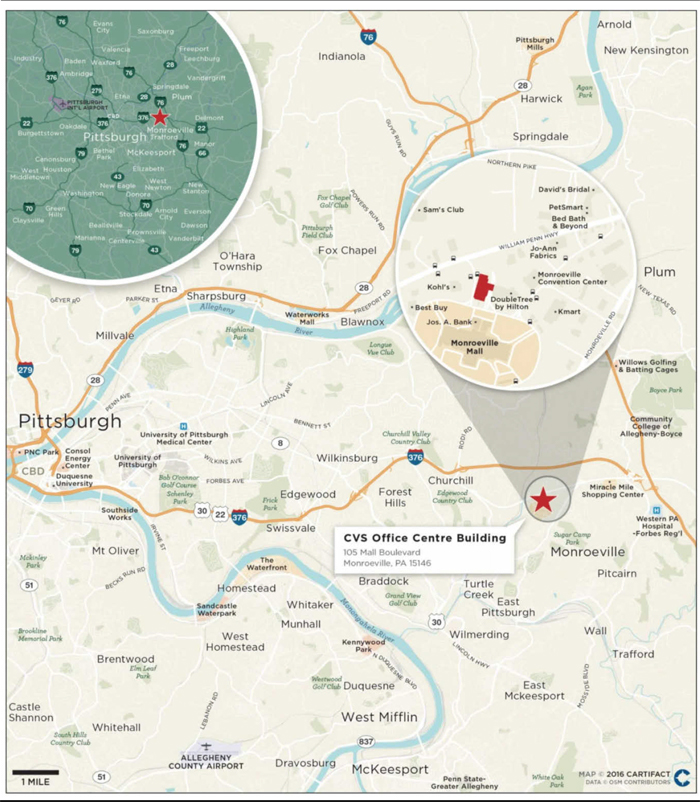
THE INFORMATION IN THIS STRUCTURAL AND COLLATERAL TERM SHEET IS NOT COMPLETE AND MAY BE AMENDED PRIOR TO THE TIME OF SALE. THIS STRUCTURAL AND COLLATERAL TERM SHEET IS NOT AN OFFER TO SELL THESE SECURITIES AND IT IS NOT A SOLICITATION OF AN OFFER TO BUY THESE SECURITIES IN ANY JURISDICTION WHERE THE OFFER OR SALE IS NOT PERMITTED.
| - 86 - |
Mortgage Loan No. 6 — CVS Office Centre Building
| Mortgage Loan Information | Property Information | |||
| Mortgage Loan Seller: | BSP | Single Asset / Portfolio: | Single Asset | |
| Original Principal Balance: | $28,500,000 | Title: | Fee and Leasehold | |
| Cut-off Date Principal Balance: | $28,500,000 | Property Type - Subtype: | Office – Suburban | |
| % of Pool by IPB: | 3.7% | Net Rentable Area (SF): | 226,501 | |
| Loan Purpose: | Refinance | Location: | Monroeville, PA | |
| Borrower: | Mart/Hotel Limited Partnership | Year Built / Renovated: | 1980 / 2009 | |
| Sponsor: | L&M Associates | Occupancy: | 100.0% | |
| Interest Rate: | 4.3900% | Occupancy Date: | 11/6/2016 | |
| Note Date: | 10/11/2016 | Number of Tenants: | 1 | |
| Maturity Date: | 11/6/2026 | 2013 NOI: | $3,345,681 | |
| Interest-only Period: | 0 months | 2014 NOI: | $3,446,647 | |
| Original Term: | 120 months | 2015 NOI: | $3,555,291 | |
| Original Amortization: | 336 months | TTM NOI(1): | $3,635,455 | |
| Amortization Type: | Balloon | UW Economic Occupancy: | 95.0% | |
| Call Protection: | L(24),Def (91),O(5) | UW Revenues: | $5,194,265 | |
| Lockbox(2): | Hard | UW Expenses: | $2,128,952 | |
| Additional Debt: | No | UW NOI: | $3,065,313 | |
| Additional Debt Balance: | N/A | UW NCF: | $2,680,261 | |
| Additional Debt Type: | N/A | Appraised Value / Per SF: | $41,800,000 / $185 | |
| Additional Future Debt Permitted: | No | Appraisal Date: | 9/2/2016 |
| Escrows and Reserves(3) | Financial Information | |||||
| Initial | Monthly | Initial Cap | Cut-off Date Loan / SF: | $126 | ||
| Taxes: | $58,037 | $58,037 | N/A | Maturity Date Loan / SF: | $98 | |
| Insurance: | $0 | Springing | N/A | Cut-off Date LTV: | 68.2% | |
| Replacement Reserves: | $0 | $3,775 | N/A | Maturity Date LTV: | 53.1% | |
| TI/LC: | $0 | $28,313 | N/A | UW NCF DSCR: | 1.51x | |
| Deferred Maintenance: | $31,250 | $0 | N/A | UW NOI Debt Yield: | 10.8% | |
| TI Reserve: | $500,000 | $0 | N/A | |||
| Lease Sweep Reserve: | $0 | Springing | N/A |
| Sources and Uses | |||||||
| Sources | Proceeds | % of Total | Uses | Proceeds | % of Total | ||
| Mortgage Loan | $28,500,000 | 100.0% | Payoff Existing Debt | $25,655,062 | 90.0% | ||
| Closing Costs | 1,969,747 | 6.9 | |||||
| Upfront Reserves | 589,287 | 2.1 | |||||
| Return of Equity | 285,905 | 1.0 | |||||
| Total Sources | $28,500,000 | 100.0% | Total Uses | $28,500,000 | 100.0% | ||
| (1) | The TTM NOI represents the trailing twelve months ending July 31, 2016. |
| (2) | For a more detailed description of lockbox, please refer to“Lockbox / Cash Management”below. |
| (3) | For a more detailed description of Escrows and Reserves, please refer to “Escrows and Reserves” below. |
THE INFORMATION IN THIS STRUCTURAL AND COLLATERAL TERM SHEET IS NOT COMPLETE AND MAY BE AMENDED PRIOR TO THE TIME OF SALE. THIS STRUCTURAL AND COLLATERAL TERM SHEET IS NOT AN OFFER TO SELL THESE SECURITIES AND IT IS NOT A SOLICITATION OF AN OFFER TO BUY THESE SECURITIES IN ANY JURISDICTION WHERE THE OFFER OR SALE IS NOT PERMITTED.
| - 87 - |
Mortgage Loan No. 6 — CVS Office Centre Building
The Loan. The CVS Office Centre Building loan is a $28.5 million first mortgage loan secured by the ground leasehold estate and the related lessor’s fee simple interest in a 226,501 SF office building located in Monroeville, Pennsylvania. The loan has a 10-year term and amortizes on a 28-year schedule.
The Borrower.The borrowing entity for the loan is Mart/Hotel Limited Partnership, a Pennsylvania limited partnership.
The Sponsor. The loan’s sponsor and nonrecourse carve-out guarantor is L&M Associates. L&M Associates is the entity through which Oxford Development Company (“Oxford”) conducts most of its operations and owns most of its assets. As of December 2015, the sponsor reported a net worth of $168.8 million and liquidity of $24.7 million. The sponsor has covenanted to maintain a minimum net worth of $25.0 million and a minimum liquidity of $5.0 million throughout the loan term.
Oxford, founded in 1963, is a full-service real estate firm in Pittsburgh, providing real estate development, asset/property management, brokerage services, investment advisory services and business operations. Oxford has managed the development of over 40.0 million SF of property in the commercial office, retail, hospitality, healthcare, education and sports and entertainment asset classes. Oxford and its affiliated companies employ over 1,000 people. Since developing the property for $20.0 million in 1980, the sponsor has invested approximately $18.0 million bringing the total basis in the property to $38.0 million.
The Property.The property is situated on a 9.37 acre site in Monroeville, Pennsylvania and is improved with one, three-story, 226,501 SF office building. The property is 100.0% leased to ProCare Pharmacy Direct, L.L.C. (“CVS”). The lease is guaranteed by CVS Health Corporation, formerly known as CVS Caremark Corporation (Moody’s/S&P rated Baa1/BBB+). CVS has been the tenant at the property since 2009 and has extended its original 10-year lease term by seven years for a lease expiration date of August 31, 2026. The lease provides two additional five-year extension options. CVS currently pays a base rent of $20.00 PSF and the underwritten base rent based on the average annual rent throughout the loan term is $21.77.
CVS, a Fortune 10 company (ranked 7), is the largest pharmacy health care provider in the U.S. with more than 5 million daily customers, 9,600 CVS Pharmacy Store locations, 30,000 pharmacists and 68,000 retail network pharmacies. CVS’ subsidiaries consist of CVS Pharmacy, MinuteClinic, CVS Caremark and CVS Specialty. CVS Specialty is the nation’s largest specialty pharmacy operating 24 retail specialty pharmacy stores and 11 specialty mail order pharmacies. The property is CVS’s largest specialty mail order pharmacy. The property also serves as backup to the second largest specialty mail order pharmacy located Illinois. In 2015, CVS revenues from the specialty drugs dispensed and managed totaled nearly $40 billion, increasing 32.0% over the prior year.
In addition to the approximately 208,501 SF of office space, the property contains approximately 18,000 SF of distribution space which includes a large server room, an assembly line and six large walk-in refrigeration units (four refrigerators and two freezers) for pharmaceutical storage. The first floor of the building houses pharmacists with the other two floors providing space for the other departments including billing, IT and a call center. The property features three loading docks and 1,034 parking spaces. A reciprocal parking agreement provides access to additional 611 parking spaces for a total parking ratio of 7.26 spaces per 1,000 SF of net rentable area. In 2014, CVS renovated the conference rooms to build out more cubicle space to support their growing staff (currently approximately 1,700 on-site employees). CVS added a visitor’s center area and built a cafeteria with on-site kitchen and chef. CVS has also made investments in infrastructure including generators, refrigeration units, numerous servers, assembly line, and other improvements.
The Market.The property is located in western Pennsylvania within the greater Pittsburgh metropolitan statistical area, approximately 14 miles east of Pittsburgh’s central business district. The property is within Allegheny County and within the borough limits of Monroeville. The property benefits from excellent frontage along US Route 22/ William Penn Highway, the main thoroughfare and retail corridor of Monroeville. Additionally, the property is within close proximity to the intersection of Interstate 76 and William Penn Highway (less than two miles), providing direct access to downtown Pittsburgh as well as regional access across the state of Pennsylvania.
The property has access to area demand drivers including shopping, entertainment, schools and employment centers surrounding the neighborhood. The property is located adjacent to the Monroeville Mall, a two level enclosed shopping center
THE INFORMATION IN THIS STRUCTURAL AND COLLATERAL TERM SHEET IS NOT COMPLETE AND MAY BE AMENDED PRIOR TO THE TIME OF SALE. THIS STRUCTURAL AND COLLATERAL TERM SHEET IS NOT AN OFFER TO SELL THESE SECURITIES AND IT IS NOT A SOLICITATION OF AN OFFER TO BUY THESE SECURITIES IN ANY JURISDICTION WHERE THE OFFER OR SALE IS NOT PERMITTED.
| - 88 - |
Mortgage Loan No. 6 — CVS Office Centre Building
with approximately 1.4 million SF of leasable space. The regional mall is anchored by Macy’s and JC Penney and recently underwent a multi-million dollar renovation to the mall’s interior. New anchors and large tenants have moved into the mall over the past few years, including a new 12-screen Cinemark theater that was added in 2013. Other retailers at the mall include Barnes and Noble, H&M, Dick’s Sporting Goods, and a number of other shops and restaurants. The Monroeville Mall was also developed by Oxford. The property is also in close proximity to other retailers within the surrounding retail corridor that include: Sam’s Club, Target, Lowe’s, DSW, Home Depot among others. Further, the property is adjacent to the Monroeville Convention Center which contains over 100,000 SF of event space to accommodate approximately 5,400 people. The property is within three miles of Forbes Hospital, a 349-bed full service hospital with level II trauma center, and the University of Pittsburgh Medical Center recently opened a state-of-the-art, 400-bed acute care hospital nearby (1.5 miles).
The property is located in the greater Pittsburgh office market which, as of the second quarter of 2016, maintained an inventory of 127,940,475 SF and an average rent $20.33 PSF. As of the second quarter of 2016, the vacancy rate for the market was 7.7%.
Office Competitive Set Summary(1)
| Property | Year Built / Renovated | Total GLA (SF) | Est. Occ. | Proximity (miles) | Tenant |
| CVS Office Center Building | 1980 / 2009 | 226,501(2) | 100.0%(2) | N/A | ProCare Pharmacy Direct, L.L.C.(2) |
| One Monroeville Center | 1983 / 2001 | 121,687 | 94.7% | 0.8 | Premier Medical Associates |
| 501 Ronda Court | 2015 | 70,529 | 100.0% | 10.1 | Express Scripts, Inc. |
| 121 Freeport Road | 1981 | 25,588 | 100.0% | 5.6 | UPMC |
| 135 Jamison Lane | 1983 | 179,000 | 100.0% | 0.8 | Bechtel Corporation |
| 4350 Northern Pike | 1971 / 2011 | 505,000 | 51.0% | 2.5 | TheraCom, LLC |
| Penn Center East VII | 1982 / 1992 | 79,148 | 90.1% | 1.0 | Sanford-Brown |
| 500 Cranberry Woods Drive | 2003 | 119,444 | 88.7% | 23.1 | Aesynt, Inc. |
| Park Place II | 1985 / 2012 | 112,481 | 100.0% | 21.1 | The Williams Companies, Inc. |
| 3000 Ericsson Drive | 1999 | 100,513 | 100.0% | 22.5 | Accredo Health Group, Inc. |
| 100 Airside Drive | 2002 | 117,003 | 100.0% | 22.8 | Michael Baker Corporation |
| 2000 Park Lane | 1994 | 229,110 | 100.0% | 20.8 | Cigna |
| (1) | Source: Appraisal. |
| (2) | Source: Tenant lease. |
Historical and Current Occupancy
| 2013 | 2014 | 2015 | Current(1) |
| 100.0% | 100.0% | 100.0% | 100.0% |
| (1) | Current occupancy is as of November 6, 2016 |
Tenant Summary(1)
| Tenant | Ratings Moody’s/S&P/Fitch(2) | Net Rentable Area (SF) | % of Total NRA | Base Rent PSF | Lease Expiration Date |
| ProCare Pharmacy Direct, L.L.C. | Baa1/BBB+/NR | 226,501 | 100.0% | $21.77 | 8/31/2026 |
| (1) | Based on the underwritten rent roll, with underwritten rent calculated based on average annual rent throughout the loan term. The current base rent is $20.00 PSF. |
| (2) | Ratings provided are for the parent company of the entity listed in the “Tenant” field which guarantees the lease. |
THE INFORMATION IN THIS STRUCTURAL AND COLLATERAL TERM SHEET IS NOT COMPLETE AND MAY BE AMENDED PRIOR TO THE TIME OF SALE. THIS STRUCTURAL AND COLLATERAL TERM SHEET IS NOT AN OFFER TO SELL THESE SECURITIES AND IT IS NOT A SOLICITATION OF AN OFFER TO BUY THESE SECURITIES IN ANY JURISDICTION WHERE THE OFFER OR SALE IS NOT PERMITTED.
| - 89 - |
Mortgage Loan No. 6 — CVS Office Centre Building
Lease Rollover Schedule(1)
| Year | Number of Leases Expiring | NRA Expiring | % of NRA Expiring | Base Rent Expiring | % of Base Rent Expiring | Cumulative NRA Expiring | Cumulative % of NRA Expiring | Cumulative Base Rent Expiring | Cumulative % of Base Rent Expiring |
| Vacant | NAP | 0 | 0.0% | NAP | NAP | 0 | 0.0% | NAP | NAP |
| MTM | 0 | 0 | 0.0 | $0 | 0.0% | 0 | 0.0% | $0 | 0.0% |
| 2016 | 0 | 0 | 0.0 | 0 | 0.0 | 0 | 0.0% | $0 | 0.0% |
| 2017 | 0 | 0 | 0.0 | 0 | 0.0 | 0 | 0.0% | $0 | 0.0% |
| 2018 | 0 | 0 | 0.0 | 0 | 0.0 | 0 | 0.0% | $0 | 0.0% |
| 2019 | 0 | 0 | 0.0 | 0 | 0.0 | 0 | 0.0% | $0 | 0.0% |
| 2020 | 0 | 0 | 0.0 | 0 | 0.0 | 0 | 0.0% | $0 | 0.0% |
| 2021 | 0 | 0 | 0.0 | 0 | 0.0 | 0 | 0.0% | $0 | 0.0% |
| 2022 | 0 | 0 | 0.0 | 0 | 0.0 | 0 | 0.0% | $0 | 0.0% |
| 2023 | 0 | 0 | 0.0 | 0 | 0.0 | 0 | 0.0% | $0 | 0.0% |
| 2024 | 0 | 0 | 0.0 | 0 | 0.0 | 0 | 0.0% | $0 | 0.0% |
| 2025 | 0 | 0 | 0.0 | 0 | 0.0 | 0 | 0.0% | $0 | 0.0% |
| 2026 & Beyond | 1 | 226,501 | 100.0 | $4,930,564 | 100.0 | 226,501 | 100.0% | $4,930,564 | 100.0% |
| Total | 1 | 226,501 | 100.0% | $4,930,564 | 100.0% |
(1) Based on the underwritten rent roll, with underwritten rent calculated based on average annual rent throughout the loan term.
Operating History and Underwritten Net Cash Flow
| 2013 | 2014 | 2015 | TTM(1) | Underwritten(2) | PSF | %(3) | |
| Rents in Place | $4,388,457 | $4,416,770 | $4,501,707 | $4,530,020 | $4,930,564 | $21.77 | 91.9% |
| Vacant Income | 0 | 0 | 0 | 0 | 0 | 0.00 | 0.0 |
| Gross Potential Rent | $4,388,457 | $4,416,770 | $4,501,707 | $4,530,020 | $4,930,564 | $21.77 | 91.9% |
| Total Reimbursements | 752,702 | 841,175 | 1,003,144 | 982,826 | 432,083 | 1.91 | 8.1 |
| Net Rental Income | $5,141,159 | $5,257,945 | $5,504,851 | $5,512,846 | $5,362,647 | $23.68 | 100.0% |
| (Vacancy/Collection Loss) | 0 | 0 | 0 | 0 | (273,382) | (1.21) | (5.1) |
| Other Income | 12,828 | 103,900 | 97,600 | 100,550 | 105,000 | 0.46 | 2.0 |
| Effective Gross Income | $5,153,988 | $5,361,845 | $5,602,451 | $5,613,396 | $5,194,265 | $22.93 | 96.9% |
| Total Expenses | $1,808,307 | $1,915,198 | $2,047,160 | $1,977,941 | $2,128,952 | $9.40 | 41.0% |
| Net Operating Income | $3,345,681 | $3,446,647 | $3,555,291 | $3,635,455 | $3,065,313 | $13.53 | 59.0% |
| Total TI/LC, Capex/RR | 0 | 0 | 0 | 0 | 385,052 | 1.70 | 7.4 |
| Net Cash Flow | $3,345,681 | $3,446,647 | $3,555,291 | $3,635,455 | $2,680,261 | $11.83 | 51.6% |
| (1) | TTM Column represents the trailing twelve month period ending July 31, 2016. |
| (2) | Underwritten Rent in Place calculated based on average annual rent throughout the loan term. |
| (3) | % column represents percent of Net Rental Income for all revenue lines and represents percent of Effective Gross Income for the remainder of fields |
Property Management. The property is managed by Oxford Development Company, an affiliate of the borrower.
Escrows and Reserves. At origination, the borrower deposited into escrow $500,000 for landlord obligations, $58,037 for real estate taxes, and $31,250 for immediate repairs.
Tax Escrows – On a monthly basis, the borrower is required to escrow 1/12th of annual tax payments, currently equal to $58,037.
Insurance Escrows - The requirement for the borrower to make monthly deposits to the insurance escrow is waived so long as (i) no event of default exists and (ii) the property is insured under an acceptable blanket policy in accordance with the loan documents.
Replacement Reserves – On a monthly basis, the borrower is required to escrow $3,775 for replacement reserves.
THE INFORMATION IN THIS STRUCTURAL AND COLLATERAL TERM SHEET IS NOT COMPLETE AND MAY BE AMENDED PRIOR TO THE TIME OF SALE. THIS STRUCTURAL AND COLLATERAL TERM SHEET IS NOT AN OFFER TO SELL THESE SECURITIES AND IT IS NOT A SOLICITATION OF AN OFFER TO BUY THESE SECURITIES IN ANY JURISDICTION WHERE THE OFFER OR SALE IS NOT PERMITTED.
| - 90 - |
Mortgage Loan No. 6 — CVS Office Centre Building
TI/LC Reserve– On a monthly basis, the borrower is required to escrow $28,313 for tenant improvements and leasing commissions.
Lease Sweep Reserve– On each monthly payment date during a Cash Sweep Period (as defined below) that was caused and exists solely due to a Specified Tenant Sweep Event (as defined below), the borrower is required to deposit all excess cash flow generated by the property, after the payment of debt service, required reserves and operating expenses, among other things, for the immediately preceding interest period into a lease sweep reserve.
Lockbox / Cash Management: The CVS Office Centre Building loan is structured with hard lockbox and springing cash management. The tenant has been directed to remit all payments due under its lease directly into the lockbox account controlled by the lender. During the continuance of a Cash Sweep Period, all funds in the lockbox account are required to be swept daily to a cash management account under the control of the lender and disbursed during each interest period of the term of the loan in accordance with the loan documents. During the continuance of a Cash Sweep Period, all excess cash flow, after payments made in accordance with the loan documents for, among other things, debt service, required reserves and operating expenses, will be held as additional collateral for the loan.
A “Cash Sweep Period” commences upon (i) an event of default, (ii) the debt service coverage ratio being less than 1.15x, (iii) the occurrence of a Specified Tenant Sweep Event, or (iv) a downgrade of the long-term credit rating of CVS below the long term credit rating of “BBB-” as rated by S&P (or such comparable rating as rated by any other rating agency). A Cash Sweep Period expires upon, with regard to clause (i) above, the cure of such event of default, with regard to clause (ii) above, the date that the debt service coverage ratio is equal to or greater than 1.25x for two consecutive calendar quarters, with regard to clause (iii) above, the expiration of all Specified Tenant Sweep Events and with regard to clause (iv) above, the restoration of the long-term credit rating of CVS to “BBB-” or higher as rated by S&P (or such comparable rating as rated by any other rating agency).
A “Specified Tenant Sweep Event” is triggered if CVS, any other tenant occupying at least 100,000 SF of NRA at the property or any replacement tenant, (i) defaults on its lease beyond notice and cure periods, (ii) goes dark or vacates its space, (iii) files for bankruptcy, (iv) terminates its lease, or (v) does not renew its lease at least 24 months prior to the scheduled lease expiration.
Ground Lease:The property is subject to a ground lease with an affiliate of the borrower, effective through December 31, 2036 with the ground lessee having the option to extend the term through December 31, 2066 by exercise of its three remaining 10-year extension options. The ground lease payment is fixed at $1 throughout the term of the ground lease and any modification would result in an event of default under the loan. The ground lessor is an indirect owner of the ground lessee. The ground lease and mortgage together include standard leasehold protections including those which permit the lender to foreclose on its mortgage on the property and become the ground lessee thereunder. In addition, the ground lease provides that (i) no amendments to the ground lease are permitted without lender’s consent, (ii) the ground lessor is required to enter into a new lease with leasehold mortgagee upon termination of the ground lease for any reason, (iii) the mortgagee is entitled to hold any casualty proceeds in accordance with the mortgage, and (iv) the mortgagee is permitted a reasonable opportunity to cure any default under the ground lease and ground lessor shall provide a copy of all notices to lender. Additionally, the lender has a mortgage on the affiliated entity’s fee interest. The lender’s title insurance policy insures that the mortgage constitutes a first priority lien on both the fee and leasehold interests in the property. The ground lessor is mortgaging their fee interest to lender by signing on to the mortgage.
THE INFORMATION IN THIS STRUCTURAL AND COLLATERAL TERM SHEET IS NOT COMPLETE AND MAY BE AMENDED PRIOR TO THE TIME OF SALE. THIS STRUCTURAL AND COLLATERAL TERM SHEET IS NOT AN OFFER TO SELL THESE SECURITIES AND IT IS NOT A SOLICITATION OF AN OFFER TO BUY THESE SECURITIES IN ANY JURISDICTION WHERE THE OFFER OR SALE IS NOT PERMITTED.
| - 91 - |
(THIS PAGE INTENTIONALLY LEFT BLANK)
| - 92 - |
Mortgage Loan No. 7 — Peachtree Mall
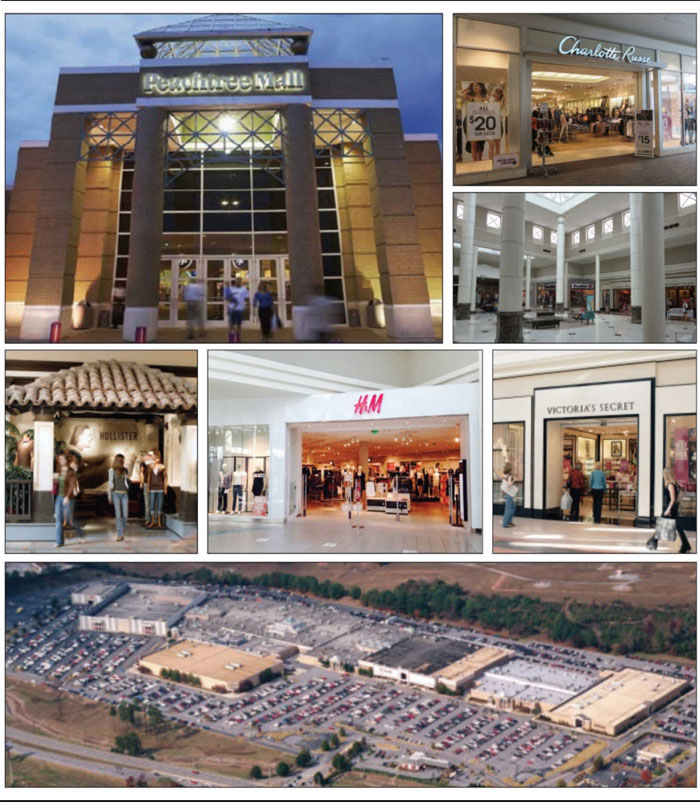
THE INFORMATION IN THIS STRUCTURAL AND COLLATERAL TERM SHEET IS NOT COMPLETE AND MAY BE AMENDED PRIOR TO THE TIME OF SALE. THIS STRUCTURAL AND COLLATERAL TERM SHEET IS NOT AN OFFER TO SELL THESE SECURITIES AND IT IS NOT A SOLICITATION OF AN OFFER TO BUY THESE SECURITIES IN ANY JURISDICTION WHERE THE OFFER OR SALE IS NOT PERMITTED.
| - 93 - |
Mortgage Loan No. 7 — Peachtree Mall
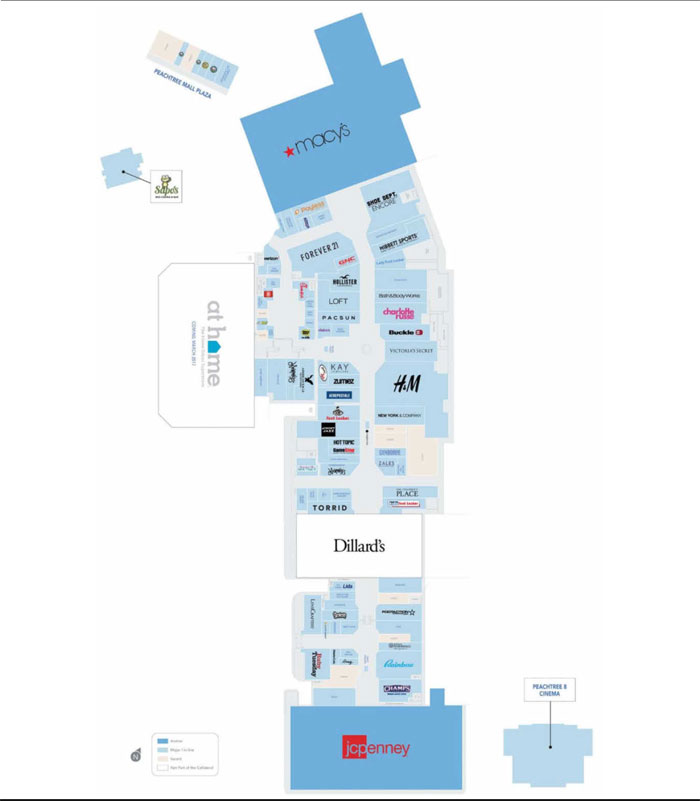
THE INFORMATION IN THIS STRUCTURAL AND COLLATERAL TERM SHEET IS NOT COMPLETE AND MAY BE AMENDED PRIOR TO THE TIME OF SALE. THIS STRUCTURAL AND COLLATERAL TERM SHEET IS NOT AN OFFER TO SELL THESE SECURITIES AND IT IS NOT A SOLICITATION OF AN OFFER TO BUY THESE SECURITIES IN ANY JURISDICTION WHERE THE OFFER OR SALE IS NOT PERMITTED.
| - 94 - |
Mortgage Loan No. 7 — Peachtree Mall

THE INFORMATION IN THIS STRUCTURAL AND COLLATERAL TERM SHEET IS NOT COMPLETE AND MAY BE AMENDED PRIOR TO THE TIME OF SALE. THIS STRUCTURAL AND COLLATERAL TERM SHEET IS NOT AN OFFER TO SELL THESE SECURITIES AND IT IS NOT A SOLICITATION OF AN OFFER TO BUY THESE SECURITIES IN ANY JURISDICTION WHERE THE OFFER OR SALE IS NOT PERMITTED.
| - 95 - |
Mortgage Loan No. 7 — Peachtree Mall
| Mortgage Loan Information | Property Information | |||
| Mortgage Loan Seller: | Silverpeak Real Estate Finance LLC | Single Asset / Portfolio: | Single Asset | |
| Original Principal Balance(1): | $25,000,000 | Title: | Fee | |
| Cut-off Date Principal Balance(1): | $24,761,505 | Property Type - Subtype: | Retail – Regional Mall | |
| % of Pool by IPB: | 3.2% | Net Rentable Area (SF): | 536,202 | |
| Loan Purpose: | Refinance | Location: | Columbus, GA | |
| Borrower: | Peachtree Mall L.L.C. | Year Built / Renovated: | 1975, 1985, 1993, 1994 / 1994, 2010-2015 | |
| Sponsor: | GGP Limited Partnership | Occupancy(2): | 90.1% | |
| Occupancy Date: | 6/30/2016 | |||
| Number of Tenants(2): | 81 | |||
| Interest Rate: | 3.9440% | 2013 NOI: | $9,271,056 | |
| Note Date: | 7/1/2016 | 2014 NOI: | $9,787,129 | |
| Maturity Date: | 12/6/2025 | 2015 NOI: | $9,307,906 | |
| Interest-only Period: | 0 months | TTM NOI(3): | $9,895,215 | |
| Original Term: | 114 months | UW Economic Occupancy: | 91.7% | |
| Original Amortization: | 300 months | UW Revenues: | $13,892,159 | |
| Amortization Type: | Balloon | UW Expenses: | $3,861,607 | |
| Call Protection(4): | L(29),Def (81),O(4) | UW NOI: | $10,030,552 | |
| Lockbox(5): | Hard | UW NCF: | $9,246,250 | |
| Additional Debt(1): | Yes | Appraised Value / Per SF: | $140,000,000 / $261 | |
| Additional Debt Balance(1): | $55,305,560 | Appraisal Date: | 9/01/2016 | |
| Additional Debt Type(1): | Pari Passu | |||
| Additional Future Debt Permitted(6): | Yes – Mezzanine |
| Escrows and Reserves(7) | Financial Information(1) | |||||
| Initial | Monthly | Initial Cap | Cut-off Date Loan / SF: | $148 | ||
| Taxes: | $0 | Springing | N/A | Maturity Date Loan / SF: | $110 | |
| Insurance: | $0 | Springing | N/A | Cut-off Date LTV: | 56.8% | |
| Replacement Reserves: | $0 | Springing | $78,266 | Maturity Date LTV: | 42.2% | |
| TI/LC: | $0 | Springing | $313,065 | UW NCF DSCR: | 1.83x | |
| JCP Sweep Reserve: | $0 | Springing | (7) | UW NOI Debt Yield: | 12.6% | |
Sources and Uses
| Sources | Proceeds | % of Total | Uses | Proceeds | % of Total | |
| Mortgage Loan(1) | $80,305,560 | 100.0% | Payoff Existing Debt(8) | $0 | 0.0% | |
| Return of Equity(8) | 79,723,913 | 99.3 | ||||
| Closing Costs | 581,647 | 0.7 | ||||
| Total Sources | $80,305,560 | 100.0% | Total Uses | $80,305,560 | 100.0% |
| (1) | The Peachtree Mall loan is part of a larger split whole loan evidenced by fourpari passunotes, with an aggregate principal balance of $80,305,560. The financial information presented in the chart above reflects the cut-off date balance of the $79,539,460 Peachtree Mall Whole Loan. |
| (2) | Occupancy excludes 26,848 SF (5.0% of net rentable area) attributed to 12 temporary tenants that were not included in the underwritten Base Rent. Occupancy including temporary tenants is 95.1%. Number of tenants does not include these 12 temporary tenants. |
| (3) | Represents trailing twelve months ending June 30, 2016. |
| (4) | The lockout period will be at least 29 payment dates beginning with the payment date of July 6, 2016. Defeasance of the Peachtree Mall Whole Loan is permitted following two years after the closing date of the securitization that includes the note last to be securitized. |
| (5) | For a more detailed description of the Lockbox, please refer to “Lockbox/Cash Management” below. |
| (6) | For a more detailed description of Additional Future Debt Permitted, please refer to “Additional Debt” below. |
| (7) | For a more detailed description of Escrows and Reserves, please refer to “Escrows and Reserves” below. |
THE INFORMATION IN THIS STRUCTURAL AND COLLATERAL TERM SHEET IS NOT COMPLETE AND MAY BE AMENDED PRIOR TO THE TIME OF SALE. THIS STRUCTURAL AND COLLATERAL TERM SHEET IS NOT AN OFFER TO SELL THESE SECURITIES AND IT IS NOT A SOLICITATION OF AN OFFER TO BUY THESE SECURITIES IN ANY JURISDICTION WHERE THE OFFER OR SALE IS NOT PERMITTED.
| - 96 - |
Mortgage Loan No. 7 — Peachtree Mall
| (8) | The Peachtree Mall property was previously securitized in the BACM 2005-4 transaction. The previous loan was paid off in February 2015, and the Peachtree Mall property remained unencumbered until the origination of the Peachtree Mall Whole Loan. The BACM 2005-4 outstanding loan balance was approximately $77.8 million at maturity. |
The Loan. The Peachtree Mall loan, which is part of a larger split whole loan, is a first mortgage secured by the borrower’s fee interest in an enclosed regional mall consisting of four one-story buildings located in Columbus, Georgia. The Peachtree Mall loan was originated on November 24, 2015, with an original balance of $88.0 million. On June 17, 2016, the sponsor paid down the Peachtree Mall loan to $80,305,560 and converted the amortization from 30 years to 25 years. The whole loan has an outstanding principal balance of $79,539,460 (”Peachtree Mall Whole Loan”) as of the cut-off date, which is comprised of fourpari passu notes, Note A-1, Note A-2 Note A-3 and Note A-4. Note A-3 has an outstanding balance as of the cut-off date of $24,761,505 and is being contributed to the CSAIL 2016-C7 Commercial Mortgage Trust. Note A-1 has an outstanding principal balance as of the cut-off date of $23,523,429 and was contributed to the SGCMS 2016-C5 Commercial Mortgage Trust. Note A-2 has an outstanding principal balance as of the cut-off date of $19,809,204 and was contributed to the WFCM 2016-NXS6 Commercial Mortgage Trust. Note A-4 has an outstanding principal balance as of the cut-off date of $11,445,323, is currently held by Silverpeak Real Estate Finance LLC or an affiliate, and is expected to be contributed to a future securitized trust. As the holder of Note A-3 (the “Controlling Noteholder”), the trustee of the CSAIL 2016-C7 Commercial Mortgage Trust (or, prior to the occurrence and continuance of a control termination event under the CSAIL 2016-C7 pooling and servicing agreement, the CSAIL 2016-C7 controlling class representative) will be entitled to exercise all of the rights of the Controlling Noteholder with respect to the Peachtree Mall Whole Loan; however, the holders of Note A-1, A-2 and A-4 will be entitled, under certain circumstances, to consult with the Controlling Noteholder with respect to certain major decisions.
Whole Loan Note Summary
| Original Balance | Cut-off Date Balance | Note Holder | Note in Controlling Securitization | |
| Note A-1 | $23,750,000 | $23,523,429 | SGCMS 2016-C5 | No |
| Note A-2 | 20,000,000 | 19,809,204 | WFCM 2016-NXS6 | No |
| Note A-3 | 25,000,000 | 24,761,505 | CSAIL 2016-C7 | Yes |
| Note A-4 | 11,555,560 | 11,445,323 | Silverpeak | No |
| Total | $80,305,560 | $79,539,460 |
The Borrower. The borrowing entity for the Peachtree Mall Whole Loan is Peachtree Mall L.L.C., a Delaware limited liability company and special purpose entity with two independent directors.
The Sponsor. The loan’s sponsor and nonrecourse carve-out guarantor is GGP Limited Partnership, an affiliate of General Growth Properties, Inc. (NYSE: GGP) (“GGP”). GGP is a fully integrated, self-managed and self-administered real estate investment trust focused on owning, managing, leasing, and redeveloping regional retail properties throughout the United States. As of September 2016, GGP owned, either entirely or with joint ventures, 128 retail properties comprising approximately 121 million square feet of gross leasable area. The borrowing entity is owned 100.0% by General Growth Partnership. The borrower and sponsor previously filed for Chapter 11 bankruptcy. The borrower emerged from bankruptcy in December 2009, and the sponsor emerged from bankruptcy on November 9, 2010. The sponsor has also been involved in several foreclosures within the past seven years. See “Mortgage Pool Characteristics – Loan Purpose; Bankruptcy Issues and Other Proceedings” in the Preliminary Prospectus.
The Property.Peachtree Mall is an 822,443 SF regional mall, of which 536,202 SF serve as collateral for the Peachtree Mall Whole Loan, and is situated on a 66.6-acre parcel of land, of which 53.4 acres serve as collateral (the “Peachtree Mall Collateral Property”). Peachtree Mall was built in 1975, most recently expanded in 1994 and renovated between 2010-2015. The sponsor has owned the property since 2003. Peachtree Mall is located in Columbus, Georgia and is adjacent to the Interstate-185 and Manchester Expressway intersection. Peachtree Mall is anchored by Dillard’s (not part of collateral), Macy’s and JCPenney (“JCP”). Other major tenants include H&M and Forever 21. A new lease with At Home, a home décor retailer, was recently executed on June 1, 2016 for 86,000 SF of a currently unoccupied anchor space (the “At Home Anchor Space”;
THE INFORMATION IN THIS STRUCTURAL AND COLLATERAL TERM SHEET IS NOT COMPLETE AND MAY BE AMENDED PRIOR TO THE TIME OF SALE. THIS STRUCTURAL AND COLLATERAL TERM SHEET IS NOT AN OFFER TO SELL THESE SECURITIES AND IT IS NOT A SOLICITATION OF AN OFFER TO BUY THESE SECURITIES IN ANY JURISDICTION WHERE THE OFFER OR SALE IS NOT PERMITTED.
| - 97 - |
Mortgage Loan No. 7 — Peachtree Mall
currently not part of collateral) that was purchased from Dillard’s by the sponsor for approximately $2.2 million in conjunction with the origination of the Peachtree Mall Whole Loan. At Home executed a five-year lease with three, five-year renewal options and is expected to take occupancy by March 2017. Additionally, the sponsor is expected to invest approximately $1.0 million into the At Home Anchor Space. The At Home Anchor Space is expected to be contributed as part of the Peachtree Mall Collateral Property by November 23, 2018. According to the sponsor, approximately 10 million customers visit Peachtree Mall each year. The property contains 3,805 parking spaces, resulting in a parking ratio of 4.6 spaces per 1,000 SF of rentable area. As of June 2016, tenants occupying 10,000 SF or less had average trailing 12-month in-line sales of $398 per square foot with an average occupancy cost of 14.3%. As of June 30, 2016, the Peachtree Mall Collateral Property was 90.1% occupied (excluding temporary tenants) by 81 tenants.
Historical and Current Occupancy(1)
| 2012(2) | 2013(2) | 2014(2) | 2015(2) | Current(3) |
| 90.1% | 85.1% | 88.3% | 89.9% | 90.1% |
| (1) | Includes collateral tenants only and excludes temporary tenants. Occupancy statistics shown exclude the At Home Anchor Space. |
| (2) | Source: Historical Occupancies were provided by the sponsor. Historical Occupancies as are of December 31 of each respective year. |
| (3) | Based on the June 2016 underwritten rent roll. Excludes 26,848 SF (5.0% of net rentable area) attributed to temporary tenants that were not included in the underwritten Base Rent. |
Historical Sales and Occupancy Costs(1)
| 2014 | 2015 | TTM(2) | ||||
| Sales PSF | Occupancy Costs % | Sales PSF | Occupancy Costs % | Sales PSF | Occupancy Costs % | |
| Anchors(3) | $145 | 2.5% | $145 | 2.5% | $140 | 2.6% |
| In-line(4)(5) | $351 | 14.8% | $409 | 13.8% | $398 | 14.3% |
| (1) | Represents comparable tenant sales and occupancy costs as provided by the sponsors. |
| (2) | TTM Sales PSF and Occupancy Costs % represent the trailing twelve months ending June 30, 2016 as provided by the sponsors. |
| (3) | Anchors include Macy’s and JCPenney. |
| (4) | In-line includes comparable tenant sales for all tenants with <10,000 SF of space. This excludes outparcel tenants. |
| (5) | The following tenants either relocated or expanded during the respective time period – 2014: GNC; 2015: Kids Foot Locker, Foot Locker and New York & Company; and TTM: Know Style. The Sales PSF excluding these tenants in 2014, 2015 and TTM are $352 PSF, $402 PSF and $401 PSF, respectively. The Occupancy Costs % excluding these tenants in 2014, 2015 and TTM are 14.8%, 13.9% and $14.2%, respectively. |
The Market. Peachtree Mall is located along the northern side of Manchester Expressway just west of I-185 in Columbus, Georgia. The Columbus central business district is located approximately 3.5 miles southwest of the property. Peachtree Mall is located across the street from Columbus State University with a student population of over 8,200 and within twelve miles of Fort Benning, one of the world’s largest military training bases. Fort Benning employs more than 40,000 military personnel, contractors, trainees, and civilians. According to the appraiser, Peachtree Mall has a primary trade area that encompasses a 10-mile radius that includes approximately 276,601 people, with an average household income of $57,168 as of 2015. The secondary trade area, defined as being within a 25-mile radius of the property, contains approximately 374,407 people, with an average household income of $58,038 as of 2015. According to the appraiser, the Columbus retail market reported an overall vacancy rate of 4.2% as of the second quarter of 2016. According to the appraisal, the property’s current primary and secondary competition consists of six properties detailed in the table below.
THE INFORMATION IN THIS STRUCTURAL AND COLLATERAL TERM SHEET IS NOT COMPLETE AND MAY BE AMENDED PRIOR TO THE TIME OF SALE. THIS STRUCTURAL AND COLLATERAL TERM SHEET IS NOT AN OFFER TO SELL THESE SECURITIES AND IT IS NOT A SOLICITATION OF AN OFFER TO BUY THESE SECURITIES IN ANY JURISDICTION WHERE THE OFFER OR SALE IS NOT PERMITTED.
| - 98 - |
Mortgage Loan No. 7 — Peachtree Mall
Competitive Set Summary(1)
| Property | Year Built / Renovated | Total GLA (SF) | Est. Occ. | Proximity (miles) | Anchor Tenants |
| Peachtree Mall | 1975 / 1994 | 536,202(2) | 90%(2) | -- | Macy’s, JCPenney, Dillard’s |
| Columbus Park Crossing | 2002/2006 | 909,133 | 99% | 2.5 | Sears, Kohl’s, Toys R Us, Dick’s, Haverty’s, Ross, Marshalls, TJ Maxx, Bed Bath & Beyond, Carmike Cinemas, JoAnn, Barnes & Noble, Old Navy, PetCo, Staples |
| Tiger Town | 2004 / NAP | 901,880 | 100% | 28.0 | Target, Home Depot, Kroger, Kohl’s, Hobby Lobby, Dick’s, Ross, TJ Maxx, Bed Bath & Beyond, Best Buy, World Market, Office Depot, PetCo, Books-A-Million, Old Navy |
| Auburn Mall | 1973 / 2005 | 447,796 | 88% | 30.0 | Dillard’s, Belk, JC Penney |
| LaGrange Mall | 1979/ 2001 | 240,107 | 70% | 34.0 | Belk, TJ Maxx, Sock Shoppe |
| The Shoppes at EastChase | 2002 /NAP | 431,428 | 91% | 72.0 | Dillard’s, Earth Fare |
| Eastdale Mall | 1977/2005 | 757,411 | 77% | 74.0 | Dillard’s, JC Penney, Belk Women’s / Belk Men / Children, Sears |
| (1) | Source: Appraisal. |
| (2) | Source: Underwritten rent roll. |
Tenant Summary(1)
| Tenant | Ratings Moody’s/S&P/ Fitch(2) | Net Rentable Area (SF) | % of Total NRA | Base Rent PSF | Sales PSF(3) | Occupancy Costs(3) | Lease Expiration Date |
| Non-Collateral- Anchor Tenants | |||||||
| Dillard’s | Baa3/BBB-/BBB- | 201,076 | NAP | NAP | NAP | NAP | NAP |
| Collateral Anchor Tenants | |||||||
| Macy’s | Baa2/BBB/BBB | 139,219 | 26.0% | $2.66 | $135 | 2.2% | 9/1/2022(4) |
| JCPenney | B1/B/B+ | 82,320 | 15.4% | $4.25 | $149 | 3.3% | 11/30/2019(5) |
| Major In-Line Tenants | |||||||
| Peachtree 8 | B2/B+/NR | 25,439 | 4.7% | $1.97 | $131,774(6) | 8.0% | 12/31/2018 |
| H&M | NR/NR/NR | 21,210 | 4.0% | $16.83 | NAP | NAP | 1/31/2026(7) |
| Encore | NR/NR/NR | 13,159 | 2.5% | $14.20 | NAP | NAP | 7/31/2025(8) |
| Forever 21 | NR/NR/NR | 10,979 | 2.0% | $27.82 | $216 | 15.0% | 5/31/2025(9) |
| (1) | Based on the underwritten rent roll including rent increases occurring though July 1, 2017. |
| (2) | Ratings provided are for the parent company of the entity listed in the “Tenant” field whether or not the parent company guarantees the lease. |
| (3) | Sales PSF and Occupancy Costs represent comparable tenant sales (tenants with 12 months reported sales) and occupancy costs for the twelve-month period ending on June 30, 2016 as provided by the sponsors. |
| (4) | Macy’s has six five-year renewal options. |
| (5) | JCPenney has three five-year renewal options. |
| (6) | Represents sales per screen. Peachtree 8 has eight screens. |
| (7) | H&M has two five-year renewal options. H&M has the right to terminate its lease if its 2019 sales do not exceed $2,800,000. To exercise such termination option, H&M must provide 365 days’ written notice by June 30, 2020 and pay a termination fee equal to 50% of all unamortized tenant improvements and leasing commissions. As of June 30, 2016, H&M sales were $2,872,954. H&M opened at the Peachtree Mall property in July 2015. |
| (8) | Encore has the right to terminate its lease if its sales for the period from July 31, 2019 through June 30, 2020 do not exceed $1,500,000. To exercise such termination option, Encore must provide 90 days’ written notice within 60 days after June 30, 2020 and pay a termination fee equal to 50% of all unamortized tenant improvements and leasing commissions. As of June 30, 2016, Encore sales were $1,390,504 at its current space, which they expanded into in October 2015. |
| (9) | Forever 21 has the right to terminate its lease if its sales for the period from June 1, 2018 through May 31, 2019 do not exceed $2,500,000. To exercise such termination option, Forever 21 must provide 180 days’ written notice within 60 days after May 31, 2019, and pay a termination fee equal to 55% of all unamortized tenant improvements and leasing commissions. As of June 30, 2016, Forever 21 sales were $2,370,120. Forever 21 opened at the Peachtree Mall property in May 2015. |
THE INFORMATION IN THIS STRUCTURAL AND COLLATERAL TERM SHEET IS NOT COMPLETE AND MAY BE AMENDED PRIOR TO THE TIME OF SALE. THIS STRUCTURAL AND COLLATERAL TERM SHEET IS NOT AN OFFER TO SELL THESE SECURITIES AND IT IS NOT A SOLICITATION OF AN OFFER TO BUY THESE SECURITIES IN ANY JURISDICTION WHERE THE OFFER OR SALE IS NOT PERMITTED.
| - 99 - |
Mortgage Loan No. 7 — Peachtree Mall
Lease Rollover Schedule(1)
| Year | Number of Leases Expiring | NRA Expiring | % of NRA Expiring | Base Rent Expiring | % of Base Rent Expiring | Cumulative NRA Expiring | Cumulative % of NRA Expiring | Cumulative Base Rent Expiring | Cumulative % of Base Rent Expiring |
| Vacant(2) | NAP | 53,145 | 9.9% | NAP | NAP | 53,145 | 9.9% | NAP | NAP |
| MTM | 1 | 150 | 0.0 | $52,406 | 0.6% | 53,295 | 9.9% | $52,406 | 0.6% |
| 2016 | 1 | 994 | 0.2 | 27,213 | 0.3 | 54,289 | 10.1% | $79,619 | 0.9% |
| 2017 | 13 | 29,688 | 5.5 | 758,900 | 8.4 | 83,977 | 15.7% | $838,519 | 9.3% |
| 2018 | 18 | 64,456 | 12.0 | 1,576,030 | 17.5 | 148,433 | 27.7% | $2,414,548 | 26.8% |
| 2019 | 14 | 121,205 | 22.6 | 1,346,227 | 15.0 | 269,638 | 50.3% | $3,760,775 | 41.8% |
| 2020 | 6 | 19,390 | 3.6 | 581,850 | 6.5 | 289,028 | 53.9% | $4,342,625 | 48.3% |
| 2021 | 6 | 19,128 | 3.6 | 715,715 | 8.0 | 308,156 | 57.5% | $5,058,340 | 56.2% |
| 2022 | 2 | 140,979 | 26.3 | 699,126 | 7.8 | 449,135 | 83.8% | $5,757,466 | 64.0% |
| 2023 | 7 | 11,783 | 2.2 | 764,747 | 8.5 | 460,918 | 86.0% | $6,522,213 | 72.5% |
| 2024 | 1 | 1,516 | 0.3 | 39,758 | 0.4 | 462,434 | 86.2% | $6,561,971 | 72.9% |
| 2025 | 8 | 43,623 | 8.1 | 1,491,239 | 16.6 | 506,057 | 94.4% | $8,053,210 | 89.5% |
| 2026 & Beyond | 4 | 30,145 | 5.6 | 942,295 | 10.5 | 536,202 | 100.0% | $8,995,505 | 100.0% |
| Total | 81 | 536,202(2) | 100.0% | $8,995,505 | 100.0% |
| (1) | Based on the underwritten rent roll. Rent includes base rent and rent increases occurring through July 2017. |
| (2) | Includes 26,848 SF (5.0% of net rentable area) attributed to temporary tenants that were not included in underwritten Base Rent. |
Operating History and Underwritten Net Cash Flow
| 2013 | 2014 | 2015 | TTM(1) | Underwritten(2) | PSF | %(3) | ||||||||
| Rents in Place(2) | $8,037,244 | $8,183,664 | $8,106,017 | $8,559,609 | $8,995,505 | $16.78 | 65.9 | % | ||||||
| Vacant Income | 0 | 0 | 0 | 0 | 1,142,949 | 2.13 | 8.4 | |||||||
| Percentage Rent | 205,469 | 168,227 | 281,693 | 306,143 | 338,546 | 0.63 | 2.5 | |||||||
| Gross Potential Rent | $8,242,713 | $8,351,892 | $8,387,710 | $8,865,751 | $10,477,000 | $19.54 | 76.7 | % | ||||||
| Total Reimbursements | 3,641,827 | 3,815,809 | 3,409,397 | 3,457,557 | 3,175,236 | 5.92 | 23.3 | |||||||
| Net Rental Income | $11,884,540 | $12,167,701 | $11,797,107 | $12,323,309 | $13,652,236 | $25.46 | 100.0 | % | ||||||
| (Vacancy/Collection Loss)(4) | (117,546 | ) | 62,563 | (4,851 | ) | 80,621 | (1,142,949 | ) | (2.13 | ) | (8.4 | ) | ||
| Other Income | 1,464,595 | 1,576,856 | 1,369,127 | 1,366,879 | 1,382,873 | 2.58 | 10.1 | |||||||
| Effective Gross Income | $13,231,589 | $13,807,120 | $13,161,383 | $13,770,809 | $13,892,159 | 25.91 | 101.8 | % | ||||||
| Total Expenses | $3,960,533 | $4,019,990 | $3,853,477 | $3,875,594 | $3,861,607 | 7.20 | 27.8 | % | ||||||
| Net Operating Income | $9,271,056 | $9,787,129 | $9,307,906 | $9,895,215 | $10,030,552 | $18.71 | 72.2 | % | ||||||
| Total TI/LC, Capex/RR | 0 | 0 | 0 | 0 | 784,302 | 1.47 | 5.6 | |||||||
| Net Cash Flow | $9,271,056 | $9,787,129 | $9,307,906 | $9,895,215 | �� | $9,246,250 | $17.24 | 66.6 | % | |||||
| (1) | TTM is as of the trailing twelve-month period ending on June 30, 2016. |
| (2) | Underwritten Rents in Place includes Base Rent and Rent Increases occurring through July 2017 totaling $107,298 and forward starting rent totaling $314,634 associated with an existing tenant that is relocating and expanding in February 2017. |
| (3) | % column represents percent of Net Rental Income for all revenue lines and represents percent of Effective Gross Income for the remainder of fields. |
| (4) | The underwritten economic vacancy is 8.4%. The Peachtree Mall Collateral Property was 90.1% physically occupied (excluding temporary tenants) as of June 30, 2016. |
Property Management. The property is self-managed by the borrower.
Escrows and Reserves.
Tax & Insurance Escrows - Following the occurrence of a Cash Management Period (defined below), the borrower is required to deposit 1/12 of the annual estimated tax payments and 1/12 of the annual insurance premiums, provided that the foregoing insurance impounds will be waived for so long as acceptable blanket insurance coverage is in place.
Replacement Reserves - Following the occurrence and continuance of a Cash Management Period, the borrower is required to deposit $6,522 per month (subject to a cap of $78,266).
THE INFORMATION IN THIS STRUCTURAL AND COLLATERAL TERM SHEET IS NOT COMPLETE AND MAY BE AMENDED PRIOR TO THE TIME OF SALE. THIS STRUCTURAL AND COLLATERAL TERM SHEET IS NOT AN OFFER TO SELL THESE SECURITIES AND IT IS NOT A SOLICITATION OF AN OFFER TO BUY THESE SECURITIES IN ANY JURISDICTION WHERE THE OFFER OR SALE IS NOT PERMITTED.
| - 100 - |
Mortgage Loan No. 7 — Peachtree Mall
TI/LC Reserves - Following the occurrence and continuance of a Cash Management Period, the borrower is required to deposit $26,089 per month (subject to a cap of $313,065). In lieu of an escrow for upfront tenant improvements and leasing commissions costs, the guarantor provided a guaranty in the amount of $242,609.
A “Cash Management Period” will commence upon the occurrence of: (i) an event of default; or (ii) the debt service coverage ratio being less than 1.25x at the end of any calendar quarter; or (iii) a JCP Sweep Period (as defined below). A Cash Management Period will end, (A) upon the Peachtree Mall Whole Loan being defeased or repaid in full or (B) with regard to clause (i), when such event of default has been cured or expressly waived by the lender in writing and no other event of default has occurred and is continuing; with regard to clause (ii), upon the debt service coverage ratio being at least 1.25x for two consecutive calendar quarters; and with regard to clause (iii), the cure of a JCP Sweep Period.
A “JCP Sweep Period” will commence on the first payment date following the occurrence of any of the following: (i) 12 months prior to the end of the term (inclusive of renewal terms) of JCP’s lease; (ii) the date that JCP’s lease (or any material portion greater than 50% of the JCP lease space) is surrendered, cancelled or terminated prior to its then current expiration date; (iii) JCP goes dark; (iv) a default under the JCP lease; or (v) a JCP insolvency proceeding.
A JCP Sweep Period will end upon the occurrence of the earlier of: (a) with respect to clauses (i), (ii) and (iii), at least 75.0% of the JCP lease space is leased pursuant to one or more qualified leases and the replacement tenant(s) are in occupancy and are paying full unabated rent, (b) with respect to clause (i) JCP exercises its renewal or extension option on a lease acceptable to the lender, (c) with respect to clause (ii) such termination option is canceled or surrendered, (d) with respect to clause (iii) on the date that JCP recommences operation of at least 50% of its lease space, or gives written notice cancelling its prior notice that it intends to go dark, (e) with respect to clause (iv) (x) such default has been cured and no other default under the JCP lease occurs for a period of four consecutive months following such cure or (y) if such default is not cured and the JCP lease is terminated, 75% of the space leased under the JCP lease is leased pursuant to one or more qualified leases pursuant to the terms of the loan documents, (f) with respect to clause (v), such insolvency proceeding has been terminated and the lease has been affirmed, assumed or assigned in a manner satisfactory to lender, (g) with respect to clauses (i), (ii), (iii), (iv) and (v), an amount equal to the JCP Sweep Deposit Amount (as defined below) has been accumulated in the lease sweep account, (h) with respect to clauses (i), (ii), (iii), (iv) and (v), when the debt service coverage ratio equals or exceeds 2.50x, as determined excluding the JCP lease and after giving effect to all rent reductions and/or terminations (if any) to which any tenant at the Peachtree Mall property is entitled as a result of the failure by JCP to operate at the Peachtree Mall property (unless any such tenants have waived their right to terminate or take a rent reduction in writing).
A “JCP Sweep Deposit Amount” means (x) an amount equal to $2,000,000, or (y) so long as 75% of the At Home Anchor space is leased to third parties unaffiliated with the borrower or the debt service coverage ratio equals or exceeds 1.86x, as determined excluding the JCP lease and after giving effect to all rent reductions and/or terminations (if any) to which any tenant at the Peachtree Mall property is entitled as a result of the failure by JCP to operate at the Peachtree Mall property (unless any such tenants have waived their right to terminate or take a rent reduction in writing), an amount equal to $1,000,000.
Lockbox / Cash Management.The loan is structured with a hard lockbox and springing cash management. The borrower is required to direct tenants to deposit all rents directly into the lender-controlled lockbox account. The borrower is required to deposit all rents received into such lockbox account within two business days of receipt. Prior to the occurrence of a Cash Management Period, all funds on deposit in the lockbox account will be released to the borrower on a daily basis. Upon the occurrence and continuance of a Cash Management Period, funds on deposit in the lockbox account will be swept on a daily basis into a lender controlled cash management account. On each payment date after a Cash Management Period, the lender is required to apply the funds on deposit in accordance with the waterfall provisions of the loan documents and any excess funds are required to be transferred to the borrower’s operating account, provided, that, upon an event of default, but prior to the acceleration of the loan or the stated maturity date, any excess funds are required to be retained by lender as cash collateral for the Peachtree Mall Whole Loan.
Free Release. The borrower may obtain the release of one or more vacant, non-income producing parcels or outlots and/or one or more parcels that adjoin the Peachtree Mall property acquired by the borrower subject to the satisfaction of certain conditions
THE INFORMATION IN THIS STRUCTURAL AND COLLATERAL TERM SHEET IS NOT COMPLETE AND MAY BE AMENDED PRIOR TO THE TIME OF SALE. THIS STRUCTURAL AND COLLATERAL TERM SHEET IS NOT AN OFFER TO SELL THESE SECURITIES AND IT IS NOT A SOLICITATION OF AN OFFER TO BUY THESE SECURITIES IN ANY JURISDICTION WHERE THE OFFER OR SALE IS NOT PERMITTED.
| - 101 - |
Mortgage Loan No. 7 — Peachtree Mall
as set forth in the loan documents, including among others, (i) no event of default under the Peachtree Mall Whole Loan is then continuing; (ii) the parcel subject to the release is not necessary for the remaining Peachtree Mall Collateral Property to comply with zoning or legal requirements; (iii) after giving effect to such release, the loan-to-value ratio of the remaining Peachtree Mall Collateral Property is equal to or less than 125%; and (iv) delivery of a rating agency confirmation.
Substitution.The borrower is permitted to substitute one or more other parcels for release parcels subject to the satisfaction of certain conditions as set forth in the loan documents, including among others, (i) no event of default under the Peachtree Mall Whole Loan is then continuing; (ii) the exchanged parcel is vacant, non-income producing and unimproved and is reasonably equivalent in use, value and condition to such release parcel; (iii) after giving effect to such substitution, the loan-to-value ratio of the remaining Peachtree Mall Collateral Property is equal to or less than 125%; and (iv) delivery of other documents as the lender may reasonably require in connection with such exchange. In addition, the borrower may at any time and at its sole expense, acquire certain additional parcels, subject to the satisfaction of certain conditions as set forth in the loan documents, including among others, (i) no event of default under the Peachtree Mall Whole Loan is then continuing; (ii) delivery of an environmental report; (iii) if the expansion parcels are improved upon, delivery of an engineering report; and (iv) delivery of other documents as the lender may reasonably require in connection with such acquisition.
Additional Debt. Future mezzanine debt is permitted subject to the satisfaction of certain conditions, including: (i) a combined loan-to-value ratio not greater than 63.8%; (ii) a combined debt service coverage ratio not less than 1.86x; (iii) the execution of an intercreditor agreement acceptable to the lender; and (iv) receipt of a rating agency confirmation from DBRS, Fitch and Moody’s that the mezzanine financing will not result in a downgrade, withdrawal or qualification of the respective ratings assigned to the CSAIL Series 2016-C7 Certificates and similar rating confirmations from each rating agency rating any securities backed by the Note A-1, Note A-2 or Note A-4 with respect to the ratings of such securities.
THE INFORMATION IN THIS STRUCTURAL AND COLLATERAL TERM SHEET IS NOT COMPLETE AND MAY BE AMENDED PRIOR TO THE TIME OF SALE. THIS STRUCTURAL AND COLLATERAL TERM SHEET IS NOT AN OFFER TO SELL THESE SECURITIES AND IT IS NOT A SOLICITATION OF AN OFFER TO BUY THESE SECURITIES IN ANY JURISDICTION WHERE THE OFFER OR SALE IS NOT PERMITTED.
| - 102 - |
(THIS PAGE INTENTIONALLY LEFT BLANK)
| - 103 - |
Mortgage Loan No. 8 — Eastern Shore Plaza

THE INFORMATION IN THIS STRUCTURAL AND COLLATERAL TERM SHEET IS NOT COMPLETE AND MAY BE AMENDED PRIOR TO THE TIME OF SALE. THIS STRUCTURAL AND COLLATERAL TERM SHEET IS NOT AN OFFER TO SELL THESE SECURITIES AND IT IS NOT A SOLICITATION OF AN OFFER TO BUY THESE SECURITIES IN ANY JURISDICTION WHERE THE OFFER OR SALE IS NOT PERMITTED.
| - 104 - |
Mortgage Loan No. 8 — Eastern Shore Plaza

THE INFORMATION IN THIS STRUCTURAL AND COLLATERAL TERM SHEET IS NOT COMPLETE AND MAY BE AMENDED PRIOR TO THE TIME OF SALE. THIS STRUCTURAL AND COLLATERAL TERM SHEET IS NOT AN OFFER TO SELL THESE SECURITIES AND IT IS NOT A SOLICITATION OF AN OFFER TO BUY THESE SECURITIES IN ANY JURISDICTION WHERE THE OFFER OR SALE IS NOT PERMITTED.
| - 105 - |
Mortgage Loan No. 8 — Eastern Shore Plaza

THE INFORMATION IN THIS STRUCTURAL AND COLLATERAL TERM SHEET IS NOT COMPLETE AND MAY BE AMENDED PRIOR TO THE TIME OF SALE. THIS STRUCTURAL AND COLLATERAL TERM SHEET IS NOT AN OFFER TO SELL THESE SECURITIES AND IT IS NOT A SOLICITATION OF AN OFFER TO BUY THESE SECURITIES IN ANY JURISDICTION WHERE THE OFFER OR SALE IS NOT PERMITTED.
| - 106 - |
Mortgage Loan No. 8 — Eastern Shore Plaza
| Mortgage Loan Information | Property Information | |||
| Mortgage Loan Seller: | BSP | Single Asset / Portfolio: | Single Asset | |
| Original Principal Balance: | $24,000,000 | Title: | Fee | |
| Cut-off Date Principal Balance: | $24,000,000 | Property Type - Subtype: | Retail – Anchored | |
| % of Pool by IPB: | 3.1% | Net Rentable Area (SF): | 270,105 | |
| Loan Purpose: | Acquisition | Location: | Spanish Fort, AL | |
| Borrower: | Eastern Shore Plaza, LLC | Year Built / Renovated: | 2004 / N/A | |
| Sponsor: | Hardam S. Azad | Occupancy: | 95.5% | |
| Interest Rate: | 4.7800% | Occupancy Date: | 8/16/2016 | |
| Note Date: | 10/14/2016 | Number of Tenants: | 21 | |
| Maturity Date: | 11/6/2026 | 2013 NOI: | $2,646,425 | |
| Interest-only Period: | 24 months | 2014 NOI: | $2,582,330 | |
| Original Term: | 120 months | 2015 NOI: | $2,515,763 | |
| Original Amortization: | 360 months | TTM NOI(1): | $2,504,217 | |
| Amortization Type: | IO-Balloon | UW Economic Occupancy: | 95.0% | |
| Call Protection: | L(24),Def(92),O(4) | UW Revenues: | $3,141,837 | |
| Lockbox(2): | Hard | UW Expenses: | $662,051 | |
| Additional Debt: | No | UW NOI: | $2,479,786 | |
| Additional Debt Balance: | N/A | UW NCF: | $2,304,270 | |
| Additional Debt Type: | N/A | Appraised Value / Per SF: | $35,000,000 / $130 | |
| Additional Future Debt Permitted: | No | Appraisal Date: | 8/4/2016 |
| Escrows and Reserves(3) | Financial Information | |||||
| Initial | Monthly | Initial Cap | Cut-off Date Loan / SF: | $89 | ||
| Taxes: | $0 | $16,617 | N/A | Maturity Date Loan / SF: | $76 | |
| Insurance: | $14,307 | $7,153 | N/A | Cut-off Date LTV: | 68.6% | |
| Replacement Reserves: | $0 | $3,376 | $121,547 | Maturity Date LTV: | 59.0% | |
| TI/LC: | $0 | $11,250 | $400,000 | UW NCF DSCR: | 1.53x | |
| Outstanding Tenant Improvements: | $230,000 | $0 | N/A | UW NOI Debt Yield: | 10.3% | |
| Rent Abatement Reserve: | $53,000 | N/A | N/A | |||
| Sweep Lease Reserve: | $0 | Springing | N/A |
Sources and Uses
| Sources | Proceeds | % of Total | Uses | Proceeds | % of Total | |
| Mortgage Loan | $24,000,000 | 72.3% | Purchase Price | $32,300,000 | 97.2% | |
| Sponsor Equity | 9,217,484 | 27.7 | Closing Costs | 620,177 | 1.9 | |
| Upfront Reserves | 297,307 | 0.9 | ||||
| Total Sources | $33,217,484 | 100.0% | Total Uses | $33,217,484 | 100.0% |
| (1) | Represents trailing twelve months ending June 30, 2016. |
| (2) | For a more detailed description of lockbox, please refer to“Lockbox / Cash Management”below. |
| (3) | For a more detailed description of Escrows and Reserves, please refer to “Escrows and Reserves” below. |
THE INFORMATION IN THIS STRUCTURAL AND COLLATERAL TERM SHEET IS NOT COMPLETE AND MAY BE AMENDED PRIOR TO THE TIME OF SALE. THIS STRUCTURAL AND COLLATERAL TERM SHEET IS NOT AN OFFER TO SELL THESE SECURITIES AND IT IS NOT A SOLICITATION OF AN OFFER TO BUY THESE SECURITIES IN ANY JURISDICTION WHERE THE OFFER OR SALE IS NOT PERMITTED.
| - 107 - |
Mortgage Loan No. 8 — Eastern Shore Plaza
The Loan. The Eastern Shore Plaza loan is a $24.0 million first mortgage loan secured by the fee interest in a 270,105 SF anchored retail center located in Spanish Fort, Alabama. The loan has a 10-year term and will amortize on a 30-year schedule after an initial 24-month interest-only period.
The Borrower. The borrowing entity for the loan is Eastern Shore Plaza, LLC, a Delaware limited liability company and special purpose entity.
The Sponsor. The loan’s sponsor and nonrecourse carve-out guarantor is Hardam S. Azad. The borrowing entity is owned by Hardam S. Azad, The Azad Family Trust and other limited partners. Hardam S. Azad is a Houston-based real estate professional who has owned and managed investment real estate for over three decades. His current portfolio includes 15 properties with over 1.2 million SF of retail space in Texas, Louisiana, Oklahoma, Alabama, and Tennessee. He founded and runs AZAD R.E. Investments Group, which exclusively invests in and manages shopping centers. The sponsor has been employed full time in his property acquisition, management, and disposition businesses since late 1995. The sponsor has borrowed over $20 million in loans that were included in CMBS 2.0 securitizations and each such loan has performed as expected with no delinquencies.
The Property.The Eastern Shore Plaza property is a 270,105 SF anchored retail center built in 2004 and located in Spanish Fort, Alabama. The approximately 36.8-acre site is improved by three buildings divided into 25 units and 95.5% leased to 21 tenants. Building one (245,355 SF) contains 18 tenant spaces including Ashley Furniture, Best Buy, Ross Dress for Less, Michael’s and PetSmart and smaller in-line tenants. Building two (12,750 SF) is located on the northeast side of the property and is fully occupied by Party City. Building three (12,000 SF) is a dual-tenant building currently leased to Shades Sunglasses & Apparel and Sleep Center. Approximately 86.0% of the total space is leased to national tenants. Approximately 83.2% of the space is leased to tenants who have been at the property for 10 years or more (including all six of the anchor / junior anchors), all of which have renewed their original leases. Since 2015, 14 tenants comprising 70.0% of the space have renewed their leases, and three new leases were signed for an additional 5.2% of the space. The property has averaged approximately 95.0% occupancy since 2006.
The property has 1,528 parking spaces amounting to a parking ratio of approximately 5.66 per 1,000 SF of net rentable area. The parking areas are along the front of the buildings and provide parking to the storefronts. The property is situated on Eastern Shore Boulevard, has visibility and benefits from traffic counts of approximately 64,700 vehicles per day due to surrounding attractions and easy access from main roads. The property’s pylon sign with a reader board is visible from Interstate 10. Eastern Shore Parkway intersects with Route 181 one-quarter mile west of the property. The property’s location and visible signage draw in shoppers from the entire Mobile metropolitan statistical area.
The property is part of a retail development area considered the commercial hub of Baldwin County. The retail development area is located at the intersection of Interstate 10 and Route 181, consists of approximately 1.0 million SF, and includes the Eastern Shore Plaza property, Eastern Shore Center (a 540,000 SF lifestyle center), Eastern Shore Crossing, a Publix-anchored shopping center and Lowe’s Home Improvement, all within a half mile of Eastern Shore Plaza.
The Market. The property is located in Baldwin County, Alabama, approximately 10 miles east of Mobile, Alabama, and 45 miles west of Pensacola, Florida. Baldwin County ranked as the 8th fastest growing area of the United States in 2014. The county was also the fastest growing county in Alabama in 2015.
The population within a 5-mile radius of the property has witnessed significant population and income growth over the last five years. From 2010-2015, the population increased nearly 16% and average household income, which is approximately $87,000, has increased 3%. The positive population and income trends are projected to continue through 2020, with population and average household income increasing by 11% and 16%, respectively. There has been recent development within the immediate area of the property. Less than a mile south of the property next to Sam’s Club, Thomas Hospital is moving forward with plans to build a $22 million, 24-hour full service emergency room with overnight hospital rooms. This type of emergency room will be only one of three in the state. DR Horton recently built three single-family home communities within a mile of the property. Route 181, which is a commercial thoroughfare featuring restaurants, limited service hotels, and small offices, is continuing to attract
THE INFORMATION IN THIS STRUCTURAL AND COLLATERAL TERM SHEET IS NOT COMPLETE AND MAY BE AMENDED PRIOR TO THE TIME OF SALE. THIS STRUCTURAL AND COLLATERAL TERM SHEET IS NOT AN OFFER TO SELL THESE SECURITIES AND IT IS NOT A SOLICITATION OF AN OFFER TO BUY THESE SECURITIES IN ANY JURISDICTION WHERE THE OFFER OR SALE IS NOT PERMITTED.
| - 108 - |
Mortgage Loan No. 8 — Eastern Shore Plaza
new businesses such as Dunkin Donuts and CVS, who are in process of building new stand-alone stores within a mile of the property along Highway 181.
The property is located in the Baldwin County submarket within the Mobile retail market. As of the second quarter 2016, the Baldwin market had a total inventory of 16,313,700 SF with average asking rents of $13.47 PSF. While the greater Mobile market had a slow first half of 2016, year-to-date absorption in Baldwin County was strong at 113,397 SF. The submarket quickly absorbed the 94,329 SF of new inventory, reflecting the area’s strength and potential for further growth. The submarket reported a second quarter vacancy rate of 3.9% with asking rents quoted at $13.47 PSF. The second quarter of 2016 vacancy rate (3.9%) is consistent with last year (4.0%) and consistent with the average vacancy over the past nine years (4.0%). The historic vacancy trend indicates stable long-term demand for retail space in the Baldwin County market.According to the appraisal, the property’s competitive set consists of the six properties detailed in the table below.
Competitive Set Summary(1)
| Property | Year Built / Renovated | Total GLA (SF) | Est. Occ. | Proximity (miles) | Anchor Tenants |
| Eastern Shore Plaza | 2004 / N/A | 270,105(2) | 95.5%(2) | NAP | Ashley Furniture, Best Buy, Ross Dress for Less, Michael’s, PetSmart, Old Navy, Cost Plus World Market(2) |
| Shoppes of Daphne | 2008 / N/A | 9,343 | 100.0% | 5.0 | Retail strip center – six tenants |
| The Shoppes at Fairhope Village | 2009 / N/A | 62,740 | 95.5% | 8.0 | Publix |
| Magnolia Place Shopping Center | 1986 / N/A | 85,018 | 100.0% | 4.5 | Publix |
| Bay Point Shopping Center | 1995 / N/A | 20,278 | 100.0% | 4.4 | Retail Strip Center |
| Azalia Road Retail | 2008 / N/A | 55,833 | 100.0% | 18.7 | Dollar Tree, Haverty’s, Infirmary Health |
| Azalea Shopping Center | 1964 / N/A | 131,208 | 84.2% | 18.0 | Party City, Dollar Tree |
| (1) | Source: Appraisal. |
| (2) | Based on the August 16, 2016 underwritten rent roll. |
Historical and Current Occupancy(1)
| 2013 | 2014 | 2015 | Current(2) |
| 97.0% | 95.0% | 90.0% | 95.5% |
| (1) | Source: Historical Occupancy is provided by the sponsor. Occupancies are as of December 31 of each respective year. |
| (2) | Based on the August 16, 2016 underwritten rent roll. |
THE INFORMATION IN THIS STRUCTURAL AND COLLATERAL TERM SHEET IS NOT COMPLETE AND MAY BE AMENDED PRIOR TO THE TIME OF SALE. THIS STRUCTURAL AND COLLATERAL TERM SHEET IS NOT AN OFFER TO SELL THESE SECURITIES AND IT IS NOT A SOLICITATION OF AN OFFER TO BUY THESE SECURITIES IN ANY JURISDICTION WHERE THE OFFER OR SALE IS NOT PERMITTED.
| - 109 - |
Mortgage Loan No. 8 — Eastern Shore Plaza
Tenant Summary(1)
| Tenant | Ratings Moody’s/S&P/Fitch(2) | Net Rentable Area (SF) | % of Total NRA | Base Rent PSF | Sales PSF(3) | Occupancy Costs(3) | Lease Expiration Date |
| Ashley Furniture | NR / NR / NR | 45,000 | 16.7% | $5.35 | $108.96 | 7.0% | 12/31/2021 |
| Best Buy | Baa1/BBB-/BBB- | 30,981 | 11.5% | $12.00 | N/A | N/A | 3/31/2021 |
| Ross Dress for Less | A3/A-/NR | 30,187 | 11.2% | $10.25 | N/A | N/A | 1/31/2021 |
| Michael’s | Ba2/B+/NR | 21,360 | 7.9% | $10.75 | N/A | N/A | 8/31/2020 |
| PetSmart | B3/B+/NR | 20,087 | 7.4% | $12.75 | N/A | N/A | 9/30/2025 |
| Old Navy | Baa2/BB+/BB+ | 18,982 | 7.0% | $8.37 | $176.57 | 5.8% | 7/31/2020 |
| Cost Plus World Market | NR / NR / NR | 18,230 | 6.7% | $7.00 | N/A | N/A | 1/31/2027 |
| Party City | NR / NR / NR | 12,750 | 4.7% | $12.25 | $98.45 | 14.8% | 12/31/2018 |
| Dollar Tree | Ba2/BB+/NR | 10,000 | 3.7% | $10.00 | $125.25 | 9.5% | 7/31/2020 |
| Tuesday Morning | NR / NR / NR | 9,660 | 3.6% | $9.50 | $115.02 | 9.7% | 1/31/2024 |
| (1) | Based on the August 16, 2016 underwritten rent roll, including rent steps occurring through the next twelve months. |
| (2) | Ratings provided are for the parent company of the entity listed in the “Tenant” field whether or not the parent company guarantees the lease. |
| (3) | Sales PSF and Occupancy Costs represent comparable tenant sales (tenants with 12 months reported sales) and occupancy costs for the most recent twelve-month period available as provided by the sponsors. |
Lease Rollover Schedule(1)
| Year | Number of Leases Expiring | NRA Expiring | % of NRA Expiring | Base Rent Expiring | % of Base Rent Expiring | Cumulative NRA Expiring | Cumulative % of NRA Expiring | Cumulative Base Rent Expiring | Cumulative % of Base Rent Expiring |
| Vacant | NAP | 12,168 | 4.5% | NAP | NAP | 12,168 | 4.5% | NAP | NAP |
| MTM | 0 | 0 | 0.0 | $0 | 0.0% | 12,168 | 4.5% | $0 | 0.0% |
| 2016 | 0 | 0 | 0.0 | 0 | 0.0 | 12,168 | 4.5% | $0 | 0.0% |
| 2017 | 2 | 9,100 | 3.4 | 25,600 | 1.0 | 21,268 | 7.9% | $25,600 | 1.0% |
| 2018 | 4 | 20,950 | 7.8 | 241,788 | 9.3 | 42,218 | 15.6% | $267,388 | 10.3% |
| 2019 | 2 | 4,800 | 1.8 | 88,000 | 3.4 | 47,018 | 17.4% | $355,388 | 13.7% |
| 2020 | 4 | 54,842 | 20.3 | 611,976 | 23.5 | 101,860 | 37.7% | $967,364 | 37.2% |
| 2021 | 5 | 114,268 | 42.3 | 1,057,053 | 40.6 | 216,128 | 80.0% | $2,024,417 | 77.8% |
| 2022 | 1 | 6,000 | 2.2 | 102,000 | 3.9 | 222,128 | 82.2% | $2,126,417 | 81.7% |
| 2023 | 0 | 0 | 0.0 | 0 | 0.0 | 222,128 | 82.2% | $2,126,417 | 81.7% |
| 2024 | 1 | 9,660 | 3.6 | 91,770 | 3.5 | 231,788 | 85.8% | $2,218,187 | 85.3% |
| 2025 | 1 | 20,087 | 7.4 | 256,109 | 9.8 | 251,875 | 93.3% | $2,474,296 | 95.1% |
| 2026 & Beyond | 1 | 18,230 | 6.7 | 127,610 | 4.9 | 270,105 | 100.0% | $2,601,906 | 100.0% |
| Total | 21 | 270,105 | 100.0% | $2,601,906 | 100.0% |
| (1) | Based on the August 16, 2016 underwritten rent roll. Rent includes base rent and rent steps occurring over the next twelve months. |
THE INFORMATION IN THIS STRUCTURAL AND COLLATERAL TERM SHEET IS NOT COMPLETE AND MAY BE AMENDED PRIOR TO THE TIME OF SALE. THIS STRUCTURAL AND COLLATERAL TERM SHEET IS NOT AN OFFER TO SELL THESE SECURITIES AND IT IS NOT A SOLICITATION OF AN OFFER TO BUY THESE SECURITIES IN ANY JURISDICTION WHERE THE OFFER OR SALE IS NOT PERMITTED.
| - 110 - |
Mortgage Loan No. 8 — Eastern Shore Plaza
Operating History and Underwritten Net Cash Flow
| 2013 | 2014 | 2015 | TTM(1) | Underwritten(2) | PSF | %(3) | |
| Rents in Place | $2,802,976 | $2,815,978 | $2,771,737 | $2,712,459 | $2,601,906 | $9.63 | 78.7% |
| Vacant Income | 0 | 0 | 0 | 0 | 130,680 | 0.48 | 4.0 |
| Percentage Rent(4) | 4,821 | 0 | 0 | 16,681 | 18,140 | 0.07 | 0.5 |
| Gross Potential Rent | $2,807,798 | $2,815,978 | $2,771,737 | $2,729,140 | $2,750,726 | $10.18 | 83.2% |
| Total Reimbursements | 512,807 | 474,710 | 498,265 | 473,826 | 556,471 | 2.06 | 16.8 |
| Net Rental Income | $3,320,605 | $3,290,688 | $3,270,002 | $3,202,966 | $3,307,197 | $12.24 | 100.0% |
| (Vacancy/Collection Loss) | 0 | 0 | 0 | 0 | (165,360) | (0.61) | (5.0) |
| Other Income | 3,207 | 3,338 | 1,702 | 138 | 0 | 0.00 | 0.0 |
| Effective Gross Income | $3,323,812 | $3,294,026 | $3,271,704 | $3,203,104 | $3,141,837 | $11.63 | 95.0% |
| Total Expenses | $677,387 | $711,696 | $755,941 | $698,887 | $662,051 | $2.45 | 21.1% |
| Net Operating Income | $2,646,424 | $2,582,330 | $2,515,763 | $2,504,217 | $2,479,786 | $9.18 | 78.9% |
| Total TI/LC, Capex/RR | 40,516 | 40,516 | 40,516 | 40,516 | 175,516 | 0.65 | 5.6 |
| Net Cash Flow | $2,605,909 | $2,541,815 | $2,475,248 | $2,463,701 | $2,304,270 | $8.53 | 73.3% |
| (1) | TTM Column represents the trailing twelve month period ending June 30, 2016. |
| (2) | Underwritten Rents In Place includes base rent, rent steps occurring over the next twelve months and a $0.48 PSF free rent adjustment. |
| (3) | % column represents percent of Net Rental Income for all revenue lines and represents percent of Effective Gross Income for the remainder of fields. |
| (4) | Percentage Rent consists of a fixed percentage of a tenant’s sales. |
Property Management. The property is managed by Azad Commercial Realty Services, LLC, an affiliate of the sponsor.
Escrows and Reserves. At origination, the borrower deposited into escrow a sum of $230,000 for outstanding tenant improvements associated with Ashley Furniture, Shades Sunglasses and Doctor’s Diet Program, $53,000 for rent abatements associated with Shades Sunglasses and Casual Apparel and The Sleep Center of Lower Alabama, LLC and $14,307 for insurance.
Tax Escrows – On a monthly basis, the borrower is required to escrow 1/12th of annual tax payments, currently equal to $16,617.
Insurance Escrows – On a monthly basis, the borrower is required to escrow 1/12th of annual insurance payments equal to $7,153.
Replacement Reserves – On a monthly basis, the borrower is required to escrow $3,376 for replacement reserves, subject to a cap of $121,547.
TI/LC Reserve– On a monthly basis, the borrower is required to escrow $11,250 for tenant improvements and leasing commissions,subject to a cap of $400,000.
Sweep Lease Reserve– On each monthly payment date during a Cash Sweep Period (as defined below) that was caused and exists solely due to a Specified Tenant Sweep Event (as defined below), the borrower is required to deposit all excess cash flow generated by the property, after the payment of debt service, required reserves and operating expenses, among other things, for the immediately preceding interest period into a lease sweep reserve.
Lockbox / Cash Management. The Eastern Shore Plaza loan is structured with hard lockbox and springing cash management. The tenants have been directed to remit all payments due under their leases directly into the lockbox account controlled by the lender. During the continuance of a Cash Sweep Period (as defined below), all funds in the lockbox account are required to be swept daily to a cash management account under the control of the lender and disbursed during each interest period of the term of the loan in accordance with the loan documents. During the continuance of a Cash Sweep Period, all excess cash flow, after payments made in accordance with the loan documents for, among other things, debt service, required reserves and operating expenses, will be held as additional collateral for the loan.
THE INFORMATION IN THIS STRUCTURAL AND COLLATERAL TERM SHEET IS NOT COMPLETE AND MAY BE AMENDED PRIOR TO THE TIME OF SALE. THIS STRUCTURAL AND COLLATERAL TERM SHEET IS NOT AN OFFER TO SELL THESE SECURITIES AND IT IS NOT A SOLICITATION OF AN OFFER TO BUY THESE SECURITIES IN ANY JURISDICTION WHERE THE OFFER OR SALE IS NOT PERMITTED.
| - 111 - |
Mortgage Loan No. 8 — Eastern Shore Plaza
A “Cash Sweep Period” will commence upon (i) the occurrence and continuance of an event of default, (ii) the debt service coverage ratio being less than 1.15x or (iii) a Specified Tenant Sweep Event. A Cash Sweep Period expires upon, with regard to clause (i) above, the cure of such event of default, with regard to clause (ii) above, the date that the debt service coverage ratio is at least 1.20x for two consecutive calendar quarters, and with regard to clause (iii) above, the cure of all Specified Tenant Sweep Events.
A “Specified Tenant Sweep Event” will be triggered if the Ashley Furniture tenant, the Best Buy tenant, the Ross Dress for Less tenant, any other tenant occupying at least 25,000 SF of NRA at the property or any replacement tenant (i) defaults on its lease beyond notice and cure periods (or if the borrower defaults under any such lease beyond any notice and cure periods), (ii) goes dark or vacates its space, (iii) files for bankruptcy, (iv) terminates its lease, (v) does not renew its lease at least 12 months prior to the scheduled lease expiration, or (vi) exercises rights or remedies pursuant to a co-tenancy provision under such its lease (including, without limitation, a reduction of rent or termination of such lease).
THE INFORMATION IN THIS STRUCTURAL AND COLLATERAL TERM SHEET IS NOT COMPLETE AND MAY BE AMENDED PRIOR TO THE TIME OF SALE. THIS STRUCTURAL AND COLLATERAL TERM SHEET IS NOT AN OFFER TO SELL THESE SECURITIES AND IT IS NOT A SOLICITATION OF AN OFFER TO BUY THESE SECURITIES IN ANY JURISDICTION WHERE THE OFFER OR SALE IS NOT PERMITTED.
| - 112 - |
Mortgage Loan No. 9 – Robert Pitt Professional Plaza
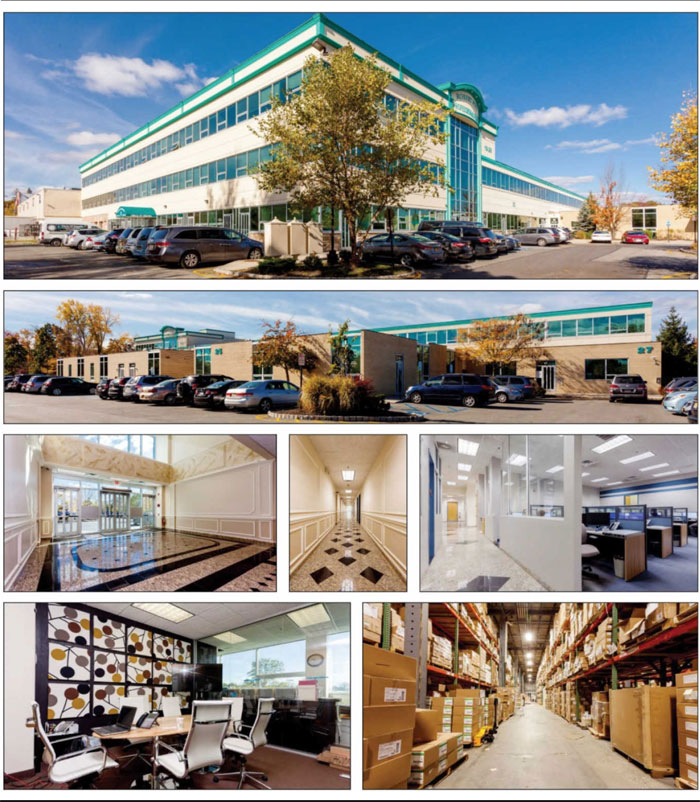
THE INFORMATION IN THIS STRUCTURAL AND COLLATERAL TERM SHEET IS NOT COMPLETE AND MAY BE AMENDED PRIOR TO THE TIME OF SALE. THIS STRUCTURAL AND COLLATERAL TERM SHEET IS NOT AN OFFER TO SELL THESE SECURITIES AND IT IS NOT A SOLICITATION OF AN OFFER TO BUY THESE SECURITIES IN ANY JURISDICTION WHERE THE OFFER OR SALE IS NOT PERMITTED.
| - 113 - |
Mortgage Loan No. 9 – Robert Pitt Professional Plaza
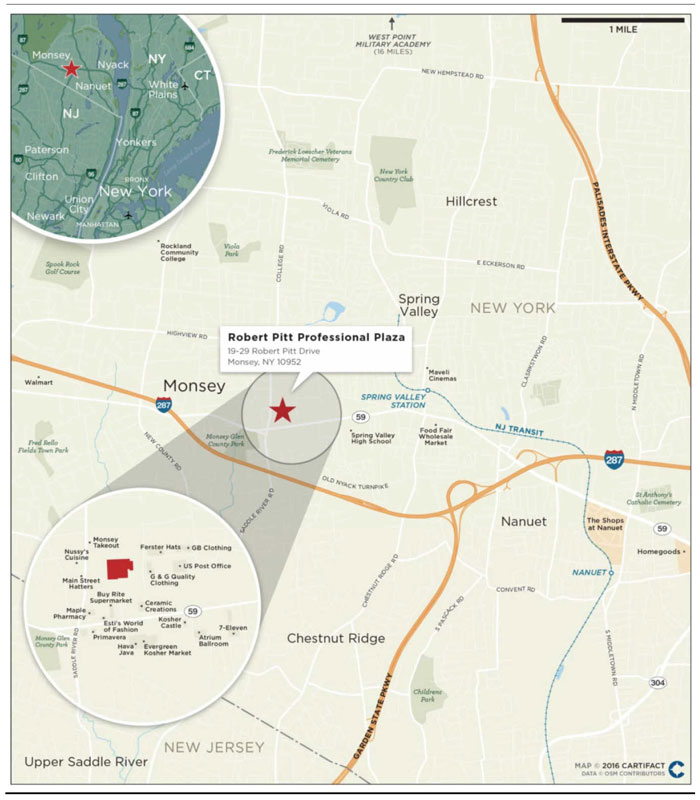
THE INFORMATION IN THIS STRUCTURAL AND COLLATERAL TERM SHEET IS NOT COMPLETE AND MAY BE AMENDED PRIOR TO THE TIME OF SALE. THIS STRUCTURAL AND COLLATERAL TERM SHEET IS NOT AN OFFER TO SELL THESE SECURITIES AND IT IS NOT A SOLICITATION OF AN OFFER TO BUY THESE SECURITIES IN ANY JURISDICTION WHERE THE OFFER OR SALE IS NOT PERMITTED.
| - 114 - |
Mortgage Loan No. 9 – Robert Pitt Professional Plaza
| Mortgage Loan Information | Property Information | |||
| Mortgage Loan Seller: | BSP | Single Asset / Portfolio: | Single Asset | |
| Original Principal Balance: | $23,000,000 | Title: | Fee | |
| Cut-off Date Principal Balance: | $22,892,017 | Property Type - Subtype: | Mixed Use – Office/Warehouse | |
| % of Pool by IPB: | 3.0% | Net Rentable Area (SF): | 143,194 | |
| Loan Purpose: | Refinance | Location: | Monsey, NY | |
| Borrowers: | Robert Pitt Professional Plaza, LLC; Robert Pitt Professional Plaza II DE LLC | Year Built / Renovated: | 1990, 2009 / N/A | |
| Sponsors: | Ephraim Grossman; Grossman Family 2012 Trust dated as of December 27, 2012 | Occupancy: | 100.0% | |
| Occupancy Date: | 9/23/2016 | |||
| Number of Tenants: | 93 | |||
| Interest Rate: | 4.7200% | 2013 NOI: | $1,906,936 | |
| Note Date: | 6/30/2016 | 2014 NOI: | $1,754,257 | |
| Maturity Date: | 7/6/2026 | 2015 NOI: | $2,018,969 | |
| Interest-only Period: | 0 months | TTM NOI(1): | $2,046,595 | |
| Original Term: | 120 months | UW Economic Occupancy: | 95.0% | |
| Original Amortization: | 360 months | UW Revenues: | $2,970,296 | |
| Amortization Type: | Balloon | UW Expenses: | $872,262 | |
| Call Protection: | L(28),Def(88),O(4) | UW NOI: | $2,098,034 | |
| Lockbox(2): | Springing | UW NCF: | $1,979,353 | |
| Additional Debt: | No | Appraised Value / Per SF: | $34,500,000 / $241 | |
| Additional Debt Balance: | N/A | Appraisal Date: | 5/25/2016 | |
| Additional Debt Type: | N/A | |||
| Additional Future Debt Permitted: | No | |||
| Escrows and Reserves(3) | Financial Information | |||||
| Initial | Monthly | Initial Cap | Cut-off Date Loan / SF: | $160 | ||
| Taxes: | $164,899 | $32,980 | N/A | Maturity Date Loan / SF: | $131 | |
| Insurance: | $4,133 | $4,133 | N/A | Cut-off Date LTV: | 66.4% | |
| Replacement Reserves: | $0 | $2,387 | N/A | Maturity Date LTV: | 54.3% | |
| TI/LC: | $275,000 | Springing | $275,000 | UW NCF DSCR: | 1.38x | |
| Deferred Maintenance: | $8,750 | N/A | N/A | UW NOI Debt Yield: | 9.2% | |
| Condominium Common Charge: | $3,000 | Springing | N/A | |||
| Specified Tenant Security Deposit: | $0 | Springing | N/A | |||
| Lease Sweep Reserve: | $0 | Springing | N/A | |||
Sources and Uses
| Sources | Proceeds | % of Total | Uses | Proceeds | % of Total | |
| Mortgage Loan | $23,000,000 | 100.0% | Payoff Existing Debt(4) | $15,201,317 | 66.1% | |
| Return of Equity | 6,851,051 | 29.8 | ||||
| Closing Costs | 491,851 | 2.1 | ||||
| Upfront Reserves | 455,781 | 2.0 | ||||
| Total Sources | $23,000,000 | 100.0% | Total Uses | $23,000,000 | 100.0% |
| (1) | Represents the trailing twelve-month period ending August 31, 2016. |
| (2) | For a more detailed description of lockbox, please refer to“Lockbox / Cash Management”below. |
| (3) | For a more detailed description of Escrows and Reserves, please refer to “Escrows and Reserves” below. |
| (4) | The prior debt was securitized in JPMCC 2006-CB16. |
THE INFORMATION IN THIS STRUCTURAL AND COLLATERAL TERM SHEET IS NOT COMPLETE AND MAY BE AMENDED PRIOR TO THE TIME OF SALE. THIS STRUCTURAL AND COLLATERAL TERM SHEET IS NOT AN OFFER TO SELL THESE SECURITIES AND IT IS NOT A SOLICITATION OF AN OFFER TO BUY THESE SECURITIES IN ANY JURISDICTION WHERE THE OFFER OR SALE IS NOT PERMITTED.
| - 115 - |
Mortgage Loan No. 9 – Robert Pitt Professional Plaza
The Loan. The Robert Pitt Professional Plaza loan is a $23.0 million first mortgage loan secured by the fee simple interest in a 143,194 SF office/warehouse complex located in Monsey, New York. The loan has a 10-year term and will amortize on a 30-year schedule.
The Borrowers. The borrowing entities for the loan are Robert Pitt Professional Plaza, LLC and Robert Pitt Professional Plaza II DE LLC, both of which are Delaware limited liability companies and special purpose entities.
The Sponsors. The loan’s sponsors and nonrecourse carve-out guarantors are Ephraim Grossman and the Grossman Family 2012 Trust dated as of December 27, 2012. Mr. Grossman is the owner of Gemstar, Inc., an importer of medical and stationary supplies with over $91.0 million in sales. Mr. Grossman’s real estate portfolio consists of 13 properties, including the property. As of June 29, 2016, the sponsors report a net worth of approximately $54.6 million and liquidity of approximately $10.1 million inclusive of approximately $11.0 million of net worth attributable to the Grossman Family 2012 Trust dated as of December 27, 2012. The sponsors are required to maintain a minimum net worth of $10 million and liquidity of $2 million throughout the term of the loan.
The Property.The property consists of two adjacent 1-3 story buildings totaling 143,194 SF of Class A office and warehouse space (28’ clear height) located on 6.63 acres in Monsey, New York, approximately 25 miles north of New York City. The property is located off Route 59 in Monsey and near Interstate-287, the Palisades Interstate Parkway, and the Garden State Parkway. As of September 23, 2016, the office component totals 95,509 SF (66.7%) and is 100.0% leased to 88 tenants and the warehouse component totals 47,685 SF (33.3%) and is 100.0% leased to 5 tenants.
Ephraim Grossman purchased the original single-story building known as Robert Pitt I in 2004. After acquiring the building, the Mr. Grossman conducted a comprehensive renovation that included the addition of approximately 25,000 SF of second story office space and an increase of warehouse clear heights from 16’ to 28’. Mr. Grossman then moved Gemstar, Inc., into the majority of the warehouse space and sold 75,000 SF in the rear of the building to an unrelated party (now a grocery store). Mr. Grossman financed this building in 2006 with a prior loan worth $10.6 million securitized in the JPMCC 2006-CB16 trust. Robert Pitt I is approximately 57% office and 43% warehouse. In 2009, the Mr. Grossman built Robert Pitt II, a three-story, 42,141 SF building that is primarily office (91% office / 9% warehouse). Mr. Grossman financed Robert Pitt II with a $6.0 million loan provided by Sterling Bank. The sponsors’ cost basis in the property is $20.5 million.
The property is an office and warehouse facility in Monsey New York, and has averaged 97.7% occupancy over the past 7 years. Both buildings have remained similarly well occupied with Robert Pitt I averaging 97.6% and Robert Pitt II averaging 97.8% since 2009.
The vast majority of the employees of the tenants live within a two-mile radius of the property and there are no other similar quality office options within such distance. Other alternatives in the immediate area include older inferior office/flex space (such as 20 Robert Pitt Drive across the street) and non-traditional spaces in smaller buildings (second story above retail, basements, home offices, etc.). The tenant spaces vary in size, exposure and access.
The property is located in Monsey, New York in the town of Ramapo, Rockland County, New York. Several major highways and local arterials traverse the immediate area including the New York State Thruway which runs east to west through the county. Interstate-287 (Westchester County), the Palisades Interstate Parkway, and the Garden State Parkway (New Jersey) all run north/south, and intersect with the Thruway. Other major nearby roadways include U.S. Routes 9W and 202, and State Routes 303, 304, 306, 340 and 59. Commuter rail service to Manhattan is provided by New Jersey Transit, and express bus service is also available. The property is situated on the west side of Robert Pitt Drive, across from Melnick Road, approximately 0.25 miles north of Route 59, the primary commercial corridor in the area.
The Market. The property’s office space is part of the Orange / Rockland office market. The property is located in the Ramapo submarket, which consists of 151 office buildings comprising 1.8 million SF of total NRA. As of the first quarter of 2016, the Ramapo submarket vacancy rate was 5.5% with average asking rents of $25.76 PSF. There are six Class A office properties in Ramapo, each 100% occupied.
THE INFORMATION IN THIS STRUCTURAL AND COLLATERAL TERM SHEET IS NOT COMPLETE AND MAY BE AMENDED PRIOR TO THE TIME OF SALE. THIS STRUCTURAL AND COLLATERAL TERM SHEET IS NOT AN OFFER TO SELL THESE SECURITIES AND IT IS NOT A SOLICITATION OF AN OFFER TO BUY THESE SECURITIES IN ANY JURISDICTION WHERE THE OFFER OR SALE IS NOT PERMITTED.
| - 116 - |
Mortgage Loan No. 9 – Robert Pitt Professional Plaza
The property’s warehouse space (47,685 SF / 33.3% of total SF) is located within the Rockland submarket in the Northern New Jersey Industrial Market. The Rockland submarket outperforms most of the 23 Northern New Jersey and southeastern New York submarkets. It is comprised of 344 buildings (15 million SF) and as of the first quarter of 2016 has a vacancy of 5.1%. The appraiser’s concluded market rate for the property’s warehouse space of $13.00 PSF. According to the appraisal, the property’s competitive set consists of the five properties detailed in the table below. Each of the properties is 100.0% occupied.
Competitive Set Summary(1)
| Property | Year Built | Total GLA (SF) | Est. Occ. | Proximity (miles) |
| Robert Pitt Professional Plaza | 1990, 2009 | 143,194(2) | 100.0%(2) | N/A |
| 777 Chestnut Ridge Road | 2009 | 27,000 | 100.0% | 3.0 |
| 2 Executive Boulevard | 1988 | 70,820 | 100.0% | 3.7 |
| 4 Executive Boulevard | 2001 | 70,820 | 100.0% | 3.8 |
| 257 Lafayette Avenue | N/A | 76,371 | 100.0% | 3.9 |
| 400 Rella Boulevard | 1988 | 193,375 | 100.0% | 3.7 |
| (1) | Source: Appraisal. |
| (2) | Based on the September 23, 2016 underwritten rent roll. |
Historical and Current Occupancy(1)
| 2013 | 2014 | 2015 | Current(2) |
| 99.2% | 97.5% | 99.5% | 100.0% |
| (1) | Source: Historical Occupancy is provided by the sponsor. Occupancies are as of December 31 of each respective year. |
| (2) | Based on the September 23, 2016 underwritten rent roll. |
Tenant Summary(1)
| Tenant | Ratings Moody’s/S&P/Fitch(2) | Net Rentable Area (SF) | % of Total NRA | Base Rent PSF(3) | Lease Expiration Date |
| Gemstar, Inc. | NR / NR / NR | 32,050 | 22.4% | $13.88 | 6/30/2031 |
| Diversified Supplies | NR / NR / NR | 11,185 | 7.8% | $12.61 | 6/30/2031 |
| Business Licenses LLC | NR / NR / NR | 8,190 | 5.7% | $21.34 | 10/31/2019 |
| Circle of Friends of Rockland, LLC | NR / NR / NR | 6,250 | 4.4% | $21.22 | 6/30/2020 |
| Bikur Cholim(4) | NR / NR / NR | 6,180 | 4.3% | $21.62 | 11/30/2019 |
| Funding Source , Inc. | NR / NR / NR | 5,000 | 3.5% | $23.04 | 5/30/2021 |
| New York Life Insurance Co. | Aaa / AA+ / AA+ | 4,700 | 3.3% | $23.17 | 12/31/2019 |
| V Corp Services, LLC | NR / NR / NR | 4,110 | 2.9% | $23.10 | 11/30/2020 |
| Hashomer Alarm Systems, Inc. | NR / NR / NR | 3,700 | 2.6% | $11.97 | 6/30/2020 |
| Gross Sales | NR / NR / NR | 3,600 | 2.5% | $11.50 | 6/30/2031 |
| (1) | Based on the September 23, 2016 underwritten rent roll, including rent increases occurring through October, 2017. |
| (2) | Ratings provided are for the parent company of the entity listed in the “Tenant” field whether or not the parent company guarantees the lease. |
| (3) | Base Rent PSF for Gemstar, Inc. and Diversified Supplies reflects weighted average of rents for each tenants’ respective spaces that include both office and warehouse space. Base Rent PSF for Hashomer Alarm Systems, Inc. and Gross Sales reflects rent from each tenant’s warehouse leased space. |
| (4) | 1,180 SF of Bikur Cholim’s total space expires on November 30, 2018. |
THE INFORMATION IN THIS STRUCTURAL AND COLLATERAL TERM SHEET IS NOT COMPLETE AND MAY BE AMENDED PRIOR TO THE TIME OF SALE. THIS STRUCTURAL AND COLLATERAL TERM SHEET IS NOT AN OFFER TO SELL THESE SECURITIES AND IT IS NOT A SOLICITATION OF AN OFFER TO BUY THESE SECURITIES IN ANY JURISDICTION WHERE THE OFFER OR SALE IS NOT PERMITTED.
| - 117 - |
Mortgage Loan No. 9 – Robert Pitt Professional Plaza
Lease Rollover Schedule(1)
| Year | Number of Leases Expiring(2) | NRA Expiring | % of NRA Expiring | Base Rent Expiring(3) | % of Base Rent Expiring(3) | Cumulative NRA Expiring | Cumulative % of NRA Expiring | Cumulative Base Rent Expiring(3) | Cumulative % of Base Rent Expiring(3) |
| Vacant | NAP | 0 | 0.0% | NAP | NAP | 0 | 0.0% | NAP | NAP |
| MTM | 3 | 4,018 | 2.8 | $63,000 | 2.2% | 4,018 | 2.8% | $63,000 | 2.2% |
| 2016 | 13 | 7,146 | 5.0 | 165,202 | 5.8 | 11,164 | 7.8% | $228,202 | 8.1% |
| 2017 | 40 | 15,340 | 10.7 | 413,590 | 14.6 | 26,504 | 18.5% | $641,792 | 22.7% |
| 2018 | 17 | 15,455 | 10.8 | 379,698 | 13.4 | 41,959 | 29.3% | $1,021,490 | 36.1% |
| 2019 | 18 | 31,789 | 22.2 | 709,029 | 25.1 | 73,748 | 51.5% | $1,730,520 | 61.2% |
| 2020 | 6 | 17,611 | 12.3 | 355,212 | 12.6 | 91,359 | 63.8% | $2,085,732 | 73.7% |
| 2021 | 1 | 5000 | 3.5 | 115,200 | 4.1 | 96,359 | 67.3% | $2,200,932 | 77.8% |
| 2022 | 0 | 0 | 0.0 | 0 | 0.0 | 96,359 | 67.3% | $2,200,932 | 77.8% |
| 2023 | 0 | 0 | 0.0 | 0 | 0.0 | 96,359 | 67.3% | $2,200,932 | 77.8% |
| 2024 | 0 | 0 | 0.0 | 0 | 0.0 | 96,359 | 67.3% | $2,200,932 | 77.8% |
| 2025 | 0 | 0 | 0.0 | 0 | 0.0 | 96,359 | 67.3% | $2,200,932 | 77.8% |
| 2026 & Beyond | 6 | 46,835 | 32.7 | 627,278 | 22.2 | 143,194 | 100.0% | $2,828,210 | 100.0% |
| Total | 104 | 143,194 | 100.0% | $2,828,210 | 100.0% |
| (1) | Based on the September 23, 2016 underwritten rent roll. |
| (2) | Certain tenants have more than one lease. |
| (3) | Base Rent Expiring includes rent increases occurring through October 2017. |
Operating History and Underwritten Net Cash Flow
| 2013 | 2014 | 2015 | TTM(1) | Underwritten(2) | PSF | %(3) | |
| Rents in Place | $2,637,395 | $2,542,109 | $2,613,797 | $2,624,018 | $2,828,210 | $19.75 | 91.3% |
| Vacant Income | 0 | 0 | 0 | 0 | 0 | 0.00 | 0.0 |
| Gross Potential Rent | $2,637,395 | $2,542,109 | $2,613,797 | $2,624,018 | $2,828,210 | $19.75 | 91.3% |
| Total Reimbursements | 92,068 | 136,973 | 248,742 | 268,596 | 269,184 | 1.88 | 8.7 |
| Net Rental Income | $2,729,463 | $2,679,082 | $2,862,538 | $2,892,614 | $3,097,394 | $21.63 | 100.0% |
| (Vacancy/Collection Loss) | 0 | 0 | 0 | 0 | (156,331) | (1.09) | (5.0) |
| Other Income | 23,600 | 20,657 | 18,081 | 29,233 | 29,233 | 0.20 | 0.9 |
| Effective Gross Income | $2,753,063 | $2,699,738 | $2,880,619 | $2,921,848 | $2,970,296 | $20.74 | 95.9% |
| Total Expenses | $846,127 | $945,481 | $861,650 | $875,253 | $872,262 | $6.09 | 29.4% |
| Net Operating Income | $1,906,936 | $1,754,257 | $2,018,969 | $2,046,595 | $2,098,034 | $14.65 | 70.6% |
| Total TI/LC, Capex/RR | 8,813 | 821 | 16,412 | 3,000 | 118,681 | 0.83 | 4.0 |
| Net Cash Flow | $1,898,123 | $1,753,436 | $2,002,557 | $2,043,595 | $1,979,353 | $13.82 | 66.6% |
| (1) | The TTM column represents the trailing twelve months ending August 31, 2016. |
| (2) | Underwritten Rents in Place includes base rent and rent increases occurring through October, 2017. |
| (3) | % column represents percent of Net Rental Income for all revenue lines and represents percent of Effective Gross Income for the remainder of fields. |
THE INFORMATION IN THIS STRUCTURAL AND COLLATERAL TERM SHEET IS NOT COMPLETE AND MAY BE AMENDED PRIOR TO THE TIME OF SALE. THIS STRUCTURAL AND COLLATERAL TERM SHEET IS NOT AN OFFER TO SELL THESE SECURITIES AND IT IS NOT A SOLICITATION OF AN OFFER TO BUY THESE SECURITIES IN ANY JURISDICTION WHERE THE OFFER OR SALE IS NOT PERMITTED.
| - 118 - |
Mortgage Loan No. 9 – Robert Pitt Professional Plaza
Property Management. The property is managed by Martel Realty Management, Inc. an affiliate of the sponsors.
Escrows and Reserves. At origination, the borrower deposited into escrow $275,000 for TI/LC reserves, $164,899 for real estate taxes, $8,750 for immediate repairs, $4,133 for insurance and $3,000 for condominium common charges.
Tax Escrows – On a monthly basis, the borrower is required to escrow 1/12th of annual tax payments, currently equal to $32,980.
Insurance Escrows – On a monthly basis, the borrower is required to escrow 1/12th of annual insurance payments, currently equal to $4,133.
Replacement Reserves – On a monthly basis, the borrower is required to escrow $2,387 for replacement reserves.
TI/LC Reserve –On a monthly basis, the borrower is required to escrow $11,933 for tenant improvements and leasing commissions, subject to a cap of $275,000. The monthly payment is waived as long as the balance in the reserve equals $275,000.
Condominium Common Charge Reserve – On a monthly basis during a Cash Sweep Period (as defined below), the borrower is required to escrow 1/12th of condominium common charges. Additionally, if the condominium common reserve falls below $3,000, the borrower will be required to deposit all excess cash flow after the payment of debt service, required reserves and operating expenses until the amount on deposit is at least $3,000.
Specified Tenant Security Deposit Reserve: After the occurrence of any Specified Tenant Sweep Event (as defined below), borrower will deposit an amount equal to the greater of (i) 12 months of rent payable by the applicable specified tenant or (ii) with respect to (A) Diversified Supplies tenant, $165,290, (B) Gemstar, Inc. tenant, $519,847, (C) Gross Sales tenant, $49,824. If such funds are not deposited within five business days after the occurrence of the Specified Tenant Sweep Event, the loan will become full recourse to the sponsor.
Lease Sweep Reserve: On each monthly payment date during a Cash Sweep Period that was caused and exists solely due to a Specified Tenant Sweep Event, the borrower is required to deposit all excess cash flow generated by the property, after the payment of debt service, required reserves and operating expenses, among other things, for the immediately preceding interest period into a lease sweep reserve.
Lockbox / Cash Management. The Robert Pitt Professional Plaza loan is structured with a springing lockbox and springing cash management. Upon the occurrence of a Cash Sweep Event, tenants will be directed to remit all payments directly to the lockbox account controlled by the lender. During the continuance of a Cash Sweep Event, all funds received into the lockbox account will be swept immediately into the cash management account and used to pay monthly reserve balances, debt service payments and outstanding expense balances.
A “Cash Sweep Event” will commence upon (i) the occurrence and continuance of an event of default, (ii) the debt service coverage ratio being less than 1.15x, (iii) a Specified Tenant Sweep Event, or (iv) the amount on deposit in the condominium common charge account falling below $3,000. A Cash Sweep Period will expire upon, with regard to clause (i) above, the cure of such event of default, with regard to clause (ii) above, the date that the debt service coverage ratio is at least 1.20x for two consecutive calendar quarters, with regard to clause (iii) above, the cure of the applicable Specified Tenant Sweep Events and, with regard to clause (iv) above, the amount on deposit in the condominium common charge account is at least $3,000.
A “Specified Tenant Sweep Event” will be triggered if the Diversified Supplies tenant, the Gemstar, Inc. tenant, the Gross Sales tenant, any parent company of the foregoing tenant or any guarantors of any such tenant’s lease, or any replacement tenant (i) defaults on its lease beyond notice and cure periods, (ii) goes dark or vacates its space, (iii) files for bankruptcy, or (iv) terminates its lease.
THE INFORMATION IN THIS STRUCTURAL AND COLLATERAL TERM SHEET IS NOT COMPLETE AND MAY BE AMENDED PRIOR TO THE TIME OF SALE. THIS STRUCTURAL AND COLLATERAL TERM SHEET IS NOT AN OFFER TO SELL THESE SECURITIES AND IT IS NOT A SOLICITATION OF AN OFFER TO BUY THESE SECURITIES IN ANY JURISDICTION WHERE THE OFFER OR SALE IS NOT PERMITTED.
| - 119 - |
(THIS PAGE INTENTIONALLY LEFT BLANK)
| - 120 - |
Mortgage Loan No. 10 – Preserve at Autumn Ridge II
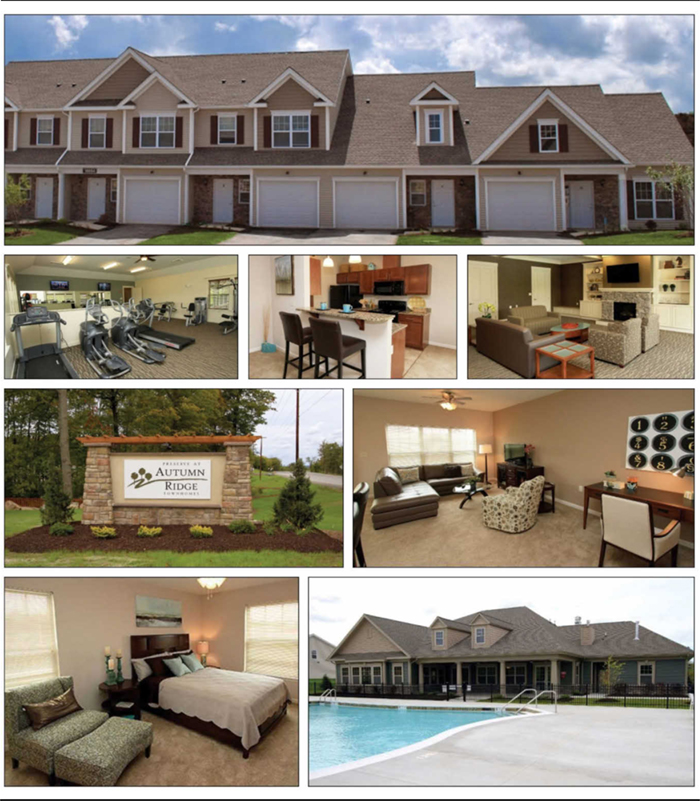
THE INFORMATION IN THIS STRUCTURAL AND COLLATERAL TERM SHEET IS NOT COMPLETE AND MAY BE AMENDED PRIOR TO THE TIME OF SALE. THIS STRUCTURAL AND COLLATERAL TERM SHEET IS NOT AN OFFER TO SELL THESE SECURITIES AND IT IS NOT A SOLICITATION OF AN OFFER TO BUY THESE SECURITIES IN ANY JURISDICTION WHERE THE OFFER OR SALE IS NOT PERMITTED.
| - 121 - |
Mortgage Loan No. 10 – Preserve at Autumn Ridge II
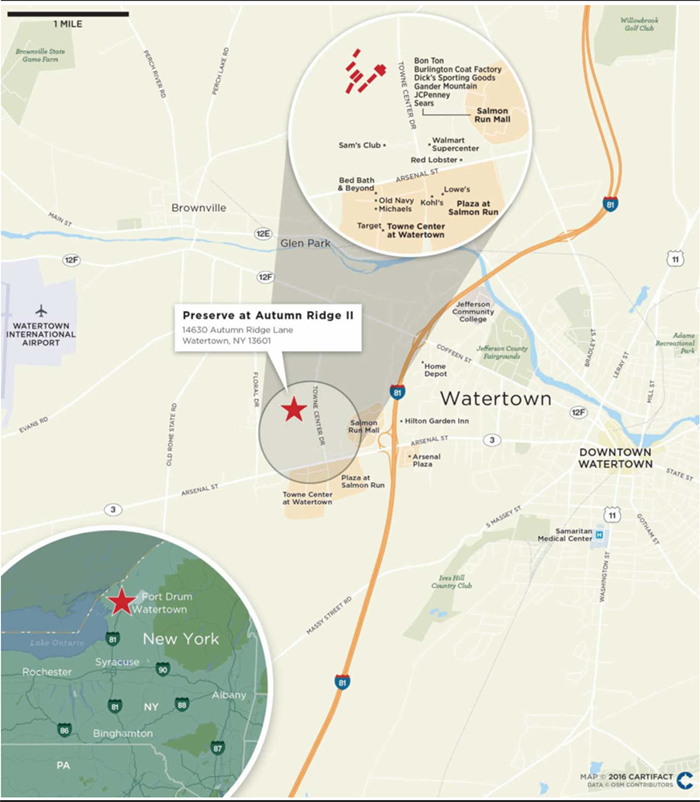
THE INFORMATION IN THIS STRUCTURAL AND COLLATERAL TERM SHEET IS NOT COMPLETE AND MAY BE AMENDED PRIOR TO THE TIME OF SALE. THIS STRUCTURAL AND COLLATERAL TERM SHEET IS NOT AN OFFER TO SELL THESE SECURITIES AND IT IS NOT A SOLICITATION OF AN OFFER TO BUY THESE SECURITIES IN ANY JURISDICTION WHERE THE OFFER OR SALE IS NOT PERMITTED.
| - 122 - |
Mortgage Loan No. 10 – Preserve at Autumn Ridge II
| Mortgage Loan Information | Property Information | |||
| Mortgage Loan Seller: | Column | Single Asset / Portfolio: | Single Asset | |
| Original Principal Balance: | $21,280,000 | Title: | Fee | |
| Cut-off Date Principal Balance: | $20,846,669 | Property Type - Subtype: | Multifamily – Garden | |
| % of Pool by IPB: | 2.7% | Net Rentable Area (Units): | 152 | |
| Loan Purpose: | Refinance | Location: | Watertown, NY | |
| Borrower: | Preserve at Autumn Ridge II LLC | Year Built / Renovated: | 2015 / N/A | |
| Sponsor: | Robert C. Morgan | Occupancy: | 99.3% | |
| Interest Rate: | 4.5400% | Occupancy Date: | 6/30/2016 | |
| Note Date: | 6/9/2015 | Number of Tenants: | N/A | |
| Maturity Date: | 7/6/2025 | 2014 NOI(1): | N/A | |
| Interest-only Period: | 0 months | 2015 NOI: | $2,177,753 | |
| Original Term: | 120 months | TTM NOI(2): | $2,300,510 | |
| Original Amortization: | 360 months | UW Economic Occupancy: | 95.0% | |
| Amortization Type: | Balloon | UW Revenues: | $2,585,706 | |
| Call Protection: | L(36),YM1(4),Def(76),O(4) | UW Expenses: | $594,993 | |
| Lockbox(3): | Springing | UW NOI: | $1,990,713 | |
| Additional Debt: | No | UW NCF: | $1,960,313 | |
| Additional Debt Balance: | N/A | Appraised Value / Per Unit(4): | $27,500,000 / $180,921 | |
| Additional Debt Type: | N/A | Appraisal Date: | 5/20/2016 | |
| Additional Debt Permitted: | No | |||
| Escrows and Reserves(5) | Financial Information | |||||
| Initial | Monthly | Initial Cap | Cut-off Date Loan / Unit: | $137,149 | ||
| Taxes: | $75,537 | $9,533 | N/A | Maturity Date Loan / Unit: | $113,367 | |
| Insurance: | $5,200 | $867 | N/A | Cut-Off Date LTV(4): | 75.8% | |
| Replacement Reserves: | $0 | $2,217 | N/A | Maturity Date LTV(4): | 62.7% | |
| Engineering: | $155,808 | N/A | N/A | UW NCF DSCR: | 1.51x | |
| UW NOI Debt Yield: | 9.5% | |||||
| Sources and Uses | ||||||||
| Sources | Proceeds | % of Total | Uses | Proceeds | % of Total | |||
| Mortgage Loan | $21,280,000 | 96.5 | % | Payoff Existing Debt | $21,312,419 | 96.7 | % | |
| Sponsor Equity | 761,555 | 3.5 | Closing Costs | 492,590 | 2.2 | |||
| Upfront Reserves | 236,545 | 1.1 | ||||||
| Total Sources | $22,041,555 | 100.0 | % | Total Uses | $22,041,555 | 100.0 | % | |
| (1) | Historical financials are not available due to the property being built in 2015. |
| (2) | Represents trailing twelve months ending June 30, 2016. |
| (3) | For a more detailed description of Lockbox, please refer to “Lockbox / Cash Management” below. |
| (4) | Appraised Value includes a $900,000 valuation for a PILOT agreement for which the property benefits. Without the value of the PILOT the property would have a Cut-Off Date LTV of 78.4% and Maturity Date LTV of 64.8%. For more information on the PILOT agreement, see “Description of the Mortgage Pool – Real Estate And Other Tax Considerations” in the Prospectus. |
| (5) | For a more detailed description of Escrows and Reserves, please refer to “Escrows and Reserves” below. |
THE INFORMATION IN THIS STRUCTURAL AND COLLATERAL TERM SHEET IS NOT COMPLETE AND MAY BE AMENDED PRIOR TO THE TIME OF SALE. THIS STRUCTURAL AND COLLATERAL TERM SHEET IS NOT AN OFFER TO SELL THESE SECURITIES AND IT IS NOT A SOLICITATION OF AN OFFER TO BUY THESE SECURITIES IN ANY JURISDICTION WHERE THE OFFER OR SALE IS NOT PERMITTED.
| - 123 - |
Mortgage Loan No. 10 – Preserve at Autumn Ridge II
The Loan. The Preserve at Autumn Ridge II loan is an approximately $20.8 million first mortgage loan secured by the fee interest in a 152 unit townhome-style multifamily property located in Watertown, New York. The loan has a 10-year term and will amortize on a 30-year schedule.
The Borrower. The borrowing entity for the loan is Preserve at Autumn Ridge II LLC, a Delaware limited liability company and special purpose entity.
The Sponsor. The loan’s sponsor and nonrecourse carve-out guarantor is Robert C. Morgan. Mr. Morgan has over 35 years of real estate experience. Mr. Morgan founded his management company, Morgan Management, LLC, in 1979 with a commercial real estate portfolio that today has grown to over 140 properties and more than 30,000 units across 14 states. The company now has more than 1,300 dedicated multifamily employees.
The Property. The property is a 152-unit townhome-style multifamily property located in Watertown, New York that was built in 2015. The property consists of 26 two-story apartment buildings located on approximately 24.4 acres. Each unit has a single vehicle attached garage, in additional the property features open asphalt parking. The property has a total of 337 parking spaces, or 2.2 parking spaces per unit. As of June 30, 2016, the property was 99.3% leased. The property is the second phase of a larger development that has an additional 242 units in Phase I. Phase II has access to all common amenities in Phase I.
The complex is comprised of one bedroom ranch units as well as two and three bedroom townhome units. All units have ground level entries. Townhome units have interior stairs. There are no interior common areas, such as stairwells. The property contains 74 two-bedroom units (48.7%) and 78 three-bedroom units (51.3%). Two-bedroom units range from approximately 995 SF to 1,156 SF, and three-bedroom units are 1,334 SF, with an overall average unit size of 1,236 SF. Property amenities include (built during Phase I) a clubhouse, theater, fitness center, outdoor pool, playground, tanning booth, and business center. Unit kitchens feature electric range/ovens, refrigerators, garbage disposals, built-in microwave and dishwashers. Bathrooms feature combination tub/shower, granite counters and built-in porcelain sink and vinyl tile flooring. Each unit has a washer and dryer and a private patio. Apartment units are individually metered for electrical usage. Tenants are responsible for water and sewer costs.
The property is currently under a single 15-year PILOT (Payment in Lieu of Taxes) agreement. The PILOT agreement provides that 50% of the property taxes will be abated for years 1 through 10 of the agreement. The property is 100% taxable after year 10 but the annual assessed value will be capped at a 1% increase during years 12 through 15 of the agreement.
Multifamily Unit Mix(1)
| Unit Type | No. of Units | % of Total | Occupied Units | Occupancy | Average Unit Size (SF) | Average Monthly Rental Rate | Average Monthly Rental Rate PSF | Monthly Market Rental Rate(2) | Monthly Market Rental Rate PSF(2) | |||||||||||
| 2 Bedroom, 1 Bath | 11 | 7.2 | % | 11 | 100.0 | % | 995 | $1,294 | $1.30 | $1,300 | $1.31 | |||||||||
| 2 Bedroom, 1.5 Bath | 63 | 41.4 | % | 62 | 98.4 | % | 1,156 | $1,355 | $1.17 | $1,360 | $1.18 | |||||||||
| 3 Bedroom, 2.5 Bath | 78 | 51.3 | % | 78 | 100.0 | % | 1,334 | $1,444 | $1.08 | $1,450 | $1.09 | |||||||||
| Total/Wtd. Avg. | 152 | 100.0 | % | 151 | 99.3 | % | 1,236 | $1,397 | $1.13 | $1,402 | $1.13 | |||||||||
| (1) | Based on the underwritten rent roll dated June 30, 2016. |
| (2) | Based on the appraisal. |
The Market. The property is located in Watertown, New York in the Watertown-Fort Drum metropolitan statistical area (MSA). The city of Watertown is the county seat of Jefferson County. The driving force of the region’s economy is Fort Drum Military Reservation, which is located approximately 12 miles northeast of the property and serves as a training facility for armed forces and new recruits. According to the appraisal, the market expects to experience an increase in population and number of households over the next five years, which is expected to increase the demand for rental housing. The property also benefits from its proximity to supporting retail, which has been developed in recent years along Route 3. Regional access to the
THE INFORMATION IN THIS STRUCTURAL AND COLLATERAL TERM SHEET IS NOT COMPLETE AND MAY BE AMENDED PRIOR TO THE TIME OF SALE. THIS STRUCTURAL AND COLLATERAL TERM SHEET IS NOT AN OFFER TO SELL THESE SECURITIES AND IT IS NOT A SOLICITATION OF AN OFFER TO BUY THESE SECURITIES IN ANY JURISDICTION WHERE THE OFFER OR SALE IS NOT PERMITTED.
| - 124 - |
Mortgage Loan No. 10 — Preserve at Autumn Ridge II
neighborhood is provided by Interstate 81. According to the appraisal, the property is an approximately 90 minute drive from Syracuse. The 2016 median household income within a one-, three- and five-mile radius was $52,048, $43,488 and $44,949, respectively.
Competitive Set Summary(1)
| Property | Year Built | No. of Units | Avg. Unit Size (SF) | Avg. $/ Unit | Occupancy | Distance from Property |
| Preserve at Autumn Ridge II | 2015 | 152 | 1,236 | $1,397 | 99.3% | |
| Preserve at Autumn Ridge – Phase I | 2013/2014 | 242 | 1,162 | $1,367 | 98% | Adjacent |
| Eagle Ridge Apartments | 2009-2014 | 738 | 1,262 | $1,155 | 75% | 8.5 miles |
| Beaver Meadow Apartments | 2013 | 296 | 1,058 | $1,138 | NAV | 1.0 miles |
| Summit Wood Apartments | 2008 | 200 | 960 | $978 | 95% | 5.5 miles |
| Creekwood Apartments | 2013 | 200 | 1,105 | $1,019 | 95% | 5.0 miles |
| Total/Wtd. Avg.(2) | 1,676 | 1,157 | $1,146 | 85% |
| (1) | Source: Appraisal and rent roll dated June 30, 2016. |
| (2) | Excludes the subject property. |
Historical and Current Occupancy(1)
| 2013(2) | 2014(2) | 2015(3) | Current(4) |
| N/A | N/A | 98.0% | 99.3% |
| (1) | Source: Historical Occupancy is provided by the sponsor. |
| (2) | Historical occupancies are not available due to the property being built in 2015. |
| (3) | Historical occupancies are as of December 31 of each respective year. |
| (4) | Based on the underwritten rent roll dated June 30, 2016. |
Operating History and Underwritten Net Cash Flow
| 2013(1) | 2014(1) | 2015 | TTM(2) | Underwritten | Unit | %(3) | ||
| Rents in Place | N/A | N/A | $2,458,821 | $2,514,428 | $2,546,796 | $16,755 | 93.6 | % |
| Vacant Income | N/A | N/A | 0 | 0 | 0 | 0 | 0.0 | |
| Other Income | N/A | N/A | 205,017 | 187,095 | 175,000 | 1,151 | 6.4 | |
| Gross Potential Rent | N/A | N/A | $2,663,837 | $2,701,523 | $2,721,796 | $17,907 | 100.0 | % |
| Total Reimbursements | N/A | N/A | 0 | 0 | 0 | 0 | 0.0 | |
| Net Rental Income | N/A | N/A | $2,663,837 | $2,701,523 | $2,721,796 | $17,907 | 100.0 | % |
| (Vacancy/Collection Loss) | N/A | N/A | 0 | 0 | (136,090) | (895) | (5.0) | |
| Effective Gross Income | N/A | N/A | $2,663,837 | $2,701,523 | $2,585,706 | $17,011 | 95.0 | % |
| Total Expenses | N/A | N/A | $486,085 | $401,012 | $594,993 | $3,914 | 23.0 | % |
| Net Operating Income | N/A | N/A | $2,177,753 | $2,300,510 | $1,990,713 | 13,097 | 77.0 | % |
| Total Capex/RR | N/A | N/A | 0 | 0 | 30,400 | 200 | 1.2 | |
| Net Cash Flow | N/A | N/A | $2,177,753 | $2,300,510 | $1,960,313 | $12,897 | 75.8 | % |
| (1) | Historical financials are not available due to the property being built in 2015. |
| (2) | TTM represents the trailing-twelve month period ending on June 30, 2016. |
| (3) | % column represents percent of Net Rental Income for all revenue lines and represents percent of Effective Gross Income for the remainder of fields. |
THE INFORMATION IN THIS STRUCTURAL AND COLLATERAL TERM SHEET IS NOT COMPLETE AND MAY BE AMENDED PRIOR TO THE TIME OF SALE. THIS STRUCTURAL AND COLLATERAL TERM SHEET IS NOT AN OFFER TO SELL THESE SECURITIES AND IT IS NOT A SOLICITATION OF AN OFFER TO BUY THESE SECURITIES IN ANY JURISDICTION WHERE THE OFFER OR SALE IS NOT PERMITTED.
| - 125 - |
Mortgage Loan No. 10 0 Preserve at Autumn Ridge II
Property Management. The property is managed by Morgan Management, LLC, an affiliate of the sponsor.
Escrows and Reserves. At origination, the borrower deposited into escrow $155,808 for engineering reserves, $75,537 for real estate taxes and $5,200 for insurance.
Tax Escrows – On a monthly basis, the borrowers are required to escrow 1/12th of the estimated tax payments, currently equal to $9,533.
Insurance Reserves – On a monthly basis, the borrowers are required to escrow 1/12th of the estimated insurance payments, currently equal to $867.
Replacement Reserves – On a monthly basis, the borrowers are required to deposit $2,217 to replacement reserves.
Lockbox / Cash Management. The loan is structured with a springing lockbox and springing cash management. The lockbox must be established from and after the occurrence of a Cash Sweep Event (defined below). From and after the occurrence of a Cash Sweep Event, the borrower shall, and shall cause the manager to, deposit all amounts received by the borrower or manager constituting rents into the lockbox account within one business day after receipt.
A “Cash Sweep Event” means the occurrence of: (a) an event of default; (b) any bankruptcy action of the borrower or property manager; or (c) a DSCR Trigger Event (defined below).
A “DSCR Trigger Event” means that as of the date of determination, the debt service coverage ratio based on the trailing three-month period immediately preceding the date of such determination is less than 1.15x.
THE INFORMATION IN THIS STRUCTURAL AND COLLATERAL TERM SHEET IS NOT COMPLETE AND MAY BE AMENDED PRIOR TO THE TIME OF SALE. THIS STRUCTURAL AND COLLATERAL TERM SHEET IS NOT AN OFFER TO SELL THESE SECURITIES AND IT IS NOT A SOLICITATION OF AN OFFER TO BUY THESE SECURITIES IN ANY JURISDICTION WHERE THE OFFER OR SALE IS NOT PERMITTED.
| - 126 - |
(THIS PAGE INTENTIONALLY LEFT BLANK)
| - 127 - |
Mortgage Loan No. 11 – BJ’s Wholesale Club - Miami
| Mortgage Loan Information | Property Information | |||
| Mortgage Loan Seller: | Column | Single Asset / Portfolio: | Single Asset | |
| Original Principal Balance: | $20,200,000 | Title: | Fee | |
| Cut-off Date Principal Balance: | $20,200,000 | Property Type - Subtype: | Retail – Single Tenant | |
| % of Pool by IPB: | 2.6% | Net Rentable Area (SF): | 113,000 | |
| Loan Purpose: | Acquisition | Location: | Miami, FL | |
| Borrower: | TGC Kendall, LLC | Year Built / Renovated: | 2006 / N/A | |
| Sponsor: | Murray H. Goodman | Occupancy: | 100.0% | |
| Interest Rate: | 4.4000% | Occupancy Date: | 11/6/2016 | |
| Note Date: | 8/25/2016 | Number of Tenants: | 1 | |
| Maturity Date: | 9/6/2026 | 2014 NOI: | N/A | |
| Interest-only Period: | 36 months | 2015 NOI: | $1,749,264 | |
| Original Term: | 120 months | TTM NOI(1): | $1,763,860 | |
| Original Amortization: | 360 months | UW Economic Occupancy: | 95.0% | |
| Amortization Type: | IO-Balloon | UW Revenues: | $1,747,121 | |
| Call Protection: | L(26),Def(89),O(5) | UW Expenses: | $54,920 | |
| Lockbox: | Hard | UW NOI: | $1,692,202 | |
| Additional Debt: | No | UW NCF: | $1,600,252 | |
| Additional Debt Balance: | N/A | Appraised Value / Per SF: | $28,750,000 / $254 | |
| Additional Debt Type: | N/A | Appraisal Date: | 6/16/2016 | |
| Additional Future Debt Permitted: | No |
| Escrows and Reserves | Financial Information | |||||
| Initial | Monthly | Initial Cap | Cut-off Date Loan / SF: | $179 | ||
| Taxes: | $0 | Springing | N/A | Maturity Date Loan / SF: | $156 | |
| Insurance: | $11,256 | Springing | N/A | Cut-off Date LTV: | 70.3% | |
| Replacement Reserves: | $0 | Springing | N/A | Maturity Date LTV: | 61.4% | |
| TI/LC(2): | $0 | $6,250 | N/A | UW NCF DSCR: | 1.32x | |
| Single Tenant Reserve(3): | $0 | $28,000 | N/A | UW NOI Debt Yield: | 8.4% |
Sources and Uses
| Sources | Proceeds | % of Total | Uses | Proceeds | % of Total | |
| Mortgage Loan | $20,200,000 | 69.2% | Purchase Price | $28,750,000 | 98.5% | |
| Sponsor Equity | 8,974,472 | 30.8 | Closing Costs | 413,216 | 1.4 | |
| Upfront Reserves | 11,256 | 0.0 | ||||
| Total Sources | $29,174,472 | 100.0% | Total Uses | $29,174,472 | 100.0% |
| (1) | Represents the trailing twelve-month period ending on June 30, 2016. |
| (2) | Monthly TI/LC reserves will be $6,250 if BJ’s Wholesale Club, Inc. maintains a debt rating of at least “B3” from Moody’s or “B-” from S&P. Such reserves will increase to $12,500 if they fail to maintain this rating. |
| (3) | The borrower is required to make payments into the single tenant reserve through the 36thpayment date. |
THE INFORMATION IN THIS STRUCTURAL AND COLLATERAL TERM SHEET IS NOT COMPLETE AND MAY BE AMENDED PRIOR TO THE TIME OF SALE. THIS STRUCTURAL AND COLLATERAL TERM SHEET IS NOT AN OFFER TO SELL THESE SECURITIES AND IT IS NOT A SOLICITATION OF AN OFFER TO BUY THESE SECURITIES IN ANY JURISDICTION WHERE THE OFFER OR SALE IS NOT PERMITTED.
| - 128 - |
Mortgage Loan No. 11 – BJ’s Wholesale Club - Miami
The Loan. The BJ’s Wholesale Club - Miami loan, is a $20.2 million first mortgage loan secured by the fee interest in a 113,000 SF single tenant retail property located in Miami, Florida. The loan has a 10-year term and will amortize on a 30-year schedule for the term of the loan after a three-year interest-only period.
The Borrower. The borrowing entity for the loan is TGC Kendall, LLC, a Delaware limited liability company and special purpose entity.
The Sponsors. The loan’s sponsor and nonrecourse carve-out guarantor is Murray H. Goodman. Mr. Goodman is the chairman of The Goodman Company, a real estate development and investment firm based in West Palm Beach, Florida. The Goodman Company was founded in 1960 and has developed, owned, and/or managed more than 11 million SF of retail, office, and hospitality properties in California, Florida, New Jersey, Ohio, Pennsylvania and Virginia. The liability of the guarantor under the nonrecourse carve-out guaranty (except with respect to bankruptcy-related carve-outs and environmental issues) is capped at $6.0 million.
The Property.The property is a 113,000 SF, single-tenant retail property located in Miami, Florida. The property was constructed in 2006 on an approximately 8.8-acre site with 415 parking spaces. The property is 100.0% leased to BJ’s Wholesale Club, Inc. (“BJ’s”). The tenant is in its 11th year of a 20-year NNN lease which has four 5-year extension options. BJ’s is an operator of membership warehouse clubs in the Eastern United States. The company currently operates over 210 clubs in 15 states including New York, Connecticut, Pennsylvania, and Florida and employs more than 25,000 people.
The property was originally built-to-suite for BJ’s and is located in a western suburb of Miami that the appraisal describes as a good, densely populated location with convenient interstate access. The lease commenced on April 22, 2006 and has a current expiration date of January 31, 2027 with four 5-year extension options. The lease is an absolute net lease and has a current base payment of $1,839,075 ($16.28 PSF) that has contractual increases in year eleven and every five years thereafter, including options, by the lesser of 3 times the percentage change in CPI or 5.0%. The guarantor on the lease is BJ’s.
The appraiser concluded an as-is value of $28,750,000 and a “Go Dark” value of $22,000,000, which results in a Cut-off Date loan to value and loan to “Go Dark” value of 70.3% and 91.8%, respectively.
The Market. The property is located in Miami-Dade County and is situated in an area known as West Kendall which is about 25 miles southwest of the Miami central business district within the Miami-Miami Beach-Kendall metropolitan statistical area. The property’s neighborhood consists of a mixture of commercial and residential development with home values ranging from $100,000 to $400,000. The property is located along a major east/west commercial corridor that benefits from its close proximity to the Dadeland area, major business districts, employments centers and regional transportation links. Access to the overall subject area is provided via Florida’s Turnpike and US Highway 1 (South Dixie Highway).
Competitive Set Summary(1)
| Property | Year Built | Total GLA (SF) | Est. Occ. | Tenants |
| BJ’s Wholesale Club - Miami | 2006 | 113,000 | 100% | BJ’s Wholesale Club, Inc. |
| BJ’s Wholesale Club - Miami, FL | 1992 | 118,622 | 100% | BJ’s Wholesale Club, Inc. |
| BJ’s Wholesale Club - Homestead, FL | 2005 | 122,843 | 100% | BJ’s Wholesale Club, Inc. |
| BJ’s Wholesale Club - Fort Lauderdale, FL | 2007 | 119,598 | 100% | BJ’s Wholesale Club, Inc. |
| BJ’s Wholesale Club - Boynton Beach, FL | 2001 | 108,532 | 100% | BJ’s Wholesale Club, Inc. |
| (1) | Source: Appraisal. |
Historical and Current Occupancy(1)
| 2011 | 2012 | 2013 | 2014 | 2015 | Current |
| 100.0% | 100.0% | 100.0% | 100.0% | 100.0% | 100.0% |
| (1) | Source: Historical Occupancy is provided by the sponsor. Historical occupancies are as of December 31 of each respective year. |
THE INFORMATION IN THIS STRUCTURAL AND COLLATERAL TERM SHEET IS NOT COMPLETE AND MAY BE AMENDED PRIOR TO THE TIME OF SALE. THIS STRUCTURAL AND COLLATERAL TERM SHEET IS NOT AN OFFER TO SELL THESE SECURITIES AND IT IS NOT A SOLICITATION OF AN OFFER TO BUY THESE SECURITIES IN ANY JURISDICTION WHERE THE OFFER OR SALE IS NOT PERMITTED.
| - 129 - |
Mortgage Loan No. 11 – BJ’s Wholesale Club - Miami
Tenant Summary
| Tenant | Ratings Moody’s/S&P/Fitch | Net Rentable Area (SF) | % of Total NRA | Base Rent PSF | Lease Expiration Date |
| BJ’s Wholesale Club, Inc. | B3/B-/NR | 113,000 | 100.0% | $16.28 | 1/31/2027 |
Lease Rollover Schedule
| Year | Number of Leases Expiring | NRA Expiring | % of NRA Expiring | Base Rent Expiring | % of Base Rent Expiring | Cumulative NRA Expiring | Cumulative % of NRA Expiring | Cumulative Base Rent Expiring | Cumulative % of Base Rent Expiring |
| Vacant | NAP | 0 | 0.0% | NAP | NAP | 0 | 0.0% | NAP | NAP |
| 2016 | 0 | 0 | 0.0 | $0 | 0.0% | 0 | 0.0% | $0 | 0.0% |
| 2017 | 0 | 0 | 0.0 | 0 | 0.0 | 0 | 0.0% | $0 | 0.0% |
| 2018 | 0 | 0 | 0.0 | 0 | 0.0 | 0 | 0.0% | $0 | 0.0% |
| 2019 | 0 | 0 | 0.0 | 0 | 0.0 | 0 | 0.0% | $0 | 0.0% |
| 2020 | 0 | 0 | 0.0 | 0 | 0.0 | 0 | 0.0% | $0 | 0.0% |
| 2021 | 0 | 0 | 0.0 | 0 | 0.0 | 0 | 0.0% | $0 | 0.0% |
| 2022 | 0 | 0 | 0.0 | 0 | 0.0 | 0 | 0.0% | $0 | 0.0% |
| 2023 | 0 | 0 | 0.0 | 0 | 0.0 | 0 | 0.0% | $0 | 0.0% |
| 2024 | 0 | 0 | 0.0 | 0 | 0.0 | 0 | 0.0% | $0 | 0.0% |
| 2025 | 0 | 0 | 0.0 | 0 | 0.0 | 0 | 0.0% | $0 | 0.0% |
| 2026 & Beyond | 1 | 113,000 | 100.0 | 1,839,075 | 100.0 | 113,000 | 100.0% | $1,839,075 | 100.0% |
| Total | 1 | 113,000 | 100.0% | $1,839,075 | 100.0% |
Operating History and Underwritten Net Cash Flow
| 2014 | 2015 | TTM(1) | Underwritten | PSF | %(2) | |
| Rents in Place | N/A | $1,751,500 | $1,766,366 | $1,839,075 | $16.28 | 100.0% |
| Vacant Income | N/A | 0 | 0 | 0 | 0.00 | 0.0 |
| Gross Potential Rent | N/A | $1,751,500 | $1,766,366 | $1,839,075 | $16.28 | 100.0% |
| Total Reimbursements | N/A | 0 | 0 | 0 | 0.00 | 0.0 |
| Net Rental Income | N/A | $1,751,500 | $1,766,366 | $1,839,075 | $16.28 | 100.0% |
| (Vacancy/Collection Loss) | N/A | 0 | 0 | (91,954) | (0.81) | (5.0) |
| Other Income | N/A | 270 | 0 | 0 | 0.00 | 0.0 |
| Effective Gross Income | N/A | $1,751,770 | $1,766,366 | $1,747,121 | $15.46 | 95.0% |
| Total Expenses | N/A | $2,506 | $2,506 | $54,920 | $0.49 | 3.1 |
| Net Operating Income | N/A | $1,749,264 | $1,763,860 | $1,692,202 | $14.98 | 96.9% |
| Total TI/LC, Capex/RR | N/A | 0 | 0 | 91,950 | 0.81 | 5.3 |
| Net Cash Flow | N/A | $1,749,264 | $1,763,860 | $1,600,252 | $14.16 | 91.6% |
| (1) | The TTM column represents the trailing twelve months ending June 30, 2016. |
| (2) | % column represents percent of Net Rental Income for all revenue lines and represents percent of Effective Gross Income (“EGI”) for the remainder of fields. |
THE INFORMATION IN THIS STRUCTURAL AND COLLATERAL TERM SHEET IS NOT COMPLETE AND MAY BE AMENDED PRIOR TO THE TIME OF SALE. THIS STRUCTURAL AND COLLATERAL TERM SHEET IS NOT AN OFFER TO SELL THESE SECURITIES AND IT IS NOT A SOLICITATION OF AN OFFER TO BUY THESE SECURITIES IN ANY JURISDICTION WHERE THE OFFER OR SALE IS NOT PERMITTED.
| - 130 - |
(THIS PAGE INTENTIONALLY LEFT BLANK)
| - 131 - |
Mortgage Loan No. 12 – Holcomb Woods
| Mortgage Loan Information | Property Information | |||
| Mortgage Loan Seller: | BSP | Single Asset / Portfolio: | Single Asset | |
| Original Principal Balance: | $18,500,000 | Title: | Fee | |
| Cut-off Date Principal Balance: | $18,500,000 | Property Type - Subtype: | Office – Suburban | |
| % of Pool by IPB: | 2.4% | Net Rentable Area (SF): | 239,139 | |
| Loan Purpose: | Refinance | Location: | Roswell, GA | |
| Borrowers: | 1615 Holcomb Member, LLC; 1625 Holcomb Member LLC | Year Built / Renovated: | 1983, 1985 / 1998 | |
| Sponsors(1): | Alan Ades; Aaron Stauber; Daniel Stauber; Robert Ades; Maurice Ades | Occupancy: | 86.6% | |
| Interest Rate: | 4.3000% | Occupancy Date: | 9/30/2016 | |
| Note Date: | 10/14/2016 | Number of Tenants: | 29 | |
| Maturity Date: | 11/6/2026 | 2013 NOI(2): | N/A | |
| Interest-only Period: | 24 months | 2014 NOI(2): | N/A | |
| Original Term: | 120 months | 2015 NOI: | $1,160,710 | |
| Original Amortization: | 360 months | TTM NOI(3)(4): | $1,257,910 | |
| Amortization Type: | IO-Balloon | UW Econmic Occupancy: | 85.4% | |
| Call Protection: | L(24),Def (92),O(4) | UW Revenues: | $2,650,350 | |
| Lockbox(5): | Hard | UW Expenses: | $716,895 | |
| Additional Debt: | No | UW NOI(4): | $1,933,455 | |
| Additional Debt Balance: | N/A | UW NCF: | $1,689,076 | |
| Additional Debt Type: | N/A | Appraised Value / Per SF: | $27,250,000 / $114 | |
| Additional Future Debt Permitted: | No | Appraisal Date: | 8/29/2016 |
| Escrows and Reserves | Financial Information | |||||
| Initial | Monthly | Initial Cap | Cut-off Date Loan / SF: | $77 | ||
| Taxes: | $19,272 | $19,272 | N/A | Maturity Date Loan / SF: | $66 | |
| Insurance: | $0 | Springing(6) | N/A | Cut-off Date LTV: | 67.9% | |
| Replacement Reserves: | $0 | $5,091 | $240,000 | Maturity Date LTV: | 57.7% | |
| TI/LC: | $0 | $16,292 | $600,000 | UW NCF DSCR: | 1.54x | |
| Free Rent Reserve: | $68,876 | $0 | N/A | UW NOI Debt Yield: | 10.5% |
Sources and Uses
| Sources | Proceeds | % of Total | Uses | Proceeds | % of Total | |
| Mortgage Loan | $18,500,000 | 100.0% | Payoff Existing Debt | $12,474,980 | 67.4% | |
| Return of Equity | 5,573,180 | 30.1 | ||||
| Closing Costs | 363,693 | 2.0 | ||||
| Upfront Reserves | 88,147 | 0.5 | ||||
| Total Sources | $18,500,000 | 100.0% | Total Uses | $18,500,000 | 100.0% |
| (1) | The nonrecourse carveout guarantors, Alan Ades, Aaron Stauber, Daniel Stauber, Robert Ades, and Maurice Ades, are all principals of Rugby Realty – Rexxhall Realty and are joint and several guarantors on the carveouts. |
| (2) | The sponsor acquired the property in December 2014; therefore, 2013 NOI and 2014 NOI are not available. |
| (3) | Represents trailing twelve months ending June 30, 2016. |
| (4) | UW NOI is higher than TTM NOI due to an increase in occupancy. The property is currently 86.6% leased (excluding the 5,352 SF of Arclin USA, LLC space which the tenant has indicated that it intends to vacate as of 12/31/2016), compared to 64.4% at acquisition in December 2014, 59.0% in June 2015, 67.5% in December 2015 and an average occupancy of 78.3% for the trailing twelve months ending September 2016. |
| (5) | The loan is structured with a hard lockbox and springing cash management. |
| (6) | Monthly insurance reserve is waived for so long as (i) no event of default has occurred and is continuing, (ii) the property is insured under a blanket insurance policy approved by the lender in its reasonable discretion, (iii) the borrower provides evidence of renewal of the blanket policy and (iv) the borrower provides evidence that all insurance premiums have been timely made. |
THE INFORMATION IN THIS STRUCTURAL AND COLLATERAL TERM SHEET IS NOT COMPLETE AND MAY BE AMENDED PRIOR TO THE TIME OF SALE. THIS STRUCTURAL AND COLLATERAL TERM SHEET IS NOT AN OFFER TO SELL THESE SECURITIES AND IT IS NOT A SOLICITATION OF AN OFFER TO BUY THESE SECURITIES IN ANY JURISDICTION WHERE THE OFFER OR SALE IS NOT PERMITTED.
| - 132 - |
Mortgage Loan No. 12 – Holcomb Woods
The Loan. The Holcomb Woods loan is an $18.5 million first mortgage loan secured by the fee interest in a 239,139 SF office building located in Roswell, Georgia. The loan has a 10-year term and will amortize on a 30-year schedule, following an interest-only period of 24 months.
The Borrowers. The borrowing entities for the loan are 1615 Holcomb Member, LLC and 1625 Holcomb Member, LLC, each a Delaware limited liability company and special purpose entity. The borrowing entities own the property as tenants-in-common.
The Sponsor. The loan’s sponsors and nonrecourse carve-out guarantors are Alan Ades, Aaron Stauber, Daniel Stauber, Robert Ades, and Maurice Ades, all of which are principals of Rugby Realty – Rexxhall Realty and are joint and several guarantors on the recourse carveouts. Rugby Realty - Rexxhall Realty is a real estate company formed in 1980 with corporate headquarters in Secaucus, New Jersey. The sponsor possesses a portfolio of properties located throughout Georgia, Florida, New York, New Jersey, Pennsylvania and Connecticut. The sponsor’s current portfolio features over 7.3 million SF and an estimated valuation of $830.0 million. The sponsor has experience in the Atlantic Metro market, having acquired approximately 1.0 million SF in the area.
The Property.The property is a 239,139 SF suburban office building located in Roswell, Georgia. The improvements consists of six, single-story office buildings configured as a suburban office park built in two phases. Buildings 100 and 200 were completed in 1983, and buildings 300 and 400 were completed in 1985, and the improvements are situated on a 21.6 acre site.
As of September 30, 2016, the property was 86.6% leased by 29 tenants featuring companies engaged in technology, manufacturing, communications, engineering and construction, and transportation industries, among others. The three largest tenants at the property, Arclin USA, LLC (21,129 SF; 8.8% of NRA), Fulton Communications (19,726 SF; 8.2% of NRA) and Courion Corporation (Core Security) (18,004 SF; 7.5% of NRA) operate their corporate headquarters at the property. Arclin USA, LLC has been at the property since November 2012. Lennar Georgia, Inc. (11,150 SF; 4.7% of NRA; rated Ba1/BB/BB+ by Moody’s/S&P/Fitch) operates its regional headquarters at the property and is the parent company of Universal American Mortgage Co. (2,336 SF; 1.0% of NRA), another in-place tenant at the property.
The property is located on Holcomb Woods Parkway at Holcomb Bridge Road, and is less than 0.5 miles from Georgia 400, the main north-south arterial for the region which provides direct access to downtown Atlanta and the surrounding northern suburbs. The property’s location just off of Georgia 400 places the property with easy access to infrastructure in Roswell, close proximity to Alpharetta and a short drive to central perimeter area in Sandy Springs. The Atlanta central business district and downtown Buckhead are also within a 30-minute drive from the property. Additionally, the immediate area offers a wide array of amenities for corporate tenants, including several golf courses and exclusive country clubs, and a host of walkable amenities including 16 restaurants, four banks, two other office parks, two retail destinations, and two private health clubs.
The Market. The property is located in the city of Roswell, located in Fulton County and is part of the Atlanta-Sandy Springs-Roswell metropolitan statistical area. More locally, the property is situated in an area regarded as the Georgia 400 Corridor, which features numerous office parks and commercial centers in Atlanta’s northern suburbs. The Georgia 400 Corridor is a major market for corporate offices. Microsoft recently signed a 43,000 SF lease to anchor the 228,000 SF, 8000 Avalon office building that is currently under construction.
As of the second quarter of 2016, the North Fulton office submarket contained 14.4 million SF of office space with an overall vacancy rate of 12.5%. The appraisal concluded market rents of $11.50 PSF for the office space. According to the appraisal, the property’s competitive set consists of the five properties detailed in the table below.
THE INFORMATION IN THIS STRUCTURAL AND COLLATERAL TERM SHEET IS NOT COMPLETE AND MAY BE AMENDED PRIOR TO THE TIME OF SALE. THIS STRUCTURAL AND COLLATERAL TERM SHEET IS NOT AN OFFER TO SELL THESE SECURITIES AND IT IS NOT A SOLICITATION OF AN OFFER TO BUY THESE SECURITIES IN ANY JURISDICTION WHERE THE OFFER OR SALE IS NOT PERMITTED.
| - 133 - |
Mortgage Loan No. 12 – Holcomb Woods
Competitive Set Summary(1)
| Property | Year Built/ Renovated | Total GLA (SF) | Est. Rent PSF | Est. Occ. | Proximity (miles) |
| Holcomb Woods | 1983, 1985 / 1998 | 239,139(2) | $10.68(2) | 86.6%(2) | N/A |
| Kings Landing | 1999 | 75,843 | $11.00 | 68.0% | 2.0 |
| Pavilion Center One | 1985 | 44,612 | $17.25 | 85.0% | 2.0 |
| Brookside Concourse Portfolio | 1999 | 155,050 | $13.00 | 100.0% | 7.0 |
| Lakeview 400, Building 200 | 1997 | 89,719 | $11.50 | 100.0% | 7.0 |
| One Point Royal | 1996 | 145,008 | $21.50 | 89.0% | 5.0 |
| (1) | Source: Appraisal. |
| (2) | Based on the September 30, 2016 underwritten rent roll. |
Historical and Current Occupancy(1)
| 2013 | 2014 | 2015 | Current(2) |
| N/A | 64.4% | 67.5% | 86.6% |
| (1) | Source: Historical Occupancy is provided by the sponsor. Occupancies are as of December 31 of each respective year. The sponsor acquired the property in December 2014, as a result historical occupancy for 2013 is not available. |
| (2) | Based on the September 30, 2016 underwritten rent roll. |
Tenant Summary(1)
| Tenant | Ratings Moody’s/S&P/ Fitch(2) | Net Rentable Area (SF) | % of Total NRA | Base Rent PSF | Lease Expiration Date |
| Arclin USA, LLC | N/A | 21,129 | 8.8% | $5.35 | 8/31/2023 |
| Fulton Communications | N/A | 19,726 | 8.2% | $10.93 | 6/30/2020 |
| Courion Corporation (Core Security) | N/A | 18,004 | 7.5% | $10.50 | 4/30/2021 |
| P. Marshall & Associates | N/A | 17,197 | 7.2% | $12.47 | 12/31/2019 |
| OTR Capital | N/A | 16,101 | 6.7% | $5.00 | 7/25/2021 |
| Lennar Georgia, Inc. | Ba1 / BB / BB+ | 11,150 | 4.7% | $9.70 | 6/30/2019 |
| Farmers Insurance Exchange | N/A | 8,750 | 3.7% | $7.65 | 4/30/2018 |
| Enveniam Inc. | N/A | 8,343 | 3.5% | $9.38 | 8/31/2017 |
| Keyston Bros Inc. | N/A | 7,327 | 3.1% | $12.57 | 7/31/2021 |
| Summit Autism Center ATL | N/A | 6,614 | 2.8% | $10.65 | 12/31/2018 |
| (1) | Based on the September 30, 2016 underwritten rent roll, including rent increases occurring through November 30, 2017. |
| (2) | Ratings provided are for the parent company of the entity listed in the “Tenant” field whether or not the parent company guarantees the lease. |
THE INFORMATION IN THIS STRUCTURAL AND COLLATERAL TERM SHEET IS NOT COMPLETE AND MAY BE AMENDED PRIOR TO THE TIME OF SALE. THIS STRUCTURAL AND COLLATERAL TERM SHEET IS NOT AN OFFER TO SELL THESE SECURITIES AND IT IS NOT A SOLICITATION OF AN OFFER TO BUY THESE SECURITIES IN ANY JURISDICTION WHERE THE OFFER OR SALE IS NOT PERMITTED.
| - 134 - |
Mortgage Loan No. 12 – Holcomb Woods
Lease Rollover Schedule(1)
| Year | Number of Leases Expiring | NRA Expiring | % of NRA Expiring | Base Rent Expiring | % of Base Rent Expiring | Cumulative NRA Expiring | Cumulative % of NRA Expiring | Cumulative Base Rent Expiring | Cumulative % of Base Rent Expiring |
| Vacant | NAP | 32,695 | 13.7% | NAP | NAP | 32,695 | 13.7% | NAP | NAP |
| MTM | 0 | 0 | 0.0 | $0 | 0.0% | 32,695 | 13.7% | $0 | 0.0% |
| 2016 | 0 | 0 | 0.0 | 0 | 0.0 | 32,695 | 13.7% | $0 | 0.0% |
| 2017 | 4 | 15,995 | 6.7 | 152,143 | 6.9 | 48,690 | 20.4% | $152,143 | 6.9% |
| 2018 | 6 | 30,240 | 12.6 | 304,047 | 13.8 | 78,930 | 33.0% | $456,189 | 20.7% |
| 2019 | 7 | 45,529 | 19.0 | 516,722 | 23.4 | 124,459 | 52.0% | $972,911 | 44.1% |
| 2020 | 3 | 27,411 | 11.5 | 300,573 | 13.6 | 151,870 | 63.5% | $1,273,484 | 57.7% |
| 2021 | 6 | 58,451 | 24.4 | 615,248 | 27.9 | 210,321 | 87.9% | $1,888,732 | 85.6% |
| 2022 | 2 | 7,689 | 3.2 | 84,670 | 3.8 | 218,010 | 91.2% | $1,973,402 | 89.5% |
| 2023 | 1 | 21,129 | 8.8 | 231,785 | 10.5 | 239,139 | 100.0% | $2,205,188 | 100.0% |
| 2024 | 0 | 0 | 0.0 | 0 | 0.0 | 239,139 | 100.0% | $2,205,188 | 100.0% |
| 2025 | 0 | 0 | 0.0 | 0 | 0.0 | 239,139 | 100.0% | $2,205,188 | 100.0% |
| 2026 & Beyond | 0 | 0 | 0.0 | 0 | 0.0 | 239,139 | 100.0% | $2,205,188 | 100.0% |
| Total | 29 | 239,139 | 100.0% | $2,205,188 | 100.0% |
| (1) | Based on the September 30, 2016 underwritten rent roll. Base Rent Expiring includes base rent and rent increases occurring through November 30, 2017. |
Operating History and Underwritten Net Cash Flow(1)
| 2015 | TTM(2) | Underwritten(3) | PSF | %(4) | |
| Rents in Place | $1,570,616 | $1,627,036 | $2,205,188 | $9.22 | 71.1% |
| Vacant Income | 0 | 0 | 375,993 | 1.57 | 12.1 |
| Gross Potential Rent | $1,570,616 | $1,627,036 | $2,581,179 | $10.79 | 83.2% |
| Total Reimbursements | 317,984 | 331,786 | 521,064 | 2.18 | 16.8 |
| Net Rental Income | $1,888,600 | $1,958,822 | $3,102,244 | $12.97 | 100.0% |
| (Vacancy/Collection Loss) | 0 | 0 | (451,893) | (1.89) | (14.6) |
| Other Income | 11,889 | 22,505 | 0 | 0.00 | 0.0 |
| Effective Gross Income | $1,900,489 | $1,981,327 | $2,650,350 | $11.08 | 85.4% |
| Total Expenses | $739,779 | $723,417 | $716,895 | $3.00 | 27.0% |
| Net Operating Income | $1,160,710 | $1,257,910 | $1,933,455 | $8.09 | 73.0% |
| Total TI/LC, Capex/RR | 0 | 0 | 244,379 | 1.02 | 9.2 |
| Net Cash Flow | $1,160,710 | $1,257,910 | $1,689,076 | $7.06 | 63.7% |
| (1) | The sponsor acquired the property in December 2014; therefore, 2013 and 2014 cash flows are not available. |
| (2) | TTM column represents the trailing twelve months ending June 30, 2016. |
| (3) | Underwritten Rents in Place includes Base Rent and Rent Increases occurring through November 30, 2017. Underwritten Net Operating Income is higher than TTM Net Operating Income due to an increase in occupancy. The property is currently 86.6% leased (excluding the 5,352 SF of Arclin USA, LLC space which the tenant has indicated that it intends to vacate as of 12/31/2016), compared to 64.4% at acquisition in December 2014, 59.0% in June 2015, 67.5% in December 2015 and an average occupancy of 78.3% for the trailing twelve months ending September 2016. |
| (4) | % column represents percent of Net Rental Income for all revenue lines and represents percent of Effective Gross Income for the remainder of fields |
THE INFORMATION IN THIS STRUCTURAL AND COLLATERAL TERM SHEET IS NOT COMPLETE AND MAY BE AMENDED PRIOR TO THE TIME OF SALE. THIS STRUCTURAL AND COLLATERAL TERM SHEET IS NOT AN OFFER TO SELL THESE SECURITIES AND IT IS NOT A SOLICITATION OF AN OFFER TO BUY THESE SECURITIES IN ANY JURISDICTION WHERE THE OFFER OR SALE IS NOT PERMITTED.
| - 135 - |
Mortgage Loan No. 13 — The Heights II
| Mortgage Loan Information | Property Information | |||
| Mortgage Loan Seller: | Column | Single Asset / Portfolio: | Single Asset | |
| Original Principal Balance: | $17,350,000 | Title: | Fee | |
| Cut-off Date Principal Balance: | $17,350,000 | Property Type - Subtype: | Multifamily – Student Housing | |
| % of Pool by IPB: | 2.3% | Net Rentable Area (Beds): | 672 | |
| Loan Purpose: | Refinance | Location: | San Marcos, TX | |
| Borrower: | University Heights II San Marcos Apartments, DST | Year Built / Renovated: | 2005 / 2015 | |
| Sponsor: | Capital Square Realty Advisors, LLC | Occupancy: | 97.2% | |
| Interest Rate: | 4.8520% | Occupancy Date: | 10/10/2016 | |
| Note Date: | 2/11/2016 | Number of Tenants: | N/A | |
| Maturity Date: | 3/6/2026 | 2014 NOI: | $1,949,974 | |
| Interest-only Period: | 24 months | 2015 NOI: | $1,474,211 | |
| Original Term: | 120 months | TTM NOI(1): | $1,651,335 | |
| Original Amortization: | 360 months | UW Economic Occupancy: | 95.0% | |
| Amortization Type: | IO-Balloon | UW Revenues: | $4,020,149 | |
| Call Protection: | L(32),Def(84),O(4) | UW Expenses: | $2,231,489 | |
| Lockbox: | Soft | UW NOI(2): | $1,788,660 | |
| Additional Debt: | No | UW NCF: | $1,728,180 | |
| Additional Debt Balance: | N/A | Appraised Value / Per Bed: | $28,730,000 / $42,753 | |
| Additional Debt Type: | N/A | Appraisal Date: | 9/14/2016 | |
| Additional Future Debt Permitted: | No |
| Escrows and Reserves | Financial Information | |||||
| Initial | Monthly | Initial Cap | Cut-off Date Loan / Bed: | $25,818 | ||
| Taxes: | $95,068 | $47,534 | N/A | Maturity Date Loan / Bed: | $22,258 | |
| Insurance: | $110,833 | $11,083 | N/A | Cut-off Date LTV: | 60.4% | |
| Replacement Reserves: | $5,000 | $5,000 | N/A | Maturity Date LTV: | 52.1% | |
| Engineering Reserve: | $6,250 | N/A | N/A | UW NCF DSCR: | 1.57x | |
| UW NOI Debt Yield: | 10.3% |
Sources and Uses
| Sources | Proceeds | % of Total | Uses | Proceeds | % of Total | |
| Mortgage Loan | $17,350,000 | 100.0% | Loan Payoff | $16,145,448 | 93.1% | |
| Closing Costs | 976,529 | 5.6 | ||||
| Upfront Reserves | 217,151 | 1.3 | ||||
| Return of Equity | 10,871 | 0.1 | ||||
| Total Sources | $17,350,000 | 100.0% | Total Uses | $17,350,000 | 100.0% |
| (1) | Represents trailing twelve months ending June 30, 2016. |
| (2) | UW NOI exceeds TTM NOI mainly due to underwriting the in-place rent roll, as well as pre-leasing for the coming year which reflects higher signed rents and a decrease in real estate taxes based on the most recent assessment. |
THE INFORMATION IN THIS STRUCTURAL AND COLLATERAL TERM SHEET IS NOT COMPLETE AND MAY BE AMENDED PRIOR TO THE TIME OF SALE. THIS STRUCTURAL AND COLLATERAL TERM SHEET IS NOT AN OFFER TO SELL THESE SECURITIES AND IT IS NOT A SOLICITATION OF AN OFFER TO BUY THESE SECURITIES IN ANY JURISDICTION WHERE THE OFFER OR SALE IS NOT PERMITTED.
| - 136 - |
Mortgage Loan No. 13 — The Heights II
The Loan. The Heights II loan is a $17.35 million first mortgage loan secured by the fee interest in a 240-unit, 672-bed student housing property located in San Marcos, Texas near Texas State University. The loan has a 10-year term and will amortize on a 30-year schedule after a two-year interest-only period.
The Borrower. The borrowing entity for the loan is University Heights II San Marcos Apartments, DST, a Delaware statutory trust and special purpose entity.
The Sponsor. The loan’s sponsor and nonrecourse carve-out guarantor is Capital Square Realty Advisors, LLC. Capital Square Realty Advisors, LLC specializes in the creation and management of commercial real estate investment programs for Section 1031 tax-deferred exchange investors and cash (non-1031) investors using the Delaware Statutory Trust structure. Louis J. Rogers, founder and chief executive officer of Capital Square Realty Advisors, LLC has been involved in the creation and management of more than 100 investment offerings totaling over $3 billion, including tenant-in-common, DST and multiple publicly registered non-traded real estate investment trusts.
The Property. The property, known as The Heights II, is a 240-unit, 672-bed, off-campus, Class-A student housing property located in San Marcos, Texas. The property is located approximately two miles from the Texas State University campus and is located on the University shuttle bus system, with its own stop, which travels frequently to and from the university campus. The property was built in 2005 and is situated on approximately 17.8 acres. Amenities at the property include a resort style pool and hot tub, outdoor lounge with a fireplace, BBQ grilling area, sand volleyball court, study rooms, clubroom with games, kitchen, cyber lounge and media room, fitness center and tanning booths. As of October 10, 2016, the property was 97.2% leased.
The property contains 96 four-bedroom units (40.0%), 72 two-bedroom units (30.0%), 36 three-bedroom units (15.0%) and 36 one-bedroom units (15.0%). One-bedroom, two-bedroom, three-bedroom and four-bedroom units have approximately 554 SF, 816 SF, 1,089 SF and 1,364 SF, respectively. Units feature individual bedrooms and bathrooms, faux wood flooring, cable with HBO, fully equipped kitchens with black GE appliances, patios & balconies, and washer & dryers.
Texas State University has over 30,000 students and according to the appraisal has one of the highest levels of enrollment growth in the state. According to the appraisal there are no competitive projects expected to be built and the only new on-campus student housing facility planned is a 598-bed facility called Moore Street Housing. The Moore Street Housing complex opened for the 2016/17 school year and includes two dorms, Angelina Hall (280 beds) and San Gabriel Hall (318 beds) along with common amenities.
Multifamily Unit Mix(1)
| Unit Type | No. of Beds | % of Total | Occupied Beds | Occupancy | Average Unit Size (SF) | Average Monthly Rental Rate(2) | Average Monthly Rental Rate PSF | Monthly Market Rental Rate(2)(3) | Monthly Market Rental Rate PSF(3) |
| One Bedroom, One Bath | 36 | 5.4% | 36 | 100.0% | 554 | $876 | $1.58 | $900 | $1.62 |
| Two Bedroom, Two Bath | 144 | 21.4 | 139 | 96.5% | 816 | $577 | $1.42 | $550 | $1.35 |
| Three Bedroom, Three Bath | 108 | 16.1 | 103 | 95.4% | 1,089 | $528 | $1.46 | $533 | $1.47 |
| Four Bedroom, Four Bath | 384 | 57.1 | 375 | 97.7% | 1,364 | $475 | $1.39 | $475 | $1.39 |
| Total/Wtd. Avg. | 672 | 100.0% | 653 | 97.2% | 1,037 | $527 | $1.42 | $523 | $1.41 |
| (1) | Based on the underwritten rent roll dated October 10, 2016. |
| (2) | Numbers are per bed. |
| (3) | Based on the Appraisal. |
The Market. The property is located in suburban San Marcos, Texas in the Austin Metropolitan Statistical Area. San Marcos is situated approximately 26 miles south of the Austin central business district. San Marcos is located in the center of the Austin-San Antonio corridor on Interstate 35, the central avenue for trade between Canada, the U.S. and Mexico, and it is less than a thirty-minute drive from Interstate Highway 10, the transportation link between the east and west coast of the U.S. Texas State University (“TSU”) is the primary economic generator and a state supported public university that offers 114 undergraduate, 81
THE INFORMATION IN THIS STRUCTURAL AND COLLATERAL TERM SHEET IS NOT COMPLETE AND MAY BE AMENDED PRIOR TO THE TIME OF SALE. THIS STRUCTURAL AND COLLATERAL TERM SHEET IS NOT AN OFFER TO SELL THESE SECURITIES AND IT IS NOT A SOLICITATION OF AN OFFER TO BUY THESE SECURITIES IN ANY JURISDICTION WHERE THE OFFER OR SALE IS NOT PERMITTED.
| - 137 - |
Mortgage Loan No. 13 — The Heights II
graduate, and five PhD programs. TSU’s main campus is in San Marcos. Land uses within the subject neighborhood include a combination of commercial and residential developments, with residential uses comprising 50% to 60% of the land uses in the San Marcos area. The remaining land uses consist of a mixture of commercial uses, including Texas State University, numerous apartment properties, and various retail properties.
Primary access to the subject neighborhood is provided by IH-35. The 2015 population within a one-, three- and five-mile radius was 6,654, 30,206, 59,571, while the 2015 average household income within the same radii was $35,765, $34,954, and $44,447.
Competitive Set Summary(1)
| Property | Location | Year Built | No. of Units | Avg. Unit Size (SF) | Avg. $/ Unit | Occupancy |
| The Heights II | San Marcos, TX | 2005 | 240 | 1,037 | $1,379(2) | 97%(2) |
| Copper Beach | San Marcos, TX | 2011 | 415 | 1,728 | $1,782 | 97% |
| The Grove | San Marcos, TX | 2009 | 76 | 1,034 | $1,224 | 97% |
| Village on Telluride | San Marcos, TX | 2011 | 385 | 1,775 | $1,858 | 99% |
| Sanctuary Lofts | San Marcos, TX | 2006 | 104 | 754 | $1,399 | 100% |
| Villagio | San Marcos, TX | 2006 | 180 | 1,057 | $1,424 | 98% |
| The Edge | San Marcos, TX | 1999 | 156 | 965 | $1,649 | 99% |
| Total/Wtd. Avg.(3) | 1,316 | 1,442 | $1,677 | 98% |
| (1) | Source: Appraisal. |
| (2) | Based on rent roll dated October 10, 2016. |
| (3) | Excludes the subject property. |
Historical and Current Occupancy(1)
| 2013 | 2014 | 2015 | Current(2) |
| 94.8% | 95.6% | 93.9% | 97.2% |
| (1) | Source: Historical Occupancy is provided by the sponsor. Historical Occupancies are as of December 31 of each respective year. |
| (2) | Based on the October 10, 2016 underwritten rent roll. |
THE INFORMATION IN THIS STRUCTURAL AND COLLATERAL TERM SHEET IS NOT COMPLETE AND MAY BE AMENDED PRIOR TO THE TIME OF SALE. THIS STRUCTURAL AND COLLATERAL TERM SHEET IS NOT AN OFFER TO SELL THESE SECURITIES AND IT IS NOT A SOLICITATION OF AN OFFER TO BUY THESE SECURITIES IN ANY JURISDICTION WHERE THE OFFER OR SALE IS NOT PERMITTED.
| - 138 - |
Mortgage Loan No. 13 — The Heights II
Operating History and Underwritten Net Cash Flow
| 2014 | 2015 | TTM(1) | Underwritten(2) | Per Bed | %(3) | |
| Rents in Place(4) | $3,951,344 | $3,883,386 | $3,938,002 | $4,125,728 | $6,139 | 100.0% |
| Vacant Income | 0 | 0 | 0 | 0 | 0 | 0.0 |
| Gross Potential Rent | $3,951,344 | $3,883,386 | $3,938,002 | $4,125,728 | $6,139 | 100.0% |
| Total Reimbursements | 0 | 0 | 0 | 0 | 0 | 0.0 |
| Net Rental Income | $3,951,344 | $3,883,386 | $3,938,002 | $4,125,728 | $6,139 | 100.0% |
| (Vacancy/Collection Loss) | (270,621) | (401,149) | (348,945) | (349,578) | (520) | (8.5) |
| Other Income | 152,626 | 243,607 | 339,703 | 244,000 | 363 | 5.9 |
| Effective Gross Income | $3,833,349 | $3,725,844 | $3,928,760 | $4,020,149 | $5,982 | 97.4% |
| Total Expenses | $1,883,375 | $2,251,633 | $2,277,425 | $2,231,489 | $3,321 | 55.5% |
| Net Operating Income | $1,949,974 | $1,474,211 | $1,651,335 | $1,788,660 | $2,662 | 44.5% |
| Replacement Reserves | 0 | 0 | 0 | 60,480 | 90 | 1.5 |
| Net Cash Flow | $1,949,974 | $1,474,211 | $1,651,335 | $1,728,180 | $2,572 | 43.0% |
| (1) | The TTM column represents the trailing twelve-month ending June 30, 2016. |
| (2) | Underwritten Net Operating Income exceeds TTM Net Operating Income mainly due to underwriting the in-place rent roll which has higher rents from the new leasing season. |
| (3) | % column represents percent of Net Rental Income for all revenue lines and represents percent of Effective Gross Income for the remainder of fields. |
| (4) | Rents in Place are based on the October 10, 2016 rent roll. |
THE INFORMATION IN THIS STRUCTURAL AND COLLATERAL TERM SHEET IS NOT COMPLETE AND MAY BE AMENDED PRIOR TO THE TIME OF SALE. THIS STRUCTURAL AND COLLATERAL TERM SHEET IS NOT AN OFFER TO SELL THESE SECURITIES AND IT IS NOT A SOLICITATION OF AN OFFER TO BUY THESE SECURITIES IN ANY JURISDICTION WHERE THE OFFER OR SALE IS NOT PERMITTED.
| - 139 - |
Mortgage Loan No. 14 — Beltway Marketplace
| Mortgage Loan Information | Property Information | |||
| Mortgage Loan Seller: | BSP | Single Asset / Portfolio: | Single Asset | |
| Original Principal Balance: | $16,700,000 | Title: | Fee | |
| Cut-off Date Principal Balance: | $16,679,330 | Property Type - Subtype: | Retail – Anchored | |
| % of Pool by IPB: | 2.2% | Net Rentable Area (SF): | 80,479 | |
| Loan Purpose: | Refinance | Location: | Las Vegas, NV | |
| Borrower: | Beltway Marketplace Owner, LLC | Year Built / Renovated: | 2002 / N/A | |
| Sponsors: | Haskel Iny; Ronnie Schwartz | Occupancy: | 100.0% | |
| Interest Rate: | 4.3300% | Occupancy Date: | 10/1/2016 | |
| Note Date: | 9/9/2016 | Number of Tenants: | 12 | |
| Maturity Date: | 10/6/2026 | 2013 NOI: | $1,439,199 | |
| Interest-only Period: | 0 months | 2014 NOI: | $1,441,568 | |
| Original Term: | 120 months | 2015 NOI: | $1,433,575 | |
| Original Amortization: | 360 months | TTM NOI(1)(2): | $1,410,808 | |
| Amortization Type: | Balloon | UW Economic Occupancy: | 95.0% | |
| Call Protection: | L(25),Def (91),O(4) | UW Revenues: | $1,916,066 | |
| Lockbox(3): | Springing | UW Expenses: | $380,877 | |
| Additional Debt: | No | UW NOI(2): | $1,535,189 | |
| Additional Debt Balance: | N/A | UW NCF: | $1,458,734 | |
| Additional Debt Type: | N/A | Appraised Value / Per SF: | $23,400,000 / $291 | |
| Additional Future Debt Permitted: | No | Appraisal Date: | 8/25/2016 |
| Escrows and Reserves | Financial Information | |||||
| Initial | Monthly | Initial Cap | Cut-off Date Loan / SF: | $207 | ||
| Taxes: | $47,250 | $7,875 | N/A | Maturity Date Loan / SF: | $167 | |
| Insurance: | $13,832 | $1,383 | N/A | Cut-off Date LTV: | 71.3% | |
| Replacement Reserves: | $0 | $1,341 | $48,288 | Maturity Date LTV: | 57.4% | |
| TI/LC: | $0 | $5,097 | $305,820 | UW NCF DSCR: | 1.47x | |
| Renovation Work Funds(4): | $500,000 | N/A | N/A | UW NOI Debt Yield: | 9.2% | |
| Lease Sweep Reserve(5): | $0 | Springing | N/A |
| Sources and Uses | ||||||
| Sources | Proceeds | % of Total | Uses | Proceeds | % of Total | |
| Mortgage Loan | $16,700,000 | 93.4% | Payoff Existing Debt(6) | $17,085,661 | 95.6% | |
| Sponsor Equity | 1,176,644 | 6.6 | Upfront Reserves | 561,082 | 3.1 | |
| Closing Costs | 229,901 | 1.3 | ||||
| Total Sources | $17,876,644 | 100.0% | Total Uses | $17,876,644 | 100.0% |
| (1) | Represents trailing twelve months ending July 31, 2016. |
| (2) | Underwritten NOI is higher than TTM NOI primarily due to: (i) rent increases associated with the expansion of Goodwill Industries of Nevada to a total space of 20,280 SF and the relocation of Nails Design Inc. to 3,339 SF, both of which are expected to come into effect by January 2017, (ii) rent associated with 1,615 SF of AA Medical which was vacant through the TTM period (lease started on 9/26/2016), and (ii) rent steps underwritten through the end of September 2017. |
| (3) | The loan is structured with a springing lockbox and springing cash management. |
| (4) | The borrower was required to deposit the Renovation Work Funds at origination to complete the tenant improvement work for the expansion of Goodwill Industries of Nevada to a total space of 20,280 SF and the relocation of Nails Design Inc. to 3,339 SF at the property. The work is expected to be completed by January 2017 and a completing guaranty was provided by the sponsor at origination. |
| (5) | The borrower is required to deposit all excess cash flow generated by the property, after the payment of debt service, required reserves and operating expenses, among other things, for the immediately preceding interest period into a lease sweep reserve in the event that: 99 Cents Only Stores, Goodwill Industries of Nevada, any other tenant occupying at least 20,000 SF of NRA at the property or any replacement tenant, (i) defaults on its lease beyond notice and cure periods, (ii) goes dark or vacates its space, (iii) files for bankruptcy, (iv) terminates its lease, or (v) does not renew its lease at least 12 months prior to the scheduled lease expiration. |
| (6) | The prior loan was securitized in LBUBS 2006-C6. |
THE INFORMATION IN THIS STRUCTURAL AND COLLATERAL TERM SHEET IS NOT COMPLETE AND MAY BE AMENDED PRIOR TO THE TIME OF SALE. THIS STRUCTURAL AND COLLATERAL TERM SHEET IS NOT AN OFFER TO SELL THESE SECURITIES AND IT IS NOT A SOLICITATION OF AN OFFER TO BUY THESE SECURITIES IN ANY JURISDICTION WHERE THE OFFER OR SALE IS NOT PERMITTED.
| - 140 - |
Mortgage Loan No. 14 — Beltway Marketplace
The Loan. The Beltway Marketplace loan is a $16.7 million first mortgage loan secured by the fee interest in an 80,479 SF anchored retail center located in Las Vegas, Nevada. The loan has a 10-year term and will amortize on a 30-year schedule.
The Borrower. The borrowing entity for the loan is Beltway Marketplace Owner, LLC, a Delaware limited liability company and special purpose entity.
The Sponsors. The loan’s sponsor and nonrecourse carve-out guarantors are Haskel Iny and Ronnie Schwartz. The borrowing entity is owned 7.5% by Haskel Iny, 7.5% by Ronnie Schwartz and 85% by five minority partners. The sponsors own a real estate development, investment and property management entity called Great American Capital. The sponsors and their company’s developments include more than 550 individual commercial and residential projects totaling 3.0 million SF of space in four states, and more than $2 billion in real estate developments in North America and Costa Rica. The sponsors and their affiliated companies currently own over 450,000 SF of retail space, 50,000 SF of office space and over 10 multi-family projects encompassing over 800 units with an estimated value of over $100.0 million.
The Property.Beltway Marketplace is an 80,479 SF anchored retail center located in Las Vegas, Nevada. The property was constructed in 2002 and is situated on approximately 6.7 acres. The property is anchored by 99 Cents Only Stores (“99 Cents Only”), Goodwill Industries of Nevada (“Goodwill”), CEC Entertainment, Inc. (“Chuck E. Cheese”) and other smaller inline tenants. There are 359 surface parking spaces at the property resulting in a parking ratio of 4.5 spaces per 1,000 SF of NRA.
As of October 1, 2016, the property was 100.0% leased by 12 tenants. The property is currently leased to a mix of discount value tenants, restaurants, and retail services that cater to residential neighborhoods in the immediate area. The three largest tenants are 99 Cents Only (27.9% of NRA, 16.9% of underwritten base rent), Goodwill (25.2% of NRA, 24.5% of underwritten base rent) and Chuck E. Cheese (14.9% of NRA, 16.0% of underwritten base rent). 99 Cents Only and Chuck E. Cheese have been at the property since 2002 and most recently executed renewals in 2013 and 2016, respectively. Goodwill, which has also been at the property since 2002, recently executed an early lease renewal in July 2016 for a 10-year extension in conjunction with an expansion of their space from 14,127 SF (17.6% NRA) to their current 20,280 SF (25.2% NRA). According to Goodwill’s Chief Operating Officer, this Goodwill location receives about 52,000 donors each year and ranks 3rd in sales performance out of 18 Goodwill locations in Las Vegas with an annual average of $210.00 PSF. 99 Cents Only is rated Caa3/CCC+ and Chuck E. Cheese is rated Caa2/B by Moody’s/S&P, respectively. Each of the three anchor tenants have at least two, five-year options to renew at fixed rents. Other tenants include Mattress Firm, Atsy Corporation/ Water Wings (“Water Wings”), two restaurants, local neighborhood retail tenants, and medical/law offices. The property is currently fully leased and has averaged over 90.0% occupancy since 2007. Since December 2014, the sponsor has executed three new leases occupying 12.8% of NRA and contributing 18.5% of underwritten base rent, and four lease renewals encompassing 45.5% of NRA and contributing 47.1% of underwritten base rent at the property.
The property is situated at the intersection of South Eastern Avenue (64,000 vehicles per day) and East Serene Avenue (27,500 vehicles per day), and has visibility from Interstate 215 (126,000 vehicles per day). Interstate 215 is part of the beltway that encircles Las Vegas, and the property is located immediately off an exit ramp on Interstate 215 that intersects South Eastern Avenue. The property’s signage is a large pylon with panels oriented toward the Interstate 215 ramp and a second large multi-panel pylon situated at the main entrance along South Eastern Avenue. The strip building that is closest to South Eastern Avenue, along the Interstate 215 ramp, has building signage on the side facing the ramp toward Interstate 215.
The Market. The property is located in a corridor that is home to several power centers occupied by national tenants. Eastern Beltway Center is located across Eastern Avenue and includes Walmart, Home Depot, Sam’s Club in addition to several pad restaurants. Beltway Plaza is located south of the property and includes EOS Fitness, Doc Holliday’s, Baja Fresh and Denny’s. Silverado Ranch Plaza is situated approximately 1.5 miles south of the property and includes a Target, Michael’s and Marshall’s. The local neighborhood includes single and multi-family residential, office and industrial uses in addition to retail. The majority of the subject neighborhood is located in two master planned communities, Green Valley and Green Valley Ranch. The Green Valley community includes 8,400 acres and has been developed with apartment complexes, single-family subdivisions and private estate homes. The community provides public and private schools, parks and recreation centers, cultural and civic
THE INFORMATION IN THIS STRUCTURAL AND COLLATERAL TERM SHEET IS NOT COMPLETE AND MAY BE AMENDED PRIOR TO THE TIME OF SALE. THIS STRUCTURAL AND COLLATERAL TERM SHEET IS NOT AN OFFER TO SELL THESE SECURITIES AND IT IS NOT A SOLICITATION OF AN OFFER TO BUY THESE SECURITIES IN ANY JURISDICTION WHERE THE OFFER OR SALE IS NOT PERMITTED.
| - 141 - |
Mortgage Loan No. 14 — Beltway Marketplace
facilities, and commercial and industrial centers. Green Valley Ranch is a 1,310-acre master-planned community comprising a planned mix of land with 775 acres of residential neighborhoods and 310 acres for retail, office, medical facilities and a planned resort gaming hotel.
According to the appraisal, the property has a primary trade area consisting of a five mile radius with a population of approximately 297,446 and an average household income of $78,690 as of 2016. The property is situated in the southeast submarket within the Las Vegas retail market. As of the second quarter of 2016, the Las Vegas market had a total inventory of 64.4 million SF with average rents of $17.28 PSF. Year-to-date absorption was 595,626 SF, resulting in an overall vacancy rate of 9.0%. Market vacancy has declined in 16 of the prior 20 quarters, declining from 14.1% in first quarter of 2011 to 9.0% in the second quarter of 2016. The Southeast submarket has been exhibiting similar characteristics over the same time period. The southeast submarket had a total inventory of 14.8 million SF with average rents of $18.72 PSF as of the second quarter of 2016. Year-to-date absorption in the submarket was 172,342 SF, resulting in a quarter-end vacancy rate of 8.7%. Quarterly vacancy has declined in seventeen of the past twenty quarters, declining from 14.4% in first quarter of 2011 to 8.7% as of second quarter of 2016. According to third party market research report, the vacancy rate for power centers in the Southeast submarket is 1.35%.
The appraisal concluded market rents of $24.00 PSF for in-line space, $27.00 PSF for restaurant space, $33.00 PSF for endcap space and $20.40 PSF for anchor space. According to the appraisal, the property’s competitive set consists of the five properties detailed in the table below.
Competitive Set Summary(1)
| Property | Year Built | Total GLA (SF) | Est. Occ. | Proximity (miles) | Anchor Tenants |
| Beltway Marketplace | 2002 | 80,479(2) | 100.0%(2) | N/A | 99 Cents Only, Goodwill, Chuck E. Cheese(2) |
| Beltway Plaza | 1999 | 85,645 | 98.0% | 0.2 | Gold’s Gym |
| Eastern Beltway | 1998 | 298,444 | 95.0% | 0.3 | Ross, Petco, Home Consignment Center |
| Durango Arby Plaza | 2015 | 70,711 | 100.0% | 11.7 | EOS Fitness |
| Paseo Verde Plaza | 1998 | 52,013 | 95.0% | 3.7 | N/A |
| Stephanie Street Power Center | 1996 | 378,972 | 100.0% | 6.5 | Sprouts, Nordstrom Rack, Barnes & Noble |
| (1) | Source: Appraisal. |
| (2) | Based on the October 1, 2016 underwritten rent roll. |
Historical and Current Occupancy(1)
| 2013 | 2014 | 2015 | Current(2) |
| 100.0% | 100.0% | 100.0% | 100.0% |
| (1) | Source: Historical Occupancy is provided by the sponsor. Occupancies are as of December 31 of each respective year. |
| (2) | Based on the October 1, 2016 underwritten rent roll. |
THE INFORMATION IN THIS STRUCTURAL AND COLLATERAL TERM SHEET IS NOT COMPLETE AND MAY BE AMENDED PRIOR TO THE TIME OF SALE. THIS STRUCTURAL AND COLLATERAL TERM SHEET IS NOT AN OFFER TO SELL THESE SECURITIES AND IT IS NOT A SOLICITATION OF AN OFFER TO BUY THESE SECURITIES IN ANY JURISDICTION WHERE THE OFFER OR SALE IS NOT PERMITTED.
| - 142 - |
Mortgage Loan No. 14 — Beltway Marketplace
Tenant Summary(1)
| Tenant | Ratings Moody’s/S&P/ Fitch(2) | Net Rentable Area (SF) | % of Total NRA | Base Rent PSF | Lease Expiration Date |
| 99 Cents Only | Caa3 / CCC+ / NR | 22,492 | 27.9% | $12.25 | 1/31/2019 |
| Goodwill(3) | NR / NR / NR | 20,280 | 25.2% | $19.71 | 8/31/2029 |
| Chuck E. Cheese | Caa2 / B / NR | 12,018 | 14.9% | $21.78 | 6/30/2022 |
| Mattress Firm | B1 / NR / NR | 5,620 | 7.0% | $33.00 | 3/5/2030 |
| Water Wings | NR / NR / NR | 4,280 | 5.3% | $27.13 | 3/31/2019 |
| Nails Design Inc.(4) | NR / NR / NR | 3,339 | 4.1% | $24.00 | 10/7/2029 |
| PHO Little Saigon Restaurant | NR / NR / NR | 3,275 | 4.1% | $26.40 | 3/15/2019 |
| Tran Trouvian IV, D.D.S. | NR / NR / NR | 3,032 | 3.8% | $25.46 | 1/31/2023 |
| Benson & Bingham | NR / NR / NR | 2,019 | 2.5% | $21.63 | 6/30/2019 |
| AA Medical | NR / NR / NR | 1,615 | 2.0% | $24.72 | 8/26/2019 |
| (1) | Based on the underwritten rent roll, including rent increases occurring through September 2017. |
| (2) | Ratings provided are for the parent company of the entity listed in the “Tenant” field whether or not the parent company guarantees the lease. |
| (3) | Goodwill has been at the property since July 2, 2002 and executed a new lease in October 2011, on a 94-month term through August 30, 2019, for 14,127 SF paying $263,843 in rent. In June 2016, Goodwill executed an early extension for 10 years through August 2029 and expanded its space to 20,280 SF. Goodwill is expected to move into its space and start paying rent in January 2017. Upon taking occupancy, Goodwill will have 20,280 SF paying $393,056. |
| (4) | Nails Design Inc. has been at the property since August 7, 2009 and executed a new lease in March 2013, on a 72-month term through October 7, 2019 for 4,776 SF of space paying $106,404 in rent. In July 2016, Nails Design Inc. executed an early extension for 10 years through October 2029, and decided to relocate to a 3,339 SF space. Nails Design Inc. is expected to move into its space and start paying rent in January 2017. |
Lease Rollover Schedule(1)
| Year | Number of Leases Expiring | NRA Expiring | % of NRA Expiring | Base Rent Expiring | % of Base Rent Expiring | Cumulative NRA Expiring | Cumulative % of NRA Expiring | Cumulative Base Rent Expiring | Cumulative % of Base Rent Expiring |
| Vacant | NAP | 0 | 0.0% | NAP | NAP | 0 | 0.0% | NAP | NAP |
| 2016 | 0 | 0 | 0.0 | $0 | 0.0% | 0 | 0.0% | $0 | 0.0% |
| 2017 | 0 | 0 | 0.0 | 0 | 0.0 | 0 | 0.0% | $0 | 0.0% |
| 2018 | 0 | 0 | 0.0 | 0 | 0.0 | 0 | 0.0% | $0 | 0.0% |
| 2019 | 6 | 35,181 | 43.7 | 602,285 | 36.8 | 35,181 | 43.7% | $602,285 | 36.8% |
| 2020 | 0 | 0 | 0.0 | 0 | 0.0 | 35,181 | 43.7% | $602,285 | 36.8% |
| 2021 | 1 | 1,009 | 1.3 | 28,073 | 1.7 | 36,190 | 45.0% | $630,358 | 38.6% |
| 2022 | 1 | 12,018 | 14.9 | 261,752 | 16.0 | 48,208 | 59.9% | $892,110 | 54.6% |
| 2023 | 1 | 3,032 | 3.8 | 77,200 | 4.7 | 51,240 | 63.7% | $969,310 | 59.3% |
| 2024 | 0 | 0 | 0.0 | 0 | 0.0 | 51,240 | 63.7% | $969,310 | 59.3% |
| 2025 | 0 | 0 | 0.0 | 0 | 0.0 | 51,240 | 63.7% | $969,310 | 59.3% |
| 2026 & Beyond | 3 | 29,239 | 36.3 | 665,248 | 40.7 | 80,479 | 100.0% | $1,634,558 | 100.0% |
| Total | 12 | 80,479 | 100.0% | $1,634,558 | 100.0% |
| (1) | Based on the underwritten rent roll. Rent includes base rent and rent increases occurring through September 2017. |
THE INFORMATION IN THIS STRUCTURAL AND COLLATERAL TERM SHEET IS NOT COMPLETE AND MAY BE AMENDED PRIOR TO THE TIME OF SALE. THIS STRUCTURAL AND COLLATERAL TERM SHEET IS NOT AN OFFER TO SELL THESE SECURITIES AND IT IS NOT A SOLICITATION OF AN OFFER TO BUY THESE SECURITIES IN ANY JURISDICTION WHERE THE OFFER OR SALE IS NOT PERMITTED.
| - 143 - |
Mortgage Loan No. 14 — Beltway Marketplace
Operating History and Underwritten Net Cash Flow
| 2013 | 2014 | 2015 | TTM(1) | Underwritten(2) | PSF | %(3) | |
| Rents in Place | $1,412,090 | $1,482,090 | $1,451,332 | $1,443,846 | $1,634,558 | $20.31 | 82.8% |
| Vacancy | 0 | 0 | 0 | 0 | 0 | 0.00 | 0.0 |
| Gross Potential Rent | $1,412,090 | $1,482,090 | $1,451,332 | $1,443,846 | $1,634,558 | $20.31 | 82.8% |
| Total Reimbursements | 329,189 | 330,049 | 338,035 | 330,614 | 339,910 | 4.22 | 17.2 |
| Net Rental Income | $1,741,279 | $1,812,139 | $1,789,367 | $1,774,460 | $1,974,468 | $24.53 | 100.0% |
| (Vacancy/Collection Loss) | 0 | 0 | 0 | 0 | (100,846) | (1.25) | (5.1) |
| Other Income | 54,865 | 43,894 | 41,818 | 42,103 | 42,444 | 0.53 | 2.1 |
| Effective Gross Income | $1,796,144 | $1,856,033 | $1,831,185 | $1,816,563 | $1,916,066 | $23.81 | 97.0% |
| Total Expenses | $356,945 | $414,465 | $397,610 | $405,755 | $380,877 | $4.73 | 19.9% |
| Net Operating Income | $1,439,199 | $1,441,568 | $1,433,575 | $1,410,808 | $1,535,189 | $19.08 | 80.1% |
| Total TI/LC, Capex/RR | 0 | 0 | 0 | 0 | 76,455 | 0.95 | 4.0 |
| Net Cash Flow | $1,439,199 | $1,441,568 | $1,433,575 | $1,410,808 | $1,458,734 | $18.13 | 76.1% |
| (1) | TTM Column represents the trailing twelve month period ending July 31, 2016. |
| (2) | Based on the underwritten rent roll. The Underwritten Net Operating Income is higher than TTM Net Operating Income primarily due to: (i) rent increases associated with Goodwill’s expansion to a total space of 20,280 SF and the relocation of Nails Design Inc. to 3,339 SF, both of which are expected to come into effect by January 2017, (ii) rent associated with 1,615 SF of AA Medical which was vacant through the TTM period (lease started on 9/26/2016), and (ii) rent steps underwritten through the end of September 2017. |
| (3) | % column represents percent of Net Rental Income for all revenue lines and represents percent of Effective Gross Income for the remainder of fields. |
THE INFORMATION IN THIS STRUCTURAL AND COLLATERAL TERM SHEET IS NOT COMPLETE AND MAY BE AMENDED PRIOR TO THE TIME OF SALE. THIS STRUCTURAL AND COLLATERAL TERM SHEET IS NOT AN OFFER TO SELL THESE SECURITIES AND IT IS NOT A SOLICITATION OF AN OFFER TO BUY THESE SECURITIES IN ANY JURISDICTION WHERE THE OFFER OR SALE IS NOT PERMITTED.
| - 144 - |
(THIS PAGE INTENTIONALLY LEFT BLANK)
| - 145 - |
Mortgage Loan No. 15 — Embarcadero Club Apartments
| Mortgage Loan Information | Property Information | |||
| Mortgage Loan Seller: | BSP | Single Asset / Portfolio: | Single Asset | |
| Original Principal Balance: | $16,000,000 | Title: | Fee | |
| Cut-off Date Principal Balance: | $15,981,857 | Property Type - Subtype: | Multifamily – Garden | |
| % of Pool by IPB: | 2.1% | Net Rentable Area (Units): | 404 | |
| Loan Purpose: | Refinance | Location: | College Park, GA | |
| Borrower: | Embarcadero Club Atlanta Apartments LP | Year Built / Renovated: | 1972, 1974 / 2005, 2014-2015 | |
| Sponsor: | Ronald Eisenberg | Occupancy: | 93.8% | |
| Interest Rate: | 4.7200% | Occupancy Date: | 8/31/2016 | |
| Note Date: | 9/27/2016 | Number of Tenants: | N/A | |
| Maturity Date: | 10/6/2026 | 2013 NOI: | $1,347,758 | |
| Interest-only Period: | 0 months | 2014 NOI: | $1,307,104 | |
| Original Term: | 120 months | 2015 NOI: | $1,454,100 | |
| Original Amortization: | 360 months | TTM NOI(2): | $1,548,227 | |
| Amortization Type: | Balloon | UW Economic Occupancy: | 88.1% | |
| Call Protection: | L(25),Def(91),O(4) | UW Revenues: | $3,419,803 | |
| Lockbox(1): | Soft | UW Expenses: | $1,867,906 | |
| Additional Debt: | No | UW NOI: | $1,551,897 | |
| Additional Debt Balance: | N/A | UW NCF: | $1,446,687 | |
| Additional Debt Type: | N/A | Appraised Value / Per Unit: | $22,200,000 / $54,950 | |
| Additional Future Debt Permitted: | No | Appraisal Date: | 8/19/2016 |
| Escrows and Reserves | Financial Information | |||||
| Initial | Monthly | Initial Cap | Cut-off Date Loan / Unit: | $39,559 | ||
| Taxes: | $48,793 | $16,927 | N/A | Maturity Date Loan / Unit: | $32,256 | |
| Insurance: | $69,891 | $9,984 | N/A | Cut-off Date LTV: | 72.0% | |
| Replacement Reserves: | $181,013 | $8,417 | N/A | Maturity Date LTV: | 58.7% | |
| Credit Enhancement Reserve(3): | $500,000 | N/A | N/A | UW NCF DSCR: | 1.45x | |
| Immediate Repair Reserve: | $89,000 | N/A | N/A | UW NOI Debt Yield: | 9.7% |
| Sources and Uses | ||||||
| Sources | Proceeds | % of Total | Uses | Proceeds | % of Total | |
| Mortgage Loan | $16,000,000 | 100.0% | Payoff Existing Debt(4) | $13,019,812 | 81.4% | |
| Return of Equity | 1,533,171 | 9.6 | ||||
| Upfront Reserves | 888,696 | 5.6 | ||||
| Closing Costs | 558,320 | 3.5 | ||||
| Total Sources | $16,000,000 | 100.0% | Total Uses | $16,000,000 | 100.0% |
| (1) | The loan is structured with a soft lockbox and springing cash management. |
| (2) | Represents the trailing twelve months ending August 31, 2016. |
| (3) | The lender will disburse the Credit Enhancement Reserve funds to the borrower on June 30, 2017, provided that (i) the revenues and NCF, each calculated for the trailing twelve month period ending June 30, 2017 (or on the last day of any subsequent calendar quarter), are $3,400,000 and $1,430,000, respectively, and (ii) the borrower has provided evidence that a security gate has been installed at the property. |
| (4) | The prior loan was securitized in COMM 2006-C8. |
THE INFORMATION IN THIS STRUCTURAL AND COLLATERAL TERM SHEET IS NOT COMPLETE AND MAY BE AMENDED PRIOR TO THE TIME OF SALE. THIS STRUCTURAL AND COLLATERAL TERM SHEET IS NOT AN OFFER TO SELL THESE SECURITIES AND IT IS NOT A SOLICITATION OF AN OFFER TO BUY THESE SECURITIES IN ANY JURISDICTION WHERE THE OFFER OR SALE IS NOT PERMITTED.
| - 146 - |
Mortgage Loan No. 15 — Embarcadero Club Apartments
The Loan. The Embarcadero Club Apartments loan is a $16.0 million first mortgage loan secured by the fee interest in a 404-unit garden style multifamily property located in College Park, Georgia. The loan has a 10-year term and will amortize on a 30-year schedule.
The Borrower. The borrowing entity for the loan is Embarcadero Club Atlanta Apartments LP, a Florida limited partnership and special purpose entity.
The Sponsor. The loan’s sponsor and nonrecourse carve-out guarantor is Ronald Eisenberg. The sponsor is the founder and owner of Ventron Realty Corporation, a real estate management, acquisition and development company, founded in 1993. Ventron Realty Corporation’s current portfolio consists of 23 properties totaling 7,180 units, with 22 of the properties located in Georgia, primarily in metro Atlanta area, and the remaining property located in Florida. Mr. Eisenberg has a net worth of approximately $25.7 million and liquidity of approximately $3.1 million.
The Property. The Embarcadero Club Apartments property is a 404-unit garden style multifamily property located in College Park, Georgia. The property was built in phases in 1972 and 1974 and acquired by the sponsor in 2006. The property is comprised of 40 two- and three-story apartment buildings with various unit sizes and layouts located on approximately 27.7 acres. The property has a total of 766 parking spaces, or 1.9 parking spaces per unit. As of August 31, 2016, the property was 93.8% occupied.
The property’s unit mix contains 80 one-bedroom/ one-bathroom units (600 SF), 108 one-bedroom/ one-bathroom units (700 SF), 80 two-bedroom/ one-bathroom units (865 SF), 80 two-bedroom/ two-bathroom units (1,000 SF), and 56 three-bedroom/two-bathroom units (1,300 SF).
The sponsor has reportedly invested approximately $1.5 million in capital improvements since 2012 including but not limited to: roof replacement, parking lot repairs, clubhouse upgrades, and fitness center and tennis court repairs.
The property is located in northern Georgia, approximately 10 miles southwest of the Atlanta central business district, the economic and cultural center of the region. The property is within Fulton County and within the city limits of College Park. The property is located adjacent to the intersection of Interstate 285 and Interstate 85 which provides access to the main retail node of College Park (approximately 3.5 miles) as well as regional access across the state of Georgia. The property’s location offers easy access to Metropolitan Atlanta Rapid Transit (MARTA) with several stations that are within close proximity to the property, inclusive of bus stops located near the property’s entrance. The property is also less than a mile from Route 29, the main local thoroughfare in College Park.
The property has access to area demand drivers including schools, shopping, entertainment and major employment centers surrounding the neighborhood. Within four miles of the property there are a number of retailers including Wal-Mart, Target, BJ’s, Publix, Lowe’s, Old Navy and Marshalls as well as a variety of restaurants and a Carmike Cinemas. The property is within six miles of Southern Regional Medical Center, a 331-bed full service hospital and there are seven schools, spanning elementary, high school and college within a 10 miles radius. The property is also in close proximity (less than three miles) to Hartsfield-Jackson Atlanta International Airport, which is one of the largest employers in the area. There are numerous hotels (Westin, Marriott, Sheraton, Hilton Garden Inn, and others) in close proximity (less than one mile) that support the airport. According to the sponsor, many of the residents of the property work for these hotels or at the airport. Other major employers in the area include AT&T Services Inc., Emory Healthcare Inc., Georgia Institute of Technology, SunTrust Bank, and The Coca-Cola Company.
THE INFORMATION IN THIS STRUCTURAL AND COLLATERAL TERM SHEET IS NOT COMPLETE AND MAY BE AMENDED PRIOR TO THE TIME OF SALE. THIS STRUCTURAL AND COLLATERAL TERM SHEET IS NOT AN OFFER TO SELL THESE SECURITIES AND IT IS NOT A SOLICITATION OF AN OFFER TO BUY THESE SECURITIES IN ANY JURISDICTION WHERE THE OFFER OR SALE IS NOT PERMITTED.
| - 147 - |
Mortgage Loan No. 15 — Embarcadero Club Apartments
Multifamily Unit Mix(1)
| Unit Type | No. of Units | % of Total | Occupied Units | Occupancy | Average Unit Size (SF) | Average Monthly Rental Rate | Average Monthly Rental Rate PSF | Monthly Market Rental Rate(2) | Monthly Market Rental Rate PSF(2) |
| 1 Bedroom, 1 Bath | 80 | 19.8% | 77 | 96.3% | 600 | $616 | $1.03 | $650 | $1.08 |
| 1 Bedroom, 1 Bath | 108 | 26.7 | 103 | 95.4% | 700 | $639 | $0.91 | $650 | $0.93 |
| 2 Bedroom, 1 Bath | 80 | 19.8 | 73 | 91.3% | 865 | $672 | $0.78 | $700 | $0.81 |
| 2 Bedroom, 2 Bath | 80 | 19.8 | 72 | 90.0% | 1,000 | $727 | $0.73 | $750 | $0.75 |
| 3 Bedroom, 2 Bath | 56 | 13.9 | 54 | 96.4% | 1,300 | $800 | $0.62 | $900 | $0.69 |
| Total/Wtd. Avg. | 404 | 100.0% | 379 | 93.8% | 855 | $680 | $0.80 | $714 | $0.84 |
| (1) | Based on the underwritten rent roll dated August 31, 2016. |
| (2) | Source: Appraisal. |
The Market.The property is located in College Park, Georgia and is part of the South Fulton submarket which contains 33,615 market rate rental units. According to a third party market research report, as of the second quarter of 2016, monthly asking rents in the South Fulton submarket averaged $787 per unit and vacancy averaged 8.6%. The submarket is showing a positive occupancy and rent growth trend both overall and in Class B/C properties in particular. The second quarter of 2016 vacancy rate for Class B/C properties in the submarket was 9.3% and the vacancy rate has decreased by 6.9% over the past five years. Asking rent averaged $717 per unit and has increased by 13.6% over the past five years.
The appraisal identified four comparable rental properties ranging from 177 units to 372 units that were constructed between 1972 and 1988. The competitive set reported a weighted average occupancy of approximately 93.6%, with average rents ranging from $689 to $765 per unit. Average rents at the subject property are in line with the competitive set. The properties in the appraisal’s competitive set are all located within approximately 5.0 miles of the property and are shown in the below table.
Competitive Set Summary(1)
| Property | Year Built / Renovated | No. of Units | Avg. Unit Size (SF) | Avg. $/ Unit | Occupancy | Distance from Property (miles) |
| Embarcadero Club Apartments | 1972,1974 / 2005, 2014-2015 | 404(2) | 855(2) | $680(2) | 93.8%(2) | N/A |
| Gardenwood | 1988 / 2006 | 370 | NAV | $689 | 95.0% | 5 |
| Lakeside Apartment Townhomes | 1987 / 2003 | 177 | 1,303 | $745 | 97.0% | 4 |
| Biscayne | 1972 / 2002 | 370 | NAV | $732 | 90.0% | 3 |
| Lakeside Reserve | 1976 / N/A | 372 | NAV | $765 | 94.0% | 4 |
| Total/Wtd. Avg.(3) | 1,289 | $731 | 93.6% |
| (1) | Source: Appraisal. |
| (2) | Based on the underwritten rent roll dated August 31, 2016. |
| (3) | Excludes the subject property. |
Historical and Current Occupancy(1)
| 2013 | 2014 | 2015 | Current(2) |
| 88.0% | 94.1% | 94.3% | 93.8% |
| (1) | Source: Historical Occupancy is provided by the sponsor or obtained from Bloomberg. Occupancies are as of December 31 of each respective year. |
| (2) | Based on the August 31, 2016 underwritten rent roll. |
THE INFORMATION IN THIS STRUCTURAL AND COLLATERAL TERM SHEET IS NOT COMPLETE AND MAY BE AMENDED PRIOR TO THE TIME OF SALE. THIS STRUCTURAL AND COLLATERAL TERM SHEET IS NOT AN OFFER TO SELL THESE SECURITIES AND IT IS NOT A SOLICITATION OF AN OFFER TO BUY THESE SECURITIES IN ANY JURISDICTION WHERE THE OFFER OR SALE IS NOT PERMITTED.
| - 148 - |
Mortgage Loan No. 15 — Embarcadero Club Apartments
Operating History and Underwritten Net Cash Flow
| 2013 | 2014 | 2015 | TTM(1) | Underwritten | Per Unit | %(2) | |
| Rents in Place | $2,832,119 | $2,906,734 | $3,080,834 | $3,184,435 | $3,094,068 | $7,659 | 79.7% |
| Vacant Income | 0 | 0 | 0 | 0 | 214,800 | 532 | 5.5 |
| Gross Potential Rent | $2,832,119 | $2,906,734 | $3,080,834 | $3,184,435 | $3,308,868 | $8,190 | 85.2% |
| Other Income | 517,258 | 525,352 | 528,330 | 574,889 | 574,889 | 1,423 | 14.8 |
| Net Rental Income | $3,349,377 | $3,432,086 | $3,609,164 | $3,759,325 | $3,883,757 | $9,613 | 100.0% |
| (Vacancy) | (266,407) | (238,234) | (223,705) | (233,111) | (354,022) | (876) | (9.1) |
| (Concessions/ Collection Loss) | (131,589) | (115,972) | (90,507) | (106,411) | (109,933) | (272) | (2.8) |
| Effective Gross Income | $2,951,381 | $3,077,880 | $3,294,952 | $3,419,803 | $3,419,803 | $8,465 | 88.1% |
| Total Expenses | $1,603,623 | $1,770,776 | $1,840,853 | $1,871,576 | $1,867,906 | $4,624 | 54.6% |
| Net Operating Income | $1,347,758 | $1,307,104 | $1,454,100 | $1,548,227 | $1,551,897 | $3,841 | 45.4% |
| Replacement Reserves | 0 | 0 | 0 | 0 | 105,210 | 260 | 3.1 |
| Net Cash Flow | $1,347,758 | $1,307,104 | $1,454,100 | $1,548,227 | $1,446,687 | $3,581 | 42.3% |
| (1) | The TTM column represents the trailing twelve months ending August 31, 2016. |
| (2) | % column represents percent of Net Rental Income for all revenue lines and represents percent of Effective Gross Income for the remainder of fields. |
THE INFORMATION IN THIS STRUCTURAL AND COLLATERAL TERM SHEET IS NOT COMPLETE AND MAY BE AMENDED PRIOR TO THE TIME OF SALE. THIS STRUCTURAL AND COLLATERAL TERM SHEET IS NOT AN OFFER TO SELL THESE SECURITIES AND IT IS NOT A SOLICITATION OF AN OFFER TO BUY THESE SECURITIES IN ANY JURISDICTION WHERE THE OFFER OR SALE IS NOT PERMITTED.
| - 149 - |