| FREE WRITING PROSPECTUS | ||
| FILED PURSUANT TO RULE 433 | ||
| REGISTRATION FILE NO.: 333-227081-01 | ||

February 15, 2019CSAIL 2019-C15 Commercial Mortgage Trust Free Writing Prospectus Structural and Collateral Term SheetCredit Suisse Commercial Mortgage Securities Corp.as DepositorCommercial Mortgage Pass-Through Certificates Series 2019-C15 Column Financial, Inc. 3650 REIT Societe Generale Financial Corporation BSPRT CMBS Finance, LLCas Sponsors and Mortgage Loan SellersCredit Suisse Société GénéraleCo-Lead Manager and Joint Bookrunner Co-Lead Manager and Joint Bookrunner THE DEPOSITOR HAS FILED A REGISTRATION STATEMENT (INCLUDING A PROSPECTUS) WITH THE SEC (SEC FILE NO. 333-227081) FOR THE OFFERING TO WHICH THIS COMMUNICATION RELATES. BEFORE YOU INVEST, YOU SHOULD READ THE PROSPECTUS IN THAT REGISTRATION STATEMENT AND OTHER DOCUMENTS THE ISSUER HAS FILED WITH THE SEC FOR MORE COMPLETE INFORMATION ABOUT THE ISSUER AND THIS OFFERING. YOU MAY GET THESE DOCUMENTS FOR FREE BY VISITING EDGAR ON THE SEC WEB SITE AT WWW.SEC.GOV. ALTERNATIVELY, CREDIT SUISSE WILL ARRANGE TO SEND YOU THE PROSPECTUS IF YOU REQUEST IT BY CALLING TOLL FREE 1-800-221-1037.

STATEMENT REGARDING ASSUMPTIONS AS TO
SECURITIES, PRICING ESTIMATES AND OTHER INFORMATION
This material is for your information, and neither Credit Suisse Securities (USA) LLC nor any other underwriter (collectively, the “Underwriters”) is soliciting any action based upon it. This material is not to be construed as an offer to sell or the solicitation of any offer to buy any security in any jurisdiction where such an offer or solicitation would be illegal.
Neither this document nor anything contained herein shall form the basis for any contract or commitment whatsoever. The information contained herein is preliminary as of the date hereof. These materials are subject to change, completion or amendment from time to time. The information contained herein will be superseded by similar information delivered to you prior to the time of sale, including as part of the Preliminary Prospectus referred to herein relating to the CSAIL 2019-C15 Commercial Mortgage Trust, Commercial Mortgage Pass-Through Certificates (the “Offering Document”). The information supersedes any such information previously delivered. The information should be reviewed only in conjunction with the entire Offering Document. All of the information contained herein is subject to the same limitations and qualifications contained in the Offering Document. The information contained herein does not contain all relevant information relating to the underlying mortgage loans or mortgaged properties. Such information is described elsewhere in the Offering Document. The information contained herein will be more fully described elsewhere in the Offering Document. The information contained herein should not be viewed as projections, forecasts, predictions or opinions with respect to value. Prior to making any investment decision, prospective investors are strongly urged to read the Offering Document in its entirety. Neither the Securities and Exchange Commission nor any state securities commission has approved or disapproved of these securities or determined if this Free Writing Prospectus is truthful or complete. Any representation to the contrary is a criminal offense.
The attached information contains certain tables and other statistical analyses (the “Computational Materials”) which have been prepared in reliance upon information furnished by the Mortgage Loan Sellers. Numerous assumptions were used in preparing the Computational Materials, which may or may not be reflected herein. As such, no assurance can be given as to the appropriateness of the assumptions used in preparing the Computational Materials, or as to whether the Computational Materials and/or the assumptions upon which they are based reflect present market conditions or future market performance. The Computational Materials should not be construed as either projections or predictions or as legal, tax, financial or accounting advice. You should consult your own counsel, accountant and other advisors as to the legal, tax, business, financial and related aspects of a purchase of these securities. Any weighted average lives, yields and principal payment periods shown in the Computational Materials are based on prepayment and/or loss assumptions, and changes in such prepayment and/or loss assumptions may dramatically affect such weighted average lives, yields and principal payment periods. In addition, it is possible that prepayments or losses on the underlying assets will occur at rates higher or lower than the rates shown in the attached Computational Materials. The specific characteristics of the securities may differ from those shown in the Computational Materials due to differences between the final underlying assets and the preliminary underlying assets used in preparing the Computational Materials. The principal amount and designation of any security described in the Computational Materials are subject to change prior to issuance. None of the Underwriters nor any of their respective affiliates makes any representation or warranty as to the actual rate or timing of payments or losses on any of the underlying assets or the payments or yield on the securities.
This document contains forward-looking statements. Those statements are subject to certain risks and uncertainties that could cause the success of collections and the actual cash flow generated to differ materially from the information set forth herein. While such information reflects projections prepared in good faith based upon methods and data that are believed to be reasonable and accurate as of the dates thereof, the depositor undertakes no obligation to revise these forward-looking statements to reflect subsequent events or circumstances. Individuals should not place undue reliance on forward-looking statements and are advised to make their own independent analysis and determination with respect to the forecasted periods, which reflect the issuer’s view only as of the date hereof.
IMPORTANT NOTICE RELATING TO AUTOMATICALLY GENERATED EMAIL DISCLAIMERS
Any legends, disclaimers or other notices that may appear at the bottom of the email communication to which this Free Writing Prospectus is attached relating to (1) these materials not constituting an offer (or a solicitation of an offer), (2) no representation being made that these materials are accurate or complete and may not be updated or (3) these materials possibly being confidential, are not applicable to these materials and should be disregarded. Such legends, disclaimers or other notices have been automatically generated as a result of these materials having been sent via Bloomberg or another system.
THE INFORMATION IN THIS STRUCTURAL AND COLLATERAL TERM SHEET IS NOT COMPLETE AND MAY BE AMENDED PRIOR TO THE TIME OF SALE. THIS TERM SHEET IS NOT AN OFFER TO SELL THESE SECURITIES AND IT IS NOT A SOLICITATION OF AN OFFER TO BUY THESE SECURITIES IN ANY JURISDICTION WHERE THE OFFER OR SALE IS NOT PERMITTED.
2
Indicative Capital Structure
Publicly Offered Certificates
| Class | Expected Ratings(1) Fitch/DBRS/Moody’s | Approximate Initial Certificate Principal Balance or Notional Amount(2)(3) | Approximate Initial Credit Support | Expected Weighted Avg. Life (years)(4) | Expected Principal Window(4) | Certificate Principal to Value Ratio(5) | Underwritten NOI Debt Yield(6) |
| A-1 | AAAsf/AAA(sf)/Aaa(sf) | $11,856,000 | 30.000%(7) | 2.87 | 1 - 55 | 41.0% | 16.5% |
| A-2 | AAAsf/AAA(sf)/Aaa(sf) | $64,072,000 | 30.000%(7) | 5.01 | 55 - 61 | 41.0% | 16.5% |
| A-3 | AAAsf/AAA(sf)/Aaa(sf) | $225,000,000(3) | 30.000%(7) | 9.44(3) | 103 - 115(3) | 41.0% | 16.5% |
| A-4 | AAAsf/AAA(sf)/Aaa(sf) | $254,026,000(3) | 30.000%(7) | 9.73(3) | 115 - 118(3) | 41.0% | 16.5% |
| A-SB | AAAsf/AAA(sf)/Aaa(sf) | $25,521,000 | 30.000%(7) | 6.93 | 61 - 103 | 41.0% | 16.5% |
| X-A(8) | AAAsf/AAA(sf)/Aa1(sf) | $642,669,000 | N/A | N/A | N/A | N/A | N/A |
| X-B(8) | A-sf/A(high)(sf)/NR | $76,706,000 | N/A | N/A | N/A | N/A | N/A |
| A-S | AAAsf/AAA(sf)/Aa3(sf) | $62,194,000 | 22.500% | 9.86 | 118 - 118 | 45.4% | 14.9% |
| B | AA-sf/AA(sf)/NR | $37,316,000 | 18.000% | 9.86 | 118 - 118 | 48.0% | 14.1% |
| C | A-sf/A(sf)/NR | $39,390,000 | 13.250% | 9.86 | 118 - 119 | 50.8% | 13.3% |
Privately Offered Certificates(9)
| Class | Expected Ratings(1) Fitch/DBRS/Moody’s | Approximate Initial Certificate Principal Balance or Notional Amount(2)(3) | Approximate Initial Credit Support | Expected Weighted Avg. Life (years)(4) | Expected Principal Window(4) | Certificate Principal to Value Ratio(5) | Underwritten NOI Debt Yield(6) |
| X-D(8)(10) | BBB-sf/A(low)(sf)/NR | $26,536,000 | N/A | N/A | N/A | N/A | N/A |
| D(10) | BBB-sf/BBB(high)(sf)/NR | $26,536,000 | 10.050% | 9.94 | 119 - 119 | 52.7% | 12.9% |
| E-RR(10) | BBB-sf/BBB(sf)/NR | $19,073,000 | 7.750% | 9.94 | 119 - 119 | 54.1% | 12.5% |
| F-RR(10) | BB-sf/BB(high)(sf)/NR | $20,731,000 | 5.250% | 9.94 | 119 - 119 | 55.5% | 12.2% |
| G-RR(10) | B-sf/B(high)(sf)/NR | $9,329,000 | 4.125% | 9.94 | 119 - 119 | 56.2% | 12.1% |
| NR-RR(10) | NR/NR/NR | $34,207,166 | 0.000% | 9.94 | 119 - 119 | 58.6% | 11.6% |
| (1) | The expected ratings presented are those of Fitch Ratings, Inc. (“Fitch”), DBRS, Inc. (“DBRS”) and Moody’s Investors Service, Inc. (“Moody’s”), which the depositor hired to rate the Offered Certificates. One or more other nationally recognized statistical rating organizations that were not hired by the depositor may use information they receive pursuant to Rule 17g-5 under the Securities Exchange Act of 1934, as amended (the “Exchange Act”) or otherwise, to rate or provide market reports and/or published commentary related to the Offered Certificates. We cannot assure you as to what ratings a non-hired nationally recognized statistical rating organization would assign or that its reports will not express differing, possibly negative, views of the mortgage loans and/or the Offered Certificates. The ratings of each class of Offered Certificates address the likelihood of the timely distribution of interest and, except in the case of the Class X-A, X-B and X-D Certificates, the ultimate distribution of principal due on those classes on or before the Rated Final Distribution Date. See “Risk Factors—Other Risks Relating to the Certificates—Nationally Recognized Statistical Rating Organizations May Assign Different Ratings to the Certificates; Ratings of the Certificates Reflect Only the Views of the Applicable Rating Agencies as of the Dates Such Ratings Were Issued; Ratings May Affect ERISA Eligibility; Ratings May Be Downgraded” and “Ratings” in the Preliminary Prospectus, expected to be dated February 15, 2019 (the “Preliminary Prospectus”). Fitch, DBRS and Moody’s have informed us that the “sf” designation in their ratings represents an identifier for structured finance product ratings. |
| (2) | Approximate, subject to a variance of plus or minus 5% and further subject to footnotes 3, 8 and 10 below. In addition, the notional amount of each class of Class X Certificates may vary depending upon the final pricing of the classes of certificates whose certificate balances comprise such notional amount and, if as a result of such pricing the pass-through rate of such class of Class X Certificates would be equal to zero, such Class X Certificates may not be issued on the closing date |
| (3) | The exact initial certificate balances of the Class A-3 and Class A-4 certificates are unknown and will be determined based on the final pricing of those classes of certificates. However, the respective approximate initial certificate balances, assumed final distribution dates, weighted average lives and expected principal windows of the Class A-3 and Class A-4 certificates are expected to be within the applicable ranges reflected in the following chart. The aggregate initial certificate balance of the Class A-3 and Class A-4 certificates is expected to be approximately $479,026,000, subject to a variance of plus or minus 5%. |
Class of Certificates | Expected Range of | Expected Range of Assumed | Expected Range of Weighted Average Life (Years) | Expected Range of Principal Window (Months) |
| Class A-3 | $50,000,000 - $225,000,000 | August 2028 / October 2028 | 9.10 / 9.44 | 103 - 113 / 103 – 115 |
| Class A-4 | $254,026,000 - $429,026,000 | January 2029 / January 2029 | 9.65 / 9.73 | 113 - 118 / 115 - 118 |
| (4) | Assumes 0% CPR / 0% CDR and a March 6, 2019 closing date. Based on “Modeling Assumptions” as described in the Preliminary Prospectus. Capitalized terms used but not defined herein have the meanings ascribed to them in the Preliminary Prospectus. |
THE INFORMATION IN THIS STRUCTURAL AND COLLATERAL TERM SHEET IS NOT COMPLETE AND MAY BE AMENDED PRIOR TO THE TIME OF SALE. THIS TERM SHEET IS NOT AN OFFER TO SELL THESE SECURITIES AND IT IS NOT A SOLICITATION OF AN OFFER TO BUY THESE SECURITIES IN ANY JURISDICTION WHERE THE OFFER OR SALE IS NOT PERMITTED.
3
Indicative Capital Structure
| (5) | The “Certificate Principal to Value Ratio” for any class (other than the Class A-1, Class A-2, Class A-3, Class A-4 and Class A-SB certificates) is calculated as the product of (a) the weighted average Cut-off Date LTV Ratio for the mortgage loans, multiplied by (b) a fraction, the numerator of which is the total initial certificate principal balance of such class of certificates and all classes of principal balance certificates senior to such class of certificates and the denominator of which is the total initial certificate principal balance of all of the principal balance certificates. The Class A-1, Class A-2, Class A-3, Class A-4 and Class A-SB Certificate Principal to Value Ratios are calculated in the aggregate for those classes as if they were a single class. Investors should note, however, that excess mortgaged property value associated with a mortgage loan will not be available to offset losses on any other mortgage loan. |
| (6) | The “Underwritten NOI Debt Yield” for any class (other than the Class A-1, Class A-2, Class A-3, Class A-4 and Class A-SB certificates) is calculated as the product of (a) the weighted average UW NOI Debt Yield for the mortgage loans and (b) the total initial certificate principal balance of all of the classes of principal balance certificates divided by the total initial certificate principal balance for such class and all classes of principal balance certificates senior to such class of certificates. The Underwritten NOI Debt Yield for each class of the Class A-1, Class A-2, Class A-3, Class A-4 and Class A-SB certificates is calculated in the aggregate for those classes as if they were a single class. Investors should note, however, that net operating income from any mortgaged property supports only the related mortgage loan and will not be available to support any other mortgage loan. |
| (7) | The credit support percentages set forth for the Class A-1, Class A-2, Class A-3, Class A-4 and Class A-SB certificates are represented in the aggregate. |
| (8) | The notional amounts of the Class X-A, Class X-B and Class X-D certificates (collectively, the “Class X Certificates”) are described in the Preliminary Prospectus. In addition, the notional amount of each class of Class X Certificates may vary depending upon the final pricing of the classes of certificates whose certificate balances comprise such notional amount and, if as a result of such pricing the pass-through rate of such class of Class X Certificates would be equal to zero, such Class X Certificates may not be issued on the closing date. |
| (9) | The Class R certificates are not shown above. |
| (10) | The initial certificate balance of each of the Class D and Class E-RR certificates are subject to change based on final pricing of all certificates and the final determination of the Class E-RR, Class F-RR, Class G-RR and Class NR-RR certificates (collectively, the “horizontal risk retention certificates”) that will be retained by the retaining sponsor as part of the U.S. risk retention requirements. Any variation in the initial certificate balances of the Class D certificates and the Class E-RR certificates would affect the credit support and yield statistics of the Class D certificates and the Class E-RR certificates, respectively, and the initial notional amount of the Class X-D certificates. For more information regarding the methodology and key inputs and assumptions used to determine the sizing of the horizontal risk retention certificates, see “Credit Risk Retention” in the Preliminary Prospectus. |
Class A-2(1)
| No. | Loan Name | Cut-off Date Balance | % of IPB | Maturity Balance | % of Certificate Class | Original Loan Term | Remaining Loan Term | UW NCF DSCR(2) | UW NOI Debt Yield(2) | Cut-off Date LTV(2) | Maturity Date LTV(2) |
| 3 | SITE JV Portfolio | $50,000,000 | 6.0% | $50,000,000 | 78.0% | 64 | 61 | 3.63x | 19.2% | 35.5% | 35.5% |
| 26 | Prudential - Digital Realty Portfolio | 11,000,000 | 1.3 | 11,000,000 | 17.2 | 60 | 55 | 2.50x | 11.9% | 54.7% | 54.7% |
| Total / Wtd. Avg.: | $61,000,000 | 7.4% | $61,000,000 | 95.2% | 63 | 60 | 3.43x | 17.9% | 39.0% | 39.0% | |
| (1) | The table above presents the mortgage loans whose balloon payments would be applied to pay down the majority of the principal balance of the Class A-2 certificates, assuming a 0% CPR and applying the “Modeling Assumptions” described in the Preliminary Prospectus, including the assumptions that (i) none of the mortgage loans in the pool experience prepayments prior to the maturity date, defaults or losses; (ii) there are no extensions of maturity dates of any mortgage loans in the pool; and (iii) each mortgage loan in the pool is paid in full on its stated maturity date. Each class of certificates, including the Class A-2 certificates, evidences undivided ownership interests in the entire pool of mortgage loans. DSCR, debt yield and LTV information does not take into account subordinate debt (whether or not secured by the mortgaged property), if any, that is allowed under the terms of the mortgage loan. |
| (2) | With respect to any mortgage loan that is part of a whole loan, the LTV, DSCR and debt yield calculations include the relatedpari passu companion loan(s) but exclude any related subordinate companion loan(s) or mezzanine loan(s). |
THE INFORMATION IN THIS STRUCTURAL AND COLLATERAL TERM SHEET IS NOT COMPLETE AND MAY BE AMENDED PRIOR TO THE TIME OF SALE. THIS TERM SHEET IS NOT AN OFFER TO SELL THESE SECURITIES AND IT IS NOT A SOLICITATION OF AN OFFER TO BUY THESE SECURITIES IN ANY JURISDICTION WHERE THE OFFER OR SALE IS NOT PERMITTED.
4
Summary of Transaction Terms
| Securities: | $829,251,166 monthly pay, multi-class, commercial mortgage REMIC pass-through certificates. |
| Managers and Bookrunners: | Credit Suisse Securities (USA) LLC and SG Americas Securities, LLC, as Co-Lead Managers and Joint Bookrunners. |
| Mortgage Loan Sellers: | Column Financial, Inc. (“Column”) (35.1%), Grass River Real Estate Credit Partners Loan Funding, LLC d/b/a 3650 REIT (“3650 REIT”) (40.1%), Societe Generale Financial Corporation (“SGFC”) (17.9%), and BSPRT CBMS Finance, LLC (“BSPRT”) (6.9%). |
| Master Servicer: | Midland Loan Services, a Division of PNC Bank, National Association (“Midland Loan Services”). |
| Special Servicer: | Midland Loan Services. |
| Directing Certificateholder: | Grass River Real Estate Credit Partners REIT LLC. |
| Trustee: | Wells Fargo Bank, National Association. |
| Certificate Administrator: | Wells Fargo Bank, National Association. |
| Operating Advisor: | Park Bridge Lender Services LLC. |
| Asset Representations Reviewer: | Park Bridge Lender Services LLC. |
| U.S. Credit Risk Retention: | For a discussion on the manner in which the U.S. credit risk retention requirements will be satisfied by 3650 REIT as the retaining sponsor, see “Credit Risk Retention” in the Preliminary Prospectus. |
| EU Credit Risk Retention: | None of the sponsors, the depositor, the issuing entity or any other party to this transaction intends to retain a material net economic interest in the securitization constituted by the issue of the Offered Certificates in accordance with the EU risk retention and due diligence requirements or to take any other action which may be required by EEA-regulated investors for the purposes of their compliance with the EU risk retention and due diligence requirements or similar requirements. |
| Closing Date: | On or about March 6, 2019. |
| Cut-off Date: | With respect to each mortgage loan, the respective due date for the monthly debt service payment that is due in March 2019 (or, in the case of any mortgage loan that has its first due date after March 2019, the date that would have been its due date in March 2019 under the terms of that mortgage loan if a monthly payment were scheduled to be due in that month). |
| Distribution Date: | The 4thbusiness day following each Determination Date, commencing in April 2019. |
| Determination Date: | 11thday of each month, or if the 11th day is not a business day, then the business day immediately following such 11th day, commencing in April 2019. |
| Rated Final Distribution Date: | The Distribution Date in March 2052. |
| Tax Treatment: | The Publicly Offered Certificates are expected to be treated as REMIC regular interests for U.S. federal income tax purposes. |
| Form of Offering: | The Class A-1, Class A-2, Class A-3, Class A-4, Class A-SB, Class X-A, Class X-B, Class A-S, Class B and Class C certificates will be offered publicly (the “Publicly Offered Certificates”). The Class X-D, Class D, Class E-RR, Class F-RR, Class G-RR, Class NR-RR and Class R certificates (the “Privately Offered Certificates”) will be offered domestically to Qualified Institutional Buyers and to Institutional Accredited Investors and to institutions that are not U.S. Persons pursuant to Regulation S. |
| SMMEA Status: | The certificates willnot constitute “mortgage related securities” for purposes of SMMEA. |
| ERISA: | The Publicly Offered Certificates are expected to be ERISA eligible. |
| Optional Termination: | 1% clean-up call. |
| Minimum Denominations: | The Publicly Offered Certificates (other than the Class X-A and Class X-B certificates) will be issued in minimum denominations of $10,000 and integral multiples of $1 in excess of $10,000. The Class X-A and Class X-B certificates will be issued in minimum denominations of $1,000,000 and in integral multiples of $1 in excess of $1,000,000. |
| Settlement Terms: | DTC, Euroclear and Clearstream Banking. |
| Analytics: | The transaction is expected to be available on Bloomberg Financial Markets, L.P., CMBS.com, Inc., Thomson Reuters Corporation, Trepp, LLC, Intex Solutions, Inc., Moody’s Analytics, RealINSIGHT and BlackRock Financial Management, Inc. |
THE INFORMATION IN THIS STRUCTURAL AND COLLATERAL TERM SHEET IS NOT COMPLETE AND MAY BE AMENDED PRIOR TO THE TIME OF SALE. THIS TERM SHEET IS NOT AN OFFER TO SELL THESE SECURITIES AND IT IS NOT A SOLICITATION OF AN OFFER TO BUY THESE SECURITIES IN ANY JURISDICTION WHERE THE OFFER OR SALE IS NOT PERMITTED.
5
Collateral Characteristics
| Loan Pool | |
| Initial Pool Balance (“IPB”)(1): | $829,251,167 |
| Number of Mortgage Loans: | 36 |
| Number of Mortgaged Properties: | 83 |
| Average Cut-off Date Balance per Mortgage Loan: | $23,034,755 |
| Weighted Average Current Mortgage Rate: | 5.0066% |
| 10 Largest Mortgage Loans as % of IPB: | 54.3% |
| Weighted Average Remaining Term to Maturity: | 112 |
| Weighted Average Seasoning: | 4 |
| Credit Statistics | |
| Weighted Average UW NCF DSCR(2)(3): | 1.92x |
| Weighted Average UW NOI Debt Yield(2): | 11.6% |
| Weighted Average Cut-off Date LTV(2): | 58.6% |
| Weighted Average Maturity Date LTV(2): | 54.9% |
| Other Statistics | |
| % of Credit Assessment Mortgage Loans(4): | 19.6% |
| % of Mortgage Loans with Additional Debt: | 30.3% |
| % of Mortgaged Properties with Single Tenants: | 15.6% |
| Amortization | |
| Weighted Average Original Amortization Term(5): | 353 |
| Weighted Average Remaining Amortization Term(5): | 352 |
| % of Mortgage Loans with Interest-Only: | 47.2% |
| % of Mortgage Loans with Partial Interest-Only followed by Amortizing Balloon: | 43.3% |
| % of Mortgage Loans with Amortizing Balloon: | 6.4% |
| % of Mortgage Loans with Partial Amortization followed by Interest-Only: | 3.1% |
| Cash Management(6) | |
| % of Mortgage Loans with In-Place, Hard Lockboxes: | 65.8% |
| % of Mortgage Loans with Springing Lockbox: | 20.0% |
| % of Mortgage Loans with In-Place, Soft Lockboxes: | 14.1% |
| % of Mortgage Loans with No Lockbox: | 0.0% |
| Reserves | |
| % of Mortgage Loans Requiring Upfront or Ongoing Tax Reserves: | 65.7% |
| % of Mortgage Loans Requiring Upfront or Ongoing Insurance Reserves: | 41.0% |
| % of Mortgage Loans Requiring Upfront or Ongoing CapEx Reserves(7): | 66.9% |
| % of Mortgage Loans Requiring Upfront or Ongoing TI/LC Reserves(8): | 56.8% |
| (1) | Subject to a permitted variance of plus or minus 5%. |
| (2) | With respect to any mortgage loan that is part of a whole loan, the Cut-off Date LTV, Maturity Date LTV, UW NCF DSCR and UW NOI Debt Yield calculations include the relatedpari passu companion loan(s) but exclude any related subordinate loan(s) or mezzanine loan(s). See the Pari Passu Loan Summary below and Annex A-1 to the Preliminary Prospectus. |
| (3) | For each partial interest-only mortgage loan, the UW NCF DSCR is calculated using the initial principal and interest payment during the term of the mortgage loan once amortization has commenced. In the case of Loan Nos. 9 and 19, each loan pays according to a non-standard amortization schedule. See Annex F and Annex G to the Preliminary Prospectus. |
| (4) | Includes loans that at least one of Moody’s, Fitch and DBRS have confirmed, in the context of its inclusion in the Initial Pool Balance, have credit characteristics consistent with an investment grade obligation. |
| (5) | Excludes mortgage loans that are interest-only for the entire term. In the case of Loan Nos. 9 and 19, each loan pays according to a non-standard amortization schedule for which assumed Original Amortization is 360 months. See Annex F and Annex G to the Preliminary Prospectus. |
| (6) | For a detailed description of cash management, refer to“Description of the Mortgage Pool—Certain Terms of the Mortgage Loans—Mortgaged Property Accounts—Lockbox Accounts” in the Preliminary Prospectus. |
| (7) | CapEx Reserves include FF&E reserves for hotel properties. |
| (8) | Calculated only with respect to the Cut-off Date Balance of mortgage loans secured by industrial, office, other, mixed use and retail properties. |
THE INFORMATION IN THIS STRUCTURAL AND COLLATERAL TERM SHEET IS NOT COMPLETE AND MAY BE AMENDED PRIOR TO THE TIME OF SALE. THIS TERM SHEET IS NOT AN OFFER TO SELL THESE SECURITIES AND IT IS NOT A SOLICITATION OF AN OFFER TO BUY THESE SECURITIES IN ANY JURISDICTION WHERE THE OFFER OR SALE IS NOT PERMITTED.
6
Collateral Characteristics
| Loan Seller | Number of Mortgage Loans | Number of Mortgaged Properties | Aggregate Cut-off Date Balance | % of IPB |
| Column(1) | 8 | 24 | $290,765,000 | 35.1% |
| 3650 REIT | 19 | 25 | 332,726,057 | 40.1 |
| SGFC(2) | 6 | 29 | 148,660,110 | 17.9 |
| BSPRT | 3 | 5 | 57,100,000 | 6.9 |
| Total: | 36 | 83 | $829,251,167 | 100.0% |
| (1) | Loan No. 8 was originated by Natixis Real Estate Capital LLC and portions were subsequently acquired by Column. Loan No. 26 is part of a whole loan that was co-originated by Column and Wells Fargo Bank, National Association. Loan No. 29 was originated by Regions Bank and subsequently acquired by Column. |
| (2) | Loan No. 9 is part of a whole loan that was co-originated by SGFC and Deutsche Bank AG, New York Branch. |
Ten Largest Mortgage Loans
| # | Loan Name | Loan Seller | No. of Properties | Cut-off Date Balance | % of IPB | Property Type | UW NCF DSCR(1)(2) | UW NOI Debt Yield(1) | Cut-off Date LTV(1) | Credit Assessment (Moody’s/Fitch/DBRS) |
| 1 | Darden Headquarters | Column | 1 | $80,000,000 | 9.6% | Office | 1.67x | 8.1% | 69.9% | NR / NR / NR |
| 2 | Embassy Suites Portland Washington Square | Column | 1 | 56,250,000 | 6.8 | Hotel | 1.53x | 11.5% | 67.9% | NR / NR / NR |
| 3 | SITE JV Portfolio | Column | 10 | 50,000,000 | 6.0 | Retail | 3.63x | 19.2% | 35.5% | A3 / A- / A(high)(3) |
| 4 | 787 Eleventh Avenue | SGFC | 1 | 45,000,000 | 5.4 | Mixed Use | 3.01x | 14.4% | 26.9% | A3 / BBB- / A(low)(3) |
| 5 | Causeway Square | 3650 REIT | 1 | 45,000,000 | 5.4 | Mixed Use | 1.29x | 8.8% | 65.3% | NR / NR / NR |
| 6 | Bernardus Lodge & Spa | 3650 REIT | 1 | 43,500,000 | 5.2 | Hotel | 1.72x | 13.7% | 54.4% | NR / NR / NR |
| 7 | ExchangeRight Net Leased Portfolio 24 | SGFC | 24 | 35,000,000 | 4.2 | Various | 2.04x | 9.5% | 62.0% | NR / NR / NR |
| 8 | 2 North 6th Place | Column | 1 | 34,000,000 | 4.1 | Multifamily | 2.68x | 12.4% | 30.3% | Baa1 / BBB / AA(low)(3) |
| 9 | Saint Louis Galleria | SGFC | 1 | 33,520,755 | 4.0 | Retail | 1.67x | 11.3% | 51.5% | Baa2 / NR / NR(3) |
| 10 | Courtyard San Antonio Riverwalk | BSPRT | 1 | 27,800,000 | 3.4 | Hotel | 2.25x | 14.2% | 58.0% | NR / NR / NR |
| Top 3 Total/Weighted Average: | 12 | $186,250,000 | 22.5% | 2.15x | 12.1% | 60.1% | ||||
| Top 5 Total/Weighted Average: | 14 | $276,250,000 | 33.3% | 2.15x | 11.9% | 55.5% | ||||
| Top 10 Total/Weighted Average: | 42 | $450,070,755 | 54.3% | 2.11x | 12.0% | 53.9% | ||||
| (1) | With respect to any mortgage loan that is part of a whole loan, the Cut-off Date LTV, UW NCF DSCR and UW NOI Debt Yield calculations include the relatedpari passu companion loan(s) but exclude any related subordinate loan(s) or mezzanine loan(s). See the Pari Passu Loan Summary below and Annex A-1 to the Preliminary Prospectus. |
| (2) | For each partial interest-only mortgage loan, the UW NCF DSCR is calculated using the first principal and interest payment to be made into the trust during the term of the mortgage loan once amortization has commenced. In the case of Loan No. 9, the loan pays according to a non-standard amortization schedule. See Annex F to the Preliminary Prospectus. |
| (3) | Moody’s, Fitch or DBRS, respectively, have confirmed the related loans have, in the context of its inclusion in the Initial Pool Balance, credit characteristics consistent with an investment grade obligation. |
THE INFORMATION IN THIS STRUCTURAL AND COLLATERAL TERM SHEET IS NOT COMPLETE AND MAY BE AMENDED PRIOR TO THE TIME OF SALE. THIS TERM SHEET IS NOT AN OFFER TO SELL THESE SECURITIES AND IT IS NOT A SOLICITATION OF AN OFFER TO BUY THESE SECURITIES IN ANY JURISDICTION WHERE THE OFFER OR SALE IS NOT PERMITTED.
7
Pari Passu Loan Summary
| # | Loan Name | Note(s) | Original Balance | Holder of Note | Lead Servicer for Whole Loan (Y/N) | Master Servicer Under Lead Securitization | Special Servicer Under Lead Securitization |
| 1 | Darden Headquarters | A-1, A-3 | $80,000,000 | CSAIL 2019-C15 | Yes | Midland Loan Services | Midland Loan Services |
| A-2 | $30,000,000 | Column | No | ||||
| 3 | SITE JV Portfolio | A-1 | $170,000,000 | CSMC 2018-SITE | Yes | Wells Fargo Bank, National Association | Midland Loan Services |
| A-2 | $50,000,000 | CSAIL 2019-C15 | No | ||||
| 4 | 787 Eleventh Avenue | A-1A | $70,000,000 | SGCMS 2019-787E(1) | Yes | Wells Fargo Bank, National Association | AEGON USA Realty Advisors, LLC |
| A-1B | $45,000,000 | CSAIL 2019-C15 | No | ||||
| A-1C, A-1D | $60,000,000 | SGFC | No | ||||
| 7 | ExchangeRight Net Leased Portfolio 24 | A-1, A-4 | $35,000,000 | CSAIL 2019-C15 | Yes | Midland Loan Services | Midland Loan Services |
| A-2 | $4,165,000 | UBS 2018-C15 | No | ||||
| A-3 | $15,000,000 | SGFC | No | ||||
| 8 | 2 North 6th Place | A-1, A-3 | $126,600,000 | Natixis Real Estate Capital LLC | No | (2) | (2) |
| A-2 | $34,000,000 | CSAIL 2019-C15 | Yes(2) | ||||
| 9 | Saint Louis Galleria | A-1-A1, A-1-A3, A-1-A4, A-1-A5 | $106,479,245 | Deutsche Bank AG, New York Branch | No | (3) | (3) |
| A-1-A2 | $55,000,000 | Benchmark 2018-B8 | Yes(3) | ||||
| A-2-A1, A-2-A3 | $45,000,000 | UBS 2018-C15 | No | ||||
| A-2-A2, A-2-A4, A-2-A5 | $33,520,755 | CSAIL 2019-C15 | No | ||||
| 11 | Georgetown Squared & Seattle Design Center | A-1, A-2 | $65,000,000 | CSAIL 2018-C14 | Yes | Wells Fargo Bank, National Association | Rialto Capital Advisors, LLC |
| A-3, A-4 | $26,000,000 | CSAIL 2019-C15 | No | ||||
| 13 | Continental Towers | A-1, A-3 | $59,500,000 | CSAIL 2018-C14 | Yes | Wells Fargo Bank, National Association | Rialto Capital Advisors, LLC |
| A-2 | $25,000,000 | CSAIL 2019-C15 | No | ||||
| 15 | Nebraska Crossing | A-1 | $35,000,000 | UBS 2018-C14 | Yes | Midland Loan Services | Rialto Capital Advisors, LLC |
| A-2, A-4 | $23,500,000 | CSAIL 2019-C15 | No | ||||
| A-3 | $13,000,000 | UBS 2018-C15 | No | ||||
| 16 | Desert Marketplace | A-1 | $23,000,000 | CSAIL 2019-C15 | Yes | Midland Loan Services | Midland Loan Services |
| A-2 | $10,000,000 | Grass River Warehouse Facility Entity One, LLC | No | ||||
| 26 | Prudential - Digital Realty Portfolio | A-1 | $70,000,000 | BANK 2018-BNK14 | Yes | Wells Fargo Bank, National Association | Rialto Capital Advisors, LLC |
| A-2-1 | $26,000,000 | BANK 2018-BNK15 | No | ||||
| A-2-2 | $10,000,000 | BANK 2019-BNK16(4) | No | ||||
| A-3 | $70,000,000 | CSAIL 2018-C14 | No | ||||
| A-4 | $11,000,000 | CSAIL 2019-C15 | No | ||||
| A-5 | $25,000,000 | WFCM 2018-C48 | No |
| (1) | The SGCMS 2019-787E transaction is expected to close on February 20, 2019. |
| (2) | The 2 North 6th Place Whole Loan is expected to initially be serviced under the CSAIL 2019-C15 pooling and servicing agreement until the securitization of Note A-1, after which the 2 North 6th Place Whole Loan will be serviced under the pooling and servicing agreement related to the securitization of the Note A-1. |
| (3) | The Saint Louis Galleria Whole Loan is being serviced pursuant to the Benchmark 2018-B8 pooling and servicing agreement. From and after the securitization of Note A1-A1, the Saint Louis Galleria Whole Loan will be serviced under the pooling and servicing agreement for the securitization that holds such note. |
| (4) | The BANK 2019-BNK16 transaction is expected to close on February 21, 2019. |
THE INFORMATION IN THIS STRUCTURAL AND COLLATERAL TERM SHEET IS NOT COMPLETE AND MAY BE AMENDED PRIOR TO THE TIME OF SALE. THIS TERM SHEET IS NOT AN OFFER TO SELL THESE SECURITIES AND IT IS NOT A SOLICITATION OF AN OFFER TO BUY THESE SECURITIES IN ANY JURISDICTION WHERE THE OFFER OR SALE IS NOT PERMITTED.
8
Mortgaged Properties by Type(1)
| Weighted Average | |||||||||
| Property Type | Property Subtype | Number of Properties | Cut-off Date Balance | % of IPB | Occupancy | UW NCF DSCR(2)(3) | UW NOI Debt Yield(2) | Cut-off Date LTV(2) | Maturity Date LTV(2) |
| Retail | |||||||||
| Anchored | 5 | $75,100,000 | 9.1% | 97.1% | 1.49x | 9.3% | 65.8% | 60.8% | |
| Power Center | 10 | 50,000,000 | 6.0 | 90.2% | 3.63x | 19.2% | 35.5% | 35.5% | |
| Super Regional Mall | 1 | 33,520,755 | 4.0 | 96.9% | 1.67x | 11.3% | 51.5% | 47.0% | |
| Single Tenant | 22 | 30,887,832 | 3.7 | 100.0% | 1.95x | 9.3% | 62.7% | 61.4% | |
| Outlet Center | 1 | 23,500,000 | 2.8 | 99.0% | 1.82x | 12.7% | 47.7% | 44.1% | |
| Shadow Anchored | 1 | 6,500,000 | 0.8 | 100.0% | 1.64x | 8.6% | 60.2% | 60.2% | |
| Retail Total | 40 | $219,508,587 | 26.5% | 96.2% | 2.11x | 12.2% | 54.2% | 51.2% | |
| Hotel | |||||||||
| Full Service | 2 | $99,750,000 | 12.0% | 77.4% | 1.61x | 12.5% | 62.0% | 57.4% | |
| Extended Stay | 9 | 48,283,945 | 5.8 | 81.3% | 1.96x | 15.5% | 58.8% | 48.0% | |
| Select Service | 1 | 27,800,000 | 3.4 | 78.1% | 2.25x | 14.2% | 58.0% | 58.0% | |
| Limited Service | 2 | 21,782,516 | 2.6 | 83.9% | 1.93x | 15.3% | 63.5% | 48.1% | |
| Hotel Total | 14 | $197,616,461 | 23.8% | 79.2% | 1.82x | 13.7% | 60.8% | 54.2% | |
| Office | |||||||||
| Suburban | 4 | $120,665,000 | 14.6% | 97.7% | 1.91x | 9.6% | 68.3% | 68.3% | |
| CBD | 2 | 38,050,000 | 4.6 | 88.3% | 1.37x | 10.5% | 73.3% | 64.6% | |
| Medical | 4 | 32,734,054 | 3.9 | 92.9% | 1.96x | 9.3% | 60.6% | 60.6% | |
| Office Total | 10 | $191,449,054 | 23.1% | 95.0% | 1.81x | 9.7% | 68.0% | 66.3% | |
| Mixed Use | |||||||||
| Retail / Office | 1 | $45,000,000 | 5.4% | 88.4% | 3.01x | 14.4% | 26.9% | 26.9% | |
| Office / Retail | 1 | 45,000,000 | 5.4 | 89.2% | 1.29x | 8.8% | 65.3% | 60.4% | |
| Office / Design Showroom | 1 | 26,000,000 | 3.1 | 82.2% | 1.05x | 7.5% | 69.8% | 61.9% | |
| Mixed Use Total | 3 | $116,000,000 | 14.0% | 87.3% | 1.90x | 10.7% | 51.4% | 47.7% | |
| Multifamily | |||||||||
| High Rise | 1 | $34,000,000 | 4.1% | 85.6% | 2.68x | 12.4% | 30.3% | 30.3% | |
| Garden | 1 | 15,600,000 | 1.9 | 96.7% | 1.24x | 8.0% | 71.6% | 61.5% | |
| Mid Rise | 3 | 14,000,000 | 1.7 | 100.0% | 1.33x | 7.6% | 70.5% | 70.5% | |
| Multifamily Total | 5 | $63,600,000 | 7.7% | 91.5% | 2.03x | 10.3% | 49.3% | 46.8% | |
| Industrial | |||||||||
| Warehouse | 1 | $25,577,065 | 3.1% | 100.0% | 1.40x | 10.8% | 64.8% | 57.8% | |
| Industrial Total | 1 | $25,577,065 | 3.1% | 100.0% | 1.40x | 10.8% | 64.8% | 57.8% | |
| Other | |||||||||
| Data Center | 8 | $11,000,000 | 1.3% | 100.0% | 2.50x | 11.9% | 54.7% | 54.7% | |
| Other Total | 8 | $11,000,000 | 1.3% | 100.0% | 2.50x | 11.9% | 54.7% | 54.7% | |
| Self Storage | |||||||||
| Self Storage | 2 | $4,500,000 | 0.5% | 91.6% | 1.26x | 8.6% | 65.2% | 60.3% | |
| Self Storage Total | 2 | $4,500,000 | 0.5% | 91.6% | 1.26x | 8.6% | 65.2% | 60.3% | |
| Total / Wtd. Avg.: | 83 | $829,251,167 | 100.0% | 90.4% | 1.92x | 11.6% | 58.6% | 54.9% | |
| (1) | This table presents information relating to the mortgaged properties and not mortgage loans, the information for mortgage loans secured by more than one mortgaged property is based on allocated loan amounts in Annex A-1 to the Preliminary Prospectus. |
| (2) | With respect to any mortgage loan that is part of a whole loan, the Cut-off Date LTV, Maturity Date LTV, UW NCF DSCR and UW NOI Debt Yield calculations include the relatedpari passu companion loan(s) but exclude any related subordinate loan(s) or mezzanine loan(s). See the Pari Passu Loan Summary above and Annex A-1 to the Preliminary Prospectus. |
| (3) | For each partial interest-only mortgage loan, the UW NCF DSCR is calculated using the first principal and interest payment to be made into the trust during the term of the mortgage loan once amortization has commenced. In the case of Loan Nos. 9 and 19, each loan pays according to a non-standard amortization schedule. See Annex F and Annex G to the Preliminary Prospectus. |
THE INFORMATION IN THIS STRUCTURAL AND COLLATERAL TERM SHEET IS NOT COMPLETE AND MAY BE AMENDED PRIOR TO THE TIME OF SALE. THIS TERM SHEET IS NOT AN OFFER TO SELL THESE SECURITIES AND IT IS NOT A SOLICITATION OF AN OFFER TO BUY THESE SECURITIES IN ANY JURISDICTION WHERE THE OFFER OR SALE IS NOT PERMITTED.
9
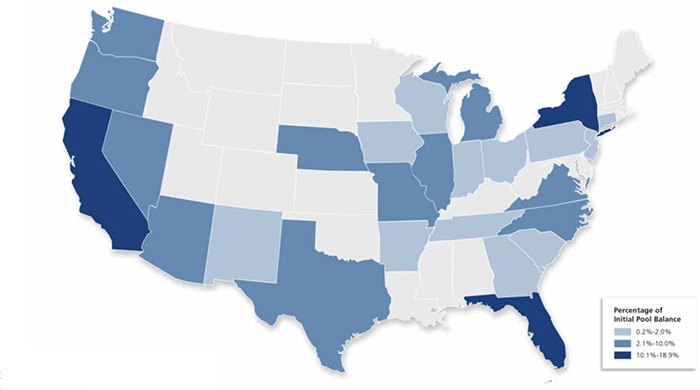
Mortgaged Properties by Location(1)
| State | Number of Properties | Cut-off Date Balance | % of IPB | Weighted Average | ||||
| Occupancy | UW NCF DSCR(2)(3) | UW NOI Debt Yield(2) | Cut-off Date LTV(2) | Maturity Date LTV(2) | ||||
| FL | 6 | $156,770,973 | 18.9% | 96.1% | 1.54x | 9.0% | 67.6% | 64.5% |
| NY | 6 | 115,750,000 | 14.0 | 88.4% | 2.37x | 12.2% | 42.3% | 40.5% |
| CA | 9 | 108,270,283 | 13.1 | 90.9% | 1.86x | 11.3% | 57.5% | 55.9% |
| OR | 1 | 56,250,000 | 6.8 | 73.4% | 1.53x | 11.5% | 67.9% | 62.9% |
| IL | 9 | 55,355,716 | 6.7 | 90.7% | 2.33x | 13.0% | 63.4% | 62.0% |
| TX | 7 | 43,885,191 | 5.3 | 82.9% | 2.14x | 13.3% | 59.8% | 58.0% |
| MO | 2 | 39,407,887 | 4.8 | 96.9% | 1.96x | 12.5% | 49.1% | 45.3% |
| NC | 6 | 39,361,015 | 4.7 | 83.6% | 2.21x | 15.2% | 56.5% | 47.0% |
| AZ | 2 | 28,422,656 | 3.4 | 93.9% | 2.32x | 13.1% | 55.3% | 49.8% |
| WA | 1 | 26,000,000 | 3.1 | 82.2% | 1.05x | 7.5% | 69.8% | 61.9% |
| MI | 1 | 25,577,065 | 3.1 | 100.0% | 1.40x | 10.8% | 64.8% | 57.8% |
| NE | 1 | 23,500,000 | 2.8 | 99.0% | 1.82x | 12.7% | 47.7% | 44.1% |
| NV | 1 | 23,000,000 | 2.8 | 99.2% | 1.25x | 8.6% | 66.3% | 60.4% |
| VA | 5 | 21,475,905 | 2.6 | 94.1% | 1.94x | 12.0% | 65.7% | 60.1% |
| SC | 3 | 14,596,712 | 1.8 | 86.1% | 2.05x | 14.6% | 60.0% | 48.3% |
| GA | 5 | 14,037,121 | 1.7 | 84.6% | 2.52x | 16.2% | 51.7% | 45.2% |
| CT | 1 | 7,661,259 | 0.9 | 94.9% | 3.63x | 19.2% | 35.5% | 35.5% |
| OH | 5 | 5,551,389 | 0.7 | 89.0% | 2.09x | 13.0% | 58.5% | 54.1% |
| WI | 2 | 3,958,460 | 0.5 | 100.0% | 2.04x | 9.5% | 62.0% | 62.0% |
| NJ | 2 | 3,899,114 | 0.5 | 77.5% | 3.25x | 16.8% | 41.9% | 41.9% |
| IN | 1 | 3,621,886 | 0.4 | 100.0% | 1.25x | 8.1% | 68.3% | 57.0% |
| IA | 1 | 3,509,370 | 0.4 | 100.0% | 2.04x | 9.5% | 62.0% | 62.0% |
| TN | 1 | 3,035,078 | 0.4 | 100.0% | 2.04x | 9.5% | 62.0% | 62.0% |
| AR | 1 | 2,391,750 | 0.3 | 71.8% | 2.06x | 16.4% | 59.0% | 44.5% |
| NM | 1 | 2,039,324 | 0.2 | 100.0% | 2.04x | 9.5% | 62.0% | 62.0% |
| PA | 3 | 1,923,013 | 0.2 | 100.0% | 2.04x | 9.5% | 62.0% | 62.0% |
| Total/ Wtd. Avg.: | 83 | $829,251,167 | 100.0% | 90.4% | 1.92x | 11.6% | 58.6% | 54.9% |
| (1) | This table presents information relating to the mortgaged properties and not mortgage loans, the information for mortgage loans secured by more than one mortgaged property is based on allocated loan amounts in Annex A-1 to the Preliminary Prospectus. In the case of Loan No. 33 and 34, occupancy is reported on a consolidated basis for the portfolio. |
| (2) | With respect to any mortgage loan that is part of a whole loan, the Cut-off Date LTV, Maturity Date LTV, UW NCF DSCR and UW NOI Debt Yield calculations include the relatedpari passu companion loan(s) but exclude any related subordinate loan(s) or mezzanine loan(s). See the Pari Passu Loan Summary above and Annex A-1 to the Preliminary Prospectus. |
| (3) | For each partial interest-only mortgage loan, the UW NCF DSCR is calculated using the first principal and interest payment to be made into the trust during the term of the mortgage loan once amortization has commenced. In the case of Loan Nos. 9 and 19, each loan pays according to a non-standard amortization schedule. See Annex F and Annex G to the Preliminary Prospectus. |
THE INFORMATION IN THIS STRUCTURAL AND COLLATERAL TERM SHEET IS NOT COMPLETE AND MAY BE AMENDED PRIOR TO THE TIME OF SALE. THIS TERM SHEET IS NOT AN OFFER TO SELL THESE SECURITIES AND IT IS NOT A SOLICITATION OF AN OFFER TO BUY THESE SECURITIES IN ANY JURISDICTION WHERE THE OFFER OR SALE IS NOT PERMITTED.
10
Cut-off Date Principal Balance
| Weighted Average | |||||||||
| Range of Principal Balances | Number of Loans | Cut-off Date Balance | % of IPB | Mortgage Rate | Remaining Loan Term | UW NCF DSCR(1)(2) | UW NOI Debt Yield(1) | Cut-off Date LTV(1) | Maturity Date LTV(1) |
| $3,621,886 - $9,999,999 | 9 | $57,205,271 | 6.9% | 4.9857% | 115 | 1.92x | 11.8% | 61.1% | 55.7% |
| $10,000,000 - $19,999,999 | 8 | 110,148,076 | 13.3 | 5.0692% | 109 | 1.71x | 11.0% | 65.9% | 59.0% |
| $20,000,000 - $29,999,999 | 10 | 239,627,065 | 28.9 | 5.1496% | 116 | 1.68x | 11.2% | 63.4% | 58.5% |
| $30,000,000 - $49,999,999 | 6 | 236,020,755 | 28.5 | 4.8903% | 116 | 2.06x | 11.7% | 48.5% | 46.1% |
| $50,000,000 - $80,000,000 | 3 | 186,250,000 | 22.5 | 4.9393% | 103 | 2.15x | 12.1% | 60.1% | 58.6% |
| Total/Wtd. Avg.: | 36 | $829,251,167 | 100.0% | 5.0066% | 112 | 1.92x | 11.6% | 58.6% | 54.9% |
Mortgage Interest Rates
| Weighted Average | |||||||||
| Range of Mortgage Interest Rates | Number of Loans | Cut-off Date Balance | % of IPB | Mortgage Rate | Remaining Loan Term | UW NCF DSCR(1)(2) | UW NOI Debt Yield(1) | Cut-off Date LTV(1) | Maturity Date LTV(1) |
| 4.4700% - 4.7499% | 7 | $172,750,000 | 20.8% | 4.5689% | 111 | 2.36x | 11.3% | 46.3% | 45.4% |
| 4.7500% - 4.9999% | 9 | 232,257,641 | 28.0 | 4.8227% | 104 | 2.22x | 12.0% | 58.5% | 57.3% |
| 5.0000% - 5.2499% | 9 | 122,827,106 | 14.8 | 5.1319% | 116 | 1.56x | 11.2% | 62.6% | 54.1% |
| 5.2500% - 5.4999% | 9 | 279,677,065 | 33.7 | 5.3263% | 117 | 1.58x | 11.7% | 63.7% | 58.2% |
| 5.5000% - 5.6800% | 2 | 21,739,355 | 2.6 | 5.6285% | 118 | 1.47x | 9.6% | 68.9% | 65.2% |
| Total/Wtd. Avg.: | 36 | $829,251,167 | 100.0% | 5.0066% | 112 | 1.92x | 11.6% | 58.6% | 54.9% |
Original Term to Maturity in Months
| Weighted Average | |||||||||
| Original Term to Maturity in Months | Number of Loans | Cut-off Date Balance | % of IPB | Mortgage Rate | Remaining Loan Term | UW NCF DSCR(1)(2) | UW NOI Debt Yield(1) | Cut-off Date LTV(1) | Maturity Date LTV(1) |
| 120 | 34 | $768,251,167 | 92.6% | 5.0265% | 116 | 1.80x | 11.1% | 60.2% | 56.1% |
| 64 | 1 | 50,000,000 | 6.0 | 4.8000% | 61 | 3.63x | 19.2% | 35.5% | 35.5% |
| 60 | 1 | 11,000,000 | 1.3 | 4.5575% | 55 | 2.50x | 11.9% | 54.7% | 54.7% |
| Total/Wtd. Avg.: | 36 | $829,251,167 | 100.0% | 5.0066% | 112 | 1.92x | 11.6% | 58.6% | 54.9% |
| (1) | With respect to any mortgage loan that is part of a whole loan, the Cut-off Date LTV, Maturity Date LTV, UW NCF DSCR and UW NOI Debt Yield calculations include the relatedpari passu companion loan(s) but exclude any related subordinate loan(s) or mezzanine loan(s). See the Pari Passu Loan Summary above and Annex A-1 to the Preliminary Prospectus. |
| (2) | For each partial interest-only mortgage loan, the UW NCF DSCR is calculated using the first principal and interest payment to be made into the trust during the term of the mortgage loan once amortization has commenced. In the case of Loan Nos. 9 and 19, each loan pays according to a non-standard amortization schedule. See Annex F and Annex G to the Preliminary Prospectus. |
THE INFORMATION IN THIS STRUCTURAL AND COLLATERAL TERM SHEET IS NOT COMPLETE AND MAY BE AMENDED PRIOR TO THE TIME OF SALE. THIS TERM SHEET IS NOT AN OFFER TO SELL THESE SECURITIES AND IT IS NOT A SOLICITATION OF AN OFFER TO BUY THESE SECURITIES IN ANY JURISDICTION WHERE THE OFFER OR SALE IS NOT PERMITTED.
11
Remaining Term to Maturity in Months
| Weighted Average | |||||||||
| Range of Remaining Term to Maturity in Months | Number of Loans | Cut-off Date Balance | % of IPB | Mortgage Rate | Remaining Loan Term | UW NCF DSCR(1)(2) | UW NOI Debt Yield(1) | Cut-off Date LTV(1) | Maturity Date LTV(1) |
| 55 - 84 | 2 | $61,000,000 | 7.4% | 4.7563% | 60 | 3.43x | 17.9% | 39.0% | 39.0% |
| 85 - 119 | 34 | 768,251,167 | 92.6 | 5.0265% | 116 | 1.80x | 11.1% | 60.2% | 56.1% |
| Total/Wtd. Avg.: | 36 | $829,251,167 | 100.0% | 5.0066% | 112 | 1.92x | 11.6% | 58.6% | 54.9% |
Original Amortization Term in Months(3)
| Weighted Average | |||||||||
| Original Amortization Term in Months | Number of Loans | Cut-off Date Balance | % of IPB | Mortgage Rate | Remaining Loan Term | UW NCF DSCR(1)(2) | UW NOI Debt Yield(1) | Cut-off Date LTV(1) | Maturity Date LTV(1) |
| Interest Only | 15 | $391,365,000 | 47.2% | 4.7696% | 108 | 2.35x | 11.9% | 53.5% | 53.5% |
| 300 | 4 | 48,361,547 | 5.8 | 5.1707% | 114 | 2.04x | 16.4% | 58.8% | 45.8% |
| 360 | 17 | 389,524,620 | 47.0 | 5.2244% | 116 | 1.46x | 10.6% | 63.7% | 57.4% |
| Total/Wtd. Avg.: | 36 | $829,251,167 | 100.0% | 5.0066% | 112 | 1.92x | 11.6% | 58.6% | 54.9% |
Remaining Amortization Term in Months(3)
| Weighted Average | |||||||||
| Range of Remaining Amortization Term in Months | Number of Loans | Cut-off Date Balance | % of IPB | Mortgage Rate | Remaining Loan Term | UW NCF DSCR(1)(2) | UW NOI Debt Yield(1) | Cut-off Date LTV(1) | Maturity Date LTV(1) |
| Interest Only | 15 | $391,365,000 | 47.2% | 4.7696% | 108 | 2.35x | 11.9% | 53.5% | 53.5% |
| 294 - 300 | 4 | 48,361,547 | 5.8 | 5.1707% | 114 | 2.04x | 16.4% | 58.8% | 45.8% |
| 301 - 359 | 4 | 50,903,865 | 6.1 | 5.3066% | 115 | 1.54x | 11.6% | 64.5% | 55.7% |
| 360 | 13 | 338,620,755 | 40.8 | 5.2120% | 116 | 1.45x | 10.5% | 63.6% | 57.7% |
| Total/Wtd. Avg.: | 36 | $829,251,167 | 100.0% | 5.0066% | 112 | 1.92x | 11.6% | 58.6% | 54.9% |
| (1) | With respect to any mortgage loan that is part of a whole loan, the Cut-off Date LTV, Maturity Date LTV, UW NCF DSCR and UW NOI Debt Yield calculations include the relatedpari passu companion loan(s) but exclude any related subordinate loan(s) or mezzanine loan(s). See thePari Passu Loan Summary above and Annex A-1 to the Preliminary Prospectus. |
| (2) | For each partial interest-only mortgage loan, the UW NCF DSCR is calculated using the first principal and interest payment to be made into the trust during the term of the mortgage loan once amortization has commenced. In the case of Loan Nos. 9 and 19, each loan pays according to a non-standard amortization schedule. See Annex F and Annex G to the Preliminary Prospectus. |
| (3) | In the case of Loan Nos. 9 and 19, each loan pays according to a non-standard amortization schedule for which assumed Original Amortization is 360 months. See Annex F and Annex G to the Preliminary Prospectus. |
THE INFORMATION IN THIS STRUCTURAL AND COLLATERAL TERM SHEET IS NOT COMPLETE AND MAY BE AMENDED PRIOR TO THE TIME OF SALE. THIS TERM SHEET IS NOT AN OFFER TO SELL THESE SECURITIES AND IT IS NOT A SOLICITATION OF AN OFFER TO BUY THESE SECURITIES IN ANY JURISDICTION WHERE THE OFFER OR SALE IS NOT PERMITTED.
12
Amortization Types
| Weighted Average | |||||||||
| Amortization Types | Number of Loans | Cut-off Date Balance | % of IPB | Mortgage Rate | Remaining Loan Term | UW NCF DSCR(1)(2) | UW NOI Debt Yield(1) | Cut-off Date LTV(1) | Maturity Date LTV(1) |
| Interest Only | 15 | $391,365,000 | 47.2% | 4.7696% | 108 | 2.35x | 11.9% | 53.5% | 53.5% |
| IO-Balloon | 14 | 359,120,755 | 43.3 | 5.2145% | 116 | 1.49x | 10.9% | 63.0% | 56.9% |
| Balloon | 6 | 53,188,347 | 6.4 | 5.1965% | 115 | 1.83x | 14.0% | 63.3% | 50.3% |
| Amortizing-IO | 1 | 25,577,065 | 3.1 | 5.3200% | 114 | 1.40x | 10.8% | 64.8% | 57.8% |
| Total/Wtd. Avg.: | 36 | $829,251,167 | 100.0% | 5.0066% | 112 | 1.92x | 11.6% | 58.6% | 54.9% |
Interest Only Periods
| Weighted Average | |||||||||
| Range of Interest Only Periods | Number of Loans | Cut-off Date Balance | % of IPB | Mortgage Rate | Remaining Loan Term | UW NCF DSCR(1)(2) | UW NOI Debt Yield(1) | Cut-off Date LTV(1) | Maturity Date LTV(1) |
| None | 6 | $53,188,347 | 6.4% | 5.1965% | 115 | 1.83x | 14.0% | 63.3% | 50.3% |
| 23 - 48 | 9 | 178,427,065 | 21.5 | 5.1983% | 115 | 1.38x | 10.3% | 67.4% | 59.3% |
| 49 - 64 | 8 | 267,270,755 | 32.2 | 5.1308% | 104 | 1.99x | 12.9% | 54.8% | 51.3% |
| 120 | 13 | 330,365,000 | 39.8 | 4.7720% | 117 | 2.16x | 10.8% | 56.1% | 56.1% |
| Total/Wtd. Avg.: | 36 | $829,251,167 | 100.0% | 5.0066% | 112 | 1.92x | 11.6% | 58.6% | 54.9% |
Underwritten Net Cash Flow Debt Service Coverage Ratios
| Weighted Average | |||||||||
| Range of Underwritten Net Cash Flow DSCRs | Number of Loans | Cut-off Date Balance | % of IPB | Mortgage Rate | Remaining Loan Term | UW NCF DSCR(1)(2) | UW NOI Debt Yield(1) | Cut-off Date LTV(1) | Maturity Date LTV(1) |
| 1.05x - 1.24x | 3 | $62,100,000 | 7.5% | 4.9895% | 113 | 1.16x | 7.9% | 70.7% | 62.2% |
| 1.25x - 1.49x | 8 | 147,648,951 | 17.8 | 5.3107% | 116 | 1.31x | 9.3% | 67.0% | 60.9% |
| 1.50x - 1.74x | 8 | 261,310,110 | 31.5 | 5.0880% | 117 | 1.65x | 10.6% | 64.0% | 60.8% |
| 1.75x - 1.99x | 6 | 91,398,076 | 11.0 | 4.9755% | 116 | 1.88x | 12.1% | 57.4% | 51.2% |
| 2.00x - 2.49x | 5 | 114,379,030 | 13.8 | 4.9459% | 116 | 2.18x | 13.3% | 61.0% | 58.4% |
| 2.50x - 3.63x | 6 | 152,415,000 | 18.4 | 4.6435% | 94 | 3.09x | 15.4% | 35.3% | 35.3% |
| Total/Wtd. Avg.: | 36 | $829,251,167 | 100.0% | 5.0066% | 112 | 1.92x | 11.6% | 58.6% | 54.9% |
| (1) | With respect to any mortgage loan that is part of a whole loan, the Cut-off Date LTV, Maturity Date LTV, UW NCF DSCR and UW NOI Debt Yield calculations include the relatedpari passu companion loan(s) but exclude any related subordinate loan(s) or mezzanine loan(s). See the Pari Passu Loan Summary above and Annex A-1 to the Preliminary Prospectus. |
| (2) | For each partial interest-only mortgage loan, the UW NCF DSCR is calculated using the first principal and interest payment to be made into the trust during the term of the mortgage loan once amortization has commenced. In the case of Loan Nos. 9 and 19, each loan pays according to a non-standard amortization schedule. See Annex F and Annex G to the Preliminary Prospectus. |
THE INFORMATION IN THIS STRUCTURAL AND COLLATERAL TERM SHEET IS NOT COMPLETE AND MAY BE AMENDED PRIOR TO THE TIME OF SALE. THIS TERM SHEET IS NOT AN OFFER TO SELL THESE SECURITIES AND IT IS NOT A SOLICITATION OF AN OFFER TO BUY THESE SECURITIES IN ANY JURISDICTION WHERE THE OFFER OR SALE IS NOT PERMITTED.
13
LTV Ratios as of the Cut-off Date
| Weighted Average | |||||||||
| Range of Cut-off Date LTVs | Number of Loans | Cut-off Date Balance | % of IPB | Mortgage Rate | Remaining Loan Term | UW NCF DSCR(1)(2) | UW NOI Debt Yield(1) | Cut-off Date LTV(1) | Maturity Date LTV(1) |
| 26.9% - 39.9% | 3 | $129,000,000 | 15.6% | 4.6353% | 95 | 3.16x | 15.7% | 31.1% | 31.1% |
| 40.0% - 49.9% | 1 | 23,500,000 | 2.8 | 5.2100% | 116 | 1.82x | 12.7% | 47.7% | 44.1% |
| 50.0% - 59.9% | 8 | 153,449,785 | 18.5 | 5.1407% | 111 | 1.98x | 13.6% | 54.4% | 50.3% |
| 60.0% - 64.9% | 10 | 164,040,141 | 19.8 | 4.9055% | 116 | 1.85x | 11.0% | 62.6% | 58.1% |
| 65.0% - 69.9% | 9 | 271,111,241 | 32.7 | 5.0769% | 117 | 1.53x | 9.5% | 68.2% | 64.5% |
| 70.0% - 73.4% | 5 | 88,150,000 | 10.6 | 5.2342% | 116 | 1.31x | 9.1% | 72.1% | 64.6% |
| Total/Wtd. Avg.: | 36 | $829,251,167 | 100.0% | 5.0066% | 112 | 1.92x | 11.6% | 58.6% | 54.9% |
LTV Ratios as of the Maturity Date
| Weighted Average | |||||||||
| Range of Maturity Date LTVs | Number of Loans | Cut-off Date Balance | % of IPB | Mortgage Rate | Remaining Loan Term | UW NCF DSCR(1)(2) | UW NOI Debt Yield(1) | Cut-off Date LTV(1) | Maturity Date LTV(1) |
| 26.9% - 39.9% | 3 | $129,000,000 | 15.6% | 4.6353% | 95 | 3.16x | 15.7% | 31.1% | 31.1% |
| 40.0% - 49.9% | 6 | 105,382,302 | 12.7 | 5.1242% | 115 | 1.88x | 14.0% | 54.0% | 45.8% |
| 50.0% - 59.9% | 10 | 153,453,865 | 18.5 | 5.1945% | 111 | 1.84x | 12.7% | 58.7% | 54.1% |
| 60.0% - 64.9% | 13 | 307,115,000 | 37.0 | 5.0667% | 116 | 1.52x | 9.5% | 66.5% | 62.0% |
| 65.0% - 70.5% | 4 | 134,300,000 | 16.2 | 4.9189% | 117 | 1.74x | 9.3% | 70.2% | 69.3% |
| Total/Wtd. Avg.: | 36 | $829,251,167 | 100.0% | 5.0066% | 112 | 1.92x | 11.6% | 58.6% | 54.9% |
Prepayment Protection
| Weighted Average | |||||||||
| Prepayment Protection | Number of Loans | Cut-off Date Balance | % of IPB | Mortgage Rate | Remaining Loan Term | UW NCF DSCR(1)(2) | UW NOI Debt Yield(1) | Cut-off Date LTV(1) | Maturity Date LTV(1) |
| Defeasance | 32 | $744,236,167 | 89.7% | 5.0417% | 112 | 1.85x | 11.5% | 60.2% | 56.2% |
| Defeasance or Yield Maintenance | 2 | 56,000,000 | 6.8 | 4.5357% | 106 | 2.91x | 13.9% | 32.4% | 32.4% |
| Yield Maintenance | 2 | 29,015,000 | 3.5 | 5.0151% | 118 | 1.69x | 10.0% | 69.2% | 63.5% |
| Total/Wtd. Avg.: | 36 | $829,251,167 | 100.0% | 5.0066% | 112 | 1.92x | 11.6% | 58.6% | 54.9% |
Loan Purpose
| Weighted Average | |||||||||
| Loan Purpose | Number of Loans | Cut-off Date Balance | % of IPB | Mortgage Rate | Remaining Loan Term | UW NCF DSCR(1)(2) | UW NOI Debt Yield(1) | Cut-off Date LTV(1) | Maturity Date LTV(1) |
| Refinance | 25 | $585,987,216 | 70.7% | 5.0233% | 115 | 1.82x | 11.1% | 57.8% | 53.9% |
| Acquisition | 11 | 243,263,951 | 29.3 | 4.9663% | 104 | 2.15x | 12.7% | 60.4% | 57.1% |
| Total/Wtd. Avg.: | 36 | $829,251,167 | 100.0% | 5.0066% | 112 | 1.92x | 11.6% | 58.6% | 54.9% |
| (1) | With respect to any mortgage loan that is part of a whole loan, the Cut-off Date LTV, Maturity Date LTV, UW NCF DSCR and UW NOI Debt Yield calculations include the relatedpari passu companion loan(s) but exclude any related subordinate loan(s) or mezzanine loan(s). See the Pari Passu Loan Summary above and Annex A-1 to the Preliminary Prospectus. |
| (2) | For each partial interest-only mortgage loan, the UW NCF DSCR is calculated using the first principal and interest payment to be made into the trust during the term of the mortgage loan once amortization has commenced. In the case of Loan Nos. 9 and 19, each loan pays according to a non-standard amortization schedule. See Annex F and Annex G to the Preliminary Prospectus. |
THE INFORMATION IN THIS STRUCTURAL AND COLLATERAL TERM SHEET IS NOT COMPLETE AND MAY BE AMENDED PRIOR TO THE TIME OF SALE. THIS TERM SHEET IS NOT AN OFFER TO SELL THESE SECURITIES AND IT IS NOT A SOLICITATION OF AN OFFER TO BUY THESE SECURITIES IN ANY JURISDICTION WHERE THE OFFER OR SALE IS NOT PERMITTED.
14
Previous Securitization History(1)
| No. | Loan / Property Name | Location | Property Type | Previous Securitization |
| 7.04 | Walgreens - Lawrenceville, GA | Lawrenceville, GA | Retail | GSMS 2013-GC16 |
| 9 | Saint Louis Galleria | St. Louis, MO | Retail | COMM 2014-CCRE14 |
| 10 | Courtyard San Antonio Riverwalk | San Antonio, TX | Hotel | JPMCC 2012-C6 |
| 18 | WHG Portfolio | Various | Hotel | COMM 2013-CR9 |
| 22 | Town Point Center | Norfolk, VA | Office | COMM 2014-UBS5 |
| (1) | The table above represents the properties for which the previously existing debt was most recently securitized, based on information provided by the related borrower or obtained through searches of a third-party database. While loans secured by the above mortgaged properties may have been securitized multiple times in prior transactions, mortgage loans in this securitization are only listed in the above chart if the mortgage loan in this securitization paid off a loan in another securitization. |
Additional Subordinate and Mezzanine Debt Summary
| No. | Loan Name | Cut-off Date Balance | % of IPB | Subordinate Debt Cut-off Date Balance | Mezzanine Cut-off Date Balance | Mortgage Loan UW NCF DSCR(1)(2) | Total Debt UW NCF DSCR(2)(3) | Mortgage Loan Cut-off Date LTV(1) | Total Debt Cut-off Date LTV(3) |
| 3 | SITE JV Portfolio | $50,000,000 | 6.0% | $144,320,000 | N/A | 3.63x | 2.19x | 35.5% | 58.8% |
| 4 | 787 Eleventh Avenue | 45,000,000 | 5.4 | $235,000,000 | N/A | 3.01x | 1.17x | 26.9% | 63.1% |
| 5 | Causeway Square | 45,000,000 | 5.4 | N/A | $1,500,000 | 1.29x | 1.22x | 65.3% | 67.5% |
| 8 | 2 North 6th Place | 34,000,000 | 4.1 | $219,400,000 | N/A | 2.68x | 1.10x | 30.3% | 71.7% |
| 9 | Saint Louis Galleria | 33,520,755 | 4.0 | N/A | $23,745,813 | 1.67x | 1.55x | 51.5% | 56.6% |
| 16 | Desert Marketplace | 23,000,000 | 2.8 | N/A | $3,000,000 | 1.25x | 1.09x | 66.3% | 72.3% |
| 19 | Country Club Corners | 20,500,000 | 2.5 | N/A | $1,000,000 | 1.24x | 1.15x | 71.2% | 74.7% |
| Total: | $251,020,755 | 30.3% |
| (1) | Mortgage Loan Cut-off Date LTV and Mortgage Loan UW NCF DSCR calculations include the relatedpari passu companion loan(s) but exclude any related subordinate loan(s) or mezzanine loan(s). |
| (2) | For each partial interest-only mortgage loan, the UW NCF DSCR is calculated using the first principal and interest payment to be made into the trust during the term of the mortgage loan once amortization has commenced. In the case of Loan Nos. 9 and 19, each loan pays according to a non-standard amortization schedule. See Annex F and Annex G to the Preliminary Prospectus. |
| (3) | Total Debt Cut-off Date LTV and Total Debt UW NCF DSCR calculations include the relatedpari passu companion loan(s), any related subordinate loan(s) and/or any mezzanine loan(s). |
THE INFORMATION IN THIS STRUCTURAL AND COLLATERAL TERM SHEET IS NOT COMPLETE AND MAY BE AMENDED PRIOR TO THE TIME OF SALE. THIS TERM SHEET IS NOT AN OFFER TO SELL THESE SECURITIES AND IT IS NOT A SOLICITATION OF AN OFFER TO BUY THESE SECURITIES IN ANY JURISDICTION WHERE THE OFFER OR SALE IS NOT PERMITTED.
15
Structural Overview
Order of Distribution:
| On each Distribution Date, funds available for distribution from the mortgage loans, net of specified trust expenses, yield maintenance charges and prepayment premiums, will be distributed in the following amounts and order of priority (in each case to the extent of remaining available funds):
First: To interest on the Class A-1, Class A-2, Class A-3, Class A-4, Class A-SB, Class X-A, Class X-B and X-D certificates, up to, andpro rata in accordance with, their respective interest entitlements.
Second: To the extent of funds allocated to principal and available for distribution: (i) first,to principal on the Class A-SB certificates, until the certificate balance of the Class A-SB certificates is reduced to the scheduled principal balance for the related distribution date set forth in Annex E to the Preliminary Prospectus, (ii) second,to principal on the Class A-1 certificates, until the certificate balance of the Class A-1 certificates has been reduced to zero, (iii)third,to principal on the Class A-2 certificates, until the certificate balance of the Class A-2 certificates has been reduced to zero, (iv) fourth,to principal on the Class A-3 certificates, until the certificate balance of the Class A-3 certificates has been reduced to zero, (v)fifth, to principal on the Class A-4 certificates until the certificate balance of the Class A-4 certificates has been reduced to zero (vi)sixth, to principal on the Class A-SB certificates, until the certificate balance of the Class A-SB certificates has been reduced to zero. If the certificate balance of each and every class of certificates other than the Class A-1, Class A-2, Class A-3, Class A-4 and Class A-SB certificates has been reduced to zero as a result of the allocation of mortgage loan losses to those certificates, funds available for distributions of principal will be distributed to the Class A-1, Class A-2, Class A-3, Class A-4 and Class A-SB certificates,pro rata, based on their respective certificate balances, without regard to the distribution priorities described above or the planned principal balance of the Class A-SB certificates.
Third: To reimburse the Class A-1, Class A-2, Class A-3, Class A-4 and Class A-SB certificates,pro rata, for any previously unreimbursed losses on the mortgage loans allocable to principal that were previously borne by those classes, together with interest on that amount at the pass-through rate for such class.
Fourth: (i)first, to interest on the Class A-S certificates in the amount of their interest entitlement; (ii)second, to the extent of funds allocated to principal remaining after any distributions in respect of principal to each class of certificates with a higher payment priority (in this case, the Class A-1, Class A-2, Class A-3, Class A-4 and Class A-SB certificates), to principal on the Class A-S certificates until their certificate balance is reduced to zero; and (iii)third, to reimburse the Class A-S certificates for any previously unreimbursed losses on the mortgage loans allocable to principal that were previously borne by that class, together with interest at its pass-through rate.
Fifth: (i)first, to interest on the Class B certificates in the amount of their interest entitlement; (ii)second, to the extent of funds allocated to principal remaining after any distributions in respect of principal to each class of certificates with a higher payment priority (in this case, the Class A-1, Class A-2, Class A-3, Class A-4, Class A-SB and Class A-S certificates), to principal on the Class B certificates until their certificate balance |
THE INFORMATION IN THIS STRUCTURAL AND COLLATERAL TERM SHEET IS NOT COMPLETE AND MAY BE AMENDED PRIOR TO THE TIME OF SALE. THIS TERM SHEET IS NOT AN OFFER TO SELL THESE SECURITIES AND IT IS NOT A SOLICITATION OF AN OFFER TO BUY THESE SECURITIES IN ANY JURISDICTION WHERE THE OFFER OR SALE IS NOT PERMITTED.
16
| Order of Distribution (continued): | is reduced to zero; and (iii)third, to reimburse the Class B certificates for any previously unreimbursed losses on the mortgage loans allocable to principal that were previously borne by that class, together with interest at its pass-through rate.
Sixth: (i)first, to interest on the Class C certificates in the amount of their interest entitlement; (ii)second, to the extent of funds allocated to principal remaining after any distributions in respect of principal to each class of certificates with a higher payment priority (in this case, the Class A-1, Class A-2, Class A-3, Class A-4, Class A-SB, Class A-S and Class B certificates), to principal on the Class C certificates until their certificate balance is reduced to zero; and (iii)third, to reimburse the Class C certificates for any previously unreimbursed losses on the mortgage loans allocable to principal that were previously borne by that class, together with interest at its pass-through rate.
Seventh:After the Class A-1, Class A-2, Class A-3, Class A-4, Class A-SB, Class X-A, Class X-B, Class X-D, Class A-S, Class B and Class C certificates are paid all amounts to which they are entitled, the remaining funds available for distribution will be used to pay interest and principal and to reimburse any unreimbursed losses to the Class D, Class E-RR, Class F-RR, Class G-RR and Class NR-RR certificates sequentially in that order in a manner analogous to that described in clausesixthabove with respect to the Class C certificates, until the certificate balance of each such class is reduced to zero.
For more detailed information regarding the distributions on the certificates, see “Description of the Certificates—Distributions—Priority of Distributions” in the Preliminary Prospectus. |
| Realized Losses: | The certificate balances of the Class A-1, Class A-2, Class A-3, Class A-4, Class A-SB, Class A-S, Class B, Class C, Class D, Class E-RR, Class F-RR, Class G-RR and Class NR-RR certificates will each be reduced without distribution on any Distribution Date as a write-off to the extent of any loss realized on the mortgage loans allocated to such class of certificates on such Distribution Date. On each Distribution Date, any such write-offs will be applied to such classes of certificates in the following order, in each case until the related certificate balance is reduced to zero:first, to the Class NR-RR certificates;second, to the Class G-RR certificates;third, to the Class F-RR certificates;fourth, to the Class E-RR certificates;fifth, to the Class D certificates;sixth, to the Class C certificates;seventh, to the Class B certificates;eighth, to the class A-S certificates; and,finally,pro rata, to the Class A-1, Class A-2, Class A-3, Class A-4 and Class A-SB certificates, based on their then-current respective certificate balances. The notional amount of the Class X-A certificates will be reduced to reflect reductions in the certificate balances of the Class A-1, Class A-2, Class A-3, Class A-4, Class A-SB and Class A-S certificates resulting from allocations of losses realized on the mortgage loans. The notional amount of the Class X-B certificates will be reduced to reflect reductions in the certificate balance of the Class B and Class C certificates resulting from allocations of losses realized on the mortgage loans. The notional amount of the Class X-D certificates will be reduced to reflect reductions in the certificate balance of the Class D certificates resulting from allocations of losses realized on the mortgage loans. |
THE INFORMATION IN THIS STRUCTURAL AND COLLATERAL TERM SHEET IS NOT COMPLETE AND MAY BE AMENDED PRIOR TO THE TIME OF SALE. THIS TERM SHEET IS NOT AN OFFER TO SELL THESE SECURITIES AND IT IS NOT A SOLICITATION OF AN OFFER TO BUY THESE SECURITIES IN ANY JURISDICTION WHERE THE OFFER OR SALE IS NOT PERMITTED.
17
| Prepayment Premiums and Yield Maintenance Charges: | On each Distribution Date, each yield maintenance charge collected on the mortgage loans during the one-month period ending on the related Determination Date is required to be distributed to certificateholders (excluding the holders of the Class E-RR, Class F-RR, Class G-RR, Class NR-RR and Class R certificates) as follows: (1)pro rata, between (x) the group (the “YM Group A”) of Class A-1, Class A-2, Class A-3, Class A-4, Class A-SB, Class X-A and Class A-S certificates, and (y) the group (the “YM Group B” and collectively with the YM Group A, the “YM Groups”) of the Class X-B, Class X-D, Class B, Class C and Class D certificates, based upon the aggregate amount of principal distributed to the classes of principal balance certificates in each YM Group on such Distribution Date, and (2) as among the respective classes of principal balance certificates in each YM Group in the following manner: (A) on apro rata basis in accordance with their respective entitlements in those yield maintenance charges, to each class of principal balance certificates in such YM Group with a certificate balance in an amount equal to the product of (x) a fraction whose numerator is the amount of principal distributed to such class of principal balance certificates on such Distribution Date and whose denominator is the total amount of principal distributed to all of the certificates in such YM Group with certificate balances on such Distribution Date, (y) the Base Interest Fraction for the related principal prepayment with respect to such class of principal balance certificates, and (z) the aggregate amount of such yield maintenance charge allocated to such YM Group; and (B) the portion of such yield maintenance charge allocated to such YM Group remaining after such distributions to the applicable class(es) of principal balance certificates in such YM Group, in the case of amounts distributable to YM Group A, to the Class X-A certificates and in the case of amounts distributable to YM Group B, on apro rata basis in accordance with their respective reductions in their notional amounts on such Distribution Date to the Class X-B and Class X-D certificates.
The “Base Interest Fraction” with respect to any principal prepayment on any mortgage loan and with respect to any class of Class A-1, Class A-2, Class A-3, Class A-4, Class A-SB, Class A-S, Class B, Class C and Class D certificates is a fraction (a) whose numerator is the greater of (x) zero and (y) the difference between (i) the pass-through rate on such class of certificates and (ii) the discount rate used in accordance with the related mortgage loan documents in calculating the yield maintenance charge with respect to such principal prepayment and (b) whose denominator is the greater of zero and the difference between (i) the mortgage loan rate on such mortgage loan (or serviced whole loan) and (ii) the discount rate used in accordance with the related mortgage loan documents in calculating the yield maintenance charge with respect to such principal prepayment;provided,however, that under no circumstances will the Base Interest Fraction be greater than one or less than zero. If such discount rate is greater than or equal to the lesser of (x) the mortgage loan rate on the related mortgage loan and (y) the pass-through rate described in the preceding sentence, then the Base Interest Fraction will equal zero;provided,however, that if such discount rate is greater than or equal to the mortgage loan rate, but less than the pass-through rate, the fraction will be one.
If a prepayment premium (calculated as a fixed percentage of the amount prepaid) is imposed in connection with a prepayment rather than a yield maintenance charge, then the prepayment premium so collected will be allocated as described above. For this purpose, the discount rate used to calculate the Base Interest Fraction will be the discount rate used to determine the yield maintenance charge for mortgage loans that require payment at the |
THE INFORMATION IN THIS STRUCTURAL AND COLLATERAL TERM SHEET IS NOT COMPLETE AND MAY BE AMENDED PRIOR TO THE TIME OF SALE. THIS TERM SHEET IS NOT AN OFFER TO SELL THESE SECURITIES AND IT IS NOT A SOLICITATION OF AN OFFER TO BUY THESE SECURITIES IN ANY JURISDICTION WHERE THE OFFER OR SALE IS NOT PERMITTED.
18
| Prepayment Premiums and Yield Maintenance Charges (continued): | greater of a yield maintenance charge or a minimum amount equal to a fixed percentage of the principal balance of the mortgage loan or, for mortgage loans that only have a prepayment premium based on a fixed percentage of the principal balance of the mortgage loan, such other discount rate as may be specified in the related loan documents.
No prepayment premiums or yield maintenance charges will be distributed to holders of the Class E-RR, Class F-RR, Class G-RR, Class NR-RR or Class R certificates. Instead, after the notional amounts of the Class X-A, Class X-B and Class X-D certificates and the certificate balances of the Class A-1, Class A-2, Class A-3, Class A-4, Class A-SB, Class A-S, Class B, Class C and Class D certificates have been reduced to zero, all prepayment premiums and yield maintenance charges with respect to the mortgage loans will be distributed to holders of the Class X-D certificates, regardless of whether the notional amount of the Class X-D certificates has been reduced to zero. For a description of prepayment premiums and yield maintenance charges required on the mortgage loans, see Annex A-1 to the Preliminary Prospectus. See also“Certain Legal Aspects of the Mortgage Loans—Default Interest and Limitations on Prepayments” in the Preliminary Prospectus. Prepayment premiums and yield maintenance charges will be distributed on any Distribution Date only to the extent they are received in respect of the mortgage loans as of the related Determination Date. See also“Description of the Certificates—Distributions” in the Preliminary Prospectus. |
| Advances: | The master servicer and, if the master servicer fails to do so, the trustee, will be obligated to make (i) P&I advances with respect to each mortgage loan in the issuing entity and (ii) with respect to each mortgage loan (other than the non-serviced mortgage loans) and serviced whole loan, servicing advances, including paying delinquent real estate taxes, assessments and hazard insurance premiums, but only to the extent that those advances are not deemed nonrecoverable from collections on the related mortgage loan (or, if applicable, the related serviced whole loan) and, in the case of P&I advances, subject to reduction in connection with any appraisal reduction amounts that may occur. The special servicer will have no obligation to make servicing advances;providedthat with respect to a specially serviced loan, the special servicer will be entitled to make a servicing advance in an urgent or emergency situation, and the master servicer will be required to reimburse the special servicer for such advance, with interest;provided that the advance is not determined by the master servicer to be nonrecoverable. Notwithstanding the foregoing, servicing advances for the non-serviced mortgage loans will be made by the parties to, and pursuant to, the applicable lead servicing agreement. |
| Appraisal Reduction Amounts: | An appraisal reduction amount generally will be created with respect to a required appraisal loan (which is a serviced mortgage loan (or serviced whole loan, if applicable)) as to which certain defaults, modifications or insolvency events have occurred (as further described in the Preliminary Prospectus) in the amount, if any, by which the principal balance of such required appraisal loan, exceeds 90% of the appraised value of the related mortgaged property (as determined by one or more appraisals obtained by the special servicer) plus certain escrows and reserves (including letters of credit) held with respect to such required appraisal loan (net of other amounts overdue or advanced in connection with such required appraisal loan). In general, subject to the discussion in the succeeding paragraph, any appraisal reduction amount calculated with respect to a whole loan will be allocated to the related mortgage loan and any relatedpari passu companion loan(s) on apro rata basis in accordance with their respective outstanding principal balances. In the case of the non-serviced mortgage loans, any appraisal reduction amounts will be calculated pursuant to, and by a party to, the related |
THE INFORMATION IN THIS STRUCTURAL AND COLLATERAL TERM SHEET IS NOT COMPLETE AND MAY BE AMENDED PRIOR TO THE TIME OF SALE. THIS TERM SHEET IS NOT AN OFFER TO SELL THESE SECURITIES AND IT IS NOT A SOLICITATION OF AN OFFER TO BUY THESE SECURITIES IN ANY JURISDICTION WHERE THE OFFER OR SALE IS NOT PERMITTED.
19
| Appraisal Reduction Amounts (continued): | lead servicing agreement. As a result of an appraisal reduction amount being calculated for and/or allocated to a given mortgage loan, the interest portion of any P&I advance for such mortgage loan will be reduced, which will have the effect of reducing the amount of interest available for distribution to the most subordinate class(es) of certificates (exclusive of the Class R certificates) then outstanding (i.e., first to the Class NR-RR certificates, then to the Class G-RR certificates, then to the Class F-RR certificates, then to the Class E-RR certificates, then to the Class D certificates, then to the Class C certificates, then to the Class B certificates, then to the Class A-S certificates, and then,pro rata based on their respective interest entitlements, to the Class A-1, Class A-2, Class A-3, Class A-4, Class A-SB, Class X-A, Class X-B and Class X-D certificates). In general, a mortgage loan (or whole loan, if applicable) serviced under the pooling and servicing agreement for this transaction will cease to be a required appraisal loan, and no longer be subject to an appraisal reduction amount, when the same has ceased to be a specially serviced loan (if applicable), has been brought current for at least three consecutive months and no other circumstances exist that would cause such serviced loan to be a required appraisal loan.
Appraisal reduction amounts with respect to each of the SITE JV Portfolio whole loan, the 787 Eleventh Avenue whole loan and the 2 North 6th Place whole loan will be allocated to notionally reduce the outstanding principal balance of the related subordinate companion loan(s) prior to anypro rata allocation to the related mortgage loan and each relatedpari passu companion loans.
At any time an appraisal is ordered under the pooling and servicing agreement with respect to a property that would result in an appraisal reduction amount with respect to a mortgage loan that would result in a change in the controlling class, certain certificateholders will have a right to request a new appraisal as described in the Preliminary Prospectus. |
| Age of Appraisals: | Appraisals (which can be an update of a prior appraisal) with respect to a mortgage loan serviced under the pooling and servicing agreement are required to be no older than 9 months for purposes of determining appraisal reduction amounts, market value, and other calculations as described in the Preliminary Prospectus. |
| Sale of Defaulted Loans: | There will be no “Fair Market Value Purchase Option”, instead defaulted loans will be sold in a process similar to the sale process for REO property. |
| Cleanup Call: | On any distribution date on which the aggregate unpaid principal balance of the mortgage loans remaining in the issuing entity is less than 1% of the aggregate principal balance of the mortgage loans as of the cut-off date, certain entities specified in the Preliminary Prospectus will have the option to purchase all of the remaining mortgage loans (and all property acquired through exercise of remedies in respect of any mortgage loan) at the price specified in the Preliminary Prospectus. If the aggregate certificate balances of all certificates (exclusive of the Class X Certificates) senior to the Class E-RR certificates, and the notional amounts of the Class X-A, Class X-B and Class X-D certificates have been reduced to zero, and if the initial pool balance has been reduced to less than 5% of such balance as of the Closing Date or the master servicer has consented, the issuing entity could also be terminated in connection with a voluntary exchange of all the then-outstanding certificates (excluding the Class R certificates), for the mortgage loans, but all of the holders of those classes of outstanding certificates (excluding the Class R certificates) would have to voluntarily participate in the exchange. |
THE INFORMATION IN THIS STRUCTURAL AND COLLATERAL TERM SHEET IS NOT COMPLETE AND MAY BE AMENDED PRIOR TO THE TIME OF SALE. THIS TERM SHEET IS NOT AN OFFER TO SELL THESE SECURITIES AND IT IS NOT A SOLICITATION OF AN OFFER TO BUY THESE SECURITIES IN ANY JURISDICTION WHERE THE OFFER OR SALE IS NOT PERMITTED.
20
| Directing Certificateholder / Directing Holder: | The “Directing Certificateholder” will generally be the controlling class certificateholder or other representative designated by the holder(s) of at least a majority of the voting rights of the controlling class. The controlling class is the most subordinate class of the Class E-RR, Class F-RR, Class G-RR and Class NR-RR certificates (the “Control Eligible Certificates”) that has an aggregate certificate balance as notionally reduced by any Cumulative Appraisal Reduction Amounts allocated to such class, that is equal to or greater than 25% of the initial certificate balance of such class of certificates, or if no class of Control Eligible Certificates meets the preceding requirement, the most senior class of Control Eligible Certificates. The Controlling Class as of the Closing Date will be the Class NR-RR certificates. At any time when Class E-RR is the controlling class, the majority Class E-RR certificateholders may elect under certain circumstances to opt-out from its rights under the pooling and servicing agreement. See “Pooling and Servicing Agreement—The Directing Holder” in the Preliminary Prospectus. No other class of certificates will be eligible to act as the controlling class or appoint a Directing Certificateholder.
Grass River Real Estate Credit Partners REIT LLC (or its affiliate) is expected to purchase the Class E-RR, Class F-RR, Class G-RR, Class NR-RR Certificates and, on the Closing Date, is expected to be the initial Directing Certificateholder.
The “Directing Holder” will initially be: (a) with respect to each Serviced Mortgage Loan or Serviced Whole Loan (other than the 2 North 6th Place Whole Loan), the directing certificateholder; and (b) with respect to the 2 North 6th Place Whole Loan, (i) if a 2 North 6th Place Note B Control Appraisal Period is not in effect, the holder of such note B, (ii) during a 2 North 6th Place Note B Control Appraisal Period, but while no 2 North 6th Place Note A-B Control Appraisal Period is in effect, the holder of such note A-B, and (iii) during a 2 North 6th Place Note A-B Control Appraisal Period, the holder of the related Companion Loan identified as note A-1;provided that if any such note has been securitized and the holder of such note is the Directing Holder, the directing certificateholder (or its equivalent) under the related pooling and servicing agreement or trust and servicing agreement is expected to exercise the rights of the Directing Holder.
The initial Directing Holder with respect to the 2 North 6th Place whole loan will be the holder of the 2 North 6th Place Note B, which is anticipated to be a separate unaffiliated third party investor.
For a description of the directing holder for the Non-Serviced Whole Loans, see “Description of the Mortgage Pool—The Whole Loans” in the Preliminary Prospectus. |
| Control/Consultation Rights: | The Directing Holder will be entitled to have consultation and approval rights with respect to certain decisions (including with respect to assumptions, waivers, loan modifications and workouts).
So long as a Control Termination Event does not exist, the Directing Holder will be entitled to direct the special servicer to take, or refrain from taking, actions that would constitute certain major decisions and non-major decisions with respect to a mortgage loan or whole loan serviced under the pooling and servicing agreement and will also have the right to notice and to consent to certain actions that would constitute major decisions and non-major decisions that the master servicer or the special servicer, as applicable, plans on taking with respect to any such mortgage loan or serviced whole loan subject to the servicing standard and other |
THE INFORMATION IN THIS STRUCTURAL AND COLLATERAL TERM SHEET IS NOT COMPLETE AND MAY BE AMENDED PRIOR TO THE TIME OF SALE. THIS TERM SHEET IS NOT AN OFFER TO SELL THESE SECURITIES AND IT IS NOT A SOLICITATION OF AN OFFER TO BUY THESE SECURITIES IN ANY JURISDICTION WHERE THE OFFER OR SALE IS NOT PERMITTED.
21
| Control/Consultation Rights (continued): | restrictions as described in the Preliminary Prospectus. During a Control Termination Event and until the occurrence of a Consultation Termination Event, all of the rights of the Directing Holder will terminate other than a right to consult with respect to certain major decisions, non-major decisions and other matters as to which it previously had approval rights. During an Operating Advisor Consultation Event, the operating advisor will be entitled to consult with the special servicer with respect to certain major decisions on behalf of the issuing entity and in the best interest of, and for the benefit of, the certificateholders, as if those certificateholders and, with respect to a servicedpari passu companion loan, the relatedpari passu companion loan holder(s) constituted a single lender.
A “Control Termination Event” will occur when (i) no class of Control Eligible Certificates exists that has a certificate balance (as notionally reduced by any Cumulative Appraisal Reduction Amounts allocable to such class) that is at least equal to 25% of the initial certificate balance of such class; (ii) such mortgage loan or whole loan is an excluded loan; or (iii) a holder of the Class E-RR certificates becomes the majority controlling class certificateholder and irrevocably waives its right, in writing, to exercise any of the rights of the controlling class certificateholder and such rights have not been reinstated to a successor controlling class certificateholder;provided that no Control Termination Event may occur with respect to the 2 North 6th Place whole loan and the term “Control Termination Event” is not applicable to the Directing Holder related to the 2 North 6th Place whole loan; andprovided, further, that a Control Termination Event shall not be deemed continuing in the event that the certificate balances of the certificates other than the Control Eligible Certificates have been reduced to zero as a result of principal payments on the mortgage loans. The “Cumulative Appraisal Reduction Amount” as of any date of determination for any mortgage loan, is equal to the sum of (i) all appraisal reduction amounts then in effect, and (ii) with respect to any AB Modified Loan, any Collateral Deficiency Amount then in effect. “AB Modified Loan” means any corrected loan (1) that became a corrected loan (which includes for purposes of this definition any non-serviced mortgage loan that became a “corrected loan” (or any term substantially similar thereto) pursuant to the lead servicing agreement governing the servicing of such non-serviced mortgage loan) due to a modification thereto that resulted in the creation of an A/B note structure (or similar structure) and as to which the new junior note(s) did not previously exist or the principal amount of the new junior note(s) was previously part of either an A note held by the issuing entity or the original unmodified mortgage loan and (2) as to which an appraisal reduction amount is not in effect.
A “Consultation Termination Event” will occur when (i) no class of Control Eligible Certificates exists where such class’ aggregate certificate balance is at least equal to 25% of the initial certificate balance of that class, in each case, without regard to the application of any Cumulative Appraisal Reduction Amounts or (ii) a holder of the Class E-RR certificates is the majority controlling class certificateholder and has irrevocably waived its right, in writing, to exercise any of the rights of the controlling class certificateholder and such rights have not been reinstated to a successor controlling class certificateholder pursuant to the terms of the pooling and servicing agreement;provided that no Consultation Termination Event resulting solely from the operation of clause (ii) will be deemed to have existed or be in continuance with respect to a successor holder of the Class E-RR certificates that has not irrevocably waived its right to exercise any of the rights of the Controlling Class Certificateholder;provided, further, that no Consultation Termination Event may occur with respect to the 2 North 6th Place whole loan and the term “Consultation Termination Event” is not applicable to |
THE INFORMATION IN THIS STRUCTURAL AND COLLATERAL TERM SHEET IS NOT COMPLETE AND MAY BE AMENDED PRIOR TO THE TIME OF SALE. THIS TERM SHEET IS NOT AN OFFER TO SELL THESE SECURITIES AND IT IS NOT A SOLICITATION OF AN OFFER TO BUY THESE SECURITIES IN ANY JURISDICTION WHERE THE OFFER OR SALE IS NOT PERMITTED.
22
| Control/Consultation Rights (continued): | the Directing Holder related to the 2 North 6th Place whole loan. With respect to each non-serviced whole loan, so long as a Consultation Termination Event does not exist, the Directing Certificateholder for this transaction will have certain consultation rights with respect to certain major decisions regarding the non-serviced whole loans (other than the SITE JV Portfolio whole loan, or unless a control appraisal period is in effect with respect to both the related subordinate companion loans, the 2 North 6th Place whole loan), and the applicable directing holder or directing certificateholder (or equivalent entity) pursuant to the related lead servicing agreement or co-lender agreement will have consultation, approval and direction rights, with respect to certain major decisions (including with respect to assumptions, waivers, loan modifications and workouts) regarding such non-serviced whole loan, as provided for in the related co-lender agreement and in the related lead servicing agreement, and as described under “Description of the Mortgage Pool—The Whole Loans” in the Preliminary Prospectus.
Notwithstanding any contrary description set forth above, in the event that, with respect to any mortgage loan, the Directing Holder or any controlling class certificateholder is a Borrower Party (any of the above, as applicable, an “Excluded Controlling Class Holder”), such Excluded Controlling Class Holder will not have any consultation or approval rights with respect to such mortgage loan and will have no right to receive asset status reports or such other information as may be specified in the pooling and servicing agreement. A “Borrower Party” is a borrower, a mortgagor, a manager of a mortgaged property or the holder of a mezzanine loan that has been accelerated or as to which foreclosure or enforcement proceedings have been commenced against the equity collateral pledged to secure the related mezzanine loan, a person controlling or controlled by or under common control with the foregoing or any other such person owning, directly or indirectly, 25% or more of the beneficial interests in such borrower, mortgagor, manager of a mortgaged property or mezzanine lender. |
| Servicing Standard: | Each of the mortgage loans (other than the non-serviced mortgage loans) and serviced whole loan(s) will be serviced by the master servicer and the special servicer pursuant to the terms of the pooling and servicing agreement. In all circumstances, each of the master servicer and the special servicer are obligated to act in the best interests of the certificateholders (and, in the case of a serviced whole loan, the holder of the related serviced companion loan) as a collective whole as if such certificateholders (and, if applicable, such companion loan holder), constituted a single lender (taking into account thepari passu or subordinate nature of any related companion loan(s)). The special servicer is required to determine the effect on net present value of various courses of action (including workout or foreclosure), using the Calculation Rate as the discount rate, and pursue the course of action that it determines would maximize recovery on a net present value basis.
“Calculation Rate” means: (a) for principal and interest payments on a mortgage loan or proceeds from the sale of a defaulted loan, the highest of (i) the rate determined by the master servicer or the special servicer, as applicable, that approximates the market rate that would be obtainable by borrowers on similar debt of the borrowers as of such date of determination, (ii) the mortgage loan rate and (iii) the yield on 10-year US treasuries; and (b) for all other cash flows, including property cash flow, the “discount rate” set forth in the most recent appraisal (or update of such appraisal). |
THE INFORMATION IN THIS STRUCTURAL AND COLLATERAL TERM SHEET IS NOT COMPLETE AND MAY BE AMENDED PRIOR TO THE TIME OF SALE. THIS TERM SHEET IS NOT AN OFFER TO SELL THESE SECURITIES AND IT IS NOT A SOLICITATION OF AN OFFER TO BUY THESE SECURITIES IN ANY JURISDICTION WHERE THE OFFER OR SALE IS NOT PERMITTED.
23
| Termination of Special Servicer: | Except as limited by certain conditions described in the Preliminary Prospectus, the special servicer may generally be replaced, prior to a Control Termination Event, at any time and without cause, by the Directing Holder so long as, among other things, the Directing Holder provides a replacement special servicer that meets the requirements of the pooling and servicing agreement.
During a Control Termination Event, the holders of at least 25% of the voting rights of the principal balance certificates may request a vote to replace the special servicer. The subsequent vote may result in the termination and replacement of such special servicer if, within 180 days of the initial request for that vote, the holders of (a) at least 66-2/3% of a “certificateholder quorum” (holders of certificates evidencing at least 75% of the aggregate voting rights (taking into account the application of realized losses) of the certificates (other than the Class X and Class R certificates)), or (b) more than 50% of the voting rights of each class of certificates other than any Class X and Class R certificates (but in the case of this clause (b) only such classes of principal balance certificates that, in each case, have an outstanding certificate balance, as notionally reduced by any appraisal reduction amounts allocated to such class, equal to or greater than 25% of the initial certificate balance of such class, minus all payments of principal made on such class of certificates), vote affirmatively to so replace such special servicer.
Other than with respect to the 2 North 6th Place whole loan, with respect to each serviced loan if the operating advisor determines, in its sole discretion exercised in good faith, that (1) the special servicer is not performing its duties as required under the pooling and servicing agreement or is otherwise not acting in accordance with the servicing standard and (2) the replacement of the special servicer would be in the best interest of the certificateholders as a collective whole, the operating advisor will have the right to recommend the replacement of the special servicer. The operating advisor’s recommendation to replace the special servicer must be confirmed within 180 days of after the notice is posted to the certificate administrator’s website by an affirmative vote of holders of certificates evidencing at least a majority of a quorum of certificateholders (which, for this purpose, is the holders of certificates that (i) evidence at least 20% of the voting rights (taking into account the application of any appraisal reduction amounts to notionally reduce the respective certificate balances) of all principal balance certificates on an aggregate basis, and (ii) consist of at least three certificateholders or certificate owners that are not Risk Retention Affiliated with each other). In the event the holders of such principal balance certificates elect to remove and replace the special servicer, the certificate administrator will be required to obtain a rating agency confirmation from each of the rating agencies at that time. |
| Excluded Special Servicer: | In the event that the special servicer has obtained knowledge that it is a Borrower Party with respect to any mortgage loan (other than any non-serviced mortgage loan) or serviced whole loan, the special servicer will be required to resign as special servicer of such mortgage loan (an “Excluded Special Servicer Loan”), and, if no Control Termination Event is continuing, the Directing Holder or the majority controlling class certificateholder on its behalf will be required to select a successor special servicer that is not a Borrower Party in accordance with the terms of the pooling and servicing agreement (an “Excluded Special Servicer”) with respect to such Excluded Special Servicer Loan unless such Excluded Special Servicer Loan is also an excluded loan with respect to such Directing Holder or the holder of the majority of the controlling class, in which case the resigning special servicer will be required to use reasonable efforts to appoint the Excluded Special Servicer. |
THE INFORMATION IN THIS STRUCTURAL AND COLLATERAL TERM SHEET IS NOT COMPLETE AND MAY BE AMENDED PRIOR TO THE TIME OF SALE. THIS TERM SHEET IS NOT AN OFFER TO SELL THESE SECURITIES AND IT IS NOT A SOLICITATION OF AN OFFER TO BUY THESE SECURITIES IN ANY JURISDICTION WHERE THE OFFER OR SALE IS NOT PERMITTED.
24
| Servicing Compensation: | Modification Fees: Certain fees resulting from modifications, amendments, waivers or other changes to the terms of the loan documents, as more fully described in the Preliminary Prospectus, will be used to offset expenses on the related serviced mortgage loan (i.e., a mortgage loan other than a non-serviced mortgage loan) or serviced whole loan, if applicable (i.e., reimburse the trust for certain expenses including unreimbursed advances and interest on unreimbursed advances previously incurred (other than special servicing fees, workout fees and liquidation fees) on the related mortgage loan (other than a non-serviced mortgage loan) or serviced whole loan, if applicable, but not yet reimbursed to the trust or servicers), or to pay expenses (other than special servicing fees, workout fees and liquidation fees) that are still outstanding, in each case unless as part of the written modification the related borrower is required to pay these amounts on a going forward basis or in the future). Any excess modification fees not so applied to offset expenses will be available as compensation to the master servicer and/or special servicer. Within any prior 12-month period, all excess modification fees earned by the master servicer or by the special servicer (after taking into account the offset described below applied during such 12-month period) with respect to any mortgage loan (other than a non-serviced mortgage loan) or serviced whole loan, if applicable, will be subject to a cap equal to the greater of (i) 1.0% of the outstanding principal balance of such mortgage loan after giving effect to such transaction and (ii) $25,000.
All excess modification fees earned by the special servicer will be required to offset any future workout fees or liquidation fees payable with respect to the related mortgage loan (other than a non-serviced mortgage loan) or serviced whole loan, if applicable, or related REO property;provided that if the mortgage loan (other than a non-serviced mortgage loan) or serviced whole loan, if applicable, ceases being a corrected loan, and is subject to a subsequent modification, any excess modification fees earned by the special servicer prior to such mortgage loan (other than a non-serviced mortgage loan) or serviced whole loan, if applicable, ceasing to be a corrected loan will no longer be offset against future liquidation fees and workout fees unless such mortgage loan (other than a non-serviced mortgage loan) or serviced whole loan, if applicable, ceased to be a corrected loan within 12 months of it becoming a modified mortgage loan (or modified whole loan, if applicable).
Penalty Charges: All late fees and default interest will first be used to reimburse certain expenses previously incurred with respect to the related mortgage loan (other than a non-serviced mortgage loan) or serviced whole loan, if applicable (other than special servicing fees, workout fees and liquidation fees) but not yet reimbursed to the trust, the master servicer or the special servicer or to pay certain expenses (other than special servicing fees, workout fees and liquidation fees) that are still outstanding on the related mortgage loan (other than a non-serviced mortgage loan) or serviced whole loan, if applicable, and any excess received with respect to a serviced loan will be paid to the master servicer or the special servicer. To the extent any amounts reimbursed out of penalty charges are subsequently recovered on a related serviced loan, they will be paid to the master servicer or special servicer who would have been entitled to the related penalty charges that were previously used to reimburse such expense.
Liquidation / Workout Fees:Liquidation fees will be calculated at the lesser of (a) 1.0% and (b) such lower rate as would result in a liquidation fee of $1,000,000, for each mortgage loan (other than a non-serviced mortgage loan) or serviced whole loan that is a specially serviced |
THE INFORMATION IN THIS STRUCTURAL AND COLLATERAL TERM SHEET IS NOT COMPLETE AND MAY BE AMENDED PRIOR TO THE TIME OF SALE. THIS TERM SHEET IS NOT AN OFFER TO SELL THESE SECURITIES AND IT IS NOT A SOLICITATION OF AN OFFER TO BUY THESE SECURITIES IN ANY JURISDICTION WHERE THE OFFER OR SALE IS NOT PERMITTED.
25
| Servicing Compensation (continued): | loan and any REO property, subject in any case to a minimum liquidation fee of $25,000, except that the liquidation fee will be zero with respect to certain liquidation events set forth in the pooling and servicing agreement, and the liquidation fee with respect to each mortgage loan or REO mortgage loan repurchased or substituted for after more than 180 days following the mortgage loan seller’s receipt of notice or discovery of a material breach or material defect will be in an amount equal to the liquidation fee rate described above of the outstanding principal balance of such mortgage loan or REO loan. For any mortgage loan (other than a non-serviced loan) or serviced whole loan that is a corrected loan, workout fees will be calculated at the lesser of (a) 1.0% and (b) such lower rate as would result in a workout fee of $1,000,000 when applied to each expected payment of principal and interest (other than default interest) on the related mortgage loan (other than a non-serviced mortgage loan) or serviced whole loan, if applicable, from the date such serviced loan becomes a corrected loan through and including the then related maturity date; or in any case such higher rate as would result in a workout fee of $25,000 when applied to each expected payment of principal and interest (other than default interest) on any mortgage loan from the date such serviced loan becomes a corrected loan through and including the then related maturity date.
Notwithstanding the foregoing, in connection with a maturity default, no liquidation or workout fee will be payable in connection with a payoff or refinancing of the related serviced loan within 90 days of the maturity default. |
| Operating Advisor: | The operating advisor will have access to any final asset status report and information available with respect to the transaction on the certificate administrator’s website and will have certain monitoring responsibilities on behalf of the entire issuing entity. During an Operating Advisor Consultation Event, the operating advisor will be entitled to consult with the special servicer with respect of the asset status reports and certain major decisions processed by the special servicer on behalf of the issuing entity and in the best interest of, and for the benefit of, the certificateholders and, in the case of a serviced whole loan, the related companion loan holder(s), as a collective whole, as if those certificateholders and, if applicable, such companion loan holder(s) constituted a single lender (taking into account thepari passu or subordinate nature of any related companion loan(s)).
During a Consultation Termination Event, the operating advisor may be removed without cause if the holders of at least 25% of the voting rights request a vote to replace the operating advisor and such vote is approved by the holders of at least 75% of the voting rights.
An “Operating Advisor Consultation Event” will occur when (i) the HRR Certificates have an aggregate certificate balance (as notionally reduced by any appraisal reduction amounts allocable to any class of the HRR certificates) is 25% or less of the initial aggregate certificate balance of the HRR Certificates, or (ii) a Control Termination Event is continuing.
The operating advisor will generally have no rights or obligations with respect to any non-serviced whole loan or the 2 North 6th Place whole loan. |
| Asset Representations Reviewer: | The asset representations reviewer will be required to review certain delinquent mortgage loans after a specified delinquency threshold has been exceeded and the required percentage of certificateholders vote to direct a review of such delinquent mortgage loans. An asset review will occur when either (1) mortgage loans with an aggregate outstanding principal balance of |
THE INFORMATION IN THIS STRUCTURAL AND COLLATERAL TERM SHEET IS NOT COMPLETE AND MAY BE AMENDED PRIOR TO THE TIME OF SALE. THIS TERM SHEET IS NOT AN OFFER TO SELL THESE SECURITIES AND IT IS NOT A SOLICITATION OF AN OFFER TO BUY THESE SECURITIES IN ANY JURISDICTION WHERE THE OFFER OR SALE IS NOT PERMITTED.
26
| Asset Representations Reviewer (continued): | 25.0% or more of the aggregate outstanding principal balance of all of the mortgage loans (including any REO loans (or a portion of any REO loan in the case of a whole loan)) held by the issuing entity as of the end of the applicable collection period are delinquent loans or (2) at least 15 mortgage loans are delinquent loans as of the end of the applicable collection period and the outstanding principal balance of such delinquent loans in the aggregate constitutes at least 20.0% of the aggregate outstanding principal balance of all of the mortgage loans (including any REO loans (or a portion of any REO loan in the case of a whole loan)) held by the issuing entity as of the end of the applicable collection period. |
| Replacement of the Asset Representations Reviewer: | The asset representations reviewer may be terminated and replaced without cause. Upon (i) the written direction of certificateholders evidencing not less than 25% of the voting rights (without regard to the application of any cumulative appraisal reduction amounts) requesting a vote to terminate and replace the asset representations reviewer with a proposed successor asset representations reviewer that is an eligible asset representations reviewer, and (ii) payment by such holders to the certificate administrator of the reasonable fees and expenses to be incurred by the certificate administrator in connection with administering such vote, the certificate administrator will promptly provide notice to all certificateholders and the asset representations reviewer of such request. Upon the written direction of certificateholders evidencing at least 75% of a certificateholder quorum (without regard to the application of any cumulative appraisal reduction amounts), the trustee will terminate all of the rights and obligations of the asset representations reviewer under the pooling and servicing agreement, and the proposed successor asset representations reviewer will be appointed. |
| Dispute Resolution Provisions: | Each mortgage loan seller will be subject to the dispute resolution provisions set forth in the pooling and servicing agreement to the extent those provisions are triggered with respect to any mortgage loan sold to the depositor by a mortgage loan seller and such mortgage loan seller will be obligated under the related mortgage loan purchase agreement to comply with all applicable provisions and to take part in any mediation or arbitration proceedings that may result.
Generally, in the event that a repurchase request is not “Resolved” (as defined below) within 180 days after the related mortgage loan seller receives such repurchase request, then the enforcing servicer will be required to send a notice to the “initial requesting certificateholder” (if any) and to the certificate administrator who will make such notice available to all other certificateholders and certificate owners indicating the enforcing servicer’s intended course of action with respect to the repurchase request. Such notice will notify all certificateholders and certificate owners that in the event any certificateholder disagrees with the enforcing servicer’s intended course of action, the enforcing servicer will be required to follow the course of action agreed to and/or proposed by the majority of the responding certificateholders that involves referring the matter to mediation or arbitration, as the case may be. If (a) the enforcing servicer’s intended course of action with respect to the repurchase request does not involve pursuing further action to exercise rights against the related mortgage loan seller with respect to the repurchase request and the initial requesting certificateholder, if any, or any other certificateholder or certificate owner wishes to exercise its right to refer the matter to mediation (including nonbinding arbitration) or arbitration, or (b) the enforcing servicer’s intended course of action is to pursue further action to exercise rights against the related mortgage loan seller with respect to the repurchase request but the initial requesting certificateholder, if any, or any other certificateholder or certificate owner |
THE INFORMATION IN THIS STRUCTURAL AND COLLATERAL TERM SHEET IS NOT COMPLETE AND MAY BE AMENDED PRIOR TO THE TIME OF SALE. THIS TERM SHEET IS NOT AN OFFER TO SELL THESE SECURITIES AND IT IS NOT A SOLICITATION OF AN OFFER TO BUY THESE SECURITIES IN ANY JURISDICTION WHERE THE OFFER OR SALE IS NOT PERMITTED.
27
| Dispute Resolution Provisions (continued): | does not agree with the dispute resolution method selected by the enforcing servicer, then the initial requesting certificateholder, if any, or such other certificateholder or certificate owner may deliver a written notice to the enforcing servicer indicating its intent to exercise its right to refer the matter to either mediation or arbitration.
“Resolved” means, with respect to a repurchase request, (i) that related material defect has been cured, (ii) the related mortgage loan has been repurchased in accordance with the related mortgage loan purchase agreement, (iii) a mortgage loan has been substituted for the related mortgage loan in accordance with the related mortgage loan purchase agreement, (iv) the applicable mortgage loan seller has paid a loss of value payment, (v) a contractually binding agreement is entered into between the enforcing servicer, on behalf of the issuing entity, and the related mortgage loan seller that settles the related mortgage loan seller’s obligations under the related mortgage loan purchase agreement, or (vi) the related mortgage loan is no longer property of the issuing entity as a result of a sale or other disposition in accordance with the pooling and servicing agreement. |
| Deal Website: | The Certificate Administrator will maintain a deal website including, but not limited to:
■ all special notices delivered
■ summaries of final asset status reports
■ all appraisals in connection with appraisal reduction amounts plus any subsequent appraisal updates
■ an “Investor Q&A Forum” and a voluntary investor registry |
THE INFORMATION IN THIS STRUCTURAL AND COLLATERAL TERM SHEET IS NOT COMPLETE AND MAY BE AMENDED PRIOR TO THE TIME OF SALE. THIS TERM SHEET IS NOT AN OFFER TO SELL THESE SECURITIES AND IT IS NOT A SOLICITATION OF AN OFFER TO BUY THESE SECURITIES IN ANY JURISDICTION WHERE THE OFFER OR SALE IS NOT PERMITTED.
28
(THIS PAGE INTENTIONALLY LEFT BLANK)
THE INFORMATION IN THIS STRUCTURAL AND COLLATERAL TERM SHEET IS NOT COMPLETE AND MAY BE AMENDED PRIOR TO THE TIME OF SALE. THIS TERM SHEET IS NOT AN OFFER TO SELL THESE SECURITIES AND IT IS NOT A SOLICITATION OF AN OFFER TO BUY THESE SECURITIES IN ANY JURISDICTION WHERE THE OFFER OR SALE IS NOT PERMITTED.
29
Mortgage Loan No. 1 — Darden Headquarters
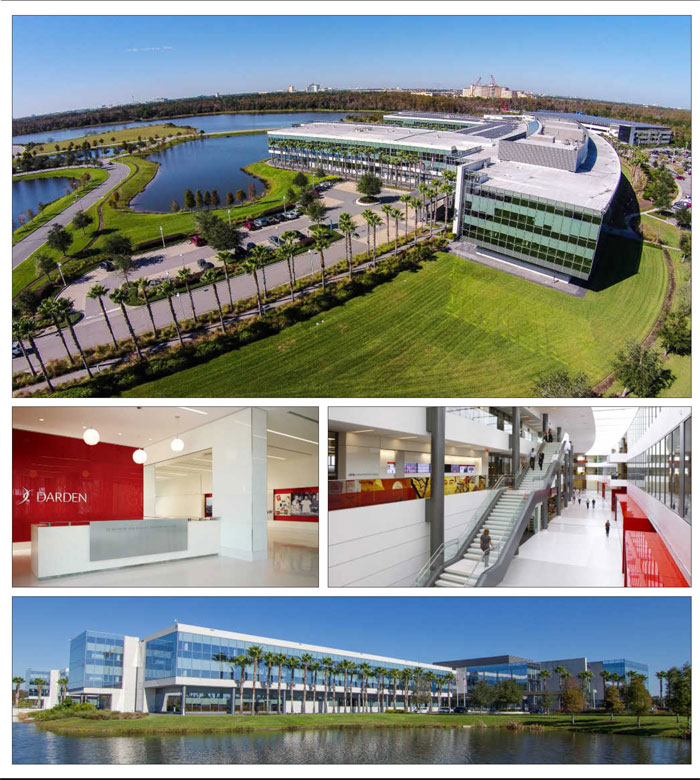
THE INFORMATION IN THIS STRUCTURAL AND COLLATERAL TERM SHEET IS NOT COMPLETE AND MAY BE AMENDED PRIOR TO THE TIME OF SALE. THIS TERM SHEET IS NOT AN OFFER TO SELL THESE SECURITIES AND IT IS NOT A SOLICITATION OF AN OFFER TO BUY THESE SECURITIES IN ANY JURISDICTION WHERE THE OFFER OR SALE IS NOT PERMITTED.
30
Mortgage Loan No. 1 — Darden Headquarters
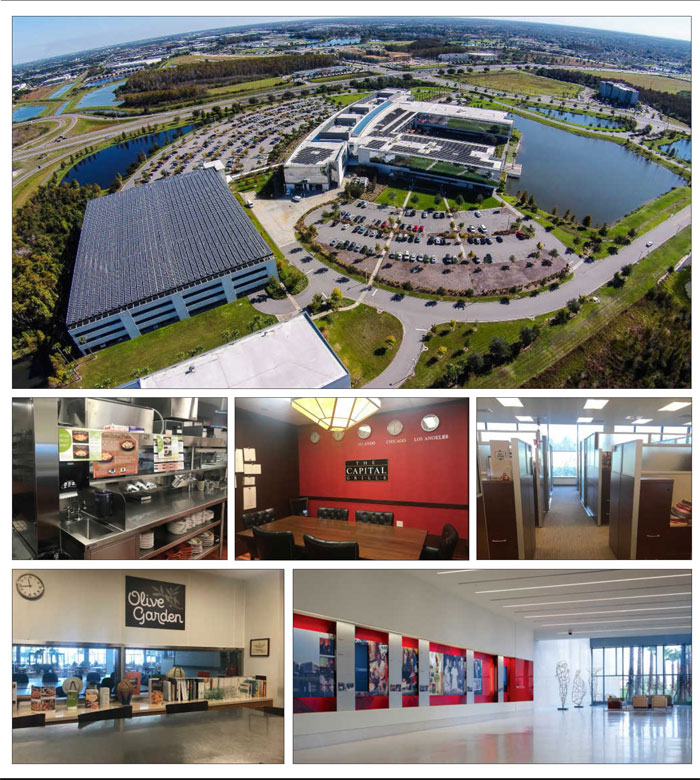
THE INFORMATION IN THIS STRUCTURAL AND COLLATERAL TERM SHEET IS NOT COMPLETE AND MAY BE AMENDED PRIOR TO THE TIME OF SALE. THIS TERM SHEET IS NOT AN OFFER TO SELL THESE SECURITIES AND IT IS NOT A SOLICITATION OF AN OFFER TO BUY THESE SECURITIES IN ANY JURISDICTION WHERE THE OFFER OR SALE IS NOT PERMITTED.
31
Mortgage Loan No. 1 — Darden Headquarters
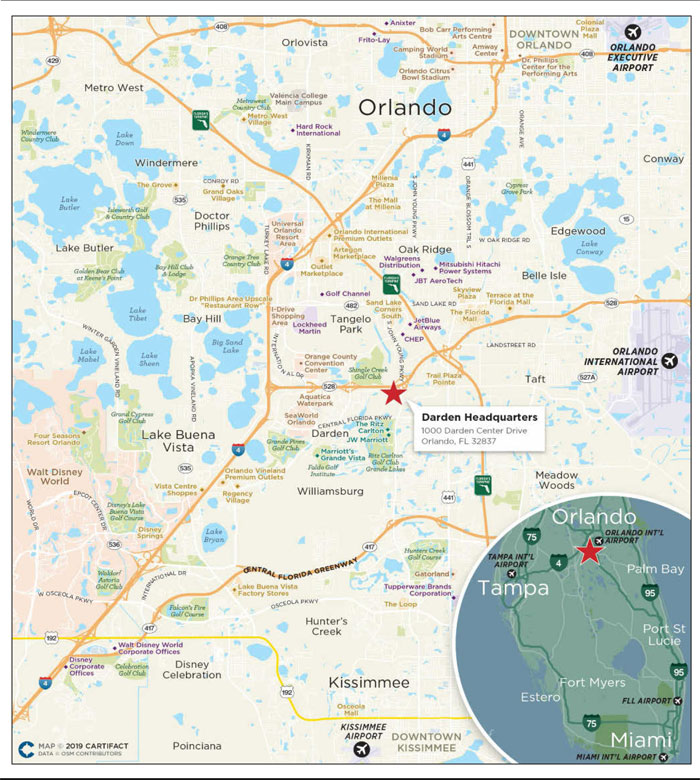
THE INFORMATION IN THIS STRUCTURAL AND COLLATERAL TERM SHEET IS NOT COMPLETE AND MAY BE AMENDED PRIOR TO THE TIME OF SALE. THIS TERM SHEET IS NOT AN OFFER TO SELL THESE SECURITIES AND IT IS NOT A SOLICITATION OF AN OFFER TO BUY THESE SECURITIES IN ANY JURISDICTION WHERE THE OFFER OR SALE IS NOT PERMITTED.
32
Mortgage Loan No. 1 — Darden Headquarters
| Mortgage Loan Information | Property Information | |||
| Mortgage Loan Seller: | Column | Single Asset / Portfolio: | Single Asset | |
| Original Principal Balance(1): | $80,000,000 | Title: | Fee | |
| Cut-off Date Principal Balance(1): | $80,000,000 | Property Type - Subtype: | Office – Suburban | |
| % of Pool by IPB: | 9.6% | Net Rentable Area (SF): | 525,000 | |
| Loan Purpose: | Refinance | Location: | Orlando, FL | |
| Borrower: | Orlando Garden Property LLC | Year Built / Renovated: | 2009 / NAP | |
| Sponsor: | U.S. Realty Advisors, LLC | Occupancy: | 100.0% | |
| Interest Rate: | 4.7700% | Occupancy Date: | 11/20/2018 | |
| Note Date: | 12/21/2018 | Number of Tenants: | 1 | |
| Maturity Date: | 1/6/2029 | 2015 NOI(4): | N/A | |
| Interest-only Period: | 120 months | 2016 NOI: | $8,014,298 | |
| Original Term: | 120 months | 2017 NOI: | $8,142,009 | |
| Original Amortization: | None | 2018 NOI: | $8,324,426 | |
| Amortization Type: | Interest Only | UW Economic Occupancy: | 97.0% | |
| Call Protection(2): | L(26), Def(89), O(5) | UW Revenues: | $13,482,829 | |
| Lockbox(3): | Hard | UW Expenses: | $4,570,793 | |
| Additional Debt(1): | Yes | UW NOI(5): | $8,912,036 | |
| Additional Debt Balance(1): | $30,000,000 | UW NCF: | $8,859,480 | |
| Additional Debt Type(1): | Pari Passu | Appraised Value / Per SF: | $157,400,000 / $300 | |
| Additional Future Debt Permitted: | No | Appraisal Date: | 11/29/2018 |
| Escrows and Reserves(6) | Financial Information(1) | |||||
| Initial | Monthly | Initial Cap | Cut-off Date Loan Per SF: | $210 | ||
| Taxes: | $0 | Springing | N/A | Maturity Date Loan Per SF: | $210 | |
| Insurance: | $0 | Springing | N/A | Cut-off Date LTV: | 69.9% | |
| Replacement Reserves: | $0 | Springing | N/A | Maturity Date LTV: | 69.9% | |
| UW NOI / UW NCF DSCR: | 1.68x / 1.67x | |||||
| UW NOI / UW NCF Debt Yield: | 8.1% / 8.1% |
Sources and Uses
| Sources | Proceeds | % of Total | Uses | Proceeds | % of Total | |
| Whole Loan: | $110,000,000 | 100.0% | Payoff Existing Debt: | $90,471,473 | 82.2% | |
| Return of Equity: | 18,190,198 | 16.5 | ||||
| Closing Costs: | 1,338,329 | 1.2 | ||||
| Total Sources: | $110,000,000 | 100.0% | Total Uses: | $110,000,000 | 100.0% |
| (1) | The Darden Headquarters loan is part of a larger split whole loan evidenced by threepari passu notes with an aggregate Cut-off Date balance of $110.0 million (collectively, the “Whole Loan”). The financial information presented in the chart above and herein reflects the balance of the Whole Loan. |
| (2) | At any time after the earlier to occur of (i) December 21, 2021 and (ii) two years from the closing date of the securitization that includes the lastpari passu note of the Whole Loan to be securitized, the borrower has the right to defease the Whole Loan. |
| (3) | For a more detailed description of lockbox, please refer to “Lockbox / Cash Management” below. |
| (4) | 2015 NOI is not available as the sale-leaseback transaction occurred in 2015. |
| (5) | UW NOI includes $847,248 of straight line rent assuming 2.0% annual rent increases. |
| (6) | For a more detailed description of Escrows and Reserves, please refer to “Escrows andReserves” below. |
THE INFORMATION IN THIS STRUCTURAL AND COLLATERAL TERM SHEET IS NOT COMPLETE AND MAY BE AMENDED PRIOR TO THE TIME OF SALE. THIS TERM SHEET IS NOT AN OFFER TO SELL THESE SECURITIES AND IT IS NOT A SOLICITATION OF AN OFFER TO BUY THESE SECURITIES IN ANY JURISDICTION WHERE THE OFFER OR SALE IS NOT PERMITTED.
33
Mortgage Loan No. 1 — Darden Headquarters
The Loan. The Darden Headquarters Whole Loan is a $110.0 million first mortgage loan secured by the fee simple interest a 525,000 SF, Class A office building located Orlando, Florida. The office is the headquarters for Darden Restaurants, Inc. (“Darden”). The loan has a 10-year term and is interest-only for the entire term.
The Whole Loan is evidenced by threepari passu notes. The controlling Note A-1 and non-controlling Note A-3 are being contributed to the CSAIL 2019-C15 Commercial Mortgage Trust. The Whole Loan is expected to be serviced under the CSAIL 2019-C15 pooling and servicing agreement. As the holder of Note A-1 (the “Controlling Noteholder”), the trustee of the CSAIL 2019-C15 Commercial Mortgage Trust is entitled to exercise all of the rights of the Controlling Noteholder with respect to the Whole Loan; however, the holders of the remaining note are entitled, under certain circumstances, to consult with respect to certain major decisions.
Whole Loan Note Summary
| Original Balance | Cut-off Date Balance | Note Holder | Lead Servicer for Whole Loan (Y/N) | Controlling Piece (Y/N) | |
| Note A-1, A-3 | $80,000,000 | $80,000,000 | CSAIL 2019-C15 | Y | Y |
| Note A-2(1) | 30,000,000 | 30,000,000 | Column | N | N |
| Total: | $110,000,000 | $110,000,000 |
| (1) | Note is expected to be contributed to one or more future securitizations. |
The Borrower. The borrowing entity for the Whole Loan is Orlando Garden Property LLC, a special purpose Delaware limited liability company. The borrowing entity is 100% owned by USRA Net Lease Investors III, LLC.
The Sponsor. The loan’s sponsor is U.S. Realty Advisors, LLC (“USRA”). The non-recourse carve-out guarantor of the Whole Loan is USRA Net Lease II Capital Corp., which is controlled by USRA. Established in 1989, USRA is a single-tenant real estate investment and asset management firm. With a 30 year, $20 billion history in the net lease process as both an advisor and investor, USRA specializes in sale-leasebacks and acquisitions from third parties or built-to-suit properties under triple-net leases. From 1990 to 2015, USRA executed over 98 real estate transactions totaling more than $4.6 billion of single-tenant assets ranging from individual properties to large portfolios involving properties leased to a single tenant, with transaction sizes ranging from $3.0 million to $1.4 billion. USRA’s current portfolio exceeds $2.7 billion of investments, including assets for USRA’s own account, institutional investors, corporate clients and private families.
The Property. The property is a Class A, 3-story, 525,000 SF, LEED Gold certified, office headquarter campus situated on 45.9 acres in Orlando, Florida. The property was constructed in 2009 by Darden as its corporate headquarters to consolidate its eight restaurant brands, which were previously located across 12 locations, under a single roof. The property includes a freestanding single story data center, 605 surface parking spaces and a four-story parking garage with 1,065 spaces resulting in a parking ratio of 3.18 spaces per 1,000 SF. USRA acquired the property from Darden in a sale-leaseback transaction in 2015 for $133.3 million ($254 PSF) with the sponsor investing approximately $40.0 million of equity. The property is leased to a subsidiary of Darden, Darden Corporation (“Darden Tenant”), and the lease is guaranteed by Darden.
Darden Tenant has occupied 100.0% of the property since construction in 2009 as its global headquarters. The property is leased on a triple-net, 20-year lease through 2035 with 4, 5-year and 1, 10-year extension options through 2065. Darden, rated Baa2/BBB/BBB by Moody’s, S&P and Fitch, respectively, guarantees the lease (which does not have optional termination rights). The lease is structured with no landlord responsibilities and features annual rent increases at the lesser of 2.0% or the consumer price index, with annual catch-up provisions up to 2.0%.
As the global headquarters location for Darden, the property is the hub of the full-service restaurateur, housing more than 1,200 employees that make up the home office, creative, marketing, technology and executive staff. The property is home to Darden’s manager training program, bringing in nearly 700 managers-in-training to the property each year. In addition, corporate executives of each brand are located at the property as well as customized test kitchens that operate daily.
THE INFORMATION IN THIS STRUCTURAL AND COLLATERAL TERM SHEET IS NOT COMPLETE AND MAY BE AMENDED PRIOR TO THE TIME OF SALE. THIS TERM SHEET IS NOT AN OFFER TO SELL THESE SECURITIES AND IT IS NOT A SOLICITATION OF AN OFFER TO BUY THESE SECURITIES IN ANY JURISDICTION WHERE THE OFFER OR SALE IS NOT PERMITTED.
34
Mortgage Loan No. 1 — Darden Headquarters
The comprehensive amenity package includes 30,000 SF of test kitchen space and 25,000 SF of meeting spaces, as well as a data center designed to support and protect Darden’s entire technology footprint. Additional amenities include a 5,000 SF full-service fitness center, a credit union and a 16,000 SF cafeteria, as well as smaller cafés throughout the campus. The solar electric system on the roof of the main building and parking garage generate approximately 20% of the required power for the property. The property’s versatile dual wing floorplan features a main building with a central common area connected with two perpendicular flexible office wings, allowing for effective segregated division configuration options while also providing the ability to convert the property for multi-tenant use.
Founded in 1938, Darden has a long history of developing and acquiring restaurant concepts. Darden is the world’s largest full service restaurant company and is a member of the S&P 500 and the Fortune 500 (#396 in 2017). Darden is a leading owner and operator of full service restaurants in the United States and Canada with more than 1,700 restaurants across 8 brands (including Olive Garden, LongHorn Steakhouse, Cheddar’s Scratch Kitchen, Yard House, The Capital Grille, Bahama Breeze, Seasons 52, and Eddie V’s), and over 180,000 full-time workers. Darden serves nearly 390 million guests each year.
During fiscal year 2018, Darden added 51 new company restaurants in the United States, including Cheddar’s Scratch Kitchen restaurants, which was acquired in August 2017 for $780 million. Organic growth is expected to continue, as 45 to 50 new restaurants are expected to open in the United States in fiscal year 2019. Darden finished fiscal year 2018 with $596.0 million in net income, as compared to $479.1 million in fiscal year 2017 and $375.0 million in fiscal year 2016.
The Market. The property is located 12.8 miles southwest of the Orlando central business district and 10.4 miles from the Orlando International Airport in the Tourist Corridor Submarket. The property is in the southwest corner of the intersection of FL Highway 528 (Beachline Expressway) and South John Young Parkway. The Beachline Expressway is the primary artery connecting I-4 and the Florida Turnpike as well as providing access to the Orlando International Airport, the FL417 Loop, and the Port Canaveral/Cocoa Beach area to the east.
According to the appraisal, Orlando is also one of the busiest cities in America for conferences and conventions, as the Orange County Convention Center is the second largest convention facility in the United States. A record 72 million visitors came to the Orlando region in 2017, making it the top tourist destination in the United States. In addition, many industry leaders including the American Automobile Association (AAA), Deloitte Consulting LLP, Electronic Arts, Lockheed Martin, Northrop Grumman, Tupperware Brands Corporation, Verizon Communications and the Walt Disney Company are either headquartered in or have a significant presence in the metropolitan statistical area.
The median household and average incomes within a five-mile radius of the property are estimated at $49,481 and $68,869, respectively. The population grew 16.41% from 2010 to 2018, and is projected to increase 8.81% through 2023. The average household growth rate through 2023 is expected to be 5.8%.
The Tourist Corridor Submarket is also known as “The Theme Park Capital of the World” as it is home to Walt Disney World Resort, Universal Orlando Resort, SeaWorld Orlando and the Fun Spot America Theme Parks. According to a third party market data provider, the Orlando area features seven of the ten most visited theme parks in North America, as well as the four most visited water parks in the United States. The property is located in close proximity to the Orlando Convention Center (3.8 miles), Walt Disney World Resort (7.8 miles), and SeaWorld (3.4 miles).
According to a third party market data provider for Q3 2018, the Tourist Corridor Office Submarket contained 8.9 million SF of office space with an overall vacancy rate of 5.7%. There is only one office project under construction in the Tourist Corridor Office market totaling 125,000 SF. The appraisal concluded per square foot market rents of $24.61 PSF NNN for the office space. According to the appraisal, the property’s competitive set consists of the six properties detailed in the following table with an average occupancy of 98.5%.
THE INFORMATION IN THIS STRUCTURAL AND COLLATERAL TERM SHEET IS NOT COMPLETE AND MAY BE AMENDED PRIOR TO THE TIME OF SALE. THIS TERM SHEET IS NOT AN OFFER TO SELL THESE SECURITIES AND IT IS NOT A SOLICITATION OF AN OFFER TO BUY THESE SECURITIES IN ANY JURISDICTION WHERE THE OFFER OR SALE IS NOT PERMITTED.
35
Mortgage Loan No. 1 — Darden Headquarters
Competitive Set Summary(1)
| Property | Year Built / Renovated | NRA (SF) | Est. Rent PSF | Est. Occ. | Proximity (miles) | Anchor Tenants |
| Darden Headquarters | 2009 | 525,000(2) | $16.16(2) | 100% | N/A | Darden Corporation |
| Millenia Lakes I, II & III | 2005 | 414,472 | $26.00 | 91% | 4.7 | Blue Green Vacations |
| Clarington Commons | 2007 | 28,224 | $19.50 | 100% | 8.3 | Undisclosed |
| Millenia Lakes II | 2006 | 107,052 | $25.50 | 100% | 4.8 | Hilton Grand Vacations |
| Former Nova Southeastern | 2000 | 71,900 | $16.50 | 100% | 5.1 | Asurion |
| LPL Financial Headquarters | 2016 | 450,000 | $16.21 | 100% | 457.5 | LPL Financial Inc. |
| Verizon Hidden Ridge Campus | 1991 | 1,150,000 | $16.00 | 100% | 971.9 | Verizon |
| (1) | Source: Appraisal. |
| (2) | Based on the November 20, 2018 underwritten rent roll. |
Historical and Current Occupancy(1)
| 2015 | 2016 | 2017 | Current(2) |
| 100.0% | 100.0% | 100.0% | 100.0% |
| (1) | Source: Historical Occupancy is provided by the sponsor. Occupancies are as of December 31 of each respective year. |
| (2) | Based on the November 20, 2018 underwritten rent roll. |
Tenant Summary(1)
| Tenant | Ratings Moody’s/S&P/Fitch(2) | NRA (SF) | % of Total NRA | UW Base Rent PSF | % of Total UW Base Rent | Lease Expiration Date(3) |
| Darden Tenant | Baa2 / BBB / BBB | 525,000 | 100.0% | $16.16 | 100.0% | 10/31/2035 |
| (1) | Based on the November 20, 2018 underwritten rent roll. The property is 100.0% leased to Darden Tenant. |
| (2) | Ratings are of Darden Restaurants, Inc. which is the parent company of the tenant and guarantor of the lease. |
| (3) | The lease has 4, 5-year and 1, 10-Year extension options through 2065. |
Operating History and Underwritten Net Cash Flow
| 2015(1) | 2016 | 2017 | 2018 | Underwritten(2)(3) | PSF | %(4) | |
| Rents in Place | N/A | $8,014,298 | $8,142,009 | $8,324,426 | $8,481,783 | $16.16 | 61.0% |
| Straight line Rent | N/A | 0 | 0 | 0 | 847,248 | $1.61 | 6.1% |
| Gross Potential Rent | N/A | $8,014,298 | $8,142,009 | $8,324,426 | $9,329,031 | $17.77 | 67.1% |
| Total Reimbursements | N/A | 0 | 0 | 0 | 4,570,793 | $8.71 | 32.9% |
| Net Rental Income | N/A | $8,014,298 | $8,142,009 | $8,324,426 | $13,899,824 | $26.48 | 100.0% |
| (Vacancy/Collection Loss) | N/A | 0 | 0 | 0 | 416,995 | ($0.79) | (3.1%) |
| Effective Gross Income | N/A | $8,014,298 | $8,142,009 | $8,324,426 | $13,482,829 | $25.68 | 100.0% |
| Total Expenses | N/A | $0 | $0 | $0 | $4,570,793 | $8.71 | 33.9% |
| Net Operating Income | N/A | $8,014,298 | $8,142,009 | $8,324,426 | $8,912,036 | $16.98 | 66.1% |
| Total TI/LC, Capex/RR | N/A | 0 | 0 | 0 | 52,556 | $0.10 | 0.4% |
| Net Cash Flow | N/A | $8,014,298 | $8,142,009 | $8,324,426 | $8,859,480 | $16.88 | 65.7% |
| (1) | 2015 cash flows are not available as the sale-leaseback transaction was completed in 2015. |
| (2) | Underwritten Rents In Place is based on the current in-place rent, which is year 4 of the lease. |
| (3) | Straight Line Rent assumes 2.0% annual rent increases. Under the lease annual rent increases at the lesser of 2.0% or the consumer price index, with annual catch-up provisions up to 2.0%. |
| (4) | % column represents percent of Net Rental Income for all revenue lines and represents percent of Effective Gross Income for the remainder of fields. |
THE INFORMATION IN THIS STRUCTURAL AND COLLATERAL TERM SHEET IS NOT COMPLETE AND MAY BE AMENDED PRIOR TO THE TIME OF SALE. THIS TERM SHEET IS NOT AN OFFER TO SELL THESE SECURITIES AND IT IS NOT A SOLICITATION OF AN OFFER TO BUY THESE SECURITIES IN ANY JURISDICTION WHERE THE OFFER OR SALE IS NOT PERMITTED.
36
Mortgage Loan No. 1 — Darden Headquarters
Property Management. The property is self-managed by the Darden Tenant.
Escrows and Reserves.
Taxes & Insurance Reserve – The requirement to make monthly deposits of (i) 1/12th of the annual estimated tax payments and (ii) 1/12th of the estimated insurance premiums into tax & insurance reserve accounts is waived unless (i) a Trigger Period (as defined below) is continuing and (ii) the Darden Tenant lease is not in full force and effect or the Darden Tenant is in monetary default thereunder.
Replacement Reserves – During the continuance of a Trigger Period, on a monthly basis, the borrower is required to deposit an amount equal to 1/12th of $0.10 per rentable SF.
Lockbox / Cash Management. The Whole Loan is structured with a hard lockbox and in-place cash management. At origination, the borrower sent a direction letter to Darden Tenant instructing it to deposit all rents and payments into the lockbox account controlled by the lender. All funds in the lockbox account are swept daily to a cash management account under the control of the lender and disbursed on each monthly payment date in accordance with the loan documents. During the continuance of a Trigger Period, all excess cash flow (unless such Trigger Period exists solely due to the existence of a Partial Go Dark Trigger Period (as defined below), in which event only 50% of excess cash flow), after payments made in accordance with the loan documents for, amongst other things, debt service, required reserves and operating expenses, will be held as additional collateral for the loan until such time as the amount of excess cash flow held as additional collateral for the loan equals or exceeds $15,750,000. Any amounts in excess of the $15,750,000 shall be disbursed to the borrower.
“Trigger Period” means (i) the occurrence of any event of default under the loan documents, (ii) any period that commences when the debt yield falls below 7.0%, (iii) notice is given by Darden Tenant or the borrower of the termination of the existing lease, (iv) the occurrence of any Go Dark Trigger Period (as defined below), (v) any period during which a bankruptcy event has occurred with respect to the borrower, Darden, Darden Tenant or any property manager, that has not been discharged or dismissed with 90 days of the filing thereof, or (vi) a monetary default under the Darden Tenant lease after 10 days’ prior notice to Darden Tenant.
“Go Dark Trigger Period” means (a) either (i) if the Darden Tenant vacates, surrenders, ceases to conduct its normal business operations or otherwise goes dark at more than 35% but not more than 50% of its current space at the property for more than 60 consecutive days (“Partial Go Dark Trigger Period”) or (ii) if the Darden Tenant goes dark or ceases operations at more than 50% of its current space at the property for more than 60 consecutive days, and (b) Darden is rated below “Baa3” by Moody’s or “BBB-” by S&P.
THE INFORMATION IN THIS STRUCTURAL AND COLLATERAL TERM SHEET IS NOT COMPLETE AND MAY BE AMENDED PRIOR TO THE TIME OF SALE. THIS TERM SHEET IS NOT AN OFFER TO SELL THESE SECURITIES AND IT IS NOT A SOLICITATION OF AN OFFER TO BUY THESE SECURITIES IN ANY JURISDICTION WHERE THE OFFER OR SALE IS NOT PERMITTED.
37
Mortgage Loan No. 2 — Embassy Suites Portland Washington Square

THE INFORMATION IN THIS STRUCTURAL AND COLLATERAL TERM SHEET IS NOT COMPLETE AND MAY BE AMENDED PRIOR TO THE TIME OF SALE. THIS TERM SHEET IS NOT AN OFFER TO SELL THESE SECURITIES AND IT IS NOT A SOLICITATION OF AN OFFER TO BUY THESE SECURITIES IN ANY JURISDICTION WHERE THE OFFER OR SALE IS NOT PERMITTED.
38
Mortgage Loan No. 2 — Embassy Suites Portland Washington Square

THE INFORMATION IN THIS STRUCTURAL AND COLLATERAL TERM SHEET IS NOT COMPLETE AND MAY BE AMENDED PRIOR TO THE TIME OF SALE. THIS TERM SHEET IS NOT AN OFFER TO SELL THESE SECURITIES AND IT IS NOT A SOLICITATION OF AN OFFER TO BUY THESE SECURITIES IN ANY JURISDICTION WHERE THE OFFER OR SALE IS NOT PERMITTED.
39
Mortgage Loan No. 2 — Embassy Suites Portland Washington Square
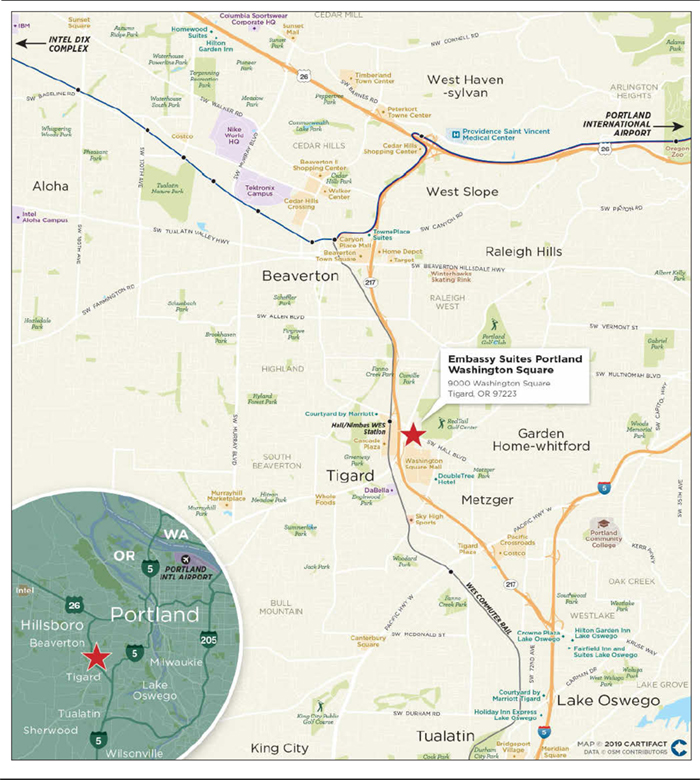
THE INFORMATION IN THIS STRUCTURAL AND COLLATERAL TERM SHEET IS NOT COMPLETE AND MAY BE AMENDED PRIOR TO THE TIME OF SALE. THIS TERM SHEET IS NOT AN OFFER TO SELL THESE SECURITIES AND IT IS NOT A SOLICITATION OF AN OFFER TO BUY THESE SECURITIES IN ANY JURISDICTION WHERE THE OFFER OR SALE IS NOT PERMITTED.
40
Mortgage Loan No. 2 — Embassy Suites Portland Washington Square
| Mortgage Loan Information | Property Information | |||
| Mortgage Loan Seller: | Column | Single Asset / Portfolio: | Single Asset | |
| Original Principal Balance: | $56,250,000 | Title: | Fee | |
| Cut-off Date Principal Balance: | $56,250,000 | Property Type - Subtype: | Hotel – Full service | |
| % of Pool by IPB: | 6.8% | Net Rentable Area (Rooms): | 356 | |
| Loan Purpose: | Acquisition | Location: | Tigard, OR | |
| Borrower: | Washington Square Property Investment LLC | Year Built / Renovated: | 1987 / 2015 - 2016 | |
| Sponsor: | Parkview International, Inc. | Occupancy / ADR / RevPAR: | 73.4% / $155.25 / $113.92 | |
| Interest Rate: | 5.3040% | Occupancy / ADR / RevPAR Date: | 11/30/2018 | |
| Note Date: | 1/25/2019 | Number of Tenants: | NAP | |
| Maturity Date: | 2/6/2029 | 2015 NOI(2): | $3,829,735 | |
| Interest-only Period: | 60 months | 2016 NOI: | $6,714,344 | |
| Original Term: | 120 months | 2017 NOI: | $6,985,516 | |
| Original Amortization: | 360 months | TTM NOI(3): | $6,419,931 | |
| Amortization Type: | IO-Balloon | UW Occupancy / ADR / RevPAR: | 73.4% / $155.25 / $113.92 | |
| Call Protection: | L(25), Def(87), O(8) | UW Revenues: | $12,587,232 | |
| Lockbox(1): | Hard | UW Expenses: | $6,094,280 | |
| Additional Debt: | No | UW NOI: | $6,492,952 | |
| Additional Debt Balance: | N/A | UW NCF: | $5,732,318 | |
| Additional Debt Type: | N/A | Appraised Value / Per Room: | $82,800,000 / $232,584 | |
| Additional Future Debt Permitted: | No | Appraisal Date: | 12/16/2018 |
| Escrows and Reserves(4) | Financial Information | |||||
| Initial | Monthly | Initial Cap | Cut-off Date Loan Per Room: | $158,006 | ||
| Taxes: | $185,292 | $44,974 | N/A | Maturity Date Loan Per Room: | $146,393 | |
| Insurance: | $17,956 | $8,978 | N/A | Cut-off Date LTV: | 67.9% | |
| PIP Reserve: | $1,232,804 | $0 | N/A | Maturity Date LTV: | 62.9% | |
| FF&E Reserve: | $0 | $63,386 | N/A | UW NOI / UW NCF IO DSCR: | 2.15x / 1.90x | |
| Required Repairs: | $198,440 | $0 | N/A | UW NOI / UW NCF Amortizing DSCR: | 1.73x / 1.53x | |
| Seasonality Reserve: | $0 | Springing | N/A | UW NOI / UW NCF Debt Yield: | 11.5% / 10.2% |
| Sources and Uses | ||||||
| Sources | Proceeds | % of Total | Uses | Proceeds | % of Total | |
| Mortgage Loan: | $56,250,000 | 62.0% | Purchase Price: | $85,873,786 | 94.7% | |
| Sponsor Equity: | 34,455,373 | 38.0 | Closing Costs: | 3,197,095 | 3.5 | |
| Upfront Reserves: | 1,634,492 | 1.8 | ||||
| Total Sources: | $90,705,373 | 100.0% | Total Uses: | $90,705,373 | 100.0% |
| (1) | For a more detailed description of lockbox, please refer to “Lockbox / Cash Management” below. |
| (2) | The hotel underwent a comprehensive $12.1 million renovation during 2015 and the first quarter of 2016. The majority of the room renovations occurred during 2015 resulting in a year-end occupancy of 58.8% and RevPAR of $83.44. The 2014 occupancy and RevPAR were 73.0% and $97.93, respectively. |
| (3) | Represents trailing twelve months ending November 30, 2018. |
| (4) | For a more detailed description of Escrows and Reserves, please refer to “Escrows and Reserves” below. |
THE INFORMATION IN THIS STRUCTURAL AND COLLATERAL TERM SHEET IS NOT COMPLETE AND MAY BE AMENDED PRIOR TO THE TIME OF SALE. THIS TERM SHEET IS NOT AN OFFER TO SELL THESE SECURITIES AND IT IS NOT A SOLICITATION OF AN OFFER TO BUY THESE SECURITIES IN ANY JURISDICTION WHERE THE OFFER OR SALE IS NOT PERMITTED.
41
Mortgage Loan No. 2 — Embassy Suites Portland Washington Square
The Loan. The Embassy Suites Portland Washington Square loan is a $56.25 million first mortgage loan secured by the fee interest in a 356-room, full-service hotel located in Tigard, Oregon. The loan has a 10-year term and will amortize on a 30-year schedule following an initial interest-only period of 60 months.
The Borrower. The borrowing entity is Washington Square Property Investment LLC, a Delaware limited liability company.
The Sponsor. The loan’s sponsor is Parkview International, Inc. (“Parkview”) and the nonrecourse carve-out guarantors are KAJ Investments I, Limited and Lakeview Hospitality Guarantor LLC. Both guarantors are controlled by Parkview. Parkview is an investment office responsible for sourcing, analyzing, and executing investments across various asset classes and geographies. Parkview’s current investments include real estate holdings (commercial, residential, and hospitality), automobile import and distribution operations, energy-related operating companies, and farmland operations. Parkview is the international investment office of Khaled A. Juffali. See “Description of the Mortgage Pool—Mortgage Pool Characteristics—Litigation and Other Considerations” in the Preliminary Prospectus.
The Property. The property is a 356-room, Embassy Suites flagged, full-service all-suite hotel located in Tigard, Oregon, a suburb of Portland. The property is a 9-story hotel located on a 4.9 acre site originally constructed in 1987. The property underwent a comprehensive $12.1 million ($33,989 per room) renovation between 2015 and 2016. Approximately 85% of the capital investment benefited guest facing areas including $6.9 million invested in guest room upgrades and $1.5 million for common area improvements. The remaining capital expenditures were contributed to the restaurant, meeting spaces and construction of the Embassy Suites atrium concept. As part of the change in ownership the property is scheduled to undergo an estimated $1.2 million brand-mandated property improvement plan (“PIP”) which will include new fire life safety upgrades, new exterior signage and upgrades, atrium skylight restoration, meeting facility upgrades and fitness center upgrades. Such PIP will take place over the next 18 months and was reserved for at closing. Additionally, the sponsor plans to invest another $2.8 million in discretionary capital expenditures, including elevator modernization and air conditioning upgrades, over the next five years.
The unit mix at the property consists of 260 king units, 60 double queen units, 26 double full units, 8 two-bedroom units, and 2 presidential suites. Each suite features two flat panel televisions, a large sectional sofa, wet-bar, microwave, and a refrigerator. Amenities at the property include Cascadia Restaurant & Bar, fitness room, indoor pool, business center, 24 hour pavilion pantry market, gift shop, complimentary breakfast area including free cooked-to-order breakfast, complimentary appetizers and beverages at the nightly evening reception, and complimentary wireless facilities. In addition, the property offers 356 parking spaces.
According to the appraisal, the hotel is situated within Portland’s “Silicon Forest” and garners significant corporate demand from the surrounding companies including Nike world headquarters (5.5 miles), Intel regional headquarters (7.1 miles), and Tektronix North American headquarters campus (4.3 miles). The property is positioned to capture a large share of the corporate and leisure event business as the only hotel in the trade area with over 200 rooms and it offers the most ballroom and event space (with full catering capability) in the local area south and west of the Portland central business district. The top 5 corporate accounts include Fortive (Tektronix), Nike, Intel, Dabella and IBM which total $1.5 million of underwritten revenue.
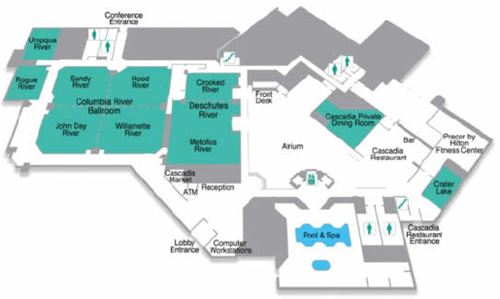
THE INFORMATION IN THIS STRUCTURAL AND COLLATERAL TERM SHEET IS NOT COMPLETE AND MAY BE AMENDED PRIOR TO THE TIME OF SALE. THIS TERM SHEET IS NOT AN OFFER TO SELL THESE SECURITIES AND IT IS NOT A SOLICITATION OF AN OFFER TO BUY THESE SECURITIES IN ANY JURISDICTION WHERE THE OFFER OR SALE IS NOT PERMITTED.
42
Mortgage Loan No. 2 — Embassy Suites Portland Washington Square
| Historical Occupancy, ADR, RevPAR | |||||||||
Competitive Set(1) | Embassy Suites Portland | Penetration Factor | |||||||
| Year | Occupancy | ADR | RevPAR | Occupancy | ADR | RevPAR | Occupancy | ADR | RevPAR |
| 2015 | 73.6% | $130.23 | $95.88 | 58.8%(3) | $141.81(3) | $83.44(3) | 79.9% | 108.9% | 87.0% |
| 2016 | 75.4% | $135.87 | $102.40 | 70.9% | $154.22 | $109.39 | 94.1% | 113.5% | 106.8% |
| 2017 | 76.5% | $136.87 | $104.73 | 73.0% | $155.76 | $113.70 | 95.4% | 113.8% | 108.6% |
| TTM(4) | 76.9% | $134.49 | $103.49 | 73.4% | $155.25 | $113.92 | 95.4% | 115.4% | 110.1% |
| (1) | Source: Third party report. Competitive set includes Holiday Inn Portland I 5 South Wilsonville, Courtyard Portland Beaverton, Crowne Plaza Portland Lake Oswego, Courtyard Portland Tigard, Hilton Garden Inn Portland Beaverton, and Embassy Suites by Hilton Portland Hillsboro. |
| (2) | Source: Borrower Financials. |
| (3) | The hotel underwent a comprehensive $12.1 million renovation during 2015 and the first quarter of 2016. The majority of the room renovations occurred during 2015 resulting in a year-end occupancy of 58.8% and a RevPAR of $83.44. The 2014 occupancy and RevPAR were 73.0% and $97.93, respectively. |
| (4) | Representing the trailing twelve month period ending November 30, 2018. |
The Market. The property is located at the intersection of Highway 217 and Southwest Hall Boulevard in Tigard, Oregon in the Portland-Vancouver-Hillsboro, OR-WA metropolitan statistical area. The property’s immediate market area is characterized as predominantly commercial with surrounding residential and light industrial development. The property benefits from its proximity to Highway 217, which connects to Interstate 5 to the south and Highway 26 to the north.
The Embassy Suites Portland Washington Square offers a convenient location as it is 7.5 miles outside Downtown Portland, 2.2 miles from Tigard City Center and 21.3 miles from the Portland International Airport. The property is located one block north of the Washington Square Mall, which contains approximately 1.2 million SF of retail space and is anchored by Nordstrom, Macy’s, Dick’s Sporting Goods and JCPenney. The mall includes the only Apple Store and Tesla Showroom outside the related central business district. Additionally, the property is in close proximity to the Japanese Gardens, the Oregon Zoo, and the World Forestry Center Museum. The property is also located 0.5 miles from the Hall/Nimbus WES Commuter Rail station.
The property is situated within Portland’s “Silicon Forest” and garners significant corporate demand from the surrounding companies including Nike, Intel, IBM, Tektronix and Columbia Sportswear. According to a market data provider, Intel is reportedly ready to commence construction in June 2019 of a multi-billion dollar, 1.1 million SF, next-generation chip manufacturing facility in nearby Hillsboro, OR on the campus of its current 2.2 million SF D1X research facility.
According the appraisal, the estimated five year population projection within a one-, three-, and five-mile radii of the property is expected to be 10,593, 153,979 and 361,528 respectively; the estimated five year average household income projection within the same one-, three-, and five- mile radii is expected to be $90,264, $108,159, and $119,020. According to the appraisal, the Portland area includes a total of 1,278,845 employees and has a 4.6% unemployment rate. The top three industries within the area are Health Care/Social Assistance, Manufacturing and Retail Trade.
The appraiser identified six comparable hotels, ranging from 94 to 179 rooms that were constructed between 1900 and 2010. The competitive set reported an average occupancy of approximately 75%. The properties in the appraisal’s competitive set are all located in the Portland area within approximately 10.4 miles of the property and are shown in the below table.
THE INFORMATION IN THIS STRUCTURAL AND COLLATERAL TERM SHEET IS NOT COMPLETE AND MAY BE AMENDED PRIOR TO THE TIME OF SALE. THIS TERM SHEET IS NOT AN OFFER TO SELL THESE SECURITIES AND IT IS NOT A SOLICITATION OF AN OFFER TO BUY THESE SECURITIES IN ANY JURISDICTION WHERE THE OFFER OR SALE IS NOT PERMITTED.
43
Mortgage Loan No. 2 — Embassy Suites Portland Washington Square
| Competitive Hotels Profile(1) | ||||||
2018 Estimated Operating Statistics | ||||||
| Property | Rooms | Year Built | Meeting Space (SF) | Occupancy | ADR | RevPAR |
| Embassy Suites Portland Washington Square | 356 | 1987 | 24,597 | 73.0% | $154.90 | $113.73 |
| Crowne Plaza Lake Oswego | 161 | 1997 | 3,120 | 70% - 75% | $135 - $140 | $100 - $105 |
| Courtyard by Marriott Tigard | 110 | 2010 | 1,127 | 80% - 85% | $135 - $140 | $110 - $115 |
| Fairfield Inn and Suites Lake Oswego | 124 | 1998 | 1,375 | 70% - 75% | $130 - $135 | $130 - $135 |
| Hilton Garden Inn Lake Oswego | 179 | 1990 | 1,200 | 80% - 85% | $140 - $145 | $115 - $120 |
| Holiday Inn Express Lake Oswego | 94 | 1900 | N/A | 70% - 75% | $125 - $130 | $90 - $95 |
| Holiday Inn Wilsonville | 169 | 1935 | 6,720 | 70% - 75% | $105 - $110 | $75 - $80 |
| Total(2) | 837 | |||||
| (1) | Source: Appraisal. |
| (2) | Excludes the subject property. |
| Operating History and Underwritten Net Cash Flow | |||||||
| 2015(1) | 2016 | 2017 | TTM(2) | Underwritten | Per Room | %(3) | |
| Occupancy | 58.8% | 70.9% | 73.0% | 73.4% | 73.4% | ||
| ADR | $141.81 | $154.22 | $155.76 | $155.25 | $155.25 | ||
| RevPAR | $83.44 | $109.39 | $113.70 | $113.92 | $113.92 | ||
| Room Revenue | $10,842,020 | $14,253,192 | $14,774,023 | $14,802,354 | $14,802,354 | $41,580 | 77.8% |
| Food and Beverage | 2,797,053 | 3,500,267 | 4,193,396 | 4,011,498 | 4,011,498 | $11,268 | 21.1% |
| Other Departmental Revenues | 49,529 | 182,223 | 256,348 | 201,995 | 201,995 | $567 | 1.1% |
| Total Revenue | $13,688,602 | $17,935,682 | $19,223,767 | $19,015,847 | $19,015,847 | $53,415 | 100.0% |
| Room Expense | 2,779,272 | 3,300,229 | 3,604,207 | 3,755,770 | 3,755,770 | $10,550 | 25.4% |
| Food and Beverage Expense | 2,040,428 | 2,325,406 | 2,685,549 | 2,672,845 | 2,672,845 | $7,508 | 66.6% |
| Departmental Expenses | $4,819,700 | $5,625,635 | $6,289,756 | $6,428,615 | $6,428,615 | $18,058 | 33.8% |
| Departmental Profit | $8,868,902 | $12,310,047 | $12,934,011 | $12,587,232 | $12,587,232 | $35,357 | 66.2% |
| Operating Expenses | 4,460,165 | 5,016,812 | 5,329,131 | 5,544,446 | 5,454,928 | $15,323 | 28.7% |
| Gross Operating Profit | $4,408,737 | $7,293,235 | $7,604,880 | $7,042,786 | $7,132,304 | $20,035 | 37.5% |
| Fixed Expenses | 579,002 | 578,891 | 619,364 | 622,855 | 639,352 | $1,796 | 3.4% |
| Net Operating Income | $3,829,735 | $6,714,344 | $6,985,516 | $6,419,931 | $6,492,952 | $18,239 | 34.1% |
| FF&E | 549,760 | 723,617 | 775,516 | 771,329 | 760,634 | $2,137 | 4.0% |
| Net Cash Flow | $3,279,975 | $5,990,727 | $6,210,000 | $5,648,602 | $5,732,318 | $16,102 | 30.1% |
| (1) | The hotel underwent a comprehensive $12.1 million renovation during 2015 and the first quarter of 2016. The majority of the room renovations occurred during 2015 resulting in a year-end occupancy of 58.8% and RevPAR of $83.44. The 2014 occupancy and RevPAR were 73.0% and $97.93, respectively. |
| (2) | TTM represents the trailing twelve month period ending November 30, 2018. |
| (3) | % column represents percent of Total Revenue except for Room Expense and Food and Beverage Expense, which is based on their corresponding revenue line items. |
THE INFORMATION IN THIS STRUCTURAL AND COLLATERAL TERM SHEET IS NOT COMPLETE AND MAY BE AMENDED PRIOR TO THE TIME OF SALE. THIS TERM SHEET IS NOT AN OFFER TO SELL THESE SECURITIES AND IT IS NOT A SOLICITATION OF AN OFFER TO BUY THESE SECURITIES IN ANY JURISDICTION WHERE THE OFFER OR SALE IS NOT PERMITTED.
44
Mortgage Loan No. 2 — Embassy Suites Portland Washington Square
Property Management. The property is managed by Aimbridge Management West, LLC, the largest independent hotel investment and management company in the United States.
Franchise Agreement. The property operates as an Embassy Suites by Hilton under a franchise agreement that expires on January 31, 2034, approximately 5 years beyond the loan term. The Hilton brand operates over 5,284 hotels, resorts, and timeshare properties, totaling over 856,115 rooms.
Escrows and Reserves. At origination, the borrower deposited $1,232,804 for the property improvement plan, $198,440 for required repairs, $185,292 for real estate taxes, and $17,956 for the insurance.
Tax Escrow – On a monthly basis, the borrower is required to escrow 1/12th of the annual estimated tax payments which currently equates to $44,974.
Insurance Escrow – On a monthly basis, the borrower is required to escrow 1/12th of the annual estimated insurance payments which currently equates to $8,978.
Seasonality Reserve –Commencing March 2023 if, as of February 2023, the amortizing DSCR is less than 1.0x for any month in the trailing twelve months the borrower will deposit $25,000 on each monthly payment date occurring in March through October for the remainder of the loan term.
FF&E Reserve – A minimum of the greater of (a) 4.0% of borrower‘s gross revenues for the month occurring two calendar months prior and (b) the amount required under the management agreement and/or franchise agreement, to be funded monthly. The monthly FF&E Reserve deposit currently equates to $63,386.
Lockbox / Cash Management. The loan is structured with a hard lockbox with springing cash management. The property manager is required to send direction letters to instruct credit card companies to deposit all credit card deposits and other income directly into the lockbox account controlled by the lender. So long as no Cash Management Period (as defined below) is continuing, all funds in the lockbox account are swept daily to the borrower’s operating account. During the continuance of a Cash Management Period, all funds in the lockbox account are swept daily to a cash management account under the control of the lender and disbursed on each monthly payment date during the term of the loan in accordance with the loan documents. During the continuance of a Cash Management Period, all excess cash flow, after payments made in accordance with the loan documents for, amongst other things, debt service, required reserves and operating expenses, will be held as additional collateral for the loan.
A “Cash Management Period” will commence upon: (i) the occurrence and continuance of any event of default under the loan documents, (ii) the debt yield falling below 7.75% and (iii) a bankruptcy event has occurred with respect to the borrower or property manager that has not been discharged or dismissed within 60 days of the filing thereof, unless in the case of property manager, a replacement property manager acceptable to the lender is appointed in accordance with the loan documents within such 60-day period.
THE INFORMATION IN THIS STRUCTURAL AND COLLATERAL TERM SHEET IS NOT COMPLETE AND MAY BE AMENDED PRIOR TO THE TIME OF SALE. THIS TERM SHEET IS NOT AN OFFER TO SELL THESE SECURITIES AND IT IS NOT A SOLICITATION OF AN OFFER TO BUY THESE SECURITIES IN ANY JURISDICTION WHERE THE OFFER OR SALE IS NOT PERMITTED.
45
Mortgage Loan No. 3 — SITE JV Portfolio
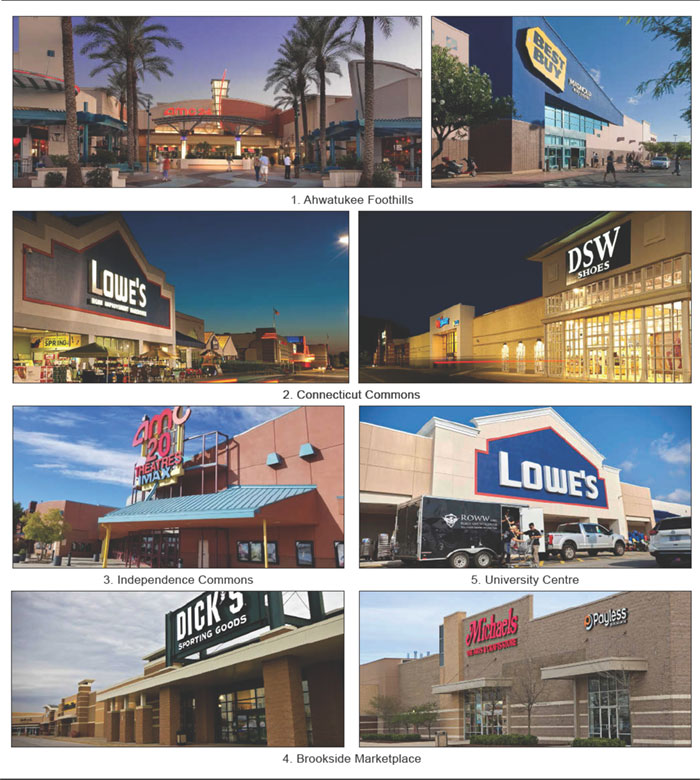
THE INFORMATION IN THIS STRUCTURAL AND COLLATERAL TERM SHEET IS NOT COMPLETE AND MAY BE AMENDED PRIOR TO THE TIME OF SALE. THIS TERM SHEET IS NOT AN OFFER TO SELL THESE SECURITIES AND IT IS NOT A SOLICITATION OF AN OFFER TO BUY THESE SECURITIES IN ANY JURISDICTION WHERE THE OFFER OR SALE IS NOT PERMITTED.
46
Mortgage Loan No. 3 — SITE JV Portfolio
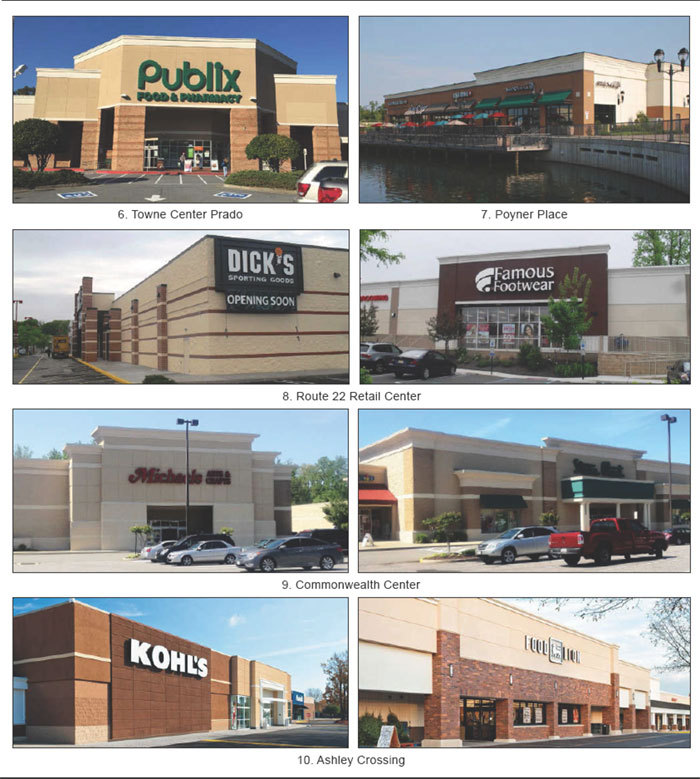
THE INFORMATION IN THIS STRUCTURAL AND COLLATERAL TERM SHEET IS NOT COMPLETE AND MAY BE AMENDED PRIOR TO THE TIME OF SALE. THIS TERM SHEET IS NOT AN OFFER TO SELL THESE SECURITIES AND IT IS NOT A SOLICITATION OF AN OFFER TO BUY THESE SECURITIES IN ANY JURISDICTION WHERE THE OFFER OR SALE IS NOT PERMITTED.
47
Mortgage Loan No. 3 — SITE JV Portfolio

THE INFORMATION IN THIS STRUCTURAL AND COLLATERAL TERM SHEET IS NOT COMPLETE AND MAY BE AMENDED PRIOR TO THE TIME OF SALE. THIS TERM SHEET IS NOT AN OFFER TO SELL THESE SECURITIES AND IT IS NOT A SOLICITATION OF AN OFFER TO BUY THESE SECURITIES IN ANY JURISDICTION WHERE THE OFFER OR SALE IS NOT PERMITTED.
48
Mortgage Loan No. 3 — SITE JV Portfolio
| Mortgage Loan Information | Property Information | |||
| Mortgage Loan Seller: | Column | Single Asset / Portfolio: | Portfolio of 10 Assets | |
| Original Principal Balance(1): | $50,000,000 | Title: | Fee | |
| Cut-off Date Principal Balance(1): | $50,000,000 | Property Type - Subtype: | Retail – Power Center | |
| % of Pool by IPB: | 6.0% | Net Rentable Area (SF): | 3,410,366 | |
| Credit Assessment (Moody’s/Fitch/DBRS)(2): | A3 / A- / A(high) | Location: | Various | |
| Loan Purpose: | Acquisition | Year Built / Renovated: | Various | |
| Borrowers: | Various | Occupancy: | 90.8% | |
| Sponsor: | Dividend Trust Portfolio JV LP | Occupancy Date: | 11/6/2018 | |
| Interest Rate: | 4.8000% | Number of Tenants: | 200 | |
| Note Date: | 11/29/2018 | 2015 NOI: | $40,215,437 | |
| Maturity Date: | 4/6/2024 | 2016 NOI: | $43,087,572 | |
| Interest-only Period: | 64 months | 2017 NOI: | $44,304,754 | |
| Original Term: | 64 months | TTM NOI(4)(5): | $43,903,845 | |
| Original Amortization: | None | UW Economic Occupancy: | 90.7% | |
| Amortization Type: | Interest Only | UW Revenues: | $59,325,476 | |
| Call Protection: | L(27), Def(24), O(13) | UW Expenses: | $17,099,458 | |
| Lockbox(3): | Hard | UW NOI(5): | $42,226,018 | |
| Additional Debt(1): | Yes | UW NCF: | $38,814,200 | |
| Additional Debt Balance(1): | $314,320,000 | Appraised Value / Per SF: | $620,000,000 / $182 | |
| Additional Debt Type(1): | Pari Passu;Subordinate | Appraisal Dates: | Various | |
| Additional Future Debt Permitted: | No |
| Escrows and Reserves(6) | Financial Information(1) | |||||
| Initial | Monthly | Initial Cap | Cut-off Date Loan Per SF: | $65 | ||
| Taxes: | $0 | Springing | N/A | Maturity Date Loan Per SF: | $65 | |
| Insurance: | $0 | Springing | N/A | Cut-off Date LTV: | 35.5% | |
| Capital Expenditure Reserves: | $0 | Springing | N/A | Maturity Date LTV: | 35.5% | |
| Leasing: | $0 | Springing | N/A | UW NOI / UW NCF DSCR: | 3.94x / 3.63x | |
| Unfunded Obligations: | $5,623,512 | $0 | N/A | UW NOI / UW NCF Debt Yield: | 19.2% / 17.6% | |
| University Centre Reserve: | $2,798,021 | $0 | N/A | |||
| Operating Expense Reserve: | $0 | Springing | N/A |
Sources and Uses
| Sources | Proceeds | % of Total | Uses | Proceeds | % of Total | |
| A Notes: | $220,000,000 | 35.3% | Implied Purchase Price(7): | $607,200,000 | 97.4% | |
| B Note: | 144,320,000 | 23.1 | Upfront Reserves: | 8,421,533 | 1.4 | |
| Implied Sponsor Equity(7): | 259,310,071 | 41.6 | Closing Costs: | 8,008,538 | 1.3 | |
| Total Sources: | $623,630,071 | 100.0% | Total Uses: | $623,630,071 | 100.0% |
| (1) | The SITE JV Portfolio loan is part of a larger split whole loan evidenced by two seniorpari passu notes (collectively, the “A Notes”), with an aggregate Cut-off Date balance of $220.0 million and one subordinate note, with a Cut-Off Date balance of $144.32 million (the “B Note”, together with the A Notes, the “Whole Loan”). The financial information presented in the chart above and herein reflects the balance of the A Notes. |
| (2) | Moody’s, Fitch and DBRS have each confirmed that the loan has, in the context of its inclusion in the Initial Pool Balance, credit characteristics consistent with an investment grade obligation. |
THE INFORMATION IN THIS STRUCTURAL AND COLLATERAL TERM SHEET IS NOT COMPLETE AND MAY BE AMENDED PRIOR TO THE TIME OF SALE. THIS TERM SHEET IS NOT AN OFFER TO SELL THESE SECURITIES AND IT IS NOT A SOLICITATION OF AN OFFER TO BUY THESE SECURITIES IN ANY JURISDICTION WHERE THE OFFER OR SALE IS NOT PERMITTED.
49
Mortgage Loan No. 3 — SITE JV Portfolio
| (3) | For a more detailed description of lockbox, please refer to “Lockbox / Cash Management” below. |
| (4) | Represents the trailing twelve month period ending September 30, 2018 |
| (5) | UW NOI excludes approximately $1.1 million of base rent and recoveries from seven tenants marked dark or bankrupt across 43,202 SF. |
| (6) | For a more detailed description of Escrows and Reserves, please refer to “Escrows and Reserves” below. |
| (7) | Implied Sponsor Equity includes an equity contribution from Frontier JV Investor of $203.8 million. Implied Purchase Price is based on Frontier JV Investor’s $485.8 million acquisition price for its 80.0% interest in Dividend JV. |
The Loan. The SITE JV Portfolio Whole Loan is a $364.32 million first mortgage loan secured by mortgages on the fee interests in ten retail properties containing approximately 3.4 million SF located across nine states. The Whole Loan has a 64 month term and is interest-only for the entire term of the loan. The Whole Loan is comprised of twopari passu A Notes with an aggregate Cut-off Date balance of $220.0 million and one B Note with a Cut-off Date balance of $144.32 million.
Note A-2 is being contributed to the CSAIL 2019-C15 Commercial Mortgage Trust. The Whole Loan is being serviced pursuant to the CSMC 2018-SITE trust and servicing agreement. As the holder of the B Note (the “Controlling Noteholder”), the trustee of the CSMC 2018-SITE Trust is entitled to exercise all of the rights of the Controlling Noteholder with respect to the Whole Loan. For more information see “Description of the Mortgage Pool – The Whole Loans – The Non-Serviced AB Whole Loans – The SITE JV Portfolio Whole Loan” in the Preliminary Prospectus.
Whole Loan Note Summary
| Original Balance | Cut-off Date Balance | Note Holder | Lead Servicer for Whole Loan (Y/N) | Controlling Piece (Y/N) | |
| Note A-1 | $170,000,000 | $170,000,000 | CSMC 2018-SITE | Y | N |
| Note A-2 | 50,000,000 | 50,000,000 | CSAIL 2019-C15 | N | N |
| Note B | 144,320,000 | 144,320,000 | CSMC 2018-SITE | Y | Y |
| Total: | $364,320,000 | $364,320,000 |
Total Debt Capital Structure
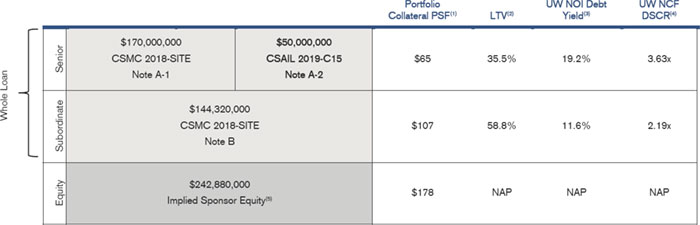
| (1) | Based on the total collateral SF of 3,410,366. |
| (2) | Based on the aggregate “as-is” appraised value of $620.0 million. |
| (3) | Based on the UW NOI of $42,226,018. |
| (4) | Based on the UW NCF of $38,814,200 and coupon of 4.8000% on both the A Notes and the B Note. |
| (5) | Based on Frontier JV Investor’s $485.8 million acquisition price for its 80.0% interest in Dividend JV, less the Whole Loan. |
THE INFORMATION IN THIS STRUCTURAL AND COLLATERAL TERM SHEET IS NOT COMPLETE AND MAY BE AMENDED PRIOR TO THE TIME OF SALE. THIS TERM SHEET IS NOT AN OFFER TO SELL THESE SECURITIES AND IT IS NOT A SOLICITATION OF AN OFFER TO BUY THESE SECURITIES IN ANY JURISDICTION WHERE THE OFFER OR SALE IS NOT PERMITTED.
50
Mortgage Loan No. 3 — SITE JV Portfolio
The Borrower. The borrowing entities for the Whole Loan are eight Delaware limited liability companies and three Delaware limited partnerships, each of which is a single-purpose bankruptcy-remote entity, indirectly wholly-owned by Dividend Trust Portfolio JV LP.
The Sponsor. The loan’s sponsor and nonrecourse carve-out guarantor is Dividend Trust Portfolio JV LP (“Dividend JV”), a newly formed limited partnership among (i) certain Delaware limited liability companies that are indirectly wholly-owned subsidiaries of SITE Centers Corp. (“SITC”) and (ii) a Cayman Islands limited liability company that is a joint venture among subsidiaries of China Merchants Group Limited and China Life Insurance (Group) Company (together with China Merchants Group Limited, “Frontier JV Investor”). SITC indirectly owned 100.0% of the portfolio and caused an 80.0% interest in Dividend JV to be sold to Frontier JV Investor for $485.8 million. Certain wholly-owned affiliates of SITC have maintained a 20.0% joint venture interest in the portfolio and continue to manage the individual assets post-closing.
SITC (formerly DDR Corp.) (NYSE: SITC, M/S&P/F: Baa3/BBB-/BBB) is a publicly traded self-administered and self-managed real estate investment trust in the business of acquiring, owning, developing, redeveloping, expanding, leasing, financing and managing shopping centers. SITC’s portfolio as of September 30, 2018, totals 182 shopping centers, of which 78 are wholly-owned and 104 are owned in joint ventures, containing a total of 45.2 million SF of owned NRA (61.8 million SF of total NRA). A wholly-owned subsidiary of SITC is the general partner of Dividend JV. China Life Insurance (Group) Company is a leading provider of life, health, accident insurance and annuities in China. As of November 23, 2018, China Life Insurance (Group) Company has a market cap of $82.0 billion. China Merchants Group Limited is a commercial bank founded in 1987 and headquartered in Shenzhen with 137 branches, 1,693 sub-branches and 10,656 self-service machines in more than 130 cities of mainland China as of June 2018.
The Portfolio. The portfolio includes ten retail properties totaling 3.4 million SF with an average occupancy of 93.4% as of September 2018 and 200 unique tenants.
| # | Property Name | Location | Collateral SF | TTM(1)Occupancy | Year Acquired | Year Renovated | Allocated Whole Loan Amount | % of ALA | UW NOI | % of UW NOI |
| 1 | Ahwatukee Foothills | Phoenix, AZ | 688,099 | 92.2% | 1998 | 2013 - 2018 | $93,431,000 | 25.6% | $10,379,002 | 24.6% |
| 2 | Connecticut Commons | Plainville, CT | 566,128 | 97.2% | 2013 | N/A | 55,823,000 | 15.3 | 6,882,263 | 16.3 |
| 3 | Independence Commons | Independence, MO | 385,803 | 97.9% | 1995 | N/A | 42,896,000 | 11.8 | 5,176,257 | 12.3 |
| 4 | Brookside Marketplace | Tinley Park, IL | 316,901 | 92.1% | 2012 | N/A | 34,669,000 | 9.5 | 4,247,972 | 10.1 |
| 5 | University Centre | Wilmington, NC | 418,099 | 93.5% | 2001 | 2001 | 32,436,000 | 8.9 | 4,396,836 | 10.4 |
| 6 | Towne Center Prado | Marietta, GA | 286,683 | 96.1% | 1995 | N/A | 28,382,000 | 7.8 | 3,333,723 | 7.9 |
| 7 | Poyner Place | Raleigh, NC | 258,839 | 85.5% | 2012 | N/A | 25,209,000 | 6.9 | 2,453,541 | 5.8 |
| 8 | Route 22 Retail Center | Union, NJ | 112,253 | 81.7% | 2007 | 2009 | 18,921,000 | 5.2 | 1,124,951 | 2.7 |
| 9 | Commonwealth Center | Midlothian, VA | 165,611 | 96.5% | 2007 | 2018 | 17,628,000 | 4.8 | 2,492,259 | 5.9 |
| 10 | Ashley Crossing | Charleston, SC | 211,950 | 90.3% | 2003 | 2011 | 14,925,000 | 4.1 | 1,739,213 | 4.1 |
| Total/Wtd Avg.: | 3,410,366 | 93.4% | $364,320,000 | 100.0% | $42,226,018 | 100.0% | ||||
| (1) | Represents the trailing twelve months ended September 30, 2018. |
The properties were constructed between 1991 and 2006. With an average occupancy of 93.4% as of September 2018, eight of the ten properties within the portfolio are anchored or shadow anchored by specialty, traditional, or discount grocers representing 2.5 million SF (72.1% of total SF) and $30.2 million of UW NOI (71.4% of total UW NOI). Four of the properties are anchored by traditional or specialty grocers (Ahwatukee Foothills Towne Center – Sprouts Farmers Market; Towne Center Prado – Publix; Commonwealth Center – The Fresh Market, Ashley Crossing – Food Lion). The four grocery anchored assets represent 1.4 million SF (39.7% of total SF) and $17.9 million of UW NOI (42.5% of total UW NOI). All other assets are anchored and/or shadow anchored by high quality discounters and mass merchandisers, such as, TJX brands (T.J. Maxx, Marshalls, HomeGoods), Ross Dress for Less, Burlington, Cost Plus World Market, Target and Kohl’s.
THE INFORMATION IN THIS STRUCTURAL AND COLLATERAL TERM SHEET IS NOT COMPLETE AND MAY BE AMENDED PRIOR TO THE TIME OF SALE. THIS TERM SHEET IS NOT AN OFFER TO SELL THESE SECURITIES AND IT IS NOT A SOLICITATION OF AN OFFER TO BUY THESE SECURITIES IN ANY JURISDICTION WHERE THE OFFER OR SALE IS NOT PERMITTED.
51
Mortgage Loan No. 3 — SITE JV Portfolio
SITC has successfully executed 54 leases totaling 364,605 SF from 2017 through the first quarter of 2018 (10.7% of total SF) with an average re-leasing spread of 7.4%. Average comparable sales for the portfolio have increased 5.1% from $243 PSF in 2015 to $255 PSF in 2017. Additionally, SITC has invested a total of $35.4 million ($10.37 PSF) in the portfolio from 2015 through August 2018 for landlord work, redevelopment work, tenant improvements and leasing commissions.
The portfolio has a diverse mix of national, regional and local retailers with a total of 200 unique tenants. The property’s tenancy caters to mid-price point customers with mainly national tenants that include AMC Theaters, Dick’s Sporting Goods, Best Buy, and Kohl’s. The top ten tenants account for 46.7% of total SF and 43.3% of underwritten base rent. Six of the top ten tenants are investment grade rated and nine are publicly traded. There is minimal tenant concentration risk as no single tenant represents more than 6.8% of the total SF and 9.6% of underwritten base rent in the portfolio.
The largest tenant in the portfolio, AMC Theatres (NYSE:AMC), rated B2/B/B by Moody’s, S&P and Fitch, respectively, leases 231,800 SF across 4 properties (9.6% of underwritten base rent). The parent company, AMC Entertainment Holdings, Inc. (“AMC”) was founded in 1920, is based in Leawood, KS, and operates more than 1,000 theatres and over 11,000 screens in 16 countries, with a combined annual attendance in excess of 344.0 million. AMC has grown through acquisitions and is currently the largest theatre chain in the world. For year-end 2017 AMC report net revenue of $5.1 billion, cash of $310 million, total assets of $9.8 billion, total equity of $2.1 billion, and had a market cap of $1.44 billion.
The second largest tenant in the portfolio, the TJX Companies (NYSE:TJX) (T.J. Maxx, Marshalls, and HomeGoods), rated A2/A+ by Moody’s and S&P, respectively, leases 204,743 SF across 8 properties (4.8% of underwritten base rent). The TJX Companies, Inc is based in Framingham, MA, and operated 4,070 discount apparel, home fashions, accessories, and other merchandise stores in 9 countries as of February 3, 2018. For fiscal year 2018 TJX reported total sales of $35.9 billion, up 8.1% compared to $33.2 billion in fiscal year 2017), net income of $2.6 billion, cash of $2.8 billion, total assets of $14.1 billion, total equity of $5.1 billion, and a market cap of $57.8 billion as of November 29, 2018.
The third largest tenant in the portfolio, Ross Dress for Less (NASDAQ:ROST), rated A3/A- by Moody’s and S&P, respectively, leases 181,294 SF across 6 properties (4.4% of underwritten base rent). Ross Stores, Inc. (“Ross”), the parent company of the tenant, founded in 1982, is the largest U.S. off-price and apparel chain, with 1,720 Ross Dress for Less or dd’s Discount stores across 38 states, D.C. and Guam as of October 15, 2018. For year end 2017 Ross reported total revenue of $14.1 billion, net income of $1.4 billion, cash of $1.3 billion, total assets of $5.7 billion, total equity of $3.0 billion, and as of November 26, 2018, has a market cap of $30.22 billion. For 2H2018 Ross reported net earnings grew 26.6% to $808.0 million as compared to 1H2017, and same store sales increased 5.0% year-over-year. Ross is an S&P 500 and Fortune 500 company ranked #209 in 2017.
The Market. All ten properties are located in strong retail markets and submarkets. According to a third party market data provider, submarket vacancies ranged from 1.8% to 8.1% and rent growth in the prior 12 months ranged from 0.3% to 4.9%. Each property is located on or adjacent to high-traffic areas, primary interstates or highways, near complimentary retail and other demand generators such as regional malls, larger power centers, universities, or convention centers. According to a third party market research provider, the average population within a 5-mile radius is 185,546 and the average household income within a 5-mile radius is $90,795, an 11.5% increase as compared to the $81,400 average for the nation (U.S. Census, 2017).
THE INFORMATION IN THIS STRUCTURAL AND COLLATERAL TERM SHEET IS NOT COMPLETE AND MAY BE AMENDED PRIOR TO THE TIME OF SALE. THIS TERM SHEET IS NOT AN OFFER TO SELL THESE SECURITIES AND IT IS NOT A SOLICITATION OF AN OFFER TO BUY THESE SECURITIES IN ANY JURISDICTION WHERE THE OFFER OR SALE IS NOT PERMITTED.
52
Mortgage Loan No. 3 — SITE JV Portfolio
Demographics Summary - 5 Mile Radius(1)
| # | Property | Location | Total Population | Annual Growth to 2023 | Total Households | Annual Growth to 2023 | Average HH Income |
| 1 | Ahwatukee Foothills Towne Center | Phoenix, AZ | 193,463 | 1.2% | 77,181 | 1.2% | $97,694 |
| 2 | Connecticut Commons | Plainville, CT | 161,528 | 0.3% | 64,964 | 0.2% | $77,199 |
| 3 | Independence Commons | Independence, MO | 133,414 | 0.5% | 54,182 | 0.5% | $78,129 |
| 4 | Brookside Marketplace | Tinley Park, IL | 172,334 | 0.0% | 63,594 | 0.0% | $98,309 |
| 5 | University Centre | Wilmington, NC | 149,706 | 1.4% | 64,363 | 1.5% | $72,727 |
| 6 | Towne Center Prado | Marietta, GA | 180,939 | 1.1% | 69,429 | 1.1% | $92,450 |
| 7 | Poyner Place | Raleigh, NC | 186,930 | 2.1% | 73,363 | 2.0% | $86,479 |
| 8 | Route 22 Retail Center | Union, NJ | 448,096 | 0.5% | 160,023 | 0.5% | $125,062 |
| 9 | Commonwealth Center | Midlothian, VA | 104,244 | 1.3% | 37,269 | 1.2% | $107,684 |
| 10 | Ashley Crossing | Charleston, SC | 124,808 | 1.5% | 52,347 | 1.5% | $72,221 |
| Total/Weighted Average: | 185,546 | 1.0% | 71,672 | 1.0% | $90,795 | ||
| (1) | Source: Third party market data provider. |
Historical and Current Occupancy(1)
| 2015 | 2016 | 2017 | Current(2) |
| 94.6% | 95.3% | 94.3% | 90.8% |
| (1) | Source: Historical Occupancy is provided by the sponsor. Occupancies are as of December 31 of each respective year. |
| (2) | Based on the November 6, 2018 underwritten rent roll. |
Tenant Summary(1)(2)
| Tenant | Ratings Moody’s/S&P/Fitch(3) | NRA (SF) | % of Total NRA | UW Base Rent PSF | % of Total UW Base Rents | Lease Expiration Date(4) | ||||||||||
| AMC Theatres | B2 / B / B | 231,800 | 6.8 | % | $19.32 | 9.6 | % | 12/31/2029 – 12/31/2034 | ||||||||
| TJX Companies | A2 / A+ / NR | 204,743 | 6.0 | $11.05 | 4.8 | 9/30/2021 – 9/30/2027 | ||||||||||
| Ross Dress for Less | A3 / A- / NR | 181,294 | 5.3 | $11.46 | 4.4 | 1/31/2020 – 1/31/2024 | ||||||||||
| Dick’s Sporting Goods(5) | NR / NR / NR | 146,216 | 4.3 | $13.79 | 4.3 | 1/31/2020 – 1/31/2023 | ||||||||||
| Best Buy | Baa1 / BBB / BBB | 141,368 | 4.1 | $14.23 | 4.3 | 7/31/2019 – 1/31/2022 | ||||||||||
| Lowe’s | A3 / A- / NR | 260,554 | 7.6 | $7.64 | 4.3 | 8/31/2019 – 10/31/2019 | ||||||||||
| Kohl’s | Baa2 / BBB- / BBB | 237,169 | 7.0 | $8.11 | 4.1 | 1/31/2021 – 1/31/2032 | ||||||||||
| Petco(2) | NR / CCC+ / NR | 60,145 | 1.8 | $21.32 | 2.7 | MTM – 2/28/2027 | ||||||||||
| Old Navy | Baa2 / BB+ / NR | 85,317 | 2.5 | $14.32 | 2.6 | 8/31/2019 – 6/30/2023 | ||||||||||
| Ulta Beauty | NR / NR / NR | 43,636 | 1.3 | $22.06 | 2.1 | 11/30/2021 – 10/31/2025 | ||||||||||
| Top 10 Total: | 1,592,242 | 46.7 | % | $12.70 | 43.3 | % | ||||||||||
| Total Other Tenants | 1,504,900 | 44.1 | % | $16.97 | 54.7 | % | ||||||||||
| Vacant(6) | 313,224 | 9.2 | $3.04 | 2.0 | ||||||||||||
| Total: | 3,410,366 | 100.0 | % | $13.70 | 100.0 | % | ||||||||||
| (1) | Based on the underwritten rent roll. UW Base Rent includes base rent, rent increases occurring through December 1, 2019 and signed but not occupied rent from Phoenix Salon Suites at Ahwatukee Foothills Towne Center which is expected to be in occupancy by July 2019, Domino’s Pizza at Poyner Place which is expected to be in occupancy by March 2019, Spectrum at Poyner Place which is expected to be in occupancy by March 2019, Bath & Body Works at Connecticut Commons which is expected to be in occupancy by June 2019, and Six Mile Wine & Spirits at Ashley Crossing which is expected to be in occupancy by March 2019. |
THE INFORMATION IN THIS STRUCTURAL AND COLLATERAL TERM SHEET IS NOT COMPLETE AND MAY BE AMENDED PRIOR TO THE TIME OF SALE. THIS TERM SHEET IS NOT AN OFFER TO SELL THESE SECURITIES AND IT IS NOT A SOLICITATION OF AN OFFER TO BUY THESE SECURITIES IN ANY JURISDICTION WHERE THE OFFER OR SALE IS NOT PERMITTED.
53
Mortgage Loan No. 3 — SITE JV Portfolio
| (2) | According to the sponsor, as of the Cut-off Date, the top five tenants at each of the properties are in place and paying rent with the exception of (i) Petco at Route 22 Retail Center (14,000 SF and $357,000 underwritten base rent) which vacated the property in December 2018, but, continues to pay rent according to the terms of its lease which expires in October 2019 and (ii) Petco at Towne Center Prado (15,000 SF and $261,150 underwritten base rent), which is currently paying rent on a month to month basis and negotiating a lease renewal through January 2020 at $9.00 PSF. |
| (3) | Ratings provided are for the parent company of the entity listed in the “Tenant” field whether or not the parent company guarantees the lease. |
| (4) | A number of tenants, including certain anchor tenants, have lease termination options related to co-tenancy provisions, exclusivity provisions and sales thresholds, and certain tenants may also have other lease termination options, in each case that may become exercisable prior to the originally stated expiration date of the tenant lease. |
| (5) | According to the sponsor, the Dick’s Sporting Goods (50,800 SF) at Connecticut Commons may not renew its lease at expiration in January 2020. The sponsor is in discussions to relet the space, however, terms are not yet final. |
| (6) | Vacant includes seven bankrupt or dark tenants (43,202 SF, 5 bankrupt and 2 dark). |
Tenant Comparable Sales & Occupancy Costs
| 2015 | 2016 | 2017 | |
| Anchor (> 40,000 SF) | $94,425,620 | $101,335,934 | $105,567,465 |
| PSF | $205 | $220 | $230 |
| Occupancy Cost(1) | 8.5% | 7.9% | 7.6% |
| # Tenants | 6 | 6 | 6 |
| SF | 459,838 | 459,838 | 459,838 |
| Junior Anchor (20,000 - 40,000 SF) | $140,246,696 | $146,488,847 | $132,599,445 |
| PSF | $269 | $281 | $297 |
| Occupancy Cost(1) | 5.6% | 5.3% | 5.0% |
| # Tenants | 19 | 19 | 16 |
| SF | 521,391 | 521,391 | 446,636 |
| Junior Anchor (10,000 - 19,999 SF) | $51,103,252 | $50,642,655 | $49,991,752 |
| PSF | $191 | $190 | $187 |
| Occupancy Cost(1) | 9.4% | 9.5% | 9.6% |
| # Tenants | 17 | 17 | 17 |
| SF | 267,241 | 267,241 | 267,241 |
| Inline (5,000 - 9,999 SF) | $37,760,113 | $34,983,013 | $33,540,115 |
| PSF | $288 | $292 | $267 |
| Occupancy Cost(1) | 8.8% | 8.9% | 9.4% |
| # Tenants | 18 | 16 | 17 |
| SF | 131,317 | 119,819 | 125,465 |
| Inline (3,000 - 4,999 SF) | $26,142,546 | $32,075,729 | $34,961,440 |
| PSF | $321 | $326 | $307 |
| Occupancy Cost(1) | 9.6% | 9.5% | 9.9% |
| # Tenants | 21 | 25 | 29 |
| SF | 81,549 | 98,347 | 113,783 |
| Inline (2,000 - 2,999 SF) | $7,526,544 | $7,604,501 | $12,010,918 |
| PSF | $384 | $350 | $344 |
| Occupancy Cost(1) | 9.7% | 10.6% | 10.9% |
| # Tenants | 9 | 10 | 15 |
| SF | 19,592 | 21,752 | 34,921 |
| Inline (0 - 1,999 SF) | $11,534,761 | $9,499,884 | $9,715,833 |
| PSF | $308 | $279 | $286 |
| Occupancy Cost(1) | 10.6% | 11.7% | 11.8% |
| # Tenants | 27 | 24 | 24 |
| SF | 37,509 | 34,101 | 33,975 |
| Total: | $368,739,534 | $382,630,564 | $378,386,968 |
| PSF | $243 | $251 | $255 |
| Occupancy Cost(1) | 7.7% | 7.5% | 7.6% |
| # Tenants | 117 | 117 | 124 |
| SF | 1,518,437 | 1,522,489 | 1,481,859 |
| (1) | Occupancy Cost is calculated based on current underwritten base rent, based on in-place rent, budgeted recoveries and steps. |
THE INFORMATION IN THIS STRUCTURAL AND COLLATERAL TERM SHEET IS NOT COMPLETE AND MAY BE AMENDED PRIOR TO THE TIME OF SALE. THIS TERM SHEET IS NOT AN OFFER TO SELL THESE SECURITIES AND IT IS NOT A SOLICITATION OF AN OFFER TO BUY THESE SECURITIES IN ANY JURISDICTION WHERE THE OFFER OR SALE IS NOT PERMITTED.
54
Mortgage Loan No. 3 — SITE JV Portfolio
Lease Rollover Schedule(1)(2)
| Year | Number of Leases Expiring | NRA Expiring | % of NRA Expiring | UW Base Rent Expiring | % of UW Base Rent Expiring | Cumulative NRA Expiring | Cumulative % of NRA Expiring | Cumulative UW Base Rent Expiring | Cumulative % of UW Base Rent Expiring |
| MTM | 2 | 2,260 | 0.1% | $67,646 | 0.1% | 2,260 | 0.1% | $67,646 | 0.1% |
| 2019 | 27 | 481,605 | 14.1 | 5,339,694 | 11.4 | 483,865 | 14.2% | $5,407,340 | 11.6% |
| 2020 | 45 | 359,080 | 10.5 | 5,761,922 | 12.3 | 842,945 | 24.7% | $11,169,262 | 23.9% |
| 2021 | 39 | 479,866 | 14.1 | 6,225,646 | 13.3 | 1,322,811 | 38.8% | $17,394,908 | 37.2% |
| 2022 | 36 | 515,796 | 15.1 | 7,223,656 | 15.5 | 1,838,607 | 53.9% | $24,618,564 | 52.7% |
| 2023 | 42 | 421,180 | 12.3 | 6,604,965 | 14.1 | 2,259,787 | 66.3% | $31,223,529 | 66.8% |
| 2024 | 17 | 111,861 | 3.3 | 2,148,594 | 4.6 | 2,371,648 | 69.5% | $33,372,123 | 71.4% |
| 2025 | 10 | 128,177 | 3.8 | 1,937,694 | 4.1 | 2,499,825 | 73.3% | $35,309,817 | 75.6% |
| 2026 | 13 | 99659 | 2.9 | 1,857,081 | 4.0 | 2,599,484 | 76.2% | $37,166,899 | 79.6% |
| 2027 | 7 | 79,987 | 2.3 | 1,650,479 | 3.5 | 2,679,471 | 78.6% | $38,817,378 | 83.1% |
| 2028 | 8 | 66,166 | 1.9 | 1,029,653 | 2.2 | 2,745,637 | 80.5% | $39,847,031 | 85.3% |
| 2029 | 5 | 118,250 | 3.5 | 1,949,504 | 4.2 | 2,863,887 | 84.0% | $41,796,535 | 89.5% |
| 2030 | 3 | 16,592 | 0.5 | 258,076 | 0.6 | 2,880,479 | 84.5% | $42,054,611 | 90.0% |
| 2031 & Beyond | 5 | 216,663 | 6.4 | 3,705,868 | 7.9 | 3,097,142 | 90.8% | $45,760,479 | 98.0% |
| Vacant(3) | N/A | 313,224 | 9.2 | 953,251 | 2.0 | 3,410,366 | 100.0% | $46,713,730 | 100.0% |
| Total | 259 | 3,410,366 | 100.0% | $46,713,730 | 100.0% |
| (1) | Based on the November 6, 2018 underwritten rent roll. UW Base Rent includes base rent, rent increases occurring through December 1, 2019 and signed but not occupied rent from Phoenix Salon Suites at Ahwatukee Foothills Towne Center which is expected to be in occupancy by July 2019, Domino’s Pizza at Poyner Place which is expected to be in occupancy by March 2019, Spectrum at Poyner Place which is expected to be in occupancy by March 2019, Bath & Body Works at Connecticut Commons which is expected to be in occupancy by June 2019, and Six Mile Wine & Spirits at Ashley Crossing which is expected to be in occupancy by March 2019. |
| (2) | Certain tenants have more than one lease. A number of tenants, including certain anchor tenants, have lease termination options related to co-tenancy provisions, exclusivity provisions and sales thresholds, and certain tenants may also have other lease termination options, in each case that may become exercisable prior to the originally stated expiration date of the tenant lease. No such termination options were considered in the Lease Rollover Schedule. |
| (3) | Vacant includes seven bankrupt or dark tenants (43,202 SF, 5 bankrupt and 2 dark). |
THE INFORMATION IN THIS STRUCTURAL AND COLLATERAL TERM SHEET IS NOT COMPLETE AND MAY BE AMENDED PRIOR TO THE TIME OF SALE. THIS TERM SHEET IS NOT AN OFFER TO SELL THESE SECURITIES AND IT IS NOT A SOLICITATION OF AN OFFER TO BUY THESE SECURITIES IN ANY JURISDICTION WHERE THE OFFER OR SALE IS NOT PERMITTED.
55
Mortgage Loan No. 3 — SITE JV Portfolio
Operating History and Underwritten Net Cash Flow
| 2015 | 2016 | 2017 | TTM(1)(2) | Underwritten(2)(3) | PSF | %(4) | |
| Rents in Place | $43,761,247 | $45,677,698 | $46,689,243 | $46,835,885 | $46,713,730 | $11.26 | 72.0% |
| Overage Rent | 233,188 | 354,520 | 391,541 | 402,708 | 403,306 | $0.10 | 0.6% |
| Gross Potential Rent | $43,994,435 | $46,032,219 | $47,080,784 | $47,238,593 | $47,117,036 | $11.36 | 72.7% |
| Total Recoveries | $12,796,642 | $13,572,770 | $13,464,988 | $13,466,645 | $12,864,327 | $3.10 | 19.8% |
| Gross Up Vacant Space – Base Rent | 0 | 0 | 0 | 0 | 3,856,925 | $0.93 | 5.9% |
| Gross Up Vacant Space – Recoveries | 0 | 0 | 0 | 0 | 1,011,495 | $0.24 | 1.6% |
| Net Rental Income | $56,791,077 | $59,604,989 | $60,545,772 | $60,705,238 | $64,849,783 | $15.64 | 100.0% |
| (Vacancy/Collection Loss) | (344,230) | (212,960) | (59,639) | (159,175) | (6,005,897) | ($1.45) | (10.1%) |
| Other Income | 283,334 | 330,123 | 450,222 | 481,589 | 481,589 | $0.12 | 0.8% |
| Effective Gross Income | $56,730,181 | $59,722,152 | $60,936,356 | $61,027,653 | $59,325,476 | $14.30 | 100.0% |
| Total Expenses | $16,514,744 | $16,634,580 | $16,631,602 | $17,123,808 | $17,099,458 | $4.12 | 28.8% |
| Net Operating Income | $40,215,437 | $43,087,572 | $44,304,754 | $43,903,845 | $42,226,018 | $10.18 | 71.2% |
| Total TI/LC, Capex/RR | 0 | 0 | 0 | 0 | 3,411,818 | $0.82 | 5.8% |
| Net Cash Flow | $40,215,437 | $43,087,572 | $44,304,754 | $43,903,845 | $38,814,200 | $9.36 | 65.4% |
| (1) | TTM represents the trailing twelve month period ending September 30, 2018. |
| (2) | UW NOI excludes approximately $1.1 million of base rent and recoveries from seven tenants marked dark or bankrupt across 43,202 SF. |
| (3) | Underwritten Rents in Place includes base rent and rent increases occurring through December 1, 2019. |
| (4) | % column represents percent of Net Rental Income for all Revenue lines and represents the percent of Effective Gross Income for the remainder of the fields |
Property Management. The portfolio is managed by DDR Property Management LLC.
Escrows and Reserves. At origination, the borrower deposited into escrow $5,623,512 for unfunded obligations for completion of all tenant improvements, leasing commissions and free rent outstanding as of the origination date and $2,798,021 in the University Centre reserve representing (i) the full amount of rent payable by Staples, Petco and America’s Best Contacts pursuant to their respective leases assuming such tenants were in possession and paying full, unabated rent and (ii) 115% of the total costs budgeted by the borrower for restoration at the University Centre property due to Hurricane Florence.
Tax & Insurance Reserves – The requirement to make monthly deposits to the into tax & insurance reserve accounts is waived so long as a Trigger Period (defined below) is not continuing. Monthly, during a Trigger Period, the borrower is required to deposit, or cause to be deposited, (i) 1/12th of an amount which would be sufficient to pay the taxes at each individual property payable, or estimated by the lender to be payable, during the next ensuing twelve months within 30 days of such taxes becoming due and payable and, (ii) 1/12th of an amount which would be sufficient to pay the insurance premiums due for the renewal of the coverage afforded by the policies covering each individual property upon the expiration thereof.
Leasing Reserves – The requirement to make monthly deposits to the leasing reserve is waived so long as a Trigger Period is not continuing. During a Trigger Period, 1/12th of $1.00 per rentable SF is required to be deposited into the leasing reserve on a monthly basis.
Capital Expenditure Reserve – The requirement to make monthly deposits to the capital expenditure reserve is waived so long as a Trigger Period is not continuing. During a Trigger Period, 1/12th of $0.25 per rentable SF is required to be deposited into the capital expenditure reserve on a monthly basis.
Operating Expense Reserve – On each payment date occurring during the continuance of a Trigger Period, the borrower is required to deposit an amount equal to the aggregate amount of approved operating expenses and approved extraordinary expenses expected to be incurred by the borrower for the then current interest accrual period.
THE INFORMATION IN THIS STRUCTURAL AND COLLATERAL TERM SHEET IS NOT COMPLETE AND MAY BE AMENDED PRIOR TO THE TIME OF SALE. THIS TERM SHEET IS NOT AN OFFER TO SELL THESE SECURITIES AND IT IS NOT A SOLICITATION OF AN OFFER TO BUY THESE SECURITIES IN ANY JURISDICTION WHERE THE OFFER OR SALE IS NOT PERMITTED.
56
Mortgage Loan No. 3 — SITE JV Portfolio
Lockbox / Cash Management. The Whole Loan is structured with hard lockboxes and springing cash management. The tenants are required to deposit rents directly into the applicable lockbox. Prior to the occurrence of a Trigger Period, all funds in each lockbox account are required to be swept into the borrower’s operating account on a daily basis. During the continuance of a Trigger Period, all funds in the lockbox accounts are required to be swept each business day into the cash management account controlled by the lender and disbursed on each payment date in accordance with the loan documents. During the continuance of a Trigger Period, all excess cash flow remaining following disbursements deposits for taxes, insurance premiums, debt service, reserves, operating expenses and other payments required by the loan documents are required to be deposited into an excess cash flow subaccount controlled by the lender and to be held as additional security for the Whole Loan. The lender will disburse any funds remaining in the excess cash flow subaccount following payment of the Required REIT Distribution (as defined below) to the borrower for lender-approved tenant improvement costs and leasing expenses, approved operating expenses, approved extraordinary expenses or capital expenditures if there are insufficient funds in the respective subaccounts for payment of the same.
A “Trigger Period” will occur upon (i) an event of default under the loan documents; (ii) the debt yield falling below 8.75% for the Whole Loan; (iii) any bankruptcy action with respect to the borrower or manager that has not been discharged or dismissed within 30 days of the occurrence thereof, or (iv) the borrower’s failure to deliver any required financial item within 10 business days after written notice from the lender.
A “Required REIT Distribution” means an amount equal to the minimum amount of the dividend required to be distributed in cash (as opposed to equity) with respect to any taxable year of the REIT subsidiary in order for it to qualify as a REIT and to avoid any U.S. federal income Taxes imposed under IRS Code Sections 857(b)(1) and 857(b)(3).
Property Release. Provided no event of default under the loan documents is continuing, the Borrower may release one or more properties from the Whole Loan after the date that is two years from the securitization closing date (but prior to April 6, 2023) by defeasance of a portion of the Whole Loan (or on or after April 6, 2023, making a partial prepayment of the Whole Loan) equal to (A) 110.0% (or, in connection with an affiliate sale, 115.0%) of the applicable allocated loan amount with respect to releases of the first 30.0% of the Whole Loan amount and (B) 115.0% (or, in connection with an affiliate sale, 120.0%) of the applicable allocated loan amount with respect to releases of the property thereafter, provided that, among other things, after giving effect to such partial release, the debt yield for the Whole Loan is at least equal to the greater of (i) 10.5% and (ii) aggregate debt yield for the Whole Loan immediately prior to such partial release. See “Description of the Mortgage Pool—Certain Terms of the Mortgage Loans—Partial Releases” in the Preliminary Prospectus.
Additional Debt. The B Note has a Cut-off Date balance of $144.32 million and is coterminous with the A Notes. The B Note requires interest-only payments through maturity. The B Note accrues interest at an interest rate of 4.8000%per annum on an Actual/360 basis. The Cut-off Date Loan / SF, Cut-off Date LTV, UW NOI DSCR, UW NCF DSCR, UW NOI Debt Yield and UW NCF Debt Yield based on the entire Whole Loan are $107, 58.8%, 2.38x, 2.19x, 11.6%, and 10.7% respectively. See “Description of the Mortgage Pool– The Whole Loans–The Non-Serviced AB Whole Loans—The SITE JV Portfolio Whole Loan” in the Preliminary Prospectus.
THE INFORMATION IN THIS STRUCTURAL AND COLLATERAL TERM SHEET IS NOT COMPLETE AND MAY BE AMENDED PRIOR TO THE TIME OF SALE. THIS TERM SHEET IS NOT AN OFFER TO SELL THESE SECURITIES AND IT IS NOT A SOLICITATION OF AN OFFER TO BUY THESE SECURITIES IN ANY JURISDICTION WHERE THE OFFER OR SALE IS NOT PERMITTED.
57
Mortgage Loan No. 4 — 787 Eleventh Avenue
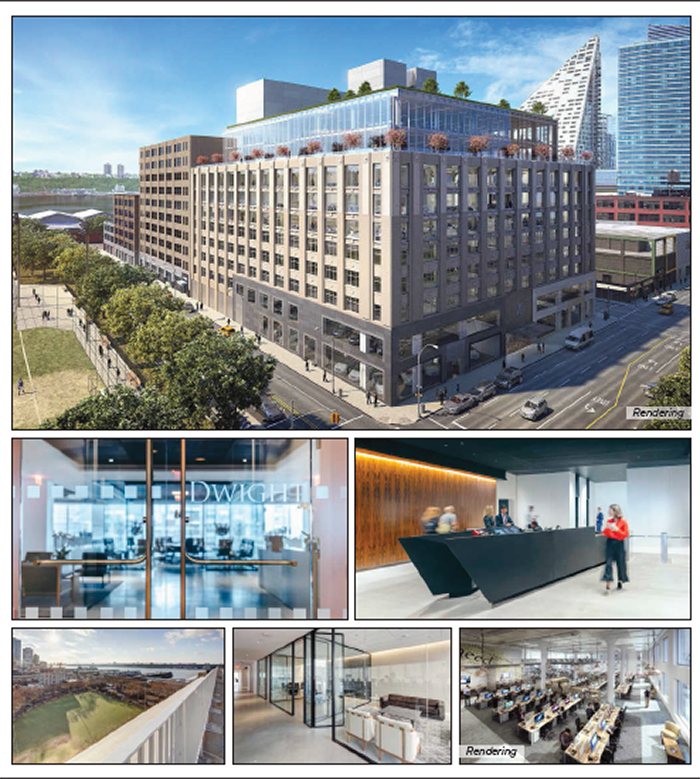
THE INFORMATION IN THIS STRUCTURAL AND COLLATERAL TERM SHEET IS NOT COMPLETE AND MAY BE AMENDED PRIOR TO THE TIME OF SALE. THIS TERM SHEET IS NOT AN OFFER TO SELL THESE SECURITIES AND IT IS NOT A SOLICITATION OF AN OFFER TO BUY THESE SECURITIES IN ANY JURISDICTION WHERE THE OFFER OR SALE IS NOT PERMITTED.
58
Mortgage Loan No. 4 — 787 Eleventh Avenue

THE INFORMATION IN THIS STRUCTURAL AND COLLATERAL TERM SHEET IS NOT COMPLETE AND MAY BE AMENDED PRIOR TO THE TIME OF SALE. THIS TERM SHEET IS NOT AN OFFER TO SELL THESE SECURITIES AND IT IS NOT A SOLICITATION OF AN OFFER TO BUY THESE SECURITIES IN ANY JURISDICTION WHERE THE OFFER OR SALE IS NOT PERMITTED.
59
Mortgage Loan No. 4 — 787 Eleventh Avenue
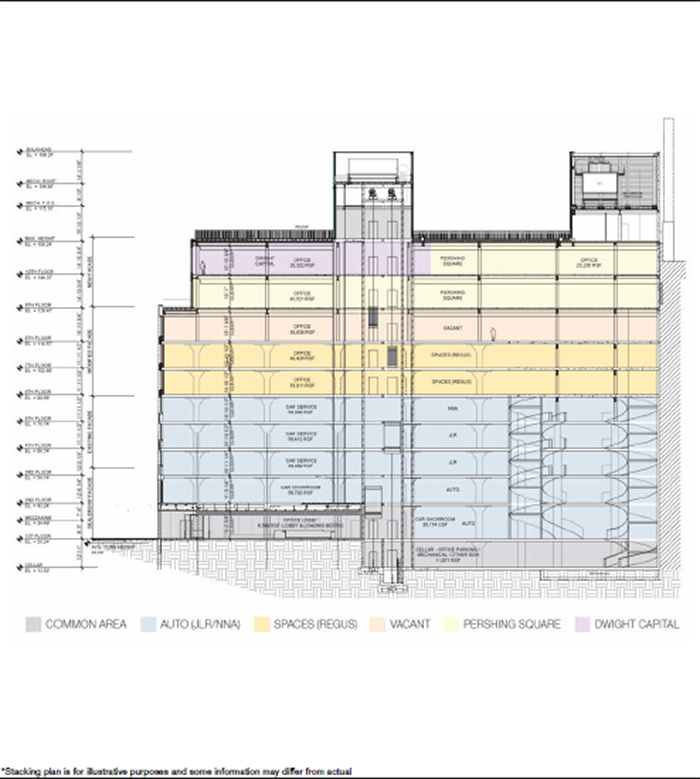
THE INFORMATION IN THIS STRUCTURAL AND COLLATERAL TERM SHEET IS NOT COMPLETE AND MAY BE AMENDED PRIOR TO THE TIME OF SALE. THIS TERM SHEET IS NOT AN OFFER TO SELL THESE SECURITIES AND IT IS NOT A SOLICITATION OF AN OFFER TO BUY THESE SECURITIES IN ANY JURISDICTION WHERE THE OFFER OR SALE IS NOT PERMITTED.
60
Mortgage Loan No. 4 — 787 Eleventh Avenue
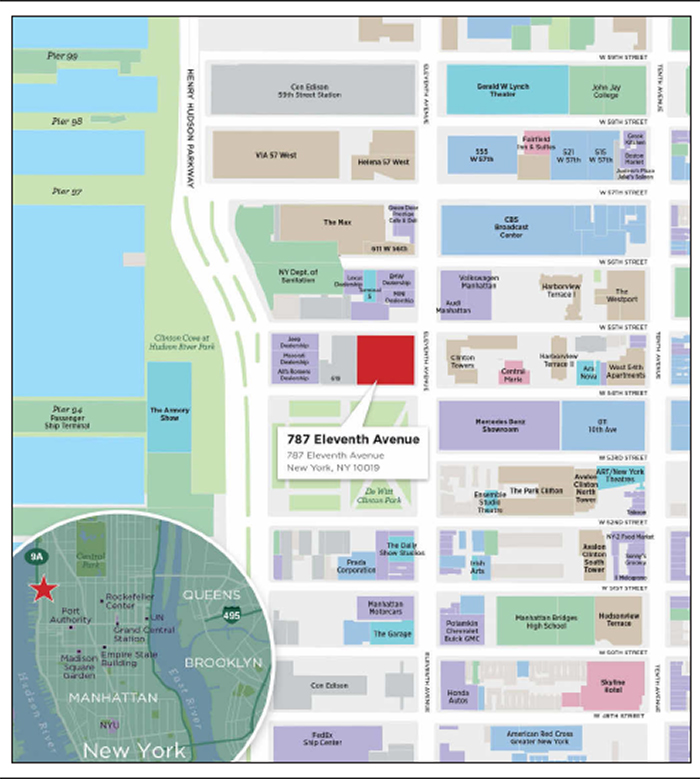
THE INFORMATION IN THIS STRUCTURAL AND COLLATERAL TERM SHEET IS NOT COMPLETE AND MAY BE AMENDED PRIOR TO THE TIME OF SALE. THIS TERM SHEET IS NOT AN OFFER TO SELL THESE SECURITIES AND IT IS NOT A SOLICITATION OF AN OFFER TO BUY THESE SECURITIES IN ANY JURISDICTION WHERE THE OFFER OR SALE IS NOT PERMITTED.
61
Mortgage Loan No. 4 — 787 Eleventh Avenue
| Mortgage Loan Information | Property Information | |||
| Mortgage Loan Seller: | SGFC | Single Asset / Portfolio: | Single Asset | |
| Original Principal Balance(1): | $45,000,000 | Title: | Fee | |
| Cut-off Date Principal Balance(1): | $45,000,000 | Property Type - Subtype: | Mixed Use – Retail / Office | |
| % of Pool by IPB: | 5.4% | Net Rentable Area (SF): | 513,638 | |
| Credit Assessment (Moody’s/Fitch/DBRS)(2): | A3 / BBB- / A(low) | Location: | New York, NY | |
| Loan Purpose: | Refinance | Year Built / Renovated: | 1929 / 2019 | |
| Borrower: | Georgetown Eleventh Avenue Owners, LLC | Occupancy(5): | 88.4% | |
| Sponsors: | TABLE Holdings, L.P.; Georgetown Company; William A. Ackman; Adam R. Flatto | Occupancy Date(5): | 11/1/2018 | |
| Interest Rate: | 4.53031685470085% | Number of Tenants: | 5 | |
| Note Date: | 1/9/2019 | 2015 NOI(6): | N/A | |
| Maturity Date: | 2/8/2029 | 2016 NOI(6): | N/A | |
| Interest-only Period: | 120 months | 2017 NOI(6): | N/A | |
| Original Term: | 120 months | TTM NOI(6): | N/A | |
| Original Amortization: | None | UW Economic Occupancy: | 88.2% | |
| Amortization Type: | Interest Only | UW Revenues: | $33,408,153 | |
| Call Protection(3): | L(25), Def or YM1(88), O(7) | UW Expenses: | $8,150,648 | |
| Lockbox(4): | Hard | UW NOI: | $25,257,505 | |
| Additional Debt(1): | Yes | UW NCF: | $24,178,865 | |
| Additional Debt Balance(1): | $365,000,000 | Appraised Value / Per SF: | $650,000,000 / $1,265 | |
| Additional Debt Type(1): | Pari Passu; Subordinate | Appraisal Date: | 12/2/2018 | |
| Additional Future Debt Permitted: | No |
| Escrows and Reserves(7) | Financial Information(1) | |||||
| Initial | Monthly | Initial Cap | Cut-off Date Loan Per SF: | $341 | ||
| Taxes: | $0 | Springing | N/A | Maturity Date Loan Per SF: | $341 | |
| Insurance: | $0 | Springing | N/A | Cut-off Date LTV: | 26.9% | |
| TI/LC Reserve: | $24,775,711 | Springing | N/A | Maturity Date LTV: | 26.9% | |
| Free Rent Reserve: | $15,664,540 | $0 | N/A | UW NOI / UW NCF DSCR: | 3.14x / 3.01x | |
| Renovation Reserve: | $6,131,548 | $0 | N/A | UW NOI / UW NCF Debt Yield: | 14.4% / 13.8% |
| Sources and Uses | ||||||
| Sources | Proceeds | % of Total | Uses | Proceeds | % of Total | |
| Whole Loan: | $410,000,000 | 100.0% | Payoff Existing Debt: | $320,367,552 | 78.1% | |
| Upfront Reserves: | 46,571,799 | 11.4 | ||||
| Return of Equity: | 36,281,750 | 8.8 | ||||
| Closing Costs: | 6,778,899 | 1.7 | ||||
| Total Sources: | $410,000,000 | 100.0% | Total Uses: | $410,000,000 | 100.0% |
| (1) | The 787 Eleventh Avenue loan is part of a larger split whole loan evidenced by fourpari passu notes with an aggregate Cut-off Date balance of $175.0 million (collectively, the “A Notes”), one senior subordinate note with Cut-off Date balance of $117.5 million (the “A-2 Note”) and one junior subordinate note with Cut- |
THE INFORMATION IN THIS STRUCTURAL AND COLLATERAL TERM SHEET IS NOT COMPLETE AND MAY BE AMENDED PRIOR TO THE TIME OF SALE. THIS TERM SHEET IS NOT AN OFFER TO SELL THESE SECURITIES AND IT IS NOT A SOLICITATION OF AN OFFER TO BUY THESE SECURITIES IN ANY JURISDICTION WHERE THE OFFER OR SALE IS NOT PERMITTED.
62
Mortgage Loan No. 4 — 787 Eleventh Avenue
| off Date balance of $117.5 million (the “B-Note”) (collectively, the “Whole Loan”). The financial information presented in the chart above and herein reflects the balance of the A Notes, but not the A-2 Note and B-Note. |
| (2) | Moody’s, Fitch and DBRS have each confirmed that the loan has, in the context of its inclusion in the Initial Pool Balance, credit characteristics consistent with an investment grade obligation. |
| (3) | At any time after the earlier to occur of (i) January 9, 2022 and (ii) two years from the closing date of the securitization that includes the last A Note of the Whole Loan to be securitized, the borrower has the right to either (a) defease the Whole Loan or (b) prepay the Whole Loan, provided that the borrower pays the greater of a yield maintenance premium or a prepayment premium equal to 1.0% of the principal balance being prepaid. |
| (4) | For a more detailed description of lockbox, please refer to “Lockbox / Cash Management” below. |
| (5) | Nissan, Regus and Pershing Square are currently building out their respective spaces and are expected to take occupancy in 2019. |
| (6) | Historical cash flows are unavailable as the property was acquired by the sponsors in 2015 and subsequently redeveloped through 2019. |
| (7) | For a more detailed description of Escrows and Reserves, please refer to “Escrows and Reserves” below. |
The Loan. The 787 Eleventh Avenue Whole Loan has a Cut-off Date balance of $410.0 million and is secured by the fee interest in a 513,638 SF, 10-story, mixed-use Class A office building and automotive retail showroom and service center space located on 11th Avenue between West 54th and 55th Streets in the Midtown West neighborhood of Manhattan. The Whole Loan has a 10-year term and is interest-only for the entire term of the loan. The Whole Loan consists of the A Notes with a Cut-off Date balance of $175.0 million, the A-2 Note with a Cut-off Date balance of $117.5 million and the B-Note with a Cut-off Date balance of $117.5 million.
Note A-1B is being contributed to the CSAIL 2019-C15 Commercial Mortgage Trust. The Whole Loan is expected to be serviced pursuant to the SGCMS 2019-787E trust and servicing agreement. As the holder of Note B (the “Controlling Noteholder”), Société Générale acting through its New York Branch is entitled to exercise all of the rights of the Controlling Noteholder with respect to the Whole Loan; however, the holders of the remaining notes are entitled, under certain circumstances, to consult with respect to certain major decisions. It is anticipated that Note B will be sold to a third-party investor.
Whole Loan Note Summary
| Original Balance | Cut-off Date Balance | Note Holder | Lead Servicer for Whole Loan (Y/N) | Controlling Piece (Y/N) | |
| Note A-1A | $70,000,000 | $70,000,000 | SGCMS 2019-787E(1) | Y | N |
| Note A-1B | 45,000,000 | 45,000,000 | CSAIL 2019-C15 | N | N |
| Notes A-1C, A-1D(2) | 60,000,000 | 60,000,000 | SGFC | N | N |
| Note A-2 | 117,500,000 | 117,500,000 | SGCMS 2019-787E(1) | N | N |
| Note B | 117,500,000 | 117,500,000 | Société Générale | N | Y |
| Total: | $410,000,000 | $410,000,000 |
| (1) | The SGCMS 2019-787E deal is expected to close on February 20, 2019. |
| (2) | Notes are expected to be contributed to one or more future securitization transactions. |
THE INFORMATION IN THIS STRUCTURAL AND COLLATERAL TERM SHEET IS NOT COMPLETE AND MAY BE AMENDED PRIOR TO THE TIME OF SALE. THIS TERM SHEET IS NOT AN OFFER TO SELL THESE SECURITIES AND IT IS NOT A SOLICITATION OF AN OFFER TO BUY THESE SECURITIES IN ANY JURISDICTION WHERE THE OFFER OR SALE IS NOT PERMITTED.
63
Mortgage Loan No. 4 — 787 Eleventh Avenue
Total Debt Capital Structure
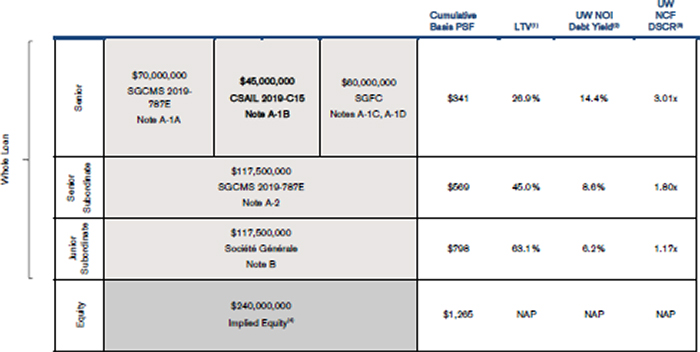
| (1) | Based on the “as-is” appraised value of $650.0 million as of December 2, 2018 per the appraisal. |
| (2) | Based on the UW NOI of $25,257,505. |
| (3) | Based on the UW NCF of $24,178,865 and the interest rate of 4.53031685470085% for both the A Notes and Note A-2 and an interest rate of 6.099424% for the B-Note. |
| (4) | Implied Equity is based on the as-is appraised value of $650.0 million, less total debt of $410.0 million. |
The Borrower. The borrowing entity for the loan is Georgetown Eleventh Avenue Owners, LLC, a Delaware limited liability company and special purpose entity. The borrower is 50.0% owned by TABLE Holdings, L.P. (“Table”) and 50.0% owned by the Georgetown Company (“Georgetown”).
The Sponsors. The sponsors are Adam R. Flatto, Georgetown, William A. Ackman and Table. The nonrecourse carve-out guarantors are Adam R. Flatto and William A. Ackman.
Founded in 1978, Georgetown is a privately-held diversified real estate company headquartered in New York. Georgetown and its principals have developed, owned and overseen in excess of 20.0 million SF of office, residential, retail and recreational properties and currently have assets under management of over $3.0 billion. Examples of their work include the renovation of the IAC building in Chelsea; the master development of the Easton project in Columbus, OH; a venture with CNA Insurance to reposition the 1.1 million SF Continental Center in Manhattan; and, in partnership with Sony Pictures Entertainment, the master planned redevelopment of Sony’s Culver City Studio Lot in Los Angeles.
Table is the investment office of William A. Ackman and his family. Table has invested more than $300.0 million of equity at cost in various real estate investments and has ownership interests in more than 2,200 multifamily apartments and hotels in New York City, Florida, California and other markets, as well as other property interests. William A. Ackman is the CEO and Portfolio Manager of Pershing Square Capital Management L.P. (“Pershing Square”), a SEC-registered investment adviser founded in 2003 with assets under management of $6.8 billion as of December 31, 2018.
THE INFORMATION IN THIS STRUCTURAL AND COLLATERAL TERM SHEET IS NOT COMPLETE AND MAY BE AMENDED PRIOR TO THE TIME OF SALE. THIS TERM SHEET IS NOT AN OFFER TO SELL THESE SECURITIES AND IT IS NOT A SOLICITATION OF AN OFFER TO BUY THESE SECURITIES IN ANY JURISDICTION WHERE THE OFFER OR SALE IS NOT PERMITTED.
64
Mortgage Loan No. 4 — 787 Eleventh Avenue
The Property. The property is a 513,638 SF, 10-story, mixed-use, Class A office and automotive retail showroom and service center building occupying the entire block on the west side of 11th Avenue between West 54th and 55th Streets in the Midtown West neighborhood of Manhattan. Originally built in 1929, the property formerly housed Ford’s automotive flagship showroom facility.
The property was acquired by the sponsors in 2015 for approximately $255.5 million ($497 PSF). Following the acquisition, the sponsors commenced a $275.2 million ($536 PSF) redevelopment and expansion of the existing improvements that created a mixed-use building with Class A office space while retaining a portion of the original automotive retail showroom and service center. The redevelopment included converting three floors of the existing building from automotive retail showroom and service center use to office use, the addition of two new office floors, renovation of the lobby, entrance and façade (including the installation of oversized windows), executive parking in the basement, a wrap-around terrace on the 9th floor and a roof deck with a private tennis court and views of Manhattan, the Hudson River and New Jersey. Additional office tenant amenities include shuttle service to public transportation and access to the Mercedes Club across the street that offers a fitness center.
Located in the Midtown West neighborhood of Manhattan known as “Automobile Row”, the property benefits from zoning that allows automotive tenants to perform both sales and service operations, a designation which is limited to properties west of 11th Avenue (unless otherwise grandfathered). The property’s close proximity to the West Side Highway, Lincoln Tunnel and 57th Street east / west corridor provides convenient access for automobile customers. According to the appraisal, the property is the only building in the surrounding marketplace that features a double-helix ramp allowing for two-way, floor-by-floor vehicular access without reliance on an elevator like neighboring properties. This access feature provides valuable time and cost savings to tenants. As of November 1, 2018, the property was 88.4% leased by 5 tenants.
The largest tenant at the property, GJM OPCO LLC – Jaguar Land Rover, leases 161,195 SF (31.4% of NRA) through November 2032 with GJM OPCO LLC – Jaguar Land Rover (“GJM OPCO”) as the franchise dealership operator. GJM OPCO is owned by Jonathan Sobel, a former partner at Goldman Sachs and owner of car dealerships throughout the New York region, including BMW, Mini, Porsche, Audi, Chrysler, Jeep, Dodge and Ram. GJM OPCO operates a Jaguar Land Rover dealership (“Jaguar Land Rover”) under a lease expiring in 2032 with two, five-year renewal options. Jaguar Land Rover is a British multinational automotive company and a subsidiary of Tata Motors, a publicly traded Indian automotive company rated AA by Crisil, an India based ratings firm owned by Standard & Poor’s. As of March 2018, the company reported total revenue of £25.8 billion and profit before taxes of £1.5 billion with reported retail sales of 614,309 cars. North America accounted for approximately 129,319 cars or 21.1% of those sales.
The second largest tenant at the property, Nissan North America, Inc. (“Nissan”), leases 106,391 SF (20.7% of NRA) through July 2032 with two, ten-year renewal options. Nissan is engaged in the manufacturing, sales and related business of automotive products and marine equipment. Nissan’s business segments include automobile sales and financing. The company offers products and services in over 160 countries across the world selling approximately 60 models under the Nissan, Infiniti and Datsun brands. As of March 2018, Nissan reported total net revenue of approximately $112.4 billion, net income from operations of approximately $7.0 billion and total assets of approximately $176.4 billion. According to the sponsors, Nissan has not yet taken occupancy but is expected to have a flagship store at the property, which would be its only dealership location in Manhattan. Nissan leases its space directly and is expected to have a third-party franchisee manage the day to day operations. See “Description of the Mortgage Pool—Mortgage Pool Characteristics—Litigation and Other Considerations”in the Preliminary Prospectus.
THE INFORMATION IN THIS STRUCTURAL AND COLLATERAL TERM SHEET IS NOT COMPLETE AND MAY BE AMENDED PRIOR TO THE TIME OF SALE. THIS TERM SHEET IS NOT AN OFFER TO SELL THESE SECURITIES AND IT IS NOT A SOLICITATION OF AN OFFER TO BUY THESE SECURITIES IN ANY JURISDICTION WHERE THE OFFER OR SALE IS NOT PERMITTED.
65
Mortgage Loan No. 4 — 787 Eleventh Avenue
The third largest tenant at the property, Regus, leases 99,337 SF (19.3% of NRA) through October 2031 with one, five-year renewal option. The company is listed on the London Stock Exchange under the name IWG Plc. Regus’s network includes a global community of 2.5 million members, over 3,000 business centers, spanning more than 1,000 cities across more than 110 countries. As of December 2017, Regus reported total revenue of £2.4 billion, operating profit of £163.2 million and total assets of approximately £2.9 billion. Regus’ Americas operations accounted for approximately £984.4 million, representing approximately 41.9% of its total revenues for 2017. Regus has not yet taken occupancy but is expected to operate at the property as a Spaces International Workplace Group (“Spaces”) location, Regus’ premium brand that provides creative workspaces that aim to promote entrepreneurial ingenuity and a collaborative work environment. The Spaces lease is guaranteed by Regus and its United States subsidiary on a joint and several basis for an amount up to approximately $14.4 million. The property will house one of only two locations in Manhattan at which Regus signed leases in 2018, with the other location being the Chrysler Building. Regus has an option to terminate its lease in October 2028 with 12 months’ notice and the payment of a termination fee equal to $7,325,110 ($73.74 PSF) to be used for re-tenanting the space.
Leasing Costs
| Leasing Costs(1) | Reserved Leasing Costs | Total Tenant Leasing Costs | Total Leasing Costs PSF | |
| Jaguar Land Rover | ||||
| Tenant Improvements | $12,282,214 | $0 | $12,282,214 | $76 |
| Leasing Commissions | 9,229,880 | 0 | 9,229,880 | $57 |
| Jaguar Land Rover Total | $21,512,094 | $0 | $21,512,094 | $133 |
| Nissan | ||||
| Tenant Improvements | $4,629,732 | $3,960,268 | $8,590,000 | $81 |
| Leasing Commissions | 4,067,520 | 0 | 4,067,520 | $38 |
| Nissan Total | $8,697,252 | $3,960,268 | $12,657,520 | $119 |
| Regus | ||||
| Tenant Improvements | $588,080 | $12,528,382 | $13,116,462 | $132 |
| Leasing Commissions | 3,128,916 | 521,488 | 3,650,404 | $37 |
| Regus Total | $3,716,996 | $13,049,870 | $16,766,866 | $169 |
| Pershing Square | ||||
| Tenant Improvements | $4,482,749 | $7,765,573 | $12,248,322 | $183 |
| Leasing Commissions | 400,000 | 0 | 400,000 | $6 |
| Pershing Square Total | $4,882,749 | $7,765,573 | $12,648,322 | $189 |
| Dwight Capital | ||||
| Tenant Improvements | $3,385,275 | $0 | $3,385,275 | $167 |
| Leasing Commissions | 698,264 | 0 | 698,264 | $34 |
| Dwight Capital Total | $4,083,539 | $0 | $4,083,539 | $201 |
| Total: | $42,892,631 | $24,775,711 | $67,668,342 | $149 |
| (1) | Based on borrower provided information as of December 17, 2018. |
The Market. The property is located on the Westside of Manhattan in New York, New York in the Westside office submarket of Midtown. The property is also located one block east of the Westside Highway and two blocks south of the 57th Street east/west corridor. This provides tenants with multiple means of access via public and private transportation. The 59th Street - Columbus Circle Transit Stop is located approximately 0.8 miles from the property, which provides commuters with access to the 1, 2, A, B, C and D subway trains. MTA bus lines with stops at or near the property include the M12, M31, M57 (which stops at West 54th Street and 11th Avenue) and the M11. The New York Waterway ferry terminal, with service to New Jersey and lower Manhattan, is available at 39th Street and the West Side Highway.
THE INFORMATION IN THIS STRUCTURAL AND COLLATERAL TERM SHEET IS NOT COMPLETE AND MAY BE AMENDED PRIOR TO THE TIME OF SALE. THIS TERM SHEET IS NOT AN OFFER TO SELL THESE SECURITIES AND IT IS NOT A SOLICITATION OF AN OFFER TO BUY THESE SECURITIES IN ANY JURISDICTION WHERE THE OFFER OR SALE IS NOT PERMITTED.
66
Mortgage Loan No. 4 — 787 Eleventh Avenue
According to a third-party report, the 2018 estimated population within a 0.5-mile radius of the property is 50,379 people. Population in the area has grown approximately 1.9% since 2010 and this trend is projected to continue with compound annual growth of 1.6% through 2023. The 2018 median household income within a 0.25-mile and 0.5-mile radius is $61,398 and $90,297, respectively.
According to the appraisal, the property is located in the Westside office submarket, which contained approximately 25.7 million SF and had an overall vacancy rate of 5.0% and an average rental rate of $66.92 PSF as of the third quarter 2018. The appraiser analyzed 32 competitive properties offering newly redeveloped Class A office space, which exhibited an average occupancy rate of 96.2% and a direct asking rent of $76.75 PSF.
According to the appraisal, the Manhattan market comprises the largest market in the five boroughs of rentable automobile retail space (43.6% of NRA). Within the Manhattan market, approximately 88.6% of the total automotive space is located along the stretch of 11th Avenue known as “Automotive Row”, which evolved after the passing of the Special Clinton District rezoning of 2011. According to the appraisal, several brands including Mercedes-Benz, BMW, VW, Audi and Porsche have collectively spent more than $1.0 billion on newly re-imagined showrooms and service centers. The appraisal noted that the only vacant space available in the entire corridor is at 748 11th Avenue, which previously housed the Nissan Infiniti dealership.
Underwritten rents for the occupied spaces at the property are approximately 15.7% below the appraiser’s concluded market rents, driven primarily by the automotive retail spaces which have a weighted average rent that is approximately 25.1% below market rents. The automotive retail leases were initially signed in 2015.
Tenant Summary(1)
| Tenant | Ratings Moody’s/S&P/Fitch(2) | NRA (SF) | % of Total NRA | UW Base Rent PSF | % of Total UW Base Rent | Lease Expiration Date | |||
| Jaguar Land Rover | NR / NR / NR | 161,195 | 31.4 | % | $57.88 | 29.8 | % | 11/30/2032 | |
| Nissan(3) | NR / A / NR | 106,391 | 20.7 | $66.83 | 22.7 | 7/31/2032 | |||
| Regus(3)(4) | NR / NR / NR | 99,337 | 19.3 | $72.50 | 23.0 | 10/31/2031 | |||
| Pershing Square(3)(5) | NR / NR / NR | 66,757 | 13.0 | $89.73 | 19.1 | 1/30/2034 | |||
| Dwight Capital | NR / NR / NR | 20,322 | 4.0 | $82.55 | 5.4 | 5/30/2029 | |||
| Total: | 454,002 | 88.4 | % | 100.0 | % | ||||
| (1) | Based on the November 1, 2018 underwritten rent roll. |
| (2) | Ratings provided are for the parent company of the entity listed in the “Tenant” field whether or not the parent company guarantees the lease. |
| (3) | Nissan, Regus and Pershing Square are currently building out their respective spaces and are expected to take occupancy in 2019. See “Description of the Mortgage Pool—Tenant Issues—Lease Expirations and Terminations—Other” in the Preliminary Prospectus. |
| (4) | Regus and its U.S. subsidiary, on a joint and several basis, provided a limited guarantee of the tenant’s obligation under its lease in an amount up to $14.4 million. Regus has an option to terminate the lease in October 2028, with 12 months’ notice, and payment of a termination fee equal to $7,325,110 ($73.74 PSF). |
| (5) | Pershing Square is an affiliate of Table, one of the sponsors; the appraisal indicates that the lease is within current market levels. Mr. Ackman provided a limited personal guarantee of the tenant’s obligations under its lease in an amount up to $6.04 million. See “Description of the Mortgage Pool– Mortgage Pool Characteristics—Tenant Issues—Affiliated Leases” in the Preliminary Prospectus. |
THE INFORMATION IN THIS STRUCTURAL AND COLLATERAL TERM SHEET IS NOT COMPLETE AND MAY BE AMENDED PRIOR TO THE TIME OF SALE. THIS TERM SHEET IS NOT AN OFFER TO SELL THESE SECURITIES AND IT IS NOT A SOLICITATION OF AN OFFER TO BUY THESE SECURITIES IN ANY JURISDICTION WHERE THE OFFER OR SALE IS NOT PERMITTED.
67
Mortgage Loan No. 4 — 787 Eleventh Avenue
Lease Rollover Schedule(1)(2)
| Year | Number of Leases Expiring | NRA Expiring | % of NRA Expiring | UW Base Rent Expiring(3) | % of UW Base Rent Expiring(3) | Cumulative NRA Expiring | Cumulative % of NRA Expiring | Cumulative UW Base Rent Expiring(3) | Cumulative % of UW Base Rent Expiring(3) | ||
| MTM | 0 | 0 | 0.0 | % | $0 | 0.0 | % | 0 | 0.0% | $0 | 0.0% |
| 2019 | 0 | 0 | 0.0 | 0 | 0.0 | 0 | 0.0% | $0 | 0.0% | ||
| 2020 | 0 | 0 | 0.0 | 0 | 0.0 | 0 | 0.0% | $0 | 0.0% | ||
| 2021 | 0 | 0 | 0.0 | 0 | 0.0 | 0 | 0.0% | $0 | 0.0% | ||
| 2022 | 0 | 0 | 0.0 | 0 | 0.0 | 0 | 0.0% | $0 | 0.0% | ||
| 2023 | 0 | 0 | 0.0 | 0 | 0.0 | 0 | 0.0% | $0 | 0.0% | ||
| 2024 | 0 | 0 | 0.0 | 0 | 0.0 | 0 | 0.0% | $0 | 0.0% | ||
| 2025 | 0 | 0 | 0.0 | 0 | 0.0 | 0 | 0.0% | $0 | 0.0% | ||
| 2026 | 0 | 0 | 0.0 | 0 | 0.0 | 0 | 0.0% | $0 | 0.0% | ||
| 2027 | 0 | 0 | 0.0 | 0 | 0.0 | 0 | 0.0% | $0 | 0.0% | ||
| 2028 | 0 | 0 | 0.0 | 0 | 0.0 | 0 | 0.0% | $0 | 0.0% | ||
| 2029 & Beyond | 5 | 454,002 | 88.4 | 31,309,531 | 100.0 | 454,002 | 88.4% | $31,309,531 | 100.0% | ||
| Vacant | NAP | 59,636 | 11.6 | NAP | NAP | 513,638 | 100.0% | NAP | NAP | ||
| Total | 5 | 513,638 | 100.0 | % | $31,309,531 | 100.0 | % | ||||
| (1) | Based on the November 1, 2018 underwritten rent roll. |
| (2) | Certain tenants have more than one lease. Certain tenants may have lease termination options that are exercisable prior to the originally stated expiration date of the subject lease and that are not considered in the Lease Rollover Schedule. |
| (3) | UW Base Rent includes rent steps based on straight line rent of $889,660 associated with the investment grade tenant, Nissan, through the term of its lease. |
Operating History and Underwritten Net Cash Flow
| 2015(1) | 2016(1) | 2017(1) | TTM(1) | Underwritten | PSF | %(2) | |
| Rents in Place | N/A | N/A | N/A | N/A | $30,419,871 | $59.22 | 80.5% |
| Vacant Income | N/A | N/A | N/A | N/A | 4,472,700 | $8.71 | 11.8% |
| Rent Steps(3) | N/A | N/A | N/A | N/A | 889,660 | $1.73 | 2.4% |
| Percentage Rent(4) | N/A | N/A | N/A | N/A | 114,081 | $0.22 | 0.3% |
| Gross Potential Rent | N/A | N/A | N/A | N/A | $35,896,312 | $69.89 | 95.0% |
| Total Reimbursements(5) | N/A | N/A | N/A | N/A | 1,886,554 | $3.67 | 5.0% |
| Net Rental Income | N/A | N/A | N/A | N/A | $37,782,866 | $73.56 | 100.0% |
| (Vacancy/Collection Loss) | N/A | N/A | N/A | N/A | (4,472,700) | ($8.71) | (13.4%) |
| Amenity Income | N/A | N/A | N/A | N/A | 51,088 | $0.10 | 0.2% |
| Mailroom Income(6) | N/A | N/A | N/A | N/A | 46,900 | $0.09 | 0.1% |
| Effective Gross Income | N/A | N/A | N/A | N/A | $33,408,154 | $65.04 | 100.0% |
| Total Expenses | N/A | N/A | N/A | N/A | $8,150,648 | $15.87 | 24.4% |
| Net Operating Income | N/A | N/A | N/A | N/A | $25,257,506 | $49.17 | 75.6% |
| Total TI/LC, Capex/RR | N/A | N/A | N/A | N/A | 1,078,640 | $2.10 | 3.2% |
| Net Cash Flow | N/A | N/A | N/A | N/A | $24,178,866 | $47.07 | 72.4% |
| (1) | Historical cash flows are unavailable as the property was acquired by the sponsors in 2015 and subsequently redeveloped through 2019. |
| (2) | % column represents percent of Net Rental Income for all revenue lines and represents percent of Effective Gross Income for the remainder of fields. |
| (3) | Underwritten Rent Steps are based on straight line rent of $889,660 associated with the investment grade tenant, Nissan, through the term of its lease. |
| (4) | Underwritten Percentage Rent is based Jaguar Land Rover’s contractual agreement of 2.0% over $145,000,000 in new car sales per annum. The car sales figure of $150,704,039 was utilized for the concluded percentage rent based on new car dealership sales. |
THE INFORMATION IN THIS STRUCTURAL AND COLLATERAL TERM SHEET IS NOT COMPLETE AND MAY BE AMENDED PRIOR TO THE TIME OF SALE. THIS TERM SHEET IS NOT AN OFFER TO SELL THESE SECURITIES AND IT IS NOT A SOLICITATION OF AN OFFER TO BUY THESE SECURITIES IN ANY JURISDICTION WHERE THE OFFER OR SALE IS NOT PERMITTED.
68
Mortgage Loan No. 4 — 787 Eleventh Avenue
(5) | Underwritten Total Reimbursements are based on each tenant’s recoveries per the contractual lease. All tenants are currently in a base year assessment period for operating expenses. For real estate tax recoveries, tenants generally pay a fixed amount in addition to their pro-rated shares over a tax base year. Tax base years and the applied real estate tax expense are calculated on the basis of the full real estate tax expense without any adjustments for the Industrial & Commercial Abatement Program. Tax base years are based on the appraiser’s estimates. See “Tax Abatement” below. |
| (6) | Underwritten Mailroom Income is attributed to the Pershing Square lease, under which the tenant is contractually responsible for $46,900 in mailroom income. |
Property Management. The property is managed by Cushman & Wakefield U.S., Inc.
Escrows and Reserves. At origination, the borrower deposited into escrow $24,775,711 for outstanding tenant improvements and leasing costs, $15,664,540 for free rent and $6,131,548 for renovations.
Tax & Insurance Reserve -collection of monthly tax and insurance reserves (and common charges, if applicable) will be waived so long as (i) no event of default has occurred and is continuing and (ii) the borrower timely pays the tax, insurance and common charge costs when incurred and promptly provides evidence to the lender of the payment of same.
TI/LC Reserve - From and after July 1, 2020 the borrower is required to deposit any amounts required in connection with a permitted lease modification or permitted surrender in connection with various lease modifications and/or terminations.
Lockbox / Cash Management. The Whole Loan is structured with a hard lockbox and springing cash management. The borrower is required to deliver to all existing and new tenants at the property a written notice instructing that all rents under leases at the property are to be delivered by such tenants directly to the deposit account. All funds in the lockbox account are required to be remitted to the borrower on a daily basis in the absence of a Cash Management Period (as defined below). Upon the commencement of a Cash Management Period, the lender will give notice thereof to the cash management bank, after which the borrower and cash management bank must establish a cash management account into which all funds on deposit in the deposit account (less any minimum peg balance required under the loan documents) will be swept on a daily basis. The cash management account is required to be in the name of the borrower but for the sole and exclusive benefit of the lender.
A “Cash Management Period” will commence upon (i) February 8, 2029 or (ii) an event of default.
Property Release. Following a permitted condominium conversion of all or a portion of the propertyin accordance with the loan documents, the borrower may obtain a one-time release of the retail condominium unit from the lien of the Whole Loan, upon conveyance of the retail condominium unit to another entity;provided that each of the following conditions, among others, are satisfied: (a) the borrower either (i) pays a prepayment of the principal in an amount equal to 105.0% of the appraised value of the retail condominium unit (together with any applicable yield maintenance premium), or (ii) elects a partial defeasance event, in which case the defeased note will be in an amount equal to 105.0% of the appraised value of the retail condominium unit; (b) after giving effect to such prepayment or defeasance, the debt yield on the Whole Loan is greater than or equal to the greater of (i) 6.2% or (ii) the debt yield on the Whole Loan immediately preceding the retail condominium release (provided that the borrower may make an additional prepayment or partially defease the loan in an amount sufficient to pass such debt yield test); (c) the LTV ratio on the Whole Loan is required to be equal to or less than the lesser of (i) 63.1% and (ii) the LTV ratio on the Whole Loan of thepropertyimmediately prior to the retail condominium release (provided that the borrower may make an additional prepayment or partially defease the Whole Loan in an amount sufficient to pass such test); (d) no event of default under the loan documents is continuing; and (e) the lender has either received a rating agency confirmation from each rating agency or each rating agency has waived such condition.See “Description of the Mortgage Pool—Certain Terms of the Mortgage Loans—Partial Releases” in the Preliminary Prospectus.
Tax Abatement. The sponsors have applied for a tax abatement for the property under the Industrial & Commercial Abatement Program (“ICAP”) program. The borrower projects that the ICAP application will be fully approved by the end of 2019 and that the abatement benefits will take effect in the 2020/2021 tax year. As projected by the sponsors, the ICAP abatement would phase out over a 10-year period with full savings being realized in years one through five of the program, which subsequently burns off at a rate of 20.0% per year over the next five years decreasing to 20.0% in years nine and ten of the abatement period. The borrower is required under the loan documents to submit a timely ICAP notice of completion reflecting completion of construction on or before December 29, 2020 and satisfy all conditions and obtain all licenses and permits required under the loan documents, in order to fully vest in the property all rights for benefits under the ICAP. The borrower is also required to comply with all legal requirements necessary to maintain, and is required to maintain, the abatement of taxes under the ICAP on or before July 1, 2020, subject to extension to July 1,
THE INFORMATION IN THIS STRUCTURAL AND COLLATERAL TERM SHEET IS NOT COMPLETE AND MAY BE AMENDED PRIOR TO THE TIME OF SALE. THIS TERM SHEET IS NOT AN OFFER TO SELL THESE SECURITIES AND IT IS NOT A SOLICITATION OF AN OFFER TO BUY THESE SECURITIES IN ANY JURISDICTION WHERE THE OFFER OR SALE IS NOT PERMITTED.
69
Mortgage Loan No. 4 — 787 Eleventh Avenue
2021, including, without limitation, the filing of all certificates of continuing use and filing real property income and expense statements. The borrower is required to provide to the lender all material notices it receives from the applicable governmental authorities with respect to the ICAP within ten business days after receipt. See “Description of the Mortgage Pool—Real Estate and Other Tax Considerations” in the Preliminary Prospectus.
THE INFORMATION IN THIS STRUCTURAL AND COLLATERAL TERM SHEET IS NOT COMPLETE AND MAY BE AMENDED PRIOR TO THE TIME OF SALE. THIS TERM SHEET IS NOT AN OFFER TO SELL THESE SECURITIES AND IT IS NOT A SOLICITATION OF AN OFFER TO BUY THESE SECURITIES IN ANY JURISDICTION WHERE THE OFFER OR SALE IS NOT PERMITTED.
70
(THIS PAGE INTENTIONALLY LEFT BLANK)
THE INFORMATION IN THIS STRUCTURAL AND COLLATERAL TERM SHEET IS NOT COMPLETE AND MAY BE AMENDED PRIOR TO THE TIME OF SALE. THIS TERM SHEET IS NOT AN OFFER TO SELL THESE SECURITIES AND IT IS NOT A SOLICITATION OF AN OFFER TO BUY THESE SECURITIES IN ANY JURISDICTION WHERE THE OFFER OR SALE IS NOT PERMITTED.
71
Mortgage Loan No. 5 — Causeway Square

THE INFORMATION IN THIS STRUCTURAL AND COLLATERAL TERM SHEET IS NOT COMPLETE AND MAY BE AMENDED PRIOR TO THE TIME OF SALE. THIS TERM SHEET IS NOT AN OFFER TO SELL THESE SECURITIES AND IT IS NOT A SOLICITATION OF AN OFFER TO BUY THESE SECURITIES IN ANY JURISDICTION WHERE THE OFFER OR SALE IS NOT PERMITTED.
72
Mortgage Loan No. 5 — Causeway Square
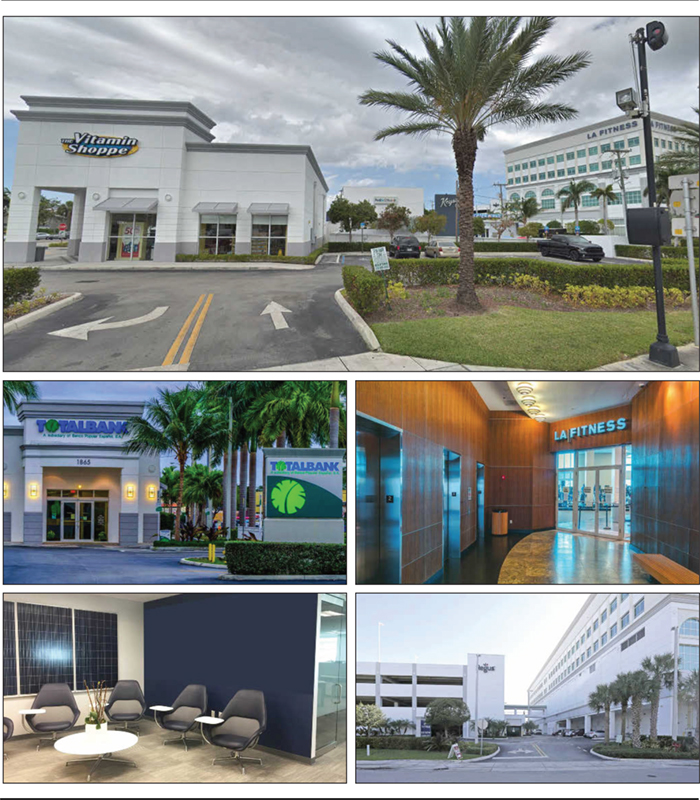
THE INFORMATION IN THIS STRUCTURAL AND COLLATERAL TERM SHEET IS NOT COMPLETE AND MAY BE AMENDED PRIOR TO THE TIME OF SALE. THIS TERM SHEET IS NOT AN OFFER TO SELL THESE SECURITIES AND IT IS NOT A SOLICITATION OF AN OFFER TO BUY THESE SECURITIES IN ANY JURISDICTION WHERE THE OFFER OR SALE IS NOT PERMITTED.
73
Mortgage Loan No. 5 — Causeway Square
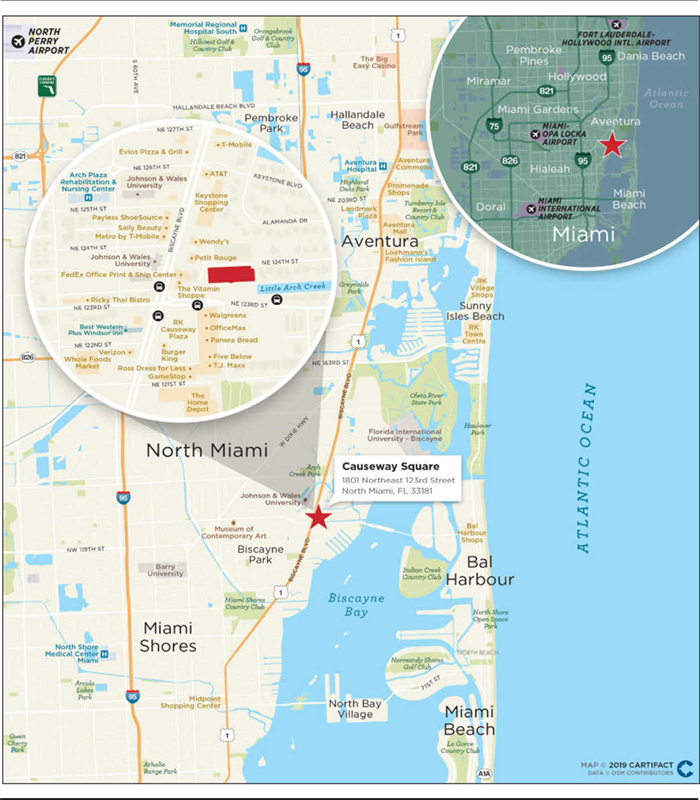
THE INFORMATION IN THIS STRUCTURAL AND COLLATERAL TERM SHEET IS NOT COMPLETE AND MAY BE AMENDED PRIOR TO THE TIME OF SALE. THIS TERM SHEET IS NOT AN OFFER TO SELL THESE SECURITIES AND IT IS NOT A SOLICITATION OF AN OFFER TO BUY THESE SECURITIES IN ANY JURISDICTION WHERE THE OFFER OR SALE IS NOT PERMITTED.
74
Mortgage Loan No. 5 — Causeway Square
| Mortgage Loan Information | Property Information | |||
| Mortgage Loan Seller: | 3650 REIT | Single Asset / Portfolio: | Single Asset | |
| Original Principal Balance: | $45,000,000 | Title: | Fee | |
| Cut-off Date Principal Balance: | $45,000,000 | Property Type - Subtype: | Mixed Use – Office / Retail | |
| % of Pool by IPB: | 5.4% | Net Rentable Area (SF): | 168,781 | |
| Loan Purpose: | Refinance | Location: | North Miami, FL | |
| Borrower: | Causeway Square LLC | Year Built / Renovated: | 2009 - 2010 / NAP | |
| Sponsor: | Irwin Elliot Tauber | Occupancy: | 89.2% | |
| Interest Rate: | 5.2650% | Occupancy Date: | 12/1/2018 | |
| Note Date: | 10/19/2018 | Number of Tenants: | 35 | |
| Maturity Date: | 11/5/2028 | 2015 NOI(3): | $1,955,541 | |
| Interest-only Period: | 59 months | 2016 NOI(3): | $3,370,045 | |
| Original Term: | 120 months | 2017 NOI: | $3,612,621 | |
| Original Amortization: | 360 months | TTM NOI(4): | $3,654,555 | |
| Amortization Type: | IO-Balloon | UW Economic Occupancy: | 94.3% | |
| Call Protection: | L(28), Def(88), O(4) | UW Revenues: | $7,235,305 | |
| Lockbox(1): | Soft | UW Expenses: | $3,254,920 | |
| Additional Debt: | Yes | UW NOI: | $3,980,385 | |
| Additional Debt Balance: | $1,500,000 | UW NCF: | $3,867,240 | |
| Additional Debt Type: | Mezzanine | Appraised Value / Per SF: | $68,900,000 / $408 | |
| Additional Future Debt Permitted(2): | Yes | Appraisal Date: | 9/28/2018 |
| Escrows and Reserves(5) | Financial Information | |||||
| Initial | Monthly | Initial Cap | Cut-off Date Loan Per SF: | $267 | ||
| Taxes: | $561,158 | $43,166 | N/A | Maturity Date Loan Per SF: | $247 | |
| Insurance: | $0 | $2,392 | N/A | Cut-off Date LTV: | 65.3% | |
| Replacement Reserves: | $0 | $2,391 | $136,000 | Maturity Date LTV: | 60.4% | |
| TI/LC: | $168,156 | $12,500 | $750,000 | UW NOI / UW NCF IO DSCR: | 1.66x / 1.61x | |
| Master Lease TI/LC: | $660,811 | $0 | N/A | UW NOI / UW NCF Amortizing DSCR: | 1.33x / 1.29x | |
| Environmental Reserve: | $75,000 | $0 | N/A | UW NOI / UW NCF Debt Yield: | 8.8% / 8.6% | |
| Free Rent: | $221,033 | $0 | N/A |
Sources and Uses
| Sources | Proceeds | % of Total | Uses | Proceeds | % of Total | |
| Mortgage Loan: | $45,000,000 | 96.8% | Payoff Existing Debt: | $43,670,627 | 93.9% | |
| Mezzanine Loan: | 1,500,000 | 3.2 | Upfront Reserves: | 1,686,158 | 3.6 | |
| Closing Costs: | 962,182 | 2.1 | ||||
| Return of Equity: | 181,033 | 0.4 | ||||
| Total Sources: | $46,500,000 | 100.0% | Total Uses: | $46,500,000 | 100.0% |
| (1) | For a more detailed description of Lockbox, please refer to “Lockbox / Cash Management” below. |
| (2) | Solely in connection with a permitted property transfer to a third-party transferee, the lender will permit the Causeway Square mezzanine loan to be repaid in full and such transferee may pledge the direct and indirect equity interests in the borrower under the loan as collateral security for a new mezzanine loan. The new mezzanine loan will be subject to certain conditions including, among other things: (i) the LTV on the combined loan is not greater than 75.0% and (ii) the DSCR on the combined loan is no less than 1.20x. |
THE INFORMATION IN THIS STRUCTURAL AND COLLATERAL TERM SHEET IS NOT COMPLETE AND MAY BE AMENDED PRIOR TO THE TIME OF SALE. THIS TERM SHEET IS NOT AN OFFER TO SELL THESE SECURITIES AND IT IS NOT A SOLICITATION OF AN OFFER TO BUY THESE SECURITIES IN ANY JURISDICTION WHERE THE OFFER OR SALE IS NOT PERMITTED.
75
Mortgage Loan No. 5 — Causeway Square
| (3) | The increase in 2016 NOI from 2015 NOI is due to the lease up of 26,598 SF from August 2015 through December 2016 and $372,667 in a true-up adjustment for operating expense reimbursement income that was recorded in 2016 but was prior year expenses. |
| (4) | TTM represents trailing twelve-month period ending July 31, 2018. |
| (5) | For a more detailed description of Escrows and Reserves, please refer to “Escrows and Reserves” below. |
The Loan. The Causeway Square loan is a $45.0 million first mortgage loan secured by the fee interest in a 168,781 SF, Class B mixed-use, office and retail building located in North Miami, Florida. The loan has a 10-year term and will amortize on a 30-year schedule following an initial 59-month interest-only period.
The Borrower. The borrowing entity for the loan is Causeway Square LLC, a Delaware limited liability company and special purpose entity. The borrowing entity is 100.0% owned by Causeway Square Mezzanine LLC, which is indirectly owned by Irwin Elliot Tauber and various related trusts.
The Sponsor. The loan’s sponsor and nonrecourse carve-out guarantor is Irwin Elliot Tauber. Mr. Tauber is a principal in Taubco, a real estate development company established in the 1990s with its own general contracting, leasing and property management divisions. Taubco is headquartered at the property. In addition to the property, Taubco has developed four shopping centers in the North Miami submarket. As of July 31, 2018, Mr. Tauber owns a portfolio of seven assets in Florida that has an estimated value of approximately $276.5 million and has a net worth and liquidity of $179.5 million and $6.3 million, respectively.
The Property. The property is a 168,781 SF Class B mixed-use building located in North Miami, Florida. The property is a 4-story building with an attached parking structure and two outparcels situated on approximately 5.8 acres constructed from 2009 to 2010. The property is located in the North Miami submarket at the corner of Northeast 123rd Street and Biscayne Boulevard (US1). The property consists of 86,703 SF of office space and 82,078 SF of retail space (including the 43,679 SF LA Fitness anchor tenant and a total of 9,000 SF for the two outparcels). The attached parking structure contains 416 spaces in addition to the 175 surface parking spaces for an overall parking ratio of 3.5 spaces per 1,000 SF. The sponsor developed the property in 2009-2010 for approximately $71.0 million ($421/SF).
As of December 2018, the property was 97.4% leased by 36 tenants and currently 89.2% occupied by 35 tenants as the tenant SunGuard Investment Systems A (13,769 SF) is dark but still paying rent. The largest tenant at the property, LA Fitness, leases 43,679 SF (25.9% of NRA) through September 2025 with three, five-year extension options remaining. LA Fitness has been a tenant at the property since 2010. LA Fitness is a health club founded in 1984 that offers group fitness classes, racquetball and basketball leagues and personalized training. The health club is open seven days a week and features childcare, an indoor heated lap pool, a whirlpool spa and sauna and a juice bar. The second largest tenant at the property, Regus, leases 13,184 SF (7.8% of NRA) through October 2026 with two, five-year extension options remaining. Regus has been a tenant at the property since 2016. Regus provides a network of office, co-working meeting spaces, business lounges and virtual office space. The company maintains 3,000 business centers located in approximately 900 cities across 120 countries. The third largest tenant at the property, Taubco, leases 7,718 SF (4.6% of NRA) through March 2029 with two, five-year extension options remaining. Taubco has been a tenant at the property since 2015. Taubco is a real estate development company based at the property with operating divisions including general contracting, leasing and property management. The company focuses on upscale retail, mixed-use and multifamily real estate. Taubco is a sponsor affiliate and the related lease is guaranteed by the sponsor.
In addition to the Taubco lease, the sponsor also executed a master lease for approximately 11,842 SF of space (the “Master Lease Premises”) at the property for an initial term of fifteen years that is personally guaranteed by the sponsor. Pursuant to the related loan documents the lender will consent to the termination of the master lease with respect to each portion of the Master Lease Premises that the Master Lease Release Conditions (as defined below) have been satisfied. Upon each such termination, the rent payable under the master lease will be reduced by the same amount as the rent that the applicable tenant is required to pay under its lease. The master lease will terminate if the lender reasonably determines that (i) the rent payable under the master lease has been reduced to zero and (ii) the aggregate rent to be collected under such Approved Leases is no less than $336,697per annum. As of December 2018, five leases have been executed for all the master lease spaces for an aggregate rental amount of $336,697per annum. All five tenants have taken possession of their respective space and one tenant, Steven Freedman, has commenced paying rent. Each of La Brasa Rotisserie & Grill, Terriyaki Madness, Crave and Rubenstein Law is in the process of building out its respective space, and
THE INFORMATION IN THIS STRUCTURAL AND COLLATERAL TERM SHEET IS NOT COMPLETE AND MAY BE AMENDED PRIOR TO THE TIME OF SALE. THIS TERM SHEET IS NOT AN OFFER TO SELL THESE SECURITIES AND IT IS NOT A SOLICITATION OF AN OFFER TO BUY THESE SECURITIES IN ANY JURISDICTION WHERE THE OFFER OR SALE IS NOT PERMITTED.
76
Mortgage Loan No. 5 — Causeway Square
rent is estimated to commence between February 2019 and May 2019. At origination, the lender escrowed $660,811 for tenant improvement and leasing commissions related to releasing the master lease premises.
“Master Lease Release Conditions” means that (i) such portion of the Master Lease Premises has been leased in accordance with the terms of an Approved Lease and (ii) the tenant under such lease has (a) accepted and is occupying the demised premises, (b) commenced the payment of regular unabated rent and (c) opened for business.
“Approved Lease” means a lease acceptable to the lender with a third party tenant having a base minimum rent of not less than (i) $32.00 PSF NNN for a retail tenant and (ii) $24.00 PSF NNN for an office tenant and, in each case, having a minimum term of not less than five years.
The property is located at the intersection of Northeast 123rd Street and Biscayne Boulevard (US1), providing frontage along both major roads in this location. Primary access to the location is provided by Biscayne Boulevard, NE 123rd Street and NE 18th Avenue (which runs between the main structure and the Vitamin Store outparcel). The property is located off the Broad Causeway (an extension of NE 123rd Street) leading to Bal Harbour from North Miami. Additionally, the property features access to Downtown Miami (8.9 miles south), Miami International Airport (13.0 miles southwest), Miami Beach (4.9 miles southeast), Aventura (4.9 miles northeast) and Interstate 95 (3.0 miles west).
The Market. The property is located in North Miami, Florida, approximately 4.9 miles from Miami Beach and 2.6 miles from Bal Harbour Beach, two tourist destinations centered around beach-side resorts, art-deco architecture, retail, restaurants and nightlife. The property is 9.0 miles from Downtown Miami, which serves as the central business district for the Miami metropolitan area in South Florida. The location of the property enables access for multiple adjacent residential neighborhoods and for commuters travelling between Hollywood and Miami along Biscayne Boulevard. Miami-Dade County benefits from its geographic location, allowing it to serve as a gateway to the Caribbean and Latin America. Miami-Dade County is known for its nightlife and ocean front resorts and is also home to over 120 financial institutions.
According to the appraisal, as of first quarter 2018, the Northeast Dade submarket contained 6.3 million SF of office space and 12.5 million SF of retail space with overall vacancy rates of 7.3% for office and 2.6% for retail. The appraisal concluded per square foot market rents of $20.00 PSF NNN for the anchor tenant retail space, $32.00 PSF NNN for storefront retail space, $45.00 PSF NNN for the bank outparcel space (along NE 123rd Street), $65.00 PSF NNN for retail outparcel space (along Biscayne Boulevard) and $27.00 PSF NNN for the office space. According to the appraisal, the property has three competitive sets: a six-property office set, a seven-property retail set and a five-property retail outparcel set, as detailed in the tables below.
THE INFORMATION IN THIS STRUCTURAL AND COLLATERAL TERM SHEET IS NOT COMPLETE AND MAY BE AMENDED PRIOR TO THE TIME OF SALE. THIS TERM SHEET IS NOT AN OFFER TO SELL THESE SECURITIES AND IT IS NOT A SOLICITATION OF AN OFFER TO BUY THESE SECURITIES IN ANY JURISDICTION WHERE THE OFFER OR SALE IS NOT PERMITTED.
77
Mortgage Loan No. 5 — Causeway Square
Competitive Office Set Summary(1)
| Property | Year Built | Total NRA (SF) | Est. Rent PSF | Est. Occupancy | Proximity (miles) |
| Causeway Square | 2009 - 2010 | 86,703(2)(3) | $25.38(2)(3) | 79.0%(2)(3) | N/A |
| 12955 Biscayne Boulevard | 1972 | 30,434 | $27.00 | 90.0% | 0.5 |
| 12000 Biscayne Boulevard | 1982 | 150,924 | $31.00 | 87.0% | 0.4 |
| 12550 Biscayne Boulevard | 1972 | 103,000 | $32.00 | 96.0% | 0.4 |
| 1133 Kane Concourse | 1968 | 12,000 | $37.00 | 100.0% | 2 |
| 1170 Kane Concourse | 2007 | 38,400 | $45.00 | 100.0% | 2 |
| 10800 Biscayne Boulevard | 1983 | 96,606 | $32.00 | 85.0% | 1.3 |
| (1) | Source: Appraisal. |
| (2) | Based on the underwritten rent roll dated December 1, 2018. |
| (3) | Reflects only office space at the property. SunGuard Investment Systems A is excluded from occupancy and Est. Rent PSF. |
Competitive Retail Set Summary(1)
| Property | Year Built | Total NRA (SF) | Est. Rent PSF | Est. Occupancy | Proximity (miles) | Anchor Tenants |
| Causeway Square | 2009 - 2010 | 73,078(2)(3) | $24.98(2)(3) | 100.0%(2)(3) | N/A | LA Fitness |
| RK Causeway Plaza | 1970 | 128,927 | $50.00 | 100.0% | 0.3 | Ross, OfficeMax, TJ Maxx, Walgreens |
| Keystone Center | 1951 | 33,813 | $32.00 | 100.0% | <0.1 | Pet Supermarket |
| 127 Street Shopping Center | 1959 | 106,289 | $38.00 | 100.0% | 0.5 | Publix, US-1 Fitness |
| Shoppes of Arch Creek | 1989 | 47,980 | $45.00 | 100.0% | 0.6 | Navarro Discount Pharmacy |
| The Shoppes of Biscayne | 1988 | 21,200 | $37.00 | 85.0% | 0.8 | N/A |
| Keystone Plaza | 2002 | 52,332 | $37.50 | 100.0% | 0.9 | N/A |
| Arena Shops | 1993 | 38,250 | $35.00 | 100.0% | 1.6 | Total Wine and More |
| (1) | Source: Appraisal. |
| (2) | Based on the underwritten rent roll dated December 1, 2018. |
| (3) | Reflects only retail space (excluding outparcel) at the property. |
Competitive Retail Outparcel Set Summary(1)
| Property | Year Built | Total NRA (SF) | Est. Rent PSF | Est. Occupancy | Proximity (miles) | Tenants |
| Causeway Square | 2009 - 2010 | 9,000(2)(3) | $62.95(2)(3) | 100.0%(2)(3) | N/A | TotalBank, Vitamin Shoppe |
| 10175 Pines Boulevard | 2013 | 4,833 | $40.86 | 100.0% | 14.6 | Chase Bank |
| 9005 Biscayne Boulevard | 2011 | 3,964 | $54.49 | 100.0% | 2.7 | TD Bank |
| 301 North Federal Highway | 2005 | 4,500 | $61.20 | 100.0% | 7.2 | HSBC Bank |
| 16800 Old Cutler Road | 1988 | 3,494 | $45.00 | 100.0% | 23.4 | BB&T |
| 1755 North University Drive | 2006 | 4,000 | $39.85 | 100.0% | 13.6 | Mercantil Commercebank |
| (1) | Source: Appraisal. |
| (2) | Based on the underwritten rent roll dated December 1, 2018. |
| (3) | Reflects only retail outparcel space at the property. |
THE INFORMATION IN THIS STRUCTURAL AND COLLATERAL TERM SHEET IS NOT COMPLETE AND MAY BE AMENDED PRIOR TO THE TIME OF SALE. THIS TERM SHEET IS NOT AN OFFER TO SELL THESE SECURITIES AND IT IS NOT A SOLICITATION OF AN OFFER TO BUY THESE SECURITIES IN ANY JURISDICTION WHERE THE OFFER OR SALE IS NOT PERMITTED.
78
Mortgage Loan No. 5 — Causeway Square
Historical and Current Occupancy
| 2015(1) | 2016(1) | 2017(1) | Current(2) |
| 88.0% | 90.4% | 92.0% | 89.2% |
| (1) | Source: Historical Occupancy is provided by the sponsor. Occupancies are as of December 31 of each respective year. |
| (2) | Based on the December 1, 2018 underwritten rent roll. SunGuard Investment Systems A (13,769 SF) is dark and was excluded from occupancy. |
Top Ten Tenant Summary(1)
| Tenant | NRA (SF) | % of Total NRA(2) | UW Base Rent PSF | % of Total UW Base Rents(3) | Lease Expiration Date |
| LA Fitness | 43,679 | 25.9% | $19.71 | 20.4% | 9/30/2025 |
| Regus | 13,184 | 7.8 | $25.60 | 8.0 | 10/31/2026(4) |
| Taubco(5) | 7,718 | 4.6 | $27.00 | 4.9 | 3/31/2029 |
| Pediatric Associates | 7,307 | 4.3 | $29.85 | 5.2 | 6/10/2020 |
| Physicians Group of S. Florida | 6,440 | 3.8 | $24.19 | 3.7 | 6/30/2024 |
| Rubenstein Law | 6,004 | 3.6 | $26.27 | 3.7 | 4/30/2024 |
| TotalBank | 5,000 | 3.0 | $46.00 | 5.4 | 5/31/2021 |
| National Brokers | 4,600 | 2.7 | $24.35 | 2.7 | 4/30/2020 |
| Vitamin Shoppe | 4,000 | 2.4 | $84.13 | 8.0 | 8/31/2020 |
| Massage Envy | 3,284 | 1.9 | $34.78 | 2.7 | 7/31/2020 |
| Top 10 Total: | 101,216 | 60.0% | 64.7% |
| (1) | Based on the underwritten rent roll, including rent increases occurring through December 1, 2019. |
| (2) | % of Total NRA is based off total SF including outparcels. |
| (3) | % of Total UW Base Rent including outparcels. |
| (4) | Regus has a one-time option to terminate its lease effective October 31, 2021 subject to 270 days’ prior notice and payment of a termination fee in the amount of $504,475. |
| (5) | Taubco is a sponsor affiliate and the related lease is guaranteed by the sponsor. See “Description of the Mortgage Pool—Tenant Issues—Affiliated Leases” in the Preliminary Prospectus. |
THE INFORMATION IN THIS STRUCTURAL AND COLLATERAL TERM SHEET IS NOT COMPLETE AND MAY BE AMENDED PRIOR TO THE TIME OF SALE. THIS TERM SHEET IS NOT AN OFFER TO SELL THESE SECURITIES AND IT IS NOT A SOLICITATION OF AN OFFER TO BUY THESE SECURITIES IN ANY JURISDICTION WHERE THE OFFER OR SALE IS NOT PERMITTED.
79
Mortgage Loan No. 5 — Causeway Square
Lease Rollover Schedule(1)(2)
| Year | Number of Leases Expiring | NRA Expiring | % of NRA Expiring | UW Base Rent Expiring | % of UW Base Rent Expiring | Cumulative NRA Expiring | Cumulative % of NRA Expiring | Cumulative UW Base Rent Expiring | Cumulative % of UW Base Rent Expiring |
| MTM | 1 | 2,317 | 1.4% | $57,369 | 1.4% | 2,317 | 1.4% | $57,369 | 1.4% |
| 2019 | 1 | 1,264 | 0.7 | 36,622 | 0.9 | 3,581 | 2.1% | $93,991 | 2.2% |
| 2020 | 6 | 22,375 | 13.3 | 893,257 | 21.2 | 25,956 | 15.4% | $987,248 | 23.4% |
| 2021 | 4 | 11,359 | 6.7 | 416,494 | 9.9 | 37,315 | 22.1% | $1,403,742 | 33.2% |
| 2022 | 4 | 7,643 | 4.5 | 225,033 | 5.3 | 44,958 | 26.6% | $1,628,775 | 38.6% |
| 2023 | 6 | 11,851 | 7.0 | 371,901 | 8.8 | 56,809 | 33.7% | $2,000,676 | 47.4% |
| 2024 | 7 | 21,766 | 12.9 | 573,027 | 13.6 | 78,575 | 46.6% | $2,573,704 | 60.9% |
| 2025 | 3 | 48,534 | 28.8 | 1,012,173 | 24.0 | 127,109 | 75.3% | $3,585,877 | 84.9% |
| 2026 | 1 | 13,184 | 7.8 | 337,504 | 8.0 | 140,293 | 83.1% | $3,923,381 | 92.9% |
| 2027 | 0 | 0 | 0.0 | 0 | 0.0 | 140,293 | 83.1% | $3,923,381 | 92.9% |
| 2028 | 1 | 2,542 | 1.5 | 91,639 | 2.2 | 142,835 | 84.6% | $4,015,020 | 95.1% |
| 2029 | 1 | 7,718 | 4.6 | 208,386 | 4.9 | 150,553 | 89.2% | $4,223,406 | 100.0% |
| 2030 & Beyond | 0 | 0 | 0.0 | 0 | 0.0 | 150,553 | 89.2% | $4,223,406 | 100.0% |
| Vacant | NAP | 18,228 | 10.8 | NAP | NAP | 168,781 | 100.0% | NAP | NAP |
| Total | 35 | 168,781 | 100.0% | $4,223,406 | 100.0% |
| (1) | Based on the underwritten rent roll. UW Base Rent includes base rent and rent increases occurring through December 1, 2019. SunGuard Investment Systems A (13,769 SF) is dark and is considered vacant for the above rollover table. |
| (2) | Certain tenants may have lease termination options that are exercisable prior to the originally stated expiration date of the subject lease and that are not considered in the Lease Rollover Schedule. |
Operating History and Underwritten Net Cash Flow
| 2015(1) | 2016(1) | 2017 | TTM(2) | Underwritten(3) | PSF | %(4) | |
| Rents in Place | $3,088,681 | $3,840,634 | $3,952,525 | $4,011,350 | $4,223,406 | $25.02 | 56.1% |
| Vacant Income | 0 | 0 | 0 | 0 | 427,004 | $2.53 | 5.7% |
| Gross Potential Rent | $3,088,681 | $3,840,634 | $3,952,525 | $4,011,350 | $4,650,411 | $27.55 | 61.8% |
| Abatements | (202,470) | (316,786) | (58,542) | (6,911) | 0 | $0.00 | 0.0% |
| Total Reimbursements | 829,876 | 1,832,693 | 2,092,619 | 1,885,067 | 2,877,629 | $17.05 | 38.2% |
| Net Rental Income | $3,716,087 | $5,356,542 | $5,986,602 | $5,889,506 | $7,528,040 | $44.60 | 100.0% |
| (Vacancy/Collection Loss) | 0 | 0 | 0 | 0 | (427,004) | ($2.53) | (5.9%) |
| Other Income | 66,357 | 117,201 | 113,785 | 134,270 | 134,270 | $0.80 | 1.9% |
| Effective Gross Income | $3,782,444 | $5,473,743 | $6,100,386 | $6,023,776 | $7,235,305 | $42.87 | 100.0% |
| Total Expenses | $1,826,903 | $2,103,697 | $2,487,766 | $2,369,221 | $3,254,920 | $19.28 | 45.0% |
| Net Operating Income | $1,955,541 | $3,370,045 | $3,612,621 | $3,654,555 | $3,980,385 | $23.58 | 55.0% |
| Total TI/LC, Capex/RR | 0 | 0 | 0 | 0 | 113,146 | $0.67 | 1.6% |
| Net Cash Flow | $1,955,541 | $3,370,045 | $3,612,621 | $3,654,555 | $3,867,240 | $22.91 | 53.4% |
| (1) | The increase in 2016 NOI from 2015 NOI is due to the lease up of 26,598 SF from August 2015 through December 2016 and $372,667 in operating expense reimbursement that occurred in 2016 for prior year reimbursements. |
| (2) | TTM represents the trailing twelve-month period ending July 31, 2018. |
| (3) | Rents in place includes Base Rent and Rent Increases occurring through December 1, 2019. |
| (4) | % column represents percent of Net Rental Income for all revenue lines and represents percent of Effective Gross Income for the remainder of fields. |
THE INFORMATION IN THIS STRUCTURAL AND COLLATERAL TERM SHEET IS NOT COMPLETE AND MAY BE AMENDED PRIOR TO THE TIME OF SALE. THIS TERM SHEET IS NOT AN OFFER TO SELL THESE SECURITIES AND IT IS NOT A SOLICITATION OF AN OFFER TO BUY THESE SECURITIES IN ANY JURISDICTION WHERE THE OFFER OR SALE IS NOT PERMITTED.
80
Mortgage Loan No. 5 — Causeway Square
Property Management. The property is managed by Tauber Realty, LLC, an affiliate of the sponsor.
Escrows and Reserves. At origination, the borrower deposited into escrow $660,811 for outstanding tenant improvements and leasing commissions associated with a master lease, $561,158 for real estate taxes, $221,033 for free rent reserves, $168,156 for TI/LC reserves and $75,000 for the potential purchase of an environmental insurance policy, however, the $75,000 was returned to the borrower as the policy was not required based on further studies.
Tax Escrow – On a monthly basis the borrower is required to escrow 1/12th of the annual estimated tax payments, which currently equates to $43,166.
Insurance Escrow – On a monthly basis the borrower is required to escrow 1/12th of the annual insurance premiums payments, which currently equates to $2,392.
Replacement Reserves – On a monthly basis the borrower is required to escrow $2,391 ($0.17 PSF annually) for replacement reserves relating to the property, subject to a cap of $136,000 ($0.81 PSF). Monthly deposits will commence again upon the replacement reserve balance being less than $75,000.
TI/LC Reserve – On a monthly basis, the borrower is required to escrow $12,500 ($0.89 PSF annually) for tenant improvements and leasing commissions relating to the property, subject to a cap of $750,000 ($4.44 PSF). Monthly deposits will commence again upon the TI/LC reserve balance being less than $250,000.
Lease Sweep Reserve – On a monthly basis during a Cash Trap Event (as defined below) continuing as a result of a Lease Sweep Period (as defined below), all available cash is required to be deposited into the lease sweep reserve.
Lockbox / Cash Management. The Causeway Square loan is structured with a soft lockbox with in place cash management. The borrower or manager is required to have all collected funds deposited into a lockbox account. Upon the occurrence of a Cash Trap Event, the borrower will be required to send direction letters to tenants instructing them to deposit all rents and payments into the lockbox account. All funds in the lockbox account are swept daily to a cash management account under the control of the lender and disbursed during each interest period of the term of the loan in accordance with the loan documents. During the continuance of a Cash Trap Event, all excess cash flow, after payments made in accordance with the loan documents for, amongst other things, debt service, required reserves and operating expenses will be held as additional collateral for the loan.
“Cash Trap Event” means (i) an event of default under the loan documents, (ii) the DSCR ratio of the loan and the mezzanine loan (based on a 30-year amortization schedule) is less than 1.15x, (iii) an event of default under the mezzanine loan or (iv) the commencement of the Lease Sweep Period.
“Lease Sweep Period” means a period beginning on any of (i) the date the Lease Sweep Lease (as defined below) is surrendered, cancelled or terminated prior to its then-current expiration date (or the receipt of such intent), (ii) the date that any tenant under a Lease Sweep Lease vacates or discontinues its business at its space (or gives written notice of such intent), (iii) a default under a Lease Sweep Lease that continues beyond any applicable notice and cure period, (iv) the occurrence of Lease Sweep Lease tenant insolvency proceeding and (v) the earlier to occur of (a) the date that is nine months prior to the Lease Sweep Lease expiration date or (b) the date required under such Lease Sweep Lease by which the tenant is required to give notice of its exercise of a renewal option thereunder.
“Lease Sweep Lease” means the LA Fitness lease and any replacement lease or leases of all or any portion of the LA Fitness leased premises.
Additional Debt. At origination, the lender provided a $1.5 million mezzanine loan to the parent of the borrower secured by 100.0% of the equity interests in the borrower. The mezzanine loan is coterminous with the loan, has an interest rate of 12.0000%per annum and will amortize on a 30-year schedule following a 59-month initial interest-only period. The Cut-off Date Loan Per SF, Cut-off Date LTV, UW NCF DSCR and UW NOI Debt Yield based on the loan and mezzanine loan are $276, 67.5%, 1.22x and 8.6% respectively. The mezzanine loan is held by a related party of 3650 REIT but is expected to be sold to a third party.
THE INFORMATION IN THIS STRUCTURAL AND COLLATERAL TERM SHEET IS NOT COMPLETE AND MAY BE AMENDED PRIOR TO THE TIME OF SALE. THIS TERM SHEET IS NOT AN OFFER TO SELL THESE SECURITIES AND IT IS NOT A SOLICITATION OF AN OFFER TO BUY THESE SECURITIES IN ANY JURISDICTION WHERE THE OFFER OR SALE IS NOT PERMITTED.
81
Mortgage Loan No. 6 — Bernardus Lodge & Spa

THE INFORMATION IN THIS STRUCTURAL AND COLLATERAL TERM SHEET IS NOT COMPLETE AND MAY BE AMENDED PRIOR TO THE TIME OF SALE. THIS TERM SHEET IS NOT AN OFFER TO SELL THESE SECURITIES AND IT IS NOT A SOLICITATION OF AN OFFER TO BUY THESE SECURITIES IN ANY JURISDICTION WHERE THE OFFER OR SALE IS NOT PERMITTED.
82
Mortgage Loan No. 6 — Bernardus Lodge & Spa

THE INFORMATION IN THIS STRUCTURAL AND COLLATERAL TERM SHEET IS NOT COMPLETE AND MAY BE AMENDED PRIOR TO THE TIME OF SALE. THIS TERM SHEET IS NOT AN OFFER TO SELL THESE SECURITIES AND IT IS NOT A SOLICITATION OF AN OFFER TO BUY THESE SECURITIES IN ANY JURISDICTION WHERE THE OFFER OR SALE IS NOT PERMITTED.
83
Mortgage Loan No. 6 — Bernardus Lodge & Spa
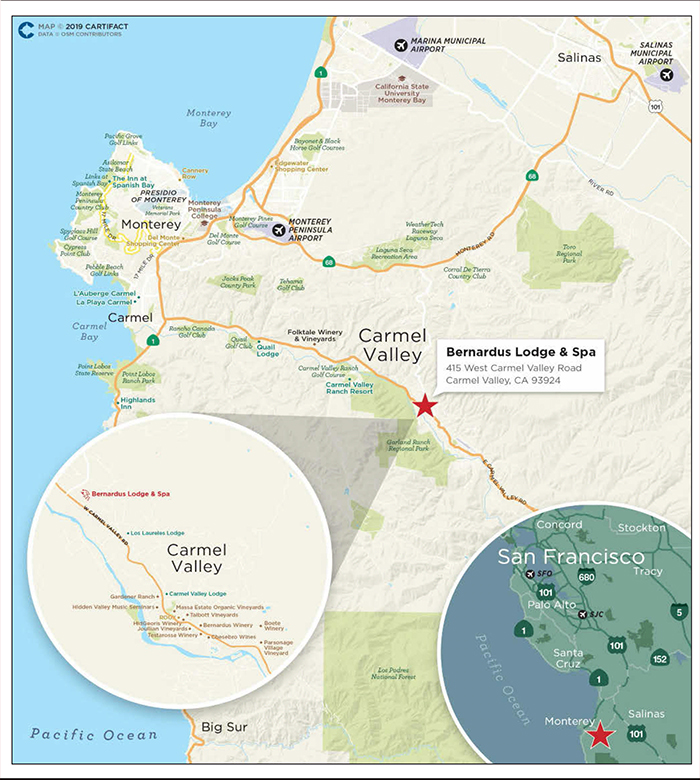
THE INFORMATION IN THIS STRUCTURAL AND COLLATERAL TERM SHEET IS NOT COMPLETE AND MAY BE AMENDED PRIOR TO THE TIME OF SALE. THIS TERM SHEET IS NOT AN OFFER TO SELL THESE SECURITIES AND IT IS NOT A SOLICITATION OF AN OFFER TO BUY THESE SECURITIES IN ANY JURISDICTION WHERE THE OFFER OR SALE IS NOT PERMITTED.
84
Mortgage Loan No. 6 — Bernardus Lodge & Spa
| Mortgage Loan Information | Property Information | |||
| Mortgage Loan Seller: | 3650 REIT | Single Asset / Portfolio: | Single Asset | |
| Original Principal Balance: | $43,500,000 | Title: | Fee | |
| Cut-off Date Principal Balance: | $43,500,000 | Property Type - Subtype: | Hotel – Full Service | |
| % of Pool by IPB: | 5.2% | Net Rentable Area (Rooms): | 73 | |
| Loan Purpose: | Refinance | Location: | Carmel Valley, CA | |
| Borrower: | Monterey Holdings, L.P. | Year Built / Renovated: | 1999 / 2014 - 2016 | |
| Sponsors: | Kambiz Babaoff; Michael Moskowitz; Randy McGrane | Occupancy / ADR / RevPAR: | 82.6% / $520.90 / $430.41 | |
| Interest Rate: | 5.3470% | Occupancy / ADR / RevPAR Date: | 10/31/2018 | |
| Note Date: | 10/3/2018 | Number of Tenants: | NAP | |
| Maturity Date: | 10/5/2028 | 2015 NOI(3): | N/A | |
| Interest-only Period: | 59 months | 2016 NOI(3): | $3,506,415 | |
| Original Term: | 120 months | 2017 NOI(3): | $5,289,195 | |
| Original Amortization: | 360 months | TTM NOI(3)(4): | $6,259,755 | |
| Amortization Type: | IO-Balloon | UW Occupancy / ADR / RevPAR: | 82.6% / $520.90 / $430.41 | |
| Call Protection: | L(29), Def(87), O(4) | UW Revenues: | $23,656,801 | |
| Lockbox(1): | Hard | UW Expenses: | $17,694,349 | |
| Additional Debt: | No | UW NOI(2): | $5,962,452 | |
| Additional Debt Balance: | N/A | UW NCF: | $5,016,180 | |
| Additional Debt Type: | N/A | Appraised Value / Per Room: | $80,000,000 / $1,095,890 | |
| Additional Future Debt Permitted(2): | Yes | Appraisal Date: | 8/1/2018 | |
| Escrows and Reserves(5) | Financial Information | |||||
| Initial | Monthly | Initial Cap | Cut-off Date Loan Per Room: | $595,890 | ||
| Taxes: | $75,000 | $19,681 | N/A | Maturity Date Loan Per Room: | $551,601 | |
| Insurance: | $0 | Springing | N/A | Cut-off Date LTV: | 54.4% | |
| FF&E Reserve: | $0 | $53,007 | N/A | Maturity Date LTV: | 50.3% | |
| PIP Reserve: | $0 | Springing | N/A | UW NOI / UW NCF IO DSCR: | 2.53x / 2.13x | |
| UW NOI / UW NCF Amortizing DSCR: | 2.05x / 1.72x | |||||
| UW NOI / UW NCF Debt Yield: | 13.7% / 11.5% |
Sources and Uses
| Sources | Proceeds | % of Total | Uses | Proceeds | % of Total | |
| Mortgage Loan: | $43,500,000 | 100.0% | Payoff Existing Debt: | $34,561,496 | 79.5% | |
| Return of Equity: | 8,134,062 | 18.7 | ||||
| Closing Costs: | 729,442 | 1.7 | ||||
| Upfront Reserves: | 75,000 | 0.2 | ||||
| Total Sources: | $43,500,000 | 100.0% | Total Uses: | $43,500,000 | 100.0% |
| (1) | For a more detailed description of lockbox, please refer to “Lockbox / Cash Management” below. |
| (2) | The borrower is permitted to obtain a mezzanine loan approved by the lender and subject to, among other things: (i) the LTV on the combined loan is not greater than 60.0%, (ii) the mezzanine loan term is coterminous with the loan, (iii) the DSCR on the combined loan is no less than 1.76x, (iv) the debt yield on the combined loan is no less than 11.7% and (v) the lender has received a rating agency confirmation. |
| (3) | 2015 NOI is not provided as the property underwent a $27.8 million reposition that was primarily completed in July 2016. The increase in 2017 NOI and TTM NOI from 2016 NOI is due to the repositioning from 2014 to 2016 and the property stabilizing over that period with occupancy and average daily rate increasing from 75.3% to 82.6% and $456.63 to $520.90, respectively. UW NOI includes a $248,832 increase in underwritten real estate taxes and insurance. |
THE INFORMATION IN THIS STRUCTURAL AND COLLATERAL TERM SHEET IS NOT COMPLETE AND MAY BE AMENDED PRIOR TO THE TIME OF SALE. THIS TERM SHEET IS NOT AN OFFER TO SELL THESE SECURITIES AND IT IS NOT A SOLICITATION OF AN OFFER TO BUY THESE SECURITIES IN ANY JURISDICTION WHERE THE OFFER OR SALE IS NOT PERMITTED.
85
Mortgage Loan No. 6 — Bernardus Lodge & Spa
| (4) | TTM represents trailing twelve-month period ending October 31, 2018. |
| (5) | For a more detailed description of Escrows and Reserves, please refer to “Escrows and Reserves” below. |
The Loan. The Bernardus Lodge & Spa loan is a $43.5 million first mortgage loan secured by the fee interest in a 73-room, full-service resort and spa located in Carmel Valley, California. The loan has a 10-year term and will amortize on a 30-year schedule following an initial interest-only period of 59 months.
The Borrower. The borrowing entity for the loan is Monterey Holdings, L.P., a Delaware limited partnership and special purpose entity. The borrowing entity is owned 99.5% by Premium Equities, LLC and 0.5% by Monterey Lodging, LLC, which is 100.0% owned by Premium Equities, LLC. Premium Equities, LLC is 6.7% owned by the sponsors and 93.3% owned by five other entities, of which 55.3% is related to at least one of the sponsors.
The Sponsors. The loan’s sponsors are Kambiz Babaoff, Michael Moskowitz and Randy McGrane and the non-recourse guarantor is Ensemble Investments, LLC. Kambiz Babaoff, Michael Moskowitz and Randy McGrane founded Ensemble Investments, LLC in 1980 and are engaged in the investment in and management and development of commercial real estate. Ensemble Investments, LLC’s hotel portfolio includes 11 hotels totaling over 2,000 keys. As of December 2017, the non-recourse guarantor had a net worth and liquidity of $25.0 million and 10.1 million, respectively.
The Property. The property is a 73-room, full-service resort and spa located in Carmel Valley, California. The property was originally constructed in 1999 and now consists of 22 one- and two-story hotel building villas on a 25.3-acre site with a restaurant, four outdoor pools, a fitness center, the Bernardus Winery, a business center, a full-service spa and 4,014 SF of dedicated meeting space. The property also features an additional 16,767 SF of outdoor event space including the Wedding Garden, the Gardenside Terrace, the Croquet Terrace and the Croquet Lawn. The aggregate amount of meeting and event space is 20,781 SF. The sponsors acquired the property in 2013 for $21.7 million ($380,108/room based on 57 original rooms). Since acquisition, the sponsors have invested an additional $27.8 million ($380,837/room) to reposition the property from 2014 to 2016, including the addition of 16 suites/villas, new hardwood floors in the guestrooms, a remodeling of the award-winning Lucia Restaurant & Bar and a refresh of the lobby, pool and meeting spaces. The sponsor’s total cost basis is $49.5 million ($677,634/room).
The property also features additional amenities including an Apiary Program and Chef’s Garden, Estate Vineyard and Rose Garden, Mercedes-Benz Drive Program, live music, daily coffee and tea service, complimentary weekend yoga and hikes, croquet and bocce lawns, lighted tennis courts and outdoor seating and fire pits. There are also several private dining venues at the property including The Wine Cellar, The Magnum Room, The Harvest Room, Chef’s Table and Cooper’s Den with capacity for up to fifty guests. In 2018, the property and its facilities were granted several awards including the Certificate of Excellence Hall of Fame from Trip Advisor, Best of Award of Excellence for Lucia Restaurant & Bar from Wine Spectator, Best Chef from the Best of Monterey County Reader’s Poll – Monterey County Weekly, Four Star Restaurant and Four Star Hotel from Forbes Travel Guide and the Four Diamond Award from AAA Travel Services.
The unit mix at the property consists of 25 luxury rooms, 38 deluxe rooms, eight villa suites and two two-bedroom villas. Each room features an outdoor seating area, work desk and chair, one or two nightstands, a dresser, flat screen televisions, sofa chair, pull-out couch, fireplace and mini refrigerator with complimentary alcoholic and non-alcoholic beverages as well as snacks. The luxury rooms contain a larger living area and outdoor patio. The villa suites and two-bedroom villas feature larger patios/balconies, larger bathrooms with soaking tubs and rain showers. Additionally, the two-bedroom villas also feature an additional private patio off of the master bath with an outdoor shower, as well as additional dining or meeting space that seats 12 people. The property offers complimentary wireless internet access in all guestrooms. In addition, the property offers 146 surface parking spaces, with valet services as well as self-parking, both of which are included in the nightly resort fee of $30.
The property is located on West Carmel Valley Road, in northwest Carmel Valley at the intersection of West Carmel Valley Road and Laureles Grade. The property is located approximately 11 miles southeast of Carmel-By-The-Sea and approximately 12.4 miles southeast of Monterey.
THE INFORMATION IN THIS STRUCTURAL AND COLLATERAL TERM SHEET IS NOT COMPLETE AND MAY BE AMENDED PRIOR TO THE TIME OF SALE. THIS TERM SHEET IS NOT AN OFFER TO SELL THESE SECURITIES AND IT IS NOT A SOLICITATION OF AN OFFER TO BUY THESE SECURITIES IN ANY JURISDICTION WHERE THE OFFER OR SALE IS NOT PERMITTED.
86
Mortgage Loan No. 6 — Bernardus Lodge & Spa
Historical Occupancy, ADR, RevPAR(1)
Competitive Set(2) | Bernardus Lodge & Spa(3) | Penetration Factor | |||||||
| Year | Occupancy | ADR | RevPAR | Occupancy | ADR | RevPAR | Occupancy | ADR | RevPAR |
| 2016 | 70.5% | $496.29 | $349.80 | 75.3% | $456.63 | $343.76 | 106.8% | 92.0% | 98.3% |
| 2017 | 70.4% | $500.71 | $352.56 | 80.4% | $499.54 | $401.40 | 114.1% | 99.8% | 113.9% |
| TTM(4) | 70.8% | $504.34 | $357.26 | 82.6% | $520.90 | $430.41 | 116.6% | 103.3% | 120.5% |
| (1) | 2015 Occupancy, ADR and RevPAR are not available as the property was repositioned from 2014 to 2016. |
| (2) | Source: Third party reports. Competitive set incudes Quail Lodge & Golf Club, Hyatt Carmel Highlands Overlooking Big Sur Coast, La Playa Carmel, Inn @ Spanish Bay, Joie De Vivre Carmel Valley Ranch and L’Auberge Carmel. |
| (3) | Source: Borrower financials. |
| (4) | Represents the trailing twelve-month period ending October 31, 2018. |
The Market. The property is located in Carmel Valley, California within Monterey County. Tourism is the second largest industry in Monterey County, second only to agriculture. As a result of favorable weather and its proximity to Monterey Bay, Monterey County draws a number of couples, families, groups and individual travelers. Some local leisure demand generators include the Monterey Bay Aquarium and Monterey Peninsula Recreational Trail. One of the largest tourist attractions in the area is the Laguna Seca Raceway located in nearby Salinas, which provides a venue for west coast automobile and motorcycle racing. The stadium has an approximate capacity of 11,000. In July 2018, the IndyCar Series announced that it would be returning to Laguna Seca Raceway in 2019 for the next three years, with the possibility of a contract extension beyond the initial three-year term. Another attraction is the Pebble Beach Golf Course located approximately 14.2 miles northwest of the property. Pebble Beach Golf Course hosts many major national events including the AT&T Pebble Beach National Pro-Am. The venue is scheduled to host its sixth U.S. Open Championship in June 2019.
Major cities and places of interest in Monterey County include Salinas, Seaside, Monterey, Soledad, Carmel-By-The-Sea, Pebble Beach and Big Sur. Carmel-by-the-Sea overlooks the Monterey Bay on the coast of California. Monterey County is home to several higher institutions of learning, such as California State University Monterey Bay, Monterey Peninsula College and Monterey Bay College of Law. The Monterey Conference Center is located approximately 14 miles northwest of the property and generates meeting and group demand for the Monterey County market. The Monterey Conference Center provides conference, trade show and meeting services for a wide range of corporations, associations and organizations in the market and underwent a significant renovation in November 2015 that was partially funded by a municipal bond and was completed early 2017.
The appraiser identified six comparable hotel properties, ranging from 20 rooms to 269 rooms that were constructed between 1905 and 1987. The competitive set reported average occupancies ranging from 55% to 80%, with average daily rates ranging from $385 to $585 per night. The average daily rate at the property is in-line with the competitive set. The properties in the appraisal’s competitive set are all located in Monterey County within approximately 16 miles of the property and are shown in the below table.
THE INFORMATION IN THIS STRUCTURAL AND COLLATERAL TERM SHEET IS NOT COMPLETE AND MAY BE AMENDED PRIOR TO THE TIME OF SALE. THIS TERM SHEET IS NOT AN OFFER TO SELL THESE SECURITIES AND IT IS NOT A SOLICITATION OF AN OFFER TO BUY THESE SECURITIES IN ANY JURISDICTION WHERE THE OFFER OR SALE IS NOT PERMITTED.
87
Mortgage Loan No. 6 — Bernardus Lodge & Spa
Competitive Hotels Profile(1)
Estimated Market Mix | 2017 Estimated Operating Statistics | ||||||||
| Property | Rooms | Year Built | Meeting Space (SF) | Commercial | Meeting & Group | Transient | Occupancy | ADR | RevPAR |
| Bernardus Lodge & Spa | 73 | 1999 | 4,014 | 0% | 30% | 70% | 80.4%(2) | $499.54(2) | $401.40(2) |
| Quail Lodge & Golf Club | 93 | 1965 | 8,500 | 0% | 40% | 60% | 75%-80% | $435-$440 | $330-$335 |
| Hyatt Carmel Highlands | 48 | 1917 | 4,945 | 0% | 25% | 75% | 55%-60% | $385-$390 | $225-$230 |
| La Playa Carmel By-The-Sea | 75 | 1905 | 6,000 | 0% | 35% | 65% | 75%-80% | $435-$440 | $325-$330 |
| The Inn at Spanish Bay | 269 | 1987 | 41,375 | 0% | 55% | 45% | 70%-75% | $580-$585 | $430-$435 |
| Carmel Valley Ranch | 181 | 1987 | 9,711 | 0% | 40% | 60% | 60%-65% | $465-$470 | $290-$295 |
| L-Auberge Carmel | 20 | 1929 | NAV | 0% | 25% | 75% | 75%-80% | $400-$405 | $300-$305 |
| Total(3) | 686 | ||||||||
| (1) | Source: Appraisal. |
| (2) | Source: December 2017 borrower financials. |
| (3) | Excludes the subject property. |
Operating History and Underwritten Net Cash Flow
| 2015(1) | 2016(1) | 2017(1) | TTM(1)(2) | Underwritten(1) | Per Room | %(3) | |
| Occupancy | N/A | 75.3% | 80.4% | 82.6% | 82.6% | ||
| ADR | N/A | $456.63 | $499.54 | $520.90 | $520.90 | ||
| RevPAR | N/A | $343.76 | $401.40 | $430.41 | $430.41 | ||
| Room Revenue | N/A | $8,019,257 | $10,695,230 | $11,468,147 | $11,468,147 | $157,098 | 48.5% |
| Food and Beverage | N/A | 6,905,719 | 8,010,146 | 9,078,761 | 9,078,761 | $124,367 | 38.4% |
| Other Departmental Revenues(4) | N/A | 2,612,135 | 2,997,267 | 3,109,893 | 3,109,893 | $42,601 | 13.1% |
| Total Revenue | N/A | $17,537,111 | $21,702,643 | $23,656,801 | $23,656,801 | $324,066 | 100.0% |
| Room Expense | N/A | 2,504,585 | 3,076,962 | 3,106,086 | 3,106,086 | $42,549 | 27.1% |
| Food and Beverage Expense | N/A | 5,344,267 | 6,067,886 | 6,692,446 | 6,692,446 | $91,677 | 73.7% |
| Other Departmental Expenses | N/A | 1,159,724 | 1,480,024 | 1,485,767 | 1,485,767 | $20,353 | 47.8% |
| Departmental Expenses | N/A | $9,008,576 | $10,624,872 | $11,284,299 | $11,284,299 | $154,579 | 47.7% |
| Departmental Profit | N/A | $8,528,535 | $11,077,771 | $12,372,502 | $12,372,502 | $169,486 | 52.3% |
| Operating Expenses | N/A | $4,528,814 | $5,273,959 | $5,546,148 | $5,594,618 | $76,639 | 23.6% |
| Gross Operating Profit | N/A | $3,999,721 | $5,803,812 | $6,826,354 | $6,777,884 | $92,848 | 28.7% |
| Fixed Expenses | N/A | 493,306 | 514,617 | 566,599 | 815,431 | $11,170 | 3.4% |
| Net Operating Income | N/A | $3,506,415 | $5,289,195 | $6,259,755 | $5,962,452 | $81,677 | 25.2% |
| FF&E | N/A | 701,484 | 868,106 | 640,297 | 946,272 | $12,963 | 4.0% |
| Net Cash Flow | N/A | $2,804,930 | $4,421,089 | $5,619,458 | $5,016,180 | $68,715 | 21.2% |
| (1) | 2015 NOI is not provided as the property underwent a $27.8 million reposition that was primarily completed in July 2016. The increase in 2017 NOI and TTM NOI from 2016 NOI is due to the repositioning from 2014 to 2016 that commenced in 2014, which included the addition of 16 new villas and suites, and the property stabilizing over that period with occupancy and average daily rate increasing from 75.3% to 82.6% and $456.63 to $520.90, respectively. The decline in TTM NOI to UW NOI is primarily due to the increase in underwritten real estate taxes and insurance of $248,832. |
| (2) | Represents the trailing twelve-month period ending October 31, 2018. |
| (3) | % column represents percent of Total Revenue except for Room Expense, Food and Beverage Expense and Other Departmental Expenses, each of which is based on its corresponding revenue line items. |
| (4) | Underwritten Other Departmental Revenues includes income from the spa ($2,107,081), resort fees ($647,018), gift shop ($48,423) and other miscellaneous income. |
THE INFORMATION IN THIS STRUCTURAL AND COLLATERAL TERM SHEET IS NOT COMPLETE AND MAY BE AMENDED PRIOR TO THE TIME OF SALE. THIS TERM SHEET IS NOT AN OFFER TO SELL THESE SECURITIES AND IT IS NOT A SOLICITATION OF AN OFFER TO BUY THESE SECURITIES IN ANY JURISDICTION WHERE THE OFFER OR SALE IS NOT PERMITTED.
88
Mortgage Loan No. 6 — Bernardus Lodge & Spa
Property Management. The property is managed by Woodside Hotel Group LTD., an operator that specializes in managing luxury resorts between Monterey and Napa Valley in California. Woodside Hotel Group LTD. is a privately-held and family-run company that was founded in 1972. Headquartered in Menlo Park, California, Woodside Hotel Group LTD. operates 10 luxury hotels: the property, Monterey Plaza Hotel Spa, Stanford Park Hotel, Hotel Drisco, Lafayette Park Hotel & Spa, Bodega Bay Lodge, Napa Valley Lodge, Dream Inn, Indian Springs Calistoga and Harvest Inn St Helena.
Escrows and Reserves. At origination the borrower deposited $75,000 for real estate taxes.
Tax Escrow – On a monthly basis the borrower is required to escrow 1/12th of the annual estimated tax payments, which currently equates to $19,681.
Insurance Escrow – The requirement of the borrower to make monthly deposits to the insurance reserve is waived so long as no event of default exists and the borrower provides satisfactory evidence that the property is insured as part of a blanket policy in accordance with the loan documents.
FF&E Reserve – On a monthly basis the borrower is required to escrow an amount equal to the greater of (i) 4.0% of room revenue and 2.0% of food and beverage revenue for the property and (ii) the then-current amount required by the property management agreement or any replacement management agreement, which currently equates to $53,007.
PIP Reserve – The borrower is required to deposit with the lender on the date that any property improvement plan is imposed pursuant to the property management or any future franchise agreement, an amount equal to 110.0% of the total PIP cost.
Lockbox / Cash Management. The Bernardus Lodge & Spa loan is structured with a hard lockbox and springing cash management. The property manager will collect all rental, credit card deposits and other income and will deposit directly into the lockbox account controlled by the borrower. All funds in the lockbox account are required to be remitted to the borrower on a daily basis in the absence of a Trigger Period (as defined below). During the continuance of a Trigger Period, all funds will be swept on a daily basis into a cash management account controlled by the lender and all excess cash flow, after payments made in accordance with the loan documents for, amongst other things, debt service, required reserves and operating expenses, will be held as additional collateral for the loan.
“Trigger Period” means (i) an event of default under the loan documents, (ii) the DSCR is less than 1.20x, (iii) a property improvement plan is required by the then franchisor or manager or (iv) the existence of any mezzanine loan secured by an equity interest in the borrower.
THE INFORMATION IN THIS STRUCTURAL AND COLLATERAL TERM SHEET IS NOT COMPLETE AND MAY BE AMENDED PRIOR TO THE TIME OF SALE. THIS TERM SHEET IS NOT AN OFFER TO SELL THESE SECURITIES AND IT IS NOT A SOLICITATION OF AN OFFER TO BUY THESE SECURITIES IN ANY JURISDICTION WHERE THE OFFER OR SALE IS NOT PERMITTED.
89
Mortgage Loan No. 7 — ExchangeRight Net Leased Portfolio 24
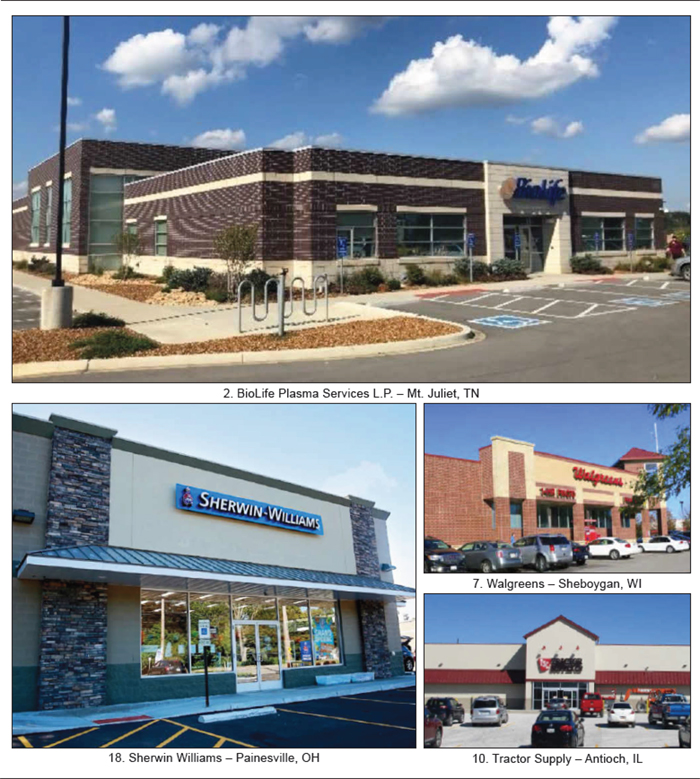
THE INFORMATION IN THIS STRUCTURAL AND COLLATERAL TERM SHEET IS NOT COMPLETE AND MAY BE AMENDED PRIOR TO THE TIME OF SALE. THIS TERM SHEET IS NOT AN OFFER TO SELL THESE SECURITIES AND IT IS NOT A SOLICITATION OF AN OFFER TO BUY THESE SECURITIES IN ANY JURISDICTION WHERE THE OFFER OR SALE IS NOT PERMITTED.
90
Mortgage Loan No. 7 — ExchangeRight Net Leased Portfolio 24
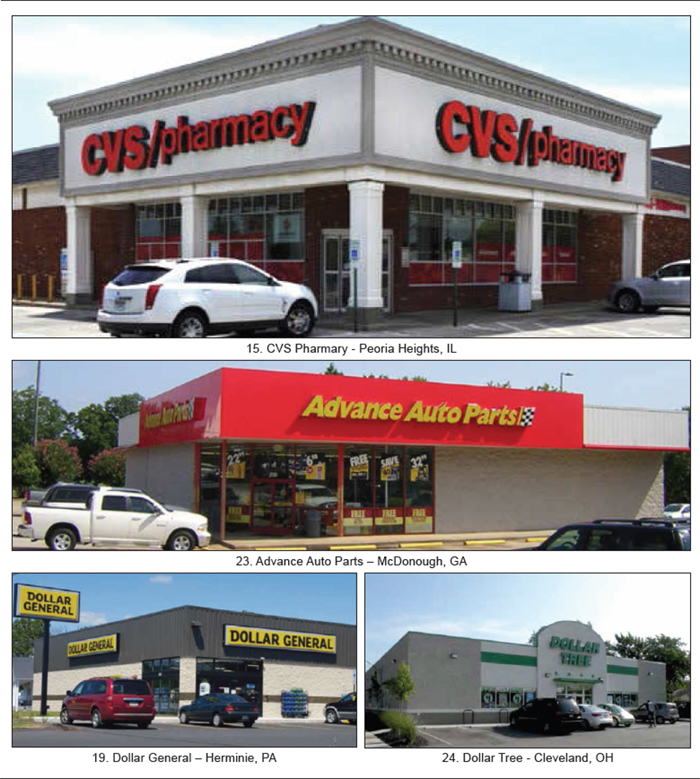
THE INFORMATION IN THIS STRUCTURAL AND COLLATERAL TERM SHEET IS NOT COMPLETE AND MAY BE AMENDED PRIOR TO THE TIME OF SALE. THIS TERM SHEET IS NOT AN OFFER TO SELL THESE SECURITIES AND IT IS NOT A SOLICITATION OF AN OFFER TO BUY THESE SECURITIES IN ANY JURISDICTION WHERE THE OFFER OR SALE IS NOT PERMITTED.
91
Mortgage Loan No. 7 — ExchangeRight Net Leased Portfolio 24
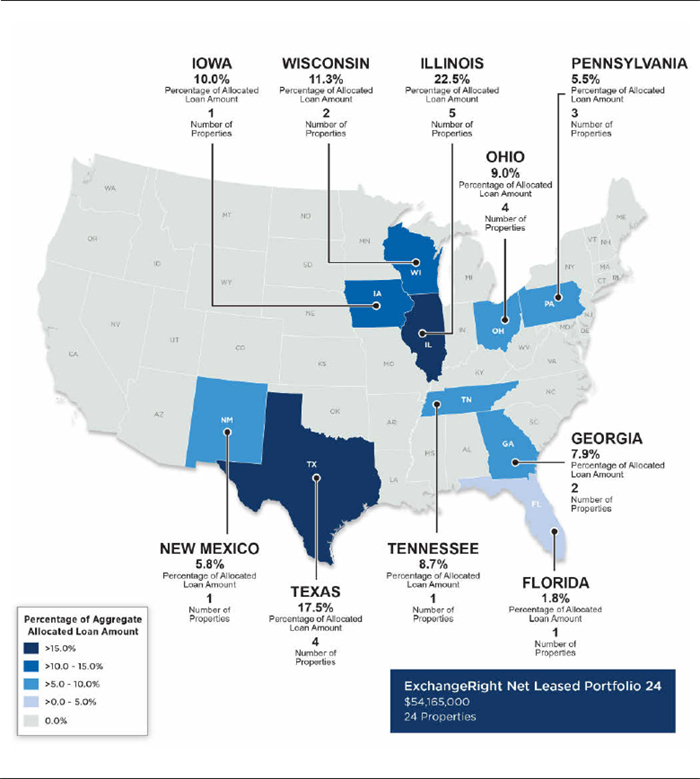
THE INFORMATION IN THIS STRUCTURAL AND COLLATERAL TERM SHEET IS NOT COMPLETE AND MAY BE AMENDED PRIOR TO THE TIME OF SALE. THIS TERM SHEET IS NOT AN OFFER TO SELL THESE SECURITIES AND IT IS NOT A SOLICITATION OF AN OFFER TO BUY THESE SECURITIES IN ANY JURISDICTION WHERE THE OFFER OR SALE IS NOT PERMITTED.
92
Mortgage Loan No. 7 — ExchangeRight Net Leased Portfolio 24
| Mortgage Loan Information | Property Information | |||
| Mortgage Loan Seller: | SGFC | Single Asset / Portfolio: | Portfolio of 24 assets | |
| Original Principal Balance(1): | $35,000,000 | Title: | Fee | |
| Cut-off Date Principal Balance(1): | $35,000,000 | Property Type - Subtype: | Various – Various | |
| % of Pool by IPB: | 4.2% | Net Rentable Area (SF): | 337,478 | |
| Loan Purpose: | Acquisition | Location: | Various | |
| Borrower: | ExchangeRight Net Leased Portfolio 24 DST | Year Built / Renovated: | Various / NAP | |
| Sponsors: | David Fisher; ExchangeRight Real Estate, LLC; Joshua Ungerecht; Warren Thomas | Occupancy: | 100.0% | |
| Interest Rate: | 4.5500% | Occupancy Date: | 10/15/2018 | |
| Note Date: | 10/23/2018 | Number of Tenants: | 10 | |
| Maturity Date: | 11/1/2028 | 2015 NOI(4): | N/A | |
| Interest-only Period: | 120 months | 2016 NOI(4): | N/A | |
| Original Term: | 120 months | 2017 NOI(4): | N/A | |
| Original Amortization: | None | TTM NOI(4): | N/A | |
| Amortization Type: | Interest Only | UW Economic Occupancy: | 96.3% | |
| Call Protection(2): | L(28), Def(88), O(4) | UW Revenues: | $5,625,154 | |
| Lockbox(3): | Hard | UW Expenses: | $462,350 | |
| Additional Debt(1): | Yes | UW NOI: | $5,162,804 | |
| Additional Debt Balance(1): | $19,165,000 | UW NCF: | $5,092,198 | |
| Additional Debt Type(1): | Pari Passu | Appraised Value / Per SF: | $87,335,000 / $259 | |
| Additional Future Debt Permitted: | No | Appraisal Date: | Various |
| Escrows and Reserves(5) | Financial Information(1) | |||||
| Initial | Monthly | Initial Cap | Cut-off Date Loan Per SF: | $161 | ||
| Taxes: | $73,329 | $14,411 | N/A | Maturity Date Loan Per SF: | $161 | |
| Insurance: | $0 | Springing | N/A | Cut-off Date LTV: | 62.0% | |
| Replacement Reserves: | $468,128 | $1,803 | N/A | Maturity Date LTV: | 62.0% | |
| TI/LC: | $500,000 | Springing | N/A | UW NOI / UW NCF DSCR: | 2.07x / 2.04x | |
| Engineering Reserve: | $17,645 | $0 | N/A | UW NOI / UW NCF Debt Yield: | 9.5% / 9.4% |
| Sources and Uses | ||||||
| Sources | Proceeds | % of Total | Uses | Proceeds | % of Total | |
| Whole Loan: | $54,165,000 | 60.7% | Purchase Price: | $86,811,329 | 97.3% | |
| Sponsor Equity: | 35,014,926 | 39.3 | Closing Costs: | 1,309,495 | 1.5 | |
| Upfront Reserves: | 1,059,102 | 1.2 | ||||
| Total Sources: | $89,179,926 | 100.0% | Total Uses: | $89,179,926 | 100.0% |
| (1) | The ExchangeRight Net Leased Portfolio 24 loan is part of a larger split whole loan evidenced by fourpari passu notes with an aggregate Cut-off Date balance of $54.165 million (collectively, the “Whole Loan”). The financial information presented in the chart above and herein reflects the balance of the Whole Loan. |
| (2) | At any time after the earlier to occur of (i) October 23, 2021 and (ii) two years from the closing date of the securitization that includes the lastpari passu note of the Whole Loan to be securitized, the borrower has the right to defease the Whole Loan. |
| (3) | For a more detailed description of lockbox, please refer to “Lockbox / Cash Management” below. |
THE INFORMATION IN THIS STRUCTURAL AND COLLATERAL TERM SHEET IS NOT COMPLETE AND MAY BE AMENDED PRIOR TO THE TIME OF SALE. THIS TERM SHEET IS NOT AN OFFER TO SELL THESE SECURITIES AND IT IS NOT A SOLICITATION OF AN OFFER TO BUY THESE SECURITIES IN ANY JURISDICTION WHERE THE OFFER OR SALE IS NOT PERMITTED.
93
Mortgage Loan No. 7 — ExchangeRight Net Leased Portfolio 24
| (4) | Historical cash flows are unavailable as the properties were acquired by the borrower between August 28, 2018 and October 23, 2018. The sellers of the properties did not provide historical operating statements to the borrower. |
| (5) | For a more detailed description of Escrows and Reserves, please refer to “Escrows and Reserves” below. |
The Loan.The ExchangeRight Net Leased Portfolio 24 Whole Loan has a Cut-off Date balance of $54.165 million and is secured by the fee interest in a 337,478 SF, 24-property single tenant retail and medical office portfolio located across Illinois, Ohio, Texas, Pennsylvania, Georgia, Wisconsin, Florida, Iowa, New Mexico and Tennessee. The loan has a 10-year term and is interest-only for the entire term of the loan.
The Whole Loan is evidenced by fourpari passu notes. The controlling Note A-1 and non-controlling Note A-4 are being contributed to the CSAIL 2019-C15 Commercial Mortgage Trust. The Whole Loan is expected to be serviced under the CSAIL 2019-C15 pooling and servicing agreement. As the holder of Note A-1 (the “Controlling Noteholder”) the trustee of the CSAIL 2019-C15 Commercial Mortgage Trust is entitled to exercise all of the rights of the Controlling Noteholder with respect to the Whole Loan, however, the holders of the remaining notes are entitled, under certain circumstances, to consult with respect to certain major decisions.
Whole Loan Note Summary
| Original Balance | Cut-off Date Balance | Note Holder | Lead Servicer for Whole Loan (Y/N) | Controlling Piece (Y/N) | |
| Note A-1, A-4 | $35,000,000 | $35,000,000 | CSAIL 2019-C15 | Y | Y |
| Note A-2 | 4,165,000 | 4,165,000 | UBS 2018-C15 | N | N |
| Note A-3(1) | 15,000,000 | 15,000,000 | SGFC | N | N |
| Total: | $54,165,000 | $54,165,000 |
| (1) | Note is expected to be contributed to one or more future securitizations. |
The Borrower.The borrowing entity is ExchangeRight Net Leased Portfolio 24 DST, a Delaware statutory trust. At origination of the Whole Loan, the properties were either purchased directly by the borrower or conveyed and assumed from ExchangeRight Net Leased Portfolio 24, LLC. The borrower has master leased the properties to ExchangeRight NLP 24 Master Lessee, LLC (the “Master Lessee”), a Delaware limited liability company that is an affiliate of the sponsors. The Master Lessee is structured as a special purpose entity in which the sponsors collectively have a 100% ownership interest. The Master Lessee’s interest in the master lease and all tenant rents are assigned to the lender as collateral. The master lease is subordinate to the Whole Loan. There is one independent trustee for the borrower and one independent manager for the Master Lessee. Legal counsel to the borrower delivered a non-consolidation opinion in connection with the origination of the Whole Loan. The sponsors are the guarantors of certain nonrecourse carveouts under the loan documents.
The Sponsors.The sponsors and nonrecourse carve-out guarantors are David Fisher, Joshua Ungerecht, Warren Thomas and ExchangeRight Real Estate, LLC (“ExchangeRight”). David Fisher, Joshua Ungerecht and Warren Thomas are the managing members of ExchangeRight. ExchangeRight has more than $1.7 billion in assets under management that includes 500 properties located across 38 states totaling over 12 million SF as of February 1, 2019. ExchangeRight’s focus is in providing long-term stable income and asset preservation through long-term net-leased portfolios backed by investment grade corporations.
The Property.The properties total 337,478 SF and are located in Illinois, Ohio, Texas, Pennsylvania, Georgia, Wisconsin, Florida, Iowa, New Mexico and Tennessee. Built between 1979 and 2018, the properties range in size from 4,528 SF to 49,580 SF. The borrower acquired the properties between August 28, 2018 and October 23, 2018 for a combined purchase price of approximately $86.8 million.
THE INFORMATION IN THIS STRUCTURAL AND COLLATERAL TERM SHEET IS NOT COMPLETE AND MAY BE AMENDED PRIOR TO THE TIME OF SALE. THIS TERM SHEET IS NOT AN OFFER TO SELL THESE SECURITIES AND IT IS NOT A SOLICITATION OF AN OFFER TO BUY THESE SECURITIES IN ANY JURISDICTION WHERE THE OFFER OR SALE IS NOT PERMITTED.
94
Mortgage Loan No. 7 — ExchangeRight Net Leased Portfolio 24
As of October 15, 2018, the properties were 100.0% occupied by 10 different tenants, nine of which are investment grade. The investment grade tenants include, BioLife Plasma Services L.P. (BBB-/Baa3, S&P/Moody’s), CVS Pharmacy (BBB/Baa1, S&P/Moody’s), Dollar General (BBB/Baa2, S&P/Moody’s), Dollar Tree (BBB-/Baa3, S&P/Moody’s), Fresenius Medical Care (BBB-/BBB-/Baa3, Fitch/S&P/ Moody’s), Walgreens (BBB/BBB/Baa2, Fitch/S&P/Moody’s), Pick ‘n Save (BBB/Baa1, S&P/ Moody’s), Advance Auto Parts (BBB-/Baa2, S&P/ Moody’s) and Sherwin Williams (BBB/BBB/Baa3, Fitch/S&P/ Moody’s). Investment grade tenants occupy 21 of the 24 properties, collectively representing 83.1% of NRA and 85.6% of underwritten base rent and, with respect to those tenants, the leases are either directly with such rated entities or are guaranteed by such rated entities. The largest property, with Pick ‘n Save as the tenant, comprises approximately 49,580 SF (14.7% of NRA) and has an underwritten base rent of $325,324 (5.9% of underwritten base rent). Outside of Pick ‘n Save - Wisconsin Rapids, WI, no individual property accounts for more than 5.6% of NRA or 10.0% of underwritten base rent. All leases are triple-net or double-net and the weighted average remaining lease term for tenants at the properties is approximately 11.6 years. Leases representing approximately 79.0% of NRA and 78.7% of underwritten base rent expire after the Whole Loan maturity date.
The Market.The properties are located across ten states and 18 markets. The following table presents certain market information relating to the properties:
| Property Name | Market/Submarket(1) | Market Vacancy(1) | Rental Rate PSF | |
| Actual(2) | Market/Submarket(1) | |||
| BioLife Plasma Services L.P. – West Des Moines, IA | Des Moines, IA | 5.7% | $31.32 | $31.00 |
| BioLife Plasma Services L.P. – Mt. Juliet, TN | Nashville, TN | 6.2% | $27.13 | $27.87 |
| Walgreens - Romeoville, IL | Chicago, IL | 11.6% | $24.06 | $24.00 |
| Walgreens - Lawrenceville, GA | Atlanta, GA | 5.9% | $22.59 | $22.59 |
| Tractor Supply - Albuquerque, NM | Albuquerque, NM | 13.6% | $16.03 | $16.00 |
| Pick ‘n Save - Wisconsin Rapids, WI | Wisconsin Rapids/Wood County | 5.5% | $6.56 | $7.00 |
| Walgreens - Oswego, IL | Chicago, IL | 11.6% | $18.89 | $19.00 |
| Walgreens - Sheboygan, WI | Sheboygan County | 4.2% | $19.27 | $20.00 |
| Walgreens - Waco, TX | Waco, TX | 5.2% | $19.55 | $19.50 |
| Tractor Supply - Antioch, IL | Chicago, IL | 11.6% | $14.07 | $15.00 |
| Walgreens - Austin, TX | Austin, TX | 3.9% | $17.72 | $18.00 |
| Walgreens - Flower Mound, TX | Dallas/Fort Worth, TX | 4.6% | $18.05 | $18.00 |
| Tractor Supply - Columbia Station, OH | Strongsville/Parma/SW Cleveland | 16.7% | $11.56 | $13.75 |
| Fresenius Medical Care - Brownsville, TX | Cameron County | 9.6% | $17.98 | $18.00 |
| CVS Pharmacy - Peoria Heights, IL | Peoria, IL | 4.3% | $16.16 | $16.00 |
| Advance Auto Parts - Grayslake, IL | Chicago, IL | 11.6% | $16.46 | $17.00 |
| Dollar General - Lancaster, PA | Lancaster County | 2.8% | $12.05 | $12.05 |
| Sherwin Williams - Painesville, OH | Cleveland, OH | 14.3% | $21.86 | $22.00 |
| Dollar General - Herminie, PA | Pittsburgh, PA | 9.5% | $11.26 | $11.26 |
| Dollar General - Tallahassee, FL | Tallahassee, FL | 3.9% | $12.81 | $13.00 |
| Dollar General - Gibsonia, PA | Pittsburgh, PA | 9.5% | $10.46 | $10.46 |
| Dollar General - Mansfield, OH | Cleveland, OH | 5.1% | $10.16 | $10.33 |
| Advance Auto Parts - McDonough, GA | McDonough/Butts, GA | 2.8% | $15.42 | $13.28 |
| Dollar Tree - Cleveland, OH | Cleveland, OH | 14.3% | $9.52 | $9.50 |
| Weighted Average:(3) | 8.0% | $16.10 | $16.38 | |
| (1) | Based on the appraisals and third-party research reports. |
| (2) | Based on the October 15, 2018 underwritten rent roll. |
| (3) | Weighted Average Market Vacancy, Actual and Market/Submarket Rental Rate PSF is based on each property’s SF. |
THE INFORMATION IN THIS STRUCTURAL AND COLLATERAL TERM SHEET IS NOT COMPLETE AND MAY BE AMENDED PRIOR TO THE TIME OF SALE. THIS TERM SHEET IS NOT AN OFFER TO SELL THESE SECURITIES AND IT IS NOT A SOLICITATION OF AN OFFER TO BUY THESE SECURITIES IN ANY JURISDICTION WHERE THE OFFER OR SALE IS NOT PERMITTED.
95
Mortgage Loan No. 7 — ExchangeRight Net Leased Portfolio 24
Historical and Current Occupancy
| 2015(1) | 2016(1) | 2017(1) | Current(2) |
| 100.0% | 100.0% | 100.0% | 100.0% |
| (1) | Occupancies are as of December 31 of each respective year and exclude properties that were built and occupied after the reporting date. |
| (2) | Based on the October 15, 2018 underwritten rent roll. |
Tenant Summary(1)
| Tenant | Number of Properties | Ratings Moody’s/S&P/Fitch(2) | NRA (SF) | % of Total NRA | Weighted Average UW Base Rent PSF | % of Total UW Base Rent | Weighted Average Remaining Lease Term |
| Walgreens(3) | 7 | Baa2 / BBB / BBB | 101,304 | 30.0% | $20.06 | 36.8% | 10.7 |
| BioLife Plasma Services L.P. | 2 | Baa3 / BBB- / NR | 33,237 | 9.8 | $30.92 | 18.6 | 13.0 |
| Tractor Supply | 3 | NR / NR / NR | 57,090 | 16.9 | $13.89 | 14.4 | 14.6 |
| Dollar General | 5 | Baa2 / BBB / NR | 46,659 | 13.8 | $11.34 | 9.6 | 12.9 |
| Pick ’n Save | 1 | Baa1 / BBB / NR | 49,580 | 14.7 | $6.56 | 5.9 | 9.7 |
| Advance Auto Parts | 2 | Baa2 / BBB- / NR | 14,940 | 4.4 | $16.21 | 4.4 | 8.9 |
| Fresenius Medical Care | 1 | Baa3 / BBB- / BBB- | 10,325 | 3.1 | $20.29 | 3.8 | 8.6 |
| CVS Pharmacy | 1 | Baa1 / BBB / NR | 10,090 | 3.0 | $16.16 | 3.0 | 9.8 |
| Sherwin Williams | 1 | Baa3 / BBB / BBB | 4,528 | 1.3 | $23.02 | 1.9 | 9.2 |
| Dollar Tree | 1 | Baa3 / BBB- / NR | 9,725 | 2.9 | $9.74 | 1.7 | 8.8 |
| Total/Weighted Average: | 24 | 337,478 | 100.0% | 100.0% | 11.6 |
| (1) | Based on the October 15, 2018 underwritten rent roll. |
| (2) | Ratings provided are for the parent company of the entity listed in the “Tenant” field whether or not the parent company guarantees the lease. |
| (3) | Walgreens has the right to terminate its lease at (i) Walgreens - Austin, TX effective as of December 31, 2023 , (ii) Walgreens - Flower Mound, TX effective as of August 31, 2028, (iii) Walgreens - Lawrenceville, GA effective as of August 31, 2030, (iv) Walgreens - Oswego, IL effective as of December 31, 2030, (v) Walgreens - Romeoville, IL effective as of January 31, 2033, (vi) Walgreens - Sheboygan, WI effective as of August 31, 2030, and (vii) Walgreens - Waco, TX effective as of October 31, 2029 and for each such lease every five years thereafter until the respective lease expires. |
THE INFORMATION IN THIS STRUCTURAL AND COLLATERAL TERM SHEET IS NOT COMPLETE AND MAY BE AMENDED PRIOR TO THE TIME OF SALE. THIS TERM SHEET IS NOT AN OFFER TO SELL THESE SECURITIES AND IT IS NOT A SOLICITATION OF AN OFFER TO BUY THESE SECURITIES IN ANY JURISDICTION WHERE THE OFFER OR SALE IS NOT PERMITTED.
96
Mortgage Loan No. 7 — ExchangeRight Net Leased Portfolio 24
Lease Rollover Schedule(1)(2)
| Year | Number of Leases Expiring | NRA Expiring | % of NRA Expiring | UW Base Rent Expiring | % of UW Base Rent Expiring | Cumulative NRA Expiring | Cumulative % of NRA Expiring | Cumulative UW Base Rent Expiring | Cumulative % of UW Base Rent Expiring |
| MTM | 0 | 0 | 0.0% | $0 | 0.0% | 0 | 0.0% | $0 | 0.0% |
| 2019 | 0 | 0 | 0.0 | 0 | 0.0 | 0 | 0.0% | $0 | 0.0% |
| 2020 | 0 | 0 | 0.0 | 0 | 0.0 | 0 | 0.0% | $0 | 0.0% |
| 2021 | 0 | 0 | 0.0 | 0 | 0.0 | 0 | 0.0% | $0 | 0.0% |
| 2022 | 0 | 0 | 0.0 | 0 | 0.0 | 0 | 0.0% | $0 | 0.0% |
| 2023 | 1 | 13,826 | 4.1 | 245,000 | 4.4 | 13,826 | 4.1% | $245,000 | 4.4% |
| 2024 | 0 | 0 | 0.0 | 0 | 0.0 | 13,826 | 4.1% | $245,000 | 4.4% |
| 2025 | 0 | 0 | 0.0 | 0 | 0.0 | 13,826 | 4.1% | $245,000 | 4.4% |
| 2026 | 0 | 0 | 0.0 | 0 | 0.0 | 13,826 | 4.1% | $245,000 | 4.4% |
| 2027 | 2 | 19,743 | 5.9 | 364,508 | 6.6 | 33,569 | 9.9% | $609,508 | 11.0% |
| 2028 | 6 | 92,446 | 27.4 | 979,881 | 17.7 | 126,015 | 37.3% | $1,589,389 | 28.8% |
| 2029 & Beyond | 15 | 211,463 | 62.7 | 3,931,808 | 71.2 | 337,478 | 100.0% | $5,521,197 | 100.0% |
| Vacant | NAP | 0 | 0.0 | NAP | NAP | 337,478 | 100.0% | NAP | NAP |
| Total | 24 | 337,478 | 100.0% | $5,521,197 | 100.0% |
| (1) | Based on the October 15, 2018 underwritten rent roll. |
| (2) | Certain tenants may have lease termination options that are exercisable prior to the originally stated expiration date of the subject lease and that are not considered in the Lease Rollover Schedule. |
Operating History and Underwritten Net Cash Flow
| 2015(1) | 2016(1) | 2017(1) | TTM(1) | Underwritten(2) | PSF | %(3) | |
| Rents in Place | N/A | N/A | N/A | N/A | $5,521,197 | $16.36 | 94.5% |
| Vacant Income | N/A | N/A | N/A | N/A | 0 | $0.00 | 0.0% |
| Percentage Rent | N/A | N/A | N/A | N/A | 0 | $0.00 | 0.0% |
| Gross Potential Rent | N/A | N/A | N/A | N/A | $5,521,197 | $16.36 | 94.5% |
| Total Reimbursements(4) | N/A | N/A | N/A | N/A | 318,636 | $0.94 | 5.5% |
| Net Rental Income | N/A | N/A | N/A | N/A | $5,839,832 | $17.30 | 100.0% |
| (Vacancy/Collection Loss) | N/A | N/A | N/A | N/A | (214,678) | ($0.64) | (3.8%) |
| Other Income | N/A | N/A | N/A | N/A | 0 | $0.00 | 0.0% |
| Effective Gross Income | N/A | N/A | N/A | N/A | $5,625,154 | $16.67 | 100.0% |
| Total Expenses(5) | N/A | N/A | N/A | N/A | $462,350 | $1.37 | 8.2% |
| Net Operating Income | N/A | N/A | N/A | N/A | $5,162,804 | $15.30 | 91.8% |
| Total TI/LC, Capex/RR | N/A | N/A | N/A | N/A | 70,607 | $0.21 | 1.3% |
| Net Cash Flow | N/A | N/A | N/A | N/A | $5,092,198 | $15.09 | 90.5% |
| (1) | Historical cash flows are unavailable as the properties were acquired by the borrower between August 28, 2018 and October 23, 2018. The sellers of the properties did not provide historical operating statements to the borrower. |
| (2) | Underwritten Rents in Place is based on in-place rent under the existing leases. |
| (3) | % column represents percent of Net Rental Income for all revenue lines and represents percent of Effective Gross Income for the remainder of fields. |
| (4) | Underwritten Total Reimbursements are underwritten based on tenant leases. There are no reimbursements at eleven of the properties as tenants pay their respective property expenses directly. |
| (5) | Underwritten Total Expenses include real estate taxes, actual insurance premiums and management fees calculated as 3.0% of the properties’ effective gross income. |
THE INFORMATION IN THIS STRUCTURAL AND COLLATERAL TERM SHEET IS NOT COMPLETE AND MAY BE AMENDED PRIOR TO THE TIME OF SALE. THIS TERM SHEET IS NOT AN OFFER TO SELL THESE SECURITIES AND IT IS NOT A SOLICITATION OF AN OFFER TO BUY THESE SECURITIES IN ANY JURISDICTION WHERE THE OFFER OR SALE IS NOT PERMITTED.
97
Mortgage Loan No. 7 — ExchangeRight Net Leased Portfolio 24
Property Management.The property is managed by NLP Management, LLC, which is wholly owned by ExchangeRight Real Estate, LLC.
Escrows and Reserves.At origination, the borrower deposited into escrow $500,000 for tenant improvement and leasing commissions, $468,128 for replacement reserves, $73,329 for real estate taxes and $17,645 for deferred maintenance.
Tax & Insurance Reserve – On a monthly basis, the borrower is required to escrow $14,411 for real estate taxes. Collection of monthly insurance reserves (and common charges, if applicable) will be waived as they relate to certain tenants who have the right or obligation pursuant to their related leases to directly pay such expenses so long as, among other conditions, (i) no event of default under the loan documents has occurred and is continuing and (ii) the borrower timely pays the tax, insurance and common charge costs when incurred and the borrower promptly provides evidence to the lender of the payment of same (the “Trigger Period”). During the continuance of a Trigger Period, the borrower is required to deposit 1/12th of the annual estimated insurance premiums.
Replacement Reserves – On a monthly basis the borrower is required to escrow $1,803 for replacement reserves.
TI/LC Reserve – During an event of default under the loan documents, on a monthly basis, the borrower is required to escrow $19,686 for leasing expenses.
Lockbox / Cash Management.The Whole Loan is structured with a hard lockbox and springing cash management. All rents are required to be paid directly into an eligible account maintained by the borrower at a local bank selected by the borrower, which bank is required at all times to be an eligible institution as defined in the loan documents. Without limiting the foregoing, if the borrower, the Master Lessee or the manager receives any rents, then (i) such amounts will be deemed to be collateral for the Whole Loan and will be held in trust by the borrower, the Master Lessee or the manager, as applicable, for the benefit, and as the property, of the lender, (ii) such amounts may not be commingled with any other funds or property of the borrower, the Master Lessee, or the manager and (iii) the borrower, the Master Lessee, or the manager, as applicable, is required to deposit such amounts into a clearing account within two business days of receipt. Funds deposited into the clearing account will be swept by the clearing bank on a daily basis into the Master Lessee’s operating account at the clearing bank, unless a Cash Management Period (as defined below) is continuing, in which event such funds will be swept on a daily basis into an eligible account at a deposit bank controlled by the lender. To the extent any Cash Management Period expires or terminates, any funds deposited into the clearing account will be swept by the clearing bank on a daily basis into the Master Lessee’s operating account by the lender’s delivery of a notice to the clearing bank, with the lender being entitled to send a subsequent notice to the clearing bank upon the occurrence of a subsequent Cash Management Period to redirect all amounts from the clearing account to the deposit account.
A “Cash Management Period” will commence upon the lender giving notice to the clearing bank of the occurrence of any of the following: (i) the stated maturity date, (ii) a default or an event of default under the loan documents, (iii) if, as of any calculation date, the DSCR is less than 1.40x, or (iv) the payment date that occurs in November 2025, to the extent a one-time transfer of all of the outstanding ownership interests in the borrower to an approved transferee has not occurred as of such date.
THE INFORMATION IN THIS STRUCTURAL AND COLLATERAL TERM SHEET IS NOT COMPLETE AND MAY BE AMENDED PRIOR TO THE TIME OF SALE. THIS TERM SHEET IS NOT AN OFFER TO SELL THESE SECURITIES AND IT IS NOT A SOLICITATION OF AN OFFER TO BUY THESE SECURITIES IN ANY JURISDICTION WHERE THE OFFER OR SALE IS NOT PERMITTED.
98
(THIS PAGE INTENTIONALLY LEFT BLANK)
THE INFORMATION IN THIS STRUCTURAL AND COLLATERAL TERM SHEET IS NOT COMPLETE AND MAY BE AMENDED PRIOR TO THE TIME OF SALE. THIS TERM SHEET IS NOT AN OFFER TO SELL THESE SECURITIES AND IT IS NOT A SOLICITATION OF AN OFFER TO BUY THESE SECURITIES IN ANY JURISDICTION WHERE THE OFFER OR SALE IS NOT PERMITTED.
99
Mortgage Loan No. 8 — 2 North 6th Place
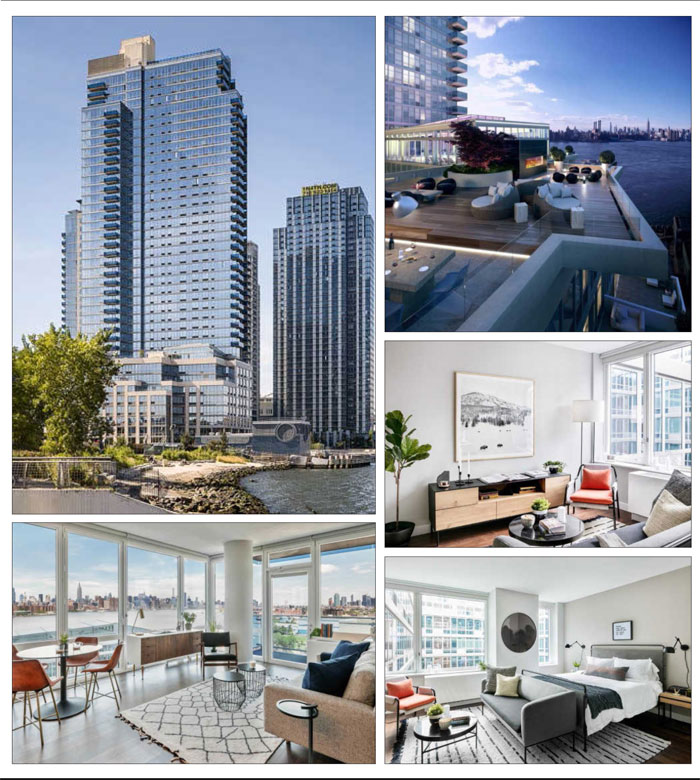
THE INFORMATION IN THIS STRUCTURAL AND COLLATERAL TERM SHEET IS NOT COMPLETE AND MAY BE AMENDED PRIOR TO THE TIME OF SALE. THIS TERM SHEET IS NOT AN OFFER TO SELL THESE SECURITIES AND IT IS NOT A SOLICITATION OF AN OFFER TO BUY THESE SECURITIES IN ANY JURISDICTION WHERE THE OFFER OR SALE IS NOT PERMITTED.
100
Mortgage Loan No. 8 — 2 North 6th Place
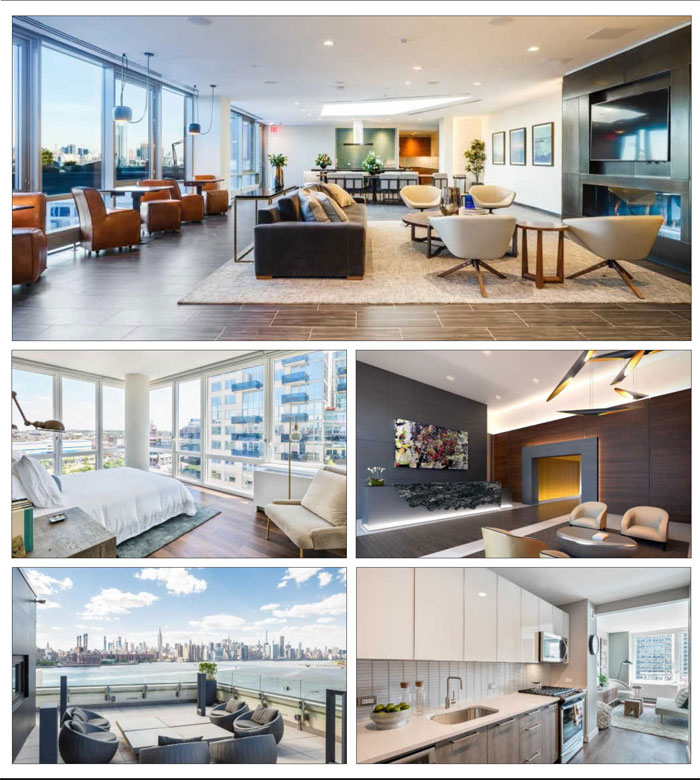
THE INFORMATION IN THIS STRUCTURAL AND COLLATERAL TERM SHEET IS NOT COMPLETE AND MAY BE AMENDED PRIOR TO THE TIME OF SALE. THIS TERM SHEET IS NOT AN OFFER TO SELL THESE SECURITIES AND IT IS NOT A SOLICITATION OF AN OFFER TO BUY THESE SECURITIES IN ANY JURISDICTION WHERE THE OFFER OR SALE IS NOT PERMITTED.
101
Mortgage Loan No. 8 — 2 North 6th Place
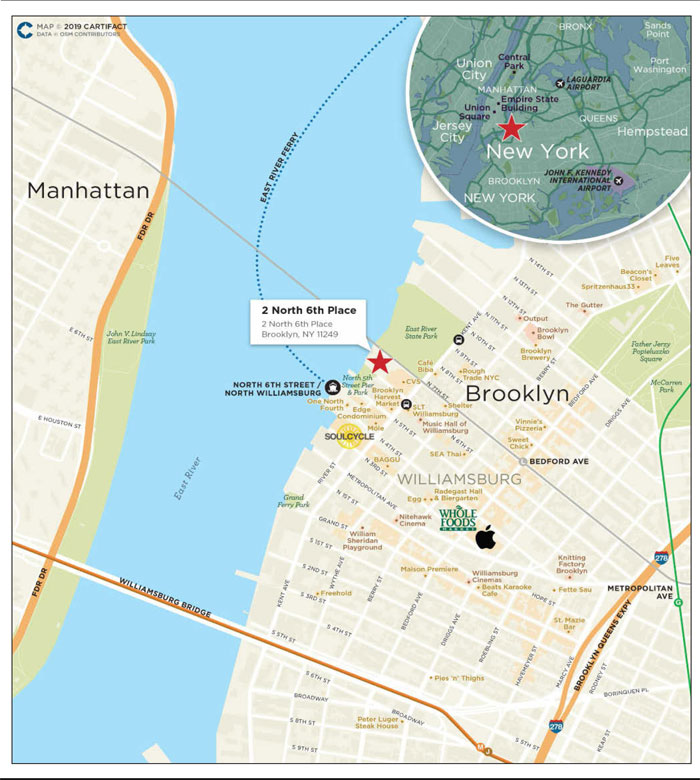
THE INFORMATION IN THIS STRUCTURAL AND COLLATERAL TERM SHEET IS NOT COMPLETE AND MAY BE AMENDED PRIOR TO THE TIME OF SALE. THIS TERM SHEET IS NOT AN OFFER TO SELL THESE SECURITIES AND IT IS NOT A SOLICITATION OF AN OFFER TO BUY THESE SECURITIES IN ANY JURISDICTION WHERE THE OFFER OR SALE IS NOT PERMITTED.
102
Mortgage Loan No. 8 — 2 North 6th Place
| Mortgage Loan Information | Property Information | |||
| Mortgage Loan Seller(1): | Column | Single Asset / Portfolio: | Single Asset | |
| Original Principal Balance(1): | $34,000,000 | Title: | Fee | |
| Cut-off Date Principal Balance(1): | $34,000,000 | Property Type - Subtype: | Multifamily – High Rise | |
| % of Pool by IPB: | 4.1% | Net Rentable Area (Units): | 554 | |
| Credit Assessment (Moody’s/Fitch/DBRS)(2): | Baa1 / BBB / AA(low) | Location: | Brooklyn, NY | |
| Loan Purpose: | Refinance | Year Built / Renovated: | 2018 / NAP | |
| Borrower: | 2 North 6th Place Property Owner LLC | Occupancy: | 85.6% | |
| Sponsor: | Jeffrey Levine | Occupancy Date: | 2/1/2019 | |
| Interest Rate: | 4.532153846% | Number of Tenants: | NAP | |
| Note Date: | 7/27/2018 | 2016 NOI(5): | N/A | |
| Maturity Date: | 8/5/2028 | 2017 NOI(5): | N/A | |
| Interest-only Period: | 120 months | T6 2018 Ann. NOI(5): | $14,752,819 | |
| Original Term: | 120 months | T3 2018 Ann. NOI(5): | $16,206,597 | |
| Original Amortization: | None | 2018 NOI(5): | $11,656,528 | |
| Amortization Type: | Interest Only | UW Economic Occupancy: | 82.4% | |
| Call Protection(3): | L(31), Def(85), O(4) | UW Revenues: | $26,244,495 | |
| Lockbox(4): | Soft | UW Expenses: | $6,380,005 | |
| Additional Debt(1): | Yes | UW NOI(5): | $19,864,491 | |
| Additional Debt Balance(1): | $346,000,000 | UW NCF(6): | $19,753,691 | |
| Additional Debt Type(1): | Pari Passu; Subordinate | Appraised Value / Per Unit: | $530,000,000 / $956,679 | |
| Additional Future Debt Permitted: | No | Appraisal Date: | 5/7/2018 |
| Escrows and Reserves(7) | Financial Information(1) | |||||
| Initial | Monthly | Initial Cap | Cut-off Date Loan Per Unit: | $289,892 | ||
| Taxes: | $0 | Springing | N/A | Maturity Date Loan Per Unit: | $289,892 | |
| Insurance: | $0 | Springing | N/A | Cut-off Date LTV: | 30.3% | |
| Replacement Reserve: | $0 | $9,233 | N/A | Maturity Date LTV: | 30.3% | |
| Leasing Expense Reserve: | $0 | Springing | N/A | UW NOI / UW NCF DSCR(6): | 2.69x / 2.68x | |
| Debt Service Reserve: | $10,000,000 | Springing | (7) | UW NOI / UW NCF Debt Yield: | 12.4% / 12.3% |
| Sources and Uses |
| Sources | Proceeds | % of Total | Uses | Proceeds | % of Total | |
| A Notes: | $160,600,000 | 42.3% | Payoff Existing Debt: | $253,203,532 | 66.6% | |
| Note A-B: | 99,400,000 | 26.2 | Return of Equity: | 109,913,550 | 28.9 | |
| B Note: | 120,000,000 | 31.6 | Upfront Reserves: | 10,000,000 | 2.6 | |
| Closing Costs: | 6,882,918 | 1.8 | ||||
| Total Sources: | $380,000,000 | 100.0% | Total Uses: | $380,000,000 | 100.0% |
| (1) | The 2 North 6th Place loan is part of a larger split whole loan evidenced by three seniorpari passu notes (collectively, the “A Notes”), with an aggregate Cut-off Date balance of $160.6 million, one senior subordinate note, with a Cut-off Date balance of $99.4 million (the “Note A-B”) and one junior subordinate note, with a Cut-off Date Balance of $120.0 million (the “B Note”, together with the A Notes and Note A-B, the “Whole Loan”), with an aggregate Cut-off Date Balance of $380.0 million. The Whole Loan was originated by Natixis Real Estate Capital LLC and the Note A-2 was subsequently acquired by Column. The financial information presented in the chart above and herein reflects the balance of the A Notes, but not the Note A-B or the B Note. |
THE INFORMATION IN THIS STRUCTURAL AND COLLATERAL TERM SHEET IS NOT COMPLETE AND MAY BE AMENDED PRIOR TO THE TIME OF SALE. THIS TERM SHEET IS NOT AN OFFER TO SELL THESE SECURITIES AND IT IS NOT A SOLICITATION OF AN OFFER TO BUY THESE SECURITIES IN ANY JURISDICTION WHERE THE OFFER OR SALE IS NOT PERMITTED.
103
Mortgage Loan No. 8 — 2 North 6th Place
| (2) | Moody’s, Fitch and DBRS have each confirmed that the loan has, in the context of its inclusion in the Initial Pool Balance, credit characteristics consistent with an investment grade obligation. |
| (3) | Following the lockout period, the Whole Loan can be defeased at any time after the earlier to occur of (i) two years after the closing date of the securitization that includes the lastpari passu note to be securitized and (ii) July 27, 2021. |
| (4) | For a more detailed description of Lockbox, please refer to “Lockbox / Cash Management” below. |
| (5) | Historical financials are not available as the construction of the property was completed in 2018. UW NOI is higher than the 2018 NOI as occupancy increased from 58.8% in July 2018 to 85.6% as of February 1, 2019 since the temporary certificate of occupancy was received in June 2018. |
| (6) | The appraiser concluded an “as-stabilized” NCF of $26,678,976 as of June 1, 2019, resulting in an “as-stabilized” NCF DSCR of 3.62x and Whole Loan NCF DSCR of 1.49x. |
| (7) | For a more detailed description of Escrows and Reserves, please refer to “Escrows and Reserves” below. |
The Loan. The 2 North 6th Place loan, which is part of the Whole Loan, is a first mortgage loan secured by the borrower’s fee simple interest in a newly constructed, 40-story, 554-unit multifamily tower located at 2 North 6th Place in Brooklyn, New York. The Whole Loan has a 10-year term and is interest-only for the entire term.
The Whole Loan is comprised of three seniorpari passu notes with an aggregate Cut-off Date balance of $160.6 million, Note A-B with a Cut-off Date balance of $99.4 million and the B Note with a Cut-off Date balance of $120.0 million.
Note A-2 is being contributed to the CSAIL 2019-C15 Commercial Mortgage Trust. The Whole Loan is expected to be serviced under the CSAIL 2019-C15 pooling and servicing agreement until the securitization of the Note A-1. After the securitization of the Note A-1, the Whole Loan is expected to be serviced under the pooling and servicing agreement or trust and servicing agreement governing the securitization of the Note A-1. Under the 2 North 6th Place co-lender agreement and the CSAIL 2019-C15 pooling and servicing agreement, the directing holder will be (i) until the outstanding principal balance of the B Note (taking into account any appraisal reduction amounts or realized losses allocated to the B Note) is less than 25% of (a) the initial principal balance of the B Note less (b) any principal payment allocated to and received by the holder of such companion loan (“B Note Control Appraisal Period”), the holder of the B Note and (ii) during the continuance of a B Note Control Appraisal Period until the outstanding principal balance of the Note A-B (taking into account any appraisal reduction amounts or realized losses allocated to the Note A-B) is less than 25% of (a) the initial principal balance of the Note A-B less (b) any principal payment allocated to and received by the holder of such companion loan (“Note A-B Control Appraisal Period”), the holder of the Note A-B and (iii) during the continuance of a Note A-B Control Appraisal Period, the holder of the Note A-1; however, the holders of the remaining senior notes are entitled, under certain circumstances and only if a Note A-B Control Appraisal Period is in effect, to consult with respect to certain major decisions. For more information see “Description of the Mortgage Pool – The Whole Loans – The Serviced AB Whole Loan – The 2 North 6th Place Whole Loan” in the Preliminary Prospectus.
Whole Loan Note Summary
| Original Balance | Cut-off Date Balance | Note Holder | Lead Servicer for Whole Loan (Y/N) | Controlling Piece (Y/N) | |
| Notes A-1, A-3(1) | $126,600,000 | $126,600,000 | Natixis Real Estate Capital LLC | Y | N |
| Note A-2 | 34,000,000 | 34,000,000 | CSAIL 2019-C15 | N | N |
| Note A-B(1) | 99,400,000 | 99,400,000 | Natixis Real Estate Capital LLC | N | N |
| B Note | 120,000,000 | 120,000,000 | Unaffiliated Third Party Investor | N | Y |
| Total: | $380,000,000 | $380,000,000 |
| (1) | Notes are expected to be contributed to one or more future securitizations. |
THE INFORMATION IN THIS STRUCTURAL AND COLLATERAL TERM SHEET IS NOT COMPLETE AND MAY BE AMENDED PRIOR TO THE TIME OF SALE. THIS TERM SHEET IS NOT AN OFFER TO SELL THESE SECURITIES AND IT IS NOT A SOLICITATION OF AN OFFER TO BUY THESE SECURITIES IN ANY JURISDICTION WHERE THE OFFER OR SALE IS NOT PERMITTED.
104
Mortgage Loan No. 8 — 2 North 6th Place
Total Debt Capital Structure
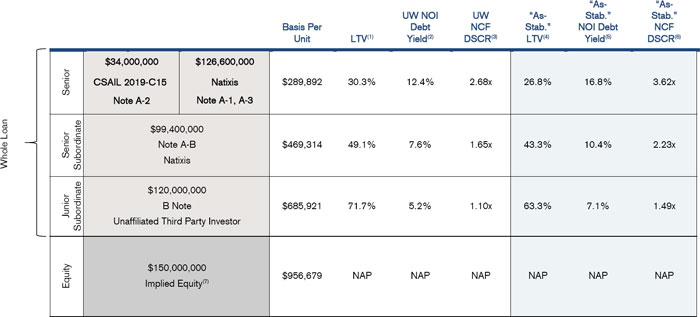
| (1) | Based on the “as-is” appraised value of $530.0 million as of May 7, 2018. |
| (2) | Based on the UW NOI of $19,864,491. |
| (3) | Based on the UW NCF of $19,753,691 and the coupon of 4.532153846% on both the A Notes and Note A-B and 4.8800% on the B Note. |
| (4) | Based on the “as-stabilized” appraised value of $600.0 million as of June 1, 2019. The appraiser concluded a 3.0% total vacancy and collection loss for the residential income throughout the holding period on a stabilized basis. |
| (5) | Based on the “as-stabilized” appraisal NOI of $26,925,302. |
| (6) | Based on the “as-stabilized” appraisal NCF of $26,678,976 and the coupon of 4.532153846% on both the A Notes and Note A-B and 4.8800% on the B Note. |
| (7) | Implied Equity is based on the “as-is” appraised value of $530.0 million, less total debt of $380.0 million. |
The Borrower. The borrowing entity for the Whole Loan is 2 North 6th Place Property Owner LLC, a Delaware limited liability company structured to be a bankruptcy remote special purpose entity with two independent directors. The Borrower is owned 80% by 2 North 6th REIT, LLC and 20% by Velin Ventures 2, LLC. 2 North 6th REIT, LLC is owned 60% by AIGGRE Edge Investor, LLC and 40% by 2 North 6th Operator, LP (ultimately controlled by MacFarlane Partners Investment Management, LLC). AIG Global Real Estate Investment Corp. (“AIG Global Real Estate”) is the non-member manager of AIGGRE Edge Investor, LLC. AIG Global Real Estate, founded in 1987, comprises a group of international companies that invests in and manages approximately $20.2 billion of real estate (as of September 30, 2018) for clients and AIG member companies in various countries. Through its network of globally located offices, AIG Global Real Estate offers fully integrated real estate investment and development with capabilities in investment, asset management, legal & finance, development & construction, portfolio management, valuation and tax, property and real estate accounting. AIG Global Real Estate is headquartered in New York and Los Angeles with several regional offices, including Atlanta, London, San Francisco, Shanghai, and Stowe, Vermont.
The Sponsor. The loan’s sponsor and nonrecourse carve-out guarantor of the Whole Loan is Jeffrey Levine. Jeffrey Levine isthe Chairman of Douglaston Development. Douglaston Development, is the development branch of Douglaston Companies, a large and active residential developer in New York City. Since its founding in 1979, Douglaston Development, along with Levine Builders (the construction management branch of Douglaston Companies), have completed over $2 billion of development, including: 4,000 market-rate and affordable residential apartments, 1,272 aggregate senior housing units and 500 hotel rooms in New York City neighborhoods. In addition, the sponsor has 2,051 market-rate units, affordable apartments, hospitality and senior housing units in its current pipeline for the New York City metro area.
THE INFORMATION IN THIS STRUCTURAL AND COLLATERAL TERM SHEET IS NOT COMPLETE AND MAY BE AMENDED PRIOR TO THE TIME OF SALE. THIS TERM SHEET IS NOT AN OFFER TO SELL THESE SECURITIES AND IT IS NOT A SOLICITATION OF AN OFFER TO BUY THESE SECURITIES IN ANY JURISDICTION WHERE THE OFFER OR SALE IS NOT PERMITTED.
105
Mortgage Loan No. 8 — 2 North 6th Place
The Property.The property is a newly constructed, 40-story, 554-unit multifamily tower located in Brooklyn, New York. The construction of this Class A multifamily property was completed in 2018 with top tier finishes and amenities. The property received its first temporary certificate of occupancy (“TCO”) in July 2017 for floors 10-19. TCOs for additional floors were received every month thereafter and the TCO for all floors was received in June 2018.The property has leased up from 58.8% occupied in July 2018 to 85.6% as of February 1, 2019.
TCO Schedule and Leasing Velocity(1)(2)
| Jul-17 | Aug-17 | Sep-17 | Oct-17 | Nov-17 | Dec-17 | Jan-18 | Feb-18 | Mar-18 | Apr-18 | May-18 | Jun-18 | |
Floors with TCO | 10-19 | 20-23 | 9, 24-26 | 5-6, 10-15 | 4N, 7, 16-20 | 6S, 8, 27-29 | 4-5S, 21-29 | 3, 30 | 31, 33-35 | 36-38 | 32, 39-40 | 1-2 |
| Leased | 6.1% | 13.0% | 16.5% | 20.3% | 24.2% | 26.6% | 31.1% | 36.2% | 41.0% | 47.7% | 53.9% | 60.0% |
| (1) | Provided by the sponsor. |
| (2) | The property is 85.6% leased as of the February 1, 2019 underwritten rent roll. |
According to the appraiser, the property is expected to stabilize in June 2019 with a 3.0% total vacancy and collection loss for the residential income throughout the holding period on a stabilized basis. The sponsor began developing the property in 2014 and completed it in June 2018 for a total cost basis of approximately $425.8 million ($768,541 per unit) including approximate land costs of $115.3 million, construction costs of $251.3 million, soft costs of $36.2 million and financing costs of $23.0 million. At origination, the borrower had approximately $39.1 million of equity remaining in the property.
The building was designed by the Stephen B. Jacobs Group with interiors by Andi Pepper. It is the fifth and final residential tower of the Williamsburg Edge Master Plan as well as the tallest and final phase of the three-building complex known as “The Edge” which was developed by Douglaston Development. The property was awarded the 2017 Building & Design Award from the Queens and Bronx Building Association and placed as a finalist for the 2017 National Association of Home Builders Pillars of the Industry Award for Best High-Rise Apartment Community. The property is comprised of approximately 590,659 gross SF, and includes 471,494 rentable residential SF, 678 SF of retail space, a parking garage with 160 spaces, and 35,000 SF of open amenity space. The property also provides immediate access to three public piers, a public esplanade and a water ferry landing, all located adjacent to the property. The property features 554 units, including 129 studio units, 182 one-bedroom units, 176 two-bedroom units, and 67 three-bedroom units. The average unit size ranges from 511 SF to 1,416 SF with an average size of 851 SF.
The property’s amenities include a 24-hour concierge, dry cleaning, pet care, housekeeping, business center, indoor valet parking, bike storage, and free Wi-Fi. In addition, there is a 7,600 SF terrace complete with an indoor/outdoor pool, hot tub, steam room and sauna. The building’s amenities also include lounge seating located on the 9th floor overlooking the East River, outdoor BBQ areas with three grills, media lounge with billiards, party room with kitchen, a children’s playroom and state of the art fitness equipment with integrated media plus yoga room/movement studio. The units are finished with approximately 9-foot ceiling heights, floor to ceiling windows with Manhattan skyline views, custom solar shades, smoked walnut wood flooring and a Bosch washer/dryer. Many units include a private balcony or terrace. In addition, green building systems have been incorporated in the construction of the property, which includes Energy Star appliances, recycled and Forest Stewardship Council certified finishes, low-E (low emissivity) double-pane windows and New York State Energy Research and Development Authority multi-family environmental certification.
The property is located at 2 North 6th Place along the East River and immediately adjacent to East River State Park. Located in the Williamsburg neighborhood of Brooklyn, the property has direct access to public transportation, including L train subways and transit bus lines. According to a statement by New York government officials in early January 2019, the originally planned 15-month L train shut down has been cancelled and an alternative repair method will be used to repair damages that occurred in 2012 from Hurricane Sandy’s floodwaters. A December 2018 third party market data provider study found that demand for rentals in Williamsburg declined 1% since October 2017. These trends may reverse now that the L train will remain at least partially open. Since the statement of the cancelled L train shut down, the property has leased up from 79.1% in December 2018 to 85.6% in February 2019. Furthermore, the North Williamsburg landing for the East River Ferry is located at the base of the property.
THE INFORMATION IN THIS STRUCTURAL AND COLLATERAL TERM SHEET IS NOT COMPLETE AND MAY BE AMENDED PRIOR TO THE TIME OF SALE. THIS TERM SHEET IS NOT AN OFFER TO SELL THESE SECURITIES AND IT IS NOT A SOLICITATION OF AN OFFER TO BUY THESE SECURITIES IN ANY JURISDICTION WHERE THE OFFER OR SALE IS NOT PERMITTED.
106
Mortgage Loan No. 8 — 2 North 6th Place
Multifamily Unit Mix(1)
| Unit Type | No. of Units | % of Total | Occupied Units | Occupancy | Average Unit Size (SF) | Average Monthly Rental Rate | Average Monthly Rental Rate PSF | Monthly Market Rental Rate(2) | Monthly Market Rental Rate PSF(2) |
| Studio | 129 | 23.3% | 125 | 96.9% | 511 | $2,910 | $5.71 | $3,162 | $5.83 |
| 1 BR | 182 | 32.9% | 159 | 87.4% | 682 | $3,946 | $5.82 | $4,124 | $5.83 |
| 2 BR(3) | 176 | 31.8% | 148 | 84.1% | 1,060 | $5,872 | $5.56 | $6,307 | $5.83 |
| 3 BR | 67 | 12.1% | 42 | 62.7% | 1,416 | $7,895 | $5.66 | $8,481 | $5.83 |
| Total/Wtd. Avg. | 554 | 100.0% | 474 | 85.6% | 851 | $4,624 | $5.67 | $6,202 | $5.83 |
| (1) | Based on the underwritten rent roll dated February 1, 2019. |
| (2) | Source: Appraisal. |
| (3) | There is one 2 BR unit totaling 1,367 SF designated as the employee unit. There is no associated rent and such unit is underwritten as vacant. |
The Market. The property is located in Brooklyn, New York within the Williamsburg neighborhood. Williamsburg is situated in the northwestern section of the borough, which has transformed during the previous two decades into a mixed-use area. The neighborhood’s close proximity to Manhattan, formerly cheap rents, and large loft spaces attracted a significant number of artists, musicians, and other young residents, which led to the development of new restaurants, art galleries, and music venues, making Williamsburg a destination for culture and nightlife in New York City. Newer residential developments have generally comprised luxury loft type space or new towers on the waterfront with full amenities. Due to the robust development of multifamily properties in the Williamsburg neighborhood, there has been significant retail growth in the area. Whole Foods and Apple, which are both located five blocks from the property, have brought foot traffic to the area and furthered Williamsburg as a prime residential and retail location in Brooklyn.
The property has direct access to public transportation. Williamsburg is served by three subway lines: the BMT Canarsie Line (L train) on the north, the BMT Jamaica Line (J, M and Z trains) on the south, and the IND Crosstown Line (G train) on the east. The Williamsburg Bridge crosses the East River to the lower east side of Manhattan. Williamsburg is also served by the Brooklyn–Queens Expressway. Several bus routes, including the B24, B32, B39, B44, B44 SBS, B46, B60 and Q54 terminate near the subject property. Additional transportation includes the East River Ferry that provides service to Manhattan, Queens, and other parts of Brooklyn, and the North Williamsburg landing for the East River Ferry which is located at the base of the property. Furthermore, New York City government officials have announced a plan to extend ferry service to South Brooklyn, Astoria, the Rockaways in Queens, as well as to the Lower East Side of Manhattan and to Soundview in the Bronx. The new “Citywide Ferry Service” is expected to operate across 6 routes and 21 landings throughout New York City at the same price as a subway fare. As part of the service, 18 new boats are expected to be delivered, each fully equipped with Wi-Fi and engines that meet the highest Environmental Protection Agency standards.
According to a third party market research report, the estimated 2018 population and average household income within a one-, three-, and five-mile radius of the property is 128,617, 1,249,941, and 3,080,341, respectively, and $106,049, $137,112, and $128,316, respectively.
According to a third party market research report, the property is located within the Kings County multifamily submarket that has a reported vacancy rate as of fourth quarter 2018 of 6.5% with effective rents of $2,484 per unit per month. The current effective rent of $2,484 has increased by 6.4% from fourth quarter 2017 and increased by 35.7% from 2013. The submarket is comprised of 40,683 units as of fourth quarter 2018. 3,795 new completion units have been delivered and 3,775 units were absorbed across the Kings County multifamily submarket in 2018. In 2019, an additional 7,395 new completion units are expected to be delivered and 6,706 units are expected to be absorbed according to a third party market research report. There is currently no competing high-rise rental product available in the Northside neighborhood of Williamsburg, other than the 509-unit development located at 1 North 4th Place. Additionally, the Greenpoint-Williamsburg Land Use and Waterfront Plan prohibits buildings over 70 feet tall in Williamsburg except in the two waterfront locations occupied by the Edge and Northside Piers zoning lots.
THE INFORMATION IN THIS STRUCTURAL AND COLLATERAL TERM SHEET IS NOT COMPLETE AND MAY BE AMENDED PRIOR TO THE TIME OF SALE. THIS TERM SHEET IS NOT AN OFFER TO SELL THESE SECURITIES AND IT IS NOT A SOLICITATION OF AN OFFER TO BUY THESE SECURITIES IN ANY JURISDICTION WHERE THE OFFER OR SALE IS NOT PERMITTED.
107
Mortgage Loan No. 8 — 2 North 6th Place
Competitive Set Summary(1)
| Property | Year Built | No. of Units | Unit Type | Avg. Unit Size (SF) | Weighted Avg. $/Unit | Proximity (miles) |
| 2 North 6th Place | 2018 | 554(2) | Studio, 1 BR, 2 BR, 3 BR(2) | 851(2) | $4,624(2) | N/A |
| 1 North 4th Place | 2015 | 509 | Studio, 1 BR, 2 BR, 3 BR | 876 | $5,574 | 0.2 |
| 325 Kent | 2017 | 522 | Studio, 1 BR, 2 BR | 617 | $4,538 | 0.6 |
| 250 N 10 | 2014 | 234 | Studio, 1 BR, 2 BR | 747 | $4,476 | 0.7 |
| Atelier | 2015 | 120 | Studio, 1 BR | 573 | $3,257 | 0.6 |
| The Williams | 2016 | 82 | Studio, 1 BR, 2 BR | 692 | $4,295 | 1.1 |
| The Ashland | 2016 | 586 | Studio, 1 BR, 2 BR, 3 BR | 908 | $5,755 | 3.3 |
| 300 Ashland | 2016 | 379 | Studio, 1 BR, 2 BR | 708 | $4,553 | 3.4 |
| 60 Water Street | 2015 | 290 | Studio, 1 BR, 2 BR | 715 | $5,229 | 2.8 |
| The Halo LIC | 2016 | 284 | 1 BR, 2 BR, 3 BR | 979 | $5,557 | 2.7 |
| Tower28 | 2017 | 451 | Studio, 1 BR, 2 BR | 761 | $4,320 | 2.8 |
| (1) | Source: Appraisal. |
| (2) | Based on the February 1, 2019 underwritten rent roll. |
Historical and Current Occupancy
| 2016(1) | 2017(1) | 2018(2) | January 2019(3) | Current(4) |
| N/A | N/A | 79.1% | 81.2% | 85.6% |
| (1) | Historical occupancy information is not available as the construction of the property was completed in 2018. |
| (2) | Based on the December 13, 2018 rent roll. The TCO for all floors was received in June 2018 and the property has leased up from 58.8% in July 2018. |
| (3) | Based on the January 7, 2019 rent roll. |
| (4) | Based on the February 1, 2019 underwritten rent roll. |
Sales Comparable Summary(1)
| Property | Year Built | No. of Units | Gross Building Area (SF) | Sale Price | Sale Date | Adj. Sale $PSF | Proximity (miles) |
| 2 North 6th Place | 2018 | 554(2) | 590,659 | $445,000,000(3) | N/A | $750 | N/A |
| 670 Pacific Street | 2016 | 86 | 68,477 | $69,200,000 | Feb-18 | $765 | 3.5 |
| The Addison | 2009 | 271 | 228,246 | $154,250,000 | Dec-16 | $815 | 3.4 |
| The Berkley | 2016 | 95 | 71,619 | $68,875,000 | Dec-16 | $808 | 0.6 |
| 341 Eastern Parkway | 2013 | 63 | 65,641 | $52,000,000 | Oct-16 | $774 | 3.8 |
| Atelier Williamsburg | 2015 | 120 | 110,161 | $79,672,500 | Mar-16 | $583 | 0.6 |
| 247 North 7th Street & 248 North 8th Street | 2015 | 169 | 151,766 | $125,000,000 | Mar-16 | $666 | 0.6 |
| 110 Green Street | 2008 | 130 | 173,476 | $103,500,000 | Jan-16 | $775 | 1.2 |
| 41-11/41-17 Crescent Street Long Island City | 2007 | 121 | 132,217 | $96,000,000 | Jan-16 | $707 | 3.0 |
| (1) | Source: Appraisal. |
| (2) | Based on the February 1, 2019 underwritten rent roll. |
| (3) | For the purpose of valuation, the appraiser analyzed the sales comparable values on a PSF basis. The appraiser concluded a prospective market value of $610,000,000 based on sales comparison approach and including the present value of the 421a tax abatement, estimated by the appraiser to be $165,000,000. |
THE INFORMATION IN THIS STRUCTURAL AND COLLATERAL TERM SHEET IS NOT COMPLETE AND MAY BE AMENDED PRIOR TO THE TIME OF SALE. THIS TERM SHEET IS NOT AN OFFER TO SELL THESE SECURITIES AND IT IS NOT A SOLICITATION OF AN OFFER TO BUY THESE SECURITIES IN ANY JURISDICTION WHERE THE OFFER OR SALE IS NOT PERMITTED.
108
Mortgage Loan No. 8 — 2 North 6th Place
Operating History and Underwritten Net Cash Flow(1)
| 2015(1) | 2016(1) | T6 2018 Ann. | T3 2018 Ann. | 2018(2) | Appraisal Stabilized Year 1(3) | Underwritten(2)(3) | Per Unit | %(4) | |
| Rents in Place | N/A | N/A | $23,015,488 | $24,747,411 | $17,695,327 | $31,516,837 | $26,302,034 | $47,477 | 79.2% |
| Vacant Income | N/A | N/A | 9,214,427 | 7,590,036 | 14,286,140 | 1,034,453 | 5,953,570 | $10,747 | 17.9% |
| Gross Potential Rent | N/A | N/A | $32,229,914 | $32,337,447 | $31,981,467 | $32,551,290 | $32,255,604 | $58,223 | 97.2% |
| Total Reimbursements | N/A | N/A | 458,758 | 510,661 | 380,427 | 800,659 | 537,927 | $971 | 1.6% |
| Other Income | N/A | N/A | 457,777 | 521,619 | 337,622 | 357,630 | 397,622 | $718 | 1.2% |
| Net Rental Income | N/A | N/A | $33,146,449 | $33,369,726 | $32,699,515 | $33,709,579 | $33,191,152 | $59,912 | 100.0% |
| (Vacancy/Concessions) | N/A | N/A | (11,167,101) | (9,754,000) | (15,274,509) | (1,034,453) | (6,946,657) | ($12,539) | (20.9%) |
| Effective Gross Income | N/A | N/A | $21,979,348 | $23,615,726 | $17,425,007 | $32,675,126 | $26,244,495 | $47,373 | 79.1% |
| Total Expenses(5) | N/A | N/A | $7,226,529 | $7,409,129 | $5,768,478 | $5,749,824 | $6,380,005 | $11,516 | 24.3% |
| Net Operating Income | N/A | N/A | $14,752,819 | $16,206,597 | $11,656,528 | $26,925,302 | $19,864,491 | $35,856 | 75.7% |
| Total TI/LC, Capex/RR | N/A | N/A | 0 | 0 | 0 | 246,326 | 110,800 | $200 | 0.4% |
| Net Cash Flow | N/A | N/A | $14,752,819 | $16,206,597 | $11,656,528 | $26,678,976 | $19,753,691 | $35,656 | 75.3% |
| (1) | Historical financial information is not available as the construction of the property was completed in 2018. |
| (2) | The Underwritten Net Operating Income (the “NOI”) is higher than the 2018 NOI due to the increase in occupancy at the property. The property received the final TCO for all floors in June 2018 and the occupancy increased from 58.8% in July 2018 to 85.6% as of the February 1, 2019 underwritten rent roll. The Underwritten Vacancy is based on actual economic vacancy and Concessions are underwritten to the 2019 budget provided by the sponsor. |
| (3) | The Appraisal Stabilized Year 1 reflects the appraiser’s forecasted performance for June 2019 to June 2020 based on following assumptions: the current vacant units at the property leased by June 1, 2019 at $70.00 PSF, stabilized residential vacancy and collection loss of 3.0%, real estate tax expenses remain at the appraiser’s 2018/2019 421a tax abatement projection, and operating expenses growing at 3.5% annually. The appraiser’s stabilized NOI growth relative to Underwritten NOI is primarily due the appraiser’s stabilized 3.0% vacancy assumption compared to the underwritten economic vacancy of 17.6%. Additionally, the appraiser’s stabilized Total Expenses exclude $817,335 of marketing fees included in Underwritten Total Expenses. |
| (4) | % column represents percent of Net Rental Income for all revenue lines and represents percent of Effective Gross Income for remainder of the fields. |
| (5) | Underwritten expenses are based on historical operating statements and 2018/2019 actual fees. Underwritten Total Expenses include marketing expense, which is underwritten to annualized amount as of July 2018, August 2018, November 2018 and December 2018. The marketing fee was not listed as an expense prior to July 2018. According to the sponsor, the marketing fee for September 2018 and October 2018 doesn’t correctly reflect the actual expense as it included historical bills not previously received. The sponsor’s 2019 budget marketing expense is $275,000. Property owner’s association expenses are underwritten to 2018 budget provided by the sponsor and underwritten insurance expense is based on the Appraisal stabilized cash flow. |
Property Management. Clinton Management, LLC, a borrower-related company, manages the property. Founded in 2002 by Douglaston Development, Clinton Management, LLC is a full-service property management company providing comprehensive property management services for a broad property portfolio that currently consists of approximately 3,000 residential units, as well as commercial, retail and parking garages.
Escrows and Reserves. At origination, the borrower deposited into escrow $10,000,000 for debt service of the Whole Loan.
Debt Service Reserves – In the event that amounts on deposit in the Debt Service Reserve fall below $2,500,000, the borrower will replenish the Debt Service Reserve to $5,000,000. If at any time, the DSCR of the Whole Loan exceeds 1.10x calculated on the 30-year amortization schedule for three consecutive months, and provided no event of default exists under the loan documents, the balance in the Debt Service Reserve will be remitted to the borrower and the borrower will have no further obligations to replenish the Debt Service Reserve.
Tax & Insurance Escrow –On a monthly basis the borrower is required to escrow 1/12th of the annual estimated tax payments and 1/12th of the annual estimated insurance payments. The monthly tax and insurance escrow is waived so long as (i) there is no event of default under the loan documents, (ii) the borrower pays all taxes when due and provides the lender evidence of such payment promptly, (iii) the insurance policies maintained by the borrower covering the property comply with the terms in the loan documents, (iv) the borrower provides evidence of renewal of such insurance policies, and (v) the borrower provides paid receipts for the payment of the insurance premiums by no later than 30 days after the expiration dates of such insurance policies.
Replacement Reserves – On a monthly basis the borrower is required to escrow $9,233 for replacement reserves.
THE INFORMATION IN THIS STRUCTURAL AND COLLATERAL TERM SHEET IS NOT COMPLETE AND MAY BE AMENDED PRIOR TO THE TIME OF SALE. THIS TERM SHEET IS NOT AN OFFER TO SELL THESE SECURITIES AND IT IS NOT A SOLICITATION OF AN OFFER TO BUY THESE SECURITIES IN ANY JURISDICTION WHERE THE OFFER OR SALE IS NOT PERMITTED.
109
Mortgage Loan No. 8 — 2 North 6th Place
Leasing Expense Reserves – On each payment date during a Cash Management Period (as defined below) the borrower is required to deposit rents attributable to the budgeted approved leasing expenses for the upcoming calendar month.
Lockbox / Cash Management. The Whole Loan is structured with a soft lockbox and springing cash management. Prior to the continuance of a Cash Management Period, all funds in the lockbox account will be disbursed to the borrower. During the continuance of a Cash Management Period, funds in the lockbox account are transferred to a cash management account and are required to be applied on each monthly payment date to fund the required reserves deposits, to pay debt service on the Whole Loan, all funds in the lockbox account will be swept daily to a cash management account under the control of the lender and all excess cash flow, after payments made in accordance with the loan documents for, amongst other things, debt service, required reserves and operating expenses, will be held as additional collateral for the loan.
A “Cash Management Period” will commence upon: (i) an event of default under the loan documents or (ii) from and after July 1, 2019, the failure by the borrower, after the end of two consecutive calendar quarters, to maintain a DSCR (based on the trailing 6 months and actual debt service payments of the Whole Loan) of at least 1.20x.
Additional Debt. In addition to the A Notes, the property is also security for the Note A-B, with a Cut-off Date balance of $99,400,000 and for the B Note, with a Cut-off Date balance of $120,000,000. The Note A-B accrues interest at a rate of 4.532153846% and is entitled to payments of interest on a subordinate basis to the A Notes. The B Note accrues interest at a rate of 4.8800% and is entitled to payments of interest on a subordinate basis to the A Notes and the Note A-B. For more information see“Description of the Mortgage Pool—The Whole Loans—The Serviced AB Whole Loan—The 2 North 6th Place Whole Loan” in the Preliminary Prospectus.
Tax Abatement. The property has the benefit of a 421-a tax abatement, resulting from the construction of 347 affordable housing units on an adjacent, non-collateral development. Under the 421-a tax exemption, taxes are based on the property’s pre-construction assessment. The property’s increase in assessed value is 100% exempt for 21 years, with taxes phasing in at 20% increments annually during the 22nd through 25th years. For more information see “Description of the Mortgage Pool—Mortgage Pool Characteristics—Property Types—Multifamily Properties” and “Description of the Mortgage Pool—Real Estate and Other Tax Considerations” in the Preliminary Prospectus.
THE INFORMATION IN THIS STRUCTURAL AND COLLATERAL TERM SHEET IS NOT COMPLETE AND MAY BE AMENDED PRIOR TO THE TIME OF SALE. THIS TERM SHEET IS NOT AN OFFER TO SELL THESE SECURITIES AND IT IS NOT A SOLICITATION OF AN OFFER TO BUY THESE SECURITIES IN ANY JURISDICTION WHERE THE OFFER OR SALE IS NOT PERMITTED.
110
(THIS PAGE INTENTIONALLY LEFT BLANK)
THE INFORMATION IN THIS STRUCTURAL AND COLLATERAL TERM SHEET IS NOT COMPLETE AND MAY BE AMENDED PRIOR TO THE TIME OF SALE. THIS TERM SHEET IS NOT AN OFFER TO SELL THESE SECURITIES AND IT IS NOT A SOLICITATION OF AN OFFER TO BUY THESE SECURITIES IN ANY JURISDICTION WHERE THE OFFER OR SALE IS NOT PERMITTED.
111
Mortgage Loan No. 9 — Saint Louis Galleria
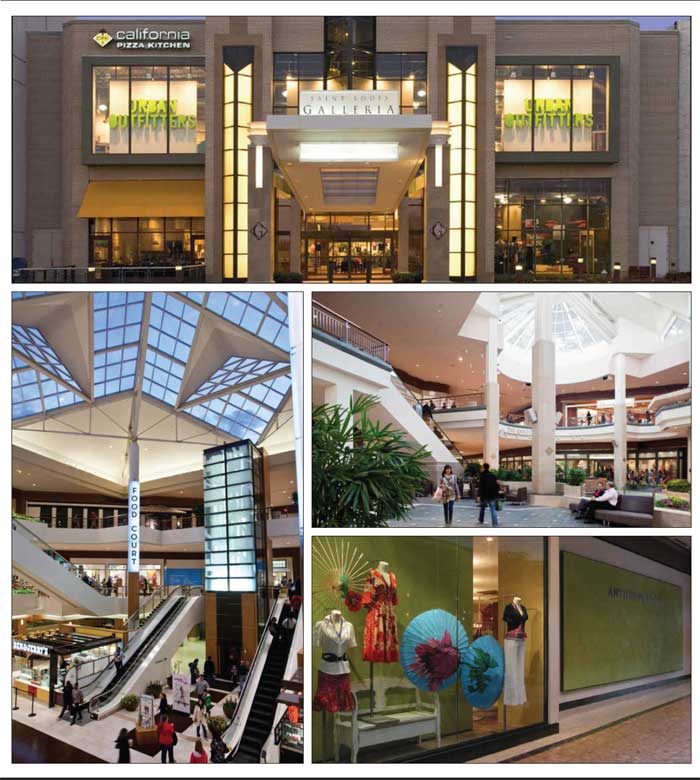
THE INFORMATION IN THIS STRUCTURAL AND COLLATERAL TERM SHEET IS NOT COMPLETE AND MAY BE AMENDED PRIOR TO THE TIME OF SALE. THIS TERM SHEET IS NOT AN OFFER TO SELL THESE SECURITIES AND IT IS NOT A SOLICITATION OF AN OFFER TO BUY THESE SECURITIES IN ANY JURISDICTION WHERE THE OFFER OR SALE IS NOT PERMITTED.
112
Mortgage Loan No. 9 — Saint Louis Galleria

THE INFORMATION IN THIS STRUCTURAL AND COLLATERAL TERM SHEET IS NOT COMPLETE AND MAY BE AMENDED PRIOR TO THE TIME OF SALE. THIS TERM SHEET IS NOT AN OFFER TO SELL THESE SECURITIES AND IT IS NOT A SOLICITATION OF AN OFFER TO BUY THESE SECURITIES IN ANY JURISDICTION WHERE THE OFFER OR SALE IS NOT PERMITTED.
113
Mortgage Loan No. 9 — Saint Louis Galleria

THE INFORMATION IN THIS STRUCTURAL AND COLLATERAL TERM SHEET IS NOT COMPLETE AND MAY BE AMENDED PRIOR TO THE TIME OF SALE. THIS TERM SHEET IS NOT AN OFFER TO SELL THESE SECURITIES AND IT IS NOT A SOLICITATION OF AN OFFER TO BUY THESE SECURITIES IN ANY JURISDICTION WHERE THE OFFER OR SALE IS NOT PERMITTED.
114
Mortgage Loan No. 9 — Saint Louis Galleria
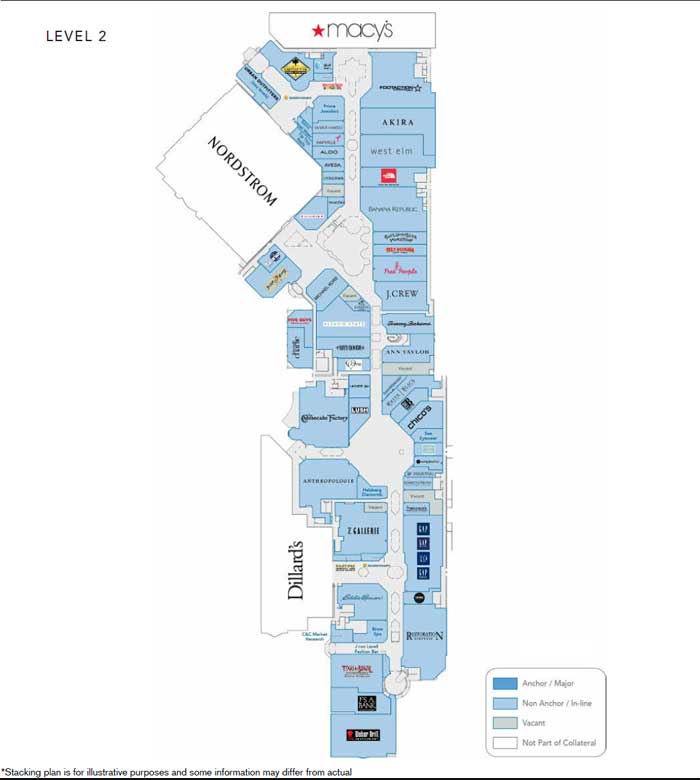
THE INFORMATION IN THIS STRUCTURAL AND COLLATERAL TERM SHEET IS NOT COMPLETE AND MAY BE AMENDED PRIOR TO THE TIME OF SALE. THIS TERM SHEET IS NOT AN OFFER TO SELL THESE SECURITIES AND IT IS NOT A SOLICITATION OF AN OFFER TO BUY THESE SECURITIES IN ANY JURISDICTION WHERE THE OFFER OR SALE IS NOT PERMITTED.
115
Mortgage Loan No. 9 — Saint Louis Galleria

THE INFORMATION IN THIS STRUCTURAL AND COLLATERAL TERM SHEET IS NOT COMPLETE AND MAY BE AMENDED PRIOR TO THE TIME OF SALE. THIS TERM SHEET IS NOT AN OFFER TO SELL THESE SECURITIES AND IT IS NOT A SOLICITATION OF AN OFFER TO BUY THESE SECURITIES IN ANY JURISDICTION WHERE THE OFFER OR SALE IS NOT PERMITTED.
116
Mortgage Loan No. 9 — Saint Louis Galleria
| Mortgage Loan Information | Property Information | |||
| Mortgage Loan Seller: | SGFC | Single Asset / Portfolio: | Single Asset | |
| Original Principal Balance(1): | $33,520,755 | Title: | Fee | |
| Cut-off Date Principal Balance(1): | $33,520,755 | Property Type - Subtype: | Retail – Super Regional Mall | |
| % of Pool by IPB: | 4.0% | Net Rentable Area (SF): | 465,695 | |
| Credit Assessment (Moody’s/Fitch/DBRS)(2): | Baa2 / NR / NR | Location: | St. Louis, MO | |
| Loan Purpose: | Refinance | Year Built / Renovated: | 1986/2011 | |
| Borrower: | Saint Louis Galleria L.L.C. | Occupancy(6): | 96.9% | |
| Sponsor: | BPR OP, LP (F/K/A GGP Operating Partnership, LP) | Occupancy Date: | 9/30/2018 | |
| Number of Tenants: | 126 | |||
| Interest Rate: | 4.99677083333333% | 2015 NOI: | $25,166,866 | |
| Note Date: | 11/1/2018 | 2016 NOI: | $26,847,500 | |
| Maturity Date: | 11/1/2028 | 2017 NOI: | $26,996,606 | |
| Interest-only Period: | 60 months | TTM NOI(7): | $27,309,350 | |
| Original Term: | 120 months | UW Economic Occupancy: | 97.1% | |
| Original Amortization(4): | 360 months | UW Revenues: | $37,642,385 | |
| Amortization Type(4): | IO-Balloon | UW Expenses: | $10,481,622 | |
| Call Protection(3): | L(28), Def(87), O(5) | UW NOI: | $27,160,764 | |
| Lockbox(5): | Hard | UW NCF: | $26,484,297 | |
| Additional Debt(1): | Yes | Appraised Value / Per SF: | $465,600,000 / $1,000 | |
| Additional Debt Balance(1): | $230,225,058 | Appraisal Date: | 9/24/2018 | |
| Additional Debt Type(1): | Pari Passu; Mezzanine | |||
| Additional Future Debt Permitted: | No |
| Escrows and Reserves(8) | Financial Information(1) | |||||
| Initial | Monthly | Initial Cap | Cut-off Date Loan Per SF: | $515 | ||
| Taxes: | $0 | Springing | N/A | Maturity Date Loan Per SF: | $470 | |
| Insurance: | $0 | Springing | N/A | Cut-off Date LTV: | 51.5% | |
| Replacement Reserves: | $0 | Springing | $236,181 | Maturity Date LTV: | 47.0% | |
| TI/LC: | $1,593,050 | Springing | $1,889,448 | UW NOI / UW NCF IO DSCR: | 2.23x / 2.18x | |
| Bridge Rent: | $82,295 | $0 | N/A | UW NOI / UW NCF Amortizing DSCR(4): | 1.72x / 1.67x | |
| UW NOI / UW NCF Debt Yield: | 11.3% / 11.0% |
| Sources and Uses | ||||||
| Sources | Proceeds | % of Total | Uses | Proceeds | % of Total | |
| Whole Loan: | $240,000,000 | 90.6% | Payoff Existing Debt: | $215,000,000 | 81.1% | |
| Mezzanine Loan: | 25,000,000 | 9.4 | Return of Equity: | 46,884,132 | 17.7 | |
| Upfront Reserves: | 1,675,345 | 0.6 | ||||
| Closing Costs: | 1,440,523 | 0.5 | ||||
| Total Sources: | $265,000,000 | 100.0% | Total Uses: | $265,000,000 | 100.0% |
| (1) | The Saint Louis Galleria loan is part of a larger split whole loan evidenced by tenpari passu notes with a Cut-off Date balance of $240.0 million (collectively, the “Whole Loan”) co-originated by SGFC and Deutsche Bank AG, New York Branch. The financial information presented in the chart above and herein reflects the balance of the Whole Loan. |
THE INFORMATION IN THIS STRUCTURAL AND COLLATERAL TERM SHEET IS NOT COMPLETE AND MAY BE AMENDED PRIOR TO THE TIME OF SALE. THIS TERM SHEET IS NOT AN OFFER TO SELL THESE SECURITIES AND IT IS NOT A SOLICITATION OF AN OFFER TO BUY THESE SECURITIES IN ANY JURISDICTION WHERE THE OFFER OR SALE IS NOT PERMITTED.
117
Mortgage Loan No. 9 — Saint Louis Galleria
| (2) | Moody’s has confirmed that the loan has, in the context of its inclusion in the Initial Pool Balance, credit characteristics consistent with an investment grade obligation. |
| (3) | At any time after the earlier to occur of (i) November 1, 2021 and (ii) two years from the closing date of the securitization that includes the lastpari passu note of the Whole Loan to be securitized, the borrower has the right to defease the Whole Loan. |
| (4) | The Whole Loan amortizes based on a non-standard amortization schedule and the UW NCF Amortizing DSCR and UW NOI Amortizing DSCR for the Whole Loan are calculated based on the aggregate 12 month debt service payments commencing December 1, 2023. See “Annex F Saint Louis Galleria Amortization Schedule” in the Preliminary Prospectus. |
| (5) | For a more detailed description of lockbox, please refer to “Lockbox / Cash Management” below. |
| (6) | Occupancy includes temporary tenants at the property, which collectively occupy 5,449 SF, and excludes three tenants vacating in the near term and one dark tenant, which four tenants collectively occupy 6,979 SF. See “The Property” below. |
| (7) | Represents trailing twelve months ending August 31, 2018. |
| (8) | For a more detailed description of Escrows and Reserves, please refer to “Escrows and Reserves” below. |
The Loan.The Saint Louis GalleriaWhole Loan has a Cut-off Date balance of $240.0 million and is evidenced by tenpari passu notes secured by the fee interest in a 465,695 SF super regional mall located in St. Louis, Missouri. Notes A-2-A2, A-2-A4 and A-2-A5 are being contributed to the CSAIL 2019-C15 Commercial Mortgage Trust. The Whole Loan has a 10-year term and will amortize on a non-standard 30-year schedule following an initial 60-month interest-only period.
The WholeLoan is being serviced pursuant to the Benchmark 2018-B8 pooling and servicing agreement. From and after the securitization of Note A-1-A1, the Whole Loan will be serviced pursuant to the pooling and servicing agreement for the securitization that holds such note. As the holder of Note A-1-A1 (the “Controlling Noteholder”) DBNY is entitled to exercise all of the rights of the Controlling Noteholder with respect to theWhole Loan; however, the holders of the remaining notes are entitled, under certain circumstances, to consult with respect to certain major decisions.
Whole Loan Note Summary
| Original Balance | Cut-off Date Balance | Note Holder | Lead Servicer for Whole Loan (Y/N) | Controlling Piece (Y/N) | |
| Notes A-1-A1, A-1-A3, A-1-A4, A-1-A5(1) | $106,479,245 | $106,479,245 | Deutsche Bank AG, New York Branch | N | Y |
| Note A-1-A2 | 55,000,000 | 55,000,000 | Benchmark 2018-B8 | Y | N |
| Notes A-2-A1, A-2-A3 | 45,000,000 | 45,000,000 | UBS 2018-C15 | N | N |
| Notes A-2-A2, A-2-A4, A-2-A5 | 33,520,755 | 33,520,755 | CSAIL 2019-C15 | N | N |
| Total: | $240,000,000 | $240,000,000 |
| (1) | Notes are expected to be contributed to one or more future securitizations. |
The Borrower.The borrowing entity for the loan is Saint Louis Galleria L.L.C., a Delaware limited liability company and special purpose entity. The borrower is 100.0% owned by Brookfield Property Partners L.P. (“BPY”).
The Sponsor.The sponsor and nonrecourse carve-out guarantor is BPR OP, LP (F/K/A GGP Operating Partnership, LP) (“BPR”). The property has historically been owned by General Growth Properties Inc. (“GGP Inc.”). In August 2018, GGP Inc. was acquired by BPY, a commercial real estate company with approximately $90.0 billion in total assets and a diversified portfolio of office and retail assets, as well as interests in multifamily, triple net lease, industrial, hospitality, self-storage, student housing and manufactured housing assets. As a result of the acquisition, BPR was created as a public partnership interest intended to offer the economic equivalence to an investment in BPY in the form of a U.S. REIT stock. BPR is the successor of GGP Inc., which along with the Rouse Properties Inc. portfolio, which BPY acquired in 2016, contains over $285 billion in assets under management within a portfolio of 163 shopping malls, across 41 states, comprising approximately 148.0 million SF of gross leasable area across the United States. In addition to the property, other BPR malls include Ala Moana Center in Honolulu, Hawaii, Tyson’s Galleria near Washington, D.C., Glendale Galleria in Glendale, California and Water Tower Place in Chicago, Illinois.
THE INFORMATION IN THIS STRUCTURAL AND COLLATERAL TERM SHEET IS NOT COMPLETE AND MAY BE AMENDED PRIOR TO THE TIME OF SALE. THIS TERM SHEET IS NOT AN OFFER TO SELL THESE SECURITIES AND IT IS NOT A SOLICITATION OF AN OFFER TO BUY THESE SECURITIES IN ANY JURISDICTION WHERE THE OFFER OR SALE IS NOT PERMITTED.
118
Mortgage Loan No. 9 — Saint Louis Galleria
The Property.The property consists of 465,695 collateral SF of a 1,179,532 SF, three-story, super-regional mall (the “Mall”) that is located approximately eight miles west of downtown St. Louis, Missouri. As of September 30, 2018, the property was 96.9% occupied by 126 tenants including nationally recognized retailers such as Apple, Forever 21, Gap Inc. brands, H&M, Microsoft and Victoria’s Secret, as well as restaurants including The Cheesecake Factory, Weber Grill Restaurant and Five Guys Burgers & Fries, as well as a food court. Additionally, the property includes a boutique style movie theater, Galleria 6 Cinemas. There are 4,768 surface parking spaces at the property that are included in the collateral, resulting in a parking ratio of 10.2 spaces per 1,000 SF. The property was most recently renovated in 2011 with work including the demolition of the former Lord & Taylor anchor, a parking garage expansion and the reconfiguration of the Mall entrance.
The property’s tenancy caters to mid-price point customers with tenants that includeH&M, Victoria Secret’s, Urban Outfitters and Forever 21. As of September 2018, gross Mall sales for reporting tenants were approximately $242.2 million. Since January 1, 2018, 11 leases were signed at the property. The approximately 1.2 million SF Mall is anchored by non-collateral tenants Dillard’s, Macy’s and Nordstrom, each of which independently owns its respective spaces and comprise in the aggregate approximately 714,052 SF.
Historical and Current Occupancy(1)
| 2015 | 2016 | 2017 | Current(2)(3) | |
| Occupancy - Excluding Anchors | 94.0% | 96.7% | 97.4% | 96.9% |
| Occupancy - Including Anchors | 97.6% | 98.7% | 99.0% | 98.8% |
| (1) | Source: Historical Occupancy is provided by the sponsor. Occupancies are as of December 31 for each respective year. |
| (2) | Based on the September 30, 2018 underwritten rent roll. |
| (3) | Includes temporary tenants at the property, which collectively occupy 5,449 SF, and excludes three tenants vacating in the near term and one dark tenant, which four tenants collectively occupy 6,979 SF. |
Tenant Summary(1)
| Tenant | Ratings Moody’s/S&P/Fitch(2) | NRA (SF) | % of Total NRA | UW Base Rent PSF | % of Total UW Base Rents | Sales PSF(3) | Occupancy Costs(3) | Lease Expiration Date(4) |
| Galleria 6 Cinemas | NR / NR / NR | 19,624 | 4.2% | $23.19 | 2.0% | $423,954(5) | 20.0% | 8/31/2023 |
| H&M | NR / NR / NR | 12,913 | 2.8 | (6) | (6) | $303 | (6) | 1/31/2021 |
| Victoria’s Secret | Ba1 / BB / NR | 12,892 | 2.8 | $46.00 | 2.6 | $259 | 29.9% | 1/31/2026 |
| Urban Outfitters | NR / NR / NR | 12,623 | 2.7 | $46.93 | 2.6 | $199 | 23.6% | 1/31/2021 |
| Forever 21 | NR / NR / NR | 11,798 | 2.5 | $62.52 | 3.2 | $267 | 24.2% | 1/31/2020 |
| Helium Comedy Club | NR / NR / NR | 11,477 | 2.5 | $13.87 | 0.7 | N/A | N/A | 1/31/2026 |
| Express Men | NR / NR / NR | 11,467 | 2.5 | $34.80 | 1.8 | $210 | 38.6% | 1/31/2024 |
| Footaction USA | Ba1 / BB+ / NR | 11,114 | 2.4 | $66.84 | 3.3 | N/A | N/A | 1/31/2026 |
| The Cheesecake Factory | NR / NR / NR | 10,104 | 2.2 | $40.00 | 1.8 | $993 | 7.4% | 1/31/2023 |
| Gap Inc. Brands | Baa2 / BB+ / NR | 10,068 | 2.2 | $64.49 | 2.9 | $335 | 33.8% | 5/31/2025 |
| Subtotal: | 124,080 | 26.6% | $42.57 | 20.8% | ||||
| Remaining Tenants | 327,038 | 70.2% | $56.94 | |||||
| Occupied Subtotal: | 451,118 | 96.9% | $53.20 | |||||
| Vacant | 14,577 | 3.1% | NAP | |||||
| Total: | 465,695 | 100.0% |
| (1) | Based on the September 30, 2018 underwritten rent roll. |
| (2) | Ratings provided are for the parent company of the entity listed in the “Tenant” field whether or not the parent company guarantees the lease. |
| (3) | Sales PSF and Occupancy Costs represent comparable tenant sales (tenants with twelve months reported sales) and occupancy costs for the twelve-month period ending on August 31, 2018 as provided by the sponsor. Occupancy Costs excludes utilities reimbursement. Based on a percentage of collateral SF, approximately 70.5% of in-line tenants (<10,000 SF) and 69.9% of total collateral tenants reported sales for the period. |
THE INFORMATION IN THIS STRUCTURAL AND COLLATERAL TERM SHEET IS NOT COMPLETE AND MAY BE AMENDED PRIOR TO THE TIME OF SALE. THIS TERM SHEET IS NOT AN OFFER TO SELL THESE SECURITIES AND IT IS NOT A SOLICITATION OF AN OFFER TO BUY THESE SECURITIES IN ANY JURISDICTION WHERE THE OFFER OR SALE IS NOT PERMITTED.
119
Mortgage Loan No. 9 — Saint Louis Galleria
| (4) | Certain tenants may have termination or contraction options due to co-tenancy provisions in the related leases (which may become exercisable prior to the originally stated expiration date of the tenant lease). |
| (5) | Galleria 6 Cinemas sales PSF reflect sales per screen (six screens). |
| (6) | H&M expressed interest in expanding at the property into approximately 21,000 SF. While the expansion is being negotiated, the sponsor plans to convert them to a percent in lieu of approximately 15.0% of gross sales through January 31, 2021, which is being negotiated. |
Lease Rollover Schedule(1)(2)
| Year | Number of Leases Expiring | NRA Expiring | % of NRA Expiring | UW Base Rent Expiring(3) | % of UW Base Rent Expiring | Cumulative NRA Expiring | Cumulative % of NRA Expiring | Cumulative UW Base Rent Expiring(3) | Cumulative % of UW Base Rent Expiring(3) |
| MTM | 3 | 5,229 | 1.1% | $300,169 | 1.3% | 5,229 | 1.1% | $300,169 | 1.3% |
| 2019 | 16 | 46,347 | 10.0 | 1,781,810 | 7.8 | 51,576 | 11.1% | $2,081,979 | 9.2% |
| 2020(4) | 12 | 38,634 | 8.3 | 1,718,583 | 7.6 | 90,210 | 19.4% | $3,800,562 | 16.7% |
| 2021 | 27 | 87,106 | 18.7 | 4,539,431 | 20.0 | 177,316 | 38.1% | $8,339,993 | 36.7% |
| 2022 | 12 | 18,244 | 3.9 | 1,224,075 | 5.4 | 195,560 | 42.0% | $9,564,068 | 42.0% |
| 2023 | 16 | 66,618 | 14.3 | 3,107,300 | 13.7 | 262,178 | 56.3% | $12,671,368 | 55.7% |
| 2024 | 7 | 32,542 | 7.0 | 1,587,181 | 7.0 | 294,720 | 63.3% | $14,258,549 | 62.7% |
| 2025 | 8 | 31,495 | 6.8 | 2,264,926 | 10.0 | 326,215 | 70.0% | $16,523,475 | 72.6% |
| 2026 | 12 | 73,919 | 15.9 | 3,524,025 | 15.5 | 400,134 | 85.9% | $20,047,500 | 88.1% |
| 2027 | 7 | 25,214 | 5.4 | 1,596,388 | 7.0 | 425,348 | 91.3% | $21,643,888 | 95.1% |
| 2028 | 3 | 16,101 | 3.5 | 725,124 | 3.2 | 441,449 | 94.8% | $22,369,012 | 98.3% |
| 2029 & Beyond | 3 | 9,669 | 2.1 | 382,820 | 1.7 | 451,118 | 96.9% | $22,751,833 | 100.0% |
| Vacant | NAP | 14,577 | 3.1 | NAP | NAP | 465,695 | 100.0% | NAP | NAP |
| Total | 126 | 465,695 | 100.0% | $22,751,833 | 100.0% |
| (1) | Based on the September 30, 2018 underwritten rent roll. |
| (2) | Certain tenants may have lease termination options that are exercisable prior to the originally stated expiration date of the subject lease and that are not considered in the Lease Rollover Schedule. |
| (3) | Total Base Rent Expiring excludes vacant space, five temporary tenants that collectively occupy 5,449 SF and tenants expected to pay percent in lieu rent (H&M and J Crew). |
| (4) | Negotiations are ongoing with J Crew (5,119 SF) to convert the tenant to percent in lieu of approximately 10.0% of gross sales through January 31, 2020. |
Historical Sales for Non-Collateral Anchors
| Sales Volume(2) | Sales Volume (PSF) | National Average(3) | |||||||||
| Tenant | Ratings Fitch/Moody’s/S&P(1) | NRA (SF) | 2015 | 2016 | 2017 | 2015 | 2016 | 2017 | NRA (SF) | Sales Volume | Sales Volume (PSF) |
| Dillard’s | NR / NR / NR | 313,913 | $22.5 | $22.6 | $22.0 | $72.0 | $72.0 | $70.0 | 168,493 | $20.6 | $127.0 |
| Macy’s | BBB / Baa3 / BBB- | 262,139 | 52.0 | 50.0 | 50.0 | $198.0 | $191.0 | $191.0 | 160,000 | $23.0 | $165.0 |
| Nordstrom | BBB+ / Baa1 / BBB+ | 138,000 | 35.0 | 32.5 | 28.7 | $254.0 | $236.0 | $208.0 | 175,000 | $43.3 | $337.0 |
| Total | 714,052 | $109.5 | $105.1 | $100.7 | $153.0 | $147.0 | $141.0 | ||||
| (1) | Ratings provided are for the parent company of the entity listed in the “Tenant” field whether or not the parent guarantees the lease. |
| (2) | Based on estimates provided by the sponsor. Sales Volume in millions. |
| (3) | Source: Industry Research Report. Sales Volume in millions. |
THE INFORMATION IN THIS STRUCTURAL AND COLLATERAL TERM SHEET IS NOT COMPLETE AND MAY BE AMENDED PRIOR TO THE TIME OF SALE. THIS TERM SHEET IS NOT AN OFFER TO SELL THESE SECURITIES AND IT IS NOT A SOLICITATION OF AN OFFER TO BUY THESE SECURITIES IN ANY JURISDICTION WHERE THE OFFER OR SALE IS NOT PERMITTED.
120
Mortgage Loan No. 9 — Saint Louis Galleria
Historical Sales PSF for Collateral Tenants(1)
| 8/31/2018 TTM | |||||
| Tenant | 2015 | 2016 | 2017 | Sales PSF | Occ. Cost |
| Major Tenants (>10,000 SF) | $386 | $380 | $321 | $304 | 19.8% |
| Galleria 6 Cinemas(2) | $396,459 | $419,059 | $416,955 | $423,954 | 20.0% |
| In-line Tenants (<10,000 SF) (including Apple)(3) | $682 | $672 | $650 | $647 | 13.0% |
| Apple | $5,427 | $5,373 | $5,520 | $6,172 | 1.2% |
| In-line Tenants (<10,000 SF) (excluding Apple)(3) | $574 | $565 | $537 | $520 | 16.3% |
| (1) | Historical Sales PSF is based on the figures provided by the sponsor historical sales reports. The sponsor defines comp in-line as tenants that have been open for more than 12-months as of the sales report date. The lender completed a separate analysis of tenant sales, in which “same-store” sales or tenants that have been at the property since 2015 and have reported sales figures through the trailing 12-month ending August 31, 2018. Based on the lender’s “same store” sales analysis, the property generated same store in-line (<10,000 SF) sales of $734 PSF with an occupancy cost ratio of 11.7% as of the trailing 12-month period ending August 31, 2018. Excluding the Apple store, the property generated same-store in-line (<10,000 SF) sales of $581 PSF with an occupancy cost ratio of 14.9% as of the trailing 12-month period ending August 31, 2018. |
| (2) | Sales information represents sales per screen and is based on six screens. |
| (3) | Approximately 95.8%, 88.6%, 94.6% and 87.8% of in-line tenants by collateral SF reported sales in 2015, 2016, 2017 and trailing 12-month ending August 31, 2018, respectively. |
The Market.The property is located approximately eight miles west of downtown St. Louis, Missouri in the St. Louis metropolitan statistical area. According to the appraisal, the property is the closest mall to downtown St. Louis, which is home to approximately 7.0 million SF of office space (over 35,000 employees) within the nearby neighborhood. Additionally, Washington University in St. Louis and St. Louis University are located within a seven-mile radius, with a combined student population of approximately 28,000 students.
According to the appraisal, the property has a primary trade area consisting of a 7-mile radius that contains approximately 598,543 people, with an average household income of $80,012 as of 2017. The secondary trade area, defined as being within a 10-mile radius of the property, contains approximately 948,538 people, with an average household income of $77,741 as of 2017. According to the appraisal, the property’s competitive set consists of the six properties detailed in the table below. According to the appraisal, the St. Louis retail market reported an overall vacancy rate of 12.9%.
Demographic Summary(1)
| 5-mile Trade Area | 7-mile Trade Area | 10-mile Trade Area | Saint Louis CBSA | State of Missouri | USA | |
| 2017 Population | 293,260 | 598,543 | 948,538 | 2,838,426 | 6,158,933 | 325,372,858 |
| 2017 Estimated # of Households | 130,617 | 258,686 | 404,750 | 1,128,197 | 2,434,861 | 123,183,573 |
| 2017 Average Household Income | $93,375 | $80,012 | $77,741 | $80,927 | $69,400 | $81,217 |
| (1) | Source: Appraisal |
THE INFORMATION IN THIS STRUCTURAL AND COLLATERAL TERM SHEET IS NOT COMPLETE AND MAY BE AMENDED PRIOR TO THE TIME OF SALE. THIS TERM SHEET IS NOT AN OFFER TO SELL THESE SECURITIES AND IT IS NOT A SOLICITATION OF AN OFFER TO BUY THESE SECURITIES IN ANY JURISDICTION WHERE THE OFFER OR SALE IS NOT PERMITTED.
121
Mortgage Loan No. 9 — Saint Louis Galleria
Competitive Set Summary(1)
| Property | Location | Year Built/ Renovated | NRA (SF) | Occ. % | Sales (PSF) | Anchor Tenants | Proximity (miles) |
| Saint Louis Galleria Mall | St. Louis, MO | 1986/2011 | 465,695(2) | 96.9%(3) | $520(4) | Dillard’s, Macy’s, Nordstrom(2) | N/A |
| St. Clair Square Mall | Fairview Heights, IL | 1974/2003 | 1,109,349 | 95.0% | $378 | Dillard’s, JC Penney, Macy’s, Sears | 20.0 |
| West County Center | Des Peres, MO | 2002 | 1,197,210 | 95.0% | $400 | Nordstrom, JC Penney, Macy’s, Dick’s Sporting Goods | 6.0 |
| South County Center | St. Louis, MO | 1963/2002 | 1,044,146 | 80.0% | $250 | Dillard’s, JC Penney, Macy’s | 9.0 |
| Plaza Frontenac | St. Louis, MO | 1974/2013 | 485,004 | 95.0% | $730 | Neiman Marcus, Saks Fifth Avenue | 3.0 |
| St. Louis Premium Outlets | Chesterfield, MO | 2013 | 350,000 | 98.0% | $485 | Saks Off 5th | 17.0 |
| Chesterfield Mall | Chesterfield, MO | 1976/2005 | 1,264,857 | 70.0% | $250 | Dillard’s, Macy’s | 12.0 |
| (1) | Source: Appraisal |
| (2) | Based on collateral of 465,695 SF as of the September 30, 2018 rent roll. The Mall is comprised of approximately 1.2 million SF, including Dillard’s (313,913 SF), Macy’s (262,139 SF) and Nordstrom (138,000 SF), which do not serve as collateral for the Whole Loan. |
| (3) | Includes temporary tenants at the property, which collectively occupy 5,449 SF, as well as one tenant that has a signed lease and has yet to take occupancy that accounts for 2,442 SF. Occ. % excludes three tenants vacating in the near term and one dark tenant, which collectively occupy 6,979 SF. The Mall is 98.8% physically occupied. |
| (4) | Based on collateral of 465,695 SF as of the September 30, 2018 rent roll. Sales PSF figures reflect sales for In-line Tenants (<10,000 SF) and excluding Apple, where applicable. |
Operating History and Underwritten Net Cash Flow
| 2015 | 2016 | 2017 | TTM(1) | Underwritten | PSF | %(4) | |
| Rents in Place(2) | $21,642,225 | $22,648,675 | $23,352,079 | $23,505,051 | $23,292,468 | $50.02 | 66.2% |
| Vacant Income | 0 | 0 | 0 | 0 | 1,140,069 | $2.45 | 3.2% |
| Percentage Rent(3) | 97,128 | 35,290 | 56,473 | 78,668 | 755,659 | $1.62 | 2.1% |
| Gross Potential Rent | $21,739,352 | $22,683,965 | $23,408,552 | $23,583,719 | $25,188,196 | $54.09 | 71.6% |
| Total Reimbursements | 10,986,639 | 11,020,889 | 10,498,671 | 9,701,744 | 9,981,597 | $21.43 | 28.4% |
| Net Rental Income | $32,725,992 | $33,704,854 | $33,907,223 | $33,285,463 | $35,169,793 | $75.52 | 100.0% |
| (Vacancy/Collection Loss) | (89,703) | (93,668) | (93,217) | (93,510) | (1,140,069) | ($2.45) | (3.0%) |
| Specialty Leasing | 2,089,966 | 2,055,726 | 1,994,393 | 2,026,772 | 2,026,772 | $4.35 | 5.4% |
| Other Income | 1,065,181 | 1,706,586 | 1,385,382 | 2,091,610 | 1,585,889 | $3.41 | 4.2% |
| Effective Gross Income | $35,791,437 | $37,373,498 | $37,193,781 | $37,310,336 | $37,642,385 | $80.83 | 100.0% |
| Total Expenses | $10,624,571 | $10,525,998 | $10,197,175 | $10,000,986 | $10,481,622 | $22.51 | 27.8% |
| Net Operating Income | $25,166,866 | $26,847,500 | $26,996,606 | $27,309,350 | $27,160,764 | $58.32 | 72.2% |
| Total TI/LC, Capex/RR | 0 | 0 | 0 | 0 | 676,467 | $1.45 | 1.8% |
| Net Cash Flow | $25,166,866 | $26,847,500 | $26,996,606 | $27,309,350 | $26,484,297 | $56.87 | 70.4% |
| (1) | TTM represents the trailing twelve-month period ending August 31, 2018. |
| (2) | Underwritten Rents in Place includes contractual rent steps of $540,635 taken through September 2019. Underwritten Base Rent excludes Chipotle (616 SF) which is currently dark and Brow Art 23 (681 SF), Passport Luggage (3,178 SF) and Hyperactive by Jimmy Jazz (2,504 SF), each of which are vacating in the near term and were underwritten as vacant. |
| (3) | Underwritten Percentage Rent includes the anticipated percentage rent from H&M and J Crew. H&M expressed interest in expanding at the property into approximately 21,000 SF. While the expansion is being negotiated, the sponsor plans to convert H&M to a percent in lieu of approximately 15.0% of gross sales through January 31, 2021, which is being negotiated. Negotiations are also ongoing with J Crew (5,119 SF) to convert the tenant to percent in lieu of approximately 10.0% of gross sales through January 31, 2020. |
| (4) | % column represents percent of Net Rental Income for all revenue lines and represents percent of Effective Gross Income for the remainder of fields. |
THE INFORMATION IN THIS STRUCTURAL AND COLLATERAL TERM SHEET IS NOT COMPLETE AND MAY BE AMENDED PRIOR TO THE TIME OF SALE. THIS TERM SHEET IS NOT AN OFFER TO SELL THESE SECURITIES AND IT IS NOT A SOLICITATION OF AN OFFER TO BUY THESE SECURITIES IN ANY JURISDICTION WHERE THE OFFER OR SALE IS NOT PERMITTED.
122
Mortgage Loan No. 9 — Saint Louis Galleria
Property Management. The property is managed by General Growth Services, Inc, an affiliate of the sponsor.
Escrows and Reserves. At origination, the borrower deposited into escrow $1,593,050 for outstanding tenant improvements and leasing commissions and $82,295 for free rent associated for tenants with executed leases that have not yet commenced paying rent.
Tax & Insurance Reserve – During a Cash Sweep Period (as defined below) the borrower is required to deposit monthly (i) 1/12th of the estimated annual real estate taxes, (ii) 1/12th of the estimated annual insurance premiums (except to the extent that the insurance required is maintained under a blanket insurance policy).
Replacement Reserves – During a Cash Sweep Period $9,841 monthly is required to be deposited monthly for replacement reserves subject to a cap of $236,181.
TI/LC Reserve– During a Cash Sweep Period $78,727 monthly is required to be deposited monthly for tenant improvements and leasing commissions subject to a cap of $1,889,448.
Lockbox / Cash Management. The Whole Loan is structured with a hard lockbox and springing cash management. All rents and other payments are required to be deposited directly into a clearing account controlled by the lender and are then transferred to an account controlled by the borrower until the occurrence of a Cash Sweep Period. Following the occurrence and during the continuance of a Cash Sweep Period, all funds in the lockbox account are required to be swept each business day to a segregated cash management account under the control of the lender and disbursed in accordance with the loan documents. During the continuance of a Cash Sweep Period, all excess cash will remain in the lender-controlled account and be held as additional collateral for the Whole Loan; provided, however, that if a Major Anchor Sweep Period (as defined below) is then continuing the excess cash will be deposited into a separate reserve account to be applied pursuant to the loan documents.
A “Cash Sweep Period” will occur (i) upon an event of default under the loan documents or mezzanine loan documents, (ii) upon any bankruptcy action of the borrower, guarantor or property manager, (iii) during any Low DSCR Trigger Period (as defined below), or (iv) during the continuance of a Major Anchor Sweep Period, and will continue until such time that the borrower has cured the applicable cause of the Cash Sweep Period in accordance with the terms of the loan documents.
A “Low DSCR Trigger Period” will occur if, as of the end of any calendar quarter, (i) DSCR based on the Whole Loan is less than 1.45x or (ii) the combined DSCR based on the Whole Loan and Mezzanine Loan is less than 1.30x.
A “Major Anchor Sweep Period” will commence upon the earliest to occur of (a) the early termination, early cancellation or early surrender of the Major Anchor (as defined below) premises (or the receipt of such intent), (b) (i) Nordstrom failing to continue to operate its business in at least 130,000 SF of its 138,000 SF of space or (ii) Macy’s failing to continue to operate its business in at least 210,000 SF of its 262,139 SF, or (c) a bankruptcy action of any Major Anchor or its direct or indirect parent.
A “Major Anchor” is any of (a) Nordstrom, (b) Macy’s, or (c) any other owner, operator or tenant with respect to substantially all of any space occupied by such anchor tenants.
“Occupancy Threshold” means 125,000 SF of the 138,000 SF Nordstrom space (90.6%) and 157,000 SF of the 262,139 SF Macy’s space (60.0%).
Additional Debt. Concurrent with the origination of the Whole Loan, SGFC and Deutsche Bank AG, New York Branch originated the Mezzanine Loan, which is secured by the direct equity ownership in the borrower. The Mezzanine Loan has an original principal balance of $25,000,000, fully amortizes on a non-standard amortization schedule and has a coupon of 6.2500%per annum and is coterminous with the Whole Loan. Including the Whole Loan and the Mezzanine Loan, the cumulative Cut-off Date LTV Ratio, cumulative amortizing UW NCF DSCR and cumulative UW NOI Debt Yield are 56.6%, 1.55x, and 10.3%, respectively. See “Description of the Mortgage Pool– The Whole Loans–The Non-Serviced AB Whole Loans—The Saint Louis Galleria Whole Loan” and Annex F in the Preliminary Prospectus.
THE INFORMATION IN THIS STRUCTURAL AND COLLATERAL TERM SHEET IS NOT COMPLETE AND MAY BE AMENDED PRIOR TO THE TIME OF SALE. THIS TERM SHEET IS NOT AN OFFER TO SELL THESE SECURITIES AND IT IS NOT A SOLICITATION OF AN OFFER TO BUY THESE SECURITIES IN ANY JURISDICTION WHERE THE OFFER OR SALE IS NOT PERMITTED.
123
Mortgage Loan No. 9 — Saint Louis Galleria
Real Estate Substitution/Expansion. If no event of default is continuing, the borrower may substitute the fee or leasehold interest to a parcel of real property at or adjacent to the property (each, an “Acquired Parcel”) in connection with the release of one or more parcels of the property (each, an “Exchange Parcel”);provided that, among other conditions, (i) the borrower provides at least 20 days’ prior written notice, (ii) the Acquired Parcel is reasonably equivalent in value to the Exchange Parcel, (iii) the Exchange Parcel is vacant, non-income producing and unimproved or improved only by landscaping facilities that are readily relocatable or surface parking areas, (iv) the borrower pays the lender a fee in the amount of $10,000, along with any reasonable out-of-pocket expenses incurred by the lender, (v) the borrower delivers a satisfactory environmental report relating to the Acquired Parcel and (vi) after giving effect to such substitution, the LTV ratio is less than or equal to 125%;provided that the borrower may prepay the “qualified amount” in order to meet such LTV ratio. In addition, the borrower may, in its sole discretion, obtain an expansion parcel (which expressly includes any anchor premises or any part thereof) (an “Acquired Expansion Parcel”) acquired in accordance with the terms and conditions in the loan documents;provided that, among other conditions, (i) the borrower satisfies the requirements in clauses (i), (iv) and (v) above. In the event that the borrower obtains an Acquired Expansion Parcel, such Acquired Expansion Parcel will also become collateral for the Whole Loan. See “Description of the Mortgage Pool—Certain Terms of the Mortgage Loans—Partial Releases” in the Preliminary Prospectus.
Release of Property. If no event of default is continuing, the borrower is permitted to release from the lien of the mortgage (i) one or more parcels (including “air rights” parcels) or outlots, or (ii) one or more Acquired Expansion Parcels (including, if applicable, any anchor premises) (each a “Release Parcel”) in connection with the transfer of the fee simple interest in such outlot parcel (or portion thereof) to a transferee which is not an affiliate of owner, directly or indirectly by the borrower in connection with the expansion or other development of the property, upon the borrower’s satisfaction of certain conditions, including, among other things: (a) the borrower delivers at least 10 days’ prior written notice, (b) the borrower delivers to the lender satisfactory evidence that the Release Parcel is (x) not necessary for the borrower’s operation or use of the property for its then-current use and (y) may be readily separated from the property without a material diminution in the value of the property, (c) the Release Parcel is vacant, non-income producing and unimproved (or improved only by landscaping or readily re-locatable facilities), (d) after giving effect to such release, the LTV ratio immediately is less than or equal to 125%, and the borrower prepays the “qualified amount” necessary in order to satisfy such ratio, (e) the borrower pays to the lender a fee in the amount of $10,000, along with any related out-of-pocket expenses, and (f) the borrower delivers a rating agency confirmation from each applicable rating agency for any such release;provided,however, that conditions (c) and (f) will not apply to an Acquired Expansion Parcel. In addition, with respect to an Acquired Expansion Parcel that is an anchor parcel, such anchor parcel may only be released with the reasonable consent of the lender to another retail operator that has agreed in writing to open and operate the anchor parcel for retail use within 24 months from the date of release and no reserve have been expended with respect to such anchor parcel and either (i) no reserve funds have been expanded with respect to such Acquired Expansion Parcel or (ii) with the lender’s consent, the borrower has replenished such reserve prior to such release. See “Description of the Mortgage Pool—Certain Terms of the Mortgage Loans—Partial Releases” in the Preliminary Prospectus.
THE INFORMATION IN THIS STRUCTURAL AND COLLATERAL TERM SHEET IS NOT COMPLETE AND MAY BE AMENDED PRIOR TO THE TIME OF SALE. THIS TERM SHEET IS NOT AN OFFER TO SELL THESE SECURITIES AND IT IS NOT A SOLICITATION OF AN OFFER TO BUY THESE SECURITIES IN ANY JURISDICTION WHERE THE OFFER OR SALE IS NOT PERMITTED.
124
(THIS PAGE INTENTIONALLY LEFT BLANK)
THE INFORMATION IN THIS STRUCTURAL AND COLLATERAL TERM SHEET IS NOT COMPLETE AND MAY BE AMENDED PRIOR TO THE TIME OF SALE. THIS TERM SHEET IS NOT AN OFFER TO SELL THESE SECURITIES AND IT IS NOT A SOLICITATION OF AN OFFER TO BUY THESE SECURITIES IN ANY JURISDICTION WHERE THE OFFER OR SALE IS NOT PERMITTED.
125
Mortgage Loan No. 10 — Courtyard San Antonio Riverwalk
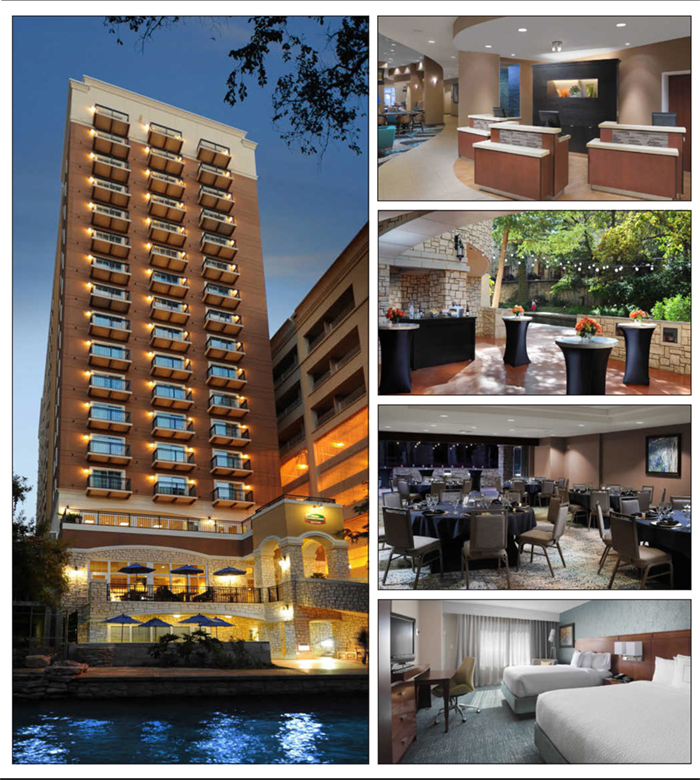
THE INFORMATION IN THIS STRUCTURAL AND COLLATERAL TERM SHEET IS NOT COMPLETE AND MAY BE AMENDED PRIOR TO THE TIME OF SALE. THIS TERM SHEET IS NOT AN OFFER TO SELL THESE SECURITIES AND IT IS NOT A SOLICITATION OF AN OFFER TO BUY THESE SECURITIES IN ANY JURISDICTION WHERE THE OFFER OR SALE IS NOT PERMITTED.
126
Mortgage Loan No. 10 — Courtyard San Antonio Riverwalk
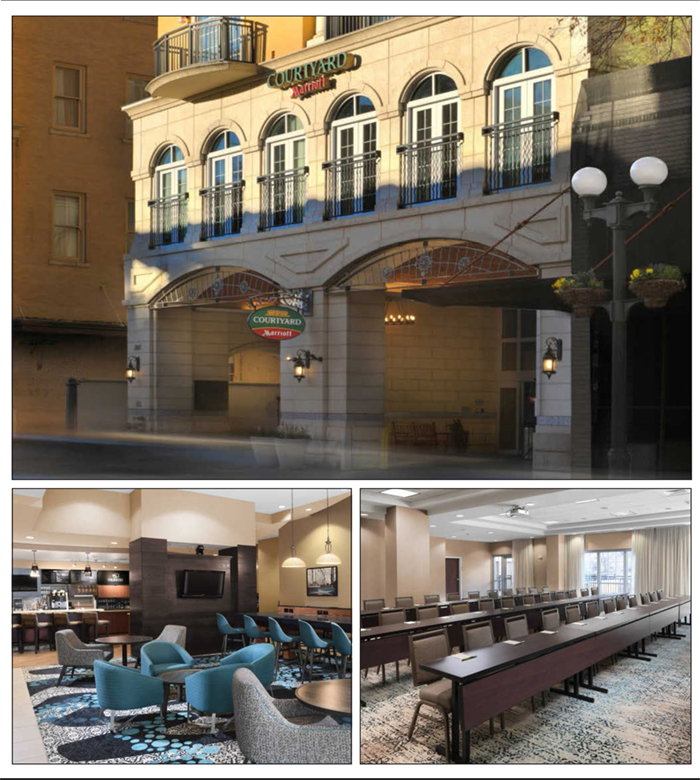
THE INFORMATION IN THIS STRUCTURAL AND COLLATERAL TERM SHEET IS NOT COMPLETE AND MAY BE AMENDED PRIOR TO THE TIME OF SALE. THIS TERM SHEET IS NOT AN OFFER TO SELL THESE SECURITIES AND IT IS NOT A SOLICITATION OF AN OFFER TO BUY THESE SECURITIES IN ANY JURISDICTION WHERE THE OFFER OR SALE IS NOT PERMITTED.
127
Mortgage Loan No. 10 — Courtyard San Antonio Riverwalk

THE INFORMATION IN THIS STRUCTURAL AND COLLATERAL TERM SHEET IS NOT COMPLETE AND MAY BE AMENDED PRIOR TO THE TIME OF SALE. THIS TERM SHEET IS NOT AN OFFER TO SELL THESE SECURITIES AND IT IS NOT A SOLICITATION OF AN OFFER TO BUY THESE SECURITIES IN ANY JURISDICTION WHERE THE OFFER OR SALE IS NOT PERMITTED.
128
Mortgage Loan No. 10 — Courtyard San Antonio Riverwalk
| Mortgage Loan Information | Property Information | |||
| Mortgage Loan Seller: | BSPRT | Single Asset / Portfolio: | Single Asset | |
| Original Principal Balance: | $27,800,000 | Title: | Fee | |
| Cut-off Date Principal Balance: | $27,800,000 | Property Type - Subtype: | Hotel – Select Service | |
| % of Pool by IPB: | 3.4% | Net Rentable Area (Rooms): | 220 | |
| Loan Purpose: | Refinance | Location: | San Antonio, TX | |
| Borrower: | Riverwalk CY, LLC | Year Built / Renovated: | 2009 / 2017 - 2018 | |
| Sponsors: | Richard I. Finvarb; Ronald J. Finvarb | Occupancy / ADR / RevPAR: | 78.1% / $156.51 / $122.23 | |
| Interest Rate: | 5.3500% | Occupancy / ADR / RevPAR Date: | 11/30/2018 | |
| Note Date: | 12/19/2018 | Number of Tenants: | NAP | |
| Maturity Date: | 1/6/2029 | 2015 NOI: | $3,573,458 | |
| Interest-only Period: | 120 months | 2016 NOI: | $3,673,850 | |
| Original Term: | 120 months | 2017 NOI(2): | $3,542,726 | |
| Original Amortization: | None | TTM NOI(2)(3): | $3,972,516 | |
| Amortization Type: | Interest Only | UW Occupancy / ADR / RevPAR: | 78.1% / $156.51 / $122.23 | |
| Call Protection: | L(26), Def(90), O(4) | UW Revenues: | $11,414,657 | |
| Lockbox(1): | Springing | UW Expenses: | $7,453,547 | |
| Additional Debt: | No | UW NOI: | $3,961,109 | |
| Additional Debt Balance: | N/A | UW NCF: | $3,390,376 | |
| Additional Debt Type: | N/A | Appraised Value / Per Room: | $47,900,000 / $217,727 | |
| Additional Future Debt Permitted: | No | Appraisal Date: | 11/20/2018 |
| Escrows and Reserves(4) | Financial Information | |||||
| Initial | Monthly | Initial Cap | Cut-off Date Loan Per Room: | $126,364 | ||
| Taxes: | $206,634 | Springing | N/A | Maturity Date Loan Per Room: | $126,364 | |
| Insurance: | $0 | Springing | N/A | Cut-off Date LTV: | 58.0% | |
| FF&E Reserve: | $0 | Springing | N/A | Maturity Date LTV: | 58.0% | |
| PIP Reserve: | Springing | $0 | N/A | UW NOI / UW NCF DSCR: | 2.63x / 2.25x | |
| Parking Rent Reserve: | $0 | Springing | N/A | UW NOI / UW NCF Debt Yield: | 14.2% / 12.2% |
| Sources and Uses | |||||||
| Sources | Proceeds | % of Total | Uses | Proceeds | % of Total | ||
| Mortgage Loan: | $27,800,000 | 100.0% | Payoff Existing Debt(5): | $27,164,936 | 97.7 | % | |
| Closing Costs: | 407,889 | 1.5 | |||||
| Upfront Reserves: | 206,634 | 0.7 | |||||
| Return of Equity: | 20,541 | 0.1 | |||||
| Total Sources: | $27,800,000 | 100.0% | Total Uses: | $27,800,000 | 100.0 | % | |
| (1) | For a more detailed description of lockbox, please refer to “Lockbox / Cash Management” below. |
| (2) | The increase in 2017 NOI to TTM NOI is attributable to the completion of the $3.3 million property improvement plan from September 2017 to January 2018. |
| (3) | Represents trailing twelve months ending November 30, 2018. |
| (4) | For a more detailed description of Escrows and Reserves, please refer to “Escrows and Reserves” below. |
| (5) | Payoff Existing Debt contains $4,385,051 of mezzanine debt, $2,012,817 of defeasance costs in connection with the prior senior loan, $129,017 of mezzanine stub interest and miscellaneous fees. The loan was previously securitized in the JPMCC 2012-C6 Mortgage Trust. |
THE INFORMATION IN THIS STRUCTURAL AND COLLATERAL TERM SHEET IS NOT COMPLETE AND MAY BE AMENDED PRIOR TO THE TIME OF SALE. THIS TERM SHEET IS NOT AN OFFER TO SELL THESE SECURITIES AND IT IS NOT A SOLICITATION OF AN OFFER TO BUY THESE SECURITIES IN ANY JURISDICTION WHERE THE OFFER OR SALE IS NOT PERMITTED.
129
Mortgage Loan No. 10 — Courtyard San Antonio Riverwalk
The Loan. The Courtyard San Antonio Riverwalk loan is a $27.8 million first mortgage loan secured by the fee interest in a 220-room select service hotel property. The loan has a 10-year term and is interest-only for the entire term.
The Borrower. The borrowing entity for the loan is Riverwalk CY, LLC, a Delaware limited liability company and special purpose entity. The borrowing entity is wholly owned by Riverwalk CY Hotel Partners, Ltd., which is in turn owned by Riverwalk CY GP, LLC, a Texas limited liability company (approximately 1.0% of ownership interest) and a pool of various investors, among which include Helen Finvarb (19.8% ownership interest) and Richard I. Finvarb (18.0% ownership interest). No other individual or entity in the investor pool has ownership interests greater than 10.2%.
The Sponsors. The loan’s sponsors and nonrecourse carve-out guarantors are Richard I. Finvarb and Ronald J. Finvarb, a father-son real estate investor team and the original developers of the property. Richard I. Finvarb has over 40 years of experience developing, owning and operating real estate and is a principal at Finvarb Group, a prominent residential and commercial real estate brokerage company based in Miami Beach, Florida that has been in business for more than 25 years. Ronald J. Finvarb has over 20 years of experience developing, owning and operating hotels. Together, Richard I. Finvarb and Ronald J. Finvarb founded the Finvarb Group, a development group that has developed real estate projects including hotels, high-rise condominiums, multifamily communities, office complexes and retail centers. The Finvarb Group currently owns a portfolio of eight Marriott-flagged hotels in Florida, Texas and Arizona, totaling over 1,170 rooms with an estimated market value of approximately $280.0 million. As of April 2018, both Richard I. Finvarb’s and Ronald J. Finvarb’s portfolios comprised over 1,281 rooms, 108 apartment units and approximately 8,000 square feet of retail with an aggregate market value of over $385.0 million.
The Property. The property is a 17-story, 220-room, select service, Courtyard Marriott situated on approximately 0.3 acres in San Antonio, Texas. The property was originally developed in 2009 by the sponsors and underwent an approximate $3.3 million ($15,000 per room) property improvement plan from September 2017 to January 2018. The PIP included renovations to guest rooms, corridors, the lobby and common areas at the property. Additionally, the property upgraded technology throughout the hotel in June 2018.
Amenities at the property include an outdoor saltwater pool, a whirlpool, a fitness center, a bistro/lobby bar, a business center and six event/meeting rooms, totaling in 8,373 SF of meeting space. Valet parking is offered to hotel guests at a nearby off-site parking garage with capacity for 125 vehicles. Guest rooms at the property are comprised of 105 double queen rooms and 115 king rooms. Each room offers complimentary high-speed Wi-Fi access, a flat panel television, a workstation and plush bedding. Select rooms at the property offer skyline views of San Antonio and Juliette balconies.
The property has frontage along the San Antonio Riverwalk, which stretches 15 miles across the city and features a variety of shops, restaurants, art galleries and various historic Spanish missions, and is located on North St. Mary’s Street and East Commerce Street in the central business district of San Antonio and is proximate to The Alamo (0.3 miles away), the Shops at Rivercenter (0.5 miles away), a retail center featuring over 100 shops, six restaurants and an AMC Movie Theater with an IMAX theater. Additionally, the property is proximate to the Henry B. Gonzalez Convention Center (0.7 miles away), which recently underwent an approximately $325 million renovation and houses the largest ballroom in Texas, and to San Antonio’s Arts and Theatre District, which includes the Empire Theater, the Aztec Theatre, and the San Antonio Museum of Art.
Historical Occupancy, ADR, RevPAR
Competitive Set(1) | Courtyard San Antonio Riverwalk(2) | Penetration Factor | |||||||
| Year | Occupancy | ADR | RevPAR | Occupancy | ADR | RevPAR | Occupancy | ADR | RevPAR |
| 2015 | 75.4% | $133.55 | $100.74 | 73.7% | $151.99 | $112.06 | 97.7% | 113.8% | 111.2% |
| 2016 | 75.3% | $133.56 | $100.51 | 75.0% | $150.88 | $113.16 | 99.7% | 113.0% | 112.6% |
| 2017 | 76.3% | $137.70 | $105.06 | 73.5% | $157.04 | $115.35 | 96.3% | 114.0% | 109.8% |
| TTM(3) | 76.8% | $143.00 | $109.77 | 78.1% | $156.51 | $122.23 | 101.7% | 109.4% | 111.4% |
| (1) | Source: Third party report. The competitive set includes Holiday Inn San Antonio Riverwalk, Hyatt Place San Antonio Riverwalk, Hotel Indigo San Antonio Riverwalk, Drury Plaza Hotel Riverwalk and Wyndham Garden Hotel San Antonio Riverwalk Museum Reach. |
| (2) | Source: Borrower Financials. |
THE INFORMATION IN THIS STRUCTURAL AND COLLATERAL TERM SHEET IS NOT COMPLETE AND MAY BE AMENDED PRIOR TO THE TIME OF SALE. THIS TERM SHEET IS NOT AN OFFER TO SELL THESE SECURITIES AND IT IS NOT A SOLICITATION OF AN OFFER TO BUY THESE SECURITIES IN ANY JURISDICTION WHERE THE OFFER OR SALE IS NOT PERMITTED.
130
Mortgage Loan No. 10 — Courtyard San Antonio Riverwalk
| (3) | Represents the trailing twelve month period ending on November 30, 2018. |
The Market. The property is located in the central business district of San Antonio, within Bexar County and the San Antonio-New Braunfels metropolitan statistical area (the “San Antonio MSA”). As of 2017, San Antonio welcomes on average 66 new residents each day, making it the fastest growing city in the country and the seventh most populous city in the United States according to the US Census Bureau.
The economy of San Antonio is supported by a variety of industries, including energy, government/military and healthcare. San Antonio is home to multiple Fortune 500 companies including Valero Energy Corporation, Tesoro Petroleum Corporation, iHeartMedia and the United States Services Automobile Association. Since 2006, employment in the San Antonio MSA has risen by 2.3% on average year-over-year, and major employers within the MSA include the Joint Base San Antonio, Bilgari Holdings and iHeartMedia. In September 2018, the University of Texas – San Antonio announced a campus expansion plan, which includes a $33.0 million National Security Collaboration Center and a $57.0 million School of Data Science. The planned expansion is expected to create a new technology corridor on the university campus. The expansion is expected to bring roughly 15,000 new students to downtown San Antonio. Additionally, a 460,000 SF, Class A office building, Frost Tower, is being developed at an estimated cost of $140.0 million. It is anticipated the tower will serve as the headquarters of Frost Bank and will be the first new office tower developed in downtown San Antonio since 1989.
San Antonio benefits from a variety of tourist and cultural attractions in the area. In addition to the San Antonio Riverwalk, San Antonio is home to the Alamo, an 18th century Spanish mission and historic site commemorating the Battle of the Alamo, the Alamodome, a sports stadium that hosts the NCAA post-season Valero Alamo Bowl and college football games, and SeaWorld San Antonio, a marine life adventure park and family entertainment showplace. The vicinity around the Alamo, the Alamo Plaza, features commercial space and a public plaza. In June 2018, the San Antonio City Council announced a $450.0 million expansion and redevelopment plan targeted at adding a new museum to the site and expanding memorials within the area. Additional projects in development in San Antonio include completion of the San Pedro Creek Culture Park, a public space for murals and artwork, and the redevelopment of The Pearl, a 26-acre dining, lodging and entertainment venue.
The appraiser identified five comparable hospitality properties, ranging from 116 rooms to 313 rooms that were constructed between 1987 and 1998. Additional color on the competitive set is described below:
Competitive Hotels Profile(1)
Estimated Market Mix | 2017 Estimated Operating Statistics | ||||||||
| Property | Rooms | Year Built | Meeting Space (SF) | Commercial | Meeting & Group | Leisure | Occupancy | ADR | RevPAR |
| Courtyard San Antonio Riverwalk | 220 | 2009 | 8,373 | 45% | 20% | 35% | 73.5%(2) | $157.04(2) | $115.35(2) |
| Hyatt Place San Antonio Riverwalk | 131 | 1995 | 2,000 | 55% | 15% | 30% | 75% - 80% | $140 - $150 | $105 - $110 |
| SpringHill Suites San Antonio Downtown Riverwalk | 116 | 1997 | 2,106 | 65% | 10% | 25% | 75% - 80% | $130 - $140 | $100 - $105 |
| Holiday Inn San Antonio Riverwalk | 313 | 1987 | 12,914 | 45% | 30% | 25% | 75% - 80% | $130 - $140 | $105 - $110 |
| Courtyard San Antonio Downtown Market Square | 149 | 1990 | 1,248 | 65% | 10% | 25% | 70% - 75% | $105 - $110 | $75 - $80 |
| Hotel Indigo San Antonio Riverwalk | 149 | 1998 | 2,025 | 55% | 10% | 35% | 75% - 80% | $125 - $130 | $95 - $100 |
| Total(3) | 858 | ||||||||
| (1) | Source: Appraisal. |
| (2) | Source: Borrower Financials. |
| (3) | Excludes the subject property. |
THE INFORMATION IN THIS STRUCTURAL AND COLLATERAL TERM SHEET IS NOT COMPLETE AND MAY BE AMENDED PRIOR TO THE TIME OF SALE. THIS TERM SHEET IS NOT AN OFFER TO SELL THESE SECURITIES AND IT IS NOT A SOLICITATION OF AN OFFER TO BUY THESE SECURITIES IN ANY JURISDICTION WHERE THE OFFER OR SALE IS NOT PERMITTED.
131
Mortgage Loan No. 10 — Courtyard San Antonio Riverwalk
Operating History and Underwritten Net Cash Flow
| 2015 | 2016 | 2017(1) | TTM(1)(2) | Underwritten | Per Room | %(3) | |
| Occupancy | 73.7% | 75.0% | 73.5% | 78.1% | 78.1% | ||
| ADR | $151.99 | $150.88 | $157.04 | $156.51 | $156.51 | ||
| RevPAR | $112.06 | $113.16 | $115.35 | $122.23 | $122.23 | ||
| Room Revenue | $8,998,494 | $9,111,961 | $9,262,345 | $9,815,014 | $9,815,014 | $44,614 | 86.0% |
| Food and Beverage | 1,340,294 | 1,070,763 | 1,033,877 | 1,279,511 | 1,279,511 | $5,816 | 11.2% |
| Other Departmental Revenues | 237,893 | 262,994 | 183,995 | 320,131 | 320,131 | $1,455 | 2.8% |
| Total Revenue | $10,576,681 | $10,445,718 | $10,480,217 | $11,414,657 | $11,414,657 | $51,885 | 100.0% |
| Room Expense | 1,910,698 | 1,809,712 | 1,952,382 | 2,023,043 | 2,023,043 | $9,196 | 20.6% |
| Food and Beverage Expense | 930,167 | 822,217 | 749,382 | 897,007 | 897,007 | $4,077 | 70.1% |
| Other Departmental Expenses | 41,484 | 39,495 | 37,879 | 40,848 | 40,848 | $186 | 12.8% |
| Departmental Expenses | $2,882,349 | $2,671,424 | $2,739,643 | $2,960,897 | $2,960,897 | $13,459 | 25.9% |
| Departmental Profit | $7,694,332 | $7,774,294 | $7,740,574 | $8,453,760 | $8,453,760 | $38,426 | 74.1% |
| Operating Expenses | 3,337,813 | 3,238,024 | 3,297,183 | 3,575,671 | 3,575,671 | $16,253 | 31.3% |
| Gross Operating Profit | $4,356,519 | $4,536,271 | $4,443,391 | $4,878,088 | $4,878,088 | $22,173 | 42.7% |
| Fixed Expenses | 783,062 | 862,421 | 900,665 | 905,573 | 916,979 | $4,168 | 8.0% |
| Net Operating Income | $3,573,458 | $3,673,850 | $3,542,726 | $3,972,516 | $3,961,109 | $18,005 | 34.7% |
| FF&E | 528,834 | 522,286 | 524,011 | 570,733 | 570,733 | $2,594 | 5.0% |
| Net Cash Flow | $3,044,623 | $3,151,564 | $3,018,715 | $3,401,783 | $3,390,376 | $15,411 | 29.7% |
| (1) | The increase in NOI from 2017 to TTM is attributable to the completion of the $3.3 million property improvement plan from September 2017 to January 2018. |
| (2) | Represents the trailing twelve month period ending November 30, 2018. |
| (3) | % column represents percent of Total Revenue except for Room Expense, Food and Beverage and Other Department Expenses, which is based on their corresponding revenue line items. |
Property Management.In lieu of a typical franchise agreement, the property is managed by the Courtyard Management Corporation, which is part of Marriott International, Inc (“Marriott”). Marriott manages the property through a management agreement that commenced at the opening of the property in 2009 and runs through the December 31, 2039, ten years beyond the loan term. Additionally, the management agreement has two, 10-year automatic renewal options. As a part of being managed by Marriott, the property has access to the Marriott loyalty program, which maintains more than 100 million members (across Marriott Rewards, Starwood Preferred Guests, and Ritz-Carlton Rewards) as of 2017.
Escrows and Reserves. At origination, the borrower deposited $206,634 into an upfront tax reserve.
Tax and Insurance Reserve – The requirement to make monthly deposits for real estate taxes in an amount equal to 1/12th of (i) an amount sufficient to pay taxes payable during the next ensuing twelve months and (ii) of an amount sufficient to pay the insurance premiums payable during the next ensuing twelve months is waived as long as no event of default exists, the management agreement is still in force and full effect and the borrower provides satisfactory evidence that the property taxes and insurance premiums are paid in full and on time.
PIP Reserve – Pursuant to the management agreement, on the date the property manager requires any property improvement plan work to be completed at the property, the borrower is required to deposit 110.0% of the cost required to pay for such property improvement plan into the PIP reserve.
THE INFORMATION IN THIS STRUCTURAL AND COLLATERAL TERM SHEET IS NOT COMPLETE AND MAY BE AMENDED PRIOR TO THE TIME OF SALE. THIS TERM SHEET IS NOT AN OFFER TO SELL THESE SECURITIES AND IT IS NOT A SOLICITATION OF AN OFFER TO BUY THESE SECURITIES IN ANY JURISDICTION WHERE THE OFFER OR SALE IS NOT PERMITTED.
132
Mortgage Loan No. 10 — Courtyard San Antonio Riverwalk
FF&E Reserve – The requirement to make monthly deposits of 1/12th of an amount equal to 5.0% of the greater of (a) gross revenues for the property in the preceding calendar year or (b) the projected gross revenue for the property for the current calendar year according to the most recently submitted Annual Budget into a FF&E reserve account maintained by the property manager is waived as long as no event of default exists, the management agreement is still in force and full effect and manager is obligated to pay and perform the costs of FF&E, the property manager is collecting ongoing reserve deposits under the management agreement for the costs of the monthly FF&E and the lender receives satisfactory evidence of the monthly FF&E reserve balance.
Parking Rent Reserve – The requirement to make monthly deposits of an amount equal to the monthly parking rent payable under the parking lease is waived as long as long as no event of default exists, the management agreement is in full force and effect, and the monthly parking rent payment is paid in a timely manner.
Lockbox/Cash Management. The loan is structured with a springing lockbox and springing cash management. Upon written notification from the lender that a Cash Sweep Period (as defined below), has occurred and is continuing, the borrower is required to promptly establish and maintain a lockbox account with the lockbox bank in trust for the benefit of the lender into which all rents and other income from the property will be deposited and held. Upon the occurrence and continuance of a Cash Sweep Period all funds in the lockbox account will be swept daily to a cash management account under the control of the lender, and all excess cash flow, after payments made in accordance with the loan documents for, amongst other things, debt service, required reserves and operating expenses, will be held as additional collateral for the loan.
A “Cash Sweep Period” means (i) an event of default under the loan documents, (ii) a debt yield being less than 8.75% and (iii) the occurrence of a Franchise Sweep Event (as defined below).
A “Franchise Sweep Event” means (i) a default under the management agreement; (ii) any expiration, termination, cancellation, surrender, or other cessation of the management agreement, or notification from the manager of its intent to terminate or cancel the management agreement; (iii) rejection of the management agreement in any bankruptcy or insolvency proceeding by the manager; and (iv) the occurrence of any other event of which the loss of the right to operate the Courtyard by Marriott brand.
THE INFORMATION IN THIS STRUCTURAL AND COLLATERAL TERM SHEET IS NOT COMPLETE AND MAY BE AMENDED PRIOR TO THE TIME OF SALE. THIS TERM SHEET IS NOT AN OFFER TO SELL THESE SECURITIES AND IT IS NOT A SOLICITATION OF AN OFFER TO BUY THESE SECURITIES IN ANY JURISDICTION WHERE THE OFFER OR SALE IS NOT PERMITTED.
133
Mortgage Loan No. 11 — Georgetown Squared & Seattle Design Center
| Mortgage Loan Information | Property Information | |||
| Mortgage Loan Seller: | Column | Single Asset / Portfolio: | Single Asset | |
| Original Principal Balance(1)(2): | $26,000,000 | Title: | Fee | |
| Cut-off Date Principal Balance(1)(2): | $26,000,000 | Property Type - Subtype: | Mixed Use – Office / Design Showroom | |
| % of Pool by IPB: | 3.1% | Net Rentable Area (SF): | 430,728 | |
| Loan Purpose: | Refinance | Location: | Seattle, WA | |
| Borrower: | SDC Creative LLC | Year Built / Renovated: | 1973 - 1983 / 2014 - 2018 | |
| Sponsors: | Fareed Kanani; Sean Hashem | Occupancy: | 82.2% | |
| Interest Rate: | 5.0600% | Occupancy Date: | 7/1/2018 | |
| Note Date: | 9/5/2018 | Number of Tenants: | 42 | |
| Maturity Date: | 9/6/2028 | 2015 NOI(3): | $1,280,278 | |
| Interest-only Period: | 36 months | 2016 NOI(3): | $893,239 | |
| Original Term: | 120 months | 2017 NOI(3): | $2,379,051 | |
| Original Amortization: | 360 months | TTM NOI(3)(4): | $4,336,875 | |
| Amortization Type: | IO-Balloon | UW Economic Occupancy: | 81.9% | |
| Call Protection: | L(30), Def(85), O(5) | UW Revenues: | $10,383,366 | |
| Lockbox: | Hard | UW Expenses: | $3,602,496 | |
| Additional Debt(1): | Yes | UW NOI(5): | $6,780,869 | |
| Additional Debt Balance(1): | $65,000,000 | UW NCF: | $6,187,073 | |
| Additional Debt Type(1): | Pari Passu | Appraised Value / Per SF: | $130,300,000 / $303 | |
| Additional Future Debt Permitted: | No | Appraisal Date: | 6/26/2018 |
| Escrows and Reserves | Financial Information(1)(2) | |||||
| Initial | Monthly | Initial Cap | Cut-off Date Loan Per SF: | $211 | ||
| Taxes: | $198,286 | $33,048 | N/A | Maturity Date Loan Per SF: | $187 | |
| Insurance: | $70,561 | $7,056 | N/A | Cut-off Date LTV: | 69.8% | |
| Replacement Reserves: | $0 | $7,179 | N/A | Maturity Date LTV: | 61.9% | |
| TI/LC: | $2,000,000 | $35,894 | $1,200,000 | UW NOI / UW NCF IO DSCR: | 1.45x / 1.33x | |
| Engineering Reserve: | $15,845 | $0 | N/A | UW NOI / UW NCF Amortizing DSCR: | 1.15x / 1.05x | |
| Unfunded Obligations: | $627,391 | $0 | N/A | UW NOI / UW NCF Debt Yield: | 7.5% / 6.8% |
Sources and Uses
| Sources | Proceeds | % of Total | Uses | Proceeds | % of Total | |
| Whole Loan(1)(2): | $91,000,000 | 99.8% | Payoff Existing Debt: | $70,976,161 | 77.8% | |
| Sponsor Equity: | 220,792 | 0.2 | Earnout Reserve(2): | 17,000,000 | 18.6 | |
| Upfront Reserves: | 2,912,083 | 3.2 | ||||
| Closing Costs: | 332,548 | 0.4 | ||||
| Total Sources: | $91,220,792 | 100.0% | Total Uses: | $91,220,792 | 100.0% |
| (1) | The Georgetown Squared & Seattle Design Center loan is part of a larger split whole loan evidenced by fourpari passu notes with an aggregate Cut-off Date balance of approximately $91.0 million (collectively, the “Whole Loan”). The financial information presented in the chart above and herein reflects the balance of the Whole Loan. |
| (2) | The Whole Loan included the funding of a $17.0 million earnout reserve controlled by the lender, which may be released in increments;provided that, among other conditions, an 8.0% net cash flow debt yield is achieved. The implied net cash flow DSCR at the release(s) is 1.56x on an interest-only basis and 1.23x on an amortizing basis. Any amounts not disbursed at the end of the 9th year of the loan term year will be used to pay down the Whole Loan on May 6, 2028. If the |
THE INFORMATION IN THIS STRUCTURAL AND COLLATERAL TERM SHEET IS NOT COMPLETE AND MAY BE AMENDED PRIOR TO THE TIME OF SALE. THIS TERM SHEET IS NOT AN OFFER TO SELL THESE SECURITIES AND IT IS NOT A SOLICITATION OF AN OFFER TO BUY THESE SECURITIES IN ANY JURISDICTION WHERE THE OFFER OR SALE IS NOT PERMITTED.
134
Mortgage Loan No. 11 — Georgetown Squared & Seattle Design Center
| full $17.0 million is applied, the resulting balloon LTV would be 49.8%. The Cut-off Date LTV, UW NCF IO DSCR, UW NCF Amortizing DSCR and UW NOI / UW NCF Debt Yield, based on the net Whole Loan amount of $74.0 million are 56.8%, 1.63x, 1.29x, 9.2% and 8.4%, respectively. For a more detailed description, please refer to “Earnout” below. |
| (3) | Tenants were relocated, and the buildings were renovated and repositioned from 2014 to 2018. As a result, NOI shown above varied and occupancy increased from 40.6% in 2016 to 82.2% in July 2018. |
| (4) | Represents trailing twelve months ending July 31, 2018. |
| (5) | UW NOI includes (i) rental income from tenants in free rent periods at loan origination totaling $701,863, (ii) 21,317 SF of space executed in leases which commenced later than July 1, 2018 totaling $429,686 of rental income and (iii) rent increases occurring through August 31, 2019. |
The Loan. The Georgetown Squared & Seattle Design Center Whole Loan is a $91.0 million first mortgage loan (which includes funding of a $17.0 million earnout reserve) secured by the fee interest in a 430,728 SF office and design center complex that consists of two main buildings attached by a second floor sky bridge located in Seattle, Washington. The loan has a 10-year term and will amortize on a 30-year schedule following an initial interest-only period of 3 years.
The Whole Loan is evidenced by fourpari passu notes. The non-controlling Notes A-3 and A-4 are being contributed to the CSAIL 2019-C15 Commercial Mortgage Trust. The Whole Loan is being serviced under the CSAIL 2018-C14 pooling and servicing agreement. As the holder of Note A-1 (the “Controlling Noteholder”), the trustee of the CSAIL 2018-C14 Commercial Mortgage Trust is entitled to exercise all of the rights of the Controlling Noteholder with respect to the Whole Loan; however, the holders of the remaining notes are entitled, under certain circumstances, to consult with respect to certain major decisions.
Whole Loan Note Summary
| Original Balance | Cut-off Date Balance | Note Holder | Lead Servicer for Whole Loan (Y/N) | Controlling Piece (Y/N) | |
| Note A-1, A-2 | $65,000,000 | $65,000,000 | CSAIL 2018-C14 | Y | Y |
| Note A-3, A-4 | 26,000,000 | 26,000,000 | CSAIL 2019-C15 | N | N |
| Total | $91,000,000 | $91,000,000 |
The Borrower. The borrowing entity for the loan is SDC Creative LLC, a Delaware limited liability company and special purpose entity. The borrowing entity is owned and controlled by Sean Hashem and Fareed Kanani.
The Sponsors. The loan’s sponsors and nonrecourse carve-out guarantors are Sean Hashem and Fareed Kanani; the founders of Greenbridge Investment Partners.
Established in 2012, Greenbridge Investment Partners is a full-service commercial real estate firm that specializes in ownership, property management, leasing, construction and turnaround of value-add and core plus properties. Sean Hashem has over 28 years of experience in commercial real estate, specializing as an owner and developer. Mr. Hashem’s real estate portfolio spans over various commercial properties located in California, Kansas, Nevada, Texas and Washington. Fareed Kanani has over 20 years of experience serving in senior banking positions and management roles and has served Fortune 500 companies in the procurement, asset management and disposition of large commercial portfolios with particular experience as a manager of distressed commercial and homebuilder construction assets.
The Property. The property is a 430,728 SF office and design center complex located 4.4 miles south of the Seattle central business district (“CBD”) in Seattle, WA. The property consists of two buildings attached by a second floor enclosed glass sky bridge on a 5.0 acre site. Settle Design Center (“SDC”) is a 153,461 SF design and showroom space and Georgetown Squared (“G2”) is a 277,267 SF Class A creative office space. The property was constructed from 1973 to 1983 and repositioned from 2014 to 2018. Together, the property is 82.2% leased to a diverse mix of 42 tenants, which have a remaining weighted average lease term of 8.8 years. No single tenant occupies more than 10.0% of the overall NRA and 12.1% of UW Base Rent.
THE INFORMATION IN THIS STRUCTURAL AND COLLATERAL TERM SHEET IS NOT COMPLETE AND MAY BE AMENDED PRIOR TO THE TIME OF SALE. THIS TERM SHEET IS NOT AN OFFER TO SELL THESE SECURITIES AND IT IS NOT A SOLICITATION OF AN OFFER TO BUY THESE SECURITIES IN ANY JURISDICTION WHERE THE OFFER OR SALE IS NOT PERMITTED.
135
Mortgage Loan No. 11 — Georgetown Squared & Seattle Design Center
The sponsors acquired the property in 2014 and invested $21.8 million ($51 PSF) through Q2 2018 to complete major renovations and reposition the property. Capital improvements at G2 include an additional elevator installation in the atrium, modernization of systems and finishes, glazing ($13.0 million), atrium, lobby and bathroom renovations ($1.2 million) and cooling tower installation ($0.8 million). At SDC the two-story atrium was refinished with a glass-dome, tile floors, glass stair case and an elevator ($3.1 million). Additionally, the sponsors have invested approximately $18.8 million in TI/LC (through Q2 2018). In total the sponsors have invested approximately $40.6 million in capital expenditures and tenanting costs resulting in increased occupancy from 40.6% in 2016 to 82.2% in July 2018. Additionally, the sponsors plan to complete the development of an additional parking lot on the adjacent Orcas Street pad, which is expected to add 101 additional parking spaces, and update the camera system. The property has 512 existing parking spaces, 264 of which are located in a covered garage.
Georgetown Squared (“G2”) -A five-story 277,267 SF building that includes a multi-story atrium and is comprised of creative office space. Amenities include a full-service fitness center with locker rooms and a common conference room with a full suite of audiovisual tools available to tenants for meetings, teleconferencing and presentations. The property’s floor to ceiling windows offer unobstructed views of the downtown Seattle skyline and Mount Rainier. Major tenants include Darigold Inc., an agricultural cooperative that produces and distributes dairy products (10.0% of NRA / 12.1% of UW Rent), R. R. Donnelley & Sons Company, a Fortune 500 integrated communications company that provides marketing and business communications, commercial printing, and related services (7.8% of NRA / 9.4% of UW Rent), and Archbright, a firm that specializes in HR, staffing, and legal counsel advisory services (6.7% of NRA / 9.0% of UW Rent). As of July 1, 2018, G2 was 77.5% leased. The sponsors have executed 17 new leases since 2015 and 3 leases since July 2018. There are two levels of garage parking below the office floors.
Seattle Design Center (“SDC”)- A two-story, 153,461 SF design and showroom space for fine home furnishings and design services. Amenities include a 10,004 SF glass-domed atrium with capacity for 899 people that is frequently used as event space. Major tenants include Jennifer West LLC, a distributor of ultra-high-end furnishings (2.7% of NRA / 4.0% of UW Rent), Trammell-Gagne LLC, a distributor of high-end furniture, lighting and wallcoverings (2.7% of NRA / 3.9% of UW Rent), and Kelly Forslund, Inc., a distributor of interior furnishings, lighting and textiles (2.3% of NRA / 2.8% of UW Rent). As of July 1, 2018, SDC was 90.7% leased. The repositioned SDC is home to numerous showrooms, which are currently occupied by a diverse roster of tenants representing over 1,500 manufacturers of furnishings, fabrics, wall coverings, floor coverings, millwork, custom cabinetry, home electronics, lighting and accessories. The repositioning included the consolidation of design and showroom uses into SDC from G2.
The property is located at 5701 & 5601 Sixth Avenue South in the Georgetown neighborhood, approximately 4.4 miles from the Seattle CBD. The Georgetown neighborhood is located just north of the Boeing airfield and just south of the Sodo District. The property is along 4th Avenue South which connects to the Seattle CBD. Primary highway access to the property is provided by I-5, SR 99, and SR 509.
The Market. The property is located in the Georgetown neighborhood of Seattle, WA, within the Seattle-Bellevue-Everett metropolitan statistical area, approximately 4.4 miles south of the Seattle CBD. The Georgetown area offers many benefits to tenants including proximity to the Seattle CBD, direct access to the freeway system, lower rents (27% discount as compared to the Seattle CBD rents according to a third party market data provider), and lower parking costs. The neighborhood generally functions as an industrial arts and design district south of downtown Seattle.
The SDC subject property and The Pacific Market Center (f/k/a the Seattle Gift Mart) are integral parts of the arts and culture district in Seattle’s Georgetown neighborhood. Many area tenants and businesses provide services to SDC and Pacific Market Center or offer related goods in a freestanding format surrounding these properties. The Pacific Market Center has traditionally catered to the wholesale gift industry and has two floors that are utilized for convention and trade show space as well has as high tech office space.
Boeing Field (a.k.a. King County International Airport) is located along the southeast fringe of the subject neighborhood. Boeing Field is one of the busiest primary non-hub airports in the nation. Boeing Field serves small commercial passenger airlines and cargo carriers, as well as private, corporate, and military aircraft.
THE INFORMATION IN THIS STRUCTURAL AND COLLATERAL TERM SHEET IS NOT COMPLETE AND MAY BE AMENDED PRIOR TO THE TIME OF SALE. THIS TERM SHEET IS NOT AN OFFER TO SELL THESE SECURITIES AND IT IS NOT A SOLICITATION OF AN OFFER TO BUY THESE SECURITIES IN ANY JURISDICTION WHERE THE OFFER OR SALE IS NOT PERMITTED.
136
Mortgage Loan No. 11 — Georgetown Squared & Seattle Design Center
The Georgetown area is mostly built out with industrial users, low-rise commercial uses, residences and retail. The capacity for new development in the Georgetown area is limited by high land prices and zoning that restricts non-industrial development. As a result, new development generally is the redevelopment of an existing, older property. Located 0.6 miles south of the property is Prologis’s Georgetown Crossroads, the first multi-story warehouse distribution center at a major seaport. The three-story project includes loading dock warehouse space on the first two floors served by truck ramps and 180,000 SF of 16 foot clear height space on the third floor marketed for light warehouse/manufacturing, creative office, laboratory, and production uses.
According to a third party market data provider, as of the second quarter of 2018 the Seattle Close-In office market contained 5.6 million SF of office space with an overall vacancy rate of 5.9%. The appraisal concluded per square foot market rents of $23.00 PSF NNN for the showroom and design space and $22.00 PSF NNN for the office space. According to the appraisal, the property’s competitive set consists of the seven properties detailed in the table below.
Office Leasing Competitive Set Summary(1)
| Property Name | Year Built / Renovated | NRA (SF) | Tenant Name | Lease Size (SF) | Lease Date | Lease Term (Yrs.) | NNN Rent/SF |
| G2 & SDC | 1973 - 1983 / 2014 - 2018 | 430,728(2) | Various | N/A | N/A | N/A | N/A |
| 705 Union Station | 2001 / N/A | 256,454 | Sound Transit | 78,538 | October 2018 | 5.2 | $32.00 |
| 1201 Western Building | 1910 / 2007 | 103,379 | Confidential | 19,241 | June 2019 | 5.0 | $25.00 |
| Home Plate Center I&II | 2012 / N/A | 349,418 | Occulus | 35,989 | December 2017 | 7.2 | $35.00 |
| 1411 Fourth Avenue | 1928 / N/A | 124,339 | WeWork | 98,483 | May 2018 | 10.5 | $28.00 |
| Triton Towers | 1980 / N/A | 407,107 | Genoa | 20,138 | April 2018 | 5.4 | $18.00 |
| American Life Building | 1968 / N/A | 48,680 | Confidential | 3,547 | June 2016 | 7.0 | $18.00 |
| Olympic Block | 1985 / N/A | 70,796 | Fierce, Inc. | 10,235 | April 2018 | 2.4 | $25.00 |
| (1) | Source: Appraisal. |
| (2) | Based on the July 1, 2018 underwritten rent roll. |
Historical and Current Occupancy(1)
| 2015(2) | 2016(3) | 2017(3) | Current(4) |
| N/A | 40.6% | 61.8% | 82.2% |
| (1) | Source: Historical Occupancy is provided by the sponsor. Occupancies are as of December 31 of each respective year. |
| (2) | 2015 occupancy is not available as the property’s repositioning was not yet completed. |
| (3) | In 2017 approximately 130,967 SF of space was leased including Darigold Inc. (36,876 SF), Archbright (28,960 SF); NETFORTRIS Acquisition Co. Inc. (15,835 SF) and Girl Scouts of Western WA (10,412 SF). |
| (4) | Based on the July 1, 2018 underwritten rent roll. In 2018 approximately 57,983 SF of space was leased, including R.R. Donnelley & Sons Company (33,469 SF expansion) and Trammell-Gagne LLC (11,552 SF). |
THE INFORMATION IN THIS STRUCTURAL AND COLLATERAL TERM SHEET IS NOT COMPLETE AND MAY BE AMENDED PRIOR TO THE TIME OF SALE. THIS TERM SHEET IS NOT AN OFFER TO SELL THESE SECURITIES AND IT IS NOT A SOLICITATION OF AN OFFER TO BUY THESE SECURITIES IN ANY JURISDICTION WHERE THE OFFER OR SALE IS NOT PERMITTED.
137
Mortgage Loan No. 11 — Georgetown Squared & Seattle Design Center
Top Ten Tenant Summary(1)
| Tenant | Type | NRA (SF) | % of Total NRA | UW Base Rent PSF | % of Total UW Base Rents | Lease Expiration Date |
| Darigold Inc. | Office Space | 43,001 | 10.0% | $19.00 | 12.1% | 10/31/2029(2) |
| R. R. Donnelley & Sons Company | Office Space | 33,469 | 7.8 | $18.87 | 9.4 | 10/31/2025(3) |
| Archbright | Office Space | 28,960 | 6.7 | $21.00 | 9.0 | 6/30/2027 |
| Andersen Construction NW | Office Space | 24,275 | 5.6 | $21.00 | 7.6 | 5/31/2027(4) |
| Open Square | Office Space | 23,422 | 5.4 | $18.54 | 6.4 | 5/31/2026 |
| NETFORTRIS Acquisition Co. Inc. | Office Space | 15,835 | 3.7 | $22.00 | 5.2 | 2/28/2023 |
| Jennifer West LLC | Design Center Space | 11,662 | 2.7 | $23.00 | 4.0 | 11/30/2023 |
| Trammell-Gagne LLC | Design Center Space | 11,552 | 2.7 | $23.00 | 3.9 | 6/30/2028 |
| Construction Loan Services LLC | Office Space | 10,972 | 2.5 | $20.00 | 3.3 | 6/30/2028 |
| Girl Scouts of Western WA | Office Space | 10,412 | 2.4 | $20.00 | 3.1 | 7/31/2029 |
| Total: | 213,560 | 49.6% | 63.9% |
| (1) | Based on the July 1, 2018 underwritten rent roll. |
| (2) | Darigold Inc. may terminate its lease after May 1, 2025 by giving 12 months’ advance notice. |
| (3) | R. R. Donnelley & Sons Company may terminate its lease effective October 1, 2023 by giving 12 months’ advance notice. |
| (4) | Andersen Construction NW may terminate its lease effective July 1, 2024 by giving notice on or after February 1, 2023 through and including June 30, 2023. |
Lease Rollover Schedule(1)
| Year | Number of Leases Expiring(2) | NRA Expiring | % of NRA Expiring | UW Base Rent Expiring | % of Rent | Cumulative NRA Expiring | Cumulative % of NRA Expiring | Cumulative Rent | Cumulative % of UW Base Rent Expiring |
| MTM | 1 | 7,585 | 1.8% | $180,000 | 2.7% | 7,585 | 1.8% | $180,000 | 2.7% |
| 2019 | 0 | 0 | 0.0 | 0 | 0.0 | 7,585 | 1.8% | $180,000 | 2.7% |
| 2020 | 4 | 6,617 | 1.5 | 127,503 | 1.9 | 14,202 | 3.3% | $307,503 | 4.6% |
| 2021 | 4 | 6,725 | 1.6 | 85,969 | 1.3 | 20,927 | 4.9% | $393,472 | 5.8% |
| 2022 | 2 | 11,481 | 2.7 | 177,694 | 2.6 | 32,408 | 7.5% | $571,166 | 8.5% |
| 2023 | 8 | 45,746 | 10.6 | 975,460 | 14.5 | 78,154 | 18.1% | $1,546,626 | 22.9% |
| 2024 | 4 | 13,384 | 3.1 | 251,764 | 3.7 | 91,538 | 21.3% | $1,798,390 | 26.6% |
| 2025 | 7 | 68,832 | 16.0 | 1,300,175 | 19.3 | 160,370 | 37.2% | $3,098,564 | 45.9% |
| 2026 | 2 | 27,114 | 6.3 | 517,314 | 7.7 | 187,484 | 43.5% | $3,615,878 | 53.6% |
| 2027 | 5 | 73,649 | 17.1 | 1,524,560 | 22.6 | 261,133 | 60.6% | $5,140,438 | 76.2% |
| 2028 | 3 | 27,217 | 6.3 | 583,689 | 8.6 | 288,350 | 66.9% | $5,724,127 | 84.8% |
| 2029 & Beyond(3) | 4 | 65,815 | 15.3 | 1,025,259 | 15.2 | 354,165 | 82.2% | $6,749,386 | 100.0% |
| Vacant | NAP | 76,563 | 17.8 | NAP | NAP | 430,728 | 100.0% | NAP | NAP |
| Total | 44 | 430,728 | 100.0% | $6,749,386 | 100.0% |
| (1) | Based on the underwritten rent roll. UW Rent includes base rent and rent increases occurring through August 31, 2019. |
| (2) | Certain tenants have more than one lease. Certain tenants may have lease termination options that are exercisable prior to the originally stated expiration date of the subject lease and that are not considered in the Lease Rollover Schedule. |
| (3) | 2029 & Beyond includes an event and gym space that does not have any rent associated. |
THE INFORMATION IN THIS STRUCTURAL AND COLLATERAL TERM SHEET IS NOT COMPLETE AND MAY BE AMENDED PRIOR TO THE TIME OF SALE. THIS TERM SHEET IS NOT AN OFFER TO SELL THESE SECURITIES AND IT IS NOT A SOLICITATION OF AN OFFER TO BUY THESE SECURITIES IN ANY JURISDICTION WHERE THE OFFER OR SALE IS NOT PERMITTED.
138
Mortgage Loan No. 11 — Georgetown Squared & Seattle Design Center
Operating History and Underwritten Net Cash Flow
| 2015(1) | 2016(1) | 2017(2) | TTM(3) | Underwritten(4) | PSF | %(5) | |
| Rents in Place | $2,352,826 | $2,402,319 | $4,570,210 | $5,545,017 | $6,749,386 | $15.67 | 57.0% |
| Rent Steps | 0 | 0 | 0 | 0 | 214,871 | $0.50 | 1.8% |
| Vacant Income | 0 | 0 | 0 | 0 | 1,517,210 | $3.52 | 12.8% |
| Gross Potential Rent | $2,352,826 | $2,402,319 | $4,570,210 | $5,545,017 | $8,481,467 | $19.69 | 71.7% |
| Total Reimbursements | 937,066 | 864,905 | 1,722,232 | 2,138,280 | 3,354,133 | $7.79 | 28.3% |
| Net Rental Income | $3,289,892 | $3,267,224 | $6,292,442 | $7,683,297 | $11,835,600 | $27.48 | 100.0% |
| (Vacancy/Collection Loss) | 0 | 0 | 0 | 0 | (2,138,909) | ($4.97) | (20.6%) |
| (Concessions) | (130,057) | (306,900) | (1,129,771) | (741,199) | 0 | $0.00 | 0.0% |
| Other Income(6) | 112,426 | 154,880 | 257,806 | 455,230 | 686,674 | $1.59 | 6.6% |
| Effective Gross Income | $3,272,261 | $3,115,204 | $5,420,477 | $7,397,327 | $10,383,366 | $24.11 | 100.0% |
| Total Expenses | $1,991,983 | $2,221,965 | $3,041,426 | $3,060,453 | $3,602,496 | $8.36 | 34.7% |
| Net Operating Income | $1,280,278 | $893,239 | $2,379,051 | $4,336,875 | $6,780,869 | $15.74 | 65.3% |
| Total TI/LC, Capex/RR | 0 | 0 | 0 | 0 | 593,796 | $1.38 | 5.7% |
| Net Cash Flow | $1,280,278 | $893,239 | $2,379,051 | $4,336,875 | $6,187,073 | $14.36 | 59.6% |
| (1) | The decrease in NOI from 2015 to 2016 is primarily due to increased rent abatements including the first five months for Workspace Development LLC (dba Open Square); one month for Andersen Construction; three months for West Highland Design LLC; and six months for Leicht NY LLC totaling approximately $273,149. |
| (2) | 2017 includes an additional 130,967 SF of leased space totaling approximately $2.2 million of additional rental income and $857,237 of additional reimbursable income. In 2018 occupancy further increased to 82.2% including $974,807 of additional rental income and $416,048 of additional reimbursable income. |
| (3) | TTM represents the trailing twelve month period ending July 31, 2018. |
| (4) | Underwritten Net Cash Flow includes (i) rental income from tenants in free rent periods at loan origination consisting primarily of R.R. Donnelley & Sons Company, Zivelo, Inc., and Conscious Eatery, LLC., totaling $701,863, (ii) 21,317 SF of space executed in leases which commenced later than July 1, 2018 comprising an additional $429,686 of rental income and (iii) rent increases occurring through August 31, 2019. |
| (5) | % column represents percent of Net Rental Income for all revenue lines and represents percent of Effective Gross Income for the remainder of fields. |
| (6) | Underwritten Other income includes $423,840 of parking income as well as storage rental income, rooftop antenna income, and event income. |
Earnout.The borrower deposited $17.0 million at origination in a lender controlled earnout reserve, which will be disbursed to the borrower upon request subject to (i) the property achieving an 8.0% net cash flow debt yield (based on the Whole Loan amount of $91.0 million less the remaining balance of the earnout reserve after giving effect to the requested earnout reserve draw), (ii) no event of default has occurred and is continuing and (iii) no cash sweep period is continuing. The borrower may request disbursements during the first nine years of the loan term but not more than twice in any calendar month and in amounts not less than $2.0 million. Any undisbursed amounts remaining in the earnout reserve on May 6, 2028 must be applied to pay down the debt on such date (which such date is the beginning of the open prepayment period).
THE INFORMATION IN THIS STRUCTURAL AND COLLATERAL TERM SHEET IS NOT COMPLETE AND MAY BE AMENDED PRIOR TO THE TIME OF SALE. THIS TERM SHEET IS NOT AN OFFER TO SELL THESE SECURITIES AND IT IS NOT A SOLICITATION OF AN OFFER TO BUY THESE SECURITIES IN ANY JURISDICTION WHERE THE OFFER OR SALE IS NOT PERMITTED.
139
Mortgage Loan No. 12 — Temperance Industrial
| Mortgage Loan Information | Property Information |
| Mortgage Loan Seller: | 3650 REIT | Single Asset / Portfolio: | Single Asset | |
| Original Principal Balance: | $25,750,000 | Title: | Fee | |
| Cut-off Date Principal Balance: | $25,577,065 | Property Type - Subtype: | Industrial – Warehouse | |
| % of Pool by IPB: | 3.1% | Net Rentable Area (SF): | 756,856 | |
| Loan Purpose: | Acquisition | Location: | Temperance, MI | |
| Borrower: | 7111 Crabb Road LLC | Year Built / Renovated: | 1978 / 2017 | |
| Sponsors: | Allan R. Adelson; Garrett Middlekauff | Occupancy: | 100.0% | |
| Interest Rate: | 5.3200% | Occupancy Date: | 1/31/2019 | |
| Note Date: | 9/4/2018 | Number of Tenants: | 2 | |
| Maturity Date: | 9/5/2028 | 2015 NOI(2): | N/A | |
| Interest-only Period(1): | 33 months | 2016 NOI(2): | N/A | |
| Original Term(1): | 120 months | 2017 NOI(2): | N/A | |
| Original Amortization(1): | 360 months | TTM NOI(2): | N/A | |
| Amortization Type(1): | Amortizing-IO | UW Economic Occupancy: | 95.5% | |
| Call Protection: | L(30), Def(88), O(2) | UW Revenues: | $3,848,276 | |
| Lockbox: | Hard | UW Expenses: | $1,097,661 | |
| Additional Debt: | No | UW NOI: | $2,750,615 | |
| Additional Debt Balance: | N/A | UW NCF: | $2,410,030 | |
| Additional Debt Type: | N/A | Appraised Value / Per SF: | $39,500,000 / $52 | |
| Additional Future Debt Permitted: | No | Appraisal Date: | 5/4/2018 |
| Escrows and Reserves | Financial Information(1) |
| Initial | Monthly | Initial Cap | Cut-off Date Loan Per SF: | $34 | ||
| Taxes: | $53,161 | $17,720 | N/A | Maturity Date Loan Per SF: | $30 | |
| Insurance: | $6,307 | $6,307 | N/A | Cut-off Date LTV: | 64.8% | |
| Replacement Reserves(3): | $200,000 | Springing | $200,000 | Maturity Date LTV: | 57.8% | |
| TI/LC: | $0 | $22,075 | N/A | UW NOI / UW NCF Amortizing DSCR: | 1.60x / 1.40x | |
| UW NOI / UW NCF IO DSCR: | 2.23x / 1.96x | |||||
| UW NOI / UW NCF Debt Yield: | 10.8% / 9.4% |
Sources and Uses
| Sources | Proceeds | % of Total | Uses | Proceeds | % of Total | |
| Mortgage Loan: | $25,750,000 | 74.8% | Purchase Price: | $33,450,000 | 97.1% | |
| Sponsor Equity: | 8,694,780 | 25.2 | Closing Costs: | 735,312 | 2.1 | |
| Upfront Reserves: | 259,468 | 0.8 | ||||
| Total Sources: | $34,444,780 | 100.0% | Total Uses: | $34,444,780 | 100.0% |
| (1) | The loan has a 10-year term and will amortize on a 30-year schedule for the first 87 months followed by an interest-only period of 33 months. |
| (2) | Historical cash flows are not available as the sponsors acquired the property in September 2018. The seller did not provide historical operating statements to the borrower. |
| (3) | Monthly deposits of $6,307 into the replacement reserve are only required when the reserve balance is less than $50,000. |
THE INFORMATION IN THIS STRUCTURAL AND COLLATERAL TERM SHEET IS NOT COMPLETE AND MAY BE AMENDED PRIOR TO THE TIME OF SALE. THIS TERM SHEET IS NOT AN OFFER TO SELL THESE SECURITIES AND IT IS NOT A SOLICITATION OF AN OFFER TO BUY THESE SECURITIES IN ANY JURISDICTION WHERE THE OFFER OR SALE IS NOT PERMITTED.
140
Mortgage Loan No. 12 — Temperance Industrial
The Loan. The Temperance Industrial loan has a Cut-off Date balance of approximately $25.6 million and is a first mortgage loan secured by the fee interest in a 756,856 SF, 100% leased, industrial-distribution warehouse located in Temperance, Michigan. The loan has a 10-year term and will amortize on a 30-year schedule for the first 87 months followed by an interest-only period of 33 months.
The Borrower. The borrowing entity for the loan is 7111 Crabb Road LLC, a Michigan limited liability company and special purpose entity. The borrowing entity is 100% owned by 7111 Crabb Road Sole Member LLC, which is indirectly owned by Allan R. Adelson, Garrett Middlekauff and various entities.
The Sponsors. The loan’s sponsors and nonrecourse carve-out guarantors are Allan R. Adelson and Garrett Middlekauff. Allan R. Adelson, the president and sole owner of Commercial Financial Management Inc. (“CFM”), has been in the real estate business for more than 47 years and has overseen the management of 66 properties totaling over 7 million SF. CFM is a full-service owner, operator and property management firm. The majority of CFM’s properties are located in Southeast Michigan and Florida and include major retail centers, commercial office buildings, warehouse and manufacturing facilities. Garrett Middlekauff is based in Michigan and is responsible for the asset management of the property. As of December 31, 2017, Allan R. Adelson owned 16 properties totaling approximately 1.8 million in aggregate SF and an estimated aggregate value of $197.0 million. As of December 31, 2017, the sponsors had a combined net worth and liquidity of $15.3 million and $1.0 million, respectively.
The Property. The property is a 756,856 SF industrial-distribution warehouse located in Temperance, Michigan. The property is a single-story building, constructed in 1978, situated on approximately 55.9 acres in the township of Bedford, Michigan. The property consists of 749,224 SF of warehouse space and 7,632 SF of office space. Property features include 28 foot clear height ceilings, 88 dock high doors, 150 trailer spots, 57 parking spots and six grade-level doors.
As of January 2019, the property was 100% leased by two tenants. The largest tenant at the property, Hollingsworth, leases 392,838 SF (51.9% of NRA) through December 2026. Hollingsworth has been a tenant at the property since 2016. Hollingsworth is a supply chain management service and solution company headquartered in Dearborn, Michigan. Hollingsworth, founded in 1925, ships over 410 million pieces annually, has over 3,500 employees and operates 25 warehouse and production facilities across the United States totaling more than 7 million SF. Hollingsworth’s space at the property is used as a distribution center for the United States Postal Service. Hollingsworth had a purchase option of $19.0 million in its original lease. According to the sponsor, upon learning of Fiat’s interest in signing a lease at the property, Hollingsworth executed its purchase option and subsequently sold the property to the sponsors in 2018. Hollingsworth agreed to extend its lease through December 2026 in connection with the sale of the property. Prior to the sale, Hollingsworth did not occupy 100.0% of the property.
The second largest tenant at the property, FCA US LLC (“Fiat”), leases 364,018 SF (48.1% of the NRA) through August 2027 with two, five-year extension options remaining. Fiat has been a tenant at the property since 2017 and is rated Ba2/BB+/BBB- by Moody’s, S&P and Fitch, respectively. Fiat is a North American automaker based in Auburn Hills, Michigan. It designs, manufactures and sells or distributes vehicles under the Chrysler, Dodge, Jeep, Ram, FIAT and Alfa Romeo brands, as well as the SRT performance vehicle designation. Fiat is a member of the Fiat Chrysler Automobiles N.V. family of companies. Fiat received $5.3 million of capital improvements which is being amortized over the term of the lease at a 7.0% rate. Fiat, one of the “big three” American automobile manufacturers and one of the largest automakers in the world based on total annual vehicle sales, is an international automotive group. Fiat is listed on the New York Stock Exchange under the symbol “FCAU” and on the Mercato Telematico Azionario under the symbol “FCA.” Fiat’s space at the property is used as a distribution facility for the Toledo North Jeep Wrangler Plant.
The property is located along Crabb Road near the intersection of Crabb Road and Sterns Road. The property benefits from its proximity to major north and south freeways in the area (US-23, US-24 and I-75), as well as proximity to major east and west connector (I-80/90), which connects New York to the east and Chicago on the west. The property is within 12 miles of several other major transportation arteries including I-280, I-475 and M-125. The aforementioned thoroughfares and several surface streets provide the property linkage to Ann Arbor, downtown Detroit and Toledo, Ohio.
THE INFORMATION IN THIS STRUCTURAL AND COLLATERAL TERM SHEET IS NOT COMPLETE AND MAY BE AMENDED PRIOR TO THE TIME OF SALE. THIS TERM SHEET IS NOT AN OFFER TO SELL THESE SECURITIES AND IT IS NOT A SOLICITATION OF AN OFFER TO BUY THESE SECURITIES IN ANY JURISDICTION WHERE THE OFFER OR SALE IS NOT PERMITTED.
141
Mortgage Loan No. 12 — Temperance Industrial
The Market. The property is located in Temperance, Michigan. The property is in southeast Michigan approximately 1.1 miles north of Toledo, Ohio, 39 miles south of Ann Arbor, Michigan and 45 miles south of Detroit, Michigan. The property’s local area has a mix of commercial uses including industrial, retail and auto dealership uses along major arterials that are interspersed with multi-family complexes and single-family residential development. Most of the industrial users in the immediate area are small industrial users (typically less than 20,000 SF). Growth in the property’s immediate area is physically restricted by the lack of sites with adequate zoning and utilities, so there is little competition from new development.
According to a third-party report, as of 2017, the I-75 corridor industrial market contained 276.4 million SF of industrial space with an overall vacancy rate of 2.9%. The appraisal concluded a market rent of $4.50 PSF for the property. According to the appraisal, the property’s competitive set consists of the six properties detailed in the table below.
Competitive Set Summary(1)
| Property | Year Built / Renovated | Total NRA (SF) | Est. Rent PSF | Lease Date | Lease Type | Est. Occ. | Proximity (miles) | Clear Height (FT) | Dock Doors (FT) | Tenant(s) |
| Temperance Industrial | 1978 / 2017 | 756,856(2) | $3.88(2) | 11/22/2016 / 8/1/2017(2) | NNN | 100.0% | N/A | 28 | 88 | Hollingsworth, Fiat |
| 17801 East 14 Mile Road | 1957 / 2016 | 301,292 | $4.35 | 7/1/2017 | NNN | 100.0% | 63.4 | 36-42 | 12 | Faurecia Interior Systems, Inc. |
| P314 County Road 12 | 2014 / N/A | 195,000 | $3.95 | 10/1/2014 | NNN | 100.0% | 37.5 | 26-30 | 27 | Campbell’s Soup Company |
| 28301 Schoolcraft Road | 2000 / N/A | 754,744 | $4.95 | 6/1/2016 | NNN | 100.0% | 45.5 | 32 | 170 | Ford Motor Company |
| 4240 Bennett Road | 1942 / N/A | 963,556 | $6.75 | 7/9/2016 | Gross | 100.0% | 3.4 | 17-30 | 16 | Willis Day Storage |
| 3220 Jeep Parkway | 2014 / N/A | 300,000 | $4.44 | 7/1/2016 | NNN | 100.0% | 4.2 | 30-32 | 12 | Dana, Inc. |
| 17950 Dix Toledo Highway | 1998 / 2009 | 495,000 | $4.75 | 5/1/2017 | NNN | 100.0% | 34.0 | 30-32 | 86 | C Mac Transportation |
| (1) | Source: Appraisal. |
| (2) | Based on the January 31, 2019 underwritten rent roll. |
Historical and Current Occupancy
| 2015(1) | 2016(1) | 2017(1) | Current(2) |
| N/A | N/A | N/A | 100.0% |
| (1) | The property was acquired in September 2018, therefore historical occupancies are not available. |
| (2) | Based on the January 31, 2019 underwritten rent roll. |
Tenant Summary(1)
| Tenant | Ratings Moody’s/S&P/Fitch(2) | NRA (SF) | % of Total NRA | UW Base Rent PSF | % of Total UW Base Rents | Lease Expiration Date |
| Hollingsworth | NR / NR / NR | 392,838 | 51.9% | $3.30 | 44.2% | 12/31/2026 |
| Fiat | Ba2 / BB+ / BBB- | 364,018 | 48.1 | $4.50 | 55.8 | 8/31/2027 |
| Total: | 756,856 | 100.0% | 100.0% |
| (1) | Based on the underwritten rent roll, including rent increases occurring through December 31, 2019 and TI Amortization for Fiat. The tenants do not have any early termination options. |
| (2) | Ratings provided are for the parent company of the entity listed in the “Tenant” field whether or not the parent company guarantees the lease or the tenant. |
THE INFORMATION IN THIS STRUCTURAL AND COLLATERAL TERM SHEET IS NOT COMPLETE AND MAY BE AMENDED PRIOR TO THE TIME OF SALE. THIS TERM SHEET IS NOT AN OFFER TO SELL THESE SECURITIES AND IT IS NOT A SOLICITATION OF AN OFFER TO BUY THESE SECURITIES IN ANY JURISDICTION WHERE THE OFFER OR SALE IS NOT PERMITTED.
142
Mortgage Loan No. 12 — Temperance Industrial
Lease Rollover Schedule(1)
| Year | Number of Leases Expiring | NRA Expiring | % of NRA Expiring | UW Base Rent Expiring | % of UW Base Rent Expiring | Cumulative NRA Expiring | Cumulative % of NRA Expiring | Cumulative UW Base Rent Expiring | Cumulative % of UW Base Rent Expiring |
| MTM | 0 | 0 | 0.0% | $0 | 0.0% | 0 | 0.0% | $0 | 0.0% |
| 2019 | 0 | 0 | 0.0 | 0 | 0.0 | 0 | 0.0% | $0 | 0.0% |
| 2020 | 0 | 0 | 0.0 | 0 | 0.0 | 0 | 0.0% | $0 | 0.0% |
| 2021 | 0 | 0 | 0.0 | 0 | 0.0 | 0 | 0.0% | $0 | 0.0% |
| 2022 | 0 | 0 | 0.0 | 0 | 0.0 | 0 | 0.0% | $0 | 0.0% |
| 2023 | 0 | 0 | 0.0 | 0 | 0.0 | 0 | 0.0% | $0 | 0.0% |
| 2024 | 0 | 0 | 0.0 | 0 | 0.0 | 0 | 0.0% | $0 | 0.0% |
| 2025 | 0 | 0 | 0.0 | 0 | 0.0 | 0 | 0.0% | $0 | 0.0% |
| 2026 | 1 | 392,838 | 51.9 | 1,295,930 | 44.2 | 392,838 | 51.9% | $1,295,930 | 44.2% |
| 2027 | 1 | 364,018 | 48.1 | 1,638,081 | 55.8 | 756,856 | 100.0% | $2,934,011 | 100.0% |
| 2028 | 0 | 0 | 0.0 | 0 | 0.0 | 756,856 | 100.0% | $2,934,011 | 100.0% |
| 2029 | 0 | 0 | 0.0 | 0 | 0.0 | 756,856 | 100.0% | $2,934,011 | 100.0% |
| 2030 & Beyond | 0 | 0 | 0.0 | 0 | 0.0 | 756,856 | 100.0% | $2,934,011 | 100.0% |
| Vacant | NAP | 0 | 0.0 | NAP | NAP | 756,856 | 100.0% | NAP | NAP |
| Total | 2 | 756,856 | 100.0% | $2,934,011 | 100.0% |
| (1) | Based on the underwritten rent roll, including rent increases occurring through December 31, 2019 and TI Amortization for Fiat. |
Operating History and Underwritten Net Cash Flow
| 2015(1) | 2016(1) | 2017(1) | TTM(1) | Underwritten(2) | PSF | %(3) | |
| Rents in Place | N/A | N/A | N/A | N/A | $2,454,490 | $3.24 | 60.9% |
| TI Amortization | N/A | N/A | N/A | N/A | 479,521 | $0.63 | 11.9% |
| Gross Potential Rent | N/A | N/A | N/A | N/A | $2,934,011 | $3.88 | 72.8% |
| Total Reimbursements | N/A | N/A | N/A | N/A | 1,095,598 | $1.45 | 27.2% |
| Net Rental Income | N/A | N/A | N/A | N/A | $4,029,609 | $5.32 | 100.0% |
| (Vacancy/Collection Loss) | N/A | N/A | N/A | N/A | (181,332) | ($0.24) | (4.7%) |
| Effective Gross Income | N/A | N/A | N/A | N/A | $3,848,276 | $5.08 | 100.0% |
| Total Expenses | N/A | N/A | N/A | N/A | $1,097,661 | $1.45 | 28.5% |
| Net Operating Income | N/A | N/A | N/A | N/A | $2,750,615 | $3.63 | 71.5% |
| Total TI/LC, Capex/RR | N/A | N/A | N/A | N/A | 340,585 | $0.45 | 8.9% |
| Net Cash Flow | N/A | N/A | N/A | N/A | $2,410,030 | $3.18 | 62.6% |
| (1) | Historical financials are not available as the property was acquired by the sponsors in September 2018. The seller did not provide historical operating statements to the borrower. |
| (2) | Underwritten rent includes base rent and rent increases occurring through December 31, 2019. |
| (3) | % column represents percent of Net Rental Income for all revenue lines and represents percent of Effective Gross Income for the remainder of fields. |
THE INFORMATION IN THIS STRUCTURAL AND COLLATERAL TERM SHEET IS NOT COMPLETE AND MAY BE AMENDED PRIOR TO THE TIME OF SALE. THIS TERM SHEET IS NOT AN OFFER TO SELL THESE SECURITIES AND IT IS NOT A SOLICITATION OF AN OFFER TO BUY THESE SECURITIES IN ANY JURISDICTION WHERE THE OFFER OR SALE IS NOT PERMITTED.
143
Mortgage Loan No. 13 — Continental Towers
| Mortgage Loan Information | Property Information | |||
| Mortgage Loan Seller: | Column | Single Asset / Portfolio: | Single Asset | |
| Original Principal Balance(1): | $25,000,000 | Title: | Fee | |
| Cut-off Date Principal Balance(1): | $25,000,000 | Property Type - Subtype: | Office - Suburban | |
| % of Pool by IPB: | 3.0% | Net Rentable Area (SF): | 910,717 | |
| Loan Purpose: | Acquisition | Location: | Rolling Meadows, IL | |
| Borrower: | CT Acquisitions, LLC | Year Built / Renovated: | 1978-1982 / 2013-2018 | |
| Sponsor: | Rubenstein Properties Fund III, L.P. | Occupancy: | 89.1% | |
| Interest Rate: | 4.7500% | Occupancy Date: | 7/10/2018 | |
| Note Date: | 8/9/2018 | Number of Tenants: | 39 | |
| Maturity Date: | 9/6/2028 | 2015 NOI(3): | $1,750,549 | |
| Interest-only Period: | 120 months | 2016 NOI(3): | $5,042,713 | |
| Original Term: | 120 months | 2017 NOI(3): | $10,705,172 | |
| Original Amortization: | None | TTM NOI(3)(4): | $9,954,385 | |
| Amortization Type: | Interest Only | UW Economic Occupancy: | 87.0% | |
| Call Protection: | L(30), Def(83), O(7) | UW Revenues(3): | $22,170,532 | |
| Lockbox: | Hard | UW Expenses: | $11,116,359 | |
| Additional Debt(1): | Yes | UW NOI(3): | $11,054,174 | |
| Additional Debt Balance(1): | $59,500,000 | UW NCF: | $9,505,955 | |
| Additional Debt Type(1): | Pari Passu | Appraised Value / Per SF: | $121,700,000 / $134 | |
| Additional Future Debt Permitted(2): | Yes | Appraisal Date: | 7/15/2018 |
| Escrows and Reserves | Financial Information(1) | |||||
| Initial | Monthly | Initial Cap | Cut-off Date Loan Per SF: | $93 | ||
| Taxes: | $914,318 | $304,773 | N/A | Maturity Date Loan Per SF: | $93 | |
| Insurance: | $111,862 | Springing | N/A | Cut-off Date LTV: | 69.4% | |
| Replacement Reserves: | $0 | $15,179 | N/A | Maturity Date LTV: | 69.4% | |
| TI/LC: | $0 | $113,840 | N/A | UW NOI / UW NCF DSCR: | 2.72x / 2.34x | |
| Tenant Allowance: | $1,070,187 | $0 | N/A | UW NOI / UW NCF Debt Yield: | 13.1% / 11.2% | |
| Rent Concession: | $938,407 | $0 | N/A | |||
| Capital Expenditure(5): | $0 | Springing | N/A |
Sources and Uses | ||||||
| Sources | Proceeds | % of Total | Uses | Proceeds | % of Total | |
| Whole Loan: | $84,500,000 | 61.2% | Purchase Price: | $121,500,000 | 88.0% | |
| Sponsor Equity: | 53,619,184 | 38.8 | Capital Expenditure Guarantee(5): | 12,000,000 | 8.7 | |
| Upfront Reserves: | 3,034,774 | 2.2 | ||||
| Closing Costs: | 1,584,410 | 1.1 | ||||
| Total Sources: | $138,119,184 | 100.0% | Total Uses: | $138,119,184 | 100.0% |
| (1) | The Continental Towers loan is part of a larger split whole loan evidenced by threepari passu notes with an aggregate Cut-off Date balance of $84.5 million (collectively, the “Whole Loan”). The financial information presented in the chart above and herein reflects the balance of the Whole Loan. |
| (2) | The borrower is permitted to obtain a mezzanine loan approved by the lender and subject to, among other things: (i) the LTV on the combined loan is not greater than 65.0%, (ii) the debt yield on the combined loan is no less than 11.75% and (iii) the lender has received a rating agency confirmation. |
THE INFORMATION IN THIS STRUCTURAL AND COLLATERAL TERM SHEET IS NOT COMPLETE AND MAY BE AMENDED PRIOR TO THE TIME OF SALE. THIS TERM SHEET IS NOT AN OFFER TO SELL THESE SECURITIES AND IT IS NOT A SOLICITATION OF AN OFFER TO BUY THESE SECURITIES IN ANY JURISDICTION WHERE THE OFFER OR SALE IS NOT PERMITTED.
144
Mortgage Loan No. 13 — Continental Towers
| (3) | The increase in NOI from 2015 to Underwritten is the result of new leasing activity that increased occupancy from approximately 60% in 2013 to the current occupancy of 89.1%. The new leasing activity was, in part, driven by an approximately $65.0 million investment for major renovations, capital improvements, a new multi-story parking structure, and tenanting costs by the seller following their acquisition of the property in 2013. |
| (4) | Represents trailing twelve months ending May 31, 2018. |
| (5) | The sponsor has guaranteed to spend $12.0 million of capital expenditures by April 6, 2022. If not spent by April 6, 2022, any unexpended portion of the $12.0 million must be either (i) deposited in a lender controlled capital expenditure reserve account or (ii) funded through an excess cash flow sweep until such time as the obligations are satisfied. Funding of the reserve and completion of the capital improvements is guaranteed by Rubenstein Properties Fund III, L.P. |
The Loan. The Continental Towers Whole Loan is an $84.5 million first mortgage loan secured by the fee interest in a 910,717 SF, 3-tower, Class A office complex located in Rolling Meadows, Illinois. The loan has a 10-year term and is interest-only for the entire term of the loan.
The Whole Loan is evidenced by threepari passu notes. The non-controlling Note A-2 is being contributed to the CSAIL 2019-C15 Commercial Mortgage Trust. The Whole Loan is being serviced under the CSAIL 2018-C14 pooling and servicing agreement. As the holder of Note A-1 (the “Controlling Noteholder”), the trustee of the CSAIL 2018-C14 Commercial Mortgage Trust is entitled to exercise all of the rights of the Controlling Noteholder with respect to the Whole Loan; however, the holders of the remaining notes are entitled, under certain circumstances, to consult with respect to certain major decisions.
Whole Loan Note Summary
| Original Balance | Cut-off Date Balance | Note Holder | Lead Servicer for Whole Loan (Y/N) | Controlling Piece (Y/N) | |
| Note A-1, A-3 | $59,500,000 | $59,500,000 | CSAIL 2018-C14 | Y | Y |
| Note A-2 | 25,000,000 | 25,000,000 | CSAIL 2019-C15 | N | N |
| Total | $84,500,000 | $84,500,000 |
The Borrower. The borrowing entity for the loan is CT Acquisitions, LLC, a Delaware limited liability company structured to be bankruptcy remote with two independent directors. The borrowing entity is owned 99% by Rubenstein Properties Fund III, L.P. and 1% by GlenStar Partners II, LLC.
The Sponsor. The sponsor and nonrecourse carve-out guarantor of the Whole Loan is Rubenstein Properties Fund III, L.P (“Rubenstein”). The sponsor is a subsidiary of Rubenstein Partners, L.P. which is a real estate investment firm specializing in value-added office properties that are experiencing significant vacancies. Rubenstein invests in assets located in central business districts and their proximate suburban markets. Rubenstein Partners, L.P. was founded in September 2005 and is based in Philadelphia, Pennsylvania. Rubenstein has ownership interest in a portfolio of eight office buildings valued over $884.7 million.
The Property. The property is a Class A, 3-tower, 12-story, 910,717 SF, LEED Silver certified office complex located in Rolling Meadows, Illinois. The property was constructed from 1978 to 1982 and most recently renovated in 2018. The property consists of 895,178 SF of office space and 15,539 SF of retail space.
The sponsor acquired the property for $121.5 million ($133.41 PSF) from a venture between Walton Street Capital and GlenStar Properties, which invested $65.0 million from 2013 to 2018 for renovations and upgrades. The previous owner’s $65.0 million investment included a full redesign of the property’s exterior and traffic flow ($17.4 million), the addition of a 734-stall parking garage ($8.0 million), renovation of the 22,535 SF fitness center ($3.5 million), renovation of the common corridors, restrooms and lobbies ($0.8 million) and approximately $35.0 million of leasing costs. The previous owner’s repositioning increased occupancy to 89.1%.
Additionally, the sponsor plans to invest an additional $20.9 million through 3Q 2023 to complete building interior and structure improvements ($7.8 million), mechanical, electrical, plumbing, life safety and security provisions ($6.1 million), parking and site updates ($5.2 million), in addition to other miscellaneous and soft costs ($1.8 million), which will bring the total investment (sponsor and previous owner) to more than $85.9 million ($94.27 PSF) in the property since 2013. Rubenstein guaranteed to spend $12.0 million on capital expenditures by April 6, 2022. If such capital expenditures are not expended by April 6, 2022, any unexpended portion of the $12.0 million must be either (i) deposited in a lender controlled capital expenditure reserve account or (ii) funded through an excess cash flow sweep until such time as the obligations are satisfied. Funding of the reserve and completion of the capital improvements is guaranteed by Rubenstein.
THE INFORMATION IN THIS STRUCTURAL AND COLLATERAL TERM SHEET IS NOT COMPLETE AND MAY BE AMENDED PRIOR TO THE TIME OF SALE. THIS TERM SHEET IS NOT AN OFFER TO SELL THESE SECURITIES AND IT IS NOT A SOLICITATION OF AN OFFER TO BUY THESE SECURITIES IN ANY JURISDICTION WHERE THE OFFER OR SALE IS NOT PERMITTED.
145
Mortgage Loan No. 13 — Continental Towers
The property has an extensive amenity package, which includes a fully updated 22,535 SF fitness facility with basketball and squash courts. In addition to food and retail service amenities, the property has an overall 4.0 per 1,000 SF parking ratio (including 99 below-grade executive stalls and a newly constructed 734-stall parking garage). There is an 11,222 SF divisible conference facility, as well as a dry cleaner, sundry shop, florist and 6,610 SF Foodbarz Deli. The property also includes enclosed walkways connecting to the garage and common area.
As of July 10, 2018, the property was 89.1% leased by 39 tenants with a 5.2 year weighted average remaining lease term. Five tenants representing 40.3% of NRA and 46.0% of base rent are investment grade rated. The largest tenant at the property, Verizon Wireless, leases 159,824 SF (17.5% of NRA) through April 2028 with two, five- or seven-year extension options remaining. Verizon Wireless is an integrated telecommunications company that provides wire line voice and data services, wireless services, Internet services, and published directory information. Verizon Wireless, rated Baa1/BBB+/A- by Moody’s, S&P and Fitch, respectively, has been at the property since May 2015 with prominent signage on the center building. Verizon Wireless relocated approximately 900 employees to the property from its Elgin, Illinois location and expanded its space by 34,824 SF in October 2015. The second largest tenant at the property, Komatsu America Corp., leases 105,437 SF (11.6% of NRA). In April 2018 Komatsu America Corp. provided three years advance notice that it will not renew its lease beyond the July 2021 expiration. Komatsu America Corp. is in occupancy and is scheduled to move out in 2020. The sponsor has begun marketing the space for lease. The third largest tenant at the property, Ceannate Corp., leases 74,340 SF (8.2% of NRA) through September 2024 with one, five-year extension option remaining. Ceannate Corp. provides business process outsourcing services including student debt collection for colleges and universities as well as public and private lenders. The property has served as Ceannate Corp.’s headquarters since 2014. The fourth largest tenant at the property, Advocate Health Partners, leases 70,972 SF (7.8% of NRA) through December 2025 with one, five-year extension option remaining. Advocate Health Partners does business as Advocate Physician Partners. It is comprised of approximately 5,000 physicians providing primary physician care in collaboration with Advocate Aurora Health, the tenth largest not-for-profit integrated health system in the United States. Advocate Physician Partners has been a tenant at the property since 2012.
The property has frontage and visibility along I-90, with excellent signage for primary tenants, in Rolling Meadows, Illinois, approximately 25.8 miles northwest of the Chicago central business district. Primary access to the location is provided by Northwest Tollway, I-90, and Route 53 (I-355), all of which are major arterial exchanges in the Chicago northwest suburbs. Additionally the property is situated 9.8 miles west from O’Hare International Airport.
The Market. The property is located along I-90 in Rolling Meadows, Illinois, 25.8 miles northwest of the Chicago central business district. Within the Chicago metropolitan statistical area, the property is located in the Northwest Suburbs office submarket. The Northwest Suburbs submarket consists of approximately 27 million SF of office space (25% of the entire suburban market) spread across 20 square miles and is home to a wide variety of world-renowned corporations and retailers such as Zurich North America, Verizon Wireless, Motorola, IBM, AT&T, Comcast, A. C. Nielsen, and Arthur J. Gallagher.
The median household and average incomes within a five-mile radius of the property are estimated at $74,534 and $97,917, respectively. The population grew 0.2% annually from 2010-2017, and is forecast to increase 0.2% per year through 2022. The household growth rate through 2022 is projected to be 0.2% annually. Approximately 44.4% of the population is comprised of 25+ year old college graduates.
In addition to the investment in and renovation of the property, the city has seen a surge in office market activity including Arthur J. Gallagher & Co., the nation’s fourth largest commercial insurance broker, which has commenced a purchase, full renovation, and move-in of 2850 Golf Road (1.3 miles from the property) that brought 1,770 new employees to the market. Additionally, Weichai America moved its North American headquarters to a 166,722 SF building at 3100 Golf Road.
The property also benefits from the nearby Woodfield Mall, the largest mall in Illinois (2.6 miles from the property) and Schaumburg Convention Center (3.2 miles from the property). Simon Property Group purchased a 50% interest in the Woodfield Mall in 2013 and reportedly spent $14 million on renovations. The Schaumburg Convention Center has a 97,200 SF exhibit hall, a 27,502 SF foot ballroom, 148,624 SF of meeting space, a new 474-room Marriott Renaissance Hotel, and a new 2,400-seat performing arts theater.
THE INFORMATION IN THIS STRUCTURAL AND COLLATERAL TERM SHEET IS NOT COMPLETE AND MAY BE AMENDED PRIOR TO THE TIME OF SALE. THIS TERM SHEET IS NOT AN OFFER TO SELL THESE SECURITIES AND IT IS NOT A SOLICITATION OF AN OFFER TO BUY THESE SECURITIES IN ANY JURISDICTION WHERE THE OFFER OR SALE IS NOT PERMITTED.
146
Mortgage Loan No. 13 — Continental Towers
Additionally, the Illinois Tollway recently finished a $2.5 billion rebuilding and widening of the Jane Addams Memorial Tollway (I-90) as part of the 15-year, $14 billion capital program, Move Illinois: The Illinois Tollway Driving the Future. Completed in 2017, I-90 is now a 21st century, state-of-the-art corridor. The property is located on the portion of the Illinois Tollway linking Rockford to O’Hare International Airport. The work also included the launch of the new I-90 SmartRoad, incorporating active traffic management on a portion of the roadway in order to make I-90 safer and more efficient for the benefit of Tollway customers.
According to a third party market data provider for 2Q 2018, the broad Northwest office submarket has approximately 26.8 million SF in 234 buildings, which is 11.5% of the total Chicago metro market. Class A space totals just over 12.0 million SF or 44.8% of the submarket. Direct vacancy was 20.7% for Class A space. The average asking rent was $26.92 PSF for Class A space. A third party market data provider noted in their Chicago Suburban office 2Q2018 report that tenants are continuing to prefer high-quality space with Class A properties accounting for nearly half of all leasing activity in 2018.
The appraisal concluded per square foot market rents of $15.75 PSF gross for the office space. According to the appraisal, the property’s competitive set consists of the eight properties detailed in the table below with an average occupancy of 87.3%, and to which, the property was judged to be more comparable than to properties in the overall Northwest Suburban Class A office market.
Competitive Set Summary(1)
| Property | Year Built / Renovated | Total NRA (SF) | Est. Rent PSF | Basis | Est. Occ. | Proximity (miles) |
| Continental Towers | 1978-1982 / 2013-2018 | 910,717(2) | $15.24 | Gross | 89.1%(2) | N/A |
| Centennial Center | 1980 / N/A | 266,884 | $11.50 | NNN | 96% | 1.9 |
| One Century Centre | 1985 / N/A | 212,212 | $20.00 | Gross | 94% | 2.1 |
| 1600 Corporate Center | 1986 / N/A | 255,440 | $24.00 | Modified Gross | 90% | 0.4 |
| Atrium Corporate Center | 1980 / N/A | 483,000 | $25.00 | Modified Gross | 100% | 1.5 |
| Schaumburg Corporate Center I-III | 1980 / N/A | 965,986 | $14.50 | NNN | 88% | 2.8 |
| Woodfield Corporate Center | 1986 / 1993 | 671,356 | $14.50 | NNN | 81% | 3.0 |
| Woodfield Preserve | 2001 / N/A | 610,462 | $16.50 | NNN | 82% | 3.5 |
| One Pierce Place | 1984 / N/A | 525,422 | $14.00 | NNN | 80% | 6.0 |
| (1) | Source: Appraisal. |
| (2) | Based on the July 10, 2018 underwritten rent roll. |
Historical and Current Occupancy(1)
| 2015 | 2016 | 2017 | Current(2) |
| 91.4% | 92.9% | 91.7% | 89.1% |
| (1) | Source: Historical Occupancy is provided by the sponsor. Occupancies are as of December 31 of each respective year. |
| (2) | Based on the July 10, 2018 underwritten rent roll. |
THE INFORMATION IN THIS STRUCTURAL AND COLLATERAL TERM SHEET IS NOT COMPLETE AND MAY BE AMENDED PRIOR TO THE TIME OF SALE. THIS TERM SHEET IS NOT AN OFFER TO SELL THESE SECURITIES AND IT IS NOT A SOLICITATION OF AN OFFER TO BUY THESE SECURITIES IN ANY JURISDICTION WHERE THE OFFER OR SALE IS NOT PERMITTED.
147
Mortgage Loan No. 13 — Continental Towers
Top Ten Tenant Summary(1)
| Tenant | Ratings Moody’s/S&P/Fitch(2) | Net Rentable Area (SF) | % of Total NRA | UW Base Rent PSF | % of Total UW Base Rents | Lease Expiration Date |
| Verizon Wireless | Baa1 / BBB+ / A- | 159,824 | 17.5% | $16.25 | 21.0% | 4/30/2028(3) |
| Komatsu America Corp. | A2 / A / NR | 105,437 | 11.6 | $15.93 | 13.6 | 7/31/2021(4) |
| Ceannate Corp. | NR / NR / NR | 74,340 | 8.2 | $24.00 | 14.4 | 9/30/2024(5) |
| Advocate Health Partners(6) | NR / NR / NR | 70,972 | 7.8 | $14.42 | 8.3 | 12/31/2025 |
| Panasonic Corporation of North America | A3 / A- / BBB | 53,231 | 5.8 | $14.50 | 6.2 | 5/31/2020 & 12/13/2022 |
| Rational Cooking Systems, Inc. | NR / NR / NR | 26,492 | 2.9 | $14.80 | 3.2 | 7/31/2021(7) |
| Lincoln National Life Insurance Company | Baa1 / A- / BBB+ | 24,141 | 2.7 | $13.00 | 2.5 | 3/25/2020 |
| Fifth Third Holdings, LLC | Baa1 / BBB+ / A- | 23,936 | 2.6 | $13.50 | 2.6 | 3/31/2022 |
| Associated Agencies, Inc. | NR / NR / NR | 23,682 | 2.6 | $16.50 | 3.2 | 9/30/2027 |
| Icon Identity Solutions, Inc. | NR / NR / NR | 23,608 | 2.6 | $15.50 | 3.0 | 11/30/2028 |
| Total: | 585,663 | 64.3% | 78.0% |
| (1) | Based on the underwritten rent roll, including rent increases occurring through August 31, 2019. |
| (2) | Ratings provided are for the parent company of the entity listed in the “Tenant” field whether or not the parent company guarantees the lease. |
| (3) | Verizon Wireless can terminate its lease effective April 30, 2026 with 15 months prior written notice and payment of a termination fee of $2.4 million or $15.02 PSF. |
| (4) | In April 2018 Komatsu America Corp. provided three years advance notice that it will not renew its space beyond the July 2021 expiration. Komatsu America Corp. is in occupancy and is scheduled to move out in 2020. |
| (5) | Ceannate Corp. can terminate its lease effective September 30, 2020 with 12 months’ prior written notice and payment of a termination fee of $2.4 million or $32.28 PSF. |
| (6) | Advocate Health Partners d.b.a. Advocate Physician Partners (“APP”) is comprised of approximately 5,000 physicians providing clinical care through Advocate Aurora Health (“AAH”). The financial results of APP are included in the consolidated financial statements of AAH. In 2018 AAH issued $1.2 billion bonds that were rated (Aa3 / AA / AA) respectively by Moody’s, S&P, and Fitch. |
| (7) | Rational Cooking Systems, Inc. can terminate its lease upon the tenant electing to expand its premises (up to 18,384 SF) and the borrower failing to deliver the space in the agreed time or upon the borrower constructing a new building at the complex that would block the view of the retention pond and the borrower failing to deliver alternate space to the tenant upon tenant’s request. In 2016 the four-level parking garage was partially constructed over the retention pond. In October 2018 Rational Cooking Systems, Inc. leased an additional 5,384 SF through July 2021. |
THE INFORMATION IN THIS STRUCTURAL AND COLLATERAL TERM SHEET IS NOT COMPLETE AND MAY BE AMENDED PRIOR TO THE TIME OF SALE. THIS TERM SHEET IS NOT AN OFFER TO SELL THESE SECURITIES AND IT IS NOT A SOLICITATION OF AN OFFER TO BUY THESE SECURITIES IN ANY JURISDICTION WHERE THE OFFER OR SALE IS NOT PERMITTED.
148
Mortgage Loan No. 13 — Continental Towers
Lease Rollover Schedule(1)(2)
| Year | Number of Leases Expiring | NRA Expiring | % of NRA Expiring | UW Base Rent Expiring | % of UW Base Rent Expiring | Cumulative NRA Expiring | Cumulative % of NRA Expiring | Cumulative UW Base Rent Expiring | Cumulative % of UW Base Rent Expiring |
| MTM | 1 | 2,779 | 0.3% | 39,601 | 0.3% | 2,779 | 0.3% | $39,601 | 0.3% |
| 2019 | 5 | 14,595 | 1.6 | 221,716 | 1.8 | 17,374 | 1.9% | $261,317 | 2.1% |
| 2020 | 10 | 66,429 | 7.3 | 915,369 | 7.4 | 83,803 | 9.2% | $1,176,686 | 9.5% |
| 2021 | 5 | 138,578 | 15.2 | 2,172,731 | 17.6 | 222,381 | 24.4% | $3,349,417 | 27.1% |
| 2022 | 3 | 74,831 | 8.2 | 1,064,757 | 8.6 | 297,212 | 32.7% | $4,414,174 | 35.7% |
| 2023 | 4 | 27,269 | 3.0 | 417,402 | 3.4 | 324,481 | 35.6% | $4,831,576 | 39.1% |
| 2024 | 3 | 107,546 | 11.8 | 2,285,555 | 18.5 | 432,027 | 47.5% | $7,117,131 | 57.6% |
| 2025 | 6 | 124,698 | 13.7 | 1,847,419 | 14.9 | 556,725 | 61.1% | $8,964,549 | 72.5% |
| 2026 | 0 | 0 | 0.0 | 0 | 0.0 | 556,725 | 61.1% | $8,964,549 | 72.5% |
| 2027 | 1 | 23,682 | 2.6 | 390,753 | 3.2 | 580,407 | 63.7% | $9,355,302 | 75.7% |
| 2028 | 3 | 186,904 | 20.5 | 3,009,936 | 24.3 | 767,311 | 84.3% | $12,365,238 | 100.0% |
| 2029 & Beyond | 0 | 0 | 0.0 | 0 | 0.0 | 767,311 | 84.3% | $12,365,238 | 100.0% |
| Management | NAP | 43,811 | 4.8 | NAP | NAP | 811,122 | 89.1% | NAP | NAP |
| Vacant | NAP | 99,595 | 10.9 | NAP | NAP | 910,717 | 100.0% | NAP | NAP |
| Total | 41 | 910,717 | 100.0% | $12,365,238 | 100.0% |
| (1) | Based on the underwritten rent roll. Rent includes base rent and rent increases occurring through August 31, 2019. |
| (2) | Certain tenants may have lease termination options that are exercisable prior to the originally stated expiration date of the subject lease and that are not considered in the Lease Rollover Schedule. |
Operating History and Underwritten Net Cash Flow
| 2015(1) | 2016(1) | 2017(1) | TTM(1)(2) | Underwritten(1)(3) | PSF | %(4) | |
| Rents in Place | $8,401,656 | $11,323,241 | $12,575,017 | $12,771,878 | $12,365,238 | $13.58 | 49.8% |
| Rent Steps / Straight Line | 0 | 0 | 0 | 0 | 804,136 | $0.88 | 3.2% |
| Vacant Income | 0 | 0 | 0 | 0 | 1,533,770 | $1.68 | 6.2% |
| Telecom / Overage Income | 0 | 0 | 0 | 0 | 162,122 | $0.18 | 0.7% |
| Gross Potential Rent | $8,401,656 | $11,323,241 | $12,575,017 | $12,771,878 | $14,865,266 | $16.32 | 59.8% |
| Total Reimbursements | 4,407,884 | 6,660,247 | 8,972,905 | 8,434,784 | 9,978,161 | $10.96 | 40.2% |
| Net Rental Income | $12,809,540 | $17,983,488 | $21,547,922 | $21,206,661 | $24,843,427 | $27.28 | 100.0% |
| (Vacancy/Collection Loss) | (2,112,263) | (2,562,256) | (229,168) | (315,039) | (3,229,646) | ($3.55) | (14.6%) |
| Other Income | 511,446 | 421,077 | 554,255 | 519,572 | 556,751 | $0.61 | 2.5% |
| Effective Gross Income | $11,208,724 | $15,842,309 | $21,873,009 | $21,411,194 | $22,170,531 | $24.34 | 100.0% |
| Total Expenses | $9,458,175 | $10,799,596 | $11,167,837 | $11,456,809 | $11,116,359 | $12.21 | 50.1% |
| Net Operating Income | $1,750,549 | $5,042,713 | $10,705,172 | $9,954,385 | $11,054,174 | $12.14 | 49.9% |
| Total TI/LC, Capex/RR | 0 | 0 | 0 | 0 | 1,548,219 | $1.70 | 7.0% |
| Net Cash Flow | $1,750,549 | $5,042,713 | $10,705,172 | $9,954,385 | $9,505,955 | $10.44 | 42.9% |
| (1) | The increase in NOI from 2015 to Underwritten is the result of new leasing activity that resulted in an increase in the occupancy rate from approximately 55% in 2013 to the current occupancy of 89.1%. The new leasing activity was, in part, driven by an approximately $65.0 million investment for major renovations, capital improvements, a new multi-story parking structure, and tenanting costs by the seller following their acquisition of the subject in 2013. |
| (2) | TTM represents the trailing twelve month period ending May 31, 2018. |
| (3) | Includes Base Rent and Rent Increases occurring through August 31, 2019. |
| (4) | % represents percent of Net Rental Income for all revenue lines and represents percent of Effective Gross Income for the remainder of fields. |
THE INFORMATION IN THIS STRUCTURAL AND COLLATERAL TERM SHEET IS NOT COMPLETE AND MAY BE AMENDED PRIOR TO THE TIME OF SALE. THIS TERM SHEET IS NOT AN OFFER TO SELL THESE SECURITIES AND IT IS NOT A SOLICITATION OF AN OFFER TO BUY THESE SECURITIES IN ANY JURISDICTION WHERE THE OFFER OR SALE IS NOT PERMITTED.
149
Mortgage Loan No. 14 — Culver City Medical
| Mortgage Loan Information | Property Information | |||
| Mortgage Loan Seller: | 3650 REIT | Single Asset / Portfolio: | Single Asset | |
| Original Principal Balance: | $25,000,000 | Title: | Fee | |
| Cut-off Date Principal Balance: | $25,000,000 | Property Type - Subtype: | Office – Medical | |
| % of Pool by IPB: | 3.0% | Net Rentable Area (SF): | 56,587 | |
| Loan Purpose: | Refinance | Location: | Culver City, CA | |
| Borrower: | Stanford Culver, LLC | Year Built / Renovated: | 1981 / 2017 - 2018 | |
| Sponsor: | David Taban | Occupancy: | 90.7% | |
| Interest Rate: | 4.6600% | Occupancy Date: | 12/6/2018 | |
| Note Date: | 12/11/2018 | Number of Tenants: | 32 | |
| Maturity Date: | 1/5/2029 | 2015 NOI(1): | N/A | |
| Interest-only Period: | 120 months | 2016 NOI(1): | N/A | |
| Original Term: | 120 months | 2017 NOI: | $1,244,344 | |
| Original Amortization: | None | TTM NOI(2)(3)(4): | $1,466,184 | |
| Amortization Type: | Interest Only | UW Economic Occupancy: | 90.8% | |
| Call Protection: | L(26), Def (89), O(5) | UW Revenues: | $3,266,066 | |
| Lockbox: | Hard | UW Expenses: | $933,617 | |
| Additional Debt: | No | UW NOI(4): | $2,332,449 | |
| Additional Debt Balance: | N/A | UW NCF: | $2,294,601 | |
| Additional Debt Type: | N/A | Appraised Value / Per SF: | $41,500,000 / $733 | |
| Additional Future Debt Permitted: | No | Appraisal Date: | 10/25/2018 |
| Escrows and Reserves | Financial Information | |||||
| Initial | Monthly | Initial Cap | Cut-off Date Loan Per SF: | $442 | ||
| Taxes: | $0 | $20,329 | N/A | Maturity Date Loan Per SF: | $442 | |
| Insurance: | $0 | Springing | N/A | Cut-off Date LTV: | 60.2% | |
| Replacement Reserves: | $0 | $566 | $34,200 | Maturity Date LTV: | 60.2% | |
| TI/LC(5): | $400,000 | $4,715 | $100,000 | UW NOI / UW NCF DSCR: | 1.97x / 1.94x | |
| Free Rent Reserve: | $73,126 | $0 | N/A | UW NOI / UW NCF Debt Yield: | 9.3% / 9.2% |
| Sources and Uses | ||||||
| Sources | Proceeds | % of Total | Uses | Proceeds | % of Total | |
| Mortgage Loan: | $25,000,000 | 100.0% | Payoff Existing Debt: | $15,028,038 | 60.1% | |
| Return of Equity: | 8,881,157 | 35.5 | ||||
| Closing Costs: | 617,679 | 2.5 | ||||
| Upfront Reserves: | 473,126 | 1.9 | ||||
| Total Sources: | $25,000,000 | 100.0% | Total Uses: | $25,000,000 | 100.0% |
| (1) | 2015 and 2016 cash flows are not available as the sponsor acquired the property in 2016. The seller did not provide historical operating statements to the borrower. |
| (2) | The sponsor acquired the property with significant outstanding deferred maintenance resulting in a 2017 occupancy of 72.0%. Post-acquisition, the sponsor invested $4.7 million in property renovations and upgrades resulting in increased occupancy to 90.7% as of December 6, 2018. |
| (3) | TTM represents the trailing twelve-month period ending November 30, 2018. |
| (4) | The increase in UW NOI from TTM NOI is due to the leasing of 15,088 SF in 2018 resulting in additional underwritten base rent of $772,250. 92.3% of the 2018 leasing had lease commencement dates on or after May 2018. |
THE INFORMATION IN THIS STRUCTURAL AND COLLATERAL TERM SHEET IS NOT COMPLETE AND MAY BE AMENDED PRIOR TO THE TIME OF SALE. THIS TERM SHEET IS NOT AN OFFER TO SELL THESE SECURITIES AND IT IS NOT A SOLICITATION OF AN OFFER TO BUY THESE SECURITIES IN ANY JURISDICTION WHERE THE OFFER OR SALE IS NOT PERMITTED.
150
Mortgage Loan No. 14 — Culver City Medical
| (5) | Monthly deposits of $4,715 into the TI/LC reserve are required until the reserve balance reaches $100,000 from the monthly deposits, irrespective of the $400,000 initial deposit. Upon the balance of the TI/LC reserve being less than $100,000 from ongoing collections monthly deposits will recommence. |
The Loan. The Culver City Medical loan is a $25.0 million first mortgage loan secured by the fee interest in a 56,587 SF, Class B, medical office building located in Culver City, California. The loan has a 10-year term and is interest-only for the entire term of the loan.
The Borrower. The borrowing entity for the loan is Stanford Culver, LLC, a Delaware limited liability company and special purpose entity. The borrowing entity is owned 100.0% by Stanford Capital, LLC, which is owned and controlled by David Taban and related entities.
The Sponsor. The loan’s sponsor and nonrecourse carve-out guarantor is David Taban. David Taban is the founder of Jade Enterprises, a privately held real estate firm based in Los Angeles, California. David Taban owns Jade Enterprises with his three brothers. Jade Enterprises, founded over 30 years ago, has interests in a portfolio of over 50 properties, including class B office buildings, medical office buildings, major power centers, multifamily properties and land for future development throughout California and Nevada. As of March 31, 2018, David Taban has an estimated net worth and liquidity of $100.3 million and $4.2 million, respectively.
The Property. The property is a 56,587 SF, Class B, medical office building located in Culver City, California, which is situated in Los Angeles County. The property was constructed in 1981 and is a 7-story building situated on approximately 0.72 acres. The property is located on Hughes Avenue between the major thoroughfares of Venice Boulevard and Washington Boulevard and across the street from the Southern California Hospital at Culver City (the “Hospital”). Additionally, the property has a 3-story parking structure totaling 307 spaces, located on floors 2-4.
The sponsor purchased the property as real estate owned from the special servicer in February 2016. Based on the lender’s review of the offering materials for the property sale and discussions with the selling broker, the property exhibited extensive deferred maintenance at the time of the sale resulting in a 2017 occupancy of 72.0%. The windows had dislocated from the main structure throughout the entirety of the building, which caused water intrusion and thus damaged drywall and the framing of the building. Post-acquisition, the sponsor invested $4.7 million in property renovations and upgrades, including exterior repairs resulting in increased occupancy to 90.7% as of the December 2018 rent roll.
As of December 6, 2018, the property was 90.7% leased by 32 tenants. The largest tenant at the property, Southern California Healthcare System, Inc. (“Southern CA Healthcare”), leases 4,381 SF (7.7% of NRA) through December 2021 with two, three-year extension option remaining. Southern CA Healthcare has been a tenant at the property since 1998. Southern CA Healthcare is a hospital operator and healthcare services provider in Culver City, California, operating the Hospital, where it provides a wide range of healthcare services. The company was founded in 1924 and, as of April 2009, is a subsidiary of Prospect Hospital Advisory Services. The second largest tenant at the property, Westside Head & Neck, leases 3,330 SF (5.9% of NRA) through April 2028 with one, five-year extension option remaining. Westside Head & Neck has been a tenant at the property since May 2018. Westside Head & Neck is a medical practice founded in 2010 specializing in ear, nose and throat conditions. The practice has nine staff members in addition to its five board certified doctors that have staff privileges at St. John’s Medical Center, UCLA Hospitals in Santa Monica and Westwood and the Hospital. The third largest tenant at the property, Betsy Blechman, leases 3,052 SF (5.4% of NRA) through September 2020. Betsy Blechman is an ophthalmologist that has been practicing in Los Angeles for over 30 years and has been a tenant at the property since 2004. The rent roll is granular with no tenant occupying more than 7.7% of the total NRA and UW Base Rents and the average term is approximately 12 years.
THE INFORMATION IN THIS STRUCTURAL AND COLLATERAL TERM SHEET IS NOT COMPLETE AND MAY BE AMENDED PRIOR TO THE TIME OF SALE. THIS TERM SHEET IS NOT AN OFFER TO SELL THESE SECURITIES AND IT IS NOT A SOLICITATION OF AN OFFER TO BUY THESE SECURITIES IN ANY JURISDICTION WHERE THE OFFER OR SALE IS NOT PERMITTED.
151
Mortgage Loan No. 14 — Culver City Medical
The property is located just south of Venice Boulevard and just north of Washington and Culver Boulevards, which provide access and visibility to the property. Primary access to the property is provided by Venice and Washington Boulevards, which provide direct access to Interstate 10, and Culver Boulevard, which provides direct access to Interstate 405 and Interstate 10. The property is across the street from the Hospital, the primary hospital for the immediate area that has 420 beds and provides general acute care and a wide range of inpatient and outpatient services. The property includes a 307-space, above-grade parking structure on floors 2-4. The improvements were recently renovated to improve infrastructure for dentists and other medical tenants, to modernize the entry and common areas and to repair the parking structure and roof.
The property is subject to a Declaration of Covenants, Conditions and Restrictions (the “CC&R”) with the Hospital which includes, among other things: (i) the Hospital has a right of first refusal to lease for any vacant space at the property and (ii) the property is restricted to a set of permitted medical uses. Within the range of permitted uses there are certain services (such as outpatient surgery, physical therapy or urgent care) that are reserved exclusively for the Hospital and excluded as permissible uses within the property without the Hospital’s consent. If the Hospital (i) rejects any proposed lease subject to the CC&R and such space continues to remain vacant for 90 days or (ii) declares a breach that the borrower has executed a lease in violation of the CC&R, then an affiliate of the borrower will be required to enter into one or more master lease agreements with the borrower for which the rental obligations will be guaranteed by the sponsor in accordance with the loan documents. See “Risk Factors—Risks Relating to the Mortgage Loans—Use Restrictions” in the Preliminary Prospectus.
The Market. The property is located in the Fox Hills/Culver City submarket of Los Angeles, approximately 11 miles southwest of the downtown Los Angeles central business district. The property is half a block from bus stops on Venice Boulevard and Washington Boulevard. According to the appraisal, Culver City is in the midst of a surge in redevelopment projects, focusing on converting former warehouse and industrial uses into retail, office and creative space, which is expected to improve the relative desirability of the city. According to the appraisal, the total populations in 1-, 3- and 5-mile radii around the property for 2018 were 47,071, 305,697 and 873,148, respectively, and average household incomes for 2018 for those radii were $97,632, $110,563 and $113,797, respectively.
As of the second quarter 2018, the Fox Hills/Culver City office submarket has a total inventory of 5.1 million SF with a direct vacancy rate of 16.1%, which is higher than the total market vacancy. The average asking rent for the Fox Hills/Culver City submarket is $55.20 PSF. According to a third-party report as of fourth quarter 2018, the Fox Hills/Culver City medical office market contained 432,219 SF of medical office space with an overall vacancy rate of 2.5% and rents of $46.08 per SF. The appraisal concluded per square foot market rents for the property of $51.00 PSF based on comparable medical office leasing. According to the appraisal, the property’s competitive set consists of the eight properties detailed in the table below.
Competitive Set Summary(1)
| Property | Location | Year Built / Renovated | Total NRA (SF) | Est. Rent PSF | Est. Occ. | Proximity (miles) |
| Culver City Medical | Culver City, CA | 1981 / 2017-2018 | 56,587(2) | $50.58(2) | 90.7%(2) | N/A |
| One Culver | Culver City, CA | 1986 / N/A | 344,670 | $71.40 | 54.0% | 0.2 |
| Brotman Physicians Plaza | Culver City, CA | 1964 / 2007 | 48,505 | $54.00 | 100.0% | 0.1 |
| Meralta Office Plaza | Culver City, CA | 1983 / N/A | 32,416 | $57.00 | 77.0% | 0.2 |
| Multi-Tenant Office | Culver City, CA | 1948 / 2007 | 16,288 | N/A | 100.0% | 1.4 |
| Parkside Medical Center | Santa Monica, CA | 1923 / 1985 | 65,610 | $49.20 | 100.0% | 5.4 |
| St, John’s Medical Plaza | Santa Monica, CA | 1987 / N/A | 90,056 | $55.80 | 100.0% | 5.7 |
| Medical Office | Santa Monica, CA | 1994 / N/A | 30,646 | $60.00 | 93.0% | 5.7 |
| Santa Monica Medical Plaza | Santa Monica, CA | 1973 / 2006 | 87,386 | $69.00 | 97.0% | 6.1 |
| (1) | Source: Appraisal. |
| (2) | Based on the December 6, 2018 underwritten rent roll. |
THE INFORMATION IN THIS STRUCTURAL AND COLLATERAL TERM SHEET IS NOT COMPLETE AND MAY BE AMENDED PRIOR TO THE TIME OF SALE. THIS TERM SHEET IS NOT AN OFFER TO SELL THESE SECURITIES AND IT IS NOT A SOLICITATION OF AN OFFER TO BUY THESE SECURITIES IN ANY JURISDICTION WHERE THE OFFER OR SALE IS NOT PERMITTED.
152
Mortgage Loan No. 14 — Culver City Medical
Historical and Current Occupancy
| 2015(1) | 2016(1) | 2017(2) | Current(2)(3) |
| N/A | N/A | 72.0% | 90.7% |
| (1) | 2015 and 2016 occupancies are not available as the sponsor acquired the property in 2016. |
| (2) | Occupancy is as of December 31, 2017. The sponsor acquired the property with significant outstanding deferred maintenance resulting in a 2017 occupancy of 72.0%. Post-acquisition, the sponsor invested $4.7 million in property renovations and upgrades following which occupancy increased to 90.7% as of December 6, 2018. |
| (3) | Based on the December 6, 2018 underwritten rent roll. |
Top Ten Tenant Summary(1)
| Tenant | Ratings Moody’s/S&P/Fitch | Net Rentable Area (SF) | % of Total NRA | Base Rent PSF | % of Total Base Rents | Lease Expiration Date |
| Southern CA Healthcare | NR / NR / NR | 4,381 | 7.7% | $45.89 | 7.7% | 12/31/2021 |
| Westside Head & Neck | NR / NR / NR | 3,330 | 5.9 | $48.69 | 6.2 | 4/30/2028 |
| Betsy Blechman | NR / NR / NR | 3,052 | 5.4 | $50.07 | 5.9 | 9/30/2020 |
| Culver City Surgical Specialists (Paul Brody) | NR / NR / NR | 2,784 | 4.9 | $43.08 | 4.6 | 10/31/2020 |
| D Houston MD & J Muro MD | NR / NR / NR | 2,667 | 4.7 | $53.04 | 5.5 | 8/30/2021 |
| Maryam Talaie (Century Smile Dental) | NR / NR / NR | 2,228 | 3.9 | $52.53 | 4.5 | 9/30/2028 |
| Complete Care Community Health Center, Inc. | NR / NR / NR | 2,112 | 3.7 | $47.74 | 3.9 | 3/31/2022 |
| Sapan G. Bhatka, Pharm D | NR / NR / NR | 2,029 | 3.6 | $48.66 | 3.8 | 3/30/2021 |
| Andra Medical Group | NR / NR / NR | 2,009 | 3.6 | $52.56 | 4.1 | 9/30/2028 |
| Rena Keynighstein MD | NR / NR / NR | 1,888 | 3.3 | $37.97 | 2.8 | 8/31/2022 |
| Top 10 Total: | 26,480 | 46.8% | $48.01 | 49.0% |
| (1) | Based on the underwritten rent roll, including rent increases occurring through February 1, 2020. |
Lease Rollover Schedule(1)
| Year | Number of Leases Expiring | NRA Expiring | % of NRA Expiring | UW Base Rent Expiring | % of Base Rent Expiring | Cumulative NRA Expiring | Cumulative % of NRA Expiring | Cumulative Base Rent Expiring | Cumulative % of Base Rent Expiring |
| MTM | 6 | 6,633 | 11.7% | $358,182 | 13.8% | 6,633 | 11.7% | $358,182 | 13.8% |
| 2019 | 3 | 2,688 | 4.8 | 111,247 | 4.3 | 9,321 | 16.5% | $469,429 | 18.1% |
| 2020 | 5 | 9,671 | 17.1 | 445,050 | 17.2 | 18,992 | 33.6% | $914,479 | 35.2% |
| 2021 | 4 | 10,919 | 19.3 | 533,266 | 20.6 | 29,911 | 52.9% | $1,447,745 | 55.8% |
| 2022 | 4 | 4,840 | 8.6 | 267,415 | 10.3 | 34,751 | 61.4% | $1,715,160 | 66.1% |
| 2023 | 2 | 1,369 | 2.4 | 103,201 | 4.0 | 36,120 | 63.8% | $1,818,362 | 70.1% |
| 2024 | 0 | 0 | 0.0 | 0 | 0.0 | 36,120 | 63.8% | $1,818,362 | 70.1% |
| 2025 | 0 | 0 | 0.0 | 0 | 0.0 | 36,120 | 63.8% | $1,818,362 | 70.1% |
| 2026 | 0 | 0 | 0.0 | 0 | 0.0 | 36,120 | 63.8% | $1,818,362 | 70.1% |
| 2027 | 0 | 0 | 0.0 | 0 | 0.0 | 36,120 | 63.8% | $1,818,362 | 70.1% |
| 2028 | 7 | 13,340 | 23.6 | 682,996 | 26.3 | 49,460 | 87.4% | $2,501,358 | 96.4% |
| 2029 | 1 | 1,844 | 3.3 | 93,454 | 3.6 | 51,304 | 90.7% | $2,594,812 | 100.0% |
| 2030 & Beyond | 0 | 0 | 0.0 | 0 | 0.0 | 51,304 | 90.7% | $2,594,812 | 100.0% |
| Vacant | NAP | 5,283 | 9.3 | NAP | NAP | 56,587 | 100.0% | NAP | NAP |
| Total | 32 | 56,587 | 100.0% | $2,594,812 | 100.0% |
|
(1) Based on the underwritten rent roll. Rent includes base rent and rent increases occurring through February 1, 2020.
THE INFORMATION IN THIS STRUCTURAL AND COLLATERAL TERM SHEET IS NOT COMPLETE AND MAY BE AMENDED PRIOR TO THE TIME OF SALE. THIS TERM SHEET IS NOT AN OFFER TO SELL THESE SECURITIES AND IT IS NOT A SOLICITATION OF AN OFFER TO BUY THESE SECURITIES IN ANY JURISDICTION WHERE THE OFFER OR SALE IS NOT PERMITTED.
153
Mortgage Loan No. 14 — Culver City Medical
Operating History and Underwritten Net Cash Flow
| 2015(1) | 2016(1) | 2017(2) | TTM(2)(3)(4) | Underwritten(4) | PSF | %(5) | |
| Rents in Place | N/A | N/A | $1,573,634 | $1,685,970 | $2,594,812 | $45.86 | 86.4% |
| Vacant Income | N/A | N/A | 0 | 0 | 277,411 | $4.90 | 9.2% |
| Gross Potential Rent | N/A | N/A | $1,573,634 | $1,685,970 | $2,872,223 | $50.76 | 95.6% |
| Abatements | N/A | N/A | (125,625) | (34,654) | 0 | $0.00 | 0.0% |
| Total Reimbursements | N/A | N/A | 113 | 85,858 | 131,254 | $2.32 | 4.4% |
| Net Rental Income | N/A | N/A | $1,448,122 | $1,737,175 | $3,003,478 | $53.08 | 100.0% |
| (Vacancy/Collection Loss) | N/A | N/A | 0 | 0 | (277,411) | $(4.90) | (8.5%) |
| Other Income(6) | N/A | N/A | 525,590 | 586,522 | 540,000 | $9.54 | 16.5% |
| Effective Gross Income | N/A | N/A | $1,973,711 | $2,323,696 | $3,266,066 | $57.72 | 100.0% |
| Total Expenses | N/A | N/A | $729,368 | $857,512 | $933,617 | $16.50 | 28.6% |
| Net Operating Income | N/A | N/A | $1,244,344 | $1,466,184 | $2,332,449 | $41.22 | 71.4% |
| Total TI/LC, Capex/RR | N/A | N/A | 0 | 0 | 37,848 | $0.67 | 1.2% |
| Net Cash Flow | N/A | N/A | $1,244,344 | $1,466,184 | $2,294,601 | $40.55 | 70.3% |
| (1) | 2015 and 2016 financials are not available as the sponsor acquired the property in 2016. The seller did not provide historical operating statements to the borrower. |
| (2) | The sponsor acquired the property with significant outstanding deferred maintenance resulting in a 2017 occupancy of 72.0%. Post-acquisition, the sponsor invested $4.7 million in property renovations and upgrades resulting in increased occupancy to 90.7% as of December 6, 2018. |
| (3) | TTM represents the trailing twelve-month period ending November 30, 2018. |
| (4) | Underwritten rent includes Base Rent and Rent Increases occurring through February 1, 2020. Increase in Underwritten NOI from TTM NOI is due to the leasing of 15,088 SF in 2018 for Underwritten Rents in Place of $772,250. 13,924 SF of the total 15,088 SF had lease commencement dates on or after May 2018. Occupancy increased from 72.0% in 2017 to 90.7% as of December 6, 2018. |
| (5) | % column represents percent of Net Rental Income for all revenue lines and represents percent of Effective Gross Income for the remainder of fields. |
| (6) | Underwritten Other Income includes $540,000 of parking income reflecting the current rent under the parking lease. The lease expires December 31, 2024 and requires rent steps of 3.0%per annum in January 2022 and January 2023. |
THE INFORMATION IN THIS STRUCTURAL AND COLLATERAL TERM SHEET IS NOT COMPLETE AND MAY BE AMENDED PRIOR TO THE TIME OF SALE. THIS TERM SHEET IS NOT AN OFFER TO SELL THESE SECURITIES AND IT IS NOT A SOLICITATION OF AN OFFER TO BUY THESE SECURITIES IN ANY JURISDICTION WHERE THE OFFER OR SALE IS NOT PERMITTED.
154
(THIS PAGE INTENTIONALLY LEFT BLANK)
THE INFORMATION IN THIS STRUCTURAL AND COLLATERAL TERM SHEET IS NOT COMPLETE AND MAY BE AMENDED PRIOR TO THE TIME OF SALE. THIS TERM SHEET IS NOT AN OFFER TO SELL THESE SECURITIES AND IT IS NOT A SOLICITATION OF AN OFFER TO BUY THESE SECURITIES IN ANY JURISDICTION WHERE THE OFFER OR SALE IS NOT PERMITTED.
155
Mortgage Loan No. 15 — Nebraska Crossing
| Mortgage Loan Information | Property Information | |||
| Mortgage Loan Seller: | SGFC | Single Asset / Portfolio: | Single Asset | |
| Original Principal Balance(1): | $23,500,000 | Title: | Fee | |
| Cut-off Date Principal Balance(1): | $23,500,000 | Property Type - Subtype: | Retail – Outlet Center | |
| % of Pool by IPB: | 2.8% | Net Rentable Area (SF)(2): | 367,047 | |
| Loan Purpose: | Refinance | Location: | Gretna, NE | |
| Borrower: | Omaha Outlets SPE, LLC | Year Built / Renovated: | 2013 / NAP | |
| Sponsor: | Rod Yates | Occupancy: | 99.0% | |
| Interest Rate: | 5.2100% | Occupancy Date: | 10/10/2018 | |
| Note Date: | 10/31/2018 | Number of Tenants: | 78 | |
| Maturity Date: | 11/1/2028 | 2015 NOI: | $8,699,463 | |
| Interest-only Period: | 60 months | 2016 NOI: | $9,487,512 | |
| Original Term: | 120 months | 2017 NOI: | $8,744,240 | |
| Original Amortization: | 360 months | TTM NOI(3): | $8,910,796 | |
| Amortization Type: | IO-Balloon | UW Economic Occupancy: | 95.0% | |
| Call Protection: | L(28), Def(85), O(7) | UW Revenues: | $12,895,891 | |
| Lockbox: | Hard | UW Expenses: | $3,834,058 | |
| Additional Debt(1): | Yes | UW NOI: | $9,061,833 | |
| Additional Debt Balance(1): | $48,000,000 | UW NCF: | $8,562,096 | |
| Additional Debt Type(1): | Pari Passu | Appraised Value / Per SF: | $150,000,000 / $409 | |
| Additional Future Debt Permitted: | No | Appraisal Date: | 5/18/2018 | |
| Escrows and Reserves | Financial Information(1) | |||||
| Initial | Monthly | Initial Cap | Cut-off Date Loan Per SF: | $195 | ||
| Taxes: | $536,831 | $134,208 | N/A | Maturity Date Loan Per SF: | $180 | |
| Insurance: | $17,831 | $8,916 | N/A | Cut-off Date LTV: | 47.7% | |
| Replacement Reserves: | $4,588 | $4,588 | $120,000 | Maturity Date LTV: | 44.1% | |
| TI/LC: | $37,057 | $37,057 | N/A | UW NOI / UW NCF IO DSCR: | 2.40x / 2.27x | |
| Outstanding Approved Leasing: | $500,000 | $0 | N/A | UW NOI / UW NCF Amortizing DSCR: | 1.92x / 1.82x | |
| UW NOI / UW NCF Debt Yield: | 12.7% / 12.0% |
Sources and Uses
| Sources | Proceeds | % of Total | Uses | Proceeds | % of Total | |
| Whole Loan: | $71,500,000 | 100.0% | Payoff Existing Debt: | $68,669,327 | 96.0% | |
| Upfront Reserves: | 1,096,307 | 1.5 | ||||
| Return of Equity: | 984,718 | 1.4 | ||||
| Closing Costs: | 749,648 | 1.0 | ||||
| Total Sources: | $71,500,000 | 100.0% | Total Uses: | $71,500,000 | 100.0% |
| (1) | The Nebraska Crossing loan is part of a larger split whole loan evidenced by fourpari passu notes with an aggregate Cut-off Date balance of $71.5 million (collectively, the “Whole Loan”). The financial information presented in the chart above and herein reflects the balance of the Whole Loan. |
| (2) | The borrower may obtain the release of all or a portion of certain non-income producing and unimproved parcels, subject to satisfaction of certain terms and conditions in the loan documents including, among others, (i) no event of default has occurred or is continuing, (ii) the borrower provides at least 20 days’ notice of its request to release an unimproved parcel and (iii) the Whole Loan continues to comply with applicable REMIC requirements following such release. |
| (3) | Represents the trailing twelve-month period ending June 30, 2018. |
THE INFORMATION IN THIS STRUCTURAL AND COLLATERAL TERM SHEET IS NOT COMPLETE AND MAY BE AMENDED PRIOR TO THE TIME OF SALE. THIS TERM SHEET IS NOT AN OFFER TO SELL THESE SECURITIES AND IT IS NOT A SOLICITATION OF AN OFFER TO BUY THESE SECURITIES IN ANY JURISDICTION WHERE THE OFFER OR SALE IS NOT PERMITTED.
156
Mortgage Loan No. 15 — Nebraska Crossing
The Loan. The Nebraska Crossing Whole Loan is a $71.5 million first mortgage loan secured by the fee interest in a 367,047 SF outlet retail center located in Gretna, Nebraska. The loan has a 10-year term and will amortize on a 30-year schedule following an initial interest-only period of 60-months.
The Whole Loan is evidenced by fourpari passu notes. Notes A-2 and A-4 are being contributed to the CSAIL 2019-C15 Commercial Mortgage Trust. The Whole Loan is being serviced pursuant to the UBS 2018-C14 pooling and servicing agreement. As the holder of Note A-1 (the “Controlling Noteholder”), the trustee of the UBS 2018-C14 Commercial Mortgage Trust is entitled to exercise all of the rights of the Controlling Noteholder with respect to the Whole Loan; however, the holders of the remaining notes are entitled, under certain circumstances, to consult with respect to certain major decisions.
Whole Loan Note Summary
| Original Balance | Cut-off Date Balance | Note Holder | Lead Servicer for Whole Loan (Y/N) | Controlling Piece (Y/N) | |
| Note A-1 | $35,000,000 | $35,000,000 | UBS 2018-C14 | Y | Y |
| Note A-2, A-4 | 23,500,000 | 23,500,000 | CSAIL 2019-C15 | N | N |
| Note A-3 | 13,000,000 | 13,000,000 | UBS 2018-C15 | N | N |
| Total | $71,500,000 | $71,500,000 |
The Borrower. The borrowing entity for the loan is Omaha Outlets SPE, LLC, a Delaware limited liability company and special purpose entity. The borrowing entity is owned by 100.0% by Rod Yates.
The Sponsor. The loan’s sponsor and nonrecourse carve-out guarantor is Rod Yates. Yates is the principal and founder of OTB Destination, an advisory and development company based in Omaha, Nebraska. In addition to the property, other notable OTB Destination projects include the $100 million redevelopment of Foothills Mall in Tucson, Arizona, seven ground-up retail developments in Phoenix, Arizona, the $200 million Legends Outlets in Kansas City, Kansas, and the anticipated $400 million redevelopment of Crossroads Village in Omaha, Nebraska.
The Property. The property consists of a Class A, 367,047 SF, open-air regional outlet center that is the only outlet center in the state of Nebraska. The property’s improvements consist of 13 buildings on a 38.56-acre parcel of land located approximately 20 miles southwest of the Omaha central business district and 30 miles northeast from the Lincoln central business district. According to the appraisal, the property is strategically located with visibility from Interstate 80 between the Omaha and Lincoln metropolitan statistical areas, the major economic centers of Nebraska.
In March of 2013, Yates had the original improvements on the site demolished and developed the property. Within nine months of such demolition, Yates held a grand opening in November 2013. The property was 80.0% pre-leased at the grand opening and reached 100.0% occupancy in the first two years. The success of the first phase of development led to the first expansion in March 2016 and the second expansion that is underway, which is expected to be completed in 2019.
The property also features a data gathering infrastructure with a network of 350 beacon sensors that track consumer traffic through the property as well as what state in which the customers reside. To date, 425,000 people have downloaded the smartphone application that was designed for the sponsor by a team comprised of a NASA engineer and the engineer who designed the Starbucks sales application. Over 100 beacons are located throughout the common areas and in every tenant suite at the property. There are over eight digital directories collecting brand affinity data from shoppers and offering personalized promotions. Digital billboards also point consumers to specific retailers through an interactive game where customers choose style preferences from a series of pictures and an algorithm provides brands at the property that would most likely appeal to their preferences.
The property was 99.0% leased as of October 10, 2018 to 78 permanent retail and restaurant tenants. Since 2015, the property has maintained an average occupancy of approximately 99.8%.
THE INFORMATION IN THIS STRUCTURAL AND COLLATERAL TERM SHEET IS NOT COMPLETE AND MAY BE AMENDED PRIOR TO THE TIME OF SALE. THIS TERM SHEET IS NOT AN OFFER TO SELL THESE SECURITIES AND IT IS NOT A SOLICITATION OF AN OFFER TO BUY THESE SECURITIES IN ANY JURISDICTION WHERE THE OFFER OR SALE IS NOT PERMITTED.
157
Mortgage Loan No. 15 — Nebraska Crossing
The Market. The property is located in Gretna, Nebraska, which is situated approximately 20 miles west of Omaha, Nebraska and approximately 30 miles east of Lincoln, Nebraska. The property is located at the intersection of Interstate 80 and Highway 31. Interstate 80 is one of two coast-to-coast interstates in the United States and provides regional access to Omaha and Lincoln. Highway 31, a north/south arterial, provides access to Gretna and rural southeast Nebraska. According to the appraisal, combined traffic counts along the interstate and highway exceed approximately 120,000 vehicles per day. Highway 370, an east/west arterial located four miles north of the property, provides the most direct route through the southern portion of the Omaha metropolitan statistical area (“Omaha MSA”). According to the appraisal, the property benefits from good regional accessibility, as well as being the only outlet center in the state of Nebraska.
According to the appraisal, the Omaha MSA’s largest employers include education and health services, government, information, trade, transportation and utilities and financial activities. Omaha’s lack of dependence on financial industries and foundation in agriculture and biofuels insulated it from the volatility of the national economy and, in its expansion, the Omaha regional economy is diversifying its core industries. Despite the Omaha MSA’s diverse industry mix, its top employers are concentrated in the healthcare industry. In addition to being the Omaha MSA’s second largest private industry, five of the ten largest Omaha employers are education and health services employers. In addition, the metro area is the home to five Fortune 500 companies including ConAgra Foods, Union Pacific, Peter Kiewit and Sons’, Inc., Mutual of Omaha Companies and Berkshire Hathaway, Inc. As of February 2018, the Bureau of Labor Statistics reported an unemployment rate of 3.1% for the Omaha MSA. Comparatively, the unemployment rate over the same period of time for Nebraska and the nation were 2.8% and 4.1%, respectively.
Lincoln is the state capital and according to the appraisal, second largest city in Nebraska. Due to Lincoln’s central geographic location within the continental United States, Lincoln and the Lincoln metropolitan statistical area (“Lincoln MSA”) are major commercial and transportation hub. Interstate 80 borders the northwestern edge of Lincoln, connecting Lincoln to Chicago to the east and Salt Lake City to the west. According to the appraisal, the Lincoln MSA benefits from a well-educated and inexpensive workforce and good transportation infrastructure. Several colleges and universities are located around the Lincoln MSA, including The University of Nebraska-Lincoln, Nebraska Wesleyan University, Union College, and Southeast Community College. The University of Nebraska-Lincoln is the largest university in the state and the flagship campus of the University of Nebraska System. As of 2017, total enrollment at the University of Nebraska-Lincoln was 26,079.
The property is located between the Omaha MSA and the Lincoln MSA and is the only outlet center in the state. The appraiser concluded the primary demographic profile is based on a 50-mile radius from the property and included a population of 1,334,231 with an average household income of $77,085 as of 2017.
Competitive Set Summary(1)
| Property | Location | Type | Year Built / Renovated / Expansion | NRA (SF) | Sales PSF(3) | Est. Occ. | Proximity (miles) |
| Nebraska Crossing | Gretna, NE | Outlet Center | 2013 / N/A / 2017 | 367,047(2) | $387 | 99%(2) | N/A |
| COMPETITION – REGIONAL MALLS | |||||||
| Westroads Mall | Omaha, NE | Regional Mall | 1968 / 2014 / 2003 | 1,045,782 | $460 | 98% | 15.0 |
| Oak View Mall | Omaha, NE | Regional Mall | 1991 / N/A / N/A | 859,439 | $430 | 95% | 11.0 |
| Gateway Mall | Lincoln, NE | Regional Center | 1960 / 2017 / N/A | 930,086 | $400 | 95% | 28.0 |
| COMPETITION – LIFESTYLE CENTERS | |||||||
| Village Pointe | Omaha, NE | Lifestyle Center | 2004 / N/A / N/A | 600,458 | $460 | 94% | 12.0 |
| Shadow Lake Town Center | Papillion, NE | Lifestyle Center | 2006 / N/A / N/A | 740,624 | N/A | 82% | 12.0 |
| SouthPointe Pavilions | Lincoln, NE | Lifestyle Center | 1998 / 1999 / 2017 | 619,854 | $348 | 97% | 33.0 |
| (1) | Source: Appraisal. |
| (2) | Based on the underwritten rent roll dated October 10, 2018. |
| (3) | Sales PSF represent TTM sales as of August 31, 2018. |
THE INFORMATION IN THIS STRUCTURAL AND COLLATERAL TERM SHEET IS NOT COMPLETE AND MAY BE AMENDED PRIOR TO THE TIME OF SALE. THIS TERM SHEET IS NOT AN OFFER TO SELL THESE SECURITIES AND IT IS NOT A SOLICITATION OF AN OFFER TO BUY THESE SECURITIES IN ANY JURISDICTION WHERE THE OFFER OR SALE IS NOT PERMITTED.
158
Mortgage Loan No. 15 — Nebraska Crossing
Historical and Current Occupancy
| 2015(1) | 2016(1) | 2017(1) | Current(2) |
| 100.0% | 100.0% | 99.0% | 99.0% |
| (1) | Source: Historical Occupancy is provided by the sponsor. Occupancies are as of December 31 of each respective year. |
| (2) | Based on the October 10, 2018 underwritten rent roll. |
Tenant Summary(1)
| Tenant | Ratings Moody’s/S&P/Fitch(2) | NRA (SF) | % of Total NRA | UW Base Rent PSF | % of Total UW Base Rents | Sales PSF(3) | Occupancy Costs(3) | Lease Expiration Date |
| H&M | NR / NR / NR | 24,000 | 6.5% | $0.00 | 0.0% | $126 | 3.7% | 1/31/2028 |
| Under Armour | Baa3 / BB / NR | 16,082 | 4.4 | $0.00 | 0.0 | $741 | 6.2% | 1/31/2024 |
| Old Navy | Baa2 / BB+ / NR | 15,231 | 4.1 | $21.00 | 4.0 | $295 | 9.2% | 4/30/2024 |
| Forever 21 | NR / NR / NR | 15,114 | 4.1 | $26.46 | 5.1 | $123 | 24.3% | 1/31/2024 |
| Nike | A1 / AA- / NR | 15,001 | 4.1 | $21.00 | 4.0 | $857 | 2.8% | 1/31/2024 |
| Polo Ralph Lauren | A2 / A- / NR | 13,000 | 3.5 | $0.00 | 0.0 | $240 | 3.0% | 11/30/2023 |
| Ulta Beauty, Inc. | NR / NR / NR | 10,037 | 2.7 | $24.00 | 3.0 | $289 | 9.4% | 4/30/2027 |
| Total | 108,465 | 29.6% | 16.1% |
| (1) | Based on the underwritten rent roll, including rent increases occurring through September 30, 2019. |
| (2) | Ratings provided are for the parent company of the entity listed in the “Tenant” field whether or not the parent company guarantees the lease. |
| (3) | Sales PSF and Occupancy Costs represent comparable tenant sales (tenants with 12 months reported sales) and occupancy costs for the twelve-month period ending on September 30, 2018 as provided by the sponsors. |
THE INFORMATION IN THIS STRUCTURAL AND COLLATERAL TERM SHEET IS NOT COMPLETE AND MAY BE AMENDED PRIOR TO THE TIME OF SALE. THIS TERM SHEET IS NOT AN OFFER TO SELL THESE SECURITIES AND IT IS NOT A SOLICITATION OF AN OFFER TO BUY THESE SECURITIES IN ANY JURISDICTION WHERE THE OFFER OR SALE IS NOT PERMITTED.
159
Mortgage Loan No. 15 — Nebraska Crossing
Lease Rollover Schedule(1)
| Year | Number of Leases Expiring | NRA Expiring | % of NRA Expiring | UW Base Rent Expiring | UW % of Base Rent Expiring | Cumulative NRA Expiring | Cumulative % of NRA Expiring | Cumulative Rent | Cumulative Rent |
| MTM | 3 | 8,087 | 2.2% | $245,235 | 3.2% | 8,087 | 2.2% | $245,235 | 3.2% |
| 2019 | 3 | 11,003 | 3.0 | 303,700 | 3.9 | 19,090 | 5.2% | $548,935 | 7.1% |
| 2020 | 3 | 5,026 | 1.4 | 178,773 | 2.3 | 24,116 | 6.6% | $727,708 | 9.4% |
| 2021 | 1 | 4,497 | 1.2 | 133,606 | 1.7 | 28,613 | 7.8% | $861,314 | 11.1% |
| 2022 | 1 | 1,234 | 0.3 | 37,452 | 0.5 | 29,847 | 8.1% | $898,766 | 11.6% |
| 2023 | 20 | 81,760 | 22.3 | 1,713,742 | 22.1 | 111,607 | 30.4% | $2,612,508 | 33.6% |
| 2024 | 33 | 181,090 | 49.3 | 3,640,491 | 46.8 | 292,697 | 79.7% | $6,252,999 | 80.5% |
| 2025 | 5 | 9,085 | 2.5 | 420,783 | 5.4 | 301,782 | 82.2% | $6,673,782 | 85.9% |
| 2026 | 4 | 15,369 | 4.2 | 495,335 | 6.4 | 317,151 | 86.4% | $7,169,117 | 92.2% |
| 2027 | 1 | 10,037 | 2.7 | 240,888 | 3.1 | 327,188 | 89.1% | $7,410,005 | 95.3% |
| 2028 | 2 | 28,000 | 7.6 | 120,000 | 1.5 | 355,188 | 96.8% | $7,530,005 | 96.9% |
| 2029 & Beyond | 2 | 8,007 | 2.2 | 241,526 | 3.1 | 363,195 | 99.0% | $7,771,531 | 100.0% |
| Vacant | NAP | 3,852 | 1.0 | NAP | NAP | 367,047 | 100.0% | NAP | NAP |
| Total | 78 | 367,047 | 100.0% | $7,771,531 | 100.0% |
| (1) | Based on the underwritten rent roll. Rent includes base rent and rent increases occurring through September 30, 2019. |
Operating History and Underwritten Net Cash Flow
| 2015 | 2016 | 2017 | TTM(1) | Underwritten(2) | PSF | %(3) | |
| Rents in Place | $6,634,108 | $7,228,425 | $7,106,791 | $7,014,868 | $7,771,531 | $21.17 | 57.7% |
| Vacant Income | 0 | 0 | 0 | 0 | 134,802 | $0.37 | 1.0% |
| Percentage Rent(4) | 2,316,108 | 2,056,512 | 2,087,529 | 2,292,865 | 2,239,806 | $6.10 | 16.6% |
| Gross Potential Rent | $8,950,216 | $9,284,937 | $9,194,320 | $9,307,733 | $10,146,139 | $27.64 | 75.3% |
| Total Reimbursements | 2,655,742 | 3,345,739 | 3,111,616 | 3,435,692 | 3,329,924 | $9.07 | 24.7% |
| Net Rental Income | $11,605,958 | $12,630,676 | $12,305,936 | $12,743,425 | $13,476,063 | $36.71 | 100.0% |
| (Vacancy/Collection Loss) | 0 | 0 | 0 | 0 | (678,731) | ($1.85) | (5.0%) |
| Other Income | 168,667 | 274,797 | 198,742 | 103,636 | 98,559 | $0.27 | 0.7% |
| Effective Gross Income | $11,774,625 | $12,905,473 | $12,504,678 | $12,847,061 | $12,895,891 | $35.13 | 100.0% |
| Total Expenses | $3,075,162 | $3,417,961 | $3,760,438 | $3,936,265 | $3,834,058 | $10.45 | 29.7% |
| Net Operating Income | $8,699,463 | $9,487,512 | $8,744,240 | $8,910,796 | $9,061,833 | $24.69 | 70.3% |
| Total TI/LC, Capex/RR | 0 | 0 | 0 | 0 | 499,737 | $1.36 | 3.9% |
| Net Cash Flow | $8,699,463 | $9,487,512 | $8,744,240 | $8,910,796 | $8,562,096 | $23.33 | 66.4% |
| (1) | TTM represents the trailing twelve-month period ending June 30, 2018. |
| (2) | Underwritten Rent includes Base Rent and Rent Increases occurring through September 30, 2019. |
| (3) | % column represents percent of Net Rental Income for all revenue lines and represents percent of Effective Gross Income for the remainder of fields. |
| (4) | Percentage Rent consists of a fixed percentage of a tenant’s sales. |
THE INFORMATION IN THIS STRUCTURAL AND COLLATERAL TERM SHEET IS NOT COMPLETE AND MAY BE AMENDED PRIOR TO THE TIME OF SALE. THIS TERM SHEET IS NOT AN OFFER TO SELL THESE SECURITIES AND IT IS NOT A SOLICITATION OF AN OFFER TO BUY THESE SECURITIES IN ANY JURISDICTION WHERE THE OFFER OR SALE IS NOT PERMITTED.
160