| FREE WRITING PROSPECTUS | ||
| FILED PURSUANT TO RULE 433 | ||
| REGISTRATION FILE NO.: 333-193376-25 | ||
November 2, 2015
FREE WRITING PROSPECTUS
STRUCTURAL AND COLLATERAL TERM SHEET
$960,912,147
(Approximate Total Mortgage Pool Balance)
$828,786,000
(Approximate Offered Certificates)
COMM 2015-LC23 |
Deutsche Mortgage & Asset Receiving Corporation
Depositor
German American Capital Corporation
Ladder Capital Finance LLC
Cantor Commercial Real Estate Lending, L.P.
Jefferies LoanCore LLC
Sponsors and Mortgage Loan Sellers
| Deutsche Bank Securities | Cantor Fitzgerald & Co. | |
| Joint Bookrunning Managers and Co-Lead Managers | ||
| Jefferies | ||
| Co-Manager | ||
The depositor has filed a registration statement (including the prospectus) with the Securities and Exchange Commission (File No. 333-193376) for the offering to which this communication relates. Before you invest, you should read the prospectus in the registration statement and other documents the depositor has filed with the Securities and Exchange Commission for more complete information about the depositor, the issuing entity and this offering. You may get these documents for free by visiting EDGAR on the SEC website at www.sec.gov. Alternatively, the depositor or Deutsche Bank Securities Inc., any other underwriter, or any dealer participating in this offering will arrange to send you the prospectus if you request it by calling toll-free 1-800-503-4611 or by email to the following address: prospectus.cpdg@db.com. The offered certificates referred to in these materials, and the asset pool backing them, are subject to modification or revision (including the possibility that one or more classes of certificates may be split, combined or eliminated at any time prior to issuance or availability of a final prospectus) and are offered on a “when, as and if issued” basis. You understand that, when you are considering the purchase of these certificates, a contract of sale will come into being no sooner than the date on which the relevant class has been priced and we have verified the allocation of certificates to be made to you; any “indications of interest” expressed by you, and any “soft circles” generated by us, will not create binding contractual obligations for you or us.
COMM 2015-LC23 Mortgage Trust
Capitalized terms used but not defined herein have the meanings assigned to them in the other Free Writing Prospectus expected to be dated November 2, 2015 relating to the offered certificates (hereinafter referred to as the “Free Writing Prospectus”).
|
| KEY FEATURES OF SECURITIZATION |
| Offering Terms: | ||
| Joint Bookrunners & Co-Lead Managers: | Deutsche Bank Securities Inc. and Cantor Fitzgerald & Co. | |
| Co-Manager: | Jefferies LLC | |
| Mortgage Loan Sellers: | German American Capital Corporation* (“GACC”) (41.1%), Ladder Capital Finance LLC (“Ladder”) (30.6%), Cantor Commercial Real Estate Lending, L.P. (“CCRE”) (16.5%) and Jefferies LoanCore LLC (“JLC”) (11.8%). *An indirect wholly owned subsidiary of Deutsche Bank AG. | |
| Master Servicer: | Wells Fargo Bank, National Association | |
| Operating Advisor: | Park Bridge Lender Services LLC | |
| Special Servicer: | LNR Partners, LLC | |
| Trustee: | Wilmington Trust, National Association | |
| Certificate Administrator: | Wells Fargo Bank, National Association | |
| Rating Agencies: | Moody’s Investors Service, Inc., Fitch Ratings, Inc. and Kroll Bond Rating Agency, Inc. | |
| Determination Date: | 6thday of each month, or if such 6th day is not a business day, the following business day, commencing in December 2015. | |
| Distribution Date: | 4thbusiness day following the Determination Date in each month, commencing in December 2015. | |
| Cut-off Date: | Payment Date in November 2015 (or related origination date, if later). Unless otherwise noted, all Mortgage Loan statistics are based on balances as of the Cut-off Date. | |
| Settlement Date: | On or about November 17, 2015 | |
| Settlement Terms: | DTC, Euroclear and Clearstream, same day funds, with accrued interest. | |
| ERISA Eligible: | All of the Offered Certificates are expected to be ERISA eligible. | |
| SMMEA Eligible: | None of the Offered Certificates will be SMMEA eligible. | |
| Day Count: | 30/360 | |
| Tax Treatment: | REMIC | |
| Rated Final Distribution Date: | October 2053 | |
| Minimum Denominations: | $10,000 (or $100,000 with respect to Class XP-A and Class XS-A Certificates) and in each case in multiples of $1 thereafter. | |
| Clean-up Call: | 1% (with certain exceptions described under“The Pooling and Servicing Agreement—Optional Termination” in the Free Writing Prospectus) | |
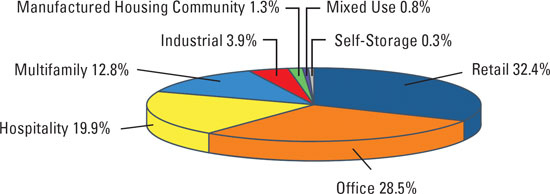
| Distribution of Collateral by Property Type |
THE INFORMATION IN THIS STRUCTURAL AND COLLATERAL TERM SHEET IS NOT COMPLETE AND MAY BE AMENDED PRIOR TO THE TIME OF SALE. THIS TERM SHEET IS NOT AN OFFER TO SELL THESE SECURITIES AND IT IS NOT A SOLICITATION OF AN OFFER TO BUY THESE SECURITIES IN ANY JURISDICTION WHERE THE OFFER OR SALE IS NOT PERMITTED.
| 3 |
COMM 2015-LC23 Mortgage Trust
|
| TRANSACTION HIGHLIGHTS |
| Mortgage Loan Sellers | Number of Mortgage Loans | Number of Mortgaged Properties | Aggregate Cut-off Date Balance | % of Outstanding Pool Balance |
| German American Capital Corporation | 17 | 17 | $362,856,940 | 37.8% |
| Ladder Capital Finance LLC | 25 | 55 | $246,060,185 | 25.6% |
| Cantor Commercial Real Estate Lending, L.P. | 11 | 13 | $158,901,949 | 16.5% |
| Jefferies LoanCore LLC | 8 | 14 | $113,093,073 | 11.8% |
| LCF / GACC(1) | 1 | 21 | $80,000,000 | 8.3% |
| Total: | 62 | 120 | $960,912,147 | 100.0% |
| Pooled Collateral Facts: | |
| Initial Outstanding Pool Balance: | $960,912,147 |
| Number of Mortgage Loans: | 62 |
| Number of Mortgaged Properties: | 120 |
| Average Mortgage Loan Cut-off Date Balance: | $15,498,583 |
| Average Mortgaged Property Cut-off Date Balance: | $8,007,601 |
| Weighted Average Mortgage Rate: | 4.6650% |
| Weighted Average Mortgage Loan Original Term to Maturity Date or ARD (months): | 107 |
| Weighted Average Mortgage Loan Remaining Term to Maturity Date or ARD (months): | 105 |
| Weighted Average Mortgage Loan Seasoning (months): | 1 |
| % of Mortgaged Properties Leased to a Single Tenant: | 12.1% |
Credit Statistics(2): | |
| Weighted Average Mortgage Loan U/W NCF DSCR: | 1.82x |
| Weighted Average Mortgage Loan Cut-off Date LTV(3)(4): | 61.6% |
| Weighted Average Mortgage Loan Maturity Date or ARD LTV(3)(4): | 55.2% |
| Weighted Average U/W NOI Debt Yield: | 10.6% |
Amortization Overview: | |
| % Mortgage Loans with Amortization through Maturity Date or ARD: | 39.4% |
| % Mortgage Loans which pay Interest Only through Maturity Date or ARD: | 38.7% |
| % Mortgage Loans which pay Interest Only followed by Amortization through Maturity Date or ARD: | 21.8% |
| Weighted Average Remaining Amortization Term (months)(5): | 349 |
Loan Structural Features: | |
| % Mortgage Loans with Upfront or Ongoing Tax Reserves: | 81.5% |
| % Mortgage Loans with Upfront or Ongoing Replacement Reserves(6): | 71.4% |
| % Mortgage Loans with Upfront or Ongoing Insurance Reserves: | 54.1% |
| % Mortgage Loans with Upfront or Ongoing TI/LC Reserves(7): | 82.4% |
| % Mortgage Loans with Upfront Engineering Reserves: | 40.1% |
| % Mortgage Loans with Upfront or Ongoing Other Reserves: | 64.5% |
| % Mortgage Loans with In Place Hard Lockboxes: | 56.2% |
| % Mortgage Loans with Cash Traps Triggered at DSCR Levels ≥ 1.05x: | 75.5% |
| % Mortgage Loans with Cash Traps Triggered at Debt Yield ≥ 7.0%: | 8.7% |
| % Mortgage Loans with Defeasance Only After a Lockout Period and Prior to an Open Period(8): | 69.2% |
| % Mortgage Loans with Prepayment Only After a Lockout Period and Prior to an Open Period with a Yield Maintenance Charge: | 30.4% |
| % Mortgage Loans with Prepayment with a Yield Maintenance Charge Prior to an Open Period and also Defeasance or Yield Maintenance After a Lockout Period and Prior to an Open Period: | 0.4% |
| (1) | The Equity Inns Portfolio Mortgage Loan was co-originated by LCF and GACC. LCF will contribute $48.0 million of the Equity Inns Portfolio Mortgage Loan, which represents 60.0% of the Equity Inns Portfolio Mortgage Loan cut-off date balance, and GACC will contribute $32.0 million of the Equity Inns Portfolio Mortgage Loan, which represents 40.0% of Equity Inns Portfolio Mortgage Loan cut-off date balance. |
| (2) | With respect to the Equity Inns Portfolio Mortgage Loan, 32 Avenue of the Americas Mortgage Loan, 11 Madison Avenue Mortgage Loan, Harvey Building Products Portfolio Mortgage Loan, Springfield Mall Mortgage Loan and 40 Wall Street Mortgage Loan, the LTV, DSCR and Debt Yield calculations include the relatedpari passu companion loan(s), but not any related subordinate companion loan(s). |
| (3) | With respect to the Equity Inns Portfolio Mortgage Loan, representing 8.3% of the initial outstanding pool balance, the Cut-off Date LTV and Maturity Date or ARD LTV have been calculated based on the portfolio appraised value, which attributes a premium to the aggregate value of the Equity Inns Portfolio mortgaged properties as a whole. For additional information, see the Footnotes to Annex A-1 in the Free Writing Prospectus. |
| (4) | With respect to 611 Cowper mortgage loan, representing 3.4% of the initial outstanding pool balance, the Cut-off Date LTV and Maturity Date or ARD LTV have been calculated based on the “as stabilized” value. For additional information, see the Footnotes to Annex A-1 in the Free Writing Prospectus. |
| (5) | Excludes loans which are interest only for the full loan term. |
| (6) | Includes FF&E Reserves. |
| (7) | Represents the percent of the allocated initial outstanding principal balance of retail, office, industrial and mixed use properties only. |
| (8) | With respect to the Beach House Hilton Head mortgage loan, defeasance is permitted for 91 payments after a lockout period. Beginning with the 59th payment after the lockout period, in lieu of defeasance, the borrower may prepay the mortgage loan in full, together with a prepayment penalty equal to (a) 4% if such prepayment is made on or after October 6, 2022 through October 5, 2023, 3% if such prepayment is made on or after October 6, 2023 through October 5, 2024 and 1% if such prepayment is made on or after October 6, 2024 through July 5, 2025. On or after July 6, 2025 through October 6, 2025, the Beach House Hilton Head mortgage loan may be prepaid without penalty. |
THE INFORMATION IN THIS STRUCTURAL AND COLLATERAL TERM SHEET IS NOT COMPLETE AND MAY BE AMENDED PRIOR TO THE TIME OF SALE. THIS TERM SHEET IS NOT AN OFFER TO SELL THESE SECURITIES AND IT IS NOT A SOLICITATION OF AN OFFER TO BUY THESE SECURITIES IN ANY JURISDICTION WHERE THE OFFER OR SALE IS NOT PERMITTED.
| 4 |
COMM 2015-LC23 Mortgage Trust
|
| STRUCTURE OVERVIEW |
OFFERED CERTIFICATES
| Class(1) | Ratings (Moody’s/Fitch/KBRA) | Initial Certificate Balance or Notional Amount(2) | Initial Subordination | Weighted Average Life | Principal Window (months)(3) | Certificate Principal to Value Ratio(4) | Underwritten NOI Debt Yield(5) |
| Class A-1 | Aaa(sf)/AAAsf/AAA(sf) | $39,109,000 | 30.000%(6) | 2.67 | 1 – 58 | 43.1% | 15.1% |
| Class A-2 | Aaa(sf)/AAAsf/AAA(sf) | $210,190,000 | 30.000%(6) | 4.89 | 58 – 59 | 43.1% | 15.1% |
| Class A-SB | Aaa(sf)/AAAsf/AAA(sf) | $53,371,000 | 30.000%(6) | 7.40 | 59 – 116 | 43.1% | 15.1% |
| Class A-3 | Aaa(sf)/AAAsf/AAA(sf) | $125,000,000 | 30.000%(6) | 9.79 | 116 – 118 | 43.1% | 15.1% |
| Class A-4 | Aaa(sf)/AAAsf/AAA(sf) | $244,968,000 | 30.000%(6) | 9.85 | 118 – 119 | 43.1% | 15.1% |
| Class XP-A(7) | Aa1(sf)/AAAsf/AAA(sf) | $733,896,000(8) | N/A | N/A | N/A | N/A | N/A |
| Class XS-A(7) | Aa1(sf)/AAAsf/AAA(sf) | $733,896,000(8) | N/A | N/A | N/A | N/A | N/A |
| Class A-M | Aa2(sf)/AAAsf/AAA(sf) | $61,258,000 | 23.625% | 9.90 | 119 – 119 | 47.0% | 13.9% |
| Class B | A1(sf)/AA-sf/AA(sf) | $51,649,000 | 18.250% | 9.90 | 119 – 119 | 50.4% | 13.0% |
| Class C | NR/A-sf/A(sf) | $43,241,000 | 13.750% | 9.90 | 119 – 119 | 53.1% | 12.3% |
NON-OFFERED CERTIFICATES
| Class(1) | Ratings Moody’s/Fitch/KBRA | Initial Certificate Balance or Notional Amount(2) | Initial Subordination | Weighted Average Life | Principal Window (months)(3) | Certificate Principal to Value Ratio(4) | Underwritten NOI Debt Yield(5) |
| Class X-B(7) | NR/A-sf/AAA(sf) | $94,890,000(8) | N/A | N/A | N/A | N/A | N/A |
| Class X-C(7) | NR/BBB-sf/BBB-(sf) | $52,850,000(8) | N/A | N/A | N/A | N/A | N/A |
| Class X-D(7) | NR/BB-sf/BB(sf) | $22,822,000(8) | N/A | N/A | N/A | N/A | N/A |
| Class X-E(7) | NR/NR/B-(sf) | $22,822,000(8) | N/A | N/A | N/A | N/A | N/A |
| Class X-F(7) | NR/NR/NR | $33,632,147(8) | N/A | N/A | N/A | N/A | N/A |
| Class D | NR/BBBsf/BBB+(sf) | $28,828,000 | 10.750% | 9.90 | 119 – 120 | 55.0% | 11.9% |
| Class E | NR/BBB-sf/BBB-(sf) | $24,022,000 | 8.250% | 9.98 | 120 – 120 | 56.5% | 11.6% |
| Class F | NR/BB-sf/BB(sf) | $22,822,000 | 5.875% | 9.98 | 120 – 120 | 58.0% | 11.3% |
| Class G | NR/B-sf/B+(sf) | $10,810,000 | 4.750% | 9.98 | 120 – 120 | 58.7% | 11.1% |
| Class H | NR/NR/B-(sf) | $12,012,000 | 3.500% | 9.98 | 120 – 120 | 59.4% | 11.0% |
| Class J | NR/NR/NR | $33,632,147 | 0.000% | 9.98 | 120 – 120 | 61.6% | 10.6% |
| (1) | The pass-through rates applicable to the Class A-1, Class A-2, Class A-SB, Class A-3, Class A-4, Class A-M, Class B, Class C, Class D, Class E, Class F, Class G, Class H and Class J Certificates will equal one of: (i) a fixed per annum rate, (ii) the weighted average of the net mortgage rates on the mortgage loans (in each case, adjusted, if necessary, to accrue on the basis of a 360-day year consisting of twelve 30-day months) as of their respective due dates in the month preceding the month in which such distribution date occurs, (iii) a rate equal to the lesser of a specified pass-through rate and the rate specified in clause (ii) or (iv) the rate specified in clause (ii), less a specified rate. |
| (2) | Approximate; subject to a permitted variance of plus or minus 5%. In addition, the notional amounts of the Class XP-A, Class XS-A, Class X-B, Class X-C, Class X-D, Class X-E and Class X-F Certificates (collectively, the “Class X Certificates”) may vary depending upon the final pricing of the classes of Certificates whose Certificate Balances comprise such notional amounts and, if as a result of such pricing the pass-through rate of any class of Class X Certificates would be equal to zero, such Class X Certificates may not be issued on the settlement date of this securitization. |
| (3) | The weighted average life and principal window during which distributions of principal would be received as set forth in the table with respect to each class of Certificates with a Certificate Balance is based on (i) modeling assumptions described in the Free Writing Prospectus, (ii) assumptions that there are no prepayments, delinquencies or losses on the mortgage loans and (iii) assumptions that there are no extensions of maturity dates and mortgage loans with anticipated repayment dates, if any, are repaid on the respective anticipated repayment dates. |
| (4) | “Certificate Principal to Value Ratio” for any class with a Certificate Balance is calculated as the product of (a) the weighted average Mortgage Loan Cut-off Date LTV of the mortgage pool, multiplied by (b) a fraction, the numerator of which is the total initial Certificate Balance of the related class of Certificates and all other classes with a Certificate Balance, if any, that are senior to such class, and the denominator of which is the total initial Certificate Balance of all Certificates. The Certificate Principal to Value Ratios of the Class A-1, Class A-2, Class A-SB, Class A-3 and Class A-4 Certificates are calculated in the aggregate for those classes as if they were a single class. |
| (5) | “Underwritten NOI Debt Yield” for any class with a Certificate Balance is calculated as the product of (a) the weighted average U/W NOI Debt Yield for the mortgage pool, multiplied by (b) a fraction, the numerator of which is the total initial Certificate Balance of all Certificates and the denominator of which is the total initial Certificate Balance of the related class of Certificates and all other classes with a Certificate Balance, if any, that are senior to such class. The Underwritten NOI Debt Yields of the Class A-1, Class A-2, Class A-SB, Class A-3 and Class A-4 Certificates are calculated in the aggregate for those classes as if they were a single class. |
| (6) | The initial subordination levels for the Class A-1, Class A-2, Class A-SB, Class A-3 and Class A-4 Certificates are represented in the aggregate. |
| (7) | As further described in the Free Writing Prospectus, the pass-through rates applicable to the Class XP-A and Class XS-A Certificates are described in “Structure Overview—Interest Payments” herein. In addition, the pass-through rate applicable to the Class X-B, Class X-C, Class X-D, Class X-E and Class X-F Certificates for each Distribution Date will generally be equal to the excess of (i) the weighted average of the net mortgage rates on the mortgage loans (in each case, adjusted, if necessary, to accrue on the basis of a 360 day year consisting of twelve 30-day months) as of their respective due dates in the month preceding the month in which such distribution date occurs over (ii)(A) with respect to the Class X-B Certificates, the weighted average of the pass-through rates of the Class B and Class C Certificates (based on their Certificate Balances), (B) with respect to the Class X-C Certificates, the weighted average of the pass-through rates of the Class D and Class E Certificates (based on their Certificate Balances), (C) with respect to the Class X-D Certificates, the pass-through rate of the Class F Certificates, (D) with respect to the Class X-E Certificates, the weighted average of the pass-through rates of the Class G and Class H Certificates (based on their Certificate Balances) and (E) with respect to the Class X-F Certificates, the pass-through rate of the Class J Certificates. |
| (8) | The Class X Certificates will not have Certificate Balances. None of the Class X Certificates will be entitled to distributions of principal. The interest accrual amounts on the Class XP-A Certificates will be calculated by reference to a notional amount equal to the sum of the component notional amounts of the components of the Class XP-A Certificates, each of which components will relate to one of the Class A-1, Class A-2, Class A-SB, Class A-3, Class A-4 and Class A-M Certificates and, at any time during any of the periods specified on Annex H to the Free Writing Prospectus, will equal the lesser of (a) the amount specified on Annex H to the Free Writing Prospectus, and (b) the then Certificate Balance of the related class of Certificates. The interest accrual amounts on the Class XS-A Certificates will be calculated by reference to a notional amount equal to the sum of the total Certificate Balance of each of the Class A-1, Class A-2, Class A-SB, Class A-3, Class A-4 and Class A-M Certificates. The interest accrual amounts on the Class X-B Certificates will be calculated by reference to a notional amount equal to the sum of the total Certificate Balance of each of the Class B and Class C Certificates. The interest accrual amounts on the Class X-C Certificates will be calculated by reference to a notional amount equal to the sum of the total Certificate Balance of the Class D and Class E Certificates. The interest accrual amounts on the Class X-D Certificates will be calculated by reference to a notional amount equal to the Certificate Balance of the Class F Certificates. The interest accrual amounts on the Class X-E Certificates will be calculated by reference to a notional amount equal to the sum of the total Certificate Balance of the Class G and Class H Certificates. The interest accrual amounts on the Class X-F Certificates will be calculated by reference to a notional amount equal to the Certificate Balance of the Class J Certificates. |
THE INFORMATION IN THIS STRUCTURAL AND COLLATERAL TERM SHEET IS NOT COMPLETE AND MAY BE AMENDED PRIOR TO THE TIME OF SALE. THIS TERM SHEET IS NOT AN OFFER TO SELL THESE SECURITIES AND IT IS NOT A SOLICITATION OF AN OFFER TO BUY THESE SECURITIES IN ANY JURISDICTION WHERE THE OFFER OR SALE IS NOT PERMITTED.
| 5 |
COMM 2015-LC23 Mortgage Trust
|
| STRUCTURE OVERVIEW |
| Class A-2 Principal Paydown(1) |
| Class | Mortgage | Mortgage Loan | Property Type | Cut-off Date Balance | Remaining Term to Maturity (Mos.) | Cut-off Date LTV Ratio | U/W NCF DSCR | U/W NOI Debt Yield | |
| A-2 | JLC | Carrollwood Station | Multifamily | $21,500,000 | 58 | 62.1% | 1.53x | 8.6% | |
| A-2 | CCRE | Warsaw Village | Retail | $3,600,000 | 58 | 73.5% | 1.33x | 10.0% | |
| A-2 | LCF / GACC | Equity Inns Portfolio | Hospitality | $80,000,000 | 59 | 64.4% | 2.35x | 13.3% | |
| A-2 | LCF | 1209 DeKalb | Multifamily | $46,000,000 | 59 | 72.3% | 1.48x | 7.1% | |
| A-2 | LCF | Harvey Building Products Portfolio | Various | $41,953,778 | 59 | 53.5% | 1.96x | 12.8% | |
| A-2 | CCRE | Murrieta Spectrum | Retail | $20,600,000 | 59 | 70.3% | 1.30x | 8.9% | |
| (1) | This table reflects the mortgage loans whose balloon payments will be applied to pay down the Class A-2 Certificates, assuming (i) that none of the mortgage loans experience prepayments, defaults or losses, (ii) there are no extensions of maturity dates and (iii) each mortgage loan is paid in full on its stated maturity date, or in the case of any mortgage loan with an anticipated repayment date, on such repayment date. See “Yield and Maturity Considerations—Yield Considerations” in the Free Writing Prospectus. |
THE INFORMATION IN THIS STRUCTURAL AND COLLATERAL TERM SHEET IS NOT COMPLETE AND MAY BE AMENDED PRIOR TO THE TIME OF SALE. THIS TERM SHEET IS NOT AN OFFER TO SELL THESE SECURITIES AND IT IS NOT A SOLICITATION OF AN OFFER TO BUY THESE SECURITIES IN ANY JURISDICTION WHERE THE OFFER OR SALE IS NOT PERMITTED.
| 6 |
COMM 2015-LC23 Mortgage Trust
| STRUCTURE OVERVIEW |
| Principal Payments: | Payments in respect of principal of the Certificates will be distributed,first, to the Class A-SB Certificates, until the Certificate Balance of such Class is reduced to the planned principal balance for the related Distribution Date set forth on Annex A-3 to the Free Writing Prospectus,then, to the Class A-1, Class A-2, Class A-3, Class A-4, Class A-SB, Class A-M, Class B, Class C, Class D, Class E, Class F, Class G, Class H and Class J Certificates, in that order, until the Certificate Balance of each such Class is reduced to zero. Notwithstanding the foregoing, if the total principal balance of the Class A-M, Class B, Class C, Class D, Class E, Class F, Class G, Class H and Class J Certificates have been reduced to zero as a result of loss allocation, payments in respect of principal of the Certificates will be distributed,first, to the Class A-1, Class A-2, Class A-SB, Class A-3 and Class A-4 Certificates, on apro rata basis, based on the Certificate Balance of each such Class,then, to the extent of any recoveries on realized losses, to the Class A-M, Class B, Class C, Class D, Class E, Class F, Class G, Class H and Class J Certificates, in that order, in each case until the Certificate Balance of each such Class is reduced to zero (or previously allocated realized losses have been fully reimbursed).
Each Class of Class X Certificates will not be entitled to receive distributions of principal; however, (i) the notional amounts of the Class XP-A and Class XS-A Certificates will be reduced by the aggregate amount of principal distributions and realized losses allocated to one or more of each of the Class A-1, Class A-2, Class A-SB, Class A-3, Class A-4 and Class A-M Certificates; (ii) the notional amount of the Class X-B Certificates will be reduced by the aggregate amount of principal distributions and realized losses allocated to the Class B and Class C Certificates; (iii) the notional amount of the Class X-C Certificates will be reduced by the aggregate amount of principal distributions and realized losses allocated to the Class D and Class E Certificates; (iv) the notional amount of the Class X-D Certificates will be reduced by the principal distributions and realized losses allocated to the Class F Certificates; (v) the notional amount of the Class X-E Certificates will be reduced by the aggregate amount of principal distributions and realized losses allocated to the Class G and Class H Certificates; and (vi) the notional amount of the Class X-F Certificates will be reduced by the principal distributions and realized losses allocated to the Class J Certificates.
|
| Interest Payments: | On each Distribution Date, interest accrued for each Class of the Certificates at the applicable pass-through rate will be distributed in the following order of priority, to the extent of available funds:first, to the Class A-1, Class A-2, Class A-SB, Class A-3, Class A-4, Class XP-A, Class XS-A, Class X-B, Class X-C, Class X-D, Class X-E and Class X-F Certificates, on apro rata basis, based on the accrued and unpaid interest on each such Class andthen, to the Class A-M, Class B, Class C, Class D, Class E, Class F Class G, Class H and Class J Certificates, in that order, in each case until the interest payable to each such Class is paid in full.
The pass-through rates applicable to the Class A-1, Class A-2, Class A-SB, Class A-3, Class A-4, Class A-M, Class B, Class C, Class D, Class E, Class F, Class G, Class H and Class J Certificates for each Distribution Date will equal one of: (i) a fixedper annum rate, (ii) the weighted average of the net mortgage rates on the mortgage loans (in each case, adjusted, if necessary, to accrue on the basis of a 360-day year consisting of twelve 30-day months) as of their respective due dates in the month preceding the month in which such Distribution Date occurs, (iii) a rate equal to the lesser of a specified pass-through rate and the rate specified in clause (ii) or (iv) the rate specified in clause (ii), less a specified rate.
As further described in the Free Writing Prospectus, the pass-through rate applicable to the Class XP-A Certificates for each Distribution Date will equal the weighted average of the respective strip rates of the related components (the “Class XP-A Components”), which each applicable strip rate will equal the excess, if any, of (a) the lesser of (1) the rateper annum for such Distribution Date set forth on Annex I to the Free Writing Prospectus and (2) the weighted average of the net mortgage rates on the mortgage loans (in each case, adjusted, if necessary, to accrue on the basis of a 360-day year consisting of twelve 30-day months) as of their respective due dates in the month preceding the month in which such Distribution Date occurs, over (b) the pass-through rate for such Distribution Date for the related class of Certificates. The pass-through rate applicable to the Class XS-A Certificates for each Distribution Date will equal the weighted average of the respective strip rates of the related components, which each applicable strip rate will equal (A) if any portion of the related component notional amount is also included in the related component of a Class XP-A Component immediately prior to the related Distribution Date, the excess, if any, of (a) the weighted average of the net mortgage rates on the mortgage loans (in each case, adjusted, if |
THE INFORMATION IN THIS STRUCTURAL AND COLLATERAL TERM SHEET IS NOT COMPLETE AND MAY BE AMENDED PRIOR TO THE TIME OF SALE. THIS TERM SHEET IS NOT AN OFFER TO SELL THESE SECURITIES AND IT IS NOT A SOLICITATION OF AN OFFER TO BUY THESE SECURITIES IN ANY JURISDICTION WHERE THE OFFER OR SALE IS NOT PERMITTED. 7 |
COMM 2015-LC23 Mortgage Trust
| STRUCTURE OVERVIEW |
necessary, to accrue on the basis of a 360-day year consisting of twelve 30-day months) as of their respective due dates in the month preceding the month in which such Distribution Date occurs, over (b) the greater of (1) the rateper annum corresponding to such Distribution Date as set forth on Annex I to the Free Writing Prospectus and (2) the pass-through rate for such Distribution Date for the related class of Certificates, and (B) if any portion of the related component notional amount is not included in the related component of a Class XP-A Component immediately prior to the related Distribution Date, the excess, if any, of (a) the weighted average of the net mortgage rates on the mortgage loans (in each case, adjusted, if necessary, to accrue on the basis of a 360-day year consisting of twelve 30-day months) as of their respective due dates in the month preceding the month in which such Distribution Date occurs, over (b) pass-through rate for such Distribution Date for the related class of Certificates.
| |
| In addition, the pass-through rates applicable to the Class X-B, Class X-C, Class X-D, Class X-E and Class X-F Certificates for each Distribution Date will generally be equal to the excess of (i) the weighted average of the net mortgage rates on the mortgage loans (in each case, adjusted, if necessary, to accrue on the basis of a 360-day year consisting of twelve 30-day months) as of their respective due dates in the month preceding the month in which such Distribution Date occurs over (ii) (A) with respect to the Class X-B Certificates, the weighted average of the pass-through rates of the Class B and Class C Certificates (based on their Certificate Balances), (B) with respect to the Class X-C Certificates, the weighted average of the pass-through rates of the Class D and Class E Certificates (based on their Certificate Balances), (C) with respect to the Class X-D Certificates, the pass-through rate of the Class F Certificates, (D) with respect to the Class X-E Certificates, the weighted average of the pass-through rates of the Class G and Class H Certificates (based on their Certificate Balances) and (E) with respect to the Class X-F Certificates, the pass-through rate of the Class J Certificates. | |
| Prepayment Interest Shortfalls: | Prepayment interest shortfalls will be allocatedpro rata based on interest entitlements, in reduction of the interest otherwise payable with respect to each of the interest-bearing Classes of Certificates. |
| Loss Allocation: | Losses will be allocated to each Class of Certificates entitled to principal in reverse alphabetical order starting with Class J through and including Class A-M and then to Class A-1, Class A-2, Class A-SB, Class A-3 and Class A-4 Certificates on apro ratabasis based on the Certificate Balance of each such Class. The notional amount of any Class of Class X Certificates will be reduced by the aggregate amount of realized losses allocated to the Certificates that are components of the notional amount of such Class of Class X Certificates.
|
Prepayment Premiums: | A percentage of all prepayment premiums (either fixed prepayment premiums or yield maintenance amounts) collected on the Mortgage Loans will be allocated to each of the Class A-1, Class A-2, Class A-SB, Class A-3, Class A-4, Class A-M, Class B, Class C, Class D and Class E Certificates (the “YM P&I Certificates”) then entitled to principal distributions, which percentage will be equal to the product of (a) a fraction, not greater than one, the numerator of which is the amount of principal distributed to such Class on such Distribution Date and the denominator of which is the total amount of principal distributed to the holders of the Class A-1, Class A-2, Class A-SB, Class A-3, Class A-4, Class A-M, Class B, Class C, Class D and Class E Certificates on such Distribution Date, and (b) a fraction (expressed as a percentage which can be no greater than 100% nor less than 0%), the numerator of which is the excess of the pass-through rate of each such Class of Certificates currently receiving principal over the relevant Discount Rate, and the denominator of which is the excess of the Mortgage Rate of the related Mortgage Loan over the relevant Discount Rate.
Prepayment Premium Allocation Percentage for all YM P&I Certificates = |
| (Pass-Through Rate - Discount Rate) | The percentage of the principal | |||
| (Mortgage Rate - Discount Rate) | X | distribution amount to such Class as | ||
| described in (a) above |
| The remaining percentage of the prepayment premiums will be allocated to the Class XS-A, Class X-B, Class X-C, Class X-D, Class X-E and Class X-F Certificates in the manner described in the Free Writing Prospectus. In general, this formula provides for an increase in the percentage of prepayment premiums allocated to the YM P&I Certificates then entitled to principal distributions relative to the Class XS-A, Class X-B, Class X-C, Class X-D, Class X-E and Class X-F Certificates as Discount Rates decrease and a decrease in the percentage |
THE INFORMATION IN THIS STRUCTURAL AND COLLATERAL TERM SHEET IS NOT COMPLETE AND MAY BE AMENDED PRIOR TO THE TIME OF SALE. THIS TERM SHEET IS NOT AN OFFER TO SELL THESE SECURITIES AND IT IS NOT A SOLICITATION OF AN OFFER TO BUY THESE SECURITIES IN ANY JURISDICTION WHERE THE OFFER OR SALE IS NOT PERMITTED. 8 |
COMM 2015-LC23 Mortgage Trust
| STRUCTURE OVERVIEW |
| allocated to such Classes as Discount Rates rise. | |
| Loan Combinations: | The portfolio of mortgaged properties identified on Annex A–1 to the Free Writing Prospectus as Equity Inns Portfolio secures (i) a Mortgage Loan evidenced by two promissory notes designated as Note A-1-A and Note A-4-A, with an aggregate outstanding principal balance as of the Cut–off Date of $80,000,000 (the “Equity Inns Portfolio Mortgage Loan”), representing approximately 8.3% of the Initial Outstanding Pool Balance, (ii) four promissory notes designated as Note A-1-B, Note A-2-A, Note A-2-B and Note A-3, with an aggregate outstanding principal balance as of the Cut-off Date of $91,200,000, which are currently held by LCF or an affiliate, and (iii) three promissory notes designated as Note A-4-B, Note A-5 and Note A-6 (together with Note A-1-B, Note A-2-A, Note A-2-B and Note A-3, the “Equity Inns Portfolio Companion Loans”), with an aggregate outstanding principal balance as of the Cut-off Date of $60,800,000, which are currently held by GACC or an affiliate. The Equity Inns Portfolio Mortgage Loan and the Equity Inns Portfolio Companion Loans arepari passu in right of payment and are collectively referred to herein as the “The Equity Inns Portfolio Loan Combination”.
The Equity Inns Portfolio Loan Combination will be serviced pursuant to the COMM 2015-LC23 pooling and servicing agreement and the related intercreditor agreement. For additional information regarding the Equity Inns Portfolio Loan Combination, see“Description of the Mortgage Pool—Loan Combinations—Equity Inns Portfolio Loan Combination”in the Free Writing Prospectus.
The Mortgaged Property identified on Annex A-1 to the Free Writing Prospectus as 32 Avenue of the Americas secures (i) a Mortgage Loan evidenced by a promissory note designated as Note A-4, with an outstanding principal balance as of the Cut-off Date of $70,000,000 (the “32 Avenue of the Americas Mortgage Loan”), representing approximately 7.3% of the Initial Outstanding Pool Balance, (ii) three promissory notes designated as Note A-1, Note A-2 and Note A-3, with an aggregate outstanding principal balance as of the Cut-off Date of $297,500,000, which are currently held by JPMorgan Chase Bank, National Association or an affiliate, and (iii) a promissory note designated as Note A-5 (together with the Note A-1, Note A-2 and Note A-3, the “32 Avenue of the Americas Companion Loans”), with an outstanding principal balance as of the Cut-off Date of $57,500,000, which is currently held by GACC or an affiliate. The 32 Avenue of the Americas Mortgage Loan and the 32 Avenue of the Americas Companion Loans arepari passu in right of payment and are collectively referred to herein as the “32 Avenue of the Americas Loan Combination”.
The 32 Avenue of the Americas Loan Combination will be serviced pursuant to the COMM 2015-LC23 pooling and servicing agreement and the related intercreditor agreement. After the 32 Avenue of the Americas Note A-1 Securitization Date (as defined below), the 32 Avenue of the Americas Loan Combination will be serviced pursuant to the 32 Avenue of the Americas pooling and servicing agreement and the related intercreditor agreement. For additional information regarding the 32 Avenue of the Americas Loan Combination, see “Description of the Mortgage Pool—Loan Combinations—32 Avenue of the Americas Loan Combination” in the Free Writing Prospectus.
The Mortgaged Property identified on Annex A–1 to the Free Writing Prospectus as 11 Madison Avenue secures (i) a Mortgage Loan evidenced by a promissory note designated as Note A-1-C3, with an outstanding principal balance as of the Cut-off Date of $69,600,000 (the “11 Madison Avenue Mortgage Loan”), representing approximately 7.2% of the Initial Outstanding Pool Balance, (ii) nine pari passu promissory notes designated as Note A-1-S1, Note A-1-S2, Note A-1-S3, Note A-2-S1, Note A-2-S2, Note A-2-S3, Note A-3-S1, Note A-3-S2 and Note A-3-S3, respectively, having an aggregate outstanding principal balance as of the Cut-off Date of $397,530,000 (the “11 Madison Avenue Standalone Pari Passu Companion Loans”), each of which is generally pari passu in right of payment with the 11 Madison Avenue Mortgage Loan and the 11 Madison Avenue Non-Standalone Pari Passu Companion Loans (as defined below); (iii) six pari passu promissory notes designated as Note A-1-C1, Note A-1-C2, Note A-2-C1, Note A-2-C2, Note A-3-C1 and Note A-3-C2, respectively, having an aggregate outstanding principal balance as of the Cut-off Date of $297,200,000 (the “11 Madison Avenue Non-Standalone Pari Passu Companion Loans” and, together with the 11 Madison Avenue Standalone Pari Passu Companion Loans, the “11 Madison Avenue Pari Passu Companion Loans”), each of which is generally pari passu in right of payment with the 11 Madison Avenue Mortgage Loan and the 11 Madison Avenue Standalone Pari Passu Companion Loans; and (iv) three promissory notes designated as Note B-1-S, Note B-2-S and
|
THE INFORMATION IN THIS STRUCTURAL AND COLLATERAL TERM SHEET IS NOT COMPLETE AND MAY BE AMENDED PRIOR TO THE TIME OF SALE. THIS TERM SHEET IS NOT AN OFFER TO SELL THESE SECURITIES AND IT IS NOT A SOLICITATION OF AN OFFER TO BUY THESE SECURITIES IN ANY JURISDICTION WHERE THE OFFER OR SALE IS NOT PERMITTED. 9 |
COMM 2015-LC23 Mortgage Trust
| STRUCTURE OVERVIEW |
Note B-3-S, respectively, with an aggregate outstanding principal balance as of the Cut-off Date of $310,670,000 (collectively, the “11 Madison Avenue Subordinate Companion Loans” and, together with the 11 Madison Avenue Pari Passu Companion Loans, the “11 Madison Avenue Companion Loans”), which are subordinate in right of payment in respect of each of the 11 Madison Avenue Mortgage Loan and the 11 Madison Avenue Pari Passu Companion Loans. The 11 Madison Avenue Standalone Pari Passu Companion Loans and the 11 Madison Avenue Subordinate Companion Loans are collectively referred to as the “11 Madison Avenue Standalone Companion Loans”.
The 11 Madison Avenue Subordinate Companion Loans, together with the 11 Madison Avenue Mortgage Loan and the 11 Madison Avenue Pari Passu Companion Loans, are referred to as the “11 Madison Avenue Loan Combination”. Only the 11 Madison Avenue Mortgage Loan is included in the Issuing Entity. Each of the 11 Madison Avenue Standalone Pari Passu Companion Loans and 11 Madison Avenue Subordinate Companion Loans was included in the MAD 2015-11MD Mortgage Trust. The 11 Madison Avenue Non-Standalone Pari Passu Companion Loans are currently being held as follows: (i) Note A-1-C1 and Note A-1-C2 were included in the COMM 2015-CCRE26 Mortgage Trust and the COMM 2015-CCRE27 Mortgage Trust, respectively, (ii) Note A-2-C1 and Note A-2-C2 are currently being held by Morgan Stanley Bank, N.A., (iii) Note A-3-C1 is included in the WFCM 2015-NXS3 Mortgage Trust and (iv) Note A-3-C2 is currently being held by Wells Fargo Bank, National Association.
The 11 Madison Avenue Loan Combination is being serviced pursuant to the MAD 2015-11MD pooling and servicing agreement and the related intercreditor agreement. For additional information regarding the 11 Madison Avenue Loan Combination, see“Description of the Mortgage Pool—Loan Combinations—11 Madison Avenue Loan Combination”in the Free Writing Prospectus.
The portfolio of mortgaged properties identified on Annex A-1 to the Free Writing Prospectus as Harvey Building Products Portfolio secures (i) a Mortgage Loan evidenced by a promissory note designated as Note A-1 with an outstanding principal balance as of the Cut-off Date of $41,953,178 (the “Harvey Building Products Portfolio Mortgage Loan”), representing approximately 4.4% of the Initial Outstanding Pool Balance, and (ii) two promissory notes designated as Note A-2 and Note A-3 (collectively, “Harvey Building Products Companion Loans”), with an aggregate outstanding principal balance as of the Cut-off Date of $67,925,164, which are currently held by LCF or an affiliate. The 32 Harvey Building Products Portfolio Mortgage Loan and the Harvey Building Products Portfolio Companion Loans arepari passu in right of payment and are collectively referred to herein as the “Harvey Building Products Portfolio Loan Combination”.
The Harvey Building Products Portfolio Loan Combination will be serviced pursuant to the COMM 2015-LC23 pooling and servicing agreement and the related intercreditor agreement. For additional information regarding the Harvey Building Products Portfolio Loan Combination, see “Description of the Mortgage Pool—Loan Combinations—Harvey Building Products Portfolio Loan Combination” in the Free Writing Prospectus.
The Mortgaged Property identified on Annex A-1 to the Free Writing Prospectus as Springfield Mall secures (i) a Mortgage Loan evidenced by a promissory note designated as Note A-1 with an outstanding principal balance as of the Cut-off Date of $32,460,817 (the “Springfield Mall Mortgage Loan”), representing approximately 3.4% of the Initial Outstanding Pool Balance and (ii) a promissory note designated as Note A-2 (the “Springfield Mall Companion Loan”), with an outstanding principal balance as of the Cut-off Date of $32,460,817, which is currently held by CCRE or an affiliate. The Springfield Mall Mortgage Loan and the Springfield Mall Companion Loan arepari passu in right of payment and are collectively referred to herein as the “Springfield Mall Loan Combination”.
The Springfield Mall Loan Combination will be serviced pursuant to the COMM 2015-LC23 pooling and servicing agreement and the related intercreditor agreement. For additional information regarding the Springfield Mall Loan Combination, see “Description of the Mortgage Pool—Loan Combinations—Springfield Mall Loan Combination” in the Free Writing Prospectus.
| |
| The Mortgaged Property identified as 40 Wall Street on Annex A-1 to the Free Writing Prospectus secures (i) a promissory note designated as Note A-1-B (the “40 Wall Street |
THE INFORMATION IN THIS STRUCTURAL AND COLLATERAL TERM SHEET IS NOT COMPLETE AND MAY BE AMENDED PRIOR TO THE TIME OF SALE. THIS TERM SHEET IS NOT AN OFFER TO SELL THESE SECURITIES AND IT IS NOT A SOLICITATION OF AN OFFER TO BUY THESE SECURITIES IN ANY JURISDICTION WHERE THE OFFER OR SALE IS NOT PERMITTED. 10 |
COMM 2015-LC23 Mortgage Trust
| STRUCTURE OVERVIEW |
| Mortgage Loan”), with an outstanding principal balance as of the Cut-off Date of $4,960,524, representing approximately 0.5% of Initial Outstanding Pool Balance, (ii) two promissory notes designated as Note A-1-A and Note A-2, with an aggregate outstanding principal balance as of the cut-off date of $94,249,948, which is included in the WFCM 2015-LC22 Mortgage Trust, and (iii) a promissory note designated as Note A-3 (together with Note A-1-A and Note A-2, the “40 Wall Street Companion Loans”), with an outstanding principal balance as of the cut-off date of $59,526,283, which is included in the COMM 2015-CCRE24 Mortgage Trust. The 40 Wall Street Mortgage Loan and the 40 Wall Street Companion Loansare pari passu in right of payment and are collectively referred to as the “40 Wall Street Loan Combination”. | |
The 40 Wall Street Loan Combination is being serviced pursuant to the WFCM 2015-LC22 pooling and servicing agreement and the related intercreditor agreement. For additional information regarding the 40 Wall Street loan combination, see “Description of the Mortgage Pool—Loan Combinations—40 Wall Street Loan Combination” in the Free Writing Prospectus.
Each of the Equity Inns Portfolio Loan Combination, the Harvey Building Products Portfolio Loan Combination and the Springfield Mall Loan Combination is referred to as a “Serviced Loan Combination”.
Each of the 11 Madison Mortgage Loan and 40 Wall Street Mortgage Loan is referred to as a “Non-Serviced Mortgage Loan”. Each of the 11 Madison Loan Combination and 40 Wall Street Loan Combination is referred to as a “Non-Serviced Loan Combination”.
The 32 Avenue of the Americas Mortgage Loan is referred to as a “Servicing Shift Mortgage Loan”, and the 32 Avenue of the Americas Loan Combination is referred to as a “Servicing Shift Loan Combination”. Prior to the applicable securitization date (the “32 Avenue of the Americas Note A-1 Securitization Date”), the 32 Avenue of the Americas Loan Combination is referred to as a “Serviced Loan Combination”. On and after the 32 Avenue of the Americas Note A-1 Securitization Date, the 32 Avenue of the Americas Mortgage Loan will be a “Non-Serviced Mortgage Loan” and the 32 Avenue of the Americas Loan Combination will be a “Non-Serviced Loan Combination”.
| |
| Control Rights and Directing Holder: | Controlling Class Certificateholders will have certain control rights over servicing matters with respect to each Mortgage Loan (other than Non-Serviced Mortgage Loans and Servicing Shift Mortgage Loans) and Serviced Loan Combinations (other than Servicing Shift Loan Combinations). The majority owner or appointed representative of the Class of Control Eligible Certificates that is the Controlling Class (such owner or representative, the “Directing Holder”), will be entitled to direct the Special Servicer to take, or refrain from taking certain actions with respect to a Mortgage Loan (other than Non-Serviced Mortgage Loans and Servicing Shift Mortgage Loans) and Serviced Loan Combinations (other than Servicing Shift Loan Combinations). Furthermore, the Directing Holder will also have the right to receive notice and consent to certain material actions that the Master Servicer and the Special Servicer proposes to take with respect to such Mortgage Loan (other than Non-Serviced Mortgage Loans and Servicing Shift Mortgage Loans) and Serviced Loan Combinations (other than Servicing Shift Loan Combinations).
It is expected that LNR Securities Holdings, LLC or its affiliate will be the initial Directing Holder with respect to each Mortgage Loan (other than Non-Serviced Mortgage Loans and Servicing Shift Mortgage Loans) and Serviced Loan Combination (other than Servicing Shift Loan Combinations).
For a description of the directing holder for each Non-Serviced Loan Combination and Servicing Shift Loan Combination, see“Description of the Mortgage Pool—Loan Combinations” and “Description of the Pooling and Servicing Agreement—The Directing Holder”in theFree Writing Prospectus.
|
| Control Eligible Certificates: | Class F, Class G, Class H and Class J Certificates.
|
| Controlling Class: | The Controlling Class will be the most subordinate Class of Control Eligible Certificates then outstanding that has an aggregate Certificate Balance, as notionally reduced by any Appraisal Reduction Amounts allocable to such Class, equal to no less than 25% of the initial Certificate Balance of such Class; provided that if at any time the Certificate Balances of the Class A-1, Class A-2, Class A-3, Class A-4, Class A-SB, Class A-M, Class B, Class C, Class D and Class E have been reduced to zero as a result of the allocation of principal payments on the |
THE INFORMATION IN THIS STRUCTURAL AND COLLATERAL TERM SHEET IS NOT COMPLETE AND MAY BE AMENDED PRIOR TO THE TIME OF SALE. THIS TERM SHEET IS NOT AN OFFER TO SELL THESE SECURITIES AND IT IS NOT A SOLICITATION OF AN OFFER TO BUY THESE SECURITIES IN ANY JURISDICTION WHERE THE OFFER OR SALE IS NOT PERMITTED. 11 |
COMM 2015-LC23 Mortgage Trust
| STRUCTURE OVERVIEW |
Mortgage Loans, then the “Controlling Class” will be the most subordinate Class of Control Eligible Certificates that has an aggregate Certificate Balance greater than zero without regard to the application of Appraisal Reduction Amounts to notionally reduce the Certificate Balance of such Class.
The Controlling Class as of the Settlement Date will be the Class J Certificates.
| |
| Appraised-Out Class: | Any Class of Control Eligible Certificates that has been determined, as a result of Appraisal Reductions Amounts allocable to such Class, to no longer be the Controlling Class.
|
| Remedies Available to Holders of an Appraised-Out Class: | Holders of the majority of any Class of Control Eligible Certificates that is determined at any time of determination to no longer be the Controlling Class as a result of an allocation of an Appraisal Reduction Amounts in respect of such Class will have the right, at their sole expense, to require the Special Servicer to order a second appraisal for any Mortgage Loan (other than Non-Serviced Mortgage Loans) for which an Appraisal Reduction Event has occurred. Upon receipt of the second appraisal, the Special Servicer will be required to determine, in accordance with the Servicing Standard, whether, based on its assessment of the second appraisal, a recalculation of the Appraisal Reduction Amount is warranted. If warranted, the Special Servicer will direct the Master Servicer to recalculate the Appraisal Reduction Amount based on the second appraisal, and if required by such recalculation, the Special Servicer will reinstate the Appraised-Out Class as the Controlling Class. The Holders of an Appraised-Out Class requesting a second appraisal will not be entitled to exercise any rights of the Controlling Class until such time, if any, as the Class is reinstated as the Controlling Class.
|
| Control Termination Event: | Will occur with respect to any Mortgage Loan (other than the Non-Serviced Mortgage Loans and Servicing Shift Mortgage Loans) or Serviced Loan Combination (other than Servicing Shift Loan Combinations) when no Class of Control Eligible Certificates has an aggregate Certificate Balance (as notionally or actually reduced by any Appraisal Reduction Amounts and Realized Losses) equal to or greater than 25% of the initial Certificate Balance of such Class (subject to “—Controlling Class” above).
Upon the occurrence and the continuance of a Control Termination Event, the Directing Holder will no longer have any Control Rights. The Directing Holder will no longer have the right to direct certain actions of the Special Servicer and will no longer have consent rights with respect to certain material actions that the Master Servicer or Special Servicer proposes to take with respect to a Mortgage Loan (other than the Non-Serviced Mortgage Loans and Servicing Shift Mortgage Loans).
Upon the occurrence and continuation of a Control Termination Event, the Directing Holder will retain non-binding consultation rights with respect to certain material actions that the Special Servicer proposes to take with respect to a Mortgage Loan (other than the Non-Serviced Mortgage Loans and Servicing Shift Mortgage Loans) and Serviced Loan Combinations (other than Servicing Shift Loan Combinations). Such consultation rights will continue until the occurrence of a Consultation Termination Event.
|
| Consultation Termination Event: | Will occur with respect to any Mortgage Loan (other than the Non-Serviced Mortgage Loans and Servicing Shift Mortgage Loans) and Serviced Loan Combinations (other than Servicing Shift Loan Combinations) when, without giving regard to the application of any Appraisal Reduction Amounts (i.e., giving effect to principal reduction through Realized Losses only), there is no Class of Control Eligible Certificates that has an aggregate Certificate Balance equal to 25% or more of the initial Certificate Balance of such Class (subject to “—Controlling Class” above).
Upon the occurrence and continuance of a Consultation Termination Event, the Directing Holder will have no rights under the Pooling and Servicing Agreement other than those rights that all Certificateholders have.
|
| Appointment and Replacement of Special Servicer: | The Directing Holder will appoint the initial Special Servicer with respect to each Mortgage Loan (other than the Non-Serviced Mortgage Loans and Servicing Shift Mortgage Loans) and each Serviced Loan Combination (other than Servicing Shift Loan Combinations) as of the Settlement Date. Prior to the occurrence and continuance of a Control Termination Event, the Directing Holder generally may replace the Special Servicer with respect to each Mortgage Loan (other than the Non-Serviced Mortgage Loans and Servicing Shift Mortgage Loans) and |
THE INFORMATION IN THIS STRUCTURAL AND COLLATERAL TERM SHEET IS NOT COMPLETE AND MAY BE AMENDED PRIOR TO THE TIME OF SALE. THIS TERM SHEET IS NOT AN OFFER TO SELL THESE SECURITIES AND IT IS NOT A SOLICITATION OF AN OFFER TO BUY THESE SECURITIES IN ANY JURISDICTION WHERE THE OFFER OR SALE IS NOT PERMITTED. 12 |
COMM 2015-LC23 Mortgage Trust
| STRUCTURE OVERVIEW |
each Serviced Loan Combination (other than Servicing Shift Loan Combinations) with or without cause at any time.
Upon the occurrence and during the continuance of a Control Termination Event, the Directing Holder will no longer have the right to replace the Special Servicer and such replacement (other than with respect to the Non-Serviced Loan Combinations and Servicing Shift Loan Combinations) will occur based on a vote of holders of all voting eligible Classes of Certificates as described below. See“Description of the Mortgage Pool—Loan Combinations” and “Description of the Pooling and Servicing Agreement”in theFree Writing Prospectus for a description of the special servicer appointment and replacement rights with respect to Non-Serviced Loan Combinations and Servicing Shift Loan Combinations. | |
| Replacement of Special Servicer by Vote of Certificateholders: | Other than with respect to Non-Serviced Loan Combinations and Servicing Shift Loan Combinations, if a Control Termination Event has occurred and is continuing, upon (i) the written direction of holders of Certificates evidencing not less than 25% of the voting rights of all Classes of Certificates entitled to principal (taking into account the application of Appraisal Reduction Amounts to notionally reduce the Certificate Balances of Classes to which such Appraisal Reduction Amounts are allocable) requesting a vote to replace the Special Servicer with a replacement Special Servicer, (ii) payment by such requesting holders to the Certificate Administrator of all reasonable fees and expenses to be incurred by the Certificate Administrator in connection with administering such vote and (iii) delivery by such holders to the Certificate Administrator of written confirmations from each Rating Agency that the appointment of the replacement Special Servicer will not result in a downgrade of the Certificates, the Certificate Administrator will be required to promptly provide written notice to all certificateholders of such request and conduct the solicitation of votes of all Certificates in such regard. Upon the written direction (within 180 days) of (i) Holders of at least 75% of a Certificateholder Quorum or (ii) the Holders of more than 50% of the voting rights of each Class of Non-Reduced Certificates, the Trustee will immediately replace the Special Servicer with the replacement Special Servicer (other than with respect to Non-Serviced Loan Combinations and Servicing Shift Loan Combinations).
“Certificateholder Quorum” means, in connection with any solicitation of votes in connection with the replacement of the Special Servicer as described above, the holders of Certificates evidencing at least 75% of the aggregate voting rights (taking into account Realized Losses and the application of any Appraisal Reduction Amounts to notionally reduce the Certificate Balance of the Certificates) of all classes of Certificates entitled to principal, on an aggregate basis.
In addition, after the occurrence of a Consultation Termination Event, if the Operating Advisor determines that the Special Servicer is not performing its duties in accordance with the Servicing Standard, the Operating Advisor will have the right to recommend the replacement of the Special Servicer (other than with respect to Non-Serviced Loan Combinations and Servicing Shift Loan Combinations). The Operating Advisor’s recommendation to replace the Special Servicer (other than with respect Non-Serviced Loan Combinations and Servicing Shift Loan Combinations) must be confirmed by a majority of the voting rights of all Classes of Certificates entitled to principal (taking into account the application of Appraisal Reduction Amounts to notionally reduce the Certificate Balances of Classes to which such Appraisal Reduction Amounts are allocable) within 180 days from the time such recommendation is posted to the Certificate Administrator website and is subject to the receipt of written confirmations from each Rating Agency that the appointment of the replacement Special Servicer will not result in a downgrade of the Certificates.
See“Description of the Mortgage Pool—Loan Combinations”and “Description of the Pooling and Servicing Agreement”in theFree Writing Prospectus for a description of the special servicer appointment and replacement rights with respect to Non-Serviced Loan Combinations and Servicing Shift Loan Combinations.
|
| Cap on Workout and Liquidation Fees: | The workout fees and liquidation fees payable to a Special Servicer under the Pooling and Servicing Agreement will be an amount equal to the lesser of: (1) 1.0% of each collection of interest and principal following a workout or liquidation and (2) $1,000,000 per workout or liquidation. All Modification Fees actually paid to the Special Servicer in connection with a workout or liquidation or in connection with any prior workout or partial liquidation that occurred within the prior 18 months will be deducted from the total workout and/or liquidation fees payable (other than Modification Fees earned while the Mortgage Loan was not in special |
THE INFORMATION IN THIS STRUCTURAL AND COLLATERAL TERM SHEET IS NOT COMPLETE AND MAY BE AMENDED PRIOR TO THE TIME OF SALE. THIS TERM SHEET IS NOT AN OFFER TO SELL THESE SECURITIES AND IT IS NOT A SOLICITATION OF AN OFFER TO BUY THESE SECURITIES IN ANY JURISDICTION WHERE THE OFFER OR SALE IS NOT PERMITTED. 13 |
COMM 2015-LC23 Mortgage Trust
| STRUCTURE OVERVIEW |
| servicing). In addition, the total amount of workout and liquidation fees actually payable by the Trust under the Pooling and Servicing Agreement will be capped in the aggregate at $1,000,000 for each related Mortgage Loan. If a new special servicer begins servicing the related Mortgage Loan, all amounts paid to the prior special servicer will be disregarded for purposes of calculating the cap. | |
| Special Servicer Compensation: | The special servicing fee will equal the greater of (i) 0.25%per annum and (ii) the rate that would result in a special servicing fee of $1,000 for the related month of the stated principal balance of the related specially serviced loan or REO property, as applicable. The Special Servicer and its affiliates will be prohibited from receiving or retaining any compensation or any other remuneration under the Pooling and Servicing Agreement (including in the form of commissions, brokerage fees, rebates, or as a result of any other fee-sharing arrangement) from any person (including the issuing entity, any borrower, any manager, any guarantor or indemnitor in respect of a Mortgage Loan or Serviced Loan Combination, if any, and any purchaser of any Mortgage Loan, Serviced Companion Loan or REO Property) in connection with the disposition, workout or foreclosure of any Mortgage Loan or Serviced Loan Combination, the management or disposition of any REO Property, or the performance of any other special servicing duties under the Pooling and Servicing Agreement, other than as expressly permitted in the Pooling and Servicing Agreement and other than commercially reasonable treasury management fees, banking fees and insurance commissions or fees received or retained by the Special Servicer or any of its Affiliates in connection with any services performed by such party with respect to any mortgage loan. Subject to certain limited exceptions, the Special Servicer will also be required to report any compensation or other remuneration the Special Servicer or its affiliates have received from any person and such information will be disclosed in the Certificateholders’ monthly distribution date statement. |
| Operating Advisor: | With respect to the Mortgage Loans (other than with respect to Non-Serviced Loan Combinations and Servicing Shift Loan Combinations) and prior to the occurrence of a Control Termination Event, the Operating Advisor will have access to any final asset status report and all information available with respect to the transaction on the Certificate Administrator’s website but will not have any approval or consultation rights. After the occurrence and during the continuance of a Control Termination Event, the Operating Advisor will have consultation rights with respect to certain major decisions and will have additional monitoring responsibilities on behalf of the entire trust. |
| The Operating Advisor will be subject to termination if holders of at least 15% of the aggregate voting rights of the Certificates (in connection with termination and replacement relating to the Mortgage Loans) vote to terminate and replace the Operating Advisor and such vote is approved by holders of more than 50% of the applicable voting rights that exercise their right to vote, provided that holders of at least 50% of the applicable voting rights have exercised their right to vote. The holders initiating such vote will be responsible for the fees and expenses in connection with the vote and replacement. | |
| The Operating Advisor will not have consultation rights in respect of Non-Serviced Loan Combinations and Servicing Shift Loan Combinations. | |
| Liquidated Loan Waterfall: | On liquidation of any Mortgage Loan, all net liquidation proceeds will be applied so that amounts allocated as a recovery of accrued and unpaid interest will not, in the first instance, include any amount by which the interest portion of P&I Advances previously made was reduced as a result of Appraisal Reduction Amounts. After the adjusted interest amount is so allocated, any remaining net liquidation proceeds will be allocated to pay principal on the Mortgage Loan until the unpaid principal amount of the Mortgage Loan has been reduced to zero. Any remaining liquidation proceeds would then be allocated as a recovery of accrued and unpaid interest corresponding to the amount by which the interest portion of P&I Advances previously made was reduced as a result of Appraisal Reduction Amounts. |
THE INFORMATION IN THIS STRUCTURAL AND COLLATERAL TERM SHEET IS NOT COMPLETE AND MAY BE AMENDED PRIOR TO THE TIME OF SALE. THIS TERM SHEET IS NOT AN OFFER TO SELL THESE SECURITIES AND IT IS NOT A SOLICITATION OF AN OFFER TO BUY THESE SECURITIES IN ANY JURISDICTION WHERE THE OFFER OR SALE IS NOT PERMITTED. 14 |
COMM 2015-LC23 Mortgage Trust
|
| OVERVIEW OF MORTGAGE POOL CHARACTERISTICS |
Distribution of Cut-off Date Balances(1) |
| Range of Cut-off Date Balances | Number of Mortgage Loans | Aggregate Cut-off Date Balance | % of Initial Pool | Weighted Averages | ||||||
| Mortgage Rate | Stated Remaining Term (Mos.) | U/W NCF DSCR | Cut-off Date LTV Ratio(2)(3) | Maturity Date or ARD LTV(2)(3) | ||||||
| $702,000 | - | $7,499,999 | 28 | $111,472,819 | 11.6% | 4.7221% | 117 | 1.54x | 65.3% | 51.6% |
| $7,500,000 | - | $14,999,999 | 14 | $149,198,164 | 15.5% | 4.6503% | 119 | 1.51x | 65.7% | 57.2% |
| $15,000,000 | - | $24,999,999 | 9 | $182,233,997 | 19.0% | 4.8435% | 105 | 1.46x | 68.0% | 61.1% |
| $25,000,000 | - | $49,999,999 | 8 | $298,407,168 | 31.1% | 4.6816% | 101 | 1.67x | 61.8% | 54.8% |
| $50,000,000 | - | $74,999,999 | 2 | $139,600,000 | 14.5% | 4.1979% | 119 | 2.88x | 43.9% | 43.9% |
| $75,000,000 | - | $80,000,000 | 1 | $80,000,000 | 8.3% | 4.9600% | 59 | 2.35x | 64.4% | 64.4% |
| Total/Weighted Average | 62 | $960,912,147 | 100.0% | 4.6650% | 105 | 1.82x | 61.6% | 55.2% | ||
Distribution of Mortgage Rates(1) |
| Range of Mortgage Rates | Number of Mortgage Loans | Aggregate Cut-off Date Balance | % of Initial Outstanding Pool Balance | Weighted Averages | ||||||
| Mortgage Rate | Stated Remaining Term (Mos.) | U/W NCF DSCR | Cut-off Date LTV Ratio(2)(3) | Maturity Date or ARD LTV(2)(3) | ||||||
| 3.5602% | - | 4.4999% | 13 | $235,547,156 | 24.5% | 4.1204% | 118 | 2.37x | 51.4% | 45.3% |
| 4.5000% | - | 4.7499% | 18 | $231,989,828 | 24.1% | 4.6214% | 107 | 1.51x | 66.8% | 59.7% |
| 4.7500% | - | 5.3380% | 31 | $493,375,163 | 51.3% | 4.9456% | 99 | 1.70x | 64.0% | 57.8% |
| Total/Weighted Average | 62 | $960,912,147 | 100.0% | 4.6650% | 105 | 1.82x | 61.6% | 55.2% | ||
Property Type Distribution(1)(4) |
| Property Type | Number of Mortgaged Properties | Aggregate Date Balance | % of Initial Outstanding Pool Balance | Number of Beds/Rooms/ Pads/Units/ NRA | Weighted Averages | ||||||
Cut-off Date Unit/NRA | Mortgage Rate | Stated Term | Occupancy | U/W NCF DSCR | Cut-off Ratio(2)(3) | Maturity Date or ARD LTV(2)(3) | |||||
| Retail | 30 | $311,283,850 | 32.4% | 2,040,752 | $253 | 4.6312% | 114 | 94.8% | 1.51x | 65.4% | 56.2% |
| Anchored(5) | 21 | $225,381,127 | 23.5% | 1,662,992 | $244 | 4.7197% | 113 | 94.6% | 1.48x | 67.1% | 58.6% |
| Unanchored | 9 | $85,902,723 | 8.9% | 377,760 | $278 | 4.3990% | 118 | 95.2% | 1.57x | 61.1% | 49.9% |
| Office | 18 | $273,595,382 | 28.5% | 5,219,507 | $391 | 4.3636% | 118 | 96.9% | 2.30x | 52.7% | 49.0% |
| CBD | 4 | $163,539,209 | 17.0% | 4,696,306 | $329 | 4.2478% | 119 | 98.7% | 2.67x | 46.2% | 44.5% |
| Suburban | 12 | $64,696,510 | 6.7% | 364,747 | $621 | 4.5143% | 114 | 96.6% | 1.61x | 61.8% | 50.6% |
| Medical | 2 | $45,359,663 | 4.7% | 158,454 | $288 | 4.5663% | 118 | 91.0% | 1.92x | 63.5% | 62.7% |
| Hospitality | 27 | $191,255,094 | 19.9% | 3,553 | $135,410 | 4.9807% | 94 | 75.2% | 1.91x | 64.3% | 57.4% |
| Full Service | 3 | $95,944,447 | 10.0% | 676 | $159,758 | 4.9837% | 119 | 73.0% | 1.55x | 64.5% | 53.8% |
| Limited Service | 13 | $45,845,129 | 4.8% | 1,438 | $84,992 | 4.9967% | 79 | 76.2% | 2.18x | 63.9% | 57.4% |
| Extended Stay | 6 | $31,310,345 | 3.3% | 784 | $164,105 | 4.9600% | 59 | 83.6% | 2.35x | 64.4% | 64.4% |
| Select Service | 5 | $18,155,172 | 1.9% | 655 | $84,564 | 4.9600% | 59 | 70.1% | 2.35x | 64.4% | 64.4% |
| Multifamily | 9 | $123,068,650 | 12.8% | 1,661 | $175,575 | 4.8713% | 86 | 97.7% | 1.44x | 68.8% | 64.5% |
| Industrial | 29 | $37,804,168 | 3.9% | 1,991,719 | $51 | 4.8500% | 59 | 100.0% | 1.96x | 53.5% | 49.3% |
| Manufactured Housing Community | 4 | $12,955,800 | 1.3% | 341 | $40,152 | 4.4831% | 119 | 98.1% | 1.74x | 64.4% | 57.1% |
| Mixed Use | 2 | $7,949,204 | 0.8% | 87,664 | $128 | 4.8385% | 119 | 86.5% | 1.31x | 68.0% | 55.7% |
| Office/Retail | 2 | $7,949,204 | 0.8% | 87,664 | $128 | 4.8385% | 119 | 86.5% | 1.31x | 68.0% | 55.7% |
| Self-Storage | 1 | $3,000,000 | 0.3% | 12,060 | $249 | 5.0800% | 119 | 85.6% | 1.57x | 73.2% | 63.4% |
| Total/Weighted Average | 120 | $960,912,147 | 100.0% | 4.6650% | 105 | 92.0% | 1.82x | 61.6% | 55.2% | ||
THE INFORMATION IN THIS STRUCTURAL AND COLLATERAL TERM SHEET IS NOT COMPLETE AND MAY BE AMENDED PRIOR TO THE TIME OF SALE. THIS TERM SHEET IS NOT AN OFFER TO SELL THESE SECURITIES AND IT IS NOT A SOLICITATION OF AN OFFER TO BUY THESE SECURITIES IN ANY JURISDICTION WHERE THE OFFER OR SALE IS NOT PERMITTED.
| 15 |
COMM 2015-LC23 Mortgage Trust
|
| OVERVIEW OF MORTGAGE POOL CHARACTERISTICS |
Geographic Distribution(1)(4) |
| State/Location | Number of Properties | Aggregate Cut-off Date Balance | % of Initial Outstanding Pool Balance | Weighted Averages | ||||
| Mortgage Rate | Stated Term (Mos.) | U/W NCF DSCR | Cut-off Date LTV Ratio(2)(3) | Maturity Date or ARD LTV(2)(3) | ||||
| California | 14 | $254,575,194 | 26.5% | 4.5703% | 112 | 1.59x | 62.8% | 55.9% |
| Southern(6) | 12 | $197,660,680 | 20.6% | 4.6167% | 111 | 1.56x | 64.0% | 56.9% |
| Northern(6) | 2 | $56,914,514 | 5.9% | 4.4092% | 119 | 1.69x | 58.6% | 52.4% |
| New York | 7 | $199,074,357 | 20.7% | 4.3316% | 105 | 2.48x | 51.3% | 50.4% |
| New York City | 4 | $190,560,524 | 19.8% | 4.3113% | 104 | 2.52x | 50.4% | 50.1% |
| Remaining New York State | 3 | $8,513,833 | 0.9% | 4.7875% | 119 | 1.43x | 71.2% | 56.0% |
| Texas | 11 | $85,658,646 | 8.9% | 4.7394% | 110 | 1.67x | 66.7% | 55.1% |
| Illinois | 12 | $65,871,854 | 6.9% | 4.8663% | 112 | 1.58x | 61.9% | 50.2% |
| Pennsylvania | 6 | $64,902,201 | 6.8% | 4.7012% | 117 | 1.54x | 64.0% | 54.4% |
| Other | 70 | $290,829,896 | 30.3% | 4.9006% | 94 | 1.74x | 65.5% | 59.2% |
| Total/Weighted Average | 120 | $960,912,147 | 100.0% | 4.6650% | 105 | 1.82x | 61.6% | 55.2% |
Distribution of Cut-off Date LTV Ratios(1)(2)(3) |
| Range of Cut-off Date LTV Ratios | Number of Mortgage Loans | Aggregate Cut-off Date Balance | % of Initial Outstanding Pool Balance | Weighted Averages | ||||||
| Mortgage Rate | Stated Remaining Term(Mos.) | U/W NCF DSCR | Cut-off Date LTV Ratio | Maturity Date or ARD LTV | ||||||
| 29.4% | - | 54.9% | 6 | $168,455,190 | 17.5% | 4.2414% | 103 | 2.69x | 43.5% | 38.9% |
| 55.0% | - | 59.9% | 9 | $183,970,181 | 19.1% | 4.6143% | 119 | 1.74x | 56.7% | 51.1% |
| 60.0% | - | 64.9% | 8 | $212,257,755 | 22.1% | 4.7763% | 90 | 1.94x | 63.2% | 60.6% |
| 65.0% | - | 69.9% | 15 | $142,823,344 | 14.9% | 4.8186% | 119 | 1.41x | 67.6% | 55.8% |
| 70.0% | - | 74.9% | 23 | $241,780,678 | 25.2% | 4.8044% | 101 | 1.45x | 72.3% | 64.1% |
| 75.0% | - | 75.0% | 1 | $11,625,000 | 1.2% | 4.7905% | 119 | 1.36x | 75.0% | 66.1% |
| Total/Weighted Average | 62 | $960,912,147 | 100.0% | 4.6650% | 105 | 1.82x | 61.6% | 55.2% | ||
Distribution of Maturity Date or ARD LTV Ratios(1)(2)(3) |
Range of LTV Ratios at Maturity or ARD | Number of Mortgage Loans | Aggregate Cut-off Date Balance | % of Initial Outstanding Pool Balance | Weighted Averages | ||||||
| Mortgage Rate | StatedRemaining Term(Mos.) | U/W NCF DSCR | Cut-off Date LTV Ratio | Maturity Date or ARD LTV | ||||||
| 21.1% | - | 49.9% | 18 | $295,899,190 | 30.8% | 4.3613% | 110 | 2.21x | 50.5% | 41.8% |
| 50.0% | - | 54.9% | 4 | $31,218,715 | 3.2% | 4.4033% | 118 | 1.58x | 61.4% | 53.3% |
| 55.0% | - | 59.9% | 18 | $261,914,921 | 27.3% | 4.7547% | 119 | 1.54x | 64.9% | 56.7% |
| 60.0% | - | 64.9% | 10 | $252,210,821 | 26.2% | 4.8793% | 95 | 1.88x | 66.2% | 62.9% |
| 65.0% | - | 72.3% | 12 | $119,668,500 | 12.5% | 4.8367% | 84 | 1.41x | 72.1% | 69.3% |
| Total/Weighted Average | 62 | $960,912,147 | 100.0% | 4.6650% | 105 | 1.82x | 61.6% | 55.2% | ||
Distribution of Underwritten NCF Debt Service Coverage Ratios(1) |
| Range of Underwritten NCF Debt Service Coverage Ratios | Number of Mortgage Loans | Aggregate Cut-off Date Balance | % of Initial Outstanding Pool Balance | Weighted Averages | ||||||
| Mortgage Rate | Stated Remaining Term (Mos.) | U/W NCF DSCR | Cut-off Date LTV Ratio(2)(3) | Maturity Date or ARD LTV(2)(3) | ||||||
| 1.13x | - | 1.39x | 23 | $232,088,778 | 24.2% | 4.7874% | 112 | 1.30x | 68.9% | 58.0% |
| 1.40x | - | 1.44x | 2 | $27,231,741 | 2.8% | 4.8125% | 119 | 1.42x | 67.3% | 57.4% |
| 1.45x | - | 1.54x | 8 | $131,926,281 | 13.7% | 4.8885% | 88 | 1.50x | 64.9% | 58.0% |
| 1.55x | - | 1.99x | 24 | $397,116,433 | 41.3% | 4.6743% | 113 | 1.77x | 61.4% | 55.7% |
| 2.00x | - | 2.49x | 4 | $102,948,914 | 10.7% | 4.7752% | 72 | 2.32x | 59.9% | 58.0% |
| 2.50x | - | 3.89x | 1 | $69,600,000 | 7.2% | 3.5602% | 118 | 3.89x | 32.5% | 32.5% |
| Total/Weighted Average | 62 | $960,912,147 | 100.0% | 4.6650% | 105 | 1.82x | 61.6% | 55.2% | ||
THE INFORMATION IN THIS STRUCTURAL AND COLLATERAL TERM SHEET IS NOT COMPLETE AND MAY BE AMENDED PRIOR TO THE TIME OF SALE. THIS TERM SHEET IS NOT AN OFFER TO SELL THESE SECURITIES AND IT IS NOT A SOLICITATION OF AN OFFER TO BUY THESE SECURITIES IN ANY JURISDICTION WHERE THE OFFER OR SALE IS NOT PERMITTED.
| 16 |
COMM 2015-LC23 Mortgage Trust
|
| OVERVIEW OF MORTGAGE POOL CHARACTERISTICS |
Original Terms to Maturity or ARD(1) |
| Original Terms to Maturity or ARD | Number of Mortgage Loans | Aggregate Cut-off Date Balance | % of Initial Outstanding Pool Balance | Weighted Averages | ||||
| Mortgage Rate | Stated Remaining Term(Mos.) | U/W NCF DSCR | Cut-off Date LTV Ratio(2)(3) | Maturity Date or ARD LTV(2)(3) | ||||
| 60 | 6 | $213,653,778 | 22.2% | 4.9297% | 59 | 1.89x | 64.5% | 63.3% |
| 120 | 56 | $747,258,370 | 77.8% | 4.5894% | 119 | 1.80x | 60.8% | 52.9% |
| Total/Weighted Average | 62 | $960,912,147 | 100.0% | 4.6650% | 105 | 1.82x | 61.6% | 55.2% |
Distribution of Remaining Terms to Maturity or ARD(1) |
| Range of Remaining Terms to Maturity or ARD | Number of Mortgage Loans | Aggregate Cut-off Date Balance | % of Initial Outstanding Pool Balance | Weighted Averages | ||||||
| Mortgage Rate | StatedRemaining Term(Mos.) | U/W NCF DSCR | Cut-off Date LTV Ratio(2)(3) | Maturity Date or ARD LTV(2)(3) | ||||||
| 58 | - | 60 | 6 | $213,653,778 | 22.2% | 4.9297% | 59 | 1.89x | 64.5% | 63.3% |
| 112 | - | 117 | 4 | $30,818,002 | 3.2% | 4.2493% | 117 | 1.67x | 58.3% | 49.5% |
| 118 | - | 120 | 52 | $716,440,367 | 74.6% | 4.6040% | 119 | 1.81x | 60.9% | 53.0% |
| Total/Weighted Average | 62 | $960,912,147 | 100.0% | 4.6650% | 105 | 1.82x | 61.6% | 55.2% | ||
Distribution of Underwritten NOI Debt Yields(1) |
| Range of Underwritten NOI Debt Yields | Number of Mortgage Loans | Aggregate Cut-off Date Balance | % of Initial Outstanding Pool Balance | Weighted Averages | ||||||
| Mortgage Rate | StatedRemaining Term(Mos.) | U/W NCF DSCR | Cut-off Date LTV Ratio(2)(3) | Maturity Date or ARD LTV(2)(3) | ||||||
| 7.1% | - | 8.9% | 23 | $290,963,657 | 30.3% | 4.7809% | 101 | 1.42x | 67.6% | 61.7% |
| 9.0% | - | 9.9% | 12 | $199,872,235 | 20.8% | 4.7444% | 119 | 1.68x | 63.3% | 57.7% |
| 10.0% | - | 12.4% | 18 | $238,886,538 | 24.9% | 4.6758% | 118 | 1.60x | 62.8% | 52.0% |
| 12.5% | - | 14.9% | 8 | $226,201,328 | 23.5% | 4.4291% | 86 | 2.70x | 51.1% | 48.5% |
| 15.0% | - | 18.4% | 1 | $4,988,391 | 0.5% | 4.9100% | 119 | 2.12x | 56.0% | 35.3% |
| Total/Weighted Average | 62 | $960,912,147 | 100.0% | 4.6650% | 105 | 1.82x | 61.6% | 55.2% | ||
Amortization Types(1) |
| Amortization Type | Number of Mortgage Loans | Aggregate Cut-off Date Balance | % of Initial Outstanding Pool Balance | Weighted Averages | ||||
| Mortgage Rate | StatedRemaining Term(Mos.) | U/W NCF DSCR | Cut-off Date LTV Ratio(2)(3) | Maturity Date or ARD LTV(2)(3) | ||||
| Amortizing Balloon | 33 | $378,778,647 | 39.4% | 4.7003% | 112 | 1.53x | 62.5% | 50.2% |
| Interest Only | 9 | $367,990,000 | 38.3% | 4.5690% | 95 | 2.29x | 57.1% | 57.1% |
| Interest Only, then Amortizing | 15 | $209,840,000 | 21.8% | 4.7632% | 112 | 1.53x | 67.7% | 60.6% |
| Interest Only, ARD | 5 | $4,303,500 | 0.4% | 4.9840% | 119 | 1.73x | 69.2% | 69.2% |
| Total/Weighted Average | 62 | $960,912,147 | 100.0% | 4.6650% | 105 | 1.82x | 61.6% | 55.2% |
Footnotes:
| (1) | With respect to the Equity Inns Portfolio Mortgage Loan, 32 Avenue of Americas Mortgage Loan, 11 Madison Avenue Mortgage Loan, Harvey Building Products Portfolio Mortgage Loan, Springfield Mall Mortgage Loan and 40 Wall Street Mortgage Loan, the LTV, DSCR, Debt Yield and Cut-off Date Balance per Bed/Room/Pad/Unit/NRA calculations include the related pari passu companion loan(s), but not any related subordinate companion loan(s). |
| (2) | With respect to the Equity Inns Portfolio Mortgage Loan, representing 8.3% of the initial outstanding pool balance, the Cut-off Date LTV and Maturity Date or ARD LTV have been calculated based on the portfolio appraised value, which attributes a premium to the aggregate value of the Equity Inns Portfolio Mortgaged Properties as a whole. For additional information, see the Footnotes to Annex A-1 in the Free Writing Prospectus. |
| (3) | With respect to 611 Cowper Mortgage Loan, representing 3.4% of the initial outstanding principal balance, the Cut-off Date LTV and Maturity Date or ARD LTV have been calculated based on the “as stabilized” value. For additional information, see the Footnotes to Annex A-1 in the Free Writing Prospectus. |
| (4) | Reflects allocated loan amount for properties securing multi-property mortgage loans. |
| (5) | Anchored retail includes anchored, single tenant and urban properties. |
| (6) | Northern California properties have a zip code greater than 93600. Southern California properties have a zip code less than or equal to 93600. |
THE INFORMATION IN THIS STRUCTURAL AND COLLATERAL TERM SHEET IS NOT COMPLETE AND MAY BE AMENDED PRIOR TO THE TIME OF SALE. THIS TERM SHEET IS NOT AN OFFER TO SELL THESE SECURITIES AND IT IS NOT A SOLICITATION OF AN OFFER TO BUY THESE SECURITIES IN ANY JURISDICTION WHERE THE OFFER OR SALE IS NOT PERMITTED.
| 17 |
COMM 2015-LC23 Mortgage Trust
|
| OVERVIEW OF MORTGAGE POOL CHARACTERISTICS |
Ten Largest Mortgage Loans |
Mortgage Loan | Mortgage Loan | City, State | Property Type | Cut-off Date Balance | % of Initial Outstanding Pool Balance | Cut-off Date Balance per Room/NRA/Unit(1) | Cut-off Date Ratio(1)(2) | U/W NCF DSCR(1) | U/W NOI Debt Yield(1) |
| Equity Inns Portfolio | LCF/GACC | Various, Various | Hospitality | $80,000,000 | 8.3% | 86,245 | 64.4% | 2.35x | 13.3% |
| 32 Avenue of the Americas | GACC | New York, NY | Office | $70,000,000 | 7.3% | 365 | 55.2% | 1.88x | 9.8% |
| 11 Madison Avenue | GACC | New York, NY | Office | $69,600,000 | 7.2% | 334 | 32.5% | 3.89x | 14.3% |
| 1209 DeKalb | LCF | Brooklyn, NY | Multifamily | $46,000,000 | 4.8% | 362,205 | 72.3% | 1.48x | 7.1% |
| Good Samaritan Medical Tower | GACC | Los Angeles, CA | Office | $42,700,000 | 4.4% | 292 | 62.8% | 1.96x | 9.7% |
| Harvey Building Products Portfolio | LCF | Various, Various | Various | $41,953,778 | 4.4% | 54 | 53.5% | 1.96x | 12.8% |
| Beach House Hilton Head | GACC | Hilton Head Island, SC | Hospitality | $40,000,000 | 4.2% | 198,020 | 72.7% | 1.58x | 11.3% |
| Whitehall Hotel | JLC | Chicago, IL | Hospitality | $35,944,447 | 3.7% | 161,912 | 53.6% | 1.51x | 11.7% |
| 611 Cowper(3) | GACC | Palo Alto, CA | Office | $32,914,514 | 3.4% | 1,097 | 55.8% | 1.60x | 10.1% |
| Springfield Mall | CCRE | Springfield Township, PA | Retail | $32,460,817 | 3.4% | 291 | 58.0% | 1.76x | 11.1% |
| Total/Weighted Average | $491,573,556 | 51.2% | 57.1% | 2.14x | 11.4% |
| (1) | With respect to the Equity Inns Portfolio Mortgage Loan, 32 Avenue of Americas Mortgage Loan, 11 Madison Avenue Mortgage Loan, Harvey Building Products Portfolio Mortgage Loan and the Springfield Mall Mortgage Loan, the LTV, DSCR, Debt Yield and Cut-off Date Balance per Room, NRA and Unit calculations include the related pari passu companion loan(s), but not any related subordinate companion loan(s). |
| (2) | With respect to the Equity Inns Portfolio Mortgage Loan, the Cut-off Date LTV Ratio has been calculated based on the portfolio appraised value, which attributes a premium to the aggregate value of the Equity Inns Portfolio properties as a whole. |
| (3) | With respect to 611 Cowper Mortgage Loan, the Cut-off Date LTV and Maturity Date or ARD LTV have been calculated based on the “as stabilized” value. For additional information, see the Footnotes to Annex A-1 in the Free Writing Prospectus. |
Pari Passu Companion Loan Summary |
| Mortgage Loan | Mortgage Loan Cut-off Date | Companion Cut-off Date | Loan Combination Cut-off Date |
Pooling & Servicing | Master Servicer | Special Servicer | Control Rights |
| Equity Inns Portfolio | $80,000,000 | $152,000,000 | $232,000,000 | COMM 2015-LC23 | Wells Fargo | LNR Partners LLC | COMM 2015-LC23 |
| 32 Avenue of the Americas | $70,000,000 | $355,000,000 | $425,000,000 | (1) | (1) | (1) | (1) |
| 11 Madison Avenue | $69,600,000 | $694,730,000 | $764,330,000(2) | MAD 2015-11MD | KeyBank National Association | KeyBank National Association | NAP |
| Harvey Building Products Portfolio | $41,953,778 | $67,925,164 | $109,878,942 | COMM 2015-LC23 | Wells Fargo | LNR Partners LLC | COMM 2015-LC23 |
| Springfield Mall | $32,460,817 | $32,460,817 | $64,921,633 | COMM 2015-LC23 | Wells Fargo | LNR Partners LLC | COMM 2015-LC23 |
| 40 Wall Street | $4,960,524 | $153,776,230 | $158,736,754 | WFCM 2015-LC22 | Wells Fargo & National Cooperative Bank | Rialto Capital Advisors and National Cooperative Bank | WFCM 2015-LC22 |
| (1) | After the 32 Avenue of the Americas Note A-1 Securitization Date, the 32 Avenue of the Americas Loan Combination will be serviced pursuant to the 32 Avenue of the Americas pooling and servicing agreement and the related intercreditor agreement. |
| (2) | The Loan Combination Cut-off Date Balance excludes three subordinate companion loans in the aggregate original amount of $310.7 million as well as two mezzanine loans in the aggregate original balance of $325.0 million. |
Existing Mezzanine Debt Summary |
| Mortgage Loan |
Mortgage Loan Cut-off Date | Mezzanine Debt Cut-off Date Balance | Trust U/W NCF DSCR | Total Debt U/W NCF DSCR | Trust Cut-off Date LTV Ratio | Total Debt Cut-off Date LTV Ratio | Trust U/W NOI Debt Yield | Total Debt U/W NOI Debt Yield | |
| 11 Madison Avenue | $69,600,000 | $325,000,000(1) | 3.89x | 1.97x(2) | 32.5% | 59.6%(2) | 14.3% | 7.8%(2) | |
| 1209 DeKalb | $46,000,000 | $8,500,000 | 1.48x | 1.08x | 72.3% | 85.7% | 7.1% | 6.0% | |
| Brentwood Retail Center | $13,290,772 | $2,000,000 | 1.29x | 1.01x | 66.5% | 76.5% | 8.2% | 7.1% | |
| (1) | Consists of two mezzanine loans, a $150,000,000 Mezzanine A Loan, which is coterminous with the Mortgage Loan, accrues interest at a fixed per annum rate equal to 4.6500% and a $175,000,000 Mezzanine B Loan, which is coterminous with the Mortgage Loan, accrues interest at a fixed per annum rate equal to 4.8500%. |
| (2) | The Total Debt U/W NCF DSCR, Total Debt Cut-off Date LTV Ratio and the Total Debt U/W NOI Debt Yield were calculated based on the total debt amount of $1.4 billion, which includes the 11 Madison Avenue Mortgage Loan and 15 seniorpari passu companion loans in the aggregate original amount $764.33 million, three subordinate companion loans in the aggregate original amount of $310.7 million and two mezzanine loans in the aggregate original amount of $325.0 million. |
Subordinate Debt Summary |
| Mortgage Loan | Mortgage Loan Cut-off Date Balance |
Pari Passu Companion | Subordinate Debt Cut-off Date Balance | Trust U/W NCF DSCR | Total Debt U/W NCF DSCR | Trust Cut-off Date LTV Ratio | Total Debt Cut-off Date LTV Ratio | Trust U/W NOI Debt Yield | Total Debt U/W NOI Debt Yield | |
| 11 Madison Avenue | $69,600,000 | $694,730,000 | $310,670,000 | 3.89x | 1.97x(1) | 32.5% | 59.6%(1) | 14.3% | 7.8%(1) | |
| (1) | The Total Debt U/W NCF DSCR, Total Debt Cut-off Date LTV Ratio and the Total Debt U/W NOI Debt Yield were calculated based on the total debt amount of $1.4 billion, which includes the 11 Madison Avenue Mortgage Loan and 15 seniorpari passu companion loans in the aggregate original amount $764.33 million, three subordinate companion loans in the aggregate original amount of $310.7 million and two mezzanine loans in the aggregate original amount of $325.0 million. |
THE INFORMATION IN THIS STRUCTURAL AND COLLATERAL TERM SHEET IS NOT COMPLETE AND MAY BE AMENDED PRIOR TO THE TIME OF SALE. THIS TERM SHEET IS NOT AN OFFER TO SELL THESE SECURITIES AND IT IS NOT A SOLICITATION OF AN OFFER TO BUY THESE SECURITIES IN ANY JURISDICTION WHERE THE OFFER OR SALE IS NOT PERMITTED.
| 18 |
(THIS PAGE INTENTIONALLY LEFT BLANK)
| 19 |
| Various | Collateral Asset Summary – Loan No. 1 Equity Inns Portfolio | Cut-off Date Balance: | $80,000,000 |
| Cut-off Date LTV: | 64.4% | ||
| U/W NCF DSCR: | 2.35x | ||
| U/W NOI Debt Yield: | 13.3% |

THE INFORMATION IN THIS STRUCTURAL AND COLLATERAL TERM SHEET IS NOT COMPLETE AND MAY BE AMENDED PRIOR TO THE TIME OF SALE. THIS TERM SHEET IS NOT AN OFFER TO SELL THESE SECURITIES AND IT IS NOT A SOLICITATION OF AN OFFER TO BUY THESE SECURITIES IN ANY JURISDICTION WHERE THE OFFER OR SALE IS NOT PERMITTED. 20 |
| Various | Collateral Asset Summary – Loan No. 1 Equity Inns Portfolio | Cut-off Date Balance: | $80,000,000 |
| Cut-off Date LTV: | 64.4% | ||
| U/W NCF DSCR: | 2.35x | ||
| U/W NOI Debt Yield: | 13.3% |
| Mortgage Loan Information | |
| Loan Seller: | LCF/GACC |
| Loan Purpose: | Refinance |
| Sponsor: | American Realty Capital Hospitality Trust, Inc. |
| Borrowers(1): | Various |
| Original Balance(2): | $80,000,000 |
| Cut-off Date Balance(2): | $80,000,000 |
| % by Initial UPB: | 8.3% |
| Interest Rate: | 4.9600% |
| Payment Date: | 6thof each month |
| First Payment Date: | November 6, 2015 |
| Maturity Date: | October 6, 2020 |
| Amortization: | Interest Only |
| Additional Debt(2): | $152,000,000Pari Passu Debt |
| Call Protection(3)(4): | L(25), YM1(31), O(4) |
| Lockbox / Cash Management: | Hard / In-Place |
| Reserves(5) | ||
| Initial | Monthly | |
| Taxes: | $890,215 | $296,738 |
| Insurance: | $0 | Springing |
| Required Repairs: | $160,928 | NAP |
| FF&E: | $0 | 1/12 of 4.0% of Annual Gross Revenue |
| PIP: | $10,000,000 | Springing |
| Financial Information(6) | ||
| Cut-off Date Balance / Room: | $86,245 | |
| Balloon Balance / Room: | $86,245 | |
| Cut-off Date LTV: | 64.4% | |
| Balloon LTV: | 64.4% | |
| Underwritten NOI DSCR: | 2.65x | |
| Underwritten NCF DSCR: | 2.35x | |
| Underwritten NOI Debt Yield: | 13.3% | |
| Underwritten NCF Debt Yield: | 11.8% | |
| Underwritten NOI Debt Yield at Balloon: | 13.3% | |
| Underwritten NCF Debt Yield at Balloon: | 11.8% | |
| Property Information | ||
| Single Asset / Portfolio: | Portfolio of 21 properties | |
| Property Type: | Various Hospitality | |
| Collateral: | Fee Simple | |
| Location: | Various | |
| Year Built / Renovated: | Various | |
| Total Rooms: | 2,690 | |
| Property Management(7): | Various | |
| Underwritten NOI: | $30,891,289 | |
| Underwritten NCF: | $27,397,249 | |
| Appraised Value(8): | $360,000,000 | |
| Appraisal Date: | August 2015 | |
| Historical NOI | ||
| Most Recent NOI: | $30,619,478 (T-12 July 31, 2015) | |
| 2014 NOI: | $30,077,135 (December 31, 2014) | |
| 2013 NOI: | $27,347,248 (December 31, 2013) | |
| 2012 NOI: | $25,736,730 (December 31, 2012) | |
| Historical Occupancy | ||
| Most Recent Occupancy: | 75.6% (July 31, 2015) | |
| 2014 Occupancy: | 74.6% (December 31, 2014) | |
| 2013 Occupancy: | 72.4% (December 31, 2013) | |
| 2012 Occupancy: | 70.0% (December 31, 2012) | |
| (1) | ARC Hospitality Portfolio II Owner, LLC; ARC Hospitality Portfolio II TRS, LLC; ARC Hospitality Portfolio II MISC TRS, LLC; ARC Hospitality Portfolio II HIL TRS, LLC; ARC Hospitality Stratford, LLC; ARC Hospitality TRS Stratford, LLC; ARC Hospitality Portfolio II NTC Owner, LP; ARC Hospitality Portfolio II NTC HIL TRS, LP; ARC Hospitality Portfolio II NTC TRS, LP |
| (2) | The Original Balance and Cut-off Date Balance of $80.0 million represent both the controlling Note A-1-A and non-controlling Note A-4-A of the $232.0 million Equity Inns Portfolio Loan Combination evidenced by nine pari passu notes. The pari passu companion loans are comprised of the non-controlling Note A-1-B, Note A-2-A, A-2-B, Note A-3, Note A-4-B, Note A-5 and Note A-6, with an aggregate original principal balance of $152.0 million. For additional information on the pari passu companion loans, see “The Loan” herein. |
| (3) | The lockout period will be at least 25 payment dates beginning with and including the first payment date of November 6, 2015. Prepayment of the full $232.0 million Equity Inns Portfolio Loan Combination is permitted on or after the date that is the earlier to occur of (i) two years after the closing date of the securitization that includes the lastpari passu note to be securitized, and (ii) December 31, 2017. The assumed lockout period of 25 payments is based on the expected COMM 2015-LC23 securitization closing date in November 2015. The actual lockout period may be longer. |
| (4) | Partial release is permitted. See “Partial Release” herein. |
| (5) | See “Initial Reserves” and “Ongoing Reserves” herein. |
| (6) | DSCR, LTV, Debt Yield, and Balance / Room calculations are based on the aggregate $232.0 million Equity Inns Portfolio Loan Combination. |
| (7) | Homewood Suites Management, LLC; Crestline Hotels & Resorts, LLC; Hampton Inns Management LLC; McKibbon Hotel Management, Inc. |
| (8) | The Appraised Value of $360.0 million reflects a premium attributed to the aggregate value of the Equity Inns Portfolio as a whole. The sum of the value of each of the properties on an individual basis is $322.4 million, which represents a Cut-off Date LTV of 72.0%. |
| Historical Occupancy, ADR, RevPAR(1) | |||||||||
| Year | Equity Inns Portfolio | Competitive Set | Penetration Factor | ||||||
| Occupancy(2) | ADR(2) | RevPAR(2) | Occupancy | ADR | RevPAR | Occupancy | ADR | RevPAR | |
| 2012 | 70.0% | $103.35 | $72.88 | 65.4% | $94.55 | $63.45 | 106.6% | 108.7% | 113.2% |
| 2013 | 72.4% | $106.32 | $77.07 | 66.1% | $98.36 | $66.68 | 109.2% | 107.7% | 115.4% |
| 2014 | 74.3% | $110.66 | $82.41 | 68.8% | $103.17 | $72.96 | 108.0% | 106.7% | 113.5% |
| T-12 Jul 2015 | 75.6% | $113.75 | $86.05 | 70.7% | $105.59 | $75.50 | 106.8% | 107.5% | 115.5% |
| (1) | Source: Hospitality Research Report. |
| (2) | The minor variances between the underwriting, the hospitality research report and the above table with respect to Occupancy, ADR and RevPAR at the Equity Inns Portfolio are attributable to variances in reporting methodologies and/or timing differences. |
THE INFORMATION IN THIS STRUCTURAL AND COLLATERAL TERM SHEET IS NOT COMPLETE AND MAY BE AMENDED PRIOR TO THE TIME OF SALE. THIS TERM SHEET IS NOT AN OFFER TO SELL THESE SECURITIES AND IT IS NOT A SOLICITATION OF AN OFFER TO BUY THESE SECURITIES IN ANY JURISDICTION WHERE THE OFFER OR SALE IS NOT PERMITTED. 21 |
| Various | Collateral Asset Summary – Loan No. 1 Equity Inns Portfolio | Cut-off Date Balance: | $80,000,000 |
| Cut-off Date LTV: | 64.4% | ||
| U/W NCF DSCR: | 2.35x | ||
| U/W NOI Debt Yield: | 13.3% |
The Loan.The Equity Inns Portfolio loan (the “Equity Inns Portfolio Loan”) consists of the controlling Note A-1-A and non-controlling Note A-4-A in the aggregate original principal amount of $80.0 million of a fixed rate loan in the aggregate principal amount of $232.0 million (the “Equity Inns Portfolio Loan Combination”). The Equity Inns Portfolio Loan Combination is secured by the applicable borrowers’ fee simple interests and operating leasehold interests in a portfolio of 21 hotel properties located across 13 states, totaling 2,690 rooms (the “Equity Inns Portfolio” or the “Equity Inns Portfolio Properties”). The Equity Inns Portfolio Loan Combination was co-originated by Ladder Capital Finance LLC (“LCF”) and German American Capital Corporation (“GACC”) and is evidenced by nine pari passu notes. Of the Equity Inns Portfolio Loan Combination, only the controlling Note A-1-A and non-controlling Note A-4-A, with an aggregate original principal balance of $80.0 million, will be included in the COMM 2015-LC23 mortgage trust. The non-controlling Note A-1-B, with an original principal balance of $12.0 million, Note A-2-A, with an original principal balance of $30.0 million, Note A-2-B, with an original principal balance of $9.6 million, and Note A-3, with an original principal balance of $39.6 million are currently held by LCF and are expected to be included in one or more future securitizations. The non-controlling Note A-4-B, with an original principal balance of $8.0 million, Note A-5, with an original principal balance of $26.4 million and Note A-6, with an original principal balance of $26.4 million are currently held by GACC and are expected to be included in one or more future securitizations.
The relationship between the holders of the Note A-1-A, Note A-1-B, Note A-2-A, Note A-2-B, Note A-3, Note A-4-A, Note A-4-B, Note A-5 and Note A-6 will be governed by a co-lender agreement as described under“Description of the Mortgage Pool – Loan Combinations – Equity Inns Portfolio”in the accompanying free writing prospectus.
| Loan Combination Summary | ||||
| Original Balance | Cut-off Date Balance | Note Holder | Controlling Piece | |
| Note A-1-A & Note A-4-A | $80,000,000 | $80,000,000 | COMM 2015-LC23 | Yes(1) |
| Note A-1-B, Note A-2-A, Note A-2-B & Note A-3 | $91,200,000 | $91,200,000 | LCF | No |
| Note A-4-B, Note A-5 & Note A-6 | $60,800,000 | $60,800,000 | GACC | No |
| Total | $232,000,000 | $232,000,000 | ||
(1) Only the $48.0 million Note A-1-A is controlling.
The Equity Inns Portfolio Loan has a five-year interest only term and accrues interest at a fixed rate equal to 4.9600% perannum. Loan proceeds were used to retire existing debt, inclusive of accrued interest and other fees, of approximately $228.8 million, fund reserves of approximately $11.1 million and pay closing costs of approximately $3.6 million. Based on the portfolio appraised value of $360.0 million the cut-off date LTV is 64.4%. The most recent prior financing of the Equity Inns Portfolio Properties was not included in a securitization.
| Sources and Uses | ||||||
| Sources | Proceeds | % of Total | Uses | Proceeds | % of Total | |
| Mortgage Loan | $232,000,000 | 95.3% | Loan Payoff | $228,749,792 | 94.0% | |
| Equity Contribution(1) | $11,371,163 | 4.7% | Reserves | $11,051,143 | 4.5% | |
| Closing Costs | $3,570,228 | 1.5% | ||||
| Total Sources | $243,371,163 | 100.0% | Total Uses | $243,371,163 | 100.0% | |
| (1) | The borrower acquired twenty of the twenty-one properties on February 27, 2015 for $346,837,695 ($135,642/Room) while also leveraging the 21st property (Homewood Suites Stratford) which the borrower acquired previously on March 21, 2014. In order to acquire the twenty properties and leverage the 21st property, the borrower used approximately $227.0 million of first mortgage debt, approximately $99.0 million of preferred equity, and approximately $38.4 million of equity. Since closing of the previous transaction, the borrower has paid down the preferred equity by approximately $23.2 million to a balance of $75.8 million, deposited $10.0 million into a PIP Reserve for such transaction, and completed the approximately $3.4 million PIP at the Homewood Suites Stratford. |
The Borrower / Sponsor.The borrower consists of six single purpose Delaware limited liability companies and three single purpose Delaware limited partnerships, each structured to be bankruptcy remote, with two independent directors in its organizational structure. The sponsor of the borrowers and non-recourse carve out guarantor is American Realty Capital Hospitality Trust, Inc.
American Realty Capital Hospitality Trust, Inc. (“ARC Hospitality”), a public non-traded real estate investment trust (“REIT”), focuses on acquiring upper midscale, upscale and upper upscale lodging properties in the select service, extended stay and small full service segments within the hospitality sector, franchised by leading global brands including Hilton, Marriott, Hyatt, IHG and Starwood Hotels & Resorts Worldwide, Inc.. The acquisition of the Equity Inns Portfolio on February 27, 2015 (and contemporaneous acquisition of 116 hotels) established ARC Hospitality as one of the largest owners of select-service hotels (by enterprise value) in the North American lodging REIT sector, with a current portfolio of approximately 122 hotels totaling 14,924 rooms.
The external advisor of ARC Hospitality is American Realty Capital Hospitality Advisors, LLC a subsidiary of AR Capital, LLC (“AR Capital”). AR Capital owns a 60% interest in Crestline Hotels & Resorts, LLC (“Crestline”), the hotel manager of twelve of the Equity Inns Portfolio Properties and a 100% interest in the Operators (as defined below) of each of the Equity Inns Portfolio Properties (and through which each of the hotel managers, including Crestline, is employed) (see Property Management section below). AR Capital also owns less than a 3.0% interest in the borrowers. In August 2015, AMH Holdings (Cayman), L.P. (“Apollo”) entered into a transaction agreement with AR Capital pursuant to which the parties agreed that Apollo will acquire a 60% stake in a new company
THE INFORMATION IN THIS STRUCTURAL AND COLLATERAL TERM SHEET IS NOT COMPLETE AND MAY BE AMENDED PRIOR TO THE TIME OF SALE. THIS TERM SHEET IS NOT AN OFFER TO SELL THESE SECURITIES AND IT IS NOT A SOLICITATION OF AN OFFER TO BUY THESE SECURITIES IN ANY JURISDICTION WHERE THE OFFER OR SALE IS NOT PERMITTED. 22 |
| Various | Collateral Asset Summary – Loan No. 1 Equity Inns Portfolio | Cut-off Date Balance: | $80,000,000 |
| Cut-off Date LTV: | 64.4% | ||
| U/W NCF DSCR: | 2.35x | ||
| U/W NOI Debt Yield: | 13.3% |
called AR Global Investments, LLC, the remaining 40% of which will be owned by AR Capital, to which AR Capital will transfer substantially all of its ongoing asset management business. Pursuant to the transaction agreement, Apollo is required to pay $200 million in cash and $178 million in stock for the stake in AR Global Investments, which will manage real estate investment trusts and other investments. There can be no assurance as to whether or not, or when, such transaction will be completed. AR Capital and certain of its principals are subject to litigation. See“Risk Factors—Risk Related to the Mortgage Loans—Prior Bankruptcies, Defaults or Other Proceedings May be Relevant to Future Performance” in the accompanying free writing prospectus.
The Properties.The Equity Inns Portfolio Loan is secured by the fee simple interests and operating leasehold interests in 21 hotel properties located across 13 states, totaling 2,690 rooms. Hotels are operated under 7 brands. A breakdown of the brands and portfolio can be found below:
| Brand Breakdown | |||||||||
| Brand | # Hotels | Rooms | % of Rooms | Allocated Loan Amount | $/Room | “As-is” Appraised Value(1) | LTV(1) | UW NCF | % UW NCF |
| Homewood Suites | 4 | 613 | 22.8% | $77,800,000 | $126,917 | $107,900,000 | 72.1% | $8,389,131 | 30.6% |
| Hampton Inn | 9 | 1,163 | 43.2% | $77,050,000 | $66,251 | $106,300,000 | 72.5% | $9,753,254 | 35.6% |
| Courtyard | 3 | 414 | 15.4% | $34,000,000 | $82,126 | $48,800,000 | 69.7% | $3,930,897 | 14.3% |
| Hilton Garden Inn | 2 | 241 | 9.0% | $18,650,000 | $77,386 | $24,700,000 | 75.5% | $2,297,055 | 8.4% |
| SpringHill Suites | 1 | 88 | 3.3% | $11,500,000 | $130,682 | $16,400,000 | 70.1% | $1,393,398 | 5.1% |
| TownePlace Suites | 1 | 93 | 3.5% | $8,500,000 | $91,398 | $12,100,000 | 70.2% | $1,028,701 | 3.8% |
| Residence Inn | 1 | 78 | 2.9% | $4,500,000 | $57,692 | $6,200,000 | 72.6% | $604,813 | 2.2% |
| Total | 21 | 2,690 | 100.0% | $232,000,000 | $86,245 | $360,000,000 | 64.4% | $27,397,249 | 100.0% |
| (1) | The Portfolio “As-Is” Appraised Value of $360.0 million reflects a premium attributed to the aggregate value of the Equity Inns Portfolio as a whole. The sum of the value of each of the properties on an individual basis is $322.4 million, which results in an LTV of 72.0%. |
| Portfolio Summary | |||||||
| Property Name | City | State | Rooms | Year | Ownership Interest | “As-is” Appraised Value(1) | Allocated Loan Amount |
| Homewood Suites Seattle | Seattle | WA | 161 | 1998 | Fee Simple | $56,700,000 | $42,100,000 |
| Homewood Suites Orlando | Orlando | FL | 252 | 1999 | Fee Simple | $26,100,000 | $18,350,000 |
| Courtyard Carlsbad | Carlsbad | CA | 145 | 2000 | Fee Simple | $21,800,000 | $14,600,000 |
| Courtyard Houston | Houston | TX | 176 | 1979 | Fee Simple | $18,200,000 | $13,500,000 |
| Homewood Suites Stratford | Stratford | CT | 135 | 2002 | Fee Simple | $18,600,000 | $12,500,000 |
| Hampton Inn Urbana | Urbana | IL | 130 | 1995 | Fee Simple | $16,800,000 | $12,400,000 |
| Springhill Suites Asheville | Asheville | NC | 88 | 2001 | Fee Simple | $16,400,000 | $11,500,000 |
| Hilton Garden Inn Louisville | Louisville | KY | 112 | 1999 | Fee Simple | $15,100,000 | $11,450,000 |
| Hampton Inn Orlando | Orlando | FL | 170 | 1999 | Fee Simple | $14,800,000 | $11,150,000 |
| Hampton Inn Austin | Austin | TX | 121 | 1985 | Fee Simple | $14,600,000 | $11,000,000 |
| Hampton Inn College Station | College Station | TX | 133 | 1986 | Fee Simple | $14,100,000 | $10,500,000 |
| Hampton Inn Indianapolis | Indianapolis | IN | 128 | 1987 | Fee Simple | $12,200,000 | $9,050,000 |
| TownePlace Suites Savannah | Savannah | GA | 93 | 2000 | Fee Simple | $12,100,000 | $8,500,000 |
| Hampton Inn East Lansing | East Lansing | MI | 86 | 2000 | Fee Simple | $10,800,000 | $8,000,000 |
| Hampton Inn Naperville | Naperville | IL | 129 | 1987 | Fee Simple | $9,800,000 | $7,300,000 |
| Hilton Garden Inn Rio Rancho | Rio Rancho | NM | 129 | 1998 | Fee Simple | $9,600,000 | $7,200,000 |
| Courtyard Dalton | Dalton | GA | 93 | 1999 | Fee Simple | $8,800,000 | $5,900,000 |
| Hampton Inn Alcoa | Alcoa | TN | 118 | 1989 | Fee Simple | $8,000,000 | $4,950,000 |
| Homewood Suites Augusta | Augusta | GA | 65 | 1997 | Fee Simple | $6,500,000 | $4,850,000 |
| Residence Inn Jacksonville(2) | Jacksonville | FL | 78 | 1999 | Fee Simple | $6,200,000 | $4,500,000 |
| Hampton Inn Milford | Milford | CT | 148 | 1986 | Fee Simple | $5,200,000 | $2,700,000 |
| Total | 2,690 | $322,400,000 | $232,000,000 | ||||
| Total w/ Portfolio Premium | $360,000,000 | ||||||
| (1) | The Portfolio “As-Is” Appraised Value of $360.0 million reflects a premium attributed to the aggregate value of the Equity Inns Portfolio as a whole. The sum of the value of each of the properties on an individual basis is $322.4 million. |
| (2) | With respect to the Residence Inn Jacksonville Property, the borrower has entered into a continuing forbearance agreement dated October 20, 2015 with the related franchisor, pursuant to which the borrower acknowledged that it was in default under its franchise agreement, and the franchisor agreed to forbear from terminating such franchise agreement provided the borrower complied with certain conditions related to the property improvement plan and the franchisor’s quality assurance program. If the borrower fails to satisfy such conditions, the franchisor will have the right to terminate the franchise agreement. See “Risk Factors—Risks Related to the Mortgage Loans—Hospitality Properties Have Special Risks” in the free writing prospectus. |
All 21 hotels in the Equity Inns Portfolio are operated under management agreements with Crestline (12 hotels), Hilton (7 hotels) or McKibbon (2 hotels). The hotels range in age from 13 to 29 years old with an average age of 20 and an average room count of 128. Approximately $56.4 million ($20,960 per room) of capital expenditures have been made since 2008 in order to update the portfolio and
THE INFORMATION IN THIS STRUCTURAL AND COLLATERAL TERM SHEET IS NOT COMPLETE AND MAY BE AMENDED PRIOR TO THE TIME OF SALE. THIS TERM SHEET IS NOT AN OFFER TO SELL THESE SECURITIES AND IT IS NOT A SOLICITATION OF AN OFFER TO BUY THESE SECURITIES IN ANY JURISDICTION WHERE THE OFFER OR SALE IS NOT PERMITTED. 23 |
| Various | Collateral Asset Summary – Loan No. 1 Equity Inns Portfolio | Cut-off Date Balance: | $80,000,000 |
| Cut-off Date LTV: | 64.4% | ||
| U/W NCF DSCR: | 2.35x | ||
| U/W NOI Debt Yield: | 13.3% |
to maintain competitiveness within each asset’s market. The borrower is required to invest approximately $45,571,108 ($17,819/Room) across 20 of the 21 hotels for Property Improvement Plans (“PIPs”) to upgrade each hotel to the most current brand standards over the next four years (through Q4 2019). The borrower deposited $10,000,000 into a PIP Reserve at origination for completion of the PIPs. Additional reserve deposits aggregating $27,500,000 are required to be made by the borrowers in eleven quarterly scheduled payments beginning in December 2015 and ending in June 2018, as described in more detail below under “Ongoing Reserves.” The borrower completed the $3.4 million ($25,185/Room) PIP at the Homewood Suites Stratford in March 2015.
| Historical Capital Expenditures(1) | ||||||
| 2008-2010 | 2011 | 2012 | 2013 | 2014 | Total | |
| Total | $34,231,898 | $5,358,103 | $5,833,847 | $3,285,312 | $7,673,988 | $56,383,148 |
| Per Room | $12,726 | $1,992 | $2,169 | $1,221 | $2,853 | $20,960 |
| (1) | Source: Borrower. |
The Equity Inns Portfolio is located across 13 states and no one state accounts for more than 18.6% of the portfolio’s total rooms or 16.7% of underwritten net cash flow. Florida represents the largest exposure to a single state, with three assets totaling 18.6% of the portfolio’s total room count and 14.1% of underwritten net cash flow. No other state accounts for more than 16.2% of total underwritten net cash flow; which is represented by the three properties in Texas. A chart demonstrating exposure to various states in the Equity Inns Portfolio can be found below.
| Regional Breakdown | |||||||||
| Region | # Hotels | Rooms | % of Rooms | Occupancy(1) | ADR(1) | RevPAR(1) | RevPAR Penetration(1) | UW NCF | % of UW NCF |
| California | 1 | 145 | 5.4% | 73.5% | $131.50 | $96.60 | 83.0% | $1,609,353 | 5.9% |
| Connecticut | 2 | 283 | 10.5% | 73.2% | $103.21 | $76.24 | 109.4% | $1,494,576 | 5.5% |
| Florida | 3 | 500 | 18.6% | 78.8% | $104.20 | $81.80 | 101.3% | $3,852,864 | 14.1% |
| Georgia | 3 | 251 | 9.3% | 80.8% | $97.21 | $78.45 | 135.0% | $2,374,046 | 8.7% |
| Illinois | 2 | 259 | 9.6% | 70.0% | $114.79 | $80.38 | 117.9% | $2,582,459 | 9.4% |
| Indiana | 1 | 128 | 4.8% | 77.9% | $101.16 | $78.82 | 121.4% | $1,127,456 | 4.1% |
| Kentucky | 1 | 112 | 4.2% | 77.1% | $120.74 | $93.11 | 121.1% | $1,440,820 | 5.3% |
| Michigan | 1 | 86 | 3.2% | 81.0% | $124.52 | $100.91 | 147.9% | $1,128,186 | 4.1% |
| North Carolina | 1 | 88 | 3.3% | 76.3% | $130.06 | $99.27 | 98.0% | $1,393,398 | 5.1% |
| New Mexico | 1 | 129 | 4.8% | 73.2% | $89.79 | $65.71 | 180.6% | $856,235 | 3.1% |
| Tennessee | 1 | 118 | 4.4% | 81.4% | $72.53 | $59.01 | 108.7% | $523,523 | 1.9% |
| Texas | 3 | 430 | 16.0% | 66.2% | $125.29 | $82.45 | 107.6% | $4,439,866 | 16.2% |
| Washington | 1 | 161 | 6.0% | 89.0% | $179.07 | $159.38 | 106.7% | $4,574,467 | 16.7% |
| Total / Wtd. Avg. | 21 | 2,690 | 100.0% | 75.6% | $113.75 | $86.05 | 115.5% | $27,397,249 | 100.0% |
| (1) | Occupancy, ADR, RevPAR and RevPAR Penetration are based on a July 2015 Hospitality Research Report. The minor variances between the underwriting, the hospitality research report and the above table with respect to Occupancy, ADR and RevPAR at the Equity Inns Portfolio are attributable to variances in reporting methodologies and/or timing differences. |
THE INFORMATION IN THIS STRUCTURAL AND COLLATERAL TERM SHEET IS NOT COMPLETE AND MAY BE AMENDED PRIOR TO THE TIME OF SALE. THIS TERM SHEET IS NOT AN OFFER TO SELL THESE SECURITIES AND IT IS NOT A SOLICITATION OF AN OFFER TO BUY THESE SECURITIES IN ANY JURISDICTION WHERE THE OFFER OR SALE IS NOT PERMITTED. 24 |
| Various | Collateral Asset Summary – Loan No. 1 Equity Inns Portfolio | Cut-off Date Balance: | $80,000,000 |
| Cut-off Date LTV: | 64.4% | ||
| U/W NCF DSCR: | 2.35x | ||
| U/W NOI Debt Yield: | 13.3% |
Additionally, other than Homewood Suites Seattle, which contributes 16.7% of the total underwritten net cash flow, no hotel contributes greater than 7.0% of the total underwritten net cash flow. The top ten assets account for 55.3% of the portfolio by room count and 66.8% of underwritten net cash flow. A breakout of the top ten Equity Inns Portfolio Properties by underwritten net cash flow is shown below.
| Top Ten Properties by UW NCF | ||||||
| Hotel Name | Rooms | % of Rooms | UW NCF | % of Total UW NCF | “As-is” Appraised Value(1) | Per Room |
| Homewood Suites Seattle | 161 | 6.0% | $4,574,467 | 16.7% | $56,700,000 | $352,174 |
| Homewood Suites Orlando | 252 | 9.4% | $1,912,755 | 7.0% | $26,100,000 | $103,571 |
| Courtyard Houston | 176 | 6.5% | $1,660,007 | 6.1% | $18,200,000 | $103,409 |
| Courtyard Carlsbad | 145 | 5.4% | $1,609,353 | 5.9% | $21,800,000 | $150,345 |
| Hampton Inn Urbana | 130 | 4.8% | $1,592,692 | 5.8% | $16,800,000 | $129,231 |
| Hilton Garden Inn Louisville | 112 | 4.2% | $1,440,820 | 5.3% | $15,100,000 | $134,821 |
| Hampton Inn College Station | 133 | 4.9% | $1,430,623 | 5.2% | $14,100,000 | $106,015 |
| Springhill Suites Asheville | 88 | 3.3% | $1,393,398 | 5.1% | $16,400,000 | $186,364 |
| Hampton Inn Austin | 121 | 4.5% | $1,349,235 | 4.9% | $14,600,000 | $120,661 |
| Hampton Inn Orlando | 170 | 6.3% | $1,335,296 | 4.9% | $14,800,000 | $87,059 |
| Subtotal | 1,488 | 55.3% | $18,298,647 | 66.8% | $214,600,000 | $144,220 |
| Remaining Hotels | 1,202 | 44.7% | $9,098,602 | 33.2% | $107,800,000 | $89,684 |
| Total | 2,690 | 100.0% | $27,397,249 | 100.0% | $322,400,000 | $119,851 |
| Total w/ Portfolio Premium | $360,000,000 | $133,829 | ||||
| (1) | The Portfolio “As-Is” Appraised Value of $360.0 million reflects a premium attributed to the aggregate value of the Equity Inns Portfolio as a whole. The sum of the value of each of the properties on an individual basis is $322.4 million. |
Environmental Matters.The Phase I environmental reports dated August 24 through August 26, 2015 recommended no further action at the Equity Inns Portfolio Properties. The Borrower is required to maintain operations and maintenance plans for asbestos-containing materials at six of the Equity Inns Portfolio Properties.
The Market. The Equity Inns Portfolio has broad exposure to the hospitality industry across the United States with properties located in 13 different states. According to the appraisals for the Equity Inns Portfolio, following the significant occupancy and RevPAR decline experienced during the last recession, demand growth in the overall U.S. hospitality industry resumed in 2010, led by select markets that had recorded growth trends in the fourth quarter of 2009. In 2010, lodging demand in the U.S. increased by 7.3% over that registered in 2009. A return of business travel and some group activity contributed to this trend. The resurgence in demand was partly fueled by the significant price discounts that were widely available in the first half of 2010. These discounting policies were largely phased out in the latter half of the year, balancing much of the early rate loss. Average rate decreased by only 0.1% in 2010 when compared to 2009.
Demand growth continued, but decelerated from 2011 through 2013, increasing at rates of 4.7%, 2.8%, and 2.0%, respectively. Average rate increased by respective rates of 3.8% and 4.2% in 2011 and 2012, followed by increases of 4.0% and 4.6%, respectively, in 2013 and 2014. In 2012, occupancy reached 61.3% (exceeding the ten-year average); moreover, occupancy gained another point in 2013, ending the year at 62.2%. The nation’s occupancy in 2014 registered an additional gain of just over two points, finishing the year at 64.4%. Average rate finished the year just over $110 in 2013, with a 4.6% gain registered in 2014; as a result, average rate ended 2014 at $115.32.
THE INFORMATION IN THIS STRUCTURAL AND COLLATERAL TERM SHEET IS NOT COMPLETE AND MAY BE AMENDED PRIOR TO THE TIME OF SALE. THIS TERM SHEET IS NOT AN OFFER TO SELL THESE SECURITIES AND IT IS NOT A SOLICITATION OF AN OFFER TO BUY THESE SECURITIES IN ANY JURISDICTION WHERE THE OFFER OR SALE IS NOT PERMITTED. 25 |
| Various | Collateral Asset Summary – Loan No. 1 Equity Inns Portfolio | Cut-off Date Balance: | $80,000,000 |
| Cut-off Date LTV: | 64.4% | ||
| U/W NCF DSCR: | 2.35x | ||
| U/W NOI Debt Yield: | 13.3% |
The appraiser identified several recent sales of hotel portfolios it considered to be comparable to the Equity Inns Portfolio which are summarized in the chart below.
| Sales Comparison(1) | ||||||
| Portfolio Name | Date of Sale | Sales Price | # of Hotels | # of Rooms | Price/Room | Buyer / Seller |
| Equity Inns Portfolio | NAP | $360,000,000(2) | 21 | 2,690 | $133,829(2) | NAP |
| Pinnacle Select Service | Jul 2015 | $203,000,000 | 15 | 1,705 | $119,062 | Blackstone Group / Pinnacle Hotel Management |
| Hyatt Hotel Portfolio 2014 | Nov 2014 | $590,000,000 | 38 | 4,950 | $119,192 | Lone Star Funds / Hyatt Hotels |
| Inland Hotel Portfolio | Nov 2014 | $1,100,000,000 | 52 | 6,976 | $157,683 | NorthStar Realty Finance / Chatham / Inland American Real Estate Trust |
| Clarion Partners Hotel Portfolio 2014 | Aug 2014 | $800,000,000 | 48 | 6,013 | $133,045 | Blackstone Group / Clarion Partners |
| Innkeepers Hotel Portfolio 2014 | Jun 2014 | $933,900,000 | 47 | 5,945 | $157,090 | NorthStar Realty Finance / Cerberus |
| (1) | Source: Appraisal. |
| (2) | Sales Price for the Equity Inns Portfolio reflects the “As-is” appraised value inclusive of the portfolio premium attributed to the aggregate value of the Equity Inns Portfolio as a whole. The sum of the value of each of the properties on an individual basis is $322.4 million. |
Cash Flow Analysis.
| Cash Flow Analysis | |||||||
| 2012 | 2013 | 2014 | T-12 7/31/2015 | U/W | U/W per Room(1) | ||
| Occupancy(2) | 70.0% | 72.4% | 74.6% | 75.6% | 75.6% | ||
| ADR(2) | $103.98 | $106.26 | $110.57 | $113.78 | $113.78 | ||
| RevPAR(2) | $72.83 | $76.97 | $82.46 | $86.00 | $86.00 | ||
| Room Revenue | $71,755,435 | $75,575,349 | $80,084,622 | $84,440,306 | $84,440,306 | $31,390 | |
| F&B Revenue | 1,452,484 | 1,475,632 | 1,498,112 | 1,491,111 | 1,491,111 | 554 | |
| Other Revenue | 1,300,394 | 1,277,394 | 1,220,137 | 1,419,603 | 1,419,603 | 528 | |
| Total Revenue | $74,508,313 | $78,328,375 | $82,802,871 | $87,351,020 | $87,351,020 | $32,472 | |
| Operating Expenses | 18,135,766 | 18,815,854 | 21,325,798 | 21,767,247 | 21,766,685 | 8,092 | |
| Undistributed Expenses | 24,497,243 | 25,990,540 | 25,273,647 | 27,445,273 | 27,445,273 | 10,203 | |
| Gross Operating Profit | $31,875,304 | $33,521,981 | $36,203,426 | $38,138,500 | $38,139,062 | $14,178 | |
| Management Fee | 1,857,069 | 1,826,486 | 1,905,426 | 2,765,568 | 2,620,531 | 974 | |
| Total Fixed Charges | 4,281,505 | 4,348,247 | 4,220,864 | 4,753,454 | 4,627,242 | 1,720 | |
| Net Operating Income | $25,736,730 | $27,347,248 | $30,077,135 | $30,619,478 | $30,891,289 | $11,484 | |
| FF&E | 3,162,953 | 3,323,030 | 3,521,489 | 3,494,041 | 3,494,041 | 1,299 | |
| Net Cash Flow | $22,573,777 | $24,024,218 | $26,555,646 | $27,125,437 | $27,397,249 | $10,185 | |
| (1) | U/W per Room is based on a total of 2,690 rooms. |
| (2) | The minor variances between the underwriting, the hospitality research report and the above table with respect to Occupancy, ADR and RevPAR at the Equity Inns Portfolio are attributable to variances in reporting methodologies and/or timing differences. |
Property Management.The Equity Inns Portfolio Properties are subject to operating agreements (“Operating Agreements”) with subsidiaries of AR Capital (the “Operators”) pursuant to which the Operators are responsible for the management of the Equity Inns Portfolio Properties. The Operators subcontract such management responsibilities under management agreements with the following four managers: Homewood Suites Management, LLC and Hampton Inns Management LLC (“Hilton”); Crestline Hotels & Resorts, LLC (“Crestline”); and McKibbon Hotel Management, Inc. (“McKibbon”; together with Hilton and Crestline, each a “Hotel Manager” and collectively the “Hotel Managers”).
| Management Company Distribution | |||||||
| Management Company | # Hotels | Rooms | % Rooms | Individual UW NCF | % of Total UW NCF | “As-is” Value(1) | Per Room |
| Crestline | 12 | 1,627 | 60.5% | $15,369,030 | 56.1% | $181,400,000 | $111,494 |
| Hilton | 7 | 882 | 32.8% | $9,606,119 | 35.1% | $112,500,000 | $127,551 |
| McKibbon | 2 | 181 | 6.7% | $2,422,099 | 8.8% | $28,500,000 | $157,459 |
| Total | 21 | 2,690 | 100.0% | $27,397,249 | 100.0% | $360,000,000 | $133,829 |
| (1) | The Portfolio “As-Is” Value of $360.0 million reflects a premium attributed to the aggregate value of the Equity Inns Portfolio as a whole. The sum of the value of each of the properties on an individual basis is $322.4 million. |
THE INFORMATION IN THIS STRUCTURAL AND COLLATERAL TERM SHEET IS NOT COMPLETE AND MAY BE AMENDED PRIOR TO THE TIME OF SALE. THIS TERM SHEET IS NOT AN OFFER TO SELL THESE SECURITIES AND IT IS NOT A SOLICITATION OF AN OFFER TO BUY THESE SECURITIES IN ANY JURISDICTION WHERE THE OFFER OR SALE IS NOT PERMITTED. 26 |
| Various | Collateral Asset Summary – Loan No. 1 Equity Inns Portfolio | Cut-off Date Balance: | $80,000,000 |
| Cut-off Date LTV: | 64.4% | ||
| U/W NCF DSCR: | 2.35x | ||
| U/W NOI Debt Yield: | 13.3% |
Lockbox / Cash Management.The Equity Inns Portfolio Loan is structured with a hard lockbox and in place cash management. All revenues are required to be deposited directly by the credit card companies and otherwise by the borrowers or managers into a lender controlled lockbox account and distributed pursuant to the terms of the loan documents, with any excess cash flow being distributed to the borrower. During the continuance of a Cash Sweep Period (as defined below), all excess cash flow is required to be swept into an excess cash flow reserve and held by the lender as additional collateral for the Equity Inns Portfolio Loan Combination. To the extent that a Cash Sweep Period is caused by occurrences of events described in clause (ii) or clause (iv) in the definition of “Cash Sweep Period” below with respect to less than all the properties, excess cash flow swept by lender is required to be capped at the sum of the allocated loan amount(s) for each such property or properties. The loan documents provide that no fees exceeding (in the aggregate) 3% of gross revenues may be paid to the Operators under the Operating Agreements or any Hotel Manager out of cash flow generated by the properties during the continuance of a Cash Sweep Period.
A “Cash Sweep Period” will commence upon (i) an event of default, (ii) an event of default by any borrower, Operator or affiliated manager under one or more management agreements, which affects five or more properties in the aggregate, (iii) the DSCR for the Equity Inns Portfolio falls below 1.75x or (iv) the delivery of one or more notices by any franchisor of any breach or default by borrower under any franchise agreement that (a) affect five or more properties in the aggregate, and (b) with the passage of time and/or delivery of notice, permits the franchisor to terminate or cancel such franchise agreement (provided, however, this will not include any notice by the franchisor solely by reason of the existence of a required PIP then being performed by a borrower at a property so long as such PIP work is being performed in accordance with the terms of the applicable franchise agreement).
A Cash Sweep Period will cease to exist with respect to clause (i) above, upon a cure of the event of default being accepted by the lender in its sole and absolute discretion; with respect to clause (ii), (a) upon the event of default having been cured to the lender’s reasonable satisfaction or (b) upon the applicable manager being replaced by the borrower in accordance with the loan documents; with respect to clause (iii) upon the DSCR being at least 1.80x for two consecutive calendar quarters, which may be achieved (x) at any time the underwritten net cash flow shall have increased to achieve such DSCR threshold, (y) prior to the prepayment lockout date, by delivery by the borrowers of a letter of credit or cash collateral, in an amount which, if applied to prepay the mortgage loan, would result in the DSCR being at least 1.80x, to be held as collateral (which may be released if the DSCR is at least 1.80x for two consecutive calendar quarters), or (z) at any time on or after the prepayment lockout date, by a prepayment of principal such that the DSCR is at least 1.80x (such payment to be accompanied by applicable yield maintenance charges); and with respect to clause (iv), upon borrowers delivering evidence reasonably satisfactory to the lender, which may include a “good standing” or similar letter from the franchisor, indicating that the franchise agreement is in full force and effect with no default thereunder.
Initial Reserves.At closing, the borrowers deposited (i) $890,215 into a tax reserve account, (ii) $160,928 into a required repairs reserve account and (iii) $10,000,000 into a PIP reserve account for property improvement plans at the Equity Inns Portfolio Properties.
Ongoing Reserves.On a monthly basis, the borrowers are required to make deposits of (i) 1/12 of the required annual taxes, which currently equates to $296,738 into a tax reserve account, (ii) 1/12 of the annual insurance premiums if, among other things, (a) an acceptable blanket policy is no longer in place, or (b) lender fails to receive evidence at least 10 days prior to the annual expiration date of any such blanket insurance program that such insurance program has been renewed, (iii) the greater of (a) 1/12 of 4% of gross revenue of the trailing 12 months ending on the last day of the most recent calendar quarter and (b) the amount required under the Franchise Agreement and Management Agreement for FF&E work and (iv) deposits into the PIP reserve account according to the PIP reserve funding schedule below:
| Date | Required Deposit |
| December 31, 2015 | $2,000,000 |
| March 31, 2016 | $3,750,000 |
| June 30, 2016 | $3,750,000 |
| September 30, 2016 | $3,000,000 |
| December 31, 2016 | $2,500,000 |
| March 31, 2017 | $2,500,000 |
| June 30, 2017 | $2,500,000 |
| September 30, 2017 | $2,500,000 |
| December 31, 2017 | $2,500,000 |
| March 31, 2018 | $1,250,000 |
| June 30, 2018 | $1,250,000 |
| Total | $27,500,000 |
Current Mezzanine or Subordinate Indebtedness.None.
Future Mezzanine or Subordinate Indebtedness Permitted. None.
THE INFORMATION IN THIS STRUCTURAL AND COLLATERAL TERM SHEET IS NOT COMPLETE AND MAY BE AMENDED PRIOR TO THE TIME OF SALE. THIS TERM SHEET IS NOT AN OFFER TO SELL THESE SECURITIES AND IT IS NOT A SOLICITATION OF AN OFFER TO BUY THESE SECURITIES IN ANY JURISDICTION WHERE THE OFFER OR SALE IS NOT PERMITTED. 27 |
| Various | Collateral Asset Summary – Loan No. 1 Equity Inns Portfolio | Cut-off Date Balance: | $80,000,000 |
| Cut-off Date LTV: | 64.4% | ||
| U/W NCF DSCR: | 2.35x | ||
| U/W NOI Debt Yield: | 13.3% |
Current Preferred Equity Holder.W2007 Equity Inns Partnership, L.P. and W2007 Equity Inns Trust (collectively, “Equity Inns PE Member”), each an affiliate of Whitehall Street Global Real Estate Limited Partnership 2007 (which is the real estate private equity unit of Goldman Sachs Group, Inc.) holds a preferred equity interest with an outstanding balance as of closing of the Equity Inns Portfolio Loan of $75,780,091 in an upper-tier affiliate of the borrowers (“Holdco”). Provided no Equity Inns PE Changeover Event (as defined below) has occurred, Equity Inns PE Member is entitled to a preferred return on its investment payable from cash flow from the Equity Inns Portfolio Properties, equal to 7.5% for the period ending August 27, 2016 and 8.0% thereafter. If an Equity Inns PE Changeover Event has occurred, Equity Inns PE Member is entitled to an increase of 5.0% above such preferred return. 50% of the Equity Inns PE Member’s original capital contributions are required to be paid to Equity Inns PE Member by February 27, 2018 and 100% of such capital contributions are required to be paid to Equity Inns PE Member by February 27, 2019. The balance of the preferred equity investment (inclusive of all returns required to be paid pursuant to the operating agreement of Holdco) is required to be redeemed in full by payment to Equity Inns PE Member of (i) all its capital contributions and (ii) Equity Inns PE Member’s required return plus (iii) any other amounts due to Equity Inns PE Member on or prior to the date that is the earlier of (x) the date of the first occurrence of an Equity Inns PE Changeover Event or (y) January 4, 2021 (the “Mandatory Equity Inns PE Redemption Date”). Upon the occurrence of certain events (each an “Equity Inns PE Changeover Event”) set forth in Holdco’s organizational documents (including Holdco’s failure to pay the monthly preferred return, the failure to repay to Equity Inns PE Member’s capital contributions as provided in Holdco’s operating agreement and the failure to redeem the preferred equity investment by the Mandatory Equity Inns PE Redemption Date), Equity Inns PE Member is entitled to take over control of Holdco and thereby control over the borrower.
In connection with the origination of the Equity Inns Portfolio Loan, the lender and Equity Inns PE Member entered into a recognition agreement. Among other things, the recognition agreement contains acknowledgements from Equity Inns PE Member that upon an event of default under the Equity Inns Portfolio Loan or upon the occurrence of a Cash Sweep Event Period under the Equity Inns Portfolio Loan, no cash from Equity Inns Portfolio Properties will be distributed to Equity Inns PE Member, until the Equity Inns Portfolio Loan has been paid in full or the distribution hold has been revoked or withdrawn by lender. The recognition agreement requires the lender to give Equity Inns PE Member copies of any default notices given to the borrower and grants Equity Inns PE Member the opportunity to cure such defaults by the borrower. The recognition agreement also provides the mechanics under which Equity Inns PE Member is permitted to exercise its remedy to take over control of Holdco (and the related remedial actions available to Equity Inns PE Member under the Holdco operating agreement), including, among other things, requiring that Whitehall Street Global Real Estate Limited Partnership 2007 and Whitehall Parallel Global Real Estate Limited Partnership 2007 satisfies financial requirements and delivers replacement guarantees and indemnities in the form attached to such recognition agreement. Such form of replacement guarantee provides that liability of the replacement guarantor for voluntary bankruptcy and related carveouts will be capped at an amount equal to the original principal balance of the mortgage loan plus accrued and unpaid interest times 0.20. See “Description of the Mortgage Pool—Certain Terms and Conditions of the Mortgage Loans—Other Financing” in the accompanying free writing prospectus.
Partial Release.From and after the prepayment lockout date, the lender is required to release an individual property or properties from the collateral in connection with a third-party, arms-length sale of such property(ies) (or to an affiliate with respect to up to 2 properties at which hotel operations have ceased and are no longer commercially viable) subject to, among other things, the following conditions: (i) no event of default has occurred or would occur as a result of the release, (ii) the remaining collateral has an LTV no greater than the lesser of (a) 64.4% and (b) the LTV in place immediately prior to the release, (iii) the remaining collateral has a Debt Service Coverage Ratio no less than the greater of (a) 2.35x and (b) the Debt Service Coverage Ratio in place immediately prior to the release, (iv) payment of a Release Price (as defined below) and any yield maintenance premium associated with the payment of the Release Price, (v) satisfaction of customary REMIC requirements, (vi) payment of all interest which would have accrued on the portion of the outstanding principal balance being prepaid through, but not including, the next occurring monthly payment date and (vii) payment of all other costs and expenses of lender in connection with the release, provided the LTV and Debt Service Coverage Ratio tests may be satisfied with an additional prepayment of principal (with yield maintenance). The “Release Price” shall equal the greater of (x) 115% of the loan amount allocated to the subject property(ies) and (y) 100% of the net sales proceeds of the subject property(ies) after deducting the costs of closing the sale, which costs are required to be capped for purposes of determining the Release Price at six percent of gross sales proceeds.
If, as a result of a casualty or condemnation, the application of net proceeds or awards in connection therewith in respect of any particular property results in a reduction of the outstanding principal balance of the Equity Inns Portfolio Loan in an amount greater than 60% of the allocated loan amount of such affected property, then, the borrower may obtain a release of such property in accordance with the terms of the preceding paragraph provided that in lieu of the Release Price and any other required payments, the borrower pays to the lender the sum of (i) the difference, if any, between 115% of the allocated loan amount in respect of such affected property and the net proceeds previously applied, plus (ii) all interest which would have accrued through, but not including, the next occurring payment date. No yield maintenance or other prepayment premium or penalty is due in connection with a prepayment made to release a property after such casualty or condemnation.
Substitution.None.
THE INFORMATION IN THIS STRUCTURAL AND COLLATERAL TERM SHEET IS NOT COMPLETE AND MAY BE AMENDED PRIOR TO THE TIME OF SALE. THIS TERM SHEET IS NOT AN OFFER TO SELL THESE SECURITIES AND IT IS NOT A SOLICITATION OF AN OFFER TO BUY THESE SECURITIES IN ANY JURISDICTION WHERE THE OFFER OR SALE IS NOT PERMITTED. 28 |
| Various | Collateral Asset Summary – Loan No. 1 Equity Inns Portfolio | Cut-off Date Balance: | $80,000,000 |
| Cut-off Date LTV: | 64.4% | ||
| U/W NCF DSCR: | 2.35x | ||
| U/W NOI Debt Yield: | 13.3% |
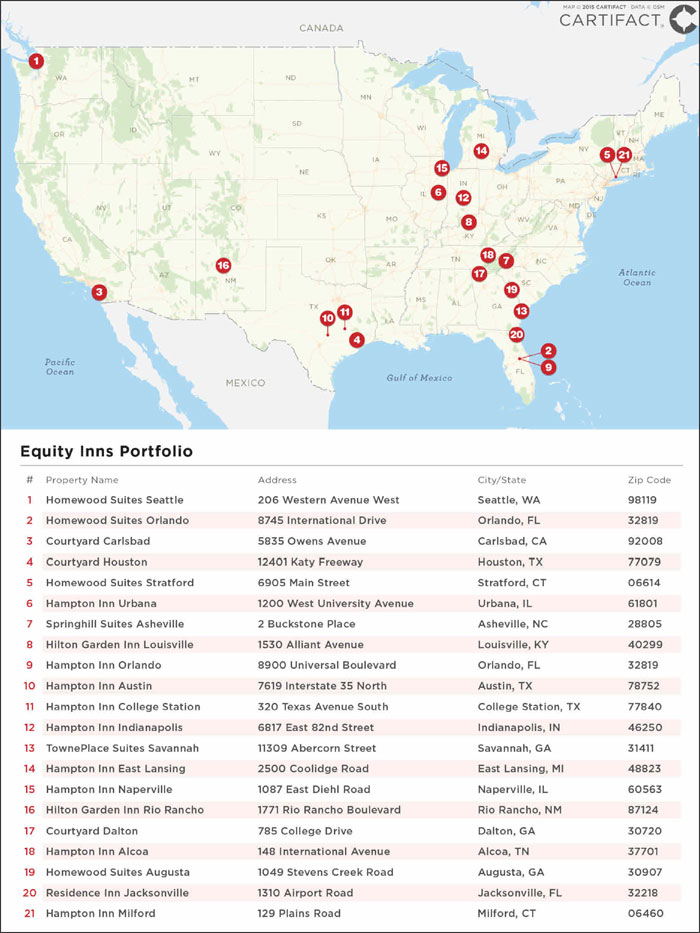
THE INFORMATION IN THIS STRUCTURAL AND COLLATERAL TERM SHEET IS NOT COMPLETE AND MAY BE AMENDED PRIOR TO THE TIME OF SALE. THIS TERM SHEET IS NOT AN OFFER TO SELL THESE SECURITIES AND IT IS NOT A SOLICITATION OF AN OFFER TO BUY THESE SECURITIES IN ANY JURISDICTION WHERE THE OFFER OR SALE IS NOT PERMITTED. 29 |
32 Avenue of the Americas New York, NY 10013 | Collateral Asset Summary – Loan No. 2 32 Avenue of the Americas | Cut-off Date Balance: Cut-off Date LTV: U/W NCF DSCR: U/W NOI Debt Yield: | $70,000,000 55.2% 1.88x 9.8% |
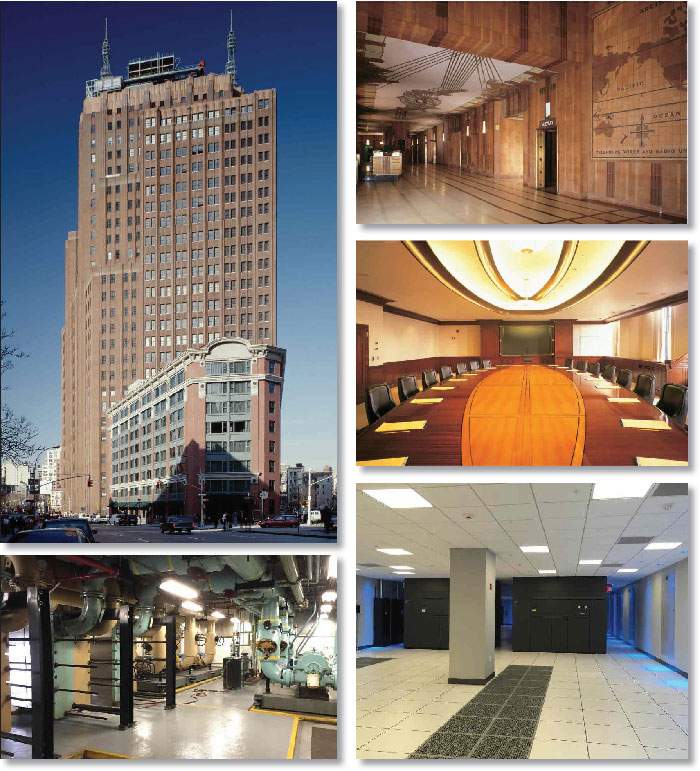
THE INFORMATION IN THIS STRUCTURAL AND COLLATERAL TERM SHEET IS NOT COMPLETE AND MAY BE AMENDED PRIOR TO THE TIME OF SALE. THIS TERM SHEET IS NOT AN OFFER TO SELL THESE SECURITIES AND IT IS NOT A SOLICITATION OF AN OFFER TO BUY THESE SECURITIES IN ANY JURISDICTION WHERE THE OFFER OR SALE IS NOT PERMITTED. |
32 Avenue of the Americas New York, NY 10013 | Collateral Asset Summary – Loan No. 2 32 Avenue of the Americas | Cut-off Date Balance: Cut-off Date LTV: U/W NCF DSCR: U/W NOI Debt Yield: | $70,000,000 55.2% 1.88x 9.8% |
| Mortgage Loan Information | |
| Loan Seller: | GACC |
| Loan Purpose: | Refinance |
| Sponsor: | Jack Rudin, William C. Rudin, Eric C. Rudin and Beth Rudin DeWoody |
| Borrower: | 32 Sixth Avenue Company LLC |
| Original Balance(1): | $70,000,000 |
| Cut-off Date Balance(1): | $70,000,000 |
| % by Initial UPB: | 7.3% |
| Interest Rate: | 4.8320% |
| Payment Date: | 1stof each month |
| First Payment Date: | December 1, 2015 |
| Maturity Date: | November 1, 2025 |
| Amortization: | Interest Only |
| Additional Debt(1)(2): | $355,000,000Pari Passu Debt; Future Mezzanine Debt Permitted |
| Call Protection: | L(25), YM1(90), O(5) |
| Lockbox / Cash Management: | Hard / Springing |
| Reserves(3) | ||
| Initial | Monthly | |
| Taxes: | $0 | Springing |
| Insurance: | $0 | Springing |
| Replacement: | $0 | Springing |
| TI/LC: | $3,908,742 | Springing |
| Free Rent: | $1,796,381 | $0 |
| Financial Information(4) | ||
| Cut-off Date Balance / Sq. Ft.: | $365 | |
| Balloon Balance / Sq. Ft.: | $365 | |
| Cut-off Date LTV: | 55.2% | |
| Balloon LTV: | 55.2% | |
| Underwritten NOI DSCR: | 2.00x | |
| Underwritten NCF DSCR: | 1.88x | |
| Underwritten NOI Debt Yield: | 9.8% | |
| Underwritten NCF Debt Yield: | 9.2% | |
| Underwritten NOI Debt Yield at Balloon: | 9.8% | |
| Underwritten NCF Debt Yield at Balloon: | 9.2% | |
| Property Information | |
| Single Asset / Portfolio: | Single Asset |
| Property Type: | CBD Office |
| Collateral: | Fee Simple |
| Location: | New York, NY |
| Year Built / Renovated: | 1932 / 1999 |
| Total Sq. Ft.: | 1,163,051 |
| Property Management: | Rudin Management Co. Inc. |
| Underwritten NOI: | $41,740,653 |
| Underwritten NCF: | $39,233,948 |
| Appraised Value: | $770,000,000 |
| Appraisal Date: | August 4, 2015 |
| Historical NOI | |
| Most Recent NOI: | $40,604,965 (T-12 June 30, 2015) |
| 2014 NOI: | $39,628,360 (December 31, 2014) |
| 2013 NOI(5): | $42,424,058 (December 31, 2013) |
| 2012 NOI: | $38,188,911 (December 31, 2012) |
| Historical Occupancy | |
| Most Recent Occupancy: | 99.6% (August 12, 2015) |
| 2014 Occupancy: | 99.2% (December 31, 2014) |
| 2013 Occupancy: | 98.7% (December 31, 2013) |
| 2012 Occupancy: | 98.7% (December 31, 2012) |
| (1) | The 32 Avenue of the Americas Loan Combination is evidenced by fivepari passu notes in the aggregate original principal amount of $425.0 million. The non-controlling Note A-4, with an original principal balance of $70.0 million, will be included in the COMM 2015-LC23 mortgage trust. The controlling Note A-1, non-controlling Note A-2, non-controlling Note A-3 and non-controlling Note A-5 with an aggregate original principal balance of $355.0 million, arepari passu companion loans and will not be included in the trust and are expected to be held by JPM or an affiliate and GACC or an affiliate or a securitization transaction as to which JPM or GACC is a loan seller. For additional information on thepari passu companion loans, see “The Loan” herein. |
| (2) | See “Future Mezzanine or Subordinate Indebtedness Permitted” herein. |
| (3) | See “Initial Reserves” and “Ongoing Reserves” herein. |
| (4) | DSCR, LTV, Debt Yield and Balance / Sq. Ft. calculations are based on the aggregate 32 Avenue of the Americas Loan Combination. |
| (5) | The increase in 2013 NOI is attributed to approximately $3.5 million in lease termination fees. |
THE INFORMATION IN THIS STRUCTURAL AND COLLATERAL TERM SHEET IS NOT COMPLETE AND MAY BE AMENDED PRIOR TO THE TIME OF SALE. THIS TERM SHEET IS NOT AN OFFER TO SELL THESE SECURITIES AND IT IS NOT A SOLICITATION OF AN OFFER TO BUY THESE SECURITIES IN ANY JURISDICTION WHERE THE OFFER OR SALE IS NOT PERMITTED. |
32 Avenue of the Americas New York, NY 10013 | Collateral Asset Summary – Loan No. 2 32 Avenue of the Americas | Cut-off Date Balance: Cut-off Date LTV: U/W NCF DSCR: U/W NOI Debt Yield: | $70,000,000 55.2% 1.88x 9.8% |
| Tenant Summary | ||||||||
Tenant | Ratings | Net Rentable | % of Net |
| U/W Base | % of Total | Lease | |
| Office Tenants | ||||||||
| AMFM Operating, Inc. | NR/NR/CCC+ | 169,304 | 14.6% | $40.07 | 11.3% | 9/30/2022 | ||
| Dentsu Holdings USA, Inc.(2) | NR/NR/NR | 168,891 | 14.5% | $39.23 | 11.0% | Various(3) | ||
| University of Cambridge(2) | NR/Aaa/NR | 64,256 | 5.5% | $36.16 | 3.9% | 1/31/2022 | ||
| Subtotal / Wtd. Avg. | 402,451 | 34.6% | $39.10 | 6.2% | ||||
| Remaining Office Space | 185,936 | 16.0% | $36.11 | 11.2% | ||||
| Total / Wtd. Avg. Office Space | 588,387 | 50.6% | $38.15 | 37.4% | ||||
| Data Center Tenants | ||||||||
| CenturyLink Communications, LLC(2)(4) | BB+/Ba2/BB | 165,034 | 14.2% | $53.97 | 14.8% | 8/31/2020 | ||
| Telx(5) | BBB/Baa2/BBB | 51,915 | 4.5% | $70.54 | 6.1% | 7/31/2033 | ||
| Telx Meet Me Room | BBB/Baa2/BBB | 27,328 | 2.3% | $256.88 | 11.7% | 7/31/2033 | ||
| MCI Communications Services, Inc | NR/NR/NR | 58,775 | 5.1% | $55.25 | 5.4% | 9/30/2025 | ||
| Subtotal / Wtd. Avg. | 303,052 | 26.1% | $75.35 | 38.1% | ||||
| Remaining Data Center Space | 264,288 | 22.7% | $54.76 | 24.1% | ||||
| Total / Wtd. Avg. Data Center Space | 567,340 | 48.8% | $65.76 | 62.2% | ||||
| Starbucks | 2,900 | 0.2% | $43.79 | 0.2% | ||||
| Other(6) | 0 | 0.0% | NAP | 0.2% | ||||
| Total / Wtd. Avg. Occupied | 1,158,627 | 99.6% | $51.79 | 100.0% | ||||
| Vacant | 4,424 | 0.4% | ||||||
| Total / Wtd. Avg. | 1,163,051 | 100.0% | ||||||
| (1) | Certain ratings are those of the parent company whether or not the parent company guarantees the lease. |
| (2) | In addition to the 168,891 sq. ft. leased by Dentsu Holdings USA, Inc., the tenant is also subleasing approximately 44,514 sq. ft. from Centurylink Communications, LLC through August 2020. Dentsu Holdings USA, Inc. has also agreed to sub-lease the full 64,256 sq. ft. University of Cambridge space effective January 1, 2016 which will bring its total leased space to 277,661 sq. ft., or 23.9% of NRA. |
| (3) | Dentsu Holdings USA, Inc. has leases for 99,184 sq. ft. that expire in September 2021, 32,862 sq. ft. that expire in December 2023 and 36,845 sq. ft. that expire in August 2025. |
| (4) | Of the 165,034 sq. ft. leased at the 32 Avenue of the Americas Property, the 44,514 sq. ft. space on the 16th floor is subleased to Dentsu Holdings USA, Inc. through the end of the lease term in August 2020. |
| (5) | Telx has three additional sub-leased spaces totaling 60,759 sq. ft. effective May 2016 that are not included as part of the Telx space in the above chart. In addition, a free rent reserve was established in the amount of $1,577,928 for free rent from May 2016 to October 2016. |
| (6) | Other includes rent received from the use of cooling towers, generators, and antennas and consists of $122,352 in U/W Base Rent. |
THE INFORMATION IN THIS STRUCTURAL AND COLLATERAL TERM SHEET IS NOT COMPLETE AND MAY BE AMENDED PRIOR TO THE TIME OF SALE. THIS TERM SHEET IS NOT AN OFFER TO SELL THESE SECURITIES AND IT IS NOT A SOLICITATION OF AN OFFER TO BUY THESE SECURITIES IN ANY JURISDICTION WHERE THE OFFER OR SALE IS NOT PERMITTED. |
32 Avenue of the Americas New York, NY 10013 | Collateral Asset Summary – Loan No. 2 32 Avenue of the Americas | Cut-off Date Balance: Cut-off Date LTV: U/W NCF DSCR: U/W NOI Debt Yield: | $70,000,000 55.2% 1.88x 9.8% |
| Lease Rollover Schedule(1) | ||||||||
| Year | # of Leases Expiring | Total Expiring Sq. Ft. | % of Total Sq. Ft. Expiring | Cumulative Sq. Ft. Expiring | Cumulative % of Sq. Ft. Expiring | Annual U/W PSF | % U/W Rolling | Cumulative % of U/W Base Rent |
| MTM | 1 | 600 | 0.1% | 600 | 0.1% | $10.00 | 0.0% | 0.0% |
| 2015 | 3 | 1,340 | 0.1% | 1,940 | 0.2% | $35.89 | 0.1% | 0.1% |
| 2016 | 5 | 18,324 | 1.6% | 20,264 | 1.7% | $32.10 | 1.0% | 1.1% |
| 2017 | 5 | 16,695 | 1.4% | 36,959 | 3.2% | $33.18 | 0.9% | 2.0% |
| 2018 | 7 | 42,182 | 3.6% | 79,141 | 6.8% | $42.98 | 3.0% | 5.0% |
| 2019 | 2 | 13,589 | 1.2% | 92,730 | 8.0% | $33.07 | 0.7% | 5.8% |
| 2020 | 8 | 168,534 | 14.5% | 261,264 | 22.5% | $53.63 | 15.1% | 20.8% |
| 2021 | 6 | 151,254 | 13.0% | 412,518 | 35.5% | $33.04 | 8.3% | 29.2% |
| 2022 | 26 | 313,378 | 26.9% | 725,896 | 62.4% | $39.23 | 20.5% | 49.6% |
| 2023 | 8 | 114,719 | 9.9% | 840,615 | 72.3% | $54.92 | 10.5% | 60.1% |
| 2024 | 0 | 0 | 0.0% | 840,615 | 72.3% | $0.00 | 0.0% | 60.1% |
| 2025 | 11 | 129,017 | 11.1% | 969,632 | 83.4% | $55.57 | 11.9% | 72.1% |
| Thereafter | 13 | 188,995 | 16.2% | 1,158,627 | 99.6% | $88.60 | 27.9% | 100.0% |
| Vacant | 0 | 4,424 | 0.4% | 1,163,051 | 100.0% | NAP | NAP | |
| Total / Wtd. Avg. | 95 | 1,163,051 | 100.0% | $51.79 | 100.0% | |||
| (1) | Certain tenants have lease termination options that may become exercisable prior to the originally stated expiration date of the tenant lease that are not considered in the lease rollover schedule. |
The Loan. The 32 Avenue of the Americas loan (the “32 Avenue of the Americas Loan”) is a fixed rate loan secured by the borrower’s fee simple interests in a 27-story Class A office and data center building consisting of 1,163,051 sq. ft. and located at 32 Avenue of the Americas in New York, New York (the “32 Avenue of the Americas Property”). The 32 Avenue of the Americas Loan is evidenced by the non-controlling Note A-4, with an original principal balance of $70.0 million, which will be included in the COMM 2015-LC23 Mortgage Trust. The controlling Note A-1, the non-controlling Note A-2, the non-controlling Note A-3 and the non-controlling Note A-5 arepari passu companion loans (together with the 32 Avenue of the Americas Loan, the “32 Avenue of the Americas Loan Combination”), with an aggregate original principal balance of $425.0 million, are expected to be held by GACC, or an affiliate, and JPM, or an affiliate, or by a securitization transaction as to which GACC or JPM is a loan seller.
The relationship between the holders of the 32 Avenue of the Americas Loan Combination will be governed by a co-lender agreement as described under“Description of the Mortgage Pool – Loan Combinations – The 32 Avenue of the Americas Loan Combination” in the accompanying Free Writing Prospectus.
| Mortgage Loan Combination Note Summary | |||||
| Note | Original Balance | Cut-off Date Balance | Note Holder | Controlling Piece | |
| Note A-4 | $70,000,000 | $70,000,000 | COMM 2015-LC23 | No | |
| Note A-1 | $125,000,000 | $125,000,000 | JPM | Yes | |
| Note A-2 | $100,000,000 | $100,000,000 | JPM | No | |
| Note A-3 | $72,500,000 | $72,500,000 | JPM | No | |
| Note A-5 | $57,500,000 | $57,500,000 | GACC | No | |
| Total | $425,000,000 | $425,000,000 | |||
The 32 Avenue of the Americas Loan Combination has a 10-year term and pays interest only for the term of the loan. The 32 Avenue of the Americas Loan Combination accrues interest at a fixed rate equal to 4.8320% and has a cut-off date balance of $425.0 million. Loan proceeds were used to refinance previous debt of approximately $371.6 million, fund upfront reserves of approximately $5.7 million, pay approximately $3.4 million in closing costs and return approximately $44.3 million to the borrower. Based on the appraised value of $770.0 million as of August 4, 2015, the cut-off date LTV is 55.2%. The most recent prior financing of the 32 Avenue of the Americas Property was included in the BSCMS 2007-PWR17 transaction.
THE INFORMATION IN THIS STRUCTURAL AND COLLATERAL TERM SHEET IS NOT COMPLETE AND MAY BE AMENDED PRIOR TO THE TIME OF SALE. THIS TERM SHEET IS NOT AN OFFER TO SELL THESE SECURITIES AND IT IS NOT A SOLICITATION OF AN OFFER TO BUY THESE SECURITIES IN ANY JURISDICTION WHERE THE OFFER OR SALE IS NOT PERMITTED. |
32 Avenue of the Americas New York, NY 10013 | Collateral Asset Summary – Loan No. 2 32 Avenue of the Americas | Cut-off Date Balance: Cut-off Date LTV: U/W NCF DSCR: U/W NOI Debt Yield: | $70,000,000 55.2% 1.88x 9.8% |
| Sources and Uses | ||||||
| Sources | Proceeds | % of Total | Uses | Proceeds | % of Total | |
| Mortgage Loan | $425,000,000 | 100.0% | Loan Payoff(1) | $371,570,253 | 87.4% | |
| Upfront Reserves | $5,705,123 | 1.3% | ||||
| Closing Costs | $3,387,104 | 0.8% | ||||
| Return of Equity | $44,337,521 | 10.4% | ||||
| Total Sources | $425,000,000 | 100.0% | Total Uses | $425,000,000 | 100.0% | |
| (1) | Includes a prepayment penalty of approximately $41.3 million. |
The Borrower / Sponsor. The borrower, 32 Sixth Avenue Company LLC, is a single purpose Delaware limited liability company structured to be bankruptcy-remote with two independent directors in its organizational structure. The sponsors of the borrower are Jack Rudin, William C. Rudin, Eric C. Rudin and Beth Rudin DeWoody, the managing members of the Rudin Management Co. Inc. There is no separate non-recourse carveout guarantor or environmental indemnitor for the 32 Avenue of the Americas Loan Combination.
Jack Rudin, William C. Rudin, Eric C. Rudin and Beth Rudin DeWoody are the managing members of the Rudin Management Co. Inc., which owns and manages one of the largest privately owned commercial and residential property portfolios in New York. The company was founded in the early 1920’s and is based in New York, New York. The firm owns and manages 16 office buildings containing approximately 15.0 million sq. ft. and 20 apartment buildings comprising over 5.0 million sq. ft. Office properties owned by the Rudin family include 3 Times Square, 345 Park Avenue, 355 Lexington Avenue, 415 Madison Avenue, 40 East 52nd Street, 560 Lexington Avenue, 845 Third Avenue, 16785 Broadway and 641 Lexington Avenue in Midtown Manhattan and 80 Pine Street, 55 Broad Street, One Whitehall Street, One Battery Park Plaza and 110 Wall Street in Downtown Manhattan.
The Property.The 32 Avenue of the Americas Property is a 27-story, 1,163,051 sq. ft., Class A office and data center located in Manhattan’s TriBeCa neighborhood. The 32 Avenue of the Americas Property was built in 1932 and was known as the AT&T Long Lines Building. In 1956, the first transatlantic telephone call via cable was switched through the 32 Avenue of the Americas Property, which connected Europe with the North American long distance network, linking New York with 360 cities in the United States and Canada via wire for the first time in history. In 1989, the New York City Landmarks Preservation Commission designated the 32 Avenue of the Americas Property as a historic landmark. Access to the 32 Avenue of the Americas Property is provided with an in-building subway entrance to the A, C and E lines which provide access to Manhattan’s West Side, Queens, Brooklyn and the Bronx. Penn Station is three stops from the 32 Avenue of the Americas Property via an express train. Within two blocks are the 6, N and Q subway lines. Buses run east/west on Canal Street and north on Hudson Street. The 32 Avenue of the Americas Property is located one block from the entrance to the Holland Tunnel, which provides access to New Jersey and New York’s outer boroughs, and is in close proximity to both the West Side Highway and Manhattan Bridge.
As of August 12 2015, the 32 Avenue of the Americas Property was 99.6% occupied by 28 office, data center, and telecommunications tenants. The occupied space consists of approximately 50.8% office space and approximately 49.0% data center space and a retail space leased by Starbucks. From 2007 to 2014, average annual occupancy at the 32 Avenue of the Americas Property has been 97.3% and has not fallen below 93.1%.
In 1999, Rudin Management Co. Inc. purchased the 32 Avenue of the Americas Property, with the intention of continuing the building’s legacy as a telecommunications center and has since invested approximately $100.0 million ($86 PSF) in renovations to the building. Renovations included restoration projects and installation of new infrastructure to host wireless technology. The 32 Avenue of the Americas Property infrastructure has heavy floor loads, expansive electrical capacity and connections to the fiber optic network which benefit telecommunications tenants. The building is also equipped with its own power generating station in the basement, making it suitable for technology companies. The approximately 28,000 sq. ft. connection center, known as “The HUB”, is located on the 24th floor and includes data storage services and a “Meet-Me-Room” that can physically connect different companies’ networks. The Meet-Me-Room is currently operated by Telx, which signed a 20-year lease for the space in 2013. According to Telx, its operations at the 32 Avenue of the Americas Property provide access to over 400 carriers, ISPs, and enterprise networks, making it one of the most connected buildings in the United States.
Environmental Matters.The Phase I environmental report dated August 4, 2015 recommended the continued implementation of an asbestos operations and maintenance plan at the 32 Avenue of the Americas Property, which is currently in place.
Major Tenants.
AMFM Operating, Inc. (Office tenant; 169,304 sq. ft.; 14.6% of NRA; 11.3% of U/W Base Rent; CCC+ by S&P)AMFM Operating, Inc. (dba iHeartMedia Inc.) owns and operates radio stations throughout the United States. The company also sells national spot advertising time for clients in the radio and television industries. Since March of 2004, AMFM Operating, Inc. has operated as a subsidiary of iHeartMedia, Inc. iHeartMedia, Inc. is a leading media company that delivers music, news, talk, sports and other content
THE INFORMATION IN THIS STRUCTURAL AND COLLATERAL TERM SHEET IS NOT COMPLETE AND MAY BE AMENDED PRIOR TO THE TIME OF SALE. THIS TERM SHEET IS NOT AN OFFER TO SELL THESE SECURITIES AND IT IS NOT A SOLICITATION OF AN OFFER TO BUY THESE SECURITIES IN ANY JURISDICTION WHERE THE OFFER OR SALE IS NOT PERMITTED. |
32 Avenue of the Americas New York, NY 10013 | Collateral Asset Summary – Loan No. 2 32 Avenue of the Americas | Cut-off Date Balance: Cut-off Date LTV: U/W NCF DSCR: U/W NOI Debt Yield: | $70,000,000 55.2% 1.88x 9.8% |
to diverse audiences across multiple platforms. iHeartMedia is the nation’s largest owner of radio stations with over 850 full-power AM & FM radio stations in the US.
AMFM Operating, Inc. has been at the 32 Avenue of the Americas Property since 2007 and has one five-year renewal option. The tenant does not have any termination options.
Dentsu Holdings USA, Inc. (Office tenant; 168,891 sq. ft.; 14.5% of NRA; 11.0% of U/W Base Rent) Dentsu Holdings USA, Inc. operates as a subsidiary of Dentsu Inc., an international advertising and public relations company based in Japan. Dentsu Inc. offers a range of services, from traditional and creative marketing to more specialized areas such as sports marketing, feature film production and broadcasting rights, public relations, digital contents, and a growing range of communication services. Dentsu Inc. is the largest Japanese advertising company in terms of net sales and the No. 1 advertising company in the domestic market. Dentsu Holdings USA, Inc. was founded in 1983 and is headquartered at the 32 Avenue of the Americas Property.
Dentsu Holdings USA, Inc. does not have any termination or renewal options. In addition to the 168,891 sq. ft. leased by Dentsu Holdings USA, Inc., the tenant is also subleasing approximately 44,514 sq. ft. from Centurylink Communications, LLC through August 2020. Dentsu Holdings USA, Inc. has also agreed to sub-lease the 64,256 sq. ft. University of Cambridge space effective January 1, 2016 through January 2022, which will bring its total leased space to 277,661 sq. ft., or 23.9% of NRA. University of Cambridge has a lease on this space through January 2022 and does not have any termination options.
CenturyLink Communications, LLC (Data Center tenant; 165,034 sq. ft.; 14.2% of NRA; 14.8% of U/W Base Rent; BB+/Ba2/BB by Fitch/Moody’s/S&P)CenturyLink Communications, LLC is a subsidiary of CenturyLink Corporate (NYSE: CTL), a global communications, hosting, cloud and IT services company. CenturyLink Corporate offers network and data systems management, Big Data analytics and IT consulting, and operates over 55 data centers in North America, Europe and Asia. The company is the third-largest telecommunications company in the United States in terms of lines served, behind AT&T and Verizon.
CenturyLink Communication, LLC has been at the 32 Avenue of the Americas Property since 2000 and has one five-year renewal option. The tenant does not have any termination options. Of the 165,034 sq. ft. leased at the 32 Avenue of the Americas Property, the 44,514 sq. ft. space on the 16th floor is subleased to Dentsu Holdings USA, Inc. through the end of the lease term in August 2020.
Telx (Data Center tenant; 79,243 sq. ft.; 6.8% of NRA; 17.8% of U/W Base Rent; BBB/Baa2/BBB by Fitch/Moody’s/S&P)Telx is a provider of interconnection and data center services headquartered at 1 State Street in New York, New York. Founded in 2000, Telx serves a broad range of industries from 20 datacenters located across 13 US markets, including three facilities in the New York metropolitan area.
In October 2015, Digital Realty (BBB/Baa2/BBB by Fitch/Moody’s/S&P), one of the leading data center operators and developers, acquired Telx in a transaction valued at approximately $1.9 billion. Digital Realty Trust is a publicly traded Real Estate Investment Trust on the New York Stock Exchange (NYSE: DLR).
Telx exclusively manages and operates the approximately 28,000 square foot HUB, which includes the 32 Avenue of the Americas Property’s signature “Meet-Me-Room” room that aggregates voice, data and wireless service providers in a single space. Telx has agreed to sublease an additional 60,759 sq. ft. from Tata effective May 1, 2016 through July 2033, which will bring its leased space to 140,002 sq. ft., or 12.0% of NRA. A free rent reserve was established for the Telx space in the amount of $1,577,928 for free rent from May 2016 to October 2016. Telx has one five-year renewal option and does not have any termination options.
The Market.The 32 Avenue of the Americas Property is located within the City Hall sub district of Downtown Manhattan in the neighborhood of TriBeCa. The district is serviced by the A, C, E, 1, 2, and 3 subway trains, which also provide access to Manhattan’s West Side, Queens, Brooklyn and the Bronx. There is also transportation linkage to New Jersey via the Holland Tunnel, which is located 0.5 mile north of the 32 Avenue of the Americas Property. The local area is composed predominantly of multi-story warehouse and industrial loft buildings that have generally been converted to commercial and residential uses.
Data Center Market.New York City benefits from numerous connections with the rest of the country; in addition, there are more than 10 undersea cables with landings near New York City that connect it with international destinations, especially in Europe. The New York data center market includes 124 active data centers and 59 data center providers which supply the region with about 500 megawatts of power dispersed throughout 3.7 million sq. ft. of data center space. The New York metro area multi-tenant data center market is considered to be composed of Manhattan, Brooklyn, Long Island/northern NJ, Jersey City, and adjacent townships. There are connectivity hubs at New York carrier hotels including 111 8th Avenue, 60 Hudson Street, and the 32 Avenue of the Americas Property. Other supporting submarkets include the small and medium sized regional businesses as well as high-frequency/low-latency trading market. Another key feature in this market is the exchanges between trading centers given the city’s role in financial services.
The most recent data space leases at the 32 Avenue of the Americas Property were signed by Telx for 60,579 sq. ft. beginning in May 2016. Telx signed leases for an average rate of $59.52 PSF, which is a 19.9% increase over the average in-place rent of $49.65 PSF for the remaining data tenants (excluding the Meet-Me-Room space, which is leased for $220.67 PSF). Moreover, leases signed by
THE INFORMATION IN THIS STRUCTURAL AND COLLATERAL TERM SHEET IS NOT COMPLETE AND MAY BE AMENDED PRIOR TO THE TIME OF SALE. THIS TERM SHEET IS NOT AN OFFER TO SELL THESE SECURITIES AND IT IS NOT A SOLICITATION OF AN OFFER TO BUY THESE SECURITIES IN ANY JURISDICTION WHERE THE OFFER OR SALE IS NOT PERMITTED. |
32 Avenue of the Americas New York, NY 10013 | Collateral Asset Summary – Loan No. 2 32 Avenue of the Americas | Cut-off Date Balance: Cut-off Date LTV: U/W NCF DSCR: U/W NOI Debt Yield: | $70,000,000 55.2% 1.88x 9.8% |
data center tenants in 2013 or later have an average rental rate of $58.99 PSF, a 21.4% increase over leases signed by data center tenants prior to 2013, which average $48.60 PSF.
The appraiser concluded to market rents of $60.00 PSF for telecom leases and $50.00 PSF for the telecom support floor (floor 15).
Office Market.According to the appraisal, the Downtown Manhattan office market remains competitive due to its pricing and growing attractiveness to both residents and employers. The market has moved away from being dominated by financial services firms and now benefits from greater industrial diversity. This trend has been helped by creative and tech firms moving south after being priced out of the tight Midtown South office market. The previous oversupply of space is beginning to be absorbed by renewed interest in the Downtown market. According to a local business alliance, 10.0 million sq. ft. of office space has been converted to residential or hotel use since 2004, and another 5.1 million sq. ft. of space is in the potential conversion pipeline. The residential conversions have the added benefit of removing excess office supply from the market.
The Downtown office inventory of 87.8 million sq. ft. is segmented into five major submarkets, with the 32 Avenue of the Americas Property located within the City Hall submarket. Asking rents for the submarket climbed to $58.25 PSF during the second quarter of 2015, a 14.1% increase since the beginning of the year. Additionally, Downtown asking rents saw the largest increase of the three major markets, rising 18.4% percent from Q2 2014. The Q2 2015 Downtown Class A overall asking rents are also up 15.1% over the past year, primarily as a result of top-end space added to the market. The City Hall submarket contains nearly 12.8 million sq. ft. of office space, with approximately 6.6 million sq. ft. of Class A space. The City Hall submarket maintains the lowest vacancy rate of the Downtown market at 1.8%, despite a 0.9% increase during Q2 2015.
The appraiser concluded to market rents of $50.00 PSF for lower floor office leases (floors 1-16) and $56.00 PSF for upper floor office leases (floors 17 and above). Of the 31 buildings surveyed by the appraiser, six office properties were identified as being comparable to the 32 Avenue of the Americas Property.
| Competitive Office Buildings(1) | |||||
| Building | Net Rentable Area | Available Sq. Ft. (Direct) | Direct Occupancy | Direct Asking Rent | |
| 32 Avenue of the Americas Property | 1,163,051 | 4,424 | 99.6% | $50.00 - $56.00(2) | |
| 40 Wall Street | 1,300,000 | 38,079 | 97.1% | $37.00 - $52.00 | |
| 115 Broadway | 409,596 | 66,463 | 83.8% | $50.00 - $54.00 | |
| 75 Varick Street | 1,003,920 | 76,098 | 92.4% | $79.00 - $79.00 | |
| 200 Varick Street | 426,000 | 8,385 | 98.0% | $52.00 - $52.00 | |
| 388 Greenwich Street | 1,600,000 | 0 | 100.0% | NAV | |
| 100 Avenue of the Americas | 302,000 | 8,682 | 97.1% | $66.00 - $66.00 | |
| Total / Wtd. Avg.(3) | 5,041,516 | 197,707 | 96.1% | $37.00 - $79.00 | |
| (1) | Source: Appraisal. |
| (2) | Represents the appraisers market office rent conclusion for the 32 Avenue of the Americas Property. |
| (3) | Total / Wtd Avg. excludes the 32 Avenue of the Americas Property |
THE INFORMATION IN THIS STRUCTURAL AND COLLATERAL TERM SHEET IS NOT COMPLETE AND MAY BE AMENDED PRIOR TO THE TIME OF SALE. THIS TERM SHEET IS NOT AN OFFER TO SELL THESE SECURITIES AND IT IS NOT A SOLICITATION OF AN OFFER TO BUY THESE SECURITIES IN ANY JURISDICTION WHERE THE OFFER OR SALE IS NOT PERMITTED. |
32 Avenue of the Americas New York, NY 10013 | Collateral Asset Summary – Loan No. 2 32 Avenue of the Americas | Cut-off Date Balance: Cut-off Date LTV: U/W NCF DSCR: U/W NOI Debt Yield: | $70,000,000 55.2% 1.88x 9.8% |
Cash Flow Analysis.
| Cash Flow Analysis | ||||||
| 2012 | 2013 | 2014 | T-12 6/30/2015 | U/W | U/W PSF | |
| Base Rent(1) | $49,968,339 | $52,735,008 | $53,123,968 | $55,176,885 | $60,003,778 | $51.59 |
| Value of Vacant Space | 0 | 0 | 0 | 0 | 246,752 | 0.21 |
| Gross Potential Rent | $49,968,339 | $52,735,008 | $53,123,968 | $55,176,885 | $60,250,530 | $51.80 |
| Total Recoveries | 6,484,754 | 7,218,925 | 7,601,119 | 6,879,442 | 7,076,221 | 6.08 |
| Total Other Income(2) | 1,944,356 | 4,021,358 | 623,286 | 20,699 | 153,426 | 0.13 |
| Less: Vacancy(3) | 0 | 0 | 0 | 0 | (3,366,338) | (2.89) |
| Effective Gross Income | $58,397,449 | $63,975,291 | $61,348,373 | $62,077,026 | $64,113,840 | $55.13 |
| Total Variable Expenses | 12,062,859 | 11,881,526 | 10,900,906 | 10,118,605 | 10,232,836 | 8.80 |
| Total Fixed Expenses | 8,145,679 | 9,669,707 | 10,819,107 | 11,353,455 | 12,140,351 | 10.44 |
| Net Operating Income | $38,188,911 | $42,424,058 | $39,628,360 | $40,604,965 | $41,740,653 | $35.89 |
| TI/LC | 0 | 0 | 0 | 0 | 2,274,094 | 1.96 |
| Capital Expenditures | 0 | 0 | 0 | 0 | 232,610 | 0.20 |
| Net Cash Flow | $38,188,911 | $42,424,058 | $39,628,360 | $40,604,965 | $39,233,948 | $33.73 |
| (1) | Base Rent includes $4,414,782 in step rent through August 2016. |
| (2) | Total Other Income in 2013 includes approximately $3.5 million in lease termination fees. |
| (3) | U/W Vacancy represents 5.0% of gross potential income. From 2007 to 2014, vacancy at the 32 Avenue of the Americas Property has averaged 2.7%. |
Property Management. The 32 Avenue of the Americas Property is managed by Rudin Management Co. Inc., a borrower affiliate.
Lockbox / Cash Management. The 32 Avenue of the Americas Loan Combination is structured with a hard lockbox and springing cash management. The borrower delivered tenant direction letters requiring all rents, revenues and receipts from the 32 Avenue of the Americas Property to be deposited directly by the tenants into a lender controlled clearing account. Prior to a Cash Sweep Period (defined below), amounts on deposit in the clearing account are required to be swept daily to the borrower’s account. During a Cash Sweep Period, any transfers to borrower’s operating account are required to cease and sums on deposit in the clearing account are required to be swept into a lender-controlled deposit account and applied to payment of all monthly amounts due under the loan documents.
A “Cash Sweep Period “ will commence upon the occurrence or commencement, as applicable, of (i) an event of default, (ii) the DSCR is less than 1.15x for two consecutive calendar quarters based on the trailing 3-month period (a “DSCR Trigger Event”) or (iii) a bankruptcy action by the borrower or manager and will end if, (a) with respect to (i) above, the default is cured, (b) with respect to (ii) above, the debt service coverage ratio is at least 1.20x for two consecutive calendar quarters based on the trailing-3 month period and (c) with respect to (iii) above, the manager is replaced with a qualified manager, but for the avoidance of doubt, in no event shall the borrower have the ability or right to cure a Cash Sweep Period caused by a bankruptcy action of the borrower.
Initial Reserves. At closing, the borrower deposited (i) $3,908,742 into the TI/LC reserve for tenant improvements and leasing commissions under existing leases and (ii) $1,796,381 into a free rent reserve for the Telx and Impact Digital tenants.
Ongoing Reserves. Ongoing monthly reserves were waived at closing. During the continuance of (a) an event of default or (b) a DSCR Trigger Event, the borrower will be required to make monthly deposits of (i) 1/12 of the taxes payable in the next 12 months, (ii) 1/12 of the insurance premiums payable in the next 12 months, so long as no blanket insurance policy is in place, (iii) $19,384 for annual capital expenditures and (iv) $193,842 into a TI/LC reserve account.
Current Mezzanine or Subordinate Indebtedness. None.
Future Mezzanine or Subordinate Indebtedness Permitted. The borrower may obtain an approved mezzanine loan provided that, among other things, the mezzanine loan (i) has a term that is coterminous with the 32 Avenue of the Americas Loan Combination, (ii) the combined LTV ratio is less than or equal to 53.7%, (iii) the combined DSCR is greater than or equal to 1.90x and (iv) lender shall receive rating agency confirmation.
THE INFORMATION IN THIS STRUCTURAL AND COLLATERAL TERM SHEET IS NOT COMPLETE AND MAY BE AMENDED PRIOR TO THE TIME OF SALE. THIS TERM SHEET IS NOT AN OFFER TO SELL THESE SECURITIES AND IT IS NOT A SOLICITATION OF AN OFFER TO BUY THESE SECURITIES IN ANY JURISDICTION WHERE THE OFFER OR SALE IS NOT PERMITTED. |
32 Avenue of the Americas New York, NY 10013 | Collateral Asset Summary – Loan No. 2 32 Avenue of the Americas | Cut-off Date Balance: Cut-off Date LTV: U/W NCF DSCR: U/W NOI Debt Yield: | $70,000,000 55.2% 1.88x 9.8% |
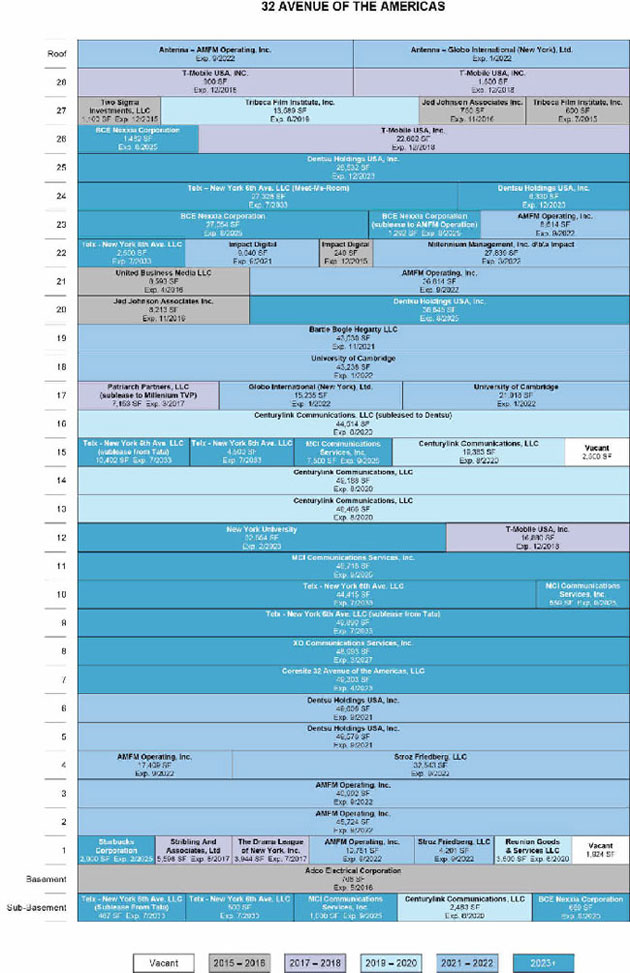
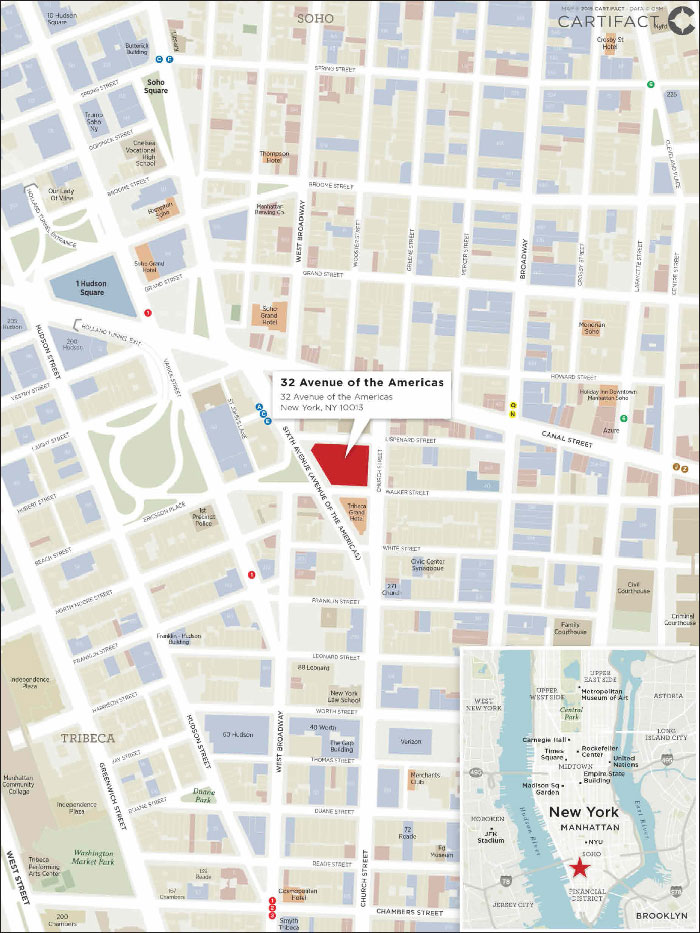
THE INFORMATION IN THIS STRUCTURAL AND COLLATERAL TERM SHEET IS NOT COMPLETE AND MAY BE AMENDED PRIOR TO THE TIME OF SALE. THIS TERM SHEET IS NOT AN OFFER TO SELL THESE SECURITIES AND IT IS NOT A SOLICITATION OF AN OFFER TO BUY THESE SECURITIES IN ANY JURISDICTION WHERE THE OFFER OR SALE IS NOT PERMITTED. |
11 Madison Avenue New York, NY 10010 | Collateral Asset Summary – Loan No. 3 11 Madison Avenue | Cut-off Date Balance: Cut-off Date LTV: U/W NCF DSCR: U/W NOI Debt Yield: | $69,600,000 32.5% 3.89x 14.3% |
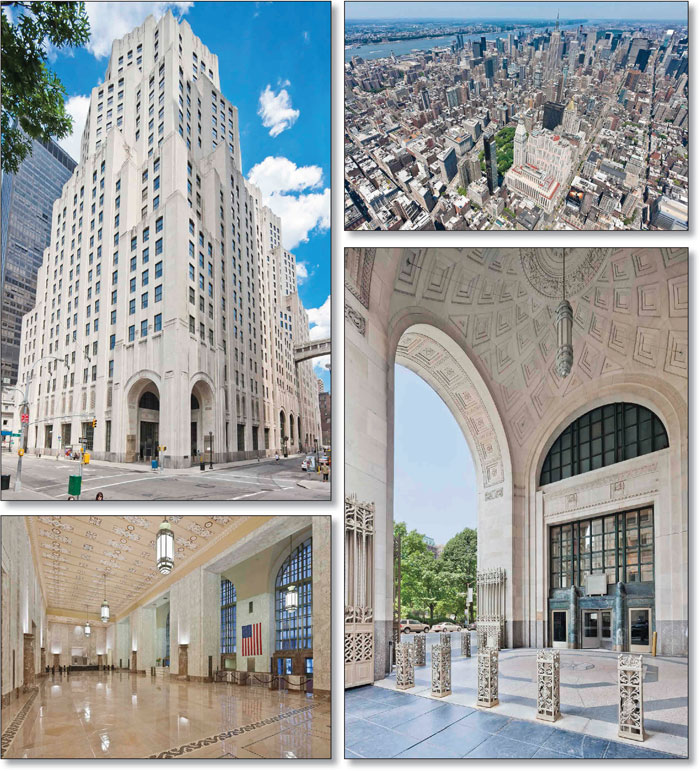
THE INFORMATION IN THIS STRUCTURAL AND COLLATERAL TERM SHEET IS NOT COMPLETE AND MAY BE AMENDED PRIOR TO THE TIME OF SALE. THIS TERM SHEET IS NOT AN OFFER TO SELL THESE SECURITIES AND IT IS NOT A SOLICITATION OF AN OFFER TO BUY THESE SECURITIES IN ANY JURISDICTION WHERE THE OFFER OR SALE IS NOT PERMITTED.
| 40 |
11 Madison Avenue New York, NY 10010 | Collateral Asset Summary – Loan No. 3 11 Madison Avenue | Cut-off Date Balance: Cut-off Date LTV: U/W NCF DSCR: U/W NOI Debt Yield: | $69,600,000 32.5% 3.89x 14.3% |
| Mortgage Loan Information | |
| Loan Seller: | GACC |
| Loan Purpose: | Acquisition |
| Credit Assessment (Fitch/KBRA/Moody’s): | AAA/AAA/A2 |
| Sponsor: | SL Green Realty Corp. |
| Borrower: | 11 Madison Avenue Owner LLC; 11 Madison Avenue Owner 2 LLC; 11 Madison Avenue Owner 3 LLC; 11 Madison Avenue Owner 4 LLC; 11 Madison Avenue Owner 5 LLC; 11 Madison Avenue Owner 6 LLC; 11 Madison EAT Lender LLC |
| Original Balance(1): | $69,600,000 |
| Cut-off Date Balance(1): | $69,600,000 |
| % by Initial UPB: | 7.2% |
| Interest Rate: | 3.5602% |
| Payment Date: | 6thof each month |
| First Payment Date: | October 6, 2015 |
| Maturity Date: | September 6, 2025 |
| Amortization: | Interest Only |
| Additional Debt(1): | $694,730,000Pari Passu Debt; $310,670,000 Subordinate Secured Debt; $325,000,000 Mezzanine Debt |
| Call Protection(2): | L(26), D(87), O(7) |
| Lockbox / Cash Management: | Hard / Springing |
| Reserves(3) | ||
| Initial | Monthly | |
| Taxes: | $0 | Springing |
| Insurance: | $0 | Springing |
| Replacement: | $0 | Springing |
| TI/LC: | $81,152,102 | Springing |
| Credit Suisse Sublease(4): | $36,500,000 | $0 |
| Sony Free Rent: | $18,847,898 | $0 |
| Endorsement: | $1,000 | $0 |
| Financial Information | ||
| Senior Notes(5) | Total Debt(6) | |
| Cut-off Date Balance / Sq. Ft.: | $334 | $613 |
| Balloon Balance / Sq. Ft.: | $334 | $613 |
| Cut-off Date LTV: | 32.5% | 59.6% |
| Balloon LTV: | 32.5% | 59.6% |
| Underwritten NOI DSCR: | 3.97x | 2.01x |
| Underwritten NCF DSCR: | 3.89x | 1.97x |
| Underwritten NOI Debt Yield: | 14.3% | 7.8% |
| Underwritten NCF Debt Yield: | 14.1% | 7.7% |
| Underwritten NOI Debt Yield at Balloon: | 14.3% | 7.8% |
| Underwritten NCF Debt Yield at Balloon: | 14.1% | 7.7% |
| Property Information | |
| Single Asset / Portfolio: | Single Asset |
| Property Type: | CBD Office |
| Collateral: | Fee Simple/Leasehold |
| Location: | New York, NY |
| Year Built / Renovated: | 1932-1950 / 1994-1997, 2015 |
| Total Sq. Ft.: | 2,285,043 |
| Property Management: | SL Green Management LLC |
| Underwritten NOI(7): | $109,493,598 |
| Underwritten NCF: | $107,431,283 |
| Appraised Value: | $2,350,000,000 |
| Appraisal Date: | July 1, 2015 |
| Historical NOI | |
| Most Recent NOI(7): | $46,389,392 (T-12 May 31, 2015) |
| 2014 NOI: | $46,705,749 (December 31, 2014) |
| 2013 NOI: | $47,051,047 (December 31, 2013) |
| 2012 NOI: | $52,397,490 (December 31, 2012) |
| Historical Occupancy | |
| Most Recent Occupancy: | 97.8% (August 11, 2015) |
| 2014 Occupancy: | 94.0% (December 31, 2014) |
| 2013 Occupancy: | 87.5% (December 31, 2013) |
| 2012 Occupancy: | 99.1% (December 31, 2012) |
| (1) | The Original Balance and Cut-off Date Balance of $69.6 million represents the senior non-controlling Note A-1-C3 which, together with the remainingpari passu Senior Notes (defined herein) with an aggregate original principal balance of $764.33 million and the Junior Notes (defined herein) with an aggregate original principal balance of $310.67 million, comprises the 11 Madison Avenue Loan Combination with an aggregate original principal balance of $1.075 billion. For additional information regarding thepari passu Senior Notes and Junior Notes, see “The Loan” and “Current Mezzanine or Subordinate Indebtedness” herein. |
| (2) | The lockout period will be at least 26 payment dates beginning with and including the first payment date of October 6, 2015. Defeasance of the full $1.075 billion 11 Madison Avenue Loan Combination is permitted on or after the date that is the earlier to occur of (i) two years after the closing date of the securitization that includes the lastpari passunote to be securitized, and (ii) August 18, 2018. The assumed lockout period of 26 payments is based on the expected COMM 2015-LC23 securitization closing date in November 2015. The actual lockout period may be longer. |
| (3) | See “Initial Reserves” and “Ongoing Reserves” herein. |
| (4) | The borrower deposited an additional $2,500,000 associated with outstanding sublease payments in relation to the Credit Suisse Sublease which were subsequently paid at closing. See “Initial Reserves” and “Ongoing Reserves” herein. |
| (5) | DSCR, LTV, Debt Yield and Balance / Sq. Ft. calculations are based on the Senior Notes only, which have an aggregate principal balance of $764.33 million. |
| (6) | DSCR, LTV, Debt Yield and Balance / Sq. Ft. calculations are based on the total debt in the amount of $1.4 billion. |
| (7) | The increase in Underwritten NOI over Most Recent NOI is due to the lender underwriting Credit Suisse’s higher contractual base rent beginning in 2017, for all floors except 11 and 13 and 8,770 sq. ft. of storage space, for which the in-place rent is reflected. The lender underwriting also includes WME’s expansion onto a portion of the 17th floor, which occurred in August 2015. |
THE INFORMATION IN THIS STRUCTURAL AND COLLATERAL TERM SHEET IS NOT COMPLETE AND MAY BE AMENDED PRIOR TO THE TIME OF SALE. THIS TERM SHEET IS NOT AN OFFER TO SELL THESE SECURITIES AND IT IS NOT A SOLICITATION OF AN OFFER TO BUY THESE SECURITIES IN ANY JURISDICTION WHERE THE OFFER OR SALE IS NOT PERMITTED.
| 41 |
11 Madison Avenue New York, NY 10010 | Collateral Asset Summary – Loan No. 3 11 Madison Avenue | Cut-off Date Balance: Cut-off Date LTV: U/W NCF DSCR: U/W NOI Debt Yield: | $69,600,000 32.5% 3.89x 14.3% |
| Tenant Summary | ||||||||||
Tenant | Ratings | Net Rentable | % of Net | U/W Base | % of Total | Lease | ||||
| Credit Suisse(2)(3) | A/A1/A | 1,079,655 | 47.2% | $63.98 | 46.7% | 5/31/2037 | ||||
| Credit Suisse (Option)(4) | A/A1/A | 186,396 | 8.2% | $26.18 | 3.3% | 5/31/2017 | ||||
| Sony(5) | BB-/Ba1/BBB- | 578,791 | 25.3% | $73.75 | 28.9% | 1/31/2031 | ||||
| Yelp | NR/NR/NR | 152,232 | 6.7% | $85.00 | 8.7% | 4/30/2025 | ||||
| WME | NR/NR/NR | 103,426 | 4.5% | $85.02 | 5.9% | 9/30/2030 | ||||
| Young & Rubicam, Inc. | NR/NR/NR | 99,107 | 4.3% | $74.65 | 5.0% | 3/30/2019 | ||||
| Fidelity Brokerage Company | NR/NR/NR | 21,999 | 1.0% | $76.59 | 1.1% | 12/31/2028 | ||||
| Eleven Madison Park | NR/NR/NR | 12,000 | 0.5% | $27.42 | 0.2% | 12/31/2017 | ||||
| Subtotal / Wtd. Avg. | 2,233,606 | 97.7% | $66.16 | 99.9% | ||||||
| Other(6) | 572 | 0.0% | $230.04 | 0.1% | ||||||
| Total / Wtd. Avg. Occupied | 2,234,178 | 97.8% | $66.21 | 100.0% | ||||||
| Vacant | 50,865 | 2.2% | ||||||||
| Total / Wtd. Avg. | 2,285,043 | 100.0% | ||||||||
| (1) | Certain ratings are those of the parent company whether or not the parent company guarantees the lease. |
| (2) | Credit Suisse pays $73.81 PSF for floors 3-10, $50.00 PSF for the second floor office space and $32.85 PSF for approximately 217,386 sq. ft. of concourse and lobby/storage space. |
| (3) | Credit Suisse has three partial termination options for one floor each, exercisable 5, 10 and 15 years into the lease term, upon 15 months’ written notice and subject to a termination fee. |
| (4) | Consists of space leased at below market rents on floors 11 and 13 as well as a portion of the first floor storage space. Credit Suisse has an option on this space to extend through 2037 at $73.81 PSF, which must be exercised by April 1, 2016. |
| (5) | Sony is not yet in occupancy and is not yet paying rent. It is anticipated that Sony will take occupancy of its space beginning in February 2016 and will commence paying rent following the expiration of the free rent periods for its respective premises. In connection with these free rent periods, the borrowers reserved $18,847,898 with the lender at loan closing. |
| (6) | Consists of Martin’s News & Sundry, which pays $77.19 PSF for 570 sq. ft., as well as two antenna / satellite tenants paying $12,000 PSF and $75,584 PSF respectively. |
| Lease Rollover Schedule(1) | ||||||||
| Year | # of | Total | % of Total Sq. | Cumulative | Cumulative % | Annual U/W | % U/W | Cumulative % |
| MTM | 0 | 0 | 0.0% | 0 | 0.0% | $0.00 | 0.0% | 0.0% |
| 2015 | 0 | 0 | 0.0% | 0 | 0.0% | $0.00 | 0.0% | 0.0% |
| 2016 | 2 | 2 | 0.0% | 2 | 0.0% | $43,792.00 | 0.1% | 0.1% |
| 2017 | 3 | 198,966 | 8.7% | 198,968 | 8.7% | $26.40 | 3.6% | 3.6% |
| 2018 | 0 | 0 | 0.0% | 198,968 | 8.7% | $0.00 | 0.0% | 3.6% |
| 2019 | 1 | 99,107 | 4.3% | 298,075 | 13.0% | $74.65 | 5.0% | 8.6% |
| 2020 | 0 | 0 | 0.0% | 298,075 | 13.0% | $0.00 | 0.0% | 8.6% |
| 2021 | 0 | 0 | 0.0% | 298,075 | 13.0% | $0.00 | 0.0% | 8.6% |
| 2022 | 0 | 0 | 0.0% | 298,075 | 13.0% | $0.00 | 0.0% | 8.6% |
| 2023 | 0 | 0 | 0.0% | 298,075 | 13.0% | $0.00 | 0.0% | 8.6% |
| 2024 | 0 | 0 | 0.0% | 298,075 | 13.0% | $0.00 | 0.0% | 8.6% |
| 2025 | 1 | 152,232 | 6.7% | 450,307 | 19.7% | $85.00 | 8.7% | 17.4% |
| Thereafter | 4 | 1,783,871 | 78.1% | 2,234,178 | 97.8% | $68.52 | 82.6% | 100.0% |
| Vacant | NAP | 50,865 | 2.2% | 2,285,043 | 100.0% | NAP | NAP | |
| Total / Wtd. Avg. | 11 | 2,285,043 | 100.0% | $66.21 | 100.0% | |||
| (1) | Certain tenants have lease termination options that may become exercisable prior to the originally stated expiration date of the tenant lease that are not considered in the lease rollover schedule. |
THE INFORMATION IN THIS STRUCTURAL AND COLLATERAL TERM SHEET IS NOT COMPLETE AND MAY BE AMENDED PRIOR TO THE TIME OF SALE. THIS TERM SHEET IS NOT AN OFFER TO SELL THESE SECURITIES AND IT IS NOT A SOLICITATION OF AN OFFER TO BUY THESE SECURITIES IN ANY JURISDICTION WHERE THE OFFER OR SALE IS NOT PERMITTED.
| 42 |
11 Madison Avenue New York, NY 10010 | Collateral Asset Summary – Loan No. 3 11 Madison Avenue | Cut-off Date Balance: Cut-off Date LTV: U/W NCF DSCR: U/W NOI Debt Yield: | $69,600,000 32.5% 3.89x 14.3% |
The Loan. The 11 Madison Avenue loan (the “11 Madison Avenue Loan”) is a fixed rate loan secured by the borrowers’ fee simple interests in 27 condominium units and leasehold interests (with the reversionary right to the fee simple interests related to such leasehold interests) in nine condominium units of the borrowers in a 29-story Class A office building consisting of 2,285,043 sq. ft. and located at 11 Madison Avenue in New York, New York (the “Property” or the “11 Madison Avenue Property”) with an original principal balance of $69.6 million. The 11 Madison Avenue Loan is comprised of the non-controlling Note A-1-C3 of a $1.075 billion whole loan that is evidenced by 19 promissory notes: 16 senior notes with an aggregate principal balance of $764,330,000 (the “Senior Notes”) and three junior notes with an aggregate principal balance of $310,670,000 (the “Junior Notes” and together with the Senior Notes the “11 Madison Avenue Loan Combination”). Only the $69.6 million non-controlling Note A-1-C3 will be included in the COMM 2015-LC23 trust. Nine of the Senior Notes with an aggregate principal balance of $397,530,000 along with the three Junior Notes have been contributed to the MAD 2015-11MD trust. The A-1-C1 Note has been contributed to the COMM 2015-CCRE26 securitization, the A-1-C2 Note has been contributed to the COMM 2015-CCRE27 securitization, the A-3-C1 Note has been contributed to the WFCM 2015-NXS3 securitization and the remaining Senior Notes are held by Morgan Stanley Bank, N.A. (“MSBNA”) or Wells Fargo Bank, National Association (“Wells Fargo Bank”) or securitizations as to which MSBNA or Wells Fargo Bank is a loan seller as summarized in the chart below.
The relationship between the holders of the Senior Notes and the Junior Notes will be governed by a co-lender agreement as described under“Description of the Mortgage Pool – Loan Combinations – The 11 Madison Avenue Loan Combination” in the accompanying Free Writing Prospectus.
| Mortgage Loan Combination Note Summary | |||||
| Note | Original Balance | Cut-off Date Balance | Note Holder | Controlling Piece | |
| A-1-C3 | $69,600,000 | $69,600,000 | COMM 2015-LC23 | No | |
| A-1-S1, A-1-S2, A-1-S3, A-2-S1, A-2-S2, A-2-S3, A-3-S1, A-3-S2, A-3-S3 | $397,530,000 | $397,530,000 | MAD 2015-11MD | No | |
| B-1-S, B-2-S, B-3-S | $310,670,000 | $310,670,000 | MAD 2015-11MD | Yes(1) | |
| A-1-C1 | $70,000,000 | $70,000,000 | COMM 2015-CCRE26 | No | |
| A-1-C2 | $70,000,000 | $70,000,000 | COMM 2015-CCRE27 | No | |
| A-2-C1, A-2-C2 | $91,700,000 | $91,700,000 | Morgan Stanley Bank, N.A. | No | |
| A-3-C1 | $35,000,000 | $35,000,000 | WFCM 2015-NXS3 | No | |
| A-3-C2 | $30,500,000 | $30,500,000 | Wells Fargo Bank | No | |
| Total | $1,075,000,000 | $1,075,000,000 | |||
| (1) | So long as the Junior Notes are included in the MAD 2015-11 MD trust, there will be no controlling class or directing holder with respect to the 11 Madison Avenue Loan Combination. |
The 11 Madison Avenue Loan Combination has a 10-year term and pays interest only for the term of the loan. The 11 Madison Avenue Loan Combination accrues interest at a fixed rate equal to 3.5602% and has a cut-off date balance of $69.6 million. Loan proceeds, in addition to approximately $1.1 billion of cash equity from the sponsor, were used to purchase the 11 Madison Avenue Property for approximately $2.3 billion, pay approximately $139.6 million in costs associated with lease-stipulated improvements to the Property, fund upfront reserves of $100.0 million and pay transaction costs of approximately $22.7 million. Based on the appraised value of $2.35 billion as of July 1, 2015, the cut-off date LTV for the Senior Notes is 32.5%. The most recent prior financing of the 11 Madison Avenue Property was included in the CSMC 2006-C4 transaction.
| Sources and Uses | ||||||
| Sources | Proceeds | % of Total | Uses(1) | Proceeds | % of Total | |
| Mortgage Loan | $1,075,000,000 | 42.2% | Purchase Price(2) | $2,285,000,000 | 89.7% | |
| First Mezzanine Loan | $150,000,000 | 5.9% | Leasing/Base Building Costs | $139,562,788 | 5.5% | |
| Second Mezzanine Loan | $175,000,000 | 6.9% | Lease Costs Funds | $81,152,102 | 3.2% | |
| Sponsor Equity | $1,147,232,451 | 45.0% | Sony Free Rent Reserve | $18,847,898 | 0.7% | |
| Closing Costs | $22,669,663 | 0.9% | ||||
| Total Sources | $2,547,232,451 | 100.0% | Total Uses | $2,547,232,451 | 100.0% | |
| (1) | SLG also delivered a guaranty at loan closing in the amount of $59,060,332 to partially collateralize leasing obligations at the Property. |
| (2) | Purchase Price includes the $39,000,000 CS Sublease Reserve, $2,500,000 of which was paid down at closing. |
The Borrower / Sponsor. The borrowers, 11 Madison Avenue Owner LLC, 11 Madison Avenue Owner 2 LLC, 11 Madison Avenue Owner 3 LLC, 11 Madison Avenue Owner 4 LLC, 11 Madison Avenue Owner 5 LLC and 11 Madison Avenue Owner 6 LLC (collectively the “TIC Owners”) and 11 Madison EAT Lender LLC, are each a single purpose Delaware limited liability company structured to be bankruptcy-remote with two independent directors in its organizational structure. Each of the TIC Owners is a tenant-in-common owner
THE INFORMATION IN THIS STRUCTURAL AND COLLATERAL TERM SHEET IS NOT COMPLETE AND MAY BE AMENDED PRIOR TO THE TIME OF SALE. THIS TERM SHEET IS NOT AN OFFER TO SELL THESE SECURITIES AND IT IS NOT A SOLICITATION OF AN OFFER TO BUY THESE SECURITIES IN ANY JURISDICTION WHERE THE OFFER OR SALE IS NOT PERMITTED.
| 43 |
11 Madison Avenue New York, NY 10010 | Collateral Asset Summary – Loan No. 3 11 Madison Avenue | Cut-off Date Balance: Cut-off Date LTV: U/W NCF DSCR: U/W NOI Debt Yield: | $69,600,000 32.5% 3.89x 14.3% |
of the Property who collectively own 100% of the fee simple and/or leasehold interest in the Property and have subsequently master leased the Property to 11 Madison EAT Lender. The sponsor of the borrowers and the non-recourse carveout guarantor is SL Green Realty Corp. (“SLG”). SLG also delivered a guaranty at loan closing in the amount of $59,060,332 to partially collateralize leasing obligations at the 11 Madison Avenue Property.
SLG (rated BBB-/Baa3/BB+ by Fitch/Moody’s/S&P), an S&P 500 company and New York City’s largest office landlord, is a fully integrated REIT that is focused primarily on acquiring, managing, and maximizing value of Manhattan commercial properties. As of June 30, 2015, SLG held interests in 120 Manhattan buildings totaling 44.1 million sq. ft. This included ownership interests in 29.0 million sq. ft. of commercial buildings and debt and preferred equity investments secured by 15.1 million sq. ft. of buildings. In addition to its Manhattan investments, SLG held ownership interests in 37 suburban buildings totaling 5.9 million sq. ft. in Brooklyn, Long Island, Westchester County, Connecticut and New Jersey.
As of June 30, 2015, SLG reported total assets of approximately $17.3 billion, including cash and cash equivalents of approximately $215.9 million. For fiscal year 2014, SLG reported total revenues of $1.5 billion, an increase of 10.9% over fiscal year 2013 revenues of approximately $1.4 billion. As of June 30, 2015, SLG reported a market capitalization of approximately $10.7 billion, and, over a 52-week period, its stock price ranged from $109.45 to $131.99.
The Property.The 11 Madison Avenue Property is a 29-story, 2,285,043 sq. ft., Class A office tower located directly east of Manhattan’s Madison Square Park. The Property enjoys full-block frontage on Madison Square Park and occupies an entire city “super block” between Park Avenue South, Madison Avenue, and East 24th and East 25th Streets. Developed by MetLife as part of its headquarters complex, the Property was constructed in three phases beginning in 1932: from 1932 to 1938, half of the building was built along Park Avenue between 24th and 25th Street; from 1938 to 1941, the northwest section of the building was completed; and from 1947 to 1950, the final phase, the southwest quadrant, was completed. The 11 Madison Avenue Property was built to an international headquarters quality standard and features an art deco design. The Property has an Alabama limestone exterior and four vaulted entrances with terrazzo floors at each corner that lead to a double-height marble lobby. Both the floors and walls are comprised of Italian Cremo marble, Tennessee granite and travertine. Due to the Property’s unique and high quality construction, the 11 Madison Avenue Property was added to the National Register of Historic Places in 1996.
Between 1994 and 1997, Credit Suisse and MetLife collectively modernized the Property at a cost exceeding $700.0 million. During that time, MetLife invested $400.0 million in technological enhancements at the Property and established the Property as a sought after headquarter location due to its modern building systems, large floor plates, landmark status, and amenity-rich park-fronting location. Furthermore, during that time, Credit Suisse invested an additional $300.0 million to create its North American headquarters, adding dedicated emergency generators, supplemental HVAC systems, its own UPS facility (additionally upgraded for $30.0 million in 2011), and other miscellaneous electrical upgrades. The Property is currently undergoing a number of base building projects totaling approximately $86.0 million, which, when combined with Sony’s and Credit Suisse’s tenant improvement and leasing commissions, will result in over $279.8 million of capital invested into the Property between 2015 and 2018. The capital is expected to be invested to modernize and update the Property to today’s headquarters standard, including a new BMS system, elevator modernization, chiller plant/cooling towers upgrade, increased ventilation capacity, private entrance and sky lobby for Sony, new 28th floor window line and a new usable rooftop garden.
The Property is 97.8% leased as of August 11, 2015 to 10 tenants including Credit Suisse (rated A/A1/A by Fitch/Moody’s/S&P) and Sony (rated BB-/Ba1/BBB- by Fitch/Moody’s/S&P). The Property has served as the North American headquarters for Credit Suisse since 1996 and is expected to be the U.S. headquarters for Sony starting in 2016. Credit Suisse recently renewed its lease at the Property through May 31, 2037 for 1,079,655 sq. ft. (which includes 862,269 sq. ft. of office space, 203,863 sq. ft. of concourse space and 13,523 sq. ft. of lobby/storage space. Credit Suisse currently occupies an additional 177,626 sq. ft. of office space and 8,770 sq. ft. of storage space that will expire in 2017. Credit Suisse has the option to extend its space on these floors through 2037. Sony is expected to relocate its headquarters to the Property from its previous location at 550 Madison Avenue in early 2016, having signed a lease through January 31, 2031 for 578,791 sq. ft. (548,113 sq. ft. of office space on the top 11 floors of the Property, 17,555 sq. ft. of retail space and 13,123 sq. ft. of storage space). Other tenants include Yelp, Young & Rubicam, Inc., William Morris Endeavor (“WME”) and the Eleven Madison Park restaurant. Credit Suisse and Sony will occupy in the aggregate 1,844,842 sq. ft. (80.7% of NRA) at the Property.
Located in Manhattan’s Midtown South neighborhood, the Property has direct access to the number 6 subway line which, along with the nearby N, R, Q, F and M lines, provides connections from the Upper East Side and Grand Central to Union Square, Downtown Manhattan and Brooklyn. Additionally, the Property is within walking distance of the Flatiron, Gramercy and Chelsea neighborhoods.
Environmental Matters.The Phase I environmental report dated April 30, 2015 recommended the continued implementation of an asbestos operation and maintenance plan at the Property, which is currently in place.
THE INFORMATION IN THIS STRUCTURAL AND COLLATERAL TERM SHEET IS NOT COMPLETE AND MAY BE AMENDED PRIOR TO THE TIME OF SALE. THIS TERM SHEET IS NOT AN OFFER TO SELL THESE SECURITIES AND IT IS NOT A SOLICITATION OF AN OFFER TO BUY THESE SECURITIES IN ANY JURISDICTION WHERE THE OFFER OR SALE IS NOT PERMITTED.
| 44 |
11 Madison Avenue New York, NY 10010 | Collateral Asset Summary – Loan No. 3 11 Madison Avenue | Cut-off Date Balance: Cut-off Date LTV: U/W NCF DSCR: U/W NOI Debt Yield: | $69,600,000 32.5% 3.89x 14.3% |
Major Tenants.
Credit Suisse (1,266,051 sq. ft.; 55.4% of NRA; 50.0% of U/W Base Rent; A/A1/A by Fitch/Moody’s/S&P) Credit Suisse is a multinational financial services company based in Zurich, Switzerland. Credit Suisse is organized as a stock corporation with four divisions: Investment Banking, Private Banking, Asset Management, and a Shared Services Group. Operating out of global headquarters in Zurich, London and New York, Credit Suisse has 45,800 employees in 344 branches and offices in over 50 countries. Credit Suisse has used the Property as its North American headquarters since 1996. In 2014, Credit Suisse vacated a portion of its space, which it subleased to the borrowers to allow for Sony to take approximately 548,000 sq. ft. of office space on the Property’s top 11 floors. Credit Suisse currently occupies 1,266,051 sq. ft., which includes its office space on floors 2-11 and 13 as well as its space in the basement, the lobby and its concourse space.
Credit Suisse recently executed a new lease for 862,269 sq. ft. commencing in June 2017 through May 2037 for floors 2 through 10, as well as 217,386 sq. ft. of concourse space, mechanical and lobby space. Credit Suisse has two, 10-year extension options for the space that expires in 2037 as well as three partial termination options for one floor each, which are exercisable 5, 10 and 15 years into the lease term, upon 15 months written notice and subject to a termination fee as described in the lease documents. Credit Suisse’s space on floors 11 and 13 expires in 2017 (along with a small portion of storage space on the first floor) and the tenant has the option to extend these floors through 2037 at $73.81 PSF. This option must be exercised by April 1, 2016. Credit Suisse currently pays a blended base rent of $26.18 PSF for these floors, which is significantly below current market rents as the leases for these floors were signed over 15 years ago.
Sony (578,791 sq. ft.; 25.3% of NRA; 28.9% of U/W Base Rent; BB-/Ba1/BBB- by Fitch/Moody’s/S&P)Sony is a multinational electronics and entertainment company based in Tokyo, Japan. The company employs nearly 140,000 people worldwide and operates in four business segments: SONY Corporation (SONY Electronics in the US), SONY Pictures Entertainment, SONY Mobile Communications, and SONY Financial.
In 2015, Sony signed a 16-year lease at the Property for the top 11 floors, as well as retail space on the ground floor and mezzanine level. The Property is expected to serve as its U.S. headquarters as well as house its flagship store, the “SONY Experience.” Sony has made a significant financial commitment to the space, and is expected to spend approximately $150.0 million to complete its build-out, in addition to a TI allowance from the borrowers. Sony is leasing 548,113 sq. ft. in the top floors of the building (19-29) for its office space at a base rent of $74.00 PSF. Additionally, Sony is leasing 17,555 sq. ft. of retail space for its “SONY Experience” store, the ground floor of which has a base rent of $225.00 PSF and 13,123 sq. ft. of storage space. Sony has two successive extension options for all of its space, the first for 10 years and the second for either 5 or 10 years. Sony has not yet taken occupancy of its space at the Property as its space is still being built out. Substantially all of the Sony space is currently leased to Credit Suisse, which has subleased such space to the borrowers, which has in turn leased such space to Sony (which converts to a direct lease upon expiration of the Credit Suisse lease for that space in 2017). Sony is entitled to free rent periods with respect to various portions of its space following the related lease commencement.
The Market.The Property is located in the Midtown South office market - Manhattan’s smallest office market - housing 66.6 million sq. ft. of space. The market has a total of 35 Class A buildings totaling 17.3 million sq. ft. As of Q1 2015, the Midtown South office market exhibited a vacancy rate of 7.0% and a rental rate of $63.28 PSF. The Property is one of seven trophy office buildings in the Midtown South office market.
The Midtown South office market is geographically segmented into five major submarkets: SoHo, Greenwich Village/NoHo, Madison/Union Square, Hudson Square/West Village, and Chelsea. The 11 Madison Avenue Property is located in the Madison/Union Square submarket. The Madison/Union Square submarket contains over 32.0 million sq. ft. of office space and is Midtown South’s largest submarket. The submarket contains 10.4 million sq. ft. of Class A space (including the Property at 2.3 million sq. ft.). As of Q1 2015, the Madison/Union Square submarket had an overall vacancy rate of 7.3% and an overall asking rent of $64.22 PSF.
The appraiser identified 34 comparable properties totaling approximately 19.3 million sq. ft. of space that exhibited a rental range of $40.00 PSF to $90.00 PSF with a weighted average occupancy of approximately 96.8%. However, according to the appraiser, the 11 Madison Avenue Property is directly competitive with ten Class A office properties located within the Madison/Union Square submarket. The average direct occupancy rate for the directly competitive buildings is 100.0%, compared to 96.8% for the full competitive set and 95.90% for the Class A Midtown South market as a whole. The chart below summarizes the ten properties considered to be directly competitive to the 11 Madison Avenue Property within the Madison/Union Square office submarket.
THE INFORMATION IN THIS STRUCTURAL AND COLLATERAL TERM SHEET IS NOT COMPLETE AND MAY BE AMENDED PRIOR TO THE TIME OF SALE. THIS TERM SHEET IS NOT AN OFFER TO SELL THESE SECURITIES AND IT IS NOT A SOLICITATION OF AN OFFER TO BUY THESE SECURITIES IN ANY JURISDICTION WHERE THE OFFER OR SALE IS NOT PERMITTED.
| 45 |
11 Madison Avenue New York, NY 10010 | Collateral Asset Summary – Loan No. 3 11 Madison Avenue | Cut-off Date Balance: Cut-off Date LTV: U/W NCF DSCR: U/W NOI Debt Yield: | $69,600,000 32.5% 3.89x 14.3% |
| Competitive Set(1) | |||||
| Building | Net Rentable Area | Available Sq. Ft. (Direct) | Available Sq. Ft. (Sublease) | Direct Occupancy | Total Occupancy |
| One Madison Avenue | 1,443,908 | 0 | 0 | 100.0% | 100.0% |
| 41 Madison Avenue | 532,525 | 0 | 55,126 | 100.0% | 89.7% |
| 51 Madison Avenue | 974,653 | 0 | 0 | 100.0% | 100.0% |
| 63 Madison Avenue | 636,660 | 0 | 8,296 | 100.0% | 98.7% |
| 114 Fifth Avenue | 287,804 | 0 | 19,326 | 100.0% | 93.3% |
| 160 Fifth Avenue | 117,900 | 0 | 0 | 100.0% | 100.0% |
| 200 Fifth Avenue | 594,089 | 0 | 0 | 100.0% | 100.0% |
| 770 Broadway | 911,213 | 0 | 0 | 100.0% | 100.0% |
| 111 Eighth Avenue | 2,300,000 | 0 | 0 | 100.0% | 100.0% |
| 51 Astor Place | 307,839 | 0 | 0 | 100.0% | 100.0% |
| Total / Wtd. Avg. | 8,106,591 | 0 | 82,748 | 100.0% | 99.0% |
| (1) | Source: Appraisal. |
The appraiser identified nine comparable transactions that are under contract or have occurred since June 2014. The transactions reflect a range of unadjusted price PSF from $713.02 to $1,819.33 PSF. After making adjustments including but not limited to location, age, condition, quality and appeal, the appraiser determined an adjusted price range of approximately $972.21 PSF to $1,107.94 PSF for the comparable sales transactions.
| Comparable Retail Sales – Multi-Level(1) | ||||||||
| Location | Net Rentable | Year Built/Renovated | No. Stories | Transaction Date | Sales Price | Sales Price/NRA | Occupancy | |
| 757 Third Avenue | 504,893 | 1964 | 27 | Mar 2015 | $360,000,000 | $713 | 95.0% | |
| 230 Park Avenue | 1,404,918 | 1928 | 34 | Mar 2015 | $1,200,000,000 | $854 | 90.0% | |
| 717 Fifth Avenue | 352,951 | 1959 / 2001 | 26 | Feb 2015 | $415,000,000 | $1,176 | 92.0% | |
| 11 Times Square | 1,107,839 | 2010 | 40 | Feb 2015 | $1,400,000,000 | $1,264 | 85.0% | |
| 601 Lexington Avenue (Allocated) | 1,669,897 | 1977 | 61 | Dec 2014 | $2,400,000,000 | $1,437 | 99.0% | |
| 1045 Sixth Avenue/7 Bryant Park (Leasehold) | 473,672 | 2015 (under construction) | 28 | Dec 2014 | $598,000,000 | $1,262 | 0.0% | |
| 1095 Sixth Avenue | 1,179,552 | 1973 / 2008 | 41 | Nov 2014 | $2,146,000,000 | $1,819 | 96.0% | |
| 1740 Broadway | 620,928 | 1950 / 2007 | 26 | Nov 2014 | $600,912,768 | $968 | 98.0% | |
| Park Avenue Tower | 616,082 | 1986 | 36 | Jun 2014 | $750,000,000 | $1,217 | 96.0% | |
| (1) | Source: Appraisal. |
The appraiser concluded an average rental rate for the 11 Madison Avenue Property in the mid $80s, as summarized in the chart below.
| Office Market Rent(1) | |
| Type | Market Rent PSF |
| Concourse | $30.00 |
| Office Floors 2, 5-12 | $80.00 |
| Office Floors 3-4 | $85.00 |
| Office Floors 13-14, 16-20 | $90.00 |
| Office Floors 15 | $70.00 |
| Office Floors 21-24 | $95.00 |
| Office Floors 25-29 | $100.00 |
| (1) | Source: Appraisal. |
THE INFORMATION IN THIS STRUCTURAL AND COLLATERAL TERM SHEET IS NOT COMPLETE AND MAY BE AMENDED PRIOR TO THE TIME OF SALE. THIS TERM SHEET IS NOT AN OFFER TO SELL THESE SECURITIES AND IT IS NOT A SOLICITATION OF AN OFFER TO BUY THESE SECURITIES IN ANY JURISDICTION WHERE THE OFFER OR SALE IS NOT PERMITTED.
| 46 |
11 Madison Avenue New York, NY 10010 | Collateral Asset Summary – Loan No. 3 11 Madison Avenue | Cut-off Date Balance: Cut-off Date LTV: U/W NCF DSCR: U/W NOI Debt Yield: | $69,600,000 32.5% 3.89x 14.3% |
Cash Flow Analysis.
| Cash Flow Analysis | ||||||
| 2013 | 2014 | T-12 5/31/2015 | Sponsor Budget (3 Year) | U/W | U/W PSF | |
| Base Rent(1) | $52,888,225 | $52,592,579 | $53,715,326 | $159,869,968 | $147,917,623 | $64.73 |
| Rent Abatements | 0 | 0 | 0 | (5,368,454) | 0 | 0.00 |
| Straight Line Rents(2) | 0 | 0 | 0 | 0 | 1,932,702 | 0.85 |
| Value of Vacant Space | 0 | 0 | 0 | 0 | 4,796,680 | 2.10 |
| Gross Potential Rent | $52,888,225 | $52,592,579 | $53,715,326 | $154,501,514 | $154,647,005 | $67.68 |
| Total Recoveries | 15,059,977 | 14,780,924 | 13,408,807 | 3,799,446 | 5,509,992 | 2.41 |
| Total Other Income | 2,724,962 | 2,996,156 | 3,461,086 | 8,005,327 | 7,679,439 | 3.36 |
| Less: Vacancy/Bad Debt(3) | (725,384) | (488,860) | (319,721) | 0 | (4,796,680) | (2.10) |
| Effective Gross Income | $69,947,780 | $69,880,799 | $70,265,498 | $166,306,287 | $163,039,756 | $71.35 |
| Total Variable Expenses | 13,213,979 | 12,999,874 | 13,312,685 | 31,651,567 | 31,569,448 | 13.82 |
| Total Fixed Expenses | 9,682,754 | 10,175,176 | 10,563,422 | 21,976,710 | 21,976,710 | 9.62 |
| Net Operating Income | $47,051,047 | $46,705,749 | $46,389,392 | $112,678,010 | $109,493,598 | $47.92 |
| TI/LC | 0 | 0 | 0 | 0 | 1,605,307 | 0.70 |
| Capital Expenditures | 0 | 0 | 0 | 0 | 457,009 | 0.20 |
| Net Cash Flow | $47,051,047 | $46,705,749 | $46,389,392 | $112,678,010 | $107,431,283 | $47.01 |
| (1) | Base Rent includes Credit Suisse’s contractual base rent beginning in 2017 for all floors except 11 and 13 and 8,770 sq. ft. of storage space, for which the in-place rent is reflected. Base Rent also includes WME’s expansion onto a portion of the 17th floor, which occurred in August 2015. |
| (2) | Straight Line Rents is equal to the average rent for Sony’s space over the loan term. |
| (3) | U/W Vacancy/Bad Debt is based on the in-place vacancy. |
Property Management. The 11 Madison Avenue Property is managed by SL Green Management LLC, a borrower affiliate.
Lockbox / Cash Management. The 11 Madison Avenue Loan Combination is structured with a hard lockbox and springing cash management. At closing, the borrowers were required to deliver tenant direction letters requiring all rents, revenues and receipts from the Property to be deposited directly by the tenants into a clearing account established by the borrowers. Amounts on deposit in the clearing account are required to be transferred daily to a deposit account controlled by the lender, and provided no Trigger Period (defined herein) exists, automatic daily transfers of such deposits are required to be made from the deposit account into borrower’s operating account. During a Trigger Period, any transfers to borrower’s operating account will cease and sums on deposit in the deposit account are required to be applied to payment of all monthly amounts due under the loan documents.
A “Trigger Period” will commence upon the occurrence or commencement, as applicable, of (i) an event of default, (ii) a Low Debt Yield Trigger Period (defined herein), (iii) a default by the borrowers of any major lease obligation, (iv) a Lease Collateral Sweep Period (defined herein), (v) a Lease Sweep Period (defined herein) or (vi) a First Mezzanine or Second Mezzanine loan default.
A “Low Debt Yield Trigger Period” will commence if , as of the last day of any quarter, the mortgage loan debt yield falls below 7.50% or the aggregate debt yield falls below 5.75% and will cease to exist if either (i) the mortgage loan debt yield exceeds 7.50% or the total debt yield exceeds 5.75% for two consecutive quarters or (ii) the borrowers provide cash or a letter of credit to the lender in the amount that the outstanding principal balance would need to be reduced to cause the mortgage loan debt yield to be equal to or greater than 7.50% or the total debt yield to be equal to or greater than 5.75% (such cash or letter of credit are required to be released to the borrowers upon the borrowers meeting the conditions set forth in subsection (i) hereof).
A “Lease Collateral Sweep Period” will commence if the long-term unsecured credit rating of the guarantor under the Lease Costs Guaranty falls below the minimum credit rating requirement as further described in “Initial Reserves” below and will end if either (i) all lease costs have been fully funded in cash into the lease costs account or (ii) upon the subsequent date that guarantor meets the minimum credit rating.
THE INFORMATION IN THIS STRUCTURAL AND COLLATERAL TERM SHEET IS NOT COMPLETE AND MAY BE AMENDED PRIOR TO THE TIME OF SALE. THIS TERM SHEET IS NOT AN OFFER TO SELL THESE SECURITIES AND IT IS NOT A SOLICITATION OF AN OFFER TO BUY THESE SECURITIES IN ANY JURISDICTION WHERE THE OFFER OR SALE IS NOT PERMITTED.
| 47 |
11 Madison Avenue New York, NY 10010 | Collateral Asset Summary – Loan No. 3 11 Madison Avenue | Cut-off Date Balance: Cut-off Date LTV: U/W NCF DSCR: U/W NOI Debt Yield: | $69,600,000 32.5% 3.89x 14.3% |
A “Lease Sweep Period” will commence upon a bankruptcy proceeding in which the tenant and/or guarantor under either the Credit Suisse Lease or the Sony Lease, or its respective parent entity, (each a “Major Tenant”) is the debtor and will end upon the earlier to occur of (i) in the event either of the Major Tenant leases are rejected in the applicable bankruptcy proceeding, the date on which a sufficient portion of the space occupied under the defaulted Major Tenant Lease is re-leased so as to achieve a mortgage loan debt yield of 7.50% or greater and an aggregate debt yield of 5.75%, (ii) the date of an assumption or assignment of the applicable Major Tenant lease out of bankruptcy or (iii) the date on which the amount of $75.00 per rentable square foot of the relevant space is deposited into a rollover reserve account for approved leasing costs.
Initial Reserves. At loan closing, the borrowers deposited (i) $18,847,898 into the Sony free rent reserve account on account of free rent concessions with respect to the Sony lease, (ii) $39,000,000 in cash on account of outstanding payments with respect to the Credit Suisse sublease ($2,500,000 of the sublease payments were paid off at closing and the remaining $36,500,000 was deposited into the Credit Suisse sublease account), (iii) $1,000 into an endorsement reserve on account of outstanding disbursements to be made with respect to the delivery of updates to the title insurance policy and (iv) (a) $81,152,102 into the lease costs account to partially fund the lease costs, and (b) the Lease Costs Guaranty (defined below). The lease costs consist of (1) outstanding TI/LC obligations with respect to the Credit Suisse, Sony, Yelp and WME leases (collectively, the “Outstanding TI/LC Expenses”) and (2) the outstanding base building work obligations, detailed in the chart below, with respect to the Credit Suisse, Sony, Yelp and WME leases (the “Base Building Work”).
On the origination date, the guarantor delivered a guaranty (the “Lease Costs Guaranty”) in the amount of $59,060,332, which represents the remaining portion of the $140,212,434 of lease costs owed by the borrowers under existing leases, less the amount deposited in the lease costs reserve. The Lease Costs Guaranty covers an amount equal to (i) the lease costs outstanding (including any cost overruns) minus (ii) the sum of (A) the reserve funds in the lease costs account and (B) the amount of any lease costs letters of credit. In the event that the long-term unsecured S&P credit rating of the guarantor is less than “BB+”, the borrowers will be required to immediately deposit cash reserves into the lease costs account in the amount of (and in exchange for) any lease costs covered by the Lease Costs Guaranty; provided that in lieu of such cash collateralization, so long as no event of default exists, the borrower may elect to have all available cash applied to the lease costs account until all of the lease costs have been fully funded in cash.
Lease cost funds are required to be released and the Lease Costs Guaranty will be reduced, generally, on a pro rata basis as the borrowers satisfy the leasing obligations and incur the lease costs. In addition, amounts on reserve in the Sony free rent reserve account will be transferred to the lease costs account monthly in connection with the amortization of Sony’s free rent. The Lease Costs Guaranty will be reduced by such deposits into the lease costs account as well as deposits of any other reserve funds into the lease costs account.
| Lease Costs | |
| Lease Costs | Outstanding Amount |
| Credit Suisse Landlord Base Building Work | $21,591,448 |
| Sony Landlord Base Building Work | 19,931,438 |
| Credit Suisse Tenant Improvements(1) | 43,898,724 |
| Sony Tenant Improvements | 43,641,509 |
| Other Tenant Improvements | 4,533,205 |
| Credit Suisse Leasing Commissions | 4,529,626 |
| Sony Leasing Commissions | 0 |
| Other Leasing Commissions | 2,086,484 |
| Total Lease Costs | $140,212,434 |
| (1) | Includes $33,806,313 in anticipated work allowance under the 2017 Credit Suisse Lease. |
Ongoing Reserves. During the continuance of a Trigger Period, the borrowers are required to deposit, on a monthly basis, (i) 1/12 of the taxes payable in the next 12 months, (ii) provided an acceptable blanket policy is no longer in place, 1/12 of the insurance premiums payable in the next 12 months and (iii) $342,756 for annual capital expenditures.
Current Mezzanine or Subordinate Indebtedness. Two mezzanine loans were funded concurrently with the closing of the 11 Madison Avenue Loan Combination. A $150,000,000 mezzanine A loan, which is coterminous with the 11 Madison Avenue Loan, and accrues interest at a fixed per annum rate equal to 4.650% and a $175,000,000 mezzanine B loan, which is coterminous with the 11 Madison Avenue Loan, and accrues interest at a fixed per annum rate equal to 4.850%. An intercreditor agreement is in place with respect to the 11 Madison Avenue Loan and the related mezzanine loans.
Future Mezzanine or Subordinate Indebtedness Permitted. None.
THE INFORMATION IN THIS STRUCTURAL AND COLLATERAL TERM SHEET IS NOT COMPLETE AND MAY BE AMENDED PRIOR TO THE TIME OF SALE. THIS TERM SHEET IS NOT AN OFFER TO SELL THESE SECURITIES AND IT IS NOT A SOLICITATION OF AN OFFER TO BUY THESE SECURITIES IN ANY JURISDICTION WHERE THE OFFER OR SALE IS NOT PERMITTED.
| 48 |
11 Madison Avenue New York, NY 10010 | Collateral Asset Summary – Loan No. 3 11 Madison Avenue | Cut-off Date Balance: Cut-off Date LTV: U/W NCF DSCR: U/W NOI Debt Yield: | $69,600,000 32.5% 3.89x 14.3% |
IDA Lease Units.A portion of the 11 Madison Avenue Property consisting of the leasehold interests in nine condominium units, the related fee simple interests of which are owned by the New York City Industrial Development Agency, (“IDA”) is subject to a certain overlease agreement dated December 22, 1995, by and between the borrowers (as successor to tenant’s interest) and the IDA (as assigned and/or amended, the “11 Madison Avenue Overlease”). The rent under the 11 Madison Avenue Overlease is $10 for the full term and has been fully prepaid. The purpose of the 11 Madison Avenue Overlease is to substitute real property tax obligations with payments in lieu of real estate taxes. Credit Suisse is required to pay all PILOT pursuant to a PILOT Agreement dated December 1, 1995 between the IDA and Credit Suisse First Boston Corporation; however, under the sublease described under “Major Tenants” above, the borrowers have agreed to make such payments as to the subleased space. The IDA structure terminates on December 31, 2016. If the 11 Madison Avenue Overlease terminates for any reason, the fee simple interest in the condominium units subject to the 11 Madison Avenue Overlease reverts back to the borrower. The mortgage provides that upon any such reversion of condominium units to the borrowers, such condominium units will automatically be subject to the mortgage.
THE INFORMATION IN THIS STRUCTURAL AND COLLATERAL TERM SHEET IS NOT COMPLETE AND MAY BE AMENDED PRIOR TO THE TIME OF SALE. THIS TERM SHEET IS NOT AN OFFER TO SELL THESE SECURITIES AND IT IS NOT A SOLICITATION OF AN OFFER TO BUY THESE SECURITIES IN ANY JURISDICTION WHERE THE OFFER OR SALE IS NOT PERMITTED.
| 49 |
11 Madison Avenue New York, NY 10010 | Collateral Asset Summary – Loan No. 3 11 Madison Avenue | Cut-off Date Balance: Cut-off Date LTV: U/W NCF DSCR: U/W NOI Debt Yield: | $69,600,000 32.5% 3.89x 14.3% |
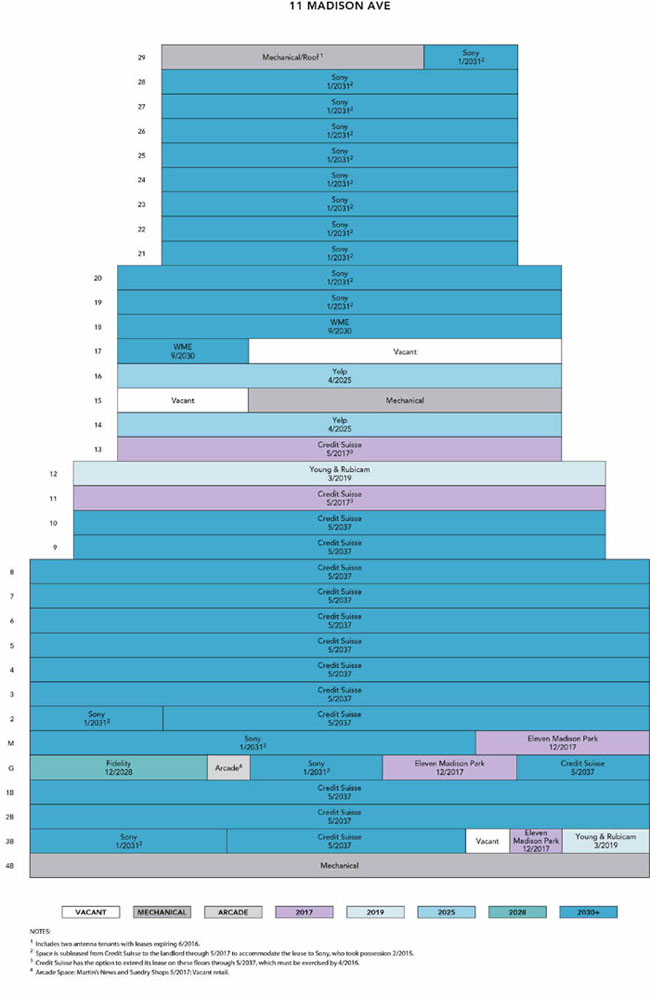
THE INFORMATION IN THIS STRUCTURAL AND COLLATERAL TERM SHEET IS NOT COMPLETE AND MAY BE AMENDED PRIOR TO THE TIME OF SALE. THIS TERM SHEET IS NOT AN OFFER TO SELL THESE SECURITIES AND IT IS NOT A SOLICITATION OF AN OFFER TO BUY THESE SECURITIES IN ANY JURISDICTION WHERE THE OFFER OR SALE IS NOT PERMITTED.
| 50 |
11 Madison Avenue New York, NY 10010 | Collateral Asset Summary – Loan No. 3 11 Madison Avenue | Cut-off Date Balance: Cut-off Date LTV: U/W NCF DSCR: U/W NOI Debt Yield: | $69,600,000 32.5% 3.89x 14.3% |
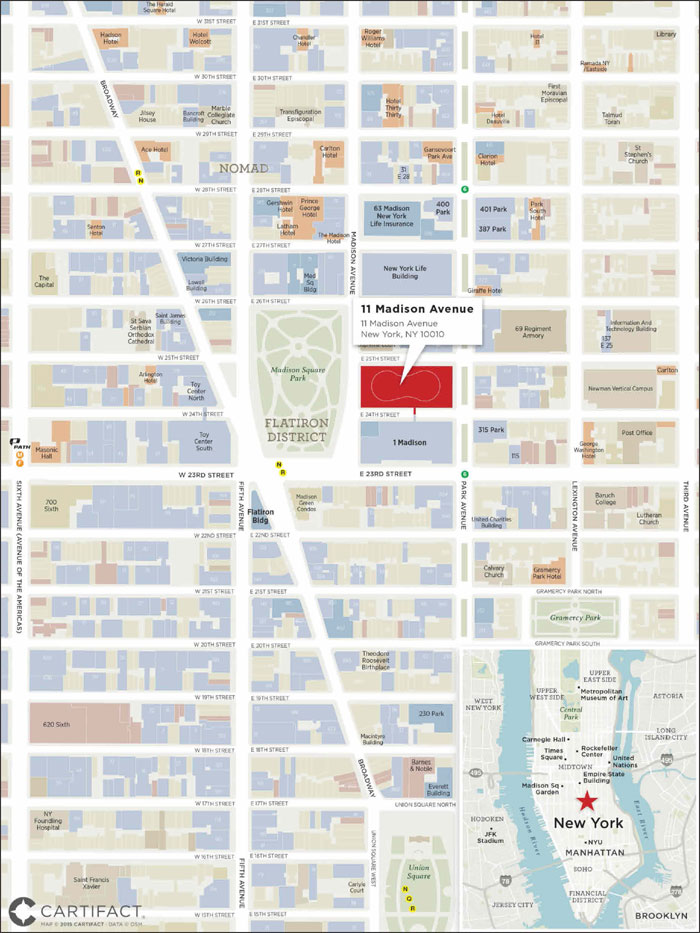
THE INFORMATION IN THIS STRUCTURAL AND COLLATERAL TERM SHEET IS NOT COMPLETE AND MAY BE AMENDED PRIOR TO THE TIME OF SALE. THIS TERM SHEET IS NOT AN OFFER TO SELL THESE SECURITIES AND IT IS NOT A SOLICITATION OF AN OFFER TO BUY THESE SECURITIES IN ANY JURISDICTION WHERE THE OFFER OR SALE IS NOT PERMITTED.
| 51 |
1209 DeKalb Avenue Brooklyn, NY 11221 | Collateral Asset Summary – Loan No. 4 1209 DeKalb | Cut-off Date Balance: Cut-off Date LTV: U/W NCF DSCR: U/W NOI Debt Yield: | $46,000,000 72.3% 1.48x 7.1% |
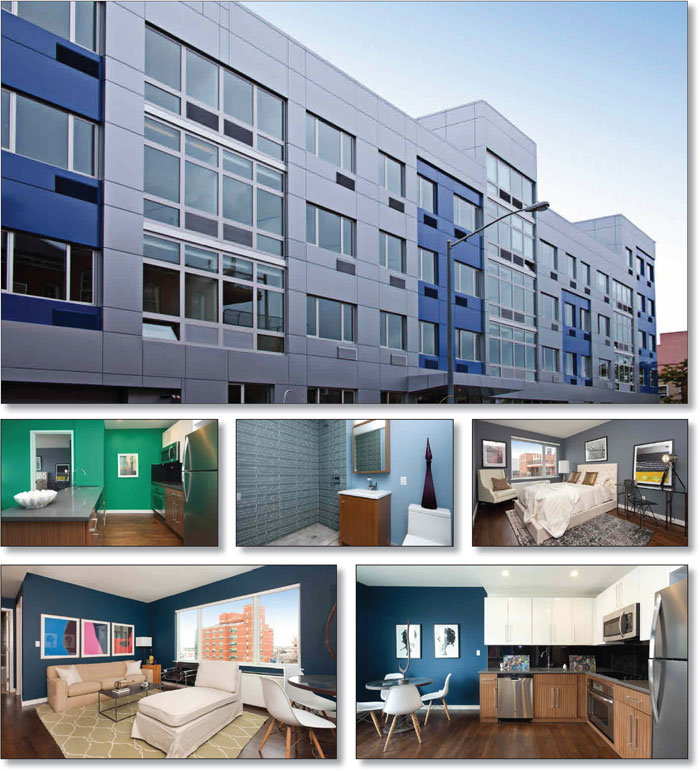
THE INFORMATION IN THIS STRUCTURAL AND COLLATERAL TERM SHEET IS NOT COMPLETE AND MAY BE AMENDED PRIOR TO THE TIME OF SALE. THIS TERM SHEET IS NOT AN OFFER TO SELL THESE SECURITIES AND IT IS NOT A SOLICITATION OF AN OFFER TO BUY THESE SECURITIES IN ANY JURISDICTION WHERE THE OFFER OR SALE IS NOT PERMITTED.
| 52 |
1209 DeKalb Avenue Brooklyn, NY 11221 | Collateral Asset Summary – Loan No. 4 1209 DeKalb | Cut-off Date Balance: Cut-off Date LTV: U/W NCF DSCR: U/W NOI Debt Yield: | $46,000,000 72.3% 1.48x 7.1% |
| Mortgage Loan Information | |
| Loan Seller: | LCF |
| Loan Purpose: | Refinance |
| Sponsor: | Joshua Crane; Robert Schwartz |
| Borrower: | Spruce 1209 LLC |
| Original Balance: | $46,000,000 |
| Cut-off Date Balance: | $46,000,000 |
| % by Initial UPB: | 4.8% |
| Interest Rate: | 4.7250% |
| Payment Date: | 6thof each month |
| First Payment Date: | November 6, 2015 |
| Maturity Date: | October 6, 2020 |
| Amortization: | Interest Only |
| Additional Debt(1)(2): | $8,500,000 Mezzanine Debt; Future Mezzanine Debt Permitted |
| Call Protection: | L(25), D(28), O(7) |
| Lockbox / Cash Management: | Soft / In-Place |
| Reserves(3) | ||
| Initial | Monthly | |
| Taxes: | $8,430 | $1,686 |
| Insurance: | $45,402 | $5,675 |
| Replacement: | $0 | $2,117 |
| Prepaid Rent: | $93,227 | NAP |
| Financial Information | ||
| Mortgage Loan | Total Debt | |
| Cut-off Date Balance / Unit: | $362,205 | $429,134 |
| Balloon Balance / Unit: | $362,205 | $429,134 |
| Cut-off Date LTV: | 72.3% | 85.7% |
| Balloon LTV: | 72.3% | 85.7% |
| Underwritten NOI DSCR: | 1.49x | 1.09x |
| Underwritten NCF DSCR: | 1.48x | 1.08x |
| Underwritten NOI Debt Yield: | 7.1% | 6.0% |
| Underwritten NCF Debt Yield: | 7.1% | 6.0% |
| Underwritten NOI Debt Yield at Balloon: | 7.1% | 6.0% |
| Underwritten NCF Debt Yieldat Balloon: | 7.1% | 6.0% |
| Property Information | ||
| Single Asset / Portfolio: | Single Asset | |
| Property Type: | Mid-Rise Multifamily | |
| Collateral: | Fee Simple | |
| Location: | Brooklyn, NY | |
| Year Built / Renovated: | 2013 / NAP | |
| Total Units: | 127 | |
| Property Management: | Rizaro Management LLC | |
| Underwritten NOI(4): | $3,276,662 | |
| Underwritten NCF: | $3,251,262 | |
| “As-is” Appraised Value: | $63,600,000 | |
| “As-is” Appraisal Date: | August 10, 2015 | |
| Historical NOI(5) | ||
| Most Recent NOI: | $2,768,829 (T-12 August 31, 2015) | |
| 2014 NOI: | NAP | |
| 2013 NOI: | NAP | |
| 2012 NOI: | NAP | |
| Historical Occupancy(5) | ||
| Current Occupancy: | 99.2% (September 14, 2015) | |
| 2014 Occupancy: | 90.6% (December 31, 2014) | |
| 2013 Occupancy: | NAP | |
| 2012 Occupancy: | NAP | |
| (1) | See “Current Mezzanine or Subordinate Indebtedness” herein. |
| (2) | See “Future Mezzanine or Subordinate Indebtedness Permitted” herein. |
| (3) | See “Initial Reserves” and “Ongoing Reserves” herein. |
| (4) | The increase in Underwritten NOI from T-12 8/31/2015 cash flows represent the lease-up of the 1209 DeKalb Property. |
| (5) | The 1209 DeKalb Property was acquired by the sponsor vacant in 2014 and as a result no prior operating history is available. |
THE INFORMATION IN THIS STRUCTURAL AND COLLATERAL TERM SHEET IS NOT COMPLETE AND MAY BE AMENDED PRIOR TO THE TIME OF SALE. THIS TERM SHEET IS NOT AN OFFER TO SELL THESE SECURITIES AND IT IS NOT A SOLICITATION OF AN OFFER TO BUY THESE SECURITIES IN ANY JURISDICTION WHERE THE OFFER OR SALE IS NOT PERMITTED.
| 53 |
1209 DeKalb Avenue Brooklyn, NY 11221 | Collateral Asset Summary – Loan No. 4 1209 DeKalb | Cut-off Date Balance: Cut-off Date LTV: U/W NCF DSCR: U/W NOI Debt Yield: | $46,000,000 72.3% 1.48x 7.1% |
The Loan. The 1209 DeKalb Loan (the “1209 DeKalb Loan”) is a fixed rate loan secured by the borrower’s fee simple interest in a mid-rise multifamily property consisting of 127 residential apartments and a 46-car parking lot, located at 1209 DeKalb Avenue in Brooklyn, New York (the “1209 DeKalb Property”) and has an original principal balance of $46.0 million. The 1209 DeKalb Loan has a 5-year term and pays interest only for the term of the loan. The 1209 DeKalb Loan accrues interest at a fixed rate equal to 4.7250%per annumand has a cut-off date balance of $46.0 million. Based on the appraised value of $63.6 million as of August 10, 2015, the cut-off date LTV ratio is 72.3%. The most recent prior financing of the 1209 DeKalb Property was not included in a securitization.
Loan proceeds, along with an $8.5 million mezzanine loan, were used to retire existing debt of approximately $42.5 million, pay closing costs of approximately $0.6 million and fund upfront reserves of approximately $0.1 million, giving the borrower a return of equity of approximately $11.3 million.
| Sources and Uses | ||||||
| Sources | Proceeds | % of Total | Uses | Proceeds | % of Total | |
| Mortgage Loan | $46,000,000 | 84.4% | Loan Payoff | $42,463,745 | 77.9% | |
| Mezzanine Loan | $8,500,000 | 15.6% | Closing Costs | $635,128 | 1.2% | |
| Reserves | $147,060 | 0.3% | ||||
| Return of Equity | $11,254,068 | 20.6% | ||||
| Total Sources | $54,500,000 | 100.0% | Total Uses | $54,500,000 | 100.0% | |
The Borrower / Sponsor. The borrower, Spruce 1209 LLC, is a single-purpose Delaware limited liability company structured to be bankruptcy-remote, with two independent directors in its organizational structure. The sponsors of the borrower and the nonrecourse carve-out guarantors are Joshua Crane and Robert Schwartz.
The sponsors of the 1209 DeKalb Loan, Joshua Crane and Robert Schwartz are principals of Spruce Capital Partners (“Spruce Capital”). Spruce Capital was founded in 2007 and has experience in construction, financing and acquisitions in New York, New York.
The Property. The 1209 DeKalb Property consists of a five-story, Class A mid-rise apartment building located in the Bushwick neighborhood of Brooklyn, New York. The 1209 DeKalb Property was constructed in 2012 and contains 127 residential apartments and a 46-car parking lot. Amenities include bicycle storage, on-site storage, a screening room, billiards room, wet bar, fitness center, art gallery, laundry center, roof terrace, and doorman. Residents have access to have 46 secured parking spaces with an on-site Zipcar. In addition, each apartment contains washer/dryer connections, stainless steel appliances, and condo-quality finishes. As of September 14, 2015, the 1209 DeKalb Property is 99.2% occupied. A breakdown of the residential apartment mix is presented in the below chart.
| Unit Mix Summary(1) | ||||||
| Unit Type | # of Units | % of Total | Occupancy | Average Unit Size | Average Monthly Rental Rate | Average Monthly Rental Rate PSF |
| Studio | 16 | 12.6% | 100.0% | 445 | $2,088 | $56.32 |
| 1 BD | 67 | 52.8% | 100.0% | 594 | $2,439 | $49.26 |
| 2 BD | 44 | 34.6% | 97.7% | 947 | $3,318 | $42.06 |
| Total / Wtd. Avg. | 127 | 100.0% | 99.2% | 697 | $2,698 | $46.36 |
| (1) | Based on a rent roll dated September 14, 2015. |
Environmental Matters. The Phase I environmental report dated August 21, 2015 recommended no further action at the 1209 DeKalb Property.
The Market. The 1209 DeKalb Property is located in the Bushwick neighborhood of Brooklyn within Kings County, New York. The 1209 DeKalb Property is located three blocks from the J train on Broadway and four blocks from the M train on Myrtle Avenue. Additionally, the 1209 DeKalb Property is within close proximity to the Myrtle Avenue station at Broadway, which includes the J, M and Z trains which run west to the Lower East Side and Downtown Manhattan in approximately 20 minutes.
According to the appraisal, the median home value in 1209 DeKalb Property’s neighborhood is $547,498 and there are 31,487 households. From 2010-2014 the Kings County population has grown by 1.14%. Estimated average household income in Kings County for 2015 was reported to be $68,494. As of the second quarter of 2015, average asking rental rates appreciated by 2.3% with average rents listed at $2,012 in Kings County.
The 1209 DeKalb Property is well situated within the neighborhood with respect to residential demand drivers such as schools, municipalities, public space, and retail centers. There are three local schools in the area which are located within 0.1 miles of the 1209 DeKalb Property. In addition, the 1209 DeKalb Property is located 1.6 miles from Interfaith Medical Center, which is a multi-site community teaching health care system. The 1209 DeKalb Property is in close proximity to Bushwick’s main retail corridor, which is
THE INFORMATION IN THIS STRUCTURAL AND COLLATERAL TERM SHEET IS NOT COMPLETE AND MAY BE AMENDED PRIOR TO THE TIME OF SALE. THIS TERM SHEET IS NOT AN OFFER TO SELL THESE SECURITIES AND IT IS NOT A SOLICITATION OF AN OFFER TO BUY THESE SECURITIES IN ANY JURISDICTION WHERE THE OFFER OR SALE IS NOT PERMITTED.
| 54 |
1209 DeKalb Avenue Brooklyn, NY 11221 | Collateral Asset Summary – Loan No. 4 1209 DeKalb | Cut-off Date Balance: Cut-off Date LTV: U/W NCF DSCR: U/W NOI Debt Yield: | $46,000,000 72.3% 1.48x 7.1% |
located along Broadway, Myrtle Avenue, and Knickerbocker Avenue. The tenants mostly comprise of local retailers, bars, and restaurants. The 1209 DeKalb Property is located 0.6 miles from C-Town Supermarket, and 0.3 miles from Family Dollar.
The chart below shows a comparison of the competitive set:
| Competitive Set(1) | |||||||
| Name | 1209 DeKalb Property | 1433 DeKalb Avenue | 114 Troutman Street | 1610 DeKalb Avenue | 74 Maujer Street | 100 Maspeth Avenue | |
| Distance from Subject | NAP | 0.4 miles | 0.4 miles | 0.7 miles | 1.7 miles | 1.8 miles | |
| Year Built / Renovated | 2013 | 2014 | 2006 | 2005 | 2014 | 2007 | |
| No. of Units | 127(2) | 28 | 144 | 24 | 40 | 87 | |
| Unit Size (Sq. Ft.) | 427 – 1,074(2) | 549 | 500 – 930 | 656 | 600– 1,000 | 453 – 728 | |
| Rent/Unit | $1,995 - $3,950(2) | $2,444 | $2,570 - $3,200 | $2,095 | $2,599 – $4,199 | $2,250 - $3,575 | |
| Annual Rent PSF | $46.36(2) | $53.42 | $41.29 - $61.68 | $38.32 | $42.84 - $51.98 | $58.93 - $62.35 | |
| (1) | Source: Appraisal |
| (2) | Based on a rent roll dated September 14, 2015 |
Cash Flow Analysis.
| Cash Flow Analysis(1) | |||||
| T-12 8/31/2015 | U/W | U/W per Unit | |||
| Gross Potential Rent(2) | $3,440,698 | $4,111,434 | $32,373 | ||
| Other Income | 133,521 | 154,416 | 1,216 | ||
| Less: Residential Vacancy(3) | 0 | (205,572) | (1,619) | ||
| Effective Gross Income | $3,574,218 | $4,060,279 | $31,971 | ||
| Total Operating Expenses(4) | 805,389 | 783,617 | 6,170 | ||
| Net Operating Income | $2,768,829 | $3,276,662 | $25,800 | ||
| Capital Expenditures | 0 | 25,400 | 200 | ||
| Net Cash Flow | $2,768,829 | $3,251,262 | $25,600 | ||
| (1) | The 1209 DeKalb Property was acquired vacant in 2014. |
| (2) | The increase in U/W Gross Potential Rent and U/W Net Operating Income from T-12 8/31/2015 cash flows represent the lease-up of the 1209 DeKalb Property. |
| (3) | U/W Residential Vacancy represents 5.0% of Gross Potential Rent. |
| (4) | The 1209 DeKalb Property is currently in its fourth year of its 421-A tax abatement. Lender’s U/W taxes of $20,641 represents the average abated taxes over a 5 year period. The 1209 DeKalb Property’s current actual taxes are $20,233. |
Property Management. The 1209 DeKalb Property is managed by Rizaro Management LLC, an affiliate of the borrower.
Lockbox / Cash Management. The 1209 DeKalb Loan is structured with a soft lockbox and in-place cash management. The borrower or manager is required to deposit all residential gross revenues into a clearing account within two business days of receipt. Funds deposited into the clearing account are required to be swept on a daily basis to the cash management account and applied in accordance with the loan documents. During the continuance of a Trigger Period (as defined below), excess cash after payment of debt service for the 1209 DeKalb Loan, reserve deposits, operating expenses (including management fees), default interest, late charges, and debt service for the mezzanine loan, shall be held by lender as additional collateral for the 1209 DeKalb Loan.
A “Trigger Period” will begin upon the occurrence of (i) an event of default or (ii) an event of default under the management agreement or (iii) the debt service coverage ratio falling below 1.05x on the aggregate of the loan and the mezzanine loan and will end upon (a) with respect to clause (i) and (ii), the date the event of default has been cured and (b) with respect to clause (iii), the date that the debt service coverage ratio is calculated to be 1.05x or greater on the aggregate of the loan and the mezzanine loan for two consecutive calendar quarters.
Initial Reserves. At closing, the borrower deposited (i) $8,430 into a tax reserve account, (ii) $45,402 into an insurance reserve account and (iii) $93,227 into a prepaid rent reserve.
Ongoing Reserves. On a monthly basis, the borrower is required to deposit reserves of (i) 1/12 of the estimated annual real estate taxes, which currently equates to $1,686, into a tax reserve account, (ii) 1/12 of the annual insurance premiums, which currently equates to $5,675, into an insurance reserve account, and (iii) $2,117 ($200 per unit annually) into a replacement reserve account.
THE INFORMATION IN THIS STRUCTURAL AND COLLATERAL TERM SHEET IS NOT COMPLETE AND MAY BE AMENDED PRIOR TO THE TIME OF SALE. THIS TERM SHEET IS NOT AN OFFER TO SELL THESE SECURITIES AND IT IS NOT A SOLICITATION OF AN OFFER TO BUY THESE SECURITIES IN ANY JURISDICTION WHERE THE OFFER OR SALE IS NOT PERMITTED.
| 55 |
1209 DeKalb Avenue Brooklyn, NY 11221 | Collateral Asset Summary – Loan No. 4 1209 DeKalb | Cut-off Date Balance: Cut-off Date LTV: U/W NCF DSCR: U/W NOI Debt Yield: | $46,000,000 72.3% 1.48x 7.1% |
Current Mezzanine or Subordinate Indebtedness. An $8,500,000 mezzanine loan was funded concurrently with the funding of the 1209 DeKalb Loan. The mezzanine loan is coterminous with the 1209 DeKalb Loan, accrues interest at a rate of 9.3750%per annumand is interest-only for the term of the mezzanine loan. The mezzanine borrower under the mezzanine loan is Spruce 1209 MEZZ LLC. The current holder of the mezzanine loan is SMHF Cayman Hotel, LLC.
Future Mezzanine or Subordinate Indebtedness Permitted. If the mezzanine loan shall be repaid in full during the term of the 1209 DeKalb Loan, the mezzanine borrower shall have the right to obtain mezzanine financing (the “Permitted Mezzanine Loan”) provided that certain conditions precedent are satisfied, including the following: (a) no default or event of default shall have occurred and be continuing or shall occur solely as a result of such Permitted Mezzanine Loan, (b) the term of the Permitted Mezzanine Loan shall be coterminous with the 1209 DeKalb Loan, and all other terms, provisions and conditions of the Permitted Mezzanine Loan shall be acceptable to lender and the rating agencies (c) the aggregate loan-to-value ratio of the 1209 DeKalb Loan and the Permitted Mezzanine Loan shall be no greater than the aggregate loan-to-value ratio of the 1209 DeKalb Loan and Permitted Mezzanine Loan as of the closing date of the 1209 DeKalb Loan, (d) the Permitted Mezzanine Loan shall be made by a Permitted Mezzanine Loan lender reasonably acceptable to Lender and the rating agencies, (e) the Permitted Mezzanine Loan lender shall enter into an intercreditor agreement in form and substance reasonably acceptable to lender and the rating agencies and (f) lender shall have received a rating agency confirmation as to the Permitted Mezzanine Loan.
THE INFORMATION IN THIS STRUCTURAL AND COLLATERAL TERM SHEET IS NOT COMPLETE AND MAY BE AMENDED PRIOR TO THE TIME OF SALE. THIS TERM SHEET IS NOT AN OFFER TO SELL THESE SECURITIES AND IT IS NOT A SOLICITATION OF AN OFFER TO BUY THESE SECURITIES IN ANY JURISDICTION WHERE THE OFFER OR SALE IS NOT PERMITTED.
| 56 |
1209 DeKalb Avenue Brooklyn, NY 11221 | Collateral Asset Summary – Loan No. 4 1209 DeKalb | Cut-off Date Balance: Cut-off Date LTV: U/W NCF DSCR: U/W NOI Debt Yield: | $46,000,000 72.3% 1.48x 7.1% |
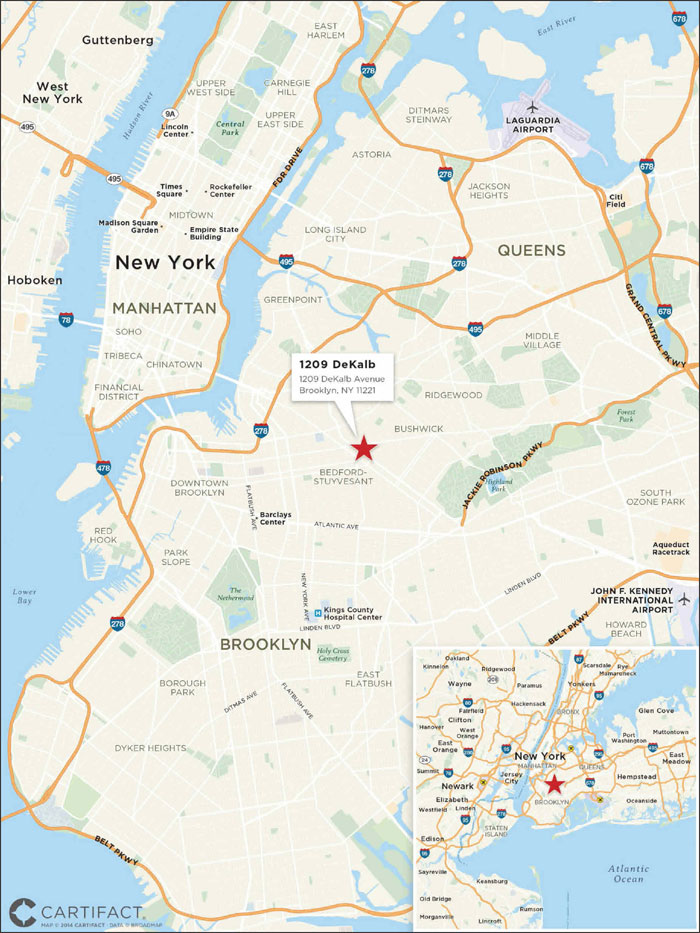
THE INFORMATION IN THIS STRUCTURAL AND COLLATERAL TERM SHEET IS NOT COMPLETE AND MAY BE AMENDED PRIOR TO THE TIME OF SALE. THIS TERM SHEET IS NOT AN OFFER TO SELL THESE SECURITIES AND IT IS NOT A SOLICITATION OF AN OFFER TO BUY THESE SECURITIES IN ANY JURISDICTION WHERE THE OFFER OR SALE IS NOT PERMITTED.
| 57 |
| 1127 Wilshire Boulevard Los Angeles, CA 90017 | Collateral Asset Summary – Loan No. 5 Good Samaritan Medical Tower | Cut-off Date Balance: Cut-off Date LTV: U/W NCF DSCR: U/W NOI Debt Yield: | $42,700,000 62.8% 1.96x 9.7% |
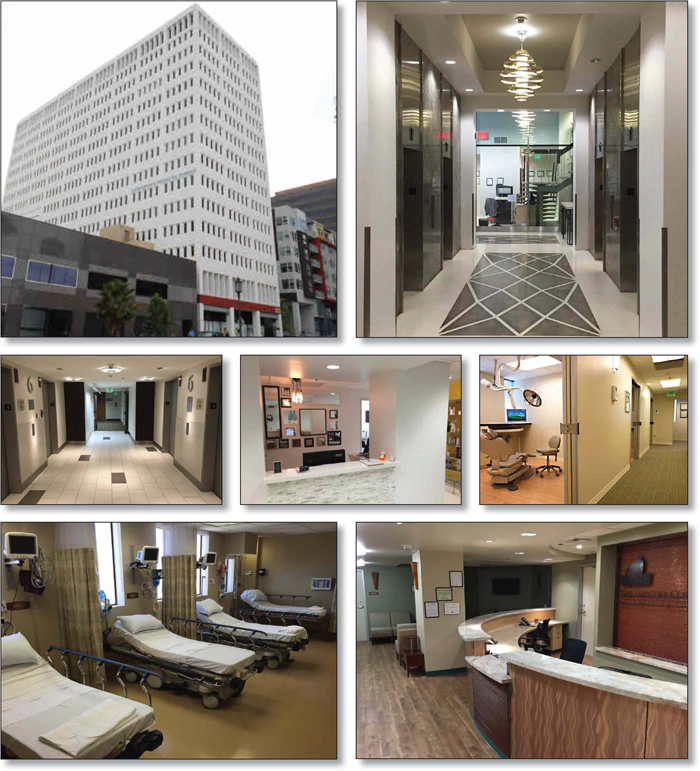
THE INFORMATION IN THIS STRUCTURAL AND COLLATERAL TERM SHEET IS NOT COMPLETE AND MAY BE AMENDED PRIOR TO THE TIME OF SALE. THIS TERM SHEET IS NOT AN OFFER TO SELL THESE SECURITIES AND IT IS NOT A SOLICITATION OF AN OFFER TO BUY THESE SECURITIES IN ANY JURISDICTION WHERE THE OFFER OR SALE IS NOT PERMITTED.
| 58 |
| 1127 Wilshire Boulevard Los Angeles, CA 90017 | Collateral Asset Summary – Loan No. 5 Good Samaritan Medical Tower | Cut-off Date Balance: Cut-off Date LTV: U/W NCF DSCR: U/W NOI Debt Yield: | $42,700,000 62.8% 1.96x 9.7% |
| Mortgage Loan Information | |
| Loan Seller: | GACC |
| Loan Purpose: | Refinance |
| Sponsor: | Edward G. Hudson |
| Borrower: | Los Angeles Medical, LLC |
| Original Balance: | $42,700,000 |
| Cut-off Date Balance: | $42,700,000 |
| % by Initial UPB: | 4.4% |
| Interest Rate: | 4.5400% |
| Payment Date: | 6thof each month |
| First Payment Date: | October 6, 2015 |
| Maturity Date: | September 6, 2025 |
| Amortization: | Interest Only |
| Additional Debt(1): | Future Mezzanine Debt Permitted |
| Call Protection: | L(12), YM2(103), O(5) |
| Lockbox / Cash Management: | Springing Soft / Springing |
| Reserves(2) | ||
| Initial | Monthly | |
| Taxes: | $73,631 | $12,272 |
| Insurance: | $0 | Springing |
| Replacement: | $0 | $3,049 |
| TI/LC: | $0 | $21,953 |
| Required Repairs: | $25,200 | NAP |
| Suite 800 Lease: | $452,542 | $0 |
| Elevator Upgrade: | $300,000 | $0 |
| Free Rent: | $275,931 | $0 |
| Financial Information | ||
| Cut-off Date Balance / Sq. Ft.: | $292 | |
| Balloon Balance / Sq. Ft.: | $292 | |
| Cut-off Date LTV: | 62.8% | |
| Balloon LTV: | 62.8% | |
| Underwritten NOI DSCR: | 2.11x | |
| Underwritten NCF DSCR: | 1.96x | |
| Underwritten NOI Debt Yield: | 9.7% | |
| Underwritten NCF Debt Yield: | 9.0% | |
| Underwritten NOI Debt Yield at Balloon: | 9.7% | |
| Underwritten NCF Debt Yield at Balloon: | 9.0% | |
| Property Information | |
| Single Asset / Portfolio: | Single Asset |
| Property Type: | Medical Office |
| Collateral: | Fee Simple |
| Location: | Los Angeles, CA |
| Year Built / Renovated: | 1965 / 2014 |
| Total Sq. Ft.: | 146,354 |
| Property Management: | Boulevard Investment Group, Inc. |
| Underwritten NOI: | $4,156,772 |
| Underwritten NCF: | $3,856,746 |
| Appraised Value: | $68,000,000 |
| Appraisal Date: | July 23, 2015 |
| Historical NOI | |
| Most Recent NOI: | $3,677,311 (T-12 April 30, 2015) |
| 2014 NOI: | $3,508,915 (December 31, 2014) |
| 2013 NOI: | $3,638,309 (December 31, 2013) |
| 2012 NOI: | $3,240,497 (December 31, 2012) |
| Historical Occupancy | |
| Most Recent Occupancy(3): | 90.4% (September 1, 2015) |
| 2014 Occupancy: | 85.2% (December 31, 2014) |
| 2013 Occupancy: | 85.3% (December 31, 2013) |
| 2012 Occupancy: | 82.5% (December 31, 2012) |
| (1) | See “Future Mezzanine or Subordinate Indebtedness Permitted” herein. |
| (2) | See “Initial Reserves” and “Ongoing Reserves” herein. |
| (3) | Most Recent Occupancy includes a 3,920 sq. ft. expansion space for University of Southern California which, if executed, is anticipated to commence in January 2016. As of October 2015, the sponsor is finalizing negotiations with the tenant and the lease has not been executed. At closing, $452,542 was deposited into a Suite 800 Lease Funds reserve account as additional collateral pending the execution of the University of Southern California expansion lease, of which $130,771 represents one year of lease payments for the tenant and $321,771 is being held for tenant improvements and leasing commissions for the expansion space. |
THE INFORMATION IN THIS STRUCTURAL AND COLLATERAL TERM SHEET IS NOT COMPLETE AND MAY BE AMENDED PRIOR TO THE TIME OF SALE. THIS TERM SHEET IS NOT AN OFFER TO SELL THESE SECURITIES AND IT IS NOT A SOLICITATION OF AN OFFER TO BUY THESE SECURITIES IN ANY JURISDICTION WHERE THE OFFER OR SALE IS NOT PERMITTED.
| 59 |
| 1127 Wilshire Boulevard Los Angeles, CA 90017 | Collateral Asset Summary – Loan No. 5 Good Samaritan Medical Tower | Cut-off Date Balance: Cut-off Date LTV: U/W NCF DSCR: U/W NOI Debt Yield: | $42,700,000 62.8% 1.96x 9.7% |
| Tenant Summary | |||||||
Tenant | Ratings (Fitch/Moody’s/S&P)(1) | Net Rentable Area (Sq. Ft.) | % of Net Rentable Area |
| Annual U/W Base Rent PSF | % of Total U/W Base Rent | Lease Expiration |
| University of Southern California(2) | NR/Aa1/AA | 14,605 | 10.0% | $33.16 | 10.2% | Various | |
| United Imaging, LLC(3) | NR/NR/NR | 8,824 | 6.0% | $35.13 | 6.5% | 1/31/2021 | |
| Samaritan Tower Surgery Center, LLC(4) | NR/NR/NR | 7,847 | 5.4% | $51.19 | 8.4% | 9/30/2026 | |
| Retina Vitreous Associates(5) | NR/NR/NR | 6,404 | 4.4% | $40.91 | 5.5% | 3/31/2016 | |
| Boulevard Medical Properties | NR/NR/NR | 5,412 | 3.7% | $37.75 | 4.3% | 6/30/2018 | |
| Total Major Tenants | 43,092 | 29.4% | $38.57 | 34.9% | |||
| Remaining Tenants | 89,171 | 60.9% | $34.84 | 65.1% | |||
| Total Occupied Collateral | 132,263 | 90.4% | $36.06 | 100.0% | |||
| Vacant | 14,091 | 9.6% | |||||
| Total | 146,354 | 100.0% | |||||
| (1) | Certain ratings may be those of the parent company whether or not the parent company guarantees the lease. |
| (2) | The University of Southern California space includes leases for 8,037 sq. ft. that expire in February 2023, 2,648 sq. ft. that expire in February 2024 and the expansion lease that is being negotiated for 3,920 sq. ft. is expected to have a December 2024 expiration date. The first year of rent ($130,771) for the expansion space was deposited into a Suite 800 reserve at closing, along with $321,771 for tenant improvements and leasing commissions in connection with such space. With respect to the lease of 2,648 sq. ft. of space, the tenant has two five-year extension options and a one-time right to terminate its lease in March 2019, upon at least six months’ notice and payment of an amount equal to the unamortized portion of the tenant improvements. |
| (3) | United Imaging, LLC has two five-year extension options each upon written notice at least six months prior to the lease expiration date of January 31, 2021. The tenant has no termination options. |
| (4) | Samaritan Tower Surgery Center, LLC has two five-year extension options each upon written notice at least six months prior to the lease expiration date of September 30, 2026. The tenant has no termination options. |
| (5) | Retina Vitreous Associates has two five-year extension options. |
| Lease Rollover Schedule(1) | ||||||||
| Year | # of Leases Expiring | Total Expiring Sq. Ft. | % of Total Sq. Ft. Expiring | Cumulative Sq. Ft. Expiring | Cumulative % of Sq. Ft. Expiring | Annual Rent PSF | % U/W Rolling | Cumulative % of U/W Base Rent |
| MTM | 1 | 529 | 0.4% | 529 | 0.4% | $33.36 | 0.4% | 0.4% |
| 2015 | 0 | 0 | 0.0% | 529 | 0.4% | $0.00 | 0.0% | 0.4% |
| 2016 | 11 | 19,616 | 13.4% | 20,145 | 13.8% | $38.52 | 15.8% | 16.2% |
| 2017 | 5 | 8,350 | 5.7% | 28,495 | 19.5% | $34.07 | 6.0% | 22.2% |
| 2018 | 9 | 17,803 | 12.2% | 46,298 | 31.6% | $34.80 | 13.0% | 35.2% |
| 2019 | 9 | 15,538 | 10.6% | 61,836 | 42.3% | $35.40 | 11.5% | 46.7% |
| 2020 | 9 | 11,970 | 8.2% | 73,806 | 50.4% | $35.77 | 9.0% | 55.7% |
| 2021 | 7 | 18,722 | 12.8% | 92,528 | 63.2% | $33.51 | 13.2% | 68.8% |
| 2022 | 1 | 812 | 0.6% | 93,340 | 63.8% | $36.45 | 0.6% | 69.5% |
| 2023 | 5 | 11,295 | 7.7% | 104,635 | 71.5% | $32.64 | 7.7% | 77.2% |
| 2024 | 2 | 6,568 | 4.5% | 111,203 | 76.0% | $34.35 | 4.7% | 81.9% |
| 2025 | 3 | 4,744 | 3.2% | 115,947 | 79.2% | $31.60 | 3.1% | 85.1% |
| Thereafter | 4 | 16,316 | 11.1% | 132,263 | 90.4% | $43.66 | 14.9% | 100.0% |
| Vacant | NAP | 14,091 | 9.6% | 146,354 | 100.0% | NAP | NAP | |
| Total / Wtd. Avg. | 66 | 146,354 | 100.0% | $36.06 | 100.0% | |||
| (1) | Certain tenants have lease termination options that may become exercisable prior to the originally stated expiration date of the tenant lease that are not considered in the lease rollover schedule. |
The Loan. The Good Samaritan Medical Tower loan (the “Good Samaritan Medical Tower Loan”) is a fixed rate loan secured by the borrower’s fee simple interest in a Class A medical office building totaling 146,354 sq. ft. located in Los Angeles, California (the “Good Samaritan Medical Tower Property”) with an original principal balance of $42.7 million. The Good Samaritan Medical Tower Loan has a 10-year term and is interest only for the entire term. The Good Samaritan Medical Tower Loan accrues interest at a fixed rate equal to 4.5400% and has a cut-off date balance of $42.7 million. Loan proceeds were used to retire existing debt of approximately $32.5 million, fund upfront reserves of approximately $1.1 million, pay closing costs of approximately $0.4 million and return equity of approximately $8.6 million to the borrower. Based on the appraised value of $68.0 million as of July 23, 2015, the cut-off date LTV ratio is 62.8%. The most recent prior financing of the Good Samaritan Medical Tower Property was included in the MLMT 2005-LC1 securitization.
THE INFORMATION IN THIS STRUCTURAL AND COLLATERAL TERM SHEET IS NOT COMPLETE AND MAY BE AMENDED PRIOR TO THE TIME OF SALE. THIS TERM SHEET IS NOT AN OFFER TO SELL THESE SECURITIES AND IT IS NOT A SOLICITATION OF AN OFFER TO BUY THESE SECURITIES IN ANY JURISDICTION WHERE THE OFFER OR SALE IS NOT PERMITTED.
| 60 |
| 1127 Wilshire Boulevard Los Angeles, CA 90017 | Collateral Asset Summary – Loan No. 5 Good Samaritan Medical Tower | Cut-off Date Balance: Cut-off Date LTV: U/W NCF DSCR: U/W NOI Debt Yield: | $42,700,000 62.8% 1.96x 9.7% |
| Sources and Uses | ||||||
| Sources | Proceeds | % of Total | Uses | Proceeds | % of Total | |
| Mortgage Loan | $42,700,000 | 100.0% | Loan Payoff | $32,525,145 | 76.2% | |
| Reserves | $1,127,305 | 2.6% | ||||
| Closing Costs | $425,176 | 1.0% | ||||
| Return of Equity | $8,622,375 | 20.2% | ||||
| Total Sources | $42,700,000 | 100.0% | Total Uses | $42,700,000 | 100.0% | |
The Borrower / Sponsor. The borrower, Los Angeles Medical, LLC is a special purpose Delaware limited liability company structured to be bankruptcy-remote, with two independent directors in its organizational structure. The sponsor of the borrower and non-recourse carve-out guarantor is Edward G. Hudson.
Edward G. Hudson is the President of Boulevard Investment Group, Inc, a private owner of medical office space in Los Angeles. Prior to joining Boulevard Investment Group, Inc., Mr. Hudson was the co-founder of Westway Properties, a Los Angeles-based real estate development firm.
The Property. The Good Samaritan Medical Tower Property is located in Los Angeles, California on Wilshire Boulevard. Constructed in 1965 and renovated in 2014, the Good Samaritan Medical Tower Property consists of a single 15-story Class A medical office building totaling 146,354 sq. ft. The 2014 renovation included common area upgrades, lobby upgrades, a new roof system and new fire and security systems. The Good Samaritan Medical Tower Property includes 330 parking spaces, which equates to a ratio of 2.25 spaces per 1,000 sq. ft., located in the adjacent 7-level parking garage connected to the office building. The Good Samaritan Medical Tower Property is monitored by a third party security system and features surveillance cameras throughout the building and public areas, motion detectors and keycard access.
The Good Samaritan Medical Tower Property’s immediate area is comprised mostly of medical office buildings and low to high rise residential buildings. Located adjacent to the Good Samaritan Medical Tower Property is the Good Samaritan Hospital, a not-for-profit hospital founded in 1885 that is affiliated with both USC and UCLA Schools of Medicine. Each year, Good Samaritan Hospital admits approximately 17,000 patients and handles more than 93,500 outpatient visits, 4,000 deliveries and 8,000 surgeries across 18 surgical suites. Good Samaritan Hospital is also currently developing a new 193,000 sq. ft. Medical Pavilion directly west of the Good Samaritan Medical Tower Property which is anticipated to open in 2016 to help serve outpatient needs.
The Good Samaritan Medical Tower Property is 90.4% leased to 61 tenants. The granular rent roll features no tenant occupying greater than 10.0% of the net rentable area and 10.2% of the annual U/W base rent. Additionally, tenants representing 42.3% of the net rentable area have been in occupancy for more than 10 years.
Environmental Matters. The Phase I environmental report dated September 3, 2015 recommended no further action at the Good Samaritan Medical Tower Property.
Major Tenants.
University of Southern California dba USC Fertility(14,605 sq. ft.; 10.0% of NRA; 10.2% of U/W Base Rent; Aa1/AA by Moody’s/S&P) The University of Southern California Fertility Center (“USC Fertility”) is among the national leaders in research and scientific breakthroughs in the field of fertility. USC Fertility has made numerous advances in the field including offering expanded fertility treatment options for in-vitro fertilization, pioneering fertility preservation in the state of California, leading research which extends fertility for women of advanced maternal age, and has become one of the few fertility clinics with a proven track record in egg freezing. As a result, USC Fertility has earned a reputation as a leader in male infertility and female infertility throughout the world.
The University of Southern California has been at the Good Samaritan Medical Tower Property since 2003 and currently occupies three suites. Included in their square footage is a 3,920 sq. ft. expansion space which, if executed, is anticipated to commence in January 2016. As of October 2015, the sponsor is finalizing negotiations with the tenant and the lease has not been executed. At closing, $452,542 was deposited into a suite 800 lease funds reserve account, of which $130,771 is being held as additional collateral pending the execution of the expansion lease, and $321,771 is being held for tenant improvements and leasing commissions related to the expansion space. The leases for suite 1400, representing 4,900 sq. ft. and suite 1410, representing 3,137 sq. ft., have no renewal or termination options. Suite 1414, representing 2,648 sq. ft., has two five-year extension options and a one-time right to terminate the lease in March 2019, upon at least six months’ notice and payment of an amount equal to the unamortized portion of the tenant improvements.
United Imaging, LLC (8,824 sq. ft.; 6.0% of NRA; 6.5% of U/W Base Rent) United Imaging, LLC offers a full spectrum of radiology services including PET, MRI, Breast MRI, Breast Biopsy, CAT Scan, Nuclear Medicine, Thyroid Biopsy, Ultrasound, Digital
THE INFORMATION IN THIS STRUCTURAL AND COLLATERAL TERM SHEET IS NOT COMPLETE AND MAY BE AMENDED PRIOR TO THE TIME OF SALE. THIS TERM SHEET IS NOT AN OFFER TO SELL THESE SECURITIES AND IT IS NOT A SOLICITATION OF AN OFFER TO BUY THESE SECURITIES IN ANY JURISDICTION WHERE THE OFFER OR SALE IS NOT PERMITTED.
| 61 |
| 1127 Wilshire Boulevard Los Angeles, CA 90017 | Collateral Asset Summary – Loan No. 5 Good Samaritan Medical Tower | Cut-off Date Balance: Cut-off Date LTV: U/W NCF DSCR: U/W NOI Debt Yield: | $42,700,000 62.8% 1.96x 9.7% |
Mammography, Fluoroscopy, DEXA Scans and Digital X-Rays. United Imaging, LLC currently operates 18 locations providing outpatient imaging facilities.
United Imaging, LLC took occupancy at the Good Samaritan Medical Tower Property in 2001 and has expanded their lease premises twice since the initial start date. In addition, United Imaging, LLC has invested over $3.0 million of capital into the build-out of their space. The United Imaging, LLC lease expires in January 2021 and has two, five-year extension options. The tenant has no termination options.
Samaritan Tower Surgery Center, LLC (7,847 sq. ft.; 5.4% of NRA; 8.4% of U/W Base Rent) Samaritan Tower Surgery Center, LLC is leased by Dr. Jorge Minor and John Kowalczyk, who both guarantee the lease. Dr. Minor is the Medical Director at LA Pain & Wellness Institute. Dr. Minor is board certified in Physical Medicine and Rehabilitation, Pain Management and Interventional Pain Medicine.
Samaritan Tower Surgery Center, LLC took occupancy at the Good Samaritan Medical Tower Property in 2014 and invested approximately $2.0 million of capital into their space. The Samaritan Tower Surgery Center, LLC lease expires in September 2026 and has two, five-year extension options remaining. The tenant has no termination options.
The Market. The Good Samaritan Medical Tower Property is located in the city of Los Angeles in the Downtown Los Angeles office submarket. Located adjacent to the Good Samaritan Medical Tower Property is the Good Samaritan Hospital, a 408-bed hospital which serves the Greater Downtown Los Angeles Area. Good Samaritan Hospital supports six award-winning medical centers that focus on advancing medical science while also providing patient care. The centers include the Heart & Vascular Center, Good Samaritan Hospital Orthopaedic Center, Tertiary Retinal Surgery, Pancreatico-Biliary Program, Transfusion-Free Medicine & Surgery Center, and the Davajan-Cabal Center for Perinatal Medicine. The Good Samaritan Hospital is also currently developing an approximately $109.0 million outpatient facility adjacent to the Good Samaritan Medical Tower Property that will feature patient lobbies, radiation oncology, pharmacy, imaging services and a café on the first floor. The outpatient facility is anticipated to be completed in 2016.
The Good Samaritan Medical Tower Property benefits from a surrounding amenity base in Downtown Los Angeles including the STAPLES Center, LA Live and the Los Angeles Convention Center. The LA Live campus is an entertainment campus with a 54-story JW Marriott and Ritz Carlton convention center hotel as its centerpiece. Other notable improvements on the LA Live Campus include the 7,100 sq. ft. Nokia Theater, 18 restaurants totaling 115,000 sq. ft. and the Grammy Museum. The Downtown Los Angeles area has also experienced residential development in recent years. Notable residential developments in the area include 6th Street and Bixel Street, a 648-apartment project currently under construction in close proximity to the Good Samaritan Medical Tower Property and a 700-unit apartment complex under construction at 8th Street and Grand Avenue.
The Downtown Los Angeles Office submarket totaled approximately 31.8 million sq. ft. of rentable area as of Q1 2015 and had an 18.1% vacancy rate and an average asking rent of $35.64 PSF. Within the Downtown Los Angeles Office submarket, as of Q1 2015 medical offices comprised approximately 1.4 million sq. ft. and had a direct vacancy rate of 7.6% with an average asking rent of $28.58 PSF.
The appraiser analyzed recent leases negotiated in competitive buildings in the marketplace, ranging in size from 1,211 sq. ft. to 4,777 sq. ft. The comparable leases exhibited a range in rents from $27.00 to $38.40 PSF, with an average price of $30.66 PSF.
Based on an analysis of five comparable properties and the Good Samaritan Medical Tower Property’s recent leasing, the appraiser determined a market rent of $34.80 PSF for medical office space, $51.00 PSF for surgical suite space and $42.00 PSF for pharmacy space. The appraiser considers the following five comparable properties to constitute the Good Samaritan Medical Tower Property’s competitive set:
| Competitive Set(1) | |||||||
| Property Name | City, State | Occupancy | Total NRA (Sq. Ft.) | Lease Sq. Ft. | Rent PSF | Term (yrs.) | Lease Date |
| Good Samaritan Medical Tower Property | Los Angeles, CA | 90%(2) | 146,354(2) | Various | $36.06(2) | Various | Various |
| California Medical Center | Los Angeles, CA | 75% | 60,000 | 2,883 | $35.40 | 8.0 | May 2014 |
| Laker Medical Arts | Los Angeles, CA | 74% | 54,700 | 1,500 | $38.40 | 5.0 | July 2015 |
| Good Samaritan Medical | Los Angeles, CA | 100% | 91,391 | 1,216 | $27.60 | 1.0 | May 2014 |
| St. Vincent Professional Building | Los Angeles, CA | 97% | 110,923 | 1,211 | $27.00 | 7.0 | July 2015 |
| California Professional Center | Los Angeles, CA | 100% | 77,946 | 4,777 | $30.36 | 3.0 | April 2014 |
| Total / Wtd. Avg.(3) | 92% | 394,960 | 11,587 | $30.66 | 4.7 | ||
| (1) | Source: Appraisal. |
| (2) | Based on the rent roll dated September 1, 2015. |
| (3) | Total / Wtd. Avg. does not include the Good Samaritan Medical Tower Property. |
THE INFORMATION IN THIS STRUCTURAL AND COLLATERAL TERM SHEET IS NOT COMPLETE AND MAY BE AMENDED PRIOR TO THE TIME OF SALE. THIS TERM SHEET IS NOT AN OFFER TO SELL THESE SECURITIES AND IT IS NOT A SOLICITATION OF AN OFFER TO BUY THESE SECURITIES IN ANY JURISDICTION WHERE THE OFFER OR SALE IS NOT PERMITTED.
| 62 |
| 1127 Wilshire Boulevard Los Angeles, CA 90017 | Collateral Asset Summary – Loan No. 5 Good Samaritan Medical Tower | Cut-off Date Balance: Cut-off Date LTV: U/W NCF DSCR: U/W NOI Debt Yield: | $42,700,000 62.8% 1.96x 9.7% |
Cash Flow Analysis.
| Cash Flow Analysis | ||||||
| 2012 | 2013 | 2014 | T-12 4/30/2015 | U/W | U/W PSF | |
| Base Rent(1) | $3,734,992 | $3,951,456 | $4,205,572 | $4,364,301 | $4,829,465 | $33.00 |
| Value of Vacant Space | 0 | 0 | 0 | 0 | 491,931 | 3.36 |
| Gross Potential Rent | $3,734,992 | $3,951,456 | $4,205,572 | $4,364,301 | $5,321,396 | $36.36 |
| Total Recoveries | 73,664 | 123,238 | 106,696 | 99,155 | 122,853 | 0.84 |
| Total Other Income | 946,286 | 1,166,567 | 711,566 | 770,580 | 795,000 | 5.43 |
| Less: Vacancy(2) | 0 | 0 | 0 | 0 | (491,931) | (3.36) |
| Less: Abatements | (155,870) | (179,191) | 0 | 0 | 0 | 0.00 |
| Effective Gross Income | $4,599,071 | $5,062,069 | $5,023,834 | $5,234,036 | $5,747,318 | $39.27 |
| Total Operating Expenses | 1,358,573 | 1,423,760 | 1,514,919 | 1,556,725 | 1,590,546 | 10.87 |
| Net Operating Income | $3,240,497 | $3,638,309 | $3,508,915 | $3,677,311 | $4,156,772 | $28.40 |
| TI/LC | $0 | $0 | $0 | $0 | 263,437 | 1.80 |
| Capital Expenditures | $0 | $0 | $0 | $0 | 36,589 | 0.25 |
| Net Cash Flow | $3,240,497 | $3,638,309 | $3,508,915 | $3,677,311 | $3,856,746 | $26.35 |
| (1) | U/W Base Rent includes $60,604 of contractual rent steps through September 2016. In addition, U/W Base Rent includes $130,771 attributed to the University of Southern California 3,920 sq. ft. expansion space (suite 800). At closing, $452,542 was deposited into a suite 800 lease funds reserve account, of which $130,771 is being held as additional collateral pending the execution of the University of Southern California expansion lease, and $321,771 is being held for tenant improvements and leasing commissions for the expansion space. |
| (2) | U/W Vacancy represents 7.9% of gross income. |
Property Management. The Good Samaritan Medical Tower Property is managed by Boulevard Investment Group, Inc., a borrower affiliate.
Lockbox / Cash Management. The Good Samaritan Medical Tower Loan is structured with a springing soft lockbox and springing cash management.Following a Trigger Period (as defined herein), all rents, revenues and receipts from the Good Samaritan Medical Tower Property are required to be deposited by the borrower or property manager within one business day of receipt. All sums deposited in the lockbox account are required to be transferred daily to a borrower controlled account, unless a Trigger Period is continuing, in which event such funds are required to be swept daily to a lender controlled account to be applied to payment of all monthly amounts due under the loan documents.
A “Trigger Period” will commence (i) upon an event of default, (ii) the DSCR is less than 1.15x on the last day of any calendar quarter or (iii) if a mezzanine loan is outstanding and will end (a) with respect to clause (i), if such event of default is cured, (b) with respect to clause (ii), the DSCR is at least 1.20x for two consecutive quarters and (c) with respect to clause (iii) such mezzanine loan is no longer outstanding.
Initial Reserves. At closing, the borrower deposited (i) $73,631 in the tax reserve account, (ii) $25,200 in the required repairs reserve account, which represents 120% of the engineer’s recommendation, (iii) $452,542 in the Suite 800 lease funds reserve account, of which $130,771 is being held as additional collateral pending the execution of the University of Southern California expansion lease, and of which $321,771 is being held for tenant improvements and leasing commissions for the expansion space, (iv) $300,000 in the elevator upgrade reserve account and (v) $275,931 in the free rent reserve account.
Ongoing Reserves. On a monthly basis, the borrower is required to deposit reserves of (i) 1/12 of the estimated annual real estate taxes, which currently equates to $12,272, into a tax reserve account, (ii) $3,049 into a replacement reserve account, subject to a cap of $109,766 and (iii) $21,953 into a TI/LC reserve account, subject to a cap of $790,312. In addition, 1/12 of the annual insurance premium will be required to be deposited into an insurance reserve account if an acceptable blanket insurance policy is no longer in place.
Current Mezzanine or Subordinate Indebtedness. None.
Future Mezzanine or Subordinate Indebtedness Permitted. The borrowers are permitted to obtain future mezzanine financing provided that, among other conditions, the principal amount of such mezzanine loan when combined with the principal amount of the Good Samaritan Medical Tower Loan will result in a (i) combined LTV of no more than 62.8%, (ii) combined DSCR greater than or equal to 1.35x and (iii) combined debt yield of no less than 8.4%.
THE INFORMATION IN THIS STRUCTURAL AND COLLATERAL TERM SHEET IS NOT COMPLETE AND MAY BE AMENDED PRIOR TO THE TIME OF SALE. THIS TERM SHEET IS NOT AN OFFER TO SELL THESE SECURITIES AND IT IS NOT A SOLICITATION OF AN OFFER TO BUY THESE SECURITIES IN ANY JURISDICTION WHERE THE OFFER OR SALE IS NOT PERMITTED.
| 63 |
| 1127 Wilshire Boulevard Los Angeles, CA 90017 | Collateral Asset Summary – Loan No. 5 Good Samaritan Medical Tower | Cut-off Date Balance: Cut-off Date LTV: U/W NCF DSCR: U/W NOI Debt Yield: | $42,700,000 62.8% 1.96x 9.7% |
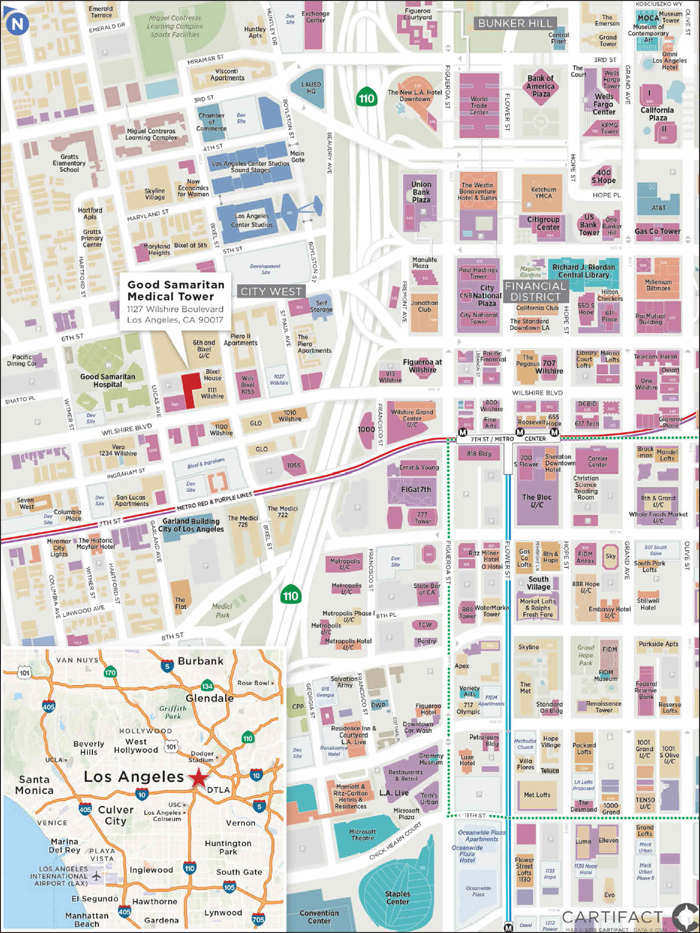
THE INFORMATION IN THIS STRUCTURAL AND COLLATERAL TERM SHEET IS NOT COMPLETE AND MAY BE AMENDED PRIOR TO THE TIME OF SALE. THIS TERM SHEET IS NOT AN OFFER TO SELL THESE SECURITIES AND IT IS NOT A SOLICITATION OF AN OFFER TO BUY THESE SECURITIES IN ANY JURISDICTION WHERE THE OFFER OR SALE IS NOT PERMITTED.
| 64 |
(THIS PAGE INTENTIONALLY LEFT BLANK)
| 65 |
| Various | Collateral Asset Summary – Loan No. 6 Harvey Building Products Portfolio | Cut-off Date Balance: Cut-off Date LTV: U/W NCF DSCR: U/W NOI Debt Yield: | $41,953,778 53.5% 1.96x 12.8% |
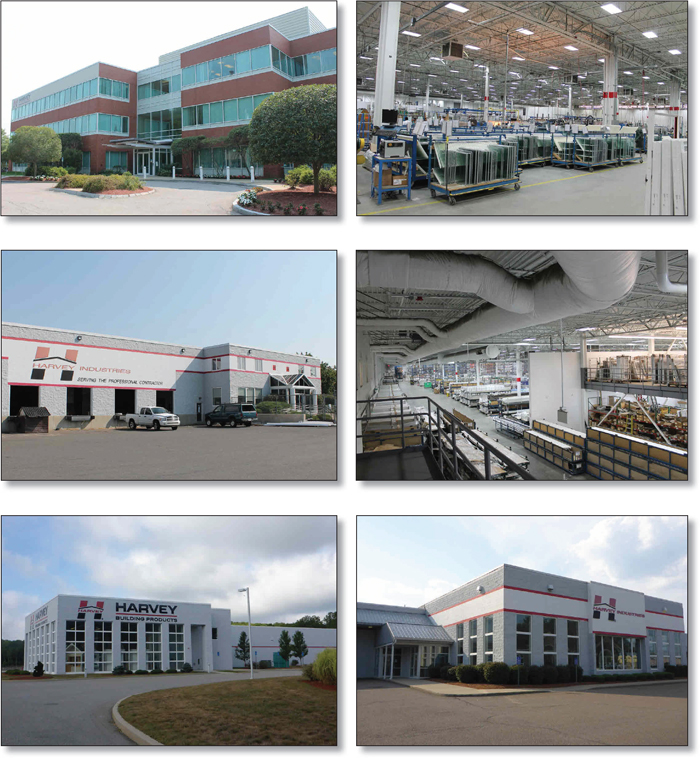
THE INFORMATION IN THIS STRUCTURAL AND COLLATERAL TERM SHEET IS NOT COMPLETE AND MAY BE AMENDED PRIOR TO THE TIME OF SALE. THIS TERM SHEET IS NOT AN OFFER TO SELL THESE SECURITIES AND IT IS NOT A SOLICITATION OF AN OFFER TO BUY THESE SECURITIES IN ANY JURISDICTION WHERE THE OFFER OR SALE IS NOT PERMITTED.
| 66 |
| Various | Collateral Asset Summary – Loan No. 6 Harvey Building Products Portfolio | Cut-off Date Balance: Cut-off Date LTV: U/W NCF DSCR: U/W NOI Debt Yield: | $41,953,778 53.5% 1.96x 12.8% |
| Mortgage Loan Information | |
| Loan Seller: | LCF |
| Loan Purpose: | Acquisition |
| Sponsor: | Dunes Point Capital |
| Borrower: | Harvey Propco, LLC |
| Original Balance(1): | $42,000,000 |
| Cut-off Date Balance(1): | $41,953,778 |
| % by Initial UPB: | 4.4% |
| Interest Rate: | 4.8500% |
| Payment Date: | 6thof each month |
| First Payment Date: | November 6, 2015 |
| Maturity Date: | October 6, 2020 |
| Amortization: | 360 months |
| Additional Debt(1)(2): | $67,925,164Pari Passu Debt; Future Secured Debt Permitted |
| Call Protection(3)(4): | L(25), D (31), O(4) |
| Lockbox / Cash Management: | Hard / In-Place |
| Reserves(5) | ||
| Initial | Monthly | |
| Taxes: | $1,207,022 | $199,837 |
| Insurance: | $594,489 | $78,692 |
| Required Repairs: | $500,000 | NAP |
| Financial Information(6) | ||
| Cut-off Date Balance / Sq. Ft.: | $54 | |
| Balloon Balance / Sq. Ft.: | $49 | |
| Cut-off Date LTV: | 53.5% | |
| Balloon LTV: | 49.3% | |
| Underwritten NOI DSCR: | 2.02x | |
| Underwritten NCF DSCR: | 1.96x | |
| Underwritten NOI Debt Yield: | 12.8% | |
| Underwritten NCF Debt Yield: | 12.5% | |
| Underwritten NOI Debt Yield at Balloon: | 13.9% | |
| Underwritten NCF Debt Yield at Balloon: | 13.5% | |
| Property Information | |
| Single Asset / Portfolio: | Portfolio of 30 properties |
| Property Type: | Various |
| Collateral: | Fee Simple |
| Location: | Various |
| Year Built / Renovated: | Various |
| Total Sq. Ft.: | 2,046,119 |
| Property Management: | Self-Managed |
| Underwritten NOI: | $14,095,158 |
| Underwritten NCF: | $13,683,832 |
| Appraised Value: | $205,460,000 |
| Appraisal Date: | September – October 2015 |
| Historical NOI(7) | |
| 2014 NOI: | NAV |
| 2013 NOI: | NAV |
| 2012 NOI: | NAV |
| Historical Occupancy(7) | |
| Most Recent Occupancy: | 100.0% (November 6, 2015) |
| 2014 Occupancy: | NAV |
| 2013 Occupancy: | NAV |
| 2012 Occupancy: | NAV |
| (1) | The Original Balance of $42.0 million represents the controlling Note A-1, of a $110.0 million whole loan (the “Harvey Building Products Portfolio Loan Combination”) evidenced by three pari passu notes. The pari passu companion loans are comprised of the non-controlling Note A-2 and non-controlling Note A-3, with an aggregate original principal amount of $68.0 million, which are expected to be included in one or more future securitizations. |
| (2) | See “Future Mezzanine or Subordinate Indebtedness Permitted” herein. |
| (3) | Partial release is permitted. See “Partial Release” herein. |
| (4) | The defeasance lockout period will be at least 25 payment dates beginning with and including the first payment date of November 6, 2015. Defeasance of the full $110.0 million Harvey Building Products Portfolio Loan Combination is permitted on or after the date that is the earlier to occur of (i) two years after the closing date of the securitization that includes the lastpari passunote to be securitized, and (ii) October 1, 2018. The assumed lockout period of 25 payments is based on the expected COMM 2015-LC23 securitization closing date in November 2015. The actual lockout period may be longer. |
| (5) | See “Initial Reserves” and “Ongoing Reserves” herein. |
| (6) | DSCR, LTV, Debt Yield and Balance / Sq. Ft. calculations are based on the aggregate Harvey Building Products Portfolio Loan Combination. |
| (7) | Historical NOI and Historical Occupancy are unavailable as the borrower entered into a new 20-year master lease with an affiliate of the borrower at closing of the Harvey Building Products Portfolio Loan. |
THE INFORMATION IN THIS STRUCTURAL AND COLLATERAL TERM SHEET IS NOT COMPLETE AND MAY BE AMENDED PRIOR TO THE TIME OF SALE. THIS TERM SHEET IS NOT AN OFFER TO SELL THESE SECURITIES AND IT IS NOT A SOLICITATION OF AN OFFER TO BUY THESE SECURITIES IN ANY JURISDICTION WHERE THE OFFER OR SALE IS NOT PERMITTED.
| 67 |
| Various | Collateral Asset Summary – Loan No. 6 Harvey Building Products Portfolio | Cut-off Date Balance: Cut-off Date LTV: U/W NCF DSCR: U/W NOI Debt Yield: | $41,953,778 53.5% 1.96x 12.8% |
| Portfolio Summary | ||||||||
| Property Name | Ownership Interest | City | State | Sq. Ft. | Year Built | Allocated Loan Amount | “As-Is” Appraised Value | Occupancy(1) |
| Londonderry Manufacturing | Fee Simple | Londonderry | NH | 376,294 | 2007 | $21,250,000 | $40,000,000 | 100.0% |
| Waltham Corporate | Fee Simple | Waltham | MA | 54,400 | 1999 | $10,880,000 | $23,900,000 | 100.0%(2) |
| Dartmouth Manufacturing | Fee Simple | North Dartmouth | MA | 235,239 | 1998 | $10,150,000 | $17,800,000 | 100.0% |
| Nashua | Fee Simple | Nashua | NH | 111,594 | 2006 | $5,120,000 | $9,500,000 | 100.0% |
| West Bridgewater | Fee Simple | West Bridgewater | MA | 81,776 | 2005 | $4,750,000 | $7,900,000 | 100.0% |
| Woburn | Fee Simple | Woburn | MA | 76,054 | 1989 | $4,700,000 | $7,400,000 | 100.0% |
| Manchester, NH | Fee Simple | Manchester | NH | 81,747 | 2003 | $3,883,000 | $7,200,000 | 100.0% |
| New London | Fee Simple | Waterford | CT | 70,642 | 2008 | $3,650,000 | $6,620,000 | 100.0% |
| East Haven | Fee Simple | East Haven | CT | 70,089 | 2005 | $3,400,000 | $6,300,000 | 100.0% |
| Salem | Fee Simple | Salem | NH | 58,286 | 2001 | $3,400,000 | $5,500,000 | 100.0% |
| Bethlehem | Fee Simple | Bethlehem | PA | 71,091 | 1973 | $3,300,000 | $5,500,000 | 100.0% |
| Lincoln | Fee Simple | Lincoln | RI | 80,240 | 2003 | $3,175,000 | $5,900,000 | 100.0% |
| Berlin | Fee Simple | Berlin | CT | 43,796 | 1995 | $3,050,000 | $5,390,000 | 100.0% |
| Woburn CPD | Fee Simple | Woburn | MA | 59,800 | 1984 | $3,000,000 | $6,400,000 | 100.0% |
| Norwalk | Fee Simple | Norwalk | CT | 40,232 | 1972 | $2,500,000 | $5,310,000 | 100.0% |
| Dartmouth | Fee Simple | Dartmouth | MA | 63,117 | 1974 | $2,400,000 | $4,900,000 | 100.0% |
| Braintree | Fee Simple | Braintree | MA | 32,531 | 1986 | $2,250,000 | $3,700,000 | 100.0% |
| Manchester, CT | Fee Simple | Manchester | CT | 49,175 | 1996 | $2,100,000 | $3,920,000 | 100.0% |
| Portland | Fee Simple | Portland | ME | 48,145 | 1976 | $2,100,000 | $3,900,000 | 100.0% |
| Norwalk | Fee Simple | Norwalk | CT | 30,000 | 1974 | $1,900,000 | $4,260,000 | 100.0% |
| Warwick | Fee Simple | Warwick | RI | 43,899 | 1997 | $1,888,000 | $3,500,000 | 100.0% |
| Fitchburg | Fee Simple | Fitchburg | MA | 39,433 | 2002 | $1,618,000 | $3,000,000 | 100.0% |
| Auburn | Fee Simple | Auburn | MA | 37,132 | 1983 | $1,564,000 | $2,900,000 | 100.0% |
| Portsmouth | Fee Simple | Portsmouth | NH | 31,470 | 1993 | $1,510,000 | $2,800,000 | 100.0% |
| Southampton | Fee Simple | Huntingdon Valley | PA | 36,421 | 2009 | $1,250,000 | $2,350,000 | 100.0% |
| Hyannis | Fee Simple | Hyannis | MA | 24,070 | 1986 | $1,187,000 | $2,200,000 | 100.0% |
| Wilkes-Barre | Fee Simple | Forty Fort | PA | 32,200 | 1950 | $1,100,000 | $1,900,000 | 100.0% |
| Berlin CPD | Fee Simple | Berlin | CT | 28,163 | 1977 | $1,075,000 | $1,910,000 | 100.0% |
| Springfield | Fee Simple | Springfield | MA | 25,347 | 1989 | $1,000,000 | $2,100,000 | 100.0% |
| White River Junction | Fee Simple | White River Junction | VT | 13,736 | 1981 | $850,000 | $1,500,000 | 100.0% |
| Total / Wtd. Avg. | 2,046,119 | $110,000,000 | $205,460,000 | 100.0% | ||||
| (1) | The Harvey Building Products Portfolio Properties are subject to a 20-year master lease with Harvey Industries, Inc. as tenant. |
| (2) | Harvey Industries, Inc. the master tenant, currently subleases 16,898 sq. ft. to three separate tenants, Massachusetts Association of Realtors, Inc., B4 Consulting, Inc. and Delphi Building Services, Inc. |
| Tenant Summary | |||||||
Tenant | Credit Rating (Fitch/Moody’s/S&P) | Net Rentable Area (Sq. Ft.) | % of Net Rentable Area |
| U/W Base Rent PSF | % of Total U/W Base Rent | Lease Expiration |
| Harvey Industries, Inc. | NR/NR/NR | 2,046,119 | 100.0% | $7.31 | 100.0% | 10/31/2035 | |
| Total Occupied Collateral | 2,046,119 | 100.0% | $7.31 | 100.0% | |||
| Vacant | 0 | 0.0% | |||||
| Total | 2,046,119 | 100.0% | |||||
THE INFORMATION IN THIS STRUCTURAL AND COLLATERAL TERM SHEET IS NOT COMPLETE AND MAY BE AMENDED PRIOR TO THE TIME OF SALE. THIS TERM SHEET IS NOT AN OFFER TO SELL THESE SECURITIES AND IT IS NOT A SOLICITATION OF AN OFFER TO BUY THESE SECURITIES IN ANY JURISDICTION WHERE THE OFFER OR SALE IS NOT PERMITTED.
| 68 |
| Various | Collateral Asset Summary – Loan No. 6 Harvey Building Products Portfolio | Cut-off Date Balance: Cut-off Date LTV: U/W NCF DSCR: U/W NOI Debt Yield: | $41,953,778 53.5% 1.96x 12.8% |
| Lease Rollover Schedule | ||||||||
| Year | # of Leases Expiring | Total Expiring Sq. Ft. | % of Total Sq. Ft. Expiring | Cumulative Sq. Ft. Expiring | Cumulative % of Sq. Ft. Expiring | Annual U/W PSF | % U/W Base Rent Rolling | Cumulative % of U/W Base Rent |
| MTM | 0 | 0 | 0.0% | 0 | 0.0% | $0.00 | 0.0% | 0.0% |
| 2015 | 0 | 0 | 0.0% | 0 | 0.0% | $0.00 | 0.0% | 0.0% |
| 2016 | 0 | 0 | 0.0% | 0 | 0.0% | $0.00 | 0.0% | 0.0% |
| 2017 | 0 | 0 | 0.0% | 0 | 0.0% | $0.00 | 0.0% | 0.0% |
| 2018 | 0 | 0 | 0.0% | 0 | 0.0% | $0.00 | 0.0% | 0.0% |
| 2019 | 0 | 0 | 0.0% | 0 | 0.0% | $0.00 | 0.0% | 0.0% |
| 2020 | 0 | 0 | 0.0% | 0 | 0.0% | $0.00 | 0.0% | 0.0% |
| 2021 | 0 | 0 | 0.0% | 0 | 0.0% | $0.00 | 0.0% | 0.0% |
| 2022 | 0 | 0 | 0.0% | 0 | 0.0% | $0.00 | 0.0% | 0.0% |
| 2023 | 0 | 0 | 0.0% | 0 | 0.0% | $0.00 | 0.0% | 0.0% |
| 2024 | 0 | 0 | 0.0% | 0 | 0.0% | $0.00 | 0.0% | 0.0% |
| 2025 | 0 | 0 | 0.0% | 0 | 0.0% | $0.00 | 0.0% | 0.0% |
| Thereafter | 1 | 2,046,119 | 100.0% | 2,046,119 | 100.0% | $7.31 | 100.0% | 100.0% |
| Vacant | NAP | 0 | 0.0% | 2,046,119 | 100.0% | NAP | NAP | |
| Total / Wtd. Avg. | 1 | 2,046,119 | 100.0% | $7.31 | 100.0% | |||
The Loan. The Harvey Building Products Portfolio loan (the “Harvey Building Products Portfolio Loan”) is a fixed rate loan secured by the borrower’s fee simple interest in a portfolio of 27 warehouse properties, two manufacturing properties, and one office property located across seven states, totaling 2,046,119 sq. ft. (the “Harvey Building Products Portfolio” or the “Harvey Building Products Portfolio Properties”). The Original Balance of $42.0 million represents the controlling Note A-1 of a $110.0 million whole loan (the “Harvey Building Products Portfolio Loan Combination”) evidenced by three pari passu notes. The pari passu companion loans are comprised of the non-controlling Note A-2 and non-controlling Note A-3, with an aggregate original principal amount of $68.0 million, which are expected to be included in one or more future securitizations.
The relationship between the holders of the Harvey Building Products Portfolio Loan Combination is governed by a co-lender agreement as described under “Description of the Mortgage Pool—Loan Combinations—The Harvey Building Products Portfolio Loan”in the free writing prospectus.
| Loan Combination Summary | ||||
| Original Balance | Cut-off Date Balance | Note Holder | Controlling Piece | |
| Note A-1 | $42,000,000 | $41,953,778 | COMM 2015-LC23 | Yes |
| Note A-2 | $35,000,000 | $34,961,481 | LCF | No |
| Note A-3 | $33,000,000 | $32,963,683 | LCF | No |
| Total | $110,000,000 | $109,878,942 | ||
The Harvey Building Products Portfolio Loan has a 5-year term and amortizes on a 30-year schedule. The Harvey Building Products Portfolio Loan accrues interest at a fixed rate equal to 4.8500% per annum and has a cut-off date balance of $109.9 million. Loan proceeds, along with approximately $113.0 million in equity, a $70.0 million Opco term loan, $5.0 million in seller preferred shares, and approximately $1.8 million under an Opco revolving loan facility were used to acquire Harvey Building Products (inclusive of the Harvey Building Products Portfolio Properties) for approximately $299.8 million cash consideration, fund upfront reserves of approximately $0.5 million and pay closing costs of approximately $4.3 million. Based on the as-is appraised values totaling approximately $205.5 million as of September and October 2015, the cut-off date LTV is 53.5%. The most recent prior financing of the Harvey Building Products Portfolio was not included in a securitization.
THE INFORMATION IN THIS STRUCTURAL AND COLLATERAL TERM SHEET IS NOT COMPLETE AND MAY BE AMENDED PRIOR TO THE TIME OF SALE. THIS TERM SHEET IS NOT AN OFFER TO SELL THESE SECURITIES AND IT IS NOT A SOLICITATION OF AN OFFER TO BUY THESE SECURITIES IN ANY JURISDICTION WHERE THE OFFER OR SALE IS NOT PERMITTED.
| 69 |
| Various | Collateral Asset Summary – Loan No. 6 Harvey Building Products Portfolio | Cut-off Date Balance: Cut-off Date LTV: U/W NCF DSCR: U/W NOI Debt Yield: | $41,953,778 53.5% 1.96x 12.8% |
| Sources and Uses | ||||||
| Sources | Proceeds | % of Total | Uses | Proceeds | % of Total | |
| Mortgage Loan | $110,000,000 | 36.7% | Purchase Price(2) | $295,000,000 | 98.4% | |
| Equity | $113,000,000 | 37.7% | Reserves | $500,000 | 0.2% | |
| Opco Term Loan(1) | $70,000,000 | 23.4% | Closing Costs(3) | $4,250,000 | 1.4% | |
| Seller Preferred Shares(1) | $5,000,000 | 1.7% | ||||
| Opco Revolver(1) | $1,750,000 | 0.6% | ||||
| Total Sources | $299,750,000 | 100.0% | Total Uses | $299,750,000 | 100.0% | |
| (1) | Dunes Point Capital acquired Harvey Building Products for a total purchase price of $295.0 million and a total cost basis of $299.8 million inclusive of closing costs. |
| (2) | The Purchase Price reflects the acquisition of both the Harvey Building Products Opco and Propco. The appraised value for the Harvey Building Products Portfolio Properties is $205.5 million. |
| (3) | The Closing Costs reflect the closing costs incurred as a result of the acquisition of the Harvey Building Products Opco and Propco. The Closing Costs for the Harvey Building Products Portfolio Properties were approximately $1.1 million. |
The Borrower / Sponsor. The borrower, Harvey Propco, LLC is a single purpose, bankruptcy remote entity organized in Delaware with two independent directors in its organizational structure. The sponsor of the borrower is Dunes Point Capital and the nonrecourse carve-out guarantor is the Harvey Parent Corporation.
Dunes Point Capital is a family office and private investment firm founded in 2013 by former Blackstone Group LP executive Timothy White. The company invests in industrial and energy companies. Dunes Point Capital is a wholly owned subsidiary of White Group Holdings. The team has invested, or overseen the investment of, over $5 billion in transactions over the last 20 years.
The Properties. The Harvey Building Products Portfolio is comprised of 30 properties totaling 2,046,119 sq. ft., including 27 light industrial warehouse properties located in Massachusetts, Connecticut, Maine, Rhode Island, Pennsylvania, New Hampshire and Vermont that serve as the distribution and sales centers for the Harvey Building Products Portfolio, two manufacturing properties, located in Massachusetts and New Hampshire, where the company produces all of its windows and doors and a corporate headquarters building in Waltham, Massachusetts, which is home to its finance, accounting, sales, and senior management teams.
Twenty-seven of the 30 properties are located in New England (93.2% sq. ft., 94.9% allocated loan amount), with the largest concentration by state located in Massachusetts, with 11 properties representing 35.6% of property sq. ft. and 39.5% of allocated loan amount. The Harvey Building Products Portfolio Properties were built between 1950 and 2009, with an average age of 19 years.
The Harvey Building Products Portfolio Properties consist of a blend of office, warehouse, and manufacturing space and range from approximately 13,736 sq. ft. to 376,294 sq. ft. in size.
Environmental Matters. The Phase I environmental reports are dated September 2015. Phase II reports were recommended for the following properties: with respect to the Waltham property, to rule out groundwater contamination; with respect to the Woburn property, to rule out groundwater contamination and ensure containment of existing aboveground storage tanks; with respect to the Woburn CPD property, to ensure that the underground storage tanks have been removed and to rule out groundwater contamination; with respect to the Bethlehem property, to rule out groundwater contamination; and with respect to the Fitchburg property, to rule out groundwater contamination. The Borrower agreed to undertake mitigating actions under the environmental indemnity and environmental insurance was obtained for the portfolio in lieu of obtaining Phase II reports.
Property Tenancy.Harvey Industries, Inc. (“Harvey Building Products” or “Opco”) executed a single 20 year absolute net unitary master lease (“Master Lease”) for the 30 properties at an initial yearly base rent of $14,950,000 ($7.31 PSF). The Master Lease represents an absolute net lease, with Harvey Building Products responsible for the direct payment of all real estate taxes, insurance premiums, and capital expenditures. The Master Lease has no termination options except with respect to substantial condemnation with respect to the affected property or other termination options tied to casualty or changes in law during the last two years of the initial term of the Master Lease or any option period. The rent steps up 10% every six years and there are two, five-year renewal options with 360 days’ notice to the Landlord.
Harvey Building Products offers a broad base of exterior products including: vinyl windows, exterior doors, vinyl siding, shutters, PVC trim, and decking. The company’s revenue streams are split approximately 40% in the manufacture and direct to contractor sale of Harvey-branded windows and doors, and approximately 60% in the distribution of third party building products to contractors. Harvey Building Products reported total revenues of $403.9 million over the trailing twelve month period ended May 31, 2015.
Harvey Building Products is a leading manufacturer and marketer of premium vinyl windows, as well as a wholesale distributor of a broad range of exterior building products, and has been in continuous operation since 1961. They currently have the leading market position for vinyl windows in its core Northeastern markets, and have installed over 10 million windows since 1990. Harvey Building Products is consistently ranked in the top 15 manufacturers on Windows & Door’s Top 100 Manufacturers list.
THE INFORMATION IN THIS STRUCTURAL AND COLLATERAL TERM SHEET IS NOT COMPLETE AND MAY BE AMENDED PRIOR TO THE TIME OF SALE. THIS TERM SHEET IS NOT AN OFFER TO SELL THESE SECURITIES AND IT IS NOT A SOLICITATION OF AN OFFER TO BUY THESE SECURITIES IN ANY JURISDICTION WHERE THE OFFER OR SALE IS NOT PERMITTED.
| 70 |
| Various | Collateral Asset Summary – Loan No. 6 Harvey Building Products Portfolio | Cut-off Date Balance: Cut-off Date LTV: U/W NCF DSCR: U/W NOI Debt Yield: | $41,953,778 53.5% 1.96x 12.8% |
According to the company’s T-12 financial statements ended July 2015, the warehouse locations that will serve as collateral for the Harvey Building Products Portfolio Loan generated total sales of $324,852,851, representing a 2.8% occupancy cost on the their allocated rental rate of $9,077,888. Overall, the collateral locations represent a majority of Harvey Building Products’ sales.
| Historical Portfolio EBITDAR | |||||||||
| State | 2009 | 2010 | 2011 | 2012 | 2013 | 2014 | 2015 | T-12 7/30/2015 | |
| EBITDAR | 30,400,000 | 36,725,000 | 32,102,000 | 32,441,000 | 33,300,000 | 31,877,000 | 33,470,000 | 36,238,000 | |
| Rent Coverage Ratio | 2.0x | 2.5x | 2.1x | 2.2x | 2.2x | 2.1x | 2.2x | 2.4x | |
The Market.The overall United States national industrial market continued to strengthen with overall availability rates declining to 9.8% in Q2 2015. Rents increased, growing by 1.3% in Q2 2015 and by nearly 3% year-to-date. Demand has been strong, with 68.6 million sq. ft. of positive net absorption recorded in Q2 2015—up 36% over the previous quarter and 20% year-over-year. According to the US Census Bureau, spending in the repair and remodel market is expected to grow by 4.4% annually between 2014 and 2018, driven by improved consumer confidence and employment.
The Harvey Building Products Portfolio Properties span across seven states in the Northeast United States, primarily focused in Massachusetts, Connecticut, and New Hampshire.
| State Level Concentrations | |||||||
| State | Number of Properties | Sq. Ft. | % of Portfolio NRA | Weighted Average Occupancy | U/W Base Rent | % of U/W Base Rent | U/W Base Rent PSF |
| Massachusetts | 11 | 728,899 | 35.6% | 100.0% | $5,902,711 | 39.5% | $8.10 |
| Connecticut | 7 | 332,097 | 16.2% | 100.0% | $2,517,589 | 16.8% | $7.58 |
| New Hampshire | 5 | 659,391 | 32.2% | 100.0% | $4,712,005 | 31.5% | $7.15 |
| Pennsylvania | 3 | 139,712 | 6.8% | 100.0% | $740,827 | 5.0% | $5.30 |
| Rhode Island | 2 | 124,139 | 6.1% | 100.0% | $683,475 | 4.6% | $5.51 |
| Maine | 1 | 48,145 | 2.4% | 100.0% | $281,254 | 1.9% | $5.84 |
| Vermont | 1 | 13,736 | 0.7% | 100.0% | $109,545 | 0.7% | $7.98 |
| Total / Wtd. Avg. | 30 | 2,046,119 | 100.0% | 100.0% | $14,947,405 | 100.0% | $7.31 |
Massachusetts Market. (11 properties totaling 728,899 sq. ft., 35.6% of NRA, 39.5% of U/W Base Rent) Boston’s economy has been expanding steadily with an unemployment rate that is well below the national average at 4.4%. In addition, multifamily permitting numbers have reached record highs. The Greater Boston Industrial market has benefited from positive absorption of 1.24 million sq. ft. in Q2 2015. This was the fourth consecutive quarter with an excess of 400,000 sq. ft. of positive absorption in the market. In addition, falling vacancy rates have pressured rents upwards across all submarkets. As a result, asking rents have grown 4.5% year-over-year. The low availability and vacancy levels in the Greater Boston Industrial Market kept average asking rents of approximately $8.00 PSF NNN mark in the Metro North submarket and $15.54 PSF NNN mark in the 128-West submarket.
The lone office property in the Harvey Building Products Portfolio is located in Waltham, Massachusetts where the suburban office market saw 549,258 sq. ft. of positive absorption in Q2 2015. The vacancy rate for the Route 128-West submarket as of the 2nd quarter 2015 was 12.6% with an average asking gross rent of $29.81 PSF.
Connecticut Market.(7 properties totaling 332,097 sq. ft., 16.2% of NRA, 16.8% of U/W Base Rent) Four of the properties in the Harvey Building Products Portfolio are part of the Greater Hartford Industrial market, which experienced over 844,000 sq. ft. of positive absorption in 2014. In addition, overall vacancy fell from 13.2% at yearend 2013 to 12.3% at yearend 2014.
Two of the seven Connecticut properties in the Harvey Building Products Portfolio are part of the Westchester/ Southern Connecticut Industrial Market, which has seen its vacancy rate decrease in Q3 2015 to a five year low of 9.3% despite adding 15,000 sq. ft. of new supply in the previous quarter. In the Norwalk Industrial submarket, average rents were $10.18 PSF and vacancy decreased by 100 basis points year-over-year.
New Hampshire Market. (5 properties totaling 659,391 sq. ft., 32.2% of NRA, 31.5% of U/W Base Rent) Four of the five properties in New Hampshire, including the largest property of the Harvey Building Products portfolio, are located within the I93/Route 3 Corridor Industrial Market where vacancy rates decreased 120 basis points year-over-year in 2014 to 9.7%. The I93/Route 3 Corridor Industrial Market is also home to a 614,000 sq. ft. UPS logistics warehouse. Just east of the warehouse, FedEx Ground is expected to open a 340,000 sq. ft. facility this year.
The fifth New Hampshire property in the Harvey Building Products Portfolio is located in the Seacoast New Hampshire Industrial Market. In this market, US Foods expanded into the 500,000 sq. ft., former Poland Spring distribution center. In addition, Andover
THE INFORMATION IN THIS STRUCTURAL AND COLLATERAL TERM SHEET IS NOT COMPLETE AND MAY BE AMENDED PRIOR TO THE TIME OF SALE. THIS TERM SHEET IS NOT AN OFFER TO SELL THESE SECURITIES AND IT IS NOT A SOLICITATION OF AN OFFER TO BUY THESE SECURITIES IN ANY JURISDICTION WHERE THE OFFER OR SALE IS NOT PERMITTED.
| 71 |
| Various | Collateral Asset Summary – Loan No. 6 Harvey Building Products Portfolio | Cut-off Date Balance: Cut-off Date LTV: U/W NCF DSCR: U/W NOI Debt Yield: | $41,953,778 53.5% 1.96x 12.8% |
Health Care secured a 50,687 sq. ft. facility for their manufacturing operations and executive offices as well as its customer service, sales and marketing departments nearby.
Cash Flow Analysis.
| Cash Flow Analysis(1) | ||
| U/W | U/W PSF | |
| Base Rent | $14,947,405 | $7.31 |
| Value of Vacant Space | 0 | 0.00 |
| Gross Potential Rent | $14,947,405 | $7.31 |
| Total Recoveries | 847,259 | 0.41 |
| Total Other Income | 0 | 0.00 |
| Less: Vacancy(2) | (1,263,573) | (0.62) |
| Effective Gross Income | $14,531,091 | $7.10 |
| Total Operating Expenses | 435,933 | 0.21 |
| Net Operating Income | $14,095,158 | $6.89 |
| TI/LC | 0 | 0.00 |
| Capital Expenditures | 411,326 | 0.20 |
| Net Cash Flow | $13,683,832 | $6.69 |
| (1) | Historical NOI is unavailable as Harvey Building Products entered into a new 20-year master lease at closing of the Harvey Building Products Portfolio Loan. |
| (2) | U/W Vacancy is based on economic vacancy and represents 8.5% of Gross Potential Rent. |
Property Management. The Harvey Building Products Portfolio is self-managed by the borrower.
Lockbox / Cash Management. The Harvey Building Products Portfolio Loan is structured with a hard lockbox and in place cash management. The borrower is required to direct all tenants to deposit all rents and other payments into the lockbox account controlled by the lender that was established by the borrower at closing. Provided no Trigger Period (as defined below) is continuing, all excess cash flow is required to be swept monthly to the borrower’s operating account. Upon the occurrence and during the continuance of a Trigger Period, excess cash flow is required to be swept to an excess cash flow account that is held as collateral for the loan.
A “Trigger Period” will commence upon the occurrence of (i) an event of default under the Loan Agreement; (ii) Opco ceases to conduct its normal business operations in at least 80% of the total square footage at the Harvey Building Products Portfolio (it being understood that one or more subtenants conducting normal business operations in up to 10% of the total square feet at the property in the aggregate may count towards the 80% requirement); (iii) Opco (or its parent) being adjudicated insolvent or filing for bankruptcy; (iv) either (a) the Opco (or its successor) failing to satisfy the 4.5x EBITDA leverage ratio under Opco’s existing term loan or (b) the borrower failing to deliver the financial information required to be delivered under the lease or under any term loan or credit facility of Opco (“Opco Debt”) (including, without limitation, a calculation of EBITDA and adjusted EBITDA and a calculation of the leverage covenant under such term loan) and/or; (v) a default in the payment of principal or interest under the Opco Debt after applicable notice and cure periods.
Initial Reserves. At or about loan closing, the borrower deposited (i) $1,207,022 into a tax reserve account, (ii) $594,489 into an insurance reserve account and (iii) $500,000 into a required repairs reserve account.
Ongoing Reserves. On a monthly basis, the borrower is required to deposit reserves of (i) $199,837 into a tax reserve account, and (ii) $78,692 into an insurance reserve account
Current Mezzanine or Subordinate Indebtedness. None.
Future Mezzanine or Subordinate Indebtedness Permitted.The Harvey Building Products Portfolio loan documents allow for the pledge of direct or indirect interests in the guarantor of the mortgage loan to secure corporate level financing, provided that the value of the Harvey Building Products Portfolio property is not more than 25% of the value of all security for such financing. There is no requirement for an intercreditor agreement in connection with such pledges.
THE INFORMATION IN THIS STRUCTURAL AND COLLATERAL TERM SHEET IS NOT COMPLETE AND MAY BE AMENDED PRIOR TO THE TIME OF SALE. THIS TERM SHEET IS NOT AN OFFER TO SELL THESE SECURITIES AND IT IS NOT A SOLICITATION OF AN OFFER TO BUY THESE SECURITIES IN ANY JURISDICTION WHERE THE OFFER OR SALE IS NOT PERMITTED.
| 72 |
| Various | Collateral Asset Summary – Loan No. 6 Harvey Building Products Portfolio | Cut-off Date Balance: Cut-off Date LTV: U/W NCF DSCR: U/W NOI Debt Yield: | $41,953,778 53.5% 1.96x 12.8% |
Partial Release. The borrower may obtain the release of one or more individual Mortgaged Properties at the expiration of the lockout period, provided, among other things, (i) no event of default has occurred and is continuing, (ii) the borrower partially defeases the mortgage loan in an amount equal to the greater of (x) the net sales proceeds with respect to such individual mortgaged property and (y) 125% of the allocated loan amount for such individual mortgaged property and (iii) if, after such release, at least $11,000,000 of the principal amount of the Harvey Building Products Portfolio Loan has been defeased or repaid, the loan-to-value ratio for the remaining Mortgaged Properties is no greater than 60%.
Substitution.None.
THE INFORMATION IN THIS STRUCTURAL AND COLLATERAL TERM SHEET IS NOT COMPLETE AND MAY BE AMENDED PRIOR TO THE TIME OF SALE. THIS TERM SHEET IS NOT AN OFFER TO SELL THESE SECURITIES AND IT IS NOT A SOLICITATION OF AN OFFER TO BUY THESE SECURITIES IN ANY JURISDICTION WHERE THE OFFER OR SALE IS NOT PERMITTED.
| 73 |
| Various | Collateral Asset Summary – Loan No. 6 Harvey Building Products Portfolio | Cut-off Date Balance: Cut-off Date LTV: U/W NCF DSCR: U/W NOI Debt Yield: | $41,953,778 53.5% 1.96x 12.8% |
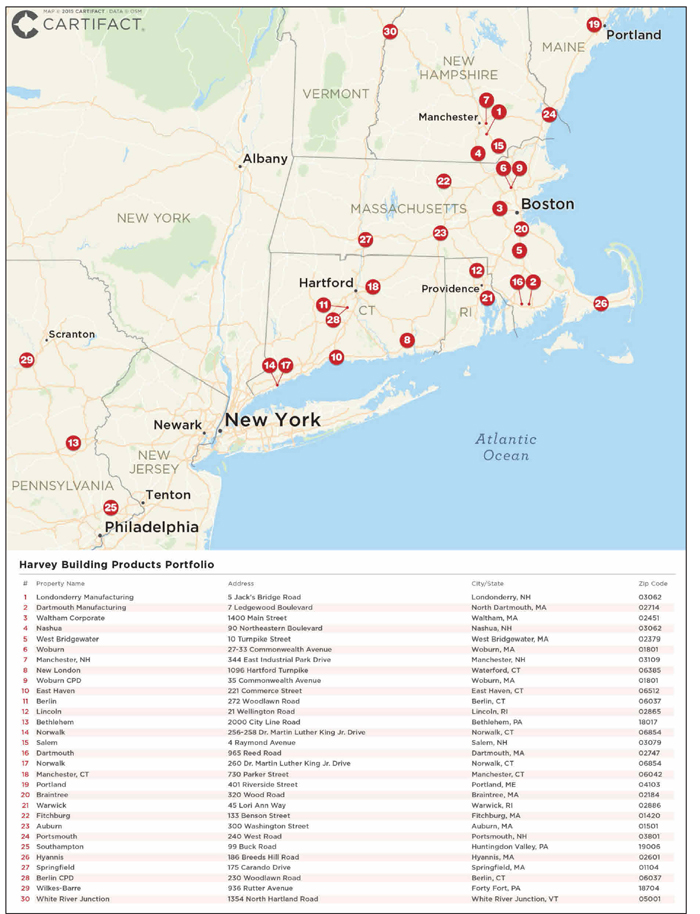
THE INFORMATION IN THIS STRUCTURAL AND COLLATERAL TERM SHEET IS NOT COMPLETE AND MAY BE AMENDED PRIOR TO THE TIME OF SALE. THIS TERM SHEET IS NOT AN OFFER TO SELL THESE SECURITIES AND IT IS NOT A SOLICITATION OF AN OFFER TO BUY THESE SECURITIES IN ANY JURISDICTION WHERE THE OFFER OR SALE IS NOT PERMITTED.
| 74 |
(THIS PAGE INTENTIONALLY LEFT BLANK)
| 75 |
1 South Forest Beach Drive Hilton Head Island, SC 29928 | Collateral Asset Summary – Loan No. 7 Beach House Hilton Head | Cut-off Date Balance: Cut-off Date LTV: U/W NCF DSCR: U/W NOI Debt Yield: | $40,000,000 72.7% 1.58x 11.3% |
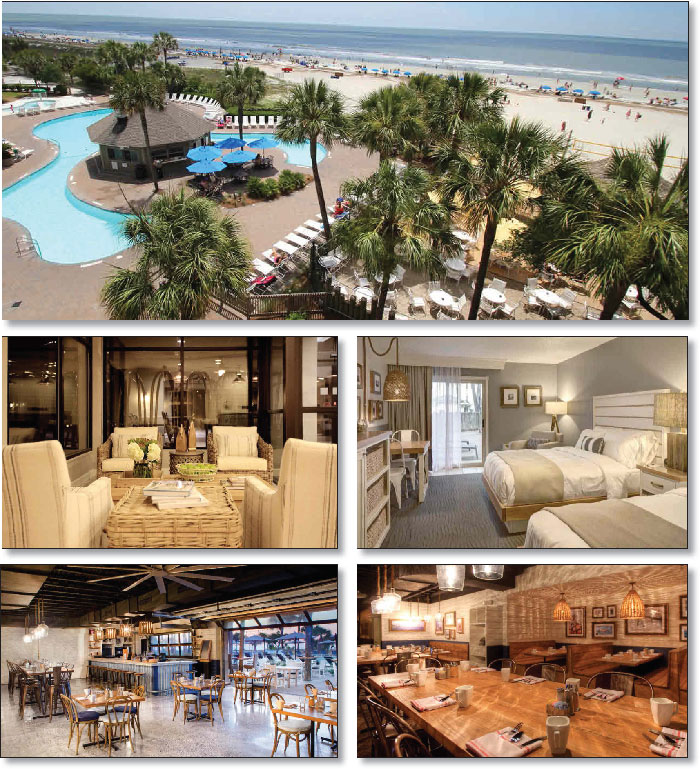
THE INFORMATION IN THIS STRUCTURAL AND COLLATERAL TERM SHEET IS NOT COMPLETE AND MAY BE AMENDED PRIOR TO THE TIME OF SALE. THIS TERM SHEET IS NOT AN OFFER TO SELL THESE SECURITIES AND IT IS NOT A SOLICITATION OF AN OFFER TO BUY THESE SECURITIES IN ANY JURISDICTION WHERE THE OFFER OR SALE IS NOT PERMITTED. |
1 South Forest Beach Drive Hilton Head Island, SC 29928 | Collateral Asset Summary – Loan No. 7 Beach House Hilton Head | Cut-off Date Balance: Cut-off Date LTV: U/W NCF DSCR: U/W NOI Debt Yield: | $40,000,000 72.7% 1.58x 11.3% |
| Mortgage Loan Information | |
| Loan Seller: | GACC |
| Loan Purpose: | Acquisition |
| Sponsors: | Mark Mance; Simon Hallgarten; David Zeuske; Matthew Trevenen |
| Borrower: | AGRE NV HH Property Owner LLC |
| Original Balance: | $40,000,000 |
| Cut-off Date Balance: | $40,000,000 |
| % by Initial UPB: | 4.2% |
| Interest Rate: | 4.9000% |
| Payment Date: | 6thof each month |
| First Payment Date: | November 6, 2015 |
| Maturity Date: | October 6, 2025 |
| Amortization: | Interest only for first 24 months; 360 months thereafter |
| Additional Debt(1): | Future Mezzanine Debt Permitted |
| Call Protection: | L(25), D(58), D or 4%(12), D or 3%(12), D or 1%(9), O(4) |
| Lockbox / Cash Management: | Hard / Springing |
| Reserves(2) | ||
| Initial | Monthly | |
| Taxes: | $271,388 | $28,122 |
| Insurance: | $0 | Springing |
| FF&E: | $0 | At least 4% of prior month’s gross revenues |
| Renovations Funds: | $4,877,111 | NAP |
| Seasonal Working Capital: | $658,778 | Springing |
| PIP: | $0 | Springing |
| Franchise Termination: | $0 | Springing |
| Financial Information | ||
| Cut-off Date Balance / Room: | $198,020 | |
| Balloon Balance / Room: | $170,902 | |
| Cut-off Date LTV: | 72.7% | |
| Balloon LTV: | 62.8% | |
| Underwritten NOI DSCR(3): | 1.78x | |
| Underwritten NCF DSCR(3): | 1.58x | |
| Underwritten NOI Debt Yield: | 11.3% | |
| Underwritten NCF Debt Yield: | 10.1% | |
| Underwritten NOI Debt Yield at Balloon: | 13.1% | |
| Underwritten NCF Debt Yield at Balloon: | 11.7% | |
| Property Information | |
| Single Asset / Portfolio: | Single Asset |
| Property Type: | Full Service Hospitality |
| Collateral: | Fee Simple |
| Location: | Hilton Head Island, SC |
| Year Built / Renovated: | 1973 / 2012 |
| Total Rooms: | 202 |
| Property Management: | NVHG Beach House Hotel Operator LLC |
| Underwritten NOI: | $4,533,024 |
| Underwritten NCF: | $4,029,018 |
| “As-is” Appraised Value: | $55,000,000 |
| “As-is” Appraisal Date: | August 1, 2015 |
| “As Renovated” Appraised Value(4): | $62,400,000 |
| “As Renovated” Appraised Date(4): | August 1, 2016 |
| “As Stabilized” Appraised Value(4): | $64,500,000 |
| “As Stabilized” Appraised Date(4): | August 1, 2017 |
| Historical NOI | |
| Most Recent NOI: | $4,503,886 (T-12 June 30, 2015) |
| 2014 NOI: | $4,132,182 (December 31, 2014) |
| 2013 NOI: | $3,483,358 (December 31, 2013) |
| 2012 NOI(5): | NAV |
| Historical Occupancy | |
| Most Recent Occupancy: | 68.4% (June 30, 2015) |
| 2014 Occupancy: | 63.8% (December 31, 2014) |
| 2013 Occupancy: | 61.7% (December 31, 2013) |
| 2012 Occupancy(5): | NAV |
| (1) | See “Future Mezzanine or Subordinate Indebtedness Permitted” herein. |
| (2) | See “Initial Reserves” and “Ongoing Reserves” herein. |
| (3) | Based on amortizing debt service payments. Based on the current interest only payments, the Underwritten NOI DSCR and Underwritten NCF DSCR for the mortgage loan are 2.28x and 2.03x, respectively. |
| (4) | The “As Renovated” Appraised Value assumes the Beach House Hilton Head Property has completed all scheduled renovations. Based on the “As Renovated” Value, the Beach House Hilton Head Property has an “As Renovated” LTV of 64.1%. The “As Stabilized” Appraised Value assumes the Beach House Hilton Head Property has achieved a stabilized occupancy of 68.0% and an ADR of $186.43. Based on the “As Stabilized” Value, the Beach House Hilton Head Property has an “As Stabilized” LTV of 62.0%. |
| (5) | The sponsor acquired the property in 2013; as such, 2012 NOI and Occupancy are not available. |
THE INFORMATION IN THIS STRUCTURAL AND COLLATERAL TERM SHEET IS NOT COMPLETE AND MAY BE AMENDED PRIOR TO THE TIME OF SALE. THIS TERM SHEET IS NOT AN OFFER TO SELL THESE SECURITIES AND IT IS NOT A SOLICITATION OF AN OFFER TO BUY THESE SECURITIES IN ANY JURISDICTION WHERE THE OFFER OR SALE IS NOT PERMITTED. |
1 South Forest Beach Drive Hilton Head Island, SC 29928 | Collateral Asset Summary – Loan No. 7 Beach House Hilton Head | Cut-off Date Balance: Cut-off Date LTV: U/W NCF DSCR: U/W NOI Debt Yield: | $40,000,000 72.7% 1.58x 11.3% |
| Historical Occupancy, ADR, RevPAR(1)(2) | |||||||||
| Beach House Hilton Head Property | Competitive Set | Penetration Factor | |||||||
| Year | Occupancy | ADR | RevPAR | Occupancy | ADR | RevPAR | Occupancy | ADR | RevPAR |
| 2013 | 62.0% | $150.97 | $93.60 | 55.9% | $180.48 | $100.85 | 111.0% | 83.6% | 92.8% |
| 2014 | 63.7% | $157.27 | $100.22 | 59.1% | $197.16 | $116.46 | 107.9% | 79.8% | 86.1% |
| T-12 Aug 2015 | 68.5% | $156.45 | $107.11 | 59.8% | $200.36 | $119.84 | 114.5% | 78.1% | 89.4% |
| (1) | Source: Hospitality research report. |
| (2) | Occupancy, ADR and RevPAR represent estimates from the hospitality research report. The minor variances between the underwriting, the appraisal and the above table with respect to Occupancy, ADR and RevPAR at the Beach House Hilton Head Property are attributable to variances in reporting methodologies and/or timing differences. |
The Loan. The Beach House Hilton Head loan (the “Beach House Hilton Head Loan”) is a $40.0 million fixed rate loan secured by the borrower’s fee simple interest in two condominium units, which collectively comprise a 202-room full service hotel located at 1 South Forest Beach Drive in Hilton Head Island, South Carolina (the “Beach House Hilton Head Property”). There are no other condominium units at the Beach House Hilton Head Property. The Beach House Hilton Head Loan has a 10-year term and, after an initial 24-month interest only period, amortizes on a 30-year schedule. The Beach House Hilton Head Loan accrues interest at a fixed rate equal to 4.9000%. Loan proceeds, along with approximately $12.9 million in sponsor equity, were used to retire existing debt of approximately $34.2 million, fund reserves of approximately $6.7 million and pay closing costs of approximately $1.4 million. Based on the “As-is” appraised value of $55.0 million as of August 1, 2015, the cut-off date LTV is 72.7%. Based on the “As Renovated” appraised value of $62.4 million, the cut-off date LTV is 64.1%. Based on the “As Stabilized” appraised value of $64.5 million, the cut-off date LTV is 62.0%. The most recent prior financing of the Beach House Hilton Head Property was not included in a securitization.
| Sources and Uses | ||||||
| Sources | Proceeds | % of Total | Uses | Proceeds | % of Total | |
| Mortgage Loan | $40,000,000 | 75.6% | Loan Payoff | $34,241,381 | 64.7% | |
| Sponsor Equity | $12,904,129 | 24.4% | Partnership Buyout(1) | $10,492,924 | 19.8% | |
| Renovation Funds(2) | $5,800,000 | 11.0% | ||||
| Reserves | $930,165 | 1.8% | ||||
| Closing Costs | $1,439,657 | 2.7% | ||||
| Total Sources | $52,904,129 | 100.0% | Total Uses | $52,904,129 | 100.0% | |
| (1) | In February 2013, a joint venture formed by affiliates of Apollo Global Real Estate Management, L.P. (“Apollo”) and NV HH Beach House Investors, LLC (affiliates of Northview Hotel Group, LLC) acquired the Beach House Hilton Head Property for a total cost basis of $39.1 million ($193,564 per room). Apollo had an 88.74% interest and NV HH Beach House Investors, LLC had an 11.26% interest in the Beach House Hilton Head Property. Loan funds, along with fresh equity from the sponsor were used to refinance prior debt as well as buyout the remaining ownership interest of the Beach House Hilton Head Property. In addition to the proceeds from the Beach House Hilton Head Loan, the borrower contributed approximately $3.7 million of fresh equity in order to complete the partnership buyout for an aggregate of approximately $14.2 million. |
| (2) | At loan closing, $922,889 was drawn from the renovation funds reserve account and distributed to the borrower for FF&E purchases. The remaining balance on deposit in the renovation funds reserve account is $4,877,111. |
The Borrower / Sponsor. The borrower, AGRE NV HH Property Owner LLC, is a single purpose Delaware limited liability company structured to be bankruptcy-remote, with two independent directors in the organizational structure. The sponsors of the borrower and nonrecourse carve-out guarantors are Mark Mance, Simon Hallgarten, David Zeuske and Matthew Trevenen, on a joint and several basis.
Northview Hotel Group (“NVHG”) is a fully-integrated hotel operating partner and management company led by Mark Mance, Simon Hallgarten, David Zeuske and Matthew Trevenen. The sponsors have experience in all phases of the lodging industry, including investing, financing, deal structuring, due diligence analysis, operations and construction management. NVHG currently operates a portfolio of thirteen properties, ranging from branded urban hotels to independent and soft-flagged destination resorts. Since formation in 2004, NVHG has acquired over $700 million in lodging assets as a joint venture partner with a number of the largest real estate private equity firms in the U.S. NVHG’s hotel management team has also operated over 100 hotels in the last 20 years with an asset value in excess of $3.0 billion.
The Property.The Beach House Hilton Head Property is a 202-room full service hotel located on Hilton Head Island, South Carolina. The Beach House Hilton Head Property, built in 1973 and renovated most recently in 2012, consists of a five-story building on a 4.62 acre oceanfront site located at Coligny Beach. There are 202 parking spaces at the property, which equates to 1.00 space per room. The Beach House Hilton Head Property underwent approximately $3.6 million ($17,821 per room) in renovations in 2012. The renovations included upgrades to the guestrooms, meeting space and common area space to transform the property from a standard Holiday Inn to “The Beach House, a Holiday Inn Resort”. In addition to the previous renovations, the sponsor plans to implement a capital improvement plan from 2015 to 2016 for a total budgeted cost of $6.4 million ($31,683 per room), of which $5.8 million was reserved for at loan closing. Since the sponsor’s acquisition in February 2013, $600,000 ($2,970 per room) has been spent for renovations at the Beach House Hilton Head Property. Of the $5.8 million in renovation funds, $4.6 million ($22,722 per room) is expected to be spent on guest rooms and $620,000 ($3,069 per room) is expected to be set aside for roofing and deferred maintenance projects. Additionally, concurrent with loan closing, $922,889 was disbursed to the borrower from the $5.8 million renovation funds
THE INFORMATION IN THIS STRUCTURAL AND COLLATERAL TERM SHEET IS NOT COMPLETE AND MAY BE AMENDED PRIOR TO THE TIME OF SALE. THIS TERM SHEET IS NOT AN OFFER TO SELL THESE SECURITIES AND IT IS NOT A SOLICITATION OF AN OFFER TO BUY THESE SECURITIES IN ANY JURISDICTION WHERE THE OFFER OR SALE IS NOT PERMITTED. |
1 South Forest Beach Drive Hilton Head Island, SC 29928 | Collateral Asset Summary – Loan No. 7 Beach House Hilton Head | Cut-off Date Balance: Cut-off Date LTV: U/W NCF DSCR: U/W NOI Debt Yield: | $40,000,000 72.7% 1.58x 11.3% |
reserve account to purchase FF&E. The remaining budget of the capital improvement plan will be used for any contingency items. Following the planned renovations, which are expected to be completed in 2016, it is anticipated that the property’s rooms will be renovated to a 4-diamond standard.
The Beach House Hilton Head Property features 9,731 sq. ft. of meeting space, lounge, outdoor pool, fitness center, sundry shop, outdoor patio, guest laundry facilities, volleyball court, private beach, The Porch Southern Kitchen and Bar, The Shack (poolside restaurant) and The Tiki Hut (beachfront bar), which has been open since 1977. The Beach House Hilton Head Property is the only beachfront hotel on Hilton Head Island with a liquor license allowed to serve alcohol on the beach. The sponsors recently reallocated space within the hotel to create a second group and meeting breakout room. In 2014, the Beach House Hilton Head Property hosted 8 weddings. Post renovation, as of June 2015, there has been over 42 weddings hosted at the property.
The Beach House Hilton Head Property guestroom unit mix consists of 135 double double-bed rooms, 54 king-bed rooms, 3 king suites and 10 accessible rooms. Room categories are further divided into oceanfront, ocean view or island view. Each of the guestrooms features a television, work space, dresser, nightstands and a lounge chair. Larger rooms also include sofas, coffee tables and other related home furnishings and the rooms facing the ocean offer a small private standing balcony.
The Beach House Hilton Head Property is operated under a franchise agreement with Holiday Hospitality Franchising, LLC, which expires in February 2023. In connection with such expiration, the borrower has the option to “de-flag” the hotel and affiliate it with a pre-approved list of hotel groups, or to replace the existing franchisor with one of a specified list of franchisors and brands, as described in the accompanying free writing prospectus under “Risks Related to the Mortgage Loans—Hospitality Properties Have Special Risks.”
Environmental Matters. The Phase I environmental report dated August 24, 2015 recommended no further action at the Beach House Hilton Head Property.
The Market.The Beach House Hilton Head Property is located on Hilton Head Island, South Carolina within Beaufort County. Hilton Head is the largest barrier island on the Atlantic coast between Florida and New Jersey. It is located at the southernmost point of South Carolina, approximately 25 miles northeast of Savannah, Georgia. Approximately 2.5 million visitors stay in Hilton Head annually, with slightly more than half of the visitors coming during the three-month period between Memorial Day and Labor Day, of which 65% are estimated to be repeat visitors. Hilton Head has an official population of approximately 39,412 as of 2014; however, this population swells to over 250,000 in the summer months.
Hilton Head Island is regarded as the most popular resort destination in South Carolina and although it is known primarily for its beaches, other major tourist and leisure attractions include 24 world class golf courses, of which seven have been nationally ranked. The island also hosts the annual RBC Heritage PGA Tour, which has been played every April since 1969. The event is played at Sea Pine’s Harbour Town Golf Links, which is recognized as one of America’s top courses and consistently draws over 100,000 fans. An economic impact study estimated the tournament infuses approximately $96.0 million into the state each and every year. Additionally, there are more than 250 restaurants and 200 outlets and stores located on the island. The largest retail development on the island includes the Shelter Cove Mall, located approximately 4 miles northeast of the Beach House Hilton Head Property, and the adjacent neighborhood shopping center. The mall entrance is directly connected to US-278, the main road through the island and features 290,000 sq. ft. of retail, restaurant and entertainment space and is anchored by Belk and Kroger while the shopping center is anchored by TJ Maxx and Whole Foods.
The primary competitive set for the Beach House Hilton Head Property consists of four hotels, which range in size from 323 to 513 rooms and contain an aggregate of 1,592 rooms. The appraiser determined there is no new supply expected to be directly competitive to the Beach House Hilton Head Property given the property’s recent renovations and beachfront location. The subsequent chart presents the primary competitive set to the Beach House Hilton Head Property:
| Primary Competitive Set(1) | ||||||
| Property | Rooms | Year Opened | Approximate Distance | 2014 Occupancy(2) | 2014 ADR(2) | 2014 RevPAR(2) |
| Beach House Hilton Head Property | 202 | 1973 | NAP | 64.0% | $157.03 | $100.01 |
| Sonesta Resort | 340 | 1981 | 5.1 miles | 60.0% | $195.00 | $117.00 |
| Omni Hilton Head Oceanfront Resort | 323 | 1981 | 5.2 miles | 61.0% | $190.00 | $115.90 |
| Marriott Hilton Head Resort | 513 | 1976 | 5.0 miles | 54.0% | $177.00 | $95.58 |
| Westin Resort | 416 | 1985 | 7.4 miles | 63.0% | $225.00 | $141.75 |
| Total / Wtd. Avg.(3) | 1,592 | 59.1% | $196.02 | $116.34 | ||
| (1) | Source: Appraisal. |
| (2) | 2014 Occupancy, 2014 ADR and 2014 RevPAR represent estimates from the appraisal. The minor variances between the underwriting, the hospitality research report and the above table with respect to 2014 Occupancy, 2014 ADR and 2014 RevPAR at the Beach House Hilton Head Property are attributable to variances in reporting methodologies and/or timing differences. |
| (3) | Total / Wtd. Avg. does not include the Beach House Hilton Head Property. |
THE INFORMATION IN THIS STRUCTURAL AND COLLATERAL TERM SHEET IS NOT COMPLETE AND MAY BE AMENDED PRIOR TO THE TIME OF SALE. THIS TERM SHEET IS NOT AN OFFER TO SELL THESE SECURITIES AND IT IS NOT A SOLICITATION OF AN OFFER TO BUY THESE SECURITIES IN ANY JURISDICTION WHERE THE OFFER OR SALE IS NOT PERMITTED. |
1 South Forest Beach Drive Hilton Head Island, SC 29928 | Collateral Asset Summary – Loan No. 7 Beach House Hilton Head | Cut-off Date Balance: Cut-off Date LTV: U/W NCF DSCR: U/W NOI Debt Yield: | $40,000,000 72.7% 1.58x 11.3% |
The appraiser determined demand segmentation of 85% leisure travel, 10% meeting and group and 5% commercial for the Beach House Hilton Head Property, compared to 70% leisure travel, 25% meeting and group and 5% commercial for the primary competitive set. The market demand mix is presented in the table below:
| Demand Segmentation(1) | ||||
| Property | Rooms | Commercial | Meeting and Group | Leisure |
| Beach House Hilton Head Property | 202 | 5% | 10% | 85% |
| Sonesta Resort | 340 | 5% | 30% | 65% |
| Omni Hilton Head Oceanfront Resort | 323 | 5% | 25% | 70% |
| Marriott Hilton Head Resort | 513 | 5% | 25% | 70% |
| Westin Resort | 416 | 5% | 30% | 65% |
| Total / Wtd. Avg.(2) | 1,592 | 5% | 27% | 68% |
| (1) | Source: Appraisal. |
| (2) | Total / Wtd. Avg. does not include the Beach House Hilton Head Property. |
Cash Flow Analysis.
| Cash Flow Analysis | ||||||
| 2013 | 2014 | T-12 6/30/2015 | U/W | U/W per Room | ||
| Occupancy | 61.7% | 63.8% | 68.4% | 68.4% | ||
| ADR | $149.05 | $156.67 | $156.65 | $156.65 | ||
| RevPAR | $91.90 | $100.01 | $107.21 | $107.21 | ||
| Room Revenue | $6,775,720 | $7,373,782 | $7,904,244 | $7,904,244 | $39,130 | |
| F&B Revenue | 2,286,850 | 3,701,389 | 3,934,611 | 3,934,611 | 19,478 | |
| Other Revenue | 533,211 | 610,470 | 760,990 | 760,990 | 3,767 | |
| Total Revenue | $9,595,781 | $11,685,641 | $12,599,845 | $12,599,845 | $62,375 | |
| Operating Expenses | 2,821,340 | 3,893,299 | 4,139,331 | 4,139,448 | 20,492 | |
| Undistributed Expenses | 2,374,023 | 2,540,525 | 2,789,425 | 2,789,425 | 13,809 | |
| Gross Operating Profit | $4,400,418 | $5,251,817 | $5,671,089 | $5,670,972 | $28,074 | |
| Management Fee(1) | 287,873 | 350,574 | 377,995 | 377,995 | 1,871 | |
| Total Fixed Charges | 629,187 | 769,061 | 789,207 | 759,952 | 3,762 | |
| Net Operating Income | $3,483,358 | $4,132,182 | $4,503,886 | $4,533,024 | $22,441 | |
| FF&E(2) | 383,831 | 467,431 | 506,006 | 504,006 | 2,495 | |
| Net Cash Flow | $3,099,527 | $3,664,751 | $3,997,881 | $4,029,018 | $19,946 | |
| (1) | U/W Management Fee is 3.0% of gross revenues. |
| (2) | U/W FF&E represents 4.0% of gross revenues. |
Property Management. The Beach House Hilton Head Property is managed by NVHG Beach House Hotel Operator LLC, an affiliate of the borrower.
Lockbox / Cash Management. The Beach House Hilton Head Loan is structured with a hard lockbox and springing cash management. All rents and other payments are required to be deposited directly into a clearing account controlled by the lender. Unless a Trigger Period (as defined herein) is ongoing, all amounts on deposit in the clearing account are required to be swept daily into the borrower’s account. During a Trigger Period, all amounts on deposit in the clearing account are required to be swept daily into an account controlled by the lender and applied to pay all monthly amounts due under the loan documents.
A “Trigger Period” will commence (i) upon an event of default, (ii) during a Low Debt Service Period (as defined herein), (iii) if a PIP is required by the franchisor or by an Acceptable Non-Flag Affiliation Group (as defined herein) or any PIP required with de-flagging (which will end when 110% of the estimated PIP costs are deposited), (iv) 12 months prior to expiration of the term of the franchise agreement (which will end as described below under “Ongoing Reserves”) or (v) a Mezzanine Trigger Period (as defined herein).
A “Low Debt Service Period” will occur if the debt service coverage ratio for the trailing 12-month period is less than 1.20x on the last day of any calendar quarter and will end if the debt service coverage ratio is at least 1.25x for two consecutive quarters.
An “Acceptable Non-Flag Affiliation Group” means (i) Preferred Hotel Group and The Leading Hotels of the World, Ltd., provided that the Beach House Hilton Head Property is given full access to their respective sales, marketing and reservations systems and is listed
THE INFORMATION IN THIS STRUCTURAL AND COLLATERAL TERM SHEET IS NOT COMPLETE AND MAY BE AMENDED PRIOR TO THE TIME OF SALE. THIS TERM SHEET IS NOT AN OFFER TO SELL THESE SECURITIES AND IT IS NOT A SOLICITATION OF AN OFFER TO BUY THESE SECURITIES IN ANY JURISDICTION WHERE THE OFFER OR SALE IS NOT PERMITTED. |
1 South Forest Beach Drive Hilton Head Island, SC 29928 | Collateral Asset Summary – Loan No. 7 Beach House Hilton Head | Cut-off Date Balance: Cut-off Date LTV: U/W NCF DSCR: U/W NOI Debt Yield: | $40,000,000 72.7% 1.58x 11.3% |
as one of the “Preferred Hotels & Resorts” or “Leading Hotels of the World”, respectively or (ii) another hotel group reasonably acceptable to the lender.
A “Mezzanine Trigger Period” will commence and continue for so long as any mezzanine loan is outstanding.
Initial Reserves.At loan closing, the borrower deposited (i) $271,388 into a tax reserve account, (ii) $5,800,000 into a renovation funds reserve, of which $922,889 has already been disbursed to the borrower for FF&E purchases and (iii) $658,778 into a seasonal working capital reserve account.
Ongoing Reserves.On a monthly basis, the borrower is required to deposit monthly reserves of (i) 1/12 of the estimated annual real estate taxes, which currently equates to $28,122, into a tax reserve account and (ii) the greater of (a) 4.0% of the property’s prior month’s gross revenues, (b) any amount required under the management agreement and (c) any amount required under the franchise agreement for FF&E work (notwithstanding the foregoing, if as a result of the deposit of excess renovation funds the balance in the FF&E reserve exceeds $1,000,000, the borrower’s obligation to make monthly payments will temporarily cease until the first monthly payment date following the date on which the amount on deposit in the FF&E reserve account falls below $500,000). In addition, the borrower is required to deposit 1/12 of the estimated annual insurance premiums into an insurance reserve account if an acceptable blanket policy is no longer in place.
Beginning in April 2016, the borrower will be required to deposit an amount equal to the Seasonal Working Capital Reserve Account Monthly Deposit (as defined herein) on each monthly payment date in April, May, June, July, August, September, October and November if the seasonal working capital reserve account balance is less than the Seasonal Working Capital Reserve Annual Deposit Amount (as defined herein).
The “Seasonal Working Capital Reserve Annual Deposit Amount” will be equal to the sum of (a) the required monthly deposits into the tax reserve account, the insurance reserve account (if any) and the FF&E reserve account due on each monthly payment date occurring in December, January, February and/or March of each year during the loan term, (b) the monthly debt service amount or monthly interest payment amount (as applicable) due on each monthly payment date occurring in December, January, February and/or March of each year during the loan term, and (c) during the continuance of a Trigger Period only, the monthly operating expense budgeted amount applicable to the months of December, January, February and/or March of each year during the loan term and an amount for the payment of approved extraordinary operating expenses applicable to the months of December, January, February and/or March of each year during the loan term as reasonably determined by lender.
The “Seasonal Working Capital Reserve Account Monthly Deposit” will be equal to the quotient of the Seasonal Working Capital Reserve Annual Deposit Amount divided by eight or such lesser amount as is necessary to cause the amount on deposit in the seasonal working capital reserve account to equal the Seasonal Working Capital Reserve Annual Deposit Amount.
If the franchisor requires the borrower to implement a PIP at the Beach House Hilton Head Property or a PIP is required by an Acceptable Non-Flag Affiliation Group or a PIP is required as reasonably determined by the lender to de-flag the property, the borrower is required to deposit 110% of the estimated cost of the PIP. In addition, if the franchise agreement has less than twelve whole calendar months of term remaining or has been terminated, all available cash is required to be deposited into an account for the benefit of the lender until either borrower renews its current franchise agreement or enters into a new franchise agreement with a new franchisor of a pre-approved brand or elects to de-flag the property.
Upon the borrower de-flagging the property, the borrower is required to deposit the Franchise Termination Collateral Amount (as defined herein).
The “Franchise Termination Collateral Amount” will be the amount by which (a) $1,515,000 exceeds (b) the amount of PIP funds deposited in accordance with the loan documents. The franchise termination reserve funds are required to be released upon the Beach House Hilton Head Property achieving a 9.0% debt yield based on the trailing 12 months of operation without a flag.
Current Mezzanine or Subordinate Indebtedness. None.
Future Mezzanine or Subordinate Indebtedness Permitted. Mezzanine debt is permitted provided, among other conditions, (i) the combined LTV must be less than or equal to 72.73%, (ii) the combined DSCR must be greater than or equal to 1.43x and (iii) the combined debt yield must be greater than or equal to 9.60%.
THE INFORMATION IN THIS STRUCTURAL AND COLLATERAL TERM SHEET IS NOT COMPLETE AND MAY BE AMENDED PRIOR TO THE TIME OF SALE. THIS TERM SHEET IS NOT AN OFFER TO SELL THESE SECURITIES AND IT IS NOT A SOLICITATION OF AN OFFER TO BUY THESE SECURITIES IN ANY JURISDICTION WHERE THE OFFER OR SALE IS NOT PERMITTED. |
1 South Forest Beach Drive Hilton Head Island, SC 29928 | Collateral Asset Summary – Loan No. 7 Beach House Hilton Head | Cut-off Date Balance: Cut-off Date LTV: U/W NCF DSCR: U/W NOI Debt Yield: | $40,000,000 72.7% 1.58x 11.3% |
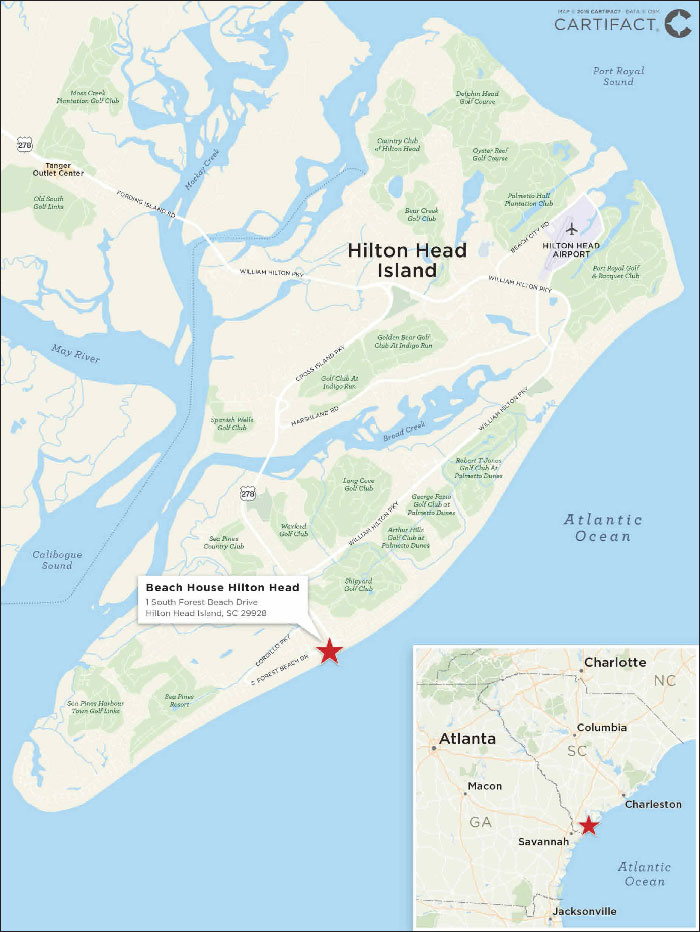
THE INFORMATION IN THIS STRUCTURAL AND COLLATERAL TERM SHEET IS NOT COMPLETE AND MAY BE AMENDED PRIOR TO THE TIME OF SALE. THIS TERM SHEET IS NOT AN OFFER TO SELL THESE SECURITIES AND IT IS NOT A SOLICITATION OF AN OFFER TO BUY THESE SECURITIES IN ANY JURISDICTION WHERE THE OFFER OR SALE IS NOT PERMITTED. |
(THIS PAGE INTENTIONALLY LEFT BLANK)
| 83 |
105 East Delaware Place Chicago, IL 60611 | Collateral Asset Summary – Loan No. 8 Whitehall Hotel | Cut-off Date Balance: Cut-off Date LTV: U/W NCF DSCR: U/W NOI Debt Yield: | $35,944,447 53.6% 1.51x 11.7% |
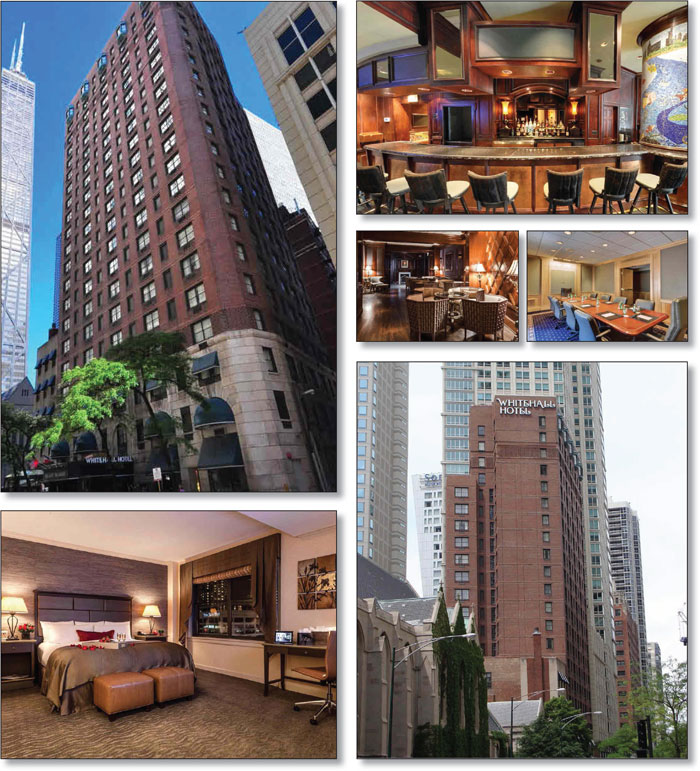
THE INFORMATION IN THIS STRUCTURAL AND COLLATERAL TERM SHEET IS NOT COMPLETE AND MAY BE AMENDED PRIOR TO THE TIME OF SALE. THIS TERM SHEET IS NOT AN OFFER TO SELL THESE SECURITIES AND IT IS NOT A SOLICITATION OF AN OFFER TO BUY THESE SECURITIES IN ANY JURISDICTION WHERE THE OFFER OR SALE IS NOT PERMITTED. 84 |
105 East Delaware Place Chicago, IL 60611 | Collateral Asset Summary – Loan No. 8 Whitehall Hotel | Cut-off Date Balance: Cut-off Date LTV: U/W NCF DSCR: U/W NOI Debt Yield: | $35,944,447 53.6% 1.51x 11.7% |
| Mortgage Loan Information | |
| Loan Seller: | JLC |
| Loan Purpose: | Refinance |
| Sponsor: | Su-Mei Yen; Hui-Hsien Bert Yen |
| Borrower: | Whitehall Hotel, L.L.C. |
| Original Balance: | $36,000,000 |
| Cut-off Date Balance: | $35,944,447 |
| % by Initial UPB: | 3.7% |
| Interest Rate: | 4.9900% |
| Payment Date: | 6thof each month |
| First Payment Date: | November 6, 2015 |
| Maturity Date: | October 6, 2025 |
| Amortization: | 300 months |
| Additional Debt: | None |
| Call Protection(1): | L(25), D(91), O(4) |
| Lockbox / Cash Management: | Hard / Springing |
| Reserves(2) | ||
| Initial | Monthly | |
| Taxes: | $225,000 | $48,900 |
| Insurance: | $138,000 | $11,900 |
| Rooms Renovation: | $300,000 | NAP |
| FF&E: | NAP | 1/12 of 4% of annual operating income |
| Required Repairs: | $38,750 | NAP |
| Capital Expense: | NAP | 1/12 of 1% of annual operating income |
| Financial Information | ||
| Cut-off Date Balance / Room: | $161,912 | |
| Balloon Balance / Room: | $121,220 | |
| Cut-off Date LTV: | 53.6% | |
| Balloon LTV: | 40.2% | |
| Underwritten NOI DSCR: | 1.67x | |
| Underwritten NCF DSCR: | 1.51x | |
| Underwritten NOI Debt Yield: | 11.7% | |
| Underwritten NCF Debt Yield: | 10.6% | |
| Underwritten NOI Debt Yield at Balloon: | 15.7% | |
| Underwritten NCF Debt Yield at Balloon: | 14.1% | |
| Property Information | |
| Single Asset / Portfolio: | Single Asset |
| Property Type: | Full Service Hospitality |
| Collateral: | Fee Simple |
| Location: | Chicago, IL |
| Year Built / Renovated: | 1928 / 1972, 1994, 2012-2014 |
| Total Rooms: | 222 |
| Property Management: | SB Yen’s Management Group, Inc. |
| Underwritten NOI: | $4,219,228 |
| Underwritten NCF: | $3,805,822 |
| Appraised Value: | $67,000,000 |
| Appraisal Date: | September 1, 2015 |
| Historical NOI | |
| Most Recent NOI: | $4,198,985 (T-12 July 31, 2015) |
| 2014 NOI: | $3,645,822 (December 31, 2014) |
| 2013 NOI: | $2,536,649 (December 31, 2013) |
| 2012 NOI: | $2,714,749 (December 31, 2012) |
| Historical Occupancy(3) | |
| Most Recent Occupancy: | 78.2% (July 31, 2015) |
| 2014 Occupancy: | 76.6% (December 31, 2014) |
| 2013 Occupancy: | 66.9% (December 31, 2013) |
| 2012 Occupancy: | 68.5% (December 31, 2012) |
| (1) | See “Partial Releases” herein. |
| (2) | See “Initial Reserves” and “Ongoing Reserves” herein. |
| (3) | The Whitehall Hotel Property was under renovation from 2012-2014 and rooms were taken offline to complete the renovations. Excluding the rooms taken offline during the renovations, 2012, 2013 and 2014 occupancy was equal to 73.3%, 73.6% and 78.9%, respectively. |
THE INFORMATION IN THIS STRUCTURAL AND COLLATERAL TERM SHEET IS NOT COMPLETE AND MAY BE AMENDED PRIOR TO THE TIME OF SALE. THIS TERM SHEET IS NOT AN OFFER TO SELL THESE SECURITIES AND IT IS NOT A SOLICITATION OF AN OFFER TO BUY THESE SECURITIES IN ANY JURISDICTION WHERE THE OFFER OR SALE IS NOT PERMITTED. 85 |
105 East Delaware Place Chicago, IL 60611 | Collateral Asset Summary – Loan No. 8 Whitehall Hotel | Cut-off Date Balance: Cut-off Date LTV: U/W NCF DSCR: U/W NOI Debt Yield: | $35,944,447 53.6% 1.51x 11.7% |
| Historical Occupancy, ADR, RevPAR(1) | |||||||||
| Whitehall Hotel Property | Competitive Set | Penetration Factor | |||||||
| Year | Occupancy | ADR | RevPAR | Occupancy | ADR | RevPAR | Occupancy | ADR | RevPAR(2) |
| 2012 | 69.1% | $144.69 | $99.94 | 74.6% | $167.95 | $125.35 | 92.6% | 86.2% | 79.7% |
| 2013 | 67.4% | $149.29 | $100.59 | 75.0% | $174.39 | $130.82 | 89.8% | 85.6% | 76.9% |
| 2014 | 77.2% | $143.55 | $110.87 | 76.0% | $171.63 | $130.46 | 101.6% | 83.6% | 85.0% |
| T-12 July 2015 | 78.5% | $154.90 | $121.67 | 77.1% | $180.09 | $138.89 | 101.9% | 86.0% | 87.6% |
| (1) | Source: Hospitality research report. |
| (2) | The Whitehall Hotel Property has ranked 1 of 6 in the competitive set in terms of RevPAR penetration over the last 24 month period ending July 31, 2015. |
The Loan. The Whitehall Hotel mortgage loan (the “Whitehall Hotel Loan”) is a $36.0 million fixed rate loan secured by the borrower’s fee simple interest in a 222-room full-service hotel located at 105 East Delaware Place in Chicago, Illinois (“The Whitehall Hotel Property”). The Whitehall Hotel Loan has a 10-year term and amortizes on a 25-year schedule. The Whitehall Hotel Loan accrues interest at a fixed rate equal to 4.9900% and has a cut-off date balance of approximately $35.9 million. Proceeds of the Whitehall Hotel Loan were used to retire existing debt of approximately $31.3 million, fund upfront reserves of approximately $0.7 million, pay closing costs of approximately $0.7 million and return approximately $3.4 million of equity to the sponsor. Based on the appraised value of $67.0 million as of September 1, 2015, the cut-off date LTV ratio is 53.6% and the remaining implied equity is approximately $31.0 million. The most recent prior financing of The Whitehall Hotel Property was included in the GCCFC 2005-GG5 transaction.
| Sources and Uses | ||||||
| Sources | Proceeds | % of Total | Uses | Proceeds | % of Total | |
| Mortgage Loan | $36,000,000 | 100.0% | Loan Payoff | $31,272,307 | 86.9% | |
| Rooms Renovation Reserve | $300,000 | 0.8% | ||||
| Upfront Reserves | $401,750 | 1.1% | ||||
| Closing Costs | $674,804 | 1.9% | ||||
| Return of Equity | $3,351,139 | 9.3% | ||||
| Total Sources | $36,000,000 | 100.0% | Total Uses | $36,000,000 | 100.0% | |
The Borrower / Sponsor. The borrower, Whitehall Hotel, L.L.C. is a single purpose Illinois limited liability company structured to be bankruptcy-remote, with two independent directors in its organizational structure. The sponsors of the borrower and the nonrecourse carve-out guarantors are Su-Mei Yen and Hui-Hsien Bert Yen, on a joint and several basis.
The sponsors of the borrower are hotel operators with over 25 years of ownership and management experience. The sponsors’ portfolio of properties includes the Whitehall Hotel Property, the Best Western Grant Park located in Chicago, Illinois, the Best Western University Plaza located in Evanston, Illinois, the Comfort Inn Downers Grove located in Grove, Illinois and the Best Western DeKalb Inn and Suites located in DeKalb, Illinois.
The Property. The Whitehall Hotel Property is a 222-room, luxury, full-service boutique hotel that was originally built in 1928 as an apartment tower and was converted to hotel use in 1972. There are a total of 222 guestrooms (of which 23 are suites, including the Delaware and Whitehall suites on the top floor which have access to private rooftop decks with views of the city and Lake Michigan).
The Whitehall Hotel Property guestrooms and suites offer king, queen and double queen layouts. Typical guest room furnishings include premium Egyptian cotton linens, white silk duvet covers over goose down comforters and Cashmere Hypnos Mattresses. Typical guest room bathrooms feature marble with hand-placed onyx mosaic tiles with shower and soaking tub, vanity and luxury bath amenities. All guestrooms feature 42-inch high definition LED televisions, wireless internet access, custom designed furniture, a cordless phone, Whitehall signature plush robes and a mini-bar.
The Whitehall Hotel Property amenities include a lobby with 24-hour front desk, concierge service, valet parking, 24-hour security, business center, fitness center, two restaurants (Fornetto Mei, a pan-Italian restaurant and Mei’s Corner, an upscale Asian restaurant), overnight shoe shines, valet laundry and 24-hour room service. The Whitehall Hotel Property also features 2,600 sq. ft. of meeting and banquet space which benefits from custom catering from the onsite restaurants and also provides a number of multi-use areas fit for entertaining and hosting up to 150 guests for special events, corporate meetings and banquet receptions.
The sponsors acquired the Whitehall Hotel Property in 1989 and subsequently completed a $25.0 restoration program in 1994. The sponsor then reopened the Whitehall Hotel Property as an elegant small European hotel operation. Since 2000, the sponsor has invested approximately $18.3 million ($82,339 per room) through a variety of building improvements, including $14.6 million ($65,913 per room) invested over the past 10 years to improve the guestrooms including all rooms on the floors 3-17, lobby and common areas, exterior façade, mechanical systems and food and beverage outlets. The sponsor has informed the lender that it plans to renovate the suites on floors 18-21 during 2016.
THE INFORMATION IN THIS STRUCTURAL AND COLLATERAL TERM SHEET IS NOT COMPLETE AND MAY BE AMENDED PRIOR TO THE TIME OF SALE. THIS TERM SHEET IS NOT AN OFFER TO SELL THESE SECURITIES AND IT IS NOT A SOLICITATION OF AN OFFER TO BUY THESE SECURITIES IN ANY JURISDICTION WHERE THE OFFER OR SALE IS NOT PERMITTED. 86 |
105 East Delaware Place Chicago, IL 60611 | Collateral Asset Summary – Loan No. 8 Whitehall Hotel | Cut-off Date Balance: Cut-off Date LTV: U/W NCF DSCR: U/W NOI Debt Yield: | $35,944,447 53.6% 1.51x 11.7% |
| Historical Capital Expenditures(1) | |||||||||
| Item | 2000-01 | 2002-03 | 2004-05 | 2006-07 | 2008-09 | 2010-11 | 2012-13 | 2014-15 | Total |
| Room Renovations, FF&E, & Interior Improvements | $1,875,280 | $81,558 | $480,463 | $2,688,498 | $136,540 | $84,770 | $1,810,045 | $305,798 | $7,462,951 |
| Lobby & Common Area Renovations | $0 | $0 | $0 | $0 | $0 | $0 | $490,104 | $0 | $490,104 |
| FF&E Restaurants / Opening of New Restaurant | $265,914 | $12,705 | $94,609 | $35,131 | $0 | $329,538 | $14,175 | $1,439 | $753,511 |
| FF&E Computers, Internet, Telephone, Office | $0 | $0 | $69,329 | $271,632 | $22,650 | $24,158 | $200,224 | $152,385 | $740,378 |
| Building Improvement - Exterior | $1,048,312 | $14,259 | $845,805 | $15,220 | $71,625 | $247,232 | $483,175 | $327,292 | $3,052,920 |
| Building Improvement - HVAC, Plumbing, Etc. | $95,520 | $32,500 | $0 | $111,634 | $3,562,242 | $1,258,530 | $149,292 | $240,430 | $5,450,147 |
| Operating Equipment & Elevator Upgrades | $0 | $0 | $0 | $329,304 | $0 | $0 | $0 | $0 | $329,304 |
| Total | $3,285,026 | $141,022 | $1,490,206 | $3,451,417 | $3,793,057 | $1,944,228 | $3,147,013 | $1,027,344 | $18,279,315 |
| (1) | Source: Sponsor |
Environmental Matters. The Phase I environmental report dated September 8, 2015 recommended no further action at the Whitehall Hotel Property.
The Market. The Whitehall Hotel Property is located in the Gold Coast neighborhood in the city of Chicago, Illinois. Located one-half block from Michigan Avenue, in close proximity to the lakefront and just off of the Magnificent Mile shopping area, the Whitehall Hotel Property is located in one of the most affluent areas in Chicago. The Gold Coast features tree-lined streets, Victorian houses, stately mansions, brownstones and luxury high-rise condominiums overlooking Lake Michigan. The 2014 average household income and population within a one-mile radius are $141,947 and 91,930, respectively. The Whitehall Hotel Property is within close proximity to some of Chicago’s historic cultural and tourist attractions including the Magnificent Mile, Water Tower, the John Hancock Center, Museum of Contemporary Art, Navy Pier, Millennium Park and Oak Street Beach.
The demand segmentation for the Whitehall Hotel Property consists of 50% commercial demand, 15% meeting and group demand and 35% leisure demand.
The Whitehall Hotel Property’s immediate marketplace includes five competitive properties, including MileNorth, Millennium Knickerbocker, Raffaello Hotel, The Talbott Hotel and The James Hotel Chicago. The five primary competitors range in size from 149 to 305 rooms and the competitive set collectively contains an aggregate of 1,346 rooms. The five primary competitors for the subject hotel are summarized in the table below:
| Primary Competitive Set(1) | ||||||
| Property | Rooms | Year Opened | Meeting | 2014 Occupancy | 2014 ADR | 2014 RevPAR |
| Whitehall Hotel Property | 222 | 1972(2) | 2,590 | 77% | $145 | $111 |
| MileNorth | 213 | 1981 | 3,000 | 76% | $165 | $125 |
| Millennium Knickerbocker | 305 | 1927 | 18,500 | 80% | $215 | $172 |
| Raffaello Hotel | 160 | 1979 | 400 | 73% | $130 | $95 |
| The Talbott Hotel | 149 | 1926 | 1,942 | 74% | $125 | $93 |
| The James Hotel Chicago | 297 | 1985 | 7,000 | 75% | $170 | $128 |
| Total / Wtd. Avg. | 1,346 | 76% | $166 | $127 | ||
| (1) | Source: Appraisal |
| (2) | The Whitehall Hotel Property was built in 1928 and first opened as a hotel in 1972. |
THE INFORMATION IN THIS STRUCTURAL AND COLLATERAL TERM SHEET IS NOT COMPLETE AND MAY BE AMENDED PRIOR TO THE TIME OF SALE. THIS TERM SHEET IS NOT AN OFFER TO SELL THESE SECURITIES AND IT IS NOT A SOLICITATION OF AN OFFER TO BUY THESE SECURITIES IN ANY JURISDICTION WHERE THE OFFER OR SALE IS NOT PERMITTED. 87 |
105 East Delaware Place Chicago, IL 60611 | Collateral Asset Summary – Loan No. 8 Whitehall Hotel | Cut-off Date Balance: Cut-off Date LTV: U/W NCF DSCR: U/W NOI Debt Yield: | $35,944,447 53.6% 1.51x 11.7% |
Cash Flow Analysis.
| Cash Flow Analysis | |||||||
| 2012 | 2013 | 2014 | T-12 7/31/2015 | U/W | U/W per Room | ||
| Occupancy(1) | 68.5% | 66.9% | 76.6% | 78.2% | 75.0% | ||
| ADR | $145.98 | $150.15 | $144.50 | $155.93 | $160.00 | ||
| RevPAR | $100.05 | $100.51 | $110.74 | $121.90 | $120.00 | ||
| Room Revenue | $8,129,201 | $8,143,979 | $8,973,227 | $9,877,689 | $9,723,680 | $43,800 | |
| F&B Revenue(2) | 837,380 | 1,098,582 | 66,908 | 63,745 | 200,000 | 901 | |
| Other Revenue | 441,998 | 434,351 | 426,221 | 417,759 | 411,472 | 1,853 | |
| Total Revenue | $9,408,579 | $9,676,912 | $9,466,357 | $10,359,193 | $10,335,152 | $46,555 | |
| Operating Expenses | 3,000,157 | 3,150,774 | 2,099,590 | 2,403,932 | 2,365,161 | 10,654 | |
| Undistributed Expenses | 2,590,360 | 2,874,207 | 2,808,589 | 2,829,491 | 2,822,925 | 12,716 | |
| Gross Operating Profit | $3,818,062 | $3,651,930 | $4,558,178 | $5,125,770 | $5,147,067 | $23,185 | |
| Management Fee | 285,996 | 289,700 | 283,991 | 310,776 | 310,055 | 1,397 | |
| Total Fixed Charges | 817,317 | 825,581 | 628,366 | 616,010 | 617,784 | 2,783 | |
| Net Operating Income | $2,714,749 | $2,536,649 | $3,645,822 | $4,198,985 | $4,219,228 | $19,006 | |
| FF&E(3) | 0 | 0 | 0 | 0 | 413,406 | 1,862 | |
| Net Cash Flow | $2,714,749 | $2,536,649 | $3,645,822 | $4,198,985 | $3,805,822 | $17,143 | |
| (1) | The Whitehall Hotel Property was under renovation from 2012-2014 and rooms were taken offline to complete the renovations. Excluding the rooms taken offline during the renovations, 2012, 2013 and 2014 occupancy was equal to 73.3%, 73.6% and 78.9%, respectively. |
| (2) | UW F&B Revenue represents an executed lease with Whitehall Hotel Restaurant, Inc, which is fully guaranteed by the sponsors. The initial term of the lease expires in 2027 and annual base rent is $200,000. |
| (3) | U/W FF&E represents approximately 4.0% of U/W Total Revenue. |
Property Management. The Whitehall Hotel Property is managed by SB Yen’s Management Group, Inc., an affiliate of the borrower.
Lockbox / Cash Management. The Whitehall Hotel Loan is structured with a hard lockbox and springing cash management. All credit card receipts are required to be deposited by credit card processing companies directly into a clearing account, and all non-credit card receipts are required to be deposited in the clearing account within one business day of receipt by borrower or property manager. Amounts on deposit in the clearing accounts are required to be transferred daily to an account controlled by the borrower unless a Cash Management Period (defined below) is continuing.
A “Cash Management Period” will commence (i) upon the maturity date of the Whitehall Hotel Loan, (ii) upon the occurrence of an event of default, or (iii) if the debt service coverage ratio is less than 1.20x, and the period will end if (A) with respect to clause (i), the Whitehall Hotel Loan has been repaid in full, (B) with respect to clause (ii), the event of default has been cured, and (C) with respect to clause (iii) the debt service coverage ratio is at least 1.30x for two consecutive calculation dates.
Initial Reserves. At loan closing, the borrower deposited (i) $225,000 into a tax reserve account, (ii) $38,750 into a required repairs reserve account, which represents 125% of the engineer’s recommendation, (iii) $138,000 into an insurance reserve account and (iv) $300,000 into a room renovation reserve account related to the planned renovation of the suites on floors 18-21 during 2016.
Ongoing Reserves. On a monthly basis, the borrower is required to deposit reserves of (i) 1/12 of the estimated annual real estate taxes, which currently equates to $48,900, into a tax reserve account and (ii) 1/12of 4.0% of annual operating income into an FF&E reserve account. The borrower is required to deposit 1/12 of the annual insurance premiums, which currently equates to $11,900, into an insurance reserve account. Additionally, on each monthly payment date the borrower is required to deposit into a capital expense reserve an amount equal to 1/12 of 1% of annual operating income.
Partial Releases. On any payment date, the borrower may obtain the release of a small, non-income producing portion of the Whitehall Hotel Property (identified in the loan agreement) from the lien of the mortgage provided, among other things, the REMIC loan-to-value ratio after the release is not more than 125% and, with respect to the adjacent development (as described below), (i) lender has approved, among other things, certain agreements and plans related to the adjacent development, (ii) borrower has delivered $1,800,000 to lender to be held as additional collateral for the Whitehall Hotel Loan (until such time that the adjacent development is completed to the satisfaction of lender) and (iii) the sponsors have delivered to lender a guaranty of lien-free completion of the adjacent development. According to the sponsors, an affiliate of the borrower intends to develop the released parcel, together with adjacent parcels owned by an affiliate of the borrower, for the purpose of developing on the property adjacent to the Whitehall Hotel Property amenities that may be used by guests at the Whitehall Hotel Property including, a ballroom, meeting and event space, parking area, office space, restaurant, gym, and other amenity spaces and services for the Whitehall Hotel Property.
THE INFORMATION IN THIS STRUCTURAL AND COLLATERAL TERM SHEET IS NOT COMPLETE AND MAY BE AMENDED PRIOR TO THE TIME OF SALE. THIS TERM SHEET IS NOT AN OFFER TO SELL THESE SECURITIES AND IT IS NOT A SOLICITATION OF AN OFFER TO BUY THESE SECURITIES IN ANY JURISDICTION WHERE THE OFFER OR SALE IS NOT PERMITTED. 88 |
105 East Delaware Place Chicago, IL 60611 | Collateral Asset Summary – Loan No. 8 Whitehall Hotel | Cut-off Date Balance: Cut-off Date LTV: U/W NCF DSCR: U/W NOI Debt Yield: | $35,944,447 53.6% 1.51x 11.7% |
Current Mezzanine or Subordinate Indebtedness. None.
Future Mezzanine or Subordinate Indebtedness Permitted. None.
THE INFORMATION IN THIS STRUCTURAL AND COLLATERAL TERM SHEET IS NOT COMPLETE AND MAY BE AMENDED PRIOR TO THE TIME OF SALE. THIS TERM SHEET IS NOT AN OFFER TO SELL THESE SECURITIES AND IT IS NOT A SOLICITATION OF AN OFFER TO BUY THESE SECURITIES IN ANY JURISDICTION WHERE THE OFFER OR SALE IS NOT PERMITTED. 89 |
105 East Delaware Place Chicago, IL 60611 | Collateral Asset Summary – Loan No. 8 Whitehall Hotel | Cut-off Date Balance: Cut-off Date LTV: U/W NCF DSCR: U/W NOI Debt Yield: | $35,944,447 53.6% 1.51x 11.7% |
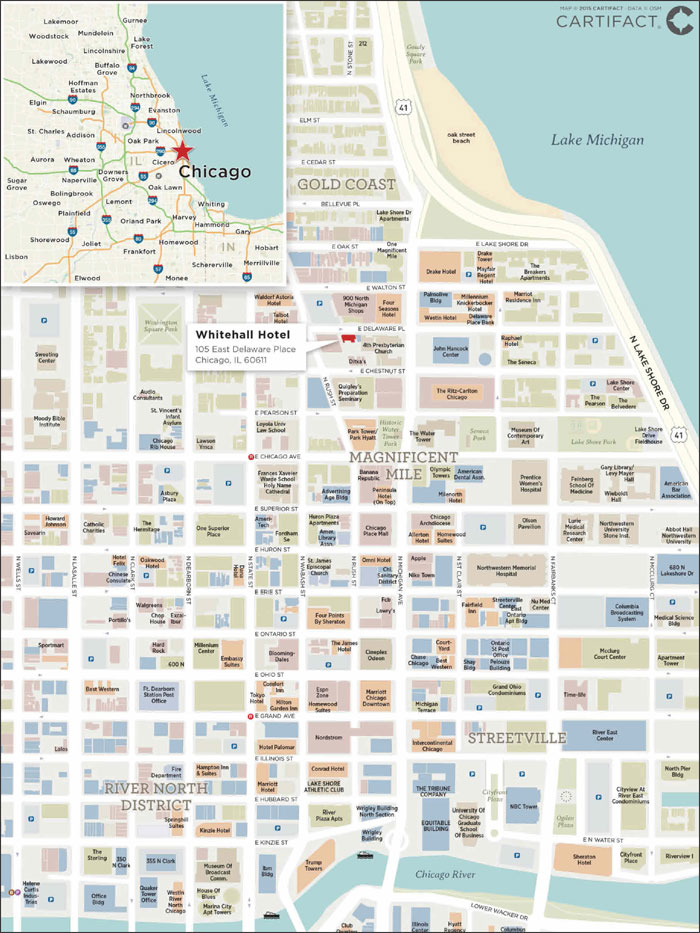
THE INFORMATION IN THIS STRUCTURAL AND COLLATERAL TERM SHEET IS NOT COMPLETE AND MAY BE AMENDED PRIOR TO THE TIME OF SALE. THIS TERM SHEET IS NOT AN OFFER TO SELL THESE SECURITIES AND IT IS NOT A SOLICITATION OF AN OFFER TO BUY THESE SECURITIES IN ANY JURISDICTION WHERE THE OFFER OR SALE IS NOT PERMITTED. 90 |
(THIS PAGE INTENTIONALLY LEFT BLANK)
| 91 |
611 Cowper Street Palo Alto, CA 94301 | Collateral Asset Summary – Loan No. 9 611 Cowper | Cut-off Date Balance: Cut-off Date LTV: U/W NCF DSCR: U/W NOI Debt Yield: | $32,914,514 55.8% 1.60x 10.1% |
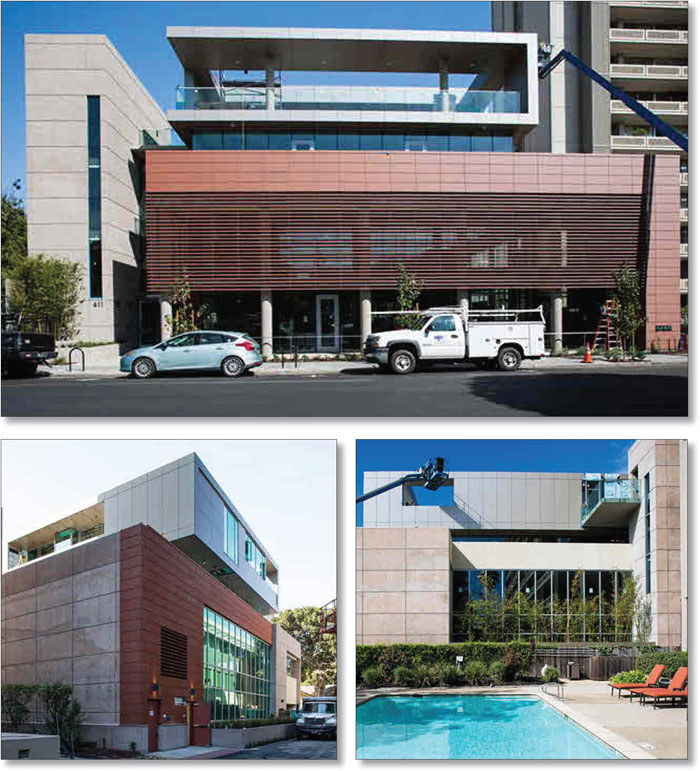
THE INFORMATION IN THIS STRUCTURAL AND COLLATERAL TERM SHEET IS NOT COMPLETE AND MAY BE AMENDED PRIOR TO THE TIME OF SALE. THIS TERM SHEET IS NOT AN OFFER TO SELL THESE SECURITIES AND IT IS NOT A SOLICITATION OF AN OFFER TO BUY THESE SECURITIES IN ANY JURISDICTION WHERE THE OFFER OR SALE IS NOT PERMITTED. 92 |
611 Cowper Street Palo Alto, CA 94301 | Collateral Asset Summary – Loan No. 9 611 Cowper | Cut-off Date Balance: Cut-off Date LTV: U/W NCF DSCR: U/W NOI Debt Yield: | $32,914,514 55.8% 1.60x 10.1% |
| Mortgage Loan Information | |
| Loan Seller: | GACC |
| Loan Purpose: | Refinance |
| Sponsors: | Stephen Reller; Mark Moragne |
| Borrower: | 611 Cowper Commercial LLC |
| Original Balance: | $33,000,000 |
| Cut-off Date Balance: | $32,914,514 |
| % by Initial UPB: | 3.4% |
| Interest Rate: | 4.3500% |
| Payment Date: | 6thof each month |
| First Payment Date: | October 6, 2015 |
| Maturity Date: | September 6, 2025 |
| Amortization: | 360 months |
| Additional Debt: | None |
| Call Protection: | L(26), D(90), O(4) |
| Lockbox / Cash Management: | Hard / Springing |
| Reserves(1) | ||
| Initial | Monthly | |
| Taxes: | $37,308 | Springing |
| Insurance: | $930 | Springing |
| Replacement: | $12,000 | Springing |
| TI/LC: | $3,043,827 | Springing |
| Free Rent: | $1,620,000 | NAP |
| Lease Sweep: | $0 | Springing |
| Common Charges | $0 | Springing |
| Financial Information | ||
| Cut-off Date Balance / Sq. Ft.: | $1,097 | |
| Balloon Balance / Sq. Ft.: | $885 | |
| Cut-off Date LTV(2): | 55.8% | |
| Balloon LTV(2): | 45.0% | |
| Underwritten NOI DSCR: | 1.68x | |
| Underwritten NCF DSCR: | 1.60x | |
| Underwritten NOI Debt Yield: | 10.1% | |
| Underwritten NCF Debt Yield: | 9.6% | |
| Underwritten NOI Debt Yield at Balloon: | 12.5% | |
| Underwritten NCF Debt Yield at Balloon: | 11.9% | |
| Property Information | |
| Single Asset / Portfolio: | Single Asset |
| Property Type: | Suburban Office |
| Collateral: | Fee Simple |
| Location: | Palo Alto, CA |
| Year Built / Renovated: | 2015 / NAP |
| Total Sq. Ft.: | 30,000 |
| Property Management: | Premier Property Management, Inc. |
| Underwritten NOI: | $3,316,626 |
| Underwritten NCF: | $3,162,396 |
| “As-is” Appraised Value: | $51,800,000 |
| “As-is” Appraisal Date: | June 29, 2015 |
| “As Stabilized” Appraised Value(3): | $59,000,000 |
| “As Stabilized” Appraisal Date(3): | November 1, 2015 |
| Historical NOI(4) | |
| 2014 NOI: | NAP |
| 2013 NOI: | NAP |
| 2012 NOI: | NAP |
| Historical Occupancy(4) | |
| Most Recent Occupancy: | 100.0% (November 6, 2015) |
| 2014 Occupancy: | NAP |
| 2013 Occupancy: | NAP |
| 2012 Occupancy: | NAP |
| (1) | See “Initial Reserves” and “Ongoing Reserves” herein. |
| (2) | The Cut-off Date LTV and Balloon LTV were calculated using the As Stabilized Appraised Value of $59.0 million. Based on the As-is Appraised Value, the Cut-off Date LTV and Balloon LTV are 63.5% and 51.2%, respectively. |
| (3) | The As Stabilized Appraised Value assumes the punch list items have been completed and all free rent and TI allowance have been exhausted at the 611 Cowper Property. |
| (4) | The 611 Cowper Property was completed in 2015; as such, Historical NOI and Historical Occupancy are not applicable. |
THE INFORMATION IN THIS STRUCTURAL AND COLLATERAL TERM SHEET IS NOT COMPLETE AND MAY BE AMENDED PRIOR TO THE TIME OF SALE. THIS TERM SHEET IS NOT AN OFFER TO SELL THESE SECURITIES AND IT IS NOT A SOLICITATION OF AN OFFER TO BUY THESE SECURITIES IN ANY JURISDICTION WHERE THE OFFER OR SALE IS NOT PERMITTED. 93 |
611 Cowper Street Palo Alto, CA 94301 | Collateral Asset Summary – Loan No. 9 611 Cowper | Cut-off Date Balance: Cut-off Date LTV: U/W NCF DSCR: U/W NOI Debt Yield: | $32,914,514 55.8% 1.60x 10.1% |
| Tenant Summary | |||||||
Tenant | Ratings | Net Rentable | % of Net |
| U/W Base | % of Total | Lease |
| A9.com | NR/Baa1/AA- | 30,000 | 100.0%(2) | $108.00 | 100.0% | 10/31/2025 | |
| Total Occupied Collateral | 30,000 | 100.0% | $108.00 | 100.0% | |||
| Vacant | 0 | 0.0% | |||||
| Total | 30,000 | 100.0% | |||||
| (1) | Credit ratings represent Amazon.com, Inc., the parent company of A9.com. Amazon.com, Inc. guarantees up to $10,000,000 of the A9.com lease. See “Tenant” below. |
| (2) | The 611 Cowper Property is 100.0% leased to A9.com. The tenant is anticipated to take occupancy in 2015. |
| Lease Rollover Schedule | ||||||||
| Year | # of | Total | % of Total Sq. | Cumulative | Cumulative % of | Annual U/W | % U/W | Cumulative % |
| MTM | 0 | 0 | 0.0% | 0 | 0.0% | $0.00 | 0.0% | 0.0% |
| 2015 | 0 | 0 | 0.0% | 0 | 0.0% | $0.00 | 0.0% | 0.0% |
| 2016 | 0 | 0 | 0.0% | 0 | 0.0% | $0.00 | 0.0% | 0.0% |
| 2017 | 0 | 0 | 0.0% | 0 | 0.0% | $0.00 | 0.0% | 0.0% |
| 2018 | 0 | 0 | 0.0% | 0 | 0.0% | $0.00 | 0.0% | 0.0% |
| 2019 | 0 | 0 | 0.0% | 0 | 0.0% | $0.00 | 0.0% | 0.0% |
| 2020 | 0 | 0 | 0.0% | 0 | 0.0% | $0.00 | 0.0% | 0.0% |
| 2021 | 0 | 0 | 0.0% | 0 | 0.0% | $0.00 | 0.0% | 0.0% |
| 2022 | 0 | 0 | 0.0% | 0 | 0.0% | $0.00 | 0.0% | 0.0% |
| 2023 | 0 | 0 | 0.0% | 0 | 0.0% | $0.00 | 0.0% | 0.0% |
| 2024 | 0 | 0 | 0.0% | 0 | 0.0% | $0.00 | 0.0% | 0.0% |
| 2025 | 1 | 30,000 | 100.0% | 30,000 | 100.0% | $108.00 | 100.0% | 100.0% |
| Thereafter | 0 | 0 | 0.0% | 30,000 | 100.0% | $0.00 | 0.0% | 100.0% |
| Vacant | NAP | 0 | 0.0% | 30,000 | 100.0% | NAP | NAP | |
| Total / Wtd. Avg. | 1 | 30,000 | 100.0% | $108.00 | 100.0% | |||
The Loan. The 611 Cowper loan (the “611 Cowper Loan”) is a fixed rate loan secured by the borrower’s fee simple interest in an office condominium totaling 30,000 sq. ft., located on the first three stories of a four-story, newly constructed Class A office and residential building located at 611 Cowper Street in Palo Alto, California (the “611 Cowper Property”) with an original principal balance of $33.0 million. The 611 Cowper Loan has a 10-year term and amortizes on a 30-year schedule. The 611 Cowper Loan accrues interest at a fixed rate equal to 4.3500% and has a cut-off date balance of $32.9 million. Loan proceeds were used to retire existing debt of approximately $15.4 million, fund upfront reserves of approximately $3.0 million, pay closing costs of approximately $2.0 million, pay punch list items of approximately $1.7 million and return approximately $11.0 million of equity to the sponsor. Based on the “As-is” appraised value of $51.8 million, the cut-off date LTV ratio is 63.5%. Based on the “As Stabilized” value of $59.0 million, the cut-off date LTV ratio is 55.8%.The most recent prior financing of the 611 Cowper Property was not included in a securitization.
| Sources and Uses | ||||||
| Sources | Proceeds | % of Total | Uses | Proceeds | % of Total | |
| Mortgage Loan | $33,000,000 | 100.0% | Loan Payoff | $15,364,048 | 46.6% | |
| Reserves | $3,020,238 | 9.2% | ||||
| Closing Costs | $1,952,063 | 5.9% | ||||
| Punch List Items | $1,693,827 | 5.1% | ||||
| Return of Equity | $10,969,824 | 33.2% | ||||
| Total Sources | $33,000,000 | 100.0% | Total Uses | $33,000,000 | 100.0% | |
THE INFORMATION IN THIS STRUCTURAL AND COLLATERAL TERM SHEET IS NOT COMPLETE AND MAY BE AMENDED PRIOR TO THE TIME OF SALE. THIS TERM SHEET IS NOT AN OFFER TO SELL THESE SECURITIES AND IT IS NOT A SOLICITATION OF AN OFFER TO BUY THESE SECURITIES IN ANY JURISDICTION WHERE THE OFFER OR SALE IS NOT PERMITTED. 94 |
611 Cowper Street Palo Alto, CA 94301 | Collateral Asset Summary – Loan No. 9 611 Cowper | Cut-off Date Balance: Cut-off Date LTV: U/W NCF DSCR: U/W NOI Debt Yield: | $32,914,514 55.8% 1.60x 10.1% |
The Borrower / Sponsor. The borrower, 611 Cowper Commercial LLC, is a special purpose Delaware limited liability company structured to be bankruptcy-remote, with one independent director in its organizational structure. The sponsors of the borrower and the nonrecourse carve-out guarantors are Stephen Reller and Mark Moragne, on a joint and several basis.
Stephen Reller and Mark Moragne own and operate R&M Properties and NorthWall Builders, a home and office developer and construction company located in Palo Alto, California. Over the past two years, the borrowers have completed a number of developments within Palo Alto including an office and residential development on Hamilton Avenue, a historical renovation of an apartment building on Gilman Street, a renovation of an office building on Hawthorne Avenue and the development of a new 44-unit assisted living facility on El Camino Way.
The sponsors are 100% owners of 611 Cowper Commercial LLC, which is the sole owner and member of both the borrowing entity and the entity which holds the residential condominium unit. The commercial portion of the 611 Cowper Property has 80% of the voting rights in the condominium association.
The Property. The 611 Cowper Property is a 30,000 sq. ft. office condominium located on the first three stories of a newly constructed four-story, Class A office and residential building. The sponsor originally purchased the 611 Cowper Property in 2012 for $7.95 million and subsequently bought out the existing tenants and tore down the existing structure. The sponsor began construction on the 611 Cowper Property in January 2014 for a total development cost of $34.3 million including land value and the building was completed in October 2015. The building, which is comprised of a two unit condominium, has a total NRA of 36,712 sq. ft. with 30,000 sq. ft. allocated to the office space and 6,712 sq. ft. allocated to the residential space, which is not part of the collateral. The residential and commercial portions of the building have no shared common area and each features its own private access and dedicated parking spaces. The 611 Cowper Property has 58 underground parking spaces, which equates to a ratio of 1.93 spaces per 1,000 sq. ft. The tenant of the commercial portion also has exclusive use of 4,500 sq. ft. of outdoor patio and terrace space which is not included in the total NRA.
The 611 Cowper Property is located in Downtown Palo Alto, approximately 30 miles south of San Francisco and 15 miles north of San Jose. The 611 Cowper Property is well served by two access routes, University Avenue and Embarcadero Road, which intersect with US Highway 101 to the east of the 611 Cowper Property. University Avenue is a main thoroughfare within the Downtown Palo Alto area and also is the main commercial area, with many shops, restaurants, offices and theaters located on the street and on side streets adjacent to University Avenue.
Environmental Matters. The Phase I environmental report dated June 5, 2015 recommended no further action at the 611 Cowper Property.
Tenant. The 611 Cowper Property is fully leased to A9.com (“A9”), a subsidiary of Amazon.com, Inc. (“Amazon”) (rated Baa1/AA- by Moody’s/S&P). Created in 2003 by Amazon, A9 develops search and advertising technology for use by Amazon and other online eCommerce retailers. Currently, the A9 search engine powers product search globally for Amazon.com and has expanded into targeted advertising, mobile apps and searches related to the Cloud.A9 currently has another office in Palo Alto on Alma Street and additional teams in Bangalore, Beijing, Dublin, Iasi, Munich and Tokyo.
Amazon provided a parent guarantee for A9’s lease with a maximum liability of $10,000,000 during the lease term. A9’s lease commenced July 1, 2015 and expires 120 months from the rent commencement date which will occur upon the later of (i) 120 days from the commencement date (October 29, 2015) or (ii) the date upon which the building is substantially completed, subject to any punch list items to be completed by the borrower that are accepted by A9. Six months of base rent has been reserved to cover any delays in rent commencement. The sole tenant is not expected to take occupancy at the 611 Cowper Property until both (i) the borrower completes certain remaining required punch list items with respect to landlord work required under the lease and (ii) the tenant completes certain tenant improvement work for which it is entitled to tenant allowances under the lease. The property does not yet have a permanent certificate of occupancy and is operating under a temporary certificate. Payment of base rent commences at $108.00 PSF with annual 3.5% increases. A9 has two five-year renewal options at 100% of the fair market rent upon nine months’ notice. The tenant has no termination options.
On July 24, 2015, Amazon reported net earnings of $92.0 million in the three months ended June 30, 2015. Q2 2015 net sales were $23.2 billion, a 19.9% increase from $19.3 billion in the second quarter of the prior fiscal year. Amazon had a $254.8 billion market capitalization as of October 14, 2015.
The Market. The 611 Cowper Property is located in the city of Palo Alto, California which lies within the Silicon Valley region. According to the appraisal, Silicon Valley has a population of approximately 2.6 million. Silicon Valley’s economy continues to benefit from its technology sector and the region’s employment growth ranked first in the nation in March 2015. The commercial real estate market in Greater Silicon Valley has also benefitted from hiring in the technology sector which has fueled demand for office and high tech space. The average household income in Silicon Valley is $122,160 which is 71.3% above the U.S. average and 45.0% of households have a bachelor or advanced degree compared to just 28.4% for the nation.
THE INFORMATION IN THIS STRUCTURAL AND COLLATERAL TERM SHEET IS NOT COMPLETE AND MAY BE AMENDED PRIOR TO THE TIME OF SALE. THIS TERM SHEET IS NOT AN OFFER TO SELL THESE SECURITIES AND IT IS NOT A SOLICITATION OF AN OFFER TO BUY THESE SECURITIES IN ANY JURISDICTION WHERE THE OFFER OR SALE IS NOT PERMITTED. 95 |
611 Cowper Street Palo Alto, CA 94301 | Collateral Asset Summary – Loan No. 9 611 Cowper | Cut-off Date Balance: Cut-off Date LTV: U/W NCF DSCR: U/W NOI Debt Yield: | $32,914,514 55.8% 1.60x 10.1% |
Palo Alto is best known as the home of Stanford University but is also recognized as a center for research and development activities and as an international hub of technology. As of 2013, Palo Alto had a population of 66,673 and very little land available for development. Population growth in the city is driven primarily by dense development replacing low density apartment and homes, mostly in the form of small condominium complexes. Similarly, new office development is primarily in the form of redevelopment of existing structures. Per a Q1 2015 market report, the downtown Palo Alto submarket had only one Class A office building and 109 Class B office properties totaling approximately 2.0 million sq. ft. The submarket featured a 2.9% vacancy rate with an average asking rent of $89.92 PSF.
The appraiser determined six recent comparable office leases with base rents ranging from $89.40 to $114.00 PSF, with an average of $97.20 PSF. The comparable leases ranged in size from 3,231 sq. ft. to 15,599 sq. ft. Based on the recent leases and the Palo Alto market fundamentals, the appraiser determined a market rent of $108.00 PSF, in line with the A9 base rent. Comparable office leases are detailed below.
| Competitive Set(1) | ||||||||
| Property Name | City, State | Class | Year Built | Total Office NRA (Sq. Ft.) | Lease SF | Rent PSF | Term (yrs.) | Lease Date |
| 611 Cowper Property | Palo Alto, CA | A | 2015 | 30,000(2) | 30,000 | $108.00(2) | 10.0(2) | Various(2) |
| Primary Competitive Set | ||||||||
| Palo Alto Office Center | Palo Alto, CA | A | 1986 | 31,317 | 10,289 | $114.00 | Neg. | Listing |
| 537 Hamilton Avenue | Palo Alto, CA | A | 2014 | 17,150 | 9,395 | $96.00 | 12.0 | December 2013 |
| Total / Wtd. Avg.(3) | 48,467 | 9,973 | $107.63 | 12.0 | ||||
| Secondary Competitive Set | ||||||||
| Bank of America Building | Palo Alto, CA | B | 1975 | 50,000 | 3,231 | $97.44 | 6.3 | December 2014 |
| Wells Fargo Building | Palo Alto, CA | B | 1984 | 97,000 | 9,320 | $91.20 | 5.0 | October 2014 |
| The Hamilton Lane Building | Palo Alto, CA | B | 1985 | 12,897 | 12,897 | $95.40 | 8.0 | October 2014 |
| 431 Waverly Street | Palo Alto, CA | B | 1955 | 15,599 | 15,599 | $89.40 | 10.0 | September 2014 |
| Total / Wtd. Avg.(3) | 175,496 | 8,406 | $93.13 | 6.0 | ||||
| (1) | Source: Appraisal. |
| (2) | Based on the rent roll dated November 6, 2015. |
| (3) | Total / Wtd. Avg. does not include the 611 Cowper Property. |
Cash Flow Analysis.
| Cash Flow Analysis | ||
| U/W | U/W PSF | |
| Base Rent(1) | $3,472,140 | $115.74 |
| Value of Vacant Space | 0 | 0.00 |
| Gross Potential Rent | $3,472,140 | $115.74 |
| Total Recoveries | 969,194 | 32.31 |
| Less: Vacancy(2) | (133,240) | (4.44) |
| Effective Gross Income | $4,308,094 | $143.60 |
| Total Operating Expenses | 991,468 | 33.05 |
| Net Operating Income | $3,316,626 | $110.55 |
| TI/LC | 148,230 | 4.94 |
| Capital Expenditures | 6,000 | 0.20 |
| Net Cash Flow | $3,162,396 | $105.41 |
| (1) | U/W Base Rent includes $232,140 in contractual step rent through November 2016 and NPV credit step rent through July 2018. |
| (2) | U/W Vacancy represents 3.0% of total gross income. The 611 Cowper Property is 100.0% leased as of November 6, 2015. |
Property Management. The 611 Cowper Property is managed by Premier Property Management, Inc.
Lockbox / Cash Management. The 611 Cowper Loan is structured with a hard lockbox and springing cash management. All rents and other payments are required to be deposited directly into a clearing account controlled by lender. Unless a Trigger Period (as defined below) is ongoing, all amounts on deposit in the clearing account are required to be swept daily into the borrower’s account. During a Trigger Period, all amounts on deposit in the clearing account are required to be swept daily into the deposit account controlled by the lender and applied to pay monthly amounts due under the loan documents.
THE INFORMATION IN THIS STRUCTURAL AND COLLATERAL TERM SHEET IS NOT COMPLETE AND MAY BE AMENDED PRIOR TO THE TIME OF SALE. THIS TERM SHEET IS NOT AN OFFER TO SELL THESE SECURITIES AND IT IS NOT A SOLICITATION OF AN OFFER TO BUY THESE SECURITIES IN ANY JURISDICTION WHERE THE OFFER OR SALE IS NOT PERMITTED. 96 |
611 Cowper Street Palo Alto, CA 94301 | Collateral Asset Summary – Loan No. 9 611 Cowper | Cut-off Date Balance: Cut-off Date LTV: U/W NCF DSCR: U/W NOI Debt Yield: | $32,914,514 55.8% 1.60x 10.1% |
A “Trigger Period” will commence (i) upon an event of default, (ii) if the debt service coverage ratio falls below 1.20x on the last day of any calendar quarter, or (iii) during a Lease Sweep Period (as defined below). A Trigger Period will cease to exist upon (a) with respect to clause (i) above, such event of default has been cured, (b) with respect to clause (ii), the debt service coverage ratio is at least 1.25x for two consecutive quarters, and (c) with respect to clause (iii), such Lease Sweep Period has ended.
A “Lease Sweep Period” will commence on the first monthly payment date following (i) the earlier of (a) 12 months prior to the earliest expiration of a Lease Sweep Lease (as defined below) or (b) the date by which any tenant under a Lease Sweep Lease is required to give notice of its exercise of a renewal option under its Lease Sweep Lease, (ii) the receipt by the borrower or manager of notice from any tenant under a Lease Sweep Lease exercising its right to terminate its Lease Sweep Lease (if applicable), (iii) the date that a Lease Sweep Lease is surrendered, cancelled or terminated prior to its then current expiration date, (iv) the date that any tenant under a Lease Sweep Lease “goes dark” or (v) a tenant under a Lease Sweep Lease defaulting under its lease or becoming subject to bankruptcy proceedings. A Lease Sweep Period will be cured if (a) with respect to clause (i), (ii), (iii) and (iv), (x) at least 20,000 sq. ft. of the Lease Sweep Lease space is leased pursuant to one or more qualified leases, as defined in the loan documents and the replacement tenant(s) are in occupancy and paying full un-abated rent (the “Occupancy Conditions”), (y) the funds in the lease sweep account are able to cover all anticipated leasing expenses, free rent periods, and rent abatement periods and (z) the debt service coverage ratio is at least 1.35x; (b) with respect to clause (i), the tenant has renewed or extended its lease pursuant to its extension option or otherwise on terms acceptable to lender with respect to its space and the funds in the sweep account are equal to the leasing expenses, free rent periods and rent abatement periods in connection with such renewal or extension, (c) with respect to clause (ii), the termination option is not validly exercised by the tenant under the Lease Sweep Lease or the exercise thereof is revoked, (d) with respect to clause (iv), the date the tenant under the Lease Sweep Lease has recommenced its business or has revoked its notice of intent to discontinue its business, (e) with respect to clause (v), the date upon which the default has been cured and the applicable insolvency proceeding has been terminated and (f) with respect to clause (i), (ii), (iii), (iv) and (v) above, the date upon which the funds in the lease sweep account are equal to the Lease Sweep Deposit Amount (defined below).
A “Lease Sweep Lease” means (i) the A9 lease or (ii) any replacement lease that covers 20,000 or more rentable sq. ft. of the 611 Cowper Property.
The “Lease Sweep Deposit Amount” means the product of (i) $40 and (ii) the total rentable sq. ft. of the Lease Sweep Lease that has not been relet.
Initial Reserves. At loan closing, the borrower deposited (i) $37,308 into a tax reserve account, (ii) $930 into an insurance reserve account, (iii) $12,000 into a replacement reserve account, (iv) $3,043,827 into a TI/LC reserve account for outstanding approved leasing expenses and (v) $1,620,000 into a free rent reserve account.
Ongoing Reserves. On a monthly basis, the borrower will be required to deposit (i) 1/12 of estimated insurance premiums into the insurance reserve, (ii) 1/12 of estimated taxes into the tax reserve, (iii) $1.50 per rentable square foot into the TI/LC reserve and (iv) an amount equal to the monthly amount due for common charges under the condominium documents for the succeeding month.
Notwithstanding the foregoing, the borrower is not obligated to make ongoing deposits for taxes, insurance, TI/LC or common charges if, among other things, (i) all of the 611 Cowper Property is occupied by A9 under the A9 lease, (ii) no default, event of default or Trigger Period is continuing, (iii) the A9 lease is in full force and effect and (iv) other than with respect to the TI/LC reserve, A9 is paying the amounts for which the reserve is established under the A9 lease.
On each monthly payment date during a Lease Sweep Period, all available cash is required to be transferred into the lease sweep account. In addition, if the replacement reserve falls below $12,000, borrower will be required to make monthly deposits of $500 into the replacement reserve account.
Current Mezzanine or Subordinate Indebtedness. None.
Future Mezzanine or Subordinate Indebtedness Permitted. None.
THE INFORMATION IN THIS STRUCTURAL AND COLLATERAL TERM SHEET IS NOT COMPLETE AND MAY BE AMENDED PRIOR TO THE TIME OF SALE. THIS TERM SHEET IS NOT AN OFFER TO SELL THESE SECURITIES AND IT IS NOT A SOLICITATION OF AN OFFER TO BUY THESE SECURITIES IN ANY JURISDICTION WHERE THE OFFER OR SALE IS NOT PERMITTED. 97 |
611 Cowper Street Palo Alto, CA 94301 | Collateral Asset Summary – Loan No. 9 611 Cowper | Cut-off Date Balance: Cut-off Date LTV: U/W NCF DSCR: U/W NOI Debt Yield: | $32,914,514 55.8% 1.60x 10.1% |
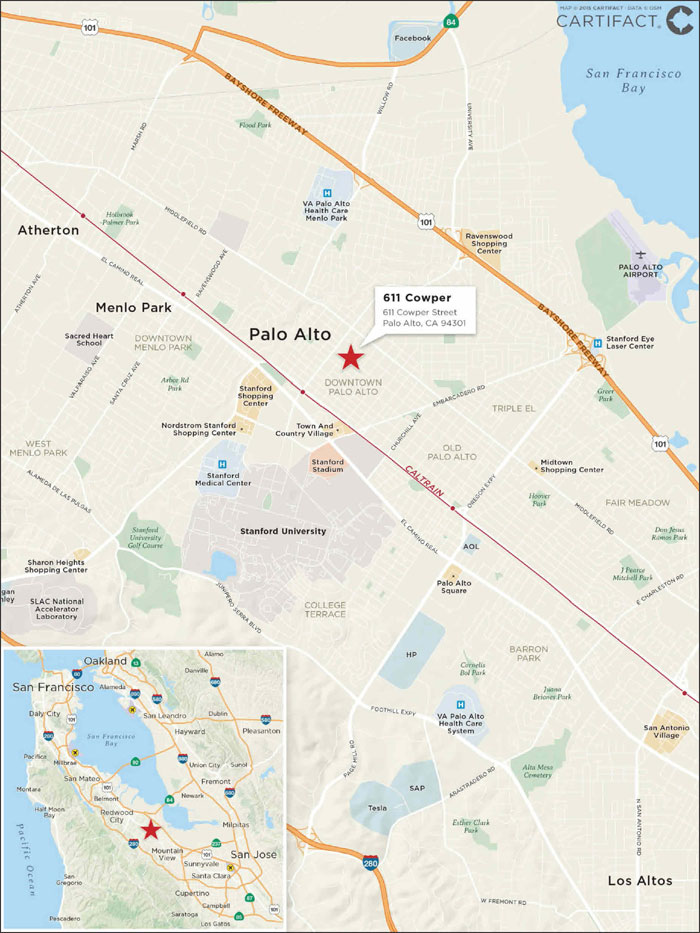
THE INFORMATION IN THIS STRUCTURAL AND COLLATERAL TERM SHEET IS NOT COMPLETE AND MAY BE AMENDED PRIOR TO THE TIME OF SALE. THIS TERM SHEET IS NOT AN OFFER TO SELL THESE SECURITIES AND IT IS NOT A SOLICITATION OF AN OFFER TO BUY THESE SECURITIES IN ANY JURISDICTION WHERE THE OFFER OR SALE IS NOT PERMITTED. 98 |
(THIS PAGE INTENTIONALLY LEFT BLANK)
| 99 |
1250 Baltimore Pike Springfield Township, PA 19064 | Collateral Asset Summary – Loan No. 10 Springfield Mall | Cut-off Date Balance: Cut-off Date LTV: U/W NCF DSCR: U/W NOI Debt Yield: | $32,460,817 58.0% 1.76x 11.1% |
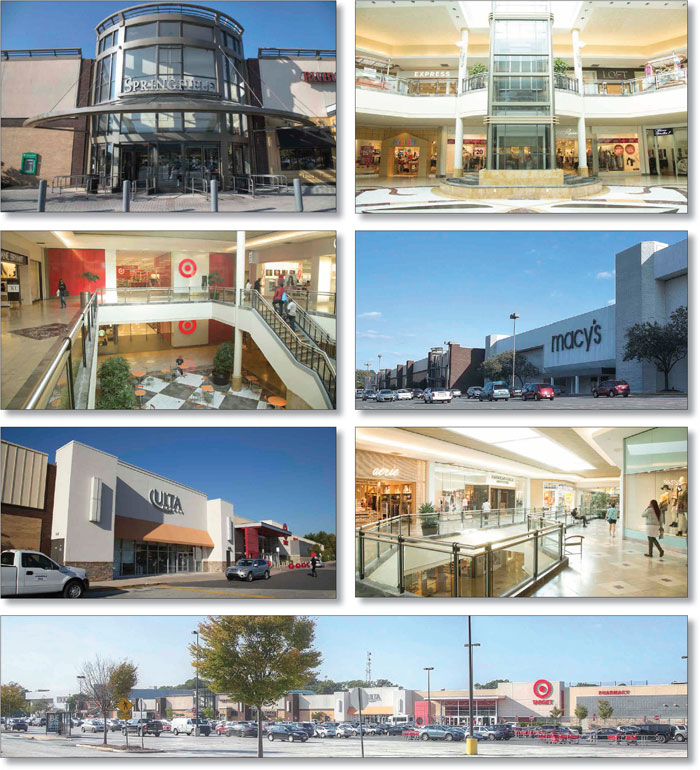
THE INFORMATION IN THIS STRUCTURAL AND COLLATERAL TERM SHEET IS NOT COMPLETE AND MAY BE AMENDED PRIOR TO THE TIME OF SALE. THIS TERM SHEET IS NOT AN OFFER TO SELL THESE SECURITIES AND IT IS NOT A SOLICITATION OF AN OFFER TO BUY THESE SECURITIES IN ANY JURISDICTION WHERE THE OFFER OR SALE IS NOT PERMITTED.
| 100 |
1250 Baltimore Pike Springfield Township, PA 19064 | Collateral Asset Summary – Loan No. 10 Springfield Mall | Cut-off Date Balance: Cut-off Date LTV: U/W NCF DSCR: U/W NOI Debt Yield: | $32,460,817 58.0% 1.76x 11.1% |
| Mortgage Loan Information | |
| Loan Seller: | CCRE |
| Loan Purpose: | Refinance |
| Sponsors: | PREIT Associates, L.P.; Simon Property Group, L.P. |
| Borrowers: | PR Springfield/Delco Limited Partnership; KS Springfield Limited Partnership |
| Original Balance(1): | $32,500,000 |
| Cut-off Date Balance(1): | $32,460,817 |
| % by Initial UPB: | 3.4% |
| Interest Rate: | 4.4485% |
| Payment Date: | 6thof each month |
| First Payment Date: | November 6, 2015 |
| Maturity Date: | October 6, 2025 |
| Amortization: | 360 months |
| Additional Debt(1): | $32,460,817Pari Passu Debt |
| Call Protection(2): | L(25), D(91), O(4) |
| Lockbox / Cash Management: | Hard / Springing |
| Reserves(3) | ||
| Initial | Monthly | |
| Taxes: | $566,919 | $174,917 |
| Insurance: | $0 | Springing |
| Replacement: | $0 | Springing |
| TI/LC: | $0 | Springing |
| Financial Information(4) | |
| Cut-off Date Balance / Sq. Ft.: | $291 |
| Balloon Balance / Sq. Ft.: | $235 |
| Cut-off Date LTV: | 58.0% |
| Balloon LTV: | 46.8% |
| Underwritten NOI DSCR: | 1.83x |
| Underwritten NCF DSCR: | 1.76x |
| Underwritten NOI Debt Yield: | 11.1% |
| Underwritten NCF Debt Yield: | 10.7% |
| Underwritten NOI Debt Yield at Balloon: | 13.7% |
| Underwritten NCF Debt Yield at Balloon: | 13.2% |
| Property Information | |
| Single Asset / Portfolio: | Single Asset |
| Property Type: | Regional Mall |
| Collateral: | Fee Simple |
| Location: | Springfield Township, PA |
| Year Built / Renovated: | 1974 / 1997 |
| Total Sq. Ft.: | 611,079 |
| Total Collateral Sq. Ft.: | 223,180 |
| Property Management: | PREIT Services LLC |
| Underwritten NOI: | $7,200,359 |
| Underwritten NCF: | $6,932,543 |
| Appraised Value: | $112,000,000 |
| Appraisal Date: | August 15, 2015 |
| Historical NOI | |
| Most Recent NOI: | $7,582,323 (T-12 July 31, 2015) |
| 2014 NOI: | $7,463,165 (December 31, 2014) |
| 2013 NOI: | $7,183,368 (December 31, 2013) |
| 2012 NOI: | $6,656,154 (December 31, 2012) |
| Historical Occupancy | |
| Most Recent Occupancy: | 95.4% (July 31, 2015) |
| 2014 Occupancy | 95.2% (December 31, 2014) |
| 2013 Occupancy: | 97.5% (December 31, 2013) |
| 2012 Occupancy: | 94.7% (December 31, 2012) |
| (1) | The Springfield Mall Loan Combination is evidenced by two pari passu notes in the aggregate original principal amount of $65.0 million. The controlling Note A-1, with an original principal balance of $32.5 million, will be included in the COMM 2015-LC23 mortgage trust. The non-controlling Note A-2, with an original balance of $32.5 million, will not be included in the trust and is expected to be held by CCRE or an affiliate and contributed to a future securitization. |
| (2) | The lockout period for defeasance will be at least 25 payment dates beginning with and including the first payment date of November 6, 2015. Defeasance of the full $65.0 million Springfield Mall Loan Combination is permitted after the date that is the earlier to occur of (i) two years after the closing date of the securitization that includes the lastpari passu note to be securitized, and (ii) November 6, 2019. The assumed lockout period of 25 payments is based on the expected COMM 2015-LC23 securitization closing date in November 2015. The actual lockout period may be longer. |
| (3) | See “Initial Reserves” and “Ongoing Reserves” herein. |
| (4) | DSCR, LTV, Debt Yield and Balance/ Sq. Ft. calculations are based on the aggregate Springfield Mall Loan Combination. |
THE INFORMATION IN THIS STRUCTURAL AND COLLATERAL TERM SHEET IS NOT COMPLETE AND MAY BE AMENDED PRIOR TO THE TIME OF SALE. THIS TERM SHEET IS NOT AN OFFER TO SELL THESE SECURITIES AND IT IS NOT A SOLICITATION OF AN OFFER TO BUY THESE SECURITIES IN ANY JURISDICTION WHERE THE OFFER OR SALE IS NOT PERMITTED.
| 101 |
1250 Baltimore Pike Springfield Township, PA 19064 | Collateral Asset Summary – Loan No. 10 Springfield Mall | Cut-off Date Balance: Cut-off Date LTV: U/W NCF DSCR: U/W NOI Debt Yield: | $32,460,817 58.0% 1.76x 11.1% |
| Tenant Summary(1) | |||||||||
| Tenant | Ratings (Fitch/Moody’s/S&P)(2) | Total Sq. Ft. | % of Total Collateral Sq. Ft. | Lease Expiration | Annual U/W Base Rent PSF(3) | Total Sales (000s)(4) | Sales PSF(4) | Occupancy | |
| Non-Collateral Anchor Tenants | |||||||||
| Target | A-/A2/A | 195,899 | NAP | NAP | NAP | $75,000 | $383 | NAP | |
| Macy’s | BBB+/Baa2/BBB+ | 192,000 | NAP | NAP | NAP | $39,000 | $203 | NAP | |
| Subtotal | 387,899 | ||||||||
| Major Tenants (≥ 7,000 sq. ft.) | |||||||||
| Ulta | NR/NR/NR | 10,287 | 4.6% | 10/31/2022 | $24.70 | $6,165 | $599 | 6.6% | |
| American Eagle Outfitters | NR/NR/NR | 8,284 | 3.7% | 8/31/2024 | $26.54 | NAP | NAP | NAP | |
| The Gap/Gap Kids | BBB-/Baa2/BBB- | 8,035 | 3.6% | 1/31/2019 | $26.26 | $1,986 | $247 | 10.6% | |
| Express | NR/NR/NR | 7,530 | 3.4% | 1/31/2019 | $33.75 | $2,689 | $357 | 18.3% | |
| Victoria’s Secret | BB+/Ba1/BB+ | 7,000 | 3.1% | 1/31/2023 | $35.00 | $5,910 | $844 | 8.8% | |
| Charlotte Russe(5) | NR/NR/NR | 7,000 | 3.1% | MTM | $29.00 | $2,709 | $387 | 16.8% | |
| Subtotal | 48,136 | 21.6% | $19,458 | $488 | 10.7% | ||||
| In-line Tenants (<7,000 sq. ft.)(6) | 164,692 | 73.8% | $32.00 | $52,059 | $393 | 13.8% | |||
| Total Occupied Collateral | 212,828 | 95.4% | |||||||
| Vacant | 10,352 | 4.6% | |||||||
| Total Collateral | 223,180 | 100.0% | |||||||
| (1) | Based on rent roll as of July 31, 2015. |
| (2) | Certain ratings may be those of the parent company whether or not the parent company guarantees the lease. |
| (3) | Annual U/W Base Rent PSF includes rent steps through September 2016 and excludes temporary tenant income. |
| (4) | Total Sales (000s) and Sales PSF were provided by the borrower as of June 30, 2015 and only include tenants which reported sales for a minimum of 12 months (81.0% of occupied NRA). Total Sales (000s) and Sales PSF for Non-Collateral Anchor Tenants were estimates provided by the borrower as of December 31, 2014. Occupancy Cost (% of Sales) is based on Annual U/W Base Rent PSF and U/W expense recoveries. |
| (5) | According to the borrower, as of October 21, 2015, Charlotte Russe is negotiating a seven-year lease renewal. |
| (6) | In-line Tenants include food court, kiosk, and temporary tenants. |
THE INFORMATION IN THIS STRUCTURAL AND COLLATERAL TERM SHEET IS NOT COMPLETE AND MAY BE AMENDED PRIOR TO THE TIME OF SALE. THIS TERM SHEET IS NOT AN OFFER TO SELL THESE SECURITIES AND IT IS NOT A SOLICITATION OF AN OFFER TO BUY THESE SECURITIES IN ANY JURISDICTION WHERE THE OFFER OR SALE IS NOT PERMITTED.
| 102 |
1250 Baltimore Pike Springfield Township, PA 19064 | Collateral Asset Summary – Loan No. 10 Springfield Mall | Cut-off Date Balance: Cut-off Date LTV: U/W NCF DSCR: U/W NOI Debt Yield: | $32,460,817 58.0% 1.76x 11.1% |
| Lease Rollover Schedule(1)(2) | ||||||||
| Year | # of Leases Expiring | Total Expiring Sq. Ft. | % of Total Sq. Ft. Expiring | Cumulative Sq. Ft. Expiring | Cumulative % of Sq. Ft. Expiring | Annual U/W PSF | % U/W Base Rent Rolling | Cumulative % of U/W Base Rent |
| Temporary Tenants | 5 | 20,380 | 9.1% | 20,380 | 9.1% | NAP | NAP | NAP |
| 2015 | 8 | 19,935 | 8.9% | 40,315 | 16.6% | $35.85 | 10.7% | 10.7% |
| 2016 | 11 | 30,054 | 13.5% | 70,369 | 31.5% | $33.86 | 15.3% | 26.0% |
| 2017 | 10 | 15,455 | 6.9% | 85,824 | 38.5% | $43.79 | 10.2% | 36.2% |
| 2018 | 7 | 20,571 | 9.2% | 106,395 | 47.7% | $33.22 | 10.3% | 46.4% |
| 2019 | 6 | 21,479 | 9.6% | 127,874 | 57.3% | $35.99 | 11.6% | 58.1% |
| 2020 | 3 | 4,138 | 1.9% | 132,012 | 59.2% | $45.08 | 2.8% | 60.9% |
| 2021 | 3 | 11,558 | 5.2% | 143,570 | 64.3% | $31.43 | 5.5% | 66.3% |
| 2022 | 4 | 18,193 | 8.2% | 161,763 | 72.5% | $33.88 | 9.3% | 75.6% |
| 2023 | 7 | 27,056 | 12.1% | 188,819 | 84.6% | $37.05 | 15.1% | 90.6% |
| 2024 | 2 | 13,302 | 6.0% | 202,121 | 90.6% | $26.25 | 5.2% | 95.9% |
| 2025 | 2 | 5,243 | 2.3% | 207,364 | 92.9% | $31.16 | 2.5% | 98.3% |
| Thereafter | 2 | 5,464 | 2.4% | 212,828 | 95.4% | $20.35 | 1.7% | 100.0% |
| Vacant | NAP | 10,352 | 4.6% | 223,180 | 100.0% | NAP | NAP | |
| Total / Wtd. Avg. | 69 | 223,180 | 100.0% | $34.60 | 100.0% | |||
| (1) | Based on rent roll as of July 31, 2015. |
| (2) | Certain tenants have lease termination options related to co-tenancy provisions and sales thresholds that may become exercisable prior to the originally stated expiration date of the tenant lease and that are not considered in the lease rollover schedule. |
The Loan.The Springfield Mall loan (the “Springfield Mall Loan”) is a fixed rate loan secured by the borrower’s fee simple interest in a portion of a two-story, enclosed regional mall located in Springfield Township, Pennsylvania. Springfield Mall is a 611,079 sq. ft. mall anchored by Macy’s and Target (both non-owned and not part of the collateral). The collateral (the “Springfield Mall Property”) for the Springfield Mall Loan consists of 223,180 sq. ft. and includes all major and in-line tenants.
The Springfield Mall Loan has an Original Balance of $32.5 million and represents the controlling Note A-1 of a $65.0 million whole loan (“the Springfield Mall Loan Combination”). The Springfield Mall Loan Combination is evidenced by two pari passu notes, the controlling Note A-1, with an original principal balance of $32.5 million, which will be included in the COMM 2015-LC23 Mortgage Trust, and the non-controlling Note A-2, with an original principal balance of $32.5 million. The non-controlling Note A-2 will not be included in the trust and is expected to be held by CCRE or an affiliate and transferred to a future securitization.
| Loan Combination Summary | |||||
| Original Balance | Cut-off Date Balance | Note Holder | Controlling Piece | ||
| Note A-1 | $32,500,000 | $32,460,817 | COMM 2015-LC23 | Yes | |
| Note A-2 | $32,500,000 | $32,460,817 | CCRE | No | |
| Total | $65,000,000 | $64,921,633 | |||
The Springfield Mall Loan has a 10-year term and amortizes on a 30-year schedule. The Springfield Mall Loan accrues interest at a fixed rate equal to 4.4485% and has a cut-off date balance of approximately $32.46 million. The Springfield Mall Loan proceeds were used to refinance existing debt of approximately $61.8 million, fund upfront reserves of approximately $0.6 million, pay closing costs of approximately $0.5 million and return approximately $2.1 million of equity to the sponsors. Based on the appraised value of $112.0 million as of August 15, 2015, the cut-off date LTV ratio is 58.0% with remaining implied equity of approximately $47.0 million. The most recent prior financing of the Springfield Mall Property was not included in a securitization.
| Sources and Uses | ||||||
| Sources | Proceeds | % of Total | Uses | Proceeds | % of Total | |
| Mortgage Loan | $65,000,000 | 100.0% | Loan Payoff | $61,815,845 | 95.1% | |
| Return of Equity | $2,084,361 | 3.2% | ||||
| Reserves | $566,919 | 0.9% | ||||
| Closing Costs | $532,875 | 0.8% | ||||
| Total Sources | $65,000,000 | 100.0% | Total Uses | $65,000,000 | 100.0% | |
THE INFORMATION IN THIS STRUCTURAL AND COLLATERAL TERM SHEET IS NOT COMPLETE AND MAY BE AMENDED PRIOR TO THE TIME OF SALE. THIS TERM SHEET IS NOT AN OFFER TO SELL THESE SECURITIES AND IT IS NOT A SOLICITATION OF AN OFFER TO BUY THESE SECURITIES IN ANY JURISDICTION WHERE THE OFFER OR SALE IS NOT PERMITTED.
| 103 |
1250 Baltimore Pike Springfield Township, PA 19064 | Collateral Asset Summary – Loan No. 10 Springfield Mall | Cut-off Date Balance: Cut-off Date LTV: U/W NCF DSCR: U/W NOI Debt Yield: | $32,460,817 58.0% 1.76x 11.1% |
The Borrower / Sponsor. The borrowers are PR Springfield/Delco Limited Partnership and KS Springfield Limited Partnership as tenants-in-common. PR Springfield/Delco Limited Partnership, is a single purpose Pennsylvania limited partnership structured to be bankruptcy remote with two independent directors in its organizational structure. KS Springfield Limited Partnership, is a single purpose Delaware limited liability company structured to be bankruptcy remote with two independent directors in its organizational structure. The sponsors of the borrowers and the non-recourse carveout guarantors are Simon Property Group, L.P. and PREIT Associates, L.P.
Simon Property Group, L.P. (“Simon”) is an S&P 500 company and the largest publicly traded retail real estate company in North America with a total market capitalization of approximately $64.76 billion as of October 2015. Simon currently owns or has an interest in more than 325 retail real estate properties, totaling approximately 241 million sq. ft., in North America and Asia. Simon also owns a 29% interest in Klépierre, a publicly-traded Paris-based real estate investment company, which owns shopping centers in 13 European countries. Headquartered in Indianapolis, Simon employs more than 5,000 people worldwide.
PREIT Associates, L.P. (“PREIT”) is an equity real estate investment trust that owns and operates over 30 malls and over 27 million sq. ft. of space. PREIT has a primary investment focus on retail shopping malls located in the eastern half of the United States, primarily in the Mid-Atlantic region. The company engages in the ownership, management, leasing, acquisition, redevelopment and development of enclosed malls. Its properties and malls include national or regional department stores, large format retailers or other anchors and a diverse mix of national, regional and local in-line stores.
The Property.Springfield Mall is a two-story, enclosed regional mall containing 611,079 sq. ft. of total leasable area, 223,180 sq. ft. of which is collateral for the Springfield Mall Loan. The Springfield Mall Property is located on Baltimore Pike in Springfield Township, Pennsylvania, approximately 12 miles outside Philadelphia. The Springfield Mall Property was constructed in 1974 and acquired by the sponsors in 2005 for $103.5 million. Since 2012, the Springfield Mall Property has undergone more than $3.2 million in capital expenditures and tenant improvement costs.
The Springfield Mall is anchored by Macy’s and Target, both of which are non-owned and not part of the collateral. Macy’s has been operating at this mall since 1986, when original anchor Bamberger’s was rebranded as Macy’s. Target opened in fall 2009 after purchasing a parcel formerly occupied by a Strawbridge’s, which closed due to a corporate merger with Macy’s. The Springfield Mall Property (collateral) is 95.4% occupied as of July 31, 2015 by 69 in-line tenants, none of which account for more than 4.6% of collateral. National in-line tenants include Aeropostale, American Eagle Outfitters, Champs Sports, Foot Locker, The Gap/Gap Kids, GNC, Ulta, Victoria’s Secret and Zales Jewelers.
In the trailing twelve month period ending June 30, 2015, in-line tenants in occupancy that reported sales for a minimum of 12 months reported annual sales of $403 PSF with an occupancy cost of 13.5%. Since 2011, in-line tenant sales have grown steadily with sales averaging $391 PSF over that time period.
| In-Line Historical Sales PSF(1) | |||||
| 2011 | 2012 | 2013 | 2014 | T-12 6/30/2015 | |
| Sales PSF | $382 | $380 | $392 | $400 | $403 |
| Occupancy Cost | 14.3% | 14.5% | 13.9% | 13.6% | 13.5% |
| (1) | As provided by borrower. In-line tenant sales include all tenants occupying less than 10,000 sq. ft., which have been in occupancy and reported sales for a minimum of 12 months. |
Environmental Matters. The Phase I environmental report dated September 9, 2015 recommended no further action at the Springfield Mall Property.
The Market. The Springfield Mall Property is located approximately 12 miles outside of Philadelphia in Springfield Township, Pennsylvania. The Mall is situated just off of Interstate 476 along Baltimore Pike, which is the main retail corridor that runs through Springfield, Pennsylvania. The subject property is located at the intersection of Baltimore Pike and Sproul Road. On a daily basis, this intersection experiences a high volume of cars, with approximately 32,000 vehicles on Baltimore Pike and approximately 15,000 vehicles on Sproul Road. In the surrounding five mile radius of the Springfield Mall Property, the average household income is approximately $82,749 and, as of 2014, the population is approximately 335,677 people.
Located on the main retail corridor of Baltimore Pike, the Springfield Mall Property is surrounded by other major retail tenants that include Pier 1 Imports, Best Buy, Kohl’s, Home Depot, Walmart, AMC Theaters, Marshalls, Burlington Coat Factory and Petco.
The appraiser concluded that four super regional / lifestyle centers are considered primary and secondary competition in nature to the Springfield Mall Property. The only primary competitor, The Court & Plaza at King of Prussia, is a super-regional mall and the largest shopping mall on the East Coast of the United States. The Court & Plaza at King of Prussia is owned and managed by Simon Property Group, a sponsor of the Springfield Mall Loan. The Macy’s located at secondary competitor Suburban Square is scheduled to close in 2016 making the next nearest Macy’s more than 12 miles away from the Springfield Mall Property.
THE INFORMATION IN THIS STRUCTURAL AND COLLATERAL TERM SHEET IS NOT COMPLETE AND MAY BE AMENDED PRIOR TO THE TIME OF SALE. THIS TERM SHEET IS NOT AN OFFER TO SELL THESE SECURITIES AND IT IS NOT A SOLICITATION OF AN OFFER TO BUY THESE SECURITIES IN ANY JURISDICTION WHERE THE OFFER OR SALE IS NOT PERMITTED.
| 104 |
1250 Baltimore Pike Springfield Township, PA 19064 | Collateral Asset Summary – Loan No. 10 Springfield Mall | Cut-off Date Balance: Cut-off Date LTV: U/W NCF DSCR: U/W NOI Debt Yield: | $32,460,817 58.0% 1.76x 11.1% |
| Springfield Mall Competitive Set(1) | |||||
| Name | Springfield Mall | Suburban Square | Concord Mall | The Court & Plaza at King of Prussia | Exton Square Mall |
| Competition | NAP | Secondary | Secondary | Primary | Secondary |
| Distance from Subject | NAP | 7.4 miles | 12.1 miles | 12.2 miles | 16.5 miles |
| City, State | Springfield, PA | Ardmore, PA | Wilmington, DE | King of Prussia, PA | Exton, PA |
| Property Type | Regional Mall | Lifestyle Center | Super Regional Mall | Super Regional Mall | Super Regional Center |
| Year Built / Renovated | 1974 /1997 | 1928 /1984 | 1969 /1984 | 1962 /2004 | 1973 / 2000 |
| Total Occupancy | 95.4%(2) | 92% | 97% | 98% | 96% |
| Anchor Size (Sq. Ft.) | 387,899(3) | 108,621 | 358,772 | 1,400,000 | 625,000 |
| Total Size (Sq. Ft.) | 611,079(3) | 354,150 | 863,251 | 2,400,000 | 1,087,728 |
| Anchor Tenants | Target, Macy’s | Macy’s (closing in 2016) | Boscov’s, Macy’s, Macy’s Home, Sears | Bloomingdale’s, Dick’s Sporting Goods, JC Penney, Lord & Taylor, Macy’s, Neiman Marcus, Nordstrom | Boscov’s, Macy’s, Sears, Whole Foods (2016) |
| (1) | Source: Appraisal |
| (2) | Total Occupancy for Springfield Mall is based on only the collateral square footage of 223,180 as of July 31, 2015 and includes temporary tenants. |
| (3) | Anchor Size (Sq. Ft.) and Total Size (Sq. Ft.) for the Springfield Mall are based on the entire mall square footage of 611,079. |
Cash Flow Analysis.
| Cash Flow Analysis | ||||||
| 2012 | 2013 | 2014 | T-12 7/31/2015 | U/W | U/W PSF | |
| Base Rent(1) | $6,145,257 | $6,649,917 | $6,816,054 | $6,796,871 | $6,657,928 | $29.83 |
| Value of Vacant Space | 0 | 0 | 0 | 0 | 356,481 | 1.60 |
| Gross Potential Rent | $6,145,257 | $6,649,917 | $6,816,054 | $6,796,871 | $7,014,409 | $31.43 |
| Total Recoveries | 5,031,396 | 5,067,222 | 5,307,136 | 5,348,856 | 5,437,593 | 24.36 |
| Total % Rents | 241,635 | 244,033 | 312,518 | 308,613 | 308,613 | 1.38 |
| Total Other Income | 784,949 | 797,343 | 726,938 | 699,460 | 699,460 | 3.13 |
| Less: Vacancy & Credit Loss(2) | 0 | 0 | 0 | 0 | (638,031) | (2.86) |
| Effective Gross Income | $12,203,237 | $12,758,515 | $13,162,646 | $13,153,800 | $12,822,044 | $57.45 |
| Total Operating Expenses | 5,547,083 | 5,575,147 | 5,699,481 | 5,571,477 | 5,621,685 | 25.19 |
| Net Operating Income | $6,656,154 | $7,183,368 | $7,463,165 | $7,582,323 | $7,200,359 | $32.26 |
| TI/LC | 0 | 0 | 0 | 0 | 223,180 | 1.00 |
| Capital Expenditures | 0 | 0 | 0 | 0 | 44,636 | 0.20 |
| Net Cash Flow | $6,656,154 | $7,183,368 | $7,463,165 | $7,582,323 | $6,932,543 | $31.06 |
| (1) | U/W Base Rent includes $90,726 in contractual rent steps through September 2016. |
| (2) | U/W Vacancy & Credit Loss is based on an economic vacancy of 5.0% of Gross Potential Rent, Total Recoveries and Total % Rents. Per rent roll dated July 31 2015, in-place physical vacancy is 95.4%. |
Property Management. The Springfield Mall Property is managed by PREIT Services LLC, which is an affiliate of one of the sponsors, PREIT Associates, L.P.
Lockbox / Cash Management. The Springfield Mall Loan is structured with a hard lockbox and springing cash management. In place cash management and a full excess cash flow sweep will occur upon (i) an event of default or (ii) the failure by the borrower after the end of two consecutive calendar quarters to maintain a DSCR of 1.25x until the DSCR is at least equal to 1.35x for two consecutive calendar quarters.
Initial Reserves. At loan closing, the borrower deposited $566,919 into a tax reserve account.
Ongoing Reserves. On a monthly basis, the borrower is required to deposit reserves of 1/12 of the estimated annual real estate taxes, which currently equates to $174,917. In addition, if the DSCR is less than 1.25x for two consecutive calendar quarters, the borrower is required to deposit reserves of (i) $3,720 into a replacement reserve account, subject to a cap of $89,272 and (ii) $18,598 into a rollover reserve account, subject to a cap of $446,360. Additionally, the borrower is required to deposit 1/12 of the estimated annual insurance premiums into an insurance reserve account if an acceptable blanket insurance policy is no longer in place.
THE INFORMATION IN THIS STRUCTURAL AND COLLATERAL TERM SHEET IS NOT COMPLETE AND MAY BE AMENDED PRIOR TO THE TIME OF SALE. THIS TERM SHEET IS NOT AN OFFER TO SELL THESE SECURITIES AND IT IS NOT A SOLICITATION OF AN OFFER TO BUY THESE SECURITIES IN ANY JURISDICTION WHERE THE OFFER OR SALE IS NOT PERMITTED.
| 105 |
1250 Baltimore Pike Springfield Township, PA 19064 | Collateral Asset Summary – Loan No. 10 Springfield Mall | Cut-off Date Balance: Cut-off Date LTV: U/W NCF DSCR: U/W NOI Debt Yield: | $32,460,817 58.0% 1.76x 11.1% |
Current Mezzanine or Subordinate Indebtedness. None.
Future Mezzanine or Subordinate Indebtedness Permitted. None.
THE INFORMATION IN THIS STRUCTURAL AND COLLATERAL TERM SHEET IS NOT COMPLETE AND MAY BE AMENDED PRIOR TO THE TIME OF SALE. THIS TERM SHEET IS NOT AN OFFER TO SELL THESE SECURITIES AND IT IS NOT A SOLICITATION OF AN OFFER TO BUY THESE SECURITIES IN ANY JURISDICTION WHERE THE OFFER OR SALE IS NOT PERMITTED.
| 106 |
1250 Baltimore Pike Springfield Township, PA 19064 | Collateral Asset Summary – Loan No. 10 Springfield Mall | Cut-off Date Balance: Cut-off Date LTV: U/W NCF DSCR: U/W NOI Debt Yield: | $32,460,817 58.0% 1.76x 11.1% |
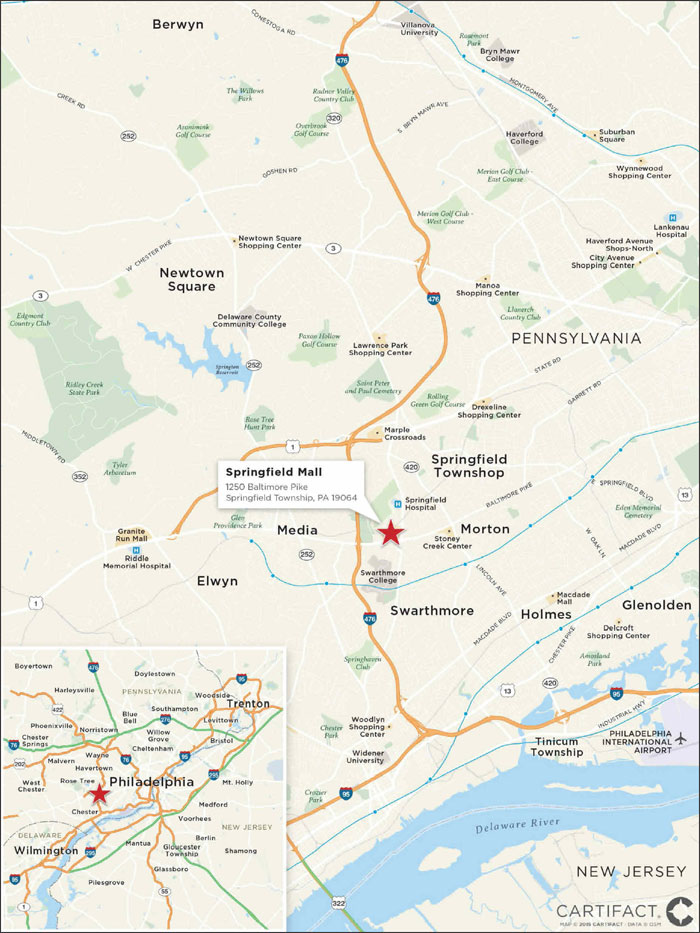
THE INFORMATION IN THIS STRUCTURAL AND COLLATERAL TERM SHEET IS NOT COMPLETE AND MAY BE AMENDED PRIOR TO THE TIME OF SALE. THIS TERM SHEET IS NOT AN OFFER TO SELL THESE SECURITIES AND IT IS NOT A SOLICITATION OF AN OFFER TO BUY THESE SECURITIES IN ANY JURISDICTION WHERE THE OFFER OR SALE IS NOT PERMITTED.
| 107 |
30000-30192 Town Center Drive Laguna Niguel, CA 92677 | Collateral Asset Summary – Loan No. 11 Laguna Niguel Town Center | Cut-off Date Balance: Cut-off Date LTV: U/W NCF DSCR: U/W NOI Debt Yield: | $26,433,612 61.5% 1.38x 8.8% |
| Mortgage Loan Information | |
| Loan Seller: | LCF |
| Loan Purpose: | Refinance |
| Sponsors: | Robert F. Buie; Jeffry L. Stoddard; Robert F. Buie, as Trustee of the Robert F. Buie and Pamela I. Buie Family Trust Under Trust Agreement; Jeffry L. Stoddard, as Trustee of the Jeff and Kris Stoddard Living Trust |
| Borrower: | Laguna Niguel Town Center LLC |
| Original Balance: | $26,500,000 |
| Cut-off Date Balance: | $26,433,612 |
| % by Initial UPB: | 2.8% |
| Interest Rate: | 4.5170% |
| Payment Date: | 6th of each month |
| First Payment Date: | October 6, 2015 |
| Maturity Date: | September 6, 2025 |
| Amortization: | 360 Months |
| Additional Debt: | None |
| Call Protection: | L(23), YM1(93), O(4) |
| Lockbox / Cash Management: | None / None |
| Reserves | ||
| Initial | Monthly | |
| Taxes: | $208,966 | $18,997 |
| Insurance: | $5,172 | $1,724 |
| Replacement: | $106,000 | $1,636 |
| TI/LC: | $0 | $7,601 |
| Major Tenant Reserve(1): | NAP | Springing |
| Financial Information | ||
| Cut-off Date Balance / Sq. Ft.: | $269 | |
| Balloon Balance / Sq. Ft.: | $218 | |
| Cut-off Date LTV: | 61.5% | |
| Balloon LTV: | 49.9% | |
| Underwritten NOI DSCR: | 1.43x | |
| Underwritten NCF DSCR: | 1.38x | |
| Underwritten NOI Debt Yield: | 8.8% | |
| Underwritten NCF Debt Yield: | 8.4% | |
| Property Information | |
| Single Asset / Portfolio: | Single Asset |
| Property Type: | Unanchored Retail |
| Collateral: | Fee Simple |
| Location: | Laguna Niguel, CA |
| Year Built / Renovated: | 1980 / 2004 |
| Total Sq. Ft.: | 98,157 |
| Property Management: | Pacific West Asset Management Corporation |
| Underwritten NOI: | $2,315,569 |
| Underwritten NCF: | $2,221,482 |
| Appraised Value: | $43,000,000 |
| Appraisal Date: | June 3, 2015 |
| Historical NOI | |
| Most Recent NOI: | $2,500,441 (T-12 July 31, 2015) |
| 2014 NOI: | $2,473,518 (December 31, 2014) |
| 2013 NOI: | $2,313,348 (December 31, 2013) |
| 2012 NOI: | $2,278,474 (December 31, 2012) |
| Historical Occupancy | |
| Most Recent Occupancy: | 91.4% (August 18, 2015) |
| 2014 Occupancy: | 95.4% (December 31, 2014) |
| 2013 Occupancy: | 93.0% (December 31, 2013) |
| 2012 Occupancy: | 95.4% (December 31, 2012) |
| (1) | Upon the earliest to occur of (i) Denault’s Hardware ceases operations at the property, (ii) Denault’s Hardware gives notice of its intent to not extend the lease, (iii) Denault’s Hardware files a petition as a debtor in a bankruptcy proceeding, or (iv) unless borrower has delivered to lender an officer’s certificate certifying to lender that Denault’s Hardware has extended the Denault’s Hardware lease in accordance with the terms thereof, on the stated date that the term of the Denault’s Hardware lease expires pursuant to the express terms of the Denault’s Hardware lease, in which case the borrower is required to post with lender $600,000 ($40.00 PSF) to be used for re-leasing the Denault’s Hardware premises. The obligation of the borrower to deposit funds is a recourse obligation of borrower and guarantor. |
TRANSACTION HIGHLIGHTS |
| ■ | Property.Laguna Niguel Town Center property is a 98,157 sq. ft. unanchored retail property located in Laguna Niguel, California that is 91.4% occupied as of August 18, 2015 by 32 tenants. The largest tenants at the property include Denault’s Hardware (15.3% of NRA, October 31, 2018 expiration) and Walgreens (13.1% of NRA, November 30, 2027 expiration). The property was constructed in 1980 and renovated in 2004. According to the appraisal, recent traffic counts in the vicinity of the property are 23,069 cars per day along Crown Valley Parkway, and 18,067 on Alicia Parkway. |
| ■ | Market.TheLaguna Niguel Town Center property is located in the South Orange County retail submarket. According to a Q1 2015 report, the submarket had a total inventory of approximately 17.9 million sq. ft. within 119 buildings. The vacancy rate in the submarket was reported at 3.7% with an average asking rental rate of $29.28 PSF. The 2015 population within a five mile radius of the property is 239,990. The 2015 median household income within a five mile radius of the property was $91,785. |
| ■ | Sponsorship.Robert F. Buie and Jeffry L. Stoddard are principals of the Buie Stoddard Group (“Buie Stoddard”), a real estate company that specializes in the acquisition, planning, funding, development, and management of retail, office, residential, and industrial projects. Buie Stoddard currently owns 30 commercial and retail properties comprising more than two million sq. ft. throughout San Diego County, Orange County, and Boise, Idaho. Additionally, Buie Stoddard owns more than four million sq. ft. of industrial space and has acquired, master-planned, and developed over 10,000 residential units in San Diego, Orange and Riverside counties. |
THE INFORMATION IN THIS STRUCTURAL AND COLLATERAL TERM SHEET IS NOT COMPLETE AND MAY BE AMENDED PRIOR TO THE TIME OF SALE. THIS TERM SHEET IS NOT AN OFFER TO SELL THESE SECURITIES AND IT IS NOT A SOLICITATION OF AN OFFER TO BUY THESE SECURITIES IN ANY JURISDICTION WHERE THE OFFER OR SALE IS NOT PERMITTED. 108 |
3001-3171 Meridian Avenue San Jose, CA 95124 | Collateral Asset Summary – Loan No. 12 Hacienda Gardens | Cut-off Date Balance: Cut-off Date LTV: U/W NCF DSCR: U/W NOI Debt Yield: | $24,000,000 62.5% 1.82x 8.6% |
| Mortgage Loan Information | |
| Loan Seller: | CCRE |
| Loan Purpose: | Refinance |
| Sponsor: | Michael T. LaBarbera; Robert B. Facchino, II |
| Borrower: | Facchino/ LaBarbera Hacienda Gardens DE LLC |
| Original Balance: | $24,000,000 |
| Cut-off Date Balance: | $24,000,000 |
| % by Initial UPB: | 2.5% |
| Interest Rate: | 4.4905% |
| Payment Date: | 6th of each month |
| First Payment Date: | December 6, 2015 |
| Maturity Date: | November 6, 2025 |
| Amortization: | Interest Only |
| Additional Debt: | None |
| Call Protection: | L(24), YM1(92), O(4) |
| Lockbox / Cash Management(1): | Springing Hard / Springing |
| Reserves | ||
| Initial | Monthly | |
| Taxes: | $148,000 | $37,000 |
| Insurance: | $30,529 | $2,775 |
| TI/LC(2): | $123,195 | NAP |
| Rent Concession(3): | $221,000 | NAP |
| Earnout(4): | $1,870,000 | NAP |
| Financial Information | ||
| Cut-off Date Balance / Sq. Ft.: | $230 | |
| Balloon Balance / Sq. Ft.: | $230 | |
| Cut-off Date LTV: | 62.5% | |
| Balloon LTV: | 62.5% | |
| Underwritten NOI DSCR: | 1.89x | |
| Underwritten NCF DSCR: | 1.82x | |
| Underwritten NOI Debt Yield: | 8.6% | |
| Underwritten NCF Debt Yield: | 8.3% | |
| Property Information | |
| Single Asset / Portfolio: | Single Asset |
| Property Type: | Anchored Retail |
| Collateral: | Fee Simple |
| Location: | San Jose, CA |
| Year Built / Renovated: | 1959, 2007, 2010, 2013, 2015 / NAP |
| Total Sq. Ft.: | 104,557 |
| Property Management: | Terracommercial Real Estate Corporation |
| Underwritten NOI(5): | $2,066,134 |
| Underwritten NCF: | $1,991,766 |
| Appraised Value: | $38,400,000 |
| Appraisal Date: | July 17, 2015 |
| Historical NOI(6) | |
| Most Recent NOI(5): | $886,570 (T-12 June 30, 2015) |
| 2014 NOI: | $625,757 (December 31, 2014) |
| 2013 NOI: | $558,276 (December 31, 2013) |
| 2012 NOI: | $451,315 (December 31, 2012) |
| Historical Occupancy(6) | |
| Most Recent Occupancy: | 90.1% (September 28, 2015) |
| 2014 Occupancy: | 97.0% (December 31, 2014) |
| 2013 Occupancy: | 90.0% (December 31, 2013) |
| 2012 Occupancy: | 57.0% (December 31, 2012) |
| (1) | A hard lockbox, in place cash management and an excess cash flow sweep will be triggered upon (i) an event of default, (ii) any bankruptcy action of the borrower, member of the borrower, guarantor or property manager, (iii) failure by the borrower, after the end of any calendar quarter to maintain a debt service coverage ratio of at least 1.10x (and the excess cash flow sweep will cease upon the borrower maintaining a debt service coverage ratio of at least 1.15x for two consecutive quarters). |
| (2) | TI/LC reserve account represents outstanding tenant improvement obligations owed to Holders Meridian Grill and Nick the Greek. |
| (3) | At closing, the borrower deposited nine months of free rent in connection to two recently executed leases. |
| (4) | Amounts in the Earnout reserve will be disbursed to the borrower when the property achieves a debt yield of no less than 9.0%. |
| (5) | The increase from Most Recent NOI to Underwritten NOI is primarily due to three recently executed leases, which represent approximately 22.9% of underwritten gross potential rent. |
| (6) | The sponsor acquired the property in 2011 at an occupancy level of approximately 50.0% and invested $10.4 million in capital expenditures. The increase in occupancy and Historical NOI is primarily due to Rite Aid executing a 20-year lease in 2013. |
TRANSACTION HIGHLIGHTS |
| ■ | Property.The Hacienda Gardens property is an anchored, neighborhood retail center located in San Jose, California. Two of the eight buildings were recently completed in September 2015 which added 13,563 sq. ft. to the existing property. Since acquiring the property in 2011, the sponsor has invested approximately $10.4 million in capital expenditures, resulting in an increase in occupancy from 57.0% in 2012 to 90.1% as of September 28, 2015. |
| ■ | Market & Location.The property is located in the Cambrian Park neighborhood in south San Jose. Land use within the neighborhood contains a mixture of commercial and residential development. Main access to the neighborhood is provided by State Highway 85, which provides access to downtown San Jose and State Highway 87, which connects to Interstate 280 and US Highway 101. The South Bay/San Jose retail market has experienced low vacancy rates of 3.6% in the previous quarter and 3.7% in the current quarter and average asking rents ending at $30.07 PSF per year. |
| ■ | Tenancy.The Hacienda Gardens property is an eight-building shopping center with a mix of local, regional, and national retailers. The five major tenants include Fitness Evolution Health Club (31,278 sq. ft.), Rite Aid (17,340 sq. ft.), Hometown Buffet, Inc. (9,600 sq. ft.), Dollar Tree Stores, Inc. (9,100 sq. ft.) and Wells Fargo Bank, NA (5,177 sq. ft.). |
| ■ | Property Management. The property manager, Terracommercial Real Estate Corporation, is a diversified San Jose-based commercial real estate company founded in 1992 specializing in shopping centers. The company’s holdings include 12 shopping centers as well as several industrial, residential and land holdings located primarily in the San Jose area. |
THE INFORMATION IN THIS STRUCTURAL AND COLLATERAL TERM SHEET IS NOT COMPLETE AND MAY BE AMENDED PRIOR TO THE TIME OF SALE. THIS TERM SHEET IS NOT AN OFFER TO SELL THESE SECURITIES AND IT IS NOT A SOLICITATION OF AN OFFER TO BUY THESE SECURITIES IN ANY JURISDICTION WHERE THE OFFER OR SALE IS NOT PERMITTED. 109 |
| 400-530 East Washington Boulevard Los Angeles, CA 90015 | Collateral Asset Summary – Loan No. 13 Washington Plaza | Cut-off Date Balance: Cut-off Date LTV: U/W NCF DSCR: U/W NOI Debt Yield: | $22,873,570 69.3% 1.24x 8.0% |
| Mortgage Loan Information | |
| Loan Seller: | CCRE |
| Loan Purpose: | Refinance |
| Sponsor: | Dennis Needleman |
| Borrower: | Eagle’s Nest Property, LLC |
| Original Balance: | $22,900,000 |
| Cut-off Date Balance: | $22,873,570 |
| % by Initial UPB: | 2.4% |
| Interest Rate: | 4.6425% |
| Payment Date: | 6thof each month |
| First Payment Date: | November 6, 2015 |
| Maturity Date: | October 6, 2025 |
| Amortization: | 360 months |
| Additional Debt: | None |
| Call Protection: | L(25), D(91), O(4) |
| Lockbox / Cash Management(1): | Springing Hard / Springing |
| Reserves | ||
| Initial | Monthly | |
| Taxes: | $133,333 | $16,667 |
| Insurance: | $47,509 | $4,319 |
| Replacement: | $0 | $1,725 |
| TI/LC(2): | $300,000 | $4,025 |
| Required Repairs: | $38,031 | NAP |
| Financial Information | ||
| Cut-off Date Balance / Sq. Ft.: | $166 | |
| Balloon Balance / Sq. Ft.: | $135 | |
| Cut-off Date LTV: | 69.3% | |
| Balloon LTV: | 56.4% | |
| Underwritten NOI DSCR: | 1.29x | |
| Underwritten NCF DSCR: | 1.24x | |
| Underwritten NOI Debt Yield: | 8.0% | |
| Underwritten NCF Debt Yield: | 7.7% | |
| Property Information | |
| Single Asset / Portfolio: | Single Asset |
| Property Type: | Anchored Retail |
| Collateral: | Fee Simple |
| Location: | Los Angeles, CA |
| Year Built / Renovated: | 1926 / 2014 |
| Total Sq. Ft.: | 138,010 |
| Property Management: | Eagle Eye Management, LLC |
| Underwritten NOI: | $1,827,491 |
| Underwritten NCF: | $1,758,485 |
| Appraised Value: | $33,000,000 |
| Appraisal Date: | July 27, 2015 |
| Historical NOI | |
| Most Recent NOI: | $1,781,959 (T-12 June 30, 2015) |
| 2014 NOI: | $1,752,361 (December 31, 2014) |
| 2013 NOI: | $1,686,724 (December 31, 2013) |
| 2012 NOI: | $1,717,263 (December 31, 2012) |
| Historical Occupancy | |
| Most Recent Occupancy: | 100.0% (August 26, 2015) |
| 2014 Occupancy: | 99.9% (December 31, 2014) |
| 2013 Occupancy: | 100.0% (December 31, 2013) |
| 2012 Occupancy: | 98.5% (December 31, 2012) |
| (1) | A hard lockbox, in place cash management and an excess cash flow sweep will be triggered upon (i) an event of default, (ii) any bankruptcy action of the borrower, sole member of the borrower, guarantor or property manager, (iii) failure by the borrower, after the end of two calendar quarters to maintain a debt service coverage ratio of at least 1.10x (and the excess cash flow sweep will cease upon the borrower maintaining a debt service coverage ratio of at least 1.15x for two consecutive quarters). |
| (2) | The TI/LC reserve account is subject to a $350,000 cap provided, (i) leased NRA is greater than or equal to 85.0%, (ii) DSCR is at least 1.20x, or, (iii) debt yield is at least 7.25%. |
TRANSACTION HIGHLIGHTS |
| ■ | Property.Washington Plaza is a 100.0% occupied, 138,010 sq. ft. multi-tenant neighborhood retail property, located in southeast Los Angeles, California. The property is anchored by two credit tenants, Rite Aid - Store (20,212 sq. ft., rated B/B2/B by Fitch/Moody’s/S&P) and 99 Cents Only Stores Inc. (19,782 sq. ft.). |
| ■ | Market & Location.The Washington Plaza property is approximately 0.9 miles southeast of the Harbor Freeway (Interstate 110) and one block south of the Santa Monica Freeway (Interstate 10). It is also in close proximity to the Washington Boulevard and the Metro Line Station. As such, although the property is situated in a predominantly residential and industrial neighborhood, it benefits from high visibility and traffic count and is easily accessible. According to market reports, as of the end of the first quarter of 2015, the Greater Los Angeles market has a total vacancy rate of 5.2%. |
| ■ | Historical Occupancy.Since 2011, the Washington Plaza property has maintained an average occupancy of 99.0%. As of August 26, 2015, the property is 100.0% occupied. Fifteen tenants, occupying approximately 52.0% of the net rentable area have been in occupancy for at least 15 years and nine tenants, occupying approximately 27.1% of the net rentable area having been at the property for more than 20 years. |
| ■ | Long Term Anchor Tenancy.The two largest anchor tenants, Rite Aid-Store and 99 Cents Only Stores Inc. have been at the property since 1985 and 1997, respectively. Rite Aid-Store recently invested $450,000 ($22.26 PSF) into its space. Renovations included new finishes, relocated fixtures, a new consultation room, restroom renovations, and new building signage. Furthermore, Rite Aid-Store began a 10-year renewal option on June 1, 2015. |
| ■ | Demographics. The population within a 3-mile radius and 5-mile radius of the property is 530,283 and 1,317,686, respectively as of July 27, 2015. |
THE INFORMATION IN THIS STRUCTURAL AND COLLATERAL TERM SHEET IS NOT COMPLETE AND MAY BE AMENDED PRIOR TO THE TIME OF SALE. THIS TERM SHEET IS NOT AN OFFER TO SELL THESE SECURITIES AND IT IS NOT A SOLICITATION OF AN OFFER TO BUY THESE SECURITIES IN ANY JURISDICTION WHERE THE OFFER OR SALE IS NOT PERMITTED.
| 110 |
| 8781 White Swan Drive Tampa, FL 33614 | Collateral Asset Summary – Loan No. 14 Carrollwood Station | Cut-off Date Balance: Cut-off Date LTV: U/W NCF DSCR: U/W NOI Debt Yield: | $21,500,000 62.1% 1.53x 8.6% |
| Mortgage Loan Information | |
| Loan Seller: | JLC |
| Loan Purpose: | Acquisition |
| Sponsors: | LMA Limited Partnership; Glider LLC |
| Borrower: | Carrollwood Station LLC |
| Original Balance: | $21,500,000 |
| Cut-off Date Balance: | $21,500,000 |
| % by Initial UPB: | 2.2% |
| Interest Rate: | 5.3380% |
| Payment Date: | 6thof each month |
| First Payment Date: | October 6, 2015 |
| Maturity Date: | September 6, 2020 |
| Amortization: | Interest Only |
| Additional Debt: | None |
| Call Protection: | L(26), D(31), O(3) |
| Lockbox / Cash Management(1): | Soft / Springing |
| Reserves | ||
| Initial | Monthly | |
| Taxes: | $300,000 | $33,300 |
| Insurance: | $55,000 | $11,200 |
| Replacement(2): | $650,000 | $7,000 |
| Financial Information | ||
| Cut-off Date Balance / Unit: | $63,988 | |
| Balloon Balance / Unit: | $63,988 | |
| Cut-off Date LTV: | 62.1% | |
| Balloon LTV: | 62.1% | |
| Underwritten NOI DSCR: | 1.60x | |
| Underwritten NCF DSCR: | 1.53x | |
| Underwritten NOI Debt Yield: | 8.6% | |
| Underwritten NCF Debt Yield: | 8.3% | |
| Property Information | |
| Single Asset / Portfolio: | Single Asset |
| Property Type: | Garden Multifamily |
| Collateral: | Fee Simple |
| Location: | Tampa, FL |
| Year Built / Renovated: | 1984 / 2015 |
| Total Units: | 336 |
| Property Management: | Providence Management Company, LLC |
| Underwritten NOI: | $1,859,464 |
| Underwritten NCF: | $1,775,464 |
| Appraised Value: | $34,600,000 |
| Appraisal Date: | August 12, 2015 |
| Historical NOI | |
| Most Recent NOI: | $1,799,151 (T-12 July 31, 2015) |
| 2014 NOI: | $1,727,015 (December 31, 2014) |
| 2013 NOI: | $1,594,105 (December 31, 2013) |
| 2012 NOI: | $1,459,271 (December 31, 2012) |
| Historical Occupancy | |
| Most Recent Occupancy: | 97.9% (August 5, 2015) |
| 2014 Occupancy: | 97.9% (December 31, 2014) |
| 2013 Occupancy: | 97.3% (December 31, 2013) |
| 2012 Occupancy: | 96.2% (December 31, 2012) |
| (1) | A cash management period and hard lockbox will be triggered(i) if the DSCR as of the end of two consecutive quarters is less than (A) 1.20x for payments 1-17, (B) 1.25x for payments 18-29 and (C)1.30x for payments 30-60; (ii) on the 30th payment date if the borrower has failed to provide to lender (A) the supplemental statement outlining capital expenditures (as required under the loan documents) and (B) the shortfall payment if the required capital expenditures to date equal less than $900,000 in the aggregate. |
| (2) | The initial Replacement reserve amount relates to the planned capital expenditure plan described below. |
TRANSACTION HIGHLIGHTS |
| ■ | Property.Carrollwood Station is a 336-unit garden apartment complex located on a 19.1 acre site. The development consists of 28 two-story buildings with an average unit size of 750 sq. ft., and 657 surface parking spaces. Carrollwood Station’s unit mix is comprised of 240 1-bedroom/1-bathroom units and 96 2-bedroom/2-bathroom units. Property amenities include a swimming pool, fitness room, tennis court, racquetball court, fishing lake, 3-hole putting green, business center and picnic area. |
| ■ | Capital Expenditure Plan.The sponsor plans to invest an additional $1.6 million in capital improvements to the property within the next 30 months. The upgrades will primarily be focused on unit upgrades and exterior site improvements. In addition to the upfront replacement reserve, the sponsor provided a guaranty for up to $900,000. |
| ■ | Market.The property is located in the Sulphur Springs multifamily submarket. As of Q2 2015, this submarket reported a vacancy rate of approximately 2.3%, as compared to the current physical vacancy rate at the property of 2.1% and the overall competitive set vacancy of 3.8%. Additionally, no new units have been delivered to the submarket since prior to 2010. |
| ■ | Sponsorship.The sponsors, LMA Limited Partnership and Glider LLC, are real estate holding entities controlled by the principals of Providence Management Company, LLC (“Providence”). Providence has purchased and sold over 25 multifamily assets over the past 20 years and has extensive experience in management of multifamily properties. Providence currently manages over 5,000 units at 18 different properties, 10 of which are in Florida. The sponsors contributed approximately $11.1 million of equity to the property at loan closing. |
THE INFORMATION IN THIS STRUCTURAL AND COLLATERAL TERM SHEET IS NOT COMPLETE AND MAY BE AMENDED PRIOR TO THE TIME OF SALE. THIS TERM SHEET IS NOT AN OFFER TO SELL THESE SECURITIES AND IT IS NOT A SOLICITATION OF AN OFFER TO BUY THESE SECURITIES IN ANY JURISDICTION WHERE THE OFFER OR SALE IS NOT PERMITTED.
| 111 |
| 25115 – 25175 Madison Avenue Murrieta, CA 92562 | Collateral Asset Summary – Loan No. 15 Murrieta Spectrum | Cut-off Date Balance: Cut-off Date LTV: U/W NCF DSCR: U/W NOI Debt Yield: | $20,600,000 70.3% 1.30x 8.9% |
| Mortgage Loan Information | |
| Loan Seller: | CCRE |
| Loan Purpose(1): | Refinance |
| Sponsors: | Steve ChengChe Chou; TsuHo Lee |
| Borrower: | Murrieta Spectrum, L.P. |
| Original Balance: | $20,600,000 |
| Cut-off Date Balance: | $20,600,000 |
| % by Initial UPB: | 2.1% |
| Interest Rate: | 4.9500% |
| Payment Date: | 6thof each month |
| First Payment Date: | November 6, 2015 |
| Maturity Date: | October 6, 2020 |
| Amortization: | Interest only for first 24 months; 360 months thereafter |
| Additional Debt: | None |
| Call Protection(2): | L(25), D(29), O(6) |
| Lockbox / Cash Management(3): | Hard / Springing |
| Reserves | ||
| Initial | Monthly | |
| Taxes: | $119,000 | $39,667 |
| Insurance: | $10,817 | $2,704 |
| Replacement: | $0 | $2,875 |
| TI/LC: | $800,000 | $7,189 |
| Earnout(4): | $800,000 | NAP |
| Free Rent(5): | $168,994 | NAP |
| Existing TI/LC Obligation: | $55,691 | NAP |
| Occupancy(6): | $0 | Springing |
| Financial Information | ||
| Cut-off Date Balance / Sq. Ft.: | $119 | |
| Balloon Balance / Sq. Ft.: | $114 | |
| Cut-off Date LTV: | 70.3% | |
| Balloon LTV: | 67.2% | |
| Underwritten NOI DSCR(7): | 1.40x | |
| Underwritten NCF DSCR(7): | 1.30x | |
| Underwritten NOI Debt Yield: | 8.9% | |
| Underwritten NCF Debt Yield: | 8.4% | |
| Property Information | |
| Single Asset / Portfolio: | Single Asset |
| Property Type: | Anchored Retail |
| Collateral: | Fee Simple |
| Location: | Murrieta, CA |
| Year Built / Renovated: | 2005 / NAP |
| Total Sq. Ft.: | 172,598 |
| Property Management: | WestMar Property Management, Inc. |
| Underwritten NOI: | $1,842,668 |
| Underwritten NCF: | $1,721,900 |
| Appraised Value: | $29,300,000 |
| Appraisal Date: | August 13, 2015 |
| Historical NOI | |
| Most Recent NOI: | $1,562,189 (T-12 July 31, 2015) |
| 2014 NOI: | $1,445,224 (December 31, 2014) |
| 2013 NOI: | $1,497,305 (December 31, 2013) |
| 2012 NOI: | $966,658 (December 31, 2012) |
| Historical Occupancy | |
| Most Recent Occupancy: | 78.0% (October 1, 2015) |
| 2014 Occupancy: | 89.0% (December 31, 2014) |
| 2013 Occupancy: | 81.0% (December 31, 2013) |
| 2012 Occupancy: | 75.0% (December 31, 2012) |
| (1) | See “Executive Summary—Modified and Refinanced Loans”, and “Risk Factors—Risks Related to the Mortgage Loans--Prior Bankruptcies, Defaults or Other Proceedings May Be Relevant to Future Performance” in the free writing prospectus. |
| (2) | After the permitted release date and prior to the open prepayment date, the borrower may obtain the release of one or more individual pad buildings provided, among other things, (i) the borrower provides defeasance collateral in an amount equal to the greater of (A) 100% of the net sales proceeds and (B) 125% of the allocated loan amount for the parcel to be released and (ii) after the release, (A) the DSCR is greater than or equal to 1.30x, (B) the debt yield is greater than or equal to 8.5% and (C) LTV is less than or equal to 75%. |
| (3) | Cash management will commence upon the occurrence of (i) an event of default; or (ii) any bankruptcy action of the borrower, general partner of the borrower, guarantor, or manager has occurred. |
| (4) | Earnout reserve of $800,000 will be disbursed to borrower, provided, among other things, (i) the debt service coverage ratio is equal to or greater than 1.25x, (ii) the debt yield is be equal to or greater than 8.5%, and (iii) no event of default has occurred at any point during the period between the borrower’s request and the lender’s disbursement of such funds. |
| (5) | The largest tenant, Ashleys, affirmed its lease with the borrower following a 2008 bankruptcy and paid $185,280 to the borrower in settlement. SeeRisk Factors—Risks Related to the Mortgage Loans—Tenant Bankruptcy Entails Risk” in the free writing prospectus. At loan closing, the borrower deposited $168,994 of that settlement amount into the Free Rent reserve and from October 1, 2015 through September 30, 2017, approximately $7,014 of this reserve will be applied to pay a portion of this tenant’s rent due. |
| (6) | During a Lease Trigger Period, all excess cash will be transferred to lender to be held for approved leasing expenses. A “Lease Trigger Period” will commence upon (i) with respect to a “Major Tenant” on the date that is the earlier of 12 months prior to the lease expiration or the date on or before which such tenant must notify the borrower of lease renewal or termination, or (ii) if any Major Tenant (a) fails to continuously operate, (b) is the subject of a bankruptcy action, (c) gives notice of lease termination or vacates the premises, (d) lease terminates or expires, or (e) is in default under its lease. “Major Tenant” means any tenant that leases 15% or more of the NRA or pays 15% or more of the in-place rents. |
| (7) | Based on amortizing debt service payments. Based on the current interest only payments, Underwritten NOI DSCR and Underwritten NCF DSCR are 1.78x and 1.67x, respectively. |
TRANSACTION HIGHLIGHTS |
| ■ | Property.Murrieta Spectrum is a seven building, 172,598 sq. ft. community shopping center in Murrieta, California. It is located between Los Angeles (80 miles north) and San Diego (65 miles south). The property consists of one large multi-tenant building, five multi-tenant pad buildings, and one single-tenant pad building. As of October 1, 2015 the subject property has a physical occupancy of 78.0%. |
| ■ | Retail Location.The property has a hard corner in a retail pocket located northwest of the junction of I-15 and Murrieta Hot Springs Road. The retail corridor consists of four retail centers including Murrieta Spectrum along Madison Avenue, with a daily average traffic count of 16,400 vehicles. |
| ■ | Recent Leasing. The property has seen a notable amount of leasing activity in the past year. There have been eight lease renewals, in addition to two new leases executed since the beginning of 2015 totaling approximately 32,934 sq. ft. and $910,256 of base rent. |
| ■ | Sponsor. The sponsors are TsuHo Lee and Steve ChengChe Chou. In addition to the subject property, the Lee family has developed multiple other commercial properties in California. The sponsors have owned the land the subject property was built on for more than 20 years and in addition to the subject property, the Lee family has developed multiple other commercial properties in southern California. |
THE INFORMATION IN THIS STRUCTURAL AND COLLATERAL TERM SHEET IS NOT COMPLETE AND MAY BE AMENDED PRIOR TO THE TIME OF SALE. THIS TERM SHEET IS NOT AN OFFER TO SELL THESE SECURITIES AND IT IS NOT A SOLICITATION OF AN OFFER TO BUY THESE SECURITIES IN ANY JURISDICTION WHERE THE OFFER OR SALE IS NOT PERMITTED.
| 112 |
| 2974 International Parkway Lake Mary, FL 32746 | Collateral Asset Summary – Loan No. 16 Westin Lake Mary | Cut-off Date Balance: Cut-off Date LTV: U/W NCF DSCR: U/W NOI Debt Yield: | $20,000,000 67.8% 1.57x 11.9% |
| Mortgage Loan Information | |
| Loan Seller: | GACC |
| Loan Purpose: | Refinance |
| Sponsors: | Mohana R. Velagapudi; K. Rao Yedla; Srinath R. Yedla; Satya N. Yedla |
| Borrower: | YRG Hotel Group III, LLC |
| Original Balance: | $20,000,000 |
| Cut-off Date Balance: | $20,000,000 |
| % by Initial UPB: | 2.1% |
| Interest Rate: | 5.1400% |
| Payment Date: | 6thof each month |
| First Payment Date: | October 6, 2015 |
| Maturity Date: | September 6, 2025 |
| Amortization: | Interest only for first 36 months; 360 months thereafter |
| Additional Debt: | None |
| Call Protection: | L(26), D(89), O(5) |
| Lockbox / Cash Management(1): | Hard / Springing |
| Reserves | ||
| Initial | Monthly | |
| Taxes: | $263,826 | $26,383 |
| Insurance: | $186,193 | $16,927 |
| FF&E(2): | $0 | At least 4.0% of prior month’s gross rents |
| Required Repairs: | $29,400 | NAP |
| PIP(3): | $1,452,172 | NAP |
| Financial Information | ||
| Cut-off Date Balance / Room: | $79,365 | |
| Balloon Balance / Room: | $70,471 | |
| Cut-off Date LTV: | 67.8% | |
| Balloon LTV: | 60.2% | |
| Underwritten NOI DSCR(4): | 1.82x | |
| Underwritten NCF DSCR(4): | 1.57x | |
| Underwritten NOI Debt Yield: | 11.9% | |
| Underwritten NCF Debt Yield: | 10.3% | |
| Property Information | |
| Single Asset / Portfolio: | Single Asset |
| Property Type: | Full Service Hospitality |
| Collateral: | Fee Simple |
| Location: | Lake Mary, FL |
| Year Built / Renovated: | 2009 / NAP |
| Total Rooms: | 252 |
| Property Management: | Yedla Management Company, Inc. |
| Underwritten NOI: | $2,380,283 |
| Underwritten NCF: | $2,059,611 |
| Appraised Value: | $29,500,000 |
| Appraisal Date: | June 1, 2015 |
| Historical NOI | |
| Most Recent NOI: | $2,394,563 (T-12 August 31, 2015) |
| 2014 NOI: | $2,189,332 (December 31, 2014) |
| 2013 NOI: | $1,846,076 (December 31, 2013) |
| 2012 NOI: | $1,946,082 (December 31, 2012) |
| Historical Occupancy | |
| Most Recent Occupancy: | 72.9% (August 31, 2015) |
| 2014 Occupancy: | 70.2% (December 31, 2014) |
| 2013 Occupancy: | 63.2% (December 31, 2013) |
| 2012 Occupancy: | 64.9% (December 31, 2012) |
| (1) | Cash management and an excess cash sweep will be triggered upon (i) an event of default, (ii) if the DSCR falls below 1.25x as of any calendar quarter or (iii) a PIP is required by the franchisor and shall continue until such event of default is cured or the DSCR is at least 1.30x for two consecutive calendar quarters or 125% of the estimated cost of such PIP has been reserved. |
| (2) | On a monthly basis, the borrower is required to deposit the greater of 4.0% of prior month’s gross rents, any amount required under the management agreement or any amount required under the franchise agreement for FF&E work into a FF&E reserve account. |
| (3) | At closing the borrower deposited $1,452,172 into a PIP reserve account for planned improvements at the property that are expected to be completed by 2016. |
| (4) | Based on amortizing debt service payments. Based on current interest only payments, the Underwritten NOI DSCR and the Underwritten NCF DSCR are 2.28x and 1.98x, respectively. |
TRANSACTION HIGHLIGHTS |
| ■ | Property.Westin Lake Mary is a seven-story, 252-room full service hotel located in Lake Mary, Florida. The hotel has a franchise agreement with Westin Hotel Management, L.P., which expires on November 12, 2034. The hotel features 252 rooms, comprised of 96 king rooms, 154 queen rooms and 2 suites. The hotel has numerous amenities including a business center, fitness center, outdoor swimming pool, Westin Executive Club, as well as the 200-seat Shula’s 347 Grill, 25-seat lobby bar and approximately 14,667 sq. ft. of meeting space, which includes 3,900 sq. ft. of outdoor space. The food and beverage options are leased to a third party, Culinaire of Florida, Inc., on a 15-year lease which commenced in 2009. |
| ■ | Market. Westin Lake Mary is located in Lake Mary, Florida within Seminole County and approximately 18 miles north of the Orlando central business district. The Lake Mary area has developed rapidly over the past 20 years as growth from Orlando continues to push north. There are several recent high-quality mixed-use developments which have improved the subject neighborhood, making it one of the fastest growing areas in Orlando. The hotel’s surrounding area is home to headquarters and regional offices for various national and international companies such as Deloitte, Verizon, AT&T, Charisma Media, Cingular Wireless, Duke Energy, Siemens Information and Communications Network, Inc., SunGard, among others. The property is in close proximity to a number of access routes including Interstate 4, a main east-west thoroughfare in the area, Interstate 95 and Florida’s Turnpike. Lake Mary is also accessible via the SunRail train service which connects to downtown Orlando, the Lynx bus service and the Orlando-Sanford International Airport, which accommodated approximately 2.2 million travelers in 2014. |
| ■ | Performance.As of August 31, 2015 the Westin Lake Mary property had occupancy of 72.9%, ADR of $108.77 and RevPAR of $79.30. According to a market research report, the property outperformed its competitive set, with a reported RevPAR penetration level of 106.7%, for the trailing 12-month period ending August 31, 2015. |
THE INFORMATION IN THIS STRUCTURAL AND COLLATERAL TERM SHEET IS NOT COMPLETE AND MAY BE AMENDED PRIOR TO THE TIME OF SALE. THIS TERM SHEET IS NOT AN OFFER TO SELL THESE SECURITIES AND IT IS NOT A SOLICITATION OF AN OFFER TO BUY THESE SECURITIES IN ANY JURISDICTION WHERE THE OFFER OR SALE IS NOT PERMITTED.
| 113 |
| 13729 Research Boulevard Austin, TX 78750 | Collateral Asset Summary – Loan 17 Lake Creek Festival | Cut-off Date Balance: Cut-off Date LTV: U/W NCF DSCR: U/W NOI Debt Yield: | $19,750,000 70.0% 1.66x 11.2% |
| Mortgage Loan Information | |
| Loan Seller: | GACC |
| Loan Purpose: | Refinance |
| Sponsors: | William Bernstein Qualified Terminable Interest Property Trust; RBC Miller Brothers Trust; Richard Miller; Craig Miller; Barton Miller |
| Borrower: | Lake Creek Festival, LLC |
| Original Balance: | $19,750,000 |
| Cut-off Date Balance: | $19,750,000 |
| % by Initial UPB: | 2.1% |
| Interest Rate: | 4.4600% |
| Payment Date: | 6thof each month |
| First Payment Date: | November 6, 2015 |
| Maturity Date: | October 6, 2025 |
| Amortization: | Interest only for first 24 months; 360 months thereafter |
| Additional Debt: | None |
| Call Protection: | L(25), D(91), O(4) |
| Lockbox / Cash Management(1): | Hard / Springing |
| Reserves | ||
| Initial | Monthly | |
| Taxes: | $347,442 | $38,605 |
| Insurance(2): | $0 | Springing |
| Replacement: | $0 | $4,758 |
| TI/LC(3): | $508,615 | $14,748 |
| Required Repairs: | $15,000 | NAP |
| Free Rent: | $141,365 | NAP |
| Lease Sweep(4): | $0 | Springing |
| Financial Information | ||
| Cut-off Date Balance / Sq. Ft.: | $69 | |
| Balloon Balance / Sq. Ft.: | $59 | |
| Cut-off Date LTV: | 70.0% | |
| Balloon LTV: | 59.8% | |
| Underwritten NOI DSCR(5): | 1.85x | |
| Underwritten NCF DSCR(5): | 1.66x | |
| Underwritten NOI Debt Yield: | 11.2% | |
| Underwritten NCF Debt Yield: | 10.0% | |
| Property Information | |
| Single Asset / Portfolio: | Single Asset |
| Property Type: | Anchored Retail |
| Collateral: | Fee Simple |
| Location: | Austin, TX |
| Year Built / Renovated: | 1990,1991 / NAP |
| Total Sq. Ft.: | 285,454 |
| Property Management: | Endura Advisory Group, GP LLC |
| Underwritten NOI: | $2,216,741 |
| Underwritten NCF: | $1,981,336 |
| Appraised Value: | $28,200,000 |
| Appraisal Date: | July 1, 2015 |
| Historical NOI(6) | |
| Most Recent NOI: | $1,775,432 (T-12 July 31, 2015) |
| 2014 NOI: | $1,456,372 (December 31, 2014) |
| 2013 NOI: | $2,467,294 (December 31, 2013) |
| Historical Occupancy(6) | |
| Most Recent Occupancy: | 98.1% (September 8, 2015) |
| 2014 Occupancy: | 84.1% (December 31, 2014) |
| 2013 Occupancy: | 96.7% (December 31, 2013) |
| (1) | Cash management will be triggered (i) upon an event of default, (ii) if the DSCR falls below 1.20x for any calendar quarter until such time that the DSCR is at least 1.25x for two consecutive calendar quarters, or (iii) the commencement of a Lease Sweep Period (as defined herein) until such Lease Sweep Period is cured as provided in the loan documents. |
| (2) | If an acceptable blanket insurance policy is no longer in place, the borrower is required to deposit 1/12 of the annual insurance premiums into the insurance reserve account on a monthly basis. |
| (3) | TI/LC reserves are subject to a cap of $535,000 (exclusive of the Initial TI/LC deposit), subject to replenishment if drawn. |
| (4) | A “Lease Sweep Period” will commence (i) twelve months prior to the expiration of a Lease Sweep Lease (as defined herein) or upon the date the Sweep Tenant (as defined herein) is required to give notice of its exercise of a renewal option (and such renewal has not been so exercised), (ii) upon the early termination, early cancellation or early surrender of a Lease Sweep Lease (or at least 25% of its space) or upon Borrower’s receipt of notice by a Sweep Tenant of its intent to effect an early termination, early cancellation or early surrender of its Lease Sweep Lease (or at least 25% of its space), (iii) upon the date the Sweep Tenant discontinues (i.e., “goes dark”) its business at all or substantially all of its Premises, (iv) upon a monetary or material nonmonetary default by Sweep Tenant under its lease or (v) upon a bankruptcy or insolvency proceeding of a Sweep Tenant or its parent. A “Lease Sweep Lease” shall mean (i) each of the Burlington Coat Factory lease and the Hobby Lobby lease and (ii) any replacement lease that, either individually, or when taken together with any other lease of the same tenant, covers all or substantially all of the rentable square feet of the space covered by the applicable Lease Sweep Lease. “Sweep Tenant” means any tenant under a Lease Sweep Lease. |
| (5) | Based on amortizing debt service payments. Based on current interest only payments, the Underwritten NOI DSCR and the Underwritten NCF DSCR are 2.48x and 2.22x, respectively. |
| (6) | In October 2013, Stein Mart vacated 34,000 sq. ft. of space. 33,900 sq. ft. of the space has since been leased to Pinballz Arcade with a lease that commenced on August 1, 2015. Pinballz Arcade has not yet taken occupancy and is entitled to free rent through January 2016, which was deposited in an upfront reserve account. |
TRANSACTION HIGHLIGHTS |
| ■ | Property.The Lake Creek Festival property is a 285,454 sq. ft. community shopping center anchored by Burlington Coat Factory and Hobby Lobby located in Austin, Texas. The improvements consist of five, single story buildings situated on 24.8 acres. The property has 1,264 surface parking spaces which equates to a ratio of 4.43 spaces per 1,000 sq. ft. The property has good visibility on Research Boulevard (US Highway 183), the primary retail corridor in the immediate area, and the back of the property abuts Hymeadow Drive, a residential road. Along Research Boulevard, there are a number of big box retailers, including Lowe’s Home Improvement, a Walmart Supercenter, Home Depot, Target and Kohl’s, all located within a mile of the property. In addition, the Lakeline Mall, a 1.3 million sq. ft. shopping center and the Lakeline Plaza, an approximately 366,000 sq. ft. center, are in close proximity. |
| ■ | Tenancy. As of September 8, 2015, the property is 98.1% leased to 19 tenants, with the top five tenants occupying approximately 80.4% of the net rentable area. The property is anchored by Burlington Coat Factory (30.3% of NRA; 19.7% of U/W Base Rent; rated Ba3 by Moody’s) and Hobby Lobby (20.1% of NRA; 11.9% of U/W Base Rent). Tenants have been in occupancy for an average of 13.1 years and the weighted average remaining lease term at the property is 5.1 years. |
| ■ | Location. The property is located in Williamson County within the city of Austin, the state capital of Texas.The property’s neighborhood is proximate to Cedar Park and is considered to be a suburban location in the Far Northwest submarket of the Austin MSA. As of Q2 2015, the property’s submarket contained approximately 4.8 sq. ft. and had a vacancy rate of 9.4% compared to 4.3% for the entire Austin region. The asking rent in the Far Northwest Submarket was $15.47 compared to $18.51 for the Austin area. |
THE INFORMATION IN THIS STRUCTURAL AND COLLATERAL TERM SHEET IS NOT COMPLETE AND MAY BE AMENDED PRIOR TO THE TIME OF SALE. THIS TERM SHEET IS NOT AN OFFER TO SELL THESE SECURITIES AND IT IS NOT A SOLICITATION OF AN OFFER TO BUY THESE SECURITIES IN ANY JURISDICTION WHERE THE OFFER OR SALE IS NOT PERMITTED.
| 114 |
| 2015 Manhattan Beach Boulevard Redondo Beach, CA 90278 | Collateral Asset Summary – Loan 18 Wedgewood Building | Cut-off Date Balance: Cut-off Date LTV: U/W NCF DSCR: U/W NOI Debt Yield: | $18,978,686 67.3% 1.27x 8.5% |
| Mortgage Loan Information | |
| Loan Seller: | JLC |
| Loan Purpose: | Refinance |
| Sponsors: | Gregory L. Geiser; David R. Wehrly; Darin Puhl |
| Borrower(1): | WWW 90278, LLC |
| Original Balance: | $19,000,000 |
| Cut-off Date Balance: | $18,978,686 |
| % by Initial UPB: | 2.0% |
| Interest Rate: | 4.7670% |
| Payment Date: | 6thof each month |
| First Payment Date: | November 6, 2015 |
| Maturity Date: | October 6, 2025 |
| Amortization: | 360 months |
| Additional Debt: | None |
| Call Protection: | L(25), D(91), O(4) |
| Lockbox / Cash Management(2): | Springing Hard / Springing |
| Reserves | ||
| Initial | Monthly | |
| Taxes: | $145,000 | $17,600 |
| Insurance: | $4,100 | $1,900 |
| Replacement: | $0 | $1,107 |
| TI/LC(3): | $0 | $7,055 |
| Special Rollover Reserve(4): | NAP | Springing |
| Financial Information | ||
| Cut-off Date Balance / Sq. Ft.: | $229 | |
| Balloon Balance / Sq. Ft.: | $187 | |
| Cut-off Date LTV: | 67.3% | |
| Balloon LTV: | 55.0% | |
| Underwritten NOI DSCR: | 1.35x | |
| Underwritten NCF DSCR: | 1.27x | |
| Underwritten NOI Debt Yield: | 8.5% | |
| Underwritten NCF Debt Yield: | 8.0% | |
| Property Information | |
| Single Asset / Portfolio: | Single Asset |
| Property Type: | CBD Office |
| Collateral: | Fee Simple |
| Location: | Redondo Beach, CA |
| Year Built / Renovated: | 1986 / 2014 |
| Total Sq. Ft.: | 83,005 |
| Property Management: | Kearny Property Services, Inc. |
| Underwritten NOI: | $1,609,412 |
| Underwritten NCF: | $1,511,612 |
| Appraised Value: | $28,200,000 |
| Appraisal Date: | August 17, 2015 |
| Historical NOI(5) | |
| 2014 NOI: | NAP |
| 2013 NOI: | NAP |
| 2012 NOI: | NAP |
| Historical Occupancy(5) | |
| Most Recent Occupancy: | 100.0% (September 1, 2015) |
| 2014 Occupancy: | NAP |
| 2013 Occupancy: | NAP |
| 2012 Occupancy: | NAP |
| (1) | The following tenants are affiliates of the borrower: Wedgewood (approximately 29.3% NRA), Maxim Properties (approximately 13.7% NRA), Greenhedge Escrow (approximately 7.6% of NRA), HMC Assets (approximately 5.8% NRA) and Civic Financial (approximately 5.2% NRA). Wedgewood Enterprises, Maxim Properties and Greenhedge Escrow executed joint and several leases guarantees for each of the five borrower-affiliated leases. |
| (2) | Cash management and a hard lockbox will be triggered upon (i) an event of default, (ii) a breach of guaranty covenants, or (iii) the commencement of a Lease Sweep Period. “A Lease Sweep Period” will commence (i) 12 months prior to the end of the term of any “Major Lease”, (ii) if any Major Lease is terminated or (iii) if any tenant under a Major Lease) “goes dark” or files for bankruptcy. “Major Lease” means the Wedgewood lease, the T-Mobile lease, any lease entered into with a tenant who is an affiliate of the borrower and any other lease which covers 12,000 or more sq. ft. |
| (3) | The TI/LC reserve is subject to a cap of $300,000. |
| (4) | On each payment date occurring during the continuance of a Lease Sweep Period, provided no cash management period is then continuing (other than a Lease Sweep Period), all available cash is required to be deposited into the Special Rollover reserve subaccount. |
| (5) | The borrower purchased the property in 2012 and invested approximately $9.9 million ($119 PSF) to renovate and convert the property into a Class A, creative office building. Some of the renovations included demolition and reconfiguration of the first floor office space, adding solar panels to the rooftop of the building and carports, security upgrades, new signage, and upgraded audio video and network equipment. The renovations were completed in 2014 and the property is currently 100.0% occupied (including 61.6% of the NRA occupied by borrower affiliates). All of the leases are new with commencement dates ranging from April 2014 to November 2015. |
TRANSACTION HIGHLIGHTS |
| ■ | Property. Wedgewood Building is a two story, 83,005 sq. ft. Class A office building located on Manhattan Beach Boulevard on a 3.9 acre site in Redondo Beach, California. |
| ■ | Capital Improvements. The property was built in 1986 and underwent a $9.9 million ($119 PSF), two-year renovation completed in 2014 to convert the building from its previous use as a call center into a Class A creative office building. Improvements over the last several years included reconfiguring the ground floor tenant suites to larger open floor plates, installing 625 solar panels, replacing the windows and adding unique architectural features intended to appeal to creative office tenants. |
| ■ | Location.Wedgewood Building is located less than one mile from Interstate 405 and the Pacific Coast Highway, less than two miles from Manhattan Beach and less than five miles from LAX Airport. The property benefits from excellent access and visibility from Manhattan Beach Boulevard and is located adjacent to the Redondo Beach Performing Arts Center, South Bay’s largest retail, business and entertainment complex providing many amenities to tenants. |
THE INFORMATION IN THIS STRUCTURAL AND COLLATERAL TERM SHEET IS NOT COMPLETE AND MAY BE AMENDED PRIOR TO THE TIME OF SALE. THIS TERM SHEET IS NOT AN OFFER TO SELL THESE SECURITIES AND IT IS NOT A SOLICITATION OF AN OFFER TO BUY THESE SECURITIES IN ANY JURISDICTION WHERE THE OFFER OR SALE IS NOT PERMITTED.
| 115 |
| 300 Kenhorst Plaza Kenhorst, PA 19607 | Collateral Asset Summary – Loan No. 19 Kenhorst Plaza | Cut-off Date Balance: Cut-off Date LTV: U/W NCF DSCR: U/W NOI Debt Yield: | $18,300,000 73.2% 1.25x 8.7% |
| Mortgage Loan Information | |
| Loan Seller: | LCF |
| Loan Purpose: | Acquisition |
| Sponsor: | Paul Sub |
| Borrower: | 1895 New Holland Road LLC |
| Original Balance: | $18,300,000 |
| Cut-off Date Balance: | $18,300,000 |
| % by Initial UPB: | 1.9% |
| Interest Rate: | 5.1000% |
| Payment Date: | 6thof each month |
| First Payment Date: | November 6, 2015 |
| Maturity Date: | October 6, 2025 |
| Amortization: | Interest only for first 60 months; 360 months thereafter |
| Additional Debt: | None |
| Call Protection: | L(25), D(92), O(3) |
| Lockbox / Cash Management | Hard / In-Place |
| Reserves | ||
| Initial | Monthly | |
| Taxes: | $183,994 | $36,799 |
| Insurance: | $26,997 | $2,454 |
| Replacement: | $0 | $2,556 |
| TI/LC(1): | $220,000 | Springing |
| Required Repairs: | $29,338 | NAP |
| Retro Fitness Reserve(2): | $810,000 | NAP |
| Financial Information | ||
| Cut-off Date Balance / Sq. Ft.: | $113 | |
| Balloon Balance / Sq. Ft.: | $105 | |
| Cut-off Date LTV: | 73.2% | |
| Balloon LTV: | 67.6% | |
| Underwritten NOI DSCR(3): | 1.33x | |
| Underwritten NCF DSCR(3): | 1.25x | |
| Underwritten NOI Debt Yield: | 8.7% | |
| Underwritten NCF Debt Yield: | 8.2% | |
| Property Information | |
| Single Asset / Portfolio: | Single Asset |
| Property Type: | Anchored Retail |
| Collateral: | Fee Simple |
| Location: | Kenhorst, PA |
| Year Built / Renovated: | 1990 / NAP |
| Total Sq. Ft.: | 161,424 |
| Property Management: | Winslow Property Management LLC |
| Underwritten NOI: | $1,588,259 |
| Underwritten NCF: | $1,492,638 |
| Appraised Value: | $25,000,000 |
| Appraisal Date: | July 21, 2015 |
| Historical NOI(4) | |
| Most Recent NOI: | $1,521,814 (T-12 June 30, 2015) |
| 2014 NOI: | $1,413,794 (December 31, 2014) |
| 2013 NOI: | $1,382,919 (December 31, 2013) |
| 2012 NOI: | NAV |
| Historical Occupancy(4) | |
| Most Recent Occupancy: | 92.2% (September 1, 2015) |
| 2014 Occupancy: | 90.8% (December 31, 2014) |
| 2013 Occupancy: | 86.0% (December 31, 2013) |
| 2012 Occupancy: | NAV |
| (1) | The borrower will be required to make monthly deposits of $5,413 into a TI/LC reserve account if the TI/LC reserve falls below $90,000. |
| (2) | At origination, the borrower deposited $810,000 into a Retro Fitness Reserve at closing. The $810,000 deposit represents the 12 months free rent per the new 10-year lease ($171,520), the difference in rent/CAM payments between Sears Hardware and Retro Fitness for the dates of closing through February 1, 2016 ($28,758), TI Allowance to be used by the Retro Fitness tenant ($500,000), landlord work to be done in premises prior to tenant work as a condition to the tenant’s obligation to take possession ($105,000), and the remainder to be used as a contingency ($4,722). |
| (3) | Based on amortizing debt service payments. Based on the current interest only payments, Underwritten NOI DSCR and Underwritten NCF DSCR are 1.68x and 1.58x, respectively. |
| (4) | The Kenhorst Plaza property was acquired in 2012; as such, 2012 NOI and 2012 Occupancy are not available. |
TRANSACTION HIGHLIGHTS |
| ■ | Property.TheKenhorst Plaza property is a 161,424 sq. ft. grocery-anchored retail property located in Kenhorst, Pennsylvania. The property is anchored by Redner’s Warehouse Markets (Redner’s Markets, Inc.) (“Redner’s Warehouse Markets”) (35.9% NRA, April 30, 2030 expiration). Redner’s Warehouse Markets reported sales of approximately $413 PSF for the full year 2014. The second largest tenant is expected to be Retro Fitness (13.3% NRA, February 28, 2026 expiration), which tenant has signed a 10-year lease and is expected to take occupancy March 1, 2016, replacing the current tenant, Sears Hardware (Sears, Roebuck & Co.) (“Sears Hardware”), which tenant has a lease expiration of February 3, 2016. |
| ■ | Market.TheKenhorst Plaza property is located in the Reading metropolitan statistical area. The Reading metropolitan retail market exhibits a current vacancy of 6.0% as of Q2 2015, while the rental comparables have a vacancy of 7.4%. As of Q2 2015, within a five mile radius of the property, there is a population of 182,396, with an average household income of $60,432, and an average home price of approximately $153,377. |
| ■ | Sponsorship.The sponsor, Paul Sub, contributed $8.2 million of equity in connection with the purchase of the Kenhorst Plaza property.Mr. Sub has been in the real estate management and development business for over 40 years. Mr. Sub’s current holdings include ownership in 10 commercial real estate properties. |
THE INFORMATION IN THIS STRUCTURAL AND COLLATERAL TERM SHEET IS NOT COMPLETE AND MAY BE AMENDED PRIOR TO THE TIME OF SALE. THIS TERM SHEET IS NOT AN OFFER TO SELL THESE SECURITIES AND IT IS NOT A SOLICITATION OF AN OFFER TO BUY THESE SECURITIES IN ANY JURISDICTION WHERE THE OFFER OR SALE IS NOT PERMITTED.
| 116 |
| 3740-3850 Beltline Road Addison, TX 75001 | Collateral Asset Summary – Loan No. 20 Addison Town Center | Cut-off Date Balance: Cut-off Date LTV: U/W NCF DSCR: U/W NOI Debt Yield: | $16,231,741 72.3% 1.43x 9.8% |
| Mortgage Loan Information | |
| Loan Seller: | CCRE |
| Loan Purpose: | Refinance |
| Sponsor: | Herbert D. Weitzman |
| Borrower: | Portfolio Addison Town Center Retail, L.P. |
| Original Balance: | $16,250,000 |
| Cut-off Date Balance: | $16,231,741 |
| % by Initial UPB: | 1.7% |
| Interest Rate: | 4.7600% |
| Payment Date: | 6thof each month |
| First Payment Date: | November 6, 2015 |
| Maturity Date: | October 6, 2025 |
| Amortization: | 360 months |
| Additional Debt: | None |
| Call Protection: | L(25), D(90), O(5) |
| Lockbox / Cash Management(1): | Hard / Springing |
| Reserves | ||
| Initial | Monthly | |
| Taxes: | $414,670 | $41,467 |
| Insurance: | $30,123 | $3,012 |
| Replacement(2): | $0 | $2,328 |
| TI/LC(3): | $250,000 | $9,314 |
| Required Repairs: | $3,025 | NAP |
| Free Rent(4): | $199,884 | NAP |
| Roof Repair: | $76,280 | NAP |
| Financial Information | ||
| Cut-off Date Balance / Sq. Ft.: | $87 | |
| Balloon Balance / Sq. Ft.: | $71 | |
| Cut-off Date LTV: | 72.3% | |
| Balloon LTV: | 59.0% | |
| Underwritten NOI DSCR: | 1.56x | |
| Underwritten NCF DSCR: | 1.43x | |
| Underwritten NOI Debt Yield: | 9.8% | |
| Underwritten NCF Debt Yield: | 8.9% | |
| Property Information | |
| Single Asset / Portfolio: | Single Asset |
| Property Type: | Anchored Retail |
| Collateral: | Fee Simple |
| Location: | Addison, TX |
| Year Built / Renovated: | 1993 – 1994 / 2003 |
| Total Sq. Ft.: | 186,275 |
| Property Management: | Weitzman Management Corporation |
| Underwritten NOI: | $1,591,766 |
| Underwritten NCF: | $1,452,604 |
| Appraised Value: | $22,460,000 |
| Appraisal Date: | July 13, 2015 |
| Historical NOI | |
| Most Recent NOI: | $1,560,805 (T-12 May 31, 2015) |
| 2014 NOI: | $1,674,901 (December 31, 2014) |
| 2013 NOI: | $1,685,576 (December 31, 2013) |
| 2012 NOI: | $1,449,627 (December 31, 2012) |
| Historical Occupancy | |
| Most Recent Occupancy: | 88.5% (September 2, 2015) |
| 2014 Occupancy: | 82.5% (December 31, 2014) |
| 2013 Occupancy: | 87.7% (December 31, 2013) |
| 2012 Occupancy: | 87.9% (December 31, 2012) |
| (1) | Cash management will be triggered upon (i) an event of default, (ii) any bankruptcy action of the borrower, general partner of the borrower, guarantor or property manager or (iii) the failure by the borrower to maintain a DSCR of at least 1.10x for two consecutive calendar quarters. |
| (2) | Replacement reserves are subject to a cap of $84,000. |
| (3) | TI/LC reserves are subject to a cap of $300,000. |
| (4) | The free rent reserve for the tenant DFW-Addison Fitness, LLC d/b/a Crunch Fitness is required to be disbursed to the borrower in equal sums on each of the initial six payment dates in the amount of $30,464 and on the seventh payment date in the amount of $17,100. |
TRANSACTION HIGHLIGHTS |
| ■ | Property.Addison Town Center is an 88.5% occupied (as of September 2, 2015) 186,275 sq. ft. anchored retail shopping center located in Addison, Texas, a small retail corridor in North Dallas. The property is anchored by Kroger Food Stores (50,540 sq. ft.), Office Depot (21,067 sq. ft.), Crunch Fitness (19,920 sq. ft.), PetSmart (19,551 sq. ft.) and Dollar Tree (6,225 sq. ft.). |
| ■ | Anchor Sales. According to the sponsor, Kroger reported sales of $428 PSF as of June 30, 2015 and have increased every year since 2006. |
| ■ | Market & Location.Addison Town Center is located in central Dallas County and is about 12 miles north of the Dallas Central Business District and 32 miles northeast of the Fort Worth Central Business District. The town has over 170 restaurants and 22 hotels as well as the Addison Airport which is one of the busiest general aviation airports in Texas. Many corporations such as Pizza Hut, Mary Kay Cosmetics, Fed Ex/Kinko’s, Tuesday Morning, Beckett, Carr and Tenet Healthcare and Comp USA have their headquarters in Addison. Primary access to the property is provided by the Dallas North Tollway which is a six-lane expressway that passes through or along the cities of Dallas, Highland Park, University Park, Farmer Branch, Plano and Frisco. |
| ■ | Sponsorship.The sponsor and non-recourse carve-out guarantor, Herbert D. Weitzman, is the executive chairman of The Weitzman Group and Cencor Realty Services. The Weitzman Group is a full-service commercial real estate brokerage firm and Cencor Realty Services is a shopping center management firm with a portfolio of more than 21.5 million sq. ft. under management. |
THE INFORMATION IN THIS STRUCTURAL AND COLLATERAL TERM SHEET IS NOT COMPLETE AND MAY BE AMENDED PRIOR TO THE TIME OF SALE. THIS TERM SHEET IS NOT AN OFFER TO SELL THESE SECURITIES AND IT IS NOT A SOLICITATION OF AN OFFER TO BUY THESE SECURITIES IN ANY JURISDICTION WHERE THE OFFER OR SALE IS NOT PERMITTED.
| 117 |
SECURITIES, PRICING ESTIMATES AND OTHER INFORMATION
This material is for your information, and none of Deutsche Bank Securities Inc., Cantor Fitzgerald & Co., Jefferies LLC or any other underwriter (the “Underwriters”) are soliciting any action based upon it. This material is not to be construed as an offer to sell or the solicitation of any offer to buy any security in any jurisdiction where such an offer or solicitation would be illegal.
Neither this document nor anything contained herein shall form the basis for any contract or commitment whatsoever. The information contained herein is preliminary as of the date hereof. These materials are subject to change, completion or amendment from time to time. The information contained herein will be superseded by similar information delivered to you as part of the offering document relating to the COMM 2015-LC23 Mortgage Trust, Commercial Mortgage Pass-Through Certificates (the “Offering Document”). The information contained herein supersedes any such information previously delivered and should be reviewed only in conjunction with the entire Offering Document. All of the information contained herein is subject to the same limitations and qualifications contained in the Offering Document. The information contained herein does not contain all relevant information relating to the underlying mortgage loans or mortgaged properties. Such information is described elsewhere in the Offering Document. The information contained herein will be more fully described elsewhere in the Offering Document. The information contained herein should not be viewed as projections, forecasts, predictions or opinions with respect to value. Prior to making any investment decision, prospective investors are strongly urged to read the Offering Document its entirety. Neither the Securities and Exchange Commission nor any state securities commission has approved or disapproved of these securities or determined if this free writing prospectus is truthful or complete. Any representation to the contrary is a criminal offense.
The attached information contains certain tables and other statistical analyses (the “Computational Materials”) which have been prepared in reliance upon information furnished by the Mortgage Loan Sellers. Numerous assumptions were used in preparing the Computational Materials, which may or may not be reflected herein. As such, no assurance can be given as to the Computational Materials’ accuracy, appropriateness or completeness in any particular context; or as to whether the Computational Materials and/or the assumptions upon which they are based reflect present market conditions or future market performance. The Computational Materials should not be construed as either projections or predictions or as legal, tax, financial or accounting advice. You should consult your own counsel, accountant and other advisors as to the legal, tax, business, financial and related aspects of a purchase of these securities. Any weighted average lives, yields and principal payment periods shown in the Computational Materials are based on prepayment and/or loss assumptions, and changes in such prepayment and/or loss assumptions may dramatically affect such weighted average lives, yields and principal payment periods. In addition, it is possible that prepayments or losses on the underlying assets will occur at rates higher or lower than the rates shown in the attached Computational Materials. The specific characteristics of the securities may differ from those shown in the Computational Materials due to differences between the final underlying assets and the preliminary underlying assets used in preparing the Computational Materials. The principal amount and designation of any security described in the Computational Materials are subject to change prior to issuance. None of Underwriters or any of their respective affiliates makes any representation or warranty as to the actual rate or timing of payments or losses on any of the underlying assets or the payments or yield on the securities.
This document contains forward-looking statements. Those statements are subject to certain risks and uncertainties that could cause the success of collections and the actual cash flow generated to differ materially from the information set forth herein. While such information reflects projections prepared in good faith based upon methods and data that are believed to be reasonable and accurate as of the dates thereof, the depositor undertakes no obligation to revise these forward-looking statements to reflect subsequent events or circumstances. Individuals should not place undue reliance on forward-looking statements and are advised to make their own independent analysis and determination with respect to the forecasted periods, which reflect the issuer’s view only as of the date hereof.
| IMPORTANT NOTICE RELATING TO AUTOMATICALLY GENERATED EMAIL DISCLAIMERS |
Any legends, disclaimers or other notices that may appear at the bottom of the email communication to which this free writing prospectus is attached relating to (1) these materials not constituting an offer (or a solicitation of an offer), (2) no representation being made that these materials are accurate or complete and may not be updated or (3) these materials possibly being confidential, are not applicable to these materials and should be disregarded. Such legends, disclaimers or other notices have been automatically generated as a result of these materials having been sent via Bloomberg or another system.