Exhibit 99.3

May 2022 Presentation
Disclaimers Forward - Looking Statements . This presentation contains certain statements that may be deemed to be “forward looking statements” within the meaning of Section 27 A of the Securities Act and Section 21 E of the Securities Exchange Act of 1934 , as amended . To the extent that the information presented in this presentation discusses financial projections, information, or expectations about the Company’s business plans, results of operations, returns on equity, markets, or otherwise makes statements about future events, such statements are forward - looking . Such forward - looking statements can be identified by the use of words such as “should,” “may,” “intends,” “anticipates,” “believes,” “estimates,” “projects,” “forecasts,” “expects,” “plans,” and “proposes” or the negative of such terms and other comparable technology . Although the Company believes that the expectations reflected in these forward - looking statements are based on reasonable assumptions, there are a number of risks and uncertainties that could cause actual results to differ materially from such forward - looking statements . You should also read carefully the factors described in the “Risk Factors” section and other parts of any prospectus we may in the future distribute, in order to better understand the risks and uncertainties inherent in our business and underlying any forward - looking statements . As a result of these factors, we cannot assure you that the forward - looking statements in this presentation will prove to be accurate . Furthermore, if our forward - looking statements prove to be inaccurate, the inaccuracy may be material . In light of the significant uncertainties in these forward - looking statements, you should not regard these statements as a representation or warranty by us or any other person that we will achieve our objectives and plans in any specified timeframe, or at all . Any forward - looking statements that we make in this presentation speak only as of the date of such statement, and we undertake no obligation to update such statements to reflect events or circumstances after the date of this presentation or to reflect the occurrence of unanticipated events . Use of Non - GAAP Financial Measures . This presentation contains certain financial measures that are not calculated in accordance with U . S . generally accepted accounting principles (“GAAP”) . Such measures include funds from operations ("FFO"), Adjusted FFO, and net operating income ("NOI") . These non - GAAP financial measures are presented because the Company's management believes these measures help investors understand its business, performance and ability to earn and distribute cash to its shareholders by providing perspectives not immediately apparent from net income or loss . These measures are also frequently used by securities analysts, investors and other interested parties in evaluating hospitality real estate companies . The presentation of FFO, Adjusted FFO, and NOI herein are not intended to be considered in isolation or as a substitute for, or superior to, the financial information prepared and presented in accordance with GAAP and should not be considered as alternative measures of liquidity . In addition, readers are advised that the Company's definitions and method of calculating these measures may be different from those used by other companies, and, accordingly, may not be comparable to similar measures as defined and calculated by other companies that do not use the same methodology as the Company .
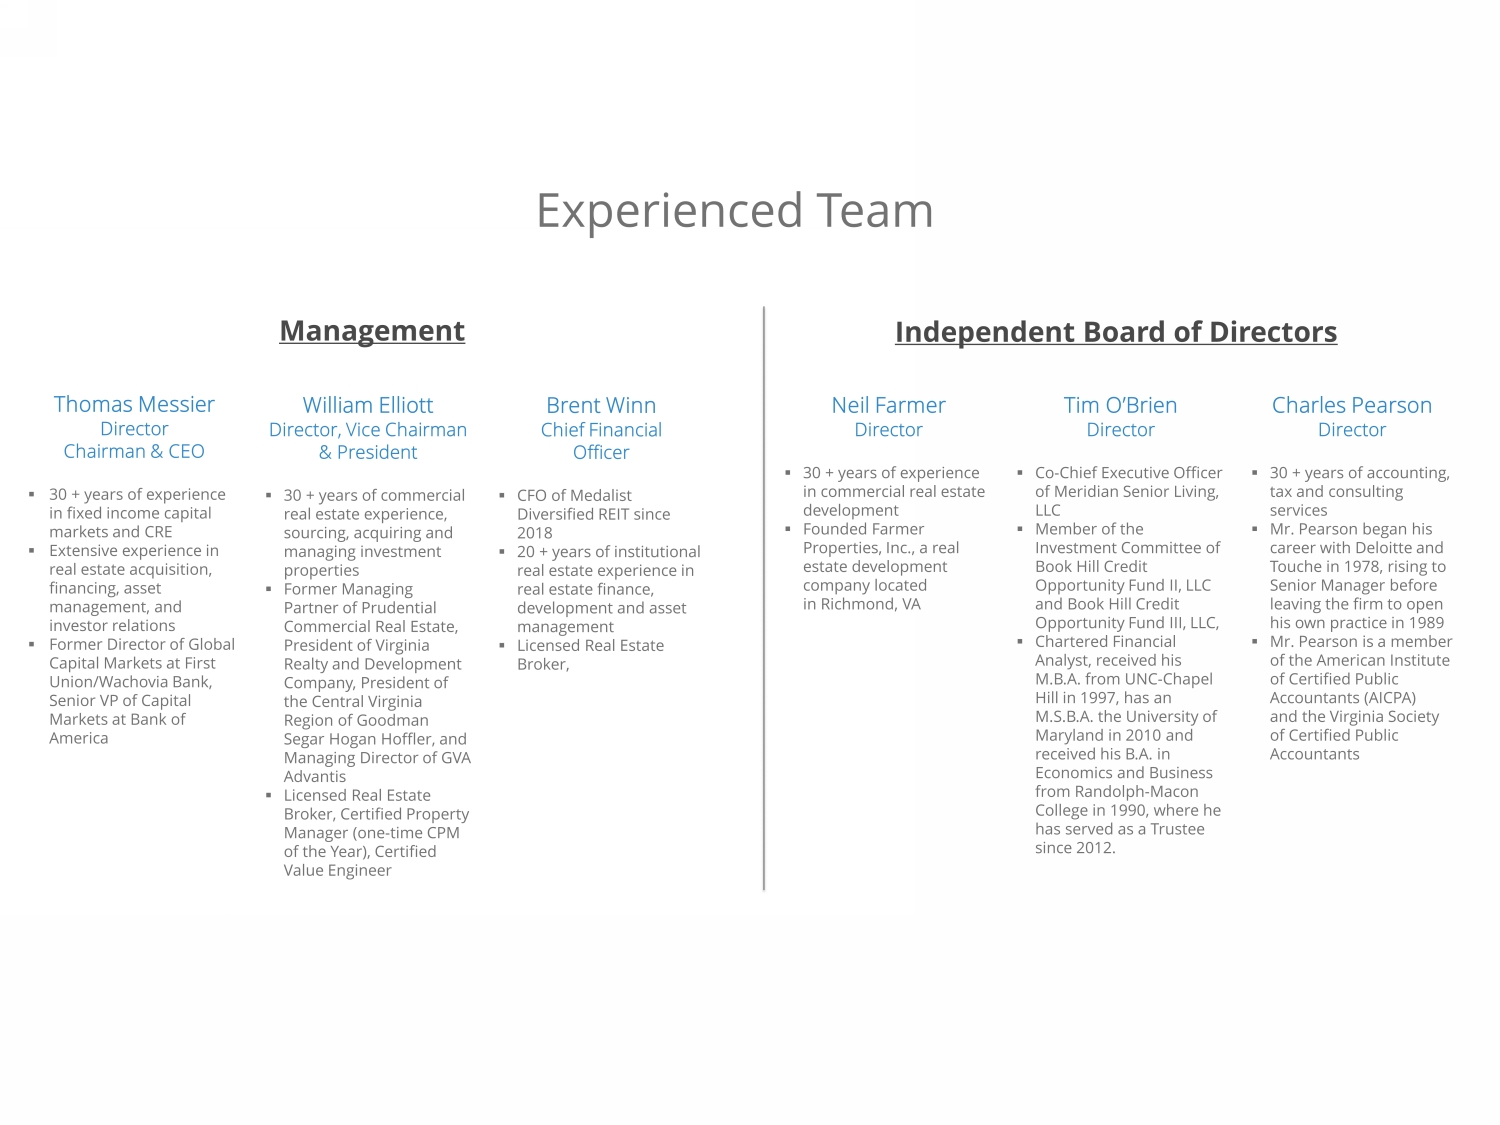
3 Experienced Team William Elliott Director, Vice Chairman & President ▪ 30 + years of commercial real estate experience, sourcing, acquiring and managing investment properties ▪ Former Managing Partner of Prudential Commercial Real Estate, President of Virginia Realty and Development Company, President of the Central Virginia Region of Goodman Segar Hogan Hoffler , and Managing Director of GVA Advantis ▪ Licensed Real Estate Broker, Certified Property Manager (one - time CPM of the Year), Certified Value Engineer Neil Farmer Director ▪ 30 + years of experience in commercial real estate development ▪ Founded Farmer Properties, Inc., a real estate development company located in Richmond, VA Tim O’Brien Director ▪ Co - Chief Executive Officer of Meridian Senior Living, LLC ▪ Member of the Investment Committee of Book Hill Credit Opportunity Fund II, LLC and Book Hill Credit Opportunity Fund III, LLC, ▪ Chartered Financial Analyst, received his M.B.A. from UNC - Chapel Hill in 1997, has an M.S.B.A. the University of Maryland in 2010 and received his B.A. in Economics and Business from Randolph - Macon College in 1990, where he has served as a Trustee since 2012. Charles Pearson Director ▪ 30 + years of accounting, tax and consulting services ▪ Mr. Pearson began his career with Deloitte and Touche in 1978, rising to Senior Manager before leaving the firm to open his own practice in 1989 ▪ Mr. Pearson is a member of the American Institute of Certified Public Accountants (AICPA) and the Virginia Society of Certified Public Accountants Management Independent Board of Directors Thomas Messier Director Chairman & CEO ▪ 30 + years of experience in fixed income capital markets and CRE ▪ Extensive experience in real estate acquisition, financing, asset management, and investor relations ▪ Former Director of Global Capital Markets at First Union/Wachovia Bank, Senior VP of Capital Markets at Bank of America Brent Winn Chief Financial Officer ▪ CFO of Medalist Diversified REIT since 2018 ▪ 20 + years of institutional real estate experience in real estate finance, development and asset management ▪ Licensed Real Estate Broker,

About Medalist Diversified REIT Our Property Managers ▪ Externally managed by Medalist Fund Manager and i nvests in commercial real estate located in the Southeast ▪ Approximately $55mm in equity raised from high net worth individuals, small institutions and retail investors ▪ Portfolio currently consists of 8 properties – 4 Retail, 3 Industrial/Flex and 1 Hotel ▪ Asset types sourced and managed include: Industrial/Flex, Retail, Multifamily, and Hospitality ▪ Medalist Fund Manager, Medalist’s external manager, has sourced and managed properties with a total asset value of approximately $200 million ▪ Medalist uses full - service third party property management firms – Dodson Companies and Marshall Hotels & Resorts Dodson Companies ▪ Dodson Companies, is a full - service real estate property management firm with over 30 years of management experience ▪ MDR’s Bill Elliott became a Partner in Dodson Companies in 2003 and maintains a 6.32% ownership stake ▪ Dodson is the property manager for all of Medalist’s non - hotel properties TPG Hotels and Resorts (Formerly Marshall Hotels & Resorts) ▪ TPG Hotels & Resorts is a full - service hotel property management firm ▪ The firm currently manages 130 hotels with nearly 20,000 rooms in 26 states ▪ Medalist has worked with Marshall Hotels & Resorts for over 10 years Over 50 years of combined real estate investment and management experience Company Overview
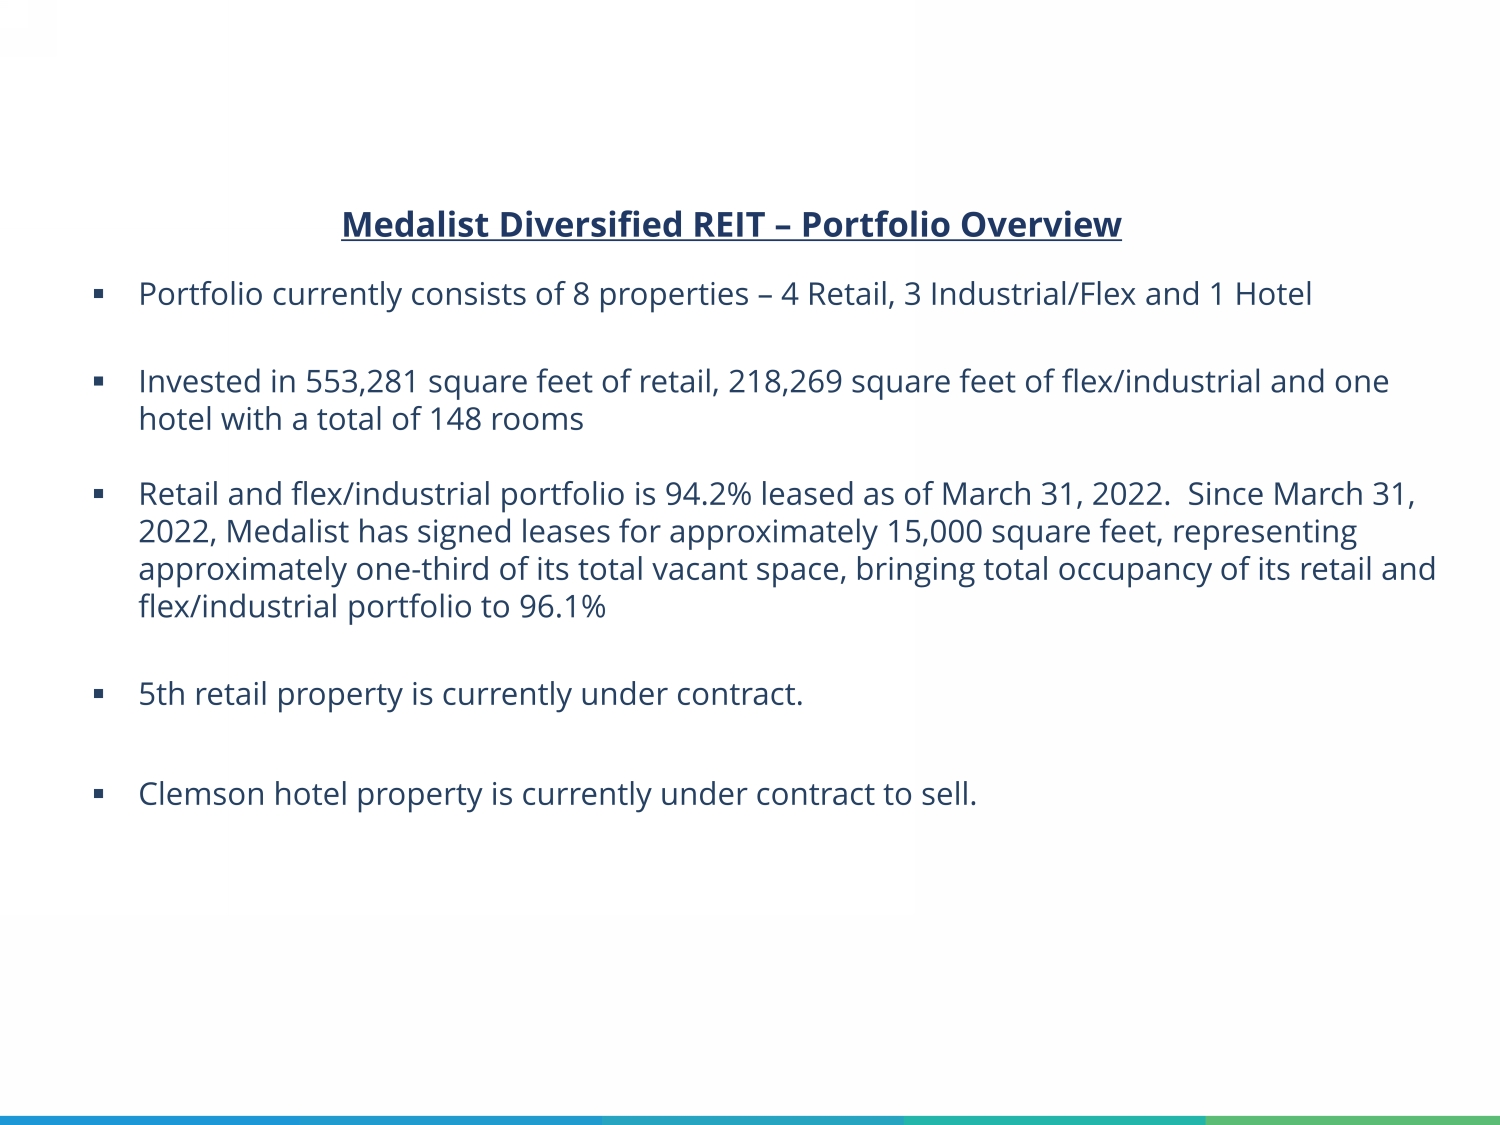
5 Medalist Diversified REIT – Portfolio Overview ▪ Portfolio currently consists of 8 properties – 4 Retail, 3 Industrial/Flex and 1 Hotel ▪ Invested in 553,281 square feet of retail, 218,269 square feet of flex/industrial and one hotel with a total of 148 rooms ▪ Retail and flex/industrial portfolio is 94.2% leased as of March 31, 2022. Since March 31, 2022, Medalist has signed leases for approximately 15,000 square feet, representing approximately one - third of its total vacant space, bringing total occupancy of its retail and flex/industrial portfolio to 96.1% ▪ 5th retail property is currently under contract. ▪ Clemson hotel property is currently under contract to sell.
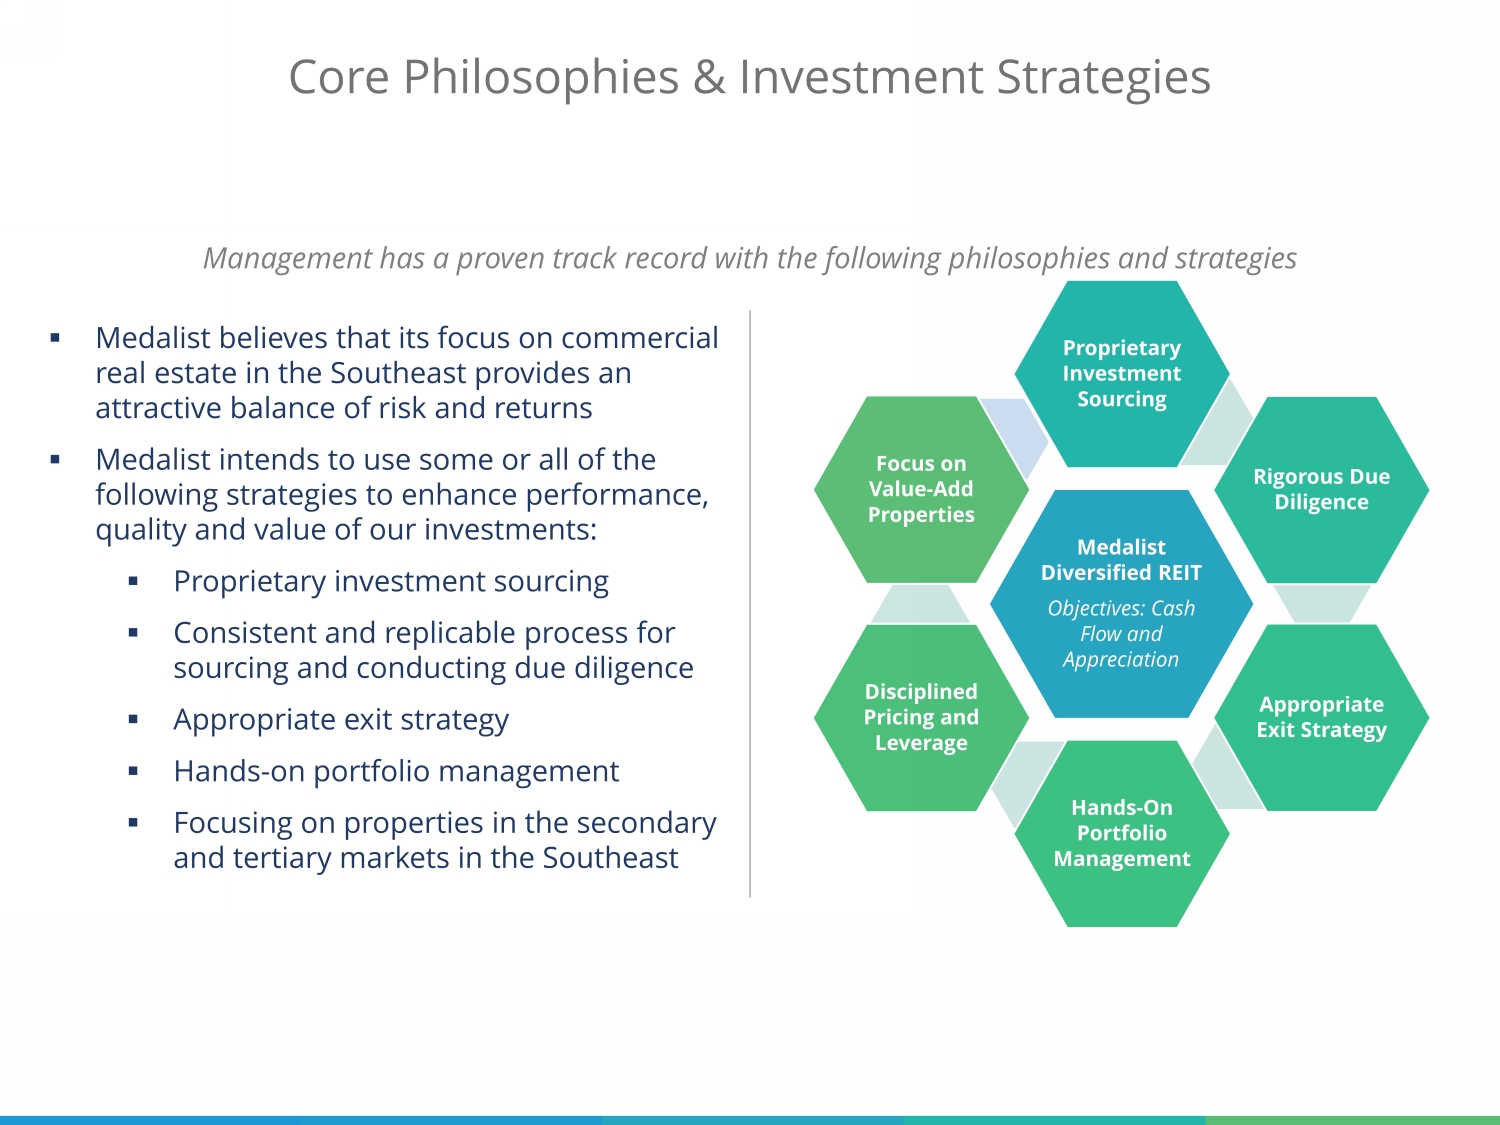
Medalist Diversified REIT Objectives: Cash Flow and Appreciation Proprietary Investment Sourcing Rigorous Due Diligence Appropriate Exit Strategy Hands - On Portfolio Management Disciplined Pricing and Leverage Focus on Value - Add Properties ▪ Medalist believes that its focus on commercial real estate in the Southeast provides an attractive balance of risk and returns ▪ Medalist intends to use some or all of the following strategies to enhance performance, quality and value of our investments: ▪ Proprietary investment sourcing ▪ Consistent and replicable process for sourcing and conducting due diligence ▪ Appropriate exit strategy ▪ Hands - on portfolio management ▪ Focusing on properties in the secondary and tertiary markets in the Southeast Management has a proven track record with the following philosophies and strategies Core Philosophies & Investment Strategies
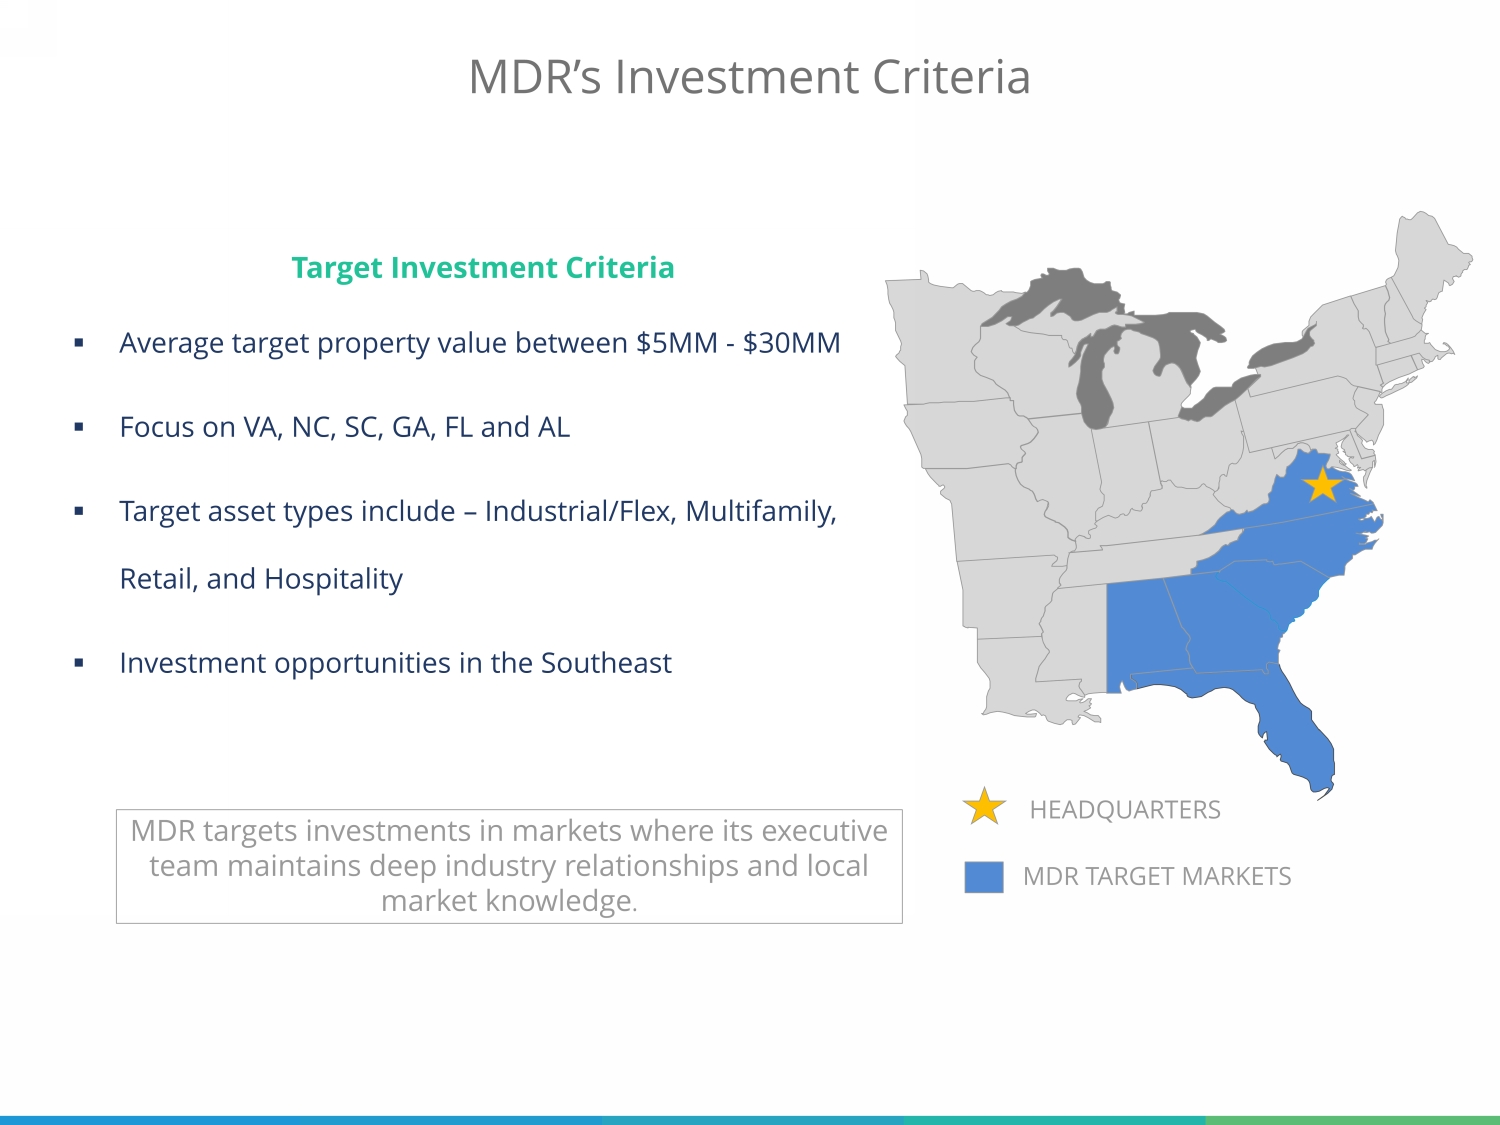
MDR’s Investment Criteria HEADQUARTERS MDR TARGET MARKETS Target Investment Criteria ▪ Average target property value between $5MM - $30MM ▪ Focus on VA, NC, SC, GA, FL and AL ▪ Target asset types include – Industrial/Flex, Multifamily, Retail, and Hospitality ▪ Investment opportunities in the Southeast MDR targets investments in markets where its executive team maintains deep industry relationships and local market knowledge .
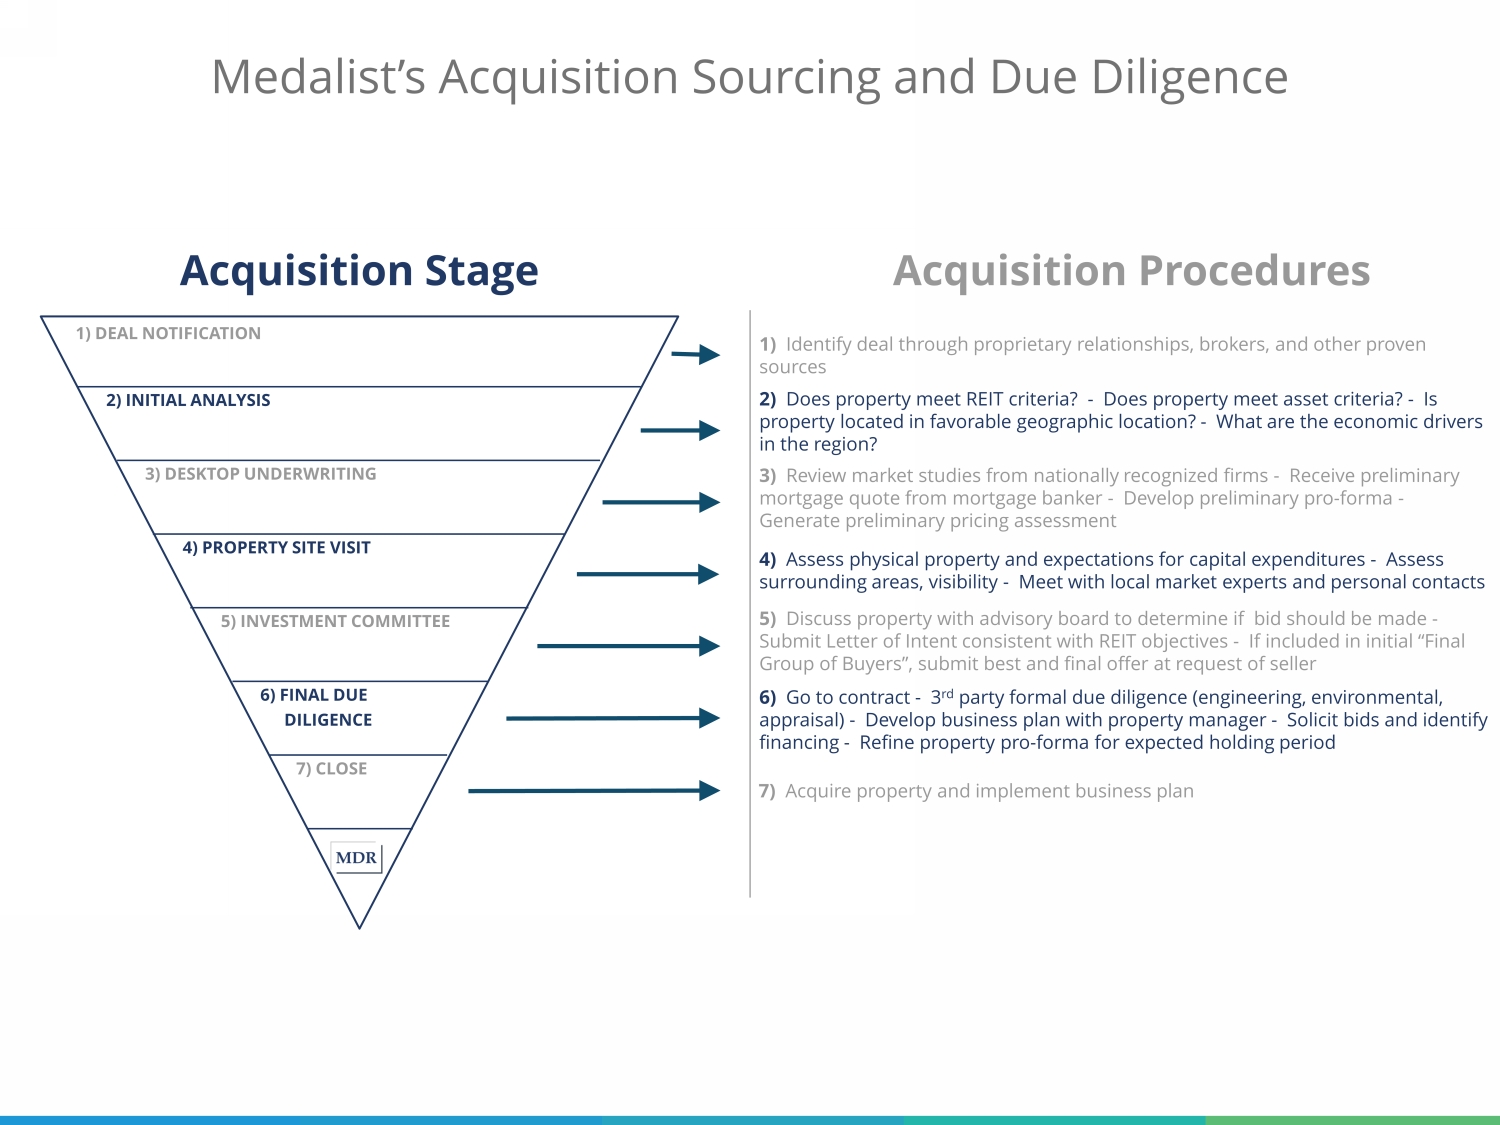
1) DEAL NOTIFICATION 2) INITIAL ANALYSIS 3) DESKTOP UNDERWRITING 4) PROPERTY SITE VISIT 5) INVESTMENT COMMITTEE 6) FINAL DUE DILIGENCE 7) CLOSE Acquisition Stage Acquisition Procedures 1) Identify deal through proprietary relationships, brokers, and other proven sources 2) Does property meet REIT criteria? - Does property meet asset criteria? - Is property located in favorable geographic location? - What are the economic drivers in the region? 3) Review market studies from nationally recognized firms - Receive preliminary mortgage quote from mortgage banker - Develop preliminary pro - forma - Generate preliminary pricing assessment 4) Assess physical property and expectations for capital expenditures - Assess surrounding areas, visibility - Meet with local market experts and personal contacts 5) Discuss property with advisory board to determine if bid should be made - Submit Letter of Intent consistent with REIT objectives - If included in initial “Final Group of Buyers”, submit best and final offer at request of seller 6) Go to contract - 3 rd party formal due diligence (engineering, environmental, appraisal) - Develop business plan with property manager - Solicit bids and identify financing - Refine property pro - forma for expected holding period 7) Acquire property and implement business plan Medalist’s Acquisition Sourcing and Due Diligence

Provides Market Access to Ownership of Portfolio Asset Transparency ▪ Public SEC filer ▪ Corporate governance, required to comply with Sarbanes - Oxley Act and Nasdaq Capital Market requirements Liquidity ▪ Ability to buy/sell MDR stock on the Nasdaq Capital Market ▪ MDR stock is listed under the symbol MDRR Dividends Requirement to distribute 90% of its taxable income Publicly – Traded REIT Benefits
Portfolio Overview: MDR’s Current Properties
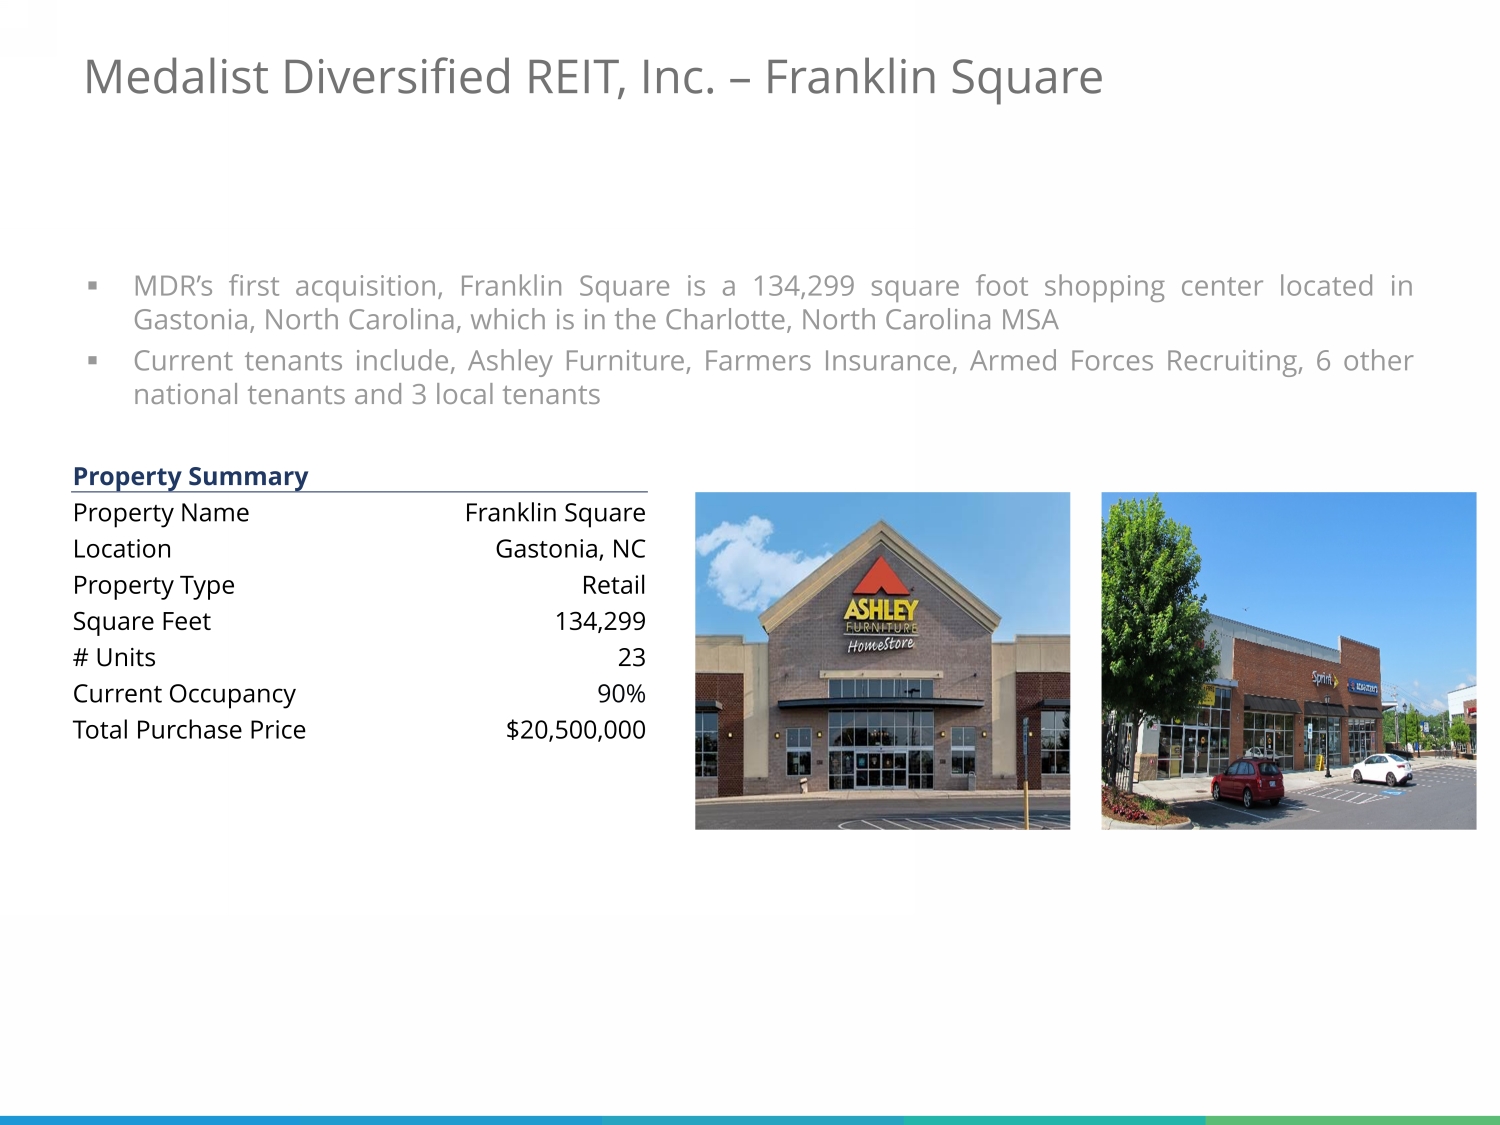
▪ MDR’s first acquisition, Franklin Square is a 134 , 299 square foot shopping center located in Gastonia, North Carolina, which is in the Charlotte, North Carolina MSA ▪ Current tenants include, Ashley Furniture, Farmers Insurance, Armed Forces Recruiting, 6 other national tenants and 3 local tenants Property Summary Property Name Franklin Square Location Gastonia, NC Property Type Retail Square Feet 134,299 # Units 23 Current Occupancy 90% Total Purchase Price $20,500,000 Medalist Diversified REIT, Inc. – Franklin Square

▪ Lancer Center is a 178 , 626 square foot grocery anchored shopping center which includes tenants KJ’s Market, Badcock Furniture, Big Lots and Harbor Freight Tools among it’s 20 total tenants ▪ The property is located in Lancaster, South Carolina less than an hour drive from Charlotte, North Carolina Property Summary Property Name Lancer Center Location Lancaster, SC Property Type Shopping Center Square Feet 181,590 # Units 20 Current Occupancy 100% Purchase Price $9,900,000 Medalist Diversified REIT, Inc. – Lancer Center

▪ The shops at Hanover Square North is a 73 , 440 SF retail center located in Mechanicsville, Virginia, which is located within Hanover County, a growth market in the MSA of Richmond, Virginia ▪ As of 2016 , the Metro Richmond area had a population of 1 , 263 , 617 ▪ 97 % of the square footage is currently occupied by national tenants including Marshalls, Old Navy, Buffalo Wild Wings and the Armed Forces Recruitment Center ▪ MDR owns an undivided 84 % tenant - in - common interest in Hanover Square North ; a third party owns the remaining 16 % interest in Hanover Square North Property Summary Property Name Hanover Square North Location Mechanicsville, VA Property Type Retail Square Feet 73,440 # Units 12 Current Occupancy 100% Purchase Price $12,173,000 Medalist Diversified REIT, Inc. – Hanover Square North
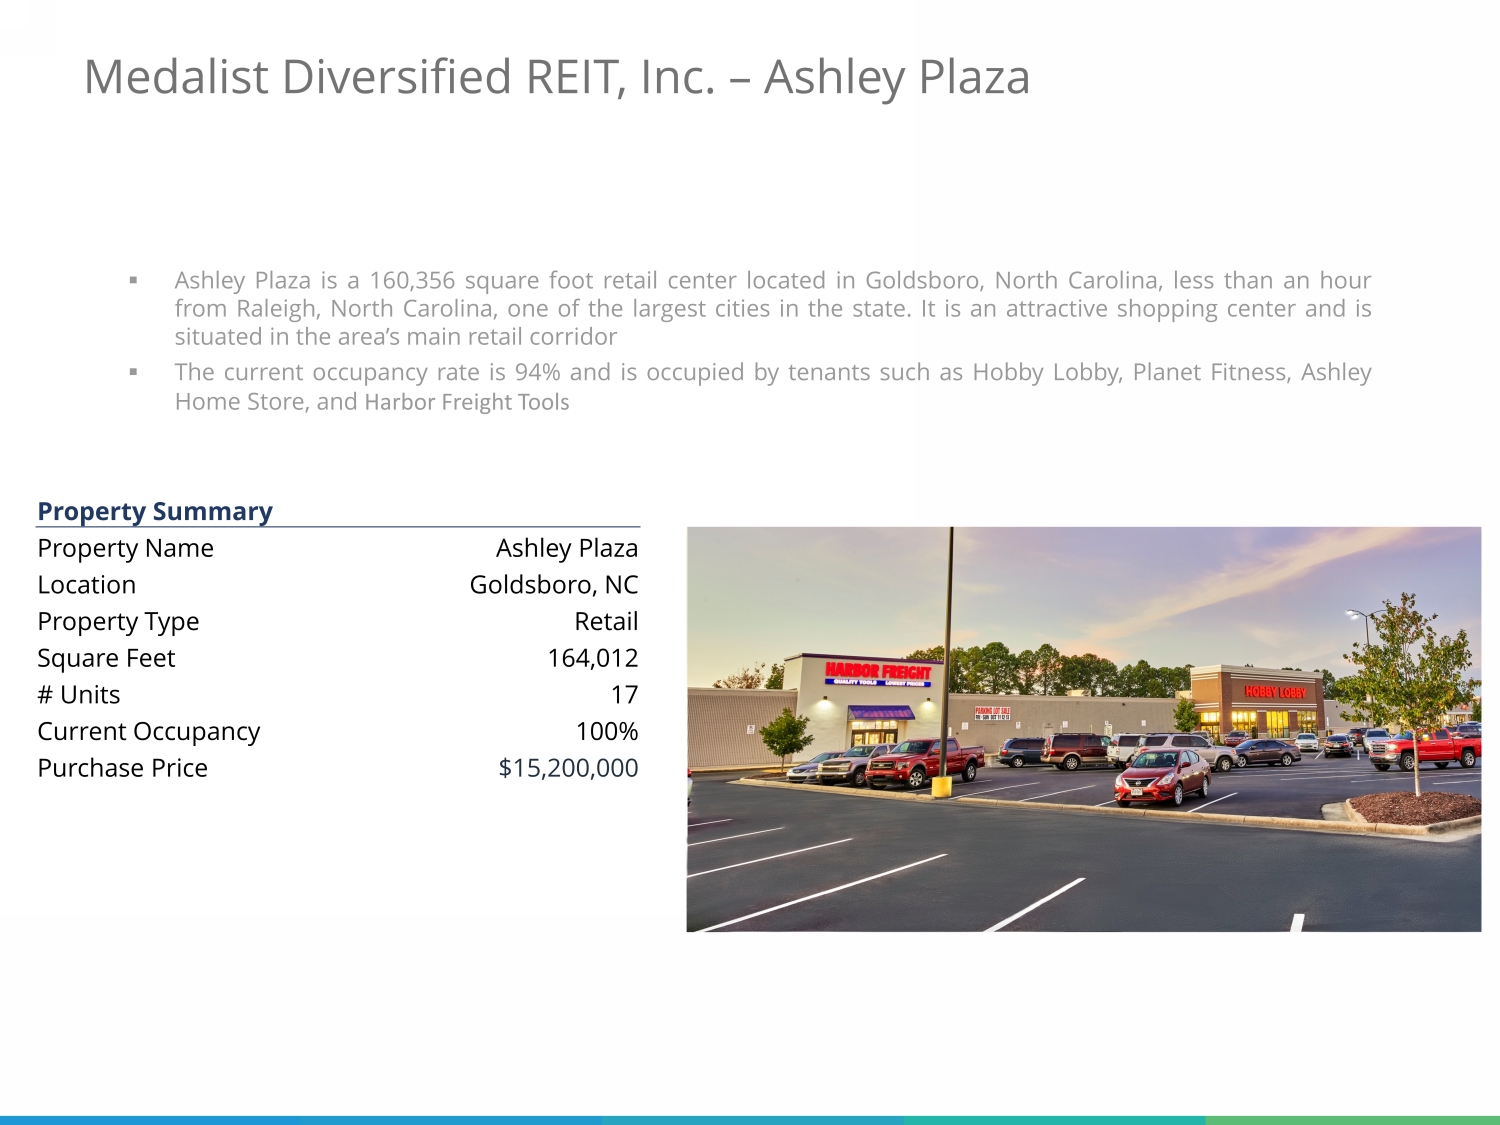
▪ Ashley Plaza is a 160 , 356 square foot retail center located in Goldsboro, North Carolina, less than an hour from Raleigh, North Carolina, one of the largest cities in the state . It is an attractive shopping center and is situated in the area’s main retail corridor ▪ The current occupancy rate is 94 % and is occupied by tenants such as Hobby Lobby, Planet Fitness, Ashley Home Store, and Harbor Freight Tools Property Summary Property Name Ashley Plaza Location Goldsboro, NC Property Type Retail Square Feet 164,012 # Units 17 Current Occupancy 100% Purchase Price $15,200,000 Medalist Diversified REIT, Inc. – Ashley Plaza
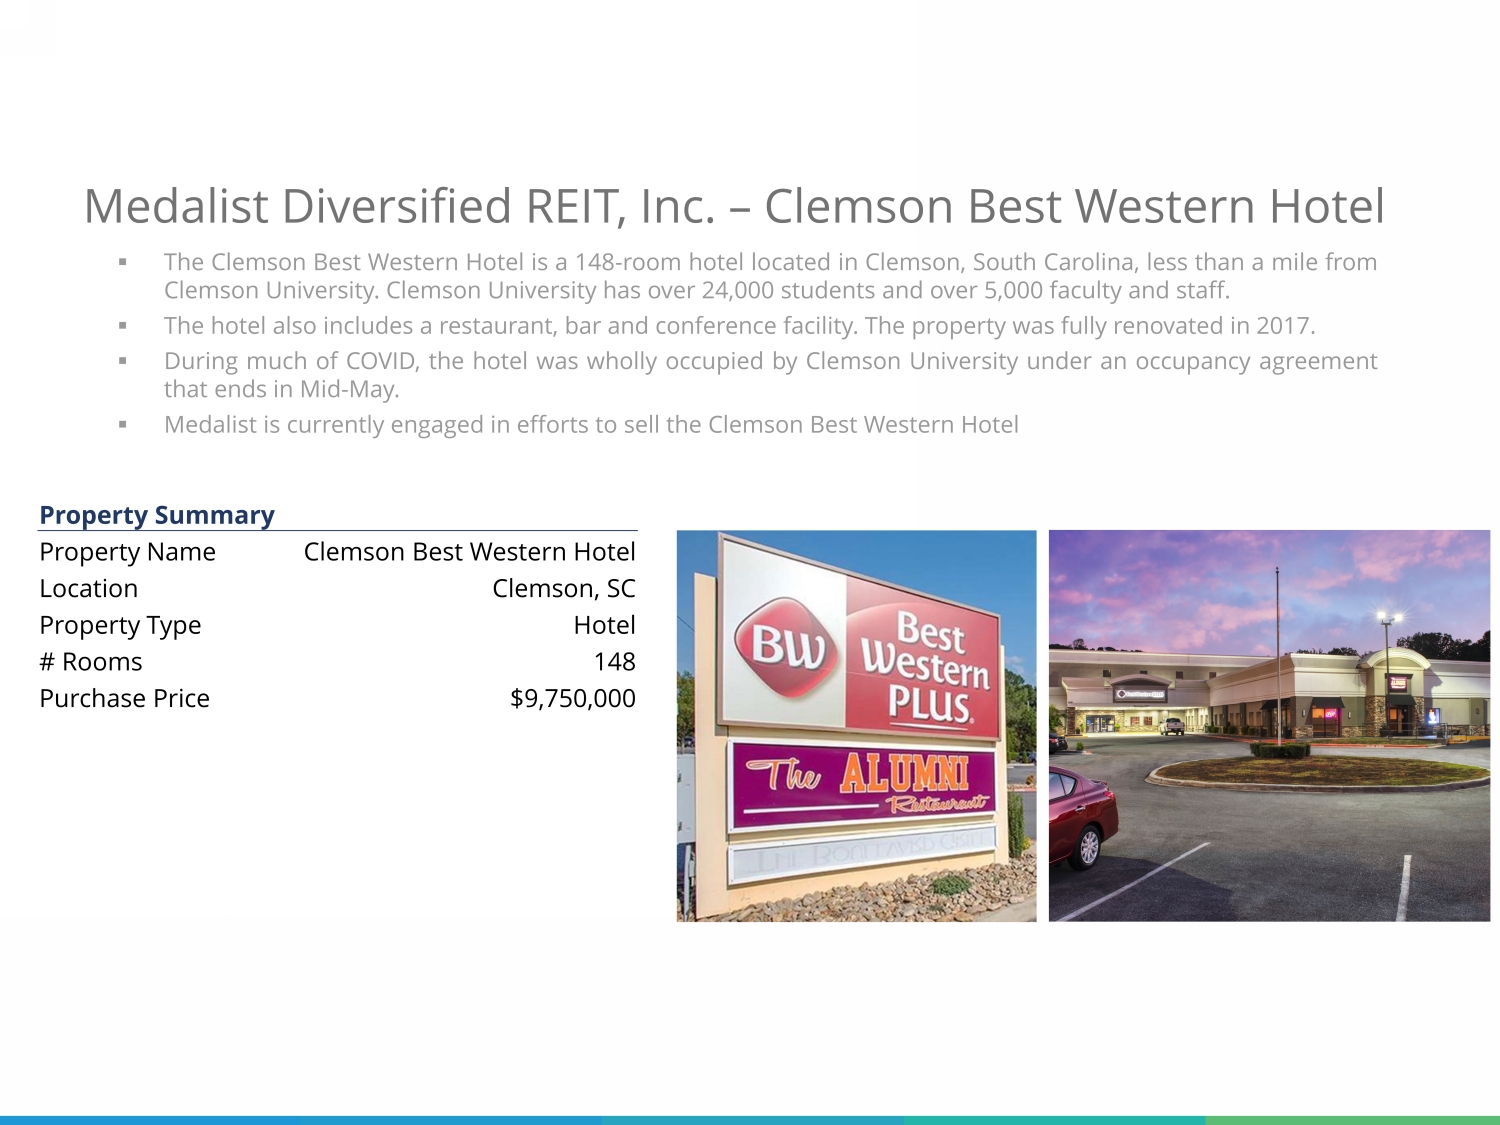
▪ The Clemson Best Western Hotel is a 148 - room hotel located in Clemson, South Carolina, less than a mile from Clemson University . Clemson University has over 24 , 000 students and over 5 , 000 faculty and staff . ▪ The hotel also includes a restaurant, bar and conference facility . The property was fully renovated in 2017 . ▪ During much of COVID, the hotel was wholly occupied by Clemson University under an occupancy agreement that ends in Mid - May . ▪ Medalist is currently engaged in efforts to sell the Clemson Best Western Hotel Property Summary Property Name Clemson Best Western Hotel Location Clemson, SC Property Type Hotel # Rooms 148 Purchase Price $9,750,000 Medalist Diversified REIT, Inc. – Clemson Best Western Hotel

▪ Brookfield Center is a 66,000 square foot flex/industrial property located in Greenville, South Carolina. Greenville is one of America’s emerging destinations and fastest growing cities. It is located off I - 85 between Charlotte, North Carolina and Atlanta, Georgia. ▪ The property is occupied by national and regional tenants . Among them are Gravitopia (the largest developer, operator and owner of trampoline parks in the world), RurouniFADI (top 100 engineering firm), Orkin Pest Control and Schindler elevator . 74 % of the tenants are corporate or have corporate guarantees Property Summary Property Name Brookfield Center Location Greenville, SC Property Type Flex/Industrial Square Feet 66,000 # Units 6 Current Occupancy 100% Purchase Price $6,700,000 Medalist Diversified REIT, Inc. – Brookfield Center
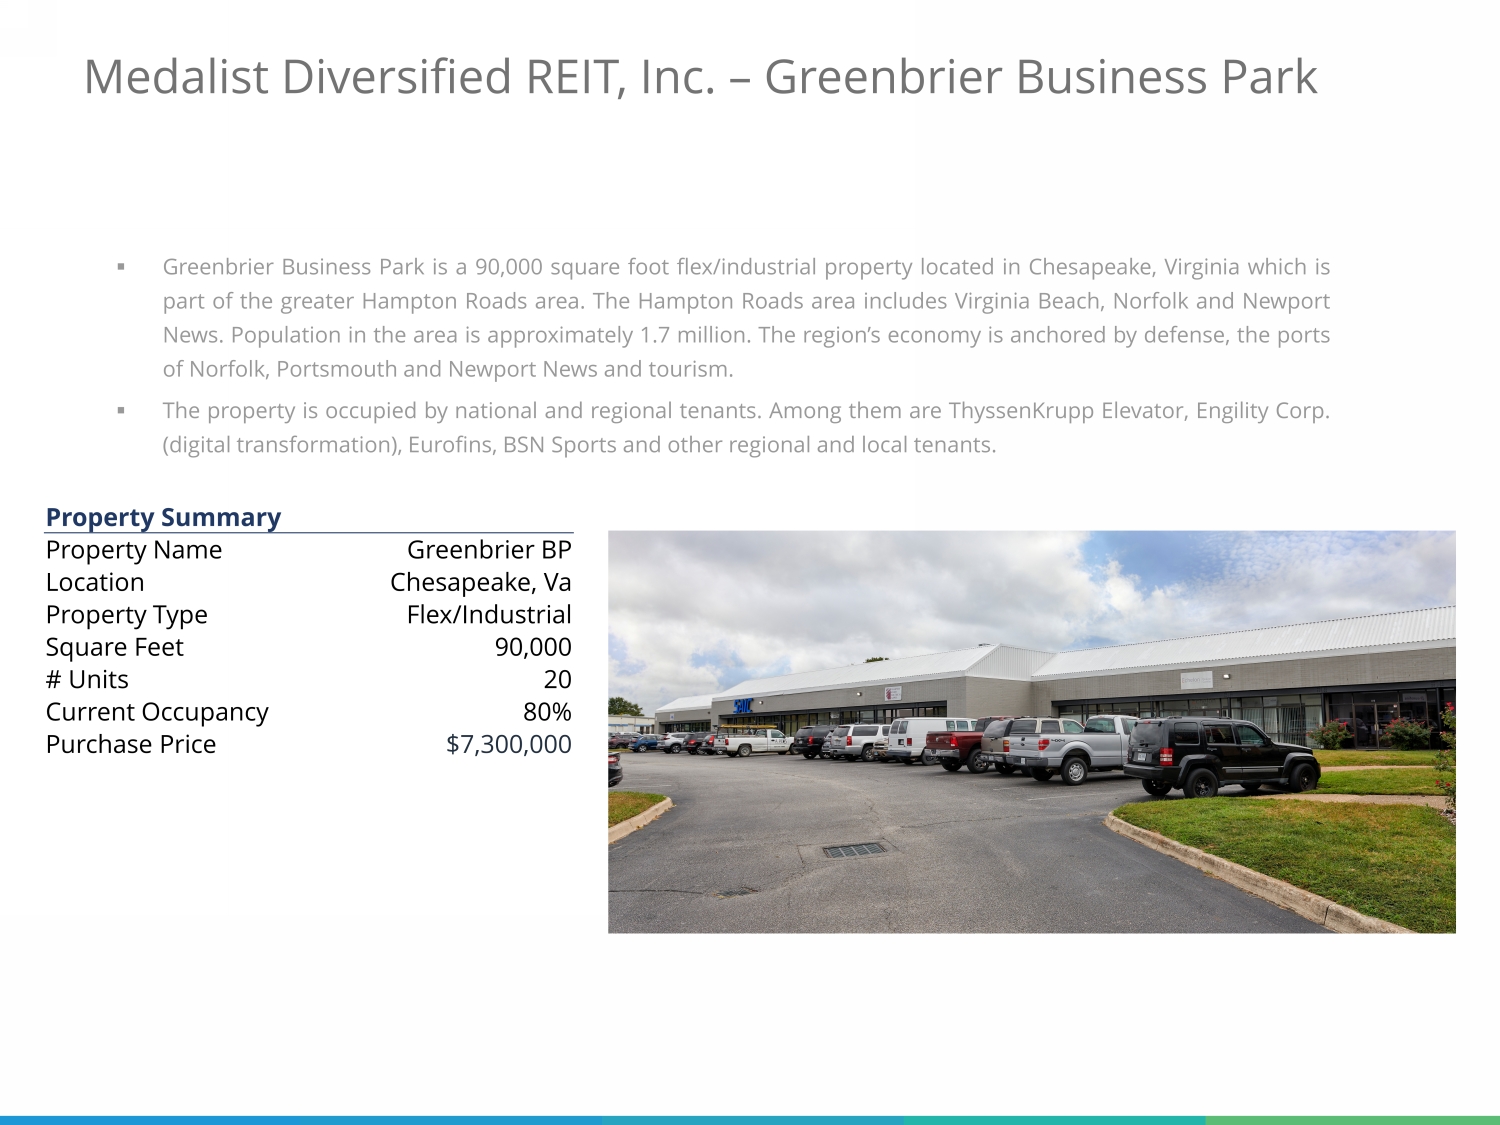
Medalist Diversified REIT, Inc. – Greenbrier Business Park ▪ Greenbrier Business Park is a 90 , 000 square foot flex/industrial property located in Chesapeake, Virginia which is part of the greater Hampton Roads area . The Hampton Roads area includes Virginia Beach, Norfolk and Newport News . Population in the area is approximately 1 . 7 million . The region’s economy is anchored by defense, the ports of Norfolk, Portsmouth and Newport News and tourism . ▪ The property is occupied by national and regional tenants . Among them are ThyssenKrupp Elevator, Engility Corp . (digital transformation), Eurofins, BSN Sports and other regional and local tenants . 17 Property Summary Property Name Greenbrier BP Location Chesapeake, Va Property Type Flex/Industrial Square Feet 90,000 # Units 20 Current Occupancy 80% Purchase Price $7,300,000
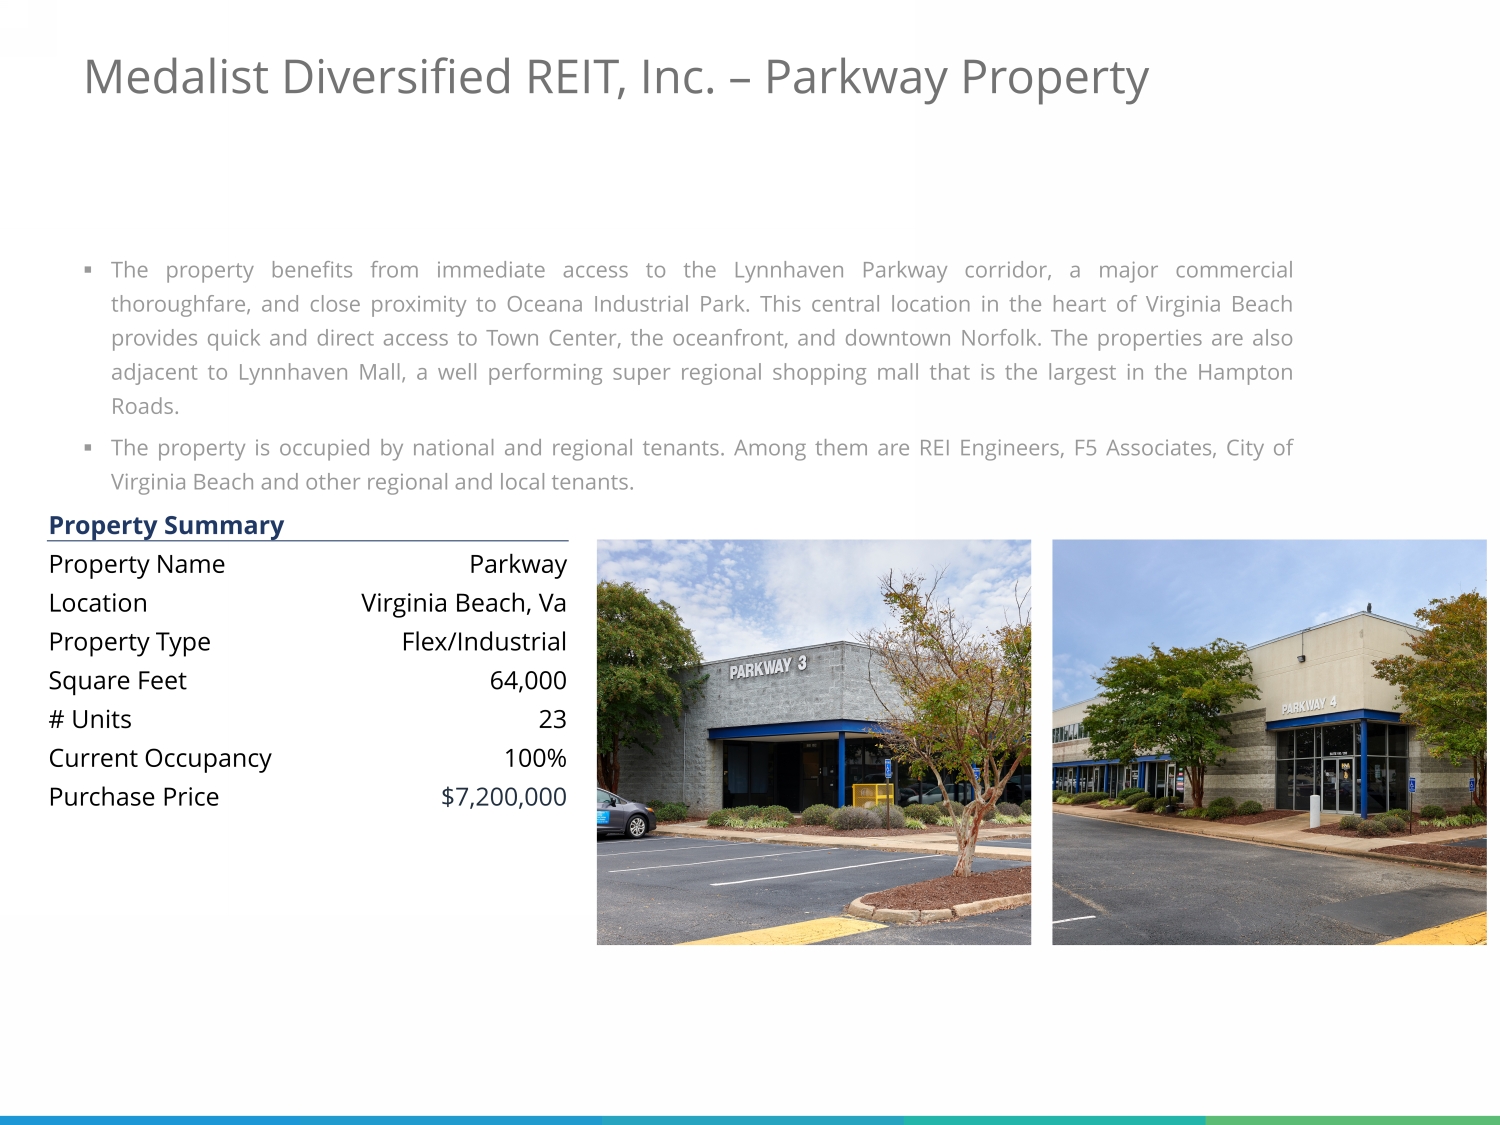
Medalist Diversified REIT, Inc. – Parkway Property ▪ The property benefits from immediate access to the Lynnhaven Parkway corridor, a major commercial thoroughfare, and close proximity to Oceana Industrial Park . This central location in the heart of Virginia Beach provides quick and direct access to Town Center, the oceanfront, and downtown Norfolk . The properties are also adjacent to Lynnhaven Mall, a well performing super regional shopping mall that is the largest in the Hampton Roads . ▪ The property is occupied by national and regional tenants . Among them are REI Engineers, F 5 Associates, City of Virginia Beach and other regional and local tenants . 18 Property Summary Property Name Parkway Location Virginia Beach, Va Property Type Flex/Industrial Square Feet 64,000 # Units 23 Current Occupancy 100% Purchase Price $7,200,000
Medalist Diversified REIT – Financial Trends

Definitions EBITDA is net income, as defined by U . S . GAAP, plus preferred dividends, interest expense, including amortization of financing costs, depreciation and amortization, net amortization of acquired above and below market lease revenue, loss on impairment, and impairment of assets held for sale . NOI from property operations is calculated as net loss, as defined by U . S . GAAP, plus preferred dividends, legal, accounting and other professional fees, corporate general and administrative expenses, depreciation, amortization of intangible assets and liabilities, interest expense, including amortization of financing costs, share based compensation expense, net amortization of above and below market leases, loss on impairment, impairment of assets held for sale, and other income . The components of NOI consist of recurring rental and reimbursement revenue, less real estate taxes and operating expenses, such as insurance, utilities, and repairs and maintenance . NOI presented in this financial supplement includes an adjustment to the Company’s net loss for amortization of above and below market leases and, as a result, varies from NOI presented in the Company’s Annual Report on Form 10 - Q for the three months ended March 31 , 2022 . Same Property NOI is calculated as the NOI of all properties owned during the entire periods presented with the exclusion of any properties acquired or sold during the periods presented . NOI, Same Property NOI, Same Property Revenues, and EBITDA, do not represent cash generated from operating activities in accordance with U . S . GAAP and are not necessarily indicative of cash available to fund cash needs, including the repayment of principal on debt, capital expenditures and payment of dividends and distributions . NOI, Same Property NOI, and EBITDA should not be considered as substitutes for net income applicable to common shareholders (calculated in accordance with U . S . GAAP) as a measure of results of operations or cash flows (calculated in accordance with U . S . GAAP) as a measure of liquidity . NOI, Same Property NOI, and Adjusted EBITDA, as currently calculated by us, may not be comparable to similarly titled, but variously calculated, measures of other REITs . FFO and AFFO Funds from operations (“FFO”), a non - GAAP measure, is an alternative measure of operating performance, specifically as it relates to results of operations and liquidity . FFO is computed in accordance with standards established by the Board of Governors of the National Association of Real Estate Investment Trusts (“NAREIT”) in its March 1995 White Paper (as amended in November 1999 , April 2002 and December 2018 ) . As defined by NAREIT, FFO represents net income (computed in accordance with GAAP), excluding gains (or losses) from sales of property, plus real estate related depreciation and amortization (excluding amortization of loan origination costs and above and below market leases) and after adjustments for unconsolidated partnerships and joint ventures . In addition to FFO, Adjusted FFO (“AFFO”), excludes non - cash items such as amortization of loans and above and below market leases, unbilled rent arising from applying straight line rent revenue recognition and share - based compensation expenses . Additionally, the impact of capital expenditures, including tenant improvement and leasing commissions, net of reimbursements of such expenditures by property escrow funds, is included in the calculation of AFFO .
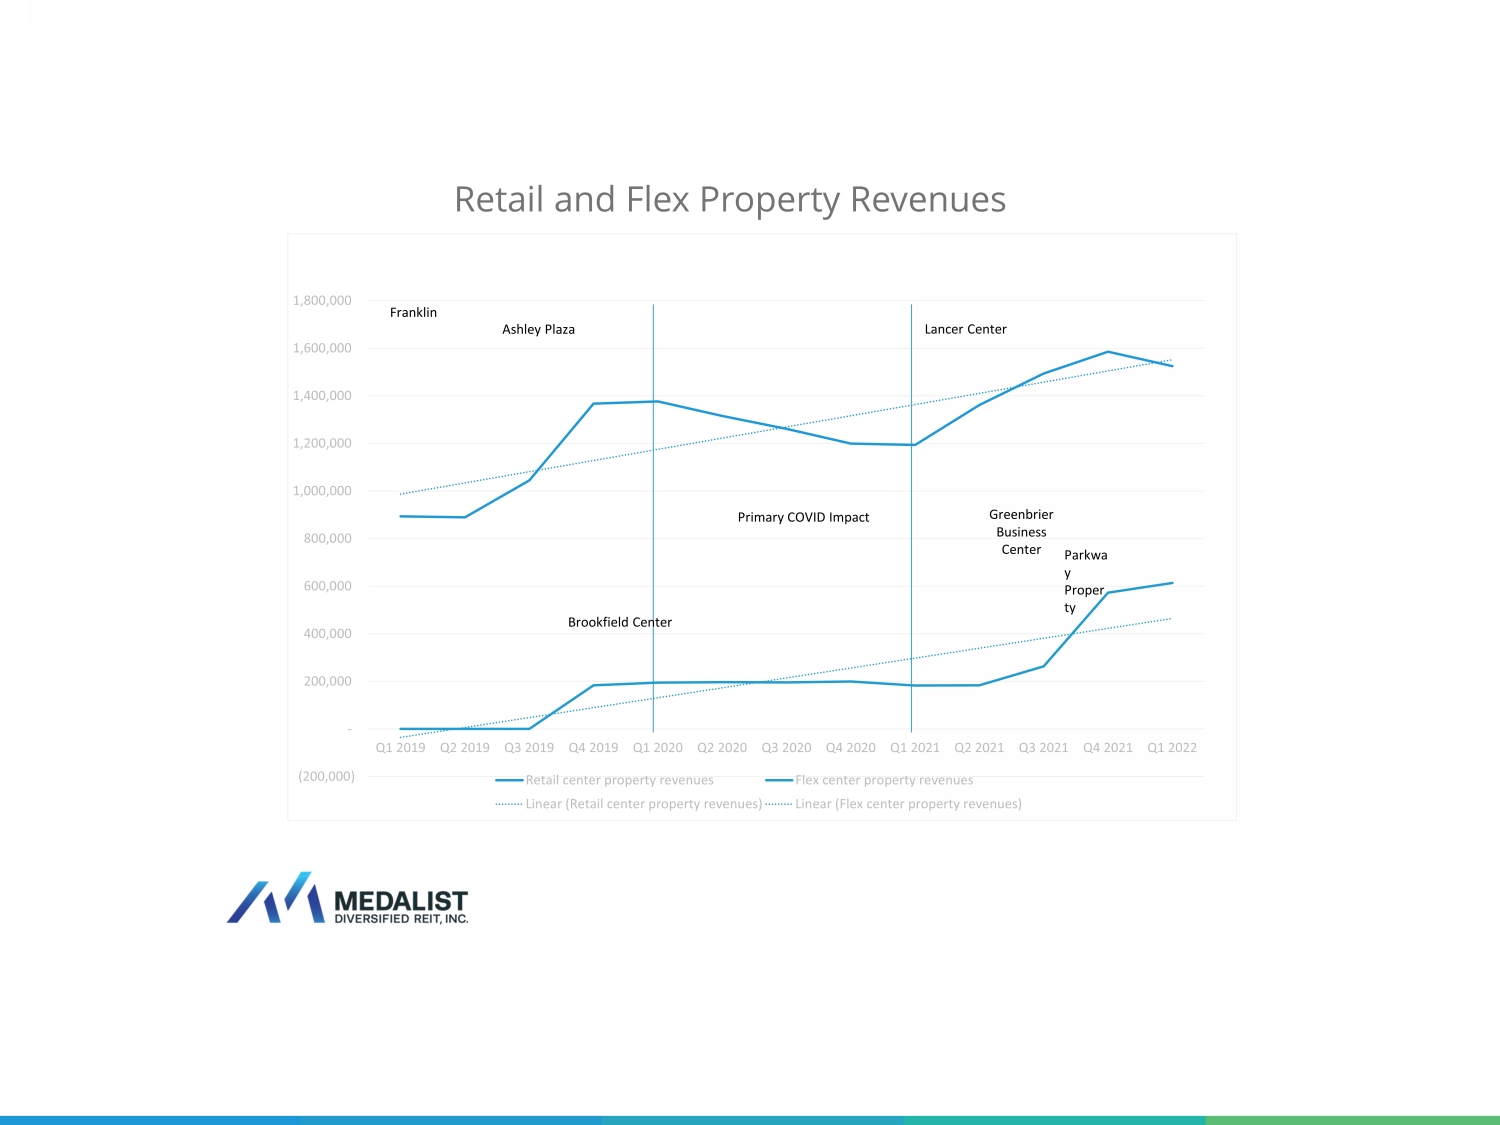
Retail and Flex Property Revenues (200,000) - 200,000 400,000 600,000 800,000 1,000,000 1,200,000 1,400,000 1,600,000 1,800,000 Q1 2019 Q2 2019 Q3 2019 Q4 2019 Q1 2020 Q2 2020 Q3 2020 Q4 2020 Q1 2021 Q2 2021 Q3 2021 Q4 2021 Q1 2022 Retail center property revenues Flex center property revenues Linear (Retail center property revenues) Linear (Flex center property revenues) Franklin Ashley Plaza Primary COVID Impact Lancer Center Greenbrier Business Center Parkwa y Proper ty Brookfield Center

EBITDA and NOI - 200,000 400,000 600,000 800,000 1,000,000 1,200,000 1,400,000 1,600,000 1,800,000 2,000,000 Q1 2019 Q2 2019 Q3 2019 Q4 2019 Q1 2020 Q2 2020 Q3 2020 Q4 2020 Q1 2021 Q2 2021 Q3 2021 Q4 2021 Q1 2022 EBITDA Net Operating Income - NOI Primary COVID Impact

FFO and AFFO (2,000,000) (1,500,000) (1,000,000) (500,000) - 500,000 1,000,000 Q1 2019 Q2 2019 Q3 2019 Q4 2019 Q1 2020 Q2 2020 Q3 2020 Q4 2020 Q1 2021 Q2 2021 Q3 2021 Q4 2021 Q1 2022 Primary COVID Impact
Experienced Management Team Strong Investment Track Record Strategy of Opportunistic Investing Market Opportunity Investment Highlights