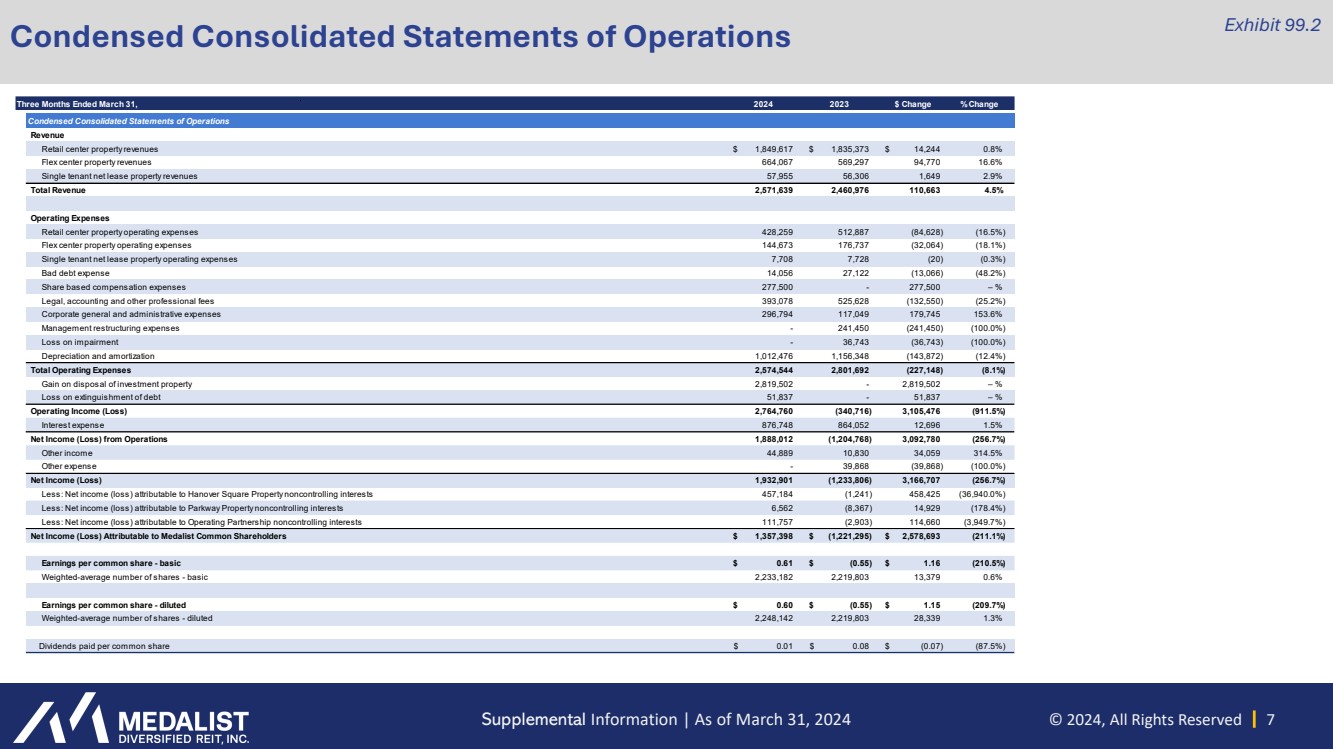
| Supplemental Information | As of March 31, 2024 © 2024, All Rights Reserved 7 Click to edit Master title style Condensed Consolidated Statements of Operations Exhibit 99.2 Three Months Ended March 31, 2024 2023 $ Change % Change Condensed Consolidated Statements of Operations Revenue Retail center property revenues $ 1,849,617 $ 1,835,373 $ 14,244 0.8% Flex center property revenues 664,067 569,297 94,770 16.6% Single tenant net lease property revenues 57,955 56,306 1,649 2.9% Total Revenue 2,571,639 2,460,976 110,663 4.5% Operating Expenses Retail center property operating expenses 428,259 512,887 (84,628) (16.5%) Flex center property operating expenses 144,673 176,737 (32,064) (18.1%) Single tenant net lease property operating expenses 7,708 7,728 (20) (0.3%) Bad debt expense 14,056 27,122 (13,066) (48.2%) Share based compensation expenses 277,500 - 277,500 – % Legal, accounting and other professional fees 393,078 525,628 (132,550) (25.2%) Corporate general and administrative expenses 296,794 117,049 179,745 153.6% Management restructuring expenses - 241,450 (241,450) (100.0%) Loss on impairment - 36,743 (36,743) (100.0%) Depreciation and amortization 1,012,476 1,156,348 (143,872) (12.4%) Total Operating Expenses 2,574,544 2,801,692 (227,148) (8.1%) Gain on disposal of investment property 2,819,502 - 2,819,502 – % Loss on extinguishment of debt 51,837 - 51,837 – % Operating Income (Loss) 2,764,760 (340,716) 3,105,476 (911.5%) Interest expense 876,748 864,052 12,696 1.5% Net Income (Loss) from Operations 1,888,012 (1,204,768) 3,092,780 (256.7%) Other income 44,889 10,830 34,059 314.5% Other expense - 39,868 (39,868) (100.0%) Net Income (Loss) 1,932,901 (1,233,806) 3,166,707 (256.7%) Less: Net income (loss) attributable to Hanover Square Property noncontrolling interests 457,184 (1,241) 458,425 (36,940.0%) Less: Net income (loss) attributable to Parkway Property noncontrolling interests 6,562 (8,367) 14,929 (178.4%) Less: Net income (loss) attributable to Operating Partnership noncontrolling interests 111,757 (2,903) 114,660 (3,949.7%) Net Income (Loss) Attributable to Medalist Common Shareholders $ 1,357,398 $ (1,221,295) $ 2,578,693 (211.1%) Earnings per common share - basic $ 0.61 $ (0.55) $ 1.16 (210.5%) Weighted-average number of shares - basic 2,233,182 2,219,803 13,379 0.6% Earnings per common share - diluted $ 0.60 $ (0.55) $ 1.15 (209.7%) Weighted-average number of shares - diluted 2,248,142 2,219,803 28,339 1.3% Dividends paid per common share $ 0.01 $ 0.08 $ (0.07) (87.5%) |