| FREE WRITING PROSPECTUS | |
| FILED PURSUANT TO RULE 433 | |
| REGISTRATION FILE NO.: 333-195164-15 | |
 |  |
Free Writing Prospectus
Structural and Collateral Term Sheet
$988,481,381
(Approximate Aggregate Cut-off Date Balance of Mortgage Pool)
$905,696,000
(Approximate Aggregate Principal Balance of Offered Certificates)
Wells Fargo Commercial Mortgage Trust 2015-C31
as Issuing Entity
Wells Fargo Commercial Mortgage Securities, Inc.
as Depositor
Wells Fargo Bank, National Association
Rialto Mortgage Finance, LLC
C-III Commercial Mortgage LLC
Société Générale
Basis Real Estate Capital II, LLC
Liberty Island Group I LLC
as Sponsors and Mortgage Loan Sellers
Commercial Mortgage Pass-Through Certificates
Series 2015-C31
October 19, 2015
| WELLS FARGO SECURITIES | SOCIETE GENERALE | |
Co-Lead Manager and | Co-Lead Manager | |
Citigroup Co-Manager | Morgan Stanley Co-Manager |
STATEMENT REGARDING THIS FREE WRITING PROSPECTUS
The depositor has filed a registration statement (including a prospectus) with the Securities and Exchange Commission (‘‘SEC’’) (SEC File No. 333-195164) for the offering to which this communication relates. Before you invest, you should read the prospectus in the registration statement and other documents the depositor has filed with the SEC for more complete information about the depositor, the issuing entity and this offering. You may get these documents for free by visiting EDGAR on the SEC Web site at www.sec.gov. Alternatively, the depositor, any underwriter, or any dealer participating in the offering will arrange to send you the prospectus after filing if you request it by calling toll free 1-800-745-2063 (8 a.m. – 5 p.m. EST) or by emailing wfs.cmbs@wellsfargo.com.
Nothing in this document constitutes an offer of securities for sale in any jurisdiction where the offer or sale is not permitted. The information contained herein is preliminary as of the date hereof, supersedes any such information previously delivered to you and will be superseded by any such information subsequently delivered and ultimately by the final prospectus relating to the securities. These materials are subject to change, completion, supplement or amendment from time to time.
This free writing prospectus has been prepared by the Underwriters for information purposes only and does not constitute, in whole or in part, a prospectus for the purposes of Directive 2003/71/EC (as amended) and/or Part VI of the Financial Services and Markets Act 2000 as amended or other offering document.
STATEMENT REGARDING ASSUMPTIONS AS TO SECURITIES, PRICING ESTIMATES AND OTHER INFORMATION
The attached information contains certain tables and other statistical analyses (the “Computational Materials”) which have been prepared in reliance upon information furnished by the Mortgage Loan Sellers. Numerous assumptions were used in preparing the Computational Materials, which may or may not be reflected herein. As such, no assurance can be given as to the Computational Materials’ accuracy, appropriateness or completeness in any particular context; or as to whether the Computational Materials and/or the assumptions upon which they are based reflect present market conditions or future market performance. The Computational Materials should not be construed as either projections or predictions or as legal, tax, financial or accounting advice. You should consult your own counsel, accountant and other advisors as to the legal, tax, business, financial and related aspects of a purchase of these securities. Any weighted average lives, yields and principal payment periods shown in the Computational Materials are based on prepayment and/or loss assumptions, and changes in such prepayment and/or loss assumptions may dramatically affect such weighted average lives, yields and principal payment periods. In addition, it is possible that prepayments or losses on the underlying assets will occur at rates higher or lower than the rates shown in the attached Computational Materials. The specific characteristics of the securities may differ from those shown in the Computational Materials due to differences between the final underlying assets and the preliminary underlying assets used in preparing the Computational Materials. The principal amount and designation of any security described in the Computational Materials are subject to change prior to issuance. None of Wells Fargo Securities, LLC, SG Americas Securities, LLC, Citigroup Global Markets, Inc., or Morgan Stanley & Co. LLC, or any of their respective affiliates, make any representation or warranty as to the actual rate or timing of payments or losses on any of the underlying assets or the payments or yield on the securities. The information in this presentation is based upon management forecasts and reflects prevailing conditions and management’s views as of this date, all of which are subject to change. In preparing this presentation, we have relied upon and assumed, without independent verification, the accuracy and completeness of all information available from public sources or which was provided to us by or on behalf of the Mortgage Loan Sellers or which was otherwise reviewed by us.
This free writing prospectus contains certain forward-looking statements. If and when included in this free writing prospectus, the words “expects”, “intends”, “anticipates”, “estimates” and analogous expressions and all statements that are not historical facts, including statements about our beliefs or expectations, are intended to identify forward-looking statements. Any forward-looking statements are made subject to risks and uncertainties which could cause actual results to differ materially from those stated. Those risks and uncertainties include, among other things, declines in general economic and business conditions, increased competition, changes in demographics, changes in political and social conditions, regulatory initiatives and changes in customer preferences, many of which are beyond our control and the control of any other person or entity related to this offering. The forward-looking statements made in this free writing prospectus are made as of the date stated on the cover. We have no obligation to update or revise any forward-looking statement.
Wells Fargo Securities is the trade name for the capital markets and investment banking services of Wells Fargo & Company and its subsidiaries, including but not limited to Wells Fargo Securities, LLC, a member of NYSE, FINRA, NFA and SIPC, Wells Fargo Prime Services, LLC, a member of FINRA, NFA and SIPC, and Wells Fargo Bank, N.A. Wells Fargo Securities, LLC and Wells Fargo Prime Services, LLC are distinct entities from affiliated banks and thrifts.
IMPORTANT NOTICE REGARDING THE OFFERED CERTIFICATES
The Offered Certificates referred to in these materials and the asset pool backing them are subject to modification or revision (including the possibility that one or more classes of certificates may be split, combined or eliminated at any time prior to issuance or availability of a final prospectus) and are offered on a “when, as and if issued” basis. Prospective investors should understand that, when considering the purchase of the Offered Certificates, a contract of sale will come into being no sooner than the date on which the relevant class of certificates has been priced and the underwriters have confirmed the allocation of certificates to be made to investors; any “indications of interest” expressed by any prospective investor, and any “soft circles” generated by the underwriters, will not create binding contractual obligations for such prospective investors, on the one hand, or the underwriters, the depositor or any of their respective agents or affiliates, on the other hand.
As a result of the foregoing, a prospective investor may commit to purchase certificates that have characteristics that may change, and each prospective investor is advised that all or a portion of the certificates referred to in these materials may be issued without all or certain of the characteristics described in these materials. The underwriters’ obligation to sell certificates to any prospective investor is conditioned on the certificates and the transaction having the characteristics described in these materials. If the underwriters determine that a condition is not satisfied in any material respect, such prospective investor will be notified, and neither the depositor nor the underwriters will have any obligation to such prospective investor to deliver any portion of the Offered Certificates which such prospective investor has committed to purchase, and there will be no liability between the underwriters, the depositor or any of their respective agents or affiliates, on the one hand, and such prospective investor, on the other hand, as a consequence of the non-delivery.
Each prospective investor has requested that the underwriters provide to such prospective investor information in connection with such prospective investor’s consideration of the purchase of the certificates described in these materials. These materials are being provided to each prospective investor for informative purposes only in response to such prospective investor’s specific request. The underwriters described in these materials may from time to time perform investment banking services for, or solicit investment banking business from, any company named in these materials. The underwriters and/or their affiliates or respective employees may from time to time have a long or short position in any security or contract discussed in these materials.
The information contained herein supersedes any previous such information delivered to any prospective investor and will be superseded by information delivered to such prospective investor prior to the time of sale.
IMPORTANT NOTICE RELATING TO AUTOMATICALLY-GENERATED EMAIL DISCLAIMERS
Any legends, disclaimers or other notices that may appear at the bottom of any email communication to which this free writing prospectus is attached relating to (1) these materials not constituting an offer (or a solicitation of an offer), (2) no representation that these materials are accurate or complete and may not be updated or (3) these materials possibly being confidential, are not applicable to these materials and should be disregarded. Such legends, disclaimers or other notices have been automatically generated as a result of these materials having been sent via Bloomberg or another system.
THE INFORMATION IN THIS STRUCTURAL AND COLLATERAL TERM SHEET IS NOT COMPLETE AND MAY BE AMENDED PRIOR TO THE TIME OF SALE. THIS TERM SHEET IS NOT AN OFFER TO SELL THESE SECURITIES AND IT IS NOT A SOLICITATION OF AN OFFER TO BUY THESE SECURITIES IN ANY JURISDICTION WHERE THE OFFER OR SALE IS NOT PERMITTED.
| 2 |
Wells Fargo Commercial Mortgage Trust 2015-C31 | Certificate Structure |
I. Certificate Structure
| Class | Expected Ratings (Fitch/Moody’s/Morningstar)(1) | Approximate Initial Certificate Principal Balance or Notional Amount(2) | Approx. Initial Credit Support(3) | Pass-Through Rate Description | Weighted Average Life (Years)(4) | Expected Principal Window(4) | Certificate Principal to Value Ratio(5) | Certificate Principal U/W NOI Debt Yield(6) | |||
| Offered Certificates | |||||||||||
| A-1 | AAAsf/Aaa(sf)/AAA | $38,222,000 | 30.000% | (7) | 2.74 | 12/15 - 09/20 | 46.5% | 14.9% | |||
| A-2 | AAAsf/Aaa(sf)/AAA | $20,290,000 | 30.000% | (7) | 4.87 | 09/20 - 10/20 | 46.5% | 14.9% | |||
| A-3 | AAAsf/Aaa(sf)/AAA | $200,000,000 | 30.000% | (7) | 9.74 | 07/25 - 08/25 | 46.5% | 14.9% | |||
| A-4 | AAAsf/Aaa(sf)/AAA | $366,122,000 | (8) | 30.000% | (7) | 9.89 | 08/25 - 10/25 | 46.5% | 14.9% | ||
| A-SB | AAAsf/Aaa(sf)/AAA | $67,302,000 | 30.000% | (7) | 7.44 | 10/20 - 07/25 | 46.5% | 14.9% | |||
| A-S(9) | AAAsf/Aa2(sf)/AAA | $49,425,000 | 25.000% | (7) | 9.93 | 10/25 - 10/25 | 49.8% | 13.9% | |||
| X-A | AAAsf/NR/AAA | $741,361,000 | (10) | N/A | Variable(11) | N/A | N/A | N/A | N/A | ||
| X-B | NR/NR/AAA | $60,544,000 | (12) | N/A | Variable(13) | N/A | N/A | N/A | N/A | ||
| X-D | NR/NR/AAA | $56,838,000 | (14) | N/A | Variable(15) | N/A | N/A | N/A | N/A | ||
| B(9) | AA-sf/NR/AA | $60,544,000 | 18.875% | (7) | 9.93 | 10/25 - 10/25 | 53.9% | 12.9% | |||
| C(9) | A-sf/NR/A- | $46,953,000 | 14.125% | (7) | 9.99 | 10/25 - 11/25 | 57.1% | 12.2% | |||
| PEX(9) | A-sf/NR/A- | $156,922,000 | 14.125% | (7) | 9.94 | 10/25 - 11/25 | 57.1% | 12.2% | |||
| D | BBB-sf/NR/BBB | $56,838,000 | 8.375% | (7) | 10.01 | 11/25 - 11/25 | 60.9% | 11.4% | |||
| Non-Offered Certificates | |||||||||||
| A-4FL | AAAsf/Aaa(sf)/AAA(16) | $366,122,000 | (17)(18) | 30.000% | LIBOR plus [ ](19) | 9.89 | 08/25 - 10/25 | 46.5% | 14.9% | ||
| A-4FX | AAAsf/Aaa(sf)/AAA | $0 | (17)(18) | 30.000% | (7) | 9.89 | 08/25 - 10/25 | 46.5% | 14.9% | ||
| E | BB-sf/NR/BB- | $24,712,000 | 5.875% | (7) | 10.01 | 11/25 - 11/25 | 62.5% | 11.1% | |||
| F | B-sf/NR/B | $11,120,000 | 4.750% | (7) | 10.01 | 11/25 - 11/25 | 63.3% | 11.0% | |||
| G | NR/NR/NR | $46,953,380 | 0.000% | (7) | 10.06 | 11/25 - 09/26 | 66.4% | 10.5% | |||
| Notes: | ||
| (1) | The expected ratings presented are those of Fitch Ratings, Inc. (“Fitch”), Moody’s Investors Service, Inc. (“Moody’s”) and Morningstar Credit Ratings, LLC (“Morningstar”) which the depositor hired to rate the offered certificates. One or more other nationally recognized statistical rating organizations that were not hired by the depositor may use information they receive pursuant to Rule 17g-5 under the Securities Exchange Act of 1934, as amended (the “Exchange Act”) or otherwise, to rate or provide market reports and/or published commentary related to the offered certificates. We cannot assure you as to what ratings a non-hired nationally recognized statistical rating organization would assign or that its reports will not express differing, possibly negative, views of the mortgage loans and/or the offered certificates. The ratings of each class of offered certificates address the likelihood of the timely distribution of interest and, except in the case of the Class X-A, Class X-B and Class X-D certificates, the ultimate distribution of principal due on those classes on or before the Rated Final Distribution Date. See “Risk Factors—Risks Related to the Offered Certificates—Ratings of the Certificates Have Substantial Limitations” and “Ratings” in the free writing prospectus, expected to be dated October 19, 2015 (the “Free Writing Prospectus”). Fitch and Moody’s have informed us that the “sf” designation in their ratings represents an identifier for structured finance product ratings. | |
| (2) | The principal balances and notional amounts set forth in the table are approximate. The actual initial principal balances and notional amounts may be larger or smaller depending on the aggregate cut-off date principal balance of the mortgage loans definitively included in the pool of mortgage loans, which aggregate cut-off date principal balance may be as much as 5% larger or smaller than the amount presented in the Free Writing Prospectus. | |
| (3) | The approximate initial credit support with respect to the Class A-1, A-2, A-3, A-4, A-4FL, A-4FX and A-SB Certificates represents the approximate credit enhancement for the Class A-1, A-2, A-3, A-4, A-4FL, A-4FX and A-SB Certificates in the aggregate. The percentage indicated under the column “Approx. Initial Credit Support” with respect to the Class C Certificates and the Class PEX Certificates represents the approximate credit support for the Class C regular interest. | |
| (4) | Weighted Average Lives and Expected Principal Windows are calculated based on an assumed prepayment rate of 0% CPR and the “Structuring Assumptions” described on Annex B to the Free Writing Prospectus. | |
| (5) | The Certificate Principal to Value Ratio for each Class of Certificates (other than the Class A-1, A-2, A-3, A-4, A-4FL, A-4FX, A-SB and PEX Certificates) is calculated as the product of (a) the weighted average Cut-off Date LTV Ratio for the mortgage loans and (b) a fraction, the numerator of which is the total initial Certificate Balance of such Class of Certificates and all Classes of Principal Balance Certificates (other than the Class PEX Certificates) senior to such Class of Certificates and the denominator of which is the total initial Certificate Balance of all of the Principal Balance Certificates (other than the Class PEX Certificates). The Certificate Principal to Value Ratio for each of the Class A-1, A-2, A-3, A-4, A-4FL, A-4FX and A-SB Certificates is calculated in the aggregate for those Classes as if they were a single Class and is calculated as the product of (a) the weighted average Cut-off Date LTV Ratio for the mortgage loans and (b) a fraction, the numerator of which is the total initial aggregate Certificate Balances of such Classes of Certificates and the denominator of which is the total initial Certificate Balance of all of the Principal Balance Certificates (other than the Class PEX Certificates). The Certificate Principal to Value Ratio of the Class PEX Certificates is equal to the Certificate Principal to Value Ratio of the Class C Certificates. In any event, however, excess mortgaged property value associated with a mortgage loan will not be available to offset losses on any other mortgage loan (unless such mortgage loans are cross-collateralized and the cross-collateralization remains in effect). | |
| (6) | The Certificate Principal U/W NOI Debt Yield for each Class of Certificates (other than the Class A-1, A-2, A-3, A-4, A-4FL, A-4FX, A-SB and PEX Certificates) is calculated as the product of (a) the weighted average U/W NOI Debt Yield for the mortgage loans and (b) a fraction, the numerator of which is the total initial Certificate Balance of all of the Classes of Principal Balance Certificates (other than the Class PEX Certificates) and the denominator of which is the total initial Certificate Balance for such Class of Certificates and all Classes of Principal Balance Certificates (other than the Class PEX Certificates) senior to such Class of Certificates. The Certificate Principal U/W NOI Debt Yield for each of the Class A-1, A-2, A-3, A-4, A-4FL, A-4FX and A-SB Certificates is calculated in the aggregate for those Classes as if they were a single Class and is calculated as the product of (a) the weighted average U/W NOI Debt Yield for the mortgage loans and (b) a fraction, the numerator of which is the total initial Certificate Balance of all of the Classes of Principal Balance Certificates (other than the Class PEX Certificates) and the denominator of which is the total aggregate initial Certificate Balances for the Class A-1, A-2, A-3, A-4, A-4FL, A-4FX and A-SB Certificates. The Certificate Principal U/W NOI Debt Yield of the Class PEX Certificates is equal to the Certificate Principal U/W NOI Debt Yield for the Class C Certificates. In any event, however, cash flow from each mortgaged property supports only the related mortgage loan and will not be available to support any other mortgage loan (unless such mortgage loans are cross-collateralized and the cross-collateralization remains in effect). |
THE INFORMATION IN THIS STRUCTURAL AND COLLATERAL TERM SHEET IS NOT COMPLETE AND MAY BE AMENDED PRIOR TO THE TIME OF SALE. THIS TERM SHEET IS NOT AN OFFER TO SELL THESE SECURITIES AND IT IS NOT A SOLICITATION OF AN OFFER TO BUY THESE SECURITIES IN ANY JURISDICTION WHERE THE OFFER OR SALE IS NOT PERMITTED.
| 3 |
Wells Fargo Commercial Mortgage Trust 2015-C31 | Certificate Structure |
| (7) | The pass-through rates for the Class A-1, A-2, A-3, A-4, A-4FX, A-SB, D, E, F and G Certificates and the Class A-4FX, A-S, B and C regular interests in each case will be one of the following: (i) a fixed rateper annum, (ii) the weighted average of the net mortgage interest rates on the mortgage loans for the related distribution date, (iii) a variable rateper annum equal to the lesser of (a) a fixed rate and (b) the weighted average of the net mortgage interest rates on the mortgage loans for the related distribution date or (iv) a variable rateper annum equal to the weighted average of the net mortgage interest rates on the mortgage loans for the related distribution date minus a specified percentage. For purposes of the calculation of the weighted average of the net mortgage interest rates on the mortgage loans for each distribution date, the mortgage interest rates will be adjusted as necessary to a 30/360 basis. The Class PEX Certificates will not have a pass-through rate, but will be entitled to receive the sum of the interest distributable on the Class PEX Components. The pass-through rate for the Class A-S Certificates, the Class A-S regular interest and the Class PEX Component A-S will, at all times, be the same. The pass-through rate for the Class B Certificates, the Class B regular interest and the Class PEX Component B will, at all times, be the same. The pass-through rate for the Class C Certificates, the Class C regular interest and the Class PEX Component C will, at all times, be the same. | |
| (8) | Represents the maximum initial principal balance of the Class A-4 Certificates that will be issued on the closing date. The aggregate initial principal balance of the Class A-4, A-4FL and A-4FX Certificates will be $366,122,000. | |
| (9) | The Class A-S, B, C and PEX Certificates are “Exchangeable Certificates”. On the closing date, the upper-tier REMIC of the issuing entity will issue the Class A-S, B and C regular interests (each a “regular interest”) which will have outstanding principal balances on the closing date of $49,425,000, $60,544,000 and $46,953,000, respectively. The regular interests will be held in a grantor trust for the benefit of the holders of the Class A-S, B, C and PEX Certificates. The Class A-S, B, C and PEX Certificates will, at all times, represent undivided beneficial ownership interests in a grantor trust that will hold those regular interests. Each class of the Class A-S, B and C Certificates will, at all times, represent an undivided beneficial ownership interest in a percentage of the outstanding certificate principal balance of the regular interest with the same alphabetical class designation. The Class PEX Certificates will, at all times, represent an undivided beneficial ownership interest in the remaining percentages of the outstanding certificate principal balances of the Class A-S, B and C regular interests and which portions of those regular interests are referred to in this Term Sheet as the “Class PEX Component A-S”, “Class PEX Component B” and “Class PEX Component C”, respectively, (collectively, the “Class PEX Components”). Following any exchange of Class A-S, B and C Certificates for Class PEX Certificates or any exchange of Class PEX Certificates for Class A-S, B and C Certificates as described in the Free Writing Prospectus, the percentage interest of the outstanding certificate principal balances of the Class A-S, B and C regular interests that is represented by the Class A-S, B, C and PEX Certificates will be increased or decreased accordingly. The initial certificate principal balance of each of the Class A-S, B and C Certificates shown in the table represents the maximum certificate principal balance of such class without giving effect to any exchange. The initial certificate principal balance of the Class PEX Certificates is equal to the aggregate of the initial certificate principal balance of the Class A-S, B and C Certificates and represents the maximum certificate principal balance of the Class PEX Certificates that could be issued in an exchange. The certificate principal balances of the Class A-S, B and C Certificates to be issued on the closing date will be reduced, in required proportions, by an amount equal to the certificate principal balance of the Class PEX Certificates issued on the closing date. Distributions and allocations of payments and losses with respect to the Exchangeable Certificates are described in this Term Sheet under “Allocations and Distributions on the Class A-S, B, C and PEX Certificates” and under “Description of the Offered Certificates—Distributions” in the Free Writing Prospectus. The maximum certificate principal balance of the Class PEX Certificates is set forth in the table but is not included in the certificate principal balance of the certificates set forth on the cover page of this Term Sheet or on the top of the cover page of the Free Writing Prospectus. | |
| (10) | The Class X-A Certificates are notional amount certificates. The Notional Amount of the Class X-A Certificates will be equal to the aggregate principal balance of the Class A-1, A-2, A-3, A-4 and A-SB Certificates and the Class A-4FX and A-S regular interests outstanding from time to time (without regard to any exchange of the Class A-S, B and C Certificates for the Class PEX Certificates). The Class X-A Certificates will not be entitled to distributions of principal. | |
| (11) | The pass-through rate for the Class X-A Certificates for any distribution date will be aper annum rate equal to the excess, if any, of (a) the weighted average of the net mortgage interest rates on the mortgage loans for the related distribution date, over (b) the weighted average of the pass-through rates on the Class A-1, A-2, A-3, A-4 and A-SB Certificates and the Class A-4FX and A-S regular interests for the related distribution date, weighted on the basis of their respective aggregate principal balances outstanding immediately prior to that distribution date. For purposes of the calculation of the weighted average of the net mortgage interest rates on the mortgage loans for each distribution date, the mortgage interest rates will be adjusted as necessary to a 30/360 basis. | |
| (12) | The Class X-B Certificates are notional amount certificates. The Notional Amount of the Class X-B Certificates will be equal to the principal balance of the Class B regular interest outstanding from time to time (without regard to any exchange of the Class A-S, B and C Certificates for the Class PEX Certificates). The Class X-B Certificates will not be entitled to distributions of principal. | |
| (13) | The pass-through rate for the Class X-B Certificates for any distribution date will be aper annum rate equal to the excess, if any, of (a) the weighted average of the net mortgage interest rates on the mortgage loans for the related distribution date, over (b) the pass-through rate on the Class B regular interest for the related distribution date. For purposes of the calculation of the weighted average of the net mortgage interest rates on the mortgage loans for each distribution date, the mortgage interest rates will be adjusted as necessary to a 30/360 basis. | |
| (14) | The Class X-D Certificates are notional amount certificates. The Notional Amount of the Class X-D Certificates will be equal to the principal balance of the Class D Certificates outstanding from time to time. The Class X-D Certificates will not be entitled to distributions of principal. | |
| (15) | The pass-through rate for the Class X-D Certificates for any distribution date will be a per annum rate equal to the excess, if any, of (a) the weighted average of the net mortgage interest rates on the mortgage loans for the related distribution date, over (b) the pass-through rate on the Class D Certificates for the related distribution date. For purposes of the calculation of the weighted average of the net mortgage interest rates on the mortgage loans for each distribution date, the mortgage interest rates will be adjusted as necessary to a 30/360 basis. | |
| (16) | The ratings assigned to the Class A-4FL Certificates reflect only the receipt of up to the fixed rate of interest at a rate equal to the pass-through rate for the Class A-4FX regular interest. The ratings of Fitch, Moody’s and Morningstar do not address any shortfalls or delays in payment that investors in the Class A-4FL Certificates may experience as a result of the conversion of the pass-through rate on Class A-4FL Certificates from a floating interest rate to a fixed rate following a default under the swap agreement. See “Ratings” in the Private Placement Memorandum. | |
| (17) | The aggregate initial principal balance of the Class A-4, A-4FL and A-4FX Certificates will be $366,122,000. The aggregate principal balance of the Class A-4FL and A-4FX Certificates will at all times equal the principal balance of the Class A-4FX regular interest. The maximum initial principal balance of the Class A-4FL certificates is $366,122,000. The principal balance of the Class A-4FX certificates will initially be $0. The maximum initial principal balance of the Class A-4FX regular interest is $366,122,000. | |
| (18) | The Class A-4FL Certificates will evidence a beneficial interest in a grantor trust that includes the Class A-4FX regular interest and an interest rate swap contract. Under some circumstances, holders of the Class A-4FL Certificates may exchange all or a portion of their certificates for a like principal amount of Class A-4FX Certificates having the same pass-through rate as the Class A-4FX regular interest. The aggregate principal balance of the Class A-4FL Certificates may be adjusted from time to time as a result of such an exchange. | |
| (19) | The pass-through rate applicable to the Class A-4FL Certificates on each distribution date will be aper annum rate equal to LIBOR plus a specified percentage; provided, however, that under certain circumstances (generally involving a default or termination under the related interest rate swap contract), the pass-through rate applicable to the Class A-4FL Certificates may convert to a fixed rate equal to the pass-through rate on the Class A-4FX regular interest. The initial LIBOR rate will be determined two LIBOR business days prior to the Closing Date, and subsequent LIBOR rates for the Class A-4FL Certificates will be determined two LIBOR business days before the start of the related interest accrual period. |
THE INFORMATION IN THIS STRUCTURAL AND COLLATERAL TERM SHEET IS NOT COMPLETE AND MAY BE AMENDED PRIOR TO THE TIME OF SALE. THIS TERM SHEET IS NOT AN OFFER TO SELL THESE SECURITIES AND IT IS NOT A SOLICITATION OF AN OFFER TO BUY THESE SECURITIES IN ANY JURISDICTION WHERE THE OFFER OR SALE IS NOT PERMITTED.
| 4 |
Wells Fargo Commercial Mortgage Trust 2015-C31 | Issue Characteristics |
II. Transaction Highlights
Mortgage Loan Sellers:
Mortgage Loan Seller | Number of | Number of | Aggregate Cut-off | % of Cut-off | ||||||||
| Wells Fargo Bank, National Association | 21 | 21 | $329,977,555 | 33.4 | % | |||||||
| Rialto Mortgage Finance, LLC | 19 | 26 | 201,913,702 | 20.4 | ||||||||
| C-III Commercial Mortgage LLC | 37 | 40 | 181,266,299 | 18.3 | ||||||||
| Société Générale | 11 | 11 | 129,597,832 | 13.1 | ||||||||
| Basis Real Estate Capital II, LLC | 9 | 12 | 90,550,234 | 9.2 | ||||||||
| Liberty Island Group I LLC | 5 | 8 | 55,175,759 | 5.6 | ||||||||
Total | 102 | 118 | $988,481,381 | 100.0 | % | |||||||
Loan Pool:
| Cut-off Date Balance: | $988,481,381 |
| Number of Mortgage Loans: | 102 |
| Average Cut-off Date Balance per Mortgage Loan: | $9,690,994 |
| Number of Mortgaged Properties: | 118 |
| Average Cut-off Date Balance per Mortgaged Property(1): | $8,376,961 |
| Weighted Average Mortgage Interest Rate: | 4.631% |
| Ten Largest Mortgage Loans as % of Cut-off Date Pool Balance: | 37.4% |
| Weighted Average Original Term to Maturity (months): | 119 |
| Weighted Average Remaining Term to Maturity (months): | 117 |
| Weighted Average Original Amortization Term (months)(2): | 353 |
| Weighted Average Remaining Amortization Term (months)(2): | 352 |
| Weighted Average Seasoning (months): | 1 |
(1) Information regarding mortgage loans secured by multiple properties is based on an allocation according to relative appraised values or the allocated loan amounts or property-specific release prices set forth in the related loan documents or such other allocation as the related mortgage loan seller deemed appropriate. (2) Excludes any mortgage loan that does not amortize. | |
Credit Statistics:
| Weighted Average U/W Net Cash Flow DSCR(1): | 1.66x |
| Weighted Average U/W Net Operating Income Debt Yield(1): | 10.5% |
| Weighted Average Cut-off Date Loan-to-Value Ratio(1): | 66.4% |
| Weighted Average Balloon Loan-to-Value Ratio(1): | 58.7% |
| % of Mortgage Loans with Additional Subordinate Debt(2): | 3.1% |
| % of Mortgage Loans with Single Tenants(3): | 4.2% |
(1) With respect to the Sheraton Lincoln Harbor Hotel mortgage loan, the CityPlace I mortgage loan, the 11 Madison Avenue mortgage loan, and the Patrick Henry Mall mortgage loan, each of which is part of a loan combination, the loan-to-value ratio, debt service coverage ratio and debt yield calculations include the relatedpari passu companion loan(s) (unless otherwise stated). The debt service coverage ratio, debt yield and loan-to-value ratio information do not take into account any subordinate debt (whether or not secured by the related mortgaged property), that is allowed under the terms of any mortgage loan. The information for each mortgaged property that relates to a mortgage loan that is cross-collateralized or cross-defaulted with other mortgage loans is based upon the principal balance of that mortgage loan, except that the applicable loan-to-value ratio, debt service coverage ratio, and debt yield for each such mortgage loan is based upon the ratio or yield (as applicable) for the aggregate indebtedness evidenced by all loans in the group. On an individual basis, without regard to the cross-collateralization feature, any mortgage loan that is part of a cross-collateralized group of mortgage loans may have a higher loan-to-value ratio, lower debt service coverage ratio and/or lower debt yield than is presented herein. See Annex A-1 and Annex B to the Free Writing Prospectus. (2) The percentage figure expressed as “% of Mortgage Loans with Additional Subordinate Debt” is determined as a percentage of cut-off date principal balance and does not take into account future subordinate debt (whether or not secured by the mortgaged property), if any, that may be permitted under the terms of any mortgage loan or the Pooling and Servicing Agreement. See “Description of the Mortgage Pool—Subordinate and/or Other Financing” in the Free Writing Prospectus. (3) Excludes mortgage loans that are secured by multiple single tenant properties and includes mortgage loans secured by multiple single tenant properties where each property is occupied by the same tenant or tenants that are affiliates of one another. | |
THE INFORMATION IN THIS STRUCTURAL AND COLLATERAL TERM SHEET IS NOT COMPLETE AND MAY BE AMENDED PRIOR TO THE TIME OF SALE. THIS TERM SHEET IS NOT AN OFFER TO SELL THESE SECURITIES AND IT IS NOT A SOLICITATION OF AN OFFER TO BUY THESE SECURITIES IN ANY JURISDICTION WHERE THE OFFER OR SALE IS NOT PERMITTED.
| 5 |
Wells Fargo Commercial Mortgage Trust 2015-C31 | Issue Characteristics |
Loan Structural Features
Amortization:Based on the Cut-off Date Pool Balance, 79.5% of the mortgage pool (93 mortgage loans) has scheduled amortization, as follows:
45.5% (42 mortgage loans) provides for an interest-only period followed by an amortization period; and
34.0% (51 mortgage loans) requires amortization during the entire loan term.
Interest-Only:Based on the Cut-off Date Pool Balance, 20.5% of the mortgage pool (nine mortgage loans) provides for interest-only payments during the entire loan term. The Weighted Average Cut-off Date Loan-to-Value Ratio and Weighted Average U/W Net Cash Flow DSCR for those mortgage loans are 59.0% and 2.19x, respectively.
Hard Lockboxes: Based on the Cut-off Date Pool Balance, 44.7% of the mortgage pool (24 mortgage loans) has hard lockboxes in place.
Reserves:The mortgage loans require amounts to be escrowed monthly as follows (excluding any mortgage loans with springing provisions):
| Real Estate Taxes: | 68.8% of the pool |
| Insurance: | 62.8% of the pool |
| Capital Replacements: | 75.1% of the pool |
| TI/LC: | 58.4% of the pool(1) |
| (1) The percentage of Cut-off Date Balance for mortgage loans with TI/LC reserves is based on the aggregate principal balance allocable to loans that include retail, office, industrial and mixed use properties. With respect to the Best Western Plus South Bay mortgage loan, there is a monthly TI/LC reserve. Please note, this reserve was not included in the percentage above. | |
Call Protection/Defeasance: Based on the Cut-off Date Pool Balance, the mortgage pool had the following call protection and defeasance features:
91.3% of the mortgage pool (92 mortgage loans) features a lockout period, then defeasance only until an open period;
7.7% of the mortgage pool (nine mortgage loans) features a lockout period, then the greater of a prepayment premium or yield maintenance until an open period; and
1.0% of the mortgage pool (one mortgage loan) features a lockout period, then defeasance or the greater of a prepayment premium or yield maintenance until an open period.
Please refer to Annex A-1 to the Free Writing Prospectus for further information regarding individual loan call protection.
THE INFORMATION IN THIS STRUCTURAL AND COLLATERAL TERM SHEET IS NOT COMPLETE AND MAY BE AMENDED PRIOR TO THE TIME OF SALE. THIS TERM SHEET IS NOT AN OFFER TO SELL THESE SECURITIES AND IT IS NOT A SOLICITATION OF AN OFFER TO BUY THESE SECURITIES IN ANY JURISDICTION WHERE THE OFFER OR SALE IS NOT PERMITTED.
| 6 |
Wells Fargo Commercial Mortgage Trust 2015-C31 | Issue Characteristics |
III. Issue Characteristics
| Securities Offered: | $905,696,000 approximate monthly pay, multi-class, commercial mortgage REMIC pass-through certificates consisting of thirteen classes (Classes A-1, A-2, A-3, A-4, A-SB, A-S, B, C, PEX, D, X-A, X-B and X-D), which are offered pursuant to a registration statement filed with the SEC. |
| Mortgage Loan Sellers: | Wells Fargo Bank, National Association (“WFB”), Rialto Mortgage Finance, LLC (“RMF”), C-III Commercial Mortgage LLC (“CIIICM”), Société Générale (“SG”), Basis Real Estate Capital II, LLC (“Basis”) and Liberty Island Group I LLC (“LIG I”) |
| Sole Bookrunner: | Wells Fargo Securities, LLC |
| Co-Lead Managers: | Wells Fargo Securities, LLC and SG Americas Securities, LLC |
| Co-Managers: | Citigroup Global Markets Inc. and Morgan Stanley & Co. LLC |
| Rating Agencies: | Fitch Ratings, Inc., Moody’s Investors Service, Inc. and Morningstar Credit Ratings, LLC |
| Master Servicer: | Wells Fargo Bank, National Association |
| Special Servicer: | Midland Loan Services, a Division of PNC Bank, National Association |
| Certificate Administrator: | Wells Fargo Bank, National Association |
| Trustee: | Wilmington Trust, National Association |
| Trust Advisor: | Trimont Real Estate Advisors, LLC |
| Initial Majority Subordinate Certificateholder: | Eightfold Real Estate Capital Fund IV, L.P. or one of its affiliates |
| Cut-off Date: | The Cut-off Date with respect to each mortgage loan is the due date for the monthly debt service payment that is due in November 2015 (or, in the case of any mortgage loan that has its first due date in December 2015, the date that would have been its due date in November 2015 under the terms of that mortgage loan if a monthly debt service payment were scheduled to be due in that month). |
| Expected Closing Date: | On or about November 12, 2015. |
| Determination Dates: | The 11th day of each month (or if that day is not a business day, the next succeeding business day), commencing in December 2015. |
| Distribution Dates: | The fourth business day following the Determination Date in each month, commencing in December 2015. |
| Rated Final Distribution Date: | The Distribution Date in November 2048. |
| Interest Accrual Period: | With respect to any Distribution Date, the calendar month immediately preceding the month in which such Distribution Date occurs. |
| Day Count: | The Offered Certificates will accrue interest on a 30/360 basis. |
| Minimum Denominations: | $10,000 for each Class of Offered Certificates (other than the Class X-A, X-B and X-D Certificates) and $1,000,000 for the Class X-A, X-B and X-D Certificates. Investments may also be made in any whole dollar denomination in excess of the applicable minimum denomination. |
| Clean-up Call: | 1% |
| Delivery: | DTC, Euroclear and Clearstream Banking |
| ERISA/SMMEA Status: | Each Class of Offered Certificates is expected to be eligible for exemptive relief under ERISA. No Class of Offered Certificates will be SMMEA eligible. |
| Risk Factors: | THE CERTIFICATES INVOLVE CERTAIN RISKS AND MAY NOT BE SUITABLE FOR ALL INVESTORS. SEE THE “RISK FACTORS” SECTION OF THE FREE WRITING PROSPECTUS. |
| Bond Analytics Information: | The Certificate Administrator will be authorized to make distribution date settlements, CREFC® reports and certain supplemental reports (other than confidential information) available to certain financial modeling and data provision services, including Bloomberg, L.P., Trepp, LLC, Intex Solutions, Inc., Markit Group Limited, Interactive Data Corp., BlackRock Financial Management, Inc., CMBS.com, Inc. and Thomson Reuters Corporation. |
THE INFORMATION IN THIS STRUCTURAL AND COLLATERAL TERM SHEET IS NOT COMPLETE AND MAY BE AMENDED PRIOR TO THE TIME OF SALE. THIS TERM SHEET IS NOT AN OFFER TO SELL THESE SECURITIES AND IT IS NOT A SOLICITATION OF AN OFFER TO BUY THESE SECURITIES IN ANY JURISDICTION WHERE THE OFFER OR SALE IS NOT PERMITTED.
| 7 |
| Wells Fargo Commercial Mortgage Trust 2015-C31 | Characteristics of the Mortgage Pool |
IV. Characteristics of the Mortgage Pool(1)
A. Ten Largest Mortgage Loans
| Mortgage Loan Seller | Mortgage Loan Name | City | State | Number of Mortgage Loans / Mortgaged Properties | Mortgage Loan Cut-off Date Balance ($) | % of Cut-off Date Pool Balance (%) | Property Type | Number of SF, Rooms or Units | Cut-off Date Balance Per SF, Room or Unit ($) | Cut-off Date LTV Ratio (%) | Balloon LTV Ratio (%) | U/W NCF DSCR (x) | U/W NOI Debt Yield (%) |
| WFB | 745 Atlantic Avenue | Boston | MA | 1 / 1 | $70,000,000 | 7.1% | Office | 174,231 | $402 | 61.0% | 61.0% | 1.79x | 8.1% |
| RMF | Sheraton Lincoln Harbor Hotel | Weehawken | NJ | 1 / 1 | 60,000,000 | 6.1 | Hospitality | 358 | 223,464 | 62.5 | 60.7 | 1.60 | 11.5 |
| WFB | CityPlace I | Hartford | CT | 1 / 1 | 45,000,000 | 4.6 | Office | 884,366 | 90 | 69.2 | 69.2 | 1.87 | 10.8 |
| SG | Courtyard Marriott - Tacoma | Tacoma | WA | 1 / 1 | 32,625,000 | 3.3 | Hospitality | 162 | 201,389 | 72.5 | 58.8 | 1.61 | 11.3 |
| WFB | 11 Madison Avenue | New York | NY | 1 / 1 | 30,500,000 | 3.1 | Office | 2,285,043 | 334 | 32.5 | 32.5 | 3.89 | 14.3 |
| WFB | Hampton Inn & Suites - Jacksonville Beach | Jacksonville Beach | FL | 1 / 1 | 29,120,000 | 2.9 | Hospitality | 177 | 164,520 | 70.0 | 59.8 | 1.87 | 12.7 |
| SG | Patrick Henry Mall | Newport News | VA | 1 / 1 | 26,564,477 | 2.7 | Retail | 432,401 | 221 | 61.7 | 49.9 | 1.66 | 11.0 |
| WFB | Philadelphia Design & Distribution Center | Philadelphia | PA | 1 / 1 | 26,000,000 | 2.6 | Mixed Use | 678,810 | 38 | 70.3 | 64.1 | 1.73 | 11.9 |
| Basis | Warren Industrial Center | Warren | MI | 1 / 3 | 25,350,000 | 2.6 | Industrial | 284,381 | 89 | 75.0 | 61.2 | 1.46 | 9.8 |
| RMF | Brooks Landing Apartments | Modesto | CA | 1 / 1 | 24,500,000 | 2.5 | Multifamily | 232 | 105,603 | 68.2 | 68.2 | 1.81 | 8.7 |
| Top Three Total/Weighted Average | 3 / 3 | $175,000,000 | 17.7% | 63.6% | 63.0% | 1.75x | 10.0% | ||||||
| Top Five Total/Weighted Average | 5 / 5 | $238,125,000 | 24.1% | 60.9% | 58.5% | 2.00x | 10.7% | ||||||
| Top Ten Total/Weighted Average | 10 / 12 | $369,659,477 | 37.4% | 63.8% | 59.2% | 1.90x | 10.8% | ||||||
| Non-Top Ten Total/Weighted Average | 92 / 106 | $618,821,904 | 62.6% | 68.0% | 58.4% | 1.52x | 10.3% | ||||||
| (1) | With respect to the Sheraton Lincoln Harbor Hotel mortgage loan, the CityPlace I mortgage loan, the 11 Madison Avenue mortgage loan, and the Patrick Henry Mall mortgage loan, each of which is part of a loan combination, the loan-to-value ratio, debt service coverage ratio and debt yield calculations include the relatedpari passu companion loans (unless otherwise stated). With respect to each mortgage loan, the debt service coverage ratio, debt yield and loan-to-value ratio information do not take into account any subordinate debt (whether or not secured by the related mortgaged property), that is allowed under the terms of any mortgage loan. |
THE INFORMATION IN THIS STRUCTURAL AND COLLATERAL TERM SHEET IS NOT COMPLETE AND MAY BE AMENDED PRIOR TO THE TIME OF SALE. THIS TERM SHEET IS NOT AN OFFER TO SELL THESE SECURITIES AND IT IS NOT A SOLICITATION OF AN OFFER TO BUY THESE SECURITIES IN ANY JURISDICTION WHERE THE OFFER OR SALE IS NOT PERMITTED.
| 8 |
| Wells Fargo Commercial Mortgage Trust 2015-C31 | Characteristics of the Mortgage Pool |
B. Summary ofPari Passu Mortgage Loans
| Property Name | Mortgage Loan Seller | Related Notes in Loan Group (Original Balance) | Holder of Note | Lead Servicer for the Entire Loan Combination | Current Master Servicer Under Related Securitization Servicing Agreement | Current Special Servicer Under Related Securitization Servicing Agreement |
| Sheraton Lincoln Harbor Hotel | RMF | $60,000,000 | WFCM 2015-C31 | Yes | Wells Fargo Bank, National Association | Midland Loan Services, a Division of PNC Bank, National Association |
| RMF | $20,000,000 | (1) | No | TBD | TBD | |
| CityPlace I | WFB | $45,000,000 | WFCM 2015-C31 | Yes | Wells Fargo Bank, National Association | Midland Loan Services, a Division of PNC Bank, National Association |
| WFB | $34,275,000 | (2) | No | TBD | TBD | |
| 11 Madison Avenue(5) | GACC/MS/WFB | $397,530,000(3) | MAD 2015-11MD | Yes | KeyBank National Association | KeyBank National Association |
| GACC | $70,000,000 | COMM 2015-CCRE26 | No | Midland Loan Services, a Division of PNC Bank, National Association | Rialto Capital Advisors, LLC | |
| GACC | $70,000,000 | COMM 2015-CCRE27 | No | Midland Loan Services, a Division of PNC Bank, National Association | Rialto Capital Advisors, LLC | |
| GACC | $69,600,000 | (4) | No | TBD | TBD | |
| MS | $50,000,000 | (4) | No | TBD | TBD | |
| MS | $41,700,000 | (4) | No | TBD | TBD | |
| WFB | $35,000,000 | WFCM 2015-NXS3 | No | Wells Fargo Bank, National Association | LNR Partners, LLC | |
| WFB | $30,500,000 | WFCM 2015-C31 | No | Wells Fargo Bank, National Association | Midland Loan Services, a Division of PNC Bank, National Association | |
| Patrick Henry Mall | LIG I | $48,100,000 | WFCM 2015-SG1 | Yes | Wells Fargo Bank, National Association | Rialto Capital Advisors, LLC |
| SG | $21,400,000 | WFCM 2015-SG1 | Yes | Wells Fargo Bank, National Association | Rialto Capital Advisors, LLC | |
| SG | $26,700,000 | WFCM 2015-C31 | No | Wells Fargo Bank, National Association | Midland Loan Services, a Division of PNC Bank, National Association |
| (1) | The relatedpari passu companion loan (Note A-2) is currently held by RMF, or an affiliate thereof, and is expected (but not required) to be contributed to one or more future securitizations. No assurance can be provided that the Note A-2 will not be split further. |
| (2) | The relatedpari passu companion loan (Note A-2) is currently held by WFB, or an affiliate thereof, and is expected (but not required) to be contributed to one or more future securitizations. No assurance can be provided that the Note A-2 will not be split further. |
| (3) | Consists of ninepari passucompanion loans with an aggregate original principal balance of $397,530,000, which were contributed to the MAD 2015-11MD securitization. |
| (4) | The relatedpari passu companion loan Note A-1-C3 is currently held by German American Capital Corporation (“GACC”) or an affiliate. The relatedpari passu companion loans designated as Note A-2-C1 and Note A-2-C2 are currently held by Morgan Stanley Bank, N.A. (“MS”) or an affiliate. Note A-1-C3, Note A-2-C1 and Note A-2-C2 are expected to be contributed to a future securitization. No assurance can be provided that any non-securitized note will not be split further. |
| (5) | The 11 Madison Avenue loan combination also includes three subordinate companion loans with an aggregate original principal balance of $310,670,000, which were contributed to the MAD 2015-11MD securitization. Such subordinate companion loans are not reflected in the “Related Notes in Loan Group” column. |
THE INFORMATION IN THIS STRUCTURAL AND COLLATERAL TERM SHEET IS NOT COMPLETE AND MAY BE AMENDED PRIOR TO THE TIME OF SALE. THIS TERM SHEET IS NOT AN OFFER TO SELL THESE SECURITIES AND IT IS NOT A SOLICITATION OF AN OFFER TO BUY THESE SECURITIES IN ANY JURISDICTION WHERE THE OFFER OR SALE IS NOT PERMITTED.
| 9 |
| Wells Fargo Commercial Mortgage Trust 2015-C31 | Characteristics of the Mortgage Pool |
C. Mortgage Loan with Additional Secured and Mezzanine Financing
| Loan No. | Mortgage Loan Seller | Mortgage Loan Name | Mortgage Loan Cut-off Date Balance ($) | % of Cut-off Date Pool Balance (%) | Sub Debt Cut-off Date Balance ($) | Mezzanine Debt Cut-off Date Balance ($) | Total Debt Interest Rate (%)(1) | Mortgage Loan U/W NCF DSCR (x)(2) | Total Debt U/W NCF DSCR (x) | Mortgage Loan Cut- off Date U/W NOI Debt Yield (%)(2) | Total Debt Cut-off Date U/W NOI Debt Yield (%) | Mortgage Loan Cut-off Date LTV Ratio (%)(2) | Total Debt Cut-off Date LTV Ratio (%) |
| 5 | WFB | 11 Madison Avenue | $30,500,000 | 3.1% | $310,670,000 | $325,000,000 | 3.838% | 3.89x | 1.97x | 14.3% | 7.8% | 32.5% | 59.6% |
| Total/Weighted Average | $30,500,000 | 3.1% | $310,670,000 | $325,000,000 | 3.838% | 3.89x | 1.97x | 14.3% | 7.8% | 32.5% | 59.6% | ||
| (1) | Total Debt Interest Rate for any specified mortgage loan reflects the weighted average of the interest rates on the respective components of the total debt. |
| (2) | With respect to the 11 Madison Avenue mortgage loan, which is part of a loan combination, debt service coverage ratio, debt yield and loan-to-value ratio calculations include the relatedpari passu companion loans. |
THE INFORMATION IN THIS STRUCTURAL AND COLLATERAL TERM SHEET IS NOT COMPLETE AND MAY BE AMENDED PRIOR TO THE TIME OF SALE. THIS TERM SHEET IS NOT AN OFFER TO SELL THESE SECURITIES AND IT IS NOT A SOLICITATION OF AN OFFER TO BUY THESE SECURITIES IN ANY JURISDICTION WHERE THE OFFER OR SALE IS NOT PERMITTED.
| 10 |
| Wells Fargo Commercial Mortgage Trust 2015-C31 | Characteristics of the Mortgage Pool |
D. Previous Securitization History(1)
| Loan No. | Mortgage Loan Seller | Mortgage Loan or Mortgaged Property Name | City | State | Property Type | Mortgage Loan or Mortgaged Property Cut-off Date Balance ($) | % of Cut- off Date Pool Balance (%) | Previous Securitization | ||
| 2 | RMF | Sheraton Lincoln Harbor Hotel | Weehawken | NJ | Hospitality | $60,000,000 | 6.1% | MSC 2007-T25 | ||
| 4 | SG | Courtyard Marriott - Tacoma | Tacoma | WA | Hospitality | 32,625,000 | 3.3 | MLCFC 2006-4 | ||
| 8 | WFB | Philadelphia Design & Distribution Center | Philadelphia | PA | Mixed Use | 26,000,000 | 2.6 | WBCMT 2006-C27 | ||
| 10 | RMF | Brooks Landing Apartments | Modesto | CA | Multifamily | 24,500,000 | 2.5 | BACM 2007-1 | ||
| 19 | WFB | Mountain Valley Center | North Bend | WA | Retail | 13,683,118 | 1.4 | WBCMT 2006-C23 | ||
| 25 | SG | Hilton Garden Inn Oshkosh | Oshkosh | WI | Hospitality | 11,180,000 | 1.1 | BSCMS 2006-PW14 | ||
| 30 | WFB | Security Public Storage - Richmond | Richmond | CA | Self Storage | 9,987,403 | 1.0 | BSCMS 2005-T20 | ||
| 31 | RMF | Princessa Plaza | Santa Clarita | CA | Mixed Use | 9,700,000 | 1.0 | CSFB 2005-C5 | ||
| 32 | SG | Manchester Run Shopping Center | Manchester | NH | Retail | 9,488,033 | 1.0 | BACM 2006-2 | ||
| 39 | RMF | Horizons Office Center | West Palm Beach | FL | Office | 7,950,000 | 0.8 | BACM 2006-4 | ||
| 42 | RMF | Kohl’s - Wadsworth | Wadsworth | OH | Retail | 7,475,199 | 0.8 | WBCMT 2005-C22 | ||
| 51 | WFB | The Pines Apartments | Topeka | KS | Multifamily | 5,770,000 | 0.6 | CD 2005-CD1 | ||
| 53 | CIIICM | Best Western Plus South Bay | Lawndale | CA | Hospitality | 5,737,194 | 0.6 | MSC 2006-HQ8 | ||
| 54.02 | RMF | Tuckaway MHC & Storage | Germantown Hills | IL | Manufactured Housing Community | 1,722,823 | 0.2 | CSFB 2002-CKS4 | ||
| 58 | RMF | Southcoast Beaches Center | Atlantic Beach; Neptune Beach | FL | Retail | 5,000,000 | 0.5 | CSMC 2006-C1 | ||
| 63 | RMF | Hampton Inn & Suites - Cape Coral | Cape Coral | FL | Hospitality | 4,600,000 | 0.5 | BSCMS 2007-PW16 | ||
| 66 | WFB | Harris Teeter - Darnestown, MD | Darnestown | MD | Retail | 4,477,877 | 0.5 | WBCMT 2005-C22 | ||
| 81 | CIIICM | Getzville Plaza | Getzville | NY | Retail | 3,267,000 | 0.3 | CD 2006-CD3 | ||
| 83 | WFB | CVS - Montgomery, AL | Montgomery | AL | Retail | 3,083,629 | 0.3 | LBUBS 2005-C5 | ||
| 85 | CIIICM | Idaho Self Storage | Boise | ID | Self Storage | 3,000,000 | 0.3 | LBUBS 2005-C5 | ||
| 87 | WFB | CVS - Douglas, GA | Douglas | GA | Retail | 2,593,724 | 0.3 | LBUBS 2005-C5 | ||
| 97 | CIIICM | Oaks MHC | Norton Shores | MI | Manufactured Housing Community | 1,560,000 | 0.2 | CSMC 2006-C1 | ||
| Total | $253,401,000 | 25.6% | ||||||||
| (1) | The table above represents the most recent securitization with respect to the mortgaged property securing the related mortgage loan, based on information provided by the related borrower or obtained through searches of a third-party database. While the above mortgage loans may have been securitized multiple times in prior transactions, mortgage loans are only listed in the above chart if the mortgage loan in this securitization paid off a mortgage loan in another securitization. The information has not otherwise been confirmed by the mortgage loan sellers. |
THE INFORMATION IN THIS STRUCTURAL AND COLLATERAL TERM SHEET IS NOT COMPLETE AND MAY BE AMENDED PRIOR TO THE TIME OF SALE. THIS TERM SHEET IS NOT AN OFFER TO SELL THESE SECURITIES AND IT IS NOT A SOLICITATION OF AN OFFER TO BUY THESE SECURITIES IN ANY JURISDICTION WHERE THE OFFER OR SALE IS NOT PERMITTED.
| 11 |
| Wells Fargo Commercial Mortgage Trust 2015-C31 | Characteristics of the Mortgage Pool |
E. Mortgage Loans with Scheduled Balloon Payments and Related Classes | ||||||||||||||||||||
| Class A-2(1) | ||||||||||||||||||||
| Loan No. | Mortgage Loan Seller | Mortgage Loan Name | State | Property Type | Mortgage Loan Cut-off Date Balance ($) | % of Cut-off Date Pool Balance (%) | Mortgage Loan Balance at Maturity ($) | % of Class A-2 Certificate Principal Balance (%)(2) | Units, SF or Pads | Loan per SF or Pad ($) | U/W NCF DSCR (x) | U/W NOI Debt Yield (%) | Cut-off Date LTV Ratio (%) | Balloon LTV Ratio (%) | Rem. IO Period (mos.) | Rem. Term to Maturity (mos.) | ||||
| 44 | RMF | Tides at Calabash | NC | Multifamily | $6,850,000 | 0.7% | $6,531,099 | 32.2% | 168 | $40,774 | 1.46x | 9.7% | 51.3% | 48.9% | 22 | 58 | ||||
| 83 | WFB | CVS - Montgomery, AL | AL | Retail | 3,083,629 | 0.3 | 2,840,539 | 14.0 | 11,970 | 258 | 1.42 | 8.9 | 64.4 | 59.3 | 0 | 58 | ||||
| 86 | WFB | WAG - Staten Island | NY | Retail | 2,800,000 | 0.3 | 2,800,000 | 13.8 | 13,650 | 205 | 2.13 | 9.7 | 68.3 | 68.3 | 59 | 59 | ||||
| 87 | WFB | CVS - Douglas, GA | GA | Retail | 2,593,724 | 0.3 | 2,387,082 | 11.8 | 10,880 | 238 | 1.53 | 9.6 | 59.9 | 55.1 | 0 | 58 | ||||
| 91 | WFB | Bell Plaza | AZ | Retail | 2,297,166 | 0.2 | 2,099,863 | 10.3 | 25,824 | 89 | 1.63 | 10.8 | 62.1 | 56.8 | 0 | 59 | ||||
| 95 | CIIICM | Cahaba Mobile Home Estates | AL | Manufactured Housing Community | 1,871,375 | 0.2 | 1,748,302 | 8.6 | 157 | 11,920 | 1.69 | 12.3 | 72.8 | 68.0 | 0 | 58 | ||||
| Total/Weighted Average | $19,495,893 | 2.0% | $18,406,884 | 90.7% | 1.60x | 9.9% | 60.3% | 56.9% | 16 | 58 | ||||||||||
| (1) | The table above presents the mortgage loan(s) whose balloon payments would be applied to pay down the principal balance of the Class A-2 Certificates, assuming a 0% CPR and applying the “Structuring Assumptions” described in the Free Writing Prospectus, including the assumptions that (i) none of the mortgage loans in the pool experience prepayments prior to maturity, defaults or losses; (ii) there are no extensions of maturity dates of any mortgage loans in the pool; and (iii) each mortgage loan in the pool is paid in full on its stated maturity date. Each Class of Certificates, including the Class A-2 Certificates, evidences undivided ownership interests in the entire pool of mortgage loans. Debt service coverage ratio, debt yield and loan-to-value ratio information take no account of subordinate debt (whether or not secured by the related mortgaged property), if any, that is allowed under the terms of any mortgage loan. See Annex A-1 to the Free Writing Prospectus. |
| (2) | Reflects the percentage equal to the Mortgage Loan Balance at Maturity divided by the initial Class A-2 Certificate Principal Balance. |
THE INFORMATION IN THIS STRUCTURAL AND COLLATERAL TERM SHEET IS NOT COMPLETE AND MAY BE AMENDED PRIOR TO THE TIME OF SALE. THIS TERM SHEET IS NOT AN OFFER TO SELL THESE SECURITIES AND IT IS NOT A SOLICITATION OF AN OFFER TO BUY THESE SECURITIES IN ANY JURISDICTION WHERE THE OFFER OR SALE IS NOT PERMITTED.
| 12 |
(THIS PAGE INTENTIONALLY LEFT BLANK)
THE INFORMATION IN THIS STRUCTURAL AND COLLATERAL TERM SHEET IS NOT COMPLETE AND MAY BE AMENDED PRIOR TO THE TIME OF SALE. THIS TERM SHEET IS NOT AN OFFER TO SELL THESE SECURITIES AND IT IS NOT A SOLICITATION OF AN OFFER TO BUY THESE SECURITIES IN ANY JURISDICTION WHERE THE OFFER OR SALE IS NOT PERMITTED.
| 13 |
| Wells Fargo Commercial Mortgage Trust 2015-C31 | Characteristics of the Mortgage Pool |
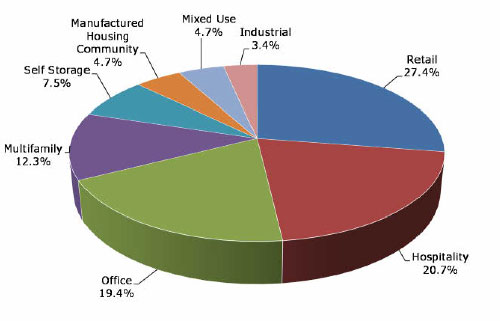
F. Property Type Distribution(1)
| Property Type | Number of Mortgaged Properties | Aggregate Cut-off Date Balance ($) | % of Cut- off Date Pool Balance (%) | Weighted Average Cut-off Date LTV Ratio (%) | Weighted Average Balloon LTV Ratio (%) | Weighted Average U/W NCF DSCR (x) | Weighted Average U/W NOI Debt Yield (%) | Weighted Average U/W NCF Debt Yield (%) | Weighted Average Mortgage Rate (%) |
| Retail | 33 | $271,021,056 | 27.4% | 68.2% | 58.7% | 1.50x | 9.8% | 9.0% | 4.606% |
| Anchored | 14 | 160,001,153 | 16.2 | 70.0 | 61.1 | 1.48 | 9.8 | 8.9 | 4.601 |
| Single Tenant | 9 | 50,710,005 | 5.1 | 66.4 | 55.8 | 1.37 | 9.0 | 8.7 | 4.670 |
| Regional Mall | 1 | 26,564,477 | 2.7 | 61.7 | 49.9 | 1.66 | 11.0 | 10.0 | 4.352 |
| Unanchored | 6 | 24,940,465 | 2.5 | 66.2 | 57.7 | 1.77 | 10.6 | 9.8 | 4.651 |
| Shadow Anchored | 3 | 8,804,957 | 0.9 | 71.9 | 60.6 | 1.41 | 10.0 | 9.2 | 4.976 |
| Hospitality | 14 | 204,877,721 | 20.7 | 65.3 | 55.7 | 1.76 | 12.8 | 11.3 | 4.817 |
| Limited Service | 12 | 132,877,721 | 13.4 | 66.1 | 53.4 | 1.82 | 13.2 | 11.8 | 4.728 |
| Full Service | 2 | 72,000,000 | 7.3 | 63.7 | 60.1 | 1.64 | 11.9 | 10.6 | 4.982 |
| Office | 11 | 191,383,333 | 19.4 | 60.6 | 57.9 | 2.04 | 10.3 | 9.3 | 4.416 |
| CBD | 4 | 153,450,000 | 15.5 | 58.4 | 58.1 | 2.21 | 10.2 | 9.3 | 4.254 |
| Suburban | 6 | 34,663,333 | 3.5 | 69.6 | 57.2 | 1.38 | 10.9 | 9.3 | 5.097 |
| Medical | 1 | 3,270,000 | 0.3 | 64.1 | 52.4 | 1.29 | 8.7 | 8.1 | 4.810 |
| Multifamily | 15 | 121,296,303 | 12.3 | 69.3 | 63.7 | 1.50 | 9.2 | 8.7 | 4.604 |
| Garden | 15 | 121,296,303 | 12.3 | 69.3 | 63.7 | 1.50 | 9.2 | 8.7 | 4.604 |
| Self Storage | 16 | 74,284,403 | 7.5 | 66.2 | 58.2 | 1.51 | 9.0 | 8.8 | 4.574 |
| Self Storage | 16 | 74,284,403 | 7.5 | 66.2 | 58.2 | 1.51 | 9.0 | 8.8 | 4.574 |
| Manufactured Housing Community | 21 | 46,304,310 | 4.7 | 70.4 | 57.7 | 1.53 | 10.2 | 9.9 | 4.972 |
| Manufactured Housing Community | 21 | 46,304,310 | 4.7 | 70.4 | 57.7 | 1.53 | 10.2 | 9.9 | 4.972 |
| Mixed Use | 4 | 46,034,254 | 4.7 | 70.1 | 61.7 | 1.55 | 10.7 | 9.5 | 4.584 |
| Industrial/Office/Retail | 1 | 26,000,000 | 2.6 | 70.3 | 64.1 | 1.73 | 11.9 | 10.3 | 4.300 |
| Office/Retail | 1 | 9,700,000 | 1.0 | 69.3 | 59.3 | 1.32 | 9.2 | 8.6 | 5.070 |
| Office/Industrial | 1 | 8,490,624 | 0.9 | 71.2 | 58.3 | 1.30 | 9.1 | 8.2 | 4.840 |
| Manufactured Housing Community/Retail | 1 | 1,843,630 | 0.2 | 67.2 | 55.2 | 1.37 | 8.9 | 8.7 | 4.860 |
| Industrial | 4 | 33,280,000 | 3.4 | 72.5 | 61.3 | 1.42 | 9.5 | 8.8 | 4.737 |
| Flex | 3 | 25,350,000 | 2.6 | 75.0 | 61.2 | 1.46 | 9.8 | 9.1 | 4.750 |
| Manufacturing | 1 | 7,930,000 | 0.8 | 64.6 | 61.6 | 1.29 | 8.6 | 8.0 | 4.695 |
| Total/Weighted Average: | 118 | $988,481,381 | 100.0% | 66.4% | 58.7% | 1.66x | 10.5% | 9.6% | 4.631% |
| (1) | Because this table presents information relating to the mortgaged properties and not the mortgage loans, (a) the information for mortgage loans secured by more than one mortgaged property (other than through cross-collateralization with other mortgage loans) is based on allocated amounts (allocating the mortgage loan principal balance to each of those properties according to the relative appraised values of the mortgaged properties or the allocated loan amounts or property-specific release prices set forth in the related mortgage loan documents or such other allocation as the related mortgage loan seller deemed appropriate), and (b) the information for each mortgaged property that relates to a mortgage loan that is cross-collateralized or cross-defaulted with other mortgage loans is based upon the principal balance of that mortgage loan, except that the applicable loan-to-value ratio, debt service coverage ratio and debt yield for each such mortgage loan is based upon the ratio or yield (as applicable) for the aggregate indebtedness evidenced by all loans in the group. On an individual basis, without regard to the cross-collateralization feature, any mortgage loan that is part of a cross-collateralized group of mortgage loans may have a higher loan-to-value ratio, lower debt service coverage ratio and/or lower debt yield than is presented herein. With respect to the Sheraton Lincoln Harbor Hotel mortgage loan, the CityPlace I mortgage loan, the 11 Madison Avenue mortgage loan, and the Patrick Henry Mall mortgage loan, each of which is part of a loan combination, the loan-to-value ratio, debt service coverage ratio and debt yield calculations include the relatedpari passu companion loans (unless otherwise stated). The debt service coverage ratio, debt yield and loan-to-value ratio information do not take into account any subordinate debt (whether or not secured by the related mortgaged property) that is allowed under the terms of any mortgage loan. See Annex A-1 to the Free Writing Prospectus. |
THE INFORMATION IN THIS STRUCTURAL AND COLLATERAL TERM SHEET IS NOT COMPLETE AND MAY BE AMENDED PRIOR TO THE TIME OF SALE. THIS TERM SHEET IS NOT AN OFFER TO SELL THESE SECURITIES AND IT IS NOT A SOLICITATION OF AN OFFER TO BUY THESE SECURITIES IN ANY JURISDICTION WHERE THE OFFER OR SALE IS NOT PERMITTED.
| 14 |
| Wells Fargo Commercial Mortgage Trust 2015-C31 | Characteristics of the Mortgage Pool |
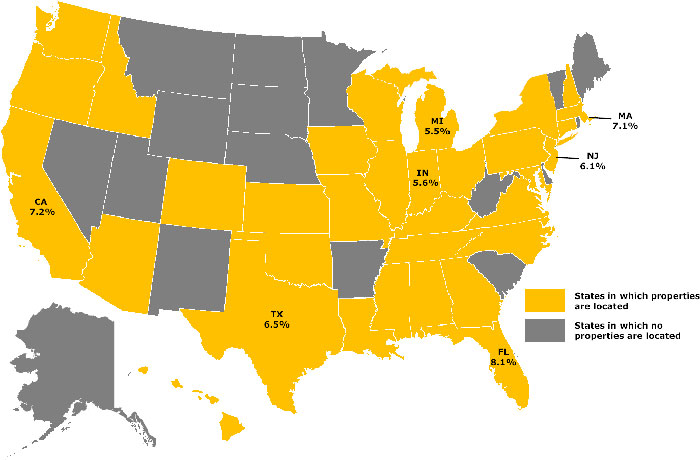
G. Geographic Distribution(1)(2)
Location | Number of Mortgaged Properties | Aggregate Cut- off Date Balance ($) | % of Cut-off Date Pool Balance (%) | Weighted Average Cut-off Date LTV Ratio (%) | Weighted Average Balloon LTV Ratio (%) | Weighted Average U/W NCF DSCR (x) | Weighted Average U/W NOI Debt Yield (%) | Weighted Average U/W NCF Debt Yield (%) | Weighted Average Mortgage Rate (%) | |
| Florida | 8 | $79,724,294 | 8.1% | 67.1% | 60.2% | 1.79x | 11.3% | 10.2% | 4.571% | |
| California | 7 | 70,745,221 | 7.2 | 65.1 | 59.5 | 1.63 | 9.5 | 9.0 | 4.694 | |
| Northern California | 4 | 47,378,027 | 4.8 | 65.0 | 60.4 | 1.74 | 9.3 | 9.0 | 4.568 | |
| Southern California | 3 | 23,367,194 | 2.4 | 65.4 | 57.6 | 1.42 | 10.0 | 9.1 | 4.948 | |
| Massachusetts | 1 | 70,000,000 | 7.1 | 61.0 | 61.0 | 1.79 | 8.1 | 7.6 | 4.170 | |
| Texas | 10 | 63,792,651 | 6.5 | 70.5 | 62.1 | 1.39 | 9.3 | 8.7 | 4.722 | |
| New Jersey | 1 | 60,000,000 | 6.1 | 62.5 | 60.7 | 1.60 | 11.5 | 10.3 | 4.990 | |
| Indiana | 7 | 55,409,000 | 5.6 | 73.0 | 63.2 | 1.46 | 9.9 | 9.0 | 4.666 | |
| Michigan | 11 | 54,793,969 | 5.5 | 73.1 | 60.8 | 1.45 | 9.8 | 9.1 | 4.781 | |
| Other(3) | 73 | 534,016,246 | 54.0 | 65.8 | 56.7 | 1.71 | 10.9 | 9.9 | 4.622 | |
| Total/Weighted Average | 118 | $988,481,381 | 100.0% | 66.4% | 58.7% | 1.66x | 10.5% | 9.6% | 4.631% | |
| (1) | The mortgaged properties are located in 33 states. |
| (2) | Because this table presents information relating to the mortgaged properties and not the mortgage loans, (a) the information for mortgage loans secured by more than one mortgaged property (other than through cross-collateralization with other mortgage loans) is based on allocated amounts (allocating the mortgage loan principal balance to each of those properties according to the relative appraised values of the mortgaged properties or the allocated loan amounts or property-specific release prices set forth in the related mortgage loan documents or such other allocation as the related mortgage loan seller deemed appropriate), and (b) the information for each mortgaged property that relates to a mortgage loan that is cross-collateralized or cross-defaulted with other mortgage loans is based upon the principal balance of that mortgage loan, except that the applicable loan-to-value ratio, debt service coverage ratio and debt yield for each such mortgage loan is based upon the ratio or yield (as applicable) for the aggregate indebtedness evidenced by all loans in the group. On an individual basis, without regard to the cross-collateralization feature, any mortgage loan that is part of a cross-collateralized group of mortgage loans may have a higher loan-to-value ratio, lower debt service coverage ratio and/or lower debt yield than is presented herein. With respect to the Sheraton Lincoln Harbor Hotel mortgage loan, the CityPlace I mortgage loan, the 11 Madison Avenue mortgage loan, and the Patrick Henry Mall mortgage loan, each of which is part of a loan combination, the loan-to-value ratio, debt service coverage ratio and debt yield calculations include the relatedpari passu companion loans (unless otherwise stated). The debt service coverage ratio, debt yield and loan-to-value ratio information do not take into account any subordinate debt (whether or not secured by the related mortgaged property), that is allowed under the terms of any mortgage loan. See Annex A-1 to the Free Writing Prospectus. |
| (3) | Includes 26 other states. |
THE INFORMATION IN THIS STRUCTURAL AND COLLATERAL TERM SHEET IS NOT COMPLETE AND MAY BE AMENDED PRIOR TO THE TIME OF SALE. THIS TERM SHEET IS NOT AN OFFER TO SELL THESE SECURITIES AND IT IS NOT A SOLICITATION OF AN OFFER TO BUY THESE SECURITIES IN ANY JURISDICTION WHERE THE OFFER OR SALE IS NOT PERMITTED.
| 15 |
| Wells Fargo Commercial Mortgage Trust 2015-C31 | Characteristics of the Mortgage Pool |
H. Characteristics of the Mortgage Pool(1)
| CUT-OFF DATE BALANCE | ||||||
| Range of Cut-off Date Balances ($) | Number of Mortgage Loans | Aggregate Cut- off Date Balance | % of Cut-off Date Pool Balance | |||
| 1,198,704 - 2,000,000 | 10 | $15,703,432 | 1.6% | |||
| 2,000,001 - 3,000,000 | 9 | 22,414,964 | 2.3 | |||
| 3,000,001 - 4,000,000 | 13 | 44,912,765 | 4.5 | |||
| 4,000,001 - 5,000,000 | 14 | 64,019,863 | 6.5 | |||
| 5,000,001 - 6,000,000 | 9 | 50,877,500 | 5.1 | |||
| 6,000,001 - 7,000,000 | 5 | 32,918,000 | 3.3 | |||
| 7,000,001 - 8,000,000 | 5 | 38,127,727 | 3.9 | |||
| 8,000,001 - 9,000,000 | 4 | 34,054,703 | 3.4 | |||
| 9,000,001 - 10,000,000 | 6 | 57,393,984 | 5.8 | |||
| 10,000,001 - 15,000,000 | 9 | 107,813,966 | 10.9 | |||
| 15,000,001 - 20,000,000 | 5 | 84,525,000 | 8.6 | |||
| 20,000,001 - 30,000,000 | 8 | 197,594,477 | 20.0 | |||
| 30,000,001 - 50,000,000 | 3 | 108,125,000 | 10.9 | |||
| 50,000,001 - 70,000,000 | 2 | 130,000,000 | 13.2 | |||
| Total: | 102 | $988,481,381 | 100.0% | |||
| Average: | $9,690,994 | |||||
UNDERWRITTEN NOI DEBT SERVICE COVERAGE RATIO | ||||||
| Range of U/W NOI DSCRs (x) | Number of Mortgage Loans | Aggregate Cut- off Date Balance | % of Cut-off Date Pool Balance | |||
| 1.27 - 1.30 | 2 | $11,070,947 | 1.1% | |||
| 1.31 - 1.40 | 17 | 130,840,705 | 13.2 | |||
| 1.41 - 1.50 | 20 | 132,567,876 | 13.4 | |||
| 1.51 - 1.60 | 16 | 121,354,446 | 12.3 | |||
| 1.61 - 1.70 | 11 | 66,399,410 | 6.7 | |||
| 1.71 - 1.80 | 5 | 109,056,375 | 11.0 | |||
| 1.81 - 1.90 | 7 | 160,450,145 | 16.2 | |||
| 1.91 - 2.00 | 5 | 31,449,687 | 3.2 | |||
| 2.01 - 2.25 | 14 | 171,326,788 | 17.3 | |||
| 2.26 - 2.50 | 2 | 9,000,000 | 0.9 | |||
| 2.76 - 3.00 | 1 | 9,465,003 | 1.0 | |||
| 3.01 - 3.50 | 1 | 5,000,000 | 0.5 | |||
| 3.51 - 3.97 | 1 | 30,500,000 | 3.1 | |||
| Total: | 102 | $988,481,381 | 100.0% | |||
| Weighted Average: | 1.81x | |||||
UNDERWRITTEN NCF DEBT SERVICE COVERAGE RATIO | ||||||
| Range of U/W NCF DSCRs (x) | Number of Mortgage Loans | Aggregate Cut- off Date Balance | % of Cut-off Date Pool Balance | |||
| 1.25 - 1.30 | 10 | $97,516,571 | 9.9% | |||
| 1.31 - 1.40 | 30 | 210,699,712 | 21.3 | |||
| 1.41 - 1.50 | 20 | 141,457,291 | 14.3 | |||
| 1.51 - 1.60 | 8 | 100,159,098 | 10.1 | |||
| 1.61 - 1.70 | 9 | 96,612,830 | 9.8 | |||
| 1.71 - 1.80 | 5 | 115,588,250 | 11.7 | |||
| 1.81 - 1.90 | 9 | 137,551,061 | 13.9 | |||
| 1.91 - 2.00 | 5 | 32,131,566 | 3.3 | |||
| 2.01 - 2.25 | 2 | 7,400,000 | 0.7 | |||
| 2.26 - 2.50 | 1 | 4,400,000 | 0.4 | |||
| 2.51 - 2.75 | 1 | 9,465,003 | 1.0 | |||
| 3.01 - 3.50 | 1 | 5,000,000 | 0.5 | |||
| 3.51 - 3.89 | 1 | 30,500,000 | 3.1 | |||
| Total: | 102 | $988,481,381 | 100.0% | |||
| Weighted Average: | 1.66x | |||||
| LOAN PURPOSE | |||
| Loan Purpose | Number of Mortgage Loans | Aggregate Cut- off Date Balance | % of Cut-off Date Pool Balance |
| Refinance | 69 | $595,007,991 | 60.2% |
| Acquisition | 33 | 393,473,390 | 39.8 |
| Total: | 102 | $988,481,381 | 100.0% |
| MORTGAGE RATE | |||
| Range of Mortgage Rates (%) | Number of Mortgage Loans | Aggregate Cut- off Date Balance | % of Cut-off Date Pool Balance |
| 3.560 - 3.750 | 1 | $30,500,000 | 3.1% |
| 4.001 - 4.250 | 3 | 89,475,436 | 9.1 |
| 4.251 - 4.500 | 14 | 158,613,668 | 16.0 |
| 4.501 - 4.750 | 40 | 390,090,354 | 39.5 |
| 4.751 - 5.000 | 32 | 251,590,495 | 25.5 |
| 5.001 - 5.250 | 9 | 45,089,294 | 4.6 |
| 5.251 - 5.500 | 1 | 5,500,759 | 0.6 |
| 5.501 - 5.750 | 2 | 17,621,375 | 1.8 |
| Total: | 102 | $988,481,381 | 100.0% |
| Weighted Average: | 4.631% | ||
| UNDERWRITTEN NOI DEBT YIELD | |||
| Range of U/W NOI Debt Yields (%) | Number of Mortgage Loans | Aggregate Cut- off Date Balance | % of Cut-off Date Pool Balance |
| 7.9 - 8.0 | 2 | $26,495,748 | 2.7% |
| 8.1 - 9.0 | 30 | 281,068,242 | 28.4 |
| 9.1 - 10.0 | 22 | 172,256,659 | 17.4 |
| 10.1 - 11.0 | 18 | 158,707,772 | 16.1 |
| 11.1 - 12.0 | 11 | 194,474,390 | 19.7 |
| 12.1 - 13.0 | 4 | 42,915,725 | 4.3 |
| 13.1 - 14.0 | 6 | 31,616,278 | 3.2 |
| 14.1 - 15.0 | 6 | 61,881,566 | 6.3 |
| 15.1 - 16.0 | 1 | 5,000,000 | 0.5 |
| 17.1 - 17.9 | 2 | 14,065,003 | 1.4 |
| Total: | 102 | $988,481,381 | 100.0% |
| Weighted Average: | 10.5% | ||
| UNDERWRITTEN NCF DEBT YIELD | |||
| Range of U/W NCF Debt Yields (%) | Number of Mortgage Loans | Aggregate Cut- off Date Balance | % of Cut-off Date Pool Balance |
| 7.6 - 8.0 | 11 | $182,112,748 | 18.4% |
| 8.1 - 9.0 | 38 | 302,094,397 | 30.6 |
| 9.1 - 10.0 | 23 | 209,774,965 | 21.2 |
| 10.1 - 11.0 | 11 | 133,426,169 | 13.5 |
| 11.1 - 12.0 | 9 | 84,785,478 | 8.6 |
| 12.1 - 13.0 | 3 | 14,382,287 | 1.5 |
| 13.1 - 14.0 | 3 | 12,340,335 | 1.2 |
| 14.1 - 15.0 | 2 | 35,500,000 | 3.6 |
| 15.1 - 16.0 | 1 | 4,600,000 | 0.5 |
| 16.1 - 16.2 | 1 | 9,465,003 | 1.0 |
| Total: | 102 | $988,481,381 | 100.0% |
| Weighted Average: | 9.6% | ||
(1) Information regarding mortgage loans that are cross-collateralized or cross-defaulted with other mortgage loans is based upon the individual loan balances, except that the applicable loan-to-value ratio, debt service coverage ratio and debt yield for each such mortgage loan is based upon the ratio or yield (as applicable) for the aggregate indebtedness evidenced by all loans in the group. On an individual basis, without regard to the cross-collateralization feature, any mortgage loan that is part of a cross-collateralized group of mortgage loans may have a higher loan-to-value ratio, lower debt service coverage ratio and/or lower debt yield than is presented herein. With respect to the Sheraton Lincoln Harbor Hotel mortgage loan, the CityPlace I mortgage loan, the 11 Madison Avenue mortgage loan, and the Patrick Henry Mall mortgage loan, each which are part of a loan combination, loan-to-value ratio, debt service coverage ratio and debt yield calculations include the relatedpari passu companion loans (unless otherwise stated). The debt service coverage ratio, debt yield and loan-to-value ratio information do not take into account any subordinate debt (whether or not secured by the related mortgaged property), that is allowed under the terms of any mortgage loan. See Annex A-1 to the Free Writing Prospectus. Prepayment provisions for each mortgage loan reflects the entire life of the loan (from origination to maturity). |
THE INFORMATION IN THIS STRUCTURAL AND COLLATERAL TERM SHEET IS NOT COMPLETE AND MAY BE AMENDED PRIOR TO THE TIME OF SALE. THIS TERM SHEET IS NOT AN OFFER TO SELL THESE SECURITIES AND IT IS NOT A SOLICITATION OF AN OFFER TO BUY THESE SECURITIES IN ANY JURISDICTION WHERE THE OFFER OR SALE IS NOT PERMITTED.
| 16 |
| Wells Fargo Commercial Mortgage Trust 2015-C31 | Characteristics of the Mortgage Pool |
| ORIGINAL TERM TO MATURITY | |||
| Original Terms to Maturity (months) | Number of Mortgage Loans | Aggregate Cut- off Date Balance | % of Cut-off Date Pool Balance |
| 60 | 6 | $19,495,893 | 2.0% |
| 120 | 95 | 964,507,611 | 97.6 |
| 132 | 1 | 4,477,877 | 0.5 |
| Total: | 102 | $988,481,381 | 100.0% |
| Weighted Average: | 119 months | ||
| REMAINING TERM TO MATURITY | |||
| Range of Remaining Terms to Maturity (months) | Number of Mortgage Loans | Aggregate Cut- off Date Balance | % of Cut-off Date Pool Balance |
| 58 - 60 | 6 | $19,495,893 | 2.0% |
| 61 - 120 | 95 | 964,507,611 | 97.6 |
| 130 | 1 | 4,477,877 | 0.5 |
| Total: | 102 | $988,481,381 | 100.0% |
| Weighted Average: | 117 months | ||
| ORIGINAL AMORTIZATION TERM(2) | |||
| Range of Original Amortization Terms (months) | Number of Mortgage Loans | Aggregate Cut- off Date Balance | % of Cut-off Date Pool Balance |
| Non-Amortizing | 9 | $202,810,000 | 20.5% |
| 240 | 2 | 14,953,725 | 1.5 |
| 241 - 300 | 9 | 55,975,686 | 5.7 |
| 301 - 360 | 82 | 714,741,969 | 72.3 |
| Total: | 102 | $988,481,381 | 100.0% |
| Weighted Average(3): | 353 months | ||
| (2) | The original amortization term shown for any mortgage loan that is interest-only for part of its term does not include the number of months in its interest-only period and reflects only the number of months as of the commencement of amortization remaining from the end of such interest-only period. | |
| (3) | Excludes the non-amortizing mortgage loans. |
| REMAINING AMORTIZATION TERM(4) | |||
| Range of Remaining Amortization Terms (months) | Number of Mortgage Loans | Aggregate Cut- off Date Balance | % of Cut-off Date Pool Balance |
| Non-Amortizing | 9 | $202,810,000 | 20.5% |
| 238 - 240 | 2 | 14,953,725 | 1.5 |
| 241 - 300 | 9 | 55,975,686 | 5.7 |
| 301 - 360 | 82 | 714,741,969 | 72.3 |
| Total: | 102 | $988,481,381 | 100.0% |
| Weighted Average(5): | 352 months | ||
| (4) | The remaining amortization term shown for any mortgage loan that is interest-only for part of its term does not include the number of months in its interest-only period and reflects only the number of months as of the commencement of amortization remaining from the end of such interest-only period. |
| (5) | Excludes the non-amortizing mortgage loans. |
| LOCKBOXES | ||||
| Type of Lockbox | Number of Mortgage Loans | Aggregate Cut- off Date Balance | % of Cut-off Date Pool Balance | |
| Springing | 71 | $493,935,420 | 50.0% | |
| Hard/Springing Cash Management | 21 | 391,039,039 | 39.6 | |
| None | 7 | 52,829,569 | 5.3 | |
| Hard/Upfront Cash Management | 3 | 50,677,353 | 5.1 | |
| Total: | 102 | $988,481,381 | 100.0% | |
| PREPAYMENT PROVISION SUMMARY | ||||
| Prepayment Provision | Number of Mortgage Loans | Aggregate Cut- off Date Balance | % of Cut-off Date Pool Balance | |
| Lockout/Defeasance/Open | 92 | $902,233,035 | 91.3% | |
| Lockout/GTR YM or 1%/Open | 8 | 50,910,943 | 5.2 | |
| Lockout/GTR YM or 2%/Open | 1 | 25,350,000 | 2.6 | |
| Lockout/GTR YM or 1% or Defeasance/Open | 1 | 9,987,403 | 1.0 | |
| Total: | 102 | $988,481,381 | 100.0% | |
| CUT-OFF DATE LOAN-TO-VALUE RATIO | |||
| Range of Cut-off Date LTV Ratios (%) | Number of Mortgage Loans | Aggregate Cut- off Date Balance | % of Cut-off Date Pool Balance |
| 32.5 - 35.0 | 1 | $30,500,000 | 3.1% |
| 40.1 - 45.0 | 1 | $5,000,000 | 0.5 |
| 50.1 - 55.0 | 6 | 32,083,475 | 3.2 |
| 55.1 - 60.0 | 7 | 39,973,083 | 4.0 |
| 60.1 - 65.0 | 16 | 241,808,547 | 24.5 |
| 65.1 - 70.0 | 32 | 283,881,625 | 28.7 |
| 70.1 - 75.0 | 39 | 355,234,652 | 35.9 |
| Total: | 102 | $988,481,381 | 100.0% |
| Weighted Average | 66.4% | ||
| BALLOON LOAN-TO-VALUE RATIO | |||
| Range of Balloon LTV Ratios (%) | Number of Mortgage Loans | Aggregate Cut- off Date Balance | % of Cut-off Date Pool Balance |
| 29.7 - 30.0 | 1 | $4,477,877 | 0.5% |
| 30.1 - 35.0 | 1 | 30,500,000 | 3.1 |
| 35.1 - 40.0 | 1 | 10,475,848 | 1.1 |
| 40.1 - 45.0 | 5 | 24,486,654 | 2.5 |
| 45.1 - 50.0 | 11 | 86,468,847 | 8.7 |
| 50.1 - 55.0 | 12 | 70,302,533 | 7.1 |
| 55.1 - 60.0 | 33 | 241,819,095 | 24.5 |
| 60.1 - 65.0 | 17 | 281,022,652 | 28.4 |
| 65.1 - 69.2 | 21 | 238,927,875 | 24.2 |
| Total: | 102 | $988,481,381 | 100.0% |
| Weighted Average | 58.7% | ||
| AMORTIZATION TYPE | |||||
| Type of Amortization | Number of Mortgage Loans | Aggregate Cut- off Date Balance | % of Cut-off Date Pool Balance | ||
| Interest-only, Amortizing Balloon | 42 | $449,589,500 | 45.5% | ||
| Amortizing Balloon | 51 | 336,081,881 | 34.0 | ||
| Interest-only, Balloon | 9 | 202,810,000 | 20.5 | ||
| Total: | 102 | $988,481,381 | 100.0% | ||
ORIGINAL TERM OF INTEREST-ONLY PERIOD FOR PARTIAL IO LOANS | |||||
| IO Term (months) | Number of Mortgage Loans | Aggregate Cut- off Date Balance | % of Cut-off Date Pool Balance | ||
| 12 | 5 | $35,727,000 | 3.6% | ||
| 18 | 1 | 9,700,000 | 1.0 | ||
| 24 | 6 | 68,970,000 | 7.0 | ||
| 36 | 15 | 97,759,500 | 9.9 | ||
| 37 | 1 | 6,318,000 | 0.6 | ||
| 48 | 3 | 34,100,000 | 3.4 | ||
| 60 | 6 | 92,680,000 | 9.4 | ||
| 61 | 1 | 13,400,000 | 1.4 | ||
| 84 | 3 | 30,935,000 | 3.1 | ||
| 96 | 1 | 60,000,000 | 6.1 | ||
| Total: | 42 | $449,589,500 | 45.5% | ||
| Weighted Average | 50 months | ||||
SEASONING | |||||
| Seasoning (months) | Number of Mortgage Loans | Aggregate Cut- off Date Balance | % of Cut-off Date Pool Balance | ||
| 0 | 23 | $203,674,500 | 20.6% | ||
| 1 | 38 | 370,842,582 | 37.5 | ||
| 2 | 21 | 191,850,769 | 19.4 | ||
| 3 | 18 | 166,429,052 | 16.8 | ||
| 4 | 2 | 55,684,477 | 5.6 | ||
| Total: | 102 | $988,481,381 | 100.0% | ||
| Weighted Average | 1 months | ||||
THE INFORMATION IN THIS STRUCTURAL AND COLLATERAL TERM SHEET IS NOT COMPLETE AND MAY BE AMENDED PRIOR TO THE TIME OF SALE. THIS TERM SHEET IS NOT AN OFFER TO SELL THESE SECURITIES AND IT IS NOT A SOLICITATION OF AN OFFER TO BUY THESE SECURITIES IN ANY JURISDICTION WHERE THE OFFER OR SALE IS NOT PERMITTED.
| 17 |
| Wells Fargo Commercial Mortgage Trust 2015-C31 | Certain Terms and Conditions |
V. Certain Terms and Conditions
| Interest Entitlements: | The interest entitlement of each Class of Offered Certificates on each Distribution Date generally will be the interest accrued during the related Interest Accrual Period on the related Certificate Principal Balance or Notional Amount at the related pass-through rate, net of any prepayment interest shortfalls allocated to that Class for such Distribution Date as described below. If prepayment interest shortfalls arise from voluntary prepayments (without Special Servicer consent) on particular non-specially serviced mortgage loans during any collection period, the Master Servicer is required to make a compensating interest payment to offset those shortfalls, generally up to an amount equal to the portion of its master servicing fees that accrue at 0.25 basis pointsper annum. The remaining amount of prepayment interest shortfalls will be allocated to reduce the interest entitlement on all Classes of Certificates (other than the Class X-A, X-B and X-D Certificates),pro rata, based on their respective amounts of accrued interest for the related Distribution Date (except with respect to the allocation among the Class A-S, B, C and PEX Certificates as described below under “Allocations and Distributions on the Class A-S, B, C and PEX Certificates”). If a Class receives less than the entirety of its interest entitlement on any Distribution Date, then the shortfall, excluding any shortfall due to prepayment interest shortfalls, will be added to its interest entitlement for the next succeeding Distribution Date. Interest entitlements on the Class D Certificates and the Class C and B regular interests, in that order, may be reduced by certain Trust Advisor expenses (subject to the discussion below under “Allocations and Distributions on the Class A-S, B, C and PEX Certificates”). | |
| Principal Distribution Amount: | The Principal Distribution Amount for each Distribution Date generally will be the aggregate amount of principal received or advanced in respect of the mortgage loans, net of any non-recoverable advances and interest thereon that are reimbursed to the applicable Master Servicer, the applicable Special Servicer or the Trustee during the related collection period. Non-recoverable advances and interest thereon are reimbursable from principal collections and advances before reimbursement from other amounts. The Principal Distribution Amount may also be reduced, with a corresponding loss, to the Class D Certificates and the Class C, B and A-S regular interests, then to the Class A-1, A-2, A-3, A-4 and A-SB Certificates and Class A-4FX regular interest (with any losses on the Class A-1, A-2, A-3, A-4 and A-SB Certificates and Class A-4FX regular interest allocatedpro rataaccording to their respective Certificate Principal Balances immediately prior to that Distribution Date), in that order, in connection with certain Trust Advisor expenses to the extent that interest entitlements on the Class B and C regular interests and the Class D Certificates are insufficient to absorb the effect of the expense on any particular Distribution Date. For a discussion on the allocation of amounts distributable in respect of the Class A-S, B and C regular interests, see “Allocations and Distributions on the Class A-S, B, C and PEX Certificates” below. | |
| Distributions: | On each Distribution Date, funds available for distribution from the mortgage loans, net of specified trust fees, expenses and reimbursements will generally be distributed in the following amounts and order of priority (in each case to the extent of remaining available funds): |
| 1. | Class A-1, A-2, A-3, A-4, A-SB, X-A, X-B and X-D Certificates and Class A-4FX regular interest: To interest on the Class A-1, A-2, A-3, A-4, A-SB, X-A, X-B and X-D Certificates and the Class A-4FX regular interest,pro rata, according to their respective interest entitlements. | ||
| 2. | Class A-1, A-2, A-3, A-4 and A-SB Certificates and Class A-4FX regular interest: To principal on the Class A-1, A-2, A-3, A-4 and A-SB Certificates and the Class A-4FX regular interest in the following amounts and order of priority: (i) first, to principal on the Class A-SB Certificates, in an amount up to the Principal Distribution Amount for such Distribution Date until their Certificate Principal Balance is reduced to the Class A-SB Planned Principal Balance for such Distribution Date; (ii) second, to principal on the Class A-1 Certificates until their Certificate Principal Balance is reduced to zero, up to the remainder of the Principal Distribution Amount for such Distribution Date; (iii) third, to principal on the Class A-2 Certificates until their Certificate Principal Balance is reduced to zero, up to the remainder of the Principal Distribution Amount for such Distribution Date; (iv) fourth, to principal on the Class A-3 Certificates until their Certificate Principal Balance is reduced to zero, up to the remainder of the Principal Distribution Amount for such Distribution Date; (v) fifth, on apro rata basis, to principal on the Class A-4 Certificates and the Class A-4FX regular interest until their respective Certificate Principal Balances are reduced to zero, up to the remainder of the Principal Distribution Amount for such Distribution Date; and (vi) sixth, to principal on the Class A-SB Certificates until their Certificate Principal Balance is reduced to zero, up to the remainder of the Principal Distribution Amount for such Distribution Date. However, if the Certificate Principal Balance of each and every Class of Principal Balance Certificates, other than the Class A-1, A-2, A-3, A-4 and A-SB Certificates and the Class A-4FX regular interest, has been |
THE INFORMATION IN THIS STRUCTURAL AND COLLATERAL TERM SHEET IS NOT COMPLETE AND MAY BE AMENDED PRIOR TO THE TIME OF SALE. THIS TERM SHEET IS NOT AN OFFER TO SELL THESE SECURITIES AND IT IS NOT A SOLICITATION OF AN OFFER TO BUY THESE SECURITIES IN ANY JURISDICTION WHERE THE OFFER OR SALE IS NOT PERMITTED.
| 18 |
| Wells Fargo Commercial Mortgage Trust 2015-C31 | Certain Terms and Conditions |
| reduced to zero as a result of the allocation of Mortgage Loan losses and expenses and any of the Class A-1, A-2, A-3, A-4 and A-SB Certificates and Class A-4FX regular interest remains outstanding, then the Principal Distribution Amount will be distributed on the Class A-1, A-2, A-3, A-4 and A-SB Certificates and the Class A-4FX regular interest,pro rata, based on their respective outstanding Certificate Principal Balances, until their Certificate Principal Balances have been reduced to zero. | |||
| 3. | Class A-1, A-2, A-3, A-4 and A-SB Certificates and Class A-4FX regular interest: To reimburse the holders of the Class A-1, A-2, A-3, A-4 and A-SB Certificates and the Class A-4FX regular interest,pro rata, for any previously unreimbursed losses (other than certain Trust Advisor expenses) on the mortgage loans that were previously allocated in reduction of the Certificate Principal Balances of such Classes. | ||
| 4. | Class A-S regular interest: To make distributions on the Class A-S regular interest as follows: (a) first, to interest on the Class A-S regular interest in the amount of the interest entitlement for that Class; (b) next, to the extent of the portion of the Principal Distribution Amount remaining after distributions in respect of principal to each Class with a higher distribution priority (in this case, the Class A-1, A-2, A-3, A-4 and A-SB Certificates and the Class A-4FX regular interest), to principal on the Class A-S regular interest until its principal balance is reduced to zero; and (c) next, to reimburse the holders of the Class A-S regular interest for any previously unreimbursed losses (other than certain Trust Advisor expenses) on the mortgage loans that were previously allocated to that Class in reduction of its principal balance. | ||
| 5. | Class B regular interest: To make distributions on the Class B regular interest as follows: (a) first, to interest on the Class B regular interest in the amount of the interest entitlement for that Class; (b) next, to the extent of the portion of the Principal Distribution Amount remaining after distributions in respect of principal to each Class with a higher distribution priority (in this case, the Class A-1, A-2, A-3, A-4 and A-SB Certificates and the Class A-4FX and A-S regular interests), to principal on the Class B regular interest until its principal balance is reduced to zero; and (c) next, to reimburse the holders of the Class B regular interest for any previously unreimbursed losses (other than certain Trust Advisor expenses) on the mortgage loans that were previously allocated to that Class in reduction of its principal balance. | ||
| 6. | Class C regular interest: To make distributions on the Class C regular interest as follows: (a) first, to interest on the Class C regular interest in the amount of the interest entitlement for that Class; (b) next, to the extent of the portion of the Principal Distribution Amount remaining after distributions in respect of principal to each Class with a higher distribution priority (in this case, the Class A-1, A-2, A-3, A-4 and A-SB Certificates and the Class A-4FX, A-S and B regular interests), to principal on the Class C regular interest until its principal balance is reduced to zero; and (c) next, to reimburse the holders of the Class C regular interest for any previously unreimbursed losses (other than certain Trust Advisor expenses) on the mortgage loans that were previously allocated to that Class in reduction of its principal balance. | ||
| 7. | Class D Certificates: To make distributions on the Class D Certificates as follows: (a) first, to interest on the Class D Certificates in the amount of the interest entitlement for that Class; (b) next, to the extent of the portion of the Principal Distribution Amount remaining after distributions in respect of principal to each Class with a higher distribution priority (in this case, the Class A-1, A-2, A-3, A-4 and A-SB Certificates and the Class A-4FX, A-S, B and C regular interests), to principal on the Class D Certificates until its principal balance is reduced to zero; and (c) next, to reimburse the holders of the Class D Certificates for any previously unreimbursed losses (other than certain Trust Advisor expenses) on the mortgage loans that were previously allocated to that Class in reduction of its principal balance. | ||
| 8. | After the Class A-1, A-2, A-3, A-4 and A-SB Certificates, the Class A-4FX, A-S, B and C regular interests and the Class D Certificates are paid all amounts to which they are entitled, the remaining funds available for distribution will be used to pay interest, principal and loss reimbursement amounts (other than certain Trust Advisor expenses) on the Class E, F and G Certificates sequentially in that order in a manner analogous to the Class D Certificates. |
THE INFORMATION IN THIS STRUCTURAL AND COLLATERAL TERM SHEET IS NOT COMPLETE AND MAY BE AMENDED PRIOR TO THE TIME OF SALE. THIS TERM SHEET IS NOT AN OFFER TO SELL THESE SECURITIES AND IT IS NOT A SOLICITATION OF AN OFFER TO BUY THESE SECURITIES IN ANY JURISDICTION WHERE THE OFFER OR SALE IS NOT PERMITTED.
| 19 |
| Wells Fargo Commercial Mortgage Trust 2015-C31 | Certain Terms and Conditions |
| Allocations and Distributions on the Class A-S, B, C and PEX Certificates: | On the closing date, the upper-tier REMIC of the issuing entity will issue the Class A-S, Class B and Class C regular interests (each a “regular interest”) which will have outstanding principal balances on the closing date of $49,425,000, $60,544,000 and $46,953,000 respectively. The regular interests will be held in a grantor trust for the benefit of the holders of the Class A-S, B, C and PEX Certificates. The Class A-S, B, C and PEX Certificates will, at all times, represent undivided beneficial ownership interests in a grantor trust that will hold those regular interests. Each class of the Class A-S, B and C Certificates will, at all times, represent an undivided beneficial ownership interest in a percentage of the outstanding principal balance of the regular interest with the same alphabetical class designation. The Class PEX Certificates will, at all times, represent an undivided beneficial ownership interest in the remaining percentages of the outstanding principal balances of the Class A-S, B and C regular interests and which percentage interests are referred to in this Term Sheet as the “Class PEX Component A-S”, “Class PEX Component B” and “Class PEX Component C”, respectively (collectively, the “Class PEX Components”).
Interest, principal, prepayment premiums, yield maintenance charges and voting rights that are allocated to the Class A-S, B or C regular interest will be distributed or allocated, as applicable, as between the Class A-S, B or C Certificates, as applicable, on the one hand, and Class PEX Component A-S, Class PEX Component B or Class PEX Component C, as applicable (and correspondingly, the Class PEX Certificates), on the other hand,pro rata, based on their respective percentage interests in the Class A-S, Class B or Class C regular interest, as applicable. In addition, any losses (including, without limitation, as a result of Trust Advisor expenses) that are allocated to the Class A-S, Class B or Class C regular interest will correspondingly be allocated as between the Class A-S, B or C Certificates, as applicable, on the one hand, and Class PEX Component A-S, Class PEX Component B or Class PEX Component C, as applicable (and correspondingly, the Class PEX Certificates), on the other hand,pro rata, based on their respective percentage interests in the Class A-S, Class B or Class C regular interest, as applicable. For a complete description of the allocations and distributions with respect to the Class A-S regular interest, the Class B regular interest and the Class C regular interest (and correspondingly the Class A-S, B, C and PEX Certificates and the Class PEX Component A-S, Class PEX Component B and Class PEX Component C), see “Description of the Offered Certificates” in the Free Writing Prospectus. See “Material Federal Income Tax Consequences” in the Free Writing Prospectus for a discussion of the tax treatment of the Exchangeable Certificates.
| |
Exchanging Certificates through Combination and Recombination:
| If you own Class A-S, B and C Certificates, you will be able to exchange them for a proportionate interest in the Class PEX Certificates, and vice versa, as described in the Free Writing Prospectus. You can exchange your Exchangeable Certificates by notifying the Certificate Administrator. If Exchangeable Certificates are outstanding and held by certificateholders, those certificates will receive principal and interest that would otherwise have been payable on the same proportion of certificates exchanged therefor if those certificates were outstanding and held by certificateholders. Any such allocations of principal and interest between classes of Exchangeable Certificates will have no effect on the principal or interest entitlements of any other class of certificates. The Free Writing Prospectus describes the available combinations of Exchangeable Certificates eligible for exchange. |
THE INFORMATION IN THIS STRUCTURAL AND COLLATERAL TERM SHEET IS NOT COMPLETE AND MAY BE AMENDED PRIOR TO THE TIME OF SALE. THIS TERM SHEET IS NOT AN OFFER TO SELL THESE SECURITIES AND IT IS NOT A SOLICITATION OF AN OFFER TO BUY THESE SECURITIES IN ANY JURISDICTION WHERE THE OFFER OR SALE IS NOT PERMITTED.
| 20 |
| Wells Fargo Commercial Mortgage Trust 2015-C31 | Certain Terms and Conditions |
| Allocation of Yield Maintenance and Prepayment Premiums: | If any yield maintenance charge or prepayment premium is collected during any particular collection period with respect to any mortgage loan, then on the distribution date corresponding to that collection period, the certificate administrator will pay that yield maintenance charge or prepayment premium (net of liquidation fees payable therefrom) in the following manner: (1) to each of the Class A-1, A-2, A-3, A-4, A-SB and D Certificates and Class A-4FX, A-S, B and C regular interests, the product of (a) such yield maintenance charge or prepayment premium, (b) the related Base Interest Fraction (as defined in the Free Writing Prospectus) for such class or regular interest, and (c) a fraction, the numerator of which is equal to the amount of principal distributed to such class or regular interest for that distribution date, and the denominator of which is the total amount of principal distributed to all Principal Balance Certificates (other than the Class A-4FX and A-4FL Certificates and the Exchangeable Certificates) and the Class A-4FX, A-S, B and C regular interests for that distribution date, and (2) to the Class X-A Certificates, the excess, if any, of (a) the product of (i) such yield maintenance charge or prepayment premium and (ii) a fraction, the numerator of which is equal to the amount of principal distributed to the Class A-1, A-2, A-3, A-4, A-SB Certificates and Class A-4FX and A-S regular interests for that distribution date, and the denominator of which is the total amount of principal distributed to all Principal Balance Certificates (other than the Class A-4FX and A-4FL Certificates and the Exchangeable Certificates) and the Class A-4FX, A-S, B and C regular interests for that distribution date, over (b) the amount of such yield maintenance charge or prepayment premium distributed to the Class A-1, A-2, A-3, A-4, A-SB Certificates and Class A-4FX and A-S regular interests as described above, and (3) to the Class X-B Certificates, any remaining such yield maintenance charge or prepayment premium not distributed as described above. No prepayment premiums or yield maintenance charges will be distributed to the holders of the Class X-D, E, F, G, V or R Certificates. For a description of when prepayment premiums and yield maintenance charges are generally required on the mortgage loans, see Annex A-1 to the Free Writing Prospectus. See also “Risk Factors—Prepayments and Repurchases of the Mortgage Assets Will Affect the Timing of Your Cash Flow and May Affect Your Yield” in the prospectus attached to the Free Writing Prospectus. Prepayment premiums and yield maintenance charges will be distributed on each Distribution Date only to the extent they are actually received on the mortgage loans as of the related Determination Date. | |
| Realized Losses: | The Certificate Principal Balances of the Class A-1, A-2, A-3, A-4, A-SB, D, E, F and G Certificates, and the Class A-4FX, A-S, B and C regular interests will be reduced without distribution on any Distribution Date as a write-off to the extent of any losses realized on the mortgage loans allocated to such Class or regular interest on such Distribution Date. Such losses (other than certain Trust Advisor expenses) will be applied in the following order, in each case until the related Certificate Principal Balance is reduced to zero: first, to Class G; second, to Class F; third, to Class E; fourth, to Class D; fifth, to the Class C regular interest; sixth, to the Class B regular interest; seventh, to the Class A-S regular interest; and, finally,pro rata, to Classes A-1, A-2, A-3, A-4 and A-SB Certificates and the Class A-4FX regular interest based on their outstanding Certificate Principal Balances. Certain Trust Advisor expenses (if not absorbed by reductions of interest entitlements on the Class D Certificates and the Class C and B regular interests) will be applied as write-offs in a similar manner, except that such write-offs will be applied only to the Class D Certificates, the Class C, B and A-S regular interests, and the Class A-1, A-2, A-3, A-4 and A-SB Certificates and the Class A-4FX regular interest (with any write-offs on the Class A-1, A-2, A-3, A-4 and A-SB Certificates and the Class A-4FX regular interest to be allocatedpro rata according to their respective Certificate Principal Balances immediately prior to that Distribution Date), in that order. Any realized losses allocated to the Class A-S, B and C regular interests will, in turn, be allocated to the Class A-S, B, C and PEX Certificates as described above in “Allocations and Distributions on the Class A-S, B, C and PEX Certificates”.
The notional amount of the Class X-A Certificates will be reduced by the amount of all losses that are allocated to the Class A-1, A-2, A-3, A-4 or A-SB Certificates or the Class A-4FX or A-S regular interests as write-offs in reduction of their Certificate Principal Balances. The notional amount of the Class X-B Certificates will be reduced by the amount of all losses that are allocated to the Class B regular interest as write-offs in reduction of its Certificate Principal Balance. The notional amount of the Class X-D Certificates will be reduced by the amount of all losses that are allocated to the Class D Certificates as write-offs in reduction of its Certificate Principal Balance.
| |
| Debt Service Advances: | The Master Servicer or, if the Master Servicer fails to do so, the Trustee, will be obligated to advance delinquent debt service payments (other than balloon payments and default interest) and assumed debt service payments on the mortgage loans (including each of the Sheraton Lincoln Harbor Hotel mortgage loan, CityPlace I mortgage loan, 11 Madison Avenue mortgage loan and the Patrick Henry Mall mortgage loan but not the relatedpari passucompanion loans), except to the extent any such advance is deemed non-recoverable from collections on the related mortgage loan. In addition, if an Appraisal Reduction Amount exists for a given mortgage loan, the interest portion of any debt service advance for such mortgage loan will be reduced, which will have the effect of reducing the amount of interest available for distribution to the Certificates in reverse alphabetical order of their Class designations (except that interest payments on the Class A-1, A- |
THE INFORMATION IN THIS STRUCTURAL AND COLLATERAL TERM SHEET IS NOT COMPLETE AND MAY BE AMENDED PRIOR TO THE TIME OF SALE. THIS TERM SHEET IS NOT AN OFFER TO SELL THESE SECURITIES AND IT IS NOT A SOLICITATION OF AN OFFER TO BUY THESE SECURITIES IN ANY JURISDICTION WHERE THE OFFER OR SALE IS NOT PERMITTED.
| 21 |
| Wells Fargo Commercial Mortgage Trust 2015-C31 | Certain Terms and Conditions |
| 2, A-3, A-4, A-SB, X-A, X-B and X-D Certificates and the Class A-4FX regular interest would be affected on apari passu basis). | ||
| Servicing Advances: | The Master Servicer or, if the Master Servicer fails to do so, the Trustee, will be obligated to make servicing advances with respect to each mortgage loan it services, including the payment of delinquent property taxes, insurance premiums and ground rent, except to the extent that those advances are deemed non-recoverable from collections on the related mortgage loan. The Master Servicer will have the primary obligation to make any servicing advances with respect to the Sheraton Lincoln Harbor Hotel loan combination and the CityPlace I loan combination. The master servicer under the MAD 2015-11MD securitization will have the primary obligation to make any servicing advances with respect to the 11 Madison Avenue loan combination. The master servicer under the WFCM 2015-SG1 securitization will have the primary obligation to make any servicing advances with respect to the Patrick Henry Mall loan combination.
| |
Appraisal Reduction Amounts:
| An Appraisal Reduction Amount generally will be created in the amount, if any, by which the principal balance of a required appraisal loan (which is a mortgage loan with respect to which certain defaults, modifications or insolvency events have occurred as further described in the Free Writing Prospectus) plus other amounts overdue or advanced in connection with such mortgage loan exceeds 90% of the appraised value of the related mortgaged property plus certain escrows and reserves (including letters of credit) held with respect to the mortgage loan.
A mortgage loan will cease to be a required appraisal loan when the same has ceased to be a specially serviced mortgage loan (if applicable), has been brought current for at least three consecutive months and no other circumstances exist that would cause such mortgage loan to be a required appraisal loan.
Appraisal Reduction Amounts will affect the amount of debt service advances on the related mortgage loan. Appraisal Reduction Amounts will also be taken into account in the determination of the identity of the Class whose majority constitutes the “majority subordinate certificateholder” and is entitled to appoint the subordinate class representative.
| |
Clean-Up Call and Exchange
Termination:
| On each Distribution Date occurring after the aggregate unpaid principal balance of the mortgage loans is reduced below 1% of the initial aggregate principal balance of the mortgage loans as of the Cut-off Date, certain specified persons will have the option to purchase all of the remaining mortgage loans (and the trust’s interest in all property acquired through exercise of remedies in respect of any mortgage loan) at the price specified in the Free Writing Prospectus. Exercise of the option will terminate the trust and retire the then-outstanding certificates.
If the aggregate Certificate Principal Balances of each of the Class A-1, A-2, A-3, A-4, A-SB, PEX and D Certificates and the Class A-4FX, A-S, B and C regular interests have been reduced to zero, the trust may also be terminated in connection with an exchange of all the then-outstanding certificates, for the mortgage loans and REO properties then remaining in the issuing entity, but all of the holders of those Classes of outstanding certificates would have to voluntarily participate in the exchange.
| |
| Liquidation Loan Waterfall: | Following the liquidation of any loan or property, the net liquidation proceeds generally will be applied (after reimbursement of advances and certain trust fund expenses), first, as a recovery of accrued interest, other than delinquent interest that was not advanced as a result of Appraisal Reduction Amounts, second, as a recovery of principal until all principal has been recovered, and then as a recovery of delinquent interest that was not advanced as a result of Appraisal Reduction Amounts. Please see “Description of the Offered Certificates—Distributions—Application of Mortgage Loan Collections” in the Free Writing Prospectus.
| |
| Majority Subordinate Certificateholder and Subordinate Class Representative: | A subordinate class representative may be appointed by the “majority subordinate certificate-holder”, which will be the holder(s) of a majority of the “subordinate class”, which means: (a) during a “subordinate control period”, the most subordinate class among the Class E, F and G Certificates that has a Certificate Principal Balance, as notionally reduced by any Appraisal Reduction Amounts allocable to that class, that is at least equal to 25% of its total initial principal balance and (b) during a “collective consultation period”, the most subordinate class among the Class E, F and G Certificates that has a total principal balance, without regard to Appraisal Reduction Amounts, that is at least equal to 25% of its initial Certificate Principal Balance. The majority subordinate certificateholder will have a continuing right to appoint, remove or replace the subordinate class representative in its sole discretion. This right may be exercised at any time and from time to time. See “Servicing of the Mortgage Loans and Administration of the Trust Fund—The Majority Subordinate Certificateholder and the Subordinate Class Representative” in the Free Writing Prospectus. | |
| Control and Consultation: | The rights of various parties to replace the Special Servicer and approve or consult with respect to major actions of the Special Servicer will vary according to defined periods. A “subordinate |
THE INFORMATION IN THIS STRUCTURAL AND COLLATERAL TERM SHEET IS NOT COMPLETE AND MAY BE AMENDED PRIOR TO THE TIME OF SALE. THIS TERM SHEET IS NOT AN OFFER TO SELL THESE SECURITIES AND IT IS NOT A SOLICITATION OF AN OFFER TO BUY THESE SECURITIES IN ANY JURISDICTION WHERE THE OFFER OR SALE IS NOT PERMITTED.
| 22 |
| Wells Fargo Commercial Mortgage Trust 2015-C31 | Certain Terms and Conditions |
control period” will exist as long as the Class E Certificates have a Certificate Principal Balance, net of any Appraisal Reduction Amounts allocable to that class, that is not less than 25% of the initial principal balance of that class (unless a senior consultation period is deemed to occur generally or with respect to a particular mortgage loan, pursuant to clause (ii) of the definition of “senior consultation period”). In general, during a subordinate control period (other than with respect to the 11 Madison Avenue loan combination and the Patrick Henry Mall loan combination), (i) the subordinate class representative will be entitled to grant or withhold approval of asset status reports prepared, and material servicing actions proposed, by the Special Servicer, and (ii) the majority subordinate certificateholder, or the subordinate class representative on its behalf, will be entitled to terminate and replace the Special Servicer with or without cause, and appoint itself or another person as the successor special servicer. It will be a condition to such appointment that Fitch, Moody’s and Morningstar confirm that the appointment would not result in a qualification, downgrade or withdrawal of any of their then-current ratings of certificates. A “collective consultation period” will exist as long as the Class E Certificates have a Certificate Principal Balance that both (i) as notionally reduced by any Appraisal Reduction Amounts allocable to that class, is less than 25% of its initial principal balance and (ii) without regard to any Appraisal Reduction Amounts allocable to that class, is 25% or more of its initial Certificate Principal Balance (unless a senior consultation period is deemed to occur generally or with respect to a particular mortgage loan, pursuant to clause (ii) of the definition of “senior consultation period”). In general, during a collective consultation period, the Special Servicer will be required to consult with the Trust Advisor (in addition to the subordinate class representative, during a collective consultation period) in connection with asset status reports and material special servicing actions (other than with respect to the 11 Madison Avenue loan combination and the Patrick Henry Mall loan combination). A “senior consultation period” will exist as long as either (i) the Class E certificates have an aggregate principal balance, without regard to any Appraisal Reduction Amounts allocable to that class, that is less than 25% of its initial principal balance or (ii) during such time as the Class E certificates are the most subordinate class of control-eligible certificates that have a then outstanding principal balance, net of Appraisal Reduction Amounts, at least equal to 25% of its initial principal balance, the then-majority subordinate certificateholder has irrevocably waived its right to appoint a subordinate class representative and to exercise any of the rights of the majority subordinate certificateholder or cause the exercise of the rights of the subordinate class representative and such rights have not been reinstated to a successor majority subordinate certificateholder as set forth in the pooling and servicing agreement. In general, during a senior consultation period, the Special Servicer must seek to consult with the Trust Advisor in connection with asset status reports and material special servicing actions (other than with respect to the 11 Madison Avenue loan combination and Patrick Henry Mall loan combination), and, in general, no subordinate class representative will be recognized or have any right to terminate the Special Servicer or approve, direct or consult with respect to servicing matters. With respect to the Sheraton Lincoln Harbor Hotel loan combination and the CityPlace I loan combination, the rights of the subordinate class representative described above will be subject to the consultation rights of the holder of any relatedpari passucompanion loan described under “Loan Combinations” below.
Notwithstanding any contrary description set forth above, with respect to the Sheraton Lincoln Harbor Hotel mortgage loan and the CityPlace I mortgage loan, (a) each of the holder(s) of thepari passu companion loans in the related loan combination (including any subordinate class representative or special servicer under any securitization of any suchpari passu companion loans) will have consultation rights with respect to asset status reports and material special servicing actions involving the related loan combination, as provided for in the related intercreditor agreement and as described in the Free Writing Prospectus, and those rights will be in addition to the rights of the subordinate class representative in this transaction described above; and (b) the existence of a subordinate control period, collective consultation period or senior consultation period under the WFCM 2015-C31 pooling and servicing agreement will not limit the consultation rights of the holder(s) of the relatedpari passu companion loans.
With respect to the 11 Madison Avenue mortgage loan, such mortgage loan will be serviced under the MAD 2015-11MD trust and servicing agreement, which does not provide for subordinate class representative (or similar party). So long as the 11 Madison Avenue subordinate companion loans are included in the MAD 2015-11MD securitization, there will be no certificateholder under the MAD 2015-11MD trust and servicing agreement or under any other pooling and servicing agreement that will be entitled to exercise control, consent or consultation rights with respect to such loan combination.
Notwithstanding any contrary description set forth above, with respect to the Patrick Henry Mall loan, in general the related loan combination will be serviced under the WFCM 2015-SG1 pooling and servicing agreement, which grants to the related subordinate class representative control rights that mayinclude the right to approve or disapprove various material servicing actions involving the related loan combination, but the subordinate class representative for this securitization will nonetheless have the right to be consulted on a non-binding basis with respect |
THE INFORMATION IN THIS STRUCTURAL AND COLLATERAL TERM SHEET IS NOT COMPLETE AND MAY BE AMENDED PRIOR TO THE TIME OF SALE. THIS TERM SHEET IS NOT AN OFFER TO SELL THESE SECURITIES AND IT IS NOT A SOLICITATION OF AN OFFER TO BUY THESE SECURITIES IN ANY JURISDICTION WHERE THE OFFER OR SALE IS NOT PERMITTED.
| 23 |
| Wells Fargo Commercial Mortgage Trust 2015-C31 | Certain Terms and Conditions |
to such actions. For purposes of the servicing of the Patrick Henry Mall loan combination, the occurrence and continuance of a collective consultation period or senior consultation period with respect to the subordinate class representative under this securitization will not limit the control or other rights of the subordinate class representative under the WFCM 2015-SG1 securitization, but any collective consultation period or senior consultation period under the WFCM 2015-SG1 securitization will operate to prevent the exercise of the consultation rights of the subordinate class representative hereof. In general, loan combination control rights also include the right, in certain circumstances, to direct the replacement of the applicable special servicer for the related loan combination only.
Notwithstanding any contrary description set forth above, in the event that, with respect to any mortgage loan, the majority subordinate certificateholder or the subordinate class representative is (i) a borrower, a mortgagor or a manager of a mortgaged property or any affiliate thereof, (ii) any person that owns, directly or indirectly, 25% or more of a borrower, mortgagor or manager of a mortgaged property, (iii) any person that owns, directly or indirectly, 25% or more of a beneficial interest in any mezzanine lender of any mezzanine loan related to a mortgage loan that has accelerated such mezzanine loan as set forth in clause (iv) or (iv) any mezzanine lender (or any affiliate thereof) of any mezzanine loan related to a Mortgage Loan that has accelerated such mezzanine loan (unless (a) acceleration was automatic under such mezzanine loan, (b) the event directly giving rise to the automatic acceleration under such mezzanine loan was not initiated by such mezzanine lender or an affiliate of such mezzanine lender and (c) such mezzanine lender is stayed from exercising and has not commenced the exercise of remedies associated with foreclosure of the equity collateral under such mezzanine loan) or commenced foreclosure proceedings with respect to such mezzanine loan against the equity interests in the borrower(s) of such mortgage loan (each, a “borrower party”), the majority subordinate certificateholder and the subordinate class representative will have no right to receive asset status reports or such other information as may be specified in the pooling and servicing agreement, to grant or withhold approval of, or consult with respect to, asset status reports prepared, and material servicing actions proposed, by the Special Servicer, with respect to such mortgage loan, and such mortgage loan will be referred to as an “excluded loan”.
In addition, notwithstanding any contrary description set forth above, in the event that, with respect to any mortgage loan, a subordinate class certificateholder is a borrower party, such subordinate class certificateholder will have no right to receive asset status reports or such other information as may be specified in the pooling and servicing agreement with respect to such mortgage loan, and such subordinate class certificateholder will be referred to as an “excluded controlling class holder”.
| ||
| Replacement of Special Servicer by General Vote of Certificateholders: | During any “collective consultation period” or “senior consultation period”, the Special Servicer may be terminated and replaced upon the affirmative direction of certificate owners holding not less than 75% of the appraisal-reduced voting rights of all certificates, following a proposal from certificate owners holding not less than 25% of the appraisal-reduced voting rights of all certificates. The certificateholders who initiate a vote on a termination and replacement of the Special Servicer without cause must cause Fitch, Moody’s and Morningstar to confirm the then-current ratings of the certificates (or decline to review the matter) and cause the payment of the fees and expenses incurred in the replacement. |
THE INFORMATION IN THIS STRUCTURAL AND COLLATERAL TERM SHEET IS NOT COMPLETE AND MAY BE AMENDED PRIOR TO THE TIME OF SALE. THIS TERM SHEET IS NOT AN OFFER TO SELL THESE SECURITIES AND IT IS NOT A SOLICITATION OF AN OFFER TO BUY THESE SECURITIES IN ANY JURISDICTION WHERE THE OFFER OR SALE IS NOT PERMITTED.
| 24 |
| Wells Fargo Commercial Mortgage Trust 2015-C31 | Certain Terms and Conditions |
| Excluded Special Servicer | In the event that, with respect to any mortgage loan, the Special Servicer is a borrower party, the Special Servicer will be required to resign as special servicer of such mortgage loan (referred to as a “excluded special servicer loan”), and, during a subordinate control period, the majority subordinate certificateholder or subordinate class representative, on its behalf, will be entitled to appoint (and may replace with or without cause) a separate special servicer that is not a borrower party (referred to as an “excluded special servicer”) with respect to such excluded special servicer loan unless such excluded special servicer loan is also an excluded loan, in which case the largest subordinate class certificateholder that is not an excluded controlling class holder will appoint (and may replace with or without cause) the excluded special servicer. During a collective consultation period, the largest subordinate class certificateholder that is not an excluded controlling class holder with respect to such excluded special servicer loan will appoint the excluded special servicer. During a senior consultation period (or during (i) a subordinate control period if the excluded special servicer loan is also an excluded loan and all subordinate class certificateholders are also excluded controlling class holders with respect to such excluded special servicer loan, or (ii) a collective consultation period if all subordinate class certificateholders are also excluded controlling class holders with respect to such excluded special servicer loan), upon resignation of the Special Servicer with respect to an excluded special servicer loan, such resigning Special Servicer will use commercially reasonable efforts to appoint the excluded special servicer; provided that if the resigning special servicer fails to appoint an excluded special servicer within 30 days of the special servicer’s notice of resignation, such resigning special servicer will, at its own expense, petition any court of competent jurisdiction for the appointment of a successor excluded special servicer. | |
| Appraisal Remedy: | Solely for purposes of determining whether a “subordinate control period” is in effect, whenever the Special Servicer obtains an appraisal or updated appraisal under the pooling and servicing agreement, the subordinate class representative, with respect to the mortgage loans serviced by the Special Servicer will have the right (at its expense) to direct such Special Servicer to hire a qualified appraiser to prepare a second appraisal of the mortgaged property. The Special Servicer must thereafter determine whether, based on its assessment of such second appraisal, any recalculation of the Appraisal Reduction Amount is warranted. The Appraisal Reduction Amount, whether based on the first or the second appraisal, will become effective following the second appraisal, except that the Appraisal Reduction Amount based on the first appraisal shall become effective if the subordinate class representative declines to demand a second appraisal within a specified number of business days, or if a second appraisal is not received within 90 days after the direction of the subordinate class representative. In addition, for the same purposes, if there is a material change in the mortgaged property securing any mortgage loan for which an Appraisal Reduction Amount has been calculated, the majority certificateholder of the Class E, F or G Certificates or other designated certificateholders will be entitled (at its expense) to present an additional appraisal to the Special Servicer, which will generally be required to recalculate the Appraisal Reduction Amount based upon such additional appraisal. This latter right may not be exercised more frequently than once in any 12-month period for each mortgage loan for which an Appraisal Reduction Amount was calculated and can only be exercised during a subordinate control period or a collective consultation period as further described in the Free Writing Prospectus.
| |
| Sale of Defaulted Assets: | There will be no “fair value” purchase option. Instead, the pooling and servicing agreement will authorize the Special Servicer to sell defaulted mortgage loans serviced by the Special Servicer to the highest bidder in a manner generally similar to sales of REO properties. In the case of the Sheraton Lincoln Harbor Hotel loan combination and the CityPlace I loan combination, pursuant to the related intercreditor agreement and the pooling and servicing agreement, if the special servicer offers to sell to any person (or offers to purchase) for cash such mortgage loan during such time as the related loan combination constitutes a defaulted mortgage loan under the pooling and servicing agreement and related intercreditor agreement, then, in connection with any such sale, the special servicer is required to sell both the applicable mortgage loan and the relatedpari passucompanion loans as a single whole loan. The sale of a defaulted loan (other than the 11 Madison Avenue mortgage loan and the Patrick Henry Mall mortgage loan) for less than par plus accrued interest and certain other fees and expenses owed on the loan will be subject to consent or consultation rights of the subordinate class representative and/or Trust Advisor and, in the case of the Sheraton Lincoln Harbor Hotel loan combination and the CityPlace I, consultation rights of the holder(s) of the relatedpari passu companion loans, as described in the Free Writing Prospectus.
In the case of the 11 Madison Avenue mortgage loan and the Patrick Henry Mall mortgage loan, pursuant to the related intercreditor agreement and the MAD 2015-11MD trust and servicing agreement and the WFCM 2015-SG1 pooling and servicing agreement, respectively, the related special servicer may offer to sell to any person (or may offer to purchase) for cash the related loan combination during such time as the relatedpari passucompanion loan constitutes a | |
THE INFORMATION IN THIS STRUCTURAL AND COLLATERAL TERM SHEET IS NOT COMPLETE AND MAY BE AMENDED PRIOR TO THE TIME OF SALE. THIS TERM SHEET IS NOT AN OFFER TO SELL THESE SECURITIES AND IT IS NOT A SOLICITATION OF AN OFFER TO BUY THESE SECURITIES IN ANY JURISDICTION WHERE THE OFFER OR SALE IS NOT PERMITTED.
| 25 |
| Wells Fargo Commercial Mortgage Trust 2015-C31 | Certain Terms and Conditions |
| defaulted mortgage loan under the related pooling and servicing agreement, and, in connection with any such sale, the related special servicer is required to sell both the applicable mortgage loan and the relatedpari passucompanion loans as a whole loan. The subordinate class representative for this securitization will have consultation rights as the holder of an interest in the relatedpari passumortgage loan, as described in the Free Writing Prospectus. | ||
“As-Is” Appraisals:
| Appraisals must be conducted on an “as-is” basis, and must be no more than 9 months old, for purposes of determining Appraisal Reduction Amounts, market value in connection with REO sales, etc. Required appraisals may consist of updates of prior appraisals. Internal valuations by the Special Servicer are permitted if the principal balance of a mortgage loan is less than $2,000,000. | |
| Trust Advisor: | The Trust Advisor will perform certain review duties that will generally include a limited annual review of and report regarding the Special Servicer to the Certificate Administrator. The review and report generally will be based on: (a) during a collective consultation period or senior consultation period, any asset status reports and additional information delivered to the Trust Advisor by the Special Servicer with respect to any mortgage loan serviced by the Special Servicer, and/or (b) during a senior consultation period, in addition to the applicable information described above, a meeting with each Special Servicer to conduct a limited review of the Special Servicer’s operational practices on a platform basis in light of the servicing standard. In addition, during any collective consultation period or any senior consultation period, the Special Servicer must seek to consult with the Trust Advisor (in addition to the subordinate class representative during a collective consultation period) in connection with material special servicing actions with respect to specially serviced mortgage loans serviced by the Special Servicer. Furthermore, under certain circumstances, but only during a senior consultation period, the Trust Advisor may recommend the replacement of the Special Servicer, in which case the Certificate Administrator will deliver notice of such recommendation to the certificateholders, and certificateholders with specified percentages of the voting rights may direct the replacement of the Special Servicer at their expense.
The Trust Advisor may be removed and replaced without cause upon the affirmative direction of certificates owners holding not less than 75% of the appraisal-reduced voting rights of all certificates, following a proposal from certificate owners holding not less than 25% of the appraisal-reduced voting rights of all certificates. The certificateholders who initiate a vote on a termination and replacement of the Trust Advisor without cause must cause Fitch, Moody’s and Morningstar to confirm the then-current ratings of the certificates (or decline to review the matter) and cause the payment of the fees and expenses incurred in the replacement. During any “subordinate control period”, the proposed replacement trust advisor will be subject to the subordinate class representative’s consent (such consent not to be unreasonably withheld). If a proposed termination and replacement of the Trust Advisor is not consummated within 180 days following the initial request of the certificateholders who requested a vote, the proposed termination and replacement shall have no further force or effect. The Trust Advisor generally may be discharged from its duties if and when the Class A-1, A-2, A-3, A-4, A-4FL, A-4FX, A-SB, A-S, B, C, PEX and D Certificates are retired.
| |
| Certain Fee Offsets: | If a workout fee is earned by the Special Servicer following a loan default with respect to any mortgage loan that it services, then certain limitations will apply to the collection and retention of a modification fee from the borrower. The modification fee generally must not exceed 1% of the principal balance of the loan as modified. In addition, if the loan re-defaults within a specified period of months and other conditions are satisfied, any subsequent workout or liquidation fee on that loan must be reduced by a portion of the previously-collected modification fee. Furthermore, workout fees, liquidation fees and modification fees collected with respect to any workout, liquidation and/or partial liquidation of a mortgage loan or loan combination that is serviced by the Special Servicer will be subject to an aggregate cap equal to the greater of (i) $1,000,000 and (ii) 1.00% of the stated principal balance of the subject mortgage loan or loan combination. | |
| Deal Website: | The Certificate Administrator will be required to maintain a deal website which will include, among other items: (a) summaries of asset status reports prepared by the Special Servicer, (b) inspection reports, (c) appraisals, (d) various “special notices” described in the Free Writing Prospectus, (e) the “Investor Q&A Forum” and (f) a voluntary “Investor Registry”. Investors may access the deal website following execution of a certification and confidentiality agreement. | |
| Initial Majority Subordinate Certificateholder: | It is expected that Eightfold Real Estate Capital Fund IV, L.P. or one of its affiliates will be the initial majority subordinate certificateholder.
| |
| Loan Combinations: | Each of the mortgaged properties identified on Annex A-1 to the Free Writing Prospectus as |
THE INFORMATION IN THIS STRUCTURAL AND COLLATERAL TERM SHEET IS NOT COMPLETE AND MAY BE AMENDED PRIOR TO THE TIME OF SALE. THIS TERM SHEET IS NOT AN OFFER TO SELL THESE SECURITIES AND IT IS NOT A SOLICITATION OF AN OFFER TO BUY THESE SECURITIES IN ANY JURISDICTION WHERE THE OFFER OR SALE IS NOT PERMITTED.
| 26 |
| Wells Fargo Commercial Mortgage Trust 2015-C31 | Certain Terms and Conditions |
| Sheraton Lincoln Harbor Hotel, CityPlace I, 11 Madison Avenue and Patrick Henry Mall secures both a mortgage loan to be included in the trust fund and one or more other mortgage loans that will not be included in the trust fund, which will bepari passuor subordinate in right of payment with the trust mortgage loan. We refer to each such group of mortgage loans as a “loan combination”. The Sheraton Lincoln Harbor Hotel loan combination and the CityPlace I loan combination will be principally serviced under the pooling and servicing agreement. The 11 Madison Avenue loan combination and the Patrick Henry Mall loan combination will be principally serviced under the trust and servicing agreement for the MAD 2015-11MD securitization and the pooling and servicing agreement WFCM 2015-SG1 securitization, respectively. | ||
| As of the closing date, the companion loans in such loan combinations will be held by the parties identified above under “IV. Characteristics of the Mortgage Pool—B. Summary ofPari Passu Mortgage Loans”. |
THE INFORMATION IN THIS STRUCTURAL AND COLLATERAL TERM SHEET IS NOT COMPLETE AND MAY BE AMENDED PRIOR TO THE TIME OF SALE. THIS TERM SHEET IS NOT AN OFFER TO SELL THESE SECURITIES AND IT IS NOT A SOLICITATION OF AN OFFER TO BUY THESE SECURITIES IN ANY JURISDICTION WHERE THE OFFER OR SALE IS NOT PERMITTED.
| 27 |
(THIS PAGE INTENTIONALLY LEFT BLANK)
THE INFORMATION IN THIS STRUCTURAL AND COLLATERAL TERM SHEET IS NOT COMPLETE AND MAY BE AMENDED PRIOR TO THE TIME OF SALE. THIS TERM SHEET IS NOT AN OFFER TO SELL THESE SECURITIES AND IT IS NOT A SOLICITATION OF AN OFFER TO BUY THESE SECURITIES IN ANY JURISDICTION WHERE THE OFFER OR SALE IS NOT PERMITTED.
| 28 |
| 745 ATLANTIC AVENUE |
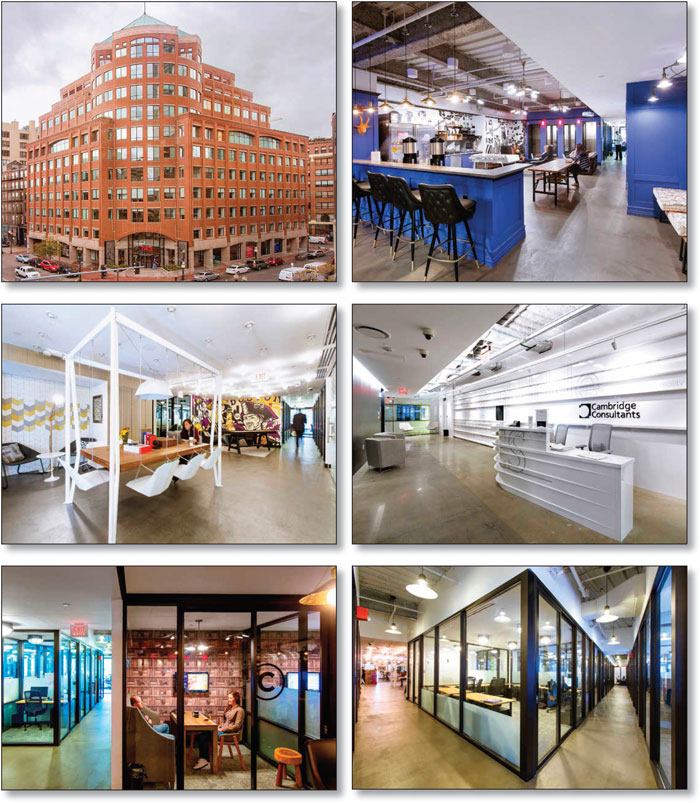
THE INFORMATION IN THIS STRUCTURAL AND COLLATERAL TERM SHEET IS NOT COMPLETE AND MAY BE AMENDED PRIOR TO THE TIME OF SALE. THIS TERM SHEET IS NOT AN OFFER TO SELL THESE SECURITIES AND IT IS NOT A SOLICITATION OF AN OFFER TO BUY THESE SECURITIES IN ANY JURISDICTION WHERE THE OFFER OR SALE IS NOT PERMITTED.
| 29 |
| 745 ATLANTIC AVENUE |
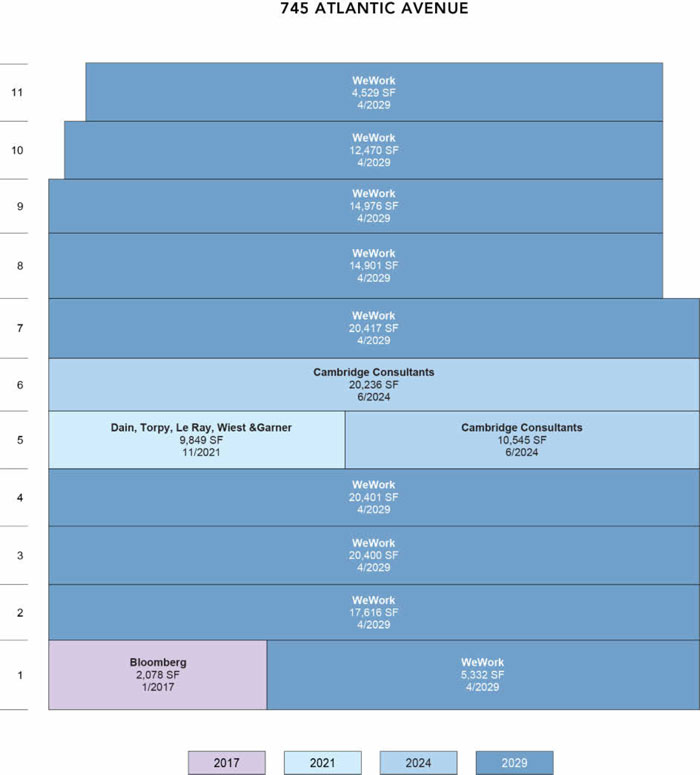
THE INFORMATION IN THIS STRUCTURAL AND COLLATERAL TERM SHEET IS NOT COMPLETE AND MAY BE AMENDED PRIOR TO THE TIME OF SALE. THIS TERM SHEET IS NOT AN OFFER TO SELL THESE SECURITIES AND IT IS NOT A SOLICITATION OF AN OFFER TO BUY THESE SECURITIES IN ANY JURISDICTION WHERE THE OFFER OR SALE IS NOT PERMITTED.
| 30 |
| 745 ATLANTIC AVENUE |

THE INFORMATION IN THIS STRUCTURAL AND COLLATERAL TERM SHEET IS NOT COMPLETE AND MAY BE AMENDED PRIOR TO THE TIME OF SALE. THIS TERM SHEET IS NOT AN OFFER TO SELL THESE SECURITIES AND IT IS NOT A SOLICITATION OF AN OFFER TO BUY THESE SECURITIES IN ANY JURISDICTION WHERE THE OFFER OR SALE IS NOT PERMITTED.
| 31 |
| No. 1 – 745 Atlantic Avenue | ||||||||
| Loan Information | Property Information | |||||||
| Mortgage Loan Seller: | Wells Fargo Bank, National Association | Single Asset/Portfolio: | Single Asset | |||||
| Credit Assessment (Fitch/Moody’s/Morningstar): | NR/NR/NR | Property Type: | Office | |||||
| Original Principal Balance: | $70,000,000 | Specific Property Type: | CBD | |||||
| Cut-off Date Principal Balance: | $70,000,000 | Location: | Boston, MA | |||||
| % of Initial Pool Balance: | 7.1% | Size: | 174,231 SF | |||||
| Loan Purpose: | Acquisition | Cut-off Date Principal Balance Per SF: | $401.77 | |||||
| Borrower Name: | OPG 745 Atlantic Owner (DE) LLC | Year Built/Renovated: | 1988/2014 | |||||
| Sponsor: | OPG Investment Holdings US Inc. | Title Vesting: | Fee | |||||
| Mortgage Rate: | 4.170% | Property Manager: | Self-managed | |||||
| Note Date: | August 5, 2015 | 3rd Most Recent Occupancy (As of)(2): | 88.5% (12/31/2012) | |||||
| Anticipated Repayment Date: | NAP | 2nd Most Recent Occupancy (As of)(2): | 78.4% (12/31/2013) | |||||
| Maturity Date: | August 11, 2025 | Most Recent Occupancy (As of)(2): | 93.9% (12/31/2014) | |||||
| IO Period: | 120 months | Current Occupancy (As of)(2): | 99.9% (8/4/2015) | |||||
| Loan Term (Original): | 120 months | |||||||
| Seasoning: | 3 months | Underwriting and Financial Information: | ||||||
| Amortization Term (Original): | NAP | |||||||
| Loan Amortization Type: | Interest-only, Balloon | 3rd Most Recent NOI (As of)(3): | $3,718,622 (12/31/2013) | |||||
| Interest Accrual Method: | Actual/360 | 2nd Most Recent NOI (As of)(3): | $281,033 (12/31/2014) | |||||
| Call Protection: | L(27),D(88),O(5) | Most Recent NOI (As of)(3): | ($68,319) (TTM 3/31/2015) | |||||
| Lockbox Type: | Hard/Springing Cash Management | |||||||
| Additional Debt: | None | |||||||
| Additional Debt Type: | NAP | U/W Revenues: | $8,747,978 | |||||
| U/W Expenses: | $3,107,951 | |||||||
| Escrows and Reserves(1): | U/W NOI: | $5,640,027 | ||||||
| U/W NCF: | $5,299,596 | |||||||
| Type: | Initial | Monthly | Cap (If Any) | U/W NOI DSCR: | 1.90x | |||
| Taxes | $0 | Springing | NAP | U/W NCF DSCR: | 1.79x | |||
| Insurance | $0 | Springing | NAP | U/W NOI Debt Yield: | 8.1% | |||
| Replacement Reserves | $0 | Springing | NAP | U/W NCF Debt Yield: | 7.6% | |||
| TI/LC Reserve | $0 | Springing | NAP | As-Is Appraised Value: | $114,800,000 | |||
| Cambridge Rent Reserve | $337,093 | $0 | NAP | As-Is Appraisal Valuation Date: | June 30, 2015 | |||
| Existing TI/LC Reserve | $1,784,225 | $0 | NAP | Cut-off Date LTV Ratio: | 61.0% | |||
| Deferred Maintenance | $1,327,560 | $0 | NAP | LTV Ratio at Maturity or ARD: | 61.0% | |||
| (1) | See “Escrows” section. |
| (2) | See “Historical Occupancy” section. |
| (3) | See “Cash Flow Analysis” section. |
The Mortgage Loan.The mortgage loan (the “745 Atlantic Avenue Mortgage Loan”) is evidenced by a single promissory note that is secured by a first mortgage encumbering the fee interest in an office building located in Boston, Massachusetts (the “745 Atlantic Avenue Property”). The 745 Atlantic Avenue Mortgage Loan was originated on August 5, 2015 by Wells Fargo Bank, National Association. The 745 Atlantic Avenue Mortgage Loan had an original principal balance of $70,000,000, has an outstanding principal balance as of the Cut-off Date of $70,000,000 and accrues interest at an interest rate of 4.170%per annum. The 745 Atlantic Avenue Mortgage Loan had an initial term of 120 months, has a remaining term of 117 months as of the Cut-off Date and requires interest-only payments through the term of the 745 Atlantic Avenue Mortgage Loan. The 745 Atlantic Avenue Mortgage Loan matures on August 11, 2025.
Following the lockout period, the borrower has the right to defease the 745 Atlantic Avenue Mortgage Loan in whole, but not in part, on any date before April 11, 2025. In addition, the 745 Atlantic Avenue Mortgage Loan is prepayable without penalty on or after April 11, 2025.
THE INFORMATION IN THIS STRUCTURAL AND COLLATERAL TERM SHEET IS NOT COMPLETE AND MAY BE AMENDED PRIOR TO THE TIME OF SALE. THIS TERM SHEET IS NOT AN OFFER TO SELL THESE SECURITIES AND IT IS NOT A SOLICITATION OF AN OFFER TO BUY THESE SECURITIES IN ANY JURISDICTION WHERE THE OFFER OR SALE IS NOT PERMITTED.
| 32 |
| 745 ATLANTIC AVENUE |
Sources and Uses
| Sources | Uses | |||||||
| Original loan amount | $70,000,000 | 59.1% | Purchase price | $114,500,000 | 96.6% | |||
| Sponsor’s new cash contribution | 48,501,761 | 40.9 | Reserves | 3,448,878 | 2.9 | |||
| Closing costs | 552,883 | 0.5 | ||||||
| Total Sources | $118,501,761 | 100.0% | Total Uses | $118,501,761 | 100.0% |
The Property.The 745 Atlantic Avenue Property is an 11-story, class A office building totaling 174,231 square feet and located in the central business district of Boston, Massachusetts. Built in 1988 and renovated in 2014, the 745 Atlantic Avenue Property is situated on a 0.5-acre parcel. The previous owner invested approximately $30.0 million into the 745 Atlantic Avenue Property over the past 24 months, and 2014 renovations included a complete lobby renovation, elevator and mechanical upgrades and improvements to the building’s façade. The renovation modernized the 745 Atlantic Avenue Property’s lobby from traditional, corporate finishes to include reclaimed wood, polished porcelain tile and energy-efficient LED lighting. The 745 Atlantic Avenue Property contains 152 parking spaces within a three-level below-grade parking structure, which results in a parking ratio of 0.9 spaces per 1,000 square feet of rentable area. As of August 4, 2015, the 745 Atlantic Avenue Property was 99.9% leased and 90.8% physically occupied by four tenants (see “Major Tenants” section).
The 745 Atlantic Avenue Property serves as the Boston flagship location for the tenant WeWork, which accounts for 75.3% of the net rentable area and 73.8% of underwritten base rent on multiple leases expiring in April 2029. WeWork, which initially took occupancy of a single floor at the 745 Atlantic Avenue Property in October 2013 and expanded four times over 15 months, offers flexible workspaces from single desks to small offices to help entrepreneurs with their office space needs. As of May 2015, WeWork had more than 23,000 members and 32 locations including New York, Boston, Seattle, Los Angeles, San Francisco, Chicago, Washington, D.C., London, Amsterdam and Tel Aviv. In June 2015, WeWork completed an approximately $400.0 million round of funding from Fidelity Management & Research Co. and existing investors and was valued at approximately $10.0 billion. Investors from prior fund raises included J.P. Morgan Chase & Co., Harvard Management Co. and Benchmark.
The following table presents certain information relating to the tenancy at the 745 Atlantic Avenue Property:
Major Tenants
| Tenant Name | Credit Rating (Fitch/ Moody’s/ S&P) | Tenant NRSF | % of NRSF | Annual U/W Base Rent PSF(1) | Annual U/W Base Rent(1) | % of Total Annual U/W Base Rent | Lease Expiration Date |
| Major Tenants | |||||||
| WeWork(2)(3) | NR/NR/NR | 131,171 | 75.3% | $44.22 | $5,800,345 | 73.8% | 4/30/2029 |
| Cambridge Consultants(4)(5) | NR/NR/NR | 30,781 | 17.7% | $49.67(6) | $1,528,932(6) | 19.5% | 6/30/2024 |
| Dain, Torpy, Le Ray, Weist & Garner, PC | NR/NR/NR | 9,848 | 5.7% | $41.25 | $406,230 | 5.2% | 11/30/2021 |
| Bloomberg, LP(7) | NR/NR/NR | 2,225 | 1.3% | $55.49 | $123,464 | 1.6% | 1/31/2017 |
| Occupied Collateral Total | 174,025 | 99.9% | $45.16 | $7,858,971 | 100.0% | ||
| Vacant Space(8) | 206 | 0.1% | |||||
| Collateral Total(9) | 174,231 | 100.0% | |||||
| (1) | Annual U/W Base Rent PSF and Annual U/W Base Rent include contractual rent steps through April 2016 totaling $44,129. |
| (2) | WeWork occupies eight office spaces totaling 125,710 square feet, one retail space comprising 5,332 square feet and one storage space comprising 129 square feet. The office spaces have Annual U/W Base Rent PSFs of $40.50 (three spaces totaling 58,417 square feet), $45.50 (two spaces totaling 35,318 square feet) and $48.50 (three spaces comprising 31,975 square feet); the retail space has an Annual U/W Base Rent PSF of $51.50; and the storage space has an Annual U/W Base Rent PSF of $16.28. |
| (3) | WeWork has a signed lease and is making rent payments for its 5,332-square-foot retail space but is not yet in occupancy. Build-out is expected to be completed in October 2015, and upon completion, a 1,775-square-foot portion of the space is expected to be subleased to La Colombe Holdings, Inc. to be operated as a coffee shop at a rental rate of $59.15 per square foot. |
| (4) | Cambridge Consultants (“Cambridge”) leases 10,545 square feet of office space with an Annual U/W Base Rent PSF of $50.00 (“Cambridge Expansion Space”) and 20,236 square feet of office space with an Annual U/W Base Rent PSF of $49.50. |
| (5) | Cambridge is not yet in occupancy of the Cambridge Expansion Space and will commence rental payments on the Cambridge Expansion Space on November 1, 2015. Gap rent related to the Cambridge Expansion Space was reserved at loan closing (see “Escrows” section). |
| (6) | Cambridge Consultants currently pays reduced rent of $44.03 per square foot on its 20,236-square-foot office space through June 30, 2017. Future rent abatements were reserved upfront (see “Escrows” section). |
| (7) | Bloomberg LP occupies 2,078 square feet of retail space and 147 square feet of storage space with Annual U/W Base Rent PSF of $58.00 and $20.00, respectively. |
| (8) | The vacant space comprises one storage space. |
| (9) | The chart does not include the management office and storage space occupied by UPS, which have no leases in-place and no attributed net rentable area or underwritten base rent. |
THE INFORMATION IN THIS STRUCTURAL AND COLLATERAL TERM SHEET IS NOT COMPLETE AND MAY BE AMENDED PRIOR TO THE TIME OF SALE. THIS TERM SHEET IS NOT AN OFFER TO SELL THESE SECURITIES AND IT IS NOT A SOLICITATION OF AN OFFER TO BUY THESE SECURITIES IN ANY JURISDICTION WHERE THE OFFER OR SALE IS NOT PERMITTED.
| 33 |
| 745 ATLANTIC AVENUE |
The following table presents certain information relating to the lease rollover schedule at the 745 Atlantic Avenue Property:
Lease Expiration Schedule(1)(2)
| Year Ending December 31, | No. of Leases Expiring | Expiring NRSF | % of Total NRSF | Cumulative Expiring NRSF | Cumulative % of Total NRSF | Annual U/W Base Rent | Annual U/W Base Rent PSF(3) |
| MTM | 0 | 0 | 0.0% | 0 | 0.0% | $0 | $0.00 |
| 2015 | 0 | 0 | 0.0% | 0 | 0.0% | $0 | $0.00 |
| 2016 | 0 | 0 | 0.0% | 0 | 0.0% | $0 | $0.00 |
| 2017 | 2 | 2,225 | 1.3% | 2,225 | 1.3% | $123,464 | $55.49 |
| 2018 | 0 | 0 | 0.0% | 2,225 | 1.3% | $0 | $0.00 |
| 2019 | 0 | 0 | 0.0% | 2,225 | 1.3% | $0 | $0.00 |
| 2020 | 0 | 0 | 0.0% | 2,225 | 1.3% | $0 | $0.00 |
| 2021 | 1 | 9,848 | 5.7% | 12,073 | 6.9% | $406,230 | $41.25 |
| 2022 | 0 | 0 | 0.0% | 12,073 | 6.9% | $0 | $0.00 |
| 2023 | 0 | 0 | 0.0% | 12,073 | 6.9% | $0 | $0.00 |
| 2024 | 2 | 30,781 | 17.7% | 42,854 | 24.6% | $1,528,932 | $49.67 |
| 2025 | 0 | 0 | 0.0% | 42,854 | 24.6% | $0 | $0.00 |
| Thereafter | 8 | 131,171 | 75.3% | 174,025 | 99.9% | $5,800,345 | $44.22 |
| Vacant | 0 | 206 | 0.1% | 174,231 | 100.0% | $0 | $0.00 |
| Total/Weighted Average | 13(4) | 174,231 | 100.0% | $7,858,971 | $45.16 |
| (1) | Information obtained from the underwritten rent roll. |
| (2) | The table does not include the management office and storage space occupied by UPS, which have no leases in-place and no attributed net rentable area or underwritten base rent. |
| (3) | Weighted Average Annual U/W Base Rent PSF excludes vacant space. |
| (4) | The 745 Atlantic Avenue Property is occupied by four tenants subject to 13 leases. |
The following table presents historical occupancy percentages at the 745 Atlantic Avenue Property:
Historical Occupancy
12/31/2012(1) | 12/31/2013(1)(2) | 12/31/2014(1) | 8/4/2015(3)(4) | |||
| 88.5% | 78.4% | 93.9% | 99.9% |
| (1) | Information obtained from the borrower. |
| (2) | Occupancy declined in 2013, as the former anchor tenant (Iron Mountain) vacated in multiple phases beginning in late 2013. The 745 Atlantic Avenue Property has averaged 94.6% occupancy since the first quarter of 2005. |
| (3) | Information obtained from the underwritten rent roll. |
| (4) | As of August 4, 2015, the 745 Atlantic Avenue Property was 99.9% leased and 90.8% physically occupied (see “Major Tenants” section). |
THE INFORMATION IN THIS STRUCTURAL AND COLLATERAL TERM SHEET IS NOT COMPLETE AND MAY BE AMENDED PRIOR TO THE TIME OF SALE. THIS TERM SHEET IS NOT AN OFFER TO SELL THESE SECURITIES AND IT IS NOT A SOLICITATION OF AN OFFER TO BUY THESE SECURITIES IN ANY JURISDICTION WHERE THE OFFER OR SALE IS NOT PERMITTED.
| 34 |
| 745 ATLANTIC AVENUE |
Operating History and Underwritten Net Cash Flow. The following table presents certain information relating to the historical operating performance and the underwritten net cash flow at the 745 Atlantic Avenue Property:
Cash Flow Analysis
| 2013(1) | 2014(1) | TTM 3/31/2015(1) | U/W | % of U/W Effective Gross Income | U/W $ per SF | |||||||
| Base Rent | $5,479,662 | $2,085,402 | $1,852,191 | $7,858,971(2) | 89.8% | $45.11 | ||||||
| Grossed Up Vacant Space | 0 | 0 | 0 | 3,090 | 0.0 | 0.02 | ||||||
| Total Reimbursables | 604,776 | 135,129 | 137,107 | 286,185 | 3.3 | 1.64 | ||||||
| Other Income | 991,315 | 910,976 | 926,265 | 992,836 | 11.3 | 5.70 | ||||||
| Less Vacancy & Credit Loss | 0 | 0 | 0 | (393,103)(3) | (4.5) | (2.26) | ||||||
| Effective Gross Income | $7,075,753 | $3,131,508 | $2,915,563 | $8,747,978 | 100.0% | $50.21 | ||||||
| Total Operating Expenses | $3,357,131 | $2,850,475 | $2,983,882 | $3,107,951 | 35.5% | $17.84 | ||||||
| Net Operating Income | $3,718,622 | $281,033 | ($68,319) | $5,640,027 | 64.5% | $32.37 | ||||||
| TI/LC | 0 | 0 | 0 | 296,873 | 3.4 | 1.70 | ||||||
| Capital Expenditures | 0 | 0 | 0 | 43,558 | 0.5 | 0.25 | ||||||
| Net Cash Flow | $3,718,622 | $281,033 | ($68,319) | $5,299,596 | 60.6% | $30.42 | ||||||
| NOI DSCR | 1.25x | 0.09x | (0.02x) | 1.90x | ||||||||
| NCF DSCR | 1.25x | 0.09x | (0.02x) | 1.79x | ||||||||
| NOI DY | 5.3% | 0.4% | (0.1%) | 8.1% | ||||||||
| NCF DY | 5.3% | 0.4% | (0.1%) | 7.6% |
| (1) | Net Operating Income in 2013, 2014 and TTM 3/31/2015 was lower than the underwritten level, as the former anchor tenant, Iron Mountain, vacated the 745 Atlantic Avenue Property in multiple phases beginning in late 2013. WeWork signed an initial lease commencing in October 2013 for 20,400 square feet and expanded multiple times (17,616 square feet in January 2014; 55,719 square feet in May 2014; 5,332 square feet in December 2014; and 31,975 square feet in January 2015). WeWork’s rent commencement dates ranged from October 2014 to April 2015. Cambridge Consultants signed an initial lease commencing July 2014 for 20,236 square feet and has signed a lease for the 10,545-square-foot Cambridge Expansion Space with a rent commencement date in November 2015. |
| (2) | U/W Base Rent includes contractual rent steps through April 2016 totalling $44,129. |
| (3) | The underwritten economic vacancy is 5.0%. The 745 Atlantic Avenue Property was 99.9% leased and 90.8% physically occupied as of August 4, 2015. |
Appraisal.As of the appraisal valuation date of June 30, 2015, the 745 Atlantic Avenue Property had an “as-is” appraised value of $114,800,000.
Environmental Matters. According to a Phase I environmental site assessment dated May 6, 2015, there was no evidence of any recognized environmental conditions at the 745 Atlantic Avenue Property.
Market Overview and Competition.The 745 Atlantic Avenue Property is located within the central business district of Boston, Massachusetts, approximately five miles southwest of Boston Logan International Airport. The 745 Atlantic Avenue Property benefits from its location directly across from South Station, one of Boston’s major transportation hubs with access to Amtrak, MTBA Commuter Rail and bus services. Additionally, the 745 Atlantic Avenue Property is less than one block away from an MBTA Red Line stop, which connects to Cambridge, and an MBTA Silver Line stop. The 745 Atlantic Avenue Property is situated within a well-established neighborhood with predominantly office, residential and retail uses and an array of nearby shops and restaurants. Situated between downtown Boston and the Seaport District, the surrounding neighborhood attracts innovative office tenants due to its live/work/play environment.
According to a third-party report, the Boston area is home to approximately 50 higher education establishments, including Harvard and MIT, and serves as a hub for life sciences research and high tech companies. In 2014, Massachusetts-based companies received over $3.5 billion in venture capital investment, behind only California in terms of total investment. In addition, during 2014, 23 Boston-area companies completed IPOs for a total of $2.5 billion. Over 40.0% of college graduates stay in the Boston area after graduation, leading to a young, highly educated population. Approximately 35.0% of Boston’s population is between the ages of 20 and 34 (compared to 20% nationwide), and over 42.0% of the city’s population holds a bachelor’s degree or higher (compared to 28% nationwide).
According to a third-party market research report, the 745 Atlantic Avenue Property is located within the Midtown submarket of the Boston office market. As of the second quarter of 2015, the submarket reported an inventory of 114 office properties totaling approximately 5.7 million square feet with a 3.7% vacancy rate. The appraiser concluded to market rents for the 745 Atlantic Avenue Property of $46.00 per square foot, modified gross, for office space on floors 1-8; $49.00 per square foot, modified gross, for office space on floors 9-11; and $15.00 per square foot, gross, for storage space. Overall, the appraiser concluded that the in-place rents at the 745 Atlantic Avenue Property are approximately 4.8% below market levels.
THE INFORMATION IN THIS STRUCTURAL AND COLLATERAL TERM SHEET IS NOT COMPLETE AND MAY BE AMENDED PRIOR TO THE TIME OF SALE. THIS TERM SHEET IS NOT AN OFFER TO SELL THESE SECURITIES AND IT IS NOT A SOLICITATION OF AN OFFER TO BUY THESE SECURITIES IN ANY JURISDICTION WHERE THE OFFER OR SALE IS NOT PERMITTED.
| 35 |
| 745 ATLANTIC AVENUE |
The following table presents certain information relating to comparable office properties for the 745 Atlantic Avenue Property:
Competitive Set(1)
745 Atlantic (Subject) | Two Financial Center | 101 Federal Street | 50 Milk Street | 225 Franklin Street | 100 Summer Street | Seaport East | |
| Location | Boston, MA | Boston, MA | Boston, MA | Boston, MA | Boston, MA | Boston, MA | Boston, MA |
| Distance from Subject | -- | 0.1 mile | 0.4 mile | 0.5 mile | 0.5 mile | 0.3 mile | 1.0 mile |
| Property Type | Office | Office | Office | Office | Office | Office | Office |
| Year Built/Renovated | 1988/2014 | 2009/NAV | 1988/2000 | 1981/NAV | 1966/1990 | 1974/1999 | 2000/NAV |
| Stories | 11 | 12 | 31 | 21 | 33 | 32 | 16 |
| Total GLA | 174,231 SF | 220,000 SF | 564,101 SF | 340,318 SF | 943,605 SF | 1,034,605 SF | 503,834 SF |
| Occupancy | 100%(2) | 100% | 84% | 88% | 93% | 75% | 96% |
| (1) | Information obtained from the appraisal and a third party market research report and the underwritten rent roll. The appraisal did not include a competitive set; the properties shown were provided as rent comparables. |
| (2) | As of August 4, 2015, the 745 Atlantic Avenue Property was 99.9% leased and 90.8% physically occupied. |
The Borrower.The borrower is OPG 745 Atlantic Owner (DE) LLC, a Delaware limited liability company and single purpose entity with two independent directors. Legal counsel to the borrower delivered a non-consolidation opinion in connection with the origination of the 745 Atlantic Avenue Mortgage Loan. The borrower has liability for certain nonrecourse carveouts under the 745 Atlantic Avenue Mortgage Loan.
The Sponsor.The sponsor is OPG Investment Holdings US Inc., a subsidiary of Oxford Properties Group (“Oxford”). Oxford is wholly owned by Ontario Municipal Employees Retirement System, one of Canada’s largest pension funds with approximately $72.0 billion in net assets. Established in 1960, Oxford is a global real estate investor, developer and manager with investments in office, retail, industrial, multifamily and hotel properties. Headquartered in Toronto with offices in Canada, New York, London, Boston and Washington, D.C., Oxford currently owns and manages a global real estate portfolio valued at approximately $33.0 billion. Oxford’s real estate portfolio consists of over 100 properties totaling nearly 48.0 million square feet of commercial space, over 15,000 residential units and 3,500 hotel rooms. Including the 745 Atlantic Avenue Property, Oxford owns and manages a portfolio of approximately 3.0 million square feet in Boston and Cambridge, Massachusetts.
Escrows.The loan documents provide for upfront deposits of $337,093 for a rent concession reserve ($210,950 for future rent abatements related to Cambridge Consultants and $126,143 for gap rent related to the Cambridge Expansion Space), $1,784,225 for existing tenant improvements and leasing commissions ($1,151,525 related to WeWork and $632,700 related to Cambridge Consultants) and $1,327,560 for deferred maintenance. The loan documents do not require monthly escrows for taxes, insurance, replacement reserves or tenant improvements and leasing commissions provided no Cash Trap Event Period (see “Lockbox and Cash Management” section) has occurred and is continuing. In lieu of any such escrows, the borrower may deliver a letter of credit or guaranty from an affiliate satisfying certain rating criteria of up to $5,000,000 (or, provided certain financial covenants are met, up to $20,000,000) of such escrows.
Lockbox and Cash Management.The 745 Atlantic Avenue Mortgage Loan requires a lender-controlled lockbox account, which is already in place, and that the borrower direct tenants to pay their rents directly into such lockbox account. The loan documents also require that all rents received by the borrower or property manager be deposited into the lockbox account within one business day of receipt. Prior to the occurrence of a Cash Trap Event Period (as defined below), all funds are distributed to the borrower. During a Cash Trap Event Period, all funds are swept to a lender-controlled cash management account. During a Cash Trap Event Period triggered by clause (iii) in the paragraph below, all excess funds will be swept to a subaccount for the payment of potential re-leasing expenses related to the WeWork space (the “WeWork Reserve Subaccount”).
A “Cash Trap Event Period” will commence upon the earlier of (i) the occurrence of an event of default; (ii) the debt service coverage ratio being less than 1.20x; or (iii) the occurrence of a WeWork Trigger Event (as defined below). A Cash Trap Event Period will end, with regard to clause (i), upon the cure of such event of default; with regard to clause (ii), upon the debt service coverage ratio being equal to or greater than 1.20x for two consecutive calendar quarters; and with regard to clause (iii), upon the date on which the aggregate amount of funds deposited in the WeWork Reserve Subaccount equals or exceeds the applicable WeWork Reserve Cap (as defined below).
A “WeWork Trigger Event” will occur upon the earlier of (1) WeWork, together with any of its clients operating in its space, failing to lease and pay rent with respect to at least 50.0% of the WeWork space; (2) any voluntary or involuntary bankruptcy filing filed by or against WeWork; (3) WeWork making an assignment for the benefit of creditors; or (4) WeWork becoming insolvent or unable to pay its debts as they become due.
The “WeWork Reserve Cap” is an amount equal to the product of (a) the net rentable square footage of the WeWork space that is unoccupied or dark and (b) $25.00. With regard to a WeWork Trigger Event triggered by clause (1) above, the WeWork Reserve Cap will be reduced proportionately if (I) any of the WeWork space is re-leased; (II) all tenant obligations have been paid with respect to such re-leased space; and (III) the replacement tenant has unconditionally accepted possession of such re-leased space
THE INFORMATION IN THIS STRUCTURAL AND COLLATERAL TERM SHEET IS NOT COMPLETE AND MAY BE AMENDED PRIOR TO THE TIME OF SALE. THIS TERM SHEET IS NOT AN OFFER TO SELL THESE SECURITIES AND IT IS NOT A SOLICITATION OF AN OFFER TO BUY THESE SECURITIES IN ANY JURISDICTION WHERE THE OFFER OR SALE IS NOT PERMITTED.
| 36 |
| 745 ATLANTIC AVENUE |
(“Proportionate WeWork Reduction”). A Proportionate WeWork Reduction does not apply to a WeWork Trigger Event triggered by clauses (2) through (4) above.
Property Management. The 745 Atlantic Avenue Property is managed by an affiliate of the borrower.
Assumption.The borrower has a two-time right to transfer the 745 Atlantic Avenue Property provided that certain conditions are satisfied, including (i) no event of default has occurred and is continuing; (ii) the transferee satisfies certain specified criteria including value of real estate owned or under management and experience, or the lender has reasonably determined that the proposed transferee and guarantor satisfy the lender’s credit review and underwriting standards, taking into consideration transferee experience, financial strength and general business standing; and (iii) the lender has received confirmation from Fitch, Moody’s and Morningstar that such assumption will not result in a downgrade, withdrawal or qualification of the respective ratings assigned to the Series 2015-C31 Certificates.
Partial Release. Not permitted.
Real Estate Substitution.Not permitted.
Subordinate and Mezzanine Indebtedness.None.
Ground Lease. None.
Terrorism Insurance.The loan documents require that the “all risk” insurance policy required to be maintained by the borrower provide coverage for terrorism in an amount equal to the full replacement cost of the 745 Atlantic Avenue Property (provided that the borrower is not required to pay terrorism insurance premiums in excess of two times the premium for all risk and business interruption coverage if Terrorism Risk Insurance Program Reauthorization Act is no longer in effect), as well as business interruption insurance covering no less than the 36-month period following the occurrence of a casualty event.
THE INFORMATION IN THIS STRUCTURAL AND COLLATERAL TERM SHEET IS NOT COMPLETE AND MAY BE AMENDED PRIOR TO THE TIME OF SALE. THIS TERM SHEET IS NOT AN OFFER TO SELL THESE SECURITIES AND IT IS NOT A SOLICITATION OF AN OFFER TO BUY THESE SECURITIES IN ANY JURISDICTION WHERE THE OFFER OR SALE IS NOT PERMITTED.
| 37 |
| SHERATON LINCOLN HARBOR HOTEL |

THE INFORMATION IN THIS STRUCTURAL AND COLLATERAL TERM SHEET IS NOT COMPLETE AND MAY BE AMENDED PRIOR TO THE TIME OF SALE. THIS TERM SHEET IS NOT AN OFFER TO SELL THESE SECURITIES AND IT IS NOT A SOLICITATION OF AN OFFER TO BUY THESE SECURITIES IN ANY JURISDICTION WHERE THE OFFER OR SALE IS NOT PERMITTED.
| 38 |
| SHERATON LINCOLN HARBOR HOTEL |
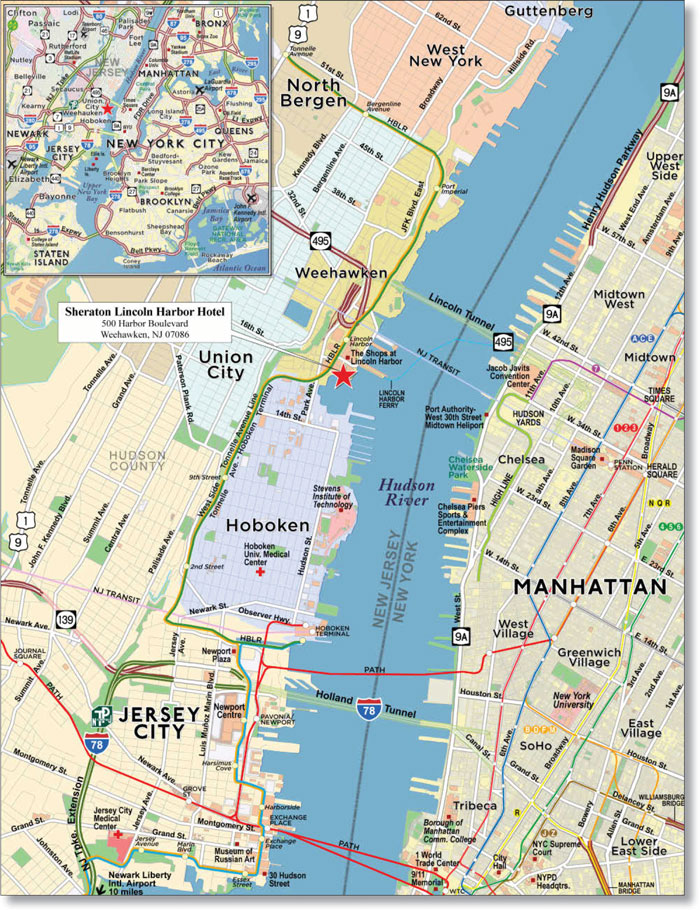
THE INFORMATION IN THIS STRUCTURAL AND COLLATERAL TERM SHEET IS NOT COMPLETE AND MAY BE AMENDED PRIOR TO THE TIME OF SALE. THIS TERM SHEET IS NOT AN OFFER TO SELL THESE SECURITIES AND IT IS NOT A SOLICITATION OF AN OFFER TO BUY THESE SECURITIES IN ANY JURISDICTION WHERE THE OFFER OR SALE IS NOT PERMITTED.
| 39 |
| No. 2 – Sheraton Lincoln Harbor Hotel | |||||||
| Loan Information | Property Information | ||||||
| Mortgage Loan Seller: | Rialto Mortgage Finance, LLC | Single Asset/Portfolio: | Single Asset | ||||
Credit Assessment (Fitch/Moody’s/Morningstar): | NR/NR/NR | Property Type: | Hospitality | ||||
| Original Principal Balance(1): | $60,000,000 | Specific Property Type: | Full Service | ||||
| Cut-off Date Principal Balance(1): | $60,000,000 | Location: | Weehawken, NJ | ||||
| % of Initial Pool Balance: | 6.1% | Size(4): | 358 Rooms | ||||
| Loan Purpose: | Refinance | Cut-off Date Principal Balance Per Room(1)(4): | $223,464 | ||||
| Borrower Name: | River-PW Hotel Limited Partnership | Year Built/Renovated: | 1991/2015 | ||||
| Sponsor: | Hartz Financial Corp. | Title Vesting: | Fee | ||||
| Mortgage Rate: | 4.990% | Property Manager: | Self-managed | ||||
| Note Date: | October 1, 2015 | 3rdMost Recent Occupancy (As of): | 80.5% (12/31/2012) | ||||
| Anticipated Repayment Date: | NAP | 2ndMost Recent Occupancy (As of): | 82.7% (12/31/2013) | ||||
| Maturity Date: | October 6, 2025 | Most Recent Occupancy (As of): | 84.5% (12/31/2014) | ||||
| IO Period: | 96 months | Current Occupancy (As of): | 83.9% (7/31/2015) | ||||
| Loan Term (Original): | 120 months | ||||||
| Seasoning: | 1 month | Underwriting and Financial Information: | |||||
| Amortization Term (Original): | 360 months | ||||||
| Loan Amortization Type: | Interest-only, Amortizing Balloon | 3rdMost Recent NOI (As of): | $7,517,525 (12/31/2013) | ||||
| Interest Accrual Method: | Actual/360 | 2ndMost Recent NOI (As of): | $8,831,821 (12/31/2014) | ||||
| Call Protection(2): | L(25),D(91),O(4) | Most Recent NOI (As of): | $8,649,021 (TTM 7/31/2015) | ||||
| Lockbox Type: | Hard/Springing Cash Management | ||||||
| Additional Debt(1): | Yes | U/W Revenues: | $22,491,786 | ||||
| Additional Debt Type(1): | Pari Passu | U/W Expenses: | $13,268,309 | ||||
| U/W NOI: | $9,223,477 | ||||||
| U/W NCF: | $8,211,347 | ||||||
| U/W NOI DSCR(1)(4): | 1.79x | ||||||
| Escrows and Reserves(3): | U/W NCF DSCR(1)(4): | 1.60x | |||||
| U/W NOI Debt Yield(1)(4): | 11.5% | ||||||
| Type: | Initial | Monthly | Cap (If Any) | U/W NCF Debt Yield(1)(4): | 10.3% | ||
| Taxes | $0 | Springing | NAP | As-Is Appraised Value(5): | $128,000,000 | ||
| Insurance | $0 | Springing | NAP | As-Is Appraisal Valuation Date: | August 20, 2015 | ||
| FF&E | $0 | $86,891 | NAP | Cut-off Date LTV Ratio(1): | 62.5% | ||
| Additional Room Reserve | $1,700,000 | $0 | NAP | LTV Ratio at Maturity or ARD(1): | 60.7% | ||
| (1) | The Sheraton Lincoln Harbor Hotel Loan Combination, with an original balance totaling $80,000,000, is comprised of two pari passu notes (Notes A-1 and A-2). The controlling Note A-1 had an original principal balance of $60,000,000, has an outstanding principal balance as of the Cut-Off Date of $60,000,000 and will be contributed to the WFCM 2015-C31 Trust. The non-controlling Note A-2 had an original principal balance of $20,000,000 and is expected to be contributed to a future trust. All statistical information related to the balances per unit, loan-to-value ratios, debt service coverage ratios and debt yield are based on the Sheraton Lincoln Harbor Hotel Loan Combination. |
| (2) | The lockout period will be at least 25 payments beginning with and including the first payment date of November 6, 2015. Defeasance of the Sheraton Lincoln Harbor Hotel Loan Combination is permitted on or after the date that is the earlier to occur of (i) two years after the closing date of the securitization that includes the last note to be securitized, and (ii) November 6, 2018. The assumed lockout period of 25 payments is based on the expected WFCM 2015-C31 Trust closing date in November 2015 |
| (3) | See “Escrows” section. |
| (4) | The Sheraton Lincoln Harbor Hotel Property currently has 343 rooms. During the first quarter of 2016, the borrower plans to reconfigure underutilized administrative and meeting space and use that space to add an additional 15 rooms, bringing room count at the Sheraton Lincoln Harbor Hotel Property to 358 rooms. The Cut-off Date Balance and underwritten metrics are based on 358 rooms. $1,700,000 has been reserved for this renovation. |
| (5) | The appraiser concluded an “as-complete” appraised value of $130,000,000 with an “as-complete” valuation date of August 20, 2015 (assuming the completion of the 15-room expansion) and an “as-stabilized” appraised value of $143,000,000 with an “as-stabilized” valuation date of August 20, 2017. The Cut-off Date LTV Ratio and LTV Ratio at Maturity or ARD based on the As-Stabilized value are 55.9% and 54.3, respectively. |
The Mortgage Loan. The mortgage loan (the “Sheraton Lincoln Harbor Hotel Loan”) is part of a loan combination (the “Sheraton Lincoln Harbor Hotel Loan Combination”) which is evidenced by twopari passu promissory notes (Notes A-1 and A-2) secured by a first mortgage encumbering the fee interest in a full-service hotel located in Weehawken, New Jersey (the “Sheraton Lincoln Harbor Hotel Property”). The Sheraton Lincoln Harbor Hotel Loan Combination was originated on October 1, 2015 by Rialto Mortgage Finance, LLC. The Sheraton Lincoln Harbor Hotel Loan Combination had an original principal balance of $80,000,000, has an outstanding principal balance as of the Cut-off Date of $80,000,000 and accrues interest at an interest rate of 4.990%per annum. The Sheraton Lincoln Harbor Hotel Loan Combination had an initial term of 120 months, has a remaining term of 119 months as of the Cut-off Date and requires interest-only payments for the first 96 payments following origination and, thereafter, requires payments of principal and interest based on a 30-year amortization schedule. The Sheraton Lincoln Harbor Hotel Loan Combination matures on October 6, 2025. See “Description of the Mortgage Pool – Loan Combinations – The Sheraton Lincoln Harbor Hotel Loan Combination” and “Servicing of the Mortgage Loans and Administration of the Trust Fund” in the Free Writing Prospectus.
The Sheraton Lincoln Harbor Hotel Mortgage Loan, evidenced by the controlling Note A-1 will be contributed to the WFCM 2015-C31 Trust, had an original principal balance of $60,000,000 and has an outstanding principal balance as of the Cut-off Date of
THE INFORMATION IN THIS STRUCTURAL AND COLLATERAL TERM SHEET IS NOT COMPLETE AND MAY BE AMENDED PRIOR TO THE TIME OF SALE. THIS TERM SHEET IS NOT AN OFFER TO SELL THESE SECURITIES AND IT IS NOT A SOLICITATION OF AN OFFER TO BUY THESE SECURITIES IN ANY JURISDICTION WHERE THE OFFER OR SALE IS NOT PERMITTED.
| 40 |
| SHERATON LINCOLN HARBOR HOTEL |
$60,000,000. Note A-2 (the “Sheraton Lincoln Harbor Hotel Companion Loan”), which represents the non-controlling interest in the Sheraton Lincoln Harbor Hotel Loan Combination, had an original principal balance of $20,000,000 and is expected to be contributed to a future trust. The lender provides no assurances that the Note A-2 will not be split further.
Following the lockout period, the borrower has the right to defease the Sheraton Lincoln Harbor Hotel Loan Combination in whole, but not in part, on any date before July 6, 2025. In addition, the Sheraton Lincoln Harbor Hotel Loan Combination is prepayable without penalty on or after July 6, 2025.
Sources and Uses
| Sources | Uses | |||||||
| Original loan amount | $80,000,000 | 100.0% | Loan payoff(1) | $58,865,158 | 73.6% | |||
| Reserves | 1,700,000 | 2.1 | ||||||
| Closing costs | 682,339 | 0.9 | ||||||
| Return of equity | 18,752,503 | 23.4 | ||||||
| Total Sources | $80,000,000 | 100.0% | Total Uses | $80,000,000 | 100.0% |
(1) The Sheraton Lincoln Harbor Hotel Property was previously securitized in the MSC 2007-TOP25 transaction.
The Property.The Sheraton Lincoln Harbor Hotel Property is a 358 room (including the additional 15-rooms that are expected to be added to the hotel (as described below)), 10-story, full service hotel located in Weehawken, New Jersey, diretly across the Hudson River from Manhattan. The Sheraton Lincoln Harbor Hotel Property is situated on 1.0 acres with the main tower originally constructed in 1991 and operating as an AmeriSuites hotel. In 1999, the west tower was constructed and the hotel was converted to the Sheraton flag. The buildings are interconnected, and the west tower is accessed via an enclosed corridor from the south side of the main tower. The Sheraton Lincoln Harbor Hotel Property’s main tower is accessible off Harbor Boulevard via a driveway marked by an attached porte cochere, and there is an additional entrance to the lobby from the parking lot area to the rear of the main tower. The first floor of the main tower accommodates the lobby, registration desk, Sheraton Link (business center), restaurant, lounge, kitchen, fitness center, indoor pool, meeting space, and administrative areas. From 2009 to 2010, the Sheraton Lincoln Harbor Hotel Property underwent a $13.5 million ($39,359 per room, based on 343 rooms) four-phase property improvement plan, which included renovation, improvements and upgrades to the lobby, guestroom design package, guest room corridors, guest room interiors, the Sheraton Lincoln Harbor Hotel Property’s exterior as well as updates to the fitness center equipment and meeting space equipment and soft goods. Other amenities at the Sheraton Lincoln Harbor Hotel Property include the Sheraton Club lounge, which provides exclusive access for complimentary breakfast, all-day snacks and beverages, free Wi-Fi, and personalized service to VIP and Club guests, located on the top floor of the west tower.
Guestrooms are located on levels 2-10 of each building and are configured as suites that feature floor plans with sitting areas in addition to the bedroom. The guestroom mix (based on 343 rooms) includes 176 king bedrooms, 150 double/double bedrooms, nine executive suites and eight queen bedrooms. Guestrooms offer the Sheraton Sweet Sleeper bed package, one or two beds, dressers, sleeper-sofa, coffee table, upholstered armchair, ottoman, desk and chair, end table and lamps. Additional in-room amenities include a built-in hair dryer, iron and board, two-line phone, safe, microwave, mini-refrigerator, coffee maker, wireless high-speed Internet access, as well as a 32” or 37” flat panel television. The bathrooms feature a tub and shower combination with separate vanity area. The 20-year franchise agreement with The Sheraton LLC expires March 16, 2029.
A planned renovation budgeted at approximately $1.7 million (approximately $113,333 per additional room) will increase the guestroom count to 358 guestrooms by converting the existing administrative and meeting rooms on the second floor into 15 additional guestrooms. The second floor renovations will take place in January and February of 2016, and will include eliminating the second floor meeting space and relocating the administrative offices to the old restaurant space on the first floor as part of the ongoing restaurant renovation. The restaurant and lounge are located east of the main lobby on the first floor and total 7,100 square feet. The restaurant and lounge are undergoing a $500,000 renovation with expected completion in October 2015 which includes the addition of an entrance from the exterior of the Sheraton Lincoln Harbor Hotel Property as well as two private dining rooms that can seat 80 and 60 people each. The restaurant and lounge are leased to a borrower affiliated entity, Harbor Boulevard Restaurant, under a 50-year lease that expires on September 26, 2039, with six, eight-year renewal options remaining. In lieu of paying rent, the restaurant contributes $108,131 annually to debt service and also pays an additional charge equal to 4.0% of gross sales for room and banquet services.
Parking is provided through an easement on a parcel located adjacent to the Sheraton Lincoln Harbor Hotel Property for which there are 202 surface parking spaces resulting in a parking ratio of 0.6 spaces per room (based on 358 rooms). Parking is available to guests at the Sheraton Lincoln Harbor Hotel Property on an exclusive basis between the hours of 6:00 pm and 8:00 am Monday through Friday and at all other times on a non-exclusive basis.
THE INFORMATION IN THIS STRUCTURAL AND COLLATERAL TERM SHEET IS NOT COMPLETE AND MAY BE AMENDED PRIOR TO THE TIME OF SALE. THIS TERM SHEET IS NOT AN OFFER TO SELL THESE SECURITIES AND IT IS NOT A SOLICITATION OF AN OFFER TO BUY THESE SECURITIES IN ANY JURISDICTION WHERE THE OFFER OR SALE IS NOT PERMITTED.
| 41 |
| SHERATON LINCOLN HARBOR HOTEL |
Operating History and Underwritten Net Cash Flow.The following table presents certain information relating to the historical operating performance and underwritten net cash Flow at the Sheraton Lincoln Harbor Hotel Property:
Cash Flow Analysis
| 2013 | 2014 | TTM 7/31/2015 | U/W | % of UW Total Revenue | U/W $ per Room(1) | ||||||||
| Occupancy | 82.7% | 84.5% | 83.9% | 83.9% | |||||||||
| ADR | $187.35 | $196.62 | $197.32 | $197.37 | |||||||||
| RevPAR | $154.98 | $166.23 | $165.59 | $165.59 | |||||||||
| Total Revenue | $20,217,239 | $21,731,120 | $21,537,690 | $22,491,786 | 100.0 | % | $62,826 | ||||||
| Total Department Expenses | 4,827,877 | 4,819,385 | 4,803,125 | 5,013,164 | 22.3 | 14,003 | |||||||
| Gross Operating Profit | $15,389,362 | $16,911,735 | $16,734,564 | $17,478,623 | 77.7 | % | $48,823 | ||||||
| Total Undistributed Expenses | 6,376,653 | 6,518,952 | 6,619,767 | 6,728,867 | 29.9 | 18,796 | |||||||
| Profit Before Fixed Charges | $9,012,708 | $10,392,783 | $10,114,797 | $10,749,756 | 47.8 | % | $30,027 | ||||||
| Total Fixed Charges | 1,495,183 | 1,560,962 | 1,465,777 | 1,526,279 | 6.8 | 4,263 | |||||||
| Net Operating Income | $7,517,525 | $8,831,821 | $8,649,021 | $9,223,477 | 41.0 | % | $25,764 | ||||||
| FF&E | 1,020,135 | 1,088,225 | 964,753 | 1,012,130 | 4.5 | 2,827 | |||||||
| Net Cash Flow | $6,497,390 | $7,743,597 | $7,684,268 | $8,211,347 | 36.5 | % | $22,937 | ||||||
| NOI DSCR | 1.46x | 1.72x | 1.68x | 1.79x | |||||||||
| NCF DSCR | 1.26x | 1.50x | 1.49x | 1.60x | |||||||||
| NOI DY | 9.4% | 11.0% | 10.8% | 11.5% | |||||||||
| NCF DY | 8.1% | 9.7% | 9.6% | 10.3% | |||||||||
| (1) | Based on 358 rooms. The Sheraton Lincoln Harbor Hotel Property currently has 343 rooms. During the 1st Quarter of 2016, the borrower plans to reconfigure underutilized administrative and meeting space and use that space to add an additional 15 rooms bringing room count at the Sheraton Lincoln Harbor Hotel Property to 358 rooms. The Cut-off Date Balance and underwritten metrics are based on 358 rooms. $1,700,000 has been reserved for this renovation. |
Appraisal.As of the appraisal valuation date of August 20, 2015, the Sheraton Lincoln Harbor Hotel Property had an “as-is” appraised value of $128,000,000. The appraiser also concluded an “as-complete” appraised value of $130,000,000 with an “as-complete” valuation date of August 20, 2015 (assuming the completion of the 15-room expansion) and an “as-stabilized” appraised value of $143,000,000 with an “as-stabilized” valuation date of August 20, 2017.
Environmental Matters.According to a Phase I environmental assessment dated August 21, 2015, there was no evidence of any recognized environmental conditions at the Sheraton Lincoln Harbor Hotel Property. For additional information, see “Description of the Mortgage Pool – Assessments of Property Value and Condition – Environmental Assessments” in the Free Writing Prospectus.
Market Overview and Competition.The Sheraton Lincoln Harbor Hotel Property is located along the banks of the Hudson River at the southeast corner of 19th Street and Harbor Boulevard within the Lincoln Harbor neighborhood of Weehawken’s Waterfront district. The Lincoln Harbor neighborhood sits across the river from New York City and is accessible via the Lincoln Tunnel which leads into the New York City’s Hudson Yards and Garment District to the east. Lincoln Harbor serves as one of two major waterfront developments in Weehawken, which has experienced growth along the western shores of the Hudson River over the past decade. Lincoln Harbor is a 60.0-acre mixed use development opposite Midtown Manhattan that contains five office buildings totaling 1.5 million square feet completed from 1987 to 1989 and is occupied by UBS and Citicorp. One of the office buildings is being redeveloped as a 227-unit apartment building. Lincoln Harbor also accommodates more than 70,000 square feet of retail shops and restaurants, a 245-unit condominium, as well as a public park, 250 slip marina, and a waterfront walkway.
TheSheraton Lincoln Harbor Hotel Property is located in Weehawken, New Jersey, within the greater New York-Newark-Jersey City metropolitan statistical area (“NY-NJ-PA MSA”). The NY-NJ-PA MSA has an estimated population of approximately 20.1 million. According to a third party report, the unemployment rate for the NY-NJ-PA MSA was 5.6% as of April 2015. In comparison, the unemployment rate in New Jersey was 6.2% and the national unemployment rate was 5.4% for the same period. The Sheraton Lincoln Harbor Hotel Property can be more specifically described as part of the Northern New Jersey region which extends 45.0 to 55.0 miles west of Midtown Manhattan in Hudson County. Hudson County benefits from a diverse economic base and convenient accessibility to public transportation into New York City via bus, rail, and waterway services. NJ Transit provides bus and rail service throughout the region and into New York City, with additional rail service provided by Amtrak, Conrail, and the Port Authority Trans Hudson. The region is also supported by the Newark-Liberty International Airport (approximately 13.0 miles southwest of the Sheraton Lincoln Harbor Hotel Property) which is the sixth largest airport in the world for passenger travel. Top employers within Hudson County primarily consist of financial services firms including UBS Financial Services, Bank of Tokyo Mitsubishi Trust, Insurance Service Office Inc., Goldman Sachs & Co. Inc., Mellon Bank, JP Morgan Chase Bank, and Citigroup Inc. Other top employers are positioned within the education, healthcare, government, distribution, and pharmaceutical sectors.
THE INFORMATION IN THIS STRUCTURAL AND COLLATERAL TERM SHEET IS NOT COMPLETE AND MAY BE AMENDED PRIOR TO THE TIME OF SALE. THIS TERM SHEET IS NOT AN OFFER TO SELL THESE SECURITIES AND IT IS NOT A SOLICITATION OF AN OFFER TO BUY THESE SECURITIES IN ANY JURISDICTION WHERE THE OFFER OR SALE IS NOT PERMITTED.
| 42 |
| SHERATON LINCOLN HARBOR HOTEL |
The following table presents certain information relating to the Sheraton Lincoln Harbor Hotel Property’s competitive set:
Subject and Market Historical Occupancy, ADR and RevPAR(1)
| Competitive Set | Sheraton Lincoln Harbor Hotel | Penetration Factor | |||||||||||||||||
Year | Occupancy | ADR | RevPAR | Occupancy | ADR | RevPAR | Occupancy | ADR | RevPAR | ||||||||||
| 7/31/2015 TTM | 77.2% | $203.70 | $157.29 | 83.8% | $196.35 | $164.61 | 108.6% | 96.4% | 104.7% | ||||||||||
| 7/31/2014 TTM | 80.0% | $197.89 | $158.28 | 84.0% | $193.11 | $162.12 | 105.0% | 97.6% | 102.4% | ||||||||||
| 7/31/2013 TTM | 79.6% | $191.07 | $152.15 | 81.7% | $182.20 | $148.78 | 102.5% | 95.4% | 97.8% | ||||||||||
| (1) | Information obtained from a third party hospitality research report dated August 18, 2015. The competitive set includes the following hotels: Hilton Meadowlands, Courtyard Jersey City Newport, Hyatt Regency Jersey City, Westin Jersey City, Renaissance Meadowlands Hotel and Doubletree Hotel Jersey City. |
The Borrower.The borrower is River-PW Hotel Limited Partnership, a single purpose entity with two independent directors. Legal counsel to the borrower delivered a non-consolidation opinion in connection with the origination of the Sheraton Lincoln Harbor Hotel Loan Combination. Hartz Financial Corp., the indirect owner of the borrower, is the guarantor of certain nonrecourse carveouts under the Sheraton Lincoln Harbor Hotel Loan Combination.
The Sponsor.The sponsor, Hartz Financial Corp., is a New Jersey corporation formed in 1997 and is a wholly-owned subsidiary of Hartz Mountain Industries, Inc., which is indirectly wholly-owned by The Hartz Group, Inc (“Hartz”). Hartz is a privately held enterprise with interests in real estate, oil, gas and financial management. The Hartz portfolio includes approximately 185 properties comprised of over 35.0 million square feet and 300.0 acres of land in the Northern New Jersey/New York area. The Hartz portfolio, is managed though its in-house property and asset management team, includes corporate offices, warehouse and distribution facilities, hotels, single and multi-family developments, retail centers, movie theaters, restaurants and land.
Escrows.The loan documents provide for an upfront escrow in the amount of $1,700,000 for an additional room reserve that will be used for the construction and addition of 15 rooms on the second floor of the Sheraton Lincoln Harbor Hotel Property. Within one year of the loan origination date, the borrower is required to either (i) complete all additional rooms or (ii) restore the Sheraton Lincoln Harbor Hotel Property to its original condition.
The loan documents also provide for monthly replacement reserves in an amount equal to 4.0% of operating income for the calendar month that is two months prior to when the deposit is to be made (initially estimated to be $86,891).Monthly reserves for real estate taxes and insurance premiums are required only during the occurrence and continuation of a Cash Sweep Event (see “Lockbox and Cash Management” section), in which case, the borrower will be required to deposit (i) to the real estate tax reserve, an amount equal to one-twelfth of the amount that the lender estimates will be necessary to pay real estate taxes over the then succeeding 12-month period; and (ii) to the insurance reserve, an amount equal to one-twelfth of the amount that the lender estimates will be necessary to pay insurance premiums over the then succeeding 12-month period.
Lockbox and Cash Management.The Sheraton Lincoln Harbor Loan Combination requires a lender-controlled lockbox account, which is already in place, and that all revenue from the Sheraton Lincoln Harbor Hotel Property is deposited directly into such lockbox account by the sponsor, borrower, manager and credit card providers. Prior to the occurrence of a Cash Sweep Event (as defined below), all funds on deposit in the lockbox account are disbursed to the borrower. During a Cash Sweep Event, all funds in such lockbox account will be swept into a lender-controlled cash management account.
A “Cash Sweep Event” will commence upon the earlier of (i) the occurrence of an event of default; (ii) the occurrence of a bankruptcy action of the borrower, the guarantor or the property manager that has not been dismissed within 60 days; or (iii) a DSCR Trigger Event (as defined below). A Cash Sweep Event will end with respect to clause (i), upon such event of default having been cured; with respect to clause (ii), when such bankruptcy petition has been discharged or dismissed within 60 days or with respect to the property manager, upon the replacement of the property manager with a qualified property manager by the lender; and with respect to (iii), once the amortizing debt service coverage ratio is greater than 1.10x for six consecutive months, among other conditions.
A “DSCR Trigger Event” occurs upon any date the amortizing debt service coverage ratio based on the trailing 12-month period immediately preceding the date of such determination is less than 1.10x.
Property Management.The Sheraton Lincoln Harbor Hotel Property is managed by an affiliate of the borrower.
Assumption.The borrower has a right to transfer the Sheraton Lincoln Harbor Hotel Property at any time one year following the origination date, provided that no event of default has occurred and is continuing and certain other conditions are satisfied, including (i) the lender’s reasonable determination that the proposed transferee and guarantor satisfy the lender’s credit review and underwriting standards, taking into consideration transferee experience, financial strength and general business standing; (ii) execution of a recourse guaranty and an environmental indemnity by an affiliate of the transferee; and (iii) if requested by the lender, rating agency confirmation from Fitch, Moody’s and Morningstar that the transfer will not result in a downgrade, withdrawal or qualification of the respective ratings assigned to the Series 2015-C31 Certificates and similar confirmations from each rating agency rating any securities backed by the Sheraton Lincoln Harbor Hotel Companion with respect to the ratings of such securities.
Partial Release.Not permitted.
Real Estate Substitution.Not permitted.
THE INFORMATION IN THIS STRUCTURAL AND COLLATERAL TERM SHEET IS NOT COMPLETE AND MAY BE AMENDED PRIOR TO THE TIME OF SALE. THIS TERM SHEET IS NOT AN OFFER TO SELL THESE SECURITIES AND IT IS NOT A SOLICITATION OF AN OFFER TO BUY THESE SECURITIES IN ANY JURISDICTION WHERE THE OFFER OR SALE IS NOT PERMITTED.
| 43 |
| SHERATON LINCOLN HARBOR HOTEL |
Subordinate and Mezzanine Indebtedness.Not permitted.
Ground Lease. None.
Terrorism Insurance.The loan documents require that the “all risk” insurance policy required to be maintained by the borrower provide coverage for terrorism in an amount equal to the full replacement cost of the Sheraton Lincoln Harbor Hotel Property, as well as business interruption insurance covering no less than the 18-month period following the occurrence of a casualty event, together with a 12-month extended period of indemnity.
THE INFORMATION IN THIS STRUCTURAL AND COLLATERAL TERM SHEET IS NOT COMPLETE AND MAY BE AMENDED PRIOR TO THE TIME OF SALE. THIS TERM SHEET IS NOT AN OFFER TO SELL THESE SECURITIES AND IT IS NOT A SOLICITATION OF AN OFFER TO BUY THESE SECURITIES IN ANY JURISDICTION WHERE THE OFFER OR SALE IS NOT PERMITTED.
| 44 |
(THIS PAGE INTENTIONALLY LEFT BLANK)
THE INFORMATION IN THIS STRUCTURAL AND COLLATERAL TERM SHEET IS NOT COMPLETE AND MAY BE AMENDED PRIOR TO THE TIME OF SALE. THIS TERM SHEET IS NOT AN OFFER TO SELL THESE SECURITIES AND IT IS NOT A SOLICITATION OF AN OFFER TO BUY THESE SECURITIES IN ANY JURISDICTION WHERE THE OFFER OR SALE IS NOT PERMITTED.
| 45 |
(THIS PAGE INTENTIONALLY LEFT BLANK)
THE INFORMATION IN THIS STRUCTURAL AND COLLATERAL TERM SHEET IS NOT COMPLETE AND MAY BE AMENDED PRIOR TO THE TIME OF SALE. THIS TERM SHEET IS NOT AN OFFER TO SELL THESE SECURITIES AND IT IS NOT A SOLICITATION OF AN OFFER TO BUY THESE SECURITIES IN ANY JURISDICTION WHERE THE OFFER OR SALE IS NOT PERMITTED.
| 46 |
CITYPLACE I |
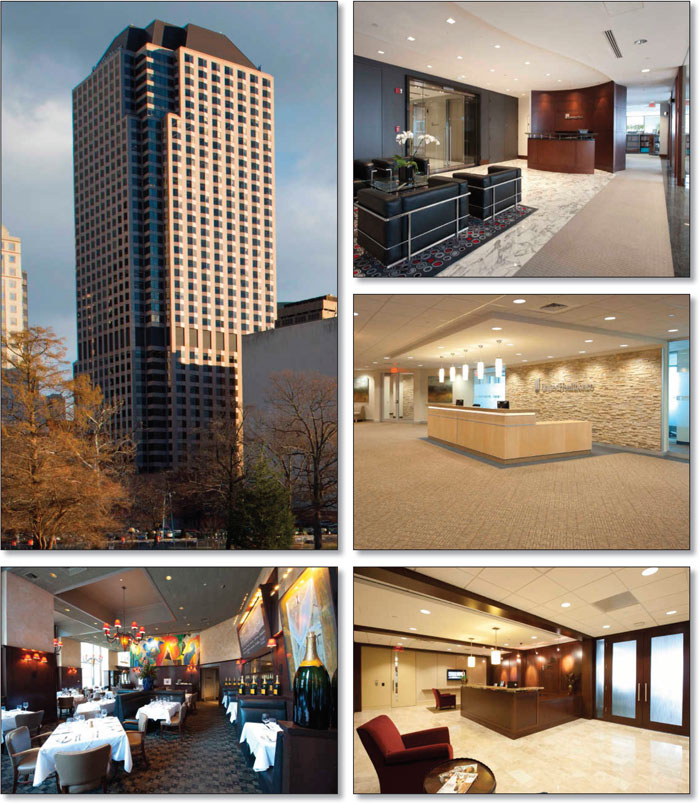
THE INFORMATION IN THIS STRUCTURAL AND COLLATERAL TERM SHEET IS NOT COMPLETE AND MAY BE AMENDED PRIOR TO THE TIME OF SALE. THIS TERM SHEET IS NOT AN OFFER TO SELL THESE SECURITIES AND IT IS NOT A SOLICITATION OF AN OFFER TO BUY THESE SECURITIES IN ANY JURISDICTION WHERE THE OFFER OR SALE IS NOT PERMITTED.
| 47 |
CITYPLACE I |
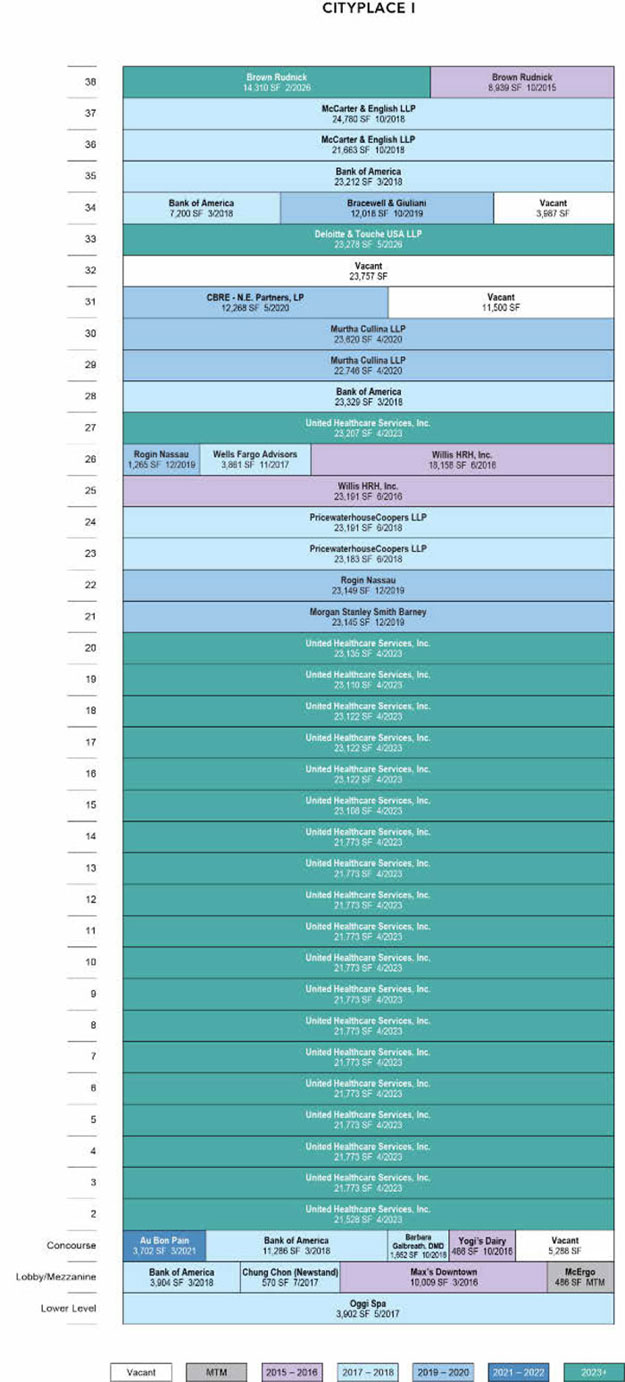
THE INFORMATION IN THIS STRUCTURAL AND COLLATERAL TERM SHEET IS NOT COMPLETE AND MAY BE AMENDED PRIOR TO THE TIME OF SALE. THIS TERM SHEET IS NOT AN OFFER TO SELL THESE SECURITIES AND IT IS NOT A SOLICITATION OF AN OFFER TO BUY THESE SECURITIES IN ANY JURISDICTION WHERE THE OFFER OR SALE IS NOT PERMITTED.
| 48 |
CITYPLACE I |

THE INFORMATION IN THIS STRUCTURAL AND COLLATERAL TERM SHEET IS NOT COMPLETE AND MAY BE AMENDED PRIOR TO THE TIME OF SALE. THIS TERM SHEET IS NOT AN OFFER TO SELL THESE SECURITIES AND IT IS NOT A SOLICITATION OF AN OFFER TO BUY THESE SECURITIES IN ANY JURISDICTION WHERE THE OFFER OR SALE IS NOT PERMITTED.
| 49 |
| No. 3 – CityPlaceI | |||||||
| Loan Information | Property Information | ||||||
| Mortgage Loan Seller: | Wells Fargo Bank, National Association | Single Asset/Portfolio: | Single Asset | ||||
Credit Assessment (Fitch/Moody’s/Morningstar): | NR/NR/NR | Property Type: | Office | ||||
| Original Principal Balance(1): | $45,000,000 | Specific Property Type: | CBD | ||||
| Cut-off Date Principal Balance(1): | $45,000,000 | Location: | Hartford, CT | ||||
| % of Initial Pool Balance: | 4.6% | Size: | 884,366 SF | ||||
| Loan Purpose: | Acquisition | Cut-off Date Principal Balance Per SF(1): | $89.64 | ||||
| Borrower Name: | RP Asylum, LLC | Year Built/Renovated: | 1983/2010 | ||||
| Sponsors: | Kevin McCall; John T. Caldwell | Title Vesting: | Fee | ||||
| Mortgage Rate: | 4.750% | Property Manager: | Self-managed | ||||
| Note Date: | September 10, 2015 | 3rd Most Recent Occupancy (As of): | 99.2% (12/31/2012) | ||||
| Anticipated Repayment Date: | NAP | 2nd Most Recent Occupancy (As of): | 99.3% (12/31/2013) | ||||
| Maturity Date: | September 11, 2025 | Most Recent Occupancy (As of): | 99.4% (12/31/2014) | ||||
| IO Period: | 120 months | Current Occupancy (As of): | 94.0% (8/1/2015) | ||||
| Loan Term (Original): | 120 months | ||||||
| Seasoning: | 2 months | Underwriting and Financial Information: | |||||
| Amortization Term (Original): | NAP | ||||||
| Loan Amortization Type: | Interest-only, Balloon | 3rd Most Recent NOI (As of): | $9,061,072 (12/31/2013) | ||||
| Interest Accrual Method: | Actual/360 | 2nd Most Recent NOI (As of): | $8,787,487 (12/31/2014) | ||||
| Call Protection(2): | L(26),D(90),O(4) | Most Recent NOI (As of): | $8,521,715 (TTM 7/31/2015) | ||||
| Lockbox Type: | Hard/Upfront Cash Management | ||||||
| Additional Debt(1): | Yes | ||||||
| Additional Debt Type(1): | Pari Passu | ||||||
| U/W Revenues: | $22,053,021 | ||||||
| U/W Expenses: | $13,489,391 | ||||||
| Escrows and Reserves(3): | U/W NOI: | $8,563,631 | |||||
| U/W NCF: | $7,155,402 | ||||||
| Type: | Initial | Monthly | Cap (If Any) | U/W NOI DSCR(1): | 2.24x | ||
| Taxes | $556,806 | $324,801 | NAP | U/W NCF DSCR(1): | 1.87x | ||
| Insurance | $10,375 | $10,373 | NAP | U/W NOI Debt Yield(1): | 10.8% | ||
| Replacement Reserves | $88,437 | $88,473 | NAP | U/W NCF Debt Yield(1): | 9.0% | ||
| TI/LC Reserve | $3,000,000 | $110,546 | $4,500,000 | As-Is Appraised Value: | $114,500,000 | ||
| Tenant Specific TI/LC Reserve | $2,056,337 | $0 | NAP | As-Is Appraisal Valuation Date: | August 5, 2015 | ||
| Rent Concession Reserve | $257,028 | $0 | NAP | Cut-off Date LTV Ratio(1): | 69.2% | ||
| Environmental Reserve | $25,000 | $0 | NAP | LTV Ratio at Maturity or ARD(1): | 69.2% | ||
| (1) | The CityPlace I Loan Combination, with an original balance totaling $79,275,000, is comprised of twoparipassu notes (Notes A-1 and A-2). The controlling Note A-1 had an original principal balance of $45,000,000, has an outstanding principal balance as of the Cut-off Date of $45,000,000 and will be contributed to the WFCM 2015-C31 Trust. The non-controlling Note A-2 had an original balance of $34,275,000, has an outstanding principal balance as of the Cut-off Date of $34,275,000 and will be contributed to a future trust. All statistical information related to the balance per square foot, loan-to-value ratios, debt service coverage ratios and debt yields are based on the CityPlace I Loan Combination. |
| (2) | The lockout period will be at least 26 payments beginning with and including the first payment date of October 11, 2015. Defeasance of the CityPlace I Loan Combination is permitted on or after the date that is the earlier to occur of (i) two years after the closing date of the securitization that includes the last note to be securitized, and (ii) September 10, 2019. The assumed lockout period of 26 payments is based on the expected WFCM 2015-C31 Trust closing date in November 2015. |
| (3) | See “Escrows” section. |
The Mortgage Loan. The mortgage loan (the “CityPlace I Mortgage Loan”) is part of a loan combination (the “CityPlace I Loan Combination”) evidenced by twopari passupromissory notes (Notes A-1 and A-2) secured by a first mortgage encumbering a 39-story office building located in Hartford, Connecticut (the “CityPlace I Property”). The CityPlace I Loan Combination was originated on September 10, 2015 by Wells Fargo Bank, National Association. The CityPlace I Loan Combination had an original principal balance of $79,275,000, has an outstanding principal balance as of the Cut-off Date of $79,275,000 and accrues interest at an interest rate of 4.750%per annum. The CityPlace I Loan Combination had an initial term of 120 months, has a remaining term of 118 months as of the Cut-off Date and requires interest-only payments through the term of the CityPlace I Loan Combination. The CityPlace I Loan Combination matures on September 11, 2025. See “Description of the Mortgage Pool – Loan Combinations – The CityPlace I Loan Combination” in the Free Writing Prospectus.
The CityPlace I Mortgage Loan, evidenced by the controlling Note A-1, will be contributed to the WFCM 2015-C31 Trust, had an original principal balance of $45,000,000 and has an outstanding principal balance as of the Cut-off Date of $45,000,000. Note A-2 (the “CityPlace I Companion Loan”), which represents the non-controlling interest in the CityPlace I Loan Combination, had an
THE INFORMATION IN THIS STRUCTURAL AND COLLATERAL TERM SHEET IS NOT COMPLETE AND MAY BE AMENDED PRIOR TO THE TIME OF SALE. THIS TERM SHEET IS NOT AN OFFER TO SELL THESE SECURITIES AND IT IS NOT A SOLICITATION OF AN OFFER TO BUY THESE SECURITIES IN ANY JURISDICTION WHERE THE OFFER OR SALE IS NOT PERMITTED.
| 50 |
CITYPLACE I |
original principal balance of $34,275,000 and will be contributed to a future trust. The lender provides no assurances that Note A-2 will not be split further.
Following the lockout period, the borrower has the right to defease the CityPlace I Loan Combination in whole, but not in part, on any date before June 11, 2025. In addition, the CityPlace I Loan Combination is prepayable without penalty on or after June 11, 2025.
Sources and Uses
| Sources | Uses | |||||||
| Original loan amount | $79,275,000 | 65.8% | Purchase price | $113,250,000 | 94.0% | |||
| Sponsor’s new cash contribution | 40,037,385 | 33.2 | Reserves | 5,993,983 | 5.0 | |||
| Seller’s credit | 1,185,001 | 1.0 | Closing costs | 1,253,404 | 1.0 | |||
| Total Sources | $120,497,387 | 100.0% | Total Uses | $120,497,387 | 100.0% |
The Property.The CityPlace I Property is a 39-story, landmark class A office tower totaling 884,366 square feet located in the Hartford, Connecticut central business district. Built in 1983, the CityPlace I Property originally served as the corporate headquarters for Aetna Life and Casualty and, through acquisitions, Travelers Insurance/Citigroup anchored the CityPlace I Property from 1996 to 2005 and then MetLife from 2005 to 2008. In October 2008, MetLife vacated the CityPlace I Property and in March 2009, United Healthcare Services, Inc. (“United Healthcare”) executed a lease for 421,528 square feet (47.7% of the net rentable area) and has since expanded to 444,735 square feet (50.3% of the net rentable area). The CityPlace I Property is comprised of two office and retail floors beneath 37 floors of office space. The second floor includes a full-service cafeteria that is leased to United Healthcare and is open to the public as well as a fitness center that is available to United Healthcare employees. The CityPlace I Property, the tallest building in Connecticut, has a saw-tooth design and, as a result, each office level is provided with at least 10 corner offices.
United Healthcare is the largest tenant, representing 50.3% of the net rentable area, and has the right to rename the CityPlace I Property. In addition, United Healthcare completed a $34.0 million ($76 per square foot) renovation of its space in 2009-2010. Other major tenants include nationally recognized companies such as Bank of America, PricewaterhouseCoopers LLP, Willis HRH, Inc., Morgan Stanley Smith Barney, Wells Fargo Advisors and Deloitte & Touche USA LLP. Approximately 63.2% of the net rentable area at the CityPlace I Property is leased to investment grade tenants and the CityPlace I Property has averaged 94.8% occupancy since 2010. Parking is provided via a three-level below grade parking garage containing 333 parking spaces, of which 235 spaces are allocated to the CityPlace I Property, resulting in a parking ratio of 0.3 spaces per 1,000 square feet of rentable area. The remaining 98 parking spaces are for use by CityPlace II, which also shares the atrium and lobby area with the CityPlace I Property. As of August 1, 2015, the CityPlace I Property was 94.0% occupied by 21 tenants.
THE INFORMATION IN THIS STRUCTURAL AND COLLATERAL TERM SHEET IS NOT COMPLETE AND MAY BE AMENDED PRIOR TO THE TIME OF SALE. THIS TERM SHEET IS NOT AN OFFER TO SELL THESE SECURITIES AND IT IS NOT A SOLICITATION OF AN OFFER TO BUY THESE SECURITIES IN ANY JURISDICTION WHERE THE OFFER OR SALE IS NOT PERMITTED.
| 51 |
CITYPLACE I |
The following table presents certain information relating to the tenancy at the CityPlace I Property:
Major Tenants
| Tenant Name | Credit Rating (Fitch/Moody’s/ S&P)(1) | Tenant NRSF | % of NRSF | Annual U/W Base Rent PSF(2) | Annual U/W Base Rent(2) | % of Total Annual U/W Base Rent | Lease Expiration Date |
| Major Tenants | |||||||
| United Healthcare | A-/A3/A+ | 444,735 | 50.3% | $10.00(3) | $4,232,070 | 30.2% | 4/30/2023(4)(5) |
| Bank of America | A/Baa1/A- | 68,931 | 7.8% | $24.59 | $1,694,738 | 12.1% | 3/31/2018(6) |
| McCarter & English LLP | NR/NR/NR | 46,443 | 5.3% | $27.98 | $1,299,480 | 9.3% | 10/31/2018(7) |
| PricewaterhouseCoopers LLP | NR/NR/NR | 46,374 | 5.2% | $26.00 | $1,205,724 | 8.6% | 6/30/2018(8) |
| Murtha Cullina LLP | NR/NR/NR | 46,366 | 5.2% | $25.50 | $1,182,333 | 8.4% | 4/30/2020(9) |
| Willis HRH, Inc. | BBB-/Baa3/BBB- | 41,349 | 4.7% | $26.72 | $1,104,828 | 7.9% | 6/30/2016(10) |
| Total Major Tenants | 694,198 | 78.5% | $15.44 | $10,719,173 | 76.5% | ||
| Non-Major Tenants(11) | 136,697 | 15.5% | $24.09 | $3,292,464 | 23.5% | ||
| Occupied Collateral Total | 830,895 | 94.0% | $16.86 | $14,011,637 | 100.0% | ||
| Vacant Space | 53,471 | 6.0% | |||||
| Collateral Total | 884,366 | 100.0% | |||||
| (1) | Certain ratings are those of the parent company whether or not the parent company guarantees the lease. |
| (2) | Annual U/W Base Rent PSF and Annual U/W Base Rent include contractual rent steps through May 1, 2016 totaling $306,226. |
| (3) | Annual U/W Base Rent PSF for United Healthcare excludes 21,528 square feet (2.4% of the net rentable area) of cafeteria space which has no associated rent. Annual U/W Base Rent PSF including the cafeteria space is $9.52 per square foot. |
| (4) | United Healthcare has the right to terminate space on any of floors 15-20 (totaling 138,719 square feet or 15.7% of the net rentable area) effective on any or all of the following dates: December 31, 2017; December 31, 2019 and/or December 31, 2020. With respect to any such termination, (i) the contraction space must consist of a full floor or contiguous floors and the contraction space must be the highest leased floor or floors at the time of contraction; (ii) United Healthcare must provide at least 15 months’ notice; and (iii) United Healthcare must pay a termination fee equal to unamortized landlord costs. |
| (5) | United Healthcare has either two 5-year or one 10-year renewal option. |
| (6) | Bank of America has two 5-year renewal options. |
| (7) | McCarter & English LLP has two 5-year renewal options. |
| (8) | PricewaterhouseCoopers LLP has either one 6-month or two 5-year renewal options. |
| (9) | Murtha Cullina LLP has two 5-year renewal options. |
| (10) | Willis HRH, Inc. has two 5-year renewal options. |
| (11) | Non-Major Tenants includes the mail room and management office totaling 2,596 square feet (0.3% of the net rentable area) which do not have leases or associated rent. |
The following table presents certain information relating to the lease rollover schedule at the CityPlace I Property:
Lease Expiration Schedule(1)(2)
Year Ending December 31, | No. of Leases Expiring | Expiring NRSF | % of Total NRSF | Cumulative Expiring NRSF | Cumulative % of Total NRSF | Annual U/W Base Rent | Annual U/W Base Rent PSF(3) |
| MTM(4) | 1 | 3,082 | 0.3% | 3,082 | 0.3% | $6,000 | $1.95 |
| 2015 | 1 | 0 | 0.0% | 3,082 | 0.3% | $0 | $0.00 |
| 2016 | 3 | 51,844 | 5.9% | 54,926 | 6.2% | $1,338,687 | $25.82 |
| 2017 | 3 | 8,333 | 0.9% | 63,259 | 7.2% | $136,512 | $16.38 |
| 2018 | 4 | 163,400 | 18.5% | 226,659 | 25.6% | $4,243,262 | $25.97 |
| 2019 | 3 | 59,577 | 6.7% | 286,236 | 32.4% | $1,478,164 | $24.81 |
| 2020 | 2 | 58,634 | 6.6% | 344,870 | 39.0% | $1,507,435 | $25.71 |
| 2021 | 1 | 3,702 | 0.4% | 348,572 | 39.4% | $51,960 | $14.04 |
| 2022 | 0 | 0 | 0.0% | 348,572 | 39.4% | $0 | $0.00 |
| 2023 | 1 | 444,735 | 50.3% | 793,307 | 89.7% | $4,232,070 | $10.00(5) |
| 2024 | 0 | 0 | 0.0% | 793,307 | 89.7% | $0 | $0.00 |
| 2025 | 0 | 0 | 0.0% | 793,307 | 89.7% | $0 | $0.00 |
| Thereafter | 2 | 37,588 | 4.3% | 830,895 | 94.0% | $1,017,547 | $27.07 |
| Vacant | 0 | 53,471 | 6.0% | 884,366 | 100.0% | $0 | $0.00 |
| Total/Weighted Average | 21 | 884,366 | 100.0% | $14,011,637 | $16.86 |
| (1) | Information obtained from the underwritten rent roll. |
| (2) | Certain tenants may have lease termination options that are exercisable prior to the originally stated expiration date of the subject lease and that are not considered in the Lease Expiration Schedule. |
| (3) | Weighted Average Annual U/W Base Rent PSF excludes vacant space. |
| (4) | MTM includes the mail room and management office totaling 2,596 square feet (0.3% of the net rentable area) which do not have leases or associated rent. |
| (5) | Annual U/W Base Rent PSF for United Healthcare excludes 21,528 square feet (2.4% of the net rentable area) of cafeteria space which has no associated rent. Annual U/W Base Rent PSF including the cafeteria space is $9.52 per square foot. |
THE INFORMATION IN THIS STRUCTURAL AND COLLATERAL TERM SHEET IS NOT COMPLETE AND MAY BE AMENDED PRIOR TO THE TIME OF SALE. THIS TERM SHEET IS NOT AN OFFER TO SELL THESE SECURITIES AND IT IS NOT A SOLICITATION OF AN OFFER TO BUY THESE SECURITIES IN ANY JURISDICTION WHERE THE OFFER OR SALE IS NOT PERMITTED.
| 52 |
CITYPLACE I |
The following table presents historical occupancy percentages at the CityPlace I Property:
Historical Occupancy
12/31/2012(1) | 12/31/2013(1) | 12/31/2014(1) | 8/1/2015(2) | |||
| 99.2% | 99.3% | 99.4% | 94.0% |
| (1) | Information obtained from the borrower. |
| (2) | Information obtained from the underwritten rent roll. |
Operating History and Underwritten Net Cash Flow. The following table presents certain information relating to the historical operating performance and underwritten net cash flow at the CityPlace I Property:
Cash Flow Analysis
| 2013 | 2014 | TTM 7/31/2015 | U/W | % of U/W Effective Gross Income | U/W $ per SF | |||||||||
| Base Rent | $14,019,766 | $14,081,900 | $14,122,265 | $14,011,637(1) | 63.5% | $15.84 | ||||||||
| Grossed Up Vacant Space | 0 | 0 | 0 | 1,386,003 | 6.3 | 1.57 | ||||||||
| Total Reimbursables | 6,816,027 | 6,942,796 | 6,909,627 | 7,220,371 | 32.7 | 8.16 | ||||||||
| Other Income | 158,527 | 164,389 | 127,610 | 127,610 | 0.6 | 0.14 | ||||||||
| Parking Income | 784,300 | 797,507 | 819,265 | 847,165 | 3.8 | 0.96 | ||||||||
| Less Vacancy & Credit Loss | 0 | (41,819) | (41,819) | (1,539,764)(2) | (7.0) | (1.74) | ||||||||
| Effective Gross Income | $21,778,620 | $21,944,773 | $21,936,948 | $22,053,021 | 100.0% | $24.94 | ||||||||
| Total Operating Expenses | $12,717,548 | $13,157,286 | $13,415,233 | $13,489,391 | 61.2% | $15.25 | ||||||||
|
|
|
|
|
| |||||||||
| Net Operating Income | $9,061,072 | $8,787,487 | $8,521,715 | $8,563,631 | 38.8% | $9.68 | ||||||||
| TI/LC | 0 | 0 | 0 | 1,187,138 | 5.4 | 1.34 | ||||||||
| Capital Expenditures | 0 | 0 | 0 | 221,092 | 1.0 | 0.25 | ||||||||
| Net Cash Flow | $9,061,072 | $8,787,487 | $8,521,715 | $7,155,402 | 32.4% | $8.09 | ||||||||
| NOI DSCR | 2.37x | 2.30x | 2.23x | 2.24x | ||||||||||
| NCF DSCR | 2.37x | 2.30x | 2.23x | 1.87x | ||||||||||
| NOI DY | 11.4% | 11.1% | 10.7% | 10.8% | ||||||||||
| NCF DY | 11.4% | 11.1% | 10.7% | 9.0% | ||||||||||
| (1) | Base Rent includes contractual rent steps through May 1, 2016 totaling $306,226. |
| (2) | The underwritten economic vacancy is 10.0%. The CityPlace I Property was 94.0% physically occupied as of August 1, 2015. |
Appraisal.As of the appraisal valuation date of August 5, 2015, the CityPlace I Property had an “as-is” appraised value of $114,500,000.
Environmental Matters.According to the Phase I environmental report dated August 7, 2015, there was no evidence of any recognized environmental conditions at the CityPlace I Property.
Market Overview and Competition.The CityPlace I Property is located in the Hartford, Connecticut central business district (“CBD”), approximately equidistant from New York, New York and Boston, Massachusetts. The CityPlace I Property has convenient access to Interstate 91 which provides north/south access throughout the state and Interstate 84 which provides east/west access. The Connecticut Governor is focused on revitalizing the Hartford CBD through a number of incentive programs in efforts to position the city as a true 24-hour destination, which has prompted a number of suburban companies and institutions to relocate into the city. In recent quarters, the CBD has seen the relocation of University of Connecticut’s West Hartford campus (approximately 130,000 square feet), CareCentrix (approximately 74,000 square feet), CohnReznick (approximately 50,000 square feet), Whittlesey & Hadley (approximately 25,000 square feet) and Backnine Networks (approximately 20,000 square feet), and several other companies are currently evaluating a downtown relocation. In addition, Hartford is witnessing a number of new residential developments and conversions with an anticipated delivery of more than 2,000 new residential units expected in the Hartford CBD in the coming quarters. Complementing the approximately $300.0 million of on-going residential development are a number of new retail and entertainment options. Most notably, the Front Street District has attracted Capital Grille, Nix’s Seafood, Ted’s Montana Grill, Infinity Music Hall & Bistro and Spotlight Theaters. In addition, the Connecticut Convention Center, Hartford Marriot Hotel and the Connecticut Science Center are located directly across the street from the Front Street District, with easy access to the riverfront. The XL Center, Hartford’s primary entertainment venue and second home to the University of Connecticut men’s and women’s basketball teams, is located across the street from the CityPlace I Property. In 2014, the Connecticut State Legislature approved $38.0 million for renovations to the XL Center that included improvements to the main concourse and concessions level, new signage and lighting, luxury seating and the installation of a new bar inside the arena. According to the appraisal, the estimated 2015 population within a one-, three- and five-mile radius of the CityPlace I Property was 23,416, 155,867 and 278,475, respectively, while the 2015 estimated average household income within the same radii was $42,214, $49,995 and $67,369, respectively.
THE INFORMATION IN THIS STRUCTURAL AND COLLATERAL TERM SHEET IS NOT COMPLETE AND MAY BE AMENDED PRIOR TO THE TIME OF SALE. THIS TERM SHEET IS NOT AN OFFER TO SELL THESE SECURITIES AND IT IS NOT A SOLICITATION OF AN OFFER TO BUY THESE SECURITIES IN ANY JURISDICTION WHERE THE OFFER OR SALE IS NOT PERMITTED.
| 53 |
CITYPLACE I |
According to the appraisal, the CityPlace I Property is located in the Hartford office market and the Downtown Hartford office submarket, which, as of the second quarter of 2015, comprises 38 buildings totaling approximately 7.7 million square feet of office space. As of the second quarter of 2015, the class A Downtown Hartford office submarket vacancy rate was 15.7% and the average class A asking rent within the submarket was $23.05 per square foot on a gross basis. Based on the mix of different office suites and floors, storage space, and retail components at the CityPlace I Property, the appraiser concluded to a blended market rate of $17.58 per square foot.
The following table presents certain information relating to comparable office properties for the CityPlace I Property:
Competitive Set(1)
CityPlace I (Subject) | One Financial Plaza | One State Street | 100 Pearl Street | Metro Center One | |
| Location | Harford, CT | Harford, CT | Harford, CT | Harford, CT | Harford, CT |
| Distance from Subject | -- | 0.3 miles | 0.7 miles | 0.2 miles | 0.5 miles |
| Property Type | Office | Office | Office | Office | Office |
| Year Built/Renovated | 1983/2010 | 1974/2002 | 1982/NAV | 1989/2008 | 1986/1998 |
| Stories | 39 | 26 | 24 | 17 | 12 |
| Total GLA | 884,366 SF | 609,266 SF | 468,162 SF | 281,182 SF | 293,639 SF |
| Total Occupancy | 94% | 91% | 85% | 96% | 98% |
| (1) Information obtained from the appraisal and the underwritten rent roll. | |||||
The Borrower.The borrower is RP Asylum, LLC, a Delaware limited liability company which is a single purpose entity with two independent directors. Legal counsel to the borrower delivered a non-consolidation opinion in connection with the origination of the CityPlace I Loan Combination. Kevin McCall and John T. Caldwell are the guarantors of certain nonrecourse carveouts under the CityPlace I Loan Combination. In lieu of a nonrecourse carveout for losses related to the breach of any representation, warranty, covenant or indemnification provisions in the CityPlace I loan documents concerning environmental laws or hazardous substances, the borrower obtained a $3.0 million environmental insurance policy. There is no evidence of any recognized environmental conditions at the CityPlace I Property (see “Environmental Matters” section).
The Sponsor.The sponsors, Kevin McCall and John T. Caldwell, are the CEO and President, respectively, of Paradigm Properties (“Paradigm”), a private real estate investor and operator formed in 1997. Paradigm currently owns, manages or is in the process of developing 31 commercial real estate properties located in Massachusetts, Michigan, Ohio and the greater Philadelphia area. Mr. McCall and Mr. Caldwell both have over 30 years of real estate experience. The sponsors disclosed six prior defaults between 2004 and 2007. See “Description of the Mortgage Pool – Default History, Bankruptcy Issues and Other Proceedings” in the Free Writing Prospectus.
Escrows.The loan documents provide for upfront reserves in the amount of $556,806 for real estate taxes; $10,375 for insurance premiums, $88,437 for replacement reserves, $257,028 for rent concessions related to the Deloitte & Touche USA LLP lease, and $25,000 for the environmental insurance deductible. The loan documents also provide for ongoing monthly escrows in the amount of $324,801 for real estate taxes, $10,373 for insurance premiums and $88,473 for replacement reserves until the September 2021 payment date and $14,739 thereafter.
The loan documents require an upfront reserve in an amount equal to $3,000,000 for tenant improvements and leasing commissions (“TI/LC”) with ongoing monthly deposits of $110,546 (subject to a cap of $4,500,000). The loan documents also require upfront reserves in an amount equal to $2,056,337 for outstanding TI/LC obligations for Deloitte & Touche USA LLP ($1,236,644), Brown Rudnick ($598,970) and CBRE ($220,723).
Lockbox and Cash Management.The CityPlace I Loan Combination requires a lender-controlled lockbox account, which is already in place, and that the borrower and property manager directs tenants to pay rents directly into such lockbox account. The loan documents also require that all rents received by the borrower or property manager be deposited into such lockbox account within one business day of receipt. Prior to the occurrence of a Cash Trap Event Period (as defined below), all excess funds on deposit in the lockbox account are disbursed to the borrower. During a Cash Trap Event Period, all excess cash flow is swept to a lender-controlled cash management account.
A “Cash Trap Event Period” will commence upon the earlier of (i) the occurrence and continuance of an event of default; (ii) the debt service coverage ratio being less than 1.20x (based on a hypothetical 30-year amortization period, disregarding interest-only periods); or (iii) the occurrence of a United Healthcare Trigger Event Period (as defined below). A Cash Trap Event Period will end, with respect to clause (i), upon the cure of such event of default; with respect to clause (ii), upon the debt service coverage ratio being at least 1.20x (based on a hypothetical 30-year amortization period) for two consecutive calendar quarters; and with respect to clause (iii), upon the end of such United Healthcare Trigger Event Period. In the event that the Cash Trap Event Period results from a United Healthcare Trigger Event Period, the excess cash flow held by the lender will be capped at $13,350,000 (including any amounts held in the TI/LC reserve) or, in the case of a partial termination of the United Healthcare lease, as described in the United Healthcare Trigger Event Period.
THE INFORMATION IN THIS STRUCTURAL AND COLLATERAL TERM SHEET IS NOT COMPLETE AND MAY BE AMENDED PRIOR TO THE TIME OF SALE. THIS TERM SHEET IS NOT AN OFFER TO SELL THESE SECURITIES AND IT IS NOT A SOLICITATION OF AN OFFER TO BUY THESE SECURITIES IN ANY JURISDICTION WHERE THE OFFER OR SALE IS NOT PERMITTED.
| 54 |
CITYPLACE I |
A “United Healthcare Trigger Event Period” will commence upon the earlier of (i) United Healthcare or its parent company files bankruptcy or an involuntary bankruptcy proceeding is filed against United Healthcare or its parent company; (ii) United Healthcare defaults under its lease, enters into a material lease modification, terminates its lease or ceases to be open for business; or (iii) United Healthcare exercises its option to terminate a portion of its space. A United Healthcare Trigger Event Period will end, with respect to clause (i), when (A) a plan of reorganization is confirmed pursuant to a final order of the bankruptcy court and the lease is affirmed and assumed pursuant to the bankruptcy proceedings or (B) one or more acceptable replacement tenants leases the United Healthcare space and are open for business and paying unabated rent; with respect to clause (ii), when (x) the lender receives acceptable evidence that United Healthcare has resumed operations, (y) the default under the lease is cured, or (z) one or more acceptable replacement tenants leases the United Healthcare space and are open for business and paying unabated rent; and with respect to clause (iii), excess cash flow is swept into the TI/LC reserve and the balance, inclusive of termination fees, reaches $30.00 per square foot of terminated space.
Property Management.The CityPlace I Office Property is managed by an affiliate of the borrower.
Assumption.The borrower has the two-time right to transfer the CityPlace I Property, provided that certain conditions are satisfied, including (i) no event of default has occurred and is continuing; (ii) the lender has reasonably determined that the proposed transferee and guarantor satisfy the lender’s credit review and underwriting standards, taking into consideration the transferee’s experience, financial strength and general business standing; and (iii) rating agency confirmation from Fitch, Moody’s, and Morningstar that the transfer will not result in a downgrade, withdrawal or qualification of the respective ratings assigned to the Series 2015-C31 Certificates.
Partial Release.Not permitted.
Real Estate Substitution.Not permitted.
Subordinate and Mezzanine Indebtedness. Not permitted.
Ground Lease. None.
Terrorism Insurance.The loan documents require that the “all risk” insurance policy required to be maintained by the borrower provide coverage for terrorism in an amount equal to the full replacement cost of the CityPlace I Property. The loan documents also require business interruption insurance covering no less than the 18-month period following the occurrence of a casualty event, together with a six-month extended period of indemnity.
THE INFORMATION IN THIS STRUCTURAL AND COLLATERAL TERM SHEET IS NOT COMPLETE AND MAY BE AMENDED PRIOR TO THE TIME OF SALE. THIS TERM SHEET IS NOT AN OFFER TO SELL THESE SECURITIES AND IT IS NOT A SOLICITATION OF AN OFFER TO BUY THESE SECURITIES IN ANY JURISDICTION WHERE THE OFFER OR SALE IS NOT PERMITTED.
| 55 |
COURTYARD MARRIOTT - TACOMA |

THE INFORMATION IN THIS STRUCTURAL AND COLLATERAL TERM SHEET IS NOT COMPLETE AND MAY BE AMENDED PRIOR TO THE TIME OF SALE. THIS TERM SHEET IS NOT AN OFFER TO SELL THESE SECURITIES AND IT IS NOT A SOLICITATION OF AN OFFER TO BUY THESE SECURITIES IN ANY JURISDICTION WHERE THE OFFER OR SALE IS NOT PERMITTED.
| 56 |
COURTYARD MARRIOTT - TACOMA |

THE INFORMATION IN THIS STRUCTURAL AND COLLATERAL TERM SHEET IS NOT COMPLETE AND MAY BE AMENDED PRIOR TO THE TIME OF SALE. THIS TERM SHEET IS NOT AN OFFER TO SELL THESE SECURITIES AND IT IS NOT A SOLICITATION OF AN OFFER TO BUY THESE SECURITIES IN ANY JURISDICTION WHERE THE OFFER OR SALE IS NOT PERMITTED.
| 57 |
| No. 4 – Courtyard Marriott - Tacoma |
| Loan Information | Property Information | |||||||
| Mortgage Loan Seller: | Société Générale | Single Asset/Portfolio: | Single Asset | |||||
Credit Assessment (Fitch/Moody’s/Morningstar): | NR/NR/NR | Property Type: | Hospitality | |||||
| Original Principal Balance: | $32,625,000 | Specific Property Type: | Limited Service | |||||
| Cut-off Date Principal Balance: | $32,625,000 | Location: | Tacoma, WA | |||||
| % of Initial Pool Balance: | 3.3% | Size: | 162 Rooms | |||||
| Loan Purpose: | Refinance | Cut-off Date Principal Balance Per Room: | $201,389 | |||||
| Borrower Name: | Tacoma Hospitality DE LLC | Year Built/Renovated: | 2005/2014 | |||||
| Sponsors: | Hollander Properties, LLC; Marlo G. Hollander; Mark A. Hollander | Title Vesting: | Fee | |||||
| Mortgage Rate: | 4.600% | Property Manager: | Self-managed | |||||
| Note Date: | October 9, 2015 | 3rd Most Recent Occupancy (As of): | 78.8% (12/31/2012) | |||||
| Anticipated Repayment Date: | NAP | 2nd Most Recent Occupancy (As of): | 82.0% (12/31/2013) | |||||
| Maturity Date: | November 1, 2025 | Most Recent Occupancy (As of): | 81.5% (12/31/2014) | |||||
| IO Period: | None | Current Occupancy (As of): | 81.2% (7/16/2015) | |||||
| Loan Term (Original): | 120 months | |||||||
| Seasoning: | 0 months | Underwriting and Financial Information: | ||||||
| Amortization Term (Original): | 360 months | |||||||
| Loan Amortization Type: | Amortizing Balloon | 3rd Most Recent NOI (As of)(2): | $3,118,356 (12/31/2013) | |||||
| Interest Accrual Method: | Actual/360 | 2nd Most Recent NOI (As of)(2): | $3,156,638 (12/31/2014) | |||||
| Call Protection: | L(24),D(89),O(7) | Most Recent NOI (As of)(2): | $3,824,594 (TTM 6/30/2015) | |||||
| Lockbox Type: | Hard/Springing Cash Management | |||||||
| Additional Debt: | None | |||||||
| Additional Debt Type: | NAP | |||||||
| U/W Revenues: | $9,276,386 | |||||||
| U/W Expenses: | $5,582,745 | |||||||
| U/W NOI: | $3,693,641 | |||||||
| U/W NCF: | $3,229,822 | |||||||
| U/W NOI DSCR: | 1.84x | |||||||
| U/W NCF DSCR: | 1.61x | |||||||
| Escrows and Reserves(1): | U/W NOI Debt Yield: | 11.3% | ||||||
| U/W NCF Debt Yield: | 9.9% | |||||||
| Type: | Initial | Monthly | Cap (If Any) | As-Is Appraised Value: | $45,000,000 | |||
| Taxes | $67,026 | $33,513 | NAP | As-Is Appraisal Valuation Date: | June 24, 2015 | |||
| Insurance | $77,832 | $5,987 | NAP | Cut-off Date LTV Ratio: | 72.5% | |||
| FF&E | $20,833 | Springing | $0 | LTV Ratio at Maturity or ARD: | 58.8% | |||
| (1) | See “Escrows” section. |
| (2) | See “Cash Flow Analysis” section. |
The Mortgage Loan. The mortgage loan (the “Courtyard Marriott - Tacoma Mortgage Loan”) is evidenced by a single promissory note that is secured by a first mortgage encumbering the fee interest in a limited service hotel located in Tacoma, Washington (the “Courtyard Marriott - Tacoma Property”). The Courtyard Marriott - Tacoma Mortgage Loan was originated on October 9, 2015 by Société Générale. The Courtyard Marriott - Tacoma Mortgage Loan had an original principal balance of $32,625,000, has an outstanding principal balance as of the Cut-off Date of $32,625,000 and accrues interest at an interest rate of 4.600%per annum. The Courtyard Marriott - Tacoma Mortgage Loan had an initial term of 120 months, has a remaining term of 120 months as of the Cut-off Date and requires payments of principal and interest based on a 30-year amortization schedule. The Courtyard Marriott - Tacoma Mortgage Loan matures on November 1, 2025.
Following the lockout period, the borrower has the right to defease the Courtyard Marriott - Tacoma Mortgage Loan in whole, but not in part, on any date before May 1, 2025. In addition, the Courtyard Marriott - Tacoma Mortgage Loan is prepayable without penalty on or after May 1, 2025.
THE INFORMATION IN THIS STRUCTURAL AND COLLATERAL TERM SHEET IS NOT COMPLETE AND MAY BE AMENDED PRIOR TO THE TIME OF SALE. THIS TERM SHEET IS NOT AN OFFER TO SELL THESE SECURITIES AND IT IS NOT A SOLICITATION OF AN OFFER TO BUY THESE SECURITIES IN ANY JURISDICTION WHERE THE OFFER OR SALE IS NOT PERMITTED.
| 58 |
COURTYARD MARRIOTT - TACOMA |
Sources and Uses
| Sources | Uses | |||||||
| Original loan amount | $32,625,000 | 100.0% | Loan payoff(1) | $20,413,832 | 62.6% | |||
| Reserves | 165,691 | 0.5 | ||||||
| Closing costs | 462,640 | 1.4 | ||||||
| Return of equity | 11,582,837 | 35.5 | ||||||
| Total Sources | $32,625,000 | 100.0% | Total Uses | $32,625,000 | 100.0% |
| (1) | The Courtyard Marriott – Tacoma Property was previously securitized in the MLCFC 2006-4 transaction. |
The Property. The Courtyard Marriott - Tacoma Property is a six-story, 162-room limited service hotel located in the central business district of Tacoma, Washington, immediately adjacent to the Tacoma Convention and Trade Center, which offers 117,000 square feet of flexible event space. Built in 2005 and renovated in 2014, the Courtyard Marriott - Tacoma Property consists of two attached buildings. The Courtyard Marriott - Tacoma Property guestrooms configuration includes 60 king guestrooms, 92 double/queen guestrooms, four two-room suites and six premium suites. Amenities at the Courtyard Marriott - Tacoma Property include an indoor pool and spa, fitness center, guest laundry, meeting space and business center. The Courtyard Marriott - Tacoma Property contains four commercial tenants, including a full service restaurant, event center, spa and Union Bank branch. The Courtyard Marriott - Tacoma Property has seven parking spaces and a use agreement with the city of Tacoma for 80 offsite spaces at the Convention Center Parking Garage, which is located across the street from the Courtyard Marriott - Tacoma Property. The sponsor developed the Courtyard Marriott - Tacoma Property in 2005 at a cost of approximately $18.0 million and has invested over $10.7-million since opening, indicating a total cost basis of approximately $28.7-million. The Courtyard Marriott - Tacoma Property underwent an extensive renovation in 2014 in conjunction with a $2.8 million property improvement plan (“PIP”) to meet brand standards and update the suites, guestrooms, and the lobby breakfast area. The PIP guest room improvements included upgrades to the furniture, drapery, carpet and artwork. The Courtyard Marriott - Tacoma Property franchise agreement with Marriott International, Inc. expires in June 2025.
Operating History and Underwritten Net Cash Flow.The following table presents certain information relating to the historical operating performance and the underwritten net cash flow at the Courtyard Marriott - Tacoma Property:
Cash Flow Analysis
| 2013(1) | 2014(1) | TTM 6/30/2015(1) | U/W | % of U/W Total Revenue | U/W $ per Room | |||||||||
| Occupancy | ��82.0% | 81.5% | 81.2% | 81.2% | ||||||||||
| ADR | $144.30 | $144.42 | $154.67 | $154.67 | ||||||||||
| RevPAR | $118.28 | $117.68 | $125.60 | $125.60 | ||||||||||
| Total Revenue | $8,359,559 | $8,240,179 | $9,276,386 | $9,276,386 | 100.0 | % | $57,262 | |||||||
| Total Department Expenses | 2,359,322 | 2,281,826 | 2,520,283 | 2,520,269 | 27.2 | 15,557 | ||||||||
| Gross Operating Profit | $6,000,237 | $5,958,353 | $6,756,103 | $6,756,117 | 72.8 | % | $41,704 | |||||||
| Total Undistributed Expenses | 2,553,596 | 2,463,436 | 2,588,442 | 2,588,476 | 27.9 | 15,978 | ||||||||
| Profit Before Fixed Charges | $3,446,641 | $3,494,917 | $4,167,661 | $4,167,641 | 44.9 | % | $25,726 | |||||||
| Total Fixed Charges | 328,285 | 338,279 | 343,067 | 474,000 | 5.1 | 2,926 | ||||||||
| Net Operating Income | $3,118,356 | $3,156,638 | $3,824,594 | $3,693,641 | 39.8 | % | $22,800 | |||||||
| FF&E | 0 | 0 | 0 | 463,819 | 5.0 | 2,863 | ||||||||
| Net Cash Flow | $3,118,356 | $3,156,638 | $3,824,594 | $3,229,822 | 34.8 | % | $19,937 | |||||||
| NOI DSCR | 1.55x | 1.57x | 1.91x | 1.84x | ||||||||||
| NCF DSCR | 1.55x | 1.57x | 1.91x | 1.61x | ||||||||||
| NOI DY | 9.6% | 9.7% | 11.7% | 11.3% | ||||||||||
| NCF DY | 9.6% | 9.7% | 11.7% | 9.9% | ||||||||||
| (1) | The Total Revenue increase from 2013 to TTM 6/30/2015 is due to renovations at the Courtyard Marriott – Tacoma Property which reduced available rooms by approximately 1,610 rooms in 2013 and 2,256 rooms in 2014. Additionally, food and beverage revenue increased by approximately $273,000 following PIP completion in 2014. |
Appraisal.As of the appraisal valuation date of June 24, 2015, the Courtyard Marriott - Tacoma Property had an “as-is” appraised value of $45,000,000.
Environmental Matters.According to the Phase I environmental site assessment dated July 13, 2015, there was no evidence of any recognized environmental conditions at the Courtyard Marriott - Tacoma Property.
Market Overview and Competition.The Courtyard Marriott - Tacoma Property is located in downtown Tacoma, Washington, immediately adjacent to the Tacoma Convention and Trade Center, which offers approximately 117,000 square feet of flexible event space. Located approximately 30.0 miles southwest of Seattle, Tacoma is the third largest city in the State of Washington. Primary access to the Courtyard Marriott - Tacoma Property is available via Commerce Street with ingress and egress also available via Pacific Avenue, which is the primary north/south artery in downtown Tacoma. Located approximately 13.0 miles south of the Courtyard Marriott - Tacoma Property, the Joint Base Lewis-McChord military base is the largest employer in Tacoma. The second
THE INFORMATION IN THIS STRUCTURAL AND COLLATERAL TERM SHEET IS NOT COMPLETE AND MAY BE AMENDED PRIOR TO THE TIME OF SALE. THIS TERM SHEET IS NOT AN OFFER TO SELL THESE SECURITIES AND IT IS NOT A SOLICITATION OF AN OFFER TO BUY THESE SECURITIES IN ANY JURISDICTION WHERE THE OFFER OR SALE IS NOT PERMITTED.
| 59 |
COURTYARD MARRIOTT - TACOMA |
largest employer, located approximately 1.4 miles northwest of the Courtyard Marriott - Tacoma Property, is the Multicare Health System, the largest provider of health care services in the city of Tacoma. Franciscan Health System is located less than half a mile south east of the Courtyard Marriott - Tacoma Property. Additionally, there are numerous museums in Downtown Tacoma, including the LeMay Automobile Museum and The Museum of Glass. Also, the University of Washington Tacoma campus is situated on 46 acres less than half a mile south east of the Courtyard Marriott - Tacoma Property. According to the appraisal, demand segmentation at the Courtyard Marriott - Tacoma Property is 65.0% Commercial, 22.0% Meeting and Group and 13.0% Leisure/Tourism.
The following table presents certain information relating to the Courtyard Marriott - Tacoma Property’s competitive set:
Subject and Market Historical Occupancy, ADR and RevPAR(1)
| Competitive Set | Courtyard Marriott - Tacoma | Penetration Factor | |||||||||||||||||
Year | Occupancy | ADR | RevPAR | Occupancy | ADR | RevPAR | Occupancy | ADR | RevPAR | ||||||||||
| 6/30/2015 TTM | 71.1% | $139.38 | $99.05 | 80.8% | $155.37 | $125.59 | 113.7% | 111.5% | 126.8% | ||||||||||
| 6/30/2014 TTM | 67.3% | $129.98 | $87.51 | 76.2% | $143.80 | $109.52 | 113.1% | 110.6% | 125.2% | ||||||||||
| 6/30/2013 TTM | 66.5% | $128.88 | $85.74 | 79.3% | $142.08 | $112.73 | 119.3% | 110.2% | 131.5% | ||||||||||
| (1) | Information obtained from a third party hospitality report dated July 17, 2015. The competitive set includes the following hotels: Hotel Murano, Courtyard Seattle Federal Way, Silver Cloud Inn Tacoma Waterfront, Hampton Inn Suites Tacoma Mall, and Holiday Inn Express & Suites Tacoma Downtown. |
The Borrower.The borrower is Tacoma Hospitality DE LLC, a Delaware limited liability company and a single purpose entity with one independent director. Legal counsel to the borrower delivered a non-consolidation opinion in connection with the origination of the Courtyard Marriott - Tacoma Mortgage Loan. Marlo G. Hollander is the guarantor of certain nonrecourse carveouts under the Courtyard Marriott - Tacoma Mortgage Loan.
The Sponsors.The sponsors are Hollander Properties, LLC, Marlo G. Hollander and Mark A. Hollander. The sponsors have more than 50 years of combined of real estate experience owning and hotels, and currently have an ownership interest in six hotel properties in the Pacific Northwest region.
Operating Lessee.The borrower leases the Courtyard Marriott – Tacoma Property to Hollander Investments, Inc. (the “Courtyard Marriott – Tacoma Operating Lessee”), pursuant to an operating lease (the “Courtyard Marriott - Tacoma Operating Lease”). The Courtyard Marriott - Tacoma Operating Lessee is an affiliate of the borrower. Pursuant to the Courtyard Marriott – Tacoma Operating Lease, the Courtyard Marriott - Tacoma Operating Lessee receives revenue from the operation of the Courtyard Marriott – Tacoma Property and pays the borrower, as rent, an amount equal to the debt service on the Courtyard Marriott – Tacoma Mortgage Loan, plus reserves and other costs of ownership, all taxes and insurance. The Courtyard Marriott – Tacoma Operating Lessee is not a single purpose bankruptcy remote entity. The Courtyard Marriott – Tacoma Operating Lease is encumbered by the Courtyard Marriott – Tacoma Property mortgage. See “Risk Factors-Risks Related to the Mortgage Loans-The Borrower’s Form of Entity May Cause Special Risks” in the Free Writing Prospectus.
Escrows.The loan documents provide for upfront escrows in the amount of $67,026 for real estate taxes, $77,832 for insurance premiums and $20,833 for FF&E. The loan documents provide for monthly escrows of $33,513 for real estate taxes and $5,987 for insurance premiums.
Ongoing monthly FF&E reserves are not required as long as (i)the balance in the FF&E subaccount is at least $250,000; (ii) the lender receives (no less frequently than every nine months) copies of a franchisor inspection report which shows required capital, ADA, fire and/or life safety repairs with an estimated cost less than or equal to $100,000 and the borrower provides evidence of completion of such repairs no later than 60 days after the franchisor’s required completion date for such work; (iii) the Marriott Brand Standard Audit score of the Courtyard Marriott – Tacoma Property is no less than 85 as determined during the most recent annual property inspection conducted by a third party auditor; and (iv) the franchisor has not instituted a current PIP.
Lockbox and Cash Management.The Courtyard Marriott - Tacoma Mortgage Loan requires a lender-controlled lockbox account, which is already in place, and that the borrower directs tenants to pay their rents and all credit card companies under merchant agreements to pay receipts directly into such lockbox account. The loan documents also require that all rents received by the borrower or property manager are deposited into the lockbox account within one business day of receipt. Prior to a Cash Management Period (as defined below), all funds are required to be distributed to the borrower. During a Cash Management Period, all excess funds are swept to a lender controlled cash management account.
A “Cash Management Period” will commence upon (i) the occurrence and continuance of an event of default; (ii) the debt service coverage ratio falling below 1.20x for two consecutive calendar quarters; or (iii) the date that is 12 months before the expiration of the franchise agreement, if the term of the franchise agreement has not been extended for at least 10 years. A Cash Management Period will expire with respect to clause (i), upon the event of default being cured, provided no other event of default has occurred and is continuing; with respect to clause (ii), upon the debt service coverage ratio being at least 1.25x for two consecutive calendar quarters; and with respect to clause (iii), upon the franchise agreement being extended for at least 10 years or the borrower entering into a replacement franchise agreement in form and substance and with a franchisor reasonably acceptable to the lender and the balance in the capital reserve subaccount being equal to or exceeding 120% of the budget for any PIP required by the franchisor in connection with such extension, renewal or replacement of the franchise agreement.
Property Management.The Courtyard Marriott - Tacoma Property is managed by an affiliate of the borrower.
THE INFORMATION IN THIS STRUCTURAL AND COLLATERAL TERM SHEET IS NOT COMPLETE AND MAY BE AMENDED PRIOR TO THE TIME OF SALE. THIS TERM SHEET IS NOT AN OFFER TO SELL THESE SECURITIES AND IT IS NOT A SOLICITATION OF AN OFFER TO BUY THESE SECURITIES IN ANY JURISDICTION WHERE THE OFFER OR SALE IS NOT PERMITTED.
| 60 |
COURTYARD MARRIOTT - TACOMA |
Assumption.The borrower has the unlimited right to transfer the Courtyard Marriott - Tacoma Property provided that certain conditions are satisfied, including but not limited to (i) no event of default has occurred and is continuing; (ii) the lender reasonably determines that the proposed transferee complies with single purpose bankruptcy remote entity requirements and the transferee and guarantor satisfy the lender’s credit review and underwriting standards; and (iii) the lender has received confirmation from Fitch, Moody’s and Morningstar that such assumption will not result in a downgrade, withdrawal or qualification of the respective ratings assigned to the Series 2015-C31 Certificates.
Partial Release.Not permitted.
Real Estate Substitution.Not permitted.
Subordinate and Mezzanine Indebtedness.Not permitted.
Ground Lease.None.
Terrorism Insurance.The loan documents require that the “all risk” insurance policy required to be maintained by the borrower provides coverage for terrorism in an amount equal to the full replacement cost of the Courtyard Marriott - Tacoma Property, as well as business interruption insurance covering no less than the 18-month period following the occurrence of a casualty event, together with a six-month extended period of indemnity.
Earthquake Insurance. The loan documents do not require earthquake insurance. The seismic report indicated a probable maximum loss of 11.0%.
THE INFORMATION IN THIS STRUCTURAL AND COLLATERAL TERM SHEET IS NOT COMPLETE AND MAY BE AMENDED PRIOR TO THE TIME OF SALE. THIS TERM SHEET IS NOT AN OFFER TO SELL THESE SECURITIES AND IT IS NOT A SOLICITATION OF AN OFFER TO BUY THESE SECURITIES IN ANY JURISDICTION WHERE THE OFFER OR SALE IS NOT PERMITTED.
| 61 |
(THIS PAGE INTENTIONALLY LEFT BLANK)
THE INFORMATION IN THIS STRUCTURAL AND COLLATERAL TERM SHEET IS NOT COMPLETE AND MAY BE AMENDED PRIOR TO THE TIME OF SALE. THIS TERM SHEET IS NOT AN OFFER TO SELL THESE SECURITIES AND IT IS NOT A SOLICITATION OF AN OFFER TO BUY THESE SECURITIES IN ANY JURISDICTION WHERE THE OFFER OR SALE IS NOT PERMITTED.
| 62 |
11 MADISON AVENUE |
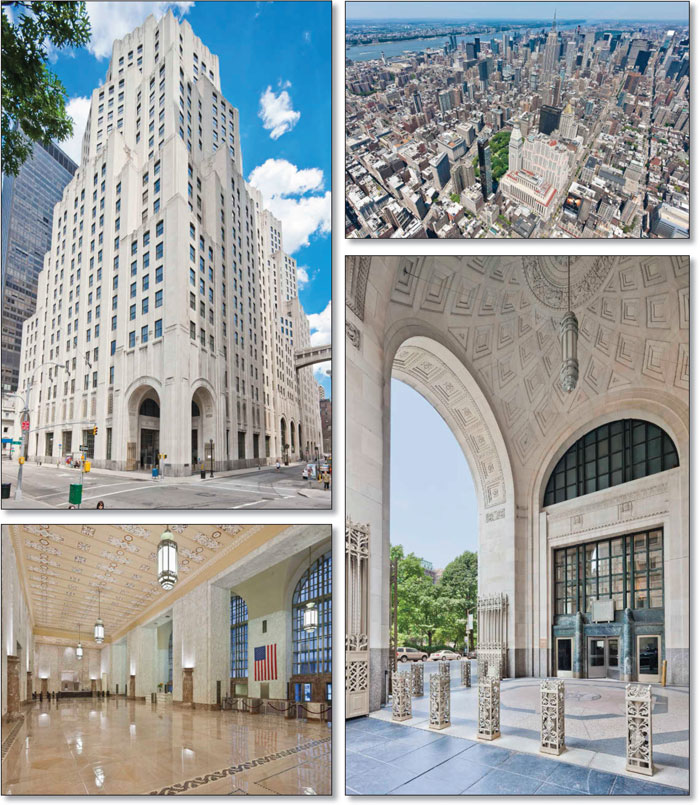
THE INFORMATION IN THIS STRUCTURAL AND COLLATERAL TERM SHEET IS NOT COMPLETE AND MAY BE AMENDED PRIOR TO THE TIME OF SALE. THIS TERM SHEET IS NOT AN OFFER TO SELL THESE SECURITIES AND IT IS NOT A SOLICITATION OF AN OFFER TO BUY THESE SECURITIES IN ANY JURISDICTION WHERE THE OFFER OR SALE IS NOT PERMITTED.
| 63 |
11 MADISON AVENUE |
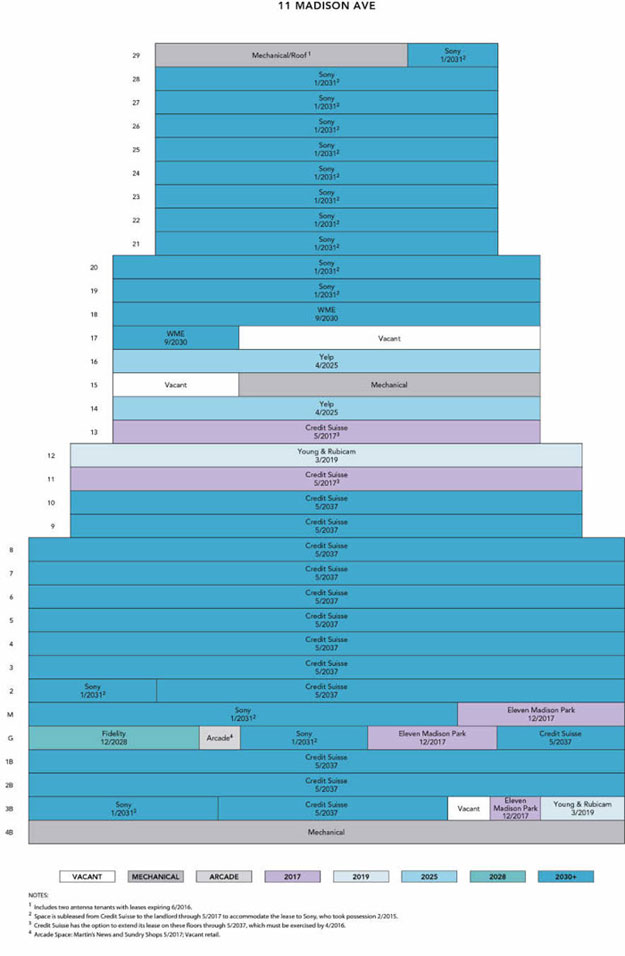
THE INFORMATION IN THIS STRUCTURAL AND COLLATERAL TERM SHEET IS NOT COMPLETE AND MAY BE AMENDED PRIOR TO THE TIME OF SALE. THIS TERM SHEET IS NOT AN OFFER TO SELL THESE SECURITIES AND IT IS NOT A SOLICITATION OF AN OFFER TO BUY THESE SECURITIES IN ANY JURISDICTION WHERE THE OFFER OR SALE IS NOT PERMITTED.
| 64 |
11 MADISON AVENUE |
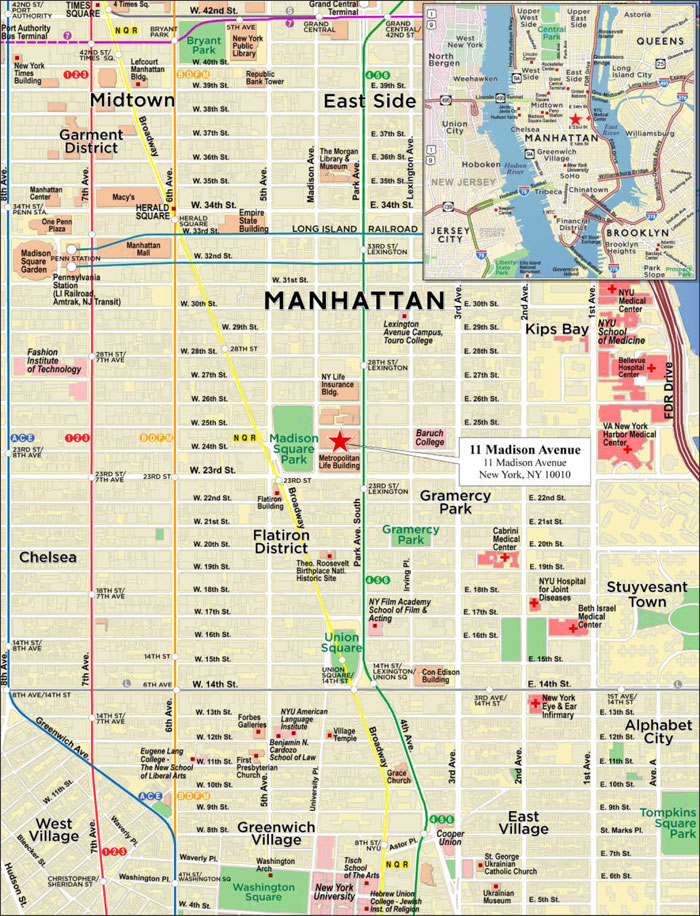
THE INFORMATION IN THIS STRUCTURAL AND COLLATERAL TERM SHEET IS NOT COMPLETE AND MAY BE AMENDED PRIOR TO THE TIME OF SALE. THIS TERM SHEET IS NOT AN OFFER TO SELL THESE SECURITIES AND IT IS NOT A SOLICITATION OF AN OFFER TO BUY THESE SECURITIES IN ANY JURISDICTION WHERE THE OFFER OR SALE IS NOT PERMITTED.
| 65 |
| No. 5 – 11 Madison Avenue |
| Loan Information | Property Information | |||||||
| Mortgage Loan Seller: | Wells Fargo Bank, National Association | Single Asset/Portfolio: | Single Asset | |||||
| Credit Assessment (Fitch/Moody’s/Morningstar): | AAAsf/A2 (sca.pd)/AA+ | Property Type: | Office | |||||
| Original Principal Balance(1): | $30,500,000 | Specific Property Type: | CBD | |||||
| Cut-off Date Principal Balance(1): | $30,500,000 | Location: | New York, NY | |||||
| % of Initial Pool Balance: | 3.1% | Size: | 2,285,043 SF | |||||
| Loan Purpose: | Acquisition | Cut-off Date Principal Balance Per SF(1): | $334.49 | |||||
| Borrower Names(2): | Various | Year Built/Renovated: | 1932-1950/1994-1997, 2015 | |||||
| Sponsor: | SL Green Realty Corp. | Title Vesting(6): | Fee | |||||
| Mortgage Rate: | 3.5602% | Property Manager: | Self-managed | |||||
| Note Date: | August 18, 2015 | 3rd Most Recent Occupancy (As of): | 99.1% (12/31/2012) | |||||
| Anticipated Repayment Date: | NAP | 2nd Most Recent Occupancy (As of): | 87.5% (12/31/2013) | |||||
| Maturity Date: | September 6, 2025 | Most Recent Occupancy (As of): | 94.0% (12/31/2014) | |||||
| IO Period: | 120 months | Current Occupancy (As of)(7): | 97.8% (8/1/2015) | |||||
| Loan Term (Original): | 120 months | |||||||
| Seasoning: | 2 months | Underwriting and Financial Information: | ||||||
| Amortization Term (Original): | NAP | |||||||
| Loan Amortization Type: | Interest-only, Balloon | 3rd Most Recent NOI (As of): | $47,051,047 (12/31/2013) | |||||
| Interest Accrual Method: | Actual/360 | 2nd Most Recent NOI (As of): | $46,705,749 (12/31/2014) | |||||
| Call Protection(3): | L(26),D(87),O(7) | Most Recent NOI (As of)(8): | $46,389,392 (TTM 5/31/2015) | |||||
| Lockbox Type: | Hard/Springing Cash Management | |||||||
| Additional Debt(1)(4): | Yes | |||||||
| Additional Debt Type(1)(4): | Pari Passuand subordinate notes; Mezzanine | |||||||
| U/W Revenues: | $163,039,756 | |||||||
| Escrows and Reserves(5): | U/W Expenses: | $53,546,158 | ||||||
| U/W NOI(8): | $109,493,598 | |||||||
| Type: | Initial | Monthly | Cap (If Any) | U/W NCF(8): | $107,431,283 | |||
| Taxes | $0 | Springing | NAP | U/W NOI DSCR(1): | 3.97x | |||
| Insurance | $0 | Springing | NAP | U/W NCF DSCR(1): | 3.89x | |||
| Replacement Reserve | $0 | Springing | NAP | U/W NOI Debt Yield(1): | 14.3% | |||
| Rollover Reserve | $0 | Springing | NAP | U/W NCF Debt Yield(1): | 14.1% | |||
| Lease Costs Reserve | $81,152,102 | $0 | NAP | As-Is Appraised Value(9): | $2,350,000,000 | |||
| Sony Free Rent Reserve | $18,847,898 | $0 | NAP | As-Is Appraisal Valuation Date(9): | July 1, 2015 | |||
| CS Sublease Reserve | $36,500,000 | $0 | NAP | Cut-off Date LTV Ratio(1)(9): | 32.5% | |||
| Title Endorsement Reserve | $1,000 | $0 | NAP | LTV Ratio at Maturity or ARD(1)(9): | 32.5% | |||
| (1) | The 11 Madison Avenue Loan Combination (as defined below), totaling $1,075,000,000, is comprised of 16 pari passu senior notes with an aggregate balance of $764,330,000 (Notes A-1-S1 through A-3-C2) and three subordinate notes with an aggregate balance of $310,670,000 (Notes B-1-S, B-2-S and B-3-S). The non-controlling senior Note A-3-C2 had an original balance of $30,500,000, has an outstanding principal balance of $30,500,000 as of the Cut-off Date and will be contributed to the WFCM 2015-C31 Trust. Nine of the senior notes with a combined outstanding principal balance of $397,530,000 and the three subordinate notes with a combined outstanding principal balance of $310,670,000 were contributed to the MAD 2015-11MD transaction. Note A-3-C1, which had an original principal balance of $35,000,000, was contributed to the WFCM 2015-NXS3 Trust; Note A-1-C1, which had an original principal balance of $70,000,000, is expected to be contributed to the COMM 2015-CCRE26 Trust; Note A-1-C2, which had an original principal balance of $70,000,000, is expected to be contributed to the COMM 2015-CCRE27 Trust; and the remaining four non-controlling notes, which had an aggregate original principal balance of $161,300,000 are expected to be contributed to future trusts. All statistical information related to balances per square foot, loan-to-value ratios, debt service coverage ratios and debt yields are based on the 16 senior notes. The Cut-off Date LTV Ratio, U/W NCF DSCR and U/W NOI DY based on the combined senior notes and subordinate notes totaling $1,075,000,000 are 45.7%, 2.77x and 10.2%, respectively. The Cut-off Date LTV Ratio, U/W NCF DSCR and U/W NOI DY based on the combined senior notes, subordinate notes and mezzanine debt (aggregate debt is $1.4 billion) are 59.6%, 1.97x and 7.8%, respectively. |
| (2) | See “The Borrowers” section. |
| (3) | The lockout period will be at least 26 payment dates beginning with and including the first payment date of October 6, 2015. Defeasance of the 11 Madison Avenue Loan Combination is permitted on or after the date that is the earlier to occur of (i) two years after the closing date of the securitization that includes the last note to be securitized, and (ii) August 18, 2018. The assumed lockout period of 26 payments is based on the expected WFCM 2015-C31 Trust closing date in November 2015. |
| (4) | See “Subordinate and Mezzanine Indebtedness” section. |
| (5) | See “Escrows” section. |
| (6) | See “Condominium” section. |
| (7) | See “Historical Occupancy” section. |
| (8) | See “Cash Flow Analysis” section. |
| (9) | See “Appraisal” section. The appraiser also concluded to an “as-stabilized” value of $2,700,000,000 based on an “as-stabilized” valuation date of July 1, 2018, which results in an “as-stabilized” Cut-off Date LTV Ratio and LTV Ratio at Maturity or ARD of 28.3% based on the senior debt. |
THE INFORMATION IN THIS STRUCTURAL AND COLLATERAL TERM SHEET IS NOT COMPLETE AND MAY BE AMENDED PRIOR TO THE TIME OF SALE. THIS TERM SHEET IS NOT AN OFFER TO SELL THESE SECURITIES AND IT IS NOT A SOLICITATION OF AN OFFER TO BUY THESE SECURITIES IN ANY JURISDICTION WHERE THE OFFER OR SALE IS NOT PERMITTED.
| 66 |
11 MADISON AVENUE |
The Mortgage Loan. The mortgage loan (the “11 Madison Avenue Mortgage Loan”) is part of a loan combination (the “11 Madison Avenue Loan Combination”) evidenced by 16 pari passu senior promissory notes (Notes A-1-S1 through A-3-C2) and three subordinate notes (Notes B-1-S, B-2-S and B-3-S) secured by an office building located in New York, New York (the “11 Madison Avenue Property”). The 11 Madison Avenue Loan Combination was co-originated on August 18, 2015 by Wells Fargo Bank, National Association, German American Capital Corporation and Morgan Stanley Bank, N.A. The 11 Madison Avenue Loan Combination had an original principal balance of $1,075,000,000, has an outstanding principal balance as of the Cut-off Date of $1,075,000,000 and accrues interest at an interest rate of 3.5602% per annum. The 11 Madison Avenue Loan Combination had an initial term of 120 months, has a remaining term of 118 months as of the Cut-off Date and requires interest-only payments through the term of the 11 Madison Avenue Loan Combination. The 11 Madison Avenue Loan Combination matures on September 6, 2025. See “Description of the Mortgage Pool—Additional Indebtedness—Loan Combinations—The 11 Madison Avenue Loan Combination” and “Servicing of the Mortgage Loans and Administration of the Trust Fund” in the Free Writing Prospectus.
The 11 Madison Avenue Mortgage Loan, evidenced by Note A-3-C2, which will be contributed to the WFCM 2015-C31 Trust, had an original principal balance of $30,500,000, has an outstanding principal balance as of the Cut-off Date of $30,500,000 and represents a seniorpari passunon-controlling interest in the 11 Madison Avenue Loan Combination. Nine of the seniorpari passunotes (Notes A-1-S1 through A-3-S3) and all of the subordinate notes, which were contributed to the MAD 2015-11MD Trust, had an original aggregate principal balance of $708,200,000 and will represent the controlling interest in the 11 Madison Avenue Loan Combination. Note A-3-C1, which had an original principal balance of $35,000,000, was contributed to the WFCM 2015-NXS3 Trust; Note A-1-C1, which had an original principal balance of $70,000,000, is expected to be contributed to the COMM 2015-CCRE26 Trust; Note A-1-C2, which had an original principal balance of $70,000,000, is expected to be contributed to the COMM 2015-CCRE27 Trust; and the remaining non-controlling notes, which had an aggregate original principal balance of $161,300,000, are expected to be contributed to future trusts. The lender provides no assurances that any non-securitized notes will not be split further.
Note Summary
| Notes | Original Balance | Note Holder | Controlling Interest | |
| A-3-C2 | $30,500,000 | WFCM 2015-C31 | No | |
| A-1-S1, A-1-S2, A-1-S3, A-2-S1, A-2-S2, A-2-S3, A-3-S1, A-3-S2, A-3-S3(1) | $397,530,000 | MAD 2015-11MD | Yes(2) | |
| B-1-S, B-2-S, B-3-S(1) | $310,670,000 | MAD 2015-11MD | Yes(2) | |
| A-1-C1(3), A-1-C2(4), A-1-C3 | $209,600,000 | GACC(5) | No | |
| A-2-C1, A-2-C2 | $91,700,000 | MS(5) | No | |
| A-3-C1(6) | $35,000,000 | WFCM 2015-NXS3 | No | |
| Total | $1,075,000,000 |
| (1) | Contributed to the MAD 2015-11MD Trust. The notes are originally held by GACC, MS and WFB. |
| (2) | The 11 Madison Avenue Loan Combination is serviced and administered according to the 11 MAD 2015-11MD Trust and Servicing Agreement. |
| (3) | The A-1-C1 note with an original balance of $70.0 million is expected to be contributed to the COMM 2015-CCRE26 transaction. |
| (4) | The A-1-C2 note with an original balance of $70.0 million is expected to be contributed to the COMM 2015-CCRE27 transaction. |
| (5) | GACC – “German American Capital Corporation”; MS – “Morgan Stanley Bank, N.A.”; and WFB – “Wells Fargo Bank, N.A.” |
| (6) | Contributed to the WFCM 2015-NXS3 transaction. |
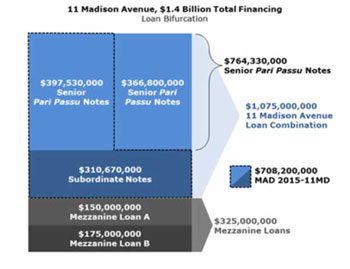
THE INFORMATION IN THIS STRUCTURAL AND COLLATERAL TERM SHEET IS NOT COMPLETE AND MAY BE AMENDED PRIOR TO THE TIME OF SALE. THIS TERM SHEET IS NOT AN OFFER TO SELL THESE SECURITIES AND IT IS NOT A SOLICITATION OF AN OFFER TO BUY THESE SECURITIES IN ANY JURISDICTION WHERE THE OFFER OR SALE IS NOT PERMITTED.
| 67 |
11 MADISON AVENUE |
Following the lockout period, the borrowers have the right to defease the 11 Madison Avenue Loan Combination in whole, but not in part, on any date before March 6, 2025. In addition, the 11 Madison Avenue Loan Combination is prepayable without penalty on or after March 6, 2025. The lockout period will expire on the earlier to occur of (i) two years after the closing date of the securitization that includes the last note to be securitized and (ii) August 18, 2018.
Sources and Uses
| Sources | Uses | |||||||||
| Original loan combination amount | $1,075,000,000 | 42.2 | % | Purchase price(1) | $2,285,000,000 | 89.7 | % | |||
| Mezzanine A loan | 150,000,000 | 5.9 | Leasing/Base building costs | 139,562,788 | 5.5 | |||||
| Mezzanine B loan | 175,000,000 | 6.9 | Reserves | 100,000,000 | 3.9 | |||||
| Sponsor equity contribution | 1,147,232,451 | 45.0 | Closing costs | 22,669,663 | 0.9 | |||||
| Total Sources | $2,547,232,451 | 100.0 | % | Total Uses | $2,547,232,451 | 100.0 | % | |||
| (1) | Purchase price includes the $39,000,000 CS Sublease Reserve. $2,500,000 of the CS Sublease Reserve was paid down at origination. |
The Property.The 11 Madison Avenue Property consists of the fee interests in 27 condominium units and the leasehold interests in nine condominium units (see “Condominium” section) of a 29-story, 2,285,043 square foot, class A office tower located directly east of Manhattan’s Madison Square Park. The 11 Madison Avenue Property enjoys frontage on Madison Square Park and occupies an entire city “super block” between Park Avenue South, Madison Avenue, and East 24th and East 25th Streets. Developed by MetLife as part of its headquarters complex, the 11 Madison Avenue Property was constructed in three phases between 1932 and 1950: phase I - from 1932 to 1938, half of the building was built along Park Avenue between 24th and 25th Street; phase II - from 1938 to 1941, the northwest section of the building was completed; and phase III - from 1947 to 1950, the final phase, the southwest quadrant, was completed. Due to the Property’s unique and high quality construction, the 11 Madison Avenue Property was added to the National Register of Historic Places in 1996.
The 11 Madison Avenue Property was originally designed as a 100-story tower, which would have made it the tallest building in the world at that time. However, following the Great Depression, plans were scaled back to the building’s present 29-story design. The 11 Madison Avenue Property’s robust infrastructure was engineered to serve the 100-story design and features three chiller plants, seven generators, an uninterrupted power supply, abundant electric capacity with dual points of entry and 46 elevators including two additional elevators currently being constructed for Sony’s exclusive use. Between 1994 and 1997, Credit Suisse and MetLife collectively modernized the 11 Madison Avenue Property at a cost exceeding $700.0 million. During that time, MetLife invested $400.0 million in technological enhancements and established the 11 Madison Avenue Property as a sought after headquarter location due to its modern building systems, large floor plates, landmark status, and park-fronting location. Furthermore, during that time, Credit Suisse invested an additional $300.0 million to create its North American headquarters in the 11 Madison Avenue Property, adding dedicated emergency generators, supplemental HVAC systems, its own uninterrupted power supply facility (additionally upgraded for $30.0 million in 2011), and other miscellaneous electrical upgrades.
The 11 Madison Avenue Property is currently undergoing a number of base building projects totaling approximately $86.0 million, which, when combined with leasing commissions and Sony’s and Credit Suisse’s Landlord build-outs, will result in over $279.0 million of capital invested into the 11 Madison Avenue Property between 2015 and 2018. The capital will be invested to modernize and update the 11 Madison Avenue Property to current headquarters standard, including a new building management system, elevator modernization, chiller plant/cooling towers upgrade, increased ventilation capacity, private entrance and sky lobby for Sony, new 28th floor window line and a new usable rooftop garden. The 11 Madison Avenue Property has a strong long-term tenant base that includes two headquarters tenants (Credit Suisse and Sony, 55.4% and 25.3% of net rentable area, respectively), each of which has leases expiring beyond the term of the 11 Madison Avenue Loan Combination (with the exception of Credit Suisse’s space on the 11th and 13th floors and a portion of the first floor storage space).
Condominium.The 11 Madison Avenue Property is comprised of the fee interests in 27 condominium units and leasehold interests (with the reversionary right to the related fee simple interests) in nine condominium units of the borrowers. In 1993, Credit Suisse entered into an agreement with the New York City Industrial Development Agency (“NYC IDA”) and the 11 Madison Avenue Property was converted into separate condominium units for purposes of conveying the fee simple estate to the NYC IDA for those units which are leased to Credit Suisse in order to provide financing and tax benefits. The NYC IDA terminates on December 31, 2016 and, at that time, the fee interest in the nine condominium units will automatically revert to the borrowers. The 11 Madison Avenue Loan Combination provides that upon any such reversion of condominium units to the borrower, such condominium units will automatically be subject to the 11 Madison Avenue Loan Combination. The 11 Madison Avenue Loan Combination borrowers control the entire condominium board.
THE INFORMATION IN THIS STRUCTURAL AND COLLATERAL TERM SHEET IS NOT COMPLETE AND MAY BE AMENDED PRIOR TO THE TIME OF SALE. THIS TERM SHEET IS NOT AN OFFER TO SELL THESE SECURITIES AND IT IS NOT A SOLICITATION OF AN OFFER TO BUY THESE SECURITIES IN ANY JURISDICTION WHERE THE OFFER OR SALE IS NOT PERMITTED.
| 68 |
11 MADISON AVENUE |
The following table presents certain information relating to the tenancy at the 11 Madison Avenue Property:
Major Tenants
| Tenant Name | Credit Rating (Fitch/Moody’s/ S&P)(1) | Tenant NRSF | % of NRSF | Annual U/W Base Rent PSF | Annual U/W Base Rent | % of Total Annual U/W Base Rent | Lease Expiration Date | ||||||||
| Major Tenants | |||||||||||||||
| Credit Suisse(2) | A/A1/A | 1,079,655 | 47.2% | $63.98 | $69,072,667 | 46.7% | 5/31/2037(3)(4) | ||||||||
| Credit Suisse (Option)(5) | A/A1/A | 186,396 | 8.2% | $26.18 | $4,879,731 | 3.3% | 5/31/2017 | ||||||||
| Sony(6) | BB-/Ba1/BBB- | 578,791 | 25.3% | $73.75(7) | $42,688,648(7) | 28.9% | 1/31/2031 | ||||||||
| Yelp | NR/NR/NR | 152,232 | 6.7% | $85.00 | $12,939,720 | 8.7% | 4/30/2025 | ||||||||
| WME | NR/NR/NR | 103,426 | 4.5% | $85.02 | $8,793,250 | 5.9% | 9/30/2030 | ||||||||
| Young & Rubicam, Inc. | BBB+/NR/BBB | 99,107 | 4.3% | $74.65 | $7,398,075 | 5.0% | 3/30/2019 | ||||||||
| Total Major Tenants | 2,199,607 | 96.3% | $66.27 | $145,772,091 | 98.5% | ||||||||||
| Non-Major Tenants | 34,571 | 1.5% | $62.06 | $2,145,532 | 1.5% | ||||||||||
| Occupied Total | 2,234,178 | 97.8% | $66.21 | $147,917,623 | 100.0% | ||||||||||
| Vacant Space | 50,865 | 2.2% | |||||||||||||
| Collateral Total | 2,285,043 | 100.0% | |||||||||||||
| (1) | Certain ratings are those of the parent company whether or not the parent guarantees the lease. |
| (2) | Credit Suisse recently signed a new lease for 1,079,655 square feet and Annual U/W Base Rent and Annual U/W Base Rent PSF for such space represents the rental rate commencing in June 2017 totaling $69,072,667 ($63.98 per square foot). Current annual rent for such space is $26,427,872 ($24.49 per square foot). |
| (3) | Credit Suisse has the right to (i) contract its space by one full floor effective between May 2022 and April 2027 with at least 15 months’ notice (“5 Year Option”); (ii) contract its space by one or two full floors (but only two full floors if the 5 Year Option has not been exercised) effective between May 2027 and April 2032 with 15 months’ notice (“10 Year Option); and (iii) contract its space on three full floors, reduced by any floors terminated under the 5 Year Option or 10 Year Option effective between May 2032 and April 2037 with 15 months’ notice. For each contraction option, a termination fee is required equal to the unamortized portion of the expenses as outlined in the lease. |
| (4) | Credit Suisse has 12 months of abated rent beginning in June 2032. |
| (5) | Consists of the below market rents on floors 11 and 13 as well as a portion of the first floor storage space. Credit Suisse has an option on this space to extend through 2037 at $73.81 PSF, which must be exercised by April 1, 2016. |
| (6) | The borrower currently leases a portion of Sony’s space from Credit Suisse and, in turn, subleases that space to Sony. Upon the expiration of Credit Suisse’s lease for that space on May 31, 2017, the sublease between the landlord and Sony will become a direct lease. |
| (7) | Sony received 12 months free rent commencing on the delivery date of each of its spaces; all remaining free rent following the origination date was reserved upfront. |
THE INFORMATION IN THIS STRUCTURAL AND COLLATERAL TERM SHEET IS NOT COMPLETE AND MAY BE AMENDED PRIOR TO THE TIME OF SALE. THIS TERM SHEET IS NOT AN OFFER TO SELL THESE SECURITIES AND IT IS NOT A SOLICITATION OF AN OFFER TO BUY THESE SECURITIES IN ANY JURISDICTION WHERE THE OFFER OR SALE IS NOT PERMITTED.
| 69 |
11 MADISON AVENUE |
The following table presents certain information relating to the lease rollover schedule at the 11 Madison Avenue Property:
Lease Expiration Schedule(1)(2)
| Year Ending December 31, | No. of Leases Expiring | Expiring NRSF | % of Total NRSF | Cumulative Expiring NRSF | Cumulative % of Total NRSF | Annual U/W Base Rent | Annual U/W Base Rent PSF(3) | ||||||||
| MTM | 0 | 0 | 0.0% | 0 | 0.0% | $0 | $0.00 | ||||||||
| 2015 | 0 | 0 | 0.0% | 0 | 0.0% | $0 | $0.00 | ||||||||
| 2016(4) | 2 | 2 | 0.0% | 2 | 0.0% | $87,584 | $43,792.00 | ||||||||
| 2017(5) | 3 | 198,966 | 8.7% | 198,968 | 8.7% | $5,252,776 | $26.40 | ||||||||
| 2018 | 0 | 0 | 0.0% | 198,968 | 8.7% | $0 | $0.00 | ||||||||
| 2019 | 1 | 99,107 | 4.3% | 298,075 | 13.0% | $7,398,075 | $74.65 | ||||||||
| 2020 | 0 | 0 | 0.0% | 298,075 | 13.0% | $0 | $0.00 | ||||||||
| 2021 | 0 | 0 | 0.0% | 298,075 | 13.0% | $0 | $0.00 | ||||||||
| 2022 | 0 | 0 | 0.0% | 298,075 | 13.0% | $0 | $0.00 | ||||||||
| 2023 | 0 | 0 | 0.0% | 298,075 | 13.0% | $0 | $0.00 | ||||||||
| 2024 | 0 | 0 | 0.0% | 298,075 | 13.0% | $0 | $0.00 | ||||||||
| 2025 | 1 | 152,232 | 6.7% | 450,307 | 19.7% | $12,939,720 | $85.00 | ||||||||
| Thereafter(5) | 4 | 1,783,871 | 78.1% | 2,234,178 | 97.8% | $122,239,468 | $68.52 | ||||||||
| Vacant | 0 | 50,865 | 2.2% | 2,285,043 | 100.0% | $0 | $0.00 | ||||||||
| Total/Weighted Average | 11 | 2,285,043 | 100.0% | $147,917,623 | $66.21 |
| (1) | Information obtained from the underwritten rent roll. |
| (2) | Certain tenants may have lease termination or contraction options that are exercisable prior to the originally stated expiration date of the subject lease and that are not considered in the Lease Expiration Schedule. |
| (3) | Weighted Average Annual U/W Base Rent PSF excludes vacant space. |
| (4) | 2016 includes two antenna leases with 1 square foot attributed to each lease. |
| (5) | Credit Suisse occupies multiple suites with 1,079,655 square feet (47.2% of the net rentable area) on leases expiring on May 31, 2037 and 186,396 (8.2% of the net rentable area) on leases expiring on May 31, 2017. Credit Suisse has an option to extend the lease on the 186,396 square feet through May 31, 2037 by providing notice by April 1, 2016. |
The following table presents historical occupancy percentages at the 11 Madison Avenue Property:
Historical Occupancy
12/31/2012(1) | 12/31/2013(1) | 12/31/2014(1) | 8/1/2015(2)(3) | ||||
| 99.1% | 87.5% | 94.0% | 97.8% |
| (1) | Information obtained from the borrowers. |
| (2) | Information obtained from the underwritten rent roll. |
| (3) | As of August 1, 2015, the 11 Madison Avenue Property was 97.8% leased; Sony (25.3% of the net rentable area) and WME (4.5% of the net rentable area) have taken possession of their respective spaces and are currently completing their buildouts. |
THE INFORMATION IN THIS STRUCTURAL AND COLLATERAL TERM SHEET IS NOT COMPLETE AND MAY BE AMENDED PRIOR TO THE TIME OF SALE. THIS TERM SHEET IS NOT AN OFFER TO SELL THESE SECURITIES AND IT IS NOT A SOLICITATION OF AN OFFER TO BUY THESE SECURITIES IN ANY JURISDICTION WHERE THE OFFER OR SALE IS NOT PERMITTED.
| 70 |
11 MADISON AVENUE |
Operating History and Underwritten Net Cash Flow. The following table presents certain information relating to the historical operating performance and the underwritten net cash flow at the 11 Madison Avenue Property:
Cash Flow Analysis
| 2013 | 2014 | TTM 5/31/2015 | Year 3 Budget | U/W | % of U/W Effective Gross Income | U/W $ per SF | |||||||||
| Base Rent | $52,888,225 | $52,592,579 | $53,715,326(1) | $154,501,514 | $147,917,623(1) | 90.7% | $64.73 | ||||||||
| Straight Line Rents | 0 | 0 | 0 | 0 | $1,932,702(2) | 1.2 | 0.85 | ||||||||
| Grossed Up Vacant Space | 0 | 0 | 0 | 0 | 4,796,680 | 2.9 | 2.10 | ||||||||
| Total Reimbursables | 15,059,977 | 14,780,924 | 13,408,807 | 3,799,446 | 5,509,992 | 3.4 | 2.41 | ||||||||
| Other Income(3) | 2,724,962 | 2,996,156 | 3,461,086 | 8,005,327 | 7,679,439 | 4.7 | 3.36 | ||||||||
| Less Vacancy & Credit Loss | (725,384) | (488,860) | (319,721) | 0 | (4,796,680)(4) | (2.9) | (2.10) | ||||||||
| Effective Gross Income | $69,947,780 | $69,880,799 | $70,265,498 | $166,306,287 | $163,039,756 | 100.0% | $71.35 | ||||||||
| Total Operating Expenses | $22,896,733 | $23,175,050 | $23,876,107 | $53,628,277 | $53,546,158(5) | 32.8% | $23.43 | ||||||||
|
|
|
|
|
|
| |||||||||
| Net Operating Income | $47,051,047 | $46,705,749 | $46,389,392 | $112,678,010 | $109,493,598 | 67.2% | $47.92 | ||||||||
| TI/LC | 0 | 0 | 0 | 0 | 1,605,307 | 1.0 | 0.70 | ||||||||
| Capital Expenditures | 0 | 0 | 0 | 0 | 457,009 | 0.3 | 0.20 | ||||||||
| Net Cash Flow | $47,051,047 | $46,705,749 | $46,389,392 | $112,678,010 | $107,431,283 | 65.9% | $47.01 | ||||||||
| NOI DSCR(6) | 1.71x | 1.69x | 1.68x | 4.08x | 3.97x | ||||||||||
| NCF DSCR(6) | 1.71x | 1.69x | 1.68x | 4.08x | 3.89x | ||||||||||
| NOI DY(6) | 6.2% | 6.1% | 6.1% | 14.7% | 14.3% | ||||||||||
| NCF DY(6) | 6.2% | 6.1% | 6.1% | 14.7% | 14.1% |
| (1) | The increase in U/W Base Rent over TTM 5/31/2015 Base Rent is due in part to Credit Suisse executing a lease extension for 1,079,655 square feet (47.2% of net rentable area) commencing on June 1, 2017 increasing its total base rent by $42.6 million and Sony executing a lease in February 2015 for 578,791 square feet (25.3% of net rentable area) with annual rent of $42.7 million. |
| (2) | Straight Line Rents is equal to the difference between Sony’s annual base rent during the first calendar year in which it will make rent payments and the average rent for Sony’s space over the 11 Madison Avenue Loan Combination term. |
| (3) | Other Income includes percentage rent, sundry income, tenant utility billbacks and miscellaneous revenue. |
| (4) | The underwritten economic vacancy is 2.9%. As of August 1, 2015, the 11 Madison Avenue Property was 97.8% leased;Sony (25.3% of the net rentable area) and WME (4.5% of the net rentable area) took possession of their respective spaces and are currently completing their buildouts. |
| (5) | The 11 Madison Avenue Property historically benefited from an NYC IDA, which resulted in a reduced property tax expense. The NYC IDA exemptions will expire on December 31, 2016 and full taxes were underwritten. |
| (6) | Based on the 16 senior notes totaling $764,330,000. |
Appraisal.As of the appraisal valuation date of July 1, 2015, the 11 Madison Avenue Property had an “as-is” appraised value of $2,350,000,000. The appraiser also concluded to an “as-stabilized” value of $2,700,000,000 with an “as-stabilized” valuation date of July 1, 2018.
Environmental Matters. According to a Phase I environmental site assessment dated April 30, 2015, there was no evidence of any recognized environmental conditions at the 11 Madison Avenue Property.
Market Overview and Competition.The 11 Madison Avenue Property is located in downtown Manhattan and overlooks Madison Square Park, giving the building an unobstructed view of the park. Located in Manhattan’s Midtown South Neighborhood, the 11 Madison Avenue Property has direct access to the number 6 subway line which, along with the nearby N, R, Q, F and M lines, provides connections from the Upper East Side and Grand Central Station to Union Square, Downtown Manhattan and Brooklyn. Additionally, the 11 Madison Avenue Property is within walking distance of the Flatiron, Gramercy and Chelsea neighborhoods. The 11 Madison Avenue Property is located in the Midtown South office market, which includes 66.6 million square feet of office space. The Midtown South office market includes 35 class A buildings totaling 17.3 million square feet. The 11 Madison Avenue Property is one of seven trophy office buildings in the Midtown South office market. The Midtown South office market is geographically segmented into five major submarkets: SoHo, Greenwich Village/NoHo, Madison/Union Square, Hudson Square/West Village, and Chelsea. The 11 Madison Avenue Property is located in the Madison/Union Square submarket. The Madison/Union Square submarket contains over 32.0 million square feet of office space and is Midtown South’s largest submarket. The Madison/Union Square submarket contains 10.4 million square feet of class A space (including the 11 Madison Avenue Property). As of the first quarter of 2015, the Midtown South office market exhibited a vacancy rate of 7.0% with an asking rental rate of $63.28 per square foot, gross and the Madison/Union Square submarket had an overall vacancy rate of 7.3% with an asking rent of $64.22 per square foot, gross.
THE INFORMATION IN THIS STRUCTURAL AND COLLATERAL TERM SHEET IS NOT COMPLETE AND MAY BE AMENDED PRIOR TO THE TIME OF SALE. THIS TERM SHEET IS NOT AN OFFER TO SELL THESE SECURITIES AND IT IS NOT A SOLICITATION OF AN OFFER TO BUY THESE SECURITIES IN ANY JURISDICTION WHERE THE OFFER OR SALE IS NOT PERMITTED.
| 71 |
11 MADISON AVENUE |
The following table presents certain information relating to comparable office properties to the 11 Madison Avenue Property:
Competitive Set(1)
| Property | NRA | Available Sq. Ft. (Direct) | Available Sq. Ft. (Sublease) | Direct Occupancy | Occupancy (including Sublease availability) | ||||||
| One Madison Avenue | 1,443,908 | 0 | 0 | 100.0% | 100.0% | ||||||
| 41 Madison Avenue | 532,525 | 0 | 55,126 | 100.0% | 89.7% | ||||||
| 51 Madison Avenue | 974,653 | 0 | 0 | 100.0% | 100.0% | ||||||
| 63 Madison Avenue | 636,660 | 0 | 8,296 | 100.0% | 98.7% | ||||||
| 114 Fifth Avenue | 287,804 | 0 | 19,326 | 100.0% | 93.3% | ||||||
| 160 Fifth Avenue | 117,900 | 0 | 0 | 100.0% | 100.0% | ||||||
| 200 Fifth Avenue | 594,089 | 0 | 0 | 100.0% | 100.0% | ||||||
| 770 Broadway | 911,213 | 0 | 0 | 100.0% | 100.0% | ||||||
| 111 Eighth Avenue | 2,300,000 | 0 | 0 | 100.0% | 100.0% | ||||||
| 51 Astor Place | 307,839 | 0 | 0 | 100.0% | 100.0% | ||||||
| Total / Weighted Average | 8,106,591 | 0 | 82,748 | 100.0% | 99.0% |
| (1) | Information obtained from the appraisal. |
The Borrowers.The borrowers, 11 Madison Avenue Owner LLC, 11 Madison Avenue Owner 2 LLC, 11 Madison Avenue Owner 3 LLC, 11 Madison Avenue Owner 4 LLC, 11 Madison Avenue Owner 5 LLC and 11 Madison Avenue Owner 6 LLC (collectively the “TIC Owners”) and 11 Madison EAT Lender LLC (together with the TIC Owners, the borrowers), are each a single purpose Delaware limited liability company entity with two independent directors. Each of the TIC Owners is a tenant-in-common owner of the 11 Madison Avenue Property and they collectively own 100% of the fee and/or leasehold interest in the 11 Madison Avenue Property which they have master leased to 11 Madison EAT Lender LLC. Legal counsel to the borrowers delivered a non-consolidation opinion in connection with the origination of the 11 Madison Avenue Loan Combination. SL Green Realty Corp. (“SLG”) is the guarantor of certain nonrecourse carveouts under the 11 Madison Avenue Loan Combination.
The Sponsors.The sponsor of the 11 Madison Avenue Loan Combination is SLG (rated Baa3/BBB-/BB+ by Moody’s/Fitch/S&P), an S&P 500 company and New York City’s largest office landlord, which is a fully integrated real estate investment trust that is focused primarily on acquiring, managing, and maximizing value of Manhattan commercial properties. As of June 30, 2015, SLG held interests in 120 Manhattan properties totaling 44.1 million square feet, which consists of ownership interests in 29.0 million square feet of commercial buildings and debt and preferred equity investments secured by 15.1 million square feet of properties. In addition to its Manhattan investments, SL Green held ownership interests in 37 suburban properties totaling 5.9 million square feet in Brooklyn, Long Island, Westchester County, Connecticut and New Jersey.
Escrows.The loan documents provide for upfront reserves in the amount of $18,847,898 for free rent related to the Sony lease, $36,500,000 for rent due to Credit Suisse for the space subleased to Sony and $1,000 for fees related to title endorsements. The borrowers owe $140.2 million in outstanding tenant improvements and leasing commissions and landlord work obligations related to the Sony, Credit Suisse, Yelp and WME leases (“Lease Costs”); loan documents provide for an upfront reserve in an amount of $81,152,102 for the Lease Costs and the sponsor provided a guaranty to the lender to fund the balance of the Lease Costs (currently $59,060,332). Upon the long-term unsecured S&P credit rating of the sponsor being less than BB+, the borrowers are required to deposit an amount equal to any Lease Costs covered by the guaranty or, so long as no event of default has occurred and is continuing, the borrowers may elect to apply all excess cash flow to the Lease Costs account until the required amount is fully funded.
| Lease Costs | |
| Lease Costs | Outstanding Amount |
| Credit Suisse Landlord Base Building Work | 21,591,448 |
| Sony Landlord Base Building Work | 19,931,438 |
| Credit Suisse Tenant Improvements(1) | 43,898,724 |
| Sony Tenant Improvements | 43,641,509 |
| Other Tenant Improvements | 4,533,205 |
| Credit Suisse Leasing Commissions | 4,529,626 |
| Sony Leasing Commissions | 0 |
| Other Leasing Commissions | 2,086,484 |
| Total Lease Costs | $140,212,434 |
| (1) | Includes $33,806,313 in anticipated work allowance under the 2017 Credit Suisse Lease |
During the continuance of a Trigger Period (as defined below), the borrowers will deposit on each monthly payment date (i) an amount equal to one-twelfth of the taxes payable in the next 12 months, (ii) provided an acceptable blanket policy is no longer in place, an amount equal to one-twelfth of the insurance premiums payable in the next 12 months and (iii) $342,756 for annual capital expenditures.
THE INFORMATION IN THIS STRUCTURAL AND COLLATERAL TERM SHEET IS NOT COMPLETE AND MAY BE AMENDED PRIOR TO THE TIME OF SALE. THIS TERM SHEET IS NOT AN OFFER TO SELL THESE SECURITIES AND IT IS NOT A SOLICITATION OF AN OFFER TO BUY THESE SECURITIES IN ANY JURISDICTION WHERE THE OFFER OR SALE IS NOT PERMITTED.
| 72 |
11 MADISON AVENUE |
During the continuance of a Lease Sweep Period (as defined below), the lender will cause all excess cash flow to be deposited into the Rollover Reserve subaccount.
Lockbox and Cash Management.The 11 Madison Avenue Loan Combination requires a lender-controlled lockbox account, which is already in place, and that the borrowers direct tenants to pay their rents directly into such lockbox account. The loan documents also require that all rents received by the borrowers or the property manager be deposited into the lockbox account within ten business days of receipt. Prior to the occurrence of a Trigger Period (as defined below), all cash flow is distributed to the borrowers. During a Trigger Period, all cash flow is swept to a lender-controlled cash management account.
A “Trigger Period” will commence upon the occurrence or commencement of (i) an event of default; (ii) a Low Debt Yield Trigger Period (as defined below); (iii) a default by the borrowers of any major lease obligation; (iv) a Lease Collateral Sweep Period (as defined below); (v) a Lease Sweep Period (as defined below); or (vi) a Mezzanine Loan A or Mezzanine Loan B loan default.
A “Low Debt Yield Trigger Period” will commence if, as of the last day of any calendar quarter, the 11 Madison Avenue Loan Combination net cash flow debt yield falls below 7.50% or the aggregate debt (inclusive of mezzanine loans) net cash flow debt yield falls below 5.75% for two consecutive calendar quarters. A Low Debt Yield Trigger Period will cease to exist if either (i) the 11 Madison Avenue Loan Combination net cash flow debt yield exceeds 7.50% and the aggregate debt net cash flow yield exceeds 5.75% for two consecutive calendar quarters; or (ii) the borrowers provide cash or a letter of credit to the lender in the amount that if applied to the outstanding principal balance would cause the 11 Madison Avenue Loan Combination net cash flow debt yield to be equal to or greater than 7.50% and the aggregate debt net cash flow debt yield to be equal to or greater than 5.75%.
A “Lease Collateral Sweep Period” will commence if the long-term unsecured S&P credit rating of the sponsor falls below BB+. The Lease Collateral Sweep Period will cease to exist if either (i) all Lease Costs have been fully funded in cash into the Lease Costs Reserve account or (ii) the sponsor meets the minimum credit rating of BB+ by S&P.
A “Lease Sweep Period” will commence upon a bankruptcy proceeding in which the tenant and/or guarantor under either the Credit Suisse lease or the Sony lease, or its respective parent entity, (each a “Major Tenant”) is the debtor. A Lease Sweep Period will end upon the earlier to occur of (i) in the event either of the Major Tenant leases are rejected in the applicable bankruptcy proceeding, the date on which a sufficient portion of the space occupied under the defaulted Major Tenant lease is re-leased so as to achieve an 11 Madison Avenue Loan Combination net cash flow debt yield of 7.50% or greater and an aggregate debt net cash flow debt yield of 5.75%; (ii) the date of an assumption or assignment of the applicable Major Tenant lease out of bankruptcy or (iii) the date on which the amount of $75.00 per rentable square foot of the defaulted Major Tenant lease is deposited into the Rollover Reserve account for approved leasing costs.
Property Management. The 11 Madison Avenue Property is managed by an affiliate of the borrowers.
Assumption.The borrowers have the right to transfer the 11 Madison Avenue Property provided that certain conditions are satisfied, including (i) no event of default has occurred and is continuing; (ii) either the transferee is a qualified transferee as described in the loan documents or the lender reasonably determines that the proposed transferee and guarantor satisfy the lender’s credit review and underwriting standards, taking into consideration the transferee’s experience, financial strength and general business standing; (iii) the replacement guarantor has a net worth not less than $500.0 million and liquid assets not less than $50.0 million; and (iv) the lender has received confirmation from Fitch, Moody’s and Morningstar that such assumption will not result in a downgrade, withdrawal or qualification of the respective ratings assigned to the Series 2015-C31 Certificates and similar confirmations from each rating agency rating any securities backed by any 11 Madison Avenue Companion Loans with respect to the ratings of such securities.
Partial Release. Not permitted.
Real Estate Substitution.Not permitted.
Subordinate and Mezzanine Indebtedness.The 11 Madison Avenue Loan Combination includes three subordinate notes with an aggregate original principal balance of $310,670,000 that were contributed to the MAD 2015-11MD transaction. See “Description of the Mortgage Pool – Subordinate and/or Other Financing – Existing (Secured Financing and Mezzanine and Similar Financing)” in the Free Writing Prospectus.
German American Capital Corporation, Morgan Stanley Mortgage Capital Holdings LLC and Wells Fargo Bank, National Association (collectively “Mezzanine Lender”) have made a $150,000,000 mezzanine loan (“Mezzanine Loan A”) to 11 Madison Mezz 1 LLC, 11 Madison Mezz 2 LLC, 11 Madison Mezz 3 LLC, 11 Madison Mezz 4 LLC, 11 Madison Mezz 5 LLC, 11 Madison Mezz 6 LLC and 11 Madison Mezz Borrower LLC. The Mezzanine Lender also made a $175,000,000 mezzanine loan (“Mezzanine Loan B”) to 11 Madison Second Mezz 1 LLC, 11 Madison Second Mezz 2 LLC, 11 Madison Second Mezz 3 LLC, 11 Madison Second Mezz 4 LLC, 11 Madison Second Mezz 5 LLC, 11 Madison Second Mezz 6 LLC and 11 Madison Second Mezz Borrower LLC. Mezzanine Loan A and Mezzanine Loan B accrue interest at an interest rate of 4.650%per annumand 4.850%per annum, respectively, and require payments of interest only. The Mezzanine Loan A and Mezzanine Loan B are coterminous with the 11 Madison Loan Combination.
Ground Lease.None.
Terrorism Insurance. The loan documents require that the “all risk” insurance policy required to be maintained by the borrowers provide coverage for terrorism in an amount equal to the full replacement cost of the 11 Madison Avenue Property, provided however, that the borrower will not be required to spend more than 200.0% of the cost of property coverage and business interruption coverage in the event the Terrorism Risk Insurance Act or a similar government backstop is no longer in effect. The loan
THE INFORMATION IN THIS STRUCTURAL AND COLLATERAL TERM SHEET IS NOT COMPLETE AND MAY BE AMENDED PRIOR TO THE TIME OF SALE. THIS TERM SHEET IS NOT AN OFFER TO SELL THESE SECURITIES AND IT IS NOT A SOLICITATION OF AN OFFER TO BUY THESE SECURITIES IN ANY JURISDICTION WHERE THE OFFER OR SALE IS NOT PERMITTED.
| 73 |
11 MADISON AVENUE |
documents also require business interruption insurance covering no less than the 24-month period following the occurrence of a casualty event, together with a 12-month extended period of indemnity.
THE INFORMATION IN THIS STRUCTURAL AND COLLATERAL TERM SHEET IS NOT COMPLETE AND MAY BE AMENDED PRIOR TO THE TIME OF SALE. THIS TERM SHEET IS NOT AN OFFER TO SELL THESE SECURITIES AND IT IS NOT A SOLICITATION OF AN OFFER TO BUY THESE SECURITIES IN ANY JURISDICTION WHERE THE OFFER OR SALE IS NOT PERMITTED.
| 74 |
(THIS PAGE INTENTIONALLY LEFT BLANK)
THE INFORMATION IN THIS STRUCTURAL AND COLLATERAL TERM SHEET IS NOT COMPLETE AND MAY BE AMENDED PRIOR TO THE TIME OF SALE. THIS TERM SHEET IS NOT AN OFFER TO SELL THESE SECURITIES AND IT IS NOT A SOLICITATION OF AN OFFER TO BUY THESE SECURITIES IN ANY JURISDICTION WHERE THE OFFER OR SALE IS NOT PERMITTED.
| 75 |
HAMPTON INN & SUITES - JACKSONVILLE BEACH |
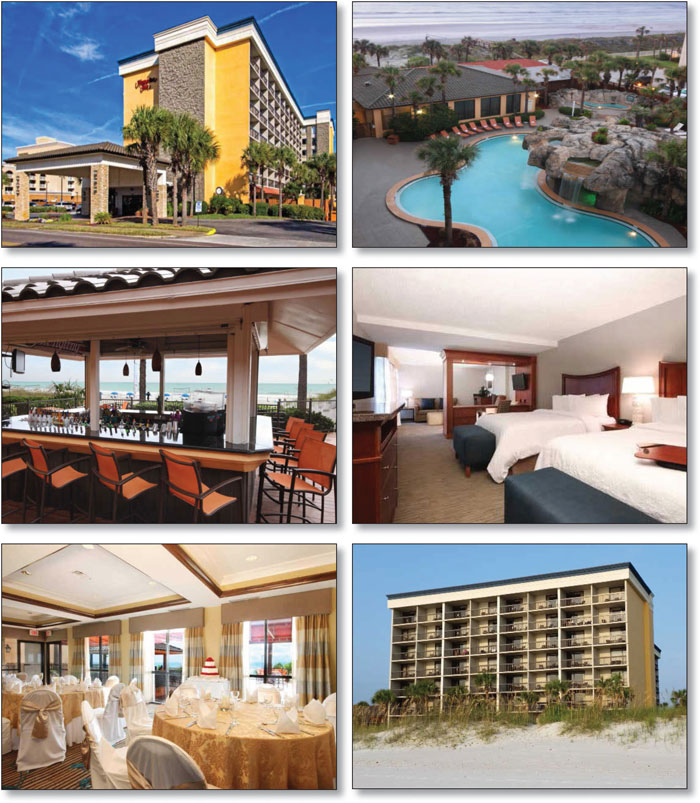
THE INFORMATION IN THIS STRUCTURAL AND COLLATERAL TERM SHEET IS NOT COMPLETE AND MAY BE AMENDED PRIOR TO THE TIME OF SALE. THIS TERM SHEET IS NOT AN OFFER TO SELL THESE SECURITIES AND IT IS NOT A SOLICITATION OF AN OFFER TO BUY THESE SECURITIES IN ANY JURISDICTION WHERE THE OFFER OR SALE IS NOT PERMITTED.
| 76 |
HAMPTON INN & SUITES - JACKSONVILLE BEACH |
THE INFORMATION IN THIS STRUCTURAL AND COLLATERAL TERM SHEET IS NOT COMPLETE AND MAY BE AMENDED PRIOR TO THE TIME OF SALE. THIS TERM SHEET IS NOT AN OFFER TO SELL THESE SECURITIES AND IT IS NOT A SOLICITATION OF AN OFFER TO BUY THESE SECURITIES IN ANY JURISDICTION WHERE THE OFFER OR SALE IS NOT PERMITTED.
| 77 |
| No. 6 – Hampton Inn & Suites - Jacksonville Beach | ||||||||
| Loan Information | Property Information | |||||||
| Mortgage Loan Seller: | Wells Fargo Bank, National Association | Single Asset/Portfolio: | Single Asset | |||||
| Credit Assessment (Fitch/Moody’s/Morningstar): | NR/NR/NR | Property Type: | Hospitality | |||||
| Original Principal Balance: | $29,120,000 | Specific Property Type: | Limited Service | |||||
| Cut-off Date Principal Balance: | $29,120,000 | Location: | Jacksonville Beach, FL | |||||
| % of Initial Pool Balance: | 2.9% | Size: | 177 Rooms | |||||
| Loan Purpose: | Acquisition | Cut-off Date Principal Balance Per Room: | $164,520 | |||||
| Borrower Name: | Pios Grande Jacksonville Resort LLC | Year Built/Renovated: | 1976/2014 | |||||
| Sponsors: | Peter G. Abessinio; Vincent T. Abessinio | Title Vesting: | Fee | |||||
| Mortgage Rate: | 4.510% | Property Manager: | MHF Jacksonville Beach Manager IV LLC | |||||
| Note Date: | June 26, 2015 | 3rdMost Recent Occupancy (As of): | 57.0% (12/31/2012) | |||||
| Anticipated Repayment Date: | NAP | 2ndMost Recent Occupancy (As of)(2): | 78.2% (12/31/2013) | |||||
| Maturity Date: | July 11, 2025 | Most Recent Occupancy (As of): | 83.0% (12/31/2014) | |||||
| IO Period: | 24 months | Current Occupancy (As of): | 85.2% (8/31/2015) | |||||
| Loan Term (Original): | 120 months | |||||||
| Seasoning: | 4 months | Underwriting and Financial Information: | ||||||
| Amortization Term (Original): | 360 months | |||||||
| Loan Amortization Type: | Interest-only, Amortizing Balloon | 3rdMost Recent NOI (As of)(2): | $2,681,315 (12/31/2013) | |||||
| Interest Accrual Method: | Actual/360 | 2ndMost Recent NOI (As of): | $3,536,989 (12/31/2014) | |||||
| Call Protection: | L(28),D(88),O(4) | Most Recent NOI (As of): | $3,882,194 (TTM 8/31/2015) | |||||
| Lockbox Type: | Springing | |||||||
| Additional Debt: | No | |||||||
| Additional Debt Type: | NAP | |||||||
| U/W Revenues: | $9,439,938 | |||||||
| U/W Expenses: | $5,755,870 | |||||||
| U/W NOI: | $3,684,068 | |||||||
| U/W NCF: | $3,306,470 | |||||||
| Escrows and Reserves(1): | U/W NOI DSCR: | 2.08x | ||||||
| U/W NCF DSCR: | 1.87x | |||||||
| Type: | Initial | Monthly | Cap (If Any) | U/W NOI Debt Yield: | 12.7% | |||
| Taxes | $297,772 | $37,221 | NAP | U/W NCF Debt Yield: | 11.4% | |||
| Insurance | $0 | Springing | NAP | As-Is Appraised Value: | $41,600,000 | |||
| FF&E Reserve | $0 | $31,192 | NAP | As-Is Appraisal Valuation Date: | June 12, 2015 | |||
| PIP Reserve | $275,000 | Springing | NAP | Cut-off Date LTV Ratio: | 70.0% | |||
| Seasonality Reserve | $67,220 | Springing | NAP | LTV Ratio at Maturity or ARD: | 59.8 % | |||
| (1) | See “Escrows” section. |
| (2) | The Hampton Inn & Suites – Jacksonville Beach Property was converted from a Comfort Inn to a Hampton Inn in June 2012. |
The Mortgage Loan. The mortgage loan (the “Hampton Inn & Suites – Jacksonville Beach Mortgage Loan”) is evidenced by a single promissory note secured by a first mortgage encumbering the fee interest in a limited service hotel located in Jacksonville Beach, Florida (the “Hampton Inn & Suites – Jacksonville Beach Property”). The Hampton Inn & Suites – Jacksonville Beach Mortgage Loan was originated on June 26, 2015 by Wells Fargo Bank, National Association. The Hampton Inn & Suites – Jacksonville Beach Mortgage Loan had an original principal balance of $29,120,000, has an outstanding principal balance as of the Cut-off Date of $29,120,000 and accrues interest at an interest rate of 4.510%per annum. The Hampton Inn & Suites – Jacksonville Beach Mortgage Loan had an initial term of 120 months, has a remaining term of 116 months as of the Cut-off Date and requires interest-only payments for the first 24 payments following origination and, thereafter, requires payments of principal and interest based on a 30-year amortization schedule. The Hampton Inn & Suites – Jacksonville Beach Mortgage Loan matures on July 11, 2025.
Following the lockout period, the borrower has the right to defease the Hampton Inn & Suites – Jacksonville Beach Mortgage Loan in whole, but not in part, on any date before April 11, 2025. In addition, the Hampton Inn & Suites – Jacksonville Beach Mortgage Loan is prepayable without penalty on or after April 11, 2025.
THE INFORMATION IN THIS STRUCTURAL AND COLLATERAL TERM SHEET IS NOT COMPLETE AND MAY BE AMENDED PRIOR TO THE TIME OF SALE. THIS TERM SHEET IS NOT AN OFFER TO SELL THESE SECURITIES AND IT IS NOT A SOLICITATION OF AN OFFER TO BUY THESE SECURITIES IN ANY JURISDICTION WHERE THE OFFER OR SALE IS NOT PERMITTED.
| 78 |
HAMPTON INN & SUITES - JACKSONVILLE BEACH |
Sources and Uses
| Sources | Uses | |||||||
| Original loan amount | $29,120,000 | 68.4% | Purchase price | $41,500,000 | 97.4% | |||
| Sponsor’s new cash contribution | 13,469,026 | 31.6 | Reserves | 639,992 | 1.5 | |||
| Closing costs | 449,034 | 1.1 | ||||||
| Total Sources | $42,589,026 | 100.0% | Total Uses | $42,589,026 | 100.0% |
The Property. The Hampton Inn & Suites – Jacksonville Beach Property is a seven-story, 177-room, limited service hotel located in Jacksonville Beach, Florida. Built in 1976 and extensively renovated between 2011 and 2014, the Hampton Inn & Suites – Jacksonville Beach Property features 40 king guestrooms, 116 double queen guestrooms, three two-room suites, 10 studio suites, and eight handicap accessible guestrooms. Each guestroom features a flat screen television, a desk & chair, a small refrigerator, a microwave oven, a coffeemaker and complimentary high speed internet. The Hampton Inn & Suites – Jacksonville Beach Property offers 2,624 square feet of meeting space, a lagoon-style swimming pool with waterfalls, fitness center, business center, guest laundry, a convenience shop, complimentary breakfast and Tides Beach Bar and Grille. The Hampton Inn & Suites – Jacksonville Beach Property includes 164 surface level parking spaces, resulting in a parking ratio of 0.9 spaces per room.
The 2011/2012 renovations cost approximately $6.9 million and converted the Hampton Inn & Suites – Jacksonville Beach Property from a Comfort Inn. The renovation included upgrades to the lobby, public space and guestrooms. The seller completed an approximately $549,104 property improvement plan (“PIP”) renovation in 2014, which included upgrades to guestrooms, common areas, the swimming pool, and the exterior. Additionally, the sponsor expects to complete a $250,000 PIP renovation by May 2017, which was reserved upfront. According to the appraisal, the 2014 market mix of the Hampton Inn & Suites – Jacksonville Beach Property was 50% leisure, 35% commercial, and 15% meeting and group. The franchise agreement with Hilton expires in June 2030.
The following table presents certain information relating to the historical operating performance and the underwritten net cash flow at the Hampton Inn & Suites – Jacksonville Beach Property:
Cash Flow Analysis
| 2013 | 2014 | TTM 8/31/2015 | U/W | % of U/W Total Revenue | U/W $ per Room | ||||||||
| Occupancy | 78.2% | 83.0% | 85.2% | 80.0% | |||||||||
| ADR | $135.66 | $149.94 | $159.45 | $164.23 | |||||||||
| RevPAR | $106.13 | $124.40 | $135.84 | $131.39 | |||||||||
| Total Revenue | $7,708,831 | $9,001,682 | $9,727,645 | $9,439,938 | 100.0% | $53,333 | |||||||
| Total Department Expenses | 2,060,916 | 2,255,193 | 2,416,757 | 2,378,101 | 25.2 | 13,436 | |||||||
| Gross Operating Profit | $5,647,915 | $6,746,489 | $7,310,888 | $7,061,837 | 74.8% | $39,897 | |||||||
| Total Undistributed Expenses | 2,649,537 | 2,654,010 | 2,842,094 | 2,774,472 | 29.4 | 15,675 | |||||||
| Profit Before Fixed Charges | $2,998,378 | $4,092,479 | $4,468,794 | $4,287,365 | 45.4% | $24,222 | |||||||
| Total Fixed Charges | 317,063 | 555,490 | 586,600 | 603,297 | 6.4 | 3,408 | |||||||
| Net Operating Income | $2,681,315(1) | $3,536,989(1) | $3,882,194 | $3,684,068 | 39.0% | $20,814 | |||||||
| FF&E | 0 | 0 | 0 | 377,598 | 4.0 | 2,133 | |||||||
| Net Cash Flow | $2,681,315 | $3,536,989 | $3,882,194 | $3,306,470 | 35.0% | $18,681 | |||||||
| NOI DSCR | 1.51x | 2.00x | 2.19x | 2.08x | |||||||||
| NCF DSCR | 1.51x | 2.00x | 2.19x | 1.87x | |||||||||
| NOI DY | 9.2% | 12.1% | 13.3% | 12.7% | |||||||||
| NCF DY | 9.2% | 12.1% | 13.3% | 11.4% | |||||||||
(1) Net Operating Income increased from 2013 to 2014 following renovations at the Hampton Inn & Suites Property that were completed in 2014. | |||||||||||||
The Appraisal.As of the appraisal valuation date of June 12, 2015, the Hampton Inn & Suites – Jacksonville Beach Property had an “as-is” appraised value of $41,600,000.
Environmental Matters. According to a Phase I environmental assessment dated June 10, 2015, there was no evidence of any recognized environmental conditions at the Hampton Inn & Suites – Jacksonville Beach Property.
Market Overview and Competition.The Hampton Inn & Suites – Jacksonville Beach Property is located in Jacksonville Beach, Florida, approximately 17.5 miles west of the Jacksonville central business district. The Hampton Inn – Jacksonville Beach Property is situated along 1st Street North, one of the primary thoroughfares in the area, approximately six blocks north of Downtown Jacksonville Beach. Downtown Jacksonville Beach offers numerous attractions including Adventure Landing and Shipwreck Island Water Park (the largest family entertainment center in northeast Florida), Beach Museum and History Park, the J. Johnson Gallery, and the Jacksonville Beach Golf Club. Per the appraisal, Downtown Jacksonville Beach has gone through extensive redevelopment over the past 20 years through the construction of new offices and an outdoor entertainment pavilion, the development of park areas, numerous restaurants, a public pier, and the addition of upscale residential developments.
THE INFORMATION IN THIS STRUCTURAL AND COLLATERAL TERM SHEET IS NOT COMPLETE AND MAY BE AMENDED PRIOR TO THE TIME OF SALE. THIS TERM SHEET IS NOT AN OFFER TO SELL THESE SECURITIES AND IT IS NOT A SOLICITATION OF AN OFFER TO BUY THESE SECURITIES IN ANY JURISDICTION WHERE THE OFFER OR SALE IS NOT PERMITTED.
| 79 |
HAMPTON INN & SUITES - JACKSONVILLE BEACH |
The Hampton Inn & Suites – Jacksonville Beach Property benefits from its beachfront location on the Atlantic Ocean and approximately 5.8 miles northeast of Mayo Clinic Jacksonville, which primarily provides adult medical and surgical care. In 2008, Mayo Clinic opened the 650,000-square-foot, 304-bed, Mayo Clinic Hospital on the Jacksonville campus, which is expected to accommodate 500 beds. The Hampton Inn & Suites – Jacksonville Beach Property is also located approximately 1.8 miles south of Beaches Town Center (one of Jacksonville’s primary tourist destinations containing 18 restaurants and 17 retail shops). The largest corporate room night generators at the Hampton Inn & Suites – Jacksonville Beach Property include Mayo Clinic, Mevion Medical Systems, General Electric, BAE Systems, and Jacksonville University. A third party hospitality research report identified six competitive hospitality properties, containing 593 rooms, which exhibited average occupancy, ADR, and RevPAR of 83.4%, $133.38, and $111.18, respectively, for the trailing 12-month period ending August 31, 2015.
The following table presents certain information relating to the Hampton Inn & Suites – Jacksonville Beach Property’s competitive set:
Subject and Market Historical Occupancy, ADR and RevPAR(1)
| Competitive Set | Hampton Inn & Suites – | Penetration Factor | ||||||||||||||||
Year | Occupancy | ADR | RevPAR | Occupancy | ADR | RevPAR | Occupancy | ADR | RevPAR | ||||||||||
| 8/31/2015 TTM | 83.4% | $133.38 | $111.18 | 85.2% | $159.65 | $135.99 | 102.2% | 119.7% | 122.3% | ||||||||||
| 8/31/2014 TTM | 77.9% | $124.41 | $96.87 | 79.7% | $148.74 | $118.48 | 102.3% | 119.6% | 122.3% | ||||||||||
| 8/31/2013 TTM | 74.6% | $116.54 | $86.89 | 75.4% | $134.60 | $101.51 | 101.2% | 115.5% | 116.8% | ||||||||||
| (1) | Information obtained from a third party hospitality research report dated September 17, 2015. The competitive set includes: Courtyard Jacksonville Beach Oceanfront, Hampton Inn Jacksonville Pointe Vedra Beach Mayo Clinic Area, Four Points by Sheraton Jacksonville Beachfront, Fairfield Inn & Suites Jacksonville Beach, Holiday Inn Express Jacksonville Beach, and Hampton Inn & Suites Jacksonville Beach Boulevard Mayo. |
The Borrower.The borrower is Pios Grande Jacksonville Resort LLC, a Delaware limited liability company with one independent director. Legal counsel to the borrower delivered a non-consolidation opinion in connection with the origination of the Hampton Inn & Suites – Jacksonville Beach Loan. PIOS Grande Holdings LLC is the guarantor of certain nonrecourse carveouts under the Hampton Inn & Suites – Jacksonville Beach Loan.
The Sponsors.The sponsors are Peter G. Abessinio and Vincent T. Abessinio, co-presidents of Roch Capital Inc. (“Roch Capital”), a capital management firm with a focus on long-term investments that currently has $1.6 billion of assets under management. Founded in 2013, Roch Capital’s real estate portfolio consists of 887,000 square feet of office space, 823 hotel rooms, and 1,147 multifamily and student housing units valued at approximately $280.5 million.
Escrows.The loan documents provide for upfront escrows in the amount of $297,772 for real estate taxes, $275,000 for planned PIP renovations, and $67,220 for a seasonality reserve. The loan documents also provide for ongoing monthly reserves in the amount of $37,221 for real estate taxes and $31,192 for FF&E reserves. In addition, if, at any time, the franchisor requires additional PIP work under the franchise agreement, the borrower will be required to deposit an amount equal to 110.0% of the estimated cost of any additional PIP work. If, immediately following the monthly payment date occurring in January of each year, the amount on deposit in the seasonality reserve account is less than $121,000, the borrower is required make monthly deposits equal to one-ninth of such deficit in February through October of such year (currently $13,444). The loan documents do not require monthly deposits for insurance as long as (i) no event of default has occurred or is continuing; (ii) the Hampton Inn & Suites – Jacksonville Beach Property is insured via an acceptable blanket insurance policy; and (iii) the borrower provides the lender with timely proof of payment of insurance premiums.
Lockbox and Cash Management.Upon the occurrence and continuance of a Cash Trap Event Period (as defined below), the Hampton Inn & Suites – Jacksonville Beach Mortgage Loan requires that the borrower establish a lender-controlled lockbox account and the borrower and manager direct all rents to be deposited directly into such lockbox account. During a Cash Trap Event Period, all cash flow is swept to a lender-controlled cash management account.
A “Cash Trap Event Period” will commence upon (i) the occurrence and continuance of an event of default; (ii) the net cash flow debt yield falling below 8.0% at the end of any calendar month; or (iii) an event of default under the franchise agreement. A Cash Trap Event Period will end with respect to clause (i) upon the cure of such event of default; with respect to clause (ii) upon the net cash flow debt yield being equal to or greater than 8.5% for two consecutive calendar quarters; and with respect to clause (iii) upon the cure of an event of default under the franchise agreement or the borrower entering into a replacement franchise agreement satisfactory to the lender.
Property Management.The Hampton Inn & Suites – Jacksonville Beach Property is managed by MHF Jacksonville Beach Manager IV LLC.
Assumption.The borrower has a two-time right to transfer the Hampton Inn & Suites – Jacksonville Beach Property provided that certain conditions are satisfied, including (i) no event of default has occurred and is continuing; (ii) the lender reasonably determines that the proposed transferee and guarantor satisfy the lender’s credit review and underwriting standards, taking into consideration transferee experience, financial strength and general business standing; and (iii) the lender has received confirmation from Fitch, Moody’s, and Morningstar that such assumption will not result in a downgrade, withdrawal or qualification of the respective ratings assigned to the Series 2015-C31 Certificates.
Partial Release.Not permitted.
THE INFORMATION IN THIS STRUCTURAL AND COLLATERAL TERM SHEET IS NOT COMPLETE AND MAY BE AMENDED PRIOR TO THE TIME OF SALE. THIS TERM SHEET IS NOT AN OFFER TO SELL THESE SECURITIES AND IT IS NOT A SOLICITATION OF AN OFFER TO BUY THESE SECURITIES IN ANY JURISDICTION WHERE THE OFFER OR SALE IS NOT PERMITTED.
| 80 |
HAMPTON INN & SUITES - JACKSONVILLE BEACH |
Real Estate Substitution.Not permitted.
Subordinate and Mezzanine Indebtedness.Not permitted.
Ground Lease.None.
Terrorism Insurance.The loan documents require that the “all risk” insurance policy required to be maintained by the borrower provide coverage for terrorism in an amount equal to the full replacement cost of the Hampton Inn & Suites – Jacksonville Beach Property. The loan documents also require business interruption insurance covering no less than the 12-month period following the occurrence of a casualty event, together with a six-month extended period of indemnity.
Windstorm Insurance.The loan documents require windstorm insurance covering the full replacement cost of the Hampton Inn & Suites – Jacksonville Beach Property during the loan term. At the time of loan closing, the Hampton Inn & Suites – Jacksonville Beach Property had windstorm insurance coverage.
THE INFORMATION IN THIS STRUCTURAL AND COLLATERAL TERM SHEET IS NOT COMPLETE AND MAY BE AMENDED PRIOR TO THE TIME OF SALE. THIS TERM SHEET IS NOT AN OFFER TO SELL THESE SECURITIES AND IT IS NOT A SOLICITATION OF AN OFFER TO BUY THESE SECURITIES IN ANY JURISDICTION WHERE THE OFFER OR SALE IS NOT PERMITTED.
| 81 |
(THIS PAGE INTENTIONALLY LEFT BLANK)
THE INFORMATION IN THIS STRUCTURAL AND COLLATERAL TERM SHEET IS NOT COMPLETE AND MAY BE AMENDED PRIOR TO THE TIME OF SALE. THIS TERM SHEET IS NOT AN OFFER TO SELL THESE SECURITIES AND IT IS NOT A SOLICITATION OF AN OFFER TO BUY THESE SECURITIES IN ANY JURISDICTION WHERE THE OFFER OR SALE IS NOT PERMITTED.
| 82 |
| PATRICK HENRY MALL |
THE INFORMATION IN THIS STRUCTURAL AND COLLATERAL TERM SHEET IS NOT COMPLETE AND MAY BE AMENDED PRIOR TO THE TIME OF SALE. THIS TERM SHEET IS NOT AN OFFER TO SELL THESE SECURITIES AND IT IS NOT A SOLICITATION OF AN OFFER TO BUY THESE SECURITIES IN ANY JURISDICTION WHERE THE OFFER OR SALE IS NOT PERMITTED.
| 83 |
| PATRICK HENRY MALL |
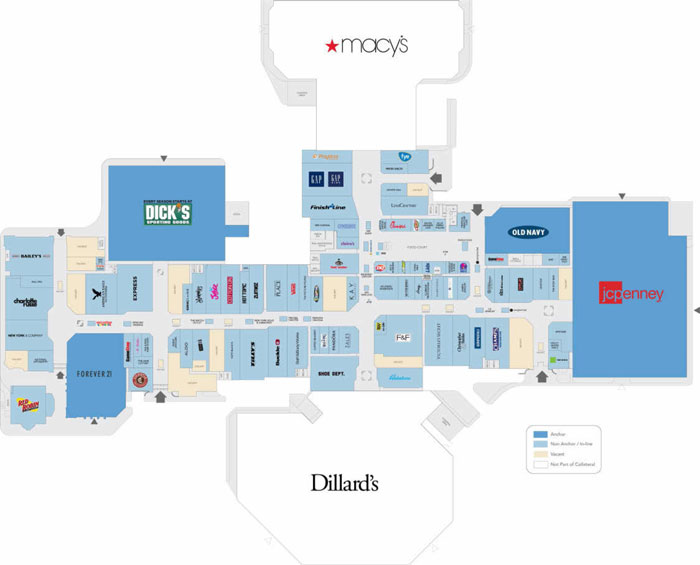
THE INFORMATION IN THIS STRUCTURAL AND COLLATERAL TERM SHEET IS NOT COMPLETE AND MAY BE AMENDED PRIOR TO THE TIME OF SALE. THIS TERM SHEET IS NOT AN OFFER TO SELL THESE SECURITIES AND IT IS NOT A SOLICITATION OF AN OFFER TO BUY THESE SECURITIES IN ANY JURISDICTION WHERE THE OFFER OR SALE IS NOT PERMITTED.
| 84 |
| PATRICK HENRY MALL |
THE INFORMATION IN THIS STRUCTURAL AND COLLATERAL TERM SHEET IS NOT COMPLETE AND MAY BE AMENDED PRIOR TO THE TIME OF SALE. THIS TERM SHEET IS NOT AN OFFER TO SELL THESE SECURITIES AND IT IS NOT A SOLICITATION OF AN OFFER TO BUY THESE SECURITIES IN ANY JURISDICTION WHERE THE OFFER OR SALE IS NOT PERMITTED.
| 85 |
| No. 7 – Patrick Henry Mall | |||||||
| Loan Information | Property Information | ||||||
| Mortgage Loan Seller: | Société Générale | Single Asset/Portfolio: | Single Asset | ||||
| Credit Assessment (Fitch/Moody’s/Morningstar): | NR/NR/NR | Property Type: | Retail | ||||
| Original Principal Balance(1): | $26,700,000 | Specific Property Type: | Regional Mall | ||||
| Cut-off Date Principal Balance(1): | $26,564,477 | Location: | Newport News, VA | ||||
| % of Initial Pool Balance: | 2.7% | Size: | 432,401 SF | ||||
| Loan Purpose: | Refinance | Cut-off Date Principal Balance Per SF(1): | $221.35 | ||||
| Borrower Name: | PR Patrick Henry LLC | Year Built/Renovated: | 1988/2005 | ||||
| Sponsor: | PREIT Associates, L.P. | Title Vesting: | Fee | ||||
| Mortgage Rate: | 4.352% | Property Manager: | Self-managed | ||||
| Note Date: | June 30, 2015 | 3rd Most Recent Occupancy (As of): | 97.8% (12/31/2012) | ||||
| Anticipated Repayment Date: | NAP | 2nd Most Recent Occupancy (As of): | 96.5% (12/31/2013) | ||||
| Maturity Date: | July 5, 2025 | Most Recent Occupancy (As of): | 97.4% (12/31/2014) | ||||
| IO Period: | None | Current Occupancy (As of): | 91.1% (4/30/2015) | ||||
| Loan Term (Original): | 120 months | ||||||
| Seasoning: | 4 months | Underwriting and Financial Information: | |||||
| Amortization Term (Original): | 360 months | ||||||
| Loan Amortization Type: | Amortizing Balloon | 3rd Most Recent NOI (As of): | $10,666,262 (12/31/2013) | ||||
| Interest Accrual Method: | Actual/360 | 2nd Most Recent NOI (As of): | $11,139,912 (12/31/2014) | ||||
| Call Protection: | L(28),D(88),O(4) | Most Recent NOI (As of): | $11,123,707 (TTM 4/30/2015) | ||||
| Lockbox Type: | Hard/Springing Cash Management | ||||||
| Additional Debt(1): | Yes | U/W Revenues: | $16,870,516 | ||||
| Additional Debt Type(1): | Pari Passu | U/W Expenses: | $6,342,794 | ||||
| U/W NOI: | $10,527,722 | ||||||
| U/W NCF: | $9,524,644 | ||||||
| U/W NOI DSCR(1): | 1.83x | ||||||
| U/W NCF DSCR(1): | 1.66x | ||||||
| Escrows and Reserves(2): | U/W NOI Debt Yield(1): | 11.0% | |||||
| U/W NCF Debt Yield(1): | 10.0% | ||||||
| Type: | Initial | Monthly | Cap (If Any) | As-Is Appraised Value: | $155,000,000 | ||
| Taxes | $0 | Springing | NAP | As-Is Appraisal Valuation Date: | April 24, 2015 | ||
| Insurance | $0 | Springing | NAP | Cut-off Date LTV Ratio(1): | 61.7% | ||
| Replacement Reserves | $0 | Springing | NAP | LTV Ratio at Maturity or ARD(1): | 49.9% | ||
| (1) | The Patrick Henry Mall Loan Combination, totaling $96,200,000, is comprised of threepari passunotes (Note A-1, Note A-2, and Note A-3). The non-controlling Note A-3 had an original principal balance of $26,700,000, has an outstanding principal balance as of the Cut-Off Date of $26,564,477 and will be contributed to the WFCM 2015-C31 Trust. Notes A-1 (the controlling Note) and A-2 had a combined original principal balance of $69,500,000, and were contributed to the WFCM 2015-SG1 Trust. All statistical financial information related to the balances per SF, loan-to-value ratios, debt service coverage ratios and debt yields are based on the Patrick Henry Mall Loan Combination. |
| (2) | See “Escrows” section. |
The Mortgage Loan.The mortgage loan (the “Patrick Henry Mall Mortgage Loan”) is part of a loan combination (the “Patrick Henry Mall Loan Combination”) that is evidenced by three promissory notes that are secured by a first mortgage encumbering a regional mall located in Newport News, Virginia (the “Patrick Henry Mall Property”). The Patrick Henry Mall Loan Combination was co-originated on June 30, 2015 by Prudential Mortgage Capital Company and Société Générale. The Patrick Henry Mall Loan Combination had an original principal balance of $96,200,000, has an outstanding principal balance as of the Cut-off Date of $95,711,711 and accrues interest at an interest rate of 4.352%per annum. The Patrick Henry Mall Loan Combination had an initial term of 120 months, has a remaining term of 116 months as of the Cut-off Date and requires payments of principal and interest based on a 30-year amortization schedule. The Patrick Henry Mall Loan Combination matures on July 5, 2025.
The Patrick Henry Mall Mortgage Loan, evidenced by non-controlling Note A-3, will be contributed to the WFCM 2015-C31 Trust, had an original principal balance of $26,700,000 and has an outstanding balance as of the Cut-Off Date of $26,564,477. Notes A-1 and A-2 (the “Patrick Henry Mall Companion Loans”), were contributed to the WFCM 2015-SG1 trust and had an aggregate original principal balance of $69,500,000. Note A-1 represents the controlling interest in the Patrick Henry Mall Loan Combination. See “Description of the Mortgage Pool—Additional Indebtedness—Loan Combinations—The Patrick Henry Mall Loan Combination” and “Servicing of the Mortgage Loans and Administration of the Trust Fund” in the Free Writing Prospectus.
Following the lockout period, the borrower has the right to defease the Patrick Henry Mall Loan Combination in whole, but not in part, on any date before April 5, 2025. In addition, the Patrick Henry Mall Loan Combination is prepayable without penalty on or after April 5, 2025.
THE INFORMATION IN THIS STRUCTURAL AND COLLATERAL TERM SHEET IS NOT COMPLETE AND MAY BE AMENDED PRIOR TO THE TIME OF SALE. THIS TERM SHEET IS NOT AN OFFER TO SELL THESE SECURITIES AND IT IS NOT A SOLICITATION OF AN OFFER TO BUY THESE SECURITIES IN ANY JURISDICTION WHERE THE OFFER OR SALE IS NOT PERMITTED.
| 86 |
| PATRICK HENRY MALL |
Sources and Uses
| Sources | Uses | |||||||
| Original loan combination amount | $96,200,000 | 100.0% | Loan payoff(1) | $85,025,854 | 88.4% | |||
| Closing costs | 1,028,993 | 1.1 | ||||||
| Return of equity | 10,145,153 | 10.5 | ||||||
| Total Sources | $96,200,000 | 100.0% | Total Uses | $96,200,000 | 100.0% |
| (1) | The Patrick Henry Mall Loan Combination is refinancing an existing Prudential balance sheet loan. |
The Property.The Patrick Henry Mall Property is a single-story regional mall located in Newport News, Virginia, approximately 65.8 miles southeast of Richmond, Virginia. The Patrick Henry Mall Property contains approximately 716,558 square feet of retail space, of which 432,401 square feet (the “Patrick Henry Mall Mortgaged Property”) serve as collateral for the Patrick Henry Mall Loan Combination. Built in 1988, the Patrick Henry Mall Property is comprised of two buildings situated on a 46.8-acre parcel. The Patrick Henry Mall Property is anchored by Dillard’s (not part of the collateral), Macy’s (not part of the collateral), Dick’s Sporting Goods, and J.C. Penney along with a variety of national retailers such as Forever 21, Old Navy Clothing Co., Victoria’s Secret, Express, Pandora, and Foot Locker. The Patrick Henry Mall Property underwent a $28.9 million renovation in 2005, which included $20.6 million in structural expansions, along with $5.5 million in tenant improvements. Based on the original acquisition price of $104.9 million along with the 2005 renovation and other capital improvements, the borrower will have 30.3% cash equity ahead of the Patrick Henry Mall Loan Combination based on a total cost basis of $137.8 million. As of March 31, 2015, tenants occupying 10,000 square feet or less had trailing 12-month in-line sales of $405 per square foot with an average occupancy cost of 14.5%. The Patrick Henry Mall Property contains 3,243 surface parking spaces, resulting in a parking ratio of 4.5 spaces per 1,000 square feet of rentable area. As of April 30, 2015, the Patrick Henry Mall Mortgaged Property was 91.1% occupied by 102 tenants.
The following table presents certain information relating to the tenancy at the Patrick Henry Mall Property:
Major Tenants
| Tenant Name | Credit Rating (Fitch/ Moody’s/ S&P)(1) | Tenant NRSF | % of NRSF | Annual U/W Base Rent PSF(2) | Annual U/W Base Rent(2) | % of Total Annual U/W Base Rent | Sales PSF(3) | Occupancy Cost(3) | Lease Expiration Date |
| Anchor Tenants – Not Part of Collateral | |||||||||
| Dillard’s(4) | BBB-/Baa3/BBB- | 144,157 | ANCHOR OWNED – NOT PART OF COLLATERAL | ||||||
| Macy’s | BBB+/Baa2/BBB+ | 140,000 | ANCHOR OWNED – NOT PART OF COLLATERAL | ||||||
| Anchor Tenant - Collateral | |||||||||
| Dick’s Sporting Goods | NR/NR/NR | 50,250 | 11.6% | $12.44 | $625,000 | 6.2% | NAV | NAV | 1/31/2022(5) |
| J.C. Penney | CCC/Caa1/CCC+ | 85,212 | 19.7% | $5.50 | $468,666 | 4.6% | $138 | 5.3% | 10/31/2020(6) |
| Total Anchor Tenants – Collateral | 135,462 | 31.3% | $8.07 | $1,093,666 | 10.8% | ||||
| Major Tenants - Collateral | |||||||||
| Forever 21 | NR/NR/NR | 21,017 | 4.9% | $17.67 | $371,370 | 3.7% | $142 | 12.2% | 10/31/2022 |
| Old Navy Clothing Co. | BBB-/Baa3/BBB- | 16,741 | 3.9% | $20.25 | $339,005 | 3.3% | $294 | 6.9% | 2/28/2017 |
| Bailey’s Pub & Grille | NR/NR/NR | 8,265 | 1.9% | $25.85 | $213,642 | 2.1% | NAV | NAV | 1/31/2021 |
| Red Robin | NR/NR/NR | 7,854 | 1.8% | $15.41 | $121,030 | 1.2% | NAV | NAV | 12/31/2020 |
| Total Major Tenants – Collateral | 53,877 | 12.5% | $19.40 | $1,045,048 | 10.3% | ||||
| Non-Major Tenants – Collateral | 204,672 | 47.3% | $39.03 | $7,987,907 | 78.9% | ||||
| Occupied Collateral Total | 394,011 | 91.1% | $25.70 | $10,126,621 | 100.0% | ||||
| Vacant Space | 38,390 | 8.9% | |||||||
| Collateral Total | 432,401 | 100.0% | |||||||
| (1) | Certain ratings are those of the parent company whether or not the parent guarantees the lease. |
| (2) | Annual U/W Base Rent PSF and Annual U/W Base Rent include contractual rent steps through July 2016, totaling $118,986. |
| (3) | Some tenants at the Patrick Henry Mall Property are not required to report sales and in such cases, Sales PSF and Occupancy Costs are not available. Sales PSF and Occupancy Cost are for the trailing 12-month period ending March 31, 2015. |
| (4) | Dillard’s owns their store and parcel, and does not make rental payments, however, they do contribute common area maintenance payments. |
| (5) | Dick’s Sporting Goods has three, five-year renewal options. |
| (6) | J.C. Penney has six, five-year renewal options. |
THE INFORMATION IN THIS STRUCTURAL AND COLLATERAL TERM SHEET IS NOT COMPLETE AND MAY BE AMENDED PRIOR TO THE TIME OF SALE. THIS TERM SHEET IS NOT AN OFFER TO SELL THESE SECURITIES AND IT IS NOT A SOLICITATION OF AN OFFER TO BUY THESE SECURITIES IN ANY JURISDICTION WHERE THE OFFER OR SALE IS NOT PERMITTED.
| 87 |
| PATRICK HENRY MALL |
The following table presents certain information relating to the historical sales and occupancy costs at the Patrick Henry Mall Mortgaged Property:
Historical Sales (PSF) and Occupancy Costs(1)(2)(3)
| Tenant Name | 2011 | 2012 | 2013 | 2014 | TTM 3/31/2015 | TTM 3/31/2015 Occupancy Cost |
| J.C. Penney | $190 | $185 | $123 | $138 | $138 | 5.3% |
| Forever 21 | $280(4) | $111(4) | $149 | $141 | $142 | 12.2% |
| Old Navy Clothing Company | $294 | $313 | $309 | $298 | $294 | 6.9% |
| Express | $253 | $223 | $229 | $213 | $216 | 21.9% |
| The Gap | $198 | $200 | $193 | $156 | $149 | 11.7% |
| Charlotte Russe | $149 | $145 | $156 | $170 | $174 | 11.7% |
| Victoria’s Secret | $500 | $491 | $545 | $571 | $582 | 8.2% |
| The Shoe Department | $157 | $167 | $168 | $163 | $165 | 18.2% |
| New York & Company | $245 | $242 | $242 | $243 | $247 | 23.8% |
| Finish Line | $358 | $412 | $410 | $435 | $434 | 15.2% |
| Bath & Body Works | $581 | $600 | $628 | $627 | $639 | 7.9% |
| Champs Sports | $267 | $340 | $455 | $478 | $464 | 14.5% |
| Cotton On | $50(5) | $198 | $211 | $218 | $214 | 20.1% |
| LensCrafters | $544 | $524 | $530 | $518 | $511 | 12.3% |
| Fye | $214 | $181 | $220 | $216 | $215 | 8.0% |
| DTLR | $601 | $522 | $548 | $485 | $519 | 12.2% |
| Foot Locker | $509 | $536 | $413 | $560 | $592 | 11.1% |
| Total In-Line (<10 000 square feet) | $382 | $389 | $392 | $386 | $405 | 14.5% |
| Total In-Line Occupancy Costs | 14.5% | 14.4% | 14.4% | 15.0% | 14.5% |
| (1) | Historical Sales (PSF) and Occupancy Costs were provided by the borrower. |
| (2) | Historical Sales (PSF) are based on lease net rentable square footage during each given period as some tenants listed may have expanded or reduced their lease net rentable square footage during such given period. |
| (3) | Historical Sales (PSF) and Occupancy Costs reflect those tenants who reported sales during the given periods. |
| (4) | Forever 21 expanded from 6,722 square feet to 21,017 square feet in 2012. |
| (5) | Represents partial year sales due to Cotton On’s lease beginning in September 2011. |
The following table presents certain information relating to the lease rollover schedule at the Patrick Henry Mall Mortgaged Property:
Lease Expiration Schedule(1)(2)
| Year Ending December 31, | No. of Leases Expiring | Expiring NRSF | % of Total NRSF | Cumulative Expiring NRSF | Cumulative % of Total NRSF | Annual U/W Base Rent | Annual U/W Base Rent PSF(3) |
| MTM | 3 | 2,544 | 0.6% | 2,544 | 0.6% | $229,219 | $90.10 |
| 2015 | 5 | 9,958 | 2.3% | 12,502 | 2.9% | $416,430 | $41.82 |
| 2016 | 17 | 54,526 | 12.6% | 67,028 | 15.5% | $1,983,389 | $36.38 |
| 2017 | 20 | 51,565 | 11.9% | 118,593 | 27.4% | $1,612,806 | $31.28 |
| 2018 | 12 | 20,396 | 4.7% | 138,989 | 32.1% | $940,902 | $46.13 |
| 2019 | 14 | 22,647 | 5.2% | 161,636 | 37.4% | $957,771 | $42.29 |
| 2020 | 10 | 106,325 | 24.6% | 267,961 | 62.0% | $1,149,372 | $10.81 |
| 2021 | 4 | 18,109 | 4.2% | 286,070 | 66.2% | $552,991 | $30.54 |
| 2022 | 7 | 81,967 | 19.0% | 368,037 | 85.1% | $1,558,908 | $19.02 |
| 2023 | 2 | 2,146 | 0.5% | 370,183 | 85.6% | $99,117 | $46.19 |
| 2024 | 7 | 20,614 | 4.8% | 390,797 | 90.4% | $560,150 | $27.17 |
| 2025 | 1 | 3,214 | 0.7% | 394,011 | 91.1% | $65,566 | $20.40 |
| Thereafter | 0 | 0 | 0.0% | 394,011 | 91.1% | $0 | $0.00 |
| Vacant | 0 | 38,390 | 8.9% | 432,401 | 100.0% | $0 | $0.00 |
| Total/Weighted Average | 102 | 432,401 | 100.0% | $10,126,621 | $25.70 |
| (1) | Information obtained from the underwritten rent roll. |
| (2) | Certain tenants may have lease termination options that are exercisable prior to the originally stated expiration date of the subject lease and that are not considered in the Lease Expiration Schedule. |
| (3) | Annual U/W Base Rent PSF excludes vacant space. |
THE INFORMATION IN THIS STRUCTURAL AND COLLATERAL TERM SHEET IS NOT COMPLETE AND MAY BE AMENDED PRIOR TO THE TIME OF SALE. THIS TERM SHEET IS NOT AN OFFER TO SELL THESE SECURITIES AND IT IS NOT A SOLICITATION OF AN OFFER TO BUY THESE SECURITIES IN ANY JURISDICTION WHERE THE OFFER OR SALE IS NOT PERMITTED.
| 88 |
| PATRICK HENRY MALL |
The following table presents historical occupancy percentages at the Patrick Henry Mall Mortgaged Property:
Historical Occupancy
12/31/2012(1) | 12/31/2013(1) | 12/31/2014(1) | 4/30/2015(2) | |||
| 97.8%(3) | 96.5%(3) | 97.4%(3) | 91.1%(3) |
| (1) | Information obtained from the borrower. |
| (2) | Information obtained from the underwritten rent roll. |
| (3) | The Patrick Henry Mall Property’s historical occupancy (inclusive of Macy’s and Dillard’s; not part of the collateral) was 98.7% for 2012, 97.9% for 2013, and 98.4% for 2014. The current occupancy inclusive of non-owned anchors is 94.6%. |
Operating History and Underwritten Net Cash Flow.The following table presents certain information relating to the historical operating performance and underwritten net cash flow at the Patrick Henry Mall Mortgaged Property:
Cash Flow Analysis
| 2013 | 2014 | TTM 4/30/2015 | U/W | % of U/W Effective Gross Income | U/W $ per SF | ||||||||
| Base Rent | $9,835,155 | $10,081,712 | $10,124,465 | $10,126,621(1) | 60.0% | $23.42 | |||||||
| Grossed Up Vacant Space | 0 | 0 | 0 | 1,557,166 | 9.2 | 3.60 | |||||||
| Percentage Rent | 498,222 | 459,048 | 494,219 | 361,568 | 2.1 | 0.84 | |||||||
| Total Reimbursables | 4,428,697 | 4,896,837 | 4,928,111 | 5,063,246 | 30.0 | 11.71 | |||||||
| Other Income | 1,526,971 | 1,451,412 | 1,402,693 | 1,402,693 | 8.3 | 3.24 | |||||||
| Less Vacancy & Credit Loss | (47,685) | (61,223) | (83,611) | (1,640,777)(2) | (9.7) | (3.79) | |||||||
| Effective Gross Income | $16,241,360 | $16,827,786 | $16,865,877 | $16,870,516 | 100.0% | $39.02 | |||||||
| Total Operating Expenses | $5,575,097 | $5,687,874 | $5,742,170 | $6,342,794 | 37.6% | $14.67 | |||||||
| Net Operating Income | $10,666,262 | $11,139,912 | $11,123,707 | $10,527,722 | 62.4% | $24.35 | |||||||
| TI/LC | 0 | 0 | 0 | 709,328 | 4.2 | 1.64 | |||||||
| Capital Expenditures | 0 | 0 | 0 | 293,750 | 1.7 | 0.68 | |||||||
| Net Cash Flow | $10,666,262 | $11,139,912 | $11,123,707 | $9,524,644 | 56.5% | $22.03 | |||||||
| NOI DSCR(3) | 1.86x | 1.94x | 1.94x | 1.83x | |||||||||
| NCF DSCR(3) | 1.86x | 1.94x | 1.94x | 1.66x | |||||||||
| NOI DY(3) | 11.1% | 11.6% | 11.6% | 11.0% | |||||||||
| NCF DY(3) | 11.1% | 11.6% | 11.6% | 10.0% |
| (1) | U/W Base Rent includes contractual rent steps through July 2016, totaling $118,986. |
| (2) | The underwritten economic vacancy is 13.3%. The Patrick Henry Mall Mortgaged Property was 91.1% physically occupied as of April 30, 2015. |
| (3) | The debt service coverage ratios and debt yields are based on the Patrick Henry Mall Loan Combination. |
Appraisal. As of the appraisal valuation date of April 24, 2015, the Patrick Henry Mall Mortgaged Property had an “as-is” appraised value of $155,000,000.
Environmental Matters.According to the Phase I environmental site assessment dated May 8, 2015, there was no evidence of any recognized environmental conditions at the Patrick Henry Mall Mortgaged Property.
Market Overview and Competition. The Patrick Henry Mall Property is located in Newport News, Virginia and is part of the Virginia Beach-Norfolk-Newport News metropolitan statistical area that is also referred to as Hampton Roads. As of 2014, Newport News was the fifth most populous city in Virginia with many local residents working in the government sector (including those employed by Newport News Shipbuilding, a joint U.S. Air Force – U.S. Army installation at Joint Base Langley–Eustis along with other military bases and suppliers). Newport News also serves as a junction between railroads from Richmond, Virginia and the Atlantic Ocean with the Newport News Marine Terminals located at the east end of the city. The city’s economy is very connected to the military and the location on the harbor and along James River facilitates a large boating industry, taking advantage of several miles of waterfront. As of 2015, the estimated population within a one-, three-, and five-mile radius of the Patrick Henry Mall Property was 10,917, 81,325 and 171,329, respectively. The estimated average household income within the same radii was $56,008, $57,027 and $60,369, respectively.
According to a third-party market research report, the Patrick Henry Mall Property is located within the Newport News/Hampton retail submarket of the Norfolk/Hampton Roads retail market. As of the first quarter of 2015, the submarket reported a total retail inventory of 5.1 million square feet with a 9.9% vacancy rate and average asking rents of $13.09 per square foot, on a triple-net basis.
THE INFORMATION IN THIS STRUCTURAL AND COLLATERAL TERM SHEET IS NOT COMPLETE AND MAY BE AMENDED PRIOR TO THE TIME OF SALE. THIS TERM SHEET IS NOT AN OFFER TO SELL THESE SECURITIES AND IT IS NOT A SOLICITATION OF AN OFFER TO BUY THESE SECURITIES IN ANY JURISDICTION WHERE THE OFFER OR SALE IS NOT PERMITTED.
| 89 |
| PATRICK HENRY MALL |
The following table presents certain information relating to comparable retail properties for the Patrick Henry Mall Property:
Competitive Set(1)
Patrick Henry (Subject) | Peninsula Town Center | MacArthur Center | The Gallery at Military Circle | Chesapeake Square | |
| Location | Newport News, VA | Hampton, VA | Norfolk, VA | Norfolk, VA | Chesapeake, VA |
| Distance from Subject | -- | 7.6 miles | 21.6 miles | 23.6 miles | 20.5 miles |
| Property Type | Regional Mall | Lifestyle Center | Super Regional Mall | Super Regional Mall | Super Regional Mall |
| Year Built/Renovated | 1988/2005 | 2010/NAV | 1999/NAV | 1969/1999 | 1989/1999 |
| Anchors | Dillard’s, Macy’s, J.C. Penney, Dick’s Sporting Goods | J.C. Penney, Macy’s, Cinema | Dillard’s, Nordstrom | Macy’s, Cinema | JC Penney, Macy’s, Sears, Target, Burlington Coat Factory |
| Total GLA | 432,401 SF | 736,027 SF | 936,273 SF | 1,016,656 SF | 792,428 SF |
| Total Occupancy | 91% | 97% | 96% | 81% | 87% |
| (1) | Information obtained from the appraisal and underwritten rent roll. |
The Borrower.The borrower is PR Patrick Henry LLC, a Delaware limited liability company and single purpose entity with two independent directors controlled by the principals of PREIT Associates, L.P. Legal counsel to the borrower delivered a non-consolidation opinion in connection with the origination of the Patrick Henry Mall Loan Combination. PREIT Associates, L.P. is the guarantor of certain nonrecourse carveouts under the Patrick Henry Mall Loan Combination.
The Sponsor.The sponsor is PREIT Associates, L.P., an entity that is 97% owned/controlled by Pennsylvania Real Estate Investment Trust (“PREIT”), which acts as the general partner, and 3% owned by other minority limited partners. PREIT, a Pennsylvania business trust, is a publicly traded real estate investment trust that was established in 1960 and is primarily engaged in the ownership, management, leasing, acquisition, redevelopment, development and disposition of shopping malls. As of December 31, 2014, the company owned interests in 42 retail properties, 32 of which are operating shopping malls.
Escrows.The loan documents do not require monthly escrows for real estate taxes, insurance premiums and capital expenditures as long as(i) no event of default has occurred and is continuing, and (ii) the Patrick Henry Mall Loan Combination debt service coverage ratio is greater than 1.25x. Upon the occurrence of the Patrick Henry Loan Combination debt service being less than or equal to 1.25x, the borrower will be required to make monthly deposits: (i) for the payment of real estate taxes, in an amount equal to one-twelfth of the annual amount of such taxes; (ii) for the payment of insurance premiums, in an amount equal to one-twelfth of the amount of the annual premiums due and payable; and (iii) for replacement reserves, an amount equal to $24,500 per month.
Lockbox and Cash Management.The Patrick Henry Mall Loan Combination requires a lender-controlled lockbox account, which is already in place, and that the borrower directs tenants to pay their rents directly into such lockbox account. The loan documents also require that all rents received by the borrower or property manager be deposited into the lockbox account within two business days of receipt. Prior to a Cash Management Period (as defined below), all funds are required to be distributed to the borrower. During a Cash Management Period, all excess funds are swept to a lender controlled cash management account.
A “Cash Management Period” will commence upon the earlier of (i) the occurrence and continuance of an event of default; or (ii) the Patrick Henry Mall Loan Combination debt service coverage ratio falling below 1.25x. A Cash Management Period will expire with regard to clause (i), upon the cure of such event of default; and with regard to clause (ii), upon the date that the Patrick Henry Mall Loan Combination debt service coverage ratio is equal to or greater than 1.25x for two consecutive calendar quarters.
Property Management. The Patrick Henry Mall Property is managed by an affiliate of the borrower.
Assumption.The borrower has the right to transfer the Patrick Henry Mall Mortgaged Property, provided that no event of default has occurred and is continuing and certain other conditions are satisfied, including, but not limited to the following: (i) the lender’s reasonable determination that the proposed transferee and guarantor satisfy the lender’s credit review and underwriting standards, taking into consideration the transferee’s experience, financial strength and general business standing; (ii) execution of a recourse guaranty and an environmental indemnity by an affiliate of the transferee; and (iii) if requested by the lender, rating agency confirmation from Fitch, Moody’s and Morningstar that the transfer will not result in a downgrade, withdrawal or qualification of the respective ratings assigned to the Series 2015-C31 Certificates and similar confirmations from each rating agency rating securities backed by a Patrick Henry Mall Companion Loan. Additionally, under the terms of the Patrick Henry Mall Loan Combination documents, the transferee is required to assume the borrower’s obligations and the execution of any required assignments or new financing statements as a condition to transfer.
Partial Release. Not permitted.
Real Estate Substitution.Not permitted.
Subordinate and Mezzanine Indebtedness. None.
Ground Lease.None.
THE INFORMATION IN THIS STRUCTURAL AND COLLATERAL TERM SHEET IS NOT COMPLETE AND MAY BE AMENDED PRIOR TO THE TIME OF SALE. THIS TERM SHEET IS NOT AN OFFER TO SELL THESE SECURITIES AND IT IS NOT A SOLICITATION OF AN OFFER TO BUY THESE SECURITIES IN ANY JURISDICTION WHERE THE OFFER OR SALE IS NOT PERMITTED.
| 90 |
| PATRICK HENRY MALL |
Terrorism Insurance.The loan documents require that the “all risk” insurance policy required to be maintained by the borrower provide coverage for terrorism in an amount equal to the full replacement cost of the Patrick Henry Mall Mortgaged Property. The loan documents also require business interruption insurance covering a period not less than 24 months and then a 180-day extended period of indemnity.
Windstorm Insurance.The loan documents require windstorm insurance covering the full replacement cost of the Patrick Henry Mall Mortgaged Property. At the time of loan closing, the Patrick Henry Mall Mortgaged Property had insurance for windstorms.
THE INFORMATION IN THIS STRUCTURAL AND COLLATERAL TERM SHEET IS NOT COMPLETE AND MAY BE AMENDED PRIOR TO THE TIME OF SALE. THIS TERM SHEET IS NOT AN OFFER TO SELL THESE SECURITIES AND IT IS NOT A SOLICITATION OF AN OFFER TO BUY THESE SECURITIES IN ANY JURISDICTION WHERE THE OFFER OR SALE IS NOT PERMITTED.
| 91 |
PHILADELPHIA DESIGN & DISTRIBUTION CENTER |

THE INFORMATION IN THIS STRUCTURAL AND COLLATERAL TERM SHEET IS NOT COMPLETE AND MAY BE AMENDED PRIOR TO THE TIME OF SALE. THIS TERM SHEET IS NOT AN OFFER TO SELL THESE SECURITIES AND IT IS NOT A SOLICITATION OF AN OFFER TO BUY THESE SECURITIES IN ANY JURISDICTION WHERE THE OFFER OR SALE IS NOT PERMITTED.
| 92 |
PHILADELPHIA DESIGN & DISTRIBUTION CENTER |

THE INFORMATION IN THIS STRUCTURAL AND COLLATERAL TERM SHEET IS NOT COMPLETE AND MAY BE AMENDED PRIOR TO THE TIME OF SALE. THIS TERM SHEET IS NOT AN OFFER TO SELL THESE SECURITIES AND IT IS NOT A SOLICITATION OF AN OFFER TO BUY THESE SECURITIES IN ANY JURISDICTION WHERE THE OFFER OR SALE IS NOT PERMITTED.
| 93 |
| No. 8 – Philadelphia Design & Distribution Center | |||||||
| Loan Information | Property Information | ||||||
| Mortgage Loan Seller: | Wells Fargo Bank, National Association | Single Asset/Portfolio: | Single Asset | ||||
Credit Assessment (Fitch/Moody’s/Morningstar): | NR/NR/NR | Property Type: | Mixed Use | ||||
| Original Principal Balance: | $26,000,000 | Specific Property Type: | Industrial/Office/Retail | ||||
| Cut-off Date Principal Balance: | $26,000,000 | Location: | Philadelphia, PA | ||||
| % of Initial Pool Balance: | 2.6% | Size: | 678,810 SF | ||||
| Loan Purpose: | Refinance | Cut-off Date Principal Balance Per SF: | $38.30 | ||||
| Borrower Names(1): | Various | Year Built/Renovated: | 1926/2006 | ||||
| Sponsors(2): | Various | Title Vesting: | Fee | ||||
| Mortgage Rate: | 4.300% | Property Manager: | Self-managed | ||||
| Note Date: | October 6, 2015 | 3rd Most Recent Occupancy (As of): | 95.0% (12/31/2013) | ||||
| Anticipated Repayment Date: | NAP | 2nd Most Recent Occupancy (As of): | 98.1% (12/31/2014) | ||||
| Maturity Date: | October 11, 2025 | Most Recent Occupancy (As of): | 94.6% (3/31/2015) | ||||
| IO Period: | 60 months | Current Occupancy (As of): | 87.0% (9/30/2015) | ||||
| Loan Term (Original): | 120 months | ||||||
| Seasoning: | 1 month | Underwriting and Financial Information: | |||||
| Amortization Term (Original): | 360 months | ||||||
| Loan Amortization Type: | Interest-only, Amortizing Balloon | 3rd Most Recent NOI (As of): | $3,403,489 (12/31/2013) | ||||
| Interest Accrual Method: | Actual/360 | 2nd Most Recent NOI (As of): | $3,498,745 (12/31/2014) | ||||
| Call Protection: | L(25),D(91),O(4) | Most Recent NOI (As of): | $3,273,065 (TTM 6/30/2015) | ||||
| Lockbox Type: | Springing | ||||||
| Additional Debt: | None | ||||||
| Additional Debt Type: | NAP | ||||||
| U/W Revenues: | $4,898,762 | ||||||
| U/W Expenses: | $1,793,302 | ||||||
| U/W NOI: | $3,105,460 | ||||||
| U/W NCF: | $2,674,646 | ||||||
| Escrows and Reserves(3): | U/W NOI DSCR: | 2.01x | |||||
| U/W NCF DSCR: | 1.73x | ||||||
| Type: | Initial | Monthly | Cap (If Any) | U/W NOI Debt Yield: | 11.9% | ||
| Taxes | $108,830 | $13,604 | NAP | U/W NCF Debt Yield: | 10.3% | ||
| Insurance | $36,534 | $12,178 | NAP | As-Is Appraised Value: | $37,000,000 | ||
| Replacement Reserves | $0 | $11,314 | NAP | As-Is Appraisal Valuation Date: | July 8, 2015 | ||
| TI/LC Reserve | $0 | $25,455 | $750,000 | Cut-off Date LTV Ratio: | 70.3% | ||
| Deferred Maintenance | $74,875 | $0 | NAP | LTV Ratio at Maturity or ARD: | 64.1% | ||
| (1) | See “The Borrowers” section. |
| (2) | See “The Sponsors” section. |
| (3) | See “Escrows” section. |
The Mortgage Loan. The mortgage loan (the “Philadelphia Design & Distribution Center Mortgage Loan”) is evidenced by a single promissory note that is secured by a first mortgage encumbering a mixed-use building located in Philadelphia, Pennsylvania (the “Philadelphia Design & Distribution Center Property”). The Philadelphia Design & Distribution Center Mortgage Loan was originated on October 6, 2015 by Wells Fargo Bank, National Association. The Philadelphia Design & Distribution Center Mortgage Loan had an original principal balance of $26,000,000, has an outstanding principal balance as of the Cut-off Date of $26,000,000 and accrues interest at an interest rate of 4.300%per annum. The Philadelphia Design & Distribution Center Mortgage Loan had an initial term of 120 months, has a remaining term of 119 months as of the Cut-off Date and requires interest-only payments for the first 60 payments following origination and, thereafter, requires payments of principal and interest based on a 30-year amortization schedule. The Philadelphia Design & Distribution Center Mortgage Loan matures on October 11, 2025.
Following the lockout period, the borrower has the right to defease the Philadelphia Design & Distribution Center Mortgage Loan in whole, but not in part, on any date before July 11, 2025. In addition, the Philadelphia Design & Distribution Center Mortgage Loan is prepayable without penalty on or after July 11, 2025.
THE INFORMATION IN THIS STRUCTURAL AND COLLATERAL TERM SHEET IS NOT COMPLETE AND MAY BE AMENDED PRIOR TO THE TIME OF SALE. THIS TERM SHEET IS NOT AN OFFER TO SELL THESE SECURITIES AND IT IS NOT A SOLICITATION OF AN OFFER TO BUY THESE SECURITIES IN ANY JURISDICTION WHERE THE OFFER OR SALE IS NOT PERMITTED.
| 94 |
PHILADELPHIA DESIGN & DISTRIBUTION CENTER |
Sources and Uses
| Sources | Uses | |||||||
| Original loan amount | $26,000,000 | 100.0% | Loan payoff(1) | $21,667,491 | 83.3% | |||
| Reserves | 220,239 | 0.8 | ||||||
| Closing costs | 260,138 | 1.0 | ||||||
| Return of equity | 3,852,132 | 14.8 | ||||||
| Total Sources | $26,000,000 | 100.0% | Total Uses | $26,000,000 | 100.0% | |||
| (1) | The Philadelphia Design & Distribution Center Property was previously securitized in the WBCMT 2006-C27 transaction. |
The Property.The Philadelphia Design & Distribution Center Property is a two-story, mixed-use industrial/office/retail building totaling 678,810 square feet and located in Philadelphia, Pennsylvania, approximately 6.7 miles north of the central business district. Constructed in 1926 and most recently renovated in 2006, the Philadelphia Design & Distribution Center Property contains approximately 313,476 square feet of industrial space (46.2% of net rentable area) and 364,934 square feet of office/retail space (53.8% of net rentable area). The Philadelphia Design & Distribution Center Property contains 436 surface parking spaces, resulting in a parking ratio of 0.6 spaces per 1,000 square feet of rentable area.
Tenants occupying approximately 65.4% of the net rentable area have been in occupancy at the Philadelphia Design & Distribution Center Property for at least 10 years, and tenants occupying approximately 41.1% of the net rentable area have been in occupancy for at least 15 years. Based on underwritten base rent, the three largest tenants at the Philadelphia Design & Distribution Center Property account for 50.8% of net rentable area and 54.0% of annual underwritten base rent and have been in occupancy on average for 16 years. The largest tenant at the Philadelphia Design & Distribution Center Property, Resources for Human Development (108,107 square feet; 15.9% of net rentable area), which houses its headquarters at the Philadelphia Design & Distribution Center Property, has been in occupancy since 1999 and has extended the term of its lease several times, most recently through September 2021. The second largest tenant, City of Philadelphia (184,128 square feet; 27.1% of net rentable area; rated A-/A2/A+ by Fitch/Moody’s/S&P), has been in occupancy at the Philadelphia Design & Distribution Center Property since 1995 and uses approximately 58.7% of the industrial space at the Philadelphia Design & Distribution Center Property to store voting machines and equipment. The third largest tenant, Northwestern Human Services (52,716 square feet; 7.8% of net rentable area) is a community-based, nonprofit, human services provider that is headquartered in Pennsylvania. As of September 30, 2015 the Philadelphia Design & Distribution Center Property was 87.0% occupied by 21 tenants. Since 2006, the Philadelphia Design & Distribution Center Property has maintained an average occupancy rate of 95.1%.
THE INFORMATION IN THIS STRUCTURAL AND COLLATERAL TERM SHEET IS NOT COMPLETE AND MAY BE AMENDED PRIOR TO THE TIME OF SALE. THIS TERM SHEET IS NOT AN OFFER TO SELL THESE SECURITIES AND IT IS NOT A SOLICITATION OF AN OFFER TO BUY THESE SECURITIES IN ANY JURISDICTION WHERE THE OFFER OR SALE IS NOT PERMITTED.
| 95 |
PHILADELPHIA DESIGN & DISTRIBUTION CENTER |
The following table presents certain information relating to the tenancy at the Philadelphia Design & Distribution Center Property:
Major Tenants
| Tenant Name | Credit Rating (Fitch/Moody’s/ S&P)(1) | Tenant NRSF | % of NRSF | Annual U/W Base Rent PSF(2) | Annual U/W Base Rent(2) | % of Total Annual U/W Base Rent | Lease Expiration Date |
| Major Tenants | |||||||
| Resources for Human Development | NR/NR/NR | 108,107 | 15.9% | $8.23(3) | $889,413 | 22.5% | Various(4)(5) |
| City of Philadelphia | A-/A2/A+ | 184,128 | 27.1% | $3.40 | $625,200 | 15.8% | 6/30/2016(6)(7) |
| Northwestern Human Services | NR/NR/NR | 52,716 | 7.8% | $11.79(8) | $621,576 | 15.7% | Various(9) |
| Wissahickon Charter School | NR/NR/NR | 53,889 | 7.9% | $8.69(10) | $468,395 | 11.8% | 7/31/2026(11) |
| GSA (U.S. Government) | AAA/Aaa/AA+ | 24,552 | 3.6% | $15.65(12) | $384,354 | 9.7% | 8/31/2016(13)(14) |
| Total Major Tenants | 423,392 | 62.4% | $7.06 | $2,988,938 | 75.5% | ||
| Non-Major Tenants | 167,499 | 24.7% | $5.78 | $968,368 | 24.5% | ||
| Occupied Collateral Total | 590,891 | 87.0% | $6.70 | $3,957,306 | 100.0% | ||
| Vacant Space | 87,919 | 13.0% | |||||
| Collateral Total | 678,810 | 100.0% | |||||
| (1) | Certain ratings are those of the parent company whether or not the parent company guarantees the lease. |
| (2) | Annual U/W Base Rent PSF and Annual U/W Base Rent includes contractual rent steps through June 30, 2016 totaling $27,936. |
| (3) | Resources for Human Development occupies space under 10 separate leases: 41,759 square feet of office space (6.2% of net rentable area; $11.18 per square foot); 2,940 square feet of office space (0.4% of net rentable area; $9.78 per square foot); 7,474 square feet of industrial space (1.1% of net rentable area; $6.91 per square foot); 23,783 square feet of industrial space (3.5% of net rentable area; $6.41 per square foot); 21,060 square feet of industrial space (3.1% of net rentable area; $6.18 per square foot); 2,200 square feet of industrial space (0.3% of net rentable area; $5.98 per square foot); and 8,306 square feet of industrial space (1.2% of net rentable area; $5.57 per square foot). |
| (4) | Resources for Human Development leases 107,522 square feet (15.8% of net rentable area) on leases that expire on September 30, 2021 and 585 square feet (0.1% of net rentable area) on a lease that expires on September 30, 2016. No base rent was underwritten for the 585 square foot space. |
| (5) | Resources for Human Development has three 5-year renewal options. |
| (6) | City of Philadelphia has two 1-year renewal options. |
| (7) | City of Philadelphia has the right to terminate its lease any time with 180 days’ prior written notice if the tenantobtains new voting machines which require less than approximately 184,128 square feet of space. |
| (8) | Northwestern Human Services occupies space under two separate leases: 38,916 square feet of office space (5.7% of net rentable area; $13.79 per square foot) and 13,800 square feet of industrial space (2.0% of net rentable area; $6.15 per square foot). |
| (9) | Northwestern Human Services leases 38,916 square feet (5.7% of net rentable area) on a lease that expires on April 30, 2019 and 13,800 square feet (2.0% of net rentable area) on a lease that expires on September 30, 2018. |
| (10) | Wissahickon Charter School occupies space under two separate leases: 34,491 square feet of office space (5.1% of net rentable area; $11.33 per square foot) and 19,398 square feet of industrial space (2.9% of net rentable area; $4.00 per square foot). |
| (11) | Wissahickon Charter School has one 5-year renewal option. |
| (12) | GSA (U.S. Government) occupies space under two separate leases; 11,557 square feet of office space (1.7% of net rentable area; $15.70 per square foot) and 12,995 square feet of office space (1.9% of net rentable area; $15.62 per square foot). |
| (13) | GSA (U.S. Government) has one 2-year renewal option. |
| (14) | GSA (U.S. Government) has the right to terminate its lease any time with 90 days’ prior written notice. |
THE INFORMATION IN THIS STRUCTURAL AND COLLATERAL TERM SHEET IS NOT COMPLETE AND MAY BE AMENDED PRIOR TO THE TIME OF SALE. THIS TERM SHEET IS NOT AN OFFER TO SELL THESE SECURITIES AND IT IS NOT A SOLICITATION OF AN OFFER TO BUY THESE SECURITIES IN ANY JURISDICTION WHERE THE OFFER OR SALE IS NOT PERMITTED.
| 96 |
PHILADELPHIA DESIGN & DISTRIBUTION CENTER |
The following table presents certain information relating to the lease rollover schedule at the Philadelphia Design & Distribution Center Property:
Lease Expiration Schedule(1)(2)(3)
| Year Ending December 31, | No. of Leases Expiring | Expiring NRSF | % of Total NRSF | Cumulative Expiring NRSF | Cumulative % of Total NRSF | Annual U/W Base Rent | Annual U/W Base Rent PSF(4) |
| MTM | 0 | 0 | 0.0% | 0 | 0.0% | $0 | $0.00 |
| 2015 | 0 | 0 | 0.0% | 0 | 0.0% | $0 | $0.00 |
| 2016 | 11 | 282,454 | 41.6% | 282,454 | 41.6% | $1,401,988 | $4.96 |
| 2017 | 3 | 21,895 | 3.2% | 304,349 | 44.8% | $119,796 | $5.47 |
| 2018 | 2 | 23,800 | 3.5% | 328,149 | 48.3% | $135,743 | $5.70 |
| 2019 | 3 | 80,921 | 11.9% | 409,070 | 60.3% | $739,768 | $9.14 |
| 2020 | 0 | 0 | 0.0% | 409,070 | 60.3% | $0 | $0.00 |
| 2021 | 14 | 127,932 | 18.8% | 537,002 | 79.1% | $1,091,616 | $8.53 |
| 2022 | 0 | 0 | 0.0% | 537,002 | 79.1% | $0 | $0.00 |
| 2023 | 0 | 0 | 0.0% | 537,002 | 79.1% | $0 | $0.00 |
| 2024 | 0 | 0 | 0.0% | 537,002 | 79.1% | $0 | $0.00 |
| 2025 | 0 | 0 | 0.0% | 537,002 | 79.1% | $0 | $0.00 |
| Thereafter | 2 | 53,889 | 7.9% | 590,891 | 87.0% | $468,395 | $8.69 |
| Vacant | 0 | 87,919 | 13.0% | 678,810 | 100.0% | $0 | $0.00 |
| Total/Weighted Average | 35(5) | 678,810 | 100.0% | $3,957,306 | $6.70 |
| (1) | Information obtained from the underwritten rent roll. |
| (2) | Certain tenants may have lease termination options that are exercisable prior to the originally stated expiration date of the subject lease and that are not considered in the Lease Expiration Schedule. |
| (3) | The table does not include roof space, an ATM, and a drop-box leased to FedEx, which have no leases in-place and no attributed square footage or underwritten base rent. |
| (4) | Weighted Average Annual U/W Base Rent PSF excludes vacant space. |
| (5) | The Philadelphia Design & Distribution Center Property is occupied by 21 tenants subject to 35 leases. |
The following table presents historical occupancy percentages at the Philadelphia Design & Distribution Center Property:
Historical Occupancy
12/31/2013(1) | 12/31/2014(1) | 3/31/2015(1) | 9/30/2015(2) | |||
| 95.0% | 98.1% | 94.6% | 87.0% |
| (1) | Information obtained from the borrower. |
| (2) | Information obtained from the underwritten rent roll. |
THE INFORMATION IN THIS STRUCTURAL AND COLLATERAL TERM SHEET IS NOT COMPLETE AND MAY BE AMENDED PRIOR TO THE TIME OF SALE. THIS TERM SHEET IS NOT AN OFFER TO SELL THESE SECURITIES AND IT IS NOT A SOLICITATION OF AN OFFER TO BUY THESE SECURITIES IN ANY JURISDICTION WHERE THE OFFER OR SALE IS NOT PERMITTED.
| 97 |
PHILADELPHIA DESIGN & DISTRIBUTION CENTER |
Operating History and Underwritten Net Cash Flow. The following table presents certain information relating to the historical operating performance and underwritten net cash flow at the Philadelphia Design & Distribution Center Property:
Cash Flow Analysis
| 2013 | 2014 | TTM 6/30/2015 | U/W | % of U/W Effective Gross Income | U/W $ per SF | |||||||||
| Base Rent | $4,271,352 | $4,159,909 | $4,167,799 | $3,957,306(1) | 80.8 | % | $5.83 | |||||||
| Grossed Up Vacant Space | 0 | 0 | 0 | 439,595 | 9.0 | 0.65 | ||||||||
| Total Reimbursables | 1,046,542 | 1,032,574 | 892,999 | 932,342 | 19.0 | 1.37 | ||||||||
| Other Income | 10,911 | 9,589 | 9,114 | 9,114 | 0.2 | 0.01 | ||||||||
| Less Vacancy & Credit Loss | 0 | 0 | 0 | (439,595)(2) | (9.0 | ) | (0.65) | |||||||
| Effective Gross Income | $5,328,805 | $5,202,073 | $5,069,912 | $4,898,762 | 100.0 | % | $7.22 | |||||||
| Total Operating Expenses | $1,925,316 | $1,703,327 | $1,796,847 | $1,793,302 | 36.6 | % | $2.64 | |||||||
|
|
|
|
|
| |||||||||
| Net Operating Income | $3,403,489 | $3,498,745 | $3,273,065 | $3,105,460 | 63.4 | % | $4.57 | |||||||
| TI/LC | 0 | 0 | 0 | 295,051 | 6.0 | 0.43 | ||||||||
| Capital Expenditures | 0 | 0 | 0 | 135,762 | 2.8 | 0.20 | ||||||||
| Net Cash Flow | $3,403,489 | $3,498,745 | $3,273,065 | $2,674,646 | 54.6 | % | $3.94 | |||||||
| NOI DSCR | 2.20x | 2.27x | 2.12x | 2.01x | ||||||||||
| NCF DSCR | 2.20x | 2.27x | 2.12x | 1.73x | ||||||||||
| NOI DY | 13.1% | 13.5% | 12.6% | 11.9% | ||||||||||
| NCF DY | 13.1% | 13.5% | 12.6% | 10.3% | ||||||||||
| (1) | Annual U/W Base Rent PSF and Annual U/W Base Rent include a contractual rent step through June 30, 2016 totaling $27,936. |
| (2) | The underwritten economic vacancy is 10.0%. The Philadelphia Design & Distribution Center Property was 87.0% physically occupied as of September 30, 2015. |
Appraisal.As of the appraisal valuation date of July 8, 2015, the Philadelphia Design & Distribution Center Property had an “as-is” appraised value of $37,000,000.
Environmental Matters.According to the Phase I environmental report dated July 7, 2015, there was no evidence of any recognized environmental conditions at the Philadelphia Design & Distribution Center Property.
Market Overview and Competition.The Philadelphia Design & Distribution Center Property is situated on a 19.9-acre site along the Roosevelt Expressway, approximately 5.6 miles north of downtown Philadelphia. The Philadelphia Design & Distribution Center Property is located on the border of the Nicetown and East Falls neighborhoods. Each neighborhood is a fully developed area within the City of Philadelphia with the Nicetown neighborhood dominated largely by industrial uses and the East Falls neighborhood consisting mainly of residential uses. According to the appraisal, there is little land available for additional industrial development in the immediate vicinity of the Philadelphia Design & Distribution Center Property, and acquiring land zoned for industrial uses has become increasingly difficult in both the city and surrounding metropolitan areas. The Philadelphia Design & Distribution Center Property’s location along the Roosevelt Expressway gives it convenient access to Interstate 76, which is the main thoroughfare for the area connecting North Philadelphia to downtown and westerly through Harrisburg to Pittsburg. The 2015 estimated population within a one-, three- and five-mile radius of the Philadelphia Design & Distribution Center Property was 35,094, 369,014 and 942,105, respectively, and the average estimated household income within the same radii was $45,504, $42,666 and $56,958, respectively.
According to a third party market research report, the Philadelphia Design & Distribution Center Property is located in the North Philadelphia submarket of the Philadelphia industrial market. As of the second quarter of 2015, the North Philadelphia submarket contained approximately 2.7 million square feet of industrial flex space with a 3.9% vacancy rate and average asking rent of $11.10 per square foot on a gross basis. For the same period, the North Philadelphia submarket contained 87.7 million square feet of total industrial space with an 11.1% vacancy rate and average asking rent of $3.98 per square foot on a gross basis. According to the same third party market research report, the Philadelphia Design & Distribution Center Property is located in the Northwest Philadelphia submarkets of the Philadelphia office and retail markets. As of the second quarter of 2015, the Northwest Philadelphia office submarket contained approximately 6.0 million square feet of office space with a 13.1% vacancy rate and average asking rent of $19.23 per square foot on a gross basis. For the same period, the North Philadelphia retail submarket contained 8.8 million square feet of total retail space with an 4.4% vacancy rate and average asking rent of $16.55 per square foot on a gross basis. Based on the mix of different spaces and components at the Philadelphia Design & Distribution Center Property, the appraiser concluded to an overall market occupancy of 92.0% and a blended market rate of $8.31 per square foot on a gross basis, implying that the blended underwritten base rent ($6.70 per square foot) is approximately 19.4% below the appraiser’s blended market rate.
THE INFORMATION IN THIS STRUCTURAL AND COLLATERAL TERM SHEET IS NOT COMPLETE AND MAY BE AMENDED PRIOR TO THE TIME OF SALE. THIS TERM SHEET IS NOT AN OFFER TO SELL THESE SECURITIES AND IT IS NOT A SOLICITATION OF AN OFFER TO BUY THESE SECURITIES IN ANY JURISDICTION WHERE THE OFFER OR SALE IS NOT PERMITTED.
| 98 |
PHILADELPHIA DESIGN & DISTRIBUTION CENTER |
The following table presents certain information relating to comparable office properties for the Philadelphia Design & Distribution Center Property:
Office Competitive Set(1)
Philadelphia (Subject) | 5548 Chestnut Street | 700 Cottman Avenue | 2010 Levick Street | 1163-65 S. Broad Street | |
| Location | Philadelphia, PA | Philadelphia, PA | Philadelphia, PA | Philadelphia, PA | Philadelphia, PA |
| Distance from Subject | -- | 6.7 miles | 7.7 miles | 6.6 miles | 8.4 miles |
| Property Type | Mixed Use(2) | Office | Office | Office | Office |
| Year Built/Renovated | 1926/2006 | 2006/NAV | 2009/NAV | 1990/NAV | 1995/NAV |
| Total GLA | 678,810 SF(2) | 46,000 SF | 20,000 SF | 9,5000 SF | 59,498 SF |
| Total Occupancy | 87% | 88% | 100% | 100% | 100% |
| (1) | Information obtained from the appraisal, underwritten rent roll, and a third party market research report. The appraisal did not include a competitive set; the properties shown were provided as rent comparables. |
| (2) | The Philadelphia Design & Distribution Center Property contains 313,476 square feet of industrial space and 364,934 square feet of office/retail space. |
The following table presents certain information relating to comparable industrial properties for the Philadelphia Design & Distribution Center Property:
Industrial Competitive Set(1)
Philadelphia (Subject) | 10814 Northeast Avenue | 5601 Tulip Street | 10980 Dutton Road | 12401 McNulty Road | |
| Location | Philadelphia, PA | Philadelphia, PA | Philadelphia, PA | Philadelphia, PA | Philadelphia, PA |
| Distance from Subject | -- | 13.1 miles | 7.7 miles | 14.0 miles | 14.5 miles |
| Property Type | Mixed Use(2) | Industrial | Industrial | Industrial | Industrial |
| Year Built/Renovated | 1926/2006 | 1983/NAV | 1922/NAV | 1970/NAV | 1988/NAV |
| Total GLA | 678,810 SF(2) | 217,000 SF | 136,337 SF | 12,000 SF | 229,755 SF |
| Total Occupancy | 87% | 86% | 100% | 100% | 100% |
| (1) | Information obtained from the appraisal, underwritten rent roll, and a third party market research report. The appraisal did not include a competitive set; the properties shown were provided as rent comparables. |
| (2) | The Philadelphia Design & Distribution Center Property contains 313,476 square feet of industrial space and 364,934 square feet of office/retail space. |
The Borrowers.The borrower structure is comprised of two tenants-in-common: Forty Seven Hundred LP (a Delaware limited partnership) and IMD Forty Seven Hundred LLC (a Delaware limited liability company), each of which is a single purpose entity with one independent director. Margaret Dolgin and Cindy Dolgin are the guarantors of certain nonrecourse carveouts under the Philadelphia Design & Distribution Center Mortgage Loan.
The Sponsors.The sponsors are Kalmon Dolgin, Neil Dolgin and Joshua M. Dolgin, principals of Kalmon Dolgin Affiliates, Inc. (“KDA”). KDA is a full-service commercial real estate firm specializing in asset and property management, development, construction, investment, and brokerage. Founded in 1904, the fourth-generation, New York-based company has a portfolio of approximately 4.5 million square feet of retail, office, and warehouse space located throughout the United States. Kalmon Dolgin, Neil Dolgin and Joshua M. Dolgin, principals of the sponsor, disclosed two prior deeds-in-lieu of foreclosure in 2010 and 2011. See “Description of the Mortgage Pool –Default History, Bankruptcy Issues and Other Proceedings” in the Free Writing Prospectus.
Escrows.The loan documents provide for upfront reserves in the amount of $108,830 for real estate taxes, $36,534 for insurance and $74,875 for deferred maintenance. The loan documents also provide for ongoing monthly escrows in the amount of $13,604 for real estate taxes, $12,178 for insurance premiums, $11,314 for replacement reserves and $25,445 for tenant improvements and leasing commissions (subject to a cap of $750,000 so long as no Cash Trap Event Period (see “Lockbox and Cash Management” section) exists).
Lockbox and Cash Management.Upon the occurrence and continuance of a Cash Trap Event Period (as defined below), the Philadelphia Design & Distribution Center Mortgage Loan requires the borrower to establish a lender-controlled lockbox account and
THE INFORMATION IN THIS STRUCTURAL AND COLLATERAL TERM SHEET IS NOT COMPLETE AND MAY BE AMENDED PRIOR TO THE TIME OF SALE. THIS TERM SHEET IS NOT AN OFFER TO SELL THESE SECURITIES AND IT IS NOT A SOLICITATION OF AN OFFER TO BUY THESE SECURITIES IN ANY JURISDICTION WHERE THE OFFER OR SALE IS NOT PERMITTED.
| 99 |
PHILADELPHIA DESIGN & DISTRIBUTION CENTER |
that the borrower and manager direct all rents to be deposited directly into such lockbox account. During a Cash Trap Event Period, all cash flow is swept to a lender-controlled cash management account.
A “Cash Trap Event Period” will commence upon (i) the occurrence and continuance of an event of default or (ii) the net cash flow debt yield falling below 8.0% at the end of any calendar month. A Cash Trap Event Period will end with respect to clause (i), upon the cure of such event of default; and with respect to clause (ii), upon the net cash flow debt yield being equal to or greater than 8.0% for two consecutive calendar quarters.
Property Management.The Philadelphia Design & Distribution Center Property is managed by an affiliate of the borrower.
Assumption. The borrower has a two-time right to transfer the Philadelphia Design & Distribution Center Property provided that certain conditions are satisfied, including (i) no event of default has occurred and is continuing; (ii) the lender has reasonably determined that the proposed transferee and guarantor satisfy the lender’s credit review and underwriting standards, taking into consideration transferee experience, financial strength and general business standing; and (iii) the lender has received confirmation from Fitch, Moody’s and Morningstar that such assumption will not result in a downgrade, withdrawal or qualification of the respective ratings assigned to the Series 2015-C31 Certificates.
Partial Release.Not permitted.
Real Estate Substitution.Not permitted.
Subordinate and Mezzanine Indebtedness.Not permitted.
Ground Lease. None
Terrorism Insurance.The loan documents require that the “all risk” insurance policy required to be maintained by the borrower provide coverage for terrorism in an amount equal to the full replacement cost of the Philadelphia Design & Distribution Center Property. The loan documents also require business interruption insurance covering no less than the 12-month period following the occurrence of a casualty event, together with a six-month extended period of indemnity.
THE INFORMATION IN THIS STRUCTURAL AND COLLATERAL TERM SHEET IS NOT COMPLETE AND MAY BE AMENDED PRIOR TO THE TIME OF SALE. THIS TERM SHEET IS NOT AN OFFER TO SELL THESE SECURITIES AND IT IS NOT A SOLICITATION OF AN OFFER TO BUY THESE SECURITIES IN ANY JURISDICTION WHERE THE OFFER OR SALE IS NOT PERMITTED.
| 100 |
(THIS PAGE INTENTIONALLY LEFT BLANK)
THE INFORMATION IN THIS STRUCTURAL AND COLLATERAL TERM SHEET IS NOT COMPLETE AND MAY BE AMENDED PRIOR TO THE TIME OF SALE. THIS TERM SHEET IS NOT AN OFFER TO SELL THESE SECURITIES AND IT IS NOT A SOLICITATION OF AN OFFER TO BUY THESE SECURITIES IN ANY JURISDICTION WHERE THE OFFER OR SALE IS NOT PERMITTED.
| 101 |
| WARREN INDUSTRIAL CENTER |

THE INFORMATION IN THIS STRUCTURAL AND COLLATERAL TERM SHEET IS NOT COMPLETE AND MAY BE AMENDED PRIOR TO THE TIME OF SALE. THIS TERM SHEET IS NOT AN OFFER TO SELL THESE SECURITIES AND IT IS NOT A SOLICITATION OF AN OFFER TO BUY THESE SECURITIES IN ANY JURISDICTION WHERE THE OFFER OR SALE IS NOT PERMITTED.
| 102 |
| WARREN INDUSTRIAL CENTER |
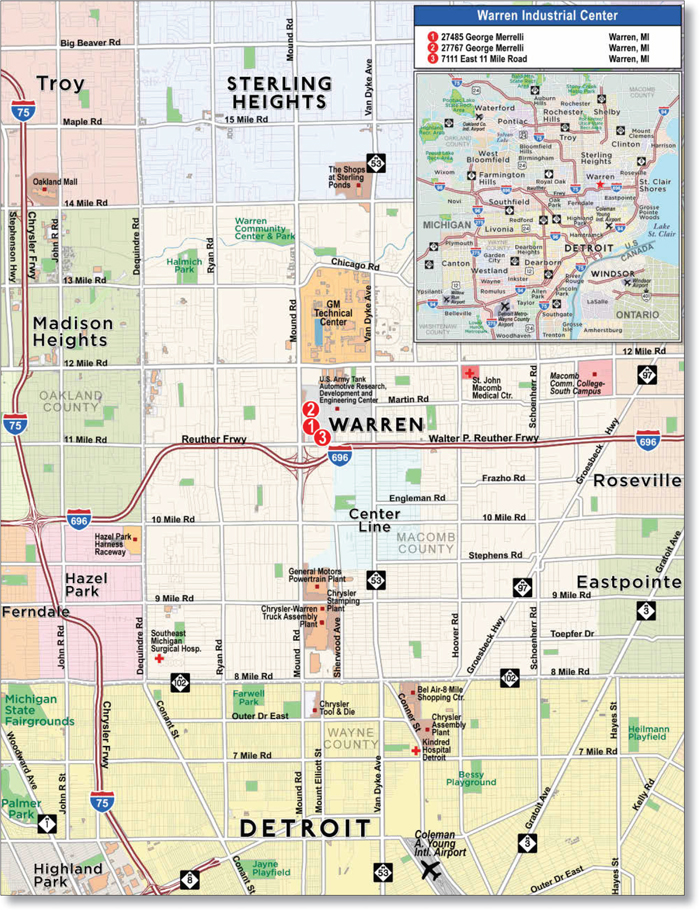
THE INFORMATION IN THIS STRUCTURAL AND COLLATERAL TERM SHEET IS NOT COMPLETE AND MAY BE AMENDED PRIOR TO THE TIME OF SALE. THIS TERM SHEET IS NOT AN OFFER TO SELL THESE SECURITIES AND IT IS NOT A SOLICITATION OF AN OFFER TO BUY THESE SECURITIES IN ANY JURISDICTION WHERE THE OFFER OR SALE IS NOT PERMITTED.
| 103 |
| No. 9 – Warren Industrial Center | ||||||
| Loan Information | Property Information | |||||
| Mortgage Loan Seller: | Basis Real Estate Capital II, LLC | Single Asset/Portfolio: | Portfolio | |||
Credit Assessment (Fitch/Moody’s/Morningstar): | NR/NR/NR | Property Type: | Industrial | |||
| Original Principal Balance: | $25,350,000 | Specific Property Type: | Flex | |||
| Cut-off Date Principal Balance: | $25,350,000 | Location: | Warren, MI | |||
| % of Initial Pool Balance: | 2.6% | Size: | 284,381 SF | |||
| Loan Purpose: | Refinance | Cut-off Date Principal Balance Per SF: | $89.14 | |||
| Borrower Name: | Warren Industrial Investors LLC | Year Built/Renovated: | Various – See Table | |||
| Sponsor: | Eric B. Larson | Title Vesting: | Fee | |||
| Mortgage Rate: | 4.750% | Property Manager: | Self-managed | |||
| Note Date: | October 8, 2015 | 3rd Most Recent Occupancy (As of): | 100.0% (12/31/2012) | |||
| Anticipated Repayment Date: | NAP | 2nd Most Recent Occupancy(As of): | 100.0% (12/31/2013) | |||
| Maturity Date: | November 1, 2025 | Most Recent Occupancy (As of): | 100.0% (12/31/2014) | |||
| IO Period: | None | Current Occupancy (As of): | 100.0% (11/1/2015) | |||
| Loan Term (Original): | 120 months | |||||
| Seasoning: | 0 months | Underwriting and Financial Information: | ||||
| Amortization Term (Original): | 360 months | |||||
| Loan Amortization Type: | Amortizing Balloon | 3rd Most Recent NOI (As of): | $3,125,158 (12/31/2012) | |||
| Interest Accrual Method: | Actual/360 | 2nd Most Recent NOI (As of): | $2,874,005 (12/31/2013) | |||
| Call Protection: | L(6);GRTR 2% or YM(112);O(2) | Most Recent NOI (As of): | $2,880,591 (12/31/2014) | |||
| Lockbox Type: | Hard/Springing Cash Management | |||||
| Additional Debt: | None | |||||
| Additional Debt Type: | NAP | U/W Revenues: | $3,110,022 | |||
| U/W Expenses: | $633,457 | |||||
| U/W NOI(2): | $2,476,564 | |||||
| U/W NCF: | $2,312,840 | |||||
| Escrows and Reserves(1): | U/W NOI DSCR: | 1.56x | ||||
| U/W NCF DSCR: | 1.46x | |||||
| Type: | Initial | Monthly | Cap (If Any) | U/W NOI Debt Yield: | 9.8% | |
| Taxes | $143,395 | $35,849 | NAP | U/W NCF Debt Yield: | 9.1% | |
| Insurance | $2,029 | $2,029 | NAP | As-Is Appraised Value(3): | $33,800,000 | |
| Replacement Reserves | $0 | $3,555 | NAP | As-Is Appraisal Valuation Date: | September 4, 2015 | |
| TI/LC Reserve | $500,000 | $10,201 | $500,000 | Cut-off Date LTV Ratio(3): | 75.0% | |
| Supplemental Rollover Reserve | $1,000,000 | NAP | NAP | LTV Ratio at Maturity or ARD(3): | 61.2% | |
| (1) | See “Escrows” section. |
| (2) | See “Cash Flow Analysis” section. |
| (3) | The As-Is Appraised Value of $33,800,000 assumes that the GM Purchase Option is exercised (see “Purchase Option” section). The appraisal also concluded to a market value of $36,650,000, assuming the GM Purchase Option is not exercised, and assuming a market value of $11,600,000 for the GM Building. Based on the $36,650,000 hypothetical appraised value, the Cut-off Date LTV Ratio and LTV Ratio at Maturity are 69.2% and 56.4%, respectively. |
The Mortgage Loan. The mortgage loan (the “Warren Industrial Center Mortgage Loan”) is evidenced by a single promissory note that is secured by a first mortgage encumbering a portfolio of three industrial properties located in Warren, Michigan (the “Warren Industrial Center Properties”). The Warren Industrial Center Mortgage Loan was originated on October 8, 2015 by Basis Real Estate Capital II, LLC. The Warren Industrial Center Mortgage Loan had an original principal balance of $25,350,000, has an outstanding principal balance as of the Cut-off Date of $25,350,000 and accrues interest at an interest rate of 4.750%per annum. The Warren Industrial Center Mortgage Loan had an initial term of 120 months, has a remaining term of 120 months as of the Cut-off Date and requires payments of principal and interest based on a 30-year amortization schedule. The Warren Industrial Center Mortgage Loan matures on November 1, 2025.
Following the lockout period, the borrower has the right to prepay the Warren Industrial Center Mortgage Loan in whole, or in part (see “Purchase Option” and “Partial Release” sections), provided that the borrower pays the greater of a yield maintenance premium or a prepayment premium equal to 2.0% of the principal amount being prepaid on any date before October 1, 2025. In addition, the Warren Industrial Center Mortgage Loan is prepayable without penalty on or after October 1, 2025.
THE INFORMATION IN THIS STRUCTURAL AND COLLATERAL TERM SHEET IS NOT COMPLETE AND MAY BE AMENDED PRIOR TO THE TIME OF SALE. THIS TERM SHEET IS NOT AN OFFER TO SELL THESE SECURITIES AND IT IS NOT A SOLICITATION OF AN OFFER TO BUY THESE SECURITIES IN ANY JURISDICTION WHERE THE OFFER OR SALE IS NOT PERMITTED.
| 104 |
| WARREN INDUSTRIAL CENTER |
Sources and Uses
| Sources | Uses | |||||||
| Original loan amount | $25,350,000 | 100.0% | Loan payoff | $22,258,223 | 87.8% | |||
| Closing costs | 970,253 | 3.8 | ||||||
| Reserves | 1,645,424 | 6.5 | ||||||
| Return of equity | 476,099 | 1.9 | ||||||
| Total Sources | $25,350,000 | 100.0% | Total Uses | $25,350,000 | 100.0% |
The Properties. The Warren Industrial Center Properties comprise three adjacent industrial warehouse/flex properties totaling 284,381 square feet located in Warren, Michigan, approximately 12.3 miles northeast of downtown Detroit. The Warren Industrial Center Properties are situated along George Merrelli Avenue, just north of I-696. The Warren Industrial Center Properties range in size from 54,830 square feet to 150,000 square feet with building clear heights ranging from 16 feet to 36 feet. Built between 1966 and 2006, the Warren Industrial Center Properties were 100.0% occupied as of November 1, 2015 by Detroit Testing Laboratory, Inc. (“Element-DTL”), Android Industries-Sterling Heights, L.L.C. (“Android”) and General Motors LLC (“GM”). The Warren Industrial Center Properties are located on part of the Detroit Arsenal Tank Plant (the “DATP”) redevelopment site that was used for tank production until 1982. A portion of the site is still used by the US Army Tank-automotive and Armaments Command and the balance was sold to the city of Warren and comprises the Arsenal Industrial District, a Renaissance Zone that originally provided tax incentives to the tenants.
The following table presents certain information relating to the Warren Industrial Center Properties:
| Property Name | Allocated Cut- off Date Principal Balance | % of Portfolio Cut-off Date Principal Balance | Current Occupancy | Year Built/ Renovated | Net Rentable Area (SF) | Appraised Value | Allocated Cut-off Date LTV | |||||||
| The Element Building | $9,027,580 | 35.6% | 100.0% | 2006/NAP | 79,551 | $13,000,000 | 69.4% | |||||||
| The Android Building | $8,367,870 | 33.0% | 100.0% | 2004/NAP | 150,000 | $12,050,000 | 69.4% | |||||||
| The GM Building(1) | $7,954,550 | 31.4% | 100.0% | 1966/2001 | 54,830 | $8,750,000 | 90.9% | |||||||
| Total/Weighted Average | $25,350,000 | 100.0% | 100.0% | 284,381 | $33,800,000(1) | 75.0%(1) |
| (1) | As of the appraisal valuation date of September 4, 2015, the Warren Industrial Center Properties had an aggregate “as-is” appraised value of $33,800,000, which assumes the GM Purchase Option (see “Purchase Option” section) is executed. The appraiser also concluded to an aggregate “as-is” appraised value of $36,650,000, which assumes that the GM Purchase Option is not executed. The Cut-off Date LTV Ratio for the Warren Industrial Center Mortgage Loan based on the $36,650,000 appraised value is 69.2%, which results in an LTV Ratio at Maturity of 56.4%. GM has not expressed interest in exercising the GM Purchase Option. |
27485 George Merrelli (the “Element Building”)
The Element Building is a one-story, class C, R&D and high-technology testing facility situated on a 6.0-acre parcel. Constructed in 2006 by the Warren Industrial Center Mortgage Loan sponsor as the headquarters for Element-DTL, the Element Building contains 79,551 square feet of net rentable area, which includes approximately 50.0% of net rentable area of finished office and lab space. Element-DTL uses the facility for vibration testing, electric and hybrid battery testing, calibration services, chemical and thermal analysis, electronics testing and other testing services. The Element Building is improved with full climate control, acoustical walls, reinforced floors, a floor drainage system and redundant power. Ceiling clear height in the warehouse area is 25 feet, and the Element Building includes an outdoor testing space. The Element Building contains 125 surface parking spaces, resulting in a parking ratio of 1.6 spaces per 1,000 square feet of rentable area. As of November 1, 2015, the Element Building was 100.0% occupied by Element-DTL.
27767 George Merrelli (the “Android Building”)
The Android Building is a two-story, class C, industrial building situated on an 8.3-acre parcel. Constructed in 2004 for Android by the Warren Industrial Center Mortgage Loan sponsor, the Android Building contains 150,000 square feet of net rentable area, which includes 15,000 square feet (10% of net rentable area) of finished office space, a clear height of 36 feet in the warehouse area and 24 truck wells and overhead doors. Android performs engine, tire and wheel assembly at the Android Building servicing both the Chrysler assembly plant in Sterling Heights (located 5.3 miles north of the Android Building) and the GM Hamtramck Assembly Center in Detroit (located 9.6 miles south of the Android Building). The Android Building features 220 surface parking spaces, resulting in a parking ratio of 1.5 spaces per 1,000 square feet of rentable area. As of November 1, 2015, the Android Building was 100.0% occupied by Android.
7111 East 11 Mile Road (the “GM Building”)
The GM Building is a one-story, class C, warehouse building situated on two parcels containing a total of 25.2 acres. Constructed in 1966 and renovated in 2001 by the Warren Industrial Center Mortgage Loan sponsor, the GM Building contains a total of 54,830 square feet of net rentable area, which includes approximately 9,321 square feet (17% of net rentable area) of finished office space and a clear height of 16 feet in the warehouse area. GM manages and services its entire corporate fleet, handles lease turn-ins and auctions vehicles from this location. The GM Building features 2,717 surface parking spaces, resulting in a parking ratio of 49.6 spaces per 1,000 square feet of rentable area. As of November 1, 2015, the GM Building was 100.0% occupied by GM.
THE INFORMATION IN THIS STRUCTURAL AND COLLATERAL TERM SHEET IS NOT COMPLETE AND MAY BE AMENDED PRIOR TO THE TIME OF SALE. THIS TERM SHEET IS NOT AN OFFER TO SELL THESE SECURITIES AND IT IS NOT A SOLICITATION OF AN OFFER TO BUY THESE SECURITIES IN ANY JURISDICTION WHERE THE OFFER OR SALE IS NOT PERMITTED.
| 105 |
| WARREN INDUSTRIAL CENTER |
The following table presents certain information relating to the tenancy at the Warren Industrial Center Properties:
Major Tenants
| Tenant Name | Credit Rating (Fitch/ Moody’s/ S&P) | Tenant NRSF | % of NRSF | Annual U/W Base Rent PSF | Annual U/W Base Rent | % of Total Annual U/W Base Rent | Lease Expiration Date | |||||||
| Major Tenants | ||||||||||||||
| Android Industries-Sterling Heights, L.L.C. | NR/NR/NR | 150,000 | 52.7% | $6.36 | $954,000 | 36.6% | 12/31/2019 | |||||||
| Detroit Testing Laboratory, Inc. | NR/NR/NR | 79,551 | 28.0% | $12.00 | $954,612 | 36.6% | 11/30/2016(1) | |||||||
| General Motors LLC | BBB-/Ba1/BBB- | 54,830 | 19.3% | $12.74 | $698,534 | 26.8% | 2/28/2017(2) | |||||||
| Occupied Collateral Total | 284,381 | 100.0% | $9.17 | $2,607,146 | 100.0% | |||||||||
| Vacant Space | 0 | 0.0% | ||||||||||||
| Collateral Total | 284,381 | 100.0% | ||||||||||||
| (1) | Detroit Testing Laboratory, Inc. (“Element-DTL”) has two remaining 5-year extension options; the first lease extension contains a rental rate of $14.00 per square foot increasing by $0.25 per square foot annually. As an incentive for Element-DTL to extend early, the sponsor has presented Element-DTL with three separate term and rental rate options all commencing at the current 11/30/2016 lease expiration: 1) a 5-year option at $13.00 per square foot with annual $0.25 per square foot increases; 2) a 10-year option at $12.75 per square foot with annual $0.25 per square foot increases; and 3) a 15-year option at $12.00 per square foot with annual $0.25 per square foot increases. The lender has underwritten the 15-year option rent starting at $12.00 per square foot, which is the mark down from the current rent of $13.20 per square foot. A lease extension is expected to be signed within the next month or two after the tenant receives Element-DTL board approval. |
| (2) | General Motors LLC has one remaining 5-year extension option. |
The following table presents certain information relating to the lease rollover schedule at the Warren Industrial Center Properties:
Lease Expiration Schedule(1)
Year Ending December 31, | No. of | Expiring NRSF | % of Total NRSF | Cumulative Expiring NRSF | Cumulative % of Total NRSF | Annual U/W Base Rent | Annual U/W | |||||||
| MTM | 0 | 0 | 0.0% | 0 | 0.0% | $0 | $0.00 | |||||||
| 2015 | 0 | 0 | 0.0% | 0 | 0.0% | $0 | $0.00 | |||||||
| 2016 | 1 | 79,551 | 28.0% | 79,551 | 28.0% | $954,612 | $12.00 | |||||||
| 2017 | 1 | 54,830 | 19.3% | 134,381 | 47.3% | $698,534 | $12.74 | |||||||
| 2018 | 0 | 0 | 0.0% | 134,381 | 47.3% | $0 | $0.00 | |||||||
| 2019 | 1 | 150,000 | 52.7% | 284,381 | 100.0% | $954,000 | $6.36 | |||||||
| 2020 | 0 | 0 | 0.0% | 284,381 | 100.0% | $0 | $0.00 | |||||||
| 2021 | 0 | 0 | 0.0% | 284,381 | 100.0% | $0 | $0.00 | |||||||
| 2022 | 0 | 0 | 0.0% | 284,381 | 100.0% | $0 | $0.00 | |||||||
| 2023 | 0 | 0 | 0.0% | 284,381 | 100.0% | $0 | $0.00 | |||||||
| 2024 | 0 | 0 | 0.0% | 284,381 | 100.0% | $0 | $0.00 | |||||||
| 2025 | 0 | 0 | 0.0% | 284,381 | 100.0% | $0 | $0.00 | |||||||
| Thereafter | 0 | 0 | 0.0% | 284,381 | 100.0% | $0 | $0.00 | |||||||
| Vacant | 0 | 0 | 0.0% | 284,381 | 100.0% | $0 | $0.00 | |||||||
| Total/Weighted Average | 3 | 284,381 | 100.0% | $2,607,146 | $9.17 |
| (1) | Information obtained from the underwritten rent roll. |
The following table presents historical occupancy percentages at the Warren Industrial Center Properties:
Historical Occupancy
12/31/2012(1) | 12/31/2013(1) | 12/31/2014(1) | 11/1/2015(2) | |||
| 100.0% | 100.0% | 100.0% | 100.0% |
| (1) | Information obtained from the leases. |
| (2) | Information obtained from the underwritten rent roll. |
THE INFORMATION IN THIS STRUCTURAL AND COLLATERAL TERM SHEET IS NOT COMPLETE AND MAY BE AMENDED PRIOR TO THE TIME OF SALE. THIS TERM SHEET IS NOT AN OFFER TO SELL THESE SECURITIES AND IT IS NOT A SOLICITATION OF AN OFFER TO BUY THESE SECURITIES IN ANY JURISDICTION WHERE THE OFFER OR SALE IS NOT PERMITTED.
| 106 |
| WARREN INDUSTRIAL CENTER |
Operating History and Underwritten Net Cash Flow. The following table presents certain information relating to the historical operating performance and underwritten net cash flow at the Warren Industrial Center Properties:
Cash Flow Analysis
| 2012 | 2013 | 2014 | U/W | % of U/W Effective Gross Income | U/W $ | ||||||||
| Base Rent | $3,096,425 | $2,921,441 | $2,838,408 | $2,607,146(1) | 83.8% | $9.17 | |||||||
| Grossed Up Vacant Space | 0 | 0 | 0 | 0 | 0.0 | 0.00 | |||||||
| Total Reimbursables | 275,392 | 302,934 | 466,362 | 441,057 | 14.2 | 1.55 | |||||||
| Other Income(2) | 206,354 | 210,208 | 216,770 | 225,504 | 7.3 | 0.79 | |||||||
| Less Vacancy & Credit Loss | 0 | 0 | 0 | ($163,685)(3) | (5.3) | (0.58) | |||||||
| Effective Gross Income | $3,578,172 | $3,434,582 | $3,521,541 | $3,110,022 | 100.0% | $10.94 | |||||||
| Total Operating Expenses | $453,014 | $560,577 | $640,950 | $633,457 | 20.4% | $2.23 | |||||||
| Net Operating Income | $3,125,158 | $2,874,005 | $2,880,591 | $2,476,564(1) | 79.6% | $8.71 | |||||||
| TI/LC | 0 | 0 | 0 | 121,067 | 3.9 | 0.43 | |||||||
| Capital Expenditures | 0 | 0 | 0 | 42,657 | 1.4 | 0.15 | |||||||
| Net Cash Flow | $3,125,158 | $2,874,005 | $2,880,591 | $2,312,840 | 74.4% | $8.13 | |||||||
| NOI DSCR | 1.97x | 1.81x | 1.82x | 1.56x | |||||||||
| NCF DSCR | 1.97x | 1.81x | 1.82x | 1.46x | |||||||||
| NOI DY | 12.3% | 11.3% | 11.4% | 9.8% | |||||||||
| NCF DY | 12.3% | 11.3% | 11.4% | 9.1% |
| (1) | U/W Base Rent and Net Operating Income are lower than historical Net Operating Income because the Android lease is structured with rent step-downs related to tenant improvement amortization. The final rent step-down occurs in January 2016, and the underwritten base rent for Android excludes the tenant improvement amortization premium. |
| (2) | Other Income is the in-place parking revenue per the GM lease. |
| (3) | The underwritten economic vacancy is 5.0%. The Warren Industrial Center Properties were 100.0% physically occupied as of November 1, 2015. |
Appraisal.As of the appraisal valuation date of September 4, 2015, the Warren Industrial Center Properties had an aggregate “as-is” appraised value of $33,800,000, which assumes the GM Purchase Option (see “Purchase Option” section) is executed. The appraiser also concluded to an aggregate “as-is” appraised value of $36,650,000, which assumes that the GM Purchase Option is not executed.
Environmental Matters. According to a Phase I environmental report dated September 14, 2015, there was no evidence of any recognized environmental conditions at the Warren Industrial Center Properties.
Market Overview.The Warren Industrial Center Properties are located in Warren, Michigan approximately 12.3 miles northeast of downtown Detroit and 29.8 miles southeast of the Detroit Metropolitan Wayne County Airport. Warren is located near the center of metropolitan Detroit, bisected by Interstate 696 and Van Dyke Road, with proximity to Interstate 75 (5.1 miles west) and Interstate 94 (6.3 miles east). The 2010 census places the city of Warren’s population at 134,056, making it the largest city in Macomb County, the third largest city in Michigan, and metropolitan Detroit’s largest suburb. The Detroit area and its immediate suburbs are also served by a square grid network of major arterial roads. Interstate 94 connects to Kings Highway 401, linking Detroit to Ontario, Canada, and providing highway access into southern Ontario cities. There are a number of single tenant users in the immediate area surrounding the Warren Industrial Center Properties including Sennett Steel, Macomb Community College (Technical Education Center), United Auto Workers Training Facility, Encore Capital Group, and Michigan DNR. The city of Warren serves as a key research and development hub for the automotive industry with the headquarter location for U.S. Manufacturing, along with other industrial/flex users, located immediately north of the Warren Industrial Center Properties. Approximately 1.6 miles north of the Warren Industrial Center Properties is the GM Tech Center which houses over 19,000 employees in engineering, design, research and development. Also nearby are the Chrysler Warren Truck Assembly Plant (Dodge City), the Sterling Heights Assembly and Stamping Plant, Detroit Axle, and the GM Powertrain plant.
According to a third-party market research report, as of the second quarter of 2015, the Detroit industrial market contained approximately 550.8 million square feet in 16,743 buildings and had a vacancy rate of 6.8%, with average asking rents of $4.97 per square foot, triple net. The Warren Industrial Center Properties are located in the West of Van Dyke/Macomb industrial submarket, which contains over 54.0 million square feet (approximately 10.0% of the Detroit industrial market) and is characterized as having little land available for development. As of the second quarter of 2015, the West of Van Dyke/Macomb industrial submarket had a vacancy rate of 2.0%, having absorbed more than 1.4 million square feet of space over the past three years, with positive net absorption in every year since 2009. The appraiser surveyed 16 comparable buildings and found that in-place lease rates at these properties ranged from $6.25 per square foot to $17.70 per square foot triple net and concluded that the lease rates at the Warren Industrial Center Properties are considered to be market based and supported.
THE INFORMATION IN THIS STRUCTURAL AND COLLATERAL TERM SHEET IS NOT COMPLETE AND MAY BE AMENDED PRIOR TO THE TIME OF SALE. THIS TERM SHEET IS NOT AN OFFER TO SELL THESE SECURITIES AND IT IS NOT A SOLICITATION OF AN OFFER TO BUY THESE SECURITIES IN ANY JURISDICTION WHERE THE OFFER OR SALE IS NOT PERMITTED.
| 107 |
| WARREN INDUSTRIAL CENTER |
The following table presents certain information relating to comparable multifamily properties for the Warren Industrial Center Properties:
Competitive Set(1)
| Warren Industrial Center | Patterson Dental | GKN Automotive | Huntsman International | Faurecia SA | GSA | ||
| Location | Warren, MI | Auburn Hills, MI | Auburn Hills, MI | Auburn Hills, MI | Auburn Hills, MI | Ann Arbor, MI | |
| Distance from Subject | -- | 23 miles | 21 miles | 19 miles | 21 miles | 47 miles | |
| Property Type | Industrial | Industrial | Industrial | Industrial | Industrial | Industrial | |
| Year Built/Renovated | Various/Various | 2006 | 2015 | 1999 | 2014 | 2008 | |
| Total SF | 284,381 | 19,509 | 178,000 | 94,000 | 278,000 | 53,000 | |
| Rent/SF | $9.17/Net | $10.03/Net | $11.90/Net | $12.87/Net | $11.37/Net | $17.70/Net | |
| Total Occupancy | 100% | 100% | 100% | 100% | 100% | 100% |
| (1) | Information obtained from the appraisal and underwritten rent roll. |
The Borrower. The borrower is Warren Industrial Investors LLC, a Delaware limited liability company and a single purpose entity, with one independent director. Legal counsel to the borrower delivered a non-consolidation opinion in connection with the origination of the Warren Industrial Center Mortgage Loan. The borrower is primarily owned by Lorenzo Cavaliere of Cavaliere Companies (16.2%), Eric Larson of Larson Realty Group (24.1% and managing member), and The Build Fund, a union pension investment fund (50.0%). Eric B. Larson and Fara H. Cavaleire are the guarantors of certain non-recourse carveouts under the Warren Industrial Center Mortgage Loan.
The Sponsor. The sponsor is Eric Larson, President and CEO of Larson Realty Group (“Larson”). Founded in 1999, Larson has developed, acquired or managed more than 2.1 million square feet of commercial real estate and has consulted on significant redevelopment projects in the City of Detroit and the City of Miami. Larson has developed and managed projects including the 760,000-square-foot Argonaut Building in Detroit and the approximately 493,000-square-foot 150 W. Jefferson building in Detroit. Larson currently owns eight office/mixed-use/industrial/retail properties in Michigan totaling approximately 560,000 square feet.
Escrows.The loan documents provide for upfront reserves in the amount of $143,395 for real estate taxes, $2,029 for insurance premiums, $500,000 for the tenant rollover reserve to be used for general re-tenanting costs and $1,000,000 for supplemental rollover reserves, to be used specifically for the lease renewals for Element-DTL and GM. The loan documents require monthly deposits of $35,849 for real estate taxes, $2,029 for insurance premiums, $3,555 for replacement reserves and $10,201 for tenant rollover reserves. Monthly tenant rollover reserves are subject to a cap of $500,000 but spring beyond the cap if there is an event of default or if the debt service coverage ratio is less than 1.20x.
Lockbox and Cash Management.The Warren Industrial Center Mortgage Loan requires a lender-controlled lockbox account, which is already in place, and that the borrower direct all tenants to deposit their rents directly into such lockbox account. The loan documents also require that all cash revenues and all other monies received by the borrower or manager relating to the Warren Industrial Center Properties be deposited into the lockbox account within two business days. Prior to the occurrence of a Trigger Event Period (as defined below) all funds on deposit in the lockbox account are disbursed to the borrower. Upon the occurrence of a Trigger Event Period, all funds in the lockbox account are swept to a lender-controlled sub-account.
A “Trigger Event Period” will commence upon the earlier of (i) an event of default; (ii) the debt service coverage ratio being less than 1.15x for two consecutive calendar quarters; or (iii) the occurrence of an Anchor Tenant Trigger Event (as defined below). A Trigger Event Period will end with respect to clause (i), upon the cure of such event of default; with regard to clause (ii), upon the date that the debt service coverage ratio is equal to or greater than 1.20x for two consecutive calendar quarters; and with respect to clause (iii), upon an Anchor Tenant Cure Event (as defined below).
An “Anchor Tenant Trigger Event” will commence upon the earlier of (i) a bankruptcy action with respect to an Anchor Tenant (as defined below); (ii) an Anchor Tenant defaulting (beyond applicable notice or cure periods) under its lease; (iii) an Anchor Tenant providing notice to terminate its lease or terminating its lease prior to the stated expiration date; or (iv) an Anchor Tenant failing to renew its lease prior to the stated expiration date; or, if the lease is silent, no later than 12 months prior to expiration, however this shall not include (1) the failure of Element-DTL to renew its lease for the period commencing on December 1, 2016 but shall include the failure of Element - DTL to renew for a term of at least five years for the period commencing December 1, 2021 and (2) the failure of GM to renew its lease for the period commencing March 1, 2017, but shall include the failure of GM to renew for a term of at least three years commencing after the expiration of the renewal period commencing March 1, 2020.
An “Anchor Tenant Cure Event” will occur with regard to clause (i), upon the Anchor Tenant no longer being insolvent or subject to bankruptcy proceedings, reaffirming its lease and paying full, unabated rent; with regard to clause (ii), upon the Anchor Tenant curing all defaults under its lease; with regard to clause (iii) upon the Anchor Tenant revoking or rescinding its notice of intent to terminate or its termination of its lease, and affirming that its lease is in full force and effect; and with regard to clause (iv), upon the Anchor Tenant renewing or extending its lease on terms acceptable to lender. In addition, an Anchor Tenant Trigger Event may be cured by the borrower leasing the entire applicable Anchor Tenant space to an acceptable replacement tenant on a lease acceptable to the lender and the replacement tenant is in occupancy, open for business and paying full, unabated rent.
“Anchor Tenant” means Element-DTL, Android, and GM, or any replacement of such tenants.
Property Management. The Warren Industrial Center Properties are managed by an affiliate of the borrower.
THE INFORMATION IN THIS STRUCTURAL AND COLLATERAL TERM SHEET IS NOT COMPLETE AND MAY BE AMENDED PRIOR TO THE TIME OF SALE. THIS TERM SHEET IS NOT AN OFFER TO SELL THESE SECURITIES AND IT IS NOT A SOLICITATION OF AN OFFER TO BUY THESE SECURITIES IN ANY JURISDICTION WHERE THE OFFER OR SALE IS NOT PERMITTED.
| 108 |
| WARREN INDUSTRIAL CENTER |
Assumption.The borrower has a one-time right to transfer the Warren Industrial Center Properties provided that no event of default has occurred and is continuing and certain other conditions are satisfied, including, but not limited to the following: (i) the lender’s reasonable determination that the proposed transferee and guarantor satisfy the lender’s credit review and underwriting standards taking into consideration the transferee’s experience, financial strength and general business standing; (ii) execution of a recourse guaranty and an environmental indemnity by an affiliate of the transferee; and (iii) if requested by the lender, rating agency confirmation from Fitch, Moody’s and Morningstar that the transfer will not result in a downgrade, withdrawal or qualification of the respective ratings assigned to the Series 2015-C31 Certificates.
Purchase Option.GM has the one-time right to purchase the GM Building for $8,750,000 at any time through February 2017. As of October 9, 2015 GM has not expressed interest in exercising the GM Purchase Option.
Partial Release.In the event GM exercises the GM Purchase Option, the borrower may obtain the release of the GM Building by paying down the loan in an amount equal to 110% of the allocated loan amount and further subject to the satisfaction of all other customary terms and conditions, including, without limitation, the following conditions: (i) no event of default beyond applicable notice and cure periods; (ii) the minimum debt yield on the remaining properties shall not be less than the greater of the debt yield as of the closing date, which is 9.1%, or the debt yield immediately prior to the release of the GM Building, (iii) the minimum debt service coverage ratio for the remaining properties shall not be less than the greater of the debt service coverage ratio as of the closing date, which is 1.46x, or the debt service coverage ratio immediately prior to the release of the GM Building; (iv) the loan-to-value ratio on the remaining properties shall be no greater than 75.0% and (v) confirmation by Moody’s, Fitch, and Morningstar that the release will not result in a downgrade, withdrawal or qualification of the respective ratings assigned to the Series 2015-C31 Certificates.
If on the date of the release of the GM Building the average unexpired remaining term of the leases in place for the remaining Warren Industrial Center Properties is less than five years, or, if on the release of the GM Building, the borrower is unable to satisfy the minimum debt yield and debt service ratio requirements as outlined above, the lender may condition the release of the GM Building upon the borrower entering into a master lease of the Warren Industrial Center Properties as tenant for a term of at least five years from the date of the release of the GM Building at a rent equal to the rent then payable under the remaining leases or such greater amount as is necessary to satisfy the minimum debt yield and debt service ratio requirements, as outlined above.
Real Estate Substitution.Not Permitted.
Subordinate and Mezzanine Indebtedness.Not Permitted.
Ground Lease.None.
Terrorism Insurance.The loan documents provide that the required “all risk” insurance policy must include coverage for terrorism in an amount equal to the full replacement cost of the Warren Industrial Center Properties, as well as business interruption insurance for an unlimited number of months based on actual losses sustained.
THE INFORMATION IN THIS STRUCTURAL AND COLLATERAL TERM SHEET IS NOT COMPLETE AND MAY BE AMENDED PRIOR TO THE TIME OF SALE. THIS TERM SHEET IS NOT AN OFFER TO SELL THESE SECURITIES AND IT IS NOT A SOLICITATION OF AN OFFER TO BUY THESE SECURITIES IN ANY JURISDICTION WHERE THE OFFER OR SALE IS NOT PERMITTED.
| 109 |
BROOKS LANDING APARTMENTS |
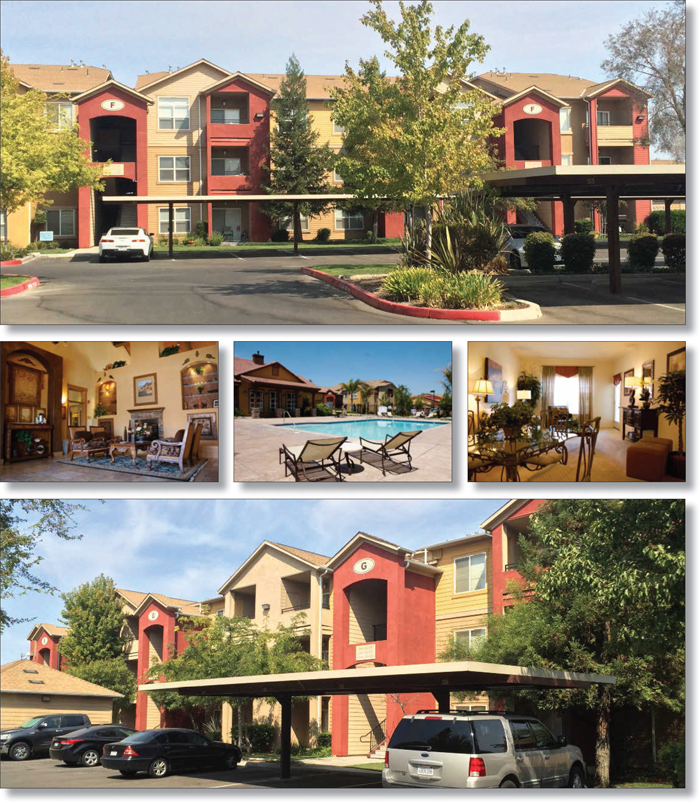
THE INFORMATION IN THIS STRUCTURAL AND COLLATERAL TERM SHEET IS NOT COMPLETE AND MAY BE AMENDED PRIOR TO THE TIME OF SALE. THIS TERM SHEET IS NOT AN OFFER TO SELL THESE SECURITIES AND IT IS NOT A SOLICITATION OF AN OFFER TO BUY THESE SECURITIES IN ANY JURISDICTION WHERE THE OFFER OR SALE IS NOT PERMITTED.
| 110 |
BROOKS LANDING APARTMENTS |
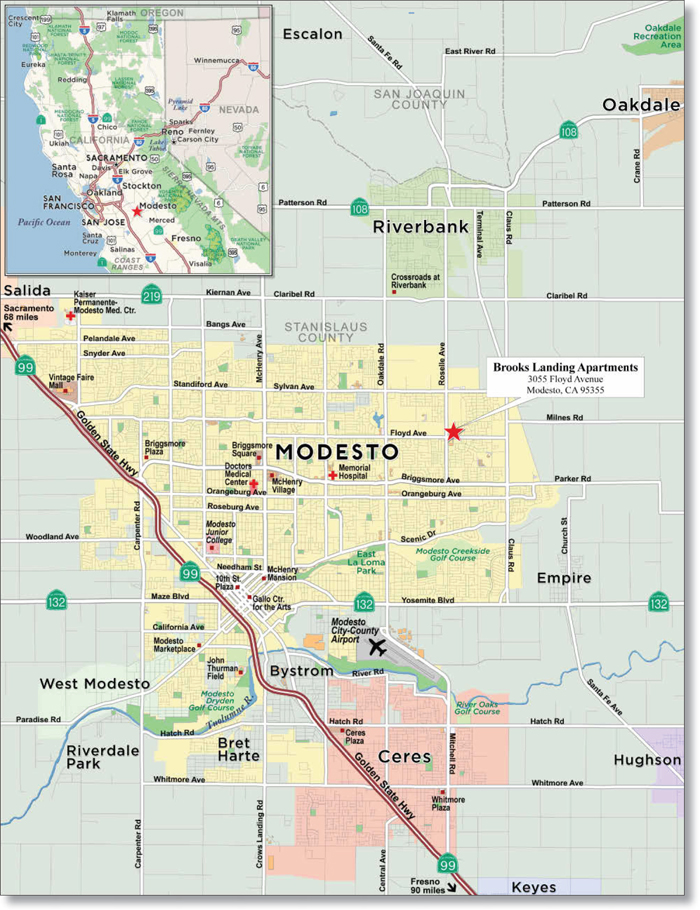
THE INFORMATION IN THIS STRUCTURAL AND COLLATERAL TERM SHEET IS NOT COMPLETE AND MAY BE AMENDED PRIOR TO THE TIME OF SALE. THIS TERM SHEET IS NOT AN OFFER TO SELL THESE SECURITIES AND IT IS NOT A SOLICITATION OF AN OFFER TO BUY THESE SECURITIES IN ANY JURISDICTION WHERE THE OFFER OR SALE IS NOT PERMITTED.
| 111 |
| No. 10 – Brooks Landing Apartments | ||||||||
| Loan Information | Property Information | |||||||
| Mortgage Loan Seller: | Rialto Mortgage Finance, LLC | Single Asset/Portfolio: | Single Asset | |||||
| Credit Assessment (Fitch/Moody’s/Morningstar): | NR/NR/NR | Property Type: | Multifamily | |||||
| Original Principal Balance: | $24,500,000 | Specific Property Type: | Garden | |||||
| Cut-off Date Principal Balance: | $24,500,000 | Location: | Modesto, CA | |||||
| % of Initial Pool Balance: | 2.5% | Size: | 232 Units | |||||
| Loan Purpose: | Refinance | Cut-off Date Principal Balance Per Unit: | $105,603 | |||||
| Borrower Name: | Brooks Landing California Partners, LLC | Year Built/Renovated: | 2005/NAP | |||||
| Sponsors: | Jon Wood and Roger Kuula | Title Vesting: | Fee | |||||
| Mortgage Rate: | 4.600% | Property Manager: | Self-managed | |||||
| Note Date: | September 28, 2015 | 3rdMost Recent Occupancy (As of): | 91.5% (12/31/2012) | |||||
| Anticipated Repayment Date: | NAP | 2ndMost Recent Occupancy (As of): | 94.4% (12/31/2013) | |||||
| Maturity Date: | October 6, 2025 | Most Recent Occupancy (As of): | 96.6% (12/31/2014) | |||||
| IO Period: | 120 months | Current Occupancy (As of): | 97.8% (9/9/2015) | |||||
| Loan Term (Original): | 120 months | |||||||
| Seasoning: | 1 month | Underwriting and Financial Information: | ||||||
| Amortization Term (Original): | NAP | |||||||
| Loan Amortization Type: | Interest-only, Balloon | 3rd Most Recent NOI (As of): | $1,641,785 (12/31/2013) | |||||
| Interest Accrual Method: | Actual/360 | 2nd Most Recent NOI (As of): | $1,822,938 (12/31/2014) | |||||
| Call Protection: | L(25),D(91),O(4) | Most Recent NOI (As of): | $2,013,424 (TTM 9/30/2015) | |||||
| Lockbox Type: | Springing | |||||||
| Additional Debt: | None | U/W Revenues: | $3,391,806 | |||||
| Additional Debt Type: | NAP | U/W Expenses: | $1,257,027 | |||||
| U/W NOI: | $2,134,778 | |||||||
| U/W NCF: | $2,076,778 | |||||||
| U/W NOI DSCR: | 1.86x | |||||||
| Escrows and Reserves(1): | U/W NCF DSCR: | 1.81x | ||||||
| U/W NOI Debt Yield: | 8.7% | |||||||
| U/W NCF Debt Yield: | 8.5% | |||||||
| Type: | Initial | Monthly | Cap (If Any) | As-Is Appraised Value: | $35,900,000 | |||
| Taxes | $256,792 | $34,938 | NAP | As-Is Appraisal Valuation Date: | June 17, 2015 | |||
| Insurance | $48,220 | $4,018 | NAP | Cut-off Date LTV Ratio: | 68.2% | |||
| Replacement Reserves | $0 | $4,833 | NAP | LTV Ratio at Maturity or ARD: | 68.2% | |||
| (1) | See “Escrows” section. |
The Mortgage Loan. The mortgage loan (the “Brooks Landing Apartments Mortgage Loan”) is evidenced by a single promissory note that is secured by a first mortgage encumbering a garden-style multifamily property located in Modesto, California (the “Brooks Landing Apartments Property”). The Brooks Landing Apartments Mortgage Loan was originated on September 28, 2015 by Rialto Mortgage Finance, LLC. The Brooks Landing Apartments Mortgage Loan had an original principal balance of $24,500,000, has an outstanding principal balance as of the Cut-off Date of $24,500,000 and accrues interest at an interest rate of 4.600%per annum. The Brooks Landing Apartments Mortgage Loan had an initial term of 120 months, has a remaining term of 119 months as of the Cut-off Date and requires interest-only payments through the term of the Brooks Landing Apartments Mortgage Loan. The Brooks Landing Apartments Mortgage Loan matures on October 6, 2025.
Following the lockout period, the borrower has the right to defease the Brooks Landing Apartments Mortgage Loan in whole, but not in part, on any date before July 6, 2025. In addition, the Brooks Landing Apartments Loan is prepayable without penalty on or after July 6, 2025.
Sources and Uses
| Sources | Uses | |||||||
| Original loan amount | $24,500,000 | 100.0% | Loan payoff(1) | $22,934,216 | 93.6% | |||
| Reserves | 305,012 | 1.2 | ||||||
| Closing costs | 568,380 | 2.3 | ||||||
| Return of equity | 692,192 | 2.8 | ||||||
| Total Sources | $24,500,000 | 100.0% | Total Uses | $24,500,000 | 100.0% |
(1) The Brooks Landing Apartments Property was previously securitized in the BACM 2007-1 transaction.
THE INFORMATION IN THIS STRUCTURAL AND COLLATERAL TERM SHEET IS NOT COMPLETE AND MAY BE AMENDED PRIOR TO THE TIME OF SALE. THIS TERM SHEET IS NOT AN OFFER TO SELL THESE SECURITIES AND IT IS NOT A SOLICITATION OF AN OFFER TO BUY THESE SECURITIES IN ANY JURISDICTION WHERE THE OFFER OR SALE IS NOT PERMITTED.
| 112 |
BROOKS LANDING APARTMENTS |
The Property.The Brooks Landing Apartments Property is a garden-style multifamily property comprised of 232 units in eight, two- and three-story buildings located in Modesto, California. Constructed in 2005, the Brooks Landing Apartments Property is situated on a 9.4-acre site. Community amenities include controlled access gates, an outdoor swimming pool/spa, and a clubhouse with business center, game room, movie theatre, billiards table and fitness center. Unit amenities include fully-equipped kitchens, tile flooring, walk-in closets and balconies. The borrower reported capital expenditures totaling approximately $285,000 since 2012, which included various updates and repairs to unit interiors, HVAC system, parking lot, signage and roofs. The Brooks Landing Apartments Property contains 290 surface parking spaces, reflecting a parking ratio of 1.3 spaces per unit. As of September 9, 2015, the Brooks Landing Apartments Property was 97.8% occupied.
The following table presents certain information relating to the unit mix of the Brooks Landing Apartments Property:
Apartment Unit Summary(1)
| Unit Type | No. of Units | % of Total Units | Average Unit Size (SF) | Average U/W Monthly Rent per Unit |
| 1 Bedroom / 1 Bath | 68 | 29.3% | 786 | $1,071 |
| 2 Bedroom / 1 Bath | 48 | 20.7% | 999 | $1,150 |
| 2 Bedroom / 2 Bath | 116 | 50.0% | 1,064 | $1,215 |
| Total/Weighted Average | 232 | 100.0% | 969 | $1,159 |
| (1) | Information obtained from the underwritten rent roll. |
The following table presents historical occupancy percentages at the Brooks Landing Apartments Property:
Historical Occupancy
12/31/2012(1) | 12/31/2013(1) | 12/31/2014(1) | 9/9/2015(2) | |||
| 91.5% | 94.4% | 96.6% | 97.8% |
| (1) | Information obtained from the borrower. |
| (2) | Information obtained from the underwritten rent roll. |
Operating History and Underwritten Net Cash Flow.The following table presents certain information relating to the historical operating performance and underwritten net cash flow at the Brooks Landing Apartments Property:
Cash Flow Analysis
| 2013 | 2014 | TTM 9/30/2015 | U/W | % of UW Total Effective Gross Income | U/W $ per Unit | ||||||||||||||
| Base Rent | $2,731,296 | $2,882,279 | $3,064,330 | $3,156,228 | 93.1 | % | $13,604 | ||||||||||||
| Grossed Up Vacant Space | 0 | 0 | 0 | 70,320 | 2.1 | 303 | |||||||||||||
| Concessions | 0 | 0 | 0 | 0 | 0.0 | 0 | |||||||||||||
| Other Income(1) | 319,055 | 307,561 | 326,588 | 325,921 | 9.6 | 1,405 | |||||||||||||
| Less Vacancy & Credit Loss | (223,176 | ) | (153,367 | ) | (135,828 | ) | (160,663 | )(2) | (4.7 | ) | (693 | ) | |||||||
| Effective Gross Income | $2,827,175 | $3,036,473 | $3,255,090 | $3,391,806 | 100.0 | % | $14,620 | ||||||||||||
| Total Operating Expenses | $1,185,390 | $1,213,535 | $1,241,666 | $1,257,027 | 37.1 | $5,418 | |||||||||||||
| Net Operating Income | $1,641,785 | $1,822,938 | $2,013,424 | $2,134,778 | 62.9 | % | $9,202 | ||||||||||||
| Capital Expenditures | 57,996 | 58,000 | 57,997 | 58,000 | 1.7 | 250 | |||||||||||||
| Net Cash Flow | $1,583,789 | $1,764,938 | $1,955,427 | $2,076,778 | 61.2 | % | $8,952 | ||||||||||||
| NOI DSCR | 1.43 | x | 1.59 | x | 1.76 | x | 1.86 | x | |||||||||||
| NCF DSCR | 1.38 | x | 1.54 | x | 1.71 | x | 1.81 | x | |||||||||||
| NOI DY | 6.7 | % | 7.4 | % | 8.2 | % | 8.7 | % | |||||||||||
| NCF DY | 6.5 | % | 7.2 | % | 8.0 | % | 8.5 | % | |||||||||||
| (1) | Other Income includes RUBS, parking and other income. |
| (2) | The underwritten economic vacancy is 5.0%. The Brooks Landing Apartments Property was 97.8% physically occupied as of September 9, 2015. |
Appraisal.As of the appraisal valuation date of June 17, 2015, the Brooks Landing Apartments Property had an “as-is” appraised value of $35,900,000.
Environmental Matters.According to a Phase I environmental assessment dated June 29, 2015, there was no evidence of any recognized environmental conditions at the Brooks Landing Apartments Property.
THE INFORMATION IN THIS STRUCTURAL AND COLLATERAL TERM SHEET IS NOT COMPLETE AND MAY BE AMENDED PRIOR TO THE TIME OF SALE. THIS TERM SHEET IS NOT AN OFFER TO SELL THESE SECURITIES AND IT IS NOT A SOLICITATION OF AN OFFER TO BUY THESE SECURITIES IN ANY JURISDICTION WHERE THE OFFER OR SALE IS NOT PERMITTED.
| 113 |
BROOKS LANDING APARTMENTS |
Market Overview and Competition.The Brooks Landing Apartments Property is located in Modesto, California, approximately 79.0 miles south of Sacramento and 92.0 miles east of San Francisco. The Brooks Landing Apartments Property is situated within the Modesto metropolitan statistical area and the San Joaquin Valley, one of the nation’s largest agricultural areas.Major economic demand drivers for the Modesto metropolitan statistical area include agriculture, healthcare/education and tourism. Healthcare and educational institutions represent the majority of the top employers in the Modesto metropolitan statistical area, including Modesto City Schools, Memorial Medical Center, Doctors Medical Center, Modesto Junior College, Sutter Gould Medical Foundation, MedAmerica, Sylvan School District and Kaiser Permanente. Primary regional access to the area is provided by State Route 108 (McHenry Avenue), State Route 132 (Yosemite Boulevard), and Highway 99, all of which connect in downtown Modesto, approximately 6.1 miles southwest of the Brooks Landing Apartments Property. The neighborhood surrounding the Brooks Landing Apartments Property is developed with residential, commercial and institutional properties. Approximately 4.0 miles west of the Brooks Landing Apartments Property is a major retail corridor along State Route 108 which includes Wal-Mart, Hobby Lobby, Burlington Coat Factory, Target and Marshalls. Residential properties in the neighborhood are primarily located along secondary streets and include single-family and multifamily uses. The 2015 estimated population within a one-, three-, and five-mile radius of the Brooks Landing Apartments Property was 12,756, 77,473 and 189,404, respectively, and the estimated average household income within the same radii was $84,859, $70,673, and $65,639, respectively.
According to a third party market research report, the Brooks Landing Apartments Property is located in the Modesto MSA multifamily market, which reported a 1.5% vacant rate as of the first quarter of 2015. The appraiser identified a competitive set totaling 4,923 units with a 3.6% vacancy rate and an average rental rate of $995 per unit.
The following table presents certain information relating to some comparable multifamily properties for the Brooks Landing Apartments Property:
Competitive Set(1)
| Brooks Landing Apartments (Subject) | Live Oak Apartments | The Villas at Villagio | Valley Oak Apartments | Meadow Lake Apartments | Crown Ridge Apartments | Park Lakewood Apartments | |
| Location | Modesto | Modesto | Modesto | Modesto | Modesto | Modesto | Modesto |
| Distance to Subject | -- | 1.5 miles | 0.2 miles | 1.3 miles | 1.0 miles | 2.5 miles | 1.0 miles |
| Property Type | Garden | Garden | Garden | Garden | Garden | Walk-Up | Garden |
| Number of Units | 232 | 328 | 240 | 208 | 196 | 184 | 126 |
| Average Rent (per unit) | |||||||
| 1BR | $1,071 | $814 | $1,130 | $939 | $770 | $860 | $820 |
| 2BR | $1,150-$1,240 | $949 | $1,330 | $1,074 | $850-$935 | $990-$1,000 | $1,000-$1,035 |
| 3BR | NAP | NAP | $1,482 | NAP | NAP | $1,175 | NAP |
| Total Occupancy | 98% | 97% | 95% | 97% | 96% | 97% | 96% |
| (1) | Information obtained from the appraisal and underwritten rent roll. |
The Borrower.The borrower is Brooks Landing California Partners, LLC, a single purpose entity with one independent director. Legal counsel to the borrower delivered a non-consolidation opinion in connection with the origination of the Brooks Landing Apartments Mortgage Loan. Roger Kuula and Jon Wood are the guarantors of certain nonrecourse carveouts under the Brooks Landing Apartments Mortgage Loan.
The Sponsors.The sponsors, Roger Kuula and Jon Wood, are co-founders of American Capital Group (“ACG”). ACG is a privately-held commercial real estate developer and home builder established in 1986. ACG is headquartered in Bellevue, Washington and operates regional offices in Sacramento, California and Scottsdale, Arizona. ACG has developed and currently maintains a portfolio of 74 multifamily properties totaling approximately 11,926 units located throughout 10 western states. Mr. Kuula serves as Chairman and Chief Executive Officer of ACG. Mr. Wood is responsible for ACG’s finance, acquisition, development and sales. See “Description of the Mortgage Pool – Default History, Bankruptcy Issues and Other Proceedings” in the Free Writing Prospectus.
Escrows.The loan documents provided for upfront reserves in the amount of $256,792 for real estate taxes and $48,220 for insurance premiums. The loan documents also provide for ongoing monthly reserves in the amount of $34,938 for real estate taxes, $4,018 for insurance premiums and $4,833 for replacement reserves.
Lockbox and Cash Management.Upon the occurrence and continuance of a Cash Management Trigger Event (as defined below) the Brooks Landing Apartments Mortgage Loan requires the borrower to establish a lender-controlled lockbox account. The loan documents also require upon a Cash Management Trigger Event that all revenues received by the borrower or the property manager be deposited into the lockbox account within five business days of receipt. Other than during a Cash Sweep Event (as defined below), all excess funds on deposit are disbursed to the borrower.
A “Cash Management Trigger Event” will commence upon the occurrence of (i) an event of default; or (ii) any bankruptcy action of the borrower, guarantor or the property manager. A Cash Management Trigger Event will end with respect to clause (i), when such event of default has been cured; and with respect to clause (ii), when such bankruptcy petition has been discharged, stayed, or dismissed within 30 days for borrower or guarantor and 120 days for the property manager, among other conditions. Clause (ii) may also be cured by the borrower replacing the property manager with a qualified manager acceptable to the lender.
A “Cash Sweep Event” will commence upon the occurrence of (i) an event of default; or (ii) any bankruptcy action of the borrower, guarantor, or the property manager. A Cash Sweep Event will end with respect to clause (i), when such event of default has been cured, and with respect to clause (ii), when such bankruptcy petition has been discharged, stayed, or dismissed, within 30 days for
THE INFORMATION IN THIS STRUCTURAL AND COLLATERAL TERM SHEET IS NOT COMPLETE AND MAY BE AMENDED PRIOR TO THE TIME OF SALE. THIS TERM SHEET IS NOT AN OFFER TO SELL THESE SECURITIES AND IT IS NOT A SOLICITATION OF AN OFFER TO BUY THESE SECURITIES IN ANY JURISDICTION WHERE THE OFFER OR SALE IS NOT PERMITTED.
| 114 |
BROOKS LANDING APARTMENTS |
the borrower or guarantor and 120 days for the property manager, among other conditions. Clause (ii) may also be cured by the borrower replacing the manager with a qualified property manager acceptable to the lender.
Property Management.The Brooks Landing Apartments Property is managed by an affiliate of the borrower.
Assumption.The borrower has a right to transfer the Brooks Landing Apartments Property commencing one year after the origination date, provided that no event of default has occurred and is continuing and certain other conditions are satisfied, including (i) the lender’s reasonable determination that the proposed transferee and guarantor satisfy the lender’s credit review and underwriting standards, taking into consideration transferee experience, financial strength and general business standing; (ii) execution of a recourse guaranty and an environmental indemnity by an affiliate of the transferee; and (iii) if requested by the lender, rating agency confirmation from Fitch, Moody’s and Morningstar that the transfer will not result in a downgrade, withdrawal or qualification of the respective ratings assigned to the Series 2015-C31 Certificates.
Partial Release.Not permitted.
Real Estate Substitution.Not permitted.
Subordinate and Mezzanine Indebtedness.Not permitted.
Terrorism Insurance.The loan documents require that the “all risk” insurance policy required to be maintained by the borrower provides coverage for terrorism in an amount equal to the full replacement cost of the Brooks Landing Apartments Property, as well as business interruption insurance covering no less than the 18-month period following the occurrence of a casualty event, together with a 12-month extended period of indemnity.
Earthquake Insurance. The loan documents do not require earthquake insurance. The seismic report indicated a probable maximum loss of 5.0%
THE INFORMATION IN THIS STRUCTURAL AND COLLATERAL TERM SHEET IS NOT COMPLETE AND MAY BE AMENDED PRIOR TO THE TIME OF SALE. THIS TERM SHEET IS NOT AN OFFER TO SELL THESE SECURITIES AND IT IS NOT A SOLICITATION OF AN OFFER TO BUY THESE SECURITIES IN ANY JURISDICTION WHERE THE OFFER OR SALE IS NOT PERMITTED.
| 115 |
| No. 11 – Palouse Mall | |||||||
| Loan Information | Property Information | ||||||
| Mortgage Loan Seller: | Liberty Island Group I LLC | Single Asset/Portfolio: | Single Asset | ||||
| Credit Assessment (Fitch/Moody’s/Morningstar): | NR/NR/NR | Property Type: | Retail | ||||
| Original Principal Balance: | $23,075,000 | Specific Property Type: | Anchored | ||||
| Cut-off Date Principal Balance: | $23,075,000 | Location: | Moscow, ID | ||||
| % of Initial Pool Balance: | 2.3% | Size: | 391,856 SF | ||||
| Loan Purpose: | Acquisition | Cut-off Date Principal Balance Per SF: | $58.89 | ||||
| Borrower Name: | Palouse Mall LLC | Year Built/Renovated(3): | 1976/NAV | ||||
| Sponsors(1): | Various | Title Vesting(4): | Leasehold | ||||
| Mortgage Rate: | 4.890% | Property Manager: | Jameson Commercial Property Management, LLC | ||||
| Note Date: | October 9, 2015 | 3rd Most Recent Occupancy (As of): | 97.1% (11/7/2012) | ||||
| Anticipated Repayment Date: | NAP | 2nd Most Recent Occupancy (As of): | 95.2% (12/14/2013) | ||||
| Maturity Date: | November 1, 2025 | Most Recent Occupancy (As of): | 89.4% (1/14/2015) | ||||
| IO Period: | 24 months | Current Occupancy (As of)(5): | 93.8% (6/14/2015) | ||||
| Loan Term (Original): | 120 months | ||||||
| Seasoning: | 0 months | Underwriting and Financial Information: | |||||
| Amortization Term (Original): | 360 months | ||||||
| Loan Amortization Type: | Interest-only, Amortizing Balloon | 3rd Most Recent NOI (As of): | $2,240,966 (12/31/2013) | ||||
| Interest Accrual Method: | Actual/360 | 2nd Most Recent NOI (As of): | $2,420,742 (12/31/2014) | ||||
| Call Protection: | L(24),D(92),O(4) | Most Recent NOI (As of)(6): | $2,013,630 (TTM 6/30/2015) | ||||
| Lockbox Type: | Hard/Springing Cash Management | ||||||
| Additional Debt: | None | ||||||
| Additional Debt Type: | NAP | ||||||
| U/W Revenues: | $4,587,587 | ||||||
| Escrows and Reserves(2): | U/W Expenses: | $2,020,905 | |||||
| U/W NOI(6): | $2,566,681 | ||||||
| Type: | Initial | Monthly | Cap (If Any) | U/W NCF: | $2,185,216 | ||
| Taxes | $0 | Springing | NAP | U/W NOI DSCR: | 1.75x | ||
| Insurance | $0 | Springing | NAP | U/W NCF DSCR: | 1.49x | ||
| Replacement Reserves | $10,120 | $10,120 | NAP | U/W NOI Debt Yield: | 11.1% | ||
| Deferred Maintenance | $115,750 | $0 | NAP | U/W NCF Debt Yield: | 9.5% | ||
| TI/LC Reserve | $750,000 | $32,000 | $550,000 | As-Is Appraised Value: | $31,400,000 | ||
| JoAnn and Sportstown Holdback | $1,036,000 | $0 | NAP | As-Is Appraisal Valuation Date: | July 20, 2015 | ||
| Alpine Vision Holdback | $638,000 | $0 | NAP | Cut-off Date LTV Ratio: | 73.5% | ||
| Staples & Petco Holdback | $1,924,000 | $0 | NAP | LTV Ratio at Maturity or ARD: | 63.4% | ||
| (1) | The sponsors are Nicholas Lindsey Dean Echelbarger, Lindsey L.R. Echelbarger, Carolyn Echelbarger and Bluff’s End Trust, a Washington irrevocable trust. |
| (2) | See “Escrows” section. |
| (3) | The Palouse Mall Property was developed in 1976 with multiple additions and renovations made thereafter. |
| (4) | The Palouse Mall Property is subject to a ground lease dated October 2, 1974, as further amended & restated on July 1, 2006 (the “Ground Lease”) with a new 60-year term, which expires June 30, 2066. The Ground Lease has three, ten-year options, which, if all such renewal options are exercised, would extend the expiration of the Ground Lease to June 30, 2096. The lessor under the Ground Lease is The Regents of the University of Idaho. The Ground Lease is not subordinate to the Palouse Mall Mortgage Loan, however, the lender received an executed estoppel by the ground lessor that provides lender protections for securitization. The current annual ground rent payment is $285,582 until June 2016. From there, the Ground Lease rent payment will increase by 10% over the immediately preceding five-year period and will remain fixed at that level for five years until the 31st year of the term (where the ground rent increases to 25% over the immediately preceding five-year period). Upon the end of that five-year period, ground rent reverts back to increasing by 10% every five years. Ground rent payments were underwritten to the annualized average monthly ground rent payment over a 12 year period. |
| (5) | See “Historical Occupancy” section. |
| (6) | See “Cash Flow Analysis” section. |
The Palouse Mall mortgage loan is evidenced by a single promissory note that is secured by a first mortgage encumbering the leasehold interest in a 13-building anchored retail shopping center located in Moscow, Idaho, which is in North Central Idaho adjacent to the Washington state line (the “Palouse Mall Property”). The Palouse Mall Property is subject to a Ground Lease with the University of Idaho. The Palouse Mall Property is situated on a 43.4-acre site, which includes an adjacent 173-room Best Western Inn with an attached convention center, which is on a ground sublease with the borrower. The Palouse Mall Property comprises 391,856 square feet and is anchored by Winco Foods and Macy’s and other tenants including a variety of national retailers such as Old Navy, Ross Dress for Less, Rite Aid, Bed Bath & Beyond, Starbucks, Buffalo Wild Wings, GameStop, and Panda Express. The Palouse Mall Property includes an indoor mall component, although many of the retail spaces have exterior access. The Palouse Mall Property is located on West Pullman Road, also known as Highway 8, which has the highest traffic volume in Moscow (according to a third-party market research report). The Palouse Mall Property is directly across the street from University of Idaho campus, which has over
THE INFORMATION IN THIS STRUCTURAL AND COLLATERAL TERM SHEET IS NOT COMPLETE AND MAY BE AMENDED PRIOR TO THE TIME OF SALE. THIS TERM SHEET IS NOT AN OFFER TO SELL THESE SECURITIES AND IT IS NOT A SOLICITATION OF AN OFFER TO BUY THESE SECURITIES IN ANY JURISDICTION WHERE THE OFFER OR SALE IS NOT PERMITTED.
| 116 |
| PALOUSE MALL |
12,000 students and nearly 3,200 faculty and staff on campus. As of 2015, the estimated population within a one-, three-, and five-mile radius of the Palouse Mall Property was 3,904, 25,151 and 27,087, respectively, and the estimated average household income within the same radii was $25,333, $35,757 and $36,200, respectively. As of June 14, 2015, the Palouse Mall Property was 93.8% occupied by 47 tenants, which takes into the account the following assumptions: (i) new tenants Staples and Petco are in occupancy and paying rent, (ii) existing tenants Sportstown and JoAnn Fabrics successfully relocate to their new locations at the premises, and (iii) new tenant Alpine Vision Center is in occupancy and paying rent. Without factoring in these assumptions, the property was approximately 92.0% occupied by 49 tenants.
Sources and Uses
| Sources | Uses | |||||||
| Original loan amount | $23,075,000 | 64.4% | Purchase price | $31,000,000 | 86.5% | |||
Sponsor’s new cash contribution Other sources | 11,121,869 | 31.0 | Reserves | 4,473,870 | 12.5 | |||
| 1,639,253 | 4.6 | Closing costs | 362,252 | 1.0 | ||||
| Total Sources | $35,836,122 | 100.0% | Total Uses | $35,836,122 | 100.0% |
The following table presents certain information relating to the tenancy at the Palouse Mall Property:
Major Tenants
| Tenant Name | Credit Rating (Fitch/ Moody’s/ S&P)(1) | Tenant NRSF | % of NRSF | Annual U/W Base Rent PSF(2) | Annual U/W Base Rent(2) | % of Total Annual U/W Base Rent | Sales PSF(3) | Occupancy Cost(3) | Lease Expiration Date | |||||||||
| Anchor Tenants | ||||||||||||||||||
| Winco Foods | NR/NR/NR | 52,759 | 13.5% | $2.92 | $153,936 | 4.7% | $823 | 1.1% | 1/31/2031(4)(5) | |||||||||
| Macy’s | BBB+/Baa2/BBB+ | 41,588 | 10.6% | $2.88 | $119,964 | 3.6% | $159 | 2.4% | 1/29/2020 | |||||||||
| Total Anchor Tenants | 94,347 | 24.1% | $2.90 | $273,900 | 8.3% | |||||||||||||
| Major Tenants | ||||||||||||||||||
| Bed Bath & Beyond | NR/Baa1/A- | 24,683 | 6.3% | $8.86 | $218,790 | 6.7% | NAV | NAV | 1/31/2018(6) | |||||||||
| Rite Aid | B/B2/B | 22,164 | 5.7% | $9.00 | $199,476 | 6.1% | $174 | 2.5% | 9/27/2021 | |||||||||
| Staples(7) | BBB-/Baa2/BBB- | 12,148 | 3.1% | $14.00 | $170,072 | 5.2% | NAV | NAV | 12/31/2026(7) | |||||||||
| Petco(7) | NR/B3/B | 11,924 | 3.0% | $14.00 | $166,936 | 5.1% | NAV | NAV | 1/31/2026 | |||||||||
| JoAnn Fabrics(8) | NR/B3/B | 17,680 | 4.5% | $9.00 | $159,120 | 4.8% | $114 | 7.0% | 1/31/2026 | |||||||||
| Total Major Tenants | 88,599 | 22.6% | $10.32 | $914,394 | 27.8% | |||||||||||||
| Non-Major Tenants | 184,707 | 47.1% | $11.37(9) | $2,100,607 | 63.9% | |||||||||||||
| Total Occupied Collateral | 367,653 | 93.8% | $8.95(9) | $3,288,901 | 100.0% | |||||||||||||
| Vacant Space | 24,203 | 6.2% | ||||||||||||||||
| Collateral Total | 391,856 | 100.0% | ||||||||||||||||
| (1) | Certain ratings are those of the parent company whether or not the parent guarantees the lease. |
| (2) | Annual U/W Base Rent PSF and Annual U/W Base Rent include contractual rent steps through March 2016, totaling $37,510. |
| (3) | Sales PSF and Occupancy Cost are for the trailing 12-month period ending December 31, 2014. |
| (4) | Winco Foods has three, five-year renewal options. |
| (5) | Winco Foods has the right to terminate its lease starting January 31, 2026 upon nine months prior notice to the landlord. |
| (6) | Bed Bath & Beyond has four, five-year renewal options. |
| (7) | Staples is expected to be leasing a portion of the Palouse Mall Property (formerly occupied by Office Depot), which is being split with Petco. The Petco lease has been executed and work is underway, while the Staples lease has not yet been signed (the Lease Expiration Date is an expected date since the lease has not been signed). The lender has structured a holdback for Staples and Petco in the amount of $1,924,000, which will be released to the borrower once each of the following have occurred: (a) Staples has signed a lease for a minimum of 12,148 square feet at a minimum rent of $14.00 per square foot with a minimum 10 year term; and (b) both Staples and Petco are in full occupancy of their respective spaces, open for business, and paying full rent. |
| (8) | JoAnn Fabrics currently leases 14,049 square feet at the Palouse Mall Property that runs through June 2018. The tenant is planning to relocate to a larger space, part of which is currently occupied by Sportstown. The Sportstown lease runs through May 2016. JoAnn Fabrics will occupy the new space totaling 17,680 square feet while Sportstown will relocate within the Palouse Mall Property. The lender has structured a holdback for JoAnn Fabrics and Sportstown where funds will be released to the borrower once each of the following have occurred: (a) JoAnn Fabrics has signed a lease for its new location for a minimum of 17,680 square feet at a minimum rent of $9.00 per square foot with a minimum 10 year term; (b) Sportstown has signed a lease in its new location at the premises for a minimum of 4,800 square feet at a minimum rent of $12.00 per square foot with a minimum 5 year term; (c) both JoAnn Fabrics and Sportstown are in full occupancy of their respective spaces, open for business, and paying full rent; and (d) the borrower provides evidence satisfactory to lender in lender’s sole discretion that the new JoAnn Fabrics lease does not result in a violation of either co-tenancy rights or exclusive use rights under the Michaels lease. |
| (9) | The Annual U/W Base Rent PSF for Non-Major Tenants and Total Occupied Collateral excludes Annual U/W Base Rent associated with Best Western Inn, which is subject to a ground sublease and has no attributed square footage. The ground sublease rent is included in Other Income in the “Cash Flow Analysis” section. |
THE INFORMATION IN THIS STRUCTURAL AND COLLATERAL TERM SHEET IS NOT COMPLETE AND MAY BE AMENDED PRIOR TO THE TIME OF SALE. THIS TERM SHEET IS NOT AN OFFER TO SELL THESE SECURITIES AND IT IS NOT A SOLICITATION OF AN OFFER TO BUY THESE SECURITIES IN ANY JURISDICTION WHERE THE OFFER OR SALE IS NOT PERMITTED.
| 117 |
| PALOUSE MALL |
The following table presents certain information relating to the historical sales and occupancy costs at the Palouse Mall Property:
Historical Sales (PSF) and Occupancy Costs(1)(2)
| Tenant Name | 2012 | 2013 | 2014 |
Occupancy |
| Winco Foods | $814 | $821 | $823 | 1.1% |
| Macy’s | $163 | $167 | $159 | 2.4% |
| Rite Aid | $187 | $171 | $174 | 2.5% |
| JoAnn Fabrics | $111 | $112 | $114 | 7.0% |
| Old Navy | $223 | $225 | $236 | 4.8% |
| (1) | Historical Sales (PSF) and Occupancy Costs were provided by the borrower. |
| (2) | The Historical Sales (PSF) reflect those tenants who reported sales during the given periods. |
The following table presents certain information relating to the lease rollover schedule at the Palouse Mall Property:
Lease Expiration Schedule(1)(2)
| Year Ending December 31, | No. of Leases Expiring | Expiring NRSF | % of Total NRSF | Cumulative Expiring NRSF | Cumulative % of Total NRSF | Annual U/W Base Rent | Annual U/W Base Rent PSF(3) |
| MTM | 0 | 0 | 0.0% | 0 | 0.0% | $0 | $0.00 |
| 2015 | 0 | 0 | 0.0% | 0 | 0.0% | $0 | $0.00 |
| 2016 | 1 | 1,305 | 0.3% | 1,305 | 0.3% | $15,660 | $12.00 |
| 2017 | 16 | 69,302 | 17.7% | 70,607 | 18.0% | $744,630 | $10.74 |
| 2018 | 6 | 35,906 | 9.2% | 106,513 | 27.2% | $398,597 | $11.10 |
| 2019 | 5 | 20,410 | 5.2% | 126,923 | 32.4% | $306,502 | $15.02 |
| 2020 | 6 | 57,474 | 14.7% | 184,397 | 47.1% | $360,278 | $6.27 |
| 2021 | 4 | 72,990 | 18.6% | 257,387 | 65.7% | $504,703 | $6.91 |
| 2022 | 2 | 6,401 | 1.6% | 263,788 | 67.3% | $83,760 | $13.09 |
| 2023 | 1 | 1,789 | 0.5% | 265,577 | 67.8% | $53,667 | $30.00 |
| 2024 | 0 | 0 | 0.0% | 265,577 | 67.8% | $0 | $0.00 |
| 2025 | 1 | 2,253 | 0.6% | 267,830 | 68.3% | $67,590 | $30.00 |
| Thereafter | 5 | 99,823 | 25.5% | 367,653 | 93.8% | $753,514 | $7.55 |
| Vacant | 0 | 24,203 | 6.2% | 391,856 | 100.0% | $0 | $0.00 |
| Total/Weighted Average | 47 | 391,856 | 100.0% | $3,288,901 | $8.95 |
| (1) | Information obtained from the underwritten rent roll. |
| (2) | Certain tenants may have lease termination options that are exercisable prior to the originally stated expiration date of the subject lease and that are not considered in the Lease Expiration Schedule. |
| (3) | Annual U/W Base Rent PSF excludes vacant space and rent attributed to the Best Western Inn, which is subject to a ground sublease. |
The following table presents historical occupancy percentages at the Palouse Mall Property:
Historical Occupancy
11/7/2012(1) | 12/14/2013(1) | 1/14/2015(1) | 6/14/2015(2) | |||
| 97.1% | 95.2% | 89.4% | 93.8% |
| (1) | Information obtained from the borrower. Year-end historical occupancies are not available, as the borrower recently acquired the Palouse Mall Property and the seller did not provide such information. |
| (2) | Information obtained from the underwritten rent roll, which assumes the following: (i) new tenants Staples and Petco are in occupancy and paying rent, (ii) existing tenants Sportstown and JoAnn Fabrics successfully relocate to their new locations at the premises, and (iii) new tenant Alpine Vision Center is in occupancy and paying rent. Without factoring in these assumptions, the property was approximately 92.0% occupied by 49 tenants |
THE INFORMATION IN THIS STRUCTURAL AND COLLATERAL TERM SHEET IS NOT COMPLETE AND MAY BE AMENDED PRIOR TO THE TIME OF SALE. THIS TERM SHEET IS NOT AN OFFER TO SELL THESE SECURITIES AND IT IS NOT A SOLICITATION OF AN OFFER TO BUY THESE SECURITIES IN ANY JURISDICTION WHERE THE OFFER OR SALE IS NOT PERMITTED.
| 118 |
| PALOUSE MALL |
Operating History and Underwritten Net Cash Flow.The following table presents certain information relating to the historical operating performance and underwritten net cash flow at the Palouse Mall Property:
Cash Flow Analysis
| 2013 | 2014 | TTM 6/30/2015 | U/W | % of U/W Effective Gross Income | U/W $ per SF | ||||||||
| Base Rent | $3,043,452 | $2,986,985 | $2,801,771(1) | $3,288,901(1) | 71.7% | $8.39 | |||||||
| Grossed Up Vacant Space | 0 | 0 | 0 | 304,116 | 6.6 | 0.78 | |||||||
| Percentage Rent | 547,408 | 577,831 | 511,969 | 254,023 | 5.5 | 0.65 | |||||||
| Total Reimbursables | 683,525 | 824,755 | 733,254 | 979,417 | 21.3 | 2.50 | |||||||
| Other Income(2) | 16,887 | 60,663 | 54,490 | 65,246 | 1.4 | 0.17 | |||||||
| Less Vacancy & Credit Loss | 0 | 0 | 0 | (304,116)(3) | (6.6) | (0.78) | |||||||
| Effective Gross Income | $4,291,272 | $4,450,234 | $4,101,484 | $4,587,587 | 100.0% | $11.71 | |||||||
| Total Operating Expenses | $2,050,306 | $2,029,491 | $2,087,854 | $2,020,905 | 44.1% | $5.16 | |||||||
|
|
|
|
|
| ||||||||
| Net Operating Income | $2,240,966 | $2,420,742 | $2,013,630 | $2,566,681 | 55.9% | $6.55 | |||||||
| TI/LC | 0 | 0 | 0 | 259,989 | 5.7 | 0.66 | |||||||
| Capital Expenditures | 0 | 0 | 0 | 121,475 | 2.6 | 0.31 | |||||||
| Net Cash Flow | $2,240,966 | $2,420,742 | $2,013,630 | $2,185,216 | 47.6% | $5.58 | |||||||
| NOI DSCR | 1.53x | 1.65x | 1.37x | 1.75x | |||||||||
| NCF DSCR | 1.53x | 1.65x | 1.37x | 1.49x | |||||||||
| NOI DY | 9.7% | 10.5% | 8.7% | 11.1% | |||||||||
| NCF DY | 9.7% | 10.5% | 8.7% | 9.5% |
| (1) | The increase in the U/W Base Rent and U/W Net Operating Income from TTM 6/30/2015 is attributed to underwriting Staples and Petco (not yet in place) and Sportstown and JoAnn Fabrics in their proposed locations, as well as contractual rent steps through March 2016 totaling $37,510. |
| (2) | Other Income includes $34,000 of ground sublease rent from Best Western Inn. |
| (3) | The underwritten economic vacancy is 8.4%. The Palouse Mall Property was 93.8% leased as of June 14, 2015. |
Escrows.The loan documents provide for upfront reserves in the amount of $750,000 for tenant improvements and leasing commissions, $115,750 for deferred maintenance, $10,120 for replacement reserves, and $3,598,000 in holdbacks for JoAnn Fabrics & Sportstown, Alpine Vision, and Staples & Petco (described in further detail below). Ongoing monthly reserves are required in amounts equal to $32,000 (only upon the tenant improvement and leasing commission reserve balance falling below $550,000) for tenant improvements and leasing commissions, and $10,120 for replacement reserves.
JoAnn and Sportstown Holdback ($1,036,000): Joann Fabrics is an existing tenant that currently occupies 14,049 square feet on a lease that runs through June 2018, but is planning to relocate to a group of four spaces (three of which are vacant, and one of which is currently leased by Sportstown). The Sportstown lease runs through May 2016. JoAnn Fabrics is expected to ultimately occupy all four spaces totaling 17,680 square feet, while Sportstown is expected to relocate to another space within the premises.
Funds will be released to the borrower once all of the following have occurred: (a) existing tenant JoAnn Fabrics has signed a lease in Building “J“ for a minimum of 17,680 square feet at a minimum rent of $9.00 per square foot with a minimum 10 year term; (b) existing tenant Sportstown has signed a lease on Building “I” for a minimum of 4,800 square feet at a minimum rent of $12.00 per square foot with a minimum five year term; (c) both JoAnn Fabrics and Sportstown are in full occupancy of their respective spaces, open for business, and paying full rent, with all landlord buildout obligations satisfied and all tenant improvement allowances paid, all as evidenced by signed tenant estoppels; and (d) the borrower has provided evidence satisfactory to the lender in the lender’s sole discretion that the new JoAnn Fabrics lease does not result in a violation of either co-tenancy rights or exclusive use rights under the Michaels lease.
Alpine Vision Holdback ($638,000): Alpine Vision signed a lease at the Palouse Mall Property effective July 1, 2015 and is not yet in occupancy or paying rent as of the cut-off date. Funds will be released to the borrower once Alpine Vision is in full occupancy of its space, open for business, and paying full rent (with all landlord buildout obligations satisfied and all tenant improvement allowances paid, all as evidenced by a signed tenant estoppel).
Staples and Petco Holdback ($1,924,000): Staples is expected to be leasing a portion of the Palouse Mall Property (formerly occupied by Office Depot), which is being split with Petco. The Petco lease has been executed and work is underway, while the Staples lease has not yet been signed.
Funds will be released to the borrower once all of the following have occurred: (a) Staples has signed a lease on the westernmost pad building adjacent to Petco for a minimum of 12,148 square feet at a minimum rent of $14.00 per square foot with a minimum 10 year term; and (b) both Staples and Petco are in full occupancy of their respective spaces, open for business, and paying full rent (with all landlord buildout obligations satisfied and all tenant improvement allowances paid, all as evidenced by signed tenant estoppels).
Any funds remaining in the holdbacks two years following origination may, at the lender’s sole discretion, be applied by the lender to the outstanding balance of the Palouse Mall Mortgage Loan.
THE INFORMATION IN THIS STRUCTURAL AND COLLATERAL TERM SHEET IS NOT COMPLETE AND MAY BE AMENDED PRIOR TO THE TIME OF SALE. THIS TERM SHEET IS NOT AN OFFER TO SELL THESE SECURITIES AND IT IS NOT A SOLICITATION OF AN OFFER TO BUY THESE SECURITIES IN ANY JURISDICTION WHERE THE OFFER OR SALE IS NOT PERMITTED.
| 119 |
| No. 12 – Silver Rock Apartments | ||||||
| Loan Information | Property Information | |||||
| Mortgage Loan Seller: | Basis Real Estate Capital II, LLC | Single Asset/Portfolio: | Single Asset | |||
| Credit Assessment (Fitch/Moody’s/Morningstar): | NR/NR/NR | Property Type: | Multifamily | |||
| Original Principal Balance: | $22,900,000 | Specific Property Type: | Garden | |||
| Cut-off Date Principal Balance: | $22,900,000 | Location: | San Antonio, TX | |||
| % of Initial Pool Balance: | 2.3% | Size: | 328 units | |||
| Loan Purpose: | Acquisition | Cut-off Date Principal Balance Per Unit: | $69,817 | |||
| Borrower Name: | SA Silver Rock Partners, LLC | Year Built/Renovated: | 1996/NAP | |||
| Sponsor: | Roosevelt T. Miller, Jr. | Title Vesting: | Fee | |||
| Mortgage Rate: | 4.480% | Property Manager: | Self-managed | |||
| Note Date: | August 11, 2015 | 3rd Most Recent Occupancy (As of): | 96.0% (12/31/2012) | |||
| Anticipated Repayment Date: | NAP | 2nd Most Recent Occupancy (As of): | 93.9% (12/31/2013) | |||
| Maturity Date: | September 1, 2025 | Most Recent Occupancy (As of): | 95.1% (12/31/2014) | |||
| IO Period: | 60 months | Current Occupancy (As of): | 97.3% (8/25/2015) | |||
| Loan Term (Original): | 120 months | |||||
| Seasoning: | 2 months | Underwriting and Financial Information: | ||||
| Amortization Term (Original): | 360 months | |||||
| Loan Amortization Type: | Interest-Only, Amortizing Balloon | 3rd Most Recent NOI (As of): | $1,864,409 (12/31/2013) | |||
| Interest Accrual Method: | Actual/360 | 2nd Most Recent NOI (As of): | $1,796,274 (12/31/2014) | |||
| Call Protection: | L(26),D(91),O(3) | Most Recent NOI (As of): | $1,733,626 (TTM 6/30/2015) | |||
| Lockbox Type: | None | |||||
| Additional Debt: | None | U/W Revenues: | $3,649,376 | |||
| Additional Debt Type: | NAP | U/W Expenses: | $1,826,227 | |||
| U/W NOI: | $1,823,148 | |||||
| U/W NCF: | $1,737,212 | |||||
| U/W NOI DSCR: | 1.31x | |||||
| Escrows and Reserves: | U/W NCF DSCR: | 1.25x | ||||
| U/W NOI Debt Yield: | 8.0% | |||||
| Type: | Initial | Monthly | Cap (If Any) | U/W NCF Debt Yield: | 7.6% | |
| Taxes | $547,271 | $60,808 | NAP | As-Is Appraised Value: | $31,200,000 | |
| Insurance | $22,269 | $7,423 | NAP | As-Is Appraisal Valuation Date: | July 8, 2015 | |
| Replacement Reserves | $0 | $7,164 | $410,000 | Cut-off Date LTV Ratio: | 73.4% | |
| Irrigation System Reserve(1) | $120,000 | $0 | NAP | LTV Ratio at Maturity or ARD: | 67.1% | |
| (1) | Irrigation System Reserve relates to $120,000 for required repairs related to the irrigation system. |
The Silver Rock Apartments mortgage loan is evidenced by a single promissory note that is secured by a first mortgage encumbering a fee interest in a multifamily property containing 19 garden-style buildings located in San Antonio, Texas (the “Silver Rock Apartments Property”), approximately 12.0 miles northwest of the central business district. The Silver Rock Apartments Property is a gated community that was built in 1996 and comprises 328 units totaling 298,196 square feet. The unit mix is made up of 124 one-bedroom/one-bathroom units, 164 two-bedroom/two-bathroom units and 40 three-bedroom/two-bathroom units. Amenities at the Silver Rock Apartments Property include a fitness center, playground, outdoor swimming pool, dog park and clubhouse with on-site management and leasing office. Unit amenities include full size washer/dryer connections, private patios or balconies, and exterior storage rooms. The Silver Rock Apartments Property’s immediate area is primarily residential with supporting commercial uses along nearby arterial roads, such as Bandera Road and Old Prue Road. Residential appeal is generated by its location within western San Antonio, the area’s well-regarded school district and general affordability. Large retail draws include Bandera Pointe, an 889,855 square foot retail property anchored by Target, Barnes & Noble, Lowes and Kohl’s, located approximately 1.3 miles northwest of the Silver Rock Apartments Property and Ingram Park Mall, a regional mall anchored by Dillard’s, JC Penney, Sears, Macy’s and Bealls, located approximately 6.2 miles southeast of the Silver Rock Apartments Property. The University of Texas-San Antonio is located approximately five miles north of the Silver Rock Apartments Property, and major area employers such as USAA and Valero Energy are located within seven miles. The Silver Rock Apartments Property features 340 surface parking spaces, 104 covered carports, and 56 detached garage spaces for a total of 500 parking spaces, resulting in an overall parking ratio of 1.5 spaces per unit. As of August 25, 2015, the Silver Rock Apartments Property was 97.3% occupied. The borrower plans to invest approximately $1.1 million to make capital improvements within 18 months of loan closing, which will include $870,000 of interior renovations and $230,000 of exterior renovations.
THE INFORMATION IN THIS STRUCTURAL AND COLLATERAL TERM SHEET IS NOT COMPLETE AND MAY BE AMENDED PRIOR TO THE TIME OF SALE. THIS TERM SHEET IS NOT AN OFFER TO SELL THESE SECURITIES AND IT IS NOT A SOLICITATION OF AN OFFER TO BUY THESE SECURITIES IN ANY JURISDICTION WHERE THE OFFER OR SALE IS NOT PERMITTED.
| 120 |
| SILVER ROCK APARTMENTS |
According to a third party market research report, the Silver Rock Apartments Property is located in the Far West submarket of the San Antonio multifamily market. As of the first quarter 2015, the San Antonio multifamily market contained 145,002 units, with a 7.4% vacancy and average monthly asking rent of $1.03 per square foot. The Far West multifamily submarket contained 15,830 units, with a 7.1% vacancy rate and average monthly asking rent of $1.09 per square foot as of the first quarter of 2015. The average underwritten monthly rent at the Silver Rock Apartments Property is $0.97 per square foot. There are currently 16 multifamily properties containing 4,805 units under construction within an 8-mile radius of the Silver Rock Apartments Property. According to the appraiser, these new Class A projects will not compete directly with Silver Rock Apartments Property due to distance (the closest new property is located 4.5 miles southwest of the Silver Rock Apartments Property) and price point.
Sources and Uses
| Sources | Uses | |||||||
| Original loan amount | $22,900,000 | 69.4% | Purchase price | $31,050,000 | 94.1% | |||
| Sponsor’s new cash contribution | 10,110,998 | 30.6 | Reserves | 689,540 | 2.1 | |||
| Closing costs | 1,271,458 | 3.9 | ||||||
| Total Sources | $33,010,998 | 100.0% | Total Uses | $33,010,998 | 100.0% |
The following table presents certain information relating to the unit mix of the Silver Rock Apartments Property:
Unit Mix Summary(1)
| Unit Type | No. of Units | % of Total Units | Average Unit Size (SF) | Average U/W Monthly Rent per Unit |
| 1 Bedroom/1 Bathroom | 124 | 37.8% | 691 | $729 |
| 2 Bedroom/2 Bathroom | 164 | 50.0% | 1,002 | $929 |
| 3 Bedroom/2 Bathroom | 40 | 12.2% | 1,205 | $1,142 |
| Total/Weighted Average | 328 | 100.0% | 909 | $879 |
| (1) | Information obtained from the underwritten rent roll. |
The following table presents historical occupancy percentages at the Silver Rock Apartments Property:
Historical Occupancy
12/31/2012(1) | 12/31/2013(1) | 12/31/2014(1) | 8/25/2015(2) | |||
| 96.0% | 93.9% | 95.1% | 97.3% |
| (1) | Information obtained from the borrower. |
| (2) | Information obtained from the underwritten rent roll. |
Operating History and Underwritten Net Cash Flow.The following table presents certain information relating to the historical operating performance and underwritten net cash flow at the Silver Rock Apartments Property:
Cash Flow Analysis
| 2013 | 2014 | TTM 6/30/2015 | U/W | % of U/W Effective Gross Income | U/W $ per Unit | ||||||||
| Base Rent | $3,542,725 | $3,451,320 | $3,448,453 | $3,240,403 | 88.8% | $9,879 | |||||||
| Grossed Up Vacant Space | 0 | 0 | 0 | 235,951 | 6.5 | 719 | |||||||
| Concessions | 0 | 0 | 0 | 0 | 0.0 | 0 | |||||||
| Other Income | 460,918 | 456,764 | 456,163 | 456,163 | 12.5 | 1,391 | |||||||
| Less Vacancy & Credit Loss | (404,150) | (358,603) | (323,910) | (283,141) | (7.8) | (863) | |||||||
| Effective Gross Income | $3,599,493 | $3,549,481 | $3,580,706 | $3,649,376 | 100.0% | $11,126 | |||||||
| Total Operating Expenses | $1,735,084 | $1,753,207 | $1,847,080 | $1,826,227 | 50.0% | $5,568 | |||||||
|
|
|
|
|
| ||||||||
| Net Operating Income | $1,864,409 | $1,796,274 | $1,733,626 | $1,823,148 | 50.0% | $5,558 | |||||||
| Capital Expenditures | 0 | 0 | 0 | 85,936 | 2.4 | 262 | |||||||
| Net Cash Flow | $1,864,409 | $1,796,274 | $1,733,626 | $1,737,212 | 47.6% | $5,296 | |||||||
| NOI DSCR | 1.34x | 1.29x | 1.25x | 1.31x | |||||||||
| NCF DSCR | 1.34x | 1.29x | 1.25x | 1.25x | |||||||||
| NOI DY | 8.1% | 7.8% | 7.6% | 8.0% | |||||||||
| NCF DY | 8.1% | 7.8% | 7.6% | 7.6% |
| (1) | The underwritten economic vacancy is 6.0%. The Silver Rock Apartments Property was 97.3% physically occupied as of August 25, 2015. |
THE INFORMATION IN THIS STRUCTURAL AND COLLATERAL TERM SHEET IS NOT COMPLETE AND MAY BE AMENDED PRIOR TO THE TIME OF SALE. THIS TERM SHEET IS NOT AN OFFER TO SELL THESE SECURITIES AND IT IS NOT A SOLICITATION OF AN OFFER TO BUY THESE SECURITIES IN ANY JURISDICTION WHERE THE OFFER OR SALE IS NOT PERMITTED.
| 121 |
| No. 13 - Ross Portfolio | |||||||
| Loan Information | Property Information | ||||||
| Mortgage Loan Seller: | Basis Real Estate Capital II, LLC | Single Asset/Portfolio: | Portfolio | ||||
Credit Assessment (Fitch/Moody’s/Morningstar): | NR/NR/NR | Property Type: | Various – See Table | ||||
| Original Principal Balance(1): | $20,085,000 | Specific Property Type: | Various – See Table | ||||
| Cut-off Date Principal Balance(1): | $20,085,000 | Location: | Various – See Table | ||||
| % of Initial Pool Balance: | 2.0% | Size: | 205,408 SF | ||||
| Loan Purpose: | Acquisition | Cut-off Date Principal Balance Per SF: | $97.78 | ||||
| Borrower Names: | Wadsworth Realty, LLC and San Sevaine Realty, LLC | Year Built/Renovated: | Various – See Table | ||||
| Sponsor: | Deane Earl Ross | Title Vesting: | Fee | ||||
| Mortgage Rate: | 4.695% | Property Manager: | Self-managed | ||||
| Note Date: | October 8, 2015 | 3rd Most Recent Occupancy (As of): | 100.0% (12/31/2012) | ||||
| Anticipated Repayment Date: | NAP | 2nd Most Recent Occupancy (As of): | 100.0% (12/31/2013) | ||||
| Maturity Date: | November 1, 2025 | Most Recent Occupancy (As of): | 100.0% (12/31/2014) | ||||
| IO Period: | 84 months | Current Occupancy (As of): | 100.0% (11/1/2015) | ||||
| Loan Term (Original): | 120 months | ||||||
| Seasoning: | 0 months | Underwriting and Financial Information: | |||||
| Amortization Term (Original): | 360 months | ||||||
| Loan Amortization Type: | Interest-only, Amortizing Balloon | 3rd Most Recent NOI (As of): | NAV | ||||
| Interest Accrual Method: | Actual/360 | 2nd Most Recent NOI (As of)(4): | $1,038,791 (12/31/2013) | ||||
| Call Protection: | L(24),D(93),O(3) | Most Recent NOI (As of) (4): | $1,035,721 (12/31/2014) | ||||
| Lockbox Type: | Hard/Springing Cash Management | ||||||
| Additional Debt: | No | U/W Revenues: | $2,277,954 | ||||
| Additional Debt Type: | NAP | U/W Expenses: | $559,452 | ||||
| U/W NOI: | $1,718,502 | ||||||
| U/W NCF: | $1,614,107 | ||||||
| U/W NOI DSCR: | 1.38x | ||||||
| Escrows and Reserves: | U/W NCF DSCR: | 1.29x | |||||
| U/W NOI Debt Yield: | 8.6% | ||||||
| Type: | Initial | Monthly | Cap (If Any) | U/W NCF Debt Yield: | 8.0% | ||
| Taxes(1) | $66,804 | Springing | NAP | As-Stabilized Appraised Value: | $31,100,000 | ||
| Insurance | $26,714 | $6,678 | NAP | As-Stabilized Appraisal Valuation Date: | Various | ||
| Replacement Reserve(2) | $0 | Springing | NAP | Cut-off Date LTV Ratio: | 64.6% | ||
| TI/LC Reserve(3) | $0 | Springing | NAP | LTV Ratio at Maturity or ARD: | 61.6% | ||
| (1) | Monthly Tax escrow is equal to one twelfth of annual property tax obligation and springs upon any of the following: (i) an event of default; (ii) lease default of Anchor Tenant (Kohl’s or Ronpak); (iii) Anchor Tenant Trigger Event (Anchor Tenant is subject of bankruptcy action, provides written notice to terminate its lease or does go dark, fails to provide 12 months prior notice of its intent to renew at lease expiration, or defaults under its lease and does not cure the default pursuant to the lease); (iv) Anchor Tenant is no longer in occupancy and open for business or is no longer paying the full unabated rent; or (v) Anchor Tenant fails to pay the taxes or provide evidence of such payments. |
| (2) | Monthly Replacement Reserve of $2,568 springs upon any of the following: (i) Anchor Tenant is no longer responsible to perform and complete, at its sole expense, the replacements in accordance with the requirements of its lease; (ii) Anchor Tenant is in default beyond any applicable notice and/or cure period under its lease; or (iii) event of default. |
| (3) | Monthly TI/LC Reserve of $5,820 springs upon an event of default. |
| (4) | Historical NOI represents Kohl’s operating statements only. Kohl’s represents 60.3% of the overall underwritten NOI. Ronpak is a sale leaseback and operating history was not available. |
The Ross Portfolio mortgage loan is evidenced by a single promissory note that is secured by two deeds of trust encumbering the borrowers’ fee interest in two properties totaling 205,408 square feet (the “Ross Portfolio Properties”).The Ross Portfolio Properties consist of two triple net lease properties, an 88,408 square foot retail property that was built in 2003 and is fully occupied by Kohl’s (the “Kohl’s Property”), and a 117,000 square foot industrial property that was built in 1987 and is fully occupied by Ronpak, Inc. (the “Ronpak Property”).
The Kohl’s Property is located in Lakewood, Colorado, approximately ten miles southwest of the Denver central business district within close proximity to numerous residential neighborhoods and is accessible through Route 121 and Route 285. These routes encompass the periphery of Denver and provide access to I-70 and I-225. Within a one and three-mile radius of the Kohl’s Property, there are 7,073 and 50,115 households respectively and the median household income within the same radii was $55,044 and $59,252, respectively. According to a third-party market research company, the Kohl’s Property is located in the West retail submarket of Denver. As of second quarter 2015, the total retail submarket consisted of 22.7 million square feet over 2,219 properties and the average vacancy was 5.2%, with 182,873 square feet of net absorption year to date. The Kohl’s Property features
THE INFORMATION IN THIS STRUCTURAL AND COLLATERAL TERM SHEET IS NOT COMPLETE AND MAY BE AMENDED PRIOR TO THE TIME OF SALE. THIS TERM SHEET IS NOT AN OFFER TO SELL THESE SECURITIES AND IT IS NOT A SOLICITATION OF AN OFFER TO BUY THESE SECURITIES IN ANY JURISDICTION WHERE THE OFFER OR SALE IS NOT PERMITTED.
| 122 |
| ROSS PORTFOLIO |
509 surface parking spaces on a 9.8-acre parcel resulting in a parking ratio of 5.8 spaces per 1,000 square feet of rentable area. The Kohl’s Property is 100.0% occupied by Kohl’s through January 31, 2025 with eight, 5-year renewal options. The lease is guaranteed by the parent company, Kohl’s Corporation (rated BBB+/BBB/Baa1 by Fitch/S&P/Moody’s).
The Ronpak Property is located in Mira Loma, California, with primary access provided by Route 60, a major arterial that crosses the Riverside County area and is 15 minutes from Ontario International Airport. Ronpak, Inc., founded in 1947, is a leading manufacturer of custom printed paper bags, packages and food wraps. The Ronpak Property features 60 surface parking spaces on a 7.0-acre parcel resulting in a parking ratio of 0.5 parking spaces per 1,000 square feet of net rentable area. The Ronpak Property has 13 loading docks, 24’ clear heights, 4,500 square feet of office space and is fully sprinklered. In 2015, the estimated population within a three-mile and five-mile radius of the Ronpak Property was 58,607 and 161,580 respectively, while median household income within the same radii was $52,176 and $65,064, respectively. The Ronpak Property has been 100.0% occupied by Ronpak, Inc. since it was built in 1987 and has a current lease expiration of July 31, 2030 with three, 5-year renewal options. This transaction represents a sale-leaseback for Ronpak, Inc.
Sources and Uses
| Sources | Uses | |||||||
| Original loan amount | $20,085,000 | 63.5% | Purchase price | $30,905,000 | 97.8% | |||
| Sponsor’s new cash contribution | 11,521,614 | 36.5 | Reserves | 93,519 | 0.3 | |||
| Closing costs | 608,096 | 1.9 | ||||||
| Total Sources | $31,606,614 | 100.0% | Total Uses | $31,606,614 | 100.0% |
The following table presents certain information relating to the Ross Portfolio Properties:
| Property Name – Location | Property Type | Specific Property Type | Allocated Cut-off Date Principal Balance | % of Portfolio Cut-off Date Principal Balance | Occupancy | Year Built/ Renovated | Net Rentable Area (SF) | Appraised Value | |||||||||
| Kohl’s – Lakewood, CO | Retail | Single Tenant | $12,155,000 | 60.5% | 100.0% | 2003/NAP | 88,408 | $18,900,000 | |||||||||
| Ronpak – Mira Loma, CA | Industrial | Manufacturing | $7,930,000 | 39.5% | 100.0% | 1987/NAP | 117,000 | $12,200,000 | |||||||||
| Total/Weighted Average | $20,085,000 | 100.0% | 100.0% | 205,408 | $31,100,000 |
The following table presents certain information relating to the tenants at the Ross Portfolio Properties:
Major Tenants
| Tenant Name | Credit Rating (Fitch/Moody’s/S&P)(1) | Tenant NRSF | % of NRSF | Annual U/W Base Rent PSF | Annual U/W Base Rent | % of Total Annual U/W Base Rent(1) | Lease Expiration Date | ||||||||
| Major Tenants | |||||||||||||||
| Kohl’s | BBB+/Baa1/BBB | 88,408 | 43.0% | $12.60 | $1,113,941 | 60.3% | 1/31/2025 | ||||||||
| Ronpak, Inc. | NR/NR/NR | 117,000 | 57.0% | $6.26 | $732,000 | 39.7% | 7/31/2030 | ||||||||
| Occupied Collateral Total | 205,408 | 100.0% | $8.99 | $1,845,941 | 100.0% | ||||||||||
| Vacant Space | 0 | 0.0% | |||||||||||||
| Collateral Total | 205,408 | 100.0% | |||||||||||||
| (1) | Certain Ratings are those of the parent company whether or not the parent guarantees the lease. |
THE INFORMATION IN THIS STRUCTURAL AND COLLATERAL TERM SHEET IS NOT COMPLETE AND MAY BE AMENDED PRIOR TO THE TIME OF SALE. THIS TERM SHEET IS NOT AN OFFER TO SELL THESE SECURITIES AND IT IS NOT A SOLICITATION OF AN OFFER TO BUY THESE SECURITIES IN ANY JURISDICTION WHERE THE OFFER OR SALE IS NOT PERMITTED.
| 123 |
| ROSS PORTFOLIO |
The following table presents certain information relating to the lease rollover schedule at the Ross Portfolio Properties:
Lease Expiration Schedule(1)
| Year Ending December 31, | No. of Leases Expiring | Expiring NRSF | % of Total NRSF | Cumulative Expiring NRSF | Cumulative % of Total NRSF | Annual U/W Base Rent | Annual U/W Base Rent PSF | ||||||||
| MTM | 0 | 0 | 0.0% | 0 | 0.0% | $0 | $0.00 | ||||||||
| 2015 | 0 | 0 | 0.0% | 0 | 0.0% | $0 | $0.00 | ||||||||
| 2016 | 0 | 0 | 0.0% | 0 | 0.0% | $0 | $0.00 | ||||||||
| 2017 | 0 | 0 | 0.0% | 0 | 0.0% | $0 | $0.00 | ||||||||
| 2018 | 0 | 0 | 0.0% | 0 | 0.0% | $0 | $0.00 | ||||||||
| 2019 | 0 | 0 | 0.0% | 0 | 0.0% | $0 | $0.00 | ||||||||
| 2020 | 0 | 0 | 0.0% | 0 | 0.0% | $0 | $0.00 | ||||||||
| 2021 | 0 | 0 | 0.0% | 0 | 0.0% | $0 | $0.00 | ||||||||
| 2022 | 0 | 0 | 0.0% | 0 | 0.0% | $0 | $0.00 | ||||||||
| 2023 | 0 | 0 | 0.0% | 0 | 0.0% | $0 | $0.00 | ||||||||
| 2024 | 0 | 0 | 0.0% | 0 | 0.0% | $0 | $0.00 | ||||||||
| 2025 | 1 | 88,408 | 43.0% | 88,408 | 43.0% | $1,113,941 | $12.60 | ||||||||
| Thereafter | 1 | 117,000 | 57.0% | 205,408 | 100.0% | $732,000 | $6.26 | ||||||||
| Vacant | 0 | 0 | 0.0% | 205,408 | 100.0% | $0 | $0.00 | ||||||||
| Total/Weighted Average | 2 | 205,408 | 100.0% | $1,845,941 | $8.99 |
| (1) | Information obtained from the underwritten rent roll. |
The following table presents historical occupancy percentages at the Ross Portfolio Properties:
Historical Occupancy
12/31/2012(1) | 12/31/2013(1) | 12/31/2014(1) | 11/1/2015(2) | |||
| 100.0% | 100.0% | 100.0% | 100.0% |
| (1) | Information obtained from in-place leases. |
| (2) | Information obtained from the underwritten rent roll. |
Operating History and Underwritten Net Cash Flow. The following table presents certain information relating to the underwritten net cash flow at the Ross Portfolio Properties:
Cash Flow Analysis(1)
| U/W | % of U/W Effective Gross Income | U/W $ per SF | |||||
| Base Rent | $1,845,941 | 81.0% | $8.99 | ||||
| Grossed Up Vacant Space | 0 | 0.0 | 0.00 | ||||
| Total Reimbursables(2) | 555,032 | 24.4 | 2.70 | ||||
| Other Income | 0 | 0.0 | 0.00 | ||||
| Less Vacancy & Credit Loss(3) | ($123,019) | (5.4) | (0.60) | ||||
| Effective Gross Income | $2,277,954 | 100.0% | $11.09 | ||||
| Total Operating Expenses | $559,452 | 24.6% | $2.72 | ||||
|
|
| |||||
| Net Operating Income | $1,718,502 | 75.4% | $8.37 | ||||
| TI/LC | 73,584 | 3.2 | 0.36 | ||||
| Capital Expenditures | 30,811 | 1.4 | 0.15 | ||||
| Net Cash Flow | $1,614,107 | 70.9% | $7.86 | ||||
| NOI DSCR | 1.38x | ||||||
| NCF DSCR | 1.29x | ||||||
| NOI DY | 8.6% | ||||||
| NCF DY | 8.0% |
| (1) | Historical operating statements were not provided by the Ronpak Property seller; however, the Ross Portfolio Properties are single tenant buildings. Tenants have each been in place for more than 10 years and the leases are on a triple net basis. |
| (2) | Leases are on a triple net basis. Expenses are fully reimbursable. |
| (3) | The underwritten economic vacancy is 5.0% for Ronpak, Inc. and 5.2% for Kohl’s. The Ross Portfolio Properties were 100.0% physically occupied as of November 1, 2015. |
THE INFORMATION IN THIS STRUCTURAL AND COLLATERAL TERM SHEET IS NOT COMPLETE AND MAY BE AMENDED PRIOR TO THE TIME OF SALE. THIS TERM SHEET IS NOT AN OFFER TO SELL THESE SECURITIES AND IT IS NOT A SOLICITATION OF AN OFFER TO BUY THESE SECURITIES IN ANY JURISDICTION WHERE THE OFFER OR SALE IS NOT PERMITTED.
| 124 |
(THIS PAGE INTENTIONALLY LEFT BLANK)
THE INFORMATION IN THIS STRUCTURAL AND COLLATERAL TERM SHEET IS NOT COMPLETE AND MAY BE AMENDED PRIOR TO THE TIME OF SALE. THIS TERM SHEET IS NOT AN OFFER TO SELL THESE SECURITIES AND IT IS NOT A SOLICITATION OF AN OFFER TO BUY THESE SECURITIES IN ANY JURISDICTION WHERE THE OFFER OR SALE IS NOT PERMITTED.
| 125 |
| No. 14 – Lawton Town Center | ||||||
| Loan Information | Property Information | |||||
| Mortgage Loan Seller: | Wells Fargo Bank, National Association | Single Asset/Portfolio: | Single Asset | |||
Credit Assessment (Fitch/Moody’s/Morningstar): | NR/NR/NR | Property Type: | Retail | |||
| Original Principal Balance: | $19,400,000 | Specific Property Type: | Anchored | |||
| Cut-off Date Principal Balance: | $19,400,000 | Location: | Lawton, OK | |||
| % of Initial Pool Balance: | 2.0% | Size: | 207,609 SF | |||
| Loan Purpose: | Refinance | Cut-off Date Principal Balance Per SF: | $93.44 | |||
| Borrower Name: | LTC Retail LLC | Year Built/Renovated: | 2014/NAP | |||
| Sponsors(1): | Various | Title Vesting: | Fee | |||
| Mortgage Rate: | 4.540% | Property Manager: | Self-managed | |||
| Note Date: | September 23, 2015 | 3rdMost Recent Occupancy(8): | NAV | |||
| Anticipated Repayment Date: | NAP | 2ndMost Recent Occupancy(8): | NAV | |||
| Maturity Date: | October 11, 2025 | Most Recent Occupancy(8): | NAV | |||
| IO Period: | 12 months | Current Occupancy (As of): | 92.6% (9/9/2015) | |||
| Loan Term (Original): | 120 months | |||||
| Seasoning: | 1 month | |||||
| Amortization Term (Original): | 360 months | Underwriting and Financial Information: | ||||
| Loan Amortization Type: | Interest-only, Amortizing Balloon | |||||
| Interest Accrual Method: | Actual/360 | 3rd Most Recent NOI(9): | NAV | |||
| Call Protection: | L(25),D(91),O(4) | 2nd Most Recent NOI(9): | NAV | |||
| Lockbox Type: | Springing | Most Recent NOI (As of): | $1,550,640 (Annualized YTD 7/31/2015) | |||
| Additional Debt: | None | |||||
| Additional Debt Type: | NAP | |||||
| U/W Revenues: | $2,122,975 | |||||
| U/W Expenses: | $476,228 | |||||
| U/W NOI: | $1,646,747 | |||||
| Escrows and Reserves: | U/W NCF: | $1,551,682 | ||||
| U/W NOI DSCR | 1.39x | |||||
| Type: | Initial | Monthly | Cap (If Any) | U/W NCF DSCR: | 1.31x | |
| Taxes(2) | $48,789 | $12,661 | NAP | U/W NOI Debt Yield: | 8.5% | |
| Insurance(3) | $28,416 | $4,737 | NAP | U/W NCF Debt Yield: | 8.0% | |
| Replacement Reserve(4) | $0 | $2,595 | $150,000 | As-Is Appraised Value: | $28,600,000 | |
| TI/LC Reserve(5) | $0 | $8,750 | $700,000 | As-Is Appraisal Valuation Date: | August 5, 2015 | |
| Tenant Specific TI/LC(6) | $419,500 | $0 | NAP | Cut-off Date LTV Ratio: | 67.8% | |
| Rent Concession Reserve(7) | $11,000 | $0 | NAP | LTV Ratio at Maturity or ARD: | 56.5% | |
| (1) | The sponsors are John Collett, Michael E. Robbe, Michael D. Smith and Tyler C. Covington. |
| (2) | Monthly deposits for taxes will increase to include taxes related to the Kohl’s parcel upon (i) an event of default; (ii) Kohl’s no longer being obligated to pay taxes directly or is not making tax payments directly; (iii) the borrower not providing the lender with evidence of tax payment; or (iv) Kohl’s lease not being in full force or effect. |
| (3) | Monthly deposits for insurance premiums will increase to include insurance related to the Kohl’s parcel upon (i) an event of default; (ii) Kohl’s not maintaining insurance as required; (iii) the borrower not providing the lender with evidence of insurance; or (iv) Kohl’s lease not being in full force or effect. |
| (4) | The replacement reserve is capped at $150,000 as long as (i) no event of default has occurred and is continuing and (ii) the lender determines that the Lawton Town Center Property is being adequately maintained. |
| (5) | The TI/LC reserve is capped at $700,000 as long as (i) no event of default has occurred and is continuing and (ii) the debt yield is at least 7.0%. |
| (6) | The Tenant Specific TI/LC reserve is related to the UPS lease ($17,500) and the vacant space ($402,000). |
| (7) | The Rent Concession reserve is related to the UPS lease. |
| (8) | See “Historical Occupancy” section. |
| (9) | See “Cash Flow Analysis” section. |
The Lawton Town Center mortgage loan is evidenced by a single promissory note that is secured by a first mortgage encumbering a 207,609 square foot, class A anchored retail center (the “Lawton Town Center Property”) located in Lawton, Oklahoma, which is positioned approximately 75.0 miles southwest of Oklahoma City, Oklahoma. Constructed in 2014, the Lawton Town Center Property is situated on a 22.6-acre site and is anchored by Dick’s Sporting Goods, Bed Bath & Beyond and Kohl’s, which is on a ground lease. The Lawton Town Center Property features 992 surface parking spaces resulting in a parking ratio of 4.8 spaces per 1,000 square feet of rentable area. The estimated 2015 population within a one-, three- and five-mile radius of the Lawton Town Center Property was 3,762, 45,627 and 229,938, respectively, while the 2015 estimated average household income within the same radii was $43,506, $50,875 and $55,188, respectively. As of September 9, 2015, the Lawton Town Center Property was 92.6% occupied by 13 tenants.
According to the appraisal, the Lawton Town Center Property is located in the Lawton retail market which, as of the second quarter of 2015, was comprised of 194 buildings totaling 1.8 million square feet. As of the second quarter of 2015, the Lawton retail market reported a vacancy rate of 2.7% and an averge annual rental rate of $6.91 per square foot, triple-net.
THE INFORMATION IN THIS STRUCTURAL AND COLLATERAL TERM SHEET IS NOT COMPLETE AND MAY BE AMENDED PRIOR TO THE TIME OF SALE. THIS TERM SHEET IS NOT AN OFFER TO SELL THESE SECURITIES AND IT IS NOT A SOLICITATION OF AN OFFER TO BUY THESE SECURITIES IN ANY JURISDICTION WHERE THE OFFER OR SALE IS NOT PERMITTED.
| 126 |
| LAWTON TOWN CENTER |
Sources and Uses
| Sources | Uses | |||||||
| Original loan amount | $19,400,000 | 100.0% | Loan payoff | $18,540,293 | 95.6% | |||
| Reserves | 507,705 | 2.6 | ||||||
| Closing costs | 145,124 | 0.7 | ||||||
| Return of equity | 206,878 | 1.1 | ||||||
| Total Sources | $19,400,000 | 100.0% | Total Uses | $19,400,000 | 100.0% |
The following table presents certain information relating to the tenancy at the Lawton Town Center Property:
Major Tenants
| Tenant Name | Credit Rating (Fitch/ Moody’s/ S&P)(1) | Tenant NRSF | % of NRSF | Annual U/W Base Rent PSF | Annual U/W Base Rent | % of Total Annual U/W Base Rent | Sales PSF(2) | Occupancy Cost(2) | Lease Expiration Date |
| Anchor Tenant | |||||||||
| Dick’s Sporting Goods | NR/NR/NR | 45,000 | 21.7% | $9.50 | $427,500 | 23.8% | NAV | NAV | 1/31/2025(3) |
| Bed Bath & Beyond | NR/Baa1/A- | 20,400 | 9.8% | $11.00 | $224,400 | 12.5% | NAV | NAV | 1/31/2025(4) |
| Kohl’s(5) | BBB+/Baa1/BBB | 55,469 | 26.7% | $3.97 | $220,000 | 12.2% | NAV | NAV | 1/31/2035(6) |
| Total Anchor Tenant | 120,869 | 58.2% | $7.21 | $871,900 | 48.5% | ||||
| Major Tenant | |||||||||
| Petco | NR/B2/B | 12,500 | 6.0% | $13.25 | $165,625 | 9.2% | NAV | NAV | 1/31/2025(7) |
| Ulta | NR/NR/NR | 10,000 | 4.8% | $14.50 | $145,000 | 8.1% | NAV | NAV | 5/31/2024(8) |
| JoAnn Fabric | NR/NR/NR | 18,000 | 8.7% | $7.50 | $135,000 | 7.5% | NAV | NAV | 1/31/2025(9) |
| Total Major Tenant | 40,500 | 19.5% | $11.00 | $445,625 | 24.8% | ||||
| Other Tenants | 30,790 | 14.8% | $15.60 | $480,383 | 26.7% | ||||
| Occupied Collateral Total | 192,159 | 92.6% | $9.36 | $1,797,908 | 100.0% | ||||
| Vacant Space | 15,450 | 7.4% | |||||||
| Collateral Total | 207,609 | 100.0% | |||||||
| (1) | Certain Ratings are those of the parent company whether or not the parent guarantees the lease. |
| (2) | Most tenants are not required to report sales. |
| (3) | Dick’s Sporting Goods has four, 5-year renewal options. |
| (4) | Bed Bath & Beyond has four, 5-year renewal options |
| (5) | Kohl’s is on a ground lease and owns its own improvements. |
| (6) | Kohl’s has eight, 5-year renewal options. |
| (7) | Petco has three, 5-year renewal options. |
| (8) | Ulta has three, 5-year renewal options. |
| (9) | JoAnn Fabrics has four, 5-year renewal options. |
THE INFORMATION IN THIS STRUCTURAL AND COLLATERAL TERM SHEET IS NOT COMPLETE AND MAY BE AMENDED PRIOR TO THE TIME OF SALE. THIS TERM SHEET IS NOT AN OFFER TO SELL THESE SECURITIES AND IT IS NOT A SOLICITATION OF AN OFFER TO BUY THESE SECURITIES IN ANY JURISDICTION WHERE THE OFFER OR SALE IS NOT PERMITTED.
| 127 |
| LAWTON TOWN CENTER |
The following table presents certain information relating to the lease rollover schedule at the Lawton Town Center Property:
Lease Expiration Schedule(1)(2)
| Year Ending December 31, | No. of Leases Expiring | Expiring NRSF | % of Total NRSF | Cumulative Expiring NRSF | Cumulative % of Total NRSF | Annual U/W Base Rent | Annual U/W Base Rent PSF(3) |
| MTM | 0 | 0 | 0.0% | 0 | 0.0% | $0 | $0.00 |
| 2015 | 0 | 0 | 0.0% | 0 | 0.0% | $0 | $0.00 |
| 2016 | 0 | 0 | 0.0% | 0 | 0.0% | $0 | $0.00 |
| 2017 | 0 | 0 | 0.0% | 0 | 0.0% | $0 | $0.00 |
| 2018 | 0 | 0 | 0.0% | 0 | 0.0% | $0 | $0.00 |
| 2019 | 3 | 12,710 | 6.1% | 12,710 | 6.1% | $181,300 | $14.26 |
| 2020 | 1 | 1,330 | 0.6% | 14,040 | 6.8% | $25,270 | $19.00 |
| 2021 | 0 | 0 | 0.0% | 14,040 | 6.8% | $0 | $0.00 |
| 2022 | 1 | 1,750 | 0.8% | 15,790 | 7.6% | $32,813 | $18.75 |
| 2023 | 0 | 0 | 0.0% | 15,790 | 7.6% | $0 | $0.00 |
| 2024 | 1 | 10,000 | 4.8% | 25,790 | 12.4% | $145,000 | $14.50 |
| 2025 | 6 | 110,900 | 53.4% | 136,690 | 65.8% | $1,193,525 | $10.76 |
| Thereafter | 1 | 55,469 | 26.7% | 192,159 | 92.6% | $220,000 | $3.97 |
| Vacant | 0 | 15,450 | 7.4% | 207,609 | 100.0% | $0 | $0.00 |
| Total/Weighted Average | 13 | 207,609 | 100.0% | $1,797,908 | $9.36 |
| (1) | Information obtained from the underwritten rent roll. |
| (2) | Certain tenants may have lease termination options that are exercisable prior to the originally stated expiration date of the subject lease and that are not considered in the Lease Expiration Schedule. |
| (3) | Weighted Average Annual U/W Base Rent PSF excludes vacant space. |
The following table presents historical occupancy percentages at the Lawton Town Center Property:
Historical Occupancy
12/31/2012(1) | 12/31/2013(1) | 12/31/2014(1) | 9/9/2015(2) | ||||
| NAV | NAV | NAV | 92.6% |
| (1) | Historical occupancy is not available as the Lawton Town Center Property was constructed in 2014. |
| (2) | Information obtained from the underwritten rent roll. |
Operating History and Underwritten Net Cash Flow. The following table presents certain information relating to the historical operating performance and underwritten net cash flow at the Lawton Town Center Property:
Cash Flow Analysis(1)
Annualized YTD 7/31/2015 | U/W | % of U/W Gross Income | U/W $ per SF | ||||||
| Base Rent | $1,761,660 | $1,797,908 | 84.7% | $8.66 | |||||
| Grossed Up Vacant Space | 0 | 243,400 | 11.5 | 1.17 | |||||
| Total Reimbursables | 219,149 | 325,067 | 15.3 | 1.57 | |||||
| Free Rent Adjustment | (114,122) | 0 | 0.0 | 0.00 | |||||
| Less Vacancy and Credit Loss | 0 | (243,400)(2) | (11.5) | (1.17) | |||||
| Effective Gross Income | $1,866,687 | $2,122,975 | 100.0% | $10.23 | |||||
| Total Operating Expenses | $316,047 | $476,228 | 22.4% | $2.29 | |||||
|
|
|
| ||||||
| Net Operating Income | $1,550,640 | $1,646,747 | 77.6% | $7.93 | |||||
| TI/LC | 0 | 74,304 | 3.5 | 0.36 | |||||
| Capital Expenditures | 0 | 20,761 | 1.0 | 0.10 | |||||
| Net Cash Flow | $1,550,640 | $1,551,682 | 73.1% | $7.47 | |||||
| NOI DSCR | 1.31x | 1.39x | |||||||
| NCF DSCR | 1.31x | 1.31x | |||||||
| NOI DY | 8.0% | 8.5% | |||||||
| NCF DY | 8.0% | 8.0% | |||||||
| (1) | Histoical cash flow is not available as the Lawton Town Center Property was constructed in 2014. |
| (2) | The underwritten economic vacancy is 11.9%. The Lawton Town Center Property was 92.6% physically occupied as of September 9, 2015. |
THE INFORMATION IN THIS STRUCTURAL AND COLLATERAL TERM SHEET IS NOT COMPLETE AND MAY BE AMENDED PRIOR TO THE TIME OF SALE. THIS TERM SHEET IS NOT AN OFFER TO SELL THESE SECURITIES AND IT IS NOT A SOLICITATION OF AN OFFER TO BUY THESE SECURITIES IN ANY JURISDICTION WHERE THE OFFER OR SALE IS NOT PERMITTED.
| 128 |
(THIS PAGE INTENTIONALLY LEFT BLANK)
THE INFORMATION IN THIS STRUCTURAL AND COLLATERAL TERM SHEET IS NOT COMPLETE AND MAY BE AMENDED PRIOR TO THE TIME OF SALE. THIS TERM SHEET IS NOT AN OFFER TO SELL THESE SECURITIES AND IT IS NOT A SOLICITATION OF AN OFFER TO BUY THESE SECURITIES IN ANY JURISDICTION WHERE THE OFFER OR SALE IS NOT PERMITTED.
| 129 |
| No. 15 – Zephyr Commons | ||||||||
| Loan Information | Property Information | |||||||
| Mortgage Loan Seller: | Wells Fargo Bank, National Association | Single Asset/Portfolio: | Single Asset | |||||
Credit Assessment (Fitch/Moody’s/Morningstar): | NR/NR/NR | Property Type: | Retail | |||||
| Original Principal Balance: | $17,000,000 | Specific Property Type: | Anchored | |||||
| Cut-off Date Principal Balance: | $17,000,000 | Location: | Zephyrhills, FL | |||||
| % of Initial Pool Balance: | 1.7% | Size: | 115,318 SF | |||||
| Loan Purpose: | Refinance | Cut-off Date Principal Balance Per SF: | $147.42 | |||||
| Borrower Name: | SF Zephyr Commons LP | Year Built/Renovated: | 2009/NAP | |||||
| Sponsors(1): | Various | Title Vesting: | Fee | |||||
| Mortgage Rate: | 4.580% | Property Manager: | Primerica Group One, Inc. | |||||
| Note Date: | September 4, 2015 | 3rd Most Recent Occupancy (As of): | 98.9% (12/31/2012) | |||||
| Anticipated Repayment Date: | NAP | 2nd Most Recent Occupancy (As of): | 98.9% (12/31/2013) | |||||
| Maturity Date: | September 11, 2025 | Most Recent Occupancy (As of): | 97.9% (12/31/2014) | |||||
| IO Period: | 60 months | Current Occupancy (As of): | 97.9% (7/27/2015) | |||||
| Loan Term (Original): | 120 months | |||||||
| Seasoning: | 2 months | |||||||
| Amortization Term (Original): | 360 months | Underwriting and Financial Information: | ||||||
| Loan Amortization Type: | Interest-only, Amortizing Balloon | |||||||
| Interest Accrual Method: | Actual/360 | 3rd Most Recent NOI (As of): | $1,511,851 (12/31/2013) | |||||
| Call Protection: | L(26),D(87),O(7) | 2nd Most Recent NOI (As of): | $1,571,667 (12/31/2014) | |||||
| Lockbox Type: | Springing | Most Recent NOI (As of): | $1,485,357 (TTM 6/30/2015) | |||||
| Additional Debt: | None | |||||||
| Additional Debt Type: | NAP | |||||||
| U/W Revenues: | $2,174,217 | |||||||
| U/W Expenses: | $700,131 | |||||||
| U/W NOI: | $1,474,086 | |||||||
| U/W NCF: | $1,364,054 | |||||||
| U/W NOI DSCR | 1.41x | |||||||
| Escrows and Reserves: | U/W NCF DSCR: | 1.31x | ||||||
| U/W NOI Debt Yield: | 8.7% | |||||||
| Type: | Initial | Monthly | Cap (If Any) | U/W NCF Debt Yield: | 8.0% | |||
| Taxes(2) | $0 | Springing | NAP | As-Is Appraised Value: | $24,750,000 | |||
| Insurance(3) | $0 | Springing | NAP | As-Is Appraisal Valuation Date: | July 16, 2015 | |||
| Replacement Reserve | $0 | $1,441 | NAP | Cut-off Date LTV Ratio: | 68.7% | |||
| TI/LC Reserve(4) | $0 | $7,207 | (4) | LTV Ratio at Maturity or ARD: | 62.9% | |||
| (1) | The sponsors are NADG US Supermarket Anchored Fund (U.S.) Limited Partnership and NADG US Supermarket Anchored Fund (Canadian) Limited Partnership. |
| (2) | Ongoing monthly reserves for taxes are not required as long as (i) no event of default has occurred and is continuing; and (ii) the borrower provides proof of payment prior to delinquency. |
| (3) | Ongoing monthly reserves for insurance are not required as long as (i) no event of default has occurred and is continuing; (ii) the Zephyr Commons Property is insured by an acceptable blanket insurance policy; and (iii) the borrower provides the lender with evidence of renewal of the insurance policies and timely proof of payment of insurance premiums. |
| (4) | Prior to January 11, 2020, the TI/LC reserve is capped at $260,000 as long as (i) there is no event of default; and (ii) the net cash flow debt yield is at least 7.75%. On or after January 11, 2020, the TI/LC reserve is capped at $200,000 as long as (i) there is no event of default; (ii) Staples has exercised its renewal option on terms acceptable to the lender, or a replacement tenant occupying at least 70.0% of the Staples space has executed a lease on terms and conditions acceptable to lender and the replacement tenant is in occupancy, paying unabated rent, and all applicable TI/LCs have been completed; and (iii) the net cash flow debt yield is at least 7.75%. |
The Zephyr Commons mortgage loan is evidenced by a single promissory note that is secured by a first mortgage encumbering a class A, anchored retail center containing 115,318 square feet and located in Zephyrhills, Florida, (the “Zephyr Commons Property”) approximately 32.1 miles north of the Tampa central business district. Constructed in 2009, the Zephyr Commons Property is situated on a 21.8-acre site and is anchored by a Publix grocery store. The Zephyr Commons Property contains 623 surface parking spaces resulting in a parking ratio of 5.4 spaces per 1,000 square feet of rentable area. The estimated 2015 population within a one-, three- and five-mile radius of the Zephyr Commons Property was 4,510, 27,686, and 53,504, respectively, and the 2015 estimated average household income within the same radii was $49,843, $50,260, and $51,243, respectively. As of July 27, 2015, the property was 97.9% occupied by 19 tenants.
According to the appraisal, the Zephyr Commons Property is located in the Pasco County retail submarket, which contained 23.2 million square feet of retail space as of the first quarter of 2015. For the same period, the submarket reported a vacancy rate of 8.6%, which is down from 9.9% as of the first quarter of 2013. The appraiser concluded to an average market rent at the Zephyr Commons Property of $16.24 per square foot, triple net.
THE INFORMATION IN THIS STRUCTURAL AND COLLATERAL TERM SHEET IS NOT COMPLETE AND MAY BE AMENDED PRIOR TO THE TIME OF SALE. THIS TERM SHEET IS NOT AN OFFER TO SELL THESE SECURITIES AND IT IS NOT A SOLICITATION OF AN OFFER TO BUY THESE SECURITIES IN ANY JURISDICTION WHERE THE OFFER OR SALE IS NOT PERMITTED.
| 130 |
| ZEPHYR COMMONS |
Sources and Uses
| Sources | Uses | |||||||
| Original loan amount | $17,000,000 | 99.4% | Loan payoff | $16,986,552 | 99.4% | |||
| Sponsor’s new cash contribution | 97,406 | 0.6 | Closing costs | 110,854 | 0.6 | |||
| Total Sources | $17,097,406 | 100.0% | Total Uses | $17,097,406 | 100.0% |
The following table presents certain information relating to the tenancy at the Zephyr Commons Property:
Major Tenants
| Tenant Name | Credit Rating (Fitch/ Moody’s/ S&P)(1) | Tenant NRSF | % of NRSF | Annual U/W Base Rent PSF | Annual U/W Base Rent | % of Total Annual U/W Base Rent | Sales PSF(2) | Occupancy Cost(2) | Lease Expiration Date |
| Anchor Tenant | |||||||||
| Publix | NR/NR/NR | 54,340 | 47.1% | $11.25 | $611,325 | 36.7% | $568 | 2.7% | 4/30/2029(3) |
| Total Anchor Tenant | 54,340 | 47.1% | $11.25 | $611,325 | 36.7% | ||||
| Major Tenant | |||||||||
| Staples | BBB-/Baa2/BBB- | 18,437 | 16.0% | $13.50 | $248,900 | 14.9% | NAV | NAV | 12/31/2019(4) |
| Pet Supermarket | NR/NR/NR | 7,800 | 6.8% | $17.00 | $132,600 | 8.0% | NAV | NAV | 1/31/2016(5) |
| Mattress Firm | NR/NR/B+ | 3,800 | 3.3% | $26.50 | $100,700 | 6.0% | NAV | NAV | 6/30/2019(6) |
| Five Guys | NR/NR/NR | 2,866 | 2.5% | $25.88 | $74,172 | 4.4% | $275 | 11.3% | 6/30/2021(7) |
| Total Major Tenant | 32,903 | 28.5% | $16.91 | $556,372 | 33.4% | ||||
| Other Tenants | 25,672 | 22.3% | $19.45 | $499,205 | 29.9% | ||||
| Occupied Collateral Total | 112,915 | 97.9% | $14.76 | $1,666,902 | 100.0% | ||||
| Vacant Space | 2,403 | 2.1% | |||||||
| Collateral Total | 115,318 | 100.0% | |||||||
| (1) | Certain Ratings are those of the parent company whether or not the parent guarantees the lease. |
| (2) | Sales PSF and occupancy costs are for the trailing 12-month period ending December 31, 2014. |
| (3) | Publix has seven, 5-year renewal options |
| (4) | Staples has four, 5-year renewal options. |
| (5) | Pet Supermarket has two, 5-year renewal options. |
| (6) | Mattress Firm has two, 5-year renewal options. |
| (7) | Five Guys has two, 5-year renewal options. |
THE INFORMATION IN THIS STRUCTURAL AND COLLATERAL TERM SHEET IS NOT COMPLETE AND MAY BE AMENDED PRIOR TO THE TIME OF SALE. THIS TERM SHEET IS NOT AN OFFER TO SELL THESE SECURITIES AND IT IS NOT A SOLICITATION OF AN OFFER TO BUY THESE SECURITIES IN ANY JURISDICTION WHERE THE OFFER OR SALE IS NOT PERMITTED.
| 131 |
| ZEPHYR COMMONS |
The following table presents certain information relating to the lease rollover schedule at the Zephyr Commons Property:
Lease Expiration Schedule(1)(2)
| Year Ending December 31, | No. of Leases Expiring | Expiring NRSF | % of Total NRSF | Cumulative Expiring NRSF | Cumulative % of Total NRSF | Annual U/W Base Rent | Annual U/W Base Rent PSF(3) |
| MTM | 0 | 0 | 0.0% | 0 | 0.0% | $0 | $0.00 |
| 2015 | 0 | 0 | 0.0% | 0 | 0.0% | $0 | $0.00 |
| 2016 | 5 | 14,200 | 12.3% | 14,200 | 12.3% | $267,600 | $18.85 |
| 2017 | 1 | 4,968 | 4.3% | 19,168 | 16.6% | $67,858 | $13.66 |
| 2018 | 2 | 4,400 | 3.8% | 23,568 | 20.4% | $75,750 | $17.22 |
| 2019 | 6 | 28,041 | 24.3% | 51,609 | 44.8% | $479,154 | $17.09 |
| 2020 | 3 | 4,100 | 3.6% | 55,709 | 48.3% | $91,042 | $22.21 |
| 2021 | 1 | 2,866 | 2.5% | 58,575 | 50.8% | $74,172 | $25.88 |
| 2022 | 0 | 0 | 0.0% | 58,575 | 50.8% | $0 | $0.00 |
| 2023 | 0 | 0 | 0.0% | 58,575 | 50.8% | $0 | $0.00 |
| 2024 | 0 | 0 | 0.0% | 58,575 | 50.8% | $0 | $0.00 |
| 2025 | 0 | 0 | 0.0% | 58,575 | 50.8% | $0 | $0.00 |
| Thereafter | 1 | 54,340 | 47.1% | 112,915 | 97.9% | $611,325 | $11.25 |
| Vacant | 0 | 2,403 | 2.1% | 115,318 | 100.0% | $0 | $0.00 |
| Total/Weighted Average | 19 | 115,318 | 100.0% | $1,666,902 | $14.76 |
| (1) | Information obtained from the underwritten rent roll. |
| (2) | Certain tenants may have lease termination options that are exercisable prior to the originally stated expiration date of the subject lease and that are not considered in the Lease Expiration Schedule. |
| (3) | Weighted Average Annual U/W Base Rent PSF excludes vacant space. |
The following table presents historical occupancy percentages at the Zephyr Commons Property:
Historical Occupancy
12/31/2012(1) | 12/31/2013(1) | 12/31/2014(1) | 7/27/2015(2) | |||
| 98.9% | 98.9% | 97.9% | 97.9% |
| (1) | Information obtained from the borrower. |
| (2) | Information obtained from the underwritten rent roll. |
Operating History and Underwritten Net Cash Flow. The following table presents certain information relating to the historical operating performance and underwritten net cash flow at the Zephyr Commons Property:
Cash Flow Analysis
| 2013 | 2014 | TTM 6/30/2015 | U/W | % of U/W Effective Gross Income | U/W $ per SF | ||||||||
| Base Rent | $1,629,133 | $1,714,475 | $1,770,512 | $1,666,902 | 76.7% | $14.45 | |||||||
| Grossed Up Vacant Space | 0 | 0 | 0 | 64,881 | 3.0 | 0.56 | |||||||
| Total Reimbursables | 518,085 | 547,684 | 593,546 | 518,104 | 23.8 | 4.49 | |||||||
| Other Income | 11,520 | 12,510 | 12,070 | 10,920 | 0.5 | 0.09 | |||||||
| Less Vacancy & Credit Loss | 0 | 0 | 0 | (86,589)(1) | (4.0) | (0.75) | |||||||
| Effective Gross Income | $2,158,739 | $2,274,669 | $2,376,128 | $2,174,217 | 100.0% | $18.85 | |||||||
| Total Operating Expenses | $646,888 | $703,003 | $890,771 | $700,131 | 32.2% | $6.07 | |||||||
|
|
|
|
|
| ||||||||
| Net Operating Income | $1,511,851 | $1,571,667 | $1,485,357 | $1,474,086 | 67.8% | $12.78 | |||||||
| TI/LC | 0 | 0 | 0 | 86,969 | 4.0 | 0.75 | |||||||
| Capital Expenditures | 0 | 0 | 0 | 23,064 | 1.1 | 0.20 | |||||||
| Net Cash Flow | $1,511,851 | $1,571,667 | $1,485,357 | $1,364,054 | 62.7% | $11.83 | |||||||
| NOI DSCR | 1.45x | 1.51x | 1.42x | 1.41x | |||||||||
| NCF DSCR | 1.45x | 1.51x | 1.42x | 1.31x | |||||||||
| NOI DY | 8.9% | 9.2% | 8.7% | 8.7% | |||||||||
| NCF DY | 8.9% | 9.2% | 8.7% | 8.0% |
| (1) | The underwritten economic vacancy is 5.0%. The Zephyr Commons Property was 97.9% physically occupied as of July 27, 2015. |
THE INFORMATION IN THIS STRUCTURAL AND COLLATERAL TERM SHEET IS NOT COMPLETE AND MAY BE AMENDED PRIOR TO THE TIME OF SALE. THIS TERM SHEET IS NOT AN OFFER TO SELL THESE SECURITIES AND IT IS NOT A SOLICITATION OF AN OFFER TO BUY THESE SECURITIES IN ANY JURISDICTION WHERE THE OFFER OR SALE IS NOT PERMITTED.
| 132 |
| Wells Fargo Commercial Mortgage Trust 2015-C31 | Transaction Contact Information |
VI. Transaction Contact Information
Questions regarding this Structural and Collateral Term Sheet may be directed to any of the following individuals:
Wells Fargo Securities, LLC
| Brigid Mattingly | Tel. (312) 269-3062 | |
| Fax (312) 658-0140 | ||
| A.J. Sfarra | Tel. (212) 214-5613 | |
| Fax (212) 214-8970 | ||
| Alex Wong | Tel. (212) 214-5615 | |
| Fax (212) 214-8970 | ||
| SG Americas Securities, LLC | ||
| Adam Ansaldi | Tel. (212) 278-6126 | |
| Jim Barnard | Tel. (212) 278-6263 | |
| John Caputo | Tel. (212) 278-5086 | |
| Warren Geiger | Tel. (212) 278-5692 |
THE INFORMATION IN THIS STRUCTURAL AND COLLATERAL TERM SHEET IS NOT COMPLETE AND MAY BE AMENDED PRIOR TO THE TIME OF SALE. THIS TERM SHEET IS NOT AN OFFER TO SELL THESE SECURITIES AND IT IS NOT A SOLICITATION OF AN OFFER TO BUY THESE SECURITIES IN ANY JURISDICTION WHERE THE OFFER OR SALE IS NOT PERMITTED.
| 133 |