UNITED STATES
SECURITIES AND EXCHANGE COMMISSION
Washington, D.C. 20549
FORM N-CSR
Certified Shareholder Report of
Registered Management Investment Companies
Investment Company Act File Number: 811-23101
American Funds Strategic Bond Fund
(Exact Name of Registrant as Specified in Charter)
6455 Irvine Center Drive
Irvine, California 92618
(Address of Principal Executive Offices)
Registrant's telephone number, including area code: (213) 486-9200
Date of fiscal year end: December 31
Date of reporting period: June 30, 2018
Steven I. Koszalka
American Funds Strategic Bond Fund
333 South Hope Street
Los Angeles, California 90071
(Name and Address of Agent for Service)
ITEM 1 – Reports to Stockholders
 | American Funds
Strategic Bond FundSM Semi-annual report
for the six months ended
June 30, 2018 |

Our distinctive
approach relies on
flexibility in the
pursuit of enhanced
long-term results.
American Funds Strategic Bond Fund seeks to provide maximum total return consistent with the preservation of capital.
This fund is one of more than 40 offered by Capital Group, home of American Funds, one of the nation’s largest mutual fund families. For more than 85 years, Capital Group has invested with a long-term focus based on thorough research and attention to risk.
Fund results shown in this report, unless otherwise indicated, are for Class A shares at net asset value. If a sales charge (maximum 3.75%) had been deducted, the results would have been lower. Results are for past periods and are not predictive of results for future periods. Current and future results may be lower or higher than those shown. Share prices and returns will vary, so investors may lose money. Investing for short periods makes losses more likely. For current information and month-end results, visit americanfunds.com.
Here are total returns on a $1,000 investment with all distributions reinvested for the period ended June 30, 2018:
| Class A shares | | 1 year | | Lifetime
(since 3/18/16) |
| | | | | |
| Reflecting 3.75% maximum sales charge | | –4.40% | | –0.08% |
For other share class results, visit americanfunds.com and americanfundsretirement.com.
The total annual fund operation expense ratio was 1.09% for Class A shares as of the prospectus dated March 1, 2018. The net expense ratio was 1.02%.
Investment results assume all distributions are reinvested and reflect applicable fees and expenses. The investment adviser is currently reimbursing a portion of other expenses. The reimbursement will be in effect through at least March 1, 2019. The adviser may elect to extend, modify or terminate the reimbursement at that time. The investment results and net expense ratio shown reflect the reimbursement, without which the results would have been lower and the expenses higher. Refer to the fund’s most recent prospectus for details.
Investments are not FDIC-insured, nor are they deposits of or guaranteed by a bank or any other entity, so they may lose value.
Fellow investors:
A period of historically low volatility came to a close as yields rose sharply amid the backdrop of a resilient U.S. economy in the first half of American Funds Strategic Bond Fund’s fiscal year.
For the six months ended June 30, 2018, the fund declined by 1.38%, with all distributions reinvested. By comparison, the unmanaged Bloomberg Barclays U.S. Aggregate Index — the core bond benchmark that the fund seeks to outpace — lost 1.62%. The fund’s peer group, as measured by the Lipper Core Plus Bond Funds Average fell 1.74%.
During the six-month period, the fund paid dividends totaling 6 cents a share, resulting in an income return of 0.59% for those investors who reinvested dividends or took their dividends in cash.
Bond market overview
The year began with the U.S. economy growing at a modest pace, benefiting from new tax cuts and increased fiscal spending. The unemployment rate hit 3.8% in May, matching the lowest reading in nearly 50 years. This tight labor market helped to push wages up in the second quarter to the highest average growth in a decade.
At 2.9% year-over-year in June, the Consumer Price Index (CPI) hit a level not seen since 2012. Core CPI, which removes volatile food and energy prices, rose to 2.2%. These and other factors kept the Federal Reserve on its tightening path, raising short-term rates twice over the period.
These factors led markets to price rates higher across the Treasury curve, with sharper increases in shorter maturities. Although the 10-year benchmark yield briefly crossed
Results at a glance
For periods ended June 30, 2018, with all distributions reinvested
| | | Cumulative
total returns | | Average annual
total returns |
| | | 6 months | | 1 year | | Lifetime
(since 3/18/16) |
| | | | | | | | | | | |
| American Funds Strategic Bond Fund (Class A shares) | | | –1.38 | % | | | –0.67 | % | | | 1.61 | % |
| Bloomberg Barclays U.S. Aggregate Index* | | | –1.62 | | | | –0.40 | | | | 0.91 | |
| Lipper Core Plus Bond Funds Average† | | | –1.74 | | | | –0.34 | | | | 2.21 | |
| * | Source: Bloomberg Index Services Ltd. The market index is unmanaged and, therefore, has no expenses. Investors cannot invest directly in an index. |
| † | Source: Thomson Reuters Lipper. Lipper averages reflect the current composition of all eligible mutual funds (all share classes) within a given category. Lipper categories are dynamic and averages may have few funds, especially over longer periods. To see the number of funds included in the Lipper category for each fund’s lifetime, please see the Quarterly Statistical Update, available on our website. |
| American Funds Strategic Bond Fund | 1 |
the 3% threshold, it settled at 2.85%, 45 basis points higher than at the start of the year. By comparison, the 2-year Treasury note ended June at 2.52%, an increase of 63 basis points over the period.
Higher rates and inflation helped spark market volatility in the first quarter, following a period of extreme calm. Uncertainty surrounding global trade policy and the effect of tighter lending and elevated borrowing costs facing emerging markets helped that moderate volatility to persist throughout the period.
Inside the portfolio
Several factors led the fund to outpace its benchmark over the period. The managers’ cautious credit stance provided protection from an investment-grade corporate bond sector that lost 3.3%, as corporate spreads to Treasuries widened by 30 basis points. They used derivatives — credit default swaps — to reduce exposure to credit, which provided a positive contribution to results.
More attractively priced corporates provided additional opportunities for managers to find value in new issues. For example, they purchased bonds offered as a part of CVS Health’s $40 billion transaction used to finance its acquisition of health insurer Aetna in the first quarter, the largest of the year.
The fund’s Treasury Inflation-Protected Securities overweight also boosted relative results. Rising inflation expectations helped the sector’s returns to outpace the broader Treasury market by roughly 100 basis points.
Managers anticipated that at this latter stage in the economic cycle, the yield curve would steepen, as investors seek higher term premiums for longer maturity bonds. However, because the market priced a greater likelihood of rising shorter term rates, the curve flattened instead. The yield on 30-year Treasury notes exceeded the 5-year yield by just 25 basis points at the end of June.
To manage duration — the fund’s sensitivity to changes in interest rates — and curve positioning, managers utilized both cash bonds and derivatives such as interest rate swaps and futures. Here, the fund primarily used these derivatives to shift its interest-rate exposure away from long maturities toward intermediate maturities.
The shift in rates has strengthened managers’ conviction that the curve will steepen, as they now see short- and intermediate-term yields more likely to fall than to move higher. That has led them to concentrate their duration in the two- to five-year part of the curve, where they believe bond prices could see stronger gains if volatility or other factors throw the Fed off course.
Looking ahead
Despite wobbles and uncertainty, U.S. growth is estimated to have risen to or even above 4% in the second quarter on an annualized basis. Managers anticipate the U.S. economy to continue to expand well into next year. However, persistent volatility is also likely due to a cloudier global outlook, central banks pulling back monetary
| 2 | American Funds Strategic Bond Fund |
stimulus and trade policy anxiety. For that reason, managers are mostly aligned with the market’s current Fed assessment — that it will continue to gradually raise rates but that volatility could prevent the central bank from hiking as many times next year as projected.
Managers also anticipate that inflation will continue to increase moderately, with core CPI rising to 2.5% by the year-end, and consequently maintain a notable TIPS position. They remain cautious on credit, despite the recent spread widening. At present levels, many corporate bonds still look expensive, but careful security selection can reveal investments with greater upside potential.
Although recent trends present challenges, managers believe the current environment is one of the best in years for fixed income investors. In this market they feel they can more readily employ their highest conviction ideas in pursuit of excess returns for shareholders.
We thank you for your support and look forward to reporting to you again in six months.
Cordially,

David A. Hoag
President
August 15, 2018
For current information about the fund, visit americanfunds.com.
The fund’s 30-day yield for Class A shares as of July 31, 2018, reflecting the 3.75% maximum sales charge and calculated in accordance with the U.S. Securities and Exchange Commission formula, was 3.55% (3.51% without the reimbursement).
The return of principal for bond funds and for funds with significant underlying bond holdings is not guaranteed. Fund shares are subject to the same interest rate, inflation and credit risks associated with the underlying bond holdings. The use of derivatives involves a variety of risks, which may be different from, or greater than, the risks associated with investing in traditional cash securities, such as stocks and bonds. Lower rated bonds are subject to greater fluctuations in value and risk of loss of income and principal than higher rated bonds. Investing outside the United States involves additional risks, such as currency fluctuations, periods of illiquidity and price volatility, as more fully described in the prospectus. These risks may be heightened in connection with investments in developing countries. Refer to the fund prospectus and the Risk Factors section of this report for more information on these and other risks associated with investing in the fund.
| American Funds Strategic Bond Fund | 3 |
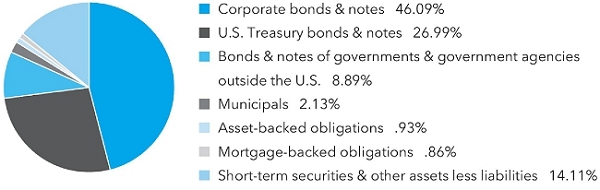
| Summary investment portfolio June 30, 2018 | unaudited |
| | |
| Portfolio by type of security | Percent of net assets |
| Portfolio quality summary* | | Percent of
net assets |
| U.S. Treasury and agency† | | 26.99 | % |
| AAA/Aaa | | 1.79 | |
| AA/Aa | | 1.72 | |
| A/A | | 16.76 | |
| BBB/Baa | | 25.61 | |
| Below investment grade | | 12.94 | |
| Unrated | | .08 | |
| Short-term securities & other assets less liabilities | | 14.11 | |
| * | Bond ratings, which typically range from AAA/Aaa (highest) to D (lowest), are assigned by credit rating agencies such as Standard & Poor’s, Moody’s and/or Fitch as an indication of an issuer’s creditworthiness. In assigning a credit rating to a security, the fund looks specifically to the ratings assigned to the issuer of the security by Standard & Poor’s, Moody’s and/or Fitch. If agency ratings differ, the security will be considered to have received the highest of those ratings, consistent with the fund’s investment policies. Securities in the “unrated” category (above) have not been rated by a rating agency; however, the investment adviser performs its own credit analysis and assigns comparable ratings that are used for compliance with the fund’s investment policies. |
| † | These securities are guaranteed by the full faith and credit of the U.S. government. |
| Bonds, notes & other debt instruments 85.89% | | Principal amount
(000) | | | Value
(000) | |
| Corporate bonds & notes 46.09% | | | | | | | | |
| Health care 8.12% | | | | | | | | |
| Anthem, Inc. 3.65% 2027 | | $ | 5,300 | | | $ | 5,028 | |
| Bayer US Finance II LLC 4.375% 20281 | | | 3,560 | | | | 3,573 | |
| CVS Health Corp. 4.30% 2028 | | | 9,015 | | | | 8,906 | |
| CVS Health Corp. 4.78% 2038 | | | 2,245 | | | | 2,226 | |
| Teva Pharmaceutical Finance Company BV 2.80% 2023 | | | 3,690 | | | | 3,190 | |
| Teva Pharmaceutical Finance Company BV 6.00% 2024 | | | 5,710 | | | | 5,709 | |
| Teva Pharmaceutical Finance Company BV 4.10% 2046 | | | 1,365 | | | | 978 | |
| Other securities | | | | | | | 19,188 | |
| | | | | | | | 48,798 | |
| 4 | American Funds Strategic Bond Fund |
| | | Principal amount
(000) | | | Value
(000) | |
| Energy 7.78% | | | | | | | | |
| Concho Resources Inc. 4.30% 2028 | | $ | 3,495 | | | $ | 3,497 | |
| Energy Transfer Partners, LP 4.20%–6.63% 2026–20492 | | | 7,278 | | | | 6,809 | |
| Petrobras Global Finance Co. 5.75%–7.38% 2027–20441 | | | 4,955 | | | | 4,542 | |
| TransCanada PipeLines Ltd. 4.25% 2028 | | | 2,685 | | | | 2,698 | |
| Western Gas Partners LP 5.30% 2048 | | | 2,900 | | | | 2,672 | |
| Other securities | | | | | | | 26,483 | |
| | | | | | | | 46,701 | |
| | | | | | | | | |
| Utilities 5.55% | | | | | | | | |
| Consolidated Edison Co. of New York 4.50% 2058 | | | 3,430 | | | | 3,415 | |
| Drax Finco PLC 6.625% 20251 | | | 3,000 | | | | 2,992 | |
| SCANA Corp. 4.13%–6.25% 2020–2022 | | | 4,150 | | | | 4,153 | |
| South Carolina Electric & Gas Co. 4.10%–5.45% 2041–2046 | | | 2,594 | | | | 2,699 | |
| Other securities | | | | | | | 20,096 | |
| | | | | | | | 33,355 | |
| | | | | | | | | |
| Financials 5.00% | | | | | | | | |
| Barclays Bank PLC 4.972% 2029 (3-month USD-LIBOR + 1.902% on 5/16/2028)2 | | | 3,000 | | | | 2,977 | |
| BNP Paribas 3.375% 20251 | | | 2,725 | | | | 2,577 | |
| Citigroup Inc. 4.044% 2024 (3-month USD-LIBOR + 1.023% on 6/1/2023)2 | | | 3,000 | | | | 3,019 | |
| Danske Bank AS 3.875% 20231 | | | 4,000 | | | | 3,972 | |
| Lloyds Banking Group PLC 2.907% 2023 (3-month USD-LIBOR + 0.81% on 11/7/2022)2 | | | 4,100 | | | | 3,908 | |
| Standard Chartered PLC 3.885% 2024 (3-month USD-LIBOR + 1.08% on 3/15/2023)1,2 | | | 4,400 | | | | 4,323 | |
| Other securities | | | | | | | 9,277 | |
| | | | | | | | 30,053 | |
| | | | | | | | | |
| Consumer staples 4.83% | | | | | | | | |
| British American Tobacco PLC 2.76%–4.54% 2022–20471 | | | 9,290 | | | | 8,748 | |
| Maple Escrow 5.085% 20481 | | | 3,518 | | | | 3,558 | |
| Reynolds American Inc. 5.85% 2045 | | | 205 | | | | 225 | |
| Wal-Mart Stores, Inc. 4.05% 2048 | | | 4,500 | | | | 4,515 | |
| Other securities | | | | | | | 11,991 | |
| | | | | | | | 29,037 | |
| | | | | | | | | |
| Industrials 3.84% | | | | | | | | |
| CSX Corp. 3.80% 2028 | | | 4,380 | | | | 4,274 | |
| Northrop Grumman Corp. 3.25% 2028 | | | 3,485 | | | | 3,286 | |
| Republic Services, Inc. 3.375% 2027 | | | 3,325 | | | | 3,156 | |
| Other securities | | | | | | | 12,362 | |
| | | | | | | | 23,078 | |
| | | | | | | | | |
| Consumer discretionary 3.53% | | | | | | | | |
| Netflix, Inc. 5.875% 20281 | | | 3,450 | | | | 3,501 | |
| Other securities | | | | | | | 17,675 | |
| | | | | | | | 21,176 | |
| | | | | | | | | |
| Materials 3.37% | | | | | | | | |
| Platform Specialty Products Corp. 5.875% 20251 | | | 2,950 | | | | 2,887 | |
| Sherwin-Williams Co. 3.45% 2027 | | | 3,680 | | | | 3,480 | |
| Other securities | | | | | | | 13,899 | |
| | | | | | | | 20,266 | |
| American Funds Strategic Bond Fund | 5 |
| Bonds, notes & other debt instruments (continued) | | Principal amount
(000) | | | Value
(000) | |
| Corporate bonds & notes (continued) | | | | | | | | |
| Information technology 2.44% | | | | | | | | |
| salesforce.com, inc. 3.70% 2028 | | $ | 4,500 | | | $ | 4,472 | |
| Other securities | | | | | | | 10,205 | |
| | | | | | | | 14,677 | |
| | | | | | | | | |
| Telecommunication services 1.30% | | | | | | | | |
| Other securities | | | | | | | 7,771 | |
| |
| Real estate 0.33% | | | | | | | | |
| Other securities | | | | | | | 1,949 | |
| | | | | | | | | |
| Total corporate bonds & notes | | | | | | | 276,861 | |
| | | | | | | | | |
| U.S. Treasury bonds & notes 26.99% | | | | | | | | |
| U.S. Treasury inflation-protected securities 17.15% | | | | | | | | |
| U.S. Treasury Inflation-Protected Security 0.375% 20253 | | | 25,535 | | | | 25,091 | |
| U.S. Treasury Inflation-Protected Security 0.125% 20263,4 | | | 9,981 | | | | 9,564 | |
| U.S. Treasury Inflation-Protected Security 0.375% 20273 | | | 10,241 | | | | 9,965 | |
| U.S. Treasury Inflation-Protected Security 0.50% 20283 | | | 11,958 | | | | 9,937 | |
| U.S. Treasury Inflation-Protected Security 2.125% 20413 | | | 2,974 | | | | 3,766 | |
| U.S. Treasury Inflation-Protected Security 0.875% 20473,4 | | | 27,086 | | | | 27,067 | |
| U.S. Treasury Inflation-Protected Security 1.00% 20483,4 | | | 12,622 | | | | 10,490 | |
| U.S. Treasury Inflation-Protected Securities 0.13%–1.00% 2023–20463,4 | | | 7,228 | | | | 7,162 | |
| | | | | | | | 103,042 | |
| | | | | | | | | |
| U.S. Treasury 9.84% | | | | | | | | |
| U.S. Treasury 2.625% 2021 | | | 9,380 | | | | 9,380 | |
| U.S. Treasury 2.625% 2023 | | | 36,191 | | | | 36,003 | |
| U.S. Treasury 2.875% 2028 | | | 11,458 | | | | 11,472 | |
| U.S. Treasury 2.00%–2.63% 2021–20244 | | | 2,305 | | | | 2,265 | |
| | | | | | | | 59,120 | |
| | | | | | | | | |
| Total U.S. Treasury bonds & notes | | | | | | | 162,162 | |
| | | | | | | | | |
| Bonds & notes of governments & government agencies outside the U.S. 8.89% | | | | | |
| Brazil (Federative Republic of) 6.00% 2050–20553 | | BRL | 10,052 | | | | 2,590 | |
| India (Republic of) 7.61% 2030 | | INR | 367,000 | | | | 5,147 | |
| India (Republic of) 7.88% 2030 | | | 333,000 | | | | 4,774 | |
| Italy (Republic of) 2.00% 2028 | | € | 4,800 | | | | 5,296 | |
| Japan, Series 20, 0.10% 20253 | | ¥ | 504,000 | | | | 4,773 | |
| Japan, Series 21, 0.10% 20263 | | | 2,019,817 | | | | 19,238 | |
| Other securities | | | | | | | 11,602 | |
| | | | | | | | 53,420 | |
| | | | | | | | | |
| Municipals 2.13% | | | | | | | | |
| Other 2.13% | | | | | | | | |
| Other securities | | | | | | | 12,810 | |
| | | | | | | | | |
| Total municipals | | | | | | | 12,810 | |
| | | | | | | | | |
| Asset-backed obligations 0.93% | | | | | | | | |
| Ford Credit Auto Owner Trust, Series 2018-1, Class A, 3.19% 20311,5 | | $ | 5,095 | | | | 5,020 | |
| Other securities | | | | | | | 567 | |
| | | | | | | | 5,587 | |
| 6 | American Funds Strategic Bond Fund |
| | | Principal amount
(000) | | | Value
(000) | |
| Mortgage-backed obligations 0.86% | | | | | | | | |
| Federal agency mortgage-backed obligations 0.86% | | | | | | | | |
| Freddie Mac, Series K076, Class A2, Multi Family, 3.90% 20285 | | $ | 3,485 | | | $ | 3,611 | |
| Other securities | | | | | | | 1,570 | |
| | | | | | | | 5,181 | |
| | | | | | | | | |
| Total bonds, notes & other debt instruments (cost: $528,482,000) | | | | | | | 516,021 | |
| | | | | | | | | |
| Short-term securities 12.83% | | | | | | | | |
| Federal Home Loan Bank 1.86% due 7/24/2018 | | | 6,000 | | | | 5,993 | |
| Merck & Co. Inc. 1.97% due 8/8/20181 | | | 11,700 | | | | 11,674 | |
| Nigerian Treasury Bills 12.86%–13.86% due 10/25/2018–3/14/2019 | | NGN | 4,800,000 | | | | 12,620 | |
| Société Générale 1.79% due 7/2/20181 | | $ | 15,000 | | | | 14,998 | |
| Swedbank AB 1.85% due 7/2/2018 | | | 15,000 | | | | 14,998 | |
| Tennessee Valley Authority 1.88% due 7/17/2018 | | | 13,900 | | | | 13,887 | |
| United Overseas Bank Ltd. 2.00% due 7/10/20181 | | | 2,900 | | | | 2,898 | |
| | | | | | | | | |
| Total short-term securities (cost: $77,050,000) | | | | | | | 77,068 | |
| Total investment securities 98.72% (cost: $605,532,000) | | | | | | | 593,089 | |
| Other assets less liabilities 1.28% | | | | | | | 7,691 | |
| | | | | | | | | |
| Net assets 100.00% | | | | | | $ | 600,780 | |
This summary investment portfolio is designed to streamline the report and help investors better focus on the fund’s principal holdings. See the inside back cover for details on how to obtain a complete schedule of portfolio holdings.
“Other securities” includes all issues that are not disclosed separately in the summary investment portfolio. “Other securities” also includes loan participations and assignments, which may be subject to legal or contractual restrictions on resale. The total value of all such loans was $2,411,000, which represented ..40% of the net assets of the fund.
Futures contracts
| | | | | | | | | | | | | | Unrealized | |
| | | | | | | | | | | | | | appreciation | |
| | | | | | | | | Notional | | | Value at | | (depreciation) | |
| | | | | Number of | | | | amount | 6 | | 6/30/2018 | 7 | at 6/30/2018 | |
| Contracts | | Type | | contracts | | Expiration | | (000) | | | (000) | | (000) | |
| 90 Day Euro Dollar Futures | | Long | | 670 | | March 2021 | | | $167,500 | | | | $162,525 | | | $ | 82 | |
| 5 Year Euro-Bobl Futures | | Short | | 25 | | September 2018 | | | (2,500 | ) | | | (3,859 | ) | | | (20 | ) |
| 5 Year U.S. Treasury Note Futures | | Short | | 667 | | October 2018 | | | (66,700 | ) | | | (75,783 | ) | | | 46 | |
| 10 Year Euro-Bund Futures | | Long | | 107 | | September 2018 | | | 10,700 | | | | 20,312 | | | | 9 | |
| 10 Year U.S. Treasury Note Futures | | Long | | 582 | | September 2018 | | | 58,200 | | | | 69,949 | | | | 222 | |
| 10 Year Ultra U.S. Treasury Note Futures | | Long | | 90 | | September 2018 | | | 9,000 | | | | 11,541 | | | | 104 | |
| American Funds Strategic Bond Fund | 7 |
Futures contracts (continued)
| | | | | | | | | | | | | | Unrealized | |
| | | | | | | | | | | | | | appreciation | |
| | | | | | | | | Notional | | | Value at | | (depreciation) | |
| | | | | Number of | | | | amount | 6 | | 6/30/2018 | 7 | at 6/30/2018 | |
| Contracts | | Type | | contracts | | Expiration | | (000) | | | (000) | | (000) | |
| 20 Year U.S. Treasury Bond Futures | | Short | | 121 | | September 2018 | | $ | (12,100 | ) | | $ | (17,545 | ) | | $ | 44 | |
| 30 Year Ultra U.S. Treasury Bond Futures | | Short | | 177 | | September 2018 | | | (17,700 | ) | | | (28,242 | ) | | | (60 | ) |
| | | | | | | | | | | | | | | | | $ | 427 | |
Forward currency contracts
| | | | | | | | | | | Unrealized | |
| | | | | | | | | | | appreciation | |
| Contract amount | | | | | | | (depreciation) | |
| Purchases | | | Sales | | | | | | | at 6/30/2018 | |
| (000) | | | (000) | | | Counterparty | | Settlement date | | (000) | |
| | USD4,596 | | | | SEK40,525 | | | Goldman Sachs | | 7/9/2018 | | | $ | 68 | |
| | JPY373,685 | | | | USD3,420 | | | Goldman Sachs | | 7/9/2018 | | | | (43 | ) |
| | USD3,730 | | | | CAD4,850 | | | JPMorgan Chase | | 7/10/2018 | | | | 40 | |
| | USD2,563 | | | | JPY280,000 | | | JPMorgan Chase | | 7/10/2018 | | | | 32 | |
| | USD2,484 | | | | JPY271,945 | | | Goldman Sachs | | 7/10/2018 | | | | 26 | |
| | USD4,582 | | | | EUR3,900 | | | Citibank | | 7/10/2018 | | | | 24 | |
| | CAD17,982 | | | | USD13,938 | | | Goldman Sachs | | 7/10/2018 | | | | (257 | ) |
| | USD1,008 | | | | GBP750 | | | Bank of America, N.A. | | 7/11/2018 | | | | 17 | |
| | USD4,106 | | | | BRL14,650 | | | JPMorgan Chase | | 7/12/2018 | | | | 333 | |
| | USD5,076 | | | | ZAR67,000 | | | Goldman Sachs | | 7/12/2018 | | | | 200 | |
| | USD10,683 | | | | INR720,000 | | | JPMorgan Chase | | 7/12/2018 | | | | 191 | |
| | USD1,872 | | | | SGD2,500 | | | Goldman Sachs | | 7/12/2018 | | | | 36 | |
| | CLP3,700,000 | | | | USD5,884 | | | Bank of America, N.A. | | 7/12/2018 | | | | (221 | ) |
| | MXN22,803 | | | | USD1,101 | | | Citibank | | 7/16/2018 | | | | 44 | |
| | USD3,333 | | | | GBP2,500 | | | Bank of America, N.A. | | 7/18/2018 | | | | 31 | |
| | GBP600 | | | | USD789 | | | Bank of New York Mellon | | 7/18/2018 | | | | 3 | |
| | GBP600 | | | | USD790 | | | Bank of New York Mellon | | 7/18/2018 | | | | 3 | |
| | AUD7,709 | | | | USD5,808 | | | Morgan Stanley | | 7/18/2018 | | | | (102 | ) |
| | USD2,919 | | | | KRW3,145,000 | | | Citibank | | 7/19/2018 | | | | 96 | |
| | USD5,914 | | | | COP17,092,000 | | | Citibank | | 7/19/2018 | | | | 88 | |
| | EUR4,619 | | | | GBP4,050 | | | Bank of New York Mellon | | 7/25/2018 | | | | 53 | |
| | CAD1,548 | | | | USD1,164 | | | JPMorgan Chase | | 7/25/2018 | | | | 14 | |
| | USD1,275 | | | | SGD1,730 | | | Citibank | | 7/25/2018 | | | | 5 | |
| | USD2,861 | | | | AUD3,875 | | | Bank of America, N.A. | | 7/25/2018 | | | | (7 | ) |
| | GBP4,055 | | | | EUR4,625 | | | Bank of New York Mellon | | 7/25/2018 | | | | (53 | ) |
| | USD5,633 | | | | EUR4,800 | | | Citibank | | 7/27/2018 | | | | 16 | |
| | JPY728,000 | | | | USD6,616 | | | Goldman Sachs | | 7/30/2018 | | | | (26 | ) |
| | MXN30,387 | | | | USD1,512 | | | Citibank | | 7/31/2018 | | | | 10 | |
| | USD1,258 | | | | SGD1,715 | | | Goldman Sachs | | 7/31/2018 | | | | (1 | ) |
| | USD5,270 | | | | GBP4,000 | | | Bank of America, N.A. | | 7/31/2018 | | | | (18 | ) |
| | JPY789,185 | | | | USD7,164 | | | Bank of New York Mellon | | 7/31/2018 | | | | (20 | ) |
| | USD17,449 | | | | EUR15,000 | | | Bank of America, N.A. | | 7/31/2018 | | | | (110 | ) |
| | USD2,179 | | | | KRW2,424,600 | | | JPMorgan Chase | | 8/3/2018 | | | | 1 | |
| | BRL4,326 | | | | USD1,119 | | | JPMorgan Chase | | 8/3/2018 | | | | (8 | ) |
| | | | | | | | | | | | | | $ | 465 | |
| 8 | American Funds Strategic Bond Fund |
Swap contracts
Interest rate swaps
| | | | | | | | | | | | | | | Unrealized | |
| | | | | | | | | | | | Upfront | | (depreciation) | |
| | | | | | | | | | Value at | | payments/ | | appreciation | |
| | | | | Expiration | | Notional | | | 6/30/2018 | | receipts | | at 6/30/2018 | |
| Receive | | Pay | | date | | (000) | | | | (000) | | (000) | | (000) | |
| 1.2975% | | 3-month Canada BA | | 7/5/2018 | | C$ | 265,152 | | | $ | (10 | ) | | $ | — | | | $ | (10 | ) |
| 1.76625% | | 3-month Canada BA | | 9/25/2018 | | | 122,000 | | | | 6 | | | | — | | | | 6 | |
| 1.9475% | | U.S. EFFR | | 9/26/2018 | | $ | 3,820,000 | | | | 67 | | | | — | | | | 67 | |
| 1.7725% | | 3-month Canada BA | | 9/26/2018 | | C$ | 122,700 | | | | 8 | | | | — | | | | 8 | |
| 1.882% | | U.S. EFFR | | 9/26/2018 | | $ | 171,400 | | | | (14 | ) | | | — | | | | (14 | ) |
| 1.8975% | | U.S. EFFR | | 9/26/2018 | | | 450,900 | | | | (27 | ) | | | — | | | | (27 | ) |
| 7.48% | | 28-day MXN-TIIE | | 1/11/2019 | | MXN | 690,000 | | | | (140 | ) | | | — | | | | (140 | ) |
| 7.46% | | 28-day MXN-TIIE | | 1/24/2019 | | | 390,000 | | | | (85 | ) | | | — | | | | (85 | ) |
| 7.195% | | 28-day MXN-TIIE | | 4/15/2019 | | | 220,000 | | | | (90 | ) | | | — | | | | (90 | ) |
| U.S. EFFR | | 2.385% | | 5/1/2019 | | $ | 2,701,565 | | | | (151 | ) | | | — | | | | (151 | ) |
| 7.51% | | 28-day MXN-TIIE | | 5/30/2019 | | MXN | 410,000 | | | | (136 | ) | | | — | | | | (136 | ) |
| 1.962% | | 3-month Canada BA | | 6/27/2019 | | C$ | 122,000 | | | | (68 | ) | | | — | | | | (68 | ) |
| 3-month USD-LIBOR | | 1.5655% | | 8/29/2019 | | $ | 102,000 | | | | 1,254 | | | | — | | | | 1,254 | |
| 1.726% | | 3-month USD-LIBOR | | 10/2/2019 | | | 53,000 | | | | (615 | ) | | | — | | | | (615 | ) |
| 1.8185% | | 3-month USD-LIBOR | | 10/31/2019 | | | 124,000 | | | | (1,412 | ) | | | — | | | | (1,412 | ) |
| 3-month USD-LIBOR | | 2.159% | | 1/11/2020 | | | 280,000 | | | | 2,386 | | | | — | | | | 2,386 | |
| 1.905% | | U.S. EFFR | | 1/11/2020 | | | 280,000 | | | | (1,614 | ) | | | — | | | | (1,614 | ) |
| (0.223)% | | EONIA | | 2/1/2020 | | € | 55,500 | | | | 117 | | | | — | | | | 117 | |
| (0.122)% | | 6-month EURIBOR | | 2/1/2020 | | | 56,100 | | | | 100 | | | | — | | | | 100 | |
| (0.2305)% | | EONIA | | 2/2/2020 | | | 109,500 | | | | 215 | | | | — | | | | 215 | |
| 1.997% | | U.S. EFFR | | 2/13/2020 | | $ | 100 | | | | — | 8 | | | — | | | | — | 8 |
| 1.8725% | | 3-month USD-LIBOR | | 3/20/2020 | | | 52,000 | | | | (767 | ) | | | — | | | | (767 | ) |
| U.S. EFFR | | 2.19% | | 3/29/2020 | | | 123,700 | | | | 350 | | | | — | | | | 350 | |
| U.S. EFFR | | 2.2025% | | 3/29/2020 | | | 124,500 | | | | 325 | | | | — | | | | 325 | |
| 2.5935% | | 3-month USD-LIBOR | | 3/29/2020 | | | 124,500 | | | | (345 | ) | | | — | | | | (345 | ) |
| 2.577% | | 3-month USD-LIBOR | | 3/29/2020 | | | 123,700 | | | | (378 | ) | | | — | | | | (378 | ) |
| U.S. EFFR | | 2.174% | | 4/4/2020 | | | 65,360 | | | | 210 | | | | — | | | | 210 | |
| 2.5725% | | 3-month USD-LIBOR | | 4/4/2020 | | | 65,364 | | | | (215 | ) | | | — | | | | (215 | ) |
| U.S. EFFR | | 2.19% | | 4/6/2020 | | | 43,300 | | | | 127 | | | | — | | | | 127 | |
| 2.599% | | 3-month USD-LIBOR | | 4/6/2020 | | | 43,300 | | | | (123 | ) | | | — | | | | (123 | ) |
| 7.14% | | 28-day MXN-TIIE | | 4/29/2020 | | MXN | 448,450 | | | | (393 | ) | | | — | | | | (393 | ) |
| 7.84% | | 28-day MXN-TIIE | | 5/8/2020 | | | 216,660 | | | | (58 | ) | | | — | | | | (58 | ) |
| 7.87% | | 28-day MXN-TIIE | | 5/8/2020 | | | 397,340 | | | | (95 | ) | | | — | | | | (95 | ) |
| 3-month USD-LIBOR | | 2.674% | | 5/31/2020 | | $ | 150,000 | | | | 285 | | | | — | | | | 285 | |
| 2.284% | | U.S. EFFR | | 5/31/2020 | | | 150,000 | | | | (309 | ) | | | — | | | | (309 | ) |
| 6.78% | | 28-day MXN-TIIE | | 7/6/2020 | | MXN | 213,540 | | | | (271 | ) | | | — | | | | (271 | ) |
| 3-month USD-LIBOR | | 2.465% | | 2/13/2021 | | $ | 86,100 | | | | 839 | | | | — | | | | 839 | |
| 2.094% | | U.S. EFFR | | 2/13/2021 | | | 85,300 | | | | (745 | ) | | | — | | | | (745 | ) |
| 1.63% | | U.S. EFFR | | 2/22/2022 | | | 32,700 | | | | (966 | ) | | | — | | | | (966 | ) |
| 6.99% | | 28-day MXN-TIIE | | 6/17/2022 | | MXN | 130,000 | | | | (206 | ) | | | — | | | | (206 | ) |
| 2.27403% | | 3-month USD-LIBOR | | 12/29/2022 | | $ | 70,000 | | | | (1,783 | ) | | | — | | | | (1,783 | ) |
| 2.10125% | | U.S. EFFR | | 1/12/2023 | | | 36,000 | | | | (592 | ) | | | — | | | | (592 | ) |
| 2.7435% | | 3-month USD-LIBOR | | 2/16/2023 | | | 48,800 | | | | (293 | ) | | | — | | | | (293 | ) |
| 2.7365% | | 3-month USD-LIBOR | | 2/20/2023 | | | 49,000 | | | | (310 | ) | | | — | | | | (310 | ) |
| 2.045% | | 3-month USD-LIBOR | | 3/24/2023 | | | 53,800 | | | | (855 | ) | | | — | | | | (855 | ) |
| 2.715% | | 3-month USD-LIBOR | | 4/6/2023 | | | 15,000 | | | | (111 | ) | | | — | | | | (111 | ) |
| 2.55% | | U.S. EFFR | | 4/26/2023 | | | 50,000 | | | | 117 | | | | — | | | | 117 | |
| 2.5815% | | U.S. EFFR | | 5/25/2023 | | | 96,000 | | | | 354 | | | | — | | | | 354 | |
| 3-month USD-LIBOR | | 2.815% | | 5/31/2023 | | | 180,000 | | | | 540 | | | | — | | | | 540 | |
| 2.437% | | U.S. EFFR | | 5/31/2023 | | | 180,000 | | | | (547 | ) | | | — | | | | (547 | ) |
| 1.8875% | | 3-month USD-LIBOR | | 6/7/2023 | | | 33,600 | | | | (622 | ) | | | — | | | | (622 | ) |
| American Funds Strategic Bond Fund | 9 |
Swap contracts (continued)
Interest rate swaps (continued)
| | | | | | | | | | | | | | | Unrealized | |
| | | | | | | | | | | | Upfront | | (depreciation) | |
| | | | | | | | | | Value at | | payments/ | | appreciation | |
| | | | | Expiration | | Notional | | | 6/30/2018 | | receipts | | at 6/30/2018 | |
| Receive | | Pay | | date | | | (000) | | | | (000) | | | | (000) | | | | (000) | |
| 1.569% | | 3-month USD-LIBOR | | 7/6/2023 | | $ | 40,500 | | | $ | (984 | ) | | $ | — | | | $ | (984 | ) |
| 1.615% | | 3-month USD-LIBOR | | 8/18/2023 | | | 73,000 | | | | (1,689 | ) | | | — | | | | (1,689 | ) |
| 2.42% | | 3-month USD-LIBOR | | 11/18/2023 | | | 50,000 | | | | (429 | ) | | | — | | | | (429 | ) |
| 2.031% | | 3-month USD-LIBOR | | 1/17/2024 | | | 8,700 | | | | (383 | ) | | | — | | | | (383 | ) |
| 3-month USD-LIBOR | | 2.0955% | | 2/10/2024 | | | 1,700 | | | | 70 | | | | — | | | | 70 | |
| 1.805% | | U.S. EFFR | | 2/21/2024 | | | 48,000 | | | | (1,746 | ) | | | — | | | | (1,746 | ) |
| 3-month USD-LIBOR | | 2.3055% | | 3/7/2024 | | | 16,000 | | | | 488 | | | | — | | | | 488 | |
| 3-month USD-LIBOR | | 2.013% | | 6/29/2024 | | | 16,500 | | | | 796 | | | | — | | | | 796 | |
| 3-month USD-LIBOR | | 2.2375% | | 10/31/2024 | | | 8,000 | | | | 303 | | | | — | | | | 303 | |
| 2.8775% | | 3-month USD-LIBOR | | 3/23/2025 | | | 36,400 | | | | (29 | ) | | | — | | | | (29 | ) |
| 2.524% | | 3-month USD-LIBOR | | 4/14/2025 | | | 9,000 | | | | (168 | ) | | | — | | | | (168 | ) |
| 2.905% | | 3-month USD-LIBOR | | 6/21/2025 | | | 48,440 | | | | 37 | | | | — | | | | 37 | |
| 2.354% | | 3-month USD-LIBOR | | 9/25/2025 | | | 109,600 | | | | (2,809 | ) | | | — | | | | (2,809 | ) |
| 6-month JPY-LIBOR | | 0.1277% | | 3/24/2026 | | ¥ | 500,000 | | | | 25 | | | | — | | | | 25 | |
| 6-month JPY-LIBOR | | (0.0823)% | | 7/11/2026 | | | 1,200,000 | | | | 255 | | | | — | | | | 255 | |
| 3-month USD-LIBOR | | 1.6835% | | 11/2/2026 | | $ | 3,900 | | | | 357 | | | | — | | | | 357 | |
| 3-month USD-LIBOR | | 1.688% | | 11/2/2026 | | | 2,100 | | | | 191 | | | | — | | | | 191 | |
| 28-day MXN-TIIE | | 8.07% | | 1/1/2027 | | MXN | 180,000 | | | | (53 | ) | | | — | | | | (53 | ) |
| 28-day MXN-TIIE | | 8.135% | | 1/14/2027 | | | 102,000 | | | | (51 | ) | | | — | | | | (51 | ) |
| 3-month USD-LIBOR | | 2.38% | | 2/15/2027 | | $ | 13,100 | | | | 536 | | | | — | | | | 536 | |
| 2.4805% | | 3-month USD-LIBOR | | 3/21/2027 | | | 27,000 | | | | (901 | ) | | | — | | | | (901 | ) |
| 2.3335% | | 3-month USD-LIBOR | | 3/29/2027 | | | 25,000 | | | | (1,124 | ) | | | — | | | | (1,124 | ) |
| 2.333% | | 3-month USD-LIBOR | | 3/29/2027 | | | 30,000 | | | | (1,350 | ) | | | — | | | | (1,350 | ) |
| 28-day MXN-TIIE | | 7.47% | | 4/5/2027 | | MXN | 60,000 | | | | 103 | | | | — | | | | 103 | |
| 0.8153% | | 6-month EURIBOR | | 4/28/2027 | | € | 14,500 | | | | 91 | | | | — | | | | 91 | |
| 3-month SEK-STIBOR | | 1.125% | | 4/28/2027 | | SKr | 138,000 | | | | (177 | ) | | | — | | | | (177 | ) |
| 3-month USD-LIBOR | | 2.293% | | 5/3/2027 | | $ | 5,800 | | | | 283 | | | | — | | | | 283 | |
| 28-day MXN-TIIE | | 7.625% | | 5/20/2027 | | MXN | 108,000 | | | | 133 | | | | — | | | | 133 | |
| 3-month USD-LIBOR | | 2.2935% | | 7/17/2027 | | $ | 15,000 | | | | 748 | | | | — | | | | 748 | |
| 0.8518% | | 6-month EURIBOR | | 8/21/2027 | | € | 6,200 | | | | 42 | | | | — | | | | 42 | |
| 3-month SEK-STIBOR | | 1.215% | | 8/21/2027 | | SKr | 60,000 | | | | (111 | ) | | | — | | | | (111 | ) |
| 2.2295% | | 3-month USD-LIBOR | | 9/22/2027 | | $ | 9,800 | | | | (551 | ) | | | — | | | | (551 | ) |
| 3-month USD-LIBOR | | 2.388% | | 10/31/2027 | | | 89,000 | | | | 3,883 | | | | — | | | | 3,883 | |
| 3-month USD-LIBOR | | 2.31934% | | 11/17/2027 | | | 11,900 | | | | 592 | | | | — | | | | 592 | |
| 3-month USD-LIBOR | | 2.31613% | | 11/17/2027 | | | 11,100 | | | | 555 | | | | — | | | | 555 | |
| 2.925% | | 3-month USD-LIBOR | | 2/1/2028 | | | 15,300 | | | | (24 | ) | | | — | | | | (24 | ) |
| 2.91% | | 3-month USD-LIBOR | | 2/1/2028 | | | 19,100 | | | | (42 | ) | | | — | | | | (42 | ) |
| 2.908% | | 3-month USD-LIBOR | | 2/1/2028 | | | 19,100 | | | | (43 | ) | | | — | | | | (43 | ) |
| 2.92% | | 3-month USD-LIBOR | | 2/2/2028 | | | 14,500 | | | | (26 | ) | | | — | | | | (26 | ) |
| 1.561% | | 6-month GBP-LIBOR | | 6/21/2028 | | £ | 23,240 | | | | 108 | | | | — | | | | 108 | |
| 6-month GBP-LIBOR | | 1.5282% | | 6/29/2028 | | | 5,500 | | | | — | | | | — | | | | — | |
| 6-month GBP-LIBOR | | 1.5262% | | 6/29/2028 | | | 5,500 | | | | — | | | | — | | | | — | |
| 6-month GBP-LIBOR | | 1.5272% | | 6/29/2028 | | | 5,500 | | | | — | | | | — | | | | — | |
| 6-month GBP-LIBOR | | 1.5302% | | 6/29/2028 | | | 5,500 | | | | — | | | | — | | | | — | |
| 3-month USD-LIBOR | | 2.679% | | 4/14/2030 | | $ | 4,800 | | | | 121 | | | | — | | | | 121 | |
| 3-month USD-LIBOR | | 2.514% | | 9/25/2030 | | | 58,300 | | | | 2,258 | | | | — | | | | 2,258 | |
| 3-month USD-LIBOR | | 2.35% | | 3/24/2031 | | | 11,700 | | | | 606 | | | | — | | | | 606 | |
| 3-month USD-LIBOR | | 2.22% | | 6/7/2031 | | | 7,300 | | | | 454 | | | | — | | | | 454 | |
| 3-month USD-LIBOR | | 1.8929% | | 7/6/2031 | | | 8,700 | | | | 772 | | | | — | | | | 772 | |
| 3-month USD-LIBOR | | 1.87% | | 8/18/2031 | | | 15,500 | | | | 1,399 | | | | — | | | | 1,399 | |
| 3-month USD-LIBOR | | 2.57% | | 11/18/2031 | | | 11,000 | | | | 368 | | | | — | | | | 368 | |
| 10 | American Funds Strategic Bond Fund |
| | | | | | | | | | | | | | | Unrealized | |
| | | | | | | | | | | | Upfront | | (depreciation) | |
| | | | | | | | | | Value at | | payments/ | | appreciation | |
| | | | | Expiration | | Notional | | | 6/30/2018 | | receipts | | at 6/30/2018 | |
| Receive | | Pay | | date | | (000) | | | (000) | | (000) | | (000) | |
| 3-month USD-LIBOR | | 2.9625% | | 2/1/2038 | | $ | 11,400 | | | $ | 37 | | | $ | — | | | $ | 37 | |
| 3-month USD-LIBOR | | 2.963% | | 2/1/2038 | | | 11,500 | | | | 36 | | | | — | | | | 36 | |
| 3-month USD-LIBOR | | 2.986% | | 2/1/2038 | | | 9,200 | | | | 15 | | | | — | | | | 15 | |
| 3-month USD-LIBOR | | 2.967% | | 2/2/2038 | | | 8,900 | | | | 26 | | | | — | | | | 26 | |
| 3-month USD-LIBOR | | 2.625% | | 2/21/2047 | | | 2,000 | | | | 126 | | | | — | | | | 126 | |
| 3-month USD-LIBOR | | 2.9825% | | 2/20/2048 | | | 11,000 | | | | (117 | ) | | | — | | | | (117 | ) |
| U.S. EFFR | | 2.505% | | 3/22/2048 | | | 2,500 | | | | (22 | ) | | | — | | | | (22 | ) |
| U.S. EFFR | | 2.51375% | | 3/22/2048 | | | 2,800 | | | | (30 | ) | | | — | | | | (30 | ) |
| 3-month USD-LIBOR | | 2.8245% | | 4/4/2048 | | | 5,550 | | | | 123 | | | | — | | | | 123 | |
| U.S. EFFR | | 2.40875% | | 4/13/2048 | | | 14,000 | | | | 158 | | | | — | | | | 158 | |
| U.S. EFFR | | 2.43625% | | 4/19/2048 | | | 14,000 | | | | 77 | | | | — | | | | 77 | |
| U.S. EFFR | | 2.554% | | 4/26/2048 | | | 11,200 | | | | (216 | ) | | | — | | | | (216 | ) |
| 3-month USD-LIBOR | | 3.016% | | 5/9/2048 | | | 4,906 | | | | (88 | ) | | | — | | | | (88 | ) |
| 3-month USD-LIBOR | | 3.0155% | | 5/9/2048 | | | 5,550 | | | | (99 | ) | | | — | | | | (99 | ) |
| 3-month USD-LIBOR | | 3.0745% | | 5/17/2048 | | | 6,100 | | | | (184 | ) | | | — | | | | (184 | ) |
| U.S. EFFR | | 2.625% | | 5/25/2048 | | | 22,000 | | | | (753 | ) | | | — | | | | (753 | ) |
| | | | | | | | | | | | | | | $ | — | | | $ | (5,073 | ) |
Credit default swaps
Centrally cleared credit default swaps on credit indices — buy protection
| | | | | | | | | | | | | | | Unrealized | |
| | | | | | | | | | Value at | | Upfront | | appreciation | |
| | | Pay/ | | Expiration | | Notional | | | 6/30/2018 | | payments | | at 6/30/2018 | |
| Receive | | Payment frequency | | date | | (000) | | | (000) | | (000) | | (000) | |
| CDX.NA.HY.29 | | 5.00%/Quarterly | | 12/20/2022 | | $ | 12,775 | | | $ | (784 | ) | | $ | (849 | ) | | $ | 65 | |
| CDX.NA.IG.30 | | 1.00%/Quarterly | | 6/20/2023 | | | 264,715 | | | | (3,916 | ) | | | (4,691 | ) | | | 775 | |
| CDX.NA.HY.30 | | 5.00%/Quarterly | | 6/20/2023 | | | 78,150 | | | | (4,490 | ) | | | (5,145 | ) | | | 655 | |
| | | | | | | | | | | | | | | $ | (10,685 | ) | | $ | 1,495 | |
The following footnotes apply to either the individual securities noted or one or more of the securities aggregated and listed as a single line item.
| 1 | Acquired in a transaction exempt from registration under Rule 144A or Section 4(2) of the Securities Act of 1933. May be resold in the U.S. in transactions exempt from registration, normally to qualified institutional buyers. The total value of all such securities, including those in “Other securities,” was $131,063,000, which represented 21.82% of the net assets of the fund. |
| 2 | Step bond; coupon rate may change at a later date. |
| 3 | Index-linked bond whose principal amount moves with a government price index. |
| 4 | All or a portion of this security was pledged as collateral. The total value of pledged collateral was $27,147,000, which represented 4.52% of the net assets of the fund. |
| 5 | Principal payments may be made periodically. Therefore, the effective maturity date may be earlier than the stated maturity date. |
| 6 | Notional amount is calculated based on the number of contracts and notional contract size. |
| 7 | Value is calculated based on the notional amount and current market price. |
| 8 | Amount less than one thousand. |
| | |
| American Funds Strategic Bond Fund | 11 |
| Key to abbreviations and symbols |
| AUD = Australian dollars |
| BA = Banker’s acceptances |
| BRL = Brazilian reais |
| CAD/C$ = Canadian dollars |
| CLP = Chilean pesos |
| COP = Colombian pesos |
| EFFR = Effective Federal Funds Rate |
| EONIA = Euro Overnight Index Average |
| EUR/€ = Euros |
| EURIBOR = Euro Interbank Offered Rate |
| GBP/£ = British pounds |
| INR = Indian rupees |
| JPY/¥ = Japanese yen |
| KRW = South Korean won |
| LIBOR = London Interbank Offered Rate |
| MXN = Mexican pesos |
| NGN = Nigerian naira |
| SEK/SKr = Swedish kronor |
| SGD = Singapore dollars |
| STIBOR = Stockholm Interbank Offered Rate |
| TIIE = Equilibrium Interbank Interest Rate |
| USD/$ = U.S. dollars |
| ZAR = South African rand |
See Notes to Financial Statements
| 12 | American Funds Strategic Bond Fund |
Financial statements
Statement of assets and liabilities
at June 30, 2018 | unaudited |
| | (dollars in thousands) |
| Assets: | | | | | | |
| Investment securities in unaffiliated issuers, at value (cost: $605,532) | | | | | | $ | 593,089 | |
| Cash | | | | | | | 8,237 | |
| Cash denominated in currencies other than U.S. dollars (cost: $3,447) | | | | | | | 3,472 | |
| Unrealized appreciation on open forward currency contracts | | | | | | | 1,331 | |
| Receivables for: | | | | | | | | |
| Sales of investments | | $ | 96,288 | | | | | |
| Sales of fund’s shares | | | 1,055 | | | | | |
| Closed forward currency contracts | | | 99 | | | | | |
| Variation margin on futures contracts | | | 37 | | | | | |
| Variation margin on swap contracts | | | 1,278 | | | | | |
| Interest | | | 4,096 | | | | | |
| Other | | | 14 | | | | 102,867 | |
| | | | | | | | 708,996 | |
| Liabilities: | | | | | | | | |
| Unrealized depreciation on open forward currency contracts | | | | | | | 866 | |
| Payables for: | | | | | | | | |
| Purchases of investments | | | 103,784 | | | | | |
| Repurchases of fund’s shares | | | 1,385 | | | | | |
| Closed forward currency contracts | | | 117 | | | | | |
| Investment advisory services | | | 268 | | | | | |
| Services provided by related parties | | | 111 | | | | | |
| Trustees’ deferred compensation | | | 1 | | | | | |
| Variation margin on futures contracts | | | 31 | | | | | |
| Variation margin on swap contracts | | | 1,501 | | | | | |
| Other | | | 152 | | | | 107,350 | |
| Net assets at June 30, 2018 | | | | | | $ | 600,780 | |
| | | | | | | | | |
| Net assets consist of: | | | | | | | | |
| Capital paid in on shares of beneficial interest | | | | | | $ | 614,818 | |
| Undistributed net investment income | | | | | | | 3,970 | |
| Accumulated net realized loss | | | | | | | (2,806 | ) |
| Net unrealized depreciation | | | | | | | (15,202 | ) |
| Net assets at June 30, 2018 | | | | | | $ | 600,780 | |
See Notes to Financial Statements
| American Funds Strategic Bond Fund | 13 |
(dollars and shares in thousands, except per-share amounts)
Shares of beneficial interest issued and outstanding (no stated par value) —
unlimited shares authorized (60,336 total shares outstanding)
| | | Net assets | | | Shares
outstanding | | | Net asset value
per share | |
| Class A | | $ | 413,259 | | | | 41,497 | | | $ | 9.96 | |
| Class C | | | 20,732 | | | | 2,088 | | | | 9.93 | |
| Class T | | | 10 | | | | 1 | | | | 9.96 | |
| Class F-1 | | | 9,756 | | | | 980 | | | | 9.95 | |
| Class F-2 | | | 67,555 | | | | 6,782 | | | | 9.96 | |
| Class F-3 | | | 25,261 | | | | 2,538 | | | | 9.95 | |
| Class 529-A | | | 17,488 | | | | 1,758 | | | | 9.95 | |
| Class 529-C | | | 4,536 | | | | 457 | | | | 9.93 | |
| Class 529-E | | | 1,166 | | | | 117 | | | | 9.95 | |
| Class 529-T | | | 10 | | | | 1 | | | | 9.96 | |
| Class 529-F-1 | | | 5,187 | | | | 521 | | | | 9.96 | |
| Class R-1 | | | 521 | | | | 52 | | | | 9.94 | |
| Class R-2 | | | 1,767 | | | | 178 | | | | 9.94 | |
| Class R-2E | | | 58 | | | | 6 | | | | 9.96 | |
| Class R-3 | | | 2,580 | | | | 259 | | | | 9.95 | |
| Class R-4 | | | 2,322 | | | | 233 | | | | 9.95 | |
| Class R-5E | | | 105 | | | | 11 | | | | 9.96 | |
| Class R-5 | | | 712 | | | | 72 | | | | 9.96 | |
| Class R-6 | | | 27,755 | | | | 2,785 | | | | 9.96 | |
See Notes to Financial Statements
| 14 | American Funds Strategic Bond Fund |
Statement of operations
for the six months ended June 30, 2018 | unaudited |
| | (dollars in thousands) |
| Investment income: | | | | | | |
| Income: | | | | | | | | |
| Interest (net of non-U.S. taxes of $23) | | | | | | $ | 12,163 | |
| Fees and expenses*: | | | | | | | | |
| Investment advisory services | | $ | 1,624 | | | | | |
| Distribution services | | | 645 | | | | | |
| Transfer agent services | | | 278 | | | | | |
| Administrative services | | | 65 | | | | | |
| Reports to shareholders | | | 33 | | | | | |
| Registration statement and prospectus | | | 262 | | | | | |
| Trustees’ compensation | | | 2 | | | | | |
| Auditing and legal | | | 1 | | | | | |
| Custodian | | | 34 | | | | | |
| Other | | | 64 | | | | | |
| Total fees and expenses before waivers/reimbursements | | | 3,008 | | | | | |
| Less waivers/reimbursements of fees and expenses: | | | | | | | | |
| Investment advisory services waiver | | | 31 | | | | | |
| Less miscellaneous reimbursements | | | 36 | | | | | |
| Total fees and expenses after waivers/reimbursements | | | | | | | 2,941 | |
| Net investment income | | | | | | | 9,222 | |
| |
| Net realized loss and unrealized depreciation: | | | | | | | | |
| Net realized (loss) gain on: | | | | | | | | |
| Investments in unaffiliated issuers | | | (5,128 | ) | | | | |
| Futures contracts | | | (2,867 | ) | | | | |
| Forward currency contracts | | | 1,365 | | | | | |
| Swap contracts | | | 4,693 | | | | | |
| Currency transactions | | | 51 | | | | (1,886 | ) |
| Net unrealized (depreciation) appreciation on: | | | | | | | | |
| Investments in unaffiliated issuers (net of non-U.S. taxes of $112) | | | (16,225 | ) | | | | |
| Futures contracts | | | 1,577 | | | | | |
| Forward currency contracts | | | 1,077 | | | | | |
| Swap contracts | | | (875 | ) | | | | |
| Currency translations | | | (28 | ) | | | (14,474 | ) |
| Net realized loss and unrealized depreciation | | | | | | | (16,360 | ) |
| | | | | | | | | |
| Net decrease in net assets resulting from operations | | | | | | $ | (7,138 | ) |
| * | Additional information related to class-specific fees and expenses is included in the Notes to Financial Statements. |
See Notes to Financial Statements
| American Funds Strategic Bond Fund | 15 |
| Statements of changes in net assets | |
| | (dollars in thousands) |
| | | Six months ended
June 30,
2018* | | | Year ended
December 31,
2017 | |
| Operations: | | | | | | | | |
| Net investment income | | $ | 9,222 | | | $ | 10,281 | |
| Net realized (loss) gain | | | (1,886 | ) | | | 2,952 | |
| Net unrealized depreciation | | | (14,474 | ) | | | (2,005 | ) |
| Net (decrease) increase in net assets resulting from operations | | | (7,138 | ) | | | 11,228 | |
| |
| Dividends and distributions paid to shareholders: | | | | | | | | |
| Dividends from net investment income | | | (3,605 | ) | | | (5,031 | ) |
| Distributions from net realized gain on investments | | | — | | | | (5,218 | ) |
| Return of capital | | | — | | | | (442 | ) |
| Total dividends and distributions paid to shareholders | | | (3,605 | ) | | | (10,691 | ) |
| |
| Net capital share transactions | | | 55,173 | | | | 270,213 | |
| |
| Total increase in net assets | | | 44,430 | | | | 270,750 | |
| |
| Net assets: | | | | | | | | |
| Beginning of period | | | 556,350 | | | | 285,600 | |
| End of period (including undistributed and distributions in excess of net investment income: $3,970 and $(1,647), respectively) | | $ | 600,780 | | | $ | 556,350 | |
See Notes to Financial Statements
| 16 | American Funds Strategic Bond Fund |
| Notes to financial statements | unaudited |
1. Organization
American Funds Strategic Bond Fund (the “fund”) is registered under the Investment Company Act of 1940 (the “1940 Act”), as an open-end, nondiversified management investment company. The fund seeks to provide maximum total return consistent with preservation of capital.
The fund has 19 share classes consisting of six retail share classes (Classes A, C, T, F-1, F-2 and F-3), five 529 college savings plan share classes (Classes 529-A, 529-C, 529-E, 529-T and 529-F-1) and eight retirement plan share classes (Classes R-1, R-2, R-2E, R-3, R-4, R-5E, R-5 and R-6). The 529 college savings plan share classes can be used to save for college education. The retirement plan share classes are generally offered only through eligible employer-sponsored retirement plans. The fund’s share classes are described further in the following table:
| Share class | | Initial sales charge | | Contingent deferred sales
charge upon redemption | | Conversion feature |
| Classes A and 529-A | | Up to 3.75% | | None (except 1% for certain redemptions within 18 months of purchase without an initial sales charge) | | None |
| Class C | | None | | 1% for redemptions within one year of purchase | | Class C converts to Class F-1 after 10 years |
| Class 529-C | | None | | 1% for redemptions within one year of purchase | | Class 529-C converts to Class 529-A after 10 years |
| Class 529-E | | None | | None | | None |
| Classes T and 529-T* | | Up to 2.50% | | None | | None |
Classes F-1, F-2,
F-3 and 529-F-1 | | None | | None | | None |
Classes R-1, R-2, R-2E,
R-3, R-4, R-5E,
R-5 and R-6 | | None | | None | | None |
| * | Class T and 529-T shares are not available for purchase. |
Holders of all share classes have equal pro rata rights to the assets, dividends and liquidation proceeds of the fund. Each share class has identical voting rights, except for the exclusive right to vote on matters affecting only its class. Share classes have different fees and expenses (“class-specific fees and expenses”), primarily due to different arrangements for distribution, transfer agent and administrative services. Differences in class-specific fees and expenses will result in differences in net investment income and, therefore, the payment of different per-share dividends by each share class.
| American Funds Strategic Bond Fund | 17 |
2. Significant accounting policies
The fund is an investment company that applies the accounting and reporting guidance issued in Topic 946 by the U.S. Financial Accounting Standards Board. The fund’s financial statements have been prepared to comply with U.S. generally accepted accounting principles (“U.S. GAAP”). These principles require the fund’s investment adviser to make estimates and assumptions that affect reported amounts and disclosures. Actual results could differ from those estimates. Subsequent events, if any, have been evaluated through the date of issuance in the preparation of the financial statements. The fund follows the significant accounting policies described in this section, as well as the valuation policies described in the next section on valuation.
Security transactions and related investment income — Security transactions are recorded by the fund as of the date the trades are executed with brokers. Realized gains and losses from security transactions are determined based on the specific identified cost of the securities. In the event a security is purchased with a delayed payment date, the fund will segregate liquid assets sufficient to meet its payment obligations. Interest income is recognized on an accrual basis. Market discounts, premiums and original issue discounts on fixed-income securities are amortized daily over the expected life of the security.
Class allocations — Income, fees and expenses (other than class-specific fees and expenses) and realized and unrealized gains and losses are allocated daily among the various share classes based on their relative net assets. Class-specific fees and expenses, such as distribution, transfer agent and administrative services, are charged directly to the respective share class.
Dividends and distributions to shareholders — Dividends and distributions to shareholders are recorded on the ex-dividend date.
Currency translation — Assets and liabilities, including investment securities, denominated in currencies other than U.S. dollars are translated into U.S. dollars at the exchange rates supplied by one or more pricing vendors on the valuation date. Purchases and sales of investment securities and income and expenses are translated into U.S. dollars at the exchange rates on the dates of such transactions. The effects of changes in exchange rates on investment securities are included with the net realized gain or loss and net unrealized appreciation or depreciation on investments in the fund’s statement of operations. The realized gain or loss and unrealized appreciation or depreciation resulting from all other transactions denominated in currencies other than U.S. dollars are disclosed separately.
3. Valuation
Capital Research and Management Company (“CRMC”), the fund’s investment adviser, values the fund’s investments at fair value as defined by U.S. GAAP. The net asset value of each share class of the fund is generally determined as of approximately 4:00 p.m.
New York time each day the New York Stock Exchange is open.
| 18 | American Funds Strategic Bond Fund |
Methods and inputs — The fund’s investment adviser uses the following methods and inputs to establish the fair value of the fund’s assets and liabilities. Use of particular methods and inputs may vary over time based on availability and relevance as market and economic conditions evolve.
Fixed-income securities, including short-term securities, are generally valued at prices obtained from one or more pricing vendors. Vendors value such securities based on one or more of the inputs described in the following table. The table provides examples of inputs that are commonly relevant for valuing particular classes of fixed-income securities in which the fund is authorized to invest. However, these classifications are not exclusive, and any of the inputs may be used to value any other class of fixed-income security.
| Fixed-income class | | Examples of standard inputs |
| All | | Benchmark yields, transactions, bids, offers, quotations from dealers and trading systems, new issues, spreads and other relationships observed in the markets among comparable securities; and proprietary pricing models such as yield measures calculated using factors such as cash flows, financial or collateral performance and other reference data (collectively referred to as “standard inputs”) |
| Corporate bonds & notes; convertible securities | | Standard inputs and underlying equity of the issuer |
| Bonds & notes of governments & government agencies | | Standard inputs and interest rate volatilities |
| Mortgage-backed; asset-backed obligations | | Standard inputs and cash flows, prepayment information, default rates, delinquency and loss assumptions, collateral characteristics, credit enhancements and specific deal information |
| Municipal securities | | Standard inputs and, for certain distressed securities, cash flows or liquidation values using a net present value calculation based on inputs that include, but are not limited to, financial statements and debt contracts |
When the fund’s investment adviser deems it appropriate to do so (such as when vendor prices are unavailable or deemed to be not representative), fixed-income securities will be valued in good faith at the mean quoted bid and ask prices that are reasonably and timely available (or bid prices, if ask prices are not available) or at prices for securities of comparable maturity, quality and type.
Exchange-traded futures are generally valued at the official settlement price of, or the last reported sale price on, the exchange or market on which such instruments are traded, as of the close of business on the day the futures are being valued or, lacking any sales, at the last available bid price. Prices for each future are taken from the exchange or market on which the security trades. Forward currency contracts are valued at the mean of representative quoted bid and ask prices, generally based on prices supplied by one or more pricing vendors. Interest rate swaps and credit default swaps are generally valued by pricing vendors based on market inputs that include the index and term of index, reset frequency, payer/receiver, currency and pay frequency.
| American Funds Strategic Bond Fund | 19 |
Securities and other assets for which representative market quotations are not readily available or are considered unreliable by the fund’s investment adviser are fair valued as determined in good faith under fair valuation guidelines adopted by authority of the fund’s board of trustees as further described. The investment adviser follows fair valuation guidelines, consistent with U.S. Securities and Exchange Commission rules and guidance, to consider relevant principles and factors when making fair value determinations. The investment adviser considers relevant indications of value that are reasonably and timely available to it in determining the fair value to be assigned to a particular security, such as the type and cost of the security; contractual or legal restrictions on resale of the security; relevant financial or business developments of the issuer; actively traded similar or related securities; conversion or exchange rights on the security; related corporate actions; significant events occurring after the close of trading in the security; and changes in overall market conditions. In addition, the closing prices of equity securities that trade in markets outside U.S. time zones may be adjusted to reflect significant events that occur after the close of local trading but before the net asset value of each share class of the fund is determined. Fair valuations and valuations of investments that are not actively trading involve judgment and may differ materially from valuations that would have been used had greater market activity occurred.
Processes and structure — The fund’s board of trustees has delegated authority to the fund’s investment adviser to make fair value determinations, subject to board oversight. The investment adviser has established a Joint Fair Valuation Committee (the “Fair Valuation Committee”) to administer, implement and oversee the fair valuation process, and to make fair value decisions. The Fair Valuation Committee regularly reviews its own fair value decisions, as well as decisions made under its standing instructions to the investment adviser’s valuation teams. The Fair Valuation Committee reviews changes in fair value measurements from period to period and may, as deemed appropriate, update the fair valuation guidelines to better reflect the results of back testing and address new or evolving issues. The Fair Valuation Committee reports any changes to the fair valuation guidelines to the board of trustees. The fund’s board and audit committee also regularly review reports that describe fair value determinations and methods.
The fund’s investment adviser has also established a Fixed-Income Pricing Review Group to administer and oversee the fixed-income valuation process, including the use of fixed-income pricing vendors. This group regularly reviews pricing vendor information and market data. Pricing decisions, processes and controls over security valuation are also subject to additional internal reviews, including an annual control self-evaluation program facilitated by the investment adviser’s compliance group.
Classifications — The fund’s investment adviser classifies the fund’s assets and liabilities into three levels based on the inputs used to value the assets or liabilities. Level 1 values are based on quoted prices in active markets for identical securities. Level 2 values are based on significant observable market inputs, such as quoted prices for similar securities and quoted prices in inactive markets. Certain securities trading outside the U.S. may transfer between Level 1 and Level 2 due to valuation adjustments resulting from significant market movements following the close of local trading. Level 3 values are
| 20 | American Funds Strategic Bond Fund |
based on significant unobservable inputs that reflect the investment adviser’s determination of assumptions that market participants might reasonably use in valuing the securities. The valuation levels are not necessarily an indication of the risk or liquidity associated with the underlying investment. For example, U.S. government securities are reflected as Level 2 because the inputs used to determine fair value may not always be quoted prices in an active market. The following tables present the fund’s valuation levels as of June 30, 2018 (dollars in thousands):
| | | Investment securities | |
| | | Level 1 | | | Level 2 | | | Level 3 | | | Total | |
| Assets: | | | | | | | | | | | | | | | | |
| Bonds, notes & other debt instruments: | | | | | | | | | | | | | | | | |
| Corporate bonds & notes | | $ | — | | | $ | 276,861 | | | $ | — | | | $ | 276,861 | |
| U.S. Treasury bonds & notes | | | — | | | | 162,162 | | | | — | | | | 162,162 | |
| Bonds & notes of governments & government agencies outside the U.S. | | | — | | | | 53,420 | | | | — | | | | 53,420 | |
| Municipals | | | — | | | | 12,810 | | | | — | | | | 12,810 | |
| Asset-backed obligations | | | — | | | | 5,587 | | | | — | | | | 5,587 | |
| Mortgage-backed obligations | | | — | | | | 5,181 | | | | — | | | | 5,181 | |
| Short-term securities | | | — | | | | 77,068 | | | | — | | | | 77,068 | |
| Total | | $ | — | | | $ | 593,089 | | | $ | — | | | $ | 593,089 | |
| | | Other investments* | |
| | | Level 1 | | | Level 2 | | | Level 3 | | | | Total | |
| Assets: | | | | | | | | | | | | | | | | |
| Unrealized appreciation on futures contracts | | $ | 507 | | | $ | — | | | $ | — | | | $ | 507 | |
| Unrealized appreciation on open forward currency contracts | | | — | | | | 1,331 | | | | — | | | | 1,331 | |
| Unrealized appreciation on interest rate swaps | | | — | | | | 23,472 | | | | — | | | | 23,472 | |
| Unrealized appreciation on credit default swaps | | | — | | | | 1,495 | | | | — | | | | 1,495 | |
| Liabilities: | | | | | | | | | | | | | | | | |
| Unrealized depreciation on futures contracts | | | (80 | ) | | | — | | | | — | | | | (80 | ) |
| Unrealized depreciation on open forward currency contracts | | | — | | | | (866 | ) | | | — | | | | (866 | ) |
| Unrealized depreciation on interest rate swaps | | | — | | | | (28,545 | ) | | | — | | | | (28,545 | ) |
| Total | | $ | 427 | | | $ | (3,113 | ) | | $ | — | | | $ | (2,686 | ) |
| * | Futures contracts, forward currency contracts, interest rate swaps and credit default swaps are not included in the investment portfolio. |
| American Funds Strategic Bond Fund | 21 |
4. Risk factors
Investing in the fund may involve certain risks including, but not limited to, those described below.
Market conditions — The prices of, and the income generated by, the securities held by the fund may decline — sometimes rapidly or unpredictably — due to various factors, including events or conditions affecting the general economy or particular industries; overall market changes; local, regional or global political, social or economic instability; governmental or governmental agency responses to economic conditions; and currency exchange rate, interest rate and commodity price fluctuations.
Issuer risks — The prices of, and the income generated by, securities held by the fund may decline in response to various factors directly related to the issuers of such securities, including reduced demand for an issuer’s goods or services, poor management performance and strategic initiatives such as mergers, acquisitions or dispositions and the market response to any such initiatives.
Investing in debt instruments — The prices of, and the income generated by, bonds and other debt securities held by the fund may be affected by changing interest rates and by changes in the effective maturities and credit ratings of these securities.
Rising interest rates will generally cause the prices of bonds and other debt securities to fall. Falling interest rates may cause an issuer to redeem, call or refinance a debt security before its stated maturity, which may result in the fund having to reinvest the proceeds in lower yielding securities. Longer maturity debt securities generally have greater sensitivity to changes in interest rates and may be subject to greater price fluctuations than shorter maturity debt securities.
Bonds and other debt securities are also subject to credit risk, which is the possibility that the credit strength of an issuer will weaken and/or an issuer of a debt security will fail to make timely payments of principal or interest and the security will go into default. Lower quality debt securities generally have higher rates of interest and may be subject to greater price fluctuations than higher quality debt securities. Credit risk is gauged, in part, by the credit ratings of the debt securities in which the fund invests. However, ratings are only the opinions of the rating agencies issuing them and are not guarantees as to credit quality or an evaluation of market risk. The fund’s investment adviser relies on its own credit analysts to research issuers and issues in seeking to mitigate various credit and default risks.
Investing in lower rated debt instruments — Lower rated bonds and other lower rated debt securities generally have higher rates of interest and involve greater risk of default or price declines due to changes in the issuer’s creditworthiness than those of higher
| 22 | American Funds Strategic Bond Fund |
quality debt securities. The market prices of these securities may fluctuate more than the prices of higher quality debt securities and may decline significantly in periods of general economic difficulty. These risks may be increased with respect to investments in junk bonds.
Investing in securities backed by the U.S. government — Securities backed by the U.S. Treasury or the full faith and credit of the U.S. government are guaranteed only as to the timely payment of interest and principal when held to maturity. Accordingly, the current market values for these securities will fluctuate with changes in interest rates. Securities issued by government-sponsored entities and federal agencies and instrumentalities that are not backed by the full faith and credit of the U.S. government are neither issued nor guaranteed by the U.S. government.
Investing in mortgage-related and other asset-backed securities — Mortgage-related securities, such as mortgage-backed securities, and other asset-backed securities, include debt obligations that represent interests in pools of mortgages or other income-bearing assets, such as consumer loans or receivables. Such securities often involve risks that are different from or more acute than the risks associated with investing in other types of debt securities. Mortgage-backed and other asset-backed securities are subject to changes in the payment patterns of borrowers of the underlying debt. When interest rates fall, borrowers are more likely to refinance or prepay their debt before its stated maturity. This may result in the fund having to reinvest the proceeds in lower yielding securities, effectively reducing the fund’s income. Conversely, if interest rates rise and borrowers repay their debt more slowly than expected, the time in which the mortgage-backed and other asset-backed securities are paid off could be extended, reducing the fund’s cash available for reinvestment in higher yielding securities.
Investing in inflation linked bonds — The values of inflation linked bonds generally fluctuate in response to changes in real interest rates — i.e., rates of interest after factoring in inflation. A rise in real interest rates may cause the prices of inflation linked securities to fall, while a decline in real interest rates may cause the prices to increase. Inflation linked bonds may experience greater losses than other debt securities with similar durations when real interest rates rise faster than nominal interest rates. There can be no assurance that the value of an inflation linked security will be directly correlated to changes in interest rates; for example, if interest rates rise for reasons other than inflation, the increase may not be reflected in the security’s inflation measure.
Investing in inflation linked bonds may also reduce the fund’s distributable income during periods of extreme deflation. If prices for goods and services decline throughout the economy, the principal and income on inflation linked securities may decline and result in losses to the fund.
Investing in future delivery contracts — The fund may enter into contracts, such as to-be-announced contracts and mortgage dollar rolls, that involve the fund selling mortgage-related securities and simultaneously contracting to repurchase similar securities for delivery at a future date at a predetermined price. This can increase the
| American Funds Strategic Bond Fund | 23 |
fund’s market exposure, and the market price of the securities that the fund contracts to repurchase could drop below their purchase price. While the fund can preserve and generate capital through the use of such contracts by, for example, realizing the difference between the sale price and the future purchase price, the income generated by the fund may be reduced by engaging in such transactions. In addition, these transactions may increase the turnover rate of the fund.
Investing in derivatives — The use of derivatives involves a variety of risks, which may be different from, or greater than, the risks associated with investing in traditional cash securities, such as stocks and bonds. Changes in the value of a derivative may not correlate perfectly with, and may be more sensitive to market events than, the underlying asset, rate or index, and a derivative instrument may expose the fund to losses in excess of its initial investment. Derivatives may be difficult for the fund to buy or sell at an opportune time or price and may be difficult to terminate or otherwise offset. The fund’s use of derivatives may result in losses to the fund, and investing in derivatives may reduce the fund’s returns and increase the fund’s price volatility. The fund’s counterparty to a derivative transaction (including, if applicable, the fund’s clearing broker, the derivatives exchange or the clearinghouse) may be unable or unwilling to honor its financial obligations in respect of the transaction.
Liquidity risk — Certain fund holdings may be deemed to be less liquid or illiquid because they cannot be readily sold without significantly impacting the value of the holdings. Liquidity risk may result from the lack of an active market for a holding, legal or contractual restrictions on resale, or the reduced number and capacity of market participants to make a market in such holding. Market prices for less liquid or illiquid holdings may be volatile, and reduced liquidity may have an adverse impact on the market price of such holdings. Additionally, the sale of less liquid or illiquid holdings may involve substantial delays (including delays in settlement) and additional costs and the fund may be unable to sell such holdings when necessary to meet its liquidity needs.
Investing outside the U.S. — Securities of issuers domiciled outside the U.S., or with significant operations or revenues outside the U.S., may lose value because of adverse political, social, economic or market developments (including social instability, regional conflicts, terrorism and war) in the countries or regions in which the issuers operate or generate revenue. These securities may also lose value due to changes in foreign currency exchange rates against the U.S. dollar and/or currencies of other countries. Issuers of these securities may be more susceptible to actions of foreign governments, such as the imposition of price controls or punitive taxes, that could adversely impact the value of these securities. Securities markets in certain countries may be more volatile and/or less liquid than those in the U.S. Investments outside the U.S. may also be subject to different accounting practices and different regulatory, legal and reporting standards and practices, and may be more difficult to value, than those in the U.S. In addition, the value of investments outside the U.S. may be reduced by foreign taxes, including foreign withholding taxes on interest and dividends. Further, there may be increased risks of delayed settlement of securities purchased or sold by the fund. The risks of investing outside the U.S. may be heightened in connection with investments in emerging markets.
| 24 | American Funds Strategic Bond Fund |
Investing in emerging markets — Investing in emerging markets may involve risks in addition to and greater than those generally associated with investing in the securities markets of developed countries. For instance, developing countries may have less developed legal and accounting systems than those in developed countries. The governments of these countries may be less stable and more likely to impose capital controls, nationalize a company or industry, place restrictions on foreign ownership and on withdrawing sale proceeds of securities from the country, and/or impose punitive taxes that could adversely affect the prices of securities. In addition, the economies of these countries may be dependent on relatively few industries that are more susceptible to local and global changes. Securities markets in these countries can also be relatively small and have substantially lower trading volumes. As a result, securities issued in these countries may be more volatile and less liquid, and may be more difficult to value, than securities issued in countries with more developed economies and/or markets. Less certainty with respect to security valuations may lead to additional challenges and risks in calculating the fund’s net asset value. Additionally, there may be increased settlement risks for transactions in local securities.
Currency — The prices of, and the income generated by, many debt securities held by the fund may also be affected by changes in relative currency values. If the U.S. dollar appreciates against foreign currencies, the value in U.S. dollars of the fund’s securities denominated in such currencies would generally fall and vice versa. U.S. dollar-denominated securities of foreign issuers may also be affected by changes in relative currency values.
Portfolio turnover — The fund may engage in frequent and active trading of its portfolio securities. Higher portfolio turnover may involve correspondingly greater transaction costs in the form of dealer spreads, brokerage commissions and other transaction costs on the sale of securities and on reinvestment in other securities. The sale of portfolio securities may also result in the realization of net capital gains, which are taxable when distributed to shareholders, unless the shareholder is exempt from taxation or his or her account is tax-favored. These costs and tax effects may adversely affect the fund’s returns to shareholders.
Nondiversification risk — As a nondiversified fund, the fund has the ability to invest a larger percentage of its assets in the securities of a smaller number of issuers than a diversified fund. Poor performance by a single large holding could adversely impact the fund’s investment results more than if the fund were invested in a larger number of issuers.
Management — The investment adviser to the fund actively manages the fund’s investments. Consequently, the fund is subject to the risk that the methods and analyses employed by the investment adviser in this process may not produce the desired results. This could cause the fund to lose value or its investment results to lag relevant benchmarks or other funds with similar objectives.
| American Funds Strategic Bond Fund | 25 |
5. Certain investment techniques
Index-linked bonds — The fund has invested in index-linked bonds, which are fixed-income securities whose principal value is periodically adjusted to a government price index. Over the life of an index-linked bond, interest is paid on the adjusted principal value. Increases or decreases in the principal value of index-linked bonds are recorded as interest income in the fund’s statement of operations.
Loan transactions — The fund has entered into loan transactions in which the fund acquires a loan either through an agent, by assignment from another holder, or as a participation interest in another holder’s portion of a loan. The loan is often administered by a financial institution that acts as agent for the holders of the loan, and the fund may be required to receive approval from the agent and/or borrower prior to the sale of the investment. The loan’s interest rate and maturity date may change based on the terms of the loan, including potential early payments of principal.
Futures contracts — The fund has entered into futures contracts, which provide for the future sale by one party and purchase by another party of a specified amount of a specific financial instrument for a specified price, date, time and place designated at the time the contract is made. Futures contracts are used to strategically manage the fund’s interest rate sensitivity by increasing or decreasing the duration of the fund or a portion of the fund’s portfolio.
Upon entering into futures contracts, and to maintain the fund’s open positions in futures contracts, the fund is required to deposit with a futures broker, or FCM, in a segregated account in the name of the FCM an amount of cash, U.S. government securities or other liquid securities, known as initial margin. The margin required for a particular futures contract is set by the exchange on which the contract is traded to serve as collateral, and may be significantly modified from time to time by the exchange during the term of the contract. Securities deposited as initial margin, if any, are disclosed in the investment portfolio and cash deposited as initial margin, if any, is reflected as restricted cash pledged for futures contracts in the fund’s statement of assets and liabilities.
On a daily basis, the fund pays or receives variation margin based on the increase or decrease in the value of the futures contracts and records variation margin on futures contracts in the statement of assets and liabilities. In addition, the fund segregates liquid assets equivalent to the fund’s outstanding obligations under the contract in excess of the initial margin and variation margin, if any. Futures contracts may involve a risk of loss in excess of the variation margin shown on the fund’s statement of assets and liabilities. The fund records realized gains or losses at the time the futures contract is closed or expires. Net realized gains or losses and net unrealized appreciation or depreciation from futures contracts are recorded in the fund’s statement of operations. The average month-end notional amount of futures contracts while held was $657,400,000.
Forward currency contracts — The fund has entered into forward currency contracts, which represent agreements to exchange currencies on specific future dates at predetermined rates. The fund’s investment adviser uses forward currency contracts to
| 26 | American Funds Strategic Bond Fund |
manage the fund’s exposure to changes in exchange rates. Upon entering into these contracts, risks may arise from the potential inability of counterparties to meet the terms of their contracts and from possible movements in exchange rates.
On a daily basis, the fund’s investment adviser values forward currency contracts and records unrealized appreciation or depreciation for open forward currency contracts in the fund’s statement of assets and liabilities. Realized gains or losses are recorded at the time the forward currency contract is closed or offset by another contract with the same broker for the same settlement date and currency.
Closed forward currency contracts that have not reached their settlement date are included in the respective receivables or payables for closed forward currency contracts in the fund’s statement of assets and liabilities. Net realized gains or losses from closed forward currency contracts and net unrealized appreciation or depreciation from open forward currency contracts are recorded in the fund’s statement of operations. The average month-end notional amount of open forward currency contracts while held was $142,325,000.
Interest rate swaps — The fund has entered into interest rate swap contracts, which are agreements to exchange one stream of future interest payments for another based on a specified notional amount. Typically, interest rate swaps exchange a fixed interest rate for a payment that floats relative to a benchmark or vice versa. The fund’s investment adviser uses interest rate swaps to seek to manage the interest rate sensitivity of the fund by increasing or decreasing the duration of the fund or a portion of the fund’s portfolio. Risks may arise as a result of the fund’s investment adviser incorrectly anticipating changes in interest rates, increased volatility, reduced liquidity and the potential inability of counterparties to meet the terms of their agreements.
Upon entering into an interest rate swap contract, the fund is required to deposit cash, U.S. government securities or other liquid securities, which is known as initial margin. Generally, the initial margin required for a particular interest rate swap is set and held as collateral by the clearinghouse on which the contract is cleared. The amount of initial margin required may be significantly modified from time to time by the clearinghouse during the term of the contract.
On a daily basis, the fund’s investment adviser records daily interest accruals related to the exchange of future payments as a receivable and payable in the fund’s statement of assets and liabilities. The fund also pays or receives a variation margin based on the increase or decrease in the value of the interest rate swaps, including accrued interest, and records variation margin on interest rate swaps in the statement of assets and liabilities. The fund records realized gains and losses on both the net accrued interest and any gain or loss recognized at the time the interest rate swap is closed or expires. Net realized gains or losses, as well as any net unrealized appreciation or depreciation, from interest rate swaps are recorded in the fund’s statement of operations. The average month-end notional amount of interest rate swaps while held was $12,711,095,000.
| American Funds Strategic Bond Fund | 27 |
Credit default swap indices — The fund has entered into centrally cleared credit default swap agreements on credit indices (“CDSI”) that involve one party (the protection buyer) making a stream of payments to another party (the protection seller) in exchange for the right to receive a specified return upon the occurrence of a credit event, such as a default or restructuring, with respect to any of the underlying issuers (reference obligations) in the referenced index. The fund’s investment adviser uses credit default swaps to assume exposure to a diversified portfolio of credits or to hedge against existing credit risks.
CDSI are portfolios of credit instruments or exposures designed to be representative of some part of the credit market, such as the high-yield or investment-grade credit market. CDSI are generally traded using standardized terms, including a fixed spread and standard maturity dates, and reference all the names in the index. If there is a credit event, it is settled based on that name’s weight in the index. The composition of the underlying issuers or obligations within a particular index may change periodically, usually every six months. A specified credit event may affect all or individual underlying reference obligations included in the index, and will be settled based upon the relative weighting of the affected obligation(s) within the index. The value of each CDSI can be used as a measure of the current payment/performance risk of the CDSI and represents the likelihood of an expected liability or profit should the notional amount of the CDSI be closed or sold as of the period end. An increasing value, as compared to the notional amount of the CDSI, represents a deterioration of the referenced indices’ credit soundness and a greater likelihood of risk of default or other credit event occurring as defined under the terms of the agreement. When the fund provides sell protection, its maximum exposure is the notional amount of the credit default swap agreement.
Upon entering into a centrally cleared CDSI contract, the fund is required to deposit with a derivatives clearing member (“DCM”) in a segregated account in the name of the DCM an amount of cash, U.S. government securities or other liquid securities, which is known as initial margin. Generally, the initial margin required for a particular credit default swap is set and held as collateral by the clearinghouse on which the contract is cleared. The amount of initial margin required may be significantly modified from time to time by the clearinghouse during the term of the contract. Securities deposited as initial margin are designated on the investment portfolio.
On a daily basis, interest accruals related to the exchange of future payments are recorded as a receivable and payable in the fund’s statement of assets and liabilities. The fund also pays or receives a variation margin based on the increase or decrease in the value of the CDSI, and records variation margin in the statement of assets and liabilities. The fund records realized gains and losses on both the net accrued interest and any gain or loss recognized at the time the swap is closed or expires. Net realized gains or losses, as well as any net unrealized appreciation or depreciation, from credit default swaps are recorded in the fund’s statement of operations. The average month-end notional amount of credit default swaps while held was $288,697,000.
| 28 | American Funds Strategic Bond Fund |
The following tables present the financial statement impacts resulting from the fund’s use of futures contracts, forward currency contracts, interest rate swaps and credit default swaps as of, or for the six months ended, June 30, 2018 (dollars in thousands):
| | | | | Assets | | | Liabilities | |
| Contracts | | Risk type | | Location on statement of
assets and liabilities | | Value | | | Location on statement of
assets and liabilities | | Value | |
| Futures | | Interest | | Unrealized appreciation* | | $ | 507 | | | Unrealized depreciation* | | $ | 80 | |
| Forward currency | | Currency | | Unrealized appreciation on open forward currency contracts | | | 1,331 | | | Unrealized depreciation on open forward currency contracts | | | 866 | |
| Forward currency | | Currency | | Receivables for closed forward currency contracts | | | 99 | | | Payables for closed forward currency contracts | | | 117 | |
| Swaps | | Interest | | Unrealized appreciation* | | | 23,472 | | | Unrealized depreciation* | | | 28,545 | |
| Swaps | | Credit | | Unrealized appreciation* | | | 1,495 | | | Unrealized depreciation* | | | — | |
| | | | | | | $ | 26,980 | | | | | $ | 29,692 | |
| | | | | Net realized (loss) gain | | | Net unrealized appreciation
(depreciation) | |
| Contracts | | Risk type | | Location on statement of
operations | | Value | | | Location on statement of
operations | | Value | |
| Futures | | Interest | | Net realized loss on futures contracts | | $ | (2,867 | ) | | Net unrealized appreciation on futures contracts | | $ | 1,577 | |
| Forward currency | | Currency | | Net realized gain on forward currency contracts | | | 1,365 | | | Net unrealized appreciation on forward currency contracts | | | 1,077 | |
| Swaps | | Interest | | Net realized gain on swap contracts | | | 5,001 | | | Net unrealized depreciation on swap contracts | | | (2,705 | ) |
| Swaps | | Credit | | Net realized loss on swap contracts | | | (308 | ) | | Net unrealized appreciation on swap contracts | | | 1,830 | |
| | | | | | | $ | 3,191 | | | | | $ | 1,779 | |
| * | Includes cumulative appreciation/depreciation on futures contracts, interest rate swaps and credit default swaps as reported in the applicable tables following the fund’s investment portfolio. Only current day’s variation margin is reported within the statement of assets and liabilities. |
Collateral — The fund participates in a collateral program that calls for the fund to either receive or pledge highly liquid assets, such as cash or U.S. government securities, as collateral due to its use of futures contracts, forward currency contracts, interest rate swaps and credit default swaps. For futures contracts, interest rate swaps and credit default swaps, the program calls for the fund to pledge collateral for initial and variation
| American Funds Strategic Bond Fund | 29 |
margin by contract. For forward currency contracts, the program calls for the fund to either receive or pledge collateral based on the net gain or loss on unsettled forward currency contracts by counterparty. The purpose of the collateral is to cover potential losses that could occur in the event that either party cannot meet its contractual obligation. Non-cash collateral pledged by the fund, if any, is disclosed in the fund’s investment portfolio, and cash collateral pledged by the fund, if any, is held in a segregated account with the fund’s custodian, which is reflected as pledged cash in the fund’s statement of assets and liabilities.
Rights of offset — The fund has entered into enforceable master netting agreements with certain counterparties for forward currency contracts, where on any date amounts payable by each party to the other (in the same currency with respect to the same transaction) may be closed or offset by each party’s payment obligation. If an early termination date occurs under these agreements following an event of default or termination event, all obligations of each party to its counterparty are settled net through a single payment in a single currency (“close-out netting”). For financial reporting purposes, the fund does not offset financial assets and financial liabilities that are subject to these master netting arrangements in the statement of assets and liabilities.
The following table presents the fund’s forward currency contracts by counterparty that are subject to master netting agreements but that are not offset in the fund’s statement of assets and liabilities. The net amount column shows the impact of offsetting on the fund’s statement of assets and liabilities as of June 30, 2018, if close-out netting was exercised (dollars in thousands):
| | | Gross amounts | | | Gross amounts not offset in the
statement of assets and liabilities and | | | | |
| | | recognized in the | | | subject to a master netting agreement | | | | |
| Counterparty | | statement of assets
and liabilities | | | Available
to offset | | | Non-cash
collateral* | | | Cash
collateral | | | Net
amount | |
| Assets: | | | | | | | | | | | | | | | | | | | | |
| Bank of America, N.A. | | $ | 82 | | | $ | (82 | ) | | $ | — | | | $ | — | | | $ | — | |
| Bank of New York Mellon | | | 59 | | | | (59 | ) | | | — | | | | — | | | | — | |
| Citibank | | | 283 | | | | (117 | ) | | | — | | | | — | | | | 166 | |
| Goldman Sachs | | | 329 | | | | (327 | ) | | | — | | | | — | | | | 2 | |
| JPMorgan Chase | | | 677 | | | | (8 | ) | | | (517 | ) | | | — | | | | 152 | |
| Total | | $ | 1,430 | | | $ | (593 | ) | | $ | (517 | ) | | $ | — | | | $ | 320 | |
| Liabilities: | | | | | | | | | | | | | | | | | | | | |
| Bank of America, N.A. | | $ | 356 | | | $ | (82 | ) | | $ | — | | | $ | — | | | $ | 274 | |
| Bank of New York Mellon | | | 73 | | | | (59 | ) | | | — | | | | — | | | | 14 | |
| Citibank | | | 117 | | | | (117 | ) | | | — | | | | — | | | | — | |
| Goldman Sachs | | | 327 | | | | (327 | ) | | | — | | | | — | | | | — | |
| JPMorgan Chase | | | 8 | | | | (8 | ) | | | — | | | | — | | | | — | |
| Morgan Stanley | | | 102 | | | | — | | | | — | | | | — | | | | 102 | |
| Total | | $ | 983 | | | $ | (593 | ) | | $ | — | | | $ | — | | | $ | 390 | |
| * | Non-cash collateral is shown on a settlement basis. |
| 30 | American Funds Strategic Bond Fund |
6. Taxation and distributions
Federal income taxation — The fund complies with the requirements under Subchapter M of the Internal Revenue Code applicable to mutual funds and intends to distribute substantially all of its net taxable income and net capital gains each year. The fund is not subject to income taxes to the extent such distributions are made. Therefore, no federal income tax provision is required.
As of and during the period ended June 30, 2018, the fund did not have a liability for any unrecognized tax benefits. The fund recognizes interest and penalties, if any, related to unrecognized tax benefits as income tax expense in the statement of operations. During the period, the fund did not incur any significant interest or penalties.
The fund’s tax returns are not subject to examination by federal, state and, if applicable, non-U.S. tax authorities after the expiration of each jurisdiction’s statute of limitations, which is generally three years after the date of filing but can be extended in certain jurisdictions.
Non-U.S. taxation — Interest income is recorded net of non-U.S. taxes paid. The fund may file withholding tax reclaims in certain jurisdictions to recover a portion of amounts previously withheld. These reclaims are recorded when the amount is known and there are no significant uncertainties on collectability. Gains realized by the fund on the sale of securities in certain countries, if any, may be subject to non-U.S. taxes. If applicable, the fund records an estimated deferred tax liability based on unrealized gains to provide for potential non-U.S. taxes payable upon the sale of these securities.
Distributions — Distributions paid to shareholders are based on net investment income and net realized gains determined on a tax basis, which may differ from net investment income and net realized gains for financial reporting purposes. These differences are due primarily to different treatment for items such as currency gains and losses; short-term capital gains and losses; capital losses related to sales of certain securities within 30 days of purchase; cost of investments sold; amortization of premiums and discounts and income on certain investments. The fiscal year in which amounts are distributed may differ from the year in which the net investment income and net realized gains are recorded by the fund for financial reporting purposes.
The components of distributable earnings on a tax basis are reported as of the fund’s most recent year-end. As of December 31, 2017, the components of distributable earnings on a tax basis were as follows (dollars in thousands):
| Distributions in excess of ordinary income | | $ | 442 | |
| Late year loss deferral* | | | (3,220 | ) |
| Post-October capital loss deferral* | | | (1,636 | ) |
| * | These deferrals are considered incurred in the subsequent year. |
| American Funds Strategic Bond Fund | 31 |
As of June 30, 2018, the tax basis unrealized appreciation (depreciation) and cost of investments were as follows (dollars in thousands):
| Gross unrealized appreciation on investments | | $ | 30,343 | |
| Gross unrealized depreciation on investments | | | (45,806 | ) |
| Net unrealized depreciation on investments | | | (15,463 | ) |
| Cost of investments | | | 616,551 | |
Tax-basis distributions paid to shareholders from ordinary income were as follows (dollars in thousands):
| | | Six months ended June 30, 2018 | | | Year ended December 31, 2017 | |
| Share class | | Ordinary
income1 | | | Long-term
capital gains | | | Total
paid | | | Ordinary
income | | | Long-term
capital gains | | | Return of
capital | | | Total
paid | |
| Class A | | $ | 2,465 | | | $ | — | | | $ | 2,465 | | | $ | 6,933 | | | $ | — | | | $ | 298 | | | $ | 7,231 | |
| Class B2 | | | | | | | | | | | | | | | — | | | | — | | | | — | | | | — | |
| Class C | | | 43 | | | | — | | | | 43 | | | | 286 | | | | — | | | | 11 | | | | 297 | |
| Class T3 | | | — | 4 | | | — | | | | — | 4 | | | — | 4 | | | — | | | | — | 4 | | | — | 4 |
| Class F-1 | | | 54 | | | | — | | | | 54 | | | | 184 | | | | — | | | | 8 | | | | 192 | |
| Class F-2 | | | 476 | | | | — | | | | 476 | | | | 1,343 | | | | — | | | | 58 | | | | 1,401 | |
| Class F-35 | | | 184 | | | | — | | | | 184 | | | | 432 | | | | — | | | | 21 | | | | 453 | |
| Class 529-A | | | 97 | | | | — | | | | 97 | | | | 223 | | | | — | | | | 10 | | | | 233 | |
| Class 529-B2 | | | | | | | | | | | | | | | — | 4 | | | — | | | | — | | | | — | 4 |
| Class 529-C | | | 9 | | | | — | | | | 9 | | | | 47 | | | | — | | | | 2 | | | | 49 | |
| Class 529-E | | | 5 | | | | — | | | | 5 | | | | 12 | | | | — | | | | — | 4 | | | 12 | |
| Class 529-T3 | | | — | 4 | | | — | | | | — | 4 | | | — | 4 | | | — | | | | — | 4 | | | — | 4 |
| Class 529-F-1 | | | 32 | | | | — | | | | 32 | | | | 80 | | | | — | | | | 3 | | | | 83 | |
| Class R-1 | | | 2 | | | | — | | | | 2 | | | | 3 | | | | — | | | | — | 4 | | | 3 | |
| Class R-2 | | | 4 | | | | — | | | | 4 | | | | 14 | | | | — | | | | 1 | | | | 15 | |
| Class R-2E | | | — | 4 | | | — | | | | — | 4 | | | — | 4 | | | — | | | | — | 4 | | | — | 4 |
| Class R-3 | | | 11 | | | | — | | | | 11 | | | | 29 | | | | — | | | | 2 | | | | 31 | |
| Class R-4 | | | 13 | | | | — | | | | 13 | | | | 36 | | | | — | | | | 1 | | | | 37 | |
| Class R-5E | | | 1 | | | | — | | | | 1 | | | | — | 4 | | | — | | | | — | 4 | | | — | 4 |
| Class R-5 | | | 5 | | | | — | | | | 5 | | | | 11 | | | | — | | | | 1 | | | | 12 | |
| Class R-6 | | | 204 | | | | — | | | | 204 | | | | 616 | | | | — | | | | 26 | | | | 642 | |
| Total | | $ | 3,605 | | | $ | — | | | $ | 3,605 | | | $ | 10,249 | | | $ | — | | | $ | 442 | | | $ | 10,691 | |
| 1 | All or a portion of these amounts may later be determined as return of capital; the determination will be made at December 31, 2018. |
| 2 | Class B and 529-B shares were fully liquidated on May 5, 2017. |
| 3 | Class T and 529-T shares began investment operations on April 7, 2017. |
| 4 | Amount less than one thousand. |
| 5 | Class F-3 shares began investment operations on January 27, 2017. |
| 32 | American Funds Strategic Bond Fund |
7. Fees and transactions with related parties
CRMC, the fund’s investment adviser, is the parent company of American Funds Distributors,® Inc. (“AFD”), the principal underwriter of the fund’s shares, and American Funds Service Company® (“AFS”), the fund’s transfer agent. CRMC, AFD and AFS are considered related parties to the fund.
Investment advisory services — The fund has an investment advisory and service agreement with CRMC that provides for monthly fees accrued daily. At the beginning of the year, these fees were based on an annual rate of 0.570% of average daily net assets. On March 5, 2018, the fund’s board of trustees approved an amended investment advisory and services agreement effective May 1, 2018, decreasing the annual rates to 0.420%, 0.350% and 0.310% on average daily net assets in excess of $500 million, $1 billion and $1.5 billion, respectively. CRMC voluntarily reduced investment advisory services fees to the approved rates in advance of the effective date. For the six months ended June 30, 2018, total investment advisory services fees waived by CRMC were $31,000. As a result, the fee of $1,624,000 shown on the statement of operations, which was equivalent to an annualized rate of 0.562% of average daily net assets, was reduced to $1,593,000, which was equivalent to an annualized rate of 0.551% of average daily net assets.
Miscellaneous fee reimbursements — CRMC has agreed to reimburse a portion of miscellaneous fees and expenses of the fund during its startup period. This reimbursement may be adjusted or discontinued by CRMC, subject to any restrictions in the fund’s prospectus. For the six months ended June 30, 2018, total fees and expenses reimbursed by CRMC were $36,000. Fees and expenses in the statement of operations are presented gross of any reimbursements from CRMC.
Class-specific fees and expenses — Expenses that are specific to individual share classes are accrued directly to the respective share class. The principal class-specific fees and expenses are further described below:
Distribution services — The fund has plans of distribution for all share classes, except Class F-2, F-3, R-5E, R-5 and R-6 shares. Under the plans, the board of trustees approves certain categories of expenses that are used to finance activities primarily intended to sell fund shares and service existing accounts. The plans provide for payments, based on an annualized percentage of average daily net assets, ranging from 0.30% to 1.00% as noted in this section. In some cases, the board of trustees has limited the amounts that may be paid to less than the maximum allowed by the plans. All share classes with a plan may use up to 0.25% of average daily net assets to pay service fees, or to compensate AFD for paying service fees, to firms that have
| American Funds Strategic Bond Fund | 33 |
entered into agreements with AFD to provide certain shareholder services. The remaining amounts available to be paid under each plan are paid to dealers to compensate them for their sales activities.
| Share class | | Currently approved limits | | Plan limits |
| Class A | | | 0.30 | % | | | 0.30 | % |
| Class 529-A | | | 0.30 | | | | 0.50 | |
| Classes C, 529-C and R-1 | | | 1.00 | | | | 1.00 | |
| Class R-2 | | | 0.75 | | | | 1.00 | |
| Class R-2E | | | 0.60 | | | | 0.85 | |
| Classes 529-E and R-3 | | | 0.50 | | | | 0.75 | |
| Classes T, F-1, 529-T, 529-F-1 and R-4 | | | 0.25 | | | | 0.50 | |
For Class A and 529-A shares, distribution-related expenses include the reimbursement of dealer and wholesaler commissions paid by AFD for certain shares sold without a sales charge. These share classes reimburse AFD for amounts billed within the prior 15 months but only to the extent that the overall annual expense limits are not exceeded. As of June 30, 2018, there were no unreimbursed expenses subject to reimbursement for Class A or 529-A shares.
Transfer agent services — The fund has a shareholder services agreement with AFS under which the fund compensates AFS for providing transfer agent services to each of the fund’s share classes. These services include recordkeeping, shareholder communications and transaction processing. In addition, the fund reimburses AFS for amounts paid to third parties for performing transfer agent services on behalf of fund shareholders.
Administrative services — The fund has an administrative services agreement with CRMC under which the fund compensates CRMC for providing administrative services to Class A, C, T, F, 529 and R shares. These services include, but are not limited to, coordinating, monitoring, assisting and overseeing third parties that provide services to fund shareholders. Under the agreement, Class A shares pay an annual fee of 0.01% and Class C, T, F, 529 and R shares pay an annual fee of 0.05% of their respective average daily net assets.
529 plan services — Each 529 share class is subject to service fees to compensate the Virginia College Savings Plan (“Virginia529”) for its oversight and administration of the 529 college savings plan. The quarterly fee is based on a series of decreasing annual rates beginning with 0.10% on the first $20 billion of the net assets invested in the Class 529 shares of the American Funds and decreasing to 0.03% on such assets in excess of $100 billion. The fee for any given calendar quarter is accrued and calculated on the basis of the average net assets of Class 529 shares of the American Funds for the last month of the prior calendar quarter. The fee is included in other expenses in the fund’s statement of operations. Virginia529 is not considered a related party to the fund.
| 34 | American Funds Strategic Bond Fund |
For the six months ended June 30, 2018, class-specific expenses under the agreements were as follows (dollars in thousands):
| | | Distribution | | | Transfer agent | | | Administrative | | | 529 plan | |
| Share class | | services | | | services | | | services | | | services | |
| Class A | | $473 | | | $210 | | | $20 | | | Not applicable | |
| Class C | | 105 | | | 11 | | | 5 | | | Not applicable | |
| Class T | | — | | | — | * | | — | * | | Not applicable | |
| Class F-1 | | 13 | | | 7 | | | 3 | | | Not applicable | |
| Class F-2 | | Not applicable | | | 30 | | | 16 | | | Not applicable | |
| Class F-3 | | Not applicable | | | 2 | | | 6 | | | Not applicable | |
| Class 529-A | | 16 | | | 7 | | | 4 | | | $5 | |
| Class 529-C | | 21 | | | 2 | | | 1 | | | 1 | |
| Class 529-E | | 3 | | | — | * | | — | * | | — | * |
| Class 529-T | | — | | | — | * | | — | * | | — | * |
| Class 529-F-1 | | — | | | 2 | | | 1 | | | 2 | |
| Class R-1 | | 1 | | | — | * | | — | * | | Not applicable | |
| Class R-2 | | 5 | | | 2 | | | — | * | | Not applicable | |
| Class R-2E | | — | * | | — | * | | — | * | | Not applicable | |
| Class R-3 | | 5 | | | 1 | | | 1 | | | Not applicable | |
| Class R-4 | | 3 | | | 1 | | | 1 | | | Not applicable | |
| Class R-5E | | Not applicable | | | — | * | | — | * | | Not applicable | |
| Class R-5 | | Not applicable | | | — | * | | — | * | | Not applicable | |
| Class R-6 | | Not applicable | | | 3 | | | 7 | | | Not applicable | |
| Total class-specific expenses | | $645 | | | $278 | | | $65 | | | $8 | |
| | * | Amount less than one thousand. |
Trustees’ deferred compensation — Trustees who are unaffiliated with CRMC may elect to defer the cash payment of part or all of their compensation. These deferred amounts, which remain as liabilities of the fund, are treated as if invested in shares of the fund or other American Funds. These amounts represent general, unsecured liabilities of the fund and vary according to the total returns of the selected funds. Trustees’ compensation of $2,000 in the fund’s statement of operations reflects $2,000 in current fees (either paid in cash or deferred) and a net increase of less than $1,000 in the value of the deferred amounts.
Affiliated officers and trustees — Officers and certain trustees of the fund are or may be considered to be affiliated with CRMC, AFD and AFS. No affiliated officers or trustees received any compensation directly from the fund.
Security transactions with related funds — The fund may purchase from, or sell securities to, other funds managed by CRMC (or funds managed by certain affiliates of CRMC) under procedures adopted by the fund’s board of trustees. The funds involved in such transactions are considered related by virtue of having a common investment adviser (or affiliated investment advisers), common trustees and/or common officers. When such transactions occur, each transaction is executed at the current market price of the security and no brokerage commissions or fees are paid in accordance with Rule 17a-7 of the 1940 Act.
| American Funds Strategic Bond Fund | 35 |
Interfund lending — Pursuant to an exemptive order issued by the SEC, the fund, along with other CRMC-managed funds (or funds managed by certain affiliates of CRMC), may participate in an interfund lending program. The program provides an alternate credit facility that permits the funds to lend or borrow cash for temporary purposes directly to or from one another, subject to the conditions of the exemptive order. The fund did not lend or borrow cash through the interfund lending program at any time during the six months ended June 30, 2018.
8. Capital share transactions
Capital share transactions in the fund were as follows (dollars and shares in thousands):
| | | | | | Reinvestments of | | | | | | Net increase | |
| | | Sales1 | | | dividends | | | Repurchases1 | | | (decrease) | |
| Share class | | Amount | | | Shares | | | Amount | | | Shares | | | Amount | | | Shares | | | Amount | | | Shares | |
| | | | | | | | | | | | | | | | | | | | | | | | | |
| Six months ended June 30, 2018 | | | | | | | | | | | | | | | | | | | | | | | | |
| | | | | | | | | | | | | | | | | | | | | | | | | | | | | | | | | |
| Class A | | $ | 82,122 | | | | 8,205 | | | $ | 2,231 | | | | 224 | | | $ | (41,609 | ) | | | (4,165 | ) | | $ | 42,744 | | | | 4,264 | |
| Class C | | | 4,627 | | | | 464 | | | | 42 | | | | 4 | | | | (5,451 | ) | | | (547 | ) | | | (782 | ) | | | (79 | ) |
| Class T | | | — | | | | — | | | | — | | | | — | | | | — | | | | — | | | | — | | | | — | |
| Class F-1 | | | 2,719 | | | | 272 | | | | 54 | | | | 5 | | | | (3,250 | ) | | | (326 | ) | | | (477 | ) | | | (49 | ) |
| Class F-2 | | | 21,532 | | | | 2,155 | | | | 475 | | | | 47 | | | | (19,733 | ) | | | (1,970 | ) | | | 2,274 | | | | 232 | |
| Class F-3 | | | 5,338 | | | | 534 | | | | 158 | | | | 16 | | | | (2,707 | ) | | | (271 | ) | | | 2,789 | | | | 279 | |
| Class 529-A | | | 5,419 | | | | 543 | | | | 97 | | | | 10 | | | | (1,602 | ) | | | (161 | ) | | | 3,914 | | | | 392 | |
| Class 529-C | | | 1,300 | | | | 131 | | | | 9 | | | | 1 | | | | (550 | ) | | | (55 | ) | | | 759 | | | | 77 | |
| Class 529-E | | | 473 | | | | 47 | | | | 5 | | | | 1 | | | | (38 | ) | | | (4 | ) | | | 440 | | | | 44 | |
| Class 529-T | | | — | | | | — | | | | — | 2 | | | — | 2 | | | — | | | | — | | | | — | 2 | | | — | 2 |
| Class 529-F-1 | | | 1,841 | | | | 185 | | | | 31 | | | | 3 | | | | (681 | ) | | | (68 | ) | | | 1,191 | | | | 120 | |
| Class R-1 | | | 328 | | | | 33 | | | | 2 | | | | — | 2 | | | — | 2 | | | — | 2 | | | 330 | | | | 33 | |
| Class R-2 | | | 851 | | | | 85 | | | | 4 | | | | 1 | | | | (325 | ) | | | (33 | ) | | | 530 | | | | 53 | |
| Class R-2E | | | 32 | | | | 3 | | | | — | 2 | | | — | 2 | | | — | | | | — | | | | 32 | | | | 3 | |
| Class R-3 | | | 763 | | | | 77 | | | | 11 | | | | 1 | | | | (97 | ) | | | (10 | ) | | | 677 | | | | 68 | |
| Class R-4 | | | 680 | | | | 68 | | | | 13 | | | | 1 | | | | (280 | ) | | | (28 | ) | | | 413 | | | | 41 | |
| Class R-5E | | | 86 | | | | 9 | | | | — | 2 | | | — | 2 | | | (6 | ) | | | (1 | ) | | | 80 | | | | 8 | |
| Class R-5 | | | 266 | | | | 26 | | | | 5 | | | | 1 | | | | (149 | ) | | | (14 | ) | | | 122 | | | | 13 | |
| Class R-6 | | | 33 | | | | 3 | | | | 204 | | | | 20 | | | | (100 | ) | | | (10 | ) | | | 137 | | | | 13 | |
| Total net increase (decrease) | | $ | 128,410 | | | | 12,840 | | | $ | 3,341 | | | | 335 | | | $ | (76,578 | ) | | | (7,663 | ) | | $ | 55,173 | | | | 5,512 | |
| 36 | American Funds Strategic Bond Fund |
| | | | | | Reinvestments of | | | | | | | |
| | | | | | dividends and | | | | | | Net increase | |
| | | Sales1 | | | distributions | | | Repurchases1 | | | (decrease) | |
| Share class | | Amount | | | Shares | | | Amount | | | Shares | | | Amount | | | Shares | | | Amount | | | Shares | |
| | | | | | | | | | | | | | | | | | | | | | | | | |
| Year ended December 31, 2017 | | | | | | | | | | | | | | | | |
| | | | | | | | | | | | | | | | | | | | | | | | | |
| Class A | | $ | 233,716 | | | | 22,805 | | | $ | 6,334 | | | | 622 | | | $ | (60,137 | ) | | | (5,855 | ) | | $ | 179,913 | | | | 17,572 | |
| Class B3 | | | 1 | | | | — | 2 | | | — | | | | — | | | | (49 | ) | | | (5 | ) | | | (48 | ) | | | (5 | ) |
| Class C | | | 16,641 | | | | 1,630 | | | | 294 | | | | 29 | | | | (5,725 | ) | | | (560 | ) | | | 11,210 | | | | 1,099 | |
| Class T4 | | | 10 | | | | 1 | | | | — | | | | — | | | | — | | | | — | | | | 10 | | | | 1 | |
| Class F-1 | | | 9,900 | | | | 966 | | | | 192 | | | | 19 | | | | (2,907 | ) | | | (283 | ) | | | 7,185 | | | | 702 | |
| Class F-2 | | | 51,107 | | | | 4,988 | | | | 1,391 | | | | 137 | | | | (27,717 | ) | | | (2,717 | ) | | | 24,781 | | | | 2,408 | |
| Class F-35 | | | 24,797 | | | | 2,429 | | | | 401 | | | | 39 | | | | (2,157 | ) | | | (209 | ) | | | 23,041 | | | | 2,259 | |
| Class 529-A | | | 11,410 | | | | 1,113 | | | | 233 | | | | 23 | | | | (1,488 | ) | | | (145 | ) | | | 10,155 | | | | 991 | |
| Class 529-B3 | | | — | | | | — | | | | — | 2 | | | — | 2 | | | (17 | ) | | | (2 | ) | | | (17 | ) | | | (2 | ) |
| Class 529-C | | | 3,746 | | | | 366 | | | | 49 | | | | 5 | | | | (1,488 | ) | | | (145 | ) | | | 2,307 | | | | 226 | |
| Class 529-E | | | 550 | | | | 54 | | | | 12 | | | | 1 | | | | (27 | ) | | | (3 | ) | | | 535 | | | | 52 | |
| Class 529-T4 | | | 10 | | | | 1 | | | | — | 2 | | | — | 2 | | | — | | | | — | | | | 10 | | | | 1 | |
| Class 529-F-1 | | | 2,267 | | | | 223 | | | | 83 | | | | 8 | | | | (306 | ) | | | (30 | ) | | | 2,044 | | | | 201 | |
| Class R-1 | | | 148 | | | | 15 | | | | 2 | | | | — | 2 | | | (82 | ) | | | (9 | ) | | | 68 | | | | 6 | |
| Class R-2 | | | 1,107 | | | | 108 | | | | 14 | | | | 2 | | | | (347 | ) | | | (33 | ) | | | 774 | | | | 77 | |
| Class R-2E | | | — | 2 | | | — | 2 | | | — | 2 | | | — | 2 | | | — | | | | — | | | | — | 2 | | | — | 2 |
| Class R-3 | | | 2,008 | | | | 196 | | | | 31 | | | | 3 | | | | (171 | ) | | | (17 | ) | | | 1,868 | | | | 182 | |
| Class R-4 | | | 1,349 | | | | 131 | | | | 36 | | | | 4 | | | | (203 | ) | | | (20 | ) | | | 1,182 | | | | 115 | |
| Class R-5E | | | — | | | | — | | | | — | | | | — | | | | — | | | | — | | | | — | | | | — | |
| Class R-5 | | | 574 | | | | 55 | | | | 11 | | | | 1 | | | | — | 2 | | | — | 2 | | | 585 | | | | 56 | |
| Class R-6 | | | 4,040 | | | | 392 | | | | 642 | | | | 63 | | | | (72 | ) | | | (6 | ) | | | 4,610 | | | | 449 | |
| Total net increase (decrease) | | $ | 363,381 | | | | 35,473 | | | $ | 9,725 | | | | 956 | | | $ | (102,893 | ) | | | (10,039 | ) | | $ | 270,213 | | | | 26,390 | |
| 1 | Includes exchanges between share classes of the fund. |
| 2 | Amount less than one thousand. |
| 3 | Class B and 529-B shares were fully liquidated on May 5, 2017. |
| 4 | Class T and 529-T shares began investment operations on April 7, 2017. |
| 5 | Class F-3 shares began investment operations on January 27, 2017. |
9. Investment transactions
The fund made purchases and sales of investment securities, excluding short-term securities and U.S. government obligations, if any, of $414,357,000 and $397,533,000, respectively, during the period ended June 30, 2018.
| American Funds Strategic Bond Fund | 37 |
Financial highlights
| | | | | | (Loss) income
from investment operations1 |
| Period ended | | Net asset
value,
beginning
of period | | | Net
investment
income | | | Net (losses)
gains on
securities (both
realized and
unrealized) | | | Total from
investment
operations | |
| Class A: | | | | | | | | | | | | | | | | |
| 6/30/184,5 | | $ | 10.15 | | | $ | .16 | | | $ | (.29 | ) | | $ | (.13 | ) |
| 12/31/17 | | | 10.05 | | | | .24 | | | | .08 | | | | .32 | |
| 12/31/164,8 | | | 10.00 | | | | .15 | | | | .05 | | | | .20 | |
| Class C: | | | | | | | | | | | | | | | | |
| 6/30/184,5 | | | 10.12 | | | | .12 | | | | (.29 | ) | | | (.17 | ) |
| 12/31/17 | | | 10.02 | | | | .17 | | | | .07 | | | | .24 | |
| 12/31/164,8 | | | 10.00 | | | | .07 | | | | .06 | | | | .13 | |
| Class T: | | | | | | | | | | | | | | | | |
| 6/30/184,5 | | | 10.15 | | | | .17 | | | | (.29 | ) | | | (.12 | ) |
| 12/31/174,11 | | | 10.16 | | | | .20 | | | | — | 12 | | | .20 | |
| Class F-1: | | | | | | | | | | | | | | | | |
| 6/30/184,5 | | | 10.14 | | | | .15 | | | | (.29 | ) | | | (.14 | ) |
| 12/31/17 | | | 10.04 | | | | .24 | | | | .07 | | | | .31 | |
| 12/31/164,8 | | | 10.00 | | | | .14 | | | | .05 | | | | .19 | |
| Class F-2: | | | | | | | | | | | | | | | | |
| 6/30/184,5 | | | 10.15 | | | | .17 | | | | (.29 | ) | | | (.12 | ) |
| 12/31/17 | | | 10.04 | | | | .27 | | | | .08 | | | | .35 | |
| 12/31/164,8 | | | 10.00 | | | | .15 | | | | .06 | | | | .21 | |
| Class F-3: | | | | | | | | | | | | | | | | |
| 6/30/184,5 | | | 10.14 | | | | .17 | | | | (.29 | ) | | | (.12 | ) |
| 12/31/174,13 | | | 10.10 | | | | .27 | | | | .02 | | | | .29 | |
| | |
| 38 | American Funds Strategic Bond Fund |
| Dividends, distributions and return of capital | | | | | | | | | | | | | | | | | | |
Dividends
(from net
investment
income) | | | Distributions
(from capital
gains) | | | Return of
capital | | | Total
dividends,
distributions
and return
of capital | | | Net asset
value, end
of period | | | Total return2,3 | | | Net assets,
end of period
(in millions) | | | Ratio of
expenses to
average net
assets before
waivers/
reimburse-
ments | | | Ratio of
expenses to
average net
assets after
waivers/
reimburse-
ments2 | | | Ratio of
net income
to average
net assets2 | |
| | | | | | | | | | | | | | | | | | | | | | | | | | | | | |
| $ | (.06 | ) | | $ | — | | | $ | — | | | $ | (.06 | ) | | $ | 9.96 | | | | (1.38 | )%6 | | $ | 413 | | | | 1.05 | %7 | | | 1.03 | %7 | | | 3.18 | %7 |
| | (.11 | ) | | | (.10 | ) | | | (.01 | ) | | | (.22 | ) | | | 10.15 | | | | 3.23 | | | | 378 | | | | 1.09 | | | | 1.02 | | | | 2.38 | |
| | (.05 | ) | | | (.10 | ) | | | — | | | | (.15 | ) | | | 10.05 | | | | 1.87 | 6,9 | | | 197 | | | | 1.03 | 7,9 | | | 1.02 | 7,9 | | | 1.89 | 7,9 |
| | | | | | | | | | | | | | | | | | | | | | | | | | | | | | | | | | | | | | | |
| | (.02 | ) | | | — | | | | — | | | | (.02 | ) | | | 9.93 | | | | (1.68 | )6 | | | 21 | | | | 1.85 | 7 | | | 1.83 | 7 | | | 2.36 | 7 |
| | (.03 | ) | | | (.10 | ) | | | (.01 | ) | | | (.14 | ) | | | 10.12 | | | | 2.42 | | | | 22 | | | | 1.84 | | | | 1.77 | | | | 1.63 | |
| | (.01 | ) | | | (.10 | ) | | | — | | | | (.11 | ) | | | 10.02 | | | | 1.32 | 6 | | | 11 | | | | 1.78 | 7 | | | 1.77 | 7 | | | .84 | 7 |
| | | | | | | | | | | | | | | | | | | | | | | | | | | | | | | | | | | | | | | |
| | (.07 | ) | | | — | | | | — | | | | (.07 | ) | | | 9.96 | | | | (1.19 | )6,9 | | | — | 10 | | | .86 | 7,9 | | | .83 | 7,9 | | | 3.37 | 7,9 |
| | (.10 | ) | | | (.10 | ) | | | (.01 | ) | | | (.21 | ) | | | 10.15 | | | | 1.99 | 6,9 | | | — | 10 | | | .79 | 7,9 | | | .71 | 7,9 | | | 2.71 | 7,9 |
| | | | | | | | | | | | | | | | | | | | | | | | | | | | | | | | | | | | | | | |
| | (.05 | ) | | | — | | | | — | | | | (.05 | ) | | | 9.95 | | | | (1.33 | )6 | | | 10 | | | | 1.13 | 7 | | | 1.11 | 7 | | | 3.08 | 7 |
| | (.10 | ) | | | (.10 | ) | | | (.01 | ) | | | (.21 | ) | | | 10.14 | | | | 3.11 | | | | 10 | | | | 1.12 | | | | 1.05 | | | | 2.37 | |
| | (.05 | ) | | | (.10 | ) | | | — | | | | (.15 | ) | | | 10.04 | | | | 1.87 | 6 | | | 3 | | | | 1.06 | 7 | | | 1.05 | 7 | | | 1.73 | 7 |
| | | | | | | | | | | | | | | | | | | | | | | | | | | | | | | | | | | | | | | |
| | (.07 | ) | | | — | | | | — | | | | (.07 | ) | | | 9.96 | | | | (1.18 | )6 | | | 68 | | | | .84 | 7 | | | .82 | 7 | | | 3.40 | 7 |
| | (.13 | ) | | | (.10 | ) | | | (.01 | ) | | | (.24 | ) | | | 10.15 | | | | 3.47 | | | | 66 | | | | .85 | | | | .79 | | | | 2.61 | |
| | (.07 | ) | | | (.10 | ) | | | — | | | | (.17 | ) | | | 10.04 | | | | 2.03 | 6 | | | 42 | | | | .80 | 7 | | | .79 | 7 | | | 1.80 | 7 |
| | | | | | | | | | | | | | | | | | | | | | | | | | | | | | | | | | | | | | | |
| | (.07 | ) | | | — | | | | — | | | | (.07 | ) | | | 9.95 | | | | (1.14 | )6 | | | 25 | | | | .76 | 7 | | | .73 | 7 | | | 3.47 | 7 |
| | (.14 | ) | | | (.10 | ) | | | (.01 | ) | | | (.25 | ) | | | 10.14 | | | | 2.85 | 6 | | | 23 | | | | .70 | 7 | | | .62 | 7 | | | 2.81 | 7 |
See end of table for footnotes.
| American Funds Strategic Bond Fund | 39 |
Financial highlights (continued)
| | | | | | (Loss) income
from investment operations1 |
| Period ended | | Net asset
value,
beginning
of period | | | Net
investment
income | | | Net (losses)
gains on
securities (both
realized and
unrealized) | | | Total from
investment
operations | |
| Class 529-A: | | | | | | | | | | | | | | | | |
| 6/30/184,5 | | $ | 10.14 | | | $ | .16 | | | $ | (.29 | ) | | $ | (.13 | ) |
| 12/31/17 | | | 10.04 | | | | .24 | | | | .07 | | | | .31 | |
| 12/31/164,8 | | | 10.00 | | | | .12 | | | | .07 | | | | .19 | |
| Class 529-C: | | | | | | | | | | | | | | | | |
| 6/30/184,5 | | | 10.12 | | | | .12 | | | | (.29 | ) | | | (.17 | ) |
| 12/31/17 | | | 10.02 | | | | .16 | | | | .08 | | | | .24 | |
| 12/31/164,8 | | | 10.00 | | | | .05 | | | | .09 | | | | .14 | |
| Class 529-E: | | | | | | | | | | | | | | | | |
| 6/30/184,5 | | | 10.15 | | | | .14 | | | | (.29 | ) | | | (.15 | ) |
| 12/31/17 | | | 10.04 | | | | .22 | | | | .08 | | | | .30 | |
| 12/31/164,8 | | | 10.00 | | | | .15 | | | | .02 | | | | .17 | |
| Class 529-T: | | | | | | | | | | | | | | | | |
| 6/30/184,5 | | | 10.15 | | | | .16 | | | | (.28 | ) | | | (.12 | ) |
| 12/31/174,11 | | | 10.16 | | | | .20 | | | | — | 12 | | | .20 | |
| Class 529-F-1: | | | | | | | | | | | | | | | | |
| 6/30/184,5 | | | 10.15 | | | | .16 | | | | (.28 | ) | | | (.12 | ) |
| 12/31/17 | | | 10.04 | | | | .26 | | | | .08 | | | | .34 | |
| 12/31/164,8 | | | 10.00 | | | | .12 | | | | .08 | | | | .20 | |
| Class R-1: | | | | | | | | | | | | | | | | |
| 6/30/184,5 | | | 10.15 | | | | .13 | | | | (.30 | ) | | | (.17 | ) |
| 12/31/17 | | | 10.05 | | | | .18 | | | | .08 | | | | .26 | |
| 12/31/164,8 | | | 10.00 | | | | .19 | | | | .02 | | | | .21 | |
| | |
| 40 | American Funds Strategic Bond Fund |
| Dividends, distributions and return of capital | | | | | | | | | | | | | | | | | | |
Dividends
(from net
investment
income) | | | Distributions
(from capital
gains) | | | Return of
capital | | | Total
dividends,
distributions
and return
of capital | | | Net asset
value, end
of period | | | Total return2,3 | | | Net assets,
end of period
(in millions) | | | Ratio of
expenses to
average net
assets before
waivers/
reimburse-
ments | | | Ratio of
expenses to
average net
assets after
waivers/
reimburse-
ments2 | | | Ratio of
net income
to average
net assets2 | |
| | | | | | | | | | | | | | | | | | | | | | | | | | | | | |
| $ | (.06 | ) | | $ | — | | | $ | — | | | $ | (.06 | ) | | $ | 9.95 | | | | (1.41 | )%6 | | $ | 17 | | | | 1.10 | %7 | | | 1.08 | %7 | | | 3.15 | %7 |
| | (.10 | ) | | | (.10 | ) | | | (.01 | ) | | | (.21 | ) | | | 10.14 | | | | 3.05 | | | | 14 | | | | 1.19 | | | | 1.12 | | | | 2.30 | |
| | (.05 | ) | | | (.10 | ) | | | — | | | | (.15 | ) | | | 10.04 | | | | 1.83 | 6 | | | 4 | | | | 1.16 | 7 | | | 1.15 | 7 | | | 1.48 | 7 |
| | | | | | | | | | | | | | | | | | | | | | | | | | | | | | | | | | | | | | | |
| | (.02 | ) | | | — | | | | — | | | | (.02 | ) | | | 9.93 | | | | (1.78 | )6 | | | 5 | | | | 1.91 | 7 | | | 1.88 | 7 | | | 2.34 | 7 |
| | (.03 | ) | | | (.10 | ) | | | (.01 | ) | | | (.14 | ) | | | 10.12 | | | | 2.35 | | | | 4 | | | | 1.90 | | | | 1.83 | | | | 1.58 | |
| | (.02 | ) | | | (.10 | ) | | | — | | | | (.12 | ) | | | 10.02 | | | | 1.32 | 6 | | | 2 | | | | 1.82 | 7 | | | 1.81 | 7 | | | .63 | 7 |
| | | | | | | | | | | | | | | | | | | | | | | | | | | | | | | | | | | | | | | |
| | (.05 | ) | | | — | | | | — | | | | (.05 | ) | | | 9.95 | | | | (1.51 | )6 | | | 1 | | | | 1.34 | 7 | | | 1.31 | 7 | | | 2.92 | 7 |
| | (.08 | ) | | | (.10 | ) | | | (.01 | ) | | | (.19 | ) | | | 10.15 | | | | 3.02 | | | | 1 | | | | 1.32 | | | | 1.24 | | | | 2.18 | |
| | (.03 | ) | | | (.10 | ) | | | — | | | | (.13 | ) | | | 10.04 | | | | 1.72 | 6,9 | | | — | 10 | | | 1.21 | 7,9 | | | 1.20 | 7,9 | | | 1.86 | 7,9 |
| | | | | | | | | | | | | | | | | | | | | | | | | | | | | | | | | | | | | | | |
| | (.07 | ) | | | — | | | | — | | | | (.07 | ) | | | 9.96 | | | | (1.22 | )6,9 | | | — | 10 | | | .92 | 7,9 | | | .89 | 7,9 | | | 3.31 | 7,9 |
| | (.10 | ) | | | (.10 | ) | | | (.01 | ) | | | (.21 | ) | | | 10.15 | | | | 1.95 | 6,9 | | | — | 10 | | | .84 | 7,9 | | | .76 | 7,9 | | | 2.66 | 7,9 |
| | | | | | | | | | | | | | | | | | | | | | | | | | | | | | | | | | | | | | | |
| | (.07 | ) | | | — | | | | — | | | | (.07 | ) | | | 9.96 | | | | (1.31 | )6 | | | 5 | | | | .90 | 7 | | | .88 | 7 | | | 3.33 | 7 |
| | (.12 | ) | | | (.10 | ) | | | (.01 | ) | | | (.23 | ) | | | 10.15 | | | | 3.41 | | | | 4 | | | | .91 | | | | .85 | | | | 2.55 | |
| | (.06 | ) | | | (.10 | ) | | | — | | | | (.16 | ) | | | 10.04 | | | | 2.00 | 6 | | | 2 | | | | .85 | 7 | | | .84 | 7 | | | 1.47 | 7 |
| | | | | | | | | | | | | | | | | | | | | | | | | | | | | | | | | | | | | | | |
| | (.04 | ) | | | — | | | | — | | | | (.04 | ) | | | 9.94 | | | | (1.70 | )6,9 | | | — | 10 | | | 1.76 | 7,9 | | | 1.72 | 7,9 | | | 2.66 | 7,9 |
| | (.05 | ) | | | (.10 | ) | | | (.01 | ) | | | (.16 | ) | | | 10.15 | | | | 2.57 | 9 | | | — | 10 | | | 1.71 | 9 | | | 1.64 | 9 | | | 1.79 | 9 |
| | (.06 | ) | | | (.10 | ) | | | — | | | | (.16 | ) | | | 10.05 | | | | 2.09 | 6,9 | | | — | 10 | | | .82 | 7,9 | | | .82 | 7,9 | | | 2.40 | 7,9 |
See end of table for footnotes.
| American Funds Strategic Bond Fund | 41 |
Financial highlights (continued)
| | | | | | (Loss) income
from investment operations1 |
| Period ended | | Net asset
value,
beginning
of period | | | Net
investment
income | | | Net (losses)
gains on
securities (both
realized and
unrealized) | | | Total from
investment
operations | |
| Class R-2: | | | | | | | | | | | | | | | | |
| 6/30/184,5 | | $ | 10.13 | | | $ | .12 | | | $ | (.29 | ) | | $ | (.17 | ) |
| 12/31/17 | | | 10.03 | | | | .19 | | | | .07 | | | | .26 | |
| 12/31/164,8 | | | 10.00 | | | | .08 | | | | .09 | | | | .17 | |
| Class R-2E: | | | | | | | | | | | | | | | | |
| 6/30/184,5 | | | 10.15 | | | | .16 | | | | (.29 | ) | | | (.13 | ) |
| 12/31/17 | | | 10.05 | | | | .27 | | | | .08 | | | | .35 | |
| 12/31/164,8 | | | 10.00 | | | | .20 | | | | .01 | | | | .21 | |
| Class R-3: | | | | | | | | | | | | | | | | |
| 6/30/184,5 | | | 10.14 | | | | .14 | | | | (.28 | ) | | | (.14 | ) |
| 12/31/17 | | | 10.05 | | | | .23 | | | | .06 | | | | .29 | |
| 12/31/164,8 | | | 10.00 | | | | .13 | | | | .07 | | | | .20 | |
| Class R-4: | | | | | | | | | | | | | | | | |
| 6/30/184,5 | | | 10.15 | | | | .16 | | | | (.30 | ) | | | (.14 | ) |
| 12/31/17 | | | 10.04 | | | | .25 | | | | .08 | | | | .33 | |
| 12/31/164,8 | | | 10.00 | | | | .01 | | | | .19 | | | | .20 | |
| Class R-5E: | | | | | | | | | | | | | | | | |
| 6/30/184,5 | | | 10.16 | | | | .18 | | | | (.31 | ) | | | (.13 | ) |
| 12/31/17 | | | 10.05 | | | | .28 | | | | .08 | | | | .36 | |
| 12/31/164,8 | | | 10.00 | | | | .20 | | | | .01 | | | | .21 | |
| Class R-5: | | | | | | | | | | | | | | | | |
| 6/30/184,5 | | | 10.15 | | | | .17 | | | | (.29 | ) | | | (.12 | ) |
| 12/31/17 | | | 10.05 | | | | .28 | | | | .06 | | | | .34 | |
| 12/31/164,8 | | | 10.00 | | | | .20 | | | | .01 | | | | .21 | |
| | |
| 42 | American Funds Strategic Bond Fund |
| Dividends, distributions and return of capital | | | | | | | | | | | | | | | | | | |
Dividends
(from net
investment
income) | | | Distributions
(from capital
gains) | | | Return of
capital | | | Total
dividends,
distributions
and return
of capital | | | Net asset
value, end
of period | | | Total return2,3 | | | Net assets,
end of period
(in millions) | | | Ratio of
expenses to
average net
assets before
waivers/
reimburse-
ments | | | Ratio of
expenses to
average net
assets after
waivers/
reimburse-
ments2 | | | Ratio of
net income
to average
net assets2 | |
| | | | | | | | | | | | | | | | | | | | | | | | | | | | | |
| $ | (.02 | ) | | $ | — | | | $ | — | | | $ | (.02 | ) | | $ | 9.94 | | | | (1.63 | )%6 | | $ | 2 | | | | 1.75 | %7 | | | 1.73 | %7 | | | 2.50 | %7 |
| | (.05 | ) | | | (.10 | ) | | | (.01 | ) | | | (.16 | ) | | | 10.13 | | | | 2.59 | | | | 1 | | | | 1.65 | | | | 1.58 | | | | 1.82 | |
| | (.04 | ) | | | (.10 | ) | | | — | | | | (.14 | ) | | | 10.03 | | | | 1.63 | 6 | | | — | 10 | | | 1.47 | 7 | | | 1.46 | 7 | | | .94 | 7 |
| | | | | | | | | | | | | | | | | | | | | | | | | | | | | | | | | | | | | | | |
| | (.06 | ) | | | — | | | | — | | | | (.06 | ) | | | 9.96 | | | | (1.29 | )6,9 | | | — | 10 | | | 1.22 | 7,9 | | | 1.18 | 7,9 | | | 3.25 | 7,9 |
| | (.14 | ) | | | (.10 | ) | | | (.01 | ) | | | (.25 | ) | | | 10.15 | | | | 3.43 | 9 | | | — | 10 | | | .87 | 9 | | | .71 | 9 | | | 2.67 | 9 |
| | (.06 | ) | | | (.10 | ) | | | — | | | | (.16 | ) | | | 10.05 | | | | 2.10 | 6,9 | | | — | 10 | | | .79 | 7,9 | | | .78 | 7,9 | | | 2.43 | 7,9 |
| | | | | | | | | | | | | | | | | | | | | | | | | | | | | | | | | | | | | | | |
| | (.05 | ) | | | — | | | | — | | | | (.05 | ) | | | 9.95 | | | | (1.51 | )6 | | | 3 | | | | 1.35 | 7 | | | 1.33 | 7 | | | 2.92 | 7 |
| | (.09 | ) | | | (.10 | ) | | | (.01 | ) | | | (.20 | ) | | | 10.14 | | | | 2.98 | | | | 2 | | | | 1.33 | | | | 1.24 | | | | 2.23 | |
| | (.05 | ) | | | (.10 | ) | | | — | | | | (.15 | ) | | | 10.05 | | | | 1.83 | 6,9 | | | — | 10 | | | 1.09 | 7,9 | | | 1.08 | 7,9 | | | 1.57 | 7,9 |
| | | | | | | | | | | | | | | | | | | | | | | | | | | | | | | | | | | | | | | |
| | (.06 | ) | | | — | | | | — | | | | (.06 | ) | | | 9.95 | | | | (1.39 | )6 | | | 2 | | | | 1.08 | 7 | | | 1.06 | 7 | | | 3.18 | 7 |
| | (.11 | ) | | | (.10 | ) | | | (.01 | ) | | | (.22 | ) | | | 10.15 | | | | 3.26 | | | | 2 | | | | 1.06 | | | | .99 | | | | 2.42 | |
| | (.06 | ) | | | (.10 | ) | | | — | | | | (.16 | ) | | | 10.04 | | | | 1.94 | 6 | | | 1 | | | | 1.01 | 7 | | | 1.00 | 7 | | | .18 | 7 |
| | | | | | | | | | | | | | | | | | | | | | | | | | | | | | | | | | | | | | | |
| | (.07 | ) | | | — | | | | — | | | | (.07 | ) | | | 9.96 | | | | (1.25 | )6 | | | — | 10 | | | .81 | 7 | | | .78 | 7 | | | 3.65 | 7 |
| | (.14 | ) | | | (.10 | ) | | | (.01 | ) | | | (.25 | ) | | | 10.16 | | | | 3.54 | | | | — | 10 | | | .85 | | | | .70 | | | | 2.68 | |
| | (.06 | ) | | | (.10 | ) | | | — | | | | (.16 | ) | | | 10.05 | | | | 2.10 | 6 | | | — | 10 | | | .78 | 7 | | | .78 | 7 | | | 2.43 | 7 |
| | | | | | | | | | | | | | | | | | | | | | | | | | | | | | | | | | | | | | | |
| | (.07 | ) | | | — | | | | — | | | | (.07 | ) | | | 9.96 | | | | (1.16 | )6 | | | 1 | | | | .81 | 7 | | | .78 | 7 | | | 3.42 | 7 |
| | (.13 | ) | | | (.10 | ) | | | (.01 | ) | | | (.24 | ) | | | 10.15 | | | | 3.41 | | | | 1 | | | | .76 | | | | .68 | | | | 2.74 | |
| | (.06 | ) | | | (.10 | ) | | | — | | | | (.16 | ) | | | 10.05 | | | | 2.09 | 6 | | | — | 10 | | | .78 | 7 | | | .78 | 7 | | | 2.43 | 7 |
See end of table for footnotes.
| American Funds Strategic Bond Fund | 43 |
Financial highlights (continued)
| | | | | | (Loss) income
from investment operations1 |
| Period ended | | Net asset
value,
beginning
of period | | | Net
investment
income | | | Net (losses)
gains on
securities (both
realized and
unrealized) | | | Total from
investment
operations | |
| Class R-6: | | | | | | | | | | | | | | | | |
| 6/30/184,5 | | $ | 10.15 | | | $ | .17 | | | $ | (.29 | ) | | $ | (.12 | ) |
| 12/31/17 | | | 10.05 | | | | .28 | | | | .07 | | | | .35 | |
| 12/31/164,8 | | | 10.00 | | | | .07 | | | | .15 | | | | .22 | |
| | | Six months
ended
June 30,
20184,5,6 | | Year ended
December 31,
2017 | | For the period
3/18/2016 to
12/31/20164,6,8 |
| Portfolio turnover rate for all share classes | | 185% | | 428% | | 539% |
See Notes to Financial Statements
| 44 | American Funds Strategic Bond Fund |
| Dividends, distributions and return of capital | | | | | | | | | | | | | | | | | | |
Dividends
(from net
investment
income) | | | Distributions
(from capital
gains) | | | Return of
capital | | | Total
dividends,
distributions
and return
of capital | | | Net asset
value, end
of period | | | Total return2,3 | | | Net assets,
end of period
(in millions) | | | Ratio of
expenses to
average net
assets before
waivers/
reimburse-
ments | | | Ratio of
expenses to
average net
assets after
waivers/
reimburse-
ments2 | | | Ratio of
net income
to average
net assets2 | |
| | | | | | | | | | | | | | | | | | | | | | | | | | | | | |
| $ | (.07 | ) | | $ | — | | | $ | — | | | $ | (.07 | ) | | $ | 9.96 | | | | (1.14 | )%6 | | $ | 28 | | | | .76 | %7 | | | .74 | %7 | | | 3.45 | %7 |
| | (.14 | ) | | | (.10 | ) | | | (.01 | ) | | | (.25 | ) | | | 10.15 | | | | 3.46 | | | | 28 | | | | .75 | | | | .69 | | | | 2.70 | |
| | (.07 | ) | | | (.10 | ) | | | — | | | | (.17 | ) | | | 10.05 | | | | 2.16 | 6 | | | 23 | | | | .72 | 7 | | | .71 | 7 | | | .89 | 7 |
| | |
| 1 | Based on average shares outstanding. |
| 2 | This column reflects the impact, if any, of certain waivers/reimbursements from CRMC. During the periods shown, CRMC reimbursed a portion of other fees and expenses. |
| 3 | Total returns exclude any applicable sales charges, including contingent deferred sales charges. |
| 4 | Based on operations for a period that is less than a full year. |
| 5 | Unaudited. |
| 6 | Not annualized. |
| 7 | Annualized. |
| 8 | For the period March 18, 2016, commencement of operations, through June 30, 2018. |
| 9 | All or a significant portion of assets in this class consisted of seed capital invested by CRMC and/or its affiliates. Fees for distribution services are not charged or accrued on these seed capital assets. If such fees were paid by the fund on seed capital assets, fund expenses would have been higher and net income and total return would have been lower. |
| 10 | Amount less than $1 million. |
| 11 | Class T and 529-T shares began investment operations on April 7, 2017. |
| 12 | Amount less than $.01. |
| 13 | Class F-3 shares began investment operations on January 27, 2017. |
| | |
| American Funds Strategic Bond Fund | 45 |
As a fund shareholder, you incur two types of costs: (1) transaction costs, such as initial sales charges on purchase payments and contingent deferred sales charges on redemptions (loads), and (2) ongoing costs, including management fees, distribution and service (12b-1) fees, and other expenses. This example is intended to help you understand your ongoing costs (in dollars) of investing in the fund so you can compare these costs with the ongoing costs of investing in other mutual funds. The example is based on an investment of $1,000 invested at the beginning of the period and held for the entire six-month period (January 1, 2018, through June 30, 2018).
Actual expenses:
The first line of each share class in the table on the following page provides information about actual account values and actual expenses. You may use the information in this line, together with the amount you invested, to estimate the expenses that you paid over the period. Simply divide your account value by $1,000 (for example, an $8,600 account value divided by $1,000 = 8.6), then multiply the result by the number in the first line under the heading titled “Expenses paid during period” to estimate the expenses you paid on your account during this period.
Hypothetical example for comparison purposes:
The second line of each share class in the table on the following page provides information about hypothetical account values and hypothetical expenses based on the actual expense ratio for the share class and an assumed rate of return of 5.00% per year before expenses, which is not the actual return of the share class. The hypothetical account values and expenses may not be used to estimate the actual ending account balance or expenses you paid for the period. You may use this information to compare the ongoing costs of investing in the fund and other funds. To do so, compare this 5.00% hypothetical example with the 5.00% hypothetical examples that appear in the shareholder reports of the other funds.
Notes:
Retirement plan participants may be subject to certain fees charged by the plan sponsor, and Class F-1, F-2, F-3 and 529-F-1 shareholders may be subject to fees charged by financial intermediaries, typically ranging from 0.75% to 1.50% of assets annually depending on services offered. You can estimate the impact of these fees by adding the amount of the fees to the total estimated expenses you paid on your account during the period as calculated above. In addition, your ending account value would be lower by the amount of these fees.
Note that the expenses shown in the table on the following page are meant to highlight your ongoing costs only and do not reflect any transactional costs, such as sales charges (loads). Therefore, the second line of each share class in the table is useful in comparing ongoing costs only and will not help you determine the relative total costs of owning different funds. In addition, if these transactional costs were included, your costs would have been higher.
| 46 | American Funds Strategic Bond Fund |
| | | Beginning
account value
1/1/2018 | | | Ending
account value
6/30/2018 | | | Expenses paid
during period* | | | Annualized
expense ratio | |
| Class A – actual return | | $ | 1,000.00 | | | $ | 986.22 | | | $ | 5.07 | | | | 1.03 | % |
| Class A – assumed 5% return | | | 1,000.00 | | | | 1,019.69 | | | | 5.16 | | | | 1.03 | |
| Class C – actual return | | | 1,000.00 | | | | 983.25 | | | | 9.00 | | | | 1.83 | |
| Class C – assumed 5% return | | | 1,000.00 | | | | 1,015.72 | | | | 9.15 | | | | 1.83 | |
| Class T – actual return | | | 1,000.00 | | | | 988.09 | | | | 4.09 | | | | .83 | |
| Class T – assumed 5% return | | | 1,000.00 | | | | 1,020.68 | | | | 4.16 | | | | .83 | |
| Class F-1 – actual return | | | 1,000.00 | | | | 986.67 | | | | 5.47 | | | | 1.11 | |
| Class F-1 – assumed 5% return | | | 1,000.00 | | | | 1,019.29 | | | | 5.56 | | | | 1.11 | |
| Class F-2 – actual return | | | 1,000.00 | | | | 988.22 | | | | 4.04 | | | | .82 | |
| Class F-2 – assumed 5% return | | | 1,000.00 | | | | 1,020.73 | | | | 4.11 | | | | .82 | |
| Class F-3 – actual return | | | 1,000.00 | | | | 988.59 | | | | 3.60 | | | | .73 | |
| Class F-3 – assumed 5% return | | | 1,000.00 | | | | 1,021.17 | | | | 3.66 | | | | .73 | |
| Class 529-A – actual return | | | 1,000.00 | | | | 985.93 | | | | 5.32 | | | | 1.08 | |
| Class 529-A – assumed 5% return | | | 1,000.00 | | | | 1,019.44 | | | | 5.41 | | | | 1.08 | |
| Class 529-C – actual return | | | 1,000.00 | | | | 982.23 | | | | 9.24 | | | | 1.88 | |
| Class 529-C – assumed 5% return | | | 1,000.00 | | | | 1,015.47 | | | | 9.39 | | | | 1.88 | |
| Class 529-E – actual return | | | 1,000.00 | | | | 984.90 | | | | 6.45 | | | | 1.31 | |
| Class 529-E – assumed 5% return | | | 1,000.00 | | | | 1,018.30 | | | | 6.56 | | | | 1.31 | |
| Class 529-T – actual return | | | 1,000.00 | | | | 987.83 | | | | 4.39 | | | | .89 | |
| Class 529-T – assumed 5% return | | | 1,000.00 | | | | 1,020.38 | | | | 4.46 | | | | .89 | |
| Class 529-F-1 – actual return | | | 1,000.00 | | | | 986.90 | | | | 4.34 | | | | .88 | |
| Class 529-F-1 – assumed 5% return | | | 1,000.00 | | | | 1,020.43 | | | | 4.41 | | | | .88 | |
| Class R-1 – actual return | | | 1,000.00 | | | | 982.97 | | | | 8.46 | | | | 1.72 | |
| Class R-1 – assumed 5% return | | | 1,000.00 | | | | 1,016.27 | | | | 8.60 | | | | 1.72 | |
| Class R-2 – actual return | | | 1,000.00 | | | | 983.70 | | | | 8.51 | | | | 1.73 | |
| Class R-2 – assumed 5% return | | | 1,000.00 | | | | 1,016.22 | | | | 8.65 | | | | 1.73 | |
| Class R-2E – actual return | | | 1,000.00 | | | | 987.08 | | | | 5.81 | | | | 1.18 | |
| Class R-2E – assumed 5% return | | | 1,000.00 | | | | 1,018.94 | | | | 5.91 | | | | 1.18 | |
| Class R-3 – actual return | | | 1,000.00 | | | | 984.87 | | | | 6.55 | | | | 1.33 | |
| Class R-3 – assumed 5% return | | | 1,000.00 | | | | 1,018.20 | | | | 6.66 | | | | 1.33 | |
| Class R-4 – actual return | | | 1,000.00 | | | | 986.08 | | | | 5.22 | | | | 1.06 | |
| Class R-4 – assumed 5% return | | | 1,000.00 | | | | 1,019.54 | | | | 5.31 | | | | 1.06 | |
| Class R-5E – actual return | | | 1,000.00 | | | | 987.53 | | | | 3.84 | | | | .78 | |
| Class R-5E – assumed 5% return | | | 1,000.00 | | | | 1,020.93 | | | | 3.91 | | | | .78 | |
| Class R-5 – actual return | | | 1,000.00 | | | | 988.36 | | | | 3.85 | | | | .78 | |
| Class R-5 – assumed 5% return | | | 1,000.00 | | | | 1,020.93 | | | | 3.91 | | | | .78 | |
| Class R-6 – actual return | | | 1,000.00 | | | | 988.56 | | | | 3.65 | | | | .74 | |
| Class R-6 – assumed 5% return | | | 1,000.00 | | | | 1,021.12 | | | | 3.71 | | | | .74 | |
| * | The “expenses paid during period” are equal to the “annualized expense ratio,” multiplied by the average account value over the period, multiplied by the number of days in the period, and divided by 365 (to reflect the one-half year period). |
| American Funds Strategic Bond Fund | 47 |
Approval of Investment Advisory and Service Agreement
American Funds Strategic Bond Fund’s board has approved the fund’s Investment Advisory and Service Agreement (the “agreement”) with Capital Research and Management Company (“CRMC”) for another one-year term through April 30, 2019. The agreement was amended to add additional advisory fee breakpoints if and when the fund’s net assets exceed $500 million, $1 billion and $1.5 billion. The board approved the agreement following the recommendation of the fund’s Contracts Committee (the “committee”), which is composed of all of the fund’s independent board members. The board and the committee determined in the exercise of their business judgment that the fund’s advisory fee structure was fair and reasonable in relation to the services provided, and that approving the agreement was in the best interests of the fund and its shareholders.
In reaching this decision, the board and the committee took into account information furnished to them throughout the year and otherwise provided to them, as well as information prepared specifically in connection with their review of the agreement, and were advised by their independent counsel. They considered the following factors, among others, but did not identify any single issue or particular piece of information that, in isolation, was the controlling factor, and each board and committee member did not necessarily attribute the same weight to each factor.
1. Nature, extent and quality of services
The board considered the depth and quality of CRMC’s investment management process, including its global research capabilities; the experience, capability and integrity of its senior management and other personnel; the low turnover rates of its key personnel; the overall financial strength and stability of CRMC and the Capital Group organization; the resources and systems CRMC devotes to investment management, compliance, trading, portfolio accounting and other services; and the ongoing evolution of CRMC’s organizational structure designed to maintain and strengthen these qualities. The board also considered the nature, extent and quality of administrative, compliance and shareholder services that would be provided by CRMC to the fund under the agreement and other agreements, as well as the benefits to fund shareholders from investing in a fund that is part of a large family of funds. The board concluded that the nature, extent and quality of the services provided by CRMC would benefit the fund and its shareholders.
2. Investment results
The board and the committee considered the investment results of the fund in light of its objective of providing maximum total return consistent with preservation of capital. They compared the fund’s investment results with those of other relevant funds (including funds that currently form the basis of the Lipper index for the category in which the fund is included), and data such as relevant market and fund indexes, over various periods through October 31, 2017. This report, including the letter to shareholders and related disclosures, contains certain information about the fund’s
| 48 | American Funds Strategic Bond Fund |
investment results. The board and the committee reviewed the fund’s investment results measured against the Lipper Core Plus Bond Funds Average, the Lipper Multi-Sector Income Funds Average and the Bloomberg Barclays U.S. Aggregate Index. They noted the fund’s short history and reviewed the results for the one-year and lifetime periods. They noted that the investment results of the fund were lower than the results of the Lipper indexes, but higher than the Bloomberg Barclays U.S. Aggregate Index over all periods. The board and the committee concluded that the fund’s investment results have been satisfactory for renewal of the agreement and that CRMC’s record in managing the fund indicated that its continued management should benefit the fund and its shareholders.
3. Advisory fees and total expenses
The board and the committee compared the advisory fees and total expense levels of the fund compared to those of other relevant funds. They observed that the fund’s advisory fees and expenses were higher than those of other similar funds included in the Lipper Average. The board and the committee also considered the breakpoint discounts in the fund’s advisory fee structure that reduce the level of fees charged by CRMC to the fund as fund assets increase, as well as CRMC’s agreement to additional breakpoints in the Fund’s advisory fee schedule. They noted that the fund was smaller than many of the funds in the peer group. In addition, the board reviewed information regarding the effective advisory fees charged to non-mutual fund clients by CRMC and its affiliates. They noted that, to the extent there were differences between the advisory fees paid by the fund and the advisory fees paid by those clients, the differences appropriately reflected the investment, operational, regulatory and market differences between advising the fund and the other clients. The board and the committee concluded that the fund’s cost structure was fair and reasonable in relation to the services provided, and that the fund’s shareholders receive reasonable value in return for the advisory fees and other amounts paid to CRMC by the fund.
4. Ancillary benefits
The board and the committee considered a variety of other benefits that CRMC and its affiliates receive as a result of CRMC’s relationship with the fund and other American Funds, including fees for administrative services provided to certain share classes; fees paid to CRMC’s affiliated transfer agent; sales charges and distribution fees received and retained by the fund’s principal underwriter, an affiliate of CRMC; and possible ancillary benefits to CRMC and its institutional management affiliates in managing other investment vehicles. The board and the committee reviewed CRMC’s portfolio trading practices, noting the benefits CRMC receives from the research obtained with commissions from portfolio transactions made on behalf of the fund. The board and the committee took these ancillary benefits into account in evaluating the reasonableness of the advisory fees and other amounts paid to CRMC by the fund.
| American Funds Strategic Bond Fund | 49 |
5. Adviser financial information
The board and the committee reviewed information regarding CRMC’s costs of providing services to the American Funds, including personnel, systems and resources of investment, compliance, trading, accounting and other administrative operations. They considered CRMC’s costs and related cost allocation methodology as well as its willingness to invest in technology, infrastructure and staff to maintain and expand services and capabilities, respond to industry and regulatory developments, and attract and retain qualified personnel. They noted information regarding the compensation structure for CRMC’s investment professionals. The board and the committee also compared CRMC’s profitability and compensation data to the reported results and data of several large, publicly held investment management companies. The board and the committee noted the competitiveness and cyclicality of both the mutual fund industry and the capital markets, and the importance in that environment of CRMC’s long-term profitability for maintaining its independence, company culture and management continuity. They further considered the breakpoint discounts in the fund’s advisory fee structure and CRMC’s sharing of any economies of scale, or efficiencies, through breakpoints and other fee reductions and costs voluntarily absorbed. The board and the committee concluded that the fund’s advisory fee structure reflected a reasonable sharing of benefits between CRMC and the fund’s shareholders.
| 50 | American Funds Strategic Bond Fund |
This page was intentionally left blank.
| American Funds Strategic Bond Fund | 51 |
Office of the fund
6455 Irvine Center Drive
Irvine, CA 92618-4518
Investment adviser
Capital Research and Management Company
333 South Hope Street
Los Angeles, CA 90071-1406
6455 Irvine Center Drive
Irvine, CA 92618-4518
Transfer agent for shareholder accounts
American Funds Service Company
(Write to the address near you.)
P.O. Box 6007
Indianapolis, IN 46206-6007
P.O. Box 2280
Norfolk, VA 23501-2280
Custodian of assets
JPMorgan Chase Bank
270 Park Avenue
New York, NY 10017-2070
Counsel
Morgan, Lewis & Bockius LLP
300 South Grand Avenue, 22nd Floor
Los Angeles, CA 90071-3132
Independent registered public accounting firm
Deloitte & Touche LLP
695 Town Center Drive
Suite 1200
Costa Mesa, CA 92626-7188
Principal underwriter
American Funds Distributors, Inc.
333 South Hope Street
Los Angeles, CA 90071-1406
| 52 | American Funds Strategic Bond Fund |
Investors should carefully consider investment objectives, risks, charges and expenses. This and other important information is contained in the fund prospectus and summary prospectus, which can be obtained from your financial professional and should be read carefully before investing. You may also call American Funds Service Company (AFS) at (800) 421-4225 or visit the American Funds website at americanfunds.com. Fund shares offered through American Funds Distributors, Inc.
“American Funds Proxy Voting Procedures and Principles” — which describes how we vote proxies relating to portfolio securities — is available on the American Funds website or upon request by calling AFS. The fund files its proxy voting record with the U.S. Securities and Exchange Commission (SEC) for the 12 months ended June 30 by August 31. The proxy voting record is available free of charge on the SEC website at sec.gov and on the American Funds website.
A complete June 30, 2018, portfolio of American Funds Strategic Bond Fund’s investments is available free of charge by calling AFS or visiting the SEC website (where it is part of Form N-CSR).
American Funds Strategic Bond Fund files a complete list of its portfolio holdings with the SEC for the first and third quarters of each fiscal year on Form N-Q. This filing is available free of charge on the SEC website. You may also review or, for a fee, copy this filing at the SEC’s Public Reference Room in Washington, D.C. Additional information regarding the operation of the Public Reference Room may be obtained by calling the SEC’s Office of Investor Education and Advocacy at (800) SEC-0330. Additionally, the list of portfolio holdings is available by calling AFS.
This report is for the information of shareholders of American Funds Strategic Bond Fund, but it also may be used as sales literature when preceded or accompanied by the current prospectus or summary prospectus, which gives details about charges, expenses, investment objectives and operating policies of the fund. If used as sales material after September 30, 2018, this report must be accompanied by an American Funds statistical update for the most recently completed calendar quarter.
American Funds from Capital Group
The Capital Advantage®
Since 1931, American Funds, part of Capital Group, has helped investors pursue long-term investment success. Our consistent approach — in combination with The Capital SystemSM — has resulted in a superior long-term track record.
Aligned with investor success
We base our decisions on a long-term perspective, which we believe aligns our goals with the interests of our clients. Our portfolio managers average 27 years of investment experience, including 22 years at our company, reflecting a career commitment to our long-term approach.1
The Capital System
The Capital System combines individual accountability with teamwork. Funds using The Capital System are divided into portions that are managed independently by investment professionals with diverse backgrounds, ages and investment approaches. An extensive global research effort is the backbone of our system.
American Funds’ superior long-term track record
Equity funds have beaten their Lipper peer indexes in 92% of 10-year periods and 99% of 20-year periods. Fixed income funds have beaten their Lipper indexes in 77% of 10-year periods and 80% of 20-year periods.2 Fund management fees have been among the lowest in the industry.3
| | 1 | Portfolio manager experience as of December 31, 2017. |
| | 2 | Based on Class F-2 share results for rolling periods through December 31, 2017. Periods covered are the shorter of the fund’s lifetime or since the comparable Lipper index inception date (except Capital Income Builder and SMALLCAP World Fund, for which the Lipper average was used). Expenses differ for each share class, so results will vary. Class F-2 shares were first offered on August 1, 2008. Class F-2 share results prior to the date of first sale are hypothetical based on Class A share results without a sales charge, adjusted for typical estimated expenses. Results for certain funds with an inception date after August 1, 2008, also include hypothetical returns because those funds’ Class F-2 shares sold after the funds’ date of first offering. Please see americanfunds.com for more information on specific expense adjustments and the actual dates of first sale. |
| | 3 | On average, our management fees were in the lowest quintile 71% of the time, based on the 20-year period ended December 31, 2017, versus comparable Lipper categories, excluding funds of funds. |

ITEM 2 – Code of Ethics
Not applicable for filing of semi-annual reports to shareholders.
ITEM 3 – Audit Committee Financial Expert
Not applicable for filing of semi-annual reports to shareholders.
ITEM 4 – Principal Accountant Fees and Services
Not applicable for filing of semi-annual reports to shareholders.
ITEM 5 – Audit Committee of Listed Registrants
Not applicable to this Registrant, insofar as the Registrant is not a listed issuer as defined in Rule 10A-3 under the Securities Exchange Act of 1934.
ITEM 6 – Schedule of Investments
American Funds Strategic Bond FundSM
Investment portfolio
June 30, 2018
Bonds, notes & other debt instruments 85.89%
Corporate bonds & notes 46.09%
Health care 8.12% | Principal amount
(000) | Value
(000) |
| Allergan Funding SCS 4.85% 2044 | $950 | $919 |
| Allergan PLC 3.80% 2025 | 1,800 | 1,750 |
| Anthem, Inc. 3.65% 2027 | 5,300 | 5,028 |
| Bayer US Finance II LLC 4.25% 20251 | 2,222 | 2,238 |
| Bayer US Finance II LLC 4.375% 20281 | 3,560 | 3,573 |
| Cardinal Health, Inc. 4.368% 2047 | 1,310 | 1,158 |
| Concordia Healthcare Corp. 9.00% 20221 | 625 | 563 |
| Concordia Healthcare Corp. 9.50% 20221,2 | 575 | 36 |
| CVS Health Corp. 4.30% 2028 | 9,015 | 8,906 |
| CVS Health Corp. 4.78% 2038 | 2,245 | 2,226 |
| GlaxoSmithKline PLC 3.875% 2028 | 1,449 | 1,462 |
| IMS Health Holdings, Inc. 5.00% 20261 | 1,400 | 1,368 |
| Kinetic Concepts, Inc. 12.50% 20211 | 365 | 405 |
| Shire PLC 2.40% 2021 | 2,592 | 2,483 |
| Shire PLC 2.875% 2023 | 1,713 | 1,613 |
| Shire PLC 3.20% 2026 | 1,885 | 1,730 |
| Teva Pharmaceutical Finance Company BV 2.80% 2023 | 3,690 | 3,190 |
| Teva Pharmaceutical Finance Company BV 6.00% 2024 | 5,710 | 5,709 |
| Teva Pharmaceutical Finance Company BV 4.10% 2046 | 1,365 | 978 |
| Valeant Pharmaceuticals International, Inc. 7.50% 20211 | 575 | 585 |
| Valeant Pharmaceuticals International, Inc. 9.25% 20261 | 2,080 | 2,166 |
| Valeant Pharmaceuticals International, Inc. 8.50% 20271 | 700 | 712 |
| | | 48,798 |
| Energy 7.78% | | |
| Anadarko Petroleum Corp. 5.55% 2026 | 1,205 | 1,293 |
| Andeavor Logistics LP 4.25% 2027 | 1,486 | 1,432 |
| Baker Hughes, a GE Co. 3.337% 2027 | 2,750 | 2,561 |
| Baker Hughes, a GE Co. 4.08% 2047 | 915 | 819 |
| Canadian Natural Resources Ltd. 2.95% 2023 | 325 | 314 |
| Canadian Natural Resources Ltd. 4.95% 2047 | 385 | 399 |
| Cenovus Energy Inc. 4.25% 2027 | 250 | 241 |
| Cenovus Energy Inc. 5.25% 2037 | 523 | 515 |
| Cenovus Energy Inc. 5.40% 2047 | 364 | 357 |
| Concho Resources Inc. 4.30% 2028 | 3,495 | 3,497 |
| Concho Resources Inc. 4.85% 2048 | 819 | 833 |
| Enbridge Energy Partners, LP 5.875% 2025 | 155 | 169 |
| Enbridge Energy Partners, LP 7.375% 2045 | 905 | 1,154 |
| Energy Transfer Partners, LP 4.75% 2026 | 710 | 704 |
| Energy Transfer Partners, LP 4.20% 2027 | 91 | 86 |
| Energy Transfer Partners, LP 4.95% 2028 | 118 | 118 |
| Energy Transfer Partners, LP 6.125% 2045 | 470 | 471 |
| Energy Transfer Partners, LP 5.30% 2047 | 647 | 594 |
| Energy Transfer Partners, LP 5.40% 2047 | 2,190 | 2,015 |
| Energy Transfer Partners, LP 6.00% 2048 | 352 | 352 |
| Energy Transfer Partners, LP 6.625% 2049 (3-month USD-LIBOR + 4.155% on 2/15/2028)3 | 2,700 | 2,469 |
American Funds Strategic Bond Fund — Page 1 of 11
Bonds, notes & other debt instruments
Corporate bonds & notes (continued)
Energy (continued) | Principal amount
(000) | Value
(000) |
| EnLink Midstream Partners, LP 4.85% 2026 | $400 | $380 |
| EnLink Midstream Partners, LP 5.45% 2047 | 610 | 514 |
| EQT Corp. 3.90% 2027 | 2,500 | 2,337 |
| Kinder Morgan, Inc. 5.55% 2045 | 1,200 | 1,216 |
| Marathon Oil Corp. 4.40% 2027 | 1,175 | 1,181 |
| MPLX LP 4.70% 2048 | 2,030 | 1,891 |
| Neptune Energy Group Holdings Ltd. 6.625% 20251 | 1,475 | 1,438 |
| NGL Energy Partners LP 6.875% 2021 | 475 | 483 |
| Petrobras Global Finance Co. 7.375% 2027 | 885 | 886 |
| Petrobras Global Finance Co. 5.999% 20281 | 2,175 | 1,972 |
| Petrobras Global Finance Co. 5.75% 2029 | 1,595 | 1,405 |
| Petrobras Global Finance Co. 7.25% 2044 | 300 | 279 |
| Petróleos Mexicanos 5.35% 20281 | 1,760 | 1,670 |
| Petróleos Mexicanos 6.75% 2047 | 685 | 653 |
| Phillips 66 3.90% 2028 | 1,500 | 1,466 |
| Phillips 66 Partners LP 4.90% 2046 | 225 | 216 |
| QEP Resources, Inc. 5.625% 2026 | 350 | 336 |
| Range Resources Corp. 4.875% 2025 | 240 | 226 |
| Schlumberger BV 4.00% 20251 | 500 | 499 |
| Southwestern Energy Co. 6.45% 2025 (6.20% on 7/23/2018)3 | 615 | 604 |
| Teekay Corp. 8.50% 2020 | 1,000 | 1,035 |
| TransCanada PipeLines Ltd. 4.25% 2028 | 2,685 | 2,698 |
| Western Gas Partners LP 4.65% 2026 | 255 | 251 |
| Western Gas Partners LP 5.30% 2048 | 2,900 | 2,672 |
| | | 46,701 |
| Utilities 5.55% | | |
| American Electric Power Co., Inc. 3.20% 2027 | 1,125 | 1,053 |
| Centerpoint Energy, Inc. 2.50% 2022 | 565 | 543 |
| Consolidated Edison Co. of New York 4.50% 2058 | 3,430 | 3,415 |
| Drax Finco PLC 6.625% 20251 | 3,000 | 2,992 |
| Duke Energy Corp. 2.65% 2026 | 953 | 860 |
| Emera Inc. 6.75% 2076 (3-month USD-LIBOR + 5.44% on 6/15/2026)3 | 475 | 496 |
| Emera US Finance LP 4.75% 2046 | 2,325 | 2,296 |
| Enel Finance International SA 3.625% 20271 | 1,800 | 1,649 |
| FirstEnergy Corp. 3.90% 2027 | 1,283 | 1,247 |
| FirstEnergy Corp. 3.50% 20281 | 780 | 741 |
| Great Plains Energy Inc. 4.20% 2047 | 850 | 838 |
| Great Plains Energy Inc. 4.20% 2048 | 1,475 | 1,455 |
| Pacific Gas and Electric Co. 2.45% 2022 | 575 | 534 |
| Pacific Gas and Electric Co. 3.25% 2023 | 575 | 549 |
| Pacific Gas and Electric Co. 2.95% 2026 | 625 | 558 |
| Pacific Gas and Electric Co. 3.30% 2027 | 2,050 | 1,844 |
| Pacific Gas and Electric Co. 3.75% 2042 | 141 | 117 |
| Pacific Gas and Electric Co. 3.95% 2047 | 525 | 451 |
| Pennsylvania Electric Co. 3.25% 20281 | 1,915 | 1,788 |
| Public Service Enterprise Group Inc. 2.00% 2021 | 930 | 885 |
| Public Service Enterprise Group Inc. 2.65% 2022 | 2,275 | 2,192 |
| SCANA Corp. 6.25% 2020 | 675 | 695 |
| SCANA Corp. 4.75% 2021 | 1,375 | 1,390 |
| SCANA Corp. 4.125% 2022 | 2,100 | 2,068 |
| South Carolina Electric & Gas Co. 5.45% 2041 | 1,894 | 2,054 |
American Funds Strategic Bond Fund — Page 2 of 11
Bonds, notes & other debt instruments
Corporate bonds & notes (continued)
Utilities (continued) | Principal amount
(000) | Value
(000) |
| South Carolina Electric & Gas Co. 4.35% 2042 | $150 | $143 |
| South Carolina Electric & Gas Co. 4.10% 2046 | 550 | 502 |
| | | 33,355 |
| Financials 5.00% | | |
| American Express Co. 3.00% 2024 | 2,391 | 2,284 |
| American International Group, Inc. 4.20% 2028 | 2,200 | 2,153 |
| American International Group, Inc. 4.75% 2048 | 1,100 | 1,064 |
| Barclays Bank PLC 4.972% 2029 (3-month USD-LIBOR + 1.902% on 5/16/2028)3 | 3,000 | 2,977 |
| BNP Paribas 3.375% 20251 | 2,725 | 2,577 |
| Citigroup Inc. 4.044% 2024 (3-month USD-LIBOR + 1.023% on 6/1/2023)3 | 3,000 | 3,019 |
| Danske Bank AS 3.875% 20231 | 4,000 | 3,972 |
| Intesa Sanpaolo SpA 4.375% 20481 | 1,225 | 956 |
| JPMorgan Chase & Co. 3.509% 2029 (3-month USD-LIBOR + 0.945% on 1/23/2028)3 | 1,395 | 1,324 |
| Lloyds Banking Group PLC 2.907% 2023 (3-month USD-LIBOR + 0.81% on 11/7/2022)3 | 4,100 | 3,908 |
| Standard Chartered PLC 3.885% 2024 (3-month USD-LIBOR + 1.08% on 3/15/2023)1,3 | 4,400 | 4,323 |
| UniCredit SPA 5.861% 20321,3 | 1,675 | 1,496 |
| | | 30,053 |
| Consumer staples 4.83% | | |
| Anheuser-Busch InBev NV 4.60% 2048 | 2,105 | 2,072 |
| B&G Foods, Inc. 5.25% 2025 | 555 | 524 |
| BJ’s Wholesale Club, Term Loan, (3-month USD-LIBOR + 7.50%) 9.53% 20254,5,6 | 498 | 504 |
| British American Tobacco PLC 2.764% 20221 | 995 | 955 |
| British American Tobacco PLC 3.222% 20241 | 2,150 | 2,038 |
| British American Tobacco PLC 3.557% 20271 | 1,845 | 1,719 |
| British American Tobacco PLC 4.39% 20371 | 2,150 | 2,022 |
| British American Tobacco PLC 4.54% 20471 | 2,150 | 2,014 |
| Church & Dwight Co., Inc. 3.15% 2027 | 1,500 | 1,394 |
| Church & Dwight Co., Inc. 3.95% 2047 | 1,395 | 1,262 |
| Constellation Brands, Inc. 2.65% 2022 | 2,090 | 2,006 |
| Maple Escrow 4.057% 20231 | 1,280 | 1,286 |
| Maple Escrow 4.597% 20281 | 1,118 | 1,124 |
| Maple Escrow 5.085% 20481 | 3,518 | 3,558 |
| Molson Coors Brewing Co. 3.00% 2026 | 570 | 519 |
| Philip Morris International Inc. 4.25% 2044 | 160 | 152 |
| Post Holdings, Inc. 5.625% 20281 | 1,220 | 1,148 |
| Reynolds American Inc. 5.85% 2045 | 205 | 225 |
| Wal-Mart Stores, Inc. 4.05% 2048 | 4,500 | 4,515 |
| | | 29,037 |
| Industrials 3.84% | | |
| Beacon Roofing Supply, Inc. 4.875% 20251 | 2,600 | 2,418 |
| CSX Corp. 3.80% 2028 | 4,380 | 4,274 |
| CSX Corp. 4.30% 2048 | 1,450 | 1,386 |
| General Dynamics Corp. 3.75% 2028 | 1,080 | 1,091 |
| Hardwoods Acquisition Inc. 7.50% 20211 | 1,170 | 1,091 |
| Northrop Grumman Corp. 3.25% 2028 | 3,485 | 3,286 |
| Pisces Parent, LLC 8.00% 20261 | 1,740 | 1,682 |
| Republic Services, Inc. 3.375% 2027 | 3,325 | 3,156 |
| Union Pacific Corp. 3.95% 2028 | 1,666 | 1,677 |
American Funds Strategic Bond Fund — Page 3 of 11
Bonds, notes & other debt instruments
Corporate bonds & notes (continued)
Industrials (continued) | Principal amount
(000) | Value
(000) |
| Union Pacific Corp. 4.50% 2048 | $590 | $598 |
| United Technologies Corp. 3.125% 2027 | 2,600 | 2,419 |
| | | 23,078 |
| Consumer discretionary 3.53% | | |
| Amazon.com, Inc. 4.05% 2047 | 540 | 530 |
| CCO Holdings LLC and CCO Holdings Capital Corp. 5.125% 20271 | 1,800 | 1,685 |
| CCO Holdings LLC and CCO Holdings Capital Corp. 4.20% 2028 | 1,410 | 1,322 |
| CCO Holdings LLC and CCO Holdings Capital Corp. 5.75% 2048 | 930 | 903 |
| Comcast Corp. 3.15% 2028 | 1,800 | 1,666 |
| Ford Motor Co. 5.291% 2046 | 1,945 | 1,811 |
| Limited Brands, Inc. 5.25% 2028 | 1,450 | 1,290 |
| Live Nation Entertainment, Inc. 5.625% 20261 | 2,550 | 2,537 |
| McDonald’s Corp. 4.45% 2047 | 1,070 | 1,066 |
| Neiman Marcus Group LTD Inc. 9.50% 2021 (100% PIK)1,7 | 1,571 | 1,053 |
| Netflix, Inc. 5.875% 20281 | 3,450 | 3,501 |
| Petsmart, Inc. 7.125% 20231 | 1,125 | 761 |
| Petsmart, Inc. 8.875% 20251 | 625 | 414 |
| S.A.C.I. Falabella 3.75% 20271 | 1,885 | 1,746 |
| Sirius XM Radio Inc. 5.00% 20271 | 950 | 891 |
| | | 21,176 |
| Materials 3.37% | | |
| Consolidated Energy Finance SA 6.50% 20261 | 1,835 | 1,819 |
| First Quantum Minerals Ltd. 6.50% 20241 | 2,450 | 2,370 |
| First Quantum Minerals Ltd. 7.50% 20251 | 625 | 619 |
| First Quantum Minerals Ltd. 6.875% 20261 | 800 | 768 |
| Hexion Inc. 10.375% 20221 | 1,090 | 1,074 |
| LSB Industries, Inc. 9.625% 20231 | 930 | 941 |
| Mosaic Co. 4.05% 2027 | 1,085 | 1,039 |
| Nova Chemicals Corp. 5.25% 20271 | 1,750 | 1,635 |
| Olin Corp. 5.125% 2027 | 425 | 414 |
| Platform Specialty Products Corp. 5.875% 20251 | 2,950 | 2,887 |
| Sherwin-Williams Co. 2.75% 2022 | 500 | 484 |
| Sherwin-Williams Co. 3.125% 2024 | 295 | 282 |
| Sherwin-Williams Co. 3.45% 2027 | 3,680 | 3,480 |
| Sherwin-Williams Co. 4.50% 2047 | 465 | 445 |
| Tronox Ltd. 5.75% 20251 | 300 | 292 |
| Tronox Ltd. 6.50% 20261 | 1,100 | 1,096 |
| Warrior Met Coal, Inc. 8.00% 20241 | 600 | 621 |
| | | 20,266 |
| Information technology 2.44% | | |
| Analog Devices, Inc. 3.125% 2023 | 1,045 | 1,016 |
| Analog Devices, Inc. 3.50% 2026 | 890 | 850 |
| Blackboard Inc., Term Loan B4, (3-month USD-LIBOR + 5.00%) 7.355% 20214,5,6 | 1,389 | 1,319 |
| BMC Software, Inc. 8.125% 20211 | 1,745 | 1,786 |
| Broadcom Ltd. 3.625% 2024 | 1,745 | 1,691 |
| Broadcom Ltd. 3.875% 2027 | 2,170 | 2,055 |
| CCC Information Services Inc., Term Loan, (3-month USD-LIBOR + 6.75%) 8.844% 20254,5,6 | 275 | 277 |
| Kronos Inc., Term Loan B, (3-month USD-LIBOR + 8.25%) 10.608% 20244,5,6 | 300 | 311 |
American Funds Strategic Bond Fund — Page 4 of 11
Bonds, notes & other debt instruments
Corporate bonds & notes (continued)
Information technology (continued) | Principal amount
(000) | Value
(000) |
| salesforce.com, inc. 3.70% 2028 | $4,500 | $4,472 |
| Unisys Corp. 10.75% 20221 | 800 | 900 |
| | | 14,677 |
| Telecommunication services 1.30% | | |
| Inmarsat PLC 6.50% 20241 | 2,000 | 2,010 |
| Verizon Communications Inc. 4.50% 2033 | 2,250 | 2,186 |
| Vodafone Group PLC 4.375% 2028 | 2,400 | 2,373 |
| Vodafone Group PLC 5.25% 2048 | 1,200 | 1,202 |
| | | 7,771 |
| Real estate 0.33% | | |
| Iron Mountain Inc. 4.875% 20271 | 535 | 496 |
| Iron Mountain Inc. 5.25% 20281 | 915 | 851 |
| iStar Inc. 4.625% 2020 | 610 | 602 |
| | | 1,949 |
| Total corporate bonds & notes | | 276,861 |
U.S. Treasury bonds & notes 26.99%
U.S. Treasury inflation-protected securities 17.15% | | |
| U.S. Treasury Inflation-Protected Security 0.125% 20238 | 1,954 | 1,910 |
| U.S. Treasury Inflation-Protected Security 0.25% 20258,9 | 2,433 | 2,367 |
| U.S. Treasury Inflation-Protected Security 0.375% 20258 | 25,535 | 25,091 |
| U.S. Treasury Inflation-Protected Security 0.125% 20268,9 | 9,981 | 9,564 |
| U.S. Treasury Inflation-Protected Security 0.625% 20268 | 1,160 | 1,154 |
| U.S. Treasury Inflation-Protected Security 0.375% 20278 | 10,241 | 9,965 |
| U.S. Treasury Inflation-Protected Security 0.50% 20288 | 11,958 | 9,937 |
| U.S. Treasury Inflation-Protected Security 2.125% 20418 | 2,974 | 3,766 |
| U.S. Treasury Inflation-Protected Security 1.00% 20468 | 1,681 | 1,731 |
| U.S. Treasury Inflation-Protected Security 0.875% 20478,9 | 27,086 | 27,067 |
| U.S. Treasury Inflation-Protected Security 1.00% 20488,9 | 12,622 | 10,490 |
| | | 103,042 |
| U.S. Treasury 9.84% | | |
| U.S. Treasury 2.625% 2021 | 9,380 | 9,380 |
| U.S. Treasury 2.625% 2021 | 1,373 | 1,373 |
| U.S. Treasury 2.375% 2023 | 1 | 1 |
| U.S. Treasury 2.625% 2023 | 36,191 | 36,003 |
| U.S. Treasury 2.00% 20249 | 931 | 891 |
| U.S. Treasury 2.875% 2028 | 11,458 | 11,472 |
| | | 59,120 |
| Total U.S. Treasury bonds & notes | | 162,162 |
| Bonds & notes of governments & government agencies outside the U.S. 8.89% | | |
| Argentine Republic 6.875% 2048 | 3,050 | 2,312 |
| Brazil (Federative Republic of) 6.00% 20508 | BRL3,151 | 812 |
| Brazil (Federative Republic of) 6.00% 20558 | 6,901 | 1,778 |
| India (Republic of) 7.61% 2030 | INR367,000 | 5,147 |
| India (Republic of) 7.88% 2030 | 333,000 | 4,774 |
| Italy (Republic of) 2.00% 2028 | €4,800 | 5,296 |
| Japan, Series 20, 0.10% 20258 | ¥504,000 | 4,773 |
| Japan, Series 21, 0.10% 20268 | 2,019,817 | 19,238 |
| Panama (Republic of) 4.50% 20505 | $1,415 | 1,364 |
American Funds Strategic Bond Fund — Page 5 of 11
Bonds, notes & other debt instruments
Bonds & notes of governments & government agencies outside the U.S. (continued) | Principal amount
(000) | Value
(000) |
| Portuguese Republic 5.125% 2024 | $2,300 | $2,388 |
| Portuguese Republic 4.10% 2045 | €1,150 | 1,656 |
| Qatar (State of) 4.50% 20281 | $1,060 | 1,072 |
| Saudi Arabia (Kingdom of) 4.625% 20471 | 555 | 519 |
| Saudi Arabia (Kingdom of) 5.00% 20491 | 965 | 941 |
| Uruguay (Oriental Republic of) 8.50% 2028 | UYU48,975 | 1,350 |
| | | 53,420 |
Municipals 2.13%
Illinois 0.94% | | |
| City of Chicago, Board of Education, Unlimited Tax G.O. Bonds (Dedicated Rev.), Series 2009-E, 6.138% 2039 | $1,875 | 1,807 |
| City of Chicago, Board of Education, Unlimited Tax G.O. Bonds (Dedicated Rev.), Series 2010-D, 6.519% 2040 | 760 | 731 |
| City of Chicago, Board of Education, Unlimited Tax G.O. Bonds (Dedicated Rev.), Series 2017-A, 7.00% 20461 | 1,540 | 1,847 |
| G.O. Bonds, Pension Funding Series 2003, 5.10% 20335 | 1,370 | 1,299 |
| | | 5,684 |
| South Carolina 0.59% | | |
| Public Service Auth., Rev. Obligations (Santee Cooper), Series 2015-A, 5.00% 2050 | 2,085 | 2,230 |
| Public Service Auth., Rev. Obligations (Santee Cooper), Series 2015-E, 5.25% 2055 | 1,200 | 1,306 |
| | | 3,536 |
| New Jersey 0.42% | | |
| Econ. Dev. Auth., State Pension Funding Bonds, Series 1997-A, National insured, 7.425% 2029 | 987 | 1,203 |
Transportation Trust Fund Auth., Transportation System Bonds, Series 2006-C,
Assured Guaranty Municipal insured, 0% 2033 | 1,500 | 810 |
Transportation Trust Fund Auth., Transportation System Bonds, Series 2006-C,
Assured Guaranty Municipal insured, 0% 2034 | 1,000 | 513 |
| | | 2,526 |
| New York 0.18% | | |
| Convention Center Dev. Corp., Rev. Bonds (Hotel Unit Fee Secured), Series 2016-A, 0% 2049 | 750 | 213 |
| Convention Center Dev. Corp., Rev. Bonds (Hotel Unit Fee Secured), Series 2016-A, 0% 2055 | 2,400 | 519 |
| Convention Center Dev. Corp., Rev. Bonds (Hotel Unit Fee Secured), Series 2016-A, 0% 2056 | 1,600 | 332 |
| | | 1,064 |
| | | 12,810 |
| Asset-backed obligations 0.93% | | |
| Ford Credit Auto Owner Trust, Series 2018-1, Class A, 3.19% 20311,5 | 5,095 | 5,020 |
| Verizon Owner Trust, Series 2016-1A, Class A, 1.42% 20211,5 | 570 | 567 |
| | | 5,587 |
Mortgage-backed obligations 0.86%
Federal agency mortgage-backed obligations 0.86% | | |
| Freddie Mac, Series K076, Class A2, Multi Family, 3.90% 20285 | 3,485 | 3,611 |
| Freddie Mac, Series K077, Class A2, Multi Family, 3.90% 2028 | 1,520 | 1,570 |
| Total mortgage-backed obligations | | 5,181 |
| Total bonds, notes & other debt instruments (cost: $528,482,000) | | 516,021 |
| Short-term securities 12.83% | | |
| Federal Home Loan Bank 1.86% due 7/24/2018 | 6,000 | 5,993 |
| Merck & Co. Inc. 1.97% due 8/8/20181 | 11,700 | 11,674 |
| Nigerian Treasury Bills 12.86%–13.86% due 10/25/2018–3/14/2019 | NGN4,800,000 | 12,620 |
American Funds Strategic Bond Fund — Page 6 of 11
| Short-term securities | Principal amount
(000) | Value
(000) |
| Société Générale 1.79% due 7/2/20181 | $15,000 | $14,998 |
| Swedbank AB 1.85% due 7/2/2018 | 15,000 | 14,998 |
| Tennessee Valley Authority 1.88% due 7/17/2018 | 13,900 | 13,887 |
| United Overseas Bank Ltd. 2.00% due 7/10/20181 | 2,900 | 2,898 |
| Total short-term securities (cost: $77,050,000) | | 77,068 |
| Total investment securities 98.72% (cost: $605,532,000) | | 593,089 |
| Other assets less liabilities 1.28% | | 7,691 |
| Net assets 100.00% | | $600,780 |
Futures contracts
| Contracts | Type | Number of
contracts | Expiration | Notional
amount10
(000) | Value at
6/30/201811
(000) | Unrealized
appreciation
(depreciation)
at 6/30/2018
(000) |
| 90 Day Euro Dollar Futures | Long | 670 | March 2021 | $167,500 | $162,525 | $82 |
| 5 Year Euro-Bobl Futures | Short | 25 | September 2018 | (2,500) | (3,859) | (20) |
| 5 Year U.S. Treasury Note Futures | Short | 667 | October 2018 | (66,700) | (75,783) | 46 |
| 10 Year Euro-Bund Futures | Long | 107 | September 2018 | 10,700 | 20,312 | 9 |
| 10 Year U.S. Treasury Note Futures | Long | 582 | September 2018 | 58,200 | 69,949 | 222 |
| 10 Year Ultra U.S. Treasury Note Futures | Long | 90 | September 2018 | 9,000 | 11,541 | 104 |
| 20 Year U.S. Treasury Bond Futures | Short | 121 | September 2018 | (12,100) | (17,545) | 44 |
| 30 Year Ultra U.S. Treasury Bond Futures | Short | 177 | September 2018 | (17,700) | (28,242) | (60) |
| | | | | | | $427 |
Forward currency contracts
| Contract amount | Counterparty | Settlement
date | Unrealized
appreciation
(depreciation)
at 6/30/2018
(000) |
Purchases
(000) | Sales
(000) |
| USD4,596 | SEK40,525 | Goldman Sachs | 7/9/2018 | $68 |
| JPY373,685 | USD3,420 | Goldman Sachs | 7/9/2018 | (43) |
| USD3,730 | CAD4,850 | JPMorgan Chase | 7/10/2018 | 40 |
| USD2,563 | JPY280,000 | JPMorgan Chase | 7/10/2018 | 32 |
| USD2,484 | JPY271,945 | Goldman Sachs | 7/10/2018 | 26 |
| USD4,582 | EUR3,900 | Citibank | 7/10/2018 | 24 |
| CAD17,982 | USD13,938 | Goldman Sachs | 7/10/2018 | (257) |
| USD1,008 | GBP750 | Bank of America, N.A. | 7/11/2018 | 17 |
| USD4,106 | BRL14,650 | JPMorgan Chase | 7/12/2018 | 333 |
| USD5,076 | ZAR67,000 | Goldman Sachs | 7/12/2018 | 200 |
| USD10,683 | INR720,000 | JPMorgan Chase | 7/12/2018 | 191 |
| USD1,872 | SGD2,500 | Goldman Sachs | 7/12/2018 | 36 |
| CLP3,700,000 | USD5,884 | Bank of America, N.A. | 7/12/2018 | (221) |
| MXN22,803 | USD1,101 | Citibank | 7/16/2018 | 44 |
| USD3,333 | GBP2,500 | Bank of America, N.A. | 7/18/2018 | 31 |
| GBP600 | USD789 | Bank of New York Mellon | 7/18/2018 | 3 |
| GBP600 | USD790 | Bank of New York Mellon | 7/18/2018 | 3 |
| AUD7,709 | USD5,808 | Morgan Stanley | 7/18/2018 | (102) |
| USD2,919 | KRW3,145,000 | Citibank | 7/19/2018 | 96 |
| USD5,914 | COP17,092,000 | Citibank | 7/19/2018 | 88 |
American Funds Strategic Bond Fund — Page 7 of 11
| Contract amount | Counterparty | Settlement
date | Unrealized
appreciation
(depreciation)
at 6/30/2018
(000) |
Purchases
(000) | Sales
(000) |
| EUR4,619 | GBP4,050 | Bank of New York Mellon | 7/25/2018 | $53 |
| CAD1,548 | USD1,164 | JPMorgan Chase | 7/25/2018 | 14 |
| USD1,275 | SGD1,730 | Citibank | 7/25/2018 | 5 |
| USD2,861 | AUD3,875 | Bank of America, N.A. | 7/25/2018 | (7) |
| GBP4,055 | EUR4,625 | Bank of New York Mellon | 7/25/2018 | (53) |
| USD5,633 | EUR4,800 | Citibank | 7/27/2018 | 16 |
| JPY728,000 | USD6,616 | Goldman Sachs | 7/30/2018 | (26) |
| MXN30,387 | USD1,512 | Citibank | 7/31/2018 | 10 |
| USD1,258 | SGD1,715 | Goldman Sachs | 7/31/2018 | (1) |
| USD5,270 | GBP4,000 | Bank of America, N.A. | 7/31/2018 | (18) |
| JPY789,185 | USD7,164 | Bank of New York Mellon | 7/31/2018 | (20) |
| USD17,449 | EUR15,000 | Bank of America, N.A. | 7/31/2018 | (110) |
| USD2,179 | KRW2,424,600 | JPMorgan Chase | 8/3/2018 | 1 |
| BRL4,326 | USD1,119 | JPMorgan Chase | 8/3/2018 | (8) |
| | | | | $465 |
Swap contracts
Interest rate swaps
| Receive | Pay | Expiration
date | Notional
(000) | Value at
6/30/2018
(000) | Upfront
payments/
receipts
(000) | Unrealized
(depreciation)
appreciation
at 6/30/2018
(000) |
| 1.2975% | 3-month Canada BA | 7/5/2018 | C$265,152 | $(10) | $— | $(10) |
| 1.76625% | 3-month Canada BA | 9/25/2018 | 122,000 | 6 | — | 6 |
| 1.9475% | U.S. EFFR | 9/26/2018 | $3,820,000 | 67 | — | 67 |
| 1.7725% | 3-month Canada BA | 9/26/2018 | C$122,700 | 8 | — | 8 |
| 1.882% | U.S. EFFR | 9/26/2018 | $171,400 | (14) | — | (14) |
| 1.8975% | U.S. EFFR | 9/26/2018 | 450,900 | (27) | — | (27) |
| 7.48% | 28-day MXN-TIIE | 1/11/2019 | MXN690,000 | (140) | — | (140) |
| 7.46% | 28-day MXN-TIIE | 1/24/2019 | 390,000 | (85) | — | (85) |
| 7.195% | 28-day MXN-TIIE | 4/15/2019 | 220,000 | (90) | — | (90) |
| U.S. EFFR | 2.385% | 5/1/2019 | $2,701,565 | (151) | — | (151) |
| 7.51% | 28-day MXN-TIIE | 5/30/2019 | MXN410,000 | (136) | — | (136) |
| 1.962% | 3-month Canada BA | 6/27/2019 | C$122,000 | (68) | — | (68) |
| 3-month USD-LIBOR | 1.5655% | 8/29/2019 | $102,000 | 1,254 | — | 1,254 |
| 1.726% | 3-month USD-LIBOR | 10/2/2019 | 53,000 | (615) | — | (615) |
| 1.8185% | 3-month USD-LIBOR | 10/31/2019 | 124,000 | (1,412) | — | (1,412) |
| 3-month USD-LIBOR | 2.159% | 1/11/2020 | 280,000 | 2,386 | — | 2,386 |
| 1.905% | U.S. EFFR | 1/11/2020 | 280,000 | (1,614) | — | (1,614) |
| (0.223)% | EONIA | 2/1/2020 | €55,500 | 117 | — | 117 |
| (0.122)% | 6-month EURIBOR | 2/1/2020 | 56,100 | 100 | — | 100 |
| (0.2305)% | EONIA | 2/2/2020 | 109,500 | 215 | — | 215 |
| 1.997% | U.S. EFFR | 2/13/2020 | $100 | —12 | — | —12 |
| 1.8725% | 3-month USD-LIBOR | 3/20/2020 | 52,000 | (767) | — | (767) |
| U.S. EFFR | 2.19% | 3/29/2020 | 123,700 | 350 | — | 350 |
| U.S. EFFR | 2.2025% | 3/29/2020 | 124,500 | 325 | — | 325 |
| 2.5935% | 3-month USD-LIBOR | 3/29/2020 | 124,500 | (345) | — | (345) |
| 2.577% | 3-month USD-LIBOR | 3/29/2020 | 123,700 | (378) | — | (378) |
| U.S. EFFR | 2.174% | 4/4/2020 | 65,360 | 210 | — | 210 |
| 2.5725% | 3-month USD-LIBOR | 4/4/2020 | 65,364 | (215) | — | (215) |
American Funds Strategic Bond Fund — Page 8 of 11
| Receive | Pay | Expiration
date | Notional
(000) | Value at
6/30/2018
(000) | Upfront
payments/
receipts
(000) | Unrealized
(depreciation)
appreciation
at 6/30/2018
(000) |
| U.S. EFFR | 2.19% | 4/6/2020 | $43,300 | $127 | $— | $127 |
| 2.599% | 3-month USD-LIBOR | 4/6/2020 | 43,300 | (123) | — | (123) |
| 7.14% | 28-day MXN-TIIE | 4/29/2020 | MXN448,450 | (393) | — | (393) |
| 7.84% | 28-day MXN-TIIE | 5/8/2020 | 216,660 | (58) | — | (58) |
| 7.87% | 28-day MXN-TIIE | 5/8/2020 | 397,340 | (95) | — | (95) |
| 3-month USD-LIBOR | 2.674% | 5/31/2020 | $150,000 | 285 | — | 285 |
| 2.284% | U.S. EFFR | 5/31/2020 | 150,000 | (309) | — | (309) |
| 6.78% | 28-day MXN-TIIE | 7/6/2020 | MXN213,540 | (271) | — | (271) |
| 3-month USD-LIBOR | 2.465% | 2/13/2021 | $86,100 | 839 | — | 839 |
| 2.094% | U.S. EFFR | 2/13/2021 | 85,300 | (745) | — | (745) |
| 1.63% | U.S. EFFR | 2/22/2022 | 32,700 | (966) | — | (966) |
| 6.99% | 28-day MXN-TIIE | 6/17/2022 | MXN130,000 | (206) | — | (206) |
| 2.27403% | 3-month USD-LIBOR | 12/29/2022 | $70,000 | (1,783) | — | (1,783) |
| 2.10125% | U.S. EFFR | 1/12/2023 | 36,000 | (592) | — | (592) |
| 2.7435% | 3-month USD-LIBOR | 2/16/2023 | 48,800 | (293) | — | (293) |
| 2.7365% | 3-month USD-LIBOR | 2/20/2023 | 49,000 | (310) | — | (310) |
| 2.045% | 3-month USD-LIBOR | 3/24/2023 | 53,800 | (855) | — | (855) |
| 2.715% | 3-month USD-LIBOR | 4/6/2023 | 15,000 | (111) | — | (111) |
| 2.55% | U.S. EFFR | 4/26/2023 | 50,000 | 117 | — | 117 |
| 2.5815% | U.S. EFFR | 5/25/2023 | 96,000 | 354 | — | 354 |
| 3-month USD-LIBOR | 2.815% | 5/31/2023 | 180,000 | 540 | — | 540 |
| 2.437% | U.S. EFFR | 5/31/2023 | 180,000 | (547) | — | (547) |
| 1.8875% | 3-month USD-LIBOR | 6/7/2023 | 33,600 | (622) | — | (622) |
| 1.569% | 3-month USD-LIBOR | 7/6/2023 | 40,500 | (984) | — | (984) |
| 1.615% | 3-month USD-LIBOR | 8/18/2023 | 73,000 | (1,689) | — | (1,689) |
| 2.42% | 3-month USD-LIBOR | 11/18/2023 | 50,000 | (429) | — | (429) |
| 2.031% | 3-month USD-LIBOR | 1/17/2024 | 8,700 | (383) | — | (383) |
| 3-month USD-LIBOR | 2.0955% | 2/10/2024 | 1,700 | 70 | — | 70 |
| 1.805% | U.S. EFFR | 2/21/2024 | 48,000 | (1,746) | — | (1,746) |
| 3-month USD-LIBOR | 2.3055% | 3/7/2024 | 16,000 | 488 | — | 488 |
| 3-month USD-LIBOR | 2.013% | 6/29/2024 | 16,500 | 796 | — | 796 |
| 3-month USD-LIBOR | 2.2375% | 10/31/2024 | 8,000 | 303 | — | 303 |
| 2.8775% | 3-month USD-LIBOR | 3/23/2025 | 36,400 | (29) | — | (29) |
| 2.524% | 3-month USD-LIBOR | 4/14/2025 | 9,000 | (168) | — | (168) |
| 2.905% | 3-month USD-LIBOR | 6/21/2025 | 48,440 | 37 | — | 37 |
| 2.354% | 3-month USD-LIBOR | 9/25/2025 | 109,600 | (2,809) | — | (2,809) |
| 6-month JPY-LIBOR | 0.1277% | 3/24/2026 | ¥500,000 | 25 | — | 25 |
| 6-month JPY-LIBOR | (0.0823)% | 7/11/2026 | 1,200,000 | 255 | — | 255 |
| 3-month USD-LIBOR | 1.6835% | 11/2/2026 | $3,900 | 357 | — | 357 |
| 3-month USD-LIBOR | 1.688% | 11/2/2026 | 2,100 | 191 | — | 191 |
| 28-day MXN-TIIE | 8.07% | 1/1/2027 | MXN180,000 | (53) | — | (53) |
| 28-day MXN-TIIE | 8.135% | 1/14/2027 | 102,000 | (51) | — | (51) |
| 3-month USD-LIBOR | 2.38% | 2/15/2027 | $13,100 | 536 | — | 536 |
| 2.4805% | 3-month USD-LIBOR | 3/21/2027 | 27,000 | (901) | — | (901) |
| 2.3335% | 3-month USD-LIBOR | 3/29/2027 | 25,000 | (1,124) | — | (1,124) |
| 2.333% | 3-month USD-LIBOR | 3/29/2027 | 30,000 | (1,350) | — | (1,350) |
| 28-day MXN-TIIE | 7.47% | 4/5/2027 | MXN60,000 | 103 | — | 103 |
| 0.8153% | 6-month EURIBOR | 4/28/2027 | €14,500 | 91 | — | 91 |
| 3-month SEK-STIBOR | 1.125% | 4/28/2027 | SKr138,000 | (177) | — | (177) |
| 3-month USD-LIBOR | 2.293% | 5/3/2027 | $5,800 | 283 | — | 283 |
| 28-day MXN-TIIE | 7.625% | 5/20/2027 | MXN108,000 | 133 | — | 133 |
| 3-month USD-LIBOR | 2.2935% | 7/17/2027 | $15,000 | 748 | — | 748 |
| 0.8518% | 6-month EURIBOR | 8/21/2027 | €6,200 | 42 | — | 42 |
American Funds Strategic Bond Fund — Page 9 of 11
| Receive | Pay | Expiration
date | Notional
(000) | Value at
6/30/2018
(000) | Upfront
payments/
receipts
(000) | Unrealized
(depreciation)
appreciation
at 6/30/2018
(000) |
| 3-month SEK-STIBOR | 1.215% | 8/21/2027 | SKr60,000 | $(111) | $— | $(111) |
| 2.2295% | 3-month USD-LIBOR | 9/22/2027 | $9,800 | (551) | — | (551) |
| 3-month USD-LIBOR | 2.388% | 10/31/2027 | 89,000 | 3,883 | — | 3,883 |
| 3-month USD-LIBOR | 2.31934% | 11/17/2027 | 11,900 | 592 | — | 592 |
| 3-month USD-LIBOR | 2.31613% | 11/17/2027 | 11,100 | 555 | — | 555 |
| 2.925% | 3-month USD-LIBOR | 2/1/2028 | 15,300 | (24) | — | (24) |
| 2.91% | 3-month USD-LIBOR | 2/1/2028 | 19,100 | (42) | — | (42) |
| 2.908% | 3-month USD-LIBOR | 2/1/2028 | 19,100 | (43) | — | (43) |
| 2.92% | 3-month USD-LIBOR | 2/2/2028 | 14,500 | (26) | — | (26) |
| 1.561% | 6-month GBP-LIBOR | 6/21/2028 | £23,240 | 108 | — | 108 |
| 6-month GBP-LIBOR | 1.5282% | 6/29/2028 | 5,500 | — | — | — |
| 6-month GBP-LIBOR | 1.5262% | 6/29/2028 | 5,500 | — | — | — |
| 6-month GBP-LIBOR | 1.5272% | 6/29/2028 | 5,500 | — | — | — |
| 6-month GBP-LIBOR | 1.5302% | 6/29/2028 | 5,500 | — | — | — |
| 3-month USD-LIBOR | 2.679% | 4/14/2030 | $4,800 | 121 | — | 121 |
| 3-month USD-LIBOR | 2.514% | 9/25/2030 | 58,300 | 2,258 | — | 2,258 |
| 3-month USD-LIBOR | 2.35% | 3/24/2031 | 11,700 | 606 | — | 606 |
| 3-month USD-LIBOR | 2.22% | 6/7/2031 | 7,300 | 454 | — | 454 |
| 3-month USD-LIBOR | 1.8929% | 7/6/2031 | 8,700 | 772 | — | 772 |
| 3-month USD-LIBOR | 1.87% | 8/18/2031 | 15,500 | 1,399 | — | 1,399 |
| 3-month USD-LIBOR | 2.57% | 11/18/2031 | 11,000 | 368 | — | 368 |
| 3-month USD-LIBOR | 2.9625% | 2/1/2038 | 11,400 | 37 | — | 37 |
| 3-month USD-LIBOR | 2.963% | 2/1/2038 | 11,500 | 36 | — | 36 |
| 3-month USD-LIBOR | 2.986% | 2/1/2038 | 9,200 | 15 | — | 15 |
| 3-month USD-LIBOR | 2.967% | 2/2/2038 | 8,900 | 26 | — | 26 |
| 3-month USD-LIBOR | 2.625% | 2/21/2047 | 2,000 | 126 | — | 126 |
| 3-month USD-LIBOR | 2.9825% | 2/20/2048 | 11,000 | (117) | — | (117) |
| U.S. EFFR | 2.505% | 3/22/2048 | 2,500 | (22) | — | (22) |
| U.S. EFFR | 2.51375% | 3/22/2048 | 2,800 | (30) | — | (30) |
| 3-month USD-LIBOR | 2.8245% | 4/4/2048 | 5,550 | 123 | — | 123 |
| U.S. EFFR | 2.40875% | 4/13/2048 | 14,000 | 158 | — | 158 |
| U.S. EFFR | 2.43625% | 4/19/2048 | 14,000 | 77 | — | 77 |
| U.S. EFFR | 2.554% | 4/26/2048 | 11,200 | (216) | — | (216) |
| 3-month USD-LIBOR | 3.016% | 5/9/2048 | 4,906 | (88) | — | (88) |
| 3-month USD-LIBOR | 3.0155% | 5/9/2048 | 5,550 | (99) | — | (99) |
| 3-month USD-LIBOR | 3.0745% | 5/17/2048 | 6,100 | (184) | — | (184) |
| U.S. EFFR | 2.625% | 5/25/2048 | 22,000 | (753) | — | (753) |
| | | | | | $— | $(5,073) |
Credit default swaps
Centrally cleared credit default swaps on credit indices — buy protection
| Receive | Pay/
Payment frequency | Expiration
date | Notional
(000) | Value at
6/30/2018
(000) | Upfront
payments
(000) | Unrealized
appreciation
at 6/30/2018
(000) |
| CDX.NA.HY.29 | 5.00%/Quarterly | 12/20/2022 | $12,775 | $(784) | $(849) | $65 |
| CDX.NA.IG.30 | 1.00%/Quarterly | 6/20/2023 | 264,715 | (3,916) | (4,691) | 775 |
| CDX.NA.HY.30 | 5.00%/Quarterly | 6/20/2023 | 78,150 | (4,490) | (5,145) | 655 |
| | | | | | $(10,685) | $1,495 |
American Funds Strategic Bond Fund — Page 10 of 11
| 1 | Acquired in a transaction exempt from registration under Rule 144A or Section 4(2) of the Securities Act of 1933. May be resold in the U.S. in transactions exempt from registration, normally to qualified institutional buyers. The total value of all such securities was $131,063,000, which represented 21.82% of the net assets of the fund. |
| 2 | Scheduled interest and/or principal payment was not received. |
| 3 | Step bond; coupon rate may change at a later date. |
| 4 | Loan participations and assignments; may be subject to legal or contractual restrictions on resale. The total value of all such loans was $2,411,000, which represented .40% of the net assets of the fund. |
| 5 | Principal payments may be made periodically. Therefore, the effective maturity date may be earlier than the stated maturity date. |
| 6 | Coupon rate may change periodically. |
| 7 | Payment in kind; the issuer has the option of paying additional securities in lieu of cash. Most recent payment was 100% cash unless otherwise noted. |
| 8 | Index-linked bond whose principal amount moves with a government price index. |
| 9 | All or a portion of this security was pledged as collateral. The total value of pledged collateral was $27,147,000, which represented 4.52% of the net assets of the fund. |
| 10 | Notional amount is calculated based on the number of contracts and notional contract size. |
| 11 | Value is calculated based on the notional amount and current market price. |
| 12 | Amount less than one thousand. |
| Key to abbreviations and symbols | |
| AUD = Australian dollars | JPY/¥ = Japanese yen |
| BA = Banker’s acceptances | KRW = South Korean won |
| BRL = Brazilian reais | LIBOR = London Interbank Offered Rate |
| CAD/C$ = Canadian dollars | MXN = Mexican pesos |
| CLP = Chilean pesos | NGN = Nigerian naira |
| COP = Colombian pesos | Rev. = Revenue |
| EFFR = Effective Federal Funds Rate | SEK/SKr = Swedish kronor |
| EONIA = Euro Overnight Index Average | SGD = Singapore dollars |
| EUR/€ = Euros | STIBOR = Stockholm Interbank Offered Rate |
| EURIBOR = Euro Interbank Offered Rate | TIIE = Equilibrium Interbank Interest Rate |
| G.O. = General Obligation | USD/$ = U.S. dollars |
| GBP/£ = British pounds | UYU = Uruguayan pesos |
| INR = Indian rupees | ZAR = South African rand |
Additional financial disclosures are included in the fund’s current shareholder report and should be read in conjunction with this report.
Investments are not FDIC-insured, nor are they deposits of or guaranteed by a bank or any other entity, so they may lose value.
Investors should carefully consider investment objectives, risks, charges and expenses. This and other important information is contained in the fund prospectus and summary prospectus, which can be obtained from your financial professional and should be read carefully before investing. You may also call American Funds Service Company (AFS) at (800) 421-4225 or visit the American Funds website at americanfunds.com. Fund shares offered through American Funds Distributors, Inc.
| MFGEFPX-112-0818O-S66010 | American Funds Strategic Bond Fund — Page 11 of 11 |
ITEM 7 – Disclosure of Proxy Voting Policies and Procedures for Closed-End Management Investment Companies
Not applicable to this Registrant, insofar as the Registrant is not a closed-end management investment company.
ITEM 8 – Portfolio Managers of Closed-End Management Investment Companies
Not applicable to this Registrant, insofar as the Registrant is not a closed-end management investment company.
ITEM 9 – Purchases of Equity Securities by Closed-End Management Investment Company and Affiliated Purchasers
Not applicable to this Registrant, insofar as the Registrant is not a closed-end management investment company.
ITEM 10 – Submission of Matters to a Vote of Security Holders
There have been no material changes to the procedures by which shareholders may recommend nominees to the Registrant’s board of trustees since the Registrant last submitted a proxy statement to its shareholders. The procedures are as follows. The Registrant has a nominating and governance committee comprised solely of persons who are not considered ‘‘interested persons’’ of the Registrant within the meaning of the Investment Company Act of 1940, as amended. The committee periodically reviews such issues as the board’s composition, responsibilities, committees, compensation and other relevant issues, and recommends any appropriate changes to the full board of trustees. While the committee normally is able to identify from its own resources an ample number of qualified candidates, it will consider shareholder suggestions of persons to be considered as nominees to fill future vacancies on the board. Such suggestions must be sent in writing to the nominating and governance committee of the Registrant, c/o the Registrant’s Secretary, and must be accompanied by complete biographical and occupational data on the prospective nominee, along with a written consent of the prospective nominee for consideration of his or her name by the nominating and governance committee.
ITEM 11 – Controls and Procedures
| (a) | The Registrant’s Principal Executive Officer and Principal Financial Officer have concluded, based on their evaluation of the Registrant’s disclosure controls and procedures (as such term is defined in Rule 30a-3 under the Investment Company Act of 1940), that such controls and procedures are adequate and reasonably designed to achieve the purposes described in paragraph (c) of such rule. |
| | |
| (b) | Effective May 28, 2018, the American Funds Strategic Bond Fund’s investment adviser implemented a new fixed income order management, trading, and compliance system. In connection with introducing this new system, additional automated and manual controls were implemented and some existing controls were modified. None of these changes were in response to any identified deficiency or weakness in the American Funds Strategic Bond Fund’s internal control over financial reporting. |
ITEM 12 – Exhibits
| (a)(1) | Not applicable for filing of semi-annual reports to shareholders. |
| | |
| (a)(2) | The certifications required by Rule 30a-2 of the Investment Company Act of 1940 and Sections 302 and 906 of the Sarbanes-Oxley Act of 2002 are attached as exhibits hereto. |
SIGNATURES
Pursuant to the requirements of the Securities Exchange Act of 1934 and the Investment Company Act of 1940, the Registrant has duly caused this report to be signed on its behalf by the undersigned, thereunto duly authorized.
| | AMERICAN FUNDS STRATEGIC BOND FUND |
| | |
| | By /s/ Kristine M. Nishiyama |
| | Kristine M. Nishiyama, Executive Vice President and Principal Executive Officer |
| | |
| | Date: August 31, 2018 |
Pursuant to the requirements of the Securities Exchange Act of 1934 and the Investment Company Act of 1940, this report has been signed below by the following persons on behalf of the Registrant and in the capacities and on the dates indicated.
| By /s/ Kristine M. Nishiyama |
Kristine M. Nishiyama, Executive Vice President and Principal Executive Officer |
| |
| Date: August 31, 2018 |
| By /s/ Brian C. Janssen |
Brian C. Janssen, Treasurer and Principal Financial Officer |
| |
| Date: August 31, 2018 |