Washington, D.C. 20549
Gifford R. Zimmerman
Form N-CSR is to be used by management investment companies to file reports with the Commission not later than 10 days after the transmission to stockholders of any report that is required to be transmitted to stockholders under Rule 30e-1 under the Investment Company Act of 1940 (17 CFR 270.30e-1). The Commission may use the information provided on Form N-CSR in its regulatory, disclosure review, inspection, and policymaking roles.
A registrant is required to disclose the information specified by Form N-CSR, and the Commission will make this information public. A registrant is not required to respond to the collection of information contained in Form N-CSR unless the Form displays a currently valid Office of Management and Budget ("OMB") control number. Please direct comments concerning the accuracy of the information collection burden estimate and any suggestions for reducing the burden to Secretary, Securities and Exchange Commission, 450 Fifth Street, NW, Washington, DC 20549-0609. The OMB has reviewed this collection of information under the clearance requirements of 44 U.S.C. ss. 3507.
ITEM 1. REPORTS TO STOCKHOLDERS.
Life is Complex
Nuveen makes things e-simple.
It only takes a minute to sign up for e-Reports. Once enrolled, you’ll receive an e-mail as soon as your Nuveen Fund information is ready—no more waiting for delivery by regular mail. Just click on the link within the e-mail to see the report and save it on your computer if you wish.
Free e-Reports right to your e-mail!
www.investordelivery.com
If you receive your Nuveen Fund dividends and statements from your financial advisor or brokerage account.
or
www.nuveen.com/accountaccess
If you receive your Nuveen Fund dividends and statements directly from Nuveen.
Table of Contents
| Chairman’s Letter to Shareholders | 4 |
| | |
| Portfolio Managers’ Comments | 5 |
| | |
| Fund Leverage | 7 |
| | |
| Common Share Information | 8 |
| | |
| Risk Considerations | 10 |
| | |
| Performance Overview and Holding Summaries | 11 |
| | |
| Portfolio of Investments | 13 |
| | |
| Statement of Assets and Liabilities | 21 |
| | |
| Statement of Operations | 22 |
| | |
| Statement of Changes in Net Assets | 23 |
| | |
| Statement of Cash Flows | 24 |
| | |
| Financial Highlights | 26 |
| | |
| Notes to Financial Statements | 28 |
| | |
| Additional Fund Information | 38 |
| | |
| Glossary of Terms Used in this Report | 39 |
| | |
| Reinvest Automatically, Easily and Conveniently | 41 |
NUVEEN 3
Chairman’s Letter to Shareholders
Dear Shareholders,
After a sluggish first half of 2016, the U.S. economy gained some momentum in the third quarter. In fact, it was the economy’s strongest quarterly acceleration in two years, propelled by healthy consumer spending, a temporary surge in exports and a turnaround in inventories. As the year wound down, 2016 looked on track to deliver the same steady-but-slow growth that has characterized the seven-year recovery.
A year ago, the U.S. Federal Reserve (Fed) took the first step toward policy “normalization” by raising its benchmark interest rate at its December 2015 meeting. Speculation about the Fed’s intentions since then has been a strong influence on the markets throughout 2016. After remaining on hold for a year, the Fed judged that the economy’s modest growth, the return to “full” employment and an uptick in inflation were sufficient to raise the target rate at the December 2016 meeting.
The global economy stayed on a path of low growth overall. Some concerns eased in 2016: China managed a gradual slowdown, stabilizing commodity prices provided some relief to emerging markets and the U.K. and eurozone economies held steady despite the U.K.’s surprise vote to leave the European Union. However, other uncertainties have surfaced. The threat of protectionism and potential trade wars has risen amid the populist sentiment underscoring the Brexit majority and the election of Donald Trump, as well as appearing in campaign rhetoric across Europe as elections loom in 2017. Moreover, there are growing concerns that global central banks’ unprecedented efforts to revive growth may be showing signs of fatigue. Interest rates are currently at or near zero across the developed world and only slightly higher than that in the U.S.; nonetheless, growth has remained subdued.
Since the election, U.S. stocks have rallied strongly on expectations that the Republican controlled Congress and Trump administration will pursue more business friendly policies. But the details have yet to be seen. Given muted global growth, the risk of policy errors by central banks around the world, the unfolding Brexit process and an uncertain political outlook (not just in the U.S. but also in Europe), we anticipate that turbulence remains on the horizon for the time being. In this environment, Nuveen remains committed to both managing downside risks and seeking upside potential. If you’re concerned about how resilient your investment portfolio might be, we encourage you to talk to your financial advisor. On behalf of the other members of the Nuveen Fund Board, we look forward to continuing to earn your trust in the months and years ahead.
Sincerely,
William J. Schneider
Chairman of the Board
January 23, 2017
4 NUVEEN
Portfolio Managers’ Comments
Nuveen Municipal 2021 Target Term Fund (NHA)
This Fund features portfolio management by Nuveen Asset Management, LLC (NAM), an affiliate of Nuveen Investments, Inc. Portfolio managers John V. Miller, CFA, and Steven M. Hlavin discuss key investment strategies and the six-month performance of NHA. John and Steve have managed NHA since its inception in 2016.
What key strategies were used to manage the Fund during the six-month reporting period ended November 30, 2016?
The Fund invests in a portfolio of primarily municipal securities, the income from which is exempt from regular U.S. federal income tax. At least 65% of its managed assets are invested in low- to medium-quality municipal securities that, at the time of investment, are rated BBB/Baa or lower or unrated but judged by the portfolio managers to be of comparable quality. The Fund does not invest in securities rated CCC+/Caa1 or lower, or unrated to be of comparable quality, nor does it invest in defaulted or distressed securities at the time of investment. No more than 25% will be in any one sector, no more than 5% in any one issuer and no more than 10% in tobacco settlement bonds. Up to 30% may be invested in securities that pay interest that is taxable under the federal alternative minimum tax applicable to individuals (AMT bonds).
The Fund seeks to identify municipal securities across diverse sectors and industries that the managers believe are undervalued. In seeking to return the original NAV of $9.85 on or about March 1, 2021, the Fund intends to utilize various portfolio and cash flow management techniques, including setting aside a portion of its net investment income, possibly retaining gains and limiting the longest maturity of any holding to no later than September 1, 2021.
As of the end of the reporting period, NHA’s maturity profile was structured with approximately 62% of the portfolio invested in bonds maturing in 2021, 33% maturing in 2020 and 5% maturing in 2019. As we continue to seek bonds that may be appropriate for the Fund, to the extent possible, we’ll focus on buying 2021 maturities while looking to sell the 2019 maturities first, to continue to reduce the Fund’s interest rate sensitivity as the Fund approaches its term date.
Certain statements in this report are forward-looking statements. Discussions of specific investments are for illustration only and are not intended as recommendations of individual investments. The forward-looking statements and other views expressed herein are those of the portfolio managers as of the date of this report. Actual future results or occurrences may differ significantly from those anticipated in any forward-looking statements, and the views expressed herein are subject to change at any time, due to numerous market and other factors. The Fund disclaims any obligation to update publicly or revise any forward-looking statements or views expressed herein.
The ratings disclosed are the lowest rating given by one of the following national rating agencies: Standard & Poor’s (S&P), Moody’s Investors Service, Inc. (Moody’s) or Fitch, Inc. (Fitch). Credit ratings are subject to change. AAA, AA, A and BBB are investment grade ratings, while BB, B, CCC, CC, C and D are below investment grade ratings. Certain bonds backed by U.S. Government or agency securities are regarded as having an implied rating equal to the rating of such securities. Holdings designated N/R are not rated by these national rating agencies.
Bond insurance guarantees only the payment of principal and interest on the bond when due, and not the value of the bonds themselves, which will fluctuate with the bond market and the financial success of the issuer and the insurer. Insurance relates specifically to the bonds in the portfolio and not to the share prices of a Fund. No representation is made as to the insurers’ ability to meet their commitments.
Refer to the Glossary of Terms Used in this Report for further definition of the terms used within this section.
NUVEEN 5
Portfolio Managers’ Comments (continued)
The Fund’s credit quality and sector positioning remained in line with Nuveen’s ongoing strategic emphasis on lower rated (including below investment grade) credits and sectors offering higher yields. After becoming fully invested in early 2016, the Fund’s trading activity since then was muted. We reinvested a small amount of proceeds generated from called and maturing bonds. As of the end of this reporting period, NHA’s larger sector exposures included dedicated/incremental tax, industrial development revenue/pollution control revenue (IDR/PCR), health care, charter schools and toll roads. We should also note that the Fund has a very limited allocation to tobacco securitization bonds. Although the sector does offer some of the investment characteristics we seek and has attractive long-term performance potential, the shorter term structures we seek for the Fund’s short duration strategy tend to be scarce in this sector.
How did the Fund perform during the six-month reporting period ended November 30, 2016?
The table in the Fund’s Performance Overview and Holding Summaries section of this report provide the Fund’s total returns for the six-month and since-inception period ended November 30, 2016. The Fund’s total returns at common share net asset value (NAV) are compared with the performance of a corresponding market index.
For the six months ended November 30, 2016, the total returns at common share NAV for NHA trailed the return for the S&P Short Duration Municipal Yield Index.
The main drivers of the Fund’s performance during this reporting period were its yield curve and duration positioning, credit quality exposure and sector allocations. Because the Fund only holds bonds with maturities of five years and shorter, its lack of exposure to the longer end of the yield curve, where yields traded with greater volatility, was advantageous to performance. On a credit ratings basis, the Fund’s overweight in BBB rated and lower, including non-rated, bonds was a detractor from performance. Outflows from municipal bond mutual funds, particularly in November 2016, drove credit spreads wider, which dampened the performance of medium- and low grade credits. This trend also disproportionately hurt certain sectors. Some of the Fund’s larger overweight sector allocations, including IDR/PCR, health care and dedicated tax, suffered from greater-than-average credit spread widening. As a result, these sector positions were detrimental to performance. Additionally, the Fund’s underweight in general obligation (GO) bonds also detracted from performance, as GOs performed well due to their perception as a relatively defensive investment during a period of heightened volatility.
A Note About Investment Valuations
The municipal securities held by the Fund are valued by the Fund’s pricing service using a range of market-based inputs and assumptions. A different municipal pricing service might incorporate different assumptions and inputs into its valuation methodology, potentially resulting in different values for the same securities. These differences could be significant, both as to such individual securities, and as to the value of a given Fund’s portfolio in its entirety. Thus, the current net asset value of a Fund’s shares may be impacted, higher or lower, if the Fund were to change pricing service, or if its pricing service were to materially change its valuation methodology. On October 4, 2016, the Fund’s current municipal bond pricing service was acquired by the parent company of another pricing service. The two services have not yet combined their valuation organizations and process, but may do so in the future. Thus there is an increased risk that the organization acting as each Fund’s pricing service may change, or that the Fund’s pricing service may change its valuation methodology, either of which could have an impact on the net asset value of the Fund’s shares.
6 NUVEEN
Fund Leverage
IMPACT OF THE FUND’S LEVERAGE STRATEGY ON PERFORMANCE
One important factor impacting the return of the Fund relative to its comparative benchmark was the Fund’s use of leverage through its issuance of preferred shares and/or investments in inverse floating rate securities, which represent leveraged investments in underlying bonds. The Fund uses leverage because our research has shown that, over time, leveraging provides opportunities for additional income, particularly in the recent market environment where short-term market rates are at or near historical lows, meaning that the short-term rates the Fund has been paying on its leveraging instruments have been much lower than the interest the Fund has been earning on its portfolio of long-term bonds that it has bought with the proceeds of that leverage. However, use of leverage also can expose the Fund to additional price volatility. When the Fund uses leverage, the Fund will experience a greater increase in its net asset value if the municipal bonds acquired through the use of leverage increase in value, but it will also experience a correspondingly larger decline in its net asset value if the bonds acquired through leverage decline in value, which will make the Fund’s net asset value more volatile, and its total return performance more variable over time. In addition, income in levered funds will typically decrease in comparison to unlevered funds when short-term interest rates increase and increase when short-term interest rates decrease. Leverage had a negative impact on the performance of the Fund over this reporting period.
| As of November 30, 2016, the Fund’s percentages of leverage are as shown in the accompanying table. | |
| | | NHA | |
| Effective Leverage* | | | 25.87 | % |
| Regulatory Leverage* | | | 25.87 | % |
| * | Effective Leverage is a Fund’s effective economic leverage, and includes both regulatory leverage and the leverage effects of certain derivative and other investments in a Fund’s port- folio that increase the Fund’s investment exposure. Currently, the leverage effects of Tender Option Bond (TOB) inverse floater holdings are included in effective leverage values, in addition to any regulatory leverage. Regulatory leverage consists of preferred shares issued or borrowings of a Fund. Both of these are part of a Fund’s capital structure. A Fund, however, may from time to time borrow on a typically transient basis in connection with its day-to-day operations, primarily in connection with the need to settle portfolio trades. Such incidental borrowings are excluded from the calculation of a Fund’s effective leverage ratio. Regulatory leverage is subject to asset coverage limits set forth in the Investment Company Act of 1940. |
THE FUND’S REGULATORY LEVERAGE
As of November 30, 2016, the Fund has issued and outstanding Variable Rate MuniFund Term Preferred (VMTP) Shares as shown in the accompanying table.
| | | |
| | VMTP Shares |
| | | Shares Issued at |
| | | Liquidation |
| | Series | Preference |
| NHA | 2019 | $28,300,000 |
Refer to Notes to Financial Statements, Note 4 — Fund Shares, Preferred Shares for further details on VMTP Shares and the Fund’s transactions.
NUVEEN 7
Common Share Information
COMMON SHARE DISTRIBUTION INFORMATION
The following information regarding the Fund’s distributions is current as of November 30, 2016. The Fund’s distribution levels may vary over time based on its investment activity and portfolio investment value changes.
During the current reporting period, the Fund’s distributions to common shareholders were as shown in the accompanying table.
| | | | |
| | | Per Common | |
| Monthly Distributions (Ex-Dividend Date) | | Share Amounts | |
| June 2016 | | $ | 0.0200 | |
| July | | | 0.0200 | |
| August | | | 0.0200 | |
| September | | | 0.0200 | |
| October | | | 0.0200 | |
| November 2016 | | | 0.0200 | |
| Total Distributions from Net Investment Income | | $ | 0.1200 | |
| Yields | | | | |
| Market Yield* | | | 2.44 | % |
| Taxable-Equivalent Yield* | | | 3.39 | % |
| * | Market Yield is based on the Fund’s current annualized monthly dividend divided by the Fund’s current market price as of the end of the reporting period. Taxable-Equivalent Yield represents the yield that must be earned on a fully taxable investment in order to equal the yield of the Fund on an after-tax basis. It is based on an income tax rate of 28.0%. When comparing the Fund to investments that generate qualified dividend income, the Taxable-Equivalent Yield is lower. |
The Fund seeks to pay regular monthly dividends out of its net investment income at a rate that reflects its past and projected net income performance. To permit the Fund to maintain a more stable monthly dividend, the Fund may pay dividends at a rate that may be more or less than the amount of net income actually earned by the Fund during the period. If the Fund has cumulatively earned more than it has paid in dividends, it will hold the excess in reserve as undistributed net investment income (UNII) as part of the Fund’s net asset value. Conversely, if the Fund has cumulatively paid in dividends more than it has earned, the excess will constitute a negative UNII that will likewise be reflected in the Fund’s net asset value. The Fund will, over time, pay all its net investment income as dividends to shareholders.
As of November 30, 2016, the Fund had a positive UNII balance for tax purposes, based upon our best estimate, and a positive UNII balance for financial reporting purposes.
All monthly dividends paid by the Fund during the current reporting period were paid from net investment income. If a portion of the Fund’s monthly distributions was sourced from or comprised of elements other than net investment income, including capital gains and/or a return of capital, shareholders would have received a notice to that effect. For financial reporting purposes, the composition and per share amounts of the Fund’s dividends for the reporting period are presented in this report’s
8 NUVEEN
Statement of Changes in Net Assets and Financial Highlights, respectively. For income tax purposes, distribution information for each Fund as of its most recent tax year end is presented in Note 6 — Income Tax Information within the Notes to Financial Statements of this report.
COMMON SHARE REPURCHASES
During August 2016, the Fund’s Board of Trustees authorized an open-market share repurchase program, allowing the Fund to repurchase an aggregate of up to approximately 10% of its outstanding shares.
As of November 30, 2016, and since the inception of the Fund’s repurchase program, the Fund has cumulatively repurchased and retired common shares as shown in the accompanying table.
| | |
| | NHA |
| Common shares cumulatively repurchased and retired | 0 |
| Common shares authorized for repurchase | 860,000 |
OTHER COMMON SHARE INFORMATION
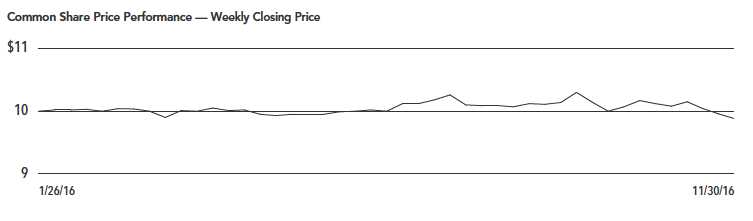
As of November 30, 2016, and during the current reporting period, the Fund’s common share price was trading at a premium/(discount) to its common share NAV as shown in the accompanying table.
| | | | |
| Common share NAV | | $ | 9.41 | |
| Common share price | | $ | 9.85 | |
| Premium/(Discount) to NAV | | | 4.68 | % |
| 6-Month average premium/(discount) to NAV | | | 1.67 | % |
The Fund has an investment objective to return $9.85 (the original net asset value following the Fund’s initial public offering (the “Original NAV”)) to common shareholders on or about the end of the Fund’s term. There can be no assurance that the Fund will be able to return the Original NAV to shareholders, and such return is not backed or otherwise guaranteed by the Fund’s investment adviser, Nuveen Fund Advisors, LLC (the “Adviser”), or any other entity.
The Fund’s ability to return Original NAV to common shareholders on or about the Termination Date will depend on market conditions and the success of various portfolio and cash flow management techniques. The Fund currently intends to set aside and retain in its net assets a portion of its net investment income and possibly all or a portion of its gains. This will reduce the amounts otherwise available for distribution prior to the liquidation of the Fund, and the Fund may incur taxes on such retained amount, which will reduce the overall amounts that the Fund would have otherwise been able to distribute. Such retained income or gains, net of any taxes, would constitute a portion of the liquidating distribution returned to investors at the end of the Fund’s term. In addition, the Fund’s investment in shorter term and lower yielding securities, especially as the Fund nears the end of its term, may reduce investment income and, therefore, the monthly dividends during the period prior to termination. Investors that purchase common shares in the secondary market (particularly if their purchase price differs meaningfully from the Original NAV) may receive more or less than their original investment.
NUVEEN 9
Risk Considerations
Fund shares are not guaranteed or endorsed by any bank or other insured depository institution, and are not federally insured by the Federal Deposit Insurance Corporation.
Nuveen Municipal 2021 Target Term Fund (NHA)
Investing in closed-end funds involves risk; principal loss is possible. There is no guarantee the Fund’s investment objectives will be achieved. Closed-end fund shares may frequently trade at a discount or premium to their net asset value. Debt or fixed income securities, such as those held by the Fund, are subject to market risk, credit risk, interest rate risk, derivatives risk, liquidity risk, and income risk. As interest rates rise, bond prices fall. Lower credit debt securities may be more likely to fail to make timely interest or principal payments. Leverage increases return volatility and magnifies the Fund’s potential return and its risks; there is no guarantee a fund’s leverage strategy will be successful. For these and other risks, including the Fund’s limited term and inverse floater risk, see the Fund’s web page at nuveen.com/NHA.
10 NUVEEN
NHA
Nuveen Municipal 2021 Target Term Fund
Performance Overview and Holding Summaries as of November 30, 2016
| | | | | | | |
Refer to the Glossary of Terms Used in this Report for further definition of the terms used within this section. | | | | | | |
| Cumulative Total Returns as of November 30, 2016 | | | | | | |
| | | Cumulative | |
| | | | | | Since | |
| | | 6-Month | | | Inception | |
| NHA at Common Share NAV | | | (3.89 | )% | | | (2.72 | )% |
| NHA at Common Share Price | | | 0.19 | % | | | 0.30 | % |
| S&P Short Duration Municipal Yield Index | | | (0.58 | )% | | | 1.29 | % |
Since inception returns are from 1/26/16. Past performance is not predictive of future results. Current performance may be higher or lower than the data shown. Returns do not reflect the deduction of taxes that shareholders may have to pay on Fund distributions or upon the sale of Fund shares. Returns at NAV are net of Fund expenses, and assume reinvestment of distributions. Comparative index return information is provided for the Fund’s shares at NAV only. Indexes are not available for direct investment.
NUVEEN 11
NHA Performance Overview and Holding Summaries as of November 30, 2016 (continued)
This data relates to the securities held in the Fund’s portfolio of investments as of the end of the reporting period. It should not be construed as a measure of performance for the Fund itself. Holdings are subject to change.
The ratings disclosed are the lowest rating given by one of the following national rating agencies: Standard & Poor’s, Moody’s Investors Service, Inc. or Fitch, Inc. Credit ratings are subject to change. AAA, AA, A and BBB are investment grade ratings; BB, B, CCC, CC, C and D are below investment grade ratings. Certain bonds backed by U.S. Government or agency securities are regarded as having an implied rating equal to the rating of such securities. Holdings designated N/R are not rated by these national rating agencies.
| Fund Allocation | |
| (% of net assets) | |
| Long-Term Municipal Bonds | 134.7% |
| Other Asset Less Liabilities | 0.2% |
| Net Asset Plus VMTP Shares, | |
| at Liquidation Preference | 134.9% |
| VMTP Shares, at Liquidation Preference | (34.9)% |
| Net Assets | 100% |
| Credit Quality | |
| (% of total investment exposure) | |
| AAA/U.S. Guaranteed | 0.0% |
| AA | 3.6% |
| A | 13.0% |
| BBB | 31.7% |
| BB or Lower | 21.7% |
| N/R (not rated) | 30.0% |
| Total | 100% |
| Portfolio Composition | |
| (% of total investments) | |
| Tax Obligation/Limited | 34.3% |
| Tax Obligation/General | 15.3% |
| Transportation | 13.2% |
| Education and Civic Organizations | 8.9% |
| Health Care | 6.6% |
| Utilities | 6.5% |
| Long-Term Care | 5.7% |
| Other | 9.5% |
| Total | 100% |
| States and Territories | |
| (% of total investments) | |
| California | 13.3% |
| Florida | 11.6% |
| Illinois | 11.6% |
| New Jersey | 9.8% |
| Pennsylvania | 9.0% |
| New York | 5.7% |
| Texas | 5.3% |
| Nevada | 3.9% |
| Alaska | 3.4% |
| Massachusetts | 2.2% |
| Arizona | 2.1% |
| Indiana | 2.1% |
| Other | 20.0% |
| Total | 100% |
12 NUVEEN
| | | | | |
| NHA | | | |
| |
| Nuveen Municipal 2021 Target Term Fund |
| Portfolio of Investments | November 30, 2016 (Unaudited) |
| Principal | | | Optional Call | | | | | | |
| Amount (000) | | Description (1) | Provisions (2) | | Ratings (3) | | | Value | |
| | | LONG-TERM INVESTMENTS – 134.7% (100.0% of Total Investments) | | | | | | | |
| | | | | | | | | | |
| | | MUNICIPAL BONDS – 134.7% (100.0% of Total Investments) | | | | | | | |
| | | | | | | | | | |
| | | Alaska – 4.5% (3.4% of Total Investments) | | | | | | | |
| $ | 2,000 | | Valdez, Alaska, Marine Terminal Revenue Bonds, BP Pipelines Inc. Project, Refunding Series | No Opt. Call | | | A– | | | $ | 2,203,659 | |
| | | | 2003B, 5.000%, 1/01/21 | | | | | | | | | |
| | 1,325 | | Valdez, Alaska, Marine Terminal Revenue Bonds, BP Pipelines Inc. Project, Refunding Series | No Opt. Call | | | A– | | | | 1,459,925 | |
| | | | 2003C, 5.000%, 1/01/21 | | | | | | | | | |
| | 3,325 | | Total Alaska | | | | | | | | 3,663,584 | |
| | | | Arizona – 2.9% (2.1% of Total Investments) | | | | | | | | | |
| | 325 | | Goodyear Community Facilities Utilities District 1, Arizona, General Obligation Bonds, | No Opt. Call | | | A– | | | | 348,910 | |
| | | | Refunding Series 2016, 4.000%, 7/15/21 | | | | | | | | | |
| | 2,000 | | Pima County Industrial Development Authority, Arizona, Education Revenue Bonds, Arizona | No Opt. Call | | Baa3 | | | | 1,963,180 | |
| | | | Charter Schools Refunding Project, Series 2016R, 2.875%, 7/01/21 | | | | | | | | | |
| | 10 | | Salt Verde Financial Corporation, Arizona, Senior Gas Revenue Bonds, Citigroup Energy Inc. | No Opt. Call | | BBB+ | | | | 10,830 | |
| | | | Prepay Contract Obligations, Series 2007, 5.250%, 12/01/19 | | | | | | | | | |
| | 2,335 | | Total Arizona | | | | | | | | 2,322,920 | |
| | | | Arkansas – 0.0% (0.0% of Total Investments) | | | | | | | | | |
| | 15 | | Arkansas Development Finance Authority, Hospital Revenue Bonds, Washington Regional Medical | No Opt. Call | | | A3 | | | | 16,593 | |
| | | | Center, Refunding Series 2015B, 5.000%, 2/01/21 | | | | | | | | | |
| | | | California – 17.9% (13.3% of Total Investments) | | | | | | | | | |
| | 1,000 | | Antelope Valley Healthcare District, California, Revenue Bonds, Series 2016A, 5.000%, 3/01/21 | No Opt. Call | | Ba3 | | | | 1,068,120 | |
| | 815 | | California County Tobacco Securitization Agency, Tobacco Settlement Asset-Backed Bonds, Golden | 6/17 at 100.00 | | | N/R | | | | 811,879 | |
| | | | Gate Tobacco Funding Corporation, Turbo, Series 2007A, 4.500%, 6/01/21 | | | | | | | | | |
| | 85 | | California Infrastructure and Economic Development Bank, Revenue Bonds, The Walt Disney Family | No Opt. Call | | | A+ | | | | 91,548 | |
| | | | Museum, Refunding Series 2016, 4.000%, 2/01/21 | | | | | | | | | |
| | | | California School Finance Authority, California, Charter School Revenue Bonds, Aspire Public | | | | | | | | | |
| | | | Schools, Refunding Series 2016: | | | | | | | | | |
| | 550 | | 5.000%, 8/01/20 | No Opt. Call | | BBB | | | | 595,749 | |
| | 500 | | 5.000%, 8/01/21 | No Opt. Call | | BBB | | | | 548,605 | |
| | 730 | | California Statewide Communities Development Authority, Revenue Bonds, American Baptist Homes | No Opt. Call | | BBB+ | | | | 798,715 | |
| | | | of the West, Refunding Series 2015, 5.000%, 10/01/20 | | | | | | | | | |
| | | | California Statewide Communities Development Authority, Special Tax Bonds, Community | | | | | | | | | |
| | | | Facilities District 2015-01, Improvement Area No. 1, University District, Series 2016A: | | | | | | | | | |
| | 260 | | 2.000%, 9/01/20 | No Opt. Call | | | N/R | | | | 256,129 | |
| | 265 | | 2.125%, 9/01/21 | No Opt. Call | | | N/R | | | | 258,966 | |
| | 235 | | California Statewide Communities Development Authority, Statewide Community Infrastructure | No Opt. Call | | | N/R | | | | 239,658 | |
| | | | Program Revenue Bonds, Series 2016A, 3.000%, 9/02/20 | | | | | | | | | |
| | 625 | | California Statewide Communities Development Authority, Student Housing Revenue Bonds, | No Opt. Call | | Baa1 | | | | 680,006 | |
| | | | University of California, Irvine East Campus Apartments, CHF-Irvine, LLC, Refunding Series | | | | | | | | | |
| | | | 2016, 5.000%, 5/15/21 | | | | | | | | | |
| | 1,625 | | California Statewide Community Development Authority, Revenue Bonds, Los Angeles Jewish Home | 2/17 at 100.00 | | | N/R | | | | 1,625,585 | |
| | | | for the Aging-Fountainview Gonda, Series 2014D, 4.750%, 8/01/20 | | | | | | | | | |
| | 200 | | Cucamonga School District, San Bernardino County, California, Special Tax Bonds, Community | No Opt. Call | | | N/R | | | | 203,944 | |
| | | | Facilities District 97-1, Series 2016, 3.000%, 9/01/21 | | | | | | | | | |
| | 305 | | Fresno, California, Airport Revenue Bonds, Refunding Series 2013B, 5.000%, 7/01/21 – BAM | No Opt. Call | | AA | | | | 337,910 | |
| | | | Insured (Alternative Minimum Tax) | | | | | | | | | |
| | 960 | | Inland Empire Tobacco Securitization Authority, California, Tobacco Settlement Asset-Backed | 6/17 at 100.00 | | | N/R | | | | 960,259 | |
| | | | Bonds, Series 2007, 4.625%, 6/01/21 | | | | | | | | | |
NUVEEN 13
| NHA | | |
| Nuveen Municipal 2021 Target Term Fund | |
Portfolio of Investments (continued) | November 30, 2016 (Unaudited) |
| | | | | | | | | | |
| Principal | | | Optional Call | | | | | | |
| Amount (000) | | Description (1) | Provisions (2) | | Ratings (3) | | | Value | |
| | | California (continued) | | | | | | | |
| $ | 50 | | Poway Unified School District, San Diego County, California, Special Tax Bonds, Community | No Opt. Call | | | N/R | | | $ | 53,124 | |
| | | | Facilities District 15 Del Sur East Improvement Area C, Series 2016, 4.000%, 9/01/21 | | | | | | | | | |
| | 1,250 | | Roseville, California, Special Tax Bonds, Community Facilities District 1 Hewlett Packard | No Opt. Call | | | N/R | | | | 1,236,300 | |
| | | | Campus Oaks, Series 2016, 3.250%, 9/01/21 | | | | | | | | | |
| | 1,005 | | Roseville, California, Special Tax Bonds, Community Facilities District 1 Westpark, Refunding | No Opt. Call | | | N/R | | | | 1,111,500 | |
| | | | Series 2015, 5.000%, 9/01/21 | | | | | | | | | |
| | 1,310 | | San Jacinto, California, Special Tax Bonds, Community Facilities District 2002-1 Rancho San | No Opt. Call | | | N/R | | | | 1,388,836 | |
| | | | Jacinto Phase 2, Series 2016, 4.000%, 9/01/21 | | | | | | | | | |
| | 10 | | South Orange County Public Financing Authority, California, Special Tax Revenue Bonds, Ladera | No Opt. Call | | BBB+ | | | | 10,935 | |
| | | | Ranch, Refunding Series 2014A, 5.000%, 8/15/20 | | | | | | | | | |
| | 460 | | West Sacramento, California, Special Tax Bonds, Community Facilities District 27 Bridge | No Opt. Call | | | N/R | | | | 511,138 | |
| | | | District, Refunding Series 2016, 5.000%, 9/01/21 | | | | | | | | | |
| | 1,340 | | Western Hills Water District, Stanislaus County, California, Special Tax Bonds, Diable Grande | No Opt. Call | | | N/R | | | | 1,323,183 | |
| | | | Community Facilities District 1, Refunding Series 2014, 4.000%, 9/01/21 | | | | | | | | | |
| | 420 | | Yuba City Redevelopment Agency, California, Tax Allocation Bonds, Redevelopment Project, | No Opt. Call | | BBB+ | | | | 405,682 | |
| | | | Refunding Series 2015, 2.000%, 9/01/21 | | | | | | | | | |
| | 14,000 | | Total California | | | | | | | | 14,517,771 | |
| | | | Colorado – 1.1% (0.8% of Total Investments) | | | | | | | | | |
| | 120 | | E-470 Public Highway Authority, Colorado, Senior Revenue Bonds, Refunding Series 2015A, | No Opt. Call | | BBB | | | | 132,796 | |
| | | | 5.000%, 9/01/20 | | | | | | | | | |
| | 230 | | E-470 Public Highway Authority, Colorado, Senior Revenue Bonds, Series 1997B, 0.000%, | No Opt. Call | | BBB | | | | 200,912 | |
| | | | 9/01/21 – NPFG Insured | | | | | | | | | |
| | 565 | | Mountain Shadows Metropolitan District, Colorado, General Obligation Limited Tax Bonds, | No Opt. Call | | | N/R | | | | 555,129 | |
| | | | Refunding Series 2016, 3.250%, 12/01/20 | | | | | | | | | |
| | 915 | | Total Colorado | | | | | | | | 888,837 | |
| | | | Connecticut – 0.1% (0.1% of Total Investments) | | | | | | | | | |
| | 100 | | Connecticut Health and Educational Facilities Authority, Revenue Bonds, Healthcare Facility | 9/17 at 100.00 | | BB | | | | 97,682 | |
| | | | Expansion Church Home of Hartford Inc. Project, TEMPS-50 Series 2016B-2, 2.875%, 9/01/20 | | | | | | | | | |
| | | | Florida – 15.7% (11.6% of Total Investments) | | | | | | | | | |
| | 150 | | Bellagio Community Development District, Hialeah, Florida, Special Assessment Bonds, Series | No Opt. Call | | BBB– | | | | 147,449 | |
| | | | 2016, 2.250%, 11/01/20 | | | | | | | | | |
| | 650 | | Belmont Community Development District, Florida, Capital Improvement Revenue Bonds, Series | No Opt. Call | | | N/R | | | | 634,108 | |
| | | | 2016A, 3.625%, 11/01/20 | | | | | | | | | |
| | 210 | | Bexley Community Development District, Pasco County, Florida, Special Assessment Revenue | No Opt. Call | | | N/R | | | | 204,899 | |
| | | | Bonds, Series 2016, 3.500%, 5/01/21 | | | | | | | | | |
| | 2,000 | | Broward County, Florida, Airport Facility Revenue Bonds, Learjet Inc., Series 2000, 7.500%, | 2/17 at 100.00 | | | B3 | | | | 2,003,060 | |
| | | | 11/01/20 (Alternative Minimum Tax) | | | | | | | | | |
| | 140 | | Champion’s Reserve Community Development District, Florida, Special Assessment Revenue Bonds, | No Opt. Call | | | N/R | | | | 136,983 | |
| | | | Series 2016, 3.625%, 11/01/20 | | | | | | | | | |
| | 1,000 | | Collier County Industrial Development Authority, Florida, Continuing Care Community Revenue | 2/17 at 100.00 | | | N/R | | | | 1,001,220 | |
| | | | Bonds, Arlington of Naples Project, TEMPS 70 Series 2014B-2, 6.500%, 5/15/20 | | | | | | | | | |
| | 400 | | Creekside at Twin Creeks Community Development District, Florida, Special Assessment Bonds, | No Opt. Call | | | N/R | | | | 391,224 | |
| | | | Area 1 Project, Series 2016A-1, 3.700%, 11/01/20 | | | | | | | | | |
| | 815 | | East Homestead Community Development District, Florida, Special Assessment Revenue Bonds, | No Opt. Call | | | N/R | | | | 804,340 | |
| | | | Refunding Series 2015, 3.750%, 5/01/20 | | | | | | | | | |
| | 2,000 | | Grand Bay at Doral Community Development District, Miami-Dade County, Florida, Special | No Opt. Call | | | N/R | | | | 1,961,720 | |
| | | | Assessment Bonds, South Parcel Assessment Area Project, Series 2016, 3.500%, 5/01/21 | | | | | | | | | |
| | 335 | | Live Oak Community Development District 2, Hillsborough County, Florida, Special Assessment | No Opt. Call | | | A– | | | | 325,834 | |
| | | | Bonds. Refunding Series 2016, 2.000%, 5/01/21 | | | | | | | | | |
14 NUVEEN
| | | | | | | | | | |
| Principal | | | Optional Call | | | | | | |
| Amount (000) | | Description (1) | Provisions (2) | | Ratings (3) | | | Value | |
| | | Florida (continued) | | | | | | | |
| $ | 815 | | Miromar Lakes Community Development District, Lee County, Florida, Capital Improvement Revenue | No Opt. Call | | | N/R | | | $ | 803,932 | |
| | | | Bonds, Refunding Series 2015, 3.500%, 5/01/20 | | | | | | | | | |
| | 15 | | Palm Beach County Health Facilities Authority, Florida, Hospital Revenue Bonds, BRCH | No Opt. Call | | BBB+ | | | | 16,508 | |
| | | | Corporation Obligated Group, Refunding Series 2014, 5.000%, 12/01/20 | | | | | | | | | |
| | | | Palm Beach County Health Facilities Authority, Florida, Revenue Bonds, Lifespace Community | | | | | | | | | |
| | | | Inc., Series 2015C: | | | | | | | | | |
| | 30 | | 4.000%, 5/15/19 | No Opt. Call | | | A | | | | 31,529 | |
| | 70 | | 5.000%, 5/15/21 | No Opt. Call | | | A | | | | 77,802 | |
| | 505 | | Palm Glades Community Development District, Florida, Special Assessment Bonds, Refunding | No Opt. Call | | BBB | | | | 492,880 | |
| | | | Series 20016, 2.250%, 5/01/21 | | | | | | | | | |
| | 815 | | Reunion East Community Development District, Osceola County, Florida, Special Assessment | No Opt. Call | | | N/R | | | | 827,991 | |
| | | | Bonds, Refunding Series 2015A, 4.000%, 5/01/20 | | | | | | | | | |
| | 400 | | Reunion West Community Development District, Florida, Special Assessment Bonds, Area 3 | No Opt. Call | | | N/R | | | | 390,220 | |
| | | | Project, Series 2016, 3.625%, 11/01/20 | | | | | | | | | |
| | | | Rolling Hills Community Development District, Florida, Capital Improvement Revenue Bonds, | | | | | | | | | |
| | | | Series 2015A-1: | | | | | | | | | |
| | 65 | | 3.750%, 5/01/17 | No Opt. Call | | | N/R | | | | 64,739 | |
| | 70 | | 4.000%, 5/01/18 | No Opt. Call | | | N/R | | | | 69,381 | |
| | 75 | | 4.100%, 5/01/19 | No Opt. Call | | | N/R | | | | 74,006 | |
| | 75 | | 4.300%, 5/01/20 | No Opt. Call | | | N/R | | | | 73,701 | |
| | 80 | | 4.600%, 5/01/21 | No Opt. Call | | | N/R | | | | 78,318 | |
| | 345 | | Six Mile Creek Community Development District, Florida, Capital Improvement Revenue Bonds, | No Opt. Call | | | N/R | | | | 337,679 | |
| | | | Assessment Area 2, Series 2016, 3.750%, 11/01/20 | | | | | | | | | |
| | 435 | | South Fork III Community Development District, Florida, Special Assessment Revenue Bonds, | No Opt. Call | | | N/R | | | | 427,844 | |
| | | | Refunding Series 2016, 4.000%, 5/01/20 | | | | | | | | | |
| | 325 | | Tapestry Community Development District, Florida, Special Assessment Revenue Bonds, Series | No Opt. Call | | | N/R | | | | 317,769 | |
| | | | 2016, 3.625%, 5/01/21 | | | | | | | | | |
| | 270 | | Union Park Community Development District, Florida, Capital Improvement Revenue Bonds, Series | No Opt. Call | | | N/R | | | | 268,955 | |
| | | | 2016A-1, 3.750%, 11/01/20 | | | | | | | | | |
| | 400 | | Windsor at Westside Community Development District, Osceola County, Florida, Special | No Opt. Call | | | N/R | | | | 391,468 | |
| | | | Assessment Bonds, Area 2 Project, Series 2016, 3.500%, 11/01/20 | | | | | | | | | |
| | 335 | | Wiregrass Community Development District, Florida, Capital Improvement Revenue Bonds, Series | No Opt. Call | | | N/R | | | | 328,076 | |
| | | | 2016, 3.625%, 5/01/21 | | | | | | | | | |
| | 12,825 | | Total Florida | | | | | | | | 12,683,635 | |
| | | | Georgia – 0.4% (0.3% of Total Investments) | | | | | | | | | |
| | 275 | | Atlanta, Georgia, Tax Allocation Bonds, Eastside Project, Series 2016, 5.000%, 1/01/21 | No Opt. Call | | | A– | | | | 304,134 | |
| | | | Guam – 2.6% (1.9% of Total Investments) | | | | | | | | | |
| | 985 | | Guam Government Department of Education, Certificates of Participation, John F. Kennedy High | No Opt. Call | | | B | + | | | 1,021,593 | |
| | | | School Project, Series 2010A, 6.000%, 12/01/20 | | | | | | | | | |
| | 1,000 | | Guam Government Waterworks Authority, Water and Wastewater System Revenue Bonds, Series 2016, | No Opt. Call | | BBB– | | | | 1,097,210 | |
| | | | 5.000%, 7/01/21 | | | | | | | | | |
| | 1,985 | | Total Guam | | | | | | | | 2,118,803 | |
| | | | Hawaii – 2.5% (1.8% of Total Investments) | | | | | | | | | |
| | 2,000 | | Hawaii Department of Budget and Finance, Special Purpose Revenue Bonds, Hawaii Pacific | No Opt. Call | | | N/ | R | | | 2,012,020 | |
| | | | University, Series 2015, 5.000%, 7/01/20 | | | | | | | | | |
| | | | Illinois – 15.6% (11.6% of Total Investments) | | | | | | | | | |
| | 255 | | Board of Trustees of Southern Illinois University, Housing and Auxiliary Facilities System | No Opt. Call | | | A3 | | | | 229,467 | |
| | | | Revenue Bonds, Series 1999A, 0.000%, 4/01/20 – NPFG Insured | | | | | | | | | |
| | 75 | | Cary, Illinois, Special Tax Bonds, Special Service Area 2, Refunding Series 2016, 1.900%, | No Opt. Call | | AA | | | | 72,487 | |
| | | | 3/01/21 – BAM Insured | | | | | | | | | |
NUVEEN 15
| NHA | | |
| Nuveen Municipal 2021 Target Term Fund | |
Portfolio of Investments (continued) | November 30, 2016 (Unaudited) |
| | | | | | | | | | |
| Principal | | | Optional Call | | | | | | |
| Amount (000) | | Description (1) | Provisions (2) | | Ratings (3) | | | Value | |
| | | Illinois (continued) | | | | | | | |
| $ | 1,000 | | Chicago Board of Education, Illinois, General Obligation Bonds, Dedicated Revenues, Refunding | No Opt. Call | | | B3 | | | $ | 1,000,680 | |
| | | | Series 2007B, 5.000%, 12/01/19 – AMBAC Insured | | | | | | | | | |
| | | | Chicago Board of Education, Illinois, General Obligation Bonds, Dedicated Revenues, Refunding | | | | | | | | | |
| | | | Series 2010F: | | | | | | | | | |
| | 220 | | 5.000%, 12/01/18 | No Opt. Call | | | B3 | | | | 203,777 | |
| | 970 | | 5.000%, 12/01/19 | No Opt. Call | | | B3 | | | | 871,797 | |
| | 150 | | 5.000%, 12/01/20 | No Opt. Call | | | B3 | | | | 132,687 | |
| | 1,000 | | Chicago Board of Education, Illinois, Unlimited Tax General Obligation Bonds, Dedicated Tax | No Opt. Call | | | B | + | | | 1,064,450 | |
| | | | Revenues, Series 1999A, 5.250%, 12/01/20 – NPFG Insured | | | | | | | | | |
| | 1,000 | | Chicago, Illinois, General Obligation Bonds, Project and Refunding Series 2003B, | No Opt. Call | | Ba1 | | | | 999,450 | |
| | | | 5.000%, 1/01/20 | | | | | | | | | |
| | 800 | | Chicago, Illinois, General Obligation Bonds, Refunding Series 2012C, 5.000%, 1/01/21 | No Opt. Call | | Ba1 | | | | 798,856 | |
| | | | Chicago, Illinois, Motor Fuel Tax Revenue Bonds, Refunding Series 2014: | | | | | | | | | |
| | 45 | | 5.000%, 1/01/20 | No Opt. Call | | Ba1 | | | | 46,690 | |
| | 10 | | 5.000%, 1/01/21 | No Opt. Call | | Ba1 | | | | 10,373 | |
| | 50 | | Chicago, Illinois, O’Hare Airport Customer Facility Charge Senior Lien Revenue Bonds, Series | No Opt. Call | | BBB | | | | 54,248 | |
| | | | 2013A, 5.000%, 1/01/20 | | | | | | | | | |
| | 630 | | Cook County School District 87, Berkeley, Illinois, General Obligation Bonds, Refunding School | No Opt. Call | | | A1 | | | | 634,618 | |
| | | | Series 2012A, 3.000%, 12/01/20 | | | | | | | | | |
| | 300 | | Cook County, Illinois, General Obligation Bonds, Refunding Series 2012C, 5.000%, 11/15/20 | No Opt. Call | | | A2 | | | | 327,534 | |
| | 620 | | Illinois Finance Authority, Revenue Bonds, Presence Health Network, Series 2016C, | No Opt. Call | | BBB– | | | | 668,434 | |
| | | | 5.000%, 2/15/21 | | | | | | | | | |
| | 315 | | Illinois Sports Facility Authority, State Tax Supported Bonds, Series 2001, 0.000%, 6/15/20 – | No Opt. Call | | BBB– | | | | 279,506 | |
| | | | AMBAC Insured | | | | | | | | | |
| | 3,000 | | Illinois State, General Obligation Bonds, January Series 2016, 5.000%, 1/01/21 | No Opt. Call | | BBB | | | | 3,128,038 | |
| | 340 | | Metropolitan Pier and Exposition Authority, Illinois, McCormick Place Expansion Project Bonds, | No Opt. Call | | BBB– | | | | 367,921 | |
| | | | Refunding Series 2012B, 5.000%, 12/15/20 | | | | | | | | | |
| | 2,000 | | Winnebago-Boone Counties School District 205 Rockford, Illinois, General Obligation Bonds, | No Opt. Call | | | A+ | | | | 1,784,400 | |
| | | | Series 2013, 0.000%, 2/01/21 | | | | | | | | | |
| | 12,780 | | Total Illinois | | | | | | | | 12,675,413 | |
| | | | Indiana – 2.8% (2.1% of Total Investments) | | | | | | | | | |
| | 1,250 | | Indiana Finance Authority, Environmental Facilities Revenue Bonds, Indianapolis Power and | No Opt. Call | | BBB+ | | | | 1,304,775 | |
| | | | Light Company Project, Refunding Series 2011A, 3.875%, 8/01/21 | | | | | | | | | |
| | 1,000 | | Indiana Finance Authority, Environmental Improvement Revenue Bonds, United States Steel | No Opt. Call | | Caa1 | | | | 1,000,840 | |
| | | | Corporation Project, Refunding Series 2011, 6.000%, 12/01/19 | | | | | | | | | |
| | 2,250 | | Total Indiana | | | | | | | | 2,305,615 | |
| | | | Iowa – 0.9% (0.7% of Total Investments) | | | | | | | | | |
| | 410 | | Iowa Finance Authority, Iowa, Midwestern Disaster Area Revenue Bonds, Iowa Fertilizer Company | No Opt. Call | | | B– | | | | 409,377 | |
| | | | Project, Series 2013, 5.000%, 12/01/19 | | | | | | | | | |
| | 350 | | Iowa Finance Authority, Iowa, Midwestern Disaster Area Revenue Bonds, Iowa Fertilizer Company | 6/18 at 105.00 | | | N/R | | | | 348,824 | |
| | | | Project, Series 2016, 5.875%, 12/01/26 | | | | | | | | | |
| | 760 | | Total Iowa | | | | | | | | 758,201 | |
| | | | Louisiana – 0.0% (0.0% of Total Investments) | | | | | | | | | |
| | 15 | | Louisiana Public Facilities Authority, Revenue Bonds, Ochsner Clinic Foundation Project, | No Opt. Call | | Baa1 | | | | 16,672 | |
| | | | Series 2015, 5.000%, 5/15/21 | | | | | | | | | |
| | | | Maine – 0.4% (0.3% of Total Investments) | | | | | | | | | |
| | 265 | | Maine Health and Higher Educational Facilities Authority, Revenue Bonds, Maine General Medical | No Opt. Call | | Ba2 | | | | 281,162 | |
| | | | Center, Series 2011, 5.250%, 7/01/21 | | | | | | | | | |
16 NUVEEN
| | | | | | | | | | |
| Principal | | | Optional Call | | | | | | |
| Amount (000) | | Description (1) | Provisions (2) | | Ratings (3) | | | Value | |
| | | Massachusetts – 2.9% (2.2% of Total Investments) | | | | | | | |
| $ | 50 | | Massachusetts Development Finance Agency, Revenue Bonds, UMass Memorial Health, Series 2011H, | No Opt. Call | | Baa3 | | | $ | 54,675 | |
| | | | 5.000%, 7/01/20 | | | | | | | | |
| | 25 | | Massachusetts Health and Educational Facilities Authority, Revenue Bonds, UMass Memorial Issue | 7/20 at 100.00 | | Baa3 | | | | 27,202 | |
| | | | Series 2010G, 5.000%, 7/01/21 | | | | | | | | |
| | | | Massachusetts Port Authority, Special Facilities Revenue Bonds, Delta Air Lines Inc., Series 2001A: | | | | | | | | |
| | 1,000 | | 5.500%, 1/01/19 – AMBAC Insured (Alternative Minimum Tax) | 2/17 at 100.00 | | | N/R | | | | 1,002,330 | |
| | 1,295 | | 5.000%, 1/01/21 – AMBAC Insured (Alternative Minimum Tax) | 2/17 at 100.00 | | | N/R | | | | 1,298,017 | |
| | 2,370 | | Total Massachusetts | | | | | | | | 2,382,224 | |
| | | | Michigan – 2.6% (1.9% of Total Investments) | | | | | | | | | |
| | 140 | | Detroit Downtown Development Authority, Michigan, Tax Increment Refunding Bonds, Development | No Opt. Call | | BB | | | | 111,198 | |
| | | | Area 1 Projects, Series 1996C-1, 0.000%, 7/01/21 | | | | | | | | | |
| | 500 | | Detroit Local Development Finance Authority, Michigan, Tax Increment Bonds, Senior Lien Series | 2/17 at 100.00 | | | B | | | | 491,640 | |
| | �� | | 1997A, 5.375%, 5/01/21 | | | | | | | | | |
| | 1,500 | | Michigan Strategic Fund, Limited Obligation Revenue Bonds, Events Center Project, Series | 7/18 at 100.00 | | | N/R | | | | 1,510,980 | |
| | | | 2014A, 4.125%, 7/01/45 (Mandatory put 1/01/19) | | | | | | | | | |
| | 2,140 | | Total Michigan | | | | | | | | 2,113,818 | |
| | | | Minnesota – 0.9% (0.7% of Total Investments) | | | | | | | | | |
| | | | Red Wing, Minnesota Senior Housing Revenue Refunding Bonds, Deer Crest Project, Series 2012A: | | | | | | | | | |
| | 100 | | 3.250%, 5/01/19 | No Opt. Call | | | N/R | | | | 100,857 | |
| | 105 | | 3.250%, 11/01/19 | No Opt. Call | | | N/R | | | | 106,078 | |
| | 105 | | 3.750%, 5/01/20 | No Opt. Call | | | N/R | | | | 107,643 | |
| | 105 | | 3.750%, 11/01/20 | No Opt. Call | | | N/R | | | | 108,007 | |
| | 70 | | Saint Cloud, Minnesota, Charter School Lease Revenue Bonds, Stride Academy Project, Series | No Opt. Call | | | B– | | | | 65,127 | |
| | | | 2016A, 3.000%, 4/01/21 | | | | | | | | | |
| | 250 | | Saint Louis Park, Minnesota, Health Care Facilities Revenue Bonds, Mount Olivet Careview Home | No Opt. Call | | | N/R | | | | 242,483 | |
| | | | Project, Series 2016C, 2.250%, 6/01/21 | | | | | | | | | |
| | 735 | | Total Minnesota | | | | | | | | 730,195 | |
| | | | Missouri – 2.7% (2.0% of Total Investments) | | | | | | | | | |
| | 1,145 | | Missouri Development Finance Board, Infrastructure Facilities Revenue Bonds, City of | No Opt. Call | | | A– | | | | 1,247,397 | |
| | | | Independence, Centerpoint Project, Refunding Series 2016B, 5.000%, 4/01/21 | | | | | | | | | |
| | 975 | | Saint Louis County Industrial Development Authority, Missouri, Health Facilities Revenue | No Opt. Call | | | N/R | | | | 974,288 | |
| | | | Bonds, Nazareth Living Center, Series 2015A, 4.000%, 8/15/20 | | | | | | | | | |
| | 2,120 | | Total Missouri | | | | | | | | 2,221,685 | |
| | | | Nebraska – 2.2% (1.7% of Total Investments) | | | | | | | | | |
| | 1,630 | | Douglas County Hospital Authority 2, Nebraska, Hospital Revenue Bonds, Madonna Rehabilitation | No Opt. Call | | BBB+ | | | | 1,805,111 | |
| | | | Hospital Project, Series 2014, 5.000%, 5/15/21 | | | | | | | | | |
| | | | Nevada – 5.2% (3.9% of Total Investments) | | | | | | | | | |
| | | | Las Vegas Redevelopment Agency, Nevada, Tax Increment Revenue Bonds, Refunding Series 2016: | | | | | | | | | |
| | 650 | | 3.000%, 6/15/20 | No Opt. Call | | BBB+ | | | | 665,418 | |
| | 1,815 | | 4.000%, 6/15/21 | No Opt. Call | | BBB+ | | | | 1,927,675 | |
| | 1,725 | | Las Vegas, Nevada, Sales Tax Increment Revenue Bonds, Symphony Park Tourism Improvement | No Opt. Call | | | N/R | | | | 1,658,191 | |
| | | | District, Series 2016, 2.750%, 6/15/21 | | | | | | | | | |
| | 4,190 | | Total Nevada | | | | | | | | 4,251,284 | |
| | | | New Hampshire – 1.0% (0.7% of Total Investments) | | | | | | | | | |
| | 850 | | Manchester Housing and Redevelopment Authority, New Hampshire, Revenue Bonds, Series 2000B, | No Opt. Call | | Caa1 | | | | 769,038 | |
| | | | 0.000%, 1/01/20 – ACA Insured | | | | | | | | | |
| | | | New Jersey – 13.3% (9.8% of Total Investments) | | | | | | | | | |
| | 500 | | New Jersey Building Authority, State Building Revenue Bonds, Refunding Series 2016A, | No Opt. Call | | BBB+ | | | | 512,035 | |
| | | | 4.000%, 6/15/21 | | | | | | | | | |
NUVEEN 17
| NHA | | |
| Nuveen Municipal 2021 Target Term Fund | |
Portfolio of Investments (continued) | November 30, 2016 (Unaudited) |
| | | | | | | | | | |
| Principal | | | Optional Call | | | | | | |
| Amount (000) | | Description (1) | Provisions (2) | | Ratings (3) | | | Value | |
| | | New Jersey (continued) | | | | | | | |
| $ | 2,000 | | New Jersey Economic Development Authority, Cigarette Tax Revenue Refunding Bonds, | No Opt. Call | | BBB+ | | | $ | 2,153,319 | |
| | | | Series 2012, 5.000%, 6/15/21 | | | | | | | | |
| | 425 | | New Jersey Economic Development Authority, Private Activity Bonds, The Goethals Bridge | No Opt. Call | | BBB– | | | | 469,013 | |
| | | | Replacement Project, Series 2013, 5.000%, 7/01/21 (Alternative Minimum Tax) | | | | | | | | |
| | 2,000 | | New Jersey Economic Development Authority, School Facilities Construction Financing Program | 3/21 at 100.00 | | BBB+ | | | | 2,114,220 | |
| | | | Bonds, Refunding Series 2011GG, 5.000%, 9/01/21 | | | | | | | | |
| | 500 | | New Jersey Economic Development Authority, School Facilities Construction Financing Program | No Opt. Call | | BBB+ | | | | 530,605 | |
| | | | Bonds, Refunding Series 2012II, 5.000%, 3/01/21 | | | | | | | | |
| | 540 | | New Jersey State, General Obligation Bonds, Refunding Series 2009O, 5.250%, 8/01/21 | No Opt. Call | | | A– | | | | 602,899 | |
| | 1,500 | | New Jersey State, General Obligation Bonds, Refunding Series 2016T, 5.000%, 6/01/21 | No Opt. Call | | | A– | | | | 1,654,155 | |
| | 1,735 | | New Jersey Transportation Trust Fund Authority, Transportation System Bonds, Refunding Series | No Opt. Call | | BBB+ | | | | 1,872,377 | |
| | | | 2006A, 5.250%, 12/15/20 | | | | | | | | | |
| | 780 | | New Jersey Transportation Trust Fund Authority, Transportation System Bonds, Series 2011B, | No Opt. Call | | BBB+ | | | | 831,683 | |
| | | | 5.000%, 6/15/20 | | | | | | | | | |
| | 9,980 | | Total New Jersey | | | | | | | | 10,740,306 | |
| | | | New Mexico – 1.3% (1.0% of Total Investments) | | | | | | | | | |
| | 1,000 | | Farmington, New Mexico, Pollution Control Revenue Bonds, Public Service Company of New | No Opt. Call | | Baa2 | | | | 1,089,000 | |
| | | | Mexico San Juan Project, Refunding Series 2010A, 5.200%, 6/01/40 (Mandatory put 6/01/20) | | | | | | | | | |
| | | | New York – 7.6% (5.7% of Total Investments) | | | | | | | | | |
| | 95 | | Dormitory Authority of the State of New York, Insured Revenue Bonds, Pace University, Series | No Opt. Call | | BB+ | | | | 100,588 | |
| | | | 2013A, 5.000%, 5/01/19 | | | | | | | | | |
| | 5 | | Dormitory Authority of the State of New York, Insured Revenue Bonds, Pace University, Series | No Opt. Call | | | N/R (4) | | | | 5,404 | |
| | | | 2013A, 5.000%, 5/01/19 (ETM) | | | | | | | | | |
| | 100 | | Dormitory Authority of the State of New York, Revenue Bonds, Saint Joseph’s College, Series | No Opt. Call | | Ba1 | | | | 104,246 | |
| | | | 2010, 4.125%, 7/01/20 | | | | | | | | | |
| | 200 | | Franklin County, New York, Solid Waste Disposal Revenue Bonds, Waste Management of Wisconsin, | No Opt. Call | | BBB | | | | 210,198 | |
| | | | Inc. Project, Series 2015A, 5.000%, 6/01/21 (Alternative Minimum Tax) | | | | | | | | | |
| | 1,000 | | New York City, New York, General Obligation Bonds, Fiscal 2016 Series C, 5.000%, 8/01/20 | No Opt. Call | | AA | | | | 1,112,480 | |
| | 2,850 | | New York Transportation Development Corporation, New York, Special Facility Revenue Bonds, | No Opt. Call | | BB– | | | | 3,094,330 | |
| | | | American Airlines, Inc. John F Kennedy International Airport Project, Refunding Series 2016, | | | | | | | | | |
| | | | 5.000%, 8/01/21 (Alternative Minimum Tax) | | | | | | | | | |
| | 185 | | Niagara Tobacco Asset Securitization Corporation, New York, Tobacco Settlement Asset-Backed | No Opt. Call | | | N/R | | | | 204,051 | |
| | | | Bonds, Series 2014, 5.000%, 5/15/21 | | | | | | | | | |
| | 250 | | Oyster Bay, New York, General Obligation Bonds, Public Improvement Refunding Series 2010, | No Opt. Call | | BB+ | | | | 235,025 | |
| | | | 3.000%, 8/15/21 | | | | | | | | | |
| | 1,000 | | Westchester County Local Development Corporation, New York, Revenue Bonds, Westchester | No Opt. Call | | BBB | | | | 1,106,290 | |
| | | | Medical Center Obligated Group Project, Refunding Series 2016, 5.000%, 11/01/20 | | | | | | | | | |
| | 5,685 | | Total New York | | | | | | | | 6,172,612 | |
| | | | Ohio – 2.4% (1.7% of Total Investments) | | | | | | | | | |
| | 1,000 | | Ohio Air Quality Development Authority, Ohio, Air Quality Development Revenue Bonds, | No Opt. Call | | Caa1 | | | | 479,350 | |
| | | | FirstEnergy Generation Corporation Project, Series 2009A, 5.700%, 8/01/20 | | | | | | | | | |
| | 1,400 | | Ohio Air Quality Development Authority, Ohio, Pollution Control Revenue Bonds, FirstEnergy | No Opt. Call | | | C | | | | 671,076 | |
| | | | Nuclear Generation Project, Refunding Series 2008C, 3.950%, 11/01/32 (Mandatory put 5/01/20) | | | | | | | | | |
| | | | (Alternative Minimum Tax) | | | | | | | | | |
| | 80 | | Ohio Air Quality Development Authority, Ohio, Revenue Bonds, Ohio Valley Electric Corporation | No Opt. Call | | BBB– | | | | 86,378 | |
| | | | Project, Series 2009E, 5.625%, 10/01/19 | | | | | | | | | |
| | 400 | | Scioto County, Ohio, Hospital Facilities Revenue Bonds, Southern Ohio Medical Center, | No Opt. Call | | | A2 | | | | 444,472 | |
| | | | Refunding Series 2016, 5.000%, 2/15/21 | | | | | | | | | |
| | 205 | | Toledo-Lucas County Port Authority, Ohio, Student Housing Revenue Bonds, CHF-Toledo, L.L.C. – | No Opt. Call | | BBB– | | | | 220,566 | |
| | | | The University of Toledo Project, Series 2014A, 5.000%, 7/01/21 | | | | | | | | | |
| | 3,085 | | Total Ohio | | | | | | | | 1,901,842 | |
18 NUVEEN
| | | | | | | | | | |
| Principal | | | Optional Call | | | | | | |
| Amount (000) | | Description (1) | Provisions (2) | | Ratings (3) | | | Value | |
| | | Pennsylvania – 12.2% (9.0% of Total Investments) | | | | | | | |
| $ | 1,000 | | Beaver County Industrial Development Authority, Pennsylvania, Pollution Control Revenue | No Opt. Call | | | | C | | $ | 590,000 | |
| | | | Refunding Bonds, FirstEnergy Nuclear Generation Project, Series 2006B, 2.500%, 12/01/41 | | | | | | | | | |
| | | | (Mandatory put 6/01/17) | | | | | | | | | |
| | 2,155 | | Bucks County Industrial Development Authority, Pennsylvania, Revenue Bonds, School Lane | No Opt. Call | | BBB– | | | | 2,134,010 | |
| | | | Charter School Project, Series 2016, 3.125%, 3/15/21 (WI/DD, Settling 12/20/16) | | | | | | | | | |
| | 375 | | Northeastern Pennsylvania Hospital and Education Authority, University Revenue Bonds, Wilkes | No Opt. Call | | BBB | | | | 404,831 | |
| | | | University Project, Refunding Series 2016A, 5.000%, 3/01/21 | | | | | | | | | |
| | 2,000 | | Pennsylvania Economic Development Financing Authority, Exempt Facilities Revenue Refunding | No Opt. Call | | BB– | | | | 1,986,160 | |
| | | | Bonds, PPL Energy Supply, LLC Project, Series 2009C, 5.000%, 12/01/37 (Mandatory put 9/01/20) | | | | | | | | | |
| | 1,000 | | Pennsylvania Economic Development Financing Authority, Special Facilities Revenue Bonds, US | No Opt. Call | | | B1 | | | | 1,115,180 | |
| | | | Airways Group Inc. Project, Series 2010A, 7.500%, 5/01/20 | | | | | | | | | |
| | 1,250 | | Pennsylvania State, General Obligation Bonds, First Refunding Series 2011-1, 5.000%, 7/01/21 | No Opt. Call | | AA– | | | | 1,397,813 | |
| | 2,000 | | Pennsylvania Turnpike Commission, Turnpike Revenue Bonds, Refunding Subordinate Series 2016, | No Opt. Call | | | A3 | | | | 2,228,059 | |
| | | | 5.000%, 6/01/21 | | | | | | | | | |
| | 9,780 | | Total Pennsylvania | | | | | | | | 9,856,053 | |
| | | | Rhode Island – 0.5% (0.4% of Total Investments) | | | | | | | | | |
| | 400 | | Providence Redevelopment Agency, Rhode Island, Revenue Bonds, Public Safety and Municipal | No Opt. Call | | BBB– | | | | 434,580 | |
| | | | Building Projects, Refunding Series 2015A, 5.000%, 4/01/21 | | | | | | | | | |
| | | | South Carolina – 0.3% (0.2% of Total Investments) | | | | | | | | | |
| | 230 | | South Carolina State, General Obligation State Institution Bonds, University of South | No Opt. Call | | AA+ | | | | 260,105 | |
| | | | Carolina, Refunding Series 2011A, 5.000%, 3/01/21 | | | | | | | | | |
| | | | Tennessee – 1.9% (1.4% of Total Investments) | | | | | | | | | |
| | 300 | | Metropolitan Government of Nashville-Davidson County Health and Educational Facilities Board, | No Opt. Call | | BBB | | | | 323,949 | |
| | | | Tennessee, Revenue Bonds, Lipscomb University, Refunding & Improvement Series 2016A, | | | | | | | | | |
| | | | 5.000%, 10/01/20 | | | | | | | | | |
| | 730 | | Tennessee Housing Development Agency, Homeownership Program Bonds, Series 2011-1A, 4.125%, | No Opt. Call | | AA+ | | | | 762,777 | |
| | | | 1/01/21 (Alternative Minimum Tax) | | | | | | | | | |
| | 260 | | The Tennessee Energy Acquisition Corporation, Gas Revenue Bonds, Series 2006A, 5.250%, 9/01/21 | No Opt. Call | | BBB+ | | | | 293,712 | |
| | 115 | | The Tennessee Energy Acquisition Corporation, Gas Revenue Bonds, Series 2006C, 5.000%, 2/01/21 | No Opt. Call | | BBB+ | | | | 127,177 | |
| | 1,405 | | Total Tennessee | | | | | | | | 1,507,615 | |
| | | | Texas – 7.1% (5.3% of Total Investments) | | | | | | | | | |
| | 195 | | Celina, Texas, Special Assessment Revenue Bonds, Glen Crossing Public Improvement District | No Opt. Call | | | N/ | R | | | 188,423 | |
| | | | Phase 1 Project, Series 2016, 3.400%, 9/01/20 | | | | | | | | | |
| | 105 | | Central Texas Regional Mobility Authority, Revenue Bonds, Senior Lien, Series 2016, | No Opt. Call | | Baa2 | | | | 115,049 | |
| | | | 5.000%, 1/01/21 | | | | | | | | | |
| | | | Dallas County Schools, Texas, Public Property Finance Contractual Obligations, Series 2014: | | | | | | | | | |
| | 300 | | 4.000%, 6/01/20 | No Opt. Call | | Baa1 | | | | 311,490 | |
| | 215 | | 5.000%, 6/01/21 | No Opt. Call | | Baa1 | | | | 231,826 | |
| | 1,000 | | Houston, Texas, Airport System Special Facilities Revenue Bonds, United Airlines Inc. Terminal | No Opt. Call | | BB– | | | | 1,068,180 | |
| | | | Improvement Project, Refunding Series 2015B-2, 5.000%, 7/15/20 (Alternative Minimum Tax) | | | | | | | | | |
| | 1,250 | | Houston, Texas, Airport System Special Facilities Revenue Bonds, United Airlines Inc. Terminal | No Opt. Call | | BB– | | | | 1,329,213 | |
| | | | Improvement Project, Refunding Series 2015C, 5.000%, 7/15/20 (Alternative Minimum Tax) | | | | | | | | | |
| | 870 | | Little Elm, Texas, Special Assessment Revenue Bonds, Valencia Public Improvement District | 3/17 at 100.00 | | | N/ | R | | | 875,255 | |
| | | | Phases 2 -5 Major Improvement Project, 6.650%, 9/01/21 | | | | | | | | | |
| | 500 | | Mesquite Health Facilities Development Corporation, Texas, Retirement Facility Revenue Bonds, | No Opt. Call | | BBB– | | | | 543,210 | |
| | | | Christian Care Centers Inc., Refunding Series 2016, 5.000%, 2/15/21 | | | | | | | | | |
| | 1,000 | | Texas Public Finance Authority, Revenue Bonds, Texas Southern University Financing System, | No Opt. Call | | Baa3 | | | | 1,102,060 | |
| | | | Refunding Series 2013, 5.000%, 11/01/20 – BAM Insured | | | | | | | | | |
| | 5,435 | | Total Texas | | | | | | | | 5,764,706 | |
NUVEEN 19
| NHA | | |
| Nuveen Municipal 2021 Target Term Fund | |
Portfolio of Investments (continued) | November 30, 2016 (Unaudited) |
| | | | | | | | | | |
| Principal | | | Optional Call | | | | | | |
| Amount (000) | | Description (1) | Provisions (2) | | Ratings (3) | | | Value | |
| | | Utah – 2.0% (1.5% of Total Investments) | | | | | | | |
| $ | 1,500 | | Salt Lake County, Utah, Research Facility Revenue Bonds, Huntsman Cancer Foundation, Series | 12/18 at 100.00 | | | N/ | R | | $ | 1,548,345 | |
| | | | 2013A-1, 5.000%, 12/01/33 (Mandatory put 12/15/20) | | | | | | | | | |
| | 40 | | Utah State Charter School Finance Authority, Charter School Revenue Bonds, Paradigm High | No Opt. Call | | BB | | | | 41,467 | |
| | | | School, Series 2010A, 5.750%, 7/15/20 | | | | | | | | | |
| | 1,540 | | Total Utah | | | | | | | | 1,589,812 | |
| | | | Virgin Islands – 0.5% (0.4% of Total Investments) | | | | | | | | | |
| | 425 | | Virgin Islands Water and Power Authority, Electric System Revenue Bonds, Refunding Series | No Opt. Call | | | B1 | | | | 385,352 | |
| | | | 2012A, 4.000%, 7/01/21 | | | | | | | | | |
| | | | Washington – 0.5% (0.4% of Total Investments) | | | | | | | | | |
| | 120 | | Washington State Housing Finance Commission, Non-Profit Housing Revenue Bonds, Bayview Manor | 7/17 at 100.00 | | | N/ | R | | | 115,352 | |
| | | | Senior Project, TEMPS 70 Series 2016B, 2.800%, 7/01/21 | | | | | | | | | |
| | 295 | | Washington State Housing Finance Commission, Revenue Bonds, Rockwood Retirement Communities | 2/17 at 100.00 | | | N/ | R | | | 295,339 | |
| | | | Project, TEMPS 80 Series 2014B-1, 5.875%, 1/01/21 | | | | | | | | | |
| | 415 | | Total Washington | | | | | | | | 410,691 | |
| | | | Wisconsin – 0.2% (0.1% of Total Investments) | | | | | | | | | |
| | 10 | | Green Bay Redevelopment Authority, Wisconsin, Industrial Development Revenue Bonds, Fort James | No Opt. Call | | | N/ | R | | | 10,578 | |
| | | | Project, Series 1999, 5.600%, 5/01/19 (Alternative Minimum Tax) | | | | | | | | | |
| | 150 | | Wisconsin Health and Educational Facilities Authority, Revenue Bonds, Bellin Memorial Hospital | No Opt. Call | | | A2 | | | | 154,452 | |
| | | | Inc., Series 2003, 5.500%, 2/15/19 – AMBAC Insured | | | | | | | | | |
| | 160 | | Total Wisconsin | | | | | | | | 165,030 | |
| $ | 107,420 | | Total Long-Term Investments (cost $113,038,879) | | | | | | | | 109,214,101 | |
| | | | Variable Rate MuniFund Term Preferred Shares, at Liquidation Preference – (34.9)% (5) | | | | | | | | (28,300,000 | ) |
| | | | Other Assets Less Liabilities – 0.2% | | | | | | | | 180,781 | |
| | | | Net Assets Applicable to Common Shares – 100% | | | | | | | $ | 81,094,882 | |
| | |
| (1) | All percentages shown in the Portfolio of Investments are based on net assets applicable to common shares unless otherwise noted. |
| (2) | Optional Call Provisions: Dates (month and year) and prices of the earliest optional call or redemption. There may be other call provisions at varying prices at later dates. Certain |
| | mortgage-backed securities may be subject to periodic principal paydowns. |
| (3) | The ratings disclosed are the lowest of Standard & Poor’s Group (“Standard & Poor’s”), Moody’s Investors Service, Inc. (“Moody’s”) or Fitch, Inc. (“Fitch”) rating. Ratings below |
| | BBB by Standard & Poor’s, Baa by Moody’s or BBB by Fitch are considered to be below investment grade. Holdings designated N/R are not rated by any of these national |
| | rating agencies. |
| (4) | Backed by an escrow or trust containing sufficient U.S. Government or U.S. Government agency securities, which ensure the timely payment of principal and interest. Certain |
| | bonds backed by U.S. Government or agency securities are regarded as having an implied rating equal to the rating of such securities. |
| (5) | Variable Rate MuniFund Term Preferred Shares, at Liquidation Preference as a percentage of Total Investments is 25.9%. |
| (ETM) | Escrowed to maturity. |
| (WI/DD) | Investment, or portion of investment, purchased on a when-issued or delayed delivery basis. |
See accompanying notes to financial statements.
20 NUVEEN
| | |
| Statement of | |
| Assets and Liabilities | November 30, 2016 (Unaudited) |
| Assets | | | |
| Long-term investments, at value (cost $113,038,879) | | $ | 109,214,101 | |
| Cash | | | 235,713 | |
| Receivable for: | | | | |
| Interest | | | 1,564,871 | |
| Investments sold | | | 717,127 | |
| Total assets | | | 111,731,812 | |
| Liabilities | | | | |
| Payable for: | | | | |
| Dividends | | | 166,607 | |
| Interest | | | 34,973 | |
| Investments purchased | | | 2,155,000 | |
| Offering costs | | | 6,743 | |
| Variable Rate MuniFund Term Preferred (“VMTP”) Shares, net of deferred offering costs (liquidation preference $28,300,000) | | | 28,182,089 | |
| Accrued expenses: | | | | |
| Management fees | | | 51,404 | |
| Trustees fees | | | 1,224 | |
| Other | | | 38,890 | |
| Total liabilities | | | 30,636,930 | |
| Net assets applicable to common shares | | $ | 81,094,882 | |
| Common shares outstanding | | | 8,613,496 | |
| Net asset value (“NAV”) per common share outstanding | | $ | 9.41 | |
| | | | | |
| Net assets applicable to common shares consist of: | | | | |
| Common shares, $0.01 par value per share | | $ | 86,135 | |
| Paid-in surplus | | | 84,573,495 | |
| Undistributed (Over-distribution of) net investment income | | | 206,646 | |
| Accumulated net realized gain (loss) | | | 53,384 | |
| Net unrealized appreciation (depreciation) | | | (3,824,778 | ) |
| Net assets applicable to common shares | | $ | 81,094,882 | |
| Authorized shares: | | | | |
| Common | | Unlimited | |
| Preferred | | Unlimited | |
See accompanying notes to financial statements.
NUVEEN 21
| | |
| Statement of | |
| Operations | Six Months Ended November 30, 2016 (Unaudited) |
| Investment Income | | $ | 1,764,313 | |
| Expenses | | | | |
| Management fees | | | 320,096 | |
| Interest expense and amortization of offering costs | | | 238,542 | |
| Custodian fees | | | 11,181 | |
| Trustees fees | | | 2,393 | |
| Professional fees | | | 17,248 | |
| Shareholder reporting expenses | | | 15,247 | |
| Shareholder servicing agent fees | | | 8,146 | |
| Investor relations expenses | | | 6,169 | |
| Other | | | 13,266 | |
| Total expenses | | | 632,288 | |
| Net investment income (loss) | | | 1,132,025 | |
| Realized and Unrealized Gain (Loss) | | | | |
| Net realized gain (loss) from investments | | | 64,903 | |
| Change in net unrealized appreciation (depreciation) of investments | | | (4,467,649 | ) |
| Net realized and unrealized gain (loss) | | | (4,402,746 | ) |
| Net increase (decrease) in net assets applicable to common shares from operations | | $ | (3,270,721 | ) |
See accompanying notes to financial statements.
22 NUVEEN
| | | |
| Statement of | | |
| Changes in Net Assets | | (Unaudited) |
| |
| | | | | | For the | |
| | | | | | period 1/26/16 | |
| | | Six Months | | | (commencement | |
| | | Ended | | | of operations) | |
| | | 11/30/16 | | | through 5/31/16 | |
| Operations | | | | | | |
| Net investment income (loss) | | $ | 1,132,025 | | | $ | 612,943 | |
| Net realized gain (loss) from investments | | | 64,903 | | | | (11,519 | ) |
| Change in net unrealized appreciation (depreciation) of investments | | | (4,467,649 | ) | | | 642,871 | |
| Net increase (decrease) in net assets applicable to common shares from operations | | | (3,270,721 | ) | | | 1,244,295 | |
| Distributions to Common Shareholders | | | | | | | | |
| From net investment income | | | (1,033,466 | ) | | | (516,619 | ) |
| Decrease in net assets applicable to common shares from distributions to common shareholders | | | (1,033,466 | ) | | | (516,619 | ) |
| Capital Share Transactions | | | | | | | | |
| Common shares: | | | | | | | | |
| Proceeds from sale of shares, net of offering costs | | | — | | | | 84,538,000 | |
| Net proceeds from shares issued to shareholders due to reinvestment of distributions | | | 29,026 | | | | 4,094 | |
| Net increase (decrease) in net assets applicable to common shares from capital share transactions | | | 29,026 | | | | 84,542,094 | |
| Net increase (decrease) in net assets applicable to common shares | | | (4,275,161 | ) | | | 85,269,770 | |
| Net assets applicable to common shares at the beginning of period | | | 85,370,043 | | | | 100,273 | |
| Net assets applicable to common shares at the end of period | | $ | 81,094,882 | | | $ | 85,370,043 | |
| Undistributed (Over-distribution of) net investment income at the end of period | | $ | 206,646 | | | $ | 108,087 | |
See accompanying notes to financial statements.
NUVEEN 23
| | |
| Statement of | |
| Cash Flows | Six Months Ended November 30, 2016 (Unaudited) |
| Cash Flows from Operating Activities: | | | |
| Net Increase (Decrease) in Net Assets Applicable to Common Shares from Operations | | $ | (3,270,721 | ) |
| Adjustments to reconcile the net increase (decrease) in net assets applicable to common | | | | |
| shares from operations to net cash provided by (used in) operating activities: | | | | |
| Purchases of investments | | | (10,602,997 | ) |
| Proceeds from sales and maturities of investments | | | 13,041,176 | |
| Amortization (Accretion) of premiums and discounts, net | | | 641,611 | |
| Amortization of deferred offering costs | | | 25,326 | |
| (Increase) Decrease in: | | | | |
| Receivable for interest | | | (128,891 | ) |
| Receivable for investments sold | | | (312,127 | ) |
| Increase (Decrease) in: | | | | |
| Payable for interest | | | 2,691 | |
| Payable for investments purchased | | | 1,957,617 | |
| Accrued management fees | | | (2,816 | ) |
| Accrued Trustees fees | | | 853 | |
| Accrued other expenses | | | (11,335 | ) |
| Net realized (gain) loss from investments | | | (64,903 | ) |
| Change in net unrealized (appreciation) depreciation of investments | | | 4,467,649 | |
| Net cash provided by (used in) operating activities | | | 5,743,133 | |
| Cash Flows from Financing Activities: | | | | |
| Increase (Decrease) in: | | | | |
| Cash overdraft | | | (4,427,145 | ) |
| Payable for offering costs | | | (74,530 | ) |
| Cash distributions paid to common shareholders | | | (1,005,745 | ) |
| Net cash provided by (used in) financing activities | | | (5,507,420 | ) |
| Net Increase (Decrease) in Cash | | | 235,713 | |
| Cash at the beginning of period | | | — | |
| Cash at the end of period | | $ | 235,713 | |
| Supplemental Disclosure of Cash Flow Information | | | | |
| Cash paid for interest (excluding amortization of offering costs) | | $ | 210,526 | |
| Non-cash financing activities not included herein consists of reinvestments of share distributions | | | 29,026 | |
See accompanying notes to financial statements.
24 NUVEEN
THIS PAGE INTENTIONALLY LEFT BLANK
NUVEEN 25
| | | | | | | | | | | |
| | | | | | | | | |
| Financial |
Highlights (Unaudited) | | | | | | | |
| |
| |
| Selected data for a common share outstanding throughout each period: | | | | |
| | | | | | | | | | | | | | | | | | | | | | | | | | | | |
| | | | | | Investment Operations | | | | | | Less Distributions to Common Shareholders | | | | | | | | | Common Share | | | | |
| | | Beginning | | | Net | | | Net | | | | | | From | | | From | | | | | | | | | | | | | |
| | | Common | | | Investment | | | Realized/ | | | | | | Net | | | Accumulated | | | | | | | | | | | | Ending | |
| | | Share | | | Income | | | Unrealized | | | | | | Investment | | | Net Realized | | | | | | Offering | | | Ending | | | Share | |
| | | NAV | | | (Loss) | | | Gain (Loss) | | | Total | | | Income | | | Gains | | | Total | | | Costs | | | NAV | | | Price | |
| Year Ended 5/31: | | | | | | | | | | | | | | | | | | | | | | | | | | | | | | |
| 2017(f) | | $ | 9.91 | | | $ | 0.14 | | | $ | (0.52 | ) | | $ | (0.38 | ) | | $ | (0.12 | ) | | $ | — | | | $ | (0.12 | ) | | $ | — | | | $ | 9.41 | | | $ | 9.85 | |
| 2016(e) | | | 9.85 | | | | 0.07 | | | | 0.07 | | | | 0.14 | | | | (0.06 | ) | | | — | | | | (0.06 | ) | | | (0.02 | ) | | | 9.91 | | | | 9.95 | |
| | | VMTP Shares | |
| | | at the End of Period | |
| | | Aggregate | | | Asset | |
| | | Amount | | | Coverage | |
| | | Outstanding | | | Per $100,000 | |
| | | | (000 | ) | | Share | |
| Year Ended 5/31: | | | | | | | |
| 2017(f) | | $ | 28,300 | | | $ | 386,554 | |
| 2016(e) | | | 28,300 | | | | 401,661 | |
26 NUVEEN
| | | | | | | | | | | | |
| | | | | | | Common Share Supplemental Data/ | | | |
| | | | | | | Ratios Applicable to Common Shares | | | |
| Common Share | | | | | | | | | |
| Total Returns | | | | Ratios to Average Net Assets(b) | | | |
| Based | | Ending | | | | Net | | | |
| Based | | on | | Net | | | | Investment | | Portfolio | |
| on | | Share | | Assets | | | | Income | | Turnover | |
| NAV(a) | | Price | (a) | | (000 | ) | Expenses(c) | | (Loss) | | Rate(d) | |
| | |
| (3.89) | % | 0.19% | | $ | 81,095 | | 1.47 | %* | 2.64 | %* | 9 | % |
| 1.22 | | 0.10 | | | 85,370 | | 1.28 | * | 2.15 | * | 2 | |
(a) Total Return Based on Common Share NAV is the combination of changes in common share NAV, reinvested dividend income at NAV and reinvested capital gains distributions at NAV, if any. The last dividend declared in the period, which is typically paid on the first business day of the following month, is assumed to be reinvested at the ending NAV. The actual reinvest price for the last dividend declared in the period may often be based on the Fund’s market price (and not its NAV), and therefore may be different from the price used in the calculation. Total returns are not annualized.
Total Return Based on Common Share Price is the combination of changes in the market price per share and the effect of reinvested dividend income and reinvested capital gains distributions, if any, at the average price paid per share at the time of reinvestment. The last dividend declared in the period, which is typically paid on the first business day of the following month, is assumed to be reinvested at the ending market price. The actual reinvestment for the last dividend declared in the period may take place over several days, and in some instances may not be based on the market price, so the actual reinvestment price may be different from the price used in the calculation. Total returns are not annualized.
(b) Net Investment Income (Loss) ratios reflect income earned and expenses incurred on assets attributable to preferred shares issued by the Fund.
(c) The expense ratios reflect, among other things, all interest expense and other costs related to preferred shares (as described in Note 4 – Fund Shares, Preferred Shares), where applicable, as follows:
| Year Ended 5/31: | | | |
| 2017(f) | | | 0.56 | %* |
| 2016(e) | | | 0.34 | * |
(d) Portfolio Turnover Rate is calculated based on the lesser of long-term purchases or sales (as disclosed in Note 5 – Investment Transactions) divided by the average long-term market value during the period.
(e) For the period January 26, 2016 (commencement of operations) through May 31, 2016. (f) For the six months ended November 30, 2016.
* Annualized.
See accompanying notes to financial statements.
NUVEEN 27
Notes to
Financial Statements (Unaudited)
1. General Information and Significant Accounting Policies
General Information
Fund Information
The fund covered in this report and its corresponding New York Stock Exchange (“NYSE”) symbol is Nuveen Municipal 2021 Target Term Fund (NHA) (the “Fund”). The Fund is registered under the Investment Company Act of 1940, as amended, as a diversified, closed-end management investment company. The Fund was organized as a Massachusetts business trust on October 13, 2015.
The end of the reporting period for the Fund is November 30, 2016, and the period covered by these Notes to Financial Statements is the period January 26, 2016 (commencement of operations) through November 30, 2016 (the “current fiscal period”).
Investment Adviser
The Fund’s investment adviser is Nuveen Fund Advisors, LLC (the “Adviser”), a wholly-owned subsidiary of Nuveen Investments, Inc. (“Nuveen”). Nuveen is an operating division of TIAA Global Asset Management. The Adviser has overall responsibility for management of the Fund, oversees the management of the Fund’s portfolios, manages the Fund’s business affairs and provides certain clerical, bookkeeping and other administrative services, and, if necessary, asset allocation decisions. The Adviser has entered into a sub-advisory agreement with Nuveen Asset Management, LLC (the “Sub-Adviser”), a subsidiary of the Adviser, under which the Sub-Adviser manages the investment portfolio of the Fund.
Investment Objectives and Principal Investment Strategies
The Fund seeks to provide a high level of current income exempt from federal income tax and to return the original $9.85 net asset value (“NAV”) per common share on or about March 1, 2021 (the “Termination Date”). Under normal market conditions:
| · | The Fund invests at least 80% of its managed assets (as defined in Note 7 – Management Fees and Other Transactions with Affiliates) in municipal securities and other related investments, the income from which is exempt from regular U.S. federal income tax. |
| · | The Fund will invest at least 65% of its managed assets in low- to medium-quality municipal securities that, at the time of investment, are rated BBB/Baa or lower or are unrated but judged to be of comparable quality by the Sub-Adviser. |
| · | The Fund may invest without limit in below investment grade quality securities. Below investment grade securities (commonly referred to as “junk bonds”) are rated BB+/Ba1 or lower or if its unrated but judged to be of comparable quality by the Sub-Adviser. |
| · | The Fund will not invest in securities that, at the time of investment, are rated CCC+/Caa1 or lower, or are unrated but judged by the Sub-Adviser to be of comparable quality. |
| · | The Fund will not invest in defaulted securities or in the securities of an issuer that is in bankruptcy or insolvency proceedings or is otherwise experiencing financial difficulties (such securities are commonly referred to as “distressed securities”). |
| · | The Fund may invest up to 30% of its managed assets in bonds subject to the alternative minimum tax (“AMT Bonds”). |
| · | The Fund will invest no more than 25% of its managed assets in municipal securities in any one sector and no more than 5% of its managed assets in any one issuer. |
| · | The Fund will invest no more than 10% of its managed assets in “tobacco settlement bonds”. |
| · | The Fund will not invest in securities with a maturity date (or mandatory redemption date for escrowed securities or other tax exempt securities) extending beyond September 1, 2021. |
The Fund also may invest in certain derivative instruments in pursuit of its investment objectives. Such instruments include options, financial futures contracts and options thereon, swaps (including interest rate swaps, total return swaps and credit default swaps), and options on swaps. The Sub-Adviser may use derivative instruments to attempt to hedge some of the risk of the Fund’s investments or as a substitute for a position in the underlying asset.
Effective August 5, 2016, the Fund changed its investment policy to limit the amount of securities subject to the alternative minimum tax (“AMT”) to no more than 20% (30% prior to August 5, 2016) of the Fund’s managed assets (as defined in Note 7 – Management Fees and Other Transactions with Affiliates).
28 NUVEEN
Significant Accounting Policies
The Fund is an investment company and follows accounting and reporting guidance under Financial Accounting Standards Board (FASB) Accounting Standards Codification (ASC) Topic 946, “Financial Services-Investment Companies.” The following is a summary of significant accounting policies followed by the Fund in the preparation of its financial statements in accordance with U.S. generally accepted accounting principles (“U.S. GAAP”).
Investment Transactions
Investment transactions are recorded on a trade date basis. Realized gains and losses from investment transactions are determined on the specific identification method, which is the same basis used for federal income tax purposes. Investments purchased on a when-issued/delayed delivery basis may have extended settlement periods. Any investments so purchased are subject to market fluctuation during this period. The Fund has earmarked securities in its portfolio with a current value at least equal to the amount of the when-issued/delayed delivery purchase commitments.
As of the end of the reporting period, the Fund’s outstanding when issued/delayed delivery purchase commitments were as follows:
| | |
| Outstanding when-issued/delayed delivery purchase commitments | $2,155,000 |
Investment Income
Investment income, which reflects the amortization of premiums and accretion of discounts for financial reporting purposes, is recorded on an accrual basis. Investment income also reflects paydown gains and losses, if any.
Professional Fees
Professional fees presented on the Statement of Operations consist of legal fees incurred in the normal course of operations, audit fees, tax consulting fees and, in some cases, workout expenditures. Workout expenditures are incurred in an attempt to protect or enhance an investment or to pursue other claims or legal actions on behalf of Fund shareholders. If a refund is received for workout expenditures paid in a prior reporting period, such amounts will be recognized as “Legal fee refund” on the Statement of Operations.
Dividends and Distributions to Common Shareholders
Dividends from net investment income are declared monthly. Net realized capital gains and/or market discount from investment transactions, if any, are distributed to shareholders at least annually. However, in seeking to achieve its investment objective, the Fund currently intends to set aside and retain in its net assets (and therefore its NAV) a portion of its net investment income, and possibly all or a portion of its gains. This will reduce the amounts otherwise available for distribution prior to the liquidation of the Fund, and the Fund may incur taxes on such retained amount. Such retained income or gains, net of any taxes, would constitute a portion of the liquidating distribution returned to investors on or about the Termination Date. Furthermore, capital gains are distributed only to the extent they exceed available capital loss carryforwards.
Distributions to common shareholders of net investment income, net realized capital gains and/or market discount, if any, are recorded on the ex-dividend date. The amount and timing of distributions are determined in accordance with federal income tax regulations, which may differ from U.S. GAAP.
Indemnifications
Under the Fund’s organizational documents, its officers and trustees are indemnified against certain liabilities arising out of the performance of their duties to the Fund. In addition, in the normal course of business, the Fund enters into contracts that provide general indemnifications to other parties. The Fund’s maximum exposure under these arrangements is unknown as this would involve future claims that may be made against the Fund that have not yet occurred. However, the Fund has not had prior claims or losses pursuant to these contracts and expects the risk of loss to be remote.
Netting Agreements
In the ordinary course of business, the Fund may enter into transactions subject to enforceable International Swaps and Derivative Association, Inc. (“ISDA”) master agreements or other similar arrangements (“netting agreements”). Generally, the right to offset in netting agreements allows the Fund to offset certain securities and derivatives with a specific counterparty, when applicable, as well as any collateral received or delivered to that counterparty based on the terms of the agreements. Generally, the Fund manages its cash collateral and securities collateral on a counterparty basis.
The Fund’s investments subject to netting agreements as of the end of the reporting period, if any, are further described in Note 3 – Portfolio Securities and Investments in Derivatives.
NUVEEN 29
Notes to Financial Statements (Unaudited) (continued)
Use of Estimates
The preparation of financial statements in conformity with U.S. GAAP requires management to make estimates and assumptions that affect the reported amounts of assets and liabilities at the date of the financial statements and the reported amounts of increases and decreases in net assets applicable to common shares from operations during the current fiscal period. Actual results may differ from those estimates.
2. Investment Valuation and Fair Value Measurements
The fair valuation input levels as described below are for fair value measurement purposes.
Fair value is defined as the price that would be received upon selling an investment or transferring a liability in an orderly transaction to an independent buyer in the principal or most advantageous market for the investment. A three-tier hierarchy is used to maximize the use of observable market data and minimize the use of unobservable inputs and to establish classification of fair value measurements for disclosure purposes. Observable inputs reflect the assumptions market participants would use in pricing the asset or liability. Observable inputs are based on market data obtained from sources independent of the reporting entity. Unobservable inputs reflect the reporting entity’s own assumptions about the assumptions market participants would use in pricing the asset or liability. Unobservable inputs are based on the best information available in the circumstances. The following is a summary of the three-tiered hierarchy of valuation input levels.
Level 1 – Inputs are unadjusted and prices are determined using quoted prices in active markets for identical securities.
Level 2 – Prices are determined using other significant observable inputs (including quoted prices for similar securities, interest rates, prepayment speeds, credit risk, etc.).
Level 3 – Prices are determined using significant unobservable inputs (including management’s assumptions in determining the fair value of investments).
Prices of fixed income securities are provided by an independent pricing service (“pricing service”) approved by the Fund’s Board of Trustees (the “Board”). The pricing service establishes a security’s fair value using methods that may include consideration of the following: yields or prices of investments of comparable quality, type of issue, coupon, maturity and rating, market quotes or indications of value from security dealers, evaluations of anticipated cash flows or collateral, general market conditions and other information and analysis, including the obligor’s credit characteristics considered relevant. These securities are generally classified as Level 2. In pricing certain securities, particularly less liquid and lower quality securities, the pricing service may consider information about a security, its issuer or market activity provided by the Adviser. These securities are generally classified as Level 2 or Level 3 depending on the observability of the significant inputs.
Certain securities may not be able to be priced by the pre-established pricing methods as described above. Such securities may be valued by the Board and/or its appointee at fair value. These securities generally include, but are not limited to, restricted securities (securities which may not be publicly sold without registration under the Securities Act of 1933, as amended) for which a pricing service is unable to provide a market price; securities whose trading has been formally suspended; debt securities that have gone into default and for which there is no current market quotation; a security whose market price is not available from a pre-established pricing source; a security with respect to which an event has occurred that is likely to materially affect the value of the security after the market has closed but before the calculation of the Fund’s NAV (as may be the case in non-U.S. markets on which the security is primarily traded) or make it difficult or impossible to obtain a reliable market quotation; and a security whose price, as provided by the pricing service, is not deemed to reflect the security’s fair value. As a general principle, the fair value of a security would appear to be the amount that the owner might reasonably expect to receive for it in a current sale. A variety of factors may be considered in determining the fair value of such securities, which may include consideration of the following: yields or prices of investments of comparable quality, type of issue, coupon, maturity and rating, market quotes or indications of value from security dealers, evaluations of anticipated cash flows or collateral, general market conditions and other information and analysis, including the obligor’s credit characteristics considered relevant. These securities are generally classified as Level 2 or Level 3 depending on the observability of the significant inputs. Regardless of the method employed to value a particular security, all valuations are subject to review by the Board and/or its appointee.
The inputs or methodologies used for valuing securities are not an indication of the risks associated with investing in those securities. The following is a summary of the Fund’s fair value measurements as of the end of the reporting period:
| | | | | |
| | Level 1 | Level 2 | Level 3 | Total |
| Long-Term Investments*: | | | | |
| Municipal Bonds | $ — | $109,214,101 | $ — | $109,214,101 |
| * Refer to the Fund’s Portfolio of Investments for state classifications. | | | | |
The Board is responsible for the valuation process and has appointed the oversight of the daily valuation process to the Adviser’s Valuation Committee. The Valuation Committee, pursuant to the valuation policies and procedures adopted by the Board, is responsible for making fair value determinations, evaluating the effectiveness of the Fund’s pricing policies and reporting to the Board. The Valuation Committee is aided in its efforts by the Adviser’s dedicated Securities Valuation Team, which is responsible for administering the daily valuation process and applying fair value methodologies as approved by the Valuation Committee. When determining the reliability of independent pricing services for investments owned by the Fund, the Valuation Committee, among other things, conducts due diligence reviews of the pricing services and monitors the quality of security prices received through various testing reports conducted by the Securities Valuation Team.
30 NUVEEN
The Valuation Committee will consider pricing methodologies it deems relevant and appropriate when making a fair value determination, based on the facts and circumstances specific to the portfolio instrument. Fair value determinations generally will be derived as follows, using public or private market information:
| (i) | If available, fair value determinations shall be derived by extrapolating from recent transactions or quoted prices for identical or comparable securities. |
| (ii) | If such information is not available, an analytical valuation methodology may be used based on other available information including, but not limited to: analyst appraisals, research reports, corporate action information, issuer financial statements and shelf registration statements. Such analytical valuation methodologies may include, but are not limited to: multiple of earnings, discount from market value of a similar freely- traded security, discounted cash flow analysis, book value or a multiple thereof, risk premium/yield analysis, yield to maturity and/or fundamental investment analysis. |
The purchase price of a portfolio instrument will be used to fair value the instrument only if no other valuation methodology is available or deemed appropriate, and it is determined that the purchase price fairly reflects the instrument’s current value.
For each portfolio security that has been fair valued pursuant to the policies adopted by the Board, the fair value price is compared against the last available and next available market quotations. The Valuation Committee reviews the results of such testing and fair valuation occurrences are reported to the Board.
3. Portfolio Securities and Investments in Derivatives
Portfolio Securities
Inverse Floating Rate Securities
The Fund is authorized to invest in inverse floating rate securities. An inverse floating rate security is created by depositing a municipal bond (referred to as an “Underlying Bond”), typically with a fixed interest rate, into a special purpose tender option bond (“TOB”) trust (referred to as the “TOB Trust”) created by or at the direction of the Fund. In turn, the TOB Trust issues (a) floating rate certificates (referred to as “Floaters”) in face amounts equal to some fraction of the Underlying Bond’s par amount or market value, and (b) an inverse floating rate certificate (referred to as an “Inverse Floater”) that represents all remaining or residual interest in the TOB Trust. Floaters typically pay short-term tax-exempt interest rates to third parties who are also provided a right to tender their certificate and receive its par value, which may be paid from the proceeds of a remarketing of the Floaters, by a loan to the TOB Trust from a third party liquidity provider (“Liquidity Provider”), or by the sale of assets from the TOB Trust. The Inverse Floater is issued to a long term investor, such as the Fund. The income received by the Inverse Floater holder varies inversely with the short-term rate paid to holders of the Floaters, and in most circumstances the Inverse Floater holder bears substantially all of the Underlying Bond’s downside investment risk and also benefits disproportionately from any potential appreciation of the Underlying Bond’s value. The value of an Inverse Floater will be more volatile than that of the Underlying Bond because the interest rate is dependent on not only the fixed coupon rate of the Underlying Bond but also on the short-term interest paid on the Floaters, and because the Inverse Floater essentially bears the risk of loss (and possible gain) of the greater face value of the Underlying Bond.
The Inverse Floater held by the Fund gives the Fund the right to (a) cause the holders of the Floaters to tender their certificates at par (or slightly more than par in certain circumstances), and (b) have the trustee of the TOB Trust (the “Trustee”) transfer the Underlying Bond held by the TOB Trust to the Fund, thereby collapsing the TOB Trust.
The Fund may acquire an Inverse Floater in a transaction where it (a) transfers an Underlying Bond that it owns to a TOB Trust created by a third party or (b) transfers an Underlying Bond that it owns, or that it has purchased in a secondary market transaction for the purpose of creating an Inverse Floater, to a TOB Trust created at its direction, and in return receives the Inverse Floater of the TOB Trust (referred to as a “self-deposited Inverse Floater”). The Fund may also purchase an Inverse Floater in a secondary market transaction from a third party creator of the TOB Trust without first owning the Underlying Bond (referred to as an “externally-deposited Inverse Floater”).
An investment in a self-deposited Inverse Floater is accounted for as a “financing” transaction (i.e., a secured borrowing). For a self-deposited Inverse Floater, the Underlying Bond deposited into the TOB Trust is identified in the Fund’s Portfolio of Investments as “(UB) – Underlying bond of an inverse floating rate trust reflected as a financing transaction,” with the Fund recognizing as liabilities, labeled “Floating rate obligations” on the Statement of Assets and Liabilities, (a) the liquidation value of Floaters issued by the TOB Trust, and (b) the amount of any borrowings by the TOB Trust from a Liquidity Provider to enable the TOB Trust to purchase outstanding Floaters in lieu of a remarketing. In addition, the Fund recognizes in “Investment Income” the entire earnings of the Underlying Bond, and recognizes (a) the interest paid to the holders of the Floaters or on the TOB Trust’s borrowings, and (b) other expenses related to remarketing, administration, trustee, liquidity and other services to a TOB Trust, as a component of “Interest expense and amortization of offering costs” on the Statement of Operations.
NUVEEN 31
Notes to Financial Statements (Unaudited) (continued)
In contrast, an investment in an externally-deposited Inverse Floater is accounted for as a purchase of the Inverse Floater and is identified in the Fund’s Portfolio of Investments as “(IF) – Inverse floating rate investment.” For an externally-deposited Inverse Floater, the Fund’s Statement of Assets and Liabilities recognizes the Inverse Floater and not the Underlying Bond as an asset, and the Fund does not recognize the Floaters, or any related borrowings from a Liquidity Provider, as a liability. Additionally, the Fund reflects in “Investment Income” only the net amount of earnings on the Inverse Floater (net of the interest paid to the holders of the Floaters or the Liquidity Provider as lender, and the expenses of the Trust), and does not show the amount of that interest paid or the expenses of the TOB Trust as described above as interest expense on the Statement of Operations.
Fees paid upon the creation of a TOB Trust for self-deposited Inverse Floaters and externally-deposited Inverse Floaters are recognized as part of the cost basis of the Inverse Floater and are capitalized over the term of the TOB Trust.
TOB Trusts are supported by a liquidity facility provided by a Liquidity Provider pursuant to which the Liquidity Provider agrees, in the event that Floaters are (a) tendered to the Trustee for remarketing and the remarketing does not occur, or (b) subject to mandatory tender pursuant to the terms of the TOB Trust agreement, to either purchase Floaters or to provide the Trustee with an advance from a loan facility to fund the purchase of Floaters by the TOB Trust. In certain circumstances, the Liquidity Provider may otherwise elect to have the Trustee sell the Underlying Bond to retire the Floaters that were tendered and not remarketed prior to providing such a loan. In these circumstances, the Liquidity Provider remains obligated to provide a loan to the extent that the proceeds of the sale of the Underlying Bond are not sufficient to pay the purchase price of the Floaters.
The size of the commitment under the loan facility for a given TOB Trust is at least equal to the balance of that TOB Trust’s outstanding Floaters plus any accrued interest. In consideration of the loan facility, fee schedules are in place and are charged by the Liquidity Provider(s). Any loans made by the Liquidity Provider will be secured by the purchased Floaters held by the TOB Trust. Interest paid on any outstanding loan balances will be effectively borne by the Fund that owns the Inverse Floaters of the TOB Trust that has incurred the borrowing and may be at a rate that is greater than the rate that would have been paid had the Floaters been successfully remarketed.
As described above, any amounts outstanding under a liquidity facility are recognized as a component of “Floating rate obligations” on the Statement of Assets and Liabilities by the Fund holding the corresponding Inverse Floaters issued by the borrowing TOB Trust. As of the end of the reporting period, there were no loans outstanding under any such facility.
The Fund may also enter into shortfall and forbearance agreements (sometimes referred to as a “recourse arrangement” or “credit recovery swap”) (TOB Trusts involving such agreements are referred to herein as “Recourse Trusts”), under which the Fund agrees to reimburse the Liquidity Provider for the Trust’s Floaters, in certain circumstances, for the amount (if any) by which the liquidation value of the Underlying Bond held by the TOB Trust may fall short of the sum of the liquidation value of the Floaters issued by the TOB Trust plus any amounts borrowed by the TOB Trust from the Liquidity Provider, plus any shortfalls in interest cash flows. Under these agreements, the Fund’s potential exposure to losses related to or on an Inverse Floater may increase beyond the value of the Inverse Floater as the Fund may potentially be liable to fulfill all amounts owed to holders of the Floaters or the Liquidity Provider. Any such shortfall amount in the aggregate is recognized as “Unrealized depreciation on Recourse Trusts” on the Statement of Assets and Liabilities.
During the current fiscal period, the Fund did not have any transactions in self-deposited Inverse Floaters and/or externally-deposited Inverse Floaters.
Zero Coupon Securities
A zero coupon security does not pay a regular interest coupon to its holders during the life of the security. Income to the holder of the security comes from accretion of the difference between the original purchase price of the security at issuance and the par value of the security at maturity and is effectively paid at maturity. The market prices of zero coupon securities generally are more volatile than the market prices of securities that pay interest periodically.
Investments in Derivatives
In addition to the inverse floating rate securities in which the Fund may invest, which are considered portfolio securities for financial reporting purposes, the Fund is authorized to invest in certain other derivative instruments such as futures, options and swap contracts. The Fund limits its investments in futures, options on futures and swap contracts to the extent necessary for the Adviser to claim the exclusion from registration by the Commodity Futures Trading Commission as a commodity pool operator with respect to the Fund. The Fund records derivative instruments at fair value, with changes in fair value recognized on the Statement of Operations, when applicable. Even though the Fund’s investments in derivatives may represent economic hedges, they are not considered to be hedge transactions for financial reporting purposes.
Although the Fund is authorized to invest in derivative instruments, and may do so in the future, it did not make any such investments during the current fiscal period.
32 NUVEEN
Market and Counterparty Credit Risk
In the normal course of business the Fund may invest in financial instruments and enter into financial transactions where risk of potential loss exists due to changes in the market (market risk) or failure of the other party to the transaction to perform (counterparty credit risk). The potential loss could exceed the value of the financial assets recorded on the financial statements. Financial assets, which potentially expose the Fund to counterparty credit risk, consist principally of cash due from counterparties on forward, option and swap transactions, when applicable. The extent of the Fund’s exposure to counterparty credit risk in respect to these financial assets approximates their carrying value as recorded on the Statement of Assets and Liabilities.
The Fund helps manage counterparty credit risk by entering into agreements only with counterparties the Adviser believes have the financial resources to honor their obligations and by having the Adviser monitor the financial stability of the counterparties. Additionally, counterparties may be required to pledge collateral daily (based on the daily valuation of the financial asset) on behalf of the Fund with a value approximately equal to the amount of any unrealized gain above a pre-determined threshold. Reciprocally, when the Fund has an unrealized loss, the Fund has instructed the custodian to pledge assets of the Fund as collateral with a value approximately equal to the amount of the unrealized loss above a pre-determined threshold. Collateral pledges are monitored and subsequently adjusted if and when the valuations fluctuate, either up or down, by at least the pre-determined threshold amount.
4. Fund Shares
Common Share Transactions
Transactions in common shares during the Fund’s current and prior fiscal period, were as follows:
| | | |
| | Six Months | For the period 1/26/16 |
| | Ended | (commencement of operations) |
| | 11/30/16 | through 5/31/16* |
| Common Shares: | | |
| Sold | — | 8,600,000 |
| Issued to shareholders due to reinvestment of distributions | 2,904 | 412 |
| Total | 2,904 | 8,600,412 |
| * Prior to the commencement of operations, the Adviser purchased 10,180 shares, which are still held as of the end of the reporting period. | | |
Preferred Shares
Variable Rate MuniFund Term Preferred Shares
The Fund has issued and outstanding Variable Rate MuniFund Term Preferred (“VMTP”) Shares, with a $100,000 liquidation preference per share.
VMTP Shares are issued via private placement and are not publicly available.
| | | |
| As of the end of the reporting period, VMTP Shares outstanding, at liquidation preference, for the Fund was as follows: | | |
| | Shares | Liquidation |
| Series | Outstanding | Preference |
| 2019 | 283 | $28,300,000 |
The Fund is obligated to redeem its VMTP Shares by the date as specified in its offering document (“Term Redemption Date”), unless earlier redeemed by the Fund. VMTP Shares are subject to optional and mandatory redemption in certain circumstances. The VMTP Shares may be redeemed at the option of the Fund, subject to payment of premium for approximately one year following the date of issuance (“Premium Expiration Date”), and at the redemption price per share thereafter. The redemption price per share is equal to the sum of the liquidation preference per share plus any accumulated but unpaid dividends. The Fund may be obligated to redeem a certain amount of the VMTP Shares if the Fund fails to maintain certain asset coverage and leverage ratio requirements and such failures are not cured by the applicable cure date. The Term Redemption Date and Premium Expiration Date for the Fund’s VMTP Shares are as follows:
| | | |
| | Term | Premium |
| Series | Redemption Date | Expiration Date |
| 2019 | April 1, 2019 | February 28, 2017 |
NUVEEN 33
Notes to Financial Statements (Unaudited) (continued)
The average liquidation preference of VMTP Shares outstanding and annualized dividend rate for the Fund during the current fiscal period were as follows:
| Average liquidation preference of VMTP Shares outstanding | | $ | 28,300,000 | |
| Annualized dividend rate | | | 1.50 | % |
VMTP Shares are subject to restrictions on transfer, generally do not trade, and market quotations are generally not available. VMTP Shares are short-term or short/intermediate-term instruments that pay a variable dividend rate tied to a short-term index, plus an additional fixed “spread” amount established at the time of issuance. The fair value of VMTP Shares is expected to be approximately their liquidation preference so long as the fixed “spread” on the VMTP Shares remains roughly in line with the “spread” being demanded by investors on instruments having similar terms in the current market environment. In present market conditions, the Fund’s Adviser has determined that fair value of VMTP Shares is approximately their liquidation preference, but their fair value could vary if market conditions change materially. For financial reporting purposes, the liquidation preference of VMTP Shares is a liability and is recognized as a component of “Variable Rate MuniFund Term Preferred (“VMTP”) Shares, net of deferred offering costs” on the Statement of Assets and Liabilities.
Dividends on the VMTP Shares (which are treated as interest payments for financial reporting purposes) are set weekly. Unpaid dividends on VMTP Shares are recognized as a component of “Interest payable” on the Statement of Assets and Liabilities. Dividends accrued on VMTP Shares are recognized as a component of “Interest expense and amortization of offering costs” on the Statement of Operations.
Costs incurred in connection with the Fund’s offering of VMTP Shares were recorded as a deferred charge, which are amortized over the life of the shares and are recognized as components of “Variable Rate MuniFund Term Preferred (“VMTP”) Shares, net of deferred offering costs” on the Statement of Assets and Liabilities and “Interest expense and amortization of offering costs” on the Statement of Operations.
| | | | |
| Preferred Share Transactions | | | |
| | | | |
| Transactions in preferred shares for the Fund during the Fund’s current and prior fiscal period are noted in the following table. | | |
| | | |
| Transactions in VMTP Shares for the Fund were as follows: | | | |
| | For the period 1/26/16 |
| | (commencement of operations) |
| | through 5/31/16 |
| | Series | Shares | Amount |
| VMTP Shares issued | 2019 | 283 | $28,300,000 |
| 5. Investment Transactions | | | |
| Long-term purchases and sales (including maturities) during the current fiscal period were as follows: | | | |
| Purchases | | $ | 10,602,997 | |
| Sales and maturities | | | 13,041,176 | |
6. Income Tax Information
The Fund intends to comply with the requirements of Subchapter M of the Internal Revenue Code applicable to regulated investment companies. In any year, the Fund may choose to distribute all or a portion of net investment income and net capital gains to shareholders, or retain a portion of its net investment income and net capital gains and pay corporate income taxes on such retained net investment income and retained net capital gains. The Fund intends to distribute at least the percentage of its net investment income and gains to maintain its status as a regulated investment company for U.S. federal income tax purposes.
Furthermore, the Fund intends to satisfy conditions that will enable interest from municipal securities, which is exempt from regular federal income tax, to retain such tax-exempt status when distributed to shareholders of the Fund. Net realized capital gains and ordinary income distributions paid by the Fund are subject to federal taxation.
For all open tax years and all major taxing jurisdictions, management of the Fund has concluded that there are no significant uncertain tax positions that would require recognition in the financial statements. Open tax years are those that are open for examination by taxing authorities (i.e., generally the last four tax year ends and the interim tax period since then). Furthermore, management of the Fund is also not aware of any tax positions for which it is reasonably possible that the total amounts of unrecognized tax benefits will significantly change in the next twelve months.
34 NUVEEN
The following information is presented on an income tax basis. Differences between amounts for financial statement and federal income tax purposes are primarily due to timing differences in recognizing taxable market discount and timing differences in recognizing certain gains and losses on investment transactions. To the extent that differences arise that are permanent in nature, such amounts are reclassified within the capital accounts as detailed below. Temporary differences do not require reclassification. Temporary and permanent differences do not impact the NAV of the Fund.
As of November 30, 2016, the cost and unrealized appreciation (depreciation) of investments, as determined on a federal income tax basis, were as follows:
| Cost of investments | | $ | 112,965,367 | |
| Gross unrealized: | | | | |
| Appreciation | | $ | 325,023 | |
| Depreciation | | | (4,076,289 | ) |
| Net unrealized appreciation (depreciation) of investments | | $ | (3,751,266 | ) |
Permanent differences, primarily due to nondeductible offering costs, resulted in reclassifications among the Fund’s components of net assets as of May 31, 2016, the Fund’s last tax year end, as follows:
| Paid-in surplus | $ (11,763 | ) |
| Undistributed (Over-distribution of) net investment income | 11,763 | |
| Accumulated net realized gain (loss) | — | |
The tax components of undistributed net tax-exempt income, net ordinary income and net long-term capital gains as of May 31, 2016, the Fund’s last tax year end, were as follows:
Undistributed net tax-exempt income1 | | $ | 271,985 | |
Undistributed net ordinary income2 | | | — | |
| Undistributed net long-term capital gains | | | — | |
1 | Undistributed net tax-exempt income (on a tax basis) has not been reduced for the dividend declared on May 2, 2016, and paid on June 1, 2016. |
2 | Net ordinary income consists of taxable market discount income and net short-term capital gains, if any. |
The tax character of distributions paid during the period January 26, 2016 (commencement of operations) through the Fund’s last tax year ended May 31, 2016, was designated for purposes of the dividends paid deduction as follows:
| Distributions from net tax-exempt income | | $ | 396,314 | |
Distributions from net ordinary income2 | | | — | |
| Distributions from net long-term capital gains | | | — | |
| 2 Net ordinary income consists of taxable market discount income and net short-term capital gains, if any. | | | | |
As of May 31, 2016, the Fund’s last tax year end, the Fund had unused capital losses carrying forward available for federal income tax purposes to be applied against future capital gains, if any. The capital losses are not subject to expiration.
Capital losses to be carried forward – not subject to expiration | | $ | 11,519 | |
7. Management Fees and Other Transactions with Affiliates
Management Fees
The Fund’s management fee compensates the Adviser for overall investment advisory and administrative services and general office facilities. The Sub-Adviser is compensated for its services to the Fund from the management fees paid to the Adviser.
The Fund’s management fee consists of two components – a fund-level fee, based only on the amount of assets within the Fund, and a complex-level fee, based on the aggregate amount of all eligible fund assets managed by the Adviser. This pricing structure enables Fund shareholders to benefit from growth in the assets within the Fund as well as from growth in the amount of complex-wide assets managed by the Adviser.
NUVEEN 35
Notes to Financial Statements (Unaudited) (continued)
For the period June 1, 2016 through July 31, 2016, the annual Fund-level fee, payable monthly, was calculated according to the following schedule:
| Average Daily Managed Assets* | | Fund-Level Fee | |
| For the first $125 million | | | 0.4000 | % |
| For the next $125 million | | | 0.3875 | |
| For the next $250 million | | | 0.3750 | |
| For the next $500 million | | | 0.3625 | |
| For the next $1 billion | | | 0.3500 | |
| For the next $3 billion | | | 0.3375 | |
| For managed assets over $5 billion | | | 0.3250 | |
Effective August 1, 2016, the annual Fund-level fee, payable monthly, is calculated according to the following schedule:
| Average Daily Net Assets | | Fund-Level Fee | |
| For the first $125 million | | | 0.4000 | % |
| For the next $125 million | | | 0.3875 | |
| For the next $250 million | | | 0.3750 | |
| For the next $500 million | | | 0.3625 | |
| For the next $1 billion | | | 0.3500 | |
| For the next $3 billion | | | 0.3250 | |
| For managed assets over $5 billion | | | 0.3125 | |
The annual complex-level fee, payable monthly, is calculated by multiplying the current complex-wide fee rate, determined according to the following schedule by the Fund’s daily managed assets:
| Complex-Level Managed Asset Breakpoint Level* | Effective Rate at Breakpoint Level | |
| $55 billion | | | 0.2000 | % |
| $56 billion | | | 0.1996 | |
| $57 billion | | | 0.1989 | |
| $60 billion | | | 0.1961 | |
| $63 billion | | | 0.1931 | |
| $66 billion | | | 0.1900 | |
| $71 billion | | | 0.1851 | |
| $76 billion | | | 0.1806 | |
| $80 billion | | | 0.1773 | |
| $91 billion | | | 0.1691 | |
| $125 billion | | | 0.1599 | |
| $200 billion | | | 0.1505 | |
| $250 billion | | | 0.1469 | |
| $300 billion | | | 0.1445 | |
| * | For the complex-level fees, managed assets include closed-end fund assets managed by the Adviser that are attributable to certain types of leverage. For these purposes, leverage includes the fund’s use of preferred stock and borrowings and certain investments in the residual interest certificates (also called inverse floating rate securities) in tender option bond (TOB) trusts, including the portion of assets held by a TOB trust that has been effectively financed by the trust’s issuance of floating rate securities, subject to an agreement by the Adviser as to certain funds to limit the amount of such assets for determining managed assets in certain circumstances. The complex-level fee is calculated based upon the aggregate daily managed assets of all Nuveen funds that constitute “eligible assets.” Eligible assets do not include assets attributable to investments in other Nuveen funds and assets in excess of a determined amount (originally $2 billion) added to the Nuveen fund complex in connection with the Adviser’s assumption of the management of the former First American Funds effective January 1, 2011. As of November 30, 2016, the complex-level fee rate for the Fund was 0.1621%. |
Other Transactions with Affiliates
The Fund pays no compensation directly to those of its trustees who are affiliated with the Adviser or to its officers, all of whom receive remuneration for their services to the Fund from the Adviser or its affiliates. The Board has adopted a deferred compensation plan for independent trustees that enables trustees to elect to defer receipt of all or a portion of the annual compensation they are entitled to receive from certain Nuveen-advised funds. Under the plan, deferred amounts are treated as though equal dollar amounts had been invested in shares of select Nuveen-advised funds.
36 NUVEEN
The Fund is permitted to purchase or sell securities from or to certain other funds managed by the Adviser (“inter-fund trade”) under specified conditions outlined in procedures adopted by the Board. These procedures have been designed to ensure that any inter-fund trade of securities by the Fund from or to another fund that is, or could be, considered an affiliate of the Fund under certain limited circumstances by virtue of having a common investment adviser (or affiliated investment adviser), common officer and/or common trustee complies with Rule 17a-7 of the 1940 Act. Further, as defined under these procedures, each inter-fund trade is effected at the current market price as provided by an independent pricing service. Unsettled inter-fund trades as of the end of the reporting period are recognized as a component of “Receivable for investments sold” and/or “Payable for investments purchased” on the Statement of Assets and Liabilities, when applicable.
During the current fiscal period, the Fund did not engage in inter-fund trades pursuant to these procedures.
8. Borrowing Arrangements
Uncommitted Line of Credit
During the current fiscal period, the Fund entered into an unsecured bank line of credit (“Unsecured Credit Line”) under which outstanding balances would bear interest at a variable rate. Although the Fund participated in the Unsecured Credit Line, it did not have any outstanding balances during the current fiscal period.
Committed Line of Credit
The Fund, along with certain other funds managed by the Adviser (“Participating Funds”), have established a 364-day, approximately $2.5 billion standby credit facility with a group of lenders, under which the Participating Funds may borrow for various purposes other than leveraging for investment purposes. A large portion of this facility’s capacity (and its associated costs as described below) is currently dedicated for use by a small number of Participating Funds, which does not include the Fund covered by this shareholder report. The remaining capacity under the facility (and the corresponding portion of the facility’s annual costs) is separately dedicated to most of the other open-end funds in the Nuveen fund family, along with a number of Nuveen closed-end funds, including the Fund covered by this shareholder report. The credit facility expires in July 2017 unless extended or renewed.
The credit facility has the following terms: a fee of 0.15% per annum on unused commitment amounts, and interest at a rate equal to the higher of (a) one-month LIBOR (London Inter-Bank Offered Rate) plus 1.25% per annum or (b) the Fed Funds rate plus 1.25% per annum on amounts borrowed. Participating Funds paid administration, legal and arrangement fees, which are recognized as a component of “Other expenses” on the Statement of Operations, and along with commitment fees, have been allocated among such Participating Funds based upon the relative proportions of the facility’s aggregate capacity reserved for them and other factors deemed relevant by the Adviser and the Board of each Participating Fund.
During the current fiscal period, the Fund did not utilize this facility.
9. New Accounting Pronouncements
Financial Accounting Standards Board (“FASB”) Accounting Standards Update (“ASU”) 2015-03: Interest-Imputation of Interest
The Fund has adopted the disclosure provisions of ASU 2015-03, Interest-Imputation of Interest (Subtopic 835-30) — Simplifying the Presentation of Debt Issuance Costs. ASU 2015-03 requires debt issuance costs to be presented in the balance sheet as a direct deduction from the carrying amount of the associated debt liability. Prior to the issuance of ASU 2015-03, debt issuance costs were required to be presented in the balance sheet as a deferred charge (i.e., an asset). ASU 2015-03 is limited to simplifying the presentation of debt issuance costs. ASU 2015-03 does not affect the recognition and measurement of debt issuance costs.
10. Subsequent Events
Uncommitted Line of Credit
On December 31, 2016, the Fund borrowed the following amount from the Unsecured Credit Line, at an annualized interest rate of 2.02% on its outstanding balance.
| Outstanding balance at December 31, 2016 | $2,671,124 |
NUVEEN 37
| | | | | | |
| Additional | | | | | |
| Fund Information |
| |
| |
| Board of Trustees | | | | | |
| William Adams IV* | Margo Cook* | Jack B. Evans | William C. Hunter | David J. Kundert | Albin F. Moschner |
| John K. Nelson | William J. Schneider | Judith M. Stockdale | Carole E. Stone | Terence J. Toth | Margaret L. Wolff |
| |
| |
* Interested Board Member. | | | | |
| |
| |
| Fund Manager | Custodian | Legal Counsel | Independent Registered | Transfer Agent and |
| Nuveen Fund Advisors, LLC | State Street Bank | Chapman and Cutler LLP | Public Accounting Firm | Shareholder Services |
| 333 West Wacker Drive | & Trust Company | Chicago, IL 60603 | KPMG LLP | | State Street Bank |
| Chicago, IL 60606 | One Lincoln Street | | 200 East Randolph Street | & Trust Company |
| | Boston, MA 02111 | | Chicago, IL 60601 | | Nuveen Funds |
| | | | | | P.O. Box 43071 |
| | | | | | Providence, RI 02940-3071 |
| | | | | | (800) 257-8787 |
| | | | | | |
Quarterly Form N-Q Portfolio of Investments Information
Each Fund is required to file its complete schedule of portfolio holdings with the Securities and Exchange Commission (SEC) for the first and third quarters of each fiscal year on Form N-Q. You may obtain this information directly from the SEC. Visit the SEC on-line at http://www.sec.gov or in person at the SEC’s Public Reference Room in Washington, D.C. Call the SEC toll-free at (800) SEC-0330 for room hours and operation.
Nuveen Funds’ Proxy Voting Information
You may obtain (i) information regarding how each fund voted proxies relating to portfolio securities held during the most recent twelve-month period ended June 30, without charge, upon request, by calling Nuveen toll-free at (800) 257-8787 or on Nuveen’s website at www.nuveen.com and (ii) a description of the policies and procedures that each fund used to determine how to vote proxies relating to portfolio securities without charge, upon request, by calling Nuveen toll free at (800) 257-8787. You may also obtain this information directly from the SEC. Visit the SEC on-line at http://www.sec.gov.
CEO Certification Disclosure
Each Fund’s Chief Executive Officer (CEO) has submitted to the New York Stock Exchange (NYSE) the annual CEO certification as required by Section 303A.12(a) of the NYSE Listed Company Manual. The Fund has filed with the SEC the certification of its CEO and Chief Financial Officer required by Section 302 of the Sarbanes-Oxley Act.
Common Share Repurchases
The Fund intends to repurchase, through its open-market share repurchase program, shares of its own common stock at such times and in such amounts as is deemed advisable. During the period covered by this report, each Fund repurchased shares of its common stock, as shown in the accompanying table. Any future repurchases will be reported to shareholders in the next annual or semi-annual report.
Common shares repurchased | — |
FINRA BrokerCheck
The Financial Industry Regulatory Authority (FINRA) provides information regarding the disciplinary history of FINRA member firms and associated investment professionals. This information as well as an investor brochure describing FINRA BrokerCheck is available to the public by calling the FINRA BrokerCheck Hotline number at (800) 289-9999 or by visiting www.FINRA.org.
38 NUVEEN
Glossary of Terms
Used in this Report
■ Average Annual Total Return: This is a commonly used method to express an investment’s performance over a particular, usually multi-year time period. It expresses the return that would have been necessary each year to equal the investment’s actual cumulative performance (including change in NAV or market price and reinvested dividends and capital gains distributions, if any) over the time period being considered.
■ Duration: Duration is a measure of the expected period over which a bond’s principal and interest will be paid, and consequently is a measure of the sensitivity of a bond’s or bond fund’s value to changes when market interest rates change. Generally, the longer a bond’s or fund’s duration, the more the price of the bond or fund will change as interest rates change.
■ Effective Leverage: Effective leverage is a fund’s effective economic leverage, and includes both regulatory leverage (see leverage) and the leverage effects of certain derivative investments in a fund’s portfolio. Currently, the leverage effects of Tender Option Bond (TOB) inverse floater holdings are included in effective leverage values, in addition to any regulatory leverage.
■ Industrial Development Revenue Bond (IDR): A unique type of revenue bond issued by a state or local government agency on behalf of a private sector company and intended to build or acquire factories or other heavy equipment and tools.
■ Inverse Floating Rate Securities: Inverse floating rate securities, also known as inverse floaters or tender option bonds (TOBs), are created by depositing a municipal bond, typically with a fixed interest rate, into a special purpose trust. This trust, in turn, (a) issues floating rate certificates typically paying short-term tax-exempt interest rates to third parties in amounts equal to some fraction of the deposited bond’s par amount or market value, and (b) issues an inverse floating rate certificate (sometimes referred to as an “inverse floater”) to an investor (such as a Fund) interested in gaining investment exposure to a long-term municipal bond. The income received by the holder of the inverse floater varies inversely with the short-term rate paid to the floating rate certificates’ holders, and in most circumstances the holder of the inverse floater bears substantially all of the underlying bond’s downside investment risk. The holder of the inverse floater typically also benefits disproportionately from any potential appreciation of the underlying bond’s value. Hence, an inverse floater essentially represents an investment in the underlying bond on a leveraged basis.
■ Leverage: Leverage is created whenever a fund has investment exposure (both reward and/or risk) equivalent to more than 100% of the investment capital.
■ Net Asset Value (NAV) Per Share: A fund’s Net Assets is equal to its total assets (securities, cash, accrued earnings and receivables) less its total liabilities. NAV per share is equal to the fund’s Net Assets divided by its number of shares outstanding.
■ Pre-Refunding: Pre-Refunding, also known as advanced refundings or refinancings, is a procedure used by state and local governments to refinance municipal bonds to lower interest expenses. The issuer sells new bonds with a lower yield and uses the proceeds to buy U.S. Treasury securities, the interest from which is used to make payments on the higher-yielding bonds. Because of this collateral, pre-refunding generally raises a bond’s credit rating and thus its value.
■ Regulatory Leverage: Regulatory Leverage consists of preferred shares issued by or borrowings of a fund. Both of these are part of a fund’s capital structure. Regulatory leverage is subject to asset coverage limits set in the Investment Company Act of 1940.
NUVEEN 39
Glossary of Terms Used in this Report (continued)
■ S&P Short Duration Municipal Yield Index: An index that contains all bonds in the S&P Municipal Bond Index that mature between 1 month and 12 years, and maintains a 10% weighting to AA rated bonds, 10% to A rated bonds, 20% to BBB rated bonds and 60% to below investment grade and non-rated bonds. Index returns assume reinvestment of distributions, but do not reflect any applicable sales charges or management fees.
■ Total Investment Exposure: Total investment exposure is a fund’s assets managed by the Adviser that are attributable to financial lever- age. For these purposes, financial leverage includes a fund’s use of preferred stock and borrowings and investments in the residual interest certificates (also called inverse floating rate securities) in tender option bond (TOB) trusts, including the portion of assets held by a TOB trust that has been effectively financed by the trust’s issuance of floating rate securities.
■ Zero Coupon Bond: A zero coupon bond does not pay a regular interest coupon to its holders during the life of the bond. Income to the holder of the bond comes from accretion of the difference between the original purchase price of the bond at issuance and the par value of the bond at maturity and is effectively paid at maturity. The market prices of zero coupon bonds generally are more volatile than the market prices of bonds that pay interest periodically.
40 NUVEEN
Reinvest Automatically,
Easily and Conveniently
Nuveen makes reinvesting easy. A phone call is all it takes to set up your reinvestment account.
Nuveen Closed-End Funds Automatic Reinvestment Plan
Nuveen Closed-End Fund allows you to conveniently reinvest distributions in additional Fund shares. By choosing to reinvest, you’ll be able to invest money regularly and automatically, and watch your investment grow through the power of compounding. Just like distributions in cash, there may be times when income or capital gains taxes may be payable on distributions that are reinvested. It is important to note that an automatic reinvestment plan does not ensure a profit, nor does it protect you against loss in a declining market.
Easy and convenient
To make recordkeeping easy and convenient, each month you’ll receive a statement showing your total distributions, the date of investment, the shares acquired and the price per share, and the total number of shares you own.
How shares are purchased
The shares you acquire by reinvesting will either be purchased on the open market or newly issued by the Fund. If the shares are trading at or above net asset value at the time of valuation, the Fund will issue new shares at the greater of the net asset value or 95% of the then-current market price. If the shares are trading at less than net asset value, shares for your account will be purchased on the open market. If the Plan Agent begins purchasing Fund shares on the open market while shares are trading below net asset value, but the Fund’s shares subsequently trade at or above their net asset value before the Plan Agent is able to complete its purchases, the Plan Agent may cease open-market purchases and may invest the uninvested portion of the distribution in newly-issued Fund shares at a price equal to the greater of the shares’ net asset value or 95% of the shares’ market value on the last business day immediately prior to the purchase date. Distributions received to purchase shares in the open market will normally be invested shortly after the distribution payment date. No interest will be paid on distributions awaiting reinvestment. Because the market price of the shares may increase before purchases are completed, the average purchase price per share may exceed the market price at the time of valuation, resulting in the acquisition of fewer shares than if the distribution had been paid in shares issued by the Fund. A pro rata portion of any applicable brokerage commissions on open market purchases will be paid by Plan participants. These commissions usually will be lower than those charged on individual transactions.
Flexible
You may change your distribution option or withdraw from the Plan at any time, should your needs or situation change. You can reinvest whether your shares are registered in your name, or in the name of a brokerage firm, bank, or other nominee. Ask your investment advisor if his or her firm will participate on your behalf. Participants whose shares are registered in the name of one firm may not be able to transfer the shares to another firm and continue to participate in the Plan. The Fund reserves the right to amend or terminate the Plan at any time. Although the Fund reserves the right to amend the Plan to include a service charge payable by the participants, there is no direct service charge to participants in the Plan at this time.
Call today to start reinvesting distributions
For more information on the Nuveen Automatic Reinvestment Plan or to enroll in or withdraw from the Plan, speak with your financial advisor or call us at (800) 257-8787.
NUVEEN 41
Notes
42 NUVEEN
Notes
NUVEEN 43
Nuveen:
Serving Investors for Generations
Since 1898, financial advisors and their clients have relied on Nuveen to provide dependable investment solutions through continued adherence to proven, long-term investing principles. Today, we offer a range of high quality equity and fixed-income solutions designed to be integral components of a well-diversified core portfolio.
Focused on meeting investor needs.
Nuveen helps secure the long-term goals of individual investors and the advisors who serve them. As an operating division of TIAA Global Asset Management, Nuveen provides access to investment expertise from leading asset managers and solutions across traditional and alternative asset classes. Built on more than a century of industry leadership, Nuveen’s teams of experts align with clients’ specific financial needs and goals, demonstrating commitment to advisors and investors through market perspectives and wealth management and portfolio advisory services. Nuveen manages more than $236 billion in assets as of December 31, 2016.
Find out how we can help you.
To learn more about how the products and services of Nuveen may be able to help you meet your financial goals, talk to your financial advisor, or call us at (800) 257-8787. Please read the information provided carefully before you invest. Investors should consider the investment objective and policies, risk considerations, charges and expenses of any investment carefully. Where applicable, be sure to obtain a prospectus, which contains this and other relevant information. To obtain a prospectus, please contact your securities representative or Nuveen, 333 W. Wacker Dr., Chicago, IL 60606. Please read the prospectus carefully before you invest or send money.
Learn more about Nuveen Funds at: www.nuveen.com/cef
Distributed by Nuveen Investments, LLC | 333 West Wacker Drive | Chicago, IL 60606 | www.nuveen.com
ESA-E-1116D 22028-INV-B-01/18
ITEM 2. CODE OF ETHICS.
Not applicable to this filing.
ITEM 3. AUDIT COMMITTEE FINANCIAL EXPERT.
Not applicable to this filing.
ITEM 4. PRINCIPAL ACCOUNTANT FEES AND SERVICES.
Not applicable to this filing.
ITEM 5. AUDIT COMMITTEE OF LISTED REGISTRANTS.
Not applicable to this filing.
ITEM 6. SCHEDULE OF INVESTMENTS.
(a) See Portfolio of Investments in Item 1.
(b) Not applicable.
ITEM 7. DISCLOSURE OF PROXY VOTING POLICIES AND PROCEDURES FOR CLOSED-END MANAGEMENT INVESTMENT COMPANIES.
Not applicable to this filing.
ITEM 8. PORTFOLIO MANAGERS OF CLOSED-END MANAGEMENT INVESTMENT COMPANIES.
Not applicable to this filing.
ITEM 9. PURCHASES OF EQUITY SECURITIES BY CLOSED-END MANAGEMENT INVESTMENT COMPANY AND AFFILIATED PURCHASERS.
Not applicable.
ITEM 10. SUBMISSION OF MATTERS TO A VOTE OF SECURITY HOLDERS.
There have been no material changes to the procedures by which shareholders may recommend nominees to the registrant's Board implemented after the registrant last provided disclosure in response to this Item.
ITEM 11. CONTROLS AND PROCEDURES.
ITEM 12. EXHIBITS.
File the exhibits listed below as part of this Form.
Pursuant to the requirements of the Securities Exchange Act of 1934 and the Investment Company Act of 1940, the registrant has duly caused this report to be signed on its behalf by the undersigned, thereunto duly authorized.
Gifford R. Zimmerman
Pursuant to the requirements of the Securities Exchange Act of 1934 and the Investment Company Act of 1940, this report has been signed below by the following persons on behalf of the registrant and in the capacities and on the dates indicated.
Cedric H. Antosiewicz
Stephen D. Foy