UNITED STATES
SECURITIES AND EXCHANGE COMMISSION
Washington, DC 20549
FORMN-CSRS
CERTIFIED SHAREHOLDER REPORT OF REGISTERED
MANAGEMENT INVESTMENT COMPANIES
Investment Company Act file number811-23124
Franklin Templeton ETF Trust
(Exact name of registrant as specified in charter)
One Franklin Parkway, San Mateo, CA 94403-1906
(Address of principal executive offices) (Zip code)
Craig S. Tyle, One Franklin Parkway, San Mateo, CA 94403-1906
(Name and address of agent for service)
Registrant’s telephone number, including area code: 650312-2000
Date of fiscal year end: 3/31
Date of reporting period: 09/30/19
| Item 1. | Reports to Stockholders. |
SEMIANNUAL REPORT
FRANKLIN TEMPLETON
ETF TRUST
September 30, 2019


| | |
Franklin LibertyQ Emerging Markets ETF | | Franklin LibertyQ Global Equity ETF |
Franklin LibertyQ Global Dividend ETF | | Franklin LibertyQ International Equity Hedged ETF |
Internet Delivery of Fund Reports Unless You Request Paper Copies: Effective January 1, 2021, as permitted by the SEC, paper copies of the Fund’s shareholder reports will no longer be sent by mail, unless you specifically request them from the Fund or your financial intermediary. Instead, the reports will be made available on a website, and you will be notified by mail each time a report is posted and provided with a website link to access the report.
If you already elected to receive shareholder reports electronically, you will not be affected by this change and you need not take any action. If you have not signed up for electronic delivery, we would encourage you to join fellow shareholders who have. You may elect to receive shareholder reports and other communications electronically from the Fund by calling(800) 632-2301 or by contacting your financial intermediary.
You may elect to continue to receive paper copies of all your future shareholder reports free of charge by contacting your financial intermediary or, if you invest directly with a Fund, calling(800) 632-2301 to let the Fund know of your request. Your election to receive reports in paper will apply to all funds held in your account.
Franklin Templeton
Successful investing begins with ambition. And achievement only comes when you reach for it. That’s why we continually strive to deliver better outcomes for investors. No matter what your goals are, our deep, global investment expertise allows us to offer solutions that can help.
During our more than 70 years of experience, we’ve managed through all kinds of markets—up, down and those in between. We’re always preparing for what may come next. It’s because of this, combined with our strength as one of the world’s largest asset managers that we’ve earned the trust of millions of investors around the world.
Visitfranklintempleton.com/ investor/investments-and-solutions/investment-options/etfs/ for fund updates and documents.
| | | | | | | | |
| Not FDIC Insured | | | | | May Lose Value | | | | | No Bank Guarantee |
| | | | | | |
| | | |
| franklintempleton.com | | Not part of the semiannual report | | | 1 | |
SEMIANNUAL REPORT
Economic and Market Overview
The global economy expanded during the six months ended September 30, 2019, despite weakness in certain regions. Global stocks were aided by upbeat economic data in some regions, encouraging corporate earnings reports, periods of optimism about a potential U.S.-China trade deal and monetary policy easing by major central banks. The U.S. Federal Reserve’s (Fed’s) patient approach to its monetary policy early in the period, rate cuts in July and September, and indications it will act appropriately to sustain U.S. economic expansion and achieve its inflation objective aided market sentiment.
However, markets also reflected concerns about political uncertainties in the U.S. (including the impeachment inquiry into U.S. President Donald Trump), geopolitical tensions in the eurozone and other regions, and the impact of U.S. trade disputes with China and other trading partners on global growth and corporate earnings. In this environment, global developed and emerging market stocks, as measured by the MSCI All Country World Index, posted a +3.91% total return for the six months under review.1
The U.S. economy grew during thesix-month period. However, the economy moderated in 2019’s second and third quarters, due partly to weakness in inventory investment and business investment. The manufacturing sector expanded during the period’s first four months, but contracted in August and September 2019. The services sector continued to expand throughout the period, although the rate of expansion slowed in September. The unemployment rate decreased from 3.8% in March 2019 to 3.5% atperiod-end.2 The annual inflation rate, as measured by the Consumer Price Index, decreased from 1.9% in March 2019 to 1.7% atperiod-end.2
At its July 2019 meeting, the Fed lowered its target range for the federal funds rate for the first time since December 2008, to 2.00%–2.25%, citing muted inflation pressures and the potential effects of global trade tensions on economic growth. Furthermore, the Fed ended its balance sheet normalization program earlier than previously indicated. In September, the Fed further lowered the federal funds target rate range to 1.75%–2.00%, reiterating the rationale cited at the July 2019 meeting.
In Europe, the U.K.’s quarterly gross domestic product (GDP) growth contracted in 2019’s second quarter, as Brexit uncertainties weighed on business sentiment. The Bank of England kept its key policy rate unchanged during thesix-month period and lowered its GDP forecasts for 2019 and 2020. The eurozone’s quarterly GDP growth moderated in 2019’s second quarter and stabilized in the third quarter. The bloc’s annual inflation rate ended the period lower. The European Central Bank (ECB) kept its benchmark interest rate unchanged during the period. In September, the ECB announced it will start a new bond-buying program in November in an effort to boost the economy and increase inflation.
In Asia, Japan’s quarterly GDP growth moderated in 2019’s second quarter. The Bank of Japan (BOJ) left its benchmark interest rate unchanged and continued its stimulus measures during thesix-month period. At its July and September meetings, the BOJ expressed its openness to increase stimulus in an effort to sustain economic growth and achieve its inflation goal.
In larger emerging markets, Brazil’s quarterly GDP growth accelerated in 2019’s second quarter. The Central Bank of Brazil lowered its benchmark interest rate twice during thesix-month period. Russia’s annual GDP growth accelerated in 2019’s second quarter. The Bank of Russia cut its key interest rate three times during the period. China’s annual GDP growth moderated in 2019’s second and third quarters. The People’s Bank of China implemented an interest-rate reform in August, designating the loan prime rate as the new benchmark for household and business loans, effectively lowering interest rates in August and September. Overall, global emerging market stocks, as measured by the MSCI Emerging Markets Index, posted a-3.40% total return during the six months under review.1
The foregoing information reflects our analysis and opinions as of September 30, 2019. The information is not a complete analysis of every aspect of any market, country, industry, security or fund. Statements of fact are from sources considered reliable.
1. Source: Morningstar.
2. Source: U.S. Bureau of Labor Statistics.
See www.franklintempletondatasources.com for additional data provider information.
| | | | |
| | | |
| 2 | | Semiannual Report | | franklintempleton.com |
Franklin LibertyQ Emerging Markets ETF
This semiannual report for Franklin LibertyQ Emerging Markets ETF covers the period ended September 30, 2019.
Your Fund’s Goal and Main Investments
The Fund seeks to provide investment results that closely correspond, before fees and expenses, to the performance of the LibertyQ Emerging Markets (EM) Index (the Underlying Index).1 Under normal market conditions, the Fund invests at least 80% of its assets in the component securities of the Underlying Index and in depositary receipts representing such securities. The Underlying Index includes stocks from emerging market countries that have favorable exposure to four investment-style factors: quality, value, momentum and low volatility, subject to a maximum 1% per company weighting. The Underlying Index seeks to achieve a lower level of risk and higher risk-adjusted performance than the MSCI EM Index over the long term by selecting equity securities from the MSCI EM Index that have exposure to these investment-style factors.
Performance Overview
During the six-month period, the Fund posted cumulative total returns of -1.47% based on market price and -1.40% based on net asset value (NAV). In comparison, the LibertyQ EM Index posted a -1.19% total return for the same period, while the MSCI EM Index (Net Returns) posted a -3.66% total return.2 You can find more of the Fund’s performance data in the Performance Summary beginning on page 6.
Performance data represent past performance, which does not guarantee future results. Investment return and principal value will fluctuate, and you may have a gain or loss when you sell your shares. Current performance may differ from figures shown. For most recentmonth-end performance, go tofranklintempleton.com or call(800)342-5236.
Investment Strategy
The Fund, using a passive or indexing investment approach, seeks investment results that closely correspond, before fees
|
| Geographic Composition* |
|
| Based on Total Net Assets as of 9/30/19 |
|
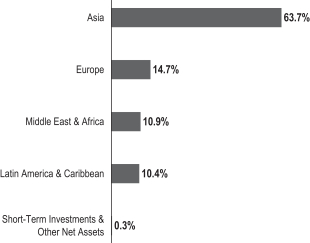 |
*Figures are stated as a percentage of total and may not equal 100% or may be negative due to rounding, use of derivatives, unsettled trades or other factors.
and expenses, to the performance of the LibertyQ EM Index. The investment manager seeks to achieve, over time, a correlation between the Fund’s performance, before fees and expenses, and that of the Underlying Index of 0.95 or better. A figure of 1.00 would indicate perfect correlation. The Fund’s intention is to replicate the component securities of the Underlying Index as closely as possible. However, under various circumstances, it may not be possible or practicable to replicate the Underlying Index. In these circumstances, the Fund may use a “representative sampling” strategy whereby the Fund would invest in what it believes to be a representative sample of the component securities of the Underlying Index, but may not track the Underlying Index with the same degree of accuracy as would an investment vehicle replicating the entire Underlying Index. The Fund’s portfolio is reconstituted semiannually following the semiannual reconstitution of the Underlying Index.
1. The LibertyQ EM Index is a systematic, rules-based proprietary index that is owned and calculated by MSCI Inc. (MSCI). It is based on the MSCI EM Index using a methodology developed with Franklin Templeton to reflect Franklin Templeton’s desired investment strategy. The MSCI EM Index is a free float-adjusted market capitalization-weighted index that is designed to measure the equity market performance of emerging markets.
2. Source: FactSet.
The indexes are unmanaged and include reinvestment of any income or distributions (after the deduction of certain withholding taxes). They do not reflect any fees, expenses or sales charges. One cannot invest directly in an index.
See www.franklintempletondatasources.com for additional data provider information.
The dollar value, number of shares or principal amount, and names of all portfolio holdings are listed in the Fund’s Statement of Investments (SOI). The SOI begins on page 28.
| | | | | | |
| | | |
| franklintempleton.com | | Semiannual Report | | | 3 | |
FRANKLIN LIBERTYQ EMERGING MARKETS ETF
| | | | |
| Top 10 Sectors/Industries | | | |
| |
| 9/30/19 | | | |
| |
| | | % of Total
Net Assets | |
Banks | | | 16.5% | |
Oil, Gas & Consumable Fuels | | | 15.3% | |
Wireless Telecommunication Services | | | 6.6% | |
Chemicals | | | 5.5% | |
Diversified Telecommunication Services | | | 4.9% | |
Metals & Mining | | | 4.6% | |
IT Services | | | 4.0% | |
Semiconductors & Semiconductor Equipment | | | 3.8% | |
Food & Staples Retailing | | | 3.0% | |
Textiles, Apparel & Luxury Goods | | | 2.8% | |
| | | | |
| Top 10 Countries | | | |
| |
| 9/30/19 | | | |
| |
| | | % of Total
Net Assets | |
China | | | 18.2% | |
Taiwan | | | 12.6% | |
Russia | | | 11.5% | |
India | | | 11.4% | |
South Korea | | | 11.0% | |
Brazil | | | 7.1% | |
Thailand | | | 4.5% | |
South Africa | | | 3.3% | |
Indonesia | | | 3.2% | |
Qatar | | | 3.1% | |
| | | | |
| Top 10 Holdings | | | |
| |
9/30/19 | | | |
| |
Company Sector/Industry, Country | | % of Total
Net Assets | |
MMC Norilsk Nickel PJSC Metals & Mining, Russia | | | 1.2% | |
Perusahaan Perseroan (Persero) PT Telekomunikasi Indonesia Tbk, B Diversified Telecommunication Services, Indonesia | | | 1.2% | |
Advanced Info Service PCL Wireless Telecommunication Services, Thailand | | | 1.2% | |
Itau Unibanco Holding SA Banks, Brazil | | | 1.2% | |
Samsung Electronics Co. Ltd. Technology Hardware, Storage & Peripherals,South Korea | | | 1.2% | |
Hindustan Unilever Ltd. Household Products, India | | | 1.2% | |
Itausa-Investimentos Itau SA Banks, Brazil | | | 1.2% | |
Surgutneftegas PJSC Oil, Gas & Consumable Fuels, Russia | | | 1.1% | |
SK Hynix Inc. Semiconductors & Semiconductor Equipment, South Korea | | | 1.1% | |
Anta Sports Products Ltd. Textiles, Apparel & Luxury Goods, China | | | 1.1% | |
| | | | |
| | | |
| 4 | | Semiannual Report | | franklintempleton.com |
FRANKLIN LIBERTYQ EMERGING MARKETS ETF
Thank you for your participation in Franklin LibertyQ Emerging Markets ETF. We look forward to serving your future investment needs.
| | |
 | | 
Dina Ting, CFA |
| | |
 | | 
Louis Hsu, CFA |
| |
| | Portfolio Management Team |
The foregoing information reflects our analysis, opinions and portfolio holdings as of September 30, 2019, the end of the reporting period. These opinions may not be relied upon as investment advice or an offer for a particular security. The information is not a complete analysis of every aspect of any market, country, industry, security or the Fund. Statements of fact are from sources considered reliable, but the investment manager makes no representation or warranty as to their completeness or accuracy. Although historical performance is no guarantee of future results, these insights may help you understand our investment management philosophy.
CFA® is a trademark owned by CFA Institute.
| | | | | | |
| | | |
| franklintempleton.com | | Semiannual Report | | | 5 | |
FRANKLIN LIBERTYQ EMERGING MARKETS ETF
Performance Summary as of September 30, 2019
Total return reflects reinvestment of the Fund’s dividends and capital gain distributions, if any, and any unrealized gains or losses. Total returns do not include brokerage commissions that may be payable on secondary market transactions. The performance table does not reflect any taxes that a shareholder would pay on Fund dividends, capital gain distributions, if any, or any realized gains on the sale of Fund shares.
Net asset value or “NAV” is the value of one share of a fund as calculated in accordance with the standard formula for valuing mutual fund shares. The price used to calculate market return (Market Price) is determined by using the midpoint between the highest bid and the lowest offer on the primary stock exchange on which shares of a fund are listed for trading, as of the time that such fund’s NAV is calculated. Since shares of the Fund did not trade in the secondary market until after the Fund’s inception, for the period from inception to the first day of secondary trading (6/3/16), the NAV of the Fund is used as a proxy for the Market Price to calculate market returns. Market and NAV returns assume that dividends and capital gain distributions have been reinvested at Market Price and NAV.
Your dividend income will vary depending on dividends or interest paid by securities in the Fund’s portfolio, adjusted for operating expenses. Capital gain distributions are net profits realized from the sale of portfolio securities.
Performance as of 9/30/191
| | | | | | | | | | | | | | | | |
| | |
| | | Cumulative Total Return2 | | | Average Annual Total Return2 | |
| | | Based on NAV3 | | | Based on market price4 | | | Based on NAV3 | | | Based on market price4 | |
6-Months | | | -1.40% | | | | -1.47% | | | | -1.40% | | | | -1.47% | |
1-Year | | | -1.99% | | | | -1.55% | | | | -1.99% | | | | -1.55% | |
3-Year | | | +12.01% | | | | +10.74% | | | | +3.85% | | | | +3.46% | |
Since Inception (6/1/16) | | | +22.18% | | | | +21.96% | | | | +6.20% | | | | +6.14% | |
Performance data represent past performance, which does not guarantee future results. Investment return and principal value will fluctuate, and you may have a gain or loss when you sell your shares. Current performance may differ from figures shown. For most recentmonth-end performance, go tofranklintempleton.com or call(800)342-5236.
See page 7 for Performance Summary footnotes.
| | | | |
| | | |
| 6 | | Semiannual Report | | franklintempleton.com |
FRANKLIN LIBERTYQ EMERGING MARKETS ETF
PERFORMANCE SUMMARY
Distributions(4/1/19–9/30/19)
|
|
Net Investment
Income |
$0.2875 |
Total Annual Operating Expenses5
All investments involve risks, including possible loss of principal. Stock prices fluctuate, sometimes rapidly and dramatically, due to factors affecting individual companies, particular industries or sectors, or general market conditions. Special risks are associated with foreign investing, including currency fluctuations, economic instability and political developments. Investments in developing markets involve heightened risks related to the same factors, in addition to those associated with these markets’ smaller size, lesser liquidity and lack of established legal, political, business and social frameworks to support securities markets. The Fund is designed for the aggressive portion of a well-diversified portfolio. There can be no assurance that the Fund’s multi-factor stock selection process will enhance performance. Exposure to such investment factors may detract from performance in some market environments, perhaps for extended periods. Performance of the Fund may vary significantly from the performance of an index, as a result of transaction costs, expenses and other factors. The Fund’s prospectus also includes a description of the main investment risks.
ETFs trade like stocks, fluctuate in market value and may trade at prices above or below their net asset value. Brokerage commissions and ETF expenses will reduce returns.
1. Effective December 1, 2017, the Fund adopted a unified fee structure whereby Management has agreed to reimburse the Fund’s acquired fund fees and expenses (if any) and pay all of the ordinary operating expenses of the Fund, including custody, transfer agency, and Trustee fees and expenses, among others, but excluding: (i) payments under the Fund’s Rule12b-1 plan (if any); (ii) brokerage expenses (including any costs incidental to transactions in portfolio securities or instruments); (iii) taxes; (iv) interest (including borrowing costs and dividend expenses on securities sold short and overdraft charges); (v) litigation expenses (including litigation to which the Trust or a Fund may be a party and indemnification of the Trustees and officers with respect thereto); and (vi) othernon-routine or extraordinary expenses.
2. Total return calculations represent the cumulative and average annual changes in value of an investment over the periods indicated. Return for less than one year, if any, has not been annualized.
3. Assumes reinvestment of distributions based on net asset value.
4. Assumes reinvestment of distributions based on market price.
5. Figures are as stated in the Fund’s current prospectus and may differ from the expense ratios disclosed in the Your Fund’s Expenses and Financial Highlights sections in this report. In periods of market volatility, assets may decline significantly, causing total annual Fund operating expenses to become higher than the figures shown.
| | | | | | |
| | | |
| franklintempleton.com | | Semiannual Report | | | 7 | |
FRANKLIN LIBERTYQ EMERGING MARKETS ETF
Your Fund’s Expenses
As a Fund shareholder, you can incur two types of costs: (1) transaction costs, including brokerage commissions on purchases and sales of Fund shares; and (2) ongoing Fund costs, including management fees and other Fund expenses. All funds have ongoing costs, sometimes referred to as operating expenses. The table below shows ongoing costs of investing in the Fund and can help you understand these costs and compare them with those of other funds. The table assumes a $1,000 investment held for the six months indicated.
Actual Fund Expenses
The table below provides information about actual account values and actual expenses in the columns under the heading “Actual.” In these columns the Fund’s actual return, which includes the effect of Fund expenses, is used to calculate the “Ending Account Value” for each class of shares. You can estimate the expenses you paid during the period by following these steps (of course, your account value and expenses will differ from those in this illustration):Divide your account value by $1,000 (if your account had an $8,600 value, then $8,600÷ $1,000 = 8.6).Then multiply the result by the number in the row for your class of shares under the headings “Actual” and “Expenses Paid During Period” (if Actual Expenses Paid During Period were $7.50, then 8.6 x $7.50 = $64.50).In this illustration, the actual expenses paid this period are $64.50.
Hypothetical Example for Comparison with Other Funds
Under the heading “Hypothetical” in the table, information is provided about hypothetical account values and hypothetical expenses based on the Fund’s actual expense ratio and an assumed rate of return of 5% per year before expenses, which is not the Fund’s actual return. This information may not be used to estimate the actual ending account balance or expenses you paid for the period, but it can help you compare ongoing costs of investing in the Fund with those of other funds. To do so, compare this 5% hypothetical example for the class of shares you hold with the 5% hypothetical examples that appear in the shareholder reports of other funds.
Please note that expenses shown in the table are meant to highlight ongoing costs and do not reflect any transactional costs.Therefore, information under the heading “Hypothetical” is useful in comparing ongoing costs only, and will not help you compare total costs of owning different funds. In addition, if transactional costs were included, your total costs would have been higher.
| | | | | | | | | | | | | | | | | | | | | | |
| | | | Actual (actual return after expenses) | | | Hypothetical (5% annual return before expenses) | | | | |
| | | | | |
Beginning
Account
Value 4/1/19 | | | Ending
Account
Value 9/30/19 | | | Expenses
Paid During
Period
4/1/19–9/30/191,2 | | | Ending
Account
Value 9/30/19 | | | Expenses
Paid During
Period
4/1/19–9/30/191,2 | | | Net Annualized
Expense Ratio2 | |
| | $1,000.00 | | | $ | 986.00 | | | $ | 2.58 | | | $ | 1,022.40 | | | $ | 2.63 | | | | 0.52 | %3 |
1. Expenses are equal to the annualized expense ratio for thesix-month period as indicated above—in the far right column—multiplied by the simple average account value over the period indicated, and then multiplied by 183/366 to reflect theone-half year period.
2. Reflects expenses after fee waivers and expense reimbursements.
3. Effective 08/01/19, the unified management fee changed to 0.45%. Had such unified management fee been in effect for the full period, the expenses paid would have been $2.23 based upon the Fund’s actual performance and $2.28 based upon a hypothetical 5% return.
| | | | |
| | | |
| 8 | | Semiannual Report | | franklintempleton.com |
Franklin LibertyQ Global Dividend ETF
This semiannual report for Franklin LibertyQ Global Dividend ETF covers the period ended September 30, 2019.
Your Fund’s Goal and Main Investments
The Fund seeks to provide investment results that closely correspond, before fees and expenses, to the performance of the LibertyQ Global Dividend Index (the Underlying Index).1Under normal market conditions, the Fund invests at least 80% of its assets in the component securities of the Underlying Index and in depositary receipts representing such securities. The Underlying Index includes stocks from developed and emerging market countries with high and persistent dividend income that have favorable exposure to a quality investment-style factor, subject to a maximum 2% per company weighting. The Underlying Index seeks to achieve a lower level of risk and higher risk-adjusted performance than the MSCI All Country World Index (ACWI) ex REITs Index over the long term by applying dividend persistence and yield screens and the quality factor selection process.
Performance Overview
For the six-month period, the Fund posted cumulative total returns of +5.39% based on market price and +5.35% based on net asset value (NAV). In comparison, the LibertyQ Global Dividend Index posted a +5.32% total return for the same period, while the MSCI ACWI ex REITs Index (Net Returns) posted a +3.47% total return for the same period.2 You can find more of the Fund’s performance data in the Performance Summary beginning on page 12.
Performance data represent past performance, which does not guarantee future results. Investment return and principal value will fluctuate, and you may have a gain or loss when you sell your shares. Current performance may differ from figures shown. For most recentmonth-end performance, go tofranklintempleton.com or call(800)342-5236.
Investment Strategy
The Fund, using a passive or indexing investment approach, seeks investment results that closely correspond, before fees
|
| Geographic Composition* |
|
| Based on Total Net Assets as of 9/30/19 |
|
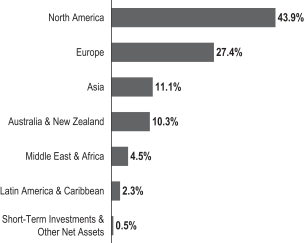 |
*Figures are stated as a percentage of total and may not equal 100% or may be negative due to rounding, use of derivatives, unsettled trades or other factors.
and expenses, to the performance of the LibertyQ Global Dividend Index. The investment manager seeks to achieve, over time, a correlation between the Fund’s performance, before fees and expenses, and that of the Underlying Index of 0.95 or better. A figure of 1.00 would indicate perfect correlation. The Fund’s intention is to replicate the component securities of the Underlying Index as closely as possible. However, under various circumstances, it may not be possible or practicable to replicate the Underlying Index. In these circumstances, the Fund may use a “representative sampling” strategy whereby the Fund would invest in what it believes to be a representative sample of the component securities of the Underlying Index, but may not track the Underlying Index with the same degree of accuracy as would an investment vehicle replicating the entire Underlying Index. The Fund’s portfolio is reconstituted semiannually following the semiannual reconstitution of the Underlying Index.
1. The LibertyQ Global Dividend Index is a systematic, rules-based proprietary index that is owned and calculated by MSCI Inc. (MSCI). It is based on the MSCI ACWI ex REITs Index using a methodology developed with Franklin Templeton to reflect Franklin Templeton’s desired investment strategy. The MSCI ACWI ex REITs Index is a free float-adjusted market capitalization-weighted index that is designed to measure the equity market performance of developed and emerging markets, excluding REIT securities.
2. Source: FactSet.
The indexes are unmanaged and include reinvestment of any income or distributions (after the deduction of certain withholding taxes). They do not reflect any fees, expenses or sales charges. One cannot invest directly in an index.
See www.franklintempletondatasources.com for additional data provider information.
The dollar value, number of shares or principal amount, and names of all portfolio holdings are listed in the Fund’s Statement of Investments (SOI). The SOI begins on page 37.
| | | | | | |
| | | |
| franklintempleton.com | | Semiannual Report | | | 9 | |
FRANKLIN LIBERTYQ GLOBAL DIVIDEND ETF
| | | | |
| Top 10 Sectors/Industries | | | |
| |
| 9/30/19 | | | |
| |
| | | % of Total
Net Assets | |
Banks | | | 16.9% | |
Pharmaceuticals | | | 10.2% | |
Insurance | | | 6.8% | |
Hotels, Restaurants & Leisure | | | 5.8% | |
Semiconductors & Semiconductor Equipment | | | 5.8% | |
Diversified Telecommunication Services | | | 5.0% | |
Capital Markets | | | 4.8% | |
Household Products | | | 4.5% | |
IT Services | | | 3.9% | |
Personal Products | | | 3.8% | |
| | | | |
| Top 10 Countries | | | |
| |
| 9/30/19 | | | |
| |
| | | % of Total
Net Assets | |
United States | | | 37.0% | |
Australia | | | 10.1% | |
United Kingdom | | | 9.8% | |
Switzerland | | | 7.2% | |
Canada | | | 6.9% | |
Japan | | | 3.3% | |
Finland | | | 2.8% | |
Germany | | | 2.8% | |
Taiwan | | | 2.7% | |
South Africa | | | 2.6% | |
| | | | |
| Top 10 Holdings | | | |
| |
| 9/30/19 | | | |
| |
Company Sector/Industry, Country | | % of Total
Net Assets | |
National Australia Bank Ltd. Banks, Australia | | | 2.3% | |
United Parcel Service Inc., B Air Freight & Logistics, United States | | | 2.3% | |
Zurich Insurance Group AG Insurance, Switzerland | | | 2.3% | |
Lockheed Martin Corp. Aerospace & Defense, United States | | | 2.2% | |
The Procter & Gamble Co. Household Products, United States | | | 2.2% | |
Intel Corp. Semiconductors & Semiconductor Equipment,United States | | | 2.2% | |
NTT DOCOMO Inc. Wireless Telecommunication Services, Japan | | | 2.2% | |
Westpac Banking Corp. Banks, Australia | | | 2.2% | |
| Taiwan Semiconductor Manufacturing Co. Ltd.Semiconductors & Semiconductor Equipment, Taiwan | | | 2.1% | |
LyondellBasell Industries NV, A Chemicals, United States | | | 2.1% | |
| | | | |
| | | |
| 10 | | Semiannual Report | | franklintempleton.com |
FRANKLIN LIBERTYQ GLOBAL DIVIDEND ETF
Thank you for your participation in Franklin LibertyQ Global Dividend ETF. We look forward to serving your future investment needs.
| | |
| |
Dina Ting, CFA |
| | |
| |
Louis Hsu, CFA |
| |
| | Portfolio Management Team |
The foregoing information reflects our analysis, opinions and portfolio holdings as of September 30, 2019, the end of the reporting period. These opinions may not be relied upon as investment advice or an offer for a particular security. The information is not a complete analysis of every aspect of any market, country, industry, security or the Fund. Statements of fact are from sources considered reliable, but the investment manager makes no representation or warranty as to their completeness or accuracy. Although historical performance is no guarantee of future results, these insights may help you understand our investment management philosophy.
| | | | | | |
| | | |
| franklintempleton.com | | Semiannual Report | | | 11 | |
FRANKLIN LIBERTYQ GLOBAL DIVIDEND ETF
Performance Summary as of September 30, 2019
Total return reflects reinvestment of the Fund’s dividends and capital gain distributions, if any, and any unrealized gains or losses. Total returns do not include brokerage commissions that may be payable on secondary market transactions. The performance table does not reflect any taxes that a shareholder would pay on Fund dividends, capital gain distributions, if any, or any realized gains on the sale of Fund shares.
Net asset value or “NAV” is the value of one share of a fund as calculated in accordance with the standard formula for valuing mutual fund shares. The price used to calculate market return (Market Price) is determined by using the midpoint between the highest bid and the lowest offer on the primary stock exchange on which shares of a fund are listed for trading, as of the time that such fund’s NAV is calculated. Since shares of the Fund did not trade in the secondary market until after the Fund’s inception, for the period from inception to the first day of secondary trading (6/3/16), the NAV of the Fund is used as a proxy for the Market Price to calculate market returns. Market and NAV returns assume that dividends and capital gain distributions have been reinvested at Market Price and NAV.
Your dividend income will vary depending on dividends or interest paid by securities in the Fund’s portfolio, adjusted for operating expenses. Capital gain distributions are net profits realized from the sale of portfolio securities.
Performance as of 9/30/191
| | | | | | | | | | | | | | | | |
| | |
| | | Cumulative Total Return2 | | | Average Annual Total Return2 | |
| | | Based on NAV3 | | | Based on market price4 | | | Based on NAV3 | | | Based on market price4 | |
6-Months | | | +5.35% | | | | +5.39% | | | | +5.35% | | | | +5.39% | |
1-Year | | | +7.08% | | | | +7.31% | | | | +7.08% | | | | +7.31% | |
3-Year | | | +23.86% | | | | +23.29% | | | | +7.39% | | | | +7.23% | |
Since Inception (6/1/16) | | | +28.00% | | | | +27.95% | | | | +7.69% | | | | +7.68% | |
Performance data represent past performance, which does not guarantee future results. Investment return and principal value will fluctuate, and you may have a gain or loss when you sell your shares. Current performance may differ from figures shown. For most recentmonth-end performance, go tofranklintempleton.com or call(800)342-5236.
See page 13 for Performance Summary footnotes.
| | | | |
| | | |
| 12 | | Semiannual Report | | franklintempleton.com |
FRANKLIN LIBERTYQ GLOBAL DIVIDEND ETF
PERFORMANCE SUMMARY
Distributions(4/1/19–9/30/19)
|
|
Net Investment
Income |
$0.5821 |
Total Annual Operating Expenses5
All investments involve risks, including possible loss of principal. Stock prices fluctuate, sometimes rapidly and dramatically, due to factors affecting individual companies, particular industries or sectors, or general market conditions. Special risks are associated with foreign investing, including currency fluctuations, economic instability and political developments; investments in emerging markets involve heightened risks related to the same factors. To the extent the Fund focuses on particular countries, regions, industries, sectors or types of investment from time to time, it may be subject to greater risks of adverse developments in such areas of focus than a fund that invests in a wider variety of countries, regions, industries, sectors or investments. Companies that have historically paid regular dividends to shareholders may decrease or eliminate dividend payments in the future. A decrease in dividend payments by an issuer may result in a decrease in the value of the issuer’s stock and less available income for the Fund. There can be no assurance that the Fund’s quality-factor stock selection process and dividend screens of the Underlying Index will enhance performance. Exposure to investment factors and the use of dividend screens may detract from performance in some market environments, perhaps for extended periods. Performance of the Fund may vary significantly from the performance of an index, as a result of transaction costs, expenses and other factors. The Fund’s prospectus also includes a description of the main investment risks.
ETFs trade like stocks, fluctuate in market value and may trade at prices above or below their net asset value. Brokerage commissions and ETF expenses will reduce returns.
1. Effective December 1, 2017, the Fund adopted a unified fee structure whereby Management has agreed to reimburse the Fund’s acquired fund fees and expenses (if any) and pay all of the ordinary operating expenses of the Fund, including custody, transfer agency, and Trustee fees and expenses, among others, but excluding: (i) payments under the Fund’s Rule12b-1 plan (if any); (ii) brokerage expenses (including any costs incidental to transactions in portfolio securities or instruments); (iii) taxes; (iv) interest (including borrowing costs and dividend expenses on securities sold short and overdraft charges); (v) litigation expenses (including litigation to which the Trust or a Fund may be a party and indemnification of the Trustees and officers with respect thereto); and (vi) othernon-routine or extraordinary expenses.
2. Total return calculations represent the cumulative and average annual changes in value of an investment over the periods indicated. Return for less than one year, if any, has not been annualized.
3. Assumes reinvestment of distributions based on net asset value.
4. Assumes reinvestment of distributions based on market price.
5. Figures are as stated in the Fund’s current prospectus and may differ from the expense ratios disclosed in the Your Fund’s Expenses and Financial Highlights sections in this report. In periods of market volatility, assets may decline significantly, causing total annual Fund operating expenses to become higher than the figures shown.
| | | | | | |
| | | |
| franklintempleton.com | | Semiannual Report | | | 13 | |
FRANKLIN LIBERTYQ GLOBAL DIVIDEND ETF
Your Fund’s Expenses
As a Fund shareholder, you can incur two types of costs: (1) transaction costs, including brokerage commissions on purchases and sales of Fund shares; and (2) ongoing Fund costs, including management fees and other Fund expenses. All funds have ongoing costs, sometimes referred to as operating expenses. The table below shows ongoing costs of investing in the Fund and can help you understand these costs and compare them with those of other funds. The table assumes a $1,000 investment held for the six months indicated.
Actual Fund Expenses
The table below provides information about actual account values and actual expenses in the columns under the heading “Actual.” In these columns the Fund’s actual return, which includes the effect of Fund expenses, is used to calculate the “Ending Account Value” for each class of shares. You can estimate the expenses you paid during the period by following these steps (of course, your account value and expenses will differ from those in this illustration):Divide your account value by $1,000 (if your account had an $8,600 value, then $8,600÷ $1,000 = 8.6).Then multiply the result by the number in the row for your class of shares under the headings “Actual” and “Expenses Paid During Period” (if Actual Expenses Paid During Period were $7.50, then 8.6 x $7.50 = $64.50).In this illustration, the actual expenses paid this period are $64.50.
Hypothetical Example for Comparison with Other Funds
Under the heading “Hypothetical” in the table, information is provided about hypothetical account values and hypothetical expenses based on the Fund’s actual expense ratio and an assumed rate of return of 5% per year before expenses, which is not the Fund’s actual return. This information may not be used to estimate the actual ending account balance or expenses you paid for the period, but it can help you compare ongoing costs of investing in the Fund with those of other funds. To do so, compare this 5% hypothetical example for the class of shares you hold with the 5% hypothetical examples that appear in the shareholder reports of other funds.
Please note that expenses shown in the table are meant to highlight ongoing costs and do not reflect any transactional costs.Therefore, information under the heading “Hypothetical” is useful in comparing ongoing costs only, and will not help you compare total costs of owning different funds. In addition, if transactional costs were included, your total costs would have been higher.
| | | | | | | | | | | | | | | | | | | | | | |
| | | | Actual (actual return after expenses) | | | Hypothetical (5% annual return before expenses) | | | | |
| | | | | |
Beginning
Account
Value 4/1/19 | | | Ending
Account
Value 9/30/19 | | | Expenses
Paid During
Period
4/1/19–9/30/191,2 | | | Ending
Account
Value 9/30/19 | | | Expenses
Paid During
Period
4/1/19–9/30/191,2 | | | Net Annualized
Expense
Ratio2 | |
| | $1,000.00 | | | $ | 1,053.50 | | | $ | 2.31 | | | $ | 1,022.75 | | | $ | 2.28 | | | | 0.45 | % |
1. Expenses are equal to the annualized expense ratio for thesix-month period as indicated above—in the far right column—multiplied by the simple average account value over the period indicated, and then multiplied by 183/366 to reflect theone-half year period.
2. Reflects expenses after fee waivers and expense reimbursements.
| | | | |
| | | |
| 14 | | Semiannual Report | | franklintempleton.com |
Franklin LibertyQ Global Equity ETF
This semiannual report for Franklin LibertyQ Global Equity ETF covers the period ended September 30, 2019.
Your Fund’s Goal and Main Investments
The Fund seeks to provide investment results that closely correspond, before fees and expenses, to the performance of the LibertyQ Global Equity Index (the Underlying Index).1Under normal market conditions, the Fund invests at least 80% of its assets in the component securities of the Underlying Index and in depositary receipts representing such securities. The Underlying Index includes stocks from developed and emerging market countries that have favorable exposure to four investment-style factors: quality, value, momentum and low volatility, subject to a maximum 1% per company weighting. The Underlying Index seeks to achieve a lower level of risk and higher risk-adjusted performance than the MSCI All Country World Index (ACWI) over the long term by selecting equity securities from the MSCI ACWI that have exposure to these investment-style factors.
Performance Overview
During the six-month period, the Fund posted cumulative total returns of +3.89% based on market price and +3.70% based on net asset value (NAV). In comparison, the LibertyQ Global Equity Index posted a +3.73% total return for the same period, while the MSCI ACWI (Net Returns) posted a +3.59% total return.2 You can find more of the Fund’s performance data in the Performance Summary beginning on page 18.
Performance data represent past performance, which does not guarantee future results. Investment return and principal value will fluctuate, and you may have a gain or loss when you sell your shares. Current performance may differ from figures shown. For most recentmonth-end performance, go tofranklintempleton.com or call(800)342-5236.
Investment Strategy
The Fund, using a passive or indexing investment approach, seeks investment results that closely correspond, before fees
|
| Geographic Composition* |
|
| Based on Total Net Assets as of 9/30/19 |
|
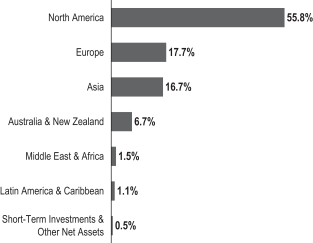 |
*Figures are stated as a percentage of total and may not equal 100% or may be negative due to rounding, use of derivatives, unsettled trades or other factors.
and expenses, to the performance of the LibertyQ Global Equity Index. The investment manager seeks to achieve, over time, a correlation between the Fund’s performance, before fees and expenses, and that of the Underlying Index of 0.95 or better. A figure of 1.00 would indicate perfect correlation. The Fund’s intention is to replicate the component securities of the Underlying Index as closely as possible. However, under various circumstances, it may not be possible or practicable to replicate the Underlying Index. In these circumstances, the Fund may use a “representative sampling” strategy whereby the Fund would invest in what it believes to be a representative sample of the component securities of the Underlying Index, but may not track the Underlying Index with the same degree of accuracy as would an investment vehicle replicating the entire Underlying Index. The Fund’s portfolio is reconstituted semiannually following the semiannual reconstitution of the Underlying Index.
1. The LibertyQ Global Equity Index is a systematic, rules-based proprietary index that is owned and calculated by MSCI Inc. (MSCI). It is based on the MSCI ACWI using a methodology developed with Franklin Templeton to reflect Franklin Templeton’s desired investment strategy. The MSCI ACWI is a free float-adjusted market capitalization-weighted index that is designed to measure the equity market performance of developed and emerging markets.
2. Source: FactSet.
The indexes are unmanaged and include reinvestment of any income or distributions (after the deduction of certain withholding taxes). They do not reflect any fees, expenses or sales charges. One cannot invest directly in an index.
See www.franklintempletondatasources.com for additional data provider information.
The dollar value, number of shares or principal amount, and names of all portfolio holdings are listed in the Fund’s Statement of Investments (SOI). The SOI begins on page 42.
| | | | | | |
| | | |
| franklintempleton.com | | Semiannual Report | | | 15 | |
FRANKLIN LIBERTYQ GLOBAL EQUITY ETF
| | | | |
| Top 10 Sectors/Industries | | | |
| |
| 9/30/19 | | | |
| |
| | | % of Total
Net Assets | |
Pharmaceuticals | | | 7.9% | |
Semiconductors & Semiconductor Equipment | | | 6.8% | |
Specialty Retail | | | 5.1% | |
Banks | | | 4.9% | |
Oil, Gas & Consumable Fuels | | | 4.6% | |
IT Services | | | 4.5% | |
Diversified Telecommunication Services | | | 4.3% | |
Biotechnology | | | 3.7% | |
Metals & Mining | | | 3.3% | |
Technology Hardware, Storage & Peripherals | | | 2.9% | |
| | | | |
| Top 10 Countries | | | |
| |
| 9/30/19 | | | |
| |
| | | % of Total
Net Assets | |
United States | | | 53.2% | |
United Kingdom | | | 6.9% | |
Australia | | | 6.5% | |
Japan | | | 5.0% | |
China | | | 2.9% | |
Switzerland | | | 2.7% | |
South Korea | | | 2.7% | |
Canada | | | 2.6% | |
Taiwan | | | 2.3% | |
Russia | | | 2.1% | |
| | | | |
| Top 10 Holdings | | | |
| |
| 9/30/19 | | | |
| |
Company Sector/Industry, Country | | % of Total
Net Assets | |
The Home Depot Inc. Specialty Retail, United States | | | 1.2% | |
AT&T Inc. Diversified Telecommunication Services,United States | | | 1.1% | |
Texas Instruments Inc. Semiconductors & Semiconductor Equipment,United States | | | 1.1% | |
Apple Inc. Technology Hardware, Storage & Peripherals,United States | | | 1.1% | |
Samsung Electronics Co. Ltd. Technology Hardware, Storage & Peripherals,South Korea | | | 1.1% | |
The Procter & Gamble Co. Household Products, United States | | | 1.1% | |
Amgen Inc. Biotechnology, United States | | | 1.1% | |
Intel Corp. Semiconductors & Semiconductor Equipment, United States | | | 1.1% | |
Starbucks Corp. Hotels, Restaurants & Leisure, United States | | | 1.1% | |
| Taiwan Semiconductor Manufacturing Co. Ltd.Semiconductors & Semiconductor Equipment, Taiwan | | | 1.1% | |
| | | | |
| | | |
| 16 | | Semiannual Report | | franklintempleton.com |
FRANKLIN LIBERTYQ GLOBAL EQUITY ETF
Thank you for your participation in Franklin LibertyQ Global Equity ETF. We look forward to serving your future investment needs.
| | |
| |
Dina Ting, CFA |
| | |
| |
Louis Hsu, CFA |
| |
| | Portfolio Management Team |
The foregoing information reflects our analysis, opinions and portfolio holdings as of September 30, 2019, the end of the reporting period. These opinions may not be relied upon as investment advice or an offer for a particular security. The information is not a complete analysis of every aspect of any market, country, industry, security or the Fund. Statements of fact are from sources considered reliable, but the investment manager makes no representation or warranty as to their completeness or accuracy. Although historical performance is no guarantee of future results, these insights may help you understand our investment management philosophy.
| | | | | | |
| | | |
| franklintempleton.com | | Semiannual Report | | | 17 | |
FRANKLIN LIBERTYQ GLOBAL EQUITY ETF
Performance Summary as of September 30, 2019
Total return reflects reinvestment of the Fund’s dividends and capital gain distributions, if any, and any unrealized gains or losses. Total returns do not include brokerage commissions that may be payable on secondary market transactions. The performance table does not reflect any taxes that a shareholder would pay on Fund dividends, capital gain distributions, if any, or any realized gains on the sale of Fund shares.
Net asset value or “NAV” is the value of one share of a fund as calculated in accordance with the standard formula for valuing mutual fund shares. The price used to calculate market return (Market Price) is determined by using the midpoint between the highest bid and the lowest offer on the primary stock exchange on which shares of a fund are listed for trading, as of the time that such fund’s NAV is calculated. Since shares of the Fund did not trade in the secondary market until after the Fund’s inception, for the period from inception to the first day of secondary trading (6/3/16), the NAV of the Fund is used as a proxy for the Market Price to calculate market returns. Market and NAV returns assume that dividends and capital gain distributions have been reinvested at Market Price and NAV.
Your dividend income will vary depending on dividends or interest paid by securities in the Fund’s portfolio, adjusted for operating expenses. Capital gain distributions are net profits realized from the sale of portfolio securities.
Performance as of 9/30/191
| | | | | | | | | | | | | | | | |
| | |
| | | Cumulative Total Return2 | | | Average Annual Total Return2 | |
| | | Based on
NAV3 | | | Based on
market price4 | | | Based on
NAV3 | | | Based on
market price4 | |
6-Months | | | +3.70% | | | | +3.89% | | | | +3.70% | | | | +3.89% | |
1-Year | | | +4.33% | | | | +4.49% | | | | +4.33% | | | | +4.49% | |
3-Year | | | +31.03% | | | | +30.17% | | | | +9.43% | | | | +9.19% | |
Since Inception (6/1/16) | | | +36.93% | | | | +37.16% | | | | +9.89% | | | | +9.95% | |
Performance data represent past performance, which does not guarantee future results. Investment return and principal value will fluctuate, and you may have a gain or loss when you sell your shares. Current performance may differ from figures shown. For most recentmonth-end performance, go tofranklintempleton.com or call(800)342-5236.
See page 19 for Performance Summary footnotes.
| | | | |
| | | |
| 18 | | Semiannual Report | | franklintempleton.com |
FRANKLIN LIBERTYQ GLOBAL EQUITY ETF
PERFORMANCE SUMMARY
Distributions(4/1/19–9/30/19)
|
|
Net Investment
Income |
$0.4684 |
Total Annual Operating Expenses5
All investments involve risks, including possible loss of principal. Stock prices fluctuate, sometimes rapidly and dramatically, due to factors affecting individual companies, particular industries or sectors, or general market conditions. Special risks are associated with foreign investing, including currency fluctuations, economic instability and political developments; investments in emerging markets involve heightened risks related to the same factors. To the extent the Fund focuses on particular countries, regions, industries, sectors or types of investment from time to time, it may be subject to greater risks of adverse developments in such areas of focus than a fund that invests in a wider variety of countries, regions, industries, sectors or investments. There can be no assurance that the Fund’s multi-factor stock selection process will enhance performance. Exposure to such investment factors may detract from performance in some market environments, perhaps for extended periods. Performance of the Fund may vary significantly from the performance of an index, as a result of transaction costs, expenses and other factors. The Fund’s prospectus also includes a description of the main investment risks.
ETFs trade like stocks, fluctuate in market value and may trade at prices above or below their net asset value. Brokerage commissions and ETF expenses will reduce returns.
1. Effective December 1, 2017, the Fund adopted a unified fee structure whereby Management has agreed to reimburse the Fund’s acquired fund fees and expenses (if any) and pay all of the ordinary operating expenses of the Fund, including custody, transfer agency, and Trustee fees and expenses, among others, but excluding: (i) payments under the Fund’s Rule12b-1 plan (if any); (ii) brokerage expenses (including any costs incidental to transactions in portfolio securities or instruments); (iii) taxes; (iv) interest (including borrowing costs and dividend expenses on securities sold short and overdraft charges); (v) litigation expenses (including litigation to which the Trust or a Fund may be a party and indemnification of the Trustees and officers with respect thereto); and (vi) othernon-routine or extraordinary expenses.
2. Total return calculations represent the cumulative and average annual changes in value of an investment over the periods indicated. Return for less than one year, if any, has not been annualized.
3. Assumes reinvestment of distributions based on net asset value.
4. Assumes reinvestment of distributions based on market price.
5. Figures are as stated in the Fund’s current prospectus and may differ from the expense ratios disclosed in the Your Fund’s Expenses and Financial Highlights sections in this report. In periods of market volatility, assets may decline significantly, causing total annual Fund operating expenses to become higher than the figures shown.
| | | | | | |
| | | |
| franklintempleton.com | | Semiannual Report | | | 19 | |
FRANKLIN LIBERTYQ GLOBAL EQUITY ETF
Your Fund’s Expenses
As a Fund shareholder, you can incur two types of costs: (1) transaction costs, including brokerage commissions on purchases and sales of Fund shares; and (2) ongoing Fund costs, including management fees and other Fund expenses. All funds have ongoing costs, sometimes referred to as operating expenses. The table below shows ongoing costs of investing in the Fund and can help you understand these costs and compare them with those of other funds. The table assumes a $1,000 investment held for the six months indicated.
Actual Fund Expenses
The table below provides information about actual account values and actual expenses in the columns under the heading “Actual.” In these columns the Fund’s actual return, which includes the effect of Fund expenses, is used to calculate the “Ending Account Value” for each class of shares. You can estimate the expenses you paid during the period by following these steps (of course, your account value and expenses will differ from those in this illustration):Divide your account value by $1,000 (if your account had an $8,600 value, then $8,600÷ $1,000 = 8.6).Then multiply the result by the number in the row for your class of shares under the headings “Actual” and “Expenses Paid During Period” (if Actual Expenses Paid During Period were $7.50, then 8.6 x $7.50 = $64.50).In this illustration, the actual expenses paid this period are $64.50.
Hypothetical Example for Comparison with Other Funds
Under the heading “Hypothetical” in the table, information is provided about hypothetical account values and hypothetical expenses based on the Fund’s actual expense ratio and an assumed rate of return of 5% per year before expenses, which is not the Fund’s actual return. This information may not be used to estimate the actual ending account balance or expenses you paid for the period, but it can help you compare ongoing costs of investing in the Fund with those of other funds. To do so, compare this 5% hypothetical example for the class of shares you hold with the 5% hypothetical examples that appear in the shareholder reports of other funds.
Please note that expenses shown in the table are meant to highlight ongoing costs and do not reflect any transactional costs.Therefore, information under the heading “Hypothetical” is useful in comparing ongoing costs only, and will not help you compare total costs of owning different funds. In addition, if transactional costs were included, your total costs would have been higher.
| | | | | | | | | | | | | | | | | | | | | | |
| | | | Actual
(actual return after expenses) | | | Hypothetical (5% annual return before expenses) | | | | |
| | | | | |
Beginning
Account
Value 4/1/19 | | | Ending
Account
Value 9/30/19 | | | Expenses
Paid During
Period
4/1/19–9/30/191,2 | | | Ending
Account
Value 9/30/19 | | | Expenses
Paid During
Period
4/1/19–9/30/191,2 | | | Net Annualized
Expense Ratio2 | |
| | $1,000.00 | | | $ | 1,037.00 | | | $ | 1.73 | | | $ | 1,023.30 | | | $ | 1.72 | | | | 0.34 | % |
1. Expenses are equal to the annualized expense ratio for thesix-month period as indicated above—in the far right column—multiplied by the simple average account value over the period indicated, and then multiplied by 183/366 to reflect theone-half year period.
2. Reflects expenses after fee waivers and expense reimbursements.
| | | | |
| | | |
| 20 | | Semiannual Report | | franklintempleton.com |
Franklin LibertyQ International Equity Hedged ETF
This semiannual report for Franklin LibertyQ International Equity Hedged ETF covers the period ended September 30, 2019.
Your Fund’s Goal and Main Investments
The Fund seeks to provide investment results that closely correspond, before fees and expenses, to the performance of the LibertyQ International Equity Hedged Index (the Underlying Index).1Under normal market conditions, the Fund invests at least 80% of its assets in the component securities of the Underlying Index and in depositary receipts representing such securities. The Underlying Index includes stocks from developed market countries in Europe, Australasia and the Far East (EAFE) that have favorable exposure to four investment-style factors: quality, value, momentum and low volatility, subject to a maximum 2% per company weighting. The Underlying Index seeks to achieve a lower level of risk and higher risk-adjusted performance than the MSCI EAFE Index over the long term by selecting equity securities from the MSCI EAFE Index that have exposure to these investment-style factors. The Underlying Index incorporates a hedge againstnon-U.S. currency fluctuations by reflecting the impact of rolling monthly currency forward contracts on the currencies represented in the Underlying Index. In order to replicate the hedge impact incorporated in the calculation of the Underlying Index, the Fund intends to enter into monthly foreign currency forward contracts designed to offset the Fund’s exposure to the component currencies of the Underlying Index.
What is a currency forward contract?
A currency forward contract is an agreement between the Fund and a counterparty to buy or sell a foreign currency in exchange for another currency at a specific exchange rate on a future date. Currency forward contracts are privately traded in the interbank market, not on a centralized exchange.
Performance Overview
During the six-month period, the Fund posted cumulative total returns of +6.20% based on market price and +6.11%
|
| Geographic Composition* |
|
| Based on Total Net Assets as of 9/30/19 |
|
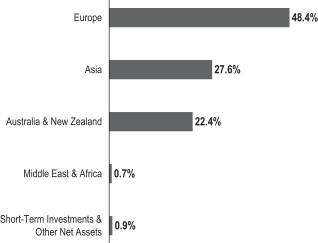 |
*Figures are stated as a percentage of total and may not equal 100% or may be negative due to rounding, use of derivatives, unsettled trades or other factors.
based on net asset value (NAV). In comparison, LibertyQ International Equity Hedged Index posted a +6.35% total return for the same period, while the MSCI EAFE 100% Hedged to USD Index (Net Returns) posted a +5.89% total return.2 You can find more of the Fund’s performance data in the Performance Summary beginning on page 24.
Performance data represent past performance, which does not guarantee future results. Investment return and principal value will fluctuate, and you may have a gain or loss when you sell your shares. Current performance may differ from figures shown. For most recentmonth-end performance, go tofranklintempleton.com or call(800)342-5236.
Investment Strategy
The Fund, using a passive or indexing investment approach, seeks investment results that closely correspond, before fees and expenses, to the performance of the LibertyQ International Equity Hedged Index. The investment manager seeks to achieve, over time, a correlation between the Fund’s performance, before fees and expenses, and that of the
1. The LibertyQ International Equity Hedged Index is a systematic, rules-based proprietary index that is owned and calculated by MSCI Inc. (MSCI). It is based on the MSCI EAFE Index using a methodology developed with Franklin Templeton to reflect Franklin Templeton’s desired investment strategy. The MSCI EAFE Index is a free float-adjusted market capitalization-weighted index that is designed to measure the equity market performance of developed markets, excluding the U.S. and Canada.
2. Source: FactSet.
The indexes are unmanaged and include reinvestment of any income or distributions (after the deduction of certain withholding taxes). They do not reflect any fees, expenses or sales charges. One cannot invest directly in an index.
See www.franklintempletondatasources.com for additional data provider information.
The dollar value, number of shares or principal amount, and names of all portfolio holdings are listed in the Fund’s Statement of Investments (SOI). The SOI begins on page 58.
| | | | | | |
| | | |
| franklintempleton.com | | Semiannual Report | | | 21 | |
FRANKLIN LIBERTYQ INTERNATIONAL EQUITY HEDGED ETF
| | | | |
| Top 10 Sectors/Industries | | | |
| |
| 9/30/19 | | | |
| |
| | | % of Total
Net Assets | |
Pharmaceuticals | | | 9.9% | |
Banks | | | 9.2% | |
Metals & Mining | | | 7.3% | |
Insurance | | | 5.1% | |
Automobiles | | | 4.9% | |
Personal Products | | | 4.8% | |
Diversified Telecommunication Services | | | 4.5% | |
Electric Utilities | | | 3.4% | |
Oil, Gas & Consumable Fuels | | | 3.3% | |
Wireless Telecommunication Services | | | 3.1% | |
| | | | |
| Top 10 Countries | | | |
| |
| 9/30/19 | | | |
| |
| | | % of Total
Net Assets | |
United Kingdom | | | 22.2% | |
Australia | | | 22.0% | |
Japan | | | 21.6% | |
Switzerland | | | 5.6% | |
France | | | 4.4% | |
Hong Kong | | | 3.8% | |
Denmark | | | 3.2% | |
Spain | | | 3.2% | |
Italy | | | 2.3% | |
Germany | | | 2.0% | |
| | | | |
| Top 10 Holdings | | | |
| |
| 9/30/19 | | | |
| |
Company Sector/Industry, Country | | % of Total
Net Assets | |
Toyota Motor Corp. Automobiles, Japan | | | 2.2% | |
CSL Ltd. Biotechnology, Australia | | | 2.2% | |
Roche Holding AG Pharmaceuticals, Switzerland | | | 2.2% | |
Novo Nordisk AS, B Pharmaceuticals, Denmark | | | 2.2% | |
GlaxoSmithKline PLC Pharmaceuticals, United Kingdom | | | 2.1% | |
Commonwealth Bank of Australia Banks, Australia | | | 2.1% | |
Westpac Banking Corp. Banks, Australia | | | 2.0% | |
Unilever NV, IDR Personal Products, United Kingdom | | | 1.9% | |
Unilever PLC Personal Products, United Kingdom | | | 1.9% | |
Sanofi Pharmaceuticals, France | | | 1.9% | |
Underlying Index of 0.95 or better. A figure of 1.00 would indicate perfect correlation. The Fund’s intention is to replicate the component securities of the Underlying Index as closely as possible. However, under various circumstances, it may not be possible or practicable to replicate the Underlying Index. In these circumstances, the Fund may use a “representative sampling” strategy whereby the Fund would invest in what it believes to be a representative sample of the component securities of the Underlying Index, but may not track the Underlying Index with the same degree of accuracy as would an investment vehicle replicating the entire Underlying Index. The Fund’s portfolio is reconstituted semiannually following the semiannual reconstitution of the Underlying Index.
| | | | |
| | | |
| 22 | | Semiannual Report | | franklintempleton.com |
FRANKLIN LIBERTYQ INTERNATIONAL EQUITY HEDGED ETF
Thank you for your participation in Franklin LibertyQ International Equity Hedged ETF. We look forward to serving your future investment needs.
| | |
| |
Dina Ting, CFA |
| | |
| |
Louis Hsu, CFA |
| |
| | Portfolio Management Team |
The foregoing information reflects our analysis, opinions and portfolio holdings as of September 30, 2019, the end of the reporting period. These opinions may not be relied upon as investment advice or an offer for a particular security. The information is not a complete analysis of every aspect of any market, country, industry, security or the Fund. Statements of fact are from sources considered reliable, but the investment manager makes no representation or warranty as to their completeness or accuracy. Although historical performance is no guarantee of future results, these insights may help you understand our investment management philosophy.
| | | | | | |
| | | |
| franklintempleton.com | | Semiannual Report | | | 23 | |
FRANKLIN LIBERTYQ INTERNATIONAL EQUITY HEDGED ETF
Performance Summary as of September 30, 2019
Total return reflects reinvestment of the Fund’s dividends and capital gain distributions, if any, and any unrealized gains or losses. Total returns do not include brokerage commissions that may be payable on secondary market transactions. The performance table does not reflect any taxes that a shareholder would pay on Fund dividends, capital gain distributions, if any, or any realized gains on the sale of Fund shares.
Net asset value or “NAV” is the value of one share of a fund as calculated in accordance with the standard formula for valuing mutual fund shares. The price used to calculate market return (Market Price) is determined by using the midpoint between the highest bid and the lowest offer on the primary stock exchange on which shares of a fund are listed for trading, as of the time that such fund’s NAV is calculated. Since shares of the Fund did not trade in the secondary market until after the Fund’s inception, for the period from inception to the first day of secondary trading (6/3/16), the NAV of the Fund is used as a proxy for the Market Price to calculate market returns. Market and NAV returns assume that dividends and capital gain distributions have been reinvested at Market Price and NAV.
Your dividend income will vary depending on dividends or interest paid by securities in the Fund’s portfolio, adjusted for operating expenses. Capital gain distributions are net profits realized from the sale of portfolio securities.
Performance as of 9/30/191
| | | | | | | | | | | | | | | | |
| | |
| | | Cumulative Total Return2 | | | Average Annual Total Return2 | |
| | | Based on
NAV3 | | | Based on
market price4 | | | Based on
NAV3 | | | Based on
market price4 | |
6-Months | | | +6.11% | | | | +6.20% | | | | +6.11% | | | | +6.20% | |
1-Year | | | +7.07% | | | | +8.16% | | | | +7.07% | | | | +8.16% | |
3-Year | | | +26.10% | | | | +26.14% | | | | +8.04% | | | | +8.05% | |
Since Inception (6/1/16) | | | +27.89% | | | | +28.72% | | | | +7.66% | | | | +7.87% | |
Performance data represent past performance, which does not guarantee future results. Investment return and principal value will fluctuate, and you may have a gain or loss when you sell your shares. Current performance may differ from figures shown. For most recentmonth-end performance, go tofranklintempleton.com or call(800)342-5236.
See page 25 for Performance Summary footnotes.
| | | | |
| | | |
| 24 | | Semiannual Report | | franklintempleton.com |
FRANKLIN LIBERTYQ INTERNATIONAL EQUITY HEDGED ETF
PERFORMANCE SUMMARY
Distributions(4/1/19–9/30/19)
|
|
Net Investment
Income |
$0.1917 |
Total Annual Operating Expenses5
All investments involve risks, including possible loss of principal. Stock prices fluctuate, sometimes rapidly and dramatically, due to factors affecting individual companies, particular industries or sectors, or general market conditions. Special risks are associated with foreign investing, including currency fluctuations, economic instability and political developments; investments in emerging markets involve heightened risks related to the same factors. To the extent the Fund focuses on particular countries, regions, industries, sectors or types of investment from time to time, it may be subject to greater risks of adverse developments in such areas of focus than a fund that invests in a wider variety of countries, regions, industries, sectors or investments. The Fund will attempt to hedge the currency exposure of non-U.S. dollar denominated securities held in its portfolio by investing in foreign currency forward contracts. Foreign currency forward contracts do not eliminate movements in the value of non-U.S. currencies and securities but rather allow the Fund to establish a fixed rate of exchange for a future point in time. Investments in derivatives involve costs and create economic leverage, which may result in significant volatility and cause the Fund to participate in losses (as well as gains) that significantly exceed the Fund’s initial investment. Currency management strategies could result in losses to the Fund if currencies do not perform as the investment manager expects. There can be no assurance that the Fund’s multi-factor stock selection process will enhance performance. Exposure to such investment factors may detract from performance in some market environments, perhaps for extended periods. Performance of the Fund may vary significantly from the performance of an index, as a result of transaction costs, expenses and other factors. The Fund’s prospectus also includes a description of the main investment risks.
ETFs trade like stocks, fluctuate in market value and may trade at prices above or below their net asset value. Brokerage commissions and ETF expenses will reduce returns.
1. Effective December 1, 2017, the Fund adopted a unified fee structure whereby Management has agreed to reimburse the Fund’s acquired fund fees and expenses (if any) and pay all of the ordinary operating expenses of the Fund, including custody, transfer agency, and Trustee fees and expenses, among others, but excluding: (i) payments under the Fund’s Rule12b-1 plan (if any); (ii) brokerage expenses (including any costs incidental to transactions in portfolio securities or instruments); (iii) taxes; (iv) interest (including borrowing costs and dividend expenses on securities sold short and overdraft charges); (v) litigation expenses (including litigation to which the Trust or a Fund may be a party and indemnification of the Trustees and officers with respect thereto); and (vi) othernon-routine or extraordinary expenses.
2. Total return calculations represent the cumulative and average annual changes in value of an investment over the periods indicated. Return for less than one year, if any, has not been annualized.
3. Assumes reinvestment of distributions based on net asset value.
4. Assumes reinvestment of distributions based on market price.
5. Figures are as stated in the Fund’s current prospectus and may differ from the expense ratios disclosed in the Your Fund’s Expenses and Financial Highlights sections in this report. In periods of market volatility, assets may decline significantly, causing total annual Fund operating expenses to become higher than the figures shown.
| | | | | | |
| | | |
| franklintempleton.com | | Semiannual Report | | | 25 | |
FRANKLIN LIBERTYQ INTERNATIONAL EQUITY HEDGED ETF
Your Fund’s Expenses
As a Fund shareholder, you can incur two types of costs: (1) transaction costs, including brokerage commissions on purchases and sales of Fund shares; and (2) ongoing Fund costs, including management fees and other Fund expenses. All funds have ongoing costs, sometimes referred to as operating expenses. The table below shows ongoing costs of investing in the Fund and can help you understand these costs and compare them with those of other funds. The table assumes a $1,000 investment held for the six months indicated.
Actual Fund Expenses
The table below provides information about actual account values and actual expenses in the columns under the heading “Actual.” In these columns the Fund’s actual return, which includes the effect of Fund expenses, is used to calculate the “Ending Account Value” for each class of shares. You can estimate the expenses you paid during the period by following these steps (of course, your account value and expenses will differ from those in this illustration):Divide your account value by $1,000 (if your account had an $8,600 value, then $8,600÷ $1,000 = 8.6).Then multiply the result by the number in the row for your class of shares under the headings “Actual” and “Expenses Paid During Period” (if Actual Expenses Paid During Period were $7.50, then 8.6 x $7.50 = $64.50).In this illustration, the actual expenses paid this period are $64.50.
Hypothetical Example for Comparison with Other Funds
Under the heading “Hypothetical” in the table, information is provided about hypothetical account values and hypothetical expenses based on the Fund’s actual expense ratio and an assumed rate of return of 5% per year before expenses, which is not the Fund’s actual return. This information may not be used to estimate the actual ending account balance or expenses you paid for the period, but it can help you compare ongoing costs of investing in the Fund with those of other funds. To do so, compare this 5% hypothetical example for the class of shares you hold with the 5% hypothetical examples that appear in the shareholder reports of other funds.
Please note that expenses shown in the table are meant to highlight ongoing costs and do not reflect any transactional costs.Therefore, information under the heading “Hypothetical” is useful in comparing ongoing costs only, and will not help you compare total costs of owning different funds. In addition, if transactional costs were included, your total costs would have been higher.
| | | | | | | | | | | | | | | | | | | | | | |
| | | | Actual (actual return after expenses) | | | Hypothetical (5% annual return before expenses) | | | | |
| | | | | |
Beginning
Account
Value 4/1/19 | | | Ending
Account
Value 9/30/19 | | | Expenses
Paid During
Period
4/1/19–9/30/191,2 | | | Ending
Account
Value 9/30/19 | | | Expenses
Paid During
Period
4/1/19–9/30/191,2 | | | Net Annualized
Expense Ratio2 | |
| | $1,000.00 | | | $ | 1,061.10 | | | $ | 2.06 | | | $ | 1,023.00 | | | $ | 2.02 | | | | 0.40 | % |
1. Expenses are equal to the annualized expense ratio for thesix-month period as indicated above—in the far right column—multiplied by the simple average account value over the period indicated, and then multiplied by 183/366 to reflect theone-half year period.
2. Reflects expenses after fee waivers and expense reimbursements.
| | | | |
| | | |
| 26 | | Semiannual Report | | franklintempleton.com |
FRANKLIN TEMPLETON ETF TRUST
Financial Highlights
Franklin LibertyQ Emerging Markets ETF
| | | | | | | | | | | | | | | | |
| | | Six Months Ended
September 30, 2019
(unaudited) | | | Year Ended March 31, | |
| | | 2019 | | | 2018 | | | 2017a | |
| | | | |
Per share operating performance (for a share outstanding throughout the period) | | | | | | | | | | | | | | | | |
| | | | |
Net asset value, beginning of period | | $ | 29.70 | | | $ | 33.41 | | | $ | 29.29 | | | $ | 25.66 | |
| | | | |
| | | | |
| Income from investment operationsb: | | | | | | | | | | | | | | | | |
| | | | |
Net investment incomec | | | 0.78 | | | | 1.14 | | | | 0.83 | | | | 0.47 | |
| | | | |
Net realized and unrealized gains (losses) | | | (1.19 | ) | | | (3.76 | ) | | | 4.15 | | | | 3.25 | |
| | | | |
| | | | |
Total from investment operations | | | (0.41 | ) | | | (2.62 | ) | | | 4.98 | | | | 3.72 | |
| | | | |
| | | | |
Less distributions from net investment income | | | (0.29 | ) | | | (1.09 | ) | | | (0.86 | ) | | | (0.09 | ) |
| | | | |
| | | | |
Net asset value, end of period | | $ | 29.00 | | | $ | 29.70 | | | $ | 33.41 | | | $ | 29.29 | |
| | | | |
| | | | |
Total returnd | | | (1.40)% | | | | (7.70)% | | | | 17.20% | | | | 14.55% | |
| | | | |
| Ratios to average net assetse | | | | | | | | | | | | | | | | |
| | | | |
Expenses before waiver and payments by affiliates | | | 0.52% | | | | 0.55% | | | | 0.69% | f | | | 0.75% | |
| | | | |
Expenses net of waiver and payments by affiliates | | | 0.52% | | | | 0.55% | | | | 0.54% | f | | | 0.55% | |
| | | | |
Net investment income | | | 5.33% | | | | 3.75% | | | | 2.61% | | | | 2.09% | |
| | | | |
| Supplemental data | | | | | | | | | | | | | | | | |
| | | | |
Net assets, end of period (000’s) | | | $336,441 | | | | $344,484 | | | | $400,908 | | | | $328,086 | |
| | | | |
Portfolio turnover rateg | | | 23.73% | | | | 52.42% | | | | 32.87% | | | | 31.66% | |
| | | | |
| Portfolio turnover rate excluding portfolio transactions that are executed as a result of the Fund offering and redeeming Creation Units solely or in part for cashg,h | | | 21.90% | | | | —% | | | | —% | | | | —% | |
aFor the period June 1, 2016 (commencement of operations) to March 31, 2017.
bThe amount shown for a share outstanding throughout the period may not correlate with the Statement of Operations for the period due to the timing of sales and repurchases of Creation Unit Fund shares in relation to income earned and/or fluctuating fair value of the investments of the Fund.
cBased on average daily shares outstanding.
dTotal return is not annualized for periods less than one year. Total return is calculated assuming an initial investment made at the net asset value at the beginning of the period, reinvestment of all dividends and distributions at net asset value during the period, and redemption at net asset value on the last day of the period.
eRatios are annualized for periods less than one year.
fEffective December 1, 2017, the Fund replaced the prior fee structure with a unified management fee. See Note 3(a).
gPortfolio turnover rate excludes the value of portfolio securities received or delivered as a result of processing capital share transactions in Creation Units, if any.
hEffective September 30, 2019.
| | | | | | |
| | | |
| franklintempleton.com | | The accompanying notes are an integral part of these financial statements. | Semiannual Report | | | 27 | |
FRANKLIN TEMPLETON ETF TRUST
Statement of Investments, September 30, 2019 (unaudited)
Franklin LibertyQ Emerging Markets ETF
| | | | | | | | | | | | | | |
| | | | |
| | | | | Industry | | | Shares | | | Value | |
| | | Common Stocks 95.6% | | | | | | | | | |
| | | Argentina 0.0%† | | | | | | | | | |
| | Transportadora de Gas del Sur SA, B, ADR | | | Oil, Gas & Consumable Fuels | | | | 15,718 | | | $ | 133,446 | |
| | | | | | | | | | | | | | |
| | | Brazil 4.1% | | | | | | | | | |
| | Banco Santander Brasil SA | | | Banks | | | | 75,400 | | | | 820,541 | |
| | BB Seguridade Participacoes SA | | | Insurance | | | | 417,600 | | | | 3,511,914 | |
| | Cielo SA | | | IT Services | | | | 551,000 | | | | 1,058,242 | |
| | Companhia de Saneamento Basico do Estado de Sao Paulo | | | Water Utilities | | | | 133,400 | | | | 1,588,477 | |
| | Cosan SA | | | Oil, Gas & Consumable Fuels | | | | 29,000 | | | | 370,385 | |
| | Engie Brasil SA | | | Independent Power and Renewable Electricity Producers | | | | 104,400 | | | | 1,112,574 | |
| | Hypera SA | | | Pharmaceuticals | | | | 63,800 | | | | 513,567 | |
| | IRB Brasil Resseguros SA | | | Insurance | | | | 165,300 | | | | 1,494,502 | |
| | Lojas Renner SA | | | Multiline Retail | | | | 139,200 | | | | 1,686,615 | |
| | M. Dias Branco SA | | | Food Products | | | | 40,600 | | | | 341,144 | |
| | Petrobras Distribuidora SA | | | Specialty Retail | | | | 75,400 | | | | 498,334 | |
| | Porto Seguro SA | | | Insurance | | | | 17,400 | | | | 245,999 | |
| | Tim Participacoes SA | | | Wireless Telecommunication Services | | | | 145,000 | | | | 414,594 | |
| | | | | | | | | | | | | | |
| | | | |
| | | | | | | | | | | | | 13,656,888 | |
| | | | | | | | | | | | | | |
| | | Chile 0.7% | | | | | | | | | |
| | Aguas Andinas SA, A | | | Water Utilities | | | | 1,139,294 | | | | 623,932 | |
| | Colbun SA | | | Independent Power and Renewable Electricity Producers | | | | 1,436,080 | | | | 259,348 | |
| | Compania Cervecerias Unidas SA | | | Beverages | | | | 52,664 | | | | 589,056 | |
| | Enel Chile SA | | | Electric Utilities | | | | 10,992,102 | | | | 951,425 | |
| | | | | | | | | | | | | | |
| | | | |
| | | | | | | | | | | | | 2,423,761 | |
| | | | | | | | | | | | | | |
| | | China 18.2% | | | | | | | | | |
| | Agricultural Bank of China Ltd., A | | | Banks | | | | 261,000 | | | | 126,458 | |
| | Agricultural Bank of China Ltd., H | | | Banks | | | | 7,424,000 | | | | 2,907,325 | |
| | Anhui Conch Cement Co. Ltd., A | | | Construction Materials | | | | 40,600 | | | | 235,031 | |
| | Anhui Conch Cement Co. Ltd., H | | | Construction Materials | | | | 421,000 | | | | 2,499,879 | |
| | Anta Sports Products Ltd. | | | Textiles, Apparel & Luxury Goods | | | | 452,200 | | | | 3,740,742 | |
| a | | Anxin Trust Co. Ltd. | | | Capital Markets | | | | 29,000 | | | | 19,127 | |
| | Bank of Beijing Co. Ltd., A | | | Banks | | | | 110,200 | | | | 82,713 | |
| | Bank of China Ltd., A | | | Banks | | | | 104,400 | | | | 52,337 | |
| | Bank of China Ltd., H | | | Banks | | | | 7,308,000 | | | | 2,871,220 | |
| | Bank of Communications Co. Ltd., A | | | Banks | | | | 301,600 | | | | 230,174 | |
| | Bank of Communications Co. Ltd., H | | | Banks | | | | 3,306,000 | | | | 2,159,186 | |
| | Bank of Hangzhou Co. Ltd. | | | Banks | | | | 29,000 | | | | 34,315 | |
| | Baoshan Iron & Steel Co. Ltd., A | | | Metals & Mining | | | | 98,600 | | | | 81,601 | |
| | China Cinda Asset Management Co. Ltd., H | | | Capital Markets | | | | 2,610,000 | | | | 512,718 | |
| | China CITIC Bank Corp. Ltd., A | | | Banks | | | | 52,200 | | | | 41,227 | |
| | China CITIC Bank Corp. Ltd., H | | | Banks | | | | 4,292,000 | | | | 2,288,512 | |
| | China Conch Venture Holdings Ltd. | | | Machinery | | | | 522,000 | | | | 1,931,015 | |
| | China Construction Bank Corp., H | | | Banks | | | | 4,118,000 | | | | 3,141,266 | |
| | China Everbright Bank Co. Ltd., A | | | Banks | | | | 150,800 | | | | 83,201 | |
| | China Everbright Bank Co. Ltd., H | | | Banks | | | | 1,450,000 | | | | 617,777 | |
| | China Medical System Holdings Ltd. | | | Pharmaceuticals | | | | 522,000 | | | | 620,588 | |
| | China Minsheng Banking Corp. Ltd., A | | | Banks | | | | 185,600 | | | | 156,460 | |
| | China Minsheng Banking Corp. Ltd., H | | | Banks | | | | 2,494,000 | | | | 1,695,668 | |
| | China Mobile Ltd. | | | Wireless Telecommunication Services | | | | 364,000 | | | | 3,011,123 | |
| | China Oriental Group Co. Ltd. | | | Metals & Mining | | | | 464,000 | | | | 160,400 | |
| | China Petroleum & Chemical Corp., A | | | Oil, Gas & Consumable Fuels | | | | 104,400 | | | | 73,389 | |
| | China Petroleum & Chemical Corp., H | | | Oil, Gas & Consumable Fuels | | | | 4,408,000 | | | | 2,620,262 | |
| | China Resources Cement Holdings Ltd. | | | Construction Materials | | | | 580,000 | | | | 581,524 | |
| | | | |
| | | |
| 28 | | Semiannual Report | | franklintempleton.com |
FRANKLIN TEMPLETON ETF TRUST
STATEMENT OF INVESTMENTS (UNAUDITED)
Franklin LibertyQ Emerging Markets ETF(continued)
| | | | | | | | | | | | | | |
| | | | |
| | | | | Industry | | | Shares | | | Value | |
| | | Common Stocks (continued) | | | | | | | | | |
| | | China (continued) | | | | | | | | | |
| | China Shenhua Energy Co. Ltd., A | | | Oil, Gas & Consumable Fuels | | | | 29,000 | | | $ | 76,264 | |
| | China Shenhua Energy Co. Ltd., H | | | Oil, Gas & Consumable Fuels | | | | 1,421,000 | | | | 2,853,093 | |
| | China South Publishing & Media Group Co. Ltd., A | | | Media | | | | 17,400 | | | | 29,482 | |
| | China Telecom Corp. Ltd., H | | | Diversified Telecommunication Services | | | | 2,320,000 | | | | 1,056,509 | |
| | China Yangtze Power Co. Ltd., A | | | Independent Power and Renewable Electricity Producers | | | | 110,200 | | | | 281,318 | |
| | China Zhongwang Holdings Ltd. | | | Metals & Mining | | | | 278,400 | | | | 113,286 | |
| | Chinese Universe Publishing and Media Group Co. Ltd., A | | | Media | | | | 5,800 | | | | 10,607 | |
| | Chongqing Rural Commercial Bank Co. Ltd., H | | | Banks | | | | 464,000 | | | | 246,815 | |
| | CNOOC Ltd. | | | Oil, Gas & Consumable Fuels | | | | 1,914,000 | | | | 2,920,050 | |
| | Country Garden Services Holdings Co. Ltd. | | | Commercial Services & Supplies | | | | 204,000 | | | | 588,106 | |
| | Dali Foods Group Co. Ltd. | | | Food Products | | | | 783,000 | | | | 480,423 | |
| | Daqin Railway Co. Ltd., A | | | Road & Rail | | | | 139,200 | | | | 147,948 | |
| | Dongfeng Motor Group Co. Ltd., H | | | Automobiles | | | | 1,508,000 | | | | 1,433,094 | |
| a | | Fangda Carbon New Material Co. Ltd. | | | Electrical Equipment | | | | 26,020 | | | | 42,339 | |
| | Focus Media Information Technology Co. Ltd. | | | Media | | | | 133,400 | | | | 98,072 | |
| | Foshan Haitian Flavouring & Food Co. Ltd. | | | Food Products | | | | 17,400 | | | | 267,803 | |
| | Fuyao Glass Industry Group Co. Ltd., A | | | Auto Components | | | | 17,400 | | | | 52,337 | |
| | Guangdong Investment Ltd. | | | Water Utilities | | | | 464,000 | | | | 907,947 | |
| | Guangzhou Automobile Group Co. Ltd., A | | | Automobiles | | | | 23,200 | | | | 39,862 | |
| | Guangzhou Automobile Group Co. Ltd., H | | | Automobiles | | | | 1,452,000 | | | | 1,389,137 | |
| | Hangzhou Robam Appliances Co. Ltd., A | | | Household Durables | | | | 5,800 | | | | 21,361 | |
| | Heilan Home Co. Ltd., A | | | Textiles, Apparel & Luxury Goods | | | | 23,200 | | | | 26,380 | |
| | Henan Shuanghui Investment & Development Co. Ltd. | | | Food Products | | | | 23,200 | | | | 80,244 | |
| | Huayu Automotive Systems Co. Ltd. | | | Auto Components | | | | 23,200 | | | | 76,346 | |
| | Industrial and Commercial Bank of China Ltd., H | | | Banks | | | | 4,698,000 | | | | 3,146,223 | |
| | Industrial Bank Co. Ltd., A | | | Banks | | | | 151,182 | | | | 371,117 | |
| | Jiangsu Expressway Co. Ltd., H | | | Transportation Infrastructure | | | | 580,000 | | | | 736,893 | |
| | Kingboard Holdings Ltd. | | | Electronic Equipment, Instruments & Components | | | | 116,000 | | | | 307,039 | |
| | Kweichow Moutai Co. Ltd., A | | | Beverages | | | | 7,700 | | | | 1,239,988 | |
| b,c | | Longfor Group Holdings Ltd., 144A, Reg S | | | Real Estate Management & Development | | | | 725,000 | | | | 2,709,710 | |
| | Luzhou Laojiao Co. Ltd. | | | Beverages | | | | 5,800 | | | | 69,215 | |
| | Maanshan Iron & Steel Co. Ltd., H | | | Metals & Mining | | | | 696,000 | | | | 261,908 | |
| | Nexteer Automotive Group Ltd. | | | Auto Components | | | | 116,000 | | | | 95,737 | |
| | Nine Dragons Paper Holdings Ltd. | | | Paper & Forest Products | | | | 638,000 | | | | 537,133 | |
| | RiseSun Real Estate Development Co. Ltd. | | | Real Estate Management & Development | | | | 29,000 | | | | 33,625 | |
| | SAIC Motor Corp. Ltd. | | | Automobiles | | | | 40,600 | | | | 135,197 | |
| | Shaanxi Coal Industry Co. Ltd. | | | Oil, Gas & Consumable Fuels | | | | 63,800 | | | | 77,994 | |
| | Shanghai International Airport Co. Ltd., A | | | Transportation Infrastructure | | | | 5,800 | | | | 64,796 | |
| | Shenzhen MindrayBio-Medical Electronics Co. Ltd., A | | | Health Care Equipment & Supplies | | | | 2,000 | | | | 51,661 | |
| | Shenzhen Salubris Pharmaceuticals Co. Ltd. | | | Pharmaceuticals | | | | 5,800 | | | | 15,188 | |
| | Shenzhou International Group Holdings Ltd. | | | Textiles, Apparel & Luxury Goods | | | | 261,000 | | | | 3,409,241 | |
| | | | | | |
| | | |
| franklintempleton.com | | Semiannual Report | | | 29 | |
FRANKLIN TEMPLETON ETF TRUST
STATEMENT OF INVESTMENTS (UNAUDITED)
Franklin LibertyQ Emerging Markets ETF(continued)
| | | | | | | | | | | | | | |
| | | | |
| | | | | Industry | | | Shares | | | Value | |
| | | Common Stocks (continued) | | | | | | | | | |
| | | China (continued) | | | | | | | | | |
| | Sihuan Pharmaceutical Holdings Group Ltd. | | | Pharmaceuticals | | | | 1,508,000 | | | $ | 228,910 | |
| | Sinopec Shanghai Petrochemical Co. Ltd., A | | | Chemicals | | | | 40,600 | | | | 23,708 | |
| | Sinopec Shanghai Petrochemical Co. Ltd., H | | | Chemicals | | | | 1,856,000 | | | | 539,796 | |
| | Weichai Power Co. Ltd., A | | | Machinery | | | | 34,800 | | | | 54,677 | |
| | Weifu High-Technology Group Co. Ltd., A | | | Auto Components | | | | 11,600 | | | | 26,607 | |
| | Wuhu Sanqi Interactive Entertainment Network Technology Group Co. Ltd. | | | Entertainment | | | | 17,400 | | | | 43,931 | |
| | Yuzhou Properties Co. | | | Real Estate Management & Development | | | | 290,000 | | | | 115,417 | |
a | | YY Inc., ADR | | | Interactive Media & Services | | | | 17,458 | | | | 981,663 | |
| | Zhejiang Semir Garment Co. Ltd. | | | Textiles, Apparel & Luxury Goods | | | | 11,600 | | | | 20,077 | |
| | | | | | | | | | | | | | |
| | | | |
| | | | | | | | | | | | | 61,111,512 | |
| | | | | | | | | | | | | | |
| | | Colombia 0.2% | | | | | | | | | |
| | Ecopetrol SA | | | Oil, Gas & Consumable Fuels | | | | 828,472 | | | | 702,609 | |
| | | | | | | | | | | | | | |
| | | Czech Republic 0.2% | | | | | | | | | |
| | Moneta Money Bank AS | | | Banks | | | | 229,100 | | | | 705,777 | |
| | | | | | | | | | | | | | |
| | | Egypt 0.6% | | | | | | | | | |
| | Commercial International Bank Egypt SAE | | | Banks | | | | 247,022 | | | | 1,177,839 | |
| | Eastern Co. SAE | | | Tobacco | | | | 467,422 | | | | 488,794 | |
| | ElSewedy Electric Co. | | | Electrical Equipment | | | | 362,442 | | | | 298,354 | |
| | | | | | | | | | | | | | |
| | | | |
| | | | | | | | | | | | | 1,964,987 | |
| | | | | | | | | | | | | | |
| | | Greece 0.2% | | | | | | | | | |
| | JUMBO SA | | | Specialty Retail | | | | 19,836 | | | | 376,495 | |
| | Motor Oil (Hellas) Corinth Refineries SA | | | Oil, Gas & Consumable Fuels | | | | 12,528 | | | | 292,555 | |
| | | | | | | | | | | | | | |
| | | | |
| | | | | | | | | | | | | 669,050 | |
| | | | | | | | | | | | | | |
| | | Hong Kong 0.2% | | | | | | | | | |
| | Kingboard Laminates Holdings Ltd. | | | Chemicals | | | | 435,000 | | | | 392,307 | |
| | Lee & Man Paper Manufacturing Ltd. | | | Paper & Forest Products | | | | 638,000 | | | | 345,067 | |
| | | | | | | | | | | | | | |
| | | | |
| | | | | | | | | | | | | 737,374 | |
| | | | | | | | | | | | | | |
| | | Hungary 0.5% | | | | | | | | | |
| | MOL Hungarian Oil and Gas PLC | | | Oil, Gas & Consumable Fuels | | | | 169,708 | | | | 1,596,272 | |
| | | | | | | | | | | | | | |
| | | India 11.4% | | | | | | | | | |
| | Bajaj Auto Ltd. | | | Automobiles | | | | 35,728 | | | | 1,483,088 | |
| | Bharat Petroleum Corp. Ltd. | | | Oil, Gas & Consumable Fuels | | | | 327,178 | | | | 2,170,298 | |
| | Bharti Infratel Ltd. | | | Diversified Telecommunication Services | | | | 64,902 | | | | 235,637 | |
| | Britannia Industries Ltd. | | | Food Products | | | | 17,574 | | | | 730,088 | |
| | Coal India Ltd. | | | Oil, Gas & Consumable Fuels | | | | 480,008 | | | | 1,353,623 | |
| | Dabur India Ltd. | | | Personal Products | | | | 207,814 | | | | 1,311,505 | |
| | Eicher Motors Ltd. | | | Automobiles | | | | 5,974 | | | | 1,497,546 | |
| | GAIL India Ltd. | | | Gas Utilities | | | | 272,078 | | | | 516,370 | |
| | HCL Technologies Ltd. | | | IT Services | | | | 218,892 | | | | 3,337,642 | |
| | Hero Motocorp Ltd. | | | Automobiles | | | | 25,230 | | | | 962,918 | |
| | Hindustan Petroleum Corp. Ltd. | | | Oil, Gas & Consumable Fuels | | | | 332,398 | | | | 1,415,072 | |
| | Hindustan Unilever Ltd. | | | Household Products | | | | 139,142 | | | | 3,891,310 | |
| | Indian Oil Corp. Ltd. | | | Oil, Gas & Consumable Fuels | | | | 773,778 | | | | 1,609,381 | |
| | Infosys Ltd. | | | IT Services | | | | 318,304 | | | | 3,618,540 | |
| | ITC Ltd. | | | Tobacco | | | | 794,310 | | | | 2,912,445 | |
| | Marico Ltd. | | | Personal Products | | | | 179,278 | | | | 997,341 | |
| | Nestle India Ltd. | | | Food Products | | | | 9,628 | | | | 1,887,002 | |
| | Oil & Natural Gas Corp. Ltd. | | | Oil, Gas & Consumable Fuels | | | | 473,396 | | | | 880,410 | |
| | Page Industries Ltd. | | | Textiles, Apparel & Luxury Goods | | | | 1,914 | | | | 608,154 | |
| | Petronet LNG Ltd. | | | Oil, Gas & Consumable Fuels | | | | 114,492 | | | | 419,881 | |
| | Pidilite Industries Ltd. | | | Chemicals | | | | 42,340 | | | | 862,557 | |
| | REC Ltd. | | | Diversified Financial Services | | | | 125,280 | | | | 217,701 | |
| | | | |
| | | |
| 30 | | Semiannual Report | The accompanying notes are an integral part of these financial statements. | | franklintempleton.com |
FRANKLIN TEMPLETON ETF TRUST
STATEMENT OF INVESTMENTS (UNAUDITED)
Franklin LibertyQ Emerging Markets ETF(continued)
| | | | | | | | | | | | | | |
| | | | |
| | | | | Industry | | | Shares | | | Value | |
| | | Common Stocks (continued) | | | | | | | | | |
| | | India (continued) | | | | | | | | | |
| | Tata Consultancy Services Ltd. | | | IT Services | | | | 111,418 | | | $ | 3,300,462 | |
| | Tech Mahindra Ltd. | | | IT Services | | | | 197,084 | | | | 1,987,003 | |
| | | | | | | | | | | | | | |
| | | | |
| | | | | | | | | | | | | 38,205,974 | |
| | | | | | | | | | | | | | |
| | | Indonesia 3.2% | | | | | | | | | |
| | Adaro Energy Tbk PT | | | Oil, Gas & Consumable Fuels | | | | 5,399,800 | | | | 490,718 | |
| | Bukit Asam Tbk PT | | | Oil, Gas & Consumable Fuels | | | | 1,084,600 | | | | 172,680 | |
| | Charoen Pokphand Indonesia Tbk PT | | | Food Products | | | | 1,252,800 | | | | 472,172 | |
| | Gudang Garam Tbk PT | | | Tobacco | | | | 87,000 | | | | 321,002 | |
| | Hanjaya Mandala Sampoerna Tbk PT | | | Tobacco | | | | 5,179,400 | | | | 835,564 | |
| | Indofood CBP Sukses Makmur Tbk PT | | | Food Products | | | | 400,200 | | | | 339,021 | |
| | Perusahaan Perseroan (Persero) PT Telekomunikasi Indonesia Tbk, B | | | Diversified Telecommunication Services | | | | 13,467,600 | | | | 4,089,141 | |
| | Surya Citra Media Tbk PT | | | Media | | | | 2,992,800 | | | | 244,568 | |
| | Unilever Indonesia Tbk PT | | | Household Products | | | | 812,000 | | | | 2,659,951 | |
| | United Tractors Tbk PT | | | Oil, Gas & Consumable Fuels | | | | 719,200 | | | | 1,042,447 | |
| | | | | | | | | | | | | | |
| | | | |
| | | | | | | | | | | | | 10,667,264 | |
| | | | | | | | | | | | | | |
| | | Malaysia 2.2% | | | | | | | | | |
| | AirAsia Group Bhd | | | Airlines | | | | 626,400 | | | | 263,307 | |
| | British American Tobacco Malaysia Bhd. | | | Tobacco | | | | 92,800 | | | | 419,783 | |
| | Digi.com Bhd. | | | Wireless Telecommunication Services | | | | 1,571,800 | | | | 1,783,150 | |
| | Hartalega Holdings Bhd. | | | Health Care Equipment & Supplies | | | | 545,200 | | | | 683,616 | |
| | Nestle (Malaysia) Bhd. | | | Food Products | | | | 34,800 | | | | 1,210,977 | |
| | Petronas Chemicals Group Bhd. | | | Chemicals | | | | 1,154,200 | | | | 2,078,497 | |
| | Petronas Gas Bhd. | | | Gas Utilities | | | | 110,200 | | | | 431,114 | |
| | Westports Holdings Bhd. | | | Transportation Infrastructure | | | | 400,200 | | | | 394,752 | |
| | | | | | | | | | | | | | |
| | | | |
| | | | | | | | | | | | | 7,265,196 | |
| | | | | | | | | | | | | | |
| | | Mexico 2.3% | | | | | | | | | |
| | Fibra Uno Administracion SA de CV | | | Equity Real Estate Investment Trusts (REITs | ) | | | 595,138 | | | | 869,316 | |
| | Grupo Aeroportuario del Pacifico SAB de CV | | | Transportation Infrastructure | | | | 151,148 | | | | 1,453,758 | |
| | Kimberly-Clark de Mexico SAB de CV, A | | | Household Products | | | | 647,280 | | | | 1,299,215 | |
| | Megacable Holdings SAB de CV | | | Media | | | | 93,264 | | | | 375,390 | |
| | Promotora y Operadora de Infraestructura SAB de CV | | | Transportation Infrastructure | | | | 39,092 | | | | 350,331 | |
| | Wal-Mart de Mexico SAB de CV, V | | | Food & Staples Retailing | | | | 1,175,138 | | | | 3,480,656 | |
| | | | | | | | | | | | | | |
| | | | |
| | | | | | | | | | | | | 7,828,666 | |
| | | | | | | | | | | | | | |
| | | Pakistan 0.1% | | | | | | | | | |
| | MCB Bank Ltd. | | | Banks | | | | 174,000 | | | | 188,742 | |
| | Oil & Gas Development Co. Ltd. | | | Oil, Gas & Consumable Fuels | | | | 330,600 | | | | 260,187 | |
| | | | | | | | | | | | | | |
| | | | |
| | | | | | | | | | | | | 448,929 | |
| | | | | | | | | | | | | | |
| | | Philippines 0.4% | | | | | | | | | |
| | DMCI Holdings Inc. | | | Industrial Conglomerates | | | | 1,850,200 | | | | 296,646 | |
| | Globe Telecom Inc. | | | Wireless Telecommunication Services | | | | 13,630 | | | | 481,244 | |
| | Manila Electric Co. | | | Electric Utilities | | | | 100,920 | | | | 720,440 | |
| | | | | | | | | | | | | | |
| | | | |
| | | | | | | | | | | | | 1,498,330 | |
| | | | | | | | | | | | | | |
| | | Poland 0.3% | | | | | | | | | |
| | | | |
| | Powszechny Zaklad Ubezpieczen SA | | | Insurance | | | | 102,718 | | | | 957,709 | |
| | | | | | | | | | | | | | |
| | | Qatar 3.1% | | | | | | | | | |
| | Barwa Real Estate Co. | | | Real Estate Management & Development | | | | 612,306 | | | | 563,369 | |
| | Industries Qatar QSC | | | Industrial Conglomerates | | | | 805,156 | | | | 2,412,593 | |
| | Masraf Al Rayan QSC | | | Banks | | | | 617,178 | | | | 600,058 | |
| | Mesaieed Petrochemical Holding Co. | | | Chemicals | | | | 843,436 | | | | 690,316 | |
| | Qatar Electricity & Water Co. QSC | | | Multi-Utilities | | | | 204,218 | | | | 866,566 | |
| | | | | | |
| | | |
| franklintempleton.com | | Semiannual Report | | | 31 | |
FRANKLIN TEMPLETON ETF TRUST
STATEMENT OF INVESTMENTS (UNAUDITED)
Franklin LibertyQ Emerging Markets ETF(continued)
| | | | | | | | | | | | | | |
| | | | |
| | | | | Industry | | | Shares | | | Value | |
| | | Common Stocks (continued) | | | | | | | | | |
| | | Qatar (continued) | | | | | | | | | |
| | Qatar Fuel QSC | | | Oil, Gas & Consumable Fuels | | | | 102,022 | | | $ | 659,318 | |
| | Qatar Islamic Bank SAQ | | | Banks | | | | 205,900 | | | | 882,186 | |
| | Qatar National Bank SAQ | | | Banks | | | | 692,578 | | | | 3,669,275 | |
| | | | | | | | | | | | | | |
| | | | |
| | | | | | | | | | | | | 10,343,681 | |
| | | | | | | | | | | | | | |
| | | Russia 10.8% | | | | | | | | | |
| | Alrosa PJSC | | | Metals & Mining | | | | 1,718,134 | | | | 1,972,812 | |
| | Gazprom PJSC | | | Oil, Gas & Consumable Fuels | | | | 1,065,402 | | | | 3,709,387 | |
| | Inter RAO UES PJSC | | | Electric Utilities | | | | 19,198,986 | | | | 1,328,461 | |
| | LUKOIL PJSC | | | Oil, Gas & Consumable Fuels | | | | 41,586 | | | | 3,453,082 | |
| | Magnitogorsk Iron & Steel Works | | | Metals & Mining | | | | 1,021,960 | | | | 616,728 | |
| | MMC Norilsk Nickel PJSC | | | Metals & Mining | | | | 15,950 | | | | 4,101,903 | |
| | Mobile TeleSystems PJSC, ADR | | | Wireless Telecommunication Services | | | | 280,894 | | | | 2,275,241 | |
| | Moscow Exchange MICEX | | | Capital Markets | | | | 223,184 | | | | 325,888 | |
| | NLMK PJSC | | | Metals & Mining | | | | 662,534 | | | | 1,452,250 | |
b | | Novatek PJSC, GDR, Reg S | | | Oil, Gas & Consumable Fuels | | | | 17,922 | | | | 3,634,582 | |
b | | PhosAgro PJSC, GDR, Reg S | | | Chemicals | | | | 20,648 | | | | 263,675 | |
| | Polymetal International PLC | | | Metals & Mining | | | | 65,250 | | | | 916,646 | |
| | Polyus Gold OJSC | | | Metals & Mining | | | | 11,136 | | | | 1,294,973 | |
| | Rosneft PJSC | | | Oil, Gas & Consumable Fuels | | | | 476,470 | | | | 3,079,164 | |
| | Severstal PJSC | | | Metals & Mining | | | | 143,260 | | | | 2,060,498 | |
| | Surgutneftegas PJSC | | | Oil, Gas & Consumable Fuels | | | | 3,244,230 | | | | 1,770,057 | |
| | Tatneft PAO | | | Oil, Gas & Consumable Fuels | | | | 319,232 | | | | 3,382,115 | |
b | | X5 Retail Group NV, GDR, Reg S | | | Food & Staples Retailing | | | | 21,286 | | | | 747,671 | |
| | | | | | | | | | | | | | |
| | | | |
| | | | | | | | | | | | | 36,385,133 | |
| | | | | | | | | | | | | | |
| | | Saudi Arabia 1.9% | | | | | | | | | |
| | Advanced Petrochemical Co. | | | Chemicals | | | | 11,166 | | | | 144,367 | |
| | Al-Rajhi Bank | | | Banks | | | | 109,156 | | | | 1,841,964 | |
| | Bupa Arabia for Cooperative Insurance Co. | | | Insurance | | | | 2,494 | | | | 70,741 | |
a | | Dar Al Arkan Real Estate Development Co. | | | Real Estate Management & Development | | | | 45,298 | | | | 144,183 | |
| | Itau Unibanco Holding SA | | | Specialty Retail | | | | 7,250 | | | | 305,369 | |
| | National Commercial Bank | | | Banks | | | | 742 | | | | 878 | |
| | National Commercial Bank | | | Banks | | | | 101,036 | | | | 1,240,325 | |
| | Riyad Bank | | | Banks | | | | 105,096 | | | | 683,606 | |
| | Saudi Airlines Catering Co. | | | Hotels, Restaurants & Leisure | | | | 4,582 | | | | 107,001 | |
| | Saudi Arabian Fertilizer Co. | | | Chemicals | | | | 16,762 | | | | 358,816 | |
| | Saudi Cement Co. | | | Construction Materials | | | | 6,786 | | | | 128,802 | |
| | Saudi Telecom Co. | | | Diversified Telecommunication Services | | | | 41,934 | | | | 1,216,256 | |
| | Yanbu National Petrochemical Co. | | | Chemicals | | | | 21,924 | | | | 312,682 | |
| | | | | | | | | | | | | | |
| | | | |
| | | | | | | | | | | | | 6,554,990 | |
| | | | | | | | | | | | | | |
| | | South Africa 3.3% | | | | | | | | | |
| | Capitec Bank Holdings Ltd. | | | Banks | | | | 9,106 | | | | 773,186 | |
| | Clicks Group Ltd. | | | Food & Staples Retailing | | | | 90,364 | | | | 1,281,277 | |
| | Exxaro Resources Ltd. | | | Oil, Gas & Consumable Fuels | | | | 118,030 | | | | 1,016,634 | |
| | Kumba Iron Ore Ltd. | | | Metals & Mining | | | | 34,568 | | | | 853,730 | |
| | Mr. Price Group Ltd. | | | Specialty Retail | | | | 135,778 | | | | 1,417,106 | |
d | | RMB Holdings Ltd. | | | Diversified Financial Services | | | | 278,748 | | | | 1,380,641 | |
| | Telkom SA SOC Ltd. | | | Diversified Telecommunication Services | | | | 120,988 | | | | 563,268 | |
| | Tiger Brands Ltd. | | | Food Products | | | | 67,454 | | | | 936,726 | |
| | Truworths International Ltd. | | | Specialty Retail | | | | 217,384 | | | | 759,858 | |
| | Vodacom Group Ltd. | | | Wireless Telecommunication Services | | | | 275,906 | | | | 2,177,042 | |
| | | | | | | | | | | | | | |
| | | | |
| | | | | | | | | | | | | 11,159,468 | |
| | | | | | | | | | | | | | |
| | | South Korea 10.7% | | | | | | | | | |
| | BGF Retail Co. Ltd. | | | Food & Staples Retailing | | | | 1,508 | | | | 248,360 | |
| | BNK Financial Group Inc. | | | Banks | | | | 118,610 | | | | 712,959 | |
| | Daelim Industrial Co. Ltd. | | | Construction & Engineering | | | | 5,394 | | | | 468,985 | |
| | | | |
| | | |
| 32 | | Semiannual Report | | franklintempleton.com |
FRANKLIN TEMPLETON ETF TRUST
STATEMENT OF INVESTMENTS (UNAUDITED)
Franklin LibertyQ Emerging Markets ETF(continued)
| | | | | | | | | | | | | | |
| | | | |
| | | | | Industry | | | Shares | | | Value | |
| | | Common Stocks (continued) | | | | | | | | | |
| | | South Korea (continued) | | | | | | | | | |
| | DB Insurance Co. Ltd. | | | Insurance | | | | 8,468 | | | $ | 365,296 | |
| | Hana Financial Group Inc. | | | Banks | | | | 107,996 | | | | 3,182,593 | |
| | Hanwha Life Insurance Co. Ltd. | | | Insurance | | | | 116,348 | | | | 231,500 | |
| | Hyundai Marine & Fire Insurance Co. Ltd. | | | Insurance | | | | 26,274 | | | | 579,888 | |
| | Industrial Bank of Korea | | | Banks | | | | 123,772 | | | | 1,365,874 | |
| | Kangwon Land Inc. | | | Hotels, Restaurants & Leisure | | | | 48,894 | | | | 1,207,890 | |
| | KB Financial Group Inc. | | | Banks | | | | 86,362 | | | | 3,082,939 | |
| | Kia Motors Corp. | | | Automobiles | | | | 45,356 | | | | 1,729,075 | |
| | Korea Zinc Co. Ltd. | | | Metals & Mining | | | | 1,450 | | | | 543,076 | |
| | KT&G Corp. | | | Tobacco | | | | 39,788 | | | | 3,509,287 | |
| | Kumho Petrochemical Co. Ltd. | | | Chemicals | | | | 3,248 | | | | 194,421 | |
| | Lotte Chemical Corp. | | | Chemicals | | | | 8,062 | | | | 1,590,630 | |
| | NCsoft Corp. | | | Entertainment | | | | 4,930 | | | | 2,147,331 | |
| b | | Orange Life Insurance Ltd., Reg S | | | Insurance | | | | 5,916 | | | | 133,786 | |
| a | | PearlAbyss Corp. | | | Entertainment | | | | 1,160 | | | | 192,016 | |
| | S-1 Corp. | | | Commercial Services & Supplies | | | | 7,134 | | | | 585,082 | |
| | Samsung Card Co. Ltd. | | | Consumer Finance | | | | 5,220 | | | | 153,395 | |
| | Samsung Electronics Co. Ltd. | | | Technology Hardware, Storage & Peripherals | | | | 82,302 | | | | 3,374,922 | |
| | Shinhan Financial Group Co. Ltd. | | | Banks | | | | 77,836 | | | | 2,720,014 | |
| | SK Hynix Inc. | | | Semiconductors & Semiconductor Equipment | | | | 55,042 | | | | 3,782,512 | |
| | SK Telecom Co. Ltd. | | | Wireless Telecommunication Services | | | | 9,860 | | | | 1,990,712 | |
| | Woongjin Coway Co. Ltd. | | | Household Durables | | | | 26,158 | | | | 1,850,075 | |
| | | | | | | | | | | | | | |
| | | | |
| | | | | | | | | | | | | 35,942,618 | |
| | | | | | | | | | | | | | |
| | | Taiwan 12.5% | | | | | | | | | |
| | Advantech Co. Ltd. | | | Technology Hardware, Storage & Peripherals | | | | 58,000 | | | | 510,371 | |
| | Catcher Technology Co. Ltd. | | | Technology Hardware, Storage & Peripherals | | | | 290,000 | | | | 2,196,651 | |
| | Chicony Electronics Co. Ltd. | | | Technology Hardware, Storage & Peripherals | | | | 232,000 | | | | 683,486 | |
| | Chunghwa Telecom Co. Ltd. | | | Diversified Telecommunication Services | | | | 928,000 | | | | 3,320,215 | |
| | Eclat Textile Co. Ltd. | | | Textiles, Apparel & Luxury Goods | | | | 33,410 | | | | 447,987 | |
| | Far EasTone Telecommunications Co. Ltd. | | | Wireless Telecommunication Services | | | | 696,000 | | | | 1,626,456 | |
| | Feng Tay Enterprise Co. Ltd. | | | Textiles, Apparel & Luxury Goods | | | | 163,285 | | | | 1,171,039 | |
| | Formosa Chemicals & Fibre Corp. | | | Chemicals | | | | 986,000 | | | | 2,755,442 | |
| | Formosa Petrochemical Corp. | | | Oil, Gas & Consumable Fuels | | | | 522,000 | | | | 1,652,255 | |
| | Formosa Plastics Corp. | | | Chemicals | | | | 958,000 | | | | 2,918,049 | |
| | Globalwafers Co. Ltd. | | | Semiconductors & Semiconductor Equipment | | | | 37,360 | | | | 378,122 | |
| | Highwealth Construction Corp. | | | Real Estate Management & Development | | | | 116,000 | | | | 186,575 | |
| | Largan Precision Co. Ltd. | | | Electronic Equipment, Instruments & Components | | | | 17,300 | | | | 2,481,426 | |
| | Lite-On Technology Corp. | | | Technology Hardware, Storage & Peripherals | | | | 406,000 | | | | 645,161 | |
| | Nan Ya Plastics Corp. | | | Chemicals | | | | 1,364,000 | | | | 3,064,378 | |
| | Nanya Technology Corp. | | | Semiconductors & Semiconductor Equipment | | | | 580,000 | | | | 1,504,940 | |
| | Nien Made Enterprise Co. Ltd. | | | Household Durables | | | | 74,000 | | | | 648,778 | |
| | Novatek Microelectronics Corp. Ltd. | | | Semiconductors & Semiconductor Equipment | | | | 269,000 | | | | 1,543,361 | |
| | Phison Electronics Corp. | | | Semiconductors & Semiconductor Equipment | | | | 69,000 | | | | 614,949 | |
| | Powertech Technology Inc. | | | Semiconductors & Semiconductor Equipment | | | | 116,000 | | | | 326,039 | |
| | President Chain Store Corp. | | | Food & Staples Retailing | | | | 273,910 | | | | 2,560,360 | |
| | Ruentex Industries Ltd. | | | Textiles, Apparel & Luxury Goods | | | | 58,000 | | | | 125,069 | |
| | Standard Foods Corp. | | | Food Products | | | | 58,000 | | | | 116,095 | |
| | Taiwan Business Bank | | | Banks | | | | 732,000 | | | | 300,827 | |
| | Taiwan Mobile Co. Ltd. | | | Wireless Telecommunication Services | | | | 696,000 | | | | 2,512,595 | |
| | Taiwan Semiconductor Manufacturing Co. Ltd. | | | Semiconductors & Semiconductor Equipment | | | | 424,000 | | | | 3,717,320 | |
| | The Shanghai Commercial & Savings Bank Ltd. | | | Banks | | | | 522,000 | | | | 876,604 | |
| | Vanguard International Semiconductor Corp. | | | Semiconductors & Semiconductor Equipment | | | | 378,000 | | | | 763,932 | |
| | Walsin Technology Corp. | | | Electronic Equipment, Instruments & Components | | | | 74,000 | | | | 416,219 | |
| | Yageo Corp. | | | Electronic Equipment, Instruments & Components | | | | 109,000 | | | | 866,041 | |
| | Yuanta Financial Holding Co. Ltd. | | | Capital Markets | | | | 1,682,000 | | | | 1,002,982 | |
| | | | | | |
| | | |
| franklintempleton.com | | Semiannual Report | | | 33 | |
FRANKLIN TEMPLETON ETF TRUST
STATEMENT OF INVESTMENTS (UNAUDITED)
Franklin LibertyQ Emerging Markets ETF(continued)
| | | | | | | | | | | | | | |
| | | | |
| | | | | Industry | | | Shares | | | Value | |
| | | Common Stocks (continued) | | | | | | | | | |
| | | Taiwan (continued) | | | | | | | | | |
| | Zhen Ding Technology Holding Ltd. | | | Electronic Equipment, Instruments & Components | | | | 83,000 | | | $ | 296,959 | |
| | | | | | | | | | | | | | |
| | | | |
| | | | | | | | | | | | | 42,230,683 | |
| | | | | | | | | | | | | | |
| | | Thailand 4.5% | | | | | | | | | |
| | Advanced Info Service PCL | | | Wireless Telecommunication Services | | | | 545,200 | | | | 3,921,661 | |
| | Bumrungrad Hospital PCL | | | Health Care Providers & Services | | | | 162,400 | | | | 679,654 | |
| | Electricity Generating PCL | | | Independent Power and Renewable Electricity Producers | | | | 52,200 | | | | 612,712 | |
| | Intouch Holdings PCL | | | Wireless Telecommunication Services | | | | 522,000 | | | | 1,117,901 | |
| | Land and Houses PCL, NVDR | | | Real Estate Management & Development | | | | 1,264,400 | | | | 396,869 | |
| | PTT Global Chemical PCL, NVDR | | | Chemicals | | | | 922,200 | | | | 1,620,672 | |
| | PTT PCL | | | Oil, Gas & Consumable Fuels | | | | 2,279,400 | | | | 3,446,861 | |
| | Ratch Group PCL, NVDR | | | Independent Power and Renewable Electricity Producers | | | | 139,200 | | | | 325,414 | |
| | The Siam Cement PCL | | | Construction Materials | | | | 214,600 | | | | 2,862,737 | |
| | | | | | | | | | | | | | |
| | | | |
| | | | | | | | | | | | | 14,984,481 | |
| | | | | | | | | | | | | | |
| | | Turkey 2.0% | | | | | | | | | |
| | BIM Birlesik Magazalar AS | | | Food & Staples Retailing | | | | 199,172 | | | | 1,732,636 | |
| | Eregli Demir ve Celik Fabrikalari AS | | | Metals & Mining | | | | 761,308 | | | | 923,574 | |
| | Ford Otomotiv Sanayi AS | | | Automobiles | | | | 38,338 | | | | 403,308 | |
| | TAV Havalimanlari Holding AS | | | Transportation Infrastructure | | | | 85,666 | | | | 358,048 | |
| | Tupras-Turkiye Petrol Rafinerileri AS | | | Oil, Gas & Consumable Fuels | | | | 66,874 | | | | 1,699,534 | |
| | Turkcell Iletisim Hizmetleri AS | | | Wireless Telecommunication Services | | | | 393,878 | | | | 907,527 | |
| a | | Turkiye Is Bankasi AS, C | | | Banks | | | | 672,510 | | | | 746,770 | |
| | Turkiye Sise Ve Cam Fabrikalari AS | | | Industrial Conglomerates | | | | 116,522 | | | | 96,371 | |
| | | | | | | | | | | | | | |
| | | | |
| | | | | | | | | | | | | 6,867,768 | |
| | | | | | | | | | | | | | |
| | | United Arab Emirates 2.0% | | | | | | | | | |
| | Abu Dhabi Commercial Bank PJSC | | | Banks | | | | 507,906 | | | | 1,086,844 | |
| | Aldar Properties PJSC | | | Real Estate Management & Development | | | | 1,589,838 | | | | 904,608 | |
| | Dubai Islamic Bank PJSC | | | Banks | | | | 705,570 | | | | 1,008,465 | |
| | Emaar Development PJSC | | | Real Estate Management & Development | | | | 299,802 | | | | 336,274 | |
| | Emirates Telecommunications Group Co. PJSC | | | Diversified Telecommunication Services | | | | 765,890 | | | | 3,440,422 | |
| | | | | | | | | | | | | | |
| | | | |
| | | | | | | | | | | | | 6,776,613 | |
| | | | | | | | | | | | | | |
| | Total Common Stocks
(Cost $311,523,412) | | | | | | | | | | | 321,819,179 | |
| | | | | | | | | | | | | | |
| | | Preferred Stocks 4.1% | | | | | | | | | |
| | | Brazil 3.1% | | | | | | | | | |
| a | | Braskem SA, pfd., A | | | Chemicals | | | | 34,800 | | | | 271,690 | |
| e | | Itau Unibanco Holding SA, 4.930%, pfd. | | | Banks | | | | 429,200 | | | | 3,609,468 | |
| e | | Itausa-Investimentos Itau SA, 5.463, pfd. | | | Banks | | | | 1,223,800 | | | | 3,872,301 | |
| e | | Telefonica Brasil SA, 6.735%, pfd. | | | Diversified Telecommunication Services | | | | 191,400 | | | | 2,524,491 | |
| | | | | | | | | | | | | | |
| | | | |
| | | | | | | | | | | | | 10,277,950 | |
| | | | | | | | | | | | | | |
| | | Russia 0.7% | | | | | | | | | |
| e | | Surgutneftegas PJSC, 20.342%, pfd. | | | Oil, Gas & Consumable Fuels | | | | 3,573,960 | | | | 2,063,431 | |
| e | | Transneft PJSC, 7.147%, pfd. | | | Oil, Gas & Consumable Fuels | | | | 174 | | | | 401,729 | |
| | | | | | | | | | | | | | |
| | | | |
| | | | | | | | | | | | | 2,465,160 | |
| | | | | | | | | | | | | | |
| | | South Korea 0.3% | | | | | | | | | |
| e | | LG Chem Ltd., 3.612%, pfd. | | | Chemicals | | | | 2,958 | | | | 414,216 | |
| | | | |
| | | |
| 34 | | Semiannual Report | | franklintempleton.com |
FRANKLIN TEMPLETON ETF TRUST
STATEMENT OF INVESTMENTS (UNAUDITED)
Franklin LibertyQ Emerging Markets ETF(continued)
| | | | | | | | | | | | | | |
| | | | |
| | | | | Industry | | | Shares | | | Value | |
| | | Preferred Stocks (continued) | | | | | | | | | |
| | | South Korea (continued) | | | | | | | | | |
| e | | Samsung Electronics Co. Ltd., 3.587%, pfd. | | | Technology Hardware, Storage & Peripherals | | | | 15,776 | | | $ | 520,965 | |
| | | | | | | | | | | | | | |
| | | | |
| | | | | | | | | | | | | 935,181 | |
| | | | | | | | | | | | | | |
| | Total Preferred Stocks
(Cost $12,978,940) | | | | | | | | | | | 13,678,291 | |
| | | | | | | | | | | | | | |
| | | Corporate Bonds & Notes 0.0%† | | | | | | | | | |
| | | India 0.0%† | | | | | | | | | |
| | Britannia Industries Ltd., senior secured note, first lien, 8.00% | | | Food Products | | | | 538,200 | | | | 7,751 | |
| | | | | | | | | | | | | | |
| | Total Corporate Bonds & Notes
(Cost $7,684) | | | | | | | | | | | 7,751 | |
| | | | | | | | | | | | | | |
| | Total Investments before Short Term Investments
(Cost $324,510,036) | | | | | | | | | | | 335,505,221 | |
| | | | | | | | | | | | | | |
| | | Short Term Investments 0.4% | | | | | | | | | |
| | Investments from Cash Collateral Received for Loaned Securities 0.4% | | | | | | | | | | | | |
| | | United States 0.4% | | | | | | | | | |
| f,g | | Institutional Fiduciary Trust Portfolio, 1.71% | | | Money Market Funds | | | | 1,150,250 | | | | 1,150,250 | |
| | | | | | | | | | | | | | |
| | Total Short-Term Investments
(Cost $1,150,250) | | | | | | | | | | | 1,150,250 | |
| | | | | | | | | | | | | | |
| | Total Investments
(Cost $325,660,286) 100.1% | | | | | | | | | | | 336,655,471 | |
| | Other Assets, less Liabilities (0.1)% | | | | | | | | | | | (214,745 | ) |
| | | | | | | | | | | | | | |
| | Net Assets 100.0% | | | | | | | | | | $ | 336,440,726 | |
| | | | | | | | | | | | | | |
See Abbreviations on page 81.
†Rounds to less than 0.1% of net assets.
aNon-income producing.
bSecurity was purchased pursuant to Regulation S under the Securities Act of 1933, which exempts from registration securities offered and sold outside of the United States. Such a security cannot be sold in the United States without either an effective registration statement filed pursuant to the Securities Act of 1933, or pursuant to an exemption from registration. These securities have been deemed liquid under guidelines approved by the Fund’s Board of Trustees. At September 30, 2019, the aggregate value of these securities was $7,489,424, representing 2.2% of net assets.
cSecurity was purchased pursuant to Rule 144A under the Securities Act of 1933 and may be sold in transactions exempt from registration only to qualified institutional buyers or in a public offering registered under the Securities Act of 1933. This security has been deemed liquid under guidelines approved by the Fund’s Board of Trustees. At September 30, 2019, the value of this security was $2,709,710, representing 0.8% of net assets.
dA portion or all of the security is on loan at September 30, 2019. See Note 1(d).
eVariable rate security. The rate shown represents the yield at period end.
fSee Note 3(c) regarding investments in affiliated management investment companies.
gThe rate shown is the annualizedseven-day effective yield at period end.
At September 30, 2019, the Fund had the following futures contracts outstanding. See Note 1(c).
| | | | | | | | | | | | | | | | | | | | |
| Futures Contracts | | | | | | | | | | | | | | | |
| | | | | |
| Description | | Type | | | Number of
Contracts | | | Notional
Amount* | | | Expiration
Date | | | Value/Unrealized
Appreciation
(Depreciation) | |
| Index Contracts | | | | | | | | | | | | | | | |
MSCI Emerging Markets Index | | | Long | | | | 17 | | | $ | 851,615 | | | | 12/20/19 | | | $ | (20,860 | ) |
*As of period end.
| | | | | | |
| | | |
| franklintempleton.com | | The accompanying notes are an integral part of these financial statements. | Semiannual Report | | | 35 | |
FRANKLIN TEMPLETON ETF TRUST
Financial Highlights
Franklin LibertyQ Global Dividend ETF
| | | | | | | | | | | | | | | | |
| | | Six Months Ended
September 30, 2019
(unaudited) | | | Year Ended March 31, | |
| | | 2019 | | | 2018 | | | 2017a | |
| | | | |
Per share operating performance (for a share outstanding throughout the period) | | | | | | | | | | | | | | | | |
| | | | |
Net asset value, beginning of period | | $ | 28.20 | | | $ | 28.22 | | | $ | 27.31 | | | $ | 25.43 | |
| | | | |
| | | | |
| Income from investment operationsb: | | | | | | | | | | | | | | | | |
| | | | |
Net investment incomec | | | 0.61 | | | | 0.95 | | | | 0.86 | | | | 0.67 | |
| | | | |
Net realized and unrealized gains (losses) | | | 0.89 | | | | (0.02 | ) | | | 1.03 | | | | 1.79 | |
| | | | |
| | | | |
Total from investment operations | | | 1.50 | | | | 0.93 | | | | 1.89 | | | | 2.46 | |
| | | | |
| | | | |
Less distributions from net investment income | | | (0.58 | ) | | | (0.95 | ) | | | (0.98 | ) | | | (0.58 | ) |
| | | | |
| | | | |
Net asset value, end of period | | $ | 29.12 | | | $ | 28.20 | | | $ | 28.22 | | | $ | 27.31 | |
| | | | |
| | | | |
Total returnd | | | 5.35% | | | | 3.51% | | | | 6.91% | | | | 9.79% | |
| | | | |
| Ratios to average net assetse | | | | | | | | | | | | | | | | |
| | | | |
Expenses before waiver and payments by affiliates | | | 0.45% | | | | 0.45% | | | | 0.75% | f | | | 0.98% | |
| | | | |
Expenses net of waiver and payments by affiliates | | | 0.45% | | | | 0.45% | | | | 0.45% | f | | | 0.45% | |
| | | | |
Net investment income | | | 4.21% | | | | 3.43% | | | | 3.05% | | | | 3.11% | |
| | | | |
| Supplemental data | | | | | | | | | | | | | | | | |
| | | | |
Net assets, end of period (000’s) | | | $17,470 | | | | $16,920 | | | | $16,933 | | | | $27,306 | |
| | | | |
Portfolio turnover rateg | | | 9.83% | | | | 25.75% | | | | 43.32% | | | | 13.38% | |
| | | | |
| Portfolio turnover rate excluding portfolio transactions that are executed as a result of the Fund offering and redeeming Creation Units solely or in part for cashg,h | | | 9.52% | | | | —% | | | | —% | | | | —% | |
aFor the period June 1, 2016 (commencement of operations) to March 31, 2017.
bThe amount shown for a share outstanding throughout the period may not correlate with the Statement of Operations for the period due to the timing of sales and repurchases of Creation Unit Fund shares in relation to income earned and/or fluctuating fair value of the investments of the Fund.
cBased on average daily shares outstanding.
dTotal return is not annualized for periods less than one year. Total return is calculated assuming an initial investment made at the net asset value at the beginning of the period, reinvestment of all dividends and distributions at net asset value during the period, and redemption at net asset value on the last day of the period.
eRatios are annualized for periods less than one year.
fEffective December 1, 2017, the Fund replaced the prior fee structure with a unified management fee. See Note 3(a).
gPortfolio turnover rate excludes the value of portfolio securities received or delivered as a result of processing capital share transactions in Creation Units, if any.
hEffective September 30, 2019.
| | | | |
| | | |
| 36 | | Semiannual Report | The accompanying notes are an integral part of these financial statements. | | franklintempleton.com |
FRANKLIN TEMPLETON ETF TRUST
Statement of Investments, September 30, 2019 (unaudited)
Franklin LibertyQ Global Dividend ETF
| | | | | | | | | | | | | | |
| | | | |
| | | | | Industry | | | Shares | | | Value | |
| | | Common Stocks 97.4% | | | | | | | | | |
| | | Australia 10.1% | | | | | | | | | |
| | Australian Stock Exchange Ltd. | | | Capital Markets | | | | 2,061 | | | $ | 112,691 | |
| | Brambles Ltd. | | | Commercial Services & Supplies | | | | 20,844 | | | | 160,264 | |
| | Challenger Ltd. | | | Diversified Financial Services | | | | 5,388 | | | | 26,782 | |
| | Commonwealth Bank of Australia | | | Banks | | | | 6,651 | | | | 362,584 | |
| | Flight Centre Travel Group Ltd. | | | Hotels, Restaurants & Leisure | | | | 606 | | | | 19,455 | |
| | Macquarie Group Ltd. | | | Capital Markets | | | | 3,333 | | | | 294,660 | |
| | National Australia Bank Ltd. | | | Banks | | | | 20,265 | | | | 405,932 | |
| | Westpac Banking Corp. | | | Banks | | | | 19,110 | | | | 382,022 | |
| | | | | | | | | | | | | | |
| | | | |
| | | | | | | | | | | | | 1,764,390 | |
| | | | | | | | | | | | | | |
| | | Belgium 0.3% | | | | | | | | | |
| | Proximus SADP | | | Diversified Telecommunication Services | | | | 1,824 | | | | 54,187 | |
| | | | | | | | | | | | | | |
| | | Canada 6.9% | | | | | | | | | |
| | Bank of Nova Scotia | | | Banks | | | | 6,282 | | | | 357,040 | |
| | Canadian Imperial Bank of Commerce | | | Banks | | | | 4,029 | | | | 332,636 | |
| | CI Financial Corp. | | | Capital Markets | | | | 5,088 | | | | 74,283 | |
| | IGM Financial Inc. | | | Capital Markets | | | | 1,059 | | | | 30,091 | |
| | Royal Bank of Canada | | | Banks | | | | 4,266 | | | | 346,274 | |
| | TELUS Corp. | | | Diversified Telecommunication Services | | | | 1,671 | | | | 59,507 | |
| | | | | | | | | | | | | | |
| | | | |
| | | | | | | | | | | | | 1,199,831 | |
| | | | | | | | | | | | | | |
| | | China 2.3% | | | | | | | | | |
| | Anta Sports Products Ltd. | | | Textiles, Apparel & Luxury Goods | | | | 12,000 | | | | 99,268 | |
| | China Vanke Co. Ltd., A | | | Real Estate Management & Development | | | | 2,700 | | | | 9,792 | |
| | China Vanke Co. Ltd., H | | | Real Estate Management & Development | | | | 14,700 | | | | 51,191 | |
| a,b | | Longfor Group Holdings Ltd., 144A, Reg S | | | Real Estate Management & Development | | | | 19,500 | | | | 72,882 | |
| | Sands China Ltd. | | | Hotels, Restaurants & Leisure | | | | 37,200 | | | | 168,457 | |
| | | | | | | | | | | | | | |
| | | | |
| | | | | | | | | | | | | 401,590 | |
| | | | | | | | | | | | | | |
| | | Denmark 0.3% | | | | | | | | | |
| | Tryg AS | | | Insurance | | | | 1,935 | | | | 55,463 | |
| | | | | | | | | | | | | | |
| | | Finland 2.8% | | | | | | | | | |
| | Elisa OYJ | | | Diversified Telecommunication Services | | | | 1,638 | | | | 84,466 | |
| | Kone OYJ, B | | | Machinery | | | | 3,666 | | | | 208,786 | |
| | Nokian Renkaat OYJ | | | Auto Components | | | | 1,665 | | | | 46,977 | |
| | Nordea Bank Abp | | | Banks | | | | 330 | | | | 2,343 | |
| | Nordea Bank Abp | | | Banks | | | | 103 | | | | 730 | |
| | Orion OYJ | | | Pharmaceuticals | | | | 741 | | | | 27,644 | |
| | Sampo OYJ, A | | | Insurance | | | | 3,147 | | | | 125,158 | |
| | | | | | | | | | | | | | |
| | | | |
| | | | | | | | | | | | | 496,104 | |
| | | | | | | | | | | | | | |
| | | France 0.1% | | | | | | | | | |
| | Societe BIC SA | | | Commercial Services & Supplies | | | | 156 | | | | 10,476 | |
| | | | | | | | | | | | | | |
| | | Germany 2.8% | | | | | | | | | |
| | Deutsche Boerse AG | | | Capital Markets | | | | 2,085 | | | | 325,958 | |
| | Hannover Rueck SE | | | Insurance | | | | 696 | | | | 117,686 | |
| | Hugo Boss AG | | | Textiles, Apparel & Luxury Goods | | | | 975 | | | | 52,244 | |
| | | | | | | | | | | | | | |
| | | | |
| | | | | | | | | | | | | 495,888 | |
| | | | | | | | | | | | | | |
| | | Indonesia 0.9% | | | | | | | | | |
| | Perusahaan Perseroan (Persero) PT Telekomunikasi Indonesia Tbk, B | | | Diversified Telecommunication Services | | | | 523,800 | | | | 159,040 | |
| | | | | | | | | | | | | | |
| | | Japan 3.3% | | | | | | | | | |
| | Daito Trust Construction Co. Ltd. | | | Real Estate Management & Development | | | | 1,400 | | | | 178,894 | |
| | Lawson Inc. | | | Food & Staples Retailing | | | | 430 | | | | 22,002 | |
| | | | | | |
| | | |
| franklintempleton.com | | Semiannual Report | | | 37 | |
FRANKLIN TEMPLETON ETF TRUST
STATEMENT OF INVESTMENTS (UNAUDITED)
Franklin LibertyQ Global Dividend ETF(continued)
| | | | | | | | | | | | | | |
| | | | |
| | | | | Industry | | | Shares | | | Value | |
| | | Common Stocks (continued) | | | | | | | | | |
| | | Japan (continued) | | | | | | | | | |
| | NTT DOCOMO Inc. | | | Wireless Telecommunication Services | | | | 15,000 | | | $ | 382,096 | |
| | | | | | | | | | | | | | |
| | | | |
| | | | | | | | | | | | | 582,992 | |
| | | | | | | | | | | | | | |
| | | Malaysia 0.2% | | | | | | | | | |
| | Nestle (Malaysia) Bhd. | | | Food Products | | | | 1,100 | | | | 38,278 | |
| | | | | | | | | | | | | | |
| | | Mexico 0.2% | | | | | | | | | |
| | Kimberly-Clark de Mexico SAB de CV, A | | | Household Products | | | | 16,884 | | | | 33,889 | |
| | | | | | | | | | | | | | |
| | | New Zealand 0.2% | | | | | | | | | |
| | Spark New Zealand Ltd. | | | Diversified Telecommunication Services | | | | 12,663 | | | | 35,017 | |
| | | | | | | | | | | | | | |
| | | Norway 0.7% | | | | | | | | | |
| | Telenor ASA | | | Diversified Telecommunication Services | | | | 6,321 | | | | 126,998 | |
| | | | | | | | | | | | | | |
| | | Qatar 1.9% | | | | | | | | | |
| | Qatar Islamic Bank SAQ | | | Banks | | | | 7,230 | | | | 30,977 | |
| | Qatar National Bank SAQ | | | Banks | | | | 58,620 | | | | 310,569 | |
| | | | | | | | | | | | | | |
| | | | |
| | | | | | | | | | | | | 341,546 | |
| | | | | | | | | | | | | | |
| | | Russia 0.7% | | | | | | | | | |
| | NLMK PJSC | | | Metals & Mining | | | | 7,854 | | | | 17,216 | |
| | Tatneft PAO | | | Oil, Gas & Consumable Fuels | | | | 9,222 | | | | 97,703 | |
| | | | | | | | | | | | | | |
| | | | |
| | | | | | | | | | | | | 114,919 | |
| | | | | | | | | | | | | | |
| | | Singapore 1.7% | | | | | | | | | |
| | ComfortDelGro Corp. Ltd. | | | Road & Rail | | | | 24,900 | | | | 43,214 | |
| | SATS Ltd. | | | Transportation Infrastructure | | | | 8,400 | | | | 29,399 | |
| | Singapore Telecommunications Ltd. | | | Diversified Telecommunication Services | | | | 85,500 | | | | 191,662 | |
| | Venture Corp. Ltd. | | | Electronic Equipment, Instruments & Components | | | | 2,700 | | | | 29,892 | |
| | | | | | | | | | | | | | |
| | | | |
| | | | | | | | | | | | | 294,167 | |
| | | | | | | | | | | | | | |
| | | South Africa 2.6% | | | | | | | | | |
| | Absa Group Ltd. | | | Banks | | | | 5,658 | | | | 57,044 | |
| | FirstRand Ltd. | | | Diversified Financial Services | | | | 43,299 | | | | 177,594 | |
| | Mr. Price Group Ltd. | | | Specialty Retail | | | | 3,813 | | | | 39,796 | |
| | Rand Merchant Investment Holdings Ltd. | | | Insurance | | | | 9,993 | | | | 19,732 | |
| | RMB Holdings Ltd. | | | Diversified Financial Services | | | | 12,489 | | | | 61,858 | |
| | Sanlam Ltd. | | | Insurance | | | | 18,777 | | | | 92,359 | |
| | | | | | | | | | | | | | |
| | | | |
| | | | | | | | | | | | | 448,383 | |
| | | | | | | | | | | | | | |
| | | Spain 0.4% | | | | | | | | | |
| | Red Electrica Corp. SA | | | Electric Utilities | | | | 3,681 | | | | 74,783 | |
| | | | | | | | | | | | | | |
| | | Sweden 2.3% | | | | | | | | | |
| | Atlas Copco AB | | | Machinery | | | | 5,535 | | | | 150,195 | |
| | Hennes & Mauritz AB, B | | | Specialty Retail | | | | 12,801 | | | | 248,465 | |
| | | | | | | | | | | | | | |
| | | | |
| | | | | | | | | | | | | 398,660 | |
| | | | | | | | | | | | | | |
| | | Switzerland 7.2% | | | | | | | | | |
| | Novartis AG | | | Pharmaceuticals | | | | 4,020 | | | | 348,885 | |
| | Roche Holding AG | | | Pharmaceuticals | | | | 1,266 | | | | 368,761 | |
| | SGS SA | | | Professional Services | | | | 58 | | | | 143,902 | |
| | Zurich Insurance Group AG | | | Insurance | | | | 1,038 | | | | 397,649 | |
| | | | | | | | | | | | | | |
| | | | |
| | | | | | | | | | | | | 1,259,197 | |
| | | | | | | | | | | | | | |
| | | Taiwan 2.7% | | | | | | | | | |
| | Chailease Holding Co. Ltd. | | | Diversified Financial Services | | | | 7,210 | | | | 29,050 | |
| | Feng Tay Enterprise Co. Ltd. | | | Textiles, Apparel & Luxury Goods | | | | 4,400 | | | | 31,556 | |
| | Phison Electronics Corp. | | | Semiconductors & Semiconductor Equipment | | | | 1,000 | | | | 8,912 | |
| | | | |
| | | |
| 38 | | Semiannual Report | | franklintempleton.com |
FRANKLIN TEMPLETON ETF TRUST
STATEMENT OF INVESTMENTS (UNAUDITED)
Franklin LibertyQ Global Dividend ETF(continued)
| | | | | | | | | | | | | | |
| | | | |
| | | | | Industry | | | Shares | | | Value | |
| | | Common Stocks (continued) | | | | | | | | | |
| | | Taiwan (continued) | | | | | | | | | |
| | Taiwan Semiconductor Manufacturing Co. Ltd. | | | Semiconductors & Semiconductor Equipment | | | | 43,000 | | | $ | 376,992 | |
| | Vanguard International Semiconductor Corp. | | | Semiconductors & Semiconductor Equipment | | | | 9,000 | | | | 18,189 | |
| | | | | | | | | | | | | | |
| | | | |
| | | | | | | | | | | | | 464,699 | |
| | | | | | | | | | | | | | |
| | | United Kingdom 9.8% | | | | | | | | | |
| | BT Group PLC | | | Diversified Telecommunication Services | | | | 74,655 | | | | 164,289 | |
| | Direct Line Insurance Group PLC | | | Insurance | | | | 19,770 | | | | 73,137 | |
| | GlaxoSmithKline PLC | | | Pharmaceuticals | | | | 16,836 | | | | 361,952 | |
| | Legal & General Group PLC | | | Insurance | | | | 55,824 | | | | 170,879 | |
| | Marks & Spencer Group PLC | | | Multiline Retail | | | | 14,431 | | | | 32,801 | |
| | Next PLC | | | Multiline Retail | | | | 1,812 | | | | 138,129 | |
| | Smiths Group PLC | | | Industrial Conglomerates | | | | 3,492 | | | | 67,560 | |
| | Taylor Wimpey PLC | | | Household Durables | | | | 20,742 | | | | 41,280 | |
| | Unilever NV, IDR | | | Personal Products | | | | 5,496 | | | | 330,444 | |
| | Unilever PLC | | | Personal Products | | | | 5,457 | | | | 328,836 | |
| | | | | | | | | | | | | | |
| | | | |
| | | | | | | | | | | | | 1,709,307 | |
| | | | | | | | | | | | | | |
| | | United States 37.0% | | | | | | | | | |
| | Altria Group Inc. | | | Tobacco | | | | 6,369 | | | | 260,492 | |
| | Amcor PLC | | | Containers & Packaging | | | | 12,528 | | | | 122,148 | |
| | Arthur J. Gallagher & Co. | | | Insurance | | | | 1,587 | | | | 142,148 | |
| | Darden Restaurants Inc. | | | Hotels, Restaurants & Leisure | | | | 1,662 | | | | 196,482 | |
| | Emerson Electric Co. | | | Electrical Equipment | | | | 5,166 | | | | 345,399 | |
| | Garmin Ltd. | | | Household Durables | | | | 1,713 | | | | 145,074 | |
| | H&R Block Inc. | | | Diversified Consumer Services | | | | 2,718 | | | | 64,199 | |
| | Intel Corp. | | | Semiconductors & Semiconductor Equipment | | | | 7,473 | | | | 385,084 | |
| | International Business Machines Corp. | | | IT Services | | | | 2,490 | | | | 362,096 | |
| | Johnson & Johnson | | | Pharmaceuticals | | | | 2,409 | | | | 311,677 | |
| | Kimberly-Clark Corp. | | | Household Products | | | | 2,586 | | | | 367,341 | |
| | Las Vegas Sands Corp. | | | Hotels, Restaurants & Leisure | | | | 4,812 | | | | 277,941 | |
| | Leggett & Platt Inc. | | | Household Durables | | | | 1,392 | | | | 56,989 | |
| | Lockheed Martin Corp. | | | Aerospace & Defense | | | | 990 | | | | 386,159 | |
| | LyondellBasell Industries NV, A | | | Chemicals | | | | 4,173 | | | | 373,358 | |
| | Maxim Integrated Products Inc. | | | Semiconductors & Semiconductor Equipment | | | | 3,987 | | | | 230,887 | |
| | McDonald’s Corp. | | | Hotels, Restaurants & Leisure | | | | 1,674 | | | | 359,425 | |
| | Merck & Co. Inc. | | | Pharmaceuticals | | | | 4,233 | | | | 356,334 | |
| | Paychex Inc. | | | IT Services | | | | 3,861 | | | | 319,575 | |
| | Philip Morris International Inc. | | | Tobacco | | | | 3,840 | | | | 291,571 | |
| | Seagate Technology PLC | | | Technology Hardware, Storage & Peripherals | | | | 3,684 | | | | 198,162 | |
| | Tapestry Inc. | | | Textiles, Apparel & Luxury Goods | | | | 3,327 | | | | 86,668 | |
| | The Gap Inc. | | | Specialty Retail | | | | 2,226 | | | | 38,643 | |
| | The Procter & Gamble Co. | | | Household Products | | | | 3,102 | | | | 385,827 | |
| | United Parcel Service Inc., B | | | Air Freight & Logistics | | | | 3,360 | | | | 402,595 | |
| | | | | | | | | | | | | | |
| | | | |
| | | | | | | | | | | | | 6,466,274 | |
| | | | | | | | | | | | | | |
| | Total Common Stocks
(Cost $16,207,089) | | | | | | | | | | | 17,026,078 | |
| | | | | | | | | | | | | | |
| | | | | | |
| | | |
| franklintempleton.com | | Semiannual Report | | | 39 | |
FRANKLIN TEMPLETON ETF TRUST
STATEMENT OF INVESTMENTS (UNAUDITED)
Franklin LibertyQ Global Dividend ETF(continued)
| | | | | | | | | | | | | | |
| | | | |
| | | | | Industry | | | Shares | | | Value | |
| | | | |
| | Preferred Stocks (Cost $243,202) 2.1% | | | | | | | | | | | | |
| | | Brazil 2.1% | | | | | | | | | |
| c | | Itau Unibanco Holding SA, 4.930%, pfd. | | | Banks | | | | 43,200 | | | $ | 363,301 | |
| | | | | | | | | | | | | | |
| | Total Investments (Cost $16,450,291) 99.5% | | | | | | | | | | | 17,389,379 | |
| | Other Assets, less Liabilities 0.5% | | | | | | | | | | | 80,916 | |
| | | | | | | | | | | | | | |
| | Net Assets 100.0% | | | | | | | | | | $ | 17,470,295 | |
| | | | | | | | | | | | | | |
See Abbreviations on page 81.
aSecurity was purchased pursuant to Rule 144A under the Securities Act of 1933 and may be sold in transactions exempt from registration only to qualified institutional buyers or in a public offering registered under the Securities Act of 1933. This security has been deemed liquid under guidelines approved by the Fund’s Board of Trustees. At September 30, 2019, the value of this security was $72,882, representing 0.4% of net assets.
bSecurity was purchased pursuant to Regulation S under the Securities Act of 1933, which exempts from registration securities offered and sold outside of the United States. Such a security cannot be sold in the United States without either an effective registration statement filed pursuant to the Securities Act of 1933, or pursuant to an exemption from registration. This security has been deemed liquid under guidelines approved by the Fund’s Board of Trustees. At September 30, 2019, the value of this security was $72,882, representing 0.4% of net assets.
cVariable rate security. The rate shown represents the yield at period end.
At September 30, 2019, the Fund had the following futures contracts outstanding. See Note 1(c).
| | | | | | | | | | | | | | | | | | | | |
| Futures Contracts | | | | | | | | | | | | | | | |
| | | | | |
| Description | | Type | | | Number of
Contracts | | | Notional
Amount* | | | Expiration
Date | | | Value/Unrealized
Appreciation
(Depreciation) | |
| Equity Contracts | | | | | | | | | | | | | | | |
MSCI All Country World Index | | | Long | | | | 2 | | | $ | 52,100 | | | | 12/20/19 | | | $ | (813 | ) |
*As of period end.
| | | | |
| | | |
| 40 | | Semiannual Report | The accompanying notes are an integral part of these financial statements. | | franklintempleton.com |
FRANKLIN TEMPLETON ETF TRUST
Financial Highlights
Franklin LibertyQ Global Equity ETF
| | | | | | | | | | | | | | | | |
| | | Six Months Ended
September 30, 2019
(unaudited) | | | Year Ended March 31, | |
| | | 2019 | | | 2018 | | | 2017a | |
| | | | |
Per share operating performance (for a share outstanding throughout the period) | | | | | | | | | | | | | | | | |
| | | | |
Net asset value, beginning of period | | $ | 30.90 | | | $ | 30.14 | | | $ | 27.18 | | | $ | 25.32 | |
| | | | |
| | | | |
| Income from investment operationsb: | | | | | | | | | | | | | | | | |
| | | | |
Net investment incomec | | | 0.50 | | | | 0.89 | | | | 0.74 | | | | 0.56 | |
| | | | |
Net realized and unrealized gains (losses) | | | 0.63 | | | | 0.67 | | | | 3.01 | | | | 1.92 | |
| | | | |
| | | | |
Total from investment operations | | | 1.13 | | | | 1.56 | | | | 3.75 | | | | 2.48 | |
| | | | |
| | | | |
Less distributions from net investment income | | | (0.47 | ) | | | (0.80 | ) | | | (0.79 | ) | | | (0.62 | ) |
| | | | |
| | | | |
Net asset value, end of period | | $ | 31.56 | | | $ | 30.90 | | | $ | 30.14 | | | $ | 27.18 | |
| | | | |
| | | | |
Total returnd | | | 3.70% | | | | 5.44% | | | | 13.91% | | | | 9.95% | |
| | | | |
| Ratios to average net assetse | | | | | | | | | | | | | | | | |
| | | | |
Expenses before waiver and payments by affiliates | | | 0.35% | | | | 0.35% | | | | 0.90%f | | | | 1.04% | |
| | | | |
Expenses net of waiver and payments by affiliates | | | 0.34% | | | | 0.34% | | | | 0.35%f | | | | 0.35% | |
| | | | |
Net investment income | | | 3.22% | | | | 2.99% | | | | 2.53% | | | | 2.60% | |
| | | | |
| Supplemental data | | | | | | | | | | | | | | | | |
| | | | |
Net assets, end of period (000’s) | | | $18,938 | | | | $24,721 | | | | $18,082 | | | | $21,744 | |
| | | | |
Portfolio turnover rateg | | | 18.73% | | | | 34.99% | | | | 35.01% | | | | 13.84% | |
| | | | |
| Portfolio turnover rate excluding portfolio transactions that are executed as a result of the Fund offering and redeeming Creation Units solely or in part for cashg,h | | | 18.46% | | | | —% | | | | —% | | | | —% | |
aFor the period June 1, 2016 (commencement of operations) to March 31, 2017.
bThe amount shown for a share outstanding throughout the period may not correlate with the Statement of Operations for the period due to the timing of sales and repurchases of Creation Unit Fund shares in relation to income earned and/or fluctuating fair value of the investments of the Fund.
cBased on average daily shares outstanding.
dTotal return is not annualized for periods less than one year. Total return is calculated assuming an initial investment made at the net asset value at the beginning of the period, reinvestment of all dividends and distributions at net asset value during the period, and redemption at net asset value on the last day of the period.
eRatios are annualized for periods less than one year.
fEffective December 1, 2017, the Fund replaced the prior fee structure with a unified management fee. See Note 3(a).
gPortfolio turnover rate excludes the value of portfolio securities received or delivered as a result of processing capital share transactions in Creation Units, if any.
hEffective September 30, 2019.
| | | | | | |
| | | |
| franklintempleton.com | | The accompanying notes are an integral part of these financial statements. | Semiannual Report | | | 41 | |
FRANKLIN TEMPLETON ETF TRUST
Statement of Investments, September 30, 2019 (unaudited)
Franklin LibertyQ Global Equity ETF
| | | | | | | | | | | | | | |
| | | | |
| | | | | Industry | | | Shares | | | Value | |
| | | Common Stocks and Other Equity Interests 97.7% | | | | | | | |
| | | Argentina 0.0%† | | | | | | | | | |
| | Transportadora de Gas del Sur SA, B, ADR | | | Oil, Gas & Consumable Fuels | | | | 165 | | | $ | 1,401 | |
| | | | | | | | | | | | | | |
| | | Australia 6.5% | | | | | | | | | |
| | AGL Energy Ltd. | | | Multi-Utilities | | | | 1,134 | | | | 14,654 | |
| | Alumina Ltd. | | | Metals & Mining | | | | 5,352 | | | | 8,555 | |
| | Aurizon Holdings Ltd. | | | Road & Rail | | | | 3,531 | | | | 14,051 | |
| | Australia & New Zealand Banking Group Ltd. | | | Banks | | | | 2,289 | | | | 44,030 | |
| | Australian Stock Exchange Ltd. | | | Capital Markets | | | | 144 | | | | 7,874 | |
| | Bank of Queensland Ltd. | | | Banks | | | | 261 | | | | 1,746 | |
| | Bendigo and Adelaide Bank Ltd. | | | Banks | | | | 606 | | | | 4,696 | |
| | BHP Group Ltd. | | | Metals & Mining | | | | 5,478 | | | | 135,667 | |
| | Bluescope Steel Ltd. | | | Metals & Mining | | | | 906 | | | | 7,339 | |
| a | | Brambles Ltd. | | | Commercial Services & Supplies | | | | 2,835 | | | | 21,797 | |
| | Cimic Group Ltd. | | | Construction & Engineering | | | | 159 | | | | 3,373 | |
| | Coca-Cola Amatil Ltd. | | | Beverages | | | | 1,260 | | | | 9,050 | |
| | Cochlear Ltd. | | | Health Care Equipment & Supplies | | | | 129 | | | | 18,110 | |
| | Commonwealth Bank of Australia | | | Banks | | | | 1,434 | | | | 78,176 | |
| | Crown Resorts Ltd. | | | Hotels, Restaurants & Leisure | | | | 777 | | | | 6,315 | |
| | CSL Ltd. | | | Biotechnology | | | | 858 | | | | 135,231 | |
| | Dexus | | | Equity Real Estate Investment Trusts (REITs | ) | | | 2,214 | | | | 17,814 | |
| | Flight Centre Travel Group Ltd. | | | Hotels, Restaurants & Leisure | | | | 126 | | | | 4,045 | |
| | Fortescue Metals Group Ltd. | | | Metals & Mining | | | | 3,249 | | | | 19,283 | |
| | Goodman Group | | | Equity Real Estate Investment Trusts (REITs | ) | | | 2,367 | | | | 22,637 | |
| | GPT Group | | | Equity Real Estate Investment Trusts (REITs | ) | | | 3,810 | | | | 15,829 | |
| | Harvey Norman Holdings Ltd. | | | Multiline Retail | | | | 1,713 | | | | 5,234 | |
| a | | Harvey Norman Holdings Ltd., rts., 10/11/19 | | | Multiline Retail | | | | 100 | | | | 121 | |
| | Macquarie Group Ltd. | | | Capital Markets | | | | 408 | | | | 36,070 | |
| | Medibank Private Ltd. | | | Insurance | | | | 6,549 | | | | 15,018 | |
| | Mirvac Group | | | Equity Real Estate Investment Trusts (REITs | ) | | | 5,412 | | | | 11,169 | |
| | National Australia Bank Ltd. | | | Banks | | | | 4,743 | | | | 95,008 | |
| | REA Group Ltd. | | | Interactive Media & Services | | | | 81 | | | | 5,912 | |
| | Rio Tinto Ltd. | | | Metals & Mining | | | | 834 | | | | 52,126 | |
| | Rio Tinto PLC | | | Metals & Mining | | | | 2,256 | | | | 117,013 | |
| | Scentre Group | | | Equity Real Estate Investment Trusts (REITs | ) | | | 7,011 | | | | 18,583 | |
| | Sonic Healthcare Ltd. | | | Health Care Providers & Services | | | | 825 | | | | 15,608 | |
| | South32 Ltd. | | | Metals & Mining | | | | 9,393 | | | | 16,598 | |
| | Telstra Corp. Ltd. | | | Diversified Telecommunication Services | | | | 9,639 | | | | 22,819 | |
| | Vicinity Centres | | | Equity Real Estate Investment Trusts (REITs | ) | | | 5,427 | | | | 9,407 | |
| | Washington H. Soul Pattinson & Co. Ltd. | | | Oil, Gas & Consumable Fuels | | | | 180 | | | | 2,553 | |
| | Wesfarmers Ltd. | | | Multiline Retail | | | | 2,412 | | | | 64,745 | |
| | Westpac Banking Corp. | | | Banks | | | | 2,934 | | | | 58,653 | |
| | Woodside Petroleum Ltd. | | | Oil, Gas & Consumable Fuels | | | | 1,380 | | | | 30,137 | |
| | Woolworths Group Ltd. | | | Food & Staples Retailing | | | | 2,589 | | | | 65,096 | |
| | | | | | | | | | | | | | |
| | | | |
| | | | | | | | | | | | | 1,232,142 | |
| | | | | | | | | | | | | | |
| | | Austria 0.1% | | | | | | | | | |
| | OMV AG | | | Oil, Gas & Consumable Fuels | | | | 225 | | | | 12,078 | |
| | | | | | | | | | | | | | |
| | | Belgium 0.1% | | | | | | | | | |
| | Colruyt SA | | | Food & Staples Retailing | | | | 165 | | | | 9,045 | |
| | Proximus SADP | | | Diversified Telecommunication Services | | | | 315 | | | | 9,358 | |
| | | | | | | | | | | | | | |
| | | | |
| | | | | | | | | | | | | 18,403 | |
| | | | | | | | | | | | | | |
| | | Brazil 0.3% | | | | | | | | | |
| | Banco Santander Brasil SA | | | Banks | | | | 600 | | | | 6,529 | |
| | BB Seguridade Participacoes SA | | | Insurance | | | | 1,800 | | | | 15,137 | |
| | Cielo SA | | | IT Services | | | | 2,700 | | | | 5,186 | |
| | Companhia de Saneamento Basico do Estado de Sao Paulo | | | Water Utilities | | | | 600 | | | | 7,145 | |
| | | | |
| | | |
| 42 | | Semiannual Report | | franklintempleton.com |
FRANKLIN TEMPLETON ETF TRUST
STATEMENT OF INVESTMENTS (UNAUDITED)
Franklin LibertyQ Global Equity ETF(continued)
| | | | | | | | | | | | | | |
| | | | |
| | | | | Industry | | | Shares | | | Value | |
| | | Common Stocks and Other Equity Interests (continued) | | | | | | | |
| | | Brazil (continued) | | | | | | | | | |
| | Cosan SA | | | Oil, Gas & Consumable Fuels | | | | 100 | | | $ | 1,277 | |
| | Engie Brasil SA | | | Independent Power and Renewable Electricity Producers | | | | 600 | | | | 6,394 | |
| | Hypera SA | | | Pharmaceuticals | | | | 600 | | | | 4,830 | |
| | IRB Brasil Resseguros SA | | | Insurance | | | | 630 | | | | 5,696 | |
| | Lojas Renner SA | | | Multiline Retail | | | | 600 | | | | 7,270 | |
| | M. Dias Branco SA | | | Food Products | | | | 300 | | | | 2,521 | |
| | Petrobras Distribuidora SA | | | Specialty Retail | | | | 300 | | | | 1,983 | |
| | Tim Participacoes SA | | | Wireless Telecommunication Services | | | | 900 | | | | 2,573 | |
| | | | | | | | | | | | | | |
| | | | |
| | | | | | | | | | | | | 66,541 | |
| | | | | | | | | | | | | | |
| | | Canada 2.6% | | | | | | | | | |
| | BCE Inc. | | | Diversified Telecommunication Services | | | | 297 | | | | 14,374 | |
| | Canadian Imperial Bank of Commerce | | | Banks | | | | 744 | | | | 61,425 | |
| | Canadian National Railway Co. | | | Road & Rail | | | | 1,299 | | | | 116,714 | |
| a | | CGI Inc., A | | | IT Services | | | | 225 | | | | 17,803 | |
| | CI Financial Corp. | | | Capital Markets | | | | 438 | | | | 6,395 | |
| | Constellation Software Inc. | | | Software | | | | 39 | | | | 38,975 | |
| | Empire Co. Ltd., A | | | Food & Staples Retailing | | | | 156 | | | | 4,226 | |
| | First Capital Realty Inc. | | | Real Estate Management & Development | | | | 255 | | | | 4,251 | |
| | Gildan Activewear Inc. | | | Textiles, Apparel & Luxury Goods | | | | 435 | | | | 15,448 | |
| | Great-West Lifeco Inc. | | | Insurance | | | | 231 | | | | 5,550 | |
| | H&R Real Estate Investment Trust | | | Equity Real Estate Investment Trusts (REITs | ) | | | 294 | | | | 5,136 | |
| | Hydro One Ltd. | | | Electric Utilities | | | | 138 | | | | 2,553 | |
| | IGM Financial Inc. | | | Capital Markets | | | | 48 | | | | 1,364 | |
| | Inter Pipeline Ltd. | | | Oil, Gas & Consumable Fuels | | | | 630 | | | | 11,063 | |
| | Magna International Inc. | | | Auto Components | | | | 741 | | | | 39,524 | |
| | Methanex Corp. | | | Chemicals | | | | 54 | | | | 1,917 | |
| | Metro Inc., A | | | Food & Staples Retailing | | | | 504 | | | | 22,204 | |
| | Newmarket Gold Inc. | | | Metals & Mining | | | | 237 | | | | 10,624 | |
| | Power Corp. of Canada | | | Insurance | | | | 408 | | | | 9,405 | |
| | Power Financial Corp. | | | Insurance | | | | 234 | | | | 5,429 | |
| | Quebecor Inc., B | | | Media | | | | 132 | | | | 2,999 | |
| | RioCan REIT | | | Equity Real Estate Investment Trusts (REITs | ) | | | 288 | | | | 5,738 | |
| | Rogers Communications Inc., B | | | Wireless Telecommunication Services | | | | 618 | | | | 30,121 | |
| | Saputo Inc. | | | Food Products | | | | 432 | | | | 13,286 | |
| | SmartCentres REIT | | | Equity Real Estate Investment Trusts (REITs | ) | | | 141 | | | | 3,461 | |
| | Teck Resources Ltd., B | | | Metals & Mining | | | | 750 | | | | 12,168 | |
| | TELUS Corp. | | | Diversified Telecommunication Services | | | | 327 | | | | 11,645 | |
| | Thomson Reuters Corp. | | | Professional Services | | | | 165 | | | | 11,035 | |
| | West Fraser Timber Co. Ltd. | | | Paper & Forest Products | | | | 108 | | | | 4,323 | |
| | | | | | | | | | | | | | |
| | | | |
| | | | | | | | | | | | | 489,156 | |
| | | | | | | | | | | | | | |
| | | Chile 0.1% | | | | | | | | | |
| | Aguas Andinas SA, A | | | Water Utilities | | | | 3,456 | | | | 1,893 | |
| | Colbun SA | | | Independent Power and Renewable Electricity Producers | | | | 7,131 | | | | 1,288 | |
| | Compania Cervecerias Unidas SA | | | Beverages | | | | 267 | | | | 2,986 | |
| | Enel Chile SA | | | Electric Utilities | | | | 45,534 | | | | 3,941 | |
| | | | | | | | | | | | | | |
| | | | |
| | | | | | | | | | | | | 10,108 | |
| | | | | | | | | | | | | | |
| | | China 2.9% | | | | | | | | | |
| | Agricultural Bank of China Ltd., A | | | Banks | | | | 4,200 | | | | 2,035 | |
| | Agricultural Bank of China Ltd., H | | | Banks | | | | 48,000 | | | | 18,797 | |
| | Anhui Conch Cement Co. Ltd., A | | | Construction Materials | | | | 300 | | | | 1,737 | |
| | Anhui Conch Cement Co. Ltd., H | | | Construction Materials | | | | 2,000 | | | | 11,876 | |
| | Anta Sports Products Ltd. | | | Textiles, Apparel & Luxury Goods | | | | 3,000 | | | | 24,817 | |
| | Bank of China Ltd., A | | | Banks | | | | 3,000 | | | | 1,504 | |
| | Bank of China Ltd., H | | | Banks | | | | 153,000 | | | | 60,112 | |
| | Bank of Communications Co. Ltd., A | | | Banks | | | | 2,200 | | | | 1,679 | |
| | | | | | |
| | | |
| franklintempleton.com | | Semiannual Report | | | 43 | |
FRANKLIN TEMPLETON ETF TRUST
STATEMENT OF INVESTMENTS (UNAUDITED)
Franklin LibertyQ Global Equity ETF(continued)
| | | | | | | | | | | | | | |
| | | | |
| | | | | Industry | | | Shares | | | Value | |
| | | Common Stocks and Other Equity Interests (continued) | | | | | | | |
| | | China (continued) | | | | | | | | | |
| | Bank of Communications Co. Ltd., H | | | Banks | | | | 15,000 | | | $ | 9,797 | |
| | China Cinda Asset Management Co. Ltd., H | | | Capital Markets | | | | 15,000 | | | | 2,947 | |
| | China CITIC Bank Corp. Ltd., H | | | Banks | | | | 18,000 | | | | 9,598 | |
| | China Conch Venture Holdings Ltd. | | | Machinery | | | | 3,000 | | | | 11,098 | |
| | China Construction Bank Corp., H | | | Banks | | | | 78,000 | | | | 59,499 | |
| | China Everbright Bank Co. Ltd., H | | | Banks | | | | 6,000 | | | | 2,556 | |
| | China Minsheng Banking Corp. Ltd., A | | | Banks | | | | 1,200 | | | | 1,012 | |
| | China Minsheng Banking Corp. Ltd., H | | | Banks | | | | 10,500 | | | | 7,139 | |
| | China Mobile Ltd. | | | Wireless Telecommunication Services | | | | 12,500 | | | | 103,404 | |
| | China Petroleum & Chemical Corp., H | | | Oil, Gas & Consumable Fuels | | | | 36,000 | | | | 21,400 | |
| | China Resources Cement Holdings Ltd. | | | Construction Materials | | | | 4,000 | | | | 4,010 | |
| | China Shenhua Energy Co. Ltd., A | | | Oil, Gas & Consumable Fuels | | | | 900 | | | | 2,367 | |
| | China Shenhua Energy Co. Ltd., H | | | Oil, Gas & Consumable Fuels | | | | 6,000 | | | | 12,047 | |
| | China Telecom Corp. Ltd., H | | | Diversified Telecommunication Services | | | | 12,000 | | | | 5,465 | |
| | China Yangtze Power Co. Ltd., A | | | Independent Power and Renewable Electricity Producers | | | | 300 | | | | 766 | |
| | China Zhongwang Holdings Ltd. | | | Metals & Mining | | | | 2,400 | | | | 977 | |
| | Chongqing Rural Commercial Bank Co. Ltd., H | | | Banks | | | | 6,000 | | | | 3,191 | |
| | CNOOC Ltd. | | | Oil, Gas & Consumable Fuels | | | | 15,000 | | | | 22,884 | |
| | Dali Foods Group Co. Ltd. | | | Food Products | | | | 6,000 | | | | 3,681 | |
| | Daqin Railway Co. Ltd., A | | | Road & Rail | | | | 1,500 | | | | 1,594 | |
| | Dongfeng Motor Group Co. Ltd., H | | | Automobiles | | | | 6,000 | | | | 5,702 | |
| | Focus Media Information Technology Co. Ltd. | | | Media | | | | 360 | | | | 265 | |
| | Foshan Haitian Flavouring & Food Co. Ltd. | | | Food Products | | | | 300 | | | | 4,617 | |
| | Guangdong Investment Ltd. | | | Water Utilities | | | | 6,000 | | | | 11,741 | |
| | Guangzhou Automobile Group Co. Ltd., H | | | Automobiles | | | | 7,600 | | | | 7,271 | |
| | Heilan Home Co. Ltd.,A-SHSC | | | Textiles, Apparel & Luxury Goods | | | | 600 | | | | 682 | |
| | Henan Shuanghui Investment & Development Co. Ltd. | | | Food Products | | | | 300 | | | | 1,038 | |
| | Industrial and Commercial Bank of China Ltd., H | | | Banks | | | | 51,000 | | | | 34,154 | |
| | Jiangsu Expressway Co. Ltd., H | | | Transportation Infrastructure | | | | 2,000 | | | | 2,541 | |
| | Kingboard Holdings Ltd. | | | Electronic Equipment, Instruments & Components | | | | 1,500 | | | | 3,970 | |
| b,c | | Longfor Group Holdings Ltd., 144A, Reg S | | | Real Estate Management & Development | | | | 3,000 | | | | 11,212 | |
| | Maanshan Iron & Steel Co. Ltd., H | | | Metals & Mining | | | | 6,000 | | | | 2,258 | |
| | Nexteer Automotive Group Ltd. | | | Auto Components | | | | 1,000 | | | | 825 | |
| | Nine Dragons Paper Holdings Ltd. | | | Paper & Forest Products | | | | 3,000 | | | | 2,526 | |
| | SAIC Motor Corp. Ltd. | | | Automobiles | | | | 600 | | | | 1,998 | |
| | Sands China Ltd. | | | Hotels, Restaurants & Leisure | | | | 5,200 | | | | 23,548 | |
| | Shaanxi Coal Industry Co. Ltd. | | | Oil, Gas & Consumable Fuels | | | | 600 | | | | 733 | |
| | Shanxi Lu’an Environmental Energy Development Co. Ltd., A | | | Oil, Gas & Consumable Fuels | | | | 600 | | | | 608 | |
| | Shenzhou International Group Holdings Ltd. | | | Textiles, Apparel & Luxury Goods | | | | 1,200 | | | | 15,675 | |
| | Sihuan Pharmaceutical Holdings Group Ltd. | | | Pharmaceuticals | | | | 12,000 | | | | 1,821 | |
| | Sino-Ocean Land Holdings Ltd. | | | Real Estate Management & Development | | | | 6,000 | | | | 2,036 | |
| | Sinopec Shanghai Petrochemical Co. Ltd., H | | | Chemicals | | | | 12,000 | | | | 3,490 | |
| | Yuzhou Properties Co. | | | Real Estate Management & Development | | | | 6,000 | | | | 2,388 | |
| a | | YY Inc., ADR | | | Interactive Media & Services | | | | 87 | | | | 4,892 | |
| | | | | | | | | | | | | | |
| | | | |
| | | | | | | | | | | | | 553,980 | |
| | | | | | | | | | | | | | |
| | | Colombia 0.0%† | | | | | | | | | |
| | Ecopetrol SA | | | Oil, Gas & Consumable Fuels | | | | 8,049 | | | | 6,826 | |
| | | | | | | | | | | | | | |
| | | | |
| | | |
| 44 | | Semiannual Report | | franklintempleton.com |
FRANKLIN TEMPLETON ETF TRUST
STATEMENT OF INVESTMENTS (UNAUDITED)
Franklin LibertyQ Global Equity ETF(continued)
| | | | | | | | | | | | | | |
| | | | |
| | | | | Industry | | | Shares | | | Value | |
| | | Common Stocks and Other Equity Interests (continued) | | | | | | | |
| | | Czech Republic 0.0%† | | | | | | | | | |
| | Moneta Money Bank AS | | | Banks | | | | 798 | | | $ | 2,458 | |
| | | | | | | | | | | | | | |
| | | Denmark 1.3% | | | | | | | | | |
| | Coloplast AS, B | | | Health Care Equipment & Supplies | | | | 285 | | | | 34,332 | |
| | Novo Nordisk AS, B | | | Pharmaceuticals | | | | 3,867 | | | | 198,840 | |
| | Pandora AS | | | Household Durables | | | | 297 | | | | 11,921 | |
| | Tryg AS | | | Insurance | | | | 84 | | | | 2,408 | |
| | | | | | | | | | | | | | |
| | | | |
| | | | | | | | | | | | | 247,501 | |
| | | | | | | | | | | | | | |
| | | Egypt 0.1% | | | | | | | | | |
| | Commercial International Bank Egypt SAE | | | Banks | | | | 1,272 | | | | 6,065 | |
| | Eastern Co. SAE | | | Tobacco | | | | 3,336 | | | | 3,489 | |
| | ElSewedy Electric Co. | | | Electrical Equipment | | | | 1,380 | | | | 1,136 | |
| | | | | | | | | | | | | | |
| | | | |
| | | | | | | | | | | | | 10,690 | |
| | | | | | | | | | | | | | |
| | | Finland 0.1% | | | | | | | | | |
| | Elisa OYJ | | | Diversified Telecommunication Services | | | | 264 | | | | 13,614 | |
| | Nokian Renkaat OYJ | | | Auto Components | | | | 258 | | | | 7,279 | |
| | Orion OYJ | | | Pharmaceuticals | | | | 198 | | | | 7,387 | |
| | | | | | | | | | | | | | |
| | | | |
| | | | | | | | | | | | | 28,280 | |
| | | | | | | | | | | | | | |
| | | France 0.8% | | | | | | | | | |
| | Cie Generale des Etablissements Michelin SCA | | | Auto Components | | | | 294 | | | | 32,821 | |
| | Covivio | | | Equity Real Estate Investment Trusts (REITs | ) | | | 57 | | | | 6,034 | |
| | Hermes International | | | Textiles, Apparel & Luxury Goods | | | | 63 | | | | 43,545 | |
| | Peugeot SA | | | Automobiles | | | | 1,101 | | | | 27,463 | |
| | Renault SA | | | Automobiles | | | | 156 | | | | 8,956 | |
| | Societe BIC SA | | | Commercial Services & Supplies | | | | 51 | | | | 3,425 | |
| | Societe Generale SA | | | Banks | | | | 1,002 | | | | 27,462 | |
| | | | | | | | | | | | | | |
| | | | |
| | | | | | | | | | | | | 149,706 | |
| | | | | | | | | | | | | | |
| | | Germany 0.4% | | | | | | | | | |
| | Aroundtown SA | | | Real Estate Management & Development | | | | 1,239 | | | | 10,136 | |
| | Covestro AG | | | Chemicals | | | | 390 | | | | 19,303 | |
| | Deutsche Lufthansa AG | | | Airlines | | | | 432 | | | | 6,867 | |
| | E.ON SE | | | Multi-Utilities | | | | 1,908 | | | | 18,552 | |
| | Hugo Boss AG | | | Textiles, Apparel & Luxury Goods | | | | 135 | | | | 7,234 | |
| | Knorr-Bremse AG | | | Machinery | | | | 33 | | | | 3,103 | |
| | TUI AG | | | Hotels, Restaurants & Leisure | | | | 747 | | | | 8,706 | |
| | | | | | | | | | | | | | |
| | | | |
| | | | | | | | | | | | | 73,901 | |
| | | | | | | | | | | | | | |
| | | Greece 0.0%† | | | | | | | | | |
| | JUMBO SA | | | Specialty Retail | | | | 195 | | | | 3,701 | |
| | Motor Oil (Hellas) Corinth Refineries SA | | | Oil, Gas & Consumable Fuels | | | | 60 | | | | 1,401 | |
| | | | | | | | | | | | | | |
| | | | |
| | | | | | | | | | | | | 5,102 | |
| | | | | | | | | | | | | | |
| | | Hong Kong 0.6% | | | | | | | | | |
| | CLP Holdings Ltd. | | | Electric Utilities | | | | 3,000 | | | | 31,514 | |
| | HKT Trust and HKT Ltd. | | | Diversified Telecommunication Services | | | | 6,000 | | | | 9,521 | |
| | Hongkong Land Holdings Ltd. | | | Real Estate Management & Development | | | | 2,100 | | | | 11,802 | |
| | Jardine Matheson Holdings Ltd. | | | Industrial Conglomerates | | | | 400 | | | | 21,400 | |
| | Kerry Properties Ltd. | | | Real Estate Management & Development | | | | 1,500 | | | | 4,621 | |
| | Kingboard Laminates Holdings Ltd. | | | Chemicals | | | | 3,000 | | | | 2,706 | |
| | Lee & Man Paper Manufacturing Ltd. | | | Paper & Forest Products | | | | 3,000 | | | | 1,623 | |
| | NWS Holdings Ltd. | | | Industrial Conglomerates | | | | 3,000 | | | | 4,646 | |
| | Power Assets Holdings Ltd. | | | Electric Utilities | | | | 1,500 | | | | 10,074 | |
| | Swire Properties Ltd. | | | Real Estate Management & Development | | | | 1,800 | | | | 5,648 | |
| | Vitasoy International Holdings Ltd. | | | Food Products | | | | 800 | | | | 3,240 | |
| c | | WH Group Ltd., Reg S | | | Food Products | | | | 13,500 | | | | 12,089 | |
| | | | | | |
| | | |
| franklintempleton.com | | Semiannual Report | | | 45 | |
FRANKLIN TEMPLETON ETF TRUST
STATEMENT OF INVESTMENTS (UNAUDITED)
Franklin LibertyQ Global Equity ETF(continued)
| | | | | | | | | | | | | | |
| | | | |
| | | | | Industry | | | Shares | | | Value | |
| | | Common Stocks and Other Equity Interests (continued) | | | | | | | |
| | | Hong Kong (continued) | | | | | | | | | |
| | Yue Yuen Industrial Holdings Ltd. | | | Textiles, Apparel & Luxury Goods | | | | 1,500 | | | $ | 4,104 | |
| | | | | | | | | | | | | | |
| | | | |
| | | | | | | | | | | | | 122,988 | |
| | | | | | | | | | | | | | |
| | | Hungary 0.0%† | | | | | | | | | |
| | MOL Hungarian Oil and Gas PLC | | | Oil, Gas & Consumable Fuels | | | | 789 | | | | 7,421 | |
| | | | | | | | | | | | | | |
| | | India 0.5% | | | | | | | | | |
| | Infosys Ltd., ADR | | | IT Services | | | | 7,570 | | | | 86,071 | |
| | | | | | | | | | | | | | |
| | | Indonesia 0.3% | | | | | | | | | |
| | Adaro Energy Tbk PT | | | Oil, Gas & Consumable Fuels | | | | 29,700 | | | | 2,699 | |
| | Bukit Asam Tbk PT | | | Oil, Gas & Consumable Fuels | | | | 6,600 | | | | 1,051 | |
| | Charoen Pokphand Indonesia Tbk PT | | | Food Products | | | | 5,700 | | | | 2,148 | |
| | Gudang Garam Tbk PT | | | Tobacco | | | | 600 | | | | 2,214 | |
| | Hanjaya Mandala Sampoerna Tbk PT | | | Tobacco | | | | 24,900 | | | | 4,017 | |
| | Indah Kiat Pulp & Paper Corp Tbk PT | | | Paper & Forest Products | | | | 1,200 | | | | 547 | |
| | Indofood CBP Sukses Makmur Tbk PT | | | Food Products | | | | 4,800 | | | | 4,066 | |
| | Perusahaan Perseroan (Persero) PT Telekomunikasi Indonesia Tbk, B | | | Diversified Telecommunication Services | | | | 96,000 | | | | 29,148 | |
| | Surya Citra Media Tbk PT | | | Media | | | | 13,800 | | | | 1,128 | |
| | Unilever Indonesia Tbk PT | | | Household Products | | | | 3,900 | | | | 12,776 | |
| | United Tractors Tbk PT | | | Oil, Gas & Consumable Fuels | | | | 3,300 | | | | 4,783 | |
| | | | | | | | | | | | | | |
| | | | |
| | | | | | | | | | | | | 64,577 | |
| | | | | | | | | | | | | | |
| | | Israel 0.3% | | | | | | | | | |
| | Azrieli Group Ltd. | | | Real Estate Management & Development | | | | 21 | | | | 1,650 | |
| | Bank LeumiLe-Israel BM | | | Banks | | | | 2,241 | | | | 15,951 | |
| a | | Check Point Software Technologies Ltd. | | | Software | | | | 240 | | | | 26,280 | |
| | Israel Chemicals Ltd. | | | Chemicals | | | | 753 | | | | 3,739 | |
| | | | | | | | | | | | | | |
| | | | |
| | | | | | | | | | | | | 47,620 | |
| | | | | | | | | | | | | | |
| | | Italy 0.8% | | | | | | | | | |
| | Assicurazioni Generali SpA | | | Insurance | | | | 927 | | | | 17,969 | |
| | Enel SpA | | | Electric Utilities | | | | 6,750 | | | | 50,415 | |
| | Intesa Sanpaolo SpA | | | Banks | | | | 23,820 | | | | 56,495 | |
| | Moncler SpA | | | Textiles, Apparel & Luxury Goods | | | | 342 | | | | 12,192 | |
| c | | Poste Italiane SpA, Reg S | | | Insurance | | | | 954 | | | | 10,848 | |
| | Recordati SpA | | | Pharmaceuticals | | | | 99 | | | | 4,248 | |
| | Snam SpA | | | Gas Utilities | | | | 1,650 | | | | 8,336 | |
| | | | | | | | | | | | | | |
| | | | |
| | | | | | | | | | | | | 160,503 | |
| | | | | | | | | | | | | | |
| | | Japan 5.0% | | | | | | | | | |
| | ABC-Mart Inc. | | | Specialty Retail | | | | 75 | | | | 4,768 | |
| | Advantest Corp. | | | Semiconductors & Semiconductor Equipment | | | | 300 | | | | 13,255 | |
| | Astellas Pharma Inc. | | | Pharmaceuticals | | | | 3,600 | | | | 51,248 | |
| | Bandai Namco Holdings Inc. | | | Leisure Products | | | | 300 | | | | 18,682 | |
| | Bridgestone Corp. | | | Auto Components | | | | 1,100 | | | | 42,585 | |
| | CANON Inc. | | | Technology Hardware, Storage & Peripherals | | | | 1,600 | | | | 42,674 | |
| | Daito Trust Construction Co. Ltd. | | | Real Estate Management & Development | | | | 150 | | | | 19,167 | |
| | Daiwa House Industry Co. Ltd. | | | Real Estate Management & Development | | | | 600 | | | | 19,464 | |
| | Hoya Corp. | | | Health Care Equipment & Supplies | | | | 700 | | | | 57,121 | |
| | Iida Group Holdings Co. Ltd. | | | Household Durables | | | | 300 | | | | 4,880 | |
| | ITOCHU Corp. | | | Trading Companies & Distributors | | | | 2,400 | | | | 49,543 | |
| | Japan Airlines Co. Ltd. | | | Airlines | | | | 300 | | | | 8,916 | |
| | Japan Post Bank Co. Ltd. | | | Banks | | | | 900 | | | | 8,719 | |
| | Japan Tobacco Inc. | | | Tobacco | | | | 2,100 | | | | 45,974 | |
| | JFE Holdings Inc. | | | Metals & Mining | | | | 600 | | | | 7,217 | |
| | JXTG Holdings Inc. | | | Oil, Gas & Consumable Fuels | | | | 4,800 | | | | 21,869 | |
| | Kakaku.com Inc. | | | Interactive Media & Services | | | | 300 | | | | 7,378 | |
| | | | |
| | | |
| 46 | | Semiannual Report | | franklintempleton.com |
FRANKLIN TEMPLETON ETF TRUST
STATEMENT OF INVESTMENTS (UNAUDITED)
Franklin LibertyQ Global Equity ETF(continued)
| | | | | | | | | | | | | | |
| | | | |
| | | | | Industry | | | Shares | | | Value | |
| | | Common Stocks and Other Equity Interests (continued) | | | | | | | |
| | | Japan (continued) | | | | | | | | | |
| | KAO Corp. | | | Personal Products | | | | 730 | | | $ | 53,929 | |
| | KDDI Corp. | | | Wireless Telecommunication Services | | | | 3,900 | | | | 101,943 | |
| | Marubeni Corp. | | | Trading Companies & Distributors | | | | 2,400 | | | | 15,938 | |
| | Mitsubishi Chemical Holdings Corp. | | | Chemicals | | | | 1,500 | | | | 10,688 | |
| | Mitsubishi Gas Chemical Co. Inc. | | | Chemicals | | | | 600 | | | | 8,006 | |
| a | | Nexon Co. Ltd. | | | Entertainment | | | | 300 | | | | 3,639 | |
| | Nippon Telegraph & Telephone Corp. | | | Diversified Telecommunication Services | | | | 1,400 | | | | 66,791 | |
| | Nissan Motor Co. Ltd. | | | Automobiles | | | | 3,900 | | | | 24,326 | |
| | NTT DOCOMO Inc. | | | Wireless Telecommunication Services | | | | 3,000 | | | | 76,419 | |
| | Oracle Corp. Japan | | | Software | | | | 75 | | | | 6,502 | |
| | Sekisui House Ltd. | | | Household Durables | | | | 300 | | | | 5,899 | |
| | Shionogi & Co. Ltd. | | | Pharmaceuticals | | | | 300 | | | | 16,652 | |
| | Showa Denko K.K. | | | Chemicals | | | | 100 | | | | 2,614 | |
| | Subaru Corp. | | | Automobiles | | | | 1,200 | | | | 33,754 | |
| | Suzuki Motor Corp. | | | Automobiles | | | | 300 | | | | 12,733 | |
| | Taisei Corp. | | | Construction & Engineering | | | | 400 | | | | 15,489 | |
| | Tokyo Electron Ltd. | | | Semiconductors & Semiconductor Equipment | | | | 300 | | | | 57,085 | |
| | Tosoh Corp. | | | Chemicals | | | | 600 | | | | 7,928 | |
| | Zozo Inc. | | | Internet & Direct Marketing Retail | | | | 300 | | | | 6,917 | |
| | | | | | | | | | | | | | |
| | | | |
| | | | | | | | | | | | | 950,712 | |
| | | | | | | | | | | | | | |
| | | Luxembourg 0.0%† | | | | | | | | | |
| | RTL Group SA | | | Media | | | | 78 | | | | 3,752 | |
| | | | | | | | | | | | | | |
| | | Macau 0.2% | | | | | | | | | |
| | Galaxy Entertainment Group Ltd. | | | Hotels, Restaurants & Leisure | | | | 4,000 | | | | 24,874 | |
| | Wynn Macau Ltd. | | | Hotels, Restaurants & Leisure | | | | 2,400 | | | | 4,684 | |
| | | | | | | | | | | | | | |
| | | | |
| | | | | | | | | | | | | 29,558 | |
| | | | | | | | | | | | | | |
| | | Malaysia 0.2% | | | | | | | | | |
| | AirAsia Group Bhd | | | Airlines | | | | 3,300 | | | | 1,387 | |
| | British American Tobacco Malaysia Bhd. | | | Tobacco | | | | 300 | | | | 1,357 | |
| | Digi.com Bhd. | | | Wireless Telecommunication Services | | | | 7,800 | | | | 8,849 | |
| | Fraser & Neave Holdings Bhd. | | | Beverages | | | | 300 | | | | 2,501 | |
| | Hartalega Holdings Bhd. | | | Health Care Equipment & Supplies | | | | 2,700 | | | | 3,385 | |
| | Nestle (Malaysia) Bhd. | | | Food Products | | | | 200 | | | | 6,960 | |
| | Petronas Chemicals Group Bhd. | | | Chemicals | | | | 5,100 | | | | 9,184 | |
| | Petronas Gas Bhd. | | | Gas Utilities | | | | 600 | | | | 2,347 | |
| | Westports Holdings Bhd. | | | Transportation Infrastructure | | | | 2,700 | | | | 2,663 | |
| | | | | | | | | | | | | | |
| | | | |
| | | | | | | | | | | | | 38,633 | |
| | | | | | | | | | | | | | |
| | | Mexico 0.3% | | | | | | | | | |
| | Fibra Uno Administracion SA de CV | | | Equity Real Estate Investment Trusts (REITs | ) | | | 4,905 | | | | 7,165 | |
| | Grupo Aeroportuario del Pacifico SAB de CV | | | Transportation Infrastructure | | | | 540 | | | | 5,194 | |
| | Kimberly-Clark de Mexico SAB de CV, A | | | Household Products | | | | 3,720 | | | | 7,467 | |
| | Megacable Holdings SAB de CV | | | Media | | | | 354 | | | | 1,425 | |
| | Promotora y Operadora de Infraestructura SAB de CV | | | Transportation Infrastructure | | | | 90 | | | | 806 | |
| | Wal-Mart de Mexico SAB de CV, V | | | Food & Staples Retailing | | | | 10,152 | | | | 30,069 | |
| | | | | | | | | | | | | | |
| | | | |
| | | | | | | | | | | | | 52,126 | |
| | | | | | | | | | | | | | |
| | | Netherlands 0.4% | | | | | | | | | |
| | Akzo Nobel NV | | | Chemicals | | | | 180 | | | | 16,050 | |
| | Koninklijke Ahold Delhaize NV | | | Food & Staples Retailing | | | | 2,100 | | | | 52,554 | |
| | | | | | | | | | | | | | |
| | | | |
| | | | | | | | | | | | | 68,604 | |
| | | | | | | | | | | | | | |
| | | | | | |
| | | |
| franklintempleton.com | | Semiannual Report | | | 47 | |
FRANKLIN TEMPLETON ETF TRUST
STATEMENT OF INVESTMENTS (UNAUDITED)
Franklin LibertyQ Global Equity ETF(continued)
| | | | | | | | | | | | | | |
| | | | |
| | | | | Industry | | | Shares | | | Value | |
| | | Common Stocks and Other Equity Interests (continued) | | | | | | | |
| | | New Zealand 0.2% | | | | | | | | | |
| | Fisher & Paykel Healthcare Corp. Ltd. | | | Health Care Equipment & Supplies | | | | 1,286 | | | $ | 13,951 | |
| | Meridian Energy Ltd. | | | Independent Power and Renewable Electricity Producers | | | | 1,083 | | | | 3,531 | |
| | Spark New Zealand Ltd. | | | Diversified Telecommunication Services | | | | 4,698 | | | | 12,991 | |
| | | | | | | | | | | | | | |
| | | | |
| | | | | | | | | | | | | 30,473 | |
| | | | | | | | | | | | | | |
| | | Norway 0.3% | | | | | | | | | |
| | Mowi ASA | | | Food Products | | | | 900 | | | | 20,791 | |
| | Telenor ASA | | | Diversified Telecommunication Services | | | | 1,344 | | | | 27,003 | |
| | | | | | | | | | | | | | |
| | | | |
| | | | | | | | | | | | | 47,794 | |
| | | | | | | | | | | | | | |
| | | Pakistan 0.0%† | | | | | | | | | |
| | MCB Bank Ltd. | | | Banks | | | | 900 | | �� | | 976 | |
| | Oil & Gas Development Co. Ltd. | | | Oil, Gas & Consumable Fuels | | | | 2,100 | | | | 1,653 | |
| | | | | | | | | | | | | | |
| | | | |
| | | | | | | | | | | | | 2,629 | |
| | | | | | | | | | | | | | |
| | | Philippines 0.0%† | | | | | | | | | |
| | DMCI Holdings Inc. | | | Industrial Conglomerates | | | | 6,900 | | | | 1,106 | |
| | Globe Telecom Inc. | | | Wireless Telecommunication Services | | | | 75 | | | | 2,648 | |
| | Manila Electric Co. | | | Electric Utilities | | | | 630 | | | | 4,498 | |
| | | | | | | | | | | | | | |
| | | | |
| | | | | | | | | | | | | 8,252 | |
| | | | | | | | | | | | | | |
| | | Poland 0.0%† | | | | | | | | | |
| | Powszechny Zaklad Ubezpieczen SA | | | Insurance | | | | 630 | | | | 5,874 | |
| | | | | | | | | | | | | | |
| | | Portugal 0.0%† | | | | | | | | | |
| | Jeronimo Martins SGPS SA | | | Food & Staples Retailing | | | | 465 | | | | 7,848 | |
| | | | | | | | | | | | | | |
| | | Qatar 0.3% | | | | | | | | | |
| | Barwa Real Estate Co. | | | Real Estate Management & Development | | | | 1,140 | | | | 1,049 | |
| | Industries Qatar QSC | | | Industrial Conglomerates | | | | 4,050 | | | | 12,136 | |
| | Masraf Al Rayan QSC | | | Banks | | | | 2,460 | | | | 2,392 | |
| | Mesaieed Petrochemical Holding Co. | | | Chemicals | | | | 4,260 | | | | 3,487 | |
| | Qatar Electricity & Water Co. QSC | | | Multi-Utilities | | | | 690 | | | | 2,928 | |
| | Qatar Fuel QSC | | | Oil, Gas & Consumable Fuels | | | | 519 | | | | 3,354 | |
| | Qatar Islamic Bank SAQ | | | Banks | | | | 1,590 | | | | 6,812 | |
| | Qatar National Bank SAQ | | | Banks | | | | 5,820 | | | | 30,834 | |
| | | | | | | | | | | | | | |
| | | | |
| | | | | | | | | | | | | 62,992 | |
| | | | | | | | | | | | | | |
| | | Russia 2.0% | | | | | | | | | |
| | Alrosa PJSC | | | Metals & Mining | | | | 7,797 | | | | 8,953 | |
| | Evraz PLC | | | Metals & Mining | | | | 681 | | | | 3,924 | |
| | Gazprom PJSC | | | Oil, Gas & Consumable Fuels | | | | 24,345 | | | | 84,761 | |
| | Inter RAO UES PJSC | | | Electric Utilities | | | | 63,657 | | | | 4,405 | |
| | LUKOIL PJSC | | | Oil, Gas & Consumable Fuels | | | | 1,101 | | | | 91,421 | |
| | Magnitogorsk Iron & Steel Works | | | Metals & Mining | | | | 4,797 | | | | 2,895 | |
| | MMC Norilsk Nickel PJSC | | | Metals & Mining | | | | 162 | | | | 41,662 | |
| | Mobile TeleSystems PJSC, ADR | | | Wireless Telecommunication Services | | | | 1,086 | | | | 8,797 | |
| | NLMK PJSC | | | Metals & Mining | | | | 3,216 | | | | 7,049 | |
| c | | Novatek PJSC, GDR, Reg S | | | Oil, Gas & Consumable Fuels | | | | 180 | | | | 36,504 | |
| | Polymetal International PLC | | | Metals & Mining | | | | 321 | | | | 4,509 | |
| | Polyus Gold OJSC | | | Metals & Mining | | | | 54 | | | | 6,280 | |
| | Rosneft PJSC | | | Oil, Gas & Consumable Fuels | | | | 2,310 | | | | 14,928 | |
| | Severstal PJSC | | | Metals & Mining | | | | 612 | | | | 8,802 | |
| | Surgutneftegas PJSC | | | Oil, Gas & Consumable Fuels | | | | 14,640 | | | | 7,988 | |
| | Tatneft PAO | | | Oil, Gas & Consumable Fuels | | | | 3,927 | | | | 41,605 | |
| c | | X5 Retail Group NV, GDR, Reg S | | | Food & Staples Retailing | | | | 99 | | | | 3,477 | |
| | | | | | | | | | | | | | |
| | | | |
| | | | | | | | | | | | | 377,960 | |
| | | | | | | | | | | | | | |
| | | | |
| | | |
| 48 | | Semiannual Report | | franklintempleton.com |
FRANKLIN TEMPLETON ETF TRUST
STATEMENT OF INVESTMENTS (UNAUDITED)
Franklin LibertyQ Global Equity ETF(continued)
| | | | | | | | | | | | | | |
| | | | |
| | | | | Industry | | | Shares | | | Value | |
| | | Common Stocks and Other Equity Interests (continued) | | | | | | | |
| | | Saudi Arabia 0.2% | | | | | | | | | |
| | Al-Rajhi Bank | | | Banks | | | | 567 | | | $ | 9,568 | |
| | Itau Unibanco Holding SA | | | Specialty Retail | | | | 69 | | | | 2,906 | |
| | National Commercial Bank | | | Banks | | | | 2 | | | | 3 | |
| | National Commercial Bank | | | Banks | | | | 495 | | | | 6,077 | |
| | Riyad Bank | | | Banks | | | | 552 | | | | 3,591 | |
| | Saudi Arabian Fertilizer Co. | | | Chemicals | | | | 114 | | | | 2,440 | |
| | Saudi Telecom Co. | | | Diversified Telecommunication Services | | | | 213 | | | | 6,178 | |
| | Yanbu National Petrochemical Co. | | | Chemicals | | | | 177 | | | | 2,524 | |
| | | | | | | | | | | | | | |
| | | | |
| | | | | | | | | | | | | 33,287 | |
| | | | | | | | | | | | | | |
| | | Singapore 0.4% | | | | | | | | | |
| | CapitaLand Mall Trust | | | Equity Real Estate Investment Trusts (REITs | ) | | | 4,500 | | | | 8,558 | |
| | ComfortDelGro Corp. Ltd. | | | Road & Rail | | | | 4,500 | | | | 7,810 | |
| | SATS Ltd. | | | Transportation Infrastructure | | | | 1,500 | | | | 5,250 | |
| | Singapore Exchange Ltd. | | | Capital Markets | | | | 2,100 | | | | 12,862 | |
| | Singapore Technologies Engineering Ltd. | | | Aerospace & Defense | | | | 3,000 | | | | 8,330 | |
| | Singapore Telecommunications Ltd. | | | Diversified Telecommunication Services | | | | 15,900 | | | | 35,642 | |
| | Venture Corp. Ltd. | | | Electronic Equipment, Instruments & Components | | | | 300 | | | | 3,321 | |
| | Yangzijiang Shipbuilding Holdings Ltd. | | | Machinery | | | | 4,200 | | | | 2,916 | |
| | | | | | | | | | | | | | |
| | | | |
| | | | | | | | | | | | | 84,689 | |
| | | | | | | | | | | | | | |
| | | South Africa 0.3% | | | | | | | | | |
| | Capitec Bank Holdings Ltd. | | | Banks | | | | 48 | | | | 4,076 | |
| | Clicks Group Ltd. | | | Food & Staples Retailing | | | | 417 | | | | 5,913 | |
| | Exxaro Resources Ltd. | | | Oil, Gas & Consumable Fuels | | | | 552 | | | | 4,754 | |
| | Kumba Iron Ore Ltd. | | | Metals & Mining | | | | 141 | | | | 3,482 | |
| | Mr. Price Group Ltd. | | | Specialty Retail | | | | 591 | | | | 6,168 | |
| | RMB Holdings Ltd. | | | Diversified Financial Services | | | | 858 | | | | 4,250 | |
| | Telkom SA SOC Ltd. | | | Diversified Telecommunication Services | | | | 534 | | | | 2,486 | |
| | Tiger Brands Ltd. | | | Food Products | | | | 336 | | | | 4,666 | |
| | Truworths International Ltd. | | | Specialty Retail | | | | 978 | | | | 3,418 | |
| | Vodacom Group Ltd. | | | Wireless Telecommunication Services | | | | 1,173 | | | | 9,256 | |
| | | | | | | | | | | | | | |
| | | | |
| | | | | | | | | | | | | 48,469 | |
| | | | | | | | | | | | | | |
| | | South Korea 2.5% | | | | | | | | | |
| | BGF Retail Co. Ltd. | | | Food & Staples Retailing | | | | 9 | | | | 1,482 | |
| | BNK Financial Group Inc. | | | Banks | | | | 360 | | | | 2,164 | |
| | Daelim Industrial Co. Ltd. | | | Construction & Engineering | | | | 30 | | | | 2,608 | |
| | DB Insurance Co. Ltd. | | | Insurance | | | | 78 | | | | 3,365 | |
| | Hana Financial Group Inc. | | | Banks | | | | 588 | | | | 17,328 | |
| | Hankook Tire & Technology Co. Ltd. | | | Auto Components | | | | 99 | | | | 2,669 | |
| | Hanwha Life Insurance Co. Ltd. | | | Insurance | | | | 810 | | | | 1,612 | |
| | Hyundai Marine & Fire Insurance Co. Ltd. | | | Insurance | | | | 141 | | | | 3,112 | |
| | Industrial Bank of Korea | | | Banks | | | | 630 | | | | 6,952 | |
| | Kangwon Land Inc. | | | Hotels, Restaurants & Leisure | | | | 255 | | | | 6,300 | |
| | KB Financial Group Inc. | | | Banks | | | | 708 | | | | 25,274 | |
| | Kia Motors Corp. | | | Automobiles | | | | 246 | | | | 9,378 | |
| | Korea Zinc Co. Ltd. | | | Metals & Mining | | | | 15 | | | | 5,618 | |
| | KT&G Corp. | | | Tobacco | | | | 267 | | | | 23,549 | |
| | Kumho Petrochemical Co. Ltd. | | | Chemicals | | | | 30 | | | | 1,796 | |
| | LG Corp. | | | Industrial Conglomerates | | | | 159 | | | | 9,305 | |
| | LG Uplus Corp. | | | Diversified Telecommunication Services | | | | 153 | | | | 1,746 | |
| | Lotte Chemical Corp. | | | Chemicals | | | | 36 | | | | 7,103 | |
| | NCsoft Corp. | | | Entertainment | | | | 21 | | | | 9,147 | |
| c | | Orange Life Insurance Ltd., Reg S | | | Insurance | | | | 60 | | | | 1,357 | |
| | S-1 Corp. | | | Commercial Services & Supplies | | | | 39 | | | | 3,199 | |
| | Samsung Electronics Co. Ltd. | | | Technology Hardware, Storage & Peripherals | | | | 4,542 | | | | 186,252 | |
| | Samsung Fire & Marine Insurance Co. Ltd. | | | Insurance | | | | 42 | | | | 7,830 | |
| | | | | | |
| | | |
| franklintempleton.com | | Semiannual Report | | | 49 | |
FRANKLIN TEMPLETON ETF TRUST
STATEMENT OF INVESTMENTS (UNAUDITED)
Franklin LibertyQ Global Equity ETF(continued)
| | | | | | | | | | | | | | |
| | | | |
| | | | | Industry | | | Shares | | | Value | |
| | | Common Stocks and Other Equity Interests (continued) | | | | | | | |
| | | South Korea (continued) | | | | | | | | | |
| | Shinhan Financial Group Co. Ltd. | | | Banks | | | | 381 | | | $ | 13,314 | |
| | SK Hynix Inc. | | | Semiconductors & Semiconductor Equipment | | | | 1,491 | | | | 102,462 | |
| | SK Telecom Co. Ltd. | | | Wireless Telecommunication Services | | | | 45 | | | | 9,085 | |
| | Woongjin Coway Co. Ltd. | | | Household Durables | | | | 111 | | | | 7,851 | |
| | | | | | | | | | | | | | |
| | | | |
| | | | | | | | | | | | | 471,858 | |
| | | | | | | | | | | | | | |
| | | Spain 1.1% | | | | | | | | | |
| | Aena SME SA | | | Transportation Infrastructure | | | | 51 | | | | 9,341 | |
| | Banco de Sabadell SA | | | Banks | | | | 8,055 | | | | 7,817 | |
| | Enagas SA | | | Gas Utilities | | | | 366 | | | | 8,483 | |
| | Endesa SA | | | Electric Utilities | | | | 684 | | | | 18,001 | |
| | Iberdrola SA | | | Electric Utilities | | | | 4,923 | | | | 51,180 | |
| | Industria de Diseno Textil SA | | | Specialty Retail | | | | 2,112 | | | | 65,391 | |
| | Red Electrica Corp. SA | | | Electric Utilities | | | | 567 | | | | 11,519 | |
| | Repsol SA | | | Oil, Gas & Consumable Fuels | | | | 2,094 | | | | 32,737 | |
| | | | | | | | | | | | | | |
| | | | |
| | | | | | | | | | | | | 204,469 | |
| | | | | | | | | | | | | | |
| | | Sweden 0.3% | | | | | | | | | |
| | Boliden AB | | | Metals & Mining | | | | 450 | | | | 10,355 | |
| | Hennes & Mauritz AB, B | | | Specialty Retail | | | | 1,785 | | | | 34,647 | |
| | Telia Co. AB | | | Diversified Telecommunication Services | | | | 3,915 | | | | 17,548 | |
| | | | | | | | | | | | | | |
| | | | |
| | | | | | | | | | | | | 62,550 | |
| | | | | | | | | | | | | | |
| | | Switzerland 2.7% | | | | | | | | | |
| | EMS-Chemie Holding AG | | | Chemicals | | | | 15 | | | | 9,349 | |
| | Geberit AG | | | Building Products | | | | 27 | | | | 12,905 | |
| | Nestle SA | | | Food Products | | | | 1,845 | | | | 200,348 | |
| | Partners Group Holding AG | | | Capital Markets | | | | 42 | | | | 32,256 | |
| | Roche Holding AG | | | Pharmaceuticals | | | | 690 | | | | 200,983 | |
| | Swiss Life Holding AG | | | Insurance | | | | 57 | | | | 27,272 | |
| | Swisscom AG | | | Diversified Telecommunication Services | | | | 45 | | | | 22,217 | |
| | | | | | | | | | | | | | |
| | | | |
| | | | | | | | | | | | | 505,330 | |
| | | | | | | | | | | | | | |
| | | Taiwan 2.3% | | | | | | | | | |
| | Advantech Co. Ltd. | | | Technology Hardware, Storage & Peripherals | | | | 1,000 | | | | 8,800 | |
| | Catcher Technology Co. Ltd. | | | Technology Hardware, Storage & Peripherals | | | | 1,000 | | | | 7,575 | |
| | Chicony Electronics Co. Ltd. | | | Technology Hardware, Storage & Peripherals | | | | 2,015 | | | | 5,936 | |
| | China Development Financial Holding Corp. | | | Insurance | | | | 12,000 | | | | 3,574 | |
| a | | China Life Insurance Co. Ltd. | | | Insurance | | | | 3,717 | | | | 2,947 | |
| | Chunghwa Telecom Co. Ltd. | | | Diversified Telecommunication Services | | | | 6,000 | | | | 21,467 | |
| | Far EasTone Telecommunications Co. Ltd. | | | Wireless Telecommunication Services | | | | 3,000 | | | | 7,011 | |
| | Feng Tay Enterprise Co. Ltd. | | | Textiles, Apparel & Luxury Goods | | | | 825 | | | | 5,917 | |
| | Formosa Chemicals & Fibre Corp. | | | Chemicals | | | | 6,000 | | | | 16,767 | |
| | Formosa Petrochemical Corp. | | | Oil, Gas & Consumable Fuels | | | | 3,000 | | | | 9,496 | |
| | Formosa Plastics Corp. | | | Chemicals | | | | 7,000 | | | | 21,322 | |
| | Largan Precision Co. Ltd. | | | Electronic Equipment, Instruments & Components | | | | 200 | | | | 28,687 | |
| | Lite-On Technology Corp. | | | Technology Hardware, Storage & Peripherals | | | | 4,000 | | | | 6,356 | |
| | Nan Ya Plastics Corp. | | | Chemicals | | | | 9,000 | | | | 20,220 | |
| | Nanya Technology Corp. | | | Semiconductors & Semiconductor Equipment | | | | 3,000 | | | | 7,784 | |
| | Novatek Microelectronics Corp. Ltd. | | | Semiconductors & Semiconductor Equipment | | | | 1,000 | | | | 5,737 | |
| | Powertech Technology Inc. | | | Semiconductors & Semiconductor Equipment | | | | 2,000 | | | | 5,621 | |
| | President Chain Store Corp. | | | Food & Staples Retailing | | | | 1,500 | | | | 14,021 | |
| | Taiwan Business Bank | | | Banks | | | | 6,300 | | | | 2,589 | |
| | Taiwan Mobile Co. Ltd. | | | Wireless Telecommunication Services | | | | 3,000 | | | | 10,830 | |
| | Taiwan Semiconductor Manufacturing Co. Ltd. | | | Semiconductors & Semiconductor Equipment | | | | 23,000 | | | | 201,647 | |
| | The Shanghai Commercial & Savings Bank Ltd. | | | Banks | | | | 3,000 | | | | 5,038 | |
| | Vanguard International Semiconductor Corp. | | | Semiconductors & Semiconductor Equipment | | | | 2,000 | | | | 4,042 | |
| | WPG Holdings Ltd. | | | Electronic Equipment, Instruments & Components | | | | 3,000 | | | | 3,694 | |
| | | | |
| | | |
| 50 | | Semiannual Report | | franklintempleton.com |
FRANKLIN TEMPLETON ETF TRUST
STATEMENT OF INVESTMENTS (UNAUDITED)
Franklin LibertyQ Global Equity ETF(continued)
| | | | | | | | | | | | | | |
| | | | |
| | | | | Industry | | | Shares | | | Value | |
| | | Common Stocks and Other Equity Interests (continued) | | | | | | | |
| | | Taiwan (continued) | | | | | | | | | |
| | Yageo Corp. | | | Electronic Equipment, Instruments & Components | | | | 600 | | | $ | 4,767 | |
| | Yuanta Financial Holding Co. Ltd. | | | Capital Markets | | | | 6,000 | | | | 3,578 | |
| | | | | | | | | | | | | | |
| | | | |
| | | | | | | | | | | | | 435,423 | |
| | | | | | | | | | | | | | |
| | | Thailand 0.6% | | | | | | | | | |
| | Advanced Info Service PCL | | | Wireless Telecommunication Services | | | | 2,100 | | | | 15,105 | |
| | Airports of Thailand Public Co. Ltd., NVDR | | | Transportation Infrastructure | | | | 6,900 | | | | 16,864 | |
| | Bumrungrad Hospital PCL | | | Health Care Providers & Services | | | | 900 | | | | 3,767 | |
| | Home Product Center PCL, NVDR | | | Specialty Retail | | | | 12,300 | | | | 6,877 | |
| | Intouch Holdings PCL | | | Wireless Telecommunication Services | | | | 3,000 | | | | 6,425 | |
| | Land and Houses PCL, NVDR | | | Real Estate Management & Development | | | | 2,700 | | | | 847 | |
| | PTT Exploration and Production PCL, NVDR | | | Oil, Gas & Consumable Fuels | | | | 1,800 | | | | 7,121 | |
| | PTT Global Chemical PCL, NVDR | | | Chemicals | | | | 4,200 | | | | 7,381 | |
| | PTT PCL | | | Oil, Gas & Consumable Fuels | | | | 19,200 | | | | 29,034 | |
| | The Siam Cement PCL | | | Construction Materials | | | | 900 | | | | 12,006 | |
| | | | | | | | | | | | | | |
| | | | |
| | | | | | | | | | | | | 105,427 | |
| | | | | | | | | | | | | | |
| | | Turkey 0.2% | | | | | | | | | |
| | BIM Birlesik Magazalar AS | | | Food & Staples Retailing | | | | 1,032 | | | | 8,977 | |
| | Eregli Demir ve Celik Fabrikalari AS | | | Metals & Mining | | | | 3,552 | | | | 4,309 | |
| | Ford Otomotiv Sanayi AS | | | Automobiles | | | | 255 | | | | 2,682 | |
| | Haci Omer Sabanci Holding AS | | | Diversified Financial Services | | | | 540 | | | | 915 | |
| | TAV Havalimanlari Holding AS | | | Transportation Infrastructure | | | | 423 | | | | 1,768 | |
| | Tupras-Turkiye Petrol Rafinerileri AS | | | Oil, Gas & Consumable Fuels | | | | 330 | | | | 8,387 | |
| | Turkcell Iletisim Hizmetleri AS | | | Wireless Telecommunication Services | | | | 1,935 | | | | 4,458 | |
| a | | Turkiye Garanti Bankasi AS | | | Banks | | | | 2,196 | | | | 3,971 | |
| a | | Turkiye Is Bankasi AS, C | | | Banks | | | | 2,433 | | | | 2,702 | |
| | Turkiye Sise Ve Cam Fabrikalari AS | | | Industrial Conglomerates | | | | 1,182 | | | | 978 | |
| | | | | | | | | | | | | | |
| | | | |
| | | | | | | | | | | | | 39,147 | |
| | | | | | | | | | | | | | |
| | | United Arab Emirates 0.3% | | | | | | | | | |
| | Abu Dhabi Commercial Bank PJSC | | | Banks | | | | 3,690 | | | | 7,896 | |
| | Aldar Properties PJSC | | | Real Estate Management & Development | | | | 5,970 | | | | 3,397 | |
| | Dubai Islamic Bank PJSC | | | Banks | | | | 2,499 | | | | 3,572 | |
| | Emaar Development PJSC | | | Real Estate Management & Development | | | | 1,050 | | | | 1,178 | |
| | Emirates Telecommunications Group Co. PJSC | | | Diversified Telecommunication Services | | | | 3,642 | | | | 16,360 | |
| | First Abu Dhabi Bank PJSC | | | Banks | | | | 4,068 | | | | 16,656 | |
| | | | | | | | | | | | | | |
| | | | |
| | | | | | | | | | | | | 49,059 | |
| | | | | | | | | | | | | | |
| | | United Kingdom 6.9% | | | | | | | | | |
| | Admiral Group PLC | | | Insurance | | | | 495 | | | | 12,920 | |
| | Anglo American PLC | | | Metals & Mining | | | | 1,671 | | | | 38,531 | |
| | Auto Trader Group PLC | | | Interactive Media & Services | | | | 1,395 | | | | 8,767 | |
| | Barratt Developments PLC | | | Household Durables | | | | 2,427 | | | | 19,380 | |
| | BHP Group PLC | | | Metals & Mining | | | | 3,009 | | | | 64,237 | |
| | British Land Co. PLC | | | Equity Real Estate Investment Trusts (REITs | ) | | | 1,368 | | | | 9,858 | |
| | BT Group PLC | | | Diversified Telecommunication Services | | | | 18,162 | | | | 39,968 | |
| | Burberry Group PLC | | | Textiles, Apparel & Luxury Goods | | | | 897 | | | | 24,031 | |
| | Centrica PLC | | | Multi-Utilities | | | | 4,272 | | | | 3,882 | |
| | Compass Group PLC | | | Hotels, Restaurants & Leisure | | | | 2,751 | | | | 70,954 | |
| | Direct Line Insurance Group PLC | | | Insurance | | | | 3,024 | | | | 11,187 | |
| | easyJet PLC | | | Airlines | | | | 99 | | | | 1,403 | |
| | GlaxoSmithKline PLC | | | Pharmaceuticals | | | | 9,180 | | | | 197,358 | |
| | Hargreaves Lansdown PLC | | | Capital Markets | | | | 630 | | | | 16,140 | |
| | Imperial Brands PLC | | | Tobacco | | | | 2,043 | | | | 46,027 | |
| | Intertek Group PLC | | | Professional Services | | | | 258 | | | | 17,416 | |
| | ITV PLC | | | Media | | | | 8,439 | | | | 13,093 | |
| | Kingfisher PLC | | | Specialty Retail | | | | 3,435 | | | | 8,754 | |
| | | | | | |
| | | |
| franklintempleton.com | | Semiannual Report | | | 51 | |
FRANKLIN TEMPLETON ETF TRUST
STATEMENT OF INVESTMENTS (UNAUDITED)
Franklin LibertyQ Global Equity ETF(continued)
| | | | | | | | | | | | | | |
| | | | |
| | | | | Industry | | | Shares | | | Value | |
| | | Common Stocks and Other Equity Interests (continued) | | | | | | | |
| | | United Kingdom (continued) | | | | | | | | | |
| | Land Securities Group PLC | | | Equity Real Estate Investment Trusts (REITs | ) | | | 1,080 | | | $ | 11,398 | |
| | Marks & Spencer Group PLC | | | Multiline Retail | | | | 3,248 | | | | 7,383 | |
| | Mondi PLC | | | Paper & Forest Products | | | | 624 | | | | 11,980 | |
| | Mondi PLC | | | Paper & Forest Products | | | | 144 | | | | 2,758 | |
| | Next PLC | | | Multiline Retail | | | | 351 | | | | 26,757 | |
| | Persimmon PLC | | | Household Durables | | | | 873 | | | | 23,345 | |
| | RELX PLC | | | Professional Services | | | | 3,768 | | | | 89,732 | |
| | Royal Dutch Shell PLC, A | | | Oil, Gas & Consumable Fuels | | | | 3,147 | | | | 92,453 | |
| | Royal Dutch Shell PLC, B | | | Oil, Gas & Consumable Fuels | | | | 2,526 | | | | 74,582 | |
| | SSE PLC | | | Electric Utilities | | | | 1,818 | | | | 27,903 | |
| | Taylor Wimpey PLC | | | Household Durables | | | | 8,184 | | | | 16,288 | |
| | The Berkeley Group Holdings PLC | | | Household Durables | | | | 267 | | | | 13,750 | |
| | Unilever NV, IDR | | | Personal Products | | | | 2,757 | | | | 165,763 | |
| | Unilever PLC | | | Personal Products | | | | 2,112 | | | | 127,268 | |
| | Whitbread PLC | | | Hotels, Restaurants & Leisure | | | | 303 | | | | 16,033 | |
| | | | | | | | | | | | | | |
| | | | |
| | | | | | | | | | | | | 1,311,299 | |
| | | | | | | | | | | | | | |
| | | United States 53.2% | | | | | | | | | |
| | AbbVie Inc. | | | Biotechnology | | | | 1,236 | | | | 93,590 | |
| | Accenture PLC, A | | | IT Services | | | | 1,029 | | | | 197,928 | |
| | AGNC Investment Corp. | | | Mortgage Real Estate Investment Trusts (REITs | ) | | | 1,032 | | | | 16,605 | |
| | Air Products and Chemicals Inc. | | | Chemicals | | | | 177 | | | | 39,269 | |
| | Altria Group Inc. | | | Tobacco | | | | 3,531 | | | | 144,418 | |
| | Amcor PLC | | | Containers & Packaging | | | | 2,577 | | | | 25,126 | |
| | American Electric Power Co. Inc. | | | Electric Utilities | | | | 834 | | | | 78,137 | |
| | American Tower Corp. | | | Equity Real Estate Investment Trusts (REITs | ) | | | 396 | | | | 87,567 | |
| | Amgen Inc. | | | Biotechnology | | | | 1,068 | | | | 206,669 | |
| | Annaly Capital Management Inc. | | | Mortgage Real Estate Investment Trusts (REITs | ) | | | 2,787 | | | | 24,526 | |
| | Apple Inc. | | | Technology Hardware, Storage & Peripherals | | | | 960 | | | | 215,011 | |
| | Applied Materials Inc. | | | Semiconductors & Semiconductor Equipment | | | | 1,794 | | | | 89,521 | |
| | AT&T Inc. | | | Diversified Telecommunication Services | | | | 5,739 | | | | 217,164 | |
| a | | AutoZone Inc. | | | Specialty Retail | | | | 21 | | | | 22,777 | |
| | Best Buy Co. Inc. | | | Specialty Retail | | | | 486 | | | | 33,529 | |
| a | | Biogen Inc. | | | Biotechnology | | | | 390 | | | | 90,800 | |
| | BorgWarner Inc. | | | Auto Components | | | | 138 | | | | 5,062 | |
| | Bristol-Myers Squibb Co. | | | Pharmaceuticals | | | | 2,670 | | | | 135,396 | |
| | Broadcom Inc. | | | Semiconductors & Semiconductor Equipment | | | | 354 | | | | 97,729 | |
| | Broadridge Financial Solutions Inc. | | | IT Services | | | | 222 | | | | 27,623 | |
| a | | Burlington Stores Inc. | | | Specialty Retail | | | | 90 | | | | 17,984 | |
| | C.H. Robinson Worldwide Inc. | | | Air Freight & Logistics | | | | 234 | | | | 19,838 | |
| | Cabot Oil & Gas Corp., A | | | Oil, Gas & Consumable Fuels | | | | 348 | | | | 6,114 | |
| a | | Cadence Design Systems Inc. | | | Software | | | | 294 | | | | 19,428 | |
| | Campbell Soup Co. | | | Food Products | | | | 333 | | | | 15,624 | |
| a | | Capri Holdings Ltd. | | | Textiles, Apparel & Luxury Goods | | | | 327 | | | | 10,843 | |
| | Carnival Corp. | | | Hotels, Restaurants & Leisure | | | | 696 | | | | 30,422 | |
| | CBS Corp., B | | | Media | | | | 270 | | | | 10,900 | |
| | Celanese Corp., A | | | Chemicals | | | | 105 | | | | 12,840 | |
| | Church & Dwight Co. Inc. | | | Household Products | | | | 222 | | | | 16,703 | |
| | Cimarex Energy Co. | | | Oil, Gas & Consumable Fuels | | | | 90 | | | | 4,315 | |
| | Cisco Systems Inc. | | | Communications Equipment | | | | 3,285 | | | | 162,312 | |
| | Citrix Systems Inc. | | | Software | | | | 129 | | | | 12,451 | |
| | Clorox Co. | | | Household Products | | | | 309 | | | | 46,928 | |
| | Cognizant Technology Solutions Corp., A | | | IT Services | | | | 882 | | | | 53,154 | |
| a | | Copart Inc. | | | Commercial Services & Supplies | | | | 333 | | | | 26,750 | |
| | Cummins Inc. | | | Machinery | | | | 276 | | | | 44,897 | |
| | D.R. Horton Inc. | | | Household Durables | | | | 285 | | | | 15,022 | |
| | Darden Restaurants Inc. | | | Hotels, Restaurants & Leisure | | | | 249 | | | | 29,437 | |
| | Delta Air Lines Inc. | | | Airlines | | | | 303 | | | | 17,453 | |
| | | | |
| | | |
| 52 | | Semiannual Report | | franklintempleton.com |
FRANKLIN TEMPLETON ETF TRUST
STATEMENT OF INVESTMENTS (UNAUDITED)
Franklin LibertyQ Global Equity ETF(continued)
| | | | | | | | | | | | | | |
| | | | |
| | | | | Industry | | | Shares | | | Value | |
| | | Common Stocks and Other Equity Interests (continued) | | | | | | | |
| | | United States (continued) | | | | | | | | | |
| | Dollar General Corp. | | | Multiline Retail | | | | 480 | | | $ | 76,291 | |
| | Dominion Energy Inc. | | | Multi-Utilities | | | | 636 | | | | 51,541 | |
| | Dow Inc. | | | Chemicals | | | | 624 | | | | 29,734 | |
| | Eli Lilly & Co. | | | Pharmaceuticals | | | | 1,557 | | | | 174,119 | |
| | Equity Lifestyle Properties Inc. | | | Equity Real Estate Investment Trusts (REITs | ) | | | 72 | | | | 9,619 | |
| | Erie Indemnity Co., A | | | Insurance | | | | 24 | | | | 4,456 | |
| | Estee Lauder Cos. Inc., A | | | Personal Products | | | | 399 | | | | 79,381 | |
| | Expeditors International of Washington Inc. | | | Air Freight & Logistics | | | | 312 | | | | 23,178 | |
| | Extra Space Storage Inc. | | | Equity Real Estate Investment Trusts (REITs | ) | | | 180 | | | | 21,028 | |
| a | | F5 Networks Inc. | | | Communications Equipment | | | | 150 | | | | 21,063 | |
| a | | Facebook Inc., A | | | Interactive Media & Services | | | | 972 | | | | 173,094 | |
| | FactSet Research Systems Inc. | | | Capital Markets | | | | 33 | | | | 8,018 | |
| | Fastenal Co. | | | Trading Companies & Distributors | | | | 1,119 | | | | 36,558 | |
| | Ford Motor Co. | | | Automobiles | | | | 5,652 | | | | 51,772 | |
| | Fox Corp., A | | | Media | | | | 285 | | | | 8,987 | |
| | Fox Corp., B | | | Media | | | | 150 | | | | 4,731 | |
| | Garmin Ltd. | | | Household Durables | | | | 264 | | | | 22,358 | |
| | General Mills Inc. | | | Food Products | | | | 1,032 | | | | 56,884 | |
| | General Motors Co. | | | Automobiles | | | | 2,466 | | | | 92,426 | |
| | Gilead Sciences Inc. | | | Biotechnology | | | | 2,514 | | | | 159,337 | |
| | H&R Block Inc. | | | Diversified Consumer Services | | | | 459 | | | | 10,842 | |
| | Hanesbrands Inc. | | | Textiles, Apparel & Luxury Goods | | | | 546 | | | | 8,365 | |
| | HCP Inc. | | | Equity Real Estate Investment Trusts (REITs | ) | | | 444 | | | | 15,820 | |
| | HollyFrontier Corp. | | | Oil, Gas & Consumable Fuels | | | | 258 | | | | 13,839 | |
| | Hormel Foods Corp. | | | Food Products | | | | 615 | | | | 26,894 | |
| | Illinois Tool Works Inc. | | | Machinery | | | | 285 | | | | 44,600 | |
| | Ingredion Inc. | | | Food Products | | | | 132 | | | | 10,790 | |
| | Intel Corp. | | | Semiconductors & Semiconductor Equipment | | | | 4,002 | | | | 206,223 | |
| | International Business Machines Corp. | | | IT Services | | | | 1,353 | | | | 196,753 | |
| | Intuit Inc. | | | Software | | | | 549 | | | | 146,001 | |
| | J.B. Hunt Transport Services Inc. | | | Road & Rail | | | | 141 | | | | 15,602 | |
| | Jack Henry & Associates Inc. | | | IT Services | | | | 162 | | | | 23,647 | |
| | Johnson & Johnson | | | Pharmaceuticals | | | | 1,311 | | | | 169,617 | |
| | Kellogg Co. | | | Food Products | | | | 357 | | | | 22,973 | |
| | Kimberly-Clark Corp. | | | Household Products | | | | 657 | | | | 93,327 | |
| | Kimco Realty Corp. | | | Equity Real Estate Investment Trusts (REITs | ) | | | 543 | | | | 11,338 | |
| | KLA Corp. | | | Semiconductors & Semiconductor Equipment | | | | 342 | | | | 54,532 | |
| | Kohl’s Corp. | | | Multiline Retail | | | | 345 | | | | 17,133 | |
| | L Brands Inc. | | | Specialty Retail | | | | 360 | | | | 7,052 | |
| | Lam Research Corp. | | | Semiconductors & Semiconductor Equipment | | | | 231 | | | | 53,386 | |
| | Las Vegas Sands Corp. | | | Hotels, Restaurants & Leisure | | | | 666 | | | | 38,468 | |
| | Lear Corp. | | | Auto Components | | | | 132 | | | | 15,563 | |
| | Leggett & Platt Inc. | | | Household Durables | | | | 219 | | | | 8,966 | |
| | Lockheed Martin Corp. | | | Aerospace & Defense | | | | 471 | | | | 183,718 | |
| | Lowe’s Cos. Inc. | | | Specialty Retail | | | | 1,410 | | | | 155,044 | |
| a | | Lululemon Athletica Inc. | | | Textiles, Apparel & Luxury Goods | | | | 192 | | | | 36,966 | |
| | LyondellBasell Industries NV, A | | | Chemicals | | | | 786 | | | | 70,323 | |
| | Macy’s Inc. | | | Multiline Retail | | | | 615 | | | | 9,557 | |
| | MarketAxess Holdings Inc. | | | Capital Markets | | | | 36 | | | | 11,790 | |
| | Mastercard Inc., A | | | IT Services | | | | 720 | | | | 195,530 | |
| | Maxim Integrated Products Inc. | | | Semiconductors & Semiconductor Equipment | | | | 534 | | | | 30,924 | |
| | Merck & Co. Inc. | | | Pharmaceuticals | | | | 2,037 | | | | 171,475 | |
| a | | Mettler-Toledo International Inc. | | | Life Sciences Tools & Services | | | | 18 | | | | 12,679 | |
| a | | Micron Technology Inc. | | | Semiconductors & Semiconductor Equipment | | | | 2,076 | | | | 88,957 | |
| | Microsoft Corp. | | | Software | | | | 1,422 | | | | 197,701 | |
| a | | Monster Beverage Corp. | | | Beverages | | | | 330 | | | | 19,160 | |
| | Moody’s Corp. | | | Capital Markets | | | | 147 | | | | 30,110 | |
| | | | | | |
| | | |
| franklintempleton.com | | Semiannual Report | | | 53 | |
FRANKLIN TEMPLETON ETF TRUST
STATEMENT OF INVESTMENTS (UNAUDITED)
Franklin LibertyQ Global Equity ETF(continued)
| | | | | | | | | | | | | | |
| | | | |
| | | | | Industry | | | Shares | | | Value | |
| | | Common Stocks and Other Equity Interests (continued) | | | | | | | |
| | | United States (continued) | | | | | | | | | |
| | MSCI Inc. | | | Capital Markets | | | | 159 | | | $ | 34,622 | |
| | National Retail Properties Inc. | | | Equity Real Estate Investment Trusts (REITs | ) | | | 198 | | | | 11,167 | |
| | NetApp Inc. | | | Technology Hardware, Storage & Peripherals | | | | 225 | | | | 11,815 | |
| | NIKE Inc., B | | | Textiles, Apparel & Luxury Goods | | | | 2,085 | | | | 195,823 | |
| d | | Nordstrom Inc. | | | Multiline Retail | | | | 228 | | | | 7,677 | |
| | Nucor Corp. | | | Metals & Mining | | | | 276 | | | | 14,051 | |
| a | | NVR Inc. | | | Household Durables | | | | 7 | | | | 26,021 | |
| a | | O’Reilly Automotive Inc. | | | Specialty Retail | | | | 162 | | | | 64,559 | |
| | Occidental Petroleum Corp. | | | Oil, Gas & Consumable Fuels | | | | 591 | | | | 26,282 | |
| | OGE Energy Corp. | | | Electric Utilities | | | | 135 | | | | 6,126 | |
| | Old Dominion Freight Line Inc. | | | Road & Rail | | | | 99 | | | | 16,827 | |
| | Omnicom Group Inc. | | | Media | | | | 384 | | | | 30,067 | |
| | PACCAR Inc. | | | Machinery | | | | 297 | | | | 20,793 | |
| | Packaging Corp. of America | | | Containers & Packaging | | | | 78 | | | | 8,276 | |
| | Paychex Inc. | | | IT Services | | | | 642 | | | | 53,138 | |
| | PepsiCo Inc. | | | Beverages | | | | 1,416 | | | | 194,134 | |
| | Pfizer Inc. | | | Pharmaceuticals | | | | 4,359 | | | | 156,619 | |
| | Philip Morris International Inc. | | | Tobacco | | | | 2,136 | | | | 162,186 | |
| | Phillips 66 | | | Oil, Gas & Consumable Fuels | | | | 402 | | | | 41,165 | |
| | PPL Corp. | | | Electric Utilities | | | | 591 | | | | 18,611 | |
| | Public Service Enterprise Group Inc. | | | Multi-Utilities | | | | 834 | | | | 51,775 | |
| | Public Storage | | | Equity Real Estate Investment Trusts (REITs | ) | | | 369 | | | | 90,505 | |
| | PulteGroup Inc. | | | Household Durables | | | | 390 | | | | 14,254 | |
| | Ralph Lauren Corp. | | | Textiles, Apparel & Luxury Goods | | | | 84 | | | | 8,019 | |
| a | | Regeneron Pharmaceuticals Inc. | | | Biotechnology | | | | 72 | | | | 19,973 | |
| | Robert Half International Inc. | | | Professional Services | | | | 243 | | | | 13,525 | |
| | Rockwell Automation Inc. | | | Electrical Equipment | | | | 93 | | | | 15,326 | |
| | Rollins Inc. | | | Commercial Services & Supplies | | | | 249 | | | | 8,483 | |
| | Ross Stores Inc. | | | Specialty Retail | | | | 867 | | | | 95,240 | |
| | S&P Global Inc. | | | Capital Markets | | | | 417 | | | | 102,157 | |
| | Seagate Technology PLC | | | Technology Hardware, Storage & Peripherals | | | | 678 | | | | 36,470 | |
| | Simon Property Group Inc. | | | Equity Real Estate Investment Trusts (REITs | ) | | | 714 | | | | 111,134 | |
| | Skyworks Solutions Inc. | | | Semiconductors & Semiconductor Equipment | | | | 402 | | | | 31,858 | |
| | Snap-on Inc. | | | Machinery | | | | 75 | | | | 11,740 | |
| | Southwest Airlines Co. | | | Airlines | | | | 252 | | | | 13,611 | |
| | Starbucks Corp. | | | Hotels, Restaurants & Leisure | | | | 2,295 | | | | 202,924 | |
| | Steel Dynamics Inc. | | | Metals & Mining | | | | 198 | | | | 5,900 | |
| | Sysco Corp. | | | Food & Staples Retailing | | | | 852 | | | | 67,649 | |
| | Tapestry Inc. | | | Textiles, Apparel & Luxury Goods | | | | 528 | | | | 13,754 | |
| | Target Corp. | | | Multiline Retail | | | | 969 | | | | 103,596 | |
| | TE Connectivity Ltd. | | | Electronic Equipment, Instruments & Components | | | | 321 | | | | 29,911 | |
| | Texas Instruments Inc. | | | Semiconductors & Semiconductor Equipment | | | | 1,674 | | | | 216,348 | |
| | The Gap Inc. | | | Specialty Retail | | | | 540 | | | | 9,374 | |
| | The Hershey Co. | | | Food Products | | | | 339 | | | | 52,542 | |
| | The Home Depot Inc. | | | Specialty Retail | | | | 945 | | | | 219,259 | |
| | The Kroger Co. | | | Food & Staples Retailing | | | | 1,398 | | | | 36,040 | |
| | The Procter & Gamble Co. | | | Household Products | | | | 1,707 | | | | 212,317 | |
| | The TJX Cos. Inc. | | | Specialty Retail | | | | 2,802 | | | | 156,183 | |
| | The Walt Disney Co. | | | Entertainment | | | | 1,341 | | | | 174,759 | |
| | Tractor Supply Co. | | | Specialty Retail | | | | 237 | | | | 21,434 | |
| | Tyson Foods Inc. | | | Food Products | | | | 522 | | | | 44,965 | |
| a | | Ulta Beauty Inc. | | | Specialty Retail | | | | 111 | | | | 27,822 | |
| | Union Pacific Corp. | | | Road & Rail | | | | 1,050 | | | | 170,079 | |
| | United Parcel Service Inc., B | | | Air Freight & Logistics | | | | 666 | | | | 79,800 | |
| | Valero Energy Corp. | | | Oil, Gas & Consumable Fuels | | | | 732 | | | | 62,396 | |
| | Ventas Inc. | | | Equity Real Estate Investment Trusts (REITs | ) | | | 429 | | | | 31,330 | |
| | Verizon Communications Inc. | | | Diversified Telecommunication Services | | | | 3,174 | | | | 191,583 | |
| | | | |
| | | |
| 54 | | Semiannual Report | | franklintempleton.com |
FRANKLIN TEMPLETON ETF TRUST
STATEMENT OF INVESTMENTS (UNAUDITED)
Franklin LibertyQ Global Equity ETF(continued)
| | | | | | | | | | | | | | |
| | | | |
| | | | | Industry | | | Shares | | | Value | |
| | | Common Stocks and Other Equity Interests (continued) | | | | | | | |
| | | United States (continued) | | | | | | | | | |
| | VF Corp. | | | Textiles, Apparel & Luxury Goods | | | | 573 | | | $ | 50,991 | |
| | Viacom Inc., B | | | Entertainment | | | | 561 | | | | 13,481 | |
| | VMware Inc., A | | | Software | | | | 78 | | | | 11,705 | |
| | W.W. Grainger Inc. | | | Trading Companies & Distributors | | | | 81 | | | | 24,069 | |
| | Walgreens Boots Alliance Inc. | | | Food & Staples Retailing | | | | 1,077 | | | | 59,569 | |
| | Waste Management Inc. | | | Commercial Services & Supplies | | | | 330 | | | | 37,950 | |
| | WEC Energy Group Inc. | | | Multi-Utilities | | | | 510 | | | | 48,501 | |
| | Xilinx Inc. | | | Semiconductors & Semiconductor Equipment | | | | 201 | | | | 19,276 | |
| | | | | | | | | | | | | | |
| | | | |
| | | | | | | | | | | | | 10,071,638 | |
| | | | | | | | | | | | | | |
| | Total Common Stocks and Other Equity Interests
(Cost $17,054,758) | | | | | | | | | | | 18,507,305 | |
| | | | | | | | | | | | | | |
| | | | |
| | Management Investment Companies (Cost $186,027) 1.1% | | | | | | | | | | | | |
| | | India 1.1% | | | | | | | | | |
| | iShares MSCI India ETF | | | Diversified Financial Services | | | | 5,902 | | | | 198,130 | |
| | | | | | | | | | | | | | |
| | | Preferred Stocks 0.7% | | | | | | | | | |
| | | Brazil 0.4% | | | | | | | | | |
| e | | Itau Unibanco Holding SA, 4.930%, pfd. | | | Banks | | | | 3,900 | | | | 32,798 | |
| e | | Itausa-Investimentos Itau SA, 5.463%, pfd. | | | Banks | | | | 9,600 | | | | 30,376 | |
| e | | Telefonica Brasil SA, 6.735%, pfd. | | | Diversified Telecommunication Services | | | | 900 | | | | 11,871 | |
| | | | | | | | | | | | | | |
| | | | |
| | | | | | | | | | | | | 75,045 | |
| | | | | | | | | | | | | | |
| | | Germany 0.1% | | | | | | | | | |
| e | | Bayerische Motoren Werke AG, 6.909%, pfd. | | | Automobiles | | | | 108 | | | | 5,999 | |
| e | | Porsche Automobil Holding SE, 3.702%, pfd. | | | Automobiles | | | | 240 | | | | 15,620 | |
| | | | | | | | | | | | | | |
| | | | |
| | | | | | | | | | | | | 21,619 | |
| | | | | | | | | | | | | | |
| | | Russia 0.1% | | | | | | | | | |
| e | | Surgutneftegas PJSC, 20.342%, pfd. | | | Oil, Gas & Consumable Fuels | | | | 18,615 | | | | 10,747 | |
| e | | Transneft PJSC, 7.147%, pfd. | | | Oil, Gas & Consumable Fuels | | | | 1 | | | | 2,309 | |
| | | | | | | | | | | | | | |
| | | | | | | | | | | 13,056 | |
| | | | | | | | | | | | | | |
| | | South Korea 0.1% | | | | | | | | | |
| e | | LG Chem Ltd., 3.612%, pfd. | | | Chemicals | | | | 9 | | | | 1,260 | |
| e | | LG Household & Health Care Ltd., 1.206%, pfd. | | | Personal Products | | | | 3 | | | | 1,934 | |
| e | | Samsung Electronics Co. Ltd., 3.587%, pfd. | | | Technology Hardware, Storage & Peripherals | | | | 849 | | | | 28,036 | |
| | | | | | | | | | | | | | |
| | | | |
| | | | | | | | | | | | | 31,230 | |
| | | | | | | | | | | | | | |
| | Total Preferred Stocks (Cost $125,451) | | | | | | | | | | | 140,950 | |
| | | | | | | | | | | | | | |
| | Total Investments before Short Term Investments
(Cost $17,366,236) | | | | | | | | | | | 18,846,385 | |
| | | | | | | | | | | | | | |
| | | | |
| | Short Term Investments (Cost $3,375) 0.0%† | | | | | | | | | | | | |
| | Investments from Cash Collateral Received for Loaned Securities 0.0%† | | | | | | | | | | | | |
| | | United States 0.0%† | | | | | | | | | |
| f,g | | Institutional Fiduciary Trust Portfolio, 1.71% | | | | | | | | | | | 3,375 | |
| | | | | | | | | | | | | | |
| | Total Investments
(Cost $17,369,611) 99.5% | | | | | | | | | | | 18,849,760 | |
| | Other Assets, less Liabilities 0.5% | | | | | | | | | | | 88,710 | |
| | | | | | | | | | | | | | |
| | Net Assets 100.0% | | | | | | | | | | $ | 18,938,470 | |
| | | | | | | | | | | | | | |
| | | | | | |
| | | |
| franklintempleton.com | | Semiannual Report | | | 55 | |
FRANKLIN TEMPLETON ETF TRUST
STATEMENT OF INVESTMENTS (UNAUDITED)
Franklin LibertyQ Global Equity ETF(continued)
See Abbreviations on page 81.
†Rounds to less than 0.1% of net assets.
aNon-income producing.
bSecurity was purchased pursuant to Rule 144A under the Securities Act of 1933 and may be sold in transactions exempt from registration only to qualified institutional buyers or in a public offering registered under the Securities Act of 1933. This security has been deemed liquid under guidelines approved by the Fund’s Board of Trustees. At September 30, 2019, the value of this security was $11,212, representing 0.1% of net assets.
cSecurity was purchased pursuant to Regulation S under the Securities Act of 1933, which exempts from registration securities offered and sold outside of the United States. Such a security cannot be sold in the United States without either an effective registration statement filed pursuant to the Securities Act of 1933, or pursuant to an exemption from registration. These securities have been deemed liquid under guidelines approved by the Fund’s Board of Trustees. At September 30, 2019, the aggregate value of these securities was $75,487, representing 0.3% of net assets.
dA portion or all of the security is on loan at September 30, 2019. See Note 1(d).
eVariable rate security. The rate shown represents the yield at period end.
fSee Note 3(c) regarding investments in affiliated management investment companies.
gThe rate shown is the annualizedseven-day effective yield at period end.
At September 30, 2019, the Fund had the following futures contracts outstanding. See Note 1(c).
| | | | | | | | | | | | | | | | | | | | |
| Futures Contracts | | | | | | | | | | | | | | | |
| | | | | |
| Description | | Type | | | Number of
Contracts | | | Notional
Amount* | | | Expiration
Date | | | Value/Unrealized
Appreciation
(Depreciation) | |
| Index Contracts | | | | | | | | | | | | | | | | | | | | |
MSCI All Country World Index | | | Long | | | | 2 | | | $ | 52,100 | | | | 12/20/19 | | | $ | (813 | ) |
*As of period end.
| | | | |
| | | |
| 56 | | Semiannual Report | The accompanying notes are an integral part of these financial statements. | | franklintempleton.com |
FRANKLIN TEMPLETON ETF TRUST
Financial Highlights
Franklin LibertyQ International Equity Hedged ETF
| | | | | | | | | | | | | | | | |
| | | Six Months Ended
September 30,
2019 (unaudited) | | | Year Ended March 31, | |
| | | 2019 | | | 2018 | | | 2017a | |
|
Per share operating performance
(for a share outstanding throughout the period) | |
| | | | |
Net asset value, beginning of period | | $ | 24.70 | | | $ | 24.25 | | | $ | 24.70 | | | $ | 25.45 | |
| | | | |
|
| Income from investment operationsb: | |
| | | | |
Net investment incomec | | | 0.52 | | | | 0.93 | | | | 0.77 | | | | 0.52 | |
| | | | |
Net realized and unrealized gains (losses) | | | 0.98 | | | | 0.79 | | | | 0.10 | | | | 1.45 | |
| | | | |
| | | | |
Total from investment operations | | | 1.50 | | | | 1.72 | | | | 0.87 | | | | 1.97 | |
| | | | |
| | | | |
| Less distributions from: | | | | | | | | | | | | | | | | |
| | | | |
Net investment income and net foreign currency gains | | | (0.19 | ) | | | (0.30 | ) | | | (1.32 | ) | | | (2.72 | ) |
| | | | |
Net realized gains | | | — | | | | (0.97 | ) | | | — | | | | — | |
| | | | |
| | | | |
Total distributions | | | (0.19 | ) | | | (1.27 | ) | | | (1.32 | ) | | | (2.72 | ) |
| | | | |
| | | | |
Net asset value, end of period | | $ | 26.01 | | | $ | 24.70 | | | $ | 24.25 | | | $ | 24.70 | |
| | | | |
| | | | |
Total returnd | | | 6.11% | | | | 7.53% | | | | 3.47% | | | | 8.30% | |
|
| Ratios to average net assetse | |
| | | | |
Expenses before waiver and payments by affiliates | | | 0.40% | | | | 0.40% | | | | 1.42% | f | | | 1.25% | |
| | | | |
Expenses net of waiver and payments by affiliates | | | 0.40% | | | | 0.40% | | | | 0.40% | f | | | 0.40% | |
| | | | |
Net investment income | | | 4.17% | | | | 3.75% | | | | 3.07% | | | | 2.47% | |
|
| Supplemental data | |
| | | | |
Net assets, end of period (000’s) | | | $10,406 | | | | $7,410 | | | | $9,702 | | | | $9,880 | |
| | | | |
Portfolio turnover rateg | | | 10.00% | | | | 39.24% | | | | 32.55% | | | | 19.09% | |
| | | | |
| Portfolio turnover rate excluding portfolio transactions that are executed as a result of the Fund offering and redeeming Creation Units solely or in part for cashg,h | | | 10.00% | | | | —% | | | | —% | | | | —% | |
aFor the period June 1, 2016 (commencement of operations) to March 31, 2017.
bThe amount shown for a share outstanding throughout the period may not correlate with the Statement of Operations for the period due to the timing of sales and repurchases of Creation Unit Fund shares in relation to income earned and/or fluctuating fair value of the investments of the Fund.
cBased on average daily shares outstanding.
dTotal return is not annualized for periods less than one year. Total return is calculated assuming an initial investment made at the net asset value at the beginning of the period, reinvestment of all dividends and distributions at net asset value during the period, and redemption at net asset value on the last day of the period.
eRatios are annualized for periods less than one year.
fEffective December 1, 2017, the Fund replaced the prior fee structure with a unified management fee. See Note 3(a).
gPortfolio turnover rate excludes the value of portfolio securities received or delivered as a result of processing capital share transactions in Creation Units, if any.
hEffective September 30, 2019.
| | | | | | |
| | | |
| franklintempleton.com | | The accompanying notes are an integral part of these financial statements. | Semiannual Report | | | 57 | |
FRANKLIN TEMPLETON ETF TRUST
Statement of Investments, September 30, 2019 (unaudited)
Franklin LibertyQ International Equity Hedged ETF
| | | | | | | | | | | | | | |
| | | |
| | | Industry | | | Shares | | | Value | |
| | | Common Stocks and Other Equity Interests 98.7% | |
| | | Australia 22.0% | |
| | AGL Energy Ltd. | | | Multi-Utilities | | | | 2,300 | | | $ | 29,722 | |
| | Alumina Ltd. | | | Metals & Mining | | | | 9,004 | | | | 14,392 | |
| | Aristocrat Leisure Ltd. | | | Hotels, Restaurants & Leisure | | | | 1,768 | | | | 36,488 | |
| | Aurizon Holdings Ltd. | | | Road & Rail | | | | 6,312 | | | | 25,117 | |
| | Australia & New Zealand Banking Group Ltd. | | | Banks | | | | 3,868 | | | | 74,402 | |
| | Australian Stock Exchange Ltd. | | | Capital Markets | | | | 556 | | | | 30,401 | |
| | Bank of Queensland Ltd. | | | Banks | | | | 824 | | | | 5,513 | |
| | Bendigo and Adelaide Bank Ltd. | | | Banks | | | | 1,188 | | | | 9,206 | |
| | BHP Group Ltd. | | | Metals & Mining | | | | 7,848 | | | | 194,362 | |
| | Bluescope Steel Ltd. | | | Metals & Mining | | | | 1,588 | | | | 12,863 | |
| | Brambles Ltd. | | | Commercial Services & Supplies | | | | 5,548 | | | | 42,657 | |
| | Cimic Group Ltd. | | | Construction & Engineering | | | | 308 | | | | 6,533 | |
| | Coca-Cola Amatil Ltd. | | | Beverages | | | | 1,624 | | | | 11,665 | |
| | Cochlear Ltd. | | | Health Care Equipment & Supplies | | | | 220 | | | | 30,885 | |
| | Commonwealth Bank of Australia | | | Banks | | | | 4,016 | | | | 218,935 | |
| | Computershare Ltd. | | | IT Services | | | | 1,248 | | | | 13,594 | |
| | Crown Resorts Ltd. | | | Hotels, Restaurants & Leisure | | | | 1,184 | | | | 9,623 | |
| | CSL Ltd. | | | Biotechnology | | | | 1,452 | | | | 228,853 | |
| | Dexus | | | Equity Real Estate Investment Trusts (REITs | ) | | | 3,772 | | | | 30,350 | |
| | Flight Centre Travel Group Ltd. | | | Hotels, Restaurants & Leisure | | | | 176 | | | | 5,650 | |
| | Fortescue Metals Group Ltd. | | | Metals & Mining | | | | 5,448 | | | | 32,335 | |
| | Goodman Group | | | Equity Real Estate Investment Trusts (REITs | ) | | | 3,928 | | | | 37,566 | |
| | GPT Group | | | Equity Real Estate Investment Trusts (REITs | ) | | | 6,168 | | | | 25,626 | |
| | Harvey Norman Holdings Ltd. | | | Multiline Retail | | | | 2,200 | | | | 6,722 | |
| a | | Harvey Norman Holdings Ltd., rts., 10/11/19 | | | Multiline Retail | | | | 129 | | | | 156 | |
| | Macquarie Group Ltd. | | | Capital Markets | | | | 652 | | | | 57,641 | |
| | Medibank Private Ltd. | | | Insurance | | | | 10,700 | | | | 24,536 | |
| | Mirvac Group | | | Equity Real Estate Investment Trusts (REITs | ) | | | 11,652 | | | | 24,048 | |
| | National Australia Bank Ltd. | | | Banks | | | | 7,800 | | �� | | 156,243 | |
| | REA Group Ltd. | | | Interactive Media & Services | | | | 168 | | | | 12,262 | |
| | Rio Tinto Ltd. | | | Metals & Mining | | | | 1,448 | | | | 90,502 | |
| | Rio Tinto PLC | | | Metals & Mining | | | | 3,448 | | | | 178,839 | |
| | Scentre Group | | | Equity Real Estate Investment Trusts (REITs | ) | | | 13,128 | | | | 34,797 | |
| | Sonic Healthcare Ltd. | | | Health Care Providers & Services | | | | 1,208 | | | | 22,853 | |
| | South32 Ltd. | | | Metals & Mining | | | | 15,536 | | | | 27,453 | |
| | Telstra Corp. Ltd. | | | Diversified Telecommunication Services | | | | 16,296 | | | | 38,578 | |
| | Vicinity Centres | | | Equity Real Estate Investment Trusts (REITs | ) | | | 9,696 | | | | 16,806 | |
| | Washington H. Soul Pattinson & Co. Ltd. | | | Oil, Gas & Consumable Fuels | | | | 264 | | | | 3,745 | |
| | Wesfarmers Ltd. | | | Multiline Retail | | | | 3,976 | | | | 106,728 | |
| | Westpac Banking Corp. | | | Banks | | | | 10,220 | | | | 204,305 | |
| | Woodside Petroleum Ltd. | | | Oil, Gas & Consumable Fuels | | | | 2,148 | | | | 46,910 | |
| | Woolworths Group Ltd. | | | Food & Staples Retailing | | | | 4,236 | | | | 106,508 | |
| | | | | | | | | | | | | | |
| | | | |
| | | | | | | | | | | | | 2,286,370 | |
| | | | | | | | | | | | | | |
| | | Austria 0.2% | |
| | OMV AG | | | Oil, Gas & Consumable Fuels | | | | 404 | | | | 21,687 | |
| | | | | | | | | | | | | | |
| | | Belgium 0.3% | |
| | Colruyt SA | | | Food & Staples Retailing | | | | 208 | | | | 11,402 | |
| | Proximus SADP | | | Diversified Telecommunication Services | | | | 536 | | | | 15,923 | |
| | | | | | | | | | | | | | |
| | | | |
| | | | | | | | | | | | | 27,325 | |
| | | | | | | | | | | | | | |
| | | China 0.4% | |
| | Sands China Ltd. | | | Hotels, Restaurants & Leisure | | | | 8,800 | | | | 39,850 | |
| | | | | | | | | | | | | | |
| | | Denmark 3.2% | |
| | Coloplast AS, B | | | Health Care Equipment & Supplies | | | | 464 | | | | 55,895 | |
| | Novo Nordisk AS, B | | | Pharmaceuticals | | | | 4,340 | | | | 223,161 | |
| | Novozymes AS | | | Chemicals | | | | 528 | | | | 22,204 | |
| | | | |
| | | |
| 58 | | Semiannual Report | | franklintempleton.com |
FRANKLIN TEMPLETON ETF TRUST
STATEMENT OF INVESTMENTS (UNAUDITED)
Franklin LibertyQ International Equity Hedged ETF(continued)
| | | | | | | | | | | | | | |
| | | |
| | | Industry | | | Shares | | | Value | |
| | | Common Stocks and Other Equity Interests (continued) | |
| | | Denmark (continued) | |
| | Pandora AS | | | Household Durables | | | | 488 | | | $ | 19,588 | |
| | Tryg AS | | | Insurance | | | | 352 | | | | 10,090 | |
| | | | | | | | | | | | | | |
| | | | |
| | | | | | | | | | | | | 330,938 | |
| | | | | | | | | | | | | | |
| | | Finland 1.3% | |
| | Elisa OYJ | | | Diversified Telecommunication Services | | | | 476 | | | | 24,546 | |
| | Kone OYJ, B | | | Machinery | | | | 912 | | | | 51,940 | |
| | Nokian Renkaat OYJ | | | Auto Components | | | | 384 | | | | 10,834 | |
| | Orion OYJ | | | Pharmaceuticals | | | | 348 | | | | 12,983 | |
| | UPM-Kymmene OYJ | | | Paper & Forest Products | | | | 1,240 | | | | 36,662 | |
| | | | | | | | | | | | | | |
| | | | |
| | | | | | | | | | | | | 136,965 | |
| | | | | | | | | | | | | | |
| | | France 4.4% | |
| | Cie Generale des Etablissements Michelin SCA | | | Auto Components | | | | 496 | | | | 55,372 | |
| | Covivio | | | Equity Real Estate Investment Trusts (REITs | ) | | | 116 | | | | 12,279 | |
| | Eutelsat Communications SA | | | Media | | | | 360 | | | | 6,701 | |
| | Hermes International | | | Textiles, Apparel & Luxury Goods | | | | 101 | | | | 69,810 | |
| | Peugeot SA | | | Automobiles | | | | 1,908 | | | | 47,593 | |
| | Renault SA | | | Automobiles | | | | 392 | | | | 22,505 | |
| | Sanofi | | | Pharmaceuticals | | | | 2,120 | | | | 196,593 | |
| | Societe BIC SA | | | Commercial Services & Supplies | | | | 92 | | | | 6,178 | |
| | Societe Generale SA | | | Banks | | | | 1,664 | | | | 45,606 | |
| | | | | | | | | | | | | | |
| | | | |
| | | | | | | | | | | | | 462,637 | |
| | | | | | | | | | | | | | |
| | | Germany 1.6% | |
| | Aroundtown SA | | | Real Estate Management & Development | | | | 1,960 | | | | 16,035 | |
| | Continental AG | | | Auto Components | | | | 296 | | | | 37,982 | |
| | Covestro AG | | | Chemicals | | | | 660 | | | | 32,667 | |
| | Deutsche Lufthansa AG | | | Airlines | | | | 720 | | | | 11,444 | |
| | E.ON SE | | | Multi-Utilities | | | | 3,216 | | | | 31,271 | |
| | Hugo Boss AG | | | Textiles, Apparel & Luxury Goods | | | | 212 | | | | 11,360 | |
| | Knorr-Bremse AG | | | Machinery | | | | 72 | | | | 6,769 | |
| | TUI AG | | | Hotels, Restaurants & Leisure | | | | 1,240 | | | | 14,452 | |
| | | | | | | | | | | | | | |
| | | | |
| | | | | | | | | | | | | 161,980 | |
| | | | | | | | | | | | | | |
| | | Hong Kong 3.8% | |
| | AIA Group Ltd. | | | Insurance | | | | 20,800 | | | | 196,474 | |
| | CK Infrastructure Holdings Ltd. | | | Electric Utilities | | | | 2,000 | | | | 13,458 | |
| | CLP Holdings Ltd. | | | Electric Utilities | | | | 4,600 | | | | 48,321 | |
| | HKT Trust and HKT Ltd. | | | Diversified Telecommunication Services | | | | 12,000 | | | | 19,042 | |
| | Hongkong Land Holdings Ltd. | | | Real Estate Management & Development | | | | 3,400 | | | | 19,108 | |
| | Jardine Matheson Holdings Ltd. | | | Industrial Conglomerates | | | | 580 | | | | 31,030 | |
| | Kerry Properties Ltd. | | | Real Estate Management & Development | | | | 2,500 | | | | 7,702 | |
| | NWS Holdings Ltd. | | | Industrial Conglomerates | | | | 5,000 | | | | 7,743 | |
| | Power Assets Holdings Ltd. | | | Electric Utilities | | | | 2,000 | | | | 13,432 | |
| | Swire Properties Ltd. | | | Real Estate Management & Development | | | | 3,200 | | | | 10,042 | |
| | Vitasoy International Holdings Ltd. | | | Food Products | | | | 1,200 | | | | 4,860 | |
| b | | WH Group Ltd., Reg S | | | Food Products | | | | 24,500 | | | | 21,939 | |
| | Yue Yuen Industrial Holdings Ltd. | | | Textiles, Apparel & Luxury Goods | | | | 2,500 | | | | 6,840 | |
| | | | | | | | | | | | | | |
| | | | |
| | | | | | | | | | | | | 399,991 | |
| | | | | | | | | | | | | | |
| | | Ireland 0.0%† | |
| | AIB Group PLC | | | Banks | | | | 1,096 | | | | 3,255 | |
| | | | | | | | | | | | | | |
| | | Israel 0.7% | |
| | Bank LeumiLe-Israel BM | | | Banks | | | | 3,780 | | | | 26,905 | |
| a | | Check Point Software Technologies Ltd. | | | Software | | | | 372 | | | | 40,734 | |
| | Israel Chemicals Ltd. | | | Chemicals | | | | 1,348 | | | | 6,694 | |
| | | | | | | | | | | | | | |
| | | | |
| | | | | | | | | | | | | 74,333 | |
| | | | | | | | | | | | | | |
| | | | | | |
| | | |
| franklintempleton.com | | Semiannual Report | | | 59 | |
FRANKLIN TEMPLETON ETF TRUST
STATEMENT OF INVESTMENTS (UNAUDITED)
Franklin LibertyQ International Equity Hedged ETF(continued)
| | | | | | | | | | | | | | |
| | | |
| | | Industry | | | Shares | | | Value | |
| | | Common Stocks and Other Equity Interests (continued) | |
| | | Italy 2.3% | |
| | Enel SpA | | | Electric Utilities | | | | 11,660 | | | $ | 87,088 | |
| | Intesa Sanpaolo SpA | | | Banks | | | | 38,744 | | | | 91,890 | |
| | Moncler SpA | | | Textiles, Apparel & Luxury Goods | | | | 496 | | | | 17,682 | |
| b | | Poste Italiane SpA, Reg S | | | Insurance | | | | 1,620 | | | | 18,421 | |
| | Recordati SpA | | | Pharmaceuticals | | | | 172 | | | | 7,381 | |
| | Snam SpA | | | Gas Utilities | | | | 2,784 | | | | 14,065 | |
| | | | | | | | | | | | | | |
| | | | |
| | | | | | | | | | | | | 236,527 | |
| | | | | | | | | | | | | | |
| | | Japan 21.6% | |
| | ABC-Mart Inc. | | | Specialty Retail | | | | 92 | | | | 5,848 | |
| | Advantest Corp. | | | Semiconductors & Semiconductor Equipment | | | | 260 | | | | 11,487 | |
| | Aisin Seiki Co. Ltd. | | | Auto Components | | | | 400 | | | | 12,565 | |
| | Asahi Kasei Corp. | | | Chemicals | | | | 3,200 | | | | 31,504 | |
| | Astellas Pharma Inc. | | | Pharmaceuticals | | | | 6,100 | | | | 86,836 | |
| | Bandai Namco Holdings Inc. | | | Leisure Products | | | | 600 | | | | 37,363 | |
| | Bridgestone Corp. | | | Auto Components | | | | 1,800 | | | | 69,685 | |
| | CANON Inc. | | | Technology Hardware, Storage & Peripherals | | | | 2,800 | | | | 74,680 | |
| | Daicel Corp. | | | Chemicals | | | | 800 | | | | 6,758 | |
| | Daito Trust Construction Co. Ltd. | | | Real Estate Management & Development | | | | 240 | | | | 30,668 | |
| | Daiwa House Industry Co. Ltd. | | | Real Estate Management & Development | | | | 1,200 | | | | 38,929 | |
| | Hoya Corp. | | | Health Care Equipment & Supplies | | | | 1,200 | | | | 97,921 | |
| | Iida Group Holdings Co. Ltd. | | | Household Durables | | | | 400 | | | | 6,507 | |
| | Isuzu Motors Ltd. | | | Automobiles | | | | 1,500 | | | | 16,523 | |
| | ITOCHU Corp. | | | Trading Companies & Distributors | | | | 4,000 | | | | 82,572 | |
| | Japan Airlines Co. Ltd. | | | Airlines | | | | 400 | | | | 11,888 | |
| | Japan Post Bank Co. Ltd. | | | Banks | | | | 1,200 | | | | 11,625 | |
| | Japan Tobacco Inc. | | | Tobacco | | | | 3,500 | | | | 76,623 | |
| | JFE Holdings Inc. | | | Metals & Mining | | | | 1,000 | | | | 12,029 | |
| | JXTG Holdings Inc. | | | Oil, Gas & Consumable Fuels | | | | 8,400 | | | | 38,271 | |
| | Kajima Corp. | | | Construction & Engineering | | | | 1,273 | | | | 16,691 | |
| | Kakaku.com Inc. | | | Interactive Media & Services | | | | 500 | | | | 12,297 | |
| | KAO Corp. | | | Personal Products | | | | 1,364 | | | | 100,765 | |
| | KDDI Corp. | | | Wireless Telecommunication Services | | | | 6,400 | | | | 167,291 | |
| | Koito Manufacturing Co. Ltd. | | | Auto Components | | | | 260 | | | | 12,702 | |
| | Marubeni Corp. | | | Trading Companies & Distributors | | | | 4,000 | | | | 26,563 | |
| | Mitsubishi Chemical Holdings Corp. | | | Chemicals | | | | 3,700 | | | | 26,365 | |
| | Mitsubishi Gas Chemical Co. Inc. | | | Chemicals | | | | 500 | | | | 6,671 | |
| | Mizuho Financial Group Inc. | | | Banks | | | | 47,600 | | | | 72,936 | |
| | MS&AD Insurance Group Holdings Inc. | | | Insurance | | | | 1,200 | | | | 38,862 | |
| a | | Nexon Co. Ltd. | | | Entertainment | | | | 800 | | | | 9,704 | |
| | Nippon Telegraph & Telephone Corp. | | | Diversified Telecommunication Services | | | | 2,200 | | | | 104,957 | |
| | Nissan Motor Co. Ltd. | | | Automobiles | | | | 7,200 | | | | 44,909 | |
| | NTT DOCOMO Inc. | | | Wireless Telecommunication Services | | | | 5,000 | | | | 127,365 | |
| | Obayashi Corp. | | | Construction & Engineering | | | | 2,000 | | | | 19,912 | |
| | Oracle Corp. Japan | | | Software | | | | 133 | | | | 11,531 | |
| | ORIX Corp. | | | Diversified Financial Services | | | | 2,800 | | | | 41,738 | |
| | Pigeon Corp. | | | Household Products | | | | 200 | | | | 8,244 | |
| | Sekisui House Ltd. | | | Household Durables | | | | 1,800 | | | | 35,392 | |
| | Shionogi & Co. Ltd. | | | Pharmaceuticals | | | | 930 | | | | 51,622 | |
| | Showa Denko K.K. | | | Chemicals | | | | 200 | | | | 5,228 | |
| | Softbank Corp. | | | Wireless Telecommunication Services | | | | 2,300 | | | | 31,156 | |
| | Subaru Corp. | | | Automobiles | | | | 2,100 | | | | 59,070 | |
| | Sumco Corp. | | | Semiconductors & Semiconductor Equipment | | | | 400 | | | | 5,367 | |
| | Sumitomo Chemical Co. Ltd. | | | Chemicals | | | | 3,200 | | | | 14,360 | |
| | Suzuki Motor Corp. | | | Automobiles | | | | 900 | | | | 38,198 | |
| | Taisei Corp. | | | Construction & Engineering | | | | 600 | | | | 23,234 | |
| | Teijin Ltd. | | | Chemicals | | | | 400 | | | | 7,684 | |
| | Tokyo Electron Ltd. | | | Semiconductors & Semiconductor Equipment | | | | 450 | | | | 85,628 | |
| | | | |
| | | |
| 60 | | Semiannual Report | | franklintempleton.com |
FRANKLIN TEMPLETON ETF TRUST
STATEMENT OF INVESTMENTS (UNAUDITED)
Franklin LibertyQ International Equity Hedged ETF(continued)
| | | | | | | | | | | | | | |
| | | |
| | | Industry | | | Shares | | | Value | |
| | | Common Stocks and Other Equity Interests (continued) | |
| | | Japan (continued) | |
| | Tosoh Corp. | | | Chemicals | | | | 900 | | | $ | 11,892 | |
| | Toyota Motor Corp. | | | Automobiles | | | | 3,469 | | | | 231,620 | |
| | USS Co. Ltd. | �� | | Specialty Retail | | | | 600 | | | | 11,642 | |
| | Yamaha Motor Co. Ltd. | | | Automobiles | | | | 600 | | | | 10,870 | |
| | Zozo Inc. | | | Internet & Direct Marketing Retail | | | | 700 | | | | 16,141 | |
| | | | | | | | | | | | | | |
| | | | |
| | | | | | | | | | | | | 2,248,889 | |
| | | | | | | | | | | | | | |
| | | Luxembourg 0.1% | |
| | RTL Group SA | | | Media | | | | 132 | | | | 6,349 | |
| | | | | | | | | | | | | | |
| | | Macau 0.4% | |
| | Galaxy Entertainment Group Ltd. | | | Hotels, Restaurants & Leisure | | | | 5,970 | | | | 37,125 | |
| | Wynn Macau Ltd. | | | Hotels, Restaurants & Leisure | | | | 3,600 | | | | 7,026 | |
| | | | | | | | | | | | | | |
| | | | |
| | | | | | | | | | | | | 44,151 | |
| | | | | | | | | | | | | | |
| | | Netherlands 0.8% | |
| | Koninklijke Ahold Delhaize NV | | | Food & Staples Retailing | | | | 3,352 | | | | 83,886 | |
| | | | | | | | | | | | | | |
| | | New Zealand 0.4% | |
| | Fisher & Paykel Healthcare Corp. Ltd. | | | Health Care Equipment & Supplies | | | | 1,888 | | | | 20,481 | |
| | Spark New Zealand Ltd. | | | Diversified Telecommunication Services | | | | 7,772 | | | | 21,492 | |
| | | | | | | | | | | | | | |
| | | | |
| | | | | | | | | | | | | 41,973 | |
| | | | | | | | | | | | | | |
| | | Norway 0.9% | |
| | Mowi ASA | | | Food Products | | | | 1,460 | | | | 33,728 | |
| | Orkla ASA | | | Food Products | | | | 1,476 | | | | 13,444 | |
| | Telenor ASA | | | Diversified Telecommunication Services | | | | 2,337 | | | | 46,954 | |
| | | | | | | | | | | | | | |
| | | | |
| | | | | | | | | | | | | 94,126 | |
| | | | | | | | | | | | | | |
| | | Portugal 0.1% | |
| | Jeronimo Martins SGPS SA | | | Food & Staples Retailing | | | | 732 | | | | 12,354 | |
| | | | | | | | | | | | | | |
| | | Russia 0.1% | |
| | Evraz PLC | | | Metals & Mining | | | | 1,168 | | | | 6,730 | |
| | | | | | | | | | | | | | |
| | | Singapore 1.4% | |
| | CapitaLand Mall Trust | | | Equity Real Estate Investment Trusts (REITs | ) | | | 7,200 | | | | 13,693 | |
| | ComfortDelGro Corp. Ltd. | | | Road & Rail | | | | 7,200 | | | | 12,495 | |
| | Jardine Cycle & Carriage Ltd. | | | Distributors | | | | 300 | | | | 6,508 | |
| | SATS Ltd. | | | Transportation Infrastructure | | | | 2,000 | | | | 7,000 | |
| | Singapore Exchange Ltd. | | | Capital Markets | | | | 3,600 | | | | 22,049 | |
| | Singapore Technologies Engineering Ltd. | | | Aerospace & Defense | | | | 4,800 | | | | 13,328 | |
| | Singapore Telecommunications Ltd. | | | Diversified Telecommunication Services | | | | 25,600 | | | | 57,387 | |
| | Venture Corp. Ltd. | | | Electronic Equipment, Instruments & Components | | | | 800 | | | | 8,857 | |
| | Yangzijiang Shipbuilding Holdings Ltd. | | | Machinery | | | | 7,600 | | | | 5,276 | |
| | | | | | | | | | | | | | |
| | | | |
| | | | | | | | | | | | | 146,593 | |
| | | | | | | | | | | | | | |
| | | Spain 3.2% | |
| | Banco de Sabadell SA | | | Banks | | | | 14,468 | | | | 14,041 | |
| | Enagas SA | | | Gas Utilities | | | | 548 | | | | 12,701 | |
| | Endesa SA | | | Electric Utilities | | | | 1,064 | | | | 28,002 | |
| | Iberdrola SA | | | Electric Utilities | | | | 8,244 | | | | 85,706 | |
| | Industria de Diseno Textil SA | | | Specialty Retail | | | | 3,532 | | | | 109,357 | |
| | Red Electrica Corp. SA | | | Electric Utilities | | | | 1,336 | | | | 27,142 | |
| | Repsol SA | | | Oil, Gas & Consumable Fuels | | | | 3,292 | | | | 51,465 | |
| | | | | | | | | | | | | | |
| | | | |
| | | | | | | | | | | | | 328,414 | |
| | | | | | | | | | | | | | |
| | | Sweden 1.7% | |
| | Atlas Copco AB | | | Machinery | | | | 1,084 | | | | 29,415 | |
| | Boliden AB | | | Metals & Mining | | | | 816 | | | | 18,777 | |
| | | | | | |
| | | |
| franklintempleton.com | | Semiannual Report | | | 61 | |
FRANKLIN TEMPLETON ETF TRUST
STATEMENT OF INVESTMENTS (UNAUDITED)
Franklin LibertyQ International Equity Hedged ETF(continued)
| | | | | | | | | | | | | | |
| | | |
| | | Industry | | | Shares | | | Value | |
| | | Common Stocks and Other Equity Interests (continued) | |
| | | Sweden (continued) | |
| | Hennes & Mauritz AB, B | | | Specialty Retail | | | | 2,948 | | | $ | 57,220 | |
| | ICA Gruppen AB | | | Food & Staples Retailing | | | | 244 | | | | 11,286 | |
| | Swedbank AB, A | | | Banks | | | | 1,764 | | | | 25,423 | |
| | Telia Co. AB | | | Diversified Telecommunication Services | | | | 7,228 | | | | 32,398 | |
| | | | | | | | | | | | | | |
| | | | |
| | | | | | | | | | | | | 174,519 | |
| | | | | | | | | | | | | | |
| | | Switzerland 5.6% | |
| | EMS-Chemie Holding AG | | | Chemicals | | | | 28 | | | | 17,452 | |
| | Geberit AG | | | Building Products | | | | 104 | | | | 49,708 | |
| | Partners Group Holding AG | | | Capital Markets | | | | 65 | | | | 49,919 | |
| | Roche Holding AG | | | Pharmaceuticals | | | | 776 | | | | 226,033 | |
| | Swiss Life Holding AG | | | Insurance | | | | 92 | | | | 44,019 | |
| | Swisscom AG | | | Diversified Telecommunication Services | | | | 80 | | | | 39,497 | |
| | Zurich Insurance Group AG | | | Insurance | | | | 420 | | | | 160,898 | |
| | | | | | | | | | | | | | |
| | | | |
| | | | | | | | | | | | | 587,526 | |
| | | | | | | | | | | | | | |
| | | United Kingdom 22.2% | |
| | 3i Group PLC | | | Capital Markets | | | | 2,572 | | | | 36,972 | |
| | Admiral Group PLC | | | Insurance | | | | 820 | | | | 21,402 | |
| | Anglo American PLC | | | Metals & Mining | | | | 2,848 | | | | 65,671 | |
| | Auto Trader Group PLC | | | Interactive Media & Services | | | | 2,404 | | | | 15,109 | |
| | BAE Systems PLC | | | Aerospace & Defense | | | | 8,520 | | | | 59,845 | |
| | Barratt Developments PLC | | | Household Durables | | | | 4,084 | | | | 32,612 | |
| | BHP Group PLC | | | Metals & Mining | | | | 5,076 | | | | 108,364 | |
| | British Land Co. PLC | | | Equity Real Estate Investment Trusts (REITs | ) | | | 2,556 | | | | 18,420 | |
| | BT Group PLC | | | Diversified Telecommunication Services | | | | 30,520 | | | | 67,164 | |
| | Burberry Group PLC | | | Textiles, Apparel & Luxury Goods | | | | 1,440 | | | | 38,578 | |
| | Centrica PLC | | | Multi-Utilities | | | | 15,204 | | | | 13,816 | |
| | Compass Group PLC | | | Hotels, Restaurants & Leisure | | | | 4,744 | | | | 122,357 | |
| | Diageo PLC | | | Beverages | | | | 4,740 | | | | 194,684 | |
| | Direct Line Insurance Group PLC | | | Insurance | | | | 4,572 | | | | 16,914 | |
| | easyJet PLC | | | Airlines | | | | 484 | | | | 6,859 | |
| | Experian PLC | | | Professional Services | | | | 2,532 | | | | 81,094 | |
| | GlaxoSmithKline PLC | | | Pharmaceuticals | | | | 10,261 | | | | 220,598 | |
| | Hargreaves Lansdown PLC | | | Capital Markets | | | | 1,008 | | | | 25,824 | |
| | Imperial Brands PLC | | | Tobacco | | | | 3,432 | | | | 77,319 | |
| | Intertek Group PLC | | | Professional Services | | | | 460 | | | | 31,052 | |
| | ITV PLC | | | Media | | | | 14,540 | | | | 22,558 | |
| | Kingfisher PLC | | | Specialty Retail | | | | 5,964 | | | | 15,199 | |
| | Land Securities Group PLC | | | Equity Real Estate Investment Trusts (REITs | ) | | | 2,252 | | | | 23,766 | |
| | Marks & Spencer Group PLC | | | Multiline Retail | | | | 5,200 | | | | 11,819 | |
| | Mondi PLC | | | Paper & Forest Products | | | | 1,084 | | | | 20,812 | |
| | Next PLC | | | Multiline Retail | | | | 584 | | | | 44,518 | |
| | Pearson PLC | | | Media | | | | 1,756 | | | | 15,970 | |
| | Persimmon PLC | | | Household Durables | | | | 1,452 | | | | 38,828 | |
| | RELX PLC | | | Professional Services | | | | 6,336 | | | | 150,887 | |
| | Royal Dutch Shell PLC, A | | | Oil, Gas & Consumable Fuels | | | | 4,060 | | | | 119,275 | |
| | Royal Dutch Shell PLC, B | | | Oil, Gas & Consumable Fuels | | | | 2,228 | | | | 65,784 | |
| | SSE PLC | | | Electric Utilities | | | | 3,128 | | | | 48,009 | |
| | Taylor Wimpey PLC | | | Household Durables | | | | 13,968 | | | | 27,799 | |
| | The Berkeley Group Holdings PLC | | | Household Durables | | | | 476 | | | | 24,513 | |
| | Unilever NV, IDR | | | Personal Products | | | | 3,364 | | | | 202,259 | |
| | Unilever PLC | | | Personal Products | | | | 3,324 | | | | 200,302 | |
| | Whitbread PLC | | | Hotels, Restaurants & Leisure | | | | 504 | | | | 26,669 | |
| | | | | | | | | | | | | | |
| | | | |
| | | | | | | | | | | | | 2,313,621 | |
| | | | | | | | | | | | | | |
| | Total Common Stocks and Other Equity Interests
(Cost $10,051,746) | | | | | | | | | | | 10,270,989 | |
| | | | | | | | | | | | | | |
| | | | |
| | | |
| 62 | | Semiannual Report | | franklintempleton.com |
FRANKLIN TEMPLETON ETF TRUST
STATEMENT OF INVESTMENTS (UNAUDITED)
Franklin LibertyQ International Equity Hedged ETF(continued)
| | | | | | | | | | | | | | |
| | | |
| | | Industry | | | Shares | | | Value | |
| | | Preferred Stocks 0.4% | |
| | | Germany 0.4% | |
| c | | Bayerische Motoren Werke AG, 6.909%, pfd. | | | Automobiles | | | | 152 | | | $ | 8,443 | |
| c | | Fuchs Petrolub SE, 2.757%, pfd. | | | Chemicals | | | | 180 | | | | 6,762 | |
| c | | Porsche Automobil Holding SE, 3.702%, pfd. | | | Automobiles | | | | 396 | | | | 25,774 | |
| | | | | | | | | | | | | | |
| | Total Preferred Stocks (Cost $44,673) | | | | | | | | | | | 40,979 | |
| | | | | | | | | | | | | | |
| | Total Investments (Cost $10,096,419) 99.1% | | | | | | | | | | | 10,311,968 | |
| | Other Assets, less Liabilities 0.9% | | | | | | | | | | | 93,858 | |
| | | | | | | | | | | | | | |
| | Net Assets 100.0% | | | | | | | | | | $ | 10,405,826 | |
| | | | | | | | | | | | | | |
See abbreviations on page 81.
†Rounds to less than 0.1% of net assets.
aNon-income producing.
bSecurity was purchased pursuant to Regulation S under the Securities Act of 1933, which exempts from registration securities offered and sold outside of the United States. Such a security cannot be sold in the United States without either an effective registration statement filed pursuant to the Securities Act of 1933, or pursuant to an exemption from registration. These securities have been deemed liquid under guidelines approved by the Fund’s Board of Trustees. At September 30, 2019, the aggregate value of these securities was $40,360, representing 0.4% of net assets.
cVariable rate security. The rate shown represents the yield at period end.
At September 30, 2019 the Fund had the following forward exchange contracts outstanding. See Note 1(c).
| | | | | | | | | | | | | | | | | | | | | | | | | | | | |
| Forward Exchange Contracts | |
| | | | | | | |
| Currency | | Counterpartya | | | Type | | | Quantity | | | Contract
Amount | | | Settlement
Date | | | Unrealized
Appreciation | | | Unrealized
Depreciation | |
| OTC Forward Exchange Contracts | | | | | | | | | | | | | | | | | | | | | | | | | |
Australian Dollar | | | BOFA | | | | Buy | | | | 3,026,267 | | | | 2,041,005 | | | | 10/2/2019 | | | $ | 60 | | | $ | — | |
Australian Dollar | | | BOFA | | | | Sell | | | | 3,026,267 | | | | 2,049,661 | | | | 10/2/2019 | | | | 8,746 | | | | (149 | ) |
Danish Krone | | | BOFA | | | | Buy | | | | 2,280,800 | | | | 333,017 | | | | 10/2/2019 | | | | 17 | | | | — | |
Danish Krone | | | BOFA | | | | Sell | | | | 2,280,800 | | | | 337,712 | | | | 10/2/2019 | | | | 4,677 | | | | — | |
Euro | | | BOFA | | | | Buy | | | | 1,491,067 | | | | 1,625,513 | | | | 10/2/2019 | | | | 48 | | | | — | |
Euro | | | BOFA | | | | Sell | | | | 1,491,067 | | | | 1,646,643 | | | | 10/2/2019 | | | | 21,082 | | | | — | |
Great British Pound | | | HSBK | | | | Buy | | | | 615,267 | | | | 758,181 | | | | 10/2/2019 | | | | 12 | | | | — | |
Great British Pound | | | UBSW | | | | Buy | | | | 615,267 | | | | 758,178 | | | | 10/2/2019 | | | | 15 | | | | — | |
Great British Pound | | | BOFA | | | | Buy | | | | 615,267 | | | | 758,171 | | | | 10/2/2019 | | | | 22 | | | | — | |
Great British Pound | | | BOFA | | | | Sell | | | | 615,267 | | | | 754,860 | | | | 10/2/2019 | | | | 2,586 | | | | (5,919 | ) |
Great British Pound | | | HSBK | | | | Sell | | | | 461,450 | | | | 562,722 | | | | 10/2/2019 | | | | 2,589 | | | | (5,922 | ) |
Great British Pound | | | UBSW | | | | Sell | | | | 1,538,167 | | | | 1,880,285 | | | | 10/2/2019 | | | | 2,590 | | | | (5,941 | ) |
Israeli Shekel | | | BOFA | | | | Buy | | | | 113,600 | | | | 32,681 | | | | 10/2/2019 | | | | 2 | | | | — | |
Israeli Shekel | | | BOFA | | | | Sell | | | | 113,600 | | | | 32,178 | | | | 10/2/2019 | | | | — | | | | (505 | ) |
Japanese Yen | | | BOFA | | | | Buy | | | | 229,385,733 | | | | 2,122,405 | | | | 10/2/2019 | | | | 63 | | | | — | |
Japanese Yen | | | BOFA | | | | Sell | | | | 57,346,433 | | | | 530,582 | | | | 10/2/2019 | | | | — | | | | (35 | ) |
Japanese Yen | | | BOFA | | | | Sell | | | | 172,039,300 | | | | 1,624,356 | | | | 10/2/2019 | | | | 32,505 | | | | — | |
New Zealand Dollar | | | BOFA | | | | Buy | | | | 64,533 | | | | 40,464 | | | | 10/2/2019 | | | | 1 | | | | — | |
New Zealand Dollar | | | BOFA | | | | Sell | | | | 64,533 | | | | 40,791 | | | | 10/2/2019 | | | | 326 | | | | — | |
Norwegian Krone | | | BOFA | | | | Buy | | | | 888,667 | | | | 97,811 | | | | 10/2/2019 | | | | — | | | | (5 | ) |
Norwegian Krone | | | BOFA | | | | Sell | | | | 222,167 | | | | 24,810 | | | | 10/2/2019 | | | | 358 | | | | — | |
Norwegian Krone | | | BOFA | | | | Sell | | | | 666,500 | | | | 73,243 | | | | 10/2/2019 | | | | — | | | | (112 | ) |
Singapore Dollar | | | BOFA | | | | Buy | | | | 200,400 | | | | 144,906 | | | | 10/2/2019 | | | | 7 | | | | — | |
Singapore Dollar | | | BOFA | | | | Sell | | | | 200,400 | | | | 144,822 | | | | 10/2/2019 | | | | 208 | | | | (299 | ) |
Swedish Krona | | | BOFA | | | | Buy | | | | 1,652,000 | | | | 168,012 | | | | 10/2/2019 | | | | 8 | | | | — | |
Swedish Krona | | | BOFA | | | | Sell | | | | 1,652,000 | | | | 169,241 | | | | 10/2/2019 | | | | 1,221 | | | | — | |
Swiss Franc | | | MSCO | | | | Buy | | | | 553,200 | | | | 554,767 | | | | 10/2/2019 | | | | 14 | | | | — | |
Swiss Franc | | | MSCO | | | | Sell | | | | 553,200 | | | | 559,687 | | | | 10/2/2019 | | | | 4,907 | | | | — | |
Hong Kong Dollar | | | MSCO | | | | Buy | | | | 3,477,333 | | | | 443,594 | | | | 10/3/2019 | | | | — | | | | (23 | ) |
Hong Kong Dollar | | | MSCO | | | | Sell | | | | 3,477,333 | | | | 443,969 | | | | 10/3/2019 | | | | 397 | | | | — | |
Australian Dollar | | | BOFA | | | | Sell | | | | 3,168,500 | | | | 2,139,400 | | | | 11/4/2019 | | | | — | | | | (98 | ) |
Danish Krone | | | BOFA | | | | Sell | | | | 2,315,500 | | | | 338,976 | | | | 11/4/2019 | | | | — | | | | (28 | ) |
| | | | | | |
| | | |
| franklintempleton.com | | Semiannual Report | | | 63 | |
FRANKLIN TEMPLETON ETF TRUST
STATEMENT OF INVESTMENTS (UNAUDITED)
Franklin LibertyQ International Equity Hedged ETF(continued)
| | | | | | | | | | | | | | | | | | | | | | | | | | | | |
| Forward Exchange Contracts | |
| | | | | | | |
| Currency | | Counterpartya | | | Type | | | Quantity | | | Contract
Amount | | | Settlement
Date | | | Unrealized
Appreciation | | | Unrealized
Depreciation | |
| OTC Forward Exchange Contracts(continued) | | | | | | | | | | | | | | | | | | | | | | | | | |
Euro | | | BOFA | | | | Sell | | | | 1,578,200 | | | | 1,724,777 | | | | 11/4/2019 | | | $ | — | | | $ | (22 | ) |
Great British Pound | | | HSBK | | | | Sell | | | | 630,208 | | | | 777,601 | | | | 11/4/2019 | | | | — | | | | (38 | ) |
Great British Pound | | | UBSW | | | | Sell | | | | 630,208 | | | | 777,604 | | | | 11/4/2019 | | | | — | | | | (34 | ) |
Great British Pound | | | BOFA | | | | Sell | | | | 630,208 | | | | 777,625 | | | | 11/4/2019 | | | | — | | | | (14 | ) |
Hong Kong Dollar | | | MSCO | | | | Sell | | | | 3,432,500 | | | | 438,104 | | | | 11/4/2019 | | | | 6 | | | | — | |
Israeli Shekel | | | BOFA | | | | Sell | | | | 119,100 | | | | 34,319 | | | | 11/4/2019 | | | | — | | | | (4 | ) |
New Zealand Dollar | | | BOFA | | | | Sell | | | | 66,500 | | | | 41,730 | | | | 11/4/2019 | | | | — | | | | (1 | ) |
Norwegian Krone | | | BOFA | | | | Sell | | | | 864,900 | | | | 95,252 | | | | 11/4/2019 | | | | 6 | | | | — | |
Singapore Dollar | | | BOFA | | | | Sell | | | | 202,400 | | | | 146,401 | | | | 11/4/2019 | | | | — | | | | (13 | ) |
Swedish Krona | | | BOFA | | | | Sell | | | | 1,738,800 | | | | 177,218 | | | | 11/4/2019 | | | | — | | | | (12 | ) |
Swiss Franc | | | MSCO | | | | Sell | | | | 589,700 | | | | 593,022 | | | | 11/4/2019 | | | | 25 | | | | — | |
Japanese Yen | | | BOFA | | | | Sell | | | | 247,132,200 | | | | 2,291,688 | | | | 11/5/2019 | | | | — | | | | (42 | ) |
| | | | | | | | | | | | | | | | | | | | | | | | |
Total Forward Exchange Contracts | | | $ | 82,498 | | | $ | (19,216 | ) |
| | | | | | | | | | | | | | | | | | | | | | | | |
Net unrealized appreciation (depreciation) | | | | | | | $ | 63,282 | |
| | | | | | | | | | | | | | | | | | | | | | | | | | | | |
aMay be comprised of multiple contracts with the same counterparty, currency and settlement date.
At September 30, 2019, the Fund had the following futures contracts outstanding. See Note 1(c).
| | | | | | | | | | | | | | | | | | | | | | |
| Futures Contracts |
| | | | | |
| Description | | Type | | | Number of
Contracts | | | Notional Amount* | | | Expiration
Date | | | Value/Unrealized
Appreciation
(Depreciation) |
| Equity Contracts |
MSCI All Country World Index | | | Long | | | | 2 | | | $ | 52,100 | | | | 12/20/19 | | | $(823) |
*As of period end.
| | | | |
| | | |
| 64 | | Semiannual Report | The accompanying notes are an integral part of these financial statements. | | franklintempleton.com |
FRANKLIN TEMPLETON ETF TRUST
FINANCIAL STATEMENTS
Statements of Assets and Liabilities
September 30, 2019 (unaudited)
| | | | | | | | | | | | | | | | |
| | | | |
| | | Franklin
LibertyQ
Emerging
Markets ETF | | | Franklin
LibertyQ Global
Dividend ETF | | | Franklin
LibertyQ Global
Equity ETF | | | Franklin LibertyQ
International
Equity Hedged ETF | |
Assets: | | | | | | | | | | | | | | | | |
Investments in securities: | | | | | | | | | | | | | | | | |
Cost – Unaffiliated issuers | | $ | 324,510,036 | | | $ | 16,450,291 | | | $ | 17,366,236 | | | $ | 10,096,419 | |
Cost –Non-controlled affiliates (Note 3c) | | | 1,150,250 | | | | — | | | | 3,375 | | | | — | |
| | | | |
Value – Unaffiliated issuers+ | | $ | 335,505,221 | | | $ | 17,389,379 | | | $ | 18,846,385 | | | $ | 10,311,968 | |
Value –Non-controlled affiliates (Note 3c) | | | 1,150,250 | | | | — | | | | 3,375 | | | | — | |
Cash | | | — | | | | 11,467 | | | | 9,952 | | | | 792 | |
Foreign currency, at value (cost $308,805, $30,189, $36,158 and $42,103) | | | 308,628 | | | | 30,025 | | | | 35,925 | | | | 41,743 | |
Receivables: | | | | | | | | | | | | | | | | |
Dividends and interest | | | 900,947 | | | | 84,567 | | | | 48,888 | | | | 51,886 | |
Variation margin on futures contracts | | | 4,165 | | | | — | | | | — | | | | — | |
Deposits with brokers for: | | | | | | | | | | | | | | | | |
Futures contracts | | | 44,200 | | | | 2,701 | | | | 2,701 | | | | 2,701 | |
Unrealized appreciation on OTC forward exchange contracts | | | — | | | | — | | | | — | | | | 82,498 | |
| | | | |
Total assets | | | 337,913,411 | | | | 17,518,139 | | | | 18,947,226 | | | | 10,491,588 | |
| | | | |
Liabilities: | | | | | | | | | | | | | | | | |
Payables: | | | | | | | | | | | | | | | | |
Investment securities purchased | | | — | | | | 41,349 | | | | — | | | | 63,580 | |
Management fees | | | 127,185 | | | | 6,425 | | | | 5,313 | | | | 2,879 | |
Variation margin on futures contracts | | | — | | | | 70 | | | | 68 | | | | 87 | |
Funds advanced by custodian | | | 1,282 | | | | — | | | | — | | | | — | |
Deferred tax | | | 193,968 | | | | — | | | | — | | | | — | |
Payable upon return of securities loaned | | | 1,150,250 | | | | — | | | | 3,375 | | | | — | |
Unrealized depreciation on OTC forward exchange contracts | | | — | | | | — | | | | — | | | | 19,216 | |
| | | | |
Total liabilities | | | 1,472,685 | | | | 47,844 | | | | 8,756 | | | | 85,762 | |
| | | | |
Net assets, at value | | $ | 336,440,726 | | | $ | 17,470,295 | | | $ | 18,938,470 | | | $ | 10,405,826 | |
| | | | |
Net assets consist of: | | | | | | | | | | | | | | | | |
Paid-in capital | | $ | 346,638,711 | | | $ | 15,911,698 | | | $ | 16,546,298 | | | $ | 9,786,556 | |
Total distributable earnings (loss) | | | (10,197,985 | ) | | | 1,558,597 | | | | 2,392,172 | | | | 619,270 | |
| | | | |
Net assets, at value | | $ | 336,440,726 | | | $ | 17,470,295 | | | $ | 18,938,470 | | | $ | 10,405,826 | |
| | | | |
Shares outstanding | | | 11,600,000 | | | | 600,000 | | | | 600,000 | | | | 400,000 | |
| | | | |
Net asset value per share | | $ | 29.00 | | | $ | 29.12 | | | $ | 31.56 | | | $ | 26.01 | |
| | | | |
| | | | |
+Includes securities loaned | | | 1,088,413 | | | | — | | | | 3,289 | | | | — | |
| | | | | | |
| | | |
| franklintempleton.com | | The accompanying notes are an integral part of these financial statements. | Semiannual Report | | | 65 | |
FRANKLIN TEMPLETON ETF TRUST
FINANCIAL STATEMENTS
Statements of Operations
for the six months ended September 30, 2019 (unaudited)
| | | | | | | | | | | | | | | | |
| | | | |
| | | Franklin
LibertyQ
Emerging
Markets ETF | | | Franklin
LibertyQ Global
Dividend ETF | | | Franklin
LibertyQ Global
Equity ETF | | | Franklin LibertyQ
International
Equity Hedged ETF | |
Investment income: | | | | | | | | | | | | | | | | |
Dividends: (net of foreign taxes)a | | | | | | | | | | | | | | | | |
Unaffiliated issuers | | $ | 10,093,231 | | | $ | 400,510 | | | $ | 370,180 | | | $ | 176,668 | |
Interest from securities loaned: | | | | | | | | | | | | | | | | |
Non-Controlled affiliates (Note 3c) | | | 2,490 | | | | 2,676 | | | | 1,954 | | | | — | |
| | | | |
Total investment income | | | 10,095,721 | | | | 403,186 | | | | 372,134 | | | | 176,668 | |
| | | | |
Expenses: | | | | | | | | | | | | | | | | |
Management fees (Note 3a) | | | 892,850 | | | | 38,892 | | | | 36,589 | | | | 15,456 | |
Other | | | 1,631 | | | | 36 | | | | 28 | | | | 14 | |
| | | | |
Total expenses | | | 894,481 | | | | 38,928 | | | | 36,617 | | | | 15,470 | |
Expenses waived/paid by affiliates (Note 3c) | | | (491 | ) | | | (24 | ) | | | (938 | ) | | | — | |
| | | | |
Net expenses | | | 893,990 | | | | 38,904 | | | | 35,679 | | | | 15,470 | |
| | | | |
Net investment income | | | 9,201,731 | | | | 364,282 | | | | 336,455 | | | | 161,198 | |
| | | | |
Realized and unrealized gains (losses): | | | | | | | | | | | | | | | | |
Net realized gain (loss) from: | | | | | | | | | | | | | | | | |
Investments: | | | | | | | | | | | | | | | | |
Unaffiliated issuers | | | (14,680,050 | ) | | | (252,256 | ) | | | (166,684 | ) | | | (37,604 | ) |
In-kind redemptions | | | 773,257 | | | | 894,361 | | | | 897,882 | | | | — | |
Foreign currency transactions | | | (279,969 | ) | | | (514 | ) | | | (3,530 | ) | | | (1,069 | ) |
Foreign exchange contracts | | | — | | | | — | | | | (98 | ) | | | 303,358 | |
Futures contracts | | | (154,313 | ) | | | 1,749 | | | | 1,885 | | | | 3,052 | |
| | | | |
Net realized gain (loss) | | | (14,341,075 | ) | | | 643,340 | | | | 729,455 | | | | 267,737 | |
| | | | |
Net change in unrealized appreciation (depreciation) on: | | | | | | | | | | | | | | | | |
Investments: | | | | | | | | | | | | | | | | |
Unaffiliated issuers | | | (144,310 | ) | | | (147,812 | ) | | | (463,982 | ) | | | 28,325 | |
Translation of other assets and liabilities denominated in foreign currencies | | | (1,171 | ) | | | 152 | | | | 236 | | | | (26 | ) |
Futures contracts | | | (37,070 | ) | | | (1,210 | ) | | | (2,506 | ) | | | (1,694 | ) |
Forward exchange contracts | | | — | | | | — | | | | — | | | | 1,604 | |
Change in deferred taxes on unrealized appreciation | | | 458,850 | | | | — | | | | — | | | | — | |
| | | | |
Net change in unrealized appreciation (depreciation) | | | 276,299 | | | | (148,870 | ) | | | (466,252 | ) | | | 28,209 | |
| | | | |
Net realized and unrealized gain (loss) | | | (14,064,776 | ) | | | 494,470 | | | | 263,203 | | | | 295,946 | |
| | | | |
Net increase (decrease) in net assets resulting from operations | | $ | (4,863,045 | ) | | $ | 858,752 | | | $ | 599,658 | | | $ | 457,144 | |
| | | | |
| | | | |
aForeign taxes withheld on dividends | | $ | 1,263,620 | | | $ | 28,152 | | | $ | 23,091 | | | $ | 14,313 | |
| | | | |
| | | | |
| | | |
| 66 | | Semiannual Report | The accompanying notes are an integral part of these financial statements. | | franklintempleton.com |
FRANKLIN TEMPLETON ETF TRUST
FINANCIAL STATEMENTS
Statements of Changes in Net Assets
| | | | | | | | | | | | | | | | |
| | |
| | | Franklin LibertyQ Emerging Markets ETF | | | Franklin LibertyQ Global Dividend ETF | |
| | | | |
| | | Six Months Ended
September 30, 2019
(unaudited) | | | Year Ended
March 31, 2019 | | | Six Months Ended
September 30, 2019
(unaudited) | | | Year Ended
March 31, 2019 | |
Increase (decrease) in net assets: | | | | | | | | | | | | | | | | |
Operations: | | | | | | | | | | | | | | | | |
Net investment income | | $ | 9,201,731 | | | $ | 12,098,074 | | | $ | 364,282 | | | $ | 567,843 | |
Net realized gain (loss) | | | (14,341,075 | ) | | | 3,121,528 | | | | 643,340 | | | | (35,818 | ) |
Net change in unrealized appreciation (depreciation) | | | 276,299 | | | | (48,192,220 | ) | | | (148,870 | ) | | | 24,564 | |
| | | | |
Net increase (decrease) in net assets resulting from operations | | | (4,863,045 | ) | | | (32,972,618 | ) | | | 858,752 | | | | 556,589 | |
| | | | |
Distributions to shareholders | | | (3,392,712 | ) | | | (11,215,046 | ) | | | (349,243 | ) | | | (569,521 | ) |
| | | | |
Capital share transactions: (Note 2) | | | 212,159 | | | | (12,217,518 | ) | | | 40,665 | | | | — | |
| | | | |
Net increase (decrease) in net assets | | | (8,043,598 | ) | | | (56,405,182 | ) | | | 550,174 | | | | (12,932 | ) |
Net assets: | | | | | | | | | | | | | | | | |
Beginning of period | | | 344,484,324 | | | | 400,889,506 | | | | 16,920,121 | | | | 16,933,053 | |
| | | | |
End of period | | $ | 336,440,726 | | | $ | 344,484,324 | | | $ | 17,470,295 | | | $ | 16,920,121 | |
| | | | |
| | | | | | |
| | | |
| franklintempleton.com | | The accompanying notes are an integral part of these financial statements. | Semiannual Report | | | 67 | |
FRANKLIN TEMPLETON ETF TRUST
FINANCIAL STATEMENTS
Statements of Changes in Net Assets(continued)
| | | | | | | | | | | | | | | | |
| | |
| | | Franklin LibertyQ
Global Equity ETF | | | Franklin LibertyQ International
Equity Hedged ETF | |
| | | | |
| | | Six Months Ended
September 30, 2019
(unaudited) | | | Year Ended
March 31, 2019 | | | Six Months Ended
September 30, 2019
(unaudited) | | | Year Ended
March 31, 2019 | |
Increase (decrease) in net assets: | | | | | | | | | | | | | | | | |
Operations: | | | | | | | | | | | | | | | | |
Net investment income | | $ | 336,455 | | | $ | 556,124 | | | $ | 161,198 | | | $ | 263,448 | |
Net realized gain (loss) | | | 729,455 | | | | 1,079,731 | | | | 267,737 | | | | 968,490 | |
Net change in unrealized appreciation (depreciation) | | | (466,252 | ) | | | (576,560 | ) | | | 28,209 | | | | (494,713 | ) |
| | | | |
Net increase (decrease) in net assets resulting from operations | | | 599,658 | | | | 1,059,295 | | | | 457,144 | | | | 737,225 | |
| | | | |
Distributions to shareholders | | | (281,027 | ) | | | (478,140 | ) | | | (57,514 | ) | | | (380,919 | ) |
| | | | |
Capital share transactions: (Note 2) | | | (6,101,460 | ) | | | 6,058,346 | | | | 2,596,506 | | | | (2,648,534 | ) |
| | | | |
Net increase (decrease) in net assets | | | (5,782,829 | ) | | | 6,639,501 | | | | 2,996,136 | | | | (2,292,228 | ) |
Net assets: | | | | | | | | | | | | | | | | |
Beginning of period | | | 24,721,299 | | | | 18,081,798 | | | | 7,409,690 | | | | 9,701,918 | |
| | | | |
End of period | | $ | 18,938,470 | | | $ | 24,721,299 | | | $ | 10,405,826 | | | $ | 7,409,690 | |
| | | | |
| | | | |
| | | |
| 68 | | Semiannual Report | The accompanying notes are an integral part of these financial statements. | | franklintempleton.com |
FRANKLIN TEMPLETON ETF TRUST
Notes to Financial Statements (unaudited)
1. Organization and Significant Accounting Policies
Franklin Templeton ETF Trust (Trust) is registered under the Investment Company Act of 1940 (1940 Act) as anopen-end management investment company, consisting of thirty-nine separate funds, four of which are included in this report (Funds) and applies the specialized accounting and reporting guidance in U.S. Generally Accepted Accounting Principles (U.S. GAAP). Each of the Funds are an exchange traded fund (ETF) and seek to provide the investment results that closely correspond, before fees and expenses, to the performance of each Fund’s corresponding underlying index.
The following summarizes the Funds’ significant accounting policies.
a. Financial Instrument Valuation
The Funds’ investments in financial instruments are carried at fair value daily. Fair value is the price that would be received to sell an asset or paid to transfer a liability in an orderly transaction between market participants on the measurement date. The Funds calculate the net asset value (NAV) per share as of 4 p.m. Eastern time each day the New York Stock Exchange (NYSE) is open for trading. Under compliance policies and procedures approved by the Trust’s Board of Trustees (the Board), the Funds’ administrator has responsibility for oversight of valuation, including leading the cross-functional Valuation Committee (VC). The Funds may utilize independent pricing services, quotations from securities and financial instrument dealers, and other market sources to determine fair value.
Equity securities and exchange traded funds listed on an exchange or on the NASDAQ National Market System are valued at the last quoted sale price or the official closing price of the day, respectively. Foreign equity securities are valued as of the close of trading on the foreign stock exchange on which the security is primarily traded or as of 4 p.m. Eastern time. The value is then converted into its U.S. dollar equivalent at the foreign exchange rate in effect at 4 p.m. London time on the day that the value of the security is determined.Over-the-counter (OTC) securities are valued within the range of the most recent quoted bid and ask prices. Securities that trade in multiple markets or on multiple exchanges are valued according to the broadest and most representative market. Certain equity securities are valued based upon fundamental characteristics or relationships to similar securities.
Investments inopen-end mutual funds are valued at the closing NAV.
Certain derivative financial instruments are centrally cleared or trade in the OTC market. The Funds’ pricing services use various techniques including industry standard option pricing models and proprietary discounted cash flow models to determine the fair value of those instruments. The Funds’ net benefit or obligation under the derivative contract, as measured by the fair value of the contract, is included in net assets.
The Funds have procedures to determine the fair value of financial instruments for which market prices are not reliable or readily available. Under these procedures, the Funds primarily employ a market-based approach which may use related or comparable assets or liabilities, recent transactions, market multiples, book values, and other relevant information for the investment to determine the fair value of the investment. An income-based valuation approach may also be used in which the anticipated future cash flows of the investment are discounted to calculate fair value. Discounts may also be applied due to the nature or duration of any restrictions on the disposition of the investments. Due to the inherent uncertainty of valuations of such investments, the fair values may differ significantly from the values that would have been used had an active market existed.
Trading in securities on foreign securities stock exchanges and OTC markets may be completed before 4 p.m. Eastern time. In addition, trading in certain foreign markets may not take place on every Funds’ business day. Occasionally, events occur between the time at which trading in a foreign security is completed and 4 p.m. Eastern time that might call into question the reliability of the value of a portfolio security held by the Fund. As a result, differences may arise between the value of the Funds’ portfolio securities as determined at the foreign market close and the latest indications of value at 4 p.m. Eastern time. The VC monitors price movements for significant events following the close of trading in foreign stock markets through a series of country specific market proxies (such as baskets of American Depositary Receipts, futures contracts and exchange traded funds). These price movements are measured against established trigger thresholds for each specific market proxy to assist in determining if an event has occurred that may call into question the reliability of the values of the foreign securities held by the Funds. If such an event occurs, the securities may be valued using fair value procedures, which may include the use of independent pricing services.
| | | | | | |
| | | |
| franklintempleton.com | | Semiannual Report | | | 69 | |
FRANKLIN TEMPLETON ETF TRUST
NOTES TO FINANCIAL STATEMENTS (UNAUDITED)
1. Organization and Significant Accounting Policies(continued)
a. Financial Instrument Valuation(continued)
When the last day of the reporting period is anon-business day, certain foreign markets may be open on those days that the Funds’ NAV is not calculated, which could result in differences between the value of the Funds’ portfolio securities on the last business day and the last calendar day of the reporting period. Any significant security valuation changes due to an open foreign market are adjusted and reflected by the Funds for financial reporting purposes.
b. Foreign Currency Translation
Portfolio securities and other assets and liabilities denominated in foreign currencies are translated into U.S. dollars based on the exchange rate of such currencies against U.S. dollars on the date of valuation. The Funds may enter into foreign currency exchange contracts to facilitate transactions denominated in a foreign currency. Purchases and sales of securities, income and expense items denominated in foreign currencies are translated into U.S. dollars at the exchange rate in effect on the transaction date. Portfolio securities and assets and liabilities denominated in foreign currencies contain risks that those currencies will decline in value relative to the U.S. dollar. Occasionally, events may impact the availability or reliability of foreign exchange rates used to convert the U.S. dollar equivalent value. If such an event occurs, the foreign exchange rate will be valued at fair value using procedures established and approved by the Board.
The Funds do not separately report the effect of changes in foreign exchange rates from changes in market prices on securities held. Such changes are included in net realized and unrealized gain or loss from investments in the Statements of Operations.
Realized foreign exchange gains or losses arise from sales of foreign currencies, currency gains or losses realized between the trade and settlement dates on securities transactions and the difference between the recorded amounts of dividends, interest, and foreign withholding taxes and the U.S. dollar equivalent of the amounts actually received or paid. Net unrealized foreign exchange gains and losses arise from changes in foreign exchange rates on foreign denominated assets and liabilities other than investments in securities held at the end of the reporting period.
c. Derivative Financial Instruments
Certain or all Funds invested in derivative financial instruments in order to manage risk or gain exposure to various
other investments or markets. Derivatives are financial contracts based on an underlying or notional amount, require no initial investment or an initial net investment that is smaller than would normally be required to have a similar response to changes in market factors, and require or permit net settlement. Derivatives contain various risks including the potential inability of the counterparty to fulfill their obligations under the terms of the contract, the potential for an illiquid secondary market, and/or the potential for market movements which expose the Fund to gains or losses in excess of the amounts shown in the Statements of Assets and Liabilities. Realized gain and loss and unrealized appreciation and depreciation on these contracts for the period are included in the Statements of Operations.
Collateral requirements differ by type of derivative. Collateral terms are contract specific for OTC derivatives. For OTC derivatives traded under an ISDA master agreement, posting of collateral is required by either the Fund or the applicable counterparty if the total net exposure of all OTC derivatives with the applicable counterparty exceeds the minimum transfer amount, which typically ranges from $100,000 to $250,000, and can vary depending on the counterparty and the type of the agreement. Generally, collateral is determined at the close of Fund business each day and any additional collateral required due to changes in derivative values may be delivered by the Fund or the counterparty the next business day, or within a few business days. Collateral pledged and/or received by the Fund, if any, is held in segregated accounts with the Fund’s custodian/counterparty broker and can be in the form of cash and/or securities. Unrestricted cash may be invested according to the Funds’ investment objectives. To the extent that the amounts due to the Fund from its counterparties are not subject to collateralization or are not fully collateralized, the Fund bears the risk of loss from counterpartynon-performance.
Certain or all Funds entered into exchange traded futures contracts primarily to manage and/or gain exposure to equity price risk. A futures contract is an agreement between the Fund and a counterparty to buy or sell an asset at a specified price on a future date. Required initial margins are pledged by the Fund, and the daily change in fair value is accounted for as a variation margin payable or receivable in the Statements of Assets and Liabilities.
Certain or all Funds entered into OTC forward exchange contracts primarily to manage and/or gain exposure to certain foreign currencies. A forward exchange contract is an agreement between the Fund and a counterparty to buy or sell a foreign currency at a specific exchange rate on a future date.
See Note 7 regarding other derivative information.
| | | | |
| | | |
| 70 | | Semiannual Report | | franklintempleton.com |
FRANKLIN TEMPLETON ETF TRUST
NOTES TO FINANCIAL STATEMENTS (UNAUDITED)
d. Securities Lending
Certain or all Funds participate in an agency based securities lending program to earn additional income. The Fund receives cash collateral against the loaned securities in an amount equal to at least 102% of the fair value of the loaned securities. Collateral is maintained over the life of the loan in an amount not less than 100% of the fair value of loaned securities, as determined at the close of Fund business each day; any additional collateral required due to changes in security values is delivered to the Fund on the next business day. The collateral is deposited into a joint cash account with other funds and is used to invest in a money market fund managed by Franklin Advisers, Inc. The Fund may receive income from the investment of cash collateral, in addition to lending fees and rebates paid by the borrower. Income from securities loaned, net of fees paid to the securities lending agent and/or third-party vendor, is reported separately in the Statements of Operations. The Fund bears the market risk with respect to the collateral investment, securities loaned, and the risk that the agent may default on its obligations to the Fund. If the borrower defaults on its obligation to return the securities loaned, the Fund has the right to repurchase the securities in the open market using the collateral received. The securities lending agent has agreed to indemnify the Fund in the event of default by a third party borrower.
e. Income and Deferred Taxes
It is each Fund’s policy to qualify as a regulated investment company under the Internal Revenue Code. Each Fund intends to distribute to shareholders substantially all of its taxable income and net realized gains to relieve it from federal income and excise taxes. As a result, no provision for U.S. federal income taxes is required.
The Funds may be subject to foreign taxation related to income received, capital gains on the sale of securities and certain foreign currency transactions in the foreign jurisdictions in which the Funds invest. Foreign taxes, if any, are recorded based on the tax regulations and rates that exist in the foreign markets in which the Funds invest. When a capital gain tax is determined to apply, certain or all Funds record an estimated deferred tax liability in an amount that would be payable if the securities were disposed of on the valuation date.
Each Fund may recognize an income tax liability related to its uncertain tax positions under U.S. GAAP when the uncertain tax position has a less than 50% probability that it will be sustained upon examination by the tax authorities based on its technical merits. As of September 30, 2019, each Fund has determined that no tax liability is required in its financial statements related to uncertain tax positions for any open tax years (or expected to be taken in future tax years). Open tax
years are those that remain subject to examination and are based on the statute of limitations in each jurisdiction in which the Fund invests.
f. Security Transactions, Investment Income, Expenses and Distributions
Security transactions are accounted for on trade date. Realized gains and losses on security transactions are determined on a specific identification basis. Estimated expenses are accrued daily. Dividend income is recorded on theex-dividend date except for certain dividends from securities where the dividend rate is not available. In such cases, the dividend is recorded as soon as the information is received by the Funds. Distributions to shareholders are recorded on theex-dividend date. Distributable earnings are determined according to income tax regulations (tax basis) and may differ from earnings recorded in accordance with U.S. GAAP. These differences may be permanent or temporary. Permanent differences are reclassified among capital accounts to reflect their tax character. These reclassifications have no impact on net assets or the results of operations. Temporary differences are not reclassified, as they may reverse in subsequent periods.
Common expenses incurred by the Trust are allocated among the Funds based on the ratio of net assets of each Fund to the combined net assets of the Trust. Certain Fund specific expenses are allocated directly to the Fund that incurred the expense. These expenses are paid by the Funds or by the investment manager, as applicable, according to the terms of the unified management fee agreement.
g. Accounting Estimates
The preparation of financial statements in accordance with U.S. GAAP requires management to make estimates and assumptions that affect the reported amounts of assets and liabilities at the date of the financial statements and the amounts of income and expenses during the reporting period. Actual results could differ from those estimates.
h. Guarantees and Indemnifications
Under the Trust’s organizational documents, its officers and trustees are indemnified by the Trust against certain liabilities arising out of the performance of their duties to the Trust. Additionally, in the normal course of business, the Trust, on behalf of the Funds, enters into contracts with service providers that contain general indemnification clauses. The Trust’s maximum exposure under these arrangements is unknown as this would involve future claims that may be made against the Trust that have not yet occurred. Currently, the Trust expects the risk of loss to be remote.
| | | | | | |
| | | |
| franklintempleton.com | | Semiannual Report | | | 71 | |
FRANKLIN TEMPLETON ETF TRUST
NOTES TO FINANCIAL STATEMENTS (UNAUDITED)
2. Shares of Beneficial Interest
Shares of the Funds are issued and redeemed at their respective NAV only in aggregations of a specified number of shares or multiples thereof (Creation Units). Only certain large institutional investors (Authorized Participants) may engage in creation or redemption transactions directly with the Funds. Once created, shares of the Funds generally trade in the secondary market in amounts less than one Creation Unit. The market price of the Funds’ shares will be based on the price in the secondary market which may be at, above or below the most recent NAV. Creation Units may be issued and redeemed in exchange for a designated portfolio of securities and/or cash (which may include cash in lieu of certain securities).
Authorized Participants pay a standard transaction fee to the shareholder servicing agent when purchasing or redeeming Creation Units of the Funds regardless of the number of Creation Units that are being created or redeemed on the same day by the Authorized Participant. The standard transaction fee is imposed to offset transfer and other transaction costs associated with the issuance and redemption of Creation Units and is not charged to or paid by the Funds.
In addition, for cash Creation Unit transactions, a variable fee for creation transactions and redemption transactions may be charged to the Authorized Participant to cover certain brokerage, tax, foreign exchange, execution, market impact and other costs and expenses related to the execution of trades. Variable fees, if any, are included in capital share transactions in the Statements of Changes in Net Assets.
At September 30, 2019, there were an unlimited number of shares authorized (without par value). Transactions in the Funds’ shares were as follows:
| | | | | | | | | | | | | | | | | | | | |
| |
| | | Franklin LibertyQ Emerging Markets ETF | |
| | | |
| | | Six Months Ended
September 30, 2019 | | | | | | Year Ended
March 31, 2019 | |
| | | | | |
| | | Shares | | | Amount | | | | | | Shares | | | Amount | |
Shares sold | | | 400,000 | | | $ | 11,928,508 | | | | | | | | 4,000,000 | | | $ | 121,573,734 | |
Shares redeemed | | | (400,000 | ) | | | (11,716,349 | ) | | | | | | | (4,400,000 | ) | | | (133,791,252 | ) |
| | | | |
Net increase (decrease) | | | — | | | $ | 212,159 | | | | | | | | (400,000 | ) | | $ | (12,217,518 | ) |
| | | | |
| |
| | | Franklin LibertyQ Global Dividend ETF | |
| | | |
| | | Six Months Ended
September 30, 2019 | | | | | | Year Ended
March 31, 2019 | |
| | | | | |
| | | Shares | | | Amount | | | | | | Shares | | | Amount | |
Shares sold | | | 200,000 | | | $ | 5,641,207 | | | | | | | | — | | | $ | — | |
Shares redeemed | | | (200,000 | ) | | | (5,600,542 | ) | | | | | | | — | | | | — | |
| | | | |
Net increase (decrease) | | | — | | | $ | 40,665 | | | | | | | | — | | | $ | — | |
| | | | |
| |
| | | Franklin LibertyQ Global Equity ETF | |
| | | |
| | | Six Months Ended
September 30, 2019 | | | | | | Year Ended
March 31, 2019 | |
| | | | | |
| | | Shares | | | Amount | | | | | | Shares | | | Amount | |
Shares sold | | | — | | | $ | — | | | | | | | | 400,000 | | | $ | 12,112,015 | |
Shares redeemed | | | (200,000 | ) | | | (6,101,460 | ) | | | | | | | (200,000 | ) | | | (6,053,669 | ) |
| | | | |
Net increase (decrease) | | | (200,000 | ) | | $ | (6,101,460 | ) | | | | | | | 200,000 | | | $ | 6,058,346 | |
| | | | |
| | | | |
| | | |
| 72 | | Semiannual Report | | franklintempleton.com |
FRANKLIN TEMPLETON ETF TRUST
NOTES TO FINANCIAL STATEMENTS (UNAUDITED)
| | | | | | | | | | | | | | | | | | | | |
| |
| | | Franklin LibertyQ International Equity Hedged ETF | |
| | | |
| | | Six Months Ended
September 30, 2019 | | | | | | Year Ended
March 31, 2019 | |
| | | | | |
| | | Shares | | | Amount | | | | | | Shares | | | Amount | |
Shares sold | | | 100,000 | | | $ | 2,596,506 | | | | | | | | 100,000 | | | $ | 2,422,854 | |
Shares redeemed | | | — | | | | — | | | | | | | | (200,000 | ) | | | (5,071,388 | ) |
| | | | |
Net increase (decrease) | | | 100,000 | | | $ | 2,596,506 | | | | | | | | (100,000 | ) | | $ | (2,648,534 | ) |
| | | | |
3. Transactions with Affiliates
Franklin Resources, Inc. is the holding company for various subsidiaries that together are referred to as Franklin Templeton. Certain officers and trustees of the Funds are also officers and/or directors of the following subsidiaries:
| | |
| |
| Subsidiary | | Affiliation |
Franklin Advisers, Inc (Advisers) | | Investment manager |
Franklin Advisory Services, LLC (FASL) | | Investment manager |
Franklin Templeton Services, LLC (FT Services) | | Administrative manager |
Franklin Templeton Distributors, Inc. (Distributors) | | Principal underwriter |
a. Management Fees
The Funds pay a unified management fee to Advisors whereby Advisors has agreed to reimburse the Funds’ acquired fund fee and expenses (if any) and pay all of the ordinary operating expenses of the Funds, including custody, transfer agency, and Trustee fees and expenses, among others, but excluding payments under the Funds’ Rule12b-1 plan (if any), brokerage expenses (including any costs incidental to transactions in portfolio securities or instruments), taxes, interest (including borrowing costs and dividend expenses on securities sold short and overdraft charges), litigation expenses (including litigation to which the Trust or a Fund may be a party and indemnification of the Trustees and officers with respect thereto), and othernon-routine or extraordinary expenses. The fees are based on the daily net assets of each of the Funds as follows:
| | |
| |
| | | Annualized Fee Rate |
Franklin LibertyQ Emerging Markets ETF | | 0.45% |
Franklin LibertyQ Global Dividend ETF | | 0.45% |
Franklin LibertyQ Global Equity ETF | | 0.35% |
Franklin LibertyQ International Equity Hedged ETF | | 0.40% |
Prior to August 1, 2019, the Franklin LibertyQ Emerging Markets ETF paid fees to Franklin Advisers, Inc. of 0.55% per year based on the average daily net assets of the Fund.
b. Administrative Fees
Under an agreement with Advisers, FT Services provides administrative services to the Funds. The fee is paid by Advisers based on the Funds’ average daily net assets, and is not an additional expense of the Funds.
c. Investments in Affiliated Management Investment Companies
Certain or all Funds invest in one or more affiliated management investment companies for purposes other than exercising a controlling influence over the management or policies. Management fees paid by the Funds are waived on assets invested in the affiliated management investment companies, as noted in the Statements of Operations, in an amount not to exceed the
| | | | | | |
| | | |
| franklintempleton.com | | Semiannual Report | | | 73 | |
FRANKLIN TEMPLETON ETF TRUST
NOTES TO FINANCIAL STATEMENTS (UNAUDITED)
3. Transactions with Affiliates(continued)
c. Investments in Affiliated Management Investment Companies(continued)
management and administrative fees paid directly or indirectly by each affiliate. During the period ended September 30, 2019, investments in affiliated management investment companies were as follows:
| | | | | | | | | | | | | | | | | | | | | | | | | | | | | | | | |
| | | | | | | | |
| | | Value at
Beginning of
Period | | | Purchases | | | Sales | | | Realized
Gain (Loss) | | | Net Change in
Unrealized
Appreciation
(Depreciation) | | | Value at
End of
Period | | | Number
of Shares
Held at
End of
Period | | | Investment
Income | |
| | | | | | | | |
| Franklin LibertyQ Emerging Markets ETF | | | | | | | | | | | | | | | | | | | | | | | | | | | | | | | | |
| Non-Controlled Affiliates | | | | | | | | | | | | | | | | | | | | | | | | | | | | | |
| Income from
securities loaned |
|
| | | | | | | | | | | | | | | | | | | | | | | | | | | | | | | | |
Institutional Fiduciary Trust Money Market Portfolio 1.71% | | $ | — | | | $ | 9,207,490 | | | $ | (8,057,240 | ) | | $ | — | | | $ | — | | | $ | 1,150,250 | | | | 1,150,250 | | | $ | 2,490 | |
| | | | | | | | | | | | | | | | | | | | | | | | |
| | | | | | | | |
| Franklin LibertyQ Global Equity ETF | | | | | | | | | | | | | | | | | | | | | | | | | | | | | | | | |
| Non-Controlled Affiliates | | | | | | | | | | | | | | | | | | | | | | | | | | | | | | | | |
Institutional Fiduciary Trust Money Market Portfolio 1.71% | | $ | — | | | $ | 150,335 | | | $ | (146,960 | ) | | $ | — | | | $ | — | | | $ | 3,375 | | | | 3,375 | | | $ | 1,954 | |
| | | | | | | | | | | | | | | | | | | | | | | | |
| | | | | | | | |
| Franklin LibertyQ Global Dividend ETF | | | | | | | | | | | | | | | | | | | | | | | | | | | | | | | | |
| Non-Controlled Affiliates | | | | | | | | | | | | | | | | | | | | | | | | | | | | | | | | |
Institutional Fiduciary Trust Money Market Portfolio 1.71% | | $ | — | | | $ | — | | | $ | — | | | $ | — | | | $ | — | | | $ | — | | | | — | | | $ | 2,676 | |
| | | | | | | | | | | | | | | | | | | | | | | | |
d. Other Affiliated Transactions
At September 30, 2019, the shares of the Funds were owned by the following entities:
| | | | | | | | |
| | |
| Funds | | Shares | | | Percentage of
Outstanding Sharesa | |
| Franklin LibertyQ Emerging Markets ETF | | | | | | | | |
Franklin Conservative Allocation Fund | | | 1,416,249 | | | | 12.2% | |
Franklin Moderate Allocation Fund | | | 3,458,865 | | | | 29.8% | |
Franklin Growth Allocation Fund | | | 3,019,830 | | | | 26.0% | |
Franklin LifeSmart™ 2020 – 2055 Retirement Target Funds | | | 1,023,723 | | | | 8.8% | |
Franklin 529 Portfolios | | | 1,075,802 | | | | 9.3% | |
| | | | |
| | | 9,994,469 | | | | 86.1% | |
| | | | |
| Franklin LibertyQ International Equity Hedged ETF | | | | | | | | |
Franklin Resources Inc. | | | 75,000 | | | | 18.8% | |
| | | | |
aInvestment activities of significant shareholders could have a material impact on the Funds.
| | | | |
| | | |
| 74 | | Semiannual Report | | franklintempleton.com |
FRANKLIN TEMPLETON ETF TRUST
NOTES TO FINANCIAL STATEMENTS (UNAUDITED)
4. Income Taxes
For tax purposes, capital losses may be carried over to offset future capital gains, if any. At March 31, 2019, the capital loss carryforwards were as follows:
| | | | | | | | | | | | | | | | |
| | | | |
| | | Franklin
LibertyQ
Emerging
Markets ETF | | | Franklin
LibertyQ
Global
Dividend ETF | | | Franklin
LibertyQ
Global
Equity ETF | | | Franklin
LibertyQ
International
Equity
Hedged ETF | |
| Capital loss carryforwards: | | | | | | | | | | | | | | | | |
Short term Long term | | $ | 7,245,482 | | | $ | 31,911 | | | $ | 7,366 | | | $ | — | |
Long term | | | 2,639,912 | | | | 1,217 | | | | — | | | | — | |
| | | | |
Total capital loss carryforwards | | $ | 9,885,394 | | | $ | 33,128 | | | $ | 7,366 | | | $ | — | |
| | | | |
During the year ended March 31, 2019, the following Funds utilized capital loss carryforwards as follows:
| | | | | | | | |
| | |
| | | Franklin
LibertyQ
Global
Equity ETF | | | Franklin
LibertyQ
International
Equity
Hedged ETF | |
| | $ | 3,601 | | | $ | 69,934 | |
For tax purposes, the Funds may elect to defer any portion of a post-October capital loss or late-year ordinary loss to the first day of the following fiscal year. At March 31, 2019, Franklin LibertyQ International Equity Hedged ETF deferred losses of $11,086.
At September 30, 2019, the cost of investments, net unrealized appreciation (depreciation) and undistributed ordinary income for income tax purposes were as follows:
| | | | | | | | | | | | | | | | |
| | | | |
| | | Franklin
LibertyQ
Emerging
Markets ETF | | | Franklin
LibertyQ
Global
Dividend ETF | | | Franklin
LibertyQ
Global
Equity ETF | | | Franklin
LibertyQ
International
Equity
Hedged ETF | |
Cost of investments | | $ | 325,660,286 | | | $ | 16,450,291 | | | $ | 17,369,611 | | | $ | 10,096,419 | |
| | | | |
Unrealized appreciation | | $ | 37,005,033 | | | $ | 1,779,176 | | | $ | 2,364,247 | | | $ | 711,791 | |
Unrealized depreciation | | | (26,009,848 | ) | | | (840,088 | ) | | | (884,098 | ) | | | (496,242 | ) |
| | | | |
Net unrealized appreciation (depreciation) | | $ | 10,995,185 | | | $ | 939,088 | | | $ | 1,480,149 | | | $ | 215,549 | |
| | | | |
Differences between income and/or capital gains as determined on a book basis and a tax basis are primarily due to differing treatments of corporate actions, passive foreign investment company shares and wash sales.
| | | | | | |
| | | |
| franklintempleton.com | | Semiannual Report | | | 75 | |
FRANKLIN TEMPLETON ETF TRUST
NOTES TO FINANCIAL STATEMENTS (UNAUDITED)
5. Investment Transactions
Purchases and sales of investments (excluding short term securities andin-kind transactions, if any) for the period ended September 30, 2019, were as follows:
| | | | | | | | | | | | | | | | |
| | | | |
| | | Franklin
LibertyQ
Emerging
Markets ETF | | | Franklin
LibertyQ
Global
Dividend ETF | | | Franklin
LibertyQ
Global
Equity ETF | | | Franklin
LibertyQ
International
Equity
Hedged ETF | |
Purchases | | $ | 87,821,539 | | | $ | 1,893,212 | | | $ | 3,955,338 | | | $ | 1,279,726 | |
Sales | | $ | 81,418,220 | | | $ | 1,683,507 | | | $ | 4,304,588 | | | $ | 786,041 | |
In-kind transactions associated with creation and redemptions for the period ended September 30, 2019, were as follows:
| | | | | | | | | | | | | | | | |
| | | | |
| | | Franklin
LibertyQ
Emerging
Markets ETF | | | Franklin
LibertyQ
Global
Dividend ETF | | | Franklin
LibertyQ
Global
Equity ETF | | | Franklin
LibertyQ
International
Equity
Hedged ETF | |
Cost of Securities Received | | $ | 5,569,479 | | | $ | 5,394,156 | | | $ | — | | | $ | 2,562,962 | |
Value of Securities Delivered | | $ | 5,344,522 | | | $ | 5,554,520 | | | $ | 5,608,433 | | | $ | — | |
At September 30, 2019, in connection with securities lending transactions, certain or all Funds loaned investments and received cash collateral as follows:
| | | | | | | | |
| | |
| | | Franklin
LibertyQ
Emerging
Markets ETF | | | Franklin
LibertyQ
Global
Equity ETF | |
| Securities lending transactionsa: | | | | | | | | |
Equity investmentsb | | | 1,150,250 | | | | 3,375 | |
| | | | | | | | |
a The agreements can be terminated at any time.
b The gross amount of recognized liability for such transactions is included in payable upon return of securities loaned in the Statements of Assets and Liabilities.
6. Concentration of Risk
Investing in foreign securities may include certain risks and considerations not typically associated with investing in U.S. securities, such as fluctuating currency values and changing local, regional and global economic, political and social conditions, which may result in greater market volatility. Current political and financial uncertainty surrounding the European Union may increase market volatility and the economic risk of investing in securities in Europe. In addition, certain foreign securities may not be as liquid as U.S. securities.
The United States and other nations have imposed and could impose additional sanctions on certain issuers in Russia due to regional conflicts. These sanctions could result in the devaluation of Russia’s currency, a downgrade in Russian issuers’ credit ratings, or a decline in the value and liquidity of Russian stocks or other securities. Such sanctions could also adversely affect Russia’s economy. Certain or all Funds may be prohibited from investing in securities issued by companies subject to such sanctions. In addition, if the Fund holds the securities of an issuer that is subject to such sanctions, an immediate freeze of that issuer’s securities could result, impairing the ability of the Fund to buy, sell, receive or deliver those securities. There is also the risk that countermeasures could be taken by Russia’s government, which could involve the seizure of the Fund’s assets. These risks could affect the value of the Funds’ portfolio. While the Funds hold securities of certain issuers impacted by the sanctions, existing investments do not presently violate the applicable terms and conditions of the sanctions. The sanctions currently do not affect the Fund’s ability to sell these securities. At September 30, 2019, Franklin LibertyQ Emerging Markets ETF had 10.8% of its net assets invested in Russia. The remaining Funds in the Trust did not have significant investment in Russia.
| | | | |
| | | |
| 76 | | Semiannual Report | | franklintempleton.com |
FRANKLIN TEMPLETON ETF TRUST
NOTES TO FINANCIAL STATEMENTS (UNAUDITED)
7. Other Derivative Information
At September 30, 2019, the Funds’ investments in derivative contracts are reflected in the Statements of Assets and Liabilities as follows:
| | | | | | | | | | | | |
| | |
| | | Asset Derivatives | | | Liability Derivatives | |
| | | | |
| | | Statements of Assets and
Liabilities Location | | Fair Value | | | Statements of Assets and
Liabilities Location | | Fair Value | |
Franklin LibertyQ Emerging Markets
ETF | | | | | | | | | | |
| | | | |
Equity contracts | | Variation margin on futures contracts | | $ | — | | | Variation margin on futures contracts | | $ | 20,860 | a |
Franklin LibertyQ Global Dividend
ETF | | | | | | | | | | |
| | | | |
Equity contracts | | Variation margin on futures contracts | | $ | — | | | Variation margin on futures contracts | | $ | 813 | a |
| Franklin LibertyQ Global Equity ETF | | | | | | | | | | |
| | | | |
Equity contracts | | Variation margin on futures contracts | | $ | — | | | Variation margin on futures contracts | | $ | 813 | a |
Franklin LibertyQ International
Equity Hedged ETF | | | | | | | | | | |
| | | | |
Equity contracts | | Variation margin on futures contracts | | $ | — | | | Variation margin on futures contracts | | $ | 823 | a |
| | | | |
Foreign exchange contracts | | Unrealized appreciation on OTC forward exchange contracts | | | 82,498 | | | Unrealized depreciation on OTC forward exchange contracts | | | 19,216 | |
| | | | | | | | | | | | |
Totals | | | | $ | 82,498 | | | | | $ | 20,039 | |
| | | | | | | | | | | | |
aThis amount reflects the cumulative appreciation (depreciation) of futures contracts as reported in the Statement of Investments. Only the variation margin receivable/payable at period end is separately reported within the Statements of Assets and Liabilities. Prior variation margin movements were recorded to cash upon receipt or payment.
For the period ended September 30, 2019, the effect of derivative contracts in the Funds’ Statements of Operations was as follows:
| | | | | | | | | | | | |
| | | | |
Derivative Contracts
Not Accounted for as
Hedging Instruments | | Statements of
Operations Locations | | Net Realized
Gain (Loss)
for the Period | | | Statements of
Operations Locations | | Net Change in
Unrealized
Appreciation
(Depreciation)
for the Period | |
| Franklin LibertyQ Emerging Markets ETF | | | | | | | | | | | | |
| | Net realized gain (loss) from: | | | | | | Net change in unrealized
appreciation (depreciation) on: | | | | |
| | | | | | | | | | | | |
| | | | |
Equity contracts | | Futures contracts | | $ | (154,313 | ) | | Futures contracts | | $ | (37,070 | ) |
| | | | |
| Franklin LibertyQ Global Dividend ETF | | | | | | | | | | | | |
| | Net realized gain (loss) from: | | | | | | Net change in unrealized
appreciation (depreciation) on: | | | | |
| | | | |
Equity contracts | | Futures contracts | | $ | 1,749 | | | Futures contracts | | $ | (1,210 | ) |
| | | | |
| Franklin LibertyQ Global Equity ETF | | | | | | | | | | | | |
| | Net realized gain (loss) from: | | | | | | Net change in unrealized
appreciation (depreciation) on: | | | | |
| | | | |
Equity contracts | | Futures contracts | | $ | 1,885 | | | Futures contracts | | $ | (2,506 | ) |
| | | | |
Foreign exchange contracts | | Forward exchange contracts | | | (98 | ) | | Forward exchange contracts | | | — | |
| | | | | | | | | | | | |
Totals | | | | $ | 1,787 | | | | | $ | (2,506 | ) |
| | | | | | | | | | | | |
| | | | | | |
| | | |
| franklintempleton.com | | Semiannual Report | | | 77 | |
FRANKLIN TEMPLETON ETF TRUST
NOTES TO FINANCIAL STATEMENTS (UNAUDITED)
7. Other Derivative Information(continued)
| | | | | | | | | | | | |
| | | | |
Derivative Contracts
Not Accounted for as
Hedging Instruments | | Statements of
Operations Locations | | Net Realized
Gain (Loss)
for the Period | | | Statements of
Operations Locations | | Net Change in
Unrealized
Appreciation
(Depreciation)
for the Period | |
| Franklin LibertyQ International Equity Hedged ETF | | | | | | | | | | | | |
| | Net realized gain (loss) from: | | | | | | Net change in unrealized
appreciation (depreciation) on: | | | | |
| | | | |
Equity contracts | | Futures contracts | | $ | 3,052 | | | Futures contracts | | $ | (1,694 | ) |
| | | | |
Foreign exchange contracts | | Forward exchange contracts | | | 303,358 | | | Forward exchange contracts | | | 1,604 | |
| | | | | | | | | | | | |
Totals | | | | $ | 306,410 | | | | | $ | (90 | ) |
| | | | | | | | | | | | |
For the period ended September 30, 2019, the average month end notional amount of futures contracts and average month end contract value for forward exchange contracts were as follows:
| | | | | | | | | | | | | | | | |
| | | Franklin
LibertyQ
Emerging
Markets ETF | | | Franklin
LibertyQ
Global
Dividend ETF | | | Franklin
LibertyQ
Global
Equity ETF | | | Franklin
LibertyQ
International
Equity
Hedged ETF | |
Futures contracts | | $ | 1,962,518 | | | $ | 51,140 | | | $ | 90,909 | | | $ | 47,361 | |
Forward exchange contracts | | $ | — | | | $ | — | | | $ | — | | | $ | (7,878,523 | ) |
At September 30, 2019, the Funds’ OTC derivative assets and liabilities are as follows:
| | | | | | | | |
| |
| | | Gross and Net Amounts of
Assets and Liabilities
Presented in the
Statements of
Assets and Liabilities | |
| | |
| | | Assetsa | | | Liabilitiesa | |
| Franklin LibertyQ International Equity Hedged ETF | | | | | | | | |
Foreign exchange contracts | | $ | 82,498 | | | $ | 19,216 | |
| | | | |
aAbsent an event of default or early termination, OTC derivative assets and liabilities are presented gross and not offset in the Statements of Assets and Liabilities.
At September 30, 2019, the Funds’ OTC derivative assets, which may be offset against the Funds’ OTC derivative liabilities and collateral received from the counterparty, are as follows:
| | | | | | | | | | | | | | | | | | | | |
| | | |
| | | | | | Amounts Not Offset in the
Statements of Assets and Liabilities | | | | |
| | | | | |
| | | Gross and Net Amounts
of Assets Presented
in the Statements of
Assets and Liabilities | | | Financial
Instruments
Available for Offset | | | Financial
Instruments
Collateral
Received | | | Cash
Collateral
Received | | | Net Amount (Not
less than zero) | |
| Franklin LibertyQ International Equity Hedged ETF | | | | | | | | | | | | | | | | | | | | |
| Counterparty | | | | | | | | | | | | | | | | | | | | |
BOFA | | $ | 71,943 | | | $ | (7,258 | ) | | $ | — | | | $ | — | | | $ | 64,685 | |
HSBK | | | 2,601 | | | | (2,601 | ) | | | — | | | | — | | | | — | |
MSCO | | | 5,349 | | | | (23 | ) | | | — | | | | — | | | | 5,326 | |
UBSW | | | 2,605 | | | | (2,605 | ) | | | — | | | | — | | | | — | |
| | | | |
Total | | $ | 82,498 | | | $ | (12,487 | ) | | $ | — | | | $ | — | | | $ | 70,011 | |
| | | | |
| | | | |
| | | |
| 78 | | Semiannual Report | | franklintempleton.com |
FRANKLIN TEMPLETON ETF TRUST
NOTES TO FINANCIAL STATEMENTS (UNAUDITED)
At September 30, 2019, the Funds’ OTC derivative liabilities, which may be offset against the Funds’ OTC derivative assets and collateral pledged to the counterparty, are as follows:
| | | | | | | | | | | | | | | | | | | | |
| | | |
| | | | | | Amounts Not Offset in the
Statements of Assets and Liabilities | | | | |
| | | | | |
| | | Gross and Net Amounts
of Liabilities Presented
in the Statements of
Assets and Liabilities | | | Financial
Instruments
Available for Offset | | | Financial
Instruments
Collateral
Pledged | | | Cash
Collateral
Pledged | | | Net Amount (Not
less than zero) | |
| Franklin LibertyQ International Equity Hedged ETF | | | | | | | | | | | | | | | | | | | | |
| Counterparty | | | | | | | | | | | | | | | | | | | | |
BOFA | | $ | 7,258 | | | $ | (7,258 | ) | | $ | — | | | $ | — | | | $ | — | |
HSBK | | | 5,960 | | | | (2,601 | ) | | | — | | | | — | | | | 3,359 | |
MSCO | | | 23 | | | | (23 | ) | | | — | | | | — | | | | — | |
UBSW | | | 5,975 | | | | (2,605 | ) | | | — | | | | — | | | | 3,370 | |
| | | | |
Total | | $ | 19,216 | | | $ | (12,487 | ) | | $ | — | | | $ | — | | | $ | 6,729 | |
| | | | |
See Note 1(c) regarding derivative financial instruments.
See abbreviations on page 81.
8. Fair Value Measurements
The Funds follow a fair value hierarchy that distinguishes between market data obtained from independent sources (observable inputs) and the Funds’ own market assumptions (unobservable inputs). These inputs are used in determining the value of the Funds’ financial instruments and are summarized in the following fair value hierarchy:
| | • | | Level 1 – quoted prices in active markets for identical financial instruments |
| | • | | Level 2 – other significant observable inputs (including quoted prices for similar financial instruments, interest rates, prepayment speed, credit risk, etc.) |
| | • | | Level 3 – significant unobservable inputs (including the Funds’ own assumptions in determining the fair value of financial instruments) |
The input levels are not necessarily an indication of the risk or liquidity associated with financial instruments at that level.
A summary of inputs used as of September 30, 2019, in valuing the Funds’ assets and liabilities carried at fair value, is as follows:
| | | | | | | | | | | | | | | | |
| | | | |
| | | Level 1 | | | Level 2 | | | Level 3 | | | Total | |
| | | | |
| Franklin LibertyQ Emerging Markets ETF | | | | | | | | | | | | | | | | |
| | | | |
| Assets: | | | | | | | | | | | | | | | | |
Investments in Securities:a | | | | | | | | | | | | | | | | |
Equity Investmentsb | | $ | 335,497,470 | | | $ | — | | | $ | — | | | $ | 335,497,470 | |
Corporate Bonds & Notes | | | — | | | | 7,751 | | | | — | | | | 7,751 | |
Short-Term Investments | | | 1,150,250 | | | | — | | | | — | | | | 1,150,250 | |
| | | | |
Total Investments in Securities | | $ | 336,647,720 | | | $ | 7,751 | | | $ | — | | | $ | 336,655,471 | |
| | | | |
| | | | |
| Liabilities: | | | | | | | | | | | | | | | | |
Other Financial Instruments: | | | | | | | | | | | | | | | | |
Futures Contracts | | $ | 20,860 | | | $ | — | | | $ | — | | | $ | 20,860 | |
| | | | |
| | | | | | |
| | | |
| franklintempleton.com | | Semiannual Report | | | 79 | |
FRANKLIN TEMPLETON ETF TRUST
NOTES TO FINANCIAL STATEMENTS (UNAUDITED)
8. Fair Value Measurements(continued)
| | | | | | | | | | | | | | | | |
| | | | |
| | | Level 1 | | | Level 2 | | | Level 3 | | | Total | |
| Franklin LibertyQ Global Dividend ETF | | | | | | | | | | | | | | | | |
| | | | |
| Assets: | | | | | | | | | | | | | | | | |
Investments in Securities:a | | | | | | | | | | | | | | | | |
Equity Investmentsb | | $ | 17,389,379 | | | $ | — | | | $ | — | | | $ | 17,389,379 | |
| | | | |
| | | | |
| Liabilities: | | | | | | | | | | | | | | | | |
Other Financial Instruments: | | | | |
Futures Contracts | | $ | 813 | | | $ | — | | | $ | — | | | $ | 813 | |
| | | | |
| | | | |
| Franklin LibertyQ Global Equity ETF | | | | | | | | | | | | | | | | |
| | | | |
| Assets: | | | | | | | | | | | | | | | | |
Investments in Securities:a | | | | | | | | | | | | | | | | |
Equity Investmentsb | | $ | 18,846,385 | | | $ | — | | | $ | — | | | $ | 18,846,385 | |
Short-Term Investments | | | 3,375 | | | | — | | | | — | | | | 3,375 | |
| | | | |
Total Investments in Securities | | $ | 18,849,760 | | | $ | — | | | $ | — | | | $ | 18,849,760 | |
| | | | |
| | | | |
| Liabilities: | | | | | | | | | | | | | | | | |
Other Financial Instruments: | | | | |
Futures Contracts | | $ | 813 | | | $ | — | | | $ | — | | | $ | 813 | |
| | | | |
| | | | |
| Franklin LibertyQ International Equity Hedged ETF | | | | | | | | | | | | | | | | |
| | | | |
| Assets: | | | | | | | | | | | | | | | | |
Investments in Securities:a | | | | | | | | | | | | | | | | |
Equity Investmentsb | | $ | 10,311,968 | | | $ | — | | | $ | — | | | $ | 10,311,968 | |
| | | | |
Other Financial Instruments: | | | | | | | | | | | | | | | | |
Forward Exchange Contracts | | $ | — | | | $ | 82,498 | | | $ | — | | | $ | 82,498 | |
| | | | |
| | | | |
| Liabilities: | | | | | | | | | | | | | | | | |
Other Financial Instruments: | | | | | | | | | | | | | | | | |
Forward Exchange Contracts | | $ | — | | | $ | 19,216 | | | $ | — | | | $ | 19,216 | |
Futures Contracts | | | 823 | | | | — | | | | — | | | | 823 | |
| | | | |
Total Other Financial Instruments | | $ | 823 | | | $ | 19,216 | | | $ | — | | | $ | 20,039 | |
| | | | |
aFor detailed categories, see the accompanying Statement of Investments.
bIncludes common and preferred stocks.
| | | | |
| | | |
| 80 | | Semiannual Report | | franklintempleton.com |
FRANKLIN TEMPLETON ETF TRUST
NOTES TO FINANCIAL STATEMENTS (UNAUDITED)
9. Subsequent Events
The Funds have evaluated subsequent events through the issuance of the financial statements and determined that no events have occurred that require disclosure.
Abbreviations
| | |
| Selected Portfolio |
| ADR | | American Depositary Receipt |
| ETF | | Exchange Traded Fund |
| GDR | | Global Depositary Receipt |
| IDR | | International Depositary Receipt |
| NVDR | | Non-Voting Depositary Receipt |
| REIT | | Real Estate Investment Trust |
|
| Counterparty |
| BOFA | | Bank of America Corp. |
| HSBK | | HSBC Bank PLC |
| IDR | | International Depository Receipt |
| MSCO | | Morgan Stanley |
| UBSW | | UBS AG |
| | | | | | |
| | | |
| franklintempleton.com | | Semiannual Report | | | 81 | |
FRANKLIN TEMPLETON ETF TRUST
Tax Information (unaudited)
At March 31, 2019, more than 50% of the Fund’s total assets were invested in securities of foreign issuers. In most instances, foreign taxes were withheld from income paid to the Funds on these investments. As shown in the table below, the Funds hereby reports to shareholders the foreign source income and foreign taxes paid, pursuant to Section 853 of the Internal Revenue Code. This written statement will allow shareholders of record on June 12, 2019, to treat their proportionate share of foreign taxes paid by the Funds as having been paid directly by them. The shareholder shall consider these amounts as foreign taxes paid in the tax year in which they receive the Fund distribution.
The following tables provides a detailed analysis of foreign tax paid, foreign source income, and foreign source qualified dividends as reported by the Funds to shareholders of record.
| | | | | | | | | | | | |
| | | |
| Fund | | Foreign Tax Paid Per Share | | | Foreign Source Income Per Share | | | Foreign Source Qualified Dividends Per Share | |
Franklin LibertyQ Emerging Markets ETF | | $ | 0.1304 | | | $ | 1.1480 | | | $ | 0.6459 | |
Franklin LibertyQ Global Dividend ETF | | $ | 0.0550 | | | $ | 0.7031 | | | $ | 0.6089 | |
Franklin LibertyQ International Equity Hedged ETF | | $ | 0.0606 | | | $ | 0.9806 | | | $ | 0.8693 | |
Foreign Tax Paid Per Share is the amount per share available to you, as a tax credit (assuming you held your shares in the Fund for a minimum of 16 days during the31-day period beginning 15 days before theex-dividend date of the Fund’s distribution to which the foreign taxes relate), or, as a tax deduction.
Foreign Source Income Per Share is the amount per share of income dividends attributable to foreign securities held by the Fund, plus any foreign taxes withheld on these dividends. The amounts reported include foreign source qualified dividends that have not been adjusted for the rate differential applicable to such dividend income.1
Foreign Source Qualified Dividends Per Share is the amount per share of foreign source qualified dividends plus any foreign taxes withheld on these dividends. These amounts represent the portion of the Foreign Source Income Per Share that were derived from qualified foreign securities held by the Fund.1
Bymid-February 2020, shareholders will receive Form 1099-DIV which will include their share of taxes paid and foreign source income distributed during the calendar year 2019. The Foreign Source Income reported on Form1099-DIV has not been adjusted for the rate differential on foreign source qualified dividend income. Shareholders are advised to check with their tax advisors for information on the treatment of these amounts on their individual income tax returns.
1. Qualified dividends are taxed at reduced long term capital gains tax rates. In determining the amount of foreign tax credit that may be applied against the U.S. tax liability of individuals receiving foreign source qualified dividends, adjustments may be required to the foreign tax credit limitation calculation to reflect the rate differential applicable to such dividend income. The rules however permit certain individuals to elect not to apply the rate differential adjustments for capital gains and/or dividends for any taxable year. Please consult your tax advisor and the instructions to Form 1116 for more information.
| | | | |
| | | |
| 82 | | Semiannual Report | | franklintempleton.com |
FRANKLIN TEMPLETON ETF TRUST
Shareholder Information
Board Approval of Investment Management Agreements
FRANKLIN TEMPLETON ETF TRUST
Franklin LibertyQ Emerging Markets ETF
Franklin LibertyQ Global Dividend ETF
Franklin LibertyQ Global Equity ETF
Franklin LibertyQ International Equity Hedged ETF
(each a Fund)
At anin-person meeting held on May 29, 2019 (Meeting), the Board of Trustees (Board) of Franklin Templeton ETF Trust (Trust), including a majority of the trustees who are not “interested persons” as defined in the Investment Company Act of 1940 (Independent Trustees), reviewed and approved the continuance of the investment management agreement between Franklin Advisory Services LLC (Manager) and the Trust, on behalf of each Fund (each a Management Agreement) for an additionalone-year period. The Independent Trustees received advice from and met separately with Independent Trustee counsel in considering whether to approve the continuation of each Management Agreement. Although the Management Agreements for the Funds were considered at the same Board meeting, the Board considered the information provided to it about the Funds together and with respect to each Fund separately as the Board deemed appropriate.
In considering the continuation of each Management Agreement, the Board reviewed and considered information provided by the Manager at the Meeting and throughout the year at meetings of the Board and its committees. The Board also reviewed and considered information provided in response to a detailed set of requests for information submitted to the Manager by Independent Trustee counsel on behalf of the Independent Trustees in connection with the annual contract renewal process. In addition, prior to the Meeting, the Independent Trustees held a telephonic contract renewal meeting at which the Independent Trustees conferred amongst themselves and Independent Trustee counsel about contract renewal matters. The Board reviewed and considered all of the factors it deemed relevant in approving the continuance of each Management Agreement, including, but not limited to: (i) the nature, extent and quality of the services provided by the Manager; (ii) the investment performance of each Fund, as well as each Fund’s tracking error against a specified benchmark index as of a recent period; (iii) the costs of the services provided and profits realized by the Manager and its affiliates from the relationship with each Fund; (iv) the extent to which economies of scale are realized as each Fund grows; and (v) whether fee levels reflect these economies of scale for the benefit of Fund investors.
In approving the continuance of each Management Agreement, the Board, including a majority of the Independent Trustees, determined that the terms of each Management Agreement are fair and reasonable and that the continuance of such Management Agreement is in the best interests of the applicable Fund and its shareholders. While attention was given to all information furnished, the following discusses some primary factors relevant to the Board’s determination.
NATURE, EXTENT AND QUALITY OF SERVICES. The Board reviewed and considered information regarding the nature, extent and quality of investment management services provided by the Manager and its affiliates to the Funds and their shareholders. This information included, among other things, the qualifications, background and experience of the senior management and investment personnel of the Manager; the structure of investment personnel compensation; oversight of third-party service providers; investment performance reports and related financial information for each Fund; reports on expenses; legal and compliance matters; risk controls; pricing and other services provided by the Manager and its affiliates; and management fees charged by the Manager and its affiliates to US funds and other accounts, including management’s explanation of differences among accounts where relevant. The Board noted management’s continuing efforts and expenditures in establishing effective business continuity plans and developing strategies to address areas of heightened concern in the registered fund industry, such as cybersecurity and liquidity risk management. The Board also recognized management’s commitment to facilitating Board oversight of liquidity through the designation of a liquidity/risk administrator and the development of reports that highlight the amount of illiquid investments for each Fund.
The Board also reviewed and considered the benefits provided to Fund shareholders of investing in a fund that is part of the Franklin Templeton family of funds. The Board noted the financial position of Franklin Resources, Inc. (FRI), the Manager’s parent, and its commitment to the registered fund business as evidenced by its continued introduction of new funds, reassessment of the fund offerings in response to the market environment and project initiatives and capital investments relating to the services provided to the Funds by the Franklin Templeton (FT) organization.
Following consideration of such information, the Board was satisfied with the nature, extent and quality of services provided by the Manager and its affiliates to the Funds and their shareholders.
| | | | | | |
| | | |
| franklintempleton.com | | Semiannual Report | | | 83 | |
FRANKLIN TEMPLETON ETF TRUST
SHAREHOLDER INFORMATION
FUND PERFORMANCE. The Board reviewed and considered the performance results of each Fund for theone-year period ended February 28, 2019. The Board considered the performance returns for each Fund in comparison to the performance returns of registered funds deemed comparable to the Fund included in a universe (Performance Universe) selected by Broadridge Financial Solutions, Inc. (Broadridge), an independent provider of investment company data. The Board received a description of the methodology used by Broadridge to select the registered funds included in a Performance Universe. The Board also reviewed and considered Fund performance reports provided and discussions that occurred with portfolio managers at Board meetings throughout the year. The Board noted its ongoing discussions with the Manager about the performance of the Funds to date and the importance of performance to asset growth. Specifically, the Board referenced earlier discussions with management on matters related to, among other things, the strategy behind the overall productline-up, the design and construction of the Manager’s proprietary indices, the comparability of peer data, the nature of the Manager’s research, the potential use of innovative data and technology, and investments in marketing and distribution. A summary of each Fund’s performance results is below.
The Performance Universe for the Franklin LibertyQ Emerging Markets ETF included the Fund and all retail and institutional emerging markets funds. The Performance Universe for the Franklin LibertyQ Global Dividend ETF included the Fund and all retail and institutional global equity income funds. The Performance Universe for the Franklin LibertyQ Global Equity ETF included the Fund and all retail and institutional globalmulti-cap growth funds. The Performance Universe for the Franklin LibertyQ International Equity Hedged ETF included the Fund and all retail and institutional internationalmulti-cap growth funds. The Funds commenced operations on June 1, 2016, and thus have been in operation for less than three years. The Board noted that the Funds’ annualized total returns for theone-year period ended February 28, 2019 were above the medians and in the first (best) and second quintiles of their respective Performance Universes. The Board further noted that, in light of the Funds’ use of a “passive” or indexing investment approach, management evaluates the Funds based on their tracking error against a specified benchmark. The Board noted that for theone-year period ended February 28, 2019, each Fund’s tracking error was within the tolerance anticipated for such Fund. The Board concluded that the Funds’ performance was satisfactory.
COMPARATIVE FEES AND EXPENSES. The Board reviewed and considered information regarding each Fund’s actual total expense ratio and its various components, including, as applicable, management fees; transfer agent expenses; underlying fund expenses; Rule12b-1 andnon-Rule12b-1 service fees; and othernon-management fees. The Board considered the actual total expense ratio and, separately, the contractual management fee rate, without the effect of fee waivers, if any (Management Rate) of each Fund in comparison to the median expense ratio and median Management Rate, respectively, of other exchange-traded funds deemed comparable to and with a similar expense structure to the Fund selected by Broadridge (Expense Group). Broadridge fee and expense data is based upon information taken from each fund’s most recent annual report, which reflects historical asset levels that may be quite different from those currently existing, particularly in a period of market volatility. While recognizing such inherent limitation and the fact that expense ratios and Management Rates generally increase as assets decline and decrease as assets grow, the Board believed the independent analysis conducted by Broadridge to be an appropriate measure of comparative fees and expenses. The Broadridge Management Rate includes administrative charges. The Board received a description of the methodology used by Broadridge to select the exchange-traded funds included in an Expense Group.
Franklin LibertyQ Emerging Markets ETF – The Expense Group for the Fund was comprised of pure-index exchange-traded funds, which included the Fund and six other emerging markets funds. The Board noted that the Management Rate and actual total expense ratio for the Fund were equal the medians of its Expense Group. The Board also noted that effective December 1, 2017, each Fund implemented a unified management fee (Unified Fee). The Board further noted that pursuant to the Unified Fee arrangement the Manager reimburses each Fund for all of its acquired fund fees and expenses (if any) and pays all of the ordinary operating expenses of the Fund, except for (i) the Fund’s investment management fee, (ii) payments under the Fund’s Rule12b-1 plan (if any), (iii) brokerage expenses, (iv) taxes, (v) interest (including borrowing costs and dividend expenses on securities sold short and overdraft charges), (vi) litigation expenses (including litigation to which the Trust or a Fund may be a party and indemnification of the Trustees and officers with respect thereto), and (vii) othernon-routine or extraordinary expenses (Unified Fee Arrangement). The Board concluded that the Management Rate charged to the Fund is reasonable.
| | | | |
| | | |
| 84 | | Semiannual Report | | franklintempleton.com |
FRANKLIN TEMPLETON ETF TRUST
SHAREHOLDER INFORMATION
Franklin LibertyQ Global Dividend ETF – The Expense Group for the Fund was comprised of pure-index exchange-traded funds, which included the Fund and seven other global equity income funds. The Board noted that the Management Rate and actual total expense ratio for the Fund were below the medians of its Expense Group. The Board also noted that effective December 1, 2017, the Fund implemented a Unified Fee. The Board further noted the terms of the Unified Fee Arrangement. The Board concluded that the Management Rate charged to the Fund is reasonable.
Franklin LibertyQ Global Equity ETF – The Expense Group for the Fund was comprised of pure-index exchange-traded funds, which included the Fund and three other globalmulti-cap core funds. The Board noted that the Management Rate for the Fund was equal to the median of its Expense Group and that the actual total expense ratio for the Fund was below the median of its Expense Group. The Board further noted the small size of the Expense Group. The Board also noted that effective December 1, 2017, the Fund implemented a Unified Fee. The Board further noted the terms of the Unified Fee Arrangement. The Board concluded that the Management Rate charged to the Fund is reasonable.
Franklin LibertyQ International Equity Hedged ETF – The Expense Group for the Fund was comprised of pure-index exchange-traded funds, which included the Fund and seven other internationalmulti-cap growth funds. The Board noted that the Management Rate for the Fund was slightly above and the actual total expense ratio for the Fund was above the medians of its Expense Group. The Board also noted that effective December 1, 2017, the Fund implemented a Unified Fee. The Board further noted the terms of the Unified Fee Arrangement. The Board also noted the first quintile (best) performance of the Fund for theone-year period ended February 28, 2019 and the fact that such performance resulted in the Fund ranking number 5 out of its 500 peers included in the Performance Universe. The Board concluded that the Management Rate charged to the Fund is reasonable.
PROFITABILITY. The Board reviewed and considered information regarding the profits realized by the Manager and its affiliates in connection with the operation of each Fund. In this respect, the Board considered the Fund profitability analysis that addresses the overall profitability of FT’s US fund business, as well as its profits in providing investment management and other services to each of the individual funds during the12-month period ended September 30, 2018, being the most recent fiscalyear-end for FRI. The Board
noted that although management continually makes refinements to its methodologies used in calculating profitability in response to organizational and product-related changes, the overall methodology has remained consistent with that used in the Funds’ profitability report presentations from prior years. Additionally, PricewaterhouseCoopers LLP, auditor to FRI and certain Franklin Templeton funds, has been engaged to periodically review and assess the allocation methodologies to be used solely by the Funds’ Board with respect to the profitability analysis.
The Board noted management’s belief that costs incurred in establishing the infrastructure necessary for the type of fund operations conducted by the Manager and its affiliates may not be fully reflected in the expenses allocated to each Fund in determining its profitability, as well as the fact that the level of profits, to a certain extent, reflected operational cost savings and efficiencies initiated by management. The Board also noted management’s expenditures in improving shareholder services provided to the Funds, as well as the need to implement systems and meet additional regulatory and compliance requirements resulting from recent SEC and other regulatory requirements.
The Board also considered the extent to which the Manager and its affiliates might derive ancillary benefits from fund operations, including revenues generated from transfer agent services, potential benefits resulting from personnel and systems enhancements necessitated by fund growth, as well as increased leverage with service providers and counterparties. Based upon its consideration of all these factors, the Board concluded that the level of profits realized by the Manager and its affiliates from providing services to each Fund was not excessive in view of the nature, extent and quality of services provided to each Fund.
ECONOMIES OF SCALE. The Board reviewed and considered the extent to which the Manager may realize economies of scale, if any, as each Fund grows larger and whether each Fund’s management fee structure reflects any economies of scale for the benefit of shareholders. The Board considered that each Fund would likely experience benefits from the Unified Fee at the Fund’s projected asset levels because of the Manager’s contractual requirement to bear most of the Fund’s ordinary operating expenses. The Board noted that, under the Unified Fee, it is not anticipated that any of the Funds will generate significant, if any, profit for the Manager and/or its affiliates for some time. The Board also considered the Manager’s view that any analyses of potential economies of scale in managing a particular fund are inherently limited in
| | | | | | |
| | | |
| franklintempleton.com | | Semiannual Report | | | 85 | |
FRANKLIN TEMPLETON ETF TRUST
SHAREHOLDER INFORMATION
light of the joint and common costs and investments the Manager incurs across the Franklin Templeton family of funds as a whole. The Board also noted that the Funds commenced operations on June 1, 2016 and that, as of December 31, 2018, each Fund’s net assets were below $20 million, except for those of the Franklin LibertyQ Emerging Markets ETF which were approximately $270 million. The Board recognized that there would not likely be any economies of scale for these Funds until each Fund’s assets grow.
CONCLUSION. Based on its review, consideration and evaluation of all factors it believed relevant, including the above-described factors and conclusions, the Board unanimously approved the continuation of each Management Agreement for an additionalone-year period.
Proxy Voting Policies and Procedures
The Trust’s investment manager has established Proxy Voting Policies and Procedures (Policies) that the Trust uses to determine how to vote proxies relating to portfolio securities. Shareholders may view the Trust’s complete Policies online at franklintempleton.com. Alternatively, shareholders may request copies of the Policies free of charge by calling the Proxy Group collect at (954)527-7678 or by sending a written request to: Franklin Templeton Companies, LLC, 300 S.E. 2nd Street, Fort Lauderdale, FL 33301, Attention: Proxy Group. Copies of the Trust’s proxy voting records are also made available online at franklintempleton.com and posted on the U.S. Securities and Exchange Commission’s website at sec.gov and reflect the most recent12-month period ended June 30.
Quarterly Statement of Investments
The Trust files a complete statement of investments with the U.S. Securities and Exchange Commission for the first and third quarters for each fiscal year as an exhibit to its report on Form N-PORT. Shareholders may view the filed FormN-PORT by visiting the Commission’s website at sec.gov. The filed form may also be viewed and copied at the Commission’s Public Reference Room in Washington, DC. Information regarding the operations of the Public Reference Room may be obtained by calling(800) SEC-0330.
Premium/Discount Information
Information about the differences between the daily market price on the secondary market for the shares of the Funds and the Funds’ net asset value may be found on the Funds’ website at franklintempleton.com.
| | | | |
| | | |
| 86 | | Semiannual Report | | franklintempleton.com |
Authorized for distribution only when accompanied or preceded by a summary prospectus and/or prospectus. Investors should carefully consider a fund’s investment goals, risks, charges and expenses before investing. A prospectus contains this and other information; please read it carefully before investing.
To help ensure we provide you with quality service, all calls to and from our service areas are monitored and/or recorded.
| | | | | | |
 | | Semiannual Report Franklin Templeton ETF Trust | | |
| | | |
| | Investment Manager | | Distributor | | Investor Services |
| | Franklin Advisory Services, LLC | | Franklin Templeton Distributors, Inc. (800) DIAL BEN®/342-5236 franklintempleton.com | | Transfer Agent State Street Bank and
Trust Company 1 Heritage Drive
Mail Stop OHD0100 North Quincy, MA 02171 |
| © 2019 Franklin Templeton Investments. All rights reserved. | | | | ETF S 11/19 |
SEMIANNUAL REPORT
FRANKLIN TEMPLETON
ETF TRUST
September 30, 2019


| | |
Franklin Liberty International Opportunities ETF | | Franklin Liberty U.S. Core Bond ETF |
Franklin Liberty Investment Grade Corporate ETF | | Franklin Liberty U.S. Low Volatility ETF |
Internet Delivery of Fund Reports Unless You Request Paper Copies: Effective January 1, 2021, as permitted by the SEC, paper copies of the Fund’s shareholder reports will no longer be sent by mail, unless you specifically request them from the Fund or your financial intermediary. Instead, the reports will be made available on a website, and you will be notified by mail each time a report is posted and provided with a website link to access the report.
If you already elected to receive shareholder reports electronically, you will not be affected by this change and you need not take any action. If you have not signed up for electronic delivery, we would encourage you to join fellow shareholders who have. You may elect to receive shareholder reports and other communications electronically from the Fund by calling(800) 632-2301 or by contacting your financial intermediary.
You may elect to continue to receive paper copies of all your future shareholder reports free of charge by contacting your financial intermediary or, if you invest directly with a Fund, calling(800) 632-2301 to let the Fund know of your request. Your election to receive reports in paper will apply to all funds held in your account.
Franklin Templeton Investments
Successful investing begins with ambition. And achievement only comes when you reach for it. That’s why we continually strive to deliver better outcomes for investors. No matter what your goals are, our deep, global investment expertise allows us to offer solutions that can help.
During our more than 70 years of experience, we’ve managed through all kinds of markets—up, down and those in between. We’re always preparing for what may come next. It��s because of this, combined with our strength as one of the world’s largest asset managers that we’ve earned the trust of millions of investors around the world.
Visit franklintempleton.com/investor/investments-and-solutions/investment-options/etfs/for fund updates and documents.
| | | | | | | | |
| Not FDIC Insured | | | | | May Lose Value | | | | | No Bank Guarantee |
| | | | | | |
| | | |
| franklintempleton.com | | Not part of the semiannual report | | | 1 | |
SEMIANNUAL REPORT
Franklin Liberty International Opportunities ETF
This semiannual report for Franklin Liberty International Opportunities ETF covers the period ended September 30, 2019.
Your Fund’s Goal and Main Investments
The Fund seeks long-term capital appreciation. Under normal market conditions, the Fund invests predominantly in equity securities in developed, developing and frontier markets outside of the U.S. across the entire market capitalization spectrum, including small- andmid-capitalization companies.
Performance Overview
During thesix-month period, the Fund posted cumulative total returns of-0.36% based on market price and-0.36% based on net asset value (NAV). In comparison, the MSCI All Country World Index (ACWI) ex USA Index, which measures stock performance in global developed and emerging markets excluding the U.S., posted a +1.47% total return for the same period.1 You can find more of the Fund’s performance data in the Performance Summary beginning on page 6.
Performance data represent past performance, which does not guarantee future results. Investment return and principal value will fluctuate, and you may have a gain or loss when you sell your shares. Current performance may differ from figures shown. For most recentmonth-end performance, go tofranklintempleton.com or call(800)342-5236.
Economic and Market Overview
The global economy expanded during the six months ended September 30, 2019, despite weakness in certain regions. Global stocks were aided by upbeat economic data in some regions, encouraging corporate earnings reports, periods of optimism about a potential U.S.-China trade deal and monetary policy easing by major central banks. The U.S. Federal Reserve’s (Fed’s) patient approach to its monetary policy early in the period, rate cuts in July and September, and indications it will act appropriately to sustain U.S. economic expansion and achieve its inflation objective aided market sentiment.
However, markets also reflected concerns about political uncertainties in the U.S. (including the impeachment inquiry into U.S. President Donald Trump), geopolitical tensions in
|
| Geographic Composition |
|
| Based on Total Net Assets as of 9/30/19 |
|
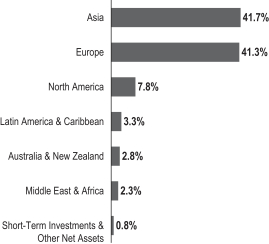 |
the eurozone and other regions, and the impact of U.S. trade disputes with China and other trading partners on global growth and corporate earnings. In this environment, global developed and emerging market stocks, as measured by the MSCI All Country World Index, posted a +3.91% total return for the six months under review.1
The U.S. economy grew during thesix-month period. However, the economy moderated in 2019’s second and third quarters, due partly to weakness in inventory and business investment. The manufacturing sector expanded during the period’s first four months, but contracted in August and September 2019. The services sector continued to expand throughout the period, although the rate of expansion slowed in September. The unemployment rate decreased from 3.8% in March 2019 to 3.5% atperiod-end.2 The annual inflation rate, as measured by the Consumer Price Index, decreased from 1.9% in March 2019 to 1.7% atperiod-end.2
At its July 2019 meeting, the Fed lowered its target range for the federal funds rate for the first time since December 2008, to 2.00%–2.25%, citing muted inflation pressures and the potential effects of global trade tensions on economic growth. Furthermore, the Fed ended its balance sheet normalization
1. Source: Morningstar.
The index is unmanaged and includes reinvestment of any income or distributions. It does not reflect any fees, expenses or sales charges. One cannot invest directly in an index, and an index is not representative of the Fund’s portfolio.
2. Source: U.S. Bureau of Labor Statistics.
See www.franklintempletondatasources.com for additional data provider information.
The dollar value, number of shares or principal amount, and names of all portfolio holdings are listed in the Fund’s Statement of Investments (SOI). The SOI begins on page 28.
| | | | |
| | | |
| 2 | | Semiannual Report | | franklintempleton.com |
FRANKLIN LIBERTY INTERNATIONAL OPPORTUNITIES ETF
program earlier than previously indicated. In September, the Fed further lowered the federal funds target rate range to 1.75%–2.00%, reiterating the rationale cited at the July 2019 meeting.
In Europe, the U.K.’s quarterly gross domestic product (GDP) growth contracted in 2019’s second quarter, as Brexit uncertainties weighed on business sentiment. The Bank of England kept its key policy rate unchanged during thesix-month period and lowered its GDP forecasts for 2019 and 2020. The eurozone’s quarterly GDP growth moderated in 2019’s second quarter and stabilized in the third quarter. The bloc’s annual inflation rate ended the period lower. The European Central Bank (ECB) kept its benchmark interest rate unchanged during the period. In September, the ECB announced it will start a new bond-buying program in November in an effort to boost the economy and increase inflation.
In Asia, Japan’s quarterly GDP growth moderated in 2019’s second quarter. The Bank of Japan (BOJ) left its benchmark interest rate unchanged and continued its stimulus measures during thesix-month period. At its July and September meetings, the BOJ expressed its openness to increase stimulus in an effort to sustain economic growth and achieve its inflation goal.
In larger emerging markets, Brazil’s quarterly GDP growth accelerated in 2019’s second quarter. The Central Bank of Brazil lowered its benchmark interest rate twice during thesix-month period. Russia’s annual GDP growth accelerated in 2019’s second quarter. The Bank of Russia cut its key interest rate three times during the period. China’s annual GDP growth moderated in 2019’s second and third quarters. The People’s Bank of China implemented an interest-rate reform in August, designating the loan prime rate as the new benchmark for household and business loans, effectively lowering interest rates in August and September. Overall, global emerging market stocks, as measured by the MSCI Emerging Markets Index, posted a-3.40% total return during the six months under review.1
Investment Strategy
The Fund’s individual country and sector weightings may vary significantly from its benchmark index, and investments will not necessarily be in the securities that comprise its benchmark index. The Fund’s exposure to various regions and markets will vary from time to time according to the investment manager’s opinions as to the prevailing conditions and prospects for these markets. In seeking to outperform the relevant market of each region, the investment manager consults with various local asset managers based in certain regions around the world(Sub-Advisors). Although theSub-Advisors assist the investment manager in the selection of local securities, the
| | | | |
| Top 10 Countries | | | |
| |
| 9/30/19 | | | |
| |
| | | % of Total
Net Assets | |
Japan | | | 13.7% | |
China | | | 12.7% | |
United Kingdom | | | 12.5% | |
Canada | | | 6.6% | |
Spain | | | 5.2% | |
Switzerland | | | 4.7% | |
Italy | | | 4.5% | |
India | | | 4.3% | |
Germany | | | 3.1% | |
Australia | | | 2.8% | |
investment manager retains the sole discretion with respect to portfolio security selection. The Fund may enter into certain derivative transactions to seek to enhance Fund returns, increase liquidity, gain exposure to certain instruments or markets in a more efficient or less expensive way and/or hedge risks associated with its other portfolio investments.
When choosing equity investments for the Fund, we apply a research-driven,bottom-up, fundamental long-term approach, focusing on the market price of a company’s securities relative to our evaluation of the company’s long-term earnings, asset value and cash flow potential. We seek to invest in companies that we consider to be financially strong with favorable growth potential and sustainable competitive advantages. We may also consider, among other factors, a company’s price/ earnings ratio, profit margins and liquidation value.
Manager’s Discussion
During the reporting period, the Fund underperformed its benchmark, the MSCI ACWI ex USA Index, as stock selection in the consumer staples and consumer discretionary sectors detracted from relative results. Security selection in the energy and financials sectors contributed.
In the consumer staples sector, Ireland-based nutritional supplement manufacturer Glanbia was weak, after reporting disappointing first-half earnings, largely in itsnon-U.S. performance nutrition business. The company also cut its full-year guidance following the results. The U.S. business remains strong, however, and its SlimFast product continues to show strong momentum.
Several China-based internet stocks detracted from relative performance during the period. Detractors included travel service provider CTrip.com International, which has seen slower use of its travel services, given the greater economic uncertainty.
| | | | | | |
| | | |
| franklintempleton.com | | Semiannual Report | | | 3 | |
FRANKLIN LIBERTY INTERNATIONAL OPPORTUNITIES ETF
| | | | |
| Top 10 Sectors/Industries | | | |
| |
| 9/30/19 | | | |
| |
| | | % of Total
Net Assets | |
Banks | | | 12.4% | |
Pharmaceuticals | | | 6.1% | |
Internet & Direct Marketing Retail | | | 5.5% | |
Insurance | | | 5.0% | |
Auto Components | | | 4.0% | |
Interactive Media & Services | | | 3.9% | |
Semiconductors & Semiconductor Equipment | | | 3.7% | |
Trading Companies & Distributors | | | 2.9% | |
Oil, Gas & Consumable Fuels | | | 2.8% | |
Capital Markets | | | 2.6% | |
| | | | |
| Top 10 Holdings | | | |
| |
| 9/30/19 | | | |
| |
Company Sector/Industry, Country | | % of Total
Net Assets | |
Alibaba Group Holding Ltd., ADR Internet & Direct Marketing Retail, China | | | 2.9% | |
Roche Holding AG Pharmaceuticals, Switzerland | | | 2.4% | |
Taiwan Semiconductor Manufacturing Co. Ltd. Semiconductors & Semiconductor Equipment, Taiwan | | | 2.4% | |
Tencent Holdings Ltd. Interactive Media & Services, China | | | 2.2% | |
Novartis AG Pharmaceuticals, Switzerland | | | 2.0% | |
AIA Group Ltd. Insurance, Hong Kong | | | 1.5% | |
Ping An Insurance (Group) Co. of China Ltd., H Insurance, China | | | 1.5% | |
Vinci SA Construction & Engineering, France | | | 1.5% | |
Silergy Corp. Semiconductors & Semiconductor Equipment, China | | | 1.3% | |
Brookfield Asset Management Inc., A Capital Markets, Canada | | | 1.3% | |
Italian multi-channel lender FinecoBank detracted, as political concerns in Italy and general worries about the regional economy weighed on the bank. Additionally, Italian bank Unicredit (not a Fund holding) sold a large stake in FinecoBank and took additional steps to make FinecoBank fully independent. Elsewhere in the sector, Norwegian online bank Sbanken hurt relative performance due to a selloff in European bank stocks amid concerns about the impact the low or negative interest-rate environment will have on the industry. Concerns about a slowdown in Sbanken’s loan growth also weighed on the stock following weaker mortgage lending in recent quarters.
In contrast, in the information technology sector, Taiwan-listed integrated circuit manufacturer Silergy and chip foundry Taiwan Semiconductor Manufacturing contributed to relative returns. Silergy has reported robust results recently, based on improving demand from its industrial and consumer end markets. Taiwan Semiconductor has also seen improving demand in recent quarters, which we believe could feed through to faster earnings growth.
Italy-based wealth manager Banca Generali contributed to relative returns as political uncertainties in Italy eased during the third calendar quarter and as it continues to take business away from structurally challenged Italian banks. The company has reported solid inflows in recent quarters, as more Italians look to generate higher investment returns in a low or negative interest-rate environment.
In the industrials sector, Italy-based electric cable manufacturer Prysmian bolstered relative returns after winning a large contract and as earnings growth has been robust in recent quarters. Prysmian has continued to see solid demand for its undersea electrical and telecommunications cables. Furthermore, we believe Prysmian could benefit from long-term secular trends such as the growing use of alternative energy sources and smart grid adoption.
The ETF did not use derivatives during the period.
| | | | |
| | | |
| 4 | | Semiannual Report | | franklintempleton.com |
FRANKLIN LIBERTY INTERNATIONAL OPPORTUNITIES ETF
Thank you for your participation in Franklin Liberty International Opportunities ETF. We look forward to serving your future investment needs.
| | |
 | | 
Purav A. Jhaveri, CFA,® FRM Portfolio Manager |
The foregoing information reflects our analysis, opinions and portfolio holdings as of September 30, 2019, the end of the reporting period. The way we implement our main investment strategies and the resulting portfolio holdings may change depending on factors such as market and economic conditions. These opinions may not be relied upon as investment advice or an offer for a particular security. The information is not a complete analysis of every aspect of any market, country, industry, security or the Fund. Statements of fact are from sources considered reliable, but the investment manager makes no representation or warranty as to their completeness or accuracy. Although historical performance is no guarantee of future results, these insights may help you understand our investment management philosophy.
CFA® is a trademark owned by CFA Institute.
| | | | | | |
| | | |
| franklintempleton.com | | Semiannual Report | | | 5 | |
FRANKLIN LIBERTY INTERNATIONAL OPPORTUNITIES ETF
Performance Summary as of September 30, 2019
Total return reflects reinvestment of the Fund’s dividends and capital gain distributions, if any, and any unrealized gains or losses. Total returns do not include brokerage commissions that may be payable on secondary market transactions. The performance table does not reflect any taxes that a shareholder would pay on Fund dividends, capital gain distributions, if any, or any realized gains on the sale of Fund shares.
Net asset value or “NAV” is the value of one share of a fund as calculated in accordance with the standard formula for valuing mutual fund shares. The price used to calculate market return (Market Price) is determined by using the midpoint between the highest bid and the lowest offer on the primary stock exchange on which shares of a fund are listed for trading, as of the time that such fund’s NAV is calculated. Since shares of the Fund did not trade in the secondary market until after the Fund’s inception, for the period from inception to the first day of secondary trading (1/27/17), the NAV of the Fund is used as a proxy for the Market Price to calculate market returns. Market and NAV returns assume that dividends and capital gain distributions have been reinvested at Market Price and NAV.
Your dividend income will vary depending on dividends or interest paid by securities in the Fund’s portfolio, adjusted for operating expenses. Capital gain distributions are net profits realized from the sale of portfolio securities.
Performance as of 9/30/191
| | | | | | | | | | | | | | | | |
| | |
| | | Cumulative Total Return2 | | | Average Annual Total Return2 | |
| | | Based on
NAV3 | | | Based on market price4 | | | Based on
NAV3 | | | Based on
market price4 | |
6-Month | | | -0.36% | | | | -0.36% | | | | -0.36% | | | | -0.36% | |
1-Year | | | -3.14% | | | | -3.26% | | | | -3.14% | | | | -3.26% | |
Since Inception (1/25/17) | | | +16.50% | | | | +16.23% | | | | +5.87% | | | | +5.77% | |
Performance data represent past performance, which does not guarantee future results. Investment return and principal value will fluctuate, and you may have a gain or loss when you sell your shares. Current performance may differ from figures shown. For most recentmonth-end performance, go tofranklintempleton.comor call(800)342-5236.
See page 7 for Performance Summary footnotes.
| | | | |
| | | |
| 6 | | Semiannual Report | | franklintempleton.com |
FRANKLIN LIBERTY INTERNATIONAL OPPORTUNITIES ETF
PERFORMANCE SUMMARY
Distributions(4/1/19–9/30/19)
|
|
Net Investment Income |
$0.425161 |
Total Annual Operating Expenses5
| | | | |
| |
| With Waiver | | Without Waiver | |
0.60% | | | 2.34% | |
All investments involve risks, including possible loss of principal. Stock prices fluctuate, sometimes rapidly and dramatically, due to factors affecting individual companies, particular industries or sectors, or general market conditions. Special risks are associated with foreign investing, including currency fluctuations, economic instability and political developments; investments in emerging markets involve heightened risks related to the same factors. Investments in developing markets involve heightened risks related to the same factors, in addition to those associated with their relatively small size and lesser liquidity. To the extent the Fund focuses on particular countries, regions, industries, sectors or types of investment from time to time, it may be subject to greater risks or adverse developments in such areas of focus than a fund that invests in a wider variety of countries, regions, industries or sectors, or investments. Smaller andmidsize-company stocks have historically experienced more price volatility than larger-company stocks, especially over the short term. Investments in derivatives involve costs and create economic leverage, which may result in significant volatility and cause the Fund to participate in losses (as well as gains) that significantly exceed the Fund’s initial investment. The Fund’s prospectus also includes a description of the main investment risks.
ETFs trade like stocks, fluctuate in market value and may trade at prices above or below their net asset value. Brokerage commissions and ETF expenses will reduce returns.
1. The Fund has a fee waiver and/or expense reimbursement contractually guaranteed through 7/31/20. Fund investment results reflect the expense reduction; without this reduction, the results would have been lower.
2. Total return calculations represent the cumulative and average annual changes in value of an investment over the periods indicated. Return for less than one year, if any, has not been annualized.
3. Assumes reinvestment of distributions based on net asset value.
4. Assumes reinvestment of distributions based on market price.
5. Figures are as stated in the Fund’s current prospectus and may differ from the expense ratios disclosed in the Your Fund’s Expenses and Financial Highlights sections in this report. In periods of market volatility, assets may decline significantly, causing total annual Fund operating expenses to become higher than the figures shown.
| | | | | | |
| | | |
| franklintempleton.com | | Semiannual Report | | | 7 | |
FRANKLIN LIBERTY INTERNATIONAL OPPORTUNITIES ETF
Your Fund’s Expenses
As a Fund shareholder, you can incur two types of costs: (1) transaction costs, including brokerage commissions on purchases and sales of Fund shares; and (2) ongoing Fund costs, including management fees and other Fund expenses. All funds have ongoing costs, sometimes referred to as operating expenses. The table below shows ongoing costs of investing in the Fund and can help you understand these costs and compare them with those of other funds. The table assumes a $1,000 investment held for the six months indicated.
Actual Fund Expenses
The table below provides information about actual account values and actual expenses in the columns under the heading “Actual.” In these columns the Fund’s actual return, which includes the effect of Fund expenses, is used to calculate the “Ending Account Value.” You can estimate the expenses you paid during the period by following these steps (of course, your account value and expenses will differ from those in this illustration): Divide your account value by $1,000 (if your account had an $8,600 value, then $8,600÷ $1,000 = 8.6). Then multiply the result by the number in the row under the headings “Actual” and “Expenses Paid During Period” (if Actual Expenses Paid During Period were $ 7.50, then 8.6× $ 7.50 = $64.50). In this illustration, the actual expenses paid this period are $64.50.
Hypothetical Example for Comparison with Other Funds
Under the heading “Hypothetical” in the table, information is provided about hypothetical account values and hypothetical expenses based on the Fund’s actual expense ratio and an assumed rate of return of 5% per year before expenses, which is not the Fund’s actual return. This information may not be used to estimate the actual ending account balance or expenses you paid for the period, but it can help you compare ongoing costs of investing in the Fund with those of other funds. To do so, compare this 5% hypothetical example with the 5% hypothetical examples that appear in the shareholder reports of other funds.
Please note that expenses shown in the table are meant to highlight ongoing costs and do not reflect any transactional costs.Therefore, information under the heading “Hypothetical” is useful in comparing ongoing costs only, and will not help you compare total costs of owning different ETFs. In addition, if transactional costs were included, your total costs would have been higher.
| | | | | | | | | | | | | | | | | | | | | | |
| | | | Actual (actual return after expenses) | | | Hypothetical (5% annual return before expenses) | | | | |
| | | | | |
Beginning
Account
Value 4/1/19 | | | Ending
Account
Value 9/30/19 | | | Expenses
Paid During
Period
4/1/19–9/30/191,2 | | | Ending
Account
Value 9/30/19 | | | Expenses
Paid During
Period
4/1/19–9/30/191,2 | | | Net Annualized
Expense Ratio2 | |
| | $1,000.00 | | | $ | 996.40 | | | $ | 2.99 | | | $ | 1,022.00 | | | $ | 3.03 | | | | 0.60 | % |
1. Expenses are equal to the annualized expense ratio for thesix-month period as indicated above—in the far right column—multiplied by the simple average account value over the period indicated, and then multiplied by 183/366 to reflect theone-half year period.
2. Reflects expenses after fee waivers and expense reimbursements.
| | | | |
| | | |
| 8 | | Semiannual Report | | franklintempleton.com |
Franklin Liberty Investment Grade Corporate ETF
This semiannual report for Franklin Liberty Investment Grade Corporate ETF covers the period ended September 30, 2019.
Your Fund’s Goal and Main Investments
The Fund seeks a high level of current income as is consistent with prudent investing, while seeking preservation of capital. Under normal market conditions, the Fund invests at least 80% of its net assets in investment-grade corporate debt securities and investments.
Performance Overview
During thesix-month period, the Fund posted cumulative total returns of +7.92% based on market price and +7.88% based on net asset value (NAV).1 In comparison, the Bloomberg Barclays U.S. Corporate Investment Grade Index posted a +7.66% total return for the same period.1 You can find more of the Fund’s performance data in the Performance Summary beginning on page 12.
Performance data represent past performance, which does not guarantee future results. Investment return and principal value will fluctuate, and you may have a gain or loss when you sell your shares. Current performance may differ from figures shown. For most recentmonth-end performance, go tofranklintempleton.com or call(800)342-5236.
Economic and Market Overview
The U.S. economy expanded during the six months ended September 30, 2019. However, the economy moderated in 2019’s second and third quarters, due partly to weakness in inventory and business investment. The manufacturing sector expanded during the period’s first four months, but contracted in August and September 2019. The services sector continued to expand throughout the period, although the rate of expansion slowed in September. The unemployment rate decreased from 3.8% in March 2019 to 3.5% atperiod-end.2 The annual inflation rate, as measured by the Consumer Price Index, decreased from 1.9% in March 2019 to 1.7% atperiod-end.2
| | | | |
| Top 10 Sectors/Industries | | | |
| |
| 9/30/19 | | | |
| |
| | | % of Total
Net Assets | |
Banks | | | 25.0% | |
Electric Utilities | | | 7.0% | |
Oil, Gas & Consumable Fuels | | | 5.9% | |
Insurance | | | 5.3% | |
Health Care Providers & Services | | | 4.9% | |
Pharmaceuticals | | | 2.8% | |
Beverages | | | 2.6% | |
Media | | | 2.4% | |
Food Products | | | 2.3% | |
Biotechnology | | | 2.2% | |
At its July 2019 meeting, the U.S. Federal Reserve (Fed) lowered its target range for the federal funds rate for the first time since December 2008, to 2.00%–2.25%, citing muted inflation pressures and the potential effects of global trade tensions on economic growth. Furthermore, the Fed ended its balance sheet normalization program earlier than previously indicated. In September, the Fed further lowered the federal funds target rate range to 1.75%–2.00%, reiterating the rationale cited at the July 2019 meeting.
The10-year Treasury yield, which moves inversely to its price, decreased during the period. The yield rose briefly at the start of the period, but fell to multi-year lows in 2019’s third quarter. Political uncertainties in the U.S. (including the impeachment inquiry into U.S. President Donald Trump), geopolitical tensions in certain regions, slower domestic and global economic growth, the Fed’s more accommodative monetary policy stance and expectations of more stimulus from global central banks weighed on the Treasury yield at certain points during the period. However, several better-than-expected U.S. economic reports and periods of optimism about a potential U.S.-China trade deal supported the yield. The10-year yield persistently fell below certain short-term yields due to weaker economic data, escalating U.S. trade tensions with China and other trading partners, and the Fed’s recent monetary policy easing. Overall, the10-year Treasury yield declined from 2.41% at the beginning of the period to 1.68% atperiod-end.
1. Source: Morningstar.
The index is unmanaged and includes reinvestment of any income or distributions. It does not reflect any fees, expenses or sales charges. One cannot invest directly in an index, and an index is not representative of the Fund’s portfolio.
2. Source: Bureau of Labor Statistics.
See www.franklintempletondatasources.com for additional data provider information.
The dollar value, number of shares or principal amount, and names of all portfolio holdings are listed in the Fund’s Statement of Investments (SOI). The SOI begins on page 34.
| | | | | | |
| | | |
| franklintempleton.com | | Semiannual Report | | | 9 | |
FRANKLIN LIBERTY INVESTMENT GRADE CORPORATE ETF
Investment Strategy
The Fund invests primarily in U.S. dollar-denominated corporate debt securities issued by U.S. and foreign companies. The Fund may invest in debt securities of any maturity or duration.
The Fund’s focus on the credit quality of its portfolio is intended to reduce credit risk and help to preserve the Fund’s capital. The Fund may also invest a portion of its assets in convertible securities, preferred securities and U.S. Treasury securities, and generally expects to invest a portion of its assets in cash, cash equivalents and high quality money market securities, including commercial paper, repurchase agreements and affiliated or unaffiliated money market funds. The Fund may invest up to 40% of its net assets in foreign securities, including those in developing markets, and up to 15% of its net assets innon-U.S. dollar-denominated securities. The Fund may enter into certain derivative transactions to seek to enhance Fund returns, increase liquidity, gain exposure to certain instruments or markets in a more efficient or less expensive way and/or hedge risks associated with its other portfolio investments.
In choosing investments, we select securities in various market sectors based on our assessment of changing economic, market, industry and issuer conditions. We use atop-down analysis of macroeconomic trends, combined with abottom-up fundamental analysis of market sectors, industries and issuers, to try to take advantage of varying sector reactions to economic events. The Fund’s portfolio is constructed by taking into account our desired duration and yield curve exposure, total return potential, as well as the appropriate diversification and risk profile at the issue, company and industry level. We may utilize quantitative models to identify investment opportunities in order to construct a portfolio of investments for the Fund. Quantitative trading models are proprietary systems that rely on mathematical computations to identify trading opportunities.
Manager’s Discussion
The investment-grade corporate bond market performed well during the period, driven mostly by lower U.S. Treasury yields. Corporate bond spreads ended slightly tighter than their ending levels in March, but there was significant volatility within the period.
Slowing economic data, increasingly accommodative central banks and headlines about global trade disputes drove the market. S&P 500 corporate earnings were weaker compared to the previous year, but corporate credit metrics remained broadly stable. Government bond yields fell during the period, with the10-year U.S. Treasury yield decreasing from 2.41% to 1.68%.
| | | | |
| Top 10 Holdings | | | |
| |
| 9/30/19 | | | |
| |
| | | % of Total
Net Assets | |
U.S. Treasury 30 Yr. Bond, 12/19/2019 Government Bonds | | | 7.1% | |
Bank of America Corp., sub. bond, 4.183%, 11/25/2027 Banks | | | 3.0% | |
Citigroup Inc., senior note, FRN, sub. note, 4.05%, 7/30/2022 Banks | | | 2.7% | |
Morgan Stanley, senior bond, FRN thereafter, 3.591%, 7/22/2028 Capital Markets | | | 2.7% | |
Credit Suisse Group Funding Guernsey Ltd., senior note, 3.80%, 9/15/2022 Banks | | | 2.6% | |
| HSBC Holdings PLC, senior note, 4.30%, 3/08/2026Banks | | | 2.5% | |
Marsh & McLennan Cos. Inc., senior bond, senior note, 3.875%, 3/15/2024 Insurance | | | 2.5% | |
BB&T Corp., sub. bond, 3.875%, 3/19/2029 Banks | | | 2.5% | |
JPMorgan Chase & Co., senior bond, FRN thereafter, sub. note, 3.375%, 5/01/2023 Banks | | | 2.1% | |
Standard Chartered PLC, senior note, 144A, FRN thereafter, 3.885%, 3/15/2024 Banks | | | 2.0% | |
Lower government bond yields globally increased demand for investment-grade corporate bonds, a higher yielding alternative. Corporate issuance remained below last year’s level, despite some companies taking advantage of low overall financing costs.
The Fund outperformed its benchmark on a net basis for the period. The Fund’s security selection was a major contributor to positive Fund performance, with quality and industry allocations also boosting results. In contrast, yield curve positioning was a slight detractor.
The Fund’s industry outperformance was driven by our holdings of government-related bonds. Major contributors on an individual company basis included AB Inbev, Enel and Verizon Communications. Detractors included Caterpillar, Duke Energy and British American Tobacco.
News stories continued to create volatility for the bond prices of some individual issuers held in the Fund. For example, news about fundamental developments and the reduction of debt by selling assets at companies including General
| | | | |
| | | |
| 10 | | Semiannual Report | | franklintempleton.com |
FRANKLIN LIBERTY INVESTMENT GRADE CORPORATE ETF
Electric, Kraft Heinz Foods and AB Inbev caused significant spread movements during the period.
The Fund’s overweight position inBBB-rated bonds helped performance. This position was based on our view that these bonds offered what we considered attractive yields based on current valuations and economic conditions. We kept the Fund’s duration positioning close to neutral relative to the benchmark for most of the period.
What is the yield curve?
The yield curve is a line that plots the interest rates, at a set point in time, of bonds having equal credit quality but differing maturity dates. The most frequently reported yield curve compares three-month,two-year and30-year U.S. Treasury debt.
What is duration?
Duration is a measure of a bond’s price sensitivity to interest-rate changes. In general, a portfolio of securities with a lower duration can be expected to be less sensitive to interest-rate changes than a portfolio with a higher duration.
The Fund held primarily cash bonds during the period, but used credit index derivatives to gain market exposure on a temporary, tactical basis. The Fund also used interest rate futures contracts to manage duration exposure.
Effective October 15, 2019, after period-end, Thomas Runkel, CFA, and Pururav Thoutireddy, Ph.D., were added asco-lead portfolio managers, joining currentco-lead portfolio managers Marc Kremer, CFA, and Shawn Lyons, CFA.
Thank you for your participation in Franklin Liberty Investment Grade Corporate ETF. We look forward to serving your future investment needs.
| | |
 | | 
Marc Kremer, CFA Co-Lead Portfolio Manager |
| | |
 | | 
Shawn Lyons, CFA Co-Lead Portfolio Manager |
The foregoing information reflects our analysis, opinions and portfolio holdings as of September 30, 2019, the end of the reporting period. The way we implement our main investment strategies and the resulting portfolio holdings may change depending on factors such as market and economic conditions. These opinions may not be relied upon as investment advice or an offer for a particular security. The information is not a complete analysis of every aspect of any market, country, industry, security or the Fund. Statements of fact are from sources considered reliable, but the investment manager makes no representation or warranty as to their completeness or accuracy. Although historical performance is no guarantee of future results, these insights may help you understand our investment management philosophy.
| | | | | | |
| | | |
| franklintempleton.com | | Semiannual Report | | | 11 | |
FRANKLIN LIBERTY INVESTMENT GRADE CORPORATE ETF
Performance Summary as of September 30, 2019
Total return reflects reinvestment of the Fund’s dividends and capital gain distributions, if any, and any unrealized gains or losses. Total returns do not include brokerage commissions that may be payable on secondary market transactions. The performance tables do not reflect any taxes that a shareholder would pay on Fund dividends, capital gain distributions, if any, or any realized gains on the sale of Fund shares.
Net asset value or “NAV” is the value of one share of a fund as calculated in accordance with the standard formula for valuing mutual fund shares. The price used to calculate market return (Market Price) is determined by using the midpoint between the highest bid and the lowest offer on the primary stock exchange on which shares of a fund are listed for trading, as of the time that such fund’s NAV is calculated. Since shares of the Fund did not trade in the secondary market until after the Fund’s inception, for the period from inception to the first day of secondary trading (10/5/16), the NAV of the Fund is used as a proxy for the Market Price to calculate market returns. Market and NAV returns assume that dividends and capital gain distributions have been reinvested at Market Price and NAV.
Your dividend income will vary depending on dividends or interest paid by securities in the Fund’s portfolio, adjusted for operating expenses. Capital gain distributions are net profits realized from the sale of portfolio securities.
Performance as of 9/30/191
| | | | | | | | | | | | | | | | |
| | |
| | | Cumulative Total Return2 | | | Average Annual Total Return2 | |
| | | Based on
NAV3 | | | Based on
market price4 | | | Based on
NAV3 | | | Based on
market price4 | |
6-Month | | | +7.88% | | | | +7.92% | | | | +7.88% | | | | +7.92% | |
1-Year | | | +12.54% | | | | +12.77% | | | | +12.54% | | | | +12.77% | |
Since Inception (10/3/16) | | | +13.26% | | | | +13.43% | | | | +4.25% | | | | +4.30% | |
| | | | | | | | |
| |
| | | 30 Day Standardized Yield6 | |
| Distribution Rate5 | | (with fee waiver) | | | (without fee waiver) | |
3.17% | | | 2.70% | | | | 2.44% | |
Performance data represent past performance, which does not guarantee future results. Investment return and principal value will fluctuate, and you may have a gain or loss when you sell your shares. Current performance may differ from figures shown. For most recentmonth-end performance, go tofranklintempleton.com or call(800)342-5236.
See page 13 for Performance Summary footnotes.
| | | | |
| | | |
| 12 | | Semiannual Report | | franklintempleton.com |
FRANKLIN LIBERTY INVESTMENT GRADE CORPORATE ETF
PERFORMANCE SUMMARY
Distributions(4/1/19–9/30/19)
|
|
Net Investment
Income |
$0.407158 |
Total Annual Operating Expenses7
| | | | |
| |
With
Fee Waiver | | Without Fee Waiver | |
0.35% | | | 1.07% | |
All investments involve risks, including possible loss of principal. Bond prices generally move in the opposite direction of interest rates. Thus, as the prices of bonds in the Fund adjust to a rise in interest rates, the Fund’s share price may decline. Distributions to shareholders may decline when prevailing interest rates fall or when the Fund experiences defaults on debt securities it holds. Changes in the financial strength of a bond issuer or in a bond’s credit rating may affect its value. The Fund’s investments in foreign securities involve certain risks including currency fluctuations, and economic and political uncertainties. Investments in developing markets involve heightened risks related to the same factors, in addition to those associated with their relatively small size and lesser liquidity. Investing in derivative securities and the use of foreign currency techniques involve special risks as such may not achieve the anticipated benefits and/or may result in losses to the Fund. The Fund’s prospectus also includes a description of the main investment risks.
ETFs trade like stocks, fluctuate in market value and may trade at prices above or below their net asset value. Brokerage commissions and ETF expenses will reduce returns.
1. The Fund has a fee waiver and/or expense reimbursement contractually guaranteed through 7/31/20. Fund investment results reflect the expense reduction; without this reduction, the results would have been lower.
2. Total return calculations represent the cumulative and average annual changes in value of an investment over the periods indicated. Return for less than one year, if any, has not been annualized.
3. Assumes reinvestment of distributions based on net asset value.
4. Assumes reinvestment of distributions based on market price.
5. Distribution rate is based on an annualization of the September dividend and the NAV per share on 9/30/19.
6. The Fund’s30-day standardized yield is calculated over a trailing30-day period using the yield to maturity on bonds and/or the dividends accrued on stocks. It may not equal the Fund’s actual income distribution rate, which reflects the Fund’s past dividends paid to shareholders.
7. Figures are as stated in the Fund’s current prospectus and may differ from the expense ratios disclosed in the Your Fund’s Expenses and Financial Highlights sections in this report. In periods of market volatility, assets may decline significantly, causing total annual Fund operating expenses to become higher than the figures shown.
| | | | | | |
| | | |
| franklintempleton.com | | Semiannual Report | | | 13 | |
FRANKLIN LIBERTY INVESTMENT GRADE CORPORATE ETF
Your Fund’s Expenses
As a Fund shareholder, you can incur two types of costs: (1) transaction costs, including brokerage commissions on purchases and sales of Fund shares; and (2) ongoing Fund costs, including management fees and other Fund expenses. All funds have ongoing costs, sometimes referred to as operating expenses. The table below shows ongoing costs of investing in the Fund and can help you understand these costs and compare them with those of other funds. The table assumes a $1,000 investment held for the six months indicated.
Actual Fund Expenses
The table below provides information about actual account values and actual expenses in the columns under the heading “Actual.” In these columns the Fund’s actual return, which includes the effect of Fund expenses, is used to calculate the “Ending Account Value.” You can estimate the expenses you paid during the period by following these steps (of course, your account value and expenses will differ from those in this illustration):Divide your account value by $1,000 (if your account had an $8,600 value, then $8,600÷ $1,000 = 8.6).Then multiply the result by the number in the row under the headings “Actual” and “Expenses Paid During Period” (if Actual Expenses Paid During Period were $7.50, then 8.6 x $7.50 = $64.50).In this illustration, the actual expenses paid this period are $64.50.
Hypothetical Example for Comparison with Other Funds
Under the heading “Hypothetical” in the table, information is provided about hypothetical account values and hypothetical expenses based on the Fund’s actual expense ratio and an assumed rate of return of 5% per year before expenses, which is not the Fund’s actual return. This information may not be used to estimate the actual ending account balance or expenses you paid for the period, but it can help you compare ongoing costs of investing in the Fund with those of other funds. To do so, compare this 5% hypothetical example with the 5% hypothetical examples that appear in the shareholder reports of other funds.
Please note that expenses shown in the table are meant to highlight ongoing costs and do not reflect any transactional costs.Therefore, information under the heading “Hypothetical” is useful in comparing ongoing costs only, and will not help you compare total costs of owning different funds. In addition, if transactional costs were included, your total costs would have been higher.
| | | | | | | | | | | | | | | | | | | | | | |
| | | | Actual (actual return after expenses) | | | Hypothetical (5% annual return before expenses) | | | | |
| | | | | |
Beginning
Account
Value 4/1/19 | | | Ending
Account
Value 9/30/19 | | | Expenses
Paid During
Period
4/1/19–9/30/191,2 | | | Ending
Account
Value 9/30/19 | | | Expenses
Paid During
Period
4/1/19–9/30/191,2 | | | Net Annualized
Expense Ratio2 | |
| | $1,000.00 | | | $ | 1,078.80 | | | $ | 1.82 | | | $ | 1,023.25 | | | $ | 1.77 | | | | 0.35 | % |
1. Expenses are equal to the annualized expense ratio for thesix-month period as indicated above—in the far right column—multiplied by the simple average account value over the period indicated, and then multiplied by 183/366 to reflect theone-half year period.
2. Reflects expenses after fee waivers and expense reimbursements.
| | | | |
| | | |
| 14 | | Semiannual Report | | franklintempleton.com |
Franklin Liberty U.S. Core Bond ETF
This semiannual report for Franklin Liberty U.S. Core Bond ETF covers the period since the Fund’s inception on September 17, 2019, through September 30, 2019.
Your Fund’s Goal and Main Investments
The Fund seeks total return. Under normal market conditions, the Fund invests at least 80% of its net assets in bonds of U.S. issuers.
Performance Overview
For the period since inception on September 17, 2019, through September 30, 2019, the Fund posted cumulative total returns of +0.86% based on market price and +0.74% based on net asset value (NAV). In comparison, the Bloomberg Barclays U.S. Aggregate Bond Index, which tracks the U.S. investment-grade, taxable bond market, posted a +0.97% total return.1 You can find more of the Fund’s performance data in the Performance Summary beginning on page 18.
Performance data represent past performance, which does not guarantee future results. Investment return and principal value will fluctuate, and you may have a gain or loss when you sell your shares. Current performance may differ from figures shown. For most recentmonth-end performance, go tofranklintempleton.comor call(800)342-5236.
Economic and Market Overview
The U.S. economy expanded at a moderate pace during the period since the Fund’s inception. The unemployment rate and the annual inflation rate, as measured by the Consumer Price Index, were 3.5% and 1.7% at period-end, respectively.2 At its September 2019 meeting, the U.S. Federal Reserve lowered its target range from 2.00%–2.25% to 1.75%–2.00%, citing muted inflation pressures and the potential effects of global trade tensions on economic growth. The 10-year Treasury yield, which moves inversely to its price, decreased during the period from 1.81% to 1.68%.
| | | | |
| Portfolio Composition | | | |
| |
| Based on Total Net Assets as of 9/30/19 | | | |
| |
U.S. Government & Agency Securities | | | 31.3% | |
Corporate Bonds & Notes | | | 29.0% | |
Mortgage-Backed Securities | | | 25.0% | |
Municipal Bonds | | | 4.4% | |
Long Futures | | | 2.3% | |
Foreign Government and Agency Securities | | | 0.9% | |
Investment Strategy
The Fund invests predominantly in investment-grade bonds of U.S. issuers, including government, corporate-debt, mortgage-backed and asset-backed securities. The Fund’s investments in mortgage-backed securities include securities that are issued or guaranteed by the U.S. government, its agencies or instrumentalities, and private issuers, including commercial mortgage-backed securities. Under normal market conditions, the Fund is generally expected to have sector, credit and duration exposures comparable to its benchmark index. However, we make investment decisions based upon our own fundamental analysis, which affects the Fund’s sector, credit and duration exposures so that they may vary from the benchmark index.
In addition, the Fund may purchase or sell mortgage-backed securities on a delayed delivery or forward commitment basis through theto-be-announced (TBA) market. With TBA transactions, the particular securities to be delivered must meet specified terms and conditions.
For purposes of pursuing its investment goal, the Fund may enter into various interest-rate and credit-related derivatives, principally U.S. Treasury futures, interest-rate swaps and credit default swaps. The use of these derivative transactions may allow the Fund to obtain net long or short exposures to select interest rates, durations or credit risks. The Fund may enter into certain derivative transactions to seek to enhance Fund returns, increase liquidity, gain exposure to certain instruments or markets in a more efficient or less expensive way and/or hedge risks associated with its other portfolio investments.
1. Source: Morningstar.
2. Source: Bureau of Labor Statistics.
The index is unmanaged and includes reinvestment of any income or distributions. It does not reflect any fees, expenses or sales charges. One cannot invest directly in an index, and an index is not representative of the Fund’s portfolio.
See www.franklintempletondatasources.com for additional data provider information.
The dollar value, number of shares or principal amount, and names of all portfolio holdings are listed in the Fund’s Statement of Investments (SOI). The SOI begins on page 45.
| | | | | | |
| | | |
| franklintempleton.com | | Semiannual Report | | | 15 | |
FRANKLIN LIBERTY U.S. CORE BOND ETF
In choosing investments, we select securities in various market sectors based on our assessment of changing economic, market, industry and issuer conditions. We use atop-down analysis of macroeconomic trends, combined with abottom-up fundamental analysis of market sectors, industries and issuers, to try to take advantage of varying sector reactions to economic events. We may consider selling a security when we believe the security has become fully valued due to either its price appreciation or changes in the issuer’s fundamentals, or when we believe another security is a more attractive investment opportunity.
Manager’s Discussion
During the short period since the Fund’s inception on September 17, 2019, through September 30, 2019, the portfolio slightly underperformed the benchmark Bloomberg Barclays U.S. Aggregate Bond Index. We invested the portfolio during a period of inflows, and the major detractor was our slightly underweighted duration positioning in a declining rate environment. In contrast, security selection within our investment-grade corporate credit exposure contributed to performance, although this effect was slightly offset by negative security selection within our fixed-rate agency mortgage-backed securities bucket.
In terms of derivatives, we utilized Treasury futures for duration management of the portfolio.
| | | | |
| Top 10 Fund Holdings | | | |
| |
| 9/30/19 | | | |
| |
| | | % of Total
Net Assets | |
U.S. Treasury Note , 2.75%, 9/15/2021 | | | 25.4% | |
Federal National Mortgage Association , 4.50%, 10/01/2049 | | | 24.5% | |
U.S. Treasury Bond , 2.75%, 11/15/2042 | | | 5.9% | |
U.S. Treasury 5 Yr. Note , 12/31/2019 | | | 2.3% | |
Contra Costa Community College District GO, Refunding, 2.926%, 8/01/2038 | | | 1.8% | |
S E Alabama State Gas Supply District Gas Supply, Revenue, Libor-Project #2, Series B, 2.25%, 6/01/2049 | | | 0.9% | |
California State GO, Various Purpose, 3.00%, 10/01/2037 | | | 0.9% | |
Texas State Water Development Board Revenue, State Water Implementation Fund, Master Trust, Series A, 4.00%, 10/15/2044 | | | 0.8% | |
Capital One Financial Corp., senior bond, senior note, 3.75%, 3/09/2027 | | | 0.7% | |
Bank of America Corp., senior note, senior sub. bond, 4.25%, 10/22/2026 | | | 0.6% | |
| | | | |
| | | |
| 16 | | Semiannual Report | | franklintempleton.com |
FRANKLIN LIBERTY U.S. CORE BOND ETF
Thank you for your participation in Franklin Liberty U.S. Core Bond ETF. We look forward to serving your future investment needs.
| | |
 | | 
David Yuen, CFA, FRM Co-Lead Portfolio Manager |
| | |
 | | 
Amy Cooper, CFA Co-Lead Portfolio Manager |
| | |
| | Patrick Klein, Ph.D. Co-Lead Portfolio Manager |
| | |
| | Tina Chou Co-Lead Portfolio Manager |
The foregoing information reflects our analysis, opinions and portfolio holdings as of September 30, 2019, the end of the reporting period. The way we implement our main investment strategies and the resulting portfolio holdings may change depending on factors such as market and economic conditions. These opinions may not be relied upon as investment advice or an offer for a particular security. The information is not a complete analysis of every aspect of any market, country, industry, security or the Fund. Statements of fact are from sources considered reliable, but the investment manager makes no representation or warranty as to their completeness or accuracy. Although historical performance is no guarantee of future results, these insights may help you understand our investment management philosophy.
| | | | | | |
| | | |
| franklintempleton.com | | Semiannual Report | | | 17 | |
FRANKLIN LIBERTY U.S. CORE BOND ETF
Performance Summary as of September 30, 2019
Total return reflects reinvestment of the Fund’s dividends and capital gain distributions, if any, and any unrealized gains or losses. Total returns do not include brokerage commissions that may be payable on secondary market transactions. The performance tables do not reflect any taxes that a shareholder would pay on Fund dividends, capital gain distributions, if any, or any realized gains on the sale or redemption of Fund shares.
Net asset value or “NAV” is the value of one share of a fund as calculated in accordance with the standard formula for valuing mutual fund shares. The price used to calculate market return (Market Price) is determined by using the midpoint between the highest bid and the lowest offer on the primary stock exchange on which shares of a fund are listed for trading, as of the time that such fund’s NAV is calculated. Since shares of the Fund did not trade in the secondary market until after the Fund’s inception, for the period from inception to the first day of secondary trading (9/19/19), the NAV of the Fund is used as a proxy for the Market Price to calculate market returns. Market and NAV returns assume that dividends and capital gain distributions have been reinvested at Market Price and NAV.
Your dividend income will vary depending on dividends or interest paid by securities in the Fund’s portfolio, adjusted for operating expenses. Capital gain distributions are net profits realized from the sale of portfolio securities.
Performance as of 9/30/191
| | | | | | | | | | | | | | | | |
| | |
| | | Cumulative Total Return2 | | | Average Annual Total Return2 | |
| | | Based on
NAV3 | | | Based on
market price4 | | | Based on
NAV3 | | | Based on
market price4 | |
Since Inception (9/17/19) | | | +0.74% | | | | +0.86% | | | | +0.74% | | | | +0.86% | |
| | | | | | | | |
| |
| | | 30 Day Standardized Yield6 | |
| Distribution Rate5 | | (with fee waiver) | | | (without fee waiver) | |
0.00%7 | | | — | | | | — | |
Performance data represent past performance, which does not guarantee future results. Investment return and principal value will fluctuate, and you may have a gain or loss when you sell your shares. Current performance may differ from figures shown. For most recentmonth-end performance, go tofranklintempleton.com or call(800)342-5236.
See page 19 for Performance Summary footnotes.
| | | | |
| | | |
| 18 | | Semiannual Report | | franklintempleton.com |
FRANKLIN LIBERTY U.S. CORE BOND ETF
PERFORMANCE SUMMARY
Distributions(9/17/19–9/30/19)
|
|
Net Investment Income |
$0.003862 |
Total Annual Operating Expenses8
| | | | |
| |
With
Fee Waiver | | Without
Fee Waiver | |
0.15% | | | 0.19% | |
All investments involve risks, including possible loss of principal. Interest rate movements, unscheduled mortgage prepayments and other risk factors will affect the Fund’s share price and yield. Bond prices, and thus a Fund’s share price, generally move in the opposite direction of interest rates. Therefore, as the prices of bonds in the Fund adjust to a rise in interest rates, the Fund’s share price may decline. Changes in the financial strength of a bond issuer or in a bond’s credit rating may affect its value. The Fund’s prospectus also includes a description of the main investment risks.
ETFs trade like stocks, fluctuate in market value and may trade at prices above or below their net asset value. Brokerage commissions and ETF expenses will reduce returns.
1. The Fund has a fee waiver and/or expense reimbursement contractually guaranteed through 7/31/21. Fund investment results reflect the expense reduction; without this reduction, the results would have been lower.
2. Total return calculations represent the cumulative and average annual changes in value of an investment over the periods indicated. Return for less than one year, if any, has not been annualized.
3. Assumes reinvestment of distributions based on net asset value.
4. Assumes reinvestment of distributions based on market price.
5. Distribution rate is based on an annualization of the September dividend and the NAV per share on 9/30/19.
6. The Fund’s30-day standardized yield is calculated over a trailing30-day period using the yield to maturity on bonds and/or the dividends accrued on stocks. It may not equal the Fund’s actual income distribution rate, which reflects the Fund’s past dividends paid to shareholders. The Fund launched on 9/17/19 and yields cannot be produced until the Fund has been in existence for 30 days. This value will not be calculated until 10/31/19.
7. Amount rounds to less than 0.01% per share.
8. Figures are as stated in the Fund’s current prospectus and may differ from the expense ratios disclosed in the Your Fund’s Expenses and Financial Highlights sections in this report. In periods of market volatility, assets may decline significantly, causing total annual Fund operating expenses to become higher than the figures shown.
| | | | | | |
| | | |
| franklintempleton.com | | Semiannual Report | | | 19 | |
FRANKLIN LIBERTY U.S. CORE BOND ETF
Your Fund’s Expenses
As a Fund shareholder, you can incur two types of costs: (1) transaction costs, including brokerage commissions on purchases and sales of Fund shares; and (2) ongoing Fund costs, including management fees and other Fund expenses. All funds have ongoing costs, sometimes referred to as operating expenses. The table below shows ongoing costs of investing in the Fund and can help you understand these costs and compare them with those of other funds. The table assumes a $1,000 investment held for the six months indicated.
Actual Fund Expenses
The table below provides information about actual account values and actual expenses in the columns under the heading “Actual.” In these columns the Fund’s actual return, which includes the effect of Fund expenses, is used to calculate the “Ending Account Value.” You can estimate the expenses you paid during the period by following these steps (of course, your account value and expenses will differ from those in this illustration):Divide your account value by $1,000 (if your account had an $8,600 value, then $8,600÷ $1,000 = 8.6).Then multiply the result by the number in the row under the headings “Actual” and “Expenses Paid During Period” (if Actual Expenses Paid During Period were $ 7.50, then 8.6 x $ 7.50 = $64.50).In this illustration, the actual expenses paid this period are $64.50.
Hypothetical Example for Comparison with Other Funds
Under the heading “Hypothetical” in the table, information is provided about hypothetical account values and hypothetical expenses based on the Fund’s actual expense ratio and an assumed rate of return of 5% per year before expenses, which is not the Fund’s actual return. This information may not be used to estimate the actual ending account balance or expenses you paid for the period, but it can help you compare ongoing costs of investing in the Fund with those of other funds. To do so, compare this 5% hypothetical example with the 5% hypothetical examples that appear in the shareholder reports of other funds.
Please note that expenses shown in the table are meant to highlight ongoing costs and do not reflect any transactional costs.Therefore, information under the heading “Hypothetical” is useful in comparing ongoing costs only, and will not help you compare total costs of owning different funds. In addition, if transactional costs were included, your total costs would have been higher.
| | | | | | | | | | | | | | | | | | | | | | |
| | | | Actual
(actual return after expenses) | | | Hypothetical
(5% annual return before expenses) | | | | |
| | | | | |
Beginning
Account
Value1 | | | Ending
Account
Value 9/30/19 | | | Expenses
Paid During
Period
9/17/19–9/30/192,3 | | | Ending
Account
Value 9/30/19 | | | Expenses
Paid During
Period
4/1/19–9/30/192,3 | | | Net Annualized
Expense Ratio3 | |
| | $1,000.00 | | | $ | 1,007.40 | | | $ | 0.05 | | | $ | 1,024.25 | | | $ | 0.76 | | | | 0.15 | % |
1. 9/17/19 for Actual; 4/1/19 for Hypothetical.
2. Expenses are equal to the annualized expense ratio for thesix-month period as indicated above—in the far right column—multiplied by the simple average account value over the period indicated, and then multiplied by 183/366 to reflect theone-half year period. For Actual expenses, the mutliplier is 13/366 to reflect the number of days since commencement of operations.
3. Reflects expenses after fee waivers and expense reimbursements.
| | | | |
| | | |
| 20 | | Semiannual Report | | franklintempleton.com |
Franklin Liberty U.S. Low Volatility ETF
This semiannual report for Franklin Liberty U.S. Low Volatility ETF covers the period ended September 30, 2019.
Your Fund’s Goal and Main Investments
The Fund seeks capital appreciation with an emphasis on lower volatility. Under normal market conditions, the Fund invests at least 80% of its net assets in U.S. investments.
Performance Overview
During thesix-month period, the Fund posted cumulative total returns of +9.42% based on market price and +9.52% based on net asset value (NAV). In comparison, the Russell 1000® Index posted a +5.73% total return for the same period.1 You can find more of the Fund’s performance data in the Performance Summary beginning on page 24.
Performance data represent past performance, which does not guarantee future results. Investment return and principal value will fluctuate, and you may have a gain or loss when you sell your shares. Current performance may differ from figures shown. For most recentmonth-end performance, go tofranklintempleton.com or call(800)342-5236.
Economic and Market Overview
The U.S. economy expanded during the six months ended September 30, 2019. However, the economy moderated in 2019’s second and third quarters, due partly to weakness in inventory investment and business investment. The manufacturing sector expanded during the period’s first four months, but contracted in August and September 2019. The services sector continued to expand throughout the period, although the rate of expansion slowed in September. The unemployment rate decreased from 3.8% in March 2019 to 3.5% atperiod-end.2 The annual inflation rate, as measured by the Consumer Price Index, decreased from 1.9% in March 2019 to 1.7% atperiod-end.2
At its July 2019 meeting, the U.S. Federal Reserve (Fed) lowered its target range for the federal funds rate for the first time since December 2008, to 2.00%–2.25%, citing muted inflation pressures and the potential effects of global trade
| | | | |
| Top 10 Sectors/Industries | | | |
| |
| 9/30/19 | | | |
| |
| | | % of Total
Net Assets | |
Information Technology | | | 21.8% | |
Health Care | | | 13.2% | |
Financials | | | 13.0% | |
Consumer Discretionary | | | 10.7% | |
Communication Services | | | 9.9% | |
Industrials | | | 9.6% | |
Consumer Staples | | | 7.1% | |
Energy | | | 4.1% | |
Real Estate | | | 4.0% | |
Utilities | | | 3.3% | |
tensions on economic growth. Furthermore, the Fed ended its balance sheet normalization program earlier than previously indicated. In September, the Fed further lowered the federal funds target rate range to 1.75%–2.00%, reiterating the rationale cited at the July 2019 meeting.
U.S. equity markets overall rose during the period, benefiting from upbeat economic data and U.S. corporate earnings, the Fed’s rate cuts and investor optimism about further monetary easing. However, markets reflected concerns about political uncertainties in the U.S. (including the impeachment inquiry into U.S. President Donald Trump), geopolitical tensions in certain regions, and the impact of U.S. trade disputes with China and other trading partners on global growth and corporate earnings. These concerns were partly alleviated at certain points during the period by easing trade tensions and optimism about a potential U.S.-China trade deal. The broad U.S. stock market, as measured by the Standard & Poor’s® 500 Index (S&P 500®), generally trended higher in the period’s first four months, reaching a newall-time high in July. Stocks retreated in August, due to escalating trade tensions and heightened concerns about U.S. and global economic growth, but recovered in September amid easing trade tensions and investor optimism about the upcoming U.S.-China trade negotiations in October 2019. Overall, the S&P 500 posted a +6.08% total return for thesix-month period.3
1. Source: Morningstar. Frank Russell Company is the source and owner of the trademarks, service marks and copyrights related to the Russell Indexes. Russell® is a trademark of Frank Russell Company.
The index is unmanaged and includes reinvestment of any income or distributions. It does not reflect any fees, expenses or sales charges. One cannot invest directly in an index, and an index is not representative of the Fund’s portfolio.
2. Source: Bureau of Labor Statistics.
3. Source: Morningstar.
The dollar value, number of shares or principal amount, and names of all portfolio holdings are listed in the Fund’s Statement of Investments (SOI). The SOI begins on page 41.
| | | | | | |
| | | |
| franklintempleton.com | | Semiannual Report | | | 21 | |
FRANKLIN LIBERTY U.S. LOW VOLATILITY ETF
Investment Strategy
The Fund invests primarily in equity securities (principally common stocks) of U.S. companies.4 The Fund seeks capital appreciation, while providing a lower level of volatility than the broader equity market as measured by the Russell 1000® Index, meaning the Fund seeks returns that fluctuate less than the returns of the Russell 1000® Index. We apply a fundamentally driven“bottom-up” research process to create a starting universe of eligible securities across a large number of sectors derived from the holdings of a number of Franklin Templeton equity funds. The investment manager screens that universe on a quarterly basis in order to identify those securities with the lowest realized volatility relative to their corresponding sectors. The Fund’s sector weightings generally are based on the current sector weightings within the Russell 1000® Index. Individual securities in the Fund’s portfolio are generally weighted equally within each sector. The investment manager may, from time to time, make adjustments to the Fund’s portfolio as a result of corporate actions, changes to the volatility profile of the Fund’s holdings, or for risk management related purposes.
Manager’s Discussion
During the period, the Fund outperformed the Russell 1000® Index benchmark. Most sectors contributed to relative performance with key contributors in the information technology (IT), health care and financials sectors. Conversely, the energy sector was a detractor during the period.
In the IT sector, electronic payment processor Total System Services was a major contributor. Shares of the company appreciated following its acquisition by a global payments provider. Strong sales growth and raised guidance was a boost for the shares of Synopsys, a software provider to the semiconductor industry. We believe the company is uniquely positioned to address the growing need and demand for complex chip designs. Semiconductor manufacturer Texas Instruments reported financial results over the period that were solidly ahead of consensus estimates. We believe analog is the most attractive product segment in the semiconductor industry, and Texas Instruments is a leading market share analog semiconductor company. In contrast, underweightings in strong performing shares of Microsoft and Apple dampened relative returns.
| | | | |
| Top 10 Holdings | | | |
| |
| 9/30/19 | | | |
| |
Company Sector/Industry | | % of Total
Net Assets | |
Oracle Corp. Information Technology | | | 1.5% | |
Amphenol Corp., A Information Technology | | | 1.5% | |
International Business Machines Corp. Information Technology | | | 1.5% | |
Automatic Data Processing Inc. Information Technology | | | 1.5% | |
Apple Inc. Information Technology | | | 1.5% | |
Cisco Systems Inc. Information Technology | | | 1.5% | |
AT&T Inc. Communication Services | | | 1.4% | |
Texas Instruments Inc. Information Technology | | | 1.5% | |
Synopsys Inc. Information Technology | | | 1.5% | |
Verizon Communications Inc. Communication Services | | | 1.4% | |
Higher revenue from strong volume growth lifted the shares of diagnostic testing company Quest Diagnostics and boosted results in the health care sector. In the financials sector, insurance company W.R. Berkley contributed to returns. A major contributor in the industrials sector was Lockheed Martin. The defense contractor has been a beneficiary of strong defense spending. In contrast, diversified industrial conglomerate Fortive struggled with slower sales and lowered its guidance. The company announced its intention to separate into two companies, which could help increase its strategic focus. Despite stock weakness, we continue to view Fortive as a high-quality business. Elsewhere, concerns about slowing global growth and its impact on energy demands pressured the energy sector and our positions in Occidental Petroleum, Schlumberger and EOG Resources.
4. “U.S. companies” are those that (i) are organized under the laws of, or have a principal office in, or for whose securities the principal trading market is, the U.S.; (ii) derive 50% or more of their total revenue or profit from either goods or services produced, or sales made, in the U.S.; or (iii) have 50% or more of their assets in the U.S.
See www.franklintempletondatasources.com for additional data provider information.
| | | | |
| | | |
| 22 | | Semiannual Report | | franklintempleton.com |
FRANKLIN LIBERTY U.S. LOW VOLATILITY ETF
Thank you for your participation in Franklin Liberty U.S. Low Volatility ETF. We look forward to serving your future investment needs.
| | |
 | | 
Todd Brighton, CFA Portfolio Manager |
The foregoing information reflects our analysis, opinions and portfolio holdings as of September 30, 2019, the end of the reporting period. The way we implement our main investment strategies and the resulting portfolio holdings may change depending on factors such as market and economic conditions. These opinions may not be relied upon as investment advice or an offer for a particular security. The information is not a complete analysis of every aspect of any market, country, industry, security or the Fund. Statements of fact are from sources considered reliable, but the investment manager makes no representation or warranty as to their completeness or accuracy. Although historical performance is no guarantee of future results, these insights may help you understand our investment management philosophy.
| | | | | | |
| | | |
| franklintempleton.com | | Semiannual Report | | | 23 | |
FRANKLIN LIBERTY U.S. LOW VOLATILITY ETF
Performance Summary as of September 30, 2019
Total return reflects reinvestment of the Fund’s dividends and capital gain distributions, if any, and any unrealized gains or losses. Total returns do not include brokerage commissions that may be payable on secondary market transactions. The performance table does not reflect any taxes that a shareholder would pay on Fund dividends, capital gain distributions, if any, or any realized gains on the sale or redemption of Fund shares.
Net asset value or “NAV” is the value of one share of a fund as calculated in accordance with the standard formula for valuing mutual fund shares. The price used to calculate market return (Market Price) is determined by using the midpoint between the highest bid and the lowest offer on the primary stock exchange on which shares of a fund are listed for trading, as of the time that such fund’s NAV is calculated. Since shares of the Fund did not trade in the secondary market until after the Fund’s inception, for the period from inception to the first day of secondary trading (9/22/16), the NAV of the Fund is used as a proxy for the Market Price to calculate market returns. Market and NAV returns assume that dividends and capital gain distributions have been reinvested at Market Price and NAV.
Your dividend income will vary depending on dividends or interest paid by securities in the Fund’s portfolio, adjusted for operating expenses. Capital gain distributions are net profits realized from the sale of portfolio securities.
Performance as of 9/30/191
| | | | | | | | | | | | | | | | |
| | |
| | | Cumulative Total Return2 | | | Average Annual Total Return2 | |
| | | Based on
NAV3 | | | Based on market price4 | | | Based on
NAV3 | | | Based on
market price4 | |
6-Month | | | +9.52% | | | | +9.42% | | | | +9.52% | | | | +9.42% | |
1-Year | | | +13.55% | | | | +13.69% | | | | +13.55% | | | | +13.69% | |
3-Year | | | +52.71% | | | | +53.65% | | | | +15.16% | | | | +15.39% | |
Since Inception (9/20/16) | | | +54.36% | | | | +54.45% | | | | +15.42% | | | | +15.44% | |
Performance data represent past performance, which does not guarantee future results. Investment return and principal value will fluctuate, and you may have a gain or loss when you sell your shares. Current performance may differ from figures shown. For most recentmonth-end performance, go tofranklintempleton.com or call(800)342-5236.
See page 25 for Performance Summary footnotes.
| | | | |
| | | |
| 24 | | Semiannual Report | | franklintempleton.com |
FRANKLIN LIBERTY U.S. LOW VOLATILITY ETF
PERFORMANCE SUMMARY
Distributions(4/1/19–9/30/19)
|
|
Net Investment
Income |
$0.217401 |
Total Annual Operating Expenses5
| | | | |
| |
| With Waiver | | Without Waiver | |
0.50% | | | 1.12% | |
All investments involve risks, including possible loss of principal. Stock prices fluctuate, sometimes rapidly and dramatically, due to factors affecting individual companies, particular industries or sectors, or general market conditions. There can be no guarantee that the Fund’s volatility strategy will be successful, and achieving the Fund’s volatility strategy does not mean the Fund will achieve a positive or competitive return. The volatility strategy can also be expected to limit the Fund’s participation in market price appreciation when compared to similar funds that do not attempt this strategy. Smaller andmidsize-company stocks have historically experienced more price volatility than larger company stocks, especially over the short term. The Fund’s prospectus also includes a description of the main investment risks.
ETFs trade like stocks, fluctuate in market value and may trade at prices above or below their net asset value. Brokerage commissions and ETF expenses will reduce returns.
1. The Fund has a fee waiver and/or expense reimbursement contractually guaranteed through 7/31/20. Fund investment results reflect the expense reduction; without this reduction, the results would have been lower.
2. Total return calculations represent the cumulative and average annual changes in value of an investment over the periods indicated. Return for less than one year, if any, has not been annualized.
3. Assumes reinvestment of distributions based on net asset value.
4. Assumes reinvestment of distributions based on market price.
5. Figures are as stated in the Fund’s current prospectus and may differ from the expense ratios disclosed in the Your Fund’s Expenses and Financial Highlights sections in this report. In periods of market volatility, assets may decline significantly, causing total annual Fund operating expenses to become higher than the figures shown.
| | | | | | |
| | | |
| franklintempleton.com | | Semiannual Report | | | 25 | |
FRANKLIN LIBERTY U.S. LOW VOLATILITY ETF
Your Fund’s Expenses
As a Fund shareholder, you can incur two types of costs: (1) transaction costs, including brokerage commissions on purchases and sales of Fund shares; and (2) ongoing Fund costs, including management fees and other Fund expenses. All funds have ongoing costs, sometimes referred to as operating expenses. The table below shows ongoing costs of investing in the Fund and can help you understand these costs and compare them with those of other funds. The table assumes a $1,000 investment held for the six months indicated.
Actual Fund Expenses
The table below provides information about actual account values and actual expenses in the columns under the heading “Actual.” In these columns the Fund’s actual return, which includes the effect of Fund expenses, is used to calculate the “Ending Account Value.” You can estimate the expenses you paid during the period by following these steps (of course, your account value and expenses will differ from those in this illustration):Divide your account value by $1,000 (if your account had an $8,600 value, then $8,600÷ $1,000 = 8.6).Then multiply the result by the number in the row under the headings “Actual” and “Expenses Paid During Period” (if Actual Expenses Paid During Period were $ 7.50, then 8.6 x $ 7.50 = $64.50).In this illustration, the actual expenses paid this period are $64.50.
Hypothetical Example for Comparison with Other Funds
Under the heading “Hypothetical” in the table, information is provided about hypothetical account values and hypothetical expenses based on the Fund’s actual expense ratio and an assumed rate of return of 5% per year before expenses, which is not the Fund’s actual return. This information may not be used to estimate the actual ending account balance or expenses you paid for the period, but it can help you compare ongoing costs of investing in the Fund with those of other funds. To do so, compare this 5% hypothetical example with the 5% hypothetical examples that appear in the shareholder reports of other funds.
Please note that expenses shown in the table are meant to highlight ongoing costs and do not reflect any transactional costs.Therefore, information under the heading “Hypothetical” is useful in comparing ongoing costs only, and will not help you compare total costs of owning different funds. In addition, if transactional costs were included, your total costs would have been higher.
| | | | | | | | | | | | | | | | | | | | | | |
| | | | Actual
(actual return after expenses) | | | Hypothetical
(5% annual return before expenses) | | | | |
| | | | | |
Beginning
Account
Value 4/1/19 | | | Ending
Account
Value 9/30/19 | | | Expenses
Paid During
Period
4/1/19–9/30/191,2 | | | Ending
Account
Value 9/30/19 | | | Expenses
Paid During
Period
4/1/19–9/30/191,2 | | | Net Annualized
Expense Ratio2 | |
| | $1,000.00 | | | $ | 1,095.20 | | | $ | 2.62 | | | $ | 1,022.50 | | | $ | 2.53 | | | | 0.50 | % |
1. Expenses are equal to the annualized expense ratio for thesix-month period as indicated above—in the far right column—multiplied by the simple average account value over the period indicated, and then multiplied by 183/366 to reflect theone-half year period.
2. Reflects expenses after fee waivers and expense reimbursements.
| | | | |
| | | |
| 26 | | Semiannual Report | | franklintempleton.com |
FRANKLIN TEMPLETON ETF TRUST
Financial Highlights
Franklin Liberty International Opportunities ETF
| | | | | | | | | | | | | | | | |
| | | Six Months Ended
September 30, 2019
(unaudited) | | | Year Ended March 31, | |
| | | 2019 | | | 2018 | | | 2017a | |
| | | | |
Per share operating performance
(for a share outstanding throughout the period) | | | | | | | | | | | | | | | | |
| | | | |
Net asset value, beginning of period | | $ | 27.09 | | | $ | 28.89 | | | $ | 25.58 | | | $ | 24.50 | |
| | | | |
| | | | |
| Income from investment operationsb: | | | | | | | | | | | | | | | | |
| | | | |
Net investment incomec | | | 0.47 | | | | 0.51 | | | | 0.45 | | | | 0.09 | |
| | | | |
Net realized and unrealized gains (losses) | | | (0.56 | ) | | | (1.89 | ) | | | 4.00 | | | | 0.99 | |
| | | | |
| | | | |
Total from investment operations | | | (0.09 | ) | | | (1.38 | ) | | | 4.45 | | | | 1.08 | |
| | | | |
| | | | |
| Less distributions from: | | | | | | | | | | | | | | | | |
| | | | |
Net investment income | | | (0.43 | ) | | | (0.24 | ) | | | (0.74 | ) | | | — | |
| | | | |
Net realized gains | | | — | | | | (0.18 | ) | | | (0.40 | ) | | | — | |
| | | | |
| | | | |
Total distributions | | | (0.43 | ) | | | (0.42 | ) | | | (1.14 | ) | | | — | |
| | | | |
| | | | |
Net asset value, end of period | | $ | 26.57 | | | $ | 27.09 | | | $ | 28.89 | | | $ | 25.58 | |
| | | | |
| | | | |
Total returnd | | | (0.36)% | | | | (4.70)% | | | | 17.50% | | | | 4.41% | |
| | | | |
| Ratios to average net assetse | | | | | | | | | | | | | | | | |
| | | | |
Expenses before waiver and payments by affiliates | | | 2.34% | | | | 2.34% | | | | 3.38% | | | | 8.50% | |
| | | | |
Expenses net of waiver and payments by affiliates | | | 0.60% | | | | 0.60% | | | | 0.59% | | | | 0.60% | |
| | | | |
Net investment income | | | 3.52% | | | | 1.89% | | | | 1.60% | | | | 1.98% | |
| | | | |
| Supplemental data | | | | | | | | | | | | | | | | |
| | | | |
Net assets, end of period (000’s) | | | $9,299 | | | | $9,480 | | | | $5,778 | | | | $5,116 | |
| | | | |
Portfolio turnover ratef | | | 19.90% | | | | 20.83% | | | | 34.08% | | | | 2.32% | |
| | | | |
| Portfolio turnover rate excluding portfolio transactions that are executed as a result of the Fund offering and redeeming Creation Units solely or in part for cashf,g | | | 19.90% | | | | —% | | | | —% | | | | —% | |
aFor the period January 25, 2017 (commencement of operations) to March 31, 2017.
bThe amount shown for a share outstanding throughout the period may not correlate with the Statement of Operations for the period due to the timing of sales and repurchases of Creation Unit Fund shares in relation to income earned and/or fluctuating fair value of the investments of the Fund.
cBased on average daily shares outstanding.
dTotal return is not annualized for periods less than one year. Total return is calculated assuming an initial investment made at the net asset value at the beginning of the period, reinvestment of all dividends and distributions at net asset value during the period, and redemption at net asset value on the last day of the period.
eRatios are annualized for periods less than one year.
fPortfolio turnover rate excludes the value of portfolio securities received or delivered as a result of processing capital share transactions in Creation Units, if any.
gEffective September 30, 2019.
| | | | | | |
| | | |
| franklintempleton.com | | The accompanying notes are an integral part of these financial statements. | Semiannual Report | | | 27 | |
FRANKLIN TEMPLETON ETF TRUST
Statement of Investments, September 30, 2019 (unaudited)
Franklin Liberty International Opportunities ETF
| | | | | | | | | | | | | | |
| | | |
| | | Industry | | | Shares | | | Value | |
| | | | | | | | | | | | | | |
| | | Common Stocks 98.5% | |
| | | Australia 2.8% | |
| | BHP Group Ltd. | | | Metals & Mining | | | | 798 | | | $ | 19,763 | |
| | Commonwealth Bank of Australia | | | Banks | | | | 425 | | | | 23,169 | |
| | CSL Ltd. | | | Biotechnology | | | | 753 | | | | 118,682 | |
| | Ramsay Health Care Ltd. | | | Health Care Providers & Services | | | | 684 | | | | 29,926 | |
| | Rio Tinto Ltd. | | | Metals & Mining | | | | 1,171 | | | | 73,189 | |
| | | | | | | | | | | | | | |
| | | | |
| | | | | | | | | | | | | 264,729 | |
| | | | | | | | | | | | | | |
| | | Austria 0.5% | | | | | | | | | |
| | Lenzing AG | | | Chemicals | | | | 443 | | | | 42,669 | |
| | | | | | | | | | | | | | |
| | | Brazil 1.4% | | | | | | | | | |
| | Ambev SA | | | Beverages | | | | 2,500 | | | | 11,554 | |
| a | | Azul SA | | | Airlines | | | | 1,000 | | | | 11,934 | |
| a | | B2W Cia Digital | | | Internet & Direct Marketing Retail | | | | 800 | | | | 9,286 | |
| a | | B2W Cia Digital, SCR | | | Internet & Direct Marketing Retail | | | | 112 | | | | 1,288 | |
| | B3 SA-Brasil Bolsa Balcao | | | Capital Markets | | | | 2,500 | | | | 26,186 | |
| | CCR SA | | | Transportation Infrastructure | | | | 4,900 | | | | 20,292 | |
| | Companhia Energetica de Minas Gerais | | | Electric Utilities | | | | 4,600 | | | | 17,559 | |
| | Energisa SA | | | Electric Utilities | | | | 900 | | | | 10,792 | |
| a | | Vale SA | | | Metals & Mining | | | | 2,100 | | | | 24,073 | |
| | | | | | | | | | | | | | |
| | | | |
| | | | | | | | | | | | | 132,964 | |
| | | | | | | | | | | | | | |
| | | Canada 6.6% | | | | | | | | | |
| | Alimentation Couche-Tard Inc., B | | | Food & Staples Retailing | | | | 2,150 | | | | 65,929 | |
| | Brookfield Asset Management Inc., A | | | Capital Markets | | | | 2,282 | | | | 121,253 | |
| | Canadian National Railway Co. | | | Road & Rail | | | | 1,025 | | | | 92,095 | |
| | Dollarama Inc. | | | Multiline Retail | | | | 963 | | | | 34,498 | |
| | Enbridge Inc. | | | Oil, Gas & Consumable Fuels | | | | 1,575 | | | | 55,315 | |
| | Nutrien Ltd. | | | Chemicals | | | | 700 | | | | 34,894 | |
| | Peyto Exploration & Development Corp. | | | Oil, Gas & Consumable Fuels | | | | 2,975 | | | | 7,505 | |
| | Royal Bank of Canada | | | Banks | | | | 1,105 | | | | 89,694 | |
| | TELUS Corp. | | | Diversified Telecommunication Services | | | | 1,338 | | | | 47,660 | |
| | The Toronto-Dominion Bank | | | Banks | | | | 1,192 | | | | 69,548 | |
| | | | | | | | | | | | | | |
| | | | |
| | | | | | | | | | | | | 618,391 | |
| | | | | | | | | | | | | | |
| | | China 12.7% | | | | | | | | | |
| a | | Alibaba Group Holding Ltd., ADR | | | Internet & Direct Marketing Retail | | | | 1,593 | | | | 266,398 | |
| | Bank of Ningbo Co. Ltd., A | | | Banks | | | | 17,500 | | | | 61,779 | |
| | Brilliance China Automotive Holdings Ltd. | | | Automobiles | | | | 48,000 | | | | 51,555 | |
| | China Merchants Bank Co. Ltd., A | | | Banks | | | | 6,700 | | | | 32,603 | |
| | China Merchants Bank Co. Ltd., H | | | Banks | | | | 15,500 | | | | 73,749 | |
| a | | Ctrip.com International Ltd., ADR | | | Internet & Direct Marketing Retail | | | | 2,870 | | | | 84,062 | |
| | Kweichow Moutai Co. Ltd., A | | | Beverages | | | | 100 | | | | 16,104 | |
| a | | New Oriental Education & Technology Group Inc., ADR | | | Diversified Consumer Services | | | | 175 | | | | 19,383 | |
| | Ping An Insurance (Group) Co. of China Ltd., H | | | Insurance | | | | 12,000 | | | | 137,842 | |
| a | | Prosus NV | | | Internet & Direct Marketing Retail | | | | 560 | | | | 41,118 | |
| | Silergy Corp. | | | Semiconductors & Semiconductor Equipment | | | | 5,000 | | | | 123,934 | |
| | Sunny Optical Technology Group Co. Ltd. | | | Electronic Equipment, Instruments & Components | | | | 1,800 | | | | 26,451 | |
| | Tencent Holdings Ltd. | | | Interactive Media & Services | | | | 4,800 | | | | 202,179 | |
| | Yum China Holdings Inc. | | | Hotels, Restaurants & Leisure | | | | 900 | | | | 40,887 | |
| | | | | | | | | | | | | | |
| | | | |
| | | | | | | | | | | | | 1,178,044 | |
| | | | | | | | | | | | | | |
| | | Denmark 0.7% | | | | | | | | | |
| | ISS AS | | | Commercial Services & Supplies | | | | 2,756 | | | | 68,210 | |
| | | | | | | | | | | | | | |
| | | Egypt 0.2% | | | | | | | | | |
| a | | Ezz Steel Co. SAE | | | Metals & Mining | | | | 37,815 | | | | 21,946 | |
| | | | | | | | | | | | | | |
| | | | |
| | | |
| 28 | | Semiannual Report | | franklintempleton.com |
FRANKLIN TEMPLETON ETF TRUST
STATEMENT OF INVESTMENTS (UNAUDITED)
Franklin Liberty International Opportunities ETF(continued)
| | | | | | | | | | | | | | |
| | | |
| | | Industry | | | Shares | | | Value | |
| | | | | | | | | | | | | | |
| | | Common Stocks (continued) | |
| | | Finland 0.7% | | | | | | | | | |
| | Tieto OYJ | | | IT Services | | | | 2,703 | | | $ | 69,250 | |
| | | | | | | | | | | | | | |
| | | France 2.6% | | | | | | | | | |
| | Maisons du Monde SA | | | Specialty Retail | | | | 3,406 | | | | 53,842 | |
| | Schneider Electric SE | | | Electrical Equipment | | | | 584 | | | | 51,252 | |
| | Vinci SA | | | Construction & Engineering | | | | 1,258 | | | | 135,529 | |
| | | | | | | | | | | | | | |
| | | | |
| | | | | | | | | | | | | 240,623 | |
| | | | | | | | | | | | | | |
| | | Germany 3.1% | | | | | | | | | |
| | 1&1 Drillisch AG | | | Wireless Telecommunication Services | | | | 2,414 | | | | 75,268 | |
| | GEA Group AG | | | Machinery | | | | 3,600 | | | | 97,215 | |
| | Hella GmbH & Co. KGaA | | | Auto Components | | | | 2,052 | | | | 91,765 | |
| | Rational AG | | | Machinery | | | | 39 | | | | 27,977 | |
| | | | | | | | | | | | | | |
| | | | |
| | | | | | | | | | | | | 292,225 | |
| | | | | | | | | | | | | | |
| | | Hong Kong 2.4% | | | | | | | | | |
| | AIA Group Ltd. | | | Insurance | | | | 15,200 | | | | 143,577 | |
| | IMAX China Holding Inc. | | | Entertainment | | | | 14,000 | | | | 33,038 | |
| | Samsonite International SA | | | Textiles, Apparel & Luxury Goods | | | | 23,100 | | | | 48,915 | |
| | | | | | | | | | | | | | |
| | | | |
| | | | | | | | | | | | | 225,530 | |
| | | | | | | | | | | | | | |
| | | India 4.3% | | | | | | | | | |
| | Bharti Airtel Ltd. | | | Wireless Telecommunication Services | | | | 8,965 | | | | 46,432 | |
| | HDFC Bank Ltd. | | | Banks | | | | 6,954 | | | | 120,443 | |
| | ICICI Bank Ltd. | | | Banks | | | | 7,364 | | | | 45,066 | |
| | Infosys Ltd. | | | IT Services | | | | 4,055 | | | | 46,098 | |
| | Kotak Mahindra Bank Ltd. | | | Banks | | | | 3,418 | | | | 79,312 | |
| a | | MakeMyTrip Ltd. | | | Internet & Direct Marketing Retail | | | | 1,225 | | | | 27,795 | |
| | UltraTech Cement Ltd. | | | Construction Materials | | | | 554 | | | | 33,937 | |
| | | | | | | | | | | | | | |
| | | | |
| | | | | | | | | | | | | 399,083 | |
| | | | | | | | | | | | | | |
| | | Indonesia 0.7% | | | | | | | | | |
| | ACE Hardware Indonesia Tbk PT | | | Specialty Retail | | | | 87,800 | | | | 10,948 | |
| | Bank Central Asia Tbk PT | | | Banks | | | | 24,800 | | | | 53,024 | |
| | | | | | | | | | | | | | |
| | | | |
| | | | | | | | | | | | | 63,972 | |
| | | | | | | | | | | | | | |
| | | Ireland 0.8% | | | | | | | | | |
| | Glanbia PLC | | | Food Products | | | | 6,036 | | | | 75,017 | |
| | | | | | | | | | | | | | |
| | | Italy 4.5% | | | | | | | | | |
| | Banca Generali SpA | | | Capital Markets | | | | 3,111 | | | | 95,982 | |
| | FinecoBank Banca Fineco SpA | | | Banks | | | | 8,380 | | | | 88,728 | |
| | Freni Brembo SpA | | | Auto Components | | | | 8,325 | | | | 81,139 | |
| | Prysmian SpA | | | Electrical Equipment | | | | 3,883 | | | | 83,395 | |
| | Technogym SpA | | | Leisure Equipment & Products | | | | 6,147 | | | | 68,355 | |
| | | | | | | | | | | | | | |
| | | | |
| | | | | | | | | | | | | 417,599 | |
| | | | | | | | | | | | | | |
| | | Japan 13.7% | | | | | | | | | |
| | Aica Kogyo Co. Ltd. | | | Building Products | | | | 900 | | | | 26,482 | |
| | Central Japan Railway Co. | | | Road & Rail | | | | 200 | | | | 41,120 | |
| | COMSYS Holdings Corp. | | | Construction & Engineering | | | | 1,900 | | | | 53,796 | |
| | Daikin Industries Ltd. | | | Building Products | | | | 600 | | | | 78,723 | |
| | Denso Corp. | | | Auto Components | | | | 1,900 | | | | 83,489 | |
| | Fast Retailing Co. Ltd. | | | Specialty Retail | | | | 100 | | | | 59,412 | |
| | Hoya Corp. | | | Health Care Equipment & Supplies | | | | 700 | | | | 57,121 | |
| | Idemitsu Kosan Co. Ltd. | | | Oil, Gas & Consumable Fuels | | | | 1,200 | | | | 33,921 | |
| | Japan Airlines Co. Ltd. | | | Airlines | | | | 800 | | | | 23,776 | |
| | Keyence Corp. | | | Electronic Equipment, Instruments & Components | | | | 100 | | | | 61,901 | |
| | Mitsubishi Corp. | | | Trading Companies & Distributors | | | | 1,700 | | | | 41,700 | |
| | | | | | |
| | | |
| franklintempleton.com | | Semiannual Report | | | 29 | |
FRANKLIN TEMPLETON ETF TRUST
STATEMENT OF INVESTMENTS (UNAUDITED)
Franklin Liberty International Opportunities ETF(continued)
| | | | | | | | | | | | | | |
| | | |
| | | Industry | | | Shares | | | Value | |
| | | | | | | | | | | | | | |
| | | Common Stocks (continued) | |
| | | Japan (continued) | | | | | | | | | |
| | Mitsubishi UFJ Financial Group Inc. | | | Banks | | | | 10,100 | | | $ | 51,250 | |
| | Mitsui Fudosan Co. Ltd. | | | Real Estate Management & Development | | | | 1,300 | | | | 32,225 | |
| | Murata Manufacturing Co. Ltd. | | | Electronic Equipment, Instruments & Components | | | | 1,200 | | | | 57,571 | |
| | Nidec Corp. | | | Electrical Equipment | | | | 600 | | | | 80,611 | |
| | Nintendo Co. Ltd. | | | Entertainment | | | | 100 | | | | 37,030 | |
| | Nippon Telegraph & Telephone Corp. | | | Diversified Telecommunication Services | | | | 1,600 | | | | 76,332 | |
| | Pola Orbis Holdings Inc. | | | Personal Products | | | | 2,600 | | | | 58,195 | |
| | Shimadzu Corp. | | | Electronic Equipment, Instruments & Components | | | | 1,300 | | | | 32,814 | |
| | Sony Corp. | | | Household Durables | | | | 1,100 | | | | 64,600 | |
| | Taiyo Nippon Sanso Corp. | | | Chemicals | | | | 2,200 | | | | 44,438 | |
| | Takeda Pharmaceutical Co. Ltd. | | | Pharmaceuticals | | | | 2,200 | | | | 75,114 | |
| | TheDai-ichi Life Holdings Inc. | | | Insurance | | | | 700 | | | | 10,551 | |
| | Toyota Motor Corp. | | | Automobiles | | | | 800 | | | | 53,415 | |
| | Z Holdings Corp. | | | Interactive Media & Services | | | | 12,200 | | | | 34,317 | |
| | | | | | | | | | | | | | |
| | | | |
| | | | | | | | | | | | | 1,269,904 | |
| | | | | | | | | | | | | | |
| | | Mexico 1.2% | | | | | | | | | |
| | America Movil SAB de CV, L | | | Wireless Telecommunication Services | | | | 70,000 | | | | 51,904 | |
| | Fomento Economico Mexicano SAB de CV | | | Beverages | | | | 6,650 | | | | 60,980 | |
| | | | | | | | | | | | | | |
| | | | |
| | | | | | | | | | | | | 112,884 | |
| | | | | | | | | | | | | | |
| | | Netherlands 0.9% | | | | | | | | | |
| | ASR Nederland NV | | | Insurance | | | | 2,392 | | | | 88,325 | |
| | | | | | | | | | | | | | |
| | | Norway 1.9% | | | | | | | | | |
| | Atea ASA | | | IT Services | | | | 6,216 | | | | 80,043 | |
| | Sbanken ASA | | | Banks | | | | 13,020 | | | | 94,147 | |
| | | | | | | | | | | | | | |
| | | | |
| | | | | | | | | | | | | 174,190 | |
| | | | | | | | | | | | | | |
| | | Philippines 0.7% | | | | | | | | | |
| | BDO Unibank Inc. | | | Banks | | | | 11,730 | | | | 32,363 | |
| | Security Bank Corp. | | | Banks | | | | 8,680 | | | | 32,992 | |
| | | | | | | | | | | | | | |
| | | | |
| | | | | | | | | | | | | 65,355 | |
| | | | | | | | | | | | | | |
| | | Portugal 0.9% | | | | | | | | | |
| | Corticeira Amorim SGPS SA | | | Containers & Packaging | | | | 7,654 | | | | 83,194 | |
| | | | | | | | | | | | | | |
| | | Russia 1.3% | | | | | | | | | |
| | Gazprom PJSC | | | Oil, Gas & Consumable Fuels | | | | 20,720 | | | | 72,140 | |
| a | | Yandex NV, A | | | Interactive Media & Services | | | | 1,400 | | | | 49,014 | |
| | | | | | | | | | | | | | |
| | | | |
| | | | | | | | | | | | | 121,154 | |
| | | | | | | | | | | | | | |
| | | Singapore 0.5% | | | | | | | | | |
| | DBS Group Holdings Ltd. | | | Banks | | | | 2,500 | | | | 45,195 | |
| | | | | | | | | | | | | | |
| | | South Africa 1.1% | | | | | | | | | |
| a | | MultiChoice Group Ltd. | | | Media | | | | 560 | | | | 4,357 | |
| | Naspers Ltd., N | | | Internet & Direct Marketing Retail | | | | 560 | | | | 84,764 | |
| | Redefine Properties Ltd. | | | Equity Real Estate Investment Trusts (REITs | ) | | | 21,308 | | | | 11,003 | |
| | | | | | | | | | | | | | |
| | | | |
| | | | | | | | | | | | | 100,124 | |
| | | | | | | | | | | | | | |
| | | South Korea 2.7% | | | | | | | | | |
| | Lotte Chemical Corp. | | | Chemicals | | | | 298 | | | | 58,795 | |
| | Naver Corp. | | | Interactive Media & Services | | | | 578 | | | | 75,865 | |
| | Samsung Electronics Co. Ltd. | | | Technology Hardware, Storage & Peripherals | | | | 2,800 | | | | 114,819 | |
| | | | | | | | | | | | | | |
| | | | |
| | | | | | | | | | | | | 249,479 | |
| | | | | | | | | | | | | | |
| | | Spain 5.2% | | | | | | | | | |
| | Applus Services SA | | | Professional Services | | | | 8,866 | | | | 115,022 | |
| | Cia de Distribucion Integral Logista Holdings SA | | | Air Freight & Logistics | | | | 4,961 | | | | 96,704 | |
| | | | |
| | | |
| 30 | | Semiannual Report | | franklintempleton.com |
FRANKLIN TEMPLETON ETF TRUST
STATEMENT OF INVESTMENTS (UNAUDITED)
Franklin Liberty International Opportunities ETF(continued)
| | | | | | | | | | | | | | |
| | | |
| | | Industry | | | Shares | | | Value | |
| | | Common Stocks (continued) | |
| | | Spain (continued) | | | | | | | | | |
| | Ebro Foods SA | | | Food Products | | | | 4,691 | | | $ | 93,793 | |
| | Merlin Properties Socimi SA | | | Equity Real Estate Investment Trusts (REITs | ) | | | 7,339 | | | | 102,492 | |
| a | | Tecnicas Reunidas SA | | | Energy Equipment & Services | | | | 2,472 | | | | 60,745 | |
| | Viscofan SA | | | Food Products | | | | 257 | | | | 12,048 | |
| | | | | | | | | | | | | | |
| | | | |
| | | | | | | | | | | | | 480,804 | |
| | | | | | | | | | | | | | |
| | | Sweden 1.0% | | | | | | | | | |
| | Dometic Group AB | | | Auto Components | | | | 11,438 | | | | 89,832 | |
| | | | | | | | | | | | | | |
| | | Switzerland 4.7% | | | | | | | | | |
| a | | Alcon Inc. | | | Health Care Equipment & Supplies | | | | 440 | | | | 25,681 | |
| | Novartis AG | | | Pharmaceuticals | | | | 2,202 | | | | 191,106 | |
| | Roche Holding AG | | | Pharmaceuticals | | | | 754 | | | | 219,625 | |
| | | | | | | | | | | | | | |
| | | | |
| | | | | | | | | | | | | 436,412 | |
| | | | | | | | | | | | | | |
| | | Taiwan 2.7% | | | | | | | | | |
| | Ennoconn Corp. | | | Technology Hardware, Storage & Peripherals | | | | 4,000 | | | | 28,300 | |
| | Taiwan Semiconductor Manufacturing Co. Ltd. | | | Semiconductors & Semiconductor Equipment | | | | 25,000 | | | | 219,182 | |
| | | | | | | | | | | | | | |
| | | | |
| | | | | | | | | | | | | 247,482 | |
| | | | | | | | | | | | | | |
| | | Thailand 1.3% | | | | | | | | | |
| | Kasikornbank PCL, fgn. | | | Banks | | | | 5,000 | | | | 25,666 | |
| | Minor International PCL, fgn. | | | Hotels, Restaurants & Leisure | | | | 38,500 | | | | 47,204 | |
| | The Siam Cement PCL, fgn. | | | Construction Materials | | | | 3,300 | | | | 44,022 | |
| | | | | | | | | | | | | | |
| | | | |
| | | | | | | | | | | | | 116,892 | |
| | | | | | | | | | | | | | |
| | | United Arab Emirates 1.0% | | | | | | | | | |
| | Emirates NBD PJSC | | | Banks | | | | 27,076 | | | | 95,459 | |
| | | | | | | | | | | | | | |
| | | United Kingdom 12.5% | | | | | | | | | |
| | Associated British Foods PLC | | | Food Products | | | | 2,013 | | | | 57,129 | |
| | AstraZeneca PLC | | | Pharmaceuticals | | | | 910 | | | | 81,424 | |
| | Bodycote PLC | | | Machinery | | | | 9,157 | | | | 80,851 | |
| | BP PLC | | | Oil, Gas & Consumable Fuels | | | | 11,103 | | | | 70,573 | |
| | British American Tobacco PLC | | | Tobacco | | | | 2,704 | | | | 100,214 | |
| | Bunzl PLC | | | Trading Companies & Distributors | | | | 3,519 | | | | 92,150 | |
| | Derwent London PLC | | | Equity Real Estate Investment Trusts (REITs | ) | | | 1,628 | | | | 67,608 | |
| | DS Smith PLC | | | Containers & Packaging | | | | 13,231 | | | | 58,762 | |
| | Ferguson PLC | | | Trading Companies & Distributors | | | | 802 | | | | 58,745 | |
| | Howden Joinery Group PLC | | | Trading Companies & Distributors | | | | 11,593 | | | | 80,059 | |
| b | | Ibstock PLC, Reg S | | | Construction Materials | | | | 18,347 | | | | 53,403 | |
| | Imperial Brands PLC | | | Tobacco | | | | 31 | | | | 698 | |
| | National Grid PLC | | | Multi-Utilities | | | | 9,087 | | | | 98,754 | |
| | Prudential PLC | | | Insurance | | | | 4,448 | | | | 80,849 | |
| | Reckitt Benckiser Group PLC | | | Household Products | | | | 578 | | | | 45,186 | |
| | RELX PLC | | | Professional Services | | | | 2,779 | | | | 66,180 | |
| | Restore PLC | | | Commercial Services & Supplies | | | | 73 | | | | 367 | |
| | Smith & Nephew PLC | | | Health Care Equipment & Supplies | | | | 3,042 | | | | 73,436 | |
| | | | | | | | | | | | | | |
| | | | |
| | | | | | | | | | | | | 1,166,388 | |
| | | | | | | | | | | | | | |
| | | United States 1.2% | | | | | | | | | |
| | Amcor PLC, IDR | | | Containers & Packaging | | | | 8,567 | | | | 82,337 | |
| | Autoliv Inc., SDR | | | Auto Components | | | | 355 | | | | 27,693 | |
| | | | | | | | | | | | | | |
| | | | |
| | | | | | | | | | | | | 110,030 | |
| | | | | | | | | | | | | | |
| | Total Common Stocks (Cost $9,371,858) | | | | | | | | | | | 9,163,355 | |
| | | | | | | | | | | | | | |
| | | | | | |
| | | |
| franklintempleton.com | | Semiannual Report | | | 31 | |
FRANKLIN TEMPLETON ETF TRUST
STATEMENT OF INVESTMENTS (UNAUDITED)
Franklin Liberty International Opportunities ETF(continued)
| | | | | | | | | | | | | | |
| | | |
| | | Industry | | | Shares | | | Value | |
| | | | | | | | | | | | | | |
| | | Preferred Stocks 0.7% | | | | | | | | | |
| | | Brazil 0.7% | | | | | | | | | |
| c | | Banco Bradesco SA, 2.969%, pfd. | | | Banks | | | | 3,180 | | | $ | 25,896 | |
| c | | Itau Unibanco Holding SA, 4.930%, pfd. | | | Banks | | | | 2,000 | | | | 16,819 | |
| c | | Petroleo Brasileiro SA, 4.123%, pfd. | | | Oil, Gas & Consumable Fuels | | | | 2,900 | | | | 19,181 | |
| | | | | | | | | | | | | | |
| | Total Preferred Stocks (Cost $53,847) | | | | | | | | | | | 61,896 | |
| | | | | | | | | | | | | | |
| | | Warrants (Cost $—) 0.0%† | | | | | | | | | |
| | | Thailand 0.0%† | | | | | | | | | |
| a | | Minor International PCL, wts., 9/30/21 | | | Hotels, Restaurants & Leisure | | | | 1,925 | | | | 251 | |
| | | | | | | | | | | | | | |
| | Total Investments (Cost $9,425,705) 99.2% | | | | | | | | | | | 9,225,502 | |
| | Other Assets, less Liabilities 0.8% | | | | | | | | | | | 73,843 | |
| | | | | | | | | | | | | | |
| | Net Assets 100.0% | | | | | | | | | | $ | 9,299,345 | |
| | | | | | | | | | | | | | |
See Abbreviations on page 63.
†Rounds to less than 0.1% of net assets.
aNon-income producing.
bSecurity was purchased pursuant to Regulation S under the Securities Act of 1933, which exempts from registration securities offered and sold outside of the United States. Such a security cannot be sold in the United States without either an effective registration statement filed pursuant to the Securities Act of 1933, or pursuant to an exemption from registration. This security has been deemed liquid under guidelines approved by the Fund’s Board of Trustees. At September 30, 2019, the value of this security was $53,403, representing 0.6% of net assets.
cVariable rate security. The rate shown represents the yield at period end.
| | | | |
| | | |
| 32 | | Semiannual Report | The accompanying notes are an integral part of these financial statements. | | franklintempleton.com |
FRANKLIN TEMPLETON ETF TRUST
Financial Highlights
Franklin Liberty Investment Grade Corporate ETF
| | | | | | | | | | | | | | | | |
| | | Six Months Ended
September 30, 2019
(unaudited) | | | Year Ended March 31, | |
| | | 2019 | | | 2018 | | | 2017a | |
| | | | |
Per share operating performance
(for a share outstanding throughout the period) | | | | | | | | | | | | | | | | |
| | | | |
Net asset value, beginning of period | | $ | 24.09 | | | $ | 23.97 | | | $ | 24.21 | | | $ | 25.00 | |
| | | | |
| | | | |
| Income from investment operationsb: | | | | | | | | | | | | | | | | |
| | | | |
Net investment incomec | | | 0.38 | | | | 0.82 | | | | 0.80 | | | | 0.32 | |
| | | | |
Net realized and unrealized gains (losses) | | | 1.51 | | | | 0.21 | | | | (0.22 | ) | | | (0.78 | ) |
| | | | |
| | | | |
Total from investment operations | | | 1.89 | | | | 1.03 | | | | 0.58 | | | | (0.46 | ) |
| | | | |
| | | | |
Less distributions from net investment income | | | (0.41 | ) | | | (0.91 | ) | | | (0.82 | ) | | | (0.33 | ) |
| | | | |
| | | | |
Net asset value, end of period | | $ | 25.57 | | | $ | 24.09 | | | $ | 23.97 | | | $ | 24.21 | |
| | | | |
| | | | |
Total returnd | | | 7.88% | | | | 4.46% | | | | 2.38% | | | | (1.83)% | |
| | | | |
| Ratios to average net assetse | | | | | | | | | | | | | | | | |
| | | | |
Expenses before waiver and payments by affiliates | | | 0.65% | | | | 1.07% | | | | 1.04% | | | | 1.06% | |
| | | | |
Expenses net of waiver and payments by affiliates | | | 0.35% | | | | 0.35% | | | | 0.37% | | | | 0.40% | |
| | | | |
Net investment income | | | 3.08% | | | | 3.49% | | | | 3.27% | | | | 2.76% | |
| | | | |
| Supplemental data | | | | | | | | | | | | | | | | |
| | | | |
Net assets, end of period (000’s) | | | $232,717 | | | | $18,065 | | | | $39,554 | | | | $53,268 | |
| | | | |
Portfolio turnover ratef | | | 13.70% | | | | 22.02% | | | | 63.14% | | | | 17.85% | |
| | | | |
| Portfolio turnover rate excluding portfolio transactions that are executed as a result of the Fund offering and redeeming Creation Units solely or in part for cashf,g | | | 13.70% | | | | —% | | | | —% | | | | —% | |
aFor the period October 3, 2016 (commencement of operations) to March 31, 2017.
bThe amount shown for a share outstanding throughout the period may not correlate with the Statement of Operations for the period due to the timing of sales and repurchases of Creation Unit Fund shares in relation to income earned and/or fluctuating fair value of the investments of the Fund.
cBased on average daily shares outstanding.
dTotal return is not annualized for periods less than one year. Total return is calculated assuming an initial investment made at the net asset value at the beginning of the period, reinvestment of all dividends and distributions at net asset value during the period, and redemption at net asset value on the last day of the period.
eRatios are annualized for periods less than one year.
fPortfolio turnover rate excludes the value of portfolio securities received or delivered as a result of processing capital share transactions in Creation Units, if any.
gEffective September 30, 2019.
| | | | | | |
| | | |
| franklintempleton.com | | The accompanying notes are an integral part of these financial statements. | Semiannual Report | | | 33 | |
FRANKLIN TEMPLETON ETF TRUST
Statement of Investments, September 30, 2019 (unaudited)
Franklin Liberty Investment Grade Corporate ETF
| | | | | | | | | | | | | | |
| | | | |
| | | | | Country | | | Principal Amount* | | | Value | |
| | | | | | | | | | | | | | |
| | | Corporate Bonds & Notes 97.2% | | | | | | | | | |
| | | Aerospace & Defense 1.8% | | | | | | | | | |
| a | | L3Harris Technologies Inc., senior note, 144A, 3.85%, 6/15/23 | | | United States | | | | 500,000 | | | $ | 527,118 | |
| | Lockheed Martin Corp., senior bond, 3.55%, 1/15/26 | | | United States | | | | 2,300,000 | | | | 2,467,772 | |
| | United Technologies Corp., senior bond, 4.50%, 6/01/42 | | | United States | | | | 1,000,000 | | | | 1,199,700 | |
| | | | | | | | | | | | | | |
| | | | |
| | | | | | | | | | | | | 4,194,590 | |
| | | | | | | | | | | | | | |
| | | Air Freight & Logistics 0.6% | | | | | | | | | |
| | FedEx Corp.,
senior bond, 4.75%, 11/15/45 | | | United States | | | | 800,000 | | | | 862,097 | |
| | senior bond, 5.10%, 1/15/44 | | | United States | | | | 500,000 | | | | 560,812 | |
| | | | | | | | | | | | | | |
| | | | |
| | | | | | | | | | | | | 1,422,909 | |
| | | | | | | | | | | | | | |
| | | Banks 25.0% | | | | | | | | | |
| a | | ANZ New Zealand International Ltd. of London, senior note, 144A, 2.875%, 1/25/22 | | | New Zealand | | | | 200,000 | | | | 203,216 | |
| | Bank of America Corp., sub. bond, 4.183%, 11/25/27 | | | United States | | | | 6,350,000 | | | | 6,860,244 | |
| | Barclays PLC, senior note, 4.375%, 1/12/26 | | | United Kingdom | | | | 1,400,000 | | | | 1,480,410 | |
| | BB&T Corp., sub. bond, 3.875%, 3/19/29 | | | United States | | | | 5,300,000 | | | | 5,748,846 | |
| a | | BPCE SA, sub note, 144A, 5.15%, 7/21/24 | | | France | | | | 1,800,000 | | | | 1,972,276 | |
| | Citigroup Inc.,
senior note, FRN, 3.352%, 4/24/25 | | | United States | | | | 5,700,000 | | | | 5,909,818 | |
| | sub. note, 4.05%, 7/30/22 | | | United States | | | | 345,000 | | | | 361,437 | |
| a | | Commonwealth Bank of Australia, sub. note, 144A, 4.50%, 12/09/25 | | | Australia | | | | 390,000 | | | | 421,439 | |
| | Credit Suisse Group Funding Guernsey Ltd., senior note, 3.80%, 9/15/22 | | | Switzerland | | | | 5,900,000 | | | | 6,137,430 | |
| | Danske Bank A/S, senior note, FRN, 3.244%, 12/20/24 | | | Denmark | | | | 2,600,000 | | | | 2,622,768 | |
| | HSBC Holdings PLC, senior note, 4.30%, 3/08/26 | | | United Kingdom | | | | 5,400,000 | | | | 5,836,962 | |
| | | | |
| | JPMorgan Chase & Co., | | | | | | | | | | | | |
| | senior bond, 3.54% to 5/01/27, FRN thereafter, 5/01/28, 3.54%, 5/01/28 | | | United States | | | | 4,150,000 | | | | 4,379,518 | |
| | sub. note, 3.375%, 5/01/23 | | | United States | | | | 425,000 | | | | 439,828 | |
| | Regions Financial Corp., senior note, 3.80%, 8/14/23 | | | United States | | | | 2,900,000 | | | | 3,058,584 | |
| | Santander UK Group Holdings PLC, senior note, 2.875%, 8/05/21 | | | United Kingdom | | | | 230,000 | | | | 231,066 | |
| a | | Standard Chartered PLC, senior note, 144A, 3.885% to 3/15/23, FRN thereafter, 3/15/24 | | | United Kingdom | | | | 4,425,000 | | | | 4,570,271 | |
| | Sumitomo Mitsui Banking Corp., senior note, 2.514%, 1/17/20 | | | Japan | | | | 450,000 | | | | 450,493 | |
| | SunTrust Bank, sub. note, 3.30%, 5/15/26 | | | United States | | | | 1,500,000 | | | | 1,557,712 | |
| | The Toronto-Dominion Bank, Sr. Unsecured, GMTN, 3.25%, 3/11/24 | | | Canada | | | | 3,200,000 | | | | 3,346,481 | |
| | Wells Fargo & Co., sub. bond, 4.75%, 12/07/46 | | | United States | | | | 185,000 | | | | 218,722 | |
| | Wells Fargo Bank NA, senior note, FRN, 2.082%, 9/09/22 | | | United States | | | | 2,300,000 | | | | 2,295,353 | |
| | | | | | | | | | | | | | |
| | | | |
| | | | | | | | | | | | | 58,102,874 | |
| | | | | | | | | | | | | | |
| | | Beverages 2.6% | | | | | | | | | |
| | Anheuser-Busch Cos. LLC/Anheuser-Busch InBev Worldwide Inc., senior bond, 4.70%, 2/01/36 | | | Belgium | | | | 340,000 | | | | 393,344 | |
| | Anheuser-Busch InBev Worldwide Inc., senior bond, 5.80%, 1/23/59 | | | Belgium | | | | 2,000,000 | | | | 2,704,565 | |
| | Coca-Cola Femsa SAB de CV, senior note, 3.875%, 11/26/23 | | | Mexico | | | | 2,700,000 | | | | 2,857,480 | |
| | | | | | | | | | | | | | |
| | | | |
| | | | | | | | | | | | | 5,955,389 | |
| | | | | | | | | | | | | | |
| | | Biotechnology 2.3% | | | | | | | | | |
| | Biogen Inc., senior bond, 5.20%, 9/15/45 | | | United States | | | | 1,685,000 | | | | 2,000,516 | |
| | Celgene Corp., senior bond, 5.00%, 8/15/45 | | | United States | | | | 1,000,000 | | | | 1,255,668 | |
| | Gilead Sciences Inc., senior bond, 4.80%, 4/01/44 | | | United States | | | | 1,700,000 | | | | 2,036,052 | |
| | | | | | | | | | | | | | |
| | | | |
| | | | | | | | | | | | | 5,292,236 | |
| | | | | | | | | | | | | | |
| | | Building Products 0.5% | | | | | | | | | |
| a | | CRH America Finance Inc., senior note, 144A, 3.95%, 4/04/28 | | | United States | | | | 1,000,000 | | | | 1,070,151 | |
| | | | | | | | | | | | | | |
| | | | |
| | | |
| 34 | | Semiannual Report | | franklintempleton.com |
FRANKLIN TEMPLETON ETF TRUST
STATEMENT OF INVESTMENTS (UNAUDITED)
Franklin Liberty Investment Grade Corporate ETF(continued)
| | | | | | | | | | | | | | |
| | | | |
| | | | | Country | | | Principal Amount* | | | Value | |
| | | | | | | | | | | | | | |
| | | Corporate Bonds & Notes (continued) | | | | | | | | | |
| | | Capital Markets 4.9% | | | | | | | | | |
| | Morgan Stanley, senior bond, 3.591% to 7/22/27, FRN thereafter,
3.591%, 7/22/28 | | | United States | | | | 5,880,000 | | | $ | 6,203,404 | |
| | The Goldman Sachs Group Inc.,
senior note, 3.50%, 1/23/25 | | | United States | | | | 2,500,000 | | | | 2,607,830 | |
| | sub. note, 4.25%, 10/21/25 | | | United States | | | | 1,475,000 | | | | 1,579,668 | |
| a | | UBS Group Funding Switzerland AG, senior note, 144A, 4.125%, 9/24/25 | | | Switzerland | | | | 1,000,000 | | | | 1,081,201 | |
| | | | | | | | | | | | | | |
| | | | |
| | | | | | | | | | | | | 11,472,103 | |
| | | | | | | | | | | | | | |
| | | Chemicals 1.3% | | | | | | | | | |
| | LYB International Finance BV, senior note, 4.00%, 7/15/23 | | | United States | | | | 2,900,000 | | | | 3,068,355 | |
| | | | | | | | | | | | | | |
| | | Communications Equipment 0.8% | | | | | | | | | |
| | Juniper Networks Inc., senior bond, 4.50%, 3/15/24 | | | United States | | | | 1,800,000 | | | | 1,934,091 | |
| | | | | | | | | | | | | | |
| | | Consumer Finance 1.3% | | | | | | | | | |
| | Capital One Financial Corp.,
senior bond, 3.80%, 1/31/28 | | | United States | | | | 1,400,000 | | | | 1,478,290 | |
| | senior note, 3.30%, 10/30/24 | | | United States | | | | 1,450,000 | | | | 1,501,765 | |
| | | | | | | | | | | | | | |
| | | | |
| | | | | | | | | | | | | 2,980,055 | |
| | | | | | | | | | | | | | |
| | | Containers & Packaging 1.1% | | | | | | | | | |
| | International Paper Co., senior bond, 3.80%, 1/15/26 | | | United States | | | | 1,400,000 | | | | 1,488,310 | |
| | WRKCo. Inc., senior note, 3.90%, 6/01/28 | | | United States | | | | 1,000,000 | | | | 1,056,034 | |
| | | | | | | | | | | | | | |
| | | | |
| | | | | | | | | | | | | 2,544,344 | |
| | | | | | | | | | | | | | |
| | | Diversified Financial Services 1.1% | | | | | | | | | |
| a | | Ashtead Capital Inc., second lien, 144A, 4.125%, 8/15/25 | | | United Kingdom | | | | 1,770,000 | | | | 1,809,825 | |
| | GE Capital International Funding Co., senior bond, 4.418%, 11/15/35 | | | United States | | | | 825,000 | | | | 864,829 | |
| | | | | | | | | | | | | | |
| | | | |
| | | | | | | | | | | | | 2,674,654 | |
| | | | | | | | | | | | | | |
| | | Diversified Telecommunication Services 1.7% | | | | | | | | | |
| | AT&T Inc., senior note, 3.60%, 7/15/25 | | | United States | | | | 225,000 | | | | 237,149 | |
| | Koninklijke KPN NV, 8.375%, 10/01/30 | | | Netherlands | | | | 700,000 | | | | 957,766 | |
| | Telefonica Emisiones SA,
senior bond, 5.52%, 3/01/49 | | | Spain | | | | 1,650,000 | | | | 2,011,734 | |
| | senior bond, 7.045%, 6/20/36 | | | Spain | | | | 185,000 | | | | 255,747 | |
| | Verizon Communications Inc., senior bond, 5.50%, 3/16/47 | | | United States | | | | 355,000 | | | | 469,168 | |
| | | | | | | | | | | | | | |
| | | | |
| | | | | | | | | | | | | 3,931,564 | |
| | | | | | | | | | | | | | |
| | | Electric Utilities 7.0% | | | | | | | | | |
| | Duke Energy Corp., senior bond, 4.80%, 12/15/45 | | | United States | | | | 2,565,000 | | | | 3,079,359 | |
| a | | Electricite de France SA, senior note, 144A, 4.50%, 9/21/28 | | | France | | | | 2,200,000 | | | | 2,458,385 | |
| a | | Enel Finance International NV, senior note, 144A, 4.25%, 9/14/23 | | | Italy | | | | 3,300,000 | | | | 3,506,954 | |
| | Georgia Power Co.,
senior bond, 4.30%, 3/15/42 | | | United States | | | | 245,000 | | | | 269,832 | |
| | senior bond, 4.75%, 9/01/40 | | | United States | | | | 1,950,000 | | | | 2,264,876 | |
| | PSEG Power LLC, senior note, 3.85%, 6/01/23 | | | United States | | | | 4,100,000 | | | | 4,333,566 | |
| a | | Saudi Electricity Global Sukuk Co. 2, senior bond, 144A, 5.06%, 4/08/43 | | | Saudi Arabia | | | | 300,000 | | | | 341,164 | |
| | | | | | | | | | | | | | |
| | | | |
| | | | | | | | | | | | | 16,254,136 | |
| | | | | | | | | | | | | | |
| | | Electronic Equipment, Instruments & Components 0.8% | | | | | | | | | |
| | Tech Data Corp., senior bond, 4.95%, 2/15/27 | | | United States | | | | 1,700,000 | | | | 1,826,005 | |
| | | | | | | | | | | | | | |
| | | Energy Equipment & Services 2.2% | | | | | | | | | |
| | Baker Hughes a GE Co. LLC/Baker HughesCo-obligator Inc., senior bond, 4.08%, 12/15/47 | | | United States | | | | 2,485,000 | | | | 2,505,342 | |
| a | | Schlumberger Holdings Corp., senior note, 144A, 3.75%, 5/01/24 | | | United States | | | | 2,400,000 | | | | 2,529,155 | |
| | | | | | | | | | | | | | |
| | | | |
| | | | | | | | | | | | | 5,034,497 | |
| | | | | | | | | | | | | | |
| | | | | | |
| | | |
| franklintempleton.com | | Semiannual Report | | | 35 | |
FRANKLIN TEMPLETON ETF TRUST
STATEMENT OF INVESTMENTS (UNAUDITED)
Franklin Liberty Investment Grade Corporate ETF(continued)
| | | | | | | | | | | | | | |
| | | | |
| | | | | Country | | | Principal Amount* | | | Value | |
| | | Corporate Bonds & Notes (continued) | | | | | | | | | |
| | | Entertainment 2.4% | | | | | | | | | |
| a | | Tencent Holdings Ltd., senior note, 144A, 3.595%, 1/19/28 | | | China | | | | 3,200,000 | | | $ | 3,343,590 | |
| a | | TWDC Holdco 613 Corp., senior bond, 144A, 6.40%, 12/15/35 | | | United States | | | | 1,603,000 | | | | 2,312,291 | |
| | | | | | | | | | | | | | |
| | | | |
| | | | | | | | | | | | | 5,655,881 | |
| | | | | | | | | | | | | | |
| | | Equity Real Estate Investment Trusts (REITs) 1.6% | | | | | | | | | |
| | American Tower Corp., senior bond, 3.55%, 7/15/27 | | | United States | | | | 3,300,000 | | | | 3,477,924 | |
| | Realty Income Corp., senior bond, 3.00%, 1/15/27 | | | United States | | | | 250,000 | | | | 257,818 | |
| | | | | | | | | | | | | | |
| | | | |
| | | | | | | | | | | | | 3,735,742 | |
| | | | | | | | | | | | | | |
| | | Food & Staples Retailing 2.1% | | | | | | | | | |
| a | | CK Hutchison International 19 Ltd., senior note, 144A, 3.25%, 4/11/24 | | | Hong Kong | | | | 1,725,000 | | | | 1,779,265 | |
| | The Kroger Co.,
senior bond, 3.50%, 2/01/26 | | | United States | | | | 2,100,000 | | | | 2,189,862 | |
| | senior bond, 5.40%, 1/15/49 | | | United States | | | | 700,000 | | | | 829,823 | |
| | | | | | | | | | | | | | |
| | | | |
| | | | | | | | | | | | | 4,798,950 | |
| | | | | | | | | | | | | | |
| | | Food Products 2.3% | | | | | | | | | |
| | Bunge Ltd. Finance Corp., senior note, 4.35%, 3/15/24 | | | United States | | | | 1,700,000 | | | | 1,791,835 | |
| | Kraft Heinz Foods Co.,
senior bond, 5.20%, 7/15/45 | | | United States | | | | 185,000 | | | | 194,790 | |
| | senior bond, 6.50%, 2/09/40 | | | United States | | | | 1,100,000 | | | | 1,304,161 | |
| | Tyson Foods Inc., senior bond, 5.10%, 9/28/48 | | | United States | | | | 1,680,000 | | | | 2,044,197 | |
| | | | | | | | | | | | | | |
| | | | |
| | | | | | | | | | | | | 5,334,983 | |
| | | | | | | | | | | | | | |
| | | Health Care Equipment & Supplies 0.7% | | | | | | | | | |
| | Abbott Laboratories, senior bond, 3.75%, 11/30/26 | | | United States | | | | 1,500,000 | | | | 1,635,466 | |
| | | | | | | | | | | | | | |
| | | Health Care Providers & Services 2.8% | | | | | | | | | |
| | Anthem Inc.,
senior bond, 5.10%, 1/15/44 | | | United States | | | | 570,000 | | | | 664,865 | |
| | senior note, 4.101%, 3/01/28 | | | United States | | | | 1,085,000 | | | | 1,172,849 | |
| | Cigna Corp., senior bond, 4.90%, 12/15/48 | | | United States | | | | 1,750,000 | | | | 2,010,281 | |
| | CVS Health Corp., senior bond, 5.30%, 12/05/43 | | | United States | | | | 2,300,000 | | | | 2,682,288 | |
| | | | | | | | | | | | | | |
| | | | |
| | | | | | | | | | | | | 6,530,283 | |
| | | | | | | | | | | | | | |
| | | Hotels, Restaurants & Leisure 0.6% | | | | | | | | | |
| | Marriott International Inc., senior note, 3.60%, 4/15/24 | | | United States | | | | 1,400,000 | | | | 1,469,973 | |
| | | | | | | | | | | | | | |
| | | Household Products 0.1% | | | | | | | | | |
| | Kimberly-Clark Corp., senior bond, 3.95%, 11/01/28 | | | United States | | | | 290,000 | | | | 329,387 | |
| | | | | | | | | | | | | | |
| | | Industrial Conglomerates 0.8% | | | | | | | | | |
| | General Electric Capital Corp., senior note, A, 6.15%, 8/07/37 | | | United States | | | | 1,500,000 | | | | 1,849,349 | |
| | | | | | | | | | | | | | |
| | | Insurance 5.3% | | | | | | | | | |
| | Aflac Inc., senior bond, 4.75%, 1/15/49 | | | United States | | | | 1,250,000 | | | | 1,528,722 | |
| | AXA SA, 8.60%, 12/15/30 | | | France | | | | 1,000,000 | | | | 1,445,900 | |
| | Marsh & McLennan Cos. Inc.,
senior bond, 3.50%, 3/10/25 | | | United States | | | | 3,100,000 | | | | 3,279,306 | |
| | senior note, 3.875%, 3/15/24 | | | United States | | | | 2,400,000 | | | | 2,557,390 | |
| | MetLife Inc., junior sub. bond, 6.40%, 12/15/66 | | | United States | | | | 1,710,000 | | | | 2,030,625 | |
| | Prudential Financial Inc., junior sub. bond, 5.20% to 3/15/24, FRN thereafter, 3/15/44 | | | United States | | | | 230,000 | | | | 240,527 | |
| | The Allstate Corp., senior bond, 4.20%, 12/15/46 | | | United States | | | | 1,000,000 | | | | 1,163,008 | |
| | | | | | | | | | | | | | |
| | | | |
| | | | | | | | | | | | | 12,245,478 | |
| | | | | | | | | | | | | | |
| | | Internet & Direct Marketing Retail 1.3% | | | | | | | | | |
| | Alibaba Group Holding Ltd.,
senior note, 2.50%, 11/28/19 | | | China | | | | 615,000 | | | | 615,111 | |
| | senior note, 3.125%, 11/28/21 | | | China | | | | 2,300,000 | | | | 2,336,699 | |
| | | | | | | | | | | | | | |
| | | | |
| | | | | | | | | | | | | 2,951,810 | |
| | | | | | | | | | | | | | |
| | | | |
| | | |
| 36 | | Semiannual Report | | franklintempleton.com |
FRANKLIN TEMPLETON ETF TRUST
STATEMENT OF INVESTMENTS (UNAUDITED)
Franklin Liberty Investment Grade Corporate ETF(continued)
| | | | | | | | | | | | | | |
| | | | |
| | | | | Country | | | Principal Amount* | | | Value | |
| | | | | | | | | | | | | | |
| | | Corporate Bonds & Notes (continued) | | | | | | | | | |
| | | Machinery 0.5% | | | | | | | | | |
| | Caterpillar Inc., senior bond, 4.75%, 5/15/64 | | | United States | | | | 1,000,000 | | | $ | 1,260,099 | |
| | | | | | | | | | | | | | |
| | | Media 2.3% | | | | | | | | | |
| | Charter Communications Operating LLC / Charter Communications Operating Capital, senior bond, first lien, 4.50%, 2/01/24 | | | United States | | | | 1,500,000 | | | | 1,612,516 | |
| | Charter Communications Operating LLC/Charter Communications Operating Capital Corp., senior secured note, first lien, 4.464%, 7/23/22 | | | United States | | | | 170,000 | | | | 179,038 | |
| | Comcast Corp., senior bond, 4.95%, 10/15/58 | | | United States | | | | 2,900,000 | | | | 3,691,148 | |
| | | | | | | | | | | | | | |
| | | | |
| | | | | | | | | | | | | 5,482,702 | |
| | | | | | | | | | | | | | |
| | | Metals & Mining 1.7% | | | | | | | | | |
| | Glencore Funding LLC,
| | | | | | | | | | | | |
| | a senior note, 144A, 4.125%, 5/30/23 | | | United States | | | | 1,925,000 | | | | 2,015,847 | |
| | a senior note, 144A, 4.625%, 4/29/24 | | | United States | | | | 1,800,000 | | | | 1,927,365 | |
| | | | | | | | | | | | | | |
| | | | |
| | | | | | | | | | | | | 3,943,212 | |
| | | | | | | | | | | | | | |
| | | Multi-Utilities 0.9% | | | | | | | | | |
| | Dominion Energy Inc., senior note, 4.25%, 6/01/28 | | | United States | | | | 1,800,000 | | | | 1,994,553 | |
| | | | | | | | | | | | | | |
| | | Multiline Retail 1.0% | | | | | | | | | |
| | Dollar General Corp., senior bond, 3.875%, 4/15/27 | | | United States | | | | 900,000 | | | | 965,409 | |
| | Dollar Tree Inc.,
senior note, 3.70%, 5/15/23 | | | United States | | | | 150,000 | | | | 155,663 | |
| | senior note, 4.00%, 5/15/25 | | | United States | | | | 1,100,000 | | | | 1,166,445 | |
| | | | | | | | | | | | | | |
| | | | |
| | | | | | | | | | | | | 2,287,517 | |
| | | | | | | | | | | | | | |
| | | Oil, Gas & Consumable Fuels 5.9% | | | | | | | | | |
| | Canadian Natural Resources Ltd., senior bond, 3.90%, 2/01/25 | | | Canada | | | | 1,450,000 | | | | 1,529,215 | |
| | Chevron Corp., senior note, 2.954%, 5/16/26 | | | United States | | | | 545,000 | | | | 570,366 | |
| | Ecopetrol SA, senior bond, 5.875%, 5/28/45 | | | Colombia | | | | 135,000 | | | | 157,951 | |
| | Energy Transfer Operating LP,
senior bond, 6.05%, 6/01/41 | | | United States | | | | 1,100,000 | | | | 1,259,842 | |
| | senior bond, 6.50%, 2/01/42 | | | United States | | | | 150,000 | | | | 180,227 | |
| | Enterprise Products Operating LLC,
senior bond, 5.10%, 2/15/45 | | | United States | | | | 1,270,000 | | | | 1,497,324 | |
| | senior bond, 6.125%, 10/15/39 | | | United States | | | | 700,000 | | | | 910,460 | |
| | Kinder Morgan Inc., senior bond, 5.55%, 6/01/45 | | | United States | | | | 2,100,000 | | | | 2,478,874 | |
| | MPLX LP, senior bond, 5.50%, 2/15/49 | | | United States | | | | 1,175,000 | | | | 1,364,666 | |
| | Occidental Petroleum Corp., senior note, 2.60%, 8/13/21 | | | United States | | | | 1,700,000 | | | | 1,711,693 | |
| | Shell International Finance BV, senior note, 2.125%, 5/11/20 | | | Netherlands | | | | 500,000 | | | | 501,284 | |
| | TC PipeLines LP, senior note, 3.90%, 5/25/27 | | | United States | | | | 400,000 | | | | 417,388 | |
| | Valero Energy Corp., senior note, 4.35%, 6/01/28 | | | United States | | | | 1,100,000 | | | | 1,195,035 | |
| | | | | | | | | | | | | | |
| | | | |
| | | | | | | | | | | | | 13,774,325 | |
| | | | | | | | | | | | | | |
| | | Pharmaceuticals 2.7% | | | | | | | | | |
| | AstraZeneca PLC, senior bond, 4.375%, 11/16/45 | | | United Kingdom | | | | 2,900,000 | | | | 3,412,260 | |
| | Shire Acquisitions Investments Ireland Designated Activity Co., senior note, 3.20%, 9/23/26 | | | Ireland | | | | 2,900,000 | | | | 2,994,650 | |
| | | | | | | | | | | | | | |
| | | | |
| | | | | | | | | | | | | 6,406,910 | |
| | | | | | | | | | | | | | |
| | | Professional Services 0.2% | | | | | | | | | |
| | IHS Markit Ltd., senior bond, 4.125%, 8/01/23 | | | Bermuda | | | | 500,000 | | | | 526,775 | |
| | | | | | | | | | | | | | |
| | | Real Estate Management & Development 0.6% | | | | | | | | | |
| | Healthcare Trust of America Holdings LP, senior bond, 3.75%, 7/01/27 | | | United States | | | | 1,300,000 | | | | 1,362,129 | |
| | | | | | | | | | | | | | |
| | | Road & Rail 0.9% | | | | | | | | | |
| | Burlington Northern Santa Fe LLC, senior bond, 3.25%, 6/15/27 | | | United States | | | | 235,000 | | | | 250,820 | |
| | | | | | |
| | | |
| franklintempleton.com | | Semiannual Report | | | 37 | |
FRANKLIN TEMPLETON ETF TRUST
STATEMENT OF INVESTMENTS (UNAUDITED)
Franklin Liberty Investment Grade Corporate ETF(continued)
| | | | | | | | | | | | | | |
| | | | |
| | | | | Country | | | Principal Amount* | | | Value | |
| | | | | | | | | | | | | | |
| | | Corporate Bonds & Notes (continued) | | | | | | | | | |
| | | Road & Rail (continued) | | | | | | | | | |
| | CSX Corp., senior bond, 4.25%, 11/01/66 | | | United States | | | | 1,800,000 | | | $ | 1,912,706 | |
| | | | | | | | | | | | | | |
| | | | |
| | | �� | | | | | | | | | | 2,163,526 | |
| | | | | | | | | | | | | | |
| | | Semiconductors & Semiconductor Equipment 1.3% | | | | | | | | | |
| | Maxim Integrated Products Inc., senior note, 3.375%, 3/15/23 | | | United States | | | | 2,900,000 | | | | 2,987,065 | |
| | | | | | | | | | | | | | |
| | | Software 1.1% | | | | | | | | | |
| | Microsoft Corp., senior note, 2.65%, 11/03/22 | | | United States | | | | 2,500,000 | | | | 2,564,230 | |
| | | | | | | | | | | | | | |
| | | Specialty Retail 0.7% | | | | | | | | | |
| | AutoZone Inc., senior note, 3.75%, 4/18/29 | | | United States | | | | 1,300,000 | | | | 1,395,117 | |
| a | | Michael Kors USA Inc., senior note, 144A, 4.00%, 11/01/24 | | | United States | | | | 190,000 | | | | 194,475 | |
| | | | | | | | | | | | | | |
| | | | |
| | | | | | | | | | | | | 1,589,592 | |
| | | | | | | | | | | | | | |
| | | Textiles, Apparel & Luxury Goods 0.1% | | | | | | | | | |
| | NIKE Inc., senior bond, 3.875%, 11/01/45 | | | United States | | | | 225,000 | | | | 257,534 | |
| | | | | | | | | | | | | | |
| | | Tobacco 1.1% | | | | | | | | | |
| a | | Imperial Brands Finance PLC, senior note, 144A, 4.25%, 7/21/25 | | | United Kingdom | | | | 1,065,000 | | | | 1,116,440 | |
| | Reynolds American Inc., senior bond, 5.85%, 8/15/45 | | | United Kingdom | | | | 1,305,000 | | | | 1,446,269 | |
| | | | | | | | | | | | | | |
| | | | |
| | | | | | | | | | | | | 2,562,709 | |
| | | | | | | | | | | | | | |
| | | Trading Companies & Distributors 0.7% | | | | | | | | | |
| | Aircastle Ltd., senior note, 4.25%, 6/15/26 | | | Bermuda | | | | 1,500,000 | | | | 1,538,737 | |
| | | | | | | | | | | | | | |
| | | Wireless Telecommunication Services 0.5% | | | | | | | | | |
| a | | Sprint Spectrum Co. LLC/Sprint Spectrum Co. II LLC, first lien,144A, 3.36%, 3/20/23 | | | United States | | | | 1,250,000 | | | | 1,257,813 | |
| | | | | | | | | | | | | | |
| | Total Corporate Bonds & Notes (Cost $215,792,979) | | | | | | | | | | | 226,254,683 | |
| | | | | | | | | | | | | | |
| | | U.S. Government & Agency Securities 1.0% | | | | | | | | | |
| | U.S. Treasury Bond, 3.75%, 8/15/41 | | | United States | | | | 1,800,000 | | | | 2,346,258 | |
| | | | | | | | | | | | | | |
| | Total U.S. Government & Agency Securities
(Cost $2,387,538) | | | | | | | | | | | 2,346,258 | |
| | | | | | | | | | | | | | |
| | Total Investments before Short Term Investments (Cost $218,180,517) | | | | | | | | | | | 228,600,941 | |
| | | | | | | | | | | | | | |
| | | Short Term Investments 1.0% | | | | | | | | | |
| | | U.S. Government & Agency Securities (Cost $2,340,000) 1.0% | | | | | | | | | |
| b | | FHLB, 1.602%, 10/01/19 | | | United States | | | | 2,340,000 | | | | 2,340,000 | |
| | | | | | | | | | | | | | |
| | Total Short-Term Investment (Cost $2,340,000) | | | | | | | | | | | 2,340,000 | |
| | | | | | | | | | | | | | |
| | Total Investments (Cost $220,520,517) 99.2% | | | | | | | | | | | 230,940,941 | |
| | Other Assets, less Liabilities 0.8% | | | | | | | | | | | 1,776,216 | |
| | | | | | | | | | | | | | |
| | Net Assets 100.0% | | | | | | | | | | $ | 232,717,157 | |
| | | | | | | | | | | | | | |
See Abbreviations on page 63.
*The principal amount is stated in U.S. dollars unless otherwise indicated.
aSecurity was purchased pursuant to Rule 144A under the Securities Act of 1933 and may be sold in transactions exempt from registration only to qualified institutional buyers or in a public offering registered under the Securities Act of 1933. These securities have been deemed liquid under guidelines approved by the Fund’s Board of Trustees. At September 30, 2019, the aggregate value of these securities was $34,438,241, representing 14.8% of net assets.
bThe security was issued on a discount basis with no stated coupon rate.
| | | | |
| | | |
| 38 | | Semiannual Report | | franklintempleton.com |
FRANKLIN TEMPLETON ETF TRUST
STATEMENT OF INVESTMENTS (UNAUDITED)
Franklin Liberty Investment Grade Corporate ETF(continued)
At September 30, 2019, the Fund had the following futures contracts outstanding. See Note 1(c).
| | | | | | | | | | | | | | | | | | | | |
| Futures Contracts | | | | | | | | | | | | | | | |
| | | | | |
| Description | | Type | | | Number of
Contracts | | | Notional
Amount* | | | Expiration
Date | | | Value/Unrealized
Appreciation
(Depreciation) | |
| Index Contracts | |
U.S. Treasury 30 Yr. Bond | | | Long | | | | 102 | | | $ | 16,555,875 | | | | 12/19/19 | | | $ | (278,254 | ) |
U.S. Treasury 5 Yr. Note | | | Short | | | | (22 | ) | | | (2,621,266 | ) | | | 12/31/19 | | | | 24,206 | |
CME Ultra Long Term U.S. Treasury Bond | | | Short | | | | (15 | ) | | | (2,878,594 | ) | | | 12/19/19 | | | | 95,603 | |
Ultra 10 Yr. U.S. Treasury Note | | | Short | | | | (38 | ) | | | (5,411,438 | ) | | | 12/19/19 | | | | 94,770 | |
U.S. Treasury 10 Yr. Note | | | Short | | | | (124 | ) | | | (16,158,750 | ) | | | 12/19/19 | | | | 230,393 | |
| | | | | | | | | | | | | | | | | | | | |
Total Futures Contracts | | | | | | | | | | | | | | | | | | $ | 166,718 | |
| | | | | | | | | | | | | | | | | | | | |
*As of period end.
See Abbreviations on page 63.
| | | | | | |
| | | |
| franklintempleton.com | | The accompanying notes are an integral part of these financial statements. | Semiannual Report | | | 39 | |
FRANKLIN TEMPLETON ETF TRUST
Financial Highlights
Franklin Liberty U.S. Low Volatility ETF
| | | | | | | | | | | | | | | | |
| | | Six Months Ended
September 30, 2019
(unaudited) | | | Year Ended March 31, | |
| | | 2019 | | | 2018 | | | 2017a | |
| | | | |
Per share operating performance
(for a share outstanding throughout the period) | | | | | | | | | | | | | | | | |
| | | | |
Net asset value, beginning of period | | $ | 33.61 | | | $ | 30.03 | | | $ | 26.97 | | | $ | 25.05 | |
| | | | |
| | | | |
| Income from investment operationsb: | | | | | | | | | | | | | | | | |
| | | | |
Net investment incomec | | | 0.28 | | | | 0.52 | | | | 0.45 | | | | 0.23 | |
| | | | |
Net realized and unrealized gains (losses) | | | 2.92 | | | | 3.88 | | | | 3.06 | | | | 1.87 | |
| | | | |
| | | | |
Total from investment operations | | | 3.20 | | | | 4.40 | | | | 3.51 | | | | 2.10 | |
| | | | |
| | | | |
| Less distributions from: | | | | | | | | | | | | | | | | |
| | | | |
Net investment income | | | (0.22 | ) | | | (0.47 | ) | | | (0.45 | ) | | | (0.18 | ) |
| | | | |
Net realized gains | | | — | | | | (0.35 | ) | | | — | | | | — | |
| | | | |
| | | | |
Total distributions | | | (0.22 | ) | | | (0.82 | ) | | | (0.45 | ) | | | (0.18 | ) |
| | | | |
| | | | |
Net asset value, end of period | | $ | 36.59 | | | $ | 33.61 | | | $ | 30.03 | | | $ | 26.97 | |
| | | | |
| | | | |
Total returnd | | | 9.52% | | | | 14.98% | | | | 13.08% | | | | 8.40% | |
| | | | |
| Ratios to average net assetse | | | | | | | | | | | | | | | | |
| | | | |
Expenses before waiver and payments by affiliates | | | 0.99% | | | | 1.12% | | | | 2.11% | | | | 2.96% | |
| | | | |
Expenses net of waiver and payments by affiliates | | | 0.50% | | | | 0.50% | | | | 0.50% | | | | 0.50% | |
| | | | |
Net investment income | | | 1.61% | | | | 1.64% | | | | 1.56% | | | | 1.69% | |
| | | | |
| Supplemental data | | | | | | | | | | | | | | | | |
| | | | |
Net assets, end of period (000’s) | | | $56,716 | | | | $13,443 | | | | $6,005 | | | | $5,393 | |
| | | | |
Portfolio turnover ratef | | | 9.67% | | | | 46.90% | | | | 65.68% | | | | 12.55% | |
| | | | |
| Portfolio turnover rate excluding portfolio transactions that are executed as a result of the Fund offering and redeeming Creation Units solely or in part for cashf,g | | | 9.67% | | | | —% | | | | —% | | | | —% | |
aFor the period September 20, 2016 (commencement of operations) to March 31, 2017.
bThe amount shown for a share outstanding throughout the period may not correlate with the Statement of Operations for the period due to the timing of sales and repurchases of Creation Unit Fund shares in relation to income earned and/or fluctuating fair value of the investments of the Fund.
cBased on average daily shares outstanding.
dTotal return is not annualized for periods less than one year. Total return is calculated assuming an initial investment made at the net asset value at the beginning of the period, reinvestment of all dividends and distributions at net asset value during the period, and redemption at net asset value on the last day of the period.
eRatios are annualized for periods less than one year.
fPortfolio turnover rate excludes the value of portfolio securities received or delivered as a result of processing capital share transactions in Creation Units, if any.
gEffective September 30, 2019.
| | | | |
| | | |
| 40 | | Semiannual Report | The accompanying notes are an integral part of these financial statements. | | franklintempleton.com |
FRANKLIN TEMPLETON ETF TRUST
Statement of Investments, September 30, 2019 (unaudited)
Franklin Liberty U.S. Low Volatility ETF
| | | | | | | | | | |
| | |
| | | Shares | | | Value | |
| | | | | | | | | | |
| | | Common Stocks 99.4% | | | | | | |
| | | Communication Services 9.8% | | | | | | |
| a | | Alphabet Inc., A | | | 653 | | | $ | 797,405 | |
| | AT&T Inc. | | | 21,895 | | | | 828,507 | |
| a | | Charter Communications Inc., A | | | 1,895 | | | | 780,967 | |
| | Comcast Corp., A | | | 17,428 | | | | 785,654 | |
| | TELUS Corp. | | | 22,140 | | | | 788,627 | |
| | The Walt Disney Co. | | | 6,107 | | | | 795,864 | |
| | Verizon Communications Inc. | | | 13,555 | | | | 818,180 | |
| | | | | | | | | | |
| | | | | | | | | 5,595,204 | |
| | | | | | | | | | |
| | | Consumer Discretionary 10.7% | | | | | | |
| | Lowe’s Cos. Inc. | | | 6,703 | | | | 737,062 | |
| | Marriott International Inc., A | | | 5,798 | | | | 721,097 | |
| | McDonald’s Corp. | | | 3,566 | | | | 765,656 | |
| | NIKE Inc., B | | | 8,558 | | | | 803,767 | |
| a | | O’Reilly Automotive Inc. | | | 1,923 | | | | 766,335 | |
| | Ross Stores Inc. | | | 6,915 | | | | 759,613 | |
| | The Home Depot Inc. | | | 3,288 | | | | 762,882 | |
| | Tractor Supply Co. | | | 8,155 | | | | 737,538 | |
| | | | | | | | | | |
| | | | | | | | | 6,053,950 | |
| | | | | | | | | | |
| | | Consumer Staples 7.1% | | | | | | |
| | Mondelez International Inc., A | | | 14,478 | | | | 800,923 | |
| | PepsiCo Inc. | | | 5,866 | | | | 804,229 | |
| | The Coca-Cola Co. | | | 14,635 | | | | 796,729 | |
| | The Procter & Gamble Co. | | | 6,519 | | | | 810,833 | |
| | Walmart Inc. | | | 6,822 | | | | 809,635 | |
| | | | | | | | | | |
| | | | | | | | | 4,022,349 | |
| | | | | | | | | | |
| | | Energy 4.1% | | | | | | |
| | Chevron Corp. | | | 3,944 | | | | 467,759 | |
| | Exxon Mobil Corp. | | | 6,761 | | | | 477,394 | |
| | Kinder Morgan Inc. | | | 23,657 | | | | 487,571 | |
| | Occidental Petroleum Corp. | | | 10,673 | | | | 474,628 | |
| | Schlumberger Ltd. | | | 12,961 | | | | 442,877 | |
| | | | | | | | | | |
| | | | | | | | | 2,350,229 | |
| | | | | | | | | | |
| | | Financials 13.0% | | | | | | |
| | Aflac Inc. | | | 12,775 | | | | 668,388 | |
| | Arthur J. Gallagher & Co. | | | 7,504 | | | | 672,133 | |
| | BB&T Corp. | | | 12,715 | | | | 678,600 | |
| | Chubb Ltd. | | | 4,223 | | | | 681,761 | |
| | Intercontinental Exchange Inc. | | | 7,168 | | | | 661,391 | |
| | JPMorgan Chase & Co. | | | 5,616 | | | | 660,947 | |
| | S&P Global Inc. | | | 2,608 | | | | 638,908 | |
| | The Progressive Corp. | | | 8,844 | | | | 683,199 | |
| | The Travelers Cos. Inc. | | | 4,561 | | | | 678,175 | |
| | U.S. Bancorp | | | 12,031 | | | | 665,796 | |
| | W.R. Berkley Corp. | | | 9,309 | | | | 672,389 | |
| | | | | | | | | | |
| | | | | | | | | 7,361,687 | |
| | | | | | | | | | |
| | | Health Care 13.2% | | | | | | |
| | Abbott Laboratories | | | 8,280 | | | | 692,788 | |
| | Baxter International Inc. | | | 7,874 | | | | 688,739 | |
| | Becton Dickinson and Co. | | | 2,672 | | | | 675,909 | |
| | Danaher Corp. | | | 4,716 | | | | 681,132 | |
| | Johnson & Johnson | | | 5,278 | | | | 682,868 | |
| | Medtronic PLC | | | 6,201 | | | | 673,553 | |
| | Merck & Co. Inc. | | | 8,190 | | | | 689,434 | |
| | | | | | |
| | | |
| franklintempleton.com | | Semiannual Report | | | 41 | |
FRANKLIN TEMPLETON ETF TRUST
STATEMENT OF INVESTMENTS (UNAUDITED)
Franklin Liberty U.S. Low Volatility ETF(continued)
| | | | | | | | | | |
| | |
| | | Shares | | | Value | |
| | | | | | | | | | |
| | | Common Stocks (continued) | | | | | | |
| | | Health Care (continued) | | | | | | |
| | Pfizer Inc. | | | 18,854 | | | $ | 677,424 | |
| | Quest Diagnostics Inc. | | | 6,512 | | | | 696,979 | |
| | Stryker Corp. | | | 3,105 | | | | 671,611 | |
| | UnitedHealth Group Inc. | | | 2,949 | | | | 640,877 | |
| | | | | | | | | | |
| | | | | | | | | 7,471,314 | |
| | | | | | | | | | |
| | | Industrials 9.6% | | | | | | |
| | General Dynamics Corp. | | | 3,228 | | | | 589,852 | |
| | Honeywell International Inc. | | | 3,635 | | | | 615,042 | |
| | Ingersoll-Rand PLC | | | 4,903 | | | | 604,099 | |
| | Lockheed Martin Corp. | | | 1,528 | | | | 596,012 | |
| | Raytheon Co. | | | 3,043 | | | | 597,006 | |
| | Republic Services Inc. | | | 7,072 | | | | 612,081 | |
| | Roper Technologies Inc. | | | 1,706 | | | | 608,360 | |
| | United Technologies Corp. | | | 4,410 | | | | 602,053 | |
| | Verisk Analytics Inc. | | | 3,821 | | | | 604,253 | |
| | | | | | | | | | |
| | | | | | | | | 5,428,758 | |
| | | | | | | | | | |
| | | Information Technology 21.8% | | | | | | |
| | Accenture PLC, A | | | 4,224 | | | | 812,486 | |
| | Amphenol Corp., A | | | 8,747 | | | | 844,086 | |
| | Apple Inc. | | | 3,725 | | | | 834,288 | |
| | Automatic Data Processing Inc. | | | 5,178 | | | | 835,833 | |
| | Cisco Systems Inc. | | | 16,774 | | | | 828,803 | |
| a | | Fiserv Inc. | | | 7,851 | | | | 813,285 | |
| | Global Payments Inc. | | | 5,060 | | | | 804,540 | |
| | International Business Machines Corp. | | | 5,768 | | | | 838,783 | |
| | Intuit Inc. | | | 3,044 | | | | 809,521 | |
| | Mastercard Inc., A | | | 2,981 | | | | 809,550 | |
| | Microsoft Corp. | | | 5,835 | | | | 811,240 | |
| | Oracle Corp. | | | 15,447 | | | | 850,049 | |
| a | | Synopsys Inc. | | | 6,016 | | | | 825,696 | |
| | Texas Instruments Inc. | | | 6,393 | | | | 826,231 | |
| | Visa Inc., A | | | 4,684 | | | | 805,695 | |
| | | | | | | | | | |
| | | | | | | | | 12,350,086 | |
| | | | | | | | | | |
| | | Materials 2.8% | | | | | | |
| | Air Products and Chemicals Inc. | | | 2,364 | | | | 524,477 | |
| | Ecolab Inc. | | | 2,675 | | | | 529,757 | |
| | Linde PLC | | | 2,706 | | | | 524,206 | |
| | | | | | | | | | |
| | | | | | | | | 1,578,440 | |
| | | | | | | | | | |
| | | Real Estate 4.0% | | | | | | |
| | Alexandria Real Estate Equities Inc. | | | 3,691 | | | | 568,562 | |
| | American Tower Corp. | | | 2,488 | | | | 550,171 | |
| | Equity Residential | | | 6,641 | | | | 572,853 | |
| | UDR Inc. | | | 11,788 | | | | 571,482 | |
| | | | | | | | | | |
| | | | | | | | | 2,263,068 | |
| | | | | | | | | | |
| | | Utilities 3.3% | | | | | | |
| | Dominion Energy Inc. | | | 5,767 | | | | 467,358 | |
| | DTE Energy Co. | | | 3,536 | | | | 470,146 | |
| | Duke Energy Corp. | | | 4,960 | | | | 475,465 | |
| | Xcel Energy Inc. | | | 7,257 | | | | 470,907 | |
| | | | | | | | | | |
| | | | | | | | | 1,883,876 | |
| | | | | | | | | | |
| | Total Investments before Short Term Investments (Cost $53,052,223) | | | | | | | 56,358,961 | |
| | | | | | | | | | |
| | | | |
| | | |
| 42 | | Semiannual Report | | franklintempleton.com |
FRANKLIN TEMPLETON ETF TRUST
STATEMENT OF INVESTMENTS (UNAUDITED)
Franklin Liberty U.S. Low Volatility ETF(continued)
| | | | | | | | | | |
| | |
| | | Shares | | | Value | |
| | | | | | | | | | |
| | | Short Term Investments 0.5% | | | | | | |
| | | U.S. Government & Agency Securities 0.5% | | | | | | |
| b | | FHLB, 1.602%, 10/01/19 | | | 295,000 | | | $ | 295,000 | |
| | | | | | | | | | |
| | Total Short-Term Investment (Cost $295,000) | | | | | | | 295,000 | |
| | | | | | | | | | |
| | Total Investments (Cost $53,347,223) 99.9% | | | | | | | 56,653,961 | |
| | Other Assets, less Liabilities 0.1% | | | | | | | 62,092 | |
| | | | | | | | | | |
| | Net Assets 100.0% | | | | | | $ | 56,716,053 | |
| | | | | | | | | | |
See Abbreviations on page 63.
aNon-income producing.
bThe security was issued on a discount basis with no stated coupon rate.
| | | | | | |
| | | |
| franklintempleton.com | | The accompanying notes are an integral part of these financial statements. | Semiannual Report | | | 43 | |
FRANKLIN TEMPLETON ETF TRUST
Financial Highlights
Franklin Liberty U.S. Core Bond ETF
| | | | |
| |
| | | Period ending
September 30, 2019
(unaudited)a | |
|
Per share operating performance
(for a share outstanding throughout the period) | |
| |
Net asset value, beginning of period | | $ | 25.00 | |
| | | | |
|
| Income from investment operationsb: | |
| |
Net investment incomec | | | 0.02 | |
| |
Net realized and unrealized gains (losses) | | | 0.16 | |
| | | | |
| |
Total from investment operations | | | 0.18 | |
| | | | |
| |
Less distributions from net investment income | | | 0.00d | |
| | | | |
| |
Net asset value, end of period | | $ | 25.18 | |
| | | | |
| |
Total returne | | | 0.74% | |
|
| Ratios to average net assetsf | |
| |
Expenses before waiver and payments by affiliates | | | 0.20% | |
| |
Expenses net of waiver and payments by affiliates | | | 0.15% | |
| |
Net investment income | | | 1.70% | |
|
| Supplemental data | |
| |
Net assets, end of period (000’s) | | | $538,905 | |
| |
Portfolio turnover rateg | | | 7.99% | |
| |
| Portfolio turnover rate excluding portfolio transactions that are executed as a result of the Fund offering and redeeming Creation Units solely or in part for cashg,h | | | 7.99% | |
aFor the period September 17, 2019 (commencement of operations) to September 30, 2019.
bThe amount shown for a share outstanding throughout the period may not correlate with the Statement of Operations for the period due to the timing of sales and repurchases of Creation Unit Fund shares in relation to income earned and/or fluctuating fair value of the investments of the Fund.
cBased on average daily shares outstanding.
dAmount rounds to less than $0.01 per share.
eTotal return is not annualized for periods less than one year. Total return is calculated assuming an initial investment made at the net asset value at the beginning of the period, reinvestment of all dividends and distributions at net asset value during the period, and redemption at net asset value on the last day of the period.
fRatios are annualized for periods less than one year.
gPortfolio turnover rate excludes the value of portfolio securities received or delivered as a result of processing capital share transactions in Creation Units, if any.
hEffective September 30, 2019.
| | | | |
| | | |
| 44 | | Semiannual Report | The accompanying notes are an integral part of these financial statements. | | franklintempleton.com |
FRANKLIN TEMPLETON ETF TRUST
Statement of Investments, September 30, 2019 (unaudited)
Franklin Liberty U.S. Core Bond ETF
| | | | | | | | | | | | | | |
| | | | |
| | | | | Country | | | Principal Amount* | | | Value | |
| | | | | | | | | | | | | | |
| | | Corporate Bonds & Notes 29.0% | | | | | | | | | |
| | | Aerospace & Defense 0.5% | | | | | | | | | |
| | Lockheed Martin Corp., senior bond, 4.09%, 9/15/52 | | | United States | | | | 1,100,000 | | | $ | 1,295,715 | |
| | United Technologies Corp., senior bond, 3.75%, 11/01/46 | | | United States | | | | 1,300,000 | | | | 1,432,835 | |
| | | | | | | | | | | | | | |
| | | | |
| | | | | | | | | | | | | 2,728,550 | |
| | | | | | | | | | | | | | |
| | | Air Freight & Logistics 0.3% | | | | | | | | | |
| | FedEx Corp., senior bond, 4.05%, 2/15/48 | | | United States | | | | 1,400,000 | | | | 1,375,425 | |
| | | | | | | | | | | | | | |
| | | Banks 4.2% | | | | | | | | | |
| | Bank of America Corp., | | | | | | | | | | | | |
| | senior note, 2.881%, 4/24/23 | | | United States | | | | 1,000,000 | | | | 1,015,120 | |
| | senior sub. bond, 4.25%, 10/22/26 | | | United States | | | | 2,250,000 | | | | 2,431,417 | |
| | BB&T Corp., sub. bond, 3.875%, 3/19/29 | | | United States | | | | 2,250,000 | | | | 2,440,548 | |
| a | | BNP Paribas SA, senior note, FRN thereafter, 144A, 4.705%, 1/10/25 | | | France | | | | 3,050,000 | | | | 3,298,708 | |
| | BPCE SA, | | | | | | | | | | | | |
| | a 144A, 4.875%, 4/01/26 | | | France | | | | 1,800,000 | | | | 1,960,767 | |
| | a senior note, 144A, 5.70%, 10/22/23 | | | France | | | | 1,100,000 | | | | 1,213,594 | |
| | Branch Banking & Trust Co., sub. note, 3.625%, 9/16/25 | | | France | | | | 800,000 | | | | 850,973 | |
| | | | |
| | Citigroup Inc., | | | | | | | | | | | | |
| | senior note, 2.876%, 7/24/23 | | | United States | | | | 3,100,000 | | | | 3,141,058 | |
| | Subordinated, 3.875%, 3/26/25 | | | United States | | | | 100,000 | | | | 105,299 | |
| | JPMorgan Chase & Co., sub. note, 3.375%, 5/01/23 | | | United States | | | | 3,100,000 | | | | 3,208,156 | |
| | SunTrust Bank Atlanta GA, senior note, 2.75%, 5/01/23 | | | United States | | | | 3,100,000 | | | | 3,156,866 | |
| | | | | | | | | | | | | | |
| | | | |
| | | | | | | | | | | | | 22,822,506 | |
| | | | | | | | | | | | | | |
| | | Biotechnology 0.9% | | | | | | | | | |
| | Biogen Inc., | | | | | | | | | | | | |
| | senior note, 3.625%, 9/15/22 | | | United States | | | | 2,650,000 | | | | 2,756,229 | |
| | senior note, 4.05%, 9/15/25 | | | United States | | | | 500,000 | | | | 542,075 | |
| | Gilead Sciences Inc., senior bond, 4.15%, 3/01/47 | | | United States | | | | 1,400,000 | | | | 1,559,986 | |
| | | | | | | | | | | | | | |
| | | | |
| | | | | | | | | | | | | 4,858,290 | |
| | | | | | | | | | | | | | |
| | | Building Products 0.4% | | | | | | | | | |
| | CRH America Finance Inc., senior note, 3.40%, 5/09/27 | | | Ireland | | | | 1,850,000 | | | | 1,912,454 | |
| | | | | | | | | | | | | | |
| | | Capital Markets 1.8% | | | | | | | | | |
| a | | Credit Suisse Group AG, senior note, FRN thereafter,
144A, 2.997%, 12/14/23 | | | Switzerland | | | | 3,350,000 | | | | 3,385,557 | |
| | Morgan Stanley, | | | | | | | | | | | | |
| | senior note, 2.625%, 11/17/21 | | | United States | | | | 200,000 | | | | 201,971 | |
| | senior note, 3.70%, 10/23/24 | | | United States | | | | 800,000 | | | | 847,644 | |
| | sub. bond, 3.95%, 4/23/27 | | | United States | | | | 2,000,000 | | | | 2,117,281 | |
| | | | |
| | The Goldman Sachs Group Inc., | | | | | | | | | | | | |
| | senior bond, 4.411%, 4/23/39 | | | United States | | | | 1,400,000 | | | | 1,583,957 | |
| | senior note, 2.908%, 6/05/23 | | | United States | | | | 1,400,000 | | | | 1,418,795 | |
| | | | | | | | | | | | | | |
| | | | |
| | | | | | | | | | | | | 9,555,205 | |
| | | | | | | | | | | | | | |
| | | Chemicals 0.6% | | | | | | | | | |
| | LYB International Finance II BV, senior note, 3.50%, 3/02/27 | | | United States | | | | 3,300,000 | | | | 3,402,305 | |
| | | | | | | | | | | | | | |
| | | Commercial Services & Supplies 0.3% | | | | | | | | | |
| | Boardwalk Pipelines LP, senior note, 4.80%, 5/03/29 | | | United States | | | | 1,450,000 | | | | 1,541,273 | |
| | | | | | | | | | | | | | |
| | | Construction Materials 0.1% | | | | | | | | | |
| a | | CRH America Inc., senior note, 144A, 3.875%, 5/18/25 | | | Ireland | | | | 500,000 | | | | 528,932 | |
| | | | | | | | | | | | | | |
| | | Consumer Finance 0.7% | | | | | | | | | |
| | Capital One Financial Corp., | | | | | | | | | | | | |
| | senior bond, 3.50%, 6/15/23 | | | United States | | | | 1,450,000 | | | | 1,511,096 | |
| | senior note, 3.75%, 3/09/27 | | | United States | | | | 2,050,000 | | | | 2,153,744 | |
| | | | | | | | | | | | | | |
| | | | |
| | | | | | | | | | | | | 3,664,840 | |
| | | | | | | | | | | | | | |
| | | | | | |
| | | |
| franklintempleton.com | | Semiannual Report | | | 45 | |
FRANKLIN TEMPLETON ETF TRUST
STATEMENT OF INVESTMENTS (UNAUDITED)
Franklin Liberty U.S. Core Bond ETF(continued)
| | | | | | | | | | | | | | |
| | | | |
| | | | | Country | | | Principal Amount* | | | Value | |
| | | | | | | | | | | | | | |
| | | Corporate Bonds & Notes (continued) | | | | | | | | | |
| | | Containers & Packaging 0.2% | | | | | | | | | |
| | WRKCo Inc., Sr. Unsecured, 4.00%, 3/15/28 | | | United States | | | | 1,100,000 | | | $ | 1,172,517 | |
| | | | | | | | | | | | | | |
| | | Diversified Telecommunication Services 0.9% | | | | | | | | | |
| | AT&T Inc., | | | | | | | | | | | | |
| | senior note, 3.875%, 1/15/26 | | | United States | | | | 2,050,000 | | | | 2,176,545 | |
| | Sr. Unsecured, 3.80%, 2/15/27 | | | United States | | | | 1,000,000 | | | | 1,059,986 | |
| | Telefonica Emisiones SA, senior bond, 4.895%, 3/06/48 | | | Spain | | | | 900,000 | | | | 1,006,341 | |
| | Time Warner Entertainment Co. LP, senior bond, 8.375%, 3/15/23 | | | United States | | | | 700,000 | | | | 829,234 | |
| | | | | | | | | | | | | | |
| | | | |
| | | | | | | | | | | | | 5,072,106 | |
| | | | | | | | | | | | | | |
| | | Electric Utilities 2.0% | | | | | | | | | |
| | Alabama Power Co., senior note, 2.45%, 3/30/22 | | | United States | | | | 300,000 | | | | 303,190 | |
| | Baltimore Gas & Electric Co., senior bond, 3.50%, 8/15/46 | | | United States | | | | 1,400,000 | | | | 1,456,006 | |
| | Duke Energy Carolinas LLC, secured bond, 3.70%, 12/01/47 | | | United States | | | | 1,400,000 | | | | 1,522,290 | |
| | Georgia Power Co., senior bond, 4.75%, 9/01/40 | | | United States | | | | 1,400,000 | | | | 1,626,065 | |
| | MidAmerican Energy Co., secured bond, 3.65%, 8/01/48 | | | United States | | | | 1,100,000 | | | | 1,200,773 | |
| | PSEG Power LLC, senior note, 3.85%, 6/01/23 | | | United States | | | | 300,000 | | | | 317,090 | |
| | Public Service Electric & Gas Co., secured bond, 3.80%, 3/01/46 | | | United States | | | | 1,100,000 | | | | 1,228,715 | |
| a | | State Grid Overseas Investment 2016 Ltd., senior note, 144A, 3.50%, 5/04/27 | | | China | | | | 1,700,000 | | | | 1,796,442 | |
| | Virginia Electric & Power Co., Sr. Unsecured, B, 3.80%, 9/15/47 | | | United States | | | | 1,100,000 | | | | 1,192,754 | |
| | | | | | | | | | | | | | |
| | | | |
| | | | | | | | | | | | | 10,643,325 | |
| | | | | | | | | | | | | | |
| | | Electronic Equipment, Instruments & Components 0.8% | | | | | | | | | |
| | Keysight Technologies Inc., senior note, 4.60%, 4/06/27 | | | United States | | | | 1,100,000 | | | | 1,211,445 | |
| | Tech Data Corp., senior note, 3.70%, 2/15/22 | | | United States | | | | 3,100,000 | | | | 3,170,553 | |
| | | | | | | | | | | | | | |
| | | | |
| | | | | | | | | | | | | 4,381,998 | |
| | | | | | | | | | | | | | |
| | | Energy Equipment & Services 0.8% | | | | | | | | | |
| | Baker Hughes a GE Co. LLC/Baker HughesCo-obligator Inc., senior bond, 4.08%, 12/15/47 | | | United States | | | | 1,100,000 | | | | 1,109,005 | |
| a | | Schlumberger Holdings Corp., Sr. Unsecured, 144A, 3.90%, 5/17/28 | | | United States | | | | 2,750,000 | | | | 2,913,318 | |
| | Total Capital International SA, Sr. Unsecured, 3.461%, 7/12/49 | | | France | | | | 400,000 | | | | 422,823 | |
| | | | | | | | | | | | | | |
| | | | |
| | | | | | | | | | | | | 4,445,146 | |
| | | | | | | | | | | | | | |
| | | Equity Real Estate Investment Trusts (REITs) 1.0% | | | | | | | | | |
| | Essex Portfolio LP, Sr. Unsecured, 4.00%, 3/01/29 | | | United States | | | | 2,250,000 | | | | 2,459,079 | |
| | Kimco Realty Corp., | | | | | | | | | | | | |
| | senior note, 3.30%, 2/01/25 | | | United States | | | | 2,250,000 | | | | 2,322,035 | |
| | Sr. Unsecured, 4.25%, 4/01/45 | | | United States | | | | 750,000 | | | | 809,171 | |
| | | | | | | | | | | | | | |
| | | | |
| | | | | | | | | | | | | 5,590,285 | |
| | | | | | | | | | | | | | |
| | | Food & Staples Retailing 0.4% | | | | | | | | | |
| | The Kroger Co., senior bond, 4.45%, 2/01/47 | | | United States | | | | 950,000 | | | | 981,622 | |
| | Walgreens Boots Alliance Inc., senior note, 3.45%, 6/01/26 | | | United States | | | | 800,000 | | | | 826,816 | |
| | Walgreens Boots Alliance, Inc., senior bond, 4.80%, 11/18/44 | | | United States | | | | 400,000 | | | | 423,109 | |
| | | | | | | | | | | | | | |
| | | | |
| | | | | | | | | | | | | 2,231,547 | |
| | | | | | | | | | | | | | |
| | | Food Products 0.6% | | | | | | | | | |
| | BAT Capital Corp., senior bond, 4.54%, 8/15/47 | | | United Kingdom | | | | 750,000 | | | | 720,223 | |
| | Bunge Ltd. Finance Corp., senior note, 3.75%, 9/25/27 | | | United States | | | | 1,450,000 | | | | 1,488,193 | |
| | Kraft Heinz Foods Co., senior bond, 4.375%, 6/01/46 | | | United States | | | | 950,000 | | | | 908,607 | |
| | | | | | | | | | | | | | |
| | | | |
| | | | | | | | | | | | | 3,117,023 | |
| | | | | | | | | | | | | | |
| | | Health Care Providers & Services 1.3% | | | | | | | | | |
| | Anthem Inc., | | | | | | | | | | | | |
| | senior bond, 3.65%, 12/01/27 | | | United States | | | | 2,250,000 | | | | 2,366,305 | |
| | senior note, 4.101%, 3/01/28 | | | United States | | | | 800,000 | | | | 864,774 | |
| | | | |
| | | |
| 46 | | Semiannual Report | | franklintempleton.com |
FRANKLIN TEMPLETON ETF TRUST
STATEMENT OF INVESTMENTS (UNAUDITED)
Franklin Liberty U.S. Core Bond ETF(continued)
| | | | | | | | | | | | | | |
| | | | |
| | | | | Country | | | Principal Amount* | | | Value | |
| | | | | | | | | | | | | | |
| | | Corporate Bonds & Notes (continued) | | | | | | | | | |
| | | Health Care Providers & Services (continued) | | | | | | | | | |
| | Cigna Corp., senior bond, 3.875%, 10/15/47 | | | United States | | | | 1,400,000 | | | $ | 1,387,121 | |
| | CVS Health Corp., senior bond, 4.875%, 7/20/35 | | | United States | | | | 1,400,000 | | | | 1,561,970 | |
| | HCA Inc., senior secured bond, first lien, 5.50%, 6/15/47 | | | United States | | | | 900,000 | | | | 1,013,353 | |
| | | | | | | | | | | | | | |
| | | | |
| | | | | | | | | | | | | 7,193,523 | |
| | | | | | | | | | | | | | |
| | | Industrial Conglomerates 0.6% | | | | | | | | | |
| | General Electric Co., | | | | | | | | | | | | |
| | senior bond, 3.10%, 1/09/23 | | | United States | | | | 3,000,000 | | | | 3,041,632 | |
| | senior bond, 4.125%, 10/09/42 | | | United States | | | | 200,000 | | | | 200,555 | |
| | | | | | | | | | | | | | |
| | | | |
| | | | | | | | | | | | | 3,242,187 | |
| | | | | | | | | | | | | | |
| | | Insurance 2.1% | | | | | | | | | |
| | Aflac Inc., senior bond, 4.75%, 1/15/49 | | | United States | | | | 400,000 | | | | 489,191 | |
| | MetLife Inc., senior bond, 5.875%, 2/06/41 | | | United States | | | | 1,100,000 | | | | 1,501,202 | |
| a | | Metropolitan Life Global Funding I, secured note, 144A, 2.40%, 6/17/22 | | | United States | | | | 1,100,000 | | | | 1,109,688 | |
| | Reinsurance Group of America Inc., Sr. Unsecured, 3.90%, 5/15/29 | | | United States | | | | 2,250,000 | | | | 2,396,090 | |
| a | | Swiss Re Treasury US Corp., senior bond, 144A, 4.25%, 12/06/42 | | | Switzerland | | | | 750,000 | | | | 862,731 | |
| | The Allstate Corp., senior bond, 5.55%, 5/09/35 | | | United States | | | | 1,800,000 | | | | 2,335,599 | |
| | Willis North America Inc., Sr. Unsecured, 3.60%, 5/15/24 | | | United States | | | | 2,250,000 | | | | 2,339,587 | |
| | | | | | | | | | | | | | |
| | | | |
| | | | | | | | | | | | | 11,034,088 | |
| | | | | | | | | | | | | | |
| | | Internet & Direct Marketing Retail 0.6% | | | | | | | | | |
| | Alibaba Group Holding Ltd., | | | | | | | | | | | | |
| | senior note, 3.125%, 11/28/21 | | | China | | | | 2,050,000 | | | | 2,082,710 | |
| | senior note, 3.40%, 12/06/27 | | | China | | | | 1,100,000 | | | | 1,145,881 | |
| | | | | | | | | | | | | | |
| | | | |
| | | | | | | | | | | | | 3,228,591 | |
| | | | | | | | | | | | | | |
| | | Interactive Media & Services 0.2% | | | | | | | | | |
| b | | Tencent Holdings Ltd., senior note, Reg S, 3.28%, 4/11/24 | | | China | | | | 1,250,000 | | | | 1,285,342 | |
| | | | | | | | | | | | | | |
| | | IT Services 0.3% | | | | | | | | | |
| | Fiserv Inc., senior bond, 4.40%, 7/01/49 | | | United States | | | | 1,400,000 | | | | 1,568,844 | |
| | | | | | | | | | | | | | |
| | | Media 0.5% | | | | | | | | | |
| | Charter Communications Operating LLC / Charter Communications Operating Capital, senior bond, first lien, 4.50%, 2/01/24 | | | United States | | | | 800,000 | | | | 860,009 | |
| | Comcast Corp., senior bond, 3.30%, 2/01/27 | | | United States | | | | 300,000 | | | | 317,192 | |
| | NBCUniversal Media LLC, senior bond, 4.45%, 1/15/43 | | | United States | | | | 1,100,000 | | | | 1,277,573 | |
| | | | | | | | | | | | | | |
| | | | |
| | | | | | | | | | | | | 2,454,774 | |
| | | | | | | | | | | | | | |
| | | Metals & Mining 1.3% | | | | | | | | | |
| | ArcelorMittal, senior note, 4.55%, 3/11/26 | | | France | | | | 2,500,000 | | | | 2,617,873 | |
| | Reliance Steel & Aluminum Co., senior note, 4.50%, 4/15/23 | | | United States | | | | 3,000,000 | | | | 3,171,114 | |
| | Southern Copper Corp., senior bond, 5.25%, 11/08/42 | | | Mexico | | | | 1,000,000 | | | | 1,130,552 | |
| | | | | | | | | | | | | | |
| | | | |
| | | | | | | | | | | | | 6,919,539 | |
| | | | | | | | | | | | | | |
| | | Oil, Gas & Consumable Fuels 2.2% | | | | | | | | | |
| | Enable Midstream Partners LP, senior note, 3.90%, 5/15/24 | | | United States | | | | 2,650,000 | | | | 2,702,957 | |
| | Energy Transfer Operating LP, senior bond, 5.15%, 3/15/45 | | | United States | | | | 850,000 | | | | 893,558 | |
| | Enterprise Products Operating LLC, senior bond, 4.25%, 2/15/48 | | | United States | | | | 650,000 | | | | 703,581 | |
| | Kinder Morgan Inc., Sr. Unsecured, 4.30%, 3/01/28 | | | United States | | | | 3,000,000 | | | | 3,256,239 | |
| | MPLX LP, senior bond, 4.70%, 4/15/48 | | | United States | | | | 950,000 | | | | 993,174 | |
| | Sabine Pass Liquefaction LLC, senior secured bond, first lien, 4.20%, 3/15/28 | | | United States | | | | 400,000 | | | | 423,588 | |
| | TC PipeLines LP, senior note, 3.90%, 5/25/27 | | | United States | | | | 2,550,000 | | | | 2,660,848 | |
| | | | | | | | | | | | | | |
| | | | |
| | | | | | | | | | | | | 11,633,945 | |
| | | | | | | | | | | | | | |
| | | Pharmaceuticals 1.2% | | | | | | | | | |
| | Activas Funding SCS, senior bond, 4.75%, 3/15/45 | | | United States | | | | 1,400,000 | | | | 1,485,697 | |
| | | | | | |
| | | |
| franklintempleton.com | | Semiannual Report | | | 47 | |
FRANKLIN TEMPLETON ETF TRUST
STATEMENT OF INVESTMENTS (UNAUDITED)
Franklin Liberty U.S. Core Bond ETF(continued)
| | | | | | | | | | | | | | |
| | | | |
| | | | | Country | | | Principal Amount* | | | Value | |
| | | | | | | | | | | | | | |
| | | Corporate Bonds & Notes (continued) | | | | | | | | | |
| | | Pharmaceuticals (continued) | | | | | | | | | |
| | Bristol-Myers Squibb Co., | | | | | | | | | | | | |
| | senior bond, 3.25%, 8/01/42 | | | United States | | | | 1,400,000 | | | $ | 1,419,220 | |
| | a sr. Unsecured, 144A, 3.20%, 6/15/26 | | | United States | | | | 100,000 | | | | 104,995 | |
| | Shire Acquisitions Investments Ireland Designated Activity Co., senior note, 3.20%, 9/23/26 | | | Ireland | | | | 200,000 | | | | 206,528 | |
| a | | Takeda Pharmaceutical Co. Ltd., senior note, 144A, 2.45%, 1/18/22 | | | Japan | | | | 3,100,000 | | | | 3,108,634 | |
| | | | | | | | | | | | | | |
| | | | |
| | | | | | | | | | | | | 6,325,074 | |
| | | | | | | | | | | | | | |
| | | Real Estate Management & Development 0.1% | | | | | | | | | |
| | Healthcare Trust of America Holdings LP, senior bond, 3.75%, 7/01/27 | | | United States | | | | 650,000 | | | | 681,065 | |
| | | | | | | | | | | | | | |
| | | Road & Rail 0.2% | | | | | | | | | |
| | CSX Corp., senior bond, 4.25%, 11/01/66 | | | United States | | | | 750,000 | | | | 796,961 | |
| | | | | | | | | | | | | | |
| | | Semiconductors & Semiconductor Equipment 0.9% | | | | | | | | | |
| | | | |
| | Maxim Integrated Products Inc., | | | | | | | | | | | | |
| | senior note, 3.375%, 3/15/23 | | | United States | | | | 800,000 | | | | 824,018 | |
| | senior note, 3.45%, 6/15/27 | | | United States | | | | 2,450,000 | | | | 2,533,628 | |
| | Xilinx Inc., senior note, 2.95%, 6/01/24 | | | United States | | | | 1,400,000 | | | | 1,438,800 | |
| | | | | | | | | | | | | | |
| | | | |
| | | | | | | | | | | | | 4,796,446 | |
| | | | | | | | | | | | | | |
| | | Software 0.6% | | | | | | | | | |
| | | | |
| | VMware Inc., | | | | | | | | | | | | |
| | senior note, 2.95%, 8/21/22 | | | United States | | | | 3,100,000 | | | | 3,144,514 | |
| | Sr. Unsecured, 3.90%, 8/21/27 | | | United States | | | | 100,000 | | | | 102,936 | |
| | | | | | | | | | | | | | |
| | | | |
| | | | | | | | | | | | | 3,247,450 | |
| | | | | | | | | | | | | | |
| | | Tobacco 0.0%c† | | | | | | | | | |
| a | | BAT International Finance PLC, Sr. Unsecured, 144A, 3.95%, 6/15/25 | | | United Kingdom | | | | 200,000 | | | | 208,374 | |
| | | | | | | | | | | | | | |
| | | Trading Companies & Distributors 0.4% | | | | | | | | | |
| | Aircastle Ltd., senior note, 4.25%, 6/15/26 | | | United States | | | | 2,250,000 | | | | 2,308,105 | |
| | | | | | | | | | | | | | |
| | Total Corporate Bonds & Notes (Cost $155,579,161) | | | | | | | | | | | 155,968,035 | |
| | | | | | | | | | | | | | |
| | | U.S. Government & Agency Securities 31.3% | | | | | | | | | |
| | U.S. Treasury Bond, | | | | | | | | | | | | |
| | 2.25%, 8/15/46 | | | United States | | | | 14,500,000 | | | | 14,872,979 | |
| | 2.25%, 8/15/49 | | | United States | | | | 500,000 | | | | 514,346 | |
| | 2.50%, 2/15/45 | | | United States | | | | 3,800,000 | | | | 4,089,973 | |
| | 2.75%, 11/15/42 | | | United States | | | | 10,650,000 | | | | 11,954,625 | |
| | U.S. Treasury Note, | | | | | | | | | | | | |
| | 1.375%, 8/31/23 | | | United States | | | | 92,500,000 | | | | 91,831,583 | |
| | 1.50%, 3/31/23 | | | United States | | | | 22,000,000 | | | | 21,953,164 | |
| | 1.625%, 8/15/29 | | | United States | | | | 9,800,000 | | | | 9,755,976 | |
| | 1.875%, 6/30/26 | | | United States | | | | 5,200,000 | | | | 5,286,328 | |
| | 2.75%, 9/15/21 | | | United States | | | | 8,100,000 | | | | 8,274,498 | |
| | | | | | | | | | | | | | |
| | Total U.S. Government & Agency Securities (Cost $167,791,690) | | | | | | | | | | | 168,533,472 | |
| | | | | | | | | | | | | | |
| | | Municipal Bonds 4.4% | | | | | | | | | |
| | | Alabama 0.9% | | | | | | | | | |
| | S E Alabama State Gas Supply District Gas Supply, Revenue, Libor-Project #2, Series, 2.25%, 6/01/49 | | | | | | | 5,000,000 | | | | 4,970,250 | |
| | | | | | | | | | | | | | |
| | | California 2.7% | | | | | | | | | |
| | California State GO, Various Purpose, 3.00%, 10/01/37 | | | | | | | 4,500,000 | | | | 4,720,050 | |
| | Contra Costa Community College District GO, Refunding, 2.926%, 8/01/38 | | | | | | | 10,000,000 | | | | 9,899,400 | |
| | | | | | | | | | | | | | |
| | | | |
| | | | | | | | | | | | | 14,619,450 | |
| | | | | | | | | | | | | | |
| | | | |
| | | |
| 48 | | Semiannual Report | | franklintempleton.com |
FRANKLIN TEMPLETON ETF TRUST
STATEMENT OF INVESTMENTS (UNAUDITED)
Franklin Liberty U.S. Core Bond ETF(continued)
| | | | | | | | | | | | | | |
| | | | |
| | | | | Country | | | Principal Amount* | | | Value | |
| | | | | | | | | | | | | | |
| | | Municipal Bonds (continued) | | | | | | | | | |
| | | Texas 0.8% | | | | | | | | | |
c | | Texas State Water Development Board Revenue, State Water Implementation Fund, Master Trust, Series A, 4.00%, 10/15/44 | | | | | | | 3,750,000 | | | $ | 4,250,062 | |
| | | | | | | | | | | | | | |
| | Total Municipal Bonds (Cost $23,732,135) | | | | | | | | | | | 23,839,762 | |
| | | | | | | | | | | | | | |
| | | Mortgage-Backed Securities 25.0% | | | | | | | | | |
| | | Freddie Mac 20.9% | | | | | | | | | |
| | | | |
| | Federal National Mortgage Association, | | | | | | | | | | | | |
| | 2.50%, 09/01/49 | | | United States | | | | 4,200,000 | | | | 4,180,805 | |
| | 3.00%, 09/01/49 | | | United States | | | | 44,100,000 | | | | 44,764,945 | |
| | 3.50%, 10/01/48 | | | United States | | | | 45,230,000 | | | | 46,396,086 | |
| | 4.00%, 10/01/48 | | | United States | | | | 16,920,000 | | | | 17,557,805 | |
| | | | | | | | | | | | | | |
| | | | |
| | | | | | | | | | | | | 112,899,641 | |
| | | | | | | | | | | | | | |
| | | Ginnie Mae 4.1% | | | | | | | | | |
| | FNMA, 4.50%, 9/01/48 | | | | | | | 18,180,000 | | | | 19,145,556 | |
| | GNMA, II, SF, 3.50%, 10/01/48 | | | | | | | 2,600,000 | | | | 2,693,692 | |
| | | | | | | | | | | | | | |
| | | | |
| | | | | | | | | | | | | 21,839,248 | |
| | | | | | | | | | | | | | |
| | Total Mortgage-Backed Securities (Cost $134,481,569) | | | | | | | | | | | 134,738,889 | |
| | | | | | | | | | | | | | |
| | | Foreign Government and Agency Securities 0.9% | | | | | | | | | |
| | | Colombia 0.3% | | | | | | | | | |
| | Government of Colombia, senior bond, 5.00%, 6/15/45 | | | | | | | 1,350,000 | | | | 1,584,563 | |
| | | | | | | | | | | | | | |
| | | Indonesia 0.2% | | | | | | | | | |
| a | | Government of Indonesia, senior bond, 144A, 4.35%, 1/08/27 | | | | | | | 1,250,000 | | | | 1,358,872 | |
| | | | | | | | | | | | | | |
| | | Mexico 0.4% | | | | | | | | | |
| | Government of Mexico, senior note, 4.15%, 3/28/27 | | | | | | | 2,000,000 | | | | 2,122,020 | |
| | | | | | | | | | | | | | |
| | Total Foreign Government and Agency Securities (Cost $5,082,620) | | | | | | | | | | | 5,065,455 | |
| | | | | | | | | | | | | | |
| | Total Investments (Cost $486,667,175) 90.6% | | | | | | | | | | | 488,145,613 | |
| | Other Assets, less Liabilities 9.4% | | | | | | | | | | | 50,759,516 | |
| | | | | | | | | | | | | | |
| | Net Assets 100.0% | | | | | | | | | | $ | 538,905,129 | |
| | | | | | | | | | | | | | |
See Abbreviations on page 63.
*The principal amount is stated in U.S. dollars unless otherwise indicated.
†Rounds to less than 0.1% of net assets.
aSecurity was purchased pursuant to Rule 144A under the Securities Act of 1933 and may be sold in transactions exempt from registration only to qualified institutional buyers or in a public offering registered under the Securities Act of 1933. These securities have been deemed liquid under guidelines approved by the Fund’s Board of Trustees. At September 30, 2019, the aggregate value of these securities was $21,850,612, representing 4.1% of net assets.
bSecurity was purchased pursuant to Regulation S under the Securities Act of 1933, which exempts from registration securities offered and sold outside of the United States. Such a security cannot be sold in the United States without either an effective registration statement filed pursuant to the Securities Act of 1933, or pursuant to an exemption from registration. This security has been deemed liquid under guidelines approved by the Fund’s Board of Trustees. At September 30, 2019, the value of this security was $1,285,342, representing 0.2% of net assets.
cSecurity purchased on a when-issued basis. See Note 1(b)
At September 30, 2019, the Fund had the following futures contracts outstanding. See Note 1(c).
| | | | | | | | | | | | | | | | | | | | |
| Futures Contracts | | | | | | | | | | | | | | | |
| | | | | |
| Description | | Type | | | Number of
Contracts | | | Notional
Amount* | | | Expiration
Date | | | Value/Unrealized
Appreciation
(Depreciation) | |
| Interest Rate Contracts | | | | | | | | | | | | | | | |
U.S. Treasury 5 Yr. Note | | | Long | | | | 105 | | | $ | 12,510,586 | | | | 12/31/19 | | | $ | 690 | |
*As of period end.
| | | | | | |
| | | |
| franklintempleton.com | | The accompanying notes are an integral part of these financial statements. | Semiannual Report | | | 49 | |
FRANKLIN TEMPLETON ETF TRUST
FINANCIAL STATEMENTS
Statements of Assets and Liabilities
September 30, 2019 (unaudited)
| | | | | | | | | | | | | | | | |
| | | | |
| | | Franklin Liberty
International
Opportunities ETF | | | Franklin Liberty
Investment Grade
Corporate ETF | | | Franklin Liberty
U.S. Low
Volatility ETF | | | Franklin Liberty
U.S. Core Bond ETF | |
Assets: | | | | | | | | | | | | | | | | |
Investments in securities: | | | | | | | | | | | | | | | | |
Cost – Unaffiliated issuers | | $ | 9,425,705 | | | $ | 220,520,517 | | | $ | 53,347,223 | | | $ | 486,667,175 | |
| | | | |
Value – Unaffiliated issuers | | $ | 9,225,502 | | | $ | 230,940,941 | | | $ | 56,653,961 | | | $ | 488,145,613 | |
Cash | | | 102,914 | | | | 447,921 | | | | 61,124 | | | | 185,962,179 | |
Foreign currency, at value (cost $1,382, $–, $– and $– respectively) | | | 1,370 | | | | — | | | | — | | | | — | |
Receivables: | | | | | | | | | | | | | | | | |
Dividends and interest | | | 34,733 | | | | 1,970,257 | | | | 46,133 | | | | 1,959,852 | |
Affiliates | | | 5,136 | | | | — | | | | — | | | | — | |
Closed swap contracts | | | — | | | | — | | | | — | | | | 1,688,568 | |
Variation margin on futures contracts | | | — | | | | 7,781 | | | | — | | | | — | |
Deposits with brokers for: | | | | | | | | | | | | | | | | |
Futures contracts | | | — | | | | 93,861 | | | | — | | | | 84,000 | |
Swap contracts | | | — | | | | — | | | | — | | | | 91,163 | |
| | | | |
Total assets | | | 9,369,655 | | | | 233,460,761 | | | | 56,761,218 | | | | 677,931,375 | |
| | | | |
Liabilities: | | | | | | | | | | | | | | | | |
Payables: | | | | | | | | | | | | | | | | |
Investment securities purchased | | | — | | | | — | | | | — | | | | 138,844,836 | |
Management fees | | | — | | | | 57,101 | | | | 3,695 | | | | 10,541 | |
Transfer agent fees | | | 7,800 | | | | 7,800 | | | | 7,800 | | | | 557 | |
Trustees’ fees and expenses | | | 167 | | | | — | | | | — | | | | 710 | |
Distributions to shareholders | | | — | | | | 615,497 | | | | — | | | | 82,647 | |
Custodian fees | | | 8,955 | | | | 10,345 | | | | 514 | | | | 298 | |
Professional fees | | | 26,253 | | | | 26,176 | | | | 18,425 | | | | 1,919 | |
Reports to shareholders | | | 620 | | | | 411 | | | | 353 | | | | — | |
Variation margin on futures contracts | | | — | | | | — | | | | — | | | | 83,310 | |
Registration and filing fees | | | 4,218 | | | | 3,764 | | | | 3,961 | | | | 498 | |
Pricing fees | | | 5,574 | | | | — | | | | — | | | | — | |
Deferred tax | | | 2,870 | | | | — | | | | — | | | | — | |
Deposits from brokers for futures contracts | | | — | | | | 6,220 | | | | — | | | | — | |
Accrued expenses and other liabilities | | | 13,853 | | | | 16,290 | | | | 10,417 | | | | 930 | |
| | | | |
Total liabilities | | | 70,310 | | | | 743,604 | | | | 45,165 | | | | 139,026,246 | |
| | | | |
Net assets, at value | | $ | 9,299,345 | | | $ | 232,717,157 | | | $ | 56,716,053 | | | $ | 538,905,129 | |
| | | | |
Net assets consist of: | | | | | | | | | | | | | | | | |
Paid-in capital | | $ | 9,530,691 | | | $ | 223,044,612 | | | $ | 53,279,476 | | | $ | 537,281,299 | |
Total distributable earnings (loss) | | | (231,346 | ) | | | 9,672,545 | | | | 3,436,577 | | | | 1,623,830 | |
| | | | |
Net assets, at value | | $ | 9,299,345 | | | $ | 232,717,157 | | | $ | 56,716,053 | | | $ | 538,905,129 | |
| | | | |
Shares outstanding | | | 350,000 | | | | 9,100,000 | | | | 1,550,000 | | | | 21,400,000 | |
| | | | |
Net asset value per share | | $ | 26.57 | | | $ | 25.57 | | | $ | 36.59 | | | $ | 25.18 | |
| | | | |
| | | | |
| | | |
| 50 | | Semiannual Report | The accompanying notes are an integral part of these financial statements. | | franklintempleton.com |
FRANKLIN TEMPLETON ETF TRUST
FINANCIAL STATEMENTS
Statements of Operations
for the six months ended September 30, 2019 (unaudited)
| | | | | | | | | | | | | | | | |
| | | | |
| | | Franklin Liberty
International
Opportunities ETF | | | Franklin Liberty
Investment Grade
Corporate ETF | | | Franklin Liberty
U.S. Low
Volatility ETF | | | Franklin Liberty
U.S. Core
Bond ETF | |
Investment income: | | | | | | | | | | | | | | | | |
Dividends: (net of foreign taxes)a | | | | | | | | | | | | | | | | |
Unaffiliated issuers | | $ | 193,554 | | | $ | — | | | $ | 180,868 | | | $ | — | |
Interest: | | | | | | | | | | | | | | | | |
Unaffiliated issuers | | | — | | | | 2,836,365 | | | | 765 | | | | 190,636 | |
| | | | |
Total investment income | | | 193,554 | | | | 2,836,365 | | | | 181,633 | | | | 190,636 | |
| | | | |
Expenses: | | | | | | | | | | | | | | | | |
Management fees (Note 3a) | | | 28,204 | | | | 475,437 | | | | 43,139 | | | | 15,452 | |
Transfer agent fees | | | 7,799 | | | | 7,799 | | | | 7,799 | | | | 557 | |
Custodian fees | | | 11,867 | | | | 10,267 | | | | 644 | | | | 298 | |
Reports to shareholders | | | 3,784 | | | | 3,800 | | | | 3,736 | | | | 398 | |
Registration and filing fees | | | 4,024 | | | | 3,830 | | | | 3,849 | | | | 498 | |
Professional fees | | | 43,958 | | | | 23,030 | | | | 20,267 | | | | 1,920 | |
Trustees’ fees and expenses | | | 650 | | | | 3,673 | | | | 853 | | | | 710 | |
Pricing fees | | | 4,297 | | | | — | | | | — | | | | — | |
Other | | | 5,526 | | | | 6,446 | | | | 4,986 | | | | 531 | |
| | | | |
Total expenses | | | 110,109 | | | | 534,282 | | | | 85,273 | | | | 20,364 | |
Expenses waived/paid by affiliates (Note 3c) | | | (81,905 | ) | | | (244,638 | ) | | | (42,134 | ) | | | (4,911 | ) |
| | | | |
Net expenses | | | 28,204 | | | | 289,644 | | | | 43,139 | | | | 15,453 | |
| | | | |
Net investment income | | | 165,350 | | | | 2,546,721 | | | | 138,494 | | | | 175,183 | |
| | | | |
Realized and unrealized gains (losses): | | | | | | | | | | | | | | | | |
Net realized gain (loss) from: | | | | | | | | | | | | | | | | |
Investments: | | | | | | | | | | | | | | | | |
Unaffiliated issuers | | | (95,303 | ) | | | 572,152 | | | | 139,702 | | | | 39,944 | |
Foreign currency transactions | | | (839 | ) | | | 130 | | | | 41 | | | | — | |
Foreign exchange contracts | | | (24 | ) | | | — | | | | — | | | | — | |
Futures contracts | | | — | | | | (224,746 | ) | | | — | | | | — | |
Swap contracts | | | — | | | | 8,526 | | | | — | | | | 12,222 | |
| | | | |
Net realized gain (loss) | | | (96,166 | ) | | | 356,062 | | | | 139,743 | | | | 52,166 | |
| | | | |
Net change in unrealized appreciation (depreciation) on: | | | | | | | | | | | | | | | | |
Investments: | | | | | | | | | | | | | | | | |
Unaffiliated issuers | | | (98,204 | ) | | | 10,258,983 | | | | 1,177,733 | | | | 1,478,438 | |
Translation of other assets and liabilities denominated in foreign currencies | | | (31 | ) | | | — | | | | (24 | ) | | | — | |
Futures contracts | | | — | | | | 166,718 | | | | — | | | | 690 | |
Change in deferred taxes on unrealized appreciation | | | (2,870 | ) | | | — | | | | — | | | | — | |
| | | | |
Net change in unrealized appreciation (depreciation) | | | (101,105 | ) | | | 10,425,701 | | | | 1,177,709 | | | | 1,479,128 | |
| | | | |
Net realized and unrealized gain (loss) | | | (197,271 | ) | | | 10,781,763 | | | | 1,317,452 | | | | 1,531,294 | |
| | | | |
Net increase (decrease) in net assets resulting from operations | | $ | (31,921 | ) | | $ | 13,328,484 | | | $ | 1,455,946 | | | $ | 1,706,477 | |
| | | | |
| | | | | | | | | | | | | | | | |
aForeign taxes withheld on dividends | | $ | 15,762 | | | $ | — | | | $ | 812 | | | $ | — | |
| | | | |
| | | | | | |
| | | |
| franklintempleton.com | | The accompanying notes are an integral part of these financial statements. | Semiannual Report | | | 51 | |
FRANKLIN TEMPLETON ETF TRUST
FINANCIAL STATEMENTS
Statements of Changes in Net Assets
| | | | | | | | | | | | | | | | |
| | |
| | | Franklin Liberty International
Opportunities ETF | | | Franklin Liberty Investment
Grade Corporate ETF | |
| | | | |
| | | Six Months Ended
September 30, 2019
(unaudited) | | | Year Ended
March 31, 2019 | | | Six Months Ended
September 30, 2019
(unaudited) | | | Year Ended
March 31, 2019 | |
Increase (decrease) in net assets: | | | | | | | | | | | | | | | | |
Operations: | | | | | | | | | | | | | | | | |
Net investment income | | $ | 165,350 | | | $ | 191,982 | | | $ | 2,546,721 | | | $ | 941,221 | |
Net realized gain (loss) | | | (96,166 | ) | | | 99,816 | | | | 356,062 | | | | (722,823 | ) |
Net change in unrealized appreciation (depreciation) | | | (101,105 | ) | | | (924,454 | ) | | | 10,425,701 | | | | 370,103 | |
| | | | |
Net increase (decrease) in net assets resulting from operations | | | (31,921 | ) | | | (632,656 | ) | | | 13,328,484 | | | | 588,501 | |
| | | | |
Distributions to shareholders | | | (148,806 | ) | | | (168,938 | ) | | | (2,846,393 | ) | | | (1,010,692 | ) |
| | | | |
Capital share transactions: (Note 2) | | | — | | | | 4,503,793 | | | | 204,170,113 | | | | (21,066,405 | ) |
| | | | |
Net increase (decrease) in net assets | | | (180,727 | ) | | | 3,702,199 | | | | 214,652,204 | | | | (21,488,596 | ) |
Net assets: | | | | | | | | | | | | | | | | |
Beginning of period | | | 9,480,072 | | | | 5,777,873 | | | | 18,064,953 | | | | 39,553,549 | |
| | | | |
End of period | | $ | 9,299,345 | | | $ | 9,480,072 | | | $ | 232,717,157 | | | $ | 18,064,953 | |
| | | | |
| | | | |
| | | |
| 52 | | Semiannual Report | The accompanying notes are an integral part of these financial statements. | | franklintempleton.com |
FRANKLIN TEMPLETON ETF TRUST
FINANCIAL STATEMENTS
Statements of Changes in Net Assets(continued)
| | | | | | | | | | | | |
| | |
| | | Franklin Liberty U.S. Low Volatility ETF | | | Franklin Liberty U.S. Core
Bond ETF | |
| | | |
| | | Six Months Ended
September 30, 2019
(unaudited) | | | Year Ended
March 31, 2019 | | | Six Months Ended September 30, 2019 (unaudited)a | |
Increase (decrease) in net assets: | |
Operations: | |
Net investment income | | $ | 138,494 | | | $ | 188,665 | | | $ | 175,183 | |
Net realized gain (loss) | | | 139,743 | | | | 251,076 | | | | 52,166 | |
Net change in unrealized appreciation (depreciation) | | | 1,177,709 | | | | 1,276,600 | | | | 1,479,128 | |
| | | | |
Net increase (decrease) in net assets resulting from operations | | | 1,455,946 | | | | 1,716,341 | | | | 1,706,477 | |
| | | | |
Distributions to shareholders | | | (106,216 | ) | | | (321,023 | ) | | | (82,647 | ) |
| | | | |
Capital share transactions: (Note 2) | | | 41,923,228 | | | | 6,042,757 | | | | 537,281,299 | |
| | | | |
Net increase (decrease) in net assets | | | 43,272,958 | | | | 7,438,075 | | | | 538,905,129 | |
Net assets: | |
Beginning of period | | | 13,443,095 | | | | 6,005,020 | | | | — | |
| | | | |
End of period | | $ | 56,716,053 | | | $ | 13,443,095 | | | $ | 538,905,129 | |
| | | | |
aFor the period September 17, 2019 (commencement of operations) to September 30, 2019.
| | | | | | |
| | | |
| franklintempleton.com | | The accompanying notes are an integral part of these financial statements. | Semiannual Report | | | 53 | |
FRANKLIN TEMPLETON ETF TRUST
Notes to Financial Statements (unaudited)
1. Organization and Significant Accounting Policies
Franklin Templeton ETF Trust (Trust) is registered under the Investment Company Act of 1940 (1940 Act) as anopen-end management investment company, consisting of thirty-nine separate funds, four of which are included in this report (Funds) and applies the specialized accounting and reporting guidance in U.S. Generally Accepted Accounting Principles (U.S. GAAP). Each of the Funds are an exchange traded fund (ETF) and are actively managed, thus they are not designed to track an index. The Trust began offering shares of Franklin Liberty U.S. Core Bond ETF.
The following summarizes the Funds’ significant accounting policies.
a. Financial Instrument Valuation
The Funds’ investments in financial instruments are carried at fair value daily. Fair value is the price that would be received to sell an asset or paid to transfer a liability in an orderly transaction between market participants on the measurement date. The Funds calculate the net asset value (NAV) per share as of 4 p.m. Eastern time each day the New York Stock Exchange (NYSE) is open for trading. Under compliance policies and procedures approved by the Trust’s Board of Trustees (the Board), the Funds’ administrator has responsibility for oversight of valuation, including leading the cross-functional Valuation Committee (VC). The Funds may utilize independent pricing services, quotations from securities and financial instrument dealers, and other market sources to determine fair value.
Equity securities and exchange traded funds listed on an exchange or on the NASDAQ National Market System are valued at the last quoted sale price or the official closing price of the day, respectively. Foreign equity securities are valued as of the close of trading on the foreign stock exchange on which the security is primarily traded or as of 4 p.m. Eastern time period. The value is then converted into its U.S. dollar equivalent at the foreign exchange rate in effect at 4 p.m. London time on the day that the value of the security is determined.Over-the-counter (OTC) securities are valued within the range of the most recent quoted bid and ask prices. Securities that trade in multiple markets or on multiple exchanges are valued according to the broadest and most representative market. Certain equity securities are valued based upon fundamental characteristics or relationships to similar securities.
Debt securities generally trade in theover-the-counter (OTC) market rather than on a securities exchange. The Funds’ pricing services use multiple valuation techniques to determine fair value. In instances where sufficient market activity exists, the pricing services may utilize a market-based approach through which quotes from market makers are used to determine fair value. In instances where sufficient market activity may not exist or is limited, the pricing services also utilize proprietary valuation models which may consider market characteristics such as benchmark yield curves, credit spreads, estimated default rates, anticipated market interest rate volatility, coupon rates, anticipated timing of principal repayments, underlying collateral, and other unique security features in order to estimate the relevant cash flows, which are then discounted to calculate the fair value.
The Funds have procedures to determine the fair value of financial instruments for which market prices are not reliable or readily available. Under these procedures, the Funds primarily employ a market-based approach which may use related or comparable assets or liabilities, recent transactions, market multiples, book values, and other relevant information for the investment to determine the fair value of the investment. An income-based valuation approach may also be used in which the anticipated future cash flows of the investment are discounted to calculate fair value. Discounts may also be applied due to the nature or duration of any restrictions on the disposition of the investments. Due to the inherent uncertainty of valuations of such investments, the fair values may differ significantly from the values that would have been used had an active market existed.
Trading in securities on foreign securities stock exchanges and OTC markets may be completed before 4 p.m. Eastern time. In addition, trading in certain foreign markets may not take place on every Funds’ business day. Occasionally, events occur between the time at which trading in a foreign security is completed and 4 p.m. Eastern time that might call into question the reliability of the value of a portfolio security held by the Fund. As a result, differences may arise between the value of the Funds’ portfolio securities as determined at the foreign market close and the latest indications of value at 4 p.m. Eastern time. The VC monitors price movements for significant events following the close of trading in foreign stock markets through a series of country specific market proxies (such as baskets of American Depositary Receipts, futures contracts and exchange traded funds). These price movements are measured against established trigger thresholds for each specific market proxy to assist in determining if
| | | | |
| | | |
| 54 | | Semiannual Report | | franklintempleton.com |
FRANKLIN TEMPLETON ETF TRUST
NOTES TO FINANCIAL STATEMENTS (UNAUDITED)
an event has occurred that may call into question the reliability of the values of the foreign securities held by the Funds. If such an event occurs, the securities may be valued using fair value procedures, which may include the use of independent pricing services.
When the last day of the reporting period is anon-business day, certain foreign markets may be open on those days that the Funds’ NAV is not calculated, which could result in differences between the value of the Funds’ portfolio securities on the last business day and the last calendar day of the reporting period. Any significant security valuation changes due to an open foreign market are adjusted and reflected by the Funds for financial reporting purposes.
b. Foreign Currency Translation
Portfolio securities and other assets and liabilities denominated in foreign currencies are translated into U.S. dollars based on the exchange rate of such currencies against U.S. dollars on the date of valuation. The Funds may enter into foreign currency exchange contracts to facilitate transactions denominated in a foreign currency. Purchases and sales of securities, income and expense items denominated in foreign currencies are translated into U.S. dollars at the exchange rate in effect on the transaction date. Portfolio securities and assets and liabilities denominated in foreign currencies contain risks that those currencies will decline in value relative to the U.S. dollar. Occasionally, events may impact the availability or reliability of foreign exchange rates used to convert the U.S. dollar equivalent value. If such an event occurs, the foreign exchange rate will be valued at fair value using procedures established and approved by the Board.
The Funds do not separately report the effect of changes in foreign exchange rates from changes in market prices on securities held. Such changes are included in net realized and unrealized gain or loss from investments in the Statements of Operations.
Realized foreign exchange gains or losses arise from sales of foreign currencies, currency gains or losses realized between the trade and settlement dates on securities transactions and the difference between the recorded amounts of dividends, interest, and foreign withholding taxes and the U.S. dollar equivalent of the amounts actually received or paid. Net unrealized foreign exchange gains and losses arise from changes in foreign exchange rates on foreign denominated assets and liabilities other than investments in securities held at the end of the reporting period.
c. Derivative Financial Instruments
Certain or all Funds invested in derivative financial instruments in order to manage risk or gain exposure to various other investments or markets. Derivatives are financial contracts based on an underlying or notional amount, require no initial investment or an initial net investment that is smaller than would normally be required to have a similar response to changes in market factors, and require or permit net settlement. Derivatives contain various risks including the potential inability of the counterparty to fulfill their obligations under the terms of the contract, the potential for an illiquid secondary market, and/or the potential for market movements which expose the Fund to gains or losses in excess of the amounts shown in the Statements of Assets and Liabilities. Realized gain and loss and unrealized appreciation and depreciation on these contracts for the period are included in the Statements of Operations.
Derivative counterparty credit risk is managed through a formal evaluation of the creditworthiness of all potential counterparties. Certain or all Funds attempt to reduce their exposure to counterparty credit risk on OTC derivatives, whenever possible, by entering into International Swaps and Derivatives Association (ISDA) master agreements with certain counterparties. These agreements contain various provisions, including but not limited to collateral requirements, events of default, or early termination.
Termination events applicable to the counterparty include certain deteriorations in the credit quality of the counterparty. Termination events applicable to the Funds include failure of the Funds to maintain certain net asset levels and/or limit the decline in net assets over various periods of time. In the event of default or early termination, the ISDA master agreement gives the nondefaulting party the right to net and close-out all transactions traded, whether or not arising under the ISDA agreement, to one net amount payable by one counterparty to the other. Early termination by the counterparty may result in an immediate payment by the Funds of any net liability owed to that counterparty under the ISDA agreement.
The Funds entered into credit default swap contracts primarily to manage and/or gain exposure to credit risk. A credit default swap is an agreement between the Fund and a counterparty whereby the buyer of the contract receives credit protection and the seller of the contract guarantees the credit worthiness of a referenced debt obligation. These agreements may be privately negotiated in the over-the-counter market (OTC credit default swaps) or may be executed in a multilateral trade facility platform, such as a registered
| | | | | | |
| | | |
| franklintempleton.com | | Semiannual Report | | | 55 | |
FRANKLIN TEMPLETON ETF TRUST
NOTES TO FINANCIAL STATEMENTS (UNAUDITED)
1. Organization and Significant Accounting Policies(continued)
exchange (centrally cleared credit default swaps). The underlying referenced debt obligation may be a single issuer of corporate or sovereign debt, a credit index, a basket of issuers or indices, or a tranche of a credit index or basket of issuers or indices. In the event of a default of the underlying referenced debt obligation, the buyer is entitled to receive the notional amount of the credit default swap contract from the seller in exchange for the referenced debt obligation, a net settlement amount equal to the notional amount of the credit default swap less the recovery value of the referenced debt obligation, or other agreed upon amount. For centrally cleared credit default swaps, required initial margins are pledged by the Fund, and the daily change in fair value is accounted for as a variation margin payable or receivable. Over the term of the contract, the buyer pays the seller a periodic stream of payments, provided that no event of default has occurred. Such periodic payments are accrued daily as an unrealized appreciation or depreciation until the payments are made, at which time they are realized. Upfront payments and receipts are reflected in the Statements of Assets and Liabilities and represent compensating factors between stated terms of the credit default swap agreement and prevailing market conditions (credit spreads and other relevant factors). These upfront payments and receipts are amortized over the term of the contract as a realized gain or loss in the Statements of Operations.
Collateral requirements differ by type of derivative. Collateral terms are contract specific for OTC derivatives. For OTC derivatives traded under an ISDA master agreement, posting of collateral is required by either the Fund or the applicable counterparty if the total net exposure of all OTC derivatives with the applicable counterparty exceeds the minimum transfer amount, which typically ranges from $100,000 to $250,000, and can vary depending on the counterparty and the type of the agreement. Generally, collateral is determined at the close of Fund business each day and any additional collateral required due to changes in derivative values may be delivered by the Fund or the counterparty the next business day, or within a few business days. Collateral pledged and/or received by the Fund, if any, is held in segregated accounts with the Fund’s custodian/counterparty broker and can be in the form of cash and/or securities. Unrestricted cash may be invested according to the Funds’ investment objectives. To the extent that the amounts due to the Fund from its counterparties are not subject to collateralization or are not fully collateralized, the Fund bears the risk of loss from counterpartynon-performance.
Certain or all Funds entered into exchange traded futures contracts primarily to manage and/or gain exposure to equity price risk. A futures contract is an agreement between the Fund and a counterparty to buy or sell an asset at a specified price on a future date. Required initial margins are pledged by the Fund, and the daily change in fair value is accounted for as a variation margin payable or receivable in the Statements of Assets and Liabilities.
See Note 7 regarding other derivative information.
d. Income and Deferred Taxes
It is each Fund’s policy to qualify as a regulated investment company under the Internal Revenue Code. Each Fund intends to distribute to shareholders substantially all of its taxable income and net realized gains to relieve it from federal income and excise taxes. As a result, no provision for U.S. federal income taxes is required.
The Funds may be subject to foreign taxation related to income received, capital gains on the sale of securities and certain foreign currency transactions in the foreign jurisdictions in which the Funds invest. Foreign taxes, if any, are recorded based on the tax regulations and rates that exist in the foreign markets in which the Funds invest. When a capital gain tax is determined to apply, certain or all Funds record an estimated deferred tax liability in an amount that would be payable if the securities were disposed of on the valuation date.
Each Fund may recognize an income tax liability related to its uncertain tax positions under U.S. GAAP when the uncertain tax position has a less than 50% probability that it will be sustained upon examination by the tax authorities based on its technical merits. As of September 30, 2019, each Fund has determined that no tax liability is required in its financial statements related to uncertain tax positions for any open tax years (or expected to be taken in future tax years). Open tax years are those that remain subject to examination and are based on the statute of limitations in each jurisdiction in which the Fund invests.
e. Security Transactions, Investment Income, Expenses and Distributions
Security transactions are accounted for on trade date. Realized gains and losses on security transactions are determined on a specific identification basis. Interest income and estimated expenses are accrued daily. Amortization of premium and accretion of discount on debt securities are included in interest income. Dividend income and capital gain distributions are recorded on theex-dividend date except for
| | | | |
| | | |
| 56 | | Semiannual Report | | franklintempleton.com |
FRANKLIN TEMPLETON ETF TRUST
NOTES TO FINANCIAL STATEMENTS (UNAUDITED)
certain dividends from securities where the dividend rate is not available. In such cases, the dividend is recorded as soon as the information is received by the Funds. Distributions to shareholders are recorded on theex-dividend date. Distributable earnings are determined according to income tax regulations (tax basis) and may differ from earnings recorded in accordance with U.S. GAAP. These differences may be permanent or temporary. Permanent differences are reclassified among capital accounts to reflect their tax character. These reclassifications have no impact on net assets or the results of operations. Temporary differences are not reclassified, as they may reverse in subsequent periods.
Common expenses incurred by the Trust are allocated among the Funds based on the ratio of net assets of each Fund to the combined net assets of the Trust. Certain Fund specific expenses are allocated directly to the Fund that incurred the expense.
f. Accounting Estimates
The preparation of financial statements in accordance with U.S. GAAP requires management to make estimates and assumptions that affect the reported amounts of assets and liabilities at the date of the financial statements and the amounts of income and expenses during the reporting period. Actual results could differ from those estimates.
g. Guarantees and Indemnifications
Under the Trust’s organizational documents, its officers and trustees are indemnified by the Trust against certain liabilities arising out of the performance of their duties to the Trust. Additionally, in the normal course of business, the Trust, on behalf of the Funds, enters into contracts with service providers that contain general indemnification clauses. The Trust’s maximum exposure under these arrangements is unknown as this would involve future claims that may be made against the Trust that have not yet occurred. Currently, the Trust expects the risk of loss to be remote.
2. Shares of Beneficial Interest
Shares of the Funds are issued and redeemed at their respective NAV only in aggregations of a specified number of shares or multiples thereof (Creation Units). Only certain large institutional investors (Authorized Participants) may engage in creation or redemption transactions directly with the Funds. Once created, shares of the Funds generally trade in the secondary market in amounts less than one Creation Unit. The market price of the Funds’ shares will be based on the price in the secondary market which may be at, above or below the most recent NAV. Creation Units may be issued and redeemed in exchange for a designated portfolio of securities and/or cash (which may include cash in lieu of certain securities).
Authorized Participants pay a standard transaction fee to the shareholder servicing agent when purchasing or redeeming Creation Units of the Funds regardless of the number of Creation Units that are being created or redeemed on the same day by the Authorized Participant. The standard transaction fee is imposed to offset transfer and other transaction costs associated with the issuance and redemption of Creation Units and is not charged to or paid by the Funds.
In addition, for cash Creation Unit transactions, a variable fee for creation transactions and redemption transactions may be charged to the Authorized Participant to cover certain brokerage, tax, foreign exchange, execution, market impact and other costs and expenses related to the execution of trades. Variable fees, if any, are included in capital share transactions in the Statements of Changes in Net Assets.
At September 30, 2019, there were an unlimited number of shares authorized (without par value). Transactions in the Funds’ shares were as follows:
| | | | | | | | | | | | | | | | | | | | |
| |
| | | Franklin Liberty International Opportunities ETF | |
| | | |
| | | Six Months Ended
September 30,
2019a | | | | | | Year Ended
March 31, 2019 | |
| | | | | |
| | | Shares | | | Amount | | | | | | Shares | | | Amount | |
Shares sold | | | — | | | $ | — | | | | | | | | 200,000 | | | $ | 5,852,625 | |
Shares redeemed | | | — | | | | — | | | | | | | | (50,000 | ) | | | (1,348,832 | ) |
| | | | |
Net increase (decrease) | | | — | | | $ | — | | | | | | | | 150,000 | | | $ | 4,503,793 | |
| | | | |
| | | | | | |
| | | |
| franklintempleton.com | | Semiannual Report | | | 57 | |
FRANKLIN TEMPLETON ETF TRUST
NOTES TO FINANCIAL STATEMENTS (UNAUDITED)
2. Shares of Beneficial Interest(continued)
| | | | | | | | | | | | | | | | | | | | |
| | | Franklin Liberty Investment Grade Corporate ETF | |
| | | |
| | | Six Months Ended
September 30, 2019 | | | | | | Year Ended
March 31, 2019 | |
| | | | | |
| | | Shares | | | Amount | | | | | | Shares | | | Amount | |
Shares sold | | | 8,350,000 | | | $ | 204,170,113 | | | | | | | | 50,000 | | | $ | 1,200,485 | |
Shares redeemed | | | — | | | | — | | | | | | | | (950,000 | ) | | | (22,266,890 | ) |
| | | | |
Net increase (decrease) | | | 8,350,000 | | | $ | 204,170,113 | | | | | | | | (900,000 | ) | | $ | (21,066,405 | ) |
| | | | |
| |
| | | Franklin Liberty U.S. Low Volatility ETF | |
| | | |
| | | Six Months Ended
September 30, 2019 | | | | | | Year Ended
March 31, 2019 | |
| | | | | |
| | | Shares | | | Amount | | | | | | Shares | | | Amount | |
Shares sold | | | 1,150,000 | | | $ | 41,923,228 | | | | | | | | 250,000 | | | $ | 7,630,864 | |
Shares redeemed | | | — | | | | — | | | | | | | | (50,000 | ) | | | (1,588,107 | ) |
| | | | |
Net increase (decrease) | | | 1,150,000 | | | $ | 41,923,228 | | | | | | | | 200,000 | | | $ | 6,042,757 | |
| | | | |
| |
| | | Franklin Liberty U.S. Core Bond ETF | |
| | | |
| | | Six Months Ended
September 30, 2019b | | | | | | Year Ended
March 31, 2019 | |
| | | | | |
| | | Shares | | | Amount | | | | | | Shares | | | Amount | |
Shares sold | | | 21,400,000 | | | $ | 537,281,299 | | | | | | | | — | | | $ | — | |
Shares redeemed | | | — | | | | — | | | | | | | | — | | | | — | |
| | | | |
Net increase (decrease) | | | 21,400,000 | | | $ | 537,281,299 | | | | | | | | — | | | $ | — | |
| | | | |
aDuring the period ended September 30, 2019, there were no transactions of the Fund’s shares.
bFor the period September 17, 2019 (commencement of operations) to September 30, 2019.
3. Transactions with Affiliates
Franklin Resources, Inc. is the holding company for various subsidiaries that together are referred to as Franklin Templeton. Certain officers and trustees of the Funds are also officers and/or directors of the following subsidiaries:
| | |
| |
| Subsidiary | | Affiliation |
Franklin Advisers, Inc. (Advisers) | | Investment manager |
Franklin Templeton Institutional, LLC (FT Institutional) | | Investment manager |
Franklin Templeton Investimentos (Brasil) Ltda. (FTI Brasil) | | Investment manager |
Franklin Templeton Investment Management Limited (FTIML) | | Investment manager |
Franklin Templeton Investment Trust Management Co., Ltd. (FT Korea) | | Investment manager |
Franklin Templeton Investments (ME) Limited (FTIME) | | Investment manager |
Franklin Templeton Investments Corp. (FTIC) | | Investment manager |
Templeton Asset Management Ltd. (TAML) | | Investment manager |
Franklin Templeton Services, LLC (FT Services) | | Administrative manager |
Franklin Templeton Distributors, Inc. (Distributors) | | Principal underwriter |
a. Management Fees
Franklin Liberty International Opportunities ETF, Franklin Liberty U.S. Low Volatility ETF and Franklin Liberty U.S. Core Bond ETF pay an investment management fee to Advisers of 0.600%, 0.500% and 0.150%, respectively, per year of the average daily net assets of each of the Funds.
| | | | |
| | | |
| 58 | | Semiannual Report | | franklintempleton.com |
FRANKLIN TEMPLETON ETF TRUST
NOTES TO FINANCIAL STATEMENTS (UNAUDITED)
Franklin Liberty Investment Grade Corporate ETF pays an investment management fee to Advisers based on the average daily net assets of the fund as follows:
| | |
| |
| Annualized Fee Rate | | Net Assets |
0.625% | | Up to and including $100 million |
0.500% | | Over $100 million, up to and including $250 million |
0.450% | | Over $250 million, up to and including $7.5 billion |
0.440% | | Over $7.5 billion, up to and including $10 billion |
0.430% | | Over $10 billion, up to and including $12.5 billion |
0.420% | | Over $12.5 billion, up to and including $15 billion |
0.400% | | Over $15 billion, up to and including $17.5 billion |
0.380% | | Over $17.5 billion, up to and including $20 billion |
0.360% | | Over $20 billion, up to and including $35 billion |
0.355% | | Over $35 billion, up to and including $50 billion |
0.350% | | In excess of $50 billion |
For the year ended March 31, 2019, the gross effective investment management fee rate was 0.625% of the Franklin Liberty Investment Grade Corporate ETF’s average daily net assets.
Under a subadvisory agreement, FTI Brasil, FTIML, FTIME, FTIC and TAML, affiliates of Advisers, provide subadvisory services to Franklin Liberty International Opportunities ETF and FT Institutional, an affiliate of Advisers, provides subadvisory services to Franklin Liberty Investment Grade Corporate ETF. The subadvisory fee is paid by Advisers based on each Fund’s average daily net assets, and is not an additional expense of the Funds. Prior to March 1, 2019, under a subadvisory agreement, FT Korea, an affiliate of Advisers, provided subadvisory services to Franklin Liberty International Opportunities ETF.
b. Administrative Fees
Under an agreement with Advisers, FT Services provides administrative services to the Funds. The fee is paid by Advisers based on the Funds’ average daily net assets, and is not an additional expense of the Funds.
c. Waiver and Expense Reimbursements
Advisers has contractually agreed in advance to waive or limit its fees and to assume as its own expense certain expenses otherwise payable by Franklin Liberty International Opportunities ETF, Franklin Liberty Investment Grade Corporate ETF, Franklin Liberty U.S. Low Volatility ETF, and Franklin Liberty U.S. Core Bond ETF so that the expenses (including acquired fund fees and expenses) of the Funds do not exceed 0.60%, 0.35%, 0.50%, and 0.15%, respectively, based on the average net assets (other than certainnon-routine expenses or costs, including those relating to litigation, indemnification, reorganizations, and liquidations) until July 31, 2020. Total expenses waived or paid are not subject to recapture subsequent to the Funds’ fiscal year end.
d. Other Affiliated Transactions
At September 30, 2019, shares of the Funds were owned by the investment companies:
| | | | | | | | |
| | |
| Funds | | Shares | | | Percentage of
Outstanding Sharesa | |
| Franklin Liberty Investment Grade Corporate ETF | | | | | | | | |
Franklin Total Return Fund | | | 8,555,000 | | | | 94.0% | |
| | | | |
| | |
| Franklin Liberty U.S. Low Volatility ETF | | | | | | | | |
Franklin Managed Income Fund | | | 1,000,000 | | | | 64.5% | |
| | | | |
| | | | | | |
| | | |
| franklintempleton.com | | Semiannual Report | | | 59 | |
FRANKLIN TEMPLETON ETF TRUST
NOTES TO FINANCIAL STATEMENTS (UNAUDITED)
3. Transactions with Affiliates(continued)
| | | | | | | | |
| | |
| Funds | | Shares | | | Percentage of
Outstanding Sharesa | |
| Franklin Liberty U.S Core Bond ETF | | | | | | | | |
Franklin Conservative Allocation Fund | | | 10,910,302 | | | | 51.0% | |
Franklin Moderate Allocation Fund | | | 6,337,507 | | | | 29.6% | |
Franklin Growth Allocation Fund | | | 2,664,750 | | | | 12.4% | |
Franklin LifeSmart™ 2020 – 2055 Retirement Target Funds | | | 1,386,830 | | | | 6.5% | |
| | | | |
| | | 21,299,389 | | | | 99.5% | |
| | | | |
aInvestment activities of significant shareholders could have a material impact on the Funds.
4. Income Taxes
For tax purposes, capital losses may be carried over to offset future capital gains, if any. At March 31, 2019, the capital loss carryforwards were as follows:
| | | | | | | | | | | | |
| | | |
| | | Franklin Liberty
International
Opportunities ETF | | | Franklin Liberty
Investment Grade
Corporate ETF | | | Franklin Liberty
U.S. Low
Volatility ETF | |
| Capital loss carryforwards: | | | | | | | | | | | | |
Short term | | $ | 44,687 | | | $ | 378,345 | | | $ | 44,747 | |
Long term | | | — | | | | 531,347 | | | | — | |
| | | | |
Total capital loss carryforwards | | $ | 44,687 | | | $ | 909,692 | | | $ | 44,747 | |
| | | | |
At September 30, 2019, the cost of investments and net unrealized appreciation (depreciation) for income tax purposes were as follows:
| | | | | | | | | | | | | | | | |
| | | | |
| | | Franklin Liberty
International
Opportunities ETF | | | Franklin Liberty
Investment Grade
Corporate ETF | | | Franklin Liberty
U.S. Low
Volatility ETF | | | Franklin Liberty
U.S. Core
Bond ETF | |
Cost of investments | | $ | 9,425,705 | | | $ | 220,520,517 | | | $ | 53,347,223 | | | $ | 486,667,175 | |
| | | | |
Unrealized appreciation | | $ | 800,253 | | | $ | 10,470,189 | | | $ | 3,529,168 | | | $ | 1,559,394 | |
Unrealized depreciation | | | (1,000,456 | ) | | | (49,765 | ) | | | (222,430 | ) | | | (80,956 | ) |
| | | | |
Net unrealized appreciation (depreciation) | | $ | (200,203 | ) | | $ | 10,420,424 | | | $ | 3,306,738 | | | $ | 1,478,438 | |
| | | | |
Differences between income and/or capital gains as determined on a book basis and a tax basis are primarily due to differing treatments of corporate actions, passive foreign investment company shares and wash sales.
5. Investment Transactions
Purchases and sales of investments (excluding short term securities andin-kind transactions, if any) for the period ended September 30, 2019, were as follows:
| | | | | | | | | | | | | | | | |
| | | | |
| | | Franklin Liberty
International
Opportunities ETF | | | Franklin Liberty
Investment Grade
Corporate ETF | | | Franklin Liberty
U.S. Low
Volatility ETF | | | Franklin Liberty
U.S. Core
Bond ETF | |
Purchases | | $ | 1,855,601 | | | $ | 221,382,553 | | | $ | 2,078,841 | | | $ | 391,110,179 | |
Sales | | $ | 1,937,948 | | | $ | 20,807,942 | | | $ | 2,057,370 | | | $ | 38,994,646 | |
| | | | |
| | | |
| 60 | | Semiannual Report | | franklintempleton.com |
FRANKLIN TEMPLETON ETF TRUST
NOTES TO FINANCIAL STATEMENTS (UNAUDITED)
In-kind transactions associated with creation and redemptions for the period ended September 30, 2019, were as follows:
| | | | | | | | | | | | | | | | |
| | | | |
| | | Franklin Liberty
International
Opportunities ETF | | | Franklin Liberty
Investment Grade
Corporate ETF | | | Franklin Liberty
U.S. Low
Volatility ETF | | | Franklin Liberty
U.S. Core
Bond ETF | |
Cost of Securities Received | | $ | — | | | $ | — | | | $ | 41,630,661 | | | $ | — | |
Value of Securities Delivereda | | $ | — | | | $ | — | | | $ | — | | | $ | — | |
aRealized gains and losses fromin-kind redemptions, as shown on the Statement of Operations, are not recognized by the Funds for tax purposes
6. Concentration of Risk
Investing in foreign securities may include certain risks and considerations not typically associated with investing in U.S. securities, such as fluctuating currency values and changing local, regional and global economic, political and social conditions, which may result in greater market volatility. Current political and financial uncertainty surrounding the European Union may increase market volatility and the economic risk of investing in securities in Europe. In addition, certain foreign securities may not be as liquid as U.S. securities.
7. Other Derivative Information
At September 30, 2019, the Funds’ investments in derivative contracts are reflected in the Statements of Assets and Liabilities as follows:
| | | | | | | | | | | | |
| | |
| | | Asset Derivatives | | | Liability Derivatives | |
| | | | |
| | | Statements of Assets and
Liabilities Location | | Fair Value | | | Statements of Assets and
Liabilities Location | | Fair Value | |
| Franklin Liberty Investment Grade Corporate ETF | | | | | | | | |
| | | | |
Interest Rate Contracts | | Variation margin on future contracts | | $ | 444,972 | a | | Variation margin on future contracts | | $ | 278,254 | a |
| | | | | | | | | | | | |
Totals | | | | $ | 444,972 | | | | | $ | 278,254 | |
| | | | | | | | | | | | |
| Franklin Liberty U.S. Core Bond ETF | | | |
| | | | |
Interest Rate contracts | | Variation margin on future contracts | | $ | 690 | a | | Variation margin on future contracts | | $ | — | |
| | | | | | | | | | | | |
Totals | | | | $ | 690 | | | | | $ | — | |
| | | | | | | | | | | | |
aThis amount reflects the cumulative appreciation (depreciation) of future contracts as reported in the Statements of Investments. Only the variation margin receivable/payable at period end is separately reported within the Statements of Assets and Liabilities. Prior variation margin movements were recorded to cash upon receipt or payment.
For the period ended September 30, 2019, the effect of derivative contracts in the Funds’ Statements of Operations was as follows:
| | | | | | | | | | | | |
| | | | |
Derivative Contracts
Not Accounted for as
Hedging Instruments | | Statements of
Operations Locations | | Net Realized
Gain (Loss)
for the Period | | | Statements of
Operations Locations | | Net Change in
Unrealized
Appreciation
(Depreciation)
for the Period | |
| Franklin Liberty Investment Grade Corporate ETF | | | | | | | | |
| | Net realized gain (loss) from: | | | | | | Net change in unrealized
appreciation (depreciation) on: | | | | |
| | | | |
Interest Rate Contracts | | Futures Contracts | | $ | (224,746 | ) | | Future Contracts | | $ | 166,718 | |
| | | | |
Credit Default Contracts | | Swap Contracts | | | 8,526 | | | Swap Contracts | | | — | |
| | | | | | | | | | | | |
| | | | $ | (216,220 | ) | | | | $ | 166,718 | |
| | | | | | | | | | | | |
| | | | | | |
| | | |
| franklintempleton.com | | Semiannual Report | | | 61 | |
FRANKLIN TEMPLETON ETF TRUST
NOTES TO FINANCIAL STATEMENTS (UNAUDITED)
7. Other Derivative Information(continued)
| | | | | | | | | | | | |
| | | | |
Derivative Contracts
Not Accounted for as
Hedging Instruments | | Statements of
Operations Locations | | Net Realized
Gain (Loss)
for the Period | | | Statements of
Operations Locations | | Net Change in
Unrealized
Appreciation
(Depreciation)
for the Period | |
Franklin Liberty U.S. Core Bond ETF | | | | | | | | |
| | Net realized gain (loss) from: | | | | | | Net change in unrealized
appreciation (depreciation) on: | | | | |
| | | | |
Interest Rate Contracts | | Futures Contracts | | $ | — | | | Futures Contracts | | $ | 690 | |
| | | | |
Credit Default Contracts | | Swap Contracts | | $ | 12,222 | | | Swap Contracts | | $ | — | |
| | | | | | | | | | | | |
| | | | $ | 12,222 | | | | | $ | 690 | |
| | | | | | | | | | | | |
For the period ended September 30, 2019, the average month end notional amount of futures contracts were as follows:
| | | | | | | | | | | | | | | | |
| | | | |
| | | Franklin Liberty
International
Opportunities ETF | | | Franklin Liberty
Investment Grade
Corporate ETF | | | Franklin Liberty
U.S. Low
Volatility ETF | | | Franklin Liberty
U.S. Core Bond ETF | |
Futures contracts | | $ | — | | | $ | 9,759,536 | | | $ | — | | | $ | 12,510,586 | |
| | | | |
Credit Default Contracts | | $ | — | | | $ | 1,028,571 | | | $ | — | | | $ | — | |
See Note 1(c) regarding derivative financial instruments.
8. Fair Value Measurements
The Funds follow a fair value hierarchy that distinguishes between market data obtained from independent sources (observable inputs) and the Funds’ own market assumptions (unobservable inputs). These inputs are used in determining the value of the Funds’ financial instruments and are summarized in the following fair value hierarchy:
| | • | | Level 1 – quoted prices in active markets for identical financial instruments |
| | • | | Level 2 – other significant observable inputs (including quoted prices for similar financial instruments, interest rates, prepayment speed, credit risk, etc.) |
| | • | | Level 3 – significant unobservable inputs (including the Funds’ own assumptions in determining the fair value of financial instruments) |
The input levels are not necessarily an indication of the risk or liquidity associated with financial instruments at that level.
A summary of inputs used as of September 30, 2019, in valuing the Funds’ assets and liabilities carried at fair value, is as follows:
| | | | | | | | | | | | | | | | |
| | | | |
| | | Level 1 | | | Level 2 | | | Level 3 | | | Total | |
| | | | |
| Franklin Liberty International Opportunities ETF | | | | | | | | | | | | | | | | |
| | | | |
| Assets: | | | | | | | | | | | | | | | | |
Investments in Securities:a | |
Equity Investmentsb | | $ | 9,225,502 | | | $ | — | | | $ | — | | | $ | 9,225,502 | |
| | | | |
| | | | |
| Franklin Liberty Investment Grade Corporate ETF | | | | | | | | | | | | | | | | |
| | | | |
| Assets: | | | | | | | | | | | | | | | | |
Investments in Securities:a | |
Corporate Bonds & Notes | | $ | — | | | $ | 226,254,683 | | | $ | — | | | $ | 226,254,683 | |
U.S. Government & Agency Securities | | | — | | | | 2,346,258 | | | | — | | | | 2,346,258 | |
Short-Term Investments | | | — | | | | 2,340,000 | | | | — | | | | 2,340,000 | |
| | | | |
Total Investments in Securities | | $ | — | | | $ | 230,940,941 | | | $ | — | | | $ | 230,940,941 | |
| | | | |
Other Financial Instruments: | | | | | | | | | | | | | | | | |
Futures Contracts | | $ | 444,972 | | | $ | — | | | $ | — | | | $ | 444,972 | |
| | | | |
| | | |
| 62 | | Semiannual Report | | franklintempleton.com |
FRANKLIN TEMPLETON ETF TRUST
NOTES TO FINANCIAL STATEMENTS (UNAUDITED)
8. Fair Value Measurements(continued)
| | | | | | | | | | | | | | | | |
| | | | |
| | | Level 1 | | | Level 2 | | | Level 3 | | | Total | |
| | | | |
| Liabilities: | | | | | | | | | | | | | | | | |
Other Financial Instruments: | | | | | | | | | | | | | | | | |
Futures Contracts | | $ | 278,254 | | | $ | — | | | $ | — | | | $ | 278,254 | |
| | | |
| Franklin Liberty U.S. Low Volatility ETF | | | | | | | | | | | | |
| | | | |
| Assets: | | | | | | | | | | | | | | | | |
Investments in Securities:a | |
Equity Investmentsb | | $ | 56,358,961 | | | $ | — | | | $ | — | | | $ | 56,358,961 | |
Short-Term Investments | | | — | | | | 295,000 | | | | — | | | | 295,000 | |
| | | | |
Total Investments in Securities | | $ | 56,358,961 | | | $ | 295,000 | | | $ | — | | | $ | 56,653,961 | |
| | | | |
| | | |
| Franklin Liberty U.S. Core Bond ETF | | | | | | | | | | | | |
| | | | |
| Assets: | | | | | | | | | | | | | | | | |
Investments in Securities:a | |
Corporate Bonds & Notes | | $ | — | | | $ | 155,968,035 | | | $ | — | | | $ | 155,968,035 | |
U.S. Government & Agency Securities | | | — | | | | 168,533,472 | | | | — | | | | 168,533,472 | |
Mortgage-Backed Securities | | | — | | | | 134,738,889 | | | | — | | | | 134,738,889 | |
Foreign Government & Agency Securities | | | — | | | | 5,065,455 | | | | — | | | | 5,065,455 | |
Municipal Bonds | | | — | | | | 23,839,762 | | | | — | | | | 23,839,762 | |
| | | | |
Total Investments in Securities | | $ | — | | | $ | 488,145,613 | | | $ | — | | | $ | 488,145,613 | |
| | | | |
Other Financial Instruments: | | | | | | | | | | | | | | | | |
Futures Contracts | | $ | 690 | | | $ | — | | | $ | — | | | $ | 690 | |
aFor detailed categories, see the accompanying Statement of Investments.
bIncludes common and convertible preferred stocks, warrants, as well as other equity investments.
9. Subsequent Events
The Funds have evaluated subsequent events through the issuance of the financial statements and determined that no events have occurred that require disclosure.
Abbreviations
| | |
| Selected Portfolio |
| ADR | | American Depository Receipt |
| IDR | | International Depositary Receipt |
| FHLB | | Federal Home Loan Bank |
| FRN | | Floating Rate Note |
| GO | | General Obligation |
| REIT | | Real Estate Investment Trust |
| SDR | | Swedish Depositary Receipt |
| | | | | | |
| | | |
| franklintempleton.com | | Semiannual Report | | | 63 | |
FRANKLIN TEMPLETON ETF TRUST
Tax Information (unaudited)
At March 31, 2019 , more than 50% of the Funds’ total assets were invested in securities of foreign issuers. In most instances, foreign taxes were withheld from income paid to the Funds on these investments. As shown in the table below, the Funds hereby report to shareholders the foreign source income and foreign taxes paid, pursuant to Section 853 of the Internal Revenue Code. This written statement will allow shareholders of record on June 12, 2019, to treat their proportionate share of foreign taxes paid by the Funds as having been paid directly by them. The shareholder shall consider these amounts as foreign taxes paid in the tax year in which they receive the Fund distribution.
The following table provides a detailed analysis of foreign tax paid, foreign source income, and foreign source qualified dividends as reported by the Funds to shareholders of record.
| | | | | | | | | | | | |
| | | |
| Fund | | Foreign Tax Paid
Per Share | | | Foreign source Income
Per share | | | Foreign Source Qualified
Dividend Per Share | |
Franklin Liberty International Opportunities ETF | | $ | 0.0732 | | | $ | 0.6078 | | | $ | 0.4934 | |
Foreign Tax Paid Per Share is the amount per share available to you, as a tax credit (assuming you held your shares in the Fund for a minimum of 16 days during the 31-day period beginning 15 days before the ex-dividend date of the Fund’s distribution to which the foreign taxes relate), or, as a tax deduction.
Foreign Source Income Per Share is the amount per share of income dividends attributable to foreign securities held by the Fund, plus any foreign taxes withheld on these dividends. The amounts reported include foreign source qualified dividends that have not been adjusted for the rate differential applicable to such dividend income.1
Foreign Source Qualified Dividends Per Share is the amount per share of foreign source qualified dividends, plus any foreign taxes withheld on these dividends. These amounts represent the portion of the Foreign Source Income reported to you in column 2 that were derived from qualified foreign securities held by the Fund.1
By mid-February 2020, shareholders will receive Form 1099-DIV which will include their share of taxes paid and foreign source income distributed during the calendar year 2019. The Foreign Source Income reported on Form 1099-DIV has not been adjusted for the rate differential on foreign source qualified dividend income. Shareholders are advised to check with their tax advisors for information on the treatment of these amounts on their individual income tax returns.
1. Qualified dividends are taxed at reduced long term capital gains tax rates. In determining the amount of foreign tax credit that may be applied against the U.S. tax liability of individuals receiving foreign source qualified dividends, adjustments may be required to the foreign tax credit limitation calculation to reflect the rate differential applicable to such dividend income. The rules however permit certain individuals to elect not to apply the rate differential adjustments for capital gains and/or dividends for any taxable year. Please consult your tax advisor and the instructions to Form 1116 for more information.
| | | | |
| | | |
| 64 | | Semiannual Report | | franklintempleton.com |
FRANKLIN TEMPLETON ETF TRUST
Shareholder Information
Board Approval of Investment Management Agreements
FRANKLIN TEMPLETON ETF TRUST
Franklin Liberty International Opportunities ETF
Franklin Liberty Investment Grade Corporate ETF
Franklin Liberty U.S. Low Volatility ETF
(each a Fund)
At anin-person meeting held on May 29, 2019 (Meeting), the Board of Trustees (Board) of Franklin Templeton ETF Trust (Trust), including a majority of the trustees who are not “interested persons” as defined in the Investment Company Act of 1940 (Independent Trustees), reviewed and approved the continuance of the investment management agreement between Franklin Advisers, Inc. (FAI) and the Trust, on behalf of each Fund, the investmentsub-advisory agreements between FAI and each of Templeton Asset Management Ltd. (TAML), Franklin Templeton Investment Management Limited (FTIML), Franklin Templeton Investimentos (Brasil) Ltda. (FTI Brasil), Franklin Templeton Investments Corp. (FTIC) and Franklin Templeton Investments (ME) Limited (FTIME), affiliates of FAI, on behalf of the Franklin Liberty International Opportunities ETF and the investmentsub-advisory agreement between FAI and Franklin Templeton Institutional, LLC (FTIL), an affiliate of FAI, on behalf of the Franklin Liberty Investment Grade Corporate ETF (each a Management Agreement) for an additionalone-year period. TAML, FTIML, FTI Brasil, FTIC, FTIME and FTIL are referred to herein individually, as aSub-Adviser and collectively, as theSub-Advisers. The Independent Trustees received advice from and met separately with Independent Trustee counsel in considering whether to approve the continuation of each Management Agreement. Although the Management Agreements for the Funds were considered at the same Board meeting, the Board considered the information provided to it about the Funds together and with respect to each Fund separately as the Board deemed appropriate. FAI and theSub-Advisers are each referred to herein as a Manager.
In considering the continuation of each Management Agreement, the Board reviewed and considered information provided by each Manager at the Meeting and throughout the year at meetings of the Board and its committees. The Board also reviewed and considered information provided in response to a detailed set of requests for information submitted to FAI by Independent Trustee counsel on behalf of the Independent Trustees in connection with the annual contract renewal process. In addition, prior to the Meeting, the Independent
Trustees held a telephonic contract renewal meeting at which the Independent Trustees conferred amongst themselves and Independent Trustee counsel about contract renewal matters. The Board reviewed and considered all of the factors it deemed relevant in approving the continuance of each Management Agreement, including, but not limited to: (i) the nature, extent and quality of the services provided by each Manager; (ii) the investment performance of each Fund; (iii) the costs of the services provided and profits realized by each Manager and its affiliates from the relationship with each Fund; (iv) the extent to which economies of scale are realized as each Fund grows; and (v) whether fee levels reflect these economies of scale for the benefit of Fund investors.
In approving the continuance of each Management Agreement, the Board, including a majority of the Independent Trustees, determined that the terms of each Management Agreement are fair and reasonable and that the continuance of such Management Agreement is in the best interests of the applicable Fund and its shareholders. While attention was given to all information furnished, the following discusses some primary factors relevant to the Board’s determination.
NATURE, EXTENT AND QUALITY OF SERVICES. The Board reviewed and considered information regarding the nature, extent and quality of investment management services provided by each Manager and its affiliates to the Funds and their shareholders. This information included, among other things, the qualifications, background and experience of the senior management and investment personnel of each Manager; the structure of investment personnel compensation; oversight of third-party service providers; investment performance reports and related financial information for each Fund; reports on expenses; legal and compliance matters; risk controls; pricing and other services provided by each Manager and its affiliates; and management fees charged by each Manager and its affiliates to US funds and other accounts, including management’s explanation of differences among accounts where relevant. The Board noted management’s continuing efforts and expenditures in establishing effective business continuity plans and developing strategies to address areas of heightened concern in the registered fund industry, such as cybersecurity and liquidity risk management. The Board also recognized management’s commitment to facilitating Board oversight of liquidity through the designation of a liquidity/risk administrator and the development of reports that highlight the amount of illiquid investments for each Fund.
| | | | | | |
| | | |
| franklintempleton.com | | Semiannual Report | | | 65 | |
FRANKLIN TEMPLETON ETF TRUST
SHAREHOLDER INFORMATION
The Board also reviewed and considered the benefits provided to Fund shareholders of investing in a fund that is part of the Franklin Templeton family of funds. The Board noted the financial position of Franklin Resources, Inc. (FRI), the Managers’ parent, and its commitment to the registered fund business as evidenced by its continued introduction of new funds, reassessment of the fund offerings in response to the market environment and project initiatives and capital investments relating to the services provided to the Funds by the Franklin Templeton (FT) organization.
Following consideration of such information, the Board was satisfied with the nature, extent and quality of services provided by each Manager and its affiliates to the Funds and their shareholders.
FUND PERFORMANCE. The Board reviewed and considered the performance results of each Fund for theone-year period ended February 28, 2019. The Board considered the performance returns for each Fund in comparison to the performance returns of registered funds deemed comparable to the Fund included in a universe (Performance Universe) selected by Broadridge Financial Solutions, Inc. (Broadridge), an independent provider of investment company data. The Board received a description of the methodology used by Broadridge to select the registered funds included in a Performance Universe. The Board also reviewed and considered Fund performance reports provided and discussions that occurred with portfolio managers at Board meetings throughout the year. The Board noted its ongoing discussions with the Manager about the performance of the Funds to date and the importance of performance to asset growth. Specifically, the Board referenced earlier discussions with management on matters related to, among other things, the strategy behind the overall productline-up, the design and construction of the Manager’s proprietary indices, the comparability of peer data, the nature of the Manager’s research, the potential use of innovative data and technology, and investments in marketing and distribution. A summary of each Fund’s performance results is below.
Franklin Liberty International Opportunities ETF – The Performance Universe for the Fund included the Fund and all retail and institutional internationalmulti-cap growth funds. The Fund commenced operations on January 25, 2017, and thus has been in operation for less than three years. The Board noted that the Fund’s annualized total return for theone-year period was 0.08% below the median of its Performance Universe. The Board concluded that the Fund’s performance was acceptable given its short period of operation.
Franklin Liberty Investment Grade Corporate ETF – The Performance Universe for the Fund included the Fund and all retail and institutionalBBB-rated corporate debt funds. The Fund commenced operations on October 3, 2016, and thus has been in operation for less than three years. The Board noted that the Fund’s annualized total return for theone-year period was 0.01% below the median of its Performance Universe. The Board concluded that the Fund’s performance was satisfactory.
Franklin Liberty U.S. Low Volatility ETF – The Performance Universe for the Fund included the Fund and all retail and institutionallarge-cap core funds. The Fund commenced operations on September 20, 2016, and thus has been in operation for less than three years. The Board noted that the Fund’s annualized total return for theone-year period was above the median and in the first quintile of its Performance Universe. The Board concluded that the Fund’s performance was satisfactory.
COMPARATIVE FEES AND EXPENSES. The Board reviewed and considered information regarding each Fund’s actual total expense ratio and its various components, including, as applicable, management fees; transfer agent expenses; underlying fund expenses; Rule12b-1 andnon-Rule12b-1 service fees; and othernon-management fees. The Board considered the actual total expense ratio and, separately, the contractual management fee rate, without the effect of fee waivers, if any (Management Rate) of each Fund in comparison to the median expense ratio and median Management Rate, respectively, of other exchange-traded funds deemed comparable to and with a similar expense structure to the Fund selected by Broadridge (Expense Group). Broadridge fee and expense data is based upon information taken from each fund’s most recent annual report, which reflects historical asset levels that may be quite different from those currently existing, particularly in a period of market volatility. While recognizing such inherent limitation and the fact that expense ratios and Management Rates generally increase as assets decline and decrease as assets grow, the Board believed the independent analysis conducted by Broadridge to be an appropriate measure of comparative fees and expenses. The Broadridge Management Rate includes administrative charges. The Board received a description of the methodology used by Broadridge to select the exchange-traded funds included in an Expense Group.
| | | | |
| | | |
| 66 | | Semiannual Report | | franklintempleton.com |
FRANKLIN TEMPLETON ETF TRUST
SHAREHOLDER INFORMATION
Franklin Liberty International Opportunities ETF–The Expense Group for the Franklin Liberty International Opportunities ETF was comprised of actively managed exchange-traded funds, which included the Fund, one other internationalmulti-cap growth fund and two internationalmulti-cap core funds. The Board noted that the Management Rate and actual total expense ratio for the Fund were below the medians of its Expense Group. The Board also noted the small size of each Fund’s Expense Group and that the Fund’s actual total expense ratio reflected a fee waiver from management. The Board further noted that theSub-Advisers to the Fund are paid by FAI out of the management fee FAI receives from the Fund. The Board concluded that the Management Rate charged to the Fund is reasonable.
Franklin Liberty Investment Grade Corporate ETF – The Expense Group for the Fund was comprised of actively managed exchange-traded funds, which included the Fund, two otherBBB-rated corporate debt funds, three short investment-grade debt funds, and one core bond fund. The Board noted that the Management Rate for the Fund was above the median and in the fifth quintile (most expensive) of its Expense Group, but its actual total expense ratio was below the median and in the first quintile (least expensive) of its Expense Group. The Board also noted the small size of the Expense Group and that the Fund’s actual total expense ratio reflected a fee waiver from management. The Board further noted that theSub-Adviser to the Fund is paid by FAI out of the management fee FAI receives from the Fund. The Board concluded that the Management Rate charged to the Fund is reasonable.
Franklin Liberty U.S. Low Volatility ETF –The Expense Group for the Fund was comprised of actively managed exchange-traded funds, which included the Fund and twomulti-cap core funds. The Board noted that the Management Rate and actual total expense ratio for the Fund were below the medians of its Expense Group. The Board also noted the small size of the Fund’s Expense Group and that the Fund’s actual total expense ratio reflected a fee waiver from management. The Board concluded that the Management Rate charged to the Fund is reasonable.
PROFITABILITY. The Board reviewed and considered information regarding the profits realized by each Manager and its affiliates in connection with the operation of each Fund. In this respect, the Board considered the Fund profitability analysis that addresses the overall profitability of FT’s US fund business, as well as its profits in providing investment management and other services to each of the individual funds during the12-month period ended September 30, 2018,
being the most recent fiscalyear-end for FRI. The Board noted that although management continually makes refinements to its methodologies used in calculating profitability in response to organizational and product-related changes, the overall methodology has remained consistent with that used in the Funds’ profitability report presentations from prior years. Additionally, PricewaterhouseCoopers LLP, auditor to FRI and certain Franklin Templeton funds, has been engaged to periodically review and assess the allocation methodologies to be used solely by the Funds’ Board with respect to the profitability analysis.
The Board noted management’s belief that costs incurred in establishing the infrastructure necessary for the type of fund operations conducted by each Manager and its affiliates may not be fully reflected in the expenses allocated to each Fund in determining its profitability, as well as the fact that the level of profits, to a certain extent, reflected operational cost savings and efficiencies initiated by management. The Board also noted management’s expenditures in improving shareholder services provided to the Funds, as well as the need to implement systems and meet additional regulatory and compliance requirements resulting from recent SEC and other regulatory requirements.
The Board also considered the extent to which each Manager and its affiliates might derive ancillary benefits from fund operations, including revenues generated from transfer agent services, potential benefits resulting from personnel and systems enhancements necessitated by fund growth, as well as increased leverage with service providers and counterparties. Based upon its consideration of all these factors, the Board concluded that the level of profits realized by each Manager and its affiliates from providing services to each Fund was not excessive in view of the nature, extent and quality of services provided to each Fund.
ECONOMIES OF SCALE. The Board reviewed and considered the extent to which each Manager may realize economies of scale, if any, as each Fund grows larger and whether each Fund’s management fee structure reflects any economies of scale for the benefit of shareholders. With respect to possible economies of scale, the Board noted the existence of management fee breakpoints for the Franklin Liberty Investment Grade Corporate ETF, which operates generally to share any economies of scale with the Fund’s shareholders by reducing the Fund’s effective management fees as the Fund grows in size. The Board considered the management’s view that any analyses of potential economies of scale in managing a particular fund are inherently limited in light of the joint and common costs and investments the
| | | | | | |
| | | |
| franklintempleton.com | | Semiannual Report | | | 67 | |
FRANKLIN TEMPLETON ETF TRUST
SHAREHOLDER INFORMATION
Managers incur across the Franklin Templeton family of funds as a whole. The Board concluded that to the extent economies of scale may be realized by a Manager and its affiliates, the Franklin Liberty Investment Grade Corporate ETF’s management fee structure provided a sharing of benefits with the Fund and its shareholders as the Fund grows. The Board noted that at the end of 2018, the net assets of each Fund were less than $20 million. The Board recognized that there would not likely be any economies of scale until these Funds’ assets grow.
CONCLUSION. Based on its review, consideration and evaluation of all factors it believed relevant, including the above-described factors and conclusions, the Board unanimously approved the continuation of each Management Agreement for an additionalone-year period.
Board Approval of Investment Management Agreements
FRANKLIN TEMPLETON ETF TRUST
Franklin Liberty Investment Grade Corporate ETF
(Fund)
At anin-person meeting held on September 6, 2019 (Meeting), the Board of Trustees (Board) of Franklin Templeton ETF Trust (Trust), including a majority of the trustees who are not “interested persons” as defined in the Investment Company Act of 1940 (Independent Trustees), reviewed and approved an investmentsub-advisory agreement between Franklin Advisers, Inc. (FAV) and Franklin Templeton Portfolio Advisors, Inc. (FT Portfolio Advisors), on behalf of the Fund(Sub-Advisory Agreement) for an initialtwo-year period. The Independent Trustees received advice from and met separately with Independent Trustee counsel in considering whether to approve theSub-Advisory Agreement. FT Portfolio Advisors and FAV are each referred to herein as a Manager.
In considering the approval of theSub-Advisory Agreement, the Board reviewed and considered information provided by each Manager at the Meeting and throughout the year at meetings of the Board and its committees. The Board reviewed and considered all of the factors it deemed relevant in approving theSub-Advisory Agreement, including, but not limited to: (i) the nature, extent and quality of the services to be provided by FT Portfolio Advisors as asub-adviser to the Fund; (ii) the investment performance of the Fund; (ii) the costs of the services to be provided by FT Portfolio Advisors and the profits realized/expected to be realized by the Managers and their affiliates from the relationship with the Fund;
and (iii) the extent to which economies of scale may be realized as the Fund grows. The Board also reviewed and considered the form ofSub-Advisory Agreement and the terms of theSub-Advisory Agreement which were explained at the Meeting, noting that the terms and conditions of theSub-Advisory Agreement were substantially identical to the terms and conditions of thesub-advisory agreement previously approved by the Board for the Fund between FAV and Franklin Templeton Institutional, LLC (FT Institutional), the current, sole investmentsub-adviser of the Fund.
In approving theSub-Advisory Agreement, the Board, including a majority of the Independent Trustees, determined that the terms of theSub-Advisory Agreement are fair and reasonable and that suchSub-Advisory Agreement is in the best interests of the Fund and its shareholders. While attention was given to all information furnished, the following discusses some primary factors relevant to the Board’s determination.
NATURE, EXTENT AND QUALITY OF SERVICES. The Board reviewed and considered information regarding the nature, extent and quality of investmentsub-advisory services to be provided by FT Portfolio Advisors to the Fund and its shareholders. This information included, among other things, management’s representation that it was proposing FT Portfolio Advisors to serve as an additionalsub-adviser to the Fund to support FAV in providing investment advice to the Fund, with Thomas Runkel being added as a portfolio manager to the Fund. Following consideration of such information, the Board was satisfied with the nature, extent and quality of services to be provided by FT Portfolio Advisors to the Fund and its shareholders under theSub-Advisory Agreement.
FUND PERFORMANCE. The Board noted that the Fund commenced investment operations on October 3, 2016. The Board further noted that it reviewed detailed performance information about the Fund at its prior Board meeting in connection with the May 2019 annual contract renewal. In light of the Fund’s shorter operating history and the recent annual contract renewal, the Board determined that the conclusions reached regarding the Fund’s performance in connection with the annual contract renewal had not changed.
COMPARATIVE FEES AND EXPENSES. The Board reviewed and considered information regarding the proposed investmentsub-advisory fee. In particular, the Board considered the fact that FAV would compensate FT Portfolio Advisors out of the fee paid to FAV under the investment management agreement between FAV and the Trust, on behalf of the Fund, and that the investmentsub-advisory fee would not be an additional fee borne by the Fund. The Board
| | | | |
| | | |
| 68 | | Semiannual Report | | franklintempleton.com |
FRANKLIN TEMPLETON ETF TRUST
SHAREHOLDER INFORMATION
noted that, in connection with the appointment of FT Portfolio Advisors as an investmentsub-adviser to the Fund, management was also proposing that FT Institutional’s current investmentsub-advisory fee be reduced correspondingly. The Board further noted management’s representation that, in light of the above, the addition of FT Portfolio Advisors as asub-adviser to the Fund will have no impact on the investment management fees paid by the Fund. The Board concluded that the proposed investmentsub-advisory fee for the Fund is reasonable.
MANAGEMENT PROFITABILITY AND ECONOMIES OF SCALE. The Board reviewed profitability information for FAV and determined that its conclusions regarding profitability and economies of scale reached in connection with the May 2019 annual contract renewal had not changed as a result of the addition of FT Portfolio Advisors to serve as an investmentsub-adviser of the Fund because FAV’s retained portion of the management fee will not change, and, therefore, the addition of FT Portfolio Advisors as a newsub-adviser is not expected to have an impact on FAV’s profitability.
CONCLUSION. Based on its review, consideration and evaluation of all factors it believed relevant, including the above-described factors and conclusions, the Board unanimously approved theSub-Advisory Agreement for the Fund for an initialtwo-year period.
Board Approval of Investment Management Agreements
FRANKLIN TEMPLETON ETF TRUST
Franklin Liberty U.S. Core Bond ETF
(Fund)
At an in-person meeting held on September 6, 2019 (Meeting), the Board of Trustees (Board) of Franklin Templeton ETF Trust (Trust), including a majority of the trustees who are not “interested persons” as defined in the Investment Company Act of 1940 (Independent Trustees), reviewed and approved an investment management agreement between Franklin Advisers, Inc. (Manager) and the Trust, on behalf of the Fund (Management Agreement) for an initial two-year period. The Independent Trustees received advice from and met separately with Independent Trustee counsel in considering whether to approve the Management Agreement.
In considering the approval of the Management Agreement, the Board reviewed and considered information provided by the Manager at the Meeting and throughout the year at meetings of the Board and its committees. The Board reviewed
and considered all of the factors it deemed relevant in approving the Management Agreement, including, but not limited to: (i) the nature, extent and quality of the services to be provided by the Manager; (ii) the costs of the services to be provided by the Manager; and (iii) the extent to which economies of scale may be realized as the Fund grows. The Board also reviewed and considered the form of Management Agreement and the terms of the Management Agreement which were explained at the Meeting, noting that the form of Management Agreement was substantially the same as the standard forms of investment management agreement (that include administration services) for the other funds in the Franklin Templeton family of funds, including other series of the Trust.
In approving the Management Agreement, the Board, including a majority of the Independent Trustees, determined that the terms of the proposed Management Agreement are fair and reasonable and that such Management Agreement is in the best interests of the Fund and its shareholders. While attention was given to all information furnished, the following discusses some primary factors relevant to the Board’s determination.
NATURE, EXTENT AND QUALITY OF SERVICES. The Board reviewed and considered information regarding the nature, extent and quality of investment management services to be provided by the Manager and its affiliates to the Fund and its shareholders. This information included, among other things, the Fund’s proposed investment strategies and the ability of the Manager to implement such investment strategies; the qualifications, background and experience of the investment personnel that will be responsible for the day-to-day portfolio management of the Fund; the Manager’s experience as the manager of other funds and accounts, including other series of the Trust and other funds in the Franklin Templeton family of funds; the Manager’s strength and reputation within the industry; the personnel, operations, financial condition, and investment management capabilities, methodologies and resources of the Manager; and the Manager’s compliance capabilities, as demonstrated by, among other things, its policies and procedures reasonably designed to prevent violations of the Federal Securities Laws (as defined in Rule 38a-1 of the Investment Company Act of 1940). Following consideration of such information, the Board was satisfied with the nature, extent and quality of services to be provided by the Manager and its affiliates to the Fund and its shareholders.
FUND PERFORMANCE. The Board noted that, as the Fund had not yet commenced investment operations, there was no investment performance for the Fund. The Board also
| | | | | | |
| | | |
| franklintempleton.com | | Semiannual Report | | | 69 | |
FRANKLIN TEMPLETON ETF TRUST
SHAREHOLDER INFORMATION
considered the proposed performance benchmark for the Fund and how such benchmark would be utilized to measure performance of the Manager.
COMPARATIVE FEES AND EXPENSES. The Board reviewed and considered information regarding the Fund’s proposed total expense ratio and its various components, including, as applicable, management fees; transfer agent expenses; underlying fund expenses; Rule 12b-1 and non-Rule 12b-1 service fees; and other non-management fees. The Board considered the proposed total expense ratio and, separately, the proposed contractual management fee rate, without the effect of fee waivers, if any (Management Rate) of the Fund in comparison to the median expense ratio and median Management Rate, respectively, of other exchange-traded funds deemed comparable to and with a similar expense structure as the Fund (Expense Group) as selected by Broadridge Financial Solutions, Inc. (Broadridge), an independent organization. Broadridge fee and expense data is based upon information taken from each fund’s most recent annual report (excluding the Fund), which reflects historical asset levels that may be quite different from those currently existing, particularly in a period of market volatility. While recognizing such inherent limitation and the fact that expense ratios and Management Rates generally increase as assets decline and decrease as assets grow, the Board believed the independent analysis conducted by Broadridge to be an appropriate measure of comparative fees and expenses. The Broadridge Management Rate includes administrative charges. The Board received a description of the methodology used by Broadridge to select the exchange-traded funds included in an Expense Group.
The Expense Group for the Fund was comprised of actively managed exchange-traded funds, which included the Fund and three other core bond funds. The Board noted that the proposed Management Rate and proposed total expense ratio for the Fund were below the medians of its respective Expense Group. The Board concluded that the Management Rate to be charged to the Fund is reasonable. In doing so, the Board noted the small size of the Expense Group and that the Fund’s proposed total expense ratio reflected a fee waiver from management.
PROFITABILITY. The Board then noted that the Manager (and its affiliates) could not report any financial results from their relationships with the Fund because the Fund has not yet commenced investment operations, and thus, the Board could not evaluate the Manager’s (or its affiliates’) profitability with respect to the Fund.
ECONOMIES OF SCALE. The Board reviewed and considered the extent to which the Manager may realize economies of scale, if any, as the Fund grows larger and whether the Fund’s management fee structure reflects any economies of scale for the benefit of shareholders. With respect to possible economies of scale in the future, the Board noted that it is not anticipated that the Fund will generate significant, if any, profit for the Manager and/or its affiliates for some time.
CONCLUSION. Based on its review, consideration and evaluation of all factors it believed relevant, including the above-described factors and conclusions, the Board unanimously approved the Management Agreement for the Fund for an initial two-year period.
Proxy Voting Policies and Procedures
The Trust’s investment manager has established Proxy Voting Policies and Procedures (Policies) that the Trust uses to determine how to vote proxies relating to portfolio securities. Shareholders may view the Trust’s complete Policies online at franklintempleton.com. Alternatively, shareholders may request copies of the Policies free of charge by calling the Proxy Group collect at (954)527-7678 or by sending a written request to: Franklin Templeton Companies, LLC, 300 S.E. 2nd Street, Fort Lauderdale, FL 33301, Attention: Proxy Group. Copies of the Trust’s proxy voting records are also made available online at franklintempleton.com and posted on the U.S. Securities and Exchange Commission’s website at sec.gov and reflect the most recent12-month period ended June 30.
Quarterly Statement of Investments
The Trust files a complete statement of investments with the U.S. Securities and Exchange Commission for the first and third quarters for each fiscal year as an exhibit to its report on FormN-PORT. Shareholders may view the filed FormN-PORT by visiting the Commission’s website at sec.gov. The filed form may also be viewed and copied at the Commission’s Public Reference Room in Washington, DC. Information regarding the operations of the Public Reference Room may be obtained by calling(800) SEC-0330.
Premium/Discount Information
Information about the differences between the daily market price on the secondary market for the shares of the Fund and the Fund’s net asset value may be found on the Fund’s website at franklintempleton.com.
| | | | |
| | | |
| 70 | | Semiannual Report | | franklintempleton.com |
Authorized for distribution only when accompanied or preceded by a summary prospectus and/or prospectus. Investors should carefully consider a fund’s investment goals, risks, charges and expenses before investing. A prospectus contains this and other information; please read it carefully before investing.
To help ensure we provide you with quality service, all calls to and from our service areas are monitored and/or recorded.
| | | | | | |
 | | Semiannual Report Franklin Templeton ETF Trust | | |
| | | |
| | Investment Manager | | Distributor | | Investor Services |
| | Franklin Advisers, Inc. | | Franklin Templeton Distributors, Inc. (800) DIAL BEN®/342-5236 franklintempleton.com | | Transfer Agent State Street Bank and
Trust Company 1 Heritage Drive
Mail Stop OHD0100 North Quincy, MA 02171 |
| © 2019 Franklin Templeton Investments. All rights reserved. | | | | ETF2 S 11/19 |
SEMIANNUAL REPORT
FRANKLIN TEMPLETON
ETF TRUST
September 30, 2019


| | |
Franklin LibertyQ U.S. Equity ETF | | Franklin LibertyQ U.S. Small Cap Equity ETF |
Franklin LibertyQ U.S. Mid Cap Equity ETF | | |
Internet Delivery of Fund Reports Unless You Request Paper Copies: Effective January 1, 2021, as permitted by the SEC, paper copies of the Fund’s shareholder reports will no longer be sent by mail, unless you specifically request them from the Fund or your financial intermediary. Instead, the reports will be made available on a website, and you will be notified by mail each time a report is posted and provided with a website link to access the report.
If you already elected to receive shareholder reports electronically, you will not be affected by this change and you need not take any action. If you have not signed up for electronic delivery, we would encourage you to join fellow shareholders who have. You may elect to receive shareholder reports and other communications electronically from the Fund by calling(800) 632-2301 or by contacting your financial intermediary.
You may elect to continue to receive paper copies of all your future shareholder reports free of charge by contacting your financial intermediary or, if you invest directly with a Fund, calling(800) 632-2301 to let the Fund know of your request. Your election to receive reports in paper will apply to all funds held in your account.
Franklin Templeton
Successful investing begins with ambition. And achievement only comes when you reach for it. That’s why we continually strive to deliver better outcomes for investors. No matter what your goals are, our deep, global investment expertise allows us to offer solutions that can help.
During our more than 70 years of experience, we’ve managed through all kinds of markets—up, down and those in between. We’re always preparing for what may come next. It’s because of this, combined with our strength as one of the world’s largest asset managers that we’ve earned the trust of millions of investors around the world.
Visitfranklintempleton.com/investor/
investments-and-solutions/
investment-options/etfs/ for fund
updates and documents.
| | | | | | | | |
| Not FDIC Insured | | | | | May Lose Value | | | | | No Bank Guarantee |
| | | | | | |
| | | |
| franklintempleton.com | | Not part of the semiannual report | | | 1 | |
SEMIANNUAL REPORT
Economic and Market Overview
The U.S. economy expanded during the six months ended September 30, 2019. However, the economy moderated in 2019’s second and third quarters, due partly to weakness in inventory and business investment. The manufacturing sector expanded during the period’s first four months, but contracted in August and September 2019. The services sector continued to expand throughout the period, although the rate of expansion slowed in September. The unemployment rate decreased from 3.8% in March 2019 to 3.5% atperiod-end.1 The annual inflation rate, as measured by the Consumer Price Index, decreased from 1.9% in March 2019 to 1.7% atperiod-end.1
At its July 2019 meeting, the U.S. Federal Reserve (Fed) lowered its target range for the federal funds rate for the first time since December 2008, to 2.00%–2.25%, citing muted inflation pressures and the potential effects of global trade tensions on economic growth. Furthermore, the Fed ended its balance sheet normalization program earlier than previously indicated. In September, the Fed further lowered the federal funds target rate range to 1.75%–2.00%, reiterating the rationale cited at the July 2019 meeting.
U.S. equity markets overall rose during the period, benefiting from upbeat economic data and U.S. corporate earnings, the Fed’s rate cuts and investor optimism about further monetary easing. However, markets reflected concerns about political uncertainties in the U.S. (including the impeachment inquiry into President Donald Trump), geopolitical tensions in certain regions, and the impact of U.S. trade disputes with China and other trading partners on global growth and corporate earnings. These concerns were partly alleviated at certain points during the period by easing trade tensions and optimism about a potentialU.S.-China trade deal. The broad U.S. stock market, as measured by the Standard & Poor’s® 500 Index (S&P 500®), generally trended higher in the period’s first four months, reaching a newall-time high in July. Stocks retreated in August, due to escalating trade tensions and heightened concerns about U.S. and global economic growth, but recovered in September amid easing trade tensions and investor optimism about the upcomingU.S.-China trade negotiations in October 2019. Overall, the S&P 500 posted a +6.08% total return for thesix-month period.2
1. Source: Bureau of Labor Statistics.
2. Source: Morningstar.
See www.franklintempletondatasources.com for additional data provider information.
| | | | |
| | | |
| 2 | | Semiannual Report | | franklintempleton.com |
Franklin LibertyQ U.S. Equity ETF
This semiannual report for Franklin LibertyQ U.S. Equity ETF covers the period ended September 30, 2019.
Your Fund’s Goal and Main Investments
The Fund seeks to provide investment results that closely correspond, before fees and expenses, to the performance of the LibertyQ U.S. Large Cap Equity Index (the Underlying Index).1 Under normal market conditions, the Fund invests at least 80% of its assets in the component securities of the Underlying Index. The Underlying Index seeks to achieve a lower level of risk and higher risk-adjusted performance than the Russell 1000® Index over the long term by applying a multi-factor selection process, which is designed to select equity securities from the Russell 1000® Index that have favorable exposure to four investment style factors: quality, value, momentum and low volatility.
Performance Overview
For the six months under review, the Fund posted cumulative total returns of +6.16% based on market price and +6.03% based on net asset value (NAV). In comparison, the LibertyQ U.S. Large Cap Equity Index posted a +6.16% total return for the same period, while the Russell 1000® Index posted a +5.73% total return.2 You can find more of the Fund’s performance data in the Performance Summary beginning on page 5.
Performance data represent past performance, which does not guarantee future results. Investment return and principal value will fluctuate, and you may have a gain or loss when you sell your shares. Current performance may differ from figures shown. For most recentmonth-end performance, go tofranklintempleton.com or call (800)342-5236.
| | | | |
| Top 10 Sectors/Industries | |
|
| 9/30/19 | |
| |
| | | % of Total
Net Assets | |
Information Technology | | | 18.9% | |
Consumer Discretionary | | | 16.7% | |
Consumer Staples | | | 15.7% | |
Industrials | | | 12.7% | |
Health Care | | | 9.9% | |
Utilities | | | 7.6% | |
Communication Services | | | 5.9% | |
Real Estate | | | 4.7% | |
Energy | | | 3.0% | |
Financials | | | 2.8% | |
Investment Strategy
The Fund, using a passive or indexing investment approach, seeks investment results that closely correspond, before fees and expenses, to the performance of the LibertyQ U.S. Large Cap Equity Index. The investment manager seeks to achieve, over time, a correlation between the Fund’s performance, before fees and expenses, and that of the Underlying Index of 0.95 or better. A figure of 1.00 would indicate perfect correlation. The Fund’s intention is to replicate the component securities of the Underlying Index as closely as possible. However, under various circumstances, it may not be possible or practicable to replicate the Underlying Index. In these circumstances, the Fund may use a “representative sampling” strategy whereby the Fund would invest in what it believes to be a representative sample of the component securities of the Underlying Index, but may not track the Underlying Index with the same degree of accuracy as would an investment vehicle replicating the entire Underlying Index. The Fund’s portfolio is reconstituted semiannually following the semiannual reconstitution of the Underlying Index.
1. Frank Russell Company is the source and owner of the trademarks, service marks and copyrights related to the Russell Indexes. Russell® is a trademark of Frank Russell Company. The LibertyQ U.S. Large Cap Equity Index is a systematic, rules-based proprietary index maintained and calculated by FTSE Russell (Russell) based on the Russell 1000® Index using a methodology developed with Franklin Templeton to reflect Franklin Templeton’s desired investment strategy. Russell 1000® Index is market capitalization weighted and measures performance of the largest companies in the Russell 3000® Index, which represents the majority of the U.S. market’s total capitalization.
2. Source: FactSet.
The indexes are unmanaged and include reinvestment of any income or distributions (after the deduction of certain withholding taxes). They do not reflect any fees, expenses or sales charges. One cannot invest directly in an index.
See www.franklintempletondatasources.com for additional data provider information.
The dollar value, number of shares or principal amount, and names of all portfolio holdings are listed in the Fund’s Statement of Investments (SOI). The SOI begins on page 19.
| | | | | | |
| | | |
| franklintempleton.com | | Semiannual Report | | | 3 | |
FRANKLIN LIBERTYQ U.S. EQUITY ETF
| | | | |
| Top 10 Holdings | |
|
| 9/30/19 | |
| |
Company Sector/Industry | | % of Total
Net Assets | |
Apple Inc. Information Technology | | | 1.2% | |
AT&T Inc. Communication Services | | | 1.1% | |
Texas Instruments Inc. Information Technology | | | 1.1% | |
Target Corp. Consumer Discretionary | | | 1.1% | |
The Home Depot Inc. Consumer Discretionary | | | 1.1% | |
NIKE Inc., B Consumer Discretionary | | | 1.1% | |
The Procter & Gamble Co. Consumer Staples | | | 1.1% | |
Costco Wholesale Corp. Consumer Staples | | | 1.1% | |
Ross Stores Inc. Consumer Discretionary | | | 1.1% | |
Intel Corp. Information Technology | | | 1.1% | |
Thank you for your participation in Franklin LibertyQ U.S. Equity ETF. We look forward to serving your future investment needs.
| | |
 | | 
Dina Ting, CFA |
| | |
 | | 
Louis Hsu, CFA |
| |
| | Portfolio Management Team |
CFA® is a trademark owned by CFA Institute.
The foregoing information reflects our analysis, opinions and portfolio holdings as of September 30, 2019, the end of the reporting period. These opinions may not be relied upon as investment advice or an offer for a particular security. The information is not a complete analysis of every aspect of any market, country, industry, security or the Fund. Statements of fact are from sources considered reliable, but the investment manager makes no representation or warranty as to their completeness or accuracy. Although historical performance is no guarantee of future results, these insights may help you understand our investment management philosophy.
| | | | |
| | | |
| 4 | | Semiannual Report | | franklintempleton.com |
FRANKLIN LIBERTYQ U.S. EQUITY ETF
Performance Summary as of September 30, 2019
Total return reflects reinvestment of the Fund’s dividends and capital gain distributions, if any, and any unrealized gains or losses. Total returns do not include brokerage commissions that may be payable on secondary market transactions. The performance table does not reflect any taxes that a shareholder would pay on Fund dividends, capital gain distributions, if any, or any realized gains on the sale of Fund shares.
Net asset value or “NAV” is the value of one share of a fund as calculated in accordance with the standard formula for valuing mutual fund shares. The price used to calculate market return (Market Price) is determined by using the midpoint between the highest bid and the lowest offer on the primary stock exchange on which shares of a fund are listed for trading, as of the time that such fund’s NAV is calculated. Since shares of the Fund did not trade in the secondary market until after the Fund’s inception, for the period from inception to the first day of secondary trading (4/28/17), the NAV of the Fund is used as a proxy for the Market Price to calculate market returns. Market and NAV returns assume that dividends and capital gain distributions have been reinvested at Market Price and NAV.
Your dividend income will vary depending on dividends or interest paid by securities in the Fund’s portfolio, adjusted for operating expenses. Capital gain distributions are net profits realized from the sale of portfolio securities.
Performance as of 9/30/191
| | | | | | | | | | | | | | | | |
| | |
| | | Cumulative Total Return2 | | | Average Annual Total Return2 | |
| | | Based on
NAV3 | | | Based on
market price4 | | | Based on
NAV3 | | | Based on
market price4 | |
6-month | | | +6.03% | | | | +6.16% | | | | +6.03% | | | | +6.16% | |
1-Year | | | +7.28% | | | | +7.31% | | | | +7.28% | | | | +7.31% | |
Since Inception (4/26/17) | | | +35.16% | | | | +35.32% | | | | +13.20% | | | | +13.26% | |
Performance data represent past performance, which does not guarantee future results. Investment return and principal value will fluctuate, and you may have a gain or loss when you sell your shares. Current performance may differ from figures shown. For most recentmonth-end performance, go tofranklintempleton.com or call (800) 342-5236.
See page 6 for Performance Summary footnotes.
| | | | | | |
| | | |
| franklintempleton.com | | Semiannual Report | | | 5 | |
FRANKLIN LIBERTYQ U.S. EQUITY ETF
PERFORMANCE SUMMARY
Distributions(4/1/19–9/30/19)
|
|
Net Investment
Income |
$0.311624 |
Total Annual Operating Expenses5
All investments involve risks, including possible loss of principal. Stock prices fluctuate, sometimes rapidly and dramatically, due to factors affecting individual companies, particular industries or sectors, or general market conditions. To the extent the Fund concentrates in a specific industry or group of industries, the Fund will carry much greater risks of adverse developments and price movements in such industries than a fund that invests in a wider variety of industries; there is also the risk that the Fund will perform poorly during a slump in demand for securities of companies in such industries. There can be no assurance that the Fund’s multi-factor stock selection process will enhance performance. Exposure to such investment factors may detract from performance in some market environments, perhaps for extended periods. Performance of the Fund may vary significantly from the performance of an index, as a result of transactions costs, expenses and other factors. The Fund’s prospectus also includes a description of the main investment risks.
ETFs trade like stocks, fluctuate in market value and may trade at prices above or below their net asset value. Brokerage commissions and ETF expenses will reduce returns.
1. Effective December 1, 2017, the Fund adopted a unified fee structure whereby Management has agreed to reimburse the Fund’s acquired fund fees and expenses (if any) and pay all of the ordinary operating expenses of the Fund, including custody, transfer agency, and Trustee fees and expenses, among others, but excluding: (i) payments under the Fund’s Rule12b-1 plan (if any); (ii) brokerage expenses (including any costs incidental to transactions in portfolio securities or instruments); (iii) taxes; (iv) interest (including borrowing costs and dividend expenses on securities sold short and overdraft charges); (v) litigation expenses (including litigation to which the Trust or a Fund may be a party and indemnification of the Trustees and officers with respect thereto); and (vi) othernon-routine or extraordinary expenses.
2. Total return calculations represent the cumulative and average annual changes in value of an investment over the periods indicated. Return for less than one year, if any, has not been annualized.
3. Assumes reinvestment of distributions based on net asset value.
4. Assumes reinvestment of distributions based on market price.
5. Figures are as stated in the Fund’s current prospectus and may differ from the expense ratios disclosed in the Your Fund’s Expenses and Financial Highlights sections in this report. In periods of market volatility, assets may decline significantly, causing total annual Fund operating expenses to become higher than the figures shown.
| | | | |
| | | |
| 6 | | Semiannual Report | | franklintempleton.com |
FRANKLIN LIBERTYQ U.S. EQUITY ETF
Your Fund’s Expenses
As a Fund shareholder, you can incur two types of costs: (1) transaction costs, including brokerage commissions on purchases and sales of Fund shares; and (2) ongoing Fund costs, including management fees and other Fund expenses. All funds have ongoing costs, sometimes referred to as operating expenses. The table below shows ongoing costs of investing in the Fund and can help you understand these costs and compare them with those of other funds. The table assumes a $1,000 investment held for the six months indicated.
Actual Fund Expenses
The table below provides information about actual account values and actual expenses in the columns under the heading “Actual.” In these columns the Fund’s actual return, which includes the effect of Fund expenses, is used to calculate the “Ending Account Value.” You can estimate the expenses you paid during the period by following these steps (of course, your account value and expenses will differ from those in this illustration):Divide your account value by $1,000 (if your account had an $8,600 value, then $8,600÷ $1,000 = 8.6).Then multiply the result by the number in the row under the headings “Actual” and “Expenses Paid During Period” (if Actual Expenses Paid During Period were $7.50, then 8.6 x $7.50 = $64.50).In this illustration, the actual expenses paid this period are $64.50.
Hypothetical Example for Comparison with Other Funds
Under the heading “Hypothetical” in the table, information is provided about hypothetical account values and hypothetical expenses based on the Fund’s actual expense ratio and an assumed rate of return of 5% per year before expenses, which is not the Fund’s actual return. This information may not be used to estimate the actual ending account balance or expenses you paid for the period, but it can help you compare ongoing costs of investing in the Fund with those of other funds. To do so, compare this 5% hypothetical example with the 5% hypothetical examples that appear in the shareholder reports of other funds.
Please note that expenses shown in the table are meant to highlight ongoing costs and do not reflect any transactional costs.Therefore, information under the heading “Hypothetical” is useful in comparing ongoing costs only, and will not help you compare total costs of owning different funds. In addition, if transactional costs were included, your total costs would have been higher.
| | | | | | | | | | | | | | | | | | | | | | |
| | | | Actual (actual return after expenses) | | | Hypothetical (5% annual return before expenses) | | | | |
| | | | | |
Beginning
Account
Value 4/1/19 | | | Ending
Account
Value 9/30/19 | | | Expenses Paid During Period 4/1/19–9/30/191,2 | | | Ending
Account
Value 9/30/19 | | | Expenses
Paid During
Period
4/1/19–9/30/191,2 | | | Net Annualized
Expense Ratio2 | |
| | $1,000.00 | | | $ | 1,060.30 | | | $ | 1.13 | | | $ | 1,023.90 | | | $ | 1.11 | | | | 0.22 | %3 |
1. Expenses are equal to the annualized expense ratio for thesix-month period as indicated above—in the far right column—multiplied by the simple average account value over the period indicated, and then multiplied by 183/366 to reflect theone-half year period.
2. Reflects expenses after fee waivers and expense reimbursements.
3. Effective 08/01/19, the unified management fee changed to 0.15%. Had such unified management fee been in effect for the full period, the expenses paid would have been $0.77 based upon the Fund’s actual performance and $0.76 based upon a hypothetical 5% return.
| | | | | | |
| | | |
| franklintempleton.com | | Semiannual Report | | | 7 | |
Franklin LibertyQ U.S. Mid Cap Equity ETF
This semiannual report for Franklin LibertyQ U.S. Mid Cap Equity ETF covers the period ended September 30, 2019.
Your Fund’s Goal and Main Investments
The Fund seeks to provide investment results that closely correspond, before fees and expenses, to the performance of the LibertyQ U.S. Mid Cap Equity Index (the Underlying Index).1Under normal market conditions, the Fund invests at least 80% of its assets in the component securities of the Underlying Index. The Underlying Index seeks to achieve a lower level of risk and higher risk-adjusted performance than the Russell Midcap® Index over the long term by applying a multi-factor selection process, which is designed to select equity securities from the Russell Midcap® Index that have favorable exposure to four investment style factors: quality, value, momentum and low volatility.
Performance Overview
For the six months under review, the Fund posted cumulative total returns of +4.46% based on market price and +4.43% based on net asset value (NAV). In comparison, the LibertyQ U.S. Mid Cap Equity Index posted a +4.57% total return for the same period, while the Russell Midcap® Index posted a +4.63% total return for the same period.2 You can find more of the Fund’s performance data in the Performance Summary beginning on page 10.
Performance data represent past performance, which does not guarantee future results. Investment return and principal value will fluctuate, and you may have a gain or loss when you sell your shares. Current performance may differ from figures shown. For most recentmonth-end performance, go tofranklintempleton.com or call (800) 342-5236.
| | | | |
| Top 10 Sectors/Industries | |
|
| 9/30/19 | |
| |
| | | % of Total
Net Assets | |
Consumer Discretionary | | | 20.5% | |
Industrials | | | 17.7% | |
Information Technology | | | 14.3% | |
Financials | | | 13.0% | |
Real Estate | | | 9.4% | |
Consumer Staples | | | 8.4% | |
Health Care | | | 7.6% | |
Utilities | | | 3.9% | |
Communication Services | | | 3.2% | |
Materials | | | 1.5% | |
Investment Strategy
The Fund, using a passive or indexing investment approach, seeks investment results that closely correspond, before fees and expenses, to the performance of the LibertyQ U.S. Mid Cap Equity Index. The investment manager seeks to achieve, over time, a correlation between the Fund’s performance, before fees and expenses, and that of the Underlying Index of 0.95 or better. A figure of 1.00 would indicate perfect correlation. The Fund’s intention is to replicate the component securities of the Underlying Index as closely as possible. However, under various circumstances, it may not be possible or practicable to replicate the Underlying Index. In these circumstances, the Fund may use a “representative sampling” strategy whereby the Fund would invest in what it believes to be a representative sample of the component securities of the Underlying Index, but may not track the Underlying Index with the same degree of accuracy as would an investment vehicle replicating the entire Underlying Index. The Fund’s portfolio is reconstituted semiannually following the semiannual reconstitution of the Underlying Index.
1. Frank Russell Company is the source and owner of the trademarks, service marks and copyrights related to the Russell Indexes. Russell® is a trademark of Frank Russell Company. The LibertyQ U.S. Mid Cap Equity Index is a systematic, rules-based proprietary index that is maintained and calculated by FTSE Russell (Russell). It is based on the Russell Midcap® Index using a methodology developed with Franklin Templeton to reflect Franklin Templeton’s desired investment strategy. Russell Midcap® Index is market capitalization weighted and measures performance of the smallest companies in the Russell 1000® Index, which represents a modest amount of the Russell 1000® Index’s total market capitalization.
2. Source: FactSet.
The indexes are unmanaged and include reinvestment of any income or distributions (after the deduction of certain withholding taxes). They do not reflect any fees, expenses or sales charges. One cannot invest directly in an index.
See www.franklintempletondatasources.com for additional data provider information.
The dollar value, number of shares or principal amount, and names of all portfolio holdings are listed in the Fund’s Statement of Investments (SOI). The SOI begins on page 26.
| | | | |
| | | |
| 8 | | Semiannual Report | | franklintempleton.com |
FRANKLIN LIBERTYQ U.S. MID CAP EQUITY ETF
| | | | |
| Top 10 Holdings | |
|
| 9/30/19 | |
| |
Company Sector/Industry | | % of Total
Net Assets | |
KLA Corp. Information Technology | | | 1.5% | |
Lam Research Corp. Information Technology | | | 1.2% | |
Dollar General Corp. Consumer Discretionary | | | 1.2% | |
Cintas Corp. Industrials | | | 1.1% | |
CDW Corp. Information Technology | | | 1.1% | |
Entergy Corp. Utilities | | | 1.2% | |
Synopsys Inc. Information Technology | | | 1.1% | |
The Hershey Co. Consumer Staples | | | 1.1% | |
The Kroger Co. Consumer Staples | | | 1.1% | |
Essex Property Trust Inc. Real Estate | | | 1.0% | |
Thank you for your participation in Franklin LibertyQ U.S. Mid Cap Equity ETF. We look forward to serving your future investment needs.
| | |
| |
Dina Ting, CFA |
| | |
| |
Louis Hsu, CFA |
| |
| | Portfolio Management Team |
The foregoing information reflects our analysis, opinions and portfolio holdings as of September 30, 2019, the end of the reporting period. These opinions may not be relied upon as investment advice or an offer for a particular security. The information is not a complete analysis of every aspect of any market, country, industry, security or the Fund. Statements of fact are from sources considered reliable, but the investment manager makes no representation or warranty as to their completeness or accuracy. Although historical performance is no guarantee of future results, these insights may help you understand our investment management philosophy.
| | | | | | |
| | | |
| franklintempleton.com | | Semiannual Report | | | 9 | |
FRANKLIN LIBERTYQ U.S. MID CAP EQUITY ETF
Performance Summary as of September 30, 2019
Total return reflects reinvestment of the Fund’s dividends and capital gain distributions, if any, and any unrealized gains or losses. Total returns do not include brokerage commissions that may be payable on secondary market transactions. The performance table does not reflect any taxes that a shareholder would pay on Fund dividends, capital gain distributions, if any, or any realized gains on the sale of Fund shares.
Net asset value or “NAV” is the value of one share of a fund as calculated in accordance with the standard formula for valuing mutual fund shares. The price used to calculate market return (Market Price) is determined by using the midpoint between the highest bid and the lowest offer on the primary stock exchange on which shares of a fund are listed for trading, as of the time that such fund’s NAV is calculated. Since shares of the Fund did not trade in the secondary market until after the Fund’s inception, for the period from inception to the first day of secondary trading (4/28/17), the NAV of the Fund is used as a proxy for the Market Price to calculate market returns. Market and NAV returns assume that dividends and capital gain distributions have been reinvested at Market Price and NAV.
Your dividend income will vary depending on dividends or interest paid by securities in the Fund’s portfolio, adjusted for operating expenses. Capital gain distributions are net profits realized from the sale of portfolio securities.
Performance as of 9/30/191
| | | | | | | | | | | | | | | | |
| | |
| | | Cumulative Total Return2 | | | Average Annual Total Return2 | |
| | | Based on
NAV3 | | | Based on
market price4 | | | Based on
NAV3 | | | Based on
market price4 | |
6-month | | | +4.43% | | | | +4.46% | | | | +4.43% | | | | +4.46% | |
1-Year | | | +5.07% | | | | +5.13% | | | | +5.07% | | | | +5.13% | |
Since Inception (4/26/17) | | | +27.51% | | | | +27.66% | | | | +10.52% | | | | +10.57% | |
Performance data represent past performance, which does not guarantee future results. Investment return and principal value will fluctuate, and you may have a gain or loss when you sell your shares. Current performance may differ from figures shown. For most recentmonth-end performance, go tofranklintempleton.com or call (800) 342-5236.
See page 11 for Performance Summary footnotes.
| | | | |
| | | |
| 10 | | Semiannual Report | | franklintempleton.com |
FRANKLIN LIBERTYQ U.S. MID CAP EQUITY ETF
PERFORMANCE SUMMARY
Distributions(4/1/19–9/30/19)
|
|
Net Investment
Income |
$0.211465 |
Total Annual Operating Expenses5
All investments involve risks, including possible loss of principal. Stock prices fluctuate, sometimes rapidly and dramatically, due to factors affecting individual companies, particular industries or sectors, or general market conditions. Historically,mid-size company securities have been more volatile in price than larger company securities, especially over the short term.Mid-size companies may be more susceptible to particular economic events or competitive factors than are larger, more broadly diversified companies. There can be no assurance that the Fund’s multi-factor stock selection process will enhance performance. Exposure to such investment factors may detract from performance in some market environments, perhaps for extended periods. Performance of the Fund may vary significantly from the performance of an index, as a result of transactions costs, expenses and other factors. The Fund’s prospectus also includes a description of the main investment risks.
ETFs trade like stocks, fluctuate in market value and may trade at prices above or below their net asset value. Brokerage commissions and ETF expenses will reduce returns.
1. Effective December 1, 2017, the Fund adopted a unified fee structure whereby Management has agreed to reimburse the Fund’s acquired fund fees and expenses (if any) and pay all of the ordinary operating expenses of the Fund, including custody, transfer agency, and Trustee fees and expenses, among others, but excluding: (i) payments under the Fund’s Rule12b-1 plan (if any); (ii) brokerage expenses (including any costs incidental to transactions in portfolio securities or instruments); (iii) taxes; (iv) interest (including borrowing costs and dividend expenses on securities sold short and overdraft charges); (v) litigation expenses (including litigation to which the Trust or a Fund may be a party and indemnification of the Trustees and officers with respect thereto); and (vi) othernon-routine or extraordinary expenses.
2. Total return calculations represent the cumulative and average annual changes in value of an investment over the periods indicated. Return for less than one year, if any, has not been annualized.
3. Assumes reinvestment of distributions based on net asset value.
4. Assumes reinvestment of distributions based on market price.
5. Figures are as stated in the Fund’s current prospectus and may differ from the expense ratios disclosed in the Your Fund’s Expenses and Financial Highlights sections in this report. In periods of market volatility, assets may decline significantly, causing total annual Fund operating expenses to become higher than the figures shown.
| | | | | | |
| | | |
| franklintempleton.com | | Semiannual Report | | | 11 | |
FRANKLIN LIBERTYQ U.S. MID CAP EQUITY ETF
Your Fund’s Expenses
As a Fund shareholder, you can incur two types of costs: (1) transaction costs, including brokerage commissions on purchases and sales of Fund shares; and (2) ongoing Fund costs, including management fees and other Fund expenses. All funds have ongoing costs, sometimes referred to as operating expenses. The table below shows ongoing costs of investing in the Fund and can help you understand these costs and compare them with those of other funds. The table assumes a $1,000 investment held for the six months indicated.
Actual Fund Expenses
The table below provides information about actual account values and actual expenses in the columns under the heading “Actual.” In these columns the Fund’s actual return, which includes the effect of Fund expenses, is used to calculate the “Ending Account Value.” You can estimate the expenses you paid during the period by following these steps (of course, your account value and expenses will differ from those in this illustration):Divide your account value by $1,000 (if your account had an $8,600 value, then $8,600÷ $1,000 = 8.6).Then multiply the result by the number in the row under the headings “Actual” and “Expenses Paid During Period” (if Actual Expenses Paid During Period were $7.50, then 8.6 x $7.50 = $64.50).In this illustration, the actual expenses paid this period are $64.50.
Hypothetical Example for Comparison with Other Funds
Under the heading “Hypothetical” in the table, information is provided about hypothetical account values and hypothetical expenses based on the Fund’s actual expense ratio and an assumed rate of return of 5% per year before expenses, which is not the Fund’s actual return. This information may not be used to estimate the actual ending account balance or expenses you paid for the period, but it can help you compare ongoing costs of investing in the Fund with those of other funds. To do so, compare this 5% hypothetical example with the 5% hypothetical examples that appear in the shareholder reports of other funds.
Please note that expenses shown in the table are meant to highlight ongoing costs and do not reflect any transactional costs.Therefore, information under the heading “Hypothetical” is useful in comparing ongoing costs only, and will not help you compare total costs of owning different funds. In addition, if transactional costs were included, your total costs would have been higher.
| | | | | | | | | | | | | | | | | | | | | | |
| | | | Actual (actual return after expenses) | | | Hypothetical (5% annual return before expenses) | | | | |
| | | | | |
Beginning
Account
Value 4/1/19 | | | Ending
Account
Value 9/30/19 | | | Expenses
Paid During
Period
4/1/19–9/30/191,2 | | | Ending
Account
Value 9/30/19 | | | Expenses
Paid During
Period
4/1/19–9/30/191,2 | | | Net Annualized
Expense Ratio2 | |
| | $1,000.00 | | | $ | 1,044.30 | | | $ | 1.53 | | | $ | 1,023.50 | | | $ | 1.52 | | | | 0.30 | % |
1. Expenses are equal to the annualized expense ratio for thesix-month period as indicated above—in the far right column—multiplied by the simple average account value over the period indicated, and then multiplied by 183/366 to reflect theone-half year period.
2. Reflects expenses after fee waivers and expense reimbursements.
| | | | |
| | | |
| 12 | | Semiannual Report | | franklintempleton.com |
Franklin LibertyQ U.S. Small Cap Equity ETF
This semiannual report for Franklin LibertyQ U.S. Small Cap Equity ETF covers the period ended September 30, 2019.
Your Fund’s Goal and Main Investments
The Fund seeks to provide investment results that closely correspond, before fees and expenses, to the performance of the LibertyQ U.S. Small Cap Equity Index (the Underlying Index).1Under normal market conditions, the Fund invests at least 80% of its assets in the component securities of the Underlying Index. The Underlying Index seeks to achieve a lower level of risk and higher risk-adjusted performance than the Russell 2000® Index over the long term by applying a multi-factor selection process, which is designed to select equity securities from the Russell 2000® Index that have favorable exposure to four investment style factors: quality, value, momentum and low volatility.
Performance Overview
For thesix-month period, the Fund posted cumulative total returns of +1.11% based on market price and +1.07% based on net asset value (NAV).2 In comparison, the LibertyQ U.S. Small Cap Equity Index posted a +1.24% total return for the same period, while the Russell 2000® Index posted a-0.36% total return.3 You can find more of the Fund’s performance data in the Performance Summary beginning on page 15.
Performance data represent past performance, which does not guarantee future results. Investment return and principal value will fluctuate, and you may have a gain or loss when you sell your shares. Current performance may differ from figures shown. For most recentmonth-end performance, go tofranklintempleton.com or call(800)342-5236.
| | | | |
| Top 10 Sectors/Industries | | | |
| |
| 9/30/19 | | | |
| |
| | | % of Total
Net Assets | |
| Consumer Discretionary | | | 23.5% | |
| Industrials | | | 20.4% | |
| Information Technology | | | 11.0% | |
| Health Care | | | 10.4% | |
| Financial | | | 9.3% | |
| Utilities | | | 7.1% | |
| Consumer Staples | | | 6.8% | |
| Real Estate | | | 6.0% | |
| Communication Services | | | 3.2% | |
| Materials | | | 1.7% | |
Investment Strategy
The Fund, using a passive or indexing investment approach, seeks investment results that closely correspond, before fees and expenses, to the performance of the LibertyQ U.S. Small Cap Equity Index. The investment manager seeks to achieve, over time, a correlation between the Fund’s performance, before fees and expenses, and that of the Underlying Index of 0.95 or better. A figure of 1.00 would indicate perfect correlation. The Fund’s intention is to replicate the component securities of the Underlying Index as closely as possible. However, under various circumstances, it may not be possible or practicable to replicate the Underlying Index. In these circumstances, the Fund may use a “representative sampling” strategy whereby the Fund would invest in what it believes to be a representative sample of the component securities of the Underlying Index, but may not track the Underlying Index with the same degree of accuracy as would an investment vehicle replicating the entire Underlying Index. The Fund’s portfolio is reconstituted semiannually following the semiannual reconstitution of the Underlying Index.
1. Frank Russell Company is the source and owner of the trademarks, service marks and copyrights related to the Russell Indexes. Russell® is a trademark of Frank Russell Company. The LibertyQ U.S. Small Cap Equity Index is a systematic, rules-based proprietary index that is maintained and calculated by FTSE Russell (Russell). It is based on the Russell 2000® Index using a methodology developed with Franklin Templeton to reflect Franklin Templeton’s desired investment strategy. Russell 2000® Index is market capitalization weighted and measures performance of the 2,000 smallest companies in the Russell 3000® Index, which represent a small amount of the total market capitalization of the Russell 3000® Index.
2. Source: FactSet.
The indexes are unmanaged and include reinvestment of any income or distributions (after the deduction of certain withholding taxes). They do not reflect any fees, expenses or sales charges. One cannot invest directly in an index.
See www.franklintempletondatasources.com for additional data provider information.
The dollar value, number of shares or principal amount, and names of all portfolio holdings are listed in the Fund’s Statement of Investments (SOI). The SOI begins on page 32.
| | | | | | |
| | | |
| franklintempleton.com | | Semiannual Report | | | 13 | |
FRANKLIN LIBERTYQ U.S. SMALL CAP EQUITY ETF
| | | | |
| Top 10 Holdings | | | |
| |
| 9/30/19 | | | |
| |
Company Sector/Industry | | % of Total
Net Assets | |
Haemonetics Corp. Health Care | | | 1.0% | |
Essent Group Ltd. Financials | | | 1.0% | |
Trex Co, Inc, Industrials | | | 0.9% | |
Deckers Outdoor Corp. Consumer Discretionary | | | 0.9% | |
Performance Food Group Co. Consumer Staples | | | 0.9% | |
J2 Global Inc. Information Technology | | | 0.9% | |
Southwest Gas Holdings Inc. Utilities | | | 0.9% | |
Silicon Laboratories Inc. Information Technology | | | 0.8% | |
Amedisys Inc. Health Care | | | 0.8% | |
Texas Roadhouse Inc., A Consumer Discretionary | | | 0.8% | |
Thank you for your participation in Franklin LibertyQ U.S. Small Cap Equity ETF. We look forward to serving your future investment needs.
| | |
| |
Dina Ting, CFA |
| |
Louis Hsu, CFA |
| |
| | Portfolio Management Team |
The foregoing information reflects our analysis, opinions and portfolio holdings as of September 30, 2019, the end of the reporting period. These opinions may not be relied upon as investment advice or an offer for a particular security. The information is not a complete analysis of every aspect of any market, country, industry, security or the Fund. Statements of fact are from sources considered reliable, but the investment manager makes no representation or warranty as to their completeness or accuracy. Although historical performance is no guarantee of future results, these insights may help you understand our investment management philosophy.
| | | | |
| | | |
| 14 | | Semiannual Report | | franklintempleton.com |
FRANKLIN LIBERTYQ U.S. SMALL CAP EQUITY ETF
Performance Summary as of September 30, 2019
Total return reflects reinvestment of the Fund’s dividends and capital gain distributions, if any, and any unrealized gains or losses. Total returns do not include brokerage commissions that may be payable on secondary market transactions. The performance table does not reflect any taxes that a shareholder would pay on Fund dividends, capital gain distributions, if any, or any realized gains on the sale of Fund shares.
Net asset value or “NAV” is the value of one share of a fund as calculated in accordance with the standard formula for valuing mutual fund shares. The price used to calculate market return (Market Price) is determined by using the midpoint between the highest bid and the lowest offer on the primary stock exchange on which shares of a fund are listed for trading, as of the time that such fund’s NAV is calculated. Since shares of the Fund did not trade in the secondary market until after the Fund’s inception, for the period from inception to the first day of secondary trading (4/28/17), the NAV of the Fund is used as a proxy for the Market Price to calculate market returns. Market and NAV returns assume that dividends and capital gain distributions have been reinvested at Market Price and NAV.
Your dividend income will vary depending on dividends or interest paid by securities in the Fund’s portfolio, adjusted for operating expenses. Capital gain distributions are net profits realized from the sale of portfolio securities.
Performance as of 9/30/191
| | | | | | | | | | | | | | | | |
| | |
| | | Cumulative Total Return2 | | | Average Annual Total Return2 | |
| | | Based on NAV3 | | | Based on market price4 | | | Based on NAV3 | | | Based on market price4 | |
6-month | | | +1.07% | | | | +1.11% | | | | +1.07% | | | | +1.11% | |
1-Year | | | -6.22% | | | | -5.81% | | | | -6.22% | | | | -5.81% | |
Since Inception (4/26/17) | | | +12.90% | | | | +13.03% | | | | +5.12% | | | | +5.17% | |
Performance data represent past performance, which does not guarantee future results. Investment return and principal value will fluctuate, and you may have a gain or loss when you sell your shares. Current performance may differ from figures shown. For most recentmonth-end performance, go tofranklintempleton.com or call(800)342-5236.
See page 16 for Performance Summary footnotes.
| | | | | | |
| | | |
| franklintempleton.com | | Semiannual Report | | | 15 | |
FRANKLIN LIBERTYQ U.S. SMALL CAP EQUITY ETF
PERFORMANCE SUMMARY
Distributions(4/1/19–9/30/19)
|
|
Net Investment
Income |
$0.207995 |
Total Annual Operating Expenses5
All investments involve risks, including possible loss of principal. Stock prices fluctuate, sometime rapidly and dramatically, due to factors affecting individual companies, particular industries or sectors, or general market conditions. Smaller,mid-sized and relatively new or unseasoned companies can be particularly sensitive to changing economic conditions, and their prospects for growth are less certain than those of larger, more established companies. Historically, these securities have experienced more price volatility than larger company stocks, especially over the short term. Smaller companies may be more susceptible to particular events or economic conditions, less certain growth prospects, lack of depth of management and funds for growth and development and limited or less developed product lines and markets. There can be no assurance that the Fund’s multi-factor stock selection process will enhance performance. Exposure to such investment factors may detract from performance in some market environments, perhaps for extended periods. Performance of the Fund may vary significantly from the performance of an index, as a result of transactions costs, expenses and other factors. The Fund’s prospectus also includes a description of the main investment risks.
ETFs trade like stocks, fluctuate in market value and may trade at prices above or below their net asset value. Brokerage commissions and ETF expenses will reduce returns.
1. Effective December 1, 2017, the Fund adopted a unified fee structure whereby Management has agreed to reimburse the Fund’s acquired fund fees and expenses (if any) and pay all of the ordinary operating expenses of the Fund, including custody, transfer agency, and Trustee fees and expenses, among others, but excluding: (i) payments under the Fund’s Rule12b-1 plan (if any); (ii) brokerage expenses (including any costs incidental to transactions in portfolio securities or instruments); (iii) taxes; (iv) interest (including borrowing costs and dividend expenses on securities sold short and overdraft charges); (v) litigation expenses (including litigation to which the Trust or a Fund may be a party and indemnification of the Trustees and officers with respect thereto); and (vi) othernon-routine or extraordinary expenses.
2. Total return calculations represent the cumulative and average annual changes in value of an investment over the periods indicated. Return for less than one year, if any, has not been annualized.
3. Assumes reinvestment of distributions based on net asset value.
4. Assumes reinvestment of distributions based on market price.
5. Figures are as stated in the Fund’s current prospectus and may differ from the expense ratios disclosed in the Your Fund’s Expenses and Financial Highlights sections in this report. In periods of market volatility, assets may decline significantly, causing total annual Fund operating expenses to become higher than the figures shown.
| | | | |
| | | |
| 16 | | Semiannual Report | | franklintempleton.com |
FRANKLIN LIBERTYQ U.S. SMALL CAP EQUITY ETF
Your Fund’s Expenses
As a Fund shareholder, you can incur two types of costs: (1) transaction costs, including brokerage commissions on purchases and sales of Fund shares; and (2) ongoing Fund costs, including management fees and other Fund expenses. All funds have ongoing costs, sometimes referred to as operating expenses. The table below shows ongoing costs of investing in the Fund and can help you understand these costs and compare them with those of other funds. The table assumes a $1,000 investment held for the six months indicated.
Actual Fund Expenses
The table below provides information about actual account values and actual expenses in the columns under the heading “Actual.” In these columns the Fund’s actual return, which includes the effect of Fund expenses, is used to calculate the “Ending Account Value.” You can estimate the expenses you paid during the period by following these steps (of course, your account value and expenses will differ from those in this illustration):Divide your account value by $1,000 (if your account had an $8,600 value, then $8,600÷ $1,000 = 8.6).Then multiply the result by the number in the row under the headings “Actual” and “Expenses Paid During Period” (if Actual Expenses Paid During Period were $7.50, then 8.6 x $7.50 = $64.50).In this illustration, the actual expenses paid this period are $64.50.
Hypothetical Example for Comparison with Other Funds
Under the heading “Hypothetical” in the table, information is provided about hypothetical account values and hypothetical expenses based on the Fund’s actual expense ratio and an assumed rate of return of 5% per year before expenses, which is not the Fund’s actual return. This information may not be used to estimate the actual ending account balance or expenses you paid for the period, but it can help you compare ongoing costs of investing in the Fund with those of other funds. To do so, compare this 5% hypothetical example with the 5% hypothetical examples that appear in the shareholder reports of other funds.
Please note that expenses shown in the table are meant to highlight ongoing costs and do not reflect any transactional costs.Therefore, information under the heading “Hypothetical” is useful in comparing ongoing costs only, and will not help you compare total costs of owning different funds. In addition, if transactional costs were included, your total costs would have been higher.
| | | | | | | | | | | | | | | | | | | | | | |
| | | | Actual (actual return after expenses) | | | Hypothetical (5% annual return before expenses) | | | | |
| | | | | |
Beginning
Account
Value 4/1/19 | | | Ending
Account
Value 9/30/19 | | | Expenses
Paid During
Period
4/1/19–9/30/191,2 | | | Ending
Account
Value 9/30/19 | | | Expenses
Paid During
Period
4/1/19–9/30/191,2 | | | Net Annualized
Expense Ratio2 | |
| | $1,000.00 | | | $ | 1,010.70 | | | $ | 1.76 | | | $ | 1,023.25 | | | $ | 1.77 | | | | 0.35 | % |
1. Expenses are equal to the annualized expense ratio for thesix-month period as indicated above—in the far right column—multiplied by the simple average account value over the period indicated, and then multiplied by 183/366 to reflect theone-half year period.
2. Reflects expenses after fee waivers and expense reimbursements.
| | | | | | |
| | | |
| franklintempleton.com | | Semiannual Report | | | 17 | |
FRANKLIN TEMPLETON ETF TRUST
Financial Highlights
Franklin LibertyQ U.S. Equity ETF
| | | | | | | | | | | | |
| | | Six Months Ended
September 30, 2019
(unaudited) | | | Year Ended March 31, | |
| | | 2019 | | | 2018a | |
| | | |
Per share operating performance
(for a share outstanding throughout the period) | | | | | | | | | | | | |
| | | |
Net asset value, beginning of period | | $ | 31.41 | | | $ | 28.51 | | | $ | 25.44 | |
| | | | |
| | | |
| Income from investment operationsb: | | | | | | | | | | | | |
| | | |
Net investment incomec | | | 0.36 | | | | 0.66 | | | | 0.53 | |
| | | |
Net realized and unrealized gains (losses) | | | 1.53 | | | | 2.71 | | | | 2.98 | |
| | | | |
| | | |
Total from investment operations | | | 1.89 | | | | 3.37 | | | | 3.51 | |
| | | | |
| | | |
Less distributions from net investment income | | | (0.31 | ) | | | (0.47 | ) | | | (0.44 | ) |
| | | | |
| | | |
Net asset value, end of period | | $ | 32.99 | | | $ | 31.41 | | | $ | 28.51 | |
| | | | |
| | | |
Total returnd | | | 6.03% | | | | 11.97% | | | | 13.84% | |
| | | |
| Ratios to average net assetse | | | | | | | | | | | | |
| | | |
Expenses before waiver and payments by affiliates | | | 0.22% | | | | 0.25% | | | | 0.32% | f |
| | | |
Expenses net of waiver and payments by affiliates | | | 0.22% | | | | 0.25% | | | | 0.25% | f |
| | | |
Net investment income | | | 2.24% | | | | 2.20% | | | | 2.10% | |
| | | |
| Supplemental data | | | | | | | | | | | | |
| | | |
Net assets, end of period (000’s) | | | $1,219,100 | | | | $1,008,255 | | | | $108,326 | |
| | | |
Portfolio turnover rateg | | | 11.16% | | | | 18.04% | | | | 20.80% | |
| | | |
| Portfolio turnover rate excluding portfolio transactions that are executed as a result of the Fund offering and redeeming Creation Units solely or in part for cashg,h | | | 11.16% | | | | —% | | | | —% | |
aFor the period April 26, 2017 (commencement of operations) to March 31, 2018.
bThe amount shown for a share outstanding throughout the period may not correlate with the Statement of Operations for the period due to the timing of sales and repurchases of Creation Unit Fund shares in relation to income earned and/or fluctuating fair value of the investments of the Fund.
cBased on average daily shares outstanding.
dTotal return is not annualized for periods less than one year. Total return is calculated assuming an initial investment made at the net asset value at the beginning of the period, reinvestment of all dividends and distributions at net asset value during the period, and redemption at net asset value on the last day of the period.
eRatios are annualized for periods less than one year.
fEffective December 1, 2017, the Fund replaced the prior fee structure with a unified management fee. See Note 3(a).
gPortfolio turnover rate excludes the value of portfolio securities received or delivered as a result of processing capital share transactions in Creation Units, if any.
hEffective September 30, 2019.
| | | | |
| | | |
| 18 | | Semiannual Report | The accompanying notes are an integral part of these financial statements. | | franklintempleton.com |
FRANKLIN TEMPLETON ETF TRUST
Statement of Investments, September 30, 2019 (unaudited)
Franklin LibertyQ U.S. Equity ETF
| | | | | | | | | | |
| | |
| | | Shares | | | Value | |
| | | Common Stocks 99.8% | | | | | | |
| | | Communication Services 5.9% | | | | | | |
| a | | AMC Networks Inc., A | | | 9,607 | | | $ | 472,280 | |
| | AT&T Inc. | | | 366,544 | | | | 13,870,025 | |
| | Cable One Inc. | | | 525 | | | | 658,718 | |
| | CBS Corp., B | | | 26,604 | | | | 1,074,004 | |
| | Cinemark Holdings Inc. | | | 13,302 | | | | 513,989 | |
| | Comcast Corp., A | | | 271,952 | | | | 12,259,596 | |
| a | | Facebook Inc., A | | | 62,815 | | | | 11,186,095 | |
| b | | Match Group Inc. | | | 11,085 | | | | 791,913 | |
| | Omnicom Group Inc. | | | 56,164 | | | | 4,397,641 | |
| | The Interpublic Group of Cos. Inc. | | | 63,554 | | | | 1,370,224 | |
| | The Walt Disney Co. | | | 84,985 | | | | 11,075,245 | |
| | Verizon Communications Inc. | | | 205,442 | | | | 12,400,479 | |
| | Viacom Inc., B | | | 62,076 | | | | 1,491,686 | |
| | | | | | | | | | |
| | | | 71,561,895 | |
| | | | | | | | | | |
| | | Consumer Discretionary 16.7% | | | | | | |
| a | | AutoZone Inc. | | | 4,618 | | | | 5,008,775 | |
| | Best Buy Co. Inc. | | | 69,466 | | | | 4,792,459 | |
| a | | Capri Holdings Ltd. | | | 43,601 | | | | 1,445,809 | |
| | Carnival Corp. | | | 93,114 | | | | 4,070,013 | |
| | Carter’s Inc. | | | 11,824 | | | | 1,078,467 | |
| | Choice Hotels International Inc. | | | 9,607 | | | | 854,639 | |
| | Darden Restaurants Inc. | | | 37,689 | | | | 4,455,594 | |
| | Dick’s Sporting Goods Inc. | | | 22,909 | | | | 934,916 | |
| | Dollar General Corp. | | | 54,686 | | | | 8,691,793 | |
| | Domino’s Pizza Inc. | | | 11,824 | | | | 2,892,032 | |
| a | | Five Below Inc. | | | 3,695 | | | | 465,940 | |
| | Foot Locker Inc. | | | 39,167 | | | | 1,690,448 | |
| a | | frontdoor Inc. | | | 6,651 | | | | 323,039 | |
| | Garmin Ltd. | | | 36,950 | | | | 3,129,296 | |
| | General Motors Co. | | | 99,026 | | | | 3,711,495 | |
| | Gentex Corp. | | | 72,422 | | | | 1,994,140 | |
| | Genuine Parts Co. | | | 39,167 | | | | 3,900,642 | |
| a | | Grand Canyon Education Inc. | | | 8,129 | | | | 798,268 | |
| | H&R Block Inc. | | | 65,771 | | | | 1,553,511 | |
| | Hanesbrands Inc. | | | 26,604 | | | | 407,573 | |
| | Hasbro Inc. | | | 31,038 | | | | 3,683,900 | |
| | Kohl’s Corp. | | | 50,991 | | | | 2,532,213 | |
| | Kontoor Brands Inc. | | | 1 | | | | 35 | |
| | L Brands Inc. | | | 70,205 | | | | 1,375,316 | |
| | Las Vegas Sands Corp. | | | 70,944 | | | | 4,097,725 | |
| | Lear Corp. | | | 16,258 | | | | 1,916,818 | |
| | Leggett & Platt Inc. | | | 33,994 | | | | 1,391,714 | |
| a | | Lululemon Athletica Inc. | | | 28,821 | | | | 5,548,907 | |
| | Macy’s Inc. | | | 84,246 | | | | 1,309,183 | |
| | McDonald’s Corp. | | | 56,164 | | | | 12,058,972 | |
| | NIKE Inc., B | | | 144,844 | | | | 13,603,749 | |
| b | | Nordstrom Inc. | | | 32,516 | | | | 1,094,814 | |
| a | | NVR Inc. | | | 739 | | | | 2,747,122 | |
| a | | O’Reilly Automotive Inc. | | | 22,909 | | | | 9,129,466 | |
| | Penske Automotive Group Inc. | | | 6,651 | | | | 314,459 | |
| | Pool Corp. | | | 9,607 | | | | 1,937,732 | |
| | PulteGroup Inc. | | | 20,692 | | | | 756,293 | |
| | Ralph Lauren Corp. | | | 8,129 | | | | 776,076 | |
| | Ross Stores Inc. | | | 120,457 | | | | 13,232,201 | |
| | Six Flags Entertainment Corp. | | | 12,563 | | | | 638,075 | |
| | Tapestry Inc. | | | 84,246 | | | | 2,194,608 | |
| | Target Corp. | | | 129,325 | | | | 13,826,136 | |
| | | | | | |
| | | |
| franklintempleton.com | | Semiannual Report | | | 19 | |
FRANKLIN TEMPLETON ETF TRUST
STATEMENT OF INVESTMENTS (UNAUDITED)
Franklin LibertyQ U.S. Equity ETF(continued)
| | | | | | | | | | |
| | |
| | | Shares | | | Value | |
| | | Common Stocks (continued) | | | | | | |
| | | Consumer Discretionary (continued) | | | | | | |
| | The Gap Inc. | | | 74,639 | | | $ | 1,295,733 | |
| | The Home Depot Inc. | | | 59,120 | | | | 13,717,022 | |
| | The TJX Cos. Inc. | | | 222,439 | | | | 12,398,750 | |
| | Thor Industries Inc. | | | 13,302 | | | | 753,425 | |
| | Tractor Supply Co. | | | 33,994 | | | | 3,074,417 | |
| a | | Ulta Beauty Inc. | | | 16,258 | | | | 4,075,068 | |
| a | | Urban Outfitters Inc. | | | 21,431 | | | | 601,997 | |
| | VF Corp. | | | 86,463 | | | | 7,694,342 | |
| | Williams-Sonoma Inc. | | | 25,126 | | | | 1,708,065 | |
| | Wyndham Destinations Inc. | | | 15,519 | | | | 714,184 | |
| | Yum! Brands Inc. | | | 101,982 | | | | 11,567,818 | |
| | | | | | | | | | |
| | | | 203,965,184 | |
| | | | | | | | | | |
| | | Consumer Staples 15.7% | | | | | | |
| | Altria Group Inc. | | | 227,612 | | | | 9,309,331 | |
| | Brown-Forman Corp., A | | | 15,519 | | | | 927,260 | |
| | Casey’s General Stores Inc. | | | 8,129 | | | | 1,310,070 | |
| | Church & Dwight Co. Inc. | | | 66,510 | | | | 5,004,212 | |
| | Clorox Co. | | | 41,384 | | | | 6,284,988 | |
| | Colgate-Palmolive Co. | | | 160,363 | | | | 11,788,284 | |
| | Costco Wholesale Corp. | | | 46,557 | | | | 13,413,537 | |
| | Estee Lauder Cos. Inc., A | | | 62,076 | | | | 12,350,020 | |
| | Flowers Foods Inc. | | | 47,296 | | | | 1,093,956 | |
| | General Mills Inc. | | | 160,363 | | | | 8,839,209 | |
| | Hormel Foods Corp. | | | 79,073 | | | | 3,457,862 | |
| | Ingredion Inc. | | | 16,258 | | | | 1,328,929 | |
| | Kellogg Co. | | | 31,038 | | | | 1,997,295 | |
| | Kimberly-Clark Corp. | | | 50,252 | | | | 7,138,297 | |
| | Lamb Weston Holdings Inc. | | | 33,994 | | | | 2,472,044 | |
| a | | Monster Beverage Corp. | | | 78,334 | | | | 4,548,072 | |
| | Nu Skin Enterprises Inc., A | | | 14,041 | | | | 597,164 | |
| | PepsiCo Inc. | | | 87,202 | | | | 11,955,394 | |
| | Philip Morris International Inc. | | | 144,844 | | | | 10,998,005 | |
| a | | Sprouts Farmers Market Inc. | | | 20,692 | | | | 400,183 | |
| | Sysco Corp. | | | 130,064 | | | | 10,327,082 | |
| | The Coca-Cola Co. | | | 227,612 | | | | 12,391,197 | |
| | The Hershey Co. | | | 46,557 | | | | 7,215,869 | |
| | The J. M. Smucker Co. | | | 18,475 | | | | 2,032,620 | |
| | The Kroger Co. | | | 108,633 | | | | 2,800,559 | |
| | The Procter & Gamble Co. | | | 108,633 | | | | 13,511,773 | |
| | Tyson Foods Inc. | | | 73,900 | | | | 6,365,746 | |
| | Walgreens Boots Alliance Inc. | | | 144,105 | | | | 7,970,448 | |
| | Walmart Inc. | | | 110,111 | | | | 13,067,973 | |
| | | | | | | | | | |
| | | | 190,897,379 | |
| | | | | | | | | | |
| | | Energy 3.0% | | | | | | |
| | Cabot Oil & Gas Corp., A | | | 32,516 | | | | 571,306 | |
| | Cimarex Energy Co. | | | 12,563 | | | | 602,270 | |
| | ConocoPhillips | | | 82,768 | | | | 4,716,121 | |
| | Exxon Mobil Corp. | | | 158,146 | | | | 11,166,689 | |
| | HollyFrontier Corp. | | | 12,563 | | | | 673,879 | |
| | Occidental Petroleum Corp. | | | 56,164 | | | | 2,497,613 | |
| | Phillips 66 | | | 74,639 | | | | 7,643,034 | |
| | Valero Energy Corp. | | | 101,243 | | | | 8,629,953 | |
| | | | | | | | | | |
| | | | 36,500,865 | |
| | | | | | | | | | |
| | | Financials 2.8% | | | | | | |
| | American National Insurance Co. | | | 2,217 | | | | 274,309 | |
| | | | |
| | | |
| 20 | | Semiannual Report | | franklintempleton.com |
FRANKLIN TEMPLETON ETF TRUST
STATEMENT OF INVESTMENTS (UNAUDITED)
Franklin LibertyQ U.S. Equity ETF(continued)
| | | | | | | | | | |
| | |
| | | Shares | | | Value | |
| | | Common Stocks (continued) | | | | | | |
| | | Financials (continued) | | | | | | |
| | Assured Guaranty Ltd. | | | 14,041 | | | $ | 624,263 | |
| | Erie Indemnity Co., A | | | 5,912 | | | | 1,097,563 | |
| | Evercore Inc. | | | 6,651 | | | | 532,745 | |
| | Everest Re Group Ltd. | | | 6,651 | | | | 1,769,765 | |
| | FactSet Research Systems Inc. | | | 9,607 | | | | 2,334,213 | |
| | Invesco Ltd. | | | 49,513 | | | | 838,750 | |
| | Lazard Ltd., A | | | 32,516 | | | | 1,138,060 | |
| | MarketAxess Holdings Inc. | | | 9,607 | | | | 3,146,292 | |
| | Mercury General Corp. | | | 7,390 | | | | 412,953 | |
| | Moody’s Corp. | | | 13,302 | | | | 2,724,649 | |
| | Morningstar Inc. | | | 5,173 | | | | 755,982 | |
| | MSCI Inc. | | | 19,953 | | | | 4,344,766 | |
| | Navient Corp. | | | 28,082 | | | | 359,450 | |
| | People’s United Financial Inc. | | | 87,941 | | | | 1,374,957 | |
| | RenaissanceRe Holdings Ltd. | | | 2,959 | | | | 572,419 | |
| | Santander Consumer USA Holdings Inc. | | | 27,343 | | | | 697,520 | |
| | SEI Investments Co. | | | 24,387 | | | | 1,445,052 | |
| | The Progressive Corp. | | | 123,413 | | | | 9,533,654 | |
| | | | | | | | | | |
| | | | 33,977,362 | |
| | | | | | | | | | |
| | | Health Care 9.9% | | | | | | |
| | AbbVie Inc. | | | 145,583 | | | | 11,023,545 | |
| | Amgen Inc. | | | 67,249 | | | | 13,013,354 | |
| a | | Biogen Inc. | | | 40,645 | | | | 9,462,969 | |
| | Bristol-Myers Squibb Co. | | | 246,087 | | | | 12,479,072 | |
| a | | Celgene Corp. | | | 51,730 | | | | 5,136,789 | |
| | Cerner Corp. | | | 64,293 | | | | 4,382,854 | |
| | Chemed Corp. | | | 2,956 | | | | 1,234,337 | |
| a | | Exelixis Inc. | | | 59,859 | | | | 1,058,607 | |
| | Gilead Sciences Inc. | | | 179,577 | | | | 11,381,590 | |
| | HCA Holdings Inc. | | | 42,862 | | | | 5,161,442 | |
| | Johnson & Johnson | | | 84,985 | | | | 10,995,359 | |
| | Merck & Co. Inc. | | | 141,149 | | | | 11,881,923 | |
| a | | Mettler-Toledo International Inc. | | | 6,651 | | | | 4,684,964 | |
| | Pfizer Inc. | | | 268,996 | | | | 9,665,026 | |
| | ResMed Inc. | | | 36,211 | | | | 4,892,468 | |
| | Universal Health Services Inc., B | | | 9,607 | | | | 1,429,041 | |
| a | | Varian Medical Systems Inc. | | | 23,648 | | | | 2,816,240 | |
| | | | | | | | | | |
| | | | 120,699,580 | |
| | | | | | | | | | |
| | | Industrials 12.7% | | | | | | |
| | 3M Co. | | | 70,205 | | | | 11,541,702 | |
| | Alaska Air Group Inc. | | | 33,994 | | | | 2,206,551 | |
| | Allison Transmission Holdings Inc. | | | 15,519 | | �� | | 730,169 | |
| | C.H. Robinson Worldwide Inc. | | | 40,645 | | | | 3,445,883 | |
| | Cintas Corp. | | | 21,431 | | | | 5,745,651 | |
| a | | Copart Inc. | | | 51,730 | | | | 4,155,471 | |
| | Cummins Inc. | | | 39,906 | | | | 6,491,509 | |
| | Delta Air Lines Inc. | | | 149,278 | | | | 8,598,413 | |
| | Emerson Electric Co. | | | 158,146 | | | | 10,573,642 | |
| | Expeditors International of Washington Inc. | | | 45,818 | | | | 3,403,819 | |
| | Fastenal Co. | | | 167,753 | | | | 5,480,491 | |
| | Graco Inc. | | | 42,123 | | | | 1,939,343 | |
| | GrafTech International Ltd. | | | 4,434 | | | | 56,755 | |
| | Honeywell International Inc. | | | 53,208 | | | | 9,002,794 | |
| | Huntington Ingalls Industries Inc. | | | 10,346 | | | | 2,191,179 | |
| | Illinois Tool Works Inc. | | | 24,387 | | | | 3,816,322 | |
| | J.B. Hunt Transport Services Inc. | | | 24,387 | | | | 2,698,422 | |
| | | | | | |
| | | |
| franklintempleton.com | | Semiannual Report | | | 21 | |
FRANKLIN TEMPLETON ETF TRUST
STATEMENT OF INVESTMENTS (UNAUDITED)
Franklin LibertyQ U.S. Equity ETF(continued)
| | | | | | | | | | |
| | |
| | | Shares | | | Value | |
| | | Common Stocks (continued) | | | | | | |
| | | Industrials (continued) | | | | | | |
| | Landstar System Inc. | | | 9,607 | | | $ | 1,081,556 | |
| | Lennox International Inc. | | | 2,956 | | | | 718,219 | |
| | Lockheed Martin Corp. | | | 33,255 | | | | 12,971,445 | |
| | MSC Industrial Direct Co. Inc., A | | | 10,346 | | | | 750,395 | |
| | PACCAR Inc. | | | 27,343 | | | | 1,914,283 | |
| | Raytheon Co. | | | 62,076 | | | | 12,178,690 | |
| | Robert Half International Inc. | | | 37,689 | | | | 2,097,770 | |
| | Rockwell Automation Inc. | | | 33,255 | | | | 5,480,424 | |
| | Rollins Inc. | | | 42,862 | | | | 1,460,308 | |
| | Schneider National Inc., B | | | 8,868 | | | | 192,613 | |
| | Snap-on Inc. | | | 7,390 | | | | 1,156,831 | |
| | Southwest Airlines Co. | | | 130,803 | | | | 7,064,670 | |
| | Toro Co. | | | 31,777 | | | | 2,329,254 | |
| | Union Pacific Corp. | | | 67,249 | | | | 10,892,993 | |
| | United Parcel Service Inc., B | | | 52,469 | | | | 6,286,836 | |
| | W.W. Grainger Inc. | | | 14,041 | | | | 4,172,283 | |
| a | | WABCO Holdings Inc. | | | 5,912 | | | | 790,730 | |
| | Watsco Inc. | | | 6,651 | | | | 1,125,216 | |
| | | | | | | | | | |
| | | | 154,742,632 | |
| | | | | | | | | | |
| | | Information Technology 18.9% | | | | | | |
| | Accenture PLC, A | | | 62,815 | | | | 12,082,465 | |
| | Amdocs Ltd. | | | 39,167 | | | | 2,589,330 | |
| | Apple Inc. | | | 64,293 | | | | 14,399,703 | |
| | Applied Materials Inc. | | | 240,914 | | | | 12,021,609 | |
| a | | Aspen Technology Inc. | | | 8,868 | | | | 1,091,473 | |
| | Automatic Data Processing Inc. | | | 69,466 | | | | 11,213,202 | |
| | Booz Allen Hamilton Holding Corp. | | | 11,085 | | | | 787,257 | |
| | Broadridge Financial Solutions Inc. | | | 33,994 | | | | 4,229,873 | |
| a | | Cadence Design Systems Inc. | | | 22,909 | | | | 1,513,827 | |
| | Cisco Systems Inc. | | | 215,049 | | | | 10,625,571 | |
| | Citrix Systems Inc. | | | 10,346 | | | | 998,596 | |
| | Cognizant Technology Solutions Corp., A | | | 91,636 | | | | 5,522,444 | |
| a | | F5 Networks Inc. | | | 18,475 | | | | 2,594,260 | |
| | HP Inc. | | | 461,136 | | | | 8,724,693 | |
| | Intel Corp. | | | 254,216 | | | | 13,099,750 | |
| | International Business Machines Corp. | | | 87,941 | | | | 12,788,380 | |
| | Intuit Inc. | | | 45,818 | | | | 12,184,839 | |
| | Jack Henry & Associates Inc. | | | 21,431 | | | | 3,128,283 | |
| | KLA Corp. | | | 38,428 | | | | 6,127,345 | |
| | Lam Research Corp. | | | 33,994 | | | | 7,856,353 | |
| a | | Manhattan Associates Inc. | | | 5,912 | | | | 476,921 | |
| | Mastercard Inc., A | | | 44,340 | | | | 12,041,414 | |
| | Maxim Integrated Products Inc. | | | 70,944 | | | | 4,108,367 | |
| a | | Micron Technology Inc. | | | 235,002 | | | | 10,069,836 | |
| | Microsoft Corp. | | | 90,158 | | | | 12,534,667 | |
| | Motorola Solutions Inc. | | | 39,167 | | | | 6,674,448 | |
| | NetApp Inc. | | | 58,381 | | | | 3,065,586 | |
| | Paychex Inc. | | | 98,287 | | | | 8,135,215 | |
| | Skyworks Solutions Inc. | | | 53,947 | | | | 4,275,300 | |
| | Texas Instruments Inc. | | | 107,155 | | | | 13,848,712 | |
| | Ubiquiti Inc. | | | 2,956 | | | | 349,577 | |
| a | | VeriSign Inc. | | | 27,343 | | | | 5,157,710 | |
| | Xilinx Inc. | | | 69,466 | | | | 6,661,789 | |
| | | | | | | | | | |
| | | | 230,978,795 | |
| | | | | | | | | | |
| | | | |
| | | |
| 22 | | Semiannual Report | | franklintempleton.com |
FRANKLIN TEMPLETON ETF TRUST
STATEMENT OF INVESTMENTS (UNAUDITED)
Franklin LibertyQ U.S. Equity ETF(continued)
| | | | | | | | | | |
| | |
| | | Shares | | | Value | |
| | | Common Stocks (continued) | | | | | | |
| | | Materials 1.9% | | | | | | |
| | Air Products and Chemicals Inc. | | | 16,997 | | | $ | 3,770,954 | |
| | Celanese Corp., A | | | 9,607 | | | | 1,174,840 | |
| | Domtar Corp. | | | 4,434 | | | | 158,782 | |
| | Eastman Chemical Co. | | | 22,909 | | | | 1,691,371 | |
| | Huntsman Corp. | | | 26,604 | | | | 618,809 | |
| | LyondellBasell Industries NV, A | | | 100,504 | | | | 8,992,093 | |
| | NewMarket Corp. | | | 2,217 | | | | 1,046,624 | |
| | Nucor Corp. | | | 24,387 | | | | 1,241,542 | |
| | Packaging Corp. of America | | | 17,736 | | | | 1,881,790 | |
| | Sonoco Products Co. | | | 26,604 | | | | 1,548,619 | |
| | Steel Dynamics Inc. | | | 29,560 | | | | 880,888 | |
| | Valvoline Inc. | | | 14,041 | | | | 309,323 | |
| | | | | | | | | | |
| | | | 23,315,635 | |
| | | | | | | | | | |
| | | Real Estate 4.7% | | | | | | |
| | American Tower Corp. | | | 34,733 | | | | 7,680,508 | |
| | EPR Properties | | | 19,214 | | | | 1,476,788 | |
| | Gaming and Leisure Properties Inc. | | | 46,557 | | | | 1,780,340 | |
| | Kimco Realty Corp. | | | 87,941 | | | | 1,836,208 | |
| | National Retail Properties Inc. | | | 46,557 | | | | 2,625,815 | |
| | OMEGA Healthcare Investors Inc. | | | 57,642 | | | | 2,408,859 | |
| | Public Storage | | | 47,296 | | | | 11,600,290 | |
| | Realty Income Corp. | | | 83,507 | | | | 6,403,317 | |
| | Simon Property Group Inc. | | | 62,076 | | | | 9,662,129 | |
| | Spirit Realty Capital Inc. | | | 26,604 | | | | 1,273,267 | |
| | STORE Capital Corp. | | | 48,774 | | | | 1,824,635 | |
| | Ventas Inc. | | | 43,601 | | | | 3,184,181 | |
| | VEREIT Inc. | | | 268,996 | | | | 2,630,781 | |
| | WP Carey Inc. | | | 31,777 | | | | 2,844,042 | |
| | | | | | | | | | |
| | | | 57,231,160 | |
| | | | | | | | | | |
| | | Utilities 7.6% | | | | | | |
| | Alliant Energy Corp. | | | 54,686 | | | | 2,949,216 | |
| | Ameren Corp. | | | 31,777 | | | | 2,543,749 | |
| | Atmos Energy Corp. | | | 27,343 | | | | 3,114,094 | |
| | Consolidated Edison Inc. | | | 78,334 | | | | 7,400,213 | |
| | Dominion Energy Inc. | | | 59,120 | | | | 4,791,085 | |
| | DTE Energy Co. | | | 48,774 | | | | 6,484,991 | |
| | Evergy Inc. | | | 31,777 | | | | 2,115,077 | |
| | Eversource Energy | | | 66,510 | | | | 5,684,610 | |
| | Exelon Corp. | | | 232,785 | | | | 11,245,843 | |
| | Hawaiian Electric Industries Inc. | | | 26,604 | | | | 1,213,409 | |
| | NextEra Energy Inc. | | | 56,164 | | | | 13,085,650 | |
| | OGE Energy Corp. | | | 46,557 | | | | 2,112,757 | |
| | Pinnacle West Capital Corp. | | | 30,299 | | | | 2,941,124 | |
| | PPL Corp. | | | 96,809 | | | | 3,048,515 | |
| | Public Service Enterprise Group Inc. | | | 143,366 | | | | 8,900,161 | |
| | The Southern Co. | | | 133,759 | | | | 8,262,293 | |
| | UGI Corp. | | | 20,692 | | | | 1,040,187 | |
| | WEC Energy Group Inc. | | | 62,076 | | | | 5,903,428 | |
| | | | | | | | | | |
| | | | | | | | | 92,836,402 | |
| | | | | | | | | | |
| | Total Investments before Short Term Investments
(Cost $1,145,588,555) | | | | | | | 1,216,706,889 | |
| | | | | | | |
| | | | | | |
| | | |
| franklintempleton.com | | Semiannual Report | | | 23 | |
FRANKLIN TEMPLETON ETF TRUST
STATEMENT OF INVESTMENTS (UNAUDITED)
Franklin LibertyQ U.S. Equity ETF(continued)
| | | | | | | | | | |
| | |
| | | Shares | | | Value | |
| | | Short Term Investments (Cost $1,434,325) 0.1% | | | | | | |
| | Investments from Cash Collateral Received for Loaned Securities 0.1% | | | | | | | | |
| | | Money Market Funds 0.1% | | | | | | |
| c,d | | Institutional Fiduciary Trust Portfolio, 1.71% | | | 1,434,325 | | | $ | 1,434,325 | |
| | | | | | | | | | |
| | Total Investments (Cost $1,147,022,880) 99.9% | | | | | | | 1,218,141,214 | |
| | Other Assets, less Liabilities 0.1% | | | | | | | 958,637 | |
| | | | | | | | | | |
| | Net Assets 100.0% | | | | | | $ | 1,219,099,851 | |
| | | | | | | | | | |
aNon-income producing.
bA portion or all of the security is on loan at September 30, 2019 Note 1(c).
cSee Note 3(c) regarding investments in affiliated management investment companies.
dThe rate shown is the annualized seven-day effective yield at period end.
At September 30, 2019, the Fund had the following futures contracts outstanding. See Note 1(c).
| | | | | | | | | | | | | | | | | | | | |
| Futures Contracts | | | | | | | | | | | | | | | |
| | | | | |
| Description | | Type | | | Number of
Contracts | | | Notional
Amount* | | | Expiration
Date | | | Value/Unrealized
Appreciation
(Depreciation) | |
| Index Contracts | | | | | | | | | | | | | | | |
S&P 500 E-Mini | | | Long | | | | 11 | | | $ | 1,638,175 | | | | 12/20/19 | | | $ | (16,683 | ) |
*As of period end.
| | | | |
| | | |
| 24 | | Semiannual Report | The accompanying notes are an integral part of these financial statements. | | franklintempleton.com |
FRANKLIN TEMPLETON ETF TRUST
Financial Highlights
Franklin LibertyQ U.S. Mid Cap Equity ETF
| | | | | | | | | | | | |
| | | Six Months Ended
September 30, 2019
(unaudited) | | | Year Ended March 31, | |
| | | 2019 | | | 2018a | |
| | | |
Per share operating performance
(for a share outstanding throughout the period) | | | | | | | | | | | | |
| | | |
Net asset value, beginning of period | | $ | 30.32 | | | $ | 27.70 | | | $ | 25.51 | |
| | | | |
| | | |
| Income from investment operationsb: | | | | | | | | | | | | |
| | | |
Net investment incomec | | | 0.26 | | | | 0.47 | | | | 0.38 | |
| | | |
Net realized and unrealized gains (losses) | | | 1.08 | | | | 2.53 | | | | 2.18 | |
| | | | |
| | | |
Total from investment operations | | | 1.34 | | | | 3.00 | | | | 2.56 | |
| | | | |
| | | |
Less distributions from net investment income | | | (0.21 | ) | | | (0.38 | ) | | | (0.37 | ) |
| | | | |
| | | |
Net asset value, end of period | | $ | 31.45 | | | $ | 30.32 | | | $ | 27.70 | |
| | | | |
| | | |
Total returnd | | | 4.43% | | | | 10.92% | | | | 10.09% | |
| | | |
| Ratios to average net assetse | | | | | | | | | | | | |
| | | |
Expenses before waiver and payments by affiliates | | | 0.30% | | | | 0.30% | | | | 0.99% | f |
| | | |
Expenses net of waiver and payments by affiliates | | | 0.30% | | | | 0.30% | | | | 0.30% | f |
| | | |
Net investment income | | | 1.65% | | | | 1.65% | | | | 1.58% | |
| | | |
| Supplemental data | | | | | | | | | | | | |
| | | |
Net assets, end of period (000’s) | | | $14,151 | | | | $10,612 | | | | $2,770 | |
| | | |
Portfolio turnover rateg | | | 12.25% | | | | 23.49% | | | | 36.21% | |
| | | |
| Portfolio turnover rate excluding portfolio transactions that are executed as a result of the Fund offering and redeeming Creation Units solely or in part for cashg,h | | | 12.25% | | | | —% | | | | —% | |
aFor the period April 26, 2017 (commencement of operations) to March 31, 2018.
bThe amount shown for a share outstanding throughout the period may not correlate with the Statement of Operations for the period due to the timing of sales and repurchases of Creation Unit Fund shares in relation to income earned and/or fluctuating fair value of the investments of the Fund.
cBased on average daily shares outstanding.
dTotal return is not annualized for periods less than one year. Total return is calculated assuming an initial investment made at the net asset value at the beginning of the period, reinvestment of all dividends and distributions at net asset value during the period, and redemption at net asset value on the last day of the period.
eRatios are annualized for periods less than one year.
fEffective December 1, 2017, the Fund replaced the prior fee structure with a unified management fee. See Note 3(a).
gPortfolio turnover rate excludes the value of portfolio securities received or delivered as a result of processing capital share transactions in Creation Units, if any.
hEffective September 30, 2019.
| | | | | | |
| | | |
| franklintempleton.com | | The accompanying notes are an integral part of these financial statements. | Semiannual Report | | | 25 | |
FRANKLIN TEMPLETON ETF TRUST
Statement of Investments, September 30, 2019 (unaudited)
Franklin LibertyQ U.S. Mid Cap Equity ETF
| | | | | | | | | | |
| | | |
| | | | | Shares | | | Value | |
| | | | | | | | | | |
| | | Common Stocks 99.8% | | | | | | |
| | | Communication Services 3.2% | | | | | | |
| a | | AMC Networks Inc., A | | | 387 | | | $ | 19,025 | |
| | CBS Corp., B | | | 2,457 | | | | 99,189 | |
| | Cinemark Holdings Inc. | | | 828 | | | | 31,994 | |
| | John Wiley & Sons Inc., A | | | 414 | | | | 18,191 | |
| b | | Match Group Inc. | | | 468 | | | | 33,434 | |
| | Omnicom Group Inc. | | | 1,575 | | | | 123,323 | |
| | The Interpublic Group of Cos. Inc. | | | 3,474 | | | | 74,899 | |
| | Viacom Inc., B | | | 2,304 | | | | 55,365 | |
| | | | | | | | | | |
| | | | 455,420 | |
| | | | | | | | | | |
| | | Consumer Discretionary 20.5% | | | | | | |
| a | | AutoNation Inc. | | | 207 | | | | 10,495 | |
| a | | AutoZone Inc. | | | 130 | | | | 141,001 | |
| | Best Buy Co. Inc. | | | 2,124 | | | | 146,535 | |
| | BorgWarner Inc. | | | 1,539 | | | | 56,450 | |
| a | | Burlington Stores Inc. | | | 621 | | | | 124,088 | |
| a | | Capri Holdings Ltd. | | | 1,314 | | | | 43,572 | |
| | Carter’s Inc. | | | 405 | | | | 36,940 | |
| | Dick’s Sporting Goods Inc. | | | 711 | | | | 29,016 | |
| | Dollar General Corp. | | | 1,044 | | | | 165,933 | |
| | Expedia Group Inc. | | | 477 | | | | 64,113 | |
| a | | Five Below Inc. | | | 198 | | | | 24,968 | |
| | Foot Locker Inc. | | | 1,134 | | | | 48,943 | |
| a | | frontdoor Inc. | | | 558 | | | | 27,102 | |
| | Garmin Ltd. | | | 1,008 | | | | 85,367 | |
| | Gentex Corp. | | | 891 | | | | 24,534 | |
| | Genuine Parts Co. | | | 1,242 | | | | 123,691 | |
| | H&R Block Inc. | | | 1,827 | | | | 43,154 | |
| | Hanesbrands Inc. | | | 2,952 | | | | 45,225 | |
| | Hasbro Inc. | | | 981 | | | | 116,435 | |
| a | | Hilton Grand Vacations Inc. | | | 666 | | | | 21,312 | |
| | Kohl’s Corp. | | | 1,647 | | | | 81,790 | |
| | L Brands Inc. | | | 2,151 | | | | 42,138 | |
| a | | Lululemon Athletica Inc. | | | 756 | | | | 145,553 | |
| | Macy’s Inc. | | | 3,240 | | | | 50,350 | |
| | Nordstrom Inc. | | | 1,206 | | | | 40,606 | |
| a | | NVR Inc. | | | 25 | | | | 92,934 | |
| a | | O’Reilly Automotive Inc. | | | 360 | | | | 143,463 | |
| a | | Ollie’s Bargain Outlet Holdings Inc. | | | 189 | | | | 11,083 | |
| | Penske Automotive Group Inc. | | | 270 | | | | 12,766 | |
| | Pool Corp. | | | 441 | | | | 88,950 | |
| | Ralph Lauren Corp. | | | 432 | | | | 41,243 | |
| | Six Flags Entertainment Corp. | | | 621 | | | | 31,540 | |
| a | | Skechers USA Inc., A | | | 1,035 | | | | 38,657 | |
| | Tapestry Inc. | | | 2,583 | | | | 67,287 | |
| a | | Tempur Sealy International Inc. | | | 324 | | | | 25,013 | |
| | The Gap Inc. | | | 2,358 | | | | 40,935 | |
| | The Wendy’s Co., A | | | 657 | | | | 13,127 | |
| | Tiffany & Co. | | | 927 | | | | 85,868 | |
| | Tractor Supply Co. | | | 1,323 | | | | 119,652 | |
| a | | Ulta Beauty Inc. | | | 396 | | | | 99,257 | |
| a | | Urban Outfitters Inc. | | | 621 | | | | 17,444 | |
| | Williams-Sonoma Inc. | | | 801 | | | | 54,452 | |
| | Wyndham Destinations Inc. | | | 936 | | | | 43,075 | |
| | Yum China Holdings Inc. | | | 3,042 | | | | 138,198 | |
| | | | | | | | | | |
| | | | 2,904,255 | |
| | | | | | | | | | |
| | | | |
| | | |
| 26 | | Semiannual Report | | franklintempleton.com |
FRANKLIN TEMPLETON ETF TRUST
STATEMENT OF INVESTMENTS (UNAUDITED)
Franklin LibertyQ U.S. Mid Cap Equity ETF(continued)
| | | | | | | | | | |
| | | |
| | | | | Shares | | | Value | |
| | | | | | | | | | |
| | | Common Stocks (continued) | | | | | | |
| | | Consumer Staples 8.5% | | | | | | |
| | Brown-Forman Corp., A | | | 414 | | | $ | 24,736 | |
| | Brown-Forman Corp., B | | | 1,782 | | | | 111,874 | |
| | Campbell Soup Co. | | | 1,404 | | | | 65,876 | |
| | Church & Dwight Co. Inc. | | | 1,791 | | | | 134,755 | |
| | Clorox Co. | | | 891 | | | | 135,316 | |
| | Coty Inc., A | | | 2,367 | | | | 24,877 | |
| | Flowers Foods Inc. | | | 2,025 | | | | 46,838 | |
| a | | Herbalife Ltd. | | | 909 | | | | 34,415 | |
| | Kellogg Co. | | | 2,052 | | | | 132,046 | |
| | McCormick & Co. Inc. | | | 855 | | | | 133,636 | |
| | Nu Skin Enterprises Inc., A | | | 513 | | | | 21,818 | |
| a | | Sprouts Farmers Market Inc. | | | 1,143 | | | | 22,106 | |
| | The Hershey Co. | | | 1,008 | | | | 156,230 | |
| | The Kroger Co. | | | 5,841 | | | | 150,581 | |
| | | | | | | | | | |
| | | | 1,195,104 | |
| | | | | | | | | | |
| | | Energy 0.2% | | | | | | |
| a | | Chesapeake Energy Corp. | | | 4,608 | | | | 6,497 | |
| | PBF Energy Inc. | | | 819 | | | | 22,269 | |
| | | | | | | | | | |
| | | | 28,766 | |
| | | | | | | | | | |
| | | Financials 13.0% | | | | | | |
| | Ally Financial Inc. | | | 2,745 | | | | 91,024 | |
| | American National Insurance Co. | | | 72 | | | | 8,909 | |
| a | | Arch Capital Group Ltd. | | | 3,150 | | | | 132,237 | |
| | Arthur J. Gallagher & Co. | | | 918 | | | | 82,225 | |
| a | | Brighthouse Financial Inc. | | | 774 | | | | 31,324 | |
| | Brown & Brown Inc. | | | 1,053 | | | | 37,971 | |
| | Cincinnati Financial Corp. | | | 1,224 | | | | 142,804 | |
| | CNA Financial Corp. | | | 252 | | | | 12,411 | |
| a | | Credit Acceptance Corp. | | | 99 | | | | 45,670 | |
| | Discover Financial Services | | | 1,782 | | | | 144,502 | |
| | Evercore Inc. | | | 252 | | | | 20,185 | |
| | Everest Re Group Ltd. | | | 342 | | | | 91,003 | |
| | FactSet Research Systems Inc. | | | 306 | | | | 74,349 | |
| | First American Financial Corp. | | | 846 | | | | 49,922 | |
| | First Republic Bank | | | 612 | | | | 59,180 | |
| | Globe Life Inc. | | | 774 | | | | 74,118 | |
| | Janus Henderson Group PLC | | | 594 | | | | 13,341 | |
| | Lazard Ltd., A | | | 891 | | | | 31,185 | |
| | Legg Mason Inc. | | | 720 | | | | 27,497 | |
| | MarketAxess Holdings Inc. | | | 279 | | | | 91,372 | |
| | Mercury General Corp. | | | 225 | | | | 12,573 | |
| | MSCI Inc. | | | 306 | | | | 66,632 | |
| | Nasdaq Inc. | | | 1,017 | | | | 101,039 | |
| | Navient Corp. | | | 1,611 | | | | 20,621 | |
| | Prosperity Bancshares Inc. | | | 531 | | | | 37,505 | |
| | Santander Consumer USA Holdings Inc. | | | 1,008 | | | | 25,714 | |
| | SEI Investments Co. | | | 1,341 | | | | 79,461 | |
| | Synchrony Financial | | | 2,583 | | | | 88,054 | |
| | Umpqua Holdings Corp. | | | 873 | | | | 14,370 | |
| | Unum Group | | | 1,836 | | | | 54,566 | |
| | W.R. Berkley Corp. | | | 1,116 | | | | 80,609 | |
| | | | | | | | | | |
| | | | 1,842,373 | |
| | | | | | | | | | |
| | | Health Care 7.6% | | | | | | |
| a | | Acadia Healthcare Co. Inc. | | | 648 | | | | 20,140 | |
| a | | Align Technology Inc. | | | 468 | | | | 84,670 | |
| | | | | | |
| | | |
| franklintempleton.com | | Semiannual Report | | | 27 | |
FRANKLIN TEMPLETON ETF TRUST
STATEMENT OF INVESTMENTS (UNAUDITED)
Franklin LibertyQ U.S. Mid Cap Equity ETF(continued)
| | | | | | | | | | |
| | | |
| | | | | Shares | | | Value | |
| | | | | | | | | | |
| | | Common Stocks (continued) | | | | | | |
| | | Health Care (continued) | | | | | | |
| | Cerner Corp. | | | 1,899 | | | $ | 129,455 | |
| | Encompass Health Corp. | | | 792 | | | | 50,118 | |
| a | | Exelixis Inc. | | | 1,044 | | | | 18,463 | |
| a | | Henry Schein Inc. | | | 1,242 | | | | 78,867 | |
| a | | IDEXX Laboratories Inc. | | | 531 | | | | 144,395 | |
| a | | Masimo Corp. | | | 324 | | | | 48,208 | |
| a | | MEDNAX Inc. | | | 792 | | | | 17,915 | |
| a | | Mettler-Toledo International Inc. | | | 180 | | | | 126,792 | |
| a | | Molina Healthcare Inc. | | | 351 | | | | 38,512 | |
| | Universal Health Services Inc., B | | | 756 | | | | 112,455 | |
| a | | Varian Medical Systems Inc. | | | 666 | | | | 79,314 | |
| a | | Waters Corp. | | | 585 | | | | 130,589 | |
| | | | | | | | | | |
| | | | 1,079,893 | |
| | | | | | | | | | |
| | | Industrials 17.7% | | | | | | |
| | Allegion PLC | | | 783 | | | | 81,158 | |
| | Allison Transmission Holdings Inc. | | | 846 | | | | 39,804 | |
| | American Airlines Group Inc. | | | 3,078 | | | | 83,014 | |
| | BWX Technologies Inc. | | | 684 | | | | 39,132 | |
| | C.H. Robinson Worldwide Inc. | | | 1,179 | | | | 99,956 | |
| | Cintas Corp. | | | 603 | | | | 161,664 | |
| | Copa Holdings SA | | | 234 | | | | 23,107 | |
| | Cummins Inc. | | | 882 | | | | 143,475 | |
| | Donaldson Co. Inc. | | | 1,017 | | | | 52,965 | |
| | Expeditors International of Washington Inc. | | | 1,404 | | | | 104,303 | |
| | Fastenal Co. | | | 4,356 | | | | 142,311 | |
| | Graco Inc. | | | 1,539 | | | | 70,856 | |
| | GrafTech International Ltd. | | | 288 | | | | 3,686 | |
| | Hubbell Inc., B | | | 405 | | | | 53,217 | |
| a | | IAA Inc. | | | 909 | | | | 37,933 | |
| | IDEX Corp. | | | 279 | | | | 45,723 | |
| | Ingersoll-Rand PLC | | | 846 | | | | 104,236 | |
| | KAR Auction Services Inc. | | | 909 | | | | 22,316 | |
| | Landstar System Inc. | | | 261 | | | | 29,383 | |
| | Lennox International Inc. | | | 279 | | | | 67,789 | |
| | Lincoln Electric Holdings Inc. | | | 216 | | | | 18,740 | |
| | ManpowerGroup Inc. | | | 531 | | | | 44,731 | |
| | MSC Industrial Direct Co. Inc., A | | | 387 | | | | 28,069 | |
| | Nordson Corp. | | | 216 | | | | 31,592 | |
| | Old Dominion Freight Line Inc. | | | 558 | | | | 94,843 | |
| | Robert Half International Inc. | | | 1,269 | | | | 70,633 | |
| | Rockwell Automation Inc. | | | 891 | | | | 146,837 | |
| | Rollins Inc. | | | 1,449 | | | | 49,367 | |
| | Schneider National Inc., B | | | 405 | | | | 8,797 | |
| | Snap-on Inc. | | | 198 | | | | 30,995 | |
| a | | Teledyne Technologies Inc. | | | 126 | | | | 40,571 | |
| | Toro Co. | | | 945 | | | | 69,268 | |
| a | | United Airlines Holdings Inc. | | | 1,332 | | | | 117,762 | |
| a | | United Rentals Inc. | | | 297 | | | | 37,018 | |
| | W.W. Grainger Inc. | | | 405 | | | | 120,346 | |
| a | | WABCO Holdings Inc. | | | 297 | | | | 39,724 | |
| | Watsco Inc. | | | 297 | | | | 50,246 | |
| | Xylem Inc. | | | 1,323 | | | | 105,337 | |
| | | | | | | | | | |
| | | | 2,510,904 | |
| | | | | | | | | | |
| | | Information Technology 14.3% | | | | | | |
| a | | Aspen Technology Inc. | | | 405 | | | | 49,847 | |
| | Booz Allen Hamilton Holding Corp. | | | 1,431 | | | | 101,630 | |
| | | | |
| | | |
| 28 | | Semiannual Report | | franklintempleton.com |
FRANKLIN TEMPLETON ETF TRUST
STATEMENT OF INVESTMENTS (UNAUDITED)
Franklin LibertyQ U.S. Mid Cap Equity ETF(continued)
| | | | | | | | | | |
| | | |
| | | | | Shares | | | Value | |
| | | | | | | | | | |
| | | Common Stocks (continued) | | | | | | |
| | | Information Technology (continued) | | | | | | |
| a | | Cadence Design Systems Inc. | | | 2,097 | | | $ | 138,570 | |
| | CDW Corp. | | | 1,305 | | | | 160,828 | |
| | Citrix Systems Inc. | | | 486 | | | | 46,909 | |
| a | | F5 Networks Inc. | | | 630 | | | | 88,465 | |
| a | | Fair Isaac Corp. | | | 198 | | | | 60,097 | |
| | Genpact Ltd. | | | 1,080 | | | | 41,850 | |
| | Jack Henry & Associates Inc. | | | 675 | | | | 98,530 | |
| | Juniper Networks Inc. | | | 2,493 | | | | 61,702 | |
| | KLA Corp. | | | 1,296 | | | | 206,647 | |
| | Lam Research Corp. | | | 765 | | | | 176,799 | |
| a | | Manhattan Associates Inc. | | | 621 | | | | 50,096 | |
| | National Instruments Corp. | | | 1,071 | | | | 44,971 | |
| | NetApp Inc. | | | 2,124 | | | | 111,531 | |
| | Paychex Inc. | | | 1,557 | | | | 128,873 | |
| | Pegasystems Inc. | | | 234 | | | | 15,924 | |
| a | | Synopsys Inc. | | | 1,143 | | | | 156,877 | |
| | Ubiquiti Inc. | | | 117 | | | | 13,836 | |
| a | | VeriSign Inc. | | | 369 | | | | 69,604 | |
| | Western Union Co. | | | 3,357 | | | | 77,782 | |
| | Xilinx Inc. | | | 1,305 | | | | 125,149 | |
| | | | | | | | | | |
| | | | 2,026,517 | |
| | | | | | | | | | |
| | | Materials 1.5% | | | | | | |
| | Ardagh Group SA | | | 117 | | | | 1,834 | |
| | Avery Dennison Corp. | | | 675 | | | | 76,660 | |
| | RPM International Inc. | | | 1,017 | | | | 69,980 | |
| | Sonoco Products Co. | | | 351 | | | | 20,432 | |
| | Steel Dynamics Inc. | | | 756 | | | | 22,529 | |
| | The Chemours Co. LLC | | | 1,080 | | | | 16,135 | |
| | | | | | | | | | |
| | | | 207,570 | |
| | | | | | | | | | |
| | | Real Estate 9.4% | | | | | | |
| | Alexandria Real Estate Equities Inc. | | | 846 | | | | 130,318 | |
| | Apple Hospitality REIT Inc. | | | 1,764 | | | | 29,247 | |
| | Camden Property Trust | | | 369 | | | | 40,963 | |
| | Coresite Realty Corp. | | | 261 | | | | 31,803 | |
| | EPR Properties | | | 648 | | | | 49,805 | |
| | Equity Lifestyle Properties Inc. | | | 585 | | | | 78,156 | |
| | Essex Property Trust Inc. | | | 450 | | | | 146,993 | |
| | Federal Realty Investment Trust | | | 540 | | | | 73,516 | |
| | Highwoods Properties Inc. | | | 792 | | | | 35,592 | |
| | Hospitality Properties Trust | | | 1,476 | | | | 38,066 | |
| | Host Hotels & Resorts Inc. | | | 5,013 | | | | 86,675 | |
| | Lamar Advertising Co., A | | | 765 | | | | 62,676 | |
| | Liberty Property Trust | | | 540 | | | | 27,718 | |
| | National Retail Properties Inc. | | | 1,530 | | | | 86,292 | |
| | Realty Income Corp. | | | 1,908 | | | | 146,305 | |
| | Retail Properties of America Inc., A | | | 1,386 | | | | 17,076 | |
| | Ventas Inc. | | | 1,539 | | | | 112,393 | |
| | Welltower Inc. | | | 1,467 | | | | 132,984 | |
| | | | | | | | | | |
| | | | 1,326,578 | |
| | | | | | | | | | |
| | | Utilities 3.9% | | | | | | |
| | Ameren Corp. | | | 1,458 | | | | 116,713 | |
| | Consolidated Edison Inc. | | | 1,548 | | | | 146,240 | |
| | Entergy Corp. | | | 1,368 | | | | 160,548 | |
| | | | | | |
| | | |
| franklintempleton.com | | Semiannual Report | | | 29 | |
FRANKLIN TEMPLETON ETF TRUST
STATEMENT OF INVESTMENTS (UNAUDITED)
Franklin LibertyQ U.S. Mid Cap Equity ETF(continued)
| | | | | | | | | | |
| | | |
| | | | | Shares | | | Value | |
| | | | | | | | | | |
| | | Common Stocks (continued) | | | | | | |
| | | Utilities (continued) | | | | | | |
| | PPL Corp. | | | 3,888 | | | $ | 122,433 | |
| | | | | | | | | | |
| | | | 545,934 | |
| | | | | | | | | | |
| | Total Investments before Short Term Investments
(Cost $12,992,971) | | | | | | | 14,123,314 | |
| | | | | | | | | | |
| | | Short Term Investments (Cost $22,200) 0.2% | |
| | Investments from Cash Collateral Received for Loaned Securities 0.2% | | | | | | | | |
| | | Money Market Funds 0.2% | | | | | | |
| c,d | | Institutional Fiduciary Trust Portfolio, 1.71% | | | 22,200 | | | | 22,200 | |
| | | | | | | | | | |
| | Total Investments (Cost $13,015,171) 100.0% | | | | | | | 14,145,514 | |
| | Other Assets, less Liabilities 0.0%† | | | | | | | 5,090 | |
| | | | | | | | | | |
| | Net Assets 100.0% | | | | | | $ | 14,150,604 | |
| | | | | | | | | | |
†Rounds to less than 0.1% of net assets.
aNon-income producing.
bA portion or all of the security is on loan at September 30, 2019. See Note 1(c).
cSee Note 3(c) regarding investments in affiliated management investment companies.
dThe rate shown is the annualized seven-day effective yield at period end.
| | | | |
| | | |
| 30 | | Semiannual Report | The accompanying notes are an integral part of these financial statements. | | franklintempleton.com |
FRANKLIN TEMPLETON ETF TRUST
Financial Highlights
Franklin LibertyQ U.S. Small Cap Equity ETF
| | | | | | | | | | | | |
| | | Six Months Ended
September 30, 2019
(unaudited) | | | Year Ended March 31, | |
| | | 2019 | | | 2018a | |
| | | |
Per share operating performance
(for a share outstanding throughout the period) | | | | | | | | | | | | |
| | | |
Net asset value, beginning of period | | $ | 27.66 | | | $ | 26.66 | | | $ | 25.36 | |
| | | | |
| | | |
| Income from investment operationsb: | | | | | | | | | | | | |
| | | |
Net investment incomec | | | 0.23 | | | | 0.47 | | | | 0.33 | |
| | | |
Net realized and unrealized gains (losses) | | | 0.07 | | | | 0.87 | | | | 1.27 | |
| | | | |
| | | |
Total from investment operations | | | 0.30 | | | | 1.34 | | | | 1.60 | |
| | | | |
| | | |
Less distributions from net investment income | | | (0.21 | ) | | | (0.34 | ) | | | (0.30 | ) |
| | | | |
| | | |
Net asset value, end of period | | $ | 27.75 | | | $ | 27.66 | | | $ | 26.66 | |
| | | | |
| | | |
Total returnd | | | 1.07% | | | | 5.05% | | | | 6.34% | |
| | | |
| Ratios to average net assetse | | | | | | | | | | | | |
| | | |
Expenses before waiver and payments by affiliates | | | 0.35% | | | | 0.35% | | | | 1.15% | f |
| | | |
Expenses net of waiver and payments by affiliates | | | 0.35% | | | | 0.35% | | | | 0.35% | f |
| | | |
Net investment income | | | 1.65% | | | | 1.69% | | | | 1.40% | |
| | | |
| Supplemental data | | | | | | | | | | | | |
| | | |
Net assets, end of period (000’s) | | | $20,816 | | | | $17,979 | | | | $2,666 | |
| | | |
Portfolio turnover rateg | | | 13.28% | | | | 22.17% | | | | 23.99% | |
| | | |
| Portfolio turnover rate excluding portfolio transactions that are executed as a result of the Fund offering and redeeming Creation Units solely or in part for cashg,h | | | 13.28% | | | | —% | | | | —% | |
aFor the period April 26, 2017 (commencement of operations) to March 31, 2018.
bThe amount shown for a share outstanding throughout the period may not correlate with the Statement of Operations for the period due to the timing of sales and repurchases of Creation Unit Fund shares in relation to income earned and/or fluctuating fair value of the investments of the Fund.
cBased on average daily shares outstanding.
dTotal return is not annualized for periods less than one year. Total return is calculated assuming an initial investment made at the net asset value at the beginning of the period, reinvestment of all dividends and distributions at net asset value during the period, and redemption at net asset value on the last day of the period.
eRatios are annualized for periods less than one year.
fEffective December 1, 2017, the Fund replaced the prior fee structure with a unified management fee. See Note 3(a).
gPortfolio turnover rate excludes the value of portfolio securities received or delivered as a result of processing capital share transactions in Creation Units, if any.
hEffective September 30, 2019.
| | | | | | |
| | | |
| franklintempleton.com | | The accompanying notes are an integral part of these financial statements. | Semiannual Report | | | 31 | |
FRANKLIN TEMPLETON ETF TRUST
Statement of Investments, September 30, 2019 (unaudited)
Franklin LibertyQ U.S. Small Cap Equity ETF
| | | | | | | | | | |
| | |
| | | Shares | | | Value | |
| | | | | | | | | | |
| | | Common Stocks 99.9% | | | | | | |
| | | Communication Services 3.2% | | | | | | |
| | AMC Entertainment Holdings Inc., A | | | 1,740 | | | $ | 18,618 | |
| a | | Cardlytics Inc. | | | 330 | | | | 11,062 | |
| a | | Care.com Inc. | | | 690 | | | | 7,210 | |
| | Cogent Communications Holdings Inc. | | | 1,620 | | | | 89,262 | |
| a | | Cumulus Media Inc., A | | | 255 | | | | 3,708 | |
| | Gannett Co. Inc. | | | 4,830 | | | | 51,874 | |
| a | | IDT Corp., B | | | 360 | | | | 3,791 | |
| a | | Lee Enterprises Inc. | | | 1,230 | | | | 2,509 | |
| a | | Liberty Latin America Ltd. | | | 3,630 | | | | 62,055 | |
| a | | Liberty Latin America Ltd., A | | | 1,425 | | | | 24,325 | |
| | Marcus Corp. | | | 795 | | | | 29,423 | |
| | Meredith Corp. | | | 1,530 | | | | 56,090 | |
| | National CineMedia Inc. | | | 2,685 | | | | 22,017 | |
| b | | New Media Investment Group Inc. | | | 2,685 | | | | 23,655 | |
| a | | Rosetta Stone Inc. | | | 765 | | | | 13,311 | |
| | Scholastic Corp. | | | 1,245 | | | | 47,011 | |
| | Spok Holdings Inc. | | | 660 | | | | 7,880 | |
| | TEGNA Inc. | | | 3,900 | | | | 60,567 | |
| a | | The Meet Group Inc. | | | 1,320 | | | | 4,323 | |
| a | | Travelzoo | | | 165 | | | | 1,764 | |
| a | | TrueCar Inc. | | | 2,955 | | | | 10,047 | |
| a | | WideOpenWest Inc. | | | 945 | | | | 5,821 | |
| a | | Yelp Inc. | | | 3,060 | | | | 106,335 | |
| | | | | | | | | | |
| | | | 662,658 | |
| | | | | | | | | | |
| | | Consumer Discretionary 23.5% | | | | | | |
| | Dine Brands Global Inc. | | | 645 | | | | 48,930 | |
| a | | 1-800-FLOWERS.Com Inc. | | | 1,140 | | | | 16,866 | |
| | Aaron’s Inc. | | | 1,980 | | | | 127,235 | |
| | Abercrombie & Fitch Co., A | | | 3,375 | | | | 52,650 | |
| | Acushnet Holdings Corp. | | | 1,365 | | | | 36,036 | |
| a | | Adtalem Global Education Inc. | | | 1,995 | | | | 75,990 | |
| a | | America’s Car-Mart Inc. | | | 270 | | | | 24,759 | |
| | American Eagle Outfitters Inc. | | | 7,275 | | | | 118,000 | |
| a | | American Public Education Inc. | | | 555 | | | | 12,399 | |
| a | | Asbury Automotive Group Inc. | | | 930 | | | | 95,167 | |
| a,b | | Ascena Retail Group Inc. | | | 7,050 | | | | 1,862 | |
| a,b | | At Home Group Inc. | | | 1,425 | | | | 13,709 | |
| a | | Barnes & Noble Education Inc. | | | 1,125 | | | | 3,510 | |
| | Bassett Furniture Industries Inc. | | | 435 | | | | 6,656 | |
| | Bed Bath & Beyond Inc. | | | 5,070 | | | | 53,945 | |
| | Big Lots Inc. | | | 2,145 | | | | 52,552 | |
| | BJ’s Restaurants Inc. | | | 840 | | | | 32,626 | |
| | Bloomin’ Brands Inc. | | | 4,665 | | | | 88,308 | |
| | Brinker International Inc. | | | 1,245 | | | | 53,124 | |
| b | | Buckle Inc. | | | 1,425 | | | | 29,355 | |
| | Caleres Inc. | | | 1,830 | | | | 42,840 | |
| | Callaway Golf Co. | | | 2,865 | | | | 55,610 | |
| b | | Camping World Holdings Inc., A | | | 1,335 | | | | 11,882 | |
| a | | Career Education Corp. | | | 2,880 | | | | 45,763 | |
| a | | Carrols Restaurant Group Inc. | | | 990 | | | | 8,207 | �� |
| | Chico’s FAS Inc. | | | 5,535 | | | | 22,306 | |
| a | | Chuy’s Holdings Inc. | | | 825 | | | | 20,427 | |
| | Citi Trends Inc. | | | 555 | | | | 10,157 | |
| | Collectors Universe Inc. | | | 195 | | | | 5,554 | |
| | Cooper Tire & Rubber Co. | | | 1,725 | | | | 45,057 | |
| | Core-Mark Holding Co. Inc. | | | 915 | | | | 29,385 | |
| | Cracker Barrel Old Country Store Inc. | | | 1,005 | | | | 163,463 | |
| | | | |
| | | |
| 32 | | Semiannual Report | | franklintempleton.com |
FRANKLIN TEMPLETON ETF TRUST
STATEMENT OF INVESTMENTS (UNAUDITED)
Franklin LibertyQ U.S. Small Cap Equity ETF(continued)
| | | | | | | | | | |
| | |
| | | Shares | | | Value | |
| | | | | | | | | | |
| | | Common Stocks (continued) | | | | | | |
| | | Consumer Discretionary (continued) | | | | | | |
| a | | Crocs Inc. | | | 2,580 | | | $ | 71,621 | |
| | Dana Inc. | | | 5,160 | | | | 74,510 | |
| | Dave & Buster’s Entertainment Inc. | | | 1,740 | | | | 67,773 | |
| a | | Deckers Outdoor Corp. | | | 1,297 | | | | 191,126 | |
| a | | Del Taco Restaurants Inc. | | | 645 | | | | 6,595 | |
| a | | Denny’s Corp. | | | 2,730 | | | | 62,148 | |
| | Designer Brands Inc., A | | | 2,910 | | | | 49,819 | |
| b | | Dillard’s Inc., A | | | 435 | | | | 28,758 | |
| a | | Dorman Products Inc. | | | 1,140 | | | | 90,676 | |
| a,b | | Duluth Holdings Inc. | | | 450 | | | | 3,816 | |
| | Escalade Inc. | | | 390 | | | | 4,247 | |
| | Ethan Allen Interiors Inc. | | | 1,230 | | | | 23,493 | |
| a | | Fiesta Restaurant Group Inc. | | | 1,125 | | | | 11,723 | |
| | Flexsteel Industries Inc. | | | 285 | | | | 4,224 | |
| a | | Fossil Group Inc. | | | 900 | | | | 11,259 | |
| a | | Genesco Inc. | | | 900 | | | | 36,018 | |
| | Group 1 Automotive Inc. | | | 810 | | | | 74,771 | |
| | Guess? Inc. | | | 2,565 | | | | 47,529 | |
| | Hamilton Beach Brands Holding Co., A | | | 270 | | | | 4,366 | |
| | Haverty Furniture Cos. Inc. | | | 975 | | | | 19,763 | |
| a | | Helen of Troy Ltd. | | | 908 | | | | 143,155 | |
| a | | Hibbett Sports Inc. | | | 765 | | | | 17,519 | |
| | Hooker Furniture Corp. | | | 390 | | | | 8,362 | |
| | International Speedway Corp., A | | | 765 | | | | 34,433 | |
| a | | iRobot Corp. | | | 1,020 | | | | 62,903 | |
| b | | J. Jill Inc. | | | 765 | | | | 1,454 | |
| | Jack in the Box Inc. | | | 1,095 | | | | 99,776 | |
| | Johnson Outdoors Inc., A | | | 210 | | | | 12,298 | |
| a | | K12 Inc. | | | 1,155 | | | | 30,492 | |
| | Kontoor Brands Inc. | | | 915 | | | | 32,116 | |
| | La-Z-Boy Inc. | | | 1,905 | | | | 63,989 | |
| | LCI Industries | | | 915 | | | | 84,043 | |
| a | | LGI Homes Inc. | | | 660 | | | | 54,991 | |
| | Lifetime Brands Inc. | | | 525 | | | | 4,646 | |
| a | | Lindblad Expeditions Holdings Inc. | | | 420 | | | | 7,039 | |
| | Lithia Motors Inc. | | | 859 | | | | 113,714 | |
| | M.D.C Holdings Inc. | | | 900 | | | | 38,790 | |
| | Marine Products Corp. | | | 315 | | | | 4,460 | |
| a | | MasterCraft Boat Holdings Inc. | | | 330 | | | | 4,925 | |
| a | | Modine Manufacturing Co. | | | 975 | | | | 11,086 | |
| a | | Monarch Casino & Resort Inc. | | | 345 | | | | 14,383 | |
| | Monro Inc. | | | 1,320 | | | | 104,293 | |
| | Movado Group Inc. | | | 735 | | | | 18,272 | |
| | Office Depot Inc. | | | 22,125 | | | | 38,829 | |
| | Oxford Industries Inc. | | | 825 | | | | 59,152 | |
| | Papa John’s International Inc. | | | 825 | | | | 43,189 | |
| b | | PetMed Express Inc. | | | 945 | | | | 17,029 | |
| a | | Potbelly Corp. | | | 750 | | | | 3,270 | |
| a | | Regis Corp. | | | 1,035 | | | | 20,928 | |
| | Rent-A-Center Inc. | | | 2,130 | | | | 54,933 | |
| | Rocky Brands Inc. | | | 240 | | | | 7,975 | |
| a | | RTW RetailWinds Inc. | | | 1,095 | | | | 1,500 | |
| | Ruth’s Hospitality Group Inc. | | | 1,185 | | | | 24,192 | |
| a | | Sally Beauty Holdings Inc. | | | 4,725 | | | | 70,355 | |
| b | | Shoe Carnival Inc. | | | 495 | | | | 16,043 | |
| a | | Shutterstock Inc. | | | 660 | | | | 23,839 | |
| | Signet Jewelers Ltd. | | | 1,800 | | | | 30,168 | |
| | | | | | |
| | | |
| franklintempleton.com | | Semiannual Report | | | 33 | |
FRANKLIN TEMPLETON ETF TRUST
STATEMENT OF INVESTMENTS (UNAUDITED)
Franklin LibertyQ U.S. Small Cap Equity ETF(continued)
| | | | | | | | | | |
| | |
| | | Shares | | | Value | |
| | | | | | | | | | |
| | | Common Stocks (continued) | | | | | | |
| | | Consumer Discretionary (continued) | | | | | | |
| a | | Sleep Number Corp. | | | 1,335 | | | $ | 55,162 | |
| | Sonic Automotive Inc. | | | 1,065 | | | | 33,452 | |
| a | | Sonos Inc. | | | 1,515 | | | | 20,316 | |
| a | | Sportsman’s Warehouse Holdings Inc. | | | 1,860 | | | | 9,635 | |
| a | | Stamps.com Inc. | | | 720 | | | | 53,604 | |
| | Standard Motor Products Inc. | | | 855 | | | | 41,510 | |
| | Steven Madden Ltd. | | | 3,585 | | | | 128,307 | |
| a,b | | Stitch Fix Inc., A | | | 975 | | | | 18,769 | |
| | Strategic Education Inc. | | | 900 | | | | 122,292 | |
| | Sturm Ruger & Co. Inc. | | | 675 | | | | 28,188 | |
| | Superior Group of Cos. Inc. | | | 405 | | | | 6,529 | |
| b | | Tailored Brands Inc. | | | 2,370 | | | | 10,428 | |
| | Tenneco Inc., A | | | 1,950 | | | | 24,414 | |
| | Texas Roadhouse Inc., A | | | 3,315 | | | | 174,104 | |
| | The Cato Corp., A | | | 960 | | | | 16,906 | |
| | The Cheesecake Factory Inc. | | | 2,220 | | | | 92,530 | |
| b | | The Children’s Place Inc. | | | 720 | | | | 55,433 | |
| a | | The Container Store Group Inc. | | | 720 | | | | 3,182 | |
| a | | The Habit Restaurants Inc., A | | | 960 | | | | 8,390 | |
| a | | The Lovesac Co. | | | 105 | | | | 1,960 | |
| a,b | | The Michaels Cos. Inc. | | | 1,860 | | | | 18,209 | |
| | Tile Shop Holdings Inc. | | | 1,995 | | | | 6,364 | |
| | Tilly’s Inc., A | | | 945 | | | | 8,921 | |
| | Tupperware Brands Corp. | | | 2,160 | | | | 34,279 | |
| | Twin River Worldwide Holdings Inc. | | | 480 | | | | 10,958 | |
| a | | Vera Bradley Inc. | | | 885 | | | | 8,939 | |
| | Weyco Group Inc. | | | 270 | | | | 6,105 | |
| | Wingstop Inc. | | | 855 | | | | 74,624 | |
| | Winmark Corp. | | | 90 | | | | 15,875 | |
| | Wolverine World Wide Inc. | | | 3,870 | | | | 109,366 | |
| a | | Zumiez Inc. | | | 780 | | | | 24,707 | |
| | | | | | | | | | |
| | | | 4,890,564 | |
| | | | | | | | | | |
| | | Consumer Staples 6.8% | | | | | | |
| b | | B&G Foods Inc., A | | | 2,340 | | | | 44,249 | |
| a | | Boston Beer Inc., A | | | 408 | | | | 148,545 | |
| a | | Bridgford Foods Corp. | | | 30 | | | | 905 | |
| a | | Central Garden & Pet Co. | | | 375 | | | | 10,961 | |
| a | | Central Garden & Pet Co., A | | | 1,350 | | | | 37,429 | |
| | Coca-Cola Consolidated Inc. | | | 180 | | | | 54,697 | |
| a | | Freshpet Inc. | | | 585 | | | | 29,115 | |
| | Ingles Markets Inc., A | | | 615 | | | | 23,899 | |
| | Inter Parfums Inc. | | | 690 | | | | 48,279 | |
| | J & J Snack Foods Corp. | | | 660 | | | | 126,720 | |
| | John B. Sanfilippo & Son Inc. | | | 360 | | | | 34,776 | |
| | Lancaster Colony Corp. | | | 735 | | | | 101,908 | |
| a | | Lifevantage Corp. | | | 315 | | | | 4,316 | |
| | Medifast Inc. | | | 510 | | | | 52,851 | |
| b | | National Beverage Corp. | | | 495 | | | | 21,958 | |
| a | | Natural Grocers by Vitamin Cottage Inc. | | | 345 | | | | 3,447 | |
| a | | Natures Sunshine Products Inc. | | | 405 | | | | 3,357 | |
| a | | Performance Food Group Co. | | | 4,035 | | | | 185,650 | |
| | PriceSmart Inc. | | | 1,020 | | | | 72,522 | |
| | Sanderson Farms Inc. | | | 705 | | | | 106,688 | |
| | SpartanNash Co. | | | 735 | | | | 8,695 | |
| a | | The Chefs’ Warehouse Inc. | | | 900 | | | | 36,288 | |
| | Tootsie Roll Industries Inc. | | | 495 | | | | 18,384 | |
| b | | Turning Point Brands Inc. | | | 285 | | | | 6,572 | |
| | | | |
| | | |
| 34 | | Semiannual Report | | franklintempleton.com |
FRANKLIN TEMPLETON ETF TRUST
STATEMENT OF INVESTMENTS (UNAUDITED)
Franklin LibertyQ U.S. Small Cap Equity ETF(continued)
| | | | | | | | | | |
| | |
| | | Shares | | | Value | |
| | | | | | | | | | |
| | | Common Stocks (continued) | | | | | | |
| | | Consumer Staples (continued) | | | | | | |
| | Universal Corp. | | | 990 | | | $ | 54,262 | |
| | Vector Group Ltd. | | | 3,856 | | | | 45,922 | |
| | Village Super Market Inc., A | | | 435 | | | | 11,506 | |
| | WD-40 Co. | | | 615 | | | | 112,877 | |
| | Weis Markets Inc. | | | 450 | | | | 17,163 | |
| | | | | | | | | | |
| | | | 1,423,941 | |
| | | | | | | | | | |
| | | Energy 0.5% | | | | | | |
| | Arch Coal Inc. | | | 315 | | | | 23,373 | |
| a | | CONSOL Mining Corp. | | | 1,020 | | | | 15,943 | |
| a | | Contura Energy Inc. | | | 345 | | | | 9,646 | |
| | CVR Energy Inc. | | | 525 | | | | 23,116 | |
| a | | FTS International Inc | | | 960 | | | | 2,150 | |
| | Liberty Oilfield Services Inc., A | | | 1,275 | | | | 13,808 | |
| a | | Penn Virginia Corp. | | | 240 | | | | 6,977 | |
| a | | SilverBow Resources Inc. | | | 240 | | | | 2,326 | |
| | | | | | | | | | |
| | | | 97,339 | |
| | | | | | | | | | |
| | | Financials 9.3% | | | | | | |
| | 1st Source Corp. | | | 540 | | | | 24,694 | |
| | AMERISAFE Inc. | | | 360 | | | | 23,800 | |
| | Ames National Corp. | | | 360 | | | | 10,300 | |
| | Apollo Commercial Finance Inc. | | | 4,575 | | | | 87,703 | |
| | Arrow Financial Corp. | | | 263 | | | | 8,770 | |
| | Banco Latinoamericano de Comercio Exterior SA | | | 900 | | | | 17,946 | |
| | Bank7 Corp. | | | 75 | | | | 1,410 | |
| | Bankwell Financial Group Inc. | | | 120 | | | | 3,300 | |
| | Bar Harbor Bankshares. | | | 270 | | | | 6,731 | |
| | Cadence BanCorp. | | | 2,400 | | | | 42,096 | |
| | Capitol Federal Financial Inc. | | | 4,470 | | | | 61,597 | |
| | Capstead Mortgage Corp. | | | 3,255 | | | | 23,924 | |
| | Central Pacific Financial Corp. | | | 510 | | | | 14,484 | |
| | Citizens & Northern Corp. | | | 465 | | | | 12,220 | |
| a,b | | Citizens Inc., A | | | 1,815 | | | | 12,469 | |
| | Codorus Valley Bancorp Inc. | | | 165 | | | | 3,838 | |
| | Cohen & Steers Inc. | | | 885 | | | | 48,613 | |
| | Colony Bankcorp Inc. | | | 150 | | | | 2,302 | |
| | Colony Credit Real Estate Inc., A | | | 2,760 | | | | 39,910 | |
| | Crawford & Co., A | | | 375 | | | | 4,080 | |
| | DNB Financial Corp. | | | 60 | | | | 2,671 | |
| | Donegal Group Inc. | | | 405 | | | | 5,937 | |
| | Dynex Capital Inc. | | | 825 | | | | 12,193 | |
| | ESSA Bancorp Inc. | | | 165 | | | | 2,709 | |
| | Essent Group Ltd. | | | 4,215 | | | | 200,929 | |
| a | | EZCORP Inc., A | | | 1,635 | | | | 10,554 | |
| | Federated Investors Inc., B | | | 3,750 | | | | 121,537 | |
| | Financial Institutions Inc. | | | 615 | | | | 18,561 | |
| | First Bancorp Inc. | | | 360 | | | | 9,896 | |
| | First Bancorp Puerto Rico | | | 3,945 | | | | 39,371 | |
| | First Citizens Bancorp | | | 495 | | | | 10,756 | |
| | Franklin Financial Services Corp. | | | 75 | | | | 2,666 | |
| a | | Genworth Financial Inc., A | | | 14,115 | | | | 62,106 | |
| | Greene County Bancorp Inc. | | | 120 | | | | 3,288 | |
| | Hawthorn Bancshares Inc. | | | 135 | | | | 3,217 | |
| | Heritage Financial Corp. | | | 1,245 | | | | 33,565 | |
| | Horace Mann Educators Corp. | | | 1,770 | | | | 82,004 | |
| | International Bancshares Corp. | | | 1,095 | | | | 42,289 | |
| | Invesco Mortgage Capital | | | 4,275 | | | | 65,450 | |
| | | | | | |
| | | |
| franklintempleton.com | | Semiannual Report | | | 35 | |
FRANKLIN TEMPLETON ETF TRUST
STATEMENT OF INVESTMENTS (UNAUDITED)
Franklin LibertyQ U.S. Small Cap Equity ETF(continued)
| | | | | | | | | | |
| | |
| | | Shares | | | Value | |
| | | | | | | | | | |
| | | Common Stocks (continued) | | | | | | |
| | | Financials (continued) | | | | | | |
| | James River Group Holdings Ltd. | | | 1,020 | | | $ | 52,265 | |
| | LCNB Corp. | | | 435 | | | | 7,717 | |
| | Midwestone Financial Group Inc. | | | 465 | | | | 14,192 | |
| a | | Mr Cooper Group Inc. | | | 1,530 | | | | 16,249 | |
| | National Western Life Group Inc., A | | | 105 | | | | 28,179 | |
| | Nelnet Inc., A | | | 720 | | | | 45,792 | |
| | Northfield Bancorp Inc. | | | 1,710 | | | | 27,463 | |
| | Northwest Bancshares Inc. | | | 3,735 | | | | 61,217 | |
| | Norwood Financial Corp. | | | 180 | | | | 5,690 | |
| a | | On Deck Capital Inc. | | | 1,905 | | | | 6,401 | |
| a | | Palomar Holdings Inc. | | | 105 | | | | 4,139 | |
| | Penns Woods Bancorp Inc. | | | 180 | | | | 8,325 | |
| | Peoples Financial Services Corp. | | | 135 | | | | 6,114 | |
| | Piper Jaffray Cos. | | | 240 | | | | 18,115 | |
| | Premier Financial Bancorp Inc. | | | 510 | | | | 8,757 | |
| | Protective Insurance Corp., B | | | 375 | | | | 6,544 | |
| | Provident Financial Services Inc. | | | 2,520 | | | | 61,816 | |
| | Pzena Investment Management Inc., A | | | 675 | | | | 6,021 | |
| a | | Regional Management Corp. | | | 465 | | | | 13,094 | |
| | Silvercrest Asset Management Group Inc., A | | | 360 | | | | 4,428 | |
| | Southern Missouri Bancorp Inc. | | | 210 | | | | 7,650 | |
| | Stewart Information Services Corp. | | | 750 | | | | 29,092 | |
| | Territorial Bancorp Inc. | | | 360 | | | | 10,289 | |
| | Tiptree Inc.,A | | | 420 | | | | 3,058 | |
| | Tompkins Financial Corp. | | | 555 | | | | 45,027 | |
| | TrustCo Bank Corp. NY | | | 3,555 | | | | 28,973 | |
| | United Bankshares Inc. | | | 1,785 | | | | 67,598 | |
| | United Fire Group Inc. | | | 825 | | | | 38,758 | |
| | United Security Bancshares | | | 255 | | | | 2,683 | |
| | Universal Insurance Holdings Inc. | | | 1,155 | | | | 34,638 | |
| | Value Line Inc. | | | 45 | | | | 1,024 | |
| | Waddell & Reed Financial Inc., A | | | 1,515 | | | | 26,028 | |
| a,b | | Watford Holdings Ltd. | | | 375 | | | | 10,106 | |
| | West Bancorp | | | 555 | | | | 12,066 | |
| | Westwood Holdings Group Inc. | | | 360 | | | | 9,961 | |
| a | | World Acceptance Corp. | | | 240 | | �� | | 30,602 | |
| | | | | | | | | | |
| | | | 1,939,957 | |
| | | | | | | | | | |
| | | Health Care 10.4% | | | | | | |
| a | | Addus Homecare Corp. | | | 375 | | | | 29,730 | |
| a | | Amedisys Inc. | | | 1,350 | | | | 176,863 | |
| a | | AMN Healthcare Services Inc. | | | 1,725 | | | | 99,291 | |
| a | | AngioDynamics Inc. | | | 1,095 | | | | 20,170 | |
| a | | AtriCure Inc. | | | 1,350 | | | | 33,669 | |
| | Atrion Corp. | | | 64 | | | | 49,867 | |
| a | | Biospecifics Technologies Corp. | | | 225 | | | | 12,042 | |
| a | | Cardiovascular Systems Inc. | | | 1,380 | | | | 65,577 | |
| a | | Community Health Systems Inc. | | | 3,210 | | | | 11,556 | |
| | CONMED Corp. | | | 1,020 | | | | 98,073 | |
| a | | Corcept Therapeutics Inc. | | | 4,110 | | | | 58,095 | |
| a | | CorVel Corp. | | | 330 | | | | 24,981 | |
| a | | Cross Country Healthcare Inc. | | | 1,080 | | | | 11,124 | |
| a | | Eagle Pharmaceuticals Inc. | | | 315 | | | | 17,819 | |
| a | | Enanta Pharmaceuticals Inc. | | | 660 | | | | 39,653 | |
| a | | Genomic Health Inc. | | | 1,065 | | | | 72,228 | |
| a | | Glaukos Corp. | | | 960 | | | | 60,010 | |
| a | | Globus Medical Inc., A | | | 3,225 | | | | 164,862 | |
| a | | Haemonetics Corp. | | | 1,605 | | | | 202,455 | |
| | | | |
| | | |
| 36 | | Semiannual Report | | franklintempleton.com |
FRANKLIN TEMPLETON ETF TRUST
STATEMENT OF INVESTMENTS (UNAUDITED)
Franklin LibertyQ U.S. Small Cap Equity ETF(continued)
| | | | | | | | | | |
| | |
| | | Shares | | | Value | |
| | | | | | | | | | |
| | | Common Stocks (continued) | | | | | | |
| | | Health Care (continued) | | | | | | |
| a | | Hanger Inc. | | | 705 | | | $ | 14,368 | |
| a | | Inogen Inc. | | | 615 | | | | 29,465 | |
| a | | iRadimed Corp. | | | 135 | | | | 2,838 | |
| a | | Lantheus Holdings Inc. | | | 720 | | | | 18,047 | |
| | LeMaitre Vascular Inc. | | | 660 | | | | 22,559 | |
| a | | LHC Group Inc. | | | 1,095 | | | | 124,348 | |
| | Meridian Bioscience Inc. | | | 1,965 | | | | 18,648 | |
| a | | Merit Medical Systems Inc. | | | 2,010 | | | | 61,225 | |
| | Mesa Laboratories Inc. | | | 60 | | | | 14,266 | |
| a | | Misonix Inc. | | | 150 | | | | 3,015 | |
| a | | Myriad Genetics Inc. | | | 2,415 | | | | 69,141 | |
| | National Healthcare Corp. | | | 525 | | | | 42,971 | |
| | National Research Corp., A | | | 525 | | | | 30,319 | |
| a | | NextGen Healthcare Inc. | | | 2,205 | | | | 34,552 | |
| a | | NuVasive Inc. | | | 1,785 | | | | 113,133 | |
| a | | Orthofix International NV | | | 765 | | | | 40,560 | |
| a | | OrthoPediatrics Corp. | | | 165 | | | | 5,818 | |
| | Patterson Cos. Inc. | | | 2,835 | | | | 50,520 | |
| | Phibro Animal Health Corp. | | | 825 | | | | 17,597 | |
| a | | Prestige Consumer Healthcare Inc. | �� | | 1,785 | | | | 61,922 | |
| | Simulations Plus Inc. | | | 435 | | | | 15,094 | |
| a | | Supernus Pharmaceuticals Inc. | | | 2,085 | | | | 57,296 | |
| a | | Tactile Systems Technology Inc. | | | 690 | | | | 29,201 | |
| a | | The Joint Corp. | | | 270 | | | | 5,025 | |
| | Utah Medical Products Inc. | | | 135 | | | | 12,938 | |
| a | | Vocera Communications Inc. | | | 1,155 | | | | 28,471 | |
| | | | | | | | | | |
| | | | 2,171,402 | |
| | | | | | | | | | |
| | | Industrials 20.4% | | | | | | |
| | ABM Industries Inc. | | | 2,715 | | | | 98,609 | |
| | ACCO Brands Corp. | | | 1,860 | | | | 18,358 | |
| a | | Advanced Disposal Services Inc. | | | 2,190 | | | | 71,328 | |
| | Aircastle Ltd. | | | 2,055 | | | | 46,094 | |
| | Alamo Group Inc. | | | 345 | | | | 40,613 | |
| | Allegiant Travel Co. | | | 495 | | | | 74,082 | |
| | Allied Motion Technologies Inc. | | | 255 | | | | 9,004 | |
| | Altra Industrial Motion Corp. | | | 1,845 | | | | 51,097 | |
| | Applied Industrial Technologies Inc. | | | 1,770 | | | | 100,536 | |
| a | | Axon Enterprise Inc. | | | 1,755 | | | | 99,649 | |
| | BG Staffing Inc. | | | 360 | | | | 6,880 | |
| a | | BMC Stock Holdings Inc. | | | 1,275 | | | | 33,380 | |
| | Brady Corp., A | | | 2,100 | | | | 111,405 | |
| a | | Builders FirstSource Inc. | | | 2,160 | | | | 44,442 | |
| a | | Casella Waste Systems Inc., A | | | 795 | | | | 34,137 | |
| a | | Cimpress NV | | | 870 | | | | 114,701 | |
| | CompX International Inc. | | | 45 | | | | 645 | |
| a | | Covenant Transportation Group Inc., A | | | 480 | | | | 7,891 | |
| | CSW Industrials Inc. | | | 270 | | | | 18,638 | |
| | Deluxe Corp. | | | 2,100 | | | | 103,236 | |
| | Douglas Dynamics Inc. | | | 765 | | | | 34,096 | |
| | Ennis Inc. | | | 1,020 | | | | 20,614 | |
| | EnPro Industries Inc. | | | 720 | | | | 49,428 | |
| | Exponent Inc. | | | 2,295 | | | | 160,420 | |
| | Forrester Research Inc. | | | 480 | | | | 15,427 | |
| | Forward Air Corp. | | | 1,290 | | | | 82,199 | |
| a | | Foundation Building Materials Inc. | | | 555 | | | | 8,597 | |
| a | | Franklin Covey Co. | | | 375 | | | | 13,125 | |
| a | | FTI Consulting Inc. | | | 735 | | | | 77,903 | |
| | | | | | |
| | | |
| franklintempleton.com | | Semiannual Report | | | 37 | |
FRANKLIN TEMPLETON ETF TRUST
STATEMENT OF INVESTMENTS (UNAUDITED)
Franklin LibertyQ U.S. Small Cap Equity ETF(continued)
| | | | | | | | | | |
| | |
| | | Shares | | | Value | |
| | | | | | | | | | |
| | | Common Stocks (continued) | | | | | | |
| | | Industrials(continued) | | | | | | |
| a | | Generac Holdings Inc. | | | 1,185 | | | $ | 92,833 | |
| | H&E Equipment Services Inc. | | | 585 | | | | 16,883 | |
| | Hawaiian Holdings Inc. | | | 1,800 | | | | 47,268 | |
| | Healthcare Services Group Inc. | | | 2,595 | | | | 63,033 | |
| | Heartland Express Inc. | | | 1,380 | | | | 29,684 | |
| | Heidrick & Struggles International Inc. | | | 840 | | | | 22,932 | |
| a | | Heritage-Crystal Clean Inc. | | | 690 | | | | 18,285 | |
| | Herman Miller Inc. | | | 2,445 | | | | 112,690 | |
| | Hillenbrand Inc. | | | 2,430 | | | | 75,038 | |
| | HNI Corp. | | | 1,860 | | | | 66,030 | |
| | Hurco Cos. Inc. | | | 120 | | | | 3,860 | |
| | Hyster-Yale Materials Handling Inc. | | | 360 | | | | 19,703 | |
| | ICF International Inc. | | | 795 | | | | 67,154 | |
| | Insperity Inc. | | | 1,665 | | | | 164,202 | |
| | Interface Inc. | | | 2,040 | | | | 29,458 | |
| | John Bean Technologies Corp. | | | 585 | | | | 58,167 | |
| | Kadant Inc. | | | 450 | | | | 39,505 | |
| | Kaman Corp., A | | | 1,035 | | | | 61,541 | |
| | Kelly Services Inc., A | | | 1,320 | | | | 31,970 | |
| | Kforce Inc. | | | 1,125 | | | | 42,564 | |
| | Kimball International Inc., B | | | 1,440 | | | | 27,792 | |
| | Knoll Inc. | | | 1,965 | | | | 49,813 | |
| | Korn Ferry | | | 2,175 | | | | 84,042 | |
| a | | Lawson Products Inc. | | | 255 | | | | 9,876 | |
| | Lindsay Corp. | | | 390 | | | | 36,211 | |
| | McGrath RentCorp | | | 915 | | | | 63,675 | |
| a | | Meritor Inc. | | | 1,545 | | | | 28,583 | |
| | Miller Industries Inc. | | | 390 | | | | 12,987 | |
| | Mobile Mini Inc. | | | 1,905 | | | | 70,218 | |
| | Moog Inc., A | | | 1,230 | | | | 99,778 | |
| | MSA Safety Inc. | | | 1,485 | | | | 162,028 | |
| | National Presto Industries Inc. | | | 180 | | | | 16,036 | |
| | Omega Flex Inc. | | | 135 | | | | 13,804 | |
| a | | P.A.M. Transportation Services Inc. | | | 75 | | | | 4,433 | |
| | Preformed Line Products Co. | | | 105 | | | | 5,732 | |
| a | | Radiant Logistics Inc. | | | 735 | | | | 3,800 | |
| | Resources Connection Inc. | | | 1,425 | | | | 24,211 | |
| | Rush Enterprises Inc., B | | | 165 | | | | 6,588 | |
| a | | SAIA Inc. | | | 1,125 | | | | 105,412 | |
| | Simpson Manufacturing Co. Inc. | | | 1,710 | | | | 118,623 | |
| | Standex International Corp. | | | 450 | | | | 32,823 | |
| | Steelcase Inc., A | | | 3,795 | | | | 69,828 | |
| | Systemax Inc. | | | 405 | | | | 8,914 | |
| | Tennant Co. | | | 660 | | | | 46,662 | |
| a | | Transcat Inc. | | | 150 | | | | 3,842 | |
| a | | Trex Co. Inc. | | | 2,130 | | | | 193,681 | |
| a | | TriNet Group Inc. | | | 795 | | | | 49,441 | |
| | UniFirst Corp. | | | 555 | | | | 108,292 | |
| | Universal Logistics Holdings Inc. | | | 315 | | | | 7,333 | |
| a | | US Xpress Enterprises Inc., A | | | 720 | | | | 3,470 | |
| a | | Vicor Corp. | | | 525 | | | | 15,498 | |
| | Watts Water Technologies Inc., A | | | 960 | | | | 89,981 | |
| | Werner Enterprises Inc. | | | 1,980 | | | | 69,894 | |
| a | | Willis Lease Fin Corp. | | | 60 | | | | 3,323 | |
| | | | | | | | | | |
| | | | 4,255,958 | |
| | | | | | | | | | |
| | | Information Technology 11.0% | | | | | | |
| a | | A10 Networks Inc. | | | 1,635 | | | | 11,347 | |
| | | | |
| | | |
| 38 | | Semiannual Report | | franklintempleton.com |
FRANKLIN TEMPLETON ETF TRUST
STATEMENT OF INVESTMENTS (UNAUDITED)
Franklin LibertyQ U.S. Small Cap Equity ETF(continued)
| | | | | | | | | | |
| | |
| | | Shares | | | Value | |
| | | | | | | | | | |
| | | Common Stocks (continued) | | | | | | |
| | | Information Technology (continued) | | | | | | |
| a | | ACI Worldwide Inc. | | | 1,935 | | | $ | 60,614 | |
| | ADTRAN Inc. | | | 1,530 | | | | 17,358 | |
| a | | Alarm.com Holdings Inc. | | | 1,140 | | | | 53,170 | |
| a | | Altair Engineering Inc. | | | 1,110 | | | | 38,428 | |
| | American Software Inc., A | | | 1,095 | | | | 16,447 | |
| | Astro-Med Inc. | | | 150 | | | | 2,425 | |
| a | | Avid Technology Inc. | | | 1,155 | | | | 7,149 | |
| | Badger Meter Inc. | | | 1,050 | | | | 56,385 | |
| | Cabot Microelectronics Corp. | | | 960 | | | | 135,562 | |
| a | | Casa Systems Inc. | | | 885 | | | | 6,952 | |
| a | | CEVA Inc. | | | 780 | | | | 23,291 | |
| a | | ChannelAdvisor Corp. | | | 840 | | | | 7,837 | |
| a | | Cirrus Logic Inc. | | | 2,250 | | | | 120,555 | |
| a | | Coda Octopus Group Inc. | | | 105 | | | | 862 | |
| a | | CommVault Systems Inc. | | | 1,590 | | | | 71,089 | |
| | CSG Systems International Inc. | | | 1,440 | | | | 74,419 | |
| | Daktronics Inc. | | | 1,365 | | | | 10,081 | |
| a | | eGain Corp. | | | 660 | | | | 5,283 | |
| a | | ePlus Inc. | | | 465 | | | | 35,382 | |
| | EVERTEC Inc. | | | 2,235 | | | | 69,777 | |
| | Hackett Group Inc. | | | 1,020 | | | | 16,789 | |
| a | | Immersion Corp. | | | 1,200 | | | | 9,180 | |
| a | | Information Services Group Inc. | | | 1,080 | | | | 2,684 | |
| a | | Insight Enterprises Inc. | | | 1,500 | | | | 83,535 | |
| a | | Iteris Inc. | | | 930 | | | | 5,343 | |
| | J2 Global Inc. | | | 1,995 | | | | 181,186 | |
| a | | Majesco | | | 180 | | | | 1,519 | |
| | ManTech International Corp., A | | | 960 | | | | 68,554 | |
| | MAXIMUS Inc. | | | 1,155 | | | | 89,235 | |
| a | | MicroStrategy Inc. | | | 315 | | | | 46,737 | |
| a | | Mitek Systems Inc. | | | 1,335 | | | | 12,883 | |
| a | | MobileIron Inc. | | | 1,815 | | | | 11,879 | |
| | Monotype Imaging Holdings Inc. | | | 1,830 | | | | 36,252 | |
| a | | Napco Security Technologies Inc. | | | 405 | | | | 10,336 | |
| | NIC Inc. | | | 2,805 | | | | 57,923 | |
| a | | Novanta Inc. | | | 1,095 | | | | 89,483 | |
| | NVE Corp. | | | 180 | | | | 11,943 | |
| a | | OSI Systems Inc. | | | 300 | | | | 30,468 | |
| | PC Connection Inc. | | | 435 | | | | 16,921 | |
| a | | Priority Technology Holdings Inc. | | | 135 | | | | 651 | |
| | Progress Software Corp. | | | 810 | | | | 30,829 | |
| | QAD Inc., A | | | 375 | | | | 17,317 | |
| a | | Qualys Inc. | | | 1,350 | | | | 102,019 | |
| a | | ScanSource Inc. | | | 945 | | | | 28,870 | |
| a | | Semtech Corp. | | | 1,185 | | | | 57,603 | |
| a | | Silicon Laboratories Inc. | | | 1,590 | | | | 177,046 | |
| a | | SMART Global Holdings Inc. | | | 390 | | | | 9,937 | |
| a | | Sonim Technologies Inc. | | | 75 | | | | 220 | |
| a | | SPS Commerce Inc. | | | 1,245 | | | | 58,602 | |
| a | | Tenable Holdings Inc. | | | 720 | | | | 16,114 | |
| | Tessco Technologies Inc. | | | 135 | | | | 1,940 | |
| | Vishay Intertechnology Inc. | | | 4,470 | | | | 75,677 | |
| a | | Vishay Precision Group Inc. | | | 345 | | | | 11,295 | |
| a | | Workiva Inc | | | 1,215 | | | | 53,253 | |
| | Xperi Corp. | | | 870 | | | | 17,992 | |
| a | | Zix Corp. | | | 2,415 | | | | 17,485 | |
| | | | | | | | | | |
| | | | 2,284,113 | |
| | | | | | | | | | |
| | | | | | |
| | | |
| franklintempleton.com | | Semiannual Report | | | 39 | |
FRANKLIN TEMPLETON ETF TRUST
STATEMENT OF INVESTMENTS (UNAUDITED)
Franklin LibertyQ U.S. Small Cap Equity ETF(continued)
| | | | | | | | | | |
| | |
| | | Shares | | | Value | |
| | | | | | | | | | |
| | | Common Stocks (continued) | | | | | | |
| | | Materials 1.7% | | | | | | |
| | Advanced Emissions Solutions Inc. | | | 585 | | | $ | 8,681 | |
| | Greif Inc., A | | | 975 | | | | 36,943 | |
| | Greif Inc., B | | | 225 | | | | 10,251 | |
| | Innophos Holdings Inc. | | | 675 | | | | 21,910 | |
| | Myers Industries Inc. | | | 1,215 | | | | 21,445 | |
| | Quaker Chemical Corp. | | | 345 | | | | 54,558 | |
| | Schweitzer-Mauduit International Inc. | | | 1,170 | | | | 43,805 | |
| | Sensient Technologies Corp. | | | 1,635 | | | | 112,243 | |
| | Valhi Inc. | | | 930 | | | | 1,767 | |
| | Warrior Met Coal Inc. | | | 1,635 | | | | 31,915 | |
| | | | | | | | | | |
| | | | 343,518 | |
| | | | | | | | | | |
| | | Real Estate 6.0% | | | | | | |
| | Agree Realty Corp. | | | 1,230 | | | | 89,974 | |
| | American Assets Trust Inc. | | | 900 | | | | 42,066 | |
| | Cedar Realty Trust Inc. | | | 3,045 | | | | 9,135 | |
| | CoreCivic Inc. | | | 3,915 | | | | 67,651 | |
| | DiamondRock Hospitality Co. | | | 3,810 | | | | 39,052 | |
| | First Industrial Realty Trust Inc. | | | 4,110 | | | | 162,592 | |
| | Franklin Street Properties Corp. | | | 4,035 | | | | 34,136 | |
| | Lexington Realty Trust | | | 9,000 | | | | 92,250 | |
| | LTC Properties Inc. | | | 1,425 | | | | 72,988 | |
| | Monmouth Real Estate Investment Corp., A | | | 2,955 | | | | 42,582 | |
| | National Health Investors Inc. | | | 1,530 | | | | 126,057 | |
| | One Liberty Properties Inc. | | | 570 | | | | 15,692 | |
| | Preferred Apartment Communities Inc., A | | | 1,890 | | | | 27,311 | |
| | PS Business Parks Inc. | | | 885 | | | | 161,026 | |
| | QTS Realty Trust Inc., A | | | 1,020 | | | | 52,438 | |
| | RE/MAX Holdings Inc., A | | | 810 | | | | 26,050 | |
| | Realogy Holdings Corp. | | | 2,505 | | | | 16,733 | |
| | RPT Realty | | | 3,240 | | | | 43,902 | |
| | Summit Hotel Properties Inc. | | | 1,905 | | | | 22,098 | |
| b | | Tanger Factory Outlet Centers Inc. | | | 1,845 | | | | 28,561 | |
| | Universal Health Realty Income Trust | | | 360 | | | | 37,008 | |
| | Urstadt Biddle Properties, A | | | 1,095 | | | | 25,952 | |
| | Whitestone REIT | | | 1,215 | | | | 16,718 | |
| | | | | | | | | | |
| | | | 1,251,972 | |
| | | | | | | | | | |
| | | Utilities 7.1% | | | | | | |
| | American States Water Co. | | | 1,545 | | | | 138,834 | |
| | Artesian Resources Corp., A | | | 270 | | | | 9,990 | |
| | Avista Corp. | | | 2,385 | | | | 115,529 | |
| | Black Hills Corp. | | | 1,995 | | | | 153,076 | |
| | California Water Service Group | | | 1,965 | | | | 104,008 | |
| | Clearway Energy Inc., A | | | 1,335 | | | | 23,149 | |
| | Clearway Energy Inc., C | | | 2,520 | | | | 45,990 | |
| | El Paso Electric Co. | | | 1,530 | | | | 102,632 | |
| | Genie Energy Ltd., B | | | 300 | | | | 2,238 | |
| | Global Water Resources Inc. | | | 375 | | | | 4,440 | |
| | MGE Energy Inc. | | | 1,275 | | | | 101,834 | |
| | New Jersey Resources Corp. | | | 3,015 | | | | 136,338 | |
| | NorthWestern Corp. | | | 1,590 | | | | 119,330 | |
| | PNM Resources Inc. | | | 2,670 | | | | 139,054 | |
| | SJW Group | | | 765 | | | | 52,242 | |
| | Southwest Gas Holdings Inc. | | | 1,980 | | | | 180,259 | |
| b | | Spark Energy Inc., A | | | 465 | | | | 4,906 | |
| | Unitil Corp. | | | 555 | | | | 35,209 | |
| | | | |
| | | |
| 40 | | Semiannual Report | | franklintempleton.com |
FRANKLIN TEMPLETON ETF TRUST
STATEMENT OF INVESTMENTS (UNAUDITED)
Franklin LibertyQ U.S. Small Cap Equity ETF(continued)
| | | | | | | | | | |
| | |
| | | Shares | | | Value | |
| | | | | | | | | | |
| | | Common Stocks (continued) | | | | | | |
| | | Utilities (continued) | | | | | | |
| | York Water Co. | | | 270 | | | $ | 11,788 | |
| | | | | | | | | | |
| | | | 1,480,846 | |
| | | | | | | | | | |
| | Total Investments before Short Term Investments (Cost $20,461,561) | | | | | | | 20,802,268 | |
| | | | | | | | | | |
| | | Short Term Investments (Cost $236,610) 1.2% | |
| | Investments from Cash Collateral Received for Loaned Securities 1.2% | | | | | | | | |
| | | Money Market Funds 1.2% | | | | | | |
| c,d | | Institutional Fiduciary Trust Portfolio, 1.71% | | | 236,610 | | | | 236,610 | |
| | | | | | | | | | |
| | Total Investments (Cost $20,698,171) 101.1% | | | | | | | 21,038,878 | |
| | Other Assets, less Liabilities (1.1)% | | | | | | | (223,284 | ) |
| | | | | | | | | | |
| | Net Assets 100.0% | | | | | | $ | 20,815,594 | |
| | | | | | | | | | |
aNon-income producing.
bA portion or all of the security is on loan at September 30, 2019. See Note 1(c).
cSee Note 3(c) regarding investments in affiliated management investment companies.
dThe rate shown is the annualized seven-day effective yield at period end.
| | | | | | |
| | | |
| franklintempleton.com | | The accompanying notes are an integral part of these financial statements. | Semiannual Report | | | 41 | |
FRANKLIN TEMPLETON ETF TRUST
FINANCIAL STATEMENTS
Statements of Assets and Liabilities
September 30, 2019 (unaudited)
| | | | | | | | | | | | |
| | | |
| | | Franklin
LibertyQ U.S.
Equity ETF | | | Franklin
LibertyQ U.S.
Mid Cap
Equity ETF | | | Franklin
LibertyQ U.S.
Small Cap
Equity ETF | |
Assets: | |
Investments in securities: | |
Cost – Unaffiliated issuers | | $ | 1,145,588,555 | | | $ | 12,992,971 | | | $ | 20,461,561 | |
Cost – Non-controlled affiliates (Note 3c) | | | 1,434,325 | | | | 22,200 | | | | 236,610 | |
| | | | |
Value – Unaffiliated issuers+ | | $ | 1,216,706,889 | | | $ | 14,123,314 | | | $ | 20,802,268 | |
Value – Non-controlled affiliates (Note 3c) | | | 1,434,325 | | | | 22,200 | | | | 236,610 | |
Cash | | | 1,013,030 | | | | 12,688 | | | | — | |
Receivables: | |
Capital shares sold | | | 1,649,660 | | | | — | | | | — | |
Dividends | | | 1,446,779 | | | | 17,700 | | | | 27,158 | |
Variation margin on futures contracts | | | 8,091 | | | | — | | | | — | |
Deposits with brokers for: | | | | | | | | | | | | |
Futures contracts | | | 69,300 | | | | — | | | | — | |
| | | | |
Total assets | | | 1,222,328,074 | | | | 14,175,902 | | | | 21,066,036 | |
| | | | |
Liabilities: | |
Payables: | |
Investment securities purchased | | | 1,645,261 | | | | — | | | | 452 | |
Management fees | | | 148,637 | | | | 3,098 | | | | 5,865 | |
Funds advanced by custodian | | | — | | | | — | | | | 7,515 | |
Payable upon return of securities loaned | | | 1,434,325 | | | | 22,200 | | | | 236,610 | |
| | | | |
Total liabilities | | | 3,228,223 | | | | 25,298 | | | | 250,442 | |
| | | | |
Net assets, at value | | $ | 1,219,099,851 | | | $ | 14,150,604 | | | $ | 20,815,594 | |
| | | | |
Net assets consist of: | |
Paid-in capital | | $ | 1,123,600,139 | | | $ | 12,922,925 | | | $ | 20,619,947 | |
Total distributable earnings (loss) | | | 95,499,712 | | | | 1,227,679 | | | | 195,647 | |
| | | | |
Net assets, at value | | $ | 1,219,099,851 | | | $ | 14,150,604 | | | $ | 20,815,594 | |
| | | | |
Shares outstanding | | | 36,950,000 | | | | 450,000 | | | | 750,000 | |
| | | | |
Net asset value per share | | $ | 32.99 | | | $ | 31.45 | | | $ | 27.75 | |
| | | | |
| | | | | | | | | | | | |
+Includes securities loaned | | | 1,400,230 | | | | 21,723 | | | | 226,451 | |
| | | | |
| | | |
| 42 | | Semiannual Report | The accompanying notes are an integral part of these financial statements. | | franklintempleton.com |
FRANKLIN TEMPLETON ETF TRUST
FINANCIAL STATEMENTS
Statements of Operations
for the period ended September 30, 2019 (unaudited)
| | | | | | | | | | | | |
| | | |
| | | Franklin
LibertyQ U.S.
Equity ETF | | | Franklin
LibertyQ U.S.
Mid Cap
Equity ETF | | | Franklin
LibertyQ U.S.
Small Cap
Equity ETF | |
Investment income: | |
Dividends: | |
Unaffiliated issuers | | $ | 14,365,007 | | | $ | 108,156 | | | $ | 196,071 | |
Interest: | |
Unaffiliated issuers | | | — | | | | 41 | | | | 57 | |
Interest from securities loaned: | |
Unaffiliated issuers (net of fees and rebates) | | | — | | | | 173 | | | | — | |
Non-Controlled affiliates (Note 3c) | | | 86,660 | | | | 176 | | | | 2,143 | |
| | | | |
Total investment income | | | 14,451,667 | | | | 108,546 | | | | 198,271 | |
| | | | |
Expenses: | |
Management fees (Note 3a) | | | 1,273,582 | | | | 16,700 | | | | 34,749 | |
| | | | |
Total expenses | | | 1,273,582 | | | | 16,700 | | | | 34,749 | |
Expenses waived/paid by affiliates (Note 3c) | | | (893 | ) | | | (24 | ) | | | (375 | ) |
| | | | |
Net expenses | | | 1,272,689 | | | | 16,676 | | | | 34,374 | |
| | | | |
Net investment income | | | 13,178,978 | | | | 91,870 | | | | 163,897 | |
| | | | |
Realized and unrealized gains (losses): | |
Net realized gain (loss) from: | |
Investments: | |
Unaffiliated issuers | | | (6,413,011 | ) | | | (157,708 | ) | | | (502,725 | ) |
In-kind redemptions | | | 32,545,997 | | | | 334,228 | | | | 655,683 | |
Futures contracts | | | 320,997 | | | | — | | | | — | |
| | | | |
Net realized gain (loss) | | | 26,453,983 | | | | 176,520 | | | | 152,958 | |
| | | | |
Net change in unrealized appreciation (depreciation) on: | |
Investments: | |
Unaffiliated issuers | | | 30,789,773 | | | | 215,689 | | | | (87,238 | ) |
Futures contracts | | | (122,143 | ) | | | — | | | | — | |
| | | | |
Net change in unrealized appreciation (depreciation) | | | 30,667,630 | | | | 215,689 | | | | (87,238 | ) |
| | | | |
Net realized and unrealized gain (loss) | | | 57,121,613 | | | | 392,209 | | | | 65,720 | |
| | | | |
Net increase (decrease) in net assets resulting from operations | | $ | 70,300,591 | | | $ | 484,079 | | | $ | 229,617 | |
| | | | |
| | | | | | |
| | | |
| franklintempleton.com | | The accompanying notes are an integral part of these financial statements. | Semiannual Report | | | 43 | |
FRANKLIN TEMPLETON ETF TRUST
FINANCIAL STATEMENTS
Statements of Changes in Net Assets
| | | | | | | | | | | | | | | | |
| | |
| | | Franklin LibertyQ U.S.
Equity ETF | | | Franklin LibertyQ U.S. Mid Cap
Equity ETF | |
| | | | |
| | | Six Months Ended
September 30, 2019
(unaudited) | | | Year Ended
March 31, 2019 | | | Six Months Ended
September 30, 2019
(unaudited) | | | Year Ended
March 31, 2019 | |
Increase (decrease) in net assets: | |
Operations: | |
Net investment income | | $ | 13,178,978 | | | $ | 7,322,781 | | | $ | 91,870 | | | $ | 121,894 | |
Net realized gain (loss) | | | 26,453,983 | | | | 9,804,269 | | | | 176,520 | | | | 106,914 | |
Net change in unrealized appreciation (depreciation) | | | 30,667,630 | | | | 31,328,794 | | | | 215,689 | | | | 734,943 | |
| | | | |
Net increase (decrease) in net assets resulting from operations | | | 70,300,591 | | | | 48,455,844 | | | | 484,079 | | | | 963,751 | |
| | | | |
Distributions to shareholders | | | (11,519,158 | ) | | | (6,162,655 | ) | | | (82,732 | ) | | | (106,377 | ) |
| | | | |
Capital share transactions: (Note 2) | | | 152,063,869 | | | | 857,635,782 | | | | 3,137,250 | | | | 6,984,672 | |
| | | | |
Net increase (decrease) in net assets | | | 210,845,302 | | | | 899,928,971 | | | | 3,538,597 | | | | 7,842,046 | |
Net assets: | |
Beginning of period | | | 1,008,254,549 | | | | 108,325,578 | | | | 10,612,007 | | | | 2,769,961 | |
| | | | |
End of period | | $ | 1,219,099,851 | | | $ | 1,008,254,549 | | | $ | 14,150,604 | | | $ | 10,612,007 | |
| | | | |
| | | | |
| | | |
| 44 | | Semiannual Report | The accompanying notes are an integral part of these financial statements. | | franklintempleton.com |
FRANKLIN TEMPLETON ETF TRUST
FINANCIAL STATEMENTS
Statements of Changes in Net Assets(continued)
| | | | | | | | |
| |
| | | Franklin LibertyQ U.S. Small Cap
Equity ETF | |
| | |
| | | Six Months Ended
September 30, 2019
(unaudited) | | | Year Ended
March 31, 2019 | |
Increase (decrease) in net assets: | |
Operations: | |
Net investment income | | $ | 163,897 | | | $ | 158,146 | |
Net realized gain (loss) | | | 152,958 | | | | (169,234 | ) |
Net change in unrealized appreciation (depreciation) | | | (87,238 | ) | | | 302,305 | |
| | | | |
Net increase (decrease) in net assets resulting from operations | | | 229,617 | | | | 291,217 | |
| | | | |
Distributions to shareholders | | | (153,888 | ) | | | (121,259 | ) |
| | | | |
Capital share transactions: (Note 2) | | | 2,760,728 | | | | 15,142,986 | |
| | | | |
Net increase (decrease) in net assets | | | 2,836,457 | | | | 15,312,944 | |
Net assets: | |
Beginning of period | | | 17,979,137 | | | | 2,666,193 | |
| | | | |
End of period | | $ | 20,815,594 | | | $ | 17,979,137 | |
| | | | |
| | | | | | |
| | | |
| franklintempleton.com | | The accompanying notes are an integral part of these financial statements. | Semiannual Report | | | 45 | |
FRANKLIN TEMPLETON ETF TRUST
Notes to Financial Statements (unaudited)
1. Organization and Significant Accounting Policies
Franklin Templeton ETF Trust (Trust) is registered under the Investment Company Act of 1940 (1940 Act) as an open-end management investment company, consisting of thirty-nine separate funds, three of which are included in this report (Funds) and applies the specialized accounting and reporting guidance in U.S. Generally Accepted Accounting Principles (U.S. GAAP). Each of the Funds are an exchange traded fund (ETF) and seek to provide the investment results that closely correspond, before fees and expenses, to the performance of each Fund’s corresponding underlying index .
The following summarizes the Funds’ significant accounting policies
a. Financial Instrument Valuation
The Funds’ investments in financial instruments are carried at fair value daily. Fair value is the price that would be received to sell an asset or paid to transfer a liability in an orderly transaction between market participants on the measurement date. The Funds calculate the net asset value (NAV) per share as of 4 p.m. Eastern time each day the New York Stock Exchange (NYSE) is open for trading. Under compliance policies and procedures approved by the Trust’s Board of Trustees (the Board), the Funds’ administrator has responsibility for oversight of valuation, including leading the cross-functional Valuation Committee (VC). The Funds may utilize independent pricing services, quotations from securities and financial instrument dealers, and other market sources to determine fair value.
Equity securities listed on an exchange or on the NASDAQ National Market System are valued at the last quoted sale price or the official closing price of the day, respectively. Over-the-counter (OTC) securities are valued within the range of the most recent quoted bid and ask prices. Securities that trade in multiple markets or on multiple exchanges are valued according to the broadest and most representative market. Certain equity securities are valued based upon fundamental characteristics or relationships to similar securities.
Investments in open-end mutual funds are valued at the closing NAV.
Certain derivative financial instruments are centrally cleared or trade in the OTC market. The Funds’ pricing services use various techniques including industry standard option pricing
models and proprietary discounted cash flow models to determine the fair value of those instruments. The Funds’ net benefit or obligation under the derivative contract, as measured by the fair value of the contract, is included in net assets.
The Funds have procedures to determine the fair value of financial instruments for which market prices are not reliable or readily available. Under these procedures, the Funds primarily employ a market-based approach which may use related or comparable assets or liabilities, recent transactions, market multiples, book values, and other relevant information for the investment to determine the fair value of the investment. An income-based valuation approach may also be used in which the anticipated future cash flows of the investment are discounted to calculate fair value. Discounts may also be applied due to the nature or duration of any restrictions on the disposition of the investments. Due to the inherent uncertainty of valuations of such investments, the fair values may differ significantly from the values that would have been used had an active market existed.
b. Derivative Financial Instruments
Certain or all Funds invested in derivative financial instruments in order to manage risk or gain exposure to various other investments or markets. Derivatives are financial contracts based on an underlying or notional amount, require no initial investment or an initial net investment that is smaller than would normally be required to have a similar response to changes in market factors, and require or permit net settlement. Derivatives contain various risks including the potential inability of the counterparty to fulfill their obligations under the terms of the contract, the potential for an illiquid secondary market, and/or the potential for market movements which expose the Fund to gains or losses in excess of the amounts shown in the Statements of Assets and Liabilities. Realized gain and loss and unrealized appreciation and depreciation on these contracts for the period are included in the Statements of Operations.
Collateral requirements differ by type of derivative. Collateral or initial margin requirements are set by the broker or exchange clearing house for exchange traded and centrally cleared derivatives. Initial margin deposited is held at the exchange and can be in the form of cash and/or securities.
Certain or all Funds entered into exchange traded futures contracts primarily to manage and/or gain exposure to equity price risk. A futures contract is an agreement between the Fund and a counterparty to buy or sell an asset at a specified
| | | | |
| | | |
| 46 | | Semiannual Report | | franklintempleton.com |
FRANKLIN TEMPLETON ETF TRUST
NOTES TO FINANCIAL STATEMENTS (UNAUDITED)
price on a future date. Required initial margins are pledged by the Fund, and the daily change in fair value is accounted for as a variation margin payable or receivable in the Statements of Assets and Liabilities.
See Note 6 regarding other derivative information.
c. Securities Lending
Certain or all Funds participate in an agency based securities lending program to earn additional income. The Fund receives cash collateral against the loaned securities in an amount equal to at least 102% of the fair value of the loaned securities. Collateral is maintained over the life of the loan in an amount not less than 100% of the fair value of loaned securities, as determined at the close of Fund business each day; any additional collateral required due to changes in security values is delivered to the Fund on the next business day. The collateral is deposited into a joint cash account with other funds and is used to invest in a money market fund managed by Franklin Advisers, Inc., an affiliate of the Funds. The Fund may receive income from the investment of cash collateral, in addition to lending fees and rebates paid by the borrower. Income from securities loaned, net of fees paid to the securities lending agent and/or third-party vendor, is reported separately in the Statements of Operations. The Fund bears the market risk with respect to the collateral investment, securities loaned, and the risk that the agent may default on its obligations to the Fund. If the borrower defaults on its obligation to return the securities loaned, the Fund has the right to repurchase the securities in the open market using the collateral received. The securities lending agent has agreed to indemnify the Fund in the event of default by a third party borrower.
d. Income Taxes
It is each Fund’s policy to qualify as a regulated investment company under the Internal Revenue Code. Each Fund intends to distribute to shareholders substantially all of its taxable income and net realized gains to relieve it from federal income and excise taxes. As a result, no provision for U.S. federal income taxes is required.
Each Fund may recognize an income tax liability related to its uncertain tax positions under U.S. GAAP when the uncertain tax position has a less than 50% probability that it will be sustained upon examination by the tax authorities based on its technical merits. As of September 30, 2019, each Fund has determined that no tax liability is required in its financial statements related to uncertain tax positions for any open tax
years (or expected to be taken in future tax years). Open tax years are those that remain subject to examination and are based on the statute of limitations in each jurisdiction in which the Fund invests.
e. Security Transactions, Investment Income, Expenses and Distributions
Security transactions are accounted for on trade date. Realized gains and losses on security transactions are determined on a specific identification basis. Estimated expenses are accrued daily. Dividend income is recorded on the ex-dividend date. Distributions to shareholders are recorded on the ex-dividend date. Distributable earnings are determined according to income tax regulations (tax basis) and may differ from earnings recorded in accordance with U.S. GAAP. These differences may be permanent or temporary. Permanent differences are reclassified among capital accounts to reflect their tax character. These reclassifications have no impact on net assets or the results of operations. Temporary differences are not reclassified, as they may reverse in subsequent periods.
Common expenses incurred by the Trust are allocated among the Funds based on the ratio of net assets of each Fund to the combined net assets of the Trust. Certain Fund specific expenses are allocated directly to the Fund that incurred the expense. These expenses are paid by the Funds or by the investment manager, as applicable, according to the terms of the unified management fee agreement.
f. Accounting Estimates
The preparation of financial statements in accordance with U.S. GAAP requires management to make estimates and assumptions that affect the reported amounts of assets and liabilities at the date of the financial statements and the amounts of income and expenses during the reporting period. Actual results could differ from those estimates.
g. Guarantees and Indemnifications
Under the Trust’s organizational documents, its officers and trustees are indemnified by the Trust against certain liabilities arising out of the performance of their duties to the Trust. Additionally, in the normal course of business, the Trust, on behalf of the Funds, enters into contracts with service providers that contain general indemnification clauses. The Trust’s maximum exposure under these arrangements is unknown as this would involve future claims that may be made against the Trust that have not yet occurred. Currently, the Trust expects the risk of loss to be remote.
| | | | | | |
| | | |
| franklintempleton.com | | Semiannual Report | | | 47 | |
FRANKLIN TEMPLETON ETF TRUST
NOTES TO FINANCIAL STATEMENTS (UNAUDITED)
2. Shares of Beneficial Interest
Shares of the Funds are issued and redeemed at their respective NAV only in aggregations of a specified number of shares or multiples thereof (Creation Units). Only certain large institutional investors (Authorized Participants) may engage in creation or redemption transactions directly with the Funds. Once created, shares of the Funds generally trade in the secondary market in amounts less than one Creation Unit. The market price of the Funds’ shares will be based on the price in the secondary market which may be at, above or below the most recent NAV. Creation Units may be issued and redeemed in exchange for a designated portfolio of securities and/or cash (which may include cash in lieu of certain securities).
Authorized participants pay a standard transaction fee to the shareholder servicing agent when purchasing or redeeming Creation Units of the Funds regardless of the number of Creation Units that are being created or redeemed on the same day by the Authorized Participant. The standard transaction fee is imposed to offset transfer and other transaction costs associated with the issuance and redemption of Creation Units and is not charged to or paid by the Funds.
In addition, for cash Creation Unit transactions, a variable fee for creation transactions and redemption transactions may be charged to the Authorized Participant to cover certain brokerage, tax, foreign exchange, execution, market impact and other costs and expenses related to the execution of trades. Variable fees, if any, are included in capital share transactions in the Statements of Changes in Net Assets.
At September 30, 2019, there were an unlimited number of shares authorized (without par value). Transactions in the Funds’ shares were as follows:
| | | | | | | | | | | | | | | | | | | | |
| |
| | | Franklin LibertyQ U.S. Equity ETF | |
| | | |
| | | Six Months Ended
September 30, 2019 | | | | | | Year Ended
March 31, 2019 | |
| | | | | |
| | | Shares | | | Amount | | | | | | Shares | | | Amount | |
Shares sold | | | 10,200,000 | | | $ | 324,704,399 | | | | | | | | 31,000,000 | | | $ | 938,802,146 | |
Shares redeemed | | | (5,350,000 | ) | | | (172,640,530 | ) | | | | | | | (2,700,000 | ) | | | (81,166,364 | ) |
| | | | |
Net increase (decrease) | | | 4,850,000 | | | $ | 152,063,869 | | | | | | | | 28,300,000 | | | $ | 857,635,782 | |
| | | | |
| |
| | | Franklin LibertyQ U.S. Mid Cap Equity ETF | |
| | | |
| | | Six Months Ended
September 30, 2019 | | | | | | Year Ended
March 31, 2019 | |
| | | | | |
| | | Shares | | | Amount | | | | | | Shares | | | Amount | |
Shares sold | | | 150,000 | | | $ | 4,696,992 | | | | | | | | 300,000 | | | $ | 8,425,958 | |
Shares redeemed | | | (50,000 | ) | | | (1,559,742 | ) | | | | | | | (50,000 | ) | | | (1,441,286 | ) |
| | | | |
Net increase (decrease) | | | 100,000 | | | $ | 3,137,250 | | | | | | | | 250,000 | | | $ | 6,984,672 | |
| | | | |
| |
| | | Franklin LibertyQ U.S. Small Cap Equity ETF | |
| | | |
| | | Six Months Ended
September 30, 2019 | | | | | | Year Ended
March 31, 2019 | |
| | | | | |
| | | Shares | | | Amount | | | | | | Shares | | | Amount | |
Shares sold | | | 200,000 | | | $ | 5,531,473 | | | | | | | | 600,000 | | | $ | 16,620,824 | |
Shares redeemed | | | (100,000 | ) | | | (2,770,745 | ) | | | | | | | (50,000 | ) | | | (1,477,838 | ) |
| | | | |
Net increase (decrease) | | | 100,000 | | | $ | 2,760,728 | | | | | | | | 550,000 | | | $ | 15,142,986 | |
| | | | |
| | | | |
| | | |
| 48 | | Semiannual Report | | franklintempleton.com |
FRANKLIN TEMPLETON ETF TRUST
NOTES TO FINANCIAL STATEMENTS (UNAUDITED)
3. Transactions with Affiliates
Franklin Resources, Inc. is the holding company for various subsidiaries that together are referred to as Franklin Templeton. Certain officers and trustees of the Funds are also officers and/or directors of the following subsidiaries:
| | |
| |
| Subsidiary | | Affiliation |
Franklin Advisers, Inc. (Advisers) | | Investment manager |
Franklin Advisory Services, LLC (FASL) | | Investment manager |
Franklin Templeton Services, LLC (FT Services) | | Administrative manager |
Franklin Templeton Distributors, Inc. (Distributors) | | Principal underwriter |
a. Management Fees
The Funds pay a unified management fee to Advisers whereby Advisers has agreed to reimburse the Funds’ acquired fund fee and expenses (if any) and pay all of the ordinary operating expenses of the Funds, including custody, transfer agency, and Trustee fees and expenses, among others, but excluding payments under the Funds’ Rule 12b-1 plan (if any), brokerage expenses (including any costs incidental to transactions in portfolio securities or instruments), taxes, interest (including borrowing costs and dividend expenses on securities sold short and overdraft charges), litigation expenses (including litigation to which the Trust or a Fund may be a party and indemnification of the Trustees and officers with respect thereto), and other nonroutine or extraordinary expenses. The fees are based on the average daily net assets of each of the Funds as follows:
| | |
| |
| | | Annualized Fee Rate |
Franklin LibertyQ U.S. Equity ETF | | 0.15% |
Franklin LibertyQ U.S. Mid Cap Equity ETF | | 0.30% |
Franklin LibertyQ U.S. Small Cap Equity ETF | | 0.35% |
Prior to August 1, 2019, Franklin LibertyQ U.S. Equity ETF paid fees to Franklin Advisers, Inc. of 0.25% per year based on the average daily net assets of the Fund.
b. Administrative Fees
Under an agreement with Advisers, FT Services provides administrative services to the Funds. The fee is paid by Advisers based on the Funds’ average daily net assets, and is not an additional expense of the Funds.
c. Investments in Affiliated Management Investment Companies
Certain or all Funds invest in one or more affiliated management investment companies for purposes other than exercising a controlling influence over the management or policies. Management fees paid by the Funds are waived on assets invested in the affiliated management investment companies, as noted in the Statements of Operations, in an amount not to exceed the
| | | | | | |
| | | |
| franklintempleton.com | | Semiannual Report | | | 49 | |
FRANKLIN TEMPLETON ETF TRUST
NOTES TO FINANCIAL STATEMENTS (UNAUDITED)
3. Transactions with Affiliates(continued)
c. Investments in Affiliated Management Investment Companies(continued)
management and administrative fees paid directly or indirectly by each affiliate. During the period ended September 30, 2019, investments in affiliated management investment companies were as follows:
| | | | | | | | | | | | | | | | | | | | | | | | | | | | | | | | |
| | | | | | | | |
| | | Value at
Beginning
of Period | | | Purchases | | | Sales | | | Realized
Gain (Loss) | | | Net Change
in Unrealized
Appreciation
(Depreciation) | | | Value at
End of
Period | | | Number
of Shares
Held at
End of
Period | | | Investment
Income | |
| | | | | | | | |
| Franklin LibertyQ U.S. Equity ETF | | | | | | | | | | | | | | | | | | | | | | | | | | | | | | | | |
| Non-Controlled Affiliates | | | | | | | | | | | | | | | | | | | | | | | Income from
securities loaned | |
| | | | | | | | | | | | | | | | | | | | | | | | | | | | | | | | |
Institutional Fiduciary Trust Money Market Portfolio 1.71% | | $ | — | | | $ | 8,696,235 | | | $ | (7,261,910 | ) | | $ | — | | | $ | — | | | $ | 1,434,325 | | | | 1,434,325 | | | $ | 86,660 | |
| | | | | | | | | | | | | | | | | | | | | | | | |
| | | | | | | | |
| Franklin LibertyQ U.S. Mid Cap Equity ETF | | | | | | | | | | | | | | | | | | | | | | | | | | | | | | | | |
| Non-Controlled Affiliates | | | | | | | | | | | | | | | | | | | | | | | | |
Institutional Fiduciary Trust Money Market Portfolio 1.71% | | $ | 27,777 | | | $ | 238,896 | | | $ | (244,473 | ) | | $ | — | | | $ | — | | | $ | 22,200 | | | | 22,200 | | | $ | 176 | |
| | | | | | | | | | | | | | | | | | | | | | | | |
| | | | | | | | |
| Franklin LibertyQ U.S. Small Cap Equity ETF | | | | | | | | | | | | | | | | | | | | | | | | | | | | | | | | |
| Non-Controlled Affiliates | | | | | | | | | | | | | | | | | | | | | | | | |
Institutional Fiduciary Trust Money Market Portfolio 1.71% | | $ | 102,580 | | | $ | 3,739,408 | | | $ | (3,605,378 | ) | | $ | — | | | $ | — | | | $ | 236,610 | | | | 236,610 | | | $ | 2,143 | |
| | | | | | | | | | | | | | | | | | | | | | | | |
d. Other Affiliated Transactions
At September 30, 2019, the shares of the Funds were owned by the following entities:
| | | | | | | | |
| | |
| Funds | | Shares | | | Percentage of
Outstanding Sharesa | |
Franklin Conservative Allocation Fund | | | 2,670,638 | | | | 7.2% | |
Franklin Moderate Allocation Fund | | | 6,596,229 | | | | 17.9% | |
Franklin Growth Allocation Fund | | | 5,782,006 | | | | 15.7% | |
Franklin LifeSmart™ 2020 – 2055 Retirement Target Funds | | | 2,561,565 | | | | 6.9% | |
Franklin 529 Portfolios | | | 11,399,544 | | | | 30.9% | |
| | | | |
| | | 29,009,982 | | | | 78.6% | |
| | | | |
aInvestment activities of significant shareholders could have a material impact on the Funds.
| | | | |
| | | |
| 50 | | Semiannual Report | | franklintempleton.com |
FRANKLIN TEMPLETON ETF TRUST
NOTES TO FINANCIAL STATEMENTS (UNAUDITED)
4. Income Taxes
For tax purposes, capital losses may be carried over to offset future capital gains, if any. At September 30, 2019, the capital loss carryforwards were as follows:
| | | | | | | | | | | | |
| | | |
| | | Franklin
LibertyQ U.S.
Equity ETF | | | Franklin
LibertyQ U.S.
Mid Cap
Equity ETF | | | Franklin
LibertyQ U.S.
Small Cap
Equity ETF | |
| Capital loss carryforwards: | | | | | | | | | | | | |
Short term | | $ | 3,709,258 | | | $ | 67,247 | | | $ | 219,018 | |
Long term | | | 1,150,711 | | | | 34,322 | | | | 90,479 | |
| | | | |
Total capital loss carryforwards | | $ | 4,859,969 | | | $ | 101,569 | | | $ | 309,497 | |
| | | | |
At September 30, 2019, the cost of investments and net unrealized appreciation (depreciation) for income tax purposes were as follows:
| | | | | | | | | | | | |
| | | |
| | | Franklin
LibertyQ U.S.
Equity ETF | | | Franklin
LibertyQ U.S.
Mid Cap
Equity ETF | | | Franklin
LibertyQ U.S.
Small Cap
Equity ETF | |
Cost of investments | | $ | 1,147,022,880 | | | $ | 13,015,171 | | | $ | 20,698,171 | |
| | | | |
Unrealized appreciation | | $ | 108,886,880 | | | $ | 1,552,700 | | | $ | 1,877,310 | |
Unrealized depreciation | | | (37,768,546 | ) | | | (422,357 | ) | | | (1,536,603 | ) |
| | | | |
Net unrealized appreciation (depreciation) | | $ | 71,118,334 | | | $ | 1,130,343 | | | $ | 340,707 | |
| | | | |
Differences between income and/or capital gains as determined on a book basis and a tax basis are primarily due to differing treatments of corporate actions, passive foreign investment company shares and wash sales.
5. Investment Transactions
Purchases and sales of investments (excluding short term securities and in-kind transactions, if any) for the period ended September 30, 2019, were as follows:
| | | | | | | | | | | | |
| | | |
| | | Franklin
LibertyQ U.S.
Equity ETF | | | Franklin
LibertyQ U.S.
Mid Cap
Equity ETF | | | Franklin
LibertyQ U.S.
Small Cap
Equity ETF | |
Purchases | | $ | 134,879,063 | | | $ | 1,387,565 | | | $ | 2,872,492 | |
Sales | | $ | 128,931,125 | | | $ | 1,376,561 | | | $ | 2,640,037 | |
In-kind transactions associated with creation and redemptions for the period ended September 30, 2019, were as follows:
| | | | | | | | | | | | |
| | | |
| | | Franklin
LibertyQ U.S.
Equity ETF | | | Franklin
LibertyQ U.S.
Mid Cap
Equity ETF | | | Franklin
LibertyQ U.S.
Small Cap
Equity ETF | |
Cost of Securities Received | | $ | 319,536,400 | | | $ | 4,668,702 | | | $ | 5,520,224 | |
Value of Securities Delivered | | $ | 169,659,867 | | | $ | 1,541,416 | | | $ | 2,757,008 | |
| | | | | | |
| | | |
| franklintempleton.com | | Semiannual Report | | | 51 | |
FRANKLIN TEMPLETON ETF TRUST
NOTES TO FINANCIAL STATEMENTS (UNAUDITED)
5. Investment Transactions(continued)
At September 30, 2019, in connection with securities lending transactions, certain or all Funds loaned investments and received cash collateral as follows:
| | | | | | | | | | | | |
| | | |
| | | Franklin
LibertyQ U.S.
Equity ETF | | | Franklin
LibertyQ U.S.
Mid Cap
Equity ETF | | | Franklin
LibertyQ U.S.
Small Cap
Equity ETF | |
| Securities lending transactionsa: | | | | | | | | | | | | |
Equity investmentsb | | $ | 1,434,325 | | | $ | 22,200 | | | $ | 236,610 | |
aThe agreements can be terminated at any time.
bThe gross amount of recognized liability for such transactions is included in payable upon return of securities loaned in the Statements of Assets and Liabilities.
6. Other Derivative Information
At September 30, 2019, the Funds’ investments in derivative contracts are reflected in the Statements of Assets and Liabilities as follows:
| | | | | | | | | | | | |
| | |
| | | Asset Derivatives | | | Liability Derivatives | |
| | | | |
| | | Statements of Assets and
Liabilities Location | | Fair Value | | | Statements of Assets and
Liabilities Location | | Fair Value | |
| Franklin LibertyQ U.S. Equity ETF | | | | | | | | | | |
| | | | |
Equity contracts | | Variation margin on futures contracts | | $ | — | | | Variation margin on futures contracts | | $ | (16,683 | )a |
aThis amount reflects the cumulative appreciation (depreciation) of futures contracts as reported in the Statement of Investments. Only the variation margin receivable/at year end is separately reported within the Statements of Assets and Liabilities. Prior variation margin movements were recorded to cash upon receipt or payment.
For the period ended September 30, 2019, the effect of derivative contracts in the Funds’ Statements of Operations was as follows:
| | | | | | | | | | | | |
| | | | |
Derivative Contracts
Not Accounted for as
Hedging Instruments | | Statements of
Operations Locations | | Net Realized
Gain (Loss)
for the Period | | | Statements of
Operations Locations | | Net Change in
Unrealized
Appreciation
(Depreciation)
for the Period | |
| Franklin LibertyQ U.S. Equity ETF | | | | | | | | | | | | |
| | Net realized gain (loss) from: | | | | | | Net change in unrealized appreciation (depreciation) on: | | | | |
| | | | |
Equity Contracts | | Futures Contracts | | $ | 320,997 | | | Futures Contracts | | $ | (122,143 | ) |
For the period ended September 30, 2019, the average month end notional amount of futures contracts was $1,840,436.
See Note 1(b) regarding derivative financial instruments.
7. Fair Value Measurements
The Funds follow a fair value hierarchy that distinguishes between market data obtained from independent sources (observable inputs) and the Funds’ own market assumptions (unobservable inputs). These inputs are used in determining the value of the Funds’ financial instruments and are summarized in the following fair value hierarchy:
| | • | | Level 1 – quoted prices in active markets for identical financial instruments |
| | • | | Level 2 – other significant observable inputs (including quoted prices for similar financial instruments, interest rates, prepayment speed, credit risk, etc.) |
| | • | | Level 3 – significant unobservable inputs (including the Funds’ own assumptions in determining the fair value of financial instruments) |
| | | | |
| | | |
| 52 | | Semiannual Report | | franklintempleton.com |
FRANKLIN TEMPLETON ETF TRUST
NOTES TO FINANCIAL STATEMENTS (UNAUDITED)
The input levels are not necessarily an indication of the risk or liquidity associated with financial instruments at that level.
At September 30, 2019, all of the Funds’ investments in financial instruments carried at fair value were valued using Level 1 inputs.
8. Subsequent Events
The Funds have evaluated subsequent events through the issuance of the financial statements and determined that no events have occurred that require disclosure.
Abbreviations
| | |
| Selected Portfolio |
| REIT | | Real Estate Investment Trust |
| | | | | | |
| | | |
| franklintempleton.com | | Semiannual Report | | | 53 | |
FRANKLIN TEMPLETON ETF TRUST
Shareholder Information
Board Approval of Investment Management Agreements
FRANKLIN TEMPLETON ETF TRUST
Franklin LibertyQ U.S. Equity ETF
Franklin LibertyQ U.S. Mid Cap Equity ETF
Franklin LibertyQ U.S. Small Cap Equity ETF
(each a Fund)
At anin-person meeting held on May 29, 2019 (Meeting), the Board of Trustees (Board) of Franklin Templeton ETF Trust (Trust), including a majority of the trustees who are not “interested persons” as defined in the Investment Company Act of 1940 (Independent Trustees), reviewed and approved the continuance of the investment management agreement between Franklin Advisory Services, LLC (Manager) and the Trust, on behalf of each Fund (each a Management Agreement) for an additionalone-year period. The Independent Trustees received advice from and met separately with Independent Trustee counsel in considering whether to approve the continuation of each Management Agreement. Although the Management Agreements for the Funds were considered at the same Board meeting, the Board considered the information provided to it about the Funds together and with respect to each Fund separately as the Board deemed appropriate.
In considering the continuation of each Management Agreement, the Board reviewed and considered information provided by the Manager at the Meeting and throughout the year at meetings of the Board and its committees. The Board also reviewed and considered information provided in response to a detailed set of requests for information submitted to the Manager by Independent Trustee counsel on behalf of the Independent Trustees in connection with the annual contract renewal process. In addition, prior to the Meeting, the Independent Trustees held a telephonic contract renewal meeting at which the Independent Trustees conferred amongst themselves and Independent Trustee counsel about contract renewal matters. The Board reviewed and considered all of the factors it deemed relevant in approving the continuance of each Management Agreement, including, but not limited to: (i) the nature, extent and quality of the services provided by the Manager; (ii) the investment performance of each Fund and each Fund’s tracking error against a specified benchmark index as of a recent period; (iii) the costs of the services provided and profits realized by the Manager and its affiliates from the relationship with each Fund; (iv) the extent to which economies of scale are realized as each Fund grows; and (v) whether fee levels reflect these economies of scale for the benefit of Fund investors.
In approving the continuance of each Management Agreement, the Board, including a majority of the Independent Trustees, determined that the terms of each Management Agreement are fair and reasonable and that the continuance of such Management Agreement is in the best interests of the applicable Fund and its shareholders. While attention was given to all information furnished, the following discusses some primary factors relevant to the Board’s determination.
NATURE, EXTENT AND QUALITY OF SERVICES. The Board reviewed and considered information regarding the nature, extent and quality of investment management services provided by the Manager and its affiliates to the Funds and their shareholders. This information included, among other things, the qualifications, background and experience of the senior management and investment personnel of the Manager; the structure of investment personnel compensation; oversight of third-party service providers; investment performance reports and related financial information for each Fund; reports on expenses; legal and compliance matters; risk controls; pricing and other services provided by the Manager and its affiliates; and management fees charged by the Manager and its affiliates to US funds and other accounts, including management’s explanation of differences among accounts where relevant. The Board noted management’s continuing efforts and expenditures in establishing effective business continuity plans and developing strategies to address areas of heightened concern in the registered fund industry, such as cybersecurity and liquidity risk management. The Board also recognized management’s commitment to facilitating Board oversight of liquidity through the designation of a liquidity/risk administrator and the development of reports that highlight the amount of illiquid investments for each Fund.
The Board also reviewed and considered the benefits provided to Fund shareholders of investing in a fund that is part of the Franklin Templeton family of funds. The Board noted the financial position of Franklin Resources, Inc. (FRI), the Manager’s parent, and its commitment to the registered fund business as evidenced by its continued introduction of new funds, reassessment of the fund offerings in response to the market environment and project initiatives and capital investments relating to the services provided to the Funds by the Franklin Templeton (FT) organization.
Following consideration of such information, the Board was satisfied with the nature, extent and quality of services provided by the Manager and its affiliates to the Funds and their shareholders.
| | | | |
| | | |
| 54 | | Semiannual Report | | franklintempleton.com |
FRANKLIN TEMPLETON ETF TRUST
SHAREHOLDER INFORMATION
FUND PERFORMANCE. The Board reviewed and considered the performance results of each Fund for theone-year period ended February 28, 2019. The Board considered the performance returns for each Fund in comparison to the performance returns of registered funds deemed comparable to the Fund included in a universe (Performance Universe) selected by Broadridge Financial Solutions, Inc. (Broadridge), an independent provider of investment company data. The Board received a description of the methodology used by Broadridge to select the registered funds included in a Performance Universe. The Board also considered the performance returns for the Franklin LibertyQ U.S. Mid Cap Equity ETF in comparison to the performance returns of a customized peer group (Performance Customized Peer Group) selected by the Manager. The Board also reviewed and considered Fund performance reports provided and discussions that occurred with portfolio managers at Board meetings throughout the year. The Board noted its ongoing discussions with the Manager about the performance of the Funds to date and the importance of performance to asset growth. Specifically, the Board referenced earlier discussions with management on matters related to, among other things, the strategy behind the overall productline-up, the design and construction of the Manager’s proprietary indices, the comparability of peer data, the nature of the Manager’s research, the potential use of innovative data and technology, and investments in marketing and distribution. A summary of each Fund’s performance results is below.
Franklin LibertyQ U.S. Equity ETF and Franklin LibertyQ U.S. Small Cap Equity ETF – The Performance Universe for the Franklin LibertyQ U.S. Equity ETF included the Fund and all retail and institutionalmulti-cap core funds. The Performance Universe for the Franklin LibertyQ U.S. Small Cap Equity ETF included the Fund and all retail and institutionalsmall-cap core funds. The Funds commenced operations on April 26, 2017, and thus have been in operation for less than three years. The Board noted that the Funds’ annualized total returns for theone-year period were above the medians and in the first quintile of their respective Performance Universes. The Board further noted that, in light of the Funds’ use of a “passive” or indexing investment approach, management evaluates the Funds based on their tracking error against a specified benchmark. The Board noted that for theone-year period ended February 28, 2019, each Fund’s tracking error was within the tolerance anticipated for such Fund. The Board concluded that the Funds’ performance was satisfactory.
Franklin LibertyQ U.S. Mid Cap Equity ETF – The Performance Universe for the Fund included the Fund and all retail and institutionalmid-cap growth funds. The Performance
Customized Peer Group for the Fund consisted of the Fund and all retail and institutionalmid-cap core funds. The Fund commenced operations on April 26, 2017, and thus has been in operation for less than three years. The Board noted that the Fund’s annualized total return for theone-year period was above the medians of its Performance Universe and Performance Customized Peer Group. The Board further noted that, in light of the Fund’s use of a “passive” or indexing investment approach, management evaluates the Fund based on its tracking error against a specified benchmark. The Board noted that for theone-year period ended February 28, 2019, the Fund’s tracking error was within the tolerance anticipated for such Fund. The Board concluded that the Fund’s performance was satisfactory.
COMPARATIVE FEES AND EXPENSES. The Board reviewed and considered information regarding each Fund’s actual total expense ratio and its various components, including, as applicable, management fees; transfer agent expenses; underlying fund expenses; Rule12b-1 andnon-Rule12b-1 service fees; and othernon-management fees. The Board considered the actual total expense ratio and, separately, the contractual management fee rate, without the effect of fee waivers, if any (Management Rate) of each Fund in comparison to the median expense ratio and median Management Rate, respectively, of other exchange-traded funds deemed comparable to and with a similar expense structure to the Fund selected by Broadridge (Expense Group). Broadridge fee and expense data is based upon information taken from each fund’s most recent annual report, which reflects historical asset levels that may be quite different from those currently existing, particularly in a period of market volatility. While recognizing such inherent limitation and the fact that expense ratios and Management Rates generally increase as assets decline and decrease as assets grow, the Board believed the independent analysis conducted by Broadridge to be an appropriate measure of comparative fees and expenses. The Broadridge Management Rate includes administrative charges. The Board received a description of the methodology used by Broadridge to select the exchange-traded funds included in an Expense Group.
Franklin LibertyQ U.S. Equity ETF – The Expense Group for the Fund was comprised of pure-index exchange-traded funds, which included the Fund and eight othermulti-cap core funds. The Board noted that the Management Rate for the Fund was below and the actual total expense ratio for the Fund was equal to the medians of its Expense Group. The also Board noted that effective December 1, 2017, the Fund implemented a unified management fee (Unified Fee). The
| | | | | | |
| | | |
| franklintempleton.com | | Semiannual Report | | | 55 | |
FRANKLIN TEMPLETON ETF TRUST
SHAREHOLDER INFORMATION
Board further noted that pursuant to the Unified Fee arrangement the Manager reimburses the Fund for all of its acquired fund fees and expenses (if any) and pays all of the ordinary operating expenses of the Fund, except for (i) the Fund’s investment management fee, (ii) payments under the Fund’s Rule12b-1 plan (if any), (iii) brokerage expenses, (iv) taxes, (v) interest (including borrowing costs and dividend expenses on securities sold short and overdraft charges), (vi) litigation expenses (including litigation to which the Trust or the Fund may be a party and indemnification of the Trustees and officers with respect thereto), and (vii) othernon-routine or extraordinary expenses (Unified Fee Arrangement). The Board concluded that the Management Rate charged to the Fund is reasonable.
Franklin LibertyQ U.S. Mid Cap Equity ETF – The Expense Group for the Fund was comprised of pure-index exchange-traded funds, which included the Fund and five othermid-cap growth funds. The Board noted that the Management Rate and actual total expense ratio for the Fund were below the medians of its Expense Group. The Board also noted that effective December 1, 2017, the Fund implemented a Unified Fee. The Board further noted the terms of the Unified Fee Arrangement. The Board concluded that the Management Rate charged to the Fund is reasonable.
Franklin LibertyQ U.S. Small Cap Equity ETF – The Expense Group for the Fund was comprised of pure-index exchange-traded funds, which included the Fund and nine othersmall-cap core funds. The Board noted that the Management Rate for the Fund was slightly above and the actual total expense ratio for the Fund was above the medians of its Expense Group. The Board also noted that effective December 1, 2017, the Fund implemented a Unified Fee and the terms of the Unified Fee Arrangement. The Board also noted the first quintile (best) performance of the Fund for theone-year period ended February 28, 2019. The Board concluded that the Management Rate charged to the Fund is reasonable.
PROFITABILITY. The Board reviewed and considered information regarding the profits realized by the Manager and its affiliates in connection with the operation of each Fund. In this respect, the Board considered the Fund profitability analysis provided by the Manager that addresses the overall profitability of FT’s US fund business, as well as its profits in providing investment management and other services to each of the individual funds during the12-month period ended September 30, 2018, being the most recent fiscalyear-end for FRI. The Board noted that although management continually makes refinements to its methodologies
used in calculating profitability in response to organizational and product-related changes, the overall methodology has remained consistent with that used in the Funds’ profitability report presentations from prior years. Additionally, PricewaterhouseCoopers LLP, auditor to FRI and certain Franklin Templeton funds, has been engaged to periodically review and assess the allocation methodologies to be used solely by the Funds’ Board with respect to the profitability analysis.
The Board noted management’s belief that costs incurred in establishing the infrastructure necessary for the type of fund operations conducted by the Manager and its affiliates may not be fully reflected in the expenses allocated to each Fund in determining its profitability, as well as the fact that the level of profits, to a certain extent, reflected operational cost savings and efficiencies initiated by management. The Board also noted management’s expenditures in improving shareholder services provided to the Funds, as well as the need to implement systems and meet additional regulatory and compliance requirements resulting from recent SEC and other regulatory requirements.
The Board also considered the extent to which the Manager and its affiliates might derive ancillary benefits from fund operations, including revenues generated from transfer agent services, potential benefits resulting from personnel and systems enhancements necessitated by fund growth, as well as increased leverage with service providers and counterparties. Based upon its consideration of all these factors, the Board concluded that the level of profits realized by the Manager and its affiliates from providing services to each Fund was not excessive in view of the nature, extent and quality of services provided to each Fund.
ECONOMIES OF SCALE. The Board reviewed and considered the extent to which the Manager may realize economies of scale, if any, as each Fund grows larger and whether each Fund’s management fee structure reflects any economies of scale for the benefit of shareholders. The Board considered that each Fund would likely experience benefits from the Unified Fee at the Fund’s projected asset levels because of the Manager’s contractual requirement to bear most of the Fund’s ordinary operating expenses. The Board noted that, under the Unified Fee, it is not anticipated that any of the Funds will generate significant, if any, profit for the Manager and/or its affiliates for some time. The Board also considered the Manager’s view that any analyses of potential economies of scale in managing a particular fund are inherently limited in light of the joint and common costs and investments the Manager incurs across the Franklin Templeton family of funds as
| | | | |
| | | |
| 56 | | Semiannual Report | | franklintempleton.com |
FRANKLIN TEMPLETON ETF TRUST
SHAREHOLDER INFORMATION
a whole. The Board also noted that the Funds commenced operations on April 26, 2017 and that, as of December 31, 2018, the net assets of the Franklin LibertyQ U.S. Mid Cap Equity ETF and the Franklin LibertyQ U.S. Small Cap Equity ETF were approximately$8-9 million, while the net assets of the Franklin LibertyQ U.S. Equity ETF were approximately $384 million. The Board recognized that there would not likely be any economies of scale for these Funds until each Fund’s assets grow.
CONCLUSION. Based on its review, consideration and evaluation of all factors it believed relevant, including the above-described factors and conclusions, the Board unanimously approved the continuation of each Management Agreement for an additionalone-year period.
Proxy Voting Policies and Procedures
The Trust’s investment manager has established Proxy Voting Policies and Procedures (Policies) that the Trust uses to determine how to vote proxies relating to portfolio securities. Shareholders may view the Trust’s complete Policies online at franklintempleton.com. Alternatively, shareholders may request copies of the Policies free of charge by calling the Proxy Group collect at (954)527-7678 or by sending a written request to: Franklin Templeton Companies, LLC, 300 S.E. 2nd Street, Fort Lauderdale, FL 33301, Attention: Proxy Group. Copies of the Trust’s proxy voting records are also made available online at franklintempleton.com and posted on the U.S. Securities and Exchange Commission’s website at sec.gov and reflect the most recent12-month period ended June 30.
Quarterly Statement of Investments
The Trust files a complete statement of investments with the U.S. Securities and Exchange Commission for the first and third quarters for each fiscal year as an exhibit to its report on FormN-PORT. Shareholders may view the filed FormN-PORT by visiting the Commission’s website at sec.gov. The filed form may also be viewed and copied at the Commission’s Public Reference Room in Washington, DC. Information regarding the operations of the Public Reference Room may be obtained by calling(800) SEC-0330.
Premium/Discount Information
Information about the differences between the daily market price on the secondary market for the shares of the Funds and the Funds’ net asset value may be found on the Funds’ website at franklintempleton.com.
| | | | | | |
| | | |
| franklintempleton.com | | Semiannual Report | | | 57 | |
Authorized for distribution only when accompanied or preceded by a summary prospectus and/or prospectus. Investors should carefully consider a fund’s investment goals, risks, charges and expenses before investing. A prospectus contains this and other information; please read it carefully before investing.
To help ensure we provide you with quality service, all calls to and from our service areas are monitored and/or recorded.
| | | | | | |
 | | Semiannual Report Franklin Templeton ETF Trust | | |
| | | |
| | Investment Manager | | Distributor | | Investor Services |
| | Franklin Advisory Services, LLC | | Franklin Templeton Distributors, Inc. (800) DIAL BEN®/342-5236 franklintempleton.com | | Transfer Agent State Street Bank and
Trust Company 1 Heritage Drive
Mail Stop OHD0100 North Quincy, MA 02171 |
| © 2019 Franklin Templeton Investments. All rights reserved. | | | | ETF3 S 11/19 |
SEMIANNUAL REPORT
FRANKLIN TEMPLETON
ETF TRUST
September 30, 2019


|
Franklin Liberty Intermediate Municipal Opportunities ETF |
Franklin Liberty Municipal Bond ETF |
Internet Delivery of Fund Reports Unless You Request Paper Copies: Effective January 1, 2021, as permitted by the SEC, paper copies of the Fund’s shareholder reports will no longer be sent by mail, unless you specifically request them from the Fund or your financial intermediary. Instead, the reports will be made available on a website, and you will be notified by mail each time a report is posted and provided with a website link to access the report.
If you already elected to receive shareholder reports electronically, you will not be affected by this change and you need not take any action. If you have not signed up for electronic delivery, we would encourage you to join fellow shareholders who have. You may elect to receive shareholder reports and other communications electronically from the Fund by calling(800) 632-2301 or by contacting your financial intermediary.
You may elect to continue to receive paper copies of all your future shareholder reports free of charge by contacting your financial intermediary or, if you invest directly with a Fund, calling(800) 632-2301 to let the Fund know of your request. Your election to receive reports in paper will apply to all funds held in your account.
Franklin Templeton
Successful investing begins with ambition. And achievement only comes when you reach for it. That’s why we continually strive to deliver better outcomes for investors. No matter what your goals are, our deep, global investment expertise allows us to offer solutions that can help.
During our more than 70 years of experience, we’ve managed through all kinds of markets—up, down and those in between. We’re always preparing for what may come next. It’s because of this, combined with our strength as one of the world’s largest asset managers that we’ve earned the trust of millions of investors around the world.
Visitfranklintempleton.com/investor/investments-and-solutions/investment-options/etfs/ for fund updates and documents.
| | | | | | | | |
| Not FDIC Insured | | | | | May Lose Value | | | | | No Bank Guarantee |
| | | | | | |
| | | |
| franklintempleton.com | | Not part of the semiannual report | | | 1 | |
SEMIANNUAL REPORT
Municipal Bond Market Overview
The financial markets experienced volatility during the six months ended September 30, 2019. Continuing trade concerns, uncertainties about the prospects for global economic growth and speculations on major central banks’ future policy decisions led to volatility in domestic fixed income and equity securities. U.S. equities rose during the period, while fixed income assets such as municipal bonds and U.S. Treasuries also rallied as interest rates moved in a generally downward trajectory. Municipal bonds delivered positive returns as favorable supply and demand dynamics, combined with interest-rate declines, continued to buoy the market.
Investment-grade municipal bonds, as measured by the Bloomberg Barclays Municipal Bond Index, posted a +3.74% total return for the period, while U.S. Treasuries, as measured by the Bloomberg Barclays U.S. Treasury Index, posted a +5.48% total return, and investment-grade corporate bonds, as measured by the Bloomberg Barclays U.S. Corporate Bond Index, posted a +7.66% total return.1 U.S. stocks, as represented by the Standard & Poor’s® 500 Index, posted a +6.08% total return, outperforming the municipal bond and U.S. Treasury markets, but underperforming the corporate bond market.1
Municipal bonds with longer maturities generally outperformed bonds with shorter maturities during thesix-month period. High-yield municipal bonds generally outperformed investment-grade municipal bonds, with the Bloomberg Barclays High Yield Municipal Bond Index posting a +5.64% total return, compared with a +3.74% total return for the Bloomberg Barclays Municipal Bond Index.1
Municipal bond issuance during thesix-month reporting period totaled approximately $197 billion, which represented a 5% increase from the prior-year’ssix-month period.2 Calendar-year 2019 municipal bond issuance through September was approximately $275 billion, which represented a 9% increase from the prior-year period.2 In our view, demand for municipal bonds remains robust, and investors have continued to add money to municipal bond mutual funds. The Investment Company Institute reported calendaryear-to-date 2019 net inflows of approximately $67 billion to the asset class through September.
The U.S. Federal Reserve (Fed) lowered its target range for the federal funds rate by 0.25% two times in 2019—first in July and again in September. The target range for the federal funds rate was 1.75%–2.00% atperiod-end. In its press release following the September decision, the Fed cited muted inflation and global economic concerns as the primary catalysts for the decision. The Fed noted, however, that the labor market remained strong and domestic economic activity was healthy, and some members believed no additional rate cuts were warranted.
Atperiod-end, we maintained our positive view of the municipal bond market. We believe municipal bonds continue to be an attractive asset class among fixed income securities, and we intend to follow our solid discipline of investing to maximize income, while seeking value in the municipal bond market.
The foregoing information reflects our analysis, opinions and portfolio holdings as of September 30, 2019, the end of the reporting period. The way we implement our main investment strategies and the resulting portfolio holdings may change depending on factors such as market and economic conditions. These opinions may not be relied upon as investment advice or an offer for a particular security. The information is not a complete analysis of every aspect of any market, state, industry, security or fund. Statements of fact are from sources considered reliable, but the investment manager makes no representation or warranty as to their completeness or accuracy. Although historical performance is no guarantee of future results, these insights may help you understand our investment management philosophy.
1. Source: Morningstar. Treasuries, if held to maturity, offer a fixed rate of return and fixed principal value; their interest payments and principal are guaranteed.
2. Source: The Bond Buyer, Thomson Reuters.
See www.franklintempletondatasources.com for additional data provider information.
| | | | |
| | | |
| 2 | | Semiannual Report | | franklintempleton.com |
Franklin Liberty Intermediate Municipal Opportunities ETF
This semiannual report for Franklin Liberty Intermediate Municipal Opportunities ETF covers the period ended September 30, 2019.
Your Fund’s Goal and Main Investments
The Fund seeks to provide a high level of current income that is exempt from federal income taxes, including the federal alternative minimum tax, by investing at least 80% of its net assets in municipal securities that pay interest free from such taxes.1 The Fund seeks to maintain a dollar-weighted average portfolio maturity (the time in which the debt must be repaid) of three to 10 years.
Performance Overview
For the six months under review, the Fund posted cumulative total returns of +4.01% based on market price and +3.81% based on net asset value (NAV). In comparison, the Bloomberg Barclays Municipal1-15 Year Index posted a +2.99% total return for the same period.2 You can find more of the Fund’s performance data in the Performance Summary beginning on page 5.
Performance data represent past performance, which does not guarantee future results. Investment return and principal value will fluctuate, and you may have a gain or loss when you sell your shares. Current performance may differ from figures shown. For most recentmonth-end performance, go tofranklintempleton.com or call(800)342-5236.
Investment Strategy
We select securities that we believe will provide the best balance between risk and return within the Fund’s range of allowable investments and we typically use abuy-and-hold strategy. The Fund is an actively managed exchange-traded fund (ETF) that does not seek to replicate the performance of a specified index.
| | | | |
| Credit Quality Composition* | |
|
| 9/30/19 | |
| |
| Ratings | | % of Total
Investments | |
AAA | | | 7.88% | |
AA | | | 32.32% | |
A | | | 12.45% | |
BB | | | 26.87% | |
Not Rated | | | 20.48% | |
*Securities, except for those labeled Not Rated, are assigned ratings by one or more Nationally Recognized Statistical Credit Rating Organizations (NRSROs), such as Standard & Poor’s, Moody’s and Fitch, that can be considered by the investment manager as part of its independent securities analysis. When ratings from multiple agencies are available, the highest is used, consistent with the portfolio investment process. Ratings reflect an NRSRO’s opinion of an issuer’s creditworthiness and typically range from AAA (highest) to D (lowest). The Below Investment Grade category consists of bonds rated below BBB-. The Refunded category generally consists of refunded bonds secured by US government or other high-quality securities and not rerated by an NRSRO. The Not Rated category consists of ratable securities that have not been rated by an NRSRO. Cash and equivalents are excluded from this composition.
1. Dividends are generally subject to state and local taxes, if any. For investors subject to alternative minimum tax, a small portion of Fund dividends may be taxable. Distributions of capital gains are generally taxable. To avoid imposition of 28% backup withholding on all Fund distributions and redemption proceeds, U.S. investors must be properly certified on FormW-9 andnon-U.S. investors on FormW-8BEN.
2. Source: Morningstar.
The index is unmanaged and includes reinvestment of any income or distributions. It does not reflect any fees, expenses or sales charges. One cannot invest directly in an index, and an index is not representative of the Fund’s portfolio.
See www.franklintempletondatasources.com for additional data provider information.
The dollar value, number of shares or principal amount, and names of all portfolio holdings are listed in the Fund’s Statement of Investments (SOI). The SOI begins on page 14.
| | | | | | |
| | | |
| franklintempleton.com | | Semiannual Report | | | 3 | |
FRANKLIN LIBERTY INTERMEDIATE MUNICIPAL OPPORTUNITIES ETF
| | | | |
| Portfolio Composition | |
|
| 9/30/19 | |
| |
| | | % of Total
Investments* | |
General Obligation Bonds | | | 25.33% | |
Hospital & Health Care | | | 21.54% | |
Tax Supported Debt | | | 14.65% | |
Utilities | | | 9.20% | |
Higher Education | | | 8.95% | |
Other Revenue Bonds | | | 6.10% | |
Housing | | | 6.09% | |
Subject to Government Approp. | | | 3.50% | |
Transportation | | | 3.23% | |
Corporate Backed | | | 1.41% | |
*Does not include cash and cash equivalents.
Manager’s Discussion
During thesix-month reporting period, we found value in securities in the10- to15-year maturity range. Given the Fund’s average maturity cannot exceed 10 years, this represented the longer end of our target universe. The municipal yield curve remains positively sloped and we believe focusing on longer maturities provides us with the best opportunities to achieve our objective of maximizingafter-tax income for investors. In addition, we were able to find attractive opportunities in the high-yield space; therefore, we selectively added higher-yielding securities to the portfolio, while selling existing positions with lower yields. The Fund is overweight inBBB-rated and noninvestment-grade securities relative to the benchmark; this positioning was the primary driver of the Fund’s outperformance versus its benchmark index. The Fund will continue to look for opportunities to add high yielding names with a focus on the seven- to15-year portion of the yield curve. The Fund does not use leverage or derivatives. We believe our consistent, disciplined strategy can help our investors achieve high,tax-free income over the long term.
Typically, in declining rate environments, our turnover declines as we maintain exposure to securities that are producing income that exceeds their replacement value in the market. However, when rates rise, our turnover increases as opportunities to purchase securities that have the potential to increase income in the portfolio become available.
Thank you for your participation in Franklin Liberty Intermediate Municipal Opportunities ETF. We look forward to serving your future investment needs.
The foregoing information reflects our analysis, opinions and portfolio holdings as of September 30, 2019, the end of the reporting period. The way we implement our main investment strategies and the resulting portfolio holdings may change depending on factors such as market and economic conditions. These opinions may not be relied upon as investment advice or an offer for a particular security. The information is not a complete analysis of every aspect of any market, state, industry, security or the Fund. Statements of fact are from sources considered reliable, but the investment manager makes no representation or warranty as to their completeness or accuracy. Although historical performance is no guarantee of future results, these insights may help you understand our investment management philosophy.
| | | | |
| | | |
| 4 | | Semiannual Report | | franklintempleton.com |
FRANKLIN LIBERTY INTERMEDIATE MUNICIPAL OPPORTUNITIES ETF
Performance Summary as of September 30, 2019
Total return reflects reinvestment of the Fund’s dividends and capital gain distributions, if any, and any unrealized gains or losses. Total returns do not include brokerage commissions that may be payable on secondary market transactions. The performance tables do not reflect any taxes that a shareholder would pay on Fund dividends, capital gain distributions, if any, or any realized gains on the sale of Fund shares.
Net asset value or “NAV” is the value of one share of a fund as calculated in accordance with the standard formula for valuing mutual fund shares. The price used to calculate market return (Market Price) is determined by using the midpoint between the highest bid and the lowest offer on the primary stock exchange on which shares of a fund are listed for trading, as of the time that such fund’s NAV is calculated. Since shares of the Fund did not trade in the secondary market until after the Fund’s inception, for the period from inception to the first day of secondary trading (9/5/17), the NAV of the Fund is used as a proxy for the Market Price to calculate market returns. Market and NAV returns assume that dividends and capital gain distributions have been reinvested at Market Price and NAV.
Your dividend income will vary depending on dividends or interest paid by securities in the Fund’s portfolio, adjusted for operating expenses. Capital gain distributions are net profits realized from the sale of portfolio securities.
Performance as of 9/30/191
| | | | | | | | | | | | | | | | |
| | |
| | | Cumulative Total Return2 | | | Average Annual Total Return2 | |
| | | Based on
NAV3 | | | Based on
market price4 | | | Based on
NAV3 | | | Based on
market price4 | |
6-month | | | +3.81% | | | | +4.01% | | | | +3.81% | | | | +4.01% | |
1-Year | | | +8.26% | | | | +8.34% | | | | +8.26% | | | | +8.34% | |
Since Inception (8/31/17) | | | +7.32% | | | | +7.44% | | | | +3.45% | | | | +3.51% | |
| | | | | | | | | | | | | | | | |
| | |
| | | 30-Day Standardized Yield6 | | | Taxable Equivalent 30-Day
Standardized Yield7 | |
| Distribution Rate5 | | (with fee waiver) | | | (without fee waiver) | | | (with fee waiver) | | | (without fee waiver) | |
2.09% | | | 1.83% | | | | 0.38% | | | | 3.09% | | | | 0.64% | |
Performance data represent past performance, which does not guarantee future results. Investment return and principal value will fluctuate, and you may have a gain or loss when you sell your shares. Current performance may differ from figures shown. For most recentmonth-end performance, go tofranklintempleton.com or call(800)342-5236.
See page 6 for Performance Summary footnotes.
| | | | | | |
| | | |
| franklintempleton.com | | Semiannual Report | | | 5 | |
FRANKLIN LIBERTY INTERMEDIATE MUNICIPAL OPPORTUNITIES ETF
PERFORMANCE SUMMARY
Distributions(4/1/19–9/30/19)
|
|
Net Investment Income |
$0.375540 |
Total Annual Operating Expenses8
| | | | |
| |
| With Fee Waiver | | Without Fee Waiver | |
0.30% | | | 2.15% | |
All investments involve risks, including possible loss of principal. Because municipal bonds are sensitive to interest-rate movements, the Fund’s yield and share price will fluctuate with market conditions. Bond prices generally move in the opposite direction of interest rates. Thus, as prices of bonds in the Fund adjust to a rise in interest rates, the Fund’s share price may decline. The Fund may invest in lower-rated bonds which include higher risk of default and loss of principal. Changes in the credit rating of a bond, or in the credit rating or financial strength of a bond’s issuer, insurer or guarantor, may affect the bond’s value. The Fund may invest a significant part of its assets in municipal securities that finance similar types of projects, such as utilities, hospitals, higher education and transportation. A change that affects one project would likely affect all similar projects, thereby increasing market risk. The Fund’s prospectus also includes a description of the main investment risks.
ETFs trade like stocks, fluctuate in market value and may trade at prices above or below their net asset value. Brokerage commissions and ETF expenses will reduce returns.
1. The Fund has a fee waiver and/or expense reimbursement contractually guaranteed through 7/31/20. Fund investment results reflect the expense reduction; without this reduction, the results would have been lower.
2. Total return calculations represent the cumulative and average annual changes in value of an investment over the periods indicated. Return for less than one year, if any, has not been annualized.
3. Assumes reinvestment of distributions based on net asset value.
4. Assumes reinvestment of distributions based on market price.
5. Distribution rate is based on an annualization of the September dividend and the NAV per share on 9/30/19.
6. The Fund’s30-day standardized yield is calculated over a trailing30-day period using the yield to maturity on bonds and/or the dividends accrued on stocks. It may not equal the Fund’s actual income distribution rate, which reflects the Fund’s past dividends paid to shareholders.
7. Taxable equivalent yield assumes the 2019 maximum federal income tax rate of 37.00% plus 3.80% Medicare tax.
8. Figures are as stated in the Fund’s current prospectus and may differ from the expense ratios disclosed in the Your Fund’s Expenses and Financial Highlights sections in this report. In periods of market volatility, assets may decline significantly, causing total annual Fund operating expenses to become higher than the figures shown.
| | | | |
| | | |
| 6 | | Semiannual Report | | franklintempleton.com |
FRANKLIN LIBERTY INTERMEDIATE MUNICIPAL OPPORTUNITIES ETF
Your Fund’s Expenses
As a Fund shareholder, you can incur two types of costs: (1) transaction costs, including brokerage commissions on purchases and sales of Fund shares; and (2) ongoing Fund costs, including management fees and other Fund expenses. All funds have ongoing costs, sometimes referred to as operating expenses. The table below shows ongoing costs of investing in the Fund and can help you understand these costs and compare them with those of other funds. The table assumes a $1,000 investment held for the six months indicated.
Actual Fund Expenses
The table below provides information about actual account values and actual expenses in the columns under the heading “Actual.” In these columns the Fund’s actual return, which includes the effect of Fund expenses, is used to calculate the “Ending Account Value.” You can estimate the expenses you paid during the period by following these steps (of course, your account value and expenses will differ from those in this illustration): Divide your account value by $1,000 (if your account had an $8,600 value, then $8,600÷ $1,000 = 8.6). Then multiply the result by the number in the row under the headings “Actual” and “Expenses Paid During Period” (if Actual Expenses Paid During Period were $7.50, then 8.6× $7.50 = $64.50). In this illustration, the actual expenses paid this period are $64.50.
Hypothetical Example for Comparison with Other Funds
Under the heading “Hypothetical” in the table, information is provided about hypothetical account values and hypothetical expenses based on the Fund’s actual expense ratio and an assumed rate of return of 5% per year before expenses, which is not the Fund’s actual return. This information may not be used to estimate the actual ending account balance or expenses you paid for the period, but it can help you compare ongoing costs of investing in the Fund with those of other funds. To do so, compare this 5% hypothetical example with the 5% hypothetical examples that appear in the shareholder reports of other funds.
Please note that expenses shown in the table are meant to highlight ongoing costs and do not reflect any transactional costs.Therefore, information under the heading “Hypothetical” is useful in comparing ongoing costs only, and will not help you compare total costs of owning different funds. In addition, if transactional costs were included, your total costs would have been higher.
| | | | | | | | | | | | | | | | | | | | | | |
| | | | Actual (actual return after expenses) | | | Hypothetical
(5% annual return before expenses) | | | | |
| | | | | |
Beginning
Account
Value 4/1/19 | | | Ending
Account
Value 9/30/19 | | | Expenses
Paid During
Period
4/1/19-9/30/191,2 | | | Ending
Account
Value 9/30/19 | | | Expenses
Paid During
Period
4/1/19-9/30/191,2 | | | Net Annualized
Expense Ratio2 | |
| | $1,000.00 | | | $ | 1,038.10 | | | $ | 1.53 | | | $ | 1,023.50 | | | $ | 1.52 | | | | 0.30 | % |
1. Expenses are equal to the annualized expense ratio for thesix-month period as indicated above—in the far right column—multiplied by the simple average account value over the period indicated, and then multiplied by 183/366 to reflect theone-half year period.
2. Reflects expenses after fee waivers and expense reimbursements.
| | | | | | |
| | | |
| franklintempleton.com | | Semiannual Report | | | 7 | |
Franklin Liberty Municipal Bond ETF
This semiannual report for Franklin Liberty Municipal Bond ETF covers the period ended September 30, 2019.
Your Fund’s Goal and Main Investments
The Fund seeks to provide a high level of current income that is exempt from federal income taxes, including the federal alternative minimum tax, by investing at least 80% of its net assets in municipal securities that pay interest free from such taxes.1 The Fund seeks to maintain a dollar-weighted average portfolio maturity (the time in which the debt must be repaid) of five to 15 years, and only buys securities rated, at the time of purchase, in one of the top four ratings categories by one or more U.S. nationally recognized rating services (or comparable unrated or short-term rated securities).
Performance Overview
For the six months under review, the Fund posted cumulative total returns of +4.78% based on market price and net asset value (NAV). In comparison, the Bloomberg Barclays Municipal Bond Index posted a +3.74% total return for the same period.2 You can find more of the Fund’s performance data in the Performance Summary beginning on page 10.
Performance data represent past performance, which does not guarantee future results. Investment return and principal value will fluctuate, and you may have a gain or loss when you sell your shares. Current performance may differ from figures shown. For most recentmonth-end performance, go tofranklintempleton.com or call(800)342-5236.
Investment Strategy
We select securities that we believe will provide the best balance between risk and return within the Fund’s range of allowable investments and we typically use abuy-and-hold strategy. The Fund is an actively managed exchange-traded fund (ETF) that does not seek to replicate the performance of a specified index.
| | | | |
| Credit Quality Composition* | | | |
| |
| 9/30/19 | | | |
| |
| Ratings | | % of Total
Investments | |
AAA | | | 23.21% | |
AA | | | 62.75% | |
A | | | 11.48% | |
Not Rated | | | 2.56% | |
*Securities, except for those labeled Not Rated, are assigned ratings by one or more Nationally Recognized Statistical Credit Rating Organizations (NRSROs), such as Standard & Poor’s, Moody’s and Fitch, that can be considered by the investment manager as part of its independent securities analysis. When ratings from multiple agencies are available, the highest is used, consistent with the portfolio investment process. Ratings reflect an NRSRO’s opinion of an issuer’s creditworthiness and typically range from AAA (highest) to D (lowest). The Below Investment Grade category consists of bonds rated below BBB-. The Refunded category generally consists of refunded bonds secured by US government or other high-quality securities and not rerated by an NRSRO. The Not Rated category consists of ratable securities that have not been rated by an NRSRO. Cash and equivalents are excluded from this composition.
1. Dividends are generally subject to state and local taxes, if any. For investors subject to alternative minimum tax, a small portion of Fund dividends may be taxable. Distributions of capital gains are generally taxable. To avoid imposition of 28% backup withholding on all Fund distributions and redemption proceeds, U.S. investors must be properly certified on FormW-9 andnon-U.S. investors on FormW-8BEN.
2. Source: Morningstar.
The index is unmanaged and includes reinvestment of any income or distributions. It does not reflect any fees, expenses or sales charges. One cannot invest directly in an index, and an index is not representative of the Fund’s portfolio.
See www.franklintempletondatasources.com for additional data provider information.
The dollar value, number of shares or principal amount, and names of all portfolio holdings are listed in the Fund’s Statement of Investments (SOI). The SOI begins on page 19.
| | | | |
| | | |
| 8 | | Semiannual Report | | franklintempleton.com |
FRANKLIN LIBERTY MUNICIPAL BOND ETF
| | | | |
| Portfolio Composition | | | |
| |
| 9/30/19 | | | |
| |
| | | % of Total
Investments* | |
General Obligation Bonds | | | 32.99% | |
Utilities | | | 24.72% | |
Tax Supported Debt | | | 11.16% | |
Higher Education | | | 10.35% | |
Hospital & Health Care | | | 5.51% | |
Transportation | | | 4.85% | |
Housing | | | 4.54% | |
Other Revenue Bonds | | | 4.36% | |
Subject to Government Approp. | | | 1.52% | |
*Does not include cash and cash equivalents.
Manager’s Discussion
During thesix-month reporting period, the Fund maintained its average maturity near 13.5 years, on the longer end of the target five- to15-year range. The municipal yield curve remains positively sloped and we believe focusing on longer maturities provides us with the best opportunities to achieve our objective of maximizingafter-tax income for investors. We selectively added high-quality names at attractive spreads as the Fund continued to grow over thesix-month period. Security selection was a key contributor to the outperformance versus the benchmark, while being overweight in bonds with maturities between 12 and 17 years also contributed positively to relative performance. We will continue to look for opportunities to add high quality names at attractive prices with a focus on the12- to17-year portion of the yield curve. The Fund does not use leverage or derivatives. We believe our consistent, disciplined strategy can help our investors achieve high,tax-free income over the long term.
What is the yield curve?
A yield curve is a line that plots the yield to maturity of bonds having equal credit quality against their maturity dates.
Typically, in declining rate environments, our turnover declines as we maintain exposure to securities that are producing income that exceeds their replacement value in the market. However, when rates rise, our turnover increases as opportunities to purchase securities that have the potential to increase income in the portfolio become available.
Thank you for your participation in Franklin Liberty Municipal Bond ETF. We look forward to serving your future investment needs.
The foregoing information reflects our analysis, opinions and portfolio holdings as of September 30, 2019, the end of the reporting period. The way we implement our main investment strategies and the resulting portfolio holdings may change depending on factors such as market and economic conditions. These opinions may not be relied upon as investment advice or an offer for a particular security. The information is not a complete analysis of every aspect of any market, state, industry, security or the Fund. Statements of fact are from sources considered reliable, but the investment manager makes no representation or warranty as to their completeness or accuracy. Although historical performance is no guarantee of future results, these insights may help you understand our investment management philosophy.
| | | | | | |
| | | |
| franklintempleton.com | | Semiannual Report | | | 9 | |
FRANKLIN LIBERTY MUNICIPAL BOND ETF
Performance Summary as of September 30, 2019
Total return reflects reinvestment of the Fund’s dividends and capital gain distributions, if any, and any unrealized gains or losses. Total returns do not include brokerage commissions that may be payable on secondary market transactions. The performance tables do not reflect any taxes that a shareholder would pay on Fund dividends, capital gain distributions, if any, or any realized gains on the sale of Fund shares.
Net asset value or “NAV” is the value of one share of a fund as calculated in accordance with the standard formula for valuing mutual fund shares. The price used to calculate market return (Market Price) is determined by using the midpoint between the highest bid and the lowest offer on the primary stock exchange on which shares of a fund are listed for trading, as of the time that such fund’s NAV is calculated. Since shares of the Fund did not trade in the secondary market until after the Fund’s inception, for the period from inception to the first day of secondary trading (9/5/17), the NAV of the Fund is used as a proxy for the Market Price to calculate market returns. Market and NAV returns assume that dividends and capital gain distributions have been reinvested at Market Price and NAV.
Your dividend income will vary depending on dividends or interest paid by securities in the Fund’s portfolio, adjusted for operating expenses. Capital gain distributions are net profits realized from the sale of portfolio securities.
Performance as of 9/30/191
| | | | | | | | | | | | | | | | |
| | |
| | | Cumulative Total Return2 | | | Average Annual Total Return2 | |
| | | Based on NAV3 | | | Based on market price4 | | | Based on NAV3 | | | Based on market price4 | |
6-month | | | +4.78% | | | | +4.78% | | | | +4.78% | | | | +4.78% | |
1-Year | | | +11.49% | | | | +11.44% | | | | +11.49% | | | | +11.44% | |
Since Inception (8/31/17) | | | +9.85% | | | | +9.88% | | | | +4.61% | | | | +4.63% | |
| | | | | | | | | | | | | | | | |
| | |
| | | 30-Day Standardized Yield6 | | | Taxable Equivalent 30-Day
Standardized Yield7 | |
| Distribution Rate5 | | (with fee waiver) | | | (without fee waiver) | | | (with fee waiver) | | | (without fee waiver) | |
1.98% | | | 1.52% | | | | 0.84% | | | | 2.57% | | | | 1.42% | |
Performance data represent past performance, which does not guarantee future results. Investment return and principal value will fluctuate, and you may have a gain or loss when you sell your shares. Current performance may differ from figures shown. For most recentmonth-end performance, go tofranklintempleton.com or call(800)342-5236.
See page 11 for Performance Summary footnotes.
| | | | |
| | | |
| 10 | | Semiannual Report | | franklintempleton.com |
FRANKLIN LIBERTY MUNICIPAL BOND ETF
PERFORMANCE SUMMARY
Distributions(4/1/19–9/30/19)
|
|
Net Investment Income |
$0.300911 |
Total Annual Operating Expenses8
| | | | |
| |
| With Fee Waiver | | Without Fee Waiver | |
0.30% | | | 2.05% | |
All investments involve risks, including possible loss of principal. Because municipal bonds are sensitive to interest-rate movements, the Fund’s yield and share price will fluctuate with market conditions. Bond prices generally move in the opposite direction of interest rates. Thus, as prices of bonds in the Fund adjust to a rise in interest rates, the Fund’s share price may decline. Changes in the credit rating of a bond, or in the credit rating or financial strength of a bond’s issuer, insurer or guarantor, may affect the bond’s value. The Fund may invest a significant part of its assets in municipal securities that finance similar types of projects, such as utilities, hospitals, higher education and transportation. A change that affects one project would likely affect all similar projects, thereby increasing market risk. The Fund’s prospectus also includes a description of the main investment risks.
ETFs trade like stocks, fluctuate in market value and may trade at prices above or below their net asset value. Brokerage commissions and ETF expenses will reduce returns.
1. The Fund has a fee waiver and/or expense reimbursement contractually guaranteed through 7/31/20. Fund investment results reflect the expense reduction; without this reduction, the results would have been lower.
2. Total return calculations represent the cumulative and average annual changes in value of an investment over the periods indicated. Return for less than one year, if any, has not been annualized.
3. Assumes reinvestment of distributions based on net asset value.
4. Assumes reinvestment of distributions based on market price.
5. Distribution rate is based on an annualization of the September dividend and the NAV per share on 9/30/19.
6. The Fund’s30-day standardized yield is calculated over a trailing30-day period using the yield to maturity on bonds and/or the dividends accrued on stocks. It may not equal the Fund’s actual income distribution rate, which reflects the Fund’s past dividends paid to shareholders.
7. Taxable equivalent yield assumes the 2019 maximum federal income tax rate of 37.00% plus 3.80% Medicare tax.
8. Figures are as stated in the Fund’s current prospectus and may differ from the expense ratios disclosed in the Your Fund’s Expenses and Financial Highlights sections in this report. In periods of market volatility, assets may decline significantly, causing total annual Fund operating expenses to become higher than the figures shown.
| | | | | | |
| | | |
| franklintempleton.com | | Semiannual Report | | | 11 | |
FRANKLIN LIBERTY MUNICIPAL BOND ETF
Your Fund’s Expenses
As a Fund shareholder, you can incur two types of costs: (1) transaction costs, including brokerage commissions on purchases and sales of Fund shares; and (2) ongoing Fund costs, including management fees and other Fund expenses. All funds have ongoing costs, sometimes referred to as operating expenses. The table below shows ongoing costs of investing in the Fund and can help you understand these costs and compare them with those of other funds. The table assumes a $1,000 investment held for the six months indicated.
Actual Fund Expenses
The table below provides information about actual account values and actual expenses in the columns under the heading “Actual.” In these columns the Fund’s actual return, which includes the effect of Fund expenses, is used to calculate the “Ending Account Value.” You can estimate the expenses you paid during the period by following these steps (of course, your account value and expenses will differ from those in this illustration):Divide your account value by $1,000 (if your account had an $8,600 value, then $8,600÷ $1,000 = 8.6).Then multiply the result by the number in the row under the headings “Actual” and “Expenses Paid During Period” (if Actual Expenses Paid During Period were $7.50, then 8.6 x $7.50 = $64.50).In this illustration, the actual expenses paid this period are $64.50.
Hypothetical Example for Comparison with Other Funds
Under the heading “Hypothetical” in the table, information is provided about hypothetical account values and hypothetical expenses based on the Fund’s actual expense ratio and an assumed rate of return of 5% per year before expenses, which is not the Fund’s actual return. This information may not be used to estimate the actual ending account balance or expenses you paid for the period, but it can help you compare ongoing costs of investing in the Fund with those of other funds. To do so, compare this 5% hypothetical example with the 5% hypothetical examples that appear in the shareholder reports of other funds.
Please note that expenses shown in the table are meant to highlight ongoing costs and do not reflect any transactional costs.Therefore, information under the heading “Hypothetical” is useful in comparing ongoing costs only, and will not help you compare total costs of owning different funds. In addition, if transactional costs were included, your total costs would have been higher.
| | | | | | | | | | | | | | | | | | | | | | |
| | | | Actual (actual return after expenses) | | | Hypothetical
(5% annual return before expenses) | | | | |
| | | | | |
Beginning
Account
Value 4/1/19 | | | Ending
Account
Value 9/30/19 | | | Expenses
Paid During
Period
4/1/19-9/30/191,2 | | | Ending
Account
Value 9/30/19 | | | Expenses
Paid During
Period
4/1/19-9/30/191,2 | | | Net Annualized
Expense Ratio2 | |
| | $1,000.00 | | | $ | 1,047.80 | | | $ | 1.54 | | | $ | 1,023.50 | | | $ | 1.52 | | | | 0.30 | % |
1. Expenses are equal to the annualized expense ratio for thesix-month period as indicated above—in the far right column—multiplied by the simple average account value over the period indicated, and then multiplied by 183/366 to reflect theone-half year period.
2. Reflects expenses after fee waivers and expense reimbursements.
| | | | |
| | | |
| 12 | | Semiannual Report | | franklintempleton.com |
FRANKLIN TEMPLETON ETF TRUST
Financial Highlights
Franklin Liberty Intermediate Municipal Opportunities ETF
| | | | | | | | | | | | |
| | | Six Months Ended
September 30, 2019
(unaudited) | | | Year Ended March 31, | |
| | | 2019 | | | 2018a | |
| | | |
Per share operating performance
(for a share outstanding throughout the period) | | | | | | | | | | | | |
| | | |
Net asset value, beginning of period | | $ | 24.97 | | | $ | 24.40 | | | $ | 25.00 | |
| | | | |
| | | |
| Income from investment operationsb: | | | | | | | | | | | | |
| | | |
Net investment incomec | | | 0.30 | | | | 0.63 | | | | 0.22 | |
| | | |
Net realized and unrealized gains (losses) | | | 0.65 | | | | 0.57 | | | | (0.60 | ) |
| | | | |
| | | |
Total from investment operations | | | 0.95 | | | | 1.20 | | | | (0.38 | ) |
| | | | |
| | | |
Less distributions from net investment income | | | (0.38 | ) | | | (0.63 | ) | | | (0.22 | ) |
| | | | |
| | | |
Net asset value, end of period | | $ | 25.54 | | | $ | 24.97 | | | $ | 24.40 | |
| | | | |
| | | |
Total returnd | | | 3.81% | | | | 4.99% | | | | (1.53)% | |
| | | |
| Ratios to average net assetse | | | | | | | | | | | | |
| | | |
Expenses before waiver and payments by affiliates | | | 1.80% | | | | 2.15% | | | | 1.71% | |
| | | |
Expenses net of waiver and payments by affiliates | | | 0.30% | | | | 0.30% | | | | 0.30% | |
| | | |
Net investment income | | | 2.34% | | | | 2.57% | | | | 1.55% | |
| | | |
| Supplemental data | | | | | | | | | | | | |
| | | |
Net assets, end of period (000’s) | | | $8,940 | | | | $7,490 | | | | $7,319 | |
| | | |
Portfolio turnover ratef | | | 1.50% | | | | 35.63% | | | | 17.49% | |
| | | |
| Portfolio turnover rate excluding portfolio transactions that are executed as a result of the Fund offering and redeeming Creation Units solely or in part for cashf,g | | | 1.50% | | | | —% | | | | —% | |
aFor the period August 31, 2017 (commencement of operations) to March 31, 2018.
bThe amount shown for a share outstanding throughout the period may not correlate with the Statement of Operations for the period due to the timing of sales and repurchases of Creation Unit Fund shares in relation to income earned and/or fluctuating fair value of the investments of the Fund.
cBased on average daily shares outstanding.
dTotal return is not annualized for periods less than one year. Total return is calculated assuming an initial investment made at the net asset value at the beginning of the period, reinvestment of all dividends and distributions at net asset value during the period, and redemption at net asset value on the last day of the period.
eRatios are annualized for periods less than one year.
fPortfolio turnover rate excludes the value of portfolio securities received or delivered as a result of processing capital share transactions in Creation Units, if any.
gEffective September 30, 2019.
| | | | | | |
| | | |
| franklintempleton.com | | The accompanying notes are an integral part of these financial statements. | Semiannual Report | | | 13 | |
FRANKLIN TEMPLETON ETF TRUST
Statement of Investments, September 30, 2019 (unaudited)
Franklin Liberty Intermediate Municipal Opportunities ETF
| | | | | | | | | | | | | | |
| | | |
| | | | | Principal Amount | | | Value | |
| | | Municipal Bonds 102.0% | | | | | | | | | |
| | | Alaska 1.9% | | | | | | | | | |
| | Matanuska-Susitna Borough Lease Revenue, Goose Creek Correctional Center Project, Refunding, 4.00%, 9/01/30 | | | 150,000 | | | | | | | $ | 166,101 | |
| | | | | | | | | | | | | | |
| | | Arizona 3.7% | | | | | | | | | |
| | Arizona IDA Hospital Revenue, Phoenix Children’s Hospital, Refunding, Series A, Daily VRDN and Put, 1.77%, 2/01/48 | | | 100,000 | | | | | | | | 100,000 | |
| | La Paz County IDA Education Facility Lease Revenue, Chartere School Solutions-Harmony Public Schools Project, Series A, 5.00%, 2/15/28 | | | 100,000 | | | | | | | | 115,412 | |
| | Phoenix Civic Improvement Corp. Wastewater System Revenue, junior lien, Series A, 5.00%, 7/01/25 | | | 100,000 | | | | | | | | 120,107 | |
| | | | | | | | | | | | | | |
| | | | | | | | | | | | | 335,519 | |
| | | | | | | | | | | | | | |
| | | California 6.5% | | | | | | | | | |
| | California School Finance Authority Charter School Revenue, Summit Public Schools-Obligated Group, 5.00%, 6/01/27 | | | 100,000 | | | | | | | | 121,478 | |
| | California Statewide CDA Revenue, California Baptist University, Refunding, Series A, 3.00%, 11/01/22 | | | 100,000 | | | | | | | | 101,472 | |
| | California Statewide CDA Special Tax Revenue, CFD No. 2015-01, Improvement Area No. 2, University District, 5.00%, 9/01/27 | | | 100,000 | | | | | | | | 113,835 | |
| | Orange County CFD No. 2017-1 Special Tax, Esencia Village Improvement Area No. 1, Series A, 5.00%, 8/15/28 | | | 100,000 | | | | | | | | 123,902 | |
| | Perris Joint Powers Authority Local Agency Revenue, CFD No. 2001-1, Improvement Area Nos. 4 and 5, CFD No. 2005-1, Improvement Area 4, Refunding, Series B, 5.00%, 9/01/25 | | | 100,000 | | | | | | | | 117,743 | |
| | | | | | | | | | | | | | |
| | | | | | | | | | | | | 578,430 | |
| | | | | | | | | | | | | | |
| | | Colorado 5.0% | | | | | | | | | |
| a | | Colorado State Health Facilities Authority Hospital Revenue, Christian Living Communities, Refunding and Improvement, 4.00%, 1/01/29 | | | 100,000 | | | | | | | | 112,930 | |
| | Regional Transportation District Sales Tax Revenue, Fastracks Project, Refunding, Series A, 5.00%, 11/01/27 | | | 100,000 | | | | | | | | 127,194 | |
| | Southglenn Metropolitan District Special Revenue, In the City of Centennial Colorado, Refunding, 5.00%, 12/01/30 | | | 100,000 | | | | | | | | 106,487 | |
| | Southlands Metropolitan District No. 1 GO, Aurora, Arapahoe County, Refunding, Series A-1, 3.50%, 12/01/27 | | | 100,000 | | | | | | | | 105,143 | |
| | | | | | | | | | | | | | |
| | | | | | | | | | | | | 451,754 | |
| | | | | | | | | | | | | | |
| | | Connecticut 1.1% | | | | | | | | | |
| | Connecticut State Health and Educational Facilities Authority Revenue, Yale University Issue,Series V-2, Daily VRDN and Put, 1.45%, 7/01/36 | | | 100,000 | | | | | | | | 100,000 | |
| | | | | | | | | | | | | | |
| | | Delaware 1.3% | | | | | | | | | |
| | Kent County Student Housing and Dining Facility Revenue, CHF-Dover LLC-Delaware State University Project, Series A, 5.00%, 7/01/29 | | | 100,000 | | | | | | | | 115,937 | |
| | | | | | | | | | | | | | |
| | | Florida 4.4% | | | | | | | | | |
| | Jacksonville Health Care Facilities Revenue, Brooks Rehabilitation, Genesis Health Inc. Obligated Group, Refunding, 5.00%, 11/01/27 | | | 100,000 | | | | | | | | 121,988 | |
| | Miami Health Facilities Authority Revenue, Miami Jewish Health Systems Inc. Project, Refunding, 5.00%, 7/01/28 | | | 150,000 | | | | | | | | 176,201 | |
| | St. Lucie County PCR, Florida Power and Light Co. Project, Refunding, Daily VRDN and Put, 1.79%, 9/01/28 | | | 100,000 | | | | | | | | 100,000 | |
| | | | | | | | | | | | | | |
| | | | | | | | | | | | | 398,189 | |
| | | | | | | | | | | | | | |
| | | Georgia 1.4% | | | | | | | | | |
| | Main Street Natural Gas Inc. Gas Supply Revenue, Series A, 5.00%, 5/15/29 | | | 100,000 | | | | | | | | 124,107 | |
| | | | | | | | | | | | | | |
| | | Illinois 6.4% | | | | | | | | | |
| | Hillside Tax Increment Revenue, Cook County, Refunding, 5.00%, 1/01/24 | | | 100,000 | | | | | | | | 104,004 | |
| | Illinois State Finance Authority MFHR,
Better Housing Foundation Blue Station Project, Series A-1, 4.25%, 12/01/28 | | | 100,000 | | | | | | | | 98,874 | |
| | bBetter Housing Foundation ERNST Portfolio Project, Series A-1, 4.375%, 12/01/28 | | | 100,000 | | | | | | | | 35,000 | |
| | | | |
| | | |
| 14 | | Semiannual Report | | franklintempleton.com |
FRANKLIN TEMPLETON ETF TRUST
STATEMENT OF INVESTMENTS (UNAUDITED)
Franklin Liberty Intermediate Municipal Opportunities ETF(continued)
| | | | | | | | | | | | | | |
| | | |
| | | | | Principal Amount | | | Value | |
| | | Municipal Bonds (continued) | | | | | | | | | |
| | | Illinois (continued) | | | | | | | | | |
| | Railsplitter Tobacco Settlement Authority Revenue, 5.00%, 6/01/27 | | | 100,000 | | | | | | | $ | 120,518 | |
| | Southwestern Illinois Development Authority Revenue, Capital Appreciation, Local Government Program, AGMC Insured, zero cpn., 12/01/24 | | | 245,000 | | | | | | | | 218,212 | |
| | | | | | | | | | | | | | |
| | | | | | | | | | | | | 576,608 | |
| | | | | | | | | | | | | | |
| | | Kentucky 3.4% | | | | | | | | | |
| | Berea Educational Facilities Revenue, Berea College Project, Series B, Daily VRDN and Put, 1.46%, 6/01/29 | | | 100,000 | | | | | | | | 100,000 | |
| | Louisville/Jefferson County Metro Government Health System Revenue, Norton Healthcare Inc., Series B, Daily VRDN and Put, 1.75%, 10/01/39 | | | 100,000 | | | | | | | | 100,000 | |
| | Louisville/Jefferson County Metro Government Revenue, College, Bellarmine University Project, Refunding and Improvement, Series A, 4.00%, 5/01/29 | | | 100,000 | | | | | | | | 104,572 | |
| | | | | | | | | | | | | | |
| | | | | | | | | | | | | 304,572 | |
| | | | | | | | | | | | | | |
| | | Louisiana 1.3% | | | | | | | | | |
| | Louisiana Local Government Environmental Facilities and CDA Revenue, Student Housing, Provident Group – ULM Properties LLC – University of Louisiana at Monroe Project, Series A, 5.00%, 7/01/29 | | | 100,000 | | | | | | | | 114,515 | |
| | | | | | | | | | | | | | |
| | | Maryland 2.7% | | | | | | | | | |
| | Maryland EDC Revenue, Economic Development, Transportation Facilities Project, Refunding, Series A, 5.00%, 6/01/27 | | | 100,000 | | | | | | | | 121,716 | |
| | Montgomery County GO, Consolidated Public Improvement, Refunding, Series A, 5.00%, 11/01/24 | | | 100,000 | | | | | | | | 118,274 | |
| | | | | | | | | | | | | | |
| | | | | | | | | | | | | 239,990 | |
| | | | | | | | | | | | | | |
| | | Massachusetts 1.3% | | | | | | | | | |
| | Massachusetts State Development Finance Agency Revenue, Foxborough Regional Charter, Series B, 5.00%, 7/01/27 | | | 100,000 | | | | | | | | 113,864 | |
| | | | | | | | | | | | | | |
| | | Michigan 2.3% | | | | | | | | | |
| | Grand Rapids EDC, EDR, Beacon Hill Eastgate Project, Refunding, Series A, 4.00%, 11/01/27 | | | 100,000 | | | | | | | | 106,094 | |
| | University of Michigan Revenue, Regents, General, Series D-1, Daily VRDN and Put, 1.72%, 12/01/24 | | | 100,000 | | | | | | | | 100,000 | |
| | | | | | | | | | | | | | |
| | | | | | | | | | | | | 206,094 | |
| | | | | | | | | | | | | | |
| | | Minnesota 5.6% | | | | | | | | | |
| | Eagan GO, Series A, 4.00%, 2/01/26 | | | 100,000 | | | | | | | | 115,425 | |
| | Mille Lacs County GO, Capital Improvement Plan, Series A, 3.00%, 2/01/24 | | | 135,000 | | | | | | | | 144,007 | |
| | Northern Municipal Power Agency Electric System Revenue, Refunding, 5.00%, 1/01/36 | | | 100,000 | | | | | | | | 118,754 | |
| | St. Louis Park Public Schools ISD No. 283 GO, School Building, Minnesota School District Credit Enhancement Program, Series A, 5.00%, 2/01/25 | | | 100,000 | | | | | | | | 118,842 | |
| | | | | | | | | | | | | | |
| | | | | | | | | | | | | 497,028 | |
| | | | | | | | | | | | | | |
| | | Missouri 2.4% | | | | | | | | | |
| | Missouri State Health and Educational Facilities Authority Educational Facilities Revenue, The Washington University, Series B, Daily VRDN and Put, 1.45%, 2/15/33 | | | 100,000 | | | | | | | | 100,000 | |
| | St. Louis County IDA Senior Living Facilities Revenue, Friendship Village, St. Louis Obligated Group, Refunding, 5.00%, 9/01/27 | | | 100,000 | | | | | | | | 119,512 | |
| | | | | | | | | | | | | | |
| | | | | | | | | | | | | 219,512 | |
| | | | | | | | | | | | | | |
| | | Montana 1.3% | | | | | | | | | |
| | Cascade County High School District No. 1 Great Falls GO, School Building, 5.00%, 7/01/25 | | | 100,000 | | | | | | | | 119,191 | |
| | | | | | | | | | | | | | |
| | | Nevada 3.9% | | | | | | | | | |
| | Carson City Hospital Revenue, Carson Tahoe Regional Healthcare Project, Refunding, Series A, 5.00%, 9/01/28 | | | 100,000 | | | | | | | | 121,529 | |
| | Las Vegas Special ID No. 812 Special Assessment, Local Improvement, Summerlin Village 24, 4.00%, 12/01/22 | | | 100,000 | | | | | | | | 104,272 | |
| | Washoe County School District GO, School Improvement, Series C, 5.00%, 10/01/26 | | | 100,000 | | | | | | | | 122,604 | |
| | | | | | | | | | | | | | |
| | | | | | | | | | | | | 348,405 | |
| | | | | | | | | | | | | | |
| | | | | | |
| | | |
| franklintempleton.com | | Semiannual Report | | | 15 | |
FRANKLIN TEMPLETON ETF TRUST
STATEMENT OF INVESTMENTS (UNAUDITED)
Franklin Liberty Intermediate Municipal Opportunities ETF(continued)
| | | | | | | | | | | | | | |
| | | |
| | | | | Principal Amount | | | Value | |
| | | Municipal Bonds (continued) | | | | | | | | | |
| | | New Hampshire 1.4% | | | | | | | | | |
| | New Hampshire State Health and Education Facilities Authority Revenue, University System of New Hampshire Issue, Refunding, Series A, 5.00%, 7/01/27 | | | 100,000 | | | | | | | $ | 125,750 | |
| | | | | | | | | | | | | | |
| | | New Jersey 1.2% | | | | | | | | | |
| | Pinelands Regional School District GO, Refunding, AGMC Insured, 3.00%, 8/01/27 | | | 100,000 | | | | | | | | 107,931 | |
| | | | | | | | | | | | | | |
| | | New York 4.8% | | | | | | | | | |
| | MTA Revenue, Transportation, Green Bonds, Climate Bond Certified, Refunding, Series B, 5.00%, 11/15/28 | | | 100,000 | | | | | | | | 128,068 | |
| | New York City Transitional Finance Authority Revenue, Future Tax Secured, Subordinate,Subseries B-5, Daily VRDN and Put, 1.75%, 8/01/42 | | | 100,000 | | | | | | | | 100,000 | |
| | Syracuse IDA Civic Facility Revenue, Syracuse University Project, Series A-1, Daily VRDN and Put, 1.75%, 7/01/37 | | | 100,000 | | | | | | | | 100,000 | |
| | Triborough Bridge and Tunnel Authority Revenue, General, MTA Bridges and Tunnels, Refunding, Subseries B-2, Daily VRDN and Put, 1.74%, 1/01/32 | | | 100,000 | | | | | | | | 100,000 | |
| | | | | | | | | | | | | | |
| | | | | | | | | | | | | 428,068 | |
| | | | | | | | | | | | | | |
| | | North Carolina 2.4% | | | | | | | | | |
| | North Carolina State Medical Care Commission Retirement Facilities Revenue, The United Methodist Retirement Homes, first mortgage, Refunding, Series A, 5.00%, 10/01/27 | | | 100,000 | | | | | | | | 114,021 | |
| | The Charlotte-Mecklenburg Hospital Authority Revenue, Carolinas HealthCare System, Refunding, Series B, Daily VRDN and Put, 1.77%, 1/15/38 | | | 100,000 | | | | | | | | 100,000 | |
| | | | | | | | | | | | | | |
| | | | | | | | | | | | | 214,021 | |
| | | | | | | | | | | | | | |
| | | Ohio 2.6% | | | | | | | | | |
| | Franklin County Hospital Facilities Revenue, Nationwide Children’s Hospital Project, Refunding, Series A, 5.00%, 11/01/28 | | | 100,000 | | | | | | | | 126,134 | |
| | Ohio State Air Quality Development Authority Exempt Facilities Revenue, Pratt Paper LLC Project, 3.75%, 1/15/28 | | | 100,000 | | | | | | | | 108,520 | |
| | | | | | | | | | | | | | |
| | | | | | | | | | | | | 234,654 | |
| | | | | | | | | | | | | | |
| | | Oregon 2.5% | | | | | | | | | |
| | Oregon State Facilities Authority Revenue, PeaceHealth, Refunding, Series B, Daily VRDN and Put, 1.72%, 8/01/34 | | | 100,000 | | | | | | | | 100,000 | |
| | Portland Community College District GO, Multnomah Washington Yamhill Clackamas and Columbia Counties, Refunding, 5.00%, 6/15/25 | | | 100,000 | | | | | | | | 120,326 | |
| | | | | | | | | | | | | | |
| | | | | | | | | | | | | 220,326 | |
| | | | | | | | | | | | | | |
| | | Pennsylvania 7.4% | | | | | | | | | |
| | Allegheny County Higher Education Building Authority University Revenue, Robert Morris University, UPMC Events Center Project, 5.00%, 10/15/26 | | | 100,000 | | | | | | | | 113,540 | |
| | Allentown Neighborhood Improvement Zone Development Authority Tax Revenue, City Center Project, 5.00%, 5/01/28 | | | 100,000 | | | | | | | | 118,199 | |
| | Franklin County IDAR, Menno Haven Inc. Project, Refunding, 5.00%, 12/01/28 | | | 100,000 | | | | | | | | 113,307 | |
| | Pennsylvania State Economic Development Financing Authority Revenue, UPMC, Refunding, Series A, 3.375%, 11/15/33 | | | 125,000 | | | | | | | | 131,921 | |
| | Pennsylvania State GO, First Series, Refunding, 5.00%, 1/01/26 | | | 150,000 | | | | | | | | 180,798 | |
| | | | | | | | | | | | | | |
| | | | | | | | | | | | | 657,765 | |
| | | | | | | | | | | | | | |
| | | Tennessee 3.6% | | | | | | | | | |
| | Lawrenceburg GO, Refunding, 2.50%, 6/01/27 | | | 100,000 | | | | | | | | 103,309 | |
| | Metropolitan Government of Nashville and Davidson County GO, Improvement, Refunding, 4.00%, 7/01/29 | | | 100,000 | | | | | | | | 117,409 | |
| | Shelby County Health Educational and Housing Facility Board Revenue, Methodist Le Bonheur Healthcare, Refunding, Series A, AGMC Insured, Daily VRDN and Put, 1.73%, 6/01/42 | | | 100,000 | | | | | | | | 100,000 | |
| | | | | | | | | | | | | | |
| | | | | | | | | | | | | 320,718 | |
| | | | | | | | | | | | | | |
| | | Texas 3.9% | | | | | | | | | |
| | Cedar Park GO, Williamson and Travis Counties, Refunding and Improvement, 5.00%, 2/15/24 | | | 100,000 | | | | | | | | 115,037 | |
| | Garland GO, Dallas Collin and Rockwall Counties, Refunding, 5.00%, 2/15/27 | | | 100,000 | | | | | | | | 125,016 | |
| | | | |
| | | |
| 16 | | Semiannual Report | | franklintempleton.com |
FRANKLIN TEMPLETON ETF TRUST
STATEMENT OF INVESTMENTS (UNAUDITED)
Franklin Liberty Intermediate Municipal Opportunities ETF(continued)
| | | | | | | | | | | | | | |
| | | |
| | | | | Principal Amount | | | Value | |
| | | Municipal Bonds (continued) | | | | | | | | | |
| | | Texas (continued) | | | | | | | | | |
| | New Hope Cultural Education Facilities Finance Corp. Student Housing Revenue, CHF-Collegiate Housing Island Campus LLC, Series A, 5.00%, 4/01/29 | | | 100,000 | | | | | | | $ | 106,289 | |
| | | | | | | | | | | | | | |
| | | | | | | | | | | | | 346,342 | |
| | | | | | | | | | | | | | |
| | | Utah 2.4% | | | | | | | | | |
| | Provo GO, Refunding, 4.00%, 1/01/23 | | | 100,000 | | | | | | | | 108,811 | |
| | Utah State Building Ownership Authority Lease Revenue, State Facilities Master Lease Program, 2.50%, 5/15/27 | | | 100,000 | | | | | | | | 104,133 | |
| | | | | | | | | | | | | | |
| | | | | | | | | | | | | 212,944 | |
| | | | | | | | | | | | | | |
| | | Vermont 1.3% | | | | | | | | | |
| | Vermont State Public Power Supply Authority Revenue, Swanton Peaking Facility Project, Refunding, Series A, 5.00%, 7/01/28 | | | 100,000 | | | | | | | | 119,959 | |
| | | | | | | | | | | | | | |
| | | Virginia 2.4% | | | | | | | | | |
| | Peninsula Town Center CDA Special Obligation Revenue, Refunding, 4.50%, 9/01/28 | | | 100,000 | | | | | | | | 110,803 | |
| | | | | | | | | | | | | | |
| | Virginia College Building Authority Educational Facilities Revenue, University of Richmond Project, Daily VRDN and Put, 1.73%, 11/01/36 | | | 100,000 | | | | | | | | 100,000 | |
| | | | | | | | | | | | | | |
| | | | | | | | | | | | | 210,803 | |
| | | | | | | | | | | | | | |
| | | Washington 6.7% | | | | | | | | | |
| | Seattle Drainage and Wastewater System Revenue, Improvement and Refunding, 4.00%, 7/01/28 | | | 100,000 | | | | | | | | 118,500 | |
| | Skagit County Public Hospital District No. 1 Revenue, Improvement, Skagit Regional Health, Refunding, 5.00%, 12/01/29 | | | 100,000 | | | | | | | | 117,197 | |
| | Spokane County School District No. 356 Central Valley GO, 5.00%, 12/01/26 | | | 100,000 | | | | | | | | 124,738 | |
| | University of Washington Revenue, General, Refunding, Series A, 5.00%, 12/01/26 | | | 100,000 | | | | | | | | 125,126 | |
| a | | Washington State Housing Finance Commission Revenue, Nonprofit Housing, Presbyterian Retirement Communities Northwest Project, Refunding, Series A, 5.00%, 1/01/34 | | | 100,000 | | | | | | | | 111,959 | |
| | | | | | | | | | | | | | |
| | | | | | | | | | | | | 597,520 | |
| | | | | | | | | | | | | | |
| | | Wisconsin 3.5% | | | | | | | | | |
| | Brookfield GO, Waukesha County, Refunding, 3.00%, 12/01/25 | | | 115,000 | | | | | | | | 124,778 | |
| | PFA Retirement Facilities Revenue, Whitestone Retirement Facilities, first mortgage, Refunding, 4.00%, 3/01/27 | | | 80,000 | | | | | | | | 85,776 | |
| | Wisconsin Health and Educational Facilities Authority Revenue, St. Johns Communities Inc. Project, Series A, 4.00%, 9/15/27 | | | 100,000 | | | | | | | | 104,880 | |
| | | | | | | | | | | | | | |
| | | | | | | | | | | | | 315,434 | |
| | | | | | | | | | | | | | |
| | Total Investments (Cost $8,811,905) 102.0% | | | | | | | | | | | 9,122,051 | |
| | Other Assets, less Liabilities (2.0)% | | | | | | | | | | | (181,864 | ) |
| | | | | | | | | | | | | | |
| | Net Assets 100.0% | | | | | | | | | | $ | 8,940,187 | |
| | | | | | | | | | | | | | |
See Abbreviations on page 32.
aSecurity purchased on a when-issued basis. See Note 1(b)
bSee Note 6 regarding defaulted securities.
| | | | | | |
| | | |
| franklintempleton.com | | The accompanying notes are an integral part of these financial statements. | Semiannual Report | | | 17 | |
FRANKLIN TEMPLETON ETF TRUST
Financial Highlights
Franklin Liberty Municipal Bond ETF
| | | | | | | | | | | | |
| | | Six Months Ended
September 30, 2019
(unaudited) | | | Year Ended March 31, | |
| | | 2019 | | | 2018a | |
| | | |
Per share operating performance
(for a share outstanding throughout the period) | | | | | | | | | | | | |
| | | |
Net asset value, beginning of period | | $ | 25.20 | | | $ | 24.34 | | | $ | 25.00 | |
| | | | |
| | | |
| Income from investment operationsb: | | | | | | | | | | | | |
| | | |
Net investment incomec | | | 0.20 | | | | 0.67 | | | | 0.30 | |
| | | |
Net realized and unrealized gains (losses) | | | 1.00 | | | | 0.85 | | | | (0.66 | ) |
| | | | |
| | | |
Total from investment operations | | | 1.20 | | | | 1.52 | | | | (0.36 | ) |
| | | | |
| | | |
Less distributions from net investment income | | | (0.30 | ) | | | (0.66 | ) | | | (0.30 | ) |
| | | | |
| | | |
Net asset value, end of period | | $ | 26.10 | | | $ | 25.20 | | | $ | 24.34 | |
| | | | |
| | | |
Total returnd | | | 4.78% | | | | 6.38% | | | | (1.45)% | |
| | | |
| Ratios to average net assetse | | | | | | | | | | | | |
| | | |
Expenses before waiver and payments by affiliates | | | 1.21% | | | | 2.05% | | | | 1.71% | |
| | | |
Expenses net of waiver and payments by affiliates | | | 0.30% | | | | 0.30% | | | | 0.30% | |
| | | |
Net investment income | | | 1.53% | | | | 2.74% | | | | 2.11% | |
| | | |
| Supplemental data | | | | | | | | | | | | |
| | | |
Net assets, end of period (000’s) | | | $27,403 | | | | $8,820 | | | | $7,302 | |
| | | |
Portfolio turnover ratef | | | 8.45% | | | | 21.21% | | | | 5.00% | |
| | | |
| Portfolio turnover rate excluding portfolio transactions that are executed as a result of the Fund offering and redeeming Creation Units solely or in part for cashf,g | | | 8.45% | | | | —% | | | | —% | |
aFor the period August 31, 2017 (commencement of operations) to March 31, 2018.
bThe amount shown for a share outstanding throughout the period may not correlate with the Statement of Operations for the period due to the timing of sales and repurchases of Creation Unit Fund shares in relation to income earned and/or fluctuating fair value of the investments of the Fund.
cBased on average daily shares outstanding.
dTotal return is not annualized for periods less than one year. Total return is calculated assuming an initial investment made at the net asset value at the beginning of the period, reinvestment of all dividends and distributions at net asset value during the period, and redemption at net asset value on the last day of the period.
eRatios are annualized for periods less than one year.
fPortfolio turnover rate excludes the value of portfolio securities received or delivered as a result of processing capital share transactions in Creation Units, if any.
gEffective September 30, 2019.
| | | | |
| | | |
| 18 | | Semiannual Report | The accompanying notes are an integral part of these financial statements. | | franklintempleton.com |
FRANKLIN TEMPLETON ETF TRUST
Statement of Investments, September 30, 2019 (unaudited)
Franklin Liberty Municipal Bond ETF
| | | | | | | | | | | | | | |
| | | |
| | | | | Principal Amount | | | Value | |
| | | Municipal Bonds 99.5% | | | | | | | | | |
| | | Alabama 1.2% | | | | | | | | | |
| | Huntsville GO, wts., Series A, 5.00%, 5/01/37 | | | 250,000 | | | | | | | $ | 317,743 | |
| | | | | | | | | | | | | | |
| | | Alaska 0.6% | | | | | | | | | |
| | Matanuska-Susitna Borough Lease Revenue, Goose Creek Correctional Center Project, Refunding, 4.00%, 9/01/30 | | | 150,000 | | | | | | | | 166,101 | |
| | | | | | | | | | | | | | |
| | | Arizona 1.7% | | | | | | | | | |
| | Phoenix Civic Improvement Corp. Wastewater System Revenue, junior lien, Series A, 5.00%, 7/01/25 | | | 100,000 | | | | | | | | 120,107 | |
| | Salt River Project Agricultural Improvement and Power District Electric System Revenue, Salt River Project, Refunding, Series A, 5.00%, 1/01/39 | | | 170,000 | | | | | | | | 210,276 | |
| | Scottsdale Municipal Property Corp. Excise Tax Revenue, Refunding, 5.00%, 7/01/34 | | | 100,000 | | | | | | | | 137,014 | |
| | | | | | | | | | | | | | |
| | | | | | | | | | | | | 467,397 | |
| | | | | | | | | | | | | | |
| | | California 5.3% | | | | | | | | | |
| | Burbank RDA Successor Agency Tax Allocation Revenue, Los Angeles County, Refunding, 3.00%, 12/01/32 | | | 100,000 | | | | | | | | 105,682 | |
| | California State GO, Various Purpose, 3.00%, 10/01/37 | | | 700,000 | | | | | | | | 734,230 | |
| | Clovis USD, GO, Capital Appreciation, Refunding, zero cpn., 8/01/35 | | | 200,000 | | | | | | | | 120,422 | |
| | Konocti USD, GO, Capital Appreciation, Election of 2004, Series C, AGMC Insured, zero cpn., 8/01/28 | | | 150,000 | | | | | | | | 121,675 | |
| | Perris Joint Powers Authority Local Agency Revenue, CFD No. 2001-1, Improvement Area Nos. 4 and 5, CFD No. 2005-1, Improvement Area 4, Refunding, Series B, 5.00%, 9/01/37 | | | 100,000 | | | | | | | | 118,141 | |
| | South Tahoe Joint Powers Financing Authority Lease Revenue, Redevelopment Project Area No. 1, Series A, BAM Insured, 5.00%, 10/01/30 | | | 100,000 | | | | | | | | 122,835 | |
| | University of California Revenue, Limited Project, Series M, 5.00%, 5/15/34 | | | 100,000 | | | | | | | | 124,828 | |
| | | | | | | | | | | | | | |
| | | | | | | | | | | | | 1,447,813 | |
| | | | | | | | | | | | | | |
| | | Colorado 2.8% | | | | | | | | | |
| | Adams and Weld Counties School District No. 27J Brighton GO, The City and County of Broomfield, 5.00%, 12/01/42 | | | 100,000 | | | | | | | | 122,121 | |
| | Cherry Creek School District No. 5 GO, Arapahoe County, Refunding, Series C, 5.00%, 12/15/35 | | | 100,000 | | | | | | | | 124,855 | |
| | Colorado Springs Utilities System Revenue, Refunding, Series A, 4.00%, 11/15/33 | | | 100,000 | | | | | | | | 114,488 | |
| | Colorado State Board of Governors University Enterprise System Revenue, Refunding, Series A, 4.00%, 3/01/35 | | | 100,000 | | | | | | | | 114,206 | |
| | Colorado Water Resources and Power Development Authority State Revolving Fund Revenue, Series A, 4.00%, 9/01/31 | | | 150,000 | | | | | | | | 180,733 | |
| | Greeley Water Revenue, Water Enterprise, 4.00%, 8/01/31 | | | 100,000 | | | | | | | | 117,744 | |
| | | | | | | | | | | | | | |
| | | | | | | | | | | | | 774,147 | |
| | | | | | | | | | | | | | |
| | | Connecticut 1.3% | | | | | | | | | |
| | Connecticut State Health and Educational Facilities Authority Revenue, Yale New Haven Health Issue, Series B, 1.80%, 7/01/49 | | | 225,000 | | | | | | | | 227,808 | |
| | Connecticut State Special Tax Obligation Revenue, Series A, 5.00%, 8/01/31 | | | 100,000 | | | | | | | | 117,841 | |
| | | | | | | | | | | | | | |
| | | | | | | | | | | | | 345,649 | |
| | | | | | | | | | | | | | |
| | | Delaware 1.2% | | | | | | | | | |
| | University of Delaware Revenue, 5.00%, 11/01/37 | | | 250,000 | | | | | | | | 317,883 | |
| | | | | | | | | | | | | | |
| | | Florida 7.7% | | | | | | | | | |
| | Fort Myers Utility System Revenue, Refunding, Series A, 4.00%, 10/01/34 | | | 500,000 | | | | | | | | 577,050 | |
| | Gainesville Utilities System Revenue, Series A, 5.00%, 10/01/36 | | | 100,000 | | | | | | | | 123,541 | |
| | Miami-Dade County Transit System Sales Surtax Revenue, Refunding, 4.00%, 7/01/36 | | | 600,000 | | | | | | | | 694,014 | |
| | Pasco County GO, Fire-Rescue Projects Improvements, Series B, 5.00%, 10/01/36 | | | 455,000 | | | | | | | | 581,294 | |
| | Sarasota County Utility System Revenue, Refunding, Series A, 5.00%, 10/01/34 | | | 100,000 | | | | | | | | 127,615 | |
| | | | | | | | | | | | | | |
| | | | | | | | | | | | | 2,103,514 | |
| | | | | | | | | | | | | | |
| | | Georgia 3.2% | | | | | | | | | |
| | Atlanta Airport Revenue, General, Series A, 5.00%, 7/01/34 | | | 175,000 | | | | | | | | 224,135 | |
| | Coweta County Water and Sewage Authority Revenue, Refunding, 4.00%, 6/01/35 | | | 100,000 | | | | | | | | 115,348 | |
| | | | | | |
| | | |
| franklintempleton.com | | Semiannual Report | | | 19 | |
FRANKLIN TEMPLETON ETF TRUST
STATEMENT OF INVESTMENTS (UNAUDITED)
Franklin Liberty Municipal Bond ETF(continued)
| | | | | | | | | | | | | | |
| | | |
| | | | | Principal Amount | | | Value | |
| | | Municipal Bonds (continued) | | | | | | | | | |
| | | Georgia (continued) | | | | | | | | | |
| | Main Street Natural Gas Inc. Gas Supply Revenue, | | | | | | | | | | | | |
| | Sub-series B, Monthly VRDN and Put, 2.15%, 4/01/48 | | | 425,000 | | | | | | | $ | 427,686 | |
| | Series A, 4.00%, 4/01/48 | | | 100,000 | | | | | | | | 108,198 | |
| | | | | | | | | | | | | | |
| | | | | | | | | | | | | 875,367 | |
| | | | | | | | | | | | | | |
| | | Illinois 1.1% | | | | | | | | | |
| | Illinois State Finance Authority Revenue, Field Museum of Natural History, Refunding, Mandatory Put 9/01/22, 2.141%, 11/01/34 | | | 300,000 | | | | | | | | 300,123 | |
| | | | | | | | | | | | | | |
| | | Indiana 1.1% | | | | | | | | | |
| | East Allen Multi School Building Corp. Revenue, Allen County, Ad Valorem Property Tax, first mortgage, 5.00%, 1/15/38 | | | 250,000 | | | | | | | | 298,358 | |
| | | | | | | | | | | | | | |
| | | Kansas 0.4% | | | | | | | | | |
| | Douglas County USD No. 497 GO, Series A, 3.50%, 9/01/32 | | | 100,000 | | | | | | | | 109,043 | |
| | | | | | | | | | | | | | |
| | | Louisiana 0.6% | | | | | | | | | |
| | Louisiana GO, Series B, 4.00%, 10/01/34 | | | 155,000 | | | | | | | | 175,472 | |
| | | | | | | | | | | | | | |
| | | Maine 2.5% | | | | | | | | | |
| | Maine Municipal Bond Bank Revenue, Series C, 5.00%, 11/01/31 | | | 100,000 | | | | | | | | 125,509 | |
| | Maine State Housing Authority Mortgage Purchase Revenue, Series F, 3.85%, 11/15/33 | | | 500,000 | | | | | | | | 550,270 | |
| | | | | | | | | | | | | | |
| | | | | | | | | | | | | 675,779 | |
| | | | | | | | | | | | | | |
| | | Maryland 0.9% | | | | | | | | | |
| | Maryland State GO, State and Local Facilities Loan, First Series, 5.00%, 3/15/32 | | | 100,000 | | | | | | | | 129,353 | |
| | Prince George’s County GO, Consolidated Public Improvement, Series A, 3.00%, 9/15/32 | | | 100,000 | | | | | | | | 105,523 | |
| | | | | | | | | | | | | | |
| | | | | | | | | | | | | 234,876 | |
| | | | | | | | | | | | | | |
| | | Massachusetts 3.6% | | | | | | | | | |
| | Braintree GO, municipal Purpose Loan of 2019, Refunding, 4.00%, 6/01/32 | | | 250,000 | | | | | | | | 294,922 | |
| | Massachusetts Bay Transportation Authority Sales Tax Revenue, Sustainability Bonds, Subordinate, Series A, Subseries A-1, 5.00%, 7/01/33 | | | 100,000 | | | | | | | | 123,685 | |
| | Massachusetts State Development Finance Agency Revenue, Worcester Polytechnic Institute Issue, 4.00%, 9/01/44 | | | 400,000 | | | | | | | | 447,336 | |
| | University of Massachusetts Building Authority Revenue, Refunding, Senior Series A-1, 5.00%, 5/01/31 | | | 100,000 | | | | | | | | 130,176 | |
| | | | | | | | | | | | | | |
| | | | | | | | | | | | | 996,119 | |
| | | | | | | | | | | | | | |
| | | Michigan 1.0% | | | | | | | | | |
| | Lansing Board of Water and Light Utility System Revenue, Series A, 5.00%, 7/01/35 | | | 225,000 | | | | | | | | 284,526 | |
| | | | | | | | | | | | | | |
| | | Minnesota 3.5% | | | | | | | | | |
| | Center City Health Care Facilities Revenue, Hazelden Betty Ford Foundation Project, Refunding, 4.00%, 11/01/34 | | | 125,000 | | | | | | | | 141,436 | |
| | Minnesota State HFAR, State Appropriation Bonds, Housing Infrastructure, Series C, 4.00%, 8/01/34 | | | 250,000 | | | | | | | | 287,115 | |
| | Minnesota State Higher Education Facilities Authority Revenue, Macalester College, Refunding, 3.00%, 3/01/35 | | | 150,000 | | | | | | | | 156,323 | |
| | Northern Municipal Power Agency Electric System Revenue, Refunding, 5.00%, 1/01/36 | | | 100,000 | | | | | | | | 118,754 | |
| | Southern Minnesota Municipal Power Agency Power Supply System Revenue, Series A, 5.00%, 1/01/31 | | | 100,000 | | | | | | | | 125,360 | |
| | University of Minnesota GO, Series A, 5.00%, 9/01/42 | | | 100,000 | | | | | | | | 122,197 | |
| | | | | | | | | | | | | | |
| | | | | | | | | | | | | 951,185 | |
| | | | | | | | | | | | | | |
| | | Missouri 2.5% | | | | | | | | | |
| | Missouri State Health and Educational Facilities Authority Health Facilities Revenue, St. Luke’s Episcopal-Presbyterian Hospitals, 4.00%, 12/01/35 | | | 510,000 | | | | | | | | 580,737 | |
| | Platte County School District Park Hill GO, Direct Deposit Program, 3.00%, 3/01/33 | | | 100,000 | | | | | | | | 103,899 | |
| | | | | | | | | | | | | | |
| | | | | | | | | | | | | 684,636 | |
| | | | | | | | | | | | | | |
| | | Montana 0.4% | | | | | | | | | |
| | Cascade County High School District No. 1 Great Falls GO, School Building, 5.00%, 7/01/25 | | | 100,000 | | | | | | | | 119,191 | |
| | | | | | | | | | | | | | |
| | | | |
| | | |
| 20 | | Semiannual Report | | franklintempleton.com |
FRANKLIN TEMPLETON ETF TRUST
STATEMENT OF INVESTMENTS (UNAUDITED)
Franklin Liberty Municipal Bond ETF(continued)
| | | | | | | | | | | | | | |
| | | |
| | | | | Principal Amount | | | Value | |
| | | Municipal Bonds (continued) | | | | | | | | | |
| | | Nevada 2.5% | | | | | | | | | |
| | Clark County School District GO, Building, Refunding, Series A, 5.00%, 6/15/26 | | | 100,000 | | | | | | | $ | 121,743 | |
| | Las Vegas GO, Limited Tax, Various Purpose, Refunding, Series C, 4.00%, 6/01/32 | | | 500,000 | | | | | | | | 572,435 | |
| | | | | | | | | | | | | | |
| | | | | | | | | | | | | 694,178 | |
| | | | | | | | | | | | | | |
| | | New Hampshire 0.5% | | | | | | | | | |
| | New Hampshire State Health and Education Facilities Authority Revenue, University System of New Hampshire Issue, Refunding, Series A, 5.00%, 7/01/27 | | | 100,000 | | | | | | | | 125,750 | |
| | | | | | | | | | | | | | |
| | | New Jersey 2.9% | | | | | | | | | |
| | New Jersey State Transportation Trust Fund Authority Revenue, Transportation System, Capital Appreciation, Series C, AGMC Insured, zero cpn., 12/15/29 | | | 870,000 | | | | | | | | 675,372 | |
| | Pinelands Regional School District GO, Refunding, AGMC Insured, 3.00%, 8/01/27 | | | 100,000 | | | | | | | | 107,931 | |
| | | | | | | | | | | | | | |
| | | | | | | | | | | | | 783,303 | |
| | | | | | | | | | | | | | |
| | | New Mexico 0.4% | | | | | | | | | |
| | Santa Fe Net Wastewater Utility System/ Environmental Services Gross Receipts Tax Improvement Revenue, Climate Bond Certified, Green Bonds, BAM Insured, 4.00%, 6/01/35 | | | 100,000 | | | | | | | | 114,246 | |
| | | | | | | | | | | | | | |
| | | New York 8.6% | | | | | | | | | |
| | Long Island Power Authority Electric System Revenue, General, Series A, 5.00%, 9/01/28 | | | 600,000 | | | | | | | | 769,410 | |
| | MTA Revenue, Transportation, Green Bonds, Climate Bond Certified, Refunding, Series B, 5.00%, 11/15/28 | | | 100,000 | | | | | | | | 128,068 | |
| | New York City GO, Fiscal 2018, Series B, Subseries B-1, 4.00%, 10/01/36 | | | 100,000 | | | | | | | | 113,895 | |
| | New York City Transitional Finance Authority Revenue, Future Tax Secured, Subordinate, Fiscal 2018, Series B, Subseries B-1, 5.00%, 8/01/34 | | | 100,000 | | | | | | | | 122,997 | |
| | New York State Dormitory Authority Revenues, | | | | | | | | | | | | |
| | a Non-State Supported Debt, Rochester Institute of Technology, Series A, 5.00%, 7/01/39 | | | 300,000 | | | | | | | | 374,412 | |
| | Non-State Supported Debt, School Districts, Financing Program, Refunding, Series G, BAM Insured, 3.00%, 10/01/33 | | | 100,000 | | | | | | | | 104,802 | |
| | New York State Dormitory Authority Sales Tax Revenue, Series A, 5.00%, 3/15/33 | | | 600,000 | | | | | | | | 749,778 | |
| | | | | | | | | | | | | | |
| | | | | | | | | | | | | 2,363,362 | |
| | | | | | | | | | | | | | |
| | | North Carolina 0.8% | | | | | | | | | |
| | University of North Carolina at Charlotte Revenue, General, Board of Governors, Refunding, 4.00%, 10/01/34 | | | 100,000 | | | | | | | | 113,601 | |
| | Winston-Salem City Water and Sewer System Revenue, 4.00%, 6/01/33 | | | 100,000 | | | | | | | | 114,920 | |
| | | | | | | | | | | | | | |
| | | | | | | | | | | | | 228,521 | |
| | | | | | | | | | | | | | |
| | | Ohio 6.7% | | | | | | | | | |
| | Columbus GO, Series A, 3.00%, 4/01/28 | | | 100,000 | | | | | | | | 109,576 | |
| | Franklin County Hospital Facilities Revenue, Nationwide Children’s Hospital Project, Refunding, Series A, 3.125%, 11/01/33 | | | 50,000 | | | | | | | | 52,529 | |
| | Franklin County Sales Tax Revenue, Various Purpose, 5.00%, 6/01/43 | | | 450,000 | | | | | | | | 555,066 | |
| | Hudson City School District GO, School Improvement, 4.00%, 12/01/31 | | | 100,000 | | | | | | | | 112,798 | |
| | Licking Heights Local School District GO, School Facilities Construction and Improvement, Series B, 5.00%, 10/01/30 | | | 100,000 | | | | | | | | 122,752 | |
| | Northeast Regional Sewer District Revenue, | | | | | | | | | | | | |
| | Wastewater Improvement, Refunding, 3.00%, 11/15/35 | | | 500,000 | | | | | | | | 529,910 | |
| | Wastewater Improvement, Refunding, 4.00%, 11/15/34 | | | 100,000 | | | | | | | | 115,373 | |
| | Ohio State GO, Highway Capital Improvements, Full Faith and Credit/Highway User Receipts, Series S, 5.00%, 5/01/23 | | | 100,000 | | | | | | | | 113,173 | |
| | Ohio State Water Development Authority Revenue, Community Assistance, Refunding, 4.00%, 12/01/30 | | | 100,000 | | | | | | | | 123,555 | |
| | | | | | | | | | | | | | |
| | | | | | | | | | | | | 1,834,732 | |
| | | | | | | | | | | | | | |
| | | Oklahoma 2.5% | | | | | | | | | |
| | Oklahoma City GO, 4.00%, 3/01/33 | | | 500,000 | | | | | | | | 575,585 | |
| | Tulsa Metropolitan Utility Authority Revenue, Refunding, Series A, 5.00%, 4/01/26 | | | 100,000 | | | | | | | | 122,527 | |
| | | | | | | | | | | | | | |
| | | | | | | | | | | | | 698,112 | |
| | | | | | | | | | | | | | |
| | | | | | |
| | | |
| franklintempleton.com | | Semiannual Report | | | 21 | |
FRANKLIN TEMPLETON ETF TRUST
STATEMENT OF INVESTMENTS (UNAUDITED)
Franklin Liberty Municipal Bond ETF(continued)
| | | | | | | | | | | | | | |
| | | |
| | | | | Principal Amount | | | Value | |
| | | Municipal Bonds (continued) | | | | | | | | | |
| | | Oregon 5.6% | | | | | | | | | |
| | Deschutes County Administrative School District No. 1 GO, Bend-La Pine, 5.00%, 6/15/30 | | | 400,000 | | | | | | | $ | 523,896 | |
| | Oregon State Housing and Community Services Department Mortgage Revenue, Series D, 3.15%, 7/01/32 | | | 95,000 | | | | | | | | 100,303 | |
| | Portland Community College District GO, Multnomah Washington Yamhill Clackamas and Columbia Counties, Refunding, 5.00%, 6/15/25 | | | 100,000 | | | | | | | | 120,326 | |
| | Salem-Keizer School District No. 24J GO, Marion and Polk Counties, 5.00%, 6/15/36 | | | 500,000 | | | | | | | | 628,660 | |
| | Washington County GO, Full Faith and Credit Obligations, Series B, 5.00%, 3/01/25 | | | 125,000 | | | | | | | | 149,334 | |
| | | | | | | | | | | | | | |
| | | | | | | | | | | | | 1,522,519 | |
| | | | | | | | | | | | | | |
| | | Pennsylvania 1.6% | | | | | | | | | |
| | Pennsylvania State Economic Development Financing Authority Revenue, UPMC, Refunding, Series A, 3.375%, 11/15/33 | | | 125,000 | | | | | | | | 131,921 | |
| | Pennsylvania State University Revenue, Series A, 5.00%, 9/01/38 | | | 250,000 | | | | | | | | 316,518 | |
| | | | | | | | | | | | | | |
| | | | | | | | | | | | | 448,439 | |
| | | | | | | | | | | | | | |
| | | Tennessee 4.6% | | | | | | | | | |
| | Chattanooga Health Educational and Housing Facility Board Revenue, Commonspirit Health, Refunding, Series A-1, 5.00%, 8/01/25 | | | 350,000 | | | | | | | | 411,663 | |
| | Kingsport GO, Series B, 3.00%, 3/01/35 | | | 130,000 | | | | | | | | 133,561 | |
| | Lawrenceburg GO, Refunding, 2.50%, 6/01/27 | | | 100,000 | | | | | | | | 103,309 | |
| | Metropolitan Government of Nashville and Davidson County GO, Improvement, Refunding, 4.00%, 7/01/29 | | | 100,000 | | | | | | | | 117,409 | |
| | Metropolitan Government of Nashville and Davidson County Water and Sewer Revenue, Green Bonds, Subordinate, Refunding, Series A, 5.00%, 7/01/36 | | | 100,000 | | | | | | | | 122,680 | |
| | Tennessee HDA Residential Finance Program Revenue, Issue 2019-2, Refunding, 1.95%, 1/01/26 | | | 250,000 | | | | | | | | 252,947 | |
| | Tennessee State School Bond Authority Revenue, Higher Educational Facilities Second Program, Series A, 5.00%, 11/01/37 | | | 100,000 | | | | | | | | 123,809 | |
| | | | | | | | | | | | | | |
| | | | | | | | | | | | | 1,265,378 | |
| | | | | | | | | | | | | | |
| | | Texas 6.5% | | | | | | | | | |
| | El Paso Water and Sewer Revenue, Refunding and Improvement, 4.00%, 3/01/33 | | | 100,000 | | | | | | | | 113,852 | |
| | Fort Worth Water and Sewer Revenue, System, 5.00%, 2/15/32 | | | 250,000 | | | | | | | | 313,168 | |
| a | | Lamar Consolidated ISD, GO, Fort Bend County, School House, PSF Guarantee, 4.00%, 2/15/30 | | | 600,000 | | | | | | | | 719,148 | |
| | Pflugerville ISD, GO, Series A, PSF Guarantee, 5.00%, 2/15/29 | | | 220,000 | | | | | | | | 280,504 | |
| | Round Rock Utility Revenue, Refunding, 2.75%, 8/01/29 | | | 100,000 | | | | | | | | 105,448 | |
| | Texas A&M University System Board of Regents Revenue, Financing System, Refunding, Series C, 5.00%, 5/15/33 | | | 100,000 | | | | | | | | 123,348 | |
| | Texas State Water Development Board Revenue, State Water Implementation Fund, Master Trust, Series A, 4.00%, 10/15/33 | | | 100,000 | | | | | | | | 115,100 | |
| | | | | | | | | | | | | | |
| | | | | | | | | | | | | 1,770,568 | |
| | | | | | | | | | | | | | |
| | | Utah 2.8% | | | | | | | | | |
| | Provo GO, Refunding, 4.00%, 1/01/23 | | | 100,000 | | | | | | | | 108,811 | |
| | South Jordan Sales Tax Revenue, Refunding, 5.00%, 8/15/38 | | | 250,000 | | | | | | | | 317,305 | |
| | Utah State Building Ownership Authority Lease Revenue, State Facilities Master Lease Program, 2.50%, 5/15/27 | | | 100,000 | | | | | | | | 104,133 | |
| | Utah State Water Finance Agency Revenue, Loan Financing Program, Series B, 5.00%, 3/01/38 | | | 200,000 | | | | | | | | 251,666 | |
| | | | | | | | | | | | | | |
| | | | | | | | | | | | | 781,915 | |
| | | | | | | | | | | | | | |
| | | Virginia 3.7% | | | | | | | | | |
| | Arlington County GO, Public Improvement, 4.00%, 6/15/35 | | | 500,000 | | | | | | | | 591,780 | |
| | Henrico County Water and Sewer System Revenue, Refunding, 4.00%, 5/01/32 | | | 250,000 | | | | | | | | 299,380 | |
| | Virginia College Building Authority Educational Facilities Revenue, Public Higher Education Financing Program, Series A, 5.00%, 9/01/32 | | | 100,000 | | | | | | | | 127,889 | |
| | | | | | | | | | | | | | |
| | | | | | | | | | | | | 1,019,049 | |
| | | | | | | | | | | | | | |
| | | Washington 6.8% | | | | | | | | | |
| | Cascase Schol District No. 228 GO, Chelan County, 5.00%, 12/01/35 | | | 455,000 | | | | | | | | 544,953 | |
| | King and Snohomish Counties School District No 417 Northshore GO, 5.00%, 12/01/31 | | | 100,000 | | | | | | | | 126,728 | |
| | | | |
| | | |
| 22 | | Semiannual Report | | franklintempleton.com |
FRANKLIN TEMPLETON ETF TRUST
STATEMENT OF INVESTMENTS (UNAUDITED)
Franklin Liberty Municipal Bond ETF(continued)
| | | | | | | | | | | | | | |
| | | |
| | | | | Principal Amount | | | Value | |
| | | Municipal Bonds (continued) | | | | | | | | | |
| | | Washington (continued) | | | | | | | | | |
| | Seattle Drainage and Wastewater Revenue, Refunding, 4.00%, 4/01/31 | | | 125,000 | | | | | | | $ | 142,478 | |
| | Seattle Municipal Light and Power Revenue, Improvement and Refunding, Series C, 4.00%, 9/01/35 | | | 700,000 | | | | | | | | 798,945 | |
| | Spokane County School District No. 356 Central Valley GO, 5.00%, 12/01/26 | | | 100,000 | | | | | | | | 124,738 | |
| | Washington Health Care Facilities Authority Revenue, MultiCare Health System, Refunding, Series B, 5.00%, 8/15/29 | | | 100,000 | | | | | | | | 125,750 | |
| | | | | | | | | | | | | | |
| | | | | | | | | | | | | 1,863,592 | |
| | | | | | | | | | | | | | |
| | | Wisconsin 0.4% | | | | | | | | | |
| | Brookfield GO, Waukesha County, Refunding, 3.00%, 12/01/25 | | | 100,000 | | | | | | | | 108,503 | |
| | | | | | | | | | | | | | |
| | Total Investments (Cost $26,612,575) 99.5% | | | | | | | | | | | 27,267,089 | |
| | Other Assets, less Liabilities 0.5% | | | | | | | | | | | 135,928 | |
| | | | | | | | | | | | | | |
| | Net Assets 100.0% | | | | | | | | | | $ | 27,403,017 | |
| | | | | | | | | | | | | | |
See Abbreviations on page 32.
aSecurity purchased on a when-issued basis. See Note 1(b)
| | | | | | |
| | | |
| franklintempleton.com | | The accompanying notes are an integral part of these financial statements. | Semiannual Report | | | 23 | |
FRANKLIN TEMPLETON ETF TRUST
FINANCIAL STATEMENTS
Statements of Assets and Liabilities
September 30, 2019 (unaudited)
| | | | | | | | |
| | |
| | | Franklin Liberty
Intermediate
Municipal
Opportunities ETF | | | Franklin Liberty
Municipal
Bond ETF | |
Assets: | | | | | | | | |
Investments in securities: | | | | | | | | |
Cost – Unaffiliated issuers | | $ | 8,811,905 | | | $ | 26,612,575 | |
| | | | |
Value – Unaffiliated issuers | | $ | 9,122,051 | | | $ | 27,267,089 | |
Cash | | | 17,348 | | | | 1,103,333 | |
Receivables: | | | | | | | | |
Interest | | | 80,815 | | | | 203,917 | |
Affiliates | | | 5,114 | | | | 1,006 | |
| | | | |
Total assets | | | 9,225,328 | | | | 28,575,345 | |
| | | | |
Liabilities: | | | | | | | | |
Payables: | | | | | | | | |
Investment securities purchased | | | 224,772 | | | | 1,082,244 | |
Transfer agent fees | | | 7,799 | | | | 7,799 | |
Trustees’ fees and expenses | | | 72 | | | | — | |
Distributions to shareholders | | | 15,540 | | | | 45,151 | |
Custodian fees | | | 619 | | | | 619 | |
Professional fees | | | 18,458 | | | | 18,613 | |
Registration and filing fees | | | 4,985 | | | | 5,007 | |
Accrued expenses and other liabilities | | | 12,896 | | | | 12,895 | |
| | | | |
Total liabilities | | | 285,141 | | | | 1,172,328 | |
| | | | |
Net assets, at value | | $ | 8,940,187 | | | $ | 27,403,017 | |
| | | | |
Net assets consist of: | | | | | | | | |
Paid-in capital | | $ | 8,773,821 | | | $ | 26,909,037 | |
Total distributable earnings (loss) | | | 166,366 | | | | 493,980 | |
| | | | |
Net assets, at value | | $ | 8,940,187 | | | $ | 27,403,017 | |
| | | | |
Shares outstanding | | | 350,000 | | | | 1,050,000 | |
| | | | |
Net asset value per share | | $ | 25.54 | | | $ | 26.10 | |
| | | | |
| | | | |
| | | |
| 24 | | Semiannual Report | The accompanying notes are an integral part of these financial statements. | | franklintempleton.com |
FRANKLIN TEMPLETON ETF TRUST
FINANCIAL STATEMENTS
Statements of Operations
for the period ended September 30, 2019 (unaudited)
| | | | | | | | |
| | |
| | | Franklin Liberty
Intermediate
Municipal
Opportunities ETF | | | Franklin Liberty
Municipal
Bond ETF | |
Investment income: | | | | | | | | |
Interest: | | | | | | | | |
Unaffiliated issuers | | | 101,603 | | | | 142,993 | |
| | | | |
Total investment income | | | 101,603 | | | | 142,993 | |
| | | | |
Expenses: | | | | | | | | |
Management fees (Note 3a) | | | 24,029 | | | | 48,734 | |
Transfer agent fees | | | 7,799 | | | | 7,799 | |
Custodian fees | | | 619 | | | | 619 | |
Reports to shareholders | | | 3,188 | | | | 3,301 | |
Registration and filing fees | | | 4,105 | | | | 4,105 | |
Professional fees | | | 21,088 | | | | 21,221 | |
Trustees’ fees and expenses | | | 450 | | | | 552 | |
Other | | | 7,858 | | | | 7,857 | |
| | | | |
Total expenses | | | 69,136 | | | | 94,188 | |
Expenses waived/paid by affiliates (Note 3c) | | | (57,602 | ) | | | (70,796 | ) |
| | | | |
Net expenses | | | 11,534 | | | | 23,392 | |
| | | | |
Net investment income | | | 90,069 | | | | 119,601 | |
| | | | |
Realized and unrealized gains (losses): | | | | | | | | |
Net realized gain (loss) from: | | | | | | | | |
Investments: | | | | | | | | |
Unaffiliated issuers | | | 1,585 | | | | (6,557 | ) |
| | | | |
Net realized gain (loss) | | | 1,585 | | | | (6,557 | ) |
| | | | |
Net change in unrealized appreciation (depreciation) on: | | | | | | | | |
Investments: | | | | | | | | |
Unaffiliated issuers | | | 199,790 | | | | 501,486 | |
| | | | |
Net change in unrealized appreciation (depreciation) | | | 199,790 | | | | 501,486 | |
| | | | |
Net realized and unrealized gain (loss) | | | 201,375 | | | | 494,929 | |
| | | | |
Net increase (decrease) in net assets resulting from operations | | $ | 291,444 | | | $ | 614,530 | |
| | | | |
| | | | | | |
| | | |
| franklintempleton.com | | The accompanying notes are an integral part of these financial statements. | Semiannual Report | | | 25 | |
FRANKLIN TEMPLETON ETF TRUST
FINANCIAL STATEMENTS
Statements of Changes in Net Assets
| | | | | | | | | | | | | | | | |
| | |
| | | Franklin Liberty Intermediate
Municipal Opportunities ETF | | | Franklin Liberty Municipal Bond ETF | |
| | | | |
| | | Six Months Ended
September 30,
2019 (unaudited) | | | Year Ended
March 31, 2019 | | | Six Months Ended
September 30,
2019 (unaudited) | | | Year Ended
March 31, 2019 | |
Increase (decrease) in net assets: | | | | | | | | | | | | | | | | |
Operations: | | | | | | | | | | | | | | | | |
Net investment income | | $ | 90,069 | | | $ | 187,936 | | | $ | 119,601 | | | $ | 200,879 | |
Net realized gain (loss) | | | 1,585 | | | | (95,411 | ) | | | (6,557 | ) | | | (68,214 | ) |
Net change in unrealized appreciation (depreciation) | | | 199,790 | | | | 266,104 | | | | 501,486 | | | | 339,144 | |
| | | | |
Net increase (decrease) in net assets resulting from operations | | | 291,444 | | | | 358,629 | | | | 614,530 | | | | 471,809 | |
| | | | |
Distributions to shareholders | | | (114,882 | ) | | | (187,559 | ) | | | (193,469 | ) | | | (200,714 | ) |
| | | | |
Capital share transactions: (Note 2) | | | 1,273,821 | | | | — | | | | 18,162,320 | | | | 1,246,717 | |
| | | | |
Net increase (decrease) in net assets | | | 1,450,383 | | | | 171,070 | | | | 18,583,381 | | | | 1,517,812 | |
Net assets: | | | | | | | | | | | | | | | | |
Beginning of period | | | 7,489,804 | | | | 7,318,734 | | | | 8,819,636 | | | | 7,301,824 | |
| | | | |
End of period | | $ | 8,940,187 | | | $ | 7,489,804 | | | $ | 27,403,017 | | | $ | 8,819,636 | |
| | | | |
| | | | |
| | | |
| 26 | | Semiannual Report | The accompanying notes are an integral part of these financial statements. | | franklintempleton.com |
FRANKLIN TEMPLETON ETF TRUST
Notes to Financial Statements (unaudited)
1. Organization and Significant Accounting Policies
Franklin Templeton ETF Trust (Trust) is registered under the Investment Company Act of 1940 (1940 Act) as an open-end management investment company, consisting of thirty-nine separate funds, two of which are included in this report (Funds) and applies the specialized accounting and reporting guidance in U.S. Generally Accepted Accounting Principles (U.S. GAAP). Each of the Funds are an exchange traded fund (ETF) and are actively managed, thus they are not designed to track an index.
The following summarizes the Fund’s significant accounting policies.
a. Financial Instrument Valuation
The Funds’ investments in financial instruments are carried at fair value daily. Fair value is the price that would be received to sell an asset or paid to transfer a liability in an orderly transaction between market participants on the measurement date. The Funds calculate the net asset value (NAV) per share as of 4 p.m. Eastern time each day the New York Stock Exchange (NYSE) is open for trading. Under compliance policies and procedures approved by the Trust’s Board of Trustees (the Board), the Funds’ administrator has responsibility for oversight of valuation, including leading the cross-functional Valuation Committee (VC). The Funds may utilize independent pricing services, quotations from securities and financial instrument dealers, and other market sources to determine fair value.
Debt securities generally trade in the over-the-counter (OTC) market rather than on a securities exchange. The Funds’ pricing services use multiple valuation techniques to determine fair value. In instances where sufficient market activity exists, the pricing services may utilize a market-based approach through which quotes from market makers are used to determine fair value. In instances where sufficient market activity may not exist or is limited, the pricing services also utilize proprietary valuation models which may consider market characteristics such as benchmark yield curves, credit spreads, estimated default rates, anticipated market interest rate volatility, coupon rates, anticipated timing of principal repayments, underlying collateral, and other unique security features in order to estimate the relevant cash flows, which are then discounted to calculate the fair value.
The Funds have procedures to determine the fair value of financial instruments for which market prices are not reliable
or readily available. Under these procedures, the Funds primarily employ a market-based approach which may use related or comparable assets or liabilities, recent transactions, market multiples, book values, and other relevant information for the investment to determine the fair value of the investment. An income-based valuation approach may also be used in which the anticipated future cash flows of the investment are discounted to calculate fair value. Discounts may also be applied due to the nature or duration of any restrictions on the disposition of the investments. Due to the inherent uncertainty of valuations of such investments, the fair values may differ significantly from the values that would have been used had an active market existed.
b. Securities Purchased on a When-Issued Basis
Certain or all Funds purchase securities on a when-issued basis, with payment and delivery scheduled for a future date. These transactions are subject to market fluctuations and are subject to the risk that the value at delivery may be more or less than the trade date purchase price. Although the Funds will generally purchase these securities with the intention of holding the securities, they may sell the securities before the settlement date. Sufficient assets have been segregated for these securities.
c. Income Taxes
It is each Fund’s policy to qualify as a regulated investment company under the Internal Revenue Code. Each Fund intends to distribute to shareholders substantially all of its taxable income and net realized gains to relieve it from federal income and excise taxes. As a result, no provision for U.S. federal income taxes is required.
Each Fund may recognize an income tax liability related to its uncertain tax positions under U.S. GAAP when the uncertain tax position has a less than 50% probability that it will be sustained upon examination by the tax authorities based on its technical merits. As of September 30, 2019, each Fund has determined that no tax liability is required in its financial statements related to uncertain tax positions for any open tax years (or expected to be taken in future tax years). Open tax years are those that remain subject to examination and are based on the statute of limitations in each jurisdiction in which the Fund invests.
d. Security Transactions, Investment Income, Expenses and Distributions
Security transactions are accounted for on trade date. Realized gains and losses on security transactions are
| | | | | | |
| | | |
| franklintempleton.com | | Semiannual Report | | | 27 | |
FRANKLIN TEMPLETON ETF TRUST
NOTES TO FINANCIAL STATEMENTS (UNAUDITED)
1. Organization and Significant Accounting Policies(continued)
d. Security Transactions, Investment Income, Expenses and Distributions(continued)
determined on a specific identification basis. Interest income and estimated expenses are accrued daily. Amortization of premium and accretion of discount on debt securities are included in interest income. Distributions to shareholders are recorded on the ex-dividend date. Distributable earnings are determined according to income tax regulations (tax basis) and may differ from earnings recorded in accordance with U.S. GAAP. These differences may be permanent or temporary. Permanent differences are reclassified among capital accounts to reflect their tax character. These reclassifications have no impact on net assets or the results of operations. Temporary differences are not reclassified, as they may reverse in subsequent periods.
Common expenses incurred by the Trust are allocated among the Funds based on the ratio of net assets of each Fund to the combined net assets of the Trust. Certain Fund specific expenses are allocated directly to the Fund that incurred the expense.
e. Insurance
The scheduled payments of interest and principal for each insured municipal security in the Trust are insured by either a new issue insurance policy or a secondary insurance policy. Some municipal securities in the Funds are secured by collateral guaranteed by an agency of the U.S. government. Depending on the type of coverage, premiums for insurance are either added the cost basis of the security or paid by a third party.
Insurance companies typically insure municipal bonds that tend to be of very high quality, with the majority of underlying municipal bonds rated A or better. However, an event involving an insurer could have an adverse effect on the value of the securities insured by that insurance company. There can be no assurance the insurer will be able to fulfill its obligations under the terms of the policy.
f. Accounting Estimates
The preparation of financial statements in accordance with U.S. GAAP requires management to make estimates and assumptions that affect the reported amounts of assets and liabilities at the date of the financial statements and the amounts of income and expenses during the reporting period. Actual results could differ from those estimates.
g. Guarantees and Indemnifications
Under the Trust’s organizational documents, its officers and trustees are indemnified by the Trust against certain liabilities arising out of the performance of their duties to the Trust. Additionally, in the normal course of business, the Trust, on behalf of the Funds, enters into contracts with service providers that contain general indemnification clauses. The Trust’s maximum exposure under these arrangements is unknown as this would involve future claims that may be made against the Trust that have not yet occurred. Currently, the Trust expects the risk of loss to be remote.
2. Shares of Beneficial Interest
Shares of the Funds are issued and redeemed at their respective NAV only in aggregations of a specific number of shares or multiples thereof (Creation Units). Only certain large institutional investors (Authorized Participants) may engage in creation or redemption transactions directly with the Funds. Once created, shares of the Funds generally trade in the secondary market in amounts less than one Creation Unit. The market price of the Funds’ shares will be based on the price in the secondary market which may be at, above or below the most recent NAV. Creation Units may be issued and redeemed in exchange for a designated portfolio of securities and/or cash (which may include cash in lieu of certain securities). For the period ended September 30, 2019, all Creation Unit transactions were made in cash.
Authorized Participants pay a standard transaction fee to the shareholder servicing agent when purchasing or redeeming Creation Units of the Funds regardless of the number of Creation Units that are being created or redeemed on the same day by the Authorized Participant. The standard transaction fee is imposed to offset transfer and other transaction costs associated with the issuance and redemption of Creation Units and is not charged to or paid by the Funds.
In addition, for cash Creation Unit transactions, a variable fee for creation transactions and redemption transactions may be charged to the Authorized Participant to cover certain brokerage, tax, foreign exchange, execution, market impact and other costs and expenses related to the execution of trades. Variable fees, if any, are included in capital share transactions in the Statements of Changes in Net Assets.
| | | | |
| | | |
| 28 | | Semiannual Report | | franklintempleton.com |
FRANKLIN TEMPLETON ETF TRUST
NOTES TO FINANCIAL STATEMENTS (UNAUDITED)
At September 30, 2019, there were an unlimited number of shares authorized (without par value). Transactions in the Funds’ shares were as follows:
| | | | | | | | | | | | | | | | | | | | |
| |
| | | Franklin Liberty Intermediate Municipal Opportunities
ETF | |
| | | |
| | | Six Months Ended
September 30, 2019 | | | | | | Year Ended
March 31, 2019 | |
| | | | | |
| | | Shares | | | Amount | | | | | | Shares | | | Amount | |
Shares sold | | | 50,000 | | | $ | 1,273,821 | | | | | | | | 200,000 | | | $ | 4,872,980 | |
Shares redeemed | | | — | | | | — | | | | | | | | (200,000 | ) | | | (4,872,980 | ) |
| | | | |
Net increase (decrease) | | | 50,000 | | | $ | 1,273,821 | | | | | | | | — | | | $ | — | |
| | | | |
| |
| | | Franklin Liberty Municipal Bond ETF | |
| | | |
| | | Six Months Ended
September 30, 2019 | | | | | | Year Ended
March 31, 2019 | |
| | | | | |
| | | Shares | | | Amount | | | | | | Shares | | | Amount | |
Shares sold | | | 750,000 | | | $ | 19,476,759 | | | | | | | | 50,000 | | | $ | 1,246,717 | |
Shares redeemed | | | (50,000 | ) | | | (1,314,439 | ) | | | | | | | — | | | | — | |
| | | | |
Net increase (decrease) | | | 700,000 | | | $ | 18,162,320 | | | | | | | | 50,000 | | | $ | 1,246,717 | |
| | | | |
3. Transactions with Affiliates
Franklin Resources, Inc. is the holding company for various subsidiaries that together are referred to as Franklin Templeton. Certain officers and trustees of the Funds are also officers and/or directors of the following subsidiaries:
| | |
| |
| Subsidiary | | Affiliation |
Franklin Advisers, Inc. (Advisers) | | Investment manager |
Franklin Templeton Services, LLC (FT Services) | | Administrative manager |
Franklin Templeton Distributors, Inc. (Distributors) | | Principal Underwriter |
a. Management Fees
The Funds pay an investment management fee to Advisers based on the daily net assets of each of the Funds as follows:
| | |
| |
| Annualized Fee Rate | | Net Assets |
0.625% | | Up to and including $100 million |
0.500% | | Over $100 million, up to and including $250 million |
0.450% | | Over $250 million, up to and including $7.5 billion |
0.440% | | Over $7.5 billion, up to and including $10 billion |
0.430% | | Over $10 billion, up to and including $12.5 billion |
0.420% | | Over $12.5 billion, up to and including $15 billion |
0.400% | | Over $15 billion, up to and including $17.5 billion |
0.380% | | Over $17.5 billion, up to and including $20 billion |
0.360% | | In excess of $20 billion |
| | | | | | |
| | | |
| franklintempleton.com | | Semiannual Report | | | 29 | |
FRANKLIN TEMPLETON ETF TRUST
NOTES TO FINANCIAL STATEMENTS (UNAUDITED)
3. Transactions with Affiliates(continued)
a. Management Fees(continued)
For the period ended September 30, 2019, each Fund’s gross effective investment management fee rate based on average daily net assets was as follows:
| | |
| |
| | | Annualized Fee Rate |
Franklin Liberty Intermediate Municipal Opportunities ETF | | 0.625% |
Franklin Liberty Municipal Bond ETF | | 0.625% |
b. Administrative Fees
Under an agreement with Advisers, FT Services provides administrative services to the Funds. The fee is paid by Advisers based on the Funds’ average daily net assets, and is not an additional expense of the Funds.
c. Waiver and Expense Reimbursements
Advisers has contractually agreed in advance to waive or limit its fees and to assume as its own expense certain expenses otherwise payable by the Funds so that the expenses (including acquired fund fees and expenses) for each of the Funds does not exceed 0.30%, based on the average net assets (other than certain non-routine expenses or costs, including those relating to litigation, indemnification, reorganizations, and liquidations) until July 31, 2020. Total expenses waived or paid are not subject to recapture subsequent to the Funds’ fiscal year end.
d. Other Affiliated Transactions
At September 30, 2019, the shares of the Funds were owned by the following entities:
| | | | | | | | |
| | |
| Funds | | Shares | | | Percentage of
Outstanding Sharesa | |
| | |
| Franklin Liberty Municipal Bond ETF | | | | | | | | |
Franklin Federal Limited-Term Tax-Free Income Fund | | | 715,000 | | | | 68.1% | |
| | | | |
aInvestment activities of significant shareholders could have a material impact on the Funds.
4. Income Taxes
For tax purposes, capital losses may be carried over to offset future capital gains, if any. At March 31, 2019, the capital loss carryforwards were as follows:
| | | | | | | | |
| | |
| | | Franklin Liberty
Intermediate
Municipal
Opportunities ETF | | | Franklin Liberty
Municipal
Bond ETF | |
| Capital loss carryforwards: | | | | | | | | |
Short term | | $ | 64,623 | | | $ | 26,801 | |
Long term | | | 57,378 | | | | 54,878 | |
| | | | |
Total capital loss carryforwards | | $ | 122,001 | | | $ | 81,679 | |
| | | | |
| | | | |
| | | |
| 30 | | Semiannual Report | | franklintempleton.com |
FRANKLIN TEMPLETON ETF TRUST
NOTES TO FINANCIAL STATEMENTS (UNAUDITED)
At September 30, 2019, the cost of investments, net unrealized appreciation (depreciation) and undistributed ordinary income for income tax purposes were as follows:
| | | | | | | | |
| | |
| | | Franklin Liberty
Intermediate
Municipal
Opportunities ETF | | | Franklin Liberty
Municipal
Bond ETF | |
Cost of investments | | $ | 8,819,762 | | | $ | 26,673,729 | |
| | | | |
Unrealized appreciation | | $ | 370,227 | | | $ | 617,668 | |
Unrealized depreciation | | | (67,939 | ) | | | (24,307 | ) |
| | | | |
Net unrealized appreciation (depreciation) | | $ | 302,288 | | | $ | 593,361 | |
| | | | |
5. Investment Transactions
Purchases and sales of investments (excluding short term securities and in-kind transactions, if any) for the period ended September 30, 2019, were as follows:
| | | | | | | | |
| | |
| | | Franklin Liberty
Intermediate
Municipal
Opportunities ETF | | | Franklin Liberty
Municipal
Bond ETF | |
Purchases | | $ | 1,736,256 | | | $ | 19,459,455 | |
Sales | | $ | 114,972 | | | $ | 1,290,495 | |
6. Credit Risk and Defaulted Securities
At September 30, 2019, Franklin Liberty Intermediate Municipal Opportunities ETF and Franklin Liberty Municipal Bond ETF had 7.88% and 2.56% of its portfolio invested in high yield securities, or other securities rated below investment grade and unrated securities, if any. These securities may be more sensitive to economic conditions causing greater price volatility and are potentially subject to a greater risk of loss due to default than higher rated securities.
The Fund may purchase the pre-default or defaulted debt of distressed companies. Distressed companies are financially troubled and could be or are already involved in financial restructuring or bankruptcy. Risks associated with purchasing these securities include the possibility that the bankruptcy or other restructuring process takes longer than expected, or that distributions in restructuring are less than anticipated, either or both of which may result in unfavorable consequences to the Fund. If it becomes probable that the income on debt securities, including those distressed companies, will not be collected, the Fund discontinues accruing income and recognizes an adjustment for uncollectible interest. At September 30, 2019, the aggregate long value of distressed company securities for which interest recognition has been discontinued representing 0.39% of the Fund’s net assets. For information as to specific securities, see the accompanying Statement of Investments.
7. Fair Value Measurements
The Funds follow a fair value hierarchy that distinguishes between market data obtained from independent sources (observable inputs) and the Funds’ own market assumptions (unobservable inputs). These inputs are used in determining the value of the Funds’ financial instruments and are summarized in the following fair value hierarchy:
| | • | | Level 1 – quoted prices in active markets for identical financial instruments |
| | • | | Level 2 – other significant observable inputs (including quoted prices for similar financial instruments, interest rates, prepayment speed, credit risk, etc.) |
| | • | | Level 3 – significant unobservable inputs (including the Funds’ own assumptions in determining the fair value of financial instruments) |
The input levels are not necessarily an indication of the risk or liquidity associated with financial instruments at that level.
| | | | | | |
| | | |
| franklintempleton.com | | Semiannual Report | | | 31 | |
FRANKLIN TEMPLETON ETF TRUST
NOTES TO FINANCIAL STATEMENTS (UNAUDITED)
At September 30, 2019, all of the Funds’ investments in financial instruments carried at fair value were valued using Level 2 inputs.
8. Subsequent Events
The Funds have evaluated subsequent events through the issuance of the financial statements and determined that no events have occurred that require disclosure.
Abbreviations
| | |
| Selected Portfolio |
| AGMC | | – Assured Guaranty Municipal Corp. |
| BAM | | – Build America Mutual Assurance Co. |
| CDA | | – Community Development Authority/Agency |
| CFD | | – Community Facilities District |
| EDC | | – Economic Development Corp. |
| EDR | | – Economic Development Revenue |
| GO | | – General Obligation |
| HDA | | – Housing Development Authority/Agency |
| HFAR | | – Housing Finance Authority Revenue |
| ID | | – Improvement District |
| ISD | | – Independent School District |
| IDAR | | – Industrial Development Authority Revenue |
| IDA | | – Industrial Development Authority/Agency |
| MTA | | – Metropolitan Transit Authority |
| MFHR | | – Multi-Family Housing Revenue |
| PCR | | – Pollution Control Revenue |
| PFA | | – Public Financing Authority |
| PSF | | – Permanent School Fund |
| RDA | | – Redevelopment Agency/Authority |
| USD | | – Unified/Union School District |
| | | | |
| | | |
| 32 | | Semiannual Report | | franklintempleton.com |
FRANKLIN TEMPLETON ETF TRUST
Shareholder Information
Board Approval of Investment Management Agreements
FRANKLIN TEMPLETON ETF TRUST
Franklin Liberty Intermediate Municipal
Opportunities ETF
Franklin Liberty Municipal Bond ETF
(each a Fund)
At anin-person meeting held on May 29, 2019 (Meeting), the Board of Trustees (Board) of Franklin Templeton ETF Trust (the Trust), including a majority of the trustees who are not “interested persons” as defined in the Investment Company Act of 1940 (Independent Trustees), reviewed and approved the continuance of the investment management agreement between Franklin Advisers, Inc. (Manager) and the Trust, on behalf of each Fund (each a Management Agreement) for an additionalone-year period. The Independent Trustees received advice from and met separately with Independent Trustee counsel in considering whether to approve the continuation of each Management Agreement. Although the Management Agreements for the Funds were considered at the same Board meeting, the Board considered the information provided to it about the Funds together and with respect to each Fund separately as the Board deemed appropriate.
In considering the continuation of each Management Agreement, the Board reviewed and considered information provided by the Manager at the Meeting and throughout the year at meetings of the Board and its committees. The Board also reviewed and considered information provided in response to a detailed set of requests for information submitted to the Manager by Independent Trustee counsel on behalf of the Independent Trustees in connection with the annual contract renewal process. In addition, prior to the Meeting, the Independent Trustees held a telephonic contract renewal meeting at which the Independent Trustees conferred amongst themselves and Independent Trustee counsel about contract renewal matters. The Board reviewed and considered all of the factors it deemed relevant in approving the continuance of each Management Agreement, including, but not limited to: (i) the nature, extent and quality of the services provided by the Manager; (ii) the investment performance of each Fund; (iii) the costs of the services provided and profits realized by the Manager and its affiliates from the relationship with each Fund; (iv) the extent to which economies of scale are realized as each Fund grows; and (v) whether fee levels reflect these economies of scale for the benefit of Fund investors.
In approving the continuance of each Management Agreement, the Board, including a majority of the Independent Trustees, determined that the terms of each Management Agreement are fair and reasonable and that the continuance of such Management Agreement is in the best interests of the applicable Fund and its shareholders. While attention was given to all information furnished, the following discusses some primary factors relevant to the Board’s determination.
NATURE, EXTENT AND QUALITY OF SERVICES. The Board reviewed and considered information regarding the nature, extent and quality of investment management services provided by the Manager and its affiliates to the Funds and their shareholders. This information included, among other things, the qualifications, background and experience of the senior management and investment personnel of the Manager; the structure of investment personnel compensation; oversight of third-party service providers; investment performance reports and related financial information for each Fund; reports on expenses; legal and compliance matters; risk controls; pricing and other services provided by the Manager and its affiliates; and management fees charged by the Manager and its affiliates to US funds and other accounts, including management’s explanation of differences among accounts where relevant. The Board noted management’s continuing efforts and expenditures in establishing effective business continuity plans and developing strategies to address areas of heightened concern in the registered fund industry, such as cybersecurity and liquidity risk management. The Board also recognized management’s commitment to facilitating Board oversight of liquidity through the designation of a liquidity/risk administrator and the development of reports that highlight the amount of illiquid investments for each Fund.
The Board also reviewed and considered the benefits provided to Fund shareholders of investing in a fund that is part of the Franklin Templeton family of funds. The Board noted the financial position of Franklin Resources, Inc. (FRI), the Manager’s parent, and its commitment to the registered fund business as evidenced by its continued introduction of new funds, reassessment of the fund offerings in response to the market environment and project initiatives and capital investments relating to the services provided to the Fund by the Franklin Templeton (FT) organization.
Following consideration of such information, the Board was satisfied with the nature, extent and quality of services provided by the Manager and its affiliates to the Funds and their shareholders.
| | | | | | |
| | | |
| franklintempleton.com | | Semiannual Report | | | 33 | |
FRANKLIN TEMPLETON ETF TRUST
SHAREHOLDER INFORMATION
FUND PERFORMANCE. The Board reviewed and considered the performance results of each Fund for various time periods ended February 28, 2019. The Board considered the performance returns for each Fund in comparison to the performance returns of registered funds deemed comparable to the Fund included in a universe (Performance Universe) selected by Broadridge Financial Solutions, Inc. (Broadridge), an independent provider of investment company data. The Board received a description of the methodology used by Broadridge to select the registered funds included in a Performance Universe. The Board also reviewed and considered Fund performance reports provided and discussions that occurred with portfolio managers at Board meetings throughout the year. The Board noted its ongoing discussions with the Manager about the performance of the Funds to date and the importance of performance to asset growth. Specifically, the Board referenced earlier discussions with management on matters related to, among other things, the strategy behind the overall productline-up, the design and construction of the Manager’s proprietary indices, the comparability of peer data, the nature of the Manager’s research, the potential use of innovative data and technology, and investments in marketing and distribution. A summary of each Fund’s performance results is below.
The Performance Universe for the Franklin Liberty Intermediate Municipal Opportunities ETF included the Fund and all retail and institutional intermediate municipal debt funds. The Performance Universe for the Franklin Liberty Municipal Bond ETF included the Fund and all retail and institutional general and insured municipal debt funds. The Funds commenced operations on August 31, 2017, and thus have been in operation for less than three years. The Board noted that the Funds’ annualized total returns for theone-year period were above the medians and in the first (best) and second quintiles of their respective Performance Universes. The Board concluded that the Funds’ performance was satisfactory.
COMPARATIVE FEES AND EXPENSES. The Board reviewed and considered information regarding each Fund��s actual total expense ratio and its various components, including, as applicable, management fees; transfer agent expenses; underlying fund expenses; Rule12b-1 andnon-Rule12b-1 service fees; and othernon-management fees. The Board considered the actual total expense ratio and, separately, the contractual management fee rate, without the effect of fee waivers, if any (Management Rate) of each Fund in comparison to the median expense ratio and median Management Rate, respectively, of other exchange-traded funds deemed comparable to and with a similar expense structure to the Fund selected by Broadridge
(Expense Group). Broadridge fee and expense data is based upon information taken from each fund’s most recent annual report, which reflects historical asset levels that may be quite different from those currently existing, particularly in a period of market volatility. While recognizing such inherent limitation and the fact that expense ratios and Management Rates generally increase as assets decline and decrease as assets grow, the Board believed the independent analysis conducted by Broadridge to be an appropriate measure of comparative fees and expenses. The Broadridge Management Rate includes administrative charges. The Board received a description of the methodology used by Broadridge to select the exchange-traded funds included in an Expense Group.
The Expense Group for the Franklin Liberty Intermediate Municipal Opportunities ETF was comprised of actively managed exchange-traded funds, which included the Fund and four other intermediate municipal debt funds. The Expense Group for the Franklin Liberty Municipal Bond ETF was comprised of actively managed exchange-traded funds, which included the Fund and three other general and insured municipal debt funds. The Board noted that the Management Rates for these Funds were above the medians of their respective Expense Groups, but their actual total expense ratios were below the medians of their respective Expense Groups. The Board also noted the small size of the Expense Groups and that each Fund’s actual total expense ratio reflected a fee waiver from management. The Board concluded that the Management Rates charged to these Funds are reasonable.
PROFITABILITY. The Board reviewed and considered information regarding the profits realized by the Manager and its affiliates in connection with the operation of each Fund. In this respect, the Board considered the Fund profitability analysis that addresses the overall profitability of FT’s US fund business, as well as its profits in providing investment management and other services to each of the individual funds during the12-month period ended September 30, 2018, being the most recent fiscalyear-end for FRI. The Board noted that although management continually makes refinements to its methodologies used in calculating profitability in response to organizational and product-related changes, the overall methodology has remained consistent with that used in the Funds’ profitability report presentations from prior years. Additionally, PricewaterhouseCoopers LLP, auditor to FRI and certain Franklin Templeton funds, has been engaged to periodically review and assess the allocation methodologies to be used solely by the Funds’ Board with respect to the profitability analysis.
| | | | |
| | | |
| 34 | | Semiannual Report | | franklintempleton.com |
FRANKLIN TEMPLETON ETF TRUST
SHAREHOLDER INFORMATION
The Board noted management’s belief that costs incurred in establishing the infrastructure necessary for the type of fund operations conducted by the Manager and its affiliates may not be fully reflected in the expenses allocated to each Fund in determining its profitability, as well as the fact that the level of profits, to a certain extent, reflected operational cost savings and efficiencies initiated by management. The Board also noted management’s expenditures in improving shareholder services provided to the Funds, as well as the need to implement systems and meet additional regulatory and compliance requirements resulting from recent SEC and other regulatory requirements.
The Board also considered the extent to which the Manager and its affiliates might derive ancillary benefits from fund operations, including revenues generated from transfer agent services, potential benefits resulting from personnel and systems enhancements necessitated by fund growth, as well as increased leverage with service providers and counterparties. Based upon its consideration of all these factors, the Board concluded that the level of profits realized by the Manager and its affiliates from providing services to each Fund was not excessive in view of the nature, extent and quality of services provided to each Fund.
ECONOMIES OF SCALE. The Board reviewed and considered the extent to which the Manager may realize economies of scale, if any, as each Fund grows larger and whether each Fund’s management fee structure reflects any economies of scale for the benefit of shareholders. The Board considered the Manager’s view that any analyses of potential economies of scale in managing a particular fund are inherently limited in light of the joint and common costs and investments the Manager incurs across the Franklin Templeton family of funds as a whole. The Board noted that each Fund commenced operations on August 31, 2017 and that, as of December 31, 2018, each Fund’s net assets were less than $20 million. The Board recognized that there would not likely be any economies of scale until each Fund’s assets grow.
CONCLUSION. Based on its review, consideration and evaluation of all factors it believed relevant, including the above-described factors and conclusions, the Board unanimously approved the continuation of each Management Agreement for an additionalone-year period.
Proxy Voting Policies and Procedures
The Trust’s investment manager has established Proxy Voting Policies and Procedures (Policies) that the Trust uses to determine how to vote proxies relating to portfolio securities.
Shareholders may view the Trust’s complete Policies online at franklintempleton.com. Alternatively, shareholders may request copies of the Policies free of charge by calling the Proxy Group collect at (954)527-7678 or by sending a written request to: Franklin Templeton Companies, LLC, 300 S.E. 2nd Street, Fort Lauderdale, FL 33301, Attention: Proxy Group. Copies of the Trust’s proxy voting records are also made available online at franklintempleton.com and posted on the U.S. Securities and Exchange Commission’s website at sec.gov and reflect the most recent12-month period ended June 30.
Quarterly Statement of Investments
The Trust files a complete statement of investments with the U.S. Securities and Exchange Commission for the first and third quarters for each fiscal year as an exhibit to its report on FormN-PORT. Shareholders may view the filed FormN-PORT by visiting the Commission’s website at sec.gov. The filed form may also be viewed and copied at the Commission’s Public Reference Room in Washington, DC. Information regarding the operations of the Public Reference Room may be obtained by calling(800) SEC-0330.
Premium/Discount Information
Information about the differences between the daily market price on the secondary market for the shares of the Fund and the Fund’s net asset value may be found on the Fund’s website at franklintempleton.com.
| | | | | | |
| | | |
| franklintempleton.com | | Semiannual Report | | | 35 | |
Authorized for distribution only when accompanied or preceded by a summary prospectus and/or prospectus. Investors should carefully consider a fund’s investment goals, risks, charges and expenses before investing. A prospectus contains this and other information; please read it carefully before investing.
To help ensure we provide you with quality service, all calls to and from our service areas are monitored and/or recorded.
| | | | | | |
 | | Semiannual Report Franklin Templeton ETF Trust | | |
| | | |
| | Investment Manager | | Distributor | | Investor Services |
| | Franklin Advisers, Inc. | | Franklin Templeton Distributors, Inc. (800) DIAL BEN®/342-5236 franklintempleton.com | | Transfer Agent State Street Bank and
Trust Company 1 Heritage Drive
Mail Stop OHD0100 North Quincy, MA 02171 |
| © 2019 Franklin Templeton Investments. All rights reserved. | | | | ETF4 S 11/19 |
SEMIANNUAL REPORT
FRANKLIN TEMPLETON
ETF TRUST
September 30, 2019


| | |
Franklin FTSE Asia ex Japan ETF | | Franklin FTSE Japan ETF |
Franklin FTSE Australia ETF | | Franklin FTSE Japan Hedged ETF |
Franklin FTSE Brazil ETF | | Franklin FTSE Latin America ETF |
Franklin FTSE Canada ETF | | Franklin FTSE Mexico ETF |
Franklin FTSE China ETF | | Franklin FTSE Russia ETF |
Franklin FTSE Europe ETF | | Franklin FTSE Saudi Arabia ETF |
Franklin FTSE Europe Hedged ETF | | Franklin FTSE South Africa ETF |
Franklin FTSE France ETF | | Franklin FTSE South Korea ETF |
Franklin FTSE Germany ETF | | Franklin FTSE Switzerland ETF |
Franklin FTSE Hong Kong ETF | | Franklin FTSE Taiwan ETF |
Franklin FTSE India ETF | | Franklin FTSE United Kingdom ETF |
Franklin FTSE Italy ETF | | |
Internet Delivery of Fund Reports Unless You Request Paper Copies: Effective January 1, 2021, as permitted by the SEC, paper copies of the Fund’s shareholder reports will no longer be sent by mail, unless you specifically request them from the Fund or your financial intermediary. Instead, the reports will be made available on a website, and you will be notified by mail each time a report is posted and provided with a website link to access the report.
If you already elected to receive shareholder reports electronically, you will not be affected by this change and you need not take any action. If you have not signed up for electronic delivery, we would encourage you to join fellow shareholders who have. You may elect to receive shareholder reports and other communications electronically from the Fund by calling(800) 632-2301 or by contacting your financial intermediary.
You may elect to continue to receive paper copies of all your future shareholder reports free of charge by contacting your financial intermediary or, if you invest directly with a Fund, calling(800) 632-2301 to let the Fund know of your request. Your election to receive reports in paper will apply to all funds held in your account.
Franklin Templeton
Successful investing begins with ambition. And achievement only comes when you reach for it. That’s why we continually strive to deliver better outcomes for investors. No matter what your goals are, our deep, global investment expertise allows us to offer solutions that can help.
During our more than 70 years of experience, we’ve managed through all kinds of markets—up, down and those in between. We’re always preparing for what may come next. It’s because of this, combined with our strength as one of the world’s largest asset managers that we’ve earned the trust of millions of investors around the world.
Visitfranklintempleton.com/investor/investments-and-solutions/investment-options/etfs/ for fund updates and documents.
| | | | | | | | |
| Not FDIC Insured | | | | | May Lose Value | | | | | No Bank Guarantee |
| | | | | | |
| | | |
| franklintempleton.com | | Not part of the semiannual report | | | 1 | |
SEMIANNUAL REPORT
Economic and Market Overview
The global economy expanded during the six months ended September 30, 2019, despite weakness in certain regions. Global stocks were aided by upbeat economic data in some regions, encouraging corporate earnings reports, periods of optimism about a potential U.S.-China trade deal and monetary policy easing by major central banks. The U.S. Federal Reserve’s (Fed’s) patient approach to its monetary policy early in the period, rate cuts in July and September, and indications it will act appropriately to sustain U.S. economic expansion and achieve its inflation objective aided market sentiment.
However, markets also reflected concerns about political uncertainties in the U.S. (including the impeachment inquiry into U.S. President Donald Trump), geopolitical tensions in the eurozone and other regions, and the impact of U.S. trade disputes with China and other trading partners on global growth and corporate earnings. In this environment, global developed and emerging market stocks, as measured by the FTSEAll-World Index, posted a positive total return for the six months under review.
The U.S. economy grew during thesix-month period. However, the economy moderated in 2019’s second and third quarters, due partly to weakness in inventory and business investment. The manufacturing sector expanded during the period’s first four months, but contracted in August and September 2019. The services sector continued to expand throughout the period, although the rate of expansion slowed in September. The unemployment rate decreased from 3.8% in March 2019 to 3.5% atperiod-end.1 The annual inflation rate, as measured by the Consumer Price Index, decreased from 1.9% in March 2019 to 1.7%at period-end.1
At its July 2019 meeting, the Fed lowered its target range for the federal funds rate for the first time since December 2008, to 2.00%–2.25%, citing muted inflation pressures and the potential effects of global trade tensions on economic growth. Furthermore, the Fed ended its balance sheet normalization program earlier than previously indicated. In September, the Fed further lowered the federal funds target rate range to 1.75%–2.00%, reiterating the rationale cited at the July 2019 meeting.
In Europe, the U.K.’s quarterly gross domestic product (GDP) growth contracted in 2019’s second quarter, as Brexit uncertainties weighed on business sentiment. The Bank of England kept its key policy rate unchanged during thesix-month period and lowered its GDP forecasts for 2019 and 2020. The eurozone’s quarterly GDP growth moderated in 2019’s second quarter and stabilized in the third quarter. The bloc’s annual inflation rate ended the period lower. The European Central Bank (ECB) kept its benchmark interest rate unchanged during the period. In September, the ECB announced it will start a new bond-buying program in November in an effort to boost the economy and increase inflation.
In Asia, Japan’s quarterly GDP growth moderated in 2019’s second quarter. The Bank of Japan (BOJ) left its benchmark interest rate unchanged and continued its stimulus measures during thesix-month period. At its July and September meetings, the BOJ expressed its openness to increase stimulus in an effort to sustain economic growth and achieve its inflation goal.
In larger emerging markets, Brazil’s quarterly GDP growth accelerated in 2019’s second quarter. The Central Bank of Brazil lowered its benchmark interest rate twice during thesix-month period. Russia’s annual GDP growth accelerated in 2019’s second quarter. The Bank of Russia cut its key interest rate three times during the period. China’s annual GDP growth moderated in 2019’s second and third quarters. The People’s Bank of China implemented an interest-rate reform in August, designating the loan prime rate as the new benchmark for household and business loans, effectively lowering interest rates in August and September. Overall, global emerging market stocks, as measured by the FTSE Emerging Index, posted a negative total return during the six months under review.
The foregoing information reflects our analysis and opinions as of September 30, 2019. The information is not a complete analysis of every aspect of any market, country, industry, security or fund. Statements of fact are from sources considered reliable.
1. Source: U.S. Bureau of Labor Statistics.
| | | | |
| | | |
| 2 | | Semiannual Report | | franklintempleton.com |
Franklin FTSE Asia ex Japan ETF
This semiannual report for Franklin FTSE Asia ex Japan ETF covers the period ended September 30, 2019.
Your Fund’s Goal and Main Investments
The Fund seeks to provide investment results that closely correspond, before fees and expenses, to the performance of the FTSE Asia ex Japan RIC Capped Index (the FTSE Asia ex Japan Capped Index or the Underlying Index).1 Under normal market conditions, the Fund invests at least 80% of its assets in the component securities of the FTSE Asia ex Japan Capped Index and in depositary receipts representing such securities.
Performance Overview
During thesix-month period, the Fund posted cumulative total returns of -5.73% based on market price and -5.07% based on net asset value. In comparison, the FTSE Asia ex Japan Capped Index posted a -5.08% total return for the same period.2 You can find more of the Fund’s performance data in the Performance Summary beginning on page 5.
Performance data represent past performance, which does not guarantee future results. Investment return and principal value will fluctuate, and you may have a gain or loss when you sell your shares. Current performance may differ from figures shown. For most recentmonth-end performance, go tofranklintempleton.com or call(800)342-5236.
Investment Strategy
The Fund, using a “passive” or indexing investment approach, seeks investment results that closely correspond, before fees and expenses, to the performance of the FTSE Asia ex Japan Capped Index. We seek to achieve, over time, a correlation between the Fund’s performance, before fees and expenses, and that of the Underlying Index of 0.95 or better. A figure of 1.00 would indicate perfect correlation. Our intention is to
| | | | |
| Top 10 Sectors/Industries | |
|
| 9/30/19 | |
| |
| | | % of Total
Net Assets | |
| Banks | | | 13.3% | |
| Internet & Direct Marketing Retail | | | 6.7% | |
| Interactive Media & Services | | | 6.6% | |
| Semiconductors & Semiconductor Equipment | | | 6.4% | |
| Insurance | | | 6.2% | |
| Technology Hardware, Storage & Peripherals | | | 5.8% | |
| Real Estate Management & Development | | | 4.9% | |
| Oil, Gas & Consumable Fuels | | | 4.4% | |
| Electronic Equipment, Instruments & Components | | | 2.4% | |
| Industrial Conglomerates | | | 2.4% | |
replicate the component securities of the Underlying Index as closely as possible (i.e., invest in all of the component securities in their respective weightings in the Underlying Index). However, under various circumstances, it may not be possible or practicable to replicate the Underlying Index. In these circumstances, we may use a “representative sampling” strategy whereby we would invest in what we believe to be a representative sample of the component securities of the Underlying Index, but may not track the Underlying Index with the same degree of accuracy as would an investment vehicle replicating the entire Underlying Index. Under the representative sampling technique, we will select securities that collectively have an investment profile similar to that of the Underlying Index, including securities that resemble those included in the Underlying Index in terms of risk factors, performance attributes and other characteristics, such as market capitalization and industry weightings. The Fund will concentrate its investments (i.e., hold 25% or more of its net assets) in a particular industry or group of industries to approximately the same extent that the Underlying Index is concentrated.
1. The FTSE Asia ex Japan Capped Index is a free float-adjusted market capitalization-weighted index maintained and calculated by FTSE Russell with a capping methodology applied quarterly to issuer weights so that no single issuer of a component exceeds 25% of the index weight, and all issuers with weights above 5% do not cumulatively exceed 50% of the index’s weight. The FTSE Asia ex Japan Capped Index is based on the FTSE Asia ex Japan Index and is designed to measure the performance of large- andmid-capitalization stocks from developed and emerging Asian countries, excluding Japan. The Chinese constituents in the FTSE Asia ex Japan Capped Index are represented byH-shares,B-shares,N-shares, Red Chips,P-Chips andS-Chips.
2. Source: FactSet.
The index is unmanaged and includes reinvestment of any income or distributions (after the deduction of certain withholding taxes). It does not reflect any fees, expenses or sales charges. One cannot invest directly in an index.
See www.franklintempletondatasources.com for additional data provider information.
The dollar value, number of shares or principal amount, and names of all portfolio holdings are listed in the Fund’s Statement of Investments (SOI). The SOI begins on page 119.
| | | | | | |
| | | |
| franklintempleton.com | | Semiannual Report | | | 3 | |
FRANKLIN FTSE ASIA EX JAPAN ETF
| | | | |
| Top 10 Holdings | | | |
|
| 9/30/19 | |
| |
Company
Sector/Industry, Country | | % of Total
Net Assets | |
Tencent Holdings Ltd.
Interactive Media & Services, China | | | 5.1% | |
Alibaba Group Holding Ltd., ADR
Internet & Direct Marketing Retail, China | | | 5.0% | |
Samsung Electronics Co. Ltd.
Technology Hardware, Storage & Peripherals, South Korea | | | 4.7% | |
Taiwan Semiconductor Manufacturing Co. Ltd.
Semiconductors & Semiconductor Equipment, Taiwan | | | 4.5% | |
AIA Group Ltd.
Insurance, Hong Kong | | | 2.4% | |
China Construction Bank Corp., A, H
Banks, China | | | 1.5% | |
Ping An Insurance (Group) Co. of China Ltd., H
Insurance, China | | | 1.3% | |
Reliance Industries Ltd.
Oil, Gas & Consumable Fuels, India | | | 1.2% | |
Industrial and Commercial Bank of China Ltd., H
Banks, China | | | 1.2% | |
Housing Development Finance Corp. Ltd.
Thrifts & Mortgage Finance, India | | | 1.0% | |
| | | | |
| Top 10 Countries | |
|
| 9/30/19 | |
| |
| | | % of Total
Net Assets | |
| China | | | 36.8% | |
| South Korea | | | 13.6% | |
| Taiwan | | | 12.9% | |
| India | | | 11.2% | |
| Hong Kong | | | 10.0% | |
| Singapore | | | 4.1% | |
| Thailand | | | 3.7% | |
| Malaysia | | | 2.8% | |
| Indonesia | | | 2.2% | |
| Philippines | | | 1.3% | |
Thank you for your participation in Franklin FTSE Asia ex Japan ETF. We look forward to serving your future investment needs.
| | |
 | | 
Dina Ting, CFA |
| | |
 | | 
Louis Hsu, CFA |
| |
| | Portfolio Management Team |
The foregoing information reflects our analysis, opinions and portfolio holdings as of September 30, 2019, the end of the reporting period. These opinions may not be relied upon as investment advice or an offer for a particular security. The information is not a complete analysis of every aspect of any market, country, industry, security or the Fund. Statements of fact are from sources considered reliable, but the investment manager makes no representation or warranty as to their completeness or accuracy. Although historical performance is no guarantee of future results, these insights may help you understand our investment management philosophy.
CFA® is a trademark owned by CFA Institute.
| | | | |
| | | |
| 4 | | Semiannual Report | | franklintempleton.com |
FRANKLIN FTSE ASIA EX JAPAN ETF
Performance Summary as of September 30, 2019
Total return reflects reinvestment of the Fund’s dividends and capital gain distributions, if any, and any unrealized gains or losses. Total returns do not include brokerage commissions that may be payable on secondary market transactions. The performance table does not reflect any taxes that a shareholder would pay on Fund dividends, capital gain distributions, if any, or any realized gains on the sale or redemption of Fund shares.
Net asset value or “NAV” is the value of one share of a fund as calculated in accordance with the standard formula for valuing mutual fund shares. The price used to calculate market return (Market Price) is determined by using the midpoint between the highest bid and the lowest offer on the primary stock exchange on which shares of a fund are listed for trading, as of the time that such fund’s NAV is calculated. Since shares of the Fund did not trade in the secondary market until after the Fund’s inception, for the period from inception to the first day of secondary trading (2/9/18), the NAV of the Fund is used as a proxy for the Market Price to calculate market returns. Market and NAV returns assume that dividends and capital gain distributions have been reinvested at Market Price and NAV.
Your dividend income will vary depending on dividends or interest paid by securities in the Fund’s portfolio, adjusted for operating expenses. Capital gain distributions are net profits realized from the sale of portfolio securities.
Performance as of 9/30/19
| | | | | | | | | | | | | | | | |
| | |
| | | Cumulative Total Return1 | | | Average Annual Total Return1 | |
| | | Based on
NAV2 | | | Based on market price3 | | | Based on
NAV2 | | | Based on market price3 | |
6-Month | | | -5.07% | | | | -5.73% | | | | -5.07% | | | | -5.73% | |
1-Year | | | -3.65% | | | | -3.97% | | | | -3.65% | | | | -3.97% | |
Since Inception (2/6/18) | | | -10.19% | | | | -10.45% | | | | -6.32% | | | | -6.48% | |
Performance data represent past performance, which does not guarantee future results. Investment return and principal value will fluctuate, and you may have a gain or loss when you sell your shares. Current performance may differ from figures shown. For most recentmonth-end performance, go tofranklintempleton.com or call(800)342-5236.
See page 6 for Performance Summary footnotes.
| | | | | | |
| | | |
| franklintempleton.com | | Semiannual Report | | | 5 | |
FRANKLIN FTSE ASIA EX JAPAN ETF
PERFORMANCE SUMMARY
Distributions(4/1/19–9/30/19)
|
|
Net Investment
Income |
$0.124210 |
Total Annual Operating Expenses4
All investments involve risks, including possible loss of principal. Stock prices fluctuate, sometimes rapidly and dramatically, due to factors affecting individual companies, particular industries or sectors, or general market conditions. Special risks are associated with foreign investing, including currency fluctuations, economic instability and political developments. Investments in developing markets involve heightened risks related to the same factors, in addition to those associated with these markets’ smaller size, lesser liquidity and lack of established legal, political, business and social frameworks to support securities markets. Investments in securities of Asian issuers involve risks that are specific to Asia, including certain legal, regulatory, political and economic risks. Because the Fund invests its assets primarily in companies in a specific country or region, the Fund may also experience greater volatility than a fund that is more broadly diversified geographically. The Fund’s prospectus also includes a description of the main investment risks.
ETFs trade like stocks, fluctuate in market value and may trade at prices above or below their net asset value. Brokerage commissions and ETF expenses will reduce returns.
1. Total return calculations represent the cumulative and average annual changes in value of an investment over the periods indicated. Return for less than one year, if any, has not been annualized.
2. Assumes reinvestment of distributions based on net asset value.
3. Assumes reinvestment of distributions based on market price.
4. Figures are as stated in the Fund’s current prospectus and may differ from the expense ratios disclosed in the Your Fund’s Expenses and Financial Highlights sections in this report. In periods of market volatility, assets may decline significantly, causing total annual Fund operating expenses to become higher than the figures shown.
| | | | |
| | | |
| 6 | | Semiannual Report | | franklintempleton.com |
FRANKLIN FTSE ASIA EX JAPAN ETF
Your Fund’s Expenses
As a Fund shareholder, you can incur two types of costs: (1) transaction costs, including brokerage commissions on purchases and sales of Fund shares; and (2) ongoing Fund costs, including management fees and other Fund expenses. All funds have ongoing costs, sometimes referred to as operating expenses. The table below shows ongoing costs of investing in the Fund and can help you understand these costs and compare them with those of other funds. The table assumes a $1,000 investment held for the six months indicated.
Actual Fund Expenses
The table below provides information about actual account values and actual expenses in the columns under the heading “Actual.” In these columns the Fund’s actual return, which includes the effect of Fund expenses, is used to calculate the “Ending Account Value.” You can estimate the expenses you paid during the period by following these steps (of course, your account value and expenses will differ from those in this illustration):Divide your account value by $1,000 (if your account had an $8,600 value, then $8,600÷ $1,000 = 8.6).Then multiply the result by the number in the row under the headings “Actual” and “Expenses Paid During Period” (if Actual Expenses Paid During Period were $7.50, then 8.6 x $7.50 = $64.50).In this illustration, the actual expenses paid this period are $64.50.
Hypothetical Example for Comparison with Other Funds
Under the heading “Hypothetical” in the table, information is provided about hypothetical account values and hypothetical expenses based on the Fund’s actual expense ratio and an assumed rate of return of 5% per year before expenses, which is not the Fund’s actual return. This information may not be used to estimate the actual ending account balance or expenses you paid for the period, but it can help you compare ongoing costs of investing in the Fund with those of other funds. To do so, compare this 5% hypothetical example with the 5% hypothetical examples that appear in the shareholder reports of other funds.
Please note that expenses shown in the table are meant to highlight ongoing costs and do not reflect any transactional costs.Therefore, information under the heading “Hypothetical” is useful in comparing ongoing costs only, and will not help you compare total costs of owning different funds. In addition, if transactional costs were included, your total costs would have been higher.
| | | | | | | | | | | | | | | | | | | | | | |
| | | | Actual (actual return after expenses) | | | Hypothetical (5% annual return before expenses) | | | | |
| | | | | |
Beginning
Account
Value 4/1/19 | | | Ending
Account
Value 9/30/19 | | | Expenses
Paid During
Period
4/1/19–9/30/191,2 | | | Ending
Account
Value 9/30/19 | | | Expenses
Paid During
Period
4/1/19–9/30/191,2 | | | Net Annualized
Expense Ratio2 | |
| | $1,000.00 | | | $ | 949.30 | | | $ | 0.93 | | | $ | 1,024.05 | | | $ | 0.96 | | | | 0.19 | % |
1. Expenses are equal to the annualized expense ratio for thesix-month period as indicated above—in the far right column—multiplied by the simple average account value over the period indicated, and then multiplied by 183/366 to reflect theone-half year period.
2. Reflects expenses after fee waivers and expense reimbursements.
| | | | | | |
| | | |
| franklintempleton.com | | Semiannual Report | | | 7 | |
Franklin FTSE Australia ETF
This semiannual report for Franklin FTSE Australia ETF covers the period ended September 30, 2019.
Your Fund’s Goal and Main Investments
The Fund seeks to provide investment results that closely correspond, before fees and expenses, to the performance of the FTSE Australia RIC Capped Index (the FTSE Australia Capped Index or the Underlying Index).1 Under normal market conditions, the Fund invests at least 80% of its assets in the component securities of the FTSE Australia Capped Index and in depositary receipts representing such securities.
Performance Overview
During thesix-month period, the Fund posted cumulative total returns of +5.72% based on market price and +5.58% based on net asset value. In comparison, the FTSE Australia Capped Index posted a +5.61% total return for the same period.2 You can find more of the Fund’s performance data in the Performance Summary beginning on page 10.
Performance data represent past performance, which does not guarantee future results. Investment return and principal value will fluctuate, and you may have a gain or loss when you sell your shares. Current performance may differ from figures shown. For most recentmonth-end performance, go tofranklintempleton.com or call(800)342-5236.
Investment Strategy
The Fund, using a “passive” or indexing investment approach, seeks investment results that closely correspond, before fees and expenses, to the performance of the FTSE Australia Capped Index. We seek to achieve, over time, a correlation between the Fund’s performance, before fees and expenses, and that of the Underlying Index of 0.95 or better. A figure of 1.00 would indicate perfect correlation. Our intention is to
| | | | |
| Top 10 Sectors/Industries | |
|
| 9/30/19 | |
| |
| | | % of Total
Net Assets | |
| Banks | | | 26.8% | |
| Metals & Mining | | | 14.5% | |
| Equity Real Estate Investment Trusts (REITs) | | | 6.9% | |
| Biotechnology | | | 6.7% | |
| Oil, Gas & Consumable Fuels | | | 5.2% | |
| Capital Markets | | | 4.3% | |
| Food & Staples Retailing | | | 4.2% | |
| Insurance | | | 3.9% | |
| Transportation Infrastructure | | | 3.7% | |
| Multiline Retail | | | 3.0% | |
replicate the component securities of the Underlying Index as closely as possible (i.e., invest in all of the component securities in their respective weightings in the Underlying Index). However, under various circumstances, it may not be possible or practicable to replicate the Underlying Index. In these circumstances, we may use a “representative sampling” strategy whereby we would invest in what we believe to be a representative sample of the component securities of the Underlying Index, but may not track the Underlying Index with the same degree of accuracy as would an investment vehicle replicating the entire Underlying Index. Under the representative sampling technique, we will select securities that collectively have an investment profile similar to that of the Underlying Index, including securities that resemble those included in the Underlying Index in terms of risk factors, performance attributes and other characteristics, such as market capitalization and industry weightings. The Fund will concentrate its investments (i.e., hold 25% or more of its net assets) in a particular industry or group of industries to approximately the same extent that the Underlying Index is concentrated.
1. The FTSE Australia Capped Index is a free float-adjusted market capitalization-weighted index maintained and calculated by FTSE Russell with a capping methodology applied quarterly to issuer weights so that no single issuer of a component exceeds 25% of the index weight, and all issuers with weights above 5% do not cumulatively exceed 50% of the index’s weight. The FTSE Australia Capped Index is based on the FTSE Australia Index and is designed to measure the performance of Australian large- andmid-capitalization stocks.
2. Source: FactSet.
The index is unmanaged and includes reinvestment of any income or distributions (after the deduction of certain withholding taxes). It does not reflect any fees, expenses or sales charges. One cannot invest directly in an index.
See www.franklintempletondatasources.com for additional data provider information.
The dollar value, number of shares or principal amount, and names of all portfolio holdings are listed in the Fund’s Statement of Investments (SOI). The SOI begins on page 152.
| | | | |
| | | |
| 8 | | Semiannual Report | | franklintempleton.com |
FRANKLIN FTSE AUSTRALIA ETF
| | | | |
| Top 10 Holdings | |
|
| 9/30/19 | |
| |
Company
Sector/Industry, Country | | % of Total
Net Assets | |
Commonwealth Bank of Australia
Banks, Australia | | | 9.1% | |
BHP Group Ltd.
Metals & Mining, Australia | | | 6.9% | |
CSL Ltd.
Biotechnology, Australia | | | 6.7% | |
Westpac Banking Corp.
Banks, Australia | | | 6.6% | |
National Australia Bank Ltd.
Banks, Australia | | | 5.4% | |
Australia & New Zealand Banking Group Ltd.
Banks, Australia | | | 5.1% | |
Woolworths Group Ltd.
Food & Staples Retailing, Australia | | | 3.0% | |
Wesfarmers Ltd.
Multiline Retail, Australia | | | 2.9% | |
Macquarie Group Ltd.
Capital Markets, Australia | | | 2.6% | |
Transurban Group
Transportation Infrastructure, Australia | | | 2.5% | |
Thank you for your participation in Franklin FTSE Australia ETF. We look forward to serving your future investment needs.
| | |
| |
Dina Ting, CFA |
| | |
| |
Louis Hsu, CFA |
| |
| | Portfolio Management Team |
The foregoing information reflects our analysis, opinions and portfolio holdings as of September 30, 2019, the end of the reporting period. These opinions may not be relied upon as investment advice or an offer for a particular security. The information is not a complete analysis of every aspect of any market, country, industry, security or the Fund. Statements of fact are from sources considered reliable, but the investment manager makes no representation or warranty as to their completeness or accuracy. Although historical performance is no guarantee of future results, these insights may help you understand our investment management philosophy.
| | | | | | |
| | | |
| franklintempleton.com | | Semiannual Report | | | 9 | |
FRANKLIN FTSE AUSTRALIA ETF
Performance Summary as of September 30, 2019
Total return reflects reinvestment of the Fund’s dividends and capital gain distributions, if any, and any unrealized gains or losses. Total returns do not include brokerage commissions that may be payable on secondary market transactions. The performance table does not reflect any taxes that a shareholder would pay on Fund dividends, capital gain distributions, if any, or any realized gains on the sale or redemption of Fund shares.
Net asset value or “NAV” is the value of one share of a fund as calculated in accordance with the standard formula for valuing mutual fund shares. The price used to calculate market return (Market Price) is determined by using the midpoint between the highest bid and the lowest offer on the primary stock exchange on which shares of a fund are listed for trading, as of the time that such fund’s NAV is calculated. Since shares of the Fund did not trade in the secondary market until after the Fund’s inception, for the period from inception to the first day of secondary trading (11/6/17), the NAV of the Fund is used as a proxy for the Market Price to calculate market returns. Market and NAV returns assume that dividends and capital gain distributions have been reinvested at Market Price and NAV.
Your dividend income will vary depending on dividends or interest paid by securities in the Fund’s portfolio, adjusted for operating expenses. Capital gain distributions are net profits realized from the sale of portfolio securities.
Performance as of 9/30/19
| | | | | | | | | | | | | | | | |
| | |
| | | Cumulative Total Return1 | | | Average Annual Total Return1 | |
| | | Based on
NAV2 | | | Based on market price3 | | | Based on
NAV2 | | | Based on market price3 | |
6-Month | | | +5.58% | | | | +5.72% | | | | +5.58% | | | | +5.72% | |
1-Year | | | +5.50% | | | | +6.92% | | | | +5.50% | | | | +6.92% | |
Since Inception (11/2/17) | | | +7.55% | | | | +8.18% | | | | +3.89% | | | | +4.20% | |
Performance data represent past performance, which does not guarantee future results. Investment return and principal value will fluctuate, and you may have a gain or loss when you sell your shares. Current performance may differ from figures shown. For most recentmonth-end performance, go tofranklintempleton.com or call(800)342-5236.
See page 11 for Performance Summary footnotes.
| | | | |
| | | |
| 10 | | Semiannual Report | | franklintempleton.com |
FRANKLIN FTSE AUSTRALIA ETF
PERFORMANCE SUMMARY
Distributions(4/1/19–9/30/19)
|
|
Net Investment
Income |
$0.689329 |
Total Annual Operating Expenses4
All investments involve risks, including possible loss of principal. Stock prices fluctuate, sometimes rapidly and dramatically, due to factors affecting individual companies, particular industries or sectors, or general market conditions. Special risks are associated with foreign investing, including currency fluctuations, economic instability and political developments. Investments in securities of Australian issuers involve risks that are specific to Australia, including certain legal, regulatory, political and economic risks. Because the Fund invests its assets primarily in companies in a specific country or region, the Fund may also experience greater volatility than a fund that is more broadly diversified geographically. As anon-diversified fund, the Fund may invest in a relatively small number of issuers and, as a result, be subject to a greater risk of loss with respect to its portfolio securities. The Fund’s prospectus also includes a description of the main investment risks.
ETFs trade like stocks, fluctuate in market value and may trade at prices above or below their net asset value. Brokerage commissions and ETF expenses will reduce returns.
1. Total return calculations represent the cumulative and average annual changes in value of an investment over the periods indicated. Return for less than one year, if any, has not been annualized.
2. Assumes reinvestment of distributions based on net asset value.
3. Assumes reinvestment of distributions based on market price.
4. Figures are as stated in the Fund’s current prospectus and may differ from the expense ratios disclosed in the Your Fund’s Expenses and Financial Highlights sections in this report. In periods of market volatility, assets may decline significantly, causing total annual Fund operating expenses to become higher than the figures shown.
| | | | | | |
| | | |
| franklintempleton.com | | Semiannual Report | | | 11 | |
FRANKLIN FTSE AUSTRALIA ETF
Your Fund’s Expenses
As a Fund shareholder, you can incur two types of costs: (1) transaction costs, including brokerage commissions on purchases and sales of Fund shares; and (2) ongoing Fund costs, including management fees and other Fund expenses. All funds have ongoing costs, sometimes referred to as operating expenses. The table below shows ongoing costs of investing in the Fund and can help you understand these costs and compare them with those of other funds. The table assumes a $1,000 investment held for the six months indicated.
Actual Fund Expenses
The table below provides information about actual account values and actual expenses in the columns under the heading “Actual.” In these columns the Fund’s actual return, which includes the effect of Fund expenses, is used to calculate the “Ending Account Value.” You can estimate the expenses you paid during the period by following these steps (of course, your account value and expenses will differ from those in this illustration):Divide your account value by $1,000 (if your account had an $8,600 value, then $8,600÷ $1,000 = 8.6).Then multiply the result by the number in the row under the headings “Actual” and “Expenses Paid During Period” (if Actual Expenses Paid During Period were $7.50, then 8.6 x $7.50 = $64.50).In this illustration, the actual expenses paid this period are $64.50.
Hypothetical Example for Comparison with Other Funds
Under the heading “Hypothetical” in the table, information is provided about hypothetical account values and hypothetical expenses based on the Fund’s actual expense ratio and an assumed rate of return of 5% per year before expenses, which is not the Fund’s actual return. This information may not be used to estimate the actual ending account balance or expenses you paid for the period, but it can help you compare ongoing costs of investing in the Fund with those of other funds. To do so, compare this 5% hypothetical example with the 5% hypothetical examples that appear in the shareholder reports of other funds.
Please note that expenses shown in the table are meant to highlight ongoing costs and do not reflect any transactional costs.Therefore, information under the heading “Hypothetical” is useful in comparing ongoing costs only, and will not help you compare total costs of owning different funds. In addition, if transactional costs were included, your total costs would have been higher.
| | | | | | | | | | | | | | | | | | | | | | |
| | | | Actual (actual return after expenses) | | | Hypothetical (5% annual return before expenses) | | | | |
| | | | | |
Beginning
Account
Value 4/1/19 | | | Ending
Account
Value 9/30/19 | | | Expenses
Paid During
Period
4/1/19–9/30/191,2 | | | Ending
Account
Value 9/30/19 | | | Expenses
Paid During
Period
4/1/19–9/30/191,2 | | | Net Annualized
Expense Ratio2 | |
| | $1,000.00 | | | $ | 1,055.80 | | | $ | 0.46 | | | $ | 1,024.55 | | | $ | 0.46 | | | | 0.09 | % |
1. Expenses are equal to the annualized expense ratio for thesix-month period as indicated above—in the far right column—multiplied by the simple average account value over the period indicated, and then multiplied by 183/366 to reflect theone-half year period.
2. Reflects expenses after fee waivers and expense reimbursements.
| | | | |
| | | |
| 12 | | Semiannual Report | | franklintempleton.com |
Franklin FTSE Brazil ETF
This semiannual report for Franklin FTSE Brazil ETF covers the period ended September 30, 2019.
Your Fund’s Goal and Main Investments
The Fund seeks to provide investment results that closely correspond, before fees and expenses, to the performance of the FTSE Brazil RIC Capped Index (the FTSE Brazil Capped Index or the Underlying Index).1 Under normal market conditions, the Fund invests at least 80% of its assets in the component securities of the FTSE Brazil Capped Index and in depositary receipts representing such securities.
Performance Overview
During thesix-month period, the Fund posted cumulative total returns of +4.17% based on market price and +2.69% based on net asset value. In comparison, the FTSE Brazil Capped Index posted a +2.82% total return for the same period.2 You can find more of the Fund’s performance data in the Performance Summary beginning on page 15.
Performance data represent past performance, which does not guarantee future results. Investment return and principal value will fluctuate, and you may have a gain or loss when you sell your shares. Current performance may differ from figures shown. For most recentmonth-end performance, go tofranklintempleton.com or call(800)342-5236.
Investment Strategy
The Fund, using a “passive” or indexing investment approach, seeks investment results that closely correspond, before fees and expenses, to the performance of the FTSE Brazil Capped Index. We seek to achieve, over time, a correlation between the Fund’s performance, before fees and expenses, and that of the Underlying Index of 0.95 or better. A figure of 1.00 would indicate perfect correlation. Our intention is to replicate
| | | | |
| Top 10 Sectors/Industries | |
|
| 9/30/19 | |
| |
| | | % of Total
Net Assets | |
| Banks | | | 26.5% | |
| Oil, Gas & Consumable Fuels | | | 12.1% | |
| Metals & Mining | | | 10.6% | |
| Capital Markets | | | 5.6% | |
| Electric Utilities | | | 5.3% | |
| Beverages | | | 4.7% | |
| Multiline Retail | | | 4.4% | |
| Insurance | | | 3.9% | |
| Food Products | | | 3.3% | |
| Road & Rail | | | 2.9% | |
the component securities of the Underlying Index as closely as possible (i.e., invest in all of the component securities in their respective weightings in the Underlying Index). However, under various circumstances, it may not be possible or practicable to replicate the Underlying Index. In these circumstances, we may use a “representative sampling” strategy whereby we would invest in what we believe to be a representative sample of the component securities of the Underlying Index, but may not track the Underlying Index with the same degree of accuracy as would an investment vehicle replicating the entire Underlying Index. Under the representative sampling technique, we will select securities that collectively have an investment profile similar to that of the Underlying Index, including securities that resemble those included in the Underlying Index in terms of risk factors, performance attributes and other characteristics, such as market capitalization and industry weightings. The Fund will concentrate its investments (i.e., hold 25% or more of its net assets) in a particular industry or group of industries to approximately the same extent that the Underlying Index is concentrated.
1. The FTSE Brazil Capped Index is a free float-adjusted market capitalization-weighted index maintained and calculated by FTSE Russell with a capping methodology applied quarterly to issuer weights so that no single issuer of a component exceeds 25% of the index weight, and all issuers with weights above 5% do not cumulatively exceed 50% of the index’s weight. The FTSE Brazil Capped Index is based on the FTSE Brazil Index and is designed to measure the performance of Brazilian large- andmid-capitalization stocks.
2. Source: FactSet.
The index is unmanaged and includes reinvestment of any income or distributions (after the deduction of certain withholding taxes). It does not reflect any fees, expenses or sales charges. One cannot invest directly in an index.
See www.franklintempletondatasources.com for additional data provider information.
The dollar value, number of shares or principal amount, and names of all portfolio holdings are listed in the Fund’s Statement of Investments (SOI). The SOI begins on page 155.
| | | | | | |
| | | |
| franklintempleton.com | | Semiannual Report | | | 13 | |
FRANKLIN FTSE BRAZIL ETF
| | | | |
| Top 10 Holdings | |
|
| 9/30/19 | |
| |
Company
Sector/Industry, Country | | % of Total
Net Assets | |
Petroleo Brasileiro SA
Oil, Gas & Consumable Fuels, Brazil | | | 10.7% | |
Banco Bradesco SA
Banks, Brazil | | | 9.2% | |
Itau Unibanco Holding SA
Banks, Brazil | | | 9.0% | |
Vale SA
Metals & Mining, Brazil | | | 8.9% | |
B3 SA – Brasil Bolsa Balcao
Capital Markets, Brazil | | | 4.8% | |
Ambev SA
Beverages, Brazil | | | 4.7% | |
Itausa – Investimentos Itau SA
Banks, Brazil | | | 4.4% | |
Banco do Brasil SA
Banks, Brazil | | | 2.6% | |
Lojas Renner SA
Multiline Retail, Brazil | | | 2.2% | |
JBS SA
Food Products, United States | | | 1.8% | |
Thank you for your participation in Franklin FTSE Brazil ETF. We look forward to serving your future investment needs.
| | |
| |
Dina Ting, CFA |
| | |
| |
Louis Hsu, CFA |
| |
| | Portfolio Management Team |
The foregoing information reflects our analysis, opinions and portfolio holdings as of September 30, 2019, the end of the reporting period. These opinions may not be relied upon as investment advice or an offer for a particular security. The information is not a complete analysis of every aspect of any market, country, industry, security or the Fund. Statements of fact are from sources considered reliable, but the investment manager makes no representation or warranty as to their completeness or accuracy. Although historical performance is no guarantee of future results, these insights may help you understand our investment management philosophy.
| | | | |
| | | |
| 14 | | Semiannual Report | | franklintempleton.com |
FRANKLIN FTSE BRAZIL ETF
Performance Summary as of September 30, 2019
Total return reflects reinvestment of the Fund’s dividends and capital gain distributions, if any, and any unrealized gains or losses. Total returns do not include brokerage commissions that may be payable on secondary market transactions. The performance table does not reflect any taxes that a shareholder would pay on Fund dividends, capital gain distributions, if any, or any realized gains on the sale or redemption of Fund shares.
Net asset value or “NAV” is the value of one share of a fund as calculated in accordance with the standard formula for valuing mutual fund shares. The price used to calculate market return (Market Price) is determined by using the midpoint between the highest bid and the lowest offer on the primary stock exchange on which shares of a fund are listed for trading, as of the time that such fund’s NAV is calculated. Since shares of the Fund did not trade in the secondary market until after the Fund’s inception, for the period from inception to the first day of secondary trading (11/7/17), the NAV of the Fund is used as a proxy for the Market Price to calculate market returns. Market and NAV returns assume that dividends and capital gain distributions have been reinvested at Market Price and NAV.
Your dividend income will vary depending on dividends or interest paid by securities in the Fund’s portfolio, adjusted for operating expenses. Capital gain distributions are net profits realized from the sale of portfolio securities.
Performance as of 9/30/19
| | | | | | | | | | | | | | | | |
| | |
| | | Cumulative Total Return1 | | | Average Annual Total Return1 | |
| | | Based on
NAV2 | | | Based on market price3 | | | Based on
NAV2 | | | Based on market price3 | |
6-Month | | | +2.69% | | | | +4.17% | | | | +2.69% | | | | +4.17% | |
1-Year | | | +26.71% | | | | +28.71% | | | | +26.71% | | | | +28.71% | |
Since Inception (11/3/17) | | | +13.25% | | | | +13.61% | | | | +6.74% | | | | +6.92% | |
Performance data represent past performance, which does not guarantee future results. Investment return and principal value will fluctuate, and you may have a gain or loss when you sell your shares. Current performance may differ from figures shown. For most recentmonth-end performance, go tofranklintempleton.com or call(800)342-5236.
See page 16 for Performance Summary footnotes.
| | | | | | |
| | | |
| franklintempleton.com | | Semiannual Report | | | 15 | |
FRANKLIN FTSE BRAZIL ETF
PERFORMANCE SUMMARY
Distributions(4/1/19–9/30/19)
|
|
Net Investment
Income |
$0.378461 |
Total Annual Operating Expenses4
All investments involve risks, including possible loss of principal. Stock prices fluctuate, sometimes rapidly and dramatically, due to factors affecting individual companies, particular industries or sector, or general market conditions. Special risks are associated with foreign investing, including currency fluctuations, economic instability and political developments. Investments in developing markets involve heightened risks related to the same factors, in addition to those associated with these markets’ smaller size, lesser liquidity and lack of established legal, political, business and social frameworks to support securities markets. Investments in securities of Brazilian issuers involve risks that are specific to Brazil, including certain legal, regulatory, political and economic risks. The Brazilian economy has experienced in the past, and may continue to experience, periods of high inflation rates and political unrest. Because the Fund invests its assets primarily in companies in a specific country or region, the Fund may also experience greater volatility than a fund that is more broadly diversified geographically. As anon-diversified fund, the Fund may invest in a relatively small number of issuers and, as a result, be subject to a greater risk of loss with respect to its portfolio securities. The Fund’s prospectus also includes a description of the main investment risks.
ETFs trade like stocks, fluctuate in market value and may trade at prices above or below their net asset value. Brokerage commissions and ETF expenses will reduce returns.
1. Total return calculations represent the cumulative and average annual changes in value of an investment over the periods indicated. Return for less than one year, if any, has not been annualized.
2. Assumes reinvestment of distributions based on net asset value.
3. Assumes reinvestment of distributions based on market price.
4. Figures are as stated in the Fund’s current prospectus and may differ from the expense ratios disclosed in the Your Fund’s Expenses and Financial Highlights sections in this report. In periods of market volatility, assets may decline significantly, causing total annual Fund operating expenses to become higher than the figures shown.
| | | | |
| | | |
| 16 | | Semiannual Report | | franklintempleton.com |
FRANKLIN FTSE BRAZIL ETF
Your Fund’s Expenses
As a Fund shareholder, you can incur two types of costs: (1) transaction costs, including brokerage commissions on purchases and sales of Fund shares; and (2) ongoing Fund costs, including management fees and other Fund expenses. All funds have ongoing costs, sometimes referred to as operating expenses. The table below shows ongoing costs of investing in the Fund and can help you understand these costs and compare them with those of other funds. The table assumes a $1,000 investment held for the six months indicated.
Actual Fund Expenses
The table below provides information about actual account values and actual expenses in the columns under the heading “Actual.” In these columns the Fund’s actual return, which includes the effect of Fund expenses, is used to calculate the “Ending Account Value.” You can estimate the expenses you paid during the period by following these steps (of course, your account value and expenses will differ from those in this illustration):Divide your account value by $1,000 (if your account had an $8,600 value, then $8,600÷ $1,000 = 8.6).Then multiply the result by the number in the row under the headings “Actual” and “Expenses Paid During Period” (if Actual Expenses Paid During Period were $7.50, then 8.6 x $7.50 = $64.50).In this illustration, the actual expenses paid this period are $64.50.
Hypothetical Example for Comparison with Other Funds
Under the heading “Hypothetical” in the table, information is provided about hypothetical account values and hypothetical expenses based on the Fund’s actual expense ratio and an assumed rate of return of 5% per year before expenses, which is not the Fund’s actual return. This information may not be used to estimate the actual ending account balance or expenses you paid for the period, but it can help you compare ongoing costs of investing in the Fund with those of other funds. To do so, compare this 5% hypothetical example with the 5% hypothetical examples that appear in the shareholder reports of other funds.
Please note that expenses shown in the table are meant to highlight ongoing costs and do not reflect any transactional costs.Therefore, information under the heading “Hypothetical” is useful in comparing ongoing costs only, and will not help you compare total costs of owning different funds. In addition, if transactional costs were included, your total costs would have been higher.
| | | | | | | | | | | | | | | | | | | | | | |
| | | | Actual (actual return after expenses) | | | Hypothetical (5% annual return before expenses) | | | | |
| | | | | |
Beginning
Account
Value 4/1/19 | | | Ending
Account
Value 9/30/19 | | | Expenses
Paid During
Period
4/1/19–9/30/191,2 | | | Ending
Account
Value 9/30/19 | | | Expenses
Paid During
Period
4/1/19–9/30/191,2 | | | Net Annualized
Expense Ratio2 | |
| | $1,000.00 | | | $ | 1,026.90 | | | $ | 0.96 | | | $ | 1,024.05 | | | $ | 0.96 | | | | 0.19 | % |
1. Expenses are equal to the annualized expense ratio for thesix-month period as indicated above—in the far right column—multiplied by the simple average account value over the period indicated, and then multiplied by 183/366 to reflect theone-half year period.
2. Reflects expenses after fee waivers and expense reimbursements.
| | | | | | |
| | | |
| franklintempleton.com | | Semiannual Report | | | 17 | |
Franklin FTSE Canada ETF
This semiannual report for Franklin FTSE Canada ETF covers the period ended September 30, 2019.
Your Fund’s Goal and Main Investments
The Fund seeks to provide investment results that closely correspond, before fees and expenses, to the performance of the FTSE Canada RIC Capped Index (the FTSE Canada Capped Index or the Underlying Index).1 Under normal market conditions, the Fund invests at least 80% of its assets in the component securities of the FTSE Canada Capped Index and in depositary receipts representing such securities.
Performance Overview
During thesix-month period, the Fund posted cumulative total returns of +7.24% based on market price and +7.18% based on net asset value. In comparison, the FTSE Canada Capped Index posted a +7.05% total return for the same period.2 You can find more of the Fund’s performance data in the Performance Summary beginning on page 20.
Performance data represent past performance, which does not guarantee future results. Investment return and principal value will fluctuate, and you may have a gain or loss when you sell your shares. Current performance may differ from figures shown. For most recentmonth-end performance, go tofranklintempleton.com or call(800)342-5236.
Investment Strategy
The Fund, using a “passive” or indexing investment approach, seeks investment results that closely correspond, before fees and expenses, to the performance of the FTSE Canada Capped Index. We seek to achieve, over time, a correlation between the Fund’s performance, before fees and expenses, and that of the Underlying Index of 0.95 or better. A figure of 1.00 would indicate perfect correlation. Our intention is to
| | | | |
| Top 10 Sectors/Industries | |
|
| 9/30/19 | |
| |
| | | % of Total
Net Assets | |
| Banks | | | 30.0% | |
| Oil, Gas & Consumable Fuels | | | 18.9% | |
| Insurance | | | 8.2% | |
| Road & Rail | | | 7.3% | |
| Metals & Mining | | | 6.1% | |
| Food & Staples Retailing | | | 4.0% | |
| IT Services | | | 3.8% | |
| Capital Markets | | | 3.7% | |
| Chemicals | | | 2.2% | |
| Commercial Services & Supplies | | | 1.8% | |
replicate the component securities of the Underlying Index as closely as possible (i.e., invest in all of the component securities in their respective weightings in the Underlying Index). However, under various circumstances, it may not be possible or practicable to replicate the Underlying Index. In these circumstances, we may use a “representative sampling” strategy whereby we would invest in what we believe to be a representative sample of the component securities of the Underlying Index, but may not track the Underlying Index with the same degree of accuracy as would an investment vehicle replicating the entire Underlying index. Under the representative sampling technique, we will select securities that collectively have an investment profile similar to that of the Underlying Index, including securities that resemble those included in the Underlying Index in terms of risk factors, performance attributes and other characteristics, such as market capitalization and industry weightings. The Fund will concentrate its investments (i.e., hold 25% or more of its net assets) in a particular industry or group of industries to approximately the same extent that the Underlying Index is concentrated.
1. The FTSE Canada Capped Index is a free float-adjusted market capitalization-weighted index maintained and calculated by FTSE Russell with a capping methodology applied quarterly to issuer weights so that no single issuer of a component exceeds 25% of the index weight, and all issuers with weights above 5% do not cumulatively exceed 50% of the index’s weight. The FTSE Canada Capped Index is based on the FTSE Canada Index and is designed to measure the performance of Canadian large- andmid-capitalization stocks.
2. Source: FactSet.
The index is unmanaged and includes reinvestment of any income or distributions (after the deduction of certain withholding taxes). It does not reflect any fees, expenses or sales charges. One cannot invest directly in an index.
See www.franklintempletondatasources.com for additional data provider information.
The dollar value, number of shares or principal amount, and names of all portfolio holdings are listed in the Fund’s Statement of Investments (SOI). The SOI begins on page 159.
| | | | |
| | | |
| 18 | | Semiannual Report | | franklintempleton.com |
FRANKLIN FTSE CANADA ETF
| | | | |
| Top 10 Holdings | |
|
| 9/30/19 | |
| |
Company
Sector/Industry, Country | | % of Total
Net Assets | |
Royal Bank of Canada
Banks, Canada | | | 8.9% | |
The Toronto-Dominion Bank
Banks, Canada | | | 8.2% | |
Bank of Nova Scotia
Banks, Canada | | | 5.3% | |
Enbridge Inc.
Oil, Gas & Consumable Fuels, Canada | | | 5.3% | |
Canadian National Railway Co.
Road & Rail, Canada | | | 4.9% | |
Suncor Energy Inc.
Oil, Gas & Consumable Fuels, Canada | | | 3.8% | |
TC Energy Corp.
Oil, Gas & Consumable Fuels, Canada | | | 3.6% | |
Bank of Montreal
Banks, Canada | | | 3.6% | |
Brookfield Asset Management Inc., A
Capital Markets, Canada | | | 3.6% | |
Canadian Imperial Bank of Commerce
Banks, Canada | | | 2.8% | |
Thank you for your participation in Franklin FTSE Canada ETF. We look forward to serving your future investment needs.
| | |
| |
Dina Ting, CFA |
| | |
| |
Louis Hsu, CFA |
| |
| | Portfolio Management Team |
The foregoing information reflects our analysis, opinions and portfolio holdings as of September 30, 2019, the end of the reporting period. These opinions may not be relied upon as investment advice or an offer for a particular security. The information is not a complete analysis of every aspect of any market, country, industry, security or the Fund. Statements of fact are from sources considered reliable, but the investment manager makes no representation or warranty as to their completeness or accuracy. Although historical performance is no guarantee of future results, these insights may help you understand our investment management philosophy.
| | | | | | |
| | | |
| franklintempleton.com | | Semiannual Report | | | 19 | |
FRANKLIN FTSE CANADA ETF
Performance Summary as of September 30, 2019
Total return reflects reinvestment of the Fund’s dividends and capital gain distributions, if any, and any unrealized gains or losses. Total returns do not include brokerage commissions that may be payable on secondary market transactions. The performance table does not reflect any taxes that a shareholder would pay on Fund dividends, capital gain distributions, if any, or any realized gains on the sale or redemption of Fund shares.
Net asset value or “NAV” is the value of one share of a fund as calculated in accordance with the standard formula for valuing mutual fund shares. The price used to calculate market return (Market Price) is determined by using the midpoint between the highest bid and the lowest offer on the primary stock exchange on which shares of a fund are listed for trading, as of the time that such fund’s NAV is calculated. Since shares of the Fund did not trade in the secondary market until after the Fund’s inception, for the period from inception to the first day of secondary trading (11/6/17), the NAV of the Fund is used as a proxy for the Market Price to calculate market returns. Market and NAV returns assume that dividends and capital gain distributions have been reinvested at Market Price and NAV.
Your dividend income will vary depending on dividends or interest paid by securities in the Fund’s portfolio, adjusted for operating expenses. Capital gain distributions are net profits realized from the sale of portfolio securities.
Performance as of 9/30/19
| | | | | | | | | | | | | | | | |
| | |
| | | Cumulative Total Return1 | | | Average Annual Total Return1 | |
| | | Based on
NAV2 | | | Based on market price3 | | | Based on
NAV2 | | | Based on market price3 | |
6-Month | | | +7.18% | | | | +7.24% | | | | +7.18% | | | | +7.24% | |
1-Year | | | +5.73% | | | | +5.87% | | | | +5.73% | | | | +5.87% | |
Since Inception (11/2/17) | | | +7.43% | | | | +7.66% | | | | +3.82% | | | | +3.94% | |
Performance data represent past performance, which does not guarantee future results. Investment return and principal value will fluctuate, and you may have a gain or loss when you sell your shares. Current performance may differ from figures shown. For most recentmonth-end performance, go tofranklintempleton.com or call(800)342-5236.
See page 21 for Performance Summary footnotes.
| | | | |
| | | |
| 20 | | Semiannual Report | | franklintempleton.com |
FRANKLIN FTSE CANADA ETF
PERFORMANCE SUMMARY
Distributions(4/1/19–9/30/19)
|
|
Net Investment
Income |
$0.231542 |
Total Annual Operating Expenses4
All investments involve risks, including possible loss of principal. Stock prices fluctuate, sometimes rapidly and dramatically, due to factors affecting individual companies, particular industries or sectors, or general market conditions. Special risks are associated with foreign investing, including currency fluctuations, economic instability and political developments. Investments in securities of Canadian issuers involve risks that are specific to Canada, including certain legal, regulatory, political and economic risks. Because the Fund invests its assets primarily in companies in a specific country or region, the Fund may also experience greater volatility than a fund that is more broadly diversified geographically. As anon-diversified fund, the Fund may invest in a relatively small number of issuers and, as a result, be subject to a greater risk of loss with respect to its portfolio securities. The Fund’s prospectus also includes a description of the main investment risks.
ETFs trade like stocks, fluctuate in market value and may trade at prices above or below their net asset value. Brokerage commissions and ETF expenses will reduce returns.
1. Total return calculations represent the cumulative and average annual changes in value of an investment over the periods indicated. Return for less than one year, if any, has not been annualized.
2. Assumes reinvestment of distributions based on net asset value.
3. Assumes reinvestment of distributions based on market price.
4. Figures are as stated in the Fund’s current prospectus and may differ from the expense ratios disclosed in the Your Fund’s Expenses and Financial Highlights sections in this report. In periods of market volatility, assets may decline significantly, causing total annual Fund operating expenses to become higher than the figures shown.
| | | | | | |
| | | |
| franklintempleton.com | | Semiannual Report | | | 21 | |
FRANKLIN FTSE CANADA ETF
Your Fund’s Expenses
As a Fund shareholder, you can incur two types of costs: (1) transaction costs, including brokerage commissions on purchases and sales of Fund shares; and (2) ongoing Fund costs, including management fees and other Fund expenses. All funds have ongoing costs, sometimes referred to as operating expenses. The table below shows ongoing costs of investing in the Fund and can help you understand these costs and compare them with those of other funds. The table assumes a $1,000 investment held for the six months indicated.
Actual Fund Expenses
The table below provides information about actual account values and actual expenses in the columns under the heading “Actual.” In these columns the Fund’s actual return, which includes the effect of Fund expenses, is used to calculate the “Ending Account Value.” You can estimate the expenses you paid during the period by following these steps (of course, your account value and expenses will differ from those in this illustration):Divide your account value by $1,000 (if your account had an $8,600 value, then $8,600÷ $1,000 = 8.6).Then multiply the result by the number in the row under the headings “Actual” and “Expenses Paid During Period” (if Actual Expenses Paid During Period were $7.50, then 8.6 x $7.50 = $64.50).In this illustration, the actual expenses paid this period are $64.50.
Hypothetical Example for Comparison with Other Funds
Under the heading “Hypothetical” in the table, information is provided about hypothetical account values and hypothetical expenses based on the Fund’s actual expense ratio and an assumed rate of return of 5% per year before expenses, which is not the Fund’s actual return. This information may not be used to estimate the actual ending account balance or expenses you paid for the period, but it can help you compare ongoing costs of investing in the Fund with those of other funds. To do so, compare this 5% hypothetical example with the 5% hypothetical examples that appear in the shareholder reports of other funds.
Please note that expenses shown in the table are meant to highlight ongoing costs and do not reflect any transactional costs.Therefore, information under the heading “Hypothetical” is useful in comparing ongoing costs only, and will not help you compare total costs of owning different funds. In addition, if transactional costs were included, your total costs would have been higher.
| | | | | | | | | | | | | | | | | | | | | | |
| | | | Actual (actual return after expenses) | | | Hypothetical (5% annual return before expenses) | | | | |
| | | | | |
Beginning
Account
Value 4/1/19 | | | Ending
Account
Value 9/30/19 | | | Expenses
Paid During
Period
4/1/19–9/30/191,2 | | | Ending
Account
Value 9/30/19 | | | Expenses
Paid During
Period
4/1/19–9/30/191,2 | | | Net Annualized
Expense Ratio2 | |
| | $1,000.00 | | | $ | 1,071.80 | | | $ | 0.47 | | | $ | 1,024.55 | | | $ | 0.46 | | | | 0.09 | % |
1. Expenses are equal to the annualized expense ratio for thesix-month period as indicated above—in the far right column—multiplied by the simple average account value over the period indicated, and then multiplied by 183/366 to reflect theone-half year period.
2. Reflects expenses after fee waivers and expense reimbursements.
| | | | |
| | | |
| 22 | | Semiannual Report | | franklintempleton.com |
Franklin FTSE China ETF
This semiannual report for Franklin FTSE China ETF covers the period ended September 30, 2019.
Your Fund’s Goal and Main Investments
The Fund seeks to provide investment results that closely correspond, before fees and expenses, to the performance of the FTSE China RIC Capped Index (the FTSE China Capped Index or the Underlying Index).1 Under normal market conditions, the Fund invests at least 80% of its assets in the component securities of the FTSE China Capped Index and in depositary receipts representing such securities.
Performance Overview
During thesix-month period, the Fund posted cumulative total returns of -9.84% based on market price and -8.58% based on net asset value. In comparison, the FTSE China Capped Index posted a -8.52% total return for the same period.2 You can find more of the Fund’s performance data in the Performance Summary beginning on page 25.
Performance data represent past performance, which does not guarantee future results. Investment return and principal value will fluctuate, and you may have a gain or loss when you sell your shares. Current performance may differ from figures shown. For most recentmonth-end performance, go tofranklintempleton.com or call(800)342-5236.
Investment Strategy
The Fund, using a “passive” or indexing investment approach, seeks investment results that closely correspond, before fees and expenses, to the performance of the FTSE China Capped Index. We seek to achieve, over time, a correlation between the Fund’s performance, before fees and expenses, and that of the Underlying Index of 0.95 or better. A figure of 1.00 would indicate perfect correlation. Our intention is to replicate
| | | | |
| Top 10 Sectors/Industries | |
|
| 9/30/19 | |
| |
| | | % of Total
Net Assets | |
| Internet & Direct Marketing Retail | | | 18.3% | |
| Interactive Media & Services | | | 16.7% | |
| Banks | | | 13.4% | |
| Insurance | | | 6.9% | |
| Real Estate Management & Development | | | 5.4% | |
| Oil, Gas & Consumable Fuels | | | 3.7% | |
| Wireless Telecommunication Services | | | 2.6% | |
| Capital Markets | | | 2.1% | |
| Pharmaceuticals | | | 1.9% | |
| Beverages | | | 1.6% | |
the component securities of the Underlying Index as closely as possible (i.e., invest in all of the component securities in their respective weightings in the Underlying Index). However, under various circumstances, it may not be possible or practicable to replicate the Underlying Index. In these circumstances, we may use a “representative sampling” strategy whereby we would invest in what we believe to be a representative sample of the component securities of the Underlying Index, but may not track the Underlying Index with the same degree of accuracy as would an investment vehicle replicating the entire Underlying Index. Under the representative sampling technique, we will select securities that collectively have an investment profile similar to that of the Underlying Index, including securities that resemble those included in the Underlying Index in terms of risk factors, performance attributes and other characteristics, such as market capitalization and industry weightings. The Fund will concentrate its investments (i.e., hold 25% or more of its net assets) in a particular industry or group of industries to approximately the same extent that the Underlying Index is concentrated.
1. The FTSE China Capped Index is a free float-adjusted market capitalization-weighted index maintained and calculated by FTSE Russell with a capping methodology applied quarterly to issuer weights so that no single issuer of a component exceeds 25% of the index weight, and all issuers with weights above 5% do not cumulatively exceed 50% of the index’s weight. The FTSE China Capped Index is based on the FTSE China Index and is designed to measure the performance of Chinese large- andmid-capitalization stocks, as represented byH-shares,B-shares,N-shares, Red Chips,P-Chips andS-Chips.
2. Source: FactSet.
The index is unmanaged and includes reinvestment of any income or distributions (after the deduction of certain withholding taxes). It does not reflect any fees, expenses or sales charges. One cannot invest directly in an index.
See www.franklintempletondatasources.com for additional data provider information.
The dollar value, number of shares or principal amount, and names of all portfolio holdings are listed in the Fund’s Statement of Investments (SOI). The SOI begins on page 162.
| | | | | | |
| | | |
| franklintempleton.com | | Semiannual Report | | | 23 | |
FRANKLIN FTSE CHINA ETF
| | | | |
| Top 10 Holdings | |
|
| 9/30/19 | |
| |
Company
Sector/Industry, Country | | % of Total
Net Assets | |
Tencent Holdings Ltd.
Interactive Media & Services, China | | | 13.9% | |
Alibaba Group Holding Ltd., ADR
Internet & Direct Marketing Retail, China | | | 13.8% | |
China Construction Bank Corp., A, H
Banks, China | | | 4.1% | |
Ping An Insurance (Group) Co. of China Ltd., H
Insurance, China | | | 3.7% | |
Industrial and Commercial Bank of China Ltd., H
Banks, China | | | 3.2% | |
China Mobile Ltd.
Wireless Telecommunication Services, China | | | 2.6% | |
Meituan Dianping, B, Reg S
Internet & Direct Marketing Retail, China | | | 2.0% | |
Bank of China Ltd., A, H
Banks, China | | | 1.8% | |
Baidu Inc., ADR
Interactive Media & Services, China | | | 1.7% | |
CNOOC Ltd.
Oil, Gas & Consumable Fuels, China | | | 1.4% | |
Thank you for your participation in Franklin FTSE China ETF. We look forward to serving your future investment needs.
| | |
| |
Dina Ting, CFA |
| | |
| |
Louis Hsu, CFA |
| |
| | Portfolio Management Team |
The foregoing information reflects our analysis, opinions and portfolio holdings as of September 30, 2019, the end of the reporting period. These opinions may not be relied upon as investment advice or an offer for a particular security. The information is not a complete analysis of every aspect of any market, country, industry, security or the Fund. Statements of fact are from sources considered reliable, but the investment manager makes no representation or warranty as to their completeness or accuracy. Although historical performance is no guarantee of future results, these insights may help you understand our investment management philosophy.
| | | | |
| | | |
| 24 | | Semiannual Report | | franklintempleton.com |
FRANKLIN FTSE CHINA ETF
Performance Summary as of September 30, 2019
Total return reflects reinvestment of the Fund’s dividends and capital gain distributions, if any, and any unrealized gains or losses. Total returns do not include brokerage commissions that may be payable on secondary market transactions. The performance table does not reflect any taxes that a shareholder would pay on Fund dividends, capital gain distributions, if any, or any realized gains on the sale or redemption of Fund shares.
Net asset value or “NAV” is the value of one share of a fund as calculated in accordance with the standard formula for valuing mutual fund shares. The price used to calculate market return (Market Price) is determined by using the midpoint between the highest bid and the lowest offer on the primary stock exchange on which shares of a fund are listed for trading, as of the time that such fund’s NAV is calculated. Since shares of the Fund did not trade in the secondary market until after the Fund’s inception, for the period from inception to the first day of secondary trading (11/6/17), the NAV of the Fund is used as a proxy for the Market Price to calculate market returns. Market and NAV returns assume that dividends and capital gain distributions have been reinvested at Market Price and NAV.
Your dividend income will vary depending on dividends or interest paid by securities in the Fund’s portfolio, adjusted for operating expenses. Capital gain distributions are net profits realized from the sale of portfolio securities.
Performance as of 9/30/19
| | | | | | | | | | | | | | | | |
| | |
| | | Cumulative Total Return1 | | | Average Annual Total Return1 | |
| | | Based on
NAV2 | | | Based on market price3 | | | Based on
NAV2 | | | Based on market price3 | |
6-Month | | | -8.58% | | | | -9.84% | | | | -8.58% | | | | -9.84% | |
1-Year | | | -4.00% | | | | -4.19% | | | | -4.00% | | | | -4.19% | |
Since Inception (11/2/17) | | | -10.42% | | | | -10.95% | | | | -5.60% | | | | -5.89% | |
Performance data represent past performance, which does not guarantee future results. Investment return and principal value will fluctuate, and you may have a gain or loss when you sell your shares. Current performance may differ from figures shown. For most recentmonth-end performance, go tofranklintempleton.com or call(800)342-5236.
See page 26 for Performance Summary footnotes.
| | | | | | |
| | | |
| franklintempleton.com | | Semiannual Report | | | 25 | |
FRANKLIN FTSE CHINA ETF
PERFORMANCE SUMMARY
Distributions(4/1/19–9/30/19)
|
|
Net Investment
Income |
$0.030378 |
Total Annual Operating Expenses4
All investments involve risks, including possible loss of principal. Stock prices fluctuate, sometimes rapidly and dramatically, due to factors affecting individual companies, particular industries or sectors, or general market conditions. Special risks are associated with foreign investing, including currency fluctuations, economic instability and political developments. Investments in developing markets involve heightened risks related to the same factors, in addition to those associated with these markets’ smaller size, lesser liquidity and lack of established legal, political, business and social frameworks to support securities markets. Investments in securities of Chinese issuers involve risks that are specific to China, including certain legal, regulatory, political and economic risks. China may be subject to considerable degrees of economic, political and social instability. Because the Fund invests its assets primarily in companies in a specific country or region, the Fund may also experience greater volatility than a fund that is more broadly diversified geographically. As anon-diversified fund, the Fund may invest in a relatively small number of issuers and, as a result, be subject to a greater risk of loss with respect to its portfolio securities. The Fund’s prospectus also includes a description of the main investment risks.
ETFs trade like stocks, fluctuate in market value and may trade at prices above or below their net asset value. Brokerage commissions and ETF expenses will reduce returns.
1. Total return calculations represent the cumulative and average annual changes in value of an investment over the periods indicated. Return for less than one year, if any, has not been annualized.
2. Assumes reinvestment of distributions based on net asset value.
3. Assumes reinvestment of distributions based on market price.
4. Figures are as stated in the Fund’s current prospectus and may differ from the expense ratios disclosed in the Your Fund’s Expenses and Financial Highlights sections in this report. In periods of market volatility, assets may decline significantly, causing total annual Fund operating expenses to become higher than the figures shown.
| | | | |
| | | |
| 26 | | Semiannual Report | | franklintempleton.com |
FRANKLIN FTSE CHINA ETF
Your Fund’s Expenses
As a Fund shareholder, you can incur two types of costs: (1) transaction costs, including brokerage commissions on purchases and sales of Fund shares; and (2) ongoing Fund costs, including management fees and other Fund expenses. All funds have ongoing costs, sometimes referred to as operating expenses. The table below shows ongoing costs of investing in the Fund and can help you understand these costs and compare them with those of other funds. The table assumes a $1,000 investment held for the six months indicated.
Actual Fund Expenses
The table below provides information about actual account values and actual expenses in the columns under the heading “Actual.” In these columns the Fund’s actual return, which includes the effect of Fund expenses, is used to calculate the “Ending Account Value.” You can estimate the expenses you paid during the period by following these steps (of course, your account value and expenses will differ from those in this illustration):Divide your account value by $1,000 (if your account had an $8,600 value, then $8,600÷ $1,000 = 8.6).Then multiply the result by the number in the row under the headings “Actual” and “Expenses Paid During Period” (if Actual Expenses Paid During Period were $7.50, then 8.6 x $7.50 = $64.50).In this illustration, the actual expenses paid this period are $64.50.
Hypothetical Example for Comparison with Other Funds
Under the heading “Hypothetical” in the table, information is provided about hypothetical account values and hypothetical expenses based on the Fund’s actual expense ratio and an assumed rate of return of 5% per year before expenses, which is not the Fund’s actual return. This information may not be used to estimate the actual ending account balance or expenses you paid for the period, but it can help you compare ongoing costs of investing in the Fund with those of other funds. To do so, compare this 5% hypothetical example with the 5% hypothetical examples that appear in the shareholder reports of other funds.
Please note that expenses shown in the table are meant to highlight ongoing costs and do not reflect any transactional costs.Therefore, information under the heading “Hypothetical” is useful in comparing ongoing costs only, and will not help you compare total costs of owning different funds. In addition, if transactional costs were included, your total costs would have been higher.
| | | | | | | | | | | | | | | | | | | | | | |
| | | | Actual (actual return after expenses) | | | Hypothetical (5% annual return before expenses) | | | | |
| | | | | |
Beginning
Account
Value 4/1/19 | | | Ending
Account
Value 9/30/19 | | | Expenses
Paid During
Period
4/1/19–9/30/191,2 | | | Ending
Account
Value 9/30/19 | | | Expenses
Paid During
Period
4/1/19–9/30/191,2 | | | Net Annualized
Expense Ratio2 | |
| | $1,000.00 | | | $ | 914.20 | | | $ | 0.91 | | | $ | 1,024.05 | | | $ | 0.96 | | | | 0.19 | % |
1. Expenses are equal to the annualized expense ratio for thesix-month period as indicated above—in the far right column—multiplied by the simple average account value over the period indicated, and then multiplied by 183/366 to reflect theone-half year period.
2. Reflects expenses after fee waivers and expense reimbursements.
| | | | | | |
| | | |
| franklintempleton.com | | Semiannual Report | | | 27 | |
Franklin FTSE Europe ETF
This semiannual report for Franklin FTSE Europe ETF covers the period ended September 30, 2019.
Your Fund’s Goal and Main Investments
The Fund seeks to provide investment results that closely correspond, before fees and expenses, to the performance of the FTSE Developed Europe RIC Capped Index (the FTSE Developed Europe Capped Index or the Underlying Index).1 Under normal market conditions, the Fund invests at least 80% of its assets in the component securities of the FTSE Developed Europe Capped Index and in depositary receipts representing such securities.
Performance Overview
During thesix-month period, the Fund posted cumulative total returns of +2.38% based on market price and +2.64% based on net asset value. In comparison, the FTSE Developed Europe Capped Index posted a +2.45% total return for the same period.2 You can find more of the Fund’s performance data in the Performance Summary beginning on page 30.
Performance data represent past performance, which does not guarantee future results. Investment return and principal value will fluctuate, and you may have a gain or loss when you sell your shares. Current performance may differ from figures shown. For most recentmonth-end performance, go tofranklintempleton.com or call(800)342-5236.
Investment Strategy
The Fund, using a “passive” or indexing investment approach, seeks investment results that closely correspond, before fees and expenses, to the performance of the FTSE Developed Europe Capped Index. We seek to achieve, over time, a correlation between the Fund’s performance, before fees and expenses, and that of the Underlying Index of 0.95 or better. A figure of 1.00 would indicate perfect correlation. Our
| | | | |
| Top 10 Sectors/Industries | |
|
| 9/30/19 | |
| |
| | | % of Total
Net Assets | |
| Pharmaceuticals | | | 10.3% | |
| Banks | | | 8.6% | |
| Oil, Gas & Consumable Fuels | | | 6.9% | |
| Insurance | | | 6.0% | |
| Food Products | | | 4.9% | |
| Textiles, Apparel & Luxury Goods | | | 3.8% | |
| Chemicals | | | 3.6% | |
| Beverages | | | 3.1% | |
| Personal Products | | | 2.6% | |
| Diversified Telecommunication Services | | | 2.5% | |
intention is to replicate the component securities of the Underlying Index as closely as possible (i.e., invest in all of the component securities in their respective weightings in the Underlying Index). However, under various circumstances, it may not be possible or practicable to replicate the Underlying Index. In these circumstances, we may use a “representative sampling” strategy whereby we would invest in what we believe to be a representative sample of the component securities of the Underlying Index, but may not track the Underlying Index with the same degree of accuracy as would an investment vehicle replicating the entire Underlying Index. Under the representative sampling technique, we will select securities that collectively have an investment profile similar to that of the Underlying Index, including securities that resemble those included in the Underlying Index in terms of risk factors, performance attributes and other characteristics, such as market capitalization and industry weightings. The Fund will concentrate its investments (i.e., hold 25% or more of its net assets) in a particular industry or group of industries to approximately the same extent that the Underlying Index is concentrated.
1. The FTSE Developed Europe Capped Index is a free float-adjusted market capitalization-weighted index maintained and calculated by FTSE Russell with a capping methodology applied quarterly to issuer weights so that no single issuer of a component exceeds 25% of the index weight, and all issuers with weights above 5% do not cumulatively exceed 50% of the index’s weight. The FTSE Developed Europe Capped Index is based on the FTSE Developed Europe Index and is designed to measure the performance of large- andmid-capitalization stocks from developed European countries.
2. Source: FactSet.
The index is unmanaged and includes reinvestment of any income or distributions (after the deduction of certain withholding taxes). It does not reflect any fees, expenses or sales charges. One cannot invest directly in an index.
See www.franklintempletondatasources.com for additional data provider information.
The dollar value, number of shares or principal amount, and names of all portfolio holdings are listed in the Fund’s Statement of Investments (SOI). The SOI begins on page 180.
| | | | |
| | | |
| 28 | | Semiannual Report | | franklintempleton.com |
FRANKLIN FTSE EUROPE ETF
| | | | |
| Top 10 Holdings | |
|
| 9/30/19 | |
| |
Company
Sector/Industry, Country | | % of Total
Net Assets | |
Nestle SA
Food Products, Switzerland | | | 3.5% | |
Royal Dutch Shell PLC, A, B
Oil, Gas & Consumable Fuels, United Kingdom | | | 2.6% | |
Roche Holding AG
Pharmaceuticals, Switzerland | | | 2.4% | |
Novartis AG
Pharmaceuticals, Switzerland | | | 2.1% | |
HSBC Holdings PLC
Banks, United Kingdom | | | 1.7% | |
BP PLC
Oil, Gas & Consumable Fuels, United Kingdom | | | 1.4% | |
Total SA
Oil, Gas & Consumable Fuels, France | | | 1.4% | |
AstraZeneca PLC
Pharmaceuticals, United Kingdom | | | 1.3% | |
SAP SE
Software, Germany | | | 1.3% | |
GlaxoSmithKline PLC
Pharmaceuticals, United Kingdom | | | 1.2% | |
Thank you for your participation in Franklin FTSE Europe ETF. We look forward to serving your future investment needs.
| | |
| |
Dina Ting, CFA |
| | |
| |
Louis Hsu, CFA |
| |
| | Portfolio Management Team |
| | | | |
| Top 10 Countries | |
|
| 9/30/19 | |
| |
| | | % of Total
Net Assets | |
| United Kingdom | | | 26.2% | |
| France | | | 17.0% | |
| Switzerland | | | 15.1% | |
| Germany | | | 13.6% | |
| Spain | | | 4.5% | |
| Netherlands | | | 4.5% | |
| Sweden | | | 4.1% | |
| Italy | | | 3.7% | |
| Denmark | | | 2.7% | |
| Finland | | | 1.9% | |
The foregoing information reflects our analysis, opinions and portfolio holdings as of September 30, 2019, the end of the reporting period. These opinions may not be relied upon as investment advice or an offer for a particular security. The information is not a complete analysis of every aspect of any market, country, industry, security or the Fund. Statements of fact are from sources considered reliable, but the investment manager makes no representation or warranty as to their completeness or accuracy. Although historical performance is no guarantee of future results, these insights may help you understand our investment management philosophy.
| | | | | | |
| | | |
| franklintempleton.com | | Semiannual Report | | | 29 | |
FRANKLIN FTSE EUROPE ETF
Performance Summary as of September 30, 2019
Total return reflects reinvestment of the Fund’s dividends and capital gain distributions, if any, and any unrealized gains or losses. Total returns do not include brokerage commissions that may be payable on secondary market transactions. The performance table does not reflect any taxes that a shareholder would pay on Fund dividends, capital gain distributions, if any, or any realized gains on the sale or redemption of Fund shares.
Net asset value or “NAV” is the value of one share of a fund as calculated in accordance with the standard formula for valuing mutual fund shares. The price used to calculate market return (Market Price) is determined by using the midpoint between the highest bid and the lowest offer on the primary stock exchange on which shares of a fund are listed for trading, as of the time that such fund’s NAV is calculated. Since shares of the Fund did not trade in the secondary market until after the Fund’s inception, for the period from inception to the first day of secondary trading (11/6/17), the NAV of the Fund is used as a proxy for the Market Price to calculate market returns. Market and NAV returns assume that dividends and capital gain distributions have been reinvested at Market Price and NAV.
Your dividend income will vary depending on dividends or interest paid by securities in the Fund’s portfolio, adjusted for operating expenses. Capital gain distributions are net profits realized from the sale of portfolio securities.
Performance as of 9/30/19
| | | | | | | | | | | | | | | | |
| | |
| | | Cumulative Total Return1 | | | Average Annual Total Return1 | |
| | | Based on
NAV2 | | | Based on market price3 | | | Based on
NAV2 | | | Based on market price3 | |
6-Month | | | +2.64% | | | | +2.38% | | | | +2.64% | | | | +2.38% | |
1-Year | | | -0.80% | | | | -0.80% | | | | -0.80% | | | | -0.80% | |
Since Inception (11/2/17) | | | -1.40% | | | | -1.57% | | | | -0.74% | | | | -0.82% | |
Performance data represent past performance, which does not guarantee future results. Investment return and principal value will fluctuate, and you may have a gain or loss when you sell your shares. Current performance may differ from figures shown. For most recentmonth-end performance, go tofranklintempleton.com or call(800)342-5236.
See page 31 for Performance Summary footnotes.
| | | | |
| | | |
| 30 | | Semiannual Report | | franklintempleton.com |
FRANKLIN FTSE EUROPE ETF
PERFORMANCE SUMMARY
Distributions(4/1/19–9/30/19)
|
|
Net Investment
Income |
$0.343062 |
Total Annual Operating Expenses4
All investments involve risks, including possible loss of principal. Stock prices fluctuate, sometimes rapidly and dramatically, due to factors affecting individual companies, particular industries or sectors, or general market conditions. Special risks are associated with foreign investing, including currency fluctuations, economic instability and political developments. Investments in securities of European issuers involve risks that are specific to Europe, including certain legal, regulatory, political and economic risks. Because the Fund invests its assets primarily in companies in a specific country or region, the Fund may also experience greater volatility than a fund that is more broadly diversified geographically. The Fund’s prospectus also includes a description of the main investment risks.
ETFs trade like stocks, fluctuate in market value and may trade at prices above or below their net asset value. Brokerage commissions and ETF expenses will reduce returns.
1. Total return calculations represent the cumulative and average annual changes in value of an investment over the periods indicated. Return for less than one year, if any, has not been annualized.
2. Assumes reinvestment of distributions based on net asset value.
3. Assumes reinvestment of distributions based on market price.
4. Figures are as stated in the Fund’s current prospectus and may differ from the expense ratios disclosed in the Your Fund’s Expenses and Financial Highlights sections in this report. In periods of market volatility, assets may decline significantly, causing total annual Fund operating expenses to become higher than the figures shown.
| | | | | | |
| | | |
| franklintempleton.com | | Semiannual Report | | | 31 | |
FRANKLIN FTSE EUROPE ETF
Your Fund’s Expenses
As a Fund shareholder, you can incur two types of costs: (1) transaction costs, including brokerage commissions on purchases and sales of Fund shares; and (2) ongoing Fund costs, including management fees and other Fund expenses. All funds have ongoing costs, sometimes referred to as operating expenses. The table below shows ongoing costs of investing in the Fund and can help you understand these costs and compare them with those of other funds. The table assumes a $1,000 investment held for the six months indicated.
Actual Fund Expenses
The table below provides information about actual account values and actual expenses in the columns under the heading “Actual.” In these columns the Fund’s actual return, which includes the effect of Fund expenses, is used to calculate the “Ending Account Value.” You can estimate the expenses you paid during the period by following these steps (of course, your account value and expenses will differ from those in this illustration):Divide your account value by $1,000 (if your account had an $8,600 value, then $8,600÷ $1,000 = 8.6).Then multiply the result by the number in the row under the headings “Actual” and “Expenses Paid During Period” (if Actual Expenses Paid During Period were $7.50, then 8.6 x $7.50 = $64.50).In this illustration, the actual expenses paid this period are $64.50.
Hypothetical Example for Comparison with Other Funds
Under the heading “Hypothetical” in the table, information is provided about hypothetical account values and hypothetical expenses based on the Fund’s actual expense ratio and an assumed rate of return of 5% per year before expenses, which is not the Fund’s actual return. This information may not be used to estimate the actual ending account balance or expenses you paid for the period, but it can help you compare ongoing costs of investing in the Fund with those of other funds. To do so, compare this 5% hypothetical example with the 5% hypothetical examples that appear in the shareholder reports of other funds.
Please note that expenses shown in the table are meant to highlight ongoing costs and do not reflect any transactional costs.Therefore, information under the heading “Hypothetical” is useful in comparing ongoing costs only, and will not help you compare total costs of owning different funds. In addition, if transactional costs were included, your total costs would have been higher.
| | | | | | | | | | | | | | | | | | | | | | |
| | | | Actual (actual return after expenses) | | | Hypothetical
(5% annual return before expenses) | | | | |
| | | | | |
Beginning
Account
Value 4/1/19 | | | Ending
Account
Value 9/30/19 | | | Expenses
Paid During
Period
4/1/19–9/30/191,2 | | | Ending
Account
Value 9/30/19 | | | Expenses
Paid During
Period
4/1/19–9/30/191,2 | | | Net Annualized
Expense Ratio2 | |
| | $1,000.00 | | | $ | 1,026.40 | | | $ | 0.46 | | | $ | 1,024.55 | | | $ | 0.46 | | | | 0.09 | % |
1. Expenses are equal to the annualized expense ratio for thesix-month period as indicated above—in the far right column—multiplied by the simple average account value over the period indicated, and then multiplied by 183/366 to reflect theone-half year period.
2. Reflects expenses after fee waivers and expense reimbursements.
| | | | |
| | | |
| 32 | | Semiannual Report | | franklintempleton.com |
Franklin FTSE Europe Hedged ETF
This semiannual report for Franklin FTSE Europe Hedged ETF covers the period ended September 30, 2019.
Your Fund’s Goal and Main Investments
The Fund seeks to provide investment results that closely correspond, before fees and expenses, to the performance of the FTSE Developed Europe RIC Capped Hedged to USD Index (the FTSE Developed Europe Capped Hedged Index or the Underlying Index).1 Under normal market conditions, the Fund invests at least 80% of its assets in the component securities of the FTSE Developed Europe Capped Hedged Index and in depositary receipts representing such securities, including indirectly through Franklin FTSE Europe ETF (Underlying Fund).
Performance Overview
During thesix-month period, the Fund posted cumulative total returns of +7.55% based on market price and +7.76% based on net asset value. In comparison, the FTSE Developed Europe Capped Hedged Index posted a +7.59% total return for the same period.2 You can find more of the Fund’s performance data in the Performance Summary beginning on page 35.
Performance data represent past performance, which does not guarantee future results. Investment return and principal value will fluctuate, and you may have a gain or loss when you sell your shares. Current performance may differ from figures shown. For most recentmonth-end performance, go tofranklintempleton.com or call(800)342-5236.
Investment Strategy
The Fund, using a “passive” or indexing investment approach, seeks investment results that closely correspond, before fees and expenses, to the performance of the FTSE Developed Europe Capped Hedged Index. We seek to achieve, over time, a correlation between the Fund’s performance, before
| | | | |
| Top 10 Sectors/Industries | |
|
| 9/30/19 | |
| |
| | | % of Total
Net Assets | |
| Pharmaceuticals | | | 10.1% | |
| Banks | | | 8.4% | |
| Oil, Gas & Consumable Fuels | | | 6.8% | |
| Insurance | | | 5.9% | |
| Food Products | | | 4.8% | |
| Textiles, Apparel & Luxury Goods | | | 3.8% | |
| Chemicals | | | 3.5% | |
| Beverages | | | 3.0% | |
| Personal Products | | | 2.6% | |
fees and expenses, and that of the Underlying Index of 0.95 or better. A figure of 1.00 would indicate perfect correlation. Our intention is to replicate the component securities of the Underlying Index as closely as possible (i.e., invest in all of the component securities in their respective weightings in the Underlying Index). However, under various circumstances, it may not be possible or practicable to replicate the Underlying Index. In these circumstances, we may use a “representative sampling” strategy whereby we would invest in what we believe to be a representative sample of the component securities of the Underlying Index, but may not track the Underlying Index with the same degree of accuracy as would an investment vehicle replicating the entire Underlying Index. Under the representative sampling technique, we will select securities that collectively have an investment profile similar to that of the Underlying Index, including securities that resemble those included in the Underlying Index in terms of risk factors, performance attributes and other characteristics, such as market capitalization and industry weightings. We intend to enter into monthly foreign currency forward contracts and/or currency futures contracts designed to offset the Fund’s exposure to the component currencies, in order to replicate the hedge impact incorporated in the calculation of
1. The FTSE Developed Europe Capped Hedged Index is a free float-adjusted market capitalization-weighted index maintained and calculated by FTSE Russell with a capping methodology applied quarterly to issuer weights so that no single issuer of a component exceeds 25% of the index weight, and all issuers with weights above 5% do not cumulatively exceed 50% of the index’s weight. The FTSE Developed Europe Capped Hedged Index is based on the FTSE Developed Europe Hedged to USD Index and is designed to measure the performance of large- andmid-capitalization stocks from developed European countries. The FTSE Developed Europe Capped Hedged Index incorporates a hedge againstnon-U.S. currency fluctuations by reflecting the impact of rolling monthly currency forward contracts on the currencies represented in the FTSE Developed Europe Capped Hedged Index.
2. Source: FactSet.
The index is unmanaged and includes reinvestment of any income or distributions (after the deduction of certain withholding taxes). It does not reflect any fees, expenses or sales charges. One cannot invest directly in an index.
See www.franklintempletondatasources.com for additional data provider information.
The dollar value, number of shares or principal amount, and names of all portfolio holdings are listed in the Fund’s Statement of Investments (SOI). The SOI begins on page 193.
| | | | | | |
| | | |
| franklintempleton.com | | Semiannual Report | | | 33 | |
FRANKLIN FTSE EUROPE HEDGED ETF
| | | | |
| Top 10 Holdings | |
|
| 9/30/19 | |
| |
Company
Sector/Industry, Country | | % of Total
Net Assets | |
Nestle SA
Food Products, Switzerland | | | 3.5% | |
Royal Dutch Shell PLC, A, B
Oil, Gas & Consumable Fuels, United Kingdom | | | 2.6% | |
Roche Holding AG
Pharmaceuticals, Switzerland | | | 2.3% | |
Novartis AG
Pharmaceuticals, Switzerland | | | 2.1% | |
HSBC Holdings PLC
Banks, United Kingdom | | | 1.7% | |
BP PLC
Oil, Gas & Consumable Fuels, United Kingdom | | | 1.4% | |
Total SA
Oil, Gas & Consumable Fuels, France | | | 1.4% | |
AstraZeneca PLC
Pharmaceuticals, United Kingdom | | | 1.3% | |
SAP SE
Software, Germany | | | 1.3% | |
GlaxoSmithKline PLC
Pharmaceuticals, United Kingdom | | | 1.2% | |
| | | | |
| Top 10 Countries | |
|
| 9/30/19 | |
| |
| | | % of Total
Net Assets | |
| United Kingdom | | | 25.8% | |
| France | | | 16.8% | |
| Switzerland | | | 14.9% | |
| Germany | | | 13.4% | |
| Spain | | | 4.5% | |
| Netherlands | | | 4.4% | |
| Sweden | | | 4.0% | |
| Italy | | | 3.7% | |
| Denmark | | | 2.7% | |
| Finland | | | 1.9% | |
the Underlying Index. The Fund’s exposure to foreign currency forward contracts and currency futures contracts is based on the aggregate exposure of the Fund to the component currencies. The Fund will concentrate its investments (i.e., hold 25% or more of its net assets) in a particular industry or group of industries to approximately the same extent that the Underlying Index is concentrated.
What is a currency forward contract?
A currency forward contract is an agreement between the Fund and a counterparty to buy or sell a foreign currency in exchange for another currency at a specific exchange rate on a future date. Currency forward contracts are privately traded in the interbank market, not on a centralized exchange.
What is a futures contract?
A futures contract is an agreement between the Fund and a counterparty made through a U.S. or foreign futures exchange to buy or sell an underlying instrument or asset at a specific price on a future date.
Thank you for your participation in Franklin FTSE Europe Hedged ETF. We look forward to serving your future investment needs.
| | |
| |
Dina Ting, CFA |
| | |
| |
Louis Hsu, CFA |
| |
| | Portfolio Management Team |
The foregoing information reflects our analysis, opinions and portfolio holdings as of September 30, 2019, the end of the reporting period. These opinions may not be relied upon as investment advice or an offer for a particular security. The information is not a complete analysis of every aspect of any market, country, industry, security or the Fund. Statements of fact are from sources considered reliable, but the investment manager makes no representation or warranty as to their completeness or accuracy. Although historical performance is no guarantee of future results, these insights may help you understand our investment management philosophy.
| | | | |
| | | |
| 34 | | Semiannual Report | | franklintempleton.com |
FRANKLIN FTSE EUROPE HEDGED ETF
Performance Summary as of September 30, 2019
Total return reflects reinvestment of the Fund’s dividends and capital gain distributions, if any, and any unrealized gains or losses. Total returns do not include brokerage commissions that may be payable on secondary market transactions. The performance table does not reflect any taxes that a shareholder would pay on Fund dividends, capital gain distributions, if any, or any realized gains on the sale or redemption of Fund shares.
Net asset value or “NAV” is the value of one share of a fund as calculated in accordance with the standard formula for valuing mutual fund shares. The price used to calculate market return (Market Price) is determined by using the midpoint between the highest bid and the lowest offer on the primary stock exchange on which shares of a fund are listed for trading, as of the time that such fund’s NAV is calculated. Since shares of the Fund did not trade in the secondary market until after the Fund’s inception, for the period from inception to the first day of secondary trading (11/6/17), the NAV of the Fund is used as a proxy for the Market Price to calculate market returns. Market and NAV returns assume that dividends and capital gain distributions have been reinvested at Market Price and NAV.
Your dividend income will vary depending on dividends or interest paid by securities in the Fund’s portfolio, adjusted for operating expenses. Capital gain distributions are net profits realized from the sale of portfolio securities.
Performance as of 9/30/19
| | | | | | | | | | | | | | | | |
| | |
| | | Cumulative Total Return1 | | | Average Annual Total Return1 | |
| | | Based on
NAV2 | | | Based on market price3 | | | Based on
NAV2 | | | Based on market price3 | |
6-Month | | | +7.76% | | | | +7.55% | | | | +7.76% | | | | +7.55% | |
1-Year | | | +8.21% | | | | +8.17% | | | | +8.21% | | | | +8.17% | |
Since Inception (11/2/17) | | | +9.97% | | | | +9.62% | | | | +5.10% | | | | +4.93% | |
Performance data represent past performance, which does not guarantee future results. Investment return and principal value will fluctuate, and you may have a gain or loss when you sell your shares. Current performance may differ from figures shown. For most recentmonth-end performance, go tofranklintempleton.com or call(800)342-5236.
See page 36 for Performance Summary footnotes.
| | | | | | |
| | | |
| franklintempleton.com | | Semiannual Report | | | 35 | |
FRANKLIN FTSE EUROPE HEDGED ETF
PERFORMANCE SUMMARY
Distributions(4/1/19–9/30/19)
|
|
Net Investment Income |
$0.308329 |
Total Annual Operating Expenses4
All investments involve risks, including possible loss of principal. Stock prices fluctuate, sometimes rapidly and dramatically, due to factors affecting individual companies, particular industries or sectors, or general market conditions. Special risks are associated with foreign investing, including currency fluctuations, economic instability and political developments. Investments in securities of European issuers involve risks that are specific to Europe, including certain legal, regulatory, political and economic risks. Because the Fund invests its assets primarily in companies in a specific country or region, the Fund may also experience greater volatility than a fund that is more broadly diversified geographically. Derivatives, including currency management strategies, involve costs and can create economic leverage in the portfolio which may result in significant volatility and cause the Fund to participate in losses on an amount that exceeds the Fund’s initial investment. The Fund may not achieve the anticipated benefits, and may realize losses when a counterparty fails to perform as promised. While the Fund’s use of foreign currency forward contracts and/or currency futures contracts is designed to minimize the impact of currency fluctuations on Fund returns, it does not necessarily eliminate the Fund’s exposure to the component currencies. The return of these currency hedging instruments will not perfectly offset the actual fluctuations between the component currencies and the U.S. dollar. Currency hedges are sometimes subject to imperfect matching between the derivative instruments and the currencies that the derivative instruments intend to hedge, and there can be no assurance that the Fund’s hedging transactions will be effective. The Fund’s exposure to the component currencies may not be fully hedged at all times. Because the Fund’s currency hedge is generally reset on a monthly basis, currency risk can develop or increase intra-month. The Fund’s prospectus also includes a description of the main investment risks.
ETFs trade like stocks, fluctuate in market value and may trade at prices above or below their net asset value. Brokerage commissions and ETF expenses will reduce returns.
1. Total return calculations represent the cumulative and average annual changes in value of an investment over the periods indicated. Return for less than one year, if any, has not been annualized.
2. Assumes reinvestment of distributions based on net asset value.
3. Assumes reinvestment of distributions based on market price.
4. Figures are as stated in the Fund’s current prospectus and may differ from the expense ratios disclosed in the Your Fund’s Expenses and Financial Highlights sections in this report. In periods of market volatility, assets may decline significantly, causing total annual Fund operating expenses to become higher than the figures shown.
| | | | |
| | | |
| 36 | | Semiannual Report | | franklintempleton.com |
FRANKLIN FTSE EUROPE HEDGED ETF
Your Fund’s Expenses
As a Fund shareholder, you can incur two types of costs: (1) transaction costs, including brokerage commissions on purchases and sales of Fund shares; and (2) ongoing Fund costs, including management fees and other Fund expenses. All funds have ongoing costs, sometimes referred to as operating expenses. The table below shows ongoing costs of investing in the Fund and can help you understand these costs and compare them with those of other funds. The table assumes a $1,000 investment held for the six months indicated.
Actual Fund Expenses
The table below provides information about actual account values and actual expenses in the columns under the heading “Actual.” In these columns the Fund’s actual return, which includes the effect of Fund expenses, is used to calculate the “Ending Account Value.” You can estimate the expenses you paid during the period by following these steps (of course, your account value and expenses will differ from those in this illustration):Divide your account value by $1,000 (if your account had an $8,600 value, then $8,600÷ $1,000 = 8.6).Then multiply the result by the number in the row under the headings “Actual” and “Expenses Paid During Period” (if Actual Expenses Paid During Period were $7.50, then 8.6 x $7.50 = $64.50).In this illustration, the actual expenses paid this period are $64.50.
Hypothetical Example for Comparison with Other Funds
Under the heading “Hypothetical” in the table, information is provided about hypothetical account values and hypothetical expenses based on the Fund’s actual expense ratio and an assumed rate of return of 5% per year before expenses, which is not the Fund’s actual return. This information may not be used to estimate the actual ending account balance or expenses you paid for the period, but it can help you compare ongoing costs of investing in the Fund with those of other funds. To do so, compare this 5% hypothetical example with the 5% hypothetical examples that appear in the shareholder reports of other funds.
Please note that expenses shown in the table are meant to highlight ongoing costs and do not reflect any transactional costs.Therefore, information under the heading “Hypothetical” is useful in comparing ongoing costs only, and will not help you compare total costs of owning different funds. In addition, if transactional costs were included, your total costs would have been higher.
| | | | | | | | | | | | | | | | | | | | | | |
| | | | Actual (actual return after expenses) | | | Hypothetical
(5% annual return before expenses) | | | | |
| | | | | |
Beginning
Account
Value 4/1/19 | | | Ending
Account
Value 9/30/19 | | | Expenses
Paid During
Period
4/1/19–9/30/191,2 | | | Ending
Account
Value 9/30/19 | | | Expenses
Paid During
Period
4/1/19–9/30/191,2 | | | Net Annualized
Expense Ratio2 | |
| | $1,000.00 | | | $ | 1,077.60 | | | $ | 0.47 | | | $ | 1,024.55 | | | $ | 0.46 | | | | 0.09 | % |
1. Expenses are equal to the annualized expense ratio for thesix-month period as indicated above—in the far right column—multiplied by the simple average account value over the period indicated, and then multiplied by 183/366 to reflect theone-half year period.
2. Reflects expenses after fee waivers and expense reimbursements.
| | | | | | |
| | | |
| franklintempleton.com | | Semiannual Report | | | 37 | |
Franklin FTSE France ETF
This semiannual report for Franklin FTSE France ETF covers the period ended September 30, 2019.
Your Fund’s Goal and Main Investments
The Fund seeks to provide investment results that closely correspond, before fees and expenses, to the performance of the FTSE France RIC Capped Index (the FTSE France Capped Index or the Underlying Index).1 Under normal market conditions, the Fund invests at least 80% of its assets in the component securities of the FTSE France Capped Index and in depositary receipts representing such securities.
Performance Overview
During thesix-month period, the Fund posted cumulative total returns of +5.24% based on market price and +5.52% based on net asset value. In comparison, the FTSE France Capped Index posted a +5.07% total return for the same period.2 You can find more of the Fund’s performance data in the Performance Summary beginning on page 40.
Performance data represent past performance, which does not guarantee future results. Investment return and principal value will fluctuate, and you may have a gain or loss when you sell your shares. Current performance may differ from figures shown. For most recentmonth-end performance, go tofranklintempleton.com or call(800)342-5236.
Investment Strategy
The Fund, using a “passive” or indexing investment approach, seeks investment results that closely correspond, before fees and expenses, to the performance of the FTSE France Capped Index. We seek to achieve, over time, a correlation between the Fund’s performance, before fees and expenses, and that of the Underlying Index of 0.95 or better. A figure of 1.00 would indicate perfect correlation. Our intention is to
| | | | |
| Top 10 Sectors/Industries | |
|
| 9/30/19 | |
| |
| | | % of Total
Net Assets | |
| Textiles, Apparel & Luxury Goods | | | 13.1% | |
| Aerospace & Defense | | | 9.0% | |
| Oil, Gas & Consumable Fuels | | | 8.2% | |
| Pharmaceuticals | | | 6.8% | |
| Banks | | | 5.7% | |
| Personal Products | | | 4.4% | |
| Chemicals | | | 4.3% | |
| Construction & Engineering | | | 4.3% | |
| Electrical Equipment | | | 4.3% | |
| Insurance | | | 3.8% | |
replicate the component securities of the Underlying Index as closely as possible (i.e., invest in all of the component securities in their respective weightings in the Underlying Index). However, under various circumstances, it may not be possible or practicable to replicate the Underlying Index. In these circumstances, we may use a “representative sampling” strategy whereby we would invest in what we believe to be a representative sample of the component securities of the Underlying Index, but may not track the Underlying Index with the same degree of accuracy as would an investment vehicle replicating the entire Underlying Index. Under the representative sampling technique, we will select securities that collectively have an investment profile similar to that of the Underlying Index, including securities that resemble those included in the Underlying Index in terms of risk factors, performance attributes and other characteristics, such as market capitalization and industry weightings. The Fund will concentrate its investments (i.e., hold 25% or more of its net assets) in a particular industry or group of industries to approximately the same extent that the Underlying Index is concentrated.
1. The FTSE France Capped Index is a free float-adjusted market capitalization-weighted index maintained and calculated by FTSE Russell with a capping methodology applied quarterly to issuer weights so that no single issuer of a component exceeds 25% of the index weight, and all issuers with weights above 5% do not cumulatively exceed 50% of the index’s weight. The FTSE France Capped Index is based on the FTSE France Index and is designed to measure the performance of French large- andmid-capitalization stocks.
2. Source: FactSet.
The index is unmanaged and includes reinvestment of any income or distributions (after the deduction of certain withholding taxes). It does not reflect any fees, expenses or sales charges. One cannot invest directly in an index.
See www.franklintempletondatasources.com for additional data provider information.
The dollar value, number of shares or principal amount, and names of all portfolio holdings are listed in the Fund’s Statement of Investments (SOI). The SOI begins on page 207.
| | | | |
| | | |
| 38 | | Semiannual Report | | franklintempleton.com |
FRANKLIN FTSE FRANCE ETF
| | | | |
| Top 10 Holdings | |
|
| 9/30/19 | |
| |
Company
Sector/Industry, Country | | % of Total
Net Assets | |
Total SA
Oil, Gas & Consumable Fuels, France | | | 8.2% | |
Sanofi
Pharmaceuticals, France | | | 6.6% | |
LVMH Moet Hennessy Louis Vuitton SE
Textiles, Apparel & Luxury Goods, France | | | 6.5% | |
Airbus SE
Aerospace & Defense, France | | | 4.7% | |
L’Oreal SA
Personal Products, France | | | 4.4% | |
Air Liquide SA
Chemicals, France | | | 3.9% | |
Danone SA
Food Products, France | | | 3.5% | |
BNP Paribas SA
Banks, France | | | 3.4% | |
Safran SA
Aerospace & Defense, France | | | 3.4% | |
Vinci SA
Construction & Engineering, France | | | 3.3% | |
Thank you for your participation in Franklin FTSE France ETF. We look forward to serving your future investment needs.
| | |
| |
Dina Ting, CFA |
| | |
| |
Louis Hsu, CFA |
| |
| | Portfolio Management Team |
The foregoing information reflects our analysis, opinions and portfolio holdings as of September 30, 2019, the end of the reporting period. These opinions may not be relied upon as investment advice or an offer for a particular security. The information is not a complete analysis of every aspect of any market, country, industry, security or the Fund. Statements of fact are from sources considered reliable, but the investment manager makes no representation or warranty as to their completeness or accuracy. Although historical performance is no guarantee of future results, these insights may help you understand our investment management philosophy.
| | | | | | |
| | | |
| franklintempleton.com | | Semiannual Report | | | 39 | |
FRANKLIN FTSE FRANCE ETF
Performance Summary as of September 30, 2019
Total return reflects reinvestment of the Fund’s dividends and capital gain distributions, if any, and any unrealized gains or losses. Total returns do not include brokerage commissions that may be payable on secondary market transactions. The performance table does not reflect any taxes that a shareholder would pay on Fund dividends, capital gain distributions, if any, or any realized gains on the sale or redemption of Fund shares.
Net asset value or “NAV” is the value of one share of a fund as calculated in accordance with the standard formula for valuing mutual fund shares. The price used to calculate market return (Market Price) is determined by using the midpoint between the highest bid and the lowest offer on the primary stock exchange on which shares of a fund are listed for trading, as of the time that such fund’s NAV is calculated. Since shares of the Fund did not trade in the secondary market until after the Fund’s inception, for the period from inception to the first day of secondary trading (11/6/17), the NAV of the Fund is used as a proxy for the Market Price to calculate market returns. Market and NAV returns assume that dividends and capital gain distributions have been reinvested at Market Price and NAV.
Your dividend income will vary depending on dividends or interest paid by securities in the Fund’s portfolio, adjusted for operating expenses. Capital gain distributions are net profits realized from the sale of portfolio securities.
Performance as of 9/30/19
| | | | | | | | | | | | | | | | |
| | |
| | | Cumulative Total Return1 | | | Average Annual Total Return1 | |
| | | Based on
NAV2 | | | Based on market price3 | | | Based on
NAV2 | | | Based on market price3 | |
6-Month | | | +5.52% | | | | +5.24% | | | | +5.52% | | | | +5.24% | |
1-Year | | | -0.65% | | | | -0.42% | | | | -0.65% | | | | -0.42% | |
Since Inception (11/2/17) | | | +2.55% | | | | +2.74% | | | | +1.33% | | | | +1.43% | |
Performance data represent past performance, which does not guarantee future results. Investment return and principal value will fluctuate, and you may have a gain or loss when you sell your shares. Current performance may differ from figures shown. For most recentmonth-end performance, go tofranklintempleton.com or call(800)342-5236.
See page 41 for Performance Summary footnotes.
| | | | |
| | | |
| 40 | | Semiannual Report | | franklintempleton.com |
FRANKLIN FTSE FRANCE ETF
PERFORMANCE SUMMARY
Distributions(4/1/19–9/30/19)
|
|
Net Investment
Income |
$0.282828 |
Total Annual Operating Expenses4
All investments involve risks, including possible loss of principal. Stock prices fluctuate, sometimes rapidly and dramatically, due to factors affecting individual companies, particular industries or sectors, or general market conditions. Special risks are associated with foreign investing, including currency fluctuations, economic instability and political developments. Investments in securities of French issuers involve risks that are specific to France, including certain legal, regulatory, political and economic risks. Because the Fund invests its assets primarily in companies in a specific country or region, the Fund may also experience greater volatility than a fund that is more broadly diversified geographically. As anon-diversified fund, the Fund may invest in a relatively small number of issuers and, as a result, be subject to a greater risk of loss with respect to its portfolio securities. The Fund’s prospectus also includes a description of the main investment risks.
ETFs trade like stocks, fluctuate in market value and may trade at prices above or below their net asset value. Brokerage commissions and ETF expenses will reduce returns.
1. Total return calculations represent the cumulative and average annual changes in value of an investment over the periods indicated. Return for less than one year, if any, has not been annualized.
2. Assumes reinvestment of distributions based on net asset value.
3. Assumes reinvestment of distributions based on market price.
4. Figures are as stated in the Fund’s current prospectus and may differ from the expense ratios disclosed in the Your Fund’s Expenses and Financial Highlights sections in this report. In periods of market volatility, assets may decline significantly, causing total annual Fund operating expenses to become higher than the figures shown.
| | | | | | |
| | | |
| franklintempleton.com | | Semiannual Report | | | 41 | |
FRANKLIN FTSE FRANCE ETF
Your Fund’s Expenses
As a Fund shareholder, you can incur two types of costs: (1) transaction costs, including brokerage commissions on purchases and sales of Fund shares; and (2) ongoing Fund costs, including management fees and other Fund expenses. All funds have ongoing costs, sometimes referred to as operating expenses. The table below shows ongoing costs of investing in the Fund and can help you understand these costs and compare them with those of other funds. The table assumes a $1,000 investment held for the six months indicated.
Actual Fund Expenses
The table below provides information about actual account values and actual expenses in the columns under the heading “Actual.” In these columns the Fund’s actual return, which includes the effect of Fund expenses, is used to calculate the “Ending Account Value.” You can estimate the expenses you paid during the period by following these steps (of course, your account value and expenses will differ from those in this illustration):Divide your account value by $1,000 (if your account had an $8,600 value, then $8,600÷ $1,000 = 8.6).Then multiply the result by the number in the row under the headings “Actual” and “Expenses Paid During Period” (if Actual Expenses Paid During Period were $7.50, then 8.6 x $7.50 = $64.50).In this illustration, the actual expenses paid this period are $64.50.
Hypothetical Example for Comparison with Other Funds
Under the heading “Hypothetical” in the table, information is provided about hypothetical account values and hypothetical expenses based on the Fund’s actual expense ratio and an assumed rate of return of 5% per year before expenses, which is not the Fund’s actual return. This information may not be used to estimate the actual ending account balance or expenses you paid for the period, but it can help you compare ongoing costs of investing in the Fund with those of other funds. To do so, compare this 5% hypothetical example with the 5% hypothetical examples that appear in the shareholder reports of other funds.
Please note that expenses shown in the table are meant to highlight ongoing costs and do not reflect any transactional costs. Therefore, information under the heading “Hypothetical” is useful in comparing ongoing costs only, and will not help you compare total costs of owning different funds. In addition, if transactional costs were included, your total costs would have been higher.
| | | | | | | | | | | | | | | | | | | | | | |
| | | | Actual (actual return after expenses) | | | Hypothetical
(5% annual return before expenses) | | | | |
| | | | | |
Beginning
Account
Value 4/1/19 | | | Ending
Account
Value 9/30/19 | | | Expenses
Paid During
Period
4/1/19–9/30/191,2 | | | Ending
Account
Value 9/30/19 | | | Expenses
Paid During
Period
4/1/19–9/30/191,2 | | | Net Annualized
Expense Ratio2 | |
| | $1,000.00 | | | $ | 1,055.20 | | | $ | 0.46 | | | $ | 1,024.55 | | | $ | 0.46 | | | | 0.09 | % |
1. Expenses are equal to the annualized expense ratio for thesix-month period as indicated above—in the far right column—multiplied by the simple average account value over the period indicated, and then multiplied by 183/366 to reflect theone-half year period.
2. Reflects expenses after fee waivers and expense reimbursements.
| | | | |
| | | |
| 42 | | Semiannual Report | | franklintempleton.com |
Franklin FTSE Germany ETF
This semiannual report for Franklin FTSE Germany ETF covers the period ended September 30, 2019.
Your Fund’s Goal and Main Investments
The Fund seeks to provide investment results that closely correspond, before fees and expenses, to the performance of the FTSE Germany RIC Capped Index (the FTSE Germany Capped Index or the Underlying Index).1 Under normal market conditions, the Fund invests at least 80% of its assets in the component securities of the FTSE Germany Capped Index and in depositary receipts representing such securities.
Performance Overview
During thesix-month period, the Fund posted cumulative total returns of +3.30% based on market price and +3.35% based on net asset value. In comparison, the FTSE Germany Capped Index posted a +3.11% total return for the same period.2 You can find more of the Fund’s performance data in the Performance Summary beginning on page 45.
Performance data represent past performance, which does not guarantee future results. Investment return and principal value will fluctuate, and you may have a gain or loss when you sell your shares. Current performance may differ from figures shown. For most recentmonth-end performance, go tofranklintempleton.com or call(800)342-5236.
Investment Strategy
The Fund, using a “passive” or indexing investment approach, seeks investment results that closely correspond, before fees and expenses, to the performance of the FTSE Germany Capped Index. We seek to achieve, over time, a correlation between the Fund’s performance, before fees and expenses, and that of the Underlying Index of 0.95 or better. A figure of 1.00 would indicate perfect correlation. Our intention is to
| | | | |
| Top 10 Sectors/Industries | |
|
| 9/30/19 | |
| |
| | | % of Total
Net Assets | |
| Insurance | | | 12.1% | |
| Software | | | 9.6% | |
| Automobiles | | | 9.4% | |
| Chemicals | | | 8.3% | |
| Industrial Conglomerates | | | 7.1% | |
| Pharmaceuticals | | | 6.6% | |
| Textiles, Apparel & Luxury Goods | | | 5.8% | |
| Diversified Telecommunication Services | | | 4.9% | |
| Real Estate Management & Development | | | 4.5% | |
| Capital Markets | | | 3.7% | |
replicate the component securities of the Underlying Index as closely as possible (i.e., invest in all of the component securities in their respective weightings in the Underlying Index). However, under various circumstances, it may not be possible or practicable to replicate the Underlying Index. In these circumstances, we may use a “representative sampling” strategy whereby we would invest in what we believe to be a representative sample of the component securities of the Underlying Index, but may not track the Underlying Index with the same degree of accuracy as would an investment vehicle replicating the entire Underlying Index. Under the representative sampling technique, we will select securities that collectively have an investment profile similar to that of the Underlying Index, including securities that resemble those included in the Underlying Index in terms of risk factors, performance attributes and other characteristics, such as market capitalization and industry weightings. The Fund will concentrate its investments (i.e., hold 25% or more of its net assets) in a particular industry or group of industries to approximately the same extent that the Underlying Index is concentrated.
1. The FTSE Germany Capped Index is a free float-adjusted market capitalization-weighted index maintained and calculated by FTSE Russell with a capping methodology applied quarterly to issuer weights so that no single issuer of a component exceeds 25% of the index weight, and all issuers with weights above 5% do not cumulatively exceed 50% of the index’s weight. The FTSE Germany Capped Index is based on the FTSE Germany Index and is designed to measure the performance of German large- andmid-capitalization stocks.
2. Source: FactSet.
The index is unmanaged and includes reinvestment of any income or distributions (after the deduction of certain withholding taxes). It does not reflect any fees, expenses or sales charges. One cannot invest directly in an index.
See www.franklintempletondatasources.com for additional data provider information.
The dollar value, number of shares or principal amount, and names of all portfolio holdings are listed in the Fund’s Statement of Investments (SOI). The SOI begins on page 210.
| | | | | | |
| | | |
| franklintempleton.com | | Semiannual Report | | | 43 | |
FRANKLIN FTSE GERMANY ETF
| | | | |
| Top 10 Holdings | |
|
| 9/30/19 | |
| |
Company
Sector/Industry, Country | | % of Total
Net Assets | |
SAP SE
Software, Germany | | | 9.4% | |
Allianz SE
Insurance, Germany | | | 8.1% | |
Siemens AG
Industrial Conglomerates, Germany | | | 6.7% | |
Bayer AG
Pharmaceuticals, Germany | | | 5.4% | |
BASF SE
Chemicals, Germany | | | 5.3% | |
Adidas AG
Textiles, Apparel & Luxury Goods, Germany | | | 5.0% | |
Deutsche Telekom AG
Diversified Telecommunication Services, Germany | | | 4.4% | |
Daimler AG
Automobiles, Germany | | | 3.5% | |
Muenchener Rueckversicherungs-Gesellschaft Aktiengesellschaft in Muenchen
Insurance, Germany | | | 3.1% | |
Volkswagen AG
Automobiles, Germany | | | 3.1% | |
Thank you for your participation in Franklin FTSE Germany ETF. We look forward to serving your future investment needs.
| | |
| |
Dina Ting, CFA |
| | |
| |
Louis Hsu, CFA |
| |
| | Portfolio Management Team |
The foregoing information reflects our analysis, opinions and portfolio holdings as of September 30, 2019, the end of the reporting period. These opinions may not be relied upon as investment advice or an offer for a particular security. The information is not a complete analysis of every aspect of any market, country, industry, security or the Fund. Statements of fact are from sources considered reliable, but the investment manager makes no representation or warranty as to their completeness or accuracy. Although historical performance is no guarantee of future results, these insights may help you understand our investment management philosophy.
| | | | |
| | | |
| 44 | | Semiannual Report | | franklintempleton.com |
FRANKLIN FTSE GERMANY ETF
Performance Summary as of September 30, 2019
Total return reflects reinvestment of the Fund’s dividends and capital gain distributions, if any, and any unrealized gains or losses. Total returns do not include brokerage commissions that may be payable on secondary market transactions. The performance table does not reflect any taxes that a shareholder would pay on Fund dividends, capital gain distributions, if any, or any realized gains on the sale or redemption of Fund shares.
Net asset value or “NAV” is the value of one share of a fund as calculated in accordance with the standard formula for valuing mutual fund shares. The price used to calculate market return (Market Price) is determined by using the midpoint between the highest bid and the lowest offer on the primary stock exchange on which shares of a fund are listed for trading, as of the time that such fund’s NAV is calculated. Since shares of the Fund did not trade in the secondary market until after the Fund’s inception, for the period from inception to the first day of secondary trading (11/6/17), the NAV of the Fund is used as a proxy for the Market Price to calculate market returns. Market and NAV returns assume that dividends and capital gain distributions have been reinvested at Market Price and NAV.
Your dividend income will vary depending on dividends or interest paid by securities in the Fund’s portfolio, adjusted for operating expenses. Capital gain distributions are net profits realized from the sale of portfolio securities.
Performance as of 9/30/19
| | | | | | | | | | | | | | | | |
| | |
| | | Cumulative Total Return1 | | | Average Annual Total Return1 | |
| | | Based on
NAV2 | | | Based on market price3 | | | Based on
NAV2 | | | Based on market price3 | |
6-Month | | | +3.35% | | | | +3.30% | | | | +3.35% | | | | +3.30% | |
1-Year | | | -6.33% | | | | -6.04% | | | | -6.33% | | | | -6.04% | |
Since Inception (11/2/17) | | | -14.15% | | | | -14.11% | | | | -7.68% | | | | -7.66% | |
Performance data represent past performance, which does not guarantee future results. Investment return and principal value will fluctuate, and you may have a gain or loss when you sell your shares. Current performance may differ from figures shown. For most recentmonth-end performance, go tofranklintempleton.com or call(800)342-5236.
See page 46 for Performance Summary footnotes.
| | | | | | |
| | | |
| franklintempleton.com | | Semiannual Report | | | 45 | |
FRANKLIN FTSE GERMANY ETF
PERFORMANCE SUMMARY
Distributions(4/1/19–9/30/19)
|
|
Net Investment
Income |
$0.480094 |
Total Annual Operating Expenses4
All investments involve risks, including possible loss of principal. Stock prices fluctuate, sometimes rapidly and dramatically, due to factors affecting individual companies, particular industries or sectors, or general market conditions. Special risks are associated with foreign investing, including currency fluctuations, economic instability and political developments. Investments in securities of German issuers involve risks that are specific to Germany, including certain legal, regulatory, political and economic risks. Because the Fund invests its assets primarily in companies in a specific country or region, the Fund may also experience greater volatility than a fund that is more broadly diversified geographically. As anon-diversified fund, the Fund may invest in a relatively small number of issuers and, as a result, be subject to a greater risk of loss with respect to its portfolio securities. The Fund’s prospectus also includes a description of the main investment risks.
ETFs trade like stocks, fluctuate in market value and may trade at prices above or below their net asset value. Brokerage commissions and ETF expenses will reduce returns.
1. Total return calculations represent the cumulative and average annual changes in value of an investment over the periods indicated. Return for less than one year, if any, has not been annualized.
2. Assumes reinvestment of distributions based on net asset value.
3. Assumes reinvestment of distributions based on market price.
4. Figures are as stated in the Fund’s current prospectus and may differ from the expense ratios disclosed in the Your Fund’s Expenses and Financial Highlights sections in this report. In periods of market volatility, assets may decline significantly, causing total annual Fund operating expenses to become higher than the figures shown.
| | | | |
| | | |
| 46 | | Semiannual Report | | franklintempleton.com |
FRANKLIN FTSE GERMANY ETF
Your Fund’s Expenses
As a Fund shareholder, you can incur two types of costs: (1) transaction costs, including brokerage commissions on purchases and sales of Fund shares; and (2) ongoing Fund costs, including management fees and other Fund expenses. All funds have ongoing costs, sometimes referred to as operating expenses. The table below shows ongoing costs of investing in the Fund and can help you understand these costs and compare them with those of other funds. The table assumes a $1,000 investment held for the six months indicated.
Actual Fund Expenses
The table below provides information about actual account values and actual expenses in the columns under the heading “Actual.” In these columns the Fund’s actual return, which includes the effect of Fund expenses, is used to calculate the “Ending Account Value.” You can estimate the expenses you paid during the period by following these steps (of course, your account value and expenses will differ from those in this illustration):Divide your account value by $1,000 (if your account had an $8,600 value, then $8,600÷ $1,000 = 8.6).Then multiply the result by the number in the row under the headings “Actual” and “Expenses Paid During Period” (if Actual Expenses Paid During Period were $7.50, then 8.6 x $7.50 = $64.50).In this illustration, the actual expenses paid this period are $64.50.
Hypothetical Example for Comparison with Other Funds
Under the heading “Hypothetical” in the table, information is provided about hypothetical account values and hypothetical expenses based on the Fund’s actual expense ratio and an assumed rate of return of 5% per year before expenses, which is not the Fund’s actual return. This information may not be used to estimate the actual ending account balance or expenses you paid for the period, but it can help you compare ongoing costs of investing in the Fund with those of other funds. To do so, compare this 5% hypothetical example with the 5% hypothetical examples that appear in the shareholder reports of other funds.
Please note that expenses shown in the table are meant to highlight ongoing costs and do not reflect any transactional costs.Therefore, information under the heading “Hypothetical” is useful in comparing ongoing costs only, and will not help you compare total costs of owning different funds. In addition, if transactional costs were included, your total costs would have been higher.
| | | | | | | | | | | | | | | | | | | | | | |
| | | | Actual (actual return after expenses) | | | Hypothetical
(5% annual return before expenses) | | | | |
| | | | | |
Beginning
Account
Value 4/1/19 | | | Ending
Account
Value 9/30/19 | | | Expenses
Paid During
Period
4/1/19–9/30/191,2 | | | Ending
Account
Value 9/30/19 | | | Expenses
Paid During
Period
4/1/19–9/30/191,2 | | | Net Annualized
Expense Ratio2 | |
| | $1,000.00 | | | $ | 1,033.50 | | | $ | 0.46 | | | $ | 1,024.55 | | | $ | 0.46 | | | | 0.09 | % |
1. Expenses are equal to the annualized expense ratio for thesix-month period as indicated above—in the far right column—multiplied by the simple average account value over the period indicated, and then multiplied by 183/366 to reflect theone-half year period.
2. Reflects expenses after fee waivers and expense reimbursements.
| | | | | | |
| | | |
| franklintempleton.com | | Semiannual Report | | | 47 | |
Franklin FTSE Hong Kong ETF
This semiannual report for Franklin FTSE Hong Kong ETF covers the period ended September 30, 2019.
Your Fund’s Goal and Main Investments
The Fund seeks to provide investment results that closely correspond, before fees and expenses, to the performance of the FTSE Hong Kong RIC Capped Index (the FTSE Hong Kong Capped Index or the Underlying Index).1 Under normal market conditions, the Fund invests at least 80% of its assets in the component securities of the FTSE Hong Kong Capped Index and in depositary receipts representing such securities.
Performance Overview
During thesix-month period, the Fund posted cumulative total returns of -10.98% based on market price and -10.63% based on net asset value. In comparison, the FTSE Hong Kong Capped Index posted a -10.60% total return for the same period.2 You can find more of the Fund’s performance data in the Performance Summary beginning on page 50.
Performance data represent past performance, which does not guarantee future results. Investment return and principal value will fluctuate, and you may have a gain or loss when you sell your shares. Current performance may differ from figures shown. For most recentmonth-end performance, go tofranklintempleton.com or call(800)342-5236.
Investment Strategy
The Fund, using a “passive” or indexing investment approach, seeks investment results that closely correspond, before fees and expenses, to the performance of the FTSE Hong Kong Capped Index. We seek to achieve, over time, a correlation between the Fund’s performance, before fees and expenses, and that of the Underlying Index of 0.95 or better. A figure of 1.00 would indicate perfect correlation. Our intention is to
| | | | |
| Top 10 Sectors/Industries | |
|
| 9/30/19 | |
| |
| | | % of Total
Net Assets | |
| Insurance | | | 19.4% | |
| Real Estate Management & Development | | | 18.8% | |
| Industrial Conglomerates | | | 8.3% | |
| Capital Markets | | | 7.3% | |
| Hotels, Restaurants & Leisure | | | 7.0% | |
| Banks | | | 6.1% | |
| Electric Utilities | | | 5.8% | |
| Food Products | | | 5.5% | |
| Equity Real Estate Investment Trusts (REITs) | | | 4.7% | |
| Gas Utilities | | | 3.8% | |
replicate the component securities of the Underlying Index as closely as possible (i.e., invest in all of the component securities in their respective weightings in the Underlying Index). However, under various circumstances, it may not be possible or practicable to replicate the Underlying Index. In these circumstances, we may use a “representative sampling” strategy whereby we would invest in what we believe to be a representative sample of the component securities of the Underlying Index, but may not track the Underlying Index with the same degree of accuracy as would an investment vehicle replicating the entire Underlying Index. Under the representative sampling technique, we will select securities that collectively have an investment profile similar to that of the Underlying Index, including securities that resemble those included in the Underlying Index in terms of risk factors, performance attributes and other characteristics, such as market capitalization and industry weightings. The Fund will concentrate its investments (i.e., hold 25% or more of its net assets) in a particular industry or group of industries to approximately the same extent that the Underlying Index is concentrated.
1. The FTSE Hong Kong Capped Index is a free float-adjusted market capitalization-weighted index maintained and calculated by FTSE Russell with a capping methodology applied quarterly to issuer weights so that no single issuer of a component exceeds 25% of the index weight, and all issuers with weights above 5% do not cumulatively exceed 50% of the index’s weight. The FTSE Hong Kong Capped Index is based on the FTSE Hong Kong Index and is designed to measure the performance of Hong Kong large- andmid-capitalization stocks.
2. Source: FactSet.
The index is unmanaged and includes reinvestment of any income or distributions (after the deduction of certain withholding taxes). It does not reflect any fees, expenses or sales charges. One cannot invest directly in an index.
See www.franklintempletondatasources.com for additional data provider information.
The dollar value, number of shares or principal amount, and names of all portfolio holdings are listed in the Fund’s Statement of Investments (SOI). The SOI begins on page 213.
| | | | |
| | | |
| 48 | | Semiannual Report | | franklintempleton.com |
FRANKLIN FTSE HONG KONG ETF
| | | | |
| Top 10 Holdings | |
|
| 9/30/19 | |
| |
Company
Sector/Industry, Country | | % of Total
Net Assets | |
AIA Group Ltd.
Insurance, Hong Kong | | | 19.4% | |
Hong Kong Exchanges and Clearing Ltd.
Capital Markets, Hong Kong | | | 7.0% | |
CK Hutchison Holdings Ltd.
Industrial Conglomerates, Hong Kong | | | 4.5% | |
Link REIT
Equity Real Estate Investment Trusts (REITs), Hong Kong | | | 4.4% | |
Sun Hung Kai Properties Ltd.
Real Estate Management & Development, Hong Kong | | | 3.9% | |
Hong Kong and China Gas Co. Ltd.
Gas Utilities, Hong Kong | | | 3.7% | |
CK Asset Holdings Ltd.
Real Estate Management & Development, Hong Kong | | | 3.5% | |
CLP Holdings Ltd.
Electric Utilities, Hong Kong | | | 3.3% | |
Hang Seng Bank Ltd.
Banks, Hong Kong | | | 3.0% | |
Galaxy Entertainment Group Ltd.
Hotels, Restaurants & Leisure, Macau | | | 2.5% | |
Thank you for your participation in Franklin FTSE Hong Kong ETF. We look forward to serving your future investment needs.
| | |
| |
Dina Ting, CFA |
| | |
| |
Louis Hsu, CFA |
| |
| | Portfolio Management Team |
The foregoing information reflects our analysis, opinions and portfolio holdings as of September 30, 2019, the end of the reporting period. These opinions may not be relied upon as investment advice or an offer for a particular security. The information is not a complete analysis of every aspect of any market, country, industry, security or the Fund. Statements of fact are from sources considered reliable, but the investment manager makes no representation or warranty as to their completeness or accuracy. Although historical performance is no guarantee of future results, these insights may help you understand our investment management philosophy.
| | | | | | |
| | | |
| franklintempleton.com | | Semiannual Report | | | 49 | |
FRANKLIN FTSE HONG KONG ETF
Performance Summary as of September 30, 2019
Total return reflects reinvestment of the Fund’s dividends and capital gain distributions, if any, and any unrealized gains or losses. Total returns do not include brokerage commissions that may be payable on secondary market transactions. The performance table does not reflect any taxes that a shareholder would pay on Fund dividends, capital gain distributions, if any, or any realized gains on the sale or redemption of Fund shares.
Net asset value or “NAV” is the value of one share of a fund as calculated in accordance with the standard formula for valuing mutual fund shares. The price used to calculate market return (Market Price) is determined by using the midpoint between the highest bid and the lowest offer on the primary stock exchange on which shares of a fund are listed for trading, as of the time that such fund’s NAV is calculated. Since shares of the Fund did not trade in the secondary market until after the Fund’s inception, for the period from inception to the first day of secondary trading (11/6/17), the NAV of the Fund is used as a proxy for the Market Price to calculate market returns. Market and NAV returns assume that dividends and capital gain distributions have been reinvested at Market Price and NAV.
Your dividend income will vary depending on dividends or interest paid by securities in the Fund’s portfolio, adjusted for operating expenses. Capital gain distributions are net profits realized from the sale of portfolio securities.
Performance as of 9/30/19
| | | | | | | | | | | | | | | | |
| | |
| | | Cumulative Total Return1 | | | Average Annual Total Return1 | |
| | | Based on
NAV2 | | | Based on market price3 | | | Based on
NAV2 | | | Based on market price3 | |
6-Month | | | -10.63% | | | | -10.98% | | | | -10.63% | | | | -10.98% | |
1-Year | | | -3.07% | | | | -3.15% | | | | -3.07% | | | | -3.15% | |
Since Inception (11/2/17) | | | -2.71% | | | | -2.60% | | | | -1.43% | | | | -1.37% | |
Performance data represent past performance, which does not guarantee future results. Investment return and principal value will fluctuate, and you may have a gain or loss when you sell your shares. Current performance may differ from figures shown. For most recentmonth-end performance, go tofranklintempleton.com or call(800)342-5236.
See page 51 for Performance Summary footnotes.
| | | | |
| | | |
| 50 | | Semiannual Report | | franklintempleton.com |
FRANKLIN FTSE HONG KONG ETF
PERFORMANCE SUMMARY
Distributions(4/1/19–9/30/19)
|
|
Net Investment
Income |
$0.350381 |
Total Annual Operating Expenses4
All investments involve risks, including possible loss of principal. Stock prices fluctuate, sometimes rapidly and dramatically, due to factors affecting individual companies, particular industries or sectors, or general market conditions. Special risks are associated with foreign investing, including currency fluctuations, economic instability and political developments. Investments in securities of Hong Kong issuers involve risks that are specific to Hong Kong, including certain legal, regulatory, political and economic risks. Because the Fund invests its assets primarily in companies in a specific country or region, the Fund may also experience greater volatility than a fund that is more broadly diversified geographically. As anon-diversified fund, the Fund may invest in a relatively small number of issuers and, as a result, be subject to a greater risk of loss with respect to its portfolio securities. The Fund’s prospectus also includes a description of the main investment risks.
ETFs trade like stocks, fluctuate in market value and may trade at prices above or below their net asset value. Brokerage commissions and ETF expenses will reduce returns.
1. Total return calculations represent the cumulative and average annual changes in value of an investment over the periods indicated. Return for less than one year, if any, has not been annualized.
2. Assumes reinvestment of distributions based on net asset value.
3. Assumes reinvestment of distributions based on market price.
4. Figures are as stated in the Fund’s current prospectus and may differ from the expense ratios disclosed in the Your Fund’s Expenses and Financial Highlights sections in this report. In periods of market volatility, assets may decline significantly, causing total annual Fund operating expenses to become higher than the figures shown.
| | | | | | |
| | | |
| franklintempleton.com | | Semiannual Report | | | 51 | |
FRANKLIN FTSE HONG KONG ETF
Your Fund’s Expenses
As a Fund shareholder, you can incur two types of costs: (1) transaction costs, including brokerage commissions on purchases and sales of Fund shares; and (2) ongoing Fund costs, including management fees and other Fund expenses. All funds have ongoing costs, sometimes referred to as operating expenses. The table below shows ongoing costs of investing in the Fund and can help you understand these costs and compare them with those of other funds. The table assumes a $1,000 investment held for the six months indicated.
Actual Fund Expenses
The table below provides information about actual account values and actual expenses in the columns under the heading “Actual.” In these columns the Fund’s actual return, which includes the effect of Fund expenses, is used to calculate the “Ending Account Value.” You can estimate the expenses you paid during the period by following these steps (of course, your account value and expenses will differ from those in this illustration):Divide your account value by $1,000 (if your account had an $8,600 value, then $8,600÷ $1,000 = 8.6).Then multiply the result by the number in the row under the headings “Actual” and “Expenses Paid During Period” (if Actual Expenses Paid During Period were $7.50, then 8.6 x $7.50 = $64.50).In this illustration, the actual expenses paid this period are $64.50.
Hypothetical Example for Comparison with Other Funds
Under the heading “Hypothetical” in the table, information is provided about hypothetical account values and hypothetical expenses based on the Fund’s actual expense ratio and an assumed rate of return of 5% per year before expenses, which is not the Fund’s actual return. This information may not be used to estimate the actual ending account balance or expenses you paid for the period, but it can help you compare ongoing costs of investing in the Fund with those of other funds. To do so, compare this 5% hypothetical example with the 5% hypothetical examples that appear in the shareholder reports of other funds.
Please note that expenses shown in the table are meant to highlight ongoing costs and do not reflect any transactional costs.Therefore, information under the heading “Hypothetical” is useful in comparing ongoing costs only, and will not help you compare total costs of owning different funds. In addition, if transactional costs were included, your total costs would have been higher.
| | | | | | | | | | | | | | | | | | | | | | |
| | | | Actual (actual return after expenses) | | | Hypothetical (5% annual return before expenses) | | | | |
| | | | | |
Beginning
Account
Value 4/1/19 | | | Ending
Account
Value 9/30/19 | | | Expenses
Paid During
Period
4/1/19–9/30/191,2 | | | Ending
Account
Value 9/30/19 | | | Expenses
Paid During
Period
4/1/19–9/30/191,2 | | | Net Annualized
Expense Ratio2 | |
| | $1,000.00 | | | $ | 893.70 | | | $ | 0.43 | | | $ | 1,024.55 | | | $ | 0.46 | | | | 0.09 | % |
1. Expenses are equal to the annualized expense ratio for thesix-month period as indicated above—in the far right column—multiplied by the simple average account value over the period indicated, and then multiplied by 183/366 to reflect theone-half year period.
2. Reflects expenses after fee waivers and expense reimbursements.
| | | | |
| | | |
| 52 | | Semiannual Report | | franklintempleton.com |
Franklin FTSE India ETF
This semiannual report for Franklin FTSE India ETF covers the period ended September 30, 2019.
Your Fund’s Goal and Main Investments
The Fund seeks to provide investment results that closely correspond, before fees and expenses, to the performance of the FTSE India RIC Capped Index (the FTSE India Capped Index or the Underlying Index).1 Under normal market conditions, the Fund invests at least 80% of its assets in the component securities of the FTSE India Capped Index and in depositary receipts representing such securities.
Performance Overview
During thesix-month period, the Fund posted cumulative total returns of -4.80% based on market price and -5.33% based on net asset value. In comparison, the FTSE India Capped Index posted a -5.21% total return for the same period.2 You can find more of the Fund’s performance data in the Performance Summary beginning on page 55.
Performance data represent past performance, which does not guarantee future results. Investment return and principal value will fluctuate, and you may have a gain or loss when you sell your shares. Current performance may differ from figures shown. For most recentmonth-end performance, go tofranklintempleton.com or call(800)342-5236.
Investment Strategy
The Fund, using a “passive” or indexing investment approach, seeks investment results that closely correspond, before fees and expenses, to the performance of the FTSE India Capped Index. We seek to achieve, over time, a correlation between the Fund’s performance, before fees and expenses, and that of the Underlying Index of 0.95 or better. A figure of 1.00 would indicate perfect correlation. Our intention is to replicate
| | | | |
| Top 10 Sectors/Industries | |
|
| 9/30/19 | |
| |
| | | % of Total
Net Assets | |
| IT Services | | | 16.6% | |
| Oil, Gas & Consumable Fuels | | | 15.9% | |
| Thrifts & Mortgage Finance | | | 9.7% | |
| Banks | | | 7.0% | |
| Automobiles | | | 5.5% | |
| Pharmaceuticals | | | 4.0% | |
| Household Products | | | 3.7% | |
| Chemicals | | | 3.3% | |
| Insurance | | | 3.0% | |
the component securities of the Underlying Index as closely as possible (i.e., invest in all of the component securities in their respective weightings in the Underlying Index). However, under various circumstances, it may not be possible or practicable to replicate the Underlying Index. In these circumstances, we may use a “representative sampling” strategy whereby we would invest in what we believe to be a representative sample of the component securities of the Underlying Index, but may not track the Underlying Index with the same degree of accuracy as would an investment vehicle replicating the entire Underlying Index. Under the representative sampling technique, we will select securities that collectively have an investment profile similar to that of the Underlying Index, including securities that resemble those included in the Underlying Index in terms of risk factors, performance attributes and other characteristics, such as market capitalization and industry weightings. The Fund will concentrate its investments (i.e., hold 25% or more of its net assets) in a particular industry or group of industries to approximately the same extent that the Underlying Index is concentrated.
1. The FTSE India Capped Index is a free float-adjusted market capitalization-weighted index maintained and calculated by FTSE Russell with a capping methodology applied quarterly to issuer weights so that no single issuer of a component exceeds 25% of the index weight, and all issuers with weights above 5% do not cumulatively exceed 50% of the index’s weight. The FTSE India Capped Index is based on the FTSE India Index and is designed to measure the performance of Indian large- andmid-capitalization stocks.
2. Source: FactSet.
The index is unmanaged and includes reinvestment of any income or distributions (after the deduction of certain withholding taxes). It does not reflect any fees, expenses or sales charges. One cannot invest directly in an index.
See www.franklintempletondatasources.com for additional data provider information.
The dollar value, number of shares or principal amount, and names of all portfolio holdings are listed in the Fund’s Statement of Investments (SOI). The SOI begins on page 217.
| | | | | | |
| | | |
| franklintempleton.com | | Semiannual Report | | | 53 | |
FRANKLIN FTSE INDIA ETF
| | | | |
| Top 10 Holdings | |
|
| 9/30/19 | |
| |
Company
Sector/Industry, Country | | % of Total
Net Assets | |
Reliance Industries Ltd.
Oil, Gas & Consumable Fuels, India | | | 11.0% | |
Housing Development Finance Corp. Ltd.
Thrifts & Mortgage Finance, India | | | 9.0% | |
Infosys Ltd.
IT Services, India | | | 7.9% | |
Tata Consultancy Services Ltd.
IT Services, India | | | 5.0% | |
Hindustan Unilever Ltd.
Household Products, India | | | 3.7% | |
Axis Bank Ltd.
Banks, India | | | 3.3% | |
Maruti Suzuki India Ltd.
Automobiles, India | | | 2.1% | |
ITC Ltd.
Tobacco, India | | | 2.0% | |
Bajaj Finance Ltd.
Consumer Finance, India | | | 1.9% | |
Bharti Airtel Ltd.
Wireless Telecommunication Services, India | | | 1.6% | |
Thank you for your participation in Franklin FTSE India ETF. We look forward to serving your future investment needs.
| | |
| |
Dina Ting, CFA |
| | |
| |
Louis Hsu, CFA |
| |
| | Portfolio Management Team |
The foregoing information reflects our analysis, opinions and portfolio holdings as of September 30, 2019, the end of the reporting period. These opinions may not be relied upon as investment advice or an offer for a particular security. The information is not a complete analysis of every aspect of any market, country, industry, security or the Fund. Statements of fact are from sources considered reliable, but the investment manager makes no representation or warranty as to their completeness or accuracy. Although historical performance is no guarantee of future results, these insights may help you understand our investment management philosophy.
| | | | |
| | | |
| 54 | | Semiannual Report | | franklintempleton.com |
FRANKLIN FTSE INDIA ETF
Performance Summary as of September 30, 2019
Total return reflects reinvestment of the Fund’s dividends and capital gain distributions, if any, and any unrealized gains or losses. Total returns do not include brokerage commissions that may be payable on secondary market transactions. The performance table does not reflect any taxes that a shareholder would pay on Fund dividends, capital gain distributions, if any, or any realized gains on the sale or redemption of Fund shares.
Net asset value or “NAV” is the value of one share of a fund as calculated in accordance with the standard formula for valuing mutual fund shares. The price used to calculate market return (Market Price) is determined by using the midpoint between the highest bid and the lowest offer on the primary stock exchange on which shares of a fund are listed for trading, as of the time that such fund’s NAV is calculated. Since shares of the Fund did not trade in the secondary market until after the Fund’s inception, for the period from inception to the first day of secondary trading (2/9/18), the NAV of the Fund is used as a proxy for the Market Price to calculate market returns. Market and NAV returns assume that dividends and capital gain distributions have been reinvested at Market Price and NAV.
Your dividend income will vary depending on dividends or interest paid by securities in the Fund’s portfolio, adjusted for operating expenses. Capital gain distributions are net profits realized from the sale of portfolio securities.
Performance as of 9/30/19
| | | | | | | | | | | | | | | | |
| | |
| | | Cumulative Total Return1 | | | Average Annual Total Return1 | |
| | | Based on
NAV2 | | | Based on market price3 | | | Based on
NAV2 | | | Based on market price3 | |
6-Month | | | -5.33% | | | | -4.80% | | | | -5.33% | | | | -4.80% | |
1-Year | | | +2.82% | | | | +3.61% | | | | +2.82% | | | | +3.61% | |
Since Inception (2/6/18) | | | -5.92% | | | | -5.11% | | | | -3.64% | | | | -3.13% | |
Performance data represent past performance, which does not guarantee future results. Investment return and principal value will fluctuate, and you may have a gain or loss when you sell your shares. Current performance may differ from figures shown. For most recentmonth-end performance, go tofranklintempleton.com or call(800)342-5236.
See page 56 for Performance Summary footnotes.
| | | | | | |
| | | |
| franklintempleton.com | | Semiannual Report | | | 55 | |
FRANKLIN FTSE INDIA ETF
PERFORMANCE SUMMARY
Distributions(4/1/19–9/30/19)
|
|
Net Investment
Income |
$0.175375 |
Total Annual Operating Expenses4
All investments involve risks, including possible loss of principal. Stock prices fluctuate, sometimes rapidly and dramatically, due to factors affecting individual companies, particular industries or sectors, or general market conditions. Special risks are associated with foreign investing, including currency fluctuations, economic instability and political developments. Investments in developing markets involve heightened risks related to the same factors, in addition to those associated with these markets’ smaller size, lesser liquidity and lack of established legal, political, business and social frameworks to support securities markets. Investments in securities of Indian issuers involve risks that are specific to India, including certain legal, regulatory, political and economic risks. There are special risks associated with investments in India, including exposure to currency fluctuations, less liquidity, expropriation, confiscatory taxation, and exchange control regulations (including currency blockage). Because the Fund invests its assets primarily in companies in a specific country or region, the Fund may also experience greater volatility than a fund that is more broadly diversified geographically. As anon-diversified fund, the Fund may invest in a relatively small number of issuers and, as a result, be subject to a greater risk of loss with respect to its portfolio securities. The Fund’s prospectus also includes a description of the main investment risks.
ETFs trade like stocks, fluctuate in market value and may trade at prices above or below their net asset value. Brokerage commissions and ETF expenses will reduce returns.
1. Total return calculations represent the cumulative and average annual changes in value of an investment over the periods indicated. Return for less than one year, if any, has not been annualized.
2. Assumes reinvestment of distributions based on net asset value.
3. Assumes reinvestment of distributions based on market price.
4. Figures are as stated in the Fund’s current prospectus and may differ from the expense ratios disclosed in the Your Fund’s Expenses and Financial Highlights sections in this report. In periods of market volatility, assets may decline significantly, causing total annual Fund operating expenses to become higher than the figures shown.
| | | | |
| | | |
| 56 | | Semiannual Report | | franklintempleton.com |
FRANKLIN FTSE INDIA ETF
Your Fund’s Expenses
As a Fund shareholder, you can incur two types of costs: (1) transaction costs, including brokerage commissions on purchases and sales of Fund shares; and (2) ongoing Fund costs, including management fees and other Fund expenses. All funds have ongoing costs, sometimes referred to as operating expenses. The table below shows ongoing costs of investing in the Fund and can help you understand these costs and compare them with those of other funds. The table assumes a $1,000 investment held for the six months indicated.
Actual Fund Expenses
The table below provides information about actual account values and actual expenses in the columns under the heading “Actual.” In these columns the Fund’s actual return, which includes the effect of Fund expenses, is used to calculate the “Ending Account Value.” You can estimate the expenses you paid during the period by following these steps (of course, your account value and expenses will differ from those in this illustration):Divide your account value by $1,000 (if your account had an $8,600 value, then $8,600÷ $1,000 = 8.6).Then multiply the result by the number in the row under the headings “Actual” and “Expenses Paid During Period” (if Actual Expenses Paid During Period were $7.50, then 8.6 x $7.50 = $64.50).In this illustration, the actual expenses paid this period are $64.50.
Hypothetical Example for Comparison with Other Funds
Under the heading “Hypothetical” in the table, information is provided about hypothetical account values and hypothetical expenses based on the Fund’s actual expense ratio and an assumed rate of return of 5% per year before expenses, which is not the Fund’s actual return. This information may not be used to estimate the actual ending account balance or expenses you paid for the period, but it can help you compare ongoing costs of investing in the Fund with those of other funds. To do so, compare this 5% hypothetical example with the 5% hypothetical examples that appear in the shareholder reports of other funds.
Please note that expenses shown in the table are meant to highlight ongoing costs and do not reflect any transactional costs.Therefore, information under the heading “Hypothetical” is useful in comparing ongoing costs only, and will not help you compare total costs of owning different funds. In addition, if transactional costs were included, your total costs would have been higher.
| | | | | | | | | | | | | | | | | | | | | | |
| | | | Actual (actual return after expenses) | | | Hypothetical (5% annual return before expenses) | | | | |
| | | | | |
Beginning
Account
Value 4/1/19 | | | Ending
Account
Value 9/30/19 | | | Expenses
Paid During
Period
4/1/19–9/30/191,2 | | | Ending
Account
Value 9/30/19 | | | Expenses
Paid During
Period
4/1/19–9/30/191,2 | | | Net Annualized
Expense Ratio2 | |
| | $1,000.00 | | | $ | 946.70 | | | $ | 0.92 | | | $ | 1,024.05 | | | $ | 0.96 | | | | 0.19 | % |
1. Expenses are equal to the annualized expense ratio for thesix-month period as indicated above—in the far right column—multiplied by the simple average account value over the period indicated, and then multiplied by 183/366 to reflect theone-half year period.
2. Reflects expenses after fee waivers and expense reimbursements.
| | | | | | |
| | | |
| franklintempleton.com | | Semiannual Report | | | 57 | |
Franklin FTSE Italy ETF
This semiannual report for Franklin FTSE Italy ETF covers the period ended September 30, 2019.
Your Fund’s Goal and Main Investments
The Fund seeks to provide investment results that closely correspond, before fees and expenses, to the performance of the FTSE Italy RIC Capped Index (the FTSE Italy Capped Index or the Underlying Index).1 Under normal market conditions, the Fund invests at least 80% of its assets in the component securities of the FTSE Italy Capped Index and in depositary receipts representing such securities.
Performance Overview
During thesix-month period, the Fund posted cumulative total returns of +2.74% based on market price and +3.01% based on net asset value. In comparison, the FTSE Italy Capped Index posted a +2.65% total return for the same period.2 You can find more of the Fund’s performance data in the Performance Summary beginning on page 60.
Performance data represent past performance, which does not guarantee future results. Investment return and principal value will fluctuate, and you may have a gain or loss when you sell your shares. Current performance may differ from figures shown. For most recentmonth-end performance, go tofranklintempleton.com or call(800)342-5236.
Investment Strategy
The Fund, using a “passive” or indexing investment approach, seeks investment results that closely correspond, before fees and expenses, to the performance of the FTSE Italy Capped Index. We seek to achieve, over time, a correlation between the Fund’s performance, before fees and expenses, and that of the Underlying Index of 0.95 or better. A figure of 1.00 would indicate perfect correlation. Our intention is to replicate
| | | | |
| Top 10 Sectors/Industries | |
|
| 9/30/19 | |
| |
| | | % of Total
Net Assets | |
| Banks | | | 22.6% | |
| Electric Utilities | | | 17.9% | |
| Oil, Gas & Consumable Fuels | | | 10.1% | |
| Insurance | | | 8.7% | |
| Automobiles | | | 8.2% | |
| Gas Utilities | | | 4.0% | |
| Diversified Telecommunication Services | | | 3.6% | |
| Transportation Infrastructure | | | 3.5% | |
| Machinery | | | 2.9% | |
| Diversified Financial Services | | | 2.8% | |
the component securities of the Underlying Index as closely as possible (i.e., invest in all of the component securities in their respective weightings in the Underlying Index). However, under various circumstances, it may not be possible or practicable to replicate the Underlying Index. In these circumstances, we may use a “representative sampling” strategy whereby we would invest in what we believe to be a representative sample of the component securities of the Underlying Index, but may not track the Underlying Index with the same degree of accuracy as would an investment vehicle replicating the entire Underlying Index. Under the representative sampling technique, we will select securities that collectively have an investment profile similar to that of the Underlying Index, including securities that resemble those included in the Underlying Index in terms of risk factors, performance attributes and other characteristics, such as market capitalization and industry weightings. The Fund will concentrate its investments (i.e., hold 25% or more of its net assets) in a particular industry or group of industries to approximately the same extent that the Underlying Index is concentrated.
1. The FTSE Italy Capped Index is a free float-adjusted market capitalization-weighted index maintained and calculated by FTSE Russell with a capping methodology applied quarterly to issuer weights so that no single issuer of a component exceeds 25% of the index weight, and all issuers with weights above 5% do not cumulatively exceed 50% of the index’s weight. The FTSE Italy Capped Index is based on the FTSE Italy Index and is designed to measure the performance of Italian large- andmid-capitalization stocks.
2. Source: FactSet.
The index is unmanaged and includes reinvestment of any income or distributions (after the deduction of certain withholding taxes). It does not reflect any fees, expenses or sales charges. One cannot invest directly in an index.
See www.franklintempletondatasources.com for additional data provider information.
The dollar value, number of shares or principal amount, and names of all portfolio holdings are listed in the Fund’s Statement of Investments (SOI). The SOI begins on page 222.
| | | | |
| | | |
| 58 | | Semiannual Report | | franklintempleton.com |
FRANKLIN FTSE ITALY ETF
| | | | |
| Top 10 Holdings | |
|
| 9/30/19 | |
| |
Company
Sector/Industry, Country | | % of Total
Net Assets | |
Enel SpA
Electric Utilities, Italy | | | 15.1% | |
Eni SpA
Oil, Gas & Consumable Fuels, Italy | | | 10.1% | |
Intesa Sanpaolo SpA
Banks, Italy | | | 9.4% | |
UniCredit SpA
Banks, Italy | | | 7.0% | |
Assicurazioni Generali SpA
Insurance, Italy | | | 6.7% | |
Ferrari NV
Automobiles, Italy | | | 4.6% | |
Fiat Chrysler Automobiles NV
Automobiles, United Kingdom | | | 3.6% | |
Atlantia SpA
Transportation Infrastructure, Italy | | | 3.5% | |
Snam SpA
Gas Utilities, Italy | | | 3.2% | |
CNH Industrial NV
Machinery, United Kingdom | | | 2.9% | |
Thank you for your participation in Franklin FTSE Italy ETF. We look forward to serving your future investment needs.
| | |
| |
Dina Ting, CFA |
| | |
| |
Louis Hsu, CFA |
| |
| | Portfolio Management Team |
The foregoing information reflects our analysis, opinions and portfolio holdings as of September 30, 2019, the end of the reporting period. These opinions may not be relied upon as investment advice or an offer for a particular security. The information is not a complete analysis of every aspect of any market, country, industry, security or the Fund. Statements of fact are from sources considered reliable, but the investment manager makes no representation or warranty as to their completeness or accuracy. Although historical performance is no guarantee of future results, these insights may help you understand our investment management philosophy.
| | | | | | |
| | | |
| franklintempleton.com | | Semiannual Report | | | 59 | |
FRANKLIN FTSE ITALY ETF
Performance Summary as of September 30, 2019
Total return reflects reinvestment of the Fund’s dividends and capital gain distributions, if any, and any unrealized gains or losses. Total returns do not include brokerage commissions that may be payable on secondary market transactions. The performance table does not reflect any taxes that a shareholder would pay on Fund dividends, capital gain distributions, if any, or any realized gains on the sale or redemption of Fund shares.
Net asset value or “NAV” is the value of one share of a fund as calculated in accordance with the standard formula for valuing mutual fund shares. The price used to calculate market return (Market Price) is determined by using the midpoint between the highest bid and the lowest offer on the primary stock exchange on which shares of a fund are listed for trading, as of the time that such fund’s NAV is calculated. Since shares of the Fund did not trade in the secondary market until after the Fund’s inception, for the period from inception to the first day of secondary trading (11/6/17), the NAV of the Fund is used as a proxy for the Market Price to calculate market returns. Market and NAV returns assume that dividends and capital gain distributions have been reinvested at Market Price and NAV.
Your dividend income will vary depending on dividends or interest paid by securities in the Fund’s portfolio, adjusted for operating expenses. Capital gain distributions are net profits realized from the sale of portfolio securities.
Performance as of 9/30/19
| | | | | | | | | | | | | | | | |
| | |
| | | Cumulative Total Return1 | | | Average Annual Total Return1 | |
| | | Based on
NAV2 | | | Based on market price3 | | | Based on
NAV2 | | | Based on market price3 | |
6-Month | | | +3.01% | | | | +2.74% | | | | +3.01% | | | | +2.74% | |
1-Year | | | +3.58% | | | | +3.81% | | | | +3.58% | | | | +3.81% | |
Since Inception (11/2/17) | | | -3.98% | | | | -3.99% | | | | -2.10% | | | | -2.11% | |
Performance data represent past performance, which does not guarantee future results. Investment return and principal value will fluctuate, and you may have a gain or loss when you sell your shares. Current performance may differ from figures shown. For most recentmonth-end performance, go tofranklintempleton.com or call(800)342-5236.
See page 61 for Performance Summary footnotes.
| | | | |
| | | |
| 60 | | Semiannual Report | | franklintempleton.com |
FRANKLIN FTSE ITALY ETF
PERFORMANCE SUMMARY
Distributions(4/1/19–9/30/19)
|
|
Net Investment
Income |
$0.671170 |
Total Annual Operating Expenses4
All investments involve risks, including possible loss of principal. Stock prices fluctuate, sometimes rapidly and dramatically, due to factors affecting individual companies, particular industries or sectors, or general market conditions. Special risks are associated with foreign investing, including currency fluctuations, economic instability and political developments. Investments in securities of Italian issuers involve risks that are specific to Italy, including certain legal, regulatory, political and economic risks. Because the Fund invests its assets primarily in companies in a specific country or region, the Fund may also experience greater volatility than a fund that is more broadly diversified geographically. As anon-diversified fund, the Fund may invest in a relatively small number of issuers and, as a result, be subject to a greater risk of loss with respect to its portfolio securities. The Fund’s prospectus also includes a description of the main investment risks.
ETFs trade like stocks, fluctuate in market value and may trade at prices above or below their net asset value. Brokerage commissions and ETF expenses will reduce returns.
1. Total return calculations represent the cumulative and average annual changes in value of an investment over the periods indicated. Return for less than one year, if any, has not been annualized.
2. Assumes reinvestment of distributions based on net asset value.
3. Assumes reinvestment of distributions based on market price.
4. Figures are as stated in the Fund’s current prospectus and may differ from the expense ratios disclosed in the Your Fund’s Expenses and Financial Highlights sections in this report. In periods of market volatility, assets may decline significantly, causing total annual Fund operating expenses to become higher than the figures shown.
| | | | | | |
| | | |
| franklintempleton.com | | Semiannual Report | | | 61 | |
FRANKLIN FTSE ITALY ETF
Your Fund’s Expenses
As a Fund shareholder, you can incur two types of costs: (1) transaction costs, including brokerage commissions on purchases and sales of Fund shares; and (2) ongoing Fund costs, including management fees and other Fund expenses. All funds have ongoing costs, sometimes referred to as operating expenses. The table below shows ongoing costs of investing in the Fund and can help you understand these costs and compare them with those of other funds. The table assumes a $1,000 investment held for the six months indicated.
Actual Fund Expenses
The table below provides information about actual account values and actual expenses in the columns under the heading “Actual.” In these columns the Fund’s actual return, which includes the effect of Fund expenses, is used to calculate the “Ending Account Value.” You can estimate the expenses you paid during the period by following these steps (of course, your account value and expenses will differ from those in this illustration):Divide your account value by $1,000 (if your account had an $8,600 value, then $8,600÷ $1,000 = 8.6).Then multiply the result by the number in the row under the headings “Actual” and “Expenses Paid During Period” (if Actual Expenses Paid During Period were $7.50, then 8.6 x $7.50 = $64.50).In this illustration, the actual expenses paid this period are $64.50.
Hypothetical Example for Comparison with Other Funds
Under the heading “Hypothetical” in the table, information is provided about hypothetical account values and hypothetical expenses based on the Fund’s actual expense ratio and an assumed rate of return of 5% per year before expenses, which is not the Fund’s actual return. This information may not be used to estimate the actual ending account balance or expenses you paid for the period, but it can help you compare ongoing costs of investing in the Fund with those of other funds. To do so, compare this 5% hypothetical example with the 5% hypothetical examples that appear in the shareholder reports of other funds.
Please note that expenses shown in the table are meant to highlight ongoing costs and do not reflect any transactional costs.Therefore, information under the heading “Hypothetical” is useful in comparing ongoing costs only, and will not help you compare total costs of owning different funds. In addition, if transactional costs were included, your total costs would have been higher.
| | | | | | | | | | | | | | | | | | | | | | |
| | | | Actual (actual return after expenses) | | | Hypothetical (5% annual return before expenses) | | | | |
| | | | | |
Beginning
Account
Value 4/1/19 | | | Ending
Account
Value 9/30/19 | | | Expenses
Paid During
Period
4/1/19–9/30/191,2 | | | Ending
Account
Value 9/30/19 | | | Expenses
Paid During
Period
4/1/19–9/30/191,2 | | | Net Annualized
Expense Ratio2 | |
| | $1,000.00 | | | $ | 1,030.10 | | | $ | 0.46 | | | $ | 1,024.55 | | | $ | 0.46 | | | | 0.09 | % |
1. Expenses are equal to the annualized expense ratio for thesix-month period as indicated above—in the far right column—multiplied by the simple average account value over the period indicated, and then multiplied by 183/366 to reflect theone-half year period.
2. Reflects expenses after fee waivers and expense reimbursements.
| | | | |
| | | |
| 62 | | Semiannual Report | | franklintempleton.com |
Franklin FTSE Japan ETF
This semiannual report for Franklin FTSE Japan ETF covers the period ended September 30, 2019.
Your Fund’s Goal and Main Investments
The Fund seeks to provide investment results that closely correspond, before fees and expenses, to the performance of the FTSE Japan RIC Capped Index (the FTSE Japan Capped Index or the Underlying Index).1 Under normal market conditions, the Fund invests at least 80% of its assets in the component securities of the FTSE Japan Capped Index and in depositary receipts representing such securities.
Performance Overview
During thesix-month period, the Fund posted cumulative total returns of +4.15% based on market price and +3.61% based on net asset value. In comparison, the FTSE Japan Capped Index posted a +3.53% total return for the same period.2 You can find more of the Fund’s performance data in the Performance Summary beginning on page 65.
Performance data represent past performance, which does not guarantee future results. Investment return and principal value will fluctuate, and you may have a gain or loss when you sell your shares. Current performance may differ from figures shown. For most recentmonth-end performance, go tofranklintempleton.com or call(800)342-5236.
Investment Strategy
The Fund, using a “passive” or indexing investment approach, seeks investment results that closely correspond, before fees and expenses, to the performance of the FTSE Japan Capped Index. We seek to achieve, over time, a correlation between the Fund’s performance, before fees and expenses, and that of the Underlying Index of 0.95 or better. A figure of 1.00 would indicate perfect correlation. Our intention is to
| | | | |
| Top 10 Sectors/Industries | |
|
| 9/30/19 | |
| |
| | | % of Total
Net Assets | |
| Automobiles | | | 7.4% | |
| Pharmaceuticals | | | 5.9% | |
| Banks | | | 5.8% | |
| Electronic Equipment, Instruments & Components | | | 5.8% | |
| Machinery | | | 5.2% | |
| Road & Rail | | | 4.8% | |
| Chemicals | | | 4.5% | |
| Wireless Telecommunication Services | | | 4.3% | |
| Trading Companies & Distributors | | | 3.5% | |
| Household Durables | | | 3.4% | |
replicate the component securities of the Underlying Index as closely as possible (i.e., invest in all of the component securities in their respective weightings in the Underlying Index). However, under various circumstances, it may not be possible or practicable to replicate the Underlying Index. In these circumstances, we may use a “representative sampling” strategy whereby we would invest in what we believe to be a representative sample of the component securities of the Underlying Index, but may not track the Underlying Index with the same degree of accuracy as would an investment vehicle replicating the entire Underlying Index. Under the representative sampling technique, we will select securities that collectively have an investment profile similar to that of the Underlying Index, including securities that resemble those included in the Underlying Index in terms of risk factors, performance attributes and other characteristics, such as market capitalization and industry weightings. The Fund will concentrate its investments (i.e., hold 25% or more of its net assets) in a particular industry or group of industries to approximately the same extent that the Underlying Index is concentrated.
1. The FTSE Japan Capped Index is a free float-adjusted market capitalization-weighted index maintained and calculated by FTSE Russell with a capping methodology applied quarterly to issuer weights so that no single issuer of a component exceeds 25% of the index weight, and all issuers with weights above 5% do not cumulatively exceed 50% of the index’s weight. The FTSE Japan Capped Index is based on the FTSE Japan Index and is designed to measure the performance of Japanese large- andmid-capitalization stocks.
2. Source: FactSet.
The index is unmanaged and includes reinvestment of any income or distributions (after the deduction of certain withholding taxes). It does not reflect any fees, expenses or sales charges. One cannot invest directly in an index.
See www.franklintempletondatasources.com for additional data provider information.
The dollar value, number of shares or principal amount, and names of all portfolio holdings are listed in the Fund’s Statement of Investments (SOI). The SOI begins on page 224.
| | | | | | |
| | | |
| franklintempleton.com | | Semiannual Report | | | 63 | |
FRANKLIN FTSE JAPAN ETF
| | | | |
| Top 10 Holdings | |
|
| 9/30/19 | |
| |
Company
Sector/Industry, Country | | % of Total
Net Assets | |
Toyota Motor Corp.
Automobiles, Japan | | | 4.5% | |
Sony Corp.
Household Durables, Japan | | | 2.0% | |
SoftBank Group Corp.
Wireless Telecommunication Services, Japan | | | 1.7% | |
Mitsubishi UFJ Financial Group Inc.
Banks, Japan | | | 1.7% | |
Keyence Corp.
Electronic Equipment, Instruments & Components, Japan | | | 1.5% | |
Takeda Pharmaceutical Co. Ltd.
Pharmaceuticals, Japan | | | 1.4% | |
KDDI Corp.
Wireless Telecommunication Services, Japan | | | 1.2% | |
Honda Motor Co. Ltd.
Automobiles, Japan | | | 1.2% | |
Sumitomo Mitsui Financial Group Inc.
Banks, Japan | | | 1.2% | |
Shin-Etsu Chemical Co. Ltd.
Chemicals, Japan | | | 1.2% | |
Thank you for your participation in Franklin FTSE Japan ETF. We look forward to serving your future investment needs.
| | |
| |
Dina Ting, CFA |
| | |
| |
Louis Hsu, CFA |
| |
| | Portfolio Management Team |
The foregoing information reflects our analysis, opinions and portfolio holdings as of September 30, 2019, the end of the reporting period. These opinions may not be relied upon as investment advice or an offer for a particular security. The information is not a complete analysis of every aspect of any market, country, industry, security or the Fund. Statements of fact are from sources considered reliable, but the investment manager makes no representation or warranty as to their completeness or accuracy. Although historical performance is no guarantee of future results, these insights may help you understand our investment management philosophy.
| | | | |
| | | |
| 64 | | Semiannual Report | | franklintempleton.com |
FRANKLIN FTSE JAPAN ETF
Performance Summary as of September 30, 2019
Total return reflects reinvestment of the Fund’s dividends and capital gain distributions, if any, and any unrealized gains or losses. Total returns do not include brokerage commissions that may be payable on secondary market transactions. The performance table does not reflect any taxes that a shareholder would pay on Fund dividends, capital gain distributions, if any, or any realized gains on the sale or redemption of Fund shares.
Net asset value or “NAV” is the value of one share of a fund as calculated in accordance with the standard formula for valuing mutual fund shares. The price used to calculate market return (Market Price) is determined by using the midpoint between the highest bid and the lowest offer on the primary stock exchange on which shares of a fund are listed for trading, as of the time that such fund’s NAV is calculated. Since shares of the Fund did not trade in the secondary market until after the Fund’s inception, for the period from inception to the first day of secondary trading (11/6/17), the NAV of the Fund is used as a proxy for the Market Price to calculate market returns. Market and NAV returns assume that dividends and capital gain distributions have been reinvested at Market Price and NAV.
Your dividend income will vary depending on dividends or interest paid by securities in the Fund’s portfolio, adjusted for operating expenses. Capital gain distributions are net profits realized from the sale of portfolio securities.
Performance as of 9/30/19
| | | | | | | | | | | | | | | | |
| | |
| | | Cumulative Total Return1 | | | Average Annual Total Return1 | |
| | | Based on
NAV2 | | | Based on market price3 | | | Based on
NAV2 | | | Based on market price3 | |
6-Month | | | +3.61% | | | | +4.15% | | | | +3.61% | | | | +4.15% | |
1-Year | | | -5.43% | | | | -4.70% | | | | -5.43% | | | | -4.70% | |
Since Inception (11/2/17) | | | -1.82% | | | | -1.07% | | | | -0.96% | | | | -0.56% | |
Performance data represent past performance, which does not guarantee future results. Investment return and principal value will fluctuate, and you may have a gain or loss when you sell your shares. Current performance may differ from figures shown. For most recentmonth-end performance, go tofranklintempleton.com or call(800)342-5236.
See page 66 for Performance Summary footnotes.
| | | | | | |
| | | |
| franklintempleton.com | | Semiannual Report | | | 65 | |
FRANKLIN FTSE JAPAN ETF
PERFORMANCE SUMMARY
Distributions(4/1/19–9/30/19)
|
|
Net Investment
Income |
$0.293796 |
Total Annual Operating Expenses4
All investments involve risks, including possible loss of principal. Stock prices fluctuate, sometimes rapidly and dramatically, due to factors affecting individual companies, particular industries or sectors, or general market conditions. Special risks are associated with foreign investing, including currency fluctuations, economic instability and political developments. Investments in securities of Japanese issuers involve risks that are specific to Japan, including certain legal, regulatory, political and economic risks. Because the Fund invests its assets primarily in companies in a specific country or region, the Fund may also experience greater volatility than a fund that is more broadly diversified geographically. The Fund’s prospectus also includes a description of the main investment risks.
ETFs trade like stocks, fluctuate in market value and may trade at prices above or below their net asset value. Brokerage commissions and ETF expenses will reduce returns.
1. Total return calculations represent the cumulative and average annual changes in value of an investment over the periods indicated. Return for less than one year, if any, has not been annualized.
2. Assumes reinvestment of distributions based on net asset value.
3. Assumes reinvestment of distributions based on market price.
4. Figures are as stated in the Fund’s current prospectus and may differ from the expense ratios disclosed in the Your Fund’s Expenses and Financial Highlights sections in this report. In periods of market volatility, assets may decline significantly, causing total annual Fund operating expenses to become higher than the figures shown.
| | | | |
| | | |
| 66 | | Semiannual Report | | franklintempleton.com |
FRANKLIN FTSE JAPAN ETF
Your Fund’s Expenses
As a Fund shareholder, you can incur two types of costs: (1) transaction costs, including brokerage commissions on purchases and sales of Fund shares; and (2) ongoing Fund costs, including management fees and other Fund expenses. All funds have ongoing costs, sometimes referred to as operating expenses. The table below shows ongoing costs of investing in the Fund and can help you understand these costs and compare them with those of other funds. The table assumes a $1,000 investment held for the six months indicated.
Actual Fund Expenses
The table below provides information about actual account values and actual expenses in the columns under the heading “Actual.” In these columns the Fund’s actual return, which includes the effect of Fund expenses, is used to calculate the “Ending Account Value.” You can estimate the expenses you paid during the period by following these steps (of course, your account value and expenses will differ from those in this illustration):Divide your account value by $1,000 (if your account had an $8,600 value, then $8,600÷ $1,000 = 8.6).Then multiply the result by the number in the row under the headings “Actual” and “Expenses Paid During Period” (if Actual Expenses Paid During Period were $7.50, then 8.6 x $7.50 = $64.50).In this illustration, the actual expenses paid this period are $64.50.
Hypothetical Example for Comparison with Other Funds
Under the heading “Hypothetical” in the table, information is provided about hypothetical account values and hypothetical expenses based on the Fund’s actual expense ratio and an assumed rate of return of 5% per year before expenses, which is not the Fund’s actual return. This information may not be used to estimate the actual ending account balance or expenses you paid for the period, but it can help you compare ongoing costs of investing in the Fund with those of other funds. To do so, compare this 5% hypothetical example with the 5% hypothetical examples that appear in the shareholder reports of other funds.
Please note that expenses shown in the table are meant to highlight ongoing costs and do not reflect any transactional costs.Therefore, information under the heading “Hypothetical” is useful in comparing ongoing costs only, and will not help you compare total costs of owning different funds. In addition, if transactional costs were included, your total costs would have been higher.
| | | | | | | | | | | | | | | | | | | | | | |
| | | | Actual (actual return after expenses) | | | Hypothetical (5% annual return before expenses) | | | | |
| | | | | |
Beginning
Account
Value 4/1/19 | | | Ending
Account
Value 9/30/19 | | | Expenses
Paid During
Period
4/1/19–9/30/191,2 | | | Ending
Account
Value 9/30/19 | | | Expenses
Paid During
Period
4/1/19–9/30/191,2 | | | Net Annualized
Expense Ratio2 | |
| | $1,000.00 | | | $ | 1,036.10 | | | $ | 0.46 | | | $ | 1,024.55 | | | $ | 0.46 | | | | 0.09 | % |
1. Expenses are equal to the annualized expense ratio for thesix-month period as indicated above—in the far right column—multiplied by the simple average account value over the period indicated, and then multiplied by 183/366 to reflect theone-half year period.
2. Reflects expenses after fee waivers and expense reimbursements.
| | | | | | |
| | | |
| franklintempleton.com | | Semiannual Report | | | 67 | |
Franklin FTSE Japan Hedged ETF
This semiannual report for Franklin FTSE Japan Hedged ETF covers the period ended September 30, 2019.
Your Fund’s Goal and Main Investments
The Fund seeks to provide investment results that closely correspond, before fees and expenses, to the performance of the FTSE Japan RIC Capped Hedged to USD Index (the FTSE Japan Capped Hedged Index or the Underlying Index).1 Under normal market conditions, the Fund invests at least 80% of its assets in the component securities of the FTSE Japan Capped Hedged Index and in depositary receipts representing such securities, including indirectly through Franklin FTSE Japan ETF (Underlying Fund).
Performance Overview
During thesix-month, the Fund posted cumulative total returns of +3.07% based on market price and +2.16% based on net asset value. In comparison, the FTSE Japan Capped Hedged Index posted a +2.22% total return for the same period.2 You can find more of the Fund’s performance data in the Performance Summary beginning on page 70.
Performance data represent past performance, which does not guarantee future results. Investment return and principal value will fluctuate, and you may have a gain or loss when you sell your shares. Current performance may differ from figures shown. For most recentmonth-end performance, go tofranklintempleton.com or call(800)342-5236.
Investment Strategy
The Fund, using a “passive” or indexing investment approach, seeks investment results that closely correspond, before fees and expenses, to the performance of the FTSE Japan Capped Hedged Index. We seek to achieve, over time, a correlation between the Fund’s performance, before fees and expenses, and that of the Underlying Index of 0.95 or better. A figure of 1.00 would indicate perfect correlation. Our intention is to replicate the component securities of the
| | | | |
| Top 10 Sectors/Industries | |
|
| 9/30/19 | |
| |
| | | % of Total
Net Assets | |
| Automobiles | | | 7.4% | |
| Pharmaceuticals | | | 5.9% | |
| Banks | | | 5.8% | |
| Electronic Equipment, Instruments & Components | | | 5.8% | |
| Machinery | | | 5.2% | |
| Road & Rail | | | 4.7% | |
| Chemicals | | | 4.4% | |
| Wireless Telecommunication Services | | | 4.3% | |
| Trading Companies & Distributors | | | 3.6% | |
| Household Durables | | | 3.4% | |
Underlying Index as closely as possible (i.e., invest in all of the component securities in their respective weightings in the Underlying Index). However, under various circumstances, it may not be possible or practicable to replicate the Underlying Index. In these circumstances, we may use a “representative sampling” strategy whereby we would invest in what we believe to be a representative sample of the component securities of the Underlying Index, but may not track the Underlying Index with the same degree of accuracy as would an investment vehicle replicating the entire Underlying Index. Under the representative sampling technique, we will select securities that collectively have an investment profile similar to that of the Underlying Index, including securities that resemble those included in the Underlying Index in terms of risk factors, performance attributes and other characteristics, such as market capitalization and industry weightings. We intend to enter into monthly foreign currency forward contracts and/or currency futures contracts designed to offset the Fund’s exposure to the Japanese yen, in order to replicate the hedge impact incorporated in the calculation of the Underlying Index. The Fund’s exposure to foreign currency forward contracts and currency futures contracts is based on the aggregate exposure of the Fund to the Japanese yen.
1. The FTSE Japan Capped Hedged Index is a free float-adjusted market capitalization-weighted index maintained and calculated by FTSE Russell with a capping methodology applied quarterly to issuer weights so that no single issuer of a component exceeds 25% of the index weight, and all issuers with weights above 5% do not cumulatively exceed 50% of the index’s weight. The FTSE Japan Capped Hedged Index is based on the FTSE Japan Hedged to USD Index and is designed to measure the performance of Japanese large- andmid-capitalization stocks. The FTSE Japan Capped Hedged Index incorporates a hedge against fluctuations of the Japanese yen by reflecting the impact of rolling monthly currency forward contracts on the Japanese yen.
2. Source: FactSet.
The index is unmanaged and includes reinvestment of any income or distributions (after the deduction of certain withholding taxes). It does not reflect any fees, expenses or sales charges. One cannot invest directly in an index.
See www.franklintempletondatasources.com for additional data provider information.
The dollar value, number of shares or principal amount, and names of all portfolio holdings are listed in the Fund’s Statement of Investments (SOI). The SOI begins on page 235.
| | | | |
| | | |
| 68 | | Semiannual Report | | franklintempleton.com |
FRANKLIN FTSE JAPAN HEDGED ETF
| | | | |
| Top 10 Holdings | |
|
| 9/30/19 | |
| |
Company
Sector/Industry, Country | | % of Total
Net Assets | |
Toyota Motor Corp.
Automobiles, Japan | | | 4.5% | |
Sony Corp.
Household Durables, Japan | | | 2.0% | |
SoftBank Group Corp.
Wireless Telecommunication Services, Japan | | | 1.7% | |
Mitsubishi UFJ Financial Group Inc.
Banks, Japan | | | 1.7% | |
Keyence Corp.
Electronic Equipment, Instruments & Components, Japan | | | 1.5% | |
Takeda Pharmaceutical Co. Ltd.
Pharmaceuticals, Japan | | | 1.4% | |
Honda Motor Co. Ltd.
Automobiles, Japan | | | 1.2% | |
KDDI Corp.
Wireless Telecommunication Services, Japan | | | 1.2% | |
Sumitomo Mitsui Financial Group Inc.
Banks, Japan | | | 1.2% | |
Shin-Etsu Chemical Co. Ltd.
Chemicals, Japan | | | 1.1% | |
The Fund will concentrate its investments (i.e., hold 25% or more of its net assets) in a particular industry or group of industries to approximately the same extent that the Underlying Index is concentrated.
What is a currency forward contract?
A currency forward contract is an agreement between the Fund and a counterparty to buy or sell a foreign currency in exchange for another currency at a specific exchange rate on a future date. Currency forward contracts are privately traded in the interbank market, not on a centralized exchange.
What is a futures contract?
A futures contract is an agreement between the Fund and a counterparty made through a U.S. or foreign futures exchange to buy or sell an underlying instrument or asset at a specific price on a future date.
Thank you for your participation in Franklin FTSE Japan Hedged ETF. We look forward to serving your future investment needs.
| | |
| |
Dina Ting, CFA |
| | |
| |
Louis Hsu, CFA |
| |
| | Portfolio Management Team |
The foregoing information reflects our analysis, opinions and portfolio holdings as of September 30, 2019, the end of the reporting period. These opinions may not be relied upon as investment advice or an offer for a particular security. The information is not a complete analysis of every aspect of any market, country, industry, security or the Fund. Statements of fact are from sources considered reliable, but the investment manager makes no representation or warranty as to their completeness or accuracy. Although historical performance is no guarantee of future results, these insights may help you understand our investment management philosophy.
| | | | | | |
| | | |
| franklintempleton.com | | Semiannual Report | | | 69 | |
FRANKLIN FTSE JAPAN HEDGED ETF
Performance Summary as of September 30, 2019
Total return reflects reinvestment of the Fund’s dividends and capital gain distributions, if any, and any unrealized gains or losses. Total returns do not include brokerage commissions that may be payable on secondary market transactions. The performance table does not reflect any taxes that a shareholder would pay on Fund dividends, capital gain distributions, if any, or any realized gains on the sale or redemption of Fund shares.
Net asset value or “NAV” is the value of one share of a fund as calculated in accordance with the standard formula for valuing mutual fund shares. The price used to calculate market return (Market Price) is determined by using the midpoint between the highest bid and the lowest offer on the primary stock exchange on which shares of a fund are listed for trading, as of the time that such fund’s NAV is calculated. Since shares of the Fund did not trade in the secondary market until after the Fund’s inception, for the period from inception to the first day of secondary trading (11/6/17), the NAV of the Fund is used as a proxy for the Market Price to calculate market returns. Market and NAV returns assume that dividends and capital gain distributions have been reinvested at Market Price and NAV.
Your dividend income will vary depending on dividends or interest paid by securities in the Fund’s portfolio, adjusted for operating expenses. Capital gain distributions are net profits realized from the sale of portfolio securities.
Performance as of 9/30/19
| | | | | | | | | | | | | | | | |
| | |
| | | Cumulative Total Return1 | | | Average Annual Total Return1 | |
| | | Based on
NAV2 | | | Based on market price3 | | | Based on
NAV2 | | | Based on market price3 | |
6-Month | | | +2.16% | | | | +3.07% | | | | +2.16% | | | | +3.07% | |
1-Year | | | -8.14% | | | | -7.39% | | | | -8.14% | | | | -7.39% | |
Since Inception (11/2/17) | | | -3.51% | | | | -2.55% | | | | -1.85% | | | | -1.34% | |
Performance data represent past performance, which does not guarantee future results. Investment return and principal value will fluctuate, and you may have a gain or loss when you sell your shares. Current performance may differ from figures shown. For most recentmonth-end performance, go tofranklintempleton.com or call(800)342-5236.
See page 71 for Performance Summary footnotes.
| | | | |
| | | |
| 70 | | Semiannual Report | | franklintempleton.com |
FRANKLIN FTSE JAPAN HEDGED ETF
PERFORMANCE SUMMARY
Total Annual Operating Expenses4
All investments involve risks, including possible loss of principal. Stock prices fluctuate, sometimes rapidly and dramatically, due to factors affecting individual companies, particular industries or sectors, or general market conditions. Special risks are associated with foreign investing, including currency fluctuations, economic instability and political developments. Investments in securities of Japanese issuers involve risks that are specific to Japan, including certain legal, regulatory, political and economic risks. Because the Fund invests its assets primarily in companies in a specific country or region, the Fund may also experience greater volatility than a fund that is more broadly diversified geographically. Derivatives, including currency management strategies, involve costs and can create economic leverage in the portfolio, which may result in significant volatility and cause the Fund to participate in losses on an amount that exceeds the Fund’s initial investment. The Fund may not achieve the anticipated benefits, and may realize losses when a counterparty fails to perform as promised. While the Fund’s use of foreign currency forward contracts and/or currency futures contracts is designed to minimize the impact of currency fluctuations on Fund returns, it does not necessarily eliminate the Fund’s exposure to the Japanese yen. The return of these currency hedging instruments will not perfectly offset the actual fluctuations between the Japanese yen and the U.S. dollar. Currency hedges are sometimes subject to imperfect matching between the derivative instruments and the currencies that the derivative instruments intend to hedge, and there can be no assurance that the Fund’s hedging transactions will be effective. The Fund’s exposure to the Japanese yen may not be fully hedged at all times. Because the Fund’s currency hedge is generally reset on a monthly basis, currency risk can develop or increase intra-month. The Fund’s prospectus also includes a description of the main investment risks.
ETFs trade like stocks, fluctuate in market value and may trade at prices above or below their net asset value. Brokerage commissions and ETF expenses will reduce returns.
1. Total return calculations represent the cumulative and average annual changes in value of an investment over the periods indicated. Return for less than one year, if any, has not been annualized.
2. Assumes reinvestment of distributions based on net asset value.
3. Assumes reinvestment of distributions based on market price.
4. Figures are as stated in the Fund’s current prospectus and may differ from the expense ratios disclosed in the Your Fund’s Expenses and Financial Highlights sections in this report. In periods of market volatility, assets may decline significantly, causing total annual Fund operating expenses to become higher than the figures shown.
| | | | | | |
| | | |
| franklintempleton.com | | Semiannual Report | | | 71 | |
FRANKLIN FTSE JAPAN HEDGED ETF
Your Fund’s Expenses
As a Fund shareholder, you can incur two types of costs: (1) transaction costs, including brokerage commissions on purchases and sales of Fund shares; and (2) ongoing Fund costs, including management fees and other Fund expenses. All funds have ongoing costs, sometimes referred to as operating expenses. The table below shows ongoing costs of investing in the Fund and can help you understand these costs and compare them with those of other funds. The table assumes a $1,000 investment held for the six months indicated.
Actual Fund Expenses
The table below provides information about actual account values and actual expenses in the columns under the heading “Actual.” In these columns the Fund’s actual return, which includes the effect of Fund expenses, is used to calculate the “Ending Account Value.” You can estimate the expenses you paid during the period by following these steps (of course, your account value and expenses will differ from those in this illustration):Divide your account value by $1,000 (if your account had an $8,600 value, then $8,600÷ $1,000 = 8.6).Then multiply the result by the number in the row under the headings “Actual” and “Expenses Paid During Period” (if Actual Expenses Paid During Period were $7.50, then 8.6 x $7.50 = $64.50).In this illustration, the actual expenses paid this period are $64.50.
Hypothetical Example for Comparison with Other Funds
Under the heading “Hypothetical” in the table, information is provided about hypothetical account values and hypothetical expenses based on the Fund’s actual expense ratio and an assumed rate of return of 5% per year before expenses, which is not the Fund’s actual return. This information may not be used to estimate the actual ending account balance or expenses you paid for the period, but it can help you compare ongoing costs of investing in the Fund with those of other funds. To do so, compare this 5% hypothetical example with the 5% hypothetical examples that appear in the shareholder reports of other funds.
Please note that expenses shown in the table are meant to highlight ongoing costs and do not reflect any transactional costs.Therefore, information under the heading “Hypothetical” is useful in comparing ongoing costs only, and will not help you compare total costs of owning different funds. In addition, if transactional costs were included, your total costs would have been higher.
| | | | | | | | | | | | | | | | | | | | | | |
| | | | Actual (actual return after expenses) | | | Hypothetical
(5% annual return before expenses) | | | | |
| | | | | |
Beginning
Account
Value 4/1/19 | | | Ending
Account
Value 9/30/19 | | | Expenses
Paid During
Period
4/1/19–9/30/191,2 | | | Ending
Account
Value 9/30/19 | | | Expenses Paid During
Period
4/1/19–9/30/191,2 | | | Net Annualized
Expense Ratio2 | |
| | $1,000.00 | | | $ | 1,021.60 | | | $ | 0.45 | | | $ | 1,024.55 | | | $ | 0.46 | | | | 0.09 | % |
1. Expenses are equal to the annualized expense ratio for thesix-month period as indicated above—in the far right column—multiplied by the simple average account value over the period indicated, and then multiplied by 183/366 to reflect theone-half year period.
2. Reflects expenses after fee waivers and expense reimbursements.
| | | | |
| | | |
| 72 | | Semiannual Report | | franklintempleton.com |
Franklin FTSE Latin America ETF
This semiannual report for Franklin FTSE Latin America ETF covers the period ended September 30, 2019.
Your Fund’s Goal and Main Investments
The Fund seeks to provide investment results that closely correspond, before fees and expenses, to the performance of the FTSE Latin America RIC Capped Index (the FTSE Latin America Capped Index or the Underlying Index).1 Under normal market conditions, the Fund invests at least 80% of its assets in the component securities of the FTSE Latin America Capped Index and in depositary receipts representing such securities.
Performance Overview
During thesix-month period, the Fund posted cumulative total returns of +0.75% based on market price and +0.10% based on net asset value. In comparison, the FTSE Latin America Capped Index posted a +0.14% total return for the same period.2 You can find more of the Fund’s performance data in the Performance Summary beginning on page 75.
Performance data represent past performance, which does not guarantee future results. Investment return and principal value will fluctuate, and you may have a gain or loss when you sell your shares. Current performance may differ from figures shown. For most recentmonth-end performance, go tofranklintempleton.com or call(800)342-5236.
Investment Strategy
The Fund, using a “passive” or indexing investment approach, seeks investment results that closely correspond, before fees and expenses, to the performance of the FTSE Latin America Capped Index. We seek to achieve, over time, a correlation between the Fund’s performance, before fees and expenses, and that of the Underlying Index of 0.95 or better. A figure of 1.00 would indicate perfect correlation.
| | | | |
| Top 10 Sectors/Industries | |
|
| 9/30/19 | |
| |
| | | % of Total
Net Assets | |
| Banks | | | 24.5% | |
| Oil, Gas & Consumable Fuels | | | 9.5% | |
| Metals & Mining | | | 9.2% | |
| Beverages | | | 7.3% | |
| Electric Utilities | | | 5.4% | |
| Food & Staples Retailing | | | 4.4% | |
| Capital Markets | | | 3.7% | |
| Multiline Retail | | | 3.7% | |
| Wireless Telecommunication Services | | | 3.6% | |
| Food Products | | | 3.3% | |
Our intention is to replicate the component securities of the Underlying Index as closely as possible (i.e., invest in all of the component securities in their respective weightings in the Underlying Index). However, under various circumstances, it may not be possible or practicable to replicate the Underlying Index. In these circumstances, we may use a “representative sampling” strategy whereby we would invest in what we believe to be a representative sample of the component securities of the Underlying Index, but may not track the Underlying Index with the same degree of accuracy as would an investment vehicle replicating the entire Underlying Index. Under the representative sampling technique, we will select securities that collectively have an investment profile similar to that of the Underlying Index, including securities that resemble those included in the Underlying Index in terms of risk factors, performance attributes and other characteristics, such as market capitalization and industry weightings. The Fund will concentrate its investments (i.e., hold 25% or more of its net assets) in a particular industry or group of industries to approximately the same extent that the Underlying Index is concentrated.
1. The FTSE Latin America Capped Index is a free float-adjusted market capitalization-weighted index maintained and calculated by FTSE Russell with a capping methodology applied quarterly to issuer weights so that no single issuer of a component exceeds 25% of the index weight, and all issuers with weights above 5% do not cumulatively exceed 50% of the index’s weight. The FTSE Latin America Capped Index is based on the FTSE Latin America Index and is designed to measure the performance of Latin American large- andmid-capitalization stocks.
2. Source: FactSet.
The index is unmanaged and includes reinvestment of any income or distributions (after the deduction of certain withholding taxes). It does not reflect any fees, expenses or sales charges. One cannot invest directly in an index.
See www.franklintempletondatasources.com for additional data provider information.
The dollar value, number of shares or principal amount, and names of all portfolio holdings are listed in the Fund’s Statement of Investments (SOI). The SOI begins on page 246.
| | | | | | |
| | | |
| franklintempleton.com | | Semiannual Report | | | 73 | |
FRANKLIN FTSE LATIN AMERICA ETF
| | | | |
| Top 10 Holdings | |
|
| 9/30/19 | |
| |
Company
Sector/Industry, Country | | % of Total
Net Assets | |
Petroleo Brasileiro SA
Oil, Gas & Consumable Fuels, Brazil | | | 7.3% | |
Banco Bradesco SA
Banks, Brazil | | | 6.2% | |
Itau Unibanco Holding SA
Banks, Brazil | | | 6.0% | |
Vale SA
Metals & Mining, Brazil | | | 6.0% | |
B3 SA – Brasil Bolsa Balcao
Capital Markets, Brazil | | | 3.1% | |
America Movil SAB de CV, L
Wireless Telecommunication Services, Mexico | | | 3.1% | |
Ambev SA
Beverages, Brazil | | | 3.1% | |
Fomento Economico Mexicano SAB de CV
Beverages, Mexico | | | 2.9% | |
Wal-Mart de Mexico SAB de CV, V
Food & Staples Retailing, Mexico | | | 2.3% | |
Grupo Financiero Banorte SAB de CV
Banks, Mexico | | | 2.3% | |
| | | | |
| Top 10 Countries | |
|
| 9/30/19 | |
| |
| | | % of Total
Net Assets | |
| Brazil | | | 64.3% | |
| Mexico | | | 22.1% | |
| Chile | | | 8.1% | |
| Colombia | | | 3.7% | |
| United States | | | 1.2% | |
| Peru | | | 0.5% | |
| Other Assets less Liabilities | | | 0.2% | |
Thank you for your participation in Franklin FTSE Latin America ETF. We look forward to serving your future investment needs.
| | |
| |
Dina Ting, CFA |
| | |
| |
Louis Hsu, CFA |
| |
| | Portfolio Management Team |
The foregoing information reflects our analysis, opinions and portfolio holdings as of September 30, 2019, the end of the reporting period. These opinions may not be relied upon as investment advice or an offer for a particular security. The information is not a complete analysis of every aspect of any market, country, industry, security or the Fund. Statements of fact are from sources considered reliable, but the investment manager makes no representation or warranty as to their completeness or accuracy. Although historical performance is no guarantee of future results, these insights may help you understand our investment management philosophy.
| | | | |
| | | |
| 74 | | Semiannual Report | | franklintempleton.com |
FRANKLIN FTSE LATIN AMERICA ETF
Performance Summary as of September 30, 2019
Total return reflects reinvestment of the Fund’s dividends and capital gain distributions, if any, and any unrealized gains or losses. Total returns do not include brokerage commissions that may be payable on secondary market transactions. The performance table does not reflect any taxes that a shareholder would pay on Fund dividends, capital gain distributions, if any, or any realized gains on the sale or redemption of Fund shares.
Net asset value or “NAV” is the value of one share of a fund as calculated in accordance with the standard formula for valuing mutual fund shares. The price used to calculate market return (Market Price) is determined by using the midpoint between the highest bid and the lowest offer on the primary stock exchange on which shares of a fund are listed for trading, as of the time that such fund’s NAV is calculated. Since shares of the Fund did not trade in the secondary market until after the Fund’s inception, for the period from inception to the first day of secondary trading (10/11/18), the NAV of the Fund is used as a proxy for the Market Price to calculate market returns. Market and NAV returns assume that dividends and capital gain distributions have been reinvested at Market Price and NAV.
Your dividend income will vary depending on dividends or interest paid by securities in the Fund’s portfolio, adjusted for operating expenses. Capital gain distributions are net profits realized from the sale of portfolio securities.
Performance as of 9/30/19
| | | | | | | | | | | | | | | | |
| | |
| | | Cumulative Total Return1 | | | Average Annual Total Return1 | |
| | | Based on
NAV2 | | | Based on market price3 | | | Based on
NAV2 | | | Based on market price3 | |
6-Month | | | +0.10% | | | | +0.75% | | | | +0.10% | | | | +0.75% | |
Since Inception (10/9/18) | | | +1.52% | | | | +1.94% | | | | +1.52% | | | | +1.94% | |
Performance data represent past performance, which does not guarantee future results. Investment return and principal value will fluctuate, and you may have a gain or loss when you sell your shares. Current performance may differ from figures shown. For most recentmonth-end performance, go tofranklintempleton.com or call(800)342-5236.
See page 76 for Performance Summary footnotes.
| | | | | | |
| | | |
| franklintempleton.com | | Semiannual Report | | | 75 | |
FRANKLIN FTSE LATIN AMERICA ETF
PERFORMANCE SUMMARY
Distributions(4/1/19–9/30/19)
|
|
Net Investment
Income |
$0.459183 |
Total Annual Operating Expenses4
All investments involve risks, including possible loss of principal. Stock prices fluctuate, sometimes rapidly and dramatically, due to factors affecting individual companies, particular industries or sectors, or general market conditions. Special risks are associated with foreign investing, including currency fluctuations, economic instability and political developments. Investments in developing markets involve heightened risks related to the same factors, in addition to those associated with these markets’ smaller size, lesser liquidity and lack of established legal, political, business and social frameworks to support securities markets. Investments in securities of Latin American issuers involve risks that are specific to Latin America, including certain legal, regulatory, political and economic risks. Because the Fund invests its assets primarily in companies in a specific country or region, the Fund may also experience greater volatility than a fund that is more broadly diversified geographically. The Fund’s prospectus also includes a description of the main investment risks.
ETFs trade like stocks, fluctuate in market value and may trade at prices above or below their net asset value. Brokerage commissions and ETF expenses will reduce returns.
1. Total return calculations represent the cumulative and average annual changes in value of an investment over the periods indicated. Return for less than one year, if any, has not been annualized.
2. Assumes reinvestment of distributions based on net asset value.
3. Assumes reinvestment of distributions based on market price.
4. Figures are as stated in the Fund’s current prospectus and may differ from the expense ratios disclosed in the Your Fund’s Expenses and Financial Highlights sections in this report. In periods of market volatility, assets may decline significantly, causing total annual Fund operating expenses to become higher than the figures shown.
| | | | |
| | | |
| 76 | | Semiannual Report | | franklintempleton.com |
FRANKLIN FTSE LATIN AMERICA ETF
Your Fund’s Expenses
As a Fund shareholder, you can incur two types of costs: (1) transaction costs, including brokerage commissions on purchases and sales of Fund shares; and (2) ongoing Fund costs, including management fees and other Fund expenses. All funds have ongoing costs, sometimes referred to as operating expenses. The table below shows ongoing costs of investing in the Fund and can help you understand these costs and compare them with those of other funds. The table assumes a $1,000 investment held for the six months indicated.
Actual Fund Expenses
The table below provides information about actual account values and actual expenses in the columns under the heading “Actual.” In these columns the Fund’s actual return, which includes the effect of Fund expenses, is used to calculate the “Ending Account Value.” You can estimate the expenses you paid during the period by following these steps (of course, your account value and expenses will differ from those in this illustration):Divide your account value by $1,000 (if your account had an $8,600 value, then $8,600÷ $1,000 = 8.6).Then multiply the result by the number in the row under the headings “Actual” and “Expenses Paid During Period” (if Actual Expenses Paid During Period were $7.50, then 8.6 x $7.50 = $64.50).In this illustration, the actual expenses paid this period are $64.50.
Hypothetical Example for Comparison with Other Funds
Under the heading “Hypothetical” in the table, information is provided about hypothetical account values and hypothetical expenses based on the Fund’s actual expense ratio and an assumed rate of return of 5% per year before expenses, which is not the Fund’s actual return. This information may not be used to estimate the actual ending account balance or expenses you paid for the period, but it can help you compare ongoing costs of investing in the Fund with those of other funds. To do so, compare this 5% hypothetical example with the 5% hypothetical examples that appear in the shareholder reports of other funds.
Please note that expenses shown in the table are meant to highlight ongoing costs and do not reflect any transactional costs.Therefore, information under the heading “Hypothetical” is useful in comparing ongoing costs only, and will not help you compare total costs of owning different funds. In addition, if transactional costs were included, your total costs would have been higher.
| | | | | | | | | | | | | | | | | | | | | | |
| | | | Actual (actual return after expenses) | | | Hypothetical
(5% annual return before expenses) | | | | |
| | | | | |
Beginning
Account
Value 4/1/19 | | | Ending
Account
Value 9/30/19 | | | Expenses
Paid During
Period
4/1/19–9/30/191,2 | | | Ending
Account
Value 9/30/19 | | | Expenses
Paid During
Period
4/1/19–9/30/191,2 | | | Net Annualized
Expense Ratio2 | |
| | $1,000.00 | | | $ | 1,001.00 | | | $ | 0.95 | | | $ | 1,024.05 | | | $ | 0.96 | | | | 0.19 | % |
1. Expenses are equal to the annualized expense ratio for thesix-month period as indicated above—in the far right column—multiplied by the simple average account value over the period indicated, and then multiplied by 183/366 to reflect theone-half year period.
2. Reflects expenses after fee waivers and expense reimbursements.
| | | | | | |
| | | |
| franklintempleton.com | | Semiannual Report | | | 77 | |
Franklin FTSE Mexico ETF
This semiannual report for Franklin FTSE Mexico ETF covers the period ended September 30, 2019.
Your Fund’s Goal and Main Investments
The Fund seeks to provide investment results that closely correspond, before fees and expenses, to the performance of the FTSE Mexico RIC Capped Index (the FTSE Mexico Capped Index or the Underlying Index).1 Under normal market conditions, the Fund invests at least 80% of its assets in the component securities of the FTSE Mexico Capped Index and in depositary receipts representing such securities.
Performance Overview
During thesix-month period, the Fund posted cumulative total returns of +0.50% based on market price and -0.46% based on net asset value. In comparison, the FTSE Mexico Capped Index posted a -0.49% total return for the same period.2 You can find more of the Fund’s performance data in the Performance Summary beginning on page 80.
Performance data represent past performance, which does not guarantee future results. Investment return and principal value will fluctuate, and you may have a gain or loss when you sell your shares. Current performance may differ from figures shown. For most recentmonth-end performance, go tofranklintempleton.com or call(800)342-5236.
Investment Strategy
The Fund, using a “passive” or indexing investment approach, seeks investment results that closely correspond, before fees and expenses, to the performance of the FTSE Mexico Capped Index. We seek to achieve, over time, a correlation between the Fund’s performance, before fees and expenses, and that of the Underlying Index of 0.95 or better. A figure of 1.00 would indicate perfect correlation. Our intention is to
| | | | |
| Top 10 Sectors/Industries | |
|
| 9/30/19 | |
| |
| | | % of Total
Net Assets | |
| Beverages | | | 17.7% | |
| Banks | | | 17.6% | |
| Wireless Telecommunication Services | | | 14.0% | |
| Food & Staples Retailing | | | 10.8% | |
| Transportation Infrastructure | | | 7.6% | |
| Metals & Mining | | | 5.7% | |
| Food Products | | | 5.4% | |
| Media | | | 3.8% | |
| Construction Materials | | | 3.5% | |
| Equity Real Estate Investment Trusts (REITs) | | | 3.2% | |
replicate the component securities of the Underlying Index as closely as possible (i.e., invest in all of the component securities in their respective weightings in the Underlying Index). However, under various circumstances, it may not be possible or practicable to replicate the Underlying Index. In these circumstances, we may use a “representative sampling” strategy whereby we would invest in what we believe to be a representative sample of the component securities of the Underlying Index, but may not track the Underlying Index with the same degree of accuracy as would an investment vehicle replicating the entire Underlying Index. Under the representative sampling technique, we will select securities that collectively have an investment profile similar to that of the Underlying Index, including securities that resemble those included in the Underlying Index in terms of risk factors, performance attributes and other characteristics, such as market capitalization and industry weightings. The Fund will concentrate its investments (i.e., hold 25% or more of its net assets) in a particular industry or group of industries to approximately the same extent that the Underlying Index is concentrated.
1. The FTSE Mexico Capped Index is a free float-adjusted market capitalization-weighted index maintained and calculated by FTSE Russell with a capping methodology applied quarterly to issuer weights so that no single issuer of a component exceeds 25% of the index weight, and all issuers with weights above 5% do not cumulatively exceed 50% of the index’s weight. The FTSE Mexico Capped Index is based on the FTSE Mexico Index and is designed to measure the performance of Mexican large- andmid-capitalization stocks.
2. Source: FactSet.
The index is unmanaged and includes reinvestment of any income or distributions (after the deduction of certain withholding taxes). It does not reflect any fees, expenses or sales charges. One cannot invest directly in an index.
See www.franklintempletondatasources.com for additional data provider information.
The dollar value, number of shares or principal amount, and names of all portfolio holdings are listed in the Fund’s Statement of Investments (SOI). The SOI begins on page 251.
| | | | |
| | | |
| 78 | | Semiannual Report | | franklintempleton.com |
FRANKLIN FTSE MEXICO ETF
| | | | |
| Top 10 Holdings | |
|
| 9/30/19 | |
| |
Company
Sector/Industry, Country | | % of Total
Net Assets | |
America Movil SAB de CV, L
Wireless Telecommunication Services, Mexico | | | 14.0% | |
Fomento Economico Mexicano SAB de CV
Beverages, Mexico | | | 13.2% | |
Wal-Mart de Mexico SAB de CV, V
Food & Staples Retailing, Mexico | | | 10.5% | |
Grupo Financiero Banorte SAB de CV
Banks, Mexico | | | 10.4% | |
Grupo Mexico SAB de CV, B
Metals & Mining, Mexico | | | 4.5% | |
Cemex SAB de CV
Construction Materials, Mexico | | | 3.6% | |
Grupo Elektra SAB de CV
Banks, Mexico | | | 3.0% | |
Fibra Uno Administracion SA de CV
Equity Real Estate Investment Trusts (REITs), Mexico | | | 3.0% | |
Grupo Televisa SA
Media, Mexico | | | 2.9% | |
Grupo Bimbo SAB de CV, A
Food Products, Mexico | | | 2.9% | |
Thank you for your participation in Franklin FTSE Mexico ETF. We look forward to serving your future investment needs.
| | |
| |
Dina Ting, CFA |
| | |
| |
Louis Hsu, CFA |
| |
| | Portfolio Management Team |
The foregoing information reflects our analysis, opinions and portfolio holdings as of September 30, 2019, the end of the reporting period. These opinions may not be relied upon as investment advice or an offer for a particular security. The information is not a complete analysis of every aspect of any market, country, industry, security or the Fund. Statements of fact are from sources considered reliable, but the investment manager makes no representation or warranty as to their completeness or accuracy. Although historical performance is no guarantee of future results, these insights may help you understand our investment management philosophy.
| | | | | | |
| | | |
| franklintempleton.com | | Semiannual Report | | | 79 | |
FRANKLIN FTSE MEXICO ETF
Performance Summary as of September 30, 2019
Total return reflects reinvestment of the Fund’s dividends and capital gain distributions, if any, and any unrealized gains or losses. Total returns do not include brokerage commissions that may be payable on secondary market transactions. The performance table does not reflect any taxes that a shareholder would pay on Fund dividends, capital gain distributions, if any, or any realized gains on the sale or redemption of Fund shares.
Net asset value or “NAV” is the value of one share of a fund as calculated in accordance with the standard formula for valuing mutual fund shares. The price used to calculate market return (Market Price) is determined by using the midpoint between the highest bid and the lowest offer on the primary stock exchange on which shares of a fund are listed for trading, as of the time that such fund’s NAV is calculated. Since shares of the Fund did not trade in the secondary market until after the Fund’s inception, for the period from inception to the first day of secondary trading (11/7/17), the NAV of the Fund is used as a proxy for the Market Price to calculate market returns. Market and NAV returns assume that dividends and capital gain distributions have been reinvested at Market Price and NAV.
Your dividend income will vary depending on dividends or interest paid by securities in the Fund’s portfolio, adjusted for operating expenses. Capital gain distributions are net profits realized from the sale of portfolio securities.
Performance as of 9/30/19
| | | | | | | | | | | | | | | | |
| | |
| | | Cumulative Total Return1 | | | Average Annual Total Return1 | |
| | | Based on
NAV2 | | | Based on market price3 | | | Based on
NAV2 | | | Based on market price3 | |
6-Month | | | -0.46% | | | | +0.50% | | | | -0.46% | | | | +0.50% | |
1-Year | | | -13.99% | | | | -13.78% | | | | -13.99% | | | | -13.78% | |
Since Inception (11/3/17) | | | -9.13% | | | | -8.84% | | | | -4.90% | | | | -4.74% | |
Performance data represent past performance, which does not guarantee future results. Investment return and principal value will fluctuate, and you may have a gain or loss when you sell your shares. Current performance may differ from figures shown. For most recentmonth-end performance, go tofranklintempleton.com or call(800)342-5236.
See page 81 for Performance Summary footnotes.
| | | | |
| | | |
| 80 | | Semiannual Report | | franklintempleton.com |
FRANKLIN FTSE MEXICO ETF
PERFORMANCE SUMMARY
Distributions(4/1/19–9/30/19)
|
|
Net Investment
Income |
$0.309582 |
Total Annual Operating Expenses4
All investments involve risks, including possible loss of principal. Stock prices fluctuate, sometimes rapidly and dramatically, due to factors affecting individual companies, particular industries or sectors, or general market conditions. Special risks are associated with foreign investing, including currency fluctuations, economic instability and political developments. Investments in developing markets involve heightened risk related to the same factors, in addition to those associated with these markets’ smaller size, lesser liquidity and lack of established legal, political, business and social frameworks to support securities markets. Investments in securities of Mexican issuers involve risks that are specific to Mexico, including certain legal, regulatory, political and economic risks. Because the Fund invests its assets primarily in companies in a specific country or region, the Fund may also experience greater volatility than a fund that is more broadly diversified geographically. As anon-diversified fund, the Fund may invest in a relatively small number of issuers and, as a result, be subject to a greater risk of loss with respect to its portfolio securities. The Fund’s prospectus also includes a description of the main investment risks.
ETFs trade like stocks, fluctuate in market value and may trade at prices above or below their net asset value. Brokerage commissions and ETF expenses will reduce returns.
1. Total return calculations represent the cumulative and average annual changes in value of an investment over the periods indicated. Return for less than one year, if any, has not been annualized.
2. Assumes reinvestment of distributions based on net asset value.
3. Assumes reinvestment of distributions based on market price.
4. Figures are as stated in the Fund’s current prospectus and may differ from the expense ratios disclosed in the Your Fund’s Expenses and Financial Highlights sections in this report. In periods of market volatility, assets may decline significantly, causing total annual Fund operating expenses to become higher than the figures shown.
| | | | | | |
| | | |
| franklintempleton.com | | Semiannual Report | | | 81 | |
FRANKLIN FTSE MEXICO ETF
Your Fund’s Expenses
As a Fund shareholder, you can incur two types of costs: (1) transaction costs, including brokerage commissions on purchases and sales of Fund shares; and (2) ongoing Fund costs, including management fees and other Fund expenses. All funds have ongoing costs, sometimes referred to as operating expenses. The table below shows ongoing costs of investing in the Fund and can help you understand these costs and compare them with those of other funds. The table assumes a $1,000 investment held for the six months indicated.
Actual Fund Expenses
The table below provides information about actual account values and actual expenses in the columns under the heading “Actual.” In these columns the Fund’s actual return, which includes the effect of Fund expenses, is used to calculate the “Ending Account Value.” You can estimate the expenses you paid during the period by following these steps (of course, your account value and expenses will differ from those in this illustration):Divide your account value by $1,000 (if your account had an $8,600 value, then $8,600÷ $1,000 = 8.6).Then multiply the result by the number in the row under the headings “Actual” and “Expenses Paid During Period” (if Actual Expenses Paid During Period were $7.50, then 8.6 x $7.50 = $64.50).In this illustration, the actual expenses paid this period are $64.50.
Hypothetical Example for Comparison with Other Funds
Under the heading “Hypothetical” in the table, information is provided about hypothetical account values and hypothetical expenses based on the Fund’s actual expense ratio and an assumed rate of return of 5% per year before expenses, which is not the Fund’s actual return. This information may not be used to estimate the actual ending account balance or expenses you paid for the period, but it can help you compare ongoing costs of investing in the Fund with those of other funds. To do so, compare this 5% hypothetical example with the 5% hypothetical examples that appear in the shareholder reports of other funds.
Please note that expenses shown in the table are meant to highlight ongoing costs and do not reflect any transactional costs.Therefore, information under the heading “Hypothetical” is useful in comparing ongoing costs only, and will not help you compare total costs of owning different funds. In addition, if transactional costs were included, your total costs would have been higher.
| | | | | | | | | | | | | | | | | | | | | | |
| | | | Actual (actual return after expenses) | | | Hypothetical
(5% annual return before expenses) | | | | |
| | | | | |
Beginning
Account
Value 4/1/19 | | | Ending
Account
Value 9/30/19 | | | Expenses
Paid During
Period
4/1/19–9/30/191,2 | | | Ending
Account
Value 9/30/19 | | | Expenses
Paid During
Period
4/1/19–9/30/191,2 | | | Net Annualized
Expense Ratio2 | |
| | $1,000.00 | | | $ | 995.40 | | | $ | 0.95 | | | $ | 1,024.05 | | | $ | 0.96 | | | | 0.19 | % |
1. Expenses are equal to the annualized expense ratio for thesix-month period as indicated above—in the far right column—multiplied by the simple average account value over the period indicated, and then multiplied by 183/366 to reflect theone-half year period.
2. Reflects expenses after fee waivers and expense reimbursements.
| | | | |
| | | |
| 82 | | Semiannual Report | | franklintempleton.com |
Franklin FTSE Russia ETF
This semiannual report for Franklin FTSE Russia ETF covers the period ended September 30, 2019.
Your Fund’s Goal and Main Investments
The Fund seeks to provide investment results that closely correspond, before fees and expenses, to the performance of the FTSE Russia RIC Capped Index (the FTSE Russia Capped Index or the Underlying Index).1 Under normal market conditions, the Fund invests at least 80% of its assets in the component securities of the FTSE Russia Capped Index and in depositary receipts representing such securities.
Performance Overview
During thesix-month period, the Fund posted cumulative total returns of +14.22% based on market price and +14.61% based on net asset value. In comparison, the FTSE Russia Capped Index posted a +14.53% total return for the same period.2 You can find more of the Fund’s performance data in the Performance Summary beginning on page 85.
Performance data represent past performance, which does not guarantee future results. Investment return and principal value will fluctuate, and you may have a gain or loss when you sell your shares. Current performance may differ from figures shown. For most recentmonth-end performance, go tofranklintempleton.com or call(800)342-5236.
Investment Strategy
The Fund, using a “passive” or indexing investment approach, seeks investment results that closely correspond, before fees and expenses, to the performance of the FTSE Russia Capped Index. We seek to achieve, over time, a correlation between the Fund’s performance, before fees and expenses, and that of the Underlying Index of 0.95 or better. A figure of 1.00 would indicate perfect correlation. Our intention is to
| | | | |
| Top 10 Sectors/Industries | |
|
| 9/30/19 | |
| |
| | | % of Total
Net Assets | |
| Oil, Gas & Consumable Fuels | | | 50.5% | |
| Banks | | | 18.2% | |
| Metals & Mining | | | 14.4% | |
| Electric Utilities | | | 5.0% | |
| Wireless Telecommunication Services | | | 3.1% | |
| Food & Staples Retailing | | | 2.5% | |
| Capital Markets | | | 2.3% | |
| Chemicals | | | 1.5% | |
| Diversified Telecommunication Services | | | 1.2% | |
| Airlines | | | 0.9% | |
replicate the component securities of the Underlying Index as closely as possible (i.e., invest in all of the component securities in their respective weightings in the Underlying Index). However, under various circumstances, it may not be possible or practicable to replicate the Underlying Index. In these circumstances, we may use a “representative sampling” strategy whereby we would invest in what we believe to be a representative sample of the component securities of the Underlying Index, but may not track the Underlying Index with the same degree of accuracy as would an investment vehicle replicating the entire Underlying Index. Under the representative sampling technique, we will select securities that collectively have an investment profile similar to that of the Underlying Index, including securities that resemble those included in the Underlying Index in terms of risk factors, performance attributes and other characteristics, such as market capitalization and industry weightings. The Fund will concentrate its investments (i.e., hold 25% or more of its net assets) in a particular industry or group of industries to approximately the same extent that the Underlying Index is concentrated.
1. The FTSE Russia Capped Index is a free float-adjusted market capitalization-weighted index maintained and calculated by FTSE Russell with a capping methodology applied quarterly to issuer weights so that no single issuer of a component exceeds 25% of the index weight, and all issuers with weights above 5% do not cumulatively exceed 50% of the index’s weight. The FTSE Russia Capped Index is based on the FTSE Russia Index and is designed to measure the performance of Russian large- andmid-capitalization stocks.
2. Source: FactSet.
The index is unmanaged and includes reinvestment of any income or distributions (after the deduction of certain withholding taxes). It does not reflect any fees, expenses or sales charges. One cannot invest directly in an index.
See www.franklintempletondatasources.com for additional data provider information.
The dollar value, number of shares or principal amount, and names of all portfolio holdings are listed in the Fund’s Statement of Investments (SOI). The SOI begins on page 253.
| | | | | | |
| | | |
| franklintempleton.com | | Semiannual Report | | | 83 | |
FRANKLIN FTSE RUSSIA ETF
| | | | |
| Top 10 Holdings | |
|
| 9/30/19 | |
| |
Company
Sector/Industry, Country | | % of Total
Net Assets | |
LUKOIL PJSC
Oil, Gas & Consumable Fuels, Russia | | | 16.2% | |
Gazprom PJSC
Oil, Gas & Consumable Fuels, Russia | | | 16.0% | |
Sberbank of Russia PJSC
Banks, Russia | | | 15.7% | |
NovaTek PJSC
Oil, Gas & Consumable Fuels, Russia | | | 4.7% | |
MMC Norilsk Nickel PJSC
Metals & Mining, Russia | | | 3.8% | |
Tatneft PAO
Oil, Gas & Consumable Fuels, Russia | | | 3.7% | |
Surgutneftegas PJSC
Oil, Gas & Consumable Fuels, Russia | | | 3.0% | |
Rosneft PJSC
Oil, Gas & Consumable Fuels, Russia | | | 3.0% | |
Magnit PJSC
Food & Staples Retailing, Russia | | | 2.5% | |
Mobile TeleSystems PJSC
Wireless Telecommunication Services, Russia | | | 2.5% | |
Thank you for your participation in Franklin FTSE Russia ETF. We look forward to serving your future investment needs.
| | |
| |
Dina Ting, CFA |
| | |
| |
Louis Hsu, CFA |
| |
| | Portfolio Management Team |
The foregoing information reflects our analysis, opinions and portfolio holdings as of September 30, 2019, the end of the reporting period. These opinions may not be relied upon as investment advice or an offer for a particular security. The information is not a complete analysis of every aspect of any market, country, industry, security or the Fund. Statements of fact are from sources considered reliable, but the investment manager makes no representation or warranty as to their completeness or accuracy. Although historical performance is no guarantee of future results, these insights may help you understand our investment management philosophy.
| | | | |
| | | |
| 84 | | Semiannual Report | | franklintempleton.com |
FRANKLIN FTSE RUSSIA ETF
Performance Summary as of September 30, 2019
Total return reflects reinvestment of the Fund’s dividends and capital gain distributions, if any, and any unrealized gains or losses. Total returns do not include brokerage commissions that may be payable on secondary market transactions. The performance table does not reflect any taxes that a shareholder would pay on Fund dividends, capital gain distributions, if any, or any realized gains on the sale or redemption of Fund shares.
Net asset value or “NAV” is the value of one share of a fund as calculated in accordance with the standard formula for valuing mutual fund shares. The price used to calculate market return (Market Price) is determined by using the midpoint between the highest bid and the lowest offer on the primary stock exchange on which shares of a fund are listed for trading, as of the time that such fund’s NAV is calculated. Since shares of the Fund did not trade in the secondary market until after the Fund’s inception, for the period from inception to the first day of secondary trading (2/9/18), the NAV of the Fund is used as a proxy for the Market Price to calculate market returns. Market and NAV returns assume that dividends and capital gain distributions have been reinvested at Market Price and NAV.
Your dividend income will vary depending on dividends or interest paid by securities in the Fund’s portfolio, adjusted for operating expenses. Capital gain distributions are net profits realized from the sale of portfolio securities.
Performance as of 9/30/19
| | | | | | | | | | | | | | | | |
| | |
| | | Cumulative Total Return1 | | | Average Annual Total Return1 | |
| | | Based on
NAV2 | | | Based on market price3 | | | Based on
NAV2 | | | Based on market price3 | |
6-Month | | | +14.61% | | | | +14.22% | | | | +14.61% | | | | +14.22% | |
1-Year | | | +16.25% | | | | +16.59% | | | | +16.25% | | | | +16.59% | |
Since Inception (2/6/18) | | | +15.51% | | | | +15.46% | | | | +9.15% | | | | +9.12% | |
Performance data represent past performance, which does not guarantee future results. Investment return and principal value will fluctuate, and you may have a gain or loss when you sell your shares. Current performance may differ from figures shown. For most recentmonth-end performance, go tofranklintempleton.com or call(800)342-5236.
See page 86 for Performance Summary footnotes.
| | | | | | |
| | | |
| franklintempleton.com | | Semiannual Report | | | 85 | |
FRANKLIN FTSE RUSSIA ETF
PERFORMANCE SUMMARY
Distributions(4/1/19–9/30/19)
|
|
Net Investment
Income |
$0.170992 |
Total Annual Operating Expenses4
All investments involve risks, including possible loss of principal. Stock prices fluctuate, sometimes rapidly and dramatically, due to factors affecting individual companies, particular industries or sectors, or general market conditions. Special risks are associated with foreign investing, including currency fluctuations, economic instability and political developments. Investments in developing markets involve heightened risks related to the same factors, in addition to those associated with these markets’ smaller size, lesser liquidity and lack of established legal, political, business and social frameworks to support securities markets. Investments in securities of Russian issuers involve significant risks that are specific to Russia, including certain legal, regulatory, political and economic risks. Because the Fund invests its assets primarily in companies in a specific country or region, the Fund may also experience greater volatility than a fund that is more broadly diversified geographically. As anon-diversified fund, the Fund may invest in a relatively small number of issuers and, as a result, be subject to a greater risk of loss with respect to its portfolio securities. The Fund’s prospectus also includes a description of the main investment risks.
ETFs trade like stocks, fluctuate in market value and may trade at prices above or below their net asset value. Brokerage commissions and ETF expenses will reduce returns.
1. Total return calculations represent the cumulative and average annual changes in value of an investment over the periods indicated. Return for less than one year, if any, has not been annualized.
2. Assumes reinvestment of distributions based on net asset value.
3. Assumes reinvestment of distributions based on market price.
4. Figures are as stated in the Fund’s current prospectus and may differ from the expense ratios disclosed in the Your Fund’s Expenses and Financial Highlights sections in this report. In periods of market volatility, assets may decline significantly, causing total annual Fund operating expenses to become higher than the figures shown.
| | | | |
| | | |
| 86 | | Semiannual Report | | franklintempleton.com |
FRANKLIN FTSE RUSSIA ETF
Your Fund’s Expenses
As a Fund shareholder, you can incur two types of costs: (1) transaction costs, including brokerage commissions on purchases and sales of Fund shares; and (2) ongoing Fund costs, including management fees and other Fund expenses. All funds have ongoing costs, sometimes referred to as operating expenses. The table below shows ongoing costs of investing in the Fund and can help you understand these costs and compare them with those of other funds. The table assumes a $1,000 investment held for the six months indicated.
Actual Fund Expenses
The table below provides information about actual account values and actual expenses in the columns under the heading “Actual.” In these columns the Fund’s actual return, which includes the effect of Fund expenses, is used to calculate the “Ending Account Value.” You can estimate the expenses you paid during the period by following these steps (of course, your account value and expenses will differ from those in this illustration):Divide your account value by $1,000 (if your account had an $8,600 value, then $8,600÷ $1,000 = 8.6).Then multiply the result by the number in the row under the headings “Actual” and “Expenses Paid During Period” (if Actual Expenses Paid During Period were $7.50, then 8.6 x $7.50 = $64.50).In this illustration, the actual expenses paid this period are $64.50.
Hypothetical Example for Comparison with Other Funds
Under the heading “Hypothetical” in the table, information is provided about hypothetical account values and hypothetical expenses based on the Fund’s actual expense ratio and an assumed rate of return of 5% per year before expenses, which is not the Fund’s actual return. This information may not be used to estimate the actual ending account balance or expenses you paid for the period, but it can help you compare ongoing costs of investing in the Fund with those of other funds. To do so, compare this 5% hypothetical example with the 5% hypothetical examples that appear in the shareholder reports of other funds.
Please note that expenses shown in the table are meant to highlight ongoing costs and do not reflect any transactional costs.Therefore, information under the heading “Hypothetical” is useful in comparing ongoing costs only, and will not help you compare total costs of owning different funds. In addition, if transactional costs were included, your total costs would have been higher.
| | | | | | | | | | | | | | | | | | | | | | |
| | | | Actual (actual return after expenses) | | | Hypothetical
(5% annual return before expenses) | | | | |
| | | | | |
Beginning
Account
Value 4/1/19 | | | Ending
Account
Value 9/30/19 | | | Expenses
Paid During
Period
4/1/19–9/30/191,2 | | | Ending
Account
Value 9/30/19 | | | Expenses
Paid During
Period
4/1/19–9/30/191,2 | | | Net Annualized
Expense Ratio2 | |
| | $1,000.00 | | | $ | 1,146.10 | | | $ | 1.02 | | | $ | 1,024.05 | | | $ | 0.96 | | | | 0.19 | % |
1. Expenses are equal to the annualized expense ratio for thesix-month period as indicated above—in the far right column—multiplied by the simple average account value over the period indicated, and then multiplied by 183/366 to reflect theone-half year period.
2. Reflects expenses after fee waivers and expense reimbursements.
| | | | | | |
| | | |
| franklintempleton.com | | Semiannual Report | | | 87 | |
Franklin FTSE Saudi Arabia ETF
This semiannual report for Franklin FTSE Saudi Arabia ETF covers the period ended September 30, 2019.
Your Fund’s Goal and Main Investments
The Fund seeks to provide investment results that closely correspond, before fees and expenses, to the performance of the FTSE Saudi Arabia RIC Capped Index (the FTSE Saudi Arabia Capped Index or the Underlying Index).1 Under normal market conditions, the Fund invests at least 80% of its assets in the component securities of the FTSE Saudi Arabia Capped Index and in depositary receipts representing such securities.
Performance Overview
During thesix-month period, the Fund posted cumulative total returns of -7.59% based on market price and -6.70% based on net asset value. In comparison, the FTSE Saudi Arabia Capped Index posted a -6.67% total return for the same period.2 You can find more of the Fund’s performance data in the Performance Summary beginning on page 90.
Performance data represent past performance, which does not guarantee future results. Investment return and principal value will fluctuate, and you may have a gain or loss when you sell your shares. Current performance may differ from figures shown. For most recentmonth-end performance, go tofranklintempleton.com or call(800)342-5236.
Investment Strategy
The Fund, using a “passive” or indexing investment approach, seeks investment results that closely correspond, before fees and expenses, to the performance of the FTSE Saudi Arabia Capped Index. We seek to achieve, over time, a correlation between the Fund’s performance, before fees and expenses, and that of the Underlying Index of 0.95 or better. A figure of 1.00 would indicate perfect correlation. Our
| | | | |
| Top 10 Sectors/Industries | |
|
| 9/30/19 | |
| |
| | | % of Total
Net Assets | |
| Banks | | | 37.4% | |
| Chemicals | | | 24.3% | |
| Diversified Telecommunication Services | | | 10.9% | |
| Food Products | | | 3.9% | |
| Metals & Mining | | | 3.3% | |
| Electric Utilities | | | 3.1% | |
| Construction Materials | | | 2.9% | |
| Wireless Telecommunication Services | | | 2.4% | |
| Specialty Retail | | | 2.1% | |
| Insurance | | | 2.1% | |
intention is to replicate the component securities of the Underlying Index as closely as possible (i.e., invest in all of the component securities in their respective weightings in the Underlying Index). However, under various circumstances, it may not be possible or practicable to replicate the Underlying Index. In these circumstances, we may use a “representative sampling” strategy whereby we would invest in what we believe to be a representative sample of the component securities of the Underlying Index, but may not track the Underlying Index with the same degree of accuracy as would an investment vehicle replicating the entire Underlying Index. Under the representative sampling technique, we will select securities that collectively have an investment profile similar to that of the Underlying Index, including securities that resemble those included in the Underlying Index in terms of risk factors, performance attributes and other characteristics, such as market capitalization and industry weightings. The Fund will concentrate its investments (i.e., hold 25% or more of its net assets) in a particular industry or group of industries to approximately the same extent that the Underlying Index is concentrated.
1. The FTSE Saudi Arabia Capped Index is a free float-adjusted market capitalization-weighted index maintained and calculated by FTSE Russell with a capping methodology applied quarterly to issuer weights so that no single issuer of a component exceeds 25% of the index weight, and all issuers with weights above 5% do not cumulatively exceed 50% of the index’s weight. The FTSE Saudi Arabia Capped Index is based on the FTSE Saudi Arabia Index and is designed to measure the performance of Saudi Arabian large- andmid-capitalization stocks.
2. Source: FactSet.
The index is unmanaged and includes reinvestment of any income or distributions (after the deduction of certain withholding taxes). It does not reflect any fees, expenses or sales charges. One cannot invest directly in an index.
See www.franklintempletondatasources.com for additional data provider information.
The dollar value, number of shares or principal amount, and names of all portfolio holdings are listed in the Fund’s Statement of Investments (SOI). The SOI begins on page 255.
| | | | |
| | | |
| 88 | | Semiannual Report | | franklintempleton.com |
FRANKLIN FTSE SAUDI ARABIA ETF
| | | | |
| Top 10 Holdings | |
|
| 9/30/19 | |
| |
Company
Sector/Industry, Country | | % of Total
Net Assets | |
Saudi Basic Industries Corp.
Chemicals, Saudi Arabia | | | 14.2% | |
Al-Rajhi Bank
Banks, Saudi Arabia | | | 12.9% | |
Saudi Telecom Co.
Diversified Telecommunication Services, Saudi Arabia | | | 10.9% | |
National Commercial Bank
Banks, Saudi Arabia | | | 10.3% | |
Riyad Bank
Banks, Saudi Arabia | | | 4.4% | |
Samba Financial Group
Banks, Saudi Arabia | | | 4.0% | |
Saudi Arabian Mining Co.
Metals & Mining, Saudi Arabia | | | 3.3% | |
Saudi Electricity Co.
Electric Utilities, Saudi Arabia | | | 3.1% | |
Saudi Arabian Fertilizer Co.
Chemicals, Saudi Arabia | | | 3.1% | |
Alinma Bank
Banks, Saudi Arabia | | | 2.9% | |
Thank you for your participation in Franklin FTSE Saudi Arabia ETF. We look forward to serving your future investment needs.
| | |
| |
Dina Ting, CFA |
| | |
| |
Louis Hsu, CFA |
| |
| | Portfolio Management Team |
The foregoing information reflects our analysis, opinions and portfolio holdings as of September 30, 2019, the end of the reporting period. These opinions may not be relied upon as investment advice or an offer for a particular security. The information is not a complete analysis of every aspect of any market, country, industry, security or the Fund. Statements of fact are from sources considered reliable, but the investment manager makes no representation or warranty as to their completeness or accuracy. Although historical performance is no guarantee of future results, these insights may help you understand our investment management philosophy.
| | | | | | |
| | | |
| franklintempleton.com | | Semiannual Report | | | 89 | |
FRANKLIN FTSE SAUDI ARABIA ETF
Performance Summary as of September 30, 2019
Total return reflects reinvestment of the Fund’s dividends and capital gain distributions, if any, and any unrealized gains or losses. Total returns do not include brokerage commissions that may be payable on secondary market transactions. The performance table does not reflect any taxes that a shareholder would pay on Fund dividends, capital gain distributions, if any, or any realized gains on the sale or redemption of Fund shares.
Net asset value or “NAV” is the value of one share of a fund as calculated in accordance with the standard formula for valuing mutual fund shares. The price used to calculate market return (Market Price) is determined by using the midpoint between the highest bid and the lowest offer on the primary stock exchange on which shares of a fund are listed for trading, as of the time that such fund’s NAV is calculated. Since shares of the Fund did not trade in the secondary market until after the Fund’s inception, for the period from inception to the first day of secondary trading (10/11/18), the NAV of the Fund is used as a proxy for the Market Price to calculate market returns. Market and NAV returns assume that dividends and capital gain distributions have been reinvested at Market Price and NAV.
Your dividend income will vary depending on dividends or interest paid by securities in the Fund’s portfolio, adjusted for operating expenses. Capital gain distributions are net profits realized from the sale of portfolio securities.
Performance as of 9/30/19
| | | | | | | | | | | | | | | | |
| | |
| | | Cumulative Total Return1 | | | Average Annual Total Return1 | |
| | | Based on
NAV2 | | | Based on market price3 | | | Based on
NAV2 | | | Based on market price3 | |
6-Month | | | -6.70% | | | | -7.59% | | | | -6.70% | | | | -7.59% | |
Since Inception (10/9/18) | | | +5.31% | | | | +5.99% | | | | +5.31% | | | | +5.99% | |
Performance data represent past performance, which does not guarantee future results. Investment return and principal value will fluctuate, and you may have a gain or loss when you sell your shares. Current performance may differ from figures shown. For most recentmonth-end performance, go tofranklintempleton.com or call(800)342-5236.
See page 91 for Performance Summary footnotes.
| | | | |
| | | |
| 90 | | Semiannual Report | | franklintempleton.com |
FRANKLIN FTSE SAUDI ARABIA ETF
PERFORMANCE SUMMARY
Distributions(4/1/19–9/30/19)
|
|
Net Investment
Income |
$0.468494 |
Total Annual Operating Expenses4
All investments involve risks, including possible loss of principal. Stock prices fluctuate, sometimes rapidly and dramatically, due to factors affecting individual companies, particular industries or sectors, or general market conditions. Special risks are associated with foreign investing, including currency fluctuations, economic instability and political developments. Investments in developing markets involve heightened risks related to the same factors, in addition to those associated with these markets’ smaller size, lesser liquidity and lack of established legal, political, business and social frameworks to support securities markets. Investments in securities of Saudi Arabian issuers involve risks that are specific to Saudi Arabia, including certain legal, regulatory, political and economic risks. Because the Fund invests its assets primarily in companies in a specific country or region, the Fund may also experience greater volatility than a fund that is more broadly diversified geographically. As anon-diversified fund, the Fund may invest in a relatively small number of issuers and, as a result, be subject to a greater risk of loss with respect to its portfolio securities. The Fund’s prospectus also includes a description of the main investment risks.
ETFs trade like stocks, fluctuate in market value and may trade at prices above or below their net asset value. Brokerage commissions and ETF expenses will reduce returns.
1. Total return calculations represent the cumulative and average annual changes in value of an investment over the periods indicated. Return for less than one year, if any, has not been annualized.
2. Assumes reinvestment of distributions based on net asset value.
3. Assumes reinvestment of distributions based on market price.
4. Figures are as stated in the Fund’s current prospectus and may differ from the expense ratios disclosed in the Your Fund’s Expenses and Financial Highlights sections in this report. In periods of market volatility, assets may decline significantly, causing total annual Fund operating expenses to become higher than the figures shown.
| | | | | | |
| | | |
| franklintempleton.com | | Semiannual Report | | | 91 | |
FRANKLIN FTSE SAUDI ARABIA ETF
Your Fund’s Expenses
As a Fund shareholder, you can incur two types of costs: (1) transaction costs, including brokerage commissions on purchases and sales of Fund shares; and (2) ongoing Fund costs, including management fees and other Fund expenses. All funds have ongoing costs, sometimes referred to as operating expenses. The table below shows ongoing costs of investing in the Fund and can help you understand these costs and compare them with those of other funds. The table assumes a $1,000 investment held for the six months indicated.
Actual Fund Expenses
The table below provides information about actual account values and actual expenses in the columns under the heading “Actual.” In these columns the Fund’s actual return, which includes the effect of Fund expenses, is used to calculate the “Ending Account Value.” You can estimate the expenses you paid during the period by following these steps (of course, your account value and expenses will differ from those in this illustration):Divide your account value by $1,000 (if your account had an $8,600 value, then $8,600÷ $1,000 = 8.6).Then multiply the result by the number in the row under the headings “Actual” and “Expenses Paid During Period” (if Actual Expenses Paid During Period were $7.50, then 8.6 x $7.50 = $64.50).In this illustration, the actual expenses paid this period are $64.50.
Hypothetical Example for Comparison with Other Funds
Under the heading “Hypothetical” in the table, information is provided about hypothetical account values and hypothetical expenses based on the Fund’s actual expense ratio and an assumed rate of return of 5% per year before expenses, which is not the Fund’s actual return. This information may not be used to estimate the actual ending account balance or expenses you paid for the period, but it can help you compare ongoing costs of investing in the Fund with those of other funds. To do so, compare this 5% hypothetical example with the 5% hypothetical examples that appear in the shareholder reports of other funds.
Please note that expenses shown in the table are meant to highlight ongoing costs and do not reflect any transactional costs.Therefore, information under the heading “Hypothetical” is useful in comparing ongoing costs only, and will not help you compare total costs of owning different funds. In addition, if transactional costs were included, your total costs would have been higher.
| | | | | | | | | | | | | | | | | | | | | | |
| | | | Actual (actual return after expenses) | | | Hypothetical
(5% annual return before expenses) | | | | |
| | | | | |
Beginning
Account
Value 4/1/19 | | | Ending
Account
Value 9/30/19 | | | Expenses
Paid During
Period
4/1/19–9/30/191,2 | | | Ending
Account
Value 9/30/19 | | | Expenses
Paid During
Period
4/1/19–9/30/191,2 | | | Net Annualized
Expense Ratio2 | |
| | $1,000.00 | | | $ | 933.00 | | | $ | 1.88 | | | $ | 1,023.05 | | | $ | 1.97 | | | | 0.39 | % |
1. Expenses are equal to the annualized expense ratio for thesix-month period as indicated above—in the far right column—multiplied by the simple average account value over the period indicated, and then multiplied by 183/366 to reflect theone-half year period.
2. Reflects expenses after fee waivers and expense reimbursements.
| | | | |
| | | |
| 92 | | Semiannual Report | | franklintempleton.com |
Franklin FTSE South Africa ETF
This semiannual report for Franklin FTSE South Africa ETF covers the period ended September 30, 2019.
Your Fund’s Goal and Main Investments
The Fund seeks to provide investment results that closely correspond, before fees and expenses, to the performance of the FTSE/JSE South Africa RIC Capped Index (the FTSE/JSE South Africa Capped Index or the Underlying Index).1 Under normal market conditions, the Fund invests at least 80% of its assets in the component securities of the FTSE/JSE South Africa Capped Index and in depositary receipts representing such securities.
Performance Overview
During thesix-month period, the Fund posted cumulative total returns of -6.82% based on market price and -6.50% based on net asset value. In comparison, the FTSE/JSE South Africa Capped Index posted a -6.44% total return for the same period.2 You can find more of the Fund’s performance data in the Performance Summary beginning on page 95.
Performance data represent past performance, which does not guarantee future results. Investment return and principal value will fluctuate, and you may have a gain or loss when you sell your shares. Current performance may differ from figures shown. For most recentmonth-end performance, go tofranklintempleton.com or call(800)342-5236.
Investment Strategy
The Fund, using a “passive” or indexing investment approach, seeks investment results that closely correspond, before fees and expenses, to the performance of the FTSE/JSE South Africa Capped Index. We seek to achieve, over time, a correlation between the Fund’s performance, before fees and expenses, and that of the Underlying Index of 0.95 or better. A figure of 1.00 would indicate perfect correlation.
| | | | |
| Top 10 Sectors/Industries | |
|
| 9/30/19 | |
| |
| | | % of Total
Net Assets | |
| Internet & Direct Marketing Retail | | | 19.2% | |
| Banks | | | 12.4% | |
| Metals & Mining | | | 11.1% | |
| Diversified Financial Services | | | 9.4% | |
| Insurance | | | 8.3% | |
| Food & Staples Retailing | | | 7.3% | |
| Wireless Telecommunication Services | | | 6.1% | |
| Equity Real Estate Investment Trusts (REITs) | | | 4.9% | |
| Chemicals | | | 3.5% | |
| Specialty Retail | | | 3.4% | |
Our intention is to replicate the component securities of the Underlying Index as closely as possible (i.e., invest in all of the component securities in their respective weightings in the Underlying Index). However, under various circumstances, it may not be possible or practicable to replicate the Underlying Index. In these circumstances, we may use a “representative sampling” strategy whereby we would invest in what we believe to be a representative sample of the component securities of the Underlying Index, but may not track the Underlying Index with the same degree of accuracy as would an investment vehicle replicating the entire Underlying Index. Under the representative sampling technique, we will select securities that collectively have an investment profile similar to that of the Underlying Index, including securities that resemble those included in the Underlying Index in terms of risk factors, performance attributes and other characteristics, such as market capitalization and industry weightings. The Fund will concentrate its investments (i.e., hold 25% or more of its net assets) in a particular industry or group of industries to approximately the same extent that the Underlying Index is concentrated.
1. The FTSE/JSE South Africa Capped Index is a free float-adjusted market capitalization-weighted index maintained and calculated by FTSE Russell with a capping methodology applied quarterly to issuer weights so that no single issuer of a component exceeds 25% of the index weight, and all issuers with weights above 5% do not cumulatively exceed 50% of the index’s weight. The FTSE/JSE South Africa Capped Index is based on the FTSE South Africa Index and is designed to measure the performance of South African large- andmid-capitalization stocks.
2. Source: FactSet.
The index is unmanaged and includes reinvestment of any income or distributions (after the deduction of certain withholding taxes). It does not reflect any fees, expenses or sales charges. One cannot invest directly in an index.
See www.franklintempletondatasources.com for additional data provider information.
The dollar value, number of shares or principal amount, and names of all portfolio holdings are listed in the Fund’s Statement of Investments (SOI). The SOI begins on page 257.
| | | | | | |
| | | |
| franklintempleton.com | | Semiannual Report | | | 93 | |
FRANKLIN FTSE SOUTH AFRICA ETF
| | | | |
| Top 10 Holdings | |
|
| 9/30/19 | |
| |
Company
Sector/Industry, Country | | % of Total
Net Assets | |
Naspers Ltd., N
Internet & Direct Marketing Retail, South Africa | | | 19.2% | |
Standard Bank Group Ltd.
Banks, South Africa | | | 5.6% | |
FirstRand Ltd.
Diversified Financial Services, South Africa | | | 5.0% | |
MTN Group Ltd.
Wireless Telecommunication Services, South Africa | | | 4.4% | |
Sasol Ltd.
Chemicals, South Africa | | | 3.5% | |
Sanlam Ltd.
Insurance, South Africa | | | 3.3% | |
AngloGold Ashanti Ltd.
Metals & Mining, South Africa | | | 3.0% | |
Absa Group Ltd.
Banks, South Africa | | | 2.8% | |
Bid Corp. Ltd.
Food & Staples Retailing, South Africa | | | 2.7% | |
Old Mutual Ltd.
Insurance, South Africa | | | 2.3% | |
Thank you for your participation in Franklin FTSE South Africa ETF. We look forward to serving your future investment needs.
| | |
| |
Dina Ting, CFA |
| | |
| |
Louis Hsu, CFA |
| |
| | Portfolio Management Team |
The foregoing information reflects our analysis, opinions and portfolio holdings as of September 30, 2019, the end of the reporting period. These opinions may not be relied upon as investment advice or an offer for a particular security. The information is not a complete analysis of every aspect of any market, country, industry, security or the Fund. Statements of fact are from sources considered reliable, but the investment manager makes no representation or warranty as to their completeness or accuracy. Although historical performance is no guarantee of future results, these insights may help you understand our investment management philosophy.
| | | | |
| | | |
| 94 | | Semiannual Report | | franklintempleton.com |
FRANKLIN FTSE SOUTH AFRICA ETF
Performance Summary as of September 30, 2019
Total return reflects reinvestment of the Fund’s dividends and capital gain distributions, if any, and any unrealized gains or losses. Total returns do not include brokerage commissions that may be payable on secondary market transactions. The performance table does not reflect any taxes that a shareholder would pay on Fund dividends, capital gain distributions, if any, or any realized gains on the sale or redemption of Fund shares.
Net asset value or “NAV” is the value of one share of a fund as calculated in accordance with the standard formula for valuing mutual fund shares. The price used to calculate market return (Market Price) is determined by using the midpoint between the highest bid and the lowest offer on the primary stock exchange on which shares of a fund are listed for trading, as of the time that such fund’s NAV is calculated. Since shares of the Fund did not trade in the secondary market until after the Fund’s inception, for the period from inception to the first day of secondary trading (10/11/18), the NAV of the Fund is used as a proxy for the Market Price to calculate market returns. Market and NAV returns assume that dividends and capital gain distributions have been reinvested at Market Price and NAV.
Your dividend income will vary depending on dividends or interest paid by securities in the Fund’s portfolio, adjusted for operating expenses. Capital gain distributions are net profits realized from the sale of portfolio securities.
Performance as of 9/30/19
| | | | | | | | | | | | | | | | |
| | |
| | | Cumulative Total Return1 | | | Average Annual Total Return1 | |
| | | Based on
NAV2 | | | Based on market price3 | | | Based on
NAV2 | | | Based on market price3 | |
6-Month | | | -6.50% | | | | -6.82% | | | | -6.50% | | | | -6.82% | |
Since Inception (10/10/18) | | | +2.16% | | | | +2.20% | | | | +2.16% | | | | +2.20% | |
Performance data represent past performance, which does not guarantee future results. Investment return and principal value will fluctuate, and you may have a gain or loss when you sell your shares. Current performance may differ from figures shown. For most recentmonth-end performance, go tofranklintempleton.com or call(800)342-5236.
See page 96 for Performance Summary footnotes.
| | | | | | |
| | | |
| franklintempleton.com | | Semiannual Report | | | 95 | |
FRANKLIN FTSE SOUTH AFRICA ETF
PERFORMANCE SUMMARY
Distributions(4/1/19–9/30/19)
|
|
Net Investment
Income |
$0.375950 |
Total Annual Operating Expenses4
All investments involve risks, including possible loss of principal. Stock prices fluctuate, sometimes rapidly and dramatically, due to factors affecting individual companies, particular industries or sectors, or general market conditions. Special risks are associated with foreign investing, including currency fluctuations, economic instability and political developments. Investments in developing markets involve heightened risks related to the same factors, in addition to those associated with these markets’ smaller size, lesser liquidity and lack of established legal, political, business and social frameworks to support securities markets. Investments in securities of South African issuers involve risks that are specific to South Africa, including certain legal, regulatory, political and economic risks. Because the Fund invests its assets primarily in companies in a specific country or region, the Fund may also experience greater volatility than a fund that is more broadly diversified geographically. As anon-diversified fund, the Fund may invest in a relatively small number of issuers and, as a result, be subject to a greater risk of loss with respect to its portfolio securities. The Fund’s prospectus also includes a description of the main investment risks.
ETFs trade like stocks, fluctuate in market value and may trade at prices above or below their net asset value. Brokerage commissions and ETF expenses will reduce returns.
1. Total return calculations represent the cumulative and average annual changes in value of an investment over the periods indicated. Return for less than one year, if any, has not been annualized.
2. Assumes reinvestment of distributions based on net asset value.
3. Assumes reinvestment of distributions based on market price.
4. Figures are as stated in the Fund’s current prospectus and may differ from the expense ratios disclosed in the Your Fund’s Expenses and Financial Highlights sections in this report. In periods of market volatility, assets may decline significantly, causing total annual Fund operating expenses to become higher than the figures shown.
| | | | |
| | | |
| 96 | | Semiannual Report | | franklintempleton.com |
FRANKLIN FTSE SOUTH AFRICA ETF
Your Fund’s Expenses
As a Fund shareholder, you can incur two types of costs: (1) transaction costs, including brokerage commissions on purchases and sales of Fund shares; and (2) ongoing Fund costs, including management fees and other Fund expenses. All funds have ongoing costs, sometimes referred to as operating expenses. The table below shows ongoing costs of investing in the Fund and can help you understand these costs and compare them with those of other funds. The table assumes a $1,000 investment held for the six months indicated.
Actual Fund Expenses
The table below provides information about actual account values and actual expenses in the columns under the heading “Actual.” In these columns the Fund’s actual return, which includes the effect of Fund expenses, is used to calculate the “Ending Account Value.” You can estimate the expenses you paid during the period by following these steps (of course, your account value and expenses will differ from those in this illustration):Divide your account value by $1,000 (if your account had an $8,600 value, then $8,600÷ $1,000 = 8.6).Then multiply the result by the number in the row under the headings “Actual” and “Expenses Paid During Period” (if Actual Expenses Paid During Period were $7.50, then 8.6 x $7.50 = $64.50).In this illustration, the actual expenses paid this period are $64.50.
Hypothetical Example for Comparison with Other Funds
Under the heading “Hypothetical” in the table, information is provided about hypothetical account values and hypothetical expenses based on the Fund’s actual expense ratio and an assumed rate of return of 5% per year before expenses, which is not the Fund’s actual return. This information may not be used to estimate the actual ending account balance or expenses you paid for the period, but it can help you compare ongoing costs of investing in the Fund with those of other funds. To do so, compare this 5% hypothetical example with the 5% hypothetical examples that appear in the shareholder reports of other funds.
Please note that expenses shown in the table are meant to highlight ongoing costs and do not reflect any transactional costs.Therefore, information under the heading “Hypothetical” is useful in comparing ongoing costs only, and will not help you compare total costs of owning different funds. In addition, if transactional costs were included, your total costs would have been higher.
| | | | | | | | | | | | | | | | | | | | | | |
| | | | Actual
(actual return after expenses) | | | Hypothetical
(5% annual return before expenses) | | | | |
| | | | | |
Beginning
Account
Value 4/1/19 | | | Ending
Account
Value 9/30/19 | | | Expenses
Paid During
Period
4/1/19–9/30/191,2 | | | Ending
Account
Value 9/30/19 | | | Expenses
Paid During
Period
4/1/19–9/30/191,2 | | | Net Annualized
Expense Ratio2 | |
| | $1,000.00 | | | $ | 935.00 | | | $ | 0.92 | | | $ | 1,024.05 | | | $ | 0.96 | | | | 0.19 | % |
1. Expenses are equal to the annualized expense ratio for thesix-month period as indicated above—in the far right column—multiplied by the simple average account value over the period indicated, and then multiplied by 183/366 to reflect theone-half year period.
2. Reflects expenses after fee waivers and expense reimbursements.
| | | | | | |
| | | |
| franklintempleton.com | | Semiannual Report | | | 97 | |
Franklin FTSE South Korea ETF
This semiannual report for Franklin FTSE South Korea ETF covers the period ended September 30, 2019.
Your Fund’s Goal and Main Investments
The Fund seeks to provide investment results that closely correspond, before fees and expenses, to the performance of the FTSE South Korea RIC Capped Index (the FTSE South Korea Capped Index or the Underlying Index).1 Under normal market conditions, the Fund invests at least 80% of its assets in the component securities of the FTSE South Korea Capped Index and in depositary receipts representing such securities.
Performance Overview
During thesix-month period, the Fund posted cumulative total returns of -6.65% based on market price and -7.12% based on net asset value. In comparison, the FTSE South Korea Capped Index posted a -7.26% total return for the same period.2 You can find more of the Fund’s performance data in the Performance Summary beginning on page 100.
Performance data represent past performance, which does not guarantee future results. Investment return and principal value will fluctuate, and you may have a gain or loss when you sell your shares. Current performance may differ from figures shown. For most recentmonth-end performance, go tofranklintempleton.com or call(800)342-5236.
Investment Strategy
The Fund, using a “passive” or indexing investment approach, seeks investment results that closely correspond, before fees and expenses, to the performance of the FTSE South Korea Capped Index. We seek to achieve, over time, a correlation between the Fund’s performance, before fees and expenses, and that of the Underlying Index of 0.95 or better. A figure of 1.00 would indicate perfect correlation. Our intention is to
| | | | |
| Top 10 Sectors/Industries | |
|
| 9/30/19 | |
| |
| | | % of Total
Net Assets | |
| Technology Hardware, Storage & Peripherals | | | 20.6% | |
| Banks | | | 9.2% | |
| Semiconductors & Semiconductor Equipment | | | 6.6% | |
| Automobiles | | | 5.5% | |
| Interactive Media & Services | | | 4.3% | |
| Industrial Conglomerates | | | 3.8% | |
| Chemicals | | | 3.7% | |
| Auto Components | | | 3.5% | |
| Metals & Mining | | | 3.5% | |
| Electronic Equipment, Instruments & Components | | | 3.2% | |
replicate the component securities of the Underlying Index as closely as possible (i.e., invest in all of the component securities in their respective weightings in the Underlying Index). However, under various circumstances, it may not be possible or practicable to replicate the Underlying Index. In these circumstances, we may use a “representative sampling” strategy whereby we would invest in what we believe to be a representative sample of the component securities of the Underlying Index, but may not track the Underlying Index with the same degree of accuracy as would an investment vehicle replicating the entire Underlying Index. Under the representative sampling technique, we will select securities that collectively have an investment profile similar to that of the Underlying Index, including securities that resemble those included in the Underlying Index in terms of risk factors, performance attributes and other characteristics, such as market capitalization and industry weightings. The Fund will concentrate its investments (i.e., hold 25% or more of its net assets) in a particular industry or group of industries to approximately the same extent that the Underlying Index is concentrated.
1. The FTSE South Korea Capped Index is a free float-adjusted market capitalization-weighted index maintained and calculated by FTSE Russell with a capping methodology applied quarterly to issuer weights so that no single issuer of a component exceeds 25% of the index weight, and all issuers with weights above 5% do not cumulatively exceed 50% of the index’s weight. The FTSE South Korea Capped Index is based on the FTSE South Korea Index and is designed to measure the performance of South Korean large- andmid-capitalization stocks.
2. Source: FactSet.
The index is unmanaged and includes reinvestment of any income or distributions (after the deduction of certain withholding taxes). It does not reflect any fees, expenses or sales charges. One cannot invest directly in an index.
See www.franklintempletondatasources.com for additional data provider information.
The dollar value, number of shares or principal amount, and names of all portfolio holdings are listed in the Fund’s Statement of Investments (SOI). The SOI begins on page 260.
| | | | |
| | | |
| 98 | | Semiannual Report | | franklintempleton.com |
FRANKLIN FTSE SOUTH KOREA ETF
| | | | |
| Top 10 Holdings | |
|
| 9/30/19 | |
| |
Company
Sector/Industry, Country | | % of Total
Net Assets | |
Samsung Electronics Co. Ltd.
Technology Hardware, Storage & Peripherals, South Korea | | | 20.6% | |
SK Hynix Inc.
Semiconductors & Semiconductor Equipment, South Korea | | | 6.6% | |
Hyundai Motor Co.
Automobiles, South Korea | | | 3.7% | |
Naver Corp.
Interactive Media & Services, South Korea | | | 3.2% | |
Shinhan Financial Group Co. Ltd.
Banks, South Korea | | | 2.9% | |
KB Financial Group Inc.
Banks, South Korea | | | 2.6% | |
Hyundai Mobis Co. Ltd.
Auto Components, South Korea | | | 2.5% | |
Celltrion Inc.
Biotechnology, South Korea | | | 2.5% | |
POSCO
Metals & Mining, South Korea | | | 2.4% | |
LG Chem Ltd.
Chemicals, South Korea | | | 2.3% | |
Thank you for your participation in Franklin FTSE South Korea ETF. We look forward to serving your future investment needs.
| | |
| |
Dina Ting, CFA |
| | |
| |
Louis Hsu, CFA |
| |
| | Portfolio Management Team |
The foregoing information reflects our analysis, opinions and portfolio holdings as of September 30, 2019, the end of the reporting period. These opinions may not be relied upon as investment advice or an offer for a particular security. The information is not a complete analysis of every aspect of any market, country, industry, security or the Fund. Statements of fact are from sources considered reliable, but the investment manager makes no representation or warranty as to their completeness or accuracy. Although historical performance is no guarantee of future results, these insights may help you understand our investment management philosophy.
| | | | | | |
| | | |
| franklintempleton.com | | Semiannual Report | | | 99 | |
FRANKLIN FTSE SOUTH KOREA ETF
Performance Summary as of September 30, 2019
Total return reflects reinvestment of the Fund’s dividends and capital gain distributions, if any, and any unrealized gains or losses. Total returns do not include brokerage commissions that may be payable on secondary market transactions. The performance table does not reflect any taxes that a shareholder would pay on Fund dividends, capital gain distributions, if any, or any realized gains on the sale or redemption of Fund shares.
Net asset value or “NAV” is the value of one share of a fund as calculated in accordance with the standard formula for valuing mutual fund shares. The price used to calculate market return (Market Price) is determined by using the midpoint between the highest bid and the lowest offer on the primary stock exchange on which shares of a fund are listed for trading, as of the time that such fund’s NAV is calculated. Since shares of the Fund did not trade in the secondary market until after the Fund’s inception, for the period from inception to the first day of secondary trading (11/6/17), the NAV of the Fund is used as a proxy for the Market Price to calculate market returns. Market and NAV returns assume that dividends and capital gain distributions have been reinvested at Market Price and NAV.
Your dividend income will vary depending on dividends or interest paid by securities in the Fund’s portfolio, adjusted for operating expenses. Capital gain distributions are net profits realized from the sale of portfolio securities.
Performance as of 9/30/19
| | | | | | | | | | | | | | | | |
| | |
| | | Cumulative Total Return1 | | | Average Annual Total Return1 | |
| | | Based on
NAV2 | | | Based on market price3 | | | Based on
NAV2 | | | Based on market price3 | |
6-Month | | | -7.12% | | | | -6.65% | | | | -7.12% | | | | -6.65% | |
1-Year | | | -15.58% | | | | -15.28% | | | | -15.58% | | | | -15.28% | |
Since Inception (11/2/17) | | | -21.33% | | | | -21.48% | | | | -11.80% | | | | -11.90% | |
Performance data represent past performance, which does not guarantee future results. Investment return and principal value will fluctuate, and you may have a gain or loss when you sell your shares. Current performance may differ from figures shown. For most recentmonth-end performance, go tofranklintempleton.com or call(800)342-5236.
See page 101 for Performance Summary footnotes.
| | | | |
| | | |
| 100 | | Semiannual Report | | franklintempleton.com |
FRANKLIN FTSE SOUTH KOREA ETF
PERFORMANCE SUMMARY
Distributions(4/1/19–9/30/19)
|
|
Net Investment
Income |
$0.052138 |
Total Annual Operating Expenses4
All investments involve risks, including possible loss of principal. Stock prices fluctuate, sometimes rapidly and dramatically, due to factors affecting individual companies, particular industries or sectors, or general market conditions. Special risks are associated with foreign investing, including currency fluctuations, economic instability and political developments. Investments in securities of South Korean issuers involve risks that are specific to South Korea, including certain legal, regulatory, political and economic risks. Because the Fund invests its assets primarily in companies in a specific country or region, the Fund may also experience greater volatility than a fund that is more broadly diversified geographically. As anon-diversified fund, the Fund may invest in a relatively small number of issuers and, as a result, be subject to a greater risk of loss with respect to its portfolio securities. The Fund’s prospectus also includes a description of the main investment risks.
ETFs trade like stocks, fluctuate in market value and may trade at prices above or below their net asset value. Brokerage commissions and ETF expenses will reduce returns.
1. Total return calculations represent the cumulative and average annual changes in value of an investment over the periods indicated. Return for less than one year, if any, has not been annualized.
2. Assumes reinvestment of distributions based on net asset value.
3. Assumes reinvestment of distributions based on market price.
4. Figures are as stated in the Fund’s current prospectus and may differ from the expense ratios disclosed in the Your Fund’s Expenses and Financial Highlights sections in this report. In periods of market volatility, assets may decline significantly, causing total annual Fund operating expenses to become higher than the figures shown.
| | | | | | |
| | | |
| franklintempleton.com | | Semiannual Report | | | 101 | |
FRANKLIN FTSE SOUTH KOREA ETF
Your Fund’s Expenses
As a Fund shareholder, you can incur two types of costs: (1) transaction costs, including brokerage commissions on purchases and sales of Fund shares; and (2) ongoing Fund costs, including management fees and other Fund expenses. All funds have ongoing costs, sometimes referred to as operating expenses. The table below shows ongoing costs of investing in the Fund and can help you understand these costs and compare them with those of other funds. The table assumes a $1,000 investment held for the six months indicated.
Actual Fund Expenses
The table below provides information about actual account values and actual expenses in the columns under the heading “Actual.” In these columns the Fund’s actual return, which includes the effect of Fund expenses, is used to calculate the “Ending Account Value.” You can estimate the expenses you paid during the period by following these steps (of course, your account value and expenses will differ from those in this illustration):Divide your account value by $1,000 (if your account had an $8,600 value, then $8,600÷ $1,000 = 8.6).Then multiply the result by the number in the row under the headings “Actual” and “Expenses Paid During Period” (if Actual Expenses Paid During Period were $7.50, then 8.6 x $7.50 = $64.50).In this illustration, the actual expenses paid this period are $64.50.
Hypothetical Example for Comparison with Other Funds
Under the heading “Hypothetical” in the table, information is provided about hypothetical account values and hypothetical expenses based on the Fund’s actual expense ratio and an assumed rate of return of 5% per year before expenses, which is not the Fund’s actual return. This information may not be used to estimate the actual ending account balance or expenses you paid for the period, but it can help you compare ongoing costs of investing in the Fund with those of other funds. To do so, compare this 5% hypothetical example with the 5% hypothetical examples that appear in the shareholder reports of other funds.
Please note that expenses shown in the table are meant to highlight ongoing costs and do not reflect any transactional costs.Therefore, information under the heading “Hypothetical” is useful in comparing ongoing costs only, and will not help you compare total costs of owning different funds. In addition, if transactional costs were included, your total costs would have been higher.
| | | | | | | | | | | | | | | | | | | | | | |
| | | | Actual
(actual return after expenses) | | | Hypothetical
(5% annual return before expenses) | | | | |
| | | | | |
Beginning
Account
Value 4/1/19 | | | Ending
Account
Value 9/30/19 | | | Expenses
Paid During
Period
4/1/19–9/30/191,2 | | | Ending
Account
Value 9/30/19 | | | Expenses
Paid During
Period
4/1/19–9/30/191,2 | | | Net Annualized
Expense Ratio2 | |
| | $1,000.00 | | | $ | 928.80 | | | $ | 0.43 | | | $ | 1,024.55 | | | $ | 0.46 | | | | 0.09 | % |
1. Expenses are equal to the annualized expense ratio for thesix-month period as indicated above—in the far right column—multiplied by the simple average account value over the period indicated, and then multiplied by 183/366 to reflect theone-half year period.
2. Reflects expenses after fee waivers and expense reimbursements.
| | | | |
| | | |
| 102 | | Semiannual Report | | franklintempleton.com |
Franklin FTSE Switzerland ETF
This semiannual report for Franklin FTSE Switzerland ETF covers the period ended September 30, 2019.
Your Fund’s Goal and Main Investments
The Fund seeks to provide investment results that closely correspond, before fees and expenses, to the performance of the FTSE Switzerland RIC Capped Index (the FTSE Switzerland Capped Index or the Underlying Index).1 Under normal market conditions, the Fund invests at least 80% of its assets in the component securities of the FTSE Switzerland Capped Index and in depositary receipts representing such securities.
Performance Overview
During thesix-month period, the Fund posted cumulative total returns of +8.79% based on market price and +8.72% based on net asset value. In comparison, the FTSE Switzerland Capped Index posted a +8.41% total return for the same period.2 You can find more of the Fund’s performance data in the Performance Summary beginning on page 105.
Performance data represent past performance, which does not guarantee future results. Investment return and principal value will fluctuate, and you may have a gain or loss when you sell your shares. Current performance may differ from figures shown. For most recentmonth-end performance, go tofranklintempleton.com or call(800)342-5236.
Investment Strategy
The Fund, using a “passive” or indexing investment approach, seeks investment results that closely correspond, before fees and expenses, to the performance of the FTSE Switzerland Capped Index. We seek to achieve, over time, a correlation between the Fund’s performance, before fees and expenses, and that of the Underlying Index of 0.95 or better. A figure of
| | | | |
| Top 10 Sectors/Industries | |
|
| 9/30/19 | |
| |
| | | % of Total
Net Assets | |
| Pharmaceuticals | | | 29.4% | |
| Food Products | | | 22.0% | |
| Insurance | | | 9.6% | |
| Capital Markets | | | 7.9% | |
| Chemicals | | | 4.8% | |
| Health Care Equipment & Supplies | | | 4.2% | |
| Textiles, Apparel & Luxury Goods | | | 4.0% | |
| Electrical Equipment | | | 3.0% | |
| Life Sciences Tools & Services | | | 2.2% | |
| Construction Materials | | | 2.2% | |
1.00 would indicate perfect correlation. Our intention is to replicate the component securities of the Underlying Index as closely as possible (i.e., invest in all of the component securities in their respective weightings in the Underlying Index). However, under various circumstances, it may not be possible or practicable to replicate the Underlying Index. In these circumstances, we may use a “representative sampling” strategy whereby we would invest in what we believe to be a representative sample of the component securities of the Underlying Index, but may not track the Underlying Index with the same degree of accuracy as would an investment vehicle replicating the entire Underlying Index. Under the representative sampling technique, we will select securities that collectively have an investment profile similar to that of the Underlying Index, including securities that resemble those included in the Underlying Index in terms of risk factors, performance attributes and other characteristics, such as market capitalization and industry weightings. The Fund will concentrate its investments (i.e., hold 25% or more of its net assets) in a particular industry or group of industries to approximately the same extent that the Underlying Index is concentrated.
1. The FTSE Switzerland Capped Index is a free float-adjusted market-capitalization weighted index maintained and calculated by FTSE Russell with a capping methodology applied quarterly to issuer weights so that no single issuer of a component exceeds 25% of the index weight, and all issuers with weights above 5% do not cumulatively exceed 50% of the index’s weight. The FTSE Switzerland Capped Index is based on the FTSE Switzerland Index and is designed to measure the performance of Swiss large- andmid-capitalization stocks.
2. Source: FactSet.
The index is unmanaged and includes reinvestment of any income or distributions (after the deduction of certain withholding taxes). It does not reflect any fees, expenses or sales charges. One cannot invest directly in an index.
See www.franklintempletondatasources.com for additional data provider information.
The dollar value, number of shares or principal amount, and names of all portfolio holdings are listed in the Fund’s Statement of Investments (SOI). The SOI begins on page 264.
| | | | | | |
| | | |
| franklintempleton.com | | Semiannual Report | | | 103 | |
FRANKLIN FTSE SWITZERLAND ETF
| | | | |
| Top 10 Holdings | |
|
| 9/30/19 | |
| |
Company
Sector/Industry, Country | | % of Total
Net Assets | |
Nestle SA
Food Products, Switzerland | | | 20.3% | |
Roche Holding AG
Pharmaceuticals, Switzerland | | | 15.2% | |
Novartis AG
Pharmaceuticals, Switzerland | | | 13.5% | |
Zurich Insurance Group AG
Insurance, Switzerland | | | 4.5% | |
UBS Group AG
Capital Markets, Switzerland | | | 3.3% | |
Compagnie Financiere Richemont SA
Textiles, Apparel & Luxury Goods, Switzerland | | | 3.1% | |
ABB Ltd.
Electrical Equipment, Switzerland | | | 3.0% | |
Credit Suisse Group AG
Capital Markets, Switzerland | | | 2.6% | |
Swiss Re AG
Insurance, Switzerland | | | 2.5% | |
Alcon Inc.
Health Care Equipment & Supplies, Switzerland | | | 2.4% | |
Thank you for your participation in Franklin FTSE Switzerland ETF. We look forward to serving your future investment needs.
| | |
| |
Dina Ting, CFA |
| | |
| |
Louis Hsu, CFA |
| |
| | Portfolio Management Team |
The foregoing information reflects our analysis, opinions and portfolio holdings as of September 30, 2019, the end of the reporting period. These opinions may not be relied upon as investment advice or an offer for a particular security. The information is not a complete analysis of every aspect of any market, country, industry, security or the Fund. Statements of fact are from sources considered reliable, but the investment manager makes no representation or warranty as to their completeness or accuracy. Although historical performance is no guarantee of future results, these insights may help you understand our investment management philosophy.
| | | | |
| | | |
| 104 | | Semiannual Report | | franklintempleton.com |
FRANKLIN FTSE SWITZERLAND ETF
Performance Summary as of September 30, 2019
Total return reflects reinvestment of the Fund’s dividends and capital gain distributions, if any, and any unrealized gains or losses. Total returns do not include brokerage commissions that may be payable on secondary market transactions. The performance table does not reflect any taxes that a shareholder would pay on Fund dividends, capital gain distributions, if any, or any realized gains on the sale or redemption of Fund shares.
Net asset value or “NAV” is the value of one share of a fund as calculated in accordance with the standard formula for valuing mutual fund shares. The price used to calculate market return (Market Price) is determined by using the midpoint between the highest bid and the lowest offer on the primary stock exchange on which shares of a fund are listed for trading, as of the time that such fund’s NAV is calculated. Since shares of the Fund did not trade in the secondary market until after the Fund’s inception, for the period from inception to the first day of secondary trading (2/9/18), the NAV of the Fund is used as a proxy for the Market Price to calculate market returns. Market and NAV returns assume that dividends and capital gain distributions have been reinvested at Market Price and NAV.
Your dividend income will vary depending on dividends or interest paid by securities in the Fund’s portfolio, adjusted for operating expenses. Capital gain distributions are net profits realized from the sale of portfolio securities.
Performance as of 9/30/19
| | | | | | | | | | | | | | | | |
| | |
| | | Cumulative Total Return1 | | | Average Annual Total Return1 | |
| | | Based on
NAV2 | | | Based on market price3 | | | Based on
NAV2 | | | Based on market price3 | |
6-Month | | | +8.72% | | | | +8.79% | | | | +8.72% | | | | +8.79% | |
1-Year | | | +10.95% | | | | +11.64% | | | | +10.95% | | | | +11.64% | |
Since Inception (2/6/18) | | | +13.18% | | | | +13.45% | | | | +7.81% | | | | +7.96% | |
Performance data represent past performance, which does not guarantee future results. Investment return and principal value will fluctuate, and you may have a gain or loss when you sell your shares. Current performance may differ from figures shown. For most recentmonth-end performance, go tofranklintempleton.com or call(800)342-5236.
See page 106 for Performance Summary footnotes.
| | | | | | |
| | | |
| franklintempleton.com | | Semiannual Report | | | 105 | |
FRANKLIN FTSE SWITZERLAND ETF
PERFORMANCE SUMMARY
Distributions(4/1/19–9/30/19)
|
|
Net Investment
Income |
$0.303216 |
Total Annual Operating Expenses4
All investments involve risks, including possible loss of principal. Stock prices fluctuate, sometimes rapidly and dramatically, due to factors affecting individual companies, particular industries or sectors, or general market conditions. Special risks are associated with foreign investing, including currency fluctuations, economic instability and political developments. Investments in securities of Swiss issuers involve risks that are specific to Switzerland, including certain legal, regulatory, political and economic risks. Because the Fund invests its assets primarily in companies in a specific country or region, the Fund may also experience greater volatility than a fund that is more broadly diversified geographically. As anon-diversified fund, the Fund may invest in a relatively small number of issuers and, as a result, be subject to a greater risk of loss with respect to its portfolio securities. The Fund’s prospectus also includes a description of the main investment risks.
ETFs trade like stocks, fluctuate in market value and may trade at prices above or below their net asset value. Brokerage commissions and ETF expenses will reduce returns.
1. Total return calculations represent the cumulative and average annual changes in value of an investment over the periods indicated. Return for less than one year, if any, has not been annualized.
2. Assumes reinvestment of distributions based on net asset value.
3. Assumes reinvestment of distributions based on market price.
4. Figures are as stated in the Fund’s current prospectus and may differ from the expense ratios disclosed in the Your Fund’s Expenses and Financial Highlights sections in this report. In periods of market volatility, assets may decline significantly, causing total annual Fund operating expenses to become higher than the figures shown.
| | | | |
| | | |
| 106 | | Semiannual Report | | franklintempleton.com |
FRANKLIN FTSE SWITZERLAND ETF
Your Fund’s Expenses
As a Fund shareholder, you can incur two types of costs: (1) transaction costs, including brokerage commissions on purchases and sales of Fund shares; and (2) ongoing Fund costs, including management fees and other Fund expenses. All funds have ongoing costs, sometimes referred to as operating expenses. The table below shows ongoing costs of investing in the Fund and can help you understand these costs and compare them with those of other funds. The table assumes a $1,000 investment held for the six months indicated.
Actual Fund Expenses
The table below provides information about actual account values and actual expenses in the columns under the heading “Actual.” In these columns the Fund’s actual return, which includes the effect of Fund expenses, is used to calculate the “Ending Account Value.” You can estimate the expenses you paid during the period by following these steps (of course, your account value and expenses will differ from those in this illustration):Divide your account value by $1,000 (if your account had an $8,600 value, then $8,600÷ $1,000 = 8.6).Then multiply the result by the number in the row under the headings “Actual” and “Expenses Paid During Period” (if Actual Expenses Paid During Period were $7.50, then 8.6 x $7.50 = $64.50).In this illustration, the actual expenses paid this period are $64.50.
Hypothetical Example for Comparison with Other Funds
Under the heading “Hypothetical” in the table, information is provided about hypothetical account values and hypothetical expenses based on the Fund’s actual expense ratio and an assumed rate of return of 5% per year before expenses, which is not the Fund’s actual return. This information may not be used to estimate the actual ending account balance or expenses you paid for the period, but it can help you compare ongoing costs of investing in the Fund with those of other funds. To do so, compare this 5% hypothetical example with the 5% hypothetical examples that appear in the shareholder reports of other funds.
Please note that expenses shown in the table are meant to highlight ongoing costs and do not reflect any transactional costs.Therefore, information under the heading “Hypothetical” is useful in comparing ongoing costs only, and will not help you compare total costs of owning different funds. In addition, if transactional costs were included, your total costs would have been higher.
| | | | | | | | | | | | | | | | | | | | | | |
| | | | Actual (actual return after expenses) | | | Hypothetical
(5% annual return before expenses) | | | | |
| | | | | |
Beginning
Account
Value 4/1/19 | | | Ending
Account
Value 9/30/19 | | | Expenses
Paid During
Period
4/1/19–9/30/191,2 | | | Ending
Account
Value 9/30/19 | | | Expenses
Paid During
Period
4/1/19–9/30/191,2 | | | Net Annualized
Expense Ratio2 | |
| | $1,000.00 | | | $ | 1,087.20 | | | $ | 0.47 | | | $ | 1,024.55 | | | $ | 0.46 | | | | 0.09 | % |
1. Expenses are equal to the annualized expense ratio for thesix-month period as indicated above—in the far right column—multiplied by the simple average account value over the period indicated, and then multiplied by 183/366 to reflect theone-half year period.
2. Reflects expenses after fee waivers and expense reimbursements.
| | | | | | |
| | | |
| franklintempleton.com | | Semiannual Report | | | 107 | |
Franklin FTSE Taiwan ETF
This semiannual report for Franklin FTSE Taiwan ETF covers the period ended September 30, 2019.
Your Fund’s Goal and Main Investments
The Fund seeks to provide investment results that closely correspond, before fees and expenses, to the performance of the FTSE Taiwan RIC Capped Index (the FTSE Taiwan Capped Index or the Underlying Index).1 Under normal market conditions, the Fund invests at least 80% of its assets in the component securities of the FTSE Taiwan Capped Index and in depositary receipts representing such securities.
Performance Overview
During thesix-month period, the Fund posted cumulative total returns of +4.61% based on market price and +4.13% based on net asset value. In comparison, the FTSE Taiwan Capped Index posted a +4.21% total return for the same period.2 You can find more of the Fund’s performance data in the Performance Summary beginning on page 110.
Performance data represent past performance, which does not guarantee future results. Investment return and principal value will fluctuate, and you may have a gain or loss when you sell your shares. Current performance may differ from figures shown. For most recentmonth-end performance, go tofranklintempleton.com or call(800)342-5236.
Investment Strategy
The Fund, using a “passive” or indexing investment approach, seeks investment results that closely correspond, before fees and expenses, to the performance of the FTSE Taiwan Capped Index. We seek to achieve, over time, a correlation between the Fund’s performance, before fees and expenses, and that of the Underlying Index of 0.95 or better. A figure of 1.00 would indicate perfect correlation. Our intention is to replicate the component securities of the Underlying
| | | | |
| Top 10 Sectors/Industries | |
|
| 9/30/19 | |
| |
| | | % of Total
Net Assets | |
| Semiconductors & Semiconductor Equipment | | | 29.2% | |
| Banks | | | 14.1% | |
| Electronic Equipment, Instruments & Components | | | 13.5% | |
| Chemicals | | | 7.7% | |
| Technology Hardware, Storage & Peripherals | | | 7.2% | |
| Insurance | | | 6.1% | |
| Diversified Telecommunication Services | | | 2.7% | |
| Food Products | | | 2.3% | |
| Textiles, Apparel & Luxury Goods | | | 1.9% | |
| Construction Materials | | | 1.9% | |
Index as closely as possible (i.e., invest in all of the component securities in their respective weightings in the Underlying Index). However, under various circumstances, it may not be possible or practicable to replicate the Underlying Index. In these circumstances, we may use a “representative sampling” strategy whereby we would invest in what we believe to be a representative sample of the component securities of the Underlying Index, but may not track the Underlying Index with the same degree of accuracy as would an investment vehicle replicating the entire Underlying Index. Under the representative sampling technique, we will select securities that collectively have an investment profile similar to that of the Underlying Index, including securities that resemble those included in the Underlying Index in terms of risk factors, performance attributes and other characteristics, such as market capitalization and industry weightings. The Fund will concentrate its investments (i.e., hold 25% or more of its net assets) in a particular industry or group of industries to approximately the same extent that the Underlying Index is concentrated.
1. The FTSE Taiwan Capped Index is a free float-adjusted market capitalization-weighted index maintained and calculated by FTSE Russell with a capping methodology applied quarterly to issuer weights so that no single issuer of a component exceeds 25% of the index weight, and all issuers with weights above 5% do not cumulatively exceed 50% of the index’s weight. The FTSE Taiwan Capped Index is based on the FTSE Taiwan Index and is designed to measure the performance of Taiwanese large- andmid-capitalization stocks.
2. Source: FactSet.
The index is unmanaged and includes reinvestment of any income or distributions (after the deduction of certain withholding taxes). It does not reflect any fees, expenses or sales charges. One cannot invest directly in an index.
See www.franklintempletondatasources.com for additional data provider information.
The dollar value, number of shares or principal amount, and names of all portfolio holdings are listed in the Fund’s Statement of Investments (SOI). The SOI begins on page 266.
| | | | |
| | | |
| 108 | | Semiannual Report | | franklintempleton.com |
FRANKLIN FTSE TAIWAN ETF
| | | | |
| Top 10 Holdings | |
|
| 9/30/19 | |
| |
Company
Sector/Industry, Country | | % of Total
Net Assets | |
Taiwan Semiconductor Manufacturing Co. Ltd.
Semiconductors & Semiconductor Equipment, Taiwan | | | 20.7% | |
Hon Hai Precision Industry Co. Ltd.
Electronic Equipment, Instruments & Components, Taiwan | | | 5.5% | |
MediaTek Inc.
Semiconductors & Semiconductor Equipment, Taiwan | | | 3.5% | |
Formosa Plastics Corp.
Chemicals, Taiwan | | | 2.9% | |
Largan Precision Co. Ltd.
Electronic Equipment, Instruments & Components, Taiwan | | | 2.9% | |
Chunghwa Telecom Co. Ltd.
Diversified Telecommunication Services, Taiwan | | | 2.7% | |
Nan Ya Plastics Corp.
Chemicals, Taiwan | | | 2.5% | |
CTBC Financial Holding Co. Ltd.
Banks, Taiwan | | | 2.4% | |
Uni-President Enterprises Corp.
Food Products, Taiwan | | | 2.3% | |
Fubon Financial Holding Co. Ltd.
Insurance, Taiwan | | | 2.1% | |
Thank you for your participation in Franklin FTSE Taiwan ETF. We look forward to serving your future investment needs.
| | |
| |
Dina Ting, CFA |
| | |
| |
Louis Hsu, CFA |
| |
| | Portfolio Management Team |
The foregoing information reflects our analysis, opinions and portfolio holdings as of September 30, 2019, the end of the reporting period. These opinions may not be relied upon as investment advice or an offer for a particular security. The information is not a complete analysis of every aspect of any market, country, industry, security or the Fund. Statements of fact are from sources considered reliable, but the investment manager makes no representation or warranty as to their completeness or accuracy. Although historical performance is no guarantee of future results, these insights may help you understand our investment management philosophy.
| | | | | | |
| | | |
| franklintempleton.com | | Semiannual Report | | | 109 | |
FRANKLIN FTSE TAIWAN ETF
Performance Summary as of September 30, 2019
Total return reflects reinvestment of the Fund’s dividends and capital gain distributions, if any, and any unrealized gains or losses. Total returns do not include brokerage commissions that may be payable on secondary market transactions. The performance table does not reflect any taxes that a shareholder would pay on Fund dividends, capital gain distributions, if any, or any realized gains on the sale or redemption of Fund shares.
Net asset value or “NAV” is the value of one share of a fund as calculated in accordance with the standard formula for valuing mutual fund shares. The price used to calculate market return (Market Price) is determined by using the midpoint between the highest bid and the lowest offer on the primary stock exchange on which shares of a fund are listed for trading, as of the time that such fund’s NAV is calculated. Since shares of the Fund did not trade in the secondary market until after the Fund’s inception, for the period from inception to the first day of secondary trading (11/6/17), the NAV of the Fund is used as a proxy for the Market Price to calculate market returns. Market and NAV returns assume that dividends and capital gain distributions have been reinvested at Market Price and NAV.
Your dividend income will vary depending on dividends or interest paid by securities in the Fund’s portfolio, adjusted for operating expenses. Capital gain distributions are net profits realized from the sale of portfolio securities.
Performance as of 9/30/19
| | | | | | | | | | | | | | | | |
| | |
| | | Cumulative Total Return1 | | | Average Annual Total Return1 | |
| | | Based on
NAV2 | | | Based on market price3 | | | Based on
NAV2 | | | Based on market price3 | |
6-Month | | | +4.13% | | | | +4.61% | | | | +4.13% | | | | +4.61% | |
1-Year | | | -2.24% | | | | -1.86% | | | | -2.24% | | | | -1.86% | |
Since Inception (11/2/17) | | | +1.66% | | | | +2.17% | | | | +0.87% | | | | +1.13% | |
Performance data represent past performance, which does not guarantee future results. Investment return and principal value will fluctuate, and you may have a gain or loss when you sell your shares. Current performance may differ from figures shown. For most recentmonth-end performance, go tofranklintempleton.com or call(800)342-5236.
See page 111 for Performance Summary footnotes.
| | | | |
| | | |
| 110 | | Semiannual Report | | franklintempleton.com |
FRANKLIN FTSE TAIWAN ETF
PERFORMANCE SUMMARY
Distributions(4/1/19–9/30/19)
|
|
Net Investment
Income |
$0.009296 |
Total Annual Operating Expenses4
All investments involve risks, including possible loss of principal. Stock prices fluctuate, sometimes rapidly and dramatically, due to factors affecting individual companies, particular industries or sectors, or general market conditions. Special risks are associated with foreign investing, including currency fluctuations, economic instability and political developments. Investments in developing markets involve heightened risks related to the same factors, in addition to those associated with these markets’ smaller size, lesser liquidity and lack of established legal, political, business and social frameworks to support securities markets. Investments in securities of Taiwanese issuers involve risks that are specific to Taiwan, including certain legal, regulatory, political and economic risks. Because the Fund invests its assets primarily in companies in a specific country or region, the Fund may also experience greater volatility than a Fund that is more broadly diversified geographically. As anon-diversified fund, the Fund may invest in a relatively small number of issuers and, as a result, be subject to a greater risk of loss with respect to its portfolio securities. The Fund’s prospectus also includes a description of the main investment risks.
ETFs trade like stocks, fluctuate in market value and may trade at prices above or below their net asset value. Brokerage commissions and ETF expenses will reduce returns.
1. Total return calculations represent the cumulative and average annual changes in value of an investment over the periods indicated. Return for less than one year, if any, has not been annualized.
2. Assumes reinvestment of distributions based on net asset value.
3. Assumes reinvestment of distributions based on market price.
4. Figures are as stated in the Fund’s current prospectus and may differ from the expense ratios disclosed in the Your Fund’s Expenses and Financial Highlights sections in this report. In periods of market volatility, assets may decline significantly, causing total annual Fund operating expenses to become higher than the figures shown.
| | | | | | |
| | | |
| franklintempleton.com | | Semiannual Report | | | 111 | |
FRANKLIN FTSE TAIWAN ETF
Your Fund’s Expenses
As a Fund shareholder, you can incur two types of costs: (1) transaction costs, including brokerage commissions on purchases and sales of Fund shares; and (2) ongoing Fund costs, including management fees and other Fund expenses. All funds have ongoing costs, sometimes referred to as operating expenses. The table below shows ongoing costs of investing in the Fund and can help you understand these costs and compare them with those of other funds. The table assumes a $1,000 investment held for the six months indicated.
Actual Fund Expenses
The table below provides information about actual account values and actual expenses in the columns under the heading “Actual.” In these columns the Fund’s actual return, which includes the effect of Fund expenses, is used to calculate the “Ending Account Value.” You can estimate the expenses you paid during the period by following these steps (of course, your account value and expenses will differ from those in this illustration):Divide your account value by $1,000 (if your account had an $8,600 value, then $8,600÷ $1,000 = 8.6).Then multiply the result by the number in the row under the headings “Actual” and “Expenses Paid During Period” (if Actual Expenses Paid During Period were $7.50, then 8.6 x $7.50 = $64.50).In this illustration, the actual expenses paid this period are $64.50.
Hypothetical Example for Comparison with Other Funds
Under the heading “Hypothetical” in the table, information is provided about hypothetical account values and hypothetical expenses based on the Fund’s actual expense ratio and an assumed rate of return of 5% per year before expenses, which is not the Fund’s actual return. This information may not be used to estimate the actual ending account balance or expenses you paid for the period, but it can help you compare ongoing costs of investing in the Fund with those of other funds. To do so, compare this 5% hypothetical example with the 5% hypothetical examples that appear in the shareholder reports of other funds.
Please note that expenses shown in the table are meant to highlight ongoing costs and do not reflect any transactional costs.Therefore, information under the heading “Hypothetical” is useful in comparing ongoing costs only, and will not help you compare total costs of owning different funds. In addition, if transactional costs were included, your total costs would have been higher.
| | | | | | | | | | | | | | | | | | | | | | |
| | | | Actual (actual return after expenses) | | | Hypothetical
(5% annual return before expenses) | | | | |
| | | | | |
Beginning
Account
Value 4/1/19 | | | Ending
Account
Value 9/30/19 | | | Expenses
Paid During
Period
4/1/19–9/30/191,2 | | | Ending
Account
Value 9/30/19 | | | Expenses
Paid During
Period
4/1/19–9/30/191,2 | | | Net Annualized
Expense Ratio2 | |
| | $1,000.00 | | | $ | 1,041.30 | | | $ | 0.97 | | | $ | 1,024.05 | | | $ | 0.96 | | | | 0.19 | % |
1. Expenses are equal to the annualized expense ratio for thesix-month period as indicated above—in the far right column—multiplied by the simple average account value over the period indicated, and then multiplied by 183/366 to reflect theone-half year period.
2. Reflects expenses after fee waivers and expense reimbursements.
| | | | |
| | | |
| 112 | | Semiannual Report | | franklintempleton.com |
Franklin FTSE United Kingdom ETF
This semiannual report for Franklin FTSE United Kingdom ETF covers the period ended September 30, 2019.
Your Fund’s Goal and Main Investments
The Fund seeks to provide investment results that closely correspond, before fees and expenses, to the performance of the FTSE UK RIC Capped Index (the FTSE UK Capped Index or the Underlying Index).1 Under normal market conditions, the Fund invests at least 80% of its assets in the component securities of the FTSE UK Capped Index and in depositary receipts representing such securities.
Performance Overview
For thesix-month period, the Fund posted cumulative total returns of -1.31% based on market price and -1.23% based on net asset value. In comparison, the FTSE UK Capped Index posted a -1.14% total return for the same period.2 You can find more of the Fund’s performance data in the Performance Summary beginning on page 115.
Performance data represent past performance, which does not guarantee future results. Investment return and principal value will fluctuate, and you may have a gain or loss when you sell your shares. Current performance may differ from figures shown. For most recentmonth-end performance, go tofranklintempleton.com or call(800)342-5236.
Investment Strategy
The Fund, using a “passive” or indexing investment approach, seeks investment results that closely correspond, before fees and expenses, to the performance of the FTSE UK Capped Index. We seek to achieve, over time, a correlation between the Fund’s performance, before fees and expenses, and that of the Underlying Index of 0.95 or better. A figure of 1.00 would indicate perfect correlation. Our intention is to replicate
| | | | |
| Top 10 Sectors/Industries | |
|
| 9/30/19 | |
| |
| | | % of Total
Net Assets | |
| Oil, Gas & Consumable Fuels | | | 15.2% | |
| Banks | | | 11.3% | |
| Pharmaceuticals | | | 9.4% | |
| Metals & Mining | | | 7.4% | |
| Insurance | | | 4.7% | |
| Tobacco | | | 4.4% | |
| Beverages | | | 4.3% | |
| Hotels, Restaurants & Leisure | | | 3.6% | |
| Professional Services | | | 3.5% | |
| Capital Markets | | | 3.2% | |
the component securities of the Underlying Index as closely as possible (i.e., invest in all of the component securities in their respective weightings in the Underlying Index). However, under various circumstances, it may not be possible or practicable to replicate the Underlying Index. In these circumstances, we may use a “representative sampling” strategy whereby we would invest in what we believe to be a representative sample of the component securities of the Underlying Index, but may not track the Underlying Index with the same degree of accuracy as would an investment vehicle replicating the entire Underlying Index. Under the representative sampling technique, we will select securities that collectively have an investment profile similar to that of the Underlying Index, including securities that resemble those included in the Underlying Index in terms of risk factors, performance attributes and other characteristics, such as market capitalization and industry weightings. The Fund will concentrate its investments (i.e., hold 25% or more of its net assets) in a particular industry or group of industries to approximately the same extent that the Underlying Index is concentrated.
1. The FTSE UK Capped Index is a free float-adjusted market capitalization-weighted index maintained and calculated by FTSE Russell with a capping methodology applied quarterly to issuer weights so that no single issuer of a component exceeds 25% of the index weight, and all issuers with weights above 5% do not cumulatively exceed 50% of the index’s weight. The FTSE UK Capped Index is based on the FTSE UK Index and is designed to measure the performance of U.K. large- andmid-capitalization stocks.
2. Source: FactSet.
The index is unmanaged and includes reinvestment of any income or distributions (after the deduction of certain withholding taxes). It does not reflect any fees, expenses or sales charges. One cannot invest directly in an index.
See www.franklintempletondatasources.com for additional data provider information.
The dollar value, number of shares or principal amount, and names of all portfolio holdings are listed in the Fund’s Statement of Investments (SOI). The SOI begins on page 269.
| | | | | | |
| | | |
| franklintempleton.com | | Semiannual Report | | | 113 | |
FRANKLIN FTSE UNITED KINGDOM ETF
| | | | |
| Top 10 Holdings | |
|
| 9/30/19 | |
| |
Company
Sector/Industry, Country | | % of Total
Net Assets | |
Royal Dutch Shell PLC, A, B
Oil, Gas & Consumable Fuels, United Kingdom | | | 9.9% | |
HSBC Holdings PLC
Banks, United Kingdom | | | 6.5% | |
BP PLC
Oil, Gas & Consumable Fuels, United Kingdom | | | 5.3% | |
AstraZeneca PLC
Pharmaceuticals, United Kingdom | | | 4.9% | |
GlaxoSmithKline PLC
Pharmaceuticals, United Kingdom | | | 4.4% | |
Diageo PLC
Beverages, United Kingdom | | | 4.0% | |
British American Tobacco PLC
Tobacco, United Kingdom | | | 3.5% | |
Unilever PLC
Personal Products, United Kingdom | | | 2.7% | |
Rio Tinto PLC
Metals & Mining, United Kingdom | | | 2.4% | |
Vodafone Group PLC
Wireless Telecommunication Services, United Kingdom | | | 2.2% | |
Thank you for your participation in Franklin FTSE United Kingdom ETF. We look forward to serving your future investment needs.
| | |
| |
Dina Ting, CFA |
| | |
| |
Louis Hsu, CFA |
| |
| | Portfolio Management Team |
The foregoing information reflects our analysis, opinions and portfolio holdings as of September 30, 2019, the end of the reporting period. These opinions may not be relied upon as investment advice or an offer for a particular security. The information is not a complete analysis of every aspect of any market, country, industry, security or the Fund. Statements of fact are from sources considered reliable, but the investment manager makes no representation or warranty as to their completeness or accuracy. Although historical performance is no guarantee of future results, these insights may help you understand our investment management philosophy.
| | | | |
| | | |
| 114 | | Semiannual Report | | franklintempleton.com |
FRANKLIN FTSE UNITED KINGDOM ETF
Performance Summary as of September 30, 2019
Total return reflects reinvestment of the Fund’s dividends and capital gain distributions, if any, and any unrealized gains or losses. Total returns do not include brokerage commissions that may be payable on secondary market transactions. The performance table does not reflect any taxes that a shareholder would pay on Fund dividends, capital gain distributions, if any, or any realized gains on the sale or redemption of Fund shares.
Net asset value or “NAV” is the value of one share of a fund as calculated in accordance with the standard formula for valuing mutual fund shares. The price used to calculate market return (Market Price) is determined by using the midpoint between the highest bid and the lowest offer on the primary stock exchange on which shares of a fund are listed for trading, as of the time that such fund’s NAV is calculated. Since shares of the Fund did not trade in the secondary market until after the Fund’s inception, for the period from inception to the first day of secondary trading (11/6/17), the NAV of the Fund is used as a proxy for the Market Price to calculate market returns. Market and NAV returns assume that dividends and capital gain distributions have been reinvested at Market Price and NAV.
Your dividend income will vary depending on dividends or interest paid by securities in the Fund’s portfolio, adjusted for operating expenses. Capital gain distributions are net profits realized from the sale of portfolio securities.
Performance as of 9/30/19
| | | | | | | | | | | | | | | | |
| | |
| | | Cumulative Total Return1 | | | Average Annual Total Return1 | |
| | | Based on
NAV2 | | | Based on market price3 | | | Based on
NAV2 | | | Based on market price3 | |
6-Month | | | -1.23% | | | | -1.31% | | | | -1.23% | | | | -1.31% | |
1-Year | | | -2.64% | | | | -2.48% | | | | -2.64% | | | | -2.48% | |
Since Inception (11/2/17) | | | +0.04% | | | | +0.12% | | | | +0.02% | | | | +0.06% | |
Performance data represent past performance, which does not guarantee future results. Investment return and principal value will fluctuate, and you may have a gain or loss when you sell your shares. Current performance may differ from figures shown. For most recentmonth-end performance, go tofranklintempleton.com or call(800)342-5236.
See page 116 for Performance Summary footnotes.
| | | | | | |
| | | |
| franklintempleton.com | | Semiannual Report | | | 115 | |
FRANKLIN FTSE UNITED KINGDOM ETF
PERFORMANCE SUMMARY
Distributions(4/1/19–9/30/19)
|
|
Net Investment
Income |
$0.530362 |
Total Annual Operating Expenses4
All investments involve risks, including possible loss of principal. Stock prices fluctuate, sometimes rapidly and dramatically, due to factors affecting individual companies, particular industries or sectors, or general market conditions. Special risks are associated with foreign investing, including currency fluctuations, economic instability and political developments. Investments in securities of U.K. issuers involve risks that are specific to the U.K., including certain legal, regulatory, political and economic risks. Because the Fund invests its assets primarily in companies in a specific country or region, the Fund may also experience greater volatility than a fund that is more broadly diversified geographically. As anon-diversified fund, the Fund may invest in a relatively small number of issuers and, as a result, be subject to a greater risk of loss with respect to its portfolio securities. The Fund’s prospectus also includes a description of the main investment risks.
ETFs trade like stocks, fluctuate in market value and may trade at prices above or below their net asset value. Brokerage commissions and ETF expenses will reduce returns.
1. Total return calculations represent the cumulative and average annual changes in value of an investment over the periods indicated. Return for less than one year, if any, has not been annualized.
2. Assumes reinvestment of distributions based on net asset value.
3. Assumes reinvestment of distributions based on market price.
4. Figures are as stated in the Fund’s current prospectus and may differ from the expense ratios disclosed in the Your Fund’s Expenses and Financial Highlights sections in this report. In periods of market volatility, assets may decline significantly, causing total annual Fund operating expenses to become higher than the figures shown.
| | | | |
| | | |
| 116 | | Semiannual Report | | franklintempleton.com |
FRANKLIN FTSE UNITED KINGDOM ETF
Your Fund’s Expenses
As a Fund shareholder, you can incur two types of costs: (1) transaction costs, including brokerage commissions on purchases and sales of Fund shares; and (2) ongoing Fund costs, including management fees and other Fund expenses. All funds have ongoing costs, sometimes referred to as operating expenses. The table below shows ongoing costs of investing in the Fund and can help you understand these costs and compare them with those of other funds. The table assumes a $1,000 investment held for the six months indicated.
Actual Fund Expenses
The table below provides information about actual account values and actual expenses in the columns under the heading “Actual.” In these columns the Fund’s actual return, which includes the effect of Fund expenses, is used to calculate the “Ending Account Value.” You can estimate the expenses you paid during the period by following these steps (of course, your account value and expenses will differ from those in this illustration):Divide your account value by $1,000 (if your account had an $8,600 value, then $8,600÷ $1,000 = 8.6).Then multiply the result by the number in the row under the headings “Actual” and “Expenses Paid During Period” (if Actual Expenses Paid During Period were $7.50, then 8.6 x $7.50 = $64.50).In this illustration, the actual expenses paid this period are $64.50.
Hypothetical Example for Comparison with Other Funds
Under the heading “Hypothetical” in the table, information is provided about hypothetical account values and hypothetical expenses based on the Fund’s actual expense ratio and an assumed rate of return of 5% per year before expenses, which is not the Fund’s actual return. This information may not be used to estimate the actual ending account balance or expenses you paid for the period, but it can help you compare ongoing costs of investing in the Fund with those of other funds. To do so, compare this 5% hypothetical example with the 5% hypothetical examples that appear in the shareholder reports of other funds.
Please note that expenses shown in the table are meant to highlight ongoing costs and do not reflect any transactional costs.Therefore, information under the heading “Hypothetical” is useful in comparing ongoing costs only, and will not help you compare total costs of owning different funds. In addition, if transactional costs were included, your total costs would have been higher.
| | | | | | | | | | | | | | | | | | | | | | |
| | | | Actual (actual return after expenses) | | | Hypothetical
(5% annual return before expenses) | | | | |
| | | | | |
Beginning
Account
Value 4/1/19 | | | Ending
Account
Value 9/30/19 | | | Expenses
Paid During
Period
4/1/19–9/30/191,2 | | | Ending
Account
Value 9/30/19 | | | Expenses
Paid During
Period
4/1/19–9/30/191,2 | | | Net Annualized
Expense Ratio2 | |
| | $1,000.00 | | | $ | 987.70 | | | $ | 0.45 | | | $ | 1,024.55 | | | $ | 0.46 | | | | 0.09 | % |
1. Expenses are equal to the annualized expense ratio for thesix-month period as indicated above—in the far right column—multiplied by the simple average account value over the period indicated, and then multiplied by 183/366 to reflect theone-half year period.
2. Reflects expenses after fee waivers and expense reimbursements.
| | | | | | |
| | | |
| franklintempleton.com | | Semiannual Report | | | 117 | |
FRANKLIN TEMPLETON ETF TRUST
Financial Highlights
Franklin FTSE Asia ex Japan ETF
| | | | | | | | | | | | |
| | | Six Months Ended
September 30, 2019 (unaudited) | | | Year Ended March 31, | |
| | | 2019 | | | 2018a | |
| | | |
Per share operating performance
(for a share outstanding throughout the period) | | | | | | | | | | | | |
| | | |
Net asset value, beginning of period | | $ | 21.86 | | | $ | 23.63 | | | $ | 23.64 | |
| | | | |
| | | |
| Income from investment operationsb: | | | | | | | | | | | | |
| | | |
Net investment incomec | | | 0.38 | | | | 0.51 | | | | 0.04 | |
| | | |
Net realized and unrealized gains (losses) | | | (1.49 | ) | | | (1.82 | ) | | | (0.05 | ) |
| | | | |
| | | |
Total from investment operations | | | (1.11 | ) | | | (1.31 | ) | | | (0.01 | ) |
| | | | |
| | | |
Less distributions from net investment income | | | (0.12 | ) | | | (0.46 | ) | | | — | |
| | | | |
| | | |
Net asset value, end of period | | $ | 20.63 | | | $ | 21.86 | | | $ | 23.63 | |
| | | | |
| | | |
Total returnd | | | (5.07)% | | | | (5.34)% | | | | (0.04)% | |
| | | |
| Ratios to average net assetse | | | | | | | | | | | | |
| | | |
Total expenses | | | 0.19% | | | | 0.19% | | | | 0.19% | |
| | | |
Net investment income | | | 3.61% | | | | 2.34% | | | | 1.06% | |
| | | |
| Supplemental data | | | | | | | | | | | | |
| | | |
Net assets, end of period (000’s) | | | $16,502 | | | | $17,488 | | | | $9,451 | |
| | | |
Portfolio turnover ratef | | | 6.43% | | | | 7.11% | | | | 0.96% | |
| | | |
| Portfolio turnover rate excluding portfolio transactions that are executed as a result of the Fund offering and redeeming Creation Units solely or in part for cashf,g | | | 6.43% | | | | —% | | | | —% | |
aFor the period February 6, 2018 (commencement of operations) to March 31, 2018.
bThe amount shown for a share outstanding throughout the period may not correlate with the Statement of Operations for the period due to the timing of sales and repurchases of Creation Unit Fund shares in relation to income earned and/or fluctuating fair value of the investments of the Fund.
cBased on average daily shares outstanding.
dTotal return is not annualized for periods less than one year. Total return is calculated assuming an initial investment made at the net asset value at the beginning of the period, reinvestment of all dividends and distributions at net asset value during the period, and redemption at net asset value on the last day of the period.
eRatios are annualized for periods less than one year.
fPortfolio turnover rate excludes the value of portfolio securities received or delivered as a result of processing capital share transactions in Creation Units, if any.
gEffective September 30, 2019.
| | | | |
| | | |
| 118 | | Semiannual Report | The accompanying notes are an integral part of these financial statements. | | franklintempleton.com |
FRANKLIN TEMPLETON ETF TRUST
Statement of Investments, September 30, 2019 (unaudited)
Franklin FTSE Asia ex Japan ETF
| | | | | | | | | | | | | | |
| | | | |
| | | | | Industry | | | Shares | | | Value | |
| | | Common Stocks and Other Equity Interests 98.5% | | | | | | | |
| | | Cambodia 0.0%† | | | | | | | | | |
| | NagaCorp Ltd. | | | Hotels, Restaurants & Leisure | | | | 4,000 | | | $ | 6,256 | |
| | | | | | | | | | | | | | |
| | | China 36.8% | | | | | | | | | |
| | 360 Security Technology Inc., A | | | Software | | | | 200 | | | | 658 | |
| a | | 3SBio Inc. | | | Biotechnology | | | | 4,000 | | | | 6,633 | |
| a | | 51job Inc., ADR | | | Professional Services | | | | 80 | | | | 5,920 | |
| a | | 58.com Inc., ADR | | | Interactive Media & Services | | | | 342 | | | | 16,864 | |
| | AAC Technologies Holdings Inc. | | | Electronic Equipment, Instruments & Components | | | | 2,000 | | | | 10,588 | |
| | AECC Aero-Engine Control Co. Ltd. | | | Aerospace & Defense | | | | 200 | | | | 382 | |
| | AECC Aviation Power Co. Ltd., A | | | Aerospace & Defense | | | | 400 | | | | 1,225 | |
| | Agile Group Holdings Ltd. | | | Real Estate Management & Development | | | | 4,000 | | | | 4,858 | |
| | Agricultural Bank of China Ltd., A | | | Banks | | | | 17,800 | | | | 8,624 | |
| | Agricultural Bank of China Ltd., H | | | Banks | | | | 108,000 | | | | 42,294 | |
| | Aier Eye Hospital Group Co. Ltd. | | | Health Care Providers & Services | | | | 400 | | | | 1,987 | |
| | Air China Ltd., A | | | Airlines | | | | 800 | | | | 896 | |
| | Air China Ltd., H | | | Airlines | | | | 4,000 | | | | 3,521 | |
| | Aisino Co. Ltd., A | | | Software | | | | 400 | | | | 1,173 | |
| a | | Alibaba Group Holding Ltd., ADR | | | Internet & Direct Marketing Retail | | | | 4,954 | | | | 828,457 | |
| a | | Alibaba Health Information Technology Ltd. | | | Health Care Technology | | | | 12,000 | | | | 10,486 | |
| a | | Alpha Group | | | Leisure Equipment & Products | | | | 200 | | | | 171 | |
| a | | Aluminum Corp. of China Ltd., A | | | Metals & Mining | | | | 1,800 | | | | 887 | |
| a | | Aluminum Corp. of China Ltd., H | | | Metals & Mining | | | | 12,000 | | | | 3,781 | |
| | An Hui Wenergy Co. Ltd. | | | Independent Power and Renewable Electricity Producers | | | | 600 | | | | 366 | |
| | Angang Steel Co. Ltd. | | | Metals & Mining | | | | 1,000 | | | | 433 | |
| | Angang Steel Co. Ltd., H | | | Metals & Mining | | | | 5,200 | | | | 1,897 | |
| | Angel Yeast Co. Ltd., A | | | Food Products | | | | 200 | | | | 758 | |
| | Anhui Anke Biotechnology Group Co. Ltd. | | | Pharmaceuticals | | | | 200 | | | | 422 | |
| | Anhui Conch Cement Co. Ltd., A | | | Construction Materials | | | | 600 | | | | 3,473 | |
| | Anhui Conch Cement Co. Ltd., H | | | Construction Materials | | | | 4,000 | | | | 23,752 | |
| | Anhui Expressway Co. Ltd., H | | | Transportation Infrastructure | | | | 4,000 | | | | 2,235 | |
| | Anhui Gujing Distillery Co. Ltd., B | | | Beverages | | | | 400 | | | | 3,361 | |
| a | | Anhui Jianghuai Automobile Group Corp. Ltd., A | | | Automobiles | | | | 400 | | | | 296 | |
| | Anhui Xinhua Media Co. Ltd., A | | | Distributors | | | | 200 | | | | 152 | |
| | Anhui Zhongding Sealing Parts Co. Ltd. | | | Auto Components | | | | 200 | | | | 243 | |
| | Anta Sports Products Ltd. | | | Textiles, Apparel & Luxury Goods | | | | 4,000 | | | | 33,089 | |
| a | | Anxin Trust Co. Ltd. | | | Capital Markets | | | | 800 | | | | 528 | |
| a | | Autohome Inc., ADR | | | Interactive Media & Services | | | | 194 | | | | 16,127 | |
| | Avary Holding Shenzhen Co. Ltd., A | | | Electronic Equipment, Instruments & Components | | | | 200 | | | | 1,124 | |
| | AVIC Aircraft Co. Ltd. | | | Aerospace & Defense | | | | 400 | | | | 871 | |
| | Avic Capital Co. Ltd., A | | | Diversified Financial Services | | | | 1,200 | | | | 785 | |
| | AVIC Electromechanical Systems Co. Ltd. | | | Aerospace & Defense | | | | 600 | | | | 547 | |
| | Avic Heavy Machinery Co. Ltd., A | | | Machinery | | | | 200 | | | | 289 | |
| | AVIC Jonhon Optronic Technology Co. Ltd. | | | Electronic Equipment, Instruments & Components | | | | 200 | | | | 1,153 | |
| a | | AVIC Shenyang Aircraft Co. Ltd., A | | | Aerospace & Defense | | | | 200 | | | | 868 | |
| | AviChina Industry & Technology Co. Ltd., H | | | Aerospace & Defense | | | | 8,000 | | | | 3,929 | |
| | BAIC Motor Corp. Ltd., H | | | Automobiles | | | | 8,000 | | | | 4,939 | |
| a | | Baidu Inc., ADR | | | Interactive Media & Services | | | | 962 | | | | 98,855 | |
| | Bank of Beijing Co. Ltd., A | | | Banks | | | | 3,200 | | | | 2,402 | |
| | Bank of Changsha Co. Ltd., A | | | Banks | | | | 600 | | | | 723 | |
| | Bank of Chengdu Co. Ltd., A | | | Banks | | | | 200 | | | | 228 | |
| | Bank of China Ltd., A | | | Banks | | | | 9,200 | | | | 4,612 | |
| | Bank of China Ltd., H | | | Banks | | | | 266,000 | | | | 104,508 | |
| | Bank of Communications Co. Ltd., A | | | Banks | | | | 6,000 | | | | 4,579 | |
| | Bank of Communications Co. Ltd., H | | | Banks | | | | 24,000 | | | | 15,675 | |
| | | | | | |
| | | |
| franklintempleton.com | | Semiannual Report | | | 119 | |
FRANKLIN TEMPLETON ETF TRUST
STATEMENT OF INVESTMENTS (UNAUDITED)
Franklin FTSE Asia ex Japan ETF(continued)
| | | | | | | | | | | | | | |
| | | | |
| | | | | Industry | | | Shares | | | Value | |
| | | Common Stocks and Other Equity Interests (continued) | | | | | | | |
| | | China (continued) | | | | | | | | | |
| | Bank of Guiyang Co. Ltd. | | | Banks | | | | 400 | | | $ | 477 | |
| | Bank of Hangzhou Co. Ltd. | | | Banks | | | | 400 | | | | 473 | |
| | Bank of Jiangsu Co. Ltd., A | | | Banks | | | | 600 | | | | 564 | |
| | Bank of Nanjing Co. Ltd., A | | | Banks | | | | 1,400 | | | | 1,684 | |
| | Bank of Ningbo Co. Ltd., A | | | Banks | | | | 800 | | | | 2,824 | |
| | Bank of Qingdao Co. Ltd., A | | | Banks | | | | 200 | | | | 161 | |
| | Bank of Shanghai Co. Ltd., A | | | Banks | | | | 2,180 | | | | 2,854 | |
| | Bank of Zhengzhou Co. Ltd. | | | Banks | | | | 400 | | | | 262 | |
| | Baoshan Iron & Steel Co. Ltd., A | | | Metals & Mining | | | | 2,800 | | | | 2,317 | |
| | BBMG Corp., A | | | Construction Materials | | | | 1,000 | | | | 465 | |
| | BBMG Corp., H | | | Construction Materials | | | | 8,000 | | | | 2,296 | |
| a | | BeiGene Ltd., ADR | | | Biotechnology | | | | 116 | | | | 14,205 | |
| | Beijing Capital Development Co. Ltd., A | | | Real Estate Management & Development | | | | 400 | | | | 455 | |
| | Beijing Capital International Airport Co. Ltd. | | | Transportation Infrastructure | | | | 8,000 | | | | 6,827 | |
| | Beijing Dabeinong Technology Group Co. Ltd. | | | Food Products | | | | 600 | | | | 384 | |
| | Beijing Enlight Media Co. Ltd. | | | Entertainment | | | | 400 | | | | 524 | |
| | Beijing Enterprises Holdings Ltd. | | | Gas Utilities | | | | 2,000 | | | | 9,197 | |
| | Beijing Enterprises Water Group Ltd. | | | Water Utilities | | | | 20,000 | | | | 10,230 | |
| | Beijing Jingneng Clean Energy Co. Ltd., H | | | Independent Power and Renewable Electricity Producers | | | | 4,000 | | | | 663 | |
| | Beijing Jingyuntong Technology Co. Ltd., A | | | Semiconductors & Semiconductor Equipment | | | | 400 | | | | 170 | |
| a | | Beijing Kunlun Tech Co. Ltd. | | | Entertainment | | | | 200 | | | | 343 | |
| a | | Beijing Lanxum Technology Co. Ltd. | | | IT Services | | | | 200 | | | | 254 | |
| | Beijing New Building Materials PLC | | | Building Products | | | | 200 | | | | 504 | |
| | Beijing North Star Co. Ltd., A | | | Real Estate Management & Development | | | | 400 | | | | 185 | |
| | Beijing North Star Co. Ltd., H | | | Real Estate Management & Development | | | | 4,000 | | | | 1,204 | |
| | Beijing Orient National Communication Science & Technology Co. Ltd. | | | Software | | | | 200 | | | | 359 | |
| | Beijing Oriental Yuhong Waterproof Technology Co. Ltd. | | | Construction Materials | | | | 200 | | | | 589 | |
| | Beijing Originwater Technology Co. Ltd. | | | Commercial Services & Supplies | | | | 400 | | | | 376 | |
| a | | Beijing Philisense Technology Co. Ltd. | | | IT Services | | | | 400 | | | | 219 | |
| | Beijing Sanju Environmental Protection and New Material Co. Ltd. | | | Chemicals | | | | 200 | | | | 174 | |
| | Beijing Shiji Information Technology Co. Ltd. | | | Software | | | | 200 | | | | 1,105 | |
| | Beijing Shunxin Agriculture Co. Ltd., A | | | Beverages | | | | 200 | | | | 1,461 | |
| | Beijing SL Pharmaceutical Co. Ltd. | | | Biotechnology | | | | 200 | | | | 350 | |
| a | | Beijing Teamsun Technology Co. Ltd., A | | | IT Services | | | | 200 | | | | 309 | |
| | Beijing Tiantan Biological Products Corp. Ltd., A | | | Biotechnology | | | | 200 | | | | 795 | |
| | Beijing Tongrentang Co. Ltd., A | | | Pharmaceuticals | | | | 200 | | | | 753 | |
| a | | Beijing Ultrapower Software Co. Ltd. | | | IT Services | | | | 400 | | | | 198 | |
| | Beijing Yanjing Brewery Co. Ltd. | | | Beverages | | | | 400 | | | | 325 | |
| | Beijing Zhong Ke San Huan High-Tech Co. Ltd. | | | Electronic Equipment, Instruments & Components | | | | 200 | | | | 265 | |
| | Bengang Steel Plates Co. Ltd., B | | | Metals & Mining | | | | 1,600 | | | | 414 | |
| | Better Life Commercial Chain Share Co. Ltd. | | | Food & Staples Retailing | | | | 200 | | | | 209 | |
| a | | Bilibili Inc., ADR | | | Entertainment | | | | 186 | | | | 2,626 | |
| | Bluedon Information Security Technology Co. Ltd. | | | Software | | | | 200 | | | | 160 | |
| | Bluefocus Intelligent Communications Group Co. Ltd. | | | Media | | | | 400 | | | | 332 | |
| | Bluestar Adisseo Co., A | | | Chemicals | | | | 200 | | | | 290 | |
| | BOE Technology Group Co. Ltd. | | | Electronic Equipment, Instruments & Components | | | | 2,800 | | | | 1,036 | |
| | BOE Technology Group Co. Ltd. | | | Electronic Equipment, Instruments & Components | | | | 5,200 | | | | 2,731 | |
| | | | |
| | | |
| 120 | | Semiannual Report | | franklintempleton.com |
FRANKLIN TEMPLETON ETF TRUST
STATEMENT OF INVESTMENTS (UNAUDITED)
Franklin FTSE Asia ex Japan ETF(continued)
| | | | | | | | | | | | | | |
| | | | |
| | | | | Industry | | | Shares | | | Value | |
| | | Common Stocks and Other Equity Interests (continued) | | | | | | | |
| | | China (continued) | | | | | | | | | |
| | Bright Dairy & Food Co. Ltd., A | | | Food Products | | | | 200 | | | $ | 293 | |
| | Brilliance China Automotive Holdings Ltd. | | | Automobiles | | | | 8,000 | | | | 8,593 | |
| | BTG Hotels Group Co. Ltd., A | | | Hotels, Restaurants & Leisure | | | | 200 | | | | 470 | |
| | BYD Co. Ltd. | | | Automobiles | | | | 200 | | | | 1,366 | |
| | BYD Co. Ltd., H | | | Automobiles | | | | 2,000 | | | | 9,988 | |
| | BYD Electronic International Co. Ltd. | | | Communications Equipment | | | | 3,000 | | | | 4,493 | |
| | Caitong Securities Co. Ltd., A | | | Capital Markets | | | | 200 | | | | 279 | |
| | Camel Group Co. Ltd., A | | | Electrical Equipment | | | | 200 | | | | 255 | |
| a | | CAR Inc. | | | Road & Rail | | | | 2,000 | | | | 1,544 | |
| | CECEP Solar Energy Co. Ltd. | | | Semiconductors & Semiconductor Equipment | | | | 800 | | | | 353 | |
| | CECEP Wind-Power Corp. | | | Independent Power and Renewable Electricity Producers | | | | 400 | | | | 136 | |
| | Central China Securities Co. Ltd., A | | | Capital Markets | | | | 600 | | | | 418 | |
| | Central China Securities Co. Ltd., H | | | Capital Markets | | | | 2,000 | | | | 395 | |
| | CGN Power Co. Ltd., H | | | Independent Power and Renewable Electricity Producers | | | | 38,000 | | | | 9,598 | |
| | Changjiang Securities Co. Ltd. | | | Capital Markets | | | | 600 | | | | 588 | |
| a | | Changyuan Group Ltd., A | | | Electrical Equipment | | | | 200 | | | | 178 | |
| | Chaozhou Three-Circle Group Co. Ltd. | | | Electronic Equipment, Instruments & Components | | | | 200 | | | | 560 | |
| | Chengdu Xingrong Environment Co. Ltd. | | | Water Utilities | | | | 800 | | | | 537 | |
| a | | China Aerospace Times Electronics Co. Ltd., A | | | Aerospace & Defense | | | | 400 | | | | 338 | |
| | China Agri-Industries Holdings Ltd. | | | Food Products | | | | 8,000 | | | | 2,602 | |
| | China Aoyuan Group Ltd. | | | Real Estate Management & Development | | | | 4,000 | | | | 4,531 | |
| | China Avic Avionics Equipment Co. Ltd., A | | | Aerospace & Defense | | | | 200 | | | | 398 | |
| | China Baoan Group Co. Ltd. | | | Industrial Conglomerates | | | | 200 | | | | 124 | |
| a | | China Biologic Products Holdings Inc. | | | Biotechnology | | | | 90 | | | | 10,302 | |
| | China Bluechemical Ltd. | | | Chemicals | | | | 8,000 | | | | 1,929 | |
| a | | China Calxon Group Co. Ltd. | | | Real Estate Management & Development | | | | 200 | | | | 180 | |
| | China Cinda Asset Management Co. Ltd., H | | | Capital Markets | | | | 32,000 | | | | 6,286 | |
| | China CITIC Bank Corp. Ltd., A | | | Banks | | | | 800 | | | | 632 | |
| | China CITIC Bank Corp. Ltd., H | | | Banks | | | | 34,000 | | | | 18,129 | |
| | China Coal Energy Co. Ltd., A | | | Oil, Gas & Consumable Fuels | | | | 600 | | | | 413 | |
| | China Coal Energy Co. Ltd., H | | | Oil, Gas & Consumable Fuels | | | | 8,000 | | | | 3,255 | |
| | China Communications Construction Co. Ltd., A | | | Construction & Engineering | | | | 600 | | | | 849 | |
| | China Communications Construction Co. Ltd., H | | | Construction & Engineering | | | | 16,000 | | | | 12,511 | |
| | China Communications Services Corp. Ltd. | | | Construction & Engineering | | | | 8,000 | | | | 4,531 | |
| | China Conch Venture Holdings Ltd. | | | Machinery | | | | 6,000 | | | | 22,196 | |
| | China Construction Bank Corp., A | | | Banks | | | | 1,600 | | | | 1,566 | |
| | China Construction Bank Corp., H | | | Banks | | | | 324,000 | | | | 247,152 | |
| a | | China COSCO Holdings Co. Ltd., A | | | Marine | | | | 800 | | | | 533 | |
| | China CYTS Tours Holding Co. Ltd., A | | | Hotels, Restaurants & Leisure | | | | 200 | | | | 339 | |
| a | | China Eastern Airlines Corp. Ltd., A | | | Airlines | | | | 1,200 | | | | 870 | |
| a | | China Eastern Airlines Corp. Ltd., H | | | Airlines | | | | 4,000 | | | | 1,944 | |
| | China Enterprise Co. Ltd., A | | | Real Estate Management & Development | | | | 600 | | | | 381 | |
| | China Everbright Bank Co. Ltd., A | | | Banks | | | | 6,200 | | | | 3,421 | |
| | China Everbright Bank Co. Ltd., H | | | Banks | | | | 10,000 | | | | 4,261 | |
| | China Everbright International Ltd. | | | Commercial Services & Supplies | | | | 11,703 | | | | 9,017 | |
| | China Everbright Ltd. | | | Capital Markets | | | | 4,000 | | | | 4,679 | |
| a | | China Evergrande Group | | | Real Estate Management & Development | | | | 8,000 | | | | 17,042 | |
| | China Film Co. Ltd., A | | | Entertainment | | | | 200 | | | | 433 | |
| | China Foods Ltd. | | | Food Products | | | | 4,000 | | | | 1,771 | |
| | China Fortune Land Development Co. Ltd., A | | | Real Estate Management & Development | | | | 400 | | | | 1,511 | |
| | China Galaxy Securities Co. Ltd., A | | | Capital Markets | | | | 400 | | | | 610 | |
| | | | | | |
| | | |
| franklintempleton.com | | Semiannual Report | | | 121 | |
FRANKLIN TEMPLETON ETF TRUST
STATEMENT OF INVESTMENTS (UNAUDITED)
Franklin FTSE Asia ex Japan ETF(continued)
| | | | | | | | | | | | | | |
| | | | |
| | | | | Industry | | | Shares | | | Value | |
| | | Common Stocks and Other Equity Interests (continued) | | | | | | | |
| | | China (continued) | | | | | | | | | |
| | China Galaxy Securities Co. Ltd., H | | | Capital Markets | | | | 12,000 | | | $ | 6,383 | |
| | China Gezhouba Group Co. Ltd., A | | | Construction & Engineering | | | | 800 | | | | 653 | |
| | China Grand Automotive Services Group Co. Ltd., A | | | Specialty Retail | | | | 600 | | | | 323 | |
| | China Great Wall Securities Co. Ltd., A | | | Capital Markets | | | | 400 | | | | 829 | |
| | China Greatwall Technology Group Co. Ltd. | | | Technology Hardware, Storage & Peripherals | | | | 400 | | | | 723 | |
| | China Hongqiao Group Ltd. | | | Metals & Mining | | | | 9,000 | | | | 5,752 | |
| | China Huarong Asset Management Co. Ltd., H | | | Capital Markets | | | | 36,000 | | | | 5,419 | |
| | China International Capital Corp. Ltd., H | | | Capital Markets | | | | 3,200 | | | | 6,205 | |
| | China International Marine Containers (Group) Co. Ltd., H | | | Machinery | | | | 1,320 | | | | 1,147 | |
| | China International Marine Containers Group Co. Ltd. | | | Machinery | | | | 600 | | | | 855 | |
| | China International Travel Service Corp. Ltd., A | | | Hotels, Restaurants & Leisure | | | | 400 | | | | 5,213 | |
| | China Jinmao Holdings Group Ltd. | | | Real Estate Management & Development | | | | 20,000 | | | | 11,455 | |
| | China Jushi Co. Ltd., A | | | Construction Materials | | | | 600 | | | | 682 | |
| | China Life Insurance Co. Ltd., A | | | Insurance | | | | 600 | | | | 2,309 | |
| | China Life Insurance Co. Ltd., H | | | Insurance | | | | 26,000 | | | | 60,229 | |
| a | | China Literature Ltd. | | | Media | | | | 800 | | | | 2,720 | |
| | China Lodging Group Ltd., ADR | | | Hotels, Restaurants & Leisure | | | | 360 | | | | 11,887 | |
| | China Longyuan Power Group Corp. | | | Independent Power and Renewable Electricity Producers | | | | 12,000 | | | | 6,735 | |
| | China Machinery Engineering Corp., H | | | Construction & Engineering | | | | 4,000 | | | | 1,694 | |
| | China Medical System Holdings Ltd. | | | Pharmaceuticals | | | | 4,000 | | | | 4,755 | |
| | China Meheco Co. Ltd., A | | | Trading Companies & Distributors | | | | 200 | | | | 362 | |
| | China Mengniu Dairy Co. Ltd. | | | Food Products | | | | 9,000 | | | | 33,695 | |
| | China Merchants Bank Co. Ltd., A | | | Banks | | | | 3,000 | | | | 14,598 | |
| | China Merchants Bank Co. Ltd., H | | | Banks | | | | 13,000 | | | | 61,854 | |
| | China Merchants Energy Shipping Co. Ltd., A | | | Oil, Gas & Consumable Fuels | | | | 600 | | | | 401 | |
| | China Merchants Expressway Network & Technology Holdings Co. Ltd. | | | Transportation Infrastructure | | | | 200 | | | | 220 | |
| | China Merchants Port Holdings Co. Ltd. | | | Transportation Infrastructure | | | | 4,000 | | | | 6,021 | |
| | China Merchants Securities Co. Ltd. | | | Capital Markets | | | | 2,800 | | | | 3,165 | |
| | China Merchants Securities Co. Ltd., A | | | Capital Markets | | | | 800 | | | | 1,843 | |
| | China Merchants Shekou Industrial Zone Holdings Co. Ltd., A | | | Real Estate Management & Development | | | | 1,000 | | | | 2,659 | |
| | China Minsheng Banking Corp. Ltd., A | | | Banks | | | | 5,000 | | | | 4,215 | |
| | China Minsheng Banking Corp. Ltd., H | | | Banks | | | | 23,000 | | | | 15,638 | |
| | China Mobile Ltd. | | | Wireless Telecommunication Services | | | | 18,000 | | | | 148,902 | |
| | China Molybdenum Co. Ltd., A | | | Metals & Mining | | | | 1,000 | | | | 510 | |
| | China Molybdenum Co. Ltd., H | | | Metals & Mining | | | | 12,000 | | | | 3,980 | |
| | China National Building Material Co. Ltd., H | | | Construction Materials | | | | 13,700 | | | | 12,303 | |
| | China National Chemical Engineering Co. Ltd., A | | | Construction & Engineering | | | | 1,200 | | | | 975 | |
| | China National Nuclear Power Co. Ltd., A | | | Independent Power and Renewable Electricity Producers | | | | 1,600 | | | | 1,185 | |
| | China Nonferrous Metal Industry’s Foreign Engineering and Construction Co. Ltd. | | | Metals & Mining | | | | 400 | | | | 246 | |
| | China Northern Rare Earth Group High-Tech Co. Ltd., A | | | Metals & Mining | | | | 600 | | | | 913 | |
| | China Oilfield Services Ltd., A | | | Energy Equipment & Services | | | | 200 | | | | 343 | |
| | China Oilfield Services Ltd., H | | | Energy Equipment & Services | | | | 8,000 | | | | 9,562 | |
| | China Orient Securities Co. Ltd., A | | | Capital Markets | | | | 600 | | | | 857 | |
| | China Overseas Land & Investment Ltd. | | | Real Estate Management & Development | | | | 12,000 | | | | 37,732 | |
| | China Pacific Insurance Group Co. Ltd., A | | | Insurance | | | | 800 | | | | 3,906 | |
| | China Pacific Insurance Group Co. Ltd., H | | | Insurance | | | | 8,800 | | | | 32,329 | |
| | | | |
| | | |
| 122 | | Semiannual Report | | franklintempleton.com |
FRANKLIN TEMPLETON ETF TRUST
STATEMENT OF INVESTMENTS (UNAUDITED)
Franklin FTSE Asia ex Japan ETF(continued)
| | | | | | | | | | | | | | |
| | | | |
| | | | | Industry | | | Shares | | | Value | |
| | | Common Stocks and Other Equity Interests (continued) | | | | | | | |
| | | China (continued) | | | | | | | | | |
| | China Petroleum & Chemical Corp., A | | | Oil, Gas & Consumable Fuels | | | | 4,000 | | | $ | 2,812 | |
| | China Petroleum & Chemical Corp., H | | | Oil, Gas & Consumable Fuels | | | | 92,000 | | | | 54,688 | |
| | China Power International Development Ltd. | | | Independent Power and Renewable Electricity Producers | | | | 16,000 | | | | 3,327 | |
| | China Railway Construction Corp. Ltd., A | | | Construction & Engineering | | | | 1,600 | | | | 2,120 | |
| | China Railway Construction Corp. Ltd., H | | | Construction & Engineering | | | | 6,000 | | | | 6,559 | |
| | China Railway Group Ltd., H | | | Construction & Engineering | | | | 14,000 | | | | 8,501 | |
| | China RailwayHi-tech Industry Co. Ltd., A | | | Construction & Engineering | | | | 400 | | | | 575 | |
| b | | China Railway Signal & Communication Corp. Ltd., H, Reg S | | | Electronic Equipment, Instruments & Components | | | | 6,000 | | | | 3,712 | |
| | China Railway Tielong Container Logistics Co. Ltd., A | | | Road & Rail | | | | 400 | | | | 330 | |
| | China Reinsurance Group Corp., H | | | Insurance | | | | 22,000 | | | | 3,564 | |
| | China Resources Beer Holdings Co. Ltd. | | | Beverages | | | | 6,000 | | | | 31,801 | |
| | China Resources Cement Holdings Ltd. | | | Construction Materials | | | | 8,000 | | | | 8,021 | |
| | China Resources Double Crane Pharmaceutical Co. Ltd., A | | | Pharmaceuticals | | | | 200 | | | | 342 | |
| | China Resources Gas Group Ltd. | | | Gas Utilities | | | | 3,000 | | | | 14,829 | |
| | China Resources Land Ltd. | | | Real Estate Management & Development | | | | 8,000 | | | | 33,523 | |
| | China Resources Pharmaceutical Group Ltd. | | | Pharmaceuticals | | | | 6,000 | | | | 5,625 | |
| | China Resources Power Holdings Co. Ltd. | | | Independent Power and Renewable Electricity Producers | | | | 8,000 | | | | 9,705 | |
| | China Resources Sanjiu Medical & Pharmaceutical Co. Ltd. | | | Pharmaceuticals | | | | 200 | | | | 816 | |
| | China Shenhua Energy Co. Ltd., A | | | Oil, Gas & Consumable Fuels | | | | 800 | | | | 2,104 | |
| | China Shenhua Energy Co. Ltd., H | | | Oil, Gas & Consumable Fuels | | | | 12,000 | | | | 24,094 | |
| | China Shipbuilding Industry Co. Ltd., A | | | Machinery | | | | 3,200 | | | | 2,469 | |
| a | | China Shipbuilding Industry Group Power Co. Ltd., A | | | Auto Components | | | | 200 | | | | 640 | |
| | China Shipping Container Lines Co. Ltd., A | | | Marine | | | | 600 | | | | 211 | |
| | China Shipping Development Co. Ltd., A | | | Marine | | | | 400 | | | | 376 | |
| | China South City Holdings Ltd. | | | Real Estate Management & Development | | | | 8,000 | | | | 949 | |
| | China South Publishing & Media Group Co. Ltd., A | | | Media | | | | 400 | | | | 678 | |
| | China Southern Airlines Co. Ltd., A | | | Airlines | | | | 1,200 | | | | 1,114 | |
| | China Southern Airlines Co. Ltd., H | | | Airlines | | | | 4,000 | | | | 2,424 | |
| | China Spacesat Co. Ltd., A | | | Aerospace & Defense | | | | 200 | | | | 607 | |
| | China State Construction Engineering Corp. Ltd., A | | | Construction & Engineering | | | | 5,800 | | | | 4,410 | |
| | China State Construction International Holdings Ltd. | | | Construction & Engineering | | | | 8,000 | | | | 7,521 | |
| | China Taiping Insurance Holdings Co. Ltd. | | | Insurance | | | | 4,800 | | | | 10,715 | |
| | China Telecom Corp. Ltd., H | | | Diversified Telecommunication Services | | | | 48,000 | | | | 21,859 | |
| b,c | | China Tower Corp. Ltd., H,144A, Reg S | | | Diversified Telecommunication Services | | | | 160,000 | | | | 36,329 | |
| | China Traditional Chinese Medicine Co. Ltd. | | | Pharmaceuticals | | | | 8,000 | | | | 3,674 | |
| | China TransInfo Technology Co. Ltd. | | | IT Services | | | | 200 | | | | 494 | |
| | China Travel International Investment Hong Kong Ltd. | | | Hotels, Restaurants & Leisure | | | | 8,000 | | | | 1,245 | |
| | China Unicom (Hong Kong) Ltd. | | | Diversified Telecommunication Services | | | | 20,000 | | | | 21,226 | |
| | China United Network Communications Ltd., A | | | Wireless Telecommunication Services | | | | 3,800 | | | | 3,198 | |
| | China Vanke Co. Ltd., A | | | Real Estate Management & Development | | | | 1,400 | | | | 5,078 | |
| | China Vanke Co. Ltd., H | | | Real Estate Management & Development | | | | 5,600 | | | | 19,502 | |
| | China Yangtze Power Co. Ltd., A | | | Independent Power and Renewable Electricity Producers | | | | 2,000 | | | | 5,106 | |
| | China Zhongwang Holdings Ltd. | | | Metals & Mining | | | | 4,800 | | | | 1,953 | |
| | | | | | |
| | | |
| franklintempleton.com | | Semiannual Report | | | 123 | |
FRANKLIN TEMPLETON ETF TRUST
STATEMENT OF INVESTMENTS (UNAUDITED)
Franklin FTSE Asia ex Japan ETF(continued)
| | | | | | | | | | | | | | |
| | | | |
| | | | | Industry | | | Shares | | | Value | |
| | | Common Stocks and Other Equity Interests (continued) | | | | | | | |
| | | China (continued) | | | | | | | | | |
| | Chinese Universe Publishing and Media Group Co. Ltd., A | | | Media | | | | 200 | | | $ | 366 | |
| | Chongqing Changan Automobile Co. Ltd. | | | Automobiles | | | | 600 | | | | 623 | |
| | Chongqing Changan Automobile Co. Ltd., B | | | Automobiles | | | | 2,600 | | | | 1,151 | |
| | Chongqing Dima Industry Co. Ltd., A | | | Real Estate Management & Development | | | | 400 | | | | 179 | |
| | Chongqing Fuling Zhacai Group Co. Ltd., A | | | Food Products | | | | 200 | | | | 625 | |
| | Chongqing Rural Commercial Bank Co. Ltd., H | | | Banks | | | | 8,000 | | | | 4,255 | |
| | Chongqing Water Group Co. Ltd., A | | | Water Utilities | | | | 200 | | | | 157 | |
| | Chongqing Zhifei Biological Products Co. Ltd. | | | Biotechnology | | | | 200 | | | | 1,329 | |
| | CIFI Holdings Group Co. Ltd. | | | Real Estate Management & Development | | | | 12,000 | | | | 7,011 | |
| | CIMC Enric Holdings Ltd. | | | Machinery | | | | 4,000 | | | | 2,301 | |
| | Cinda Real Estate Co. Ltd., A | | | Real Estate Management & Development | | | | 400 | | | | 215 | |
| a | | CITIC Guoan Information Industry Co. Ltd. | | | Media | | | | 400 | | | | 202 | |
| | Citic Pacific Ltd. | | | Industrial Conglomerates | | | | 16,000 | | | | 20,206 | |
| | CITIC Securities Co. Ltd., A | | | Capital Markets | | | | 1,400 | | | | 4,407 | |
| | CITIC Securities Co. Ltd., H | | | Capital Markets | | | | 8,000 | | | | 14,981 | |
| | CMST Development Co. Ltd., A | | | Air Freight & Logistics | | | | 200 | | | | 139 | |
| | CNOOC Ltd. | | | Oil, Gas & Consumable Fuels | | | | 56,000 | | | | 85,435 | |
| | Contemporary Amperex Technology Co. Ltd. | | | Electrical Equipment | | | | 200 | | | | 2,002 | |
| | COSCO SHIPPING Development Co. Ltd., H | | | Marine | | | | 16,000 | | | | 1,837 | |
| | COSCO Shipping Energy Transportation Co. Ltd., H | | | Marine | | | | 4,000 | | | | 1,771 | |
| a | | COSCO Shipping Holdings Co. Ltd. | | | Marine | | | | 8,000 | | | | 2,847 | |
| | COSCO SHIPPING Ports Ltd. | | | Transportation Infrastructure | | | | 8,183 | | | | 6,534 | |
| | Country Garden Holdings Co. Ltd. | | | Real Estate Management & Development | | | | 26,000 | | | | 32,934 | |
| | Country Garden Services Holdings Co. Ltd. | | | Commercial Services & Supplies | | | | 4,000 | | | | 11,532 | |
| a | | CPT Technology Group Co. Ltd. | | | Electronic Equipment, Instruments & Components | | | | 400 | | | | 155 | |
| | CRRC Corp. Ltd., A | | | Machinery | | | | 2,800 | | | | 2,870 | |
| | CRRC Corp. Ltd., H | | | Machinery | | | | 14,000 | | | | 9,769 | |
| | CSC Financial Co. Ltd., A | | | Capital Markets | | | | 200 | | | | 625 | |
| | CSC Financial Co. Ltd., H | | | Capital Markets | | | | 3,000 | | | | 2,197 | |
| | CSG Holding Co. Ltd. | | | Construction Materials | | | | 3,101 | | | | 981 | |
| | CSG Holding Co. Ltd. | | | Construction Materials | | | | 400 | | | | 236 | |
| | CSPC Pharmaceutical Group Ltd. | | | Pharmaceuticals | | | | 16,000 | | | | 32,125 | |
| a | | CSSC Offshore and Marine Engineering Group Co. Ltd. | | | Machinery | | | | 2,000 | | | | 1,564 | |
| a | | CSSC Offshore and Marine Engineering Group Co. Ltd., A | | | Machinery | | | | 200 | | | | 476 | |
| a | | Ctrip.com International Ltd., ADR | | | Internet & Direct Marketing Retail | | | | 1,334 | | | | 39,073 | |
| | Da An Gene Co. Ltd. of SunYat-Sen University | | | Biotechnology | | | | 200 | | | | 283 | |
| | Dairy Farm International Holdings Ltd. | | | Food & Staples Retailing | | | | 1,000 | | | | 6,300 | |
| | Dali Foods Group Co. Ltd. | | | Food Products | | | | 7,000 | | | | 4,295 | |
| | Dalian Port PDA Co. Ltd., A | | | Transportation Infrastructure | | | | 1,400 | | | | 396 | |
| | Daqin Railway Co. Ltd., A | | | Road & Rail | | | | 2,400 | | | | 2,551 | |
| | Datang International Power Generation Co. Ltd., H | | | Independent Power and Renewable Electricity Producers | | | | 8,000 | | | | 1,653 | |
| a | | Datong Coal Industry Co. Ltd., A | | | Oil, Gas & Consumable Fuels | | | | 400 | | | | 235 | |
| | Dawning Information Industry Co. Ltd., A | | | Technology Hardware, Storage & Peripherals | | | | 200 | | | | 961 | |
| | Dazhong Transportation (Group) Co. Ltd., B | | | Road & Rail | | | | 2,400 | | | | 1,135 | |
| | Dazhong Transportation Group Co. Ltd., A | | | Road & Rail | | | | 800 | | | | 451 | |
| | DHC Software Co. Ltd. | | | IT Services | | | | 600 | | | | 566 | |
| | | | |
| | | |
| 124 | | Semiannual Report | | franklintempleton.com |
FRANKLIN TEMPLETON ETF TRUST
STATEMENT OF INVESTMENTS (UNAUDITED)
Franklin FTSE Asia ex Japan ETF(continued)
| | | | | | | | | | | | | | |
| | | | |
| | | | | Industry | | | Shares | | | Value | |
| | | Common Stocks and Other Equity Interests (continued) | | | | | | | |
| | | China (continued) | | | | | | | | | |
| | Digital China Information Service Co. Ltd. | | | IT Services | | | | 200 | | | $ | 352 | |
| | Dong-E-E-Jiao Co. Ltd., A | | | Pharmaceuticals | | | | 200 | | | | 854 | |
| | Dongfang Electric Corp. Ltd., A | | | Electrical Equipment | | | | 400 | | | | 516 | |
| | Dongfang Electric Corp. Ltd., H | | | Electrical Equipment | | | | 800 | | | | 445 | |
| | Dongfeng Motor Group Co. Ltd., H | | | Automobiles | | | | 12,000 | | | | 11,404 | |
| | Dongguan Development Holdings Co. Ltd. | | | Transportation Infrastructure | | | | 200 | | | | 228 | |
| | Dongxing Securities Co. Ltd., A | | | Capital Markets | | | | 400 | | | | 613 | |
| a | | Dr Peng Telecom & Media Group Co. Ltd., A | | | Diversified Telecommunication Services | | | | 200 | | | | 187 | |
| | East Money Information Co. Ltd. | | | Capital Markets | | | | 1,000 | | | | 2,070 | |
| | ENN Ecological Holdings Co. Ltd., A | | | Chemicals | | | | 200 | | | | 293 | |
| | ENN Energy Holdings Ltd. | | | Gas Utilities | | | | 2,600 | | | | 26,897 | |
| | Eternal Asia Supply Chain Management Ltd. | | | Commercial Services & Supplies | | | | 200 | | | | 116 | |
| a | | Eve Energy Co. Ltd. | | | Electrical Equipment | | | | 200 | | | | 851 | |
| | Everbright Securities Co. Ltd., A | | | Capital Markets | | | | 600 | | | | 952 | |
| | Everbright Securities Co. Ltd., H | | | Capital Markets | | | | 400 | | | | 303 | |
| a | | Fangda Carbon New Material Co. Ltd. | | | Electrical Equipment | | | | 400 | | | | 651 | |
| | Far East Horizon Ltd. | | | Diversified Financial Services | | | | 8,000 | | | | 7,429 | |
| | FAW CAR Co. Ltd. | | | Automobiles | | | | 200 | | | | 232 | |
| | Fiberhome Telecommunication Technologies Co. Ltd., A | | | Communications Equipment | | | | 200 | | | | 766 | |
| a | | FIH Mobile Ltd. | | | Electronic Equipment, Instruments & Components | | | | 10,000 | | | | 1,225 | |
| | Financial Street Holdings Co. Ltd. | | | Real Estate Management & Development | | | | 600 | | | | 647 | |
| | First Capital Securities Co. Ltd. | | | Capital Markets | | | | 200 | | | | 178 | |
| | Focus Media Information Technology Co. Ltd. | | | Media | | | | 2,000 | | | | 1,470 | |
| | Foshan Electrical and Lighting Co. Ltd. | | | Electrical Equipment | | | | 800 | | | | 564 | |
| | Foshan Haitian Flavouring & Food Co. Ltd. | | | Food Products | | | | 200 | | | | 3,078 | |
| | Fosun International Ltd. | | | Industrial Conglomerates | | | | 8,000 | | | | 9,899 | |
| | Founder Securities Co. Ltd., A | | | Capital Markets | | | | 1,200 | | | | 1,158 | |
| | Foxconn Industrial Internet Co. Ltd., A | | | Electronic Equipment, Instruments & Components | | | | 600 | | | | 1,210 | |
| | Fujian Funeng Co. Ltd., A | | | Independent Power and Renewable Electricity Producers | | | | 200 | | | | 240 | |
| | Fujian Longking Co. Ltd., A | | | Machinery | | | | 200 | | | | 278 | |
| | Fujian Sunner Development Co. Ltd. | | | Food Products | | | | 200 | | | | 691 | |
| | Future Land Development Holdings Ltd. | | | Real Estate Management & Development | | | | 4,000 | | | | 3,490 | |
| | Fuyao Glass Industry Group Co. Ltd., A | | | Auto Components | | | | 400 | | | | 1,203 | |
| | Fuyao Group Glass Industries Co. Ltd., H | | | Auto Components | | | | 1,600 | | | | 4,439 | |
| | Ganfeng Lithium Co. Ltd. | | | Metals & Mining | | | | 200 | | | | 632 | |
| a | | GCL System Integration Technology Co. Ltd. | | | Semiconductors & Semiconductor Equipment | | | | 800 | | | | 752 | |
| a | | GCL-Poly Energy Holdings Ltd. | | | Semiconductors & Semiconductor Equipment | | | | 48,000 | | | | 1,929 | |
| | GD Power Development Co. Ltd., A | | | Independent Power and Renewable Electricity Producers | | | | 3,800 | | | | 1,272 | |
| a | | GDS Holdings Ltd., ADR | | | IT Services | | | | 182 | | | | 7,295 | |
| | Geely Automobile Holdings Ltd. | | | Automobiles | | | | 16,000 | | | | 27,145 | |
| | GEM Co. Ltd. | | | Metals & Mining | | | | 800 | | | | 499 | |
| | Gemdale Corp., A | | | Real Estate Management & Development | | | | 600 | | | | 970 | |
| a | | Genscript Biotech Corp. | | | Life Sciences Tools & Services | | | | 4,000 | | | | 7,664 | |
| a | | GF Securities Co. Ltd. | | | Capital Markets | | | | 800 | | | | 1,520 | |
| a | | GF Securities Co. Ltd., H | | | Capital Markets | | | | 5,200 | | | | 5,446 | |
| | Global TopE-Commerce Co. Ltd. | | | Internet & Direct Marketing Retail | | | | 200 | | | | 213 | |
| | Glodon Co. Ltd. | | | Software | | | | 200 | | | | 994 | |
| | GoerTek Inc. | | | Electronic Equipment, Instruments & Components | | | | 400 | | | | 985 | |
| a | | GOME Retail Holdings Ltd. | | | Specialty Retail | | | | 42,000 | | | | 3,804 | |
| | Gosuncn Technology Group Co. Ltd. | | | Communications Equipment | | | | 200 | | | | 192 | |
| | Grandjoy Holdings Group Co. Ltd., A | | | Real Estate Management & Development | | | | 400 | | | | 379 | |
| | Great Wall Motor Co. Ltd., A | | | Automobiles | | | | 400 | | | | 431 | |
| | Great Wall Motor Co. Ltd., H | | | Automobiles | | | | 11,000 | | | | 7,367 | |
| | | | | | |
| | | |
| franklintempleton.com | | Semiannual Report | | | 125 | |
FRANKLIN TEMPLETON ETF TRUST
STATEMENT OF INVESTMENTS (UNAUDITED)
Franklin FTSE Asia ex Japan ETF(continued)
| | | | | | | | | | | | | | |
| | | | |
| | | | | Industry | | | Shares | | | Value | |
| | | Common Stocks and Other Equity Interests (continued) | | | | | | | |
| | | China (continued) | | | | | | | | | |
| | Greattown Holdings Ltd., A | | | Real Estate Management & Development | | | | 200 | | | $ | 206 | |
| | Gree Electric Appliances Inc. of Zhuhai, A | | | Household Durables | | | | 800 | | | | 6,419 | |
| | Greendland Holdings Corp. Ltd., A | | | Real Estate Management & Development | | | | 600 | | | | 593 | |
| | Greentown China Holdings Ltd. | | | Real Estate Management & Development | | | | 3,000 | | | | 2,430 | |
| | GRG Banking Equipment Co. Ltd. | | | Technology Hardware, Storage & Peripherals | | | | 400 | | | | 483 | |
| | Guangdong Baolihua New Energy Stock Co. Ltd. | | | Independent Power and Renewable Electricity Producers | | | | 600 | | | | 519 | |
| | Guangdong Electric Power Development Co. Ltd., B | | | Independent Power and Renewable Electricity Producers | | | | 4,000 | | | | 1,219 | |
| | Guangdong Ellington Electronics Technology Co. Ltd., A | | | Electronic Equipment, Instruments & Components | | | | 200 | | | | 309 | |
| a | | Guangdong Golden Dragon Development Inc. | | | Capital Markets | | | | 200 | | | | 357 | |
| | Guangdong Haid Group Co. Ltd. | | | Food Products | | | | 200 | | | | 877 | |
| | Guangdong HEC Technology Holding Co. Ltd., A | | | Metals & Mining | | | | 400 | | | | 409 | |
| | Guangdong Investment Ltd. | | | Water Utilities | | | | 8,000 | | | | 15,654 | |
| a | | Guangdong LY Intelligent Manufacturing Co. Ltd. | | | Electrical Equipment | | | | 800 | | | | 1,049 | |
| | Guanghui Energy Co. Ltd., A | | | Oil, Gas & Consumable Fuels | | | | 1,200 | | | | 558 | |
| | Guangshen Railway Co. Ltd., A | | | Road & Rail | | | | 2,000 | | | | 863 | |
| | Guangshen Railway Co. Ltd., H | | | Road & Rail | | | | 4,000 | | | | 1,265 | |
| | Guangxi Guiguan Electric Power Co. Ltd., A | | | Independent Power and Renewable Electricity Producers | | | | 600 | | | | 383 | |
| | Guangxi Liugong Machinery Co. Ltd. | | | Machinery | | | | 800 | | | | 701 | |
| | Guangxi Wuzhou Zhongheng Group Co. Ltd., A | | | Pharmaceuticals | | | | 1,000 | | | | 402 | |
| | Guangzhou Automobile Group Co. Ltd., A | | | Automobiles | | | | 200 | | | | 344 | |
| | Guangzhou Automobile Group Co. Ltd., H | | | Automobiles | | | | 12,000 | | | | 11,480 | |
| | Guangzhou Baiyun International Airport Co. Ltd., A | | | Transportation Infrastructure | | | | 200 | | | | 629 | |
| | Guangzhou Baiyunshan Pharmaceutical Holdings Co. Ltd. | | | Pharmaceuticals | | | | 600 | | | | 1,978 | |
| | Guangzhou Baiyunshan Pharmaceutical Holdings Co. Ltd., A | | | Pharmaceuticals | | | | 200 | | | | 972 | |
| | Guangzhou Haige Communications Group Inc. Co. | | | Communications Equipment | | | | 400 | | | | 549 | |
| | Guangzhou R&F Properties Co. Ltd., H | | | Real Estate Management & Development | | | | 4,000 | | | | 6,051 | |
| | Guangzhou Zhujiang Brewery Co. Ltd. | | | Beverages | | | | 200 | | | | 186 | |
| | Guizhou Panjiang Refined Coal Co. Ltd., A | | | Oil, Gas & Consumable Fuels | | | | 800 | | | | 575 | |
| a | | Guizhou Xinbang Pharmaceutical Co. Ltd. | | | Pharmaceuticals | | | | 200 | | | | 155 | |
| | Guosen Securities Co. Ltd. | | | Capital Markets | | | | 600 | | | | 1,032 | |
| a | | Guosheng Financial Holding Inc. | | | Electrical Equipment | | | | 200 | | | | 318 | |
| | Guotai Junan International holdings Ltd. | | | Capital Markets | | | | 10,000 | | | | 1,697 | |
| | Guotai Junan Securities Co. Ltd. | | | Capital Markets | | | | 2,400 | | | | 3,735 | |
| | Guotai Junan Securities Co. Ltd., A | | | Capital Markets | | | | 1,000 | | | | 2,460 | |
| | Guoxuan High-Tech Co. Ltd. | | | Electrical Equipment | | | | 200 | | | | 350 | |
| | Guoyuan Securities Co. Ltd. | | | Capital Markets | | | | 400 | | | | 478 | |
| b,c | | Haidilao International Holding Ltd., 144A, Reg S | | | Hotels, Restaurants & Leisure | | | | 1,000 | | | | 4,273 | |
| | Haier Electronics Group Co. Ltd. | | | Household Durables | | | | 4,000 | | | | 10,434 | |
| | Haier Smart Home Co. Ltd., A | | | Household Durables | | | | 800 | | | | 1,714 | |
| | Haining China Leather Market Co. Ltd. | | | Real Estate Management & Development | | | | 800 | | | | 467 | |
| | Haitian International Holdings Ltd. | | | Machinery | | | | 2,000 | | | | 4,097 | |
| | Haitong Securities Co. Ltd., A | | | Capital Markets | | | | 1,200 | | | | 2,403 | |
| | Haitong Securities Co. Ltd., H | | | Capital Markets | | | | 11,200 | | | | 11,744 | |
| | Han’s Laser Technology Industry Group Co. Ltd., A | | | Machinery | | | | 200 | | | | 996 | |
| | | | |
| | | |
| 126 | | Semiannual Report | | franklintempleton.com |
FRANKLIN TEMPLETON ETF TRUST
STATEMENT OF INVESTMENTS (UNAUDITED)
Franklin FTSE Asia ex Japan ETF(continued)
| | | | | | | | | | | | | | |
| | | | |
| | | | | Industry | | | Shares | | | Value | |
| | | Common Stocks and Other Equity Interests (continued) | | | | | | | |
| | | China (continued) | | | | | | | | | |
| a | | Hang Zhou Great Star Industrial Co. Ltd. | | | Household Durables | | | | 200 | | | $ | 307 | |
| | Hangzhou Binjiang Real Estate Group Co. Ltd. | | | Real Estate Management & Development | | | | 400 | | | | 214 | |
| | Hangzhou Century Co. Ltd. | | | Electronic Equipment, Instruments & Components | | | | 200 | | | | 330 | |
| | Hangzhou Hangyang Co. Ltd. | | | Machinery | | | | 200 | | | | 353 | |
| | Hangzhou Hikvision Digital Technology Co. Ltd., A | | | Electronic Equipment, Instruments & Components | | | | 1,400 | | | | 6,332 | |
| | Hangzhou Robam Appliances Co. Ltd., A | | | Household Durables | | | | 200 | | | | 737 | |
| a | | Hangzhou Shunwang Technology Co. Ltd. | | | Entertainment | | | | 200 | | | | 522 | |
| | Hangzhou Tigermed Consulting Co. Ltd. | | | Life Sciences Tools & Services | | | | 200 | | | | 1,738 | |
| a | | Harbin Pharmaceutical Group Co. Ltd., A | | | Pharmaceuticals | | | | 400 | | | | 214 | |
| | Heilan Home Co. Ltd.,A-SHSC | | | Textiles, Apparel & Luxury Goods | | | | 600 | | | | 682 | |
| | Heilongjiang Agriculture Co. Ltd., A | | | Food Products | | | | 400 | | | | 543 | |
| | Henan Senyuan Electric Co. Ltd. | | | Electrical Equipment | | | | 200 | | | | 209 | |
| | Henan Shuanghui Investment & Development Co. Ltd. | | | Food Products | | | | 400 | | | | 1,384 | |
| | Henan Zhongyuan Expressway Co. Ltd., A | | | Transportation Infrastructure | | | | 400 | | | | 229 | |
| | Hengan International Group Co. Ltd. | | | Personal Products | | | | 2,000 | | | | 13,113 | |
| | Hengdian Group DMEGC Magnetics Co. Ltd. | | | Electronic Equipment, Instruments & Components | | | | 400 | | | | 382 | |
| | Hengli Petrochemical Co. Ltd., A | | | Chemicals | | | | 360 | | | | 753 | |
| a | | HengTen Networks Group Ltd. | | | Internet & Direct Marketing Retail | | | | 48,000 | | | | 729 | |
| | Hengtong Optic-electric Co. Ltd., A | | | Communications Equipment | | | | 400 | | | | 872 | |
| | Hesteel Co. Ltd. | | | Metals & Mining | | | | 1,400 | | | | 494 | |
| | Hisense Electric Co. Ltd., A | | | Household Durables | | | | 400 | | | | 455 | |
| | Hithink RoyalFlush Information Network Co. Ltd. | | | Capital Markets | | | | 200 | | | | 2,778 | |
| | Holitech Technology Co. Ltd. | | | Electronic Equipment, Instruments & Components | | | | 400 | | | | 325 | |
| | Hopson Development Holdings Ltd. | | | Real Estate Management & Development | | | | 4,000 | | | | 4,000 | |
| | Huaan Securities Co. Ltd., A | | | Capital Markets | | | | 400 | | | | 345 | |
| | Huabao Flavours & Fragrances Co. Ltd. | | | Chemicals | | | | 200 | | | | 853 | |
| | Huadian Fuxin Energy Corp. Ltd., H | | | Independent Power and Renewable Electricity Producers | | | | 8,000 | | | | 1,398 | |
| | Huadian Power International Corp. Ltd., A | | | Independent Power and Renewable Electricity Producers | | | | 600 | | | | 301 | |
| | Huadian Power International Corp. Ltd., H | | | Independent Power and Renewable Electricity Producers | | | | 4,000 | | | | 1,521 | |
| | Huadong Medicine Co. Ltd., A | | | Health Care Providers & Services | | | | 200 | | | | 734 | |
| | Huafa Industrial Co. Ltd. Zhuhai, A | | | Real Estate Management & Development | | | | 400 | | | | 394 | |
| | Huagong Tech Co. Ltd. | | | Electronic Equipment, Instruments & Components | | | | 200 | | | | 532 | |
| | Hualan Biological Engineering Inc. | | | Biotechnology | | | | 200 | | | | 961 | |
| | Huaneng Power International Inc., A | | | Independent Power and Renewable Electricity Producers | | | | 800 | | | | 650 | |
| | Huaneng Power International Inc., H | | | Independent Power and Renewable Electricity Producers | | | | 16,000 | | | | 7,694 | |
| | Huaneng Renewables Corp. Ltd., H | | | Independent Power and Renewable Electricity Producers | | | | 16,000 | | | | 5,449 | |
| | Huapont Life Sciences Co. Ltd. | | | Chemicals | | | | 600 | | | | 406 | |
| | Huatai Securities Co. Ltd., A | | | Capital Markets | | | | 1,000 | | | | 2,673 | |
| | Huatai Securities Co. Ltd., H | | | Capital Markets | | | | 6,000 | | | | 8,985 | |
| | Huaxi Securities Co. Ltd. | | | Capital Markets | | | | 400 | | | | 550 | |
| | Huaxia Bank Co. Ltd., A | | | Banks | | | | 2,000 | | | | 2,067 | |
| | Huaxin Cement Co. Ltd., A | | | Construction Materials | | | | 200 | | | | 528 | |
| | Huaxin Cement Co. Ltd., B | | | Construction Materials | | | | 1,000 | | | | 1,965 | |
| a | | Huayi Brothers Media Corp. | | | Entertainment | | | | 400 | | | | 265 | |
| | Huayu Automotive Systems Co. Ltd. | | | Auto Components | | | | 400 | | | | 1,316 | |
| | Hubei Biocause Pharmaceutical Co. Ltd. | | | Insurance | | | | 200 | | | | 197 | |
| | Hubei Energy Group Co. Ltd. | | | Independent Power and Renewable Electricity Producers | | | | 800 | | | | 456 | |
| | Hubei Xinyangfeng Fertilizer Co. Ltd. | | | Chemicals | | | | 400 | | | | 577 | |
| | Hunan Gold Corp. Ltd. | | | Metals & Mining | | | | 200 | | | | 239 | |
| a | | Hunan Valin Steel Co. Ltd. | | | Metals & Mining | | | | 600 | | | | 343 | |
| | Hundsun Technologies Inc., A | | | Software | | | | 200 | | | | 2,071 | |
| a | | Huolinhe Opencut Coal Industry Corp. Ltd. of Inner Mongolia | | | Oil, Gas & Consumable Fuels | | | | 200 | | | | 229 | |
| | | | | | |
| | | |
| franklintempleton.com | | Semiannual Report | | | 127 | |
FRANKLIN TEMPLETON ETF TRUST
STATEMENT OF INVESTMENTS (UNAUDITED)
Franklin FTSE Asia ex Japan ETF(continued)
| | | | | | | | | | | | | | |
| | | | |
| | | | | Industry | | | Shares | | | Value | |
| | | Common Stocks and Other Equity Interests (continued) | | | | | | | |
| | | China (continued) | | | | | | | | | |
| a | | Hybio Pharmaceutical Co. Ltd. | | | Pharmaceuticals | | | | 200 | | | $ | 203 | |
| | Hytera Communications Corp. Ltd., A | | | Communications Equipment | | | | 200 | | | | 287 | |
| | HyUnion Holding Co. Ltd. | | | Auto Components | | | | 200 | | | | 265 | |
| a | | Iflytek Co. Ltd. | | | Software | | | | 400 | | | | 1,785 | |
| | Industrial and Commercial Bank of China Ltd. | | | Banks | | | | 10,200 | | | | 7,899 | |
| | Industrial and Commercial Bank of China Ltd., H | | | Banks | | | | 272,000 | | | | 182,157 | |
| | Industrial Bank Co. Ltd., A | | | Banks | | | | 3,000 | | | | 7,364 | |
| | Industrial Securities Co. Ltd., A | | | Capital Markets | | | | 800 | | | | 697 | |
| | Inner Mongolia BaoTou Steel Union Co. Ltd., A | | | Metals & Mining | | | | 4,200 | | | | 859 | |
| | Inner Mongolia First Machinery Group Co. Ltd., A | | | Machinery | | | | 200 | | | | 295 | |
| | Inner Mongolia MengDian HuaNeng Thermal Power Co. Ltd., A | | | Independent Power and Renewable Electricity Producers | | | | 1,200 | | | | 501 | |
| | Inner Mongolia Xishui Strong Year Co. Ltd., A | | | Insurance | | | | 200 | | | | 245 | |
| | Inner Mongolia Yili Industrial Group Co. Ltd., A | | | Food Products | | | | 800 | | | | 3,195 | |
| | Inner Mongolia Yitai Coal Co. Ltd., B | | | Oil, Gas & Consumable Fuels | | | | 4,000 | | | | 3,668 | |
| a,b,c | | Innovent Biologics Inc., 144A, Reg S | | | Biotechnology | | | | 3,000 | | | | 9,548 | |
| | Inspur Electronic Information Industry Co. Ltd. | | | Technology Hardware, Storage & Peripherals | | | | 200 | | | | 720 | |
| a,d | | Iqiyi Inc., ADR | | | Entertainment | | | | 456 | | | | 7,355 | |
| a | | JD.com Inc., ADR | | | Internet & Direct Marketing Retail | | | | 2,750 | | | | 77,578 | |
| a | | Jiangsu Changjiang Electronics Technology Co. Ltd., A | | | Semiconductors & Semiconductor Equipment | | | | 200 | | | | 482 | |
| | Jiangsu Expressway Co. Ltd., A | | | Transportation Infrastructure | | | | 200 | | | | 291 | |
| | Jiangsu Expressway Co. Ltd., H | | | Transportation Infrastructure | | | | 4,000 | | | | 5,082 | |
| | Jiangsu Financial Leasing Co. Ltd., A | | | Diversified Financial Services | | | | 600 | | | | 482 | |
| | Jiangsu Hengli Hydraulic Co. Ltd., A | | | Machinery | | | | 200 | | | | 1,078 | |
| | Jiangsu Hengrui Medicine Co. Ltd., A | | | Pharmaceuticals | | | | 600 | | | | 6,779 | |
| | Jiangsu King’s Luck Brewery JSC Ltd. | | | Beverages | | | | 200 | | | | 905 | |
| | Jiangsu Linyang Energy Co. Ltd., A | | | Electrical Equipment | | | | 200 | | | | 133 | |
| | Jiangsu Yanghe Brewery JST Co. Ltd., A | | | Beverages | | | | 200 | | | | 2,913 | |
| | Jiangsu Yuyue Medical Equipment & Supply Co. Ltd. | | | Health Care Equipment & Supplies | | | | 200 | | | | 605 | |
| | Jiangsu Zhangjiagang Rural Commercial Bank Co. Ltd. | | | Banks | | | | 200 | | | | 150 | |
| | Jiangsu Zhongnan Construction Group Co. Ltd. | | | Real Estate Management & Development | | | | 400 | | | | 435 | |
| | Jiangsu Zhongtian Technology Co. Ltd., A | | | Electrical Equipment | | | | 400 | | | | 484 | |
| | Jiangsu Zijin Rural Commercial Bank Co. Ltd., A | | | Banks | | | | 200 | | | | 174 | |
| | Jiangxi Bank Co. Ltd., H | | | Banks | | | | 3,000 | | | | 1,776 | |
| | Jiangxi Copper Co. Ltd., A | | | Metals & Mining | | | | 400 | | | | 805 | |
| | Jiangxi Copper Co. Ltd., H | | | Metals & Mining | | | | 4,000 | | | | 4,633 | |
| a | | Jiangxi Special Electric Motor Co. Ltd. | | | Electrical Equipment | | | | 200 | | | | 112 | |
| | Jiangxi Zhengbang Technology Co. Ltd., A | | | Food Products | | | | 400 | | | | 846 | |
| | Jiayuan International Group Ltd. | | | Real Estate Management & Development | | | | 4,000 | | | | 1,669 | |
| | Jilin Aodong Pharmaceutical Group Co. Ltd. | | | Pharmaceuticals | | | | 400 | | | | 863 | |
| | Jinduicheng Molybdenum Co. Ltd., A | | | Metals & Mining | | | | 600 | | | | 634 | |
| | Jinke Properties Group Co. Ltd. | | | Real Estate Management & Development | | | | 800 | | | | 735 | |
| | | | |
| | | |
| 128 | | Semiannual Report | | franklintempleton.com |
FRANKLIN TEMPLETON ETF TRUST
STATEMENT OF INVESTMENTS (UNAUDITED)
Franklin FTSE Asia ex Japan ETF(continued)
| | | | | | | | | | | | | | |
| | | | |
| | | | | Industry | | | Shares | | | Value | |
| | | Common Stocks and Other Equity Interests (continued) | | | | | | | |
| | | China (continued) | | | | | | | | | |
| | JinyuBio-Technology Co. Ltd., A | | | Biotechnology | | | | 200 | | | $ | 528 | |
| | Jiuzhitang Co. Ltd. | | | Pharmaceuticals | | | | 200 | | | | 230 | |
| | Jizhong Energy Resources Co. Ltd. | | | Oil, Gas & Consumable Fuels | | | | 1,000 | | | | 490 | |
| | JoInc. Aare Pharmaceutical Group Industry Co. Ltd., A | | | Pharmaceuticals | | | | 400 | | | | 550 | |
| | Jointo Energy Investment Co. Ltd. | | | Independent Power and Renewable Electricity Producers | | | | 200 | | | | 151 | |
| | Jointown Pharmaceutical Group Co. Ltd., A | | | Health Care Providers & Services | | | | 200 | | | | 400 | |
| | JonjeeHi-Tech Industrial And Commercial Holding Co. Ltd., A | | | Food Products | | | | 200 | | | | 1,188 | |
| | Joyoung Co. Ltd. | | | Household Durables | | | | 200 | | | | 613 | |
| | Kerry Logistics Network Ltd. | | | Air Freight & Logistics | | | | 2,000 | | | | 3,199 | |
| | Kingboard Holdings Ltd. | | | Electronic Equipment, Instruments & Components | | | | 3,000 | | | | 7,941 | |
| | Kingdee International Software Group Co. Ltd. | | | Software | | | | 8,000 | | | | 8,429 | |
| a | | Kingsoft Corp. Ltd. | | | Software | | | | 2,000 | | | | 4,245 | |
| a | | Kuang-Chi Technologies Co. Ltd. | | | Auto Components | | | | 200 | | | | 251 | |
| | Kunlun Energy Co. Ltd. | | | Gas Utilities | | | | 12,000 | | | | 10,332 | |
| | Kweichow Moutai Co. Ltd., A | | | Beverages | | | | 200 | | | | 32,207 | |
| | KWG Group Holdings Ltd. | | | Real Estate Management & Development | | | | 4,000 | | | | 3,505 | |
| | Lao Feng Xiang Co. Ltd., B | | | Textiles, Apparel & Luxury Goods | | | | 1,000 | | | | 3,378 | |
| | Legend Holdings Corp., H | | | Technology Hardware, Storage & Peripherals | | | | 1,800 | | | | 3,890 | |
| a,e | | Legend Holdings Corp., rts., 2/20/49 | | | Technology Hardware, Storage & Peripherals | | | | 123 | | | | — | |
| | Lenovo Group Ltd. | | | Technology Hardware, Storage & Peripherals | | | | 24,000 | | | | 16,011 | |
| | Lens Technology Co. Ltd. | | | Electronic Equipment, Instruments & Components | | | | 200 | | | | 288 | |
| a | | Leo Group Co. Ltd. | | | Media | | | | 1,200 | | | | 281 | |
| | Lepu Medical Technology Beijing Co. Ltd. | | | Health Care Equipment & Supplies | | | | 200 | | | | 702 | |
| | Leyard Optoelectronic Co. Ltd. | | | Electronic Equipment, Instruments & Components | | | | 200 | | | | 195 | |
| | Li Ning Co. Ltd. | | | Textiles, Apparel & Luxury Goods | | | | 6,000 | | | | 17,221 | |
| a | | Liaoning Cheng Da Co. Ltd., A | | | Distributors | | | | 200 | | | | 371 | |
| | Liuzhou Iron & Steel Co. Ltd., A | | | Metals & Mining | | | | 200 | | | | 143 | |
| | Livzon Pharmaceutical Group Inc. | | | Pharmaceuticals | | | | 260 | | | | 966 | |
| | Livzon Pharmaceutical Group Inc., H | | | Pharmaceuticals | | | | 380 | | | | 974 | |
| | Logan Property Holdings Co. Ltd. | | | Real Estate Management & Development | | | | 4,000 | | | | 5,694 | |
| | Lomon Billions Group Co. Ltd. | | | Chemicals | | | | 200 | | | | 355 | |
| | Loncin Motor Co. Ltd., A | | | Automobiles | | | | 400 | | | | 197 | |
| b,c | | Longfor Group Holdings Ltd., 144A, Reg S | | | Real Estate Management & Development | | | | 6,000 | | | | 22,425 | |
| | LONGi Green Energy Technology Co. Ltd., A | | | Semiconductors & Semiconductor Equipment | | | | 600 | | | | 2,204 | |
| | Luolai Lifestyle Technology Co. Ltd. | | | Textiles, Apparel & Luxury Goods | | | | 200 | | | | 253 | |
| | Luxi Chemical Group Co. Ltd. | | | Chemicals | | | | 400 | | | | 552 | |
| | Luxshare Precision Industry Co. Ltd. | | | Electronic Equipment, Instruments & Components | | | | 720 | | | | 2,698 | |
| | Luye Pharma Group Ltd. | | | Pharmaceuticals | | | | 6,000 | | | | 4,278 | |
| | Luzhou Laojiao Co. Ltd. | | | Beverages | | | | 200 | | | | 2,387 | |
| | Maanshan Iron & Steel Co. Ltd., A | | | Metals & Mining | | | | 800 | | | | 301 | |
| | Maanshan Iron & Steel Co. Ltd., H | | | Metals & Mining | | | | 8,000 | | | | 3,010 | |
| a | | Mango Excellent Media Co. Ltd. | | | Entertainment | | | | 200 | | | | 1,282 | |
| | Meinian Onehealth Healthcare Holdings Co. Ltd. | | | Health Care Providers & Services | | | | 520 | | | | 885 | |
| a,b,c | | Meitu Inc., 144A, Reg S | | | Technology Hardware, Storage & Peripherals | | | | 7,000 | | | | 1,607 | |
| a,b | | Meituan Dianping, B, Reg S | | | Internet & Direct Marketing Retail | | | | 11,800 | | | | 120,568 | |
| | Metallurgical Corp. Of China Ltd. | | | Construction & Engineering | | | | 10,000 | | | | 2,245 | |
| | Metallurgical Corp. of China Ltd., A | | | Construction & Engineering | | | | 2,000 | | | | 781 | |
| | MGM China Holdings Ltd. | | | Hotels, Restaurants & Leisure | | | | 2,400 | | | | 3,741 | |
| | Minth Group Ltd. | | | Auto Components | | | | 2,000 | | | | 6,773 | |
| a | | MMG Ltd. | | | Metals & Mining | | | | 8,000 | | | | 1,888 | |
| | | | | | |
| | | |
| franklintempleton.com | | Semiannual Report | | | 129 | |
FRANKLIN TEMPLETON ETF TRUST
STATEMENT OF INVESTMENTS (UNAUDITED)
Franklin FTSE Asia ex Japan ETF(continued)
| | | | | | | | | | | | | | |
| | | | |
| | | | | Industry | | | Shares | | | Value | |
| | | Common Stocks and Other Equity Interests (continued) | | | | | | | |
| | | China (continued) | | | | | | | | | |
| | Momo Inc., ADR | | | Interactive Media & Services | | | | 356 | | | $ | 11,029 | |
| a | | Montnets Rongxin Technology Group Co. Ltd. | | | Software | | | | 200 | | | | 471 | |
| | Muyuan Foodstuff Co. Ltd. | | | Food Products | | | | 200 | | | | 1,974 | |
| | MYS Group Co. Ltd. | | | Containers & Packaging | | | | 200 | | | | 133 | |
| a | | NanJiE-Commerce Co. Ltd. | | | Textiles, Apparel & Luxury Goods | | | | 400 | | | | 578 | |
| | Nanjing Iron & Steel Co. Ltd., A | | | Metals & Mining | | | | 600 | | | | 258 | |
| | Nanjing Securities Co. Ltd., A | | | Capital Markets | | | | 200 | | | | 234 | |
| | Nari Technology Development Co. Ltd., A | | | Electrical Equipment | | | | 600 | | | | 1,718 | |
| | NavInfo Co. Ltd. | | | Household Durables | | | | 200 | | | | 456 | |
| | NetEase Inc., ADR | | | Entertainment | | | | 248 | | | | 66,013 | |
| | New China Life Insurance Co. Ltd., A | | | Insurance | | | | 200 | | | | 1,363 | |
| | New China Life Insurance Co. Ltd., H | | | Insurance | | | | 3,000 | | | | 11,863 | |
| | New Hope Liuhe Co. Ltd. | | | Food Products | | | | 600 | | | | 1,443 | |
| a | | New Oriental Education & Technology Group Inc., ADR | | | Diversified Consumer Services | | | | 474 | | | | 52,500 | |
| | Newland Digital Technology Co. Ltd. | | | Software | | | | 200 | | | | 459 | |
| | Nexteer Automotive Group Ltd. | | | Auto Components | | | | 2,000 | | | | 1,651 | |
| | Nine Dragons Paper Holdings Ltd. | | | Paper & Forest Products | | | | 6,000 | | | | 5,051 | |
| a | | Ningbo Joyson Electronic Corp. | | | Auto Components | | | | 200 | | | | 486 | |
| | Ningbo Sanxing Medical Electric Co. Ltd., A | | | Electrical Equipment | | | | 200 | | | | 199 | |
| | Ningbo Shanshan Co. Ltd., A | | | Chemicals | | | | 200 | | | | 300 | |
| | Ningbo Zhoushan Port Co. Ltd., A | | | Transportation Infrastructure | | | | 600 | | | | 313 | |
| a,d | | NIO Inc., ADR | | | Automobiles | | | | 576 | | | | 899 | |
| | North Huajin Chemical Industries Co. Ltd. | | | Chemicals | | | | 800 | | | | 643 | |
| | Northeast Securities Co. Ltd. | | | Capital Markets | | | | 400 | | | | 455 | |
| | NSFOCUS Information Technology Co. Ltd. | | | Software | | | | 200 | | | | 471 | |
| | Oceanwide Holdings Co. Ltd. | | | Real Estate Management & Development | | | | 400 | | | | 242 | |
| | Offshore Oil Engineering Co. Ltd., A | | | Energy Equipment & Services | | | | 1,000 | | | | 755 | |
| a | | OFILM Group Co. Ltd. | | | Electronic Equipment, Instruments & Components | | | | 400 | | | | 667 | |
| a | | ORG Technology Co. Ltd. | | | Containers & Packaging | | | | 400 | | | | 264 | |
| | Orient Securities Co. Ltd. of China, H | | | Capital Markets | | | | 3,200 | | | | 1,902 | |
| | Oriental Pearl Group Co. Ltd., A | | | Media | | | | 400 | | | | 513 | |
| a | | Ourpalm Co. Ltd. | | | Entertainment | | | | 800 | | | | 531 | |
| a | | Pangang Group Vanadium Titanium & Resources Co. Ltd., A | | | Metals & Mining | | | | 1,400 | | | | 586 | |
| | People’s Insurance Co. Group of China Ltd., H | | | Insurance | | | | 28,000 | | | | 11,215 | |
| | PetroChina Co. Ltd., H | | | Oil, Gas & Consumable Fuels | | | | 72,000 | | | | 37,013 | |
| | PICC Property and Casualty Co. Ltd., H | | | Insurance | | | | 24,000 | | | | 28,012 | |
| a | | Pinduoduo Inc., ADR | | | Internet & Direct Marketing Retail | | | | 368 | | | | 11,857 | |
| | Ping An Bank Co. Ltd., A | | | Banks | | | | 2,400 | | | | 5,239 | |
| a,b | | Ping An Healthcare and Technology Co. Ltd., Reg S | | | Health Care Technology | | | | 600 | | | | 3,509 | |
| | Ping An Insurance (Group) Co. of China Ltd., H | | | Insurance | | | | 19,000 | | | | 218,250 | |
| | Ping An Insurance Group Co. of China Ltd., A | | | Insurance | | | | 1,600 | | | | 19,501 | |
| a | | Pingdingshan Tianan Coal Mining Co. Ltd., A | | | Oil, Gas & Consumable Fuels | | | | 600 | | | | 318 | |
| | Poly Developments and Holdings Group Co. Ltd., A | | | Real Estate Management & Development | | | | 1,800 | | | | 3,604 | |
| | Poly Property Group Co. Ltd. | | | Real Estate Management & Development | | | | 8,000 | | | | 2,786 | |
| | Postal Savings Bank of China Co. Ltd., H | | | Banks | | | | 32,000 | | | | 19,512 | |
| | Power Construction Corp. of China Ltd. | | | Construction & Engineering | | | | 800 | | | | 519 | |
| | Qingdao Port International Co. Ltd., A | | | Transportation Infrastructure | | | | 200 | | | | 208 | |
| b | | Qingdao Port International Co. Ltd., H, Reg S | | | Transportation Infrastructure | | | | 4,000 | | | | 2,449 | |
| | Qingdao TGOOD Electric Co. Ltd. | | | Electrical Equipment | | | | 200 | | | | 452 | |
| | Rainbow Department Store Co. Ltd. | | | Multiline Retail | | | | 200 | | | | 336 | |
| | Realcan Pharmaceutical Group Co. Ltd. | | | Health Care Providers & Services | | | | 200 | | | | 225 | |
| | Red Star Macalline Group Corp. Ltd. | | | Real Estate Management & Development | | | | 2,000 | | | | 1,671 | |
| | Red Star Macalline Group Corp. Ltd., A | | | Real Estate Management & Development | | | | 200 | | | | 318 | |
| | RiseSun Real Estate Development Co. Ltd. | | | Real Estate Management & Development | | | | 600 | | | | 696 | |
| | | | |
| | | |
| 130 | | Semiannual Report | | franklintempleton.com |
FRANKLIN TEMPLETON ETF TRUST
STATEMENT OF INVESTMENTS (UNAUDITED)
Franklin FTSE Asia ex Japan ETF(continued)
| | | | | | | | | | | | | | |
| | | | |
| | | | | Industry | | | Shares | | | Value | |
| | | Common Stocks and Other Equity Interests (continued) | | | | | | | |
| | | China (continued) | | | | | | | | | |
| | Rongsheng Petro Chemical Co. Ltd. | | | Chemicals | | | | 200 | | | $ | 307 | |
| | SAIC Motor Corp. Ltd. | | | Automobiles | | | | 1,400 | | | | 4,662 | |
| | Sanan Optoelectronics Co. Ltd., A | | | Semiconductors & Semiconductor Equipment | | | | 600 | | | | 1,183 | |
| | Sands China Ltd. | | | Hotels, Restaurants & Leisure | | | | 8,000 | | | | 36,227 | |
| | Sansteel Minguang Co. Ltd. | | | Metals & Mining | | | | 400 | | | | 450 | |
| | Sany Heavy Industry Co. Ltd., A | | | Machinery | | | | 1,200 | | | | 2,400 | |
| | SDIC Capital Co. Ltd., A | | | Capital Markets | | | | 400 | | | | 698 | |
| | SDIC Power Holdings Co. Ltd., A | | | Independent Power and Renewable Electricity Producers | | | | 1,000 | | | | 1,262 | |
| | Sealand Securities Co. Ltd. | | | Capital Markets | | | | 600 | | | | 415 | |
| | Seazen Holdings Co. Ltd., A | | | Real Estate Management & Development | | | | 400 | | | | 1,590 | |
| a | | Semiconductor Manufacturing International Corp. | | | Semiconductors & Semiconductor Equipment | | | | 11,000 | | | | 13,751 | |
| | SF Holding Co. Ltd. | | | Air Freight & Logistics | | | | 400 | | | | 2,208 | |
| | Shaan Xi ProvIncial Natural Gas Co. Ltd. | | | Gas Utilities | | | | 400 | | | | 401 | |
| | Shaanxi Aerospace PowerHi-Tech Co. Ltd., A | | | Machinery | | | | 200 | | | | 265 | |
| | Shaanxi Coal Industry Co. Ltd. | | | Oil, Gas & Consumable Fuels | | | | 1,000 | | | | 1,222 | |
| | Shaanxi International Trust Co. Ltd. | | | Capital Markets | | | | 400 | | | | 230 | |
| | Shandong Chenming Paper Holdings Ltd. | | | Paper & Forest Products | | | | 1,000 | | | | 664 | |
| | Shandong Chenming Paper Holdings Ltd., B | | | Paper & Forest Products | | | | 2,800 | | | | 1,136 | |
| | Shandong Chenming Paper Holdings Ltd., H | | | Paper & Forest Products | | | | 1,000 | | | | 401 | |
| b,c | | Shandong Gold Mining Co. Ltd., 144A, Reg S | | | Metals & Mining | | | | 1,000 | | | | 2,477 | |
| | Shandong Gold Mining Co. Ltd., A | | | Metals & Mining | | | | 400 | | | | 1,898 | |
| | ShandongHi-speed Co. Ltd., A | | | Transportation Infrastructure | | | | 600 | | | | 367 | |
| | Shandong Hualu Hengsheng Chemical Co. Ltd., A | | | Chemicals | | | | 200 | | | | 460 | |
| a | | Shandong Humon Smelting Co. Ltd. | | | Metals & Mining | | | | 200 | | | | 368 | |
| | Shandong Linglong Tyre Co. Ltd., A | | | Auto Components | | | | 200 | | | | 571 | |
| | Shandong Nanshan Aluminum Co. Ltd., A | | | Metals & Mining | | | | 2,800 | | | | 831 | |
| | Shandong Publishing & Media Co. Ltd., A | | | Media | | | | 400 | | | | 401 | |
| | Shandong Sun Paper Industry JSC Ltd. | | | Paper & Forest Products | | | | 400 | | | | 444 | |
| | Shandong Weigao Group Medical Polymer Co. Ltd., H | | | Health Care Equipment & Supplies | | | | 8,000 | | | | 8,235 | |
| a | | Shandong XInc. Ahao Energy Corp. Ltd., A | | | Oil, Gas & Consumable Fuels | | | | 400 | | | | 113 | |
| | Shanghai 2345 Network Holding Group Co. Ltd. | | | Software | | | | 600 | | | | 278 | |
| | Shanghai AJ Group Co. Ltd., A | | | Diversified Financial Services | | | | 200 | | | | 243 | |
| | Shanghai Bailian Group Co. Ltd., B | | | Food & Staples Retailing | | | | 1,000 | | | | 925 | |
| | Shanghai Baosight Software Co. Ltd., B | | | Software | | | | 1,100 | | | | 2,132 | |
| | Shanghai Chlor-Alkali Chemical Co. Ltd., B | | | Chemicals | | | | 1,800 | | | | 1,107 | |
| | Shanghai Construction Group Co. Ltd., A | | | Construction & Engineering | | | | 1,400 | | | | 665 | |
| | Shanghai Dazhong Public Utilities Group Co. Ltd., A | | | Gas Utilities | | | | 400 | | | | 273 | |
| | Shanghai Electric Group Co. Ltd., A | | | Electrical Equipment | | | | 1,000 | | | | 703 | |
| | Shanghai Electric Group Co. Ltd., H | | | Electrical Equipment | | | | 8,000 | | | | 2,582 | |
| | Shanghai Electric Power Co. Ltd., A | | | Independent Power and Renewable Electricity Producers | | | | 200 | | | | 221 | |
| | Shanghai Environment Group Co. Ltd., A | | | Commercial Services & Supplies | | | | 200 | | | | 311 | |
| | Shanghai Fosun Pharmaceutical Group Co. Ltd., A | | | Pharmaceuticals | | | | 400 | | | | 1,415 | |
| | Shanghai Fosun Pharmaceutical Group Co. Ltd., H | | | Pharmaceuticals | | | | 2,000 | | | | 5,370 | |
| | Shanghai Haixin Group Co., B | | | Pharmaceuticals | | | | 2,200 | | | | 904 | |
| | | | | | |
| | | |
| franklintempleton.com | | Semiannual Report | | | 131 | |
FRANKLIN TEMPLETON ETF TRUST
STATEMENT OF INVESTMENTS (UNAUDITED)
Franklin FTSE Asia ex Japan ETF(continued)
| | | | | | | | | | | | | | |
| | | | |
| | | | | Industry | | | Shares | | | Value | |
| | | Common Stocks and Other Equity Interests (continued) | | | | | | | |
| | | China (continued) | | | | | | | | | |
| | Shanghai Huayi Group Co. Ltd., B | | | Chemicals | | | | 1,200 | | | $ | 828 | |
| | Shanghai Industrial Development Co. Ltd., A | | | Real Estate Management & Development | | | | 200 | | | | 167 | |
| | Shanghai Industrial Holdings Ltd. | | | Industrial Conglomerates | | | | 2,000 | | | | 3,725 | |
| | Shanghai Industrial Urban Development Group Ltd. | | | Real Estate Management & Development | | | | 2,000 | | | | 253 | |
| | Shanghai International Airport Co. Ltd., A | | | Transportation Infrastructure | | | | 200 | | | | 2,234 | |
| | Shanghai International Port Group Co. Ltd., A | | | Transportation Infrastructure | | | | 1,400 | | | | 1,116 | |
| | Shanghai Jahwa United Co. Ltd., A | | | Personal Products | | | | 200 | | | | 962 | |
| | Shanghai Jinjiang International Hotels Co. Ltd. | | | Hotels, Restaurants & Leisure | | | | 600 | | | | 1,145 | |
| | Shanghai Jinjiang International Industrial Investment Co. Ltd. | | | Road & Rail | | | | 1,000 | | | | 948 | |
| | Shanghai Jinqiao Export Processing Zone Development, B | | | Real Estate Management & Development | | | | 1,400 | | | | 1,490 | |
| | Shanghai Lujiazui Finance & Trade Zone Develop Co. Ltd., B | | | Real Estate Management & Development | | | | 4,280 | | | | 4,802 | |
| | Shanghai Mechanical and Electrical Industry Co. Ltd., A | | | Machinery | | | | 200 | | | | 466 | |
| | Shanghai Mechanical and Electrical Industry Co. Ltd., B | | | Machinery | | | | 1,000 | | | | 1,674 | |
| | Shanghai Pharmaceuticals Holding Co. Ltd., A | | | Health Care Providers & Services | | | | 400 | | | | 1,019 | |
| | Shanghai Pharmaceuticals Holding Co. Ltd., H | | | Health Care Providers & Services | | | | 3,000 | | | | 5,434 | |
| | Shanghai Pudong Development Bank Co. Ltd., A | | | Banks | | | | 4,000 | | | | 6,632 | |
| | Shanghai ShibeiHi-Tech Co. Ltd., B | | | Real Estate Management & Development | | | | 1,800 | | | | 704 | |
| | Shanghai Shimao Co. Ltd., A | | | Real Estate Management & Development | | | | 800 | | | | 473 | |
| | Shanghai Tunnel Engineering Co. Ltd., A | | | Construction & Engineering | | | | 800 | | | | 660 | |
| | Shanghai Waigaoqiao Free Trade Zone Group Co. Ltd. | | | Trading Companies & Distributors | | | | 800 | | | | 1,113 | |
| | Shanghai Yuyuan Tourist Mart Group Co. Ltd., A | | | Specialty Retail | | | | 600 | | | | 685 | |
| | Shanghai Zhangjiang High-Tech Park Development Co. Ltd., A | | | Real Estate Management & Development | | | | 200 | | | | 434 | |
| | Shanghai Zhenhua Port Machinery Co. Ltd., B | | | Machinery | | | | 4,080 | | | | 1,395 | |
| | Shanxi LanhuaSci-Tech Venture Co. Ltd., A | | | Oil, Gas & Consumable Fuels | | | | 600 | | | | 547 | |
| | Shanxi Lu’an Environmental Energy Development Co. Ltd., A | | | Oil, Gas & Consumable Fuels | | | | 400 | | | | 406 | |
| | Shanxi Securities Co. Ltd. | | | Capital Markets | | | | 400 | | | | 440 | |
| | Shanxi Xinghuacun Fen Wine Factory Co. Ltd., A | | | Beverages | | | | 200 | | | | 2,165 | |
| | Shanxi Xishan Coal & Electricity Power Co. Ltd. | | | Oil, Gas & Consumable Fuels | | | | 600 | | | | 494 | |
| a | | Shanxi Zhangze Electric Power Co. Ltd. | | | Independent Power and Renewable Electricity Producers | | | | 800 | | | | 282 | |
| a | | Shanying International Holding Co. Ltd., A | | | Paper & Forest Products | | | | 600 | | | | 259 | |
| | Shenergy Co. Ltd., A | | | Independent Power and Renewable Electricity Producers | | | | 1,000 | | | | 777 | |
| | Shenghe Resources Holding Co. Ltd., A | | | Metals & Mining | | | | 200 | | | | 255 | |
| | Shengyi Technology Co. Ltd., A | | | Electronic Equipment, Instruments & Components | | | | 400 | | | | 1,397 | |
| | Shenwan Hongyuan Group Co. Ltd. | | | Capital Markets | | | | 2,800 | | | | 1,874 | |
| | Shenzhen Accord Pharmaceutical Co. Ltd., B | | | Health Care Providers & Services | | | | 200 | | | | 733 | |
| | Shenzhen Agricultural Products Group Co. Ltd. | | | Food & Staples Retailing | | | | 200 | | | | 146 | |
| | | | |
| | | |
| 132 | | Semiannual Report | | franklintempleton.com |
FRANKLIN TEMPLETON ETF TRUST
STATEMENT OF INVESTMENTS (UNAUDITED)
Franklin FTSE Asia ex Japan ETF(continued)
| | | | | | | | | | | | | | |
| | | | |
| | | | | Industry | | | Shares | | | Value | |
| | | Common Stocks and Other Equity Interests (continued) | | | | | | | |
| | | China (continued) | | | | | | | | | |
| | Shenzhen Airport Co. Ltd. | | | Transportation Infrastructure | | | | 400 | | | $ | 617 | |
| | Shenzhen Aisidi Co. Ltd. | | | Electronic Equipment, Instruments & Components | | | | 200 | | | | 151 | |
| | Shenzhen Energy Group Co. Ltd. | | | Independent Power and Renewable Electricity Producers | | | | 400 | | | | 324 | |
| | Shenzhen Everwin Precision Technology Co. Ltd. | | | Electronic Equipment, Instruments & Components | | | | 200 | | | | 397 | |
| | Shenzhen Expressway Co. Ltd., H | | | Transportation Infrastructure | | | | 4,000 | | | | 5,215 | |
| | Shenzhen Gas Corporation Ltd., A | | | Gas Utilities | | | | 600 | | | | 541 | |
| | Shenzhen Grandland Group Co. Ltd. | | | Construction & Engineering | | | | 400 | | | | 260 | |
| | Shenzhen Huaqiang Industry Co. Ltd. | | | Real Estate Management & Development | | | | 200 | | | | 405 | |
| | Shenzhen Inovance Technology Co. Ltd. | | | Machinery | | | | 200 | | | | 681 | |
| | Shenzhen International Holdings Ltd. | | | Transportation Infrastructure | | | | 3,000 | | | | 5,763 | |
| | Shenzhen Investment Ltd. | | | Real Estate Management & Development | | | | 12,000 | | | | 4,424 | |
| | Shenzhen Jinjia Group Co. Ltd. | | | Containers & Packaging | | | | 200 | | | | 269 | |
| | Shenzhen Kaifa Technology Co. Ltd. | | | Technology Hardware, Storage & Peripherals | | | | 200 | | | | 312 | |
| a | | Shenzhen KingdomSci-Tech Co. Ltd., A | | | Software | | | | 200 | | | | 585 | |
| a | | Shenzhen MTC Co. Ltd. | | | Household Durables | | | | 400 | | | | 156 | |
| a | | Shenzhen Noposion Agrochemicals Co. Ltd. | | | Chemicals | | | | 200 | | | | 168 | |
| | Shenzhen Overseas Chinese Town Co. Ltd. | | | Hotels, Restaurants & Leisure | | | | 1,400 | | | | 1,378 | |
| | Shenzhen Salubris Pharmaceuticals Co. Ltd. | | | Pharmaceuticals | | | | 200 | | | | 524 | |
| a | | Shenzhen Sunway Communication Co. Ltd. | | | Communications Equipment | | | | 200 | | | | 1,003 | |
| | Shenzhen Yan Tian Port Holding Co. Ltd. | | | Transportation Infrastructure | | | | 200 | | | | 164 | |
| | Shenzhen Zhongjin Lingnan Nonfemet Co. Ltd. | | | Metals & Mining | | | | 600 | | | | 339 | |
| | Shenzhou International Group Holdings Ltd. | | | Textiles, Apparel & Luxury Goods | | | | 2,400 | | | | 31,349 | |
| a | | Shijiazhuang Changshan BeiMing Technology Co. Ltd. | | | Textiles, Apparel & Luxury Goods | | | | 200 | | | | 150 | |
| | Shijiazhuang Yiling Pharmaceutical Co. Ltd. | | | Pharmaceuticals | | | | 200 | | | | 302 | |
| | Shimao Property Holdings Ltd. | | | Real Estate Management & Development | | | | 4,000 | | | | 11,685 | |
| | Shougang Fushan Resources Group Ltd. | | | Metals & Mining | | | | 12,000 | | | | 2,480 | |
| | Shui On Land Ltd. | | | Real Estate Management & Development | | | | 13,000 | | | | 2,587 | |
| a | | Siasun Robot & Automation Co. Ltd. | | | Machinery | | | | 200 | | | | 404 | |
| | Sichuan Chuantou Energy Co. Ltd., A | | | Independent Power and Renewable Electricity Producers | | | | 800 | | | | 1,118 | |
| | Sichuan Expressway Co. Ltd., H | | | Transportation Infrastructure | | | | 8,000 | | | | 2,378 | |
| a | | Sichuan Hebang Biotechnology Co. Ltd., A | | | Chemicals | | | | 1,200 | | | | 260 | |
| | Sichuan Kelun Pharmaceutical Co. Ltd. | | | Pharmaceuticals | | | | 200 | | | | 724 | |
| | Sichuan Languang Development Co. Ltd., A | | | Real Estate Management & Development | | | | 200 | | | | 168 | |
| | Sichuan Road & Bridge Co. Ltd., A | | | Construction & Engineering | | | | 1,000 | | | | 452 | |
| | Sieyuan Electric Co. Ltd. | | | Electrical Equipment | | | | 200 | | | | 310 | |
| | Sihuan Pharmaceutical Holdings Group Ltd. | | | Pharmaceuticals | | | | 14,000 | | | | 2,125 | |
| a | | SINA Corp. | | | Interactive Media & Services | | | | 214 | | | | 8,387 | |
| | Sino-Ocean Land Holdings Ltd. | | | Real Estate Management & Development | | | | 10,000 | | | | 3,393 | |
| | Sinochem International Corp., A | | | Trading Companies & Distributors | | | | 600 | | | | 416 | |
| | Sinolink Securities Co. Ltd., A | | | Capital Markets | | | | 400 | | | | 488 | |
| | Sinoma International Engineering Co. | | | Construction & Engineering | | | | 600 | | | | 492 | |
| | Sinoma Science & Technology Co. Ltd. | | | Chemicals | | | | 200 | | | | 292 | |
| | Sinopec Engineering Group Co. Ltd. | | | Construction & Engineering | | | | 5,000 | | | | 3,138 | |
| a | | Sinopec Oilfield Service Corp. | | | Energy Equipment & Services | | | | 8,000 | | | | 837 | |
| a | | Sinopec Oilfield Service Corp., A | | | Energy Equipment & Services | | | | 600 | | | | 188 | |
| | | | | | |
| | | |
| franklintempleton.com | | Semiannual Report | | | 133 | |
FRANKLIN TEMPLETON ETF TRUST
STATEMENT OF INVESTMENTS (UNAUDITED)
Franklin FTSE Asia ex Japan ETF(continued)
| | | | | | | | | | | | | | |
| | | | |
| | | | | Industry | | | Shares | | | Value | |
| | | Common Stocks and Other Equity Interests (continued) | | | | | | | |
| | | China (continued) | | | | | | | | | |
| | Sinopec Shanghai Petrochemical Co. Ltd., A | | | Chemicals | | | | 600 | | | $ | 350 | |
| | Sinopec Shanghai Petrochemical Co. Ltd., H | | | Chemicals | | | | 12,000 | | | | 3,490 | |
| | Sinopharm Group Co. Ltd., H | | | Health Care Providers & Services | | | | 4,000 | | | | 12,526 | |
| | Sinotrans Ltd., A | | | Air Freight & Logistics | | | | 800 | | | | 476 | |
| | Sinotrans Ltd., H | | | Air Freight & Logistics | | | | 6,000 | | | | 1,883 | |
| | Sinotruk Hong Kong Ltd. | | | Machinery | | | | 2,000 | | | | 2,965 | |
| | Soho China Ltd. | | | Real Estate Management & Development | | | | 7,000 | | | | 2,000 | |
| | Songcheng Performance Development Co. Ltd. | | | Hotels, Restaurants & Leisure | | | | 200 | | | | 783 | |
| | SooChow Securities Co. Ltd., A | | | Capital Markets | | | | 400 | | | | 518 | |
| | Southwest Securities Co. Ltd., A | | | Capital Markets | | | | 800 | | | | 505 | |
| | STO Express Co. Ltd. | | | Air Freight & Logistics | | | | 200 | | | | 644 | |
| | Sunac China Holdings Ltd. | | | Real Estate Management & Development | | | | 8,000 | | | | 32,145 | |
| | Sungrow Power Supply Co. Ltd. | | | Electrical Equipment | | | | 200 | | | | 316 | |
| | Suning Universal Co. Ltd. | | | Real Estate Management & Development | | | | 1,000 | | | | 517 | |
| | Suning.com Co. Ltd. | | | Specialty Retail | | | | 1,200 | | | | 1,741 | |
| | Sunny Optical Technology Group Co. Ltd. | | | Electronic Equipment, Instruments & Components | | | | 2,200 | | | | 32,329 | |
| | Sunwoda Electronic Co. Ltd. | | | Electrical Equipment | | | | 200 | | | | 424 | |
| | Suofeiya Home Collection Co. Ltd. | | | Household Durables | | | | 200 | | | | 479 | |
| | Suzhou Gold Mantis Construction Decoration Co. Ltd. | | | Construction & Engineering | | | | 400 | | | | 508 | |
| | Tahoe Group Co. Ltd. | | | Real Estate Management & Development | | | | 200 | | | | 168 | |
| a | | TAL Education Group, ADR | | | Diversified Consumer Services | | | | 1,180 | | | | 40,403 | |
| | Tangshan Jidong Cement Co. Ltd. | | | Construction Materials | | | | 200 | | | | 429 | |
| | TangShan Port Group Co. Ltd., A | | | Transportation Infrastructure | | | | 800 | | | | 276 | |
| | Tangshan Sanyou Chemical Industries Co. Ltd., A | | | Chemicals | | | | 400 | | | | 289 | |
| | Tasly Pharmaceutical Group Co. Ltd., A | | | Pharmaceuticals | | | | 200 | | | | 436 | |
| | TBEA Co. Ltd., A | | | Electrical Equipment | | | | 1,000 | | | | 910 | |
| | TCL Corp. | | | Household Durables | | | | 2,000 | | | | 997 | |
| | Tencent Holdings Ltd. | | | Interactive Media & Services | | | | 19,800 | | | | 833,987 | |
| a | | Tencent Music Entertainment Group, ADR | | | Entertainment | | | | 384 | | | | 4,904 | |
| a | | The China Pacific Securities Co. Ltd., A | | | Capital Markets | | | | 1,000 | | | | 479 | |
| | Tian Di Science & Technology Co. Ltd., A | | | Machinery | | | | 800 | | | | 367 | |
| | Tianfeng Securities Co. Ltd., A | | | Capital Markets | | | | 800 | | | | 962 | |
| | Tianjin Capital Environmental Protection Group Co. Ltd., A | | | Commercial Services & Supplies | | | | 200 | | | | 196 | |
| | Tianjin Chase Sun Pharmaceutical Co. Ltd. | | | Pharmaceuticals | | | | 1,000 | | | | 468 | |
| | Tianjin Port Co. Ltd., A | | | Transportation Infrastructure | | | | 1,200 | | | | 1,035 | |
| | Tianjin Zhonghuan Semiconductor Co. Ltd. | | | Semiconductors & Semiconductor Equipment | | | | 400 | | | | 678 | |
| | Tianma Microelectronics Co. Ltd. | | | Electronic Equipment, Instruments & Components | | | | 200 | | | | 387 | |
| | Tianqi Lithium Corp. | | | Chemicals | | | | 200 | | | | 762 | |
| | Times China Holdings Ltd. | | | Real Estate Management & Development | | | | 2,000 | | | | 3,112 | |
| | Tingyi Cayman Islands Holding Corp. | | | Food Products | | | | 8,000 | | | | 11,266 | |
| a,b | | Tongcheng-Elong Holdings Ltd., Reg S | | | Internet & Direct Marketing Retail | | | | 2,400 | | | | 3,686 | |
| | Tongding Interconnection Information Co. Ltd. | | | Communications Equipment | | | | 200 | | | | 215 | |
| | Tonghua Dongbao Pharmaceutical Co. Ltd. | | | Pharmaceuticals | | | | 400 | | | | 980 | |
| | Tongkun Group Co. Ltd., A | | | Chemicals | | | | 200 | | | | 356 | |
| | Tongling Nonferrous Metals Group Co. Ltd. | | | Metals & Mining | | | | 1,400 | | | | 425 | |
| | Tongwei Co. Ltd., A | | | Food Products | | | | 200 | | | | 357 | |
| | Towngas China Co. Ltd. | | | Gas Utilities | | | | 4,000 | | | | 3,000 | |
| | TravelSky Technology Ltd., H | | | IT Services | | | | 4,000 | | | | 8,307 | |
| | Tsingtao Brewery Co. Ltd., A | | | Beverages | | | | 200 | | | | 1,358 | |
| | Tsingtao Brewery Co. Ltd., H | | | Beverages | | | | 1,800 | | | | 10,861 | |
| | Tunghsu Optoelectronic Technology Co. Ltd. | | | Electronic Equipment, Instruments & Components | | | | 600 | | | | 477 | |
| | Tus-Sound Environmental Resources Co. Ltd. | | | Commercial Services & Supplies | | | | 200 | | | | 264 | |
| | Uni-President China Holdings Ltd. | | | Food Products | | | | 4,000 | | | | 4,317 | |
| | Unisplendour Corp. Ltd. | | | Electronic Equipment, Instruments & Components | | | | 200 | | | | 882 | |
| | | | |
| | | |
| 134 | | Semiannual Report | | franklintempleton.com |
FRANKLIN TEMPLETON ETF TRUST
STATEMENT OF INVESTMENTS (UNAUDITED)
Franklin FTSE Asia ex Japan ETF(continued)
| | | | | | | | | | | | | | |
| | | | |
| | | | | Industry | | | Shares | | | Value | |
| | | Common Stocks and Other Equity Interests (continued) | | | | | | | |
| | | China (continued) | | | | | | | | | |
| | Universal Scientific Industrial Shanghai Co. Ltd., A | | | Electronic Equipment, Instruments & Components | | | | 200 | | | $ | 432 | |
| | Venustech Group Inc. | | | Software | | | | 200 | | | | 896 | |
| a | | Vipshop Holdings Ltd., ADR | | | Internet & Direct Marketing Retail | | | | 1,450 | | | | 12,934 | |
| | Walvax Biotechnology Co. Ltd. | | | Biotechnology | | | | 200 | | | | 756 | |
| | Wangfujing Group Co. Ltd., A | | | Multiline Retail | | | | 200 | | | | 403 | |
| | Wangsu Science & Technology Co. Ltd. | | | IT Services | | | | 400 | | | | 560 | |
| | Wanhua Chemical Group Co. Ltd., A | | | Chemicals | | | | 400 | | | | 2,473 | |
| | Want Want China Holdings Ltd. | | | Food Products | | | | 18,000 | | | | 14,397 | |
| | Wanxiang Qianchao Co. Ltd. | | | Auto Components | | | | 200 | | | | 145 | |
| a | | Weibo Corp., ADR | | | Interactive Media & Services | | | | 182 | | | | 8,145 | |
| | Weichai Power Co. Ltd., A | | | Machinery | | | | 1,000 | | | | 1,571 | |
| | Weichai Power Co. Ltd., H | | | Machinery | | | | 6,000 | | | | 8,649 | |
| | Weifu High-Technology Co. Ltd., B | | | Auto Components | | | | 600 | | | | 951 | |
| | Weifu High-Technology Group Co. Ltd., A | | | Auto Components | | | | 400 | | | | 918 | |
| | Wens Foodstuffs Group Co. Ltd. | | | Food Products | | | | 200 | | | | 1,041 | |
| a | | Western Mining Co. Ltd., A | | | Metals & Mining | | | | 1,000 | | | | 776 | |
| | Western Securities Co. Ltd. | | | Capital Markets | | | | 600 | | | | 749 | |
| | Westone Information Industry Inc. | | | Electronic Equipment, Instruments & Components | | | | 200 | | | | 781 | |
| | Winning Health Technology Group Co. Ltd. | | | Health Care Technology | | | | 200 | | | | 445 | |
| | Wolong Electric Group Co. Ltd., A | | | Electrical Equipment | | | | 200 | | | | 233 | |
| | Wonders Information Co. Ltd. | | | IT Services | | | | 200 | | | | 381 | |
| | Wuchan Zhongda Group Co. Ltd., A | | | Distributors | | | | 600 | | | | 460 | |
| | Wuhan Guide Infrared Co. Ltd. | | | Electronic Equipment, Instruments & Components | | | | 200 | | | | 665 | |
| | Wuhu Sanqi Interactive Entertainment Network Technology Group Co. Ltd. | | | Entertainment | | | | 200 | | | | 505 | |
| | Wuliangye Yibin Co. Ltd. | | | Beverages | | | | 600 | | | | 10,906 | |
| | WUS Printed Circuit Kunshan Co. Ltd. | | | Electronic Equipment, Instruments & Components | | | | 200 | | | | 686 | |
| | WuXi AppTec Co. Ltd., H | | | Life Sciences Tools & Services | | | | 600 | | | | 6,559 | |
| a,b,c | | Wuxi Biologics Cayman Inc., 144A, Reg S | | | Life Sciences Tools & Services | | | | 2,000 | | | | 20,410 | |
| | Wuxi Lead Intelligent Equipment Co. Ltd. | | | Electronic Equipment, Instruments & Components | | | | 200 | | | | 944 | |
| | XCMG Construction Machinery Co. Ltd. | | | Machinery | | | | 1,400 | | | | 868 | |
| | Xiamen C & D Inc., A | | | Trading Companies & Distributors | | | | 600 | | | | 731 | |
| | Xiamen ITG Group Corp. Ltd., A | | | Trading Companies & Distributors | | | | 400 | | | | 411 | |
| | Xiamen Meiya Pico Information Co. Ltd. | | | Electronic Equipment, Instruments & Components | | | | 200 | | | | 480 | |
| | Xiamen Tungsten Co. Ltd., A | | | Metals & Mining | | | | 200 | | | | 376 | |
| a | | Xiaomi Corp., B | | | Technology Hardware, Storage & Peripherals | | | | 31,600 | | | | 35,472 | |
| | Xinhu Zhongbao Co. Ltd., A | | | Real Estate Management & Development | | | | 1,200 | | | | 486 | |
| | Xinhua Winshare Publishing and Media Co. Ltd., H | | | Distributors | | | | 2,000 | | | | 1,418 | |
| | Xinjiang Goldwind Science & Technology Co. Ltd. | | | Electrical Equipment | | | | 600 | | | | 1,052 | |
| | Xinjiang Goldwind Science & Technology Co. Ltd., H | | | Electrical Equipment | | | | 2,000 | | | | 2,368 | |
| | Xinjiang Machinery Research Institute Co. Ltd. | | | Machinery | | | | 200 | | | | 120 | |
| | Xinjiang Zhongtai Chemical Co. Ltd. | | | Chemicals | | | | 200 | | | | 196 | |
| | Xinxing Ductile Iron Pipes Co. Ltd. | | | Metals & Mining | | | | 2,000 | | | | 1,092 | |
| | Xinyi Solar Holdings Ltd. | | | Semiconductors & Semiconductor Equipment | | | | 12,000 | | | | 7,194 | |
| | Yang Quan Coal Industry Group Co. Ltd., A | | | Oil, Gas & Consumable Fuels | | | | 600 | | | | 434 | |
| | Yango Group Co. Ltd. | | | Real Estate Management & Development | | | | 400 | | | | 330 | |
| b | | Yangtze Optical Fibre and Cable Joint Stock Ltd. Co., H, Reg S | | | Communications Equipment | | | | 1,000 | | | | 1,612 | |
| | Yantai Changyu Pioneer Wine Co. Ltd., B | | | Beverages | | | | 800 | | | | 1,631 | |
| | Yantai Jereh Oilfield Services Group Co. Ltd. | | | Energy Equipment & Services | | | | 200 | | | | 756 | |
| | Yanzhou Coal Mining Co. Ltd., A | | | Oil, Gas & Consumable Fuels | | | | 200 | | | | 298 | |
| | Yanzhou Coal Mining Co. Ltd., H | | | Oil, Gas & Consumable Fuels | | | | 8,000 | | | | 8,123 | |
| | Yifan Pharmaceutical Co. Ltd. | | | Pharmaceuticals | | | | 200 | | | | 376 | |
| | | | | | |
| | | |
| franklintempleton.com | | Semiannual Report | | | 135 | |
FRANKLIN TEMPLETON ETF TRUST
STATEMENT OF INVESTMENTS (UNAUDITED)
Franklin FTSE Asia ex Japan ETF(continued)
| | | | | | | | | | | | | | |
| | | | |
| | | | | Industry | | | Shares | | | Value | |
| | | Common Stocks and Other Equity Interests (continued) | | | | | | | |
| | | China (continued) | | | | | | | | | |
| | Yihai International Holding Ltd. | | | Food Products | | | | 2,000 | | | $ | 11,889 | |
| | Yintai Resources Co. Ltd. | | | Metals & Mining | | | | 200 | | | | 365 | |
| | Yonghui Superstores Co. Ltd., A | | | Food & Staples Retailing | | | | 1,200 | | | | 1,494 | |
| | Yonyou Network Technology Co. Ltd., A | | | Software | | | | 400 | | | | 1,730 | |
| | Yotrio Group Co. Ltd. | | | Leisure Equipment & Products | | | | 400 | | | | 203 | |
| | Yuan Longping High-tech Agriculture Co. Ltd. | | | Food Products | | | | 200 | | | | 351 | |
| | Yuexiu Property Co. Ltd. | | | Real Estate Management & Development | | | | 24,000 | | | | 5,204 | |
| a | | Yunnan Aluminium Co. Ltd. | | | Metals & Mining | | | | 600 | | | | 378 | |
| | Yunnan Baiyao Group Co. Ltd. | | | Pharmaceuticals | | | | 200 | | | | 2,130 | |
| a | | Yunnan Copper Co. Ltd. | | | Metals & Mining | | | | 200 | | | | 281 | |
| a | | Yunnan Tin Co. Ltd. | | | Metals & Mining | | | | 200 | | | | 284 | |
| a | | YY Inc., ADR | | | Interactive Media & Services | | | | 188 | | | | 10,571 | |
| | Zhangzhou Pientzehuang Pharmaceutical Co. Ltd., A | | | Pharmaceuticals | | | | 200 | | | | 2,853 | |
| | Zhaojin Mining Industry Co. Ltd., H | | | Metals & Mining | | | | 3,000 | | | | 3,471 | |
| | Zhefu Holding Group Co. Ltd. | | | Electrical Equipment | | | | 400 | | | | 255 | |
| | Zhejiang China Commodities City Group Co. Ltd., A | | | Real Estate Management & Development | | | | 600 | | | | 318 | |
| | Zhejiang Chint Electrics Co. Ltd., A | | | Electrical Equipment | | | | 200 | | | | 611 | |
| | Zhejiang Conba Pharmaceutical Co. Ltd., A | | | Pharmaceuticals | | | | 400 | | | | 355 | |
| | Zhejiang Crystal-Optech Co. Ltd. | | | Electronic Equipment, Instruments & Components | | | | 180 | | | | 370 | |
| | Zhejiang Dahua Technology Co. Ltd. | | | Electronic Equipment, Instruments & Components | | | | 400 | | | | 967 | |
| | Zhejiang Expressway Co. Ltd., H | | | Transportation Infrastructure | | | | 4,000 | | | | 3,459 | |
| | Zhejiang Hailiang Co. Ltd. | | | Metals & Mining | | | | 200 | | | | 290 | |
| | Zhejiang Hisoar Pharmaceutical Co. Ltd. | | | Pharmaceuticals | | | | 200 | | | | 193 | |
| | Zhejiang Huace Film & TV Co. Ltd., A | | | Entertainment | | | | 200 | | | | 185 | |
| a | | Zhejiang Huahai Pharmaceutical Co. Ltd., A | | | Pharmaceuticals | | | | 200 | | | | 414 | |
| | Zhejiang Huayou Cobalt Co. Ltd., A | | | Metals & Mining | | | | 200 | | | | 754 | |
| | Zhejiang Juhua Co. Ltd., A | | | Chemicals | | | | 400 | | | | 396 | |
| | Zhejiang Longsheng Group Co. Ltd., A | | | Chemicals | | | | 400 | | | | 788 | |
| | Zhejiang Medicine Co. Ltd., A | | | Pharmaceuticals | | | | 200 | | | | 321 | |
| | Zhejiang NHU Co. Ltd. | | | Pharmaceuticals | | | | 400 | | | | 1,198 | |
| | Zhejiang Runtu Co. Ltd. | | | Chemicals | | | | 200 | | | | 327 | |
| | Zhejiang Sanhua Intelligent Controls Co. Ltd. | | | Machinery | | | | 400 | | | | 737 | |
| | Zhejiang Semir Garment Co. Ltd. | | | Textiles, Apparel & Luxury Goods | | | | 200 | | | | 346 | |
| | Zhejiang Wanfeng Auto Wheel Co. Ltd. | | | Auto Components | | | | 200 | | | | 197 | |
| | Zhejiang Wanliyang Co. Ltd. | | | Machinery | | | | 200 | | | | 201 | |
| | Zhejiang Wanma Co. Ltd. | | | Electrical Equipment | | | | 200 | | | | 155 | |
| | Zhejiang Weixing New Building Materials Co. Ltd. | | | Building Products | | | | 200 | | | | 445 | |
| | Zhejiang Yasha Decoration Co. Ltd. | | | Diversified Consumer Services | | | | 600 | | | | 451 | |
| | Zhengzhou Coal Mining Machinery Group Co. Ltd., A | | | Machinery | | | | 200 | | | | 173 | |
| | Zhengzhou Yutong Bus Co. Ltd., A | | | Machinery | | | | 400 | | | | 779 | |
| | Zheshang Securities Co. Ltd., A | | | Capital Markets | | | | 200 | | | | 242 | |
| a,b | | ZhongAn Online P&C Insurance Co. Ltd., Reg S | | | Insurance | | | | 1,200 | | | | 2,832 | |
| | Zhongjin Gold Corp. Ltd., A | | | Metals & Mining | | | | 400 | | | | 486 | |
| | Zhongshan Public Utilities Group Co. Ltd. | | | Water Utilities | | | | 400 | | | | 445 | |
| | Zhongsheng Group Holdings Ltd. | | | Specialty Retail | | | | 2,000 | | | | 6,314 | |
| | Zhuzhou CRRC Times Electric Co. Ltd., H | | | Electrical Equipment | | | | 1,800 | | | | 7,451 | |
| | Zijin Mining Group Co. Ltd., A | | | Metals & Mining | | | | 2,400 | | | | 1,099 | |
| | Zijin Mining Group Co. Ltd., H | | | Metals & Mining | | | | 20,000 | | | | 6,914 | |
| | Zoomlion Heavy Industry Science and Technology Co. Ltd. | | | Machinery | | | | 1,200 | | | | 958 | |
| | Zoomlion Heavy Industry Science and Technology Development Co. Ltd., H | | | Machinery | | | | 4,400 | | | | 2,980 | |
| a | | ZTE Corp. | | | Communications Equipment | | | | 600 | | | | 2,689 | |
| | | | |
| | | |
| 136 | | Semiannual Report | | franklintempleton.com |
FRANKLIN TEMPLETON ETF TRUST
STATEMENT OF INVESTMENTS (UNAUDITED)
Franklin FTSE Asia ex Japan ETF(continued)
| | | | | | | | | | | | | | |
| | | | |
| | | | | Industry | | | Shares | | | Value | |
| | | Common Stocks and Other Equity Interests (continued) | | | | | | | |
| | | China (continued) | | | | | | | | | |
| a | | ZTE Corp., H | | | Communications Equipment | | | | 2,800 | | | $ | 7,429 | |
| | ZTO Express Cayman Inc., ADR | | | Air Freight & Logistics | | | | 1,122 | | | | 23,932 | |
| | | | | | | | | | | | | | |
| | | | |
| | | | | | | | | | | | | 6,075,920 | |
| | | | | | | | | | | | | | |
| | | Hong Kong 10.0% | | | | | | | | | |
| | AIA Group Ltd. | | | Insurance | | | | 42,000 | | | | 396,727 | |
| a | | Alibaba Pictures Group Ltd. | | | Entertainment | | | | 40,000 | | | | 6,480 | |
| | ASM Pacific Technology Ltd. | | | Semiconductors & Semiconductor Equipment | | | | 1,000 | | | | 12,208 | |
| | BOC Hong Kong (Holdings) Ltd. | | | Banks | | | | 12,000 | | | | 40,717 | |
| | Bosideng International Holdings Ltd. | | | Textiles, Apparel & Luxury Goods | | | | 8,000 | | | | 3,408 | |
| | Cathay Pacific Airways Ltd. | | | Airlines | | | | 2,000 | | | | 2,500 | |
| | Champion REIT | | | Equity Real Estate Investment Trusts (REITs | ) | | | 8,000 | | | | 5,174 | |
| | China Gas Holdings Ltd. | | | Gas Utilities | | | | 7,200 | | | | 27,829 | |
| | Chow Tai Fook Jewellery Co. Ltd. | | | Specialty Retail | | | | 3,600 | | | | 2,971 | |
| | CK Asset Holdings Ltd. | | | Real Estate Management & Development | | | | 9,000 | | | | 60,961 | |
| | CK Hutchison Holdings Ltd. | | | Industrial Conglomerates | | | | 9,500 | | | | 83,859 | |
| | CK Infrastructure Holdings Ltd. | | | Electric Utilities | | | | 2,000 | | | | 13,458 | |
| | CLP Holdings Ltd. | | | Electric Utilities | | | | 6,000 | | | | 63,028 | |
| | Dah Sing Banking Group Ltd. | | | Banks | | | | 800 | | | | 1,076 | |
| | Dah Sing Financial Group | | | Banks | | | | 800 | | | | 2,959 | |
| | First Pacific Co. Ltd. | | | Diversified Financial Services | | | | 8,000 | | | | 3,061 | |
| a | | Fullshare Holdings Ltd. | | | Electrical Equipment | | | | 25,000 | | | | 813 | |
| | Haitong International Securities Group Ltd. | | | Capital Markets | | | | 8,000 | | | | 2,266 | |
| | Hang Lung Group Ltd. | | | Real Estate Management & Development | | | | 4,000 | | | | 9,960 | |
| | Hang Lung Properties Ltd. | | | Real Estate Management & Development | | | | 8,000 | | | | 18,165 | |
| | Hang Seng Bank Ltd. | | | Banks | | | | 2,400 | | | | 51,739 | |
| | Henderson Land Development Co. Ltd. | | | Real Estate Management & Development | | | | 4,840 | | | | 22,535 | |
| | Hong Kong and China Gas Co. Ltd. | | | Gas Utilities | | | | 34,320 | | | | 66,894 | |
| | Hong Kong Exchanges and Clearing Ltd. | | | Capital Markets | | | | 4,400 | | | | 129,092 | |
| | Hongkong Land Holdings Ltd. | | | Real Estate Management & Development | | | | 4,000 | | | | 22,480 | |
| | Huabao International Holdings Ltd. | | | Chemicals | | | | 4,000 | | | | 1,464 | |
| | Hutchison Telecommunications Hong Kong Holdings Ltd. | | | Wireless Telecommunication Services | | | | 4,000 | | | | 674 | |
| | Hysan Development Co. Ltd. | | | Real Estate Management & Development | | | | 2,000 | | | | 8,062 | |
| | Jardine Matheson Holdings Ltd. | | | Industrial Conglomerates | | | | 800 | | | | 42,800 | |
| | Jardine Strategic Holdings Ltd. | | | Industrial Conglomerates | | | | 600 | | | | 17,928 | |
| | Johnson Electric Holdings Ltd. | | | Electrical Equipment | | | | 1,000 | | | | 1,791 | |
| | Kerry Properties Ltd. | | | Real Estate Management & Development | | | | 2,000 | | | | 6,161 | |
| | Kingboard Laminates Holdings Ltd. | | | Chemicals | | | | 4,000 | | | | 3,607 | |
| | Lee & Man Paper Manufacturing Ltd. | | | Paper & Forest Products | | | | 6,000 | | | | 3,245 | |
| | Li & Fung Ltd. | | | Textiles, Apparel & Luxury Goods | | | | 20,000 | | | | 2,271 | |
| | Lifestyle International Holdings Ltd. | | | Multiline Retail | | | | 2,000 | | | | 2,084 | |
| | Link REIT | | | Equity Real Estate Investment Trusts (REITs | ) | | | 7,500 | | | | 82,707 | |
| | Melco International Development Ltd. | | | Hotels, Restaurants & Leisure | | | | 2,000 | | | | 4,756 | |
| | MTR Corp. Ltd. | | | Road & Rail | | | | 5,000 | | | | 28,063 | |
| | New World Development Co. Ltd. | | | Real Estate Management & Development | | | | 20,000 | | | | 25,971 | |
| | NWS Holdings Ltd. | | | Industrial Conglomerates | | | | 4,000 | | | | 6,194 | |
| | PCCW Ltd. | | | Diversified Telecommunication Services | | | | 16,000 | | | | 8,980 | |
| | Power Assets Holdings Ltd. | | | Electric Utilities | | | | 5,000 | | | | 33,580 | |
| | Sa Sa International Holdings Ltd. | | | Specialty Retail | | | | 4,153 | | | | 922 | |
| | Samsonite International SA | | | Textiles, Apparel & Luxury Goods | | | | 4,200 | | | | 8,894 | |
| | Shangri-La Asia Ltd. | | | Hotels, Restaurants & Leisure | | | | 4,000 | | | | 4,082 | |
| | Shun Tak Holdings Ltd. | | | Industrial Conglomerates | | | | 8,000 | | | | 3,184 | |
| | Sino Biopharmaceutical Ltd. | | | Pharmaceuticals | | | | 22,000 | | | | 27,951 | |
| | Sino Land Co. Ltd. | | | Real Estate Management & Development | | | | 12,000 | | | | 18,032 | |
| | Sun Art Retail Group Ltd. | | | Food & Staples Retailing | | | | 8,000 | | | | 8,123 | |
| | Sun Hung Kai Properties Ltd. | | | Real Estate Management & Development | | | | 5,000 | | | | 71,944 | |
| | Swire Pacific Ltd., A | | | Real Estate Management & Development | | | | 2,000 | | | | 18,611 | |
| | | | | | |
| | | |
| franklintempleton.com | | Semiannual Report | | | 137 | |
FRANKLIN TEMPLETON ETF TRUST
STATEMENT OF INVESTMENTS (UNAUDITED)
Franklin FTSE Asia ex Japan ETF(continued)
| | | | | | | | | | | | | | |
| | | | |
| | | | | Industry | | | Shares | | | Value | |
| | | Common Stocks and Other Equity Interests (continued) | | | | | | | |
| | | Hong Kong (continued) | | | | | | | | | |
| | Swire Properties Ltd. | | | Real Estate Management & Development | | | | 3,600 | | | $ | 11,297 | |
| | Techtronic Industries Co. Ltd. | | | Machinery | | | | 4,000 | | | | 27,834 | |
| | Television Broadcasts Ltd. | | | Media | | | | 1,200 | | | | 1,956 | |
| | The Bank of East Asia Ltd. | | | Banks | | | | 4,400 | | | | 10,833 | |
| | The Wharf Holdings Ltd. | | | Real Estate Management & Development | | | | 4,000 | | | | 8,725 | |
| a | | United Energy Group Ltd. | | | Oil, Gas & Consumable Fuels | | | | 24,000 | | | | 4,929 | |
| | Vitasoy International Holdings Ltd. | | | Food Products | | | | 2,000 | | | | 8,100 | |
| | VTech Holdings Ltd. | | | Communications Equipment | | | | 600 | | | | 5,231 | |
| | WH Group Ltd., Reg S | | | Food Products | | | | 29,000 | | | | 25,969 | |
| | Wharf Real Estate Investment Co. Ltd. | | | Real Estate Management & Development | | | | 4,000 | | | | 21,838 | |
| | Wheelock and Co. Ltd. | | | Real Estate Management & Development | | | | 3,000 | | | | 17,087 | |
| | Xinyi Glass Holdings Ltd. | | | Auto Components | | | | 8,000 | | | | 8,807 | |
| | Yue Yuen Industrial Holdings Ltd. | | | Textiles, Apparel & Luxury Goods | | | | 2,000 | | | | 5,472 | |
| | | | | | | | | | | | | | |
| | | | |
| | | | | | | | | | | | | 1,650,519 | |
| | | | | | | | | | | | | | |
| | | India 11.2% | | | | | | | | | |
| a | | 3M India Ltd. | | | Industrial Conglomerates | | | | 6 | | | | 1,750 | |
| | ABB India Ltd. | | | Electrical Equipment | | | | 170 | | | | 3,635 | |
| | ACC Ltd. | | | Construction Materials | | | | 174 | | | | 3,948 | |
| | Adani Enterprises Ltd. | | | Trading Companies & Distributors | | | | 1,018 | | | | 2,095 | |
| | Adani Ports And Special Economic Zone Ltd. | | | Transportation Infrastructure | | | | 2,378 | | | | 13,890 | |
| a | | Adani Power Ltd. | | | Independent Power and Renewable Electricity Producers | | | | 3,204 | | | | 2,907 | |
| a | | Adani Transmissions Ltd. | | | Electric Utilities | | | | 894 | | | | 2,884 | |
| a | | Aditya Birla Capital Ltd. | | | Diversified Financial Services | | | | 1,764 | | | | 2,112 | |
| | Alkem Laboratories Ltd. | | | Pharmaceuticals | | | | 128 | | | | 3,441 | |
| | Ambuja Cements Ltd. | | | Construction Materials | | | | 2,584 | | | | 7,436 | |
| | Ashok Leyland Ltd. | | | Machinery | | | | 4,202 | | | | 4,073 | |
| | Asian Paints Ltd. | | | Chemicals | | | | 994 | | | | 24,716 | |
| | AU Small Finance Bank Ltd. | | | Banks | | | | 470 | | | | 4,374 | |
| | Aurobindo Pharma Ltd. | | | Pharmaceuticals | | | | 926 | | | | 7,696 | |
| a | | Avenue Supermarts Ltd. | | | Food & Staples Retailing | | | | 398 | | | | 10,449 | |
| | Axis Bank Ltd. | | | Banks | | | | 6,356 | | | | 61,435 | |
| | Bajaj Auto Ltd. | | | Automobiles | | | | 302 | | | | 12,536 | |
| | Bajaj Finance Ltd. | | | Consumer Finance | | | | 602 | | | | 34,369 | |
| | Bajaj Finserv Ltd. | | | Insurance | | | | 132 | | | | 15,856 | |
| | Bajaj Holdings & Investment Ltd. | | | Diversified Financial Services | | | | 90 | | | | 4,563 | |
| | Bandhan Bank Ltd. | | | Banks | | | | 374 | | | | 2,596 | |
| a | | Bank of Baroda | | | Banks | | | | 2,666 | | | | 3,500 | |
| a | | Bank of India | | | Banks | | | | 972 | | | | 863 | |
| | Berger Paints India Ltd. | | | Chemicals | | | | 830 | | | | 5,092 | |
| | Bharat Electronics Ltd. | | | Aerospace & Defense | | | | 2,016 | | | | 3,081 | |
| | Bharat Forge Ltd. | | | Auto Components | | | | 668 | | | | 4,207 | |
| | Bharat Heavy Electricals Ltd. | | | Electrical Equipment | | | | 2,868 | | | | 1,959 | |
| | Bharat Petroleum Corp. Ltd. | | | Oil, Gas & Consumable Fuels | | | | 3,446 | | | | 22,859 | |
| | Bharti Airtel Ltd. | | | Wireless Telecommunication Services | | | | 5,638 | | | | 29,201 | |
| | Bharti Infratel Ltd. | | | Diversified Telecommunication Services | | | | 3,012 | | | | 10,936 | |
| | Biocon Ltd. | | | Biotechnology | | | | 984 | | | | 3,096 | |
| | Bosch Ltd. | | | Auto Components | | | | 24 | | | | 4,763 | |
| | Britannia Industries Ltd. | | | Food Products | | | | 202 | | | | 8,392 | |
| | Cadila Healthcare Ltd. | | | Pharmaceuticals | | | | 816 | | | | 2,686 | |
| a | | Canara Bank Ltd. | | | Banks | | | | 546 | | | | 1,405 | |
| | Castrol India Ltd. | | | Chemicals | | | | 1,746 | | | | 3,352 | |
| | Cholamandalam Investment and Finance Co. Ltd. | | | Consumer Finance | | | | 652 | | | | 2,832 | |
| | Cipla Ltd. | | | Pharmaceuticals | | | | 1,130 | | | | 6,785 | |
| | Coal India Ltd. | | | Oil, Gas & Consumable Fuels | | | | 4,968 | | | | 14,010 | |
| | Colgate-Palmolive India Ltd. | | | Personal Products | | | | 242 | | | | 5,136 | |
| | | | |
| | | |
| 138 | | Semiannual Report | | franklintempleton.com |
FRANKLIN TEMPLETON ETF TRUST
STATEMENT OF INVESTMENTS (UNAUDITED)
Franklin FTSE Asia ex Japan ETF(continued)
| | | | | | | | | | | | | | |
| | | | |
| | | | | Industry | | | Shares | | | Value | |
| | | Common Stocks and Other Equity Interests (continued) | | | | | | | |
| | | India (continued) | | | | | | | | | |
| | Container Corp. of India Ltd. | | | Road & Rail | | | | 734 | | | $ | 6,264 | |
| | Cummins India Ltd. | | | Machinery | | | | 256 | | | | 2,069 | |
| | Dabur India Ltd. | | | Personal Products | | | | 1,880 | | | | 11,865 | |
| | Dalmia Bharat Ltd. | | | Construction Materials | | | | 142 | | | | 1,648 | |
| | Divi’s Laboratories Ltd. | | | Life Sciences Tools & Services | | | | 282 | | | | 6,627 | |
| | DLF Ltd. | | | Real Estate Management & Development | | | | 2,114 | | | | 4,642 | |
| | Dr Reddy’s Laboratories Ltd. | | | Pharmaceuticals | | | | 288 | | | | 10,982 | |
| | Eicher Motors Ltd. | | | Automobiles | | | | 46 | | | | 11,531 | |
| | Emami Ltd. | | | Personal Products | | | | 420 | | | | 1,888 | |
| | Exide Industries Ltd. | | | Auto Components | | | | 786 | | | | 2,165 | |
| | Federal Bank Ltd. | | | Banks | | | | 5,306 | | | | 6,768 | |
| a | | Future Retail Ltd. | | | Multiline Retail | | | | 696 | | | | 3,740 | |
| | GAIL India Ltd. | | | Gas Utilities | | | | 3,792 | | | | 7,197 | |
| | Gillette India Ltd. | | | Personal Products | | | | 28 | | | | 2,805 | |
| | GlaxoSmithKline Consumer Healthcare Ltd. | | | Food Products | | | | 34 | | | | 4,092 | |
| | Glenmark Pharmaceuticals Ltd. | | | Pharmaceuticals | | | | 474 | | | | 2,174 | |
| a | | GMR Infrastructure Ltd. | | | Construction & Engineering | | | | 5,980 | | | | 1,434 | |
| | Godrej Consumer Products Ltd. | | | Personal Products | | | | 1,284 | | | | 12,452 | |
| | Godrej Industries Ltd. | | | Industrial Conglomerates | | | | 270 | | | | 1,556 | |
| a | | Godrej Properties Ltd. | | | Real Estate Management & Development | | | | 208 | | | | 3,049 | |
| | Grasim Industries Ltd. | | | Construction Materials | | | | 1,106 | | | | 11,394 | |
| | Gruh Finance Ltd. | | | Thrifts & Mortgage Finance | | | | 1,006 | | | | 3,823 | |
| | Havell’s India Ltd. | | | Electrical Equipment | | | | 866 | | | | 8,777 | |
| | HCL Technologies Ltd. | | | IT Services | | | | 1,882 | | | | 28,697 | |
| | HDFC Asset Management Co. Ltd. | | | Capital Markets | | | | 96 | | | | 3,795 | |
| | HDFC Life Insurance Co. Ltd. | | | Insurance | | | | 1,576 | | | | 13,369 | |
| a,e | | Hemisphere Properties India Ltd. | | | Real Estate Management & Development | | | | 262 | | | | 617 | |
| | Hero Motocorp Ltd. | | | Automobiles | | | | 342 | | | | 13,053 | |
| | Hindalco Industries Ltd. | | | Metals & Mining | | | | 3,164 | | | | 8,543 | |
| | Hindustan Petroleum Corp. Ltd. | | | Oil, Gas & Consumable Fuels | | | | 2,108 | | | | 8,974 | |
| | Hindustan Unilever Ltd. | | | Household Products | | | | 2,460 | | | | 68,798 | |
| | Hindustan Zinc Ltd. | | | Metals & Mining | | | | 690 | | | | 2,078 | |
| | Housing Development Finance Corp. Ltd. | | | Thrifts & Mortgage Finance | | | | 5,960 | | | | 166,268 | |
| | ICICI Bank Ltd. | | | Banks | | | | 1,060 | | | | 6,487 | |
| b | | ICICI Lombard General Insurance Co. Ltd., Reg S | | | Insurance | | | | 546 | | | | 9,321 | |
| b | | ICICI Prudential Life Insurance Co. Ltd., Reg S | | | Insurance | | | | 1,046 | | | | 6,841 | |
| a | | IDFC First Bank Ltd. | | | Banks | | | | 7,850 | | | | 4,453 | |
| | IDFC Ltd. | | | Diversified Financial Services | | | | 1,692 | | | | 821 | |
| | Indiabulls Housing Finance Ltd. | | | Thrifts & Mortgage Finance | | | | 1,154 | | | | 4,167 | |
| | Indian Oil Corp. Ltd. | | | Oil, Gas & Consumable Fuels | | | | 7,364 | | | | 15,316 | |
| | Info Edge India Ltd. | | | Interactive Media & Services | | | | 214 | | | | 6,103 | |
| | Infosys Ltd. | | | IT Services | | | | 12,862 | | | | 146,218 | |
| b | | InterGlobe Aviation Ltd., Reg S | | | Airlines | | | | 326 | | | | 8,692 | |
| | ITC Ltd. | | | Tobacco | | | | 10,136 | | | | 37,165 | |
| a | | Jindal Steel & Power Ltd. | | | Metals & Mining | | | | 1,410 | | | | 2,060 | |
| | JSW Energy Ltd. | | | Independent Power and Renewable Electricity Producers | | | | 1,352 | | | | 1,241 | |
| | JSW Steel Ltd. | | | Metals & Mining | | | | 4,052 | | | | 13,148 | |
| | Kansai Nerolac Paints Ltd. | | | Chemicals | | | | 428 | | | | 3,170 | |
| | L&T Finance Holdings Ltd. | | | Diversified Financial Services | | | | 1,686 | | | | 2,016 | |
| b | | Larsen & Toubro Infotech Ltd., Reg S | | | IT Services | | | | 114 | | | | 2,431 | |
| | Larsen & Toubro Ltd. | | | Construction & Engineering | | | | 1,170 | | | | 24,339 | |
| | LIC Housing Finance Ltd. | | | Thrifts & Mortgage Finance | | | | 886 | | | | 4,709 | |
| | Lupin Ltd. | | | Pharmaceuticals | | | | 772 | | | | 7,796 | |
| | Mahindra & Mahindra Financial Services Ltd. | | | Consumer Finance | | | | 1,052 | | | | 4,869 | |
| | | | | | |
| | | |
| franklintempleton.com | | Semiannual Report | | | 139 | |
FRANKLIN TEMPLETON ETF TRUST
STATEMENT OF INVESTMENTS (UNAUDITED)
Franklin FTSE Asia ex Japan ETF(continued)
| | | | | | | | | | | | | | |
| | | | |
| | | | | Industry | | | Shares | | | Value | |
| | | Common Stocks and Other Equity Interests (continued) | | | | | | | |
| | | India (continued) | | | | | | | | | |
| | Mahindra & Mahindra Ltd. | | | Automobiles | | | | 2,024 | | | $ | 15,627 | |
| | Mangalore Refinery and Petrochemicals Ltd. | | | Oil, Gas & Consumable Fuels | | | | 446 | | | | 305 | |
| | Marico Ltd. | | | Personal Products | | | | 1,620 | | | | 9,012 | |
| | Maruti Suzuki India Ltd. | | | Automobiles | | | | 420 | | | | 39,801 | |
| | Motherson Sumi Systems Ltd. | | | Auto Components | | | | 3,225 | | | | 4,776 | |
| | Mphasis Ltd. | | | IT Services | | | | 275 | | | | 3,714 | |
| | MRF Ltd. | | | Auto Components | | | | 4 | | | | 3,572 | |
| | Muthoot Finance Ltd. | | | Consumer Finance | | | | 354 | | | | 3,376 | |
| | Nestle India Ltd. | | | Food Products | | | | 80 | | | | 15,679 | |
| | NHPC Ltd. | | | Independent Power and Renewable Electricity Producers | | | | 9,042 | | | | 2,845 | |
| | NMDC Ltd. | | | Metals & Mining | | | | 2,567 | | | | 3,213 | |
| | NTPC Ltd. | | | Independent Power and Renewable Electricity Producers | | | | 8,220 | | | | 13,629 | |
| | Oberoi Realty Ltd. | | | Real Estate Management & Development | | | | 290 | | | | 2,077 | |
| | Oil & Natural Gas Corp. Ltd. | | | Oil, Gas & Consumable Fuels | | | | 10,316 | | | | 19,185 | |
| | Oil India Ltd. | | | Oil, Gas & Consumable Fuels | | | | 984 | | | | 2,017 | |
| a | | Oracle Financial Services Software Ltd. | | | Software | | | | 76 | | | | 3,403 | |
| | Page Industries Ltd. | | | Textiles, Apparel & Luxury Goods | | | | 18 | | | | 5,719 | |
| | Petronet LNG Ltd. | | | Oil, Gas & Consumable Fuels | | | | 1,926 | | | | 7,063 | |
| | Pidilite Industries Ltd. | | | Chemicals | | | | 426 | | | | 8,679 | |
| | Piramal Enterprises Ltd. | | | Pharmaceuticals | | | | 324 | | | | 7,463 | |
| a | | Power Finance Corp. Ltd. | | | Diversified Financial Services | | | | 2,200 | | | | 3,086 | |
| | Power Grid Corp. of India Ltd. | | | Electric Utilities | | | | 1,746 | | | | 4,904 | |
| a | | Punjab National Bank Ltd. | | | Banks | | | | 3,206 | | | | 2,803 | |
| | Rajesh Exports Ltd. | | | Textiles, Apparel & Luxury Goods | | | | 478 | | | | 4,498 | |
| b | | RBL Bank Ltd., Reg S | | | Banks | | | | 1,086 | | | | 5,039 | |
| | REC Ltd. | | | Diversified Financial Services | | | | 2,438 | | | | 4,237 | |
| | Reliance Industries Ltd. | | | Oil, Gas & Consumable Fuels | | | | 10,758 | | | | 202,238 | |
| | SBI Life Insurance Co. Ltd. | | | Insurance | | | | 814 | | | | 9,722 | |
| | Shree Cement Ltd. | | | Construction Materials | | | | 28 | | | | 7,463 | |
| | Shriram Transport Finance Co. Ltd. | | | Consumer Finance | | | | 584 | | | | 8,826 | |
| | Siemens Ltd. | | | Industrial Conglomerates | | | | 294 | | | | 6,289 | |
| a | | State Bank of India | | | Banks | | | | 6,178 | | | | 23,607 | |
| | Steel Authority of India Ltd. | | | Metals & Mining | | | | 3,318 | | | | 1,566 | |
| | Sun Pharmaceutical Industries Ltd. | | | Pharmaceuticals | | | | 3,784 | | | | 20,794 | |
| | Sun TV Network Ltd. | | | Media | | | | 324 | | | | 2,161 | |
| | Tata Communications Ltd. | | | Diversified Telecommunication Services | | | | 262 | | | | 1,387 | |
| | Tata Consultancy Services Ltd. | | | IT Services | | | | 3,122 | | | | 92,481 | |
| a | | Tata Motors Ltd. | | | Automobiles | | | | 3,862 | | | | 6,400 | |
| a | | Tata Motors Ltd., A | | | Automobiles | | | | 1,030 | | | | 772 | |
| | Tata Power Co. Ltd. | | | Electric Utilities | | | | 3,270 | | | | 2,884 | |
| | Tata Steel Ltd. | | | Metals & Mining | | | | 946 | | | | 4,812 | |
| | Tech Mahindra Ltd. | | | IT Services | | | | 1,658 | | | | 16,716 | |
| | Titan Co. Ltd. | | | Textiles, Apparel & Luxury Goods | | | | 1,092 | | | | 19,616 | |
| | Torrent Pharmaceuticals Ltd. | | | Pharmaceuticals | | | | 144 | | | | 3,388 | |
| | Torrent Power Ltd. | | | Electric Utilities | | | | 444 | | | | 1,801 | |
| | TVS Motor Co. Ltd. | | | Automobiles | | | | 390 | | | | 2,322 | |
| | UltraTech Cement Ltd. | | | Construction Materials | | | | 356 | | | | 21,808 | |
| a | | Union Bank of India Ltd. | | | Banks | | | | 1,284 | | | | 957 | |
| | United Breweries Ltd. | | | Beverages | | | | 234 | | | | 4,448 | |
| a | | United Spirits Ltd. | | | Beverages | | | | 1,032 | | | | 9,713 | |
| | UPL Ltd. | | | Chemicals | | | | 1,854 | | | | 15,800 | |
| | Vedanta Ltd. | | | Metals & Mining | | | | 5,832 | | | | 12,685 | |
| a | | Vodafone Idea Ltd. | | | Wireless Telecommunication Services | | | | 30,442 | | | | 2,642 | |
| | Voltas Ltd. | | | Construction & Engineering | | | | 384 | | | | 3,682 | |
| | Whirlpool of India Ltd. | | | Household Durables | | | | 102 | | | | 2,717 | |
| | Wipro Ltd. | | | IT Services | | | | 5,004 | | | | 16,932 | |
| | | | |
| | | |
| 140 | | Semiannual Report | | franklintempleton.com |
FRANKLIN TEMPLETON ETF TRUST
STATEMENT OF INVESTMENTS (UNAUDITED)
Franklin FTSE Asia ex Japan ETF(continued)
| | | | | | | | | | | | | | |
| | | | |
| | | | | Industry | | | Shares | | | Value | |
| | | Common Stocks and Other Equity Interests (continued) | | | | | | | |
| | | India (continued) | | | | | | | | | |
| a | | Wockhardt Ltd. | | | Pharmaceuticals | | | | 112 | | | $ | 405 | |
| | Yes Bank Ltd. | | | Banks | | | | 5,922 | | | | 3,460 | |
| | Zee Entertainment Enterprises Ltd. | | | Media | | | | 1,850 | | | | 6,931 | |
| | | | | | | | | | | | | | |
| | | | |
| | | | | | | | | | | | | 1,848,560 | |
| | | | | | | | | | | | | | |
| | | Indonesia 2.3% | | | | | | | | | |
| | Adaro Energy Tbk PT | | | Oil, Gas & Consumable Fuels | | | | 44,600 | | | | 4,053 | |
| | Astra Agro Lestari Tbk PT | | | Food Products | | | | 1,400 | | | | 1,063 | |
| | Astra International Tbk PT | | | Automobiles | | | | 70,000 | | | | 32,547 | |
| | Bank Central Asia Tbk PT | | | Banks | | | | 33,400 | | | | 71,412 | |
| | Bank Danamon Indonesia Tbk PT | | | Banks | | | | 2,400 | | | | 803 | |
| | Bank Mandiri Persero Tbk PT | | | Banks | | | | 64,400 | | | | 31,644 | |
| | Bank Negara Indonesia Persero Tbk PT | | | Banks | | | | 25,800 | | | | 13,359 | |
| | Bank Rakyat Indonesia Persero Tbk PT | | | Banks | | | | 183,200 | | | | 53,172 | |
| | Bukit Asam Tbk PT | | | Oil, Gas & Consumable Fuels | | | | 15,600 | | | | 2,484 | |
| a | | Bumi Serpong Damai Tbk PT | | | Real Estate Management & Development | | | | 25,200 | | | | 2,468 | |
| | Charoen Pokphand Indonesia Tbk PT | | | Food Products | | | | 25,200 | | | | 9,498 | |
| | Gudang Garam Tbk PT | | | Tobacco | | | | 1,600 | | | | 5,903 | |
| | Hanjaya Mandala Sampoerna Tbk PT | | | Tobacco | | | | 28,400 | | | | 4,582 | |
| | Indah Kiat Pulp & Paper Corp Tbk PT | | | Paper & Forest Products | | | | 9,000 | | | | 4,105 | |
| | Indocement Tunggal Prakarsa Tbk PT | | | Construction Materials | | | | 4,400 | | | | 5,804 | |
| | Indofood CBP Sukses Makmur Tbk PT | | | Food Products | | | | 7,800 | | | | 6,608 | |
| | Indofood Sukses Makmur Tbk PT | | | Food Products | | | | 15,200 | | | | 8,245 | |
| | Jasa Marga Persero Tbk PT | | | Transportation Infrastructure | | | | 8,000 | | | | 3,212 | |
| | Kalbe Farma Tbk PT | | | Pharmaceuticals | | | | 64,600 | | | | 7,623 | |
| | Matahari Department Store Tbk PT | | | Multiline Retail | | | | 8,600 | | | | 2,078 | |
| | Media Nusantara Citra Tbk PT | | | Media | | | | 19,000 | | | | 1,653 | |
| | Perusahaan Gas Negara (Persero) Tbk PT | | | Gas Utilities | | | | 37,600 | | | | 5,562 | |
| | Perusahaan Perseroan (Persero) PT Telekomunikasi Indonesia Tbk, B | | | Diversified Telecommunication Services | | | | 160,200 | | | | 48,641 | |
| | PT Barito Pacific Tbk | | | Chemicals | | | | 63,800 | | | | 4,450 | |
| a | | PT XL Axiata Tbk | | | Wireless Telecommunication Services | | | | 12,800 | | | | 3,102 | |
| | Semen Indonesia (Persero) Tbk PT | | | Construction Materials | | | | 10,000 | | | | 8,137 | |
| a | | Smartfren Telecom Tbk PT | | | Wireless Telecommunication Services | | | | 130,200 | | | | 1,559 | |
| | Surya Citra Media Tbk PT | | | Media | | | | 22,000 | | | | 1,798 | |
| | Tower Bersama Infrastructure Tbk PT | | | Diversified Telecommunication Services | | | | 7,200 | | | | 3,107 | |
| | Unilever Indonesia Tbk PT | | | Household Products | | | | 3,800 | | | | 12,448 | |
| | United Tractors Tbk PT | | | Oil, Gas & Consumable Fuels | | | | 5,200 | | | | 7,537 | |
| a | | Vale Indonesia Tbk PT | | | Metals & Mining | | | | 7,000 | | | | 1,731 | |
| | | | | | | | | | | | | | |
| | | | |
| | | | | | | | | | | | | 370,388 | |
| | | | | | | | | | | | | | |
| | | Italy 0.0%† | | | | | | | | | |
| | Prada SpA | | | Textiles, Apparel & Luxury Goods | | | | 1,800 | | | | 5,235 | |
| | | | | | | | | | | | | | |
| | | Luxembourg 0.0%† | | | | | | | | | |
| | L’Occitane International SA | | | Personal Products | | | | 1,500 | | | | 2,985 | |
| | | | | | | | | | | | | | |
| | | Macau 0.4% | | | | | | | | | |
| | Galaxy Entertainment Group Ltd. | | | Hotels, Restaurants & Leisure | | | | 8,000 | | | | 49,749 | |
| a | | Macau Legend Development Ltd. | | | Hotels, Restaurants & Leisure | | | | 4,000 | | | | 444 | |
| | SJM Holdings Ltd. | | | Hotels, Restaurants & Leisure | | | | 6,000 | | | | 5,702 | |
| | Wynn Macau Ltd. | | | Hotels, Restaurants & Leisure | | | | 4,800 | | | | 9,368 | |
| | | | | | | | | | | | | | |
| | | | |
| | | | | | | | | | | | | 65,263 | |
| | | | | | | | | | | | | | |
| | | Malaysia 2.8% | | | | | | | | | |
| | AirAsia Group Bhd | | | Airlines | | | | 5,800 | | | | 2,438 | |
| | Alliance Bank Malaysia Bhd. | | | Banks | | | | 4,200 | | | | 2,859 | |
| | AMMB Holdings Bhd. | | | Banks | | | | 7,000 | | | | 6,921 | |
| | Astro Malaysia Holdings Bhd. | | | Media | | | | 5,400 | | | | 1,883 | |
| | | | | | |
| | | |
| franklintempleton.com | | Semiannual Report | | | 141 | |
FRANKLIN TEMPLETON ETF TRUST
STATEMENT OF INVESTMENTS (UNAUDITED)
Franklin FTSE Asia ex Japan ETF(continued)
| | | | | | | | | | | | | | |
| | | | |
| | | | | Industry | | | Shares | | | Value | |
| | | Common Stocks and Other Equity Interests (continued) | | | | | | | |
| | | Malaysia (continued) | | | | | | | | | |
| | Axiata Group Bhd. | | | Wireless Telecommunication Services | | | | 15,400 | | | $ | 15,816 | |
| | British American Tobacco Malaysia Bhd. | | | Tobacco | | | | 400 | | | | 1,809 | |
| | CIMB Group Holdings Bhd. | | | Banks | | | | 23,800 | | | | 28,592 | |
| | Dialog Group Bhd. | | | Energy Equipment & Services | | | | 16,400 | | | | 13,317 | |
| | Digi.com Bhd. | | | Wireless Telecommunication Services | | | | 12,800 | | | | 14,521 | |
| a | | FGV Holdings Bhd. | | | Food Products | | | | 7,200 | | | | 1,530 | |
| | Fraser & Neave Holdings Bhd. | | | Beverages | | | | 400 | | | | 3,334 | |
| | Gamuda Bhd. | | | Construction & Engineering | | | | 7,600 | | | | 6,716 | |
| | Genting Bhd. | | | Hotels, Restaurants & Leisure | | | | 8,000 | | | | 10,967 | |
| | Genting Malaysia Bhd. | | | Hotels, Restaurants & Leisure | | | | 9,800 | | | | 7,092 | |
| | HAP Seng Consolidated Bhd. | | | Industrial Conglomerates | | | | 2,400 | | | | 5,652 | |
| | Hartalega Holdings Bhd. | | | Health Care Equipment & Supplies | | | | 5,200 | | | | 6,520 | |
| | Hong Leong Bank Bhd. | | | Banks | | | | 2,200 | | | | 8,596 | |
| | Hong Leong Financial Group Bhd. | | | Banks | | | | 800 | | | | 3,107 | |
| | IHH Healthcare Bhd. | | | Health Care Providers & Services | | | | 10,000 | | | | 13,566 | |
| | IJM Corp. Bhd. | | | Construction & Engineering | | | | 10,600 | | | | 5,544 | |
| | IOI Corp. Bhd. | | | Food Products | | | | 10,800 | | | | 11,427 | |
| | IOI Properties Group Bhd. | | | Real Estate Management & Development | | | | 6,600 | | | | 1,797 | |
| | Kuala Lumpur Kepong Bhd. | | | Food Products | | | | 1,600 | | | | 8,820 | |
| | Malayan Banking Bhd. | | | Banks | | | | 21,038 | | | | 42,759 | |
| | Malaysia Airports Holdings Bhd. | | | Transportation Infrastructure | | | | 3,200 | | | | 6,611 | |
| | Maxis Bhd. | | | Wireless Telecommunication Services | | | | 9,200 | | | | 12,305 | |
| | MISC Bhd. | | | Marine | | | | 4,800 | | | | 8,942 | |
| | Nestle (Malaysia) Bhd. | | | Food Products | | | | 200 | | | | 6,960 | |
| | Petronas Chemicals Group Bhd. | | | Chemicals | | | | 9,600 | | | | 17,288 | |
| | Petronas Dagangan Bhd. | | | Oil, Gas & Consumable Fuels | | | | 1,000 | | | | 5,637 | |
| | Petronas Gas Bhd. | | | Gas Utilities | | | | 2,600 | | | | 10,172 | |
| | PPB Group Bhd. | | | Food Products | | | | 2,440 | | | | 10,571 | |
| | Press Metal Aluminium Holdings Bhd. | | | Metals & Mining | | | | 6,600 | | | | 7,503 | |
| | Public Bank Bhd. | | | Banks | | | | 10,800 | | | | 51,795 | |
| | QL Resources Bhd. | | | Food Products | | | | 2,600 | | | | 4,477 | |
| | RHB Bank Bhd. | | | Banks | | | | 5,600 | | | | 7,543 | |
| | Sime Darby Bhd. | | | Industrial Conglomerates | | | | 12,400 | | | | 6,664 | |
| | Sime Darby Plantation Bhd. | | | Food Products | | | | 12,000 | | | | 13,556 | |
| | Sime Darby Property Bhd. | | | Real Estate Management & Development | | | | 13,600 | | | | 2,729 | |
| | Telekom Malaysia Bhd. | | | Diversified Telecommunication Services | | | | 3,800 | | | | 3,267 | |
| | Tenaga Nasional Bhd. | | | Electric Utilities | | | | 13,400 | | | | 43,653 | |
| | Top Glove Corp. Bhd. | | | Health Care Equipment & Supplies | | | | 6,200 | | | | 6,589 | |
| a | | UEM Sunrise Bhd. | | | Real Estate Management & Development | | | | 4,800 | | | | 762 | |
| | Westports Holdings Bhd. | | | Transportation Infrastructure | | | | 3,800 | | | | 3,748 | |
| | YTL Corp. Bhd. | | | Multi-Utilities | | | | 15,400 | | | | 3,384 | |
| | | | | | | | | | | | | | |
| | | | |
| | | | | | | | | | | | | 459,739 | |
| | | | | | | | | | | | | | |
| | | Pakistan 0.0%† | | | | | | | | | |
| | Fauji Fertilizer Co. Ltd. | | | Chemicals | | | | 2,000 | | | | 1,190 | |
| | Habib Bank Ltd. | | | Banks | | | | 2,000 | | | | 1,512 | |
| | Oil & Gas Development Co. Ltd. | | | Oil, Gas & Consumable Fuels | | | | 2,000 | | | | 1,574 | |
| | Pakistan Petroleum Ltd. | | | Oil, Gas & Consumable Fuels | | | | 1,670 | | | | 1,453 | |
| | | | | | | | | | | | | | |
| | | | |
| | | | | | | | | | | | | 5,729 | |
| | | | | | | | | | | | | | |
| | | Philippines 1.4% | | | | | | | | | |
| | Aboitiz Power Corp. | | | Independent Power and Renewable Electricity Producers | | | | 5,200 | | | | 3,848 | |
| | Alliance Global Group Inc. | | | Industrial Conglomerates | | | | 15,000 | | | | 3,154 | |
| | Ayala Corp. | | | Industrial Conglomerates | | | | 865 | | | | 14,761 | |
| | Ayala Land Inc. | | | Real Estate Management & Development | | | | 24,200 | | | | 23,089 | |
| | Bank of the Philippine Islands | | | Banks | | | | 6,124 | | | | 10,988 | |
| | BDO Unibank Inc. | | | Banks | | | | 6,720 | | | | 18,541 | |
| | | | |
| | | |
| 142 | | Semiannual Report | | franklintempleton.com |
FRANKLIN TEMPLETON ETF TRUST
STATEMENT OF INVESTMENTS (UNAUDITED)
Franklin FTSE Asia ex Japan ETF(continued)
| | | | | | | | | | | | | | |
| | | | |
| | | | | Industry | | | Shares | | | Value | |
| | | Common Stocks and Other Equity Interests (continued) | | | | | | | |
| | | Philippines (continued) | | | | | | | | | |
| | Bloomberry Resorts Corp. | | | Hotels, Restaurants & Leisure | | | | 11,800 | | | $ | 2,472 | |
| | DMCI Holdings Inc. | | | Industrial Conglomerates | | | | 14,200 | | | | 2,277 | |
| | Globe Telecom Inc. | | | Wireless Telecommunication Services | | | | 100 | | | | 3,531 | |
| | GT Capital Holdings Inc. | | | Industrial Conglomerates | | | | 337 | | | | 5,475 | |
| | International Container Terminal Services Inc. | | | Transportation Infrastructure | | | | 3,700 | | | | 8,595 | |
| | JG Summit Holdings Inc. | | | Industrial Conglomerates | | | | 9,680 | | | | 13,540 | |
| | Jollibee Foods Corp. | | | Hotels, Restaurants & Leisure | | | | 1,420 | | | | 6,082 | |
| | LT Group Inc. | | | Industrial Conglomerates | | | | 9,000 | | | | 2,421 | |
| | Manila Electric Co. | | | Electric Utilities | | | | 920 | | | | 6,568 | |
| | Megaworld Corp. | | | Real Estate Management & Development | | | | 41,000 | | | | 3,457 | |
| | Metro Pacific Investments Corp. | | | Diversified Financial Services | | | | 50,000 | | | | 4,804 | |
| | Metropolitan Bank & Trust Co. | | | Banks | | | | 5,546 | | | | 7,319 | |
| | PLDT Inc. | | | Wireless Telecommunication Services | | | | 420 | | | | 9,173 | |
| | San Miguel Corp. | | | Industrial Conglomerates | | | | 1,240 | | | | 4,103 | |
| | San Miguel Pure Foods Co. Inc. | | | Food Products | | | | 2,200 | | | | 3,905 | |
| | Semirara Mining and Power Corp. | | | Oil, Gas & Consumable Fuels | | | | 4,000 | | | | 1,760 | |
| | SM Investments Corp. | | | Industrial Conglomerates | | | | 1,660 | | | | 31,099 | |
| | SM Prime Holdings Inc. | | | Real Estate Management & Development | | | | 31,200 | | | | 22,393 | |
| | Universal Robina Corp. | | | Food Products | | | | 3,020 | | | | 9,090 | |
| | | | | | | | | | | | | | |
| | | | |
| | | | | | | | | | | | | 222,445 | |
| | | | | | | | | | | | | | |
| | | Singapore 4.1% | | | | | | | | | |
| | Ascendas REIT | | | Equity Real Estate Investment Trusts (REITs | ) | | | 9,000 | | | | 20,305 | |
| | BOC Aviation Ltd. | | | Trading Companies & Distributors | | | | 800 | | | | 7,383 | |
| | CapitaLand Commercial Trust | | | Equity Real Estate Investment Trusts (REITs | ) | | | 8,800 | | | | 13,172 | |
| | CapitaLand Ltd. | | | Real Estate Management & Development | | | | 8,600 | | | | 21,952 | |
| | CapitaLand Mall Trust | | | Equity Real Estate Investment Trusts (REITs | ) | | | 8,400 | | | | 15,975 | |
| | City Developments Ltd. | | | Real Estate Management & Development | | | | 1,600 | | | | 11,362 | |
| | ComfortDelGro Corp. Ltd. | | | Road & Rail | | | | 7,200 | | | | 12,496 | |
| | DBS Group Holdings Ltd. | | | Banks | | | | 6,200 | | | | 112,083 | |
| | Frasers Property Ltd. | | | Real Estate Management & Development | | | | 600 | | | | 759 | |
| | Genting Singapore Ltd. | | | Hotels, Restaurants & Leisure | | | | 20,400 | | | | 12,981 | |
| | Golden Agri-Resources Ltd. | | | Food Products | | | | 21,200 | | | | 3,449 | |
| | Hutchison Port Holdings Trust | | | Transportation Infrastructure | | | | 18,800 | | | | 2,933 | |
| | Jardine Cycle & Carriage Ltd. | | | Distributors | | | | 400 | | | | 8,677 | |
| | Keppel Corp. Ltd. | | | Industrial Conglomerates | | | | 5,000 | | | | 21,441 | |
| | Keppel REIT | | | Equity Real Estate Investment Trusts (REITs | ) | | | 7,200 | | | | 6,560 | |
| | Mapletree Commercial Trust | | | Equity Real Estate Investment Trusts (REITs | ) | | | 6,600 | | | | 10,929 | |
| b | | Mapletree Greater China Commercial Trust, Reg S | | | Equity Real Estate Investment Trusts (REITs | ) | | | 7,800 | | | | 7,445 | |
| | Mapletree Industrial Trust | | | Equity Real Estate Investment Trusts (REITs | ) | | | 5,200 | | | | 9,137 | |
| | Mapletree Logistics Trust | | | Equity Real Estate Investment Trusts (REITs | ) | | | 8,600 | | | | 10,075 | |
| | Olam International Ltd. | | | Food & Staples Retailing | | | | 1,800 | | | | 2,343 | |
| | Oversea-Chinese Banking Corp. Ltd. | | | Banks | | | | 11,600 | | | | 91,096 | |
| | SATS Ltd. | | | Transportation Infrastructure | | | | 2,200 | | | | 7,700 | |
| | SembCorp Industries Ltd. | | | Industrial Conglomerates | | | | 3,200 | | | | 4,813 | |
| a | | SembCorp Marine Ltd. | | | Machinery | | | | 3,000 | | | | 2,560 | |
| | SIA Engineering Co. Ltd. | | | Transportation Infrastructure | | | | 800 | | | | 1,493 | |
| | Singapore Airlines Ltd. | | | Airlines | | | | 1,800 | | | | 11,897 | |
| | Singapore Exchange Ltd. | | | Capital Markets | | | | 2,800 | | | | 17,150 | |
| | Singapore Post Ltd. | | | Air Freight & Logistics | | | | 5,200 | | | | 3,666 | |
| | Singapore Press Holdings Ltd. | | | Media | | | | 6,000 | | | | 9,025 | |
| | Singapore Technologies Engineering Ltd. | | | Aerospace & Defense | | | | 5,200 | | | | 14,439 | |
| | Singapore Telecommunications Ltd. | | | Diversified Telecommunication Services | | | | 25,600 | | | | 57,387 | |
| | StarHub Ltd. | | | Wireless Telecommunication Services | | | | 2,200 | | | | 2,068 | |
| | Suntec REIT | | | Equity Real Estate Investment Trusts (REITs | ) | | | 7,600 | | | | 10,442 | |
| | United Overseas Bank Ltd. | | | Banks | | | | 4,400 | | | | 81,643 | |
| | UOL Group Ltd. | | | Real Estate Management & Development | | | | 1,600 | | | | 8,677 | |
| | | | | | |
| | | |
| franklintempleton.com | | Semiannual Report | | | 143 | |
FRANKLIN TEMPLETON ETF TRUST
STATEMENT OF INVESTMENTS (UNAUDITED)
Franklin FTSE Asia ex Japan ETF(continued)
| | | | | | | | | | | | | | |
| | | | |
| | | | | Industry | | | Shares | | | Value | |
| | | Common Stocks and Other Equity Interests (continued) | | | | | | | |
| | | Singapore (continued) | | | | | | | | | |
| | Venture Corp. Ltd. | | | Electronic Equipment, Instruments & Components | | | | 1,000 | | | $ | 11,071 | |
| | Wilmar International Ltd. | | | Food Products | | | | 6,600 | | | | 17,802 | |
| | Wing Tai Holdings Ltd. | | | Real Estate Management & Development | | | | 1,800 | | | | 2,668 | |
| | Yangzijiang Shipbuilding Holdings Ltd. | | | Machinery | | | | 7,200 | | | | 4,998 | |
| | Yanlord Land Group Ltd. | | | Real Estate Management & Development | | | | 2,200 | | | | 1,861 | |
| | | | | | | | | | | | | | |
| | | | |
| | | | | | | | | | | | | 673,913 | |
| | | | | | | | | | | | | | |
| | | South Korea 12.9% | | | | | | | | | |
| | Amorepacific Corp. | | | Personal Products | | | | 110 | | | | 12,921 | |
| | AmorePacific Group | | | Personal Products | | | | 96 | | | | 5,249 | |
| | BGF Co. Ltd. | | | Industrial Conglomerates | | | | 150 | | | | 752 | |
| | BGF Retail Co. Ltd. | | | Food & Staples Retailing | | | | 20 | | | | 3,294 | |
| | BNK Financial Group Inc. | | | Banks | | | | 1,016 | | | | 6,107 | |
| a | | Celltrion Healthcare Co. Ltd. | | | Health Care Providers & Services | | | | 198 | | | | 8,343 | |
| a | | Celltrion Inc. | | | Biotechnology | | | | 340 | | | | 46,616 | |
| | Cheil Worldwide Inc. | | | Media | | | | 246 | | | | 5,100 | |
| | CJ CheilJedang Corp. | | | Food Products | | | | 28 | | | | 5,489 | |
| | CJ Corp. | | | Industrial Conglomerates | | | | 40 | | | | 2,742 | |
| | CJ ENM Co. Ltd. | | | Internet & Direct Marketing Retail | | | | 34 | | | | 4,815 | |
| a | | CJ Logistics Corp. | | | Road & Rail | | | | 24 | | | | 2,899 | |
| | Daelim Industrial Co. Ltd. | | | Construction & Engineering | | | | 92 | | | | 7,999 | |
| a | | Daewoo Engineering & Construction Co. Ltd. | | | Construction & Engineering | | | | 558 | | | | 2,253 | |
| a | | Daewoo Shipbuilding & Marine Engineering Co. Ltd. | | | Machinery | | | | 166 | | | | 4,247 | |
| | DB Insurance Co. Ltd. | | | Insurance | | | | 160 | | | | 6,902 | |
| | DGB Financial Group Inc. | | | Banks | | | | 616 | | | | 3,837 | |
| | Dongsuh Cos. Inc. | | | Food & Staples Retailing | | | | 118 | | | | 1,776 | |
| | Doosan Bobcat Inc. | | | Machinery | | | | 86 | | | | 2,545 | |
| e | | Doosan Corp. | | | Industrial Conglomerates | | | | 22 | | | | 1,926 | |
| a | | Doosan Heavy Industries and Construction Co. Ltd. | | | Electrical Equipment | | | | 415 | | | | 2,359 | |
| a | | Doosan Infracore Co. Ltd. | | | Machinery | | | | 478 | | | | 2,518 | |
| | E-MART Inc. | | | Food & Staples Retailing | | | | 72 | | | | 6,802 | |
| | Fila Korea Ltd. | | | Textiles, Apparel & Luxury Goods | | | | 180 | | | | 8,713 | |
| | GS Engineering & Construction Corp. | | | Construction & Engineering | | | | 202 | | | | 5,573 | |
| | GS Holdings Corp. | | | Oil, Gas & Consumable Fuels | | | | 176 | | | | 7,401 | |
| | GS Retail Co. Ltd. | | | Food & Staples Retailing | | | | 88 | | | | 3,035 | |
| | Hana Financial Group Inc. | | | Banks | | | | 1,030 | | | | 30,354 | |
| | Hankook Tire & Technology Co. Ltd. | | | Auto Components | | | | 254 | | | | 6,848 | |
| | Hanmi Pharm Co. Ltd. | | | Pharmaceuticals | | | | 24 | | | | 5,538 | |
| | Hanmi Science Co. Ltd. | | | Pharmaceuticals | | | | 43 | | | | 1,424 | |
| | Hanon Systems | | | Auto Components | | | | 548 | | | | 5,498 | |
| | Hanssem Co. Ltd. | | | Household Durables | | | | 30 | | | | 1,505 | |
| a | | Hanwha Aerospace Co. Ltd. | | | Aerospace & Defense | | | | 118 | | | | 4,158 | |
| | Hanwha Chemical Corp. | | | Chemicals | | | | 266 | | | | 3,992 | |
| | Hanwha Corp. | | | Industrial Conglomerates | | | | 120 | | | | 2,533 | |
| | Hanwha Corp. | | | Industrial Conglomerates | | | | 140 | | | | 1,609 | |
| | Hanwha Life Insurance Co. Ltd. | | | Insurance | | | | 940 | | | | 1,870 | |
| | HDC Holdings Co. Ltd. | | | Construction & Engineering | | | | 136 | | | | 1,467 | |
| | HDC Hyundai DevelopmentCo-Engineering & Construction | | | Construction & Engineering | | | | 102 | | | | 2,801 | |
| a | | Helixmith Co. Ltd. | | | Biotechnology | | | | 63 | | | | 3,492 | |
| | Hite Jinro Co. Ltd. | | | Beverages | | | | 116 | | | | 2,638 | |
| a | | HLB Inc. | | | Leisure Equipment & Products | | | | 126 | | | | 6,362 | |
| | Hotel Shilla Co. Ltd. | | | Specialty Retail | | | | 108 | | | | 7,783 | |
| | Hyundai Construction Equipment Co. Ltd. | | | Machinery | | | | 44 | | | | 1,162 | |
| | Hyundai Department Store Co. Ltd. | | | Multiline Retail | | | | 54 | | | | 3,526 | |
| | Hyundai Engineering & Construction Co. Ltd. | | | Construction & Engineering | | | | 252 | | | | 9,754 | |
| | | | |
| | | |
| 144 | | Semiannual Report | | franklintempleton.com |
FRANKLIN TEMPLETON ETF TRUST
STATEMENT OF INVESTMENTS (UNAUDITED)
Franklin FTSE Asia ex Japan ETF(continued)
| | | | | | | | | | | | | | |
| | | | |
| | | | | Industry | | | Shares | | | Value | |
| | | Common Stocks and Other Equity Interests (continued) | | | | | | | |
| | | South Korea (continued) | | | | | | | | | |
| | Hyundai Glovis Co. Ltd. | | | Air Freight & Logistics | | | | 62 | | | $ | 8,086 | |
| | Hyundai Heavy Industries Holdings Co. Ltd. | | | Machinery | | | | 36 | | | | 10,519 | |
| | Hyundai Marine & Fire Insurance Co. Ltd. | | | Insurance | | | | 206 | | | | 4,547 | |
| | Hyundai Mipo Dockyard Co. Ltd. | | | Machinery | | | | 76 | | | | 2,866 | |
| | Hyundai Mobis Co. Ltd. | | | Auto Components | | | | 224 | | | | 47,191 | |
| | Hyundai Motor Co. | | | Automobiles | | | | 488 | | | | 54,669 | |
| | Hyundai Steel Co. | | | Metals & Mining | | | | 250 | | | | 8,130 | |
| | Hyundai Wia Corp. | | | Auto Components | | | | 54 | | | | 2,302 | |
| | Industrial Bank of Korea | | | Banks | | | | 964 | | | | 10,638 | |
| | Kakao Corp. | | | Interactive Media & Services | | | | 172 | | | | 19,484 | |
| | Kangwon Land Inc. | | | Hotels, Restaurants & Leisure | | | | 376 | | | | 9,289 | |
| | KB Financial Group Inc. | | | Banks | | | | 1,338 | | | | 47,764 | |
| | KCC Corp. | | | Building Products | | | | 20 | | | | 3,645 | |
| | KEPCO Plant Service and Engineering Co. Ltd. | | | Commercial Services & Supplies | | | | 82 | | | | 2,368 | |
| | Kia Motors Corp. | | | Automobiles | | | | 884 | | | | 33,700 | |
| | Korea Aerospace Industries Ltd. | | | Aerospace & Defense | | | | 220 | | | | 7,191 | |
| a | | Korea Electric Power Corp. | | | Electric Utilities | | | | 872 | | | | 18,881 | |
| | Korea Gas Corp. | | | Gas Utilities | | | | 102 | | | | 3,377 | |
| | Korea Investment Holdings Co. Ltd. | | | Capital Markets | | | | 132 | | | | 8,310 | |
| a | | Korea Shipbuilding & Offshore Engineering Co Ltd. | | | Machinery | | | | 148 | | | | 15,343 | |
| | Korea Zinc Co. Ltd. | | | Metals & Mining | | | | 34 | | | | 12,734 | |
| | Korean Air Lines Co. Ltd. | | | Airlines | | | | 174 | | | | 3,331 | |
| | KT&G Corp. | | | Tobacco | | | | 382 | | | | 33,692 | |
| | Kumho Petrochemical Co. Ltd. | | | Chemicals | | | | 60 | | | | 3,591 | |
| | LG Chem Ltd. | | | Chemicals | | | | 158 | | | | 39,561 | |
| | LG Corp. | | | Industrial Conglomerates | | | | 312 | | | | 18,259 | |
| a | | LG Display Co. Ltd. | | | Electronic Equipment, Instruments & Components | | | | 770 | | | | 9,109 | |
| | LG Electronics Inc. | | | Household Durables | | | | 382 | | | | 21,525 | |
| | LG Household & Health Care Ltd. | | | Personal Products | | | | 30 | | | | 32,780 | |
| | LG Uplus Corp. | | | Diversified Telecommunication Services | | | | 672 | | | | 7,669 | |
| | Lotte Chemical Corp. | | | Chemicals | | | | 50 | | | | 9,865 | |
| | Lotte Chilsung Beverage Co. Ltd. | | | Beverages | | | | 12 | | | | 1,389 | |
| | Lotte Corp. | | | Industrial Conglomerates | | | | 76 | | | | 2,303 | |
| | LOTTE Fine Chemical Co. Ltd. | | | Chemicals | | | | 68 | | | | 2,592 | |
| | Lotte Shopping Co. Ltd. | | | Multiline Retail | | | | 40 | | | | 4,314 | |
| | LS Corp. | | | Electrical Equipment | | | | 66 | | | | 2,618 | |
| | Mando Corp. | | | Auto Components | | | | 114 | | | | 3,450 | |
| | Medy-tox Inc. | | | Biotechnology | | | | 14 | | | | 4,215 | |
| | Mirae Asset Daewoo Co. Ltd. | | | Capital Markets | | | | 202 | | | | 714 | |
| | Mirae Asset Daewood Co. Ltd. | | | Capital Markets | | | | 1,486 | | | | 9,317 | |
| | Naver Corp. | | | Interactive Media & Services | | | | 460 | | | | 60,377 | |
| | NCsoft Corp. | | | Entertainment | | | | 58 | | | | 25,263 | |
| a | | Netmarble Corp. | | | Entertainment | | | | 58 | | | | 4,582 | |
| | NH Investment & Securities Co. Ltd. | | | Capital Markets | | | | 468 | | | | 4,969 | |
| a | | NHN Corp. | | | Entertainment | | | | 38 | | | | 1,979 | |
| | Nongshim Co. Ltd. | | | Food Products | | | | 10 | | | | 2,086 | |
| | OCI Co. Ltd. | | | Chemicals | | | | 66 | | | | 3,835 | |
| | Orion Corp. | | | Food Products | | | | 74 | | | | 6,088 | |
| | Ottogi Corp. | | | Food Products | | | | 4 | | | | 1,950 | |
| | Paradise Co. Ltd. | | | Hotels, Restaurants & Leisure | | | | 174 | | | | 2,691 | |
| | POSCO | | | Metals & Mining | | | | 234 | | | | 44,407 | |
| | POSCO Chemical Co. Ltd. | | | Construction Materials | | | | 76 | | | | 2,805 | |
| | Posco International Corp. | | | Trading Companies & Distributors | | | | 168 | | | | 2,683 | |
| | S-1 Corp. | | | Commercial Services & Supplies | | | | 64 | | | | 5,249 | |
| | S-Oil Corp. | | | Oil, Gas & Consumable Fuels | | | | 140 | | | | 11,634 | |
| a | | Samsung Biologics Co. Ltd. | | | Life Sciences Tools & Services | | | | 46 | | | | 11,825 | |
| | | | | | |
| | | |
| franklintempleton.com | | Semiannual Report | | | 145 | |
FRANKLIN TEMPLETON ETF TRUST
STATEMENT OF INVESTMENTS (UNAUDITED)
Franklin FTSE Asia ex Japan ETF(continued)
| | | | | | | | | | | | | | |
| | | | |
| | | | | Industry | | | Shares | | | Value | |
| | | Common Stocks and Other Equity Interests (continued) | | | | | | | |
| | | South Korea (continued) | | | | | | | | | |
| | Samsung C&T Corp. | | | Industrial Conglomerates | | | | 284 | | | $ | 21,297 | |
| | Samsung Card Co. Ltd. | | | Consumer Finance | | | | 106 | | | | 3,115 | |
| | Samsung Electro-Mechanics Co. Ltd. | | | Electronic Equipment, Instruments & Components | | | | 196 | | | | 16,877 | |
| | Samsung Electronics Co. Ltd. | | | Technology Hardware, Storage & Peripherals | | | | 16,268 | | | | 667,095 | |
| a | | Samsung Engineering Co. Ltd. | | | Construction & Engineering | | | | 546 | | | | 7,669 | |
| | Samsung Fire & Marine Insurance Co. Ltd. | | | Insurance | | | | 110 | | | | 20,507 | |
| a | | Samsung Heavy Industries Co. Ltd. | | | Machinery | | | | 1,520 | | | | 10,013 | |
| | Samsung Life Insurance Co. Ltd. | | | Insurance | | | | 218 | | | | 12,958 | |
| | Samsung SDI Co. Ltd. | | | Electronic Equipment, Instruments & Components | | | | 182 | | | | 33,931 | |
| | Samsung SDS Co. Ltd. | | | IT Services | | | | 110 | | | | 17,519 | |
| | Samsung Securities Co. Ltd. | | | Capital Markets | | | | 228 | | | | 6,738 | |
| | Shinhan Financial Group Co. Ltd. | | | Banks | | | | 1,558 | | | | 54,445 | |
| | Shinsegae Co. Ltd. | | | Multiline Retail | | | | 24 | | | | 5,267 | |
| a | | SillaJen Inc. | | | Biotechnology | | | | 196 | | | | 1,334 | |
| | SK Holdings Co. Ltd. | | | Industrial Conglomerates | | | | 112 | | | | 19,101 | |
| | SK Hynix Inc. | | | Semiconductors & Semiconductor Equipment | | | | 1,786 | | | | 122,735 | |
| | SK Innovation Co. Ltd. | | | Oil, Gas & Consumable Fuels | | | | 198 | | | | 27,478 | |
| | SK Networks Co. Ltd. | | | Trading Companies & Distributors | | | | 538 | | | | 2,501 | |
| | SK Telecom Co. Ltd. | | | Wireless Telecommunication Services | | | | 80 | | | | 16,152 | |
| | SKC Co. Ltd. | | | Chemicals | | | | 72 | | | | 2,396 | |
| | Ssangyong Cement Industrial Co. Ltd. | | | Construction Materials | | | | 372 | | | | 1,900 | |
| | Woongjin Coway Co. Ltd. | | | Household Durables | | | | 192 | | | | 13,580 | |
| | Woori Financial Group Inc. | | | Banks | | | | 1,928 | | | | 20,067 | |
| | Yuhan Corp. | | | Pharmaceuticals | | | | 31 | | | | 5,922 | |
| | | | | | | | | | | | | | |
| | | | |
| | | | | | | | | | | | | 2,120,875 | |
| | | | | | | | | | | | | | |
| | | Taiwan 12.9% | | | | | | | | | |
| | Acer Inc. | | | Technology Hardware, Storage & Peripherals | | | | 10,000 | | | | 5,737 | |
| | Advantech Co. Ltd. | | | Technology Hardware, Storage & Peripherals | | | | 1,000 | | | | 8,800 | |
| | ASE Industrial Holding Co. Ltd. | | | Semiconductors & Semiconductor Equipment | | | | 11,500 | | | | 26,244 | |
| | Asia Cement Corp. | | | Construction Materials | | | | 8,000 | | | | 11,165 | |
| | Asustek Computer Inc. | | | Technology Hardware, Storage & Peripherals | | | | 2,000 | | | | 13,312 | |
| | AU Optronics Corp. | | | Electronic Equipment, Instruments & Components | | | | 32,000 | | | | 8,107 | |
| | Capital Securities Corp. | | | Capital Markets | | | | 10,840 | | | | 3,078 | |
| | Catcher Technology Co. Ltd. | | | Technology Hardware, Storage & Peripherals | | | | 2,780 | | | | 21,058 | |
| | Cathay Financial Holding Co. Ltd. | | | Insurance | | | | 28,000 | | | | 36,913 | |
| | Chailease Holding Co. Ltd. | | | Diversified Financial Services | | | | 4,120 | | | | 16,600 | |
| | Chang Hwa Commercial Bank Ltd. | | | Banks | | | | 21,337 | | | | 14,890 | |
| | Cheng Shin Rubber Industry Co. Ltd. | | | Auto Components | | | | 6,000 | | | | 8,858 | |
| | Chicony Electronics Co. Ltd. | | | Technology Hardware, Storage & Peripherals | | | | 2,010 | | | | 5,922 | |
| | China Airlines Ltd. | | | Airlines | | | | 8,000 | | | | 2,341 | |
| | China Development Financial Holding Corp. | | | Insurance | | | | 48,000 | | | | 14,296 | |
| a | | China Life Insurance Co. Ltd. | | | Insurance | | | | 9,550 | | | | 7,572 | |
| e | | China Motor Corp. | | | Automobiles | | | | 800 | | | | 1,202 | |
| | China Steel Corp. | | | Metals & Mining | | | | 42,000 | | | | 31,137 | |
| | Chunghwa Telecom Co. Ltd. | | | Diversified Telecommunication Services | | | | 14,000 | | | | 50,089 | |
| | Compal Electronics Inc. | | | Technology Hardware, Storage & Peripherals | | | | 16,000 | | | | 9,231 | |
| | CTBC Financial Holding Co. Ltd. | | | Banks | | | | 62,000 | | | | 41,167 | |
| | Delta Electronics Inc. | | | Electronic Equipment, Instruments & Components | | | | 8,000 | | | | 34,167 | |
| | E.Sun Financial Holding Co. Ltd. | | | Banks | | | | 37,052 | | | | 31,350 | |
| | Eclat Textile Co. Ltd. | | | Textiles, Apparel & Luxury Goods | | | | 700 | | | | 9,386 | |
| a | | Epistar Corp. | | | Semiconductors & Semiconductor Equipment | | | | 4,000 | | | | 3,127 | |
| | Eternal Materials Co. Ltd. | | | Chemicals | | | | 4,000 | | | | 3,268 | |
| | EVA Airways Corp. | | | Airlines | | | | 7,124 | | | | 3,134 | |
| a | | Evergreen Marine Corp. Taiwan Ltd. | | | Marine | | | | 6,878 | | | | 2,882 | |
| | Far Eastern International Bank | | | Banks | | | | 8,212 | | | | 3,176 | |
| | Far Eastern New Century Corp. | | | Industrial Conglomerates | | | | 14,000 | | | | 12,929 | |
| | | | |
| | | |
| 146 | | Semiannual Report | | franklintempleton.com |
FRANKLIN TEMPLETON ETF TRUST
STATEMENT OF INVESTMENTS (UNAUDITED)
Franklin FTSE Asia ex Japan ETF(continued)
| | | | | | | | | | | | | | |
| | | | |
| | | | | Industry | | | Shares | | | Value | |
| | | Common Stocks and Other Equity Interests (continued) | | | | | | | |
| | | Taiwan (continued) | | | | | | | | | |
| | Far EasTone Telecommunications Co. Ltd. | | | Wireless Telecommunication Services | | | | 6,000 | | | $ | 14,021 | |
| | Feng Tay Enterprise Co. Ltd. | | | Textiles, Apparel & Luxury Goods | | | | 1,100 | | | | 7,889 | |
| | First Financial Holding Co. Ltd. | | | Banks | | | | 34,743 | | | | 24,413 | |
| | FIT Hon Teng Ltd. | | | Electronic Equipment, Instruments & Components | | | | 2,000 | | | | 821 | |
| | Formosa Chemicals & Fibre Corp. | | | Chemicals | | | | 12,000 | | | | 33,535 | |
| | Formosa Petrochemical Corp. | | | Oil, Gas & Consumable Fuels | | | | 4,000 | | | | 12,661 | |
| | Formosa Plastics Corp. | | | Chemicals | | | | 16,000 | | | | 48,736 | |
| | Formosa Taffeta Co. Ltd. | | | Textiles, Apparel & Luxury Goods | | | | 4,000 | | | | 4,358 | |
| | Foxconn Technology Co. Ltd. | | | Electronic Equipment, Instruments & Components | | | | 4,000 | | | | 8,342 | |
| | Fubon Financial Holding Co. Ltd. | | | Insurance | | | | 26,000 | | | | 37,335 | |
| | Giant Manufacturing Co. Ltd. | | | Leisure Equipment & Products | | | | 1,000 | | | | 6,801 | |
| | Globalwafers Co. Ltd. | | | Semiconductors & Semiconductor Equipment | | | | 1,000 | | | | 10,121 | |
| | Hon Hai Precision Industry Co. Ltd. | | | Electronic Equipment, Instruments & Components | | | | 40,800 | | | | 96,265 | |
| | Hotai Motor Co. Ltd. | | | Specialty Retail | | | | 1,000 | | | | 15,198 | |
| | HTC Corp. | | | Technology Hardware, Storage & Peripherals | | | | 2,000 | | | | 2,289 | |
| | Hua Nan Financial Holdings Co. Ltd. | | | Banks | | | | 31,153 | | | | 21,037 | |
| | Innolux Corp. | | | Electronic Equipment, Instruments & Components | | | | 30,000 | | | | 6,382 | |
| | Inventec Corp. | | | Technology Hardware, Storage & Peripherals | | | | 12,000 | | | | 8,277 | |
| | Largan Precision Co. Ltd. | | | Electronic Equipment, Instruments & Components | | | | 360 | | | | 51,637 | |
| | Lite-On Technology Corp. | | | Technology Hardware, Storage & Peripherals | | | | 8,000 | | | | 12,713 | |
| | MediaTek Inc. | | | Semiconductors & Semiconductor Equipment | | | | 5,000 | | | | 59,469 | |
| | Mega Financial Holding Co. Ltd. | | | Banks | | | | 38,000 | | | | 35,214 | |
| | Nan Ya Plastics Corp. | | | Chemicals | | | | 20,000 | | | | 44,932 | |
| | Nanya Technology Corp. | | | Semiconductors & Semiconductor Equipment | | | | 2,000 | | | | 5,189 | |
| | Novatek Microelectronics Corp. Ltd. | | | Semiconductors & Semiconductor Equipment | | | | 2,000 | | | | 11,475 | |
| | Oriental Union Chemical Corp. | | | Chemicals | | | | 2,000 | | | | 1,421 | |
| | Pegatron Corp. | | | Technology Hardware, Storage & Peripherals | | | | 6,000 | | | | 10,443 | |
| | Pou Chen Corp. | | | Textiles, Apparel & Luxury Goods | | | | 10,000 | | | | 12,812 | |
| | President Chain Store Corp. | | | Food & Staples Retailing | | | | 2,000 | | | | 18,695 | |
| | Quanta Computer Inc. | | | Technology Hardware, Storage & Peripherals | | | | 10,000 | | | | 18,244 | |
| | Realtek Semiconductor Corp. | | | Semiconductors & Semiconductor Equipment | | | | 2,000 | | | | 14,827 | |
| | Shin Kong Financial Holding Co. Ltd. | | | Insurance | | | | 41,275 | | | | 12,492 | |
| | SinoPac Financial Holdings Co. Ltd. | | | Banks | | | | 36,800 | | | | 14,353 | |
| | Synnex Technology International Corp. | | | Electronic Equipment, Instruments & Components | | | | 6,000 | | | | 7,020 | |
| | Taishin Financial Holding Co. Ltd. | | | Banks | | | | 35,357 | | | | 15,784 | |
| | Taiwan Business Bank | | | Banks | | | | 15,372 | | | | 6,317 | |
| | Taiwan Cement Corp. | | | Construction Materials | | | | 16,479 | | | | 21,061 | |
| | Taiwan Cooperative Financial Holding Co. Ltd. | | | Banks | | | | 32,010 | | | | 21,151 | |
| | Taiwan Fertilizer Co. Ltd. | | | Chemicals | | | | 2,000 | | | | 2,933 | |
| | Taiwan Glass Industry Corp. | | | Building Products | | | | 4,000 | | | | 1,502 | |
| | Taiwan High Speed Rail Corp. | | | Transportation Infrastructure | | | | 8,000 | | | | 9,102 | |
| | Taiwan Mobile Co. Ltd. | | | Wireless Telecommunication Services | | | | 6,000 | | | | 21,660 | |
| | Taiwan Secom Co. Ltd. | | | Commercial Services & Supplies | | | | 1,000 | | | | 2,836 | |
| | Taiwan Semiconductor Manufacturing Co. Ltd. | | | Semiconductors & Semiconductor Equipment | | | | 84,000 | | | | 736,450 | |
| | Teco Electric & Machinery Co. Ltd. | | | Electrical Equipment | | | | 6,000 | | | | 4,835 | |
| | The Shanghai Commercial & Savings Bank Ltd. | | | Banks | | | | 12,000 | | | | 20,152 | |
| a | | TPK Holding Co. Ltd. | | | Electronic Equipment, Instruments & Components | | | | 2,000 | | | | 3,604 | |
| | Transcend Information Inc. | | | Technology Hardware, Storage & Peripherals | | | | 2,000 | | | | 4,152 | |
| | U-Ming Marine Transport Corp. | | | Marine | | | | 2,000 | | | | 2,163 | |
| | Uni-President Enterprises Corp. | | | Food Products | | | | 16,000 | | | | 38,576 | |
| | Unimicron Technology Corp. | | | Electronic Equipment, Instruments & Components | | | | 4,000 | | | | 5,628 | |
| | United Microelectronics Corp. | | | Semiconductors & Semiconductor Equipment | | | | 38,000 | | | | 16,413 | |
| | Vanguard International Semiconductor Corp. | | | Semiconductors & Semiconductor Equipment | | | | 4,000 | | | | 8,084 | |
| | Walsin Lihwa Corp. | | | Electrical Equipment | | | | 12,000 | | | | 5,608 | |
| | Walsin Technology Corp. | | | Electronic Equipment, Instruments & Components | | | | 2,000 | | | | 11,249 | |
| | Wan Hai Lines Ltd. | | | Marine | | | | 2,000 | | | | 1,177 | |
| | Wistron Corp. | | | Technology Hardware, Storage & Peripherals | | | | 10,293 | | | | 8,311 | |
| | | | | | |
| | | |
| franklintempleton.com | | Semiannual Report | | | 147 | |
FRANKLIN TEMPLETON ETF TRUST
STATEMENT OF INVESTMENTS (UNAUDITED)
Franklin FTSE Asia ex Japan ETF(continued)
| | | | | | | | | | | | | | |
| | | | |
| | | | | Industry | | | Shares | | | Value | |
| | | Common Stocks and Other Equity Interests (continued) | | | | | | | |
| | | Taiwan (continued) | | | | | | | | | |
| | Yageo Corp. | | | Electronic Equipment, Instruments & Components | | | | 1,000 | | | $ | 7,945 | |
| | Yuanta Financial Holding Co. Ltd. | | | Capital Markets | | | | 40,000 | | | | 23,852 | |
| | Yulon Motor Co. Ltd. | | | Automobiles | | | | 4,000 | | | | 2,533 | |
| | | | | | | | | | | | | | |
| | | | |
| | | | | | | | | | | | | 2,133,633 | |
| | | | | | | | | | | | | | |
| | | Thailand 3.7% | | | | | | | | | |
| | Advanced Info Service PCL | | | Wireless Telecommunication Services | | | | 3,800 | | | | 27,334 | |
| | Airports of Thailand Public Co. Ltd., NVDR | | | Transportation Infrastructure | | | | 14,800 | | | | 36,171 | |
| | B Grimm Power PCL, NVDR | | | Independent Power and Renewable Electricity Producers | | | | 2,389 | | | | 3,378 | |
| | Bangkok Bank PCL, fgn. | | | Banks | | | | 1,600 | | | | 9,207 | |
| | Bangkok Dusit Medical Services PCL | | | Health Care Providers & Services | | | | 30,400 | | | | 24,054 | |
| | Bangkok Expressway and Metro PCL, NVDR | | | Transportation Infrastructure | | | | 28,200 | | | | 9,958 | |
| | Bangkok Life Assurance PCL, NVDR | | | Insurance | | | | 1,400 | | | | 929 | |
| | Banpu PCL, NVDR | | | Oil, Gas & Consumable Fuels | | | | 15,200 | | | | 5,864 | |
| | Berli Jucker PCL, NVDR | | | Food & Staples Retailing | | | | 3,400 | | | | 5,864 | |
| | BTS Group Holdings PCL, NVDR | | | Road & Rail | | | | 27,600 | | | | 12,092 | |
| | Bumrungrad Hospital PCL | | | Health Care Providers & Services | | | | 1,200 | | | | 5,022 | |
| | Central Pattana PCL | | | Real Estate Management & Development | | | | 8,600 | | | | 19,120 | |
| | Charoen Pokphand Foods PCL, NVDR | | | Food Products | | | | 12,400 | | | | 10,642 | |
| | CP ALL PCL | | | Food & Staples Retailing | | | | 18,000 | | | | 47,817 | |
| | Delta Electronics Thailand PCL | | | Electronic Equipment, Instruments & Components | | | | 1,400 | | | | 2,266 | |
| | Digital Telecommunications Infrastructure Fund, fgn. | | | Diversified Financial Services | | | | 15,000 | | | | 8,534 | |
| | Electricity Generating PCL | | | Independent Power and Renewable Electricity Producers | | | | 1,000 | | | | 11,738 | |
| | Energy Absolute PCL, NVDR | | | Independent Power and Renewable Electricity Producers | | | | 5,600 | | | | 8,789 | |
| | Global Power Synergy PCL | | | Independent Power and Renewable Electricity Producers | | | | 2,400 | | | | 5,512 | |
| a | | Global Power Synergy PCL, rts., 10/04/19 | | | Independent Power and Renewable Electricity Producers | | | | 1,234 | | | | 575 | |
| | Gulf Energy Development PCL, NVDR | | | Independent Power and Renewable Electricity Producers | | | | 2,600 | | | | 13,601 | |
| | Home Product Center PCL, NVDR | | | Specialty Retail | | | | 20,000 | | | | 11,182 | |
| | Indorama Ventures PCL, NVDR | | | Chemicals | | | | 6,400 | | | | 6,801 | |
| | Intouch Holdings PCL | | | Wireless Telecommunication Services | | | | 7,600 | | | | 16,276 | |
| | IRPC PCL | | | Oil, Gas & Consumable Fuels | | | | 36,400 | | | | 4,380 | |
| | Kasikornbank PCL, fgn. | | | Banks | | | | 4,000 | | | | 20,533 | |
| | Kasikornbank PCL, NVDR | | | Banks | | | | 2,800 | | | | 14,327 | |
| | Krung Thai Bank PCL | | | Banks | | | | 22,400 | | | | 12,597 | |
| | Krungthai Card PCL, NVDR | | | Consumer Finance | | | | 4,644 | | | | 6,491 | |
| | Land and Houses PCL, NVDR | | | Real Estate Management & Development | | | | 25,800 | | | | 8,098 | |
| | Minor International PCL | | | Hotels, Restaurants & Leisure | | | | 12,600 | | | | 15,449 | |
| | Muangthai Capital PCL | | | Consumer Finance | | | | 2,400 | | | | 4,473 | |
| | Osotspa PCL, NVDR | | | Beverages | | | | 4,200 | | | | 5,115 | |
| | PTT Exploration and Production PCL, NVDR | | | Oil, Gas & Consumable Fuels | | | | 4,800 | | | | 18,990 | |
| | PTT Global Chemical PCL, NVDR | | | Chemicals | | | | 7,400 | | | | 13,005 | |
| | PTT PCL | | | Oil, Gas & Consumable Fuels | | | | 49,400 | | | | 74,702 | |
| | Ratch Group PCL, NVDR | | | Independent Power and Renewable Electricity Producers | | | | 2,800 | | | | 6,546 | |
| | Siam City Cement PCL, NVDR | | | Construction Materials | | | | 200 | | | | 1,406 | |
| | Siam Commercial Bank PCL | | | Banks | | | | 8,400 | | | | 32,408 | |
| | Siam Makro Public Company Ltd. | | | Food & Staples Retailing | | | | 800 | | | | 883 | |
| a | | Thai Airways International PCL, NVDR | | | Airlines | | | | 3,600 | | | | 1,071 | |
| | Thai Oil PCL | | | Oil, Gas & Consumable Fuels | | | | 3,600 | | | | 8,210 | |
| | Thai Union Frozen Products PCL | | | Food Products | | | | 10,000 | | | | 5,460 | |
| | The Siam Cement PCL | | | Construction Materials | | | | 3,000 | | | | 40,020 | |
| | TMB Bank PCL, rts., 02/20/49 | | | Banks | | | | 73,600 | | | | 3,778 | |
| a | | TMB Bank PCL, rts., 2/20/49 | | | Banks | | | | 50,951 | | | | 283 | |
| | Total Access Communication PCL | | | Wireless Telecommunication Services | | | | 2,400 | | | | 4,512 | |
| | | | |
| | | |
| 148 | | Semiannual Report | | franklintempleton.com |
FRANKLIN TEMPLETON ETF TRUST
STATEMENT OF INVESTMENTS (UNAUDITED)
Franklin FTSE Asia ex Japan ETF(continued)
| | | | | | | | | | | | | | |
| | | | |
| | | | | Industry | | | Shares | | | Value | |
| | | Common Stocks and Other Equity Interests (continued) | | | | | | | |
| | | Thailand (continued) | | | | | | | | | |
| | True Corporation PCL, NVDR | | | Diversified Telecommunication Services | | | | 36,600 | | | $ | 6,282 | |
| | | | | | | | | | | | | | |
| | | | |
| | | | | | | | | | | | | 611,745 | |
| | | | | | | | | | | | | | |
| | | | |
| | Total Common Stocks and Other Equity Interests
(Cost $18,418,254) | | | | | | | | | | | 16,253,205 | |
| | | | | | | | | | | | | | |
| | | Preferred Stocks 0.7% | | | | | | | | | |
| | | South Korea 0.7% | | | | | | | | | |
| f | | Amorepacific Corp., 1.617%, pfd. | | | Personal Products | | | | 30 | | | | 1,838 | |
| f | | CJ CheilJedang Corp., 3.381%, pfd. | | | Food Products | | | | 4 | | | | 351 | |
| f | | Hyundai Motor Co., 4.829%, pfd., 2 | | | Automobiles | | | | 124 | | | | 8,801 | |
| f | | Hyundai Motor Co., 5.301%, pfd. | | | Automobiles | | | | 76 | | | | 4,854 | |
| f | | LG Chem Ltd., 3.612%, pfd. | | | Chemicals | | | | 24 | | | | 3,361 | |
| f | | LG Electronics Inc., 2.914%, pfd. | | | Household Durables | | | | 66 | | | | 1,515 | |
| f | | LG Household & Health Care Ltd., 1.206%, pfd. | | | Personal Products | | | | 6 | | | | 3,867 | |
| f | | Samsung Electronics Co. Ltd., 3.587%, pfd. | | | Technology Hardware, Storage & Peripherals | | | | 2,848 | | | | 94,049 | |
| f | | Samsung Fire & Marine Insurance Co. Ltd., 7.080%, pfd. | | | Insurance | | | | 14 | | | | 1,902 | |
| | | | | | | | | | | | | | |
| | Total Preferred Stocks
(Cost $140,067) | | | | | | | | | | | 120,538 | |
| | | | | | | | | | | | | | |
| | | | |
| | Warrants (Cost $—) 0.0%† | | | | | | | | | | | | |
| | | Thailand 0.0%† | | | | | | | | | |
| a | | BTS Group Holdings PCL, wts., 11/29/19 | | | Road & Rail | | | | 1 | | | | — | |
| | | | | | | | | | | | | | |
| | | | |
| | Corporate Bonds & Notes (Cost $90) 0.0%† | | | | | | | | | | | | |
| | | India 0.0%† | | | | | | | | | |
| | Britannia Industries Ltd., senior secured note,
first lien, 8.00% | | | Food Products | | | | 6,300 | | | | 91 | |
| | | | | | | | | | | | | | |
| | | Short Term Investments 0.1% | | | | | | | | | |
| | Investments from Cash Collateral Received for Loaned Securities 0.1% | | | | | | | | | | | | |
| | | United States 0.1% | | | | | | | | | |
| g,h | | Institutional Fiduciary Trust Portfolio, 1.71% | | | Money Market Funds | | | | 5,820 | | | | 5,820 | |
| | | | | | | | | | | | | | |
| | Total Investments
(Cost $18,564,231) 99.3% | | | | | | | | | | | 16,379,654 | |
| | Other Assets, less Liabilities 0.7% | | | | | | | | | | | 122,447 | |
| | | | | | | | | | | | | | |
| | Net Assets 100.0% | | | | | | | | | | $ | 16,502,101 | |
| | | | | | | | | | | | | | |
See Abbreviations on page 322.
†Rounds to less than 0.1% of net assets.
aNon-income producing.
bSecurity was purchased pursuant to Regulation S under the Securities Act of 1933, which exempts from registration securities offered and sold outside of the United States. Such a security cannot be sold in the United States without either an effective registration statement filed pursuant to the Securities Act of 1933, or pursuant to an exemption from registration. These securities have been deemed liquid under guidelines approved by the Fund’s Board of Trustees. At September 30, 2019, the aggregate value of these securities was $275,206, representing 1.7% of net assets.
cSecurity was purchased pursuant to Rule 144A under the Securities Act of 1933 and may be sold in transactions exempt from registration only to qualified institutional buyers or in a public offering registered under the Securities Act of 1933. These securities have been deemed liquid under guidelines approved by the Fund’s Board of Trustees. At September 30, 2019, the aggregate value of these securities was $97,069, representing 0.6% of net assets.
dA portion or all of the security is on loan at September 30, 2019. See Note 1(c).
eFair valued using significant unobservable inputs. See Note 8 regarding fair value measurements.
fVariable rate security. The rate shown represents the yield at period end.
gSee Note 3(c) regarding investments in affiliated management investment companies.
hThe rate shown is the annualizedseven-day effective yield at period end.
| | | | | | |
| | | |
| franklintempleton.com | | Semiannual Report | | | 149 | |
FRANKLIN TEMPLETON ETF TRUST
STATEMENT OF INVESTMENTS (UNAUDITED)
Franklin FTSE Asia ex Japan ETF(continued)
At September 30, 2019, the Fund had the following futures contracts outstanding. See Note 1(c).
| | | | | | | | | | | | | | | | | | | | |
| Futures Contracts | | | | | | | | | | | | | | | |
| | | | | |
| Description | | Type | | | Number of
Contracts | | | Notional
Amount* | | | Expiration
Date | | | Value/Unrealized
Appreciation
(Depreciation) | |
| Index Contracts | | | | | | | | | | | | | | | |
MSCI Emerging Markets Index | | | Long | | | | 2 | | | $ | 100,190 | | | | 12/20/19 | | | $ | (2,454 | ) |
*As of period end.
| | | | |
| | | |
| 150 | | Semiannual Report | The accompanying notes are an integral part of these financial statements. | | franklintempleton.com |
FRANKLIN TEMPLETON ETF TRUST
Financial Highlights
Franklin FTSE Australia ETF
| | | | | | | | | | | | |
| | | Six Months Ended
September 30, 2019
(unaudited) | | | Year Ended March 31, | |
| | | 2019 | | | 2018a | |
|
Per share operating performance
(for a share outstanding throughout the period) | |
| | | |
Net asset value, beginning of period | | $ | 24.63 | | | $ | 24.67 | | | $ | 25.23 | |
| | | | |
|
| Income from investment operationsb: | |
| | | |
Net investment incomec | | | 0.60 | | | | 1.29 | | | | 0.52 | |
| | | |
Net realized and unrealized gains (losses) | | | 0.77 | | | | (0.37 | ) | | | (1.03 | ) |
| | | | |
| | | |
Total from investment operations | | | 1.37 | | | | 0.92 | | | | (0.51 | ) |
| | | | |
| | | |
Less distributions from net investment income | | | (0.69 | ) | | | (0.96 | ) | | | (0.05 | ) |
| | | | |
| | | |
Net asset value, end of period | | $ | 25.31 | | | $ | 24.63 | | | $ | 24.67 | |
| | | | |
| | | |
Total returnd | | | 5.58% | | | | 4.00% | | | | (2.05)% | |
|
| Ratios to average net assetse | |
| | | |
Total expenses | | | 0.09% | | | | 0.09% | | | | 0.09% | |
| | | |
Net investment income | | | 4.78% | | | | 5.30% | | | | 4.96% | |
|
| Supplemental data | |
| | | |
Net assets, end of period (000’s) | | | $11,389 | | | | $7,389 | | | | $2,467 | |
| | | |
Portfolio turnover ratef | | | 5.55% | | | | 4.56% | | | | 1.63% | |
| | | |
| Portfolio turnover rate excluding portfolio transactions that are executed as a result of the Fund offering and redeeming Creation Units solely or in part for cashf,g | | | 5.55% | | | | —% | | | | —% | |
aFor the period November 2, 2017 (commencement of operations) to March 31, 2018.
bThe amount shown for a share outstanding throughout the period may not correlate with the Statement of Operations for the period due to the timing of sales and repurchases of Creation Unit Fund shares in relation to income earned and/or fluctuating fair value of the investments of the Fund.
cBased on average daily shares outstanding.
dTotal return is not annualized for periods less than one year. Total return is calculated assuming an initial investment made at the net asset value at the beginning of the period, reinvestment of all dividends and distributions at net asset value during the period, and redemption at net asset value on the last day of the period.
eRatios are annualized for periods less than one year.
fPortfolio turnover rate excludes the value of portfolio securities received or delivered as a result of processing capital share transactions in Creation Units, if any.
gEffective September 30, 2019.
| | | | | | |
| | | |
| franklintempleton.com | | The accompanying notes are an integral part of these financial statements. | Semiannual Report | | | 151 | |
FRANKLIN TEMPLETON ETF TRUST
Statement of Investments, September 30, 2019 (unaudited)
Franklin FTSE Australia ETF
| | | | | | | | | | | | | | |
| | | |
| | | Industry | | | Shares | | | Value | |
| | | Common Stocks 99.7% | | | | | | | | | |
| | | Australia 97.8% | | | | | | | | | |
| | Adelaide Brighton Ltd. | | | Construction Materials | | | | 4,932 | | | $ | 10,145 | |
| a | | Afterpay Touch Group Ltd. | | | IT Services | | | | 1,962 | | | | 47,466 | |
| | AGL Energy Ltd. | | | Multi-Utilities | | | | 7,011 | | | | 90,599 | |
| | ALS Ltd. | | | Professional Services | | | | 5,166 | | | | 27,943 | |
| | Altium Ltd. | | | Software | | | | 1,152 | | | | 25,912 | |
| | Alumina Ltd. | | | Metals & Mining | | | | 26,604 | | | | 42,525 | |
| | AMP Ltd. | | | Diversified Financial Services | | | | 35,856 | | | | 44,134 | |
| | Ansell Ltd. | | | Health Care Equipment & Supplies | | | | 1,431 | | | | 26,454 | |
| | Apa Group | | | Gas Utilities | | | | 12,654 | | | | 97,805 | |
| | Aristocrat Leisure Ltd. | | | Hotels, Restaurants & Leisure | | | | 6,822 | | | | 140,794 | |
| | Atlas Arteria Ltd. | | | Transportation Infrastructure | | | | 7,173 | | | | 37,735 | |
| | Aurizon Holdings Ltd. | | | Road & Rail | | | | 20,484 | | | | 81,511 | |
| | AusNet Services | | | Electric Utilities | | | | 19,395 | | | | 23,742 | |
| | Australia & New Zealand Banking Group Ltd. | | | Banks | | | | 30,312 | | | | 583,061 | |
| | Australian Stock Exchange Ltd. | | | Capital Markets | | | | 2,070 | | | | 113,183 | |
| | Bank of Queensland Ltd. | | | Banks | | | | 4,320 | | | | 28,903 | |
| | Beach Energy Ltd. | | | Oil, Gas & Consumable Fuels | | | | 18,747 | | | | 31,989 | |
| | Bendigo and Adelaide Bank Ltd. | | | Banks | | | | 5,247 | | | | 40,661 | |
| | BHP Group Ltd. | | | Metals & Mining | | | | 31,518 | | | | 780,568 | |
| | Bluescope Steel Ltd. | | | Metals & Mining | | | | 5,481 | | | | 44,397 | |
| | Boral Ltd. | | | Construction Materials | | | | 12,447 | | | | 40,547 | |
| | Brambles Ltd. | | | Commercial Services & Supplies | | | | 17,055 | | | | 131,131 | |
| | Caltex Australia Ltd. | | | Oil, Gas & Consumable Fuels | | | | 2,664 | | | | 47,290 | |
| | Challenger Ltd. | | | Diversified Financial Services | | | | 6,093 | | | | 30,286 | |
| | Charter Hall Group | | | Equity Real Estate Investment Trusts (REITs | ) | | | 4,896 | | | | 38,470 | |
| | Cimic Group Ltd. | | | Construction & Engineering | | | | 1,044 | | | | 22,145 | |
| | Cleanaway Waste Management Ltd. | | | Commercial Services & Supplies | | | | 14,211 | | | | 18,690 | |
| | Coca-Cola Amatil Ltd. | | | Beverages | | | | 5,490 | | | | 39,434 | |
| | Cochlear Ltd. | | | Health Care Equipment & Supplies | | | | 603 | | | | 84,653 | |
| | Coles Group Ltd. | | | Food & Staples Retailing | | | | 12,114 | | | | 125,822 | |
| | Commonwealth Bank of Australia | | | Banks | | | | 18,945 | | | | 1,032,801 | |
| | Computershare Ltd. | | | IT Services | | | | 5,166 | | | | 56,270 | |
| | Crown Resorts Ltd. | | | Hotels, Restaurants & Leisure | | | | 3,735 | | | | 30,355 | |
| | CSL Ltd. | | | Biotechnology | | | | 4,833 | | | | 761,740 | |
| | CSR Ltd. | | | Construction Materials | | | | 5,355 | | | | 15,422 | |
| | Dexus | | | Equity Real Estate Investment Trusts (REITs | ) | | | 11,655 | | | | 93,778 | |
| | Domain Holdings Australia Ltd. | | | Interactive Media & Services | | | | 2,520 | | | | 5,762 | |
| | Domino’s Pizza Enterprises Ltd. | | | Hotels, Restaurants & Leisure | | | | 639 | | | | 20,019 | |
| | Downer EDI Ltd. | | | Commercial Services & Supplies | | | | 6,327 | | | | 33,285 | |
| | Evolution Mining Ltd. | | | Metals & Mining | | | | 11,223 | | | | 34,289 | |
| | Flight Centre Travel Group Ltd. | | | Hotels, Restaurants & Leisure | | | | 603 | | | | 19,359 | |
| | Fortescue Metals Group Ltd. | | | Metals & Mining | | | | 17,010 | | | | 100,957 | |
| | Goodman Group | | | Equity Real Estate Investment Trusts (REITs | ) | | | 19,026 | | | | 181,959 | |
| | GPT Group | | | Equity Real Estate Investment Trusts (REITs | ) | | | 20,691 | | | | 85,963 | |
| | Harvey Norman Holdings Ltd. | | | Multiline Retail | | | | 6,111 | | | | 18,671 | |
| a | | Harvey Norman Holdings Ltd., rts., 10/11/19 | | | Multiline Retail | | | | 356 | | | | 431 | |
| | IDP Education Ltd. | | | Diversified Consumer Services | | | | 1,341 | | | | 14,082 | |
| | Iluka Resources Ltd. | | | Metals & Mining | | | | 4,473 | | | | 24,104 | |
| | Incitec Pivot Ltd. | | | Chemicals | | | | 17,145 | | | | 39,200 | |
| | Insurance Australia Group Ltd. | | | Insurance | | | | 24,714 | | | | 131,680 | |
| | IOOF Holdings Ltd. | | | Capital Markets | | | | 3,681 | | | | 15,864 | |
| | James Hardie Industries PLC, CDI | | | Construction Materials | | | | 4,725 | | | | 79,223 | |
| | LendLease Group | | | Real Estate Management & Development | | | | 6,039 | | | | 71,522 | |
| | Macquarie Group Ltd. | | | Capital Markets | | | | 3,294 | | | | 291,212 | |
| | Magellan Financial Group Ltd. | | | Capital Markets | | | | 1,422 | | | | 49,334 | |
| | Medibank Private Ltd. | | | Insurance | | | | 29,448 | | | | 67,528 | |
| | Metcash Ltd. | | | Food & Staples Retailing | | | | 9,684 | | | | 19,529 | |
| | | | |
| | | |
| 152 | | Semiannual Report | | franklintempleton.com |
FRANKLIN TEMPLETON ETF TRUST
STATEMENT OF INVESTMENTS (UNAUDITED)
Franklin FTSE Australia ETF(continued)
| | | | | | | | | | | | | | |
| | | |
| | | Industry | | | Shares | | | Value | |
| | | Common Stocks (continued) | | | | | | | | | |
| | | Australia (continued) | | | | | | | | | |
| | Mirvac Group | | | Equity Real Estate Investment Trusts (REITs | ) | | | 41,787 | | | $ | 86,241 | |
| | National Australia Bank Ltd. | | | Banks | | | | 30,789 | | | | 616,739 | |
| | Newcrest Mining Ltd. | | | Metals & Mining | | | | 8,226 | | | | 192,794 | |
| | Northern Star Resources Ltd. | | | Metals & Mining | | | | 6,606 | | | | 49,188 | |
| | Nufarm Ltd. | | | Chemicals | | | | 3,087 | | | | 11,743 | |
| | Oil Search Ltd. | | | Oil, Gas & Consumable Fuels | | | | 14,202 | | | | 70,115 | |
| | Orica Ltd. | | | Chemicals | | | | 4,059 | | | | 61,705 | |
| | Origin Energy Ltd. | | | Oil, Gas & Consumable Fuels | | | | 18,792 | | | | 101,014 | |
| | Orora Ltd. | | | Containers & Packaging | | | | 12,870 | | | | 25,086 | |
| | OZ Minerals Ltd. | | | Metals & Mining | | | | 3,357 | | | | 21,758 | |
| | Perpetual Ltd. | | | Capital Markets | | | | 468 | | | | 11,818 | |
| | Platinum Asset Management Ltd. | | | Capital Markets | | | | 3,114 | | | | 8,905 | |
| | Qantas Airways Ltd. | | | Airlines | | | | 6,570 | | | | 27,872 | |
| | QBE Insurance Group Ltd. | | | Insurance | | | | 14,148 | | | | 119,849 | |
| | Qube Logistics Holdings Ltd. | | | Transportation Infrastructure | | | | 13,032 | | | | 28,126 | |
| | Ramsay Health Care Ltd. | | | Health Care Providers & Services | | | | 1,368 | | | | 59,852 | |
| | REA Group Ltd. | | | Interactive Media & Services | | | | 540 | | | | 39,414 | |
| | Rio Tinto Ltd. | | | Metals & Mining | | | | 3,969 | | | | 248,068 | |
| | Santos Ltd. | | | Oil, Gas & Consumable Fuels | | | | 18,909 | | | | 98,582 | |
| | Scentre Group | | | Equity Real Estate Investment Trusts (REITs | ) | | | 54,657 | | | | 144,873 | |
| | Seek Ltd. | | | Professional Services | | | | 3,708 | | | | 53,693 | |
| | Seven Group Holdings Ltd. | | | Trading Companies & Distributors | | | | 1,404 | | | | 16,495 | |
| | Shopping Centres Australasia Property Group | | | Equity Real Estate Investment Trusts (REITs | ) | | | 9,711 | | | | 17,094 | |
| | Sonic Healthcare Ltd. | | | Health Care Providers & Services | | | | 5,058 | | | | 95,689 | |
| | South32 Ltd. | | | Metals & Mining | | | | 53,784 | | | | 95,040 | |
| | Stockland | | | Equity Real Estate Investment Trusts (REITs | ) | | | 25,524 | | | | 78,327 | |
| | Suncorp-Metway Ltd. | | | Insurance | | | | 13,493 | | | | 124,220 | |
| | Sydney Airport | | | Transportation Infrastructure | | | | 11,862 | | | | 64,243 | |
| | Tabcorp Holdings Ltd. | | | Hotels, Restaurants & Leisure | | | | 20,061 | | | | 65,621 | |
| | Telstra Corp. Ltd. | | | Diversified Telecommunication Services | | | | 44,640 | | | | 105,677 | |
| | The Star Entertainment Group Ltd. | | | Hotels, Restaurants & Leisure | | | | 8,829 | | | | 25,963 | |
| | TPG Telecom Ltd. | | | Diversified Telecommunication Services | | | | 3,843 | | | | 17,988 | |
| | Transurban Group | | | Transportation Infrastructure | | | | 28,953 | | | | 286,857 | |
| | Treasury Wine Estates Ltd. | | | Beverages | | | | 7,686 | | | | 96,264 | |
| | Vicinity Centres | | | Equity Real Estate Investment Trusts (REITs | ) | | | 33,471 | | | | 58,017 | |
| a | | Vocus Group Ltd. | | | Diversified Telecommunication Services | | | | 6,345 | | | | 14,892 | |
| | Washington H. Soul Pattinson & Co. Ltd. | | | Oil, Gas & Consumable Fuels | | | | 963 | | | | 13,659 | |
| | Wesfarmers Ltd. | | | Multiline Retail | | | | 12,114 | | | | 325,177 | |
| | Westpac Banking Corp. | | | Banks | | | | 37,332 | | | | 746,293 | |
| | Whitehaven Coal Ltd. | | | Oil, Gas & Consumable Fuels | | | | 7,272 | | | | 15,253 | |
| | Wisetech Global Ltd. | | | Software | | | | 873 | | | | 20,449 | |
| | Woodside Petroleum Ltd. | | | Oil, Gas & Consumable Fuels | | | | 9,990 | | | | 218,168 | |
| | Woolworths Group Ltd. | | | Food & Staples Retailing | | | | 13,464 | | | | 338,532 | |
| | WorleyParsons Ltd. | | | Energy Equipment & Services | | | | 3,411 | | | | 29,930 | |
| | | | | | | | | | | | | | |
| | | | |
| | | | | | | | | | | | | 11,139,617 | |
| | | | | | | | | | | | | | |
| | | New Zealand 0.3% | |
| a | | Xero Ltd. | | | Software | | | | 990 | | | | 41,592 | |
| | | | | | | | | | | | | | |
| | | United States 1.6% | |
| | Amcor PLC, IDR | | | Containers & Packaging | | | | 17,307 | | | | 166,336 | |
| | Sims Metal Management Ltd. | | | Metals & Mining | | | | 1,773 | | | | 12,436 | |
| | | | | | | | | | | | | | |
| | | | |
| | | | | | | | | | | | | 178,772 | |
| | | | | | | | | | | | | | |
| | Total Investments
(Cost $11,483,850) 99.7% | | | | | | | | | | | 11,359,981 | |
| | Other Assets, less Liabilities 0.3% | | | | | | | | | | | 29,468 | |
| | | | | | | | | | | | | | |
| | Net Assets 100.0% | | | | | | | | | | $ | 11,389,449 | |
| | | | | | | | | | | | | | |
See Abbreviations on page 322.
aNon-income producing.
| | | | | | |
| | | |
| franklintempleton.com | | Semiannual Report | | | 153 | |
FRANKLIN TEMPLETON ETF TRUST
Financial Highlights
Franklin FTSE Brazil ETF
| | | | | | | | | | | | |
| | | Six Months Ended
September 30, 2019
(unaudited) | | | Year Ended March 31, | |
| | | 2019 | | | 2018a | |
| | | |
Per share operating performance
(for a share outstanding throughout the period) | | | | | | | | | | | | |
| | | |
Net asset value, beginning of period | | $ | 25.72 | | | $ | 27.87 | | | $ | 24.37 | |
| | | | |
| | | |
| Income from investment operationsb: | | | | | | | | | | | | |
| | | |
Net investment incomec | | | 0.29 | | | | 0.80 | | | | 0.50 | |
| | | |
Net realized and unrealized gains (losses) | | | 0.41 | | | | (2.07 | ) | | | 3.11 | |
| | | | |
| | | |
Total from investment operations | | | 0.70 | | | | (1.27 | ) | | | 3.61 | |
| | | | |
| | | |
Less distributions from net investment income | | | (0.38 | ) | | | (0.88 | ) | | | (0.11 | ) |
| | | | |
| | | |
Net asset value, end of period | | $ | 26.04 | | | $ | 25.72 | | | $ | 27.87 | |
| | | | |
| | | |
Total returnd | | | 2.69% | | | | (3.98)% | | | | 14.86% | |
| | | |
| Ratios to average net assetse | | | | | | | | | | | | |
| | | |
Total expenses | | | 0.19% | | | | 0.19% | | | | 0.19% | |
| | | |
Net investment income | | | 2.23% | | | | 3.37% | | | | 4.53% | |
| | | |
| Supplemental data | | | | | | | | | | | | |
| | | |
Net assets, end of period (000’s) | | | $15,623 | | | | $20,579 | | | | $44,593 | |
| | | |
Portfolio turnover ratef | | | 4.67% | | | | 39.76% | | | | 4.79% | |
| | | |
| Portfolio turnover rate excluding portfolio transactions that are executed as a result of the Fund offering and redeeming Creation Units solely or in part for cashf,g | | | 4.67% | | | | 0.00% | | | | 0.00% | |
aFor the period November 3, 2017 (commencement of operations) to March 31, 2018.
bThe amount shown for a share outstanding throughout the period may not correlate with the Statement of Operations for the period due to the timing of sales and repurchases of Creation Unit Fund shares in relation to income earned and/or fluctuating fair value of the investments of the Fund.
cBased on average daily shares outstanding.
dTotal return is not annualized for periods less than one year. Total return is calculated assuming an initial investment made at the net asset value at the beginning of the period, reinvestment of all dividends and distributions at net asset value during the period, and redemption at net asset value on the last day of the period.
eRatios are annualized for periods less than one year, except fornon-recurring expenses, if any.
fPortfolio turnover rate excludes the value of portfolio securities received or delivered as a result of processing capital share transactions in Creation Units, if any.
gEffective September 30, 2019.
| | | | |
| | | |
| 154 | | Semiannual Report | The accompanying notes are an integral part of these financial statements. | | franklintempleton.com |
FRANKLIN TEMPLETON ETF TRUST
Statement of Investments, September 30, 2019 (unaudited)
Franklin FTSE Brazil ETF
| | | | | | | | | | | | | | |
| | | | |
| | | | | Industry | | | Shares | | | Value | |
| | | Common Stocks 65.9% | | | | | | | | | |
| | | Brazil 64.1% | | | | | | | | | |
| | Ambev SA | | | Beverages | | | | 157,320 | | | $ | 727,039 | |
| | Atacadao Distribuicao Comercio e Industria Ltd. | | | Food & Staples Retailing | | | | 12,000 | | | | 60,642 | |
| a | | Azul SA | | | Airlines | | | | 7,200 | | | | 85,925 | |
| a | | B2W Cia Digital | | | Internet & Direct Marketing Retail | | | | 6,000 | | | | 69,645 | |
| a | | B2W Cia Digital, SCR | | | Internet & Direct Marketing Retail | | | | 1,120 | | | | 12,877 | |
| | B3 SA – Brasil Bolsa Balcao | | | Capital Markets | | | | 71,700 | | | | 751,013 | |
| | Banco Bradesco SA | | | Banks | | | | 36,600 | | | | 274,584 | |
| | Banco BTG Pactual SA | | | Capital Markets | | | | 9,000 | | | | 126,506 | |
| | Banco do Brasil SA | | | Banks | | | | 37,404 | | | | 408,486 | |
| | Banco Santander Brasil SA | | | Banks | | | | 14,400 | | | | 156,708 | |
| | BB Seguridade Participacoes SA | | | Insurance | | | | 24,000 | | | | 201,834 | |
| | BR Malls Paricipacoes SA | | | Real Estate Management & Development | | | | 27,600 | | | | 95,481 | |
| a | | BRF SA | | | Food Products | | | | 19,800 | | | | 181,582 | |
| | CCR SA | | | Transportation Infrastructure | | | | 40,200 | | | | 166,479 | |
| | Centrais Eletricas Brasileiras SA | | | Electric Utilities | | | | 13,800 | | | | 133,017 | |
| | Cia Siderurgica Nacional SA | | | Metals & Mining | | | | 22,200 | | | | 70,511 | |
| | Cielo SA | | | IT Services | | | | 40,200 | | | | 77,208 | |
| | Companhia de Saneamento Basico do Estado de Sao Paulo | | | Water Utilities | | | | 12,000 | | | | 142,891 | |
| | Companhia Energetica de Minas Gerais | | | Electric Utilities | | | | 3,000 | | | | 11,452 | |
| | Companhia Paranaense de Energia-Copel | | | Electric Utilities | | | | 600 | | | | 7,361 | |
| | Cosan SA | | | Oil, Gas & Consumable Fuels | | | | 6,000 | | | | 76,631 | |
| | CPFL Energia SA | | | Electric Utilities | | | | 6,600 | | | | 52,114 | |
| | CVC Brasil Operadora e Agencia de Viagens SA | | | Hotels, Restaurants & Leisure | | | | 4,200 | | | | 56,314 | |
| | EDP-Energias do Brasil SA | | | Electric Utilities | | | | 10,800 | | | | 50,819 | |
| | Embraer SA | | | Aerospace & Defense | | | | 26,400 | | | | 113,512 | |
| | Energisa SA | | | Electric Utilities | | | | 6,880 | | | | 82,503 | |
| | Engie Brasil SA | | | Independent Power and Renewable Electricity Producers | | | | 6,200 | | | | 66,072 | |
| | Equatorial Energia SA | | | Electric Utilities | | | | 6,200 | | | | 149,277 | |
| | Fleury SA | | | Health Care Providers & Services | | | | 7,800 | | | | 49,473 | |
| | Grendene SA | | | Textiles, Apparel & Luxury Goods | | | | 9,600 | | | | 20,120 | |
| b,c | | Hapvida Participacoes e Investimentos SA, Reg S, 144A | | | Health Care Providers & Services | | | | 5,200 | | | | 67,225 | |
| | Hypera SA | | | Pharmaceuticals | | | | 14,400 | | | | 115,915 | |
| | IRB Brasil Resseguros SA | | | Insurance | | | | 29,748 | | | | 268,956 | |
| | Klabin SA | | | Containers & Packaging | | | | 25,800 | | | | 95,324 | |
| | Kroton Educacional SA | | | Diversified Consumer Services | | | | 53,400 | | | | 143,326 | |
| | Localiza Rent a Car SA | | | Road & Rail | | | | 19,200 | | | | 209,543 | |
| | Lojas Americanas SA | | | Multiline Retail | | | | 8,400 | | | | 30,108 | |
| | Lojas Renner SA | | | Multiline Retail | | | | 28,520 | | | | 345,562 | |
| | M. Dias Branco SA | | | Food Products | | | | 3,000 | | | | 25,208 | |
| | Magazine Luiza SA | | | Multiline Retail | | | | 21,120 | | | | 187,805 | |
| | Multiplan Empreendimentos Imobiliarios SA | | | Real Estate Management & Development | | | | 9,600 | | | | 66,491 | |
| | Natura Cosmeticos SA | | | Personal Products | | | | 13,200 | | | | 107,301 | |
| | Notre Dame Intermedica Participacoes SA | | | Health Care Providers & Services | | | | 13,600 | | | | 177,126 | |
| | Odontoprev SA | | | Health Care Providers & Services | | | | 9,600 | | | | 37,244 | |
| | Petrobras Distribuidora SA | | | Specialty Retail | | | | 24,600 | | | | 162,587 | |
| | Petroleo Brasileiro SA | | | Oil, Gas & Consumable Fuels | | | | 104,040 | | | | 753,062 | |
| | Porto Seguro SA | | | Insurance | | | | 3,600 | | | | 50,896 | |
| | Raia Drogasil SA | | | Food & Staples Retailing | | | | 8,172 | | | | 187,967 | |
| a | | Rumo SA | | | Road & Rail | | | | 40,160 | | | | 236,213 | |
| | Sao Martinho SA | | | Food Products | | | | 6,000 | | | | 27,296 | |
| | Sul America SA | | | Insurance | | | | 8,200 | | | | 93,922 | |
| | Suzano SA | | | Paper & Forest Products | | | | 28,872 | | | | 233,241 | |
| | Tim Participacoes SA | | | Wireless Telecommunication Services | | | | 28,800 | | | | 82,347 | |
| | Transmissora Alianca de Energia Eletrica SA | | | Electric Utilities | | | | 7,800 | | | | 53,930 | |
| | Ultrapar Participacoes SA | | | Oil, Gas & Consumable Fuels | | | | 30,528 | | | | 135,512 | |
| | | | | | |
| | | |
| franklintempleton.com | | Semiannual Report | | | 155 | |
FRANKLIN TEMPLETON ETF TRUST
STATEMENT OF INVESTMENTS (UNAUDITED)
Franklin FTSE Brazil ETF(continued)
| | | | | | | | | | | | | | |
| | | | |
| | | | | Industry | | | Shares | | | Value | |
| | | Common Stocks (continued) | | | | | | | | | |
| | | Brazil (continued) | | | | | | | | | |
| a | | Vale SA | | | Metals & Mining | | | | 121,300 | | | $ | 1,390,521 | |
| a | | Via Varejo SA | | | Specialty Retail | | | | 13,800 | | | | 26,239 | |
| | Weg SA | | | Electrical Equipment | | | | 26,400 | | | | 153,568 | |
| | YDUQS PART | | | Diversified Consumer Services | | | | 9,000 | | | | 77,957 | |
| | | | | | | | | | | | | | |
| | | | | | | | | | | | | 10,020,468 | |
| | | | | | | | | | | | | | |
| | | United States 1.8% | | | | | | | | | |
| | JBS SA | | | Food Products | | | | 34,800 | | | | 273,945 | |
| | | | | | | | | | | | | | |
| | Total Common Stocks (Cost $8,822,025) | | | | | | | | | | | 10,294,413 | |
| | | | | | | | | | | | | | |
| | | Preferred Stocks 33.8% | | | | | | | | | |
| | | Brazil 33.8% | | | | | | | | | |
| a | | Alpargatas SA, pfd. | | | Textiles, Apparel & Luxury Goods | | | | 6,800 | | | | 42,282 | |
| d | | Banco Bradesco SA, 2.969%, pfd. | | | Banks | | | | 142,080 | | | | 1,156,997 | |
| d | | Banco do Estado do Rio Grande do Sul SA, 9.761%, pfd., B | | | Banks | | | | 7,200 | | | | 38,978 | |
| d | | Bradespar SA, 3.926%, pfd. | | | Metals & Mining | | | | 7,800 | | | | 59,098 | |
| a | | Braskem SA, pfd., A | | | Chemicals | | | | 7,000 | | | | 54,650 | |
| d | | Centrais Eletricas Brasileiras SA, 3.372%, pfd., B | | | Electric Utilities | | | | 8,400 | | | | 84,738 | |
| d | | Cia de Transmissao de Energia Eletrica Paulista, 9.802%, pfd. | | | Electric Utilities | | | | 6,600 | | | | 39,137 | |
| d | | Cia Energetica de Sao Paulo, 3.112%, pfd., B | | | Independent Power and Renewable Electricity Producers | | | | 6,600 | | | | 45,158 | |
| d | | Companhia Brasileira de Distribuicao, 2.023%, pfd., A | | | Food & Staples Retailing | | | | 5,748 | | | | 110,119 | |
| d | | Companhia Energetica de Minas Gerais, 4.152%, pfd. | | | Electric Utilities | | | | 33,600 | | | | 115,592 | |
| d | | Companhia Paranaense de Energia, 2.927%, pfd., B | | | Electric Utilities | | | | 3,600 | | | | 42,876 | |
| d | | Gerdau SA, 2.432%, pfd. | | | Metals & Mining | | | | 37,200 | | | | 117,528 | |
| d | | Itau Unibanco Holding SA, 4.930%, pfd. | | | Banks | | | | 166,800 | | | | 1,402,747 | |
| d | | Itausa-Investimentos Itau SA, 5.463%, pfd. | | | Banks | | | | 219,360 | | | | 694,091 | |
| d | | Lojas Americanas SA, 0.376%, pfd. | | | Multiline Retail | | | | 26,400 | | | | 126,505 | |
| d | | Petroleo Brasileiro SA, 4.123%, pfd. | | | Oil, Gas & Consumable Fuels | | | | 139,240 | | | | 920,935 | |
| d | | Telefonica Brasil SA, 6.735%, pfd. | | | Diversified Telecommunication Services | | | | 15,000 | | | | 197,844 | |
| d | | Usinas Siderurgicas de Minas Gerais SA Usiminas, 2.036%, pfd., A | | | Metals & Mining | | | | 13,800 | | | | 25,875 | |
| | | | | | | | | | | | | | |
| | Total Preferred Stocks (Cost $5,020,104) | | | | | | | | | | | 5,275,150 | |
| | | | | | | | | | | | | | |
| | Total Investments
(Cost $13,842,129) 99.7% | | | | | | | | | | | 15,569,563 | |
| | Other Assets, less Liabilities 0.3% | | | | | | | | | | | 53,113 | |
| | | | | | | | | | | | | | |
| | Net Assets 100.0% | | | | | | | | | | $ | 15,622,676 | |
| | | | | | | | | | | | | | |
See Abbreviations on page 322.
aNon-income producing.
bSecurity was purchased pursuant to Regulation S under the Securities Act of 1933, which exempts from registration securities offered and sold outside of the United States. Such a security cannot be sold in the United States without either an effective registration statement filed pursuant to the Securities Act of 1933, or pursuant to an exemption from registration. This security has been deemed liquid under guidelines approved by the Fund’s Board of Trustees. At September 30, 2019, the value of this security was $67,225, representing 0.4% of net assets.
cSecurity was purchased pursuant to Rule 144A under the Securities Act of 1933 and may be sold in transactions exempt from registration only to qualified institutional buyers or in a public offering registered under the Securities Act of 1933. This security has been deemed liquid under guidelines approved by the Fund’s Board of Trustees. At September 30, 2019, the value of this security was $67,225, representing 0.4% of net assets.
dVariable rate security. The rate shown represents the yield at period end.
| | | | |
| | | |
| 156 | | Semiannual Report | | franklintempleton.com |
FRANKLIN TEMPLETON ETF TRUST
STATEMENT OF INVESTMENTS (UNAUDITED)
Franklin FTSE Brazil ETF(continued)
At September 30, 2019, the Fund had the following futures contracts outstanding. See Note 1(c).
| | | | | | | | | | | | | | | | | | | | |
| Futures Contracts | | | | | | | | | | | | | | | |
| | | | | |
| Description | | Type | | | Number of
Contracts | | | Notional
Amount* | | | Expiration
Date | | | Value/Unrealized
Appreciation
(Depreciation) | |
| Equity Contracts | | | | | | | | | | | | | | | |
MINI Bovespa Index | | | Long | | | | 10 | | | $ | 50,482 | | | | 10/16/19 | | | $ | 3,066 | |
*As of period end.
See Note 7 regarding other derivative information.
| | | | | | |
| | | |
| franklintempleton.com | | The accompanying notes are an integral part of these financial statements. | Semiannual Report | | | 157 | |
FRANKLIN TEMPLETON ETF TRUST
Financial Highlights
Franklin FTSE Canada ETF
| | | | | | | | | | | | |
| | | Six Months Ended
September 30, 2019
(unaudited) | | | Year Ended March 31, | |
| | | 2019 | | | 2018a | |
| | | |
Per share operating performance (for a share outstanding throughout the period) | | | | | | | | | | | | |
| | | |
Net asset value, beginning of period | | $ | 24.13 | | | $ | 23.77 | | | $ | 24.80 | |
| | | | |
| | | |
| Income from investment operationsb: | | | | | | | | | | | | |
| | | |
Net investment incomec | | | 0.35 | | | | 0.67 | | | | 0.24 | |
| | | |
Net realized and unrealized gains (losses) | | | 1.37 | | | | 0.33 | | | | (1.25 | ) |
| | | | |
| | | |
Total from investment operations | | | 1.72 | | | | 1.00 | | | | (1.01 | ) |
| | | | |
| | | |
Less distributions from net investment income | | | (0.23 | ) | | | (0.64 | ) | | | (0.02 | ) |
| | | | |
| | | |
Net asset value, end of period | | $ | 25.62 | | | $ | 24.13 | | | $ | 23.77 | |
| | | | |
| | | |
Total returnd | | | 7.18% | | | | 4.48% | | | | (4.06)% | |
| | | |
| Ratios to average net assetse | | | | | | | | | | | | |
| | | |
Total expenses | | | 0.09% | | | | 0.09% | | | | 0.09% | |
| | | |
Net investment income | | | 2.78% | | | | 2.79% | | | | 2.39% | |
| | | |
| Supplemental data | | | | | | | | | | | | |
| | | |
Net assets, end of period (000’s) | | | $5,124 | | | | $4,827 | | | | $2,377 | |
| | | |
Portfolio turnover ratef | | | 2.48% | | | | 6.95% | | | | 1.26% | |
| | | |
| Portfolio turnover rate excluding portfolio transactions that are executed as a result of the Fund offering and redeeming Creation Units solely or in part for cashf,g | | | 2.48% | | | | —% | | | | —% | |
aFor the period November 2, 2017 (commencement of operations) to March 31, 2018.
bThe amount shown for a share outstanding throughout the period may not correlate with the Statement of Operations for the period due to the timing of sales and repurchases of Creation Unit Fund shares in relation to income earned and/or fluctuating fair value of the investments of the Fund.
cBased on average daily shares outstanding.
dTotal return is not annualized for periods less than one year. Total return is calculated assuming an initial investment made at the net asset value at the beginning of the period, reinvestment of all dividends and distributions at net asset value during the period, and redemption at net asset value on the last day of the period.
eRatios are annualized for periods less than one year.
fPortfolio turnover rate excludes the value of portfolio securities received or delivered as a result of processing capital share transactions in Creation Units, if any.
gEffective September 30, 2019.
| | | | |
| | | |
| 158 | | Semiannual Report | The accompanying notes are an integral part of these financial statements. | | franklintempleton.com |
FRANKLIN TEMPLETON ETF TRUST
Statement of Investments, September 30, 2019 (unaudited)
Franklin FTSE Canada ETF
| | | | | | | | | | | | | | |
| | | | |
| | | | | Industry | | | Shares | | | Value | |
| | | | | | | | | | | | | | |
| | | Common Stocks 100.0% | | | | | | | | | |
| | | Canada 97.6% | | | | | | | | | |
| | Agnico Eagle Mines Ltd. | | | Metals & Mining | | | | 928 | | | $ | 49,764 | |
| | Alimentation Couche-Tard Inc., B | | | Food & Staples Retailing | | | | 3,312 | | | | 101,561 | |
| | Bank of Montreal | | | Banks | | | | 2,484 | | | | 183,073 | |
| | Bank of Nova Scotia | | | Banks | | | | 4,796 | | | | 272,582 | |
| | Barrick Gold Corp. | | | Metals & Mining | | | | 6,848 | | | | 118,547 | |
| | BCE Inc. | | | Diversified Telecommunication Services | | | | 1,168 | | | | 56,530 | |
| | Brookfield Asset Management Inc., A | | | Capital Markets | | | | 3,432 | | | | 182,357 | |
| | Canadian Imperial Bank of Commerce | | | Banks | | | | 1,728 | | | | 142,664 | |
| | Canadian National Railway Co. | | | Road & Rail | | | | 2,824 | | | | 253,733 | |
| | Canadian Natural Resources Ltd. | | | Oil, Gas & Consumable Fuels | | | | 4,572 | | | | 121,724 | |
| | Canadian Pacific Railway Ltd. | | | Road & Rail | | | | 540 | | | | 120,081 | |
| | Canadian Tire Corp. Ltd., A | | | Multiline Retail | | | | 224 | | | | 25,153 | |
| | Canadian Utilities Ltd., A | | | Multi-Utilities | | | | 472 | | | | 13,921 | |
| a | | Canopy Growth Corp. | | | Pharmaceuticals | | | | 700 | | | | 16,046 | |
| | Cenovus Energy Inc. | | | Oil, Gas & Consumable Fuels | | | | 3,972 | | | | 37,290 | |
| a | | CGI Inc., A | | | IT Services | | | | 924 | | | | 73,111 | |
| | Constellation Software Inc. | | | Software | | | | 78 | | | | 77,950 | |
| | Dollarama Inc. | | | Multiline Retail | | | | 1,212 | | | | 43,418 | |
| | Enbridge Inc. | | | Oil, Gas & Consumable Fuels | | | | 7,708 | | | | 270,712 | |
| | EnCana Corp. | | | Oil, Gas & Consumable Fuels | | | | 5,772 | | | | 26,462 | |
| | Fairfax Financial Holdings Ltd. | | | Insurance | | | | 104 | | | | 45,873 | |
| | Fortis Inc. | | | Electric Utilities | | | | 1,680 | | | | 71,070 | |
| | Franco-Nevada Corp. | | | Metals & Mining | | | | 712 | | | | 64,919 | |
| | George Weston Ltd. | | | Food & Staples Retailing | | | | 280 | | | | 23,572 | |
| | Great-West Lifeco Inc. | | | Insurance | | | | 1,012 | | | | 24,314 | |
| | Husky Energy Inc. | | | Oil, Gas & Consumable Fuels | | | | 1,184 | | | | 8,335 | |
| | Hydro One Ltd. | | | Electric Utilities | | | | 1,228 | | | | 22,714 | |
| | IGM Financial Inc. | | | Capital Markets | | | | 328 | | | | 9,320 | |
| | Imperial Oil Ltd. | | | Oil, Gas & Consumable Fuels | | | | 904 | | | | 23,556 | |
| | Intact Financial Corp. | | | Insurance | | | | 536 | | | | 53,981 | |
| | Inter Pipeline Ltd. | | | Oil, Gas & Consumable Fuels | | | | 1,592 | | | | 27,956 | |
| | Loblaw Cos. Ltd. | | | Food & Staples Retailing | | | | 708 | | | | 40,352 | |
| | Magna International Inc. | | | Auto Components | | | | 1,152 | | | | 61,446 | |
| | Manulife Financial Corp. | | | Insurance | | | | 7,656 | | | | 140,514 | |
| | Metro Inc., A | | | Food & Staples Retailing | | | | 932 | | | | 41,060 | |
| | National Bank of Canada | | | Banks | | | | 1,308 | | | | 65,123 | |
| | Nutrien Ltd. | | | Chemicals | | | | 2,228 | | | | 111,063 | |
| | Pembina Pipeline Corp. | | | Oil, Gas & Consumable Fuels | | | | 1,984 | | | | 73,591 | |
| | Power Corp. of Canada | | | Insurance | | | | 1,364 | | | | 31,442 | |
| | Power Financial Corp. | | | Insurance | | | | 896 | | | | 20,789 | |
| | Restaurant Brands International Inc. | | | Hotels, Restaurants & Leisure | | | | 936 | | | | 66,595 | |
| | RioCan REIT | | | Equity Real Estate Investment Trusts (REITs | ) | | | 1,196 | | | | 23,830 | |
| | Rogers Communications Inc., B | | | Wireless Telecommunication Services | | | | 1,392 | | | | 67,844 | |
| | Royal Bank of Canada | | | Banks | | | | 5,620 | | | | 456,179 | |
| | Saputo Inc. | | | Food Products | | | | 852 | | | | 26,204 | |
| | Shaw Communications Inc. | | | Media | | | | 1,744 | | | | 34,287 | |
| a | | Shopify Inc., A | | | IT Services | | | | 384 | | | | 119,580 | |
| | Sun Life Financial Inc. | | | Insurance | | | | 2,304 | | | | 103,088 | |
| | Suncor Energy Inc. | | | Oil, Gas & Consumable Fuels | | | | 6,116 | | | | 193,042 | |
| | TC Energy Corp. | | | Oil, Gas & Consumable Fuels | | | | 3,572 | | | | 185,075 | |
| | Teck Resources Ltd., B | | | Metals & Mining | | | | 1,956 | | | | 31,733 | |
| | TELUS Corp. | | | Diversified Telecommunication Services | | | | 776 | | | | 27,635 | |
| | The Toronto-Dominion Bank | | | Banks | | | | 7,180 | | | | 418,924 | |
| | Thomson Reuters Corp. | | | Professional Services | | | | 768 | | | | 51,364 | |
| | Wheaton Precious Metals Corp. | | | Metals & Mining | | | | 1,732 | | | | 45,445 | |
| | | | | | | | | | | | | | |
| | | | |
| | | | | | | | | | | | | 4,998,494 | |
| | | | | | | | | | | | | | |
| | | | | | |
| | | |
| franklintempleton.com | | Semiannual Report | | | 159 | |
FRANKLIN TEMPLETON ETF TRUST
STATEMENT OF INVESTMENTS (UNAUDITED)
Franklin FTSE Canada ETF(continued)
| | | | | | | | | | | | | | |
| | | | |
| | | | | Industry | | | Shares | | | Value | |
| | | | | | | | | | | | | | |
| | | Common Stocks (continued) | | | | | | | | | |
| | | United States 2.4% | | | | | | | | | |
| a | | Bausch Health Cos. Inc. | | | Pharmaceuticals | | | | 1,344 | | | $ | 29,337 | |
| | IESI-BFC Ltd. | | | Commercial Services & Supplies | | | | 1,024 | | | | 94,132 | |
| | | | | | | | | | | | | | |
| | | | |
| | | | | | | | | | | | | 123,469 | |
| | | | | | | | | | | | | | |
| | Total Investments
(Cost $4,896,342) 100.0% | | | | | | | | | | | 5,121,963 | |
| | Other Assets, less Liabilities 0.0%† | | | | | | | | | | | 1,973 | |
| | | | | | | | | | | | | | |
| | Net Assets 100.0% | | | | | | | | | | $ | 5,123,936 | |
| | | | | | | | | | | | | | |
See Abbreviations on page 322.
†Rounds to less than 0.1% of net assets.
aNon-income producing.
| | | | |
| | | |
| 160 | | Semiannual Report | The accompanying notes are an integral part of these financial statements. | | franklintempleton.com |
FRANKLIN TEMPLETON ETF TRUST
Financial Highlights
Franklin FTSE China ETF
| | | | | | | | | | | | |
| | | Six Months Ended
September 30, 2019
(unaudited) | | | Year Ended March 31, | |
| | | 2019 | | | 2018a | |
| | | |
Per share operating performance
(for a share outstanding throughout the period) | | | | | | | | | | | | |
| | | |
Net asset value, beginning of period | | $ | 24.01 | | | $ | 25.99 | | | $ | 24.95 | |
| | | | |
| | | |
| Income from investment operationsb: | | | | | | | | | | | | |
| | | |
Net investment income (loss)c | | | 0.44 | | | | 0.40 | | | | (0.01 | ) |
| | | |
Net realized and unrealized gains (losses) | | | (2.50 | ) | | | (1.99 | ) | | | 1.05 | |
| | | | |
| | | |
Total from investment operations | | | (2.06 | ) | | | (1.59 | ) | | | 1.04 | |
| | | | |
| | | |
Less distributions from net investment income | | | (0.03 | ) | | | (0.39 | ) | | | — | d |
| | | | |
| | | |
Net asset value, end of period | | $ | 21.92 | | | $ | 24.01 | | | $ | 25.99 | |
| | | | |
| | | |
Total returne | | | (8.58)% | | | | (5.94)% | | | | 4.17% | |
| | | |
| Ratios to average net assetsf | | | | | | | | | | | | |
| | | |
Total expenses | | | 0.19% | | | | 0.19% | | | | 0.19% | |
| | | |
Net investment income (loss) | | | 3.83% | | | | 1.70% | | | | (0.12)% | |
| | | |
| Supplemental data | | | | | | | | | | | | |
| | | |
Net assets, end of period (000’s) | | | $39,450 | | | | $43,220 | | | | $31,191 | |
| | | |
Portfolio turnover rateg | | | 13.38% | | | | 7.21% | | | | 2.71% | |
| | | |
| Portfolio turnover rate excluding portfolio transactions that are executed as a result of the Fund offering and redeeming Creation Units solely or in part for cashg,h | | | 13.38% | | | | —% | | | | —% | |
aFor the period November 2, 2017 (commencement of operations) to March 31, 2018.
bThe amount shown for a share outstanding throughout the period may not correlate with the Statement of Operations for the period due to the timing of sales and repurchases of Creation Unit Fund shares in relation to income earned and/or fluctuating fair value of the investments of the Fund.
cBased on average daily shares outstanding.
dAmount rounds to less than $0.01 per share.
eTotal return is not annualized for periods less than one year. Total return is calculated assuming an initial investment made at the net asset value at the beginning of the period, reinvestment of all dividends and distributions at net asset value during the period, and redemption at net asset value on the last day of the period.
fRatios are annualized for periods less than one year.
gPortfolio turnover rate excludes the value of portfolio securities received or delivered as a result of processing capital share transactions in Creation Units, if any.
hEffective September 30, 2019.
| | | | | | |
| | | |
| franklintempleton.com | | The accompanying notes are an integral part of these financial statements. | Semiannual Report | | | 161 | |
FRANKLIN TEMPLETON ETF TRUST
Statement of Investments, September 30, 2019 (unaudited)
Franklin FTSE China ETF
| | | | | | | | | | | | | | |
| | | |
| | | Industry | | | Shares | | | Value | |
| | | Common Stocks 99.8% | | | | | | | | | |
| | | China 98.5% | | | | | | | | | |
| | 360 Security Technology Inc., A | | | Software | | | | 1,800 | | | $ | 5,918 | |
| a | | 3SBio Inc. | | | Biotechnology | | | | 27,000 | | | | 44,774 | |
| a | | 51job Inc., ADR | | | Professional Services | | | | 522 | | | | 38,628 | |
| a | | 58.com Inc., ADR | | | Interactive Media & Services | | | | 2,214 | | | | 109,172 | |
| | AECC Aviation Power Co. Ltd., A | | | Aerospace & Defense | | | | 1,800 | | | | 5,513 | |
| | Agile Group Holdings Ltd. | | | Real Estate Management & Development | | | | 36,000 | | | | 43,718 | |
| | Agricultural Bank of China Ltd., A | | | Banks | | | | 128,700 | | | | 62,357 | |
| | Agricultural Bank of China Ltd., H | | | Banks | | | | 702,000 | | | | 274,911 | |
| | Aier Eye Hospital Group Co. Ltd. | | | Health Care Providers & Services | | | | 3,600 | | | | 17,881 | |
| | Air China Ltd., A | | | Airlines | | | | 8,100 | | | | 9,074 | |
| | Air China Ltd., H | | | Airlines | | | | 36,000 | | | | 31,686 | |
| | Aisino Co. Ltd., A | | | Software | | | | 1,800 | | | | 5,281 | |
| a | | Alibaba Group Holding Ltd., ADR | | | Internet & Direct Marketing Retail | | | | 32,616 | | | | 5,454,374 | |
| a | | Alibaba Health Information Technology Ltd. | | | Health Care Technology | | | | 90,000 | | | | 78,641 | |
| a | | Alpha Group | | | Leisure Equipment & Products | | | | 1,800 | | | | 1,543 | |
| a | | Aluminum Corp. of China Ltd., A | | | Metals & Mining | | | | 11,700 | | | | 5,767 | |
| a | | Aluminum Corp. of China Ltd., H | | | Metals & Mining | | | | 90,000 | | | | 28,357 | |
| | An Hui Wenergy Co. Ltd. | | | Independent Power and Renewable Electricity Producers | | | | 3,600 | | | | 2,198 | |
| | Angang Steel Co. Ltd. | | | Metals & Mining | | | | 8,190 | | | | 3,544 | |
| | Angang Steel Co. Ltd., H | | | Metals & Mining | | | | 36,000 | | | | 13,134 | |
| | Angel Yeast Co. Ltd., A | | | Food Products | | | | 900 | | | | 3,409 | |
| | Anhui Anke Biotechnology Group Co. Ltd. | | | Pharmaceuticals | | | | 900 | | | | 1,899 | |
| | Anhui Conch Cement Co. Ltd., A | | | Construction Materials | | | | 4,500 | | | | 26,050 | |
| | Anhui Conch Cement Co. Ltd., H | | | Construction Materials | | | | 27,000 | | | | 160,325 | |
| | Anhui Expressway Co. Ltd., H | | | Transportation Infrastructure | | | | 18,000 | | | | 10,057 | |
| | Anhui Gujing Distillery Co. Ltd., B | | | Beverages | | | | 2,700 | | | | 22,687 | |
| | Anta Sports Products Ltd. | | | Textiles, Apparel & Luxury Goods | | | | 27,000 | | | | 223,353 | |
| a | | Anxin Trust Co. Ltd. | | | Capital Markets | | | | 6,300 | | | | 4,155 | |
| a | | Autohome Inc., ADR | | | Interactive Media & Services | | | | 1,242 | | | | 103,247 | |
| | Avary Holding Shenzhen Co. Ltd., A | | | Electronic Equipment, Instruments & Components | | | | 900 | | | | 5,056 | |
| | AVIC Aircraft Co. Ltd. | | | Aerospace & Defense | | | | 1,800 | | | | 3,920 | |
| | Avic Capital Co. Ltd., A | | | Diversified Financial Services | | | | 9,000 | | | | 5,886 | |
| | AVIC Electromechanical Systems Co. Ltd. | | | Aerospace & Defense | | | | 4,500 | | | | 4,102 | |
| | AVIC Jonhon Optronic Technology Co. Ltd. | | | Electronic Equipment, Instruments & Components | | | | 900 | | | | 5,190 | |
| a | | AVIC Shenyang Aircraft Co. Ltd., A | | | Aerospace & Defense | | | | 1,800 | | | | 7,814 | |
| | AviChina Industry & Technology Co. Ltd., H | | | Aerospace & Defense | | | | 54,000 | | | | 26,520 | |
| | BAIC Motor Corp. Ltd., H | | | Automobiles | | | | 54,000 | | | | 33,339 | |
| a | | Baidu Inc., ADR | | | Interactive Media & Services | | | | 6,300 | | | | 647,388 | |
| | Bank of Beijing Co. Ltd., A | | | Banks | | | | 21,600 | | | | 16,212 | |
| | Bank of Changsha Co. Ltd., A | | | Banks | | | | 3,600 | | | | 4,340 | |
| | Bank of China Ltd., A | | | Banks | | | | 70,200 | | | | 35,192 | |
| | Bank of China Ltd., H | | | Banks | | | | 1,737,000 | | | | 682,445 | |
| | Bank of Communications Co. Ltd., A | | | Banks | | | | 37,800 | | | | 28,848 | |
| | Bank of Communications Co. Ltd., H | | | Banks | | | | 171,000 | | | | 111,682 | |
| | Bank of Guiyang Co. Ltd. | | | Banks | | | | 2,700 | | | | 3,218 | |
| | Bank of Hangzhou Co. Ltd. | | | Banks | | | | 1,800 | | | | 2,130 | |
| | Bank of Jiangsu Co. Ltd., A | | | Banks | | | | 4,500 | | | | 4,228 | |
| | Bank of Nanjing Co. Ltd., A | | | Banks | | | | 7,200 | | | | 8,661 | |
| | Bank of Ningbo Co. Ltd., A | | | Banks | | | | 5,400 | | | | 19,063 | |
| | Bank of Shanghai Co. Ltd., A | | | Banks | | | | 13,510 | | | | 17,689 | |
| | Baoshan Iron & Steel Co. Ltd., A | | | Metals & Mining | | | | 18,900 | | | | 15,642 | |
| | BBMG Corp., A | | | Construction Materials | | | | 10,800 | | | | 5,021 | |
| | BBMG Corp., H | | | Construction Materials | | | | 54,000 | | | | 15,499 | |
| | | | |
| | | |
| 162 | | Semiannual Report | | franklintempleton.com |
FRANKLIN TEMPLETON ETF TRUST
STATEMENT OF INVESTMENTS (UNAUDITED)
Franklin FTSE China ETF(continued)
| | | | | | | | | | | | | | |
| | | |
| | | Industry | | | Shares | | | Value | |
| | | Common Stocks (continued) | | | | | | | | | |
| | | China (continued) | | | | | | | | | |
| a | | BeiGene Ltd., ADR | | | Biotechnology | | | | 738 | | | $ | 90,375 | |
| | Beijing Capital Development Co. Ltd., A | | | Real Estate Management & Development | | | | 2,700 | | | | 3,070 | |
| | Beijing Capital International Airport Co. Ltd. | | | Transportation Infrastructure | | | | 36,000 | | | | 30,722 | |
| | Beijing Dabeinong Technology Group Co. Ltd. | | | Food Products | | | | 4,500 | | | | 2,880 | |
| | Beijing Enlight Media Co. Ltd. | | | Entertainment | | | | 3,600 | | | | 4,719 | |
| | Beijing Enterprises Holdings Ltd. | | | Gas Utilities | | | | 13,500 | | | | 62,081 | |
| | Beijing Enterprises Water Group Ltd. | | | Water Utilities | | | | 126,000 | | | | 64,451 | |
| | Beijing Jingneng Clean Energy Co. Ltd., H | | | Independent Power and Renewable Electricity Producers | | | | 36,000 | | | | 5,970 | |
| a | | Beijing Kunlun Tech Co. Ltd. | | | Entertainment | | | | 1,800 | | | | 3,088 | |
| | Beijing New Building Materials PLC | | | Building Products | | | | 900 | | | | 2,269 | |
| | Beijing North Star Co. Ltd., H | | | Real Estate Management & Development | | | | 18,000 | | | | 5,419 | |
| | Beijing Orient National Communication Science & Technology Co. Ltd. | | | Software | | | | 1,800 | | | | 3,234 | |
| | Beijing Oriental Yuhong Waterproof Technology Co. Ltd. | | | Construction Materials | | | | 900 | | | | 2,649 | |
| | Beijing Originwater Technology Co. Ltd. | | | Commercial Services & Supplies | | | | 4,500 | | | | 4,228 | |
| | Beijing Sanju Environmental Protection and New Material Co. Ltd. | | | Chemicals | | | | 4,500 | | | | 3,926 | |
| | Beijing Shiji Information Technology Co. Ltd. | | | Software | | | | 900 | | | | 4,972 | |
| a | | Beijing Shougang Co. Ltd. | | | Metals & Mining | | | | 5,400 | | | | 2,526 | |
| | Beijing Shunxin Agriculture Co. Ltd., A | | | Beverages | | | | 900 | | | | 6,574 | |
| | Beijing SL Pharmaceutical Co. Ltd. | | | Biotechnology | | | | 1,800 | | | | 3,146 | |
| a | | Beijing Teamsun Technology Co. Ltd., A | | | IT Services | | | | 1,800 | | | | 2,785 | |
| | Beijing Tiantan Biological Products Corp. Ltd., A | | | Biotechnology | | | | 900 | | | | 3,578 | |
| | Beijing Tongrentang Co. Ltd., A | | | Pharmaceuticals | | | | 1,800 | | | | 6,780 | |
| | Beijing Yanjing Brewery Co. Ltd. | | | Beverages | | | | 4,500 | | | | 3,661 | |
| | Bengang Steel Plates Co. Ltd., B | | | Metals & Mining | | | | 10,800 | | | | 2,797 | |
| a | | Bilibili Inc., ADR | | | Entertainment | | | | 1,089 | | | | 15,377 | |
| | Bluefocus Intelligent Communications Group Co. Ltd. | | | Media | | | | 2,700 | | | | 2,242 | |
| | Bluestar Adisseo Co., A | | | Chemicals | | | | 1,800 | | | | 2,609 | |
| | BOE Technology Group Co. Ltd. | | | Electronic Equipment, Instruments & Components | | | | 18,900 | | | | 6,992 | |
| | BOE Technology Group Co. Ltd. | | | Electronic Equipment, Instruments & Components | | | | 33,300 | | | | 17,487 | |
| | Bright Dairy & Food Co. Ltd., A | | | Food Products | | | | 1,800 | | | | 2,634 | |
| | Brilliance China Automotive Holdings Ltd. | | | Automobiles | | | | 62,000 | | | | 66,592 | |
| | BTG Hotels Group Co. Ltd., A | | | Hotels, Restaurants & Leisure | | | | 1,800 | | | | 4,232 | |
| | BYD Co. Ltd. | | | Automobiles | | | | 1,800 | | | | 12,295 | |
| | BYD Co. Ltd., H | | | Automobiles | | | | 16,000 | | | | 79,904 | |
| | BYD Electronic International Co. Ltd. | | | Communications Equipment | | | | 18,000 | | | | 26,956 | |
| a | | CAR Inc. | | | Road & Rail | | | | 18,000 | | | | 13,891 | |
| | Central China Securities Co. Ltd., A | | | Capital Markets | | | | 3,600 | | | | 2,505 | |
| | Central China Securities Co. Ltd., H | | | Capital Markets | | | | 18,000 | | | | 3,559 | |
| | CGN Power Co. Ltd., H | | | Independent Power and Renewable Electricity Producers | | | | 243,000 | | | | 61,375 | |
| | Changchun High & New Technology Industry Group Inc. | | | Pharmaceuticals | | | | 200 | | | | 11,045 | |
| | Changjiang Securities Co. Ltd. | | | Capital Markets | | | | 5,400 | | | | 5,293 | |
| | Chaozhou Three-Circle Group Co. Ltd. | | | Electronic Equipment, Instruments & Components | | | | 1,800 | | | | 5,041 | |
| | Chengdu Xingrong Environment Co. Ltd. | | | Water Utilities | | | | 3,600 | | | | 2,415 | |
| a | | China Aerospace Times Electronics Co. Ltd., A | | | Aerospace & Defense | | | | 2,700 | | | | 2,280 | |
| | China Agri-Industries Holdings Ltd. | | | Food Products | | | | 45,000 | | | | 14,638 | |
| | China Aoyuan Group Ltd. | | | Real Estate Management & Development | | | | 27,000 | | | | 30,584 | |
| | China Avic Avionics Equipment Co. Ltd., A | | | Aerospace & Defense | | | | 1,800 | | | | 3,579 | |
| | China Baoan Group Co. Ltd. | | | Industrial Conglomerates | | | | 3,600 | | | | 2,223 | |
| | | | | | |
| | | |
| franklintempleton.com | | Semiannual Report | | | 163 | |
FRANKLIN TEMPLETON ETF TRUST
STATEMENT OF INVESTMENTS (UNAUDITED)
Franklin FTSE China ETF(continued)
| | | | | | | | | | | | | | |
| | | |
| | | Industry | | | Shares | | | Value | |
| | | Common Stocks (continued) | | | | | | | | | |
| | | China (continued) | | | | | | | | | |
| a | | China Biologic Products Holdings Inc. | | | Biotechnology | | | | 567 | | | $ | 64,905 | |
| | China Bluechemical Ltd. | | | Chemicals | | | | 36,000 | | | | 8,679 | |
| | China Cinda Asset Management Co. Ltd., H | | | Capital Markets | | | | 198,000 | | | | 38,896 | |
| | China CITIC Bank Corp. Ltd., A | | | Banks | | | | 9,900 | | | | 7,819 | |
| | China CITIC Bank Corp. Ltd., H | | | Banks | | | | 216,000 | | | | 115,172 | |
| | China Coal Energy Co. Ltd., A | | | Oil, Gas & Consumable Fuels | | | | 7,200 | | | | 4,961 | |
| | China Coal Energy Co. Ltd., H | | | Oil, Gas & Consumable Fuels | | | | 45,000 | | | | 18,311 | |
| | China Communications Construction Co. Ltd., A | | | Construction & Engineering | | | | 5,400 | | | | 7,645 | |
| | China Communications Construction Co. Ltd., H | | | Construction & Engineering | | | | 99,000 | | | | 77,413 | |
| | China Communications Services Corp. Ltd. | | | Construction & Engineering | | | | 54,000 | | | | 30,584 | |
| | China Conch Venture Holdings Ltd. | | | Machinery | | | | 36,000 | | | | 133,173 | |
| | China Construction Bank Corp., A | | | Banks | | | | 9,900 | | | | 9,690 | |
| | China Construction Bank Corp., H | | | Banks | | | | 2,133,000 | | | | 1,627,081 | |
| a | | China COSCO Holdings Co. Ltd., A | | | Marine | | | | 9,900 | | | | 6,599 | |
| a | | China Eastern Airlines Corp. Ltd., A | | | Airlines | | | | 9,000 | | | | 6,528 | |
| a | | China Eastern Airlines Corp. Ltd., H | | | Airlines | | | | 36,000 | | | | 17,496 | |
| | China Enterprise Co. Ltd., A | | | Real Estate Management & Development | | | | 4,500 | | | | 2,855 | |
| | China Everbright Bank Co. Ltd., A | | | Banks | | | | 39,600 | | | | 21,848 | |
| | China Everbright Bank Co. Ltd., H | | | Banks | | | | 72,000 | | | | 30,676 | |
| | China Everbright International Ltd. | | | Commercial Services & Supplies | | | | 81,000 | | | | 62,408 | |
| | China Everbright Ltd. | | | Capital Markets | | | | 18,000 | | | | 21,055 | |
| a | | China Evergrande Group | | | Real Estate Management & Development | | | | 45,000 | | | | 95,862 | |
| | China Film Co. Ltd., A | | | Entertainment | | | | 2,700 | | | | 5,841 | |
| | China Foods Ltd. | | | Food Products | | | | 18,000 | | | | 7,967 | |
| | China Fortune Land Development Co. Ltd., A | | | Real Estate Management & Development | | | | 2,700 | | | | 10,197 | |
| | China Galaxy Securities Co. Ltd., A | | | Capital Markets | | | | 1,800 | | | | 2,745 | |
| | China Galaxy Securities Co. Ltd., H | | | Capital Markets | | | | 85,500 | | | | 45,480 | |
| | China Gezhouba Group Co. Ltd., A | | | Construction & Engineering | | | | 5,400 | | | | 4,409 | |
| | China Grand Automotive Services Group Co. Ltd., A | | | Specialty Retail | | | | 9,900 | | | | 5,337 | |
| | China Great Wall Securities Co. Ltd., A | | | Capital Markets | | | | 1,800 | | | | 3,730 | |
| | China Greatwall Technology Group Co. Ltd. | | | Technology Hardware, Storage & Peripherals | | | | 2,700 | | | | 4,877 | |
| | China Hongqiao Group Ltd. | | | Metals & Mining | | | | 58,500 | | | | 37,386 | |
| | China Huarong Asset Management Co. Ltd., H | | | Capital Markets | | | | 252,000 | | | | 37,931 | |
| | China International Capital Corp. Ltd., H | | | Capital Markets | | | | 25,200 | | | | 48,861 | |
| | China International Marine Containers (Group) Co. Ltd., H | | | Machinery | | | | 11,700 | | | | 10,164 | |
| | China International Travel Service Corp. Ltd., A | | | Hotels, Restaurants & Leisure | | | | 1,800 | | | | 23,457 | |
| | China Jinmao Holdings Group Ltd. | | | Real Estate Management & Development | | | | 126,000 | | | | 72,166 | |
| | China Jushi Co. Ltd., A | | | Construction Materials | | | | 4,500 | | | | 5,117 | |
| | China Life Insurance Co. Ltd., A | | | Insurance | | | | 5,400 | | | | 20,780 | |
| | China Life Insurance Co. Ltd., H | | | Insurance | | | | 171,000 | | | | 396,122 | |
| a | | China Literature Ltd. | | | Media | | | | 5,400 | | | | 18,357 | |
| | China Lodging Group Ltd., ADR | | | Hotels, Restaurants & Leisure | | | | 2,277 | | | | 75,187 | |
| | China Longyuan Power Group Corp. | | | Independent Power and Renewable Electricity Producers | | | | 72,000 | | | | 40,411 | |
| | China Machinery Engineering Corp., H | | | Construction & Engineering | | | | 18,000 | | | | 7,623 | |
| | China Medical System Holdings Ltd. | | | Pharmaceuticals | | | | 27,000 | | | | 32,099 | |
| | China Meheco Co. Ltd., A | | | Trading Companies & Distributors | | | | 1,800 | | | | 3,259 | |
| | China Merchants Bank Co. Ltd., A | | | Banks | | | | 19,800 | | | | 96,349 | |
| | China Merchants Bank Co. Ltd., H | | | Banks | | | | 85,500 | | | | 406,810 | |
| | | | |
| | | |
| 164 | | Semiannual Report | | franklintempleton.com |
FRANKLIN TEMPLETON ETF TRUST
STATEMENT OF INVESTMENTS (UNAUDITED)
Franklin FTSE China ETF(continued)
| | | | | | | | | | | | | | |
| | | |
| | | Industry | | | Shares | | | Value | |
| | | Common Stocks (continued) | | | | | | | | | |
| | | China (continued) | | | | | | | | | |
| | China Merchants Energy Shipping Co. Ltd., A | | | Oil, Gas & Consumable Fuels | | | | 4,500 | | | $ | 3,006 | |
| | China Merchants Expressway Network & Technology Holdings Co. Ltd. | | | Transportation Infrastructure | | | | 1,800 | | | | 1,984 | |
| | China Merchants Port Holdings Co. Ltd. | | | Transportation Infrastructure | | | | 36,000 | | | | 54,188 | |
| | China Merchants Securities Co. Ltd. | | | Capital Markets | | | | 21,600 | | | | 24,412 | |
| | China Merchants Securities Co. Ltd., A | | | Capital Markets | | | | 5,400 | | | | 12,439 | |
| | China Merchants Shekou Industrial Zone Holdings Co. Ltd., A | | | Real Estate Management & Development | | | | 7,200 | | | | 19,146 | |
| | China Minsheng Banking Corp. Ltd., A | | | Banks | | | | 34,200 | | | | 28,830 | |
| | China Minsheng Banking Corp. Ltd., H | | | Banks | | | | 144,000 | | | | 97,905 | |
| | China Mobile Ltd. | | | Wireless Telecommunication Services | | | | 121,500 | | | | 1,005,087 | |
| | China Molybdenum Co. Ltd., A | | | Metals & Mining | | | | 12,600 | | | | 6,422 | |
| | China Molybdenum Co. Ltd., H | | | Metals & Mining | | | | 81,000 | | | | 26,864 | |
| | China National Building Material Co. Ltd., H | | | Construction Materials | | | | 90,000 | | | | 80,823 | |
| | China National Chemical Engineering Co. Ltd., A | | | Construction & Engineering | | | | 5,400 | | | | 4,386 | |
| | China National Nuclear Power Co. Ltd., A | | | Independent Power and Renewable Electricity Producers | | | | 10,800 | | | | 8,000 | |
| | China National Software & Service Co. Ltd., A | | | Software | | | | 900 | | | | 9,046 | |
| | China Nonferrous Metal Industry’s Foreign Engineering and Construction Co. Ltd. | | | Metals & Mining | | | | 3,600 | | | | 2,213 | |
| | China Northern Rare Earth Group High-Tech Co. Ltd., A | | | Metals & Mining | | | | 2,700 | | | | 4,110 | |
| | China Oilfield Services Ltd., A | | | Energy Equipment & Services | | | | 3,600 | | | | 6,175 | |
| | China Oilfield Services Ltd., H | | | Energy Equipment & Services | | | | 36,000 | | | | 43,029 | |
| | China Orient Securities Co. Ltd., A | | | Capital Markets | | | | 5,400 | | | | 7,713 | |
| | China Overseas Land & Investment Ltd. | | | Real Estate Management & Development | | | | 90,000 | | | | 282,994 | |
| | China Pacific Insurance Group Co. Ltd., A | | | Insurance | | | | 6,300 | | | | 30,762 | |
| | China Pacific Insurance Group Co. Ltd., H | | | Insurance | | | | 59,400 | | | | 218,221 | |
| | China Petroleum & Chemical Corp., A | | | Oil, Gas & Consumable Fuels | | | | 32,400 | | | | 22,776 | |
| | China Petroleum & Chemical Corp., H | | | Oil, Gas & Consumable Fuels | | | | 594,000 | | | | 353,093 | |
| | China Power International Development Ltd. | | | Independent Power and Renewable Electricity Producers | | | | 90,000 | | | | 18,713 | |
| | China Railway Construction Corp. Ltd., A | | | Construction & Engineering | | | | 10,800 | | | | 14,307 | |
| | China Railway Construction Corp. Ltd., H | | | Construction & Engineering | | | | 45,000 | | | | 49,194 | |
| | China Railway Group Ltd., H | | | Construction & Engineering | | | | 90,000 | | | | 54,647 | |
| | China RailwayHi-tech Industry Co. Ltd., A | | | Construction & Engineering | | | | 1,800 | | | | 2,586 | |
| b | | China Railway Signal & Communication Corp. Ltd., H, Reg S | | | Electronic Equipment, Instruments & Components | | | | 36,000 | | | | 22,272 | |
| | China Reinsurance Group Corp., H | | | Insurance | | | | 144,000 | | | | 23,328 | |
| | China Resources Beer Holdings Co. Ltd. | | | Beverages | | | | 36,000 | | | | 190,805 | |
| | China Resources Cement Holdings Ltd. | | | Construction Materials | | | | 54,000 | | | | 54,142 | |
| | China Resources Double Crane Pharmaceutical Co. Ltd., A | | | Pharmaceuticals | | | | 900 | | | | 1,538 | |
| | China Resources Gas Group Ltd. | | | Gas Utilities | | | | 18,000 | | | | 88,974 | |
| | China Resources Land Ltd. | | | Real Estate Management & Development | | | | 61,500 | | | | 257,708 | |
| | China Resources Pharmaceutical Group Ltd. | | | Pharmaceuticals | | | | 36,000 | | | | 33,753 | |
| | China Resources Power Holdings Co. Ltd. | | | Independent Power and Renewable Electricity Producers | | | | 44,100 | | | | 53,498 | |
| | China Resources Sanjiu Medical & Pharmaceutical Co. Ltd. | | | Pharmaceuticals | | | | 900 | | | | 3,671 | |
| | China Shenhua Energy Co. Ltd., A | | | Oil, Gas & Consumable Fuels | | | | 7,200 | | | | 18,935 | |
| | China Shenhua Energy Co. Ltd., H | | | Oil, Gas & Consumable Fuels | | | | 76,500 | | | | 153,597 | |
| | China Shipbuilding Industry Co. Ltd., A | | | Machinery | | | | 21,600 | | | | 16,666 | |
| a | | China Shipbuilding Industry Group Power Co. Ltd., A | | | Auto Components | | | | 1,800 | | | | 5,762 | |
| | | | | | |
| | | |
| franklintempleton.com | | Semiannual Report | | | 165 | |
FRANKLIN TEMPLETON ETF TRUST
STATEMENT OF INVESTMENTS (UNAUDITED)
Franklin FTSE China ETF(continued)
| | | | | | | | | | | | | | |
| | | |
| | | Industry | | | Shares | | | Value | |
| | | Common Stocks (continued) | | | | | | | | | |
| | | China (continued) | | | | | | | | | |
| | China Shipping Container Lines Co. Ltd., A | | | Marine | | | | 10,800 | | | $ | 3,796 | |
| | China Shipping Development Co. Ltd., A | | | Marine | | | | 4,500 | | | | 4,235 | |
| | China South City Holdings Ltd. | | | Real Estate Management & Development | | | | 54,000 | | | | 6,406 | |
| | China South Publishing & Media Group Co. Ltd., A | | | Media | | | | 1,800 | | | | 3,050 | |
| | China Southern Airlines Co. Ltd., A | | | Airlines | | | | 8,100 | | | | 7,520 | |
| | China Southern Airlines Co. Ltd., H | | | Airlines | | | | 36,000 | | | | 21,813 | |
| | China Spacesat Co. Ltd., A | | | Aerospace & Defense | | | | 1,800 | | | | 5,462 | |
| | China State Construction Engineering Corp. Ltd., A | | | Construction & Engineering | | | | 39,600 | | | | 30,111 | |
| | China State Construction International Holdings Ltd. | | | Construction & Engineering | | | | 36,000 | | | | 33,844 | |
| | China Taiping Insurance Holdings Co. Ltd. | | | Insurance | | | | 34,200 | | | | 76,345 | |
| | China Telecom Corp. Ltd., H | | | Diversified Telecommunication Services | | | | 324,000 | | | | 147,547 | |
| b,c | | China Tower Corp. Ltd., H,144A, Reg S | | | Diversified Telecommunication Services | | | | 1,062,000 | | | | 241,136 | |
| | China Traditional Chinese Medicine Co. Ltd. | | | Pharmaceuticals | | | | 54,000 | | | | 24,798 | |
| | China TransInfo Technology Co. Ltd. | | | IT Services | | | | 900 | | | | 2,223 | |
| | China Unicom (Hong Kong) Ltd. | | | Diversified Telecommunication Services | | | | 126,000 | | | | 133,725 | |
| | China United Network Communications Ltd., A | | | Wireless Telecommunication Services | | | | 25,200 | | | | 21,208 | |
| | China Vanke Co. Ltd., A | | | Real Estate Management & Development | | | | 9,000 | | | | 32,642 | |
| | China Vanke Co. Ltd., H | | | Real Estate Management & Development | | | | 35,100 | | | | 122,233 | |
| | China Yangtze Power Co. Ltd., A | | | Independent Power and Renewable Electricity Producers | | | | 12,600 | | | | 32,165 | |
| | China Zhongwang Holdings Ltd. | | | Metals & Mining | | | | 36,000 | | | | 14,649 | |
| | Chinese Universe Publishing and Media Group Co. Ltd., A | | | Media | | | | 1,800 | | | | 3,292 | |
| | Chongqing Brewery Co. Ltd., A | | | Beverages | | | | 900 | | | | 5,171 | |
| | Chongqing Changan Automobile Co. Ltd. | | | Automobiles | | | | 3,600 | | | | 3,736 | |
| | Chongqing Changan Automobile Co. Ltd., B | | | Automobiles | | | | 18,000 | | | | 7,967 | |
| | Chongqing Fuling Zhacai Group Co. Ltd., A | | | Food Products | | | | 900 | | | | 2,814 | |
| | Chongqing Rural Commercial Bank Co. Ltd., H | | | Banks | | | | 54,000 | | | | 28,724 | |
| | Chongqing Water Group Co. Ltd., A | | | Water Utilities | | | | 2,700 | | | | 2,117 | |
| | Chongqing Zhifei Biological Products Co. Ltd. | | | Biotechnology | | | | 900 | | | | 5,980 | |
| | CIFI Holdings Group Co. Ltd. | | | Real Estate Management & Development | | | | 72,000 | | | | 42,064 | |
| | CIMC Enric Holdings Ltd. | | | Machinery | | | | 18,000 | | | | 10,355 | |
| a | | CITIC Guoan Information Industry Co. Ltd. | | | Media | | | | 5,400 | | | | 2,730 | |
| | Citic Pacific Ltd. | | | Industrial Conglomerates | | | | 108,000 | | | | 136,388 | |
| | CITIC Securities Co. Ltd., A | | | Capital Markets | | | | 9,000 | | | | 28,331 | |
| | CITIC Securities Co. Ltd., H | | | Capital Markets | | | | 54,000 | | | | 101,120 | |
| | CMST Development Co. Ltd., A | | | Air Freight & Logistics | | | | 2,700 | | | | 1,872 | |
| | CNOOC Ltd. | | | Oil, Gas & Consumable Fuels | | | | 360,000 | | | | 549,226 | |
| | Contemporary Amperex Technology Co. Ltd. | | | Electrical Equipment | | | | 900 | | | | 9,011 | |
| | COSCO SHIPPING Development Co. Ltd., H | | | Marine | | | | 81,000 | | | | 9,299 | |
| | COSCO Shipping Energy Transportation Co. Ltd., H | | | Marine | | | | 36,000 | | | | 15,935 | |
| a | | COSCO Shipping Holdings Co. Ltd. | | | Marine | | | | 54,000 | | | | 19,218 | |
| | COSCO SHIPPING Ports Ltd. | | | Transportation Infrastructure | | | | 36,000 | | | | 28,747 | |
| | | | |
| | | |
| 166 | | Semiannual Report | | franklintempleton.com |
FRANKLIN TEMPLETON ETF TRUST
STATEMENT OF INVESTMENTS (UNAUDITED)
Franklin FTSE China ETF(continued)
| | | | | | | | | | | | | | |
| | | |
| | | Industry | | | Shares | | | Value | |
| | | Common Stocks (continued) | | | | | | | | | |
| | | China (continued) | | | | | | | | | |
| | Country Garden Holdings Co. Ltd. | | | Real Estate Management & Development | | | | 171,000 | | | $ | 216,602 | |
| | Country Garden Services Holdings Co. Ltd. | | | Commercial Services & Supplies | | | | 27,000 | | | | 77,838 | |
| | CRRC Corp. Ltd., A | | | Machinery | | | | 26,100 | | | | 26,754 | |
| | CRRC Corp. Ltd., H | | | Machinery | | | | 90,000 | | | | 62,798 | |
| | CSC Financial Co. Ltd., A | | | Capital Markets | | | | 1,800 | | | | 5,626 | |
| | CSC Financial Co. Ltd., H | | | Capital Markets | | | | 18,000 | | | | 13,180 | |
| | CSG Holding Co. Ltd. | | | Construction Materials | | | | 29,700 | | | | 9,396 | |
| | CSPC Pharmaceutical Group Ltd. | | | Pharmaceuticals | | | | 100,000 | | | | 200,781 | |
| a | | CSSC Offshore and Marine Engineering Group Co. Ltd. | | | Machinery | | | | 6,000 | | | | 4,692 | |
| a | | Ctrip.com International Ltd., ADR | | | Internet & Direct Marketing Retail | | | | 8,829 | | | | 258,601 | |
| | Dali Foods Group Co. Ltd. | | | Food Products | | | | 45,000 | | | | 27,611 | |
| | Dalian Port PDA Co. Ltd., A | | | Transportation Infrastructure | | | | 7,200 | | | | 2,037 | |
| | Daqin Railway Co. Ltd., A | | | Road & Rail | | | | 12,600 | | | | 13,392 | |
| | Datang International Power Generation Co. Ltd., A | | | Independent Power and Renewable Electricity Producers | | | | 8,100 | | | | 3,040 | |
| | Datang International Power Generation Co. Ltd., H | | | Independent Power and Renewable Electricity Producers | | | | 54,000 | | | | 11,159 | |
| | Dawning Information Industry Co. Ltd., A | | | Technology Hardware, Storage & Peripherals | | | | 900 | | | | 4,327 | |
| | Dazhong Transportation (Group) Co. Ltd., B | | | Road & Rail | | | | 20,700 | | | | 9,791 | |
| | DHC Software Co. Ltd. | | | IT Services | | | | 4,500 | | | | 4,247 | |
| | Dongfang Electric Corp. Ltd., A | | | Electrical Equipment | | | | 2,700 | | | | 3,482 | |
| | Dongfang Electric Corp. Ltd., H | | | Electrical Equipment | | | | 9,000 | | | | 5,005 | |
| | Dongfeng Motor Group Co. Ltd., H | | | Automobiles | | | | 72,000 | | | | 68,424 | |
| | Dongxing Securities Co. Ltd., A | | | Capital Markets | | | | 2,700 | | | | 4,140 | |
| a | | Dr Peng Telecom & Media Group Co. Ltd., A | | | Diversified Telecommunication Services | | | | 2,700 | | | | 2,518 | |
| | East Money Information Co. Ltd. | | | Capital Markets | | | | 5,400 | | | | 11,176 | |
| | ENN Energy Holdings Ltd. | | | Gas Utilities | | | | 17,100 | | | | 176,903 | |
| a | | Eve Energy Co. Ltd. | | | Electrical Equipment | | | | 900 | | | | 3,830 | |
| | Everbright Securities Co. Ltd., A | | | Capital Markets | | | | 4,500 | | | | 7,140 | |
| | Everbright Securities Co. Ltd., H | | | Capital Markets | | | | 3,600 | | | | 2,728 | |
| a | | Fangda Carbon New Material Co. Ltd. | | | Electrical Equipment | | | | 2,682 | | | | 4,364 | |
| | Far East Horizon Ltd. | | | Diversified Financial Services | | | | 45,000 | | | | 41,789 | |
| | FAW CAR Co. Ltd. | | | Automobiles | | | | 1,800 | | | | 2,092 | |
| | Fiberhome Telecommunication Technologies Co. Ltd., A | | | Communications Equipment | | | | 1,800 | | | | 6,896 | |
| | Financial Street Holdings Co. Ltd. | | | Real Estate Management & Development | | | | 4,500 | | | | 4,852 | |
| | Focus Media Information Technology Co. Ltd. | | | Media | | | | 15,300 | | | | 11,248 | |
| | Foshan Haitian Flavouring & Food Co. Ltd. | | | Food Products | | | | 900 | | | | 13,852 | |
| | Fosun International Ltd. | | | Industrial Conglomerates | | | | 49,500 | | | | 61,248 | |
| | Founder Securities Co. Ltd., A | | | Capital Markets | | | | 7,200 | | | | 6,947 | |
| | Foxconn Industrial Internet Co. Ltd., A | | | Electronic Equipment, Instruments & Components | | | | 4,500 | | | | 9,074 | |
| | Fujian Longking Co. Ltd., A | | | Machinery | | | | 1,800 | | | | 2,503 | |
| | Fujian Sunner Development Co. Ltd. | | | Food Products | | | | 900 | | | | 3,108 | |
| | Future Land Development Holdings Ltd. | | | Real Estate Management & Development | | | | 36,000 | | | | 31,411 | |
| | Fuyao Glass Industry Group Co. Ltd., A | | | Auto Components | | | | 2,700 | | | | 8,121 | |
| | Fuyao Group Glass Industries Co. Ltd., H | | | Auto Components | | | | 10,800 | | | | 29,964 | |
| | Ganfeng Lithium Co. Ltd. | | | Metals & Mining | | | | 900 | | | | 2,843 | |
| a | | GCL System Integration Technology Co. Ltd. | | | Semiconductors & Semiconductor Equipment | | | | 5,400 | | | | 5,074 | |
| a | | GCL-Poly Energy Holdings Ltd. | | | Semiconductors & Semiconductor Equipment | | | | 315,000 | | | | 12,657 | |
| | GD Power Development Co. Ltd., A | | | Independent Power and Renewable Electricity Producers | | | | 13,500 | | | | 4,518 | |
| a | | GDS Holdings Ltd., ADR | | | IT Services | | | | 1,152 | | | | 46,172 | |
| | | | | | |
| | | |
| franklintempleton.com | | Semiannual Report | | | 167 | |
FRANKLIN TEMPLETON ETF TRUST
STATEMENT OF INVESTMENTS (UNAUDITED)
Franklin FTSE China ETF(continued)
| | | | | | | | | | | | | | |
| | | |
| | | Industry | | | Shares | | | Value | |
| | | Common Stocks (continued) | | | | | | | | | |
| | | China (continued) | | | | | | | | | |
| | Geely Automobile Holdings Ltd. | | | Automobiles | | | | 108,000 | | | $ | 183,228 | |
| | GEM Co. Ltd. | | | Metals & Mining | | | | 4,500 | | | | 2,804 | |
| | Gemdale Corp., A | | | Real Estate Management & Development | | | | 3,600 | | | | 5,823 | |
| a | | Genscript Biotech Corp. | | | Life Sciences Tools & Services | | | | 20,000 | | | | 38,319 | |
| a | | GF Securities Co. Ltd. | | | Capital Markets | | | | 5,400 | | | | 10,261 | |
| a | | GF Securities Co. Ltd., H | | | Capital Markets | | | | 36,000 | | | | 37,702 | |
| | Gigadevice Semiconductor Beijing Inc., A | | | Semiconductors & Semiconductor Equipment | | | | 400 | | | | 8,143 | |
| | Glodon Co. Ltd. | | | Software | | | | 900 | | | | 4,473 | |
| | GoerTek Inc. | | | Electronic Equipment, Instruments & Components | | | | 4,500 | | | | 11,078 | |
| a | | GOME Retail Holdings Ltd. | | | Specialty Retail | | | | 243,000 | | | | 22,008 | |
| | Grandjoy Holdings Group Co. Ltd., A | | | Real Estate Management & Development | | | | 2,700 | | | | 2,560 | |
| | Great Wall Motor Co. Ltd., A | | | Automobiles | | | | 4,500 | | | | 4,852 | |
| | Great Wall Motor Co. Ltd., H | | | Automobiles | | | | 72,000 | | | | 48,218 | |
| | Greattown Holdings Ltd., A | | | Real Estate Management & Development | | | | 2,700 | | | | 2,787 | |
| | Gree Electric Appliances Inc. of Zhuhai, A | | | Household Durables | | | | 5,400 | | | | 43,329 | |
| | Greendland Holdings Corp. Ltd., A | | | Real Estate Management & Development | | | | 6,300 | | | | 6,228 | |
| | Greentown China Holdings Ltd. | | | Real Estate Management & Development | | | | 18,000 | | | | 14,580 | |
| | GRG Banking Equipment Co. Ltd. | | | Technology Hardware, Storage & Peripherals | | | | 2,700 | | | | 3,259 | |
| | Guangdong Baolihua New Energy Stock Co. Ltd. | | | Independent Power and Renewable Electricity Producers | | | | 2,700 | | | | 2,337 | |
| | Guangdong Electric Power Development Co. Ltd. | | | Independent Power and Renewable Electricity Producers | | | | 3,600 | | | | 1,966 | |
| | Guangdong Electric Power Development Co. Ltd., B | | | Independent Power and Renewable Electricity Producers | | | | 12,600 | | | | 3,841 | |
| | Guangdong Haid Group Co. Ltd. | | | Food Products | | | | 1,800 | | | | 7,889 | |
| | Guangdong HEC Technology Holding Co. Ltd., A | | | Metals & Mining | | | | 2,700 | | | | 2,760 | |
| | Guangdong Investment Ltd. | | | Water Utilities | | | | 72,000 | | | | 140,888 | |
| a | | Guangdong LY Intelligent Manufacturing Co. Ltd. | | | Electrical Equipment | | | | 6,300 | | | | 8,257 | |
| | Guanghui Energy Co. Ltd., A | | | Oil, Gas & Consumable Fuels | | | | 7,200 | | | | 3,347 | |
| | Guangshen Railway Co. Ltd., A | | | Road & Rail | | | | 7,200 | | | | 3,105 | |
| | Guangshen Railway Co. Ltd., H | | | Road & Rail | | | | 36,000 | | | | 11,389 | |
| | Guangxi Guiguan Electric Power Co. Ltd., A | | | Independent Power and Renewable Electricity Producers | | | | 3,600 | | | | 2,299 | |
| | Guangxi Wuzhou Zhongheng Group Co. Ltd., A | | | Pharmaceuticals | | | | 5,400 | | | | 2,170 | |
| | Guangzhou Automobile Group Co. Ltd., A | | | Automobiles | | | | 4,500 | | | | 7,732 | |
| | Guangzhou Automobile Group Co. Ltd., H | | | Automobiles | | | | 72,000 | | | | 68,883 | |
| | Guangzhou Baiyun International Airport Co. Ltd., A | | | Transportation Infrastructure | | | | 1,800 | | | | 5,659 | |
| | Guangzhou Baiyunshan Pharmaceutical Holdings Co. Ltd. | | | Pharmaceuticals | | | | 5,400 | | | | 17,806 | |
| | Guangzhou Baiyunshan Pharmaceutical Holdings Co. Ltd., A | | | Pharmaceuticals | | | | 1,800 | | | | 8,746 | |
| | Guangzhou Haige Communications Group Inc. Co. | | | Communications Equipment | | | | 1,800 | | | | 2,470 | |
| | Guangzhou R&F Properties Co. Ltd., H | | | Real Estate Management & Development | | | | 21,600 | | | | 32,678 | |
| | Guangzhou Zhujiang Brewery Co. Ltd. | | | Beverages | | | | 2,700 | | | | 2,514 | |
| a | | Guizhou Xinbang Pharmaceutical Co. Ltd. | | | Pharmaceuticals | | | | 2,700 | | | | 2,098 | |
| | Guosen Securities Co. Ltd. | | | Capital Markets | | �� | | 3,600 | | | | 6,191 | |
| a | | Guosheng Financial Holding Inc. | | | Electrical Equipment | | | | 1,800 | | | | 2,861 | |
| | Guotai Junan Securities Co. Ltd. | | | Capital Markets | | | | 18,000 | | | | 28,012 | |
| | Guotai Junan Securities Co. Ltd., A | | | Capital Markets | | | | 7,200 | | | | 17,715 | |
| | Guoxuan High-Tech Co. Ltd. | | | Electrical Equipment | | | | 2,700 | | | | 4,730 | |
| | Guoyuan Securities Co. Ltd. | | | Capital Markets | | | | 3,600 | | | | 4,305 | |
| b,c | | Haidilao International Holding Ltd., 144A, Reg S | | | Hotels, Restaurants & Leisure | | | | 9,000 | | | | 38,460 | |
| | | | |
| | | |
| 168 | | Semiannual Report | | franklintempleton.com |
FRANKLIN TEMPLETON ETF TRUST
STATEMENT OF INVESTMENTS (UNAUDITED)
Franklin FTSE China ETF(continued)
| | | | | | | | | | | | | | |
| | | |
| | | Industry | | | Shares | | | Value | |
| | | Common Stocks (continued) | | | | | | | | | |
| | | China (continued) | | | | | | | | | |
| | Haier Electronics Group Co. Ltd. | | | Household Durables | | | | 27,000 | | | $ | 70,433 | |
| | Haier Smart Home Co. Ltd., A | | | Household Durables | | | | 6,300 | | | | 13,498 | |
| | Haisco Pharmaceutical Group Co. Ltd. | | | Pharmaceuticals | | | | 900 | | | | 2,286 | |
| | Haitian International Holdings Ltd. | | | Machinery | | | | 9,000 | | | | 18,438 | |
| | Haitong Securities Co. Ltd., A | | | Capital Markets | | | | 7,200 | | | | 14,418 | |
| | Haitong Securities Co. Ltd., H | | | Capital Markets | | | | 75,600 | | | | 79,270 | |
| | Han’s Laser Technology Industry Group Co. Ltd., A | | | Machinery | | | | 1,800 | | | | 8,961 | |
| a | | Hang Zhou Great Star Industrial Co. Ltd. | | | Household Durables | | | | 2,700 | | | | 4,148 | |
| | Hangzhou Binjiang Real Estate Group Co. Ltd. | | | Real Estate Management & Development | | | | 6,300 | | | | 3,370 | |
| | Hangzhou Hikvision Digital Technology Co. Ltd., A | | | Electronic Equipment, Instruments & Components | | | | 9,000 | | | | 40,707 | |
| | Hangzhou Robam Appliances Co. Ltd., A | | | Household Durables | | | | 900 | | | | 3,315 | |
| | Hangzhou Tigermed Consulting Co. Ltd. | | | Life Sciences Tools & Services | | | | 900 | | | | 7,820 | |
| | Harbin Boshi Automation Co. Ltd. | | | Machinery | | | | 1,800 | | | | 2,478 | |
| a | | Harbin Pharmaceutical Group Co. Ltd., A | | | Pharmaceuticals | | | | 3,600 | | | | 1,926 | |
| | Health & Happiness H&H International Holdings Ltd. | | | Food Products | | | | 4,500 | | | | 18,971 | |
| | Heilan Home Co. Ltd.,A-SHSC | | | Textiles, Apparel & Luxury Goods | | | | 3,600 | | | | 4,093 | |
| | Heilongjiang Agriculture Co. Ltd., A | | | Food Products | | | | 2,700 | | | | 3,664 | |
| | Henan Pinggao Electric Co. Ltd., A | | | Electrical Equipment | | | | 2,700 | | | | 2,639 | |
| | Henan Shuanghui Investment & Development Co. Ltd. | | | Food Products | | | | 2,700 | | | | 9,339 | |
| | Henan Zhongyuan Expressway Co. Ltd., A | | | Transportation Infrastructure | | | | 3,600 | | | | 2,062 | |
| | Hengan International Group Co. Ltd. | | | Personal Products | | | | 18,000 | | | | 118,019 | |
| | Hengdian Group DMEGC Magnetics Co. Ltd. | | | Electronic Equipment, Instruments & Components | | | | 2,700 | | | | 2,579 | |
| | Hengli Petrochemical Co. Ltd., A | | | Chemicals | | | | 4,520 | | | | 9,450 | |
| a | | HengTen Networks Group Ltd. | | | Internet & Direct Marketing Retail | | | | 468,000 | | | | 7,104 | |
| | Hengtong Optic-electric Co. Ltd., A | | | Communications Equipment | | | | 1,800 | | | | 3,922 | |
| | Hesteel Co. Ltd. | | | Metals & Mining | | | | 14,400 | | | | 5,082 | |
| | Hisense Electric Co. Ltd., A | | | Household Durables | | | | 2,700 | | | | 3,070 | |
| | Hithink RoyalFlush Information Network Co. Ltd. | | | Capital Markets | | | | 900 | | | | 12,502 | |
| | Holitech Technology Co. Ltd. | | | Electronic Equipment, Instruments & Components | | | | 4,500 | | | | 3,655 | |
| | Hopson Development Holdings Ltd. | | | Real Estate Management & Development | | | | 18,000 | | | | 18,001 | |
| | Huaan Securities Co. Ltd., A | | | Capital Markets | | | | 4,500 | | | | 3,882 | |
| | Huadian Fuxin Energy Corp. Ltd., H | | | Independent Power and Renewable Electricity Producers | | | | 54,000 | | | | 9,437 | |
| | Huadian Power International Corp. Ltd., A | | | Independent Power and Renewable Electricity Producers | | | | 8,100 | | | | 4,061 | |
| | Huadian Power International Corp. Ltd., H | | | Independent Power and Renewable Electricity Producers | | | | 36,000 | | | | 13,685 | |
| | Huadong Medicine Co. Ltd., A | | | Health Care Providers & Services | | | | 2,700 | | | | 9,906 | |
| | Huafa Industrial Co. Ltd. Zhuhai, A | | | Real Estate Management & Development | | | | 3,600 | | | | 3,544 | |
| | Huagong Tech Co. Ltd. | | | Electronic Equipment, Instruments & Components | | | | 900 | | | | 2,392 | |
| | Huaibei Mining Holdings Co. Ltd., A | | | Metals & Mining | | | | 1,800 | | | | 2,558 | |
| | Hualan Biological Engineering Inc. | | | Biotechnology | | | | 1,800 | | | | 8,646 | |
| | Huaneng Power International Inc., A | | | Independent Power and Renewable Electricity Producers | | | | 8,100 | | | | 6,579 | |
| | Huaneng Power International Inc., H | | | Independent Power and Renewable Electricity Producers | | | | 90,000 | | | | 43,281 | |
| | Huaneng Renewables Corp. Ltd., H | | | Independent Power and Renewable Electricity Producers | | | | 108,000 | | | | 36,783 | |
| | Huatai Securities Co. Ltd., A | | | Capital Markets | | | | 7,200 | | | | 19,247 | |
| | Huatai Securities Co. Ltd., H | | | Capital Markets | | | | 39,600 | | | | 59,304 | |
| | Huaxi Securities Co. Ltd. | | | Capital Markets | | | | 1,800 | | | | 2,475 | |
| | Huaxia Bank Co. Ltd., A | | | Banks | | | | 15,300 | | | | 15,812 | |
| | | | | | |
| | | |
| franklintempleton.com | | Semiannual Report | | | 169 | |
FRANKLIN TEMPLETON ETF TRUST
STATEMENT OF INVESTMENTS (UNAUDITED)
Franklin FTSE China ETF(continued)
| | | | | | | | | | | | | | |
| | | |
| | | Industry | | | Shares | | | Value | |
| | | Common Stocks (continued) | | | | | | | | | |
| | | China (continued) | | | | | | | | | |
| | Huaxin Cement Co. Ltd., A | | | Construction Materials | | | | 1,800 | | | $ | 4,751 | |
| | Huaxin Cement Co. Ltd., B | | | Construction Materials | | | | 6,320 | | | | 12,419 | |
| a | | Huayi Brothers Media Corp. | | | Entertainment | | | | 5,400 | | | | 3,577 | |
| | Huayu Automotive Systems Co. Ltd. | | | Auto Components | | | | 3,600 | | | | 11,847 | |
| | Hubei Biocause Pharmaceutical Co. Ltd. | | | Insurance | | | | 5,400 | | | | 5,331 | |
| | Hubei Energy Group Co. Ltd. | | | Independent Power and Renewable Electricity Producers | | | | 5,400 | | | | 3,078 | |
| | Hubei Xinyangfeng Fertilizer Co. Ltd. | | | Chemicals | | | | 1,800 | | | | 2,596 | |
| | Hunan Gold Corp. Ltd. | | | Metals & Mining | | | | 1,800 | | | | 2,150 | |
| a | | Hunan Valin Steel Co. Ltd. | | | Metals & Mining | | | | 5,400 | | | | 3,085 | |
| | Hundsun Technologies Inc., A | | | Software | | | | 900 | | | | 9,317 | |
| | Hytera Communications Corp. Ltd., A | | | Communications Equipment | | | | 1,800 | | | | 2,586 | |
| a | | Iflytek Co. Ltd. | | | Software | | | | 2,700 | | | | 12,046 | |
| | Industrial and Commercial Bank of China Ltd. | | | Banks | | | | 72,900 | | | | 56,452 | |
| | Industrial and Commercial Bank of China Ltd., H | | | Banks | | | | 1,782,000 | | | | 1,193,395 | |
| | Industrial Bank Co. Ltd., A | | | Banks | | | | 19,800 | | | | 48,604 | |
| | Industrial Securities Co. Ltd., A | | | Capital Markets | | | | 6,300 | | | | 5,487 | |
| | Inner Mongolia BaoTou Steel Union Co. Ltd., A | | | Metals & Mining | | | | 37,800 | | | | 7,728 | |
| | Inner Mongolia First Machinery Group Co. Ltd., A | | | Machinery | | | | 1,800 | | | | 2,654 | |
| | Inner Mongolia MengDian HuaNeng Thermal Power Co. Ltd., A | | | Independent Power and Renewable Electricity Producers | | | | 7,200 | | | | 3,005 | |
| | Inner Mongolia Yili Industrial Group Co. Ltd., A | | | Food Products | | | | 5,400 | | | | 21,566 | |
| | Inner Mongolia Yitai Coal Co. Ltd., B | | | Oil, Gas & Consumable Fuels | | | | 22,500 | | | | 20,633 | |
| a,b,c | | Innovent Biologics Inc., 144A, Reg S | | | Biotechnology | | | | 22,500 | | | | 71,609 | |
| | Inspur Electronic Information Industry Co. Ltd. | | | Technology Hardware, Storage & Peripherals | | | | 1,800 | | | | 6,478 | |
| a | | Iqiyi Inc., ADR | | | Entertainment | | | | 2,970 | | | | 47,906 | |
| a | | JD.com Inc., ADR | | | Internet & Direct Marketing Retail | | | | 18,171 | | | | 512,604 | |
| a | | Jiangsu Changjiang Electronics Technology Co. Ltd., A | | | Semiconductors & Semiconductor Equipment | | | | 2,700 | | | | 6,507 | |
| | Jiangsu Eastern Shenghong Co. Ltd. | | | Chemicals | | | | 4,500 | | | | 3,239 | |
| | Jiangsu Expressway Co. Ltd., H | | | Transportation Infrastructure | | | | 36,000 | | | | 45,738 | |
| | Jiangsu Financial Leasing Co. Ltd., A | | | Diversified Financial Services | | | | 2,700 | | | | 2,170 | |
| a | | Jiangsu Guoxin Corp. Ltd. | | | Electric Utilities | | | | 2,700 | | | | 2,862 | |
| | Jiangsu Hengli Hydraulic Co. Ltd., A | | | Machinery | | | | 900 | | | | 4,852 | |
| | Jiangsu Hengrui Medicine Co. Ltd., A | | | Pharmaceuticals | | | | 4,500 | | | | 50,840 | |
| | Jiangsu King’s Luck Brewery JSC Ltd. | | | Beverages | | | | 900 | | | | 4,073 | |
| | Jiangsu Yanghe Brewery JST Co. Ltd., A | | | Beverages | | | | 1,800 | | | | 26,214 | |
| | Jiangsu Yuyue Medical Equipment & Supply Co. Ltd. | | | Health Care Equipment & Supplies | | | | 900 | | | | 2,722 | |
| | Jiangsu Zhongnan Construction Group Co. Ltd. | | | Real Estate Management & Development | | | | 4,500 | | | | 4,890 | |
| | Jiangsu Zhongtian Technology Co. Ltd., A | | | Electrical Equipment | | | | 4,500 | | | | 5,444 | |
| | Jiangsu Zijin Rural Commercial Bank Co. Ltd., A | | | Banks | | | | 2,700 | | | | 2,348 | |
| | Jiangxi Bank Co. Ltd., H | | | Banks | | | | 22,500 | | | | 13,317 | |
| | Jiangxi Copper Co. Ltd., A | | | Metals & Mining | | | | 1,800 | | | | 3,622 | |
| | Jiangxi Copper Co. Ltd., H | | | Metals & Mining | | | | 27,000 | | | | 31,273 | |
| | Jiangxi Zhengbang Technology Co. Ltd., A | | | Food Products | | | | 1,800 | | | | 3,809 | |
| | Jiayuan International Group Ltd. | | | Real Estate Management & Development | | | | 36,000 | | | | 15,016 | |
| | | | |
| | | |
| 170 | | Semiannual Report | | franklintempleton.com |
FRANKLIN TEMPLETON ETF TRUST
STATEMENT OF INVESTMENTS (UNAUDITED)
Franklin FTSE China ETF(continued)
| | | | | | | | | | | | | | |
| | | |
| | | Industry | | | Shares | | | Value | |
| | | Common Stocks (continued) | | | | | | | | | |
| | | China (continued) | | | | | | | | | |
| | Jilin Aodong Pharmaceutical Group Co. Ltd. | | | Pharmaceuticals | | | | 900 | | | $ | 1,941 | |
| | Jinduicheng Molybdenum Co. Ltd., A | | | Metals & Mining | | | | 4,500 | | | | 4,758 | |
| | Jinke Properties Group Co. Ltd. | | | Real Estate Management & Development | | | | 4,500 | | | | 4,134 | |
| | JinyuBio-Technology Co. Ltd., A | | | Biotechnology | | | | 900 | | | | 2,378 | |
| | Jizhong Energy Resources Co. Ltd. | | | Oil, Gas & Consumable Fuels | | | | 5,400 | | | | 2,647 | |
| | JoInc. Aare Pharmaceutical Group Industry Co. Ltd., A | | | Pharmaceuticals | | | | 1,800 | | | | 2,473 | |
| | Jointown Pharmaceutical Group Co. Ltd., A | | | Health Care Providers & Services | | | | 1,800 | | | | 3,597 | |
| | JonjeeHi-Tech Industrial And Commercial Holding Co. Ltd., A | | | Food Products | | | | 900 | | | | 5,347 | |
| | Joyoung Co. Ltd. | | | Household Durables | | | | 900 | | | | 2,758 | |
| | Kingboard Holdings Ltd. | | | Electronic Equipment, Instruments & Components | | | | 18,000 | | | | 47,644 | |
| | Kingdee International Software Group Co. Ltd. | | | Software | | | | 54,000 | | | | 56,897 | |
| a | | Kingsoft Corp. Ltd. | | | Software | | | | 21,000 | | | | 44,575 | |
| a | | Kuang-Chi Technologies Co. Ltd. | | | Auto Components | | | | 3,600 | | | | 4,517 | |
| | Kunlun Energy Co. Ltd. | | | Gas Utilities | | | | 72,000 | | | | 61,995 | |
| | Kweichow Moutai Co. Ltd., A | | | Beverages | | | | 1,200 | | | | 193,245 | |
| | KWG Group Holdings Ltd. | | | Real Estate Management & Development | | | | 27,000 | | | | 23,661 | |
| | Lao Feng Xiang Co. Ltd., B | | | Textiles, Apparel & Luxury Goods | | | | 5,400 | | | | 18,241 | |
| | Legend Holdings Corp., H | | | Technology Hardware, Storage & Peripherals | | | | 11,700 | | | | 25,282 | |
| a,d | | Legend Holdings Corp., rts., 2/20/49 | | | Technology Hardware, Storage & Peripherals | | | | 830 | | | | — | |
| | Lens Technology Co. Ltd. | | | Electronic Equipment, Instruments & Components | | | | 1,800 | | | | 2,596 | |
| a | | Leo Group Co. Ltd. | | | Media | | | | 11,700 | | | | 2,736 | |
| | Lepu Medical Technology Beijing Co. Ltd. | | | Health Care Equipment & Supplies | | | | 1,800 | | | | 6,317 | |
| | Leyard Optoelectronic Co. Ltd. | | | Electronic Equipment, Instruments & Components | | | | 3,600 | | | | 3,509 | |
| | Li Ning Co. Ltd. | | | Textiles, Apparel & Luxury Goods | | | | 40,500 | | | | 116,240 | |
| a | | Liaoning Cheng Da Co. Ltd., A | | | Distributors | | | | 1,800 | | | | 3,335 | |
| | Livzon Pharmaceutical Group Inc., H | | | Pharmaceuticals | | | | 4,500 | | | | 11,538 | |
| | Logan Property Holdings Co. Ltd. | | | Real Estate Management & Development | | | | 22,000 | | | | 31,319 | |
| | Lomon Billions Group Co. Ltd. | | | Chemicals | | | | 1,800 | | | | 3,199 | |
| b,c | | Longfor Group Holdings Ltd., 144A, Reg S | | | Real Estate Management & Development | | | | 36,000 | | | | 134,551 | |
| | LONGi Green Energy Technology Co. Ltd., A | | | Semiconductors & Semiconductor Equipment | | | | 3,600 | | | | 13,223 | |
| | Luenmei Quantum Co. Ltd., A | | | Water Utilities | | | | 2,700 | | | | 4,235 | |
| | Luxi Chemical Group Co. Ltd. | | | Chemicals | | | | 1,800 | | | | 2,483 | |
| | Luxshare Precision Industry Co. Ltd. | | | Electronic Equipment, Instruments & Components | | | | 5,440 | | | | 20,385 | |
| | Luye Pharma Group Ltd. | | | Pharmaceuticals | | | | 36,000 | | | | 25,670 | |
| | Luzhou Laojiao Co. Ltd. | | | Beverages | | | | 1,800 | | | | 21,480 | |
| | Maanshan Iron & Steel Co. Ltd., H | | | Metals & Mining | | | | 36,000 | | | | 13,547 | |
| a | | Mango Excellent Media Co. Ltd. | | | Entertainment | | | | 900 | | | | 5,767 | |
| | Meinian Onehealth Healthcare Holdings Co. Ltd. | | | Health Care Providers & Services | | | | 4,560 | | | | 7,765 | |
| a,b,c | | Meitu Inc., 144A, Reg S | | | Technology Hardware, Storage & Peripherals | | | | 45,000 | | | | 10,332 | |
| a,b | | Meituan Dianping, B, Reg S | | | Internet & Direct Marketing Retail | | | | 77,400 | | | | 790,844 | |
| | Metallurgical Corp. Of China Ltd. | | | Construction & Engineering | | | | 63,000 | | | | 14,144 | |
| | Metallurgical Corp. of China Ltd., A | | | Construction & Engineering | | | | 19,800 | | | | 7,736 | |
| | Momo Inc., ADR | | | Interactive Media & Services | | | | 2,385 | | | | 73,887 | |
| | Muyuan Foodstuff Co. Ltd. | | | Food Products | | | | 1,800 | | | | 17,770 | |
| a | | NanJiE-Commerce Co. Ltd. | | | Textiles, Apparel & Luxury Goods | | | | 2,700 | | | | 3,898 | |
| | Nanjing Securities Co. Ltd., A | | | Capital Markets | | | | 1,800 | | | | 2,110 | |
| | Nari Technology Development Co. Ltd., A | | | Electrical Equipment | | | | 4,500 | | | | 12,886 | |
| | NAURA Technology Group Co. Ltd., A | | | Electronic Equipment, Instruments & Components | | | | 900 | | | | 8,265 | |
| | NavInfo Co. Ltd. | | | Household Durables | | | | 2,700 | | | | 6,155 | |
| | NetEase Inc., ADR | | | Entertainment | | | | 1,629 | | | | 433,607 | |
| | New China Life Insurance Co. Ltd., A | | | Insurance | | | | 1,800 | | | | 12,268 | |
| | New China Life Insurance Co. Ltd., H | | | Insurance | | | | 19,800 | | | | 78,297 | |
| | New Hope Liuhe Co. Ltd. | | | Food Products | | | | 3,600 | | | | 8,656 | |
| a | | New Oriental Education & Technology Group Inc., ADR | | | Diversified Consumer Services | | | | 3,123 | | | | 345,903 | |
| | | | | | |
| | | |
| franklintempleton.com | | Semiannual Report | | | 171 | |
FRANKLIN TEMPLETON ETF TRUST
STATEMENT OF INVESTMENTS (UNAUDITED)
Franklin FTSE China ETF(continued)
| | | | | | | | | | | | | | |
| | | |
| | | Industry | | | Shares | | | Value | |
| | | Common Stocks (continued) | | | | | | | | | |
| | | China (continued) | | | | | | | | | |
| | Newland Digital Technology Co. Ltd. | | | Software | | | | 1,800 | | | $ | 4,129 | |
| | Nine Dragons Paper Holdings Ltd. | | | Paper & Forest Products | | | | 36,000 | | | | 30,308 | |
| a | | Ningbo Joyson Electronic Corp. | | | Auto Components | | | | 1,260 | | | | 3,059 | |
| | Ningbo Shanshan Co. Ltd., A | | | Chemicals | | | | 1,800 | | | | 2,700 | |
| | Ningbo Zhoushan Port Co. Ltd., A | | | Transportation Infrastructure | | | | 6,300 | | | | 3,291 | |
| a | | NIO Inc., ADR | | | Automobiles | | | | 3,537 | | | | 5,518 | |
| | Northeast Securities Co. Ltd. | | | Capital Markets | | | | 1,800 | | | | 2,049 | |
| | Oceanwide Holdings Co. Ltd. | | | Real Estate Management & Development | | | | 5,400 | | | | 3,267 | |
| | Offshore Oil Engineering Co. Ltd., A | | | Energy Equipment & Services | | | | 5,400 | | | | 4,076 | |
| a | | OFILM Group Co. Ltd. | | | Electronic Equipment, Instruments & Components | | | | 2,700 | | | | 4,499 | |
| a | | ORG Technology Co. Ltd. | | | Containers & Packaging | | | | 3,600 | | | | 2,374 | |
| | Orient Securities Co. Ltd. of China, H | | | Capital Markets | | | | 18,000 | | | | 10,700 | |
| | Oriental Pearl Group Co. Ltd., A | | | Media | | | | 1,800 | | | | 2,306 | |
| a | | Pangang Group Vanadium Titanium & Resources Co. Ltd., A | | | Metals & Mining | | | | 8,100 | | | | 3,391 | |
| | People’s Insurance Co. Group of China Ltd., H | | | Insurance | | | | 180,000 | | | | 72,097 | |
| | Perfect World Co. Ltd. | | | Entertainment | | | | 900 | | | | 3,491 | |
| | PetroChina Co. Ltd., H | | | Oil, Gas & Consumable Fuels | | | | 468,000 | | | | 240,585 | |
| | PICC Property and Casualty Co. Ltd., H | | | Insurance | | | | 154,000 | | | | 179,746 | |
| a | | Pinduoduo Inc., ADR | | | Internet & Direct Marketing Retail | | | | 2,403 | | | | 77,425 | |
| | Ping An Bank Co. Ltd., A | | | Banks | | | | 16,200 | | | | 35,366 | |
| a,b | | Ping An Healthcare and Technology Co. Ltd., Reg S | | | Health Care Technology | | | | 3,600 | | | | 21,055 | |
| | Ping An Insurance (Group) Co. of China Ltd., H | | | Insurance | | | | 126,000 | | | | 1,447,343 | |
| | Ping An Insurance Group Co. of China Ltd., A | | | Insurance | | | | 10,800 | | | | 131,635 | |
| a | | Pingdingshan Tianan Coal Mining Co. Ltd., A | | | Oil, Gas & Consumable Fuels | | | | 3,600 | | | | 1,911 | |
| | Poly Developments and Holdings Group Co. Ltd., A | | | Real Estate Management & Development | | | | 9,900 | | | | 19,824 | |
| | Poly Property Group Co. Ltd. | | | Real Estate Management & Development | | | | 45,000 | | | | 15,671 | |
| | Postal Savings Bank of China Co. Ltd., H | | | Banks | | | | 216,000 | | | | 131,704 | |
| | Power Construction Corp. of China Ltd. | | | Construction & Engineering | | | | 11,700 | | | | 7,586 | |
| | Qingdao Port International Co. Ltd., A | | | Transportation Infrastructure | | | | 1,800 | | | | 1,875 | |
| b | | Qingdao Port International Co. Ltd., H, Reg S | | | Transportation Infrastructure | | | | 27,000 | | | | 16,532 | |
| | Qingdao TGOOD Electric Co. Ltd. | | | Electrical Equipment | | | | 900 | | | | 2,035 | |
| | Red Star Macalline Group Corp. Ltd. | | | Real Estate Management & Development | | | | 10,800 | | | | 9,024 | |
| | Red Star Macalline Group Corp. Ltd., A | | | Real Estate Management & Development | | | | 2,700 | | | | 4,291 | |
| | RiseSun Real Estate Development Co. Ltd. | | | Real Estate Management & Development | | | | 3,600 | | | | 4,174 | |
| | Rongsheng Petro Chemical Co. Ltd. | | | Chemicals | | | | 1,800 | | | | 2,760 | |
| | SAIC Motor Corp. Ltd. | | | Automobiles | | | | 9,900 | | | | 32,967 | |
| | Sanan Optoelectronics Co. Ltd., A | | | Semiconductors & Semiconductor Equipment | | | | 4,500 | | | | 8,872 | |
| | Sansteel Minguang Co. Ltd. | | | Metals & Mining | | | | 3,600 | | | | 4,053 | |
| | Sany Heavy Industry Co. Ltd., A | | | Machinery | | | | 7,200 | | | | 14,398 | |
| | SDIC Capital Co. Ltd., A | | | Capital Markets | | | | 3,600 | | | | 6,281 | |
| | SDIC Power Holdings Co. Ltd., A | | | Independent Power and Renewable Electricity Producers | | | | 5,400 | | | | 6,813 | |
| | Sealand Securities Co. Ltd. | | | Capital Markets | | | | 5,400 | | | | 3,736 | |
| | Seazen Holdings Co. Ltd., A | | | Real Estate Management & Development | | | | 1,800 | | | | 7,153 | |
| | SF Holding Co. Ltd. | | | Air Freight & Logistics | | | | 2,700 | | | | 14,904 | |
| | Shaanxi Coal Industry Co. Ltd. | | | Oil, Gas & Consumable Fuels | | | | 6,300 | | | | 7,702 | |
| | Shaanxi International Trust Co. Ltd. | | | Capital Markets | | | | 5,400 | | | | 3,108 | |
| | Shandong Chenming Paper Holdings Ltd. | | | Paper & Forest Products | | | | 7,200 | | | | 4,779 | |
| | Shandong Chenming Paper Holdings Ltd., B | | | Paper & Forest Products | | | | 12,600 | | | | 5,111 | |
| | | | |
| | | |
| 172 | | Semiannual Report | | franklintempleton.com |
FRANKLIN TEMPLETON ETF TRUST
STATEMENT OF INVESTMENTS (UNAUDITED)
Franklin FTSE China ETF(continued)
| | | | | | | | | | | | | | |
| | | |
| | | Industry | | | Shares | | | Value | |
| | | Common Stocks (continued) | | | | | | | | | |
| | | China (continued) | | | | | | | | | |
| | Shandong Chenming Paper Holdings Ltd., H | | | Paper & Forest Products | | | | 4,500 | | | $ | 1,802 | |
| b,c | | Shandong Gold Mining Co. Ltd., 144A, Reg S | | | Metals & Mining | | | | 9,000 | | | | 22,295 | |
| | Shandong Gold Mining Co. Ltd., A | | | Metals & Mining | | | | 1,860 | | | | 8,827 | |
| | ShandongHi-speed Co. Ltd., A | | | Transportation Infrastructure | | | | 3,600 | | | | 2,203 | |
| | Shandong Hualu Hengsheng Chemical Co. Ltd., A | | | Chemicals | | | | 1,800 | | | | 4,141 | |
| | Shandong Linglong Tyre Co. Ltd., A | | | Auto Components | | | | 900 | | | | 2,568 | |
| | Shandong Nanshan Aluminum Co. Ltd., A | | | Metals & Mining | | | | 16,200 | | | | 4,809 | |
| | Shandong Sun Paper Industry JSC Ltd. | | | Paper & Forest Products | | | | 1,800 | | | | 1,999 | |
| | Shandong Weigao Group Medical Polymer Co. Ltd., H | | | Health Care Equipment & Supplies | | | | 52,000 | | | | 53,530 | |
| a | | Shandong XInc. Ahao Energy Corp. Ltd., A | | | Oil, Gas & Consumable Fuels | | | | 10,800 | | | | 3,040 | |
| | Shanghai 2345 Network Holding Group Co. Ltd. | | | Software | | | | 3,600 | | | | 1,669 | |
| | Shanghai Bailian Group Co. Ltd., B | | | Food & Staples Retailing | | | | 4,500 | | | | 4,163 | |
| | Shanghai Baosight Software Co. Ltd., A | | | Software | | | | 900 | | | | 4,507 | |
| | Shanghai Baosight Software Co. Ltd., B | | | Software | | | | 6,320 | | | | 12,248 | |
| | Shanghai Chlor-Alkali Chemical Co. Ltd., B | | | Chemicals | | | | 10,800 | | | | 6,642 | |
| | Shanghai Construction Group Co. Ltd., A | | | Construction & Engineering | | | | 4,500 | | | | 2,136 | |
| | Shanghai Electric Group Co. Ltd., A | | | Electrical Equipment | | | | 7,200 | | | | 5,061 | |
| | Shanghai Electric Group Co. Ltd., H | | | Electrical Equipment | | | | 72,000 | | | | 23,236 | |
| | Shanghai Electric Power Co. Ltd., A | | | Independent Power and Renewable Electricity Producers | | | | 1,800 | | | | 1,989 | |
| | Shanghai Fosun Pharmaceutical Group Co. Ltd., A | | | Pharmaceuticals | | | | 1,800 | | | | 6,370 | |
| | Shanghai Fosun Pharmaceutical Group Co. Ltd., H | | | Pharmaceuticals | | | | 13,500 | | | | 36,250 | |
| | Shanghai Haixin Group Co., B | | | Pharmaceuticals | | | | 10,800 | | | | 4,439 | |
| | Shanghai Huayi Group Co. Ltd., B | | | Chemicals | | | | 6,300 | | | | 4,347 | |
| | Shanghai Industrial Development Co. Ltd., A | | | Real Estate Management & Development | | | | 2,700 | | | | 2,257 | |
| | Shanghai Industrial Holdings Ltd. | | | Industrial Conglomerates | | | | 9,000 | | | | 16,762 | |
| | Shanghai Industrial Urban Development Group Ltd. | | | Real Estate Management & Development | | | | 9,000 | | | | 1,137 | |
| | Shanghai International Airport Co. Ltd., A | | | Transportation Infrastructure | | | | 1,800 | | | | 20,109 | |
| | Shanghai International Port Group Co. Ltd., A | | | Transportation Infrastructure | | | | 9,900 | | | | 7,888 | |
| | Shanghai Jahwa United Co. Ltd., A | | | Personal Products | | | | 900 | | | | 4,329 | |
| | Shanghai Jinjiang International Hotels Co. Ltd. | | | Hotels, Restaurants & Leisure | | | | 3,600 | | | | 6,869 | |
| | Shanghai Jinjiang International Industrial Investment Co. Ltd. | | | Road & Rail | | | | 4,500 | | | | 4,266 | |
| | Shanghai Jinqiao Export Processing Zone Development, B | | | Real Estate Management & Development | | | | 6,300 | | | | 6,703 | |
| | Shanghai Lujiazui Finance & Trade Zone Develop Co. Ltd., B | | | Real Estate Management & Development | | | | 25,200 | | | | 28,274 | |
| | Shanghai Lujiazui Finance & Trade Zone Development Co. Ltd., A | | | Real Estate Management & Development | | | | 1,800 | | | | 3,443 | |
| | Shanghai M&G Stationery Inc., A | | | Commercial Services & Supplies | | | | 900 | | | | 5,616 | |
| | Shanghai Mechanical and Electrical Industry Co. Ltd., B | | | Machinery | | | | 8,100 | | | | 13,559 | |
| | Shanghai Pharmaceuticals Holding Co. Ltd., A | | | Health Care Providers & Services | | | | 1,800 | | | | 4,587 | |
| | Shanghai Pharmaceuticals Holding Co. Ltd., H | | | Health Care Providers & Services | | | | 18,900 | | | | 34,235 | |
| | Shanghai Pudong Development Bank Co. Ltd., A | | | Banks | | | | 27,900 | | | | 46,258 | |
| | | | | | |
| | | |
| franklintempleton.com | | Semiannual Report | | | 173 | |
FRANKLIN TEMPLETON ETF TRUST
STATEMENT OF INVESTMENTS (UNAUDITED)
Franklin FTSE China ETF(continued)
| | | | | | | | | | | | | | |
| | | |
| | | Industry | | | Shares | | | Value | |
| | | Common Stocks (continued) | | | | | | | | | |
| | | China (continued) | | | | | | | | | |
| | Shanghai ShibeiHi-Tech Co. Ltd., B | | | Real Estate Management & Development | | | | 12,600 | | | $ | 4,927 | |
| | Shanghai Shimao Co. Ltd., A | | | Real Estate Management & Development | | | | 6,300 | | | | 3,723 | |
| | Shanghai Tunnel Engineering Co. Ltd., A | | | Construction & Engineering | | | | 5,400 | | | | 4,454 | |
| | Shanghai Waigaoqiao Free Trade Zone Group Co. Ltd. | | | Trading Companies & Distributors | | | | 6,300 | | | | 8,763 | |
| | Shanghai Yuyuan Tourist Mart Group Co. Ltd., A | | | Specialty Retail | | | | 4,500 | | | | 5,136 | |
| | Shanghai Zhangjiang High-Tech Park Development Co. Ltd., A | | | Real Estate Management & Development | | | | 900 | | | | 1,953 | |
| | Shanghai Zhenhua Port Machinery Co. Ltd., B | | | Machinery | | | | 24,340 | | | | 8,324 | |
| | Shanxi Lu’an Environmental Energy Development Co. Ltd., A | | | Oil, Gas & Consumable Fuels | | | | 3,600 | | | | 3,650 | |
| | Shanxi Securities Co. Ltd. | | | Capital Markets | | | | 3,600 | | | | 3,957 | |
| | Shanxi Xinghuacun Fen Wine Factory Co. Ltd., A | | | Beverages | | | | 900 | | | | 9,743 | |
| | Shanxi Xishan Coal & Electricity Power Co. Ltd. | | | Oil, Gas & Consumable Fuels | | | | 4,500 | | | | 3,705 | |
| a | | Shanying International Holding Co. Ltd., A | | | Paper & Forest Products | | | | 4,500 | | | | 1,941 | |
| | Shenergy Co. Ltd., A | | | Independent Power and Renewable Electricity Producers | | | | 4,500 | | | | 3,497 | |
| | Shenghe Resources Holding Co. Ltd., A | | | Metals & Mining | | | | 1,800 | | | | 2,299 | |
| | Shengyi Technology Co. Ltd., A | | | Electronic Equipment, Instruments & Components | | | | 1,800 | | | | 6,286 | |
| | Shenwan Hongyuan Group Co. Ltd. | | | Capital Markets | | | | 21,600 | | | | 14,458 | |
| | Shenzhen Accord Pharmaceutical Co. Ltd., B | | | Health Care Providers & Services | | | | 1,800 | | | | 6,601 | |
| | Shenzhen Airport Co. Ltd. | | | Transportation Infrastructure | | | | 1,800 | | | | 2,775 | |
| | Shenzhen Energy Group Co. Ltd. | | | Independent Power and Renewable Electricity Producers | | | | 4,500 | | | | 3,642 | |
| | Shenzhen Everwin Precision Technology Co. Ltd. | | | Electronic Equipment, Instruments & Components | | | | 1,800 | | | | 3,577 | |
| | Shenzhen Expressway Co. Ltd., H | | | Transportation Infrastructure | | | | 18,000 | | | | 23,466 | |
| | Shenzhen Gas Corporation Ltd., A | | | Gas Utilities | | | | 2,700 | | | | 2,435 | |
| | Shenzhen Huaqiang Industry Co. Ltd. | | | Real Estate Management & Development | | | | 1,800 | | | | 3,645 | |
| | Shenzhen Infogem Technologies Co. Ltd. | | | Software | | | | 900 | | | | 2,015 | |
| | Shenzhen Inovance Technology Co. Ltd. | | | Machinery | | | | 1,800 | | | | 6,133 | |
| | Shenzhen International Holdings Ltd. | | | Transportation Infrastructure | | | | 22,500 | | | | 43,224 | |
| | Shenzhen Investment Ltd. | | | Real Estate Management & Development | | | | 72,000 | | | | 26,543 | |
| | Shenzhen Jinjia Group Co. Ltd. | | | Containers & Packaging | | | | 1,800 | | | | 2,422 | |
| | Shenzhen Kaifa Technology Co. Ltd. | | | Technology Hardware, Storage & Peripherals | | | | 1,800 | | | | 2,805 | |
| | Shenzhen Kangtai Biological Products Co. Ltd. | | | Biotechnology | | | | 900 | | | | 9,356 | |
| a | | Shenzhen KingdomSci-Tech Co. Ltd., A | | | Software | | | | 900 | | | | 2,634 | |
| | Shenzhen MindrayBio-Medical Electronics Co. Ltd., A | | | Health Care Equipment & Supplies | | | | 400 | | | | 10,332 | |
| a | | Shenzhen MTC Co. Ltd. | | | Household Durables | | | | 9,900 | | | | 3,868 | |
| | Shenzhen Neptunus Bioengineering Co. Ltd. | | | Health Care Providers & Services | | | | 4,500 | | | | 2,092 | |
| | Shenzhen Overseas Chinese Town Co. Ltd. | | | Hotels, Restaurants & Leisure | | | | 9,000 | | | | 8,860 | |
| a | | Shenzhen Sunway Communication Co. Ltd. | | | Communications Equipment | | | | 900 | | | | 4,512 | |
| | Shenzhen Yan Tian Port Holding Co. Ltd. | | | Transportation Infrastructure | | | | 2,700 | | | | 2,219 | |
| | Shenzhen Zhongjin Lingnan Nonfemet Co. Ltd. | | | Metals & Mining | | | | 5,400 | | | | 3,055 | |
| | Shenzhou International Group Holdings Ltd. | | | Textiles, Apparel & Luxury Goods | | | | 16,200 | | | | 211,608 | |
| a | | Shijiazhuang Changshan BeiMing Technology Co. Ltd. | | | Textiles, Apparel & Luxury Goods | | | | 4,500 | | | | 3,384 | |
| | Shimao Property Holdings Ltd. | | | Real Estate Management & Development | | | | 27,000 | | | | 78,871 | |
| | | | |
| | | |
| 174 | | Semiannual Report | | franklintempleton.com |
FRANKLIN TEMPLETON ETF TRUST
STATEMENT OF INVESTMENTS (UNAUDITED)
Franklin FTSE China ETF(continued)
| | | | | | | | | | | | | | |
| | | |
| | | Industry | | | Shares | | | Value | |
| | | Common Stocks (continued) | | | | | | | | | |
| | | China (continued) | | | | | | | | | |
| a | | Siasun Robot & Automation Co. Ltd. | | | Machinery | | | | 2,700 | | | $ | 5,456 | |
| | Sichuan Chuantou Energy Co. Ltd., A | | | Independent Power and Renewable Electricity Producers | | | | 2,700 | | | | 3,773 | |
| | Sichuan Expressway Co. Ltd., H | | | Transportation Infrastructure | | | | 18,000 | | | | 5,350 | |
| a | | Sichuan Hebang Biotechnology Co. Ltd., A | | | Chemicals | | | | 14,400 | | | | 3,126 | |
| | Sichuan Kelun Pharmaceutical Co. Ltd. | | | Pharmaceuticals | | | | 900 | | | | 3,259 | |
| | Sichuan Languang Development Co. Ltd., A | | | Real Estate Management & Development | | | | 2,700 | | | | 2,272 | |
| | Sichuan Swellfun Co. Ltd., A | | | Beverages | | | | 900 | | | | 5,712 | |
| | Sihuan Pharmaceutical Holdings Group Ltd. | | | Pharmaceuticals | | | | 99,000 | | | | 15,028 | |
| a | | SINA Corp. | | | Interactive Media & Services | | | | 1,386 | | | | 54,317 | |
| | Sino-Ocean Land Holdings Ltd. | | | Real Estate Management & Development | | | | 63,000 | | | | 21,377 | |
| | Sinolink Securities Co. Ltd., A | | | Capital Markets | | | | 3,600 | | | | 4,391 | |
| | Sinoma Science & Technology Co. Ltd. | | | Chemicals | | | | 1,800 | | | | 2,626 | |
| | Sinopec Engineering Group Co. Ltd. | | | Construction & Engineering | | | | 36,000 | | | | 22,594 | |
| a | | Sinopec Oilfield Service Corp. | | | Energy Equipment & Services | | | | 36,000 | | | | 3,766 | |
| a | | Sinopec Oilfield Service Corp., A | | | Energy Equipment & Services | | | | 10,800 | | | | 3,388 | |
| | Sinopec Shanghai Petrochemical Co. Ltd., A | | | Chemicals | | | | 8,100 | | | | 4,730 | |
| | Sinopec Shanghai Petrochemical Co. Ltd., H | | | Chemicals | | | | 72,000 | | | | 20,940 | |
| | Sinopharm Group Co. Ltd., H | | | Health Care Providers & Services | | | | 28,800 | | | | 90,191 | |
| | Sinotrans Ltd., A | | | Air Freight & Logistics | | | | 4,500 | | | | 2,678 | |
| | Sinotrans Ltd., H | | | Air Freight & Logistics | | | | 45,000 | | | | 14,121 | |
| | Sinotruk Hong Kong Ltd. | | | Machinery | | | | 13,500 | | | | 20,010 | |
| | Soho China Ltd. | | | Real Estate Management & Development | | | | 36,000 | | | | 10,287 | |
| | Songcheng Performance Development Co. Ltd. | | | Hotels, Restaurants & Leisure | | | | 1,800 | | | | 7,043 | |
| | SooChow Securities Co. Ltd., A | | | Capital Markets | | | | 3,600 | | | | 4,663 | |
| | Southwest Securities Co. Ltd., A | | | Capital Markets | | | | 5,400 | | | | 3,410 | |
| | STO Express Co. Ltd. | | | Air Freight & Logistics | | | | 900 | | | | 2,897 | |
| | Sunac China Holdings Ltd. | | | Real Estate Management & Development | | | | 54,000 | | | | 216,981 | |
| | Sungrow Power Supply Co. Ltd. | | | Electrical Equipment | | | | 1,800 | | | | 2,848 | |
| | Suning Universal Co. Ltd. | | | Real Estate Management & Development | | | | 3,600 | | | | 1,860 | |
| | Suning.com Co. Ltd. | | | Specialty Retail | | | | 9,900 | | | | 14,362 | |
| | Sunny Optical Technology Group Co. Ltd. | | | Electronic Equipment, Instruments & Components | | | | 14,400 | | | | 211,608 | |
| | Sunwoda Electronic Co. Ltd. | | | Electrical Equipment | | | | 1,800 | | | | 3,819 | |
| | Suofeiya Home Collection Co. Ltd. | | | Household Durables | | | | 900 | | | | 2,158 | |
| | Suzhou Gold Mantis Construction Decoration Co. Ltd. | | | Construction & Engineering | | | | 4,500 | | | | 5,715 | |
| | Tahoe Group Co. Ltd. | | | Real Estate Management & Development | | | | 2,700 | | | | 2,272 | |
| a | | TAL Education Group, ADR | | | Diversified Consumer Services | | | | 7,767 | | | | 265,942 | |
| | Tangshan Jidong Cement Co. Ltd. | | | Construction Materials | | | | 1,800 | | | | 3,864 | |
| | TangShan Port Group Co. Ltd., A | | | Transportation Infrastructure | | | | 11,700 | | | | 4,030 | |
| | Tasly Pharmaceutical Group Co. Ltd., A | | | Pharmaceuticals | | | | 900 | | | | 1,964 | |
| | TBEA Co. Ltd., A | | | Electrical Equipment | | | | 5,400 | | | | 4,915 | |
| | TCL Corp. | | | Household Durables | | | | 10,800 | | | | 5,384 | |
| | Tencent Holdings Ltd. | | | Interactive Media & Services | | | | 130,200 | | | | 5,484,098 | |
| a | | Tencent Music Entertainment Group, ADR | | | Entertainment | | | | 2,448 | | | | 31,261 | |
| a | | The China Pacific Securities Co. Ltd., A | | | Capital Markets | | | | 8,100 | | | | 3,879 | |
| | Tian Di Science & Technology Co. Ltd., A | | | Machinery | | | | 7,200 | | | | 3,307 | |
| | Tianfeng Securities Co. Ltd., A | | | Capital Markets | | | | 4,500 | | | | 5,413 | |
| | Tianjin Capital Environmental Protection Group Co. Ltd. | | | Commercial Services & Supplies | | | | 18,000 | | | | 6,199 | |
| | Tianjin Port Co. Ltd., A | | | Transportation Infrastructure | | | | 2,700 | | | | 2,329 | |
| | Tianjin Zhonghuan Semiconductor Co. Ltd. | | | Semiconductors & Semiconductor Equipment | | | | 3,600 | | | | 6,105 | |
| | Tianma Microelectronics Co. Ltd. | | | Electronic Equipment, Instruments & Components | | | | 1,800 | | | | 3,483 | |
| | Tianqi Lithium Corp. | | | Chemicals | | | | 1,800 | | | | 6,856 | |
| | | | | | |
| | | |
| franklintempleton.com | | Semiannual Report | | | 175 | |
FRANKLIN TEMPLETON ETF TRUST
STATEMENT OF INVESTMENTS (UNAUDITED)
Franklin FTSE China ETF(continued)
| | | | | | | | | | | | | | |
| | | |
| | | Industry | | | Shares | | | Value | |
| | | Common Stocks (continued) | | | | | | | | | |
| | | China (continued) | | | | | | | | | |
| | Times China Holdings Ltd. | | | Real Estate Management & Development | | | | 18,000 | | | $ | 28,012 | |
| a,b | | Tongcheng-Elong Holdings Ltd., Reg S | | | Internet & Direct Marketing Retail | | | | 18,000 | | | | 27,645 | |
| | Tonghua Dongbao Pharmaceutical Co. Ltd. | | | Pharmaceuticals | | | | 900 | | | | 2,206 | |
| | Tongkun Group Co. Ltd., A | | | Chemicals | | | | 1,800 | | | | 3,201 | |
| | Tongling Nonferrous Metals Group Co. Ltd. | | | Metals & Mining | | | | 9,900 | | | | 3,008 | |
| | Tongwei Co. Ltd., A | | | Food Products | | | | 1,800 | | | | 3,211 | |
| | TravelSky Technology Ltd., H | | | IT Services | | | | 18,000 | | | | 37,380 | |
| | Tsingtao Brewery Co. Ltd., A | | | Beverages | | | | 900 | | | | 6,112 | |
| | Tsingtao Brewery Co. Ltd., H | | | Beverages | | | | 9,000 | | | | 54,303 | |
| | Tunghsu Optoelectronic Technology Co. Ltd. | | | Electronic Equipment, Instruments & Components | | | | 6,300 | | | | 5,011 | |
| | Unigroup Guoxin Microelectronics Co. Ltd. | | | Electronic Equipment, Instruments & Components | | | | 900 | | | | 6,439 | |
| | Unisplendour Corp. Ltd. | | | Electronic Equipment, Instruments & Components | | | | 900 | | | | 3,967 | |
| | Venustech Group Inc. | | | Software | | | | 900 | | | | 4,030 | |
| a | | Vipshop Holdings Ltd., ADR | | | Internet & Direct Marketing Retail | | | | 9,342 | | | | 83,331 | |
| | Walvax Biotechnology Co. Ltd. | | | Biotechnology | | | | 1,800 | | | | 6,803 | |
| | Wangsu Science & Technology Co. Ltd. | | | IT Services | | | | 4,500 | | | | 6,301 | |
| | Wanhua Chemical Group Co. Ltd., A | | | Chemicals | | | | 2,700 | | | | 16,693 | |
| | Wanxiang Qianchao Co. Ltd. | | | Auto Components | | | | 5,400 | | | | 3,917 | |
| a | | Weibo Corp., ADR | | | Interactive Media & Services | | | | 1,179 | | | | 52,760 | |
| | Weichai Power Co. Ltd., A | | | Machinery | | | | 6,300 | | | | 9,898 | |
| | Weichai Power Co. Ltd., H | | | Machinery | | | | 45,000 | | | | 64,865 | |
| | Weifu High-Technology Co. Ltd., B | | | Auto Components | | | | 4,500 | | | | 7,129 | |
| | Wens Foodstuffs Group Co. Ltd. | | | Food Products | | | | 1,800 | | | | 9,372 | |
| a | | Western Mining Co. Ltd., A | | | Metals & Mining | | | | 2,700 | | | | 2,095 | |
| | Western Securities Co. Ltd. | | | Capital Markets | | | | 3,600 | | | | 4,492 | |
| | Winning Health Technology Group Co. Ltd. | | | Health Care Technology | | | | 1,800 | | | | 4,003 | |
| | Wolong Electric Group Co. Ltd., A | | | Electrical Equipment | | | | 1,800 | | | | 2,095 | |
| | Wonders Information Co. Ltd. | | | IT Services | | | | 1,800 | | | | 3,431 | |
| | Wuchan Zhongda Group Co. Ltd., A | | | Distributors | | | | 5,400 | | | | 4,144 | |
| | Wuhan Guide Infrared Co. Ltd. | | | Electronic Equipment, Instruments & Components | | | | 900 | | | | 2,994 | |
| | Wuhu Sanqi Interactive Entertainment Network Technology Group Co. Ltd. | | | Entertainment | | | | 1,800 | | | | 4,545 | |
| | Wuliangye Yibin Co. Ltd. | | | Beverages | | | | 3,600 | | | | 65,434 | |
| | WUS Printed Circuit Kunshan Co. Ltd. | | | Electronic Equipment, Instruments & Components | | | | 1,800 | | | | 6,175 | |
| | WuXi AppTec Co. Ltd., A | | | Life Sciences Tools & Services | | | | 900 | | | | 10,927 | |
| | WuXi AppTec Co. Ltd., H | | | Life Sciences Tools & Services | | | | 3,600 | | | | 39,355 | |
| a,b,c | | Wuxi Biologics Cayman Inc., 144A, Reg S | | | Life Sciences Tools & Services | | | | 13,500 | | | | 137,766 | |
| | Wuxi Lead Intelligent Equipment Co. Ltd. | | | Electronic Equipment, Instruments & Components | | | | 1,800 | | | | 8,494 | |
| | XCMG Construction Machinery Co. Ltd. | | | Machinery | | | | 8,100 | | | | 5,025 | |
| | Xiamen C & D Inc., A | | | Trading Companies & Distributors | | | | 4,500 | | | | 5,482 | |
| | Xiamen Tungsten Co. Ltd., A | | | Metals & Mining | | | | 1,800 | | | | 3,380 | |
| a | | Xiaomi Corp., B | | | Technology Hardware, Storage & Peripherals | | | | 208,800 | | | | 234,385 | |
| | Xinhu Zhongbao Co. Ltd., A | | | Real Estate Management & Development | | | | 9,900 | | | | 4,006 | |
| | Xinhua Winshare Publishing and Media Co. Ltd., H | | | Distributors | | | | 9,000 | | | | 6,383 | |
| | Xinjiang Goldwind Science & Technology Co. Ltd. | | | Electrical Equipment | | | | 3,600 | | | | 6,312 | |
| | Xinjiang Goldwind Science & Technology Co. Ltd., H | | | Electrical Equipment | | | | 14,400 | | | | 17,046 | |
| | Xinjiang Zhongtai Chemical Co. Ltd. | | | Chemicals | | | | 2,700 | | | | 2,639 | |
| | Xinxing Ductile Iron Pipes Co. Ltd. | | | Metals & Mining | | | | 8,100 | | | | 4,424 | |
| | Yang Quan Coal Industry Group Co. Ltd., A | | | Oil, Gas & Consumable Fuels | | | | 3,600 | | | | 2,601 | |
| | Yango Group Co. Ltd. | | | Real Estate Management & Development | | | | 4,500 | | | | 3,718 | |
| b | | Yangtze Optical Fibre and Cable Joint Stock Ltd. Co., H, Reg S | | | Communications Equipment | | | | 4,500 | | | | 7,256 | |
| | Yantai Changyu Pioneer Wine Co. Ltd., B | | | Beverages | | | | 5,400 | | | | 11,007 | |
| | Yantai Jereh Oilfield Services Group Co. Ltd. | | | Energy Equipment & Services | | | | 1,800 | | | | 6,808 | |
| | Yanzhou Coal Mining Co. Ltd., A | | | Oil, Gas & Consumable Fuels | | | | 4,500 | | | | 6,711 | |
| | | | |
| | | |
| 176 | | Semiannual Report | | franklintempleton.com |
FRANKLIN TEMPLETON ETF TRUST
STATEMENT OF INVESTMENTS (UNAUDITED)
Franklin FTSE China ETF(continued)
| | | | | | | | | | | | | | |
| | | |
| | | Industry | | | Shares | | | Value | |
| | | Common Stocks (continued) | | | | | | | | | |
| | | China (continued) | | | | | | | | | |
| | Yanzhou Coal Mining Co. Ltd., H | | | Oil, Gas & Consumable Fuels | | | | 36,000 | | | $ | 36,554 | |
| | Yifan Pharmaceutical Co. Ltd. | | | Pharmaceuticals | | | | 1,800 | | | | 3,380 | |
| | Yihai International Holding Ltd. | | | Food Products | | | | 11,000 | | | | 65,388 | |
| | Yintai Resources Co. Ltd. | | | Metals & Mining | | | | 1,800 | | | | 3,287 | |
| | Yonghui Superstores Co. Ltd., A | | | Food & Staples Retailing | | | | 7,200 | | | | 8,963 | |
| | Yonyou Network Technology Co. Ltd., A | | | Software | | | | 2,700 | | | | 11,679 | |
| | YTO Express Group Co. Ltd., A | | | Air Freight & Logistics | | | | 1,800 | | | | 2,901 | |
| | Yuan Longping High-tech Agriculture Co. Ltd. | | | Food Products | | | | 2,700 | | | | 4,741 | |
| | Yuexiu Property Co. Ltd. | | | Real Estate Management & Development | | | | 144,000 | | | | 31,227 | |
| | Yunda Holding Co. Ltd. | | | Air Freight & Logistics | | | | 900 | | | | 4,335 | |
| a | | Yunnan Aluminium Co. Ltd. | | | Metals & Mining | | | | 3,600 | | | | 2,269 | |
| | Yunnan Baiyao Group Co. Ltd. | | | Pharmaceuticals | | | | 900 | | | | 9,585 | |
| | Yunnan Hongxiang Yixintang Pharmaceutical Co. Ltd. | | | Food & Staples Retailing | | | | 900 | | | | 2,824 | |
| a | | Yunnan Tin Co. Ltd. | | | Metals & Mining | | | | 1,800 | | | | 2,558 | |
| a | | YY Inc., ADR | | | Interactive Media & Services | | | | 1,215 | | | | 68,319 | |
| | Zhangzhou Pientzehuang Pharmaceutical Co. Ltd., A | | | Pharmaceuticals | | | | 900 | | | | 12,840 | |
| | Zhaojin Mining Industry Co. Ltd., H | | | Metals & Mining | | | | 22,500 | | | | 26,032 | |
| | Zhefu Holding Group Co. Ltd. | | | Electrical Equipment | | | | 3,600 | | | | 2,299 | |
| | Zhejiang China Commodities City Group Co. Ltd., A | | | Real Estate Management & Development | | | | 8,100 | | | | 4,288 | |
| | Zhejiang Chint Electrics Co. Ltd., A | | | Electrical Equipment | | | | 1,800 | | | | 5,502 | |
| | Zhejiang Crystal-Optech Co. Ltd. | | | Electronic Equipment, Instruments & Components | | | | 1,800 | | | | 3,698 | |
| | Zhejiang Dahua Technology Co. Ltd. | | | Electronic Equipment, Instruments & Components | | | | 3,600 | | | | 8,706 | |
| | Zhejiang Expressway Co. Ltd., H | | | Transportation Infrastructure | | | | 36,000 | | | | 31,135 | |
| | Zhejiang Hailiang Co. Ltd. | | | Metals & Mining | | | | 1,800 | | | | 2,609 | |
| | Zhejiang Hisoar Pharmaceutical Co. Ltd. | | | Pharmaceuticals | | | | 2,700 | | | | 2,601 | |
| | Zhejiang Huace Film & TV Co. Ltd., A | | | Entertainment | | | | 2,700 | | | | 2,495 | |
| a | | Zhejiang Huahai Pharmaceutical Co. Ltd., A | | | Pharmaceuticals | | | | 900 | | | | 1,863 | |
| | Zhejiang Huayou Cobalt Co. Ltd., A | | | Metals & Mining | | | | 900 | | | | 3,391 | |
| | Zhejiang Juhua Co. Ltd., A | | | Chemicals | | | | 4,500 | | | | 4,455 | |
| | Zhejiang Longsheng Group Co. Ltd., A | | | Chemicals | | | | 3,600 | | | | 7,088 | |
| | Zhejiang Medicine Co. Ltd., A | | | Pharmaceuticals | | | | 1,800 | | | | 2,886 | |
| | Zhejiang NHU Co. Ltd. | | | Pharmaceuticals | | | | 2,700 | | | | 8,087 | |
| | Zhejiang Runtu Co. Ltd. | | | Chemicals | | | | 1,800 | | | | 2,939 | |
| | Zhejiang Sanhua Intelligent Controls Co. Ltd. | | | Machinery | | | | 2,700 | | | | 4,976 | |
| | Zhejiang Satellite Petrochemical Co. Ltd. | | | Chemicals | | | | 1,800 | | | | 3,133 | |
| | Zhejiang Semir Garment Co. Ltd. | | | Textiles, Apparel & Luxury Goods | | | | 1,800 | | | | 3,115 | |
| | Zhejiang Supor Co. Ltd. | | | Household Durables | | | | 900 | | | | 9,040 | |
| | Zhejiang Wanfeng Auto Wheel Co. Ltd. | | | Auto Components | | | | 1,800 | | | | 1,777 | |
| | Zhejiang Weixing New Building Materials Co. Ltd. | | | Building Products | | | | 1,800 | | | | 4,008 | |
| | Zhengzhou Coal Mining Machinery Group Co. Ltd., A | | | Machinery | | | | 2,700 | | | | 2,340 | |
| | Zhengzhou Yutong Bus Co. Ltd., A | | | Machinery | | | | 1,800 | | | | 3,504 | |
| a,b | | ZhongAn Online P&C Insurance Co. Ltd., Reg S | | | Insurance | | | | 8,100 | | | | 19,115 | |
| | Zhongji Innolight Co. Ltd. | | | Machinery | | | | 900 | | | | 5,122 | |
| | Zhongjin Gold Corp. Ltd., A | | | Metals & Mining | | | | 2,700 | | | | 3,282 | |
| | Zhongshan Public Utilities Group Co. Ltd. | | | Water Utilities | | | | 1,800 | | | | 2,004 | |
| | Zhongsheng Group Holdings Ltd. | | | Specialty Retail | | | | 13,500 | | | | 42,621 | |
| | Zhuzhou CRRC Times Electric Co. Ltd., H | | | Electrical Equipment | | | | 11,700 | | | | 48,430 | |
| | Zijin Mining Group Co. Ltd., A | | | Metals & Mining | | | | 18,000 | | | | 8,242 | |
| | Zijin Mining Group Co. Ltd., H | | | Metals & Mining | | | | 126,000 | | | | 43,557 | |
| | Zoomlion Heavy Industry Science and Technology Co. Ltd. | | | Machinery | | | | 6,300 | | | | 5,029 | |
| | Zoomlion Heavy Industry Science and Technology Development Co. Ltd., H | | | Machinery | | | | 28,800 | | | | 19,508 | |
| | | | | | |
| | | |
| franklintempleton.com | | Semiannual Report | | | 177 | |
FRANKLIN TEMPLETON ETF TRUST
STATEMENT OF INVESTMENTS (UNAUDITED)
Franklin FTSE China ETF(continued)
| | | | | | | | | | | | | | |
| | | |
| | | Industry | | | Shares | | | Value | |
| | | Common Stocks (continued) | | | | | | | | | |
| | | China (continued) | | | | | | | | | |
| a | | ZTE Corp. | | | Communications Equipment | | | | 3,600 | | | $ | 16,137 | |
| a | | ZTE Corp., H | | | Communications Equipment | | | | 18,000 | | | | 47,759 | |
| | ZTO Express Cayman Inc., ADR | | | Air Freight & Logistics | | | | 7,452 | | | | 158,951 | |
| | | | | | | | | | | | | | |
| | | | |
| | | | | | | | | | | | | 38,846,020 | |
| | | | | | | | | | | | | | |
| | | Hong Kong 1.2% | | | | | | | | | |
| a | | Alibaba Pictures Group Ltd. | | | Entertainment | | | | 270,000 | | | | 43,740 | |
| | Bosideng International Holdings Ltd. | | | Textiles, Apparel & Luxury Goods | | | | 54,000 | | | | 23,007 | |
| | China Gas Holdings Ltd. | | | Gas Utilities | | | | 46,800 | | | | 180,886 | |
| a | | Fullshare Holdings Ltd. | | | Electrical Equipment | | | | 202,500 | | | | 6,587 | |
| | Kingboard Laminates Holdings Ltd. | | | Chemicals | | | | 22,500 | | | | 20,292 | |
| | Lee & Man Paper Manufacturing Ltd. | | | Paper & Forest Products | | | | 36,000 | | | | 19,471 | |
| | Sino Biopharmaceutical Ltd. | | | Pharmaceuticals | | | | 144,000 | | | | 182,953 | |
| | | | | | | | | | | | | | |
| | | | |
| | | | | | | | | | | | | 476,936 | |
| | | | | | | | | | | | | | |
| | | Singapore 0.1% | | | | | | | | | |
| | Yangzijiang Shipbuilding Holdings Ltd. | | | Machinery | | | | 47,700 | | | | 33,113 | |
| | Yanlord Land Group Ltd. | | | Real Estate Management & Development | | | | 14,400 | | | | 12,183 | |
| | | | | | | | | | | | | | |
| | | | |
| | | | | | | | | | | | | 45,296 | |
| | | | | | | | | | | | | | |
| | Total Investments (Cost $45,021,637) 99.8% | | | | | | | | | | | 39,368,252 | |
| | Other Assets, less Liabilities 0.2% | | | | | | | | | | | 82,120 | |
| | | | | | | | | | | | | | |
| | Net Assets 100.0% | | | | | | | | | | $ | 39,450,372 | |
| | | | | | | | | | | | | | |
See Abbreviations on page 322.
aNon-income producing.
bSecurity was purchased pursuant to Regulation S under the Securities Act of 1933, which exempts from registration securities offered and sold outside of the United States. Such a security cannot be sold in the United States without either an effective registration statement filed pursuant to the Securities Act of 1933, or pursuant to an exemption from registration. These securities have been deemed liquid under guidelines approved by the Fund’s Board of Trustees. At September 30, 2019, the aggregate value of these securities was $1,560,868, representing 4.0% of net assets.
cSecurity was purchased pursuant to Rule 144A under the Securities Act of 1933 and may be sold in transactions exempt from registration only to qualified institutional buyers or in a public offering registered under the Securities Act of 1933. These securities have been deemed liquid under guidelines approved by the Fund’s Board of Trustees. At September 30, 2019, the aggregate value of these securities was $656,149, representing 1.7% of net assets.
dFair valued using significant unobservable inputs. See Note 6 regarding fair value measurements.
At September 30, 2019, the Fund had the following futures contracts outstanding. See Note 1(c).
| | | | | | | | | | | | | | | | | | | | |
| Futures Contracts | | | | | | | | | | | | | | | |
| | | | | |
| Description | | Type | | | Number of
Contracts | | | Notional
Amount* | | | Expiration
Date | | | Value/Unrealized
Appreciation
(Depreciation) | |
| Equity Contracts | | | | | | | | | | | | | | | |
HKG Mini Hang Seng China Enterprise Index | | | Long | | | | 5 | | | $ | 65,120 | | | | 10/30/19 | | | $ | (2,831 | ) |
*As of period end.
See Note 7 regarding other derivative information.
| | | | |
| | | |
| 178 | | Semiannual Report | The accompanying notes are an integral part of these financial statements. | | franklintempleton.com |
FRANKLIN TEMPLETON ETF TRUST
Financial Highlights
Franklin FTSE Europe ETF
| | | | | | | | | | | | |
| | | Six Months Ended
September 30, 2019
(unaudited) | | | Year Ended March 31, | |
| | | 2019 | | | 2018a | |
| | | |
Per share operating performance
(for a share outstanding throughout the period) | | | | | | | | | | | | |
| | | |
Net asset value, beginning of period | | $ | 23.24 | | | $ | 24.98 | | | $ | 25.05 | |
| | | | |
| | | |
| Income from investment operationsb: | | | | | | | | | | | | |
| | | |
Net investment incomec | | | 0.49 | | | | 0.86 | | | | 0.24 | |
| | | |
Net realized and unrealized gains (losses) | | | 0.12 | | | | (1.79 | ) | | | (0.30 | ) |
| | | | |
| | | |
Total from investment operations | | | 0.61 | | | | (0.93 | ) | | | (0.06 | ) |
| | | | |
| | | |
Less distributions from net investment income | | | (0.34 | ) | | | (0.81 | ) | | | (0.01 | ) |
| | | | |
| | | |
Net asset value, end of period | | $ | 23.51 | | | $ | 23.24 | | | $ | 24.98 | |
| | | | |
| | | |
Total returnd | | | 2.64% | | | | (3.69)% | | | | (0.26)% | |
| | | |
| Ratios to average net assetse | | | | | | | | | | | | |
| | | |
Total expenses | | | 0.09% | | | | 0.09% | | | | 0.09% | |
| | | |
Net investment income | | | 4.16% | | | | 3.61% | | | | 2.35% | |
| | | |
| Supplemental data | | | | | | | | | | | | |
| | | |
Net assets, end of period (000’s) | | | $65,825 | | | | $74,359 | | | | $104,911 | |
| | | |
Portfolio turnover ratef | | | 2.11% | | | | 5.81% | | | | 0.96% | |
| | | |
| Portfolio turnover rate excluding portfolio transactions that are executed as a result of the Fund offering and redeeming Creation Units solely or in part for cashf,g | | | 2.11% | | | | —% | | | | —% | |
aFor the period November 2, 2017 (commencement of operations) to March 31, 2018.
bThe amount shown for a share outstanding throughout the period may not correlate with the Statement of Operations for the period due to the timing of sales and repurchases of Creation Unit Fund shares in relation to income earned and/or fluctuating fair value of the investments of the Fund.
cBased on average daily shares outstanding.
dTotal return is not annualized for periods less than one year. Total return is calculated assuming an initial investment made at the net asset value at the beginning of the period, reinvestment of all dividends and distributions at net asset value during the period, and redemption at net asset value on the last day of the period.
eRatios are annualized for periods less than one year.
fPortfolio turnover rate excludes the value of portfolio securities received or delivered as a result of processing capital share transactions in Creation Units, if any.
gEffective September 30, 2019.
| | | | | | |
| | | |
| franklintempleton.com | | The accompanying notes are an integral part of these financial statements. | Semiannual Report | | | 179 | |
FRANKLIN TEMPLETON ETF TRUST
Statement of Investments, September 30, 2019 (unaudited)
Franklin FTSE Europe ETF
| | | | | | | | | | | | | | |
| | | |
| | | Industry | | | Shares | | | Value | |
| | | Common Stocks and Other Equity Interests 98.6% | |
| | | Australia 0.6% | |
| | Rio Tinto PLC | | | Metals & Mining | | | | 8,092 | | | $ | 419,712 | |
| | | | | | | | | | | | | | |
| | | Austria 0.4% | | | | | | | | | |
| | Andritz AG | | | Machinery | | | | 518 | | | | 21,177 | |
| | Erste Group Bank AG | | | Banks | | | | 2,100 | | | | 69,461 | |
| | OMV AG | | | Oil, Gas & Consumable Fuels | | | | 1,036 | | | | 55,614 | |
| | Raiffeisen Bank International AG | | | Banks | | | | 952 | | | | 22,096 | |
| | Telekom Austria AG | | | Diversified Telecommunication Services | | | | 1,008 | | | | 7,330 | |
| | Verbund AG | | | Electric Utilities | | | | 476 | | | | 26,051 | |
| | Vienna Insurance Group AG Wiener Versicherung Gruppe | | | Insurance | | | | 294 | | | | 7,660 | |
| | Voestalpine AG | | | Metals & Mining | | | | 826 | | | | 18,983 | |
| | | | | | | | | | | | | | |
| | | | | | | | | | | | | 228,372 | |
| | | | | | | | | | | | | | |
| | | Belgium 1.7% | | | | | | | | | |
| | Ackermans & van Haaren NV | | | Diversified Financial Services | | | | 168 | | | | 25,532 | |
| | Ageas | | | Insurance | | | | 1,358 | | | | 75,327 | |
| | Anheuser-Busch InBev SA/NV | | | Beverages | | | | 5,670 | | | | 540,381 | |
| | Colruyt SA | | | Food & Staples Retailing | | | | 364 | | | | 19,953 | |
| a | | Galapagos NV | | | Biotechnology | | | | 350 | | | | 53,343 | |
| | Groupe Bruxelles Lambert SA | | | Diversified Financial Services | | | | 546 | | | | 52,441 | |
| | KBC Groep NV | | | Banks | | | | 2,016 | | | | 131,035 | |
| | Proximus SADP | | | Diversified Telecommunication Services | | | | 1,022 | | | | 30,362 | |
| | Sofina SA | | | Diversified Financial Services | | | | 112 | | | | 24,909 | |
| | Solvay SA | | | Chemicals | | | | 504 | | | | 52,199 | |
| | Telenet Group Holding NV | | | Media | | | | 350 | | | | 16,522 | |
| | UCB SA | | | Pharmaceuticals | | | | 882 | | | | 64,040 | |
| | Umicore SA | | | Chemicals | | | | 1,526 | | | | 57,612 | |
| | | | | | | | | | | | | | |
| | | | | | | | | | | | | 1,143,656 | |
| | | | | | | | | | | | | | |
| | | China 0.3% | | | | | | | | | |
| a | | Prosus NV | | | Internet & Direct Marketing Retail | | | | 3,010 | | | | 221,009 | |
| | | | | | | | | | | | | | |
| | | Denmark 2.7% | | | | | | | | | |
| | A.P. Moeller-Maersk AS, A | | | Marine | | | | 28 | | | | 29,886 | |
| | A.P. Moeller-Maersk AS, B | | | Marine | | | | 42 | | | | 47,504 | |
| | Ambu AS, B | | | Health Care Equipment & Supplies | | | | 1,260 | | | | 20,882 | |
| | Carlsberg AS, B | | | Beverages | | | | 784 | | | | 115,908 | |
| | Chr. Hansen Holding AS | | | Chemicals | | | | 756 | | | | 64,180 | |
| | Coloplast AS, B | | | Health Care Equipment & Supplies | | | | 980 | | | | 118,054 | |
| | Danske Bank AS | | | Banks | | | | 4,928 | | | | 68,632 | |
| | DSV AS | | | Road & Rail | | | | 1,498 | | | | 142,570 | |
| a | | Genmab AS | | | Biotechnology | | | | 434 | | | | 88,117 | |
| | GN Store Nord AS | | | Health Care Equipment & Supplies | | | | 952 | | | | 38,658 | |
| | H. Lundbeck AS | | | Pharmaceuticals | | | | 434 | | | | 14,398 | |
| | ISS AS | | | Commercial Services & Supplies | | | | 1,386 | | | | 34,303 | |
| a | | Jyske Bank AS | | | Banks | | | | 476 | | | | 15,381 | |
| | Novo Nordisk AS, B | | | Pharmaceuticals | | | | 12,138 | | | | 624,132 | |
| | Novozymes AS | | | Chemicals | | | | 1,526 | | | | 64,172 | |
| | Orsted AS | | | Electric Utilities | | | | 1,092 | | | | 101,506 | |
| | Pandora AS | | | Household Durables | | | | 644 | | | | 25,850 | |
| | Rockwool International AS, B | | | Building Products | | | | 42 | | | | 8,402 | |
| a | | The Drilling Co. of 1972 AS | | | Energy Equipment & Services | | | | 140 | | | | 7,854 | |
| | Tryg AS | | | Insurance | | | | 882 | | | | 25,281 | |
| | Vestas Wind Systems AS | | | Electrical Equipment | | | | 1,415 | | | | 109,877 | |
| a | | William Demant Holding AS | | | Health Care Equipment & Supplies | | | | 784 | | | | 20,085 | |
| | | | | | | | | | | | | | |
| | | | | | | | | | | | | 1,785,632 | |
| | | | | | | | | | | | | | |
| | | Finland 1.9% | | | | | | | | | |
| | Elisa OYJ | | | Diversified Telecommunication Services | | | | 1,050 | | | | 54,145 | |
| | | | |
| | | |
| 180 | | Semiannual Report | | franklintempleton.com |
FRANKLIN TEMPLETON ETF TRUST
STATEMENT OF INVESTMENTS (UNAUDITED)
Franklin FTSE Europe ETF(continued)
| | | | | | | | | | | | | | |
| | | |
| | | Industry | | | Shares | | | Value | |
| | | Common Stocks and Other Equity Interests (continued) | |
| | | Finland (continued) | | | | | | | | | |
| b | | Fortum OYJ, Reg S | | | Electric Utilities | | | | 3,164 | | | $ | 74,817 | |
| | Huhtamaki OYJ | | | Containers & Packaging | | | | 686 | | | | 27,357 | |
| | Kesko OYJ | | | Food & Staples Retailing | | | | 490 | | | | 30,962 | |
| | Kone OYJ, B | | | Machinery | | | | 2,884 | | | | 164,250 | |
| | Metso OYJ | | | Machinery | | | | 784 | | | | 29,291 | |
| | Neste Oil OYJ | | | Oil, Gas & Consumable Fuels | | | | 3,024 | | | | 100,123 | |
| | Nokia OYJ, A | | | Communications Equipment | | | | 41,370 | | | | 209,722 | |
| | Nokian Renkaat OYJ | | | Auto Components | | | | 980 | | | | 27,650 | |
| | Nordea Bank Abp | | | Banks | | | | 23,704 | | | | 168,025 | |
| | Orion OYJ | | | Pharmaceuticals | | | | 742 | | | | 27,682 | |
| | Sampo OYJ, A | | | Insurance | | | | 3,598 | | | | 143,094 | |
| | Stora Enso OYJ, R | | | Paper & Forest Products | | | | 4,186 | | | | 50,450 | |
| | UPM-Kymmene OYJ | | | Paper & Forest Products | | | | 3,906 | | | | 115,486 | |
| | Wartsila OYJ ABP | | | Machinery | | | | 3,570 | | | | 39,991 | |
| | | | | | | | | | | | | | |
| | | | | | | | | | | | | 1,263,045 | |
| | | | | | | | | | | | | | |
| | | France 17.0% | | | | | | | | | |
| | Accor SA | | | Hotels, Restaurants & Leisure | | | | 1,400 | | | | 58,380 | |
| a | | Adevinta ASA, A | | | Interactive Media & Services | | | | 588 | | | | 6,821 | |
| a | | Adevinta ASA, B | | | Interactive Media & Services | | | | 1,092 | | | | 12,644 | |
| | Aeroports de Paris SA | | | Transportation Infrastructure | | | | 210 | | | | 37,363 | |
| a | | AirFrance-KLM | | | Airlines | | | | 1,400 | | | | 14,655 | |
| | Air Liquide SA | | | Chemicals | | | | 3,108 | | | | 442,517 | |
| | Airbus SE | | | Aerospace & Defense | | | | 4,060 | | | | 527,604 | |
| c | | ALD SA, 144A | | | Road & Rail | | | | 630 | | | | 8,997 | |
| | Alstom SA | | | Machinery | | | | 1,372 | | | | 56,884 | |
| | Amundi SA | | | Capital Markets | | | | 406 | | | | 28,328 | |
| | ArcelorMittal | | | Metals & Mining | | | | 4,410 | | | | 62,049 | |
| | Arkema SA | | | Chemicals | | | | 518 | | | | 48,295 | |
| | Atos SE | | | IT Services | | | | 686 | | | | 48,373 | |
| | AXA SA | | | Insurance | | | | 14,140 | | | | 361,183 | |
| | Biomerieux | | | Health Care Equipment & Supplies | | | | 308 | | | | 25,486 | |
| | BNP Paribas SA | | | Banks | | | | 7,924 | | | | 385,893 | |
| | Bollore | | | Air Freight & Logistics | | | | 7,480 | | | | 31,004 | |
| | Bouygues SA | | | Construction & Engineering | | | | 1,526 | | | | 61,139 | |
| | Bureau Veritas SA | | | Professional Services | | | | 2,058 | | | | 49,584 | |
| | Capgemini SE | | | IT Services | | | | 1,148 | | | | 135,292 | |
| | Carrefour SA | | | Food & Staples Retailing | | | | 4,250 | | | | 74,412 | |
| | Casino Guichard-Perrachon SA | | | Food & Staples Retailing | | | | 420 | | | | 20,051 | |
| | Cie Generale des Etablissements Michelin SCA | | | Auto Components | | | | 1,302 | | | | 145,351 | |
| | CNP Assurances | | | Insurance | | | | 1,176 | | | | 22,731 | |
| | Compagnie de Saint-Gobain | | | Building Products | | | | 3,570 | | | | 140,112 | |
| | Covivio | | | Equity Real Estate Investment Trusts (REITs | ) | | | 322 | | | | 34,086 | |
| | Credit Agricole SA | | | Banks | | | | 8,400 | | | | 102,017 | |
| | Danone SA | | | Food Products | | | | 4,382 | | | | 386,098 | |
| | Dassault Aviation SA | | | Aerospace & Defense | | | | 14 | | | | 19,811 | |
| | Dassault Systemes | | | Software | | | | 966 | | | | 137,697 | |
| | Edenred | | | Commercial Services & Supplies | | | | 1,778 | | | | 85,347 | |
| | EDF SA | | | Electric Utilities | | | | 3,696 | | | | 41,382 | |
| | Eiffage SA | | | Construction & Engineering | | | | 532 | | | | 55,168 | |
| | Elis SA | | | Commercial Services & Supplies | | | | 1,414 | | | | 25,004 | |
| | Engie SA | | | Multi-Utilities | | | | 12,208 | | | | 199,371 | |
| | EssilorLuxottica SA | | | Textiles, Apparel & Luxury Goods | | | | 2,156 | | | | 310,850 | |
| | Eurazeo SE | | | Diversified Financial Services | | | | 328 | | | | 24,405 | |
| | Eutelsat Communications SA | | | Media | | | | 1,358 | | | | 25,279 | |
| | Faurecia SE | | | Auto Components | | | | 546 | | | | 25,905 | |
| | Gecina SA | | | Equity Real Estate Investment Trusts (REITs | ) | | | 378 | | | | 59,424 | |
| | Getlink SE | | | Transportation Infrastructure | | | | 3,318 | | | | 49,846 | |
| | | | | | |
| | | |
| franklintempleton.com | | Semiannual Report | | | 181 | |
FRANKLIN TEMPLETON ETF TRUST
STATEMENT OF INVESTMENTS (UNAUDITED)
Franklin FTSE Europe ETF(continued)
| | | | | | | | | | | | | | |
| | | |
| | | Industry | | | Shares | | | Value | |
| | | Common Stocks and Other Equity Interests (continued) | |
| | | France (continued) | | | | | | | | | |
| | Hermes International | | | Textiles, Apparel & Luxury Goods | | | | 224 | | | $ | 154,826 | |
| | ICADE | | | Equity Real Estate Investment Trusts (REITs | ) | | | 238 | | | | 21,289 | |
| | Iliad SA | | | Diversified Telecommunication Services | | | | 182 | | | | 17,107 | |
| | Imerys SA | | | Construction Materials | | | | 280 | | | | 11,258 | |
| | Ingenico Group SA | | | Electronic Equipment, Instruments & Components | | | | 446 | | | | 43,518 | |
| | Ipsen SA | | | Pharmaceuticals | | | | 252 | | | | 23,929 | |
| | JCDecaux SA | | | Media | | | | 532 | | | | 14,407 | |
| | Kering SA | | | Textiles, Apparel & Luxury Goods | | | | 546 | | | | 278,309 | |
| | Klepierre SA | | | Equity Real Estate Investment Trusts (REITs | ) | | | 1,400 | | | | 47,559 | |
| | L’Oreal SA | | | Personal Products | | | | 1,764 | | | | 494,048 | |
| | Lagardere SCA | | | Media | | | | 840 | | | | 18,590 | |
| | Legrand SA | | | Electrical Equipment | | | | 1,960 | | | | 139,917 | |
| | LVMH Moet Hennessy Louis Vuitton SE | | | Textiles, Apparel & Luxury Goods | | | | 1,834 | | | | 729,091 | |
| | Natixis SA | | | Capital Markets | | | | 6,118 | | | | 25,379 | |
| | Orange SA | | | Diversified Telecommunication Services | | | | 14,070 | | | | 220,807 | |
| | Orpea | | | Health Care Providers & Services | | | | 336 | | | | 41,063 | |
| | Pernod Ricard SA | | | Beverages | | | | 1,554 | | | | 276,827 | |
| | Peugeot SA | | | Automobiles | | | | 3,990 | | | | 99,526 | |
| | Plastic Omnium SA | | | Auto Components | | | | 392 | | | | 10,752 | |
| | Publicis Groupe | | | Media | | | | 1,596 | | | | 78,507 | |
| | Remy Cointreau SA | | | Beverages | | | | 182 | | | | 24,167 | |
| | Renault SA | | | Automobiles | | | | 1,344 | | | | 77,159 | |
| | Rexel SA | | | Trading Companies & Distributors | | | | 2,212 | | | | 23,676 | |
| | Rubis SCA | | | Gas Utilities | | | | 677 | | | | 39,339 | |
| | Safran SA | | | Aerospace & Defense | | | | 2,422 | | | | 381,415 | |
| | Sanofi | | | Pharmaceuticals | | | | 7,966 | | | | 738,706 | |
| | Sartorius Stedim Biotech | | | Life Sciences Tools & Services | | | | 182 | | | | 25,477 | |
| | Schneider Electric SE | | | Electrical Equipment | | | | 3,850 | | | | 337,880 | |
| | SCOR SE | | | Insurance | | | | 1,162 | | | | 48,000 | |
| | SEB SA | | | Household Durables | | | | 196 | | | | 29,766 | |
| | Societe BIC SA | | | Commercial Services & Supplies | | | | 168 | | | | 11,282 | |
| | Societe Generale SA | | | Banks | | | | 5,656 | | | | 155,018 | |
| | Sodexo SA | | | Hotels, Restaurants & Leisure | | | | 630 | | | | 70,743 | |
| | Suez | | | Multi-Utilities | | | | 2,660 | | | | 41,832 | |
| | Teleperformance | | | Professional Services | | | | 420 | | | | 91,073 | |
| | Thales SA | | | Aerospace & Defense | | | | 728 | | | | 83,732 | |
| | Total SA | | | Oil, Gas & Consumable Fuels | | | | 17,752 | | | | 926,729 | |
| a | | UbiSoft Entertainment SA | | | Entertainment | | | | 616 | | | | 44,552 | |
| | Unibail-Rodamco-Westfield | | | Equity Real Estate Investment Trusts (REITs | ) | | | 14 | | | | 2,041 | |
| | Unibail-Rodamco-Westfield | | | Equity Real Estate Investment Trusts (REITs | ) | | | 980 | | | | 142,898 | |
| | Valeo SA | | | Auto Components | | | | 1,750 | | | | 56,759 | |
| | Veolia Environnement SA | | | Multi-Utilities | | | | 3,682 | | | | 93,368 | |
| | Vinci SA | | | Construction & Engineering | | | | 3,430 | | | | 369,526 | |
| | Vivendi SA | | | Entertainment | | | | 5,978 | | | | 164,103 | |
| | Wendel SA | | | Diversified Financial Services | | | | 210 | | | | 28,984 | |
| a,b | | Worldline SA, Reg S | | | IT Services | | | | 616 | | | | 38,884 | |
| | | | | | | | | | | | | | |
| | | | | | | | | | | | | 11,180,656 | |
| | | | | | | | | | | | | | |
| | | Germany 12.8% | | | | | | | | | |
| | 1&1 Drillisch AG | | | Wireless Telecommunication Services | | | | 350 | | | | 10,913 | |
| | Adidas AG | | | Textiles, Apparel & Luxury Goods | | | | 1,442 | | | | 449,061 | |
| | Allianz SE | | | Insurance | | | | 3,108 | | | | 724,597 | |
| | Aroundtown SA | | | Real Estate Management & Development | | | | 6,566 | | | | 53,715 | |
| | Axel Springer SE | | | Media | | | | 322 | | | | 22,221 | |
| | BASF SE | | | Chemicals | | | | 6,706 | | | | 468,774 | |
| | Bayer AG | | | Pharmaceuticals | | | | 6,846 | | | | 482,814 | |
| | Bayerische Motoren Werke AG | | | Automobiles | | | | 2,380 | | | | 167,590 | |
| | Beiersdorf AG | | | Personal Products | | | | 742 | | | | 87,526 | |
| | | | |
| | | |
| 182 | | Semiannual Report | | franklintempleton.com |
FRANKLIN TEMPLETON ETF TRUST
STATEMENT OF INVESTMENTS (UNAUDITED)
Franklin FTSE Europe ETF(continued)
| | | | | | | | | | | | | | |
| | | |
| | | Industry | | | Shares | | | Value | |
| | | Common Stocks and Other Equity Interests (continued) | |
| | | Germany (continued) | | | | | | | | | |
| | Brenntag AG | | | Trading Companies & Distributors | | | | 1,134 | | | $ | 54,891 | |
| | Carl Zeiss Meditec AG | | | Health Care Equipment & Supplies | | | | 280 | | | | 31,930 | |
| | Commerzbank AG | | | Banks | | | | 7,644 | | | | 44,351 | |
| | Continental AG | | | Auto Components | | | | 798 | | | | 102,396 | |
| | Covestro AG | | | Chemicals | | | | 1,260 | | | | 62,364 | |
| | Daimler AG | | | Automobiles | | | | 6,314 | | | | 314,026 | |
| a | | Delivery Hero SE | | | Internet & Direct Marketing Retail | | | | 812 | | | | 36,082 | |
| | Deutsche Bank AG | | | Capital Markets | | | | 15,120 | | | | 113,260 | |
| | Deutsche Boerse AG | | | Capital Markets | | | | 1,344 | | | | 210,114 | |
| | Deutsche Lufthansa AG | | | Airlines | | | | 1,764 | | | | 28,039 | |
| | Deutsche Post AG | | | Air Freight & Logistics | | | | 7,168 | | | | 239,477 | |
| | Deutsche Telekom AG | | | Diversified Telecommunication Services | | | | 23,744 | | | | 398,484 | |
| | Deutsche Wohnen AG | | | Real Estate Management & Development | | | | 2,660 | | | | 97,119 | |
| c | | DWS Group GmbH & Co. KGaA, 144A | | | Capital Markets | | | | 252 | | | | 7,451 | |
| | E.ON SE | | | Multi-Utilities | | | | 15,946 | | | | 155,051 | |
| | Evonik Industries AG | | | Chemicals | | | | 1,190 | | | | 29,385 | |
| | Fielmann AG | | | Specialty Retail | | | | 168 | | | | 12,372 | |
| | Fraport AG Frankfurt Airport Services Worldwide | | | Transportation Infrastructure | | | | 266 | | | | 22,567 | |
| | Fresenius Medical Care AG & Co. KGaA | | | Health Care Providers & Services | | | | 1,526 | | | | 102,647 | |
| | Fresenius SE and Co. KGaA | | | Health Care Providers & Services | | | | 2,996 | | | | 140,105 | |
| | Fuchs Petrolub SE | | | Chemicals | | | | 266 | | | | 9,671 | |
| | GEA Group AG | | | Machinery | | | | 1,232 | | | | 33,269 | |
| | Grenkeleasing AG | | | Consumer Finance | | | | 196 | | | | 16,154 | |
| | Hannover Rueck SE | | | Insurance | | | | 448 | | | | 75,752 | |
| | Hapag-Lloyd AG | | | Marine | | | | 196 | | | | 14,103 | |
| | HeidelbergCement AG | | | Construction Materials | | | | 1,092 | | | | 78,954 | |
| | Hella GmbH & Co. KGaA | | | Auto Components | | | | 322 | | | | 14,400 | |
| | Henkel AG & Co. KGaA | | | Household Products | | | | 742 | | | | 67,950 | |
| | Hochtief AG | | | Construction & Engineering | | | | 140 | | | | 15,965 | |
| | Hugo Boss AG | | | Textiles, Apparel & Luxury Goods | | | | 476 | | | | 25,506 | |
| | Infineon Technologies AG | | | Semiconductors & Semiconductor Equipment | | | | 9,170 | | | | 165,073 | |
| | K+S AG | | | Chemicals | | | | 1,400 | | | | 19,407 | |
| | KION Group AG | | | Machinery | | | | 518 | | | | 27,248 | |
| | Knorr-Bremse AG | | | Machinery | | | | 350 | | | | 32,907 | |
| | Lanxess AG | | | Chemicals | | | | 616 | | | | 37,607 | |
| | LEG Immobilien AG | | | Real Estate Management & Development | | | | 462 | | | | 52,886 | |
| | Merck KGaA | | | Pharmaceuticals | | | | 952 | | | | 107,264 | |
| | METRO AG | | | Food & Staples Retailing | | | | 1,246 | | | | 19,669 | |
| | MTU Aero Engines AG | | | Aerospace & Defense | | | | 378 | | | | 100,469 | |
| | Muenchener Rueckversicherungs-Gesellschaft Aktiengesellschaft in Muenchen | | | Insurance | | | | 1,050 | | | | 271,754 | |
| | Nemetschek AG | | | Software | | | | 420 | | | | 21,438 | |
| | Osram Licht AG | | | Electrical Equipment | | | | 644 | | | | 28,329 | |
| | ProSiebenSat.1 Media SE | | | Media | | | | 1,484 | | | | 20,450 | |
| | Puma SE | | | Textiles, Apparel & Luxury Goods | | | | 602 | | | | 46,597 | |
| | Rational AG | | | Machinery | | | | 28 | | | | 20,086 | |
| | Rheinmetall AG | | | Industrial Conglomerates | | | | 322 | | | | 40,739 | |
| a,c | | Rocket Internet SE, 144A | | | Internet & Direct Marketing Retail | | | | 490 | | | | 12,660 | |
| | RWE AG | | | Multi-Utilities | | | | 4,186 | | | | 130,929 | |
| | SAP SE | | | Software | | | | 7,112 | | | | 836,448 | |
| b | | Scout24 AG, Reg S | | | Interactive Media & Services | | | | 798 | | | | 45,500 | |
| | Siemens AG | | | Industrial Conglomerates | | | | 5,572 | | | | 596,829 | |
| | Siemens Healthineers AG | | | Health Care Equipment & Supplies | | | | 966 | | | | 38,013 | |
| | Suedzucker AG | | | Food Products | | | | 574 | | | | 8,830 | |
| | Symrise AG | | | Chemicals | | | | 910 | | | | 88,454 | |
| a | | Talanx AG | | | Insurance | | | | 294 | | | | 12,705 | |
| | Telefonica Deutschland Holding AG | | | Diversified Telecommunication Services | | | | 4,914 | | | | 13,704 | |
| | thyssenkrupp AG | | | Metals & Mining | | | | 3,416 | | | | 47,315 | |
| | | | | | |
| | | |
| franklintempleton.com | | Semiannual Report | | | 183 | |
FRANKLIN TEMPLETON ETF TRUST
STATEMENT OF INVESTMENTS (UNAUDITED)
Franklin FTSE Europe ETF(continued)
| | | | | | | | | | | | | | |
| | | |
| | | Industry | | | Shares | | | Value | |
| | | Common Stocks and Other Equity Interests (continued) | |
| | | Germany (continued) | | | | | | | | | |
| | TUI AG | | | Hotels, Restaurants & Leisure | | | | 3,192 | | | $ | 37,203 | |
| | Uniper SE | | | Independent Power and Renewable Electricity Producers | | | | 1,442 | | | | 47,303 | |
| | United Internet AG | | | Diversified Telecommunication Services | | | | 854 | | | | 30,473 | |
| | Volkswagen AG | | | Automobiles | | | | 238 | | | | 40,918 | |
| | Vonovia SE | | | Real Estate Management & Development | | | | 3,990 | | | | 202,488 | |
| | Wacker Chemie AG | | | Chemicals | | | | 112 | | | | 7,363 | |
| | Wirecard AG | | | IT Services | | | | 840 | | | | 134,389 | |
| a,c | | Zalando SE, 144A | | | Internet & Direct Marketing Retail | | | | 1,092 | | | | 49,858 | |
| | | | | | | | | | | | | | |
| | | | | | | | | | | | | 8,414,351 | |
| | | | | | | | | | | | | | |
| | | Ireland 0.8% | | | | | | | | | |
| | AIB Group PLC | | | Banks | | | | 6,006 | | | | 17,836 | |
| | Bank of Ireland Group PLC | | | Banks | | | | 6,804 | | | | 27,000 | |
| | CRH PLC | | | Construction Materials | | | | 5,880 | | | | 202,016 | |
| | Flutter Entertainment PLC | | | Hotels, Restaurants & Leisure | | | | 546 | | | | 51,203 | |
| | Glanbia PLC | | | Food Products | | | | 1,428 | | | | 18,106 | |
| | Kerry Group | | | Food Products | | | | 1,078 | | | | 126,103 | |
| | Kingspan Group PLC | | | Building Products | | | | 1,092 | | | | 53,334 | |
| | Smurfit Kappa Group PLC | | | Containers & Packaging | | | | 1,736 | | | | 52,070 | |
| | | | | | | | | | | | | | |
| | | | | | | | | | | | | 547,668 | |
| | | | | | | | | | | | | | |
| | | Italy 3.7% | | | | | | | | | |
| | A2A SpA | | | Multi-Utilities | | | | 11,312 | | | | 20,768 | |
| | Amplifon SpA | | | Health Care Providers & Services | | | | 896 | | | | 21,978 | |
| | Assicurazioni Generali SpA | | | Insurance | | | | 9,422 | | | | 182,634 | |
| | Atlantia SpA | | | Transportation Infrastructure | | | | 3,892 | | | | 94,153 | |
| | Banca Mediolanum SpA | | | Diversified Financial Services | | | | 2,114 | | | | 15,879 | |
| a | | Banco BPM SpA | | | Banks | | | | 11,116 | | | | 22,710 | |
| | Buzzi Unicem SpA | | | Construction Materials | | | | 518 | | | | 11,882 | |
| | Buzzi Unicem SpA, di Risp | | | Construction Materials | | | | 308 | | | | 4,459 | |
| | Davide Campari-Milano SpA | | | Beverages | | | | 4,158 | | | | 37,579 | |
| | DiaSorin SpA | | | Health Care Equipment & Supplies | | | | 154 | | | | 17,914 | |
| | Enel SpA | | | Electric Utilities | | | | 57,288 | | | | 427,882 | |
| | Eni SpA | | | Oil, Gas & Consumable Fuels | | | | 18,396 | | | | 281,456 | |
| | Ferrari NV | | | Automobiles | | | | 910 | | | | 140,429 | |
| | FinecoBank Banca Fineco SpA | | | Banks | | | | 4,466 | | | | 47,286 | |
| | Hera SpA | | | Multi-Utilities | | | | 6,160 | | | | 25,291 | |
| b | | Infrastrutture Wireless Italiane SpA, Reg S | | | Diversified Telecommunication Services | | | | 1,806 | | | | 18,744 | |
| | Intesa Sanpaolo SpA | | | Banks | | | | 109,774 | | | | 260,354 | |
| | Italgas Reti SpA | | | Gas Utilities | | | | 2,814 | | | | 18,168 | |
| | Leonardo SpA | | | Aerospace & Defense | | | | 2,842 | | | | 33,431 | |
| a | | Mediaset SpA | | | Media | | | | 2,520 | | | | 7,423 | |
| | Mediobanca Banca di Credito Finanziario SpA | | | Banks | | | | 5,264 | | | | 57,503 | |
| | Moncler SpA | | | Textiles, Apparel & Luxury Goods | | | | 1,344 | | | | 47,913 | |
| | Pirelli & C SpA | | | Auto Components | | | | 3,206 | | | | 18,972 | |
| b | | Poste Italiane SpA, Reg S | | | Insurance | | | | 3,388 | | | | 38,524 | |
| | Prysmian SpA | | | Electrical Equipment | | | | 1,834 | | | | 39,389 | |
| | Recordati SpA | | | Pharmaceuticals | | | | 686 | | | | 29,436 | |
| a | | Saipem SpA | | | Energy Equipment & Services | | | | 4,186 | | | | 18,948 | |
| | Salvatore Ferragamo SpA | | | Textiles, Apparel & Luxury Goods | | | | 462 | | | | 8,540 | |
| | Snam SpA | | | Gas Utilities | | | | 16,674 | | | | 84,237 | |
| a | | Telecom Italia SpA/Milano | | | Diversified Telecommunication Services | | | | 79,786 | | | | 45,535 | |
| | Telecom Italia SpA/Milano, di Risp | | | Diversified Telecommunication Services | | | | 44,212 | | | | 24,177 | |
| | Tenaris SA | | | Energy Equipment & Services | | | | 3,430 | | | | 36,399 | |
| | Terna Rete Elettrica Nazionale SpA | | | Electric Utilities | | | | 10,346 | | | | 66,480 | |
| | UniCredit SpA | | | Banks | | | | 16,352 | | | | 192,888 | |
| | Unione di Banche Italiane SpA | | | Banks | | | | 7,196 | | | | 20,209 | |
| | | | |
| | | |
| 184 | | Semiannual Report | | franklintempleton.com |
FRANKLIN TEMPLETON ETF TRUST
STATEMENT OF INVESTMENTS (UNAUDITED)
Franklin FTSE Europe ETF(continued)
| | | | | | | | | | | | | | |
| | | |
| | | Industry | | | Shares | | | Value | |
| | | Common Stocks and Other Equity Interests (continued) | |
| | | Italy (continued) | | | | | | | | | |
| | UnipolSai Assicurazioni SpA | | | Insurance | | | | 4,326 | | | $ | 11,508 | |
| | | | | | | | | | | | | | |
| | | | | | | | | | | | | 2,431,078 | |
| | | | | | | | | | | | | | |
| | | Kazakhstan 0.0%† | | | | | | | | | |
| | KAZ Minerals PLC | | | Metals & Mining | | | | 1,722 | | | | 9,195 | |
| | | | | | | | | | | | | | |
| | | Luxembourg 0.2% | | | | | | | | | |
| | Eurofins Scientific SE | | | Life Sciences Tools & Services | | | | 84 | | | | 39,048 | |
| | RTL Group SA | | | Media | | | | 294 | | | | 14,141 | |
| | SES SA, IDR | | | Media | | | | 2,576 | | | | 46,970 | |
| | | | | | | | | | | | | | |
| | | | | | | | | | | | | 100,159 | |
| | | | | | | | | | | | | | |
| | | Netherlands 4.5% | | | | | | | | | |
| | Aalberts NV | | | Machinery | | | | 700 | | | | 27,748 | |
| | ABN AMRO Bank NV, GDR, | | | Banks | | | | 3,038 | | | | 53,572 | |
| a | | Adyen NV | | | IT Services | | | | 70 | | | | 46,124 | |
| | Aegon NV | | | Insurance | | | | 14,197 | | | | 59,078 | |
| | Akzo Nobel NV | | | Chemicals | | | | 1,680 | | | | 149,801 | |
| a | | Argenx SE | | | Biotechnology | | | | 266 | | | | 30,188 | |
| | ASML Holding NV | | | Semiconductors & Semiconductor Equipment | | | | 2,940 | | | | 728,379 | |
| | ASR Nederland NV | | | Insurance | | | | 1,036 | | | | 38,254 | |
| | Boskalis Westminster | | | Construction & Engineering | | | | 616 | | | | 12,854 | |
| b | | Euronext NV, Reg S | | | Capital Markets | | | | 462 | | | | 37,801 | |
| | EXOR NV | | | Diversified Financial Services | | | | 756 | | | | 50,671 | |
| | Grandvision NV | | | Specialty Retail | | | | 364 | | | | 10,905 | |
| | Heineken Holding NV | | | Beverages | | | | 770 | | | | 76,684 | |
| | Heineken NV | | | Beverages | | | | 1,736 | | | | 187,669 | |
| | ING Groep NV | | | Banks | | | | 28,714 | | | | 300,644 | |
| | Koninklijke Ahold Delhaize NV | | | Food & Staples Retailing | | | | 8,134 | | | | 203,558 | |
| | Koninklijke DSM NV | | | Chemicals | | | | 1,303 | | | | 156,826 | |
| | Koninklijke KPN NV | | | Diversified Telecommunication Services | | | | 24,164 | | | | 75,369 | |
| | Koninklijke Philips NV | | | Health Care Equipment & Supplies | | | | 6,664 | | | | 308,766 | |
| | Koninklijke Vopak NV | | | Oil, Gas & Consumable Fuels | | | | 490 | | | | 25,193 | |
| | NN Group NV | | | Insurance | | | | 2,458 | | | | 87,198 | |
| a | | OCI NV | | | Chemicals | | | | 700 | | | | 16,530 | |
| a | | QIAGEN NV | | | Life Sciences Tools & Services | | | | 1,624 | | | | 53,185 | |
| | Randstad NV | | | Professional Services | | | | 812 | | | | 39,916 | |
| | Signify NV | | | Electrical Equipment | | | | 756 | | | | 20,794 | |
| a,b | | Takeaway.com NV, Reg S | | | Internet & Direct Marketing Retail | | | | 294 | | | | 23,462 | |
| | Wolters Kluwer NV | | | Professional Services | | | | 2,016 | | | | 147,211 | |
| | | | | | | | | | | | | | |
| | | | | | | | | | | | | 2,968,380 | |
| | | | | | | | | | | | | | |
| | | Norway 1.1% | | | | | | | | | |
| | Aker ASA | | | Diversified Financial Services | | | | 182 | | | | 9,695 | |
| | Aker BP ASA | | | Oil, Gas & Consumable Fuels | | | | 812 | | | | 21,752 | |
| | DNB ASA | | | Banks | | | | 7,672 | | | | 135,312 | |
| | Equinor ASA | | | Oil, Gas & Consumable Fuels | | | | 7,280 | | | | 138,654 | |
| | Gjensidige Forsikring ASA | | | Insurance | | | | 1,218 | | | | 24,177 | |
| | Leroy Seafood Group ASA | | | Food Products | | | | 1,848 | | | | 11,239 | |
| | Mowi ASA | | | Food Products | | | | 3,150 | | | | 72,770 | |
| | Norsk Hydro ASA | | | Metals & Mining | | | | 9,772 | | | | 34,416 | |
| | Orkla ASA | | | Food Products | | | | 5,684 | | | | 51,773 | |
| | Salmar ASA | | | Food Products | | | | 378 | | | | 16,600 | |
| | Schibsted ASA, A | | | Media | | | | 588 | | | | 17,415 | |
| | Schibsted ASA, B | | | Media | | | | 700 | | | | 19,646 | |
| | Telenor ASA | | | Diversified Telecommunication Services | | | | 4,760 | | | | 95,635 | |
| | Yara International ASA | | | Chemicals | | | | 1,274 | | | | 54,937 | |
| | | | | | | | | | | | | | |
| | | | | | | | | | | | | 704,021 | |
| | | | | | | | | | | | | | |
| | | | | | |
| | | |
| franklintempleton.com | | Semiannual Report | | | 185 | |
FRANKLIN TEMPLETON ETF TRUST
STATEMENT OF INVESTMENTS (UNAUDITED)
Franklin FTSE Europe ETF(continued)
| | | | | | | | | | | | | | |
| | | |
| | | Industry | | | Shares | | | Value | |
| | | Common Stocks and Other Equity Interests (continued) | |
| | | Poland 0.5% | | | | | | | | | |
| | Bank Pekao SA | | | Banks | | | | 1,148 | | | $ | 29,322 | |
| | CD Projekt SA | | | Entertainment | | | | 448 | | | | 27,199 | |
| | Cyfrowy Polsat SA | | | Media | | | | 1,862 | | | | 12,270 | |
| a | | Dino Polska SA | | | Food & Staples Retailing | | | | 350 | | | | 13,706 | |
| | Grupa Lotos SA | | | Oil, Gas & Consumable Fuels | | | | 728 | | | | 16,081 | |
| a | | KGHM Polska Miedz SA | | | Metals & Mining | | | | 1,008 | | | | 20,114 | |
| | LPP SA | | | Textiles, Apparel & Luxury Goods | | | | 7 | | | | 15,016 | |
| a | | mBank SA | | | Banks | | | | 112 | | | | 9,711 | |
| a | | PGE Polska Grupa Energetyczna SA | | | Electric Utilities | | | | 5,334 | | | | 10,633 | |
| | Polski Koncern Naftowy Orlen SA | | | Oil, Gas & Consumable Fuels | | | | 2,296 | | | | 56,525 | |
| | Polskie Gornictwo Naftowe i Gazownictwo SA | | | Oil, Gas & Consumable Fuels | | | | 12,390 | | | | 14,537 | |
| | Powszechna Kasa Oszczednosci Bank Polski SA | | | Banks | | | | 6,244 | | | | 61,238 | |
| | Powszechny Zaklad Ubezpieczen SA | | | Insurance | | | | 4,130 | | | | 38,507 | |
| | Santander Bank Polska SA | | | Banks | | | | 196 | | | | 15,331 | |
| | | | | | | | | | | | | | |
| | | | | | | | | | | | | 340,190 | |
| | | | | | | | | | | | | | |
| | | Portugal 0.2% | | | | | | | | | |
| | EDP-Energias de Portugal SA | | | Electric Utilities | | | | 16,604 | | | | 64,478 | |
| | Galp Energia SGPS SA, B | | | Oil, Gas & Consumable Fuels | | | | 3,766 | | | | 56,761 | |
| | Jeronimo Martins SGPS SA | | | Food & Staples Retailing | | | | 1,792 | | | | 30,243 | |
| | | | | | | | | | | | | | |
| | | | | | | | | | | | | 151,482 | |
| | | | | | | | | | | | | | |
| | | Russia 0.1% | | | | | | | | | |
| | Evraz PLC | | | Metals & Mining | | | | 3,990 | | | | 22,991 | |
| | Polymetal International PLC | | | Metals & Mining | | | | 2,254 | | | | 31,665 | |
| | | | | | | | | | | | | | |
| | | | | | | | | | | | | 54,656 | |
| | | | | | | | | | | | | | |
| | | South Africa 0.0%† | | | | | | | | | |
| | Investec PLC | | | Capital Markets | | | | 4,928 | | | | 25,427 | |
| | | | | | | | | | | | | | |
| | | Spain 4.6% | | | | | | | | | |
| | Acciona SA | | | Electric Utilities | | | | 154 | | | | 16,302 | |
| | ACS Actividades de Construccion y Servicios SA | | | Construction & Engineering | | | | 1,793 | | | | 71,660 | |
| | Aena SME SA | | | Transportation Infrastructure | | | | 518 | | | | 94,874 | |
| | Amadeus IT Group SA, A | | | IT Services | | | | 2,940 | | | | 210,645 | |
| | Banco Bilbao Vizcaya Argentaria SA | | | Banks | | | | 48,818 | | | | 254,425 | |
| | Banco de Sabadell SA | | | Banks | | | | 41,076 | | | | 39,864 | |
| | Banco Santander SA | | | Banks | | | | 120,890 | | | | 492,449 | |
| | Bankia SA | | | Banks | | | | 8,988 | | | | 16,976 | |
| | Bankinter SA | | | Banks | | | | 5,026 | | | | 31,747 | |
| | CaixaBank SA | | | Banks | | | | 26,390 | | | | 69,337 | |
| | Cellnex Telecom SA | | | Diversified Telecommunication Services | | | | 1,526 | | | | 63,052 | |
| | Corporacion Financiera Alba SA | | | Diversified Financial Services | | | | 168 | | | | 8,187 | |
| | Corporacion Mapfre SA | | | Insurance | | | | 7,238 | | | | 19,498 | |
| | EDP Renovaveis SA | | | Independent Power and Renewable Electricity Producers | | | | 1,120 | | | | 12,076 | |
| | Enagas SA | | | Gas Utilities | | | | 1,666 | | | | 38,614 | |
| | Endesa SA | | | Electric Utilities | | | | 2,324 | | | | 61,162 | |
| | Ferrovial SA | | | Construction & Engineering | | | | 3,464 | | | | 100,114 | |
| | Fomento de Construcciones y Contratas SA | | | Construction & Engineering | | | | 560 | | | | 6,423 | |
| | Grifols SA | | | Biotechnology | | | | 2,422 | | | | 71,398 | |
| | Iberdrola SA | | | Electric Utilities | | | | 43,414 | | | | 451,338 | |
| | Industria de Diseno Textil SA | | | Specialty Retail | | | | 7,686 | | | | 237,972 | |
| | Inmobiliaria Colonial SA | | | Equity Real Estate Investment Trusts (REITs | ) | | | 2,338 | | | | 28,216 | |
| | Merlin Properties Socimi SA | | | Equity Real Estate Investment Trusts (REITs | ) | | | 2,450 | | | | 34,215 | |
| | Naturgy Energy Group SA | | | Gas Utilities | | | | 2,268 | | | | 60,182 | |
| | | | |
| | | |
| 186 | | Semiannual Report | | franklintempleton.com |
FRANKLIN TEMPLETON ETF TRUST
STATEMENT OF INVESTMENTS (UNAUDITED)
Franklin FTSE Europe ETF(continued)
| | | | | | | | | | | | | | |
| | | |
| | | Industry | | | Shares | | | Value | |
| | | Common Stocks and Other Equity Interests (continued) | |
| | | Spain (continued) | | | | | | | | | |
| | Red Electrica Corp. SA | | | Electric Utilities | | | | 3,164 | | | $ | 64,280 | |
| | Repsol SA | | | Oil, Gas & Consumable Fuels | | | | 9,846 | | | | 153,927 | |
| | Siemens Gamesa Renewable Energy SA | | | Electrical Equipment | | | | 1,638 | | | | 22,233 | |
| | Telefonica SA | | | Diversified Telecommunication Services | | | | 33,278 | | | | 253,994 | |
| | Zardoya Otis SA | | | Machinery | | | | 1,302 | | | | 8,843 | |
| | | | | | | | | | | | | | |
| | | | | | | | | | | | | 2,994,003 | |
| | | | | | | | | | | | | | |
| | | Sweden 4.1% | | | | | | | | | |
| | Alfa Laval AB | | | Machinery | | | | 2,296 | | | | 45,373 | |
| | Assa Abloy AB, B | | | Building Products | | | | 6,804 | | | | 151,621 | |
| | Atlas Copco AB | | | Machinery | | | | 2,772 | | | | 75,219 | |
| | Atlas Copco AB, A | | | Machinery | | | | 4,634 | | | | 142,901 | |
| | Boliden AB | | | Metals & Mining | | | | 2,002 | | | | 46,068 | |
| | Castellum AB | | | Real Estate Management & Development | | | | 1,946 | | | | 41,722 | |
| | Electrolux AB, B | | | Household Durables | | | | 1,806 | | | | 42,872 | |
| | Elekta AB, B | | | Health Care Equipment & Supplies | | | | 2,646 | | | | 34,904 | |
| | Epiroc AB, A | | | Machinery | | | | 4,606 | | | | 49,985 | |
| | Epiroc AB, B | | | Machinery | | | | 2,772 | | | | 28,672 | |
| | Ericsson, B | | | Communications Equipment | | | | 21,966 | | | | 175,734 | |
| | Essity AB, B | | | Household Products | | | | 4,438 | | | | 129,680 | |
| a | | Fastighets AB Balder, B | | | Real Estate Management & Development | | | | 728 | | | | 27,603 | |
| | Hennes & Mauritz AB, B | | | Specialty Retail | | | | 6,468 | | | | 125,542 | |
| | Hexagon AB, B | | | Electronic Equipment, Instruments & Components | | | | 1,834 | | | | 88,528 | |
| | Husqvarna AB, B | | | Household Durables | | | | 3,010 | | | | 22,924 | |
| | ICA Gruppen AB | | | Food & Staples Retailing | | | | 574 | | | | 26,551 | |
| | Industrivarden AB, A | | | Diversified Financial Services | | | | 1,526 | | | | 34,362 | |
| | Industrivarden AB, C | | | Diversified Financial Services | | | | 1,246 | | | | 27,310 | |
| | Investment AB Latour, B | | | Industrial Conglomerates | | | | 882 | | | | 11,626 | |
| | Investor AB, A | | | Diversified Financial Services | | | | 1,008 | | | | 48,533 | |
| | Investor AB, B | | | Diversified Financial Services | | | | 3,318 | | | | 162,354 | |
| | Kinnevik AB, B | | | Diversified Financial Services | | | | 1,806 | | | | 47,556 | |
| | L E Lundbergforetagen AB, B | | | Diversified Financial Services | | | | 560 | | | | 21,096 | |
| | Lundin Petroleum AB | | | Oil, Gas & Consumable Fuels | | | | 1,260 | | | | 37,843 | |
| | Nibe Industrier AB | | | Building Products | | | | 2,212 | | | | 28,088 | |
| | Saab AB, B | | | Aerospace & Defense | | | | 672 | | | | 19,315 | |
| | Sandvik AB | | | Machinery | | | | 7,868 | | | | 122,716 | |
| | Securitas AB, B | | | Commercial Services & Supplies | | | | 2,352 | | | | 36,074 | |
| | Skandinaviska Enskilda Banken AB, A | | | Banks | | | | 10,472 | | | | 96,368 | |
| | Skandinaviska Enskilda Banken AB, C | | | Banks | | | | 154 | | | | 1,435 | |
| | Skanska AB, B | | | Construction & Engineering | | | | 2,604 | | | | 52,810 | |
| | SKF AB, B | | | Machinery | | | | 2,786 | | | | 46,102 | |
| | Svenska Cellulosa AB, A | | | Paper & Forest Products | | | | 210 | | | | 1,959 | |
| | Svenska Cellulosa AB, B | | | Paper & Forest Products | | | | 4,340 | | | | 38,747 | |
| | Svenska Handelsbanken AB, A | | | Banks | | | | 10,752 | | | | 100,804 | |
| | Svenska Handelsbanken AB, B | | | Banks | | | | 266 | | | | 2,516 | |
| | Swedbank AB, A | | | Banks | | | | 7,336 | | | | 105,726 | |
| | Swedish Match AB | | | Tobacco | | | | 1,232 | | | | 51,011 | |
| a | | Swedish Orphan Biovitrum AB | | | Biotechnology | | | | 1,330 | | | | 20,406 | |
| | Tele2 AB, B | | | Wireless Telecommunication Services | | | | 3,948 | | | | 58,826 | |
| | Telefonaktiebolaget LM Ericsson, A | | | Communications Equipment | | | | 266 | | | | 2,132 | |
| | Telia Co. AB | | | Diversified Telecommunication Services | | | | 19,586 | | | | 87,789 | |
| | Trelleborg AB, B | | | Machinery | | | | 1,778 | | | | 24,973 | |
| | Volvo AB, B | | | Machinery | | | | 10,990 | | | | 154,531 | |
| | | | | | | | | | | | | | |
| | | | | | | | | | | | | 2,698,907 | |
| | | | | | | | | | | | | | |
| | | Switzerland 15.1% | | | | | | | | | |
| | ABB Ltd. | | | Electrical Equipment | | | | 13,090 | | | | 257,429 | |
| | Adecco Group AG | | | Professional Services | | | | 1,120 | | | | 62,023 | |
| | | | | | |
| | | |
| franklintempleton.com | | Semiannual Report | | | 187 | |
FRANKLIN TEMPLETON ETF TRUST
STATEMENT OF INVESTMENTS (UNAUDITED)
Franklin FTSE Europe ETF(continued)
| | | | | | | | | | | | | | |
| | | |
| | | Industry | | | Shares | | | Value | |
| | | Common Stocks and Other Equity Interests (continued) | |
| | | Switzerland (continued) | | | | | | | | | |
| a | | Alcon Inc. | | | Health Care Equipment & Supplies | | | | 3,374 | | | $ | 196,928 | |
| | Baloise Holding AG | | | Insurance | | | | 336 | | | | 60,249 | |
| | Banque Cantonale Vaudoise | | | Banks | | | | 28 | | | | 21,453 | |
| | Barry Callebaut AG | | | Food Products | | | | 14 | | | | 28,894 | |
| | Chocoladefabriken Lindt & Spruengli AG | | | Food Products | | | | 14 | | | | 103,475 | |
| | Clariant AG | | | Chemicals | | | | 1,498 | | | | 29,189 | |
| | Coca-Cola HBC AG | | | Beverages | | | | 1,428 | | | | 46,756 | |
| | Compagnie Financiere Richemont SA | | | Textiles, Apparel & Luxury Goods | | | | 3,752 | | | | 275,507 | |
| | Credit Suisse Group AG | | | Capital Markets | | | | 18,480 | | | | 226,749 | |
| | DKSH Holding AG | | | Professional Services | | | | 266 | | | | 13,290 | |
| | Dufry AG | | | Specialty Retail | | | | 210 | | | | 17,581 | |
| | EMS-Chemie Holding AG | | | Chemicals | | | | 56 | | | | 34,903 | |
| | Flughafen Zurich AG | | | Transportation Infrastructure | | | | 140 | | | | 25,946 | |
| | Geberit AG | | | Building Products | | | | 266 | | | | 127,138 | |
| | Georg Fischer AG | | | Machinery | | | | 28 | | | | 24,275 | |
| | Givaudan AG | | | Chemicals | | | | 70 | | | | 195,437 | |
| | Glencore PLC | | | Metals & Mining | | | | 81,284 | | | | 245,157 | |
| | Helvetia Holding AG | | | Insurance | | | | 238 | | | | 32,866 | |
| | Julius Baer Group Ltd. | | | Capital Markets | | | | 1,582 | | | | 70,156 | |
| | Kuehne + Nagel International AG | | | Marine | | | | 378 | | | | 55,725 | |
| | LafargeHolcim Ltd., B | | | Construction Materials | | | | 3,738 | | | | 184,135 | |
| | Logitech International SA | | | Technology Hardware, Storage & Peripherals | | | | 1,078 | | | | 43,762 | |
| | Lonza Group AG | | | Life Sciences Tools & Services | | | | 546 | | | | 184,747 | |
| | Nestle SA | | | Food Products | | | | 21,294 | | | | 2,312,304 | |
| | Novartis AG | | | Pharmaceuticals | | | | 15,862 | | | | 1,376,621 | |
| | OC Oerlikon Corp. AG | | | Machinery | | | | 1,470 | | | | 14,757 | |
| | Pargesa Holding SA, B | | | Diversified Financial Services | | | | 280 | | | | 21,551 | |
| | Partners Group Holding AG | | | Capital Markets | | | | 126 | | | | 96,767 | |
| | PSP Swiss Property AG | | | Real Estate Management & Development | | | | 294 | | | | 37,356 | |
| | Roche Holding AG | | | Pharmaceuticals | | | | 210 | | | | 60,821 | |
| | Roche Holding AG | | | Pharmaceuticals | | | | 5,110 | | | | 1,488,442 | |
| | Schindler Holding AG | | | Machinery | | | | 140 | | | | 31,253 | |
| | Schindler Holding AG, PC | | | Machinery | | | | 294 | | | | 65,808 | |
| | SGS SA | | | Professional Services | | | | 42 | | | | 104,205 | |
| | Sika AG | | | Chemicals | | | | 1,022 | | | | 149,639 | |
| | Sonova Holding AG | | | Health Care Equipment & Supplies | | | | 406 | | | | 94,461 | |
| | STMicroelectronics NV | | | Semiconductors & Semiconductor Equipment | | | | 4,662 | | | | 90,113 | |
| | Straumann Holding AG | | | Health Care Equipment & Supplies | | | | 70 | | | | 57,269 | |
| | Sulzer AG | | | Machinery | | | | 126 | | | | 12,402 | |
| | Swatch Group AG | | | Textiles, Apparel & Luxury Goods | | | | 210 | | | | 55,788 | |
| | Swatch Group AG | | | Textiles, Apparel & Luxury Goods | | | | 336 | | | | 16,899 | |
| | Swiss Life Holding AG | | | Insurance | | | | 252 | | | | 120,573 | |
| | Swiss Prime Site AG | | | Real Estate Management & Development | | | | 560 | | | | 54,840 | |
| | Swiss Re AG | | | Insurance | | | | 2,044 | | | | 213,389 | |
| | Swisscom AG | | | Diversified Telecommunication Services | | | | 182 | | | | 89,855 | |
| | Temenos AG | | | Software | | | | 434 | | | | 72,685 | |
| | UBS Group AG | | | Capital Markets | | | | 25,200 | | | | 286,332 | |
| | Vifor Pharma AG | | | Pharmaceuticals | | | | 322 | | | | 51,490 | |
| | Zurich Insurance Group AG | | | Insurance | | | | 1,078 | | | | 412,973 | |
| | | | | | | | | | | | | | |
| | | | | | | | | | | | | 9,952,363 | |
| | | | | | | | | | | | | | |
| | | United Arab Emirates 0.0%† | | | | | | | | | |
| | NMC Health PLC | | | Health Care Providers & Services | | | | 644 | | | | 21,507 | |
| | | | | | | | | | | | | | |
| | | United Kingdom 26.2% | | | | | | | | | |
| | 3i Group PLC | | | Capital Markets | | | | 6,972 | | | | 100,221 | |
| | Admiral Group PLC | | | Insurance | | | | 1,554 | | | | 40,560 | |
| | Anglo American PLC | | | Metals & Mining | | | | 9,226 | | | | 212,740 | |
| | | | |
| | | |
| 188 | | Semiannual Report | | franklintempleton.com |
FRANKLIN TEMPLETON ETF TRUST
STATEMENT OF INVESTMENTS (UNAUDITED)
Franklin FTSE Europe ETF(continued)
| | | | | | | | | | | | | | |
| | | |
| | | Industry | | | Shares | | | Value | |
| | | Common Stocks and Other Equity Interests (continued) | |
| | | United Kingdom (continued) | | | | | | | | | |
| | Antofagasta PLC | | | Metals & Mining | | | | 2,534 | | | $ | 28,073 | |
| | Ashmore Group PLC | | | Capital Markets | | | | 2,814 | | | | 17,547 | |
| | Ashtead Group PLC | | | Trading Companies & Distributors | | | | 3,416 | | | | 95,304 | |
| | Associated British Foods PLC | | | Food Products | | | | 2,548 | | | | 72,312 | |
| | AstraZeneca PLC | | | Pharmaceuticals | | | | 9,646 | | | | 863,098 | |
| | Auto Trader Group PLC | | | Interactive Media & Services | | | | 6,678 | | | | 41,969 | |
| | Aveva Group PLC | | | Software | | | | 448 | | | | 20,427 | |
| | Aviva PLC | | | Insurance | | | | 28,784 | | | | 141,634 | |
| | B&M European Value Retail SA | | | Multiline Retail | | | | 6,146 | | | | 28,735 | |
| | Babcock International Group PLC | | | Commercial Services & Supplies | | | | 1,848 | | | | 12,707 | |
| | BAE Systems PLC | | | Aerospace & Defense | | | | 23,506 | | | | 165,109 | |
| | Barclays PLC | | | Banks | | | | 127,190 | | | | 235,731 | |
| | Barratt Developments PLC | | | Household Durables | | | | 7,336 | | | | 58,580 | |
| | Bellway PLC | | | Household Durables | | | | 924 | | | | 38,099 | |
| | BHP Group PLC | | | Metals & Mining | | | | 15,246 | | | | 325,477 | |
| | BP PLC | | | Oil, Gas & Consumable Fuels | | | | 146,762 | | | | 932,849 | |
| | British American Tobacco PLC | | | Tobacco | | | | 16,772 | | | | 621,594 | |
| | British Land Co. PLC | | | Equity Real Estate Investment Trusts (REITs | ) | | | 7,070 | | | | 50,950 | |
| | BT Group PLC | | | Diversified Telecommunication Services | | | | 64,540 | | | | 142,029 | |
| | Bunzl PLC | | | Trading Companies & Distributors | | | | 2,464 | | | | 64,523 | |
| | Burberry Group PLC | | | Textiles, Apparel & Luxury Goods | | | | 3,024 | | | | 81,014 | |
| | Centrica PLC | | | Multi-Utilities | | | | 42,560 | | | | 38,674 | |
| | Cineworld Group PLC | | | Entertainment | | | | 7,644 | | | | 21,477 | |
| | CNH Industrial NV | | | Machinery | | | | 7,294 | | | | 74,271 | |
| a | | Cobham PLC | | | Aerospace & Defense | | | | 17,528 | | | | 33,879 | |
| | Compass Group PLC | | | Hotels, Restaurants & Leisure | | | | 11,662 | | | | 300,787 | |
| | ConvaTec Group PLC | | | Health Care Equipment & Supplies | | | | 10,752 | | | | 23,213 | |
| | Croda International PLC | | | Chemicals | | | | 910 | | | | 54,500 | |
| | CYBG PLC | | | Banks | | | | 8,820 | | | | 12,488 | |
| | DCC PLC | | | Industrial Conglomerates | | | | 742 | | | | 64,883 | |
| | Derwent London PLC | | | Equity Real Estate Investment Trusts (REITs | ) | | | 728 | | | | 30,233 | |
| | Diageo PLC | | | Beverages | | | | 17,178 | | | | 705,544 | |
| | Direct Line Insurance Group PLC | | | Insurance | | | | 10,080 | | | | 37,290 | |
| | DS Smith PLC | | | Containers & Packaging | | | | 9,212 | | | | 40,912 | |
| | easyJet PLC | | | Airlines | | | | 1,442 | | | | 20,435 | |
| | Experian PLC | | | Professional Services | | | | 6,720 | | | | 215,225 | |
| | Ferguson PLC | | | Trading Companies & Distributors | | | | 1,680 | | | | 123,056 | |
| | Fiat Chrysler Automobiles NV | | | Automobiles | | | | 8,134 | | | | 105,277 | |
| | Fresnillo PLC | | | Metals & Mining | | | | 1,358 | | | | 11,440 | |
| | G4S PLC | | | Commercial Services & Supplies | | | | 11,340 | | | | 26,439 | |
| | GlaxoSmithKline PLC | | | Pharmaceuticals | | | | 36,022 | | | | 774,426 | |
| | GVC Holdings PLC | | | Hotels, Restaurants & Leisure | | | | 4,270 | | | | 39,117 | |
| | Halma PLC | | | Electronic Equipment, Instruments & Components | | | | 2,772 | | | | 67,328 | |
| | Hargreaves Lansdown PLC | | | Capital Markets | | | | 1,988 | | | | 50,932 | |
| | Hikma Pharmaceuticals PLC | | | Pharmaceuticals | | | | 1,022 | | | | 27,707 | |
| | Hiscox Ltd. | | | Insurance | | | | 2,072 | | | | 42,385 | |
| | Howden Joinery Group PLC | | | Trading Companies & Distributors | | | | 4,410 | | | | 30,455 | |
| | HSBC Holdings PLC | | | Banks | | | | 149,156 | | | | 1,148,045 | |
| | IMI PLC | | | Machinery | | | | 1,960 | | | | 23,192 | |
| | Imperial Brands PLC | | | Tobacco | | | | 7,042 | | | | 158,648 | |
| | Inchcape PLC | | | Distributors | | | | 3,052 | | | | 23,751 | |
| | Informa PLC | | | Media | | | | 9,296 | | | | 97,600 | |
| | InterContinental Hotels Group PLC | | | Hotels, Restaurants & Leisure | | | | 1,344 | | | | 84,053 | |
| | International Consolidated Airlines Group SA | | | Airlines | | | | 4,816 | | | | 28,190 | |
| | Intertek Group PLC | | | Professional Services | | | | 1,204 | | | | 81,276 | |
| | ITV PLC | | | Media | | | | 27,300 | | | | 42,355 | |
| | J Sainsbury PLC | | | Food & Staples Retailing | | | | 11,802 | | | | 31,967 | |
| | JD Sports Fashion PLC | | | Specialty Retail | | | | 2,702 | | | | 25,019 | |
| | | | | | |
| | | |
| franklintempleton.com | | Semiannual Report | | | 189 | |
FRANKLIN TEMPLETON ETF TRUST
STATEMENT OF INVESTMENTS (UNAUDITED)
Franklin FTSE Europe ETF(continued)
| | | | | | | | | | | | | | |
| | | |
| | | Industry | | | Shares | | | Value | |
| | | Common Stocks and Other Equity Interests (continued) | |
| | | United Kingdom (continued) | | | | | | | | | |
| | John Wood Group PLC | | | Energy Equipment & Services | | | | 4,900 | | | $ | 22,939 | |
| | Johnson Matthey PLC | | | Chemicals | | | | 1,386 | | | | 52,213 | |
| a | | Just Eat PLC | | | Internet & Direct Marketing Retail | | | | 4,200 | | | | 34,584 | |
| | Kingfisher PLC | | | Specialty Retail | | | | 15,484 | | | | 39,459 | |
| | Land Securities Group PLC | | | Equity Real Estate Investment Trusts (REITs | ) | | | 5,222 | | | | 55,110 | |
| | Legal & General Group PLC | | | Insurance | | | | 43,904 | | | | 134,392 | |
| | Lloyds Banking Group PLC | | | Banks | | | | 521,458 | | | | 347,771 | |
| | London Stock Exchange Group PLC | | | Capital Markets | | | | 2,296 | | | | 206,770 | |
| | Marks & Spencer Group PLC | | | Multiline Retail | | | | 14,198 | | | | 32,272 | |
| | Meggitt PLC | | | Aerospace & Defense | | | | 5,670 | | | | 44,368 | |
| | Melrose Industries PLC | | | Electrical Equipment | | | | 35,532 | | | | 88,273 | |
| | Merlin Entertainments PLC | | | Hotels, Restaurants & Leisure | | | | 5,138 | | | | 28,644 | |
| | Micro Focus International PLC | | | Software | | | | 2,506 | | | | 35,106 | |
| | Mondi PLC | | | Paper & Forest Products | | | | 3,570 | | | | 68,541 | |
| | National Grid PLC | | | Multi-Utilities | | | | 25,704 | | | | 279,342 | |
| | Next PLC | | | Multiline Retail | | | | 924 | | | | 70,437 | |
| a | | Ocado Group PLC | | | Internet & Direct Marketing Retail | | | | 3,360 | | | | 54,758 | |
| | Pearson PLC | | | Media | | | | 5,726 | | | | 52,074 | |
| | Pennon Group PLC | | | Water Utilities | | | | 3,052 | | | | 31,103 | |
| | Persimmon PLC | | | Household Durables | | | | 2,338 | | | | 62,520 | |
| | Phoenix Group Holdings PLC | | | Insurance | | | | 3,892 | | | | 33,156 | |
| | Prudential PLC | | | Insurance | | | | 19,180 | | | | 348,624 | |
| | Quilter PLC | | | Capital Markets | | | | 13,328 | | | | 22,394 | |
| | Reckitt Benckiser Group PLC | | | Household Products | | | | 4,606 | | | | 360,084 | |
| | RELX PLC | | | Professional Services | | | | 13,832 | | | | 329,398 | |
| | Renishaw PLC | | | Electronic Equipment, Instruments & Components | | | | 252 | | | | 11,378 | |
| | Rentokil Initial PLC | | | Commercial Services & Supplies | | | | 13,482 | | | | 77,720 | |
| | Rightmove PLC | | | Interactive Media & Services | | | | 6,468 | | | | 43,886 | |
| | Rolls-Royce Holdings PLC | | | Aerospace & Defense | | | | 12,516 | | | | 122,215 | |
| | Royal Bank of Scotland Group PLC | | | Banks | | | | 33,488 | | | | 85,671 | |
| | Royal Dutch Shell PLC, A | | | Oil, Gas & Consumable Fuels | | | | 31,598 | | | | 928,287 | |
| | Royal Dutch Shell PLC, B | | | Oil, Gas & Consumable Fuels | | | | 27,594 | | | | 814,738 | |
| | RSA Insurance Group PLC | | | Insurance | | | | 7,462 | | | | 49,122 | |
| | Schroders PLC | | | Capital Markets | | | | 826 | | | | 31,300 | |
| | Segro PLC | | | Equity Real Estate Investment Trusts (REITs | ) | | | 8,050 | | | | 80,431 | |
| | Severn Trent PLC | | | Water Utilities | | | | 1,736 | | | | 46,315 | |
| | Smith & Nephew PLC | | | Health Care Equipment & Supplies | | | | 6,412 | | | | 154,790 | |
| | Smiths Group PLC | | | Industrial Conglomerates | | | | 2,898 | | | | 56,068 | |
| | Spirax-Sarco Engineering PLC | | | Machinery | | | | 532 | | | | 51,431 | |
| | SSE PLC | | | Electric Utilities | | | | 7,546 | | | | 115,818 | |
| | St. James’s Place Capital PLC | | | Capital Markets | | | | 3,822 | | | | 46,128 | |
| | Standard Chartered PLC | | | Banks | | | | 19,516 | | | | 164,547 | |
| | Standard Life Aberdeen PLC | | | Capital Markets | | | | 17,710 | | | | 62,373 | |
| | Subsea 7 SA | | | Energy Equipment & Services | | | | 1,736 | | | | 17,956 | |
| | Tate & Lyle PLC | | | Food Products | | | | 3,402 | | | | 30,855 | |
| | Taylor Wimpey PLC | | | Household Durables | | | | 23,800 | | | | 47,366 | |
| | TechnipFMC PLC | | | Energy Equipment & Services | | | | 3,346 | | | | 80,288 | |
| | Tesco PLC | | | Food & Staples Retailing | | | | 71,036 | | | | 210,966 | |
| | The Berkeley Group Holdings PLC | | | Household Durables | | | | 854 | | | | 43,979 | |
| | The Sage Group PLC | | | Software | | | | 7,924 | | | | 67,513 | |
| | Travis Perkins PLC | | | Trading Companies & Distributors | | | | 1,848 | | | | 29,400 | |
| | Unilever NV, IDR | | | Personal Products | | | | 10,654 | | | | 640,567 | |
| | Unilever PLC | | | Personal Products | | | | 8,022 | | | | 483,401 | |
| | United Utilities Group PLC | | | Water Utilities | | | | 4,998 | | | | 50,861 | |
| | Vodafone Group PLC | | | Wireless Telecommunication Services | | | | 198,212 | | | | 395,696 | |
| | Weir Group PLC | | | Machinery | | | | 1,918 | | | | 33,692 | |
| | Whitbread PLC | | | Hotels, Restaurants & Leisure | | | | 994 | | | | 52,597 | |
| | William Morrison Supermarkets PLC | | | Food & Staples Retailing | | | | 16,436 | | | | 40,569 | |
| | | | |
| | | |
| 190 | | Semiannual Report | | franklintempleton.com |
FRANKLIN TEMPLETON ETF TRUST
STATEMENT OF INVESTMENTS (UNAUDITED)
Franklin FTSE Europe ETF(continued)
| | | | | | | | | | | | | | |
| | | |
| | | Industry | | | Shares | | | Value | |
| | | Common Stocks and Other Equity Interests (continued) | |
| | | United Kingdom (continued) | | | | | | | | | |
| | WPP PLC | | | Media | | | | 9,002 | | | $ | 112,928 | |
| | | | | | | | | | | | | | |
| | | | |
| | | | | | | | | | | | | 17,222,935 | |
| | | | | | | | | | | | | | |
| | | United States 0.1% | | | | | | | | | |
| | Carnival PLC | | | Hotels, Restaurants & Leisure | | | | 1,148 | | | | 47,675 | |
| | | | | | | | | | | | | | |
| | Total Common Stocks and Other Equity Interests
(Cost $72,563,639) | | | | | | | | | | | 64,926,079 | |
| | | | | | | | | | | | | | |
| | | Preferred Stocks 0.8% | | | | | | | | | |
| | | Germany 0.8% | | | | | | | | | |
| d | | Bayerische Motoren Werke AG, 6.909%, pfd. | | | Automobiles | | | | 420 | | | | 23,329 | |
| d | | Fuchs Petrolub SE, 2.757%, pfd. | | | Chemicals | | | | 518 | | | | 19,460 | |
| d | | Henkel AG & Co. KGaA, 2.037%, pfd. | | | Household Products | | | | 1,288 | | | | 127,499 | |
| d | | Porsche Automobil Holding SE, 3.702%, pfd. | | | Automobiles | | | | 1,106 | | | | 71,984 | |
| d | | Sartorius AG, 0.370%, pfd. | | | Health Care Equipment & Supplies | | | | 252 | | | | 45,990 | |
| d | | Volkswagen AG, 3.114%, pfd. | | | Automobiles | | | | 1,344 | | | | 228,664 | |
| | | | | | | | | | | | | | |
| | Total Preferred Stocks (Cost $640,032) | | | | | | | | | | | 516,926 | |
| | | | | | | | | | | | | | |
| | Total Investments (Cost $73,203,671) 99.4% | | | | | | | | | | | 65,443,005 | |
| | Other Assets, less Liabilities 0.6% | | | | | | | | | | | 381,807 | |
| | | | | | | | | | | | | | |
| | Net Assets 100.0% | | | | | | | | | | $ | 65,824,812 | |
| | | | | | | | | | | | | | |
See Abbreviations on page 322.
†Rounds to less than 0.1% of net assets.
aNon-income producing.
bSecurity was purchased pursuant to Regulation S under the Securities Act of 1933, which exempts from registration securities offered and sold outside of the United States. Such a security cannot be sold in the United States without either an effective registration statement filed pursuant to the Securities Act of 1933, or pursuant to an exemption from registration. These securities have been deemed liquid under guidelines approved by the Fund’s Board of Trustees. At September 30, 2019, the aggregate value of these securities was $277,732, representing 0.4% of net assets.
cSecurity was purchased pursuant to Rule 144A under the Securities Act of 1933 and may be sold in transactions exempt from registration only to qualified institutional buyers or in a public offering registered under the Securities Act of 1933. These securities have been deemed liquid under guidelines approved by the Fund’s Board of Trustees. At September 30, 2019, the aggregate value of these securities was $78,966, representing 0.1% of net assets.
dVariable rate security. The rate shown represents the yield at period end.
At September 30, 2019, the Fund had the following futures contracts outstanding. See Note 1(c).
| | | | | | | | | | | | | | | | | | | | |
| Futures Contracts | | | | | | | | | | | | | | | |
| | | | | |
| Description | | Type | | | Number of
Contracts | | | Notional
Amount* | | | Expiration
Date | | | Value/Unrealized
Appreciation
(Depreciation) | |
| Equity Contracts | | | | | | | | | | | | | | | |
EURO STOXX 50 Index | | | Long | | | | 5 | | | $ | 193,783 | | | | 12/20/19 | | | $ | 8,039 | |
FTSE 100 Index | | | Long | | | | 1 | | | | 90,987 | | | | 12/20/19 | | | | 3,887 | |
| | | | | | | | | | | | | | | | | | | | |
Total Futures Contracts | | | | | | | | | | | | | | | | | | | 11,926 | |
| | | | | | | | | | | | | | | | | | | | |
*As of period end.
See Note 7 regarding other derivative information.
| | | | | | |
| | | |
| franklintempleton.com | | The accompanying notes are an integral part of these financial statements. | Semiannual Report | | | 191 | |
FRANKLIN TEMPLETON ETF TRUST
Financial Highlights
Franklin FTSE Europe Hedged ETF
| | | | | | | | | | | | |
| | | Six Months Ended
September 30, 2019
(unaudited) | | | Year Ended March 31, | |
| | | 2019 | | | 2018a | |
| | | |
Per share operating performance
(for a share outstanding throughout the period) | | | | | | | | | | | | |
| | | |
Net asset value, beginning of period | | $ | 22.81 | | | $ | 23.88 | | | $ | 25.05 | |
| | | | |
| | | |
| Income from investment operationsb: | | | | | | | | | | | | |
| | | |
Net investment incomec | | | 0.52 | | | | 0.79 | | | | 0.25 | |
| | | |
Net realized and unrealized gains (losses) | | | 1.24 | | | | 0.62 | | | | (1.40 | ) |
| | | | |
| | | |
Total from investment operations | | | 1.76 | | | | 1.41 | | | | (1.15 | ) |
| | | | |
| | | |
| Less distributions from: | | | | | | | | | | | | |
| | | |
Net investment income | | | (0.31 | ) | | | (0.38 | ) | | | (0.02 | ) |
| | | |
Net realized gains | | | — | | | | (2.10 | ) | | | — | d |
| | | | |
| | | |
Total distributions | | | (0.31 | ) | | | (2.48 | ) | | | (0.02 | ) |
| | | | |
| | | |
Net asset value, end of period | | $ | 24.26 | | | $ | 22.81 | | | $ | 23.88 | |
| | | | |
| | | |
Total returne | | | 7.76% | | | | 6.98% | | | | (4.61)% | |
| | | |
| Ratios to average net assetsf | | | | | | | | | | | | |
| | | |
Total expenses | | | 0.09% | | | | 0.09% | | | | 0.09% | |
| | | |
Net investment income | | | 4.40% | | | | 3.28% | | | | 2.47% | |
| | | |
| Supplemental data | | | | | | | | | | | | |
| | | |
Net assets, end of period (000’s) | | | $4,853 | | | | $4,563 | | | | $33,428 | |
| | | |
Portfolio turnover rateg | | | 4.11% | | | | 26.81% | | | | 5.33% | |
| | | |
| Portfolio turnover rate excluding portfolio transactions that are executed as a result of the Fund offering and redeeming Creation Units solely or in part for cashg,h | | | 4.11% | | | | —% | | | | —% | |
aFor the period November 2, 2017 (commencement of operations) to March 31, 2018.
bThe amount shown for a share outstanding throughout the period may not correlate with the Statement of Operations for the period due to the timing of sales and repurchases of Creation Unit Fund shares in relation to income earned and/or fluctuating fair value of the investments of the Fund.
cBased on average daily shares outstanding.
dAmount rounds to less than $0.001 per share.
eTotal return is not annualized for periods less than one year. Total return is calculated assuming an initial investment made at the net asset value at the beginning of the period, reinvestment of all dividends and distributions at net asset value during the period, and redemption at net asset value on the last day of the period.
fRatios are annualized for periods less than one year.
gPortfolio turnover rate excludes the value of portfolio securities received or delivered as a result of processing capital share transactions in Creation Units, if any.
hEffective September 30, 2019.
| | | | |
| | | |
| 192 | | Semiannual Report | The accompanying notes are an integral part of these financial statements. | | franklintempleton.com |
FRANKLIN TEMPLETON ETF TRUST
Statement of Investments, September 30, 2019 (unaudited)
Franklin FTSE Europe Hedged ETF
| | | | | | | | | | | | | | |
| | | | |
| | | | | Industry | | | Shares | | | Value | |
| | | Common Stocks and Other Equity Interests 97.3% | |
| | | Australia 0.6% | | | | | | | | | |
| | Rio Tinto PLC | | | Metals & Mining | | | | 588 | | | $ | 30,498 | |
| | | | | | | | | | | | | | |
| | | Austria 0.4% | | | | | | | | | |
| | Andritz AG | | | Machinery | | | | 37 | | | | 1,513 | |
| | Erste Group Bank AG | | | Banks | | | | 156 | | | | 5,160 | |
| | OMV AG | | | Oil, Gas & Consumable Fuels | | | | 76 | | | | 4,080 | |
| | Raiffeisen Bank International AG | | | Banks | | | | 65 | | | | 1,509 | |
| | Telekom Austria AG | | | Diversified Telecommunication Services | | | | 53 | | | | 385 | |
| | Verbund AG | | | Electric Utilities | | | | 35 | | | | 1,915 | |
| | Vienna Insurance Group AG Wiener Versicherung Gruppe | | | Insurance | | | | 22 | | | | 573 | |
| | Voestalpine AG | | | Metals & Mining | | | | 66 | | | | 1,517 | |
| | | | | | | | | | | | | | |
| | | | |
| | | | | | | | | | | | | 16,652 | |
| | | | | | | | | | | | | | |
| | | Belgium 1.7% | | | | | | | | | |
| | Ackermans & van Haaren NV | | | Diversified Financial Services | | | | 14 | | | | 2,128 | |
| | Ageas | | | Insurance | | | | 102 | | | | 5,658 | |
| | Anheuser-Busch InBev SA/NV | | | Beverages | | | | 413 | | | | 39,361 | |
| | Colruyt SA | | | Food & Staples Retailing | | | | 25 | | | | 1,370 | |
| a | | Galapagos NV | | | Biotechnology | | | | 25 | | | | 3,810 | |
| | Groupe Bruxelles Lambert SA | | | Diversified Financial Services | | | | 41 | | | | 3,938 | |
| | KBC Groep NV | | | Banks | | | | 145 | | | | 9,425 | |
| | Proximus SADP | | | Diversified Telecommunication Services | | | | 76 | | | | 2,258 | |
| | Sofina SA | | | Diversified Financial Services | | | | 9 | | | | 2,002 | |
| | Solvay SA | | | Chemicals | | | | 36 | | | | 3,728 | |
| | Telenet Group Holding NV | | | Media | | | | 23 | | | | 1,086 | |
| | UCB SA | | | Pharmaceuticals | | | | 63 | | | | 4,574 | |
| | Umicore SA | | | Chemicals | | | | 108 | | | | 4,077 | |
| | | | | | | | | | | | | | |
| | | | |
| | | | | | | | | | | | | 83,415 | |
| | | | | | | | | | | | | | |
| | | China 0.3% | | | | | | | | | |
| a | | Prosus NV | | | Internet & Direct Marketing Retail | | | | 220 | | | | 16,153 | |
| | | | | | | | | | | | | | |
| | | Denmark 2.7% | | | | | | | | | |
| | A.P. Moeller-Maersk AS, A | | | Marine | | | | 2 | | | | 2,135 | |
| | A.P. Moeller-Maersk AS, B | | | Marine | | | | 3 | | | | 3,393 | |
| | Ambu AS, B | | | Health Care Equipment & Supplies | | | | 86 | | | | 1,425 | |
| | Carlsberg AS, B | | | Beverages | | | | 56 | | | | 8,279 | |
| | Chr. Hansen Holding AS | | | Chemicals | | | | 53 | | | | 4,499 | |
| | Coloplast AS, B | | | Health Care Equipment & Supplies | | | | 70 | | | | 8,432 | |
| | Danske Bank AS | | | Banks | | | | 360 | | | | 5,014 | |
| | DSV AS | | | Road & Rail | | | | 110 | | | | 10,469 | |
| a | | Genmab AS | | | Biotechnology | | | | 31 | | | | 6,294 | |
| | GN Store Nord AS | | | Health Care Equipment & Supplies | | | | 70 | | | | 2,843 | |
| | H. Lundbeck AS | | | Pharmaceuticals | | | | 37 | | | | 1,228 | |
| | ISS AS | | | Commercial Services & Supplies | | | | 104 | | | | 2,574 | |
| a | | Jyske Bank AS | | | Banks | | | | 36 | | | | 1,163 | |
| | Novo Nordisk AS, B | | | Pharmaceuticals | | | | 884 | | | | 45,455 | |
| | Novozymes AS | | | Chemicals | | | | 109 | | | | 4,584 | |
| | Orsted AS | | | Electric Utilities | | | | 79 | | | | 7,343 | |
| | Pandora AS | | | Household Durables | | | | 50 | | | | 2,007 | |
| | Rockwool International AS, B | | | Building Products | | | | 4 | | | | 800 | |
| a | | The Drilling Co. of 1972 AS | | | Energy Equipment & Services | | | | 17 | | | | 954 | |
| | Tryg AS | | | Insurance | | | | 59 | | | | 1,691 | |
| | Vestas Wind Systems AS | | | Electrical Equipment | | | | 106 | | | | 8,231 | |
| a | | William Demant Holding AS | | | Health Care Equipment & Supplies | | | | 59 | | | | 1,512 | |
| | | | | | | | | | | | | | |
| | | | |
| | | | | | | | | | | | | 130,325 | |
| | | | | | | | | | | | | | |
| | | Finland 1.9% | | | | | | | | | |
| | Elisa OYJ | | | Diversified Telecommunication Services | | | | 74 | | | | 3,816 | |
| | | | | | |
| | | |
| franklintempleton.com | | Semiannual Report | | | 193 | |
FRANKLIN TEMPLETON ETF TRUST
STATEMENT OF INVESTMENTS (UNAUDITED)
Franklin FTSE Europe Hedged ETF(continued)
| | | | | | | | | | | | | | |
| | | | |
| | | | | Industry | | | Shares | | | Value | |
| | | Common Stocks and Other Equity Interests (continued) | |
| | | Finland (continued) | | | | | | | | | |
| b | | Fortum OYJ, Reg S | | | Electric Utilities | | | | 228 | | | $ | 5,392 | |
| | Huhtamaki OYJ | | | Containers & Packaging | | | | 48 | | | | 1,914 | |
| | Kesko OYJ | | | Food & Staples Retailing | | | | 38 | | | | 2,401 | |
| | Kone OYJ, B | | | Machinery | | | | 211 | | | | 12,017 | |
| | Metso OYJ | | | Machinery | | | | 56 | | | | 2,092 | |
| | Neste Oil OYJ | | | Oil, Gas & Consumable Fuels | | | | 221 | | | | 7,317 | |
| | Nokia OYJ, A | | | Communications Equipment | | | | 2,991 | | | | 15,163 | |
| | Nokian Renkaat OYJ | | | Auto Components | | | | 74 | | | | 2,088 | |
| | Nordea Bank Abp | | | Banks | | | | 1,706 | | | | 12,093 | |
| | Orion OYJ | | | Pharmaceuticals | | | | 53 | | | | 1,977 | |
| | Sampo OYJ, A | | | Insurance | | | | 260 | | | | 10,340 | |
| | Stora Enso OYJ, R | | | Paper & Forest Products | | | | 317 | | | | 3,821 | |
| | UPM-Kymmene OYJ | | | Paper & Forest Products | | | | 283 | | | | 8,367 | |
| | Wartsila OYJ ABP | | | Machinery | | | | 263 | | | | 2,946 | |
| | | | | | | | | | | | | | |
| | | | |
| | | | | | | | | | | | | 91,744 | |
| | | | | | | | | | | | | | |
| | | France 16.8% | | | | | | | | | |
| | Accor SA | | | Hotels, Restaurants & Leisure | | | | 100 | | | | 4,170 | |
| a | | Adevinta ASA, A | | | Interactive Media & Services | | | | 38 | | | | 441 | |
| a | | Adevinta ASA, B | | | Interactive Media & Services | | | | 74 | | | | 857 | |
| | Aeroports de Paris SA | | | Transportation Infrastructure | | | | 14 | | | | 2,491 | |
| a | | AirFrance-KLM | | | Airlines | | | | 109 | | | | 1,141 | |
| | Air Liquide SA | | | Chemicals | | | | 224 | | | | 31,893 | |
| | Airbus SE | | | Aerospace & Defense | | | | 295 | | | | 38,336 | |
| c | | ALD SA, 144A | | | Road & Rail | | | | 46 | | | | 657 | |
| | Alstom SA | | | Machinery | | | | 100 | | | | 4,146 | |
| | Amundi SA | | | Capital Markets | | | | 32 | | | | 2,233 | |
| | ArcelorMittal | | | Metals & Mining | | | | 322 | | | | 4,531 | |
| | Arkema SA | | | Chemicals | | | | 40 | | | | 3,729 | |
| | Atos SE | | | IT Services | | | | 53 | | | | 3,737 | |
| | AXA SA | | | Insurance | | | | 1,033 | | | | 26,386 | |
| | Biomerieux | | | Health Care Equipment & Supplies | | | | 23 | | | | 1,903 | |
| | BNP Paribas SA | | | Banks | | | | 581 | | | | 28,294 | |
| | Bollore | | | Air Freight & Logistics | | | | 519 | | | | 2,151 | |
| | Bouygues SA | | | Construction & Engineering | | | | 109 | | | | 4,367 | |
| | Bureau Veritas SA | | | Professional Services | | | | 141 | | | | 3,397 | |
| | Capgemini SE | | | IT Services | | | | 82 | | | | 9,664 | |
| | Carrefour SA | | | Food & Staples Retailing | | | | 307 | | | | 5,375 | |
| | Casino Guichard-Perrachon SA | | | Food & Staples Retailing | | | | 30 | | | | 1,432 | |
| | Cie Generale des Etablissements Michelin SCA | | | Auto Components | | | | 95 | | | | 10,605 | |
| | CNP Assurances | | | Insurance | | | | 85 | | | | 1,643 | |
| | Compagnie de Saint-Gobain | | | Building Products | | | | 264 | | | | 10,361 | |
| | Covivio | | | Equity Real Estate Investment Trusts (REITs | ) | | | 27 | | | | 2,858 | |
| | Credit Agricole SA | | | Banks | | | | 606 | | | | 7,360 | |
| | Danone SA | | | Food Products | | | | 319 | | | | 28,107 | |
| | Dassault Aviation SA | | | Aerospace & Defense | | | | 1 | | | | 1,415 | |
| | Dassault Systemes | | | Software | | | | 71 | | | | 10,121 | |
| | Edenred | | | Commercial Services & Supplies | | | | 132 | | | | 6,336 | |
| | EDF SA | | | Electric Utilities | | | | 264 | | | | 2,956 | |
| | Eiffage SA | | | Construction & Engineering | | | | 38 | | | | 3,941 | |
| | Elis SA | | | Commercial Services & Supplies | | | | 107 | | | | 1,892 | |
| | Engie SA | | | Multi-Utilities | | | | 888 | | | | 14,502 | |
| | EssilorLuxottica SA | | | Textiles, Apparel & Luxury Goods | | | | 156 | | | | 22,492 | |
| | Eurazeo SE | | | Diversified Financial Services | | | | 26 | | | | 1,935 | |
| | Eutelsat Communications SA | | | Media | | | | 100 | | | | 1,862 | |
| | Faurecia SE | | | Auto Components | | | | 40 | | | | 1,898 | |
| | Gecina SA | | | Equity Real Estate Investment Trusts (REITs | ) | | | 28 | | | | 4,402 | |
| | Getlink SE | | | Transportation Infrastructure | | | | 248 | | | | 3,726 | |
| | | | |
| | | |
| 194 | | Semiannual Report | | franklintempleton.com |
FRANKLIN TEMPLETON ETF TRUST
STATEMENT OF INVESTMENTS (UNAUDITED)
Franklin FTSE Europe Hedged ETF(continued)
| | | | | | | | | | | | | | |
| | | | |
| | | | | Industry | | | Shares | | | Value | |
| | | Common Stocks and Other Equity Interests (continued) | |
| | | France (continued) | | | | | | | | | |
| | Hermes International | | | Textiles, Apparel & Luxury Goods | | | | 17 | | | $ | 11,750 | |
| | ICADE | | | Equity Real Estate Investment Trusts (REITs | ) | | | 18 | | | | 1,610 | |
| | Iliad SA | | | Diversified Telecommunication Services | | | | 14 | | | | 1,316 | |
| | Imerys SA | | | Construction Materials | | | | 19 | | | | 764 | |
| | Ingenico Group SA | | | Electronic Equipment, Instruments & Components | | | | 33 | | | | 3,220 | |
| | Ipsen SA | | | Pharmaceuticals | | | | 20 | | | | 1,899 | |
| | JCDecaux SA | | | Media | | | | 40 | | | | 1,083 | |
| | Kering SA | | | Textiles, Apparel & Luxury Goods | | | | 40 | | | | 20,389 | |
| | Klepierre SA | | | Equity Real Estate Investment Trusts (REITs | ) | | | 102 | | | | 3,465 | |
| | L’Oreal SA | | | Personal Products | | | | 129 | | | | 36,129 | |
| | Lagardere SCA | | | Media | | | | 61 | | | | 1,350 | |
| | Legrand SA | | | Electrical Equipment | | | | 142 | | | | 10,137 | |
| | LVMH Moet Hennessy Louis Vuitton SE | | | Textiles, Apparel & Luxury Goods | | | | 133 | | | | 52,873 | |
| | Natixis SA | | | Capital Markets | | | | 452 | | | | 1,875 | |
| | Orange SA | | | Diversified Telecommunication Services | | | | 1,014 | | | | 15,913 | |
| | Orpea | | | Health Care Providers & Services | | | | 24 | | | | 2,933 | |
| | Pernod Ricard SA | | | Beverages | | | | 112 | | | | 19,952 | |
| | Peugeot SA | | | Automobiles | | | | 289 | | | | 7,209 | |
| | Plastic Omnium SA | | | Auto Components | | | | 29 | | | | 795 | |
| | Publicis Groupe | | | Media | | | | 115 | | | | 5,657 | |
| | Remy Cointreau SA | | | Beverages | | | | 13 | | | | 1,726 | |
| | Renault SA | | | Automobiles | | | | 98 | | | | 5,626 | |
| | Rexel SA | | | Trading Companies & Distributors | | | | 163 | | | | 1,745 | |
| | Rubis SCA | | | Gas Utilities | | | | 49 | | | | 2,847 | |
| | Safran SA | | | Aerospace & Defense | | | | 177 | | | | 27,874 | |
| | Sanofi | | | Pharmaceuticals | | | | 580 | | | | 53,785 | |
| | Sartorius Stedim Biotech | | | Life Sciences Tools & Services | | | | 12 | | | | 1,680 | |
| | Schneider Electric SE | | | Electrical Equipment | | | | 279 | | | | 24,485 | |
| | SCOR SE | | | Insurance | | | | 83 | | | | 3,429 | |
| | SEB SA | | | Household Durables | | | | 15 | | | | 2,278 | |
| | Societe BIC SA | | | Commercial Services & Supplies | | | | 13 | | | | 873 | |
| | Societe Generale SA | | | Banks | | | | 415 | | | | 11,374 | |
| | Sodexo SA | | | Hotels, Restaurants & Leisure | | | | 45 | | | | 5,053 | |
| | Suez | | | Multi-Utilities | | | | 196 | | | | 3,082 | |
| | Teleperformance | | | Professional Services | | | | 30 | | | | 6,505 | |
| | Thales SA | | | Aerospace & Defense | | | | 54 | | | | 6,211 | |
| | Total SA | | | Oil, Gas & Consumable Fuels | | | | 1,290 | | | | 67,343 | |
| a | | UbiSoft Entertainment SA | | | Entertainment | | | | 46 | | | | 3,327 | |
| | Unibail-Rodamco-Westfield | | | Equity Real Estate Investment Trusts (REITs | ) | | | 71 | | | | 10,353 | |
| | Valeo SA | | | Auto Components | | | | 125 | | | | 4,054 | |
| | Veolia Environnement SA | | | Multi-Utilities | | | | 267 | | | | 6,771 | |
| | Vinci SA | | | Construction & Engineering | | | | 247 | | | | 26,610 | |
| | Vivendi SA | | | Entertainment | | | | 436 | | | | 11,969 | |
| | Wendel SA | | | Diversified Financial Services | | | | 15 | | | | 2,070 | |
| a,b | | Worldline SA, Reg S | | | IT Services | | | | 47 | | | | 2,967 | |
| | | | | | | | | | | | | | |
| | | | |
| | | | | | | | | | | | | 814,099 | |
| | | | | | | | | | | | | | |
| | | Germany 12.6% | | | | | | | | | |
| | 1&1 Drillisch AG | | | Wireless Telecommunication Services | | | | 23 | | | | 717 | |
| | Adidas AG | | | Textiles, Apparel & Luxury Goods | | | | 104 | | | | 32,387 | |
| | Allianz SE | | | Insurance | | | | 226 | | | | 52,689 | |
| | Aroundtown SA | | | Real Estate Management & Development | | | | 471 | | | | 3,853 | |
| | Axel Springer SE | | | Media | | | | 24 | | | | 1,656 | |
| | BASF SE | | | Chemicals | | | | 488 | | | | 34,113 | |
| | Bayer AG | | | Pharmaceuticals | | | | 499 | | | | 35,192 | |
| | Bayerische Motoren Werke AG | | | Automobiles | | | | 171 | | | | 12,041 | |
| | Beiersdorf AG | | | Personal Products | | | | 53 | | | | 6,252 | |
| | Brenntag AG | | | Trading Companies & Distributors | | | | 80 | | | | 3,872 | |
| | | | | | |
| | | |
| franklintempleton.com | | Semiannual Report | | | 195 | |
FRANKLIN TEMPLETON ETF TRUST
STATEMENT OF INVESTMENTS (UNAUDITED)
Franklin FTSE Europe Hedged ETF(continued)
| | | | | | | | | | | | | | |
| | | | |
| | | | | Industry | | | Shares | | | Value | |
| | | Common Stocks and Other Equity Interests (continued) | |
| | | Germany (continued) | | | | | | | | | |
| | Carl Zeiss Meditec AG | | | Health Care Equipment & Supplies | | | | 20 | | | $ | 2,281 | |
| | Commerzbank AG | | | Banks | | | | 542 | | | | 3,145 | |
| | Continental AG | | | Auto Components | | | | 57 | | | | 7,314 | |
| | Covestro AG | | | Chemicals | | | | 88 | | | | 4,356 | |
| | Daimler AG | | | Automobiles | | | | 457 | | | | 22,729 | |
| a | | Delivery Hero SE | | | Internet & Direct Marketing Retail | | | | 60 | | | | 2,666 | |
| | Deutsche Bank AG | | | Capital Markets | | | | 1,091 | | | | 8,172 | |
| | Deutsche Boerse AG | | | Capital Markets | | | | 98 | | | | 15,321 | |
| | Deutsche Lufthansa AG | | | Airlines | | | | 126 | | | | 2,003 | |
| | Deutsche Post AG | | | Air Freight & Logistics | | | | 525 | | | | 17,540 | |
| | Deutsche Telekom AG | | | Diversified Telecommunication Services | | | | 1,729 | | | | 29,017 | |
| | Deutsche Wohnen AG | | | Real Estate Management & Development | | | | 189 | | | | 6,901 | |
| c | | DWS Group GmbH & Co. KGaA, 144A | | | Capital Markets | | | | 21 | | | | 621 | |
| | E.ON SE | | | Multi-Utilities | | | | 1,148 | | | | 11,163 | |
| | Evonik Industries AG | | | Chemicals | | | | 91 | | | | 2,247 | |
| | Fielmann AG | | | Specialty Retail | | | | 14 | | | | 1,031 | |
| | Fraport AG Frankfurt Airport Services Worldwide | | | Transportation Infrastructure | | | | 19 | | | | 1,612 | |
| | Fresenius Medical Care AG & Co. KGaA | | | Health Care Providers & Services | | | | 112 | | | | 7,534 | |
| | Fresenius SE and Co. KGaA | | | Health Care Providers & Services | | �� | | 216 | | | | 10,101 | |
| | Fuchs Petrolub SE | | | Chemicals | | | | 17 | | | | 618 | |
| | GEA Group AG | | | Machinery | | | | 92 | | | | 2,484 | |
| | Grenkeleasing AG | | | Consumer Finance | | | | 14 | | | | 1,154 | |
| | Hannover Rueck SE | | | Insurance | | | | 33 | | | | 5,580 | |
| | Hapag-Lloyd AG | | | Marine | | | | 17 | | | | 1,223 | |
| | HeidelbergCement AG | | | Construction Materials | | | | 78 | | | | 5,640 | |
| | Hella GmbH & Co. KGaA | | | Auto Components | | | | 24 | | | | 1,073 | |
| | Henkel AG & Co. KGaA | | | Household Products | | | | 54 | | | | 4,945 | |
| | Hochtief AG | | | Construction & Engineering | | | | 11 | | | | 1,254 | |
| | Hugo Boss AG | | | Textiles, Apparel & Luxury Goods | | | | 36 | | | | 1,929 | |
| | Infineon Technologies AG | | | Semiconductors & Semiconductor Equipment | | | | 670 | | | | 12,061 | |
| | K+S AG | | | Chemicals | | | | 98 | | | | 1,358 | |
| | KION Group AG | | | Machinery | | | | 41 | | | | 2,157 | |
| | Knorr-Bremse AG | | | Machinery | | | | 25 | | | | 2,350 | |
| | Lanxess AG | | | Chemicals | | | | 45 | | | | 2,747 | |
| | LEG Immobilien AG | | | Real Estate Management & Development | | | | 34 | | | | 3,892 | |
| | Merck KGaA | | | Pharmaceuticals | | | | 70 | | | | 7,887 | |
| | METRO AG | | | Food & Staples Retailing | | | | 86 | | | | 1,358 | |
| | MTU Aero Engines AG | | | Aerospace & Defense | | | | 27 | | | | 7,176 | |
| | Muenchener Rueckversicherungs-Gesellschaft Aktiengesellschaft in Muenchen | | | Insurance | | | | 77 | | | | 19,929 | |
| | Nemetschek AG | | | Software | | | | 28 | | | | 1,429 | |
| | Osram Licht AG | | | Electrical Equipment | | | | 46 | | | | 2,024 | |
| | ProSiebenSat.1 Media SE | | | Media | | | | 130 | | | | 1,791 | |
| | Puma SE | | | Textiles, Apparel & Luxury Goods | | | | 44 | | | | 3,406 | |
| | Rational AG | | | Machinery | | | | 2 | | | | 1,435 | |
| | Rheinmetall AG | | | Industrial Conglomerates | | | | 22 | | | | 2,783 | |
| a,c | | Rocket Internet SE, 144A | | | Internet & Direct Marketing Retail | | | | 33 | | | | 853 | |
| | RWE AG | | | Multi-Utilities | | | | 311 | | | | 9,727 | |
| | SAP SE | | | Software | | | | 518 | | | | 60,922 | |
| b | | Scout24 AG, Reg S | | | Interactive Media & Services | | | | 56 | | | | 3,193 | |
| | Siemens AG | | | Industrial Conglomerates | | | | 404 | | | | 43,273 | |
| | Siemens Healthineers AG | | | Health Care Equipment & Supplies | | | | 74 | | | | 2,912 | |
| | Suedzucker AG | | | Food Products | | | | 42 | | | | 646 | |
| | Symrise AG | | | Chemicals | | | | 68 | | | | 6,610 | |
| a | | Talanx AG | | | Insurance | | | | 17 | | | | 735 | |
| | Telefonica Deutschland Holding AG | | | Diversified Telecommunication Services | | | | 351 | | | | 979 | |
| | thyssenkrupp AG | | | Metals & Mining | | | | 244 | | | | 3,380 | |
| | TUI AG | | | Hotels, Restaurants & Leisure | | | | 243 | | | | 2,832 | |
| | | | |
| | | |
| 196 | | Semiannual Report | | franklintempleton.com |
FRANKLIN TEMPLETON ETF TRUST
STATEMENT OF INVESTMENTS (UNAUDITED)
Franklin FTSE Europe Hedged ETF(continued)
| | | | | | | | | | | | | | |
| | | | |
| | | | | Industry | | | Shares | | | Value | |
| | | Common Stocks and Other Equity Interests (continued) | |
| | | Germany (continued) | | | | | | | | | |
| | Uniper SE | | | Independent Power and Renewable Electricity Producers | | | | 106 | | | $ | 3,477 | |
| | United Internet AG | | | Diversified Telecommunication Services | | | | 59 | | | | 2,105 | |
| | Volkswagen AG | | | Automobiles | | | | 18 | | | | 3,095 | |
| | Vonovia SE | | | Real Estate Management & Development | | | | 291 | | | | 14,768 | |
| | Wacker Chemie AG | | | Chemicals | | | | 8 | | | | 526 | |
| | Wirecard AG | | | IT Services | | | | 61 | | | | 9,759 | |
| a,c | | Zalando SE, 144A | | | Internet & Direct Marketing Retail | | | | 77 | | | | 3,516 | |
| | | | | | | | | | | | | | |
| | | | |
| | | | | | | | | | | | | 611,517 | |
| | | | | | | | | | | | | | |
| | | Ireland 0.8% | | | | | | | | | |
| | AIB Group PLC | | | Banks | | | | 402 | | | | 1,194 | |
| | Bank of Ireland Group PLC | | | Banks | | | | 517 | | | | 2,052 | |
| | CRH PLC | | | Construction Materials | | | | 423 | | | | 14,533 | |
| | Flutter Entertainment PLC | | | Hotels, Restaurants & Leisure | | | | 40 | | | | 3,751 | |
| | Glanbia PLC | | | Food Products | | | | 99 | | | | 1,255 | |
| | Kerry Group | | | Food Products | | | | 78 | | | | 9,124 | |
| | Kingspan Group PLC | | | Building Products | | | | 79 | | | | 3,859 | |
| | Smurfit Kappa Group PLC | | | Containers & Packaging | | | | 124 | | | | 3,719 | |
| | | | | | | | | | | | | | |
| | | | |
| | | | | | | | | | | | | 39,487 | |
| | | | | | | | | | | | | | |
| | | Italy 3.7% | | | | | | | | | |
| | A2A SpA | | | Multi-Utilities | | | | 819 | | | | 1,504 | |
| | Amplifon SpA | | | Health Care Providers & Services | | | | 63 | | | | 1,545 | |
| | Assicurazioni Generali SpA | | | Insurance | | | | 686 | | | | 13,297 | |
| | Atlantia SpA | | | Transportation Infrastructure | | | | 282 | | | | 6,822 | |
| | Banca Mediolanum SpA | | | Diversified Financial Services | | | | 130 | | | | 976 | |
| a | | Banco BPM SpA | | | Banks | | | | 888 | | | | 1,814 | |
| | Buzzi Unicem SpA | | | Construction Materials | | | | 43 | | | | 986 | |
| | Buzzi Unicem SpA, di Risp | | | Construction Materials | | | | 23 | | | | 333 | |
| | Davide Campari-Milano SpA | | | Beverages | | | | 297 | | | | 2,684 | |
| | DiaSorin SpA | | | Health Care Equipment & Supplies | | | | 12 | | | | 1,396 | |
| | Enel SpA | | | Electric Utilities | | | | 4,147 | | | | 30,974 | |
| | Eni SpA | | | Oil, Gas & Consumable Fuels | | | | 1,343 | | | | 20,548 | |
| | Ferrari NV | | | Automobiles | | | | 67 | | | | 10,339 | |
| | FinecoBank Banca Fineco SpA | | | Banks | | | | 322 | | | | 3,409 | |
| | Hera SpA | | | Multi-Utilities | | | | 463 | | | | 1,901 | |
| b | | Infrastrutture Wireless Italiane SpA, Reg S | | | Diversified Telecommunication Services | | | | 124 | | | | 1,287 | |
| | Intesa Sanpaolo SpA | | | Banks | | | | 7,968 | | | | 18,898 | |
| | Italgas Reti SpA | | | Gas Utilities | | | | 201 | | | | 1,298 | |
| | Leonardo SpA | | | Aerospace & Defense | | | | 217 | | | | 2,553 | |
| a | | Mediaset SpA | | | Media | | | | 178 | | | | 524 | |
| | Mediobanca Banca di Credito Finanziario SpA | | | Banks | | | | 385 | | | | 4,206 | |
| | Moncler SpA | | | Textiles, Apparel & Luxury Goods | | | | 98 | | | | 3,494 | |
| | Pirelli & C SpA | | | Auto Components | | | | 231 | | �� | | 1,367 | |
| b | | Poste Italiane SpA, Reg S | | | Insurance | | | | 235 | | | | 2,672 | |
| | Prysmian SpA | | | Electrical Equipment | | | | 139 | | | | 2,985 | |
| | Recordati SpA | | | Pharmaceuticals | | | | 50 | | | | 2,146 | |
| a | | Saipem SpA | | | Energy Equipment & Services | | | | 299 | | | | 1,353 | |
| | Salvatore Ferragamo SpA | | | Textiles, Apparel & Luxury Goods | | | | 39 | | | | 721 | |
| | Snam SpA | | | Gas Utilities | | | | 1,212 | | | | 6,123 | |
| | Telecom Italia SpA, di Risp | | | Diversified Telecommunication Services | | | | 3,158 | | | | 1,727 | |
| a | | Telecom Italia SpA/Milano | | | Diversified Telecommunication Services | | | | 5,942 | | | | 3,391 | |
| | Tenaris SA | | | Energy Equipment & Services | | | | 244 | | | | 2,589 | |
| | Terna Rete Elettrica Nazionale SpA | | | Electric Utilities | | | | 753 | | | | 4,839 | |
| | UniCredit SpA | | | Banks | | | | 1,204 | | | | 14,202 | |
| | Unione di Banche Italiane SpA | | | Banks | | | | 540 | | | | 1,517 | |
| | UnipolSai Assicurazioni SpA | | | Insurance | | | | 285 | | | | 758 | |
| | | | | | | | | | | | | | |
| | | | |
| | | | | | | | | | | | | 177,178 | |
| | | | | | | | | | | | | | |
| | | | | | |
| | | |
| franklintempleton.com | | Semiannual Report | | | 197 | |
FRANKLIN TEMPLETON ETF TRUST
STATEMENT OF INVESTMENTS (UNAUDITED)
Franklin FTSE Europe Hedged ETF(continued)
| | | | | | | | | | | | | | |
| | | | |
| | | | | Industry | | | Shares | | | Value | |
| | | Common Stocks and Other Equity Interests (continued) | |
| | | Kazakhstan 0.0%† | | | | | | | | | |
| | KAZ Minerals PLC | | | Metals & Mining | | | | 118 | | | $ | 630 | |
| | | | | | | | | | | | | | |
| | | Luxembourg 0.2% | | | | | | | | | |
| | Eurofins Scientific SE | | | Life Sciences Tools & Services | | | | 6 | | | | 2,789 | |
| | RTL Group SA | | | Media | | | | 21 | | | | 1,010 | |
| | SES SA, IDR | | | Media | | | | 188 | | | | 3,428 | |
| | | | | | | | | | | | | | |
| | | | |
| | | | | | | | | | | | | 7,227 | |
| | | | | | | | | | | | | | |
| | | Netherlands 4.4% | | | | | | | | | |
| | Aalberts NV | | | Machinery | | | | 52 | | | | 2,061 | |
| | ABN AMRO Bank NV, GDR, | | | Banks | | | | 219 | | | | 3,862 | |
| a | | Adyen NV | | | IT Services | | | | 5 | | | | 3,295 | |
| | Aegon NV | | | Insurance | | | | 960 | | | | 3,995 | |
| | Akzo Nobel NV | | | Chemicals | | | | 121 | | | | 10,789 | |
| a | | Argenx SE | | | Biotechnology | | | | 19 | | | | 2,156 | |
| | ASML Holding NV | | | Semiconductors & Semiconductor Equipment | | | | 214 | | | | 53,018 | |
| | ASR Nederland NV | | | Insurance | | | | 78 | | | | 2,880 | |
| | Boskalis Westminster | | | Construction & Engineering | | | | 45 | | | | 939 | |
| b | | Euronext NV, Reg S | | | Capital Markets | | | | 32 | | | | 2,618 | |
| | EXOR NV | | | Diversified Financial Services | | | | 56 | | | | 3,754 | |
| | Grandvision NV | | | Specialty Retail | | | | 27 | | | | 809 | |
| | Heineken Holding NV | | | Beverages | | | | 58 | | | | 5,776 | |
| | Heineken NV | | | Beverages | | | | 127 | | | | 13,729 | |
| | ING Groep NV | | | Banks | | | | 2,075 | | | | 21,726 | |
| | Koninklijke Ahold Delhaize NV | | | Food & Staples Retailing | | | | 597 | | | | 14,940 | |
| | Koninklijke DSM NV | | | Chemicals | | | | 94 | | | | 11,314 | |
| | Koninklijke KPN NV | | | Diversified Telecommunication Services | | | | 1,776 | | | | 5,540 | |
| | Koninklijke Philips NV | | | Health Care Equipment & Supplies | | | | 484 | | | | 22,425 | |
| | Koninklijke Vopak NV | | | Oil, Gas & Consumable Fuels | | | | 36 | | | | 1,851 | |
| | NN Group NV | | | Insurance | | | | 176 | | | | 6,244 | |
| a | | OCI NV | | | Chemicals | | | | 50 | | | | 1,181 | |
| a | | QIAGEN NV | | | Life Sciences Tools & Services | | | | 115 | | | | 3,766 | |
| | Randstad NV | | | Professional Services | | | | 60 | | | | 2,949 | |
| | Signify NV | | | Electrical Equipment | | | | 60 | | | | 1,650 | |
| a,b | | Takeaway.com NV, Reg S | | | Internet & Direct Marketing Retail | | | | 20 | | | | 1,596 | |
| | Wolters Kluwer NV | | | Professional Services | | | | 147 | | | | 10,734 | |
| | | | | | | | | | | | | | |
| | | | |
| | | | | | | | | | | | | 215,597 | |
| | | | | | | | | | | | | | |
| | | Norway 1.1% | | | | | | | | | |
| | Aker ASA | | | Diversified Financial Services | | | | 13 | | | | 693 | |
| | Aker BP ASA | | | Oil, Gas & Consumable Fuels | | | | 55 | | | | 1,473 | |
| | DNB ASA | | | Banks | | | | 561 | | | | 9,895 | |
| | Equinor ASA | | | Oil, Gas & Consumable Fuels | | | | 519 | | | | 9,885 | |
| | Gjensidige Forsikring ASA | | | Insurance | | | | 84 | | | | 1,667 | |
| | Leroy Seafood Group ASA | | | Food Products | | | | 140 | | | | 852 | |
| | Mowi ASA | | | Food Products | | | | 224 | | | | 5,175 | |
| | Norsk Hydro ASA | | | Metals & Mining | | | | 717 | | | | 2,525 | |
| | Orkla ASA | | | Food Products | | | | 415 | | | | 3,780 | |
| | Salmar ASA | | | Food Products | | | | 31 | | | | 1,361 | |
| | Schibsted ASA, A | | | Media | | | | 47 | | | | 1,392 | |
| | Schibsted ASA, B | | | Media | | | | 49 | | | | 1,375 | |
| | Telenor ASA | | | Diversified Telecommunication Services | | | | 349 | | | | 7,012 | |
| | Yara International ASA | | | Chemicals | | | | 93 | | | | 4,010 | |
| | | | | | | | | | | | | | |
| | | | |
| | | | | | | | | | | | | 51,095 | |
| | | | | | | | | | | | | | |
| | | Poland 0.5% | | | | | | | | | |
| | Bank Pekao SA | | | Banks | | | | 82 | | | | 2,094 | |
| | CD Projekt SA | | | Entertainment | | | | 33 | | | | 2,003 | |
| | | | |
| | | |
| 198 | | Semiannual Report | | franklintempleton.com |
FRANKLIN TEMPLETON ETF TRUST
STATEMENT OF INVESTMENTS (UNAUDITED)
Franklin FTSE Europe Hedged ETF(continued)
| | | | | | | | | | | | | | |
| | | | |
| | | | | Industry | | | Shares | | | Value | |
| | | Common Stocks and Other Equity Interests (continued) | |
| | | Poland (continued) | | | | | | | | | |
| | Cyfrowy Polsat SA | | | Media | | | | 158 | | | $ | 1,041 | |
| a | | Dino Polska SA | | | Food & Staples Retailing | | | | 22 | | | | 862 | |
| | Grupa Lotos SA | | | Oil, Gas & Consumable Fuels | | | | 52 | | | | 1,149 | |
| a | | KGHM Polska Miedz SA | | | Metals & Mining | | | | 71 | | | | 1,417 | |
| | LPP SA | | | Textiles, Apparel & Luxury Goods | | | | 1 | | | | 2,145 | |
| a | | mBank SA | | | Banks | | | | 7 | | | | 607 | |
| a | | PGE Polska Grupa Energetyczna SA | | | Electric Utilities | | | | 353 | | | | 704 | |
| | Polski Koncern Naftowy Orlen SA | | | Oil, Gas & Consumable Fuels | | | | 159 | | | | 3,914 | |
| | Polskie Gornictwo Naftowe i Gazownictwo SA | | | Oil, Gas & Consumable Fuels | | | | 897 | | | | 1,052 | |
| | Powszechna Kasa Oszczednosci Bank Polski SA | | | Banks | | | | 442 | | | | 4,335 | |
| | Powszechny Zaklad Ubezpieczen SA | | | Insurance | | | | 288 | | | | 2,685 | |
| | Santander Bank Polska SA | | | Banks | | | | 16 | | | | 1,252 | |
| | | | | | | | | | | | | | |
| | | | |
| | | | | | | | | | | | | 25,260 | |
| | | | | | | | | | | | | | |
| | | Portugal 0.2% | | | | | | | | | |
| | EDP- Energias de Portugal SA | | | Electric Utilities | | | | 1,209 | | | | 4,695 | |
| | Galp Energia SGPS SA, B | | | Oil, Gas & Consumable Fuels | | | | 267 | | | | 4,024 | |
| | Jeronimo Martins SGPS SA | | | Food & Staples Retailing | | | | 128 | | | | 2,160 | |
| | | | | | | | | | | | | | |
| | | | |
| | | | | | | | | | | | | 10,879 | |
| | | | | | | | | | | | | | |
| | | Russia 0.1% | | | | | | | | | |
| | Evraz PLC | | | Metals & Mining | | | | 281 | | | | 1,619 | |
| | Polymetal International PLC | | | Metals & Mining | | | | 164 | | | | 2,304 | |
| | | | | | | | | | | | | | |
| | | | |
| | | | | | | | | | | | | 3,923 | |
| | | | | | | | | | | | | | |
| | | South Africa 0.0%† | | | | | | | | | |
| | Investec PLC | | | Capital Markets | | | | 371 | | | | 1,914 | |
| | | | | | | | | | | | | | |
| | | Spain 4.5% | | | | | | | | | |
| | Acciona SA | | | Electric Utilities | | | | 11 | | | | 1,164 | |
| | ACS Actividades de Construccion y Servicios SA | | | Construction & Engineering | | | | 133 | | | | 5,316 | |
| | Aena SME SA | | | Transportation Infrastructure | | | | 38 | | | | 6,960 | |
| | Amadeus IT Group SA, A | | | IT Services | | | | 213 | | | | 15,261 | |
| | Banco Bilbao Vizcaya Argentaria SA | | | Banks | | | | 3,534 | | | | 18,418 | |
| | Banco de Sabadell SA | | | Banks | | | | 2,921 | | | | 2,835 | |
| | Banco Santander SA | | | Banks | | | | 8,805 | | | | 35,867 | |
| | Bankia SA | | | Banks | | | | 700 | | | | 1,322 | |
| | Bankinter SA | | | Banks | | | | 350 | | | | 2,211 | |
| | CaixaBank SA | | | Banks | | | | 1,938 | | | | 5,092 | |
| | Cellnex Telecom SA | | | Diversified Telecommunication Services | | | | 112 | | | | 4,628 | |
| | Corporacion Financiera Alba SA | | | Diversified Financial Services | | | | 10 | | | | 487 | |
| | Corporacion Mapfre SA | | | Insurance | | | | 505 | | | | 1,360 | |
| | EDP Renovaveis SA | | | Independent Power and Renewable Electricity Producers | | | | 103 | | | | 1,111 | |
| | Enagas SA | | | Gas Utilities | | | | 114 | | | | 2,642 | |
| | Endesa SA | | | Electric Utilities | | | | 168 | | | | 4,421 | |
| | Ferrovial SA | | | Construction & Engineering | | | | 251 | | | | 7,254 | |
| | Fomento de Construcciones y Contratas SA | | | Construction & Engineering | | | | 33 | | | | 378 | |
| | Grifols SA | | | Biotechnology | | | | 181 | | | | 5,336 | |
| | Iberdrola SA | | | Electric Utilities | | | | 3,170 | | | | 32,956 | |
| | Industria de Diseno Textil SA | | | Specialty Retail | | | | 560 | | | | 17,339 | |
| | Inmobiliaria Colonial SA | | | Equity Real Estate Investment Trusts (REITs | ) | | | 175 | | | | 2,112 | |
| | Merlin Properties Socimi SA | | | Equity Real Estate Investment Trusts (REITs | ) | | | 169 | | | | 2,360 | |
| | Naturgy Energy Group SA | | | Gas Utilities | | | | 167 | | | | 4,431 | |
| | Red Electrica Corp. SA | | | Electric Utilities | | | | 235 | | | | 4,774 | |
| | Repsol SA | | | Oil, Gas & Consumable Fuels | | | | 718 | | | | 11,225 | |
| | Siemens Gamesa Renewable Energy SA | | | Electrical Equipment | | | | 113 | | | | 1,534 | |
| | | | | | |
| | | |
| franklintempleton.com | | Semiannual Report | | | 199 | |
FRANKLIN TEMPLETON ETF TRUST
STATEMENT OF INVESTMENTS (UNAUDITED)
Franklin FTSE Europe Hedged ETF(continued)
| | | | | | | | | | | | | | |
| | | | |
| | | | | Industry | | | Shares | | | Value | |
| | | Common Stocks and Other Equity Interests (continued) | |
| | | Spain (continued) | | | | | | | | | |
| | Telefonica SA | | | Diversified Telecommunication Services | | | | 2,422 | | | $ | 18,486 | |
| | Zardoya Otis SA | | | Machinery | | | | 112 | | | | 761 | |
| | | | | | | | | | | | | | |
| | | | |
| | | | | | | | | | | | | 218,041 | |
| | | | | | | | | | | | | | |
| | | Sweden 4.0% | | | | | | | | | |
| | Alfa Laval AB | | | Machinery | | | | 166 | | | | 3,280 | |
| | Assa Abloy AB, B | | | Building Products | | | | 486 | | | | 10,830 | |
| | Atlas Copco AB | | | Machinery | | | | 200 | | | | 5,427 | |
| | Atlas Copco AB, A | | | Machinery | | | | 337 | | | | 10,392 | |
| | Boliden AB | | | Metals & Mining | | | | 149 | | | | 3,429 | |
| | Castellum AB | | | Real Estate Management & Development | | | | 144 | | | | 3,087 | |
| | Electrolux AB, B | | | Household Durables | | | | 126 | | | | 2,991 | |
| | Elekta AB, B | | | Health Care Equipment & Supplies | | | | 196 | | | | 2,586 | |
| | Epiroc AB, A | | | Machinery | | | | 340 | | | | 3,690 | |
| | Epiroc AB, B | | | Machinery | | | | 199 | | | | 2,058 | |
| | Ericsson, B | | | Communications Equipment | | | | 1,604 | | | | 12,833 | |
| | Essity AB, B | | | Household Products | | | | 325 | | | | 9,497 | |
| a | | Fastighets AB Balder, B | | | Real Estate Management & Development | | | | 53 | | | | 2,010 | |
| | Hennes & Mauritz AB, B | | | Specialty Retail | | | | 468 | | | | 9,084 | |
| | Hexagon AB, B | | | Electronic Equipment, Instruments & Components | | | | 133 | | | | 6,420 | |
| | Husqvarna AB, B | | | Household Durables | | | | 217 | | | | 1,653 | |
| | ICA Gruppen AB | | | Food & Staples Retailing | | | | 40 | | | | 1,850 | |
| | Industrivarden AB, A | | | Diversified Financial Services | | | | 121 | | | | 2,725 | |
| | Industrivarden AB, C | | | Diversified Financial Services | | | | 95 | | | | 2,082 | |
| | Investment AB Latour, B | | | Industrial Conglomerates | | | | 63 | | | | 830 | |
| | Investor AB, A | | | Diversified Financial Services | | | | 70 | | | | 3,370 | |
| | Investor AB, B | | | Diversified Financial Services | | | | 245 | | | | 11,988 | |
| | Kinnevik AB, B | | | Diversified Financial Services | | | | 133 | | | | 3,502 | |
| | L E Lundbergforetagen AB, B | | | Diversified Financial Services | | | | 40 | | | | 1,507 | |
| | Lundin Petroleum AB | | | Oil, Gas & Consumable Fuels | | | | 91 | | | | 2,733 | |
| | Nibe Industrier AB | | | Building Products | | | | 167 | | | | 2,121 | |
| | Saab AB, B | | | Aerospace & Defense | | | | 48 | | | | 1,380 | |
| | Sandvik AB | | | Machinery | | | | 582 | | | | 9,077 | |
| | Securitas AB, B | | | Commercial Services & Supplies | | | | 157 | | | | 2,408 | |
| | Skandinaviska Enskilda Banken AB, A | | | Banks | | | | 756 | | | | 6,957 | |
| | Skandinaviska Enskilda Banken AB, C | | | Banks | | | | 12 | | | | 112 | |
| | Skanska AB, B | | | Construction & Engineering | | | | 195 | | | | 3,955 | |
| | SKF AB, B | | | Machinery | | | | 203 | | | | 3,359 | |
| | Svenska Cellulosa AB, A | | | Paper & Forest Products | | | | 12 | | | | 112 | |
| | Svenska Cellulosa AB, B | | | Paper & Forest Products | | | | 321 | | | | 2,866 | |
| | Svenska Handelsbanken AB, A | | | Banks | | | | 763 | | | | 7,153 | |
| | Svenska Handelsbanken AB, B | | | Banks | | | | 18 | | | | 170 | |
| | Swedbank AB, A | | | Banks | | | | 527 | | | | 7,595 | |
| | Swedish Match AB | | | Tobacco | | | | 88 | | | | 3,644 | |
| a | | Swedish Orphan Biovitrum AB | | | Biotechnology | | | | 103 | | | | 1,580 | |
| | Tele2 AB, B | | | Wireless Telecommunication Services | | | | 290 | | | | 4,321 | |
| | Telefonaktiebolaget LM Ericsson, A | | | Communications Equipment | | | | 19 | | | | 152 | |
| | Telia Co. AB | | | Diversified Telecommunication Services | | | | 1,418 | | | | 6,356 | |
| | Trelleborg AB, B | | | Machinery | | | | 121 | | | | 1,700 | |
| | Volvo AB, B | | | Machinery | | | | 794 | | | | 11,164 | |
| | | | | | | | | | | | | | |
| | | | |
| | | | | | | | | | | | | 196,036 | |
| | | | | | | | | | | | | | |
| | | Switzerland 14.9% | | | | | | | | | |
| | ABB Ltd. | | | Electrical Equipment | | | | 951 | | | | 18,702 | |
| | Adecco Group AG | | | Professional Services | | | | 81 | | | | 4,486 | |
| a | | Alcon Inc. | | | Health Care Equipment & Supplies | | | | 243 | | | | 14,183 | |
| | Baloise Holding AG | | | Insurance | | | | 26 | | | | 4,662 | |
| | Banque Cantonale Vaudoise | | | Banks | | | | 2 | | | | 1,532 | |
| | | | |
| | | |
| 200 | | Semiannual Report | | franklintempleton.com |
FRANKLIN TEMPLETON ETF TRUST
STATEMENT OF INVESTMENTS (UNAUDITED)
Franklin FTSE Europe Hedged ETF(continued)
| | | | | | | | | | | | | | |
| | | | |
| | | | | Industry | | | Shares | | | Value | |
| | | Common Stocks and Other Equity Interests (continued) | |
| | | Switzerland (continued) | | | | | | | | | |
| | Barry Callebaut AG | | | Food Products | | | | 1 | | | $ | 2,064 | |
| | Chocoladefabriken Lindt & Spruengli AG | | | Food Products | | | | 1 | | | | 7,391 | |
| | Clariant AG | | | Chemicals | | | | 112 | | | | 2,182 | |
| | Coca-Cola HBC AG | | | Beverages | | | | 103 | | | | 3,373 | |
| | Compagnie Financiere Richemont SA | | | Textiles, Apparel & Luxury Goods | | | | 271 | | | | 19,899 | |
| | Credit Suisse Group AG | | | Capital Markets | | | | 1,338 | | | | 16,417 | |
| | DKSH Holding AG | | | Professional Services | | | | 18 | | | | 899 | |
| | Dufry AG | | | Specialty Retail | | | | 16 | | | | 1,340 | |
| | EMS-Chemie Holding AG | | | Chemicals | | | | 4 | | | | 2,493 | |
| | Flughafen Zurich AG | | | Transportation Infrastructure | | | | 10 | | | | 1,853 | |
| | Geberit AG | | | Building Products | | | | 19 | | | | 9,081 | |
| | Georg Fischer AG | | | Machinery | | | | 2 | | | | 1,734 | |
| | Givaudan AG | | | Chemicals | | | | 5 | | | | 13,960 | |
| | Glencore PLC | | | Metals & Mining | | | | 5,963 | | | | 17,985 | |
| | Helvetia Holding AG | | | Insurance | | | | 19 | | | | 2,624 | |
| | Julius Baer Group Ltd. | | | Capital Markets | | | | 119 | | | | 5,277 | |
| | Kuehne + Nagel International AG | | | Marine | | | | 27 | | | | 3,980 | |
| | LafargeHolcim Ltd., B | | | Construction Materials | | | | 267 | | | | 13,153 | |
| | Logitech International SA | | | Technology Hardware, Storage & Peripherals | | | | 76 | | | | 3,085 | |
| | Lonza Group AG | | | Life Sciences Tools & Services | | | | 40 | | | | 13,535 | |
| | Nestle SA | | | Food Products | | | | 1,546 | | | | 167,879 | |
| | Novartis AG | | | Pharmaceuticals | | | | 1,152 | | | | 99,979 | |
| | OC Oerlikon Corp. AG | | | Machinery | | | | 103 | | | | 1,034 | |
| | Pargesa Holding SA, B | | | Diversified Financial Services | | | | 20 | | | | 1,539 | |
| | Partners Group Holding AG | | | Capital Markets | | | | 9 | | | | 6,912 | |
| | PSP Swiss Property AG | | | Real Estate Management & Development | | | | 23 | | | | 2,923 | |
| | Roche Holding AG | | | Pharmaceuticals | | | | 15 | | | | 4,344 | |
| | Roche Holding AG | | | Pharmaceuticals | | | | 372 | | | | 108,356 | |
| | Schindler Holding AG | | | Machinery | | | | 11 | | | | 2,456 | |
| | Schindler Holding AG, PC | | | Machinery | | | | 21 | | | | 4,701 | |
| | SGS SA | | | Professional Services | | | | 3 | | | | 7,443 | |
| | Sika AG | | | Chemicals | | | | 74 | | | | 10,835 | |
| | Sonova Holding AG | | | Health Care Equipment & Supplies | | | | 29 | | | | 6,747 | |
| | STMicroelectronics NV | | | Semiconductors & Semiconductor Equipment | | | | 339 | | | | 6,553 | |
| | Straumann Holding AG | | | Health Care Equipment & Supplies | | | | 5 | | | | 4,091 | |
| | Sulzer AG | | | Machinery | | | | 10 | | | | 984 | |
| | Swatch Group AG | | | Textiles, Apparel & Luxury Goods | | | | 15 | | | | 3,985 | |
| | Swatch Group AG | | | Textiles, Apparel & Luxury Goods | | | | 24 | | | | 1,207 | |
| | Swiss Life Holding AG | | | Insurance | | | | 18 | | | | 8,612 | |
| | Swiss Prime Site AG | | | Real Estate Management & Development | | | | 40 | | | | 3,917 | |
| | Swiss Re AG | | | Insurance | | | | 147 | | | | 15,347 | |
| | Swisscom AG | | | Diversified Telecommunication Services | | | | 14 | | | | 6,912 | |
| | Temenos AG | | | Software | | | | 31 | | | | 5,192 | |
| | UBS Group AG | | | Capital Markets | | | | 1,841 | | | | 20,918 | |
| | Vifor Pharma AG | | | Pharmaceuticals | | | | 24 | | | | 3,838 | |
| | Zurich Insurance Group AG | | | Insurance | | | | 78 | | | | 29,881 | |
| | | | | | | | | | | | | | |
| | | | |
| | | | | | | | | | | | | 722,475 | |
| | | | | | | | | | | | | | |
| | United Arab Emirates 0.0%† | | | | | | | | | | | | |
| | NMC Health PLC | | | Health Care Providers & Services | | | | 48 | | | | 1,603 | |
| | | | | | | | | | | | | | |
| | | United Kingdom 25.8% | | | | | | | | | |
| | 3i Group PLC | | | Capital Markets | | | | 509 | | | | 7,317 | |
| | Admiral Group PLC | | | Insurance | | | | 113 | | | | 2,949 | |
| | Anglo American PLC | | | Metals & Mining | | | | 672 | | | | 15,495 | |
| | Antofagasta PLC | | | Metals & Mining | | | | 179 | | | | 1,983 | |
| | Ashmore Group PLC | | | Capital Markets | | | | 192 | | | | 1,197 | |
| | Ashtead Group PLC | | | Trading Companies & Distributors | | | | 249 | | | | 6,947 | |
| | Associated British Foods PLC | | | Food Products | | | | 187 | | | | 5,307 | |
| | | | | | |
| | | |
| franklintempleton.com | | Semiannual Report | | | 201 | |
FRANKLIN TEMPLETON ETF TRUST
STATEMENT OF INVESTMENTS (UNAUDITED)
Franklin FTSE Europe Hedged ETF(continued)
| | | | | | | | | | | | | | |
| | | | |
| | | | | Industry | | | Shares | | | Value | |
| | | Common Stocks and Other Equity Interests (continued) | |
| | | United Kingdom (continued) | | | | | | | | | |
| | AstraZeneca PLC | | | Pharmaceuticals | | | | 703 | | | $ | 62,902 | |
| | Auto Trader Group PLC | | | Interactive Media & Services | | | | 473 | | | | 2,973 | |
| | Aveva Group PLC | | | Software | | | | 36 | | | | 1,641 | |
| | Aviva PLC | | | Insurance | | | | 2,071 | | | | 10,190 | |
| | B&M European Value Retail SA | | | Multiline Retail | | | | 466 | | | | 2,179 | |
| | Babcock International Group PLC | | | Commercial Services & Supplies | | | | 132 | | | | 908 | |
| | BAE Systems PLC | | | Aerospace & Defense | | | | 1,726 | | | | 12,124 | |
| | Barclays PLC | | | Banks | | | | 9,204 | | | | 17,058 | |
| | Barratt Developments PLC | | | Household Durables | | | | 545 | | | | 4,352 | |
| | Bellway PLC | | | Household Durables | | | | 64 | | | | 2,639 | |
| | BHP Group PLC | | | Metals & Mining | | | | 1,108 | | | | 23,654 | |
| | BP PLC | | | Oil, Gas & Consumable Fuels | | | | 10,674 | | | | 67,846 | |
| | British American Tobacco PLC | | | Tobacco | | | | 1,223 | | | | 45,326 | |
| | British Land Co. PLC | | | Equity Real Estate Investment Trusts (REITs | ) | | | 489 | | | | 3,524 | |
| | BT Group PLC | | | Diversified Telecommunication Services | | | | 4,608 | | | | 10,141 | |
| | Bunzl PLC | | | Trading Companies & Distributors | | | | 174 | | | | 4,556 | |
| | Burberry Group PLC | | | Textiles, Apparel & Luxury Goods | | | | 219 | | | | 5,867 | |
| | Centrica PLC | | | Multi-Utilities | | | | 2,949 | | | | 2,680 | |
| | Cineworld Group PLC | | | Entertainment | | | | 531 | | | | 1,492 | |
| | CNH Industrial NV | | | Machinery | | | | 535 | | | | 5,448 | |
| a | | Cobham PLC | | | Aerospace & Defense | | | | 1,261 | | | | 2,437 | |
| | Compass Group PLC | | | Hotels, Restaurants & Leisure | | | | 852 | | | | 21,975 | |
| | ConvaTec Group PLC | | | Health Care Equipment & Supplies | | | | 758 | | | | 1,637 | |
| | Croda International PLC | | | Chemicals | | | | 66 | | | | 3,953 | |
| | CYBG PLC | | | Banks | | | | 641 | | | | 908 | |
| | DCC PLC | | | Industrial Conglomerates | | | | 52 | | | | 4,547 | |
| | Derwent London PLC | | | Equity Real Estate Investment Trusts (REITs | ) | | | 53 | | | | 2,201 | |
| | Diageo PLC | | | Beverages | | | | 1,252 | | | | 51,423 | |
| | Direct Line Insurance Group PLC | | | Insurance | | | | 708 | | | | 2,619 | |
| | DS Smith PLC | | | Containers & Packaging | | | | 675 | | | | 2,998 | |
| | easyJet PLC | | | Airlines | | | | 95 | | | | 1,346 | |
| | Experian PLC | | | Professional Services | | | | 485 | | | | 15,533 | |
| | Ferguson PLC | | | Trading Companies & Distributors | | | | 124 | | | | 9,083 | |
| | Fiat Chrysler Automobiles NV | | | Automobiles | | | | 591 | | | | 7,649 | |
| | Fresnillo PLC | | | Metals & Mining | | | | 93 | | | | 783 | |
| | G4S PLC | | | Commercial Services & Supplies | | | | 828 | | | | 1,930 | |
| | GlaxoSmithKline PLC | | | Pharmaceuticals | | | | 2,625 | | | | 56,434 | |
| | GVC Holdings PLC | | | Hotels, Restaurants & Leisure | | | | 322 | | | | 2,950 | |
| | Halma PLC | | | Electronic Equipment, Instruments & Components | | | | 207 | | | | 5,028 | |
| | Hargreaves Lansdown PLC | | | Capital Markets | | | | 142 | | | | 3,638 | |
| | Hikma Pharmaceuticals PLC | | | Pharmaceuticals | | | | 73 | | | | 1,979 | |
| | Hiscox Ltd. | | | Insurance | | | | 153 | | | | 3,130 | |
| | Howden Joinery Group PLC | | | Trading Companies & Distributors | | | | 318 | | | | 2,196 | |
| | HSBC Holdings PLC | | | Banks | | | | 10,825 | | | | 83,319 | |
| | IMI PLC | | | Machinery | | | | 136 | | | | 1,609 | |
| | Imperial Brands PLC | | | Tobacco | | | | 509 | | | | 11,467 | |
| | Inchcape PLC | | | Distributors | | | | 212 | | | | 1,650 | |
| | Informa PLC | | | Media | | | | 667 | | | | 7,003 | |
| | InterContinental Hotels Group PLC | | | Hotels, Restaurants & Leisure | | | | 96 | | | | 6,004 | |
| | International Consolidated Airlines Group SA | | | Airlines | | | | 361 | | | | 2,113 | |
| | Intertek Group PLC | | | Professional Services | | | | 85 | | | | 5,738 | |
| | ITV PLC | | | Media | | | | 1,936 | | | | 3,004 | |
| | J Sainsbury PLC | | | Food & Staples Retailing | | | | 905 | | | | 2,451 | |
| | JD Sports Fashion PLC | | | Specialty Retail | | | | 190 | | | | 1,759 | |
| | John Wood Group PLC | | | Energy Equipment & Services | | | | 364 | | | | 1,704 | |
| | Johnson Matthey PLC | | | Chemicals | | | | 100 | | | | 3,767 | |
| a | | Just Eat PLC | | | Internet & Direct Marketing Retail | | | | 305 | | | | 2,511 | |
| | Kingfisher PLC | | | Specialty Retail | | | | 1,174 | | | | 2,992 | |
| | | | |
| | | |
| 202 | | Semiannual Report | | franklintempleton.com |
FRANKLIN TEMPLETON ETF TRUST
STATEMENT OF INVESTMENTS (UNAUDITED)
Franklin FTSE Europe Hedged ETF(continued)
| | | | | | | | | | | | | | |
| | | | |
| | | | | Industry | | | Shares | | | Value | |
| | | Common Stocks and Other Equity Interests (continued) | |
| | | United Kingdom (continued) | | | | | | | | | |
| | Land Securities Group PLC | | | Equity Real Estate Investment Trusts (REITs | ) | | | 387 | | | $ | 4,084 | |
| | Legal & General Group PLC | | | Insurance | | | | 3,210 | | | | 9,826 | |
| | Lloyds Banking Group PLC | | | Banks | | | | 37,578 | | | | 25,062 | |
| | London Stock Exchange Group PLC | | | Capital Markets | | | | 168 | | | | 15,129 | |
| | Marks & Spencer Group PLC | | | Multiline Retail | | | | 1,027 | | | | 2,334 | |
| | Meggitt PLC | | | Aerospace & Defense | | | | 428 | | | | 3,349 | |
| | Melrose Industries PLC | | | Electrical Equipment | | | | 2,620 | | | | 6,509 | |
| | Merlin Entertainments PLC | | | Hotels, Restaurants & Leisure | | | | 394 | | | | 2,197 | |
| | Micro Focus International PLC | | | Software | | | | 177 | | | | 2,480 | |
| | Mondi PLC | | | Paper & Forest Products | | | | 257 | | | | 4,934 | |
| | National Grid PLC | | | Multi-Utilities | | | | 1,865 | | | | 20,268 | |
| | Next PLC | | | Multiline Retail | | | | 69 | | | | 5,260 | |
| a | | Ocado Group PLC | | | Internet & Direct Marketing Retail | | | | 242 | | | | 3,944 | |
| | Pearson PLC | | | Media | | | | 425 | | | | 3,865 | |
| | Pennon Group PLC | | | Water Utilities | | | | 218 | | | | 2,222 | |
| | Persimmon PLC | | | Household Durables | | | | 164 | | | | 4,385 | |
| | Phoenix Group Holdings PLC | | | Insurance | | | | 264 | | | | 2,249 | |
| | Prudential PLC | | | Insurance | | | | 1,386 | | | | 25,192 | |
| | Quilter PLC | | | Capital Markets | | | | 989 | | | | 1,662 | |
| | Reckitt Benckiser Group PLC | | | Household Products | | | | 337 | | | | 26,346 | |
| | RELX PLC | | | Professional Services | | | | 1,009 | | | | 24,029 | |
| | Renishaw PLC | | | Electronic Equipment, Instruments & Components | | | | 19 | | | | 858 | |
| | Rentokil Initial PLC | | | Commercial Services & Supplies | | | | 989 | | | | 5,701 | |
| | Rightmove PLC | | | Interactive Media & Services | | | | 487 | | | | 3,304 | |
| | Rolls-Royce Holdings PLC | | | Aerospace & Defense | | | | 898 | | | | 8,769 | |
| | Royal Bank of Scotland Group PLC | | | Banks | | | | 2,390 | | | | 6,114 | |
| | Royal Dutch Shell PLC, A | | | Oil, Gas & Consumable Fuels | | | | 2,296 | | | | 67,452 | |
| | Royal Dutch Shell PLC, B | | | Oil, Gas & Consumable Fuels | | | | 2,007 | | | | 59,258 | |
| | RSA Insurance Group PLC | | | Insurance | | | | 554 | | | | 3,647 | |
| | Schroders PLC | | | Capital Markets | | | | 59 | | | | 2,236 | |
| | Segro PLC | | | Equity Real Estate Investment Trusts (REITs | ) | | | 587 | | | | 5,865 | |
| | Severn Trent PLC | | | Water Utilities | | | | 123 | | | | 3,282 | |
| | Smith & Nephew PLC | | | Health Care Equipment & Supplies | | | | 467 | | | | 11,274 | |
| | Smiths Group PLC | | | Industrial Conglomerates | | | | 216 | | | | 4,179 | |
| | Spirax-Sarco Engineering PLC | | | Machinery | | | | 39 | | | | 3,770 | |
| | SSE PLC | | | Electric Utilities | | | | 549 | | | | 8,426 | |
| | St. James’s Place Capital PLC | | | Capital Markets | | | | 286 | | | | 3,452 | |
| | Standard Chartered PLC | | | Banks | | | | 1,406 | | | | 11,855 | |
| | Standard Life Aberdeen PLC | | | Capital Markets | | | | 1,281 | | | | 4,512 | |
| | Subsea 7 SA | | | Energy Equipment & Services | | | | 125 | | | | 1,293 | |
| | Tate & Lyle PLC | | | Food Products | | | | 250 | | | | 2,267 | |
| | Taylor Wimpey PLC | | | Household Durables | | | | 1,801 | | | | 3,584 | |
| | TechnipFMC PLC | | | Energy Equipment & Services | | | | 246 | | | | 5,903 | |
| | Tesco PLC | | | Food & Staples Retailing | | | | 5,182 | | | | 15,390 | |
| | The Berkeley Group Holdings PLC | | | Household Durables | | | | 62 | | | | 3,193 | |
| | The Sage Group PLC | | | Software | | | | 581 | | | | 4,950 | |
| | Travis Perkins PLC | | | Trading Companies & Distributors | | | | 142 | | | | 2,259 | |
| | Unilever NV, IDR | | | Personal Products | | | | 776 | | | | 46,657 | |
| | Unilever PLC | | | Personal Products | | | | 581 | | | | 35,011 | |
| | United Utilities Group PLC | | | Water Utilities | | | | 357 | | | | 3,633 | |
| | Vodafone Group PLC | | | Wireless Telecommunication Services | | | | 14,411 | | | | 28,769 | |
| | Weir Group PLC | | | Machinery | | | | 138 | | | | 2,424 | |
| | Whitbread PLC | | | Hotels, Restaurants & Leisure | | | | 70 | | | | 3,704 | |
| | William Morrison Supermarkets PLC | | | Food & Staples Retailing | | | | 1,240 | | | | 3,061 | |
| | WPP PLC | | | Media | | | | 651 | | | | 8,167 | |
| | | | | | | | | | | | | | |
| | | | |
| | | | | | | | | | | | | 1,251,708 | |
| | | | | | | | | | | | | | |
| | | | | | |
| | | |
| franklintempleton.com | | Semiannual Report | | | 203 | |
FRANKLIN TEMPLETON ETF TRUST
STATEMENT OF INVESTMENTS (UNAUDITED)
Franklin FTSE Europe Hedged ETF(continued)
| | | | | | | | | | | | | | |
| | | | |
| | | | | Industry | | | Shares | | | Value | |
| | | Common Stocks and Other Equity Interests (continued) | |
| | | United States 0.1% | | | | | | | | | |
| | Carnival PLC | | | Hotels, Restaurants & Leisure | | | | 85 | | | $ | 3,530 | |
| | | | | | | | | | | | | | |
| | Total Common Stocks and Other Equity Interests
(Cost $5,395,371) | | | | | | | | | | | 4,720,986 | |
| | | | | | | | | | | | | | |
| | | Preferred Stocks 0.8% | | | | | | | | | |
| | | Germany 0.8% | | | | | | | | | |
| d | | Bayerische Motoren Werke AG, 6.909%, pfd. | | | Automobiles | | | | 34 | | | | 1,889 | |
| d | | Fuchs Petrolub SE, 2.757%, pfd. | | | Chemicals | | | | 40 | | | | 1,503 | |
| d | | Henkel AG & Co. KGaA, 2.037%, pfd. | | | Household Products | | | | 93 | | | | 9,206 | |
| d | | Porsche Automobil Holding SE, 3.702%, pfd. | | | Automobiles | | | | 80 | | | | 5,207 | |
| d | | Sartorius AG, 0.370%, pfd. | | | Health Care Equipment & Supplies | | | | 19 | | | | 3,467 | |
| d | | Volkswagen AG, 3.114%, pfd. | | | Automobiles | | | | 97 | | | | 16,503 | |
| | | | | | | | | | | | | | |
| | Total Preferred Stocks (Cost $48,688) | | | | | | | | | | | 37,775 | |
| | | | | | | | | | | | | | |
| | | Short Term Investments (Cost $41,913) 0.8% | | | | | | | | | |
| | | United States 0.8% | | | | | | | | | |
| e,f | | Institutional Fiduciary Trust Portfolio, 1.71% | | | Money Market Funds | | | | 41,913 | | | | 41,913 | |
| | | | | | | | | | | | | | |
| | Total Investments (Cost $5,485,972) 98.9% | | | | | | | | | | | 4,800,674 | |
| | Other Assets, less Liabilities 1.1% | | | | | | | | | | | 51,945 | |
| | | | | | | | | | | | | | |
| | Net Assets 100.0% | | | | | | | | | | $ | 4,852,619 | |
| | | | | | | | | | | | | | |
See Abbreviations on page 322.
†Rounds to less than 0.1% of net assets.
aNon-income producing.
bSecurity was purchased pursuant to Regulation S under the Securities Act of 1933, which exempts from registration securities offered and sold outside of the United States. Such a security cannot be sold in the United States without either an effective registration statement filed pursuant to the Securities Act of 1933, or pursuant to an exemption from registration. These securities have been deemed liquid under guidelines approved by the Fund’s Board of Trustees. At September 30, 2019, the aggregate value of these securities was $19,725, representing 0.4% of net assets.
cSecurity was purchased pursuant to Rule 144A under the Securities Act of 1933 and may be sold in transactions exempt from registration only to qualified institutional buyers or in a public offering registered under the Securities Act of 1933. These securities have been deemed liquid under guidelines approved by the Fund’s Board of Trustees. At September 30, 2019, the aggregate value of these securities was $5,647, representing 0.1% of net assets.
dVariable rate security. The rate shown represents the yield at period end.
eSee Note 4(a) regarding investments in affiliated management investment companies.
fThe rate shown is the annualizedseven-day effective yield at period end.
At September 30, 2019 the Fund had the following forward exchange contracts outstanding. See Note 1(c).
| | | | | | | | | | | | | | | | | | | | | | | | | | | | |
| Forward Exchange Contracts | |
| | | | | | | |
| Currency | | Counterpartya | | | Type | | | Quantity | | | Contract
Amount | | | Settlement
Date | | | Unrealized
Appreciation | | | Unrealized
Depreciation | |
| OTC Forward Exchange Contracts | | | | | | | | | | | | | | | | | | | | | |
Danish Krone | | | BOFA | | | | Buy | | | | 902,885 | | | $ | 131,829 | | | | 10/02/19 | | | $ | 7 | | | $ | — | |
Danish Krone | | | BOFA | | | | Sell | | | | 902,885 | | | | 133,667 | | | | 10/02/19 | | | | 1,831 | | | | — | |
Euro | | | HSBK | | | | Buy | | | | 707,130 | | | | 770,899 | | | | 10/02/19 | | | | 14 | | | | — | |
Euro | | | UBSW | | | | Buy | | | | 707,130 | | | | 770,898 | | | | 10/02/19 | | | | 15 | | | | — | |
Euro | | | BOFA | | | | Buy | | | | 707,130 | | | | 770,890 | | | | 10/02/19 | | | | 22 | | | | — | |
Euro | | | BOFA | | | | Sell | | | | 707,130 | | | | 780,490 | | | | 10/02/19 | | | | 9,577 | | | | — | |
Euro | | | UBSW | | | | Sell | | | | 707,130 | | | | 780,486 | | | | 10/02/19 | | | | 9,573 | | | | — | |
Euro | | | HSBK | | | | Sell | | | | 707,130 | | | | 780,485 | | | | 10/02/19 | | | | 9,572 | | | | — | |
Great British Pound | | | BOFA | | | | Buy | | | | 1,019,640 | | | | 1,256,466 | | | | 10/02/19 | | | | 36 | | | | — | |
Great British Pound | | | BOFA | | | | Sell | | | | 1,019,640 | | | | 1,243,423 | | | | 10/02/19 | | | | — | | | | (13,078 | ) |
Norwegian Krone | | | BOFA | | | | Buy | | | | 483,385 | | | | 53,204 | | | | 10/02/19 | | | | — | | | | (3 | ) |
Norwegian Krone | | | BOFA | | | | Sell | | | | 483,385 | | | | 53,120 | | | | 10/02/19 | | | | — | | | | (81 | ) |
Polish Zloty | | | BOFA | | | | Buy | | | | 95,405 | | | | 23,795 | | | | 10/02/19 | | | | 2 | | | | — | |
Polish Zloty | | | BOFA | | | | Sell | | | | 95,405 | | | | 24,034 | | | | 10/02/19 | | | | 237 | | | | — | |
| | | | |
| | | |
| 204 | | Semiannual Report | | franklintempleton.com |
FRANKLIN TEMPLETON ETF TRUST
STATEMENT OF INVESTMENTS (UNAUDITED)
Franklin FTSE Europe Hedged ETF(continued)
| | | | | | | | | | | | | | | | | | | | | | | | | | | | |
| Forward Exchange Contracts(continued) | |
| | | | | | | |
| Currency | | Counterpartya | | | Type | | | Quantity | | | Contract
Amount | | | Settlement
Date | | | Unrealized
Appreciation | | | Unrealized
Depreciation | |
| OTC Forward Exchange Contracts(continued) | | | | | | | | | | | | | | | | |
Swedish Krona | | | BOFA | | | | Buy | | | | 1,874,170 | | | $ | 190,607 | | | | 10/02/19 | | | $ | 9 | | | $ | — | |
Swedish Krona | | | BOFA | | | | Sell | | | | 1,874,170 | | | | 191,480 | | | | 10/02/19 | | | | 864 | | | | — | |
Swiss Franc | | | MSCO | | | | Buy | | | | 699,970 | | | | 701,953 | | | | 10/02/19 | | | | 18 | | | | — | |
Swiss Franc | | | MSCO | | | | Sell | | | | 699,970 | | | | 709,315 | | | | 10/02/19 | | | | 7,345 | | | | — | |
Danish Krone | | | BOFA | | | | Sell | | | | 919,000 | | | | 134,536 | | | | 11/04/19 | | | | — | | | | (11 | ) |
Euro | | | HSBK | | | | Sell | | | | 740,333 | | | | 809,059 | | | | 11/04/19 | | | | — | | | | (44 | ) |
Euro | | | UBSW | | | | Sell | | | | 740,333 | | | | 809,057 | | | | 11/04/19 | | | | — | | | | (46 | ) |
Euro | | | BOFA | | | | Sell | | | | 740,333 | | | | 809,093 | | | | 11/04/19 | | | | — | | | | (10 | ) |
Great British Pound | | | BOFA | | | | Sell | | | | 1,052,100 | | | | 1,298,205 | | | | 11/04/19 | | | | — | | | | (23 | ) |
Norwegian Krone | | | BOFA | | | | Sell | | | | 496,600 | | | | 54,691 | | | | 11/04/19 | | | | 3 | | | | — | |
Polish Zloty | | | BOFA | | | | Sell | | | | 101,700 | | | | 25,376 | | | | 11/04/19 | | | | — | | | | (3 | ) |
Swedish Krona | | | BOFA | | | | Sell | | | | 1,960,800 | | | | 199,844 | | | | 11/04/19 | | | | — | | | | (13 | ) |
Swiss Franc | | | MSCO | | | | Sell | | | | 704,000 | | | | 707,966 | | | | 11/04/19 | | | | 30 | | | | — | |
| | | | | | | | | | | | | | | | | | | | | | | | |
Total Forward Exchange Contracts | | | $ | 39,155 | | | $ | (13,312 | ) |
| | | | | | | | | | | | | | | | | | | | | | | | |
Net unrealized appreciation (depreciation) | | | | | | | $ | 25,843 | |
| | | | | | | | | | | | | | | | | | | | | | | | | | | | |
aMay be comprised of multiple contracts with the same counterparty, currency and settlement date.
At September 30, 2019, the Fund had the following futures contracts outstanding. See Note 1(c).
| | | | | | | | | | | | | | | | | | | | |
| Futures Contracts | | | | | | | | | | | | | | | |
| | | | | |
| Description | | Type | | | Number of
Contracts | | | Notional
Amount* | | | Expiration
Date | | | Value/Unrealized
Appreciation
(Depreciation) | |
| Equity Contracts | | | | | | | | | | | | | | | |
EURO STOXX 50 Index | | | Long | | | | 2 | | | $ | 77,513 | | | | 12/20/19 | | | $ | 1,240 | |
*As of period end.
See Note 7 regarding other derivative information.
| | | | | | |
| | | |
| franklintempleton.com | | The accompanying notes are an integral part of these financial statements. | Semiannual Report | | | 205 | |
FRANKLIN TEMPLETON ETF TRUST
Financial Highlights
Franklin FTSE France ETF
| | | | | | | | | | | | |
| | | Six Months Ended
September 30, 2019
(unaudited) | | | Year Ended March 31, | |
| | | 2019 | | | 2018a | |
|
Per share operating performance
(for a share outstanding throughout the period) | |
| | | |
Net asset value, beginning of period | | $ | 23.86 | | | $ | 25.33 | | | $ | 25.32 | |
| | | | |
|
| Income from investment operationsb: | |
| | | |
Net investment incomec | | | 0.56 | | | | 0.70 | | | | 0.08 | |
| | | |
Net realized and unrealized gains (losses) | | | 0.75 | | | | (1.48 | ) | | | (0.01 | ) |
| | | | |
| | | |
Total from investment operations | | | 1.31 | | | | (0.78 | ) | | | 0.07 | |
| | | | |
| | | |
Less distributions from net investment income | | | (0.28 | ) | | | (0.69 | ) | | | (0.06 | ) |
| | | | |
| | | |
Net asset value, end of period | | $ | 24.89 | | | $ | 23.86 | | | $ | 25.33 | |
| | | | |
| | | |
Total returnd | | | 5.52% | | | | (3.07)% | | | | 0.26% | |
|
| Ratios to average net assetse | |
| | | |
Total expenses | | | 0.09% | | | | 0.09% | | | | 0.09% | |
| | | |
Net investment income | | | 4.60% | | | | 2.90% | | | | 0.78% | |
|
| Supplemental data | |
| | | |
Net assets, end of period (000’s) | | | $3,733 | | | | $2,386 | | | | $2,533 | |
| | | |
Portfolio turnover ratef | | | 1.50% | | | | 5.80% | | | | 1.90% | |
| | | |
| Portfolio turnover rate excluding portfolio transactions that are executed as a result of the Fund offering and redeeming Creation Units solely or in part for cashf,g | | | 1.50% | | | | —% | | | | —% | |
aFor the period November 2, 2017 (commencement of operations) to March 31, 2018.
bThe amount shown for a share outstanding throughout the period may not correlate with the Statement of Operations for the period due to the timing of sales and repurchases of Creation Unit Fund shares in relation to income earned and/or fluctuating fair value of the investments of the Fund.
cBased on average daily shares outstanding.
dTotal return is not annualized for periods less than one year. Total return is calculated assuming an initial investment made at the net asset value at the beginning of the period, reinvestment of all dividends and distributions at net asset value during the period, and redemption at net asset value on the last day of the period.
eRatios are annualized for periods less than one year.
fPortfolio turnover rate excludes the value of portfolio securities received or delivered as a result of processing capital share transactions in Creation Units, if any.
gEffective September 30, 2019.
| | | | |
| | | |
| 206 | | Semiannual Report | The accompanying notes are an integral part of these financial statements. | | franklintempleton.com |
FRANKLIN TEMPLETON ETF TRUST
Statement of Investments, September 30, 2019 (unaudited)
Franklin FTSE France ETF
| | | | | | | | | | | | | | |
| | | |
| | | Industry | | | Shares | | | Value | |
| | | Common Stocks 100.0% | |
| | | France 97.4% | |
| | Accor SA | | | Hotels, Restaurants & Leisure | | | | 462 | | | $ | 19,265 | |
| | Aeroports de Paris SA | | | Transportation Infrastructure | | | | 69 | | | | 12,277 | |
| a | | AirFrance-KLM | | | Airlines | | | | 471 | | | | 4,930 | |
| | Air Liquide SA | | | Chemicals | | | | 1,026 | | | | 146,082 | |
| | Airbus SE | | | Aerospace & Defense | | | | 1,341 | | | | 174,265 | |
| b | | ALD SA, 144A | | | Road & Rail | | | | 198 | | | | 2,828 | |
| | Alstom SA | | | Machinery | | | | 447 | | | | 18,533 | |
| | Amundi SA | | | Capital Markets | | | | 138 | | | | 9,629 | |
| | Arkema SA | | | Chemicals | | | | 174 | | | | 16,223 | |
| | Atos SE | | | IT Services | | | | 231 | | | | 16,289 | |
| | AXA SA | | | Insurance | | | | 4,680 | | | | 119,543 | |
| | Biomerieux | | | Health Care Equipment & Supplies | | | | 102 | | | | 8,440 | |
| | BNP Paribas SA | | | Banks | | | | 2,637 | | | | 128,420 | |
| | Bollore | | | Air Freight & Logistics | | | | 2,394 | | | | 9,923 | |
| | Bouygues SA | | | Construction & Engineering | | | | 507 | | | | 20,313 | |
| | Bureau Veritas SA | | | Professional Services | | | | 672 | | | | 16,191 | |
| | Capgemini SE | | | IT Services | | | | 378 | | | | 44,548 | |
| | Carrefour SA | | | Food & Staples Retailing | | | | 1,398 | | | | 24,477 | |
| | Casino Guichard-Perrachon SA | | | Food & Staples Retailing | | | | 132 | | | | 6,302 | |
| | Cie Generale des Etablissements Michelin SCA | | | Auto Components | | | | 429 | | | | 47,892 | |
| | CNP Assurances | | | Insurance | | | | 390 | | | | 7,538 | |
| | Compagnie de Saint-Gobain | | | Building Products | | | | 1,185 | | | | 46,508 | |
| | Covivio | | | Equity Real Estate Investment Trusts (REITs | ) | | | 114 | | | | 12,068 | |
| | Credit Agricole SA | | | Banks | | | | 2,799 | | | | 33,993 | |
| | Danone SA | | | Food Products | | | | 1,461 | | | | 128,729 | |
| | Dassault Aviation SA | | | Aerospace & Defense | | | | 6 | | | | 8,490 | |
| | Dassault Systemes | | | Software | | | | 321 | | | | 45,757 | |
| | Edenred | | | Commercial Services & Supplies | | | | 594 | | | | 28,513 | |
| | EDF SA | | | Electric Utilities | | | | 1,226 | | | | 13,727 | |
| | Eiffage SA | | | Construction & Engineering | | | | 180 | | | | 18,666 | |
| | Elis SA | | | Commercial Services & Supplies | | | | 459 | | | | 8,117 | |
| | Engie SA | | | Multi-Utilities | | | | 4,038 | | | | 65,945 | |
| | EssilorLuxottica SA | | | Textiles, Apparel & Luxury Goods | | | | 717 | | | | 103,376 | |
| | Eurazeo SE | | | Diversified Financial Services | | | | 114 | | | | 8,482 | |
| | Eutelsat Communications SA | | | Media | | | | 450 | | | | 8,377 | |
| | Faurecia SE | | | Auto Components | | | | 180 | | | | 8,540 | |
| | Gecina SA | | | Equity Real Estate Investment Trusts (REITs | ) | | | 126 | | | | 19,808 | |
| | Getlink SE | | | Transportation Infrastructure | | | | 1,104 | | | | 16,585 | |
| | Hermes International | | | Textiles, Apparel & Luxury Goods | | | | 75 | | | | 51,839 | |
| | ICADE | | | Equity Real Estate Investment Trusts (REITs | ) | | | 78 | | | | 6,977 | |
| | Iliad SA | | | Diversified Telecommunication Services | | | | 57 | | | | 5,358 | |
| | Imerys SA | | | Construction Materials | | | | 90 | | | | 3,619 | |
| | Ingenico Group SA | | | Electronic Equipment, Instruments & Components | | | | 150 | | | | 14,636 | |
| | Ipsen SA | | | Pharmaceuticals | | | | 84 | | | | 7,976 | |
| | JCDecaux SA | | | Media | | | | 177 | | | | 4,793 | |
| | Kering SA | | | Textiles, Apparel & Luxury Goods | | | | 180 | | | | 91,750 | |
| | Klepierre SA | | | Equity Real Estate Investment Trusts (REITs | ) | | | 465 | | | | 15,796 | |
| | L’Oreal SA | | | Personal Products | | | | 588 | | | | 164,683 | |
| | Lagardere SCA | | | Media | | | | 282 | | | | 6,241 | |
| | Legrand SA | | | Electrical Equipment | | | | 651 | | | | 46,472 | |
| | LVMH Moet Hennessy Louis Vuitton SE | | | Textiles, Apparel & Luxury Goods | | | | 606 | | | | 240,910 | |
| | Natixis SA | | | Capital Markets | | | | 2,046 | | | | 8,487 | |
| | Orange SA | | | Diversified Telecommunication Services | | | | 4,668 | | | | 73,257 | |
| | Orpea | | | Health Care Providers & Services | | | | 108 | | | | 13,199 | |
| | Pernod Ricard SA | | | Beverages | | | | 516 | | | | 91,920 | |
| | Peugeot SA | | | Automobiles | | | | 1,326 | | | | 33,075 | |
| | Plastic Omnium SA | | | Auto Components | | | | 135 | | | | 3,703 | |
| | Publicis Groupe | | | Media | | | | 525 | | | | 25,825 | |
| | Remy Cointreau SA | | | Beverages | | | | 60 | | | | 7,967 | |
| | | | | | |
| | | |
| franklintempleton.com | | Semiannual Report | | | 207 | |
FRANKLIN TEMPLETON ETF TRUST
STATEMENT OF INVESTMENTS (UNAUDITED)
Franklin FTSE France ETF(continued)
| | | | | | | | | | | | | | |
| | | |
| | | Industry | | | Shares | | | Value | |
| | | Common Stocks (continued) | |
| | | France (continued) | |
| | Renault SA | | | Automobiles | | | | 447 | | | $ | 25,662 | |
| | Rexel SA | | | Trading Companies & Distributors | | | | 735 | | | | 7,867 | |
| | Rubis SCA | | | Gas Utilities | | | | 222 | | | | 12,900 | |
| | Safran SA | | | Aerospace & Defense | | | | 804 | | | | 126,613 | |
| | Sanofi | | | Pharmaceuticals | | | | 2,643 | | | | 245,092 | |
| | Sartorius Stedim Biotech | | | Life Sciences Tools & Services | | | | 60 | | | | 8,399 | |
| | Schneider Electric SE | | | Electrical Equipment | | | | 1,281 | | | | 112,422 | |
| | SCOR SE | | | Insurance | | | | 381 | | | | 15,738 | |
| | SEB SA | | | Household Durables | | | | 66 | | | | 10,023 | |
| | Societe BIC SA | | | Commercial Services & Supplies | | | | 63 | | | | 4,231 | |
| | Societe Generale SA | | | Banks | | | | 1,875 | | | | 51,389 | |
| | Sodexo SA | | | Hotels, Restaurants & Leisure | | | | 213 | | | | 23,918 | |
| | Suez | | | Multi-Utilities | | | | 894 | | | | 14,059 | |
| | Teleperformance | | | Professional Services | | | | 141 | | | | 30,575 | |
| | Thales SA | | | Aerospace & Defense | | | | 243 | | | | 27,949 | |
| | Total SA | | | Oil, Gas & Consumable Fuels | | | | 5,886 | | | | 307,274 | |
| a | | UbiSoft Entertainment SA | | | Entertainment | | | | 210 | | | | 15,188 | |
| | Valeo SA | | | Auto Components | | | | 579 | | | | 18,779 | |
| | Veolia Environnement SA | | | Multi-Utilities | | | | 1,224 | | | | 31,038 | |
| | Vinci SA | | | Construction & Engineering | | | | 1,134 | | | | 122,170 | |
| | Vivendi SA | | | Entertainment | | | | 1,971 | | | | 54,106 | |
| | Wendel SA | | | Diversified Financial Services | | | | 66 | | | | 9,109 | |
| a,c | | Worldline SA, Reg S | | | IT Services | | | | 204 | | | | 12,877 | |
| | | | | | | | | | | | | | |
| | | | |
| | | | | | | | | | | | | 3,635,450 | |
| | | | | | | | | | | | | | |
| | | Luxembourg 0.8% | |
| | Eurofins Scientific SE | | | Life Sciences Tools & Services | | | | 27 | | | | 12,551 | |
| | SES SA, IDR | | | Media | | | | 858 | | | | 15,645 | |
| | | | | | | | | | | | | | |
| | | | |
| | | | | | | | | | | | | 28,196 | |
| | | | | | | | | | | | | | |
| | | Netherlands 0.3% | |
| c | | Euronext NV, Reg S | | | Capital Markets | | | | 150 | | | | 12,273 | |
| | | | | | | | | | | | | | |
| | | Switzerland 0.8% | |
| | STMicroelectronics NV | | | Semiconductors & Semiconductor Equipment | | | | 1,539 | | | | 29,748 | |
| | | | | | | | | | | | | | |
| | | United Kingdom 0.7% | |
| | TechnipFMC PLC | | | Energy Equipment & Services | | | | 1,116 | | | | 26,779 | |
| | | | | | | | | | | | | | |
| | Total Investments
(Cost $3,756,365) 100.0% | | | | | | | | | | | 3,732,446 | |
| | Other Assets, less Liabilities 0.0%† | | | | | | | | | | | 565 | |
| | | | | | | | | | | | | | |
| | Net Assets 100.0% | | | | | | | | | | $ | 3,733,011 | |
| | | | | | | | | | | | | | |
See Abbreviations on page 322.
†Rounds to less than 0.1% of net assets.
aNon-income producing.
bSecurity was purchased pursuant to Rule 144A under the Securities Act of 1933 and may be sold in transactions exempt from registration only to qualified institutional buyers or in a public offering registered under the Securities Act of 1933. This security has been deemed liquid under guidelines approved by the Trust’s Board of Trustees. At September 30, 2019, the value of this security was $2,828, representing 0.1% of net assets.
cSecurity was purchased pursuant to Regulation S under the Securities Act of 1933, which exempts from registration securities offered and sold outside of the United States. Such a security cannot be sold in the United States without either an effective registration statement filed pursuant to the Securities Act of 1933, or pursuant to an exemption from registration. These securities have been deemed liquid under guidelines approved by the Fund’s Board of Trustees. At September 30, 2019, the aggregate value of these securities was $25,150, representing 0.7% of net assets.
| | | | |
| | | |
| 208 | | Semiannual Report | The accompanying notes are an integral part of these financial statements. | | franklintempleton.com |
FRANKLIN TEMPLETON ETF TRUST
Financial Highlights
Franklin FTSE Germany ETF
| | | | | | | | | | | | |
| | | Six Months Ended
September 30, 2019
(unaudited) | | | Year Ended March 31, | |
| | | 2019 | | | 2018a | |
| | | |
Per share operating performance
(for a share outstanding throughout the period) | | | | | | | | | | | | |
| | | |
Net asset value, beginning of period | | $ | 20.70 | | | $ | 24.60 | | | $ | 25.55 | |
| | | | |
| | | |
| Income from investment operationsb: | | | | | | | | | | | | |
| | | |
Net investment incomec | | | 0.48 | | | | 0.53 | | | | 0.05 | |
| | | |
Net realized and unrealized gains (losses) | | | 0.22 | | | | (3.83 | ) | | | (1.00 | ) |
| | | | |
| | | |
Total from investment operations | | | 0.70 | | | | (3.30 | ) | | | (0.95 | ) |
| | | | |
| | | |
Less distributions from net investment income | | | (0.48 | ) | | | (0.60 | ) | | | — | |
| | | | |
| | | |
Net asset value, end of period | | $ | 20.92 | | | $ | 20.70 | | | $ | 24.60 | |
| | | | |
| | | |
Total returnd | | | 3.35% | | | | (13.72)% | | | | (3.72)% | |
| | | |
| Ratios to average net assetse | | | | | | | | | | | | |
| | | |
Total expenses | | | 0.09% | | | | 0.09% | | | | 0.09% | |
| | | |
Net investment income | | | 4.54% | | | | 2.44% | | | | 0.52% | |
|
| Supplemental data | |
| | | |
Net assets, end of period (000’s) | | | $4,185 | | | | $4,140 | | | | $2,460 | |
| | | |
Portfolio turnover ratef | | | 3.30% | | | | 10.75% | | | | 1.75% | |
| | | |
| Portfolio turnover rate excluding portfolio transactions that are executed as a result of the Fund offering and redeeming Creation Units solely or in part for cashf,g | | | 3.30% | | | | —% | | | | —% | |
aFor the period November 2, 2017 (commencement of operations) to March 31, 2018.
bThe amount shown for a share outstanding throughout the period may not correlate with the Statement of Operations for the period due to the timing of sales and repurchases of Creation Unit Fund shares in relation to income earned and/or fluctuating fair value of the investments of the Fund.
cBased on average daily shares outstanding.
dTotal return is not annualized for periods less than one year. Total return is calculated assuming an initial investment made at the net asset value at the beginning of the period, reinvestment of all dividends and distributions at net asset value during the period, and redemption at net asset value on the last day of the period.
eRatios are annualized for periods less than one year.
fPortfolio turnover rate excludes the value of portfolio securities received or delivered as a result of processing capital share transactions in Creation Units, if any.
gEffective September 30, 2019.
| | | | | | |
| | | |
| franklintempleton.com | | The accompanying notes are an integral part of these financial statements. | Semiannual Report | | | 209 | |
FRANKLIN TEMPLETON ETF TRUST
Statement of Investments, September 30, 2019 (unaudited)
Franklin FTSE Germany ETF
| | | | | | | | | | | | | | |
| | | |
| | | Industry | | | Shares | | | Value | |
| | | Common Stocks 94.2% | |
| | | Germany 93.5% | |
| | 1&1 Drillisch AG | | | Wireless Telecommunication Services | | | | 160 | | | $ | 4,989 | |
| | Adidas AG | | | Textiles, Apparel & Luxury Goods | | | | 672 | | | | 209,271 | |
| | Allianz SE | | | Insurance | | | | 1,452 | | | | 338,518 | |
| | Aroundtown SA | | | Real Estate Management & Development | | | | 3,032 | | | | 24,804 | |
| | Axel Springer SE | | | Media | | | | 152 | | | | 10,489 | |
| | BASF SE | | | Chemicals | | | | 3,144 | | | | 219,777 | |
| | Bayer AG | | | Pharmaceuticals | | | | 3,204 | | | | 225,962 | |
| | Bayerische Motoren Werke AG | | | Automobiles | | | | 1,100 | | | | 77,458 | |
| | Beiersdorf AG | | | Personal Products | | | | 344 | | | | 40,578 | |
| | Brenntag AG | | | Trading Companies & Distributors | | | | 532 | | | | 25,751 | |
| | Carl Zeiss Meditec AG | | | Health Care Equipment & Supplies | | | | 128 | | | | 14,596 | |
| | Commerzbank AG | | | Banks | | | | 3,576 | | | | 20,748 | |
| | Continental AG | | | Auto Components | | | | 372 | | | | 47,734 | |
| | Covestro AG | | | Chemicals | | | | 588 | | | | 29,103 | |
| | Daimler AG | | | Automobiles | | | | 2,948 | | | | 146,619 | |
| a | | Delivery Hero SE | | | Internet & Direct Marketing Retail | | | | 376 | | | | 16,708 | |
| | Deutsche Bank AG | | | Capital Markets | | | | 7,012 | | | | 52,525 | |
| | Deutsche Boerse AG | | | Capital Markets | | | | 628 | | | | 98,178 | |
| | Deutsche Lufthansa AG | | | Airlines | | | | 812 | | | | 12,907 | |
| | Deutsche Post AG | | | Air Freight & Logistics | | | | 3,352 | | | | 111,988 | |
| | Deutsche Telekom AG | | | Diversified Telecommunication Services | | | | 11,092 | | | | 186,152 | |
| | Deutsche Wohnen AG | | | Real Estate Management & Development | | | | 1,224 | | | | 44,689 | |
| b | | DWS Group GmbH & Co. KGaA, 144A | | | Capital Markets | | | | 120 | | | | 3,548 | |
| | E.ON SE | | | Multi-Utilities | | | | 7,436 | | | | 72,304 | |
| | Evonik Industries AG | | | Chemicals | | | | 572 | | | | 14,124 | |
| | Fielmann AG | | | Specialty Retail | | | | 84 | | | | 6,186 | |
| | Fraport AG Frankfurt Airport Services Worldwide | | | Transportation Infrastructure | | | | 124 | | | | 10,520 | |
| | Fresenius Medical Care AG & Co. KGaA | | | Health Care Providers & Services | | | | 720 | | | | 48,431 | |
| | Fresenius SE and Co. KGaA | | | Health Care Providers & Services | | | | 1,396 | | | | 65,283 | |
| | Fuchs Petrolub SE | | | Chemicals | | | | 120 | | | | 4,363 | |
| | GEA Group AG | | | Machinery | | | | 576 | | | | 15,554 | |
| | Grenkeleasing AG | | | Consumer Finance | | | | 88 | | | | 7,253 | |
| | Hannover Rueck SE | | | Insurance | | | | 204 | | | | 34,494 | |
| | Hapag-Lloyd AG | | | Marine | | | | 92 | | | | 6,620 | |
| | HeidelbergCement AG | | | Construction Materials | | | | 512 | | | | 37,019 | |
| | Hella GmbH & Co. KGaA | | | Auto Components | | | | 156 | | | | 6,976 | |
| | Henkel AG & Co. KGaA | | | Household Products | | | | 348 | | | | 31,869 | |
| | Hochtief AG | | | Construction & Engineering | | | | 68 | | | | 7,754 | |
| | Hugo Boss AG | | | Textiles, Apparel & Luxury Goods | | | | 212 | | | | 11,360 | |
| | Infineon Technologies AG | | | Semiconductors & Semiconductor Equipment | | | | 4,276 | | | | 76,974 | |
| | K+S AG | | | Chemicals | | | | 656 | | | | 9,093 | |
| | KION Group AG | | | Machinery | | | | 244 | | | | 12,835 | |
| | Knorr-Bremse AG | | | Machinery | | | | 164 | | | | 15,419 | |
| | Lanxess AG | | | Chemicals | | | | 284 | | | | 17,339 | |
| | LEG Immobilien AG | | | Real Estate Management & Development | | | | 220 | | | | 25,184 | |
| | Merck KGaA | | | Pharmaceuticals | | | | 444 | | | | 50,026 | |
| | METRO AG | | | Food & Staples Retailing | | | | 576 | | | | 9,093 | |
| | MTU Aero Engines AG | | | Aerospace & Defense | | | | 176 | | | | 46,779 | |
| | Muenchener Rueckversicherungs-Gesellschaft Aktiengesellschaft in Muenchen | | | Insurance | | | | 496 | | | | 128,372 | |
| | Nemetschek AG | | | Software | | | | 188 | | | | 9,596 | |
| | Osram Licht AG | | | Electrical Equipment | | | | 300 | | | | 13,197 | |
| | ProSiebenSat.1 Media SE | | | Media | | | | 700 | | | | 9,646 | |
| | Puma SE | | | Textiles, Apparel & Luxury Goods | | | | 284 | | | | 21,983 | |
| | Rational AG | | | Machinery | | | | 12 | | | | 8,608 | |
| | Rheinmetall AG | | | Industrial Conglomerates | | | | 148 | | | | 18,725 | |
| a,b | | Rocket Internet SE, 144A | | | Internet & Direct Marketing Retail | | | | 220 | | | | 5,684 | |
| | | | |
| | | |
| 210 | | Semiannual Report | | franklintempleton.com |
FRANKLIN TEMPLETON ETF TRUST
STATEMENT OF INVESTMENTS (UNAUDITED)
Franklin FTSE Germany ETF(continued)
| | | | | | | | | | | | | | |
| | | |
| | | Industry | | | Shares | | | Value | |
| | | Common Stocks (continued) | |
| | | Germany (continued) | |
| | RWE AG | | | Multi-Utilities | | | | 1,964 | | | $ | 61,430 | |
| | SAP SE | | | Software | | | | 3,328 | | | | 391,409 | |
| c | | Scout24 AG, Reg S | | | Interactive Media & Services | | | | 368 | | | | 20,982 | |
| | Siemens AG | | | Industrial Conglomerates | | | | 2,600 | | | | 278,492 | |
| | Siemens Healthineers AG | | | Health Care Equipment & Supplies | | | | 452 | | | | 17,787 | |
| | Suedzucker AG | | | Food Products | | | | 268 | | | | 4,123 | |
| | Symrise AG | | | Chemicals | | | | 432 | | | | 41,991 | |
| a | | Talanx AG | | | Insurance | | | | 132 | | | | 5,704 | |
| | Telefonica Deutschland Holding AG | | | Diversified Telecommunication Services | | | | 2,308 | | | | 6,436 | |
| | thyssenkrupp AG | | | Metals & Mining | | | | 1,592 | | | | 22,051 | |
| | Uniper SE | | | Independent Power and Renewable Electricity Producers | | | | 672 | | | | 22,044 | |
| | United Internet AG | | | Diversified Telecommunication Services | | | | 396 | | | | 14,130 | |
| | Volkswagen AG | | | Automobiles | | | | 112 | | | | 19,256 | |
| | Vonovia SE | | | Real Estate Management & Development | | | | 1,864 | | | | 94,596 | |
| | Wacker Chemie AG | | | Chemicals | | | | 52 | | | | 3,418 | |
| | Wirecard AG | | | IT Services | | | | 392 | | | | 62,715 | |
| a,b | | Zalando SE, 144A | | | Internet & Direct Marketing Retail | | | | 512 | | | | 23,377 | |
| | | | | | | | | | | | | | |
| | | | |
| | | | | | | | | | | | | 3,911,696 | |
| | | | | | | | | | | | | | |
| | | Luxembourg 0.1% | |
| | RTL Group SA | | | Media | | | | 132 | | | | 6,349 | |
| | | | | | | | | | | | | | |
| | | Netherlands 0.6% | |
| a | | QIAGEN NV | | | Life Sciences Tools & Services | | | | 756 | | | | 24,759 | |
| | | | | | | | | | | | | | |
| | Total Common Stocks
(Cost $4,359,835) | | | | | | | | | | | 3,942,804 | |
| | | | | | | | | | | | | | |
| | | Preferred Stocks 5.8% | |
| | | Germany 5.8% | |
| d | | Bayerische Motoren Werke AG, 6.909%, pfd. | | | Automobiles | | | | 196 | | | | 10,887 | |
| d | | Fuchs Petrolub SE, 2.757%, pfd. | | | Chemicals | | | | 236 | | | | 8,866 | |
| d | | Henkel AG & Co. KGaA, 2.037%, pfd. | | | Household Products | | | | 600 | | | | 59,394 | |
| d | | Porsche Automobil Holding SE, 3.702%, pfd. | | | Automobiles | | | | 524 | | | | 34,104 | |
| d | | Sartorius AG, 0.370%, pfd. | | | Health Care Equipment & Supplies | | | | 116 | | | | 21,170 | |
| d | | Volkswagen AG, 3.114%, pfd. | | | Automobiles | | | | 628 | | | | 106,846 | |
| | | | | | | | | | | | | | |
| | Total Preferred Stocks (Cost $269,116) | | | | | | | | | | | 241,267 | |
| | | | | | | | | | | | | | |
| | Total Investments (Cost $4,628,951) 100.0% | | | | | | | | | | | 4,184,071 | |
| | Other Assets, less Liabilities 0.0%† | | | | | | | | | | | 477 | |
| | | | | | | | | | | | | | |
| | Net Assets 100.0% | | | | | | | | | | $ | 4,184,548 | |
| | | | | | | | | | | | | | |
See Abbreviations on page 322.
†Rounds to less than 0.1% of net assets.
aNon-income producing.
bSecurity was purchased pursuant to Rule 144A under the Securities Act of 1933 and may be sold in transactions exempt from registration only to qualified institutional buyers or in a public offering registered under the Securities Act of 1933. These securities have been deemed liquid under guidelines approved by the Fund’s Board of Trustees. At September 30, 2019, the aggregate value of these securities was $32,609, representing 0.8% of net assets.
cSecurity was purchased pursuant to Regulation S under the Securities Act of 1933, which exempts from registration securities offered and sold outside of the United States. Such a security cannot be sold in the United States without either an effective registration statement filed pursuant to the Securities Act of 1933, or pursuant to an exemption from registration. This security has been deemed liquid under guidelines approved by the Fund’s Board of Trustees. At September 30, 2019, the value of this security was $20,982, representing 0.5% of net assets.
dVariable rate security. The rate shown represents the yield at period end.
| | | | | | |
| | | |
| franklintempleton.com | | The accompanying notes are an integral part of these financial statements. | Semiannual Report | | | 211 | |
FRANKLIN TEMPLETON ETF TRUST
Financial Highlights
Franklin FTSE Hong Kong ETF
| | | | | | | | | | | | |
| | | Six Months Ended
September 30, 2019
(unaudited) | | | Year Ended March 31, | |
| | | 2019 | | | 2018a | |
| | | |
Per share operating performance
(for a share outstanding throughout the period) | | | | | | | | | | | | |
| | | |
Net asset value, beginning of period | | $ | 26.82 | | | $ | 26.17 | | | $ | 25.30 | |
| | | | |
| | | |
| Income from investment operationsb: | | | | | | | | | | | | |
| | | |
Net investment incomec | | | 0.56 | | | | 0.66 | | | | 0.16 | |
| | | |
Net realized and unrealized gains (losses) | | | (3.38 | ) | | | 0.59 | | | | 0.78 | |
| | | | |
| | | |
Total from investment operations | | | (2.82 | ) | | | 1.25 | | | | 0.94 | |
| | | | |
| | | |
Less distributions from net investment income | | | (0.35 | ) | | | (0.60 | ) | | | (0.07 | ) |
| | | | |
| | | |
Net asset value, end of period | | $ | 23.65 | | | $ | 26.82 | | | $ | 26.17 | |
| | | | |
| | | |
Total returnd | | | (10.63)% | | | | 4.97% | | | | 3.70% | |
| | | |
| Ratios to average net assetse | | | | | | | | | | | | |
| | | |
Total expenses | | | 0.09% | | | | 0.09% | | | | 0.09% | |
| | | |
Net investment income | | | 4.31% | | | | 2.67% | | | | 1.49% | |
| | | |
| Supplemental data | | | | | | | | | | | | |
| | | |
Net assets, end of period (000’s) | | | $17,738 | | | | $20,118 | | | | $7,852 | |
| | | |
Portfolio turnover ratef | | | 2.61% | | | | 5.33% | | | | 0.93% | |
| | | |
Portfolio turnover rate excluding portfolio transactions that are executed as a result of the Fund offering and redeeming Creation Units solely or in part for cashf,g | | | 2.61% | | | | —% | | | | —% | |
aFor the period November 2, 2017 (commencement of operations) to March 31, 2018.
bThe amount shown for a share outstanding throughout the period may not correlate with the Statement of Operations for the period due to the timing of sales and repurchases of Creation Unit Fund shares in relation to income earned and/or fluctuating fair value of the investments of the Fund.
cBased on average daily shares outstanding.
dTotal return is not annualized for periods less than one year. Total return is calculated assuming an initial investment made at the net asset value at the beginning of the period, reinvestment of all dividends and distributions at net asset value during the period, and redemption at net asset value on the last day of the period.
eRatios are annualized for periods less than one year.
fPortfolio turnover rate excludes the value of portfolio securities received or delivered as a result of processing capital share transactions in Creation Units, if any.
gEffective September 30, 2019.
| | | | |
| | | |
| 212 | | Semiannual Report | The accompanying notes are an integral part of these financial statements. | | franklintempleton.com |
FRANKLIN TEMPLETON ETF TRUST
Statement of Investments, September 30, 2019 (unaudited)
Franklin FTSE Hong Kong ETF
| | | | | | | | | | | | | | |
| | | | |
| | | | | Industry | | | Shares | | | Value | |
| | | | | | | | | | | | | | |
| | | Common Stocks 99.6% | | | | | | | | | |
| | | Cambodia 0.4% | | | | | | | | | |
| | NagaCorp Ltd. | | | Hotels, Restaurants & Leisure | | | | 50,000 | | | $ | 78,195 | |
| | | | | | | | | | | | | | |
| | | China 10.4% | | | | | | | | | |
| | AAC Technologies Holdings Inc. | | | Electronic Equipment, Instruments & Components | | | | 22,500 | | | | 119,110 | |
| | China Mengniu Dairy Co. Ltd. | | | Food Products | | | | 90,000 | | | | 336,952 | |
| | China Travel International Investment Hong Kong Ltd. | | | Hotels, Restaurants & Leisure | | | | 80,000 | | | | 12,450 | |
| | Dairy Farm International Holdings Ltd. | | | Food & Staples Retailing | | | | 10,000 | | | | 63,000 | |
| a | | FIH Mobile Ltd. | | | Electronic Equipment, Instruments & Components | | | | 100,000 | | | | 12,246 | |
| | Guotai Junan International holdings Ltd. | | | Capital Markets | | | | 105,000 | | | | 17,814 | |
| | Kerry Logistics Network Ltd. | | | Air Freight & Logistics | | | | 20,000 | | | | 31,992 | |
| | Lenovo Group Ltd. | | | Technology Hardware, Storage & Peripherals | | | | 250,000 | | | | 166,786 | |
| | MGM China Holdings Ltd. | | | Hotels, Restaurants & Leisure | | | | 26,000 | | | | 40,529 | |
| | Minth Group Ltd. | | | Auto Components | | | | 23,050 | | | | 78,064 | |
| a | | MMG Ltd. | | | Metals & Mining | | | | 80,000 | | | | 18,879 | |
| | Nexteer Automotive Group Ltd. | | | Auto Components | | | | 30,000 | | | | 24,760 | |
| | Sands China Ltd. | | | Hotels, Restaurants & Leisure | | | | 82,000 | | | | 371,329 | |
| a | | Semiconductor Manufacturing International Corp. | | | Semiconductors & Semiconductor Equipment | | | | 102,500 | | | | 128,135 | |
| | Shougang Fushan Resources Group Ltd. | | | Metals & Mining | | | | 120,000 | | | | 24,798 | |
| | Shui On Land Ltd. | | | Real Estate Management & Development | | | | 115,000 | | | | 22,884 | |
| | Tingyi Cayman Islands Holding Corp. | | | Food Products | | | | 64,000 | | | | 90,129 | |
| | Towngas China Co. Ltd. | | | Gas Utilities | | | | 35,000 | | | | 26,252 | |
| | Uni-President China Holdings Ltd. | | | Food Products | | | | 40,000 | | | | 43,167 | |
| | Want Want China Holdings Ltd. | | | Food Products | | | | 185,000 | | | | 147,964 | |
| | Xinyi Solar Holdings Ltd. | | | Semiconductors & Semiconductor Equipment | | | | 120,000 | | | | 71,944 | |
| | | | | | | | | | | | | | |
| | | | |
| | | | | | | | | | | | | 1,849,184 | |
| | | | | | | | | | | | | | |
| | | Hong Kong 84.3% | | | | | | | | | |
| | AIA Group Ltd. | | | Insurance | | | | 364,000 | | | | 3,438,299 | |
| | ASM Pacific Technology Ltd. | | | Semiconductors & Semiconductor Equipment | | | | 10,500 | | | | 128,179 | |
| | BOC Hong Kong (Holdings) Ltd. | | | Banks | | | | 122,500 | | | | 415,657 | |
| | Cafe de Coral Holdings Ltd. | | | Hotels, Restaurants & Leisure | | | | 10,000 | | | | 26,788 | |
| | Cathay Pacific Airways Ltd. | | | Airlines | | | | 20,000 | | | | 25,002 | |
| | Champion REIT | | | Equity Real Estate Investment Trusts (REITs | ) | | | 65,000 | | | | 42,038 | |
| | Chow Tai Fook Jewellery Co. Ltd. | | | Specialty Retail | | | | 37,000 | | | | 30,537 | |
| | CK Asset Holdings Ltd. | | | Real Estate Management & Development | | | | 91,500 | | | | 619,773 | |
| | CK Hutchison Holdings Ltd. | | | Industrial Conglomerates | | | | 91,000 | | | | 803,276 | |
| | CK Infrastructure Holdings Ltd. | | | Electric Utilities | | | | 21,000 | | | | 141,305 | |
| | CLP Holdings Ltd. | | | Electric Utilities | | | | 55,500 | | | | 583,007 | |
| | Dah Sing Banking Group Ltd. | | | Banks | | | | 12,000 | | | | 16,134 | |
| | Dah Sing Financial Group | | | Banks | | | | 4,000 | | | | 14,797 | |
| | First Pacific Co. Ltd. | | | Diversified Financial Services | | | | 80,000 | | | | 30,615 | |
| | Haitong International Securities Group Ltd. | | | Capital Markets | | | | 85,000 | | | | 24,071 | |
| | Hang Lung Group Ltd. | | | Real Estate Management & Development | | | | 30,000 | | | | 74,700 | |
| | Hang Lung Properties Ltd. | | | Real Estate Management & Development | | | | 70,000 | | | | 158,941 | |
| | Hang Seng Bank Ltd. | | | Banks | | | | 24,500 | | | | 528,165 | |
| | Henderson Land Development Co. Ltd. | | | Real Estate Management & Development | | | | 44,000 | | | | 204,863 | |
| | Hong Kong and China Gas Co. Ltd. | | | Gas Utilities | | | | 335,000 | | | | 652,958 | |
| | Hong Kong Exchanges and Clearing Ltd. | | | Capital Markets | | | | 42,500 | | | | 1,246,907 | |
| | Hongkong Land Holdings Ltd. | | | Real Estate Management & Development | | | | 39,000 | | | | 219,180 | |
| | Huabao International Holdings Ltd. | | | Chemicals | | | | 30,000 | | | | 10,983 | |
| | Hutchison Telecommunications Hong Kong Holdings Ltd. | | | Wireless Telecommunication Services | | | | 40,000 | | | | 6,735 | |
| | Hysan Development Co. Ltd. | | | Real Estate Management & Development | | | | 20,000 | | | | 80,618 | |
| | Jardine Matheson Holdings Ltd. | | | Industrial Conglomerates | | | | 7,200 | | | | 385,200 | |
| | Jardine Strategic Holdings Ltd. | | | Industrial Conglomerates | | | | 6,100 | | | | 182,268 | |
| | Johnson Electric Holdings Ltd. | | | Electrical Equipment | | | | 12,500 | | | | 22,387 | |
| | Kerry Properties Ltd. | | | Real Estate Management & Development | | | | 20,000 | | | | 61,612 | |
| | Li & Fung Ltd. | | | Textiles, Apparel & Luxury Goods | | | | 190,000 | | | | 21,571 | |
| | Lifestyle International Holdings Ltd. | | | Multiline Retail | | | | 15,000 | | | | 15,633 | |
| | | | | | |
| | | |
| franklintempleton.com | | Semiannual Report | | | 213 | |
FRANKLIN TEMPLETON ETF TRUST
STATEMENT OF INVESTMENTS (UNAUDITED)
Franklin FTSE Hong Kong ETF(continued)
| | | | | | | | | | | | | | |
| | | | |
| | | | | Industry | | | Shares | | | Value | |
| | | Common Stocks (continued) | | | | | | | | | |
| | | Hong Kong (continued) | | | | | | | | | |
| | Link REIT | | | Equity Real Estate Investment Trusts (REITs | ) | | | 71,500 | | | $ | 788,476 | |
| | Melco International Development Ltd. | | | Hotels, Restaurants & Leisure | | | | 25,000 | | | | 59,443 | |
| | MTR Corp. Ltd. | | | Road & Rail | | | | 47,500 | | | | 266,602 | |
| | New World Development Co. Ltd. | | | Real Estate Management & Development | | | | 195,000 | | | | 253,221 | |
| | NWS Holdings Ltd. | | | Industrial Conglomerates | | | | 50,000 | | | | 77,429 | |
| | PCCW Ltd. | | | Diversified Telecommunication Services | | | | 145,000 | | | | 81,384 | |
| | Power Assets Holdings Ltd. | | | Electric Utilities | | | | 46,500 | | | | 312,298 | |
| | Sa Sa International Holdings Ltd. | | | Specialty Retail | | | | 40,000 | | | | 8,878 | |
| | Samsonite International SA | | | Textiles, Apparel & Luxury Goods | | | | 43,500 | | | | 92,112 | |
| | Shangri-La Asia Ltd. | | | Hotels, Restaurants & Leisure | | | | 40,000 | | | | 40,819 | |
| | Shun Tak Holdings Ltd. | | | Industrial Conglomerates | | | | 60,000 | | | | 23,879 | |
| | Sino Land Co. Ltd. | | | Real Estate Management & Development | | | | 110,000 | | | | 165,293 | |
| | Sun Art Retail Group Ltd. | | | Food & Staples Retailing | | | | 75,000 | | | | 76,154 | |
| | Sun Hung Kai Properties Ltd. | | | Real Estate Management & Development | | | | 48,000 | | | | 690,665 | |
| | Swire Pacific Ltd., A | | | Real Estate Management & Development | | | | 17,500 | | | | 162,847 | |
| | Swire Pacific Ltd., B | | | Real Estate Management & Development | | | | 30,000 | | | | 43,855 | |
| | Swire Properties Ltd. | | | Real Estate Management & Development | | | | 36,000 | | | | 112,968 | |
| | Techtronic Industries Co. Ltd. | | | Machinery | | | | 42,500 | | | | 295,734 | |
| | Television Broadcasts Ltd. | | | Media | | | | 10,000 | | | | 16,302 | |
| | The Bank of East Asia Ltd. | | | Banks | | | | 42,000 | | | | 103,401 | |
| | The Wharf Holdings Ltd. | | | Real Estate Management & Development | | | | 40,000 | | | | 87,252 | |
| a | | United Energy Group Ltd. | | | Oil, Gas & Consumable Fuels | | | | 250,000 | | | | 51,343 | |
| | Vitasoy International Holdings Ltd. | | | Food Products | | | | 27,000 | | | | 109,351 | |
| | VTech Holdings Ltd. | | | Communications Equipment | | | | 5,500 | | | | 47,953 | |
| b | | WH Group Ltd., Reg S | | | Food Products | | | | 285,000 | | | | 255,211 | |
| | Wharf Real Estate Investment Co. Ltd. | | | Real Estate Management & Development | | | | 41,000 | | | | 223,844 | |
| | Wheelock and Co. Ltd. | | | Real Estate Management & Development | | | | 27,800 | | | | 158,337 | |
| | Xinyi Glass Holdings Ltd. | | | Auto Components | | | | 70,000 | | | | 77,059 | |
| | Yue Yuen Industrial Holdings Ltd. | | | Textiles, Apparel & Luxury Goods | | | | 25,000 | | | | 68,404 | |
| | | | | | | | | | | | | | |
| | | | |
| | | | | | | | | | | | | 14,962,713 | |
| | | | | | | | | | | | | | |
| | | Italy 0.3% | | | | | | | | | |
| | Prada SpA | | | Textiles, Apparel & Luxury Goods | | | | 17,500 | | | | 50,897 | |
| | | | | | | | | | | | | | |
| | | Luxembourg 0.2% | | �� | | | | | | | |
| | L’Occitane International SA | | | Personal Products | | | | 15,000 | | | | 29,849 | |
| | | | | | | | | | | | | | |
| | | Macau 3.5% | | | | | | | | | |
| | Galaxy Entertainment Group Ltd. | | | Hotels, Restaurants & Leisure | | | | 72,000 | | | | 447,738 | |
| a | | Macau Legend Development Ltd. | | | Hotels, Restaurants & Leisure | | | | 55,000 | | | | 6,104 | |
| | SJM Holdings Ltd. | | | Hotels, Restaurants & Leisure | | | | 65,000 | | | | 61,771 | |
| | Wynn Macau Ltd. | | | Hotels, Restaurants & Leisure | | | | 50,000 | | | | 97,584 | |
| | | | | | | | | | | | | | |
| | | | |
| | | | | | | | | | | | | 613,197 | |
| | | | | | | | | | | | | | |
| | | Singapore 0.4% | | | | | | | | | |
| | BOC Aviation Ltd. | | | Trading Companies & Distributors | | | | 7,000 | | | | 64,603 | |
| | | | | | | | | | | | | | |
| | | Taiwan 0.1% | | | | | | | | | |
| | FIT Hon Teng Ltd. | | | Electronic Equipment, Instruments & Components | | | | 35,000 | | | | 14,376 | |
| | | | | | | | | | | | | | |
| | Total Investments (Cost $18,470,227) 99.6% | | | | | | | | | | | 17,663,014 | |
| | Other Assets, less Liabilities 0.4% | | | | | | | | | | | 74,810 | |
| | | | | | | | | | | | | | |
| | Net Assets 100.0% | | | | | | | | | | $ | 17,737,824 | |
| | | | | | | | | | | | | | |
See Abbreviations on page 322.
aNon-income producing.
bSecurity was purchased pursuant to Regulation S under the Securities Act of 1933, which exempts from registration securities offered and sold outside of the United States. Such a security cannot be sold in the United States without either an effective registration statement filed pursuant to the Securities Act of 1933, or pursuant to an exemption from registration. This security has been deemed liquid under guidelines approved by the Fund’s Board of Trustees. At September 30, 2019, the value of this security was $255,211, representing 1.4% of net assets.
| | | | |
| | | |
| 214 | | Semiannual Report | | franklintempleton.com |
FRANKLIN TEMPLETON ETF TRUST
STATEMENT OF INVESTMENTS (UNAUDITED)
Franklin FTSE Hong Kong ETF(continued)
At September 30, 2019, the Fund had the following futures contracts outstanding. See Note 1(c).
| | | | | | | | | | | | | | | | | | | | |
| Futures Contracts | | | | | | | | | | | | | | | |
| | | | | |
| Description | | Type | | | Number of
Contracts | | | Notional
Amount* | | | Expiration
Date | | | Value/Unrealized
Appreciation
(Depreciation) | |
| Equity Contracts | | | | | | | | | | | | | | | |
HKG Mini Hang Seng Index | | | Long | | | | 1 | | | $ | 33,293 | | | | 12/30/19 | | | $ | (384 | ) |
HKG Mini Hang Seng Index | | | Long | | | | 1 | | | | 33,220 | | | | 10/30/19 | | | | (1,500 | ) |
| | | | | | | | | | | | | | | | | | | | |
Total Futures Contracts | | | | | | | | | | | | | | | | | | | (1,884 | ) |
| | | | | | | | | | | | | | | | | | | | |
*As of period end.
See Note 7 regarding other derivative information.
| | | | | | |
| | | |
| franklintempleton.com | | The accompanying notes are an integral part of these financial statements. | Semiannual Report | | | 215 | |
FRANKLIN TEMPLETON ETF TRUST
Financial Highlights
Franklin FTSE India ETF
| | | | | | | | | | | | |
| | | Six Months Ended
September 30, 2019
(unaudited) | | | Year Ended March 31, | |
| | | 2019 | | | 2018a | |
| | | |
Per share operating performance
(for a share outstanding throughout the period) | | | | | | | | | | | | |
| | | |
Net asset value, beginning of period | | $ | 23.36 | | | $ | 22.74 | | | $ | 23.72 | |
| | | | |
| | | |
| Income from investment operationsb: | | | | | | | | | | | | |
| | | |
Net investment incomec | | | 0.15 | | | | 0.29 | | | | 0.09 | |
| | | |
Net realized and unrealized gains (losses) | | | (1.38 | ) | | | 0.53 | | | | (1.07 | ) |
| | | | |
| | | |
Total from investment operations | | | (1.23 | ) | | | 0.82 | | | | (0.98 | ) |
| | | | |
| | | |
Less distributions from net investment income | | | (0.18 | ) | | | (0.20 | ) | | | — | |
| | | | |
| | | |
Net asset value, end of period | | $ | 21.95 | | | $ | 23.36 | | | $ | 22.74 | |
| | | | |
| | | |
Total returnd | | | (5.33)% | | | | 3.66% | | | | (4.13)% | |
| | | |
| Ratios to average net assetse | | | | | | | | | | | | |
| | | |
Total expenses | | | 0.19% | | | | 0.19% | | | | 0.19% | |
| | | |
Net investment income | | | 1.33% | | | | 1.33% | | | | 2.78% | |
| | | |
| Supplemental data | | | | | | | | | | | | |
| | | |
Net assets, end of period (000’s) | | | $15,366 | | | | $7,007 | | | | $2,274 | |
| | | |
Portfolio turnover ratef | | | 3.87% | | | | 8.03% | | | | 1.59% | |
| | | |
Portfolio turnover rate excluding portfolio transactions that are executed as a result of the Fund offering and redeeming Creation Units solely or in part for cashf,g | | | 3.84% | | | | 0.00% | | | | 0.00% | |
aFor the period February 6, 2018 (commencement of operations) to March 31, 2018.
bThe amount shown for a share outstanding throughout the period may not correlate with the Statement of Operations for the period due to the timing of sales and repurchases of Creation Unit Fund shares in relation to income earned and/or fluctuating fair value of the investments of the Fund.
cBased on average daily shares outstanding.
dTotal return is not annualized for periods less than one year. Total return is calculated assuming an initial investment made at the net asset value at the beginning of the period, reinvestment of all dividends and distributions at net asset value during the period, and redemption at net asset value on the last day of the period.
eRatios are annualized for periods less than one year.
fPortfolio turnover rate excludes the value of portfolio securities received or delivered as a result of processing capital share transactions in Creation Units, if any.
gEffective September 30, 2019.
| | | | |
| | | |
| 216 | | Semiannual Report | The accompanying notes are an integral part of these financial statements. | | franklintempleton.com |
FRANKLIN TEMPLETON ETF TRUST
Statement of Investments, September 30, 2019 (unaudited)
Franklin FTSE India ETF
| | | | | | | | | | | | | | |
| | | | |
| | | | | Industry | | | Shares | | | Value | |
| | | Common Stocks100.1% | | | | | | | | | |
| | | India 100.1% | | | | | | | | | |
| a | | 3M India Ltd. | | | Industrial Conglomerates | | | | 56 | | | $ | 16,334 | |
| | ABB India Ltd. | | | Electrical Equipment | | | | 1,456 | | | | 31,133 | |
| | ACC Ltd. | | | Construction Materials | | | | 1,316 | | | | 29,863 | |
| | Adani Enterprises Ltd. | | | Trading Companies & Distributors | | | | 7,672 | | | | 15,789 | |
| | Adani Ports And Special Economic Zone Ltd. | | | Transportation Infrastructure | | | | 20,201 | | | | 117,996 | |
| a | | Adani Power Ltd. | |
| Independent Power and Renewable
Electricity Producers |
| | | 26,698 | | | | 24,223 | |
| a | | Adani Transmissions Ltd. | | | Electric Utilities | | | | 7,868 | | | | 25,380 | |
| a | | Aditya Birla Capital Ltd. | | | Diversified Financial Services | | | | 14,868 | | | | 17,801 | |
| | Alkem Laboratories Ltd. | | | Pharmaceuticals | | | | 1,148 | | | | 30,861 | |
| | Ambuja Cements Ltd. | | | Construction Materials | | | | 22,358 | | | | 64,343 | |
| | Ashok Leyland Ltd. | | | Machinery | | | | 33,922 | | | | 32,884 | |
| | Asian Paints Ltd. | | | Chemicals | | | | 8,316 | | | | 206,777 | |
| | AU Small Finance Bank Ltd. | | | Banks | | | | 4,074 | | | | 37,912 | |
| | Aurobindo Pharma Ltd. | | | Pharmaceuticals | | | | 7,672 | | | | 63,763 | |
| a | | Avenue Supermarts Ltd. | | | Food & Staples Retailing | | | | 3,388 | | | | 88,949 | |
| | Axis Bank Ltd. | | | Banks | | | | 52,906 | | | | 511,376 | |
| | Bajaj Auto Ltd. | | | Automobiles | | | | 2,506 | | | | 104,025 | |
| | Bajaj Finance Ltd. | | | Consumer Finance | | | | 5,012 | | | | 286,146 | |
| | Bajaj Finserv Ltd. | | | Insurance | | | | 1,106 | | | | 132,856 | |
| | Bajaj Holdings & Investment Ltd. | | | Diversified Financial Services | | | | 770 | | | | 39,041 | |
| | Bandhan Bank Ltd. | | | Banks | | | | 3,402 | | | | 23,613 | |
| a | | Bank of Baroda | | | Banks | | | | 22,218 | | | | 29,172 | |
| a | | Bank of India | | | Banks | | | | 8,568 | | | | 7,611 | |
| | Berger Paints India Ltd. | | | Chemicals | | | | 6,748 | | | | 41,401 | |
| | Bharat Electronics Ltd. | | | Aerospace & Defense | | | | 17,038 | | | | 26,037 | |
| | Bharat Forge Ltd. | | | Auto Components | | | | 5,390 | | | | 33,948 | |
| | Bharat Heavy Electricals Ltd. | | | Electrical Equipment | | | | 24,346 | | | | 16,627 | |
| | Bharat Petroleum Corp. Ltd. | | | Oil, Gas & Consumable Fuels | | | | 28,882 | | | | 191,585 | |
| | Bharti Airtel Ltd. | | | Wireless Telecommunication Services | | | | 47,324 | | | | 245,105 | |
| | Bharti Infratel Ltd. | | | Diversified Telecommunication Services | | | | 24,808 | | | | 90,069 | |
| | Biocon Ltd. | | | Biotechnology | | | | 8,176 | | | | 25,721 | |
| | Bosch Ltd. | | | Auto Components | | | | 199 | | | | 39,491 | |
| | Britannia Industries Ltd. | | | Food Products | | | | 1,666 | | | | 69,212 | |
| | Cadila Healthcare Ltd. | | | Pharmaceuticals | | | | 7,084 | | | | 23,320 | |
| a | | Canara Bank Ltd. | | | Banks | | | | 4,368 | | | | 11,242 | |
| | Castrol India Ltd. | | | Chemicals | | | | 14,126 | | | | 27,118 | |
| | Cholamandalam Investment and Finance Co. Ltd. | | | Consumer Finance | | | | 5,334 | | | | 23,167 | |
| | Cipla Ltd. | | | Pharmaceuticals | | | | 9,310 | | | | 55,898 | |
| | Coal India Ltd. | | | Oil, Gas & Consumable Fuels | | | | 41,944 | | | | 118,282 | |
| | Colgate-Palmolive India Ltd. | | | Personal Products | | | | 1,904 | | | | 40,406 | |
| | Container Corp. of India Ltd. | | | Road & Rail | | | | 6,020 | | | | 51,371 | |
| | Cummins India Ltd. | | | Machinery | | | | 1,946 | | | | 15,729 | |
| | Dabur India Ltd. | | | Personal Products | | | | 15,330 | | | | 96,747 | |
| | Dalmia Bharat Ltd. | | | Construction Materials | | | | 1,302 | | | | 15,113 | |
| | Divi’s Laboratories Ltd. | | | Life Sciences Tools & Services | | | | 2,310 | | | | 54,288 | |
| | DLF Ltd. | | | Real Estate Management & Development | | | | 17,192 | | | | 37,747 | |
| | Dr Reddy’s Laboratories Ltd. | | | Pharmaceuticals | | | | 2,352 | | | | 89,682 | |
| | Eicher Motors Ltd. | | | Automobiles | | | | 392 | | | | 98,265 | |
| | Emami Ltd. | | | Personal Products | | | | 3,122 | | | | 14,035 | |
| | Embassy Office Parks REIT | | | Equity Real Estate Investment Trusts (REITs | ) | | | 3,200 | | | | 18,131 | |
| | Exide Industries Ltd. | | | Auto Components | | | | 5,810 | | | | 16,003 | |
| | Federal Bank Ltd. | | | Banks | | | | 42,462 | | | | 54,164 | |
| a | | Future Retail Ltd. | | | Multiline Retail | | | | 5,950 | | | | 31,971 | |
| | GAIL India Ltd. | | | Gas Utilities | | | | 31,724 | | | | 60,208 | |
| | Gillette India Ltd. | | | Personal Products | | | | 224 | | | | 22,439 | |
| | GlaxoSmithKline Consumer Healthcare Ltd. | | | Food Products | | | | 294 | | | | 35,382 | |
| | | | | | |
| | | |
| franklintempleton.com | | Semiannual Report | | | 217 | |
FRANKLIN TEMPLETON ETF TRUST
STATEMENT OF INVESTMENTS (UNAUDITED)
Franklin FTSE India ETF(continued)
| | | | | | | | | | | | | | |
| | | | |
| | | | | Industry | | | Shares | | | Value | |
| | | Common Stocks (continued) | | | | | | | | | |
| | | India(continued) | | | | | | | | | |
| | Glenmark Pharmaceuticals Ltd. | | | Pharmaceuticals | | | | 3,990 | | | $ | 18,301 | |
| a | | GMR Infrastructure Ltd. | | | Construction & Engineering | | | | 40,544 | | | | 9,726 | |
| | Godrej Consumer Products Ltd. | | | Personal Products | | | | 10,640 | | | | 103,189 | |
| | Godrej Industries Ltd. | | | Industrial Conglomerates | | | | 1,974 | | | | 11,376 | |
| a | | Godrej Properties Ltd. | | | Real Estate Management & Development | | | | 1,736 | | | | 25,444 | |
| | Grasim Industries Ltd. | | | Construction Materials | | | | 9,268 | | | | 95,480 | |
| | Gruh Finance Ltd. | | | Thrifts & Mortgage Finance | | | | 8,442 | | | | 32,085 | |
| | Havell’s India Ltd. | | | Electrical Equipment | | | | 6,958 | | | | 70,524 | |
| | HCL Technologies Ltd. | | | IT Services | | | | 15,624 | | | | 238,233 | |
| | HDFC Asset Management Co. Ltd. | | | Capital Markets | | | | 812 | | | | 32,101 | |
| | HDFC Life Insurance Co. Ltd. | | | Insurance | | | | 13,160 | | | | 111,631 | |
| a,b | | Hemisphere Properties India Ltd. | | | Real Estate Management & Development | | | | 2,002 | | | | 4,712 | |
| | Hero Motocorp Ltd. | | | Automobiles | | | | 2,828 | | | | 107,932 | |
| | Hindalco Industries Ltd. | | | Metals & Mining | | | | 25,816 | | | | 69,705 | |
| | Hindustan Petroleum Corp. Ltd. | | | Oil, Gas & Consumable Fuels | | | | 17,668 | | | | 75,216 | |
| | Hindustan Unilever Ltd. | | | Household Products | | | | 20,468 | | | | 572,418 | |
| | Hindustan Zinc Ltd. | | | Metals & Mining | | | | 6,874 | | | | 20,704 | |
| | Housing Development Finance Corp. Ltd. | | | Thrifts & Mortgage Finance | | | | 49,728 | | | | 1,387,278 | |
| | ICICI Bank Ltd. | | | Banks | | | | 9,240 | | | | 56,547 | |
| c | | ICICI Lombard General Insurance Co. Ltd., Reg S | | | Insurance | | | | 4,606 | | | | 78,632 | |
| c | | ICICI Prudential Life Insurance Co. Ltd., Reg S | | | Insurance | | | | 8,820 | | | | 57,685 | |
| a | | IDFC First Bank Ltd. | | | Banks | | | | 66,808 | | | | 37,897 | |
| | IDFC Ltd. | | | Diversified Financial Services | | | | 7,504 | | | | 3,642 | |
| | Indiabulls Housing Finance Ltd. | | | Thrifts & Mortgage Finance | | | | 9,464 | | | | 34,174 | |
| | Indian Oil Corp. Ltd. | | | Oil, Gas & Consumable Fuels | | | | 61,264 | | | | 127,423 | |
| | Info Edge India Ltd. | | | Interactive Media & Services | | | | 1,764 | | | | 50,309 | |
| | Infosys Ltd. | | | IT Services | | | | 106,974 | | | | 1,216,101 | |
| c | | InterGlobe Aviation Ltd., Reg S | | | Airlines | | | | 2,772 | | | | 73,913 | |
| | ITC Ltd. | | | Tobacco | | | | 85,078 | | | | 311,950 | |
| a | | Jindal Steel & Power Ltd. | | | Metals & Mining | | | | 11,662 | | | | 17,040 | |
| | JSW Energy Ltd. | |
| Independent Power and Renewable
Electricity Producers |
| | | 10,976 | | | | 10,075 | |
| | JSW Steel Ltd. | | | Metals & Mining | | | | 33,992 | | | | 110,295 | |
| | Kansai Nerolac Paints Ltd. | | | Chemicals | | | | 3,738 | | | | 27,689 | |
| | L&T Finance Holdings Ltd. | | | Diversified Financial Services | | | | 13,930 | | | | 16,658 | |
| c | | Larsen & Toubro Infotech Ltd., Reg S | | | IT Services | | | | 826 | | | | 17,614 | |
| | Larsen & Toubro Ltd. | | | Construction & Engineering | | | | 9,730 | | | | 202,409 | |
| | LIC Housing Finance Ltd. | | | Thrifts & Mortgage Finance | | | | 7,168 | | | | 38,096 | |
| | Lupin Ltd. | | | Pharmaceuticals | | | | 6,412 | | | | 64,754 | |
| | Mahindra & Mahindra Financial Services Ltd. | | | Consumer Finance | | | | 8,512 | | | | 39,396 | |
| | Mahindra & Mahindra Ltd. | | | Automobiles | | | | 16,800 | | | | 129,706 | |
| | Mangalore Refinery and Petrochemicals Ltd. | | | Oil, Gas & Consumable Fuels | | | | 5,600 | | | | 3,832 | |
| | Marico Ltd. | | | Personal Products | | | | 13,104 | | | | 72,899 | |
| | Maruti Suzuki India Ltd. | | | Automobiles | | | | 3,486 | | | | 330,347 | |
| | Motherson Sumi Systems Ltd. | | | Auto Components | | | | 27,300 | | | | 40,429 | |
| | Mphasis Ltd. | | | IT Services | | | | 2,128 | | | | 28,736 | |
| | MRF Ltd. | | | Auto Components | | | | 28 | | | | 25,006 | |
| | Muthoot Finance Ltd. | | | Consumer Finance | | | | 2,758 | | | | 26,304 | |
| | Nestle India Ltd. | | | Food Products | | | | 672 | | | | 131,706 | |
| | NHPC Ltd. | |
| Independent Power and Renewable
Electricity Producers |
| | | 69,734 | | | | 21,943 | |
| | NMDC Ltd. | | | Metals & Mining | | | | 21,406 | | | | 26,792 | |
| | NTPC Ltd. | |
| Independent Power and Renewable
Electricity Producers |
| | | 68,643 | | | | 113,810 | |
| | Oberoi Realty Ltd. | | | Real Estate Management & Development | | | | 2,534 | | | | 18,150 | |
| | Oil & Natural Gas Corp. Ltd. | | | Oil, Gas & Consumable Fuels | | | | 87,290 | | | | 162,340 | |
| | Oil India Ltd. | | | Oil, Gas & Consumable Fuels | | | | 7,546 | | | | 15,466 | |
| | | | |
| | | |
| 218 | | Semiannual Report | | franklintempleton.com |
FRANKLIN TEMPLETON ETF TRUST
STATEMENT OF INVESTMENTS (UNAUDITED)
Franklin FTSE India ETF(continued)
| | | | | | | | | | | | | | |
| | | | |
| | | | | Industry | | | Shares | | | Value | |
| | | Common Stocks (continued) | | | | | | | | | |
| | | India(continued) | | | | | | | | | |
| a | | Oracle Financial Services Software Ltd. | | | Software | | | | 630 | | | $ | 28,210 | |
| | Page Industries Ltd. | | | Textiles, Apparel & Luxury Goods | | | | 140 | | | | 44,484 | |
| | Petronet LNG Ltd. | | | Oil, Gas & Consumable Fuels | | | | 15,246 | | | | 55,912 | |
| | Pidilite Industries Ltd. | | | Chemicals | | | | 3,528 | | | | 71,873 | |
| | Piramal Enterprises Ltd. | | | Pharmaceuticals | | | | 2,660 | | | | 61,273 | |
| a | | Power Finance Corp. Ltd. | | | Diversified Financial Services | | | | 18,354 | | | | 25,743 | |
| | Power Grid Corp. of India Ltd. | | | Electric Utilities | | | | 14,602 | | | | 41,013 | |
| a | | Punjab National Bank Ltd. | | | Banks | | | | 26,586 | | | | 23,240 | |
| | Rajesh Exports Ltd. | | | Textiles, Apparel & Luxury Goods | | | | 3,976 | | | | 37,413 | |
| c | | RBL Bank Ltd., Reg S | | | Banks | | | | 9,100 | | | | 42,226 | |
| | REC Ltd. | | | Diversified Financial Services | | | | 19,068 | | | | 33,135 | |
| | Reliance Industries Ltd. | | | Oil, Gas & Consumable Fuels | | | | 89,768 | | | | 1,687,533 | |
| | SBI Life Insurance Co. Ltd. | | | Insurance | | | | 6,916 | | | | 82,599 | |
| | Shree Cement Ltd. | | | Construction Materials | | | | 238 | | | | 63,432 | |
| | Shriram Transport Finance Co. Ltd. | | | Consumer Finance | | | | 4,858 | | | | 73,416 | |
| | Siemens Ltd. | | | Industrial Conglomerates | | | | 2,478 | | | | 53,010 | |
| a | | State Bank of India | | | Banks | | | | 51,590 | | | | 197,133 | |
| | Steel Authority of India Ltd. | | | Metals & Mining | | | | 28,280 | | | | 13,348 | |
| | Sun Pharmaceutical Industries Ltd. | | | Pharmaceuticals | | | | 31,654 | | | | 173,950 | |
| | Sun TV Network Ltd. | | | Media | | | | 2,436 | | | | 16,248 | |
| | Tata Communications Ltd. | | | Diversified Telecommunication Services | | | | 1,852 | | | | 9,802 | |
| | Tata Consultancy Services Ltd. | | | IT Services | | | | 26,026 | | | | 770,951 | |
| a | | Tata Motors Ltd. | | | Automobiles | | | | 29,050 | | | | 48,144 | |
| a | | Tata Motors Ltd., A | | | Automobiles | | | | 11,200 | | | | 8,392 | |
| | Tata Power Co. Ltd. | | | Electric Utilities | | | | 27,174 | | | | 23,965 | |
| | Tata Steel Ltd. | | | Metals & Mining | | | | 7,826 | | | | 39,810 | |
| | Tech Mahindra Ltd. | | | IT Services | | | | 13,398 | | | | 135,079 | |
| | Titan Co. Ltd. | | | Textiles, Apparel & Luxury Goods | | | | 8,988 | | | | 161,456 | |
| | Torrent Pharmaceuticals Ltd. | | | Pharmaceuticals | | | | 1,162 | | | | 27,339 | |
| | Torrent Power Ltd. | | | Electric Utilities | | | | 3,332 | | | | 13,517 | |
| | TVS Motor Co. Ltd. | | | Automobiles | | | | 3,290 | | | | 19,591 | |
| | UltraTech Cement Ltd. | | | Construction Materials | | | | 3,010 | | | | 184,385 | |
| a | | Union Bank of India Ltd. | | | Banks | | | | 10,262 | | | | 7,646 | |
| | United Breweries Ltd. | | | Beverages | | | | 1,932 | | | | 36,725 | |
| a | | United Spirits Ltd. | | | Beverages | | | | 8,582 | | | | 80,772 | |
| | UPL Ltd. | | | Chemicals | | | | 15,487 | | | | 131,982 | |
| | Vedanta Ltd. | | | Metals & Mining | | | | 48,188 | | | | 104,816 | |
| a | | Vodafone Idea Ltd. | | | Wireless Telecommunication Services | | | | 236,642 | | | | 20,536 | |
| | Voltas Ltd. | | | Construction & Engineering | | | | 2,884 | | | | 27,654 | |
| | Whirlpool of India Ltd. | | | Household Durables | | | | 868 | | | | 23,117 | |
| | Wipro Ltd. | | | IT Services | | | | 41,692 | | | | 141,074 | |
| a | | Wockhardt Ltd. | | | Pharmaceuticals | | | | 854 | | | | 3,090 | |
| | Yes Bank Ltd. | | | Banks | | | | 49,476 | | | | 28,903 | |
| | Zee Entertainment Enterprises Ltd. | | | Media | | | | 15,358 | | | | 57,537 | |
| | | | | | | | | | | | | | |
| | Total Common Stocks (Cost $15,298,184) | | | | | | | | | | | 15,385,046 | |
| | | | | | | | | | | | | | |
| | | Corporate Bonds & Notes (Cost $415) 0.0%† | | | | | | | | | |
| | | India 0.0%† | | | | | | | | | |
| | Britannia Industries Ltd., senior secured note, first lien, 8.00% | | | Food Products | | | | 29,040 | | | | 418 | |
| | | | | | | | | | | | | | |
| | Total Investments (Cost $15,298,599) 100.1% | | | | | | | | | | | 15,385,464 | |
| | Other Assets, less Liabilities (0.1)% | | | | | | | | | | | (19,683 | ) |
| | | | | | | | | | | | | | |
| | Net Assets 100.0% | | | | | | | | | | $ | 15,365,781 | |
| | | | | | | | | | | | | | |
| | | | | | |
| | | |
| franklintempleton.com | | Semiannual Report | | | 219 | |
FRANKLIN TEMPLETON ETF TRUST
STATEMENT OF INVESTMENTS (UNAUDITED)
Franklin FTSE India ETF(continued)
See Abbreviations on page 322.
†Rounds to less than 0.1% of net assets.
aNon-income producing.
bFair valued using significant unobservable inputs. See Note 8 regarding fair value measurements.
cSecurity was purchased pursuant to Regulation S under the Securities Act of 1933, which exempts from registration securities offered and sold outside of the United States. Such a security cannot be sold in the United States without either an effective registration statement filed pursuant to the Securities Act of 1933, or pursuant to an exemption from registration. These securities have been deemed liquid under guidelines approved by the Fund’s Board of Trustees. At September 30, 2019, the aggregate value of these securities was $270,070, representing 1.8% of net assets.
At September 30, 2019, the Fund had the following futures contracts outstanding. See Note 1(c).
| | | | | | | | | | | | | | | | | | | | |
| Futures Contracts | | | | | | | | | | | | | | | |
| | | | | |
| Description | | Type | | | Number of
Contracts | | | Notional
Amount* | | | Expiration
Date | | | Value/Unrealized
Appreciation
(Depreciation) | |
| Equity Contracts | | | | | | | | | | | | | | | |
SGX Nifty 50 | | | Long | | | | 1 | | | $ | 23,076 | | | | 10/31/19 | | | $ | (351 | ) |
*As of period end.
See Note 7 regarding other derivative information.
| | | | |
| | | |
| 220 | | Semiannual Report | The accompanying notes are an integral part of these financial statements. | | franklintempleton.com |
FRANKLIN TEMPLETON ETF TRUST
Financial Highlights
Franklin FTSE Italy ETF
| | | | | | | | | | | | |
| | | Six Months Ended
September 30, 2019
(unaudited) | | | Year Ended March 31, | |
| | | 2019 | | | 2018a | |
| | | |
Per share operating performance
(for a share outstanding throughout the period) | | | | | | | | | | | | |
| | | |
Net asset value, beginning of period | | $ | 23.13 | | | $ | 26.27 | | | $ | 25.51 | |
| | | | |
| | | |
| Income from investment operationsb: | | | | | | | | | | | | |
| | | |
Net investment incomec | | | 0.78 | | | | 0.46 | | | | 0.11 | |
| | | |
Net realized and unrealized gains (losses) | | | (0.11 | ) | | | (2.99 | ) | | | 0.70 | |
| | | | |
| | | |
Total from investment operations | | | 0.67 | | | | (2.53 | ) | | | 0.81 | |
| | | | |
| | | |
Less distributions from net investment income | | | (0.67 | ) | | | (0.61 | ) | | | (0.05 | ) |
| | | | |
| | | |
Net asset value, end of period | | $ | 23.13 | | | $ | 23.13 | | | $ | 26.27 | |
| | | | |
| | | |
Total returnd | | | 3.01% | | | | (9.67)% | | | | 3.19% | |
| | | |
| Ratios to average net assetse | | | | | | | | | | | | |
| | | |
Total expenses | | | 0.09% | | | | 0.09% | | | | 0.09% | |
| | | |
Net investment income | | | 6.78% | | | | 2.05% | | | | 1.01% | |
| | | |
| Supplemental data | | | | | | | | | | | | |
| | | |
Net assets, end of period (000’s) | | | $11,563 | | | | $10,410 | | | | $2,627 | |
| | | |
Portfolio turnover ratef | | | 6.50% | | | | 16.67% | | | | 3.09% | |
| | | |
Portfolio turnover rate excluding portfolio transactions that are executed as a result of the Fund offering and redeeming Creation Units solely or in part for cashf,g | | | 6.50% | | | | —% | | | | —% | |
aFor the period November 2, 2017 (commencement of operations) to March 31, 2018.
bThe amount shown for a share outstanding throughout the period may not correlate with the Statement of Operations for the period due to the timing of sales and repurchases of Creation Unit Fund shares in relation to income earned and/or fluctuating fair value of the investments of the Fund.
cBased on average daily shares outstanding.
dTotal return is not annualized for periods less than one year. Total return is calculated assuming an initial investment made at the net asset value at the beginning of the period, reinvestment of all dividends and distributions at net asset value during the period, and redemption at net asset value on the last day of the period.
eRatios are annualized for periods less than one year.
fPortfolio turnover rate excludes the value of portfolio securities received or delivered as a result of processing capital share transactions in Creation Units, if any.
gEffective September 30, 2019.
| | | | | | |
| | | |
| franklintempleton.com | | The accompanying notes are an integral part of these financial statements. | Semiannual Report | | | 221 | |
FRANKLIN TEMPLETON ETF TRUST
Statement of Investments, September 30, 2019 (unaudited)
Franklin FTSE Italy ETF
| | | | | | | | | | | | | | |
| | | |
| | | Industry | | | Shares | | | Value | |
| | | | | | | | | | | | | | |
| | | Common Stocks 100.0% | | | | | | | | | |
| | | Italy 91.4% | | | | | | | | | |
| | A2A SpA | | | Multi-Utilities | | | | 54,490 | | | $ | 100,038 | |
| | Amplifon SpA | | | Health Care Providers & Services | | | | 4,200 | | | | 103,024 | |
| | Assicurazioni Generali SpA | | | Insurance | | | | 39,940 | | | | 774,187 | |
| | Atlantia SpA | | | Transportation Infrastructure | | | | 16,500 | | | | 399,160 | |
| | Banca Mediolanum SpA | | | Diversified Financial Services | | | | 10,110 | | | | 75,941 | |
| a | | Banco BPM SpA | | | Banks | | | | 53,510 | | | | 109,323 | |
| | Buzzi Unicem SpA | | | Construction Materials | | | | 2,360 | | | | 54,133 | |
| | Buzzi Unicem SpA, di Risp | | | Construction Materials | | | | 1,420 | | | | 20,559 | |
| | Davide Campari-Milano SpA | | | Beverages | | | | 19,530 | | | | 176,507 | |
| | DiaSorin SpA | | | Health Care Equipment & Supplies | | | | 790 | | | | 91,896 | |
| | Enel SpA | | | Electric Utilities | | | | 234,430 | | | | 1,750,948 | |
| | Eni SpA | | | Oil, Gas & Consumable Fuels | | | | 76,300 | | | | 1,167,380 | |
| | Ferrari NV | | | Automobiles | | | | 3,450 | | | | 532,396 | |
| | FinecoBank Banca Fineco SpA | | | Banks | | | | 21,460 | | | | 227,219 | |
| | Hera SpA | | | Multi-Utilities | | | | 28,750 | | | | 118,039 | |
| b | | Infrastrutture Wireless Italiane SpA, Reg S | | | Diversified Telecommunication Services | | | | 8,440 | | | | 87,596 | |
| | Intesa Sanpaolo SpA | | | Banks | | | | 457,370 | | | | 1,084,758 | |
| | Italgas Reti SpA | | | Gas Utilities | | | | 13,390 | | | | 86,448 | |
| | Leonardo SpA | | | Aerospace & Defense | | | | 13,630 | | | | 160,333 | |
| a | | Mediaset SpA | | | Media | | | | 10,870 | | | | 32,020 | |
| | Mediobanca Banca di Credito Finanziario SpA | | | Banks | | | | 25,680 | | | | 280,523 | |
| | Moncler SpA | | | Textiles, Apparel & Luxury Goods | | | | 6,440 | | | | 229,583 | |
| | Pirelli & C SpA | | | Auto Components | | | | 15,180 | | | | 89,829 | |
| b | | Poste Italiane SpA, Reg S | | | Insurance | | | | 16,100 | | | | 183,070 | |
| | Prysmian SpA | | | Electrical Equipment | | | | 8,820 | | | | 189,427 | |
| | Recordati SpA | | | Pharmaceuticals | | | | 3,340 | | | | 143,320 | |
| a | | Saipem SpA | | | Energy Equipment & Services | | | | 19,810 | | | | 89,670 | |
| | Salvatore Ferragamo SpA | | | Textiles, Apparel & Luxury Goods | | | | 2,360 | | | | 43,623 | |
| | Snam SpA | | | Gas Utilities | | | | 74,300 | | | | 375,363 | |
| a | | Telecom Italia SpA/Milano | | | Diversified Telecommunication Services | | | | 371,800 | | | | 212,194 | |
| | Telecom Italia SpA/Milano, di Risp | | | Diversified Telecommunication Services | | | | 210,750 | | | | 115,247 | |
| | Tenaris SA | | | Energy Equipment & Services | | | | 16,500 | | | | 175,098 | |
| | Terna Rete Elettrica Nazionale SpA | | | Electric Utilities | | | | 49,790 | | | | 319,933 | |
| | UniCredit SpA | | | Banks | | | | 69,070 | | | | 814,747 | |
| | Unione di Banche Italiane SpA | | | Banks | | | | 33,720 | | | | 94,698 | |
| | UnipolSai Assicurazioni SpA | | | Insurance | | | | 20,440 | | | | 54,372 | |
| | | | | | | | | | | | | | |
| | | | | | | | | | | | | 10,562,602 | |
| | | | | | | | | | | | | | |
| | | Netherlands 2.1% | | | | | | | | | |
| | EXOR NV | | | Diversified Financial Services | | | | 3,680 | | | | 246,654 | |
| | | | | | | | | | | | | | |
| | | United Kingdom 6.5% | | | | | | | | | |
| | CNH Industrial NV | | | Machinery | | | | 32,480 | | | | 330,727 | |
| | Fiat Chrysler Automobiles NV | | | Automobiles | | | | 32,470 | | | | 420,254 | |
| | | | | | | | | | | | | | |
| | | | |
| | | | | | | | | | | | | 750,981 | |
| | | | | | | | | | | | | | |
| | Total Investments (Cost $10,967,451) 100.0% | | | | | | | | | | | 11,560,237 | |
| | Other Assets, less Liabilities 0.0%† | | | | | | | | | | | 3,038 | |
| | | | | | | | | | | | | | |
| | Net Assets 100.0% | | | | | | | | | | $ | 11,563,275 | |
| | | | | | | | | | | | | | |
See Abbreviations on page 322.
†Rounds to less than 0.1% of net assets.
aNon-income producing.
bSecurity was purchased pursuant to Regulation S under the Securities Act of 1933, which exempts from registration securities offered and sold outside of the United States. Such a security cannot be sold in the United States without either an effective registration statement filed pursuant to the Securities Act of 1933, or pursuant to an exemption from registration. These securities have been deemed liquid under guidelines approved by the Fund’s Board of Trustees. At September 30, 2019, the aggregate value of these securities was $270,666, representing 2.3% of net assets.
| | | | |
| | | |
| 222 | | Semiannual Report | The accompanying notes are an integral part of these financial statements. | | franklintempleton.com |
FRANKLIN TEMPLETON ETF TRUST
Financial Highlights
Franklin FTSE Japan ETF
| | | | | | | | | | | | |
| | | Six Months Ended
September 30, 2019
(unaudited) | | | Year Ended March 31, | |
| | | 2019 | | | 2018a | |
| | | |
Per share operating performance
(for a share outstanding throughout the period) | | | | | | | | | | | | |
| | | |
Net asset value, beginning of period | | $ | 24.18 | | | $ | 26.69 | | | $ | 25.91 | |
| | | | |
| | | |
| Income from investment operationsb: | | | | | | | | | | | | |
| | | |
Net investment incomec | | | 0.22 | | | | 0.59 | | | | 0.44 | |
| | | |
Net realized and unrealized gains (losses) | | | 0.63 | | | | (2.76 | ) | | | 0.37 | |
| | | | |
| | | |
Total from investment operations | | | 0.85 | | | | (2.17 | ) | | | 0.81 | |
| | | | |
| | | |
Less distributions from net investment income | | | (0.29 | ) | | | (0.34 | ) | | | (0.03 | ) |
| | | | |
| | | |
Net asset value, end of period | | $ | 24.74 | | | $ | 24.18 | | | $ | 26.69 | |
| | | | |
| | | |
Total returnd | | | 3.61% | | | | (8.10)% | | | | 3.11% | |
| | | |
| Ratios to average net assetse | | | | | | | | | | | | |
| | | |
Total expenses | | | 0.09% | | | | 0.09% | | | | 0.09% | |
| | | |
Net investment income | | | 1.82% | | | | 2.39% | | | | 4.07% | |
| | | |
| Supplemental data | | | | | | | | | | | | |
| | | |
Net assets, end of period (000’s) | | | $207,857 | | | | $290,205 | | | | $96,082 | |
| | | |
Portfolio turnover ratef | | | 3.32% | | | | 4.35% | | | | 0.93% | |
| | | |
| Portfolio turnover rate excluding portfolio transactions that are executed as a result of the Fund offering and redeeming Creation Units solely or in part for cashf,g | | | 3.27% | | | | 0.00% | | | | 0.00% | |
aFor the period November 2, 2017 (commencement of operations) to March 31, 2018.
bThe amount shown for a share outstanding throughout the period may not correlate with the Statement of Operations for the period due to the timing of sales and repurchases of Creation Unit Fund shares in relation to income earned and/or fluctuating fair value of the investments of the Fund.
cBased on average daily shares outstanding.
dTotal return is not annualized for periods less than one year. Total return is calculated assuming an initial investment made at the net asset value at the beginning of the period, reinvestment of all dividends and distributions at net asset value during the period, and redemption at net asset value on the last day of the period.
eRatios are annualized for periods less than one year.
fPortfolio turnover rate excludes the value of portfolio securities received or delivered as a result of processing capital share transactions in Creation Units, if any.
gEffective September 30, 2019.
| | | | | | |
| | | |
| franklintempleton.com | | The accompanying notes are an integral part of these financial statements. | Semiannual Report | | | 223 | |
FRANKLIN TEMPLETON ETF TRUST
Statement of Investments, September 30, 2019 (unaudited)
Franklin FTSE Japan ETF
| | | | | | | | | | | | | | |
| | | | |
| | | | | Industry | | | Shares | | | Value | |
| | | Common Stocks 99.1% | | | | | | | |
| | | Japan 99.1% | | | | | | | | | |
| | ABC-Mart Inc. | | | Specialty Retail | | | | 1,400 | | | $ | 88,994 | |
| | Acom Co. Ltd. | | | Consumer Finance | | | | 21,000 | | | | 82,387 | |
| | Advantest Corp. | | | Semiconductors & Semiconductor Equipment | | | | 11,200 | | | | 494,842 | |
| | AEON Co. Ltd. | | | Food & Staples Retailing | | | | 39,200 | | | | 718,349 | |
| | AEON Financial Service Co. Ltd. | | | Consumer Finance | | | | 7,000 | | | | 105,316 | |
| | AEON Mall Co. Ltd. | | | Real Estate Management & Development | | | | 7,000 | | | | 110,433 | |
| | AGC Inc. | | | Building Products | | | | 9,800 | | | | 303,771 | |
| | Aica Kogyo Co. Ltd. | | | Building Products | | | | 2,800 | | | | 82,387 | |
| | AIN Holdings Inc. | | | Food & Staples Retailing | | | | 1,400 | | | | 81,480 | |
| | Air Water Inc. | | | Chemicals | | | | 8,400 | | | | 150,162 | |
| | Aisin Seiki Co. Ltd. | | | Auto Components | | | | 9,800 | | | | 307,851 | |
| | Ajinomoto Co. Inc. | | | Food Products | | | | 26,600 | | | | 502,096 | |
| | Alfresa Holdings Corp. | | | Health Care Providers & Services | | | | 9,800 | | | | 218,805 | |
| | Alps Alpine Co. Ltd. | | | Electronic Equipment, Instruments & Components | | | | 11,200 | | | | 209,025 | |
| | Amada Holdings Co. Ltd. | | | Machinery | | | | 18,200 | | | | 196,019 | |
| | Amano Corp. | | | Electronic Equipment, Instruments & Components | | | | 2,800 | | | | 85,237 | |
| | ANA Holdings Inc. | | | Airlines | | | | 5,600 | | | | 188,299 | |
| | Anritsu Corp. | | | Electronic Equipment, Instruments & Components | | | | 7,000 | | | | 137,247 | |
| | Aozora Bank Ltd. | | | Banks | | | | 5,600 | | | | 140,006 | |
| | Ariake Japan Co. Ltd. | | | Food Products | | | | 1,400 | | | | 109,072 | |
| | Asahi Group Holdings Ltd. | | | Beverages | | | | 21,000 | | | | 1,039,556 | |
| | Asahi Intecc Co. Ltd. | | | Health Care Equipment & Supplies | | | | 11,200 | | | | 294,003 | |
| | Asahi Kasei Corp. | | | Chemicals | | | | 70,000 | | | | 689,151 | |
| | Asics Corp. | | | Textiles, Apparel & Luxury Goods | | | | 9,800 | | | | 167,300 | |
| | ASKUL Corp. | | | Internet & Direct Marketing Retail | | | | 1,400 | | | | 37,813 | |
| | Astellas Pharma Inc. | | | Pharmaceuticals | | | | 105,000 | | | | 1,494,726 | |
| | Autobacs Seven Co. Ltd. | | | Specialty Retail | | | | 2,800 | | | | 45,805 | |
| | Azbil Corp. | | | Electronic Equipment, Instruments & Components | | | | 7,000 | | | | 187,120 | |
| | Bandai Namco Holdings Inc. | | | Leisure Products | | | | 11,200 | | | | 697,442 | |
| | Benefit One Inc. | | | Professional Services | | | | 2,800 | | | | 52,904 | |
| | Benesse Holdings Inc. | | | Diversified Consumer Services | | | | 4,200 | | | | 109,047 | |
| | BIC CAMERA Inc. | | | Specialty Retail | | | | 8,400 | | | | 88,372 | |
| | Bridgestone Corp. | | | Auto Components | | | | 33,600 | | | | 1,300,786 | |
| | Brother Industries Ltd. | | | Technology Hardware, Storage & Peripherals | | | | 12,600 | | | | 228,042 | |
| | Calbee Inc. | | | Food Products | | | | 4,200 | | | | 130,576 | |
| | CANON Inc. | | | Technology Hardware, Storage & Peripherals | | | | 56,000 | | | | 1,493,592 | |
| | Canon Marketing Japan Inc. | | | Electronic Equipment, Instruments & Components | | | | 2,800 | | | | 59,433 | |
| | Capcom Co. Ltd. | | | Entertainment | | | | 5,600 | | | | 148,349 | |
| | Casio Computer Co. Ltd. | | | Household Durables | | | | 12,600 | | | | 195,281 | |
| | Central Japan Railway Co. | | | Road & Rail | | | | 10,000 | | | | 2,055,980 | |
| | Chubu Electric Power Co. Inc. | | | Electric Utilities | | | | 37,800 | | | | 547,370 | |
| | Chugai Pharmaceutical Co. Ltd. | | | Pharmaceuticals | | | | 12,600 | | | | 979,320 | |
| | Chuo Mitsui Trust Holdings Inc. | | | Banks | | | | 21,000 | | | | 757,030 | |
| | Citizen Watch Co. Ltd. | | | Electronic Equipment, Instruments & Components | | | | 15,400 | | | | 75,237 | |
| | Coca-Cola Bottlers Japan Holdings Inc. | | | Beverages | | | | 8,400 | | | | 188,403 | |
| | COMSYS Holdings Corp. | | | Construction & Engineering | | | | 7,000 | | | | 198,196 | |
| | Concordia Financial Group Ltd. | | | Banks | | | | 65,800 | | | | 252,058 | |
| | Cosmo Energy Holdings Co. Ltd. | | | Oil, Gas & Consumable Fuels | | | | 4,200 | | | | 86,468 | |
| | Cosmos Pharmaceutical Corp. | | | Food & Staples Retailing | | | | 500 | | | | 97,849 | |
| | Credit Saison Co. Ltd. | | | Consumer Finance | | | | 8,400 | | | | 112,622 | |
| | CyberAgent Inc. | | | Media | | | | 5,600 | | | | 215,036 | |
| | Dai Nippon Printing Co. Ltd. | | | Commercial Services & Supplies | | | | 16,800 | | | | 433,854 | |
| | Daicel Corp. | | | Chemicals | | | | 15,400 | | | | 130,097 | |
| | Daido Steel Co. Ltd. | | | Metals & Mining | | | | 1,400 | | | | 54,860 | |
| | Daifuku Co. Ltd. | | | Machinery | | | | 5,600 | | | | 288,614 | |
| | Daiichi Sankyo Co. Ltd. | | | Pharmaceuticals | | | | 35,000 | | | | 2,203,470 | |
| | Daiichikosho Co. Ltd. | | | Entertainment | | | | 2,800 | | | | 129,281 | |
| | | | |
| | | |
| 224 | | Semiannual Report | | franklintempleton.com |
FRANKLIN TEMPLETON ETF TRUST
STATEMENT OF INVESTMENTS (UNAUDITED)
Franklin FTSE Japan ETF(continued)
| | | | | | | | | | | | | | |
| | | | |
| | | | | Industry | | | Shares | | | Value | |
| | | Common Stocks (continued) | | | | | | | |
| | | Japan (continued) | | | | | | | | | |
| | Daikin Industries Ltd. | | | Building Products | | | | 14,600 | | | $ | 1,915,596 | |
| | Daishi Hokuetsu Financial Group Inc. | | | Banks | | | | 2,800 | | | | 70,418 | |
| | Daito Trust Construction Co. Ltd. | | | Real Estate Management & Development | | | | 3,708 | | | | 473,814 | |
| | Daiwa House Industry Co. Ltd. | | | Real Estate Management & Development | | | | 36,400 | | | | 1,180,832 | |
| | Daiwa Securities Group Inc. | | | Capital Markets | | | | 84,000 | | | | 374,162 | |
| | DeNA Co. Ltd. | | | Entertainment | | | | 5,600 | | | | 98,813 | |
| | Denka Co. Ltd. | | | Chemicals | | | | 4,200 | | | | 115,459 | |
| | Denso Corp. | | | Auto Components | | | | 25,200 | | | | 1,107,331 | |
| | Dentsu Inc. | | | Media | | | | 12,600 | | | | 443,609 | |
| | DIC Corp. | | | Chemicals | | | | 4,200 | | | | 116,508 | |
| | Disco Corp. | | | Semiconductors & Semiconductor Equipment | | | | 1,567 | | | | 296,653 | |
| | DMG Mori Co. Ltd. | | | Machinery | | | | 5,600 | | | | 79,330 | |
| | Dowa Holdings Co. Ltd. | | | Metals & Mining | | | | 2,800 | | | | 95,600 | |
| | East Japan Railway Co. | | | Road & Rail | | | | 20,400 | | | | 1,946,093 | |
| | EBARA Corp. | | | Machinery | | | | 5,600 | | | | 149,074 | |
| | Eisai Co. Ltd. | | | Pharmaceuticals | | | | 14,000 | | | | 711,302 | |
| | Electric Power Development Co. Ltd. | |
| Independent Power and Renewable Electricity
Producers |
| | | 9,800 | | | | 223,521 | |
| | Ezaki Glico Co. Ltd. | | | Food Products | | | | 2,800 | | | | 116,197 | |
| | FamilyMart Co. Ltd. | | | Food & Staples Retailing | | | | 12,600 | | | | 306,970 | |
| | Fancl Corp. | | | Personal Products | | | | 4,200 | | | | 111,650 | |
| | FANUC Corp. | | | Machinery | | | | 11,200 | | | | 2,107,870 | |
| | Fast Retailing Co. Ltd. | | | Specialty Retail | | | | 2,800 | | | | 1,663,548 | |
| | FP Corp. | | | Containers & Packaging | | | | 1,400 | | | | 87,310 | |
| | Fuji Electric Co. Ltd. | | | Electrical Equipment | | | | 7,000 | | | | 214,064 | |
| | Fuji Media Holdings Inc. | | | Media | | | | 2,800 | | | | 36,038 | |
| | Fuji Oil Holdings Inc. | | | Food Products | | | | 2,800 | | | | 81,092 | |
| | Fuji Seal International Inc. | | | Containers & Packaging | | | | 2,800 | | | | 70,703 | |
| | FUJIFILM Holdings Corp. | | | Technology Hardware, Storage & Peripherals | | | | 19,600 | | | | 859,625 | |
| | Fujikura Ltd. | | | Electrical Equipment | | | | 15,400 | | | | 58,992 | |
| | Fujitsu General Ltd. | | | Household Durables | | | | 2,800 | | | | 46,608 | |
| | Fujitsu Ltd. | | | IT Services | | | | 11,200 | | | | 896,933 | |
| | Fukuoka Financial Group Inc. | | | Banks | | | | 8,400 | | | | 158,634 | |
| | Fukuyama Transporting Co. Ltd. | | | Road & Rail | | | | 1,400 | | | | 49,096 | |
| | Furukawa Electric Co. Ltd. | | | Electrical Equipment | | | | 2,800 | | | | 67,335 | |
| | Fuyo General Lease Co. Ltd. | | | Diversified Financial Services | | | | 1,400 | | | | 83,942 | |
| | Glory Ltd. | | | Machinery | | | | 2,800 | | | | 78,501 | |
| | GMO Internet Inc. | | | IT Services | | | | 2,800 | | | | 48,085 | |
| | GMO Payment Gateway Inc. | | | IT Services | | | | 2,500 | | | | 167,245 | |
| | Goldwin Inc. | | | Textiles, Apparel & Luxury Goods | | | | 2,000 | | | | 171,362 | |
| | GS Yuasa Corp. | | | Electrical Equipment | | | | 4,200 | | | | 72,555 | |
| | GungHo Online Entertainment Inc. | | | Entertainment | | | | 2,250 | | | | 51,006 | |
| | Gunma Bank Ltd. | | | Banks | | | | 23,800 | | | | 77,076 | |
| | H2O Retailing Corp. | | | Multiline Retail | | | | 4,200 | | | | 45,896 | |
| | Hachijuni Bank Ltd. | | | Banks | | | | 23,800 | | | | 96,896 | |
| | Hakuhodo DY Holdings Inc. | | | Media | | | | 14,000 | | | | 202,211 | |
| | Hamamatsu Photonics K.K. | | | Electronic Equipment, Instruments & Components | | | | 7,000 | | | | 259,727 | |
| | Hankyu Hanshin Holdings Inc. | | | Road & Rail | | | | 12,600 | | | | 485,579 | |
| | Haseko Corp. | | | Household Durables | | | | 15,400 | | | | 179,257 | |
| | Heiwa Corp. | | | Leisure Products | | | | 2,800 | | | | 57,645 | |
| | Hikari Tsushin Inc. | | | Specialty Retail | | | | 1,400 | | | | 302,864 | |
| | Hino Motors Ltd. | | | Machinery | | | | 15,400 | | | | 126,819 | |
| | Hirose Electric Co. Ltd. | | | Electronic Equipment, Instruments & Components | | | | 1,800 | | | | 220,514 | |
| | HIS Co. Ltd. | | | Hotels, Restaurants & Leisure | | | | 1,400 | | | | 34,755 | |
| | Hisamitsu Pharmaceutical Co. Inc. | | | Pharmaceuticals | | | | 4,200 | | | | 183,622 | |
| | Hitachi Capital Corp. | | | Consumer Finance | | | | 2,800 | | | | 56,868 | |
| | Hitachi Chemical Co. Ltd. | | | Chemicals | | | | 5,600 | | | | 182,651 | |
| | Hitachi Construction Machinery Co. Ltd. | | | Machinery | | | | 5,600 | | | | 134,980 | |
| | | | | | |
| | | |
| franklintempleton.com | | Semiannual Report | | | 225 | |
FRANKLIN TEMPLETON ETF TRUST
STATEMENT OF INVESTMENTS (UNAUDITED)
Franklin FTSE Japan ETF(continued)
| | | | | | | | | | | | | | |
| | | | |
| | | | | Industry | | | Shares | | | Value | |
| | | Common Stocks (continued) | | | | | | | |
| | | Japan (continued) | | | | | | | | | |
| | Hitachi High-Technologies Corp. | | | Electronic Equipment, Instruments & Components | | | | 4,200 | | | $ | 242,498 | |
| | Hitachi Ltd. | | | Electronic Equipment, Instruments & Components | | | | 51,800 | | | | 1,928,211 | |
| | Hitachi Metals Ltd. | | | Metals & Mining | | | | 11,200 | | | | 120,835 | |
| | Hitachi Transport System Ltd. | | | Road & Rail | | | | 2,800 | | | | 81,869 | |
| | Hokkaido Electric Power Co. Inc. | | | Electric Utilities | | | | 9,800 | | | | 51,596 | |
| | Hokugin Financial Group Inc. | | | Banks | | | | 7,000 | | | | 67,684 | |
| a | | Hokuriku Electric Power Co. | | | Electric Utilities | | | | 9,800 | | | | 65,832 | |
| | Honda Motor Co. Ltd. | | | Automobiles | | | | 96,600 | | | | 2,501,366 | |
| | HORIBA Ltd. | | | Electronic Equipment, Instruments & Components | | | | 2,800 | | | | 161,666 | |
| | Hoshizaki Corp. | | | Machinery | | | | 2,800 | | | | 219,958 | |
| | House Foods Group Inc. | | | Food Products | | | | 4,200 | | | | 157,002 | |
| | Hoya Corp. | | | Health Care Equipment & Supplies | | | | 21,000 | | | | 1,713,616 | |
| | Ibiden Co. Ltd. | | | Electronic Equipment, Instruments & Components | | | | 5,600 | | | | 112,700 | |
| | Ichigo Inc. | | | Real Estate Management & Development | | | | 9,800 | | | | 39,445 | |
| | Idemitsu Kosan Co. Ltd. | | | Oil, Gas & Consumable Fuels | | | | 12,600 | | | | 356,169 | |
| | IHI Corp. | | | Machinery | | | | 7,000 | | | | 152,080 | |
| | Iida Group Holdings Co. Ltd. | | | Household Durables | | | | 8,400 | | | | 136,638 | |
| | INPEX Corp. | | | Oil, Gas & Consumable Fuels | | | | 51,800 | | | | 475,031 | |
| | Isetan Mitsukoshi Holdings Ltd. | | | Multiline Retail | | | | 19,600 | | | | 156,328 | |
| | Isuzu Motors Ltd. | | | Automobiles | | | | 29,400 | | | | 323,856 | |
| | Ito En Ltd. | | | Beverages | | | | 2,800 | | | | 131,871 | |
| | ITOCHU Corp. | | | Trading Companies & Distributors | | | | 77,000 | | | | 1,589,517 | |
| | ITOCHU Techno-Solutions Corp. | | | IT Services | | | | 5,600 | | | | 148,297 | |
| | Itoham Yonekyu Holdings Inc. | | | Food Products | | | | 8,400 | | | | 52,697 | |
| | Izumi Co. Ltd. | | | Multiline Retail | | | | 2,800 | | | | 109,591 | |
| | J Front Retailing Co. Ltd. | | | Multiline Retail | | | | 14,000 | | | | 163,738 | |
| | Japan Airlines Co. Ltd. | | | Airlines | | | | 7,000 | | | | 208,041 | |
| | Japan Airport Terminal Co. Ltd. | | | Transportation Infrastructure | | | | 2,800 | | | | 121,249 | |
| | Japan Aviatn Elect | | | Electronic Equipment, Instruments & Components | | | | 1,400 | | | | 19,833 | |
| | Japan Exchange Group Inc. | | | Capital Markets | | | | 29,400 | | | | 462,185 | |
| | Japan Petroleum Exploration Co. Ltd. | | | Oil, Gas & Consumable Fuels | | | | 1,400 | | | | 35,481 | |
| | Japan Post Bank Co. Ltd. | | | Banks | | | | 22,400 | | | | 217,005 | |
| | Japan Post Holdings Co. Ltd. | | | Insurance | | | | 74,200 | | | | 683,127 | |
| | Japan Post Insurance Co. Ltd. | | | Insurance | | | | 11,200 | | | | 168,920 | |
| | Japan Tobacco Inc. | | | Tobacco | | | | 65,800 | | | | 1,440,507 | |
| | JFE Holdings Inc. | | | Metals & Mining | | | | 28,000 | | | | 336,803 | |
| | JGC Holdings Corp. | | | Construction & Engineering | | | | 12,600 | | | | 164,736 | |
| | JSR Corp. | | | Chemicals | | | | 11,200 | | | | 179,179 | |
| | JTEKT Corp. | | | Machinery | | | | 12,600 | | | | 144,450 | |
| | Justsystems Corp. | | | Software | | | | 1,400 | | | | 52,982 | |
| | JXTG Holdings Inc. | | | Oil, Gas & Consumable Fuels | | | | 172,200 | | | | 784,560 | |
| | K’s Holdings Corp. | | | Specialty Retail | | | | 11,200 | | | | 121,871 | |
| | Kagome Co. Ltd. | | | Food Products | | | | 4,200 | | | | 106,054 | |
| | Kajima Corp. | | | Construction & Engineering | | | | 25,200 | | | | 330,404 | |
| | Kakaku.com Inc. | | | Interactive Media & Services | | | | 7,000 | | | | 172,158 | |
| | Kaken Pharmaceutical Co. Ltd. | | | Pharmaceuticals | | | | 1,400 | | | | 64,899 | |
| | Kamigumi Co. Ltd. | | | Transportation Infrastructure | | | | 5,600 | | | | 126,845 | |
| | Kandenko Co. Ltd. | | | Construction & Engineering | | | | 5,600 | | | | 50,054 | |
| | Kaneka Corp. | | | Chemicals | | | | 2,800 | | | | 87,180 | |
| | Kansai Electric Power Co. Inc. | | | Electric Utilities | | | | 40,600 | | | | 453,991 | |
| | Kansai Mirai Financial Group Inc | | | Banks | | | | 8,400 | | | | 52,774 | |
| | Kansai Paint Co. Ltd. | | | Chemicals | | | | 11,200 | | | | 260,219 | |
| | KAO Corp. | | | Personal Products | | | | 26,354 | | | | 1,946,892 | |
| | Kawasaki Heavy Industries Ltd. | | | Machinery | | | | 8,400 | | | | 185,915 | |
| a | | Kawasaki Kisen Kaisha Ltd. | | | Marine | | | | 4,200 | | | | 48,849 | |
| | KDDI Corp. | | | Wireless Telecommunication Services | | | | 96,600 | | | | 2,525,052 | |
| | Keihan Holdings Co. Ltd. | | | Industrial Conglomerates | | | | 5,600 | | | | 248,975 | |
| | Keikyu Corp. | | | Road & Rail | | | | 14,000 | | | | 271,386 | |
| | | | |
| | | |
| 226 | | Semiannual Report | | franklintempleton.com |
FRANKLIN TEMPLETON ETF TRUST
STATEMENT OF INVESTMENTS (UNAUDITED)
Franklin FTSE Japan ETF(continued)
| | | | | | | | | | | | | | |
| | | | |
| | | | | Industry | | | Shares | | | Value | |
| | | Common Stocks (continued) | | | | | | | |
| | | Japan (continued) | | | | | | | | | |
| | Keio Corp. | | | Road & Rail | | | | 7,000 | | | $ | 435,901 | |
| | Keisei Electric Railway Co. Ltd. | | | Road & Rail | | | | 8,400 | | | | 345,482 | |
| | Kewpie Corp. | | | Food Products | | | | 5,600 | | | | 130,731 | |
| | Keyence Corp. | | | Electronic Equipment, Instruments & Components | | | | 5,026 | | | | 3,111,167 | |
| | Kikkoman Corp. | | | Food Products | | | | 9,800 | | | | 467,897 | |
| | Kinden Corp. | | | Construction & Engineering | | | | 7,000 | | | | 103,826 | |
| | Kintetsu Group Holdings Co. Ltd. | | | Road & Rail | | | | 9,800 | | | | 510,516 | |
| | Kirin Holdings Co. Ltd. | | | Beverages | | | | 44,800 | | | | 948,438 | |
| | Kissei Pharmaceutical Co. Ltd. | | | Pharmaceuticals | | | | 1,400 | | | | 33,693 | |
| | Kobayashi Pharmaceutical Co. Ltd. | | | Personal Products | | | | 3,500 | | | | 266,204 | |
| | Kobe Bussan Co Ltd | | | Food & Staples Retailing | | | | 800 | | | | 38,788 | |
| | Kobe Steel Ltd. | | | Metals & Mining | | | | 16,800 | | | | 89,538 | |
| | Koei Tecmo Holdings Co. Ltd. | | | Entertainment | | | | 2,800 | | | | 60,806 | |
| | Koito Manufacturing Co. Ltd. | | | Auto Components | | | | 7,000 | | | | 341,985 | |
| | Kokuyo Co. Ltd. | | | Commercial Services & Supplies | | | | 4,200 | | | | 58,604 | |
| | Komatsu Ltd. | | | Machinery | | | | 50,400 | | | | 1,154,198 | |
| | Konami Holdings Corp. | | | Entertainment | | | | 5,600 | | | | 270,479 | |
| | Konica Minolta Inc. | | | Technology Hardware, Storage & Peripherals | | | | 25,200 | | | | 175,345 | |
| | KOSE Corp. | | | Personal Products | | | | 1,400 | | | | 236,410 | |
| | Kubota Corp. | | | Machinery | | | | 61,600 | | | | 931,623 | |
| | Kuraray Co. Ltd. | | | Chemicals | | | | 19,600 | | | | 240,659 | |
| | Kurita Water Industries Ltd. | | | Machinery | | | | 5,600 | | | | 149,903 | |
| | Kusuri No Aoki Holdings Co. Ltd. | | | Food & Staples Retailing | | | | 1,000 | | | | 68,101 | |
| | Kyocera Corp. | | | Electronic Equipment, Instruments & Components | | | | 16,800 | | | | 1,042,276 | |
| | Kyoritsu Maintenance Co. Ltd. | | | Hotels, Restaurants & Leisure | | | | 1,400 | | | | 59,912 | |
| | Kyowa Exeo Corp. | | | Construction & Engineering | | | | 5,600 | | | | 135,758 | |
| | Kyowa Kirin Co. Ltd. | | | Pharmaceuticals | | | | 14,000 | | | | 271,774 | |
| | Kyudenko Corp. | | | Construction & Engineering | | | | 2,800 | | | | 93,269 | |
| | Kyushu Electric Power Co. Inc. | | | Electric Utilities | | | | 25,200 | | | | 237,835 | |
| | Kyushu Financial Group Inc. | | | Banks | | | | 22,400 | | | | 91,196 | |
| | Kyushu Railway Co. | | | Road & Rail | | | | 8,400 | | | | 267,759 | |
| | Lawson Inc. | | | Food & Staples Retailing | | | | 2,800 | | | | 143,271 | |
| a | | Line Corp. | | | Interactive Media & Services | | | | 2,800 | | | | 100,134 | |
| | LINTEC Corp. | | | Chemicals | | | | 2,800 | | | | 55,365 | |
| | Lion Corp. | | | Household Products | | | | 14,000 | | | | 276,049 | |
| | LIXIL Group Corp. | | | Building Products | | | | 14,000 | | | | 246,125 | |
| | M3 Inc. | | | Health Care Technology | | | | 23,800 | | | | 573,006 | |
| | Mabuchi Motor Co. Ltd. | | | Electrical Equipment | | | | 2,800 | | | | 104,279 | |
| | Maeda Corp. | | | Construction & Engineering | | | | 7,000 | | | | 61,013 | |
| | Maeda Road Construction Co. Ltd. | | | Construction & Engineering | | | | 2,800 | | | | 60,884 | |
| | Makita Corp. | | | Machinery | | | | 14,000 | | | | 440,435 | |
| | Mani Inc. | | | Health Care Equipment & Supplies | | | | 2,800 | | | | 73,604 | |
| | Marubeni Corp. | | | Trading Companies & Distributors | | | | 85,400 | | | | 567,121 | |
| | Maruha Nichiro Corp. | | | Food Products | | | | 1,400 | | | | 35,287 | |
| | Marui Group Co. Ltd. | | | Multiline Retail | | | | 11,200 | | | | 236,488 | |
| | Maruichi Steel Tube Ltd. | | | Metals & Mining | | | | 4,200 | | | | 110,873 | |
| | Matsui Securities Co. Ltd. | | | Capital Markets | | | | 7,000 | | | | 58,811 | |
| | Matsumotokiyoshi Holdings Co. Ltd. | | | Food & Staples Retailing | | | | 4,200 | | | | 153,699 | |
| | Mazda Motor Corp. | | | Automobiles | | | | 32,200 | | | | 285,875 | |
| | Mebuki Financial Group Inc. | | | Banks | | | | 57,400 | | | | 141,276 | |
| | Medipal Holdings Corp. | | | Health Care Providers & Services | | | | 8,400 | | | | 187,003 | |
| | Megmilk Snow Brand Co. Ltd. | | | Food Products | | | | 2,800 | | | | 67,387 | |
| | Meiji Holdings Co. Ltd. | | | Food Products | | | | 7,000 | | | | 510,386 | |
| | Minebea Mitsumi Inc. | | | Machinery | | | | 22,400 | | | | 354,628 | |
| | Miraca Holdings Inc. | | | Health Care Providers & Services | | | | 2,800 | | | | 63,785 | |
| | MISUMI Group Inc. | | | Machinery | | | | 15,400 | | | | 362,361 | |
| | Mitsubishi Chemical Holdings Corp. | | | Chemicals | | | | 72,800 | | | | 518,744 | |
| | Mitsubishi Corp. | | | Trading Companies & Distributors | | | | 71,400 | | | | 1,751,389 | |
| | | | | | |
| | | |
| franklintempleton.com | | Semiannual Report | | | 227 | |
FRANKLIN TEMPLETON ETF TRUST
STATEMENT OF INVESTMENTS (UNAUDITED)
Franklin FTSE Japan ETF(continued)
| | | | | | | | | | | | | | |
| | | | |
| | | | | Industry | | | Shares | | | Value | |
| | | Common Stocks (continued) | | | | | | | |
| | | Japan (continued) | | | | | | | | | |
| | Mitsubishi Electric Corp. | | | Electrical Equipment | | | | 109,200 | | | $ | 1,447,412 | |
| | Mitsubishi Estate Co. Ltd. | | | Real Estate Management & Development | | | | 65,800 | | | | 1,268,815 | |
| | Mitsubishi Gas Chemical Co. Inc. | | | Chemicals | | | | 9,800 | | | | 130,757 | |
| | Mitsubishi Heavy Industries Ltd. | | | Machinery | | | | 15,400 | | | | 603,033 | |
| | Mitsubishi Logistics Corp. | | | Transportation Infrastructure | | | | 4,200 | | | | 106,754 | |
| | Mitsubishi Materials Corp. | | | Metals & Mining | | | | 7,000 | | | | 188,804 | |
| | Mitsubishi Motors Corp. | | | Automobiles | | | | 35,000 | | | | 151,885 | |
| | Mitsubishi Shokuhin Co. Ltd. | | | Food & Staples Retailing | | | | 1,400 | | | | 35,040 | |
| | Mitsubishi Tanabe Pharma Corp. | | | Pharmaceuticals | | | | 12,600 | | | | 138,154 | |
| | Mitsubishi UFJ Financial Group Inc. | | | Banks | | | | 694,400 | | | | 3,523,562 | |
| | Mitsubishi UFJ Lease & Finance Co. Ltd. | | | Diversified Financial Services | | | | 25,200 | | | | 145,499 | |
| | Mitsui & Co. Ltd. | | | Trading Companies & Distributors | | | | 93,800 | | | | 1,534,475 | |
| | Mitsui Chemicals Inc. | | | Chemicals | | | | 9,800 | | | | 219,077 | |
| | Mitsui Fudosan Co. Ltd. | | | Real Estate Management & Development | | | | 51,800 | | | | 1,284,036 | |
| | Mitsui Mining and Smelting Co. Ltd. | | | Metals & Mining | | | | 2,800 | | | | 66,143 | |
| | Mitsui O.S.K. Lines Ltd. | | | Marine | | | | 5,600 | | | | 141,457 | |
| | Miura Co. Ltd. | | | Machinery | | | | 5,600 | | | | 155,966 | |
| | Mizuho Financial Group Inc. | | | Banks | | | | 1,409,800 | | | | 2,160,193 | |
| | Mochida Pharmaceutical Co. Ltd. | | | Pharmaceuticals | | | | 1,400 | | | | 53,500 | |
| | Monotaro Co. Ltd. | | | Trading Companies & Distributors | | | | 7,000 | | | | 183,040 | |
| | Morinaga & Co. Ltd. | | | Food Products | | | | 2,800 | | | | 136,017 | |
| | Morinaga Milk Industry Co. Ltd. | | | Food Products | | | | 2,800 | | | | 106,741 | |
| | MS&AD Insurance Group Holdings Inc. | | | Insurance | | | | 26,600 | | | | 861,439 | |
| | Murata Manufacturing Co. Ltd. | | | Electronic Equipment, Instruments & Components | | | | 32,200 | | | | 1,544,825 | |
| | Nabtesco Corp. | | | Machinery | | | | 7,000 | | | | 216,655 | |
| | Nagase & Co. Ltd. | | | Trading Companies & Distributors | | | | 5,600 | | | | 78,035 | |
| | Nagoya Railroad Co. Ltd. | | | Road & Rail | | | | 11,200 | | | | 334,731 | |
| | Nankai Electric Railway Co. Ltd. | | | Road & Rail | | | | 5,600 | | | | 141,716 | |
| | NEC Corp. | | | Technology Hardware, Storage & Peripherals | | | | 14,000 | | | | 590,701 | |
| | Net One Systems Co. Ltd. | | | IT Services | | | | 4,200 | | | | 113,205 | |
| a | | Nexon Co. Ltd. | | | Entertainment | | | | 22,400 | | | | 271,722 | |
| | NGK Insulators Ltd. | | | Machinery | | | | 15,400 | | | | 219,298 | |
| | NGK Spark Plug Co. Ltd. | | | Auto Components | | | | 11,200 | | | | 213,274 | |
| | NH Foods Ltd. | | | Food Products | | | | 5,600 | | | | 225,140 | |
| | NHK Spring Co. Ltd. | | | Auto Components | | | | 8,400 | | | | 64,044 | |
| | Nichirei Corp. | | | Food Products | | | | 5,600 | | | | 127,674 | |
| | Nidec Corp. | | | Electrical Equipment | | | | 13,000 | | | | 1,746,565 | |
| | Nifco Inc. | | | Auto Components | | | | 4,200 | | | | 100,303 | |
| | Nihon Kohden Corp. | | | Health Care Equipment & Supplies | | | | 4,200 | | | | 123,387 | |
| | Nihon M&A Center Inc. | | | Professional Services | | | | 7,000 | | | | 196,900 | |
| | Nihon Unisys Ltd. | | | IT Services | | | | 4,200 | | | | 135,239 | |
| | Nikon Corp. | | | Household Durables | | | | 19,600 | | | | 244,467 | |
| | Nintendo Co. Ltd. | | | Entertainment | | | | 6,000 | | | | 2,221,790 | |
| | Nippo Corp. | | | Construction & Engineering | | | | 2,800 | | | | 51,790 | |
| | Nippon Electric Glass Co. Ltd. | | | Electronic Equipment, Instruments & Components | | | | 4,200 | | | | 93,424 | |
| | Nippon Express Co. Ltd. | | | Road & Rail | | | | 4,200 | | | | 214,129 | |
| | Nippon Kayaku Co. Ltd. | | | Chemicals | | | | 9,800 | | | | 116,974 | |
| | Nippon Paint Holdings Co. Ltd. | | | Chemicals | | | | 8,400 | | | | 436,031 | |
| | Nippon Paper Industries Co. Ltd. | | | Paper & Forest Products | | | | 5,600 | | | | 91,144 | |
| | Nippon Shinyaku Co. Ltd. | | | Pharmaceuticals | | | | 2,800 | | | | 235,503 | |
| | Nippon Shobukai Co. Ltd. | | | Chemicals | | | | 1,400 | | | | 79,537 | |
| | Nippon Steel Corp. | | | Metals & Mining | | | | 46,200 | | | | 643,573 | |
| | Nippon Telegraph & Telephone Corp. | | | Diversified Telecommunication Services | | | | 35,000 | | | | 1,669,766 | |
| | Nippon Television Holdings Inc. | | | Media | | | | 1,400 | | | | 17,928 | |
| | Nippon Yusen KK | | | Marine | | | | 9,800 | | | | 163,673 | |
| | Nipro Corp. | | | Health Care Equipment & Supplies | | | | 7,000 | | | | 78,566 | |
| | Nishi-Nippon Financial Holdings Inc. | | | Banks | | | | 8,400 | | | | 58,837 | |
| | Nishi-Nippon Railroad Co. Ltd. | | | Road & Rail | | | | 4,200 | | | | 92,180 | |
| | | | |
| | | |
| 228 | | Semiannual Report | | franklintempleton.com |
FRANKLIN TEMPLETON ETF TRUST
STATEMENT OF INVESTMENTS (UNAUDITED)
Franklin FTSE Japan ETF(continued)
| | | | | | | | | | | | | | |
| | | | |
| | | | | Industry | | | Shares | | | Value | |
| | | Common Stocks (continued) | | | | | | | |
| | | Japan (continued) | | | | | | | | | |
| | Nissan Chemical Corp. | | | Chemicals | | | | 7,000 | | | $ | 291,140 | |
| | Nissan Motor Co. Ltd. | | | Automobiles | | | | 106,400 | | | | 663,652 | |
| | Nissan Shatai Co. Ltd. | | | Automobiles | | | | 2,800 | | | | 22,669 | |
| | Nisshin Seifun Group Inc. | | | Food Products | | | | 14,000 | | | | 258,820 | |
| | Nisshinbo Holdings Inc. | | | Industrial Conglomerates | | | | 7,000 | | | | 54,536 | |
| | Nissin Foods Holdings Co. Ltd. | | | Food Products | | | | 4,200 | | | | 303,123 | |
| | Nitori Co. Ltd. | | | Specialty Retail | | | | 4,200 | | | | 614,407 | |
| | Nitto Denko Corp. | | | Chemicals | | | | 8,400 | | | | 404,475 | |
| | Noevir Holdings Co. Ltd. | | | Personal Products | | | | 1,400 | | | | 73,060 | |
| | NOF Corp. | | | Chemicals | | | | 4,200 | | | | 138,154 | |
| | NOK Corp. | | | Auto Components | | | | 7,000 | | | | 103,761 | |
| | Nomura Holdings Inc. | | | Capital Markets | | | | 183,400 | | | | 777,042 | |
| | Nomura Real Estate Holdings Inc. | | | Real Estate Management & Development | | | | 7,000 | | | | 151,173 | |
| | Nomura Research Institute Ltd. | | | IT Services | | | | 14,000 | | | | 278,640 | |
| | NS Solutions Corp. | | | IT Services | | | | 1,400 | | | | 45,663 | |
| | NSK Ltd. | | | Machinery | | | | 23,800 | | | | 200,398 | |
| | NTN Corp. | | | Machinery | | | | 21,000 | | | | 60,236 | |
| | NTT Data Corp. | | | IT Services | | | | 35,000 | | | | 451,446 | |
| | NTT DOCOMO Inc. | | | Wireless Telecommunication Services | | | | 64,400 | | | | 1,640,464 | |
| | Obayashi Corp. | | | Construction & Engineering | | | | 37,800 | | | | 376,339 | |
| | OBIC Business Consultants Co. Ltd. | | | Software | | | | 1,400 | | | | 56,674 | |
| | OBIC Co. Ltd. | | | IT Services | | | | 3,900 | | | | 444,580 | |
| | Odakyu Electric Railway Co. Ltd. | | | Road & Rail | | | | 16,800 | | | | 402,298 | |
| | Oji Holdings Corp. | | | Paper & Forest Products | | | | 51,800 | | | | 241,566 | |
| | Okuma Corp. | | | Machinery | | | | 1,400 | | | | 75,781 | |
| | Olympus Corp. | | | Health Care Equipment & Supplies | | | | 61,600 | | | | 829,883 | |
| | Omron Corp. | | | Electronic Equipment, Instruments & Components | | | | 11,200 | | | | 612,464 | |
| | Ono Pharmaceutical Co. Ltd. | | | Pharmaceuticals | | | | 23,800 | | | | 430,966 | |
| | Open House Co. Ltd. | | | Real Estate Management & Development | | | | 2,800 | | | | 66,687 | |
| | Oracle Corp. Japan | | | Software | | | | 1,895 | | | | 164,295 | |
| | Orient Corp. | | | Consumer Finance | | | | 32,200 | | | | 43,201 | |
| | Oriental Land Co. Ltd. | | | Hotels, Restaurants & Leisure | | | | 10,400 | | | | 1,582,012 | |
| | ORIX Corp. | | | Diversified Financial Services | | | | 71,400 | | | | 1,064,311 | |
| | Osaka Gas Co. Ltd. | | | Gas Utilities | | | | 21,000 | | | | 401,638 | |
| | OSG Corp. | | | Machinery | | | | 4,200 | | | | 86,817 | |
| | Otsuka Corp. | | | IT Services | | | | 5,600 | | | | 223,067 | |
| | Otsuka Holdings Co. Ltd. | | | Pharmaceuticals | | | | 23,800 | | | | 889,678 | |
| | Paltac Corp. | | | Distributors | | | | 1,400 | | | | 68,397 | |
| | Pan Pacific International Holdings Corp. | | | Multiline Retail | | | | 28,000 | | | | 467,638 | |
| | Panasonic Corp. | | | Household Durables | | | | 117,600 | | | | 952,769 | |
| | Park24 Co. Ltd. | | | Commercial Services & Supplies | | | | 5,600 | | | | 129,954 | |
| | Penta-Ocean Construction Co. Ltd. | | | Construction & Engineering | | | | 15,400 | | | | 85,211 | |
| a | | PeptiDream Inc. | | | Biotechnology | | | | 4,200 | | | | 199,362 | |
| | Persol Holdings Co. Ltd. | | | Professional Services | | | | 9,800 | | | | 185,164 | |
| | Pigeon Corp. | | | Household Products | | | | 5,600 | | | | 230,840 | |
| | Pilot Corp. | | | Commercial Services & Supplies | | | | 1,400 | | | | 51,816 | |
| | Pola Orbis Holdings Inc. | | | Personal Products | | | | 4,200 | | | | 94,007 | |
| | Rakuten Inc. | | | Internet & Direct Marketing Retail | | | | 44,800 | | | | 441,471 | |
| | Recruit Holdings Co. Ltd. | | | Professional Services | | | | 71,400 | | | | 2,170,904 | |
| | Relo Group Inc. | | | Real Estate Management & Development | | | | 5,600 | | | | 137,208 | |
| a | | Renesas Electronics Corp. | | | Semiconductors & Semiconductor Equipment | | | | 39,200 | | | | 254,623 | |
| | Rengo Co. Ltd. | | | Containers & Packaging | | | | 11,200 | | | | 80,625 | |
| | Resona Holdings Inc. | | | Banks | | | | 121,800 | | | | 521,799 | |
| | Resorttrust Inc. | | | Hotels, Restaurants & Leisure | | | | 4,200 | | | | 67,931 | |
| | Ricoh Co. Ltd. | | | Technology Hardware, Storage & Peripherals | | | | 37,800 | | | | 340,314 | |
| | Rinnai Corp. | | | Household Durables | | | | 1,400 | | | | 94,046 | |
| | Rohm Co. Ltd. | | | Semiconductors & Semiconductor Equipment | | | | 5,000 | | | | 381,679 | |
| | Rohto Pharmaceutical Co. Ltd. | | | Personal Products | | | | 5,600 | | | | 152,753 | |
| | | | | | |
| | | |
| franklintempleton.com | | Semiannual Report | | | 229 | |
FRANKLIN TEMPLETON ETF TRUST
STATEMENT OF INVESTMENTS (UNAUDITED)
Franklin FTSE Japan ETF(continued)
| | | | | | | | | | | | | | |
| | | | |
| | | | | Industry | | | Shares | | | Value | |
| | | Common Stocks (continued) | | | | | | | |
| | | Japan (continued) | | | | | | | | | |
| | Ryohin Keikaku Co. Ltd. | | | Multiline Retail | | | | 14,000 | | | $ | 261,411 | |
| | Sankyo Co. Ltd. | | | Leisure Products | | | | 2,800 | | | | 96,248 | |
| | Sankyu Inc. | | | Road & Rail | | | | 2,800 | | | | 145,344 | |
| | Sanrio Co. Ltd. | | | Specialty Retail | | | | 2,800 | | | | 53,914 | |
| | Santen Pharmaceutical Co. Ltd. | | | Pharmaceuticals | | | | 19,600 | | | | 340,586 | |
| | Sanwa Holdings Corp. | | | Building Products | | | | 11,200 | | | | 125,187 | |
| | Sapporo Holdings Ltd. | | | Beverages | | | | 4,200 | | | | 104,694 | |
| | Sawai Pharmaceutical Co. Ltd. | | | Pharmaceuticals | | | | 1,400 | | | | 72,283 | |
| | SBI Holdings Inc. | | | Capital Markets | | | | 12,600 | | | | 269,430 | |
| | SCREEN Holdings Co. Ltd. | | | Semiconductors & Semiconductor Equipment | | | | 2,000 | | | | 117,881 | |
| | SCSK Corp. | | | IT Services | | | | 1,400 | | | | 65,677 | |
| | Secom Co. Ltd. | | | Commercial Services & Supplies | | | | 11,200 | | | | 1,021,602 | |
| | Sega Sammy Holdings Inc. | | | Leisure Products | | | | 11,200 | | | | 156,691 | |
| | Seibu Holdings Inc. | | | Road & Rail | | | | 12,600 | | | | 219,531 | |
| | Seiko Epson Corp. | | | Technology Hardware, Storage & Peripherals | | | | 15,400 | | | | 216,590 | |
| | Seino Holdings Co. Ltd. | | | Road & Rail | | | | 8,400 | | | | 105,083 | |
| | Sekisui Chemical Co. Ltd. | | | Household Durables | | | | 19,600 | | | | 303,408 | |
| | Sekisui House Ltd. | | | Household Durables | | | | 32,200 | | | | 633,125 | |
| | Seven & i Holdings Co. Ltd. | | | Food & Staples Retailing | | | | 43,400 | | | | 1,659,300 | |
| | Seven Bank Ltd. | | | Banks | | | | 36,400 | | | | 99,694 | |
| | SG Holdings Co. Ltd. | | | Air Freight & Logistics | | | | 11,200 | | | | 274,106 | |
| | Sharp Corp. | | | Household Durables | | | | 8,400 | | | | 92,880 | |
| | Shikoku Electric Power Co. Inc. | | | Electric Utilities | | | | 8,400 | | | | 79,201 | |
| | Shimadzu Corp. | | | Electronic Equipment, Instruments & Components | | | | 15,400 | | | | 388,723 | |
| | Shimamura Co. Ltd. | | | Specialty Retail | | | | 1,400 | | | | 110,886 | |
| | SHIMANO Inc. | | | Leisure Products | | | | 4,200 | | | | 632,672 | |
| | Shimizu Corp. | | | Construction & Engineering | | | | 32,200 | | | | 291,387 | |
| | Shin-Etsu Chemical Co. Ltd. | | | Chemicals | | | | 22,400 | | | | 2,395,966 | |
| | Shinsei Bank Ltd. | | | Banks | | | | 9,800 | | | | 142,727 | |
| | Shionogi & Co. Ltd. | | | Pharmaceuticals | | | | 15,400 | | | | 854,819 | |
| | Shiseido Co. Ltd. | | | Personal Products | | | | 21,700 | | | | 1,732,587 | |
| | SHO-BOND Holdings Co. Ltd. | | | Construction & Engineering | | | | 2,800 | | | | 98,191 | |
| | Shochiku Co. Ltd. | | | Entertainment | | | | 495 | | | | 64,122 | |
| | Shoei Co. Ltd. | | | Real Estate Management & Development | | | | 21,000 | | | | 214,712 | |
| | Showa Denko K.K. | | | Chemicals | | | | 8,400 | | | | 219,570 | |
| | Sky Perfect JSAT Holdings Inc. | | | Media | | | | 7,000 | | | | 28,304 | |
| | Skylark Holdings Co. Ltd. | | | Hotels, Restaurants & Leisure | | | | 11,200 | | | | 203,740 | |
| | SMC Corp. | | | Machinery | | | | 3,213 | | | | 1,370,523 | |
| | Softbank Corp. | | | Wireless Telecommunication Services | | | | 89,600 | | | | 1,213,735 | |
| | SoftBank Group Corp. | | | Wireless Telecommunication Services | | | | 91,000 | | | | 3,570,113 | |
| | Sohgo Security Services Co. Ltd. | | | Commercial Services & Supplies | | | | 4,200 | | | | 219,958 | |
| | Sojitz Corp. | | | Trading Companies & Distributors | | | | 70,000 | | | | 216,979 | |
| | Sompo Holdings Inc. | | | Insurance | | | | 19,600 | | | | 819,183 | |
| | Sony Corp. | | | Household Durables | | | | 70,000 | | | | 4,110,941 | |
| | Sony Financial Holdings Inc. | | | Insurance | | | | 8,400 | | | | 182,029 | |
| | Sotetsu Holdings Inc. | | | Road & Rail | | | | 4,200 | | | | 109,707 | |
| | Square Enix Holdings Co. Ltd. | | | Entertainment | | | | 4,200 | | | | 204,025 | |
| | Stanley Electric Co. Ltd. | | | Auto Components | | | | 8,400 | | | | 221,979 | |
| | Subaru Corp. | | | Automobiles | | | | 33,600 | | | | 945,121 | |
| | Sugi Pharmacy Co. Ltd. | | | Food & Staples Retailing | | | | 1,400 | | | | 75,781 | |
| | Sumco Corp. | | | Semiconductors & Semiconductor Equipment | | | | 12,600 | | | | 169,049 | |
| | Sumitomo Bakelite Co. Ltd. | | | Chemicals | | | | 1,400 | | | | 54,666 | |
| | Sumitomo Chemical Co. Ltd. | | | Chemicals | | | | 84,000 | | | | 376,960 | |
| | Sumitomo Corp. | | | Trading Companies & Distributors | | | | 61,600 | | | | 962,117 | |
| | Sumitomo Dainippon Pharma Co. Ltd. | | | Pharmaceuticals | | | | 9,800 | | | | 160,953 | |
| | Sumitomo Electric Industries Ltd. | | | Auto Components | | | | 42,000 | | | | 532,797 | |
| | Sumitomo Forestry Co. Ltd. | | | Household Durables | | | | 7,000 | | | | 93,009 | |
| | Sumitomo Heavy Industries Ltd. | | | Machinery | | | | 7,000 | | | | 207,263 | |
| | | | |
| | | |
| 230 | | Semiannual Report | | franklintempleton.com |
FRANKLIN TEMPLETON ETF TRUST
STATEMENT OF INVESTMENTS (UNAUDITED)
Franklin FTSE Japan ETF(continued)
| | | | | | | | | | | | | | |
| | | | |
| | | | | Industry | | | Shares | | | Value | |
| | | Common Stocks (continued) | | | | | | | |
| | | Japan (continued) | | | | | | | | | |
| | Sumitomo Metal Mining Co. Ltd. | | | Metals & Mining | | | | 14,000 | | | $ | 433,569 | |
| | Sumitomo Mitsui Financial Group Inc. | | | Banks | | | | 72,800 | | | | 2,488,975 | |
| | Sumitomo Osaka Cement Co. Ltd. | | | Construction Materials | | | | 1,400 | | | | 59,912 | |
| | Sumitomo Realty & Development Co. Ltd. | | | Real Estate Management & Development | | | | 21,000 | | | | 799,195 | |
| | Sumitomo Rubber Industries Ltd. | | | Auto Components | | | | 11,200 | | | | 132,856 | |
| | Sundrug Co. Ltd. | | | Food & Staples Retailing | | | | 4,200 | | | | 132,130 | |
| | Suntory Beverage & Food Ltd. | | | Beverages | | | | 7,000 | | | | 299,237 | |
| | Suzuken Co. Ltd. | | | Health Care Providers & Services | | | | 4,200 | | | | 225,399 | |
| | Suzuki Motor Corp. | | | Automobiles | | | | 23,800 | | | | 1,010,137 | |
| | Sysmex Corp. | | | Health Care Equipment & Supplies | | | | 10,400 | | | | 695,932 | |
| | T&D Holdings Inc. | | | Insurance | | | | 30,800 | | | | 326,310 | |
| | Tadano Ltd. | | | Machinery | | | | 5,600 | | | | 53,319 | |
| | Taiheiyo Cement Corp. | | | Construction Materials | | | | 7,000 | | | | 187,250 | |
| | Taisei Corp. | | | Construction & Engineering | | | | 11,200 | | | | 433,699 | |
| | Taisho Pharmaceutical Holdings Co. Ltd. | | | Pharmaceuticals | | | | 2,800 | | | | 203,377 | |
| | Taiyo Nippon Sanso Corp. | | | Chemicals | | | | 8,400 | | | | 169,671 | |
| | Taiyo Yuden Co. Ltd. | | | Electronic Equipment, Instruments & Components | | | | 7,000 | | | | 170,280 | |
| | Takara Bio Inc. | | | Biotechnology | | | | 2,800 | | | | 57,023 | |
| | Takara Holdings Inc. | | | Beverages | | | | 9,800 | | | | 96,935 | |
| | Takashimaya Co. Ltd. | | | Multiline Retail | | | | 7,000 | | | | 81,545 | |
| | Takeda Pharmaceutical Co. Ltd. | | | Pharmaceuticals | | | | 85,400 | | | | 2,915,808 | |
| | TDK Corp. | | | Electronic Equipment, Instruments & Components | | | | 7,000 | | | | 626,324 | |
| | TechnoPro Holdings Inc. | | | Professional Services | | | | 1,400 | | | | 82,905 | |
| | Teijin Ltd. | | | Chemicals | | | | 9,800 | | | | 188,247 | |
| | Terumo Corp. | | | Health Care Equipment & Supplies | | | | 36,400 | | | | 1,172,075 | |
| | The 77 Bank Ltd. | | | Banks | | | | 4,200 | | | | 62,296 | |
| | The Bank of Kyoto Ltd. | | | Banks | | | | 4,200 | | | | 164,192 | |
| | The Chiba Bank Ltd. | | | Banks | | | | 36,400 | | | | 187,263 | |
| | The Chugoku Bank Ltd. | | | Banks | | | | 9,800 | | | | 92,038 | |
| | The Chugoku Electric Power Co. Inc. | | | Electric Utilities | | | | 15,400 | | | | 197,924 | |
| | TheDai-ichi Life Holdings Inc. | | | Insurance | | | | 61,600 | | | | 928,489 | |
| | The Hiroshima Bank Ltd. | | | Banks | | | | 16,800 | | | | 83,009 | |
| | The Iyo Bank Ltd. | | | Banks | | | | 15,400 | | | | 80,509 | |
| | The Japan Steel Works Ltd. | | | Machinery | | | | 2,800 | | | | 53,785 | |
| | The Shiga Bank Ltd. | | | Banks | | | | 2,800 | | | | 63,604 | |
| | The Shizuoka Bank Ltd. | | | Banks | | | | 28,000 | | | | 208,559 | |
| | THK Co. Ltd. | | | Machinery | | | | 7,000 | | | | 183,493 | |
| | TIS Inc. | | | IT Services | | | | 4,200 | | | | 242,110 | |
| | Tobu Railway Co. Ltd. | | | Road & Rail | | | | 11,200 | | | | 362,711 | |
| | Toda Corp. | | | Construction & Engineering | | | | 14,000 | | | | 80,444 | |
| | Toho Co. Ltd. | | | Entertainment | | | | 5,600 | | | | 245,348 | |
| | Toho Gas Co. Ltd. | | | Gas Utilities | | | | 5,600 | | | | 214,000 | |
| | Tohoku Electric Power Co. Inc. | | | Electric Utilities | | | | 25,200 | | | | 245,763 | |
| | Tokai Carbon Co. Ltd. | | | Chemicals | | | | 11,200 | | | | 112,648 | |
| | Tokai Rika Co. Ltd. | | | Auto Components | | | | 2,800 | | | | 47,308 | |
| | Tokio Marine Holdings Inc. | | | Insurance | | | | 36,400 | | | | 1,946,385 | |
| | Tokuyama Corp. | | | Chemicals | | | | 4,200 | | | | 96,261 | |
| | Tokyo Broadcasting System Holdings Inc. | | | Media | | | | 1,400 | | | | 22,644 | |
| | Tokyo Century Corp. | | | Diversified Financial Services | | | | 2,800 | | | | 129,410 | |
| a | | Tokyo Electric Power Co. Holdings Inc. | | | Electric Utilities | | | | 86,800 | | | | 424,864 | |
| | Tokyo Electron Ltd. | | | Semiconductors & Semiconductor Equipment | | | | 8,400 | | | | 1,598,390 | |
| | Tokyo Gas Co. Ltd. | | | Gas Utilities | | | | 23,800 | | | | 599,982 | |
| | Tokyo Tatemono Co. Ltd. | | | Real Estate Management & Development | | | | 11,200 | | | | 157,313 | |
| | TOKYU Corp. | | | Road & Rail | | | | 28,000 | | | | 525,413 | |
| | Tokyu Fudosan Holdings Corp. | | | Real Estate Management & Development | | | | 33,600 | | | | 214,207 | |
| | Topcon Corp. | | | Electronic Equipment, Instruments & Components | | | | 5,600 | | | | 74,252 | |
| | Toppan Printing Co. Ltd. | | | Commercial Services & Supplies | | | | 14,000 | | | | 247,680 | |
| | Toray Industries Inc. | | | Chemicals | | | | 85,400 | | | | 633,813 | |
| | | | | | |
| | | |
| franklintempleton.com | | Semiannual Report | | | 231 | |
FRANKLIN TEMPLETON ETF TRUST
STATEMENT OF INVESTMENTS (UNAUDITED)
Franklin FTSE Japan ETF(continued)
| | | | | | | | | | | | | | |
| | | | |
| | | | | Industry | | | Shares | | | Value | |
| | | Common Stocks (continued) | | | | | | | |
| | | Japan (continued) | | | | | | | | | |
| | Toshiba Corp. | | | Industrial Conglomerates | | | | 28,000 | | | $ | 854,962 | |
| | Toshiba Plant Systems & Services Corp. | | | Construction & Engineering | | | | 2,800 | | | | 46,686 | |
| | Tosoh Corp. | | | Chemicals | | | | 15,400 | | | | 203,481 | |
| | TOTO Ltd. | | | Building Products | | | | 8,400 | | | | 314,393 | |
| | Toyo Seikan Group Holdings Ltd. | | | Containers & Packaging | | | | 8,400 | | | | 130,265 | |
| | Toyo Suisan Kaisha Ltd. | | | Food Products | | | | 5,600 | | | | 224,363 | |
| | Toyo Tire Corp. | | | Auto Components | | | | 5,600 | | | | 70,780 | |
| | Toyobo Co. Ltd. | | | Chemicals | | | | 5,600 | | | | 73,423 | |
| | Toyoda Gosei Co. Ltd. | | | Auto Components | | | | 4,200 | | | | 84,058 | |
| | Toyota Boshoku Corp. | | | Auto Components | | | | 4,200 | | | | 58,720 | |
| | Toyota Industries Corp. | | | Auto Components | | | | 8,400 | | | | 481,888 | |
| | Toyota Motor Corp. | | | Automobiles | | | | 138,600 | | | | 9,254,107 | |
| | Toyota Tsusho Corp. | | | Trading Companies & Distributors | | | | 12,600 | | | | 406,301 | |
| | Trend Micro Inc. | | | Software | | | | 7,000 | | | | 332,917 | |
| | TS TECH Co. Ltd. | | | Auto Components | | | | 2,800 | | | | 84,978 | |
| | Tsumura & Co. | | | Pharmaceuticals | | | | 4,200 | | | | 112,311 | |
| | Tsuruha Holdings Inc. | | | Food & Staples Retailing | | | | 2,000 | | | | 217,812 | |
| | TV Asahi Holdings Corp. | | | Media | | | | 1,400 | | | | 21,957 | |
| | Ube Industries Ltd. | | | Chemicals | | | | 5,600 | | | | 112,907 | |
| | Ulvac Inc. | | | Semiconductors & Semiconductor Equipment | | | | 2,800 | | | | 112,440 | |
| | Unicharm Corp. | | | Household Products | | | | 21,000 | | | | 664,539 | |
| | Ushio Inc. | | | Electrical Equipment | | | | 7,000 | | | | 98,839 | |
| | USS Co. Ltd. | | | Specialty Retail | | | | 12,600 | | | | 244,480 | |
| | Wacoal Corp. | | | Textiles, Apparel & Luxury Goods | | | | 2,800 | | | | 71,946 | |
| | Welcia Holdings Co. Ltd. | | | Food & Staples Retailing | | | | 2,800 | | | | 140,939 | |
| | West Japan Railway Co. | | | Road & Rail | | | | 9,800 | | | | 827,979 | |
| | Yakult Honsha Co. Ltd. | | | Food Products | | | | 7,000 | | | | 391,210 | |
| | Yamada Denki Co. Ltd. | | | Specialty Retail | | | | 44,800 | | | | 216,798 | |
| | Yamaguchi Financial Group Inc. | | | Banks | | | | 12,600 | | | | 86,507 | |
| | Yamaha Corp. | | | Leisure Products | | | | 8,400 | | | | 376,960 | |
| | Yamaha Motor Co. Ltd. | | | Automobiles | | | | 15,400 | | | | 279,003 | |
| | Yamato Holdings Co. Ltd. | | | Air Freight & Logistics | | | | 19,600 | | | | 294,884 | |
| | Yamato Kogyo Co. Ltd. | | | Metals & Mining | | | | 1,400 | | | | 34,717 | |
| | Yamazaki Baking Co. Ltd. | | | Food Products | | | | 7,000 | | | | 124,876 | |
| | Yaoko Co. Ltd. | | | Food & Staples Retailing | | | | 1,400 | | | | 62,568 | |
| | YASKAWA Electric Corp. | | | Electronic Equipment, Instruments & Components | | | | 14,000 | | | | 513,625 | |
| | Yokogawa Electric Corp. | | | Electronic Equipment, Instruments & Components | | | | 14,000 | | | | 256,100 | |
| | Yokohama Rubber Co. Ltd. | | | Auto Components | | | | 5,600 | | | | 111,974 | |
| | Z Holdings Corp. | | | Interactive Media & Services | | | | 147,000 | | | | 413,491 | |
| | Zenkoku Hosho Co. Ltd. | | | Diversified Financial Services | | | | 2,800 | | | | 108,943 | |
| | Zensho Holdings Co. Ltd. | | | Hotels, Restaurants & Leisure | | | | 5,600 | | | | 120,731 | |
| | Zeon Corp. | | | Chemicals | | | | 8,400 | | | | 102,362 | |
| | Zozo Inc. | | | Internet & Direct Marketing Retail | | | | 9,800 | | | | 225,969 | |
| | | | | | | | | | | | | | |
| | Total Investments before Short Term Investments
(Cost $232,856,638) | | | | | | | | | | | 205,943,393 | |
| | | | | | | | | | | | | | |
| | | Short Term Investments
(Cost $64,467) 0.0%† | | | | | | | | | |
| | | United States 0.0%† | | | | | | | | | |
| b,c | | Institutional Fiduciary Trust Portfolio, 2.05% | | | | | | | 64,467 | | | | 64,467 | |
| | | | | | | | | | | | | | |
| | Total Investments (Cost $232,921,105) 99.1% | | | | | | | | | | | 206,007,860 | |
| | Other Assets, less Liabilities 0.9% | | | | | | | | | | | 1,849,455 | |
| | | | | | | | | | | | | | |
| | Net Assets 100.0% | | | | | | | | | | $ | 207,857,315 | |
| | | | | | | | | | | | | | |
| | | | |
| | | |
| 232 | | Semiannual Report | | franklintempleton.com |
FRANKLIN TEMPLETON ETF TRUST
STATEMENT OF INVESTMENTS (UNAUDITED)
Franklin FTSE Japan ETF(continued)
See Abbreviations on page 322.
†Rounds to less than 0.1% of net assets.
aNon-income producing.
bSee Note 4(a) regarding investments in affiliated management investment companies.
cThe rate shown is the annualizedseven-day effective yield at period end.
At September 30, 2019, the Fund had the following futures contracts outstanding. See Note 1(c).
| | | | | | | | | | | | | | | | | | | | |
| Futures Contracts | | | | | | | | | | | | | | | |
| | | | | |
| Description | | Type | | | Number of
Contracts | | | Notional
Amount* | | | Expiration
Date | | | Value/Unrealized
Appreciation
(Depreciation) | |
| Equity Contracts | | | | | | | | | | | | | | | |
Nikkei 225 Mini | | | Long | | | | 70 | | | $ | 1,409,391 | | | | 12/12/19 | | | $ | (6,935 | ) |
Nikkei 225 Mini | | | Long | | | | 7 | | | | 140,907 | | | | 10/10/19 | | | | 3,426 | |
| | | | | | | | | | | | | | | | | | | | |
Total Futures Contracts | | | | | | | | | | | | | | | | | | | (3,509 | ) |
| | | | | | | | | | | | | | | | | | | | |
*As of period end.
See Note 7 regarding other derivative information.
| | | | | | |
| | | |
| franklintempleton.com | | The accompanying notes are an integral part of these financial statements. | Semiannual Report | | | 233 | |
FRANKLIN TEMPLETON ETF TRUST
Financial Highlights
Franklin FTSE Japan Hedged ETF
| | | | | | | | | | | | |
| | | Six Months Ended
September 30, 2019
(unaudited) | | | Year Ended March 31, | |
| | | 2019 | | | 2018a | |
| | | |
Per share operating performance
(for a share outstanding throughout the period) | | | | | | | | | | | | |
| | | |
Net asset value, beginning of period | | $ | 23.12 | | | $ | 25.11 | | | $ | 25.91 | |
| | | | |
| | | |
| Income from investment operationsb: | | | | | | | | | | | | |
| | | |
Net investment incomec | | | 0.14 | | | | 0.38 | | | | 0.32 | |
| | | |
Net realized and unrealized gains (losses) | | | 0.35 | | | | (1.11 | ) | | | (1.11 | ) |
| | | | |
| | | |
Total from investment operations | | | 0.49 | | | | (0.73 | ) | | | (0.79 | ) |
| | | | |
| | | |
| Less distributions from: | | | | | | | | | | | | |
| | | |
Net investment income | | | — | | | | (0.01 | ) | | | (0.01 | ) |
| | | |
Net realized gains | | | — | | | | (1.25 | ) | | | — | d |
| | | | |
| | | |
Total distributions | | | — | | | | (1.26 | ) | | | (0.01 | ) |
| | | | |
| | | |
Net asset value, end of period | | $ | 23.61 | | | $ | 23.12 | | | $ | 25.11 | |
| | | | |
| | | |
Total returne | | | 2.16% | | | | (2.59)% | | | | (3.04)% | |
| | | |
| Ratios to average net assetsf | | | | | | | | | | | | |
| | | |
Total expenses | | | 0.09% | | | | 0.09% | | | | 0.09% | |
| | | |
Net investment income | | | 1.25% | | | | 1.51% | | | | 3.10% | |
| | | |
| Supplemental data | | | | | | | | | | | | |
| | | |
Net assets, end of period (000’s) | | | $4,723 | | | | $13,870 | | | | $45,197 | |
| | | |
Portfolio turnover rateg | | | 6.19% | | | | 19.78% | | | | 1.92% | |
| | | |
| Portfolio turnover rate excluding portfolio transactions that are executed as a result of the Fund offering and redeeming Creation Units solely or in part for cashg,h | | | 6.19% | | | | 0.00% | | | | 0.00% | |
aFor the period November 2, 2017 (commencement of operations) to March 31, 2018.
bThe amount shown for a share outstanding throughout the period may not correlate with the Statement of Operations for the period due to the timing of sales and repurchases of Creation Unit Fund shares in relation to income earned and/or fluctuating fair value of the investments of the Fund.
cBased on average daily shares outstanding.
dAmount rounds to less than $0.001 per share.
eTotal return is not annualized for periods less than one year. Total return is calculated assuming an initial investment made at the net asset value at the beginning of the period, reinvestment of all dividends and distributions at net asset value during the period, and redemption at net asset value on the last day of the period.
fRatios are annualized for periods less than one year, except for non-recurring expenses, if any.
gPortfolio turnover rate excludes the value of portfolio securities received or delivered as a result of processing capital share transactions in Creation Units, if any.
hEffective September 30, 2019.
| | | | |
| | | |
| 234 | | Semiannual Report | The accompanying notes are an integral part of these financial statements. | | franklintempleton.com |
FRANKLIN TEMPLETON ETF TRUST
Statement of Investments, September 30, 2019 (unaudited)
Franklin FTSE Japan Hedged ETF
| | | | | | | | | | | | | | |
| | | |
| | | Industry | | | Shares | | | Value | |
| | | Common Stocks 98.8% | | | | | | | | | |
| | | Japan 98.8% | | | | | | | | | |
| | ABC-Mart Inc. | | | Specialty Retail | | | | 34 | | | $ | 2,161 | |
| | Acom Co. Ltd. | | | Consumer Finance | | | | 668 | | | | 2,621 | |
| | Advantest Corp. | | | Semiconductors & Semiconductor Equipment | | | | 250 | | | | 11,046 | |
| | AEON Co. Ltd. | | | Food & Staples Retailing | | | | 868 | | | | 15,906 | |
| | AEON Financial Service Co. Ltd. | | | Consumer Finance | | | | 134 | | | | 2,016 | |
| | AEON Mall Co. Ltd. | | | Real Estate Management & Development | | | | 168 | | | | 2,650 | |
| | AGC Inc. | | | Building Products | | | | 234 | | | | 7,253 | |
| | Aica Kogyo Co. Ltd. | | | Building Products | | | | 68 | | | | 2,001 | |
| | AIN Holdings Inc. | | | Food & Staples Retailing | | | | 34 | | | | 1,979 | |
| | Air Water Inc. | | | Chemicals | | | | 200 | | | | 3,575 | |
| | Aisin Seiki Co. Ltd. | | | Auto Components | | | | 214 | | | | 6,722 | |
| | Ajinomoto Co. Inc. | | | Food Products | | | | 614 | | | | 11,590 | |
| | Alfresa Holdings Corp. | | | Health Care Providers & Services | | | | 200 | | | | 4,465 | |
| | Alps Alpine Co. Ltd. | | | Electronic Equipment, Instruments & Components | | | | 268 | | | | 5,002 | |
| | Amada Holdings Co. Ltd. | | | Machinery | | | | 434 | | | | 4,674 | |
| | Amano Corp. | | | Electronic Equipment, Instruments & Components | | | | 100 | | | | 3,044 | |
| | ANA Holdings Inc. | | | Airlines | | | | 142 | | | | 4,775 | |
| | Anritsu Corp. | | | Electronic Equipment, Instruments & Components | | | | 200 | | | | 3,921 | |
| | Aozora Bank Ltd. | | | Banks | | | | 168 | | | | 4,200 | |
| | Ariake Japan Co. Ltd. | | | Food Products | | | | 24 | | | | 1,870 | |
| | Asahi Group Holdings Ltd. | | | Beverages | | | | 481 | | | | 23,811 | |
| | Asahi Intecc Co. Ltd. | | | Health Care Equipment & Supplies | | | | 200 | | | | 5,250 | |
| | Asahi Kasei Corp. | | | Chemicals | | | | 1,561 | | | | 15,368 | |
| | Asics Corp. | | | Textiles, Apparel & Luxury Goods | | | | 200 | | | | 3,414 | �� |
| | ASKUL Corp. | | | Internet & Direct Marketing Retail | | | | 34 | | | | 918 | |
| | Astellas Pharma Inc. | | | Pharmaceuticals | | | | 2,300 | | | | 32,742 | |
| | Autobacs Seven Co. Ltd. | | | Specialty Retail | | | | 68 | | | | 1,112 | |
| | Azbil Corp. | | | Electronic Equipment, Instruments & Components | | | | 168 | | | | 4,491 | |
| | Bandai Namco Holdings Inc. | | | Leisure Products | | | | 245 | | | | 15,257 | |
| | Benefit One Inc. | | | Professional Services | | | | 68 | | | | 1,285 | |
| | Benesse Holdings Inc. | | | Diversified Consumer Services | | | | 100 | | | | 2,596 | |
| | BIC CAMERA Inc. | | | Specialty Retail | | | | 168 | | | | 1,767 | |
| | Bridgestone Corp. | | | Auto Components | | | | 746 | | | | 28,881 | |
| | Brother Industries Ltd. | | | Technology Hardware, Storage & Peripherals | | | | 300 | | | | 5,430 | |
| | Calbee Inc. | | | Food Products | | | | 100 | | | | 3,109 | |
| | CANON Inc. | | | Technology Hardware, Storage & Peripherals | | | | 1,300 | | | | 34,673 | |
| | Canon Marketing Japan Inc. | | | Electronic Equipment, Instruments & Components | | | | 68 | | | | 1,443 | |
| | Capcom Co. Ltd. | | | Entertainment | | | | 113 | | | | 2,993 | |
| | Casio Computer Co. Ltd. | | | Household Durables | | | | 268 | | | | 4,154 | |
| | Central Japan Railway Co. | | | Road & Rail | | | | 228 | | | | 46,876 | |
| | Chubu Electric Power Co. Inc. | | | Electric Utilities | | | | 885 | | | | 12,815 | |
| | Chugai Pharmaceutical Co. Ltd. | | | Pharmaceuticals | | | | 273 | | | | 21,219 | |
| | Chuo Mitsui Trust Holdings Inc. | | | Banks | | | | 468 | | | | 16,871 | |
| | Citizen Watch Co. Ltd. | | | Electronic Equipment, Instruments & Components | | | | 434 | | | | 2,120 | |
| | Coca-Cola Bottlers Japan Holdings Inc. | | | Beverages | | | | 168 | | | | 3,768 | |
| | COMSYS Holdings Corp. | | | Construction & Engineering | | | | 134 | | | | 3,794 | |
| | Concordia Financial Group Ltd. | | | Banks | | | | 1,568 | | | | 6,006 | |
| | Cosmo Energy Holdings Co. Ltd. | | | Oil, Gas & Consumable Fuels | | | | 80 | | | | 1,647 | |
| | Cosmos Pharmaceutical Corp. | | | Food & Staples Retailing | | | | 11 | | | | 2,153 | |
| | Credit Saison Co. Ltd. | | | Consumer Finance | | | | 200 | | | | 2,681 | |
| | CyberAgent Inc. | | | Media | | | | 124 | | | | 4,762 | |
| | Dai Nippon Printing Co. Ltd. | | | Commercial Services & Supplies | | | | 368 | | | | 9,503 | |
| | Daicel Corp. | | | Chemicals | | | | 268 | | | | 2,264 | |
| | Daido Steel Co. Ltd. | | | Metals & Mining | | | | 42 | | | | 1,646 | |
| | Daifuku Co. Ltd. | | | Machinery | | | | 120 | | | | 6,185 | |
| | Daiichi Sankyo Co. Ltd. | | | Pharmaceuticals | | | | 808 | | | | 50,869 | |
| | Daiichikosho Co. Ltd. | | | Entertainment | | | | 34 | | | | 1,570 | |
| | | | | | |
| | | |
| franklintempleton.com | | Semiannual Report | | | 235 | |
FRANKLIN TEMPLETON ETF TRUST
STATEMENT OF INVESTMENTS (UNAUDITED)
Franklin FTSE Japan Hedged ETF(continued)
| | | | | | | | | | | | | | |
| | | |
| | | Industry | | | Shares | | | Value | |
| | | Common Stocks (continued) | | | | | | | | | |
| | | Japan (continued) | | | | | | | | | |
| | Daikin Industries Ltd. | | | Building Products | | | | 326 | | | $ | 42,773 | |
| | Daishi Hokuetsu Financial Group Inc. | | | Banks | | | | 34 | | | | 855 | |
| | Daito Trust Construction Co. Ltd. | | | Real Estate Management & Development | | | | 86 | | | | 10,989 | |
| | Daiwa House Industry Co. Ltd. | | | Real Estate Management & Development | | | | 818 | | | | 26,536 | |
| | Daiwa Securities Group Inc. | | | Capital Markets | | | | 2,034 | | | | 9,060 | |
| | DeNA Co. Ltd. | | | Entertainment | | | | 134 | | | | 2,364 | |
| | Denka Co. Ltd. | | | Chemicals | | | | 100 | | | | 2,749 | |
| | Denso Corp. | | | Auto Components | | | | 574 | | | | 25,223 | |
| | Dentsu Inc. | | | Media | | | | 275 | | | | 9,682 | |
| | DIC Corp. | | | Chemicals | | | | 100 | | | | 2,774 | |
| | Disco Corp. | | | Semiconductors & Semiconductor Equipment | | | | 34 | | | | 6,437 | |
| | DMG Mori Co. Ltd. | | | Machinery | | | | 134 | | | | 1,898 | |
| | Dowa Holdings Co. Ltd. | | | Metals & Mining | | | | 68 | | | | 2,322 | |
| | East Japan Railway Co. | | | Road & Rail | | | | 447 | | | | 42,642 | |
| | EBARA Corp. | | | Machinery | | | | 134 | | | | 3,567 | |
| | Eisai Co. Ltd. | | | Pharmaceuticals | | | | 332 | | | | 16,868 | |
| | Electric Power Development Co. Ltd. | | | Independent Power and Renewable Electricity Producers | | | | 200 | | | | 4,562 | |
| | Ezaki Glico Co. Ltd. | | | Food Products | | | | 68 | | | | 2,822 | |
| | FamilyMart Co. Ltd. | | | Food & Staples Retailing | | | | 286 | | | | 6,968 | |
| | Fancl Corp. | | | Personal Products | | | | 83 | | | | 2,206 | |
| | FANUC Corp. | | | Machinery | | | | 257 | | | | 48,368 | |
| | Fast Retailing Co. Ltd. | | | Specialty Retail | | | | 65 | | | | 38,618 | |
| | FP Corp. | | | Containers & Packaging | | | | 34 | | | | 2,120 | |
| | Fuji Electric Co. Ltd. | | | Electrical Equipment | | | | 168 | | | | 5,138 | |
| | Fuji Media Holdings Inc. | | | Media | | | | 68 | | | | 875 | |
| | Fuji Oil Holdings Inc. | | | Food Products | | | | 68 | | | | 1,969 | |
| | Fuji Seal International Inc. | | | Containers & Packaging | | | | 68 | | | | 1,717 | |
| | FUJIFILM Holdings Corp. | | | Technology Hardware, Storage & Peripherals | | | | 456 | | | | 19,999 | |
| | Fujikura Ltd. | | | Electrical Equipment | | | | 534 | | | | 2,046 | |
| | Fujitsu General Ltd. | | | Household Durables | | | | 68 | | | | 1,132 | |
| | Fujitsu Ltd. | | | IT Services | | | | 240 | | | | 19,220 | |
| | Fukuoka Financial Group Inc. | | | Banks | | | | 200 | | | | 3,777 | |
| | Fukuyama Transporting Co. Ltd. | | | Road & Rail | | | | 34 | | | | 1,192 | |
| | Furukawa Electric Co. Ltd. | | | Electrical Equipment | | | | 78 | | | | 1,876 | |
| | Fuyo General Lease Co. Ltd. | | | Diversified Financial Services | | | | 25 | | | | 1,499 | |
| | Glory Ltd. | | | Machinery | | | | 68 | | | | 1,906 | |
| | GMO Internet Inc. | | | IT Services | | | | 100 | | | | 1,717 | |
| | GMO Payment Gateway Inc. | | | IT Services | | | | 52 | | | | 3,479 | |
| | Goldwin Inc. | | | Textiles, Apparel & Luxury Goods | | | | 44 | | | | 3,770 | |
| | GS Yuasa Corp. | | | Electrical Equipment | | | | 100 | | | | 1,728 | |
| | GungHo Online Entertainment Inc. | | | Entertainment | | | | 50 | | | | 1,133 | |
| | Gunma Bank Ltd. | | | Banks | | | | 734 | | | | 2,377 | |
| | H2O Retailing Corp. | | | Multiline Retail | | | | 100 | | | | 1,093 | |
| | Hachijuni Bank Ltd. | | | Banks | | | | 568 | | | | 2,312 | |
| | Hakuhodo DY Holdings Inc. | | | Media | | | | 300 | | | | 4,333 | |
| | Hamamatsu Photonics K.K. | | | Electronic Equipment, Instruments & Components | | | | 168 | | | | 6,233 | |
| | Hankyu Hanshin Holdings Inc. | | | Road & Rail | | | | 275 | | | | 10,598 | |
| | Haseko Corp. | | | Household Durables | | | | 268 | | | | 3,120 | |
| | Heiwa Corp. | | | Leisure Products | | | | 68 | | | | 1,400 | |
| | Hikari Tsushin Inc. | | | Specialty Retail | | | | 29 | | | | 6,274 | |
| | Hino Motors Ltd. | | | Machinery | | | | 368 | | | | 3,030 | |
| | Hirose Electric Co. Ltd. | | | Electronic Equipment, Instruments & Components | | | | 42 | | | | 5,145 | |
| | HIS Co. Ltd. | | | Hotels, Restaurants & Leisure | | | | 34 | | | | 844 | |
| | Hisamitsu Pharmaceutical Co. Inc. | | | Pharmaceuticals | | | | 100 | | | | 4,372 | |
| | Hitachi Capital Corp. | | | Consumer Finance | | | | 68 | | | | 1,381 | |
| | Hitachi Chemical Co. Ltd. | | | Chemicals | | | | 134 | | | | 4,371 | |
| | Hitachi Construction Machinery Co. Ltd. | | | Machinery | | | | 134 | | | | 3,230 | |
| | | | |
| | | |
| 236 | | Semiannual Report | | franklintempleton.com |
FRANKLIN TEMPLETON ETF TRUST
STATEMENT OF INVESTMENTS (UNAUDITED)
Franklin FTSE Japan Hedged ETF(continued)
| | | | | | | | | | | | | | |
| | | |
| | | Industry | | | Shares | | | Value | |
| | | Common Stocks (continued) | | | | | | | | | |
| | | Japan (continued) | | | | | | | | | |
| | Hitachi High-Technologies Corp. | | | Electronic Equipment, Instruments & Components | | | | 80 | | | $ | 4,619 | |
| | Hitachi Ltd. | | | Electronic Equipment, Instruments & Components | | | | 1,168 | | | | 43,478 | |
| | Hitachi Metals Ltd. | | | Metals & Mining | | | | 268 | | | | 2,891 | |
| | Hitachi Transport System Ltd. | | | Road & Rail | | | | 52 | | | | 1,520 | |
| | Hokkaido Electric Power Co. Inc. | | | Electric Utilities | | | | 134 | | | | 705 | |
| | Hokugin Financial Group Inc. | | | Banks | | | | 134 | | | | 1,296 | |
| a | | Hokuriku Electric Power Co. | | | Electric Utilities | | | | 200 | | | | 1,344 | |
| | Honda Motor Co. Ltd. | | | Automobiles | | | | 2,206 | | | | 57,122 | |
| | HORIBA Ltd. | | | Electronic Equipment, Instruments & Components | | | | 46 | | | | 2,656 | |
| | Hoshizaki Corp. | | | Machinery | | | | 68 | | | | 5,342 | |
| | House Foods Group Inc. | | | Food Products | | | | 100 | | | | 3,738 | |
| | Hoya Corp. | | | Health Care Equipment & Supplies | | | | 459 | | | | 37,455 | |
| | Ibiden Co. Ltd. | | | Electronic Equipment, Instruments & Components | | | | 134 | | | | 2,697 | |
| | Ichigo Inc. | | | Real Estate Management & Development | | | | 400 | | | | 1,610 | |
| | Idemitsu Kosan Co. Ltd. | | | Oil, Gas & Consumable Fuels | | | | 297 | | | | 8,395 | |
| | IHI Corp. | | | Machinery | | | | 168 | | | | 3,650 | |
| | Iida Group Holdings Co. Ltd. | | | Household Durables | | | | 168 | | | | 2,733 | |
| | INPEX Corp. | | | Oil, Gas & Consumable Fuels | | | | 1,160 | | | | 10,638 | |
| | Isetan Mitsukoshi Holdings Ltd. | | | Multiline Retail | | | | 334 | | | | 2,664 | |
| | Isuzu Motors Ltd. | | | Automobiles | | | | 634 | | | | 6,984 | |
| | Ito En Ltd. | | | Beverages | | | | 68 | | | | 3,203 | |
| | ITOCHU Corp. | | | Trading Companies & Distributors | | | | 1,738 | | | | 35,878 | |
| | ITOCHU Techno-Solutions Corp. | | | IT Services | | | | 100 | | | | 2,648 | |
| | Itoham Yonekyu Holdings Inc. | | | Food Products | | | | 68 | | | | 427 | |
| | Izumi Co. Ltd. | | | Multiline Retail | | | | 52 | | | | 2,035 | |
| | J Front Retailing Co. Ltd. | | | Multiline Retail | | | | 300 | | | | 3,509 | |
| | Japan Airlines Co. Ltd. | | | Airlines | | | | 146 | | | | 4,339 | |
| | Japan Airport Terminal Co. Ltd. | | | Transportation Infrastructure | | | | 68 | | | | 2,945 | |
| | Japan Aviatn Elect | | | Electronic Equipment, Instruments & Components | | | | 68 | | | | 963 | |
| | Japan Exchange Group Inc. | | | Capital Markets | | | | 668 | | | | 10,501 | |
| | Japan Petroleum Exploration Co. Ltd. | | | Oil, Gas & Consumable Fuels | | | | 34 | | | | 862 | |
| | Japan Post Bank Co. Ltd. | | | Banks | | | | 525 | | | | 5,086 | |
| | Japan Post Holdings Co. Ltd. | | | Insurance | | | | 1,734 | | | | 15,964 | |
| | Japan Post Insurance Co. Ltd. | | | Insurance | | | | 249 | | | | 3,755 | |
| | Japan Tobacco Inc. | | | Tobacco | | | | 1,500 | | | | 32,838 | |
| | JFE Holdings Inc. | | | Metals & Mining | | | | 653 | | | | 7,855 | |
| | JGC Holdings Corp. | | | Construction & Engineering | | | | 268 | | | | 3,504 | |
| | JSR Corp. | | | Chemicals | | | | 234 | | | | 3,744 | |
| | JTEKT Corp. | | | Machinery | | | | 300 | | | | 3,439 | |
| | Justsystems Corp. | | | Software | | | | 50 | | | | 1,892 | |
| | JXTG Holdings Inc. | | | Oil, Gas & Consumable Fuels | | | | 4,016 | | | | 18,297 | |
| | K’s Holdings Corp. | | | Specialty Retail | | | | 234 | | | | 2,546 | |
| | Kagome Co. Ltd. | | | Food Products | | | | 100 | | | | 2,525 | |
| | Kajima Corp. | | | Construction & Engineering | | | | 568 | | | | 7,447 | |
| | Kakaku.com Inc. | | | Interactive Media & Services | | | | 168 | | | | 4,132 | |
| | Kaken Pharmaceutical Co. Ltd. | | | Pharmaceuticals | | | | 40 | | | | 1,854 | |
| | Kamigumi Co. Ltd. | | | Transportation Infrastructure | | | | 134 | | | | 3,035 | |
| | Kandenko Co. Ltd. | | | Construction & Engineering | | | | 134 | | | | 1,198 | |
| | Kaneka Corp. | | | Chemicals | | | | 68 | | | | 2,117 | |
| | Kansai Electric Power Co. Inc. | | | Electric Utilities | | | | 920 | | | | 10,287 | |
| | Kansai Mirai Financial Group Inc | | | Banks | | | | 200 | | | | 1,257 | |
| | Kansai Paint Co. Ltd. | | | Chemicals | | | | 247 | | | | 5,739 | |
| | KAO Corp. | | | Personal Products | | | | 581 | | | | 42,921 | |
| | Kawasaki Heavy Industries Ltd. | | | Machinery | | | | 178 | | | | 3,940 | |
| a | | Kawasaki Kisen Kaisha Ltd. | | | Marine | | | | 100 | | | | 1,163 | |
| | KDDI Corp. | | | Wireless Telecommunication Services | | | | 2,149 | | | | 56,173 | |
| | Keihan Holdings Co. Ltd. | | | Industrial Conglomerates | | | | 123 | | | | 5,469 | |
| | | | | | |
| | | |
| franklintempleton.com | | Semiannual Report | | | 237 | |
FRANKLIN TEMPLETON ETF TRUST
STATEMENT OF INVESTMENTS (UNAUDITED)
Franklin FTSE Japan Hedged ETF(continued)
| | | | | | | | | | | | | | |
| | | |
| | | Industry | | | Shares | | | Value | |
| | | Common Stocks (continued) | | | | | | | | | |
| | | Japan (continued) | | | | | | | | | |
| | Keikyu Corp. | | | Road & Rail | | | | 300 | | | $ | 5,815 | |
| | Keio Corp. | | | Road & Rail | | | | 145 | | | | 9,029 | |
| | Keisei Electric Railway Co. Ltd. | | | Road & Rail | | | | 176 | | | | 7,239 | |
| | Kewpie Corp. | | | Food Products | | | | 134 | | | | 3,128 | |
| | Keyence Corp. | | | Electronic Equipment, Instruments & Components | | | | 111 | | | | 68,711 | |
| | Kikkoman Corp. | | | Food Products | | | | 234 | | | | 11,172 | |
| | Kinden Corp. | | | Construction & Engineering | | | | 168 | | | | 2,492 | |
| | Kintetsu Group Holdings Co. Ltd. | | | Road & Rail | | | | 224 | | | | 11,669 | |
| | Kirin Holdings Co. Ltd. | | | Beverages | | | | 1,016 | | | | 21,509 | |
| | Kissei Pharmaceutical Co. Ltd. | | | Pharmaceuticals | | | | 34 | | | | 818 | |
| | Kobayashi Pharmaceutical Co. Ltd. | | | Personal Products | | | | 76 | | | | 5,780 | |
| | Kobe Steel Ltd. | | | Metals & Mining | | | | 300 | | | | 1,599 | |
| | Koei Tecmo Holdings Co. Ltd. | | | Entertainment | | | | 84 | | | | 1,824 | |
| | Koito Manufacturing Co. Ltd. | | | Auto Components | | | | 142 | | | | 6,937 | |
| | Kokuyo Co. Ltd. | | | Commercial Services & Supplies | | | | 100 | | | | 1,395 | |
| | Komatsu Ltd. | | | Machinery | | | | 1,149 | | | | 26,313 | |
| | Konami Holdings Corp. | | | Entertainment | | | | 119 | | | | 5,748 | |
| | Konica Minolta Inc. | | | Technology Hardware, Storage & Peripherals | | | | 468 | | | | 3,256 | |
| | KOSE Corp. | | | Personal Products | | | | 36 | | | | 6,079 | |
| | Kubota Corp. | | | Machinery | | | | 1,396 | | | | 21,113 | |
| | Kuraray Co. Ltd. | | | Chemicals | | | | 434 | | | | 5,329 | |
| | Kurita Water Industries Ltd. | | | Machinery | | | | 134 | | | | 3,587 | |
| | Kusuri No Aoki Holdings Co. Ltd. | | | Food & Staples Retailing | | | | 10 | | | | 681 | |
| | Kyocera Corp. | | | Electronic Equipment, Instruments & Components | | | | 386 | | | | 23,948 | |
| | Kyoritsu Maintenance Co. Ltd. | | | Hotels, Restaurants & Leisure | | | | 34 | | | | 1,455 | |
| | Kyowa Exeo Corp. | | | Construction & Engineering | | | | 134 | | | | 3,248 | |
| | Kyowa Kirin Co. Ltd. | | | Pharmaceuticals | | | | 334 | | | | 6,484 | |
| | Kyudenko Corp. | | | Construction & Engineering | | | | 45 | | | | 1,499 | |
| | Kyushu Electric Power Co. Inc. | | | Electric Utilities | | | | 568 | | | | 5,361 | |
| | Kyushu Financial Group Inc. | | | Banks | | | | 268 | | | | 1,091 | |
| | Kyushu Railway Co. | | | Road & Rail | | | | 200 | | | | 6,375 | |
| | Lawson Inc. | | | Food & Staples Retailing | | | | 68 | | | | 3,479 | |
| a | | Line Corp. | | | Interactive Media & Services | | | | 68 | | | | 2,432 | |
| | LINTEC Corp. | | | Chemicals | | | | 68 | | | | 1,345 | |
| | Lion Corp. | | | Household Products | | | | 314 | | | | 6,191 | |
| | LIXIL Group Corp. | | | Building Products | | | | 334 | | | | 5,872 | |
| | M3 Inc. | | | Health Care Technology | | | | 527 | | | | 12,688 | |
| | Mabuchi Motor Co. Ltd. | | | Electrical Equipment | | | | 68 | | | | 2,533 | |
| | Maeda Corp. | | | Construction & Engineering | | | | 168 | | | | 1,464 | |
| | Maeda Road Construction Co. Ltd. | | | Construction & Engineering | | | | 68 | | | | 1,479 | |
| | Makita Corp. | | | Machinery | | | | 307 | | | | 9,658 | |
| | Mani Inc. | | | Health Care Equipment & Supplies | | | | 100 | | | | 2,629 | |
| | Marubeni Corp. | | | Trading Companies & Distributors | | | | 1,968 | | | | 13,069 | |
| | Maruha Nichiro Corp. | | | Food Products | | | | 43 | | | | 1,084 | |
| | Marui Group Co. Ltd. | | | Multiline Retail | | | | 268 | | | | 5,659 | |
| | Maruichi Steel Tube Ltd. | | | Metals & Mining | | | | 78 | | | | 2,059 | |
| | Matsui Securities Co. Ltd. | | | Capital Markets | | | | 134 | | | | 1,126 | |
| | Matsumotokiyoshi Holdings Co. Ltd. | | | Food & Staples Retailing | | | | 100 | | | | 3,660 | |
| | Mazda Motor Corp. | | | Automobiles | | | | 724 | | | | 6,428 | |
| | Mebuki Financial Group Inc. | | | Banks | | | | 1,568 | | | | 3,859 | |
| | Medipal Holdings Corp. | | | Health Care Providers & Services | | | | 200 | | | | 4,452 | |
| | Megmilk Snow Brand Co. Ltd. | | | Food Products | | | | 46 | | | | 1,107 | |
| | Meiji Holdings Co. Ltd. | | | Food Products | | | | 168 | | | | 12,249 | |
| | Minebea Mitsumi Inc. | | | Machinery | | | | 534 | | | | 8,454 | |
| | Miraca Holdings Inc. | | | Health Care Providers & Services | | | | 68 | | | | 1,549 | |
| | MISUMI Group Inc. | | | Machinery | | | | 345 | | | | 8,118 | |
| | Mitsubishi Chemical Holdings Corp. | | | Chemicals | | | | 1,600 | | | | 11,401 | |
| | Mitsubishi Corp. | | | Trading Companies & Distributors | | | | 1,626 | | | | 39,885 | |
| | | | |
| | | |
| 238 | | Semiannual Report | | franklintempleton.com |
FRANKLIN TEMPLETON ETF TRUST
STATEMENT OF INVESTMENTS (UNAUDITED)
Franklin FTSE Japan Hedged ETF(continued)
| | | | | | | | | | | | | | |
| | | |
| | | Industry | | | Shares | | | Value | |
| | | Common Stocks (continued) | | | | | | | | | |
| | | Japan (continued) | | | | | | | | | |
| | Mitsubishi Electric Corp. | | | Electrical Equipment | | | | 2,487 | | | $ | 32,964 | |
| | Mitsubishi Estate Co. Ltd. | | | Real Estate Management & Development | | | | 1,488 | | | | 28,693 | |
| | Mitsubishi Gas Chemical Co. Inc. | | | Chemicals | | | | 234 | | | | 3,122 | |
| | Mitsubishi Heavy Industries Ltd. | | | Machinery | | | | 360 | | | | 14,097 | |
| | Mitsubishi Logistics Corp. | | | Transportation Infrastructure | | | | 81 | | | | 2,059 | |
| | Mitsubishi Materials Corp. | | | Metals & Mining | | | | 168 | | | | 4,531 | |
| | Mitsubishi Motors Corp. | | | Automobiles | | | | 700 | | | | 3,038 | |
| | Mitsubishi Shokuhin Co. Ltd. | | | Food & Staples Retailing | | | | 34 | | | | 851 | |
| | Mitsubishi Tanabe Pharma Corp. | | | Pharmaceuticals | | | | 300 | | | | 3,289 | |
| | Mitsubishi UFJ Financial Group Inc. | | | Banks | | | | 15,700 | | | | 79,666 | |
| | Mitsubishi UFJ Lease & Finance Co. Ltd. | | | Diversified Financial Services | | | | 534 | | | | 3,083 | |
| | Mitsui & Co. Ltd. | | | Trading Companies & Distributors | | | | 2,137 | | | | 34,959 | |
| | Mitsui Chemicals Inc. | | | Chemicals | | | | 234 | | | | 5,231 | |
| | Mitsui Fudosan Co. Ltd. | | | Real Estate Management & Development | | | | 1,181 | | | | 29,275 | |
| | Mitsui Mining and Smelting Co. Ltd. | | | Metals & Mining | | | | 68 | | | | 1,606 | |
| | Mitsui O.S.K. Lines Ltd. | | | Marine | | | | 134 | | | | 3,385 | |
| | Miura Co. Ltd. | | | Machinery | | | | 134 | | | | 3,732 | |
| | Mizuho Financial Group Inc. | | | Banks | | | | 32,300 | | | | 49,492 | |
| | Mochida Pharmaceutical Co. Ltd. | | | Pharmaceuticals | | | | 34 | | | | 1,299 | |
| | Monotaro Co. Ltd. | | | Trading Companies & Distributors | | | | 145 | | | | 3,792 | |
| | Morinaga & Co. Ltd. | | | Food Products | | | | 51 | | | | 2,477 | |
| | Morinaga Milk Industry Co. Ltd. | | | Food Products | | | | 52 | | | | 1,982 | |
| | MS&AD Insurance Group Holdings Inc. | | | Insurance | | | | 618 | | | | 20,014 | |
| | Murata Manufacturing Co. Ltd. | | | Electronic Equipment, Instruments & Components | | | | 713 | | | | 34,207 | |
| | Nabtesco Corp. | | | Machinery | | | | 144 | | | | 4,457 | |
| | Nagase & Co. Ltd. | | | Trading Companies & Distributors | | | | 134 | | | | 1,867 | |
| | Nagoya Railroad Co. Ltd. | | | Road & Rail | | | | 244 | | | | 7,292 | |
| | Nankai Electric Railway Co. Ltd. | | | Road & Rail | | | | 134 | | | | 3,391 | |
| | NEC Corp. | | | Technology Hardware, Storage & Peripherals | | | | 315 | | | | 13,291 | |
| | Net One Systems Co. Ltd. | | | IT Services | | | | 100 | | | | 2,695 | |
| a | | Nexon Co. Ltd. | | | Entertainment | | | | 518 | | | | 6,284 | |
| | NGK Insulators Ltd. | | | Machinery | | | | 268 | | | | 3,816 | |
| | NGK Spark Plug Co. Ltd. | | | Auto Components | | | | 247 | | | | 4,703 | |
| | NH Foods Ltd. | | | Food Products | | | | 134 | | | | 5,387 | |
| | NHK Spring Co. Ltd. | | | Auto Components | | | | 200 | | | | 1,525 | |
| | Nichirei Corp. | | | Food Products | | | | 134 | | | | 3,055 | |
| | Nidec Corp. | | | Electrical Equipment | | | | 287 | | | | 38,559 | |
| | Nifco Inc. | | | Auto Components | | | | 100 | | | | 2,388 | |
| | Nihon Kohden Corp. | | | Health Care Equipment & Supplies | | | | 100 | | | | 2,938 | |
| | Nihon M&A Center Inc. | | | Professional Services | | | | 168 | | | | 4,726 | |
| | Nihon Unisys Ltd. | | | IT Services | | | | 78 | | | | 2,512 | |
| | Nikon Corp. | | | Household Durables | | | | 434 | | | | 5,413 | |
| | Nintendo Co. Ltd. | | | Entertainment | | | | 133 | | | | 49,250 | |
| | Nippo Corp. | | | Construction & Engineering | | | | 68 | | | | 1,258 | |
| | Nippon Electric Glass Co. Ltd. | | | Electronic Equipment, Instruments & Components | | | | 100 | | | | 2,224 | |
| | Nippon Express Co. Ltd. | | | Road & Rail | | | | 100 | | | | 5,098 | |
| | Nippon Kayaku Co. Ltd. | | | Chemicals | | | | 200 | | | | 2,387 | |
| | Nippon Paint Holdings Co. Ltd. | | | Chemicals | | | | 200 | | | | 10,382 | |
| | Nippon Paper Industries Co. Ltd. | | | Paper & Forest Products | | | | 114 | | | | 1,855 | |
| | Nippon Shinyaku Co. Ltd. | | | Pharmaceuticals | | | | 64 | | | | 5,383 | |
| | Nippon Shobukai Co. Ltd. | | | Chemicals | | | | 39 | | | | 2,216 | |
| | Nippon Steel Corp. | | | Metals & Mining | | | | 1,025 | | | | 14,278 | |
| | Nippon Telegraph & Telephone Corp. | | | Diversified Telecommunication Services | | | | 781 | | | | 37,260 | |
| | Nippon Television Holdings Inc. | | | Media | | | | 68 | | | | 871 | |
| | Nippon Yusen KK | | | Marine | | | | 200 | | | | 3,340 | |
| | Nipro Corp. | | | Health Care Equipment & Supplies | | | | 134 | | | | 1,504 | |
| | Nishi-Nippon Financial Holdings Inc. | | | Banks | | | | 200 | | | | 1,401 | |
| | | | | | |
| | | |
| franklintempleton.com | | Semiannual Report | | | 239 | |
FRANKLIN TEMPLETON ETF TRUST
STATEMENT OF INVESTMENTS (UNAUDITED)
Franklin FTSE Japan Hedged ETF(continued)
| | | | | | | | | | | | | | |
| | | |
| | | Industry | | | Shares | | | Value | |
| | | Common Stocks (continued) | | | | | | | | | |
| | | Japan (continued) | | | | | | | | | |
| | Nishi-Nippon Railroad Co. Ltd. | | | Road & Rail | | | | 100 | | | $ | 2,195 | |
| | Nissan Chemical Corp. | | | Chemicals | | | | 168 | | | | 6,987 | |
| | Nissan Motor Co. Ltd. | | | Automobiles | | | | 2,546 | | | | 15,880 | |
| | Nissan Shatai Co. Ltd. | | | Automobiles | | | | 68 | | | | 551 | |
| | Nisshin Seifun Group Inc. | | | Food Products | | | | 316 | | | | 5,842 | |
| | Nisshinbo Holdings Inc. | | | Industrial Conglomerates | | | | 168 | | | | 1,309 | |
| | Nissin Foods Holdings Co. Ltd. | | | Food Products | | | | 88 | | | | 6,351 | |
| | Nitori Co. Ltd. | | | Specialty Retail | | | | 93 | | | | 13,605 | |
| | Nitto Denko Corp. | | | Chemicals | | | | 195 | | | | 9,390 | |
| | Noevir Holdings Co. Ltd. | | | Personal Products | | | | 23 | | | | 1,200 | |
| | NOF Corp. | | | Chemicals | | | | 100 | | | | 3,289 | |
| | NOK Corp. | | | Auto Components | | | | 168 | | | | 2,490 | |
| | Nomura Holdings Inc. | | | Capital Markets | | | | 4,100 | | | | 17,371 | |
| | Nomura Real Estate Holdings Inc. | | | Real Estate Management & Development | | | | 134 | | | | 2,894 | |
| | Nomura Research Institute Ltd. | | | IT Services | | | | 402 | | | | 8,001 | |
| | NS Solutions Corp. | | | IT Services | | | | 34 | | | | 1,109 | |
| | NSK Ltd. | | | Machinery | | | | 568 | | | | 4,783 | |
| | NTN Corp. | | | Machinery | | | | 734 | | | | 2,105 | |
| | NTT Data Corp. | | | IT Services | | | | 900 | | | | 11,609 | |
| | NTT DOCOMO Inc. | | | Wireless Telecommunication Services | | | | 1,482 | | | | 37,751 | |
| | Obayashi Corp. | | | Construction & Engineering | | | | 968 | | | | 9,637 | |
| | OBIC Business Consultants Co. Ltd. | | | Software | | | | 21 | | | | 850 | |
| | OBIC Co. Ltd. | | | IT Services | | | | 83 | | | | 9,462 | |
| | Odakyu Electric Railway Co. Ltd. | | | Road & Rail | | | | 380 | | | | 9,100 | |
| | Oji Holdings Corp. | | | Paper & Forest Products | | | | 1,100 | | | | 5,130 | |
| | Okuma Corp. | | | Machinery | | | | 34 | | | | 1,840 | |
| | Olympus Corp. | | | Health Care Equipment & Supplies | | | | 1,412 | | | | 19,023 | |
| | Omron Corp. | | | Electronic Equipment, Instruments & Components | | | | 234 | | | | 12,796 | |
| | Ono Pharmaceutical Co. Ltd. | | | Pharmaceuticals | | | | 551 | | | | 9,977 | |
| | Open House Co. Ltd. | | | Real Estate Management & Development | | | | 68 | | | | 1,620 | |
| | Oracle Corp. Japan | | | Software | | | | 40 | | | | 3,468 | |
| | Orient Corp. | | | Consumer Finance | | | | 1,100 | | | | 1,476 | |
| | Oriental Land Co. Ltd. | | | Hotels, Restaurants & Leisure | | | | 233 | | | | 35,443 | |
| | ORIX Corp. | | | Diversified Financial Services | | | | 1,617 | | | | 24,104 | |
| | Osaka Gas Co. Ltd. | | | Gas Utilities | | | | 500 | | | | 9,563 | |
| | OSG Corp. | | | Machinery | | | | 100 | | | | 2,067 | |
| | Otsuka Corp. | | | IT Services | | | | 134 | | | | 5,338 | |
| | Otsuka Holdings Co. Ltd. | | | Pharmaceuticals | | | | 526 | | | | 19,663 | |
| | Paltac Corp. | | | Distributors | | | | 40 | | | | 1,954 | |
| | Pan Pacific International Holdings Corp. | | | Multiline Retail | | | | 632 | | | | 10,555 | |
| | Panasonic Corp. | | | Household Durables | | | | 2,668 | | | | 21,616 | |
| | Park24 Co. Ltd. | | | Commercial Services & Supplies | | | | 143 | | | | 3,318 | |
| | Penta-Ocean Construction Co. Ltd. | | | Construction & Engineering | | | | 234 | | | | 1,295 | |
| a | | PeptiDream Inc. | | | Biotechnology | | | | 105 | | | | 4,984 | |
| | Persol Holdings Co. Ltd. | | | Professional Services | | | | 210 | | | | 3,968 | |
| | Pigeon Corp. | | | Household Products | | | | 134 | | | | 5,524 | |
| | Pilot Corp. | | | Commercial Services & Supplies | | | | 41 | | | | 1,517 | |
| | Pola Orbis Holdings Inc. | | | Personal Products | | | | 100 | | | | 2,238 | |
| | Rakuten Inc. | | | Internet & Direct Marketing Retail | | | | 993 | | | | 9,785 | |
| | Recruit Holdings Co. Ltd. | | | Professional Services | | | | 1,611 | | | | 48,982 | |
| | Relo Group Inc. | | | Real Estate Management & Development | | | | 134 | | | | 3,283 | |
| a | | Renesas Electronics Corp. | | | Semiconductors & Semiconductor Equipment | | | | 900 | | | | 5,846 | |
| | Rengo Co. Ltd. | | | Containers & Packaging | | | | 268 | | | | 1,929 | |
| | Resona Holdings Inc. | | | Banks | | | | 2,534 | | | | 10,856 | |
| | Resorttrust Inc. | | | Hotels, Restaurants & Leisure | | | | 68 | | | | 1,100 | |
| | Ricoh Co. Ltd. | | | Technology Hardware, Storage & Peripherals | | | | 759 | | | | 6,833 | |
| | Rinnai Corp. | | | Household Durables | | | | 44 | | | | 2,956 | |
| | | | |
| | | |
| 240 | | Semiannual Report | | franklintempleton.com |
FRANKLIN TEMPLETON ETF TRUST
STATEMENT OF INVESTMENTS (UNAUDITED)
Franklin FTSE Japan Hedged ETF(continued)
| | | | | | | | | | | | | | |
| | | |
| | | Industry | | | Shares | | | Value | |
| | | Common Stocks (continued) | | | | | | | | | |
| | | Japan (continued) | | | | | | | | | |
| | Rohm Co. Ltd. | | | Semiconductors & Semiconductor Equipment | | | | 109 | | | $ | 8,321 | |
| | Rohto Pharmaceutical Co. Ltd. | | | Personal Products | | | | 134 | | | | 3,655 | |
| | Ryohin Keikaku Co. Ltd. | | | Multiline Retail | | | | 300 | | | | 5,602 | |
| | Sankyo Co. Ltd. | | | Leisure Products | | | | 68 | | | | 2,337 | |
| | Sankyu Inc. | | | Road & Rail | | | | 68 | | | | 3,530 | |
| | Sanrio Co. Ltd. | | | Specialty Retail | | | | 68 | | | | 1,309 | |
| | Santen Pharmaceutical Co. Ltd. | | | Pharmaceuticals | | | | 448 | | | | 7,785 | |
| | Sanwa Holdings Corp. | | | Building Products | | | | 234 | | | | 2,616 | |
| | Sapporo Holdings Ltd. | | | Beverages | | | | 68 | | | | 1,695 | |
| | Sawai Pharmaceutical Co. Ltd. | | | Pharmaceuticals | | | | 47 | | | | 2,427 | |
| | SBI Holdings Inc. | | | Capital Markets | | | | 278 | | | | 5,945 | |
| | SCREEN Holdings Co. Ltd. | | | Semiconductors & Semiconductor Equipment | | | | 48 | | | | 2,829 | |
| | SCSK Corp. | | | IT Services | | | | 56 | | | | 2,627 | |
| | Secom Co. Ltd. | | | Commercial Services & Supplies | | | | 244 | | | | 22,256 | |
| | Sega Sammy Holdings Inc. | | | Leisure Products | | | | 234 | | | | 3,274 | |
| | Seibu Holdings Inc. | | | Road & Rail | | | | 268 | | | | 4,669 | |
| | Seiko Epson Corp. | | | Technology Hardware, Storage & Peripherals | | | | 334 | | | | 4,697 | |
| | Seino Holdings Co. Ltd. | | | Road & Rail | | | | 200 | | | | 2,502 | |
| | Sekisui Chemical Co. Ltd. | | | Household Durables | | | | 468 | | | | 7,245 | |
| | Sekisui House Ltd. | | | Household Durables | | | | 734 | | | | 14,432 | |
| | Seven & i Holdings Co. Ltd. | | | Food & Staples Retailing | | | | 973 | | | | 37,200 | |
| | Seven Bank Ltd. | | | Banks | | | | 968 | | | | 2,651 | |
| | SG Holdings Co. Ltd. | | | Air Freight & Logistics | | | | 268 | | | | 6,559 | |
| | Sharp Corp. | | | Household Durables | | | | 200 | | | | 2,211 | |
| | Shikoku Electric Power Co. Inc. | | | Electric Utilities | | | | 200 | | | | 1,886 | |
| | Shimadzu Corp. | | | Electronic Equipment, Instruments & Components | | | | 334 | | | | 8,431 | |
| | Shimamura Co. Ltd. | | | Specialty Retail | | | | 34 | | | | 2,693 | |
| | SHIMANO Inc. | | | Leisure Products | | | | 100 | | | | 15,064 | |
| | Shimizu Corp. | | | Construction & Engineering | | | | 734 | | | | 6,642 | |
| | Shin-Etsu Chemical Co. Ltd. | | | Chemicals | | | | 500 | | | | 53,481 | |
| | Shinsei Bank Ltd. | | | Banks | | | | 300 | | | | 4,369 | |
| | Shionogi & Co. Ltd. | | | Pharmaceuticals | | | | 353 | | | | 19,594 | |
| | Shiseido Co. Ltd. | | | Personal Products | | | | 482 | | | | 38,484 | |
| | SHO-BOND Holdings Co. Ltd. | | | Construction & Engineering | | | | 68 | | | | 2,385 | |
| | Shochiku Co. Ltd. | | | Entertainment | | | | 14 | | | | 1,814 | |
| | Shoei Co. Ltd. | | | Real Estate Management & Development | | | | 534 | | | | 5,460 | |
| | Showa Denko K.K. | | | Chemicals | | | | 178 | | | | 4,653 | |
| | Sky Perfect JSAT Holdings Inc. | | | Media | | | | 268 | | | | 1,084 | |
| | Skylark Holdings Co. Ltd. | | | Hotels, Restaurants & Leisure | | | | 234 | | | | 4,257 | |
| | SMC Corp. | | | Machinery | | | | 73 | | | | 31,139 | |
| | Softbank Corp. | | | Wireless Telecommunication Services | | | | 2,031 | | | | 27,512 | |
| | SoftBank Group Corp. | | | Wireless Telecommunication Services | | | | 2,043 | | | | 80,151 | |
| | Sohgo Security Services Co. Ltd. | | | Commercial Services & Supplies | | | | 82 | | | | 4,294 | |
| | Sojitz Corp. | | | Trading Companies & Distributors | | | | 1,768 | | | | 5,480 | |
| | Sompo Holdings Inc. | | | Insurance | | | | 434 | | | | 18,139 | |
| | Sony Corp. | | | Household Durables | | | | 1,588 | | | | 93,260 | |
| | Sony Financial Holdings Inc. | | | Insurance | | | | 200 | | | | 4,334 | |
| | Sotetsu Holdings Inc. | | | Road & Rail | | | | 100 | | | | 2,612 | |
| | Square Enix Holdings Co. Ltd. | | | Entertainment | | | | 100 | | | | 4,858 | |
| | Stanley Electric Co. Ltd. | | | Auto Components | | | | 179 | | | | 4,730 | |
| | Subaru Corp. | | | Automobiles | | | | 768 | | | | 21,603 | |
| | Sugi Pharmacy Co. Ltd. | | | Food & Staples Retailing | | | | 41 | | | | 2,219 | |
| | Sumco Corp. | | | Semiconductors & Semiconductor Equipment | | | | 300 | | | | 4,025 | |
| | Sumitomo Bakelite Co. Ltd. | | | Chemicals | | | | 34 | | | | 1,328 | |
| | Sumitomo Chemical Co. Ltd. | | | Chemicals | | | | 2,000 | | | | 8,975 | |
| | Sumitomo Corp. | | | Trading Companies & Distributors | | | | 1,500 | | | | 23,428 | |
| | Sumitomo Dainippon Pharma Co. Ltd. | | | Pharmaceuticals | | | | 200 | | | | 3,285 | |
| | | | | | |
| | | |
| franklintempleton.com | | Semiannual Report | | | 241 | |
FRANKLIN TEMPLETON ETF TRUST
STATEMENT OF INVESTMENTS (UNAUDITED)
Franklin FTSE Japan Hedged ETF(continued)
| | | | | | | | | | | | | | |
| | | |
| | | Industry | | | Shares | | | Value | |
| | | Common Stocks (continued) | | | | | | | | | |
| | | Japan (continued) | | | | | | | | | |
| | Sumitomo Electric Industries Ltd. | | | Auto Components | | | | 934 | | | $ | 11,848 | |
| | Sumitomo Forestry Co. Ltd. | | | Household Durables | | | | 168 | | | | 2,232 | |
| | Sumitomo Heavy Industries Ltd. | | | Machinery | | | | 134 | | | | 3,968 | |
| | Sumitomo Metal Mining Co. Ltd. | | | Metals & Mining | | | | 300 | | | | 9,291 | |
| | Sumitomo Mitsui Financial Group Inc. | | | Banks | | | | 1,622 | | | | 55,455 | |
| | Sumitomo Osaka Cement Co. Ltd. | | | Construction Materials | | | | 41 | | | | 1,755 | |
| | Sumitomo Realty & Development Co. Ltd. | | | Real Estate Management & Development | | | | 495 | | | | 18,838 | |
| | Sumitomo Rubber Industries Ltd. | | | Auto Components | | | | 234 | | | | 2,776 | |
| | Sundrug Co. Ltd. | | | Food & Staples Retailing | | | | 77 | | | | 2,422 | |
| | Suntory Beverage & Food Ltd. | | | Beverages | | | | 183 | | | | 7,823 | |
| | Suzuken Co. Ltd. | | | Health Care Providers & Services | | | | 100 | | | | 5,367 | |
| | Suzuki Motor Corp. | | | Automobiles | | | | 543 | | | | 23,046 | |
| | Sysmex Corp. | | | Health Care Equipment & Supplies | | | | 238 | | | | 15,926 | |
| | T&D Holdings Inc. | | | Insurance | | | | 700 | | | | 7,416 | |
| | Tadano Ltd. | | | Machinery | | | | 134 | | | | 1,276 | |
| | Taiheiyo Cement Corp. | | | Construction Materials | | | | 145 | | | | 3,879 | |
| | Taisei Corp. | | | Construction & Engineering | | | | 268 | | | | 10,378 | |
| | Taisho Pharmaceutical Holdings Co. Ltd. | | | Pharmaceuticals | | | | 54 | | | | 3,922 | |
| | Taiyo Nippon Sanso Corp. | | | Chemicals | | | | 181 | | | | 3,656 | |
| | Taiyo Yuden Co. Ltd. | | | Electronic Equipment, Instruments & Components | | | | 168 | | | | 4,087 | |
| | Takara Bio Inc. | | | Biotechnology | | | | 68 | | | | 1,385 | |
| | Takara Holdings Inc. | | | Beverages | | | | 200 | | | | 1,978 | |
| | Takashimaya Co. Ltd. | | | Multiline Retail | | | | 168 | | | | 1,957 | |
| | Takeda Pharmaceutical Co. Ltd. | | | Pharmaceuticals | | | | 1,914 | | | | 65,350 | |
| | TDK Corp. | | | Electronic Equipment, Instruments & Components | | | | 155 | | | | 13,869 | |
| | TechnoPro Holdings Inc. | | | Professional Services | | | | 44 | | | | 2,606 | |
| | Teijin Ltd. | | | Chemicals | | | | 234 | | | | 4,495 | |
| | Terumo Corp. | | | Health Care Equipment & Supplies | | | | 814 | | | | 26,211 | |
| | The 77 Bank Ltd. | | | Banks | | | | 84 | | | | 1,246 | |
| | The Bank of Kyoto Ltd. | | | Banks | | | | 100 | | | | 3,909 | |
| | The Chiba Bank Ltd. | | | Banks | | | | 900 | | | | 4,630 | |
| | The Chugoku Bank Ltd. | | | Banks | | | | 200 | | | | 1,878 | |
| | The Chugoku Electric Power Co. Inc. | | | Electric Utilities | | | | 468 | | | | 6,015 | |
| | The Dai-ichi Life Holdings Inc. | | | Insurance | | | | 1,368 | | | | 20,620 | |
| | The Hiroshima Bank Ltd. | | | Banks | | | | 368 | | | | 1,818 | |
| | The Iyo Bank Ltd. | | | Banks | | | | 334 | | | | 1,746 | |
| | The Japan Steel Works Ltd. | | | Machinery | | | | 100 | | | | 1,921 | |
| | The Shiga Bank Ltd. | | | Banks | | | | 68 | | | | 1,545 | |
| | The Shizuoka Bank Ltd. | | | Banks | | | | 634 | | | | 4,722 | |
| | THK Co. Ltd. | | | Machinery | | | | 145 | | | | 3,801 | |
| | TIS Inc. | | | IT Services | | | | 100 | | | | 5,765 | |
| | Tobu Railway Co. Ltd. | | | Road & Rail | | | | 268 | | | | 8,679 | |
| | Toda Corp. | | | Construction & Engineering | | | | 200 | | | | 1,149 | |
| | Toho Co. Ltd. | | | Entertainment | | | | 140 | | | | 6,134 | |
| | Toho Gas Co. Ltd. | | | Gas Utilities | | | | 109 | | | | 4,165 | |
| | Tohoku Electric Power Co. Inc. | | | Electric Utilities | | | | 568 | | | | 5,539 | |
| | Tokai Carbon Co. Ltd. | | | Chemicals | | | | 234 | | | | 2,354 | |
| | Tokai Rika Co. Ltd. | | | Auto Components | | | | 68 | | | | 1,149 | |
| | Tokio Marine Holdings Inc. | | | Insurance | | | | 832 | | | | 44,489 | |
| | Tokuyama Corp. | | | Chemicals | | | | 100 | | | | 2,292 | |
| | Tokyo Broadcasting System Holdings Inc. | | | Media | | | | 68 | | | | 1,100 | |
| | Tokyo Century Corp. | | | Diversified Financial Services | | | | 68 | | | | 3,143 | |
| a | | Tokyo Electric Power Co. Holdings Inc. | | | Electric Utilities | | | | 1,934 | | | | 9,466 | |
| | Tokyo Electron Ltd. | | | Semiconductors & Semiconductor Equipment | | | | 187 | | | | 35,583 | |
| | Tokyo Gas Co. Ltd. | | | Gas Utilities | | | | 544 | | | | 13,714 | |
| | Tokyo Tatemono Co. Ltd. | | | Real Estate Management & Development | | | | 268 | | | | 3,764 | |
| | TOKYU Corp. | | | Road & Rail | | | | 616 | | | | 11,559 | |
| | | | |
| | | |
| 242 | | Semiannual Report | | franklintempleton.com |
FRANKLIN TEMPLETON ETF TRUST
STATEMENT OF INVESTMENTS (UNAUDITED)
Franklin FTSE Japan Hedged ETF(continued)
| | | | | | | | | | | | | | |
| | | |
| | | Industry | | | Shares | | | Value | |
| | | Common Stocks (continued) | | | | | | | | | |
| | | Japan (continued) | | | | | | | | | |
| | Tokyu Fudosan Holdings Corp. | | | Real Estate Management & Development | | | | 768 | | | $ | 4,896 | |
| | Topcon Corp. | | | Electronic Equipment, Instruments & Components | | | | 134 | | | | 1,777 | |
| | Toppan Printing Co. Ltd. | | | Commercial Services & Supplies | | | | 334 | | | | 5,909 | |
| | Toray Industries Inc. | | | Chemicals | | | | 1,900 | | | | 14,101 | |
| | Toshiba Corp. | | | Industrial Conglomerates | | | | 611 | | | | 18,656 | |
| | Toshiba Plant Systems & Services Corp. | | | Construction & Engineering | | | | 34 | | | | 567 | |
| | Tosoh Corp. | | | Chemicals | | | | 368 | | | | 4,862 | |
| | TOTO Ltd. | | | Building Products | | | | 179 | | | | 6,700 | |
| | Toyo Seikan Group Holdings Ltd. | | | Containers & Packaging | | | | 200 | | | | 3,102 | |
| | Toyo Suisan Kaisha Ltd. | | | Food Products | | | | 111 | | | | 4,447 | |
| | Toyo Tire Corp. | | | Auto Components | | | | 134 | | | | 1,694 | |
| | Toyobo Co. Ltd. | | | Chemicals | | | | 100 | | | | 1,311 | |
| | Toyoda Gosei Co. Ltd. | | | Auto Components | | | | 100 | | | | 2,001 | |
| | Toyota Boshoku Corp. | | | Auto Components | | | | 68 | | | | 951 | |
| | Toyota Industries Corp. | | | Auto Components | | | | 200 | | | | 11,474 | |
| | Toyota Motor Corp. | | | Automobiles | | | | 3,150 | | | | 210,321 | |
| | Toyota Tsusho Corp. | | | Trading Companies & Distributors | | | | 300 | | | | 9,674 | |
| | Trend Micro Inc. | | | Software | | | | 142 | | | | 6,753 | |
| | TS TECH Co. Ltd. | | | Auto Components | | | | 68 | | | | 2,064 | |
| | Tsumura & Co. | | | Pharmaceuticals | | | | 100 | | | | 2,674 | |
| | Tsuruha Holdings Inc. | | | Food & Staples Retailing | | | | 46 | | | | 5,010 | |
| | TV Asahi Holdings Corp. | | | Media | | | | 34 | | | | 533 | |
| | Ube Industries Ltd. | | | Chemicals | | | | 134 | | | | 2,702 | |
| | Ulvac Inc. | | | Semiconductors & Semiconductor Equipment | | | | 68 | | | | 2,731 | |
| | Unicharm Corp. | | | Household Products | | | | 487 | | | | 15,411 | |
| | Ushio Inc. | | | Electrical Equipment | | | | 134 | | | | 1,892 | |
| | USS Co. Ltd. | | | Specialty Retail | | | | 268 | | | | 5,200 | |
| | Wacoal Corp. | | | Textiles, Apparel & Luxury Goods | | | | 68 | | | | 1,747 | |
| | Welcia Holdings Co. Ltd. | | | Food & Staples Retailing | | | | 68 | | | | 3,423 | |
| | West Japan Railway Co. | | | Road & Rail | | | | 230 | | | | 19,432 | |
| | Yakult Honsha Co. Ltd. | | | Food Products | | | | 153 | | | | 8,551 | |
| | Yamada Denki Co. Ltd. | | | Specialty Retail | | | | 1,000 | | | | 4,839 | |
| | Yamaguchi Financial Group Inc. | | | Banks | | | | 268 | | | | 1,840 | |
| | Yamaha Corp. | | | Leisure Products | | | | 200 | | | | 8,975 | |
| | Yamaha Motor Co. Ltd. | | | Automobiles | | | | 349 | | | | 6,323 | |
| | Yamato Holdings Co. Ltd. | | | Air Freight & Logistics | | | | 446 | | | | 6,710 | |
| | Yamato Kogyo Co. Ltd. | | | Metals & Mining | | | | 34 | | | | 843 | |
| | Yamazaki Baking Co. Ltd. | | | Food Products | | | | 168 | | | | 2,997 | |
| | Yaoko Co. Ltd. | | | Food & Staples Retailing | | | | 34 | | | | 1,520 | |
| | YASKAWA Electric Corp. | | | Electronic Equipment, Instruments & Components | | | | 334 | | | | 12,254 | |
| | Yokogawa Electric Corp. | | | Electronic Equipment, Instruments & Components | | | | 300 | | | | 5,488 | |
| | Yokohama Rubber Co. Ltd. | | | Auto Components | | | | 134 | | | | 2,679 | |
| | Z Holdings Corp. | | | Interactive Media & Services | | | | 3,434 | | | | 9,659 | |
| | Zenkoku Hosho Co. Ltd. | | | Diversified Financial Services | | | | 68 | | | | 2,646 | |
| | Zensho Holdings Co. Ltd. | | | Hotels, Restaurants & Leisure | | | | 113 | | | | 2,436 | |
| | Zeon Corp. | | | Chemicals | | | | 168 | | | | 2,047 | |
| | Zozo Inc. | | | Internet & Direct Marketing Retail | | | | 234 | | | | 5,396 | |
| | | | | | | | | | | | | | |
| | Total Investments before Short Term Investments
(Cost $5,311,863) | | | | | | | | | | | 4,663,266 | |
| | | | | | | | | | | | | | |
| | | | | | |
| | | |
| franklintempleton.com | | Semiannual Report | | | 243 | |
FRANKLIN TEMPLETON ETF TRUST
STATEMENT OF INVESTMENTS (UNAUDITED)
Franklin FTSE Japan Hedged ETF(continued)
| | | | | | | | | | | | | | |
| | | |
| | | Industry | | | Shares | | | Value | |
| | | Short Term Investments (Cost $1,813) 0.0%† | | | | | | | | | |
| | | United States 0.0%† | | | | | | | | | |
| b,c | | Institutional Fiduciary Trust Portfolio, 1.71% | | | Money Market Funds | | | | 1,813 | | | $ | 1,813 | |
| | | | | | | | | | | | | | |
| | Total Investments (Cost $5,313,676) 98.8% | | | | | | | | | | | 4,665,079 | |
| | Other Assets, less Liabilities 1.2% | | | | | | | | | | | 57,533 | |
| | | | | | | | | | | | | | |
| | Net Assets 100.0% | | | | | | | | | | $ | 4,722,612 | |
| | | | | | | | | | | | | | |
See Abbreviations on page 322.
†Rounds to less than 0.1% of net assets.
aNon-income producing.
bSee Note 4(a) regarding investments in affiliated management investment companies.
cThe rate shown is the annualized seven-day effective yield at period end.
At September 30, 2019 the Fund had the following forward exchange contracts outstanding. See Note #1(c).
| | | | | | | | | | | | | | | | | | | | | | | | | | | | |
| Forward Exchange Contracts | |
| | | | | | | |
| Currency | | Counterpartya | | | Type | | | Quantity | | | Contract
Amount | | | Settlement
Date | | | Unrealized
Appreciation | | | Unrealized
Depreciation | |
| OTC Forward Exchange Contracts | | | | | | | | | | | | | | | | | | | | | |
Japanese Yen | | | HSBK | | | | Buy | | | | 138,445,000 | | | $ | 1,280,990 | | | | 10/02/19 | | | $ | 19 | | | $ | — | |
Japanese Yen | | | UBSW | | | | Buy | | | | 138,445,000 | | | | 1,280,982 | | | | 10/02/19 | | | | 26 | | | | — | |
Japanese Yen | | | BOFA | | | | Buy | | | | 138,445,000 | | | | 1,280,971 | | | | 10/02/19 | | | | 38 | | | | — | |
Japanese Yen | | | MSCO | | | | Buy | | | | 56,637,000 | | | | 524,040 | | | | 10/02/19 | | | | 13 | | | | — | |
Japanese Yen | | | MSCO | | | | Sell | | | | 56,637,000 | | | | 534,754 | | | | 10/02/19 | | | | 10,701 | | | | — | |
Japanese Yen | | | BOFA | | | | Sell | | | | 138,445,000 | | | | 1,307,166 | | | | 10/02/19 | | | | 26,158 | | | | — | |
Japanese Yen | | | UBSW | | | | Sell | | | | 138,445,000 | | | | 1,307,141 | | | | 10/02/19 | | | | 26,132 | | | | — | |
Japanese Yen | | | HSBK | | | | Sell | | | | 138,445,000 | | | | 1,307,142 | | | | 10/02/19 | | | | 26,133 | | | | — | |
Japanese Yen | | | MSCO | | | | Sell | | | | 61,169,000 | | | | 567,215 | | | | 11/05/19 | | | | — | | | | (23 | ) |
Japanese Yen | | | HSBK | | | | Sell | | | | 149,525,000 | | | | 1,386,511 | | | | 11/05/19 | | | | — | | | | (79 | ) |
Japanese Yen | | | UBSW | | | | Sell | | | | 149,525,000 | | | | 1,386,260 | | | | 11/05/19 | | | | — | | | | (330 | ) |
Japanese Yen | | | BOFA | | | | Sell | | | | 149,525,000 | | | | 1,386,564 | | | | 11/05/19 | | | | — | | | | (26 | ) |
| | | | | | | | | | | | | | | | | | | | | | | | |
Total Forward Exchange Contracts | | | $ | 89,220 | | | $ | (458 | ) |
| | | | | | | | | | | | | | | | | | | | | | | | |
Net unrealized appreciation (depreciation) | | | | | | | $ | 88,762 | |
| | | | | | | | | | | | | | | | | | | | | | | | | | | | |
aMay be comprised of multiple contracts with the same counterparty, currency and settlement date.
At September 30, 2019, the Fund had the following futures contracts outstanding. See Note 1(c).
| | | | | | | | | | | | | | | | | | | | |
| Futures Contracts | | | | | | | | | | | | | | | |
| | | | | |
| Description | | Type | | | Number of
Contracts | | | Notional
Amount* | | | Expiration
Date | | | Value/Unrealized
Appreciation
(Depreciation) | |
| Equity Contracts | | | | | | | | | | | | | | | | | | | | |
Nikkei 225 Mini | | | Long | | | | 2 | | | $ | 40,268 | | | | 12/12/19 | | | $ | (233 | ) |
*As of period end.
See Note 7 regarding other derivative information.
| | | | |
| | | |
| 244 | | Semiannual Report | The accompanying notes are an integral part of these financial statements. | | franklintempleton.com |
FRANKLIN TEMPLETON ETF TRUST
Financial Highlights
Franklin FTSE Latin America ETF
| | | | | | | | |
| | |
| | | Six Months Ended
September 30, 2019
(unaudited) | | | Year Ended
March 31, 2019a | |
Per share operating performance
(for a share outstanding throughout the period) | | | | | | | | |
| | |
Net asset value, beginning of period | | $ | 26.41 | | | $ | 26.17 | |
| | | | |
|
| Income from investment operationsb: | |
| | |
Net investment incomec | | | 0.38 | | | | 0.38 | |
| | |
Net realized and unrealized gains (losses) | | | (0.34 | ) | | | (0.02 | ) |
| | | | |
| | |
Total from investment operations | | | 0.04 | | | | 0.36 | |
| | | | |
| | |
| Less distributions from net investment income | | | (0.46 | ) | | | (0.12 | ) |
| | | | |
| | |
Net asset value, end of period | | $ | 25.99 | | | $ | 26.41 | |
| | | | |
| | |
Total returnd | | | 0.10% | | | | 1.42% | |
| | |
| Ratios to average net assetse | | | | | | | | |
| | |
Total expenses | | | 0.19% | | | | 0.19% | |
| | |
Net investment income | | | 2.89% | | | | 3.08% | |
| | |
| Supplemental data | | | | | | | | |
| | |
Net assets, end of period (000’s) | | | $2,599 | | | | $2,641 | |
| | |
Portfolio turnover ratef | | | 6.22% | | | | 4.08% | |
| | |
| Portfolio turnover rate excluding portfolio transactions that are executed as a result of the Fund offering and redeeming Creation Units solely or in part for cashf,g | | | 6.22% | | | | —% | |
aFor the period October 9, 2018 (commencement of operations) to March 31, 2019.
bThe amount shown for a share outstanding throughout the period may not correlate with the Statement of Operations for the period due to the timing of sales and repurchases of Creation Unit Fund shares in relation to income earned and/or fluctuating fair value of the investments of the Fund.
cBased on average daily shares outstanding.
dTotal return is not annualized for periods less than one year. Total return is calculated assuming an initial investment made at the net asset value at the beginning of the period, reinvestment of all dividends and distributions at net asset value during the period, and redemption at net asset value on the last day of the period.
eRatios are annualized for periods less than one year.
fPortfolio turnover rate excludes the value of portfolio securities received or delivered as a result of processing capital share transactions in Creation Units, if any.
gEffective September 30, 2019.
| | | | | | |
| | | |
| franklintempleton.com | | The accompanying notes are an integral part of these financial statements. | Semiannual Report | | | 245 | |
FRANKLIN TEMPLETON ETF TRUST
Statement of Investments, September 30, 2019 (unaudited)
Franklin FTSE Latin America ETF
| | | | | | | | | | | | | | |
| | | |
| | | Industry | | | Shares | | | Value | |
| | | Common Stocks 76.4% | | | | | | | | | |
| | | Brazil 42.5% | | | | | | | | | |
| | Ambev SA | | | Beverages | | | | 17,200 | | | $ | 79,488 | |
| | Atacadao Distribuicao Comercio e Industria Ltd. | | | Food & Staples Retailing | | | | 1,300 | | | | 6,570 | |
| a | | Azul SA | | | Airlines | | | | 800 | | | | 9,547 | |
| a | | B2W Cia Digital | | | Internet & Direct Marketing Retail | | | | 600 | | | | 6,964 | |
| a | | B2W Cia Digital, SCR | | | Internet & Direct Marketing Retail | | | | 98 | | | | 1,127 | |
| | B3 SA – Brasil Bolsa Balcao | | | Capital Markets | | | | 7,800 | | | | 81,700 | |
| | Banco Bradesco SA | | | Banks | | | | 4,100 | | | | 30,759 | |
| | Banco BTG Pactual SA | | | Capital Markets | | | | 1,000 | | | | 14,056 | |
| | Banco do Brasil SA | | | Banks | | | | 4,100 | | | | 44,776 | |
| | Banco Santander Brasil SA | | | Banks | | | | 1,600 | | | | 17,412 | |
| | BB Seguridade Participacoes SA | | | Insurance | | | | 2,700 | | | | 22,706 | |
| | BR Malls Paricipacoes SA | | | Real Estate Management & Development | | | | 2,800 | | | | 9,686 | |
| a | | BRF SA | | | Food Products | | | | 2,200 | | | | 20,176 | |
| | CCR SA | | | Transportation Infrastructure | | | | 4,400 | | | | 18,222 | |
| | Centrais Eletricas Brasileiras SA | | | Electric Utilities | | | | 1,500 | | | | 14,458 | |
| | Cia Siderurgica Nacional SA | | | Metals & Mining | | | | 2,400 | | | | 7,623 | |
| | Cielo SA | | | IT Services | | | | 4,400 | | | | 8,451 | |
| | Companhia de Saneamento Basico do Estado de Sao Paulo | | | Water Utilities | | | | 1,300 | | | | 15,480 | |
| | Companhia Energetica de Minas Gerais | | | Electric Utilities | | | | 300 | | | | 1,145 | |
| | Companhia Paranaense de Energia-Copel | | | Electric Utilities | | | | 100 | | | | 1,227 | |
| | Cosan SA | | | Oil, Gas & Consumable Fuels | | | | 700 | | | | 8,940 | |
| | CPFL Energia SA | | | Electric Utilities | | | | 700 | | | | 5,527 | |
| | CVC Brasil Operadora e Agencia de Viagens SA | | | Hotels, Restaurants & Leisure | | | | 500 | | | | 6,704 | |
| | EDP-Energias do Brasil SA | | | Electric Utilities | | | | 1,200 | | | | 5,646 | |
| | Embraer SA | | | Aerospace & Defense | | | | 2,900 | | | | 12,469 | |
| | Energisa SA | | | Electric Utilities | | | | 735 | | | | 8,814 | |
| | Engie Brasil SA | | | Independent Power and Renewable Electricity Producers | | | | 725 | | | | 7,726 | |
| | Equatorial Energia SA | | | Electric Utilities | | | | 700 | | | | 16,854 | |
| | Fleury SA | | | Health Care Providers & Services | | | | 800 | | | | 5,074 | |
| | Grendene SA | | | Textiles, Apparel & Luxury Goods | | | | 800 | | | | 1,677 | |
| b,c | | Hapvida Participacoes e Investimentos SA, Reg S, 144A | | | Health Care Providers & Services | | | | 600 | | | | 7,757 | |
| | Hypera SA | | | Pharmaceuticals | | | | 1,600 | | | | 12,879 | |
| | IRB Brasil Resseguros SA | | | Insurance | | | | 3,300 | | | | 29,836 | |
| | Klabin SA | | | Containers & Packaging | | | | 2,900 | | | | 10,715 | |
| | Kroton Educacional SA | | | Diversified Consumer Services | | | | 5,800 | | | | 15,567 | |
| | Localiza Rent a Car SA | | | Road & Rail | | | | 2,100 | | | | 22,919 | |
| | Lojas Americanas SA | | | Multiline Retail | | | | 900 | | | | 3,226 | |
| | Lojas Renner SA | | | Multiline Retail | | | | 3,080 | | | | 37,319 | |
| | M. Dias Branco SA | | | Food Products | | | | 300 | | | | 2,521 | |
| | Magazine Luiza SA | | | Multiline Retail | | | | 2,328 | | | | 20,701 | |
| | Multiplan Empreendimentos Imobiliarios SA | | | Real Estate Management & Development | | | | 1,100 | | | | 7,619 | |
| | Natura Cosmeticos SA | | | Personal Products | | | | 1,400 | | | | 11,380 | |
| | Notre Dame Intermedica Participacoes SA | | | Health Care Providers & Services | | | | 1,500 | | | | 19,536 | |
| | Odontoprev SA | | | Health Care Providers & Services | | | | 1,100 | | | | 4,268 | |
| | Petrobras Distribuidora SA | | | Specialty Retail | | | | 2,700 | | | | 17,845 | |
| | Petroleo Brasileiro SA | | | Oil, Gas & Consumable Fuels | | | | 11,700 | | | | 84,687 | |
| | Porto Seguro SA | | | Insurance | | | | 400 | | | | 5,655 | |
| | Raia Drogasil SA | | | Food & Staples Retailing | | | | 899 | | | | 20,678 | |
| a | | Rumo SA | | | Road & Rail | | | | 4,400 | | | | 25,880 | |
| | Sao Martinho SA | | | Food Products | | | | 600 | | | | 2,730 | |
| | Sul America SA | | | Insurance | | | | 900 | | | | 10,308 | |
| | Suzano SA | | | Paper & Forest Products | | | | 3,119 | | | | 25,197 | |
| | Tim Participacoes SA | | | Wireless Telecommunication Services | | | | 3,300 | | | | 9,436 | |
| | Transmissora Alianca de Energia Eletrica SA | | | Electric Utilities | | | | 900 | | | | 6,223 | |
| | | | |
| | | |
| 246 | | Semiannual Report | | franklintempleton.com |
FRANKLIN TEMPLETON ETF TRUST
STATEMENT OF INVESTMENTS (UNAUDITED)
Franklin FTSE Latin America ETF(continued)
| | | | | | | | | | | | | | |
| | | |
| | | Industry | | | Shares | | | Value | |
| | | Common Stocks (continued) | | | | | | | | | |
| | | Brazil (continued) | | | | | | | | | |
| | Ultrapar Participacoes SA | | | Oil, Gas & Consumable Fuels | | | | 3,364 | | | $ | 14,933 | |
| a | | Vale SA | | | Metals & Mining | | | | 13,600 | | | | 155,903 | |
| a | | Via Varejo SA | | | Specialty Retail | | | | 1,600 | | | | 3,042 | |
| | Weg SA | | | Electrical Equipment | | | | 2,900 | | | | 16,869 | |
| | YDUQS PART | | | Diversified Consumer Services | | | | 1,000 | | | | 8,662 | |
| | | | | | | | | | | | | | |
| | | | |
| | | | | | | | | | | | | 1,105,295 | |
| | | | | | | | | | | | | | |
| | | Chile 7.6% | | | | | | | | | |
| | AES Gener SA | | | Independent Power and Renewable Electricity Producers | | | | 11,437 | | | | 2,489 | |
| | Aguas Andinas SA, A | | | Water Utilities | | | | 11,033 | | | | 6,042 | |
| | Banco de Chile | | | Banks | | | | 175,481 | | | | 24,604 | |
| | Banco de Credito e Inversiones SA | | | Banks | | | | 174 | | | | 10,973 | |
| | Banco Santander Chile SA | | | Banks | | | | 245,168 | | | | 17,295 | |
| | Cencosud SA | | | Food & Staples Retailing | | | | 5,308 | | | | 8,747 | |
| | Colbun SA | | | Independent Power and Renewable Electricity Producers | | | | 27,494 | | | | 4,965 | |
| | Compania Cervecerias Unidas SA | | | Beverages | | | | 579 | | | | 6,476 | |
| | E CL SA | | | Electric Utilities | | | | 1,895 | | | | 3,357 | |
| a | | Empresa Nacional de Telecomunicaciones SA | | | Wireless Telecommunication Services | | | | 530 | | | | 4,653 | |
| | Empresas CMPC SA | | | Paper & Forest Products | | | | 4,428 | | | | 10,313 | |
| | Empresas COPEC SA | | | Oil, Gas & Consumable Fuels | | | | 1,930 | | | | 18,221 | |
| | Enel Americas SA | | | Electric Utilities | | | | 144,848 | | | | 26,555 | |
| | Enel Chile SA | | | Electric Utilities | | | | 107,798 | | | | 9,331 | |
| | Itau CorpBanca | | | Banks | | | | 649,633 | | | | 4,925 | |
| | Latam Airlines Group SA | | | Airlines | | | | 1,215 | | | | 13,448 | |
| | Parque Arauco SA | | | Real Estate Management & Development | | | | 2,321 | | | | 6,630 | |
| | Plaza SA | | | Real Estate Management & Development | | | | 941 | | | | 2,363 | |
| | S.A.C.I. Falabella | | | Multiline Retail | | | | 2,799 | | | | 15,663 | |
| | | | | | | | | | | | | | |
| | | | |
| | | | | | | | | | | | | 197,050 | |
| | | | | | | | | | | | | | |
| | | Colombia 2.5% | | | | | | | | | |
| d | | Almacenes Exito SA | | | Food & Staples Retailing | | | | 819 | | | | 4,149 | |
| | Bancolombia SA | | | Banks | | | | 1,086 | | | | 12,332 | |
| | Cementos Argos SA | | | Construction Materials | | | | 2,021 | | | | 4,323 | |
| a | | Corporacion Financiera Colombiana SA | | | Diversified Financial Services | | | | 428 | | | | 3,450 | |
| | Ecopetrol SA | | | Oil, Gas & Consumable Fuels | | | | 18,757 | | | | 15,907 | |
| | Grupo Agros SA | | | Construction Materials | | | | 1,288 | | | | 6,317 | |
| | Grupo Inversiones Suramericana SA | | | Diversified Financial Services | | | | 993 | | | | 9,420 | |
| | Interconexion Electrica SA ESP | | | Electric Utilities | | | | 1,665 | | | | 8,731 | |
| | | | | | | | | | | | | | |
| | | | |
| | | | | | | | | | | | | 64,629 | |
| | | | | | | | | | | | | | |
| | | Mexico 22.1% | | | | | | | | | |
| | Alfa SAB de CV | | | Industrial Conglomerates | | | | 12,070 | | | | 10,594 | |
| | Alpek SAB de CV | | | Chemicals | | | | 1,472 | | | | 1,713 | |
| a | | Alsea de Mexico S.A.B de C.V. | | | Hotels, Restaurants & Leisure | | | | 2,039 | | | | 4,738 | |
| | America Movil SAB de CV, L | | | Wireless Telecommunication Services | | | | 108,556 | | | | 80,493 | |
| | Arca Continental SAB de CV | | | Beverages | | | | 1,541 | | | | 8,325 | |
| | Banco del Bajio SA | | | Banks | | | | 2,693 | | | | 4,451 | |
| | Banco Santander (Mexico), SA, Institucion de Banca Multiple, Grupo Financiero Santander, B | | | Banks | | | | 2,272 | | | | 2,865 | |
| | Becle SA de CV | | | Beverages | | | | 2,168 | | | | 3,194 | |
| | Cemex SAB de CV | | | Construction Materials | | | | 59,933 | | | | 23,343 | |
| | Coca-Cola FEMSA SA de CV | | | Beverages | | | | 2,040 | | | | 12,408 | |
| | Concentradora Fibra Danhos SA de CV | | | Equity Real Estate Investment Trusts (REITs | ) | | | 895 | | | | 1,245 | |
| | El Puerto de Liverpool SAB de CV | | | Multiline Retail | | | | 770 | | | | 4,217 | |
| | Fibra Uno Administracion SA de CV | | | Equity Real Estate Investment Trusts (REITs | ) | | | 12,021 | | | | 17,559 | |
| | Fomento Economico Mexicano SAB de CV | | | Beverages | | | | 8,339 | | | | 76,468 | |
| | | | | | |
| | | |
| franklintempleton.com | | Semiannual Report | | | 247 | |
FRANKLIN TEMPLETON ETF TRUST
STATEMENT OF INVESTMENTS (UNAUDITED)
Franklin FTSE Latin America ETF(continued)
| | | | | | | | | | | | | | |
| | | |
| | | Industry | | | Shares | | | Value | |
| | | Common Stocks (continued) | | | | | | | | | |
| | | Mexico (continued) | | | | | | | | | |
| c | | GMexico Transportes SAB de CV, 144A | | | Road & Rail | | | | 1,697 | | | $ | 2,109 | |
| | Gruma SAB de CV | | | Food Products | | | | 795 | | | | 8,131 | |
| | Grupo Aeroportuario del Centro Norte SAB de CV | | | Transportation Infrastructure | | | | 1,264 | | | | 7,495 | |
| | Grupo Aeroportuario del Pacifico SAB de CV | | | Transportation Infrastructure | | | | 1,397 | | | | 13,437 | |
| | Grupo Aeroportuario del Sureste SAB de CV, B | | | Transportation Infrastructure | | | | 800 | | | | 12,222 | |
| | Grupo Bimbo SAB de CV, A | | | Food Products | | | | 9,418 | | | | 17,167 | |
| | Grupo Carso SAB de CV | | | Industrial Conglomerates | | | | 1,882 | | | | 5,522 | |
| | Grupo Comercial Chedraui SA de CV | | | Food & Staples Retailing | | | | 1,180 | | | | 1,844 | |
| | Grupo Elektra SAB de CV | | | Banks | | | | 256 | | | | 18,149 | |
| | Grupo Financiero Banorte SAB de CV | | | Banks | | | | 11,129 | | | | 59,788 | |
| | Grupo Financiero Inbursa SAB de CV | | | Banks | | | | 8,928 | | | | 11,350 | |
| | Grupo Lala SAB de CV | | | Food Products | | | | 2,276 | | | | 2,609 | |
| | Grupo Mexico SAB de CV, B | | | Metals & Mining | | | | 14,191 | | | | 33,163 | |
| | Grupo Televisa SA | | | Media | | | | 8,493 | | | | 16,617 | |
| | Industrias Bachoco SAB de CV, B | | | Food Products | | | | 633 | | | | 2,785 | |
| | Industrias Penoles SA | | | Metals & Mining | | | | 490 | | | | 6,519 | |
| a | | Infraestructura Energetica Nova SAB de CV | | | Gas Utilities | | | | 2,045 | | | | 8,124 | |
| | Kimberly-Clark de Mexico SAB de CV, A | | | Household Products | | | | 3,284 | | | | 6,592 | |
| | Megacable Holdings SAB de CV | | | Media | | | | 1,181 | | | | 4,754 | |
| | Nemak SAB de CV | | | Auto Components | | | | 2,300 | | | | 1,037 | |
| | Orbia Advance Corp SAB de CV | | | Chemicals | | | | 4,095 | | | | 7,987 | |
| | Promotora y Operadora de Infraestructura SAB de CV | | | Transportation Infrastructure | | | | 844 | | | | 7,564 | |
| | Regional SAB de CV | | | Banks | | | | 903 | | | | 4,139 | |
| a | | Telesites SAB de CV | | | Diversified Telecommunication Services | | | | 4,973 | | | | 3,284 | |
| | Wal-Mart de Mexico SAB de CV, V | | | Food & Staples Retailing | | | | 20,411 | | | | 60,456 | |
| | | | | | | | | | | | | | |
| | | | |
| | | | | | | | | | | | | 574,457 | |
| | | | | | | | | | | | | | |
| | | Peru 0.5% | | | | | | | | | |
| | Compania de Minas Buenaventura SA, ADR | | | Metals & Mining | | | | 834 | | | | 12,660 | |
| | | | | | | | | | | | | | |
| | | United States 1.2% | | | | |
| | JBS SA | | | Food Products | | | | 3,800 | | | | 29,914 | |
| | | | | | | | | | | | | | |
| | Total Common Stocks
(Cost $2,005,036) | | | | | | | | | | | 1,984,005 | |
| | | | | | | | | | | | | | |
| | | Preferred Stocks 23.4% | | | | | | | | | |
| | | Brazil 21.7% | | | | | | | | | |
| a | | Alpargatas SA, pfd. | | | Textiles, Apparel & Luxury Goods | | | | 750 | | | | 4,663 | |
e | | Banco Bradesco SA, 2.969%, pfd. | | | Banks | | | | 15,920 | | | | 129,641 | |
e | | Banco do Estado do Rio Grande do Sul SA, 9.761%, pfd., B | | | Banks | | | | 800 | | | | 4,331 | |
e | | Bradespar SA, 3.926%, pfd. | | | Metals & Mining | | | | 900 | | | | 6,819 | |
| a | | Braskem SA, pfd., A | | | Chemicals | | | | 700 | | | | 5,465 | |
| e | | Centrais Eletricas Brasileiras SA, 3.372%, pfd., B | | | Electric Utilities | | | | 900 | | | | 9,079 | |
| e | | Cia de Transmissao de Energia Eletrica Paulista, 9.802%, pfd. | | | Electric Utilities | | | | 800 | | | | 4,744 | |
| e | | Cia Energetica de Sao Paulo, 3.112%, pfd., B | |
| Independent Power and Renewable
Electricity Producers |
| | | 700 | | | | 4,789 | |
| e | | Companhia Brasileira de Distribuicao, 2.023%, pfd., A | | | Food & Staples Retailing | | | | 619 | | | | 11,859 | |
| e | | Companhia Energetica de Minas Gerais, 4.152%, pfd. | | | Electric Utilities | | | | 3,700 | | | | 12,729 | |
| e | | Companhia Paranaense de Energia, 2.927%, pfd., B | | | Electric Utilities | | | | 400 | | | | 4,764 | |
| e | | Gerdau SA, 2.432%, pfd. | | | Metals & Mining | | | | 4,100 | | | | 12,953 | |
| e | | Itau Unibanco Holding SA, 4.930%, pfd. | | | Banks | | | | 18,700 | | | | 157,262 | |
| e | | Itausa-Investimentos Itau SA, 5.463, pfd. | | | Banks | | | | 17,200 | | | | 54,424 | |
| e | | Lojas Americanas SA, 0.376%, pfd. | | | Multiline Retail | | | | 3,000 | | | | 14,376 | |
| e | | Petroleo Brasileiro SA, 4.123%, pfd. | | | Oil, Gas & Consumable Fuels | | | | 15,600 | | | | 103,179 | |
| e | | Telefonica Brasil SA, 6.735%, pfd. | | | Diversified Telecommunication Services | | | | 1,600 | | | | 21,103 | |
| e | | Usinas Siderurgicas de Minas Gerais SA Usiminas, 2.036%, pfd., A | | | Metals & Mining | | | | 1,600 | | | | 3,000 | |
| | | | | | | | | | | | | | |
| | | | |
| | | | | | | | | | | | | 565,180 | |
| | | | | | | | | | | | | | |
| | | | |
| | | |
| 248 | | Semiannual Report | | franklintempleton.com |
FRANKLIN TEMPLETON ETF TRUST
STATEMENT OF INVESTMENTS (UNAUDITED)
Franklin FTSE Latin America ETF(continued)
| | | | | | | | | | | | | | |
| | | |
| | | Industry | | | Shares | | | Value | |
| | | Preferred Stocks (continued) | | | | | | | | | |
| | | Chile 0.5% | | | | | | | | | |
e | | Embotelladora Andina SA, 3.877%, pfd., B | | | Beverages | | | | 775 | | | $ | 2,597 | |
e | | Sociedad Quimica y Minera de Chile SA, 0.006%, pfd., B | | | Chemicals | | | | 376 | | | | 10,363 | |
| | | | | | | | | | | | | | |
| | | | |
| | | | | | | | | | | | | 12,960 | |
| | | | | | | | | | | | | | |
| | | Colombia 1.2% | | | | | | | | | |
e | | Bancolombia SA, 2.498%, pfd. | | | Banks | | | | 1,779 | | | | 21,992 | |
e | | Grupo Aval Acciones y Valores SA, 4.231%, pfd. | | | Banks | | | | 15,903 | | | | 5,943 | |
e | | Grupo de Inversiones Suramericana SA, 1.845%, pfd. | | | Diversified Financial Services | | | | 302 | | | | 2,551 | |
| | | | | | | | | | | | | | |
| | | | | | | | | | | | | 30,486 | |
| | | | | | | | | | | | | | |
| | Total Preferred Stocks (Cost $611,869) | | | | | | | | | | | 608,626 | |
| | | | | | | | | | | | | | |
| | Total Investments (Cost $2,616,905) 99.8% | | | | | | | | | | | 2,592,631 | |
| | Other Assets, less Liabilities 0.2% | | | | | | | | | | | 5,908 | |
| | | | | | | | | | | | | | |
| | Net Assets 100.0% | | | | | | | | | | $ | 2,598,539 | |
| | | | | | | | | | | | | | |
See Abbreviations on page 322.
aNon-income producing.
bSecurity was purchased pursuant to Regulation S under the Securities Act of 1933, which exempts from registration securities offered and sold outside of the United States. Such a security cannot be sold in the United States without either an effective registration statement filed pursuant to the Securities Act of 1933, or pursuant to an exemption from registration. This security has been deemed liquid under guidelines approved by the Fund’s Board of Trustees. At September 30, 2019, the value of this security was $7,757, representing 0.3% of net assets.
cSecurity was purchased pursuant to Rule 144A under the Securities Act of 1933 and may be sold in transactions exempt from registration only to qualified institutional buyers or in a public offering registered under the Securities Act of 1933. These securities have been deemed liquid under guidelines approved by the Fund’s Board of Trustees. At September 30, 2019, the aggregate value of these securities was $9,866, representing 0.4% of net assets.
dFair valued using significant unobservable inputs. See Note 8 regarding fair value measurements.
eVariable rate security. The rate shown represents the yield at period end.
| | | | | | |
| | | |
| franklintempleton.com | | The accompanying notes are an integral part of these financial statements. | Semiannual Report | | | 249 | |
FRANKLIN TEMPLETON ETF TRUST
Financial Highlights
Franklin FTSE Mexico ETF
| | | | | | | | | | | | |
| | | Six Months Ended
September 30, 2019
(unaudited) | | | Year Ended March 31, | |
| | | 2019 | | | 2018a | |
Per share operating performance (for a share outstanding throughout the period) | |
| | | |
Net asset value, beginning of period | | $ | 22.11 | | | $ | 24.98 | | | $ | 24.90 | |
| | | | |
|
| Income from investment operationsb: | |
| | | |
Net investment incomec | | | 0.44 | | | | 0.51 | | | | 0.12 | |
| | | |
Net realized and unrealized gains (losses) | | | (0.53 | ) | | | (2.86 | ) | | | 0.04 | |
| | | | |
| | | |
Total from investment operations | | | (0.09 | ) | | | (2.35 | ) | | | 0.16 | |
| | | | |
| | | |
Less distributions from net investment income | | | (0.31 | ) | | | (0.52 | ) | | | (0.08 | ) |
| | | | |
| | | |
Net asset value, end of period | | $ | 21.71 | | | $ | 22.11 | | | $ | 24.98 | |
| | | | |
| | | |
Total returnd | | | (0.46)% | | | | (9.28)% | | | | 0.63% | |
|
| Ratios to average net assetse | |
| | | |
Total expenses | | | 0.19% | | | | 0.19% | | | | 0.19% | |
| | | |
Net investment income | | | 3.99% | | | | 2.21% | | | | 1.18% | |
|
| Supplemental data | |
| | | |
Net assets, end of period (000’s) | | | $4,342 | | | | $4,422 | | | | $2,498 | |
| | | |
Portfolio turnover ratef | | | 8.50% | | | | 10.31% | | | | 9.64% | |
| | | |
| Portfolio turnover rate excluding portfolio transactions that are executed as a result of the Fund offering and redeeming Creation Units solely or in part for cashf,g | | | 8.50% | | | | —% | | | | —% | |
aFor the period November 3, 2017 (commencement of operations) to March 31, 2018.
bThe amount shown for a share outstanding throughout the period may not correlate with the Statement of Operations for the period due to the timing of sales and repurchases of Creation Unit Fund shares in relation to income earned and/or fluctuating fair value of the investments of the Fund.
cBased on average daily shares outstanding.
dTotal return is not annualized for periods less than one year. Total return is calculated assuming an initial investment made at the net asset value at the beginning of the period, reinvestment of all dividends and distributions at net asset value during the period, and redemption at net asset value on the last day of the period.
eRatios are annualized for periods less than one year.
fPortfolio turnover rate excludes the value of portfolio securities received or delivered as a result of processing capital share transactions in Creation Units, if any.
gEffective September 30, 2019.
| | | | |
| | | |
| 250 | | Semiannual Report | The accompanying notes are an integral part of these financial statements. | | franklintempleton.com |
FRANKLIN TEMPLETON ETF TRUST
Statement of Investments, September 30, 2019 (unaudited)
Franklin FTSE Mexico ETF
| | | | | | | | | | | | | | |
| | | |
| | | Industry | | | Shares | | | Value | |
| | | Common Stocks 99.9% | |
| | | Mexico 99.9% | |
| | Alfa SAB de CV | | | Industrial Conglomerates | | | | 97,028 | | | $ | 85,165 | |
| | Alpek SAB de CV | | | Chemicals | | | | 12,068 | | | | 14,040 | |
| a | | Alsea de Mexico S.A.B de C.V. | | | Hotels, Restaurants & Leisure | | | | 16,672 | | | | 38,742 | |
| | America Movil SAB de CV, L | | | Wireless Telecommunication Services | | | | 817,520 | | | | 606,184 | |
| | Arca Continental SAB de CV | | | Beverages | | | | 12,428 | | | | 67,144 | |
| | Banco del Bajio SA | | | Banks | | | | 22,040 | | | | 36,425 | |
| | Banco Santander (Mexico), SA, Institucion de Banca Multiple, Grupo Financiero Santander, B | | | Banks | | | | 18,000 | | | | 22,701 | |
| | Becle SA de CV | | | Beverages | | | | 17,552 | | | | 25,860 | |
| | Cemex SAB de CV | | | Construction Materials | | | | 395,576 | | | | 154,071 | |
| | Coca-Cola FEMSA SA de CV | | | Beverages | | | | 16,428 | | | | 99,921 | |
| | Concentradora Fibra Danhos SA de CV | | | Equity Real Estate Investment Trusts (REITs | ) | | | 7,180 | | | | 9,990 | |
| | El Puerto de Liverpool SAB de CV | | | Multiline Retail | | | | 6,320 | | | | 34,612 | |
| | Fibra Uno Administracion SA de CV | | | Equity Real Estate Investment Trusts (REITs | ) | | | 88,400 | | | | 129,126 | |
| | Fomento Economico Mexicano SAB de CV | | | Beverages | | | | 62,620 | | | | 574,218 | |
| b | | GMexico Transportes SAB de CV, 144A | | | Road & Rail | | | | 13,796 | | | | 17,147 | |
| | Gruma SAB de CV | | | Food Products | | | | 6,428 | | | | 65,745 | |
| | Grupo Aeroportuario del Centro Norte SAB de CV | | | Transportation Infrastructure | | | | 10,248 | | | | 60,770 | |
| | Grupo Aeroportuario del Pacifico SAB de CV | | | Transportation Infrastructure | | | | 11,264 | | | | 108,338 | |
| | Grupo Aeroportuario del Sureste SAB de CV, B | | | Transportation Infrastructure | | | | 6,476 | | | | 98,937 | |
| | Grupo Bimbo SAB de CV, A | | | Food Products | | | | 69,052 | | | | 125,870 | |
| | Grupo Carso SAB de CV | | | Industrial Conglomerates | | | | 15,352 | | | | 45,044 | |
| | Grupo Comercial Chedraui SA de CV | | | Food & Staples Retailing | | | | 9,720 | | | | 15,192 | |
| | Grupo Elektra SAB de CV | | | Banks | | | | 1,852 | | | | 131,297 | |
| | Grupo Financiero Banorte SAB de CV | | | Banks | | | | 83,832 | | | | 450,368 | |
| | Grupo Financiero Inbursa SAB de CV | | | Banks | | | | 72,272 | | | | 91,877 | |
| | Grupo Lala SAB de CV | | | Food Products | | | | 18,508 | | | | 21,213 | |
| | Grupo Mexico SAB de CV, B | | | Metals & Mining | | | | 83,984 | | | | 196,263 | |
| | Grupo Televisa SA | | | Media | | | | 64,568 | | | | 126,330 | |
| | Industrias Bachoco SAB de CV, B | | | Food Products | | | | 5,160 | | | | 22,700 | |
| | Industrias Penoles SA | | | Metals & Mining | | | | 3,968 | | | | 52,789 | |
| a | | Infraestructura Energetica Nova SAB de CV | | | Gas Utilities | | | | 16,488 | | | | 65,504 | |
| | Kimberly-Clark de Mexico SAB de CV, A | | | Household Products | | | | 26,624 | | | | 53,440 | |
| | Megacable Holdings SAB de CV | | | Media | | | | 9,596 | | | | 38,624 | |
| | Nemak SAB de CV | | | Auto Components | | | | 19,008 | | | | 8,568 | |
| | Orbia Advance Corp SAB de CV | | | Chemicals | | | | 32,968 | | | | 64,303 | |
| | Promotora y Operadora de Infraestructura SAB de CV | | | Transportation Infrastructure | | | | 6,848 | | | | 61,370 | |
| | Regional SAB de CV | | | Banks | | | | 7,256 | | | | 33,255 | |
| a | | Telesites SAB de CV | | | Diversified Telecommunication Services | | | | 41,408 | | | | 27,348 | |
| | Wal-Mart de Mexico SAB de CV, V | | | Food & Staples Retailing | | | | 153,732 | | | | 455,341 | |
| | | | | | | | | | | | | | |
| | Total Investments (Cost $4,659,333) 99.9% | | | | | | | | | | | 4,335,832 | |
| | Other Assets, less Liabilities 0.1% | | | | | | | | | | | 6,445 | |
| | | | | | | | | | | | | | |
| | Net Assets 100.0% | | | | | | | | | | $ | 4,342,277 | |
| | | | | | | | | | | | | | |
See Abbreviations on page 322.
aNon-income producing.
bSecurity was purchased pursuant to Rule 144A under the Securities Act of 1933 and may be sold in transactions exempt from registration only to qualified institutional buyers or in a public offering registered under the Securities Act of 1933. This security has been deemed liquid under guidelines approved by the Fund’s Board of Trustees. At September 30, 2019, the value of this security was $17,147, representing 0.4% of net assets.
| | | | | | |
| | | |
| franklintempleton.com | | The accompanying notes are an integral part of these financial statements. | Semiannual Report | | | 251 | |
FRANKLIN TEMPLETON ETF TRUST
Financial Highlights
Franklin FTSE Russia ETF
| | | | | | | | | | | | |
| | | Six Months Ended
September 30, 2019
(unaudited) | | | Year Ended March 31, | |
| | | 2019 | | | 2018a | |
Per share operating performance (for a share outstanding throughout the period) | |
| | | |
Net asset value, beginning of period | | $ | 23.37 | | | $ | 24.24 | | | $ | 23.90 | |
| | | | |
|
| Income from investment operationsb: | |
| | | |
Net investment income (loss)c | | | 1.35 | | | | 1.03 | | | | (— | )d |
| | | |
Net realized and unrealized gains (losses) | | | 2.06 | | | | (1.26 | ) | | | 0.34 | |
| | | | |
| | | |
Total from investment operations | | | 3.41 | | | | (0.23 | ) | | | 0.34 | |
| | | | |
| | | |
Less distributions from net investment income | | | (0.17 | ) | | | (0.64 | ) | | | — | |
| | | | |
| | | |
Net asset value, end of period | | $ | 26.61 | | | $ | 23.37 | | | $ | 24.24 | |
| | | | |
| | | |
Total returne | | | 14.61% | | | | (0.63)% | | | | 1.42% | |
|
| Ratios to average net assetsf | |
| | | |
Total expenses | | | 0.19% | | | | 0.19% | | | | 0.19% | |
| | | |
Net investment income (loss) | | | 10.45% | | | | 4.57% | | | | (0.13)% | |
|
| Supplemental data | |
| | | |
Net assets, end of period (000’s) | | | $17,293 | | | | $11,683 | | | | $2,424 | |
| | | |
Portfolio turnover rateg | | | 4.82% | | | | 31.57% | | | | 7.58% | |
| | | |
| Portfolio turnover rate excluding portfolio transactions that are executed as a result of the Fund offering and redeeming Creation Units solely or in part for cashg,h | | | 4.82% | | | | —% | | | | —% | |
aFor the period February 6, 2018 (commencement of operations) to March 31, 2018.
bThe amount shown for a share outstanding throughout the period may not correlate with the Statement of Operations for the period due to the timing of sales and repurchases of Creation Unit Fund shares in relation to income earned and/or fluctuating fair value of the investments of the Fund.
cBased on average daily shares outstanding.
dAmount rounds to less than $0.01 per share.
eTotal return is not annualized for periods less than one year. Total return is calculated assuming an initial investment made at the net asset value at the beginning of the period, reinvestment of all dividends and distributions at net asset value during the period, and redemption at net asset value on the last day of the period.
fRatios are annualized for periods less than one year.
gPortfolio turnover rate excludes the value of portfolio securities received or delivered as a result of processing capital share transactions in Creation Units, if any.
hEffective September 30, 2019.
| | | | |
| | | |
| 252 | | Semiannual Report | The accompanying notes are an integral part of these financial statements. | | franklintempleton.com |
FRANKLIN TEMPLETON ETF TRUST
Statement of Investments, September 30, 2019 (unaudited)
Franklin FTSE Russia ETF
| | | | | | | | | | | | | | |
| | | | |
| | | | | Industry | | | Shares | | | Value | |
| | | Common Stocks 95.0% | | | | | | | | | |
| | | Russia 95.0% | | | | | | | | | |
| | Aeroflot – Russian Airlines PJSC | | | Airlines | | | | 100,308 | | | $ | 159,516 | |
| | Alrosa PJSC | | | Metals & Mining | | | | 357,318 | | | | 410,283 | |
| | Federal Grid Co. Unified Energy System PJSC | | | Electric Utilities | | | | 49,859,693 | | | | 142,749 | |
| | Federal Hydrogenerating Co. | | | Electric Utilities | | | | 22,010,352 | | | | 176,978 | |
| | Gazprom PJSC | | | Oil, Gas & Consumable Fuels | | | | 794,443 | | | | 2,765,995 | |
| | Inter RAO UES PJSC | | | Electric Utilities | | | | 5,468,502 | | | | 378,389 | |
| | LUKOIL PJSC | | | Oil, Gas & Consumable Fuels | | | | 33,800 | | | | 2,806,574 | |
| | Magnit PJSC | | | Food & Staples Retailing | | | | 7,904 | | | | 433,436 | |
| | Magnitogorsk Iron & Steel Works | | | Metals & Mining | | | | 339,027 | | | | 204,595 | |
| | MMC Norilsk Nickel PJSC | | | Metals & Mining | | | | 2,561 | | | | 658,619 | |
| | Mobile TeleSystems PJSC | | | Wireless Telecommunication Services | | | | 105,989 | | | | 432,892 | |
| | Moscow Exchange MICEX | | | Capital Markets | | | | 270,894 | | | | 395,554 | |
| | Mosenergo PAO | | | Electric Utilities | | | | 1,533,376 | | | | 53,186 | |
| | NLMK PJSC | | | Metals & Mining | | | | 178,646 | | | | 391,585 | |
| | NovaTek PJSC | | | Oil, Gas & Consumable Fuels | | | | 40,417 | | | | 817,528 | |
| | PhosAgro PJSC | | | Chemicals | | | | 6,760 | | | | 259,012 | |
| | Polyus Gold OJSC | | | Metals & Mining | | | | 3,692 | | | | 429,332 | |
| | Rosneft PJSC | | | Oil, Gas & Consumable Fuels | | | | 81,016 | | | | 523,562 | |
| | Rosseti PJSC | | | Electric Utilities | | | | 5,652,855 | | | | 107,590 | |
| | Rostelecom PJSC | | | Diversified Telecommunication Services | | | | 165,347 | | | | 200,050 | |
| a | | RussNeft PJSC | | | Oil, Gas & Consumable Fuels | | | | 8,502 | | | | 75,556 | |
| | Sberbank of Russia PJSC | | | Banks | | | | 775,359 | | | | 2,721,181 | |
| | Severstal PJSC | | | Metals & Mining | | | | 26,936 | | | | 387,418 | |
| | Sistema PJSFC | | | Wireless Telecommunication Services | | | | 543,647 | | | | 106,245 | |
| | Surgutneftegas PJSC | | | Oil, Gas & Consumable Fuels | | | | 448,370 | | | | 244,631 | |
| | Tatneft PAO | | | Oil, Gas & Consumable Fuels | | | | 60,034 | | | | 636,032 | |
| | Unipro PJSC | |
| Independent Power and
Renewable Electricity Producers |
| | | 1,977,339 | | | | 80,822 | |
| | VTB Bank PJSC | | | Banks | | | | 651,464,255 | | | | 427,683 | |
| | | | | | | | | | | | | | |
| | Total Common Stocks (Cost $14,920,273) | | | | | | | | | | | 16,426,993 | |
| | | | | | | | | | | | | | |
| | | Preferred Stocks 4.9% | | | | | | | | | |
| | | Russia 4.9% | | | | | | | | | |
| b | | Bashneft PJSC, 9.547%, pfd. | | | Oil, Gas & Consumable Fuels | | | | 3,679 | | | | 94,410 | |
| b | | Surgutneftegas PJSC, 20.342%, pfd. | | | Oil, Gas & Consumable Fuels | | | | 483,366 | | | | 279,072 | |
| b | | Tatneft PJSC, 19.949%, pfd., 3 | | | Oil, Gas & Consumable Fuels | | | | 5,902 | | | | 57,007 | |
| b | | Transneft PJSC, 7.147%, pfd. | | | Oil, Gas & Consumable Fuels | | | | 184 | | | | 424,817 | |
| | | | | | | | | | | | | | |
| | Total Preferred Stocks (Cost $888,425) | | | | | | | | | | | 855,306 | |
| | | | | | | | | | | | | | |
| | Total Investments
(Cost $15,808,698) 99.9% | | | | | | | | | | | 17,282,299 | |
| | Other Assets, less Liabilities 0.1% | | | | | | | | | | | 10,969 | |
| | | | | | | | | | | | | | |
| | Net Assets 100.0% | | | | | | | | | | $ | 17,293,268 | |
| | | | | | | | | | | | | | |
See Abbreviations on page 322.
aNon-income producing.
bVariable rate security. The rate shown represents the yield at period end.
| | | | | | |
| | | |
| franklintempleton.com | | The accompanying notes are an integral part of these financial statements. | Semiannual Report | | | 253 | |
FRANKLIN TEMPLETON ETF TRUST
Financial Highlights
Franklin FTSE Saudi Arabia ETF
| | | | | | | | |
| | |
| | | Six Months Ended
September 30, 2019
(unaudited) | | | Year Ended
March 31, 2019a | |
| |
Per share operating performance (for a share outstanding throughout the period) | | | | | |
| | |
Net asset value, beginning of period | | $ | 27.89 | | | $ | 24.71 | |
| | | | | | | | |
| |
| Income from investment operationsb: | | | | | |
| | |
Net investment incomec | | | 0.70 | | | | 0.11 | |
| | |
Net realized and unrealized gains (losses) | | | (2.51 | ) | | | 3.07 | |
| | | | | | | | |
| | |
Total from investment operations | | | (1.81 | ) | | | 3.18 | |
| | | | | | | | |
| | |
Less distributions from net investment income | | | (0.47 | ) | | | — | |
| | | | | | | | |
| | |
Net asset value, end of period | | $ | 25.61 | | | $ | 27.89 | |
| | | | | | | | |
| | |
Total returnd | | | (6.70)% | | | | 12.87% | |
| |
| Ratios to average net assetse | | | | | |
| | |
Total expenses | | | 0.39% | | | | 0.39% | |
| | |
Net investment income | | | 5.06% | | | | 0.93% | |
| |
| Supplemental data | | | | | |
| | |
Net assets, end of period (000’s) | | | $2,561 | | | | $2,789 | |
| | |
Portfolio turnover ratef | | | 14.22% | | | | 12.41% | |
| | |
| Portfolio turnover rate excluding portfolio transactions that are executed as a result of the Fund offering and redeeming Creation Units solely or in part for cashf,g | | | 14.22% | | | | —% | |
aFor the period October 9, 2018 (commencement of operations) to March 31, 2019.
bThe amount shown for a share outstanding throughout the period may not correlate with the Statement of Operations for the period due to the timing of sales and repurchases of Creation Unit Fund shares in relation to income earned and/or fluctuating fair value of the investments of the Fund.
cBased on average daily shares outstanding.
dTotal return is not annualized for periods less than one year. Total return is calculated assuming an initial investment made at the net asset value at the beginning of the period, reinvestment of all dividends and distributions at net asset value during the period, and redemption at net asset value on the last day of the period.
eRatios are annualized for periods less than one year.
fPortfolio turnover rate excludes the value of portfolio securities received or delivered as a result of processing capital share transactions in Creation Units, if any.
gEffective September 30, 2019.
| | | | |
| | | |
| 254 | | Semiannual Report | The accompanying notes are an integral part of these financial statements. | | franklintempleton.com |
FRANKLIN TEMPLETON ETF TRUST
Statement of Investments, September 30, 2019 (unaudited)
Franklin FTSE Saudi Arabia ETF
| | | | | | | | | | | | | | |
| | | | |
| | | | | Industry | | | Shares | | | Value | |
| | | Common Stocks 99.7% | | | | | | | | | |
| | | Saudi Arabia 99.7% | | | | | | | | | |
| | Abdullah Al Othaim Markets Co. | | | Food & Staples Retailing | | | | 808 | | | $ | 17,792 | |
| | Advanced Petrochemical Co. | | | Chemicals | | | | 2,118 | | | | 27,384 | |
| | Al-Rajhi Bank | | | Banks | | | | 19,586 | | | | 330,506 | |
| | Alinma Bank | | | Banks | | | | 12,426 | | | | 74,466 | |
| | Almarai Co. JSC | | | Food Products | | | | 4,636 | | | | 61,485 | |
| | BankAl-Jazira | | | Banks | | | | 7,370 | | | | 26,563 | |
| | Bank Albilad | | | Banks | | | | 6,742 | | | | 47,628 | |
| | Bupa Arabia for Cooperative Insurance Co. | | | Insurance | | | | 1,140 | | | | 32,335 | |
| | Dallah Healthcare Co. | | | Health Care Providers & Services | | | | 524 | | | | 6,789 | |
| a | | Dar Al Arkan Real Estate Development Co. | | | Real Estate Management & Development | | | | 9,708 | | | | 30,900 | |
| a | | Emaar Economic City | | | Real Estate Management & Development | | | | 7,640 | | | | 20,204 | |
| a | | Etihad Etisalat Co. | | | Wireless Telecommunication Services | | | | 6,922 | | | | 44,545 | |
| a | | Fawaz Abdulaziz Al Hokair & Co. | | | Specialty Retail | | | | 1,194 | | | | 8,212 | |
| | Jarir Marketing Co. | | | Specialty Retail | | | | 1,078 | | | | 45,405 | |
| a | | Mobile Telecommunications Co. | | | Wireless Telecommunication Services | | | | 5,246 | | | | 16,754 | |
| | Mouwasat Medical Services Co. | | | Health Care Providers & Services | | | | 880 | | | | 20,597 | |
| | National Commercial Bank | | | Banks | | | | 21,560 | | | | 264,672 | |
| | National Petrochemical Co. | | | Chemicals | | | | 2,898 | | | | 18,387 | |
| a | | Rabigh Refining and Petrochemical Co. | | | Oil, Gas & Consumable Fuels | | | | 4,018 | | | | 21,273 | |
| | Riyad Bank | | | Banks | | | | 17,210 | | | | 111,944 | |
| | Sahara International Petrochemical Co. | | | Chemicals | | | | 7,676 | | | | 36,874 | |
| | Samba Financial Group | | | Banks | | | | 13,486 | | | | 102,820 | |
| | Saudi Airlines Catering Co. | | | Hotels, Restaurants & Leisure | | | | 696 | | | | 16,253 | |
| | Saudi Arabian Fertilizer Co. | | | Chemicals | | | | 3,650 | | | | 78,134 | |
| a | | Saudi Arabian Mining Co. | | | Metals & Mining | | | | 7,058 | | | | 85,422 | |
| | Saudi Basic Industries Corp. | | | Chemicals | | | | 14,806 | | | | 363,124 | |
| | Saudi Cement Co. | | | Construction Materials | | | | 1,498 | | | | 28,433 | |
| | Saudi Electricity Co. | | | Electric Utilities | | | | 14,008 | | | | 79,540 | |
| | Saudi Ground Services Co. | | | Transportation Infrastructure | | | | 1,638 | | | | 14,366 | |
| | Saudi Industrial Investment Group | | | Chemicals | | | | 5,104 | | | | 31,403 | |
| | Saudi Pharmaceutical Industries & Medical Appliances Corp. | | | Pharmaceuticals | | | | 1,078 | | | | 7,558 | |
| a | | Saudi Research & Marketing Group | | | Media | | | | 602 | | | | 12,807 | |
| | Saudi Telecom Co. | | | Diversified Telecommunication Services | | | | 9,656 | | | | 280,063 | |
| a | | SavolaAl-Azizia United Co. | | | Food Products | | | | 4,800 | | | | 39,475 | |
| a | | Seera Group Holdings | | | Hotels, Restaurants & Leisure | | | | 2,696 | | | | 13,368 | |
| | Southern Province Cement Co. | | | Construction Materials | | | | 1,258 | | | | 19,149 | |
| a | | The Company for Cooperative Insurance | | | Insurance | | | | 1,124 | | | | 20,315 | |
| | The Qassim Cement | | | Construction Materials | | | | 878 | | | | 12,452 | |
| | Yanbu Cement | | | Construction Materials | | | | 1,646 | | | | 15,204 | |
| | Yanbu National Petrochemical Co. | | | Chemicals | | | | 4,750 | | | | 67,745 | |
| | | | | | | | | | | | | | |
| | Total Investments (Cost $2,502,418) 99.7% | | | | | | | | | | | 2,552,346 | |
| | Other Assets, less Liabilities 0.3% | | | | | | | | | | | 8,212 | |
| | | | | | | | | | | | | | |
| | Net Assets 100.0% | | | | | | | | | | $ | 2,560,558 | |
| | | | | | | | | | | | | | |
See Abbreviations on page 322.
aNon-income producing.
| | | | | | |
| | | |
| franklintempleton.com | | The accompanying notes are an integral part of these financial statements. | Semiannual Report | | | 255 | |
FRANKLIN TEMPLETON ETF TRUST
Financial Highlights
Franklin FTSE South Africa ETF
| | | | | | | | |
| | |
| | | Six Months Ended
September 30, 2019
(unaudited) | | | Year Ended
March 31, 2019a | |
| |
Per share operating performance (for a share outstanding throughout the period) | | | | | |
| | |
Net asset value, beginning of period | | $ | 26.62 | | | $ | 24.42 | |
| | | | | | | | |
| |
| Income from investment operationsb: | | | | | |
| | |
Net investment incomec | | | 2.42 | | | | 0.22 | |
| | |
Net realized and unrealized gains (losses) | | | (4.11 | ) | | | 2.04 | |
| | | | | | | | |
| | |
Total from investment operations | | | (1.69 | ) | | | 2.26 | |
| | | | | | | | |
| | |
Less distributions from net investment income | | | (0.38 | ) | | | (0.06 | ) |
| | | | | | | | |
| | |
Net asset value, end of period | | $ | 24.55 | | | $ | 26.62 | |
| | | | | | | | |
| | |
Total returnd | | | (6.50)% | | | | 9.26% | |
| |
| Ratios to average net assetse | | | | | |
| | |
Total expenses | | | 0.19% | | | | 0.19% | |
| | |
Net investment income | | | 17.98% | | | | 1.75% | |
| |
| Supplemental data | | | | | |
| | |
Net assets, end of period (000’s) | | | $2,455 | | | | $2,662 | |
| | |
Portfolio turnover ratef | | | 11.35% | | | | 7.12% | |
| | |
| Portfolio turnover rate excluding portfolio transactions that are executed as a result of the Fund offering and redeeming Creation Units solely or in part for cashf,g | | | 11.35% | | | | —% | |
aFor the period October 10, 2018 (commencement of operations) to March 31, 2019.
bThe amount shown for a share outstanding throughout the period may not correlate with the Statement of Operations for the period due to the timing of sales and repurchases of Creation Unit Fund shares in relation to income earned and/or fluctuating fair value of the investments of the Fund.
cBased on average daily shares outstanding.
dTotal return is not annualized for periods less than one year. Total return is calculated assuming an initial investment made at the net asset value at the beginning of the period, reinvestment of all dividends and distributions at net asset value during the period, and redemption at net asset value on the last day of the period.
eRatios are annualized for periods less than one year.
fPortfolio turnover rate excludes the value of portfolio securities received or delivered as a result of processing capital share transactions in Creation Units, if any.
gEffective September 30, 2019.
| | | | |
| | | |
| 256 | | Semiannual Report | The accompanying notes are an integral part of these financial statements. | | franklintempleton.com |
FRANKLIN TEMPLETON ETF TRUST
Statement of Investments, September 30, 2019 (unaudited)
Franklin FTSE South Africa ETF
| | | | | | | | | | | | | | |
| | | | |
| | | | | Industry | | | Shares | | | Value | |
| | | Common Stocks 100.0% | | | | | | | | | |
| | | Isle Of Man 0.2% | | | | | | | | | |
| | MAS Real Estate Inc. | | | Real Estate Management & Development | | | | 4,048 | | | $ | 4,859 | |
| | | | | | | | | | | | | | |
| | | Romania 1.2% | | | | | | | | | |
| | NEPI Rockcastle PLC | | | Real Estate Management & Development | | | | 3,292 | | | | 28,820 | |
| | | | | | | | | | | | | | |
| | | South Africa 98.6% | | | | | | | | | |
| | Absa Group Ltd. | | | Banks | | | | 6,760 | | | | 68,155 | |
| | African Rainbow Minerals Ltd. | | | Metals & Mining | | | | 972 | | | | 9,022 | |
| | Anglo American Platinum Ltd. | | | Metals & Mining | | | | 564 | | | | 33,962 | |
| | AngloGold Ashanti Ltd. | | | Metals & Mining | | | | 3,880 | | | | 72,697 | |
| | Aspen Pharmacare Holdings Ltd. | | | Pharmaceuticals | | | | 3,580 | | | | 20,294 | |
| | Assore Ltd. | | | Metals & Mining | | | | 314 | | | | 5,282 | |
| | AVI Ltd. | | | Food Products | | | | 3,060 | | | | 16,603 | |
| | Barloworld Ltd. | | | Trading Companies & Distributors | | | | 1,988 | | | | 15,157 | |
| | Bid Corp. Ltd. | | | Food & Staples Retailing | | | | 3,104 | | | | 65,929 | |
| | Bidvest Group Ltd. | | | Industrial Conglomerates | | | | 3,158 | | | | 39,741 | |
| | Capitec Bank Holdings Ltd. | | | Banks | | | | 498 | | | | 42,285 | |
| | Clicks Group Ltd. | | | Food & Staples Retailing | | | | 2,360 | | | | 33,463 | |
| | Coronation Fund Managers Ltd. | | | Capital Markets | | | | 2,416 | | | | 6,643 | |
| a | | Dis-Chem Pharmacies Ltd., Reg S | | | Food & Staples Retailing | | | | 3,672 | | | | 5,449 | |
| | Discovery Ltd. | | | Insurance | | | | 3,388 | | | | 25,484 | |
| | Distell Group Holdings Ltd. | | | Beverages | | | | 750 | | | | 6,727 | |
| | Exxaro Resources Ltd. | | | Oil, Gas & Consumable Fuels | | | | 2,348 | | | | 20,224 | |
| | FirstRand Ltd. | | | Diversified Financial Services | | | | 29,736 | | | | 121,964 | |
| | Fortress REIT Ltd. | | | Equity Real Estate Investment Trusts (REITs | ) | | | 8,160 | | | | 5,091 | |
| | Fortress REIT Ltd., A | | | Equity Real Estate Investment Trusts (REITs | ) | | | 10,964 | | | | 14,896 | |
| | Gold Fields Ltd. | | | Metals & Mining | | | | 7,604 | | | | 38,174 | |
| | Growthpoint Properties Ltd. | | | Equity Real Estate Investment Trusts (REITs | ) | | | 27,092 | | | | 41,274 | |
| b | | Harmony Gold Mining Co. Ltd. | | | Metals & Mining | | | | 4,272 | | | | 12,200 | |
| | Hyprop Investments Ltd. | | | Equity Real Estate Investment Trusts (REITs | ) | | | 2,346 | | | | 9,568 | |
| b | | Impala Platinum Holdings Ltd. | | | Metals & Mining | | | | 6,844 | | | | 43,007 | |
| | Investec Ltd. | | | Capital Markets | | | | 2,818 | | | | 14,840 | |
| | JSE Ltd. | | | Capital Markets | | | | 780 | | | | 6,739 | |
| | KAP Industrial Holdings Ltd. | | | Industrial Conglomerates | | | | 24,668 | | | | 7,695 | |
| | Kumba Iron Ore Ltd. | | | Metals & Mining | | | | 482 | | | | 11,904 | |
| | Liberty Holdings Ltd. | | | Insurance | | | | 1,124 | | | | 8,332 | |
| | Life Healthcare Group Holdings Ltd. | | | Health Care Providers & Services | | | | 12,980 | | | | 19,415 | |
| | Massmart Holdings Ltd. | | | Food & Staples Retailing | | | | 956 | | | | 2,763 | |
| | Momentum Metropolitan Holdings | | | Insurance | | | | 9,302 | | | | 11,442 | |
| | Motus Holdings Ltd. | | | Specialty Retail | | | | 1,622 | | | | 7,362 | |
| | Mr. Price Group Ltd. | | | Specialty Retail | | | | 2,342 | | | | 24,443 | |
| | MTN Group Ltd. | | | Wireless Telecommunication Services | | | | 16,838 | | | | 106,941 | |
| b | | MultiChoice Group Ltd. | | | Media | | | | 3,990 | | | | 31,044 | |
| | Naspers Ltd., N | | | Internet & Direct Marketing Retail | | | | 3,118 | | | | 471,952 | |
| | Nedbank Group Ltd. | | | Banks | | | | 3,726 | | | | 55,738 | |
| | Netcare Ltd. | | | Health Care Providers & Services | | | | 13,476 | | | | 15,598 | |
| b | | Northam Platinum Ltd. | | | Metals & Mining | | | | 3,278 | | | | 17,970 | |
| | Old Mutual Ltd. | | | Insurance | | | | 44,200 | | | | 56,349 | |
| a | | PepKor Holdings Ltd., Reg S | | | Specialty Retail | | | | 6,516 | | | | 7,628 | |
| | Pick ‘N Pay Stores Ltd. | | | Food & Staples Retailing | | | | 3,186 | | | | 12,511 | |
| | Pioneer Foods Group Ltd. | | | Food Products | | | | 1,290 | | | | 9,019 | |
| | PSG Group Ltd. | | | Diversified Financial Services | | | | 1,526 | | | | 21,252 | |
| | Rand Merchant Investment Holdings Ltd. | | | Insurance | | | | 7,046 | | | | 13,913 | |
| | Redefine Properties Ltd. | | | Equity Real Estate Investment Trusts (REITs | ) | | | 52,710 | | | | 27,220 | |
| | Remgro Ltd. | | | Diversified Financial Services | | | | 4,816 | | | | 51,833 | |
| | Resilient REIT Ltd. | | | Equity Real Estate Investment Trusts (REITs | ) | | | 2,514 | | | | 10,744 | |
| | Reunert Ltd. | | | Industrial Conglomerates | | | | 1,492 | | | | 6,790 | |
| | RMB Holdings Ltd. | | | Diversified Financial Services | | | | 7,010 | | | | 34,721 | |
| | Sanlam Ltd. | | | Insurance | | | | 16,344 | | | | 80,391 | |
| | | | | | |
| | | |
| franklintempleton.com | | Semiannual Report | | | 257 | |
FRANKLIN TEMPLETON ETF TRUST
STATEMENT OF INVESTMENTS (UNAUDITED)
Franklin FTSE South Africa ETF(continued)
| | | | | | | | | | | | | | |
| | | | |
| | | | | Industry | | | Shares | | | Value | |
| | | Common Stocks (continued) | | | | | | | | | |
| | | South Africa (continued) | | | | | | | | | |
| | Santam Ltd. | | | Insurance | | | | 388 | | | $ | 7,523 | |
| | Sappi Ltd. | | | Paper & Forest Products | | | | 5,120 | | | | 12,680 | |
| | Sasol Ltd. | | | Chemicals | | | | 5,222 | | | | 87,154 | |
| | Shoprite Holdings Ltd. | | | Food & Staples Retailing | | | | 4,410 | | | | 35,670 | |
| b | | Sibanye Gold Ltd. | | | Metals & Mining | | | | 20,234 | | | | 27,997 | |
| | Standard Bank Group Ltd. | | | Banks | | | | 11,982 | | | | 138,047 | |
| b | | Super Group Ltd. | | | Specialty Retail | | | | 3,376 | | | | 6,179 | |
| | Telkom SA SOC Ltd. | | | Diversified Telecommunication Services | | | | 2,746 | | | | 12,784 | |
| | The Foschini Group Ltd. | | | Specialty Retail | | | | 2,150 | | | | 23,178 | |
| | The Spar Group Ltd. | | | Food & Staples Retailing | | | | 1,804 | | | | 22,726 | |
| | Tiger Brands Ltd. | | | Food Products | | | | 1,550 | | | | 21,525 | |
| | Truworths International Ltd. | | | Specialty Retail | | | | 3,994 | | | | 13,961 | |
| | Tsogo Sun Gaming Ltd. | | | Hotels, Restaurants & Leisure | | | | 4,884 | | | | 4,249 | |
| b | | Tsogo Sun Hotels Ltd. | | | Hotels, Restaurants & Leisure | | | | 4,884 | | | | 1,305 | |
| | Vodacom Group Ltd. | | | Wireless Telecommunication Services | | | | 5,580 | | | | 44,029 | |
| | Vukile Property Fund Ltd. | | | Equity Real Estate Investment Trusts (REITs | ) | | | 8,262 | | | | 10,353 | |
| | Woolworths Holdings Ltd. | | | Multiline Retail | | | | 8,942 | | | | 32,483 | |
| | | | | | | | | | | | | | |
| | | | | | | | | | | | | 2,421,683 | |
| | | | | | | | | | | | | | |
| | Total Investments (Cost $2,641,499) 100.0% | | | | | | | | | | | 2,455,362 | |
| | Other Assets, less Liabilities 0.0%† | | | | | | | | | | | (146 | ) |
| | | | | | | | | | | | | | |
| | Net Assets 100.0% | | | | | | | | | | $ | 2,455,216 | |
| | | | | | | | | | | | | | |
See Abbreviations on page 322.
†Rounds to less than 0.1% of net assets.
aSecurity was purchased pursuant to Regulation S under the Securities Act of 1933, which exempts from registration securities offered and sold outside of the United States. Such a security cannot be sold in the United States without either an effective registration statement filed pursuant to the Securities Act of 1933, or pursuant to an exemption from registration. These securities have been deemed liquid under guidelines approved by the Fund’s Board of Trustees. At September 30, 2019, the aggregate value of these securities was $13,077, representing 0.5% of net assets.
bNon-income producing.
| | | | |
| | | |
| 258 | | Semiannual Report | The accompanying notes are an integral part of these financial statements. | | franklintempleton.com |
FRANKLIN TEMPLETON ETF TRUST
Financial Highlights
Franklin FTSE South Korea ETF
| | | | | | | | | | | | |
| | | Six Months Ended
September 30, 2019
(unaudited) | | | Year Ended March 31, | |
| | | 2019 | | | 2018a | |
| | | |
Per share operating performance
(for a share outstanding throughout the period) | | | | | | | | | | | | |
| | | |
Net asset value, beginning of period | | $ | 21.19 | | | $ | 25.98 | | | $ | 25.75 | |
| | | | |
| | | |
| Income from investment operationsb: | | | | | | | | | | | | |
| | | |
Net investment incomec | | | 0.07 | | | | 0.40 | | | | 0.10 | |
| | | |
Net realized and unrealized gains (losses) | | | (1.58 | ) | | | (4.81 | ) | | | 0.40 | |
| | | | |
| | | |
Total from investment operations | | | (1.51 | ) | | | (4.41 | ) | | | 0.50 | |
| | | | |
| | | |
Less distributions from net investment income | | | (0.05 | ) | | | (0.38 | ) | | | (0.27 | ) |
| | | | |
| | | |
Net asset value, end of period | | $ | 19.63 | | | $ | 21.19 | | | $ | 25.98 | |
| | | | |
| | | |
Total returnd | | | (7.12)% | | | | (16.92)% | | | | 1.95% | |
| | | |
| Ratios to average net assetse | | | | | | | | | | | | |
| | | |
Total expenses | | | 0.09% | | | | 0.09% | | | | 0.09% | |
| | | |
Net investment income | | | 0.69% | | | | 1.74% | | | | 0.94% | |
| | | |
| Supplemental data | | | | | | | | | | | | |
| | | |
Net assets, end of period (000’s) | | | $13,740 | | | | $16,948 | | | | $25,981 | |
| | | |
Portfolio turnover ratef | | | 16.95% | | | | 5.21% | | | | 3.85% | |
| | | |
| Portfolio turnover rate excluding portfolio transactions that are executed as a result of the Fund offering and redeeming Creation Units solely or in part for cashf,g | | | 2.34% | | | | 0.00% | | | | 0.00% | |
aFor the period November 2, 2017 (commencement of operations) to March 31, 2018.
bThe amount shown for a share outstanding throughout the period may not correlate with the Statement of Operations for the period due to the timing of sales and repurchases of Creation Unit Fund shares in relation to income earned and/or fluctuating fair value of the investments of the Fund.
cBased on average daily shares outstanding.
dTotal return is not annualized for periods less than one year. Total return is calculated assuming an initial investment made at the net asset value at the beginning of the period, reinvestment of all dividends and distributions at net asset value during the period, and redemption at net asset value on the last day of the period.
eRatios are annualized for periods less than one year.
fPortfolio turnover rate excludes the value of portfolio securities received or delivered as a result of processing capital share transactions in Creation Units, if any.
gEffective September 30, 2019.
| | | | | | |
| | | |
| franklintempleton.com | | The accompanying notes are an integral part of these financial statements. | Semiannual Report | | | 259 | |
FRANKLIN TEMPLETON ETF TRUST
Statement of Investments, September 30, 2019 (unaudited)
Franklin FTSE South Korea ETF
| | | | | | | | | | | | | | |
| | | | |
| | | | | Industry | | | Shares | | | Value | |
| | | Common Stocks 95.6% | | | | | | | | | |
| | | South Korea 95.6% | | | | | | | | | |
| | Amorepacific Corp. | | | Personal Products | | | | 805 | | | $ | 94,555 | |
| | AmorePacific Group | | | Personal Products | | | | 742 | | | | 40,569 | |
| | BGF Co. Ltd. | | | Industrial Conglomerates | | | | 672 | | | | 3,371 | |
| | BGF Retail Co. Ltd. | | | Food & Staples Retailing | | | | 154 | | | | 25,363 | |
| | BNK Financial Group Inc. | | | Banks | | | | 7,280 | | | | 43,760 | |
| a | | Celltrion Healthcare Co. Ltd. | | | Health Care Providers & Services | | | | 1,463 | | | | 61,644 | |
| a | | Celltrion Inc. | | | Biotechnology | | | | 2,492 | | | | 341,670 | |
| | Cheil Worldwide Inc. | | | Media | | | | 1,771 | | | | 36,718 | |
| | CJ CheilJedang Corp. | | | Food Products | | | | 196 | | | | 38,425 | |
| | CJ Corp. | | | Industrial Conglomerates | | | | 315 | | | | 21,594 | |
| | CJ ENM Co. Ltd. | | | Internet & Direct Marketing Retail | | | | 245 | | | | 34,697 | |
| a | | CJ Logistics Corp. | | | Road & Rail | | | | 182 | | | | 21,986 | |
| | Daelim Industrial Co. Ltd. | | | Construction & Engineering | | | | 686 | | | | 59,645 | |
| a | | Daewoo Engineering & Construction Co. Ltd. | | | Construction & Engineering | | | | 4,522 | | | | 18,260 | |
| a | | Daewoo Shipbuilding & Marine Engineering Co. Ltd. | | | Machinery | | | | 1,218 | | | | 31,159 | |
| | DB Insurance Co. Ltd. | | | Insurance | | | | 1,190 | | | | 51,335 | |
| | DGB Financial Group Inc. | | | Banks | | | | 3,815 | | | | 23,761 | |
| | Dongsuh Cos. Inc. | | | Food & Staples Retailing | | | | 805 | | | | 12,114 | |
| | Doosan Bobcat Inc. | | | Machinery | | | | 616 | | | | 18,230 | |
| b | | Doosan Corp. | | | Industrial Conglomerates | | | | 147 | | | | 12,867 | |
| a | | Doosan Heavy Industries and Construction Co. Ltd. | | | Electrical Equipment | | | | 3,017 | | | | 17,151 | |
| a | | Doosan Infracore Co. Ltd. | | | Machinery | | | | 3,409 | | | | 17,955 | |
| | E-MART Inc. | | | Food & Staples Retailing | | | | 511 | | | | 48,274 | |
| | Fila Korea Ltd. | | | Textiles, Apparel & Luxury Goods | | | | 1,316 | | | | 63,701 | |
| | GS Engineering & Construction Corp. | | | Construction & Engineering | | | | 1,477 | | | | 40,748 | |
| | GS Holdings Corp. | | | Oil, Gas & Consumable Fuels | | | | 1,288 | | | | 54,162 | |
| | GS Retail Co. Ltd. | | | Food & Staples Retailing | | | | 679 | | | | 23,416 | |
| | Hana Financial Group Inc. | | | Banks | | | | 7,504 | | | | 221,139 | |
| | Hankook Tire & Technology Co. Ltd. | | | Auto Components | | | | 1,897 | | | | 51,146 | |
| | Hanmi Pharm Co. Ltd. | | | Pharmaceuticals | | | | 179 | | | | 41,303 | |
| | Hanmi Science Co. Ltd. | | | Pharmaceuticals | | | | 350 | | | | 11,587 | |
| | Hanon Systems | | | Auto Components | | | | 4,102 | | | | 41,152 | |
| | Hanssem Co. Ltd. | | | Household Durables | | | | 252 | | | | 12,641 | |
| a | | Hanwha Aerospace Co. Ltd. | | | Aerospace & Defense | | | | 903 | | | | 31,820 | |
| | Hanwha Chemical Corp. | | | Chemicals | | | | 2,030 | | | | 30,463 | |
| | Hanwha Corp. | | | Industrial Conglomerates | | | | 1,085 | | | | 22,904 | |
| a | | Hanwha Corp. | | | Industrial Conglomerates | | | | 553 | | | | 6,357 | |
| | Hanwha Life Insurance Co. Ltd. | | | Insurance | | | | 7,063 | | | | 14,053 | |
| | HDC Holdings Co. Ltd. | | | Construction & Engineering | | | | 980 | | | | 10,569 | |
| | HDC Hyundai DevelopmentCo-Engineering & Construction | | | Construction & Engineering | | | | 784 | | | | 21,531 | |
| a | | Helixmith Co. Ltd. | | | Biotechnology | | | | 462 | | | | 25,608 | |
| | Hite Jinro Co. Ltd. | | | Beverages | | | | 749 | | | | 17,032 | |
| a | | HLB Inc. | | | Leisure Equipment & Products | | | | 896 | | | | 45,244 | |
| | Hotel Shilla Co. Ltd. | | | Specialty Retail | | | | 784 | | | | 56,499 | |
| | Hyundai Construction Equipment Co. Ltd. | | | Machinery | | | | 308 | | | | 8,137 | |
| | Hyundai Department Store Co. Ltd. | | | Multiline Retail | | | | 385 | | | | 25,138 | |
| | Hyundai Engineering & Construction Co. Ltd. | | | Construction & Engineering | | | | 1,841 | | | | 71,261 | |
| | Hyundai Glovis Co. Ltd. | | | Air Freight & Logistics | | | | 469 | | | | 61,166 | |
| | Hyundai Heavy Industries Holdings Co. Ltd. | | | Machinery | | | | 266 | | | | 77,722 | |
| | Hyundai Marine & Fire Insurance Co. Ltd. | | | Insurance | | | | 1,540 | | | | 33,989 | |
| | Hyundai Mipo Dockyard Co. Ltd. | | | Machinery | | | | 511 | | | | 19,267 | |
| | Hyundai Mobis Co. Ltd. | | | Auto Components | | | | 1,652 | | | | 348,037 | |
| | Hyundai Motor Co. | | | Automobiles | | | | 3,584 | | | | 401,501 | |
| | Hyundai Steel Co. | | | Metals & Mining | | | | 1,897 | | | | 61,692 | |
| | Hyundai Wia Corp. | | | Auto Components | | | | 399 | | | | 17,012 | |
| | Industrial Bank of Korea | | | Banks | | | | 6,867 | | | | 75,780 | |
| | Kakao Corp. | | | Interactive Media & Services | | | | 1,267 | | | | 143,526 | |
| | Kangwon Land Inc. | | | Hotels, Restaurants & Leisure | | | | 2,695 | | | | 66,578 | |
| | | | |
| | | |
| 260 | | Semiannual Report | | franklintempleton.com |
FRANKLIN TEMPLETON ETF TRUST
STATEMENT OF INVESTMENTS (UNAUDITED)
Franklin FTSE South Korea ETF(continued)
| | | | | | | | | | | | | | |
| | | |
| | | Industry | | | Shares | | | Value | |
| | | Common Stocks (continued) | | | | | | | | | |
| | | South Korea (continued) | | | | | | | | | |
| | KB Financial Group Inc. | | | Banks | | | | 9,828 | | | $ | 350,839 | |
| | KCC Corp. | | | Building Products | | | | 140 | | | | 25,515 | |
| | KEPCO Plant Service and Engineering Co. Ltd. | | | Commercial Services & Supplies | | | | 539 | | | | 15,569 | |
| | Kia Motors Corp. | | | Automobiles | | | | 6,517 | | | | 248,443 | |
| | Korea Aerospace Industries Ltd. | | | Aerospace & Defense | | | | 1,638 | | | | 53,543 | |
| a | | Korea Electric Power Corp. | | | Electric Utilities | | | | 6,433 | | | | 139,292 | |
| | Korea Gas Corp. | | | Gas Utilities | | | | 672 | | | | 22,247 | |
| | Korea Investment Holdings Co. Ltd. | | | Capital Markets | | | | 959 | | | | 60,371 | |
| a | | Korea Shipbuilding & Offshore Engineering Co Ltd. | | | Machinery | | | | 1,085 | | | | 112,478 | |
| | Korea Zinc Co. Ltd. | | | Metals & Mining | | | | 252 | | | | 94,383 | |
| | Korean Air Lines Co. Ltd. | | | Airlines | | | | 1,190 | | | | 22,782 | |
| | KT&G Corp. | | | Tobacco | | | | 2,800 | | | | 246,959 | |
| | Kumho Petrochemical Co. Ltd. | | | Chemicals | | | | 448 | | | | 26,817 | |
| | LG Chem Ltd. | | | Chemicals | | | | 1,155 | | | | 289,197 | |
| | LG Corp. | | | Industrial Conglomerates | | | | 2,282 | | | | 133,545 | |
| a | | LG Display Co. Ltd. | | | Electronic Equipment, Instruments & Components | | | | 5,691 | | | | 67,322 | |
| | LG Electronics Inc. | | | Household Durables | | | | 2,716 | | | | 153,040 | |
| | LG Household & Health Care Ltd. | | | Personal Products | | | | 224 | | | | 244,759 | |
| | LG Uplus Corp. | | | Diversified Telecommunication Services | | | | 4,907 | | | | 55,997 | |
| | Lotte Chemical Corp. | | | Chemicals | | | | 371 | | | | 73,198 | |
| | Lotte Chilsung Beverage Co. Ltd. | | | Beverages | | | | 91 | | | | 10,537 | |
| | Lotte Corp. | | | Industrial Conglomerates | | | | 651 | | | | 19,729 | |
| | LOTTE Fine Chemical Co. Ltd. | | | Chemicals | | | | 441 | | | | 16,812 | |
| | Lotte Shopping Co. Ltd. | | | Multiline Retail | | | | 287 | | | | 30,952 | |
| | LS Corp. | | | Electrical Equipment | | | | 448 | | | | 17,772 | |
| | Mando Corp. | | | Auto Components | | | | 847 | | | | 25,633 | |
| | Medy-tox Inc. | | | Biotechnology | | | | 102 | | | | 30,707 | |
| a | | Mirae Asset Daewoo Co. Ltd. | | | Capital Markets | | | | 3,815 | | | | 13,491 | |
| | Mirae Asset Daewood Co. Ltd. | | | Capital Markets | | | | 9,541 | | | | 59,823 | |
| | Naver Corp. | | | Interactive Media & Services | | | | 3,381 | | | | 443,771 | |
| | NCsoft Corp. | | | Entertainment | | | | 427 | | | | 185,986 | |
| a | | Netmarble Corp. | | | Entertainment | | | | 441 | | | | 34,841 | |
| | NH Investment & Securities Co. Ltd. | | | Capital Markets | | | | 3,248 | | | | 34,485 | |
| a | | NHN Corp. | | | Entertainment | | | | 245 | | | | 12,761 | |
| | Nongshim Co. Ltd. | | | Food Products | | | | 77 | | | | 16,061 | |
| | OCI Co. Ltd. | | | Chemicals | | | | 462 | | | | 26,844 | |
| | Orion Corp. | | | Food Products | | | | 553 | | | | 45,492 | |
| | Ottogi Corp. | | | Food Products | | | | 35 | | | | 17,059 | |
| | Paradise Co. Ltd. | | | Hotels, Restaurants & Leisure | | | | 1,162 | | | | 17,972 | |
| | POSCO | | | Metals & Mining | | | | 1,722 | | | | 326,793 | |
| | POSCO Chemical Co. Ltd. | | | Construction Materials | | | | 546 | | | | 20,153 | |
| | Posco International Corp. | | | Trading Companies & Distributors | | | | 1,253 | | | | 20,008 | |
| | S-1 Corp. | | | Commercial Services & Supplies | | | | 490 | | | | 40,186 | |
| | S-Oil Corp. | | | Oil, Gas & Consumable Fuels | | | | 1,036 | | | | 86,092 | |
| a | | Samsung Biologics Co. Ltd. | | | Life Sciences Tools & Services | | | | 336 | | | | 86,377 | |
| | Samsung C&T Corp. | | | Industrial Conglomerates | | | | 2,121 | | | | 159,055 | |
| | Samsung Card Co. Ltd. | | | Consumer Finance | | | | 749 | | | | 22,010 | |
| | Samsung Electro-Mechanics Co. Ltd. | | | Electronic Equipment, Instruments & Components | | | | 1,407 | | | | 121,156 | |
| | Samsung Electronics Co. Ltd. | | | Technology Hardware, Storage & Peripherals | | | | 60,459 | | | | 2,479,216 | |
| a | | Samsung Engineering Co. Ltd. | | | Construction & Engineering | | | | 3,983 | | | | 55,941 | |
| | Samsung Fire & Marine Insurance Co. Ltd. | | | Insurance | | | | 833 | | | | 155,297 | |
| a | | Samsung Heavy Industries Co. Ltd. | | | Machinery | | | | 11,025 | | | | 72,631 | |
| | Samsung Life Insurance Co. Ltd. | | | Insurance | | | | 1,603 | | | | 95,283 | |
| | Samsung SDI Co. Ltd. | | | Electronic Equipment, Instruments & Components | | | | 1,330 | | | | 247,954 | |
| | Samsung SDS Co. Ltd. | | | IT Services | | | | 805 | | | | 128,205 | |
| | Samsung Securities Co. Ltd. | | | Capital Markets | | | | 1,596 | | | | 47,167 | |
| | Shinhan Financial Group Co. Ltd. | | | Banks | | | | 11,459 | | | | 400,440 | |
| | | | | | |
| | | |
| franklintempleton.com | | Semiannual Report | | | 261 | |
FRANKLIN TEMPLETON ETF TRUST
STATEMENT OF INVESTMENTS (UNAUDITED)
Franklin FTSE South Korea ETF(continued)
| | | | | | | | | | | | | | |
| | | |
| | | Industry | | | Shares | | | Value | |
| | | Common Stocks (continued) | | | | | | | | | |
| | | South Korea (continued) | | | | | | | | | |
| | Shinsegae Co. Ltd. | | | Multiline Retail | | | | 175 | | | $ | 38,404 | |
| a | | SillaJen Inc. | | | Biotechnology | | | | 1,379 | | | | 9,384 | |
| | SK Holdings Co. Ltd. | | | Industrial Conglomerates | | | | 840 | | | | 143,260 | |
| | SK Hynix Inc. | | | Semiconductors & Semiconductor Equipment | | | | 13,118 | | | | 901,475 | |
| | SK Innovation Co. Ltd. | | | Oil, Gas & Consumable Fuels | | | | 1,449 | | | | 201,090 | |
| | SK Networks Co. Ltd. | | | Trading Companies & Distributors | | | | 3,633 | | | | 16,887 | |
| | SK Telecom Co. Ltd. | | | Wireless Telecommunication Services | | | | 588 | | | | 118,716 | |
| | SKC Co. Ltd. | | | Chemicals | | | | 469 | | | | 15,605 | |
| | Ssangyong Cement Industrial Co. Ltd. | | | Construction Materials | | | | 2,674 | | | | 13,659 | |
| | Woongjin Coway Co. Ltd. | | | Household Durables | | | | 1,428 | | | | 100,998 | |
| | Woori Financial Group Inc. | | | Banks | | | | 14,140 | | | | 147,175 | |
| | Yuhan Corp. | | | Pharmaceuticals | | | | 217 | | | | 41,453 | |
| | | | | | | | | | | | | | |
| | Total Common Stocks
(Cost $16,946,332) | | | | | | | | | | | 13,138,078 | |
| | | | | | | | | | | | | | |
| | | Preferred Stocks 4.1% | | | | | | | | | |
| | | South Korea 4.1% | | | | | | | | | |
| c | | Amorepacific Corp., 1.617%, pfd. | | | Personal Products | | | | 273 | | | | 16,729 | |
| c | | CJ CheilJedang Corp., 3.381%, pfd. | | | Food Products | | | | 42 | | | | 3,687 | |
| c | | Hyundai Motor Co., 4.829%, pfd., 2 | | | Automobiles | | | | 910 | | | | 64,590 | |
| c | | Hyundai Motor Co., 5.301%, pfd. | | | Automobiles | | | | 574 | | | | 36,662 | |
| c | | LG Chem Ltd., 3.612%, pfd. | | | Chemicals | | | | 196 | | | | 27,446 | |
| c | | LG Electronics Inc., 2.914%, pfd. | | | Household Durables | | | | 469 | | | | 10,763 | |
| c | | LG Household & Health Care Ltd., 1.206%, pfd. | | | Personal Products | | | | 53 | | | | 34,162 | |
| c | | Samsung Electronics Co. Ltd., 3.587%, pfd. | | | Technology Hardware, Storage & Peripherals | | | | 10,605 | | | | 350,205 | |
| c | | Samsung Fire & Marine Insurance Co. Ltd., 7.080%, pfd. | | | Insurance | | | | 70 | | | | 9,510 | |
| | | | | | | | | | | | | | |
| | Total Preferred Stocks
(Cost $657,045) | | | | | | | | | | | 553,754 | |
| | | | | | | | | | | | | | |
| | Total Investments
(Cost $17,603,377) 99.7% | | | | | | | | | | | 13,691,832 | |
| | Other Assets, less Liabilities 0.3% | | | | | | | | | | | 47,956 | |
| | | | | | | | | | | | | | |
| | Net Assets 100.0% | | | | | | | | | | $ | 13,739,788 | |
| | | | | | | | | | | | | | |
See Abbreviations on page 322.
aNon-income producing.
bFair valued using significant unobservable inputs. See Note 8 regarding fair value measurements.
cVariable rate security. The rate shown represents the yield at period end.
Futures Contracts
At September 30, 2019, the Fund had the following futures contracts outstanding. See Note 1(c).
| | | | | | | | | | | | | | | | | | | | |
| Futures Contracts | | | | | | | | | | | | | | | |
| | | | | |
| Description | | Type | | | Number of
Contracts | | | Notional
Amount* | | | Expiration
Date | | | Value/Unrealized
Appreciation
(Depreciation) | |
| Equity Contracts | | | | | | | | | | | | | | | |
Kospi 200 Mini | | | Long | | | | 3 | | | $ | 34,298 | | | | 10/10/19 | | | $ | 717 | |
*As of period end.
See Note 7 regarding other derivative information.
| | | | |
| | | |
| 262 | | Semiannual Report | The accompanying notes are an integral part of these financial statements. | | franklintempleton.com |
FRANKLIN TEMPLETON ETF TRUST
Financial Highlights
Franklin FTSE Switzerland ETF
| | | | | | | | | | | | |
| | | Six Months Ended
September 30, 2019
(unaudited) | | | Year Ended March 31, | |
| | | 2019 | | | 2018a | |
| | | |
Per share operating performance
(for a share outstanding throughout the period) | | | | | | | | | | | | |
| | | |
Net asset value, beginning of period | | $ | 23.86 | | | $ | 23.11 | | | $ | 23.56 | |
| | | | |
| | | |
| Income from investment operationsb: | | | | | | | | | | | | |
| | | |
Net investment incomec | | | 0.25 | | | | 0.53 | | | | 0.22 | |
| | | |
Net realized and unrealized gains (losses) | | | 1.82 | | | | 0.83 | | | | (0.67 | ) |
| | | | |
| | | |
Total from investment operations | | | 2.07 | | | | 1.36 | | | | (0.45 | ) |
| | | | |
| | | |
Less distributions from net investment income | | | (0.30 | ) | | | (0.61 | ) | | | — | |
| | | | |
| | | |
Net asset value, end of period | | $ | 25.63 | | | $ | 23.86 | | | $ | 23.11 | |
| | | | |
| | | |
Total returnd | | | 8.72% | | | | 6.13% | | | | (1.91)% | |
| | | |
| Ratios to average net assetse | | | | | | | | | | | | |
| | | |
Total expenses | | | 0.09% | | | | 0.09% | | | | 0.09% | |
| | | |
Net investment income | | | 1.97% | | | | 2.35% | | | | 6.54% | |
| | | |
| Supplemental data | | | | | | | | | | | | |
| | | |
Net assets, end of period (000’s) | | | $7,689 | | | | $2,386 | | | | $2,311 | |
| | | |
Portfolio turnover ratef | | | 5.85% | | | | 14.06% | | | | 2.72% | |
| | | |
| Portfolio turnover rate excluding portfolio transactions that are executed as a result of the Fund offering and redeeming Creation Units solely or in part for cashf,g | | | 5.85% | | | | —% | | | | —% | |
aFor the period February 6, 2018 (commencement of operations) to March 31, 2018.
bThe amount shown for a share outstanding throughout the period may not correlate with the Statement of Operations for the period due to the timing of sales and repurchases of Creation Unit Fund shares in relation to income earned and/or fluctuating fair value of the investments of the Fund.
cBased on average daily shares outstanding.
dTotal return is not annualized for periods less than one year. Total return is calculated assuming an initial investment made at the net asset value at the beginning of the period, reinvestment of all dividends and distributions at net asset value during the period, and redemption at net asset value on the last day of the period.
eRatios are annualized for periods less than one year.
fPortfolio turnover rate excludes the value of portfolio securities received or delivered as a result of processing capital share transactions in Creation Units, if any.
gEffective September 30, 2019.
| | | | | | |
| | | |
| franklintempleton.com | | The accompanying notes are an integral part of these financial statements. | Semiannual Report | | | 263 | |
FRANKLIN TEMPLETON ETF TRUST
Statement of Investments, September 30, 2019 (unaudited)
Franklin FTSE Switzerland ETF
| | | | | | | | | | | | | | |
| | | |
| | | Industry | | | Shares | | | Value | |
| | | | | | | | | | | | | | |
| | | Common Stocks 99.8% | | | | | | | | | |
| | | Switzerland 99.8% | | | | | | | | | |
| | ABB Ltd. | | | Electrical Equipment | | | | 11,622 | | | $ | 228,559 | |
| | Adecco Group AG | | | Professional Services | | | | 1,044 | | | | 57,815 | |
| a | | Alcon Inc. | | | Health Care Equipment & Supplies | | | | 3,117 | | | | 181,928 | |
| | Baloise Holding AG | | | Insurance | | | | 315 | | | | 56,483 | |
| | Banque Cantonale Vaudoise | | | Banks | | | | 18 | | | | 13,791 | |
| | Barry Callebaut AG | | | Food Products | | | | 15 | | | | 30,958 | |
| | Chocoladefabriken Lindt & Spruengli AG | | | Food Products | | | | 14 | | | | 103,475 | |
| | Clariant AG | | | Chemicals | | | | 1,362 | | | | 26,539 | |
| | Compagnie Financiere Richemont SA | | | Textiles, Apparel & Luxury Goods | | | | 3,264 | | | | 239,673 | |
| | Credit Suisse Group AG | | | Capital Markets | | | | 16,590 | | | | 203,559 | |
| | DKSH Holding AG | | | Professional Services | | | | 243 | | | | 12,141 | |
| | Dufry AG | | | Specialty Retail | | | | 195 | | | | 16,325 | |
| | EMS-Chemie Holding AG | | | Chemicals | | | | 48 | | | | 29,917 | |
| | Flughafen Zurich AG | | | Transportation Infrastructure | | | | 129 | | | | 23,907 | |
| | Geberit AG | | | Building Products | | | | 243 | | | | 116,145 | |
| | Georg Fischer AG | | | Machinery | | | | 27 | | | | 23,408 | |
| | Givaudan AG | | | Chemicals | | | | 63 | | | | 175,893 | |
| | Helvetia Holding AG | | | Insurance | | | | 222 | | | | 30,657 | |
| | Julius Baer Group Ltd. | | | Capital Markets | | | | 1,467 | | | | 65,056 | |
| | Kuehne + Nagel International AG | | | Marine | | | | 342 | | | | 50,418 | |
| | LafargeHolcim Ltd., B | | | Construction Materials | | | | 3,426 | | | | 168,766 | |
| | Logitech International SA | | | Technology Hardware, Storage & Peripherals | | | | 990 | | | | 40,190 | |
| | Lonza Group AG | | | Life Sciences Tools & Services | | | | 504 | | | | 170,536 | |
| | Nestle SA | | | Food Products | | | | 14,352 | | | | 1,558,476 | |
| | Novartis AG | | | Pharmaceuticals | | | | 11,985 | | | | 1,040,146 | |
| | OC Oerlikon Corp. AG | | | Machinery | | | | 1,323 | | | | 13,281 | |
| | Pargesa Holding SA, B | | | Diversified Financial Services | | | | 258 | | | | 19,858 | |
| | Partners Group Holding AG | | | Capital Markets | | | | 111 | | | | 85,247 | |
| | PSP Swiss Property AG | | | Real Estate Management & Development | | | | 267 | | | | 33,926 | |
| | Roche Holding AG | | | Pharmaceuticals | | | | 147 | | | | 42,575 | |
| | Roche Holding AG | | | Pharmaceuticals | | | | 3,864 | | | | 1,125,507 | |
| | Schindler Holding AG | | | Machinery | | | | 129 | | | | 28,798 | |
| | Schindler Holding AG, PC | | | Machinery | | | | 276 | | | | 61,779 | |
| | SGS SA | | | Professional Services | | | | 34 | | | | 84,356 | |
| | Sika AG | | | Chemicals | | | | 942 | | | | 137,925 | |
| | Sonova Holding AG | | | Health Care Equipment & Supplies | | | | 375 | | | | 87,249 | |
| | Straumann Holding AG | | | Health Care Equipment & Supplies | | | | 69 | | | | 56,451 | |
| | Sulzer AG | | | Machinery | | | | 117 | | | | 11,516 | |
| | Swatch Group AG | | | Textiles, Apparel & Luxury Goods | | | | 300 | | | | 15,088 | |
| | Swatch Group AG | | | Textiles, Apparel & Luxury Goods | | | | 198 | | | | 52,600 | |
| | Swiss Life Holding AG | | | Insurance | | | | 228 | | | | 109,090 | |
| | Swiss Prime Site AG | | | Real Estate Management & Development | | | | 513 | | | | 50,238 | |
| | Swiss Re AG | | | Insurance | | | | 1,875 | | | | 195,745 | |
| | Swisscom AG | | | Diversified Telecommunication Services | | | | 174 | | | | 85,905 | |
| | Temenos AG | | | Software | | | | 405 | | | | 67,828 | |
| | UBS Group AG | | | Capital Markets | | | | 22,008 | | | | 250,063 | |
| | Vifor Pharma AG | | | Pharmaceuticals | | | | 303 | | | | 48,451 | |
| | Zurich Insurance Group AG | | | Insurance | | | | 903 | | | | 345,932 | |
| | | | | | | | | | | | | | |
| | Total Investments (Cost $7,332,109) 99.8% | | | | | | | | | | | 7,674,169 | |
| | Other Assets, less Liabilities 0.2% | | | | | | | | | | | 14,620 | |
| | | | | | | | | | | | | | |
| | Net Assets 100.0% | | | | | | | | | | $ | 7,688,789 | |
| | | | | | | | | | | | | | |
See Abbreviations on page 322.
aNon-income producing.
| | | | |
| | | |
| 264 | | Semiannual Report | The accompanying notes are an integral part of these financial statements. | | franklintempleton.com |
FRANKLIN TEMPLETON ETF TRUST
Financial Highlights
Franklin FTSE Taiwan ETF
| | | | | | | | | | | | |
| | | Six Months Ended
September 30, 2019
(unaudited) | | | Year Ended March 31, | |
| | | 2019 | | | 2018a | |
| | | |
Per share operating performance
(for a share outstanding throughout the period) | | | | | | | | | | | | |
| | | |
Net asset value, beginning of period | | $ | 24.72 | | | $ | 26.34 | | | $ | 25.59 | |
| | | | |
| | | |
| Income from investment operationsb: | | | | | | | | | | | | |
| | | |
Net investment income (loss)c | | | 0.84 | | | | 0.47 | | | | (0.02 | ) |
| | | |
Net realized and unrealized gains (losses) | | | 0.18 | | | | (1.85 | ) | | | 0.77 | |
| | | | |
| | | |
Total from investment operations | | | 1.02 | | | | (1.38 | ) | | | 0.75 | |
| | | | |
| | | |
Less distributions from net investment income | | | (0.01 | ) | | | (0.24 | ) | | | (— | )d |
| | | | |
| | | |
Net asset value, end of period | | $ | 25.73 | | | $ | 24.72 | | | $ | 26.34 | |
| | | | |
| | | |
Total returne | | | 4.13% | | | | (5.15)% | | | | 2.93% | |
| | | |
| Ratios to average net assetsf | | | | | | | | | | | | |
| | | |
Total expenses | | | 0.19% | | | | 0.19% | | | | 0.19% | |
| | | |
Net investment income (loss) | | | 6.74% | | | | 1.96% | | | | (0.19)% | |
| | | |
| Supplemental data | | | | | | | | | | | | |
| | | |
Net assets, end of period (000’s) | | | $15,438 | | | | $14,834 | | | | $5,268 | |
| | | |
Portfolio turnover rateg | | | 2.31% | | | | 8.71% | | | | 3.63% | |
| | | |
| Portfolio turnover rate excluding portfolio transactions that are executed as a result of the Fund offering and redeeming Creation Units solely or in part for cashg,h | | | 2.31% | | | | —% | | | | —% | |
aFor the period November 2, 2017 (commencement of operations) to March 31, 2018.
bThe amount shown for a share outstanding throughout the period may not correlate with the Statement of Operations for the period due to the timing of sales and repurchases of Creation Unit Fund shares in relation to income earned and/or fluctuating fair value of the investments of the Fund.
cBased on average daily shares outstanding.
dAmount rounds to less than $0.001 per share.
eTotal return is not annualized for periods less than one year. Total return is calculated assuming an initial investment made at the net asset value at the beginning of the period, reinvestment of all dividends and distributions at net asset value during the period, and redemption at net asset value on the last day of the period.
fRatios are annualized for periods less than one year.
gPortfolio turnover rate excludes the value of portfolio securities received or delivered as a result of processing capital share transactions in Creation Units, if any.
hEffective September 30, 2019.
| | | | | | |
| | | |
| franklintempleton.com | | The accompanying notes are an integral part of these financial statements. | Semiannual Report | | | 265 | |
FRANKLIN TEMPLETON ETF TRUST
Statement of Investments, September 30, 2019 (unaudited)
Franklin FTSE Taiwan ETF
| | | | | | | | | | | | | | |
| | | |
| | | Industry | | | Shares | | | Value | |
| | | | | | | | | | | | | | |
| | | Common Stocks 99.6% | | | | | | | | | |
| | | Taiwan 99.6% | | | | | | | | | |
| | Acer Inc. | | | Technology Hardware, Storage & Peripherals | | | | 87,000 | | | $ | 49,915 | |
| | Advantech Co. Ltd. | | | Technology Hardware, Storage & Peripherals | | | | 11,000 | | | | 96,795 | |
| | ASE Industrial Holding Co. Ltd. | | | Semiconductors & Semiconductor Equipment | | | | 102,000 | | | | 232,771 | |
| | Asia Cement Corp. | | | Construction Materials | | | | 72,000 | | | | 100,488 | |
| | Asustek Computer Inc. | | | Technology Hardware, Storage & Peripherals | | | | 21,000 | | | | 139,777 | |
| | AU Optronics Corp. | | | Electronic Equipment, Instruments & Components | | | | 267,000 | | | | 67,644 | |
| | Capital Securities Corp. | | | Capital Markets | | | | 66,470 | | | | 18,875 | |
| | Catcher Technology Co. Ltd. | | | Technology Hardware, Storage & Peripherals | | | | 23,000 | | | | 174,217 | |
| | Cathay Financial Holding Co. Ltd. | | | Insurance | | | | 240,000 | | | | 316,395 | |
| | Chailease Holding Co. Ltd. | | | Diversified Financial Services | | | | 37,080 | | | | 149,398 | |
| | Chang Hwa Commercial Bank Ltd. | | | Banks | | | | 192,000 | | | | 133,985 | |
| | Cheng Shin Rubber Industry Co. Ltd. | | | Auto Components | | | | 57,000 | | | | 84,146 | |
| | Chicony Electronics Co. Ltd. | | | Technology Hardware, Storage & Peripherals | | | | 18,030 | | | | 53,118 | |
| | China Airlines Ltd. | | | Airlines | | | | 81,000 | | | | 23,706 | |
| | China Development Financial Holding Corp. | | | Insurance | | | | 423,000 | | | | 125,982 | |
| a | | China Life Insurance Co. Ltd. | | | Insurance | | | | 87,000 | | | | 68,984 | |
| b | | China Motor Corp. | | | Automobiles | | | | 8,400 | | | | 12,624 | |
| | China Steel Corp. | | | Metals & Mining | | | | 375,000 | | | | 278,006 | |
| | Chunghwa Telecom Co. Ltd. | | | Diversified Telecommunication Services | | | | 117,000 | | | | 418,605 | |
| | Compal Electronics Inc. | | | Technology Hardware, Storage & Peripherals | | | | 126,000 | | | | 72,697 | |
| | CTBC Financial Holding Co. Ltd. | | | Banks | | | | 552,000 | | | | 366,523 | |
| | Delta Electronics Inc. | | | Electronic Equipment, Instruments & Components | | | | 66,000 | | | | 281,874 | |
| | E.Sun Financial Holding Co. Ltd. | | | Banks | | | | 333,543 | | | | 282,213 | |
| | Eclat Textile Co. Ltd. | | | Textiles, Apparel & Luxury Goods | | | | 6,000 | | | | 80,453 | |
| | Epistar Corp. | | | Semiconductors & Semiconductor Equipment | | | | 30,000 | | | | 23,449 | |
| | Eternal Materials Co. Ltd. | | | Chemicals | | | | 30,630 | | | | 25,028 | |
| | EVA Airways Corp. | | | Airlines | | | | 72,000 | | | | 31,678 | |
| a | | Evergreen Marine Corp. Taiwan Ltd. | | | Marine | | | | 69,196 | | | | 28,995 | |
| | Far Eastern International Bank | | | Banks | | | | 63,146 | | | | 24,424 | |
| | Far Eastern New Century Corp. | | | Industrial Conglomerates | | | | 120,000 | | | | 110,816 | |
| | Far EasTone Telecommunications Co. Ltd. | | | Wireless Telecommunication Services | | | | 48,000 | | | | 112,169 | |
| | Feng Tay Enterprise Co. Ltd. | | | Textiles, Apparel & Luxury Goods | | | | 11,000 | | | | 78,889 | |
| | First Financial Holding Co. Ltd. | | | Banks | | | | 300,000 | | | | 210,801 | |
| | Formosa Chemicals & Fibre Corp. | | | Chemicals | | | | 105,000 | | | | 293,429 | |
| | Formosa Petrochemical Corp. | | | Oil, Gas & Consumable Fuels | | | | 42,000 | | | | 132,940 | |
| | Formosa Plastics Corp. | | | Chemicals | | | | 147,000 | | | | 447,759 | |
| | Formosa Taffeta Co. Ltd. | | | Textiles, Apparel & Luxury Goods | | | | 30,000 | | | | 32,684 | |
| | Foxconn Technology Co. Ltd. | | | Electronic Equipment, Instruments & Components | | | | 33,000 | | | | 68,820 | |
| | Fubon Financial Holding Co. Ltd. | | | Insurance | | | | 222,000 | | | | 318,784 | |
| | Giant Manufacturing Co. Ltd. | | | Leisure Equipment & Products | | | | 9,000 | | | | 61,210 | |
| | Globalwafers Co. Ltd. | | | Semiconductors & Semiconductor Equipment | | | | 6,300 | | | | 63,763 | |
| | Hon Hai Precision Industry Co. Ltd. | | | Electronic Equipment, Instruments & Components | | | | 363,000 | | | | 856,472 | |
| | Hotai Motor Co. Ltd. | | | Specialty Retail | | | | 9,480 | | | | 144,074 | |
| | HTC Corp. | | | Technology Hardware, Storage & Peripherals | | | | 21,000 | | | | 24,029 | |
| | Hua Nan Financial Holdings Co. Ltd. | | | Banks | | | | 276,000 | | | | 186,375 | |
| | Innolux Corp. | | | Electronic Equipment, Instruments & Components | | | | 261,000 | | | | 55,524 | |
| | Inventec Corp. | | | Technology Hardware, Storage & Peripherals | | | | 93,000 | | | | 64,149 | |
| | Largan Precision Co. Ltd. | | | Electronic Equipment, Instruments & Components | | | | 3,120 | | | | 447,517 | |
| | Lite-On Technology Corp. | | | Technology Hardware, Storage & Peripherals | | | | 66,000 | | | | 104,878 | |
| | MediaTek Inc. | | | Semiconductors & Semiconductor Equipment | | | | 45,000 | | | | 535,222 | |
| | Mega Financial Holding Co. Ltd. | | | Banks | | | | 330,000 | | | | 305,807 | |
| | Nan Ya Plastics Corp. | | | Chemicals | | | | 171,000 | | | | 384,171 | |
| | Nanya Technology Corp. | | | Semiconductors & Semiconductor Equipment | | | | 24,000 | | | | 62,273 | |
| | Novatek Microelectronics Corp. Ltd. | | | Semiconductors & Semiconductor Equipment | | | | 18,000 | | | | 103,273 | |
| a | | OBI Pharma Inc. | | | Biotechnology | | | | 4,194 | | | | 18,858 | |
| | Oriental Union Chemical Corp. | | | Chemicals | | | | 21,000 | | | | 14,925 | |
| | Pegatron Corp. | | | Technology Hardware, Storage & Peripherals | | | | 60,000 | | | | 104,434 | |
| | | | |
| | | |
| 266 | | Semiannual Report | | franklintempleton.com |
FRANKLIN TEMPLETON ETF TRUST
STATEMENT OF INVESTMENTS (UNAUDITED)
Franklin FTSE Taiwan ETF(continued)
| | | | | | | | | | | | | | |
| | | |
| | | Industry | | | Shares | | | Value | |
| | | | | | | | | | | | | | |
| | | Common Stocks (continued) | | | | | | | | | |
| | | Taiwan (continued) | | | | | | | | | |
| | Pou Chen Corp. | | | Textiles, Apparel & Luxury Goods | | | | 81,000 | | | $ | 103,781 | |
| | President Chain Store Corp. | | | Food & Staples Retailing | | | | 17,100 | | | | 159,841 | |
| | Quanta Computer Inc. | | | Technology Hardware, Storage & Peripherals | | | | 81,000 | | | | 147,774 | |
| | Realtek Semiconductor Corp. | | | Semiconductors & Semiconductor Equipment | | | | 14,000 | | | | 103,789 | |
| | Shin Kong Financial Holding Co. Ltd. | | | Insurance | | | | 355,008 | | | | 107,448 | |
| | SinoPac Financial Holdings Co. Ltd. | | | Banks | | | | 321,040 | | | | 125,210 | |
| | Synnex Technology International Corp. | | | Electronic Equipment, Instruments & Components | | | | 42,000 | | | | 49,142 | |
| | Taishin Financial Holding Co. Ltd. | | | Banks | | | | 309,114 | | | | 137,995 | |
| | Taiwan Business Bank | | | Banks | | | | 135,822 | | | | 55,818 | |
| | Taiwan Cement Corp. | | | Construction Materials | | | | 147,000 | | | | 187,869 | |
| | Taiwan Cooperative Financial Holding Co. Ltd. | | | Banks | | | | 285,000 | | | | 188,319 | |
| | Taiwan Fertilizer Co. Ltd. | | | Chemicals | | | | 21,000 | | | | 30,798 | |
| | Taiwan Glass Industry Corp. | | | Building Products | | | | 51,000 | | | | 19,151 | |
| | Taiwan High Speed Rail Corp. | | | Transportation Infrastructure | | | | 63,000 | | | | 71,682 | |
| | Taiwan Mobile Co. Ltd. | | | Wireless Telecommunication Services | | | | 48,000 | | | | 173,282 | |
| | Taiwan Secom Co. Ltd. | | | Commercial Services & Supplies | | | | 9,000 | | | | 25,528 | |
| | Taiwan Semiconductor Manufacturing Co. Ltd. | | | Semiconductors & Semiconductor Equipment | | | | 364,000 | | | | 3,191,284 | |
| | Teco Electric & Machinery Co. Ltd. | | | Electrical Equipment | | | | 54,000 | | | | 43,514 | |
| | The Shanghai Commercial & Savings Bank Ltd. | | | Banks | | | | 99,000 | | | | 166,253 | |
| a | | TPK Holding Co. Ltd. | | | Electronic Equipment, Instruments & Components | | | | 9,000 | | | | 16,216 | |
| | Transcend Information Inc. | | | Technology Hardware, Storage & Peripherals | | | | 9,000 | | | | 18,682 | |
| | U-Ming Marine Transport Corp. | | | Marine | | | | 12,000 | | | | 12,977 | |
| | Uni-President Enterprises Corp. | | | Food Products | | | | 147,000 | | | | 354,417 | |
| | Unimicron Technology Corp. | | | Electronic Equipment, Instruments & Components | | | | 39,000 | | | | 54,871 | |
| | United Microelectronics Corp. | | | Semiconductors & Semiconductor Equipment | | | | 333,000 | | | | 143,828 | |
| | Vanguard International Semiconductor Corp. | | | Semiconductors & Semiconductor Equipment | | | | 27,000 | | | | 54,567 | |
| | Walsin Lihwa Corp. | | | Electrical Equipment | | | | 93,000 | | | | 43,466 | |
| | Walsin Technology Corp. | | | Electronic Equipment, Instruments & Components | | | | 15,000 | | | | 84,369 | |
| | Wan Hai Lines Ltd. | | | Marine | | | | 21,000 | | | | 12,353 | |
| | Wistron Corp. | | | Technology Hardware, Storage & Peripherals | | | | 84,000 | | | | 67,824 | |
| | Yageo Corp. | | | Electronic Equipment, Instruments & Components | | | | 12,000 | | | | 95,344 | |
| | Yuanta Financial Holding Co. Ltd. | | | Capital Markets | | | | 339,000 | | | | 202,147 | |
| | Yulon Motor Co. Ltd. | | | Automobiles | | | | 27,000 | | | | 17,101 | |
| | Yulon Nissan Motor Co. Ltd. | | | Automobiles | | | | 1,000 | | | | 8,042 | |
| | | | | | | | | | | | | | |
| | Total Investments (Cost $14,744,842) 99.6% | | | | | | | | | | | 15,381,492 | |
| | Other Assets, less Liabilities 0.4% | | | | | | | | | | | 56,903 | |
| | | | | | | | | | | | | | |
| | Net Assets 100.0% | | | | | | | | | | $ | 15,438,395 | |
| | | | | | | | | | | | | | |
See Abbreviations on page 322.
aNon-income producing.
bFair valued using significant unobservable inputs. See Note 8 regarding fair value measurements.
At September 30, 2019, the Fund had the following futures contracts outstanding. See Note 1(c).
| | | | | | | | | | | | | | | | | | | | |
| Futures Contracts | | | | | | | | | | | | | | | |
| | | | | |
| Description | | Type | | | Number of
Contracts | | | Notional
Amount* | | | Expiration
Date | | | Value/Unrealized
Appreciation
(Depreciation) | |
| Equity Contracts | | | | | | | | | | | | | | | |
SGX MSCI Taiwan Index | | | Long | | | | 1 | | | $ | 40,710 | | | | 10/30/19 | | | $ | 248 | |
*As of period end.
See Note 7 regarding other derivative information.
| | | | | | |
| | | |
| franklintempleton.com | | The accompanying notes are an integral part of these financial statements. | Semiannual Report | | | 267 | |
FRANKLIN TEMPLETON ETF TRUST
Financial Highlights
Franklin FTSE United Kingdom ETF
| | | | | | | | | | | | |
| | | Six Months Ended
September 30, 2019
(unaudited) | | | Year Ended March 31, | |
| | | 2019 | | | 2018a | |
| | | |
Per share operating performance
(for a share outstanding throughout the period) | | | | | | | | | | | | |
| | | |
Net asset value, beginning of period | | $ | 24.23 | | | $ | 25.23 | | | $ | 24.89 | |
| | | | |
| | | |
| Income from investment operationsb: | | | | | | | | | | | | |
| | | |
Net investment incomec | | | 0.63 | | | | 1.05 | | | | 0.38 | |
| | | |
Net realized and unrealized gains (losses) | | | (0.92 | ) | | | (1.21 | ) | | | 0.07 | |
| | | | |
| | | |
Total from investment operations | | | (0.29 | ) | | | (0.16 | ) | | | 0.45 | |
| | | | |
| | | |
Less distributions from net investment income | | | (0.53 | ) | | | (0.84 | ) | | | (0.11 | ) |
| | | | |
| | | |
Net asset value, end of period | | $ | 23.41 | | | $ | 24.23 | | | $ | 25.23 | |
| | | | |
| | | |
Total returnd | | | (1.23)% | | | | (0.51)% | | | | 1.80% | |
| | | |
| Ratios to average net assetse | | | | | | | | | | | | |
| | | |
Total expenses | | | 0.09% | | | | 0.09% | | | | 0.09% | |
| | | |
Net investment income | | | 5.34% | | | | 4.46% | | | | 3.68% | |
| | | |
| Supplemental data | | | | | | | | | | | | |
| | | |
Net assets, end of period (000’s) | | | $28,097 | | | | $29,076 | | | | $2,523 | |
| | | |
Portfolio turnover ratef | | | 2.27% | | | | 10.10% | | | | 1.61% | |
| | | |
| Portfolio turnover rate excluding portfolio transactions that are executed as a result of the Fund offering and redeeming Creation Units solely or in part for cashf,g | | | 2.27% | | | | 0.00% | | | | 0.00% | |
aFor the period November 2, 2017 (commencement of operations) to March 31, 2018.
bThe amount shown for a share outstanding throughout the period may not correlate with the Statement of Operations for the period due to the timing of sales and repurchases of Creation Unit Fund shares in relation to income earned and/or fluctuating fair value of the investments of the Fund.
cBased on average daily shares outstanding.
dTotal return is not annualized for periods less than one year. Total return is calculated assuming an initial investment made at the net asset value at the beginning of the period, reinvestment of all dividends and distributions at net asset value during the period, and redemption at net asset value on the last day of the period.
eRatios are annualized for periods less than one year, except fornon-recurring expenses, if any.
fPortfolio turnover rate excludes the value of portfolio securities received or delivered as a result of processing capital share transactions in Creation Units, if any.
gEffective September 30, 2019.
| | | | |
| | | |
| 268 | | Semiannual Report | The accompanying notes are an integral part of these financial statements. | | franklintempleton.com |
FRANKLIN TEMPLETON ETF TRUST
Statement of Investments, September 30, 2019 (unaudited)
Franklin FTSE United Kingdom ETF
| | | | | | | | | | | | | | |
| | | |
| | | Industry | | | Shares | | | Value | |
| | | | | | | | | | | | | | |
| | | Common Stocks 99.3% | | | | | | | | | |
| | | Australia 2.4% | | | | | | | | | |
| | Rio Tinto PLC | | | Metals & Mining | | | | 12,888 | | | $ | 668,468 | |
| | | | | | | | | | | | | | |
| | | Germany 0.2% | | | | | | | | | |
| | TUI AG | | | Hotels, Restaurants & Leisure | | | | 5,160 | | | | 60,140 | |
| | | | | | | | | | | | | | |
| | | Ireland 1.7% | | | | | | | | | |
| | CRH PLC | | | Construction Materials | | | | 9,360 | | | | 321,577 | |
| | Flutter Entertainment PLC | | | Hotels, Restaurants & Leisure | | | | 888 | | | | 83,275 | |
| | Smurfit Kappa Group PLC | | | Containers & Packaging | | | | 2,760 | | | | 82,784 | |
| | | | | | | | | | | | | | |
| | | | |
| | | | | | | | | | | | | 487,636 | |
| | | | | | | | | | | | | | |
| | | Kazakhstan 0.1% | | | | | | | | | |
| | KAZ Minerals PLC | | | Metals & Mining | | | | 2,520 | | | | 13,456 | |
| | | | | | | | | | | | | | |
| | | Russia 0.3% | | | | | | | | | |
| | Evraz PLC | | | Metals & Mining | | | | 6,312 | | | | 36,371 | |
| | Polymetal International PLC | | | Metals & Mining | | | | 3,600 | | | | 50,574 | |
| | | | | | | | | | | | | | |
| | | | |
| | | | | | | | | | | | | 86,945 | |
| | | | | | | | | | | | | | |
| | | South Africa 0.1% | | | | | | | | | |
| | Investec PLC | | | Capital Markets | | | | 7,824 | | | | 40,369 | |
| | | | | | | | | | | | | | |
| | | Switzerland 1.7% | | | | | | | | | |
| | Coca-Cola HBC AG | | | Beverages | | | | 2,304 | | | | 75,438 | |
| | Glencore PLC | | | Metals & Mining | | | | 128,784 | | | | 388,419 | |
| | | | | | | | | | | | | | |
| | | | |
| | | | | | | | | | | | | 463,857 | |
| | | | | | | | | | | | | | |
| | | United Arab Emirates 0.1% | | | | | | | | | |
| | NMC Health PLC | | | Health Care Providers & Services | | | | 1,008 | | | | 33,662 | |
| | | | | | | | | | | | | | |
| | | United Kingdom 92.4% | | | | | | | | | |
| | 3i Group PLC | | | Capital Markets | | | | 11,232 | | | | 161,457 | |
| | Admiral Group PLC | | | Insurance | | | | 2,448 | | | | 63,893 | |
| | Anglo American PLC | | | Metals & Mining | | | | 14,688 | | | | 338,688 | |
| | Antofagasta PLC | | | Metals & Mining | | | | 4,080 | | | | 45,200 | |
| | Ashmore Group PLC | | | Capital Markets | | | | 4,488 | | | | 27,985 | |
| | Ashtead Group PLC | | | Trading Companies & Distributors | | | | 5,400 | | | | 150,656 | |
| | Associated British Foods PLC | | | Food Products | | | | 4,104 | | | | 116,471 | |
| | AstraZeneca PLC | | | Pharmaceuticals | | | | 15,384 | | | | 1,376,518 | |
| | Auto Trader Group PLC | | | Interactive Media & Services | | | | 10,560 | | | | 66,367 | |
| | Aveva Group PLC | | | Software | | | | 768 | | | | 35,017 | |
| | Aviva PLC | | | Insurance | | | | 45,840 | | | | 225,559 | |
| | B&M European Value Retail SA | | | Multiline Retail | | | | 10,128 | | | | 47,352 | |
| | Babcock International Group PLC | | | Commercial Services & Supplies | | | | 3,011 | | | | 20,704 | |
| | BAE Systems PLC | | | Aerospace & Defense | | | | 37,560 | | | | 263,826 | |
| | Barclays PLC | | | Banks | | | | 201,360 | | | | 373,196 | |
| | Barratt Developments PLC | | | Household Durables | | | | 11,688 | | | | 93,332 | |
| | Bellway PLC | | | Household Durables | | | | 1,488 | | | | 61,354 | |
| | BHP Group PLC | | | Metals & Mining | | | | 24,384 | | | | 520,558 | |
| | BP PLC | | | Oil, Gas & Consumable Fuels | | | | 233,424 | | | | 1,483,690 | |
| | British American Tobacco PLC | | | Tobacco | | | | 26,760 | | | | 991,763 | |
| | British Land Co. PLC | | | Equity Real Estate Investment Trusts (REITs | ) | | | 10,992 | | | | 79,214 | |
| | BT Group PLC | | | Diversified Telecommunication Services | | | | 102,264 | | | | 225,046 | |
| | Bunzl PLC | | | Trading Companies & Distributors | | | | 3,984 | | | | 104,326 | |
| | Burberry Group PLC | | | Textiles, Apparel & Luxury Goods | | | | 4,800 | | | | 128,593 | |
| | Centrica PLC | | | Multi-Utilities | | | | 67,632 | | | | 61,457 | |
| | Cineworld Group PLC | | | Entertainment | | | | 11,688 | | | | 32,839 | |
| a | | Cobham PLC | | | Aerospace & Defense | | | | 27,744 | | | | 53,625 | |
| | Compass Group PLC | | | Hotels, Restaurants & Leisure | | | | 18,576 | | | | 479,113 | |
| | ConvaTec Group PLC | | | Health Care Equipment & Supplies | | | | 17,496 | | | | 37,774 | |
| | Croda International PLC | | | Chemicals | | | | 1,464 | | | | 87,679 | |
| | | | | | |
| | | |
| franklintempleton.com | | Semiannual Report | | | 269 | |
FRANKLIN TEMPLETON ETF TRUST
STATEMENT OF INVESTMENTS (UNAUDITED)
Franklin FTSE United Kingdom ETF(continued)
| | | | | | | | | | | | | | |
| | | |
| | | Industry | | | Shares | | | Value | |
| | | | | | | | | | | | | | |
| | | Common Stocks (continued) | | | | | | | | | |
| | | United Kingdom (continued) | | | | | | | | | |
| | CYBG PLC | | | Banks | | | | 14,376 | | | $ | 20,355 | |
| | DCC PLC | | | Industrial Conglomerates | | | | 1,152 | | | | 100,735 | |
| | Derwent London PLC | | | Equity Real Estate Investment Trusts (REITs | ) | | | 1,224 | | | | 50,831 | |
| | Diageo PLC | | | Beverages | | | | 27,384 | | | | 1,124,731 | |
| | Direct Line Insurance Group PLC | | | Insurance | | | | 16,344 | | | | 60,462 | |
| | DS Smith PLC | | | Containers & Packaging | | | | 15,024 | | | | 66,725 | |
| | easyJet PLC | | | Airlines | | | | 2,280 | | | | 32,311 | |
| | Experian PLC | | | Professional Services | | | | 10,632 | | | | 340,516 | |
| | Ferguson PLC | | | Trading Companies & Distributors | | | | 2,688 | | | | 196,890 | |
| | Fresnillo PLC | | | Metals & Mining | | | | 2,160 | | | | 18,196 | |
| | G4S PLC | | | Commercial Services & Supplies | | | | 17,832 | | | | 41,576 | |
| | GlaxoSmithKline PLC | | | Pharmaceuticals | | | | 57,408 | | | | 1,234,197 | |
| | GVC Holdings PLC | | | Hotels, Restaurants & Leisure | | | | 6,744 | | | | 61,781 | |
| | Halma PLC | | | Electronic Equipment, Instruments & Components | | | | 4,464 | | | | 108,424 | |
| | Hargreaves Lansdown PLC | | | Capital Markets | | | | 3,120 | | | | 79,933 | |
| | Hikma Pharmaceuticals PLC | | | Pharmaceuticals | | | | 1,632 | | | | 44,244 | |
| | Hiscox Ltd. | | | Insurance | | | | 3,240 | | | | 66,278 | |
| | Howden Joinery Group PLC | | | Trading Companies & Distributors | | | | 6,672 | | | | 46,076 | |
| | HSBC Holdings PLC | | | Banks | | | | 237,240 | | | | 1,826,023 | |
| | IMI PLC | | | Machinery | | | | 3,096 | | | | 36,634 | |
| | Imperial Brands PLC | | | Tobacco | | | | 11,160 | | | | 251,423 | |
| | Inchcape PLC | | | Distributors | | | | 4,824 | | | | 37,540 | |
| | Informa PLC | | | Media | | | | 14,640 | | | | 153,708 | |
| | InterContinental Hotels Group PLC | | | Hotels, Restaurants & Leisure | | | | 2,136 | | | | 133,584 | |
| | International Consolidated Airlines Group SA | | | Airlines | | | | 7,512 | | | | 43,971 | |
| | Intertek Group PLC | | | Professional Services | | | | 1,896 | | | | 127,990 | |
| | ITV PLC | | | Media | | | | 43,872 | | | | 68,066 | |
| | J Sainsbury PLC | | | Food & Staples Retailing | | | | 18,864 | | | | 51,095 | |
| | JD Sports Fashion PLC | | | Specialty Retail | | | | 4,152 | | | | 38,445 | |
| | John Wood Group PLC | | | Energy Equipment & Services | | | | 7,800 | | | | 36,516 | |
| | Johnson Matthey PLC | | | Chemicals | | | | 2,256 | | | | 84,987 | |
| a | | Just Eat PLC | | | Internet & Direct Marketing Retail | | | | 6,696 | | | | 55,136 | |
| | Kingfisher PLC | | | Specialty Retail | | | | 25,056 | | | | 63,853 | |
| | Land Securities Group PLC | | | Equity Real Estate Investment Trusts (REITs | ) | | | 8,400 | | | | 88,649 | |
| | Legal & General Group PLC | | | Insurance | | | | 69,480 | | | | 212,681 | |
| | Lloyds Banking Group PLC | | | Banks | | | | 826,824 | | | | 551,426 | |
| | London Stock Exchange Group PLC | | | Capital Markets | | | | 3,672 | | | | 330,687 | |
| | Marks & Spencer Group PLC | | | Multiline Retail | | | | 22,516 | | | | 51,178 | |
| | Meggitt PLC | | | Aerospace & Defense | | | | 9,000 | | | | 70,426 | |
| | Melrose Industries PLC | | | Electrical Equipment | | | | 56,448 | | | | 140,235 | |
| | Merlin Entertainments PLC | | | Hotels, Restaurants & Leisure | | | | 8,232 | | | | 45,893 | |
| | Micro Focus International PLC | | | Software | | | | 3,912 | | | | 54,802 | |
| | Mondi PLC | | | Paper & Forest Products | | | | 5,640 | | | | 108,284 | |
| | National Grid PLC | | | Multi-Utilities | | | | 40,752 | | | | 442,878 | |
| | Next PLC | | | Multiline Retail | | | | 1,488 | | | | 113,430 | |
| a | | Ocado Group PLC | | | Internet & Direct Marketing Retail | | | | 5,280 | | | | 86,049 | |
| | Pearson PLC | | | Media | | | | 9,072 | | | | 82,504 | |
| | Pennon Group PLC | | | Water Utilities | | | | 4,848 | | | | 49,407 | |
| | Persimmon PLC | | | Household Durables | | | | 3,720 | | | | 99,476 | |
| | Phoenix Group Holdings PLC | | | Insurance | | | | 6,120 | | | | 52,136 | |
| | Prudential PLC | | | Insurance | | | | 30,480 | | | | 554,017 | |
| | Quilter PLC | | | Capital Markets | | | | 21,600 | | | | 36,293 | |
| | Reckitt Benckiser Group PLC | | | Household Products | | | | 7,368 | | | | 576,009 | |
| | RELX PLC | | | Professional Services | | | | 22,032 | | | | 524,674 | |
| | Renishaw PLC | | | Electronic Equipment, Instruments & Components | | | | 432 | | | | 19,505 | |
| | Rentokil Initial PLC | | | Commercial Services & Supplies | | | | 21,731 | | | | 125,273 | |
| | Rightmove PLC | | | Interactive Media & Services | | | | 10,224 | | | | 69,370 | |
| | Rolls-Royce Holdings PLC | | | Aerospace & Defense | | | | 19,944 | | | | 194,748 | |
| | | | |
| | | |
| 270 | | Semiannual Report | | franklintempleton.com |
FRANKLIN TEMPLETON ETF TRUST
STATEMENT OF INVESTMENTS (UNAUDITED)
Franklin FTSE United Kingdom ETF(continued)
| | | | | | | | | | | | | | |
| | | |
| | | Industry | | | Shares | | | Value | |
| | | | | | | | | | | | | | |
| | | Common Stocks (continued) | | | | | | | | | |
| | | United Kingdom (continued) | | | | | | | | | |
| | Royal Bank of Scotland Group PLC | | | Banks | | | | 53,208 | | | $ | 136,120 | |
| | Royal Dutch Shell PLC, A | | | Oil, Gas & Consumable Fuels | | | | 50,304 | | | | 1,477,832 | |
| | Royal Dutch Shell PLC, B | | | Oil, Gas & Consumable Fuels | | | | 43,920 | | | | 1,296,777 | |
| | RSA Insurance Group PLC | | | Insurance | | | | 12,096 | | | | 79,627 | |
| | Schroders PLC | | | Capital Markets | | | | 1,344 | | | | 50,928 | |
| | Segro PLC | | | Equity Real Estate Investment Trusts (REITs | ) | | | 12,816 | | | | 128,051 | |
| | Severn Trent PLC | | | Water Utilities | | | | 2,760 | | | | 73,635 | |
| | Smith & Nephew PLC | | | Health Care Equipment & Supplies | | | | 10,272 | | | | 247,974 | |
| | Smiths Group PLC | | | Industrial Conglomerates | | | | 4,608 | | | | 89,151 | |
| | Spirax-Sarco Engineering PLC | | | Machinery | | | | 864 | | | | 83,526 | |
| | SSE PLC | | | Electric Utilities | | | | 12,000 | | | | 184,180 | |
| | St. James’s Place Capital PLC | | | Capital Markets | | | | 6,072 | | | | 73,284 | |
| | Standard Chartered PLC | | | Banks | | | | 30,864 | | | | 260,227 | |
| | Standard Life Aberdeen PLC | | | Capital Markets | | | | 27,904 | | | | 98,275 | |
| | Tate & Lyle PLC | | | Food Products | | | | 5,496 | | | | 49,847 | |
| | Taylor Wimpey PLC | | | Household Durables | | | | 38,136 | | | | 75,897 | |
| | Tesco PLC | | | Food & Staples Retailing | | | | 113,352 | | | | 336,638 | |
| | The Berkeley Group Holdings PLC | | | Household Durables | | | | 1,392 | | | | 71,685 | |
| | The Sage Group PLC | | | Software | | | | 12,768 | | | | 108,785 | |
| | Travis Perkins PLC | | | Trading Companies & Distributors | | | | 2,952 | | | | 46,963 | |
| | Unilever PLC | | | Personal Products | | | | 12,768 | | | | 769,393 | |
| | United Utilities Group PLC | | | Water Utilities | | | | 7,920 | | | | 80,597 | |
| | Vodafone Group PLC | | | Wireless Telecommunication Services | | | | 314,208 | | | | 627,261 | |
| | Weir Group PLC | | | Machinery | | | | 3,024 | | | | 53,121 | |
| | Whitbread PLC | | | Hotels, Restaurants & Leisure | | | | 1,584 | | | | 83,817 | |
| | William Morrison Supermarkets PLC | | | Food & Staples Retailing | | | | 25,536 | | | | 63,030 | |
| | WPP PLC | | | Media | | | | 14,352 | | | | 180,043 | |
| | | | | | | | | | | | | | |
| | | | |
| | | | | | | | | | | | | 25,963,178 | |
| | | | | | | | | | | | | | |
| | | United States 0.3% | | | | | | | | | |
| | Carnival PLC | | | Hotels, Restaurants & Leisure | | | | 1,824 | | | | 75,748 | |
| | | | | | | | | | | | | | |
| | Total Investments (Cost $29,743,820) 99.3% | | | | | | | | | | | 27,893,459 | |
| | Other Assets, less Liabilities 0.7% | | | | | | | | | | | 203,993 | |
| | | | | | | | | | | | | | |
| | Net Assets 100.0% | | | | | | | | | | $ | 28,097,452 | |
| | | | | | | | | | | | | | |
See Abbreviations on page 322.
aNon-income producing.
At September 30, 2019, the Fund had the following futures contracts outstanding. See Note 1(c).
| | | | | | | | | | | | | | | | | | | | |
| Futures Contracts | | | | | | | | | | | | | | | |
| | | | | |
| Description | | Type | | | Number of
Contracts | | | Notional
Amount* | | | Expiration
Date | | | Value/Unrealized
Appreciation
(Depreciation) | |
| Equity Contracts | | | | | | | | | | | | | | | |
FTSE 100 Index | | | Long | | | | 2 | | | $ | 181,974 | | | | 12/20/19 | | | $ | 2,487 | |
*As of period end.
See Note 7 regarding other derivative information.
| | | | | | |
| | | |
| franklintempleton.com | | The accompanying notes are an integral part of these financial statements. | Semiannual Report | | | 271 | |
FRANKLIN TEMPLETON ETF TRUST
FINANCIAL STATEMENTS
Statements of Assets and Liabilities
September 30, 2019 (unaudited)
| | | | | | | | | | | | | | | | |
| | | | |
| | | Franklin FTSE
Asia ex Japan
ETF | | | Franklin FTSE
Australia ETF | | | Franklin FTSE
Brazil ETF | | | Franklin FTSE
Canada ETF | |
Assets: | | | | | | | | | | | | | | | | |
Investments in securities: | | | | | | | | | | | | | | | | |
Cost – Unaffiliated issuers | | $ | 18,558,411 | | | $ | 11,483,850 | | | $ | 13,842,129 | | | $ | 4,896,342 | |
Cost – Non-controlled affiliates (Note 3c) | | | 5,820 | | | | — | | | | — | | | | — | |
| | | | |
Value – Unaffiliated issuers+ | | $ | 16,373,834 | | | $ | 11,359,981 | | | $ | 15,569,563 | | | $ | 5,121,963 | |
Value – Non-controlled affiliates (Note 3c) | | | 5,820 | | | | — | | | | — | | | | — | |
Cash | | | 11,208 | | | | — | | | | — | | | | — | |
Foreign currency, at value (cost $82,995, $45,153, $36,668 and $-, respectively) | | | 82,903 | | | | 45,051 | | | | 36,725 | | | | — | |
Receivables: | | | | | | | | | | | | | | | | |
Dividends and interest | | | 33,673 | | | | 34,810 | | | | 68,203 | | | | 12,012 | |
Variation margin on futures contracts | | | 509 | | | | — | | | | 3,077 | | | | — | |
Deposits with brokers for: | | | | | | | | | | | | | | | | |
Futures contracts | | | 5,200 | | | | — | | | | 6,988 | | | | — | |
| | | | |
Total assets | | | 16,513,147 | | | | 11,439,842 | | | | 15,684,556 | | | | 5,133,975 | |
| | | | |
Liabilities: | | | | | | | | | | | | | | | | |
Payables: | | | | | | | | | | | | | | | | |
Investment securities purchased | | | — | | | | — | | | | — | | | | 7,557 | |
Management fees | | | 2,577 | | | | 843 | | | | 3,085 | | | | 376 | |
Funds advanced by custodian | | | — | | | | 49,550 | | | | 58,795 | | | | 133 | |
Foreign currency advanced by custodian | | | — | | | | — | | | | — | | | | 1,973 | |
Deferred tax | | | 2,649 | | | | — | | | | — | | | | — | |
Payable upon return of securities loaned | | | 5,820 | | | | — | | | | — | | | | — | |
| | | | |
Total liabilities | | | 11,046 | | | | 50,393 | | | | 61,880 | | | | 10,039 | |
| | | | |
Net assets, at value | | $ | 16,502,101 | | | $ | 11,389,449 | | | $ | 15,622,676 | | | $ | 5,123,936 | |
| | | | |
Net assets consist of: | | | | | | | | | | | | | | | | |
Paid-in capital | | $ | 18,898,409 | | | $ | 11,490,787 | | | $ | 24,145,329 | | | $ | 4,915,900 | |
Total distributable earnings (loss) | | | (2,396,308 | ) | | | (101,338 | ) | | | (8,522,653 | ) | | | 208,036 | |
| | | | |
Net assets, at value | | $ | 16,502,101 | | | $ | 11,389,449 | | | $ | 15,622,676 | | | $ | 5,123,936 | |
| | | | |
Shares outstanding | | | 800,000 | | | | 450,000 | | | | 600,000 | | | | 200,000 | |
| | | | |
Net asset value per share | | $ | 20.63 | | | $ | 25.31 | | | $ | 26.04 | | | $ | 25.62 | |
| | | | |
| | | | | | | | | | | | | | | | |
+Includes securities loaned | | $ | 5,683 | | | $ | — | | | $ | — | | | $ | — | |
| | | | |
| | | | |
| | | |
| 272 | | Semiannual Report | The accompanying notes are an integral part of these financial statements. | | franklintempleton.com |
FRANKLIN TEMPLETON ETF TRUST
FINANCIAL STATEMENTS
Statements of Assets and Liabilities(continued)
September 30, 2019 (unaudited)
| | | | | | | | | | | | | | | | |
| | | | |
| | | Franklin FTSE
China ETF | | | Franklin FTSE
Europe ETF | | | Franklin FTSE
Europe Hedged
ETF | | | Franklin FTSE
France ETF | |
Assets: | | | | | | | | | | | | | | | | |
Investments in securities: | | | | | | | | | | | | | | | | |
Cost – Unaffiliated issuers | | $ | 45,021,637 | | | $ | 73,203,671 | | | $ | 5,444,059 | | | $ | 3,756,365 | |
Cost –Non-controlled affiliates (Note 3c) | | | — | | | | — | | | | 41,913 | | | | — | |
| | | | |
Value – Unaffiliated issuers | | $ | 39,368,252 | | | $ | 65,443,005 | | | $ | 4,758,761 | | | $ | 3,732,446 | |
Value –Non-controlled affiliates (Note 3c) | | | — | | | | — | | | | 41,913 | | | | — | |
Cash | | | — | | | | 15,788 | | | | — | | | | 209 | |
Foreign currency, at value (cost $14,677, $152,684, $20,528 and $4,003, respectively) | | | 14,674 | | | | 152,021 | | | | 20,342 | | | | 3,968 | |
Receivables: | | | | | | | | | | | | | | | | |
Dividends and interest | | | 71,659 | | | | 201,210 | | | | 33,089 | | | | 4,377 | |
Variation margin on futures contracts | | | — | | | | 1,216 | | | | 511 | | | | — | |
Deposits with brokers for: | | | | | | | | | | | | | | | | |
Futures contracts | | | 5,183 | | | | 17,670 | | | | 5,408 | | | | — | |
Unrealized appreciation on OTC forward exchange contracts | | | — | | | | — | | | | 39,155 | | | | — | |
| | | | |
Total assets | | | 39,459,768 | | | | 65,830,910 | | | | 4,899,179 | | | | 3,741,000 | |
| | | | |
Liabilities: | | | | | | | | | | | | | | | | |
Payables: | | | | | | | | | | | | | | | | |
Investment securities purchased | | | — | | | | — | | | | 14,698 | | | | 7,714 | |
Management fees | | | 6,308 | | | | 6,098 | | | | 343 | | | | 275 | |
Variation margin on futures contracts | | | 114 | | | | — | | | | — | | | | — | |
Funds advanced by custodian | | | 2,974 | | | | — | | | | 18,207 | | | | — | |
Unrealized depreciation on OTC forward exchange contracts | | | — | | | | — | | | | 13,312 | | | | — | |
| | | | |
Total liabilities | | | 9,396 | | | | 6,098 | | | | 46,560 | | | | 7,989 | |
| | | | |
Net assets, at value | | $ | 39,450,372 | | | $ | 65,824,812 | | | $ | 4,852,619 | | | $ | 3,733,011 | |
| | | | |
Net assets consist of: | | | | | | | | | | | | | | | | |
Paid-in capital | | $ | 46,922,952 | | | $ | 70,748,087 | | | $ | 5,849,092 | | | $ | 3,735,560 | |
Total distributable earnings (loss) | | | (7,472,580 | ) | | | (4,923,275 | ) | | | (996,473 | ) | | | (2,549 | ) |
| | | | |
Net assets, at value | | $ | 39,450,372 | | | $ | 65,824,812 | | | $ | 4,852,619 | | | $ | 3,733,011 | |
| | | | |
Shares outstanding | | | 1,800,000 | | | | 2,800,000 | | | | 200,000 | | | | 150,000 | |
| | | | |
Net asset value per share | | $ | 21.92 | | | $ | 23.51 | | | $ | 24.26 | | | $ | 24.89 | |
| | | | |
| | | | | | |
| | | |
| franklintempleton.com | | The accompanying notes are an integral part of these financial statements. | Semiannual Report | | | 273 | |
FRANKLIN TEMPLETON ETF TRUST
FINANCIAL STATEMENTS
Statements of Assets and Liabilities(continued)
September 30, 2019 (unaudited)
| | | | | | | | | | | | | | | | |
| | | | |
| | | Franklin FTSE
Germany ETF | | | Franklin FTSE
Hong Kong ETF | | | Franklin FTSE
India ETF | | | Franklin FTSE
Italy ETF | |
Assets: | | | | | | | | | | | | | | | | |
Investments in securities: | | | | | | | | | | | | | | | | |
Cost – Unaffiliated issuers | | $ | 4,628,951 | | | $ | 18,470,227 | | | $ | 15,298,599 | | | $ | 10,967,451 | |
| | | | |
Value – Unaffiliated issuers | | $ | 4,184,071 | | | $ | 17,663,014 | | | $ | 15,385,464 | | | $ | 11,560,237 | |
Cash | | | 84 | | | | 1,019 | | | | 16,061 | | | | 465 | |
Foreign currency, at value (cost $220, $25,870, $6,801 and $3,014, respectively) | | | 219 | | | | 25,860 | | | | 6,804 | | | | 2,998 | |
Receivables: | | | | | | | | | | | | | | | | |
Dividends and interest | | | 484 | | | | 43,901 | | | | 1,828 | | | | 417 | |
Variation margin on futures contracts | | | — | | | | 53 | | | | — | | | | — | |
Deposits with brokers for: | | | | | | | | | | | | | | | | |
Futures contracts | | | — | | | | 5,317 | | | | 990 | | | | 10 | |
| | | | |
Total assets | | | 4,184,858 | | | | 17,739,164 | | | | 15,411,147 | | | | 11,564,127 | |
| | | | |
Liabilities: | | | | | | | | | | | | | | | | |
Payables: | | | | | | | | | | | | | | | | |
Management fees | | | 310 | | | | 1,340 | | | | 2,333 | | | | 852 | |
Variation margin on futures contracts | | | — | | | | — | | | | 75 | | | | — | |
Deferred tax | | | — | | | | — | | | | 42,958 | | | | — | |
| | | | |
Total liabilities | | | 310 | | | | 1,340 | | | | 45,366 | | | | 852 | |
| | | | |
Net assets, at value | | $ | 4,184,548 | | | $ | 17,737,824 | | | $ | 15,365,781 | | | $ | 11,563,275 | |
| | | | |
Net assets consist of: | | | | | | | | | | | | | | | | |
Paid-in capital | | $ | 4,666,843 | | | $ | 18,380,357 | | | $ | 15,506,134 | | | $ | 11,136,047 | |
Total distributable earnings (loss) | | | (482,295 | ) | | | (642,533 | ) | | | (140,353 | ) | | | 427,228 | |
| | | | |
Net assets, at value | | $ | 4,184,548 | | | $ | 17,737,824 | | | $ | 15,365,781 | | | $ | 11,563,275 | |
| | | | |
Shares outstanding | | | 200,000 | | | | 750,000 | | | | 700,000 | | | | 500,000 | |
| | | | |
Net asset value per share | | $ | 20.92 | | | $ | 23.65 | | | $ | 21.95 | | | $ | 23.13 | |
| | | | |
| | | | |
| | | |
| 274 | | Semiannual Report | The accompanying notes are an integral part of these financial statements. | | franklintempleton.com |
FRANKLIN TEMPLETON ETF TRUST
FINANCIAL STATEMENTS
Statements of Assets and Liabilities(continued)
September 30, 2019 (unaudited)
| | | | | | | | | | | | | | | | |
| | | | |
| | | Franklin FTSE
Japan ETF | | | Franklin FTSE
Japan Hedged
ETF | | | Franklin FTSE
Latin America
ETF | | | Franklin FTSE
Mexico ETF | |
Assets: | | | | | | | | | | | | | | | | |
Investments in securities: | | | | | | | | | | | | | | | | |
Cost – Unaffiliated issuers | | $ | 232,856,638 | | | $ | 5,311,863 | | | $ | 2,616,905 | | | $ | 4,659,333 | |
Cost – Non-controlled affiliates (Note 3c) | | | 64,467 | | | | 1,813 | | | | — | | | | — | |
| | | | |
Value – Unaffiliated issuers | | $ | 205,943,393 | | | $ | 4,663,266 | | | $ | 2,592,631 | | | $ | 4,335,832 | |
Value – Non-controlled affiliates (Note 3c) | | | 64,467 | | | | 1,813 | | | | — | | | | — | |
Cash | | | — | | | | — | | | | — | | | | 2,008 | |
Foreign currency, at value (cost $10,757, $-, $9,207 and $5,017, respectively) | | | 10,764 | | | | — | | | | 9,131 | | | | 4,940 | |
Receivables: | | | | | | | | | | | | | | | | |
Dividends and interest | | | 1,873,342 | | | | 41,838 | | | | 5,973 | | | | 176 | |
Deposits with brokers for: | | | | | | | | | | | | | | | | |
Futures contracts | | | 49,160 | | | | 1,277 | | | | 49 | | | | — | |
Unrealized appreciation on OTC forward exchange contracts | | | — | | | | 89,220 | | | | — | | | | — | |
| | | | |
Total assets | | | 207,941,126 | | | | 4,797,414 | | | | 2,607,784 | | | | 4,342,956 | |
| | | | |
Liabilities: | |
Payables: | | | | | | | | | | | | | | | | |
Investment securities purchased | | | 96 | | | | 72,893 | | | | — | | | | — | |
Management fees | | | 16,055 | | | | 342 | | | | 406 | | | | 679 | |
Variation margin on futures contracts | | | 3,754 | | | | 191 | | | | — | | | | — | |
Funds advanced by custodian | | | 63,906 | | | | 72 | | | | 8,839 | | | | — | |
Foreign currency advanced by custodian | | | — | | | | 846 | | | | — | | | | — | |
Unrealized depreciation on OTC forward exchange contracts | | | — | | | | 458 | | | | — | | | | — | |
| | | | |
Total liabilities | | | 83,811 | | | | 74,802 | | | | 9,245 | | | | 679 | |
| | | | |
Net assets, at value | | $ | 207,857,315 | | | $ | 4,722,612 | | | $ | 2,598,539 | | | $ | 4,342,277 | |
| | | | |
Net assets consist of: | |
Paid-in capital | | $ | 235,234,911 | | | $ | 8,407,339 | | | $ | 2,619,441 | | | $ | 4,836,326 | |
Total distributable earnings (loss) | | | (27,377,596 | ) | | | (3,684,727 | ) | | | (20,902 | ) | | | (494,049 | ) |
| | | | |
Net assets, at value | | $ | 207,857,315 | | | $ | 4,722,612 | | | $ | 2,598,539 | | | $ | 4,342,277 | |
| | | | |
Shares outstanding | | | 8,400,000 | | | | 200,000 | | | | 100,000 | | | | 200,000 | |
| | | | |
Net asset value per share | | $ | 24.74 | | | $ | 23.61 | | | $ | 25.99 | | | $ | 21.71 | |
| | | | |
| | | | | | |
| | | |
| franklintempleton.com | | The accompanying notes are an integral part of these financial statements. | Semiannual Report | | | 275 | |
FRANKLIN TEMPLETON ETF TRUST
FINANCIAL STATEMENTS
Statements of Assets and Liabilities(continued)
September 30, 2019 (unaudited)
| | | | | | | | | | | | | | | | |
| | | | |
| | | Franklin FTSE
Russia ETF | | | Franklin FTSE
Saudi Arabia
ETF | | | Franklin FTSE
South Africa
ETF | | | Franklin FTSE
South Korea
ETF | |
Assets: | | | | | | | | | | | | | | | | |
Investments in securities: | | | | | | | | | | | | | | | | |
Cost – Unaffiliated issuers | | $ | 15,808,698 | | | $ | 2,502,418 | | | $ | 2,641,499 | | | $ | 17,603,377 | |
| | | | |
Value – Unaffiliated issuers | | $ | 17,282,299 | | | $ | 2,552,346 | | | $ | 2,455,362 | | | $ | 13,691,832 | |
Cash | | | 10,717 | | | | 345 | | | | 47 | | | | 6,927 | |
Foreign currency, at value (cost $-, $8,674, $6,470 and $37,663, respectively) | | | — | | | | 8,674 | | | | 6,441 | | | | 37,651 | |
Receivables: | | | | | | | | | | | | | | | | |
Dividends and interest | | | 47,406 | | | | — | | | | 1,104 | | | | 21,365 | |
Variation margin on futures contracts | | | — | | | | — | | | | — | | | | 260 | |
Deposits with brokers for: | | | | | | | | | | | | | | | | |
Futures contracts | | | — | | | | — | | | | — | | | | 2,573 | |
| | | | |
Total assets | | | 17,340,422 | | | | 2,561,365 | | | | 2,462,954 | | | | 13,760,608 | |
| | | | |
Liabilities: | | | | | | | | | | | | | | | | |
Payables: | | | | | | | | | | | | | | | | |
Investment securities purchased | | | 44,767 | | | | — | | | | 7,337 | | | | 19,817 | |
Management fees | | | 2,387 | | | | 807 | | | | 401 | | | | 1,003 | |
| | | | |
Total liabilities | | | 47,154 | | | | 807 | | | | 7,738 | | | | 20,820 | |
| | | | |
Net assets, at value | | $ | 17,293,268 | | | $ | 2,560,558 | | | $ | 2,455,216 | | | $ | 13,739,788 | |
| | | | |
Net assets consist of: | | | | | | | | | | | | | | | | |
Paid-in capital | | $ | 15,300,794 | | | $ | 2,482,525 | | | $ | 2,441,624 | | | $ | 21,044,528 | |
Total distributable earnings (loss) | | | 1,992,474 | | | | 78,033 | | | | 13,592 | | | | (7,304,740 | ) |
| | | | |
Net assets, at value | | $ | 17,293,268 | | | $ | 2,560,558 | | | $ | 2,455,216 | | | $ | 13,739,788 | |
| | | | |
Shares outstanding | | | 650,000 | | | | 100,000 | | | | 100,000 | | | | 700,000 | |
| | | | |
Net asset value per share | | $ | 26.61 | | | $ | 25.61 | | | $ | 24.55 | | | $ | 19.63 | |
| | | | |
| | | | |
| | | |
| 276 | | Semiannual Report | The accompanying notes are an integral part of these financial statements. | | franklintempleton.com |
FRANKLIN TEMPLETON ETF TRUST
FINANCIAL STATEMENTS
Statements of Assets and Liabilities(continued)
September 30, 2019 (unaudited)
| | | | | | | | | | | | |
| | | |
| | | Franklin FTSE
Switzerland ETF | | | Franklin FTSE
Taiwan ETF | | | Franklin FTSE
United Kingdom
ETF | |
Assets: | | | | | | | | | | | | |
Investments in securities: | | | | | | | | | | | | |
Cost – Unaffiliated issuers | | $ | 7,332,109 | | | $ | 14,744,842 | | | $ | 29,743,820 | |
| | | | |
Value – Unaffiliated issuers | | $ | 7,674,169 | | | $ | 15,381,492 | | | $ | 27,893,459 | |
Cash | | | — | | | | 4,172 | | | | 34,274 | |
Foreign currency, at value (cost $5,886, $4,925 and $116,395, respectively) | | | 5,831 | | | | 4,922 | | | | 116,064 | |
Receivables: | | | | | | | | | | | | |
Dividends and interest | | | 23,568 | | | | 48,038 | | | | 47,455 | |
Variation margin on futures contracts | | | — | | | | 292 | | | | — | |
Deposits with brokers for: | | | | | | | | | | | | |
Futures contracts | | | — | | | | 1,870 | | | | 8,160 | |
| | | | |
Total assets | | | 7,703,568 | | | | 15,440,786 | | | | 28,099,412 | |
| | | | |
Liabilities: | | | | | | | | | | | | |
Payables: | | | | | | | | | | | | |
Management fees | | | 568 | | | | 2,391 | | | | 1,839 | |
Variation margin on futures contracts | | | — | | | | — | | | | 121 | |
Funds advanced by custodian | | | 14,211 | | | | — | | | | — | |
| | | | |
Total liabilities | | | 14,779 | | | | 2,391 | | | | 1,960 | |
| | | | |
Net assets, at value | | $ | 7,688,789 | | | $ | 15,438,395 | | | $ | 28,097,452 | |
| | | | |
Net assets consist of: | | | | | | | | | | | | |
Paid-in capital | | $ | 7,394,668 | | | $ | 14,383,078 | | | $ | 29,505,800 | |
Total distributable earnings (loss) | | | 294,121 | | | | 1,055,317 | | | | (1,408,348 | ) |
| | | | |
Net assets, at value | | $ | 7,688,789 | | | $ | 15,438,395 | | | $ | 28,097,452 | |
| | | | |
Shares outstanding | | | 300,000 | | | | 600,000 | | | | 1,200,000 | |
| | | | |
Net asset value per share | | $ | 25.63 | | | $ | 25.73 | | | $ | 23.41 | |
| | | | |
| | | | | | |
| | | |
| franklintempleton.com | | The accompanying notes are an integral part of these financial statements. | Semiannual Report | | | 277 | |
FRANKLIN TEMPLETON ETF TRUST
FINANCIAL STATEMENTS
Statements of Operations
for the period ended September 30, 2019 (unaudited)
| | | | | | | | | | | | | | | | |
| | | | |
| | | Franklin FTSE
Asia ex Japan
ETF | | | Franklin FTSE
Australia ETF | | | Franklin FTSE
Brazil ETF | | | Franklin FTSE
Canada ETF | |
Investment income: | | | | | | | | | | | | | | | | |
Dividends: (net of foreign taxes)a | | | | | | | | | | | | | | | | |
Unaffiliated issuers | | $ | 321,229 | | | $ | 238,784 | | | $ | 251,555 | | | $ | 71,463 | |
Interest: | | | | | | | | | | | | | | | | |
Unaffiliated issuers | | | — | | | | — | | | | 26 | | | | — | |
Interest from securities loaned: | | | | | | | | | | | | | | | | |
Unaffiliated issuers (net of fees and rebates) | | | 23 | | | | — | | | | — | | | | — | |
Non-Controlled affiliates (Note 3c) | | | 17 | | | | — | | | | — | | | | — | |
| | | | |
Total investment income | | | 321,269 | | | | 238,784 | | | | 251,581 | | | | 71,463 | |
| | | | |
Expenses: | | | | | | | | | | | | | | | | |
Management fees (Note 3a) | | | 16,078 | | | | 4,413 | | | | 19,778 | | | | 2,244 | |
Other | | | 17 | | | | — | | | | 77 | | | | — | |
| | | | |
Total expenses | | | 16,095 | | | | 4,413 | | | | 19,855 | | | | 2,244 | |
Expenses waived/paid by affiliates (Note 3c) | | | (59 | ) | | | — | | | | — | | | | — | |
| | | | |
Net investment income | | | 305,233 | | | | 234,371 | | | | 231,726 | | | | 69,219 | |
| | | | |
Realized and unrealized gains (losses): | | | | | | | | | | | | | | | | |
Net realized gain (loss) from: | | | | | | | | | | | | | | | | |
Investments: | | | | | | | | | | | | | | | | |
Unaffiliated issuers | | | (200,036 | ) | | | (69,982 | ) | | | (395,755 | ) | | | (26,423 | ) |
Foreign currency transactions | | | (2,311 | ) | | | (16 | ) | | | (2,556 | ) | | | 387 | |
Futures contracts | | | (2,427 | ) | | | — | | | | 3,822 | | | | — | |
| | | | |
Net realized gain (loss) | | | (204,774 | ) | | | (69,998 | ) | | | (394,489 | ) | | | (26,036 | ) |
| | | | |
Net change in unrealized appreciation (depreciation) on: | | | | | | | | | | | | | | | | |
Investments: | | | | | | | | | | | | | | | | |
Unaffiliated issuers | | | (998,511 | ) | | | 327,365 | | | | 700,446 | | | | 300,217 | |
Translation of other assets and liabilities denominated in foreign currencies | | | 431 | | | | (375 | ) | | | (2,870 | ) | | | (52 | ) |
Futures contracts | | | (2,973 | ) | | | — | | | | 5,381 | | | | — | |
Change in deferred taxes on unrealized appreciation | | | 13,992 | | | | — | | | | — | | | | — | |
| | | | |
Net change in unrealized appreciation (depreciation) | | | (987,061 | ) | | | 326,990 | | | | 702,957 | | | | 300,165 | |
| | | | |
Net realized and unrealized gain (loss) | | | (1,191,835 | ) | | | 256,992 | | | | 308,468 | | | | 274,129 | |
| | | | |
Net increase (decrease) in net assets resulting from operations | | $ | (886,602 | ) | | $ | 491,363 | | | $ | 540,194 | | | $ | 343,348 | |
| | | | |
| | | | |
aForeign taxes withheld on dividends | | | $34,866 | | | | $4,169 | | | | $15,921 | | | | $12,610 | |
| | | | |
| | | | |
| | | |
| 278 | | Semiannual Report | The accompanying notes are an integral part of these financial statements. | | franklintempleton.com |
FRANKLIN TEMPLETON ETF TRUST
FINANCIAL STATEMENTS
Statements of Operations(continued)
for the period ended September 30, 2019 (unaudited)
| | | | | | | | | | | | | | | | |
| | | | |
| | | Franklin FTSE
China ETF | | | Franklin FTSE
Europe ETF | | | Franklin FTSE
Europe Hedged
ETF | | | Franklin FTSE
France ETF | |
Investment income: | | | | | | | | | | | | | | | | |
Dividends: (net of foreign taxes)a | | | | | | | | | | | | | | | | |
Unaffiliated issuers | | $ | 825,917 | | | $ | 2,039,578 | | | $ | 105,250 | | | $ | 79,346 | |
Non-Controlled affiliates (Note 3c) | | | — | | | | — | | | | 278 | | | | — | |
Interest: | | | | | | | | | | | | | | | | |
Unaffiliated issuers | | | — | | | | — | | | | 45 | | | | — | |
Interest from securities loaned: | | | | | | | | | | | | | | | | |
Unaffiliated issuers (net of fees and rebates) | | | — | | | | 236 | | | | — | | | | — | |
Non-Controlled affiliates (Note 3) | | | — | | | | 489 | | | | — | | | | — | |
| | | | |
Total investment income | | | 825,917 | | | | 2,040,303 | | | | 105,573 | | | | 79,346 | |
| | | | |
Expenses: | | | | | | | | | | | | | | | | |
Management fees (Note 3a) | | | 39,032 | | | | 43,234 | | | | 2,117 | | | | 1,521 | |
Other | | | — | | | | 85 | | | | 101 | | | | — | |
| | | | |
Total expenses | | | 39,032 | | | | 43,319 | | | | 2,218 | | | | 1,521 | |
Expenses waived/paid by affiliates (Note 3c) | | | — | | | | — | | | | (44 | ) | | | — | |
| | | | |
Net investment income | | | 786,885 | | | | 1,996,984 | | | | 103,399 | | | | 77,825 | |
| | | | |
Realized and unrealized gains (losses): | | | | | | | | | | | | | | | | |
Net realized gain (loss) from: | | | | | | | | | | | | | | | | |
Investments: | | | | | | | | | | | | | | | | |
Unaffiliated issuers | | | (1,898,474 | ) | | | (320,924 | ) | | | (11,926 | ) | | | (4,812 | ) |
In-kind redemptions | | | — | | | | 2,479,647 | | | | — | | | | — | |
Foreign currency transactions | | | 7,664 | | | | (12,073 | ) | | | 19,003 | | | | 115 | |
Futures contracts | | | (765 | ) | | | 38,389 | | | | 10,957 | | | | 965 | |
Foreign exchange contracts | | | — | | | | — | | | | 404,827 | | | | — | |
| | | | |
Net realized gain (loss) | | | (1,891,575 | ) | | | 2,185,039 | | | | 422,861 | | | | (3,732 | ) |
| | | | |
Net change in unrealized appreciation (depreciation) on: | | | | | | | | | | | | | | | | |
Investments: | | | | | | | | | | | | | | | | |
Unaffiliated issuers | | | (2,615,024 | ) | | | (1,250,007 | ) | | | 24,556 | | | | 111,489 | |
Translation of other assets and liabilities denominated in foreign currencies | | | (30 | ) | | | 2,432 | | | | 285 | | | | (57 | ) |
Futures contracts | | | (2,831 | ) | | | 5,970 | | | | 334 | | | | — | |
Forward exchange contracts | | | — | | | | — | | | | (199,957 | ) | | | — | |
| | | | |
Net change in unrealized appreciation (depreciation) | | | (2,617,885 | ) | | | (1,241,605 | ) | | | (174,782 | ) | | | 111,432 | |
| | | | |
Net realized and unrealized gain (loss) | | | (4,509,460 | ) | | | 943,434 | | | | 248,079 | | | | 107,700 | |
| | | | |
Net increase (decrease) in net assets resulting from operations | | $ | (3,722,575 | ) | | $ | 2,940,418 | | | $ | 351,478 | | | $ | 185,525 | |
| | | | |
| | | | |
aForeign taxes withheld on dividends | | | $65,337 | | | | $219,116 | | | | $13,435 | | | | $13,368 | |
| | | | |
| | | | | | |
| | | |
| franklintempleton.com | | The accompanying notes are an integral part of these financial statements. | Semiannual Report | | | 279 | |
FRANKLIN TEMPLETON ETF TRUST
FINANCIAL STATEMENTS
Statements of Operations(continued)
for the period ended September 30, 2019 (unaudited)
| | | | | | | | | | | | | | | | |
| | | | |
| | | Franklin FTSE
Germany ETF | | | Franklin FTSE
Hong Kong ETF | | | Franklin FTSE
India ETF | | | Franklin FTSE
Italy ETF | |
Investment income: | | | | | | | | | | | | | | | | |
Dividends: (net of foreign taxes)a | | | | | | | | | | | | | | | | |
Unaffiliated issuers | | $ | 98,201 | | | $ | 425,490 | | | $ | 68,857 | | | $ | 366,261 | |
| | | | |
Total investment income | | | 98,201 | | | | 425,490 | | | | 68,857 | | | | 366,261 | |
| | | | |
Expenses: | | | | | | | | | | | | | | | | |
Management fees (Note 3a) | | | 1,908 | | | | 8,699 | | | | 8,624 | | | | 4,795 | |
Other | | | — | | | | — | | | | 44 | | | | 7 | |
| | | | |
Total expenses | | | 1,908 | | | | 8,699 | | | | 8,668 | | | | 4,802 | |
| | | | |
Net investment income | | | 96,293 | | | | 416,791 | | | | 60,189 | | | | 361,459 | |
| | | | |
Realized and unrealized gains (losses): | | | | | | | | | | | | | | | | |
Net realized gain (loss) from: | | | | | | | | | | | | | | | | |
Investments: | | | | | | | | | | | | | | | | |
Unaffiliated issuers | | | (29,803 | ) | | | 24,783 | | | | (84,357 | ) | | | (113,336 | ) |
Foreign currency transactions | | | 173 | | | | 258 | | | | (41,926 | ) | | | 127 | |
Futures contracts | | | — | | | | 2,699 | | | | (177 | ) | | | 6 | |
| | | | |
Net realized gain (loss) | | | (29,630 | ) | | | 27,740 | | | | (126,460 | ) | | | (113,203 | ) |
| | | | |
Net change in unrealized appreciation (depreciation) on: | | | | | | | | | | | | | | | | |
Investments: | | | | | | | | | | | | | | | | |
Unaffiliated issuers | | | 73,704 | | | | (2,559,699 | ) | | | (18,355 | ) | | | 87,702 | |
Translation of other assets and liabilities denominated in foreign currencies | | | 35 | | | | (34 | ) | | | 146 | | | | 108 | |
Futures contracts | | | — | | | | (1,885 | ) | | | (771 | ) | | | — | |
Change in deferred taxes on unrealized appreciation | | | — | | | | — | | | | (4,567 | ) | | | — | |
| | | | |
Net change in unrealized appreciation (depreciation) | | | 73,739 | | | | (2,561,618 | ) | | | (23,547 | ) | | | 87,810 | |
| | | | |
Net realized and unrealized gain (loss) | | | 44,109 | | | | (2,533,878 | ) | | | (150,007 | ) | | | (25,393 | ) |
| | | | |
Net increase (decrease) in net assets resulting from operations | | $ | 140,402 | | | $ | (2,117,087 | ) | | $ | (89,818 | ) | | $ | 336,066 | |
| | | | |
| | | | |
aForeign taxes withheld on dividends | | | $15,439 | | | | $242 | | | | $— | | | | $50,891 | |
| | | | |
| | | | |
| | | |
| 280 | | Semiannual Report | The accompanying notes are an integral part of these financial statements. | | franklintempleton.com |
FRANKLIN TEMPLETON ETF TRUST
FINANCIAL STATEMENTS
Statements of Operations(continued)
for the period ended September 30, 2019 (unaudited)a
| | | | | | | | | | | | | | | | |
| | | | |
| | | Franklin FTSE
Japan ETF | | | Franklin FTSE
Japan Hedged
ETF | | | Franklin FTSE
Latin America
ETF | | | Franklin FTSE
Mexico ETF | |
Investment income: | | | | | | | | | | | | | | | | |
Dividends: (net of foreign taxes)a | | | | | | | | | | | | | | | | |
Unaffiliated issuers | | $ | 2,360,897 | | | $ | 54,928 | | | $ | 40,629 | | | $ | 91,963 | |
Non-Controlled affiliates (Note 3c) | | | 1,583 | | | | 431 | | | | — | | | | — | |
Interest from securities loaned: | | | | | | | | | | | | | | | | |
Unaffiliated issuers (net of fees and rebates) | | | 1,599 | | | | — | | | | — | | | | — | |
Non-Controlled affiliates (Note 3c) | | | 1,012 | | | | — | | | | — | | | | — | |
| | | | |
Total investment income | | | 2,365,091 | | | | 55,359 | | | | 40,629 | | | | 91,963 | |
| | | | |
Expenses: | | | | | | | | | | | | | | | | |
Management fees (Note 3a) | | | 111,460 | | | | 3,715 | | | | 2,506 | | | | 4,182 | |
Other | | | 1,021 | | | | 77 | | | | — | | | | — | |
| | | | |
Total expenses | | | 112,481 | | | | 3,792 | | | | 2,506 | | | | 4,182 | |
Expenses waived/paid by affiliates (Note 3c) | | | (422 | ) | | | (89 | ) | | | — | | | | — | |
| | | | |
Net investment income | | | 2,253,032 | | | | 51,656 | | | | 38,123 | | | | 87,781 | |
| | | | |
Realized and unrealized gains (losses): | | | | | | | | | | | | | | | | |
Net realized gain (loss) from: | | | | | | | | | | | | | | | | |
Investments: | | | | | | | | | | | | | | | | |
Unaffiliated issuers | | | (1,391,937 | ) | | | (95,693 | ) | | | (8,279 | ) | | | (115,719 | ) |
In-kind redemptions | | | 620,514 | | | | (1,341,580 | ) | | | — | | | | — | |
Foreign currency transactions | | | 69,094 | | | | 1,990 | | | | (775 | ) | | | 374 | |
Futures contracts | | | 62,163 | | | | (5,731 | ) | | | 156 | | | | 127 | |
Foreign exchange contracts | | | — | | | | (252,553 | ) | | | — | | | | — | |
| | | | |
Net realized gain (loss) | | | (640,166 | ) | | | (1,693,567 | ) | | | (8,898 | ) | | | (115,218 | ) |
| | | | |
Net change in unrealized appreciation (depreciation) on: | | | | | | | | | | | | | |
Investments: | | | | | | | | | | | | | | | | |
Unaffiliated issuers | | | 5,776,595 | | | | 1,542,664 | | | | (25,753 | ) | | | 9,982 | |
Translation of other assets and liabilities denominated in foreign currencies | | | 7,877 | | | | 253 | | | | 30 | | | | 30 | |
Futures contracts | | | 2,273 | | | | 1,470 | | | | 245 | | | | — | |
Forward exchange contracts | | | — | | | | 69,721 | | | | — | | | | — | |
| | | | |
Net change in unrealized appreciation (depreciation) | | | 5,786,745 | | | | 1,614,108 | | | | (25,478 | ) | | | 10,012 | |
| | | | |
Net realized and unrealized gain (loss) | | | 5,146,579 | | | | (79,459 | ) | | | (34,376 | ) | | | (105,206 | ) |
| | | | |
Net increase (decrease) in net assets resulting from operations | | $ | 7,399,611 | | | $ | (27,803 | ) | | $ | 3,747 | | | $ | (17,425 | ) |
| | | | |
aFor the period October 9, 2018 (commencement of operations) to March 31, 2019.
| | | | | | | | | | | | | | | | |
aForeign taxes withheld on dividends | | $ | 263,009 | | | $ | 6,168 | | | $ | 3,203 | | | $ | 4,260 | |
| | | | |
| | | | | | |
| | | |
| franklintempleton.com | | The accompanying notes are an integral part of these financial statements. | Semiannual Report | | | 281 | |
FRANKLIN TEMPLETON ETF TRUST
FINANCIAL STATEMENTS
Statements of Operations(continued)
for the period ended September 30, 2019 (unaudited)a
| | | | | | | | | | | | | | | | |
| | | | |
| | | Franklin FTSE
Russia ETF | | | Franklin FTSE
Saudi Arabia
ETF | | | Franklin FTSE
South Africa
ETF | | | Franklin FTSE
South Korea
ETF | |
Investment income: | | | | | | | | | | | | | | | | |
Dividends: (net of foreign taxes)a | | | | | | | | | | | | | | | | |
Unaffiliated issuers | | $ | 730,470 | | | $ | 75,024 | | | $ | 244,053 | | | $ | 59,396 | |
Interest from securities loaned: | | | | | | | | | | | | | | | | |
Unaffiliated issuers (net of fees and rebates) | | | 4 | | | | — | | | | — | | | | 578 | |
Non-Controlled affiliates (Note 3) | | | 359 | | | | — | | | | — | | | | 79 | |
| | | | |
Total investment income | | | 730,833 | | | | 75,024 | | | | 244,053 | | | | 60,053 | |
| | | | |
Expenses: | | | | | | | | | | | | | | | | |
Management fees (Note 3a) | | | 13,053 | | | | 5,371 | | | | 2,552 | | | | 6,968 | |
Other | | | — | | | | — | | | | — | | | | 14 | |
| | | | |
Total expenses | | | 13,053 | | | | 5,371 | | | | 2,552 | | | | 6,982 | |
Expenses waived/paid by affiliates (Note 3c) | | | (133 | ) | | | — | | | | — | | | | (13 | ) |
| | | | |
Net investment income | | | 717,913 | | | | 69,653 | | | | 241,501 | | | | 53,084 | |
| | | | |
Realized and unrealized gains (losses): | | | | | | | | | | | | | | | | |
Net realized gain (loss) from: | | | | | | | | | | | | | | | | |
Investments: | | | | | | | | | | | | | | | | |
Unaffiliated issuers | | | 8,485 | | | | (3,991 | ) | | | (15,476 | ) | | | (1,834,788 | ) |
Foreign currency transactions | | | (8,641 | ) | | | (48 | ) | | | (69 | ) | | | 19,031 | |
Futures contracts | | | — | | | | — | | | | — | | | | 2,099 | |
Foreign exchange contracts | | | — | | | | (36 | ) | | | — | | | | — | |
| | | | |
Net realized gain (loss) | | | (156 | ) | | | (4,075 | ) | | | (15,545 | ) | | | (1,813,658 | ) |
| | | | |
Net change in unrealized appreciation (depreciation) on: | | | | | | | | | | | | | |
Investments: | | | | | | | | | | | | | | | | |
Unaffiliated issuers | | | 937,552 | | | | (247,050 | ) | | | (394,849 | ) | | | 222,650 | |
Translation of other assets and liabilities denominated in foreign currencies | | | 293 | | | | — | | | | (93 | ) | | | 3,576 | |
Futures contracts | | | — | | | | — | | | | — | | | | 2,015 | |
| | | | |
Net change in unrealized appreciation (depreciation) | | | 937,845 | | | | (247,050 | ) | | | (394,942 | ) | | | 228,241 | |
| | | | |
Net realized and unrealized gain (loss) | | | 937,689 | | | | (251,125 | ) | | | (410,487 | ) | | | (1,585,417 | ) |
| | | | |
Net increase (decrease) in net assets resulting from operations | | $ | 1,655,602 | | | $ | (181,472 | ) | | $ | (168,986 | ) | | $ | (1,532,333 | ) |
| | | | |
aFor the period October 9, 2018 (commencement of operations) to September, 2019.
| | | | | | | | | | | | | | | | |
aForeign taxes withheld on dividends | | $ | 81,163 | | | $ | 2,556 | | | $ | 8,250 | | | $ | 11,193 | |
| | | | |
| | | | |
| | | |
| 282 | | Semiannual Report | The accompanying notes are an integral part of these financial statements. | | franklintempleton.com |
FRANKLIN TEMPLETON ETF TRUST
FINANCIAL STATEMENTS
Statements of Operations(continued)
for the period ended September 30, 2019 (unaudited)
| | | | | | | | | | | | |
| | | |
| | | Franklin FTSE
Switzerland ETF | | | Franklin FTSE
Taiwan ETF | | | Franklin FTSE
United Kingdom
ETF | |
Investment income: | | | | | | | | | | | | |
Dividends: (net of foreign taxes)a | | | | | | | | | | | | |
Unaffiliated issuers | | $ | 50,628 | | | $ | 518,692 | | | $ | 767,295 | |
Interest: | | | | | | | | | | | | |
Unaffiliated issuers | | | — | | | | 36 | | | | — | |
| | | | |
Total investment income | | | 50,628 | | | | 518,728 | | | | 767,295 | |
| | | | |
Expenses: | | | | | | | | | | | | |
Management fees (Note 3a) | | | 2,216 | | | | 14,213 | | | | 12,722 | |
| | | | |
Total expenses | | | 2,216 | | | | 14,213 | | | | 12,722 | |
| | | | |
Net investment income | | | 48,412 | | | | 504,515 | | | | 754,573 | |
| | | | |
Realized and unrealized gains (losses): | | | | | | | | | | | | |
Net realized gain (loss) from: | | | | | | | | | | | | |
Investments: | | | | | | | | | | | | |
Unaffiliated issuers | | | (23,991 | ) | | | 15,174 | | | | (131,648 | ) |
In-kind redemptions | | | — | | | | — | | | | 162,136 | |
Foreign currency transactions | | | (103 | ) | | | (900 | ) | | | (17,249 | ) |
Futures contracts | | | — | | | | 3,185 | | | | 16,542 | |
| | | | |
Net realized gain (loss) | | | (24,094 | ) | | | 17,459 | | | | 29,781 | |
| | | | |
Net change in unrealized appreciation (depreciation) on: | | | | | | | | | |
Investments: | | | | | | | | | | | | |
Unaffiliated issuers | | | 389,743 | | | | 87,944 | | | | (1,673,355 | ) |
Translation of other assets and liabilities denominated in foreign currencies | | | 19 | | | | 191 | | | | 3,104 | |
Futures contracts | | | — | | | | 248 | | | | (4,316 | ) |
| | | | |
Net change in unrealized appreciation (depreciation) | | | 389,762 | | | | 88,383 | | | | (1,674,567 | ) |
| | | | |
Net realized and unrealized gain (loss) | | | 365,668 | | | | 105,842 | | | | (1,644,786 | ) |
| | | | |
Net increase (decrease) in net assets resulting from operations | | $ | 414,080 | | | $ | 610,357 | | | $ | (890,213 | ) |
| | | | |
| | | |
aForeign taxes withheld on dividends | | | $7,957 | | | | $139,085 | | | | $9,090 | |
| | | | |
| | | | | | |
| | | |
| franklintempleton.com | | The accompanying notes are an integral part of these financial statements. | Semiannual Report | | | 283 | |
FRANKLIN TEMPLETON ETF TRUST
FINANCIAL STATEMENTS
Statements of Changes in Net Assets
| | | | | | | | | | | | | | | | |
| | |
| | | Franklin FTSE Asia ex Japan ETF | | | Franklin FTSE Australia ETF | |
| | | | |
| | | Six Months Ended
September 30, 2019
(unaudited) | | | Year Ended
March 31, 2019 | | | Six Months Ended
September 30, 2019 (unaudited) | | | Year Ended
March 31, 2019 | |
Increase (decrease) in net assets: | | | | | | | | | | | | | | | | |
Operations: | | | | | | | | | | | | | | | | |
Net investment income | | $ | 305,233 | | | $ | 382,992 | | | $ | 234,371 | | | $ | 374,062 | |
Net realized gain (loss) | | | (204,774 | ) | | | (215,726 | ) | | | (69,998 | ) | | | 392,801 | |
Net change in unrealized appreciation (depreciation) | | | (987,061 | ) | | | (1,187,115 | ) | | | 326,990 | | | | (276,343 | ) |
| | | | |
Net increase (decrease) in net assets resulting from operations | | | (886,602 | ) | | | (1,019,849 | ) | | | 491,363 | | | | 490,520 | |
| | | | |
Distributions to shareholders: | | | (99,368 | ) | | | (370,953 | ) | | | (275,732 | ) | | | (242,641 | ) |
| | | | |
Capital share transactions: (Note 2) | | | — | | | | 9,428,138 | | | | 3,784,703 | | | | 4,674,690 | |
| | | | |
Net increase (decrease) in net assets | | | (985,970 | ) | | | 8,037,336 | | | | 4,000,334 | | | | 4,922,569 | |
Net assets: | | | | | | | | | | | | | | | | |
Beginning of period | | | 17,488,071 | | | | 9,450,735 | | | | 7,389,115 | | | | 2,466,546 | |
| | | | |
End of period | | $ | 16,502,101 | | | $ | 17,488,071 | | | $ | 11,389,449 | | | $ | 7,389,115 | |
| | | | |
| | | | |
| | | |
| 284 | | Semiannual Report | The accompanying notes are an integral part of these financial statements. | | franklintempleton.com |
FRANKLIN TEMPLETON ETF TRUST
FINANCIAL STATEMENTS
Statements of Changes in Net Assets(continued)
| | | | | | | | | | | | | | | | |
| | |
| | | Franklin FTSE Brazil ETF | | | Franklin FTSE Canada ETF | |
| | | | |
| | | Six Months Ended
September 30, 2019
(unaudited) | | | Year Ended
March 31, 2019 | | | Six Months Ended
September 30, 2019
(unaudited) | | | Year Ended
March 31, 2019 | |
Increase (decrease) in net assets: | | | | | | | | | | | | | | | | |
Operations: | | | | | | | | | | | | | | | | |
Net investment income | | $ | 231,726 | | | $ | 831,596 | | | $ | 69,219 | | | $ | 110,177 | |
Net realized gain (loss) | | | (394,489 | ) | | | (9,920,956 | ) | | | (26,036 | ) | | | (143,008 | ) |
Net change in unrealized appreciation (depreciation) | | | 702,957 | | | | 950,677 | | | | 300,165 | | | | 91,259 | |
| | | | |
Net increase (decrease) in net assets resulting from operations | | | 540,194 | | | | (8,138,683 | ) | | | 343,348 | | | | 58,428 | |
| | | | |
Distributions to shareholders: | | | (302,769 | ) | | | (923,263 | ) | | | (46,308 | ) | | | (95,664 | ) |
| | | | |
Capital share transactions: (Note 2) | | | (5,193,574 | ) | | | (14,952,279 | ) | | | — | | | | 2,487,064 | |
| | | | |
Net increase (decrease) in net assets | | | (4,956,149 | ) | | | (24,014,225 | ) | | | 297,040 | | | | 2,449,828 | |
Net assets: | | | | | | | | | | | | | | | | |
Beginning of period | | | 20,578,825 | | | | 44,593,050 | | | | 4,826,896 | | | | 2,377,068 | |
| | | | |
End of period | | $ | 15,622,676 | | | $ | 20,578,825 | | | $ | 5,123,936 | | | $ | 4,826,896 | |
| | | | |
| | | | | | |
| | | |
| franklintempleton.com | | The accompanying notes are an integral part of these financial statements. | Semiannual Report | | | 285 | |
FRANKLIN TEMPLETON ETF TRUST
FINANCIAL STATEMENTS
Statements of Changes in Net Assets(continued)
| | | | | | | | | | | | | | | | |
| | |
| | | Franklin FTSE China ETF | | | Franklin FTSE Europe ETF | |
| | | | |
| | | Six Months Ended
September 30, 2019
(unaudited) | | | Year Ended
March 31, 2019 | | | Six Months Ended
September 30, 2019
(unaudited) | | | Year Ended
March 31, 2019 | |
Increase (decrease) in net assets: | | | | | | | | | | | | | | | | |
Operations: | | | | | | | | | | | | | | | | |
Net investment income | | $ | 786,885 | | | $ | 576,193 | | | $ | 1,996,984 | | | $ | 3,116,118 | |
Net realized gain (loss) | | | (1,891,575 | ) | | | (603,039 | ) | | | 2,185,039 | | | | (1,055,832 | ) |
Net change in unrealized appreciation (depreciation) | | | (2,617,885 | ) | | | (1,780,744 | ) | | | (1,241,605 | ) | | | (5,306,884 | ) |
| | | | |
Net increase (decrease) in net assets resulting from operations | | | (3,722,575 | ) | | | (1,807,590 | ) | | | 2,940,418 | | | | (3,246,598 | ) |
| | | | |
Distributions to shareholders: | | | (54,680 | ) | | | (584,365 | ) | | | (1,646,698 | ) | | | (3,141,008 | ) |
| | | | |
Capital share transactions: (Note 2) | | | 7,205 | | | | 14,421,020 | | | | (9,828,228 | ) | | | (24,163,732 | ) |
| | | | |
Net increase (decrease) in net assets | | | (3,770,050 | ) | | | 12,029,065 | | | | (8,534,508 | ) | | | (30,551,338 | ) |
Net assets: | | | | | | | | | | | | | | | | |
Beginning of period | | | 43,220,422 | | | | 31,191,357 | | | | 74,359,320 | | | | 104,910,658 | |
| | | | |
End of period | | $ | 39,450,372 | | | $ | 43,220,422 | | | $ | 65,824,812 | | | $ | 74,359,320 | |
| | | | |
| | | | |
| | | |
| 286 | | Semiannual Report | The accompanying notes are an integral part of these financial statements. | | franklintempleton.com |
FRANKLIN TEMPLETON ETF TRUST
FINANCIAL STATEMENTS
Statements of Changes in Net Assets(continued)
| | | | | | | | | | | | | | | | |
| | |
| | | Franklin FTSE Europe Hedged ETF | | | Franklin FTSE France ETF | |
| | | | |
| | | Six Months Ended
September 30, 2019
(unaudited) | | | Year Ended
March 31, 2019 | | | Six Months Ended
September 30, 2019
(unaudited) | | | Year Ended
March 31, 2019 | |
Increase (decrease) in net assets: | | | | | | | | | | | | | | | | |
Operations: | | | | | | | | | | | | | | | | |
Net investment income | | $ | 103,399 | | | $ | 1,007,339 | | | $ | 77,825 | | | $ | 70,225 | |
Net realized gain (loss) | | | 422,861 | | | | (619,268 | ) | | | (3,732 | ) | | | (13,591 | ) |
Net change in unrealized appreciation (depreciation) | | | (174,782 | ) | | | 581,744 | | | | 111,432 | | | | (134,495 | ) |
| | | | |
Net increase (decrease) in net assets resulting from operations | | | 351,478 | | | | 969,815 | | | | 185,525 | | | | (77,861 | ) |
| | | | |
Distributions to shareholders: | | | (61,666 | ) | | | (3,462,145 | ) | | | (42,424 | ) | | | (68,766 | ) |
| | | | |
Capital share transactions: (Note 2) | | | — | | | | (26,372,741 | ) | | | 1,203,488 | | | | — | |
| | | | |
Net increase (decrease) in net assets | | | 289,812 | | | | (28,865,071 | ) | | | 1,346,589 | | | | (146,627 | ) |
Net assets: | | | | | | | | | | | | | | | | |
Beginning of period | | | 4,562,807 | | | | 33,427,878 | | | | 2,386,422 | | | | 2,533,049 | |
| | | | |
End of period | | $ | 4,852,619 | | | $ | 4,562,807 | | | $ | 3,733,011 | | | $ | 2,386,422 | |
| | | | |
| | | | | | |
| | | |
| franklintempleton.com | | The accompanying notes are an integral part of these financial statements. | Semiannual Report | | | 287 | |
FRANKLIN TEMPLETON ETF TRUST
FINANCIAL STATEMENTS
Statements of Changes in Net Assets(continued)
| | | | | | | | | | | | | | | | |
| | |
| | | Franklin FTSE Germany ETF | | | Franklin FTSE Hong Kong ETF | |
| | | | |
| | | Six Months Ended
September 30, 2019
(unaudited) | | | Year Ended
March 31, 2019 | | | Six Months Ended
September 30, 2019
(unaudited) | | | Year Ended
March 31, 2019 | |
Increase (decrease) in net assets: | | | | | | | | | | | | | | | | |
Operations: | | | | | | | | | | | | | | | | |
Net investment income | | $ | 96,293 | | | $ | 74,153 | | | $ | 416,791 | | | $ | 329,771 | |
Net realized gain (loss) | | | (29,630 | ) | | | (26,064 | ) | | | 27,740 | | | | (82,452 | ) |
Net change in unrealized appreciation (depreciation) | | | 73,739 | | | | (420,241 | ) | | | (2,561,618 | ) | | | 1,512,009 | |
| | | | |
Net increase (decrease) in net assets resulting from operations | | | 140,402 | | | | (372,152 | ) | | | (2,117,087 | ) | | | 1,759,328 | |
| | | | |
Distributions to shareholders: | | | (96,019 | ) | | | (59,669 | ) | | | (262,786 | ) | | | (273,434 | ) |
| | | | |
Capital share transactions: (Note 2) | | | — | | | | 2,111,997 | | | | — | | | | 10,779,669 | |
| | | | |
Net increase (decrease) in net assets | | | 44,383 | | | | 1,680,176 | | | | (2,379,873 | ) | | | 12,265,563 | |
Net assets: | | | | | | | | | | | | | | | | |
Beginning of period | | | 4,140,165 | | | | 2,459,989 | | | | 20,117,697 | | | | 7,852,134 | |
| | | | |
End of period | | $ | 4,184,548 | | | $ | 4,140,165 | | | $ | 17,737,824 | | | $ | 20,117,697 | |
| | | | |
| | | | |
| | | |
| 288 | | Semiannual Report | The accompanying notes are an integral part of these financial statements. | | franklintempleton.com |
FRANKLIN TEMPLETON ETF TRUST
FINANCIAL STATEMENTS
Statements of Changes in Net Assets(continued)
| | | | | | | | | | | | | | | | |
| | |
| | | Franklin FTSE India ETF | | | Franklin FTSE Italy ETF | |
| | | | |
| | | Six Months Ended
September 30, 2019
(unaudited) | | | Year Ended
March 31, 2019 | | | Six Months Ended
September 30, 2019
(unaudited) | | | Year Ended
March 31, 2019 | |
Increase (decrease) in net assets: | | | | | | | | | | | | | | | | |
Operations: | | | | | | | | | | | | | | | | |
Net investment income | | $ | 60,189 | | | $ | 70,302 | | | $ | 361,459 | | | $ | 117,532 | |
Net realized gain (loss) | | | (126,460 | ) | | | (78,187 | ) | | | (113,203 | ) | | | (226,842 | ) |
Net change in unrealized appreciation (depreciation) | | | (23,547 | ) | | | 175,178 | | | | 87,810 | | | | 433,507 | |
| | | | |
Net increase (decrease) in net assets resulting from operations | | | (89,818 | ) | | | 167,293 | | | | 336,066 | | | | 324,197 | |
| | | | |
Distributions to shareholders: | | | (61,381 | ) | | | (47,624 | ) | | | (302,027 | ) | | | (91,568 | ) |
| | | | |
Capital share transactions: (Note 2) | | | 8,509,806 | | | | 4,613,517 | | | | 1,118,853 | | | | 7,550,898 | |
| | | | |
Net increase (decrease) in net assets | | | 8,358,607 | | | | 4,733,186 | | | | 1,152,892 | | | | 7,783,527 | |
Net assets: | | | | | | | | | | | | | | | | |
Beginning of period | | | 7,007,174 | | | | 2,273,988 | | | | 10,410,383 | | | | 2,626,856 | |
| | | | |
End of period | | $ | 15,365,781 | | | $ | 7,007,174 | | | $ | 11,563,275 | | | $ | 10,410,383 | |
| | | | |
| | | | | | |
| | | |
| franklintempleton.com | | The accompanying notes are an integral part of these financial statements. | Semiannual Report | | | 289 | |
FRANKLIN TEMPLETON ETF TRUST
FINANCIAL STATEMENTS
Statements of Changes in Net Assets(continued)
| | | | | | | | | | | | | | | | |
| | |
| | | Franklin FTSE Japan ETF | | | Franklin FTSE Japan Hedged ETF | |
| | | | |
| | | Six Months Ended
September 30, 2019
(unaudited) | | | Year Ended
March 31, 2019 | | | Six Months Ended
September 30, 2019
(unaudited) | | | Year Ended
March 31, 2019 | |
Increase (decrease) in net assets: | | | | | | | | | | | | | | | | |
Operations: | | | | | | | | | | | | | | | | |
Net investment income | | $ | 2,253,032 | | | $ | 5,403,894 | | | $ | 51,656 | | | $ | 618,951 | |
Net realized gain (loss) | | | (640,166 | ) | | | 1,361,394 | | | | (1,693,567 | ) | | | (379,945 | ) |
Net change in unrealized appreciation (depreciation) | | | 5,786,745 | | | | (27,193,949 | ) | | | 1,614,108 | | | | (1,905,925 | ) |
| | | | |
Net increase (decrease) in net assets resulting from operations | | | 7,399,611 | | | | (20,428,661 | ) | | | (27,803 | ) | | | (1,666,919 | ) |
| | | | |
Distributions to shareholders: | | | (2,996,719 | ) | | | (3,317,982 | ) | | | — | | | | (2,263,375 | ) |
| | | | |
Capital share transactions: (Note 2) | | | (86,750,981 | ) | | | 217,869,864 | | | | (9,119,220 | ) | | | (27,397,137 | ) |
| | | | |
Net increase (decrease) in net assets | | | (82,348,089 | ) | | | 194,123,221 | | | | (9,147,023 | ) | | | (31,327,431 | ) |
Net assets: | | | | | | | | | | | | | | | | |
Beginning of period | | | 290,205,404 | | | | 96,082,183 | | | | 13,869,635 | | | | 45,197,066 | |
| | | | |
End of period | | $ | 207,857,315 | | | $ | 290,205,404 | | | $ | 4,722,612 | | | $ | 13,869,635 | |
| | | | |
| | | | |
| | | |
| 290 | | Semiannual Report | The accompanying notes are an integral part of these financial statements. | | franklintempleton.com |
FRANKLIN TEMPLETON ETF TRUST
FINANCIAL STATEMENTS
Statements of Changes in Net Assets(continued)
| | | | | | | | | | | | | | | | |
| | |
| | | Franklin FTSE Latin America ETF | | | Franklin FTSE Mexico ETF | |
| | | | |
| | | Six Months Ended
September 30, 2019
(unaudited) | | | Year Ended
March 31, 2019a | | | Six Months Ended
September 30, 2019
(unaudited) | | | Year Ended
March 31, 2019 | |
Increase (decrease) in net assets: | | | | | | | | | | | | | | | | |
Operations: | | | | | | | | | | | | | | | | |
Net investment income | | $ | 38,123 | | | $ | 37,946 | | | $ | 87,781 | | | $ | 79,171 | |
Net realized gain (loss) | | | (8,898 | ) | | | (5,596 | ) | | | (115,218 | ) | | | (72,084 | ) |
Net change in unrealized appreciation (depreciation) | | | (25,478 | ) | | | 834 | | | | 10,012 | | | | (350,568 | ) |
| | | | |
Net increase (decrease) in net assets resulting from operations | | | 3,747 | | | | 33,184 | | | | (17,425 | ) | | | (343,481 | ) |
| | | | |
Distributions to shareholders: | | | (45,918 | ) | | | (11,915 | ) | | | (61,916 | ) | | | (78,632 | ) |
| | | | |
Capital share transactions: (Note 2) | | | — | | | | 2,619,441 | | | | — | | | | 2,346,009 | |
| | | | |
Net increase (decrease) in net assets | | | (42,171 | ) | | | 2,640,710 | | | | (79,341 | ) | | | 1,923,896 | |
Net assets: | | | | | | | | | | | | | | | | |
Beginning of period | | | 2,640,710 | | | | — | | | | 4,421,618 | | | | 2,497,722 | |
| | | | |
End of period | | $ | 2,598,539 | | | $ | 2,640,710 | | | $ | 4,342,277 | | | $ | 4,421,618 | |
| | | | |
aFor the period October 9, 2018 (commencement of operations) to March 31, 2019.
| | | | | | |
| | | |
| franklintempleton.com | | The accompanying notes are an integral part of these financial statements. | Semiannual Report | | | 291 | |
FRANKLIN TEMPLETON ETF TRUST
FINANCIAL STATEMENTS
Statements of Changes in Net Assets(continued)
| | | | | | | | | | | | | | | | |
| | |
| | | Franklin FTSE Russia ETF | | | Franklin FTSE Saudi Arabia ETF | |
| | | | |
| | | Six Months Ended
September 30, 2019
(unaudited) | | | Year Ended
March 31, 2019 | | | Six Months Ended
September 30, 2019
(unaudited) | | | Year Ended
March 31, 2019a | |
Increase (decrease) in net assets: | | | | | | | | | | | | | | | | |
Operations: | | | | | | | | | | | | | | | | |
Net investment income | | $ | 717,913 | | | $ | 319,495 | | | $ | 69,653 | | | $ | 11,269 | |
Net realized gain (loss) | | | (156 | ) | | | (76,440 | ) | | | (4,075 | ) | | | (1,893 | ) |
Net change in unrealized appreciation (depreciation) | | | 937,845 | | | | 499,491 | | | | (247,050 | ) | | | 296,978 | |
| | | | |
Net increase (decrease) in net assets resulting from operations | | | 1,655,602 | | | | 742,546 | | | | (181,472 | ) | | | 306,354 | |
| | | | |
Distributions to shareholders: | | | (85,496 | ) | | | (307,541 | ) | | | (46,849 | ) | | | — | |
| | | | |
Capital share transactions: (Note 2) | | | 4,040,147 | | | | 8,824,329 | | | | — | | | | 2,482,525 | |
| | | | |
Net increase (decrease) in net assets | | | 5,610,253 | | | | 9,259,334 | | | | (228,321 | ) | | | 2,788,879 | |
Net assets: | | | | | | | | | | | | | | | | |
Beginning of period | | | 11,683,015 | | | | 2,423,681 | | | | 2,788,879 | | | | — | |
| | | | |
End of period | | $ | 17,293,268 | | | $ | 11,683,015 | | | $ | 2,560,558 | | | $ | 2,788,879 | |
| | | | |
aFor the period October 9, 2018 (commencement of operations) to March 31, 2019.
| | | | |
| | | |
| 292 | | Semiannual Report | The accompanying notes are an integral part of these financial statements. | | franklintempleton.com |
FRANKLIN TEMPLETON ETF TRUST
FINANCIAL STATEMENTS
Statements of Changes in Net Assets(continued)
| | | | | | | | | | | | | | | | |
| | |
| | | Franklin FTSE South Africa ETF | | | Franklin FTSE South Korea ETF | |
| | | | |
| | | Six Months Ended
September 30, 2019
(unaudited) | | | Year Ended
March 31, 2019a | | | Six Months Ended
September 30, 2019
(unaudited) | | | Year Ended
March 31, 2019 | |
Increase (decrease) in net assets: | | | | | | | | | | | | | | | | |
Operations: | | | | | | | | | | | | | | | | |
Net investment income | | $ | 241,501 | | | $ | 21,691 | | | $ | 53,084 | | | $ | 378,016 | |
Net realized gain (loss) | | | (15,545 | ) | | | (4,371 | ) | | | (1,813,658 | ) | | | (1,589,948 | ) |
Net change in unrealized appreciation (depreciation) | | | (394,942 | ) | | | 208,803 | | | | 228,241 | | | | (3,252,311 | ) |
| | | | |
Net increase (decrease) in net assets resulting from operations | | | (168,986 | ) | | | 226,123 | | | | (1,532,333 | ) | | | (4,464,243 | ) |
| | | | |
Distributions to shareholders: | | | (37,595 | ) | | | (5,950 | ) | | | (41,710 | ) | | | (340,269 | ) |
| | | | |
Capital share transactions: (Note 2) | | | — | | | | 2,441,624 | | | | (1,634,635 | ) | | | (4,227,746 | ) |
| | | | |
Net increase (decrease) in net assets | | | (206,581 | ) | | | 2,661,797 | | | | (3,208,678 | ) | | | (9,032,258 | ) |
Net assets: | | | | | | | | | | | | | | | | |
Beginning of period | | | 2,661,797 | | | | — | | | | 16,948,466 | | | | 25,980,724 | |
| | | | |
End of period | | $ | 2,455,216 | | | $ | 2,661,797 | | | $ | 13,739,788 | | | $ | 16,948,466 | |
| | | | |
aFor the period October 10, 2018 (commencement of operations) to March 31, 2019.
| | | | | | |
| | | |
| franklintempleton.com | | The accompanying notes are an integral part of these financial statements. | Semiannual Report | | | 293 | |
FRANKLIN TEMPLETON ETF TRUST
FINANCIAL STATEMENTS
Statements of Changes in Net Assets(continued)
| | | | | | | | | | | | | | | | |
| | |
| | | Franklin FTSE Switzerland ETF | | | Franklin FTSE Taiwan ETF | |
| | | | |
| | | Six Months Ended
September 30, 2019
(unaudited) | | | Year Ended
March 31, 2019 | | | Six Months Ended
September 30, 2019
(unaudited) | | | Year Ended
March 31, 2019 | |
Increase (decrease) in net assets: | | | | | | | | | | | | | | | | |
Operations: | | | | | | | | | | | | | | | | |
Net investment income | | $ | 48,412 | | | $ | 57,316 | | | $ | 504,515 | | | $ | 158,804 | |
Net realized gain (loss) | | | (24,094 | ) | | | (119,463 | ) | | | 17,459 | | | | (103,534 | ) |
Net change in unrealized appreciation (depreciation) | | | 389,762 | | | | 18,957 | | | | 88,383 | | | | 400,486 | |
| | | | |
Net increase (decrease) in net assets resulting from operations | | | 414,080 | | | | (43,190 | ) | | | 610,357 | | | | 455,756 | |
| | | | |
Distributions to shareholders: | | | (60,643 | ) | | | (60,937 | ) | | | (5,578 | ) | | | (144,725 | ) |
| | | | |
Capital share transactions: (Note 2) | | | 4,949,338 | | | | 179,347 | | | | — | | | | 9,254,307 | |
| | | | |
Net increase (decrease) in net assets | | | 5,302,775 | | | | 75,220 | | | | 604,779 | | | | 9,565,338 | |
Net assets: | | | | | | | | | | | | | | | | |
Beginning of period | | | 2,386,014 | | | | 2,310,794 | | | | 14,833,616 | | | | 5,268,278 | |
| | | | |
End of period | | $ | 7,688,789 | | | $ | 2,386,014 | | | $ | 15,438,395 | | | $ | 14,833,616 | |
| | | | |
| | | | |
| | | |
| 294 | | Semiannual Report | The accompanying notes are an integral part of these financial statements. | | franklintempleton.com |
FRANKLIN TEMPLETON ETF TRUST
FINANCIAL STATEMENTS
Statements of Changes in Net Assets(continued)
| | | | | | | | |
| |
| | | Franklin FTSE United Kingdom ETF | |
| | |
| | | Six Months Ended
September 30, 2019
(unaudited) | | | Year Ended
March 31, 2019 | |
Increase (decrease) in net assets: | | | | | | | | |
Operations: | | | | | | | | |
Net investment income | | $ | 754,573 | | | $ | 633,075 | |
Net realized gain (loss) | | | 29,781 | | | | 680,822 | |
Net change in unrealized appreciation (depreciation) | | | (1,674,567 | ) | | | (181,708 | ) |
| | | | |
Net increase (decrease) in net assets resulting from operations | | | (890,213 | ) | | | 1,132,189 | |
| | | | |
Distributions to shareholders: | | | (636,434 | ) | | | (324,863 | ) |
| | | | |
Capital share transactions: (Note 2) | | | 547,878 | | | | 25,746,068 | |
| | | | |
Net increase (decrease) in net assets | | | (978,769 | ) | | | 26,553,394 | |
Net assets: | | | | | | | | |
Beginning of period | | | 29,076,221 | | | | 2,522,827 | |
| | | | |
End of period | | $ | 28,097,452 | | | $ | 29,076,221 | |
| | | | |
| | | | | | |
| | | |
| franklintempleton.com | | The accompanying notes are an integral part of these financial statements. | Semiannual Report | | | 295 | |
FRANKLIN TEMPLETON ETF TRUST
Notes to Financial Statements
1. Organization and Significant Accounting Policies
Franklin Templeton ETF Trust (Trust) is registered under the Investment Company Act of 1940 (1940 Act) as anopen-end management investment company, consisting of thirty-nine separate funds, twenty-three of which are included in this report (Funds) and applies the specialized accounting and reporting guidance in U.S. Generally Accepted Accounting Principles (U.S. GAAP). Each of the Funds are an exchange traded fund (ETF) and seek to provide the investment results that closely correspond, before fees and expenses, to the performance of each Fund’s corresponding underlying index.
The following summarizes the Funds’ significant accounting policies.
a. Financial Instrument Valuation
The Funds’ investments in financial instruments are carried at fair value daily. Fair value is the price that would be received to sell an asset or paid to transfer a liability in an orderly transaction between market participants on the measurement date. The Funds calculate the net asset value (NAV) per share as of 4 p.m. Eastern time each day the New York Stock Exchange (NYSE) is open for trading. Under compliance policies and procedures approved by the Trust’s Board of Trustees (the Board), the Funds’ administrator has responsibility for oversight of valuation, including leading the cross-functional Valuation Committee (VC). The Funds may utilize independent pricing services, quotations from securities and financial instrument dealers, and other market sources to determine fair value.
Equity securities and derivative financial instruments listed on an exchange or on the NASDAQ National Market System are valued at the last quoted sale price or the official closing price of the day, respectively. Foreign equity securities are valued as of the close of trading on the foreign stock exchange on which the security is primarily traded or as of 4 p.m. Eastern time. The value is then converted into its U.S. dollar equivalent at the foreign exchange rate in effect at 4 p.m. London time on the day that the value of the security is determined.Over-the-counter (OTC) securities are valued within the range of the most recent quoted bid and ask prices. Securities that trade in multiple markets or on multiple exchanges are valued according to the broadest and most representative market. Certain equity securities are valued based upon fundamental characteristics or relationships to similar securities.
Certain derivative financial instruments are centrally cleared or trade in the OTC market. The Funds’ pricing services use various techniques including industry standard option pricing models and proprietary discounted cash flow models to determine the fair value of those instruments. The Funds’ net benefit or obligation under the derivative contract, as measured by the fair value of the contract, is included in net assets.
The Funds have procedures to determine the fair value of financial instruments for which market prices are not reliable or readily available. Under these procedures, the Funds primarily employ a market-based approach which may use related or comparable assets or liabilities, recent transactions, market multiples, book values, and other relevant information for the investment to determine the fair value of the investment. An income-based valuation approach may also be used in which the anticipated future cash flows of the investment are discounted to calculate fair value. Discounts may also be applied due to the nature or duration of any restrictions on the disposition of the investments. Due to the inherent uncertainty of valuations of such investments, the fair values may differ significantly from the values that would have been used had an active market existed.
Trading in securities on foreign securities stock exchanges and OTC markets may be completed before 4 p.m. Eastern time. In addition, trading in certain foreign markets may not take place on every Funds’ business day. Occasionally, events occur between the time at which trading in a foreign security is completed and 4 p.m. Eastern time that might call into question the reliability of the value of a portfolio security held by the Fund. As a result, differences may arise between the value of the Funds’ portfolio securities as determined at the foreign market close and the latest indications of value at 4 p.m. Eastern time. The VC monitors price movements for significant events following the close of trading in foreign stock markets through a series of country specific market proxies (such as baskets of American Depositary Receipts, futures contracts and exchange traded funds). These price movements are measured against established trigger thresholds for each specific market proxy to assist in determining if an event has occurred that may call into question the reliability of the values of the foreign securities held by the Funds. If such an event occurs, the securities may be valued using fair value procedures, which may include the use of independent pricing services.
When the last day of the reporting period is anon-business day, certain foreign markets may be open on those days that
| | | | |
| | | |
| 296 | | Semiannual Report | | franklintempleton.com |
FRANKLIN TEMPLETON ETF TRUST
NOTES TO FINANCIAL STATEMENTS
the Funds’ NAV is not calculated, which could result in differences between the value of the Funds’ portfolio securities on the last business day and the last calendar day of the reporting period. Any significant security valuation changes due to an open foreign market are adjusted and reflected by the Funds for financial reporting purposes.
b. Foreign Currency Translation
Portfolio securities and other assets and liabilities denominated in foreign currencies are translated into U.S. dollars based on the exchange rate of such currencies against U.S. dollars on the date of valuation. The Funds may enter into foreign currency exchange contracts to facilitate transactions denominated in a foreign currency. Purchases and sales of securities, income and expense items denominated in foreign currencies are translated into U.S. dollars at the exchange rate in effect on the transaction date. Portfolio securities and assets and liabilities denominated in foreign currencies contain risks that those currencies will decline in value relative to the U.S. dollar. Occasionally, events may impact the availability or reliability of foreign exchange rates used to convert the U.S. dollar equivalent value. If such an event occurs, the foreign exchange rate will be valued at fair value using procedures established and approved by the Board.
The Funds do not separately report the effect of changes in foreign exchange rates from changes in market prices on securities held. Such changes are included in net realized and unrealized gain or loss from investments in the Statements of Operations.
Realized foreign exchange gains or losses arise from sales of foreign currencies, currency gains or losses realized between the trade and settlement dates on securities transactions and the difference between the recorded amounts of dividends, interest, and foreign withholding taxes and the U.S. dollar equivalent of the amounts actually received or paid. Net unrealized foreign exchange gains and losses arise from changes in foreign exchange rates on foreign denominated assets and liabilities other than investments in securities held at the end of the reporting period.
c. Derivative Financial Instruments
Certain or all Funds invested in derivative financial instruments in order to manage risk or gain exposure to various other investments or markets. Derivatives are financial contracts based on an underlying or notional amount, require no initial investment or an initial net investment that is smaller than would normally be required to have a similar response
to changes in market factors, and require or permit net settlement. Derivatives contain various risks including the potential inability of the counterparty to fulfill their obligations under the terms of the contract, the potential for an illiquid secondary market, and/or the potential for market movements which expose the Fund to gains or losses in excess of the amounts shown in the Statements of Assets and Liabilities. Realized gain and loss and unrealized appreciation and depreciation on these contracts for the period are included in the Statements of Operations.
Derivative counterparty credit risk is managed through a formal evaluation of the creditworthiness of all potential counterparties. Certain or all Funds attempt to reduce their exposure to counterparty credit risk on OTC derivatives, whenever possible, by entering into International Swaps and Derivatives Association (ISDA) master agreements with certain counterparties. These agreements contain various provisions, including but not limited to collateral requirements, events of default, or early termination. Termination events applicable to the counterparty include certain deteriorations in the credit quality of the counterparty. Termination events applicable to the Funds include failure of the Funds to maintain certain net asset levels and/or limit the decline in net assets over various periods of time. In the event of default or early termination, the ISDA master agreement gives thenon-defaulting party the right to net andclose-out all transactions traded, whether or not arising under the ISDA agreement, to one net amount payable by one counterparty to the other. However, absent an event of default or early termination, OTC derivative assets and liabilities are presented gross and not offset in the Statements of Assets and Liabilities. Early termination by the counterparty may result in an immediate payment by the Funds of any net liability owed to that counterparty under the ISDA agreement.
Collateral requirements differ by type of derivative. Collateral terms are contract specific for OTC derivatives. For OTC derivatives traded under an ISDA master agreement, posting of collateral is required by either the Fund or the applicable counterparty if the total net exposure of all OTC derivatives with the applicable counterparty exceeds the minimum transfer amount, which typically ranges from $100,000 to $250,000, and can vary depending on the counterparty and the type of the agreement. Generally, collateral is determined at the close of Fund business each day and any additional collateral required due to changes in derivative values may be delivered by the Fund or the counterparty the next business day, or within a few business days. Collateral pledged
| | | | | | |
| | | |
| franklintempleton.com | | Semiannual Report | | | 297 | |
FRANKLIN TEMPLETON ETF TRUST
NOTES TO FINANCIAL STATEMENTS
and/or received by the Fund, if any, is held in segregated accounts with the Fund’s custodian/counterparty broker and can be in the form of cash and/or securities. Unrestricted cash may be invested according to the Funds’ investment objectives. To the extent that the amounts due to the Fund from its counterparties are not subject to collateralization or are not fully collateralized, the Fund bears the risk of loss from counterpartynon-performance.
Certain or all Funds entered into exchange traded futures contracts primarily to manage and/or gain exposure to equity price risk. A futures contract is an agreement between the Fund and a counterparty to buy or sell an asset at a specified price on a future date. Required initial margins are pledged by the Fund, and the daily change in fair value is accounted for as a variation margin payable or receivable in the Statements of Assets and Liabilities.
Certain or all Funds entered into OTC forward exchange contracts primarily to manage and/or gain exposure to certain foreign currencies. A forward exchange contract is an agreement between the Fund and a counterparty to buy or sell a foreign currency at a specific exchange rate on a future date.
See Note 7 regarding other derivative information.
d. Securities Lending
Certain or all Funds participate in an agency based securities lending program to earn additional income. The Fund receives cash collateral against the loaned securities in an amount equal to at least 102% of the fair value of the loaned securities. Collateral is maintained over the life of the loan in an amount not less than 100% of the fair value of loaned securities, as determined at the close of Fund business each day; any additional collateral required due to changes in security values is delivered to the Fund on the next business day. The collateral is deposited into a joint cash account with other funds and is used to invest in a money market fund managed by Franklin Advisers, Inc., an affiliate of the Funds. The Fund may receive income from the investment of cash collateral, in addition to lending fees and rebates paid by the borrower. Income from securities loaned, net of fees paid to the securities lending agent and/or third-party vendor, is reported separately in the Statements of Operations. The Fund bears the market risk with respect to the collateral
investment, securities loaned, and the risk that the agent may default on its obligations to the Fund. If the borrower defaults on its obligation to return the securities loaned, the Fund has the right to repurchase the securities in the open market using the collateral received. The securities lending agent has agreed to indemnify the Fund in the event of default by a third party borrower.
e. Income and Deferred Taxes
It is each Fund’s policy to qualify as a regulated investment company under the Internal Revenue Code. Each Fund intends to distribute to shareholders substantially all of its taxable income and net realized gains to relieve it from federal income and excise taxes. As a result, no provision for U.S. federal income taxes is required.
The Funds may be subject to foreign taxation related to income received, capital gains on the sale of securities and certain foreign currency transactions in the foreign jurisdictions in which the Funds invest. Foreign taxes, if any, are recorded based on the tax regulations and rates that exist in the foreign markets in which the Funds invest. When a capital gain tax is determined to apply, certain or all Funds record an estimated deferred tax liability in an amount that would be payable if the securities were disposed of on the valuation date.
Each Fund may recognize an income tax liability related to its uncertain tax positions under U.S. GAAP when the uncertain tax position has a less than 50% probability that it will be sustained upon examination by the tax authorities based on its technical merits. As of September 30, 2019, each Fund has determined that no tax liability is required in its financial statements related to uncertain tax positions for any open tax years (or expected to be taken in future tax years). Open tax years are those that remain subject to examination and are based on the statute of limitations in each jurisdiction in which the Fund invests.
f. Security Transactions, Investment Income, Expenses and Distributions
Security transactions are accounted for on trade date. Realized gains and losses on security transactions are determined on a specific identification basis. Estimated expenses are accrued daily. Dividend income is recorded on theex-dividend date except for certain dividends from securities where the dividend rate is not available. In such cases, the dividend is recorded as soon as the information is received by the Funds. Distributions to shareholders are
| | | | |
| | | |
| 298 | | Semiannual Report | | franklintempleton.com |
1. Organization and Significant Accounting Policies(continued)
c. Derivative Financial Instruments(continued)
FRANKLIN TEMPLETON ETF TRUST
NOTES TO FINANCIAL STATEMENTS
recorded on theex-dividend date. Distributable earnings are determined according to income tax regulations (tax basis) and may differ from earnings recorded in accordance with U.S. GAAP. These differences may be permanent or temporary. Permanent differences are reclassified among capital accounts to reflect their tax character. These reclassifications have no impact on net assets or the results of operations. Temporary differences are not reclassified, as they may reverse in subsequent periods.
Common expenses incurred by the Trust are allocated among the Funds based on the ratio of net assets of each Fund to the combined net assets of the Trust. Certain Fund specific expenses are allocated directly to the Fund that incurred the expense. These expenses are paid by the Funds or by the investment manager, as applicable, according to the terms of the unified management fee agreement.
g. Accounting Estimates
The preparation of financial statements in accordance with U.S. GAAP requires management to make estimates and
assumptions that affect the reported amounts of assets and liabilities at the date of the financial statements and the amounts of income and expenses during the reporting period. Actual results could differ from those estimates.
h. Guarantees and Indemnifications
Under the Trust’s organizational documents, its officers and trustees are indemnified by the Trust against certain liabilities arising out of the performance of their duties to the Trust. Additionally, in the normal course of business, the Trust, on behalf of the Funds, enters into contracts with service providers that contain general indemnification clauses. The Trust’s maximum exposure under these arrangements is unknown as this would involve future claims that may be made against the Trust that have not yet occurred. Currently, the Trust expects the risk of loss to be remote.
2. Shares of Beneficial Interest
Shares of the Funds are issued and redeemed at their respective NAV only in aggregations of a specified number of shares or multiples thereof (Creation Units). Only certain large institutional investors (Authorized Participants) may engage in creation or redemption transactions directly with the Funds. Once created, shares of the Funds generally trade in the secondary market in amounts less than one Creation Unit. The market price of the Funds’ shares will be based on the price in the secondary market which may be at, above or below the most recent NAV. Creation Units may be issued and redeemed in exchange for a designated portfolio of securities and/or cash (which may include cash in lieu of certain securities).
Authorized Participants pay a standard transaction fee to the shareholder servicing agent when purchasing or redeeming Creation Units of the Funds regardless of the number of Creation Units that are being created or redeemed on the same day by the Authorized Participant. The standard transaction fee is imposed to offset transfer and other transaction costs associated with the issuance and redemption of Creation Units and is not charged to or paid by the Funds.
In addition, for cash Creation Unit transactions, a variable fee for creation transactions and redemption transactions may be charged to the Authorized Participant to cover certain brokerage, tax, foreign exchange, execution, market impact and other costs and expenses related to the execution of trades. Variable fees, if any, are included in capital share transactions in the Statements of Changes in Net Assets.
| | | | | | |
| | | |
| franklintempleton.com | | Semiannual Report | | | 299 | |
FRANKLIN TEMPLETON ETF TRUST
NOTES TO FINANCIAL STATEMENTS
2. Shares of Beneficial Interest(continued)
At September 30, 2019, there were an unlimited number of shares authorized (without par value). Transactions in the Funds’ shares were as follows:
| | | | | | | | | | | | | | | | | | | | |
| | | Franklin FTSE Asia ex Japan ETF | |
| | | |
| | | Six Months Ended
September 30, 2019 | | | | | | Year Ended
March 31, 2019 | |
| | | | | |
| | | Shares | | | Amount | | | | | | Shares | | | Amount | |
Shares sold | | | — | | | $ | — | | | | | | | | 400,000 | | | $ | 9,428,138 | |
| | | | |
Net increase (decrease) | | | — | | | $ | — | | | | | | | | 400,000 | | | $ | 9,428,138 | |
| | | | |
| |
| | | Franklin FTSE Australia ETF | |
| | | |
| | | Six Months Ended
September 30, 2019 | | | | | | Year Ended
March 31, 2019 | |
| | | | | |
| | | Shares | | | Amount | | | | | | Shares | | | Amount | |
Shares sold | | | 150,000 | | | $ | 3,784,703 | | | | | | | | 500,000 | | | $ | 12,241,732 | |
Shares redeemed | | | — | | | | — | | | | | | | | (300,000 | ) | | | (7,567,042 | ) |
| | | | |
Net increase (decrease) | | | 150,000 | | | $ | 3,784,703 | | | | | | | | 200,000 | | | $ | 4,674,690 | |
| | | | |
| |
| | | Franklin FTSE Brazil ETF | |
| | | |
| | | Six Months Ended
September 30, 2019 | | | | | | Year Ended
March 31, 2019 | |
| | | | | |
| | | Shares | | | Amount | | | | | | Shares | | | Amount | |
Shares sold | | | — | | | $ | 4,614 | | | | | | | | 300,000 | | | $ | 7,431,063 | |
Shares redeemed | | | (200,000 | ) | | | (5,198,188 | ) | | | | | | | (1,100,000 | ) | | | (22,383,342 | ) |
| | | | |
Net increase (decrease) | | | (200,000 | ) | | $ | (5,193,574 | ) | | | | | | | (800,000 | ) | | $ | (14,952,279 | ) |
| | | | |
| |
| | | Franklin FTSE Canada ETF | |
| | | |
| | | Six Months Ended
September 30, 2019 | | | | | | Year Ended
March 31, 2019 | |
| | | | | |
| | | Shares | | | Amount | | | | | | Shares | | | Amount | |
Shares sold | | | — | | | $ | — | | | | | | | | 200,000 | | | $ | 4,802,307 | |
Shares redeemed | | | — | | | | — | | | | | | | | (100,000 | ) | | | (2,315,243 | ) |
| | | | |
Net increase (decrease) | | | — | | | $ | — | | | | | | | | 100,000 | | | $ | 2,487,064 | |
| | | | |
| |
| | | Franklin FTSE China ETF | |
| | | |
| | | Six Months Ended
September 30, 2019 | | | | | | Year Ended
March 31, 2019 | |
| | | | | |
| | | Shares | | | Amount | | | | | | Shares | | | Amount | |
Shares sold | | | — | | | $ | 7,205 | | | | | | | | 600,000 | | | $ | 14,421,020 | |
| | | | |
Net increase (decrease) | | | — | | | $ | 7,205 | | | | | | | | 600,000 | | | $ | 14,421,020 | |
| | | | |
| | | | |
| | | |
| 300 | | Semiannual Report | | franklintempleton.com |
FRANKLIN TEMPLETON ETF TRUST
NOTES TO FINANCIAL STATEMENTS
| | | | | | | | | | | | | | | | | | | | |
| | | Franklin FTSE Europe ETF | |
| | | |
| | | Six Months Ended
September 30, 2019 | | | | | | Year Ended
March 31, 2019 | |
| | | | | |
| | | Shares | | | Amount | | | | | | Shares | | | Amount | |
Shares sold | | | 1,600,000 | | | $ | 36,983,074 | | | | | | | | — | | | $ | — | |
Shares redeemed | | | (2,000,000 | ) | | | (46,811,302 | ) | | | | | | | (1,000,000 | ) | | | (24,163,732 | ) |
| | | | |
Net increase (decrease) | | | (400,000 | ) | | $ | (9,828,228 | ) | | | | | | | (1,000,000 | ) | | $ | (24,163,732 | ) |
| | | | |
| |
| | | Franklin FTSE Europe Hedged ETF | |
| | | |
| | | Six Months Ended
September 30, 2019 | | | | | | Year Ended
March 31, 2019 | |
| | | | | |
| | | Shares | | | Amount | | | | | | Shares | | | Amount | |
Shares redeemed | | | — | | | $ | — | | | | | | | | (1,200,000 | ) | | $ | (26,372,741 | ) |
| | | | |
Net increase (decrease) | | | — | | | $ | — | | | | | | | | (1,200,000 | ) | | $ | (26,372,741 | ) |
| | | | |
| |
| | | Franklin FTSE France ETF | |
| | | |
| | | Six Months Ended
September 30, 2019 | | | | | | Year Ended
March 31, 2019 | |
| | | | | |
| | | Shares | | | Amount | | | | | | Shares | | | Amount | |
Shares sold | | | 50,000 | | | $ | 1,203,488 | | | | | | | | — | | | $ | — | |
| | | | |
Net increase (decrease) | | | 50,000 | | | $ | 1,203,488 | | | | | | | | — | | | $ | — | |
| | | | |
| |
| | | Franklin FTSE Germany ETF | |
| | | |
| | | Six Months Ended
September 30, 2019 | | | | | | Year Ended
March 31, 2019 | |
| | | | | |
| | | Shares | | | Amount | | | | | | Shares | | | Amount | |
Shares sold | | | — | | | $ | — | | | | | | | | 100,000 | | | $ | 2,111,997 | |
| | | | |
Net increase (decrease) | | | — | | | $ | — | | | | | | | | 100,000 | | | $ | 2,111,997 | |
| | | | |
| |
| | | Franklin FTSE Hong Kong ETF | |
| | | |
| | | Six Months Ended
September 30, 2019 | | | | | | Year Ended
March 31, 2019 | |
| | | | | |
| | | Shares | | | Amount | | | | | | Shares | | | Amount | |
Shares sold | | | — | | | $ | — | | | | | | | | 450,000 | | | $ | 10,779,669 | |
| | | | |
Net increase (decrease) | | | — | | | $ | — | | | | | | | | 450,000 | | | $ | 10,779,669 | |
| | | | |
| |
| | | Franklin FTSE India ETF | |
| | | |
| | | Six Months Ended
September 30, 2019 | | | | | | Year Ended
March 31, 2019 | |
| | | | | |
| | | Shares | | | Amount | | | | | | Shares | | | Amount | |
Shares sold | | | 400,000 | | | $ | 8,509,806 | | | | | | | | 200,000 | | | $ | 4,613,517 | |
| | | | |
Net increase (decrease) | | | 400,000 | | | $ | 8,509,806 | | | | | | | | 200,000 | | | $ | 4,613,517 | |
| | | | |
| | | | | | |
| | | |
| franklintempleton.com | | Semiannual Report | | | 301 | |
FRANKLIN TEMPLETON ETF TRUST
NOTES TO FINANCIAL STATEMENTS
2. Shares of Beneficial Interest(continued)
| | | | | | | | | | | | | | | | | | | | |
| | | Franklin FTSE Italy ETF | |
| | | |
| | | Six Months Ended
September 30, 2019 | | | | | | Year Ended
March 31, 2019 | |
| | | | | |
| | | Shares | | | Amount | | | | | | Shares | | | Amount | |
Shares sold | | | 50,000 | | | $ | 1,118,853 | | | | | | | | 650,000 | | | $ | 14,664,447 | |
Shares redeemed | | | — | | | | — | | | | | | | | (300,000 | ) | | | (7,113,549 | ) |
| | | | |
Net increase (decrease) | | | 50,000 | | | $ | 1,118,853 | | | | | | | | 350,000 | | | $ | 7,550,898 | |
| | | | |
| |
| | | Franklin FTSE Japan ETF | |
| | | |
| | | Six Months Ended
September 30, 2019 | | | | | | Year Ended
March 31, 2019 | |
| | | | | |
| | | Shares | | | Amount | | | | | | Shares | | | Amount | |
Shares sold | | | 600,000 | | | $ | 14,601,379 | | | | | | | | 9,600,000 | | | $ | 246,910,441 | |
Shares redeemed | | | (4,200,000 | ) | | | (101,352,360 | ) | | | | | | | (1,200,000 | ) | | | (29,040,577 | ) |
| | | | |
Net increase (decrease) | | | (3,600,000 | ) | | $ | (86,750,981 | ) | | | | | | | 8,400,000 | | | $ | 217,869,864 | |
| | | | |
| |
| | | Franklin FTSE Japan Hedged ETF | |
| | | |
| | | Six Months Ended
September 30, 2019 | | | | | | Year Ended
March 31, 2019 | |
| | | | | |
| | | Shares | | | Amount | | | | | | Shares | | | Amount | |
Shares redeemed | | | (400,000 | ) | | $ | (9,119,220 | ) | | | | | | | (1,200,000 | ) | | $ | (27,397,137 | ) |
| | | | |
Net increase (decrease) | | | (400,000 | ) | | $ | (9,119,220 | ) | | | | | | | (1,200,000 | ) | | $ | (27,397,137 | ) |
| | | | |
| |
| | | Franklin FTSE Latin America ETF | |
| | | |
| | | Six Months Ended
September 30, 2019 | | | | | | Year Ended
March 31, 2019a | |
| | | | | |
| | | Shares | | | Amount | | | | | | Shares | | | Amount | |
Shares sold | | | — | | | $ | — | | | | | | | | 100,000 | | | $ | 2,619,441 | |
| | | | |
Net increase (decrease) | | | — | | | $ | — | | | | | | | | 100,000 | | | $ | 2,619,441 | |
| | | | |
| |
| | | Franklin FTSE Mexico ETF | |
| | | |
| | | Six Months Ended
September 30, 2019 | | | | | | Year Ended
March 31, 2019 | |
| | | | | |
| | | Shares | | | Amount | | | | | | Shares | | | Amount | |
Shares sold | | | — | | | $ | — | | | | | | | | 100,000 | | | $ | 2,346,009 | |
| | | | |
Net increase (decrease) | | | — | | | $ | — | | | | | | | | 100,000 | | | $ | 2,346,009 | |
| | | | |
| |
| | | Franklin FTSE Russia ETF | |
| | | |
| | | Six Months Ended
September 30, 2019 | | | | | | Year Ended
March 31, 2019 | |
| | | | | |
| | | Shares | | | Amount | | | | | | Shares | | | Amount | |
Shares sold | | | 150,000 | | | $ | 4,040,147 | | | | | | | | 500,000 | | | $ | 11,087,284 | |
Shares redeemed | | | — | | | | — | | | | | | | | (100,000 | ) | | | (2,262,955 | ) |
| | | | |
Net increase (decrease) | | | 150,000 | | | $ | 4,040,147 | | | | | | | | 400,000 | | | $ | 8,824,329 | |
| | | | |
| | | | |
| | | |
| 302 | | Semiannual Report | | franklintempleton.com |
FRANKLIN TEMPLETON ETF TRUST
NOTES TO FINANCIAL STATEMENTS
| | | | | | | | | | | | | | | | | | | | |
| | | Franklin FTSE Saudi Arabia ETF | |
| | | |
| | | Six Months Ended
September 30, 2019 | | | | | | Year Ended
March 31, 2019a | |
| | | | | |
| | | Shares | | | Amount | | | | | | Shares | | | Amount | |
Shares sold | | | — | | | $ | — | | | | | | | | 100,000 | | | $ | 2,482,525 | |
| | | | |
Net increase (decrease) | | | — | | | $ | — | | | | | | | | 100,000 | | | $ | 2,482,525 | |
| | | | |
| |
| | | Franklin FTSE South Africa ETF | |
| | | |
| | | Six Months Ended
September 30, 2019 | | | | | | Year Ended
March 31, 2019b | |
| | | | | |
| | | Shares | | | Amount | | | | | | Shares | | | Amount | |
Shares sold | | | — | | | $ | — | | | | | | | | 100,000 | | | $ | 2,441,624 | |
| | | | |
Net increase (decrease) | | | — | | | $ | — | | | | | | | | 100,000 | | | $ | 2,441,624 | |
| | | | |
| |
| | | Franklin FTSE South Korea ETF | |
| | | |
| | | Six Months Ended
September 30, 2019 | | | | | | Year Ended
March 31, 2019 | |
| | | | | |
| | | Shares | | | Amount | | | | | | Shares | | | Amount | |
Shares sold | | | 100,000 | | | $ | 2,002,593 | | | | | | | | — | | | $ | 13,712 | |
Shares redeemed | | | (200,000 | ) | | | (3,637,228 | ) | | | | | | | (200,000 | ) | | | (4,241,458 | ) |
| | | | |
Net increase (decrease) | | | (100,000 | ) | | $ | (1,634,635 | ) | | | | | | | (200,000 | ) | | $ | (4,227,746 | ) |
| | | | |
| |
| | | Franklin FTSE Switzerland ETF | |
| | | |
| | | Six Months Ended
September 30, 2019 | | | | | | Year Ended
March 31, 2019 | |
| | | | | |
| | | Shares | | | Amount | | | | | | Shares | | | Amount | |
Shares sold | | | 200,000 | | | $ | 4,949,338 | | | | | | | | 100,000 | | | $ | 2,352,537 | |
Shares redeemed | | | — | | | | — | | | | | | | | (100,000 | ) | | | (2,173,190 | ) |
| | | | |
Net increase (decrease) | | | 200,000 | | | $ | 4,949,338 | | | | | | | | — | | | $ | 179,347 | |
| | | | |
| |
| | | Franklin FTSE Taiwan ETF | |
| | | |
| | | Six Months Ended
September 30, 2019 | | | | | | Year Ended
March 31, 2019 | |
| | | | | |
| | | Shares | | | Amount | | | | | | Shares | | | Amount | |
Shares sold | | | — | | | $ | — | | | | | | | | 400,000 | | | $ | 9,254,307 | |
| | | | |
Net increase (decrease) | | | — | | | $ | — | | | | | | | | 400,000 | | | $ | 9,254,307 | |
| | | | |
| |
| | | Franklin FTSE United Kingdom ETF | |
| | | |
| | | Six Months Ended
September 30, 2019 | | | | | | Year Ended
March 31, 2019 | |
| | | | | |
| | | Shares | | | Amount | | | | | | Shares | | | Amount | |
Shares sold | | | 400,000 | | | $ | 9,464,061 | | | | | | | | 1,450,000 | | | $ | 34,027,374 | |
Shares redeemed | | | (400,000 | ) | | | (8,916,183 | ) | | | | | | | (350,000 | ) | | | (8,281,306 | ) |
| | | | |
Net increase (decrease) | | | — | | | $ | 547,878 | | | | | | | | 1,100,000 | | | $ | 25,746,068 | |
| | | | |
aFor the period October 9, 2018 (commencement of operations) to March 31, 2019.
bFor the period October 10, 2018 (commencement of operations) to March 31, 2019.
| | | | | | |
| | | |
| franklintempleton.com | | Semiannual Report | | | 303 | |
FRANKLIN TEMPLETON ETF TRUST
NOTES TO FINANCIAL STATEMENTS
3. Transactions with Affiliates
Franklin Resources, Inc. is the holding company for various subsidiaries that together are referred to as Franklin Templeton. Certain officers and trustees of the Funds are also officers and/or directors of the following subsidiaries:
| | |
| |
| Subsidiary | | Affiliation |
Franklin Advisers, Inc (Advisers) | | Investment manager |
Franklin Advisory Services, LLC (FASL) | | Investment manager |
Franklin Templeton Services, LLC (FT Services) | | Administrative manager |
Franklin Templeton Distributors, Inc. (Distributors) | | Principal underwriter |
a. Management Fees
The Funds pay a unified management fee to Advisers whereby Advisers has agreed to reimburse the Funds’ acquired fund fee and expenses (if any) and pay all of the ordinary operating expenses of the Funds, including custody, transfer agency, and Trustee fees and expenses, among others, but excluding payments under the Funds’ Rule12b-1 plan (if any), brokerage expenses (including any costs incidental to transactions in portfolio securities or instruments), taxes, interest (including borrowing costs and dividend expenses on securities sold short and overdraft charges), litigation expenses (including litigation to which the Trust or a Fund may be a party and indemnification of the Trustees and officers with respect thereto), and othernon-routine or extraordinary expenses. The fees are based on the daily net assets of each of the Funds as follows:
| | |
| |
| | | Annualized Fee Rate |
Franklin FTSE Asia ex Japan ETF | | 0.19% |
Franklin FTSE Australia ETF | | 0.09% |
Franklin FTSE Brazil ETF | | 0.19% |
Franklin FTSE Canada ETF | | 0.09% |
Franklin FTSE China ETF | | 0.19% |
Franklin FTSE Europe ETF | | 0.09% |
Franklin FTSE Europe Hedged ETF | | 0.09% |
Franklin FTSE France ETF | | 0.09% |
Franklin FTSE Germany ETF | | 0.09% |
Franklin FTSE Hong Kong ETF | | 0.09% |
Franklin FTSE India ETF | | 0.19% |
Franklin FTSE Italy ETF | | 0.09% |
Franklin FTSE Japan ETF | | 0.09% |
Franklin FTSE Japan Hedged ETF | | 0.09% |
Franklin FTSE Latin America ETF | | 0.19% |
Franklin FTSE Mexico ETF | | 0.19% |
Franklin FTSE Russia ETF | | 0.19% |
Franklin FTSE Saudi Arabia ETF | | 0.39% |
Franklin FTSE South Africa ETF | | 0.19% |
Franklin FTSE South Korea ETF | | 0.09% |
Franklin FTSE Switzerland ETF | | 0.09% |
Franklin FTSE Taiwan ETF | | 0.19% |
Franklin FTSE United Kingdom ETF | | 0.09% |
| | | | |
| | | |
| 304 | | Semiannual Report | | franklintempleton.com |
FRANKLIN TEMPLETON ETF TRUST
NOTES TO FINANCIAL STATEMENTS
b. Administrative Fees
Under an agreement with Advisers, FT Services provides administrative services to the Funds. The fee is paid by Advisers based on the Funds’ average daily net assets, and is not an additional expense of the Funds.
c. Investments in Affiliated Management Investment Companies
Certain or all Funds invest in one or more affiliated management investment companies for purposes other than exercising a controlling influence over the management or policies. Management fees paid by the Funds are waived on assets invested in the affiliated management investment companies, as noted in the Statements of Operations, in an amount not to exceed the management and administrative fees paid directly or indirectly by each affiliate. During the period ended September 30, 2019, investments in affiliated management investment companies were as follows:
| | | | | | | | | | | | | | | | | | | | | | | | | | | | | | | | |
| | | | | | | | |
| | | Value at
Beginning
of Period | | | Purchases | | | Sales | | | Realized
Gain (Loss) | | | Net Change in
Unrealized
Appreciation
(Depreciation) | | | Value at
End of
Period | | | Number
of Shares
Held at
End
of Period | | | Investment
Income | |
| | | | | | | |
| Franklin FTSE Asia ex Japan ETF | | | | | | | | | | | | | | | | | | | | | | | | | | | | | |
| Non-Controlled Affiliates | | | | | | | | | | | | | | | | | | | | | | | | | | | | | |
| Income from
securities
loaned |
|
| | | | | | | | | | | | | | | | | | | | | | | | | | | | | | | | |
Institutional Fiduciary Trust Money Market Portfolio 1.71% | | $ | — | | | $ | 51,360 | | | $ | (45,540 | ) | | $ | — | | | $ | — | | | $ | 5,820 | | | | 5,820 | | | $ | 17 | |
| | | | | | | | | | | | | | | | | | | | |
| | | | | | | |
| Franklin FTSE Europe Hedged ETF | | | | | | | | | | | | | | | | | | | | | | | | | | | | | |
| Non-Controlled Affiliates | | | | | | | | | | | | | | | | | | | | | | | Dividend
Income | |
| | | | | | | | | | | | | | | | | | | | | | | | | | | | | | | | |
Institutional Fiduciary Trust Money Market Portfolio 1.71% | | $ | 38 | | | $ | 154,400 | | | $ | (112,525 | ) | | $ | — | | | $ | — | | | $ | 41,913 | | | | 41,913 | | | $ | 278 | |
| | | | | | | | | | | | | | | | | | | | |
| | | | | | | |
| Franklin FTSE Japan ETF | | | | | | | | | | | | | | | | | | | | | | | | | | | | | |
| Non-Controlled Affiliates | | | | | | | | | | | | | | | | | | | | | | | Dividend
Income | |
| | | | | | | | | | | | | | | | | | | | | | | | | | | | | | | | |
Institutional Fiduciary Trust Money Market Portfolio 1.71% | | $ | 114,341 | | | $ | 3,244,997 | | | $ | (3,294,870 | ) | | $ | — | | | $ | — | | | $ | 64,468 | | | | 64,468 | | | $ | 1,583 | |
| | | | | | | | | | | | | | | | | | | | |
| Non-Controlled Affiliates | | | | | | | | | | | | | | | | | | | | | | | Income from
securities
loaned | |
| | | | | | | | | | | | | | | | | | | | | | | | | | | | | | | | |
Institutional Fiduciary Trust Money Market Portfolio 1.71% | | $ | 117,035 | | | $ | 444,973 | | | $ | (562,008 | ) | | $ | — | | | | — | | | $ | — | | | | — | | | $ | 1,012 | |
| | | | | | | | | | | | | | | | | | | | |
Total Affiliated Securities | | $ | 231,376 | | | $ | 3,689,970 | | | $ | (3,856,878 | ) | | $ | — | | | $ | — | | | $ | 64,468 | | | | 64,468 | | | $ | 2,595 | |
| | | | | | | | | | | | | | | | | | | | |
| | | | | | | |
| Franklin FTSE Japan Hedged ETF | | | | | | | | | | | | | | | | | | | | | | | | | | | | | |
| Non-Controlled Affiliates | | | | | | | | | | | | | | | | | | | | | | | Dividend
Income | |
| | | | | | | | | | | | | | | | | | | | | | | | | | | | | | | | |
Institutional Fiduciary Trust Money Market Portfolio 1.71% | | $ | 28,014 | | | $ | 116,660 | | | $ | (142,861 | ) | | $ | — | | | $ | — | | | $ | 1,813 | | | | 1,813 | | | $ | 431 | |
| | | | | | | | | | | | | | | | | | | | |
| | | | | | | |
| Franklin FTSE Russia ETF | | | | | | | | | | | | | | | | | | | | | | | | | | | | | |
| Non-Controlled Affiliates | | | | | | | | | | | | | | | | | | | | | | | Income from
securities
loaned | |
| | | | | | | | | | | | | | | | | | | | | | | | | | | | | | | | |
Institutional Fiduciary Trust Money Market Portfolio 1.71% | | $ | — | | | $ | 1,728,315 | | | $ | (1,728,315 | ) | | $ | — | | | $ | — | | | $ | — | | | | — | | | $ | 359 | |
| | | | | | | | | | | | | | | | | | | | |
| | | | | | |
| | | |
| franklintempleton.com | | Semiannual Report | | | 305 | |
FRANKLIN TEMPLETON ETF TRUST
NOTES TO FINANCIAL STATEMENTS
3. Transactions with Affiliates(continued)
c. Investments in Affiliated Management Investment Companies(continued)
| | | | | | | | | | | | | | | | | | | | | | | | | | | | | | | | |
| | | | | | | | |
| | | Value at
Beginning
of Period | | | Purchases | | | Sales | | | Realized
Gain (Loss) | | | Net Change in
Unrealized
Appreciation
(Depreciation) | | | Value at
End of
Period | | | Number
of Shares
Held at
End
of Period | | | Investment
Income | |
| | | | | | | |
| Franklin FTSE South Korea ETF | | | | | | | | | | | | | | | | | | | | | | | | | | | | | |
| Non-Controlled Affiliates | | | | | | | | | | | | | | | | | | | | | | | Income from
securities
loaned | |
| | | | | | | | | | | | | | | | | | | | | | | | | | | | | | | | |
Institutional Fiduciary Trust Money Market Portfolio 1.71% | | $ | — | | | $ | 64,622 | | | $ | (64,622 | ) | | $ | — | | | $ | — | | | $ | — | | | | — | | | $ | 79 | |
| | | | | | | | | | | | | | | | | | | | |
d. Other Affiliated Transactions
At September 30, 2019, shares of the Funds were owned by the following entities:
| | | | | | | | |
| | |
| Funds | | Shares | | | Percentage of
Outstanding Sharesa | |
| Franklin FTSE Europe ETF | | | | | | |
Franklin Conservative Allocation Fund | | | 386,855 | | | | 13.8% | |
Franklin Moderate Allocation Fund | | | 964,812 | | | | 34.5% | |
Franklin Growth Allocation Fund | | | 851,550 | | | | 30.4% | |
Franklin LifeSmart™ 2020 – 2055 Retirement Target Funds | | | 343,805 | | | | 12.3% | |
| | | | |
| | | 2,547,022 | | | | 91.0% | |
| | | | |
| Franklin FTSE Europe Hedged ETF | | | | | | |
Franklin Resources Inc. | | | 50,000 | | | | 25.0% | |
| | | | |
| Franklin FTSE Japan ETF | | | | | | |
Franklin Moderate Allocation Fund | | | 466,227 | | | | 5.6% | |
| | | | |
| Franklin FTSE Japan Hedged ETF | | | | | | |
Franklin Resources Inc. | | | 75,000 | | | | 37.5% | |
| | | | |
| Franklin FTSE Latin America ETF | | | | | | |
Franklin Resources Inc. | | | 46,000 | | | | 46.0% | |
| | | | |
| Franklin FTSE Saudi Arabia ETF | | | | | | |
Franklin Resources Inc. | | | 46,000 | | | | 46.0% | |
| | | | |
| Franklin FTSE South Africa ETF | | | | | | |
Franklin Resources Inc. | | | 41,000 | | | | 41.0% | |
| | | | |
aInvestment activities of significant shareholders could have a material impact on the Funds.
4. Income Taxes
For tax purposes, capital losses may be carried over to offset future capital gains, if any. At March 31, 2019, the capital loss carryforwards were as follows:
| | | | | | | | | | | | | | | | |
| | | | |
| | | Franklin
FTSE
Asia ex Japan
ETF | | | Franklin
FTSE
Australia
ETF | | | Franklin
FTSE
Brazil
ETF | | | Franklin
FTSE
Canada
ETF | |
Capital loss carryforwards: | | | | | | | | | | | | | | | | |
Long term | | $ | 167,800 | | | $ | 18,758 | | | $ | 9,461,679 | | | $ | 24,527 | |
Short term | | | 39,257 | | | | 8,557 | | | | 55,524 | | | | 13,525 | |
| | | | |
Total capital loss carryforwards | | $ | 207,057 | | | $ | 27,315 | | | $ | 9,517,203 | | | $ | 38,052 | |
| | | | |
| | | | |
| | | |
| 306 | | Semiannual Report | | franklintempleton.com |
FRANKLIN TEMPLETON ETF TRUST
NOTES TO FINANCIAL STATEMENTS
| | | | | | | | | | | | | | | | |
| | | | |
| | | Franklin
FTSE
China
ETF | | | Franklin
FTSE
Europe
ETF | | | Franklin
FTSE
Europe Hedged
ETF | | | Franklin
FTSE
France
ETF | |
Capital loss carryforwards: | | | | | | | | | | | | | | | | |
Long term | | $ | 471,553 | | | $ | 117,199 | | | $ | — | | | $ | 6,306 | |
Short term | | | 10,748 | | | | 165,782 | | | | — | | | | 4,724 | |
| | | | |
Total capital loss carryforwards | | $ | 482,301 | | | $ | 282,981 | | | $ | — | | | $ | 11,030 | |
| | | | |
| | | | |
| | | Franklin
FTSE
Germany
ETF | | | Franklin
FTSE
Hong Kong
ETF | | | Franklin
FTSE
India
ETF | | | Franklin
FTSE
Italy
ETF | |
Capital loss carryforwards: | | | | | | | | | | | | | | | | |
Long term | | $ | 16,006 | | | $ | 47,969 | | | $ | 43,692 | | | $ | 17,074 | |
Short term | | | 6,197 | | | | 46,860 | | | | 14,398 | | | | 62,987 | |
| | | | |
Total capital loss carryforwards | | $ | 22,203 | | | $ | 94,829 | | | $ | 58,090 | | | $ | 80,061 | |
| | | | |
| | | | |
| | | Franklin
FTSE
Japan
ETF | | | Franklin
FTSE
Japan Hedged
ETF | | | Franklin
FTSE
Latin
America
ETF | | | Franklin
FTSE
Mexico
ETF | |
Capital loss carryforwards: | | | | | | | | | | | | | | | | |
Long term | | $ | 1,690,921 | | | $ | — | | | $ | 2,923 | | | $ | 50,983 | |
Short term | | | 240,746 | | | | — | | | | — | | | | 24,533 | |
| | | | |
Total capital loss carryforwards | | $ | 1,931,667 | | | $ | — | | | $ | 2,923 | | | $ | 75,516 | |
| | | | |
| | | | |
| | | Franklin
FTSE
Russia
ETF | | | Franklin
FTSE
Saudi Arabia
ETF | | | Franklin
FTSE
South Africa
ETF | | | Franklin
FTSE
South Korea
ETF | |
Capital loss carryforwards: | | | | | | | | | | | | | | | | |
Long term | | $ | 79,193 | | | $ | 33 | | | $ | 4,187 | | | $ | 870,257 | |
Short term | | | 5,575 | | | | — | | | | — | | | | 679,368 | |
| | | | |
Total capital loss carryforwards | | $ | 84,768 | | | $ | 33 | | | $ | 4,187 | | | $ | 1,549,625 | |
| | | | |
| | | | |
| | | Franklin
FTSE
Switzerland
ETF | | | Franklin
FTSE
Taiwan
ETF | | | Franklin
FTSE
United Kingdom
ETF | | | | |
Capital loss carryforwards: | | | | | | | | | | | | | | | | |
Long term | | $ | 18,741 | | | $ | 8,374 | | | $ | — | | | | | |
Short term | | | 8,968 | | | | 36,114 | | | | — | | | | | |
| | | | | | | | |
Total capital loss carryforwards | | $ | 27,709 | | | $ | 44,488 | | | $ | — | | | | | |
| | | | | | | | |
| | | | | | |
| | | |
| franklintempleton.com | | Semiannual Report | | | 307 | |
FRANKLIN TEMPLETON ETF TRUST
NOTES TO FINANCIAL STATEMENTS
4. Income Taxes (continued)
For tax purposes, the Funds may elect to defer any portion of a post-October capital loss or late-year ordinary loss to the first day of the following fiscal year. At March 31, 2019, the deferred losses were as follows:
| | | | | | | | | | | | | | | | |
| | | | |
| | | Franklin
FTSE
Europe Hedged
ETF | | | Franklin
FTSE
Japan Hedged
ETF | | | | | | | |
Late-year ordinary losses | | $ | — | | | $ | (255,715 | ) | | | | | | | | |
| | | | | | | | | | | | |
Post-October capital losses | | $ | (580,305 | ) | | $ | (1,183,142 | ) | | | | | | | | |
| | | | | | | | | | | | |
At September 30, 2019, the cost of investments, net unrealized appreciation (depreciation) and undistributed ordinary income for income tax purposes were as follows:
| | | | | | | | | | | | | | | | |
| | | | |
| | | Franklin
FTSE
Asia ex Japan ETF | | | Franklin
FTSE
Australia
ETF | | | Franklin
FTSE
Brazil
ETF | | | Franklin
FTSE
Canada
ETF | |
Cost of investments | | $ | 18,558,411 | | | $ | 11,483,850 | | | $ | 13,842,129 | | | $ | 4,896,342 | |
| | | | |
Unrealized appreciation | | $ | 827,306 | | | $ | 403,397 | | | $ | 2,396,482 | | | $ | 387,317 | |
Unrealized depreciation | | | (3,011,883 | ) | | | (527,266 | ) | | | (669,048 | ) | | | (161,696 | ) |
| | | | |
Net unrealized appreciation (depreciation) | | $ | (2,184,577 | ) | | $ | (123,869 | ) | | $ | 1,727,434 | | | $ | 225,621 | |
| | | | |
| | | | |
| | | Franklin
FTSE
China
ETF | | | Franklin
FTSE
Europe
ETF | | | Franklin
FTSE
Europe Hedged
ETF | | | Franklin
FTSE
France
ETF | |
Cost of investments | | $ | 45,021,637 | | | $ | 73,203,671 | | | $ | 5,485,972 | | | $ | 3,756,365 | |
| | | | |
Unrealized appreciation | | $ | 1,467,411 | | | $ | 3,097,938 | | | $ | 260,913 | | | $ | 253,098 | |
Unrealized depreciation | | | (7,120,796 | ) | | | (10,858,604 | ) | | | (946,211 | ) | | | (277,017 | ) |
| | | | |
Net unrealized appreciation (depreciation) | | $ | (5,653,385 | ) | | $ | (7,760,666 | ) | | $ | (685,298 | ) | | $ | (23,919 | ) |
| | | | |
| | | | |
| | | Franklin
FTSE
Germany
ETF | | | Franklin
FTSE
Hong Kong
ETF | | | Franklin
FTSE
India
ETF | | | Franklin
FTSE
Italy
ETF | |
Cost of investments | | $ | 4,628,951 | | | $ | 18,470,227 | | | $ | 15,298,599 | | | $ | 10,967,451 | |
| | | | |
Unrealized appreciation | | $ | 241,064 | | | $ | 976,266 | | | $ | 1,039,481 | | | $ | 1,056,106 | |
Unrealized depreciation | | | (685,944 | ) | | | (1,783,479 | ) | | | (952,616 | ) | | | (463,320 | ) |
| | | | |
Net unrealized appreciation (depreciation) | | $ | (444,880 | ) | | $ | (807,213 | ) | | $ | 86,865 | | | $ | 592,786 | |
| | | | |
| | | | |
| | | Franklin FTSE
Japan
ETF | | | Franklin
FTSE
Japan Hedged
ETF | | | Franklin
FTSE
Latin America
ETF | | | Franklin
FTSE
Mexico
ETF | |
Cost of investments | | $ | 232,921,105 | | | $ | 5,313,676 | | | $ | 2,616,905 | | | $ | 4,659,333 | |
| | | | |
Unrealized appreciation | | $ | 7,249,198 | | | $ | 214,276 | | | $ | 246,607 | | | $ | 163,892 | |
Unrealized depreciation | | | (34,162,443 | ) | | | (862,873 | ) | | | (270,881 | ) | | | (487,393 | ) |
| | | | |
Net unrealized appreciation (depreciation) | | $ | (26,913,245 | ) | | $ | (648,597 | ) | | $ | (24,274 | ) | | $ | (323,501 | ) |
| | | | |
| | | | |
| | | |
| 308 | | Semiannual Report | | franklintempleton.com |
FRANKLIN TEMPLETON ETF TRUST
NOTES TO FINANCIAL STATEMENTS
| | | | | | | | | | | | | | | | |
| | | | |
| | | Franklin
FTSE
Russia
ETF | | | Franklin
FTSE
Saudi Arabia
ETF | | | Franklin
FTSE
South Africa
ETF | | | Franklin
FTSE
South Korea
ETF | |
Cost of investments | | $ | 15,808,698 | | | $ | 2,502,418 | | | $ | 2,641,499 | | | $ | 17,603,377 | |
| | | | |
Unrealized appreciation | | $ | 1,838,580 | | | $ | 220,321 | | | $ | 171,199 | | | $ | 105,973 | |
Unrealized depreciation | | | (364,979 | ) | | | (170,393 | ) | | | (357,336 | ) | | | (4,017,518 | ) |
| | | | |
Net unrealized appreciation (depreciation) | | $ | 1,473,601 | | | $ | 49,928 | | | $ | (186,137 | ) | | $ | (3,911,545 | ) |
| | | | |
| | | | |
| | | Franklin
FTSE
Switzerland
ETF | | | Franklin
FTSE
Taiwan
ETF | | | Franklin
FTSE
United Kingdom
ETF | | | | |
Cost of investments | | $ | 7,332,109 | | | $ | 14,744,842 | | | $ | 29,743,820 | | | | | |
| | | | | | | | |
Unrealized appreciation | | $ | 464,156 | | | $ | 1,432,875 | | | $ | 682,417 | | | | | |
Unrealized depreciation | | | (122,096 | ) | | | (796,225 | ) | | | (2,532,778 | ) | | | | |
| | | | | | | | |
Net unrealized appreciation (depreciation) | | $ | 342,060 | | | $ | 636,650 | | | $ | (1,850,361 | ) | | | | |
| | | | | | | | |
Differences between income and/or capital gains as determined on a book basis and a tax basis are primarily due to differing treatment of foreign currency transactions, financial futures transactions, passive foreign investment company shares and wash sales.
5. Investment Transactions
Purchases and sales of investments (excluding short term securities andin-kind transactions, if any) for the period ended September 30, 2019, were as follows:
| | | | | | | | | | | | | | | | |
| | | | |
| | | Franklin
FTSE
Asia ex Japan
ETF | | | Franklin FTSE
Australia ETF | | | Franklin
FTSE
Brazil
ETF | | | Franklin
FTSE
Canada
ETF | |
Purchases | | $ | 1,236,631 | | | $ | 537,776 | | | $ | 943,222 | | | $ | 159,544 | |
Sales | | $ | 1,082,556 | | | $ | 565,140 | | | $ | 6,136,279 | | | $ | 123,202 | |
| | | | |
| | | Franklin FTSE
China
ETF | | | Franklin FTSE
Europe ETF | | | Franklin
FTSE
Europe Hedged
ETF | | | Franklin
FTSE
France
ETF | |
Purchases | | $ | 6,163,985 | | | $ | 2,724,321 | | | $ | 552,500 | | | $ | 92,706 | |
Sales | | $ | 5,477,845 | | | $ | 1,971,755 | | | $ | 190,191 | | | $ | 49,893 | |
| | | | |
| | | Franklin FTSE
Germany ETF | | | Franklin
FTSE
Hong Kong
ETF | | | Franklin
FTSE
India
ETF | | | Franklin
FTSE
Italy ETF | |
Purchases | | $ | 151,867 | | | $ | 771,696 | | | $ | 8,841,532 | | | $ | 762,198 | |
Sales | | $ | 139,086 | | | $ | 497,657 | | | $ | 377,741 | | | $ | 687,570 | |
| | | | |
| | | Franklin FTSE
Japan
ETF | | | Franklin
FTSE
Japan Hedged
ETF | | | Franklin
FTSE
Latin America
ETF | | | Franklin
FTSE
Mexico
ETF | |
Purchases | | $ | 8,218,942 | | | $ | 522,557 | | | $ | 163,508 | | | $ | 398,123 | |
Sales | | $ | 8,276,956 | | | $ | 570,123 | | | $ | 164,392 | | | $ | 371,432 | |
| | | | | | |
| | | |
| franklintempleton.com | | Semiannual Report | | | 309 | |
FRANKLIN TEMPLETON ETF TRUST
NOTES TO FINANCIAL STATEMENTS
5. Investment Transactions(continued)
| | | | | | | | | | | | | | | | |
| | | | |
| | | Franklin
FTSE
Russia ETF | | | Franklin
FTSE
Saudi Arabia
ETF | | | Franklin
FTSE
South Africa
ETF | | | Franklin
FTSE
South Korea
ETF | |
Purchases | | $ | 1,312,009 | | | $ | 403,657 | | | $ | 318,151 | | | $ | 2,650,719 | |
Sales | | $ | 671,006 | | | $ | 387,778 | | | $ | 301,212 | | | $ | 3,990,704 | |
| | | | |
| | | Franklin
FTSE
Switzerland
ETF | | | Franklin
FTSE
Taiwan ETF | | | Franklin
FTSE
United Kingdom
ETF | | | | |
Purchases | | $ | 293,336 | | | $ | 787,539 | | | $ | 1,056,280 | | | | | |
Sales | | $ | 296,545 | | | $ | 344,832 | | | $ | 629,806 | | | | | |
In-kind transactions associated with creation and redemptions for the period ended September 30, 2019, were as follows:
| | | | | | | | | | | | | | | | |
| | | | |
| | | Franklin
FTSE
Asia ex Japan
ETF | | | Franklin
FTSE
Australia
ETF | | | Franklin
FTSE Brazil ETF | | | Franklin
FTSE
Canada ETF | |
Cost of Securities Received | | $ | — | | | $ | 3,780,508 | | | $ | — | | | $ | — | |
Value of Securities Delivered | | $ | — | | | $ | — | | | $ | — | | | $ | — | |
| | | | |
| | | Franklin
FTSE
China
ETF | | | Franklin
FTSE
Europe ETF | | | Franklin
FTSE
Europe Hedged
ETF | | | Franklin
FTSE
France ETF | |
Cost of Securities Received | | $ | — | | | $ | 36,634,002 | | | $ | — | | | $ | 1,201,434 | |
Value of Securities Delivered | | $ | — | | | $ | 46,582,428 | | | $ | — | | | $ | — | |
| | | | |
| | | Franklin
FTSE
Germany
ETF | | | Franklin
FTSE
Hong Kong
ETF | | | Franklin
FTSE
India
ETF | | | Franklin
FTSE
Italy
ETF | |
Cost of Securities Received | | $ | — | | | $ | — | | | $ | — | | | $ | 1,115,735 | |
Value of Securities Delivered | | $ | — | | | $ | — | | | $ | — | | | $ | — | |
| | | | |
| | | Franklin
FTSE
Japan
ETF | | | Franklin
FTSE
Japan Hedged
ETF | | | Franklin
FTSE
Latin America
ETF | | | Franklin
FTSE
Mexico
ETF | |
Cost of Securities Received | | $ | 14,338,754 | | | $ | — | | | $ | — | | | $ | — | |
Value of Securities Delivered | | $ | 99,995,106 | | | $ | 9,007,028 | | | $ | — | | | $ | — | |
| | | | |
| | | Franklin
FTSE
Russia
ETF | | | Franklin
FTSE
Saudi Arabia
ETF | | | Franklin
FTSE
South Africa
ETF | | | Franklin
FTSE
South Korea
ETF | |
Cost of Securities Received | | $ | 4,030,887 | | | $ | — | | | $ | — | | | $ | — | |
Value of Securities Delivered | | $ | — | | | $ | — | | | $ | — | | | $ | — | |
| | | | |
| | | Franklin
FTSE
Switzerland
ETF | | | Franklin
FTSE
Taiwan
ETF | | | Franklin
FTSE
United Kingdom
ETF | | | | |
Cost of Securities Received | | $ | 4,935,191 | | | $ | — | | | $ | 9,285,379 | | | | | |
Value of Securities Delivered | | $ | — | | | $ | — | | | $ | 8,816,629 | | | | | |
| | | | |
| | | |
| 310 | | Semiannual Report | | franklintempleton.com |
FRANKLIN TEMPLETON ETF TRUST
NOTES TO FINANCIAL STATEMENTS
At September 30, 2019, in connection with securities lending transactions, certain or all Funds loaned investments and received cash collateral as follows:
| | | | |
| |
| | | Franklin
FTSE
Asia Ex Japan
ETF | |
| Securities lending transactionsa: | | | |
Equity investmentsb | | $ | 5,820 | |
| | | | |
aThe agreements can be terminated at any time.
bThe gross amount of recognized liability for such transactions is included in payable upon return of securities loaned in the Statements of Assets and Liabilities.
6. Concentration of Risk
Investing in foreign securities may include certain risks and considerations not typically associated with investing in U.S. securities, such as fluctuating currency values and changing local, regional and global economic, political and social conditions, which may result in greater market volatility. Current political and financial uncertainty surrounding the European Union may increase market volatility and the economic risk of investing in securities in Europe. In addition, certain foreign securities may not be as liquid as U.S. securities.
The United States and other nations have imposed and could impose additional sanctions on certain issuers in Russia due to regional conflicts. These sanctions could result in the devaluation of Russia’s currency, a downgrade in Russian issuers’ credit ratings, or a decline in the value and liquidity of Russian stocks or other securities. Such sanctions could also adversely affect Russia’s economy. Certain or all Funds may be prohibited from investing in securities issued by companies subject to such sanctions. In addition, if the Fund holds the securities of an issuer that is subject to such sanctions, an immediate freeze of that issuer’s securities could result, impairing the ability of the Fund to buy, sell, receive or deliver those securities. There is also the risk that countermeasures could be taken by Russia’s government, which could involve the seizure of the Fund’s assets. These risks could affect the value of the Funds’ portfolio. While the Funds hold securities of certain issuers recently impacted by the sanctions, existing investments do not presently violate the applicable terms and conditions of the sanctions. The sanctions currently do not affect the Funds’ ability to sell these securities. At September 30, 2019, Franklin FTSE Russia ETF had 99.9% of its net assets invested in Russia. The remaining Funds in the Trust did not have significant investment in Russia.
7. Other Derivative Information
At September 30, 2019, the Funds’ investments in derivative contracts are reflected in the Statements of Assets and Liabilities as follows:
| | | | | | | | | | | | |
| | |
| | | Asset Derivatives | | | Liability Derivatives | |
| | | | |
| | | Statements of Assets and
Liabilities Location | | Fair Value | | | Statements of Assets and
Liabilities Location | | Fair Value | |
| Franklin FTSE Asia ex Japan ETF | | | | | | | | | | |
| | | | |
Equity contracts | | Variation margin on futures contracts | | $ | — | | | Variation margin on futures contracts | | $ | 2,454 | a |
| | | | | | | | | | | | |
Totals | | | | $ | — | | | | | $ | 2,454 | |
| | | | | | | | | | | | |
| Franklin FTSE Brazil ETF | | | | | | | | | | |
| | | | |
Equity contracts | | Variation margin on futures contracts | | $ | 3,066 | a | | Variation margin on futures contracts | | $ | — | |
| | | | | | | | | | | | |
Totals | | | | $ | 3,066 | | | | | $ | — | |
| | | | | | | | | | | | |
| Franklin FTSE China ETF | | | | | | | | | | |
| | | | |
Equity contracts | | Variation margin on futures contracts | | $ | — | | | Variation margin on futures contracts | | $ | 2,831 | a |
| | | | | | | | | | | | |
Totals | | | | $ | — | | | | | $ | 2,831 | |
| | | | | | | | | | | | |
| | | | | | |
| | | |
| franklintempleton.com | | Semiannual Report | | | 311 | |
FRANKLIN TEMPLETON ETF TRUST
NOTES TO FINANCIAL STATEMENTS
7. Other Derivative Information(continued)
| | | | | | | | | | | | |
| | |
| | | Asset Derivatives | | | Liability Derivatives | |
| | | | |
| | | Statements of Assets and
Liabilities Location | | Fair Value | | | Statements of Assets and
Liabilities Location | | Fair Value | |
| Franklin FTSE Europe ETF | | | | | | | | | | |
| | | | |
Equity contracts | | Variation margin on futures contracts | | $ | 11,926 | a | | Variation margin on futures contracts | | $ | — | |
| | | | | | | | | | | | |
Totals | | | | $ | 11,926 | | | | | $ | — | |
| | | | | | | | | | | | |
| Franklin FTSE Europe Hedged ETF | | | | | | | | | | |
| | | | |
Foreign exchange contracts | | Unrealized appreciation on OTC forward exchange contracts | | $ | 39,155 | | | Unrealized depreciation on OTC forward exchange contracts | | $ | 13,312 | |
| | | | |
Equity contracts | | Variation margin on futures contracts | | | 1,240 | a | | Variation margin on futures contracts | | | — | |
| | | | | | | | | | | | |
Totals | | | | $ | 40,395 | | | | | $ | 13,312 | |
| | | | | | | | | | | | |
| Franklin FTSE Hong Kong ETF | | | | | | | | | | |
| | | | |
Equity contracts | | Variation margin on futures contracts | | $ | — | | | Variation margin on futures contracts | | $ | 1,884 | a |
| | | | | | | | | | | | |
Totals | | | | $ | — | | | | | $ | 1,884 | |
| | | | | | | | | | | | |
| Franklin FTSE India ETF | | | | | | | | | | |
| | | | |
Equity contracts | | Variation margin on futures contracts | | $ | — | | | Variation margin on futures contracts | | $ | 351 | a |
| | | | | | | | | | | | |
Totals | | | | $ | — | | | | | $ | 351 | |
| | | | | | | | | | | | |
| Franklin FTSE Japan ETF | | | | | | | | | | |
| | | | |
Equity contracts | | Variation margin on futures contracts | | $ | 3,426 | a | | Variation margin on futures contracts | | $ | 6,935 | a |
| | | | | | | | | | | | |
Totals | | | | $ | 3,426 | | | | | $ | 6,935 | |
| | | | | | | | | | | | |
| Franklin FTSE Japan Hedged ETF | | | | | | | | | | |
| | | | |
Foreign exchange contracts | | Unrealized appreciation on OTC forward exchange contracts | | $ | 89,220 | | | Unrealized depreciation on OTC forward exchange contracts | | $ | 458 | |
| | | | |
Equity contracts | | Variation margin on futures contracts | | | — | | | Variation margin on futures contracts | | | 233 | a |
| | | | | | | | | | | | |
Totals | | | | $ | 89,220 | | | | | $ | 691 | |
| | | | | | | | | | | | |
| Franklin FTSE South Korea ETF | | | | | | | | | | |
| | | | |
Equity Contracts | | Variation margin on futures contracts | | $ | 717 | a | | Variation margin on futures contracts | | $ | — | |
| | | | | | | | | | | | |
| | | | |
Totals | | | | $ | 717 | | | | | $ | — | |
| | | | | | | | | | | | |
| Franklin FTSE Taiwan ETF | | | | | | | | | | |
| | | | |
Equity contracts | | Variation margin on futures contracts | | $ | 248 | a | | Variation margin on futures contracts | | $ | — | |
| | | | | | | | | | | | |
Totals | | | | $ | 248 | | | | | $ | — | |
| | | | | | | | | | | | |
| Franklin FTSE United Kingdom ETF | | | | | | | | | | |
| | | | |
Equity contracts | | Variation margin on futures contracts | | $ | 2,487 | a | | Variation margin on futures contracts | | $ | — | |
| | | | | | | | | | | | |
Totals | | | | $ | 2,487 | | | | | $ | — | |
| | | | | | | | | | | | |
aThis amount reflects the cumulative appreciation (depreciation) of futures contracts as reported in the Statement of Investments. Only the variation margin receivable/payable at period end is separately reported within the Statements of Assets and Liabilities. Prior variation margin movements were recorded to cash upon receipt or payment.
| | | | |
| | | |
| 312 | | Semiannual Report | | franklintempleton.com |
FRANKLIN TEMPLETON ETF TRUST
NOTES TO FINANCIAL STATEMENTS
For the period ended September 30, 2019, the effect of derivative contracts in the Funds’ Statements of Operations was as follows:
| | | | | | | | | | | | |
| | | | |
Derivative Contracts
Not Accounted for as
Hedging Instruments | | Statements of
Operations Locations | | Net Realized Gain (Loss) for the Period | | | Statements of
Operations Locations | | Net Change in
Unrealized
Appreciation
(Depreciation)
for the Period | |
| Franklin FTSE Asia ex Japan ETF | | | | | | | | | | |
| | Net realized gain (loss) from: | | | | | | Net change in unrealized appreciation (depreciation) on: | | | | |
| | | | |
Equity contracts | | Futures contracts | | $ | (2,427 | ) | | Futures contracts | | $ | (2,973 | ) |
| | | | | | | | | | | | |
| | | | |
Totals | | | | $ | (2,427 | ) | | | | $ | (2,973 | ) |
| | | | | | | | | | | | |
| Franklin FTSE Brazil ETF | | | |
| | | | |
| | Net realized gain (loss) from: | | | | | | Net change in unrealized appreciation (depreciation) on: | | | | |
Equity contracts | | Futures contracts | | $ | 3,822 | | | Futures contracts | | $ | 5,381 | |
| | | | | | | | | | | | |
Totals | | | | $ | 3,822 | | | | | $ | 5,381 | |
| | | | | | | | | | | | |
| Franklin FTSE China ETF | | | |
| | | | |
| | Net realized gain (loss) from: | | | | | | Net change in unrealized appreciation (depreciation) on: | | | | |
| | | | |
Equity contracts | | Futures contracts | | $ | (765 | ) | | Futures contracts | | $ | (2,831 | ) |
| | | | | | | | | | | | |
Totals | | | | $ | (765 | ) | | | | $ | (2,831 | ) |
| | | | | | | | | | | | |
| Franklin FTSE Europe ETF | |
| | Net realized gain (loss) from: | | | | | | Net change in unrealized appreciation (depreciation) on: | | | | |
| | | | |
Equity contracts | | Futures contracts | | $ | 38,389 | | | Futures contracts | | $ | 5,970 | |
| | | | | | | | | | | | |
Totals | | | | $ | 38,389 | | | | | $ | 5,970 | |
| | | | | | | | | | | | |
| Franklin FTSE Europe Hedged ETF | |
| | Net realized gain (loss) from: | | | | | | Net change in unrealized appreciation (depreciation) on: | | | | |
| | | | |
Equity contracts | | Futures contracts | | $ | 10,957 | | | Futures contracts | | $ | 334 | |
| | | | |
Foreign exchange contracts | | Foreign currency transactions | | | 404,827 | | | Translation of other assets and liabilities denominated in foreign currencies | | | (199,957 | ) |
| | | | | | | | | | | | |
Totals | | | | $ | 415,784 | | | | | $ | (199,623 | ) |
| | | | | | | | | | | | |
| Franklin FTSE France ETF | |
| | | | |
| | Net realized gain (loss) from: | | | | | | Net change in unrealized appreciation (depreciation) on: | | | | |
| | | | |
Equity contracts | | Futures contracts | | $ | 965 | | | Futures contracts | | $ | — | |
| | | | | | | | | | | | |
Totals | | | | $ | 965 | | | | | $ | — | |
| | | | | | | | | | | | |
| Franklin FTSE Hong Kong ETF | |
| | | | |
| | Net realized gain (loss) from: | | | | | | Net change in unrealized appreciation (depreciation) on: | | | | |
| | | | |
Equity contracts | | Futures contracts | | $ | 2,699 | | | Futures contracts | | $ | (1,885 | ) |
| | | | | | | | | | | | |
Totals | | | | $ | 2,699 | | | | | $ | (1,885 | ) |
| | | | | | | | | | | | |
| | | | | | |
| | | |
| franklintempleton.com | | Semiannual Report | | | 313 | |
FRANKLIN TEMPLETON ETF TRUST
NOTES TO FINANCIAL STATEMENTS
7. Other Derivative Information(continued)
| | | | | | | | | | | | |
| | | | |
Derivative Contracts
Not Accounted for as
Hedging Instruments | | Statements of
Operations Locations | | Net Realized Gain (Loss) for the Period | | | Statements of
Operations Locations | | Net Change in
Unrealized
Appreciation
(Depreciation)
for the Period | |
| Franklin FTSE India ETF | |
| | | | |
| | Net realized gain (loss) from: | | | | | | Net change in unrealized appreciation (depreciation) on: | | | | |
| | | | |
Equity contracts | | Futures contracts | | $ | (177 | ) | | Futures contracts | | $ | (771 | ) |
| | | | | | | | | | | | |
Totals | | | | $ | (177 | ) | | | | $ | (771 | ) |
| | | | | | | | | | | | |
| Franklin FTSE Italy ETF | |
| | | | |
| | Net realized gain (loss) from: | | | | | | Net change in unrealized appreciation (depreciation) on: | | | | |
| | | | |
Equity contracts | | Futures contracts | | $ | 6 | | | Futures contracts | | $ | — | |
| | | | | | | | | | | | |
Totals | | | | $ | 6 | | | | | $ | — | |
| | | | | | | | | | | | |
| Franklin FTSE Japan ETF | |
| | | | |
| | Net realized gain (loss) from: | | | | | | Net change in unrealized appreciation (depreciation) on: | | | | |
| | | | |
Equity contracts | | Futures contracts | | $ | 62,163 | | | Futures contracts | | $ | 2,273 | |
| | | | | | | | | | | | |
Totals | | | | $ | 62,163 | | | | | $ | 2,273 | |
| | | | | | | | | | | | |
| Franklin FTSE Japan Hedged ETF | |
| | | | |
| | Net realized gain (loss) from: | | | | | | Net change in unrealized appreciation (depreciation) on: | | | | |
| | | | |
Equity contracts | | Futures contracts | | $ | (5,731 | ) | | Futures contracts | | $ | 1,470 | |
| | | | |
Foreign exchange contracts | | Foreign currency transactions | | | (252,553 | ) | | Translation of other assets and liabilities denominated in foreign currencies | | | 69,721 | |
| | | | | | | | | | | | |
Totals | | | | $ | (258,284 | ) | | | | $ | 71,191 | |
| | | | | | | | | | | | |
| Franklin FTSE Latin America ETF | |
| | | | |
| | Net realized gain (loss) from: | | | | | | Net change in unrealized
appreciation (depreciation) on: | | | | |
| | | | |
Equity contracts | | Futures contracts | | $ | 156 | | | Futures contracts | | $ | 245 | |
| | | | | | | | | | | | |
Totals | | | | $ | 156 | | | | | $ | 245 | |
| | | | | | | | | | | | |
| Franklin FTSE Mexico ETF | |
| | | | |
| | Net realized gain (loss) from: | | | | | | Net change in unrealized appreciation (depreciation) on: | | | | |
| | | | |
Equity contracts | | Futures contracts | | $ | 127 | | | Futures contracts | | $ | — | |
| | | | | | | | | | | | |
Totals | | | | $ | 127 | | | | | $ | — | |
| | | | | | | | | | | | |
| Franklin FTSE South Korea ETF | |
| | | | |
| | Net realized gain (loss) from: | | | | | | Net change in unrealized appreciation (depreciation) on: | | | | |
| | | | |
Equity contracts | | Futures contracts | | $ | 2,099 | | | Futures contracts | | $ | 2,015 | |
| | | | | | | | | | | | |
Totals | | | | $ | 2,099 | | | | | $ | 2,015 | |
| | | | | | | | | | | | |
| | | | |
| | | |
| 314 | | Semiannual Report | | franklintempleton.com |
FRANKLIN TEMPLETON ETF TRUST
NOTES TO FINANCIAL STATEMENTS
| | | | | | | | | | | | |
| | | | |
Derivative Contracts
Not Accounted for as
Hedging Instruments | | Statements of
Operations Locations | | Net Realized Gain (Loss) for the Period | | | Statements of
Operations Locations | | Net Change in
Unrealized
Appreciation
(Depreciation)
for the Period | |
| Franklin FTSE Taiwan ETF | |
| | | | |
| | Net realized gain (loss) from: | | | | | | Net change in unrealized appreciation (depreciation) on: | | | | |
| | | | |
Equity contracts | | Futures contracts | | $ | 3,185 | | | Futures contracts | | $ | 248 | |
| | | | | | | | | | | | |
Totals | | | | $ | 3,185 | | | | | $ | 248 | |
| | | | | | | | | | | | |
| Franklin FTSE United Kingdom ETF | |
| | | | |
| | Net realized gain (loss) from: | | | | | | Net change in unrealized appreciation (depreciation) on: | | | | |
| | | | |
Equity contracts | | Futures contracts | | $ | 16,542 | | | Futures contracts | | $ | (4,316 | ) |
| | | | | | | | | | | | |
Totals | | | | $ | 16,542 | | | | | $ | (4,316 | ) |
| | | | | | | | | | | | |
For the period ended September 30, 2019, the average month end notional amount of futures contracts and average month end contract value for forward exchange contracts were as follows:
| | | | | | | | | | | | | | | | |
| | | | |
| | | Franklin
FTSE
Asia ex Japan
ETF | | | Franklin
FTSE
Brazil ETF | | | Franklin
FTSE China ETF | | | Franklin
FTSE Europe ETF | |
Futures contracts | | $ | 72,958 | | | $ | 84,259 | | | $ | 94,755 | | | $ | 542,477 | |
| | | | |
| | | Franklin
FTSE
Europe Hedged ETF | | | Franklin
FTSE Hong Kong ETF | | | Franklin
FTSE India ETF | | | Franklin
FTSE Italy ETF | |
Futures contracts | | $ | 86,135 | | | $ | 74,919 | | | $ | 23,123 | | | $ | 23,370 | |
Foreign exchange contracts | | $ | 17,753,517 | | | $ | — | | | $ | — | | | $ | — | |
| | | | |
| | | Franklin
FTSE Japan ETF | | | Franklin
FTSE Japan Hedged ETF | | | Franklin
FTSE South Korea ETF | | | Franklin
FTSE Taiwan ETF | |
Futures contracts | | $ | 2,191,122 | | | $ | 124,803 | | | $ | 69,344 | | | $ | 79,025 | |
Foreign exchange contracts | | $ | — | | | $ | 32,181,376 | | | $ | — | | | $ | — | |
| | | | |
| | | Franklin
FTSE United Kingdom ETF | | | | | | | | | | |
Futures contracts | | $ | 289,621 | | | | | | | | | | | | | |
| | | | | | |
| | | |
| franklintempleton.com | | Semiannual Report | | | 315 | |
FRANKLIN TEMPLETON ETF TRUST
NOTES TO FINANCIAL STATEMENTS
7. Other Derivative Information(continued)
At September 30, 2019, the Funds’ OTC derivative assets and liabilities are as follows:
| | | | | | | | |
| |
| | | Gross and Net Amounts of
Assets and Liabilities
Presented in the
Statements of
Assets and Liabilities | |
| | |
| | | Assetsa | | | Liabilitiesa | |
| Franklin FTSE Europe Hedged ETF | | | | | | |
Foreign exchange contracts | | $ | 39,155 | | | $ | 13,312 | |
| | | | |
| | |
| Franklin FTSE Japan Hedged ETF | | | | | | | | |
Foreign exchange contracts | | $ | 89,220 | | | $ | 458 | |
| | | | |
aAbsent an event of default or early termination, OTC derivative assets and liabilities are presented gross and not offset in the Statements of Assets and Liabilities.
At September 30, 2019, the Funds’ OTC derivative assets, which may be offset against the Funds’ OTC derivative liabilities and collateral received from the counterparty, are as follows:
| | | | | | | | | | | | | | | | | | | | |
| | | |
| | | | | | Amounts Not Offset in the
Statements of Assets and Liabilities | | | | |
| | | | | |
| | | Gross and Net Amounts
of Assets Presented
in the Statements of
Assets and Liabilities | | | Financial
Instruments
Available for Offset | | | Financial
Instruments
Collateral
Receiveda | | | Cash
Collateral
Receiveda | | | Net Amount (Not
less than zero) | |
Franklin FTSE Europe
Hedged ETF | | | | | | | | | | | | | | | |
| Counterparty | | | | | | | | | | | | | | | |
BOFA | | $ | 12,588 | | | $ | (12,588 | ) | | $ | — | | | $ | — | | | $ | — | |
HSBK | | | 9,586 | | | | (44 | ) | | | — | | | | — | | | | 9,542 | |
MSCO | | | 7,393 | | | | — | | | | — | | | | — | | | | 7,393 | |
UBSW | | | 9,588 | | | | (46 | ) | | | — | | | | — | | | | 9,542 | |
| | | | |
Total | | $ | 39,155 | | | $ | (12,678 | ) | | $ | — | | | $ | — | | | $ | 26,477 | |
| | | | |
| | | |
| | | | | | Amounts Not Offset in the
Statements of Assets and Liabilities | | | | |
| | | | | |
| | | Gross and Net Amounts
of Assets Presented
in the Statements of
Assets and Liabilities | | | Financial
Instruments
Available for Offset | | | Financial
Instruments
Collateral
Receiveda | | | Cash
Collateral
Receiveda | | | Net Amount (Not
less than zero) | |
Franklin FTSE Japan
Hedged ETF | | | | | | | | | | | | | | | |
| Counterparty | | | | | | | | | | | | | | | |
BOFA | | $ | 26,196 | | | $ | (26 | ) | | $ | — | | | $ | — | | | $ | 26,170 | |
HSBK | | | 26,152 | | | | (79 | ) | | | — | | | | — | | | | 26,073 | |
MSCO | | | 10,714 | | | | (23 | ) | | | — | | | | — | | | | 10,691 | |
UBSW | | | 26,158 | | | | (330 | ) | | | — | | | | — | | | | 25,828 | |
| | | | |
Total | | $ | 89,220 | | | $ | (458 | ) | | $ | — | | | $ | — | | | $ | 88,762 | |
| | | | |
| | | | |
| | | |
| 316 | | Semiannual Report | | franklintempleton.com |
FRANKLIN TEMPLETON ETF TRUST
NOTES TO FINANCIAL STATEMENTS
At September 30, 2019, the Funds’ OTC derivative liabilities, which may be offset against the Funds’ OTC derivative assets and collateral pledged to the counterparty, are as follows:
| | | | | | | | | | | | | | | | | | | | |
| | | |
| | | | | | Amounts Not Offset in the
Statements of Assets and Liabilities | | | | |
| | | | | |
| | | Gross and Net Amounts
of Assets Presented
in the Statements of
Assets and Liabilities | | | Financial
Instruments
Available for Offset | | | Financial
Instruments
Collateral
Receiveda | | | Cash
Collateral
Receiveda | | | Net Amount (Not
less than zero) | |
Franklin FTSE Europe
Hedged ETF | | | | | | | | | | | | | | | |
| Counterparty | | | | | | | | | | | | | | | |
BOFA | | $ | 13,222 | | | $ | (12,588 | ) | | $ | — | | | $ | — | | | $ | 634 | |
HSBK | | | 44 | | | | (44 | ) | | | — | | | | — | | | | — | |
UBSW | | | 46 | | | | (46 | ) | | | — | | | | — | | | | — | |
| | | | |
Total | | $ | 13,312 | | | $ | (12,678 | ) | | $ | — | | | $ | — | | | $ | 634 | |
| | | | |
| | | |
| | | | | | Amounts Not Offset in the
Statements of Assets and Liabilities | | | | |
| | | | | |
| | | Gross and Net Amounts
of Assets Presented
in the Statements of
Assets and Liabilities | | | Financial
Instruments
Available for Offset | | | Financial
Instruments
Collateral
Receiveda | | | Cash
Collateral
Receiveda | | | Net Amount (Not
less than zero) | |
Franklin FTSE Japan
Hedged ETF | | | | | | | | | | | | | | | |
| Counterparty | | | | | | | | | | | | | | | |
BOFA | | $ | 26 | | | $ | (26 | ) | | $ | — | | | $ | — | | | $ | — | |
HSBK | | | 79 | | | | (79 | ) | | | — | | | | — | | | | — | |
MSCO | | | 23 | | | | (23 | ) | | | — | | | | — | | | | — | |
UBSW | | | 330 | | | | (330 | ) | | | — | | | | — | | | | — | |
| | | | |
Total | | $ | 458 | | | $ | (458 | ) | | $ | — | | | $ | — | | | $ | — | |
| | | | |
See Note 1(c) regarding derivative financial instruments.
8. Fair Value Measurements
The Funds follow a fair value hierarchy that distinguishes between market data obtained from independent sources (observable inputs) and the Funds’ own market assumptions (unobservable inputs). These inputs are used in determining the value of the Funds’ financial instruments and are summarized in the following fair value hierarchy:
| | • | | Level 1 – quoted prices in active markets for identical financial instruments |
| | • | | Level 2 – other significant observable inputs (including quoted prices for similar financial instruments, interest rates, prepayment speed, credit risk, etc.) |
| | • | | Level 3 – significant unobservable inputs (including the Funds’ own assumptions in determining the fair value of financial instruments) |
The input levels are not necessarily an indication of the risk or liquidity associated with financial instruments at that level.
| | | | | | |
| | | |
| franklintempleton.com | | Semiannual Report | | | 317 | |
FRANKLIN TEMPLETON ETF TRUST
NOTES TO FINANCIAL STATEMENTS
8. Fair Value Measurements(continued)
A summary of inputs used as of September 30, 2019, in valuing the Funds’ assets and liabilities carried at fair value, is as follows:
| | | | | | | | | | | | | | | | |
| | | | |
| | | Level 1 | | | Level 2 | | | Level 3 | | | Total | |
| | | | |
| Franklin FTSE Asia ex Japan ETF | | | | | | | | | | | | | | | | |
| | | | |
| Assets: | | | | | | | | | | | | | | | | |
Investments in Securities:a | | | | | | | | | | | | | | | | |
Equity Investments:b | | | | | | | | | | | | | | | | |
China | | $ | 6,070,225 | | | $ | 5,695 | | | $ | — | c | | $ | 6,075,920 | |
India | | | 1,847,943 | | | | — | | | | 617 | | | | 1,848,560 | |
South Korea | | | 2,239,487 | | | | — | | | | 1,926 | | | | 2,241,413 | |
Taiwan | | | 2,132,431 | | | | — | | | | 1,202 | | | | 2,133,633 | |
Thailand | | | 611,745 | | | | — | | | | — | | | | 611,745 | |
Other Equity Investments | | | 3,462,472 | | | | — | | | | — | | | | 3,462,472 | |
Corporate Bonds & Notes | | | — | | | | 91 | | | | — | | | | 91 | |
Short-Term Investments | | | 5,820 | | | | — | | | | — | | | | 5,820 | |
| | | | |
Total Investments in Securities | | $ | 16,370,123 | | | $ | 5,786 | | | $ | 3,745 | c | | $ | 16,379,654 | |
| | | | |
| | | | |
| Liabilities: | | | | | | | | | | | | | | | | |
Other Financial Instruments: | | | | | | | | | | | | | | | | |
Futures Contracts | | $ | 2,454 | | | $ | — | | | $ | — | | | $ | 2,454 | |
| | | | |
| | | | |
| Franklin FTSE Australia ETF | | | | | | | | | | | | | | | | |
| | | | |
| Assets: | | | | | | | | | | | | | | | | |
Investments in Securities:a | | | | | | | | | | | | | | | | |
Equity Investmentsb | | $ | 11,359,981 | | | $ | — | | | $ | — | | | $ | 11,359,981 | |
| | | | |
| | | | |
| Franklin FTSE Brazil ETF | | | | | | | | | | | | | | | | |
| | | | |
| Assets: | | | | | | | | | | | | | | | | |
Investments in Securities:a | | | | | | | | | | | | | | | | |
Equity Investmentsb | | $ | 15,569,563 | | | $ | — | | | $ | — | | | $ | 15,569,563 | |
| | | | |
Other Financial Instruments: | | | | | | | | | | | | | | | | |
Futures Contracts | | $ | 3,066 | | | $ | — | | | $ | — | | | $ | 3,066 | |
| | | | |
| | | | |
| Franklin FTSE Canada ETF | | | | | | | | | | | | | | | | |
| | | | |
| Assets: | | | | | | | | | | | | | | | | |
Investments in Securities:a | | | | | | | | | | | | | | | | |
Equity Investmentsb | | $ | 5,121,963 | | | $ | — | | | $ | — | | | $ | 5,121,963 | |
| | | | |
| | | | |
| Franklin FTSE China ETF | | | | | | | | | | | | | | | | |
| | | | |
| Assets: | | | | | | | | | | | | | | | | |
Investments in Securities:a | | | | | | | | | | | | | | | | |
Equity Investments:b | | | | | | | | | | | | | | | | |
China | | $ | 38,807,024 | | | $ | 38,996 | | | $ | — | c | | $ | 38,846,020 | |
Other Equity Investments | | | 522,232 | | | | — | | | | — | | | | 522,232 | |
| | | | |
Total Investments in Securities | | $ | 39,329,256 | | | $ | 38,996 | | | $ | — | c | | $ | 39,368,252 | |
| | | | |
| | | | |
| Liabilities: | | | | | | | | | | | | | | | | |
Other Financial Instruments: | | | | | | | | | | | | | | | | |
Futures Contracts | | $ | 2,831 | | | $ | — | | | $ | — | | | $ | 2,831 | |
| | | | |
| | | | |
| | | |
| 318 | | Semiannual Report | | franklintempleton.com |
FRANKLIN TEMPLETON ETF TRUST
NOTES TO FINANCIAL STATEMENTS
| | | | | | | | | | | | | | | | |
| | | | |
| | | Level 1 | | | Level 2 | | | Level 3 | | | Total | |
| | | | |
| Franklin FTSE Europe ETF | | | | | | | | | | | | | | | | |
| | | | |
| Assets: | | | | | | | | | | | | | | | | |
Investments in Securities:a | | | | | | | | | | | | | | | | |
Equity Investmentsb | | $ | 65,443,005 | | | $ | — | | | $ | — | | | $ | 65,443,005 | |
| | | | |
Other Financial Instruments: | | | | | | | | | | | | | | | | |
Futures Contracts | | $ | 11,926 | | | $ | — | | | $ | — | | | $ | 11,926 | |
| | | | |
| | | | |
| Franklin FTSE Europe Hedged ETF | | | | | | | | | | | | | | | | |
| | | | |
| Assets: | | | | | | | | | | | | | | | | |
Investments in Securities:a | | | | | | | | | | | | | | | | |
Equity Investmentsb | | $ | 4,758,761 | | | $ | — | | | $ | — | | | $ | 4,758,761 | |
Short-Term Investments | | | 41,913 | | | | — | | | | — | | | | 41,913 | |
| | | | |
Total Investments in Securities | | $ | 4,800,674 | | | $ | — | | | $ | — | | | $ | 4,800,674 | |
| | | | |
Other Financial Instruments: | | | | | | | | | | | | | | | | |
Forward Exchange Contracts | | $ | — | | | $ | 39,155 | | | $ | — | | | $ | 39,155 | |
Futures Contracts | | | 1,240 | | | | — | | | | — | | | | 1,240 | |
| | | | |
Total Other Financial Instruments | | $ | 1,240 | | | $ | 39,155 | | | $ | — | | | $ | 40,395 | |
| | | | |
| | | | |
| Liabilities: | | | | | | | | | | | | | | | | |
Other Financial Instruments: | | | | | | | | | | | | | | | | |
Forward Exchange Contracts | | $ | — | | | $ | 13,312 | | | $ | — | | | $ | 13,312 | |
| | | | |
| | | | |
| Franklin FTSE France ETF | | | | | | | | | | | | | | | | |
| | | | |
| Assets: | | | | | | | | | | | | | | | | |
Investments in Securities:a | | | | | | | | | | | | | | | | |
Equity Investmentsb | | $ | 3,732,446 | | | $ | — | | | $ | — | | | $ | 3,732,446 | |
| | | | |
| | | | |
| Franklin FTSE Germany ETF | | | | | | | | | | | | | | | | |
| | | | |
| Assets: | | | | | | | | | | | | | | | | |
Investments in Securities:a | | | | | | | | | | | | | | | | |
Equity Investmentsb | | $ | 4,184,071 | | | $ | — | | | $ | — | | | $ | 4,184,071 | |
| | | | |
| | | | |
| Franklin FTSE Hong Kong ETF | | | | | | | | | | | | | | | | |
| | | | |
| Assets: | | | | | | | | | | | | | | | | |
Investments in Securities:a | | | | | | | | | | | | | | | | |
Equity Investmentsb | | $ | 17,663,014 | | | $ | — | | | $ | — | | | $ | 17,663,014 | |
| | | | |
| | | | |
| Liabilities: | | | | | | | | | | | | | | | | |
Other Financial Instruments: | | | | | | | | | | | | | | | | |
Futures Contracts | | $ | 1,884 | | | $ | — | | | $ | — | | | $ | 1,884 | |
| | | | |
| | | | |
| Franklin FTSE India ETF | | | | | | | | | | | | | | | | |
| | | | |
| Assets: | | | | | | | | | | | | | | | | |
Investments in Securities:a | | | | | | | | | | | | | | | | |
Equity Investments:b | | | | | | | | | | | | | | | | |
India | | $ | 15,380,334 | | | $ | — | | | $ | 4,712 | c | | $ | 15,385,046 | |
Corporate Bonds & Notes | | | — | | | | 418 | | | | — | | | | 418 | |
| | | | |
Total Investments in Securities | | $ | 15,380,334 | | | $ | 418 | | | $ | 4,712 | c | | $ | 15,385,464 | |
| | | | |
| | | | |
| Liabilities: | | | | | | | | | | | | | | | | |
Other Financial Instruments: | | | | | | | | | | | | | | | | |
Futures Contracts | | $ | 351 | | | $ | — | | | $ | — | | | $ | 351 | |
| | | | |
| | | | | | |
| | | |
| franklintempleton.com | | Semiannual Report | | | 319 | |
FRANKLIN TEMPLETON ETF TRUST
NOTES TO FINANCIAL STATEMENTS
8. Fair Value Measurements(continued)
| | | | | | | | | | | | | | | | |
| | | | |
| | | Level 1 | | | Level 2 | | | Level 3 | | | Total | |
| | | | |
| Franklin FTSE Italy ETF | | | | | | | | | | | | | | | | |
| | | | |
| Assets: | | | | | | | | | | | | | | | | |
Investments in Securities:a | | | | | | | | | | | | | | | | |
Equity Investmentsb | | $ | 11,560,237 | | | $ | — | | | $ | — | | | $ | 11,560,237 | |
| | | | |
| | | | |
| Franklin FTSE Japan ETF | | | | | | | | | | | | | | | | |
| | | | |
| Assets: | | | | | | | | | | | | | | | | |
Investments in Securities:a | | | | | | | | | | | | | | | | |
Equity Investmentsb | | $ | 205,943,393 | | | $ | — | | | $ | — | | | $ | 205,943,393 | |
Short-Term Investments | | | 64,467 | | | | — | | | | — | | | | 64,467 | |
| | | | |
Total Investments in Securities | | $ | 206,007,860 | | | $ | — | | | $ | — | | | $ | 206,007,860 | |
| | | | |
Other Financial Instruments: | | | | | | | | | | | | | | | | |
Futures Contracts | | $ | 3,426 | | | $ | — | | | $ | — | | | $ | 3,426 | |
| | | | |
| | | | |
| Liabilities: | | | | | | | | | | | | | | | | |
Other Financial Instruments: | | | | | | | | | | | | | | | | |
Futures Contracts | | $ | 6,935 | | | $ | — | | | $ | — | | | $ | 6,935 | |
| | | | |
| | | | |
| Franklin FTSE Japan Hedged ETF | | | | | | | | | | | | | | | | |
| | | | |
| Assets: | | | | | | | | | | | | | | | | |
Investments in Securities:a | | | | | | | | | | | | | | | | |
Equity Investmentsb | | $ | 4,663,266 | | | $ | — | | | $ | — | | | $ | 4,663,266 | |
Short-Term Investments | | | 1,813 | | | | — | | | | — | | | | 1,813 | |
| | | | |
Total Investments in Securities | | $ | 4,665,079 | | | $ | — | | | $ | — | | | $ | 4,665,079 | |
| | | | |
Other Financial Instruments: | | | | | | | | | | | | | | | | |
Forward Exchange Contracts | | $ | — | | | $ | 89,220 | | | $ | — | | | $ | 89,220 | |
| | | | |
| Liabilities: | | | | | | | | | | | | | | | | |
Other Financial Instruments: | | | | | | | | | | | | | | | | |
Forward Exchange Contracts | | $ | — | | | $ | 458 | | | $ | — | | | $ | 458 | |
Futures Contracts | | | 233 | | | | — | | | | — | | | | 233 | |
| | | | |
Total Other Financial Instruments | | $ | 233 | | | $ | 458 | | | $ | — | | | $ | 691 | |
| | | | |
| | | | |
| Franklin FTSE Latin America ETF | | | | | | | | | | | | | | | | |
| | | | |
| Assets: | | | | | | | | | | | | | | | | |
Investments in Securities:a | | | | | | | | | | | | | | | | |
Equity Investments:b | | | | | | | | | | | | | | | | |
Colombia | | $ | 90,966 | | | $ | — | | | $ | 4,149 | | | $ | 95,115 | |
Other Equity Investments | | | 2,497,516 | | | | — | | | | — | | | | 2,497,516 | |
| | | | |
Total Investments in Securities | | $ | 2,588,482 | | | $ | — | | | $ | 4,149 | | | $ | 2,592,631 | |
| | | | |
| | | | |
| Franklin FTSE Mexico ETF | | | | | | | | | | | | | | | | |
| | | | |
| Assets: | | | | | | | | | | | | | | | | |
Investments in Securities:a | | | | | | | | | | | | | | | | |
Equity Investmentsb | | $ | 4,335,832 | | | $ | — | | | $ | — | | | $ | 4,335,832 | |
| | | | |
| | | | |
| Franklin FTSE Russia ETF | | | | | | | | | | | | | | | | |
| | | | |
| Assets: | | | | | | | | | | | | | | | | |
Investments in Securities:a | | | | | | | | | | | | | | | | |
Equity Investmentsb | | $ | 17,282,299 | | | $ | — | | | $ | — | | | $ | 17,282,299 | |
| | | | |
| | | | |
| | | |
| 320 | | Semiannual Report | | franklintempleton.com |
FRANKLIN TEMPLETON ETF TRUST
NOTES TO FINANCIAL STATEMENTS
| | | | | | | | | | | | | | | | |
| | | | |
| | | Level 1 | | | Level 2 | | | Level 3 | | | Total | |
| | | | |
| Franklin FTSE Saudi Arabia ETF | | | | | | | | | | | | | | | | |
| | | | |
| Assets: | | | | | | | | | | | | | | | | |
Investments in Securities:a | | | | | | | | | | | | | | | | |
Equity Investmentsb | | $ | 2,552,346 | | | $ | — | | | $ | — | | | $ | 2,552,346 | |
| | | | |
| | | | |
| Franklin FTSE South Africa ETF | | | | | | | | | | | | | | | | |
| | | | |
| Assets: | | | | | | | | | | | | | | | | |
Investments in Securities:a | | | | | | | | | | | | | | | | |
Equity Investmentsb | | $ | 2,455,362 | | | $ | — | | | $ | — | | | $ | 2,455,362 | |
| | | | |
| | | | |
| Franklin FTSE South Korea ETF | | | | | | | | | | | | | | | | |
| | | | |
| Assets: | | | | | | | | | | | | | | | | |
Investments in Securities:a | | | | | | | | | | | | | | | | |
Equity Investments:b | | | | | | | | | | | | | | | | |
South Korea | | $ | 13,678,965 | | | $ | — | | | $ | 12,867 | | | $ | 13,691,832 | |
| | | | |
Other Financial Instruments: | | | | | | | | | | | | | | | | |
Futures Contracts | | $ | 717 | | | $ | — | | | $ | — | | | $ | 717 | |
| | | | |
| | | | |
| Franklin FTSE Switzerland ETF | | | | | | | | | | | | | | | | |
| | | | |
| Assets: | | | | | | | | | | | | | | | | |
Investments in Securities:a | | | | | | | | | | | | | | | | |
Equity Investmentsb | | $ | 7,674,169 | | | $ | — | | | $ | — | | | $ | 7,674,169 | |
| | | | |
| | | | |
| Franklin FTSE Taiwan ETF | | | | | | | | | | | | | | | | |
| | | | |
| Assets: | | | | | | | | | | | | | | | | |
Investments in Securities:a | | | | | | | | | | | | | | | | |
Equity Investments:b | | | | | | | | | | | | | | | | |
Taiwan | | $ | 15,368,868 | | | $ | — | | | $ | 12,624 | | | $ | 15,381,492 | |
| | | | |
Other Financial Instruments: | | | | | | | | | | | | | | | | |
Futures Contracts | | $ | 248 | | | $ | — | | | $ | — | | | $ | 248 | |
| | | | |
| | | | |
| Franklin FTSE United Kingdom ETF | | | | | | | | | | | | | | | | |
| | | | |
| Assets: | | | | | | | | | | | | | | | | |
Investments in Securities:a | | | | | | | | | | | | | | | | |
Equity Investmentsb | | $ | 27,893,459 | | | $ | — | | | $ | — | | | $ | 27,893,459 | |
| | | | |
Other Financial Instruments: | | | | | | | | | | | | | | | | |
Futures Contracts | | $ | 2,487 | | | $ | — | | | $ | — | | | $ | 2,487 | |
| | | | |
aFor detailed categories, see the accompanying Statement of Investments.
bIncludes common and convertible preferred stocks, warrants, as well as other equity investments.
cIncludes securities determined to have no value at September 30, 2019
| | | | | | |
| | | |
| franklintempleton.com | | Semiannual Report | | | 321 | |
FRANKLIN TEMPLETON ETF TRUST
NOTES TO FINANCIAL STATEMENTS
9. Subsequent Events
The Funds have evaluated subsequent events through the issuance of the financial statements and determined that no events have occurred that require disclosure.
Abbreviations
| | |
| Selected Portfolio |
| ADR | | American Depositary Receipt |
| CDI | | Clearing House Electronic Subregister System Depositary Interest |
| GDR | | Global Depositary Receipt |
| IDR | | International Depositary Receipt |
| NVDR | | Non-Voting Depositary Receipt |
| REIT | | Real Estate Investment Trust |
| SF | | Single Family |
|
| Counterparty |
| BOFA | | Bank of America Corp. |
| HSBK | | HSBC Bank PLC |
| MSCO | | Morgan Stanley |
| UBSW | | UBS AG |
| | | | |
| | | |
| 322 | | Semiannual Report | | franklintempleton.com |
FRANKLIN TEMPLETON ETF TRUST
Tax Information (unaudited)
At March 31, 2019, more than 50% of the Funds’ total assets were invested in securities of foreign issuers. In most instances, foreign taxes were withheld from income paid to the Funds on these investments. As shown in the table below, the Funds hereby report to shareholders the foreign source income and foreign taxes paid, pursuant to Section 853 of the Internal Revenue Code. This written statement will allow shareholders of record on June 12, 2019, to treat their proportionate share of foreign taxes paid by the Funds as having been paid directly by them. The shareholder shall consider these amounts as foreign taxes paid in the tax year in which they receive the Fund distribution.
The following table provides a detailed analysis of foreign tax paid, foreign source income, and foreign source qualified dividends as reported by the Funds to shareholders of record.
| | | | | | | | | | | | |
| | | |
| Fund | | Foreign Tax Paid Per Share | | | Foreign Source Income Per Share | | | Foreign Source Qualified
Dividends Per Share | |
Franklin FTSE Asia ex Japan ETF | | $ | 0.0558 | | | $ | 0.5368 | | | $ | 0.2337 | |
Franklin FTSE Australia ETF | | $ | 0.0129 | | | $ | 0.9498 | | | $ | 0.8684 | |
Franklin FTSE Brazil ETF | | $ | 0.0959 | | | $ | 1.1363 | | | $ | 0.0000 | |
Franklin FTSE Canada ETF | | $ | 0.0972 | | | $ | 0.6481 | | | $ | 0.6128 | |
Franklin FTSE Europe ETF | | $ | 0.0655 | | | $ | 0.7150 | | | $ | 0.7057 | |
Franklin FTSE Europe Hedged ETF | | $ | 0.5101 | | | $ | 5.4492 | | | $ | 5.3667 | |
Franklin FTSE France ETF | | $ | 0.0867 | | | $ | 0.5548 | | | $ | 0.5538 | |
Franklin FTSE Germany ETF | | $ | 0.0524 | | | $ | 0.4232 | | | $ | 0.4226 | |
Franklin FTSE Italy ETF | | $ | 0.0477 | | | $ | 0.3092 | | | $ | 0.3072 | |
Franklin FTSE Japan ETF | | $ | 0.0611 | | | $ | 0.5897 | | | $ | 0.5171 | |
Franklin FTSE Japan Hedged ETF | | $ | 0.3720 | | | $ | 3.7665 | | | $ | 3.6029 | |
Franklin FTSE Mexico ETF | | $ | 0.0226 | | | $ | 0.4264 | | | $ | 0.4253 | |
Franklin FTSE South Korea ETF | | $ | 0.0900 | | | $ | 0.5572 | | | $ | 0.5359 | |
Franklin FTSE Switzerland ETF | | $ | 0.0496 | | | $ | 0.3356 | | | $ | 0.3342 | |
Franklin FTSE United Kingdom ETF | | $ | 0.0070 | | | $ | 0.5349 | | | $ | 0.4869 | |
Franklin FTSE China ETF | | $ | 0.0285 | | | $ | 0.3493 | | | $ | 0.2491 | |
Franklin FTSE Taiwan ETF | | $ | 0.0744 | | | $ | 0.3398 | | | $ | 0.0000 | |
Franklin FTSE Latin America ETF | | $ | 0.0418 | | | $ | 0.4240 | | | $ | 0.0539 | |
Franklin FTSE Saudi Arabia ETF | | $ | 0.0078 | | | $ | 0.1214 | | | $ | 0.0000 | |
Franklin FTSE Russia ETF | | $ | 0.1164 | | | $ | 0.7571 | | | $ | 0.7389 | |
Franklin FTSE South Africa ETF | | $ | 0.0435 | | | $ | 0.2613 | | | $ | 0.2497 | |
Franklin FTSE Hong Kong ETF | | $ | 0.0003 | | | $ | 0.4404 | | | $ | 0.0007 | |
Foreign Tax Paid Per Share is the amount per share available to you, as a tax credit (assuming you held your shares in the Fund for a minimum of 16 days during the31-day period beginning 15 days before theex-dividend date of the Fund’s distribution to which the foreign taxes relate), or, as a tax deduction.
Foreign Source Income Per Share is the amount per share of income dividends attributable to foreign securities held by the Fund, plus any foreign taxes withheld on these dividends. The amounts reported include foreign source qualified dividends that have not been adjusted for the rate differential applicable to such dividend income.1
Foreign Source Qualified Dividends Per Share is the amount per share of foreign source qualified dividends, plus any foreign taxes withheld on these dividends. These amounts represent the portion of the Foreign Source Income reported to you in column 2 that were derived from qualified foreign securities held by the Fund.1
Bymid-February 2020, shareholders will receive Form1099-DIV which will include their share of taxes paid and foreign source income distributed during the prior calendar year 2019. The Foreign Source Income reported on Form1099-DIV has not been adjusted for the rate differential on foreign source qualified dividend income. Shareholders are advised to check with their tax advisors for information on the treatment of these amounts on their individual income tax returns.
1. Qualified dividends are taxed at reduced long term capital gains tax rates. In determining the amount of foreign tax credit that may be applied against the U.S. tax liability of individuals receiving foreign source qualified dividends, adjustments may be required to the foreign tax credit limitation calculation to reflect the rate differential applicable to such dividend income. The rules however permit certain individuals to elect not to apply the rate differential adjustments for capital gains and/or dividends for any taxable year. Please consult your tax advisor and the instructions to Form 1116 for more information.
| | | | | | |
| | | |
| franklintempleton.com | | Semiannual Report | | | 323 | |
FRANKLIN TEMPLETON ETF TRUST
Shareholder Information
Board Approval of Investment Management Agreements
FRANKLIN TEMPLETON ETF TRUST
Franklin FTSE Asia ex Japan ETF
Franklin FTSE Australia ETF
Franklin FTSE Brazil ETF
Franklin FTSE Canada ETF
Franklin FTSE China ETF
Franklin FTSE Europe ETF
Franklin FTSE Europe Hedged ETF
Franklin FTSE France ETF
Franklin FTSE Germany ETF
Franklin FTSE Hong Kong ETF
Franklin FTSE India ETF
Franklin FTSE Italy ETF
Franklin FTSE Japan ETF
Franklin FTSE Japan Hedged ETF
Franklin FTSE Mexico ETF
Franklin FTSE Russia ETF
Franklin FTSE South Korea ETF
Franklin FTSE Switzerland ETF
Franklin FTSE Taiwan ETF
Franklin FTSE United Kingdom ETF
(each a Fund)
At anin-person meeting held on May 29, 2019 (Meeting), the Board of Trustees (Board) of Franklin Templeton ETF Trust (Trust), including a majority of the trustees who are not “interested persons” as defined in the Investment Company Act of 1940 (Independent Trustees), reviewed and approved the continuance of the investment management agreement between Franklin Advisory Services, LLC (Manager) and the Trust, on behalf of each Fund (each a Management Agreement) for an additionalone-year period. The Independent Trustees received advice from and met separately with Independent Trustee counsel in considering whether to approve the continuation of each Management Agreement. Although the Management Agreements for the Funds were considered at the same Board meeting, the Board considered the information provided to it about the Funds together and with respect to each Fund separately as the Board deemed appropriate.
In considering the continuation of each Management Agreement, the Board reviewed and considered information provided by the Manager at the Meeting and throughout the year at meetings of the Board and its committees. The Board also reviewed and considered information provided in
response to a detailed set of requests for information submitted to the Manager by Independent Trustee counsel on behalf of the Independent Trustees in connection with the annual contract renewal process. In addition, prior to the Meeting, the Independent Trustees held a telephonic contract renewal meeting at which the Independent Trustees conferred amongst themselves and Independent Trustee counsel about contract renewal matters. The Board reviewed and considered all of the factors it deemed relevant in approving the continuance of each Management Agreement, including, but not limited to: (i) the nature, extent and quality of the services provided by the Manager; (ii) each Fund’s tracking error against a specified benchmark index as of a recent period; (iii) the costs of the services provided and profits realized by the Manager and its affiliates from the relationship with each Fund; (iv) the extent to which economies of scale are realized as each Fund grows; and (v) whether fee levels reflect these economies of scale for the benefit of Fund investors.
In approving the continuance of each Management Agreement, the Board, including a majority of the Independent Trustees, determined that the terms of each Management Agreement are fair and reasonable and that the continuance of such Management Agreement is in the best interests of the applicable Fund and its shareholders. While attention was given to all information furnished, the following discusses some primary factors relevant to the Board’s determination.
NATURE, EXTENT AND QUALITY OF SERVICES. The Board reviewed and considered information regarding the nature, extent and quality of investment management services provided by the Manager and its affiliates to the Funds and their shareholders. This information included, among other things, the qualifications, background and experience of the senior management and investment personnel of the Manager; the structure of investment personnel compensation; oversight of third-party service providers; investment performance reports and related financial information for each Fund; reports on expenses; legal and compliance matters; risk controls; pricing and other services provided by the Manager and its affiliates; and management fees charged by the Manager and its affiliates to US funds and other accounts, including management’s explanation of differences among accounts where relevant. The Board noted management’s continuing efforts and expenditures in establishing effective business continuity plans and developing strategies to address areas of heightened concern in the registered fund industry, such as cybersecurity and liquidity risk management. The Board also recognized management’s
| | | | |
| | | |
| 324 | | Semiannual Report | | franklintempleton.com |
FRANKLIN TEMPLETON ETF TRUST
SHAREHOLDER INFORMATION
commitment to facilitating Board oversight of liquidity through the designation of a liquidity/risk administrator and the development of reports that highlight the amount of illiquid investments for each Fund.
The Board also reviewed and considered the benefits provided to Fund shareholders of investing in a fund that is part of the Franklin Templeton family of funds. The Board noted the financial position of Franklin Resources, Inc. (FRI), the Manager’s parent, and its commitment to the registered fund business as evidenced by its continued introduction of new funds, reassessment of the fund offerings in response to the market environment and project initiatives and capital investments relating to the services provided to the Funds by the Franklin Templeton (FT) organization.
Following consideration of such information, the Board was satisfied with the nature, extent and quality of services provided by the Manager and its affiliates to the Funds and their shareholders.
FUND PERFORMANCE. The Board noted that, in light of the Funds’ use of a “passive” or indexing investment approach, management evaluates the Funds based on their tracking error against a specified benchmark. The Board also noted that management did not provide peer fund performance analysis typically prepared by Broadridge Financial Solutions, Inc. (Broadridge), an independent provider of investment company data, as the Funds’ are pure-index exchange-traded funds as opposed to active or smart beta funds. The Board referenced earlier discussions with management on matters related to, among other things, the strategy behind the overall productline-up, the design and construction of the Manager’s proprietary indices, the comparability of peer data, the nature of the Manager’s research, the potential use of innovative data and technology, and investments in marketing and distribution. The Board noted that for theone-year period ended February 28, 2019, each Fund’s tracking error was within the tolerance anticipated for such Fund, except that the tracking error for the Franklin FTSE Switzerland ETF was 9.6 basis points above the tolerance anticipated for this Fund.
COMPARATIVE FEES AND EXPENSES. The Board reviewed and considered information regarding each Fund’s actual total expense ratio and its various components, including, as applicable, management fees; transfer agent expenses; underlying fund expenses; Rule12b-1 andnon-Rule12b-1 service fees; and othernon-management fees. The Board considered the actual total expense ratio and, separately, the contractual management fee rate, without the effect of fee waivers, if any (Management Rate) of
each Fund in comparison to the median expense ratio and median Management Rate, respectively, of other exchange-traded funds deemed comparable to and with a similar expense structure to the Fund selected by Broadridge (Expense Group). Broadridge fee and expense data is based upon information taken from each fund’s most recent annual report, which reflects historical asset levels that may be quite different from those currently existing, particularly in a period of market volatility. While recognizing such inherent limitation and the fact that expense ratios and Management Rates generally increase as assets decline and decrease as assets grow, the Board believed the independent analysis conducted by Broadridge to be an appropriate measure of comparative fees and expenses. The Broadridge Management Rate includes administrative charges. The Board received a description of the methodology used by Broadridge to select the exchange-traded funds included in an Expense Group. The Expense Group for each Fund was as follows:
| | • | | The Expense Group for the Franklin FTSE Asia Ex Japan ETF was comprised of pure-index exchange-traded funds, which included the Fund and two other Pacificex-Japan funds. |
| | • | | The Expense Group for the Franklin FTSE Australia ETF was comprised of pure-index exchange-traded funds, which included the Fund and one other Pacific region fund. |
| | • | | The Expense Group for the Franklin FTSE Brazil ETF was comprised of pure-index exchange-traded funds, which included the Fund and two other Latin American funds. |
| | • | | The Expense Group for the Franklin FTSE Canada ETF was comprised of pure-index exchange-traded funds, which included the Fund and two internationalmulti-cap core funds. |
| | • | | The Expense Group for the Franklin FTSE China ETF was comprised of pure-index exchange-traded funds, which included the Fund and seven other China region funds. |
| | • | | The Expense Group for the Franklin FTSE Europe ETF was comprised of pure-index exchange-traded funds, which included the Fund and five other European region funds. |
| | • | | The Expense Group for the Franklin FTSE Europe Hedged ETF was comprised of pure-index exchange-traded funds, which included the Fund and three other European region funds. |
| | • | | The Expense Group for the Franklin FTSE France ETF was comprised of pure-index exchange-traded funds, |
| | | | | | |
| | | |
| franklintempleton.com | | Semiannual Report | | | 325 | |
FRANKLIN TEMPLETON ETF TRUST
SHAREHOLDER INFORMATION
| | | which included the Fund and three other European region funds. |
| | • | | The Expense Group for the Franklin FTSE German ETF was comprised of pure-index exchange-traded funds, which included the Fund and four other European region funds. |
| | • | | The Expense Group for the Franklin FTSE Hong Kong ETF was comprised of pure-index exchange-traded funds, which included the Fund and one other China region fund. |
| | • | | The Expense Group for the Franklin FTSE India ETF was comprised of pure-index exchange-traded funds, which included the Fund and four other India region funds. |
| | • | | The Expense Group for the Franklin FTSE Italy ETF was comprised of pure-index exchange-traded funds, which included the Fund and one other European region fund. |
| | • | | The Expense Group for the Franklin FTSE Japan ETF was comprised of pure-index exchange-traded funds, which included the Fund and four other Japanese funds. |
| | • | | The Expense Group for the Franklin FTSE Japan Hedged ETF was comprised of pure-index exchange-traded funds, which included the Fund and four other Japanese funds. |
| | • | | The Expense Group for the Franklin FTSE Mexico ETF was comprised of pure-index exchange-traded funds, which included the Fund and two other Latin American funds. |
| | • | | The Expense Group for the Franklin FTSE Russia ETF was comprised of pure-index exchange-traded funds, which included the Fund and two other emerging markets funds. |
| | • | | The Expense Group for the Franklin FTSE South Korea ETF was comprised of pure-index exchange-traded funds, which included the Fund and two other Pacificex-Japan funds. |
| | • | | The Expense Group for the Franklin FTSE Switzerland ETF was comprised of pure-index exchange-traded funds, which included the Fund and one other European region fund. |
| | • | | The Expense Group for the Franklin FTSE Taiwan ETF was comprised of pure-index exchange-traded funds, which included the Fund and one other China region fund. |
| | • | | The Expense Group for the Franklin FTSE United Kingdom ETF was comprised of pure-index exchange-traded funds, which included the Fund and three other European region funds. |
The Board noted that the Management Rates and actual total expense ratios for the Funds were below the medians of their respective Expense Groups, except that the actual total expense ratio for the Franklin FTSE Mexico ETF was equal to the median of its Expense Group. The Board also noted the small size of each Fund’s Expense Group, except for the Franklin FTSE China ETF which had 8 peers in its Expense Group. The Board further noted each Fund’s unified management fee (Unified Fee). The Board also noted that pursuant to the Unified Fee arrangement the Manager reimburses the Fund for all of its acquired fund fees and expenses (if any) and pays all of the ordinary operating expenses of the Fund, except for (i) the Fund’s investment management fee, (ii) payments under the Fund’s Rule12b-1 plan (if any), (iii) brokerage expenses, (iv) taxes, (v) interest (including borrowing costs and dividend expenses on securities sold short and overdraft charges), (vi) litigation expenses (including litigation to which the Trust or the Fund may be a party and indemnification of the Trustees and officers with respect thereto), and (vii) othernon-routine or extraordinary expenses (Unified Fee Arrangement). The Board concluded that the Management Rate charged to each Fund is reasonable.
PROFITABILITY. The Board reviewed and considered information regarding the profits realized by the Manager and its affiliates in connection with the operation of each Fund. In this respect, the Board considered the Fund profitability analysis that addresses the overall profitability of FT’s US fund business, as well as its profits in providing investment management and other services to each of the individual funds during the12-month period ended September 30, 2018, being the most recent fiscalyear-end for FRI. The Board noted that although management continually makes refinements to its methodologies used in calculating profitability in response to organizational and product-related changes, the overall methodology has remained consistent with that used in the Funds’ profitability report presentations from prior years. Additionally, PricewaterhouseCoopers LLP, auditor to FRI and certain Franklin Templeton funds, has been engaged to periodically review and assess the allocation methodologies to be used solely by the Funds’ Board with respect to the profitability analysis.
The Board noted management’s belief that costs incurred in establishing the infrastructure necessary for the type of fund operations conducted by the Manager and its affiliates may not be fully reflected in the expenses allocated to each Fund in determining its profitability, as well as the fact that the level of profits, to a certain extent, reflected operational cost savings and efficiencies initiated by management. The Board
| | | | |
| | | |
| 326 | | Semiannual Report | | franklintempleton.com |
FRANKLIN TEMPLETON ETF TRUST
SHAREHOLDER INFORMATION
also noted management’s expenditures in improving shareholder services provided to the Funds, as well as the need to implement systems and meet additional regulatory and compliance requirements resulting from recent SEC and other regulatory requirements.
The Board also considered the extent to which the Manager and its affiliates might derive ancillary benefits from fund operations, including revenues generated from transfer agent services, potential benefits resulting from personnel and systems enhancements necessitated by fund growth, as well as increased leverage with service providers and counterparties. Based upon its consideration of all these factors, the Board concluded that the level of profits realized by the Manager and its affiliates from providing services to each Fund was not excessive in view of the nature, extent and quality of services provided to each Fund.
ECONOMIES OF SCALE. The Board reviewed and considered the extent to which the Manager may realize economies of scale, if any, as each Fund grows larger and whether each Fund’s management fee structure reflects any economies of scale for the benefit of shareholders. The Board considered that each Fund would likely experience benefits from the Unified Fee at the Fund’s projected asset levels because of the Manager’s contractual requirement to bear most of the Fund’s ordinary operating expenses. The Board noted that, under the Unified Fee, it is not anticipated that any of the Funds will generate significant, if any, profit for the Manager and/or its affiliates for some time. The Board considered the Manager’s view that any analyses of potential economies of scale in managing a particular fund are inherently limited in light of the joint and common costs and investments the Manager incurs across the Franklin Templeton family of funds as a whole. The Board noted that at the end of 2018, the net assets of each Fund were less than $68 million (and in most cases much less), except for the Franklin FTSE Japan ETF which had assets of approximately $258 million. The Board recognized that there would not likely be any economies of scale until these Funds’ assets grow.
CONCLUSION. Based on its review, consideration and evaluation of all factors it believed relevant, including the above-described factors and conclusions, the Board unanimously approved the continuation of each Management Agreement for an additionalone-year period.
Proxy Voting Policies and Procedures
The Trust’s investment manager has established Proxy Voting Policies and Procedures (Policies) that the Trust uses to determine how to vote proxies relating to portfolio securities. Shareholders may view the Trust’s complete Policies online at franklintempleton.com. Alternatively, shareholders may request copies of the Policies free of charge by calling the Proxy Group collect at (954)527-7678 or by sending a written request to: Franklin Templeton Companies, LLC, 300 S.E. 2nd Street, Fort Lauderdale, FL 33301, Attention: Proxy Group. Copies of the Trust’s proxy voting records are also made available online at franklintempleton.com and posted on the U.S. Securities and Exchange Commission’s website at sec.gov and reflect the most recent12-month period ended June 30.
Quarterly Statement of Investments
The Trust files a complete statement of investments with the U.S. Securities and Exchange Commission for the first and third quarters for each fiscal year as an exhibit to its report on FormN-PORT. Shareholders may view the filedForm N-PORT by visiting the Commission’s website at sec.gov. The filed form may also be viewed and copied at the Commission’s Public Reference Room in Washington, DC. Information regarding the operations of the Public Reference Room may be obtained by calling(800) SEC-0330.
Premium/Discount Information
Information about the differences between the daily market price on the secondary market for the shares of the Fund and the Fund’s net asset value may be found on the Fund’s website at franklintempleton.com.
| | | | | | |
| | | |
| franklintempleton.com | | Semiannual Report | | | 327 | |
Authorized for distribution only when accompanied or preceded by a summary prospectus and/or prospectus. Investors should carefully consider a fund’s investment goals, risks, charges and expenses before investing. A prospectus contains this and other information; please read it carefully before investing.
To help ensure we provide you with quality service, all calls to and from our service areas are monitored and/or recorded.
| | | | | | |
 | | Semiannual Report Franklin Templeton ETF Trust | | |
| | | |
| | Investment Manager | | Distributor | | Investor Services |
| | Franklin Advisory Services, LLC | | Franklin Templeton Distributors, Inc. (800) DIAL BEN®/342-5236 franklintempleton.com | | Transfer Agent State Street Bank and
Trust Company 1 Heritage Drive
Mail Stop OHD0100 North Quincy, MA 02171 |
| © 2019 Franklin Templeton Investments. All rights reserved. | | | | ETF5 S 11/19 |
SEMIANNUAL REPORT
FRANKLIN TEMPLETON
ETF TRUST
September 30, 2019


| | |
Franklin Liberty High Yield Corporate ETF | | Franklin Liberty Senior Loan ETF |
Franklin Liberty International Aggregate Bond ETF | | |
Internet Delivery of Fund Reports Unless You Request Paper Copies: Effective January 1, 2021, as permitted by the SEC, paper copies of the Fund’s shareholder reports will no longer be sent by mail, unless you specifically request them from the Fund or your financial intermediary. Instead, the reports will be made available on a website, and you will be notified by mail each time a report is posted and provided with a website link to access the report.
If you already elected to receive shareholder reports electronically, you will not be affected by this change and you need not take any action. If you have not signed up for electronic delivery, we would encourage you to join fellow shareholders who have. You may elect to receive shareholder reports and other communications electronically from the Fund by calling(800) 632-2301 or by contacting your financial intermediary.
You may elect to continue to receive paper copies of all your future shareholder reports free of charge by contacting your financial intermediary or, if you invest directly with a Fund, calling(800) 632-2301 to let the Fund know of your request. Your election to receive reports in paper will apply to all funds held in your account.
Franklin Templeton Investments
Successful investing begins with ambition. And achievement only comes when you reach for it. That’s why we continually strive to deliver better outcomes for investors. No matter what your goals are, our deep, global investment expertise allows us to offer solutions that can help.
During our more than 70 years of experience, we’ve managed through all kinds of markets—up, down and those in between. We’re always preparing for what may come next. It’s because of this, combined with our strength as one of the world’s largest asset managers that we’ve earned the trust of millions of investors around the world.
Visitfranklintempleton.com/investor/investments-and-solutions/investment-options/etfs/for fund updates and documents.
| | | | | | | | |
| Not FDIC Insured | | | | | May Lose Value | | | | | No Bank Guarantee |
| | | | | | |
| | | |
| franklintempleton.com | | Not part of the semiannual report | | | 1 | |
SEMIANNUAL REPORT
Economic and Market Overview
The U.S. economy expanded during the six months ended September 30, 2019. However, the economy moderated in 2019’s second and third quarters, due partly to weakness in inventory and business investment. The manufacturing sector expanded during the period’s first four months, but contracted in August and September 2019. The services sector continued to expand throughout the period, although the rate of expansion slowed in September. The unemployment rate decreased from 3.8% in March 2019 to 3.5% atperiod-end.1 The annual inflation rate, as measured by the Consumer Price Index, decreased from 1.9% in March 2019 to 1.7% atperiod-end.1
At its July 2019 meeting, the U.S. Federal Reserve (Fed) lowered its target range for the federal funds rate for the first time since December 2008, to 2.00%–2.25%, citing muted inflation pressures and the potential effects of global trade tensions on economic growth. Furthermore, the Fed ended its balance sheet normalization program earlier than previously indicated. In September, the Fed further lowered the federal funds target rate range to 1.75%–2.00%, reiterating the rationale cited at the July 2019 meeting.
The10-year Treasury yield, which moves inversely to its price, decreased during the period. The yield rose briefly at the start of the period, but fell to multi-year lows in 2019’s third quarter. Political uncertainties in the U.S. (including the impeachment inquiry into President Donald Trump), geopolitical tensions in certain regions, slower domestic and global economic growth, the Fed’s more accommodative monetary policy stance and expectations of more stimulus from global central banks weighed on the Treasury yield at certain points during the period. However, several better-than-expected U.S. economic reports and periods of optimism about a potential U.S.-China trade deal supported the yield. The10-year yield persistently fell below certain short-term yields due to weaker economic data, escalating U.S. trade tensions with China and other trading partners, and the Fed’s recent monetary policy easing. Overall, the10-year Treasury yield declined from 2.41% at the beginning of the period to 1.68% atperiod-end.
International bonds outside the U.S. generally registered strong gains over the review period, as yields in many government bond markets fell to record low levels, amid heightened concerns among investors about global economic growth and trade tensions. Many central banks eased monetary policy, with the U.S. Fed cutting interest rates in July and September, and the European Central Bank responding with a package of easing measures in September, including a rate cut and restarting its bond purchases. The overall impact of global headwinds on the U.S. economy remained unclear, and while data showed that overall growth had slowed in the second quarter, activity remained robust in many areas, particularly consumer spending. The eurozone economy, however, appeared more vulnerable to global trade concerns than the U.S., and activity in many member countries showed what we considered signs of faltering. We believe Germany, in particular, appeared to be close to a recession.
The foregoing information reflects our analysis and opinions as of September 30, 2019. The information is not a complete analysis of every aspect of any market, country, industry, security or fund. Statements of fact are from sources considered reliable.
1. Source: Bureau of Labor Statistics
| | | | |
| | | |
| 2 | | Semiannual Report | | franklintempleton.com |
Franklin Liberty High Yield Corporate ETF
This semiannual report for Franklin Liberty High Yield Corporate ETF covers the period ended September 30, 2019.
Your Fund’s Goal and Main Investments
The Fund seeks a high level of current income with a secondary goal of seeking capital appreciation to the extent it is possible and consistent with the Fund’s principal goal. The Fund invests at least 80% of its net assets in high yield corporate debt securities and investments that provide exposure to high yield corporate debt securities, including fixed or floating rate corporate loans and corporate debt securities.
Performance Overview
During thesix-month period, the Fund posted cumulative total returns of +4.54% based on market price and +4.43% based on net asset value (NAV). In comparison, the ICE BofAML U.S. High Yield Constrained Index posted a +3.82% total return for the same period.1 You can find more of the Fund’s performance data in the Performance Summary beginning on page 6.
Performance data represent past performance, which does not guarantee future results. Investment return and principal value will fluctuate, and you may have a gain or loss when you sell your shares. Current performance may differ from figures shown. For most recentmonth-end performance, go tofranklintempleton.com or call(800)342-5236.
Investment Strategy
The Fund may invest up to 100% of its total assets in high yield debt securities. The Fund may buy both rated and unrated debt securities, including securities rated below B by Moody’s or Standard & Poor’s® (or deemed comparable by the Fund’s investment manager). The Fund may invest in fixed or floating rate corporate loans and corporate debt securities. The Fund may also invest in defaulted debt securities. The Fund may invest in debt securities of any maturity or duration.
The Fund may invest in debt securities of U.S. and foreign issuers, including those in developing or emerging markets.
| | | | |
| Top 10 Sectors/Industries | | | |
| |
| 9/30/19 | | | |
| |
| | | % of Total
Net Assets | |
Media | | | 11.2% | |
Containers & Packaging | | | 9.4% | |
Oil, Gas & Consumable Fuels | | | 7.9% | |
Hotels Restaurants & Leisure | | | 5.5% | |
Health Care Providers & Services | | | 5.1% | |
Machinery | | | 4.7% | |
Entertainment | | | 4.6% | |
Chemicals | | | 4.3% | |
Energy Equipment & Services | | | 3.4% | |
Pharmaceuticals | | | 3.2% | |
The Fund may enter into certain derivative transactions, principally currency and cross currency forwards; and swap agreements, including interest rate and credit default swaps (including credit default index swaps). The use of these derivative transactions may allow the Fund to obtain net long or short exposures to select currencies, interest rates, countries, durations or credit risks.
We are research driven, fundamental investors who rely on our team of analysts to providein-depth industry expertise and use qualitative and quantitative analysis to evaluate companies. Asbottom-up investors, we focus primarily on individual securities but consider sectors when choosing investments. In selecting securities, we do not rely principally on the ratings assigned by rating agencies, but perform our own independent investment analysis to evaluate the creditworthiness of the issuer. We consider a variety of factors, including the issuer’s experience and managerial strength, its sensitivity to economic conditions, and its current and prospective financial condition.
What is a currency forward contract?
A currency forward contract, or a currency forward, is an agreement between the Fund and a counterparty to buy or sell a foreign currency in exchange for another currency at a specific exchange rate on a future date.
1. Source: Factset.
The index is unmanaged and includes reinvestment of any income or distributions. It does not reflect any fees, expenses or sales charges. One cannot invest directly in an index, and an index is not representative of the Fund’s portfolio.
See www.franklintempletondatasources.com for additional data provider information.
The dollar value, number of shares or principal amount, and names of all portfolio holdings are listed in the Fund’s Statement of Investments (SOI). The SOI begins on page 21.
| | | | | | |
| | | |
| franklintempleton.com | | Semiannual Report | | | 3 | |
FRANKLIN LIBERTY HIGH YIELD CORPORATE ETF
|
| Portfolio Composition |
|
| Based on Total Net Assets as of 9/30/19 |
|
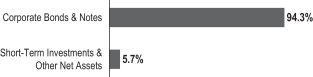 |
What is a credit default swap?
A credit default swap, or CDS, is an agreement between two parties whereby the buyer receives credit protection from the seller. The buyer makes periodic payments over the term of the agreement in return for a payment by the seller in the event of a default or other credit event.
Manager’s Discussion
High-yield corporate bonds generally performed well during the period under review, as the benchmark ICE BofAML U.S. High Yield Constrained Index returned +3.82%. However, performance was decidedly more mixed compared to the first three months of the calendar year, as the market experienced meaningful trade policy-related sell-offs in May and early August. Market drivers included slowing economic data, increasingly accommodative central banks and headlines about global trade disputes. Standard & Poor’s 500® Index corporate earnings were weaker compared to the prior year, but corporate credit metrics remained broadly stable.
U.S. Treasury yields generally declined across the curve and lower government bond yields globally likely helped to support demand for high-yield corporate bonds during the period, particularly for higher rated segments of the market, which notably outperformed. Based on Bloomberg Barclays High Yield indexes, BB rated bonds led the way with a return of +5.17%, compared to respective returns of +4.35% and-1.47% for the B and CCC rated segments. Based on the ICE BofAML U.S. High Yield Index, high-yield spreads narrowed very slightly from 405 basis points (bps) to 402 bps, levels that belied market volatility more accurately captured by a low of 364 bps inmid-May and a high of 470 bps in early June. From an industry standpoint, all major groups posted positive total returns during the period with the exception of energy, which underperformed by a notable margin as volatile oil prices and geopolitical tensions in the Middle East presented headwinds for the segment. Despite positive absolute results, health care, metals and mining, and chemicals all lagged the broader high-yield market as well. In contrast, the retail, financial services and housing industries posted strong performance during the period.
| | | | |
| Top 10 Fund Holdings | | | |
| |
| 9/30/19 | | | |
| |
Company Sector/Industry | | % of Total
Net Assets | |
FHLB, 1.602%, 10/01/2019 Bank | | | 3.3% | |
CCO Holdings LLC / CCO Holdings Capital Corp., senior bond, senior bond, 144A, 5.375%, 6/01/2029 Media | | | 2.4% | |
Cheniere Energy Partners LP, senior bond, 144A, senior secured note, first lien, 5.25%, 10/01/2025 Oil, Gas & Consumable Fuels | | | 2.3% | |
CSC Holdings LLC, senior bond, 144A, 6.625%, 10/15/2025 Media | | | 2.1% | |
Altice Luxembourg SA, first lien, 144A, 10.50%, 5/15/2027 Media | | | 1.5% | |
Performance Food Group Inc., senior note, 144A, 5.50%, 10/15/2027 Food & Staples Retailing | | | 1.4% | |
Trivium Packaging Finance BV, senior secured note, 144A, 5.50%, 8/15/2026 Containers & Packaging | | | 1.4% | |
Ardagh Packaging Finance PLC / Ardagh Holdings USA Inc., senior note, 144A, 6.00%, 2/15/2025 Containers & Packaging | | | 1.4% | |
CyrusOne LP / CyrusOne Finance Corp., senior note, 5.00%, 3/15/2024 Equity Real Estate Investment Trusts | | | 1.3% | |
Terex Corp., senior note, 144A, 5.625%, 2/01/25 Machinery | | | 1.3% | |
The Fund outperformed its benchmark as well as its Morningstar High Yield category average both in market price and NAV terms.
During the period, the primary driver of relative performance was the overall allocation effect, which saw meaningful contributions from both quality and sector contexts. Specifically, the Fund benefited from its overweight exposures to BBB and BB rated bonds, which outperformed, along with its concurrent underweight to CCC bonds, which notably underperformed during the period. The quality trend also generally applied to the Fund’s sector performance, where the Fund benefited significantly from its underweight to the energy sector. The Fund’s overweight to the building industry also contributed as it outperformed the broader market for the period.
| | | | |
| | | |
| 4 | | Semiannual Report | | franklintempleton.com |
FRANKLIN LIBERTY HIGH YIELD CORPORATE ETF
In contrast, security selection detracted from relative results overall, with energy representing a major detractor as select holdings experienced bouts of distress during the period. For similar reasons, the packaging sector also detracted based on a select holding which struggled due to idiosyncratic factors. We continued to see positive selection effects across several sectors, particularly in the media/cable and health care sectors.
The Fund held only cash bonds during the period and had no exposure to derivatives.
Thank you for your participation in Franklin Liberty High Yield Corporate ETF. We look forward to serving your future investment needs.
| | |
 | | 
Glenn I. Voyles, CFA® |
| | |
 | | 
Patricia O’Connor, CFA |
| |
| | Portfolio Management Team |
The foregoing information reflects our analysis, opinions and portfolio holdings as of September 30, 2019, the end of the reporting period. The way we implement our main investment strategies and the resulting portfolio holdings may change depending on factors such as market and economic conditions. These opinions may not be relied upon as investment advice or an offer for a particular security. The information is not a complete analysis of every aspect of any market, country, industry, security or the Fund. Statements of fact are from sources considered reliable, but the investment manager makes no representation or warranty as to their completeness or accuracy. Although historical performance is no guarantee of future results, these insights may help you understand our investment management philosophy.
CFA® is a trademark owned by CFA Institute.
| | | | | | |
| | | |
| franklintempleton.com | | Semiannual Report | | | 5 | |
FRANKLIN LIBERTY HIGH YIELD CORPORATE ETF
Performance Summary as of September 30, 2019
Total return reflects reinvestment of the Fund’s dividends and capital gain distributions, if any, and any unrealized gains or losses. Total returns do not include brokerage commissions that may be payable on secondary market transactions. The performance tables do not reflect any taxes that a shareholder would pay on Fund dividends, capital gain distributions, if any, or any realized gains on the sale of Fund shares.
Net asset value or “NAV” is the value of one share of a fund as calculated in accordance with the standard formula for valuing mutual fund shares. The price used to calculate market return (Market Price) is determined by using the midpoint between the highest bid and the lowest offer on the primary stock exchange on which shares of a fund are listed for trading, as of the time that such fund’s NAV is calculated. Since shares of the Fund did not trade in the secondary market until after the Fund’s inception, for the period from inception to the first day of secondary trading (6/1/18), the NAV of the Fund is used as a proxy for the Market Price to calculate market returns. Market and NAV returns assume that dividends and capital gain distributions have been reinvested at Market Price and NAV.
Your dividend income will vary depending on dividends or interest paid by securities in the Fund’s portfolio, adjusted for operating expenses. Capital gain distributions are net profits realized from the sale of portfolio securities.
Performance as of 9/30/191
| | | | | | | | | | | | | | | | |
| | |
| | | Cumulative Total Return2 | | | Average Annual Total Return2 | |
| | | Based on
NAV3 | | | Based on market price4 | | | Based on
NAV3 | | | Based on market price4 | |
6-Month7 | | | +4.43% | | | | +4.54% | | | | +4.43% | | | | +4.54% | |
1-Year | | | +8.28% | | | | +8.73% | | | | +8.28% | | | | +8.73% | |
Since Inception (5/30/18) | | | +11.82% | | | | +12.28% | | | | +8.71% | | | | +9.05% | |
| | | | | | | | |
| |
| | | 30-Day Standardized Yield6 | |
| Distribution Rate5 | | (with fee waiver) | | | (without fee waiver) | |
2.16% | | | 4.97% | | | | 4.09% | |
Performance data represent past performance, which does not guarantee future results. Investment return and principal value will fluctuate, and you may have a gain or loss when you sell your shares. Current performance may differ from figures shown. For most recentmonth-end performance, go to franklintempleton.com or call(800)342-5236.
See page 7 for Performance Summary footnotes.
| | | | |
| | | |
| 6 | | Semiannual Report | | franklintempleton.com |
FRANKLIN LIBERTY HIGH YIELD CORPORATE ETF
PERFORMANCE SUMMARY
Distributions(4/1/19–9/30/19)
|
|
Net Investment
Income |
$0.827208 |
Total Annual Operating Expenses8
| | | | |
| |
With Fee Waiver | | Without
Fee Waiver | |
0.40% | | | 1.54% | |
All investments involve risks, including possible loss of principal. Bond prices generally move in the opposite direction of interest rates. Thus, as the prices of bonds in the Fund adjust to a rise in interest rates, the Fund’s share price may decline. Distributions to shareholders may decline when prevailing interest rates fall or when the Fund experiences defaults on debt securities it holds. The high-yield corporate debt securities and instruments in which the Fund invests tend be rated below investment grade. Investing in higher-yielding, lower-rated corporate debt securities and instruments involves greater risk of default, which could result in loss of principal—a risk that may be heightened in a slowing economy. Changes in the financial strength of a bond issuer or in a bond’s credit rating may affect its value. The markets for particular securities or types of securities are or may become relatively illiquid. Reduced liquidity will have an adverse impact on the security’s value and on the Fund’s ability to sell such securities when necessary to meet the Fund’s liquidity needs or in response to a specific market event. Investing in derivative securities and the use of foreign currency techniques involve special risks as such may not achieve the anticipated benefits and/or may result in losses to the Fund. The Fund’s prospectus also includes a description of the main investment risks.
ETFs trade like stocks, fluctuate in market value and may trade at prices above or below their net asset value. Brokerage commissions and ETF expenses will reduce returns.
1. The Fund has a fee waiver and/or expense reimbursement contractually guaranteed through 7/31/20. Fund investment results reflect the expense reduction; without this reduction, the results would have been lower.
2. Total return calculations represent the cumulative and average annual changes in value of an investment over the period indicated. Return for less than one year, if any, has not been annualized.
3. Assumes reinvestment of distributions based on net asset value.
4. Assumes reinvestment of distributions based on market price.
5. Distribution rate is based on an annualization of the September dividend and the NAV per share on 9/30/19.
6. The Fund’s30-day standardized yield is calculated over a trailing30-day period using the yield to maturity on bonds and/or the dividends accrued on stocks. It may not equal the Fund’s actual income distribution rate, which reflects the Fund’s past dividends paid to shareholders.
7. Total return information is based on net asset values calculated for shareholder transactions. Certain adjustments were made to the net assets of the Fund at 9/30/19 for financial reporting purposes, and as a result, the total returns based on those net asset values differ from the adjusted total returns reported in the Financial Highlights.
8. Figures are as stated in the Fund’s current prospectus and may differ from the expense ratios disclosed in the Your Fund’s Expenses and Financial Highlights sections in this report. In periods of market volatility, assets may decline significantly, causing total annual Fund operating expenses to become higher than the figures shown.
| | | | | | |
| | | |
| franklintempleton.com | | Semiannual Report | | | 7 | |
FRANKLIN LIBERTY HIGH YIELD CORPORATE ETF
Your Fund’s Expenses
As a Fund shareholder, you can incur two types of costs: (1) transaction costs, including brokerage commissions on purchases and sales of Fund shares; and (2) ongoing Fund costs, including management fees and other Fund expenses. All funds have ongoing costs, sometimes referred to as operating expenses. The table below shows ongoing costs of investing in the Fund and can help you understand these costs and compare them with those of other funds. The table assumes a $1,000 investment held for the six months indicated.
Actual Fund Expenses
The table below provides information about actual account values and actual expenses in the columns under the heading “Actual.” In these columns the Fund’s actual return, which includes the effect of Fund expenses, is used to calculate the “Ending Account Value.” You can estimate the expenses you paid during the period by following these steps (of course, your account value and expenses will differ from those in this illustration): Divide your account value by $1,000 (if your account had an $8,600 value, then $8,600÷ $1,000 = 8.6). Then multiply the result by the number in the row under the headings “Actual” and “Expenses Paid During Period” (if Actual Expenses Paid During Period were $ 7.50, then 8.6× $ 7.50 = $64.50). In this illustration, the actual expenses paid this period are $64.50.
Hypothetical Example for Comparison with Other Funds
Under the heading “Hypothetical” in the table, information is provided about hypothetical account values and hypothetical expenses based on the Fund’s actual expense ratio and an assumed rate of return of 5% per year before expenses, which is not the Fund’s actual return. This information may not be used to estimate the actual ending account balance or expenses you paid for the period, but it can help you compare ongoing costs of investing in the Fund with those of other funds. To do so, compare this 5% hypothetical example with the 5% hypothetical examples that appear in the shareholder reports of other funds.
Please note that expenses shown in the table are meant to highlight ongoing costs and do not reflect any transactional costs.Therefore, information under the heading “Hypothetical” is useful in comparing ongoing costs only, and will not help you compare total costs of owning different ETFs. In addition, if transactional costs were included, your total costs would have been higher.
| | | | | | | | | | | | | | | | | | | | | | |
| | | | Actual (actual return after expenses) | | | Hypothetical (5% annual return before expenses) | | | | |
| | | | | |
Beginning
Account
Value 4/1/19 | | | Ending
Account
Value 9/30/19 | | | Expenses
Paid During
Period
4/1/19–9/30/191,2 | | | Ending
Account
Value 9/30/19 | | | Expenses
Paid During
Period
4/1/19–9/30/191,2 | | | Net Annualized
Expense Ratio2 | |
| | $1,000.00 | | | $ | 1,044.30 | | | $ | 2.04 | | | $ | 1,023.00 | | | $ | 2.02 | | | | 0.40 | % |
1. Expenses are equal to the annualized expense ratio for thesix-month period as indicated above—in the far right column—multiplied by the simple average account value over the period indicated, and then multiplied by 183/366 to reflect theone-half year period.
2. Reflects expenses after fee waivers and expense reimbursements.
| | | | |
| | | |
| 8 | | Semiannual Report | | franklintempleton.com |
Franklin Liberty International Aggregate Bond ETF
This semiannual report for Franklin Liberty International Aggregate Bond ETF covers the period ended September 30, 2019.
Your Fund’s Goal and Main Investments
The Fund seeks total investment return, consisting of a combination of interest income and capital appreciation. Under normal market conditions, the Fund invests at least 80% of its net assets in bonds and investments that provide exposure to bonds.
Performance Overview
During thesix-month period, the Fund posted cumulative total returns of +5.09% based on market price and +5.02% based on net asset value (NAV). In comparison, the Bloomberg Barclays Global Aggregateex-USD Index posted a +2.82% total return for the same period.1 You can find more of the Fund’s performance data in the Performance Summary beginning on page 11.
Performance data represent past performance, which does not guarantee future results. Investment return and principal value will fluctuate, and you may have a gain or loss when you sell your shares. Current performance may differ from figures shown. For most recentmonth-end performance, go tofranklintempleton.com or call(800)342-5236.
Investment Strategy
The Fund invests predominantly in fixed and floating-rate bonds issued by governments, government agencies and governmental-related or corporate issuers located outside the U.S. The Fund may also invest in securities or structured products that are linked to or derive their value from another security, asset or currency of any nation. In addition, the Fund’s assets are invested in issuers located in at least three countries (excluding the U.S.).
The Fund may invest in debt securities of any maturity or duration, and the average maturity or duration of debt securities in the Fund’s portfolio will fluctuate depending on the investment manager’s outlook on changing market, economic and political conditions.
| | | | |
| Geographic Composition | | | |
| |
| Based on Total Net Assets as of 9/30/19 | | | |
| |
Europe | | | 57.7% | |
Asia | | | 16.8% | |
Supranationals | | | 8.6% | |
North America | | | 4.8% | |
Australia & New Zealand | | | 2.2% | |
Latin America & Caribbean | | | 1.0% | |
Middle East & Africa | | | 0.5% | |
Short-Term Investments & Other Net Assets | | | 8.4% | |
The Fund is a“non-diversified” fund, which means it generally invests a greater portion of its assets in the securities of one or more issuers and invests overall in a smaller number of issuers than a diversified fund.
What is duration?
Duration is a measure of a bond’s price sensitivity to interest rate changes. In general, a portfolio of securities with a lower duration can be expected to be less sensitive to interest rate changes than a portfolio with a higher duration.
When choosing investments for the Fund, we allocate the Fund’s assets based upon our assessment of changing market, political and economic conditions. We consider various factors, including evaluation of interest rates, currency exchange rate changes and credit risks. We may consider selling a security when we believe the security has become fully valued due to either its price appreciation or changes in the issuer’s fundamentals, or when we believe another security is a more attractive investment opportunity.
Manager’s Discussion
The Fund’s security selection and sector allocation contributed to relative returns, boosted mainly by positioning in Italian and Spanish government bonds as well as selection among corporate financial issues.
The Fund’s duration and yield-curve positioning also helped relative results, largely due to overweight duration exposure to eurozone and Polish bonds. An underweight duration
1. Source: Factset.
The index is unmanaged and includes reinvestment of any income or distributions. It does not reflect any fees, expenses or sales charges. One cannot invest directly in an index, and an index is not representative of the Fund’s portfolio.
See www.franklintempletondatasources.com for additional data provider information
The dollar value, number of shares or principal amount, and names of all portfolio holdings are listed in the Fund’s Statement of Investments (SOI). The SOI begins on page 25.
| | | | | | |
| | | |
| franklintempleton.com | | Semiannual Report | | | 9 | |
FRANKLIN LIBERTY INTERNATIONAL AGGREGATE BOND ETF
|
| Portfolio Composition |
|
| Based on Total Net Assets as of 9/30/19 |
|
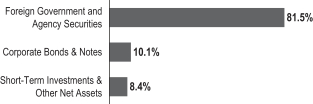 |
position in U.K. issues taken early in the period had a positive impact, although a similar stance in Canadian debt detracted from relative performance.
The Fund’s currency positioning further added to relative returns, partly due to underweight exposures to the Chinese renminbi and South Korean won. However, an overweight allocation to the Polish zloty weighed on relative results.
In contrast, the Fund’s local market allocation slightly detracted from relative returns, largely as a result of an overweight exposure to the Polish market.
Effective October 15, 2019, after period-end, David Zahn, CFA, and Patrick Klein, Ph.D., were added asco-lead portfolio managers, joining currentco-lead portfolio managers John Beck and Sonal Desai, Ph.D.
Thank you for your participation in Franklin Liberty International Aggregate Bond ETF. We look forward to serving your future investment needs.
| | |
 | | 
John Beck Co-Lead Portfolio Manager |
| | |
 | | 
Sonal Desai, Ph.D. Co-Lead Portfolio Manager |
The foregoing information reflects our analysis, opinions and portfolio holdings as of September 30, 2019, the end of the reporting period. The way we implement our main investment strategies and the resulting portfolio holdings may change depending on factors such as market and economic conditions. These opinions may not be relied upon as investment advice or an offer for a particular security. The information is not a complete analysis of every aspect of any market, country, industry, security or the Fund. Statements of fact are from sources considered reliable, but the investment manager makes no representation or warranty as to their completeness or accuracy. Although historical performance is no guarantee of future results, these insights may help you understand our investment management philosophy.
| | | | |
| | | |
| 10 | | Semiannual Report | | franklintempleton.com |
FRANKLIN LIBERTY INTERNATIONAL AGGREGATE BOND ETF
Performance Summary as of September 30, 2019
Total return reflects reinvestment of the Fund’s dividends and capital gain distributions, if any, and any unrealized gains or losses. Total returns do not include brokerage commissions that may be payable on secondary market transactions. The performance tables do not reflect any taxes that a shareholder would pay on Fund dividends, capital gain distributions, if any, or any realized gains on the sale of Fund shares.
Net asset value or “NAV” is the value of one share of a fund as calculated in accordance with the standard formula for valuing mutual fund shares. The price used to calculate market return (Market Price) is determined by using the midpoint between the highest bid and the lowest offer on the primary stock exchange on which shares of a fund are listed for trading, as of the time that such fund’s NAV is calculated. Since shares of the Fund did not trade in the secondary market until after the Fund’s inception, for the period from inception to the first day of secondary trading (6/1/18), the NAV of the Fund is used as a proxy for the Market Price to calculate market returns. Market and NAV returns assume that dividends and capital gain distributions have been reinvested at Market Price and NAV.
Your dividend income will vary depending on dividends or interest paid by securities in the Fund’s portfolio, adjusted for operating expenses. Capital gain distributions are net profits realized from the sale of portfolio securities.
Performance as of 9/30/191
| | | | | | | | | | | | | | | | |
| | |
| | | Cumulative Total Return2 | | | Average Annual Total Return2 | |
| | | Based on
NAV3 | | | Based on
market price4 | | | Based on
NAV3 | | | Based on
market price4 | |
6-Month | | | +5.02% | | | | +5.09% | | | | +5.02% | | | | +5.09% | |
1-Year | | | +7.08% | | | | +7.85% | | | | +7.08% | | | | +7.85% | |
Since Inception (5/30/18) | | | +5.02% | | | | +5.22% | | | | +3.73% | | | | +3.88% | |
| | | | | | | | |
| |
| | | 30-Day Standardized Yield6 | |
| Distribution Rate5 | | (with fee waiver) | | | (without fee waiver) | |
2.15% | | | 0.46% | | | | -2.02% | |
Performance data represent past performance, which does not guarantee future results. Investment return and principal value will fluctuate, and you may have a gain or loss when you sell your shares. Current performance may differ from figures shown. For most recentmonth-end performance, go to franklintempleton.com or call(800)342-5236.
See page 12 for Performance Summary footnotes.
| | | | | | |
| | | |
| franklintempleton.com | | Semiannual Report | | | 11 | |
FRANKLIN LIBERTY INTERNATIONAL AGGREGATE BOND ETF
PERFORMANCE SUMMARY
Distributions(4/1/19–9/30/19)
|
|
Net Investment
Income |
$0.089110 |
Total Annual Operating Expenses7
| | | | |
| |
With Fee Waiver | | Without
Fee Waiver | |
0.25% | | | 2.32% | |
All investments involve risks, including possible loss of principal. Bond prices generally move in the opposite direction of interest rates. As the prices of bonds in the Fund adjust to a rise in interest rates, the Fund’s share price may decline. Changes in the financial strength of a bond issuer or in a bond’s credit rating may affect its value. The Fund’s investments in foreign securities involve certain risks including currency fluctuations, and economic and political uncertainties. Investments in developing markets involve heightened risks related to the same factors, in addition to those associated with their relatively small size and lesser liquidity. Investing in derivative securities and the use of foreign currency techniques involve special risks as such may not achieve the anticipated benefits and/or may result in losses to the Fund. The Fund may not achieve the anticipated benefits, and may realize losses when a counterparty fails to perform as promised. Sovereign debt securities are subject to various risks in addition to those relating to debt securities and foreign securities generally, including, but not limited to, the risk that a governmental entity may be unwilling or unable to pay interest and repay principal on its sovereign debt, or otherwise meet its obligations when due because of cash flow problems, insufficient foreign reserves, the relative size of the debt service burden to the economy as a whole, the government’s policy toward principal international lenders such as the International Monetary Fund, or the political considerations to which the government may be subject. The Fund’s prospectus also includes a description of the main investment risks.
ETFs trade like stocks, fluctuate in market value and may trade at prices above or below their net asset value. Brokerage commissions and ETF expenses will reduce returns.
1. The Fund has a fee waiver and/or expense reimbursement contractually guaranteed through 7/31/20. Fund investment results reflect the expense reduction; without this reduction, the results would have been lower.
2. Total return calculations represent the cumulative and average annual changes in value of an investment over the period indicated. Return for less than one year, if any, has not been annualized.
3. Assumes reinvestment of distributions based on net asset value.
4. Assumes reinvestment of distributions based on market price.
5. Distribution rate is based on an annualization of the September dividend and the NAV per share on 9/30/19.
6. The Fund’s30-day standardized yield is calculated over a trailing30-day period using the yield to maturity on bonds and/or the dividends accrued on stocks. It may not equal the Fund’s actual income distribution rate, which reflects the Fund’s past dividends paid to shareholders.
7. Figures are as stated in the Fund’s current prospectus and may differ from the expense ratios disclosed in the Your Fund’s Expenses and Financial Highlights sections in this report. In periods of market volatility, assets may decline significantly, causing total annual Fund operating expenses to become higher than the figures shown.
| | | | |
| | | |
| 12 | | Semiannual Report | | franklintempleton.com |
FRANKLIN LIBERTY INTERNATIONAL AGGREGATE BOND ETF
Your Fund’s Expenses
As a Fund shareholder, you can incur two types of costs: (1) transaction costs, including brokerage commissions on purchases and sales of Fund shares; and (2) ongoing Fund costs, including management fees and other Fund expenses. All funds have ongoing costs, sometimes referred to as operating expenses. The table below shows ongoing costs of investing in the Fund and can help you understand these costs and compare them with those of other funds. The table assumes a $1,000 investment held for the six months indicated.
Actual Fund Expenses
The table below provides information about actual account values and actual expenses in the columns under the heading “Actual.” In these columns the Fund’s actual return, which includes the effect of Fund expenses, is used to calculate the “Ending Account Value.” You can estimate the expenses you paid during the period by following these steps (of course, your account value and expenses will differ from those in this illustration):Divide your account value by $1,000 (if your account had an $8,600 value, then $8,600÷ $1,000 = 8.6).Then multiply the result by the number in the row under the headings “Actual” and “Expenses Paid During Period” (if Actual Expenses Paid During Period were $7.50, then 8.6 x $7.50 = $64.50).In this illustration, the actual expenses paid this period are $64.50.
Hypothetical Example for Comparison with Other Funds
Under the heading “Hypothetical” in the table, information is provided about hypothetical account values and hypothetical expenses based on the Fund’s actual expense ratio and an assumed rate of return of 5% per year before expenses, which is not the Fund’s actual return. This information may not be used to estimate the actual ending account balance or expenses you paid for the period, but it can help you compare ongoing costs of investing in the Fund with those of other funds. To do so, compare this 5% hypothetical example with the 5% hypothetical examples that appear in the shareholder reports of other funds.
Please note that expenses shown in the table are meant to highlight ongoing costs and do not reflect any transactional costs.Therefore, information under the heading “Hypothetical” is useful in comparing ongoing costs only, and will not help you compare total costs of owning different funds. In addition, if transactional costs were included, your total costs would have been higher.
| | | | | | | | | | | | | | | | | | | | | | |
| | | | Actual (actual return after expenses) | | | Hypothetical (5% annual return before expenses) | | | | |
| | | | | |
Beginning
Account
Value 4/1/19 | | | Ending
Account
Value 9/30/19 | | | Expenses
Paid During
Period
4/1/19–9/30/191,2 | | | Ending
Account
Value 9/30/19 | | | Expenses
Paid During
Period
4/1/19–9/30/191,2 | | | Net Annualized
Expense Ratio2 | |
| | $1,000.00 | | | $ | 1,050.20 | | | $ | 1.64 | | | $ | 1,023.40 | | | $ | 1.62 | | | | 0.32 | %3 |
1. Expenses are equal to the annualized expense ratio for thesix-month period as indicated above—in the far right column—multiplied by the simple average account value over the period indicated, and then multiplied by 183/366 to reflect theone-half year period.
2. Reflects expenses after fee waivers and expense reimbursements.
3. Effective 08/01/19, the investment manager has contractually agreed to waive or assume certain expenses so that expenses (including acquired fund fees and expenses) do not exceed 0.25% (other than certain non-routine expenses) until 07/31/20. Prior to 08/01/19, the fund was capped at 0.35%. The table above is calculated at a rate of 0.32%, which reflects a blended rate for the period noted.
| | | | | | |
| | | |
| franklintempleton.com | | Semiannual Report | | | 13 | |
Franklin Liberty Senior Loan ETF
This semiannual report for Franklin Liberty Senior Loan ETF covers the period ended September 30, 2019.
Your Fund’s Goal and Main Investments
The Fund seeks to provide a high level of current income with a secondary goal of preservation of capital. The Fund invests at least 80% of its net assets in senior loans and investments that provide exposure to senior loans.
Performance Overview
During thesix-month period, the Fund posted cumulative total returns of +2.93% based on market price and +2.65% based on net asset value (NAV). In comparison, the Fund’s primary benchmark, the S&P/LSTA U.S. Leveraged Loan 100 Index, posted a +2.93% total return for the same period.1 The Fund’s additional benchmark, the Custom Franklin Senior Loan Index, posted a +3.75% total return for the same period.1 You can find more of the Fund’s performance data in the Performance Summary beginning on page 17.
Performance data represent past performance, which does not guarantee future results. Investment return and principal value will fluctuate, and you may have a gain or loss when you sell your shares. Current performance may differ from figures shown. For most recentmonth-end performance, go tofranklintempleton.com or call(800)342-5236.
Investment Strategy
The Fund invests predominantly in income-producing senior floating interest rate corporateloans made to or issued by U.S. companies,non-U.S. entities and U.S. subsidiaries ofnon-U.S. entities. Floating interest rates vary with and are periodically adjusted to a generally recognized base interest rate such as the London Interbank Offered Rate (LIBOR) or the Prime Rate. The Fund may invest in companies whose financial condition is troubled or uncertain and that may be involved in bankruptcy proceedings, reorganizations or financial restructurings.
Senior loans generally have credit ratings below investment grade and may be subject to restrictions on resale. Under
| | | | |
| Top 10 Sectors/Industries | | | |
| |
| 9/30/19 | | | |
| |
| | | % of Total
Net Assets | |
Diversified Financial Services | | | 14.6% | |
Media | | | 10.6% | |
Hotels Restaurants & Leisure | | | 8.7% | |
Health Care Providers & Services | | | 7.3% | |
Pharmaceuticals | | | 6.2% | |
Containers & Packaging | | | 4.9% | |
Commercial Services & Supplies | | | 4.5% | |
Food & Staples Retailing | | | 4.2% | |
Food Products | | | 4.1% | |
Chemicals | | | 3.8% | |
normal market conditions, the Fund invests at least 75% of its net assets in senior loans that are ratedB- or higher at the time of purchase by a nationally recognized statistical rating organization (NRSRO) or, if unrated, are determined to be of comparable quality by the Fund’s investment manager. Under normal market conditions, the Fund may invest up to 25% of its net assets in senior loans that are rated belowB- by an NRSRO or, if unrated, are determined to be of comparable quality by the investment manager.
Manager’s Discussion
Expectations of rate cuts that would decrease income generation helped to limit principal gains during the period, as retail investors continued to redeem from loan mutual funds. However, healthy demand from collateralized loan obligations remained, which helped to support loan prices amid periodic bouts of volatility. While the market experienced an increase in new issuance to finance mergers and acquisitions, there were also large paydowns that helped to keep net new issuance relatively lower, which balanced out technical conditions.
During the period, the Fund underperformed its primary benchmark, the S&P/LSTA U.S. Leveraged Loan 100 Index, and its additional benchmark, the Custom Franklin Senior Loan Index. The Fund continued to invest in loans from the largest obligors in the loan market, which outperformed the
1. Source: FactSet. The Custom Franklin Senior Loan Index comprises the Subset Index of Top 50 Obligors in Credit Suisse Leveraged Loan Index, which includes only the top 50 obligors of the Credit Suisse Leveraged Loan Index. Credit Suisse is not responsible for or involved in the calculation or management of the Subset Index of Top 50 Obligors in Credit Suisse Leveraged Loan Index.
The indexes are unmanaged and includes reinvestment of any income or distributions. They do not reflect any fees, expenses or sales charges. One cannot invest directly in an index, and an index is not representative of the Fund’s portfolio.
See www.franklintempletondatasources.com for additional data provider information
The dollar value, number of shares or principal amount, and names of all portfolio holdings are listed in the Fund’s Statement of Investments (SOI). The SOI begins on page 28.
| | | | |
| | | |
| 14 | | Semiannual Report | | franklintempleton.com |
FRANKLIN LIBERTY SENIOR LOAN ETF
| | |
| Portfolio Composition |
| |
| Based on Total Net Assets as of 9/30/19 | | |
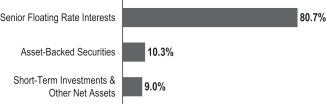
broader market during the period. These larger loans had higher weightings in the custom benchmark, which led to higher returns compared to our primary benchmark, as well as the portfolio. Higher-rated loans outperformed within the broader loan market, but within the Fund’s investable universe, middle-tier loans outperformed. During the period, upper-tier loans in the custom index returned +3.74%, middle-tier loans returned +3.77% and lower-tier loans returned +6.55%. As of 9/30/19, the Fund had approximately 76% of its loan portfolio in the upper tier and 23% in the middle tier, compared to the custom index, which had 44% in the upper tier and 54% in the middle tier.
Among individual positions, US Foods (a foodservice distributor) contributed to performance as it reported solid results during the period and completed an acquisition with an incremental term loan that attracted strong demand. The term loan of CSC Holdings (a broadband and communications provider) also contributed to performance as the company reported solid results during the period and the company was able to refinance a portion of its debt. However, two specialty pharmaceutical companies, Endo International and Mallinckrodt International detracted from performance during the period. The term loans traded lower amid uncertainty of future liability obligations due to ongoing litigation concerning the opioid crisis.
| | | | |
| Top 10 Fund Holdings | | | |
| |
| 9/30/19 | | | |
| |
Company Sector/Industry | | % of Total
Net Assets | |
FHLB , 1.602%, 10/01/2019 Banks | | | 9.1% | |
DaVita, Inc., Term Loan B, 4.431%, 8/12/2026 Health Care Providers & Services | | | 2.8% | |
Nexstar Broadcasting, Inc., TermB-4 Loan, 4.807%, 9/18/2026 Media | | | 2.8% | |
CommScope, Inc., Initial Term Loans, 5.362%, 4/06/2026 Communications Equipment | | | 2.8% | |
Panther BF Aggregator 2 LP, Initial Dollar Term Loan, 5.612%, 4/30/2026 Auto Components | | | 2.8% | |
Asurion LLC, ReplacementB-6 Term Loans, 5.112%, 11/03/2023 Diversified Financial Services | | | 2.7% | |
Berry Global, Inc., Term Q Loan, 4.299%, Term U Loans, 4.549%, 7/01/2026 Containers & Packaging | | | 2.7% | |
Grifols Worldwide Operations USA, Inc., Tranche B Term Loan, 4.196%, 1/31/2025 Pharmaceuticals | | | 2.7% | |
Global Medical Response, Inc., New Term Loans, 6.652%, 3/14/2025 Health Care Providers & Services | | | 2.6% | |
CSC Holdings, LLC, March 2017 Incremental Term Loans, 4.277%, 7/17/2025 Media | | | 2.6% | |
| | | | | | |
| | | |
| franklintempleton.com | | Semiannual Report | | | 15 | |
FRANKLIN LIBERTY SENIOR LOAN ETF
Thank you for your participation in Franklin Liberty Senior Loan ETF. We look forward to serving your future investment needs.
| | |
 | | 
Reema Agarwal, CFA Co-Lead Portfolio Manager |
| | |
 | | 
Justin Ma, CFA Co-Lead Portfolio Manager |
| | Margaret Chiu, CFA, FRM |
| |
| | Portfolio Management Team |
The foregoing information reflects our analysis, opinions and portfolio holdings as of September 30, 2019, the end of the reporting period. The way we implement our main investment strategies and the resulting portfolio holdings may change depending on factors such as market and economic conditions. These opinions may not be relied upon as investment advice or an offer for a particular security. The information is not a complete analysis of every aspect of any market, country, industry, security or the Fund. Statements of fact are from sources considered reliable, but the investment manager makes no representation or warranty as to their completeness or accuracy. Although historical performance is no guarantee of future results, these insights may help you understand our investment management philosophy.
| | | | |
| | | |
| 16 | | Semiannual Report | | franklintempleton.com |
FRANKLIN LIBERTY SENIOR LOAN ETF
Performance Summary as of September 30, 2019
Total return reflects reinvestment of the Fund’s dividends and capital gain distributions, if any, and any unrealized gains or losses. Total returns do not include brokerage commissions that may be payable on secondary market transactions. The performance tables do not reflect any taxes that a shareholder would pay on Fund dividends, capital gain distributions, if any, or any realized gains on the sale of Fund shares.
Net asset value or “NAV” is the value of one share of a fund as calculated in accordance with the standard formula for valuing mutual fund shares. The price used to calculate market return (Market Price) is determined by using the midpoint between the highest bid and the lowest offer on the primary stock exchange on which shares of a fund are listed for trading, as of the time that such fund’s NAV is calculated. Since shares of the Fund did not trade in the secondary market until after the Fund’s inception, for the period from inception to the first day of secondary trading (6/1/18), the NAV of the Fund is used as a proxy for the Market Price to calculate market returns. Market and NAV returns assume that dividends and capital gain distributions have been reinvested at Market Price and NAV.
Your dividend income will vary depending on dividends or interest paid by securities in the Fund’s portfolio, adjusted for operating expenses. Capital gain distributions are net profits realized from the sale of portfolio securities.
Performance as of 9/30/191
| | | | | | | | | | | | | | | | |
| | |
| | | Cumulative Total Return2 | | | Average Annual Total Return2 | |
| | | Based on
NAV3 | | | Based on
market price4 | | | Based on
NAV3 | | | Based on
market price4 | |
6-Month | | | +2.65% | | | | +2.93% | | | | +2.65% | | | | +2.93% | |
1-Year | | | +3.22% | | | | +3.42% | | | | +3.22% | | | | +3.42% | |
Since Inception (5/30/18) | | | +5.15% | | | | +5.60% | | | | +3.83% | | | | +4.16% | |
| | | | | | | | |
| |
| | | 30-Day Standardized Yield6 | |
| Distribution Rate5 | | (with fee waiver) | | | (without fee waiver) | |
3.75% | | | 4.27% | | | | 3.78% | |
Performance data represent past performance, which does not guarantee future results. Investment return and principal value will fluctuate, and you may have a gain or loss when you sell your shares. Current performance may differ from figures shown. For most recentmonth-end performance, go to franklintempleton.com or call(800)342-5236.
See page 18 for Performance Summary footnotes.
| | | | | | |
| | | |
| franklintempleton.com | | Semiannual Report | | | 17 | |
FRANKLIN LIBERTY SENIOR LOAN ETF
PERFORMANCE SUMMARY
Distributions(4/1/19–9/30/19)
|
|
Net Investment Income |
$0.611602 |
Total Annual Operating Expenses7
| | | | |
| |
With Fee Waiver | | Without
Fee Waiver | |
0.45% | | | 1.00% | |
All investments involve risks, including possible loss of principal. Investors should be aware that the Fund’s share price and yield will fluctuate with market conditions. The Fund should not be considered an alternative to money market funds or certificates of deposit (CDs). The senior loans and debt securities in which the Fund invests tend to be rated below investment grade. Investing in higher-yielding, lower-rated, senior loans and debt securities involves greater risk of default, which could result in loss of principal—a risk that may be heightened in a slowing economy. Interest earned on senior loans varies with changes in prevailing interest rates. Therefore, while senior loans offer higher interest income when interest rates rise, they will also generate less income when interest rates decline. Changes in the financial strength of a bond issuer or in a bond’s credit rating may affect its value. The markets for particular securities or types of securities are or may become relatively illiquid. Reduced liquidity will have an adverse impact on the security’s value and on the Fund’s ability to sell such securities when necessary to meet the Fund’s liquidity needs or in response to a specific market event. The Fund’s prospectus also includes a description of the main investment risks
ETFs trade like stocks, fluctuate in market value and may trade at prices above or below their net asset value. Brokerage commissions and ETF expenses will reduce returns.
1. The Fund has a fee waiver and/or expense reimbursement contractually guaranteed through 7/31/20. Fund investment results reflect the expense reduction; without this reduction, the results would have been lower.
2. Total return calculations represent the cumulative and average annual changes in value of an investment over the period indicated. Return for less than one year, if any, has not been annualized.
3. Assumes reinvestment of distributions based on net asset value.
4. Assumes reinvestment of distributions based on market price.
5. Distribution rate is based on an annualization of the September dividend and the NAV per share on 9/30/19.
6. The Fund’s30-day standardized yield is calculated over a trailing30-day period using the yield to maturity on bonds and/or the dividends accrued on stocks. It may not equal the Fund’s actual income distribution rate, which reflects the Fund’s past dividends paid to shareholders.
7. Figures are as stated in the Fund’s current prospectus and may differ from the expense ratios disclosed in the Your Fund’s Expenses and Financial Highlights sections in this report. In periods of market volatility, assets may decline significantly, causing total annual Fund operating expenses to become higher than the figures shown.
| | | | |
| | | |
| 18 | | Semiannual Report | | franklintempleton.com |
FRANKLIN LIBERTY SENIOR LOAN ETF
Your Fund’s Expenses
As a Fund shareholder, you can incur two types of costs: (1) transaction costs, including brokerage commissions on purchases and sales of Fund shares; and (2) ongoing Fund costs, including management fees and other Fund expenses. All funds have ongoing costs, sometimes referred to as operating expenses. The table below shows ongoing costs of investing in the Fund and can help you understand these costs and compare them with those of other funds. The table assumes a $1,000 investment held for the six months indicated.
Actual Fund Expenses
The table below provides information about actual account values and actual expenses in the columns under the heading “Actual.” In these columns the Fund’s actual return, which includes the effect of Fund expenses, is used to calculate the “Ending Account Value.” You can estimate the expenses you paid during the period by following these steps (of course, your account value and expenses will differ from those in this illustration):Divide your account value by $1,000 (if your account had an $8,600 value, then $8,600÷ $1,000 = 8.6).Then multiply the result by the number in the row under the headings “Actual” and “Expenses Paid During Period” (if Actual Expenses Paid During Period were $7.50, then 8.6 x $7.50 = $64.50).In this illustration, the actual expenses paid this period are $64.50.
Hypothetical Example for Comparison with Other Funds
Under the heading “Hypothetical” in the table, information is provided about hypothetical account values and hypothetical expenses based on the Fund’s actual expense ratio and an assumed rate of return of 5% per year before expenses, which is not the Fund’s actual return. This information may not be used to estimate the actual ending account balance or expenses you paid for the period, but it can help you compare ongoing costs of investing in the Fund with those of other funds. To do so, compare this 5% hypothetical example with the 5% hypothetical examples that appear in the shareholder reports of other funds.
Please note that expenses shown in the table are meant to highlight ongoing costs and do not reflect any transactional costs.Therefore, information under the heading “Hypothetical” is useful in comparing ongoing costs only, and will not help you compare total costs of owning different funds. In addition, if transactional costs were included, your total costs would have been higher.
| | | | | | | | | | | | | | | | | | | | | | |
| | | | Actual (actual return after expenses) | | | Hypothetical (5% annual return before expenses) | | | | |
| | | | | |
Beginning
Account
Value 4/1/19 | | | Ending
Account
Value 9/30/19 | | | Expenses
Paid During
Period
4/1/19–9/30/191,2 | | | Ending
Account
Value 9/30/19 | | | Expenses
Paid During
Period
4/1/19–9/30/191,2 | | | Net Annualized
Expense Ratio2 | |
| | $1,000.00 | | | $ | 1,026.50 | | | $ | 2.28 | | | $ | 1,022.75 | | | $ | 2.28 | | | | 0.45 | % |
1. Expenses are equal to the annualized expense ratio for thesix-month period as indicated above—in the far right column—multiplied by the simple average account value over the period indicated, and then multiplied by 183/366 to reflect theone-half year period.
2. Reflects expenses after fee waivers and expense reimbursements.
| | | | | | |
| | | |
| franklintempleton.com | | Semiannual Report | | | 19 | |
FRANKLIN TEMPLETON ETF TRUST
Financial Highlights
Franklin Liberty High Yield Corporate ETF
| | | | | | | | |
| | |
| | | Six Months Ended
September 30, 2019
(unaudited) | | | Year Ended
March 31, 2019a | |
| | |
Per share operating performance
(for a share outstanding throughout the period) | | | | | | | | |
| | |
Net asset value, beginning of period | | $ | 25.45 | | | $ | 25.00 | |
| | | | |
| | |
| Income from investment operationsb: | | | | | | | | |
| | |
Net investment incomec | | | 0.72 | | | | 1.21 | |
| | |
Net realized and unrealized gains (losses) | | | 0.45 | | | | 0.49 | |
| | | | |
| | |
Total from investment operations | | | 1.17 | | | | 1.70 | |
| | | | |
| | |
| Less distributions from: | | | | | | | | |
| | | | |
| | |
Net investment income | | | (0.83 | ) | | | (1.23 | ) |
| | |
Net realized gains | | | — | | | | (0.02 | ) |
| | | | |
| | |
Total distributions | | | (0.83 | ) | | | (1.25 | ) |
| | | | |
| | |
Net asset value, end of period | | $ | 25.79 | | | $ | 25.45 | |
| | | | |
| | |
Total returnd | | | 4.43% | | | | 7.07% | |
| | |
| Ratios to average net assetse | | | | | | | | |
| | |
Expenses before waiver and payments by affiliates | | | 1.58% | | | | 1.54% | |
| | |
Expenses net of waiver and payments by affiliates | | | 0.40% | | | | 0.40% | |
| | |
Net investment income | | | 5.70% | | | | 5.80% | |
| | |
| Supplemental data | | | | | | | | |
| | |
Net assets, end of period (000’s) | | | $30,944 | | | | $10,181 | |
| | |
Portfolio turnover ratef | | | 21.24% | | | | 23.57% | |
| | |
| Portfolio turnover rate excluding portfolio transactions that are executed as a result of the Fund offering and redeeming Creation Units solely or in part for cashf,g | | | 21.24% | | | | —% | |
aFor the period May 30, 2018 (commencement of operations) to March 31, 2019.
bThe amount shown for a share outstanding throughout the period may not correlate with the Statement of Operations for the period due to the timing of sales and repurchases of Creation Unit Fund shares in relation to income earned and/or fluctuating fair value of the investments of the Fund.
cBased on average daily shares outstanding.
dTotal return is not annualized for periods less than one year. Total return is calculated assuming an initial investment made at the net asset value at the beginning of the period, reinvestment of all dividends and distributions at net asset value during the period, and redemption at net asset value on the last day of the period.
eRatios are annualized for periods less than one year.
fPortfolio turnover rate excludes the value of portfolio securities received or delivered as a result of processing capital share transactions in Creation Units, if any.
gEffective September 30, 2019.
| | | | |
| | | |
| 20 | | Semiannual Report | The accompanying notes are an integral part of these financial statements. | | franklintempleton.com |
FRANKLIN TEMPLETON ETF TRUST
Statement of Investments, September 30, 2019 (unaudited)
Franklin Liberty High Yield Corporate ETF
| | | | | | | | | | | | | | |
| | | | |
| | | | | Country | | | Principal Amount* | | | Value | |
| | | Corporate Bonds & Notes 94.3% | | | | | | | | | |
| | | Automobiles & Components 1.0% | | | | | | | | | |
| a | | Adient US LLC, senior secured note, 144A, 7.00%, 5/15/26 | | | United States | | | | 300,000 | | | $ | 314,250 | |
| | | | | | | | | | | | | | |
| | | Banks 1.0% | | | | | | | | | |
| | Royal Bank of Scotland Group PLC, sub. note, 5.125%, 5/28/24 | | | United Kingdom | | | | 300,000 | | | | 320,039 | |
| | | | | | | | | | | | | | |
| | | Capital Goods 11.6% | | | | | | | | | |
| a | | BBA US Holdings Inc., senior note, 144A, 5.375%, 5/01/26 | | | United States | | | | 300,000 | | | | 315,750 | |
| a | | Beacon Roofing Supply Inc., senior note, 144A, 4.875%, 11/01/25 | | | United States | | | | 400,000 | | | | 393,440 | |
| a | | Cloud Crane LLC, secured note, second lien, 144A, 10.125%, 8/01/24 | | | United States | | | | 300,000 | | | | 321,750 | |
| a | | Cornerstone Building Brands Inc., senior secured note, 144A, 8.00%, 4/15/26 | | | United States | | | | 400,000 | | | | 395,000 | |
| | H&E Equipment Services Inc., senior note, 5.625%, 9/01/25 | | | United States | | | | 300,000 | | | | 309,945 | |
| a | | Harsco Corp., senior note, 144A, 5.75%, 7/31/27 | | | United States | | | | 300,000 | | | | 313,140 | |
| a | | Jeld-Wen Inc., senior note, 144A, 4.625%, 12/15/25 | | | United States | | | | 400,000 | | | | 402,512 | |
| a | | Manitowoc Co. Inc., secured note, second lien, 144A, 9.00%, 4/01/26 | | | United States | | | | 400,000 | | | | 393,000 | |
| a | | Terex Corp., senior note, 144A, 5.625%, 2/01/25 | | | United States | | | | 400,000 | | | | 411,000 | |
| a | | TransDigm Inc., senior secured note, 144A, 6.25%, 3/15/26 | | | United States | | | | 300,000 | | | | 322,875 | |
| | | | | | | | | | | | | | |
| | | | |
| | | | | | | | | | | | | 3,578,412 | |
| | | | | | | | | | | | | | |
| | | Commercial & Professional Services 1.3% | | | | | | | | | |
| | United Rentals North America Inc., senior bond, 5.875%, 9/15/26 | | | United States | | | | 300,000 | | | | 321,015 | |
| a | | West Corp., senior note, 144A, 8.50%, 10/15/25 | | | United States | | | | 100,000 | | | | 80,875 | |
| | | | | | | | | | | | | | |
| | | | |
| | | | | | | | | | | | | 401,890 | |
| | | | | | | | | | | | | | |
| | | Consumer Durables & Apparel 1.1% | | | | | | | | | |
| a | | Ashton Woods USA LLC / Ashton Woods Finance Co., senior note, 144A, 9.875%, 4/01/27 | | | United States | | | | 300,000 | | | | 329,250 | |
| | | | | | | | | | | | | | |
| | | Consumer Services 5.5% | | | | | | | | | |
| a | | 24 Hour Holdings III LLC, senior note, 144A, 8.00%, 6/01/22 | | | United States | | | | 400,000 | | | | 334,500 | |
| | CONTRA CB DOWNEY FIN D, 10.50%, 2/15/23 | | | United States | | | | 100,000 | | | | 1,250 | |
| a | | Downstream Development Authority of Quapaw Tribe of Oklahoma, secured note, 144A, 10.50%, 2/15/23 | | | United States | | | | 100,000 | | | | 107,000 | |
| a | | Golden Nugget Inc., senior note, 144A, 6.75%, 10/15/24 | | | United States | | | | 300,000 | | | | 306,000 | |
| a | | Stars Group Holdings BV / Stars Group USCo-Borrower LLC, senior note, 144A, 7.00%, 7/15/26 | | | Netherlands | | | | 300,000 | | | | 320,250 | |
| a | | Studio City Finance Ltd., senior note, 144A, 7.25%, 2/11/24 | | | Macau | | | | 300,000 | | | | 316,500 | |
| a | | Wynn Las Vegas LLC / Wynn Las Vegas Capital Corp., senior bond, 144A, 5.50%, 3/01/25 | | | United States | | | | 300,000 | | | | 316,590 | |
| | | | | | | | | | | | | | |
| | | | |
| | | | | | | | | | | | | 1,702,090 | |
| | | | | | | | | | | | | | |
| | | Diversified Financials 2.1% | | | | | | | | | |
| a | | HAT Holdings I LLC / HAT Holdings II LLC, senior note, 144A, 5.25%, 7/15/24 | | | United States | | | | 300,000 | | | | 316,125 | |
| | Springleaf Finance Corp., senior note, 6.625%, 1/15/28 | | | United States | | | | 300,000 | | | | 323,340 | |
| | | | | | | | | | | | | | |
| | | | |
| | | | | | | | | | | | | 639,465 | |
| | | | | | | | | | | | | | |
| | | Energy 10.0% | | | | | | | | | |
| a | | Archrock Partners LP / Archrock Partners Finance Corp., senior note, 144A, 6.875%, 4/01/27 | | | United States | | | | 300,000 | | | | 319,863 | |
| a | | California Resources Corp., secured note, second lien, 144A, 8.00%, 12/15/22 | | | United States | | | | 100,000 | | | | 50,000 | |
| | Cheniere Corpus Christi Holdings LLC, senior secured note, first lien, 5.875%, 3/31/25 | | | United States | | | | 300,000 | | | | 334,539 | |
| | Cheniere Energy Partners LP, | | | | | | | | | | | | |
| | a senior bond, 144A, 4.50%, 10/01/29 | | | United States | | | | 400,000 | | | | 410,500 | |
| | senior secured note, first lien, 5.25%, 10/01/25 | | | United States | | | | 300,000 | | | | 312,375 | |
| | Chesapeake Energy Corp., senior note, 7.50%, 10/01/26 | | | United States | | | | 400,000 | | | | 274,000 | |
| | Crestwood Midstream Partners LP / Crestwood Midstream Finance Corp., senior note, 5.75%, 4/01/25 | | | United States | | | | 300,000 | | | | 309,750 | |
| | Martin Midstream Partners LP / Martin Midstream Finance Corp., senior note, 7.25%, 2/15/21 | | | United States | | | | 100,000 | | | | 93,376 | |
| | | | | | |
| | | |
| franklintempleton.com | | Semiannual Report | | | 21 | |
FRANKLIN TEMPLETON ETF TRUST
STATEMENT OF INVESTMENTS (UNAUDITED)
Franklin Liberty High Yield Corporate ETF(continued)
| | | | | | | | | | | | | | |
| | | | |
| | | | | Country | | | Principal Amount* | | | Value | |
| | | Corporate Bonds & Notes (continued) | | | | | | | | | |
| | | Energy (continued) | | | | | | | | | |
| | Nabors Industries Inc., senior note, 5.50%, 1/15/23 | | | United States | | | | 400,000 | | | $ | 331,000 | |
| | QEP Resources Inc., senior note, 5.625%, 3/01/26 | | | United States | | | | 400,000 | | | | 347,120 | |
| | Sunoco LP / Sunoco Finance Corp., senior note, 5.50%, 2/15/26 | | | United States | | | | 300,000 | | | | 313,851 | |
| | | | | | | | | | | | | | |
| | | | |
| | | | | | | | | | | | | 3,096,374 | |
| | | | | | | | | | | | | | |
| | | Food & Staples Retailing 1.4% | | | | | | | | | |
| a | | Performance Food Group Inc., senior note, 144A, 5.50%, 10/15/27 | | | United States | | | | 400,000 | | | | 423,000 | |
| | | | | | | | | | | | | | |
| | | Food, Beverage & Tobacco 1.0% | | | | | | | | | |
| | B&G Foods Inc., senior note, 5.25%, 4/01/25 | | | United States | | | | 300,000 | | | | 307,500 | |
| | | | | | | | | | | | | | |
| | | Health Care Equipment & Services 5.4% | | | | | | | | | |
| a | | CHS / Community Health Systems Inc., senior note, 144A, 8.125%, 6/30/24 | | | United States | | | | 400,000 | | | | 320,000 | |
| | DaVita Inc., senior bond, 5.125%, 7/15/24 | | | United States | | | | 100,000 | | | | 101,875 | |
| | HCA Inc., senior bond, 5.875%, 2/01/29 | | | United States | | | | 300,000 | | | | 337,344 | |
| a | | Hill-Rom Holdings Inc., senior note, 144A, 4.375%, 9/15/27 | | | United States | | | | 100,000 | | | | 102,485 | |
| a | | MEDNAX Inc., senior note, 144A, 6.25%, 1/15/27 | | | United States | | | | 400,000 | | | | 397,972 | |
| a,b | | Polaris Intermediate Corp., senior note, 144A, PIK, 8.50%, 12/01/22 | | | United States | | | | 100,000 | | | | 85,500 | |
| | Tenet Healthcare Corp., senior note, 8.125%, 4/01/22 | | | United States | | | | 300,000 | | | | 325,590 | |
| | | | | | | | | | | | | | |
| | | | |
| | | | | | | | | | | | | 1,670,766 | |
| | | | | | | | | | | | | | |
| | | Materials 17.1% | | | | | | | | | |
| a | | Ardagh Packaging Finance PLC / Ardagh Holdings USA Inc., senior note, 144A, 6.00%, 2/15/25 | | | Ireland | | | | 400,000 | | | | 419,240 | |
| a | | Cemex Finance LLC, senior secured note, first lien, 144A, 6.00%, 4/01/24 | | | United States | | | | 200,000 | | | | 205,800 | |
| a | | Element Solutions Inc., senior note, 144A, 5.875%, 12/01/25 | | | United States | | | | 300,000 | | | | 314,969 | |
| a | | First Quantum Minerals Ltd., senior note, 144A, 7.25%, 4/01/23 | | | Zambia | | | | 400,000 | | | | 396,000 | |
| a | | Mauser Packaging Solutions Holding Co., senior note, 144A, 7.25%, 4/15/25 | | | United States | | | | 400,000 | | | | 379,620 | |
| a | | Neon Holdings Inc., senior note, 144A, 10.125%, 4/01/26 | | | United States | | | | 300,000 | | | | 303,000 | |
| a | | Novelis Corp., senior bond, 144A, 5.875%, 9/30/26 | | | United States | | | | 300,000 | | | | 315,360 | |
| a | | Owens-Brockway Glass Container Inc., senior note, 144A, 5.875%, 8/15/23 | | | United States | | | | 300,000 | | | | 319,500 | |
| a | | Plastipak Holdings Inc., senior note, 144A, 6.25%, 10/15/25 | | | United States | | | | 400,000 | | | | 332,000 | |
| a | | Rain CII Carbon LLC / CII Carbon Corp., senior note, second lien, 144A, 7.25%, 4/01/25 | | | United States | | | | 400,000 | | | | 384,000 | |
| a | | Reynolds Group Issuer Inc. / Reynolds Group Issuer LLC / Reynolds Group Issuer Luxembourg SA, senior secured note, first lien, 144A, 5.125%, 7/15/23 | | | United States | | | | 400,000 | | | | 410,500 | |
| a | | Sealed Air Corp., senior bond, 144A, 5.25%, 4/01/23 | | | United States | | | | 300,000 | | | | 321,000 | |
| | Steel Dynamics Inc., senior bond, 5.00%, 12/15/26 | | | United States | | | | 100,000 | | | | 105,000 | |
| a | | SunCoke Energy Partners LP / SunCoke Energy Partners Finance Corp., senior note, 144A, 7.50%, 6/15/25 | | | United States | | | | 400,000 | | | | 357,500 | |
| a | | TPC Group Inc., secured note, 144A, 10.50%, 8/01/24 | | | United States | | | | 300,000 | | | | 314,250 | |
| a | | Trivium Packaging Finance BV, senior secured note, 144A, 5.50%, 8/15/26 | | | Netherlands | | | | 400,000 | | | | 421,480 | |
| | | | | | | | | | | | | | |
| | | | |
| | | | | | | | | | | | | 5,299,219 | |
| | | | | | | | | | | | | | |
| | | Media & Entertainment 18.2% | | | | | | | | | |
| a | | Altice Luxembourg SA, first lien, 144A, 10.50%, 5/15/27 | | | Luxembourg | | | | 400,000 | | | | 451,800 | |
| | AMC Entertainment Holdings Inc., senior sub. note, 5.875%, 11/15/26 | | | United States | | | | 400,000 | | | | 365,000 | |
| | CCO Holdings LLC / CCO Holdings Capital Corp., | | | | | | | | | | | | |
| | senior bond, 5.125%, 2/15/23 | | | United States | | | | 400,000 | | | | 407,500 | |
| | a senior bond, 144A, 5.375%, 6/01/29 | | | United States | | | | 300,000 | | | | 320,250 | |
| a | | Clear Channel Worldwide Holdings Inc., first lien, senior secured note, 144A, 5.125%, 8/15/27 | | | United States | | | | 300,000 | | | | 313,305 | |
| a | | CSC Holdings LLC, senior bond, 144A, 6.625%, 10/15/25 | | | United States | | | | 600,000 | | | | 643,680 | |
| a | | Diamond Sports Group LLC / Diamond Sports Finance Co., senior note, 144A, 6.625%, 8/15/27 | | | United States | | | | 300,000 | | | | 312,000 | |
| | DISH DBS Corp., senior note, 5.875%, 7/15/22 | | | United States | | | | 300,000 | | | | 313,125 | |
| a | | iHeartCommunications Inc., senior secured note, first lien, 144A, 5.25%, 8/15/27 | | | United States | | | | 300,000 | | | | 312,750 | |
| | Netflix Inc., senior bond, 5.875%, 2/15/25 | | | United States | | | | 300,000 | | | | 330,192 | |
| a | | Nexstar Escrow Corp., senior note, 144A, 5.625%, 7/15/27 | | | United States | | | | 300,000 | | | | 315,000 | |
| a | | Scripps Escrow Inc., senior note, 144A, 5.875%, 7/15/27 | | | United States | | | | 400,000 | | | | 407,500 | |
| a | | Sirius XM Radio Inc., senior note, 144A, 4.625%, 7/15/24 | | | United States | | | | 300,000 | | | | 311,799 | |
| | | | |
| | | |
| 22 | | Semiannual Report | | franklintempleton.com |
FRANKLIN TEMPLETON ETF TRUST
STATEMENT OF INVESTMENTS (UNAUDITED)
Franklin Liberty High Yield Corporate ETF(continued)
| | | | | | | | | | | | | | |
| | | | |
| | | | | Country | | | Principal Amount* | | | Value | |
| | | Corporate Bonds & Notes (continued) | | | | | | | | | |
| | | Media & Entertainment (continued) | | | | | | | | | |
| a | | Univision Communications Inc., senior secured note, first lien, 144A, 5.125%, 5/15/23 | | | United States | | | | 400,000 | | | $ | 403,250 | |
| a | | WMG Acquisition Corp., secured note, first lien, 144A, 5.00%, 8/01/23 | | | United States | | | | 400,000 | | | | 410,500 | |
| | | | | | | | | | | | | | |
| | | | |
| | | | | | | | | | | | | 5,617,651 | |
| | | | | | | | | | | | | | |
| | | Pharmaceuticals, Biotechnology & Life Sciences 3.2% | | | | | | | | | |
| a,b | | Eagle Holding Co. II LLC, senior note, 144A, PIK, 7.625%, 5/15/22 | | | United States | | | | 400,000 | | | | 404,000 | |
| a | | Horizon Pharma USA Inc., senior note, 144A, 5.50%, 8/01/27 | | | United States | | | | 200,000 | | | | 208,500 | |
| a | | Par Pharmaceutical Inc., senior secured note, 144A, 7.50%, 4/01/27 | | | United States | | | | 400,000 | | | | 367,500 | |
| | | | | | | | | | | | | | |
| | | | |
| | | | | | | | | | | | | 980,000 | |
| | | | | | | | | | | | | | |
| | | Real Estate 1.3% | | | | | | | | | |
| | CyrusOne LP / CyrusOne Finance Corp., senior note, 5.00%, 3/15/24 | | | United States | | | | 400,000 | | | | 415,000 | |
| | | | | | | | | | | | | | |
| | | Retailing 2.5% | | | | | | | | | |
| | Murphy Oil USA Inc., senior bond, 4.75%, 9/15/29 | | | United States | | | | 400,000 | | | | 410,000 | |
| a | | Party City Holdings Inc., senior note, 144A, 6.625%, 8/01/26 | | | United States | | | | 400,000 | | | | 397,000 | |
| | | | | | | | | | | | | | |
| | | | |
| | | | | | | | | | | | | 807,000 | |
| | | | | | | | | | | | | | |
| | | Semiconductors & Semiconductor Equipment 1.1% | | | | | | | | | |
| a | | Amkor Technology Inc., senior note, 144A, 6.625%, 9/15/27 | | | United States | | | | 300,000 | | | | 328,500 | |
| | | | | | | | | | | | | | |
| | | Technology Hardware & Equipment 2.5% | | | | | | | | | |
| a | | CommScope Technologies LLC, senior bond, 144A, 6.00%, 6/15/25 | | | United States | | | | 400,000 | | | | 364,000 | |
| a | | Dell International LLC / EMC Corp., senior note, 144A, 7.125%, 6/15/24 | | | United States | | | | 100,000 | | | | 105,525 | |
| a | | Tempo Acquisition LLC / Tempo Acquisition Finance Corp., senior note, 144A, 6.75%, 6/01/25 | | | United States | | | | 300,000 | | | | 310,500 | |
| | | | | | | | | | | | | | |
| | | | |
| | | | | | | | | | | | | 780,025 | |
| | | | | | | | | | | | | | |
| | | Telecommunication Services 2.4% | | | | | | | | | |
| a | | Block Communications Inc., senior note, 144A, 6.875%, 2/15/25 | | | United States | | | | 100,000 | | | | 104,750 | |
| | Sprint Corp., senior note, 7.625%, 2/15/25 | | | United States | | | | 300,000 | | | | 330,750 | |
| | T-Mobile USA Inc., senior note, 5.125%, 4/15/25 | | | United States | | | | 300,000 | | | | 311,625 | |
| | | | | | | | | | | | | | |
| | | | |
| | | | | | | | | | | | | 747,125 | |
| | | | | | | | | | | | | | |
| | | Transportation 1.0% | | | | | | | | | |
| a | | DAE Funding LLC, senior note, 144A, 5.75%, 11/15/23 | | | United States | | | | 300,000 | | | | 316,005 | |
| | | | | | | | | | | | | | |
| | | Utilities 3.6% | | | | | | | | | |
| | Calpine Corp., senior note, 5.375%, 1/15/23 | | | United States | | | | 400,000 | | | | 406,000 | |
| | Clearway Energy Operating LLC, senior bond, 5.00%, 9/15/26 | | | United States | | | | 400,000 | | | | 411,000 | |
| | Talen Energy Supply LLC, senior note, 6.50%, 6/01/25 | | | United States | | | | 400,000 | | | | 306,000 | |
| | | | | | | | | | | | | | |
| | | | |
| | | | | | | | | | | | | 1,123,000 | |
| | | | | | | | | | | | | | |
| | Total Investments before Short Term Investments
(Cost $29,137,118) | | | | | | | | | | | 29,196,561 | |
| | | | | | | | | | | | | | |
| | | Short Term Investments 3.3% | | | | | | | | | |
| | U.S. Government & Agency Securities
(Cost $1,020,000) 3.3% | | | | | | | | | | | | |
| c | | FHLB, 10/01/19 | | | | | | | 1,020,000 | | | | 1,020,000 | |
| | | | | | | | | | | | | | |
| | Total Investments
(Cost $30,157,118) 97.6% | | | | | | | | | | | 30,216,561 | |
| | Other Assets, less Liabilities 2.4% | | | | | | | | | | | 727,870 | |
| | | | | | | | | | | | | | |
| | Net Assets 100.0% | | | | | | | | | | $ | 30,944,431 | |
| | | | | | | | | | | | | | |
See abbreviations on page 42.
*The principal amount is stated in U.S. dollars unless otherwise indicated.
aSecurity was purchased pursuant to Rule 144A under the Securities Act of 1933 and may be sold in transactions exempt from registration only to qualified institutional buyers or in a public offering registered under the Securities Act of 1933. These securities have been deemed liquid under guidelines approved by the Fund’s Board of Trustees. At September 30, 2019, the aggregate value of these securities was $20,421,460, representing 66.0% of net assets.
bIncome may be received in additional securities and/or cash.
cThe security was issued on a discount basis with no stated coupon rate.
| | | | | | |
| | | |
| franklintempleton.com | | The accompanying notes are an integral part of these financial statements. | Semiannual Report | | | 23 | |
FRANKLIN TEMPLETON ETF TRUST
Financial Highlights
Franklin Liberty International Aggregate Bond ETF
| | | | | | | | |
| | |
| | | Six Months Ended September 30, 2019
(unaudited) | | | Year Ended March 31, 2019a | |
| |
Per share operating performance
(for a share outstanding throughout the period) | | | | | |
| | |
Net asset value, beginning of period | | $ | 24.56 | | | $ | 25.00 | |
| | | | | | | | |
| |
| Income from investment operationsb: | | | | | |
| | |
Net investment incomec | | | 0.14 | | | | 0.39 | |
| | |
Net realized and unrealized gains (losses) | | | 1.09 | | | | (0.40 | ) |
| | | | | | | | |
| | |
Total from investment operations | | | 1.23 | | | | (0.01 | ) |
| | | | | | | | |
| | |
Less distributions from net investment income | | | (0.09 | ) | | | (0.43 | ) |
| | | | | | | | |
| | |
Net asset value, end of period | | $ | 25.70 | | | $ | 24.56 | |
| | | | | | | | |
| | |
Total returnd | | | 5.02% | | | | 0.00% | |
| |
| Ratios to average net assetse | | | | | |
| | |
Expenses before waiver and payments by affiliates | | | 3.17% | | | | 2.32% | |
| | |
Expenses net of waiver and payments by affiliates | | | 0.32% | | | | 0.35% | |
| | |
Net investment income | | | 1.13% | | | | 1.91% | |
| |
| Supplemental data | | | | | |
| | |
Net assets, end of period (000’s) | | | $5,140 | | | | $4,912 | |
| | |
Portfolio turnover ratef | | | 63.79% | | | | 50.32% | |
| | |
| Portfolio turnover rate excluding portfolio transactions that are executed as a result of the Fund offering and redeeming Creation Units solely or in part for cashf,g | | | 63.79% | | | | —% | |
aFor the period May 30, 2018 (commencement of operations) to March 31, 2019.
bThe amount shown for a share outstanding throughout the period may not correlate with the Statement of Operations for the period due to the timing of sales and repurchases of Creation Unit Fund shares in relation to income earned and/or fluctuating fair value of the investments of the Fund.
cBased on average daily shares outstanding.
dTotal return is not annualized for periods less than one year. Total return is calculated assuming an initial investment made at the net asset value at the beginning of the period, reinvestment of all dividends and distributions at net asset value during the period, and redemption at net asset value on the last day of the period.
eRatios are annualized for periods less than one year.
fPortfolio turnover rate excludes the value of portfolio securities received or delivered as a result of processing capital share transactions in Creation Units, if any.
gEffective September 30, 2019.
| | | | |
| | | |
| 24 | | Semiannual Report | The accompanying notes are an integral part of these financial statements. | | franklintempleton.com |
FRANKLIN TEMPLETON ETF TRUST
Statement of Investments, September 30, 2019 (unaudited)
Franklin Liberty International Aggregate Bond ETF
| | | | | | | | | | | | | | |
| | | |
| | | | | Principal Amount* | | | Value | |
| | | Foreign Government and Agency Securities 81.5% | | | | | | | | | |
| | | Australia 2.2% | | | | | | | | | |
| a | | New South Wales Treasury Corp., senior bond, Reg S, 3.00%, 5/20/27 | | | 50,000 | | | | AUD | | | $ | 37,961 | |
| a,b | | Queensland Treasury Corp., senior bond, Reg S, 144A, 3.25%, 8/21/29 | | | 50,000 | | | | AUD | | | | 39,145 | |
| a | | Western Australian Treasury Corp., senior note, 26, Reg S, 3.00%, 10/21/26 | | | 50,000 | | | | AUD | | | | 37,637 | |
| | | | | | | | | | | | | | |
| | | | |
| | | | | | | | | | | | | 114,743 | |
| | | | | | | | | | | | | | |
| | | Belgium 3.1% | | | | | | | | | |
| a | | Government of Belgium, Reg S, 1.25%, 4/22/33 | | | 125,000 | | | | EUR | | | | 160,868 | |
| | | | | | | | | | | | | | |
| | | Canada 4.8% | | | | | | | | | |
| | Government of Canada, 2.75%, 6/01/22 | | | 320,000 | | | | CAD | | | | 249,302 | |
| | | | | | | | | | | | | | |
| | | Finland 1.9% | | | | | | | | | |
| a | | Government of Finland, Reg S, .375%, 9/15/20 | | | 90,000 | | | | EUR | | | | 99,059 | |
| | | | | | | | | | | | | | |
| | | France 5.5% | | | | | | | | | |
| | Government of France, | | | | | | | | | | | | |
| | aReg S, 1.00%, 11/25/25 | | | 200,000 | | | | EUR | | | | 238,886 | |
| | a,esenior note, Reg S, 0.00%, 5/25/22 | | | 40,000 | | | | EUR | | | | 44,453 | |
| | | | | | | | | | | | | | |
| | | | |
| | | | | | | | | | | | | 283,339 | |
| | | | | | | | | | | | | | |
| | | Germany 10.2% | | | | | | | | | |
| | Government of Germany, | | | | | | | | | | | | |
| | aReg S, 1.50%, 9/04/22 | | | 140,000 | | | | EUR | | | | 163,137 | |
| | aReg S, 5.50%, 1/04/31 | | | 30,000 | | | | EUR | | | | 55,830 | |
| | a,eStrip, Reg S, 0.00%, 10/08/21 | | | 80,000 | | | | EUR | | | | 88,594 | |
| | KFW, senior note, 2.05%, 2/16/26 | | | 20,000,000 | | | | JPY | | | | 216,201 | |
| | | | | | | | | | | | | | |
| | | | |
| | | | | | | | | | | | | 523,762 | |
| | | | | | | | | | | | | | |
| | | Indonesia 0.7% | | | | | | | | | |
| | Indonesia Treasury Bond, senior bond, 8.25%, 5/15/36 | | | 500,000,000 | | | | IDR | | | | 36,799 | |
| | | | | | | | | | | | | | |
| | | Ireland 3.6% | | | | | | | | | |
| a | | Government of Ireland, Reg S, 1.50%, 5/15/50 | | | 140,000 | | | | EUR | | | | 183,129 | |
| | | | | | | | | | | | | | |
| | | Italy 5.0% | | | | | | | | | |
| | Italy Treasury Bond, | | | | | | | | | | | | |
| | senior bond, 1.25%, 12/01/26 | | | 150,000 | | | | EUR | | | | 172,320 | |
| | a,bsenior bond, Reg S, 144A, 4.00%, 2/01/37 | | | 55,000 | | | | EUR | | | | 82,868 | |
| | | | | | | | | | | | | | |
| | | | |
| | | | | | | | | | | | | 255,188 | |
| | | | | | | | | | | | | | |
| | | Japan 16.1% | | | | | | | | | |
| | Development Bank of Japan, senior bond, 2.30%, 3/19/26 | | | 20,000,000 | | | | JPY | | | | 216,153 | |
| | Government of Japan, | | | | | | | | | | | | |
| | senior bond, 1.00%, 12/20/35 | | | 40,000,000 | | | | JPY | | | | 425,381 | |
| | senior bond, 1.50%, 3/20/33 | | | 16,500,000 | | | | JPY | | | | 184,458 | |
| | | | | | | | | | | | | | |
| | | | |
| | | | | | | | | | | | | 825,992 | |
| | | | | | | | | | | | | | |
| | | Mexico 1.0% | | | | | | | | | |
| | Government of Mexico, M, 7.50%, 6/03/27 | | | 10,000 | c | | | MXN | | | | 52,660 | |
| | | | | | | | | | | | | | |
| | | Netherlands 2.6% | | | | | | | | | |
| a,b | | Government of Netherlands, senior bond, Reg S,144A, .50%, 1/15/40 | | | 40,000 | | | | EUR | | | | 49,104 | |
| a | | Government of the Netherlands, Reg S, .50%, 7/15/26 | | | 70,000 | | | | EUR | | | | 82,192 | |
| | | | | | | | | | | | | | |
| | | | |
| | | | | | | | | | | | | 131,296 | |
| | | | | | | | | | | | | | |
| | | Poland 2.3% | | | | | | | | | |
| | Government of Poland, | | | | | | | | | | | | |
| | 2.50%, 7/25/27 | | | 200,000 | | | | PLN | | | | 51,886 | |
| | 5.75%, 4/25/29 | | | 200,000 | | | | PLN | | | | 66,967 | |
| | | | | | | | | | | | | | |
| | | | |
| | | | | | | | | | | | | 118,853 | |
| | | | | | | | | | | | | | |
| | | | | | |
| | | |
| franklintempleton.com | | Semiannual Report | | | 25 | |
FRANKLIN TEMPLETON ETF TRUST
STATEMENT OF INVESTMENTS (UNAUDITED)
Franklin Liberty International Aggregate Bond ETF(continued)
| | | | | | | | | | | | | | |
| | | |
| | | | | Principal Amount* | | | Value | |
| | | Foreign Government and Agency Securities (continued) | | | | | | | | | |
| | | South Africa 0.5% | | | | | | | | | |
| | Government of South Africa, senior bond, 7.00%, 2/28/31 | | | 500,000 | | | | ZAR | | | $ | 27,956 | |
| | | | | | | | | | | | | | |
| | | Spain 4.9% | | | | | | | | | |
| | Government of Spain, | | | | | | | | | | | | |
| | a,bsenior bond, Reg S, 144A, 1.85%, 7/30/35 | | | 100,000 | | | | EUR | | | | 130,137 | |
| | a,bsenior bond, Reg S,144A, 2.70%, 10/31/48 | | | 80,000 | | | | EUR | | | | 123,313 | |
| | | | | | | | | | | | | | |
| | | | |
| | | | | | | | | | | | | 253,450 | |
| | | | | | | | | | | | | | |
| d | | Supranational 8.6% | | | | | | | | | |
| | Asian Development Bank, senior bond,339-00-1, 2.35%, 6/21/27 | | | 20,000,000 | | | | JPY | | | | 225,798 | |
| a | | European Investment Bank, senior note, Reg S, 1.90%, 1/26/26 | | | 20,000,000 | | | | JPY | | | | 213,929 | |
| | | | | | | | | | | | | | |
| | | | |
| | | | | | | | | | | | | 439,727 | |
| | | | | | | | | | | | | | |
| | | United Kingdom 8.5% | | | | | | | | | |
| | United Kingdom Treasury Bond, | | | | | | | | | | | | |
| | aReg S, 1.75%, 9/07/37 | | | 60,000 | | | | GBP | | | | 84,573 | |
| | aReg S, 2.25%, 9/07/23 | | | 120,000 | | | | GBP | | | | 158,919 | |
| | aReg S, 3.50%, 7/22/68 | | | 10,000 | | | | GBP | | | | 25,101 | |
| | aReg S, 4.25%, 12/07/46 | | | 35,000 | | | | GBP | | | | 76,791 | |
| | aReg S, 4.75%, 12/07/30 | | | 50,000 | | | | GBP | | | | 89,991 | |
| | | | | | | | | | | | | | |
| | | | |
| | | | | | | | | | | | | 435,375 | |
| | | | | | | | | | | | | | |
| | Total Foreign Government and Agency Securities
(Cost $4,132,476) | | | | | | | | | | | 4,191,498 | |
| | | | | | | | | | | | | | |
| | | Corporate Bonds & Notes 10.1% | | | | | | | | | |
| | | Belgium 1.4% | | | | | | | | | |
| a | | Anheuser-Busch InBev SA/NV, senior note, Reg S, 1.50%, 3/17/25 | | | 60,000 | | | | EUR | | | | 70,518 | |
| | | | | | | | | | | | | | |
| | | Czech Republic 2.2% | | | | | | | | | |
| a | | Energo-Pro AS, senior note, Reg S, 4.00%, 12/07/22 | | | 100,000 | | | | EUR | | | | 112,625 | |
| | | | | | | | | | | | | | |
| | | Denmark 2.0% | | | | | | | | | |
| a | | Nordea Kredit Realkreditaktieselskab, secured bond, Reg S, 1.00%, 10/01/50 | | | 350,000 | | | | DKK | | | | 51,581 | |
| a | | Nykredit Realkredit AS, secured bond, Reg S, 1.00%, 10/01/50 | | | 350,000 | | | | DKK | | | | 51,555 | |
| | | | | | | | | | | | | | |
| | | | |
| | | | | | | | | | | | | 103,136 | |
| | | | | | | | | | | | | | |
| | | Germany 2.2% | | | | | | | | | |
| a | | Aroundtown SA, senior note, Reg S, 1.625%, 1/31/28 | | | 100,000 | | | | EUR | | | | 112,970 | |
| | | | | | | | | | | | | | |
| | | Romania 2.3% | | | | | | | | | |
| a | | Globalworth Real Estate Investments Ltd., senior note, Reg S, 3.00%, 3/29/25 | | | 100,000 | | | | EUR | | | | 119,163 | |
| | | | | | | | | | | | | | |
| | Total Corporate Bonds & Notes (Cost $494,713) | | | | | | | | | | | 518,412 | |
| | | | | | | | | | | | | | |
| | Total Investments
(Cost $4,627,189) 91.6% | | | | | | | | | | | 4,709,910 | |
| | Other Assets, less Liabilities 8.4% | | | | | | | | | | | 430,089 | |
| | | | | | | | | | | | | | |
| | Net Assets 100.0% | | | | | | | | | | $ | 5,139,999 | |
| | | | | | | | | | | | | | |
See abbreviations on page 42.
*The principal amount is stated in U.S. dollars unless otherwise indicated.
aSecurity was purchased pursuant to Regulation S under the Securities Act of 1933, which exempts from registration securities offered and sold outside of the United States. Such a security cannot be sold in the United States without either an effective registration statement filed pursuant to the Securities Act of 1933, or pursuant to an exemption from registration. These securities have been deemed liquid under guidelines approved by the Fund’s Board of Trustees. At September 30, 2019, the aggregate value of these securities was $2,784,029, representing 54.2% of net assets.
bSecurity was purchased pursuant to Rule 144A under the Securities Act of 1933 and may be sold in transactions exempt from registration only to qualified institutional buyers or in a public offering registered under the Securities Act of 1933. These securities have been deemed liquid under guidelines approved by the Fund’s Board of Trustees. At September 30, 2019, the aggregate value of these securities was $424,567, representing 8.3% of net assets.
cPrincipal amount is stated in 100 Mexican Peso Units.
dA supranational organization is an entity formed by two or more central governments through international treaties.
eThe security was issued on a discount basis with no stated coupon rate.
| | | | |
| | | |
| 26 | | Semiannual Report | The accompanying notes are an integral part of these financial statements. | | franklintempleton.com |
FRANKLIN TEMPLETON ETF TRUST
Financial Highlights
Franklin Liberty Senior Loan ETF
| | | | | | | | |
| | |
| | | Six Months Ended September 30, 2019
(unaudited) | | | Year Ended March 31, 2019a | |
|
Per share operating performance
(for a share outstanding throughout the period) | |
| | |
Net asset value, beginning of period | | $ | 24.85 | | | $ | 25.00 | |
| | | | |
|
| Income from investment operationsb: | |
| | |
Net investment incomec | | | 0.52 | | | | 0.81 | |
| | |
Net realized and unrealized gains (losses) | | | 0.13 | | | | (0.21 | ) |
| | | | |
| | |
Total from investment operations | | | 0.65 | | | | 0.60 | |
| | | | |
| | |
Less distributions from net investment income | | | (0.61 | ) | | | (0.75 | ) |
| | | | |
| | |
Net asset value, end of period | | $ | 24.89 | | | $ | 24.85 | |
| | | | |
| | |
Total returnd | | | 2.65% | | | | 2.44% | |
|
| Ratios to average net assetse | |
| | |
Expenses before waiver and payments by affiliates | | | 0.96% | | | | 1.00% | |
| | |
Expenses net of waiver and payments by affiliates | | | 0.45% | | | | 0.45% | |
| | |
Net investment income | | | 4.21% | | | | 3.90% | |
|
| Supplemental data | |
| | |
Net assets, end of period (000’s) | | | $57,256 | | | | $57,165 | |
| | |
Portfolio turnover ratef | | | 24.63% | | | | 10.62% | |
| | |
| Portfolio turnover rate excluding portfolio transactions that are executed as a result of the Fund offering and redeeming Creation Units solely or in part for cashf,g | | | 24.63% | | | | —% | |
aFor the period May 30, 2018 (commencement of operations) to March 31, 2019.
bThe amount shown for a share outstanding throughout the period may not correlate with the Statement of Operations for the period due to the timing of sales and repurchases of Creation Unit Fund shares in relation to income earned and/or fluctuating fair value of the investments of the Fund.
cBased on average daily shares outstanding.
dTotal return is not annualized for periods less than one year. Total return is calculated assuming an initial investment made at the net asset value at the beginning of the period, reinvestment of all dividends and distributions at net asset value during the period, and redemption at net asset value on the last day of the period.
eRatios are annualized for periods less than one year.
fPortfolio turnover rate excludes the value of portfolio securities received or delivered as a result of processing capital share transactions in Creation Units, if any.
gEffective September 30, 2019.
| | | | | | |
| | | |
| franklintempleton.com | | The accompanying notes are an integral part of these financial statements. | Semiannual Report | | | 27 | |
FRANKLIN TEMPLETON ETF TRUST
Statement of Investments, September 30, 2019 (unaudited)
Franklin Liberty Senior Loan ETF
| | | | | | | | | | | | | | |
| | | | |
| | | | | Country | | | Principal Amount* | | | Value | |
| a,b | | Senior Floating Rate Interests 80.7% | | | | | | | | | |
| | | Airlines 2.2% | | | | | | | | | |
| | American Airlines, Inc., 2018 Replacement Term Loans, 4.061%,(3-month USD LIBOR + 1.75%), 6/27/25 | | | United States | | | | 1,267,200 | | | $ | 1,255,320 | |
| | | | | | | | | | | | | | |
| | | Application Software 1.5% | | | | | | | | | |
| c | | SS&C European Holdings Sarl, TermB-4 Loans, TBD,(1-month USD LIBOR + 2.25%), 4/16/25 | | | Luxembourg | | | | 215,718 | | | | 216,886 | |
| | SS&C Technologies Inc., Term B-3 Loans, TBD, (1-month USD LIBOR + 2.25%), 4/16/25 | | | United States | | | | 326,586 | | | | 328,355 | |
| | SS&C Technologies Inc., Term B-5 Loan, TBD, (1-month USD LIBOR + 2.25%), 4/16/25 | | | United States | | | | 296,965 | | | | 298,636 | |
| | | | | | | | | | | | | | |
| | | | |
| | | | | | | | | | | | | 843,877 | |
| | | | | | | | | | | | | | |
| | | Auto Parts & Equipment 2.8% | | | | | | | | | |
| | Panther BF Aggregator 2 LP, Initial Dollar Term Loan, 5.612%,(1-month USD LIBOR + 3.500%), 4/30/26 | | | United States | | | | 1,600,000 | | | | 1,591,333 | |
| | | | | | | | | | | | | | |
| | | Broadcasting 6.0% | | | | | | | | | |
| | Diamond Sports Group, LLC, Term Loan, 5.3%,(1-month USD LIBOR + 3.250%), 8/24/26 | | | United States | | | | 711,752 | | | | 716,534 | |
| | Gray Television, Inc., Term C Loan, 4.831%,(3-month USD LIBOR + 2.50%), 1/02/26 | | | United States | | | | 297,750 | | | | 299,318 | |
| c,d | | Nexstar Broadcasting, Inc., TBD, TermB-4 Loan, 4.807%,(3-month USD LIBOR + 2.750%), 9/18/26 | | | United States | | | | 1,600,000 | | | | 1,609,834 | |
| | Sinclair Television Group Inc., Tranche B Term Loans, 4.37%,(1-month USD LIBOR + 2.25%), 1/03/24 | | | United States | | | | 827,241 | | | | 831,108 | |
| | | | | | | | | | | | | | |
| | | | |
| | | | | | | | | | | | | 3,456,794 | |
| | | | | | | | | | | | | | |
| | | Cable & Satellite 4.6% | | | | | | | | | |
| | Charter Communications Operating, LLC, Term B Loan, 4.33%,(3-month USD LIBOR + 2.00%), 4/30/25 | | | United States | | | | 1,135,188 | | | | 1,143,250 | |
| | CSC Holdings, LLC, March 2017 Incremental Term Loans, 4.277%,(1-month USD LIBOR + 2.25%), 7/17/25 | | | United States | | | | 1,474,946 | | | | 1,475,676 | |
| | | | | | | | | | | | | | |
| | | | |
| | | | | | | | | | | | | 2,618,926 | |
| | | | | | | | | | | | | | |
| | | Casinos & Gaming 4.3% | | | | | | | | | |
| | Aristocrat Technologies, Inc., TermB-3 Loans, 4.027%,(3-month USD LIBOR + 1.75%), 10/19/24 | | | United States | | | | 1,103,020 | | | | 1,108,104 | |
| | Caesars Resort Collection, LLC, Term B Loans, 4.862%,(1-month USD LIBOR + 2.75%), 12/22/24 | | | United States | | | | 1,391,625 | | | | 1,384,294 | |
| | | | | | | | | | | | | | |
| | | | |
| | | | | | | | | | | | | 2,492,398 | |
| | | | | | | | | | | | | | |
| | | Commodity Chemicals 1.8% | | | | | | | | | |
| | Univar Inc., Initial Term Loans, 4.112%,(1-month USD LIBOR + 2.25%), 7/01/24 | | | United States | | | | 1,049,095 | | | | 1,053,497 | |
| | | | | | | | | | | | | | |
| | | Communications Equipment 2.8% | | | | | | | | | |
| | CommScope, Inc., Initial Term Loans, 5.362%,(1-month USD LIBOR + 3.25%), 4/04/26 | | | United States | | | | 1,600,000 | | | | 1,597,320 | |
| | | | | | | | | | | | | | |
| | | Data Processing & Outsourced Services 2.0% | | | | | | | | | |
| | West Corporation, Term B Loans, 6.112%,(1-month USD LIBOR + 4.00%), 10/10/24 | | | United States | | | | 1,293,418 | | | | 1,155,453 | |
| | | | | | | | | | | | | | |
| | | Food Distributors 4.2% | | | | | | | | | |
| | Aramark Corporation, U.S. TermB-3 Loan, 4.079%,(3-month USD LIBOR + 1.75%), 3/11/25 | | | United States | | | | 997,750 | | | | 1,001,492 | |
| | U.S. Foods, Inc., Initial Term Loans, 4.112%,(1-month USD LIBOR + 2.00%), 6/27/23 | | | United States | | | | 1,399,909 | | | | 1,406,179 | |
| | | | | | | | | | | | | | |
| | | | |
| | | | | | | | | | | | | 2,407,671 | |
| | | | | | | | | | | | | | |
| | | Health Care Distributors 0.3% | | | | | | | | | |
| | Mallinckrodt International Finance SA & Mallinckrodt CB LLC, 2017 Term B Loans, 5.079%,(3-month USD LIBOR + 2.75%), 9/24/24 | | | Luxembourg | | | | 191,527 | | | | 146,438 | |
| | | | | | | | | | | | | | |
| | | | |
| | | |
| 28 | | Semiannual Report | | franklintempleton.com |
FRANKLIN TEMPLETON ETF TRUST
STATEMENT OF INVESTMENTS (UNAUDITED)
Franklin Liberty Senior Loan ETF(continued)
| | | | | | | | | | | | | | |
| | | | |
| | | | | Country | | | Principal Amount* | | | Value | |
| a,b | | Senior Floating Rate Interests (continued) | | | | | | | | | |
| | | Health Care Facilities 1.7% | | | | | | | | | |
| | HCA Inc., Term Loan B11, 4.079%,(3-month USD LIBOR + 1.75%), 3/18/23 | | | United States | | | | 947,778 | | | $ | 951,859 | |
| | | | | | | | | | | | | | |
| | | Health Care Services 5.4% | | | | | | | | | |
| | Air Medical Group Holdings Inc., 2018 New Term Loans, 6.362%,(1-month USD LIBOR + 4.25%), 3/14/25 | | | United States | | | | 1,588,270 | | | | 1,490,989 | |
| | DaVita, Inc., Term Loan B, 4.431%,(1-month USD LIBOR + 2.250%), 8/12/26 | | | United States | | | | 1,600,000 | | | | 1,610,777 | |
| | | | | | | | | | | | | | |
| | | | |
| | | | | | | | | | | | | 3,101,766 | |
| | | | | | | | | | | | | | |
| | | Hotels, Resorts & Cruise Lines 1.7% | | | | | | | | | |
| | Hilton Worldwide Finance, LLC, Refinanced SeriesB-2 Term Loans, 3.768%,1-month USD LIBOR + 1.750%, 6/17/26 | | | United States | | | | 985,592 | | | | 992,642 | |
| | | | | | | | | | | | | | |
| | | Other Diversified Financial Services 4.3% | | | | | | | | | |
| | Asurion LLC, ReplacementB-6 Term Loans, 5.112%,(1-month USD LIBOR + 3.00%), 11/03/23 | | | United States | | | | 1,538,800 | | | | 1,546,334 | |
| | Trans Union, LLC, 2017 Replacement TermA-2 Loans, 4.152%,(1-month USD LIBOR + 1.50%), 8/09/22 | | | United States | | | | 916,199 | | | | 916,389 | |
| | | | | | | | | | | | | | |
| | | | |
| | | | | | | | | | | | | 2,462,723 | |
| | | | | | | | | | | | | | |
| | | Packaged Foods & Meats 4.1% | | | | | | | | | |
| | JBS USA Lux S.A., New Term Loans, 4.612%,(1-month USD LIBOR + 2.50%), 5/01/26 | | | United States | | | | 971,953 | | | | 977,927 | |
| | Post Holdings Inc., Series A Incremental Term Loans, 4.04%,(1-month USD LIBOR + 2.00%), 5/24/24 | | | United States | | | | 1,345,777 | | | | 1,351,139 | |
| | | | | | | | | | | | | | |
| | | | |
| | | | | | | | | | | | | 2,329,066 | |
| | | | | | | | | | | | | | |
| | | Paper Packaging 4.9% | | | | | | | | | |
| | Berry Global, Inc., | | | | | | | | | | | | |
| | Term Q Loan, 2.25%, 10/01/22 | | | United States | | | | 1,227,840 | | | | 1,234,688 | |
| | Term U Loan, 2.50%, 7/01/26 | | | United States | | | | 299,250 | | | | 301,035 | |
| | Reynolds Group Holdings Inc., U.S. Term Loans, 4.862%,(1-month USD LIBOR + 2.75%), 2/05/23 | | | United States | | | | 1,265,465 | | | | 1,268,924 | |
| | | | | | | | | | | | | | |
| | | | |
| | | | | | | | | | | | | 2,804,647 | |
| | | | | | | | | | | | | | |
| | | Personal Products 2.5% | | | | | | | | | |
| c | | Sunshine Luxembourg VII SARL, Facility B1 Commitments, TBD, 9/25/26 | | | Luxembourg | | | | 1,400,000 | | | | 1,407,657 | |
| | | | | | | | | | | | | | |
| | | Pharmaceuticals 6.2% | | | | | | | | | |
| | Bausch Health Companies Inc., Initial Term Loans , 5.411%,(1-month USD LIBOR + 3.00%), 6/02/25 | | | United States | | | | 1,447,423 | | | | 1,454,919 | |
| | Endo Luxembourg Finance Co. I S.A R.L. and Endo LLC, Initial Term Loans, 6.375%,(1-month USD LIBOR + 4.25%), 4/29/24 | | | United States | | | | 650,836 | | | | 593,563 | |
| | Grifols Worldwide Operations USA, Inc., Tranche B Term Loan, 4.196%,(1-week USD LIBOR + 2.25%), 1/31/25 | | | United States | | | | 1,513,146 | | | | 1,522,367 | |
| | | | | | | | | | | | | | |
| | | | |
| | | | | | | | | | | | | 3,570,849 | |
| | | | | | | | | | | | | | |
| | | Research & Consulting Services 2.4% | | | | | | | | | |
| | Nielsen Finance LLC,Class B-4 Term Loans, 4.042%,(1-month USD LIBOR + 2.00%), 10/04/23 | | | United States | | | | 1,368,621 | | | | 1,369,965 | |
| | | | | | | | | | | | | | |
| | | Restaurants 2.6% | | | | | | | | | |
| | 1011778 B.C. Unlimited Liability Company, TermB-3 Loan, 4.362%,(1-month USD LIBOR + 2.25%), 2/17/24 | | | Canada | | | | 1,465,732 | | | | 1,472,292 | |
| | | | | | | | | | | | | | |
| | | Security & Alarm Services 2.5% | | | | | | | | | |
| c | | Prime Security Services Borrower, LLC, TermB-1 Facility, TBD,(1-month USD LIBOR + 3.25%), 9/12/26 | | | United States | | | | 1,440,385 | | | | 1,434,534 | |
| | | | | | | | | | | | | | |
| | | | | | |
| | | |
| franklintempleton.com | | Semiannual Report | | | 29 | |
FRANKLIN TEMPLETON ETF TRUST
STATEMENT OF INVESTMENTS (UNAUDITED)
Franklin Liberty Senior Loan ETF(continued)
| | | | | | | | | | | | | | |
| | | | |
| | | | | Country | | | Principal Amount* | | | Value | |
| a,b | | Senior Floating Rate Interests (continued) | | | | | | | | | |
| | | Specialized Consumer Services 0.5% | | | | | | | | | |
| | Sabre GLBL Inc., 2018 Other Term B Loans, 4.112%,(1-month USD LIBOR + 2.00%), 2/22/24 | | | United States | | | | 265,940 | | | $ | 267,311 | |
| | | | | | | | | | | | | | |
| | | Specialty Chemicals 1.9% | | | | | | | | | |
| | Axalta Coating Systems US Holdings Inc., TermB-3 Dollar Loan, 4.079%,(3-month USD LIBOR + 1.75%), 6/01/24 | | | United States | | | | 1,115,426 | | | | 1,117,604 | |
| | | | | | | | | | | | | | |
| | | Specialty Stores 3.5% | | | | | | | | | |
| | Harbor Freight Tools USA, Inc., Refinancing Loans, 4.612%,(1-month USD LIBOR + 2.50%), 8/19/23 | | | United States | | | | 917,198 | | | | 893,504 | |
| | Michaels Stores, Inc., 2018 New Replacement Term B Loan, 4.594%,(1-month USD LIBOR + 2.50%), 1/28/23 | | | United States | | | | 1,142,041 | | | | 1,117,773 | |
| | | | | | | | | | | | | | |
| | | | |
| | | | | | | | | | | | | 2,011,277 | |
| | | | | | | | | | | | | | |
| | | Systems Software 1.9% | | | | | | | | | |
| | Go Daddy Operating Company, LLC, TrancheB-1 Term Loans, 4.112%,(1-month USD LIBOR + 2.00%), 2/15/24 | | | United States | | | | 1,101,838 | | | | 1,104,975 | |
| | | | | | | | | | | | | | |
| | | Technology Hardware, Storage & Peripherals 2.1% | | | | | | | | | |
| | Western Digital Corporation, U.S. TermB-4 Loan, 4.011%,(3-month USD LIBOR + 1.75%), 4/29/23 | | | United States | | | | 1,177,308 | | | | 1,176,674 | |
| | | | | | | | | | | | | | |
| | | | |
| | Total Floating Rate Loans (Cost $46,353,428) | | | | | | | | | | | 46,194,868 | |
| | | | | | | | | | | | | | |
| | | Asset-Backed Securities 10.3% | | | | | | | | | |
| e,f | | AMMC CLO 15 Ltd.,2014-15A, CRR, 144A, 4.603%, 01/15/2032 | | | United States | | | | 1,000,000 | | | | 987,106 | |
| e,f | | Atrium XV, 15A, C 144A, 4.459%, 01/23/2031 | | | United States | | | | 1,000,000 | | | | 987,212 | |
| e,f | | BlueMountain CLO Ltd.,2018-3A, C, 144A, 4.475%, 10/25/2030 | | | United States | | | | 1,000,000 | | | | 978,113 | |
| e,f | | Dryden 45 Senior Loan Fund,2016-45A, CR, 144A, 4.50%, 10/15/2030 | | | United States | | | | 1,000,000 | | | | 988,276 | |
| e,f | | Harbor Park CLO Ltd., 1A, C, 144A, 4.377%, 01/20/2031 | | | United States | | | | 1,000,000 | | | | 980,552 | |
| e,f | | LCM XVIII LP, 2018A, CR, 144A, 4.13%, 04/20/2031 | | | United States | | | | 1,000,000 | | | | 966,344 | |
| | | | | | | | | | | | | | |
| | Total Asset-Backed Securities
(Cost $5,996,875) | | | | | | | | | | | 5,887,603 | |
| | | | | | | | | | | | | | |
| | Total Investments before Short Term Investments
(Cost $52,350,303) | | | | | | | | | | | 52,082,471 | |
| | | | | | | | | | | | | | |
| | | Short Term Investments 9.1% | | | | | | | | | |
| | U.S. Government & Agency Securities
(Cost $5,220,000) 9.1% | | | | | | | | | | | | |
| g | | FHLB,10/01/19 | | | United States | | | | 5,220,000 | | | | 5,220,000 | |
| | | | | | | | | | | | | | |
| | Total Investments
(Cost $57,570,303) 100.1% | | | | | | | | | | | 57,302,471 | |
| | Other Assets, less Liabilities (0.1)% | | | | | | | | | | | (46,895 | ) |
| | | | | | | | | | | | | | |
| | Net Assets 100.0% | | | | | | | | | | $ | 57,255,576 | |
| | | | | | | | | | | | | | |
See abbreviations on page 42.
*The principal amount is stated in U.S. dollars unless otherwise indicated.
aThe coupon rate shown represents the rate at period end.
bSee Note 1(d) regarding senior floating rate interests.
cA portion or all of the security represents an unsettled loan commitment. The coupon rate isto-be determined (TBD) at the time of settlement and will be based upon a reference index/floor plus a spread.
dA portion or all of the security purchased on a delayed delivery basis. Note 1(c)
eSecurity was purchased pursuant to Rule 144A under the Securities Act of 1933 and may be sold in transactions exempt from registration only to qualified institutional buyers or in a public offering registered under the Securities Act of 1933. These securities have been deemed liquid under guidelines approved by the Fund’s Board of Trustees. At September 30, 2019, the aggregate value of these securities was $5,887,603, representing 10.3% of net assets.
fThe coupon rate shown represents the rate inclusive of any caps or floors, if applicable, in effect at period end.
gThe security was issued on a discount basis with no stated coupon rate.
| | | | |
| | | |
| 30 | | Semiannual Report | The accompanying notes are an integral part of these financial statements. | | franklintempleton.com |
FRANKLIN TEMPLETON ETF TRUST
FINANCIAL STATEMENTS
Statements of Assets and Liabilities
September 30, 2019 (unaudited)
| | | | | | | | | | | | |
| | | |
| | | Franklin
Liberty
High Yield
Corporate ETF | | | Franklin
Liberty
International
Aggregate
Bond ETF | | | Franklin
Liberty
Senior
Loan ETF | |
Assets: | | | | | | | | | | | | |
Investments in securities: | | | | | | | | | | | | |
Cost – Unaffiliated issuers | | $ | 30,157,118 | | | $ | 4,627,189 | | | $ | 57,570,303 | |
| | | | |
Value – Unaffiliated issuers | | $ | 30,216,561 | | | $ | 4,709,910 | | | $ | 57,302,471 | |
Cash | | | 559,175 | | | | 69,760 | | | | 1,127,857 | |
Foreign currency, at value (cost $–, $347,985 and $–, respectively) | | | — | | | | 343,913 | | | | — | |
Receivables: | | | | | | | | | | | | |
Investment securities sold | | | — | | | | — | | | | 606,645 | |
Interest | | | 542,769 | | | | 30,530 | | | | 156,824 | |
Affiliates | | | 4,798 | | | | 17,673 | | | | — | |
| | | | |
Total assets | | | 31,323,303 | | | | 5,171,786 | | | | 59,193,797 | |
| | | | |
Liabilities: | | | | | | | | | | | | |
Payables: | | | | | | | | | | | | |
Investment securities purchased | | | 290,948 | | | | — | | | | 1,697,625 | |
Management fees | | | — | | | | — | | | | 4,781 | |
Transfer agent fees | | | 6,500 | | | | 6,500 | | | | 6,500 | |
Distributions to shareholders | | | 55,466 | | | | — | | | | 178,664 | |
Custodian fees | | | 2,505 | | | | 2,657 | | | | 24,802 | |
Professional fees | | | 12,528 | | | | 12,532 | | | | 12,542 | |
Reports to shareholders | | | 1,796 | | | | 1,609 | | | | 1,700 | |
Registration and filing fees | | | 3,255 | | | | 2,753 | | | | 5,448 | |
Accrued expenses and other liabilities | | | 5,874 | | | | 5,736 | | | | 6,159 | |
| | | | |
Total liabilities | | | 378,872 | | | | 31,787 | | | | 1,938,221 | |
| | | | |
Net assets, at value | | $ | 30,944,431 | | | $ | 5,139,999 | | | $ | 57,255,576 | |
| | | | |
Net assets consist of: | | | | | | | | | | | | |
Paid-in capital | | $ | 30,820,579 | | | $ | 5,005,000 | | | $ | 57,928,461 | |
Total distributable earnings (loss) | | | 123,852 | | | | 134,999 | | | | (672,885 | ) |
| | | | |
Net assets, at value | | $ | 30,944,431 | | | $ | 5,139,999 | | | $ | 57,255,576 | |
| | | | |
Shares outstanding | | | 1,200,000 | | | | 200,000 | | | | 2,300,000 | |
| | | | |
Net asset value per share | | $ | 25.79 | | | $ | 25.70 | | | $ | 24.89 | |
| | | | |
| | | | | | |
| | | |
| franklintempleton.com | | The accompanying notes are an integral part of these financial statements. | Semiannual Report | | | 31 | |
FRANKLIN TEMPLETON ETF TRUST
FINANCIAL STATEMENTS
Statements of Operations
for the six months ended September 30, 2019 (unaudited)
| | | | | | | | | | | | |
| | | |
| | | Franklin
Liberty
High Yield
Corporate ETF | | | Franklin
Liberty
International
Aggregate
Bond ETF | | | Franklin
Liberty
Senior
Loan ETF | |
Investment income: | | | | | | | | | | | | |
Interest: (net of foreign taxes)a | | | | | | | | | | | | |
Unaffiliated issuers | | $ | 333,186 | | | $ | 36,549 | | | $ | 1,336,414 | |
| | | | |
Total investment income | | | 333,186 | | | | 36,549 | | | | 1,336,414 | |
| | | | |
Expenses: | | | | | | | | | | | | |
Management fees (Note 3a) | | | 34,116 | | | | 11,390 | | | | 186,529 | |
Transfer agent fees | | | 7,799 | | | | 7,799 | | | | 7,799 | |
Custodian fees | | | 2,448 | | | | 2,727 | | | | 24,924 | |
Reports to shareholders | | | 3,201 | | | | 3,201 | | | | 3,201 | |
Registration and filing fees | | | 2,332 | | | | 2,230 | | | | 2,775 | |
Professional fees | | | 27,640 | | | | 44,932 | | | | 38,007 | |
Trustees’ fees and expenses | | | 628 | | | | 298 | | | | 3,506 | |
Other | | | 7,980 | | | | 7,679 | | | | 8,139 | |
| | | | |
Total expenses | | | 86,144 | | | | 80,256 | | | | 274,880 | |
Expenses waived/paid by affiliates (Note 3c) | | | (64,310 | ) | | | (72,260 | ) | | | (145,744 | ) |
| | | | |
Net expenses | | | 21,834 | | | | 7,996 | | | | 129,136 | |
| | | | |
Net investment income | | | 311,352 | | | | 28,553 | | | | 1,207,278 | |
| | | | |
Realized and unrealized gains (losses): | | | | | | | | | | | | |
Net realized gain (loss) from: | | | | | | | | | | | | |
Investments: | | | | | | | | | | | | |
Unaffiliated issuers | | | 109,197 | | | | 146,487 | | | | (170,889 | ) |
Foreign currency transactions | | | — | | | | (41,835 | ) | | | — | |
| | | | |
Net realized gain (loss) | | | 109,197 | | | | 104,652 | | | | (170,889 | ) |
| | | | |
Net change in unrealized appreciation (depreciation) on: | | | | | | | | | | | | |
Investments: | | | | | | | | | | | | |
Unaffiliated issuers | | | (74,577 | ) | | | 113,304 | | | | 460,799 | |
Translation of other assets and liabilities denominated in foreign currencies | | | — | | | | (436 | ) | | | — | |
| | | | |
Net change in unrealized appreciation (depreciation) | | | (74,577 | ) | | | 112,868 | | | | 460,799 | |
| | | | |
Net realized and unrealized gain (loss) | | | 34,620 | | | | 217,520 | | | | 289,910 | |
| | | | |
Net increase (decrease) in net assets resulting from operations | | $ | 345,972 | | | $ | 246,073 | | | $ | 1,497,188 | |
| | | | |
| | | | | | | | | | | | |
aForeign taxes withheld on interest | | $ | — | | | $ | 31 | | | $ | — | |
| | | | |
| | | | |
| | | |
| 32 | | Semiannual Report | The accompanying notes are an integral part of these financial statements. | | franklintempleton.com |
FRANKLIN TEMPLETON ETF TRUST
FINANCIAL STATEMENTS
Statements of Changes in Net Assets
| | | | | | | | | | | | | | | | |
| | |
| | | Franklin Liberty High Yield
Corporate ETF | | | Franklin Liberty International
Aggregate Bond ETF | |
| | | | |
| | | Six Months Ended
September 30, 2019
(unaudited) | | | Year Ended
March 31, 2019a | | | Six Months
Ended
September 30, 2019
(unaudited) | | | Year Ended
March 31, 2019a | |
Increase (decrease) in net assets: | | | | | | | | | | | | | | | | |
Operations: | | | | | | | | | | | | | | | | |
Net investment income | | $ | 311,352 | | | $ | 484,624 | | | $ | 28,553 | | | $ | 77,976 | |
Net realized gain (loss) | | | 109,197 | | | | 28,881 | | | | 104,652 | | | | (49,575 | ) |
Net change in unrealized appreciation (depreciation) | | | (74,577 | ) | | | 134,020 | | | | 112,868 | | | | (34,953 | ) |
| | | | |
Net increase (decrease) in net assets resulting from operations | | | 345,972 | | | | 647,525 | | | | 246,073 | | | | (6,552 | ) |
| | | | |
Distributions to shareholders | | | (367,861 | ) | | | (501,784 | ) | | | (17,822 | ) | | | (86,700 | ) |
| | | | |
Capital share transactions: (Note 2) | | | 20,785,579 | | | | 10,035,000 | | | | — | | | | 5,005,000 | |
| | | | |
Net increase (decrease) in net assets | | | 20,763,690 | | | | 10,180,741 | | | | 228,251 | | | | 4,911,748 | |
Net assets: | | | | | | | | | | | | | | | | |
Beginning of period | | | 10,180,741 | | | | — | | | | 4,911,748 | | | | — | |
| | | | |
End of period | | $ | 30,944,431 | | | $ | 10,180,741 | | | $ | 5,139,999 | | | $ | 4,911,748 | |
| | | | |
aFor the period May 30, 2018 (commencement of operations) to March 31, 2019.
| | | | | | |
| | | |
| franklintempleton.com | | The accompanying notes are an integral part of these financial statements. | Semiannual Report | | | 33 | |
FRANKLIN TEMPLETON ETF TRUST
FINANCIAL STATEMENTS
Statements of Changes in Net Assets(continued)
| | | | | | | | |
| |
| | | Franklin Liberty Senior Loan ETF | |
| | |
| | | Six Months Ended
September 30, 2019
(unaudited) | | | Year Ended
March 31, 2019a | |
Increase (decrease) in net assets: | | | | | | | | |
Operations: | | | | | | | | |
Net investment income | | $ | 1,207,278 | | | $ | 1,318,709 | |
Net realized gain (loss) | | | (170,889 | ) | | | (52,149 | ) |
Net change in unrealized appreciation (depreciation) | | | 460,799 | | | | (728,631 | ) |
| | | | |
Net increase (decrease) in net assets resulting from operations | | | 1,497,188 | | | | 537,929 | |
| | | | |
Distributions to shareholders | | | (1,406,685 | ) | | | (1,301,317 | ) |
| | | | |
Capital share transactions: (Note 2) | | | — | | | | 57,928,461 | |
| | | | |
Net increase (decrease) in net assets | | | 90,503 | | | | 57,165,073 | |
Net assets: | | | | | | | | |
Beginning of period | | | 57,165,073 | | | | — | |
| | | | |
End of period | | $ | 57,255,576 | | | $ | 57,165,073 | |
| | | | |
aFor the period May 30, 2018 (commencement of operations) to March 31, 2019.
| | | | |
| | | |
| 34 | | Semiannual Report | The accompanying notes are an integral part of these financial statements. | | franklintempleton.com |
FRANKLIN TEMPLETON ETF TRUST
Notes to Financial Statements
1. Organization and Significant Accounting Policies
Franklin Templeton ETF Trust (Trust) is registered under the Investment Company Act of 1940 (1940 Act) as anopen-end management investment company, consisting of thirty-nine separate funds, three of which are included in this report (Funds) and applies the specialized accounting and reporting guidance in U.S. Generally Accepted Accounting Principles (U.S. GAAP). Each of the Funds are an exchange traded fund (ETF) and are actively managed, thus they are not designed to track an index. The Trust began offering shares of Franklin Liberty High Yield Corporate ETF, Franklin Liberty International Aggregate Bond ETF and Franklin Liberty Senior Loan ETF.
The following summarizes the Funds’ significant accounting policies.
a. Financial Instrument Valuation
The Funds’ investments in financial instruments are carried at fair value daily. Fair value is the price that would be received to sell an asset or paid to transfer a liability in an orderly transaction between market participants on the measurement date. The Funds calculate the net asset value (NAV) per share as of 4 p.m. Eastern time each day the New York Stock Exchange (NYSE) is open for trading. Under compliance policies and procedures approved by the Trust’s Board of Trustees (the Board), the Funds’ administrator has responsibility for oversight of valuation, including leading the cross-functional Valuation Committee (VC). The Funds may utilize independent pricing services, quotations from securities and financial instrument dealers, and other market sources to determine fair value.
Debt securities generally trade in theover-the-counter (OTC) market rather than on a securities exchange. The Funds’ pricing services use multiple valuation techniques to determine fair value. In instances where sufficient market activity exists, the pricing services may utilize a market-based approach through which quotes from market makers are used to determine fair value. In instances where sufficient market activity may not exist or is limited, the pricing services also utilize proprietary valuation models which may consider market characteristics such as benchmark yield curves, credit spreads, estimated default rates, anticipated market interest rate volatility, coupon rates, anticipated timing of principal repayments, underlying collateral, and other unique security features in order to estimate the relevant cash flows, which are then discounted to calculate the fair value.
Securities denominated in a foreign currency are converted into their U.S. dollar equivalent at the foreign exchange rate in effect at 4 p.m. Eastern time on the date that the values of the foreign debt securities are determined.
The Funds have procedures to determine the fair value of financial instruments for which market prices are not reliable or readily available. Under these procedures, the Funds primarily employ a market-based approach which may use related or comparable assets or liabilities, recent transactions, market multiples, book values, and other relevant information for the investment to determine the fair value of the investment. An income-based valuation approach may also be used in which the anticipated future cash flows of the investment are discounted to calculate fair value. Discounts may also be applied due to the nature or duration of any restrictions on the disposition of the investments. Due to the inherent uncertainty of valuations of such investments, the fair values may differ significantly from the values that would have been used had an active market existed.
b. Foreign Currency Translation
Portfolio securities and other assets and liabilities denominated in foreign currencies are translated into U.S. dollars based on the exchange rate of such currencies against U.S. dollars on the date of valuation. The Funds may enter into foreign currency exchange contracts to facilitate transactions denominated in a foreign currency. Purchases and sales of securities, income and expense items denominated in foreign currencies are translated into U.S. dollars at the exchange rate in effect on the transaction date. Portfolio securities and assets and liabilities denominated in foreign currencies contain risks that those currencies will decline in value relative to the U.S. dollar. Occasionally, events may impact the availability or reliability of foreign exchange rates used to convert the U.S. dollar equivalent value. If such an event occurs, the foreign exchange rate will be valued at fair value using procedures established and approved by the Board.
The Funds do not separately report the effect of changes in foreign exchange rates from changes in market prices on securities held. Such changes are included in net realized and unrealized gain or loss from investments in the Statements of Operations.
Realized foreign exchange gains or losses arise from sales of foreign currencies, currency gains or losses realized between the trade and settlement dates on securities transactions and the difference between the recorded amounts of dividends, interest, and foreign withholding taxes and the
| | | | | | |
| | | |
| franklintempleton.com | | Semiannual Report | | | 35 | |
FRANKLIN TEMPLETON ETF TRUST
NOTES TO FINANCIAL STATEMENTS
1. Organization and Significant Accounting Policies(continued)
b. Foreign Currency Translation(continued)
U.S. dollar equivalent of the amounts actually received or paid. Net unrealized foreign exchange gains and losses arise from changes in foreign exchange rates on foreign denominated assets and liabilities other than investments in securities held at the end of the reporting period.
c. Securities Purchased on a Delayed Delivery Basis
Certain or all Funds purchase securities on a delayed delivery basis, with payment and delivery scheduled for a future date. These transactions are subject to market fluctuations and are subject to the risk that the value at delivery may be more or less than the trade date purchase price. Although the Funds will generally purchase these securities with the intention of holding the securities, they may sell the securities before the settlement date.
d. Senior Floating Rate Interests
Certain or all Funds invest in senior secured corporate loans that pay interest at rates which are periodically reset by reference to a base lending rate plus a spread. These base lending rates are generally the prime rate offered by a designated U.S. bank or the London InterBank Offered Rate (LIBOR). Senior secured corporate loans often require prepayment of principal from excess cash flows or at the discretion of the borrower. As a result, actual maturity may be substantially less than the stated maturity. Senior secured corporate loans in which the Funds invest are generally readily marketable, but may be subject to certain restrictions on resale. On July 27, 2017, the United Kingdom’s Financial Conduct Authority announced its intention to cease sustaining LIBOR after 2021. There remains uncertainty regarding the future utilization of LIBOR and the nature of any replacement rate. As such, the potential effect of a transition away from LIBOR on the Fund or the Fund’s investments that use or may use a floating rate based on LIBOR cannot yet be determined.
e. Income and Deferred Taxes
It is each Fund’s policy to qualify as a regulated investment company under the Internal Revenue Code. Each Fund intends to distribute to shareholders substantially all of its taxable income and net realized gains to relieve it from federal income and excise taxes. As a result, no provision for U.S. federal income taxes is required.
The Funds may be subject to foreign taxation related to income received, capital gains on the sale of securities and certain foreign currency transactions in the foreign jurisdictions in which the Funds invest. Foreign taxes, if any, are recorded based on the tax regulations and rates that exist in the foreign markets in which the Funds invest. When a capital gain tax is determined to apply, certain or all Funds record an estimated deferred tax liability in an amount that would be payable if the securities were disposed of on the valuation date.
Each Fund may recognize an income tax liability related to its uncertain tax positions under U.S. GAAP when the uncertain tax position has a less than 50% probability that it will be sustained upon examination by the tax authorities based on its technical merits. As of September 30, 2019, each Fund has determined that no tax liability is required in its financial statements related to uncertain tax positions for any open tax years (or expected to be taken in future tax years).
f. Security Transactions, Investment Income, Expenses and Distributions
Security transactions are accounted for on trade date. Realized gains and losses on security transactions are determined on a specific identification basis. Interest income and estimated expenses are accrued daily. Amortization of premium and accretion of discount on debt securities are included in interest income. Distributions to shareholders are recorded on theex-dividend date. Distributable earnings are determined according to income tax regulations (tax basis) and may differ from earnings recorded in accordance with U.S. GAAP. These differences may be permanent or temporary. Permanent differences are reclassified among capital accounts to reflect their tax character. These reclassifications have no impact on net assets or the results of operations. Temporary differences are not reclassified, as they may reverse in subsequent periods.
Common expenses incurred by the Trust are allocated among the Funds based on the ratio of net assets of each Fund to the combined net assets of the Trust. Certain Fund specific expenses are allocated directly to the Fund that incurred the expense. These expenses are paid by the Funds or by investment manager, as applicable, according to the terms of the unified management fee agreement.
g. Accounting Estimates
The preparation of financial statements in accordance with U.S. GAAP requires management to make estimates and
| | | | |
| | | |
| 36 | | Semiannual Report | | franklintempleton.com |
FRANKLIN TEMPLETON ETF TRUST
NOTES TO FINANCIAL STATEMENTS
assumptions that affect the reported amounts of assets and liabilities at the date of the financial statements and the amounts of income and expenses during the reporting period. Actual results could differ from those estimates.
h. Guarantees and Indemnifications
Under the Trust’s organizational documents, its officers and trustees are indemnified by the Trust against certain liabilities
arising out of the performance of their duties to the Trust. Additionally, in the normal course of business, the Trust, on behalf of the Funds, enters into contracts with service providers that contain general indemnification clauses. The Trust’s maximum exposure under these arrangements is unknown as this would involve future claims that may be made against the Trust that have not yet occurred. Currently, the Trust expects the risk of loss to be remote.
2. Shares of Beneficial Interest
Shares of the Funds are issued and redeemed at their respective NAV only in aggregations of a specific number of shares or multiples thereof (Creation Units). Only certain large institutional investors (Authorized Participants) may engage in creation or redemption transactions directly with the Funds. Once created, shares of the Funds generally trade in the secondary market in amounts less than one Creation Unit. The market price of the Funds’ shares will be based on the price in the secondary market which may be at, above or below the most recent NAV. Creation Units may be issued and redeemed in exchange for a designated portfolio of securities and/or cash (which may include cash in lieu of certain securities). For the period ended September 30, 2019, all Creation Unit transactions were made in cash.
Authorized Participants pay a standard transaction fee to the shareholder servicing agent when purchasing or redeeming Creation Units of the Funds regardless of the number of Creation Units that are being created or redeemed on the same day by the Authorized Participant. The standard transaction fee is imposed to offset transfer and other transaction costs associated with the issuance and redemption of Creation Units and is not charged to or paid by the Funds.
In addition, for cash Creation Unit transactions, a variable fee for creation transactions and redemption transactions may be charged to the Authorized Participant to cover certain brokerage, tax, foreign exchange, execution, market impact and other costs and expenses related to the execution of trades. Variable fees, if any, are included in capital share transactions in the Statements of Changes in Net Assets.
At September 30, 2019, there were an unlimited number of shares authorized (without par value). Transactions in the Funds’ shares were as follows:
| | | | | | | | | | | | | | | | | | | | |
| |
| | | Franklin Liberty High Yield Corporate ETF | |
| | | |
| | | Six Months Ended
September 30, 2019 | | | | | | Year Ended
March 31, 2019a | |
| | | | | |
| | | Shares | | | Amount | | | | | | Shares | | | Amount | |
Shares sold | | | 800,000 | | | $ | 20,785,579 | | | | | | | | 400,000 | | | $ | 10,035,000 | |
| | | | |
Net increase (decrease) | | | 800,000 | | | $ | 20,785,579 | | | | | | | | 400,000 | | | $ | 10,035,000 | |
| | �� | | |
| |
| | | Franklin Liberty International Aggregate Bond ETF | |
| | | |
| | | Six Months Ended
September 30, 2019b | | | | | | Year Ended
March 31, 2019a | |
| | | | | |
| | | Shares | | | Amount | | | | | | Shares | | | Amount | |
Shares sold | | | — | | | $ | — | | | | | | | | 200,000 | | | $ | 5,005,000 | |
| | | | |
Net increase (decrease) | | | — | | | $ | — | | | | | | | | 200,000 | | | $ | 5,005,000 | |
| | | | |
| | | | | | |
| | | |
| franklintempleton.com | | Semiannual Report | | | 37 | |
FRANKLIN TEMPLETON ETF TRUST
NOTES TO FINANCIAL STATEMENTS
2. Shares of Beneficial Interest(continued)
| | | | | | | | | | | | | | | | | | | | |
| | | Franklin Liberty Senior Loan ETF | |
| | | |
| | | Six Months Ended
September 30, 2019b | | | | | | Year Ended
March 31, 2019a | |
| | | | | |
| | | Shares | | | Amount | | | | | | Shares | | | Amount | |
Shares sold | | | — | | | $ | — | | | | | | | | 2,300,000 | | | $ | 57,928,461 | |
| | | | |
Net increase (decrease) | | | — | | | $ | — | | | | | | | | 2,300,000 | | | $ | 57,928,461 | |
| | | | |
aFor the period May 30, 2018 (commencement of operations) to March 31, 2019.
bDuring the period ended September 30, 2019, there were no transactions of the Fund’s shares.
3. Transactions with Affiliates
Franklin Resources, Inc. is the holding company for various subsidiaries that together are referred to as Franklin Templeton. Certain officers and trustees of the Funds are also officers and/or directors of the following subsidiaries:
| | |
| |
| Subsidiary | | Affiliation |
Franklin Advisers, Inc. (Advisers) | | Investment manager |
Franklin Templeton Investment Management Limited (FTIML) | | Investment manager |
Franklin Templeton Services, LLC (FT Services) | | Administrative manager |
Franklin Templeton Distributors, Inc. (Distributors) | | Principal underwriter |
a. Management Fees
Franklin Liberty High Yield Corporate ETF pays an investment management fee to Advisers based on the average daily net assets of the fund as follows:
| | |
| |
| Annualized Fee Rate | | Net Assets |
0.625% | | Up to and including $100 million |
0.500% | | Over $100 million, up to and including $250 million |
0.450% | | Over $250 million, up to and including $7.5 billion |
0.440% | | Over $7.5 billion, up to and including $10 billion |
0.430% | | Over $10 billion, up to and including $12.5 billion |
0.420% | | Over $12.5 billion, up to and including $15 billion |
0.400% | | Over $15 billion, up to and including $17.5 billion |
0.380% | | Over $17.5 billion, up to and including $20 billion |
0.360% | | Over $20 billion, up to and including $35 billion |
0.355% | | Over $35 billion, up to and including $50 billion |
0.350% | | In excess of $50 billion |
Franklin Liberty International Aggregate Bond ETF pays an investment management fee to FTIML based on the average daily net assets of the fund as follows:
| | |
| |
| Annualized Fee Rate | | Net Assets |
0.450% | | Up to and including $1 billion |
0.400% | | Over $1 billion, up to and including $5 billion |
0.350% | | Over $5 billion, up to and including $10 billion |
0.345% | | Over $10 billion, up to and including $15 billion |
0.340% | | Over $15 billion, up to and including $20 billion |
0.335% | | In excess of $20 billion |
| | | | |
| | | |
| 38 | | Semiannual Report | | franklintempleton.com |
FRANKLIN TEMPLETON ETF TRUST
NOTES TO FINANCIAL STATEMENTS
Franklin Liberty Senior Loan ETF pays an investment management fee to Advisers based on the average daily net assets of the fund as follows:
| | |
| |
| Annualized Fee Rate | | Net Assets |
0.650% | | Up to and including $500 million |
0.550% | | Over $500 million, up to and including $1 billion |
0.500% | | Over $1 billion, up to and including $1.5 billion |
0.450% | | Over $1.5 billion, up to and including $6.5 billion |
0.425% | | Over $6.5 billion, up to and including $11.5 billion |
0.400% | | Over $11.5 billion, up to and including $16.5 billion |
0.390% | | Over $16.5 billion, up to and including $19 billion |
0.380% | | Over $19 billion, up to and including $21.5 billion |
0.370% | | In excess of $21.5 billion |
For the period ended September 30, 2019, each Fund’s annualized effective investment management fee rate based on daily net assets was as follows:
| | |
| |
| | | Annualized Fee Rate |
Franklin Liberty High Yield Corporate ETF | | 0.625% |
Franklin Liberty International Aggregate Bond ETF | | 0.450% |
Franklin Liberty Senior Loan ETF | | 0.650% |
Effective March 1, 2019, under a subadvisory agreement, FTIML, an affiliate of Advisers, provides subadvisory services to Franklin Liberty International Aggregate Bond ETF. The subadvisory fee is paid by Advisers based on the Fund’s average daily net assets, and is not an additional expense of the Fund.
b. Administrative Fees
Under an agreement with Advisers, and FTIML, FT Services provides administrative services to the Funds. The fee is paid by Advisers, and FTIML, based on each of the Funds’ average daily net assets, and is not an additional expense of the Funds.
c. Waiver and Expense Reimbursements
Advisers has contractually agreed in advance to waive or limit its fees and to assume as its own expense certain expenses otherwise payable by Franklin Liberty High Yield Corporate ETF and Franklin Liberty Senior Loan ETF so that the expenses (including acquired fund fees and expenses) for each of the Funds do not exceed 0.40% and 0.45%, respectively, based on the average net assets (other than certainnon-routine expenses or costs, including those relating to litigation, indemnification, reorganizations, and liquidations) until July 31, 2020. FTIML has contractually agreed in advance to waive or limit its fees and to assume as its own expense certain expenses otherwise payable by Franklin Liberty International Aggregate Bond ETF so that the expenses (including acquired fund fees and expenses) of the Fund do not exceed 0.25% based on the average net assets (other than certainnon-routine expenses or costs, including those relating to litigation, indemnification, reorganizations, and liquidations) until July 31, 2020. Prior to August 1, 2019, expenses (including acquired fund fees and expenses) for Franklin Liberty International Aggregate Bond ETF were limited to 0.35% based on the average net assets of the fund. Total expenses waived or paid are not subject to recapture subsequent to the Funds’ fiscal year end.
| | | | | | |
| | | |
| franklintempleton.com | | Semiannual Report | | | 39 | |
FRANKLIN TEMPLETON ETF TRUST
NOTES TO FINANCIAL STATEMENTS
3. Transactions with Affiliates(continued)
d. Other Affiliated Transactions
At September 30, 2019, the shares of the Funds were owned by the following entities:
| | | | | | | | |
| | |
| Funds | | Shares | | | Percentage of
Outstanding Sharesa | |
| Franklin Liberty High Yield Corporate ETF | | | | | | |
Franklin Moderate Allocation Fund | | | 334,505 | | | | 27.9% | |
Franklin LifeSmart™ 2020 – 2055 Retirement Target Funds | | | 62,218 | | | | 5.2% | |
Franklin 529 Portfolios | | | 576,433 | | | | 48.0% | |
| | | | | | | | |
| | | 973,156 | | | | 81.1% | |
| | | | | | | | |
| Franklin Liberty International Aggregate Bond ETF | | | | | | |
Franklin Resources Inc. | | | 110,000 | | | | 55.0% | |
| | | | | | | | |
| Franklin Liberty Senior Loan ETF | | | | | | |
Franklin Total Return Fund | | | 914,900 | | | | 39.8% | |
Franklin Floating Rate Master Trust | | | 1,093,000 | | | | 47.5% | |
| | | | | | | | |
| | | 2,007,900 | | | | 87.3% | |
| | | | | | | | |
aInvestment activities of significant shareholders could have a material impact on the Funds.
4. Income Taxes
For tax purposes, capital losses may be carried over to offset future capital gains, if any. At March 31, 2019, the capital loss carryforwards were as follows:
| | | | |
| |
| | | Franklin
Liberty
Senior Loan ETF | |
| Capital loss carryforwards: | | | | |
Long term | | $ | — | |
Short term | | | 52,758 | |
| | | | |
Total capital loss carryforwards | | $ | 52,758 | |
| | | | |
For tax purposes, the Funds may elect to defer any portion of a late-year ordinary loss to the first day of the following fiscal year. At March 31, 2019, Franklin Liberty International Aggregate Bond ETF deferred late-year ordinary losses of $23,917.
At September 30, 2019, the cost of investments, net unrealized appreciation (depreciation) and undistributed ordinary income for income tax purposes were as follows:
| | | | | | | | | | | | |
| | | |
| | | Franklin
Liberty
High Yield
Corporate ETF | | | Franklin
Liberty
International
Aggregate
Bond ETF | | | Franklin
Liberty Senior
Loan ETF | |
Cost of investments | | $ | 30,172,626 | | | $ | 4,653,372 | | | $ | 57,583,593 | |
| | | | |
Unrealized appreciation | | $ | 385,513 | | | $ | 108,210 | | | $ | 160,544 | |
Unrealized depreciation | | | (341,578 | ) | | | (51,672 | ) | | | (441,666 | ) |
| | | | |
Net unrealized appreciation (depreciation) | | $ | 43,935 | | | $ | 56,538 | | | $ | (281,122 | ) |
| | | | |
Differences between income and/or capital gains as determined on a book basis and a tax basis are primarily due to differing treatments of bond discounts and premiums.
| | | | |
| | | |
| 40 | | Semiannual Report | | franklintempleton.com |
FRANKLIN TEMPLETON ETF TRUST
NOTES TO FINANCIAL STATEMENTS
5. Investment Transactions
Purchases and sales of investments (excluding short term securities andin-kind transactions, if any) for the period ended September 30, 2019, were as follows:
| | | | | | | | | | | | |
| | | |
| | | Franklin
Liberty
High Yield
Corporate ETF | | | Franklin
Liberty
International
Aggregate
Bond ETF | | | Franklin
Liberty Senior
Loan ETF | |
Purchases | | $ | 21,915,471 | | | $ | 3,429,883 | | | $ | 13,212,962 | |
Sales | | $ | 2,694,254 | | | $ | 2,990,731 | | | $ | 14,479,147 | |
6. Credit Risk
At September 30, 2019, Franklin Liberty High Yield ETF, Franklin Liberty International Aggregate Bond ETF, and Franklin Liberty Senoir Loan ETF had 97.76%, 2.98%, and 80.51%, respectively, of their portfolio invested in high yield securities, senior secured floating rate notes, or other securities rated below investment grade and unrated securities, if any. These securities may be more sensitive to economic conditions causing greater price volatility and are potentially subject to a greater risk of loss due to default than higher rated securities.
7. Global Credit Facility
The Funds, except for Franklin Liberty International Aggregate Bond Fund ETF, together with other U.S. registered and foreign investment funds (collectively, Borrowers), managed by Franklin Templeton, are borrowers in a joint syndicated senior unsecured credit facility totaling $2 billion (Global Credit Facility) which the Funds entered into on February 8, 2019 and matures on February 7, 2020. This Global Credit Facility provides a source of funds to the Borrowers for temporary and emergency purposes, including the ability to meet future unanticipated or unusually large redemption requests.
Under the terms of the Global Credit Facility, the Funds shall, in addition to interest charged on any borrowings made by the Funds and other costs incurred by the Funds, pay their share of fees and expenses incurred in connection with the implementation and maintenance of the Global Credit Facility, based upon their relative share of the aggregate net assets of all of the Borrowers, including an annual commitment fee of 0.15% based upon the unused portion of the Global Credit Facility. These fees are reflected in other expenses in the Statement of Operations. During the period ended September 30, 2019, the Fund did not use the Global Credit Facility.
8. Concentration of Risk
Investing in foreign securities may include certain risks and considerations not typically associated with investing in U.S. securities, such as fluctuating currency values and changing local, regional and global economic, political and social conditions, which may result in greater market volatility. Current political and financial uncertainty surrounding the European Union may increase market volatility and the economic risk of investing in securities in Europe. In addition, certain foreign securities may not be as liquid as U.S. securities.
9. Fair Value Measurements
The Funds follow a fair value hierarchy that distinguishes between market data obtained from independent sources (observable inputs) and the Funds’ own market assumptions (unobservable inputs). These inputs are used in determining the value of the Funds’ financial instruments and are summarized in the following fair value hierarchy:
| | • | | Level 1 – quoted prices in active markets for identical financial instruments |
| | • | | Level 2 – other significant observable inputs (including quoted prices for similar financial instruments, interest rates, prepayment speed, credit risk, etc.) |
| | • | | Level 3 – significant unobservable inputs (including the Funds’ own assumptions in determining the fair value of financial instruments) |
| | | | | | |
| | | |
| franklintempleton.com | | Semiannual Report | | | 41 | |
FRANKLIN TEMPLETON ETF TRUST
NOTES TO FINANCIAL STATEMENTS
9. Fair Value Measurements(continued)
The input levels are not necessarily an indication of the risk or liquidity associated with financial instruments at that level.
At September 30, 2019, all of the Funds’ investments in financial instruments carried at fair value were valued using Level 2 inputs.
10. Subsequent Events
The Funds have evaluated subsequent events through the issuance of the financial statements and determined that no events have occurred that require disclosure.
Abbreviations
| | | | | | |
| Selected Portfolio | | Currency |
| CLO | | Collateralized Loan Obligation | | AUD | | Australian Dollar |
| FHLB | | Federal Home Loan Bank Rate | | CAD | | Canadian Dollar |
| LIBOR | | London InterBank Offered | | EUR | | Euro |
| PIK | | Payment-In-Kind | | JPY | | Japanese Yen |
| TBD | | To be determined | | IDR | | Indonesian Rupiah |
| | | | MXN | | Mexican Peso |
| | | | PLN | | Polish Zloty |
| | | | USD | | United States Dollar |
| | | | ZAR | | South African Rand |
| | | | |
| | | |
| 42 | | Semiannual Report | | franklintempleton.com |
FRANKLIN TEMPLETON ETF TRUST
Tax Information (unaudited)
At March 31, 2019 , more than 50% of the Funds’ total assets were invested in securities of foreign issuers. In most instances, foreign taxes were withheld from income paid to the Funds on these investments. As shown in the table below, the Funds hereby report to shareholders the foreign source income and foreign taxes paid, pursuant to Section 853 of the Internal Revenue Code. This written statement will allow shareholders of record on June 12, 2019, to treat their proportionate share of foreign taxes paid by the Funds as having been paid directly by them. The shareholder shall consider these amounts as foreign taxes paid in the tax year in which they receive the Fund distribution.
The following table provides a detailed analysis of foreign tax paid, foreign source income, and foreign source qualified dividends as reported by the Funds to shareholders of record.
| | | | | | | | | | | | |
| | | |
| Fund | | Foreign Tax Paid
Per Share | | | Foreign Source Income
Per Share | | | Foreign Source Qualified
Dividends Per Share | |
Franklin Liberty International Aggregate Bond ETF | | $ | 0.0086 | | | $ | 0.5143 | | | $ | — | |
Foreign Tax Paid Per Share is the amount per share available to you, as a tax credit (assuming you held your shares in the Fund for a minimum of 16 days during the31-day period beginning 15 days before theex-dividend date of the Fund’s distribution to which the foreign taxes relate), or, as a tax deduction.
Foreign Source Income Per Share is the amount per share of income dividends attributable to foreign securities held by the Fund, plus any foreign taxes withheld on these dividends. The amounts reported include foreign source qualified dividends that have not been adjusted for the rate differential applicable to such dividend income.1
Foreign Source Qualified Dividends Per Share is the amount per share of foreign source qualified dividends, plus any foreign taxes withheld on these dividends. These amounts represent the portion of the Foreign Source Income reported to you in column 2 that were derived from qualified foreign securities held by the Fund.1
Bymid-February 2020, shareholders will receive Form1099-DIV which will include their share of taxes paid and foreign source income distributed during the calendar year 2019. The Foreign Source Income reported on Form1099-DIV has not been adjusted for the rate differential on foreign source qualified dividend income. Shareholders are advised to check with their tax advisors for information on the treatment of these amounts on their individual income tax returns.
1. Qualified dividends are taxed at reduced long term capital gains tax rates. In determining the amount of foreign tax credit that may be applied against the U.S. tax liability of individuals receiving foreign source qualified dividends, adjustments may be required to the foreign tax credit limitation calculation to reflect the rate differential applicable to such dividend income. The rules however permit certain individuals to elect not to apply the rate differential adjustments for capital gains and/or dividends for any taxable year. Please consult your tax advisor and the instructions to Form 1116 for more information.
| | | | | | |
| | | |
| franklintempleton.com | | Semiannual Report | | | 43 | |
FRANKLIN TEMPLETON ETF TRUST
Shareholder Information
Proxy Voting Policies and Procedures
The Trust’s investment manager has established Proxy Voting Policies and Procedures (Policies) that the Trust uses to determine how to vote proxies relating to portfolio securities. Shareholders may view the Trust’s complete Policies online at franklintempleton.com. Alternatively, shareholders may request copies of the Policies free of charge by calling the Proxy Group collect at (954)527-7678 or by sending a written request to: Franklin Templeton Companies, LLC, 300 S.E. 2nd Street, Fort Lauderdale, FL 33301, Attention: Proxy Group. Copies of the Trust’s proxy voting records are also made available online at franklintempleton.com and posted on the U.S. Securities and Exchange Commission’s website at sec.gov and reflect the most recent12-month period ended June 30.
Quarterly Statement of Investments
The Trust files a complete statement of investments with the U.S. Securities and Exchange Commission for the first and third quarters for each fiscal year as an exhibit to its report on FormN-PORT. Shareholders may view the filedForm N-PORT by visiting the Commission’s website at sec.gov. The filed form may also be viewed and copied at the Commission’s Public Reference Room in Washington, DC. Information regarding the operations of the Public Reference Room may be obtained by calling(800) SEC-0330.
Premium/Discount Information
Information about the differences between the daily market price on the secondary market for the shares of the Fund and the Fund’s net asset value may be found on the Fund’s website at libertyshares.com.
| | | | |
| | | |
| 44 | | Semiannual Report | | franklintempleton.com |
Authorized for distribution only when accompanied or preceded by a summary prospectus and/or prospectus. Investors should carefully consider a fund’s investment goals, risks, charges and expenses before investing. A prospectus contains this and other information; please read it carefully before investing.
To help ensure we provide you with quality service, all calls to and from our service areas are monitored and/or recorded.
| | | | | | |
 | | Semiannual Report Franklin Templeton ETF Trust | | |
| | | |
| | Investment Managers | | Distributor | | Investor Services |
| | Franklin Advisers, Inc. Franklin Templeton Investment Management Limited | | Franklin Templeton Distributors, Inc. (800) DIAL BEN®/342-5236 franklintempleton.com | | Transfer Agent State Street Bank and
Trust Company 1 Heritage Drive
Mail Stop OHD0100 North Quincy, MA 02171 |
| © 2019 Franklin Templeton Investments. All rights reserved. | | | | ETF6 S 11/19 |
(a) The Registrant has adopted a code of ethics that applies to its principal executive officers and principal financial and accounting officer.
(c) N/A
(d) N/A
(f) Pursuant to Item 13(a)(1), the Registrant is attaching as an exhibit a copy of its code of ethics that applies to its principal executive officers and principal financial and accounting officer.
| Item 3. | Audit Committee Financial Expert. |
(a) (1) The Registrant has an audit committee financial expert serving on its audit committee.
(2) The audit committee financial expert is Rohit Baghat and he is “independent” as defined under the relevant Securities and Exchange Commission Rules and Releases.
| Item 4. | Principal Accountant Fees and Services. N/A |
| Item 5. | Audit Committee of Listed Registrants. N/A |
| Item 6. | Schedule of Investments. N/A |
| Item 7. | Disclosure of Proxy Voting Policies and Procedures forClosed-End Management Investment Companies. N/A |
| Item 8. | Portfolio Managers ofClosed-End Management Investment Companies. N/A |
| Item 9. | Purchases of Equity Securities byClosed-End Management Investment Company and Affiliated Purchasers. N/A |
| Item 10. | Submission of Matters to a Vote of Security Holders. |
There have been no changes to the procedures by which shareholders may recommend nominees to the Registrant’s Board of Trustees that would require disclosure herein.
| Item 11. | Controls and Procedures. |
(a)Evaluation of Disclosure Controls and Procedures. The Registrant maintains disclosure controls and procedures that are designed to provide reasonable assurance that information required to be disclosed in the Registrant’s filings under the Securities Exchange Act of 1934, as amended, and the Investment Company Act of 1940 is recorded, processed, summarized and reported within the periods specified in the rules and forms of the Securities and Exchange Commission. Such information is accumulated and communicated to the Registrant’s management, including its principal executive officer and principal financial officer, as appropriate, to allow timely decisions regarding required disclosure. The Registrant’s management, including the principal executive officer and the principal financial officer, recognizes that any set of controls and procedures, no matter how well designed and operated, can provide only reasonable assurance of achieving the desired control objectives.
Within 90 days prior to the filing date of this Shareholder Report onForm N-CSR, the Registrant had carried out an evaluation, under the supervision and with the participation of the Registrant’s management, including the Registrant’s principal executive officer and the Registrant’s principal financial officer, of the effectiveness of the design and operation of the Registrant’s disclosure controls and procedures. Based on such evaluation, the Registrant’s principal executive officer and principal financial officer concluded that the Registrant’s disclosure controls and procedures are effective.
(b)Changes in Internal Controls. There have been no changes in the Registrant’s internal control over financial reporting that occurred during the period covered by this report that has materially affected, or is reasonably likely to materially affect the internal control over financial reporting.
| Item 12. | Disclosure of Securities Lending Activities for Closed-End Management Investment Company. N/A |
(a) (1) Code of Ethics
(a) (2) Certifications pursuant to Section 302 of the Sarbanes-Oxley Act of 2002 of Matthew T. Hinkle, Chief Executive Officer – Finance and Administration, and Vivek Pai, Chief Financial Officer and Chief Accounting Officer
(b) Certifications pursuant to Section 906 of the Sarbanes-Oxley Act of 2002 of Matthew T. Hinkle, Chief Executive Officer – Finance and Administration, and Vivek Pai, Chief Financial Officer and Chief Accounting Officer
SIGNATURES
Pursuant to the requirements of the Securities Exchange Act of 1934 and the Investment Company Act of 1940, the registrant has duly caused this report to be signed on its behalf by the undersigned, thereunto duly authorized.
| | |
| FRANKLIN TEMPLETON ETF TRUST |
| |
| By | | /s/ Matthew T. Hinkle |
| | Matthew T. Hinkle |
| | Chief Executive Officer – Finance and Administration |
| Date | | November 29, 2019 |
Pursuant to the requirements of the Securities Exchange Act of 1934 and the Investment Company Act of 1940, this report has been signed below by the following persons on behalf of the registrant and in the capacities and on the dates indicated.
| | |
| By | | /s/ Matthew T. Hinkle |
| | Matthew T. Hinkle |
| | Chief Executive Officer – Finance and Administration |
| Date | | November 29, 2019 |
| |
| By | | /s/ Vivek Pai |
| | Vivek Pai |
| | Chief Financial Officer and Chief Accounting Officer |
| Date | | November 29, 2019 |