Exhibit 99.1
HIGHLIGHTS
RESULTS
| • | TCE for Q3 2022: USD/day 44,376 (Q3 2021: USD/day 12,854) |
| • | TCE for Q1-Q3 2022: 29,970 (Q1-Q3 2021: 13,617) |
| • | Profit before tax for Q3 2022: USD 217.3m (Q3 2021: USD -14.1m) |
| • | Profit before tax for Q1-Q3 2022: USD 335.0m (Q1-Q3 2021: USD -32.8m) |
| • | EPS: Q3 2022: USD 2.7/share, DKK 19.7/share (Q3 2021: USD -0.2/share, DKK -1.1/share) |
| • | EPS: Q1-Q3 2022: USD 4.1/share DKK 28.9/share (Q1-Q3 2021: USD -0.4/share, DKK -2.7/share) |
| • | Return on Invested Capital: Q3 2022: 43.0% (Q3 2021: -0.9%) |
| • | Return on Invested Capital: Q1-Q3 2022: 23.6% (Q1 – Q3 2021: -0.3%) |
| • | Declared dividends for Q3 2022 of USD 1.46/share, with an expected total dividend of USD 119m. Expected payment date is 8 December 2022 based on shareholders on record on 23 November 2022. Ex-dividend date will be 22 November 2022 |
COVERAGE
| • | As of 06 November 2022, the coverage for the third quarter of 2022 was 55% at USD/day 45,257 |
| • | LR2: 49% at USD/day 55,105 |
| • | LR1: 44% at USD/day 47,661 |
| • | MR: 58% at USD/day 43,268 |
BUSINESS HIGHLIGHTS
| • | Completed the acquisition of Marine Exhaust Technology on 01 September 2022, the transaction was announced in August 2022 |
| • | Reached a total of 53 installed scrubbers during Q3 2022 out of 68 planned across the fleet. After the end of Q3 2022, TORM installed two additional scrubbers |
| • | Took delivery of the previously announced LR2 purchase (TORM Hannah) in August 2022 |
| • | Delivered four previously sold vessels to their new owners including: two LR2s (TORM Valborg and TORM Ingeborg), one MR (TORM Moselle) and the last handysize vessel in TORM´s fleet (TORM Gyda) |
| • | Based on broker valuations, TORM’s fleet had a market value of USD 2,523.6m as of 30 September 2022, an increase since 30 June 2022 of USD 420m or 20% |
| • | Maintained commitment to suspend all new business with Russia |
| • | Announced the plan to open a new office in Dubai becoming TORM´s ninth geographical presence |
TORM INTERIM RESULTS FOR THE THIRD QUARTER AND NINE MONTHS ENDED 30 SEPTEMBER 2022 | 1 |
SAFE HARBOR STATEMENTS AS TO THE FUTURE Matters discussed in this release may constitute forward looking statements. The Private Securities Litigation Reform Act of 1995 provides safe harbor protections for forward-looking statements in order to encourage companies to provide prospective information about their business. Forward-looking statements reflect our current views with respect to future events and financial performance and may include statements concerning plans, objectives, goals, strategies, future events or performance, and underlying assumptions and other statements, which are other than statements of historical facts. The Company desires to take advantage of the safe harbor provisions of the Private Securities Litigation Reform Act of 1995 and is including this cautionary statement in connection with this safe harbor legislation. Words such as, but not limited to, “believe”, “anticipate”, “intend”, “estimate”, “forecast”, “project”, “plan”, “potential”, “may”, “should”, “expect”, “pending” and similar expressions or phrases may identify forward-looking statements. The forward-looking statements in this release are based upon various assumptions, many of which are, in turn, based upon further assumptions, including without limitation, management’s examination of historical operating trends, data contained in our records and other data available from third parties. Although the Company believes that these assumptions were reasonable when made, because these assumptions are inherently subject to significant uncertainties and contingencies that are difficult or impossible to predict and are beyond our control, the Company cannot guarantee that it will achieve these expectations, beliefs or projections. | Important factors that, in our view, could cause actual results to differ materially from those discussed in the forward-looking statements include, but are not limited to, the strength of the world economy and currencies, general market conditions, including fluctuations in charter hire rates and vessel values, the duration and severity of the ongoing COVID-19 pandemic, including its impact on the demand for petroleum products and the seaborne transportation of these and the ability to change crew and operate a vessel with COVID-19 infected crew, the operations of our customers and our business in general, the failure of our contract counterparties to meet their obligations, changes in demand for “ton-miles” of oil carried by oil tankers and changes in demand for tanker vessel capacity, the effect of changes in OPEC’s petroleum production levels and worldwide oil consumption and storage, changes in demand that may affect attitudes of time charterers to scheduled and unscheduled dry-docking, changes in TORM’s operating expenses, including bunker prices, dry-docking and insurance costs, changes in the regulation of shipping operations, including actions taken by regulatory authorities including but not limited to CO2 tariffs or trade tariffs , potential liability from pending or future litigation, domestic and international political conditions, potential disruption of shipping routes due to war (including the war between Russia and Ukraine), accidents, weather, political events including “trade wars”, or acts of terrorism. | In light of these risks and uncertainties, undue reliance should not be placed on forward-looking statements contained in this release because they are statements about events that are not certain to occur as described or at all. These forward-looking statements are not guarantees of our future performance, and actual results and future developments may vary materially from those projected in the forward-looking statements. Except to the extent required by applicable law or regulation, the Company undertakes no obligation to release publicly any revisions or updates to these forward-looking statements to reflect events or circumstances after the date of this release or to reflect the occurrence of unanticipated events. Please see TORM’s filings with the U.S. Securities and Exchange Commission for a more complete discussion of certain of these and other risks and uncertainties. The information set forth herein speaks only as of the date hereof, and the Company disclaims any intention or obligation to update any forward-looking statements as a result of developments occurring after the date of this communication. |
TORM INTERIM RESULTS FOR THE THIRD QUARTER AND NINE MONTHS ENDED 30 SEPTEMBER 2022 | 2 |
KEY FIGURES
| USDm | Q3 2022 | Q3 2021 | Q1-Q3 2022 | Q1-Q3 2021 | FY 2021 |
| INCOME STATEMENT | |||||
| Revenue | 448.1 | 155.5 | 996.0 | 430.4 | 619.5 |
Time charter equivalent earnings (TCE) ¹⁾ ⁵⁾ | 316.8 | 91.6 | 649.8 | 271.8 | 378.6 |
Gross profit ¹⁾ | 266.4 | 42.7 | 499.0 | 133.2 | 188.1 |
EBITDA ¹⁾ | 262.2 | 30.4 | 476.0 | 94.0 | 136.9 |
| Operating profit/(loss) (EBIT) | 228.6 | -3.7 | 369.9 | -2.9 | 1.4 |
| Financial items | -11.3 | -10.4 | -34.9 | -29.9 | -42.2 |
| Profit/(loss) before tax | 217.3 | -14.1 | 335.0 | -32.8 | -40.8 |
| Net profit/(loss) for the year/period | 217.1 | -14.7 | 334.1 | -33.9 | -42.1 |
Net profit/(loss) ex. non-recurrent items¹⁾ | 201.9 | -14.7 | 314.6 | -33.1 | -36.4 |
| BALANCE SHEET AND CASH FLOW | |||||
| Non-current assets | 1,893.9 | 1,972.0 | 1,893.9 | 1,972.0 | 1,967.7 |
| Total assets | 2,545.1 | 2,235.3 | 2,545.1 | 2,235.3 | 2,331.0 |
| Equity | 1,403.4 | 1,050.0 | 1,403.4 | 1,050.0 | 1,052.2 |
| Total liabilities | 1,141.7 | 1,185.3 | 1,141.7 | 1,185.3 | 1,278.8 |
Invested capital ¹⁾ | 2,155.8 | 1,975.9 | 2,155.8 | 1,975.9 | 2,011.3 |
Net interest-bearing debt ¹⁾ | 764.0 | 938.2 | 764.0 | 938.2 | 972.1 |
Net Asset Value (NAV) (USDm) ²⁾ | 2,058.9 | 937.5 | 2,058.9 | 937.5 | 1,007.5 |
| Cash and cash equivalents incl. restricted cash | 238.5 | 109.9 | 238.5 | 109.9 | 171.7 |
| Free cash flow | 192.6 | -48.3 | 267.4 | -48.3 | -242.7 |
¹⁾ For definition of the calculated key figures, please refer to the glossary on pages 28-33. | |||||
| Q3 2022 | Q3 2021 | Q1-Q3 2022 | Q1-Q3 2021 | FY 2021 | |
KEY FINANCIAL FIGURES ¹⁾ | |||||
| Gross margins: | |||||
| Gross profit | 59.5% | 27.5% | 50.1% | 30.9% | 30.4% |
| EBITDA | 58.5% | 19.5% | 47.8% | 21.8% | 22.1% |
| Operating profit/(loss) | 51.0% | -2.4% | 37.1% | -0.7% | 0.2% |
| Return on Equity (RoE) | 66.3% | -5.6% | 36.3% | -4.4% | -4.1% |
| Return on Invested Capital (RoIC) | 43.0% | -0.9% | 23.6% | -0.3% | 0.0% |
| Adjusted RoIC | 41.8% | -0.9% | 22.8% | -0.2% | 0.2% |
Equity ratio ³⁾ | 55.1% | 47.0% | 55.1% | 47.0% | 45.1% |
TCE per day (USD) ⁵⁾ | 44,376 | 12,854 | 29,970 | 13,617 | 13,703 |
OPEX per day (USD) ⁵⁾ | 7,041 | 6,467 | 6,760 | 6,586 | 6,633 |
Loan-to-value (LTV) ratio ³⁾ ⁵⁾ | 30.9% | 53.6% | 30.9% | 53.6% | 52.3% |
SHARE-RELATED KEY FIGURES ¹⁾ | |||||
| Basic earnings/(loss) per share | 2.66 | -0.18 | 4.12 | -0.44 | -0.54 |
| Diluted earnings/(loss) per share | 2.63 | -0.19 | 4.07 | -0.43 | -0.54 |
| Dividend per share | 1.46 | - | 2.04 | - | - |
Net Asset Value per share (NAV/share) ³⁾ | 25.2 | 11.6 | 25.2 | 11.6 | 12.5 |
Stock price in DKK, end of period ³⁾ | 155.7 | 49.3 | 155.7 | 49.3 | 51.7 |
Number of shares ³⁾ ⁴⁾ | 81.6 | 80.6 | 81.6 | 80.6 | 80.7 |
Number of shares, weighted average (million) ⁴⁾ | 81.5 | 80.3 | 81.2 | 77.2 | 78.1 |
²⁾ Based on broker valuations, excluding charter commitments. | |||||
³⁾ End of period | |||||
⁴⁾ Excluding treasury shares | |||||
⁵⁾ For Tank segment | |||||
TORM INTERIM RESULTS FOR THE THIRD QUARTER AND NINE MONTHS ENDED 30 SEPTEMBER 2022 | 3 |
FINANCIAL REVIEW
TCE
Revenue for the nine months’ period increased by USD 565.6m to USD 996.0m compared to the same period last year, corresponding to a 131% increase. For the current quarter, revenue increased by 188% or USD 292.6m to USD 448.1m compared to same period last year. The significant increase in the revenue can primarily be attributed to the higher freight rates. Higher freight rates are driven by a strong product tanker market supported by the trade recalibration caused by the sanctions and self-sanctioning of Russian product exports as a consequence of the Russian invasion of Ukraine. In particular, we saw a significant increase in the average TCE rate/day by 120% from 13,617 to 29,970 in the first nine months compared to same period last year. For the third quarter, the increase in the average TCE rate/day was 245% from 12,854 in the same period last year to 44,376 in the current quarter.
Port expenses, bunkers, commissions and other cost of goods sold for the nine months period was USD 345.3m (2021, same period, USD 158.6m). For the current quarter, port expenses, bunkers, commissions and other cost of goods sold was USD 130.4m (2021, same period, USD 63.9m). The increases are primarily driven by an increase in bunker consumption at substantial higher bunker prices compared to previous periods.
ASSETS
As of 30 September 2022, total assets were USD 2,545.1m (2021, same period, USD 2,235.3m). The increase was primarily driven by an increase in trade receivables of USD 178.7m and an increase in cash position of USD 128.6m resulting from higher revenue. TORM´s liquidity position by the end of Q3 2022 was
USD 333.5m including restricted cash of USD 14.5m and undrawn credit facilities of USD 95.0m.
The carrying value of the fleet was USD 1,876.2m (2021, same period, USD 1,930.4m). The decrease was due to the divestment of eight vessels of USD 90.8m as well as depreciations and impairment of USD 140.0m offset by investment of three vessels and capitalized drydocking of USD 176.6m. Based on broker valuations, TORM’s fleet had a market value of USD 2,523.6m as of 30 September 2022, 35% above carrying value.
EQUITY
As of 30 September 2022, TORM’s equity was USD 1,403.4m (2021, same period, USD 1,050.0m). The increase was primarily driven by an increase in retained profit, which was driven primarily by the freight rate increases. Additionally, the hedging reserve primarily stemming from unrealized gains on interest derivatives has increased as a consequence of increasing interest rates. During Q3 2022 5-year USD swaps increased from approximately 1% at the end of Q3 2021 to approximately 4% at the end of Q3 2022. On average, TORM has fixed 93.4% of its interest rate exposure over the coming three years and 88.9% over the coming five years.
CASH FLOW STATEMENT
Net cash flow from operating activities for the nine months’ period was USD 254.3m (2021, same period USD 35.2m). The increase was primarily driven by an increase in TCE.
For the current quarter, net cash flow from operating activities was USD 165.3m (2021, same quarter USD 12.0m). The increase was likewise driven by an increase in TCE.
Net cash flow from investing activities for the nine months’ period was USD 13.1m (2021, same period USD -221.9m), as a result of the divestment of eight older vessels and the purchase of one newbuilding and one newer secondhand vessel.
For the current quarter, net cash flow from investing activities was USD 27.3m (2021, same quarter USD -60.3m). The increase was primarily driven by the sale of four vessels delivered in Q3 2022.
Net cash flow from financing activities for the nine months’ period was USD -188.2 (2021, same period USD 201.4m). The decrease was driven primarily by ordinary loan installments and fewer proceeds from borrowings due to reduced vessel purchase activities.
For the current quarter, net cash flow from financing activities was USD -101.9m (2021, same quarter USD 48.3m). The decrease was also primarily driven by ordinary loan installments and fewer proceeds from borrowings due to reduced vessel purchase activities. Secondly, the decrease was also driven by the dividend payout announced in connection with the Q2 2022 report of USD 47.3m.
DISTRIBUTION
A dividend of USD 1.46 per share has been approved by the Board of Directors for the three months ended 30 September 2022. The distribution is in line with TORM’s Distribution Policy with cash position (USD +238.5m), Working Capital Facilities (USD +95.0m), restricted cash (USD -14.5m) and earmarked proceeds (USD - 57.1m) and a cash position related to Marine
TORM INTERIM RESULTS FOR THE THIRD QUARTER AND NINE MONTHS ENDED 30 SEPTEMBER 2022 | 4 |
Exhaust Technology A/S (USD -2.2m). Cash reservation per vessel is USD 1.8m or for 78 vessels USD 140.4m in total.
RISK AND UNCERTAINTIES
A number of key risks and uncertainties could have a material impact on the TORM’s performance over the remaining three months of 2022. Risks and uncertainties, along with the mitigation measures put in place to reduce risks, remain unchanged from those published in the Annual Report 2021 and are summarized below:
| • | Tanker freight rates – The risk of sustained low tanker freight rates or of TORM not being able to predict and act on the development of these. Further, TORM is active in the cyclical product tanker industry where earnings may also be affected by seasonality and geopolitical events. The outbreak of COVID-19 and the oil demand, supply and price development underpin the risk |
| • | The geopolitical risks increased significantly following Russia’s invasion of Ukraine in February 2022. The sanctions imposed on Russia by Western and other nations increased uncertainty on the general energy market. Due to the continuous development and complexity of the situation, the impact on the tanker markets going forward is uncertain. We do not expect any direct impact on our operations although we expect increased volatility in freight rates, bunker cost, foreign exchange rates and vessel values |
| • | Bunker price – The risk of unexpected bunker price increases not covered by corresponding freight rate increases |
| • | Timing of sale and purchase of vessels – The risk of TORM not selling and purchasing vessels timely relative to market developments and business requirements |
For further information and a detailed description of the most significant risks, please refer to Note 21 of the Annual Report 2021.
-------------
After the acquisition of Marine Exhaust Technology A/S on 01 September 2022, the TORM Group now consists of two segments; the ‘Tank’ segment and the ‘Marine Exhaust’ segment. This report concerns the TORM Group if not otherwise explicitly stated.
TORM INTERIM RESULTS FOR THE THIRD QUARTER AND NINE MONTHS ENDED 30 SEPTEMBER 2022 | 5 |
THE PRODUCT TANKER MARKET
MARKET DEVELOPMENT IN Q3
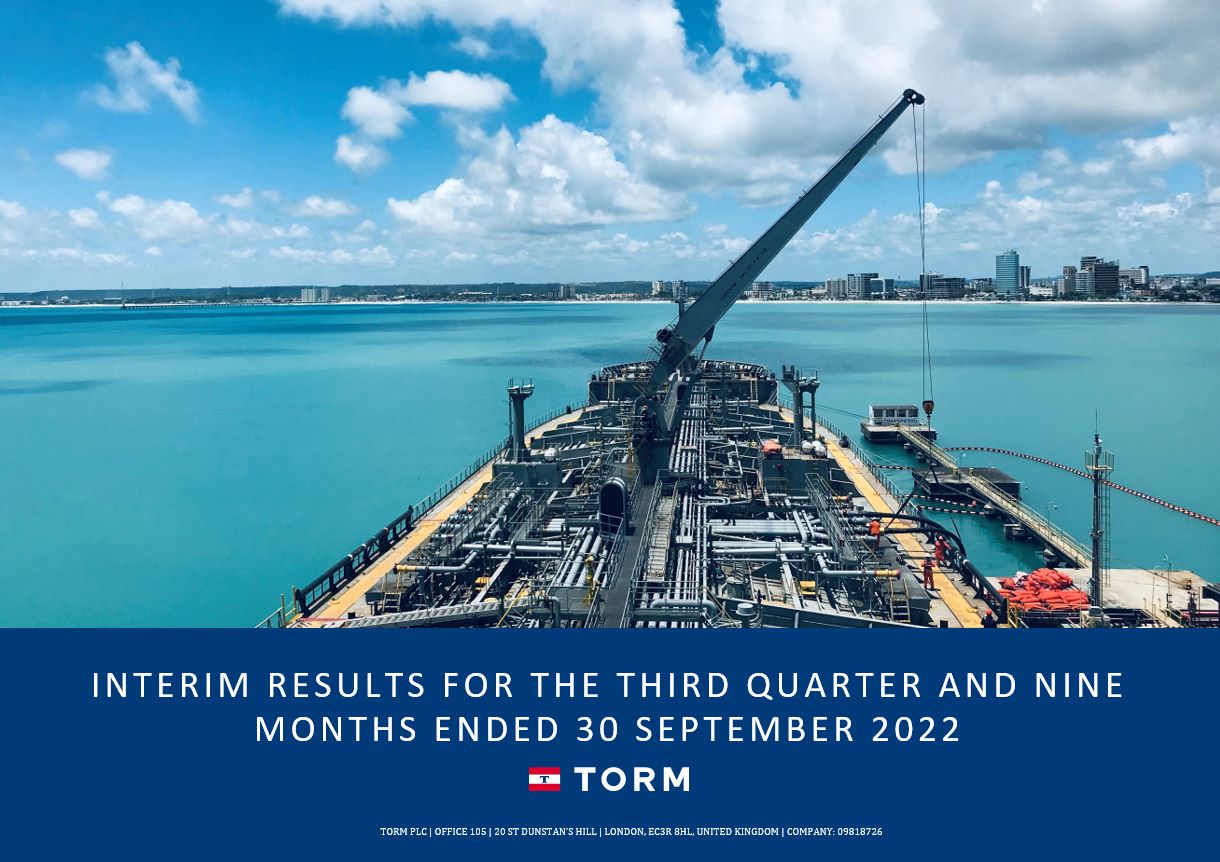
The product tanker market remained strong in Q3 2022, although with a high degree of volatility. Weekly benchmark rates remained below historical highs, but on a quarterly basis, benchmark MR earnings posted an all-time high level and LR2 benchmarks saw the second-highest historical value in Q3 2022. The strong freight market was reflected in vessel values, with prices for modern product tankers increasing by around 20% from the previous quarter.
Despite looming risks from the worsening of the global economic situation, the product tanker market remained supported by increased trade volumes and longer trade distances. This was partly due to Europe sourcing more products from the Middle East/Asia instead of Russia. Further
support came from strong import demand in especially Latin America but also regions where refineries had closed down earlier this year and last year (e.g. Australia), not only adding ton-miles but also contributing with increased ballast time.
MARKET OUTLOOK
The product tanker market has continued to show strong performance into Q4 2022. Any potential slower volume growth – whether due to OPEC+ quota cuts or worsening macroeconomic climate – is expected to be outweighed by longer trade distances arising from Europe’s shift away from Russian diesel ahead of the sanctions taking full effect in February 2023. This is likely to be further facilitated by China’s new batch of clean product exports in Q4 2022 (likely extended into Q1 2023), which – if exported to Europe – would
significantly increase the resulting ton-mile compared to more traditional supply sources in the Middle East and the US. In the medium term, the market remains supported by low order books and a potential replenishing of product inventories.
LR2 RATES (IN THOUSANDS)
Clarksons
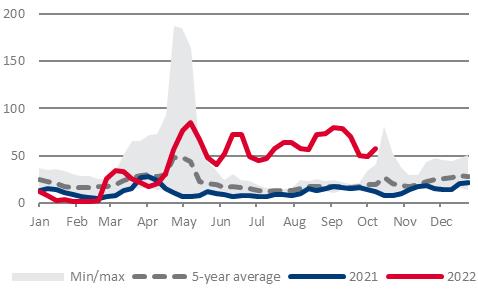
MR RATES (IN THOUSANDS)
Clarksons
TORM INTERIM RESULTS FOR THE THIRD QUARTER AND NINE MONTHS ENDED 30 SEPTEMBER 2022 | 6 |
OUTLOOK FOR Q3 AND FULL YEAR 2022
FINANCIAL OUTLOOK FOR 2022
For 2022, TORM expects higher rates than in 2021 (2021: USD/day 13,703) and to return to a net profit before tax (2021: loss of USD 41m). TORM expects to maintain a low-cost base in line with a normalized profit before tax (PBT) with a break-even TCE rate in FY 2022 of approximately USD/day 15,000. The below table illustrates the PBT sensitivity per each increase in the TCE rate of USD/day 1,000 assuming 3,065 open days in 2022.
As of 06 November 2022, TORM had covered 55% of the remaining earning days in 2022 at USD/day 45,257. Assuming an unchanged TCE rate of USD/day 45,257 for the rest of 2022 and a rate sensitivity of +/- USD/day, 1,000 profit before tax excluding non-recurrent items, it will amount to USD 539-546m assuming all other things being equal.
Disclaimer on financial outlook:
The purpose of this Financial Outlook for 2022 is to comply with reporting requirements for companies listed in Denmark. Actual results may vary, and this information may not be accurate or appropriate for other purposes. Information about our financial outlook for 2022, including the various assumptions underlying it, is forward-looking and should be read in conjunction with the Safe Harbor Statements on page 4, and the related disclosure and information about various economic, competitive, and regulatory assumptions, factors, and risks which may cause our actual future financial and operating results to differ materially from what we currently expect.
The information included in this Financial Outlook for 2022 is preliminary, unaudited and based on estimates and information available to us at this time. TORM has not finalized its financial statements for the periods presented. During the course of the financial statement closing process, TORM may identify items which could require it to make adjustments and which may be material to the information provided in this section. As mentioned above, the provided information constitutes forward-looking statements and is subject to risks and uncertainties, including possible adjustments to the financial outlook for 2022.
PROFIT BEFORE TAX SENSITIVITY TO USD 1,000 / DAY TCE EARNINGS (BASED ON DATA AS OF 06 NOVEMBER 2022) | |||
| 1H 2022 | 2H 2022 | FY 2022 | |
| Earning days | 14,866 | 13,893 | 28,759 |
| Open days | - | 3,065 | 3,065 |
| Coverage Ratio | 100.0% | 77.9% | 89.2% |
| PBT effect | USD 0m | USD 3m | USD 3m |
TORM INTERIM RESULTS FOR THE THIRD QUARTER AND NINE MONTHS ENDED 30 SEPTEMBER 2022 | 7 |
COVERED AND CHARTERED-IN DAYS IN TORM – DATA AS OF 30 SEPTEMBER 2022 |
| ROY | 2023 | 2024 | |
| Total physical days | |||
| LR2 | 1,084 | 4,593 | 4,611 |
| LR1 | 618 | 2,837 | 2,912 |
| MR | 5,142 | 20,132 | 20,505 |
| Total | 6,844 | 27,562 | 28,028 |
| Covered days | |||
| LR2 | 125 | - | - |
| LR1 | 48 | - | - |
| MR | 1,038 | 145 | - |
| Total | 1,212 | 145 | - |
Fair value of freight rate contracts that are mark-to-market in the income statement:
- Contracts not included above: USD 2.4m
- Contracts included above: USD –8.2m
| ROY | 2023 | 2024 | |
| Covered, % | |||
| LR2 | 12 | - | - |
| LR1 | 8 | - | - |
| MR | 20 | 1 | - |
| Total | 18 | - | - |
| Coverage rates, USD/day | |||
| LR2 | 70,685 | - | - |
| LR1 | 72,718 | - | - |
| MR | 44,124 | 16,008 | - |
| Total | 48,010 | 16,008 | - |
Actual no. of days can vary from projected no. of days primarily due to vessel sales and delays of vessel deliveries.
TORM INTERIM RESULTS FOR THE THIRD QUARTER AND NINE MONTHS ENDED 30 SEPTEMBER 2022 | 8 |
EARNINGS DATA
| USDm | Q3 2021 | Q4 2021 | Q1 2022 | Q2 2022 | Q3 2022 | Change Q3 21 - Q3 22 |
| LR2 vessels | ||||||
| Available earning days | 1.143 | 1.201 | 1.340 | 1.306 | 1.184 | 4% |
| Spot rates ¹⁾ | 13.217 | 16.658 | 17.220 | 39.027 | 52.595 | 298% |
| TCE per earning day ²⁾ | 15.315 | 15.529 | 18.432 | 30.741 | 55.532 | 263% |
| Operating days | 1.148 | 1.228 | 1.346 | 1.331 | 1.220 | 6% |
| Operating expenses per operating day | 6.833 | 7.276 | 6.615 | 6.961 | 7.196 | 5% |
| LR1 vessels | ||||||
| Available earning days | 760 | 828 | 694 | 691 | 685 | -10% |
| Spot rates ¹⁾ | 11.694 | 15.196 | 20.201 | 36.535 | 51.089 | 337% |
| TCE per earning day ²⁾ | 11.211 | 16.347 | 16.424 | 33.269 | 51.102 | 356% |
| Operating days | 828 | 828 | 810 | 729 | 736 | -11% |
| Operating expenses per operating day | 6.271 | 6.527 | 6.668 | 6.588 | 6.640 | 6% |
| MR vessels | ||||||
| Available earning days | 5.227 | 5.348 | 5.254 | 5.309 | 5.161 | -1% |
| Spot rates ¹⁾ | 12.578 | 13.194 | 16.525 | 34.115 | 43.284 | 244% |
| TCE per earning day ²⁾ | 12.785 | 13.329 | 16.462 | 29.174 | 40.968 | 220% |
| Operating days | 5.407 | 5.428 | 5.310 | 5.347 | 5.315 | -2% |
| Operating expenses per operating day | 6.402 | 6.694 | 6.391 | 6.808 | 7.055 | 10% |
| Handy vessels | ||||||
| Available earning days | 184 | 184 | 180 | 92 | 6 | -97% |
| Spot rates ¹⁾ | 6.283 | 10.444 | 13.391 | 12.602 | 12.505 | 99% |
| TCE per earning day ²⁾ | 6.304 | 10.060 | 13.614 | 12.196 | 6.397 | 1% |
| Operating days | 184 | 184 | 180 | 103 | 7 | -96% |
| Operating expenses per operating day | 7.007 | 6.387 | 5.762 | 6.455 | 11.462 | 64% |
| Tanker segment | ||||||
| Available earning days | 7.314 | 7.561 | 7.468 | 7.398 | 7.035 | -4% |
| Spot rates ¹⁾ | 12.350 | 13.805 | 16.884 | 34.844 | 45.646 | 270% |
| TCE per earning day ²⁾ | 12.854 | 13.929 | 16.743 | 29.622 | 44.376 | 245% |
| Operating days | 7.567 | 7.668 | 7.646 | 7.510 | 7.278 | -4% |
| Operating expenses per operating day | 6.467 | 6.762 | 6.445 | 6.809 | 7.041 | 9% |
¹⁾ Spot rates = Time Charter Equivalent Earnings for all charters with less than six months' duration = Gross freight income less bunker, commissions and port expenses. |
²⁾ TCE = Time Charter Equivalent Earnings = Gross freight income less bunker, commissions and port expenses. |
TORM INTERIM RESULTS FOR THE THIRD QUARTER AND NINE MONTHS ENDED 30 SEPTEMBER 2022 | 9 |
TORM FLEET DEVELOPMENT
TORM FLEET DEVELOPMENT The table shows TORM’s operating fleet. In addition to 55 owned product tankers on the water, TORM had 23 vessels under sale-and-leaseback agreements with options to buy back the vessels as of 30 September 2022 (financially reported as owned vessels in accordance with our accounting policies). During Q3 2022, TORM delivered four vessels including two LR2 vessels (TORM Valborg and TORM Ingeborg), one MR vessel (TORM Moselle) and the last handysize vessel (TORM Gyda). In addition, TORM took delivery of a second-hand LR2 vessel (TORM Hannah). The vessel is financed under a sale-and- leaseback agreement. At the time of reporting, TORM does not expect any changes to the fleet. | TORM FLEET DEVELOPMENT | ||||||
| Q2 2022 | Changes | Q3 2022 | Changes | FY 2022 | |||
| Owned vessels | |||||||
| LR2 | 9 | -2 | 7 | - | 7 | ||
| LR1 | 8 | - | 8 | - | 8 | ||
| MR | 41 | -1 | 40 | - | 40 | ||
| Handysize | 1 | -1 | - | - | - | ||
| Total | 59 | -4 | 55 | - | 55 | ||
| Chartered-in and leaseback vessels | |||||||
| LR2 | 5 | 1 | 6 | - | 6 | ||
| LR1 | - | - | - | - | - | ||
| MR | 17 | - | 17 | - | 17 | ||
| Handysize | - | - | - | - | - | ||
| Total | 22 | - | 23 | - | 23 | ||
| - | |||||||
| Total fleet | 81 | -3 | 78 | - | 78 |
TORM INTERIM RESULTS FOR THE THIRD QUARTER AND NINE MONTHS ENDED 30 SEPTEMBER 2022 | 10 |
RESPONSIBILITY STATEMENT
We confirm that to the best of our knowledge:
| • | The condensed consolidated set of financial statements has been prepared in accordance with IAS 34 Interim Financial Reporting (“IAS 34”) as adopted in the UK and also in accordance with IAS 34 as issued by the International Accounting Standards Board (”IASB”) and IAS 34 as adopted by the EU, as applied to the financial periods beginning on or after 01 January 2022 and additional Danish disclosure requirements for interim reports of listed companies. |
| • | The interim report gives a true and fair view of the Group’s financial position as of 30 September 2022 as well as of the Group’s financial performance and cash flow for the period 01 January – 30 September 2022. |
| • | The interim management report includes a fair review of the development and performance of the Group’s business and of the financial position as a whole and a description of the principal risks and uncertainties for the remaining three months of 2022. |
| • | The interim management report includes a fair review of the material related party transactions which have taken place in the period and material changes to those described in the last annual report. |
By order of the Board of Directors
Jacob Meldgaard
Executive Director
10 November 2022
DISCLAIMER
The interim report has been prepared solely to provide additional information to shareholders to assess the Group’s strategies and the potential for those strategies to succeed. The interim report should not be relied on by any other party or for any other purpose.
The interim report contains certain forward-looking statements. These statements are made by the Directors in good faith based on the information available to them up to the time of their approval of this report. Such statements should be treated with caution due to the inherent uncertainties, including both economic and business risk factors, underlying any such forward-looking statements.
TORM INTERIM RESULTS FOR THE THIRD QUARTER AND NINE MONTHS ENDED 30 SEPTEMBER 2022 | 11 |
CONDENSED CONSOLIDATED INCOME STATEMENT
| USDm | Note | Q3 2022 | Q3 2021 | Q1-Q3 2022 | Q1-Q3 2021 | FY 2021 |
| Revenue | 448.1 | 155.5 | 996.0 | 430.4 | 619.5 | |
| Port expenses, bunkers, commissions and other cost of goods sold | -130.4 | -63.9 | -345.3 | -158.6 | -240.9 | |
| Operating expenses | 1 | -51.3 | -48.9 | -151.7 | -138.6 | -190.5 |
| Profit from sale of vessels | 2 | 9.2 | - | 10.0 | - | - |
| Administrative expenses | 1, 2 | -13.4 | -12.3 | -39.3 | -39.1 | -51.5 |
| Other operating income and expenses | -0.3 | 0.1 | 6.1 | - | 0.4 | |
| Share of profit/(loss) from joint ventures | 0.3 | -0.1 | 0.2 | -0.1 | -0.1 | |
| Impairment losses and reversal of impairment on tangible assets | 2 | 0.2 | - | -2.6 | -0.8 | -4.6 |
| Depreciation | 2 | -33.8 | -34.1 | -103.5 | -96.1 | -130.9 |
| Operating profit/(loss) (EBIT) | 228.6 | -3.7 | 369.9 | -2.9 | 1.4 | |
| Financial income | 1.2 | 0.1 | 1.5 | 0.2 | 0.2 | |
| Financial expenses | -12.5 | -10.5 | -36.4 | -30.1 | -42.4 | |
| Profit/(loss) before tax | 217.3 | -14.1 | 335.0 | -32.8 | -40.8 | |
| Tax | -0.2 | -0.6 | -0.9 | -1.1 | -1.3 | |
| Net profit/(loss) for the period | 217.1 | -14.7 | 334.1 | -33.9 | -42.1 | |
| Net profit/loss for the period attributable to: | ||||||
| TORM plc shareholders | 217.1 | -14.7 | 334.1 | -33.9 | -42.1 | |
| Non-controlling interest | - | - | - | - | - | |
| Net profit/(loss) for the period | 217.1 | -14.7 | 334.1 | -33.9 | -42.1 | |
| EARNINGS PER SHARE | ||||||
| Basic earnings/(loss) per share (USD) | 2.66 | -0.18 | 4.12 | -0.44 | -0.54 | |
| Diluted earnings/(loss) per share (USD) | 2.63 | -0.19 | 4.07 | -0.43 | -0.54 | |
TORM INTERIM RESULTS FOR THE THIRD QUARTER AND NINE MONTHS ENDED 30 SEPTEMBER 2022 | 12 |
CONDENSED CONSOLIDATED STATEMENT OF COMPREHENSIVE INCOME
| USDm | Q3 2022 | Q3 2021 | Q1-Q3 2022 | Q1-Q3 2021 | FY 2021 |
| Net profit/(loss) for the year | 217.1 | -14.7 | 334.1 | -33.9 | -42.1 |
| Other comprehensive income/(loss): | |||||
| Items that may be reclassified to profit or loss: | |||||
| Exchange rate adjustment arising from translation of entities using a functional currency different from USD | -0.7 | - | -1.0 | -0.2 | -0.2 |
| Reclassification of exchange rate adjustments on disposal of joint venture | 0.1 | - | 0.1 | ||
| Fair value adjustment on hedging instruments | 15.5 | -1.5 | 50.5 | 2.7 | 8.4 |
| Fair value adjustment on hedging instruments transferred to income statement | -0.1 | 2.8 | 4.2 | 5.5 | 8.7 |
| Items that may not be reclassified to profit or loss: | |||||
| Remeasurements of net pension and other post-retirement benefit liability or asset | - | - | - | - | - |
Other comprehensive income/(loss) after tax ¹⁾ | 14.8 | 1.3 | 53.8 | 8.0 | 16.9 |
| Total comprehensive income/(loss) for the period | 231.9 | -13.4 | 387.9 | -25.9 | -25.2 |
| Total comprehensive income/(loss) for the period attributable to: | |||||
| TORM plc shareholders | 231.9 | -13.4 | 387.9 | -25.9 | -25.2 |
| Non-controlling interest | - | - | - | - | - |
| Total comprehensive income/(loss) for the period | 231.9 | -13.4 | 387.9 | -25.9 | -25.2 |
¹⁾ No income tax was incurred relating to other comprehensive income/(loss) items. | |||||
TORM INTERIM RESULTS FOR THE THIRD QUARTER AND NINE MONTHS ENDED 30 SEPTEMBER 2022 | 13 |
CONDENSED CONSOLIDATED BALANCE SHEET
| 30 September | 30 September | 31 December | ||
| USDm | Note | 2022 | 2021 | 2021 |
| ASSETS | ||||
| NON-CURRENT ASSETS | ||||
| Intangible assets | ||||
| Goodwill | 12 | 1.9 | - | - |
| Other intangible assets | 12 | 0.5 | - | - |
| Total intangible assets | 2.4 | - | - | |
| Tangible fixed assets | ||||
| Land and buildings | 3.1 | 4.9 | 4.8 | |
| Vessels and capitalized dry-docking | 2 | 1,876.2 | 1,930.4 | 1,937.8 |
| Prepayments on vessels | 3 | - | 22.8 | 12.0 |
| Other plant and operating equipment | 6.7 | 7.1 | 6.3 | |
| Total tangible fixed assets | 1,886.0 | 1,965.2 | 1,960.9 | |
| Financial assets | ||||
| Investments in joint ventures | 0.1 | 1.6 | 1.5 | |
| Loan receivables | 4.6 | 4.6 | 4.6 | |
| Deferred tax asset | 0.6 | 0.6 | 0.7 | |
| Other investments | 0.2 | - | - | |
| Total financial assets | 5.5 | 6.8 | 6.8 | |
| Total non-current assets | 1,893.9 | 1,972.0 | 1,967.7 | |
| CURRENT ASSETS | ||||
| Inventories | 72.4 | 43.7 | 48.8 | |
| Trade receivables | 247.7 | 69.0 | 84.0 | |
| Other receivables | 78.7 | 36.6 | 40.0 | |
| Prepayments | 13.9 | 4.1 | 5.6 | |
| Cash and cash equivalents incl. restricted cash | 238.5 | 109.9 | 171.7 | |
| Current assets, excl. assets held-for-sale | 651.2 | 263.3 | 350.1 | |
| Assets held-for-sale | 2 | - | - | 13.2 |
| Total current assets | 651.2 | 263.3 | 363.3 | |
| TOTAL ASSETS | 2,545.1 | 2,235.3 | 2,331.0 |
| 30 September | 30 September | 31 December | ||
| USDm | Note | 2022 | 2021 | 2021 |
| EQUITY AND LIABILITIES | ||||
| EQUITY | ||||
| Common shares | 0.8 | 0.8 | 0.8 | |
| Share premium | 166.4 | 158.9 | 159.8 | |
| Treasury shares | -4.2 | -4.2 | -4.2 | |
| Hedging reserves | 51.1 | -12.5 | -3.6 | |
| Translation reserves | -0.7 | 0.2 | 0.2 | |
| Retained profit | 1,187.6 | 906.8 | 899.2 | |
| Equity attributable to TORM plc shareholders | 1,401.0 | 1,050.0 | 1,052.2 | |
| Non-controlling interests | 12 | 2.4 | - | - |
| Total equity | 1,403.4 | 1,050.0 | 1,052.2 | |
| LIABILITIES | ||||
| NON-CURRENT LIABILITIES | ||||
| Non-current tax liability related to held over gains | 45.2 | 45.2 | 45.2 | |
| Deferred tax liability | 0.1 | - | - | |
| Borrowings | 4 | 880.3 | 862.8 | 926.4 |
| Other non-current liabilities | 3.0 | - | - | |
| Total non-current liabilities | 928.6 | 908.0 | 971.6 | |
| CURRENT LIABILITIES | ||||
| Borrowings | 4 | 115.2 | 177.6 | 209.0 |
| Trade payables | 40.8 | 29.9 | 35.3 | |
| Current tax liabilities | 1.5 | 1.8 | 0.9 | |
| Other liabilities | 45.3 | 49.7 | 43.7 | |
| Provisions | 6 | 6.5 | 18.3 | 18.3 |
| Deferred income | 3.8 | - | - | |
| Total current liabilities | 213.1 | 277.3 | 307.2 | |
| Total liabilities | 1,141.7 | 1,185.3 | 1,278.8 | |
| TOTAL EQUITY AND LIABILITIES | 2,545.1 | 2,235.3 | 2,331.0 | |
| Note 5 and 7-11 on page 21 to 23 |
TORM INTERIM RESULTS FOR THE THIRD QUARTER AND NINE MONTHS ENDED 30 SEPTEMBER 2022 | 14 |
CONDENSED CONSOLIDATED STATEMENT OF CHANGES IN EQUITY
01 JANUARY- 30 SEPTEMBER
| USDm | Common shares | Share premium | Treasury shares | Hedging reserves | Translation reserves | Retained profit | Equity attri- butable to shareholders of TORM plc | Non-controlling interest | Total |
| Equity as of 1 January 2022 | 0.8 | 159.8 | -4.2 | -3.6 | 0.2 | 899.2 | 1,052.2 | - | 1,052.2 |
| Comprehensive income/loss for the period | |||||||||
| Net profit/(loss) for the period | - | - | - | - | - | 334.1 | 334.1 | - | 334.1 |
| Other comprehensive income/(loss) for the period | - | - | - | 54.7 | -0.9 | - | 53.8 | - | 53.8 |
| Total comprehensive income/(loss) for the period | - | - | - | 54.7 | -0.9 | 334.1 | 387.9 | - | 387.9 |
Capital increase ¹⁾ | - | 6.7 | - | - | - | - | 6.7 | - | 6.7 |
| Share-based compensation | - | - | - | - | - | 1.6 | 1.6 | - | 1.6 |
| Dividend | - | - | - | - | - | -47.3 | -47.3 | - | -47.3 |
| Total changes in equity for the period | - | 6.6 | - | 54.7 | -0.9 | 288.4 | 348.8 | - | 348.8 |
| Non-controlling interest arising on acquisition | - | - | - | - | - | - | - | 2.4 | 2.4 |
| Equity as of 30 September 2022 | 0.8 | 166.4 | -4.2 | 51.1 | -0.7 | 1,187.6 | 1,401.0 | 2.4 | 1,403.4 |
¹⁾ During the year, the share capital was increased amounting to USD 6.7m as a result of the exercise of Restricted Share Units. | |||||||||
| USDm | Common shares | Share premium | Treasury shares | Hedging reserves | Translation reserves | Retained profit | Equity attri- butable to shareholders of TORM plc | Non-controlling interest | Total |
| Equity as of 1 January 2021 | 0.7 | 102.0 | -4.2 | -20.7 | 0.4 | 939.3 | 1,017.5 | - | 1,017.5 |
| Comprehensive income/(loss) for the period: | |||||||||
| Net profit/(loss) for the period | - | - | - | - | - | -33.9 | -33.9 | - | -33.9 |
| Other comprehensive income/(loss) for the period | - | - | - | 8.2 | -0.2 | - | 8.0 | - | 8.0 |
| Total comprehensive income/(loss) for the period | - | - | - | 8.2 | -0.2 | -33.9 | -25.9 | - | -25.9 |
Capital increase ¹⁾ | 0.1 | 56.9 | - | - | - | - | 57.0 | - | 57.0 |
| Transaction costs capital increase | - | - | - | - | - | -0.3 | -0.3 | - | -0.3 |
| Share-based compensation | - | - | - | - | - | 1.7 | 1.7 | - | 1.7 |
| Total changes in equity for the period | 0.1 | 56.9 | - | 8.2 | -0.2 | -32.5 | 32.5 | - | 32.5 |
| Equity as of 30 September 2021 | 0.8 | 158.9 | -4.2 | -12.5 | 0.2 | 906.8 | 1,050.0 | - | 1,050.0 |
¹⁾During the year share capital was increased by USD 57.0m in total including an USD 55.0m non cash share issue in relation to eight vessels. | |||||||||
TORM INTERIM RESULTS FOR THE THIRD QUARTER AND NINE MONTHS ENDED 30 SEPTEMBER 2022 | 15 |
CONDENSED CONSOLIDATED CASHFLOW STATEMENT
| USDm | Note | Q1-Q3 2022 | Q1-Q3 2021 | FY 2021 |
| CASH FLOW FROM OPERATING ACTIVITIES | ||||
| Net profit/(loss) for the year | 334.1 | -33.9 | -42.1 | |
| Reversals: | ||||
| Profit from sale of vessels | -10.0 | - | - | |
| Depreciation | 103.5 | 96.1 | 130.9 | |
| Impairment losses | 2.6 | 0.8 | 4.6 | |
| Share of profit/(loss) from joint ventures | -0.2 | 0.1 | 0.1 | |
| Financial income | -1.5 | -0.2 | -0.2 | |
| Financial expenses | 36.4 | 30.1 | 42.4 | |
| Tax expenses | 0.9 | 1.1 | 1.3 | |
| Other non-cash movements | 1.7 | 2.3 | 1.3 | |
| Dividends received from joint ventures | - | 0.3 | 0.3 | |
| Interest received and realized exchange gains | 1.4 | 0.2 | 0.2 | |
| Interest paid and realized exchange losses | -38.2 | -32.1 | -41.0 | |
| Income taxes paid | -0.4 | -0.3 | -1.4 | |
| Change in inventories, receivables and payables, etc. | -176.0 | -29.3 | -48.5 | |
| Net cash flow from operating activities | 254.3 | 35.2 | 47.9 | |
| USDm | Note | Q1-Q3 2022 | Q1-Q3 2021 | FY 2021 |
| CASH FLOW FROM INVESTING ACTIVITIES | ||||
Investment in tangible fixed assets ¹⁾ | -106.7 | -272.3 | -319.8 | |
| Acquisition of subsidiaries, net of cash acquired | 12 | 1.0 | - | - |
| Sale of tangible fixed assets | 106.4 | 10.0 | 10.0 | |
| Change in restricted cash | 12.4 | 40.4 | 19.2 | |
| Net cash flow from investing activities | 13.1 | -221.9 | -290.6 | |
| CASH FLOW FROM FINANCING ACTIVITIES | ||||
| Proceeds, borrowings | 96.3 | 338.7 | 548.9 | |
| Repayment, borrowings | -243.9 | -139.0 | -253.5 | |
| Dividend paid | -47.3 | - | - | |
Capital increase ¹⁾ | 6.7 | 2.0 | 2.9 | |
| Transaction costs share issue | - | -0.3 | -0.3 | |
| Net cash flow from financing activities | -188.2 | 201.4 | 298.0 | |
| Net cash flow from operating, investing and financing activities | 79.2 | 14.7 | 55.3 | |
| Cash and cash equivalents beginning balance | 144.8 | 89.5 | 89.5 | |
| Cash and cash equivalents ending balance | 224.0 | 104.2 | 144.8 | |
| Restricted cash equivalents ending balance | 14.5 | 5.7 | 26.9 | |
| Cash and cash equivalents including restricted cash ending balance | 238.5 | 109.9 | 171.7 | |
¹⁾In Q2-2021 and Q3-2021 share capital was increased by USD 57.0m (full year: USD 57.9m) in total including an USD 55.0m (full year: USD 55.0m) non cash share issue in relation to eight (full year: eight) vessels.
TORM INTERIM RESULTS FOR THE THIRD QUARTER AND NINE MONTHS ENDED 30 SEPTEMBER 2022 | 16 |
CONDENSED CONSOLIDATED INCOME STATEMENT SEGMENT REPORTING
| Q3 2022 | Q3 2021 | Q1-Q3 2022 | Q1-Q3 2021 | FY 2021 | |||||||||||
| USDm | Tank | Marine Exhaust | Total | Tank | Marine Exhaust | Total | Tank | Marine Exhaust | Total | Tank | Marine Exhaust | Total | Tank | Marine Exhaust | Total |
| Revenue | 446.7 | 1.4 | 448.1 | 155.5 | - | 155.5 | 994.6 | 1.4 | 996.0 | 430.4 | - | 430.4 | 619.5 | - | 619.5 |
| Port expenses, bunkers and commissions | -129.9 | - | -129.9 | -63.9 | - | -63.9 | -344.8 | - | -344.8 | -158.6 | - | -158.6 | -240.9 | - | -240.9 |
| Other cost of goods sold | - | -0.5 | -0.5 | - | - | - | - | -0.5 | -0.5 | - | - | - | - | - | - |
| Operating expenses | -51.3 | - | -51.3 | -48.9 | - | -48.9 | -151.7 | - | -151.7 | -138.6 | - | -138.6 | -190.5 | - | -190.5 |
| Profit from sale of vessels | 9.2 | - | 9.2 | - | - | - | 10.0 | - | 10.0 | - | - | - | - | - | - |
| Administrative expenses | -12.7 | -0.7 | -13.4 | -12.3 | - | -12.3 | -38.6 | -0.7 | -39.3 | -39.1 | - | -39.1 | -51.5 | - | -51.5 |
| Other operating income and expenses | -0.3 | - | -0.3 | 0.1 | - | 0.1 | 6.1 | - | 6.1 | - | - | - | 0.4 | - | 0.4 |
| Share of profit/(loss) from joint ventures | 0.3 | - | 0.3 | -0.1 | - | -0.1 | 0.2 | - | 0.2 | -0.1 | - | -0.1 | -0.1 | - | -0.1 |
| Impairment losses and reversal of impairment on tangible assets | 0.2 | - | 0.2 | - | - | - | -2.6 | - | -2.6 | -0.8 | - | -0.8 | -4.6 | - | -4.6 |
| Depreciation | -33.7 | -0.1 | -33.8 | -34.1 | - | -34.1 | -103.4 | -0.1 | -103.5 | -96.1 | - | -96.1 | -130.9 | - | -130.9 |
| Operating profit/(loss) (EBIT) | 228.5 | 0.1 | 228.6 | -3.7 | - | -3.7 | 369.8 | 0.1 | 369.9 | -2.9 | - | -2.9 | 1.4 | - | 1.4 |
| Financial income | 1.2 | - | 1.2 | 0.1 | - | 0.1 | 1.5 | - | 1.5 | 0.2 | - | 0.2 | 0.2 | - | 0.2 |
| Financial expenses | -12.5 | - | -12.5 | -10.5 | - | -10.5 | -36.4 | - | -36.4 | -30.1 | - | -30.1 | -42.4 | - | -42.4 |
| Profit/(loss) before tax | 217.2 | 0.1 | 217.3 | -14.1 | - | -14.1 | 334.9 | 0.1 | 335.0 | -32.8 | - | -32.8 | -40.8 | - | -40.8 |
| Tax | -0.2 | - | -0.2 | -0.6 | - | -0.6 | -0.9 | - | -0.9 | -1.1 | - | -1.1 | -1.3 | - | -1.3 |
| Net profit/(loss) for the period | 217.0 | 0.1 | 217.1 | -14.7 | - | -14.7 | 334.0 | 0.1 | 334.1 | -33.9 | - | -33.9 | -42.1 | - | -42.1 |
TORM INTERIM RESULTS FOR THE THIRD QUARTER AND NINE MONTHS ENDED 30 SEPTEMBER 2022 | 17 |
CONDENSED CONSOLIDATED BALANCE SHEET SEGMENT REPORTING
| USDm | Note | 30 September 2022 | 30 September 2021 | 31 December 2021 | ||||||
| Tank | Marine Exhaust | Total | Tank | Marine Exhaust | Total | Tank | Marine Exhaust | Total | ||
| ASSETS | ||||||||||
| NON-CURRENT ASSETS | ||||||||||
| Intangible assets | ||||||||||
| Goodwill | - | 1.9 | 1.9 | - | - | - | - | - | - | |
| Other intangible assets | - | 0.5 | 0.5 | - | - | - | - | - | - | |
| Total intangible assets | - | 2.4 | 2.4 | - | - | - | - | - | - | |
| TANGIBLE FIXED ASSETS | ||||||||||
| Land and buildings | 3.1 | - | 3.1 | 4.9 | - | 4.9 | 4.8 | - | 4.8 | |
| Vessels and capitalized dry-docking | 2 | 1,876.2 | - | 1,876.2 | 1,930.4 | - | 1,930.4 | 1,937.8 | - | 1,937.8 |
| Prepayments on vessels | 3 | - | - | - | 22.8 | - | 22.8 | 12.0 | - | 12.0 |
| Other plant and operating equipment | 5.2 | 1.5 | 6.7 | 7.1 | - | 7.1 | 6.3 | - | 6.3 | |
| Total tangible fixed assets | 1,884.5 | 1.5 | 1,886.0 | 1,965.2 | - | 1,965.2 | 1,960.9 | - | 1,960.9 | |
| FINANCIAL ASSETS | ||||||||||
| Investments in joint ventures | 0.1 | - | 0.1 | 1.6 | - | 1.6 | 1.5 | - | 1.5 | |
| Loan receivables | 4.6 | - | 4.6 | 4.6 | - | 4.6 | 4.6 | - | 4.6 | |
| Deferred tax asset | 0.5 | 0.1 | 0.6 | 0.6 | - | 0.6 | 0.7 | - | 0.7 | |
| Other investments | 0.2 | - | 0.2 | - | - | - | - | - | - | |
| Total financial assets | 5.4 | 0.1 | 5.5 | 6.8 | - | 6.8 | 6.8 | - | 6.8 | |
| Total non-current assets | 1,889.9 | 4.0 | 1,893.9 | 1,972.0 | - | 1,972.0 | 1,967.7 | - | 1,967.7 | |
| CURRENT ASSETS | ||||||||||
| Inventories | 65.4 | 7.0 | 72.4 | 43.7 | - | 43.7 | 48.8 | - | 48.8 | |
| Trade receivables | 246.7 | 1.0 | 247.7 | 69.0 | - | 69.0 | 84.0 | - | 84.0 | |
| Other receivables | 76.1 | 2.6 | 78.7 | 36.6 | - | 36.6 | 40.0 | - | 40.0 | |
| Prepayments | 10.4 | 3.5 | 13.9 | 4.1 | - | 4.1 | 5.6 | - | 5.6 | |
| Cash and cash equivalents incl. restricted cash | 236.3 | 2.2 | 238.5 | 109.9 | - | 109.9 | 171.7 | - | 171.7 | |
| Current assets, excl. assets held-for-sale | 634.9 | 16.3 | 651.2 | 263.3 | - | 263.3 | 350.1 | - | 350.1 | |
| Assets held-for-sale | 2 | - | - | - | - | - | - | 13.2 | - | 13.2 |
| Total current assets | 634.9 | 16.3 | 651.2 | 263.3 | - | 263.3 | 363.3 | - | 363.3 | |
| TOTAL ASSETS | 2,524.8 | 20.3 | 2,545.1 | 2,235.3 | - | 2,235.3 | 2,331.0 | - | 2,331.0 | |
TORM INTERIM RESULTS FOR THE THIRD QUARTER AND NINE MONTHS ENDED 30 SEPTEMBER 2022 | 18 |
CONDENSED BALANCE SHEET SEGMENT REPORTING
| USDm | Note | 30 September 2022 | 30 September 2021 | 31 December 2021 | ||||||
| Tank | Marine Exhaust | Total | Tank | Marine Exhaust | Total | Tank | Marine Exhaust | Total | ||
| EQUITY AND LIABILITIES | ||||||||||
| Total equity | 1,397.3 | 6.1 | 1,403.4 | 1,050.0 | - | 1,050.0 | 1,052.2 | - | 1,052.2 | |
| LIABILITIES | ||||||||||
| NON-CURRENT LIABILITIES | ||||||||||
| Non-current tax liability related to held over gains | 45.2 | - | 45.2 | 45.2 | - | 45.2 | 45.2 | - | 45.2 | |
| Deferred tax liability | - | 0.1 | 0.1 | - | - | - | - | - | - | |
| Borrowings | 4 | 873.7 | 6.6 | 880.3 | 862.8 | - | 862.8 | 926.4 | - | 926.4 |
| Other non-current liabilities | 1.9 | 1.1 | 3.0 | - | - | |||||
| Total non-current liabilities | 920.8 | 7.8 | 928.6 | 908.0 | - | 908.0 | 971.6 | - | 971.6 | |
| CURRENT LIABILITIES | ||||||||||
| Borrowings | 4 | 115.2 | - | 115.2 | 177.6 | - | 177.6 | 209.0 | - | 209.0 |
| Trade payables | 38.8 | 2.0 | 40.8 | 29.9 | - | 29.9 | 35.3 | - | 35.3 | |
| Current tax liabilities | 1.2 | 0.3 | 1.5 | 1.8 | - | 1.8 | 0.9 | - | 0.9 | |
| Other liabilities | 45.0 | 0.3 | 45.3 | 49.7 | - | 49.7 | 43.7 | - | 43.7 | |
| Provisions | 6 | 6.5 | - | 6.5 | 18.3 | - | 18.3 | 18.3 | - | 18.3 |
| Deferred income | - | 3.8 | 3.8 | - | - | - | - | - | - | |
| Total current liabilities | 206.7 | 6.4 | 213.1 | 277.3 | - | 277.3 | 307.2 | - | 307.2 | |
| Total liabilities | 1,127.5 | 14.2 | 1,141.7 | 1,185.3 | - | 1,185.3 | 1,278.8 | - | 1,278.8 | |
| TOTAL EQUITY AND LIABILITIES | 2,524.8 | 20.3 | 2,545.1 | 2,235.3 | - | 2,235.3 | 2,331.0 | - | 2,331.0 | |
TORM INTERIM RESULTS FOR THE THIRD QUARTER AND NINE MONTHS ENDED 30 SEPTEMBER 2022 | 19 |
NOTES
NOTE 1 – STAFF COSTS
| USDm | Q3 2022 | Q3 2021 | Q1-Q3 2022 | Q1-Q3 2021 | FY 2021 |
| Included in operating expenses | 1.8 | 2.4 | 6.0 | 7.2 | 9.7 |
| Included in administrative expenses | 9.3 | 10.2 | 29.6 | 32.6 | 42.4 |
| Total staff costs | 11.1 | 12.6 | 35.6 | 39.8 | 52.1 |
NOTE 2 – VESSELS AND CAPITALIZED DRY-DOCKING
Included in the carrying amount for "Vessels and capitalized dry-docking" are capitalized dry-docking costs in the amount of USD 49.3m (30 September 2021: USD 71.3m, 31 December 2021: USD 65.9m).
The depreciation for the nine months ended 30 September 2022 related to "Other plant and operating equipment" of USD 1.8m (30 September 2021: USD 1.9m, 31 December 2021: USD 2.4m) and “Land and buildings” of USD 1.7m (30 September 2021: USD 1.5m, 31 December 2021: USD 2.3m) is related to “Administrative expenses”.
Impairment assessment
For determination of the vessel values, TORM has carried out an impairment indicator assessment of the most significant assumptions used in the fair value and value in use calculations for the Annual Report 2021 (please refer to Note 8 in the Annual Report 2021). Based on a combined assessment, TORM has found no indication of impairment, and therefore, TORM does not find any need to reassess the recoverable amount as of 30 September 2022.
Assets held for sale
During the first nine months of 2022, TORM sold seven vessels. All the vessels sold in in the first nine months of 2022 and one vessel sold in the prior year have been delivered to the new owners. Two vessels are no longer held for sale and reclassified to Vessels and capitalized dry-docking.
The sales resulted in an impairment loss of USD 2.8m and a profit of USD 10.0m which are recognized in the income statement.
NOTE 2 – continued
| 30 September | 30 September | 31 December | |
| USDm | 2022 | 2021 | 2021 |
| Cost: | |||
| Balance as of beginning of period | 2,443.3 | 2,160.1 | 2,160.1 |
| Additions | 63.5 | 283.4 | 290.3 |
| Disposals | -5.3 | -20.1 | -40.9 |
| Transferred from prepayments | 55.1 | 27.5 | 78.6 |
| Transferred to assets held-for-sale | -140.1 | -17.2 | -44.8 |
| Balance | 2,416.5 | 2,433.7 | 2,443.3 |
| Depreciation: | |||
| Balance as of beginning of period | 475.0 | 406.2 | 406.2 |
| Disposals | -5.3 | -20.1 | -40.9 |
| Depreciation for the period | 99.9 | 92.7 | 126.2 |
| Transferred to assets held-for-sale | -50.7 | -6.5 | -16.5 |
| Balance | 518.9 | 472.3 | 475.0 |
| Impairment: | |||
| Balance as of beginning of period | 30.5 | 31.4 | 31.4 |
| Impairment losses on tangible fixed assets | 2.8 | 0.8 | 4.6 |
| Transferred to assets held-for-sale | -11.9 | -1.2 | -5.5 |
| Balance | 21.4 | 31.0 | 30.5 |
| Carrying amount | 1,876.2 | 1,930.4 | 1,937.8 |
TORM INTERIM RESULTS FOR THE THIRD QUARTER AND NINE MONTHS ENDED 30 SEPTEMBER 2022 | 20 |
NOTE 3 – PREPAYMENTS ON VESSELS
| 30 September | 30 September | 31 December | |
| USDm | 2022 | 2021 | 2021 |
| Balance as of beginning of period | 12.0 | 12.0 | 12.0 |
| Additions | 43.1 | 38.3 | 78.6 |
| Transferred to vessels | -55.1 | -27.5 | -78.6 |
| Carrying amount | - | 22.8 | 12.0 |
NOTE 4 – BORROWINGS
| 30 September | 30 September | 31 December | |
| USDm | 2022 | 2021 | 2021 |
| Mortgage debt and bank loans to be repaid as follows: | |||
| Falling due within one year | 116.8 | 177.7 | 209.2 |
| Falling due between one and two years | 129.8 | 132.9 | 128.1 |
| Falling due between two and three years | 133.0 | 143.8 | 138.3 |
| Falling due between three and four years | 186.2 | 143.2 | 134.1 |
| Falling due between four and five years | 56.0 | 210.4 | 181.3 |
| Falling due after five years | 382.0 | 238.4 | 351.8 |
| Total | 1,003.8 | 1,046.4 | 1,142.8 |
The presented amounts to be repaid do not include directly related costs arising from the issuing of the loans of USD 11.6m (30 September 2021: USD 12.3m, 31 December 2021: USD 13.0m), which are amortized over the term of the loans and debt regarding Land and buildings & Other plant and operating equipment USD 3.3m (30 September 2021: USD 6.3m, 31 December 2021: USD 5.6m).
As of 30 September 2022, TORM was in compliance with the financial covenants. TORM expects to remain in compliance with the financial covenants in the remaining period of 2022.
NOTE 5 – DERIVATIVE FINANCIAL INSTRUMENTS
| 30 September | 30 September | 31 December | |
| USDm | 2022 | 2021 | 2021 |
| Fair value of derivatives: | |||
| Derivative financial instruments regarding freight and bunkers: | |||
| Forward freight agreements - fair value through profit and loss | -8.2 | -1.8 | 0.4 |
| Bunker swaps - fair value through profit and loss | 2.2 | 1.1 | 0.2 |
| Bunker swaps - hedge accounting | 0.2 | 0.9 | 0.1 |
| Derivative financial instruments regarding interest and currency exchange rate: | |||
| Forward exchange contracts - hedge accounting | -3.7 | -1.5 | -1.6 |
| Interest rate swaps - hedge accounting | 55.2 | -11.8 | -2.2 |
| Total | 45.7 | -13.1 | -3.1 |
Derivative financial instruments are recognized in the following balance sheet items:
| 30 September | 30 September | 31 December | |
| USDm | 2022 | 2021 | 2021 |
| Other receivables | 57.6 | 3.8 | 7.7 |
| Other liabilities | -11.9 | -16.9 | -10.8 |
| Total | 45.7 | -13.1 | -3.1 |
The fair value hierarchy for the above derivative financial instruments is Level 2.
There are no changes in the methods and assumptions used in determining the fair value of the financial instruments. Please refer to the Annual Report 2021, page 153.
TORM INTERIM RESULTS FOR THE THIRD QUARTER AND NINE MONTHS ENDED 30 SEPTEMBER 2022 | 21 |
NOTE 6 – PROVISIONS
In 2020, TORM was involved in cargo claims relating to a customer having granted indemnities for discharge of cargoes, and not being able to honor those obligations. The cases involved irregular activities by the customer. Legal action was initiated by TORM in the UK and in India against the customer and related individuals. TORM has previously made provisions for USD 18.3m in relation to the claims.
In August 2022, TORM settled one claim and reassessed its provisions for the remaining part of the case complex.
TORM has reversed provisions amounting to USD 6.3m and the total amount as of 30 September 2022 relating to the claims is USD 6.5m. Legal proceedings are still ongoing and therefore the provisions recognized are subject to uncertainty relating to both timing and amount.
NOTE 7 – CONTINGENT LIABILITIES
TORM is involved in certain legal proceedings and disputes. It is Management’s opinion that the outcome of these proceedings and disputes will not have any material impact on TORM’s financial position, results of operations and cash flows.
NOTE 8 – CONTRACTUAL OBLIGATIONS AND RIGHTS
As of 30 September 2022, TORM had contractual obligations regarding scrubber investments and other minor commitments of USD 23.2m (30 September 2021: USD 78.3m, 31 December 2021: USD 39.9m).
NOTE 9 – POST BALANCE SHEET DATE EVENTS
After the reporting date, TORM’s Board of Directors has decided to declare a dividend of USD 1.46 per share, with an expected total dividend payment of USD 119m. The distribution is in line with TORM’s Distribution Policy with cash position (USD +238.5m), Working Capital Facilities (USD +95.0m), restricted cash (USD -14.5m) and earmarked proceeds (USD - 57.1m) and a cash position related to Marine Exhaust (USD -2.2m). Cash reservation per vessel is USD 1.8m or for 78 vessels USD 140.4m in total. Payment is expected on 08 December 2022 of shareholder of record on 23 November 2022, with the ex-dividend date on 22 November 2022. The dividends have not been recognized as liabilities and there are no tax consequences.
NOTE 10 – RELATED PARTY TRANSACTIONS
On 01 September 2022, TORM purchased 75% of the shares in Marine Exhaust Technology A/S thereby obtaining a controlling interest in its joint venture entity Marine Exhaust Technology Ltd in Hong Kong. Until 01 September 2022, TORM’s transactions with its joint venture entity producing scrubbers for the TORM fleet covered CAPEX of USD 5.6m in total.
NOTE 11 – ACCOUNTING POLICIES & GOING CONCERN
General information
The information for the year ended 31 December 2021 does not constitute statutory accounts as defined in section 434 of the Companies Act 2006. A copy of the statutory accounts for that year has been delivered to the Registrar of Companies. The auditor's report on those accounts was not qualified, did not include a reference to any matters to which the auditors drew attention by way of emphasis without qualifying the report and did not contain statements under section 498(2) or (3) of the Companies Act 2006.
The interim report for the period 01 January-30 September 2022 is not audited or reviewed.
Significant accounting policies
The interim report for the period 01 January-30 September 2022 is presented in accordance with IAS 34 "Interim Financial Reporting" (“IAS 34”) as adopted in the UK. The interim financial statements are also prepared in accordance with IAS 34 as issued by the International Accounting Standards Board (“IASB”) and IAS 34 as adopted by the EU, as applied to financial periods beginning on or after 01 January 2022.
TORM has implemented the following standards and amendments issued by the IASB and adopted by the UK in the consolidated financial statements for 2022:
| • | Annual Improvements to IFRS 2018-2020 relating to IFRS 1, IFRS 9 and IAS 41 |
| • | Amendments to IFRS 3 – Reference to the Conceptual Framework |
| • | Amendments to IAS 16 – Property, Plant and Equipment: Proceeds before intended use |
| • | Amendments to IAS 37 – Onerous Contracts – Cost of Fulfilling a Contract |
It is assessed that application of these effective on 01 January 2022 has not had any material impact on the consolidated financial statements in 2022. The interim report has been prepared using the same accounting policies and methods of computation as in the Annual Report 2021 except for the changes following the acquisition of Marine Exhaust Technology A/S described below.
For critical estimates and judgements, please refer to the Annual Report 2021, pages 124-125.
Update of accounting policies
Business combinations
Newly acquired or formed entities are recognized in the consolidated financial statements from the date of acquisition or formation. The date of acquisition is the date on which control over the entity is effectively transferred.
Business combinations are accounted for by applying the purchase method, whereby the acquired entities’ identifiable assets, liabilities and contingent liabilities are measured at fair value at the acquisition date. The tax effect of the revaluation activities is also taken into account.
TORM INTERIM RESULTS FOR THE THIRD QUARTER AND NINE MONTHS ENDED 30 SEPTEMBER 2022 | 22 |
NOTE 11 – continued
When a business combination agreement provides for an adjustment to the cost of the combination contingent on future events, the amount of that adjustment is included in the cost of the combination if the event is probable and the adjustment can be measured reliably. Costs of issuing debt or equity instruments in connection with a business combination are accounted for together with the debt or equity issuance. All other costs associated with the acquisition are expensed in the income statement.
The excess of the cost of the business combination over the fair value of the acquired assets, liabilities and contingent liabilities is recognized as goodwill under intangible assets and is tested for impairment at least once every year. Upon acquisition, goodwill is allocated to the cash generating units, which subsequently form the basis for the impairment test. If the fair value of the acquired assets, liabilities and contingent liabilities exceeds the cost of the business combination, the identification of assets and liabilities and the processes of measuring the fair value of the assets and liabilities and the cost of the business combination are reassessed. If the fair value of the business combination continues to exceed the cost, the resulting gain is recognized in the income statement.
Goodwill
Goodwill is measured as the excess of the cost of the business combination over the fair value of the acquired assets, liabilities and contingent liabilities and is recognized as an asset under intangible assets. Goodwill is not amortized as it is considered to have an indefinite useful life, but the recoverable amount of goodwill is assessed every quarter. For impairment testing purposes, goodwill is on initial recognition allocated to the cash generating unit expected to benefit from the synergies of the combination. If the recoverable amount of the cash generating unit is less than the carrying amount of the unit, the impairment loss is first allocated to reduce the carrying amount of any goodwill allocated to the unit and then to the other assets of the unit pro-rata on the basis of the carrying amount of each asset in the unit. An impairment loss for goodwill is not reversed in a subsequent period.
Segment information
The segmentation is based on the Group’s internal management and reporting structure. The Group has two operating segments, the Tank Segment, for which the services provided primarily comprise transportation of refined oil products such as gasoline, jet fuel, and naphtha and the Marine Exhaust Segment for which the services provided primarily comprise developing and producing advanced and green marine equipment.
TORM considers the global product tanker market as a whole, and as the individual vessels are not limited to specific parts of the world, the Group has only one geographical segment for the Tank Segment. Further, the internal management reporting does not provide geographical information for either the Tank Segment or the Marine Exhaust Segment. Consequently, it is not possible to provide geographical segment information on revenue from external customers or non-current segment assets for the Tank Segment or the Marine Exhaust Segment.
NOTE 11 – continued
Cash-generating units
Following the acquisition of Marine Exhaust Technology A/S and the disposal of the two handysize vessels, TORM has revised the assessment of cash-generating units. The Management of TORM has now assessed that TORM has two CGUs, being the Tanker Fleet and the Marine Exhaust cash-generating unit.
Going concern
TORM monitors its funding position throughout the year to ensure that it has access to sufficient funds to meet its forecast cash requirements, including newbuilding and loan commitments, and to monitor compliance with the financial covenants within its loan facilities. As of 30 September 2022, TORM’s available liquidity including undrawn facilities was USD 333.5m, including a total cash position of USD 238.5m (including restricted cash of USD 14.5m) and USD 95.0m undrawn credit facilities. TORM’s net interest-bearing debt was USD 764.0m. The net loan-to-value ratio was 30.9% for the Tank Segment. TORM performs sensitivity calculations to reflect different scenarios including, but not limited to, future freight rates and vessel. valuations in order to identify risks to future liquidity and covenant compliance and to enable Management to take corrective action, if required.
The sensitivity calculations are similar to those applied in connection with covenant testing in the Annual Report 2021. The principal risks and uncertainties facing TORM are set out on page 5.
TORM continues to pay special attention to the significantly increased geopolitical risk following Russia’s invasion of Ukraine in February 2022 and the associated effects on the product tanker market and to a smaller extent than earlier the global development in COVID-19. The financial impact going forward is uncertain, but TORM currently expects that the possible effects are covered within the sensitivity calculations.
The Board of Directors has considered TORM’s cash flow forecasts and the expected compliance with TORM’s financial covenants for the period until 31 December 2023. Based on this review, the Board of Directors has a reasonable expectation that, taking into account reasonably possible changes in trading performance and vessel valuations, TORM will be able to continue in operational existence and comply with its financial covenants in the period until 31 December 2023. Accordingly, TORM continues to adopt the going concern basis in preparing its financial statements.
TORM INTERIM RESULTS FOR THE THIRD QUARTER AND NINE MONTHS ENDED 30 SEPTEMBER 2022 | 23 |
NOTE 12 – BUSINESS COMBINATION
On 01 September 2022, TORM acquired an ownership stake of 75% of Marine Exhaust Technology A/S (MET), a Danish industrial company specializing in developing and producing advanced and green marine equipment for a cash consideration of USD 2.0m. TORM acquired MET because the entity has gained strong expertise in developing and producing components for the maritime industry, including scrubbers for the shipping industry. As part of the transaction, TORM also obtained control over the joint venture entity Marine Exhaust Technology Ltd in Hong Kong in which TORM previously held a 27.5% interest.
TORM has elected to measure the non-controlling interest in the acquiree at fair value.
The fair value of the non-controlling interest in MET has been assessed based on the EBITDA multiples method using estimated 2023 financials based on expected scrubber orders. The value includes an adjustment based on development cost to account for potential future income from the sales of Flettner rotors. Based on the enterprise value estimate the equity value is calculated through a standard adjustment for net interest-bearing debt.
The previously held interest in Marine Exhaust Technology Ltd in Hong Kong was remeasured at fair value as part of the transaction leading to a gain of USD 0.3m recognized in the share of profit/loss from joint ventures in the consolidated income statement.
The acquired assets include contractual receivables of USD 5.9m of which USD 0.3m were considered to be uncollectible at the day of the acquisition.
Transaction costs in connection with the acquisition amount to less than USD 0.1m recognized as administration expenses.
The goodwill of USD 1.9m represents the value of expected synergies arising from the acquisition and is allocated entirely to the Marine Exhaust segment. The goodwill recognized is not expected to be deductible for tax purposes.
Revenue and profit for the period generated by the acquired entity amount to USD 1.4 and 0.1m, respectively, and have been recognized in the consolidated income statement since the acquisition. Had the acquisition taken place on 01 January 2022, the revenue and profit for the combined entity for the period 01 January – 30 September would have been USD 1,009.6m and USD 333.8m, respectively.
Because of the proximity of the acquisition date to the end of the reporting period, the initial accounting for the business combination is incomplete and the fair values, including for intangible assets, tangible fixed assets, inventories, non-controlling interests and the previously held interest in Marine Exhaust Technology Ltd, are provisional. The following table summarizes the provisional fair values of the assets acquired and the liabilities assumed on 01 September 2022:
NOTE 12 – continued
| 1 September | |
| USDm | 2022 |
| Intangible assets | 0.5 |
| Tangible fixed assets | 1.6 |
| Deferred tax assets | 0.1 |
| Inventories | 5.6 |
| Trade receivables | 1.8 |
| Other receivables | 3.8 |
| Prepayments | 1.5 |
| Cash and cash equivalents | 3.0 |
| Borrowings | -6.9 |
| Deferred tax liabilities | -0.1 |
| Provisions | -0.4 |
| Other non-current liabilities | -0.8 |
| Trade payables | -1.5 |
| Other liabilities | -0.5 |
| Deferred income | -3.3 |
| Current tax liabilities | -0.3 |
| Net identifiable assets acquired | 4.1 |
| Goodwill | 1.9 |
| Total net assets acquired | 6.0 |
| Of which fair value of non-controlling interest | -2.4 |
| Total purchase consideration | 3.6 |
| Cash consideration | 2.0 |
| Fair value previously held interests | 1.6 |
| Total purchase consideration | 3.6 |
| Cash acquired | 3.0 |
| Cash consideration | -2.0 |
| Acquisition of subsidiaries, net of cash acquired | 1.0 |
TORM INTERIM RESULTS FOR THE THIRD QUARTER AND NINE MONTHS ENDED 30 SEPTEMBER 2022 | 24 |
CONDENSED CONSOLIDATED INCOME STATEMENT PER QUARTER
| USDm | Q3 2022 | Q2 2022 | Q1 2022 | Q4 2021 | Q3 2021 |
| Revenue | 448.1 | 338.5 | 209.4 | 189.1 | 155.5 |
| Port expenses, bunkers, commissions and other cost of goods sold | -130.4 | -128.9 | -86.0 | -82.3 | -63.9 |
| Operating expenses | -51.3 | -51.1 | -49.3 | -51.9 | -48.9 |
| Profit from sale of vessels | 9.2 | 0.8 | - | - | - |
| Administrative expenses | -13.4 | -12.5 | -13.4 | -12.4 | -12.3 |
| Other operating income and expenses | -0.3 | 6.7 | -0.3 | 0.4 | 0.1 |
| Share of profit/(loss) from joint ventures | 0.3 | -0.1 | - | - | -0.1 |
| Impairment losses and reversal of impairment on tangible assets | 0.2 | -0.2 | -2.6 | -3.8 | - |
| Depreciation | -33.8 | -34.5 | -35.2 | -34.8 | -34.1 |
| Operating profit/(loss) (EBIT) | 228.6 | 118.7 | 22.6 | 4.3 | -3.7 |
| Financial income | 1.2 | 0.3 | - | - | 0.1 |
| Financial expenses | -12.5 | -12.0 | -11.9 | -12.3 | -10.5 |
| Profit/(loss) before tax | 217.3 | 107.0 | 10.7 | -8.0 | -14.1 |
| Tax | -0.2 | -0.4 | -0.3 | -0.2 | -0.6 |
| Net profit/(loss) for the period | 217.1 | 106.6 | 10.4 | -8.2 | -14.7 |
| EARNINGS PER SHARE | |||||
| Basic earnings/(loss) per share (USD) | 2.66 | 1.31 | 0.13 | -0.10 | -0.18 |
| Diluted earnings/(loss) per share (USD) | 2.63 | 1.31 | 0.12 | -0.10 | -0.19 |
TORM INTERIM RESULTS FOR THE THIRD QUARTER AND NINE MONTHS ENDED 30 SEPTEMBER 2022 | 25 |
CONDENSED CONSOLIDATED STATEMENT OF CASH FLOW PER QUARTER
| USDm | Q3 2022 | Q2 2022 | Q1 2022 | Q4 2021 | Q3 2021 |
| CASH FLOW FROM OPERATING ACTIVITIES | |||||
| Net profit/(loss) for the year | 217.1 | 106.6 | 10.4 | -8.2 | -14.7 |
| Reversals: | |||||
| Profit from sale of vessels | -9.2 | -0.8 | - | - | - |
| Depreciation | 33.8 | 34.5 | 35.2 | 34.8 | 34.1 |
| Impairment losses | -0.2 | 0.2 | 2.6 | 3.8 | - |
| Share of profit/(loss) from joint ventures | -0.3 | 0.1 | - | - | 0.1 |
| Financial income | -1.2 | -0.3 | - | - | -0.1 |
| Financial expenses | 12.5 | 12.0 | 11.9 | 12.3 | 10.5 |
| Tax expenses | 0.2 | 0.4 | 0.3 | 0.2 | 0.6 |
| Other non-cash movements | -4.3 | 3.6 | 2.4 | -1.0 | 2.9 |
| Interest received and realized exchange gains | 1.3 | 0.1 | - | - | - |
| Interest paid and realized exchange losses | -12.1 | -11.9 | -14.2 | -8.9 | -12.2 |
| Income taxes paid | -0.1 | - | -0.3 | -1.1 | -0.2 |
| Change in inventories, receivables and payables, etc. | -72.2 | -73.4 | -30.4 | -19.2 | -9.0 |
| Net cash flow from operating activities | 165.3 | 71.1 | 17.9 | 12.7 | 12.0 |
TORM INTERIM RESULTS FOR THE THIRD QUARTER AND NINE MONTHS ENDED 30 SEPTEMBER 2022 | 26 |
CONDENSED CONSOLIDATED STATEMENT OF CASH FLOW PER QUARTER
| USDm | Q3 2022 | Q2 2022 | Q1 2022 | Q4 2021 | Q3 2021 |
| CASH FLOW FROM INVESTING ACTIVITIES | |||||
| Investment in tangible fixed assets | -47.1 | -12.7 | -46.9 | -47.5 | -61.8 |
| Acquisition of subsidiaries, net of cash acquired | 1.0 | - | - | - | - |
| Sale of tangible fixed assets | 63.5 | 42.9 | - | - | - |
| Change in restricted cash | 9.9 | -4.7 | 7.2 | -21.2 | 1.5 |
| Net cash flow from investing activities | 27.3 | 25.5 | -39.7 | -68.7 | -60.3 |
| CASH FLOW FROM FINANCING ACTIVITIES | |||||
| Proceeds, borrowings | 38.1 | 20.0 | 38.2 | 210.2 | 128.1 |
| Repayment, borrowings | -94.0 | -62.3 | -87.6 | -114.5 | -80.8 |
| Dividend paid | -47.3 | - | - | - | - |
| Capital increase | 1.3 | 4.1 | 1.3 | 0.9 | 1.0 |
| Net cash flow from financing activities | -101.9 | -38.2 | -48.1 | 96.6 | 48.3 |
| Net cash flow from operating, investing and financing activities | 90.7 | 58.4 | -69.9 | 40.6 | - |
| Cash and cash equivalents beginning balance | 133.3 | 74.9 | 144.8 | 104.2 | 104.2 |
| Cash and cash equivalents, ending balance | 224.0 | 133.3 | 74.9 | 144.8 | 104.2 |
| Restricted cash equivalents ending balance | 14.5 | 24.4 | 19.7 | 26.9 | 5.7 |
| Cash and cash equivalents including restricted cash, ending balance | 238.5 | 157.7 | 94.6 | 171.7 | 109.9 |
TORM INTERIM RESULTS FOR THE THIRD QUARTER AND NINE MONTHS ENDED 30 SEPTEMBER 2022 | 27 |
GLOSSARY
KEY FINANCIAL FIGURES
TCE per day | = | TCE excluding unrealized gains/losses on derivatives Available earning days | ||
Gross profit % | = | Gross profit Revenue | ||
EBITDA % | = | EBITDA Revenue | ||
Operating profit/(loss) % | = | Operating profit/(loss) (EBIT) Revenue | ||
Return on Equity (RoE) % | = | Net profit/(loss) for the year Average equity | ||
Return on Invested Capital (RoiC) % | = | Operating profit/(loss) less tax Average invested capital | ||
Equity ratio | = | Equity Total assets | ||
Earnings per share, EPS | = | Net profit/(loss) for the year Average number of shares | ||
Diluted earnings/(loss) per share, EPS (USD) | = | Net profit/(loss) for the year Average number of shares less average number of treasury shares | ||
TORM INTERIM RESULTS FOR THE THIRD QUARTER AND NINE MONTHS ENDED 30 SEPTEMBER 2022 | 28 |
GLOSSARY
ALTERNATIVE PERFORMANCE MEASURES GROUP
Throughout the interim report, several alternative performance measures (APMs) are used. The APMs used are the same as in the Annual Report 2021 and therefore we refer to the principles for these on pages 174-179 in the TORM plc Annual Report 2021. The following APMs relate to the Group.
Net profit/(loss) for the year excluding non-recurrent items: Net profit excluding impairment is net profit less impairment and reversals of impairment generated from impairment testing during the year (Please refer to Note 2). TORM reports net profit excluding impairment because we believe it provides additional meaningful information to investors regarding the operational performance excluding fluctuations in the valuation of fixed assets.
| USDm | Q3 2022 | Q3 2021 | Q1-Q3 2022 | Q1-Q3 2021 | FY 2021 |
| Reconciliation to net profit/(loss) | |||||
| Net profit/(loss) for the period | 217.1 | -14.7 | 334.1 | -33.9 | -42.1 |
| Profit from sale of vessels | -9.2 | - | -10.0 | - | - |
| Impairment losses and reversals on tangible assets | -0.2 | - | 2.6 | 0.8 | 4.6 |
| Provisions | -5.5 | - | -11.8 | - | - |
| Expense of capitalized bank fees at refinancing | - | - | - | - | 1.1 |
| Step up gain related to acquisition | -0.3 | - | -0.3 | - | - |
| Net profit/(loss) for the year ex.non-recurrent items | 201.9 | -14.7 | 314.6 | -33.1 | -36.4 |
Gross profit: TORM defines gross profit, a performance measure, as revenues less port expenses, bunkers and commissions, charter hire and operating expenses. TORM reports gross profit because we believe it provides additional meaningful information to investors, as gross profit measures the net earnings from shipping activities. Gross profit is calculated as follows:
| USDm | Q3 2022 | Q3 2021 | Q1-Q3 2022 | Q1-Q3 2021 | FY 2021 |
| Reconciliation to revenue | |||||
| Revenue | 448.1 | 155.5 | 996.0 | 430.4 | 619.5 |
| Port expenses, bunkers, commissions and other cost of goods sold | -130.4 | -63.9 | -345.3 | -158.6 | -240.9 |
| Operating expenses | -51.3 | -48.9 | -151.7 | -138.6 | -190.5 |
| Gross profit | 266.4 | 42.7 | 499.0 | 133.2 | 188.1 |
Return on Invested Capital (RoIC): TORM defines RoIC as earnings before interest and tax (EBIT) less tax, divided by the average invested capital for the period. Invested capital is defined below.
RoIC expresses the returns generated on capital invested in TORM. The progression of RoIC is used by TORM to measure progress against our longer-term value creation goals outlined to investors. RoIC is calculated as follows:
| USDm | Q3 2022 | Q3 2021 | Q1-Q3 2022 | Q1-Q3 2021 | FY 2021 |
| Operating profit/(loss) (EBIT) | 228.6 | -3.7 | 369.9 | -2.9 | 1.4 |
| Tax | -0.2 | -0.6 | -0.9 | -1.1 | -1.3 |
| EBIT less Tax | 228.4 | -4.3 | 369.0 | -4.0 | 0.1 |
| EBIT less Tax - Full year equivalent | 913.6 | -17.2 | 492.0 | -5.3 | 0.1 |
| Invested capital, opening balance | 2,096.7 | 1,925.5 | 2,011.3 | 1,719.7 | 1,719.7 |
| Invested capital, ending balance | 2,158.2 | 1,975.9 | 2,158.2 | 1,975.9 | 2,011.3 |
| Average invested capital | 2,127.5 | 1,950.7 | 2,084.8 | 1,847.8 | 1,865.5 |
| Return on Invested Capital (RoIC) | 42.9% | -0.9% | 23.6% | -0.3% | 0.0% |
TORM INTERIM RESULTS FOR THE THIRD QUARTER AND NINE MONTHS ENDED 30 SEPTEMBER 2022 | 29 |
GLOSSARY
ALTERNATIVE PERFORMANCE MEASURES GROUP
Adjusted Return on Invested Capital (Adjusted RoIC): TORM defines adjusted RoIC as earnings before interest and tax (EBIT) less tax and impairment losses and reversals, divided by the average invested capital less average impairment for the period. Invested capital is defined below.
The Adjusted RoIC expresses the returns generated on capital invested in TORM adjusted for impacts related to the impairment of the fleet. The progression of RoIC is used by TORM to measure progress against our longer-term value creation goals outlined to investors. Adjusted RoIC is calculated as follows:
| USDm | Q3 2022 | Q3 2021 | Q1-Q3 2022 | Q1-Q3 2021 | FY 2021 |
| EBIT less Tax - Full year equivalent | 913.6 | -17.2 | 492.0 | -5.3 | 0.1 |
| Profit from sale of vessels | -9.2 | - | -10.0 | - | - |
| Impairment losses and reversals on tangible assets | -0.2 | - | 2.6 | 0.8 | 4.6 |
| EBIT less tax and impairment | 904.2 | -17.2 | 484.6 | -4.5 | 4.7 |
Average invested capital¹⁾ | 2,127.5 | 1,950.7 | 2,084.8 | 1,847.8 | 1,865.5 |
Average impairment ²⁾ | 37.4 | 42.4 | 37.4 | 42.6 | 42.3 |
| Average invested capital adjusted for impairment | 2,164.9 | 1,993.1 | 2,122.2 | 1,890.4 | 1,907.8 |
| Adjusted RoIC | 41.8% | -0.9% | 22.8% | -0.2% | 0.2% |
¹⁾ Average invested capital is calculated as the average of the opening and closing balance of invested capital. | |||||
²⁾ Average impairment is calculated as the average of the opening and closing balances of impairment charges on vessels and goodwill in the balance sheet. | |||||
EBITDA: TORM defines EBITDA as earnings before financial income and expenses, depreciation, impairment, amortization, and taxes. The computation of EBITDA refers to financial income and expenses which TORM deems to be equivalent to “interest” for purposes of presenting EBITDA. Financial expenses consist of interest on bank loans and leasing liabilities, losses on foreign exchange transactions and bank charges. Financial income consists of interest income and gains on foreign exchange transactions.
EBITDA is used as a supplemental financial measure by Management and external users of financial statements, such as lenders, to assess TORM's operating performance as well as compliance with the financial covenants and restrictions contained in TORM's financing agreements. TORM believes that EBITDA assists Management and investors in evaluating TORM’s operating performance by increasing comparability of TORM's performance from period to period. This increased comparability is achieved by excluding the potentially disparate effects of interest, depreciation, impairment, amortization, and taxes. These are items which could be affected by various changing financing methods and capital structures, which may significantly affect profit/(loss) between periods. Including EBITDA as a measure benefits investor in selecting between investment alternatives.
EBITDA excludes some, but not all, items which affect profit/(loss), and these items may vary among other companies and may therefore not be directly comparable. The following table reconciles EBITDA to net profit/ (loss), the most directly comparable IFRS financial measure, for the periods presented:
| USDm | Q3 2022 | Q3 2021 | Q1-Q3 2022 | Q1-Q3 2021 | FY 2021 |
| Reconciliation to net profit/(loss) | |||||
| Net profit/(loss) for the period | 217.1 | -14.7 | 334.1 | -33.9 | -42.1 |
| Tax | 0.2 | 0.6 | 0.9 | 1.1 | 1.3 |
| Financial expenses | 12.5 | 10.5 | 36.4 | 30.1 | 42.4 |
| Financial income | -1.2 | -0.1 | -1.5 | -0.2 | -0.2 |
| Depreciation | 33.8 | 34.1 | 103.5 | 96.1 | 130.9 |
| Impairment losses and reversal of impairment on tangible assets | -0.2 | - | 2.6 | 0.8 | 4.6 |
| EBITDA | 262.2 | 30.4 | 476.0 | 94.0 | 136.9 |
TORM INTERIM RESULTS FOR THE THIRD QUARTER AND NINE MONTHS ENDED 30 SEPTEMBER 2022 | 30 |
GLOSSARY
ALTERNATIVE PERFORMANCE MEASURES GROUP
Invested capital: TORM defines invested capital as the sum of intangible assets, tangible fixed assets, investments in joint ventures, deferred tax assets, other investments, bunkers, accounts receivables, assets held for sale (when applicable), non-current tax liability related to held over gains, trade payables, current tax liabilities and deferred income. Invested capital measures the net investment used to achieve our operating profit. TORM believes that invested capital is a relevant measure which Management uses to measure the overall development of the assets and liabilities generating our net profit. Such measure may not be comparable to similarly titled measures of other companies. Invested capital is calculated as follows:
| 30 September | 30 September | 31 December | |
| USDm | 2022 | 2021 | 2021 |
| Tangible and intangible fixed assets | 1,888.4 | 1,965.2 | 1,960.9 |
| Investments in joint ventures | 0.1 | 1.6 | 1.5 |
| Deferred tax asset | 0.6 | 0.6 | 0.7 |
| Other investments | 0.2 | - | - |
| Inventories | 72.4 | 43.7 | 48.8 |
| Trade receivables | 340.3 | 109.7 | 129.6 |
| Assets held-for-sale | - | - | 13.2 |
| Non-current tax liability related to held over gains | -45.2 | -45.2 | -45.2 |
Trade payables ²⁾ | -86.1 | -79.6 | -79.0 |
| Other non-current liabilities | -3.0 | - | - |
| Provisions | -6.5 | -18.3 | -18.3 |
| Deferred tax liability | -0.1 | - | - |
| Current tax liabilities | -1.5 | -1.8 | -0.9 |
| Deferred income | -3.8 | - | - |
| Invested capital | 2,155.8 | 1,975.9 | 2,011.3 |
¹⁾ Accounts receivables includes Freight receivables, Other receivables and Prepayments. | |||
²⁾ Trade payables includes Trade payables and Other liabilities. | |||
Net interest-bearing debt: Net interest-bearing debt is defined as mortgage debt and bank loans (current and non-current), lease liabilities less cash equivalents and interest-bearing loan receivables. Net interest-bearing debt depicts the net capital resources, which cause net interest expenditure and interest rate risk and which, together with equity, are used to finance our investments. As such, TORM believes that net interest-bearing debt is a relevant measure, which Management uses to measure the overall development of our use of financing, other than equity. Such measure may not be comparable to similarly titled measures of other companies. Net interest-bearing debt is calculated as follows:
| 30 September | 30 September | 31 December | |
| USDm | 2022 | 2021 | 2021 |
Borrowings¹⁾ | 1,007.1 | 1,052.7 | 1,148.4 |
| Loan receivables | -4.6 | -4.6 | -4.6 |
| Cash and cash equivalents, including restricted cash | -238.5 | -109.9 | -171.7 |
| Net interest-bearing debt | 764.0 | 938.2 | 972.1 |
¹⁾ Borrowings include long-term and short-term borrowings, excluding capitalized loan costs of USD 11.6m. | |||
TORM INTERIM RESULTS FOR THE THIRD QUARTER AND NINE MONTHS ENDED 30 SEPTEMBER 2022 | 31 |
GLOSSARY
ALTERNATIVE PERFORMANCE MEASURES GROUP
Liquidity: TORM defines liquidity as available cash, comprising cash and cash equivalents, including restricted cash, as well as undrawn and committed credit facilities. TORM finds the APM important as the liquidity expresses TORM’s financial position, ability to meet current liabilities and cash buffer. Further, it expresses TORM’s ability to act and invest when new possibilities occur.
| 30 September | 30 September | 31 December | |
| USDm | 2022 | 2021 | 2021 |
| Cash and cash equivalents, including restricted cash | 238.5 | 109.9 | 171.7 |
| Undrawn credit facilities and committed facilities incl. sale & leaseback financing transactions | 95.0 | 75.6 | 38.2 |
| Liquidity | 333.5 | 185.5 | 209.9 |
Free cash flow: TORM defines free cash flow as net cash flow from operating activities less the net cash flow from investing activities. TORM finds the APM important as free cash flow reflects our ability to generate cash, repay liabilities and pay dividends.
| USDm | Q3 2022 | Q3 2021 | Q1-Q3 2022 | Q1-Q3 2021 | FY 2021 |
| Net cash flow from operating activities | 165.3 | 12.0 | 254.3 | 35.2 | 47.9 |
| Net cash flow from investing activities | 27.3 | -60.3 | 13.1 | -221.9 | -290.6 |
| Free cash flow | 192.6 | -48.3 | 267.4 | -186.7 | -242.7 |
Net Asset Value per share (NAV/share): TORM believes that the NAV/share is a relevant measure which Management uses to measure the overall development of the assets and liabilities per share. Such measure may not be comparable to similarly titled measures of other companies. NAV/share is calculated using broker values of vessels and excluding charter commitments. NAV/share is calculated as follows:
| 30 September | 30 September | 31 December | |
| USDm | 2022 | 2021 | 2021 |
| Total vessel values (broker values) | 2,523.6 | 1,886.1 | 1,926.0 |
| Committed CAPEX | -23.2 | -78.3 | -39.9 |
| Goodwill | 1.9 | - | - |
| Other intangible assets | 0.5 | - | - |
| Land and buildings | 3.1 | 4.9 | 4.8 |
| Other plant and operating equipment | 6.7 | 7.1 | 6.3 |
| Investments in joint ventures | 0.1 | 1.6 | 1.5 |
| Loan receivables | 4.6 | 4.6 | 4.6 |
| Deferred tax asset | 0.6 | 0.6 | 0.7 |
| Other investments | 0.2 | - | - |
| Inventories | 72.4 | 43.7 | 48.8 |
| Trade receivables | 247.7 | 69.0 | 84.0 |
| Other receivables | 78.7 | 36.6 | 40.0 |
| Prepayments | 13.9 | 4.1 | 5.6 |
| Cash position | 238.5 | 109.9 | 171.7 |
Borrowings ¹⁾ | -1,007.1 | -1,052.7 | -1,148.4 |
| Deferred tax liability | -0.1 | - | - |
| Trade payables | -40.8 | -29.9 | -35.3 |
| Current tax liabilities | -1.5 | -1.8 | -0.9 |
| Other liabilities | -45.3 | -49.7 | -43.7 |
| Other non-current liabilities | -3.0 | - | - |
| Deferred income | -3.8 | - | - |
| Provisions | -6.5 | -18.3 | -18.3 |
| Total Net Asset Value (NAV) | 2,061.3 | 937.5 | 1,007.5 |
| Non-controlling interest | -2.4 | - | - |
| Total Net Asset Value (NAV) excl. non-controlling interest | 2,058.9 | 937.5 | 1,007.5 |
| Total number of shares, end of period excluding treasury shares (million) | 81.6 | 80.6 | 80.7 |
| Total Net Asset Value per share (NAV/share) | 25.2 | 11.6 | 12.5 |
¹⁾ Borrowings include long-term and short-term borrowings, excluding capitalized loan costs of USD 11.6m. | |||
TORM INTERIM RESULTS FOR THE THIRD QUARTER AND NINE MONTHS ENDED 30 SEPTEMBER 2022 | 32 |
GLOSSARY
ALTERNATIVE PERFORMANCE MEASURES TANK SEGMENT
Throughout the interim report, several alternative performance measures (APMs) are used. The APMs used are the same as in the Annual Report 2021 and therefore we refer to the principles for these on pages 174-179 in the TORM plc Annual Report 2021. After the acquisition of Marine Exhaust Technology A/S on 01 September 2022, the following APMs relate to the primary segment, the Tank segment.
Time Charter Equivalent (TCE) earnings: TORM defines TCE earnings, a performance measure, as revenue less port expenses, bunkers and commissions incl. freight and bunker derivatives. TORM reports TCE earnings because we believe it provides additional meaningful information to investors in relation to revenue, the most directly comparable IFRS measure. TCE earnings is a standard shipping industry performance measure used primarily to compare period-to-period changes in a shipping company’s performance irrespective of changes in the mix of charter types (i.e., spot charters, time charters and bareboat charters) under which the vessels may be employed between the periods. Below is presented a reconciliation from revenue to TCE earnings:
| USDm | Q3 2022 | Q3 2021 | Q1-Q3 2022 | Q1-Q3 2021 | FY 2021 |
| Reconciliation to revenue | |||||
| Revenue | 446.7 | 155.5 | 994.6 | 430.4 | 619.5 |
| Port expenses, bunkers and commissions | -129.9 | -63.9 | -344.8 | -158.6 | -240.9 |
| TCE earnings | 316.8 | 91.6 | 649.8 | 271.8 | 378.6 |
Net Loan-to-value (LTV): TORM defines Loan-to-value (LTV) ratio as vessel values divided by net borrowings of the vessels.
LTV describes the net debt ratio of the vessels and is used by TORM to describe the financial situation and the liquidity risk as well as to express the future possibilities to raise new capital by new loan facilities.
| 30 September | 30 September | 31 December | |
| USDm | 2022 | 2021 | 2021 |
| Vessel values including newbuildings (broker values) | 2,523.6 | 1,886.1 | 1,926.0 |
| Total vessel values (broker values) | 2,523.6 | 1,886.1 | 1,926.0 |
Borrowings ¹⁾ | 1,000.5 | 1,052.7 | 1,148.4 |
- Hereof debt regarding Land and buildings & Other plant and operating equipment | -3.3 | -6.3 | -5.6 |
| Committed CAPEX | 23.2 | 78.3 | 39.9 |
| Loan receivable | -4.6 | -4.6 | -4.6 |
| Cash and cash equivalents, including restricted cash | -236.3 | -109.9 | -171.7 |
| Total (loan) | 779.5 | 1,010.2 | 1,006.4 |
| Net Loan-to-value (LTV) ratio | 30.9% | 53.6% | 52.3% |
¹⁾ Borrowings include long-term and short-term borrowings, excluding capitalized loan costs of USD 11.6m. | |||
TORM INTERIM RESULTS FOR THE THIRD QUARTER AND NINE MONTHS ENDED 30 SEPTEMBER 2022 | 33 |