UNITED STATES
SECURITIES AND EXCHANGE COMMISSION
Washington, D.C. 20549
FORM N-CSR
CERTIFIED SHAREHOLDER REPORT OF REGISTERED
MANAGEMENT INVESTMENT COMPANIES
Investment Company Act file number: 811-23117
JPMorgan Trust IV
(Exact name of registrant as specified in charter)
277 Park Avenue
New York, NY 10172
(Address of principal executive offices) (Zip code)
Gregory S. Samuels
277 Park Avenue
New York, NY 10172
(Name and Address of Agent for Service)
Registrant’s telephone number, including area code: (800) 480-4111
Date of fiscal year end: Last day of February
Date of reporting period: March 1, 2020 through August 31, 2020
Form N-CSR is to be used by management investment companies to file reports with the Commission not later than 10 days after the transmission to stockholders of any report that is required to be transmitted to stockholders under Rule 30e-1 under the Investment Company Act of 1940 (17 CFR 270.30e-1). The Commission may use the information provided on Form N-CSR in its regulatory, disclosure review, inspection, and policymaking roles.
A registrant is required to disclose the information specified by Form N-CSR, and the Commission will make this information public. A registrant is not required to respond to the collection of information contained in Form N-CSR unless the Form displays a currently valid Office of Management and Budget (“OMB”) control number. Please direct comments concerning the accuracy of the information collection burden estimate and any suggestions for reducing the burden to Secretary, Securities and Exchange Commission, 450 Fifth Street, NW, Washington, DC 20549-0609. The OMB has reviewed this collection of information under the clearance requirements of 44 U.S.C. Section 3507.
ITEM 1. REPORTS TO STOCKHOLDERS.
The following is a copy of the report transmitted to shareholders pursuant to Rule 30e-1 under the Investment Company Act of 1940 (17 CFR 270.30e-1).
Semi-Annual Report
J.P. Morgan Money Market Funds
August 31, 2020 (Unaudited)
JPMorgan Prime Money Market Fund
JPMorgan Institutional Tax Free Money Market Fund
JPMorgan Securities Lending Money Market Fund
JPMorgan Liquid Assets Money Market Fund
JPMorgan U.S. Government Money Market Fund
JPMorgan U.S. Treasury Plus Money Market Fund
JPMorgan Federal Money Market Fund
JPMorgan 100% U.S. Treasury Securities Money Market Fund
JPMorgan Tax Free Money Market Fund
JPMorgan Municipal Money Market Fund
JPMorgan California Municipal Money Market Fund
JPMorgan New York Municipal Money Market Fund
Beginning on January 1, 2021, as permitted by regulations adopted by the Securities and Exchange Commission, paper copies of the Funds’ annual and semi-annual shareholder reports will no longer be sent by mail, unless you specifically request paper copies of the reports. Instead, the reports will be made available on the Funds’ website www.jpmorganfunds.com and you will be notified by mail each time a report is posted and provided with a website to access the report. If you already elected to receive shareholder reports electronically, you will not be affected by this change and you need not take any action.
You may elect to receive shareholder reports and other communications from the Funds electronically anytime by contacting your financial intermediary (such as a broker dealer, bank, or retirement plan) or, if you are a direct investor, by going to www.jpmorganfunds.com/edelivery.
You may elect to receive paper copies of all future reports free of charge. Contact your financial intermediary or, if you invest directly with the Funds, email us at funds.website.support@jpmorganfunds.com or call 1-800-480-4111. Your election to receive paper reports will apply to all funds held within your account(s).

CONTENTS
The following disclosure applies to the JPMorgan Liquid Assets Money Market Fund, JPMorgan Tax Free Money Market Fund, JPMorgan Municipal Money Market Fund, JPMorgan California Municipal Money Market Fund and JPMorgan New York Municipal Money Market Fund.
You could lose money by investing in a Fund. Although each Fund seeks to preserve the value of your investment at $1.00 per share, it cannot guarantee it will do so. A Fund may impose a fee upon the sale of your shares or may temporarily suspend your ability to sell shares if the Fund’s liquidity falls below required minimums because of market conditions or other factors. An investment in a Fund is not insured or guaranteed by the Federal Deposit Insurance Corporation or any other government agency. The Funds’ sponsor has no legal obligation to provide financial support to the Funds, and you should not expect that the sponsor will provide financial support to the Funds at any time.
The following disclosure applies to the JPMorgan Prime Money Market Fund, JPMorgan Institutional Tax Free Money Market Fund and JPMorgan Securities Lending Money Market Fund.
You could lose money by investing in a Fund. Because the share price of each Fund will fluctuate, when you sell your shares they may be worth more or less than what you originally paid for them. A Fund may impose a fee upon the sale of your shares or may temporarily suspend your ability to sell shares if the Fund’s liquidity falls below required minimums because of market conditions or other factors. An investment in a Fund is not insured or guaranteed by the Federal Deposit Insurance Corporation or any other government agency. The Funds’ sponsor has no legal obligation to provide financial support to the Funds, and you should not expect that the sponsor will provide financial support to the Funds at any time.
Any gain resulting from the sale or exchange of Fund shares will be taxable as long-term or short-term gain, depending upon how long you have held your shares.
The following disclosure applies to the JPMorgan U.S. Government Money Market Fund, JPMorgan U.S. Treasury Plus Money Market Fund, JPMorgan Federal Money Market Fund and the JPMorgan 100% U.S. Treasury Securities Money Market Fund.
You could lose money by investing in a Fund. Although each Fund seeks to preserve the value of your investment at $1.00 per share, it cannot guarantee it will do so. An investment in a Fund is not insured or guaranteed by the Federal Deposit Insurance Corporation or any other government agency. The Funds’ sponsor has no legal obligation to provide financial support to the Funds, and you should not expect that the sponsor will provide financial support to the Funds at any time.
Past performance is no guarantee of future performance. The general market views expressed in this report are opinions based on market and other conditions through the end of the reporting period and are subject to change without notice. These views are not intended to predict the future performance of a Fund or the securities markets. References to specific securities and their issuers are for illustrative purposes only and are not intended to be, and should not be interpreted as, recommendations to purchase or sell such securities. Such views are not meant as investment advice and may not be relied on as an indication of trading intent on behalf of any Fund.
Prospective investors should refer to the Funds’ prospectuses for a discussion of the Funds’ investment objectives, strategies and risks. Call J.P. Morgan Funds Service Center at 1-800-480-4111 (retail investors) or 1-800-766-7722 (institutional investors) for a prospectus containing more complete information about a Fund, including management fees and other expenses. Please read it carefully before investing.
LETTER TO SHAREHOLDERS
OCTOBER 23, 2020 (Unaudited)
Dear Shareholders,
Even as the U.S. economy has endured a severe contraction since the start of the pandemic, financial markets have generally rebounded from lows seen in March 2020 amid unprecedented support from the Federal Reserve (the “Fed”) and investor optimism about efforts to contain the spread of COVID-19.
| | |
 | | “Throughout this tumultuous year, J.P. Morgan Asset Management has responded to unprecedented conditions by continuing to seek to provide our clients with effective investment solutions and dependable service.” — Andrea L. Lisher |
In response to an acute sell-off in financial markets in February and March 2020, the Fed unveiled an array of lending and asset purchasing programs designed to head off a liquidity crisis in credit markets and maintain the flow of credit to the public and private sectors. The Fed also slashed interest rates in March 2020, as jobless claims spiked to record highs, which helped to bolster equity markets. In the following months, financial market volatility subsided and asset prices generally began to rebound, though global oil prices remained at historically low levels amid a steep drop off in demand and slower economic
activity. For the six months ended August 31, 2020, the S&P 500 Index returned 19.6% and the Bloomberg Barclays U.S. Aggregate Index returned 2.9%.
Our long-term view remains one of cautious optimism, but we recognize the near-term risks stemming from uncertainty surrounding additional fiscal support and efforts to contain COVID-19. The pace of economic activity looks set to slow into the end of the year as services remain under pressure, and additional stimulus may be required to keep the economy on track in 2021. That said, volatility in financial markets could begin to recede as the results of the November 3rd election provide clarity on the contours of the political landscape going forward. Throughout this tumultuous year, J.P. Morgan Asset Management has responded to unprecedented conditions by continuing to seek to provide our clients with effective investment solutions and dependable service.
On behalf of J.P. Morgan Asset Management, thank you for entrusting us to manage your investment. Should you have any questions, please visit www.jpmorganfunds.com or contact the J.P. Morgan Funds Service Center at 1-800-480-4111.
Sincerely yours,

Andrea L. Lisher
Head of Americas, Client
J.P. Morgan Asset Management
| | | | | | | | |
| | | |
| AUGUST 31, 2020 | | J.P. MORGAN MONEY MARKET FUNDS | | | | | 1 | |
FUNDS COMMENTARY
October 27, 2020
Dear Shareholders,
The emergence of COVID-19 caused the deepest downturn in economic activity since World War II. The rapid spread of the COVID-19 virus led to a collapse in the economy that fed back into financial markets. Money market flows were shaped by investors’ need to preserve and build liquidity buffers. At the height of financial market uncertainty in early March, demand for liquidity strained short-term credit markets and spread into broader financial markets.
| | |
 | | “Throughout this turbulent year, JPMorgan Global Liquidity has responded to unprecedented conditions by drawing on JPMorgan’s global resources and expertise to seek to deliver effective short-term fixed income strategies.”
— John T. Donohue |
U.S. government money market funds served as the liquidity vehicle of choice for our Funds’ investors. Industry wide, hundreds of billions of dollars were allocated into these funds as investors of all types were seeking liquidity and government money market funds’ assets under management increased by $834 billion in March 2020. Conversely, prime money market funds experienced $139 billion in outflows during the month. If one were to assume that all prime money market outflows were inflows into government money market funds, an additional $695 billion had also flowed into government money market funds from other sources.
In response to the severe sell-off in financial markets in February and March 2020, the U.S. Federal Reserve (the “Fed”) introduced an array of facilities designed to restore liquidity and maintain the flow of credit to the public and private sectors, in addition to cutting interest rates. Primarily targeting the short-term markets, the Fed launched the Commercial
Paper Funding Facility and the Money Market Mutual Fund Liquidity Facility (MMLF). MMLF assets reached a high of $53 billion on April 8, 2020 and have since declined sharply. The Fed’s strong actions telegraphed to the financial market a willingness to take the necessary steps to ensure liquidity and the flow of credit to the financial markets.
Following the Fed’s actions, the return of investor confidence was evident as a rotation of assets from government money market funds and other sources found their way back to prime money market funds. Flows into prime money market funds were swift, with prime sector total assets under management rising above pre-pandemic levels. Additionally, as interest rates continued to drift lower, the yield spread between prime money market funds and government money market funds became a larger consideration for investors.
There remains great uncertainty regarding the path of the U.S. economy and financial markets given that efforts to contain COVID-19 have had mixed results, coupled with lack of a readily available and effective vaccine. Throughout this turbulent year, JPMorgan Global Liquidity has responded to unprecedented conditions by drawing on JPMorgan’s global resources and expertise to seek to deliver effective short-term fixed income strategies.
On behalf of JPMorgan Global Liquidity, we thank you for your continued partnership and trust in our company and our product.
Sincerely yours,

John T. Donohue
CEO Asset Management Americas & Head of Global Liquidity
J.P. Morgan Asset Management
| | | | | | |
| | | |
| 2 | | | | J.P. MORGAN MONEY MARKET FUNDS | | AUGUST 31, 2020 |
JPMorgan Prime Money Market Fund
FUND FACTS
SIX MONTHS ENDED AUGUST 31, 2020 (Unaudited)
| | |
| Objective† | | Seeks current income while seeking to maintain liquidity and a low volatility of principal |
| Primary Investments | | High quality, short-term, U.S. dollar-denominated money market instruments |
| Suggested investment time frame | | Short-term |
| Share classes offered | | Class C, Academy, Agency, Capital, IM, Institutional Class, Morgan, Premier and Reserve |
| Net Assets as of August 31, 2020 | | $87.5 Billion |
| Weighted Average Maturity^ | | 54 calendar days |
| Weighted Average Life^^ | | 81 calendar days |
| | | | |
MATURITY SCHEDULE*^ | |
| 1 calendar day | | | 32.6 | % |
| 2–7 calendar days | | | 5.1 | |
| 8–30 calendar days | | | 12.9 | |
| 31–60 calendar days | | | 16.5 | |
| 61–90 calendar days | | | 13.9 | |
| 91–180 calendar days | | | 12.1 | |
| 181+ calendar days | | | 6.9 | |
| | | | |
7-DAY SEC YIELD AS OF AUGUST 31, 2020(1) | |
| Class C Shares | | | 0.01 | % |
| Academy Shares | | | 0.20 | |
| Agency Shares | | | 0.12 | |
| Capital Shares | | | 0.20 | |
| IM Shares | | | 0.24 | |
| Institutional Class Shares | | | 0.17 | |
| Morgan Shares | | | 0.01 | |
| Premier Shares | | | 0.01 | |
| Reserve Shares | | | 0.01 | |
The performance quoted is past performance and is not a guarantee of future results. Mutual funds are subject to certain market risks. Investment returns and principal value of an investment will fluctuate so that an investor’s shares, when redeemed, may be worth more or less than their original cost. Current performance may be higher or lower than the performance data shown. For up-to-date month-end performance information please call 1-800-480-4111 (retail investors) or 1-800-766-7722 (institutional investors).
An investment in a money market fund is not insured by the FDIC or any other government agency.
| † | The adviser seeks to achieve the Fund’s objective. There can be no guarantee it will be achieved. |
| ^ | The calculation takes into account the period remaining until the date on which, in accordance with the terms of the security, the principal amount must unconditionally be paid, or in the case of a security called for redemption, the date on which the redemption payment must be made and may utilize the interest rate reset date for variable or floating rate securities. |
| ^^ | The calculation takes into account the period remaining until the date on which, in accordance with the terms of the security, the principal amount must unconditionally be paid, or in the case of a security called for redemption, the date on which the redemption payment must be made. |
| * | Percentages indicated are based upon total investments as of August 31, 2020. |
| (1) | The yields for Class C Shares, Academy Shares, Agency Shares, Capital Shares, IM Shares, Institutional Class Shares, Morgan Shares, Premier Shares and Reserve Shares reflect the reimbursements and/or waivers of certain expenses. Without these reimbursements and/or waivers, the yields would have been (4.93)%, 0.18%, 0.09%, 0.19%, 0.24%, 0.14%, (0.13)%, (0.06)% and (2.57)% for Class C Shares, Academy Shares, Agency Shares, Capital Shares, IM Shares, Institutional Class Shares, Morgan Shares, Premier Shares and Reserve Shares, respectively. |
| | An unaudited, uncertified list of prior-day portfolio holdings of the JPMorgan Prime Money Market Fund is available upon request. Please contact your J.P. Morgan representative to obtain further information regarding this facility and information on holdings. |
| | | | | | | | |
| | | |
| AUGUST 31, 2020 | | J.P. MORGAN MONEY MARKET FUNDS | | | | | 3 | |
JPMorgan Institutional Tax Free Money Market Fund
FUND FACTS
SIX MONTHS ENDED AUGUST 31, 2020 (Unaudited)
| | |
| Objective† | | Aims to provide current income, while seeking to maintain liquidity and a low volatility of principal |
| Primary Investments | | High quality short-term municipal securities, the interest on which is excluded from federal income taxes |
| Suggested investment time frame | | Short-term |
| Share classes offered | | Agency, Capital, IM and Institutional Class |
| Net Assets as of August 31, 2020 | | $1.8 Billion |
| Weighted Average Maturity^ | | 31 calendar days |
| Weighted Average Life^^ | | 34 calendar days |
| | | | |
MATURITY SCHEDULE*^ | |
| 1 calendar day | | | 32.8 | % |
| 2–7 calendar days | | | 0.1 | |
| 8–30 calendar days | | | 50.8 | |
| 31–60 calendar days | | | 2.3 | |
| 61–90 calendar days | | | 2.1 | |
| 91–180 calendar days | | | 6.1 | |
| 181+ calendar days | | | 5.8 | |
| | | | |
7-DAY SEC YIELD AS OF AUGUST 31, 2020(1) | |
| Agency Shares | | | 0.01 | % |
| Capital Shares | | | 0.02 | |
| IM Shares | | | 0.05 | |
| Institutional Class Shares | | | 0.01 | |
The performance quoted is past performance and is not a guarantee of future results. Mutual funds are subject to certain market risks. Investment returns and principal value of an investment will fluctuate so that an investor’s shares, when redeemed, may be worth more or less than their original cost. Current performance may be higher or lower than the performance data shown. For up-to-date month-end performance information please call 1-800-766-7722 (institutional investors).
An investment in a money market fund is not insured by the FDIC or any other government agency.
| † | The adviser seeks to achieve the Fund’s objective. There can be no guarantee it will be achieved. |
| ^ | The calculation takes into account the period remaining until the date on which, in accordance with the terms of the security, the principal amount must unconditionally be paid, or in the case of a security called for redemption, the date on which the redemption payment must be made and may utilize the interest rate reset date for variable or floating rate securities. |
| ^^ | The calculation takes into account the period remaining until the date on which, in accordance with the terms of the security, the principal amount must unconditionally be paid, or in the case of a security called for redemption, the date on which the redemption payment must be made. |
| * | Percentages indicated are based upon total investments as of August 31, 2020. |
| (1) | The yields for Agency Shares, Capital Shares, IM Shares and Institutional Class Shares reflect the reimbursements and/or waivers of certain expenses. Without these reimbursements and/or waivers, the yields would have been (0.13)%, (0.01)%, 0.05% and (0.06)% for Agency Shares, Capital Shares, IM Shares and Institutional Class Shares, respectively. |
| | An unaudited, uncertified list of prior-day portfolio holdings of the JPMorgan Institutional Tax Free Money Market Fund is available upon request. Please contact your J.P. Morgan representative to obtain further information regarding this facility and information on holdings. |
| | | | | | |
| | | |
| 4 | | | | J.P. MORGAN MONEY MARKET FUNDS | | AUGUST 31, 2020 |
JPMorgan Securities Lending Money Market Fund
FUND FACTS
SIX MONTHS ENDED AUGUST 31, 2020 (Unaudited)
| | |
| Objective† | | Seeks current income while seeking to maintain liquidity and a low volatility of principal |
| Primary Investments | | High quality, short-term, U.S. dollar-denominated money market instruments |
| Suggested investment time frame | | Short-term |
| Share classes offered | | Agency SL |
| Net Assets as of August 31, 2020 | | $3.7 Billion |
| Weighted Average Maturity^ | | 40 calendar days |
| Weighted Average Life^^ | | 79 calendar days |
| | | | |
MATURITY SCHEDULE*^ | |
| 1 calendar day | | | 45.0 | % |
| 2–7 calendar days | | | 0.3 | |
| 8–30 calendar days | | | 12.5 | |
| 31–60 calendar days | | | 15.6 | |
| 61–90 calendar days | | | 14.5 | |
| 91–180 calendar days | | | 8.9 | |
| 181+ calendar days | | | 3.2 | |
| | | | |
7-DAY SEC YIELD AS OF AUGUST 31, 2020(1) | |
| Agency SL Shares | | | 0.32 | % |
The performance quoted is past performance and is not a guarantee of future results. Mutual funds are subject to certain market risks. Investment returns and principal value of an investment will fluctuate so that an investor’s shares, when redeemed, may be worth more or less than their original cost. Current performance may be higher or lower than the performance data shown. For up-to-date month-end performance information please call 1-800-766-7722 (institutional investors).
An investment in a money market fund is not insured by the FDIC or any other government agency.
| † | The adviser seeks to achieve the Fund’s objective. There can be no guarantee it will be achieved. |
| ^ | The calculation takes into account the period remaining until the date on which, in accordance with the terms of the security, the principal amount must unconditionally be paid, or in the case of a security called for redemption, the date on which the redemption payment must be made and may utilize the interest rate reset date for variable or floating rate securities. |
| ^^ | The calculation takes into account the period remaining until the date on which, in accordance with the terms of the security, the principal amount must unconditionally be paid, or in the case of a security called for redemption, the date on which the redemption payment must be made. |
| * | Percentages indicated are based upon total investments as of August 31, 2020. |
| (1) | The yield for Agency SL Shares reflects the reimbursements and/or waivers of certain expenses. Without these reimbursements and/or waivers, the yield would have been 0.24% for Agency SL Shares. |
| | An unaudited, uncertified list of prior-day portfolio holdings of the JPMorgan Securities Lending Money Market Fund is available upon request. Please contact your J.P. Morgan representative to obtain further information regarding this facility and information on holdings. |
| | | | | | | | |
| | | |
| AUGUST 31, 2020 | | J.P. MORGAN MONEY MARKET FUNDS | | | | | 5 | |
JPMorgan Liquid Assets Money Market Fund
FUND FACTS
SIX MONTHS ENDED AUGUST 31, 2020 (Unaudited)
| | |
| Objective† | | Seeks current income with liquidity and stability of principal |
| Primary Investments | | High quality, short-term instruments including corporate notes, U.S. government securities, asset-backed securities, repurchase agreements, commercial paper, funding agreements, certificates of deposit, municipal obligations and bank obligations |
| Suggested investment time frame | | Short-term |
| Share classes offered | | Class C, Agency, Capital, E*Trade^, Institutional Class, Investor, Morgan, Premier and Reserve Shares |
| Net Assets as of August 31, 2020 | | $12.5 Billion |
| Weighted Average Maturity^^ | | 54 calendar days |
| Weighted Average Life^^^ | | 85 calendar days |
| | | | |
MATURITY SCHEDULE*^^ | |
| 1 calendar day | | | 31.7 | % |
| 2–7 calendar days | | | 6.3 | |
| 8–30 calendar days | | | 11.6 | |
| 31–60 calendar days | | | 15.1 | |
| 61–90 calendar days | | | 14.2 | |
| 91–180 calendar days | | | 15.0 | |
| 181+ calendar days | | | 6.1 | |
| | | | |
7-DAY SEC YIELD AS OF AUGUST 31, 2020(1) | |
| Class C Shares | | | 0.01 | % |
| Agency Shares | | | 0.14 | |
| Capital Shares | | | 0.21 | |
| Institutional Class Shares | | | 0.19 | |
| Investor Shares | | | 0.01 | |
| Morgan Shares | | | 0.01 | |
| Premier Shares | | | 0.01 | |
| Reserve Shares | | | 0.01 | |
The performance quoted is past performance and is not a guarantee of future results. Mutual funds are subject to certain market risks. Investment returns and principal value of an investment will fluctuate so that an investor’s shares, when redeemed, may be worth more or less than their original cost. Current performance may be higher or lower than the performance data shown. For up-to-date month-end performance information please call 1-800-480-4111 (retail investors) or 1-800-766-7722 (institutional investors).
An investment in a money market fund is not insured by the FDIC or any other government agency. Although the Fund strives to preserve the value of the investment at $1.00 per share, it is possible to lose money by investing in the Fund.
| † | The adviser seeks to achieve the Fund’s objective. There can be no guarantee it will be achieved. |
| ^ | E*Trade Shares had no assets from the close of business on October 19, 2016. |
| ^^ | The calculation takes into account the period remaining until the date on which, in accordance with the terms of the security, the principal amount must unconditionally be paid, or in the case of a security called for redemption, the date on which the redemption payment must be made and may utilize the interest rate reset date for variable or floating rate securities. |
| ^^^ | The calculation takes into account the period remaining until the date on which, in accordance with the terms of the security, the principal amount must unconditionally be paid, or in the case of a security called for redemption, the date on which the redemption payment must be made. |
| * | Percentages indicated are based upon total investments as of August 31, 2020. |
| (1) | The yields for Class C Shares, Agency Shares, Capital Shares, Institutional Class Shares, Investor Shares, Morgan Shares, Premier Shares and Reserve Shares reflect the reimbursements and/or waivers of certain expenses. Without these reimbursements and/or waivers, the yields would have been (0.75)%, 0.11%, 0.21%, 0.16%, (0.28)%, (0.21)%, (0.05)% and (1.00)% for Class C Shares, Agency Shares, Capital Shares, Institutional Class Shares, Investor Shares, Morgan Shares, Premier Shares and Reserve Shares, respectively. |
| | An unaudited, uncertified list of prior-day portfolio holdings of the JPMorgan Liquid Assets Money Market Fund is available upon request. Please contact your J.P. Morgan representative to obtain further information regarding this facility and information on holdings. |
| | | | | | |
| | | |
| 6 | | | | J.P. MORGAN MONEY MARKET FUNDS | | AUGUST 31, 2020 |
JPMorgan U.S. Government Money Market Fund
FUND FACTS
SIX MONTHS ENDED AUGUST 31, 2020 (Unaudited)
| | |
| Objective† | | Seeks high current income with liquidity and stability of principal |
| Primary Investments | | High quality, short-term securities issued or guaranteed by the U.S. government or by U.S. government agencies or instrumentalities and repurchase agreements collateralized by such obligations |
| Suggested investment time frame | | Short-term |
| Share classes offered | | Academy, Agency, Capital, E*Trade, IM, Institutional Class, Investor, Morgan, Premier, Reserve and Service Shares |
| Net Assets as of August 31, 2020 | | $180.9 Billion |
| Weighted Average Maturity^ | | 32 calendar days |
| Weighted Average Life^^ | | 101 calendar days |
| | | | |
MATURITY SCHEDULE*^ | |
| 1 calendar day | | | 35.0 | % |
| 2–7 calendar days | | | 6.4 | |
| 8–30 calendar days | | | 23.0 | |
| 31–60 calendar days | | | 13.2 | |
| 61–90 calendar days | | | 13.1 | |
| 91–180 calendar days | | | 7.0 | |
| 181+ calendar days | | | 2.3 | |
| | | | |
7-DAY SEC YIELD AS OF AUGUST 31, 2020(1) | |
| Academy Shares | | | 0.03 | % |
| Agency Shares | | | 0.01 | |
| Capital Shares | | | 0.03 | |
| E*Trade Shares | | | 0.01 | |
| IM Shares | | | 0.08 | |
| Institutional Class Shares | | | 0.01 | |
| Investor Shares | | | 0.01 | |
| Morgan Shares | | | 0.01 | |
| Premier Shares | | | 0.01 | |
| Reserve Shares | | | 0.01 | |
| Service Shares | | | 0.01 | |
The performance quoted is past performance and is not a guarantee of future results. Mutual funds are subject to certain market risks. Investment returns and principal value of an investment will fluctuate so that an investor’s shares, when redeemed, may be worth more or less than their original cost. Current performance may be higher or lower than the performance data shown. For up-to-date month-end performance information please call 1-800-480-4111 (retail investors) or 1-800-766-7722 (institutional investors).
An investment in a money market fund is not insured by the FDIC or any other government agency. Although the Fund strives to preserve the value of the investment at $1.00 per share, it is possible to lose money by investing in the Fund.
| † | The adviser seeks to achieve the Fund’s objective. There can be no guarantee it will be achieved. |
| ^ | The calculation takes into account the period remaining until the date on which, in accordance with the terms of the security, the principal amount must unconditionally be paid, or in the case of a security called for redemption, the date on which the redemption payment must be made and may utilize the interest rate reset date for variable or floating rate securities. |
| ^^ | The calculation takes into account the period remaining until the date on which, in accordance with the terms of the security, the principal amount must unconditionally be paid, or in the case of a security called for redemption, the date on which the redemption payment must be made. |
| * | Percentages indicated are based upon total investments as of August 31, 2020. |
| (1) | The yields for Academy Shares, Agency Shares, Capital Shares, E*Trade Shares, IM Shares, Institutional Class Shares, Investor Shares, Morgan Shares, Premier Shares, Reserve Shares and Service Shares reflect the reimbursements and/or waivers of certain expenses. Without these reimbursements and/or waivers, the yields would have been 0.03%, (0.07)%, 0.02%, (0.82)%, 0.08%, (0.02)%, (0.27)%, (0.37)%, (0.22)%, (0.49)% and (0.81)% for Academy Shares, Agency Shares, Capital Shares, E*Trade Shares, IM Shares, Institutional Class Shares, Investor Shares, Morgan Shares, Premier Shares, Reserve Shares and Service Shares, respectively. |
| | An unaudited, uncertified list of prior-day portfolio holdings of the JPMorgan U.S. Government Money Market Fund is available upon request. Please contact your J.P. Morgan representative to obtain further information regarding this facility and information on holdings. |
| | | | | | | | |
| | | |
| AUGUST 31, 2020 | | J.P. MORGAN MONEY MARKET FUNDS | | | | | 7 | |
JPMorgan U.S. Treasury Plus Money Market Fund
FUND FACTS
SIX MONTHS ENDED AUGUST 31, 2020 (Unaudited)
| | |
| Objective† | | Seeks current income with liquidity and stability of principal |
| Primary Investments | | Direct obligations of the U.S. Treasury including Treasury bills, bonds and notes and other obligations issued or guaranteed by the U.S. Treasury and repurchase agreements collateralized by U.S. Treasury securities |
| Suggested investment time frame | | Short-term |
| Share classes offered | | Class C, Agency, Capital, IM, Institutional Class, Investor, Morgan, Premier and Reserve Shares |
| Net Assets as of August 31, 2020 | | $37.0 Billion |
| Weighted Average Maturity^ | | 28 calendar days |
| Weighted Average Life^^ | | 58 calendar days |
| | | | |
MATURITY SCHEDULE*^ | |
| 1 calendar day | | | 45.2 | % |
| 2–7 calendar days | | | 1.3 | |
| 8–30 calendar days | | | 24.6 | |
| 31–60 calendar days | | | 5.9 | |
| 61–90 calendar days | | | 13.1 | |
| 91–180 calendar days | | | 9.0 | |
| 181+ calendar days | | | 0.9 | |
| | | | |
7-DAY SEC YIELD AS OF AUGUST 31, 2020(1) | |
| Class C Shares | | | 0.01 | % |
| Agency Shares | | | 0.01 | |
| Capital Shares | | | 0.06 | |
| IM Shares | | | 0.11 | |
| Institutional Class Shares | | | 0.03 | |
| Investor Shares | | | 0.01 | |
| Morgan Shares | | | 0.01 | |
| Premier Shares | | | 0.01 | |
| Reserve Shares | | | 0.01 | |
The performance quoted is past performance and is not a guarantee of future results. Mutual funds are subject to certain market risks. Investment returns and principal value of an investment will fluctuate so that an investor’s shares, when redeemed, may be worth more or less than their original cost. Current performance may be higher or lower than the performance data shown. For up-to-date month-end performance information please call 1-800-480-4111 (retail investors) or 1-800-766-7722 (institutional investors).
An investment in a money market fund is not insured by the FDIC or any other government agency. Although the Fund strives to preserve the value of the investment at $1.00 per share, it is possible to lose money by investing in the Fund.
| † | The adviser seeks to achieve the Fund’s objective. There can be no guarantee it will be achieved. |
| ^ | The calculation takes into account the period remaining until the date on which, in accordance with the terms of the security, the principal amount must unconditionally be paid, or in the case of a security called for redemption, the date on which the redemption payment must be made and may utilize the interest rate reset date for variable or floating rate securities. |
| ^^ | The calculation takes into account the period remaining until the date on which, in accordance with the terms of the security, the principal amount must unconditionally be paid, or in the case of a security called for redemption, the date on which the redemption payment must be made. |
| * | Percentages indicated are based upon total investments as of August 31, 2020 . |
| (1) | The yields for Class C Shares, Agency Shares, Capital Shares, IM Shares, Institutional Class Shares, Investor Shares, Morgan Shares, Premier Shares and Reserve Shares reflect the reimbursements and/or waivers of certain expenses. Without these reimbursements and/or waivers, the yields would have been (0.89)%, (0.04)%, 0.05%, 0.11%, 0.00%, (0.24)%, (0.34)%, (0.19)% and (0.63)% for Class C Shares, Agency Shares, Capital Shares, IM Shares, Institutional Class Shares, Investor Shares, Morgan Shares, Premier Shares and Reserve Shares, respectively. |
| | An unaudited, uncertified list of prior-day portfolio holdings of the JPMorgan U.S. Treasury Plus Money Market Fund is available upon request. Please contact your J.P. Morgan representative to obtain further information regarding this facility and information on holdings. |
| | | | | | |
| | | |
| 8 | | | | J.P. MORGAN MONEY MARKET FUNDS | | AUGUST 31, 2020 |
JPMorgan Federal Money Market Fund
FUND FACTS
SIX MONTHS ENDED AUGUST 31, 2020 (Unaudited)
| | |
| Objective† | | Aims to provide current income while still preserving capital and maintaining liquidity |
| Primary Investments | | Direct obligations of the U.S. Treasury including Treasury bills, bonds and notes as well as debt obligations issued or guaranteed by U.S. government agencies or instrumentalities |
| Suggested investment time frame | | Short-term |
| Share classes offered | | Agency, Institutional Class, Morgan and Premier Shares |
| Net Assets as of August 31, 2020 | | $3.2 Billion |
| Weighted Average Maturity^ | | 38 calendar days |
| Weighted Average Life^^ | | 88 calendar days |
| | | | |
MATURITY SCHEDULE*^ | |
| 1 calendar day | | | 30.1 | % |
| 8–30 calendar days | | | 22.9 | |
| 31–60 calendar days | | | 9.5 | |
| 61–90 calendar days | | | 34.4 | |
| 91–180 calendar days | | | 3.1 | |
| | | | |
7-DAY SEC YIELD AS OF AUGUST 31, 2020(1) | |
| Agency Shares | | | 0.01 | % |
| Institutional Class Shares | | | 0.01 | |
| Morgan Shares | | | 0.01 | |
| Premier Shares | | | 0.01 | |
The performance quoted is past performance and is not a guarantee of future results. Mutual funds are subject to certain market risks. Investment returns and principal value of an investment will fluctuate so that an investor’s shares, when redeemed, may be worth more or less than their original cost. Current performance may be higher or lower than the performance data shown. For up-to-date month-end performance information please call 1-800-480-4111 (retail investors) or 1-800-766-7722 (institutional investors).
An investment in a money market fund is not insured by the FDIC or any other government agency. Although the Fund strives to preserve the value of the investment at $1.00 per share, it is possible to lose money by investing in the Fund.
| † | The adviser seeks to achieve the Fund’s objective. There can be no guarantee it will be achieved. |
| ^ | The calculation takes into account the period remaining until the date on which, in accordance with the terms of the security, the principal amount must unconditionally be paid, or in the case of a security called for redemption, the date on which the redemption payment must be made and may utilize the interest rate reset date for variable or floating rate securities. |
| ^^ | The calculation takes into account the period remaining until the date on which, in accordance with the terms of the security, the principal amount must unconditionally be paid, or in the case of a security called for redemption, the date on which the redemption payment must be made. |
| * | Percentages indicated are based upon total investments as of August 31, 2020. |
| (1) | The yields for Agency Shares, Institutional Class Shares, Morgan Shares and Premier Shares reflect the reimbursements and/or waivers of certain expenses. Without these reimbursements and/or waivers, the yields would have been (0.08)%, (0.03)%, (0.41)% and (0.23)% for Agency Shares, Institutional Class Shares, Morgan Shares and Premier Shares, respectively. |
| | An unaudited, uncertified list of prior-day portfolio holdings of the JPMorgan Federal Money Market Fund is available upon request. Please contact your J.P. Morgan representative to obtain further information regarding this facility and information on holdings. |
| | | | | | | | |
| | | |
| AUGUST 31, 2020 | | J.P. MORGAN MONEY MARKET FUNDS | | | | | 9 | |
JPMorgan 100% U.S. Treasury Securities Money Market Fund
FUND FACTS
SIX MONTHS ENDED AUGUST 31, 2020 (Unaudited)
| | |
| Objective† | | Aims to provide the highest possible level of current income while still maintaining liquidity and providing maximum safety of principal |
| Primary Investments | | Direct obligations of the U.S. Treasury including Treasury bills, bonds and notes |
| Suggested investment time frame | | Short-term |
| Share classes offered | | Agency, Capital, IM, Institutional Class, Morgan, Premier and Reserve Shares |
| Net Assets as of August 31, 2020 | | $111.6 Billion |
| Weighted Average Maturity^ | | 54 calendar days |
| Weighted Average Life^^ | | 96 calendar days |
| | | | |
MATURITY SCHEDULE*^ | |
| 1 calendar day | | | 15.7 | % |
| 2–7 calendar days | | | 0.6 | |
| 8–30 calendar days | | | 16.1 | |
| 31–60 calendar days | | | 12.9 | |
| 61–90 calendar days | | | 38.2 | |
| 91–180 calendar days | | | 16.5 | |
| | | | |
7-DAY SEC YIELD AS OF AUGUST 31, 2020(1) | |
| Agency Shares | | | 0.01 | % |
| Capital Shares | | | 0.04 | |
| IM Shares | | | 0.07 | |
| Institutional Class Shares | | | 0.01 | |
| Morgan Shares | | | 0.01 | |
| Premier Shares | | | 0.01 | |
| Reserve Shares | | | 0.01 | |
The performance quoted is past performance and is not a guarantee of future results. Mutual funds are subject to certain market risks. Investment returns and principal value of an investment will fluctuate so that an investor’s shares, when redeemed, may be worth more or less than their original cost. Current performance may be higher or lower than the performance data shown. For up-to-date month-end performance information please call 1-800-480-4111 (retail investors) or 1-800-766-7722 (institutional investors).
An investment in a money market fund is not insured by the FDIC or any other government agency. Although the Fund strives to preserve the value of the investment at $1.00 per share, it is possible to lose money by investing in the Fund.
| † | The adviser seeks to achieve the Fund’s objective. There can be no guarantee it will be achieved. |
| ^ | The calculation takes into account the period remaining until the date on which, in accordance with the terms of the security, the principal amount must unconditionally be paid, or in the case of a security called for redemption, the date on which the redemption payment must be made and may utilize the interest rate reset date for variable or floating rate securities. |
| ^^ | The calculation takes into account the period remaining until the date on which, in accordance with the terms of the security, the principal amount must unconditionally be paid, or in the case of a security called for redemption, the date on which the redemption payment must be made. |
| * | Percentages indicated are based upon total investments as of August 31, 2020. |
| (1) | The yields for Agency Shares, Capital Shares, IM Shares, Institutional Class Shares, Morgan Shares, Premier Shares and Reserve Shares reflect the reimbursements and/or waivers of certain expenses. Without these reimbursements and/or waivers, the yields would have been (0.07)%, 0.03%, 0.07%, (0.03)%, (0.37)%, (0.22)% and (0.47)% for Agency Shares, Capital Shares, IM Shares, Institutional Class Shares, Morgan Shares, Premier Shares and Reserve Shares, respectively. |
| | An unaudited, uncertified list of prior-day portfolio holdings of the JPMorgan 100% U.S. Treasury Securities Money Market Fund is available upon request. Please contact your J.P. Morgan representative to obtain further information regarding this facility and information on holdings. |
| | | | | | |
| | | |
| 10 | | | | J.P. MORGAN MONEY MARKET FUNDS | | AUGUST 31, 2020 |
JPMorgan Tax Free Money Market Fund
FUND FACTS
SIX MONTHS ENDED AUGUST 31, 2020 (Unaudited)
| | |
| Objective† | | Aims to provide the highest possible level of current income which is excluded from gross income, while still preserving capital and maintaining liquidity* |
| Primary Investments | | High quality short-term municipal securities, the interest on which is excluded from federal income taxes |
| Suggested investment time frame | | Short-term |
| Share classes offered | | Agency, Institutional Class, Morgan, Premier and Reserve Shares |
| Net Assets as of August 31, 2020 | | $10.7 Billion |
| Weighted Average Maturity^ | | 41 calendar days |
| Weighted Average Life^^ | | 41 calendar days |
| | | | |
MATURITY SCHEDULE**^ | |
| 1 calendar day | | | 17.1 | % |
| 8–30 calendar days | | | 63.1 | |
| 31–60 calendar days | | | 4.0 | |
| 61–90 calendar days | | | 0.9 | |
| 91–180 calendar days | | | 5.9 | |
| 181+ calendar days | | | 9.0 | |
| | | | |
7-DAY SEC YIELD AS OF AUGUST 31, 2020(1) | |
| Agency Shares | | | 0.01 | % |
| Institutional Class Shares | | | 0.02 | |
| Morgan Shares | | | 0.01 | |
| Premier Shares | | | 0.01 | |
| Reserve Shares | | | 0.01 | |
The performance quoted is past performance and is not a guarantee of future results. Mutual funds are subject to certain market risks. Investment returns and principal value of an investment will fluctuate so that an investor’s shares, when redeemed, may be worth more or less than their original cost. Current performance may be higher or lower than the performance data shown. For up-to-date month-end performance information please call 1-800-480-4111 (retail investors) or 1-800-766-7722 (institutional investors).
An investment in a money market fund is not insured by the FDIC or any other government agency. Although the Fund strives to preserve the value of the investment at $1.00 per share, it is possible to lose money by investing in the Fund.
| † | The adviser seeks to achieve the Fund’s objective. There can be no guarantee it will be achieved. |
| ^ | The calculation takes into account the period remaining until the date on which, in accordance with the terms of the security, the principal amount must unconditionally be paid, or in the case of a security called for redemption, the date on which the redemption payment must be made and may utilize the interest rate reset date for variable or floating rate securities. |
| ^^ | The calculation takes into account the period remaining until the date on which, in accordance with the terms of the security, the principal amount must unconditionally be paid, or in the case of a security called for redemption, the date on which the redemption payment must be made. |
| * | A portion of the Fund’s income distributions may be subject to the Alternative Minimum Tax (AMT), and some investors may be subject to certain state and local taxes. |
| ** | Percentages indicated are based upon total investments as of August 31, 2020. |
| (1) | The yields for Agency Shares, Institutional Class Shares, Morgan Shares, Premier Shares and Reserve Shares reflect the reimbursements and/or waivers of certain expenses. Without these reimbursements and/or waivers, the yields would have been (0.07)%, (0.02)%, (0.37)%, (0.22)% and (0.47)% for Agency Shares, Institutional Class Shares, Morgan Shares, Premier Shares and Reserve Shares, respectively. |
| | An unaudited, uncertified list of prior-day portfolio holdings of the JPMorgan Tax Free Money Market Fund is available upon request. Please contact your J.P. Morgan representative to obtain further information regarding this facility and information on holdings. |
| | | | | | | | |
| | | |
| AUGUST 31, 2020 | | J.P. MORGAN MONEY MARKET FUNDS | | | | | 11 | |
JPMorgan Municipal Money Market Fund
FUND FACTS
SIX MONTHS ENDED AUGUST 31, 2020 (Unaudited)
| | |
| Objective† | | Seeks as high a level of current interest income exempt from federal income tax as is consistent with liquidity and stability of principal* |
| Primary Investments | | High quality short-term municipal securities, the interest on which is excluded from federal income taxes |
| Suggested investment time frame | | Short-term |
| Share classes offered | | Agency, E*Trade^, Institutional Class, Morgan, Premier and Service Shares |
| Net Assets as of August 31, 2020 | | $1.2 Billion |
| Weighted Average Maturity^^ | | 38 calendar days |
| Weighted Average Life^^^ | | 38 calendar days |
| | | | |
MATURITY SCHEDULE**^^ | |
| 1 calendar day | | | 21.4 | % |
| 2–7 calendar days | | | 2.8 | |
| 8–30 calendar days | | | 58.2 | |
| 31–60 calendar days | | | 2.7 | |
| 61–90 calendar days | | | 1.5 | |
| 91–180 calendar days | | | 5.5 | |
| 181+ calendar days | | | 7.9 | |
| | | | |
7-DAY SEC YIELD AS OF AUGUST 31, 2020(1) | |
| Agency Shares | | | 0.05 | % |
| Institutional Class Shares | | | 0.10 | |
| Morgan Shares | | | 0.01 | |
| Premier Shares | | | 0.01 | |
| Service Shares | | | 0.01 | |
The performance quoted is past performance and is not a guarantee of future results. Mutual funds are subject to certain market risks. Investment returns and principal value of an investment will fluctuate so that an investor’s shares, when redeemed, may be worth more or less than their original cost. Current performance may be higher or lower than the performance data shown. For up-to-date month-end performance information please call 1-800-480-4111 (retail investors) or 1-800-766-7722 (institutional investors).
An investment in a money market fund is not insured by the FDIC or any other government agency. Although the Fund strives to preserve the value of the investment at $1.00 per share, it is possible to lose money by investing in the Fund.
| † | The adviser seeks to achieve the Fund’s objective. There can be no guarantee it will be achieved. |
| ^ | E*Trade Shares had no assets from the close of business on September 21, 2016. |
| ^^ | The calculation takes into account the period remaining until the date on which, in accordance with the terms of the security, the principal amount must unconditionally be paid, or in the case of a security called for redemption, the date on which the redemption payment must be made and may utilize the interest rate reset date for variable or floating rate securities. |
| ^^^ | The calculation takes into account the period remaining until the date on which, in accordance with the terms of the security, the principal amount must unconditionally be paid, or in the case of a security called for redemption, the date on which the redemption payment must be made. |
| * | A portion of the Fund’s income distributions may be subject to the Alternative Minimum Tax (AMT), and some investors may be subject to certain state and local taxes. |
| ** | Percentages indicated are based upon total investments as of August 31, 2020. |
| (1) | The yields for Agency Shares, Institutional Class Shares, Morgan Shares, Premier Shares and Service Shares reflect the reimbursements and/or waivers of certain expenses. Without these reimbursements and/or waivers, the yields would have been 0.01%, 0.06%, (0.29)%, (0.14)% and (0.73)% for Agency Shares, Institutional Class Shares, Morgan Shares, Premier Shares and Service Shares, respectively. |
| | An unaudited, uncertified list of prior-day portfolio holdings of the JPMorgan Municipal Money Market Fund is available upon request. Please contact your J.P. Morgan representative to obtain further information regarding this facility and information on holdings. |
| | | | | | |
| | | |
| 12 | | | | J.P. MORGAN MONEY MARKET FUNDS | | AUGUST 31, 2020 |
JPMorgan California Municipal Money Market Fund
FUND FACTS
SIX MONTHS ENDED AUGUST 31, 2020 (Unaudited)
| | |
|
| Objective† | | Aims to provide the highest possible level of current income which is exempt from federal and California personal income taxes, while still preserving capital and maintaining liquidity* |
| Primary Investment | | California short-term municipal obligations |
| Suggested investment time frame | | Short-term |
| Share classes offered | | Agency, E*Trade^, Institutional Class, Morgan, Premier and Service |
| Net Assets as of August 31, 2020 | | $412.0 Million |
| Weighted Average Maturity^^ | | 47 calendar days |
| Weighted Average Life^^^ | | 47 calendar days |
| | | | |
MATURITY SCHEDULE**^^ | |
| 1 calendar day | | | 11.4 | % |
| 2–7 calendar days | | | 9.3 | |
| 8–30 calendar days | | | 49.7 | |
| 31–60 calendar days | | | 9.7 | |
| 61–90 calendar days | | | 4.1 | |
| 91–180 calendar days | | | 3.8 | |
| 181+ calendar days | | | 12.0 | |
| | | | |
7-DAY SEC YIELD AS OF AUGUST 31, 2020(1) | |
| Agency Shares | | | 0.01 | % |
| Institutional Class Shares | | | 0.01 | |
| Morgan Shares | | | 0.01 | |
| Premier Shares | | | 0.01 | |
| Service Shares | | | 0.01 | |
The performance quoted is past performance and is not a guarantee of future results. Mutual funds are subject to certain market risks. Investment returns and principal value of an investment will fluctuate so that an investor’s shares, when redeemed, may be worth more or less than their original cost. Current performance may be higher or lower than the performance data shown. For up-to-date month-end performance information please call 1-800-480-4111 (retail investors) or 1-800-766-7722 (institutional investors).
An investment in a money market fund is not insured by the FDIC or any other government agency. Although the Fund strives to preserve the value of the investment at $1.00 per share, it is possible to lose money by investing in the Fund.
| † | The adviser seeks to achieve the Fund’s objective. There can be no guarantee it will be achieved. |
| ^ | E*Trade Shares had no assets from the close of business on September 21, 2016. |
| ^^ | The calculation takes into account the period remaining until the date on which, in accordance with the terms of the security, the principal amount must unconditionally be paid, or in the case of a security called for redemption, the date on which the redemption payment must be made and may utilize the interest rate reset date for variable or floating rate securities. |
| ^^^ | The calculation takes into account the period remaining until the date on which, in accordance with the terms of the security, the principal amount must unconditionally be paid, or in the case of a security called for redemption, the date on which the redemption payment must be made. |
| * | A portion of the Fund’s income distributions may be subject to the Alternative Minimum Tax (AMT), and some investors may be subject to certain state and local taxes. |
| ** | Percentages indicated are based upon total investments as of August 31, 2020. |
| (1) | The yields for Agency Shares, Institutional Class Shares, Morgan Shares, Premier Shares and Service Shares reflect the reimbursements and/or waivers of certain expenses. Without these reimbursements and/or waivers, the yields would have been (0.12)%, (0.06)%, (0.41)%, (0.27)% and (0.86)% for Agency Shares, Institutional Class Shares, Morgan Shares, Premier Shares and Service Shares, respectively. |
| | An unaudited, uncertified list of prior-day portfolio holdings of the JPMorgan California Municipal Money Market Fund is available upon request. Please contact your J.P. Morgan representative to obtain further information regarding this facility and information on holdings. |
| | | | | | | | |
| | | |
| AUGUST 31, 2020 | | J.P. MORGAN MONEY MARKET FUNDS | | | | | 13 | |
JPMorgan New York Municipal Money Market Fund
FUND FACTS
SIX MONTHS ENDED AUGUST 31, 2020 (Unaudited)
| | |
|
| Objective† | | Aims to provide the highest possible level of current income which is excluded from gross income and exempt from New York State and New York City personal income taxes, while still preserving capital and maintaining liquidity* |
| Primary Investment | | New York short-term municipal obligations |
| Suggested investment time frame. | | Short-term |
| Share classes offered | | Agency, E*Trade^, Institutional Class, Morgan, Premier, Reserve and Service |
| Net Assets as of August 31, 2020 | | $1.2 Billion |
| Weighted Average Maturity^^ | | 40 calendar days |
| Weighted Average Life^^^ | | 40 calendar days |
| | | | |
MATURITY SCHEDULE**^^ | |
| 1 calendar day | | | 12.1 | % |
| 2–7 calendar days | | | 0.1 | |
| 8–30 calendar days | | | 73.5 | |
| 31–60 calendar days | | | 2.1 | |
| 61–90 calendar days | | | 0.2 | |
| 91–180 calendar days | | | 0.4 | |
| 181+ calendar days | | | 11.6 | |
| | | | |
7-DAY SEC YIELD AS OF AUGUST 31, 2020(1) | |
| Agency Shares | | | 0.01 | % |
| Institutional Class Shares | | | 0.04 | |
| Morgan Shares | | | 0.01 | |
| Premier Shares | | | 0.01 | |
| Reserve Shares | | | 0.01 | |
| Service Shares | | | 0.01 | |
The performance quoted is past performance and is not a guarantee of future results. Mutual funds are subject to certain market risks. Investment returns and principal value of an investment will fluctuate so that an investor’s shares, when redeemed, may be worth more or less than their original cost. Current performance may be higher or lower than the performance data shown. For up-to-date month-end performance information please call 1-800-480-4111 (retail investors) or 1-800-766-7722 (institutional investors).
An investment in a money market fund is not insured by the FDIC or any other government agency. Although the Fund strives to preserve the value of the investment at $1.00 per share, it is possible to lose money by investing in the Fund.
| † | The adviser seeks to achieve the Fund’s objective. There can be no guarantee it will be achieved. |
| ^ | E*Trade Shares had no assets from the close of business on September 21, 2016. |
| ^^ | The calculation takes into account the period remaining until the date on which, in accordance with the terms of the security, the principal amount must unconditionally be paid, or in the case of a security called for redemption, the date on which the redemption payment must be made and may utilize the interest rate reset date for variable or floating rate securities. |
| ^^^ | The calculation takes into account the period remaining until the date on which, in accordance with the terms of the security, the principal amount must unconditionally be paid, or in the case of a security called for redemption, the date on which the redemption payment must be made. |
| * | A portion of the Fund’s income distributions may be subject to the Alternative Minimum Tax (AMT), and some investors may be subject to certain state and local taxes. |
| ** | Percentages indicated are based upon total investments as of August 31, 2020. |
| (1) | The yields for Agency Shares, Institutional Class Shares, Morgan Shares, Premier Shares, Reserve Shares and Service Shares reflect the reimbursements and/or waivers of certain expenses. Without these reimbursements and/or waivers, the yields would have been (0.06)%, (0.01)%, (0.39)%, (0.21)%, (0.46)% and (0.81)% for Agency Shares, Institutional Class Shares, Morgan Shares, Premier Shares, Reserve Shares and Service Shares, respectively. |
| | An unaudited, uncertified list of prior-day portfolio holdings of the JPMorgan New York Municipal Money Market Fund is available upon request. Please contact your J.P. Morgan representative to obtain further information regarding this facility and information on holdings. |
| | | | | | |
| | | |
| 14 | | | | J.P. MORGAN MONEY MARKET FUNDS | | AUGUST 31, 2020 |
JPMorgan Prime Money Market Fund
SCHEDULE OF PORTFOLIO INVESTMENTS
AS OF AUGUST 31, 2020 (Unaudited)
| | | | | | | | |
| INVESTMENTS (a) | | PRINCIPAL
AMOUNT
($000) | | | VALUE
($000) | |
Repurchase Agreements — 29.8% | |
| | |
Bank of Montreal, 0.11%, dated 8/31/2020, due 9/7/2020, repurchase price $400,009, collateralized by FHLMC, 0.46% - 6.50%, due 5/15/2025 - 10/25/2049, FNMA, 0.43% - 6.00%, due 8/25/2024 - 9/25/2049 and GNMA, 1.50% - 4.00%, due 6/16/2028 - 1/20/2070, with a value of $412,079. | | | 400,000 | | | | 400,000 | |
| | |
Barclays Capital, Inc., 0.36%, dated 8/31/2020, due 10/5/2020, repurchase price $400,138, collateralized by Collateralized Mortgage Obligations, 0.00% - 29.08%, due 10/25/2021 - 11/17/2062, FHLMC, 2.53% - 11.93%, due 10/25/2029 - 8/25/2056 and FNMA Connecticut Avenue Securities, 3.43% - 9.43%, due 10/25/2029 - 10/25/2049, with a value of $432,000. | | | 400,000 | | | | 400,000 | |
| | |
Barclays Capital, Inc., 0.41%, dated 8/31/2020, due 10/5/2020, repurchase price $180,071, collateralized by Collateralized Mortgage Obligations, 0.00% - 6.05%, due 5/15/2028 - 3/25/2061, FHLMC, 1.83% - 5.28%, due 7/25/2030 - 6/27/2050 and FNMA Connecticut Avenue Securities, 2.18% - 4.33%, due 9/25/2029 - 1/25/2040, with a value of $194,400. | | | 180,000 | | | | 180,000 | |
| | |
BMO Capital Markets Corp., 0.20%, dated 8/31/2020, due 9/1/2020, repurchase price $110,001, collateralized by Asset-Backed Securities, 0.00% - 4.34%, due 2/15/2022 - 8/15/2068, Collateralized Mortgage Obligations, 0.81% - 3.06%, due 7/25/2035 - 10/13/2048, Corporate Notes and Bonds, 0.91% - 9.38%, due 1/25/2021 - 2/1/2055, FHLMC, 2.54%, due 7/25/2026, FNMA, 6.30%, due 10/17/2038 and Sovereign Government Securities, 0.30% - 2.50%, due 10/16/2020 - 7/29/2025, with a value of $116,439. | | | 110,000 | | | | 110,000 | |
| | | | | | | | |
| INVESTMENTS (a) | | PRINCIPAL
AMOUNT
($000) | | | VALUE
($000) | |
| | | | | | | | |
| | |
BMO Capital Markets Corp., 0.20%, dated 8/31/2020, due 9/1/2020, repurchase price $275,002, collateralized by Asset-Backed Securities, 0.00% - 6.18%, due 8/10/2022 - 1/25/2043, Collateralized Mortgage Obligations, 0.51% - 2.38%, due 7/25/2035 - 1/15/2049, Corporate Notes and Bonds, 0.44% - 9.81%, due 9/21/2020 - 12/31/2099, FHLMC, 1.50% - 5.33%, due 11/1/2030 - 8/1/2050, FNMA, 0.30% - 6.30%, due 3/1/2021 - 2/1/2048, GNMA, 2.50% - 4.50%, due 2/15/2022 - 8/20/2050 and Sovereign Government Securities, 0.30% - 0.38%, due 10/16/2020 - 7/29/2025 with a value of $289,748. | | | 275,000 | | | | 275,000 | |
| | |
BMO Capital Markets Corp., 0.23%, dated 8/31/2020, due 9/7/2020, repurchase price $105,005, collateralized by Asset-Backed Securities, 0.00% - 4.23%, due 9/15/2022 - 1/25/2043, Collateralized Mortgage Obligations, 0.93% - 1.90%, due 8/12/2042 - 4/12/2049 and Corporate Notes and Bonds, 3.35%, due 10/22/2022, with a value of $110,315. | | | 105,000 | | | | 105,000 | |
| | |
BMO Capital Markets Corp., 0.33%, dated 8/31/2020, due 9/7/2020, repurchase price $20,001, collateralized by Asset-Backed Securities, 0.00% - 3.68%, due 8/10/2022 - 2/18/2042, Collateralized Mortgage Obligations, 0.11% - 4.01%, due 6/10/2038 - 3/17/2048, Corporate Notes and Bonds, 2.20% - 6.25%, due 11/22/2020 - 3/25/2040 and FHLMC, 2.00% - 2.50%, due 8/1/2050 - 9/1/2050 with a value of $21,597. | | | 20,000 | | | | 20,000 | |
| | |
BMO Capital Markets Corp., 0.33%, dated 8/31/2020, due 9/8/2020, repurchase price $25,002, collateralized by Asset-Backed Securities, 0.00% - 8.10%, due 2/15/2022 - 1/25/2057, Collateralized Mortgage Obligations, 0.37% - 7.39%, due 11/25/2032 - 11/25/2058, Corporate Notes and Bonds, 0.91% - 6.88%, due 3/22/2022 - 1/1/2099, FHLMC, 2.00% - 2.50%, due 8/1/2040 - 9/1/2050, FNMA, 1.21% - 4.00%, due 8/1/2030 - 8/1/2050, GNMA, 2.27% - 5.50%, due 2/20/2049 - 8/20/2062 and Sovereign Government Securities, 0.38%, due 7/29/2025 with a value of $26,578. | | | 25,000 | | | | 25,000 | |
SEE NOTES TO FINANCIAL STATEMENTS.
| | | | | | | | |
| | | |
| AUGUST 31, 2020 | | J.P. MORGAN MONEY MARKET FUNDS | | | | | 15 | |
JPMorgan Prime Money Market Fund
SCHEDULE OF PORTFOLIO INVESTMENTS
AS OF AUGUST 31, 2020 (Unaudited) (continued)
| | | | | | | | |
| INVESTMENTS (a) | | PRINCIPAL
AMOUNT
($000) | | | VALUE
($000) | |
Repurchase Agreements — continued | |
| | |
BNP Paribas SA, 0.26%, dated 8/31/2020, due 9/1/2020, repurchase price $205,001, collateralized by Asset-Backed Securities, 0.56% - 5.72%, due 3/15/2027 - 6/20/2047, Collateralized Mortgage Obligations, 0.71% - 5.30%, due 11/26/2029 - 1/25/2066, Corporate Notes and Bonds, 0.00% - 7.00%, due 11/15/2022 - 4/6/2050 and U.S. Treasury Securities, 0.00% - 2.13%, due 9/1/2020 - 11/30/2024 with a value of $218,658. | | | 205,000 | | | | 205,000 | |
| | |
Bofa Securities, Inc., 0.18%, dated 8/31/2020, due 9/1/2020, repurchase price $200,001, collateralized by Common Stocks, 0.00%, due 1/1/2099 and Preferred Stocks, 0.00% - 10.88%, due 10/30/2020 - 11/1/2102, with a value of $216,000. | | | 200,000 | | | | 200,000 | |
| | |
Bofa Securities, Inc., 0.36%, dated 8/31/2020, due 10/5/2020, repurchase price $250,088, collateralized by Common Stocks, 0.00%, due 1/1/2099 and Preferred Stocks, 5.15% - 10.00%, due 8/1/2042 - 1/1/2099, with a value of $270,000. | | | 250,000 | | | | 250,000 | |
| | |
Bofa Securities, Inc., 0.49%, dated 8/31/2020, due 10/5/2020, repurchase price $200,095, collateralized by Asset-Backed Securities, 0.46% - 4.50%, due 7/20/2027 - 10/15/2048 and Collateralized Mortgage Obligations, 1.56% - 4.98%, due 7/12/2030 - 4/17/2063, with a value of $214,649. | | | 200,000 | | | | 200,000 | |
| | |
Bofa Securities, Inc., 0.49%, dated 8/31/2020, due 10/20/2020, repurchase price $342,033, collateralized by Corporate Notes and Bonds, 0.00% - 13.00%, due 1/15/2021 - 12/31/2099, with a value of $369,144. | | | 341,800 | | | | 341,800 | |
| | |
Credit Suisse Securities USA LLC, 0.29%, dated 8/31/2020, due 9/2/2020, repurchase price $60,001, collateralized by Collateralized Mortgage Obligations, 0.00%, due 4/25/2045, with a value of $64,804. | | | 60,000 | | | | 60,000 | |
| | |
Credit Suisse Securities USA LLC, 0.51%, dated 8/31/2020, due 10/5/2020, repurchase price $150,074, collateralized by Asset-Backed Securities, 0.44% - 15.00%, due 8/28/2023 - 5/29/2059 and Collateralized Mortgage Obligations, 0.00% - 45.34%, due 4/7/2033 - 1/26/2051, with a value of $162,998. | | | 150,000 | | | | 150,000 | |
| | | | | | | | |
| INVESTMENTS (a) | | PRINCIPAL
AMOUNT
($000) | | | VALUE
($000) | |
| | | | | | | | |
| | |
Fixed Income Clearing Corp., 0.09%, dated 8/31/2020, due 9/1/2020, repurchase price $5,000,013, collateralized by U.S. Treasury Securities, 0.13% - 4.50%, due 4/15/2022 - 11/15/2049, with a value of $5,100,000. | | | 5,000,000 | | | | 5,000,000 | |
| | |
Fixed Income Clearing Corp., 0.09%, dated 8/31/2020, due 9/1/2020, repurchase price $5,000,013, collateralized by U.S. Treasury Securities, 0.50% - 3.13%, due 8/15/2027 - 8/15/2040, with a value of $5,100,000. | | | 5,000,000 | | | | 5,000,000 | |
| | |
Fixed Income Clearing Corp., 0.09%, dated 8/31/2020, due 9/1/2020, repurchase price $7,000,018, collateralized by U.S. Treasury Securities, 0.13% - 0.75%, due 7/15/2023 - 2/15/2042, with a value of $7,140,000. | | | 7,000,000 | | | | 7,000,000 | |
| | |
HSBC Securities USA, Inc., 0.19%, dated 8/31/2020, due 9/1/2020, repurchase price $20,000, collateralized by Asset-Backed Securities, 0.64%, due 6/15/2039 and Municipal Debt Securities, 0.00%, due 8/1/2031, with a value of $21,200. | | | 20,000 | | | | 20,000 | |
| | |
HSBC Securities USA, Inc., 0.19%, dated 8/31/2020, due 9/1/2020, repurchase price $75,000, collateralized by Corporate Notes and Bonds, 2.25% - 6.75%, due 1/8/2021 - 12/15/2066 and Sovereign Government Securities, 0.96% - 4.50%, due 2/27/2022 - 4/15/2070, with a value of $78,750. | | | 75,000 | | | | 75,000 | |
| | |
ING Financial Markets LLC, 0.23%, dated 8/31/2020, due 9/1/2020, repurchase price $75,000, collateralized by Sovereign Government Securities, 6.84% - 6.88%, due 8/4/2026 - 1/23/2030, with a value of $81,001. | | | 75,000 | | | | 75,000 | |
| | |
ING Financial Markets LLC, 0.23%, dated 8/31/2020, due 9/1/2020, repurchase price $400,003, collateralized by Corporate Notes and Bonds, 4.56% - 7.00%, due 3/17/2024 - 1/1/2099 and Sovereign Government Securities, 4.63% - 8.88%, due 1/22/2021 - 1/14/2041, with a value of $432,004. | | | 400,000 | | | | 400,000 | |
| | |
ING Financial Markets LLC, 0.32%, dated 8/31/2020, due 9/2/2020, repurchase price $100,002, collateralized by Corporate Notes and Bonds, 4.56% - 7.00%, due 1/27/2025 - 1/1/2099 and Sovereign Government Securities, 5.63% - 6.88%, due 8/4/2026 - 2/21/2047, with a value of $108,028. | | | 100,000 | | | | 100,000 | |
SEE NOTES TO FINANCIAL STATEMENTS.
| | | | | | |
| | | |
| 16 | | | | J.P. MORGAN MONEY MARKET FUNDS | | AUGUST 31, 2020 |
| | | | | | | | |
| INVESTMENTS (a) | | PRINCIPAL
AMOUNT
($000) | | | VALUE
($000) | |
Repurchase Agreements — continued | |
| | |
ING Financial Markets LLC, 0.32%, dated 8/31/2020, due 9/4/2020, repurchase price $10,000, collateralized by Corporate Notes and Bonds, 5.30% - 6.75%, due 1/27/2025 - 6/3/2050 and Sovereign Government Securities, 6.84%, due 1/23/2030, with a value of $10,803. | | | 10,000 | | | | 10,000 | |
| | |
ING Financial Markets LLC, 0.32%, dated 8/31/2020, due 9/10/2020, repurchase price $50,004, collateralized by Corporate Notes and Bonds, 4.56% - 6.75%, due 3/17/2024 - 6/3/2050 and Sovereign Government Securities, 6.84%, due 1/23/2030, with a value of $54,015. | | | 50,000 | | | | 50,000 | |
| | |
ING Financial Markets LLC, 0.28%, dated 8/31/2020, due 9/28/2020, repurchase price $50,011, collateralized by Corporate Notes and Bonds, 4.38% - 6.75%, due 5/20/2023 - 6/3/2050 and Sovereign Government Securities, 6.84%, due 1/23/2030, with a value of $54,013. | | | 50,000 | | | | 50,000 | |
| | |
Mitsubishi UFJ Trust & Banking Corp., 0.28%, dated 8/31/2020, due 9/2/2020, repurchase price $1,000,016, collateralized by Corporate Notes and Bonds, 0.00% - 4.15%, due 5/13/2022 - 5/1/2030, with a value of $1,042,997. | | | 1,000,000 | | | | 1,000,000 | |
| | |
Societe Generale SA, 0.09%, dated 8/31/2020, due 9/1/2020, repurchase price $1,000,003, collateralized by FHLMC, 0.00% - 5.55%, due 10/15/2022 - 9/1/2050, FNMA, 0.88% - 5.70%, due 5/25/2023 - 8/1/2050, GNMA, 0.41% - 3.50%, due 12/20/2026 - 8/20/2050 and U.S. Treasury Securities, 0.00% - 8.13%, due 9/17/2020 - 2/15/2050 with a value of $1,020,055. | | | 1,000,000 | | | | 1,000,000 | |
| | |
Societe Generale SA, 0.20%, dated 8/31/2020, due 9/1/2020, repurchase price $736,004, collateralized by Asset-Backed Securities, 2.70% - 8.00%, due 2/15/2027 - 11/1/2033, Corporate Notes and Bonds, 0.40% - 8.63%, due 1/19/2021 - 12/31/2099 and Sovereign Government Securities, 0.82% - 5.35%, due 9/14/2021 - 5/15/2051, with a value of $772,943. | | | 736,000 | | | | 736,000 | |
| | | | | | | | |
| INVESTMENTS (a) | | PRINCIPAL
AMOUNT
($000) | | | VALUE
($000) | |
| | | | | | | | |
| | |
Societe Generale SA, 0.30%, dated 8/31/2020, due 9/1/2020, repurchase price $700,006, collateralized by Asset-Backed Securities, 0.28% - 8.09%, due 1/25/2030 - 2/28/2041, Collateralized Mortgage Obligations, 0.37% - 6.21%, due 1/12/2034 - 8/17/2049, Corporate Notes and Bonds, 4.63%, due 1/15/2025, FHLMC, 0.83% - 3.73%, due 8/27/2029 - 3/25/2050, FNMA Connecticut Avenue Securities, 2.18% - 3.83%, due 9/25/2029 - 1/25/2040 and Sovereign Government Securities, 2.63% - 11.88%, due 1/22/2021 - 1/23/2050, with a value of $756,006. | | | 700,000 | | | | 700,000 | |
| | |
Societe Generale SA, 0.32%, dated 8/31/2020, due 9/1/2020, repurchase price $200,002, collateralized by Asset-Backed Securities, 0.32% - 5.02%, due 7/15/2030 - 3/25/2037, Collateralized Mortgage Obligations, 0.37% - 6.00%, due 1/12/2034 - 12/16/2072, Corporate Notes and Bonds, 3.88% - 12.00%, due 6/1/2021 - 7/23/2048, FHLMC, 2.03% - 3.28%, due 2/25/2050 - 3/25/2050, FNMA Connecticut Avenue Securities, 2.18% - 3.18%, due 10/25/2029 - 1/25/2040 and Sovereign Government Securities, 4.25% - 11.88%, due 4/15/2024 - 2/17/2045, with a value of $215,409. | | | 200,000 | | | | 200,000 | |
| | |
Societe Generale SA, 0.32%, dated 8/31/2020, due 9/3/2020, repurchase price $365,010, collateralized by Asset-Backed Securities, 0.32% - 8.09%, due 3/17/2025 - 10/25/2046, Collateralized Mortgage Obligations, 0.37% - 6.21%, due 11/15/2032 - 12/16/2072, Corporate Notes and Bonds, 4.25% - 12.00%, due 11/15/2022 - 2/1/2031, FHLMC, 2.03% - 3.28%, due 12/26/2029 - 3/25/2050, FNMA Connecticut Avenue Securities, 2.18% - 3.83%, due 9/25/2029 - 1/25/2040 and Sovereign Government Securities, 2.63% - 11.88%, due 1/22/2021 - 5/11/2047, with a value of $394,225. | | | 365,000 | | | | 365,000 | |
SEE NOTES TO FINANCIAL STATEMENTS.
| | | | | | | | |
| | | |
| AUGUST 31, 2020 | | J.P. MORGAN MONEY MARKET FUNDS | | | | | 17 | |
JPMorgan Prime Money Market Fund
SCHEDULE OF PORTFOLIO INVESTMENTS
AS OF AUGUST 31, 2020 (Unaudited) (continued)
| | | | | | | | |
| INVESTMENTS (a) | | PRINCIPAL
AMOUNT
($000) | | | VALUE
($000) | |
Repurchase Agreements — continued | |
| | |
Societe Generale SA, 0.33%, dated 8/31/2020, due 10/1/2020, repurchase price $400,114, collateralized by Collateralized Mortgage Obligations, 2.75%, due 12/16/2072, Corporate Notes and Bonds, 4.25% - 11.75%, due 11/1/2023 - 2/1/2031, FHLMC, 2.08%, due 1/25/2050, FNMA Connecticut Avenue Securities, 2.33%, due 11/25/2039 and Sovereign Government Securities, 4.25% - 11.88%, due 3/25/2022 - 5/11/2047, with a value of $432,123. | | | 400,000 | | | | 400,000 | |
| | |
TD Securities (USA) LLC, 0.20%, dated 8/31/2020, due 9/1/2020, repurchase price $250,001, collateralized by Asset-Backed Securities, 4.80%, due 2/15/2029 and Corporate Notes and Bonds, 1.10% - 6.50%, due 2/4/2021 - 7/1/2050, with a value of $262,581. | | | 250,000 | | | | 250,000 | |
| | |
UBS Securities LLC, 0.29%, dated 8/31/2020, due 9/7/2020, repurchase price $300,017, collateralized by Asset-Backed Securities, 0.99%, due 11/9/2020, Collateralized Mortgage Obligations, 3.44%, due 9/17/2048, Commercial Paper, 0.00%, due 1/28/2021 and Corporate Notes and Bonds, 0.73% - 11.50%, due 9/15/2020 - 12/31/2099 with a value of $321,044. | | | 300,000 | | | | 300,000 | |
| | |
Wells Fargo Securities LLC, 0.23%, dated 8/31/2020, due 9/2/2020, repurchase price $52,001, collateralized by Certificates of Deposit, 0.00%, due 12/21/2020 - 10/3/2025, with a value of $54,602. | | | 52,000 | | | | 52,000 | |
| | |
Wells Fargo Securities LLC, 0.23%, dated 8/31/2020, due 9/3/2020, repurchase price $104,002, collateralized by Sovereign Government Securities, 2.38% - 10.63%, due 1/15/2021 - 9/20/2048, with a value of $109,219. | | | 104,000 | | | | 104,000 | |
| | |
Wells Fargo Securities LLC, 0.55%, dated 8/31/2020, due 9/21/2020, repurchase price $250,080, collateralized by Certificates of Deposit, 0.00% - 0.28%, due 9/15/2020 - 8/25/2021, with a value of $262,861. | | | 250,000 | | | | 250,000 | |
| | | | | | | | |
| | |
Total Repurchase Agreements
(Cost $26,058,800) | | | | | | | 26,058,800 | |
| | | | | | | | |
| | | | | | | | |
| INVESTMENTS (a) | | PRINCIPAL
AMOUNT
($000) | | | VALUE
($000) | |
U.S. Treasury Obligations — 0.7% | |
| | |
U.S. Treasury Floating Rate Notes (US Treasury 3 Month Bill Money Market Yield + 0.12%), 0.22%, 9/1/2020 (b)
(Cost $649,943) | | | 650,000 | | | | 649,943 | |
| | | | | | | | |
Corporate Notes — 0.4% | |
|
Banks — 0.4% | |
| |
Barclays Bank plc (United Kingdom) | | | | | |
| | |
(OBFR + 0.15%), 0.23%, 9/1/2020 (b) (c) | | | 125,000 | | | | 125,000 | |
| | |
(OBFR + 0.30%), 0.38%, 9/1/2020 (b) (c) | | | 200,000 | | | | 200,000 | |
| | | | | | | | |
| |
Total Corporate Notes
(Cost $325,000) | | | | 325,000 | |
| | | | | |
Municipal Bonds — 0.2% | |
|
Alaska — 0.1% | |
| | |
Alaska Housing Finance Corp., State Capital Project Series 2018A, Rev., VRDO, 0.17%, 9/8/2020 (d) | | | 65,000 | | | | 65,000 | |
| | | | | | | | |
|
New York — 0.1% | |
| | |
New York State Dormitory Authority, State Personal Income Tax, General Purpose Series 2020B, Rev., RAN, 5.00%, 3/31/2021 | | | 110,000 | | | | 113,103 | |
| | | | | | | | |
| |
Total Municipal Bonds
(Cost $177,827) | | | | 178,103 | |
| | | | | |
Short-Term Investments — 68.5% | |
|
Certificates of Deposit — 41.7% | |
| | |
ABN Amro Bank NV (Netherlands) 0.25%, 2/22/2021 (e) | | | 65,000 | | | | 64,919 | |
| | |
Agricultural Bank of China Ltd. (China) 0.65%, 10/20/2020 | | | 100,000 | | | | 100,049 | |
| | |
Banco Del Estado De Chile (Chile) | | | | | | | | |
| | |
0.35%, 9/14/2020 | | | 50,000 | | | | 50,004 | |
| | |
0.32%, 9/25/2020 | | | 24,000 | | | | 24,003 | |
| | |
0.30%, 10/6/2020 | | | 100,000 | | | | 100,014 | |
| | |
0.28%, 10/23/2020 | | | 150,000 | | | | 150,023 | |
| | |
Bank of Montreal (Canada) | | | | | | | | |
| | |
1.53%, 9/28/2020 | | | 200,000 | | | | 200,000 | |
| | |
1.40%, 10/1/2020 | | | 200,000 | | | | 200,222 | |
| | |
0.20%, 10/30/2020 | | | 100,000 | | | | 100,010 | |
| | |
(ICE LIBOR USD 3 Month + 0.03%), 0.29%, 11/27/2020 (b) | | | 100,000 | | | | 100,000 | |
| | |
0.23%, 2/12/2021 | | | 200,000 | | | | 200,014 | |
| | |
0.23%, 5/26/2021 | | | 200,000 | | | | 200,000 | |
| | |
Bank of Nova Scotia (The) (Canada) | | | | | | | | |
| | |
(ICE LIBOR USD 1 Month + 0.17%), 0.35%, 9/24/2020 (b) | | | 165,000 | | | | 165,058 | |
| | |
(ICE LIBOR USD 3 Month + 0.10%), 0.40%, 10/6/2020 (b) | | | 110,000 | | | | 110,000 | |
SEE NOTES TO FINANCIAL STATEMENTS.
| | | | | | |
| | | |
| 18 | | | | J.P. MORGAN MONEY MARKET FUNDS | | AUGUST 31, 2020 |
| | | | | | | | |
| INVESTMENTS (a) | | PRINCIPAL
AMOUNT
($000) | | | VALUE
($000) | |
Short-Term Investments — continued | |
|
Certificates of Deposit — continued | |
| | |
(ICE LIBOR USD 3 Month + 0.11%), 0.41%, 10/6/2020 (b) | | | 60,000 | | | | 60,000 | |
| | |
(ICE LIBOR USD 3 Month + 0.05%), 0.33%, 10/8/2020 (b) | | | 60,000 | | | | 60,000 | |
| | |
(ICE LIBOR USD 3 Month + 0.08%), 0.36%, 10/8/2020 (b) | | | 180,000 | | | | 180,000 | |
| | |
(ICE LIBOR USD 3 Month + 0.08%), 0.34%, 10/23/2020 (b) | | | 70,000 | | | | 70,031 | |
| | |
(ICE LIBOR USD 3 Month + 0.05%), 0.30%, 10/28/2020 (b) | | | 85,000 | | | | 85,000 | |
| | |
(ICE LIBOR USD 3 Month + 0.08%), 0.35%, 10/29/2020 (b) | | | 25,000 | | | | 25,011 | |
| | |
(ICE LIBOR USD 3 Month + 0.13%), 0.38%, 11/6/2020 (b) | | | 150,000 | | | | 150,000 | |
| | |
(ICE LIBOR USD 3 Month + 0.10%), 0.36%, 11/14/2020 (b) | | | 200,000 | | | | 200,126 | |
| | |
0.57%, 11/30/2020 | | | 200,000 | | | | 200,183 | |
| | |
BNP Paribas SA (France) | | | | | | | | |
| | |
(ICE LIBOR USD 3 Month + 0.08%), 0.38%, 10/3/2020(b) | | | 180,000 | | | | 180,000 | |
| | |
0.40%, 3/3/2021 | | | 553,000 | | | | 553,475 | |
| | |
0.24%, 5/24/2021 | | | 100,000 | | | | 99,993 | |
| | |
0.24%, 5/25/2021 | | | 75,000 | | | | 74,995 | |
| | |
Canadian Imperial Bank of Commerce (Canada) | | | | | | | | |
| | |
(ICE LIBOR USD 3 Month + 0.11%), 0.43%, 9/10/2020(b) | | | 260,000 | | | | 260,201 | |
| | |
1.65%, 10/1/2020 | | | 500,000 | | | | 500,000 | |
| | |
0.42%, 7/7/2021 | | | 330,000 | | | | 330,462 | |
| | |
China Construction Bank Corp. (China) | | | | | | | | |
| | |
0.65%, 10/21/2020 | | | 50,000 | | | | 50,021 | |
| | |
0.65%, 10/22/2020 | | | 55,000 | | | | 55,023 | |
| | |
0.65%, 10/23/2020 | | | 45,000 | | | | 45,019 | |
| | |
0.61%, 10/26/2020 | | | 100,000 | | | | 100,037 | |
| | |
0.61%, 11/2/2020 | | | 100,000 | | | | 100,037 | |
| | |
0.61%, 11/3/2020 | | | 75,000 | | | | 75,027 | |
| | |
Cooperatieve Rabobank UA (Netherlands) | | | | | | | | |
| | |
(ICE LIBOR USD 3 Month + 0.09%), 0.43%, 9/2/2020 (b) | | | 200,000 | | | | 200,000 | |
| | |
(ICE LIBOR USD 1 Month + 0.10%), 0.26%, 9/28/2020 (b) | | | 50,000 | | | | 50,017 | |
| | |
1.35%, 10/6/2020 | | | 100,000 | | | | 100,126 | |
| | |
1.10%, 10/14/2020 | | | 80,000 | | | | 80,097 | |
| | |
(ICE LIBOR USD 3 Month + 0.08%), 0.35%, 10/30/2020 (b) | | | 170,000 | | | | 169,969 | |
| | |
(ICE LIBOR USD 3 Month + 0.15%), 0.40%, 11/6/2020 (b) | | | 45,000 | | | | 45,040 | |
| | | | | | | | |
| INVESTMENTS (a) | | PRINCIPAL
AMOUNT
($000) | | | VALUE
($000) | |
| | | | | | | | |
|
Certificates of Deposit — continued | |
| | |
(ICE LIBOR USD 3 Month + 0.32%), 0.56%, 11/7/2020 (b) | | | 133,000 | | | | 133,216 | |
| | |
(ICE LIBOR USD 3 Month + 0.04%), 0.32%, 11/17/2020 (b) | | | 430,000 | | | | 430,000 | |
| | |
Credit Agricole Corporate and Investment Bank (France) | | | | | | | | |
| | |
(ICE LIBOR USD 3 Month + 0.11%), 0.39%, 10/8/2020 (b) | | | 162,000 | | | | 162,039 | |
| | |
0.39%, 3/16/2021 | | | 102,000 | | | | 102,108 | |
| | |
Credit Industriel et Commercial (France) | | | | | | | | |
| | |
1.84%, 9/10/2020 (e) | | | 450,000 | | | | 449,974 | |
| | |
1.40%, 10/1/2020 | | | 130,000 | | | | 130,147 | |
| | |
1.35%, 10/5/2020 | | | 200,000 | | | | 200,245 | |
| | |
(ICE LIBOR USD 3 Month + 0.08%), 0.38%, 10/5/2020 (b) | | | 150,000 | | | | 150,000 | |
| | |
1.71%, 11/16/2020 (e) | | | 195,000 | | | | 194,901 | |
| | |
0.65%, 11/20/2020 (e) | | | 185,000 | | | | 184,901 | |
| | |
0.58%, 11/23/2020 (e) | | | 340,000 | | | | 339,809 | |
| | |
0.50%, 12/1/2020 (e) | | | 225,000 | | | | 224,859 | |
| | |
0.34%, 1/4/2021 | | | 120,000 | | | | 120,066 | |
| | |
0.31%, 1/7/2021 | | | 135,000 | | | | 135,061 | |
| | |
0.26%, 6/2/2021 | | | 125,000 | | | | 125,000 | |
| | |
Credit Suisse AG (Switzerland) | | | | | | | | |
| | |
1.40%, 10/2/2020 | | | 75,000 | | | | 75,082 | |
| | |
1.55%, 10/6/2020 | | | 70,000 | | | | 70,000 | |
| | |
1.33%, 11/24/2020 | | | 350,000 | | | | 350,934 | |
| | |
1.45%, 1/7/2021 | | | 385,000 | | | | 386,690 | |
| | |
0.47%, 2/26/2021 | | | 240,000 | | | | 240,274 | |
| | |
0.39%, 4/8/2021 | | | 100,000 | | | | 100,078 | |
| | |
0.39%, 4/9/2021 | | | 75,000 | | | | 75,058 | |
| | |
0.38%, 4/12/2021 | | | 300,000 | | | | 300,216 | |
| | |
0.29%, 5/11/2021 | | | 200,000 | | | | 200,014 | |
| | |
0.29%, 5/17/2021 | | | 300,000 | | | | 300,013 | |
| | |
0.28%, 6/4/2021 | | | 190,000 | | | | 189,980 | |
| | |
DNB Bank ASA (Norway) (ICE LIBOR USD 3 Month + 0.15%), 0.40%, 11/6/2020(b) | | | 100,000 | | | | 100,068 | |
| | |
DZ Bank AG (Germany) | | | | | | | | |
| | |
0.72%, 10/29/2020 (e) | | | 210,000 | | | | 209,944 | |
| | |
0.30%, 11/12/2020 (e) | | | 70,000 | | | | 69,976 | |
| | |
0.50%, 11/13/2020 (e) | | | 100,000 | | | | 99,965 | |
| | |
0.22%, 5/28/2021 (e) | | | 100,000 | | | | 99,836 | |
| | |
HSBC Bank USA NA | | | | | | | | |
| | |
1.25%, 10/7/2020 | | | 335,000 | | | | 335,357 | |
| | |
1.15%, 10/14/2020 | | | 192,000 | | | | 192,215 | |
| | |
0.95%, 10/20/2020 | | | 60,000 | | | | 60,058 | |
SEE NOTES TO FINANCIAL STATEMENTS.
| | | | | | | | |
| | | |
| AUGUST 31, 2020 | | J.P. MORGAN MONEY MARKET FUNDS | | | | | 19 | |
JPMorgan Prime Money Market Fund
SCHEDULE OF PORTFOLIO INVESTMENTS
AS OF AUGUST 31, 2020 (Unaudited) (continued)
| | | | | | | | |
| INVESTMENTS (a) | | PRINCIPAL
AMOUNT
($000) | | | VALUE
($000) | |
Short-Term Investments — continued | |
|
Certificates of Deposit — continued | |
| | |
Industrial & Commercial Bank of China Ltd. (China) | | | | | | | | |
| | |
0.63%, 10/23/2020 | | | 102,000 | | | | 102,060 | |
| | |
0.60%, 10/26/2020 | | | 185,000 | | | | 185,106 | |
| | |
ING Bank Australia Ltd. (Australia) (ICE LIBOR USD 3 Month + 0.18%), 0.42%, 11/8/2020 (b) | | | 295,000 | | | | 295,100 | |
| | |
ING Bank NV (Netherlands) | | | | | | | | |
| | |
(ICE LIBOR USD 3 Month + 0.12%), 0.40%, 10/8/2020 (b) | | | 583,000 | | | | 583,082 | |
| | |
(ICE LIBOR USD 3 Month + 0.10%), 0.35%, 11/5/2020 (b) | | | 331,000 | | | | 331,000 | |
| | |
(ICE LIBOR USD 3 Month + 0.08%), 0.33%, 11/6/2020 (b) | | | 185,000 | | | | 185,000 | |
| | |
0.54%, 2/11/2021 | | | 135,000 | | | | 135,151 | |
| | |
KBC Bank NV (Cayman Islands) | | | | | | | | |
| | |
0.10%, 9/1/2020 | | | 100,000 | | | | 100,000 | |
| | |
0.31%, 1/8/2021 (e) | | | 255,000 | | | | 254,795 | |
| | |
Landesbank Hessen-Thueringen Girozentrale (Germany) | | | | | | | | |
| | |
0.67%, 11/4/2020 (e) | | | 200,000 | | | | 199,961 | |
| | |
0.65%, 11/5/2020 (e) | | | 200,000 | | | | 199,961 | |
| | |
0.64%, 11/6/2020 (e) | | | 125,000 | | | | 124,975 | |
| | |
0.58%, 11/16/2020 (e) | | | 150,000 | | | | 149,964 | |
| | |
Mitsubishi UFJ Trust & Banking Corp. (Japan) | | | | | | | | |
| | |
0.39%, 10/5/2020 (e) | | | 60,000 | | | | 59,991 | |
| | |
0.36%, 1/15/2021 | | | 50,000 | | | | 50,030 | |
| | |
0.36%, 1/19/2021 | | | 100,000 | | | | 100,061 | |
| | |
0.37%, 1/20/2021 | | | 150,000 | | | | 150,097 | |
| | |
0.36%, 1/28/2021 | | | 150,000 | | | | 150,094 | |
| | |
Mizuho Bank Ltd. (Japan) | | | | | | | | |
| | |
0.36%, 9/2/2020 (e) | | | 100,000 | | | | 99,999 | |
| | |
(ICE LIBOR USD 1 Month + 0.10%), 0.26%, 9/10/2020 (b) | | | 150,000 | | | | 150,000 | |
| | |
0.31%, 9/15/2020 | | | 173,000 | | | | 173,014 | |
| | |
(ICE LIBOR USD 1 Month + 0.18%), 0.34%, 9/20/2020 (b) | | | 100,000 | | | | 100,026 | |
| | |
(ICE LIBOR USD 3 Month + 0.07%), 0.34%, 10/29/2020 (b) | | | 173,000 | | | | 173,028 | |
| | |
(ICE LIBOR USD 3 Month + 0.06%), 0.31%, 11/3/2020 (b) | | | 50,000 | | | | 50,004 | |
| | |
(ICE LIBOR USD 3 Month + 0.05%), 0.32%, 11/16/2020 (b) | | | 175,000 | | | | 175,008 | |
| | |
0.40%, 12/2/2020 (e) | | | 100,000 | | | | 99,933 | |
| | |
0.49%, 12/2/2020 (e) | | | 300,000 | | | | 299,798 | |
| | |
0.36%, 1/15/2021 | | | 100,000 | | | | 100,057 | |
| | | | | | | | |
| INVESTMENTS (a) | | PRINCIPAL
AMOUNT
($000) | | | VALUE
($000) | |
| | | | | | | | |
|
Certificates of Deposit — continued | |
| | |
0.36%, 1/19/2021 | | | 40,000 | | | | 40,023 | |
| | |
0.27%, 2/10/2021 | | | 330,000 | | | | 330,061 | |
| | |
0.27%, 2/22/2021 | | | 150,000 | | | | 150,024 | |
| | |
0.23%, 2/26/2021 | | | 200,000 | | | | 200,000 | |
| | |
MUFG Bank Ltd. (Japan) | | | | | | | | |
| | |
0.40%, 9/21/2020 (e) | | | 100,000 | | | | 99,991 | |
| | |
1.15%, 10/19/2020 | | | 305,000 | | | | 305,422 | |
| | |
0.39%, 11/20/2020 | | | 230,000 | | | | 230,115 | |
| | |
0.48%, 11/20/2020 (e) | | | 100,000 | | | | 99,949 | |
| | |
0.25%, 11/30/2020 | | | 170,000 | | | | 170,029 | |
| | |
0.38%, 11/30/2020 | | | 127,000 | | | | 127,063 | |
| | |
0.23%, 1/20/2021 | | | 100,000 | | | | 99,996 | |
| | |
0.29%, 1/29/2021 | | | 170,000 | | | | 170,036 | |
| | |
0.22%, 2/1/2021 | | | 146,000 | | | | 145,988 | |
| | |
National Australia Bank Ltd. (Australia) | | | | | | | | |
| | |
(ICE LIBOR USD 3 Month + 0.13%), 0.38%, 11/25/2020 (b) | | | 325,000 | | | | 325,039 | |
| | |
(ICE LIBOR USD 3 Month + 0.13%), 0.38%, 11/27/2020 (b) | | | 245,000 | | | | 245,030 | |
| | |
0.37%, 3/8/2021 (e) | | | 220,000 | | | | 219,782 | |
| | |
0.38%, 3/23/2021 (e) | | | 435,000 | | | | 434,520 | |
| | |
0.40%, 4/30/2021 (e) | | | 171,000 | | | | 170,757 | |
| | |
Natixis SA (France) | | | | | | | | |
| | |
(ICE LIBOR USD 3 Month + 0.11%), 0.44%, 9/4/2020 (b) | | | 175,000 | | | | 175,000 | |
| | |
(ICE LIBOR USD 1 Month + 0.17%), 0.33%, 9/19/2020 (b) | | | 185,000 | | | | 185,095 | |
| | |
1.40%, 10/2/2020 | | | 75,000 | | | | 75,086 | |
| | |
(ICE LIBOR USD 3 Month + 0.11%), 0.41%, 10/2/2020 (b) | | | 300,000 | | | | 300,000 | |
| | |
1.40%, 10/6/2020 | | | 225,000 | | | | 225,290 | |
| | |
1.35%, 10/8/2020 | | | 300,000 | | | | 300,391 | |
| | |
1.10%, 11/16/2020 | | | 82,000 | | | | 82,166 | |
| | |
0.57%, 12/2/2020 | | | 34,000 | | | | 34,034 | |
| | |
0.52%, 12/14/2020 | | | 25,000 | | | | 25,024 | |
| | |
1.00%, 1/21/2021 | | | 150,000 | | | | 150,482 | |
| | |
0.55%, 2/17/2021 | | | 98,000 | | | | 98,160 | |
| | |
0.39%, 4/8/2021 | | | 50,000 | | | | 50,044 | |
| | |
0.29%, 5/3/2021 | | | 160,000 | | | | 160,025 | |
| | |
Nordea Bank Abp (Finland) | | | | | | | | |
| | |
(ICE LIBOR USD 3 Month + 0.10%), 0.47%, 9/1/2020 (b) | | | 350,000 | | | | 350,262 | |
| | |
(ICE LIBOR USD 3 Month + 0.10%), 0.43%, 9/8/2020 (b) | | | 300,000 | | | | 300,231 | |
SEE NOTES TO FINANCIAL STATEMENTS.
| | | | | | |
| | | |
| 20 | | | | J.P. MORGAN MONEY MARKET FUNDS | | AUGUST 31, 2020 |
| | | | | | | | |
| INVESTMENTS (a) | | PRINCIPAL
AMOUNT
($000) | | | VALUE
($000) | |
Short-Term Investments — continued | |
|
Certificates of Deposit — continued | |
| | |
(ICE LIBOR USD 3 Month + 0.12%), 0.44%, 9/17/2020 (b) | | | 234,000 | | | | 234,222 | |
| | |
(ICE LIBOR USD 3 Month + 0.10%), 0.37%, 10/13/2020 (b) | | | 50,000 | | | | 50,039 | |
| | |
1.12%, 10/15/2020 | | | 96,000 | | | | 96,121 | |
| | |
(ICE LIBOR USD 3 Month + 0.10%), 0.36%, 11/14/2020 (b) | | | 287,000 | | | | 287,221 | |
| | |
1.10%, 11/17/2020 | | | 210,000 | | | | 210,437 | |
| | |
(ICE LIBOR USD 3 Month + 0.10%), 0.35%, 11/21/2020 (b) | | | 146,000 | | | | 146,115 | |
| | |
Norinchukin Bank (The) (Japan) | | | | | | | | |
| | |
0.30%, 9/1/2020 | | | 150,000 | | | | 150,001 | |
| | |
1.20%, 9/4/2020 | | | 92,000 | | | | 92,011 | |
| | |
0.18%, 9/22/2020 | | | 100,000 | | | | 100,003 | |
| | |
0.17%, 10/9/2020 | | | 350,000 | | | | 350,002 | |
| | |
0.17%, 10/19/2020 | | | 125,000 | | | | 124,999 | |
| | |
0.17%, 10/23/2020 | | | 125,000 | | | | 124,999 | |
| | |
Oversea-Chinese Banking Corp. Ltd. (Singapore) | | | | | | | | |
| | |
(ICE LIBOR USD 1 Month + 0.14%), 0.32%, 9/24/2020 (b) | | | 125,000 | | | | 125,049 | |
| | |
1.54%, 10/5/2020 | | | 50,000 | | | | 50,066 | |
| | |
(SOFR + 0.17%), 0.24%, 11/6/2020 (b) | | | 50,000 | | | | 49,993 | |
| | |
Rabobank International (United Kingdom) 0.26%, 2/26/2021 (e) | | | 170,000 | | | | 169,807 | |
| | |
Royal Bank of Canada (Canada) | | | | | | | | |
| | |
(ICE LIBOR USD 3 Month + 0.12%), 0.44%, 9/16/2020 (b) | | | 70,000 | | | | 70,050 | |
| | |
(ICE LIBOR USD 3 Month + 0.12%), 0.42%, 9/24/2020 (b) | | | 103,000 | | | | 103,075 | |
| | |
1.46%, 10/1/2020 | | | 135,000 | | | | 135,158 | |
| | |
(ICE LIBOR USD 3 Month + 0.11%), 0.38%, 10/9/2020 (b) | | | 100,000 | | | | 100,060 | |
| | |
(ICE LIBOR USD 3 Month + 0.07%), 0.34%, 10/29/2020 (b) | | | 132,000 | | | | 132,036 | |
| | |
(ICE LIBOR USD 3 Month + 0.30%), 0.55%, 11/4/2020 (b) | | | 100,000 | | | | 100,189 | |
| | |
(ICE LIBOR USD 3 Month + 0.21%), 0.46%, 11/5/2020 (b) | | | 83,000 | | | | 83,107 | |
| | |
1.30%, 1/7/2021 | | | 400,000 | | | | 401,661 | |
| | |
Skandinaviska Enskilda Banken AB (Sweden) | | | | | | | | |
| | |
1.35%, 10/2/2020 | | | 100,000 | | | | 100,109 | |
| | |
1.25%, 10/8/2020 | | | 100,000 | | | | 100,119 | |
| | |
0.25%, 2/26/2021 | | | 50,000 | | | | 50,011 | |
| | |
0.20%, 3/9/2021 | | | 150,000 | | | | 149,998 | |
| | |
0.25%, 5/11/2021 | | | 325,000 | | | | 325,059 | |
| | | | | | | | |
| INVESTMENTS (a) | | PRINCIPAL
AMOUNT
($000) | | | VALUE
($000) | |
| |
|
Certificates of Deposit — continued | |
| | |
0.24%, 5/20/2021 | | | 100,000 | | | | 100,009 | |
| | |
0.22%, 5/27/2021 | | | 120,000 | | | | 119,991 | |
| | |
Standard Chartered Bank (United Kingdom) | | | | | | | | |
| | |
1.45%, 10/13/2020 | | | 200,000 | | | | 200,295 | |
| | |
0.97%, 10/27/2020 | | | 200,000 | | | | 200,237 | |
| | |
Sumitomo Mitsui Banking Corp. (Japan) | | | | | | | | |
| | |
(ICE LIBOR USD 1 Month + 0.20%), 0.37%, 9/12/2020 (b) | | | 270,000 | | | | 270,107 | |
| | |
(ICE LIBOR USD 1 Month + 0.22%), 0.38%, 9/13/2020 (b) | | | 450,000 | | | | 450,209 | |
| | |
(ICE LIBOR USD 1 Month + 0.22%), 0.38%, 9/17/2020 (b) | | | 175,000 | | | | 175,080 | |
| | |
(ICE LIBOR USD 1 Month + 0.12%), 0.29%, 9/18/2020 (b) | | | 150,000 | | | | 150,005 | |
| | |
(ICE LIBOR USD 1 Month + 0.18%), 0.36%, 9/22/2020 (b) | | | 170,000 | | | | 170,060 | |
| | |
(ICE LIBOR USD 1 Month + 0.18%), 0.34%, 9/28/2020 (b) | | | 169,000 | | | | 169,061 | |
| | |
(ICE LIBOR USD 3 Month + 0.07%), 0.34%, 10/27/2020 (b) | | | 85,000 | | | | 85,021 | |
| | |
0.35%, 12/1/2020 | | | 135,000 | | | | 135,062 | |
| | |
0.30%, 2/4/2021 | | | 500,000 | | | | 500,148 | |
| | |
0.26%, 2/5/2021 | | | 115,000 | | | | 115,014 | |
| | |
0.26%, 2/5/2021 | | | 100,000 | | | | 100,012 | |
| | |
0.25%, 2/24/2021 | | | 200,000 | | | | 200,011 | |
| | |
0.26%, 2/24/2021 (e) | | | 75,000 | | | | 74,897 | |
| | |
0.26%, 2/26/2021 (e) | | | 100,000 | | | | 99,861 | |
| | |
Sumitomo Mitsui Trust Bank Ltd. (Japan) | | | | | | | | |
| | |
0.10%, 9/2/2020 | | | 100,000 | | | | 100,000 | |
| | |
0.10%, 9/3/2020 | | | 100,000 | | | | 100,000 | |
| | |
0.30%, 9/9/2020 | | | 260,000 | | | | 260,012 | |
| | |
1.19%, 10/20/2020 (e) | | | 100,000 | | | | 99,975 | |
| | |
0.57%, 11/12/2020 (e) | | | 125,000 | | | | 124,946 | |
| | |
0.55%, 11/13/2020 (e) | | | 240,000 | | | | 239,894 | |
| | |
0.40%, 11/18/2020 | | | 240,000 | | | | 240,125 | |
| | |
0.40%, 11/20/2020 | | | 100,000 | | | | 100,053 | |
| | |
Sumitomo Trust and Banking Co. (United Kingdom) | | | | | | | | |
| | |
0.50%, 11/16/2020 (e) | | | 150,000 | | | | 149,929 | |
| | |
0.50%, 11/18/2020 (e) | | | 75,000 | | | | 74,963 | |
| | |
0.50%, 11/19/2020 (e) | | | 100,000 | | | | 99,950 | |
| | |
0.50%, 11/20/2020 (e) | | | 100,000 | | | | 99,949 | |
| | |
Svenska Handelsbanken AB (Sweden) | | | | | | | | |
| | |
(ICE LIBOR USD 1 Month + 0.10%), 0.26%, 9/10/2020 (b) | | | 200,000 | | | | 200,000 | |
SEE NOTES TO FINANCIAL STATEMENTS.
| | | | | | | | |
| | | |
| AUGUST 31, 2020 | | J.P. MORGAN MONEY MARKET FUNDS | | | | | 21 | |
JPMorgan Prime Money Market Fund
SCHEDULE OF PORTFOLIO INVESTMENTS
AS OF AUGUST 31, 2020 (Unaudited) (continued)
| | | | | | | | |
| INVESTMENTS (a) | | PRINCIPAL
AMOUNT
($000) | | | VALUE
($000) | |
Short-Term Investments — continued | |
|
Certificates of Deposit — continued | |
| | |
(ICE LIBOR USD 3 Month + 0.11%), 0.43%, 9/16/2020 (b) | | | 100,000 | | | | 100,087 | |
| | |
(ICE LIBOR USD 3 Month + 0.12%), 0.44%, 9/16/2020 (b) | | | 51,000 | | | | 51,048 | |
| | |
(ICE LIBOR USD 3 Month + 0.12%), 0.44%, 9/19/2020 (b) | | | 175,000 | | | | 175,167 | |
| | |
(ICE LIBOR USD 3 Month + 0.07%), 0.37%, 10/2/2020 (b) | | | 110,000 | | | | 110,000 | |
| | |
1.13%, 10/14/2020 | | | 300,000 | | | | 300,372 | |
| | |
(ICE LIBOR USD 3 Month + 0.10%), 0.38%, 10/15/2020 (b) | | | 125,000 | | | | 125,097 | |
| | |
(ICE LIBOR USD 3 Month + 0.09%), 0.36%, 10/20/2020 (b) | | | 215,000 | | | | 215,151 | |
| | |
(ICE LIBOR USD 3 Month + 0.05%), 0.31%, 10/30/2020 (b) | | | 185,000 | | | | 185,066 | |
| | |
(ICE LIBOR USD 3 Month + 0.13%), 0.37%, 11/7/2020 (b) | | | 140,000 | | | | 140,132 | |
| | |
0.39%, 7/7/2021 | | | 100,000 | | | | 100,130 | |
| | |
Toronto-Dominion Bank (The) (Canada) | | | | | | | | |
| | |
(US Federal Funds Effective Rate (continuous series) + 0.35%), 0.44%, 9/1/2020 (b) | | | 120,000 | | | | 120,071 | |
| | |
(ICE LIBOR USD 3 Month + 0.11%), 0.43%, 9/10/2020 (b) | | | 140,000 | | | | 140,054 | |
| | |
(ICE LIBOR USD 1 Month + 0.18%), 0.35%, 9/21/2020 (b) | | | 50,000 | | | | 50,022 | |
| | |
(ICE LIBOR USD 3 Month + 0.19%), 0.47%, 10/7/2020 (b) | | | 216,000 | | | | 216,000 | |
| | |
(ICE LIBOR USD 3 Month + 0.07%), 0.34%, 10/28/2020 (b) | | | 170,000 | | | | 170,000 | |
| | |
(ICE LIBOR USD 3 Month + 0.09%), 0.36%, 11/19/2020 (b) | | | 156,000 | | | | 156,045 | |
| | |
1.27%, 1/28/2021 | | | 350,000 | | | | 351,571 | |
| | |
0.41%, 7/6/2021 | | | 170,000 | | | | 170,270 | |
| | |
UBS AG (Switzerland) | | | | | | | | |
| | |
1.50%, 10/2/2020 | | | 200,000 | | | | 200,240 | |
| | |
1.17%, 10/15/2020 | | | 200,000 | | | | 200,251 | |
| | |
1.15%, 12/21/2020 | | | 100,000 | | | | 100,281 | |
| | |
1.55%, 1/4/2021 | | | 200,000 | | | | 200,910 | |
| | |
1.55%, 1/6/2021 | | | 200,000 | | | | 200,925 | |
| | |
Wells Fargo Bank NA (ICE LIBOR USD 3 Month + 0.11%), 0.41%, 10/6/2020 (b) | | | 55,000 | | | | 55,000 | |
| | | | | | | | |
| |
Total Certificates of Deposit
(Cost $36,478,655) | | | | 36,505,183 | |
| | | | | |
| | | | | | | | |
| INVESTMENTS (a) | | PRINCIPAL
AMOUNT
($000) | | | VALUE
($000) | |
| | | | | | | | |
|
Commercial Paper — 14.4% | |
| | |
Agricultural Bank of China Ltd. (China) 0.45%, 11/5/2020 (c) (e) | | | 125,000 | | | | 124,911 | |
| | |
Albion Capital Corp. SA (Luxembourg) 0.25%, 10/28/2020 (e) | | | 54,208 | | | | 54,198 | |
| | |
Alpine Securitization LLC (Switzerland) | | | | | | | | |
| | |
(ICE LIBOR USD 3 Month + 0.08%), 0.33%, 11/20/2020 (b) (c) | | | 35,000 | | | | 35,000 | |
| | |
0.37%, 1/6/2021 (c) (e) | | | 50,000 | | | | 49,960 | |
| | |
0.40%, 4/6/2021 (c) (e) | | | 75,000 | | | | 74,886 | |
| | |
0.31%, 5/5/2021 (c) (e) | | | 125,000 | | | | 124,770 | |
| | |
Antalis SA (France) | | | | | | | | |
| | |
0.31%, 9/16/2020 (c) (e) | | | 100,000 | | | | 99,993 | |
| | |
0.25%, 2/1/2021 (c) (e) | | | 20,380 | | | | 20,361 | |
| | |
Atlantic Asset Securitization LLC 1.40%, 10/1/2020 (c) (e) | | | 200,000 | | | | 199,972 | |
| | |
Banco Del Estado De Chile (Chile) Series B, 0.27%, 9/25/2020 (c) (e) | | | 50,000 | | | | 49,989 | |
| | |
Bank of Nova Scotia (The) (Canada) (ICE LIBOR USD 3 Month + 0.07%), 0.34%, 10/14/2020 (b) (c) | | | 100,000 | | | | 100,033 | |
| | |
Barclays Bank plc (United Kingdom) | | | | | | | | |
| | |
Series 44105, 0.30%, 9/11/2020 (c) (e) | | | 100,000 | | | | 99,995 | |
| | |
0.31%, 9/16/2020 (c) (e) | | | 150,000 | | | | 149,991 | |
| | |
Barton Capital LLC 0.36%, 1/8/2021 (c) (e) | | | 30,000 | | | | 29,986 | |
| | |
Barton Capital SA | | | | | | | | |
| | |
0.15%, 9/4/2020 (c) (e) | | | 50,000 | | | | 49,999 | |
| | |
0.30%, 9/14/2020 (c) (e) | | | 50,000 | | | | 49,998 | |
| | |
0.24%, 10/30/2020 (c) (e) | | | 25,000 | | | | 24,992 | |
| | |
0.22%, 11/13/2020 (c) (e) | | | 50,000 | | | | 49,982 | |
| | |
0.38%, 11/16/2020 (c) (e) | | | 25,000 | | | | 24,991 | |
| | |
0.36%, 11/18/2020 (c) (e) | | | 75,000 | | | | 74,972 | |
| | |
0.28%, 12/7/2020 (c) (e) | | | 125,000 | | | | 124,953 | |
| | |
Bedford Row Funding Corp. | | | | | | | | |
| | |
(ICE LIBOR USD 3 Month + 0.10%), 0.42%, 9/3/2020 (b) (c) | | | 175,000 | | | | 175,092 | |
| | |
(US Federal Funds Effective Rate (continuous series) + 0.22%), 0.32%, 9/21/2020 (b) (c) | | | 110,000 | | | | 110,000 | |
| | |
1.54%, 10/2/2020 (c) (e) | | | 100,000 | | | | 99,867 | |
| | |
1.54%, 10/5/2020 (c) (e) | | | 110,000 | | | | 109,840 | |
| | |
(ICE LIBOR USD 3 Month + 0.04%), 0.29%, 11/19/2020 (b) (c) | | | 115,000 | | | | 115,000 | |
| | |
(ICE LIBOR USD 3 Month + 0.10%), 0.36%, 11/25/2020 (b) (c) | | | 50,000 | | | | 50,026 | |
| | |
1.32%, 1/6/2021 (c) (e) | | | 105,000 | | | | 104,939 | |
| | |
BPCE SA (France) 0.46%, 3/19/2021 (c) (e) | | | 315,000 | | | | 314,627 | |
SEE NOTES TO FINANCIAL STATEMENTS.
| | | | | | |
| | | |
| 22 | | | | J.P. MORGAN MONEY MARKET FUNDS | | AUGUST 31, 2020 |
| | | | | | | | |
| INVESTMENTS (a) | | PRINCIPAL
AMOUNT
($000) | | | VALUE
($000) | |
Short-Term Investments — continued | |
|
Commercial Paper — continued | |
| | |
Canadian Imperial Bank of Commerce (Canada) | | | | | | | | |
| | |
1.05%, 9/10/2020 (c) (e) | | | 102,000 | | | | 101,997 | |
| | |
(ICE LIBOR USD 1 Month + 0.19%), 0.37%, 9/26/2020 (b) (c) | | | 85,000 | | | | 85,080 | |
| | |
Cancara Asset Securitisation LLC 0.15%, 9/10/2020 (e) | | | 100,000 | | | | 99,997 | |
| | |
China Construction Bank Corp. (China) 0.61%, 10/27/2020 (c) (e) | | | 100,000 | | | | 99,943 | |
| | |
Commonwealth Bank of Australia (Australia) | | | | | | | | |
| | |
(ICE LIBOR USD 3 Month + 0.12%), 0.46%, 9/4/2020 (b) (c) | | | 200,000 | | | | 200,072 | |
| | |
(ICE LIBOR USD 3 Month + 0.08%), 0.39%, 10/6/2020 (b) (c) | | | 40,000 | | | | 40,014 | |
| | |
(ICE LIBOR USD 3 Month + 0.05%), 0.31%, 10/22/2020 (b) (c) | | | 35,000 | | | | 35,000 | |
| | |
Cooperatieve Rabobank UA (ICE LIBOR USD 1 Month + 0.00%), 0.25%, 9/3/2020 (b) | | | 100,000 | | | | 100,013 | |
| | |
DBS Bank Ltd. (Singapore) 0.23%, 2/5/2021 (c) (e) | | | 100,000 | | | | 99,911 | |
| | |
Dexia Credit Local SA (France) | | | | | | | | |
| | |
0.57%, 10/28/2020 (c) (e) | | | 100,000 | | | | 99,981 | |
| | |
0.57%, 10/29/2020 (c) (e) | | | 500,000 | | | | 499,902 | |
| | |
0.23%, 2/22/2021 (c) (e) | | | 50,000 | | | | 49,964 | |
| | |
DNB Bank ASA (Norway) | | | | | | | | |
| | |
(ICE LIBOR USD 1 Month + 0.18%), 0.36%, 9/21/2020 (b) (c) | | | 60,000 | | | | 60,061 | |
| | |
(ICE LIBOR USD 3 Month + 0.07%), 0.34%, 10/22/2020 (b) (c) | | | 155,000 | | | | 155,034 | |
| | |
(ICE LIBOR USD 3 Month + 0.15%), 0.41%, 11/5/2020 (b) (c) | | | 70,000 | | | | 70,062 | |
| | |
(ICE LIBOR USD 3 Month + 0.04%), 0.29%, 11/6/2020 (b) (c) | | | 90,000 | | | | 90,000 | |
| | |
0.22%, 5/24/2021 (c) (e) | | | 330,000 | | | | 329,349 | |
| | |
Fairway Finance Co. LLC | | | | | | | | |
| | |
1.80%, 10/1/2020 (c) (e) | | | 75,000 | | | | 74,888 | |
| | |
0.26%, 1/25/2021 (c) (e) | | | 10,600 | | | | 10,591 | |
| | |
Federation des Caisses Desjardins du Quebec (Canada) (ICE LIBOR USD 3 Month + 0.10%), 0.42%, 9/11/2020 (b) (c) | | | 25,000 | | | | 25,001 | |
| | |
First Abu Dhabi Bank PJSC (United Arab Emirates) | | | | | | | | |
| | |
0.25%, 10/14/2020 (c) (e) | | | 300,000 | | | | 299,958 | |
| | |
0.25%, 10/23/2020 (c) (e) | | | 163,000 | | | | 162,972 | |
| | |
0.24%, 11/3/2020 (c) (e) | | | 75,000 | | | | 74,983 | |
| | |
0.23%, 11/16/2020 (c) (e) | | | 375,000 | | | | 374,890 | |
| | |
0.21%, 11/19/2020 (c) (e) | | | 400,000 | | | | 399,876 | |
| | | | | | | | |
| INVESTMENTS (a) | | PRINCIPAL
AMOUNT
($000) | | | VALUE
($000) | |
| | | | | | | | |
|
Commercial Paper — continued | |
| | |
0.23%, 11/20/2020 (c) (e) | | | 271,000 | | | | 270,914 | |
| | |
0.21%, 11/25/2020 (c) (e) | | | 185,000 | | | | 184,935 | |
| | |
FMS Wertmanagement (Germany) | | | | | | | | |
| | |
0.27%, 1/7/2021 (c) (e) | | | 200,000 | | | | 199,888 | |
| | |
0.25%, 1/11/2021 (c) (e) | | | 30,000 | | | | 29,982 | |
| | |
0.25%, 1/20/2021 (e) | | | 132,000 | | | | 131,914 | |
| | |
0.23%, 2/4/2021 (c) (e) | | | 80,000 | | | | 79,940 | |
| | |
Honeywell International, Inc. 1.20%, 10/21/2020 (c) (e) | | | 200,000 | | | | 199,970 | |
| | |
ING US Funding LLC (Netherlands) | | | | | | | | |
| | |
(ICE LIBOR USD 3 Month + 0.15%), 0.47%, 9/14/2020 (b) | | | 50,000 | | | | 50,000 | |
| | |
(ICE LIBOR USD 3 Month + 0.15%), 0.47%, 9/18/2020 (b) (c) | | | 200,000 | | | | 200,000 | |
| | |
(ICE LIBOR USD 3 Month + 0.15%), 0.41%, 11/3/2020 (b) | | | 70,000 | | | | 70,021 | |
| | |
LMA-Americas LLC | | | | | | | | |
| | |
0.41%, 11/4/2020 (c) (e) | | | 37,150 | | | | 37,138 | |
| | |
0.35%, 12/2/2020 (c) (e) | | | 60,000 | | | | 59,969 | |
| | |
0.35%, 12/4/2020 (c) (e) | | | 51,000 | | | | 50,973 | |
| | |
0.40%, 1/19/2021 (c) (e) | | | 200,700 | | | | 200,502 | |
| | |
0.26%, 2/5/2021 (c) (e) | | | 36,000 | | | | 35,956 | |
| | |
0.23%, 4/1/2021 (c) (e) | | | 103,500 | | | | 103,346 | |
| | |
Matchpoint Finance plc (Ireland) | | | | | | | | |
| | |
Series A, 0.28%, 9/16/2020 (c) (e) | | | 75,000 | | | | 74,996 | |
| | |
Series A, 0.24%, 2/8/2021 (c) (e) | | | 50,000 | | | | 49,961 | |
| | |
MetLife Short Term Funding LLC 1.25%, 9/8/2020 (c) (e) | | | 11,000 | | | | 10,997 | |
| | |
National Australia Bank Ltd. (Australia) | | | | | | | | |
| | |
(ICE LIBOR USD 1 Month + 0.22%), 0.38%, 9/1/2020 (b) (c) | | | 50,000 | | | | 50,044 | |
| | |
(ICE LIBOR USD 1 Month + 0.14%), 0.30%, 9/4/2020 (b) (c) | | | 160,000 | | | | 160,069 | |
| | |
(ICE LIBOR USD 1 Month + 0.22%), 0.38%, 9/10/2020 (b) (c) | | | 125,000 | | | | 125,102 | |
| | |
National Bank of Canada (Canada) | | | | | | | | |
| | |
0.25%, 1/22/2021 (c) (e) | | | 170,000 | | | | 169,874 | |
| | |
0.23%, 2/4/2021 (c) (e) | | | 240,000 | | | | 239,799 | |
| | |
0.23%, 2/5/2021 (c) (e) | | | 350,000 | | | | 349,704 | |
| | |
Natixis SA (France) | | | | | | | | |
| | |
(ICE LIBOR USD 3 Month + 0.03%), 0.29%, 10/23/2020 (b) | | | 130,000 | | | | 130,000 | |
| | |
0.49%, 2/22/2021 (e) | | | 45,000 | | | | 44,957 | |
| | |
Nieuw Amsterdam Receivables Corp. 0.27%, 9/16/2020 (c) (e) | | | 80,000 | | | | 79,995 | |
SEE NOTES TO FINANCIAL STATEMENTS.
| | | | | | | | |
| | | |
| AUGUST 31, 2020 | | J.P. MORGAN MONEY MARKET FUNDS | | | | | 23 | |
JPMorgan Prime Money Market Fund
SCHEDULE OF PORTFOLIO INVESTMENTS
AS OF AUGUST 31, 2020 (Unaudited) (continued)
| | | | | | | | |
| INVESTMENTS (a) | | PRINCIPAL
AMOUNT
($000) | | | VALUE
($000) | |
Short-Term Investments — continued | |
|
Commercial Paper — continued | |
| | |
Old Line Funding LLC 0.28%, 11/23/2020 (c) (e) | | | 200,000 | | | | 199,930 | |
| | |
Oversea-Chinese Banking Corp. Ltd. (Singapore) 1.20%, 10/19/2020 (c) (e) | | | 100,000 | | | | 99,978 | |
| | |
Pricoa Short Term Funding LLC 0.30%, 1/4/2021 (c) (e) | | | 50,000 | | | | 49,981 | |
| | |
Royal Bank of Canada (Canada) (ICE LIBOR USD 3 Month + 0.05%), 0.30%, 10/28/2020 (b) (c) | | | 100,000 | | | | 100,020 | |
| | |
Shell International Finance BV (Netherlands) | | | | | | | | |
| | |
2.20%, 1/11/2021 (c) (e) | | | 120,000 | | | | 119,894 | |
| | |
2.15%, 1/15/2021 (c) (e) | | | 115,000 | | | | 114,895 | |
| | |
Sumitomo Mitsui Trust Bank Ltd. (Japan) | | | | | | | | |
| | |
0.40%, 11/30/2020 (c) (e) | | | 100,000 | | | | 99,957 | |
| | |
0.26%, 2/4/2021 (c) (e) | | | 125,000 | | | | 124,882 | |
| | |
Suncorp-Metway Ltd. (Australia) 0.19%, 11/2/2020 (c) (e) | | | 75,000 | | | | 74,962 | |
| | |
Svenska Handelsbanken AB (Sweden) | | | | | | | | |
| | |
(ICE LIBOR USD 1 Month + 0.10%), 0.26%, 9/10/2020 (b) (c) | | | 50,000 | | | | 50,008 | |
| | |
(ICE LIBOR USD 3 Month + 0.08%), 0.36%, 10/27/2020 (b) (c) | | | 165,000 | | | | 165,104 | |
| | |
Thunder Bay Funding LLC 0.28%, 11/23/2020 (c) (e) | | | 50,000 | | | | 49,984 | |
| | |
Toronto-Dominion Bank (The) (Canada) | | | | | | | | |
| | |
(US Federal Funds Effective Rate (continuous series) + 0.35%), 0.45%, 9/1/2020 (b) (c) | | | 50,000 | | | | 50,030 | |
| | |
(ICE LIBOR USD 1 Month + 0.14%), 0.30%, 9/4/2020 (b) (c) | | | 65,000 | | | | 65,030 | |
| | |
(ICE LIBOR USD 1 Month + 0.15%), 0.31%, 9/5/2020 (b) (c) | | | 150,000 | | | | 150,075 | |
| | |
(ICE LIBOR USD 3 Month + 0.07%), 0.35%, 10/7/2020 (b) (c) | | | 175,000 | | | | 175,036 | |
| | |
(ICE LIBOR USD 3 Month + 0.23%), 0.49%, 11/3/2020 (b) (c) | | | 80,000 | | | | 80,096 | |
| | |
(ICE LIBOR USD 3 Month + 0.18%), 0.44%, 11/5/2020 (b) (c) | | | 100,000 | | | | 100,088 | |
| | |
Total Capital Canada Ltd. (France) 0.28%, 1/4/2021 (c) (e) | | | 100,000 | | | | 99,943 | |
| | |
Toyota Finance Australia Ltd. (Australia) 0.22%, 9/18/2020 (e) | | | 160,000 | | | | 159,992 | |
| | |
UBS AG (Switzerland) | | | | | | | | |
| | |
1.14%, 1/20/2021 (c) (e) | | | 153,000 | | | | 152,827 | |
| | |
1.14%, 1/22/2021 (c) (e) | | | 318,000 | | | | 317,635 | |
| | |
Versailles Commercial Paper LLC 0.21%, 11/5/2020 (c) (e) | | | 74,000 | | | | 73,975 | |
| | | | | | | | |
| INVESTMENTS (a) | | PRINCIPAL
AMOUNT
($000) | | | VALUE
($000) | |
| | | | | | | | |
|
Commercial Paper — continued | |
| | |
Westpac Banking Corp. (Australia) 0.37%, 3/4/2021 (c) (e) | | | 200,000 | | | | 199,720 | |
| | | | | | | | |
| |
Total Commercial Paper
(Cost $12,590,004) | | | | 12,597,850 | |
| | | | | |
|
U.S. Treasury Obligations — 6.7% | |
| | |
U.S. Treasury Bills | | | | | | | | |
| | |
0.15%, 9/8/2020 (e) | | | 275,000 | | | | 274,995 | |
| | |
0.15%, 9/10/2020 (e) | | | 200,000 | | | | 199,996 | |
| | |
0.18%, 9/17/2020 (e) | | | 400,000 | | | | 399,984 | |
| | |
0.10%, 9/22/2020 (e) | | | 800,000 | | | | 799,957 | |
| | |
0.15%, 9/24/2020 (e) | | | 900,000 | | | | 899,948 | |
| | |
0.17%, 9/29/2020 (e) | | | 700,000 | | | | 699,950 | |
| | |
0.15%, 10/20/2020 (e) | | | 650,000 | | | | 649,908 | |
| | |
0.12%, 11/10/2020 (e) | | | 100,000 | | | | 99,982 | |
| | |
0.10%, 11/12/2020 (e) | | | 250,000 | | | | 249,947 | |
| | |
0.12%, 11/19/2020 (e) | | | 1,600,000 | | | | 1,599,623 | |
| | | | | | | | |
| |
Total U.S. Treasury Obligations
(Cost $5,874,102) | | | | 5,874,290 | |
| | | | | |
|
Time Deposits — 5.7% | |
| | |
Australia & New Zealand Banking Group Ltd. 0.11%, 9/3/2020 | | | 700,000 | | | | 700,000 | |
| | |
BNP Paribas SA 0.07%, 9/1/2020 | | | 18,330 | | | | 18,330 | |
| | |
Credit Agricole Corporate and Investment Bank | | | | | | | | |
| | |
0.15%, 9/1/2020 | | | 100,000 | | | | 100,000 | |
| | |
0.15%, 9/4/2020 | | | 300,000 | | | | 300,000 | |
Industrial & Commercial Bank of China Ltd. 0.09%, 9/1/2020 | | | 500,000 | | | | 500,000 | |
| | |
KBC Bank NV 0.09%, 9/1/2020 | | | 1,000,000 | | | | 1,000,000 | |
| | |
National Bank of Canada 0.11%, 9/1/2020 | | | 300,000 | | | | 300,000 | |
| | |
Royal Bank of Canada 0.09%, 9/1/2020 | | | 600,000 | | | | 600,000 | |
| | |
Societe Generale SA | | | | | | | | |
| | |
0.09%, 9/1/2020 | | | 200,000 | | | | 200,000 | |
| | |
0.09%, 9/1/2020 | | | 200,000 | | | | 200,000 | |
| | |
Swedbank AB 0.09%, 9/1/2020 | | | 1,050,000 | | | | 1,050,000 | |
| | | | | | | | |
| |
Total Time Deposits
(Cost $4,968,330) | | | | 4,968,330 | |
| | | | | |
| | |
Total Short-Term Investments
(Cost $59,911,091) | | | | | | | 59,945,653 | |
| | | | | | | | |
Total Investments — 99.6%
(Cost $87,122,661) | | | | | | | 87,157,499 | |
Other Assets Less Liabilities — 0.4% | | | | | | | 332,786 | |
| | | | | | | | |
NET ASSETS — 100.0% | | | | | | | 87,490,285 | |
| | | | | | | | |
SEE NOTES TO FINANCIAL STATEMENTS.
| | | | | | |
| | | |
| 24 | | | | J.P. MORGAN MONEY MARKET FUNDS | | AUGUST 31, 2020 |
Percentages indicated are based on net assets.
Abbreviations
| | |
| FHLMC | | Federal Home Loan Mortgage Corp. |
| FNMA | | Federal National Mortgage Association |
| GNMA | | Government National Mortgage Association |
| ICE | | Intercontinental Exchange |
| LIBOR | | London Interbank Offered Rate |
| OBFR | | Overnight Bank Funding Rate |
| PJSC | | Public Joint Stock Company |
| RAN | | Revenue Anticipation Note |
| Rev. | | Revenue |
| SOFR | | Secured Overnight Financing Rate |
| USD | | United States Dollar |
| VRDO | | Variable Rate Demand Obligation |
| | |
| (a) | | The date shown represents the earliest of the next put date, next demand date or final maturity date. |
| (b) | | Variable or floating rate security, linked to the referenced benchmark. The interest rate shown is the current rate as of August 31, 2020. |
| (c) | | Securities exempt from registration under Rule 144A or section 4(a)(2), of the Securities Act of 1933, as amended. |
| (d) | | Variable or floating rate security, the interest rate of which adjusts periodically based on changes in current interest rates and prepayments on the underlying pool of assets. The interest rate shown is the current rate as of August 31, 2020. |
| (e) | | The rate shown is the effective yield as of August 31, 2020. |
SEE NOTES TO FINANCIAL STATEMENTS.
| | | | | | | | |
| | | |
| AUGUST 31, 2020 | | J.P. MORGAN MONEY MARKET FUNDS | | | | | 25 | |
JPMorgan Institutional Tax Free Money Market Fund
SCHEDULE OF PORTFOLIO INVESTMENTS
AS OF AUGUST 31, 2020 (Unaudited)
| | | | | | | | |
| INVESTMENTS (a) | | PRINCIPAL
AMOUNT
($000) | | | VALUE
($000) | |
| | | | | | | | |
Municipal Bonds — 83.6% | |
|
Alabama — 0.4% | |
| | |
Mobile Downtown Redevelopment Authority, Gulf Opportunity Zone, Austal USA LLC Project Series 2011B, Rev., VRDO, LOC: Citibank NA, 0.11%, 9/8/2020 (b) (c) | | | 7,295 | | | | 7,295 | |
| | | | | | | | |
|
Alaska — 0.8% | |
| | |
Alaska Housing Finance Corp., Home Mortgage Series 2007A, Rev., VRDO, LIQ: FHLB, 0.08%, 9/8/2020 (b) | | | 2,540 | | | | 2,540 | |
| | |
City of Valdez, Exxon Pipeline Co. Project | | | | | | | | |
| | |
Rev., VRDO, 0.03%, 9/1/2020 (b) | | | 3,500 | | | | 3,500 | |
| | |
Series 1993-A, Rev., VRDO, 0.03%, 9/1/2020 (b) | | | 4,750 | | | | 4,750 | |
| | |
Municipality of Anchorage Alaska GO, TAN, 1.50%, 12/18/2020 | | | 5,000 | | | | 5,012 | |
| | | | | | | | |
| | |
| | | | | | | 15,802 | |
| | | | | | | | |
|
Arizona — 1.6% | |
| | |
Arizona Health Facilities Authority, Catholic Healthcare West Loan Program Series 2009F, Rev., VRDO, LOC: Mizuho Bank Ltd., 0.11%, 9/8/2020 (b) | | | 17,050 | | | | 17,050 | |
| | |
Arizona State University Series 2008B, Rev., VRDO, 0.08%, 9/8/2020 (b) | | | 10,000 | | | | 10,000 | |
| | |
Tender Option Bond Trust Receipts/Certificates Series 2019-XG0231, Rev., VRDO, LOC: Bank of America NA, 0.17%, 9/8/2020 (b) (c) | | | 4,065 | | | | 4,065 | |
| | | | | | | | |
| | |
| | | | | | | 31,115 | |
| | | | | | | | |
|
California — 1.0% | |
| | |
California Health Facilities Financing Authority, Catholic Healthcare West Loan Program Series 2005H, Rev., VRDO, LOC: Sumitomo Mitsui Banking Corp., 0.09%, 9/8/2020 (b) | | | 3,765 | | | | 3,765 | |
| | |
Orange County Water District Series 2003 A, COP, VRDO, LOC: Citibank NA, 0.07%, 9/8/2020 (b) | | | 1,135 | | | | 1,135 | |
| | |
RBC Municipal Products, Inc. Trust, Floater Certificates Series G-26, Rev., VRDO, LOC: Royal Bank of Canada, 0.24%, 9/8/2020 (b) (c) | | | 5,000 | | | | 5,000 | |
| | |
San Francisco City and County Airport Commission, International Airport Series C, Rev., VRDO, LOC: Sumitomo Mitsui Banking Corp., 0.08%, 9/8/2020 (b) | | | 3,820 | | | | 3,820 | |
| | |
State of California Series B, Subseries 2010B-3, GO, VRDO, LOC: Sumitomo Mitsui Banking Corp., 0.07%, 9/8/2020 (b) | | | 1,295 | | | | 1,295 | |
| | |
Tender Option Bond Trust Receipts/Certificates Series 2020-XM0837, Rev., VRDO, LIQ: Morgan Stanley Bank, 0.11%, 9/8/2020 (b) (c) | | | 2,600 | | | | 2,600 | |
| | | | | | | | |
| | |
| | | | | | | 17,615 | |
| | | | | | | | |
| | | | | | | | |
| INVESTMENTS (a) | | PRINCIPAL
AMOUNT
($000) | | | VALUE
($000) | |
| | | | | | | | |
|
Colorado — 1.9% | |
| | |
City of Colorado Springs, Utilities System Series 2010C, Rev., VRDO, LIQ: Barclays Bank plc, 0.08%, 9/8/2020 (b) | | | 1,905 | | | | 1,905 | |
| | |
Colorado Educational and Cultural Facilities Authority, Nature Conservancy Project Series 2012, Rev., VRDO, 0.11%, 9/8/2020 (b) | | | 21,195 | | | | 21,195 | |
| | |
Tender Option Bond Trust Receipts/Certificates Series 2018-XG0195, COP, VRDO, LIQ: Bank of America NA, 0.18%, 9/8/2020 (b) (c) | | | 3,615 | | | | 3,615 | |
| | |
University of Colorado Hospital Authority | | | | | | | | |
| | |
Series 2018 C, Rev., VRDO, LIQ: TD Bank NA, 0.09%, 9/8/2020 (b) | | | 6,600 | | | | 6,600 | |
| | |
Series 2019A, Rev., VRDO, 0.09%, 9/8/2020 (b) | | | 1,850 | | | | 1,850 | |
| | | | | | | | |
| | |
| | | | | | | 35,165 | |
| | | | | | | | |
|
Connecticut — 1.7% | |
| | |
City of Milford GO, BAN, 2.50%, 11/3/2020 | | | 4,720 | | | | 4,738 | |
| | |
Connecticut Housing Finance Authority, Housing Mortgage Finance Program Series 2020A-3, Rev., VRDO, LIQ: Barclays Bank plc, 0.08%, 9/8/2020 (b) | | | 3,140 | | | | 3,140 | |
| | |
Connecticut State Health and Educational Facilities Authority, The Jerome Home Series 2007D, Rev., VRDO, LOC: Bank of America NA, 0.11%, 9/8/2020 (b) | | | 2,875 | | | | 2,875 | |
| | |
State of Connecticut, Health and Educational Facilities Authority, Yale New Haven Hospital Issue Series O, Rev., VRDO, 0.09%, 9/8/2020 (b) | | | 2,250 | | | | 2,250 | |
| | |
Tender Option Bond Trust Receipts/Certificates Series 2019-G-110, Rev., VRDO, LOC: Royal Bank of Canada, 0.27%, 9/8/2020 (b) (c) | | | 10,000 | | | | 10,000 | |
| | |
Town of Greenwich GO, BAN, 1.50%, 1/14/2021 | | | 2,000 | | | | 2,008 | |
| | |
Town of Groton Series 2020B, GO, BAN, 2.00%, 4/29/2021 | | | 7,045 | | | | 7,108 | |
| | | | | | | | |
| | |
| | | | | | | 32,119 | |
| | | | | | | | |
|
Florida — 4.5% | |
| | |
City of Jacksonville, Florida Power and Light Co., Project Rev., VRDO, 0.06%, 9/1/2020 (b) | | | 15,600 | | | | 15,600 | |
| | |
City of Jacksonville, Health Care Facilities, Baptist Health Series 2019C, Rev., VRDO, 0.09%, 9/8/2020 (b) | | | 10,035 | | | | 10,035 | |
| | |
County of Martin, Florida Power and Light Co., Project Rev., VRDO, 0.08%, 9/1/2020 (b) | | | 3,500 | | | | 3,500 | |
| | |
Florida Housing Finance Corp., Kings Terrace LLC Series 2013B, Rev., VRDO, LIQ: FHLMC, 0.09%, 9/8/2020 (b) | | | 12,000 | | | | 12,000 | |
SEE NOTES TO FINANCIAL STATEMENTS.
| | | | | | |
| | | |
| 26 | | | | J.P. MORGAN MONEY MARKET FUNDS | | AUGUST 31, 2020 |
| | | | | | | | |
| INVESTMENTS (a) | | PRINCIPAL
AMOUNT
($000) | | | VALUE
($000) | |
Municipal Bonds — continued | |
|
Florida — continued | |
| | |
Tender Option Bond Trust Receipts/Certificates | | | | | | | | |
| | |
Series 2019-XX1109, Rev., VRDO, LIQ: Barclays Bank plc, 0.12%, 9/8/2020 (b) (c) | | | 4,375 | | | | 4,375 | |
| | |
Series 2020-XF2882, Rev., VRDO, AGM-CR, LOC: Barclays Bank plc, 0.13%, 9/8/2020 (b) (c) | | | 2,800 | | | | 2,800 | |
| | |
Series 2020-XG0295, Rev., VRDO, LIQ: Bank of America NA, 0.13%, 9/8/2020 (b) (c) | | | 6,000 | | | | 6,000 | |
| | |
Series 2020-XX1136, Rev., VRDO, LOC: Barclays Bank plc, 0.13%, 9/8/2020 (b) (c) | | | 2,375 | | | | 2,375 | |
| | |
Series 2020-YX1128, Rev., VRDO, LOC: Barclays Bank plc, 0.13%, 9/8/2020 (b) (c) | | | 3,870 | | | | 3,870 | |
| | |
Series 2018-G-41, Rev., VRDO, LOC: Royal Bank of Canada, 0.29%, 9/8/2020 (b) (c) | | | 5,665 | | | | 5,665 | |
| | |
Series 2019-G113, Rev., VRDO, LOC: Royal Bank of Canada, 0.29%, 9/8/2020 (b) (c) | | | 17,500 | | | | 17,500 | |
| | | | | | | | |
| | |
| | | | | | | 83,720 | |
| | | | | | | | |
|
Georgia — 1.0% | |
| | |
Brookhaven Development Authority, Children’s Healthcare Series 2019D, Rev., VRDO, LIQ: PNC Bank NA, 0.10%, 9/8/2020 (b) | | | 6,860 | | | | 6,860 | |
| | |
Tender Option Bond Trust Receipts/Certificates | | | | | | | | |
| | |
Series 2020-ZF0871, Rev., VRDO, LIQ: TD Bank NA, 0.14%, 9/8/2020 (b) (c) | | | 4,765 | | | | 4,765 | |
| | |
Series 2020-ZF0872, Rev., VRDO, LIQ: TD Bank NA, 0.14%, 9/8/2020 (b) (c) | | | 2,000 | | | | 2,000 | |
| | |
Series 2020-ZF0873, Rev., VRDO, LIQ: TD Bank NA, 0.14%, 9/8/2020 (b) (c) | | | 3,000 | | | | 3,000 | |
| | | | | | | | |
| | |
| | | | | | | 16,625 | |
| | | | | | | | |
|
Illinois — 1.1% | |
| | |
County of Kane, Glenwood School for Boys Rev., VRDO, LOC: Northern Trust Co., 0.10%, 9/8/2020 (b) | | | 3,450 | | | | 3,450 | |
| | |
Illinois Educational Facilities Authority, The Adler Planetarium Rev., VRDO, LOC: PNC Bank NA, 0.10%, 9/8/2020 (b) | | | 10,100 | | | | 10,100 | |
| | |
Illinois Finance Authority, Clearbrook Project 2008 Rev., VRDO, LOC: BMO Harris Bank NA, 0.09%, 9/8/2020 (b) | | | 1,500 | | | | 1,500 | |
| | |
Illinois Finance Authority, Northwestern Memorial Hospital Series 2008A-1, Rev., VRDO, 0.09%, 9/8/2020 (b) | | | 1,560 | | | | 1,560 | |
| | |
Illinois Finance Authority, The University of Chicago Medical Center Series 2011B, Rev., VRDO, LOC: Sumitomo Mitsui Banking Corp., 0.14%, 9/8/2020 (b) | | | 2,330 | | | | 2,330 | |
| | | | | | | | |
| INVESTMENTS (a) | | PRINCIPAL
AMOUNT
($000) | | | VALUE
($000) | |
| | | | | | | | |
|
Illinois — continued | |
| | |
Illinois Finance Authority, Youth Hostels Project Rev., VRDO, LOC: BMO Harris Bank NA, 0.09%, 9/8/2020 (b) | | | 1,795 | | | | 1,795 | |
| | | | | | | | |
| | |
| | | | | | | 20,735 | |
| | | | | | | | |
|
Indiana — 1.4% | |
| | |
Indiana Finance Authority, Ascension Health Senior Credit Group Series 2008E-8, Rev., VRDO, 0.10%, 9/8/2020 (b) | | | 18,375 | | | | 18,375 | |
| | |
Indiana Finance Authority, Parkview Health System Obligated Group Series 2009D, Rev., VRDO, LOC: Wells Fargo Bank NA, 0.03%, 9/1/2020 (b) | | | 7,535 | | | | 7,535 | |
| | | | | | | | |
| | |
| | | | | | | 25,910 | |
| | | | | | | | |
|
Iowa — 2.3% | |
| | |
County of Louisa, Pollution Control, Midwest Power System, Inc. Rev., VRDO, 0.11%, 9/8/2020 (b) | | | 20,100 | | | | 20,100 | |
| | |
Iowa Finance Authority, Midwestern Disaster Area, Archer-Daniels-Midland Co. Project Rev., VRDO, 0.11%, 9/8/2020 (b) | | | 7,795 | | | | 7,795 | |
| | |
Iowa Finance Authority, Single Family Mortgage-Backed Securities Program Series 2019E, Rev., VRDO, GNMA/FNMA/FHLMC, LIQ: TD Bank NA, 0.08%, 9/8/2020 (b) | | | 900 | | | | 900 | |
| | |
Iowa Higher Education Loan Authority, Loras College | | | | | | | | |
| | |
Rev., VRDO, LOC: Bank of America NA, 0.03%, 9/1/2020 (b) | | | 3,900 | | | | 3,900 | |
| | |
Rev., VRDO, LOC: Bank of America NA, 0.03%, 9/1/2020 (b) | | | 6,850 | | | | 6,850 | |
| | |
Tender Option Bond Trust Receipts/Certificates Series 2018-ZM0582, Rev., VRDO, LIQ: Barclays Bank plc, 0.12%, 9/8/2020 (b) (c) | | | 3,750 | | | | 3,750 | |
| | | | | | | | |
| | |
| | | | | | | 43,295 | |
| | | | | | | | |
|
Kentucky — 1.8% | |
| | |
Kentucky Economic Development Finance Authority, Hospital Facilities, Saint Elizabeth Medical Center, Inc. Series 2009B, Rev., VRDO, LOC: TD Bank NA, 0.09%, 9/8/2020 (b) | | | 4,725 | | | | 4,725 | |
| | |
Louisville & Jefferson County Metropolitan Government, Norton Healthcare, Inc. Series 2011A, Rev., VRDO, LOC: PNC Bank NA, 0.09%, 9/8/2020 (b) | | | 8,410 | | | | 8,410 | |
| | |
Louisville & Jefferson County Metropolitan Sewer and Drainage District Rev., BAN, 3.00%, 10/23/2020 | | | 3,925 | | | | 3,939 | |
SEE NOTES TO FINANCIAL STATEMENTS.
| | | | | | | | |
| | | |
| AUGUST 31, 2020 | | J.P. MORGAN MONEY MARKET FUNDS | | | | | 27 | |
JPMorgan Institutional Tax Free Money Market Fund
SCHEDULE OF PORTFOLIO INVESTMENTS
AS OF AUGUST 31, 2020 (Unaudited) (continued)
| | | | | | | | |
| INVESTMENTS (a) | | PRINCIPAL
AMOUNT
($000) | | | VALUE
($000) | |
Municipal Bonds — continued | |
|
Kentucky — continued | |
| | |
RBC Municipal Products, Inc. Trust Series G-116, Rev., VRDO, LOC: Royal Bank of Canada, 0.29%, 9/8/2020 (b) (c) | | | 12,000 | | | | 12,000 | |
| | |
Tender Option Bond Trust Receipts/Certificates Series 2020-XM0881, Rev., VRDO, AGM, LIQ: Royal Bank of Canada, 0.13%, 9/8/2020 (b) (c) | | | 2,800 | | | | 2,800 | |
| | | | | | | | |
| | |
| | | | | | | 31,874 | |
| | | | | | | | |
|
Louisiana — 0.7% | |
| | |
Consolidated Government of the City of Baton Rouge and Parish of East Baton Rouge, State of Louisiana Road and Street Improvement Series 2008A, Rev., VRDO, LOC: Citibank NA, 0.09%, 9/8/2020 (b) | | | 8,310 | | | | 8,310 | |
| | |
East Baton Rouge Parish Industrial Development Board, Inc., Exxonmobile Project, Gulf Opportunity Zone Series A, Rev., VRDO, 0.03%, 9/1/2020 (b) | | | 700 | | | | 700 | |
| | |
Tender Option Bond Trust Receipts/Certificates Series 2019-XM0738, Rev., VRDO, LOC: Royal Bank of Canada, 0.14%, 9/8/2020 (b) (c) | | | 3,245 | | | | 3,245 | |
| | | | | | | | |
| | |
| | | | | | | 12,255 | |
| | | | | | | | |
|
Maine — 0.1% | |
| | |
Tender Option Bond Trust Receipts/Certificates Series 2018-ZF2749, Rev., VRDO, LIQ: Morgan Stanley Bank, 0.12%, 9/8/2020 (b) (c) | | | 1,785 | | | | 1,785 | |
| | | | | | | | |
|
Maryland — 1.7% | |
| | |
City of Baltimore Series 2015-ZF2095, Rev., VRDO, LIQ: Morgan Stanley Bank, 0.16%, 9/8/2020 (b) (c) | | | 6,665 | | | | 6,665 | |
| | |
Maryland Economic Development Corp., Howard Hughes Medical Institute Series 2008A, Rev., VRDO, 0.10%, 9/8/2020 (b) | | | 800 | | | | 800 | |
| | |
RBC Municipal Products, Inc. Trust, Floater Certificates Series G-28, Rev., VRDO, LOC: Royal Bank of Canada, 0.29%, 9/8/2020 (b) (c) | | | 10,115 | | | | 10,115 | |
| | |
Tender Option Bond Trust Receipts/Certificates | | | | | | | | |
| | |
Series 2018-ZM0618, Rev., VRDO, LIQ: Morgan Stanley Bank, 0.12%, 9/8/2020 (b) (c) | | | 3,350 | | | | 3,350 | |
| | |
Series 2018-ZM0621, Rev., VRDO, LIQ: Morgan Stanley Bank, 0.14%, 9/8/2020 (b) (c) | | | 4,000 | | | | 4,000 | |
| | |
Series 2018-G-42, Rev., VRDO, LOC: Royal Bank of Canada, 0.29%, 9/8/2020 (b) (c) | | | 5,000 | | | | 5,000 | |
| | | | | | | | |
| | |
| | | | | | | 29,930 | |
| | | | | | | | |
| | | | | | | | |
| INVESTMENTS (a) | | PRINCIPAL
AMOUNT
($000) | | | VALUE
($000) | |
| | | | | | | | |
|
Massachusetts — 1.8% | |
| | |
City of Salem GO, BAN, 1.00%, 11/19/2020 | | | 7,769 | | | | 7,781 | |
| | |
City of Somerville Series B, GO, BAN, 1.00%, 10/23/2020 | | | 6,000 | | | | 6,005 | |
| | |
Massachusetts Bay Transportation Authority, Sales Tax Series 2018A-2, Rev., VRDO, LIQ: State Street Bank & Trust, 0.08%, 9/8/2020 (b) | | | 10,000 | | | | 10,000 | |
| | |
Tender Option Bond Trust Receipts/Certificates Series 2020-ZF0968, Rev., VRDO, FHA, LIQ: TD Bank NA, 0.14%, 9/8/2020 (b) (c) | | | 3,335 | | | | 3,335 | |
| | |
Town of Scituate GO, BAN, 1.75%, 12/11/2020 | | | 1,290 | | | | 1,295 | |
| | |
Town of Yarmouth GO, BAN, 2.00%, 2/15/2021 | | | 5,000 | | | | 5,039 | |
| | | | | | | | |
| | |
| | | | | | | 33,455 | |
| | | | | | | | |
|
Michigan — 2.6% | |
| | |
Central Michigan University Series 2008A, Rev., VRDO, LOC: TD Bank NA, 0.08%, 9/8/2020 (b) | | | 4,555 | | | | 4,555 | |
| | |
L’Anse Creuse Public Schools GO, VRDO, Q-SBLF, LOC: TD Bank NA, 0.08%, 9/8/2020 (b) | | | 26,140 | | | | 26,140 | |
| | |
Rib Floater Trust Various States Series 2018-009, Rev., VRDO, LIQ: Barclays Bank plc, 0.13%, 9/8/2020 (b) (c) | | | 19,200 | | | | 19,200 | |
| | | | | | | | |
| | |
| | | | | | | 49,895 | |
| | | | | | | | |
|
Minnesota — 2.0% | |
| | |
City of Minneapolis, Health Care System, Fairview Health Services Series 2018C, Rev., VRDO, LOC: Wells Fargo Bank NA, 0.03%, 9/1/2020 (b) | | | 35,620 | | | | 35,620 | |
| | |
Minnesota Housing Finance Agency, Residential Housing Finance Series 2015G, Rev., VRDO, AMT, LIQ: Royal Bank of Canada, 0.09%, 9/8/2020 (b) | | | 1,240 | | | | 1,240 | |
| | | | | | | | |
| | |
| | | | | | | 36,860 | |
| | | | | | | | |
|
Mississippi — 4.2% | |
| | |
County of Jackson, Pollution Control, Chevron USA, Inc., Project Rev., VRDO, 0.03%, 9/1/2020 (b) | | | 19,270 | | | | 19,270 | |
| | |
County of Jackson, Port Facility, Chevron USA, Inc. Project Rev., VRDO, 0.03%, 9/1/2020 (b) | | | 10,850 | | | | 10,850 | |
| | |
Mississippi Business Finance Corp., Gulf Opportunity Zone Industrial Development, Chevron USA, Inc. Project | | | | | | | | |
| | |
Series 2007B, Rev., VRDO, 0.03%, 9/1/2020 (b) | | | 1,125 | | | | 1,125 | |
SEE NOTES TO FINANCIAL STATEMENTS.
| | | | | | |
| | | |
| 28 | | | | J.P. MORGAN MONEY MARKET FUNDS | | AUGUST 31, 2020 |
| | | | | | | | |
| INVESTMENTS (a) | | PRINCIPAL
AMOUNT
($000) | | | VALUE
($000) | |
Municipal Bonds — continued | |
|
Mississippi — continued | |
| | |
Series 2009C, Rev., VRDO, 0.03%, 9/1/2020 (b) | | | 4,895 | | | | 4,895 | |
| | |
Series 2009G, Rev., VRDO, 0.03%, 9/1/2020 (b) | | | 6,685 | | | | 6,685 | |
| | |
Series 2010 H, Rev., VRDO, 0.03%, 9/1/2020 (b) | | | 18,500 | | | | 18,500 | |
| | |
Series 2010G, Rev., VRDO, 0.03%, 9/1/2020 (b) | | | 4,275 | | | | 4,275 | |
| | |
Series 2010L, Rev., VRDO, 0.03%, 9/1/2020 (b) | | | 4,600 | | | | 4,600 | |
| | |
Series 2011C, Rev., VRDO, 0.03%, 9/1/2020 (b) | | | 7,100 | | | | 7,100 | |
| | | | | | | | |
| | |
| | | | | | | 77,300 | |
| | | | | | | | |
|
Missouri — 2.5% | |
| | |
City of Kansas City, Roe Bartle Convention Center Series 2008F, Rev., VRDO, LOC: Sumitomo Mitsui Banking Corp., 0.09%, 9/8/2020 (b) | | | 3,500 | | | | 3,500 | |
| | |
Health and Educational Facilities Authority of the State of Missouri, BJC Health System Series C, Rev., VRDO, LIQ: BJC Health System, 0.07%, 9/8/2020 (b) | | | 16,440 | | | | 16,440 | |
| | |
Health and Educational Facilities Authority of the State of Missouri, Washington University (The) Series 1996D, Rev., VRDO, LIQ: Wells Fargo Bank NA, 0.02%, 9/1/2020 (b) | | | 1,200 | | | | 1,200 | |
| | |
Missouri Development Finance Board, Cultural Facilities, Kauffman Center For The Performing Arts Project Series 2007A, Rev., VRDO, LIQ: PNC Bank NA, 0.04%, 9/1/2020 (b) | | | 13,775 | | | | 13,775 | |
| | |
RBC Municipal Products, Inc. Trust, Floater Certificates Rev., VRDO, LOC: Royal Bank of Canada, 0.14%, 9/8/2020 (b) (c) | | | 4,000 | | | | 4,000 | |
| | |
Tender Option Bond Trust Receipts/Certificates Rev., VRDO, LOC: Royal Bank of Canada, 0.16%, 9/8/2020 (b) (c) | | | 4,950 | | | | 4,950 | |
| | | | | | | | |
| | |
| | | | | | | 43,865 | |
| | | | | | | | |
|
Nevada — 0.4% | |
| | |
City of Reno, Renown Regional Medical Center | | | | | | | | |
| | |
Series 2009-A, Rev., VRDO, LOC: Wells Fargo Bank NA, 0.08%, 9/8/2020 (b) | | | 700 | | | | 700 | |
| | |
Tender Option Bond Trust Receipts/Certificates | | | | | | | | |
| | |
Series 2020-XM0866, Rev., VRDO, LOC: Royal Bank of Canada, 0.13%, 9/8/2020 (b) (c) | | | 6,000 | | | | 6,000 | |
| | | | | | | | |
| | |
| | | | | | | 6,700 | |
| | | | | | | | |
| | | | | | | | |
| INVESTMENTS (a) | | PRINCIPAL
AMOUNT
($000) | | | VALUE
($000) | |
| | | | | | | | |
|
New Jersey — 4.4% | |
| | |
Borough of Beachwood Series 2020A, GO, BAN, 2.00%, 3/4/2021 | | | 5,000 | | | | 5,027 | |
| | |
County of Cumberland GO, BAN, 2.00%, 11/13/2020 | | | 680 | | | | 681 | |
| | |
County of Hudson GO, BAN, 2.00%, 12/8/2020 | | | 6,045 | | | | 6,074 | |
| | |
County of Mercer, Capital Improvement Series 2020A, GO, BAN, 2.00%, 6/10/2021 | | | 300 | | | | 304 | |
| | |
County of Passaic, County of Hudson Series 2019A, GO, BAN, 2.00%, 12/3/2020 | | | 450 | | | | 452 | |
| | |
Hudson County Improvement Authority | | | | | | | | |
| | |
Series 2020C-1B, Rev., GTD, 1.50%, 2/19/2021 | | | 1,000 | | | | 1,006 | |
| | |
Series 2020C-1A, Rev., GTD, 1.50%, 9/2/2021 | | | 8,988 | | | | 9,098 | |
| | |
Hudson County Improvement Authority, Guaranteed Pooled Notes Series 2019C-1, Rev., GTD, 2.50%, 9/18/2020 | | | 5,570 | | | | 5,576 | |
| | |
Hudson County Improvement Authority, Tax Exempt, County Guaranteed Pooled Notes Series 2020B-1, Rev., GTD, 2.50%, 5/11/2021 | | | 7,000 | | | | 7,109 | |
| | |
Township of East Windsor GO, BAN, 2.00%, 12/4/2020 | | | 8,700 | | | | 8,718 | |
| | |
Township of Florence Series 2020A, GO, BAN, 1.75%, 1/15/2021 | | | 6,000 | | | | 6,035 | |
| | |
Township of Lacey Series 2020A, GO, BAN, 2.00%, 5/20/2021 | | | 8,051 | | | | 8,117 | |
| | |
Township of Lumberton Series 2020A, GO, BAN, 1.75%, 5/3/2021 | | | 5,237 | | | | 5,283 | |
| | |
Township of Readington GO, BAN, 1.50%, 4/29/2021 | | | 12,984 | | | | 13,082 | |
| | |
Township of Robbinsville Series 2020A, GO, BAN, 1.25%, 7/20/2021 | | | 2,375 | | | | 2,394 | |
| | |
Township of Woodbridge, Sewer and Recreation Utility GO, BAN, 3.00%, 10/16/2020 | | | 3,120 | | | | 3,131 | |
| | | | | | | | |
| | |
| | | | | | | 82,087 | |
| | | | | | | | |
|
New York — 19.1% | |
| | |
Albany City School District Series 2020B, GO, BAN, 1.25%, 7/30/2021 | | | 4,272 | | | | 4,305 | |
| | |
City of New York, Fiscal Year 2006 Series I, Subseries I-4, GO, VRDO, LOC: TD Bank NA, 0.02%, 9/1/2020 (b) | | | 11,425 | | | | 11,425 | |
| | |
City of New York, Fiscal Year 2008 Subseries J-6, GO, VRDO, LOC: Landesbank Hessen-Thueringen, 0.04%, 9/1/2020 (b) | | | 10,245 | | | | 10,245 | |
| | |
City of New York, Fiscal Year 2012 | | | | | | | | |
| | |
Subseries G-7, GO, VRDO, LOC: Bank of Tokyo-Mitsubishi UFJ Ltd., 0.02%, 9/1/2020 (b) | | | 9,670 | | | | 9,670 | |
SEE NOTES TO FINANCIAL STATEMENTS.
| | | | | | | | |
| | | |
| AUGUST 31, 2020 | | J.P. MORGAN MONEY MARKET FUNDS | | | | | 29 | |
JPMorgan Institutional Tax Free Money Market Fund
SCHEDULE OF PORTFOLIO INVESTMENTS
AS OF AUGUST 31, 2020 (Unaudited) (continued)
| | | | | | | | |
| INVESTMENTS (a) | | PRINCIPAL
AMOUNT
($000) | | | VALUE
($000) | |
Municipal Bonds — continued | |
|
New York — continued | |
| | |
Series D, Subseries D-3A, GO, VRDO, LIQ: Bank of New York Mellon, 0.03%, 9/1/2020 (b) | | | 100 | | | | 100 | |
| | |
City of New York, Fiscal Year 2013 Subseries A-2, GO, VRDO, LIQ: Mizuho Bank Ltd., 0.03%, 9/1/2020 (b) | | | 23,525 | | | | 23,525 | |
| | |
City of New York, Fiscal Year 2014 Series D, Subseries D-4, GO, VRDO, LOC: TD Bank NA, 0.02%, 9/1/2020 (b) | | | 3,300 | | | | 3,300 | |
| | |
County of Broome Series 2020A, GO, BAN, 2.00%, 4/30/2021 | | | 930 | | | | 938 | |
| | |
Evans-Brant Central School District Series 2020B, GO, BAN, 1.25%, 6/25/2021 | | | 4,000 | | | | 4,021 | |
| | |
Frontier Central School District GO, BAN, 1.25%, 7/22/2021 | | | 2,568 | | | | 2,587 | |
| | |
Geneva City School District GO, BAN, 1.25%, 6/25/2021 | | | 5,000 | | | | 5,034 | |
| | |
Gorham-Middlesex Central School District Series 2020A, GO, BAN, 1.25%, 6/24/2021 | | | 5,000 | | | | 5,028 | |
| | |
Metropolitan Transportation Authority | | | | | | | | |
| | |
Series 2008A-1, Rev., VRDO, LOC: TD Bank NA, 0.02%, 9/1/2020 (b) | | | 12,655 | | | | 12,655 | |
| | |
Series 2012G-1, Rev., VRDO, LOC: Barclays Bank plc, 0.03%, 9/1/2020 (b) | | | 10,600 | | | | 10,600 | |
| | |
Subseries E-3, Rev., VRDO, LOC: Bank of America NA, 0.03%, 9/1/2020 (b) | | | 16,285 | | | | 16,285 | |
| | |
Subseries 2005D-2, Rev., VRDO, LOC: Landesbank Hessen-Thueringen, 0.06%, 9/1/2020 (b) | | | 5,055 | | | | 5,055 | |
| | |
Subseries E-2, Rev., VRDO, LOC: Bank of America NA, 0.09%, 9/8/2020 (b) | | | 8,555 | | | | 8,555 | |
| | |
Series 2008A-2B, Rev., VRDO, LOC: PNC Bank NA, 0.10%, 9/8/2020 (b) | | | 14,100 | | | | 14,100 | |
| | |
Subseries E-3, Rev., VRDO, LOC: PNC Bank NA, 0.10%, 9/8/2020 (b) | | | 784 | | | | 784 | |
| | |
New York City Municipal Water Finance Authority, Water and Sewer System, Fiscal Year 2012 | | | | | | | | |
| | |
Subseries A-1, Rev., VRDO, LIQ: Mizuho Bank Ltd., 0.03%, 9/1/2020 (b) | | | 7,965 | | | | 7,965 | |
| | |
Subseries A-2, Rev., VRDO, LIQ: Mizuho Bank Ltd., 0.03%, 9/1/2020 (b) | | | 3,595 | | | | 3,595 | |
| | |
New York City Municipal Water Finance Authority, Water and Sewer System, Second General Resolution | | | | | | | | |
| | |
Series BB-1B, Rev., VRDO, LIQ: State Street Bank & Trust, 0.03%, 9/1/2020 (b) | | | 11,735 | | | | 11,735 | |
| | |
Series BB-2, Rev., VRDO, LIQ: Landesbank Hessen-Thueringen, 0.05%, 9/1/2020 (b) | | | 1,425 | | | | 1,425 | |
| | | | | | | | |
| INVESTMENTS (a) | | PRINCIPAL
AMOUNT
($000) | | | VALUE
($000) | |
| | | | | | | | |
|
New York — continued | |
| | |
New York City Municipal Water Finance Authority, Water and Sewer System, Second General Resolution, Fiscal Year 2011 | | | | | | | | |
| | |
Series DD-1, Rev., VRDO, LIQ: TD Bank NA, 0.02%, 9/1/2020 (b) | | | 2,400 | | | | 2,400 | |
| | |
Subseries FF-1, Rev., VRDO, LIQ: Bank of America NA, 0.03%, 9/1/2020 (b) | | | 2,605 | | | | 2,605 | |
| | |
New York City Municipal Water Finance Authority, Water and Sewer System, Second General Resolution, Fiscal Year 2014 Series AA, Subseries AA-5, Rev., VRDO, LIQ: Mizuho Bank Ltd., 0.02%, 9/1/2020 (b) | | | 5,060 | | | | 5,060 | |
| | |
New York City Municipal Water Finance Authority, Water and Sewer System, Second General Resolution, Fiscal Year 2015 | | | | | | | | |
| | |
Series BB, Rev., VRDO, LIQ: Mizuho Bank Ltd., 0.03%, 9/1/2020 (b) | | | 18,050 | | | | 18,050 | |
| | |
Subseries BB-4, Rev., VRDO, LIQ: Barclays Bank plc, 0.03%, 9/1/2020 (b) | | | 3,600 | | | | 3,600 | |
| | |
New York City Municipal Water Finance Authority, Water and Sewer System, Second General Resolution, Fiscal Year 2016 | | | | | | | | |
| | |
Series AA-2, Rev., VRDO, LIQ: PNC Bank NA, 0.10%, 9/8/2020 (b) | | | 4,555 | | | | 4,555 | |
| | |
New York City Transitional Finance Authority Future Tax Secured | | | | | | | | |
| | |
Subseries C-5, Rev., VRDO, LIQ: Bank of America NA, 0.03%, 9/1/2020 (b) | | | 1,730 | | | | 1,730 | |
| | |
Series 2014C, Rev., 5.00%, 11/1/2020 | | | 265 | | | | 267 | |
| | |
New York City Transitional Finance Authority, Future Tax Secured Subseries D-4, Rev., VRDO, LIQ: Mizuho Bank Ltd., 0.10%, 9/8/2020 (b) | | | 4,700 | | | | 4,700 | |
| | |
New York City Transitional Finance Authority, Future Tax Secured, Fiscal Year 2003 Subseries A-3, Rev., VRDO, LOC: Bank of Tokyo-Mitsubishi UFJ Ltd., 0.08%, 9/8/2020 (b) | | | 2,615 | | | | 2,615 | |
| | |
New York City Transitional Finance Authority, Future Tax Secured, Fiscal Year 2013 Subseries C-5, Rev., VRDO, LOC: Sumitomo Mitsui Banking Corp., 0.09%, 9/8/2020 (b) | | | 11,850 | | | | 11,850 | |
| | |
New York City Transitional Finance Authority, Future Tax Secured, Fiscal Year 2014 | | | | | | | | |
| | |
Subseries B-3, Rev., VRDO, LIQ: Barclays Bank plc, 0.03%, 9/1/2020 (b) | | | 2,160 | | | | 2,160 | |
| | |
Subseries D-3, Rev., VRDO, LIQ: Mizuho Bank Ltd., 0.04%, 9/1/2020 (b) | | | 22,950 | | | | 22,950 | |
| | |
New York City Transitional Finance Authority, Future Tax Secured, Fiscal Year 2015 Subseries A-3, Rev., VRDO, LIQ: Mizuho Bank Ltd., 0.04%, 9/1/2020 (b) | | | 4,935 | | | | 4,935 | |
SEE NOTES TO FINANCIAL STATEMENTS.
| | | | | | |
| | | |
| 30 | | | | J.P. MORGAN MONEY MARKET FUNDS | | AUGUST 31, 2020 |
| | | | | | | | |
| INVESTMENTS (a) | | PRINCIPAL
AMOUNT
($000) | | | VALUE
($000) | |
Municipal Bonds — continued | |
|
New York — continued | |
| | |
New York City Trust for Cultural Resources, American Museum of Natural History Series 2008-B3, Rev., VRDO, LIQ: Wells Fargo Bank NA, 0.08%, 9/8/2020 (b) | | | 5,275 | | | | 5,275 | |
| | |
New York City Water and Sewer System, Second General Resolution Subseries CC-1, Rev., VRDO, LIQ: Sumitomo Mitsui Banking Corp., 0.09%, 9/8/2020 (b) | | | 2,120 | | | | 2,120 | |
| | |
New York State Dormitory Authority, City University System, CONS Fifth General Resolution Series 2008D, Rev., VRDO, LOC: TD Bank NA, 0.07%, 9/8/2020 (b) | | | 1,600 | | | | 1,600 | |
| | |
New York State Housing Finance Agency, 160 Madison Avenue Housing Series 2013A, Rev., VRDO, LOC: Landesbank Hessen-Thueringen, 0.04%, 9/1/2020 (b) | | | 5,915 | | | | 5,915 | |
| | |
New York State Housing Finance Agency, Housing, 160 Madison Avenue Series 2014A, Rev., VRDO, LOC: Landesbank Hessen-Thueringen, 0.04%, 9/1/2020 (b) | | | 3,900 | | | | 3,900 | |
| | |
North Colonie Central School District GO, BAN, 1.25%, 7/16/2021 | | | 3,500 | | | | 3,527 | |
| | |
Orchard Park Central School District GO, BAN, 1.50%, 5/5/2021 | | | 5,000 | | | | 5,040 | |
| | |
RBC Municipal Products, Inc. Trust Series E-86, GO, VRDO, LOC: Royal Bank of Canada, 0.12%, 9/8/2020 (b) (c) | | | 9,165 | | | | 9,165 | |
| | |
Tender Option Bond Trust Receipts/Certificates | | | | | | | | |
| | |
Series 2018-XM0692, Rev., VRDO, LIQ: Royal Bank of Canada, 0.12%, 9/8/2020 (b) (c) | | | 1,600 | | | | 1,600 | |
| | |
Series 2015-XF0238, Rev., VRDO, LIQ: TD Bank NA, 0.13%, 9/8/2020 (b) (c) | | | 13,815 | | | | 13,815 | |
| | |
Series 2016-ZF0381, Rev., VRDO, LIQ: TD Bank NA, 0.14%, 9/8/2020 (b) (c) | | | 4,370 | | | | 4,370 | |
| | |
Town of Vestal GO, BAN, 2.00%, 5/7/2021 | | | 8,418 | | | | 8,505 | |
| | |
Triborough Bridge and Tunnel Authority, MTA Bridges and Tunnels | | | | | | | | |
| | |
Series 2003 B-1, Rev., VRDO, LOC: Bank of America NA, 0.03%, 9/1/2020 (b) | | | 17,525 | | | | 17,525 | |
| | |
Union Springs Central School District GO, BAN, 1.75%, 4/30/2021 | | | 9,900 | | | | 9,988 | |
| | | | | | | | |
| | |
| | | | | | | 352,754 | |
| | | | | | | | |
|
North Carolina — 2.3% | |
| | |
Charlotte-Mecklenburg Hospital Authority, Health Care Series 2018F, Rev., VRDO, 0.08%, 9/8/2020 (b) | | | 11,115 | | | | 11,115 | |
| | |
City of Raleigh, Downtown Improvement Projects Series 2005-B-2, COP, VRDO, LIQ: PNC Bank NA, 0.10%, 9/8/2020 (b) | | | 5,885 | | | | 5,885 | |
| | | | | | | | |
| INVESTMENTS (a) | | PRINCIPAL
AMOUNT
($000) | | | VALUE
($000) | |
| | | | | | | | |
|
North Carolina — continued | |
| | |
Tender Option Bond Trust Receipts/Certificates Series 2019-ZF2813, Rev., VRDO, LIQ: Barclays Bank plc, 0.14%, 9/8/2020 (b) (c) | | | 3,415 | | | | 3,415 | |
| | |
University of North Carolina, Hospital at Chapel Hill | | | | | | | | |
| | |
Series 2001 A, Rev., VRDO, LIQ: Landesbank Hessen-Thueringen, 0.04%, 9/1/2020 (b) | | | 8,670 | | | | 8,670 | |
| | |
Series 2001 B, Rev., VRDO, LIQ: Landesbank Hessen-Thueringen, 0.04%, 9/1/2020 (b) | | | 5,935 | | | | 5,935 | |
| | |
Series 2003 B, Rev., VRDO, LIQ: TD Bank NA, 0.07%, 9/8/2020 (b) | | | 6,755 | | | | 6,755 | |
| | | | | | | | |
| | |
| | | | | | | 41,775 | |
| | | | | | | | |
|
Ohio — 2.6% | |
| | |
Ohio Higher Educational Facility Commission, Cleveland Clinic Health System Obligated Group | | | | | | | | |
| | |
Series 2008-B4, Rev., VRDO, LIQ: Barclays Bank plc, 0.03%, 9/1/2020 (b) | | | 15,000 | | | | 15,000 | |
| | |
Series 2013-B-1, Rev., VRDO, LIQ: Wells Fargo Bank NA, 0.03%, 9/1/2020 (b) | | | 8,650 | | | | 8,650 | |
| | |
State of Ohio, Cleveland Clinic Health System Series 2019D-2, Rev., VRDO, 0.09%, 9/8/2020 (b) | | | 9,000 | | | | 9,000 | |
| | |
Tender Option Bond Trust Receipts/Certificates | | | | | | | | |
| | |
Series 2019-E132, Rev., VRDO, LOC: Royal Bank of Canada, 0.12%, 9/8/2020 (b) (c) | | | 10,000 | | | | 10,000 | |
| | |
Series 2020-XF2889, Rev., VRDO, LOC: Barclays Bank plc, 0.13%, 9/8/2020 (b) (c) | | | 4,705 | | | | 4,705 | |
| | | | | | | | |
| | |
| | | | | | | 47,355 | |
| | | | | | | | |
|
Oklahoma — 0.1% | |
| | |
Tender Option Bond Trust Receipts/Certificates Series 2020-XF2884, Rev., VRDO, LOC: Barclays Bank plc, 0.13%, 9/8/2020 (b) (c) | | | 1,370 | | | | 1,370 | |
| | | | | | | | |
|
Oregon — 0.2% | |
| | |
Oregon State Facilities Authority, PeaceHealth Series 2018B, Rev., VRDO, LOC: TD Bank NA, 0.02%, 9/1/2020 (b) | | | 3,555 | | | | 3,555 | |
| | | | | | | | |
|
Pennsylvania — 4.9% | |
| | |
Delaware Valley Regional Finance Authority Series 2020A, Rev., VRDO, LOC: TD Bank NA, 0.09%, 9/8/2020 (b) | | | 25,000 | | | | 25,000 | |
| | |
Pennsylvania Turnpike Commission Series 2020A, Rev., VRDO, LOC: Barclays Bank plc, 0.07%, 9/8/2020 (b) | | | 18,000 | | | | 18,000 | |
| | |
Philadelphia Authority for Industrial Development, The Franklin Institute Project Rev., VRDO, LOC: Bank of America NA, 0.15%, 9/8/2020 (b) | | | 2,840 | | | | 2,840 | |
SEE NOTES TO FINANCIAL STATEMENTS.
| | | | | | | | |
| | | |
| AUGUST 31, 2020 | | J.P. MORGAN MONEY MARKET FUNDS | | | | | 31 | |
JPMorgan Institutional Tax Free Money Market Fund
SCHEDULE OF PORTFOLIO INVESTMENTS
AS OF AUGUST 31, 2020 (Unaudited) (continued)
| | | | | | | | |
| INVESTMENTS (a) | | PRINCIPAL
AMOUNT
($000) | | | VALUE
($000) | |
Municipal Bonds — continued | |
|
Pennsylvania — continued | |
| | |
RBC Municipal Products, Inc. Trust Series 2018-G-43, Rev., VRDO, LOC: Royal Bank of Canada, 0.29%, 9/8/2020 (b) (c) | | | 5,000 | | | | 5,000 | |
| | |
RBC Municipal Products, Inc. Trust, Floater Certificates | | | | | | | | |
| | |
Series E-111, Rev., VRDO, LOC: Royal Bank of Canada, 0.05%, 9/1/2020 (b) (c) | | | 23,860 | | | | 23,860 | |
| | |
Series E-101, Rev., VRDO, LOC: Royal Bank of Canada, 0.12%, 9/8/2020 (b) (c) | | | 10,000 | | | | 10,000 | |
| | |
Tender Option Bond Trust Receipts/Certificates Series 2020-XF2885, Rev., VRDO, LOC: Barclays Bank plc, 0.13%, 9/8/2020 (b) (c) | | | 1,250 | | | | 1,250 | |
| | |
Series 2020-XM0876, Rev., VRDO, LIQ: Royal Bank of Canada, 0.13%, 9/8/2020 (b) (c) | | | 1,875 | | | | 1,875 | |
| | | | | | | | |
| | |
| | | | | | | 87,825 | |
| | | | | | | | |
|
Rhode Island — 0.8% | |
| | |
Tender Option Bond Trust Receipts/Certificates | | | | | | | | |
| | |
Series 2018-ZF2712, Rev., VRDO, GNMA/FNMA/FHLMC, LIQ: Morgan Stanley Bank, 0.12%, 9/8/2020 (b) (c) | | | 2,265 | | | | 2,265 | |
| | |
Series 2019-ZF2826, Rev., VRDO, GNMA/FNMA/FHLMC, LIQ: Barclays Bank plc, 0.13%, 9/8/2020 (b) (c) | | | 3,570 | | | | 3,570 | |
| | |
Series 2018-ZM0631, Rev., VRDO, LIQ: Royal Bank of Canada, 0.15%, 9/8/2020 (b) (c) | | | 6,035 | | | | 6,035 | |
| | |
Series 2018-ZM0632, Rev., VRDO, LIQ: Royal Bank of Canada, 0.15%, 9/8/2020 (b) (c) | | | 4,050 | | | | 4,050 | |
| | | | | | | | |
| | |
| | | | | | | 15,920 | |
| | | | | | | | |
|
South Carolina — 1.2% | |
| | |
County of Richland GO, BAN, 3.00%, 2/25/2021 | | | 5,250 | | | | 5,301 | |
| | |
County Square Redevelopment Corp., Installment Purchase Rev., BAN, 2.00%, 3/24/2021 | | | 3,000 | | | | 3,022 | |
| | |
South Carolina Public Service Authority Series 2019A, Rev., VRDO, LOC: Bank of America NA, 0.20%, 9/8/2020 (b) | | | 4,970 | | | | 4,970 | |
| | |
Tender Option Bond Trust Receipts/Certificates Series 2019-G-109, Rev., VRDO, LOC: Royal Bank of Canada, 0.29%, 9/8/2020 (b) (c) | | | 5,000 | | | | 5,000 | |
| | |
Town of Lexington, Combined Waterworks and Sewer System Rev., BAN, 2.50%, 10/27/2020 | | | 3,330 | | | | 3,336 | |
| | | | | | | | |
| | |
| | | | | | | 21,629 | |
| | | | | | | | |
|
South Dakota — 0.4% | |
| | |
South Dakota Housing Development Authority Series 2020D, Rev., VRDO, LIQ: FHLB, 0.10%, 9/8/2020 (b) | | | 7,600 | | | | 7,600 | |
| | | | | | | | |
| | | | | | | | |
| INVESTMENTS (a) | | PRINCIPAL
AMOUNT
($000) | | | VALUE
($000) | |
| | | | | | | | |
|
Tennessee — 1.2% | |
| | |
Clarksville Public Building Authority, Pooled Financing, Tennessee Municipal Bond Fund Rev., VRDO, LOC: Bank of America NA, 0.06%, 9/1/2020 (b) | | | 12,195 | | | | 12,195 | |
| | |
Montgomery County Public Building Authority, Pooled Financing Series 1999, Rev., VRDO, LOC: Bank of America NA, 0.12%, 9/8/2020 (b) | | | 3,840 | | | | 3,840 | |
| | |
Tender Option Bond Trust Receipts/Certificates Series 2015-XF1023, Rev., VRDO, LOC: Barclays Bank plc, 0.13%, 9/8/2020 (b) (c) | | | 5,905 | | | | 5,905 | |
| | | | | | | | |
| | |
| | | | | | | 21,940 | |
| | | | | | | | |
|
Texas — 5.9% | |
| | |
City of Austin, Texas Hotel Occupancy Tax, Subordinate Lien Series 2008B, Rev., VRDO, LOC: Sumitomo Mitsui Banking Corp., 0.11%, 9/8/2020 (b) | | | 1,150 | | | | 1,150 | |
| | |
City of Dallas GO, 5.00%, 2/15/2021 | | | 3,240 | | | | 3,310 | |
| | |
City of Houston, Airport System Subordinate Lien Rev., VRDO, LOC: Barclays Bank plc, 0.10%, 9/8/2020 (b) | | | 1,200 | | | | 1,200 | |
| | |
Harris County Cultural Education Facilities Finance Corp., Memorial Hermann Health System | | | | | | | | |
| | |
Series 2016D, Rev., VRDO, 0.10%, 9/8/2020 (b) | | | 7,075 | | | | 7,075 | |
| | |
Series 2019F, Rev., VRDO, 0.10%, 9/8/2020 (b) | | | 9,000 | | | | 9,000 | |
| | |
Lower Neches Valley Authority Industrial Development Corp., Exxonmobil Project | | | | | | | | |
| | |
Rev., VRDO, 0.03%, 9/1/2020 (b) | | | 10,245 | | | | 10,245 | |
| | |
Series 2001A-2, Rev., VRDO, 0.03%, 9/1/2020 (b) | | | 2,635 | | | | 2,635 | |
| | |
Series 2002A, Rev., VRDO, 0.03%, 9/1/2020 (b) | | | 250 | | | | 250 | |
| | |
Series A-3, Rev., VRDO, 0.03%, 9/1/2020 (b) | | | 300 | | | | 300 | |
| | |
RBC Municipal Products, Inc. Trust, Floater Certificates Series 2019-G112, Rev., VRDO, LOC: Royal Bank of Canada, 0.29%, 9/8/2020 (b) (c) | | | 9,000 | | | | 9,000 | |
| | |
State of Texas, Veterans | | | | | | | | |
| | |
Series 2012A, GO, VRDO, LIQ: State Street Bank & Trust, 0.11%, 9/8/2020 (b) | | | 1,815 | | | | 1,815 | |
| | |
Series 2015 A, GO, VRDO, LIQ: State Street Bank & Trust, 0.14%, 9/8/2020 (b) | | | 5,920 | | | | 5,920 | |
| | |
State of Texas, Veterans Housing Assistance Program Series 2008 B, GO, VRDO, LIQ: State Street Bank & Trust, 0.14%, 9/8/2020 (b) | | | 19,465 | | | | 19,465 | |
SEE NOTES TO FINANCIAL STATEMENTS.
| | | | | | |
| | | |
| 32 | | | | J.P. MORGAN MONEY MARKET FUNDS | | AUGUST 31, 2020 |
| | | | | | | | |
| INVESTMENTS (a) | | PRINCIPAL
AMOUNT
($000) | | | VALUE
($000) | |
Municipal Bonds — continued | |
|
Texas — continued | |
| | |
Tarrant County Cultural Education Facilities Finance Corp., Texas Health Resources System | | | | | | | | |
| | |
Series 2008 A, Rev., VRDO, 0.10%, 9/8/2020 (b) | | | 2,000 | | | | 2,000 | |
| | |
Series 2012 B, Rev., VRDO, 0.10%, 9/8/2020 (b) | | | 11,155 | | | | 11,155 | |
| | |
Tender Option Bond Trust Receipts/Certificates | | | | | | | | |
| | |
Series 2018-ZF2570, Rev., VRDO, LIQ: Morgan Stanley Bank, 0.12%, 9/8/2020 (b) (c) | | | 5,995 | | | | 5,995 | |
| | |
Series 2018-ZF2662, GO, VRDO, PSF-GTD, LIQ: Morgan Stanley Bank, 0.12%, 9/8/2020 (b) (c) | | | 3,840 | | | | 3,840 | |
| | |
Series 2018-ZF2721, GO, VRDO, LIQ: Morgan Stanley Bank, 0.12%, 9/8/2020 (b) (c) | | | 3,335 | | | | 3,335 | |
| | |
Series 2020-YX1132, Rev., VRDO, LOC: Barclays Bank plc, 0.13%, 9/8/2020 (b) (c) | | | 5,005 | | | | 5,005 | |
| | |
Series 2018-XF0645, Rev., VRDO, LIQ: TD Bank NA, 0.14%, 9/8/2020 (b) (c) | | | 4,000 | | | | 4,000 | |
| | | | | | | | |
| | |
| | | | | | | 106,695 | |
| | | | | | | | |
|
Utah — 0.4% | |
| | |
Tender Option Bond Trust Receipts/Certificates | | | | | | | | |
| | |
Series 2018-ZM0652, Rev., VRDO, LIQ: Morgan Stanley Bank, 0.12%, 9/8/2020 (b) (c) | | | 3,425 | | | | 3,425 | |
| | |
Series 2018-XG0171, Rev., VRDO, LIQ: Royal Bank of Canada, 0.15%, 9/8/2020 (b) (c) | | | 3,000 | | | | 3,000 | |
| | | | | | | | |
| | |
| | | | | | | 6,425 | |
| | | | | | | | |
|
Vermont — 0.1% | |
| | |
Vermont Educational and Health Buildings Financing Agency, Southwestern Vermont Medical Center Series 2008A, Rev., VRDO, LOC: TD Bank NA, 0.05%, 9/1/2020 (b) | | | 1,550 | | | | 1,550 | |
| | | | | | | | |
|
Virginia — 4.2% | |
| | |
Albermarle County Economic Development Authority, Sentara Martha Jefferson Hospital Series 2018B, Rev., VRDO, LIQ: TD Bank NA, 0.03%, 9/1/2020 (b) | | | 7,870 | | | | 7,870 | |
| | |
Albermarle County Economic Development Authority, Virginia Hospital Facilities, Sentara Martha Jefferson Hospital Series 2018B, Rev., VRDO, LIQ: TD Bank NA, 0.09%, 9/8/2020 (b) | | | 445 | | | | 445 | |
| | |
Fairfax County Industrial Development Authority, Health Care System Series 2016C, Rev., VRDO, 0.09%, 9/8/2020 (b) | | | 4,350 | | | | 4,350 | |
| | | | | | | | |
| INVESTMENTS (a) | | PRINCIPAL
AMOUNT
($000) | | | VALUE
($000) | |
| | | | | | | | |
|
Virginia — continued | |
| | |
Loudoun County Economic Development Authority, Howard Hughes Medical Institute | | | | | | | | |
| | |
Series 2003D, Rev., VRDO, 0.09%, 9/8/2020 (b) | | | 1,100 | | | | 1,100 | |
| | |
Series 2009B, Rev., VRDO, 0.09%, 9/8/2020 (b) | | | 125 | | | | 125 | |
| | |
Series 2003E, Rev., VRDO, 0.10%, 9/8/2020 (b) | | | 1,200 | | | | 1,200 | |
| | |
Series 2003F, Rev., VRDO, 0.10%, 9/8/2020 (b) | | | 3,695 | | | | 3,695 | |
| | |
Norfolk Economic Development Authority, Sentara Healthcare Obligated Group Series 2016A, Rev., VRDO, 0.09%, 9/8/2020 (b) | | | 700 | | | | 700 | |
| | |
Roanoke Economic Development Authority, Carilion Clinic Obligated Group Series 2020B, Rev., VRDO, LIQ: PNC Bank NA, 0.10%, 9/8/2020 (b) | | | 10,000 | | | | 10,000 | |
| | |
Roanoke Economic Development Authority, Health System Series 2005A, Rev., VRDO, LIQ: PNC Bank NA, 0.10%, 9/8/2020 (b) | | | 39,470 | | | | 39,470 | |
| | |
Tender Option Bond Trust Receipts/Certificates | | | | | | | | |
| | |
Series 2018-XL0069, Rev., VRDO, LIQ: Barclays Bank plc, 0.12%, 9/8/2020 (b) (c) | | | 4,230 | | | | 4,230 | |
| | |
Series 2020-XF0955, Rev., VRDO, LIQ: TD Bank NA, 0.14%, 9/8/2020 (b) (c) | | | 5,335 | | | | 5,335 | |
| | | | | | | | |
| | |
| | | | | | | 78,520 | |
| | | | | | | | |
|
Washington — 0.2% | |
| | |
State of Washington Series R-2020D, GO, 5.00%, 1/1/2021 | | | 260 | | | | 264 | |
| | |
State of Washington, Various Purpose
Series R-2020C, GO, 5.00%, 1/1/2021 | | | 3,000 | | | | 3,048 | |
| | | | | | | | |
| | |
| | | | | | | 3,312 | |
| | | | | | | | |
|
Wisconsin — 0.1% | |
| | |
Wisconsin Housing and Economic Development Authority Series 2009A, Rev., VRDO, LOC: Bank of America NA, 0.10%, 9/8/2020 (b) | | | 1,200 | | | | 1,200 | |
| | | | | | | | |
| |
Total Municipal Bonds
(Cost $1,534,463) | | | | 1,534,827 | |
| | | | | |
Repurchase Agreements — 5.4% | |
| | |
Citigroup Global Markets Holdings, Inc., 0.07%, dated 8/31/2020, due 9/1/2020, repurchase price $99,840, collateralized by U.S. Treasury Securities, 0.25% - 3.00%, due 2/15/2049 - 2/15/2050, with a value of $101,837. (Cost $99,840) | | | 99,840 | | | | 99,840 | |
| | | | | | | | |
SEE NOTES TO FINANCIAL STATEMENTS.
| | | | | | | | |
| | | |
| AUGUST 31, 2020 | | J.P. MORGAN MONEY MARKET FUNDS | | | | | 33 | |
JPMorgan Institutional Tax Free Money Market Fund
SCHEDULE OF PORTFOLIO INVESTMENTS
AS OF AUGUST 31, 2020 (Unaudited) (continued)
| | | | | | | | |
| INVESTMENTS (a) | | SHARES
(000) | | | VALUE
($000) | |
Variable Rate Demand Preferred Shares — 3.3% | |
|
New York — 0.6% | |
| | |
Nuveen New York AMT-Free Quality Municipal Income Fund Series 3, LIQ: Citi Bank NA, 0.12%, 9/8/2020 # (c) | | | 10,000 | | | | 10,000 | |
| | | | | | | | |
|
Other — 2.7% | |
| | |
Nuveen AMT-Free Municipal Credit Income Fund | | | | | | | | |
| | |
Series 1, LIQ: Citi Bank NA, 0.14%, 9/8/2020 # (c) | | | 11,000 | | | | 11,000 | |
| | |
Series 5, LIQ: Societe Generale, 0.14%, 9/8/2020 # (c) | | | 10,000 | | | | 10,000 | |
| | |
Series 6, LIQ: Sumitomo Mitsui Banking Corp., 0.14%, 9/8/2020 # (c) | | | 9,000 | | | | 9,000 | |
| | |
Nuveen AMT-Free Quality Municipal Income Fund | | | | | | | | |
| | |
Series 3, LIQ: TD Bank NA, 0.14%, 9/8/2020 # (c) | | | 5,000 | | | | 5,000 | |
| | |
Series 4 - 4895, LIQ: Barclays Bank plc, 0.14%, 9/8/2020 # (c) | | | 10,000 | | | | 10,000 | |
| | |
Series 5 - 1000, LOC: Sumitomo Mitsui Banking Corp., 0.14%, 9/8/2020 # (c) | | | 5,000 | | | | 5,000 | |
| | | | | | | | |
| | |
| | | | | | | 50,000 | |
| | | | | | | | |
| |
Total Variable Rate Demand Preferred Shares
(Cost $60,000) | | | | 60,000 | |
| | | | | |
| | |
| | | PRINCIPAL
AMOUNT
($000) | | | | |
Short-Term Investments — 9.9% | |
|
Commercial Paper — 9.9% | |
| | |
Alachua County Health Facilities Authority Series 08-A, 0.18%, 10/8/2020 | | | 5,000 | | | | 5,000 | |
| | |
Board of Regents of the University of Texas System | | | | | | | | |
| | |
Series A, 0.23%, 2/2/2021 | | | 5,000 | | | | 5,001 | |
| | |
Series A, 0.24%, 2/3/2021 | | | 1,000 | | | | 1,000 | |
| | |
Series A, 0.45%, 2/18/2021 | | | 5,000 | | | | 5,006 | |
| | |
Series A, 0.43%, 2/19/2021 | | | 3,500 | | | | 3,504 | |
| | |
Series A, 0.40%, 2/22/2021 | | | 5,000 | | | | 5,005 | |
| | |
California Statewide Communities Development Authority | | | | | | | | |
| | |
0.50%, 9/9/2020 | | | 5,000 | | | | 5,001 | |
| | |
Series 08-C, 0.28%, 12/9/2020 | | | 17,500 | | | | 17,504 | |
| | |
Series B-5, 0.21%, 1/6/2021 | | | 5,000 | | | | 5,001 | |
| | |
Series 9B-4, 0.24%, 2/2/2021 | | | 5,000 | | | | 5,001 | |
| | |
City of Garland | | | | | | | | |
| | |
0.23%, 9/14/2020 | | | 5,000 | | | | 5,000 | |
| | |
0.25%, 9/21/2020 | | | 4,500 | | | | 4,500 | |
| | |
City of Houston Series H-2, 0.24%, 10/7/2020 | | | 5,000 | | | | 5,000 | |
| | |
City of Jacksonville, Health Care Authority 0.23%, 2/4/2021 | | | 6,000 | | | | 6,000 | |
| | | | | | | | |
| INVESTMENTS (a) | | PRINCIPAL
AMOUNT
($000) | | | VALUE
($000) | |
| | | | | | | | |
|
Commercial Paper — continued | |
| | |
City of Philadelphia | | | | | | | | |
| | |
Series A-1, 0.19%, 11/12/2020 | | | 5,100 | | | | 5,100 | |
| | |
City of San Antonio, Electric and Gas System | | | | | | | | |
| | |
Series C, 0.61%, 9/8/2020 | | | 10,000 | | | | 10,001 | |
| | |
County of Harris | | | | | | | | |
| | |
Series J-1, 0.22%, 1/19/2021 | | | 100 | | | | 100 | |
| | |
Series J-1, 0.30%, 1/19/2021 | | | 250 | | | | 250 | |
| | |
County of Harris, Toll Road Authority (The) | | | | | | | | |
| | |
Series E-2, 0.22%, 9/17/2020 | | | 2,450 | | | | 2,450 | |
| | |
Series E-1, 0.30%, 9/17/2020 | | | 3,060 | | | | 3,060 | |
| | |
Series E-1, 0.23%, 10/15/2020 | | | 3,300 | | | | 3,300 | |
| | |
Series E-2, 0.21%, 11/5/2020 | | | 10,000 | | | | 10,001 | |
| | |
County of Hillsborough | | | | | | | | |
| | |
Series A, 0.24%, 9/24/2020 | | | 3,300 | | | | 3,300 | |
| | |
County of York | | | | | | | | |
| | |
Series 00B3, 0.22%, 9/1/2020 | | | 12,000 | | | | 12,000 | |
| | |
Illinois Finance Authority | | | | | | | | |
| | |
Series 12-H, 0.17%, 9/10/2020 | | | 5,000 | | | | 5,000 | |
| | |
Louisville & Jefferson County Metropolitan Sewer District | | | | | | | | |
| | |
Series A-1, 0.32%, 9/1/2020 | | | 10,000 | | | | 10,000 | |
| | |
Massachusetts Health and Educational Facilities Authority | | | | | | | | |
| | |
Series H-2, 0.25%, 11/5/2020 | | | 10,750 | | | | 10,752 | |
| | |
Omaha Public Power District | | | | | | | | |
| | |
Series A, 0.19%, 12/7/2020 | | | 8,700 | | | | 8,701 | |
| | |
Southwestern Illinois Development Authority, Health Facilities | | | | | | | | |
| | |
Series 17-B, 0.26%, 10/5/2020 | | | 4,870 | | | | 4,871 | |
| | |
Series 17-B, 0.19%, 10/16/2020 | | | 5,000 | | | | 5,000 | |
| | |
University of California | | | | | | | | |
| | |
Series A, 0.35%, 2/22/2021 | | | 5,000 | | | | 5,006 | |
| | |
University of Houston | | | | | | | | |
| | |
Series TE-A, 0.27%, 9/2/2020 | | | 679 | | | | 679 | |
| | |
University of Minnesota | | | | | | | | |
| | |
0.18%, 10/9/2020 | | | 4,500 | | | | 4,500 | |
| | | | | | | | |
| |
Total Commercial Paper
(Cost $181,560) | | | | 181,594 | |
| | | | | |
| |
Total Short-Term Investments
(Cost $181,560) | | | | 181,594 | |
| | | | | |
Total Investments — 102.2%
(Cost $1,875,863) | | | | 1,876,261 | |
Liabilities in Excess of
Other Assets — (2.2)% | | | | (40,421 | ) |
| | | | | |
NET ASSETS — 100.0% | | | | 1,835,840 | |
| | | | | |
Percentages indicated are based on net assets.
SEE NOTES TO FINANCIAL STATEMENTS.
| | | | | | |
| | | |
| 34 | | | | J.P. MORGAN MONEY MARKET FUNDS | | AUGUST 31, 2020 |
Abbreviations
| | |
| AGM | | Insured by Assured Guaranty Municipal Corp. |
| AMT | | Alternative Minimum Tax |
| BAN | | Bond Anticipation Note |
| CONS | | Consolidated Bonds |
| COP | | Certificate of Participation |
| CR | | Custodial Receipts |
| FHA | | Federal Housing Administration |
| FHLB | | Federal Home Loan Bank |
| FHLMC | | Federal Home Loan Mortgage Corp. |
| FNMA | | Federal National Mortgage Association |
| GNMA | | Government National Mortgage Association |
| GO | | General Obligation |
| GTD | | Guaranteed |
| LIQ | | Liquidity Agreement |
| LOC | | Letter of Credit |
| MTA | | Metropolitan Transportation Authority |
| | |
| PSF-GTD | | Permanent School Fund Guaranteed |
| Q-SBLF | | Qualified School Bond Loan Fund |
| Rev. | | Revenue |
| TAN | | Tax Anticipation Note |
| VRDO | | Variable Rate Demand Obligation |
| |
| (a) | | The date shown represents the earliest of the next put date, next demand date or final maturity date. |
| (b) | | Variable or floating rate security, the interest rate of which adjusts periodically based on changes in current interest rates and prepayments on the underlying pool of assets. The interest rate shown is the current rate as of August 31, 2020. |
| (c) | | Securities exempt from registration under Rule 144A or section 4(a)(2), of the Securities Act of 1933, as amended. |
| # | | Variable Rate Demand Preferred Shares of a closed-end investment company which has a weekly demand feature. The interest rate shown is the rate in effect as of August 31, 2020. |
SEE NOTES TO FINANCIAL STATEMENTS.
| | | | | | | | |
| | | |
| AUGUST 31, 2020 | | J.P. MORGAN MONEY MARKET FUNDS | | | | | 35 | |
JPMorgan Securities Lending Money Market Fund
SCHEDULE OF PORTFOLIO INVESTMENTS
AS OF AUGUST 31, 2020 (Unaudited)
| | | | | | | | |
| INVESTMENTS (a) | | PRINCIPAL
AMOUNT
($000) | | | VALUE
($000) | |
Repurchase Agreements — 7.4% | |
| | |
Agency Joint Trading Account II, J.P. Morgan Investment Management Inc., as agent, 0.09%, dated 8/31/2020, due 9/1/2020, repurchase price $233,814.[2] | | | 233,813 | | | | 233,813 | |
| | |
Societe Generale SA, 0.30%, dated 8/31/2020, due 9/1/2020, repurchase price $25,000, collateralized by Asset-Backed Securities, 0.42% - 8.09%, due 1/25/2030 -1/25/2037, Collateralized Mortgage Obligations, 0.58% - 6.21%, due 7/25/2036 - 6/11/2042, Corporate Notes and Bonds, 4.88% - 12.00%, due 12/15/2022 - 2/15/2030, FHLMC, 2.48% - 3.28%, due 12/26/2029 - 3/25/2050, FNMA Connecticut Avenue Securities, 2.23% - 3.83%, due 9/25/2029 - 1/25/2040 and Sovereign Government Securities, 6.35% - 7.63%, due 8/10/2024 -1/23/2030, with a value of $27,000. | | | 25,000 | | | | 25,000 | |
| | |
Societe Generale SA, 0.32%, dated 8/31/2020, due 9/3/2020, repurchase price $10,000, collateralized by Asset-Backed Securities, 0.32% - 8.09%, due 1/25/2030 - 2/28/2040, Collateralized Mortgage Obligations, 0.37% - 6.00%, due 5/25/2035 - 7/20/2046, Corporate Notes and Bonds, 4.63% - 11.75%, due 4/1/2023 - 9/30/2039, FHLMC, 0.83% - 3.28%, due 12/26/2029 - 3/25/2050, FNMA Connecticut Avenue Securities, 2.18% - 3.83%, due 9/25/2029 - 1/25/2040 and Sovereign Government Securities, 4.25% -11.88%, due 12/23/2023 - 9/30/2049, with a value of $10,801. | | | 10,000 | | | | 10,000 | |
| | | | | | | | |
| |
Total Repurchase Agreements
(Cost $268,813) | | | | 268,813 | |
| | | | | |
Municipal Bonds — 0.4% | |
|
Alaska — 0.3% | |
| | |
Alaska Housing Finance Corp., State Capital Project Series 2019A, Rev., VRDO, 0.20%, 9/8/2020 (b) | | | 10,000 | | | | 10,000 | |
| | | | | | | | |
|
New York — 0.1% | |
| | |
New York State Dormitory Authority, State Personal Income Tax, General Purpose Series 2020B, Rev., RAN, 5.00%, 3/31/2021 | | | 5,000 | | | | 5,141 | |
| | | | | | | | |
| |
Total Municipal Bonds
(Cost $15,128) | | | | 15,141 | |
| | | | | |
| | | | | | | | |
| INVESTMENTS (a) | | PRINCIPAL
AMOUNT
($000) | | | VALUE
($000) | |
Short-Term Investments — 92.2% | |
|
Commercial Paper — 51.1% | |
| | |
Atlantic Asset Securitization LLC 1.17%, 10/2/2020 (c) (d) | | | 50,000 | | | | 49,993 | |
| | |
Banco Del Estado De Chile (Chile) | | | | | | | | |
| | |
0.30%, 10/20/2020 (c) (d) | | | 10,000 | | | | 9,998 | |
| | |
0.29%, 10/22/2020 (c) (d) | | | 39,000 | | | | 38,990 | |
| | |
Barclays Bank plc (United Kingdom) 0.09%, 9/1/2020 (c) (d) | | | 134,998 | | | | 134,998 | |
| | |
Barton Capital SA 0.11%, 9/1/2020 (c) (d) | | | 90,374 | | | | 90,374 | |
| | |
BNG Bank NV (Netherlands) 1.20%, 9/1/2020 (c) (d) | | | 34,000 | | | | 34,000 | |
| | |
BNP Paribas SA (France) (ICE LIBOR USD 3 Month + 0.07%), 0.34%, 10/9/2020 (e) | | | 75,000 | | | | 75,008 | |
| | |
BNZ International Funding Ltd. (New Zealand) 0.19%, 11/9/2020 (c) (d) | | | 55,000 | | | | 54,988 | |
| | |
BPCE SA (France) 0.46%, , 3/19/2021 (c) (d) | | �� | 25,000 | | | | 24,970 | |
| | |
Caisse d’Amortissement de la Dette Sociale (France) 0.40%, 3/25/2021 (c) (d) | | | 40,000 | | | | 39,946 | |
| | |
China Construction Bank Corp. (China) 0.10%, 9/1/2020 (c) (d) | | | 120,649 | | | | 120,649 | |
| | |
Cooperatieve Rabobank UA (Netherlands) 0.08%, 9/1/2020 (d) | | | 160,000 | | | | 160,000 | |
| | |
DBS Group Holdings Ltd. (Singapore) 0.83%, 11/4/2020 (c) (d) | | | 45,000 | | | | 44,987 | |
| | |
Dexia Credit Local SA (France) | | | | | | | | |
| | |
0.32%, 10/27/2020 (c) (d) | | | 13,000 | | | | 12,998 | |
| | |
0.57%, 10/30/2020 (c) (d) | | | 30,000 | | | | 29,994 | |
| | |
DNB Bank ASA (Norway) | | | | | | | | |
| | |
(ICE LIBOR USD 1 Month + 0.18%),
0.36%, 9/21/2020 (c) (e) | | | 75,000 | | | | 75,076 | |
| | |
(ICE LIBOR USD 3 Month + 0.07%),
0.34%, , 10/22/2020 (c) (e) | | | 20,000 | | | | 20,004 | |
| | |
(ICE LIBOR USD 3 Month + 0.15%),
0.41%, 11/5/2020 (c) (e) | | | 15,000 | | | | 15,013 | |
| | |
Exxon Mobil Corp. 2.15%, 9/24/2020 (d) | | | 50,000 | | | | 49,931 | |
| | |
First Abu Dhabi Bank PJSC (United Arab Emirates) 0.23%, 11/16/2020 (c) (d) | | | 30,000 | | | | 29,991 | |
| | |
Industrial & Commercial Bank of China Ltd. 0.09%, 9/1/2020 (c) (d) | | | 113,056 | | | | 113,056 | |
| | |
ING US Funding LLC (Netherlands) 0.45%, 2/1/2021 (d) | | | 100,000 | | | | 99,931 | |
| | |
Landesbank Baden-Wurttemberg (Germany) 0.13%, 9/1/2020 (d) | | | 80,000 | | | | 80,000 | |
| | |
LMA-Americas LLC | | | | | | | | |
| | |
0.20%, 11/4/2020 (c) (d) | | | 29,000 | | | | 28,991 | |
| | |
1.36%, 11/20/2020 (c) (d) | | | 30,000 | | | | 29,987 | |
| | |
Mitsubishi UFJ Trust & Banking Corp. (Japan) 0.32%, 10/5/2020 (c) (d) | | | 8,400 | | | | 8,399 | |
SEE NOTES TO FINANCIAL STATEMENTS.
| | | | | | |
| | | |
| 36 | | | | J.P. MORGAN MONEY MARKET FUNDS | | AUGUST 31, 2020 |
| | | | | | | | |
| INVESTMENTS (a) | | PRINCIPAL
AMOUNT
($000) | | | VALUE
($000) | |
Short-Term Investments — 92.2% | |
|
Commercial Paper — 51.1% | |
| | |
National Australia Bank Ltd. (Australia) (ICE LIBOR USD 1 Month + 0.22%),
0.41%, 9/24/2020 (c) (e) | | | 100,000 | | | | 100,086 | |
| | |
Natixis SA (France) 1.91%, 11/13/2020 (d) | | | 4,010 | | | | 3,995 | |
| | |
Oversea-Chinese Banking Corp. Ltd. (Singapore) (ICE LIBOR USD 3 Month + 0.10%),
0.42%, 9/10/2020 (c) (e) | | | 50,000 | | | | 50,002 | |
| | |
Sinopec Century Bright Capital Investment Ltd. (China) 0.40%, 9/1/2020 (c) (d) | | | 30,000 | | | | 30,000 | |
| | |
Societe Generale SA (France) | | | | | | | | |
| | |
0.56%, 10/26/2020 (c) (d) | | | 22,600 | | | | 22,595 | |
| | |
0.49%, 11/2/2020 (c) (d) | | | 3,000 | | | | 2,999 | |
| | |
Sumitomo Mitsui Trust Bank Ltd. (Japan) 0.50%, 10/26/2020 (c) (d) | | | 50,000 | | | | 49,988 | |
| | |
Svenska Handelsbanken AB (Sweden) (ICE LIBOR USD 3 Month + 0.15%),
0.41%, 11/6/2020 (c) (e) | | | 75,000 | | | | 75,082 | |
| | |
Toronto-Dominion Bank (The) (Canada) | | | | | | | | |
| | |
(US Federal Funds Effective Rate (continuous series) + 0.36%), 0.46%, 9/1/2020 (c) (e) | | | 50,000 | | | | 50,016 | |
| | |
(ICE LIBOR USD 3 Month + 0.23%),
0.49%, 11/3/2020 (c) (e) | | | 10,000 | | | | 10,012 | |
| | | | | | | | |
| |
Total Commercial Paper
(Cost $1,866,288) | | | | 1,867,047 | |
| | | | | |
|
Certificates of Deposit — 22.2% | |
| | |
Bank of Nova Scotia (The) (Canada) (ICE LIBOR USD 3 Month + 0.08%),
0.35%, 11/19/2020 (e) | | | 35,000 | | | | 35,017 | |
| | |
Canadian Imperial Bank of Commerce (Canada) | | | | | | | | |
| | |
(ICE LIBOR USD 3 Month + 0.11%),
0.43%, 9/10/2020 (e) | | | 12,000 | | | | 12,009 | |
| | |
0.42%, 7/7/2021 | | | 35,000 | | | | 35,062 | |
| | |
Cooperatieve Rabobank UA (Netherlands) (ICE LIBOR USD 3 Month + 0.15%),
0.40%, 11/6/2020 (e) | | | 15,000 | | | | 15,013 | |
| | |
Credit Industriel et Commercial (France) 0.35%, 1/4/2021 | | | 35,000 | | | | 35,021 | |
| | |
Credit Suisse AG (Switzerland) 1.55%, 10/6/2020 | | | 5,000 | | | | 5,000 | |
| | |
Industrial & Commercial Bank of China Ltd. (China) 0.60%, 10/23/2020 | | | 35,000 | | | | 35,019 | |
| | |
MUFG Bank Ltd. (Japan) | | | | | | | | |
| | |
1.15%, 10/19/2020 | | | 65,000 | | | | 65,090 | |
| | |
0.38%, 11/23/2020 | | | 35,000 | | | | 35,017 | |
| | | | | | | | |
| INVESTMENTS (a) | | PRINCIPAL
AMOUNT
($000) | | | VALUE
($000) | |
| | | | | | | | |
|
Certificates of Deposit — continued | |
| | |
Natixis SA (France) | | | | | | | | |
| | |
(US Federal Funds Effective Rate (continuous series) + 0.21%), 0.30%, 11/4/2020 (e) | | | 12,000 | | | | 12,000 | |
| | |
0.57%, 12/2/2020 | | | 14,500 | | | | 14,514 | |
| | |
1.00%, 1/21/2021 | | | 20,000 | | | | 20,064 | |
| | |
0.55%, 2/17/2021 | | | 20,000 | | | | 20,033 | |
| | |
0.43%, 3/23/2021 | | | 10,270 | | | | 10,281 | |
| | |
Nordea Bank Abp (Finland) (ICE LIBOR USD 3 Month + 0.10%),
0.43%, 9/8/2020 (e) | | | 75,000 | | | | 75,058 | |
| | |
Oversea-Chinese Banking Corp. Ltd. (Singapore) 1.60%, 10/2/2020 | | | 30,000 | | | | 30,000 | |
| | |
Royal Bank of Canada (Canada) | | | | | | | | |
| | |
(US Federal Funds Effective Rate (continuous series) + 0.18%), 0.27%, 9/1/2020 (e) | | | 30,000 | | | | 30,000 | |
| | |
(ICE LIBOR USD 3 Month + 0.30%),
0.55%, 11/4/2020 (e) | | | 10,000 | | | | 10,019 | |
| | |
Skandinaviska Enskilda Banken AB (Sweden) (ICE LIBOR USD 3 Month + 0.04%),
0.29%, 11/12/2020 (e) | | | 23,000 | | | | 23,000 | |
| | |
Standard Chartered Bank (United Kingdom) | | | | | | | | |
| | |
2.09%, 9/18/2020 | | | 6,000 | | | | 6,006 | |
| | |
1.36%, 10/13/2020 | | | 65,000 | | | | 65,089 | |
| | |
Sumitomo Mitsui Banking Corp. (Japan) | | | | | | | | |
| | |
0.22%, 11/30/2020 | | | 22,000 | | | | 22,003 | |
| | |
0.26%, 2/4/2021 | | | 90,000 | | | | 90,011 | |
| | |
Sumitomo Mitsui Trust Bank Ltd. (Japan) | | | | | | | | |
| | |
0.42%, 11/2/2020 | | | 12,750 | | | | 12,756 | |
| | |
0.21%, 11/16/2020 | | | 11,000 | | | | 11,001 | |
| | |
Toronto-Dominion Bank (The) (Canada) (ICE LIBOR USD 3 Month + 0.09%),
0.36%, 11/19/2020 (e) | | | 30,000 | | | | 30,009 | |
| | |
UBS AG (Switzerland) 1.55%, 1/4/2021 | | | 25,000 | | | | 25,114 | |
| | |
Wells Fargo Bank NA (ICE LIBOR USD 3 Month + 0.08%), 0.39%, 9/9/2020 (e) | | | 30,000 | | | | 30,000 | |
| | | | | | | | |
| |
Total Certificates of Deposit
(Cost $808,540) | | | | 809,206 | |
| | | | | |
|
Time Deposits — 14.8% | |
| | |
Credit Agricole Corporate and Investment Bank 0.09%, , 9/1/2020 | | | 70,000 | | | | 70,000 | |
| | |
Erste Group Bank AG 0.09%, , 9/1/2020 | | | 150,000 | | | | 150,000 | |
| | |
First Abu Dhabi Bank PJSC 0.08%, , 9/1/2020 | | | 140,000 | | | | 140,000 | |
| | |
Mizuho Bank Ltd. 0.09%, , 9/1/2020 | | | 180,000 | | | | 180,000 | |
| | | | | | | | |
| |
Total Time Deposits
(Cost $540,000) | | | | 540,000 | |
| | | | | |
SEE NOTES TO FINANCIAL STATEMENTS.
| | | | | | | | |
| | | |
| AUGUST 31, 2020 | | J.P. MORGAN MONEY MARKET FUNDS | | | | | 37 | |
JPMorgan Securities Lending Money Market Fund
SCHEDULE OF PORTFOLIO INVESTMENTS
AS OF AUGUST 31, 2020 (Unaudited) (continued)
| | | | | | | | |
| INVESTMENTS (a) | | PRINCIPAL
AMOUNT
($000) | | | VALUE
($000) | |
|
U.S. Treasury Obligations — 4.1% | |
| | |
U.S. Treasury Bills | | | | | | | | |
| | |
0.24%, 9/15/2020 (d) | | | 50,000 | | | | 49,998 | |
| | |
0.26%, 10/15/2020 (d) | | | 50,000 | | | | 49,995 | |
| | |
0.18%, 11/3/2020 (d) | | | 50,000 | | | | 49,992 | |
| | | | | | | | |
| |
Total U.S. Treasury Obligations
(Cost $149,964) | | | | 149,985 | |
| | | | | |
| |
Total Short-Term Investments
(Cost $3,364,792) | | | | 3,366,238 | |
| | | | | | | | |
Total Investments — 100.0%
(Cost $3,648,733) | | | | 3,650,192 | |
Other Assets Less Liabilities — 0.0% | | | | 425 | |
| | | | | |
NET ASSETS — 100.0% | | | | 3,650,617 | |
| | | | | |
| Percentages | indicated are based on net assets. |
Abbreviations
| | |
| FHLB | | Federal Home Loan Bank |
| FHLMC | | Federal Home Loan Mortgage Corp. |
| FNMA | | Federal National Mortgage Association |
| GNMA | | Government National Mortgage Association |
| ICE | | Intercontinental Exchange |
| LIBOR | | London Interbank Offered Rate |
| PJSC | | Public Joint Stock Company |
| RAN | | Revenue Anticipation Note |
| Rev. | | Revenue |
| USD | | United States Dollar |
| VRDO | | Variable Rate Demand Obligation |
| |
| (a) | | The date shown represents the earliest of the next put date, next demand date or final maturity date. |
| (b) | | Variable or floating rate security, the interest rate of which adjusts periodically based on changes in current interest rates and prepayments on the underlying pool of assets. The interest rate shown is the current rate as of August 31, 2020. |
| (c) | | Securities exempt from registration under Rule 144A or section 4(a)(2), of the Securities Act of 1933, as amended. |
| (d) | | The rate shown is the effective yield as of August 31, 2020. |
| (e) | | Variable or floating rate security, linked to the referenced benchmark. The interest rate shown is the current rate as of August 31, 2020. |
Additional Investment Information:
[2] Agency Joint Trading Account II — At August 31, 2020, certain Funds had undivided interests in the Agency Joint Trading Account II with a maturity date of September 1, 2020, as follows (amounts in thousands):
| | | | | | | | | | |
| | | |
| Fund | | Principal
Amount | | Repurchase
Price | | | Collateral
Value
Allocation | |
JPMorgan Securities Lending Money Market Fund | | $233,813 | | $ | 233,814 | | | $ | 238,500 | |
Repurchase Agreements — At August 31, 2020, the Principal Amounts of certain Funds’ interests in the Agency Joint Trading Account II were as follows (amounts in thousands):
| | | | | | | | |
| | |
| Counterparty | | Interest
Rate | | | JPMorgan Securities
Lending Money
Market Fund | |
Bofa Securities, Inc. | | | 0.09 | % | | $ | 172,112 | |
Citibank NA | | | 0.09 | % | | | 29,227 | |
Citigroup Global Markets Holdings, Inc. | | | 0.09 | % | | | 32,474 | |
| | | | | | | | |
Total | | | | | | $ | 233,813 | |
| | | | | | | | |
At August 31, 2020, the Agency Joint Trading Account II was fully collateralized by:
| | | | | | | | |
| | |
| Issuer | | Interest Rates | | | Maturity Dates | |
FHLB | | | 2.13% - 3.60% | | | | 12/14/2029 - 5/10/2038 | |
FHLMC | | | 1.50% - 5.00% | | | | 2/1/2026 - 9/1/2050 | |
FNMA | | | 2.00% - 6.10% | | | | 4/1/2021 - 9/1/2050 | |
GNMA | | | 2.49% - 6.50% | | | | 3/20/2048 - 6/15/2049 | |
U.S. Treasury Securities | | | 1.75% | | | | 6/15/2022 | |
SEE NOTES TO FINANCIAL STATEMENTS.
| | | | | | |
| | | |
| 38 | | | | J.P. MORGAN MONEY MARKET FUNDS | | AUGUST 31, 2020 |
JPMorgan Liquid Assets Money Market Fund
SCHEDULE OF PORTFOLIO INVESTMENTS
AS OF AUGUST 31, 2020 (Unaudited)
| | | | | | | | |
| INVESTMENTS (a) | | PRINCIPAL
AMOUNT
($000) | | | VALUE
($000) | |
Repurchase Agreements — 25.1% | |
| | |
Barclays Capital, Inc., 0.36%, dated 8/31/2020, due 10/5/2020, repurchase price $30,010, collateralized by Asset-Backed Securities, 0.68% - 8.29%, due 2/25/2024 - 4/25/2036, with a value of $33,000. | | | 30,000 | | | | 30,000 | |
| | |
Barclays Capital, Inc., 0.41%, dated 8/31/2020, due 10/5/2020, repurchase price $20,008, collateralized by Asset-Backed Securities, 4.23% - 5.52%, due 2/18/2025 - 1/25/2043, with a value of $22,000. | | | 20,000 | | | | 20,000 | |
| | |
BMO Capital Markets Corp., 0.20%, dated 8/31/2020, due 9/1/2020, repurchase price $100,001, collateralized by Asset-Backed Securities, 0.00% - 4.34%, due 4/8/2022 - 3/15/2040, Collateralized Mortgage Obligations, 0.00% - 3.06%, due 2/18/2030 - 10/13/2048, Corporate Notes and Bonds, 0.44% - 8.38%, due 9/21/2020 - 9/15/2115, FHLMC, 2.00% - 4.50%, due 6/15/2032 - 8/1/2050, FNMA, 2.00% - 3.55%, due 11/1/2048 - 8/1/2050, GNMA, 1.40% - 5.50%, due 6/15/2028 - 5/20/2066 and Sovereign Government Securities, 0.38% - 2.63%, due 1/25/2022 - 7/29/2025, with a value of $105,544. | | | 100,000 | | | | 100,000 | |
| | |
BMO Capital Markets Corp., 0.23%, dated 8/31/2020, due 9/7/2020, repurchase price $25,001, collateralized by Asset-Backed Securities, 2.38%, due 3/25/2035, Corporate Notes and Bonds, 0.91% - 6.50%, due 3/10/2022 - 12/31/2099, FHLMC, 2.54%, due 7/25/2026, FNMA, 2.60%, due 5/25/2024, GNMA, 3.16%, due 3/15/2062 and Sovereign Government Securities, 0.38% - 2.25%, due 1/25/2022 - 7/29/2025, with a value of $26,335. | | | 25,000 | | | | 25,000 | |
| | |
BNP Paribas SA, 0.26%, dated 8/31/2020, due 9/1/2020, repurchase price $100,001, collateralized by Asset-Backed Securities, 0.33% - 5.13%, due 4/20/2026 - 7/20/2043 and Corporate Notes and Bonds, 0.00% - 7.83%, due 10/30/2020 - 1/1/2099, with a value of $109,550. | | | 100,000 | | | | 100,000 | |
| | | | | | | | |
| INVESTMENTS (a) | | PRINCIPAL
AMOUNT
($000) | | | VALUE
($000) | |
| | | | | | | | |
| | |
Bofa Securities, Inc., 0.18%, dated 8/31/2020, due 9/1/2020, repurchase price $100,001, collateralized by Common Stocks, 0.00%, due 1/1/2099 and Preferred Stocks, 0.00% - 10.88%, due 10/30/2020 - 1/1/2099, with a value of $108,000. | | | 100,000 | | | | 100,000 | |
| | |
Bofa Securities, Inc., 0.49%, dated 8/31/2020, due 10/5/2020, repurchase price $50,024, collateralized by FHLMC, 2.53% - 3.67%, due 4/25/2030 - 9/25/2045, FNMA Connecticut Avenue Securities, 1.40% - 2.30%, due 9/25/2029 - 7/25/2030 and Sovereign Government Securities, 2.55% - 7.88%, due 1/30/2025 - 5/15/2051, with a value of $52,814. | | | 50,000 | | | | 50,000 | |
| | |
Bofa Securities, Inc., 0.49%, dated 8/31/2020, due 10/20/2020, repurchase price $100,068, collateralized by Corporate Notes and Bonds, 0.00% - 10.00%, due 9/30/2021 - 12/31/2099, with a value of $108,000. | | | 100,000 | | | | 100,000 | |
| | |
Credit Suisse Securities USA LLC, 0.29%, dated 8/31/2020, due 9/2/2020, repurchase price $40,001, collateralized by Collateralized Mortgage Obligations, 0.00% - 1.66%, due 12/15/2036 - 5/25/2065, with a value of $43,202. | | | 40,000 | | | | 40,000 | |
| | |
Credit Suisse Securities USA LLC, 0.51%, dated 8/31/2020, due 10/5/2020, repurchase price $50,025, collateralized by Asset-Backed Securities, 0.00% - 2.93%, due 8/1/2021 - 4/12/2024 and Collateralized Mortgage Obligations, 0.00% - 7.02%, due 8/25/2035 - 4/25/2065, with a value of $54,469. | | | 50,000 | | | | 50,000 | |
| | |
Fixed Income Clearing Corp., 0.09%, dated 8/31/2020, due 9/1/2020, repurchase price $2,000,005, collateralized by U.S. Treasury Securities, 0.00% - 4.63%, due 11/27/2020 - 2/15/2050, with a value of $2,040,000. | | | 2,000,000 | | | | 2,000,000 | |
| | |
ING Financial Markets LLC, 0.23%, dated 8/31/2020, due 9/1/2020, repurchase price $100,001, collateralized by Sovereign Government Securities, 5.63% - 8.75%, due 2/4/2025 - 2/21/2047, with a value of $108,001. | | | 100,000 | | | | 100,000 | |
SEE NOTES TO FINANCIAL STATEMENTS.
| | | | | | | | |
| | | |
| AUGUST 31, 2020 | | J.P. MORGAN MONEY MARKET FUNDS | | | | | 39 | |
JPMorgan Liquid Assets Money Market Fund
SCHEDULE OF PORTFOLIO INVESTMENTS
AS OF AUGUST 31, 2020 (Unaudited) (continued)
| | | | | | | | |
| INVESTMENTS (a) | | PRINCIPAL
AMOUNT
($000) | | | VALUE
($000) | |
Repurchase Agreements — continued | |
| | |
Societe Generale SA, 0.20%, dated 8/31/2020, due 9/1/2020, repurchase price $64,000, collateralized by Asset-Backed Securities, 4.00% - 4.55%, due 3/22/2029 - 2/25/2033, Corporate Notes and Bonds, 0.40% - 6.88%, due 3/9/2021 - 12/31/2099 and Sovereign Government Securities, 2.78% - 5.35%, due 3/15/2022 - 1/15/2050, with a value of $67,207. | | | 64,000 | | | | 64,000 | |
| | |
Societe Generale SA, 0.30%, dated 8/31/2020, due 9/1/2020, repurchase price $170,001, collateralized by Asset-Backed Securities, 0.31% - 8.09%, due 11/18/2028 - 10/25/2046, Collateralized Mortgage Obligations, 0.37% - 4.35%, due 11/15/2032 - 12/16/2072, Corporate Notes and Bonds, 3.30% - 12.00%, due 6/1/2021 - 3/1/2030, FHLMC, 0.83% - 3.28%, due 12/26/2029 - 3/25/2050, FNMA Connecticut Avenue Securities, 2.18% - 3.83%, due 9/25/2029 - 1/25/2040 and Sovereign Government Securities, 2.63% - 10.13%, due 1/22/2021 - 1/23/2050, with a value of $183,602. | | | 170,000 | | | | 170,000 | |
| | |
Societe Generale SA, 0.32%, dated 8/31/2020, due 9/3/2020, repurchase price $75,002, collateralized by Asset-Backed Securities, 0.32% - 8.09%, due 3/17/2025 - 1/25/2037, Collateralized Mortgage Obligations, 0.46% - 6.21%, due 7/15/2036 - 8/17/2049, Corporate Notes and Bonds, 4.63% - 12.00%, due 11/21/2022 - 2/15/2030, FHLMC, 2.08% - 3.28%, due 1/25/2050 - 3/25/2050, FNMA Connecticut Avenue Securities, 2.23% - 3.83%, due 9/25/2029 - 1/25/2040 and Sovereign Government Securities, 4.25% - 7.63%, due 5/9/2024 - 5/30/2040, with a value of $81,005. | | | 75,000 | | | | 75,000 | |
| | |
Wells Fargo Securities LLC, 0.23%, dated 8/31/2020, due 9/2/2020, repurchase price $28,000, collateralized by Sovereign Government Securities, 2.13%, due 6/15/2022, with a value of $29,401. | | | 28,000 | | | | 28,000 | |
| | |
Wells Fargo Securities LLC, 0.23%, dated 8/31/2020, due 9/3/2020, repurchase price $46,001, collateralized by Sovereign Government Securities, 2.13% - 6.95%, due 6/15/2022 - 1/28/2060, with a value of $48,372. | | | 46,000 | | | | 46,000 | |
| | | | | | | | |
| INVESTMENTS (a) | | PRINCIPAL
AMOUNT
($000) | | | VALUE
($000) | |
| | | | | | | | |
| | |
Wells Fargo Securities LLC, 0.55%, dated 8/31/2020, due 9/21/2020, repurchase price $50,016, collateralized by Sovereign Government Securities, 2.13%, due 6/15/2022, with a value of $52,572. | | | 50,000 | | | | 50,000 | |
| | | | | | | | |
| |
Total Repurchase Agreements
(Cost $3,148,000) | | | | 3,148,000 | |
| | | | | |
Corporate Notes — 0.7% | |
|
Banks — 0.7% | |
| |
Barclays Bank plc (United Kingdom) | | | | | |
| | |
(OBFR + 0.15%), 0.23%, 9/1/2020 (b) (c) | | | 50,000 | | | | 50,000 | |
| | |
(OBFR + 0.30%), 0.38%, 9/1/2020 (b) (c) | | | 40,000 | | | | 40,000 | |
| | | | | | | | |
| |
Total Corporate Notes
(Cost $90,000) | | | | 90,000 | |
| | | | | |
Municipal Bonds — 0.2% | |
|
New York — 0.2% | |
| | |
New York State Dormitory Authority, State Personal Income Tax, General Purpose Series 2020B, Rev., RAN, 5.00%, 3/31/2021 (Cost $20,514) | | | 20,000 | | | | 20,514 | |
| | | | | | | | |
Short-Term Investments — 73.9% | |
|
Certificates of Deposit — 41.1% | |
| | |
Banco Del Estado De Chile (Chile) 0.35%, 9/14/2020 | | | 25,000 | | | | 25,000 | |
| | |
Bank of Montreal (Canada)
0.23%, 2/12/2021 | | | 50,000 | | | | 50,000 | |
| | |
Bank of Nova Scotia (The) (Canada) | | | | | | | | |
| | |
(ICE LIBOR USD 1 Month + 0.17%), 0.35%, 9/24/2020 (b) | | | 25,000 | | | | 25,000 | |
| | |
(ICE LIBOR USD 3 Month + 0.10%), 0.40%, 10/6/2020 (b) | | | 17,000 | | | | 17,000 | |
| | |
(ICE LIBOR USD 3 Month + 0.08%), 0.34%, 10/23/2020 (b) | | | 10,000 | | | | 10,000 | |
| | |
(ICE LIBOR USD 3 Month + 0.05%), 0.30%, 10/28/2020 (b) | | | 14,000 | | | | 14,000 | |
| | |
(ICE LIBOR USD 3 Month + 0.13%), 0.38%, 11/6/2020 (b) | | | 50,000 | | | | 50,000 | |
| | |
(ICE LIBOR USD 3 Month + 0.10%), 0.36%, 11/14/2020 (b) | | | 50,000 | | | | 50,000 | |
| | |
(ICE LIBOR USD 3 Month + 0.12%), 0.39%, 11/19/2020 (b) | | | 40,000 | | | | 40,000 | |
| | |
BNP Paribas SA (France) | | | | | | | | |
| | |
(ICE LIBOR USD 3 Month + 0.08%), 0.38%, 10/3/2020 (b) | | | 30,000 | | | | 30,000 | |
| | |
0.40%, 3/3/2021 | | | 50,000 | | | | 50,000 | |
| | |
Canadian Imperial Bank of Commerce (Canada) | | | | | | | | |
| | |
(ICE LIBOR USD 3 Month + 0.11%), 0.43%, 9/10/2020 (b) | | | 50,000 | | | | 50,000 | |
| | |
0.42%, 7/7/2021 | | | 50,000 | | | | 50,000 | |
SEE NOTES TO FINANCIAL STATEMENTS.
| | | | | | |
| | | |
| 40 | | | | J.P. MORGAN MONEY MARKET FUNDS | | AUGUST 31, 2020 |
| | | | | | | | |
| INVESTMENTS (a) | | PRINCIPAL
AMOUNT
($000) | | | VALUE
($000) | |
Short-Term Investments — continued | |
|
Certificates of Deposit — continued | |
| | |
China Construction Bank Corp. (China) | | | | | | | | |
| | |
0.65%, 10/22/2020 | | | 20,000 | | | | 20,000 | |
| | |
0.61%, 11/3/2020 | | | 25,000 | | | | 25,000 | |
| | |
Cooperatieve Rabobank UA (Netherlands) | | | | | | | | |
| | |
(ICE LIBOR USD 3 Month + 0.09%), 0.43%, 9/2/2020 (b) | | | 50,000 | | | | 50,000 | |
| | |
(ICE LIBOR USD 3 Month + 0.10%), 0.37%, 10/13/2020 (b) | | | 10,000 | | | | 10,000 | |
| | |
1.10%, 10/14/2020 | | | 14,000 | | | | 14,000 | |
| | |
(ICE LIBOR USD 3 Month + 0.08%), 0.35%, 10/30/2020 (b) | | | 29,000 | | | | 29,000 | |
| | |
(ICE LIBOR USD 3 Month + 0.15%), 0.40%, 11/6/2020 (b) | | | 8,000 | | | | 8,000 | |
| | |
(ICE LIBOR USD 3 Month + 0.32%), 0.56%, 11/7/2020 (b) | | | 13,000 | | | | 13,000 | |
| | |
(ICE LIBOR USD 3 Month + 0.04%), 0.32%, 11/17/2020 (b) | | | 70,000 | | | | 70,000 | |
| | |
Credit Agricole Corporate and Investment Bank (France) 0.39%, 3/16/2021 | | | 17,000 | | | | 17,000 | |
| | |
Credit Industriel et Commercial (France) | | | | | | | | |
| | |
1.40%, 10/1/2020 | | | 20,000 | | | | 20,000 | |
| | |
(ICE LIBOR USD 3 Month + 0.08%), 0.38%, 10/5/2020 (b) | | | 25,000 | | | | 25,000 | |
| | |
1.25%, 10/13/2020 | | | 25,000 | | | | 25,000 | |
| | |
1.71%, 11/16/2020 (d) | | | 25,000 | | | | 24,910 | |
| | |
0.65%, 11/20/2020 (d) | | | 50,000 | | | | 49,928 | |
| | |
0.58%, 11/23/2020 (d) | | | 50,000 | | | | 49,933 | |
| | |
0.50%, 12/1/2020 (d) | | | 50,000 | | | | 49,937 | |
| | |
0.51%, 12/8/2020 (d) | | | 50,000 | | | | 49,931 | |
| | |
0.34%, 1/4/2021 | | | 20,000 | | | | 20,000 | |
| | |
Credit Suisse AG (Switzerland) | | | | | | | | |
| | |
1.40%, 10/2/2020 | | | 25,000 | | | | 25,000 | |
| | |
1.33%, 11/24/2020 | | | 60,000 | | | | 60,000 | |
| | |
0.47%, 2/26/2021 | | | 35,000 | | | | 35,000 | |
| | |
0.38%, 4/12/2021 | | | 50,000 | | | | 50,000 | |
| | |
0.29%, 5/17/2021 | | | 50,000 | | | | 50,000 | |
| | |
DNB Bank ASA (Norway) (ICE LIBOR USD 3 Month + 0.15%), 0.40%, 11/6/2020 (b) | | | 16,000 | | | | 16,000 | |
| | |
HSBC Bank USA NA | | | | | | | | |
| | |
1.25%, 10/7/2020 | | | 65,000 | | | | 65,000 | |
| | |
1.15%, 10/14/2020 | | | 33,000 | | | | 33,000 | |
| | |
0.95%, 10/20/2020 | | | 20,000 | | | | 20,000 | |
| | |
Industrial & Commercial Bank of China Ltd. (China) | | | | | | | | |
| | |
0.63%, 10/23/2020 | | | 17,000 | | | | 17,000 | |
| | |
0.60%, 10/26/2020 | | | 30,000 | | | | 30,000 | |
| | | | | | | | |
| INVESTMENTS (a) | | PRINCIPAL
AMOUNT
($000) | | | VALUE
($000) | |
| | | | | | | | |
|
Certificates of Deposit — continued | |
| | |
ING Bank Australia Ltd. (Australia) (ICE LIBOR USD 3 Month + 0.18%), 0.42%, 11/8/2020 (b) | | | 45,000 | | | | 45,000 | |
| | |
ING Bank NV (Netherlands) | | | | | | | | |
| | |
(ICE LIBOR USD 3 Month + 0.12%),
0.40%, 10/8/2020 (b) | | | 80,000 | | | | 80,000 | |
| | |
(ICE LIBOR USD 3 Month + 0.10%),
0.35%, 11/5/2020 (b) | | | 39,000 | | | | 39,000 | |
| | |
(ICE LIBOR USD 3 Month + 0.08%),
0.33%, 11/6/2020 (b) | | | 15,000 | | | | 15,000 | |
| | |
0.54%, 2/11/2021 | | | 50,000 | | | | 50,000 | |
| | |
KBC Bank NV (Cayman Islands) 0.31%, 1/8/2021 (d) | | | 25,000 | | | | 24,972 | |
| | |
Landesbank Hessen-Thueringen Girozentrale (Germany) | | | | | | | | |
| | |
0.67%, 11/4/2020 (d) | | | 50,000 | | | | 49,941 | |
| | |
0.58%, 11/16/2020 (d) | | | 50,000 | | | | 49,939 | |
| | |
Mitsubishi UFJ Trust & Banking Corp. (Japan) | | | | | | | | |
| | |
0.39%, 10/5/2020 (d) | | | 25,000 | | | | 24,991 | |
| | |
0.36%, 1/15/2021 | | | 25,000 | | | | 25,000 | |
| | |
0.36%, 1/28/2021 | | | 50,000 | | | | 50,000 | |
| | |
Mizuho Bank Ltd. (Japan) | | | | | | | | |
| | |
0.38%, 9/8/2020 (d) | | | 25,000 | | | | 24,998 | |
| | |
0.31%, 9/15/2020 | | | 29,000 | | | | 29,000 | |
| | |
0.40%, 9/17/2020 | | | 15,000 | | | | 15,000 | |
| | |
(ICE LIBOR USD 1 Month + 0.18%),
0.34%, 9/20/2020 (b) | | | 10,000 | | | | 10,000 | |
| | |
(ICE LIBOR USD 3 Month + 0.07%),
0.34%, 10/29/2020 (b) | | | 29,000 | | | | 29,000 | |
| | |
0.39%, 12/3/2020 (d) | | | 100,000 | | | | 99,899 | |
| | |
0.36%, 1/19/2021 | | | 25,000 | | | | 25,000 | |
| | |
0.27%, 2/10/2021 | | | 35,000 | | | | 34,999 | |
| | |
MUFG Bank Ltd. (Japan) | | | | | | | | |
| | |
0.40%, 9/21/2020 (d) | | | 20,000 | | | | 19,996 | |
| | |
1.15%, 10/19/2020 | | | 50,000 | | | | 50,000 | |
| | |
0.39%, 11/20/2020 | | | 30,000 | | | | 30,000 | |
| | |
0.25%, 11/30/2020 | | | 29,000 | | | | 29,000 | |
| | |
0.38%, 11/30/2020 | | | 21,000 | | | | 21,000 | |
| | |
0.39%, 12/18/2020 (d) | | | 50,000 | | | | 49,942 | |
| | |
0.23%, 1/20/2021 | | | 25,000 | | | | 25,000 | |
| | |
0.29%, 1/29/2021 | | | 30,000 | | | | 30,000 | |
| | |
0.27%, 2/4/2021 | | | 30,000 | | | | 30,000 | |
| | |
National Australia Bank Ltd. (Australia) | | | | | | | | |
| | |
(ICE LIBOR USD 3 Month + 0.13%),
0.38%, 11/25/2020 (b) | | | 25,000 | | | | 25,000 | |
SEE NOTES TO FINANCIAL STATEMENTS.
| | | | | | | | |
| | | |
| AUGUST 31, 2020 | | J.P. MORGAN MONEY MARKET FUNDS | | | | | 41 | |
JPMorgan Liquid Assets Money Market Fund
SCHEDULE OF PORTFOLIO INVESTMENTS
AS OF AUGUST 31, 2020 (Unaudited) (continued)
| | | | | | | | |
| INVESTMENTS (a) | | PRINCIPAL
AMOUNT
($000) | | | VALUE
($000) | |
Short-Term Investments — continued | |
|
Certificates of Deposit — continued | |
| | |
(ICE LIBOR USD 3 Month + 0.13%),
0.38%, 11/27/2020 (b) | | | 30,000 | | | | 30,000 | |
| | |
0.37%, 3/8/2021 (d) | | | 200,000 | | | | 199,615 | |
| | |
0.38%, 3/23/2021 (d) | | | 15,000 | | | | 14,968 | |
| | |
0.40%, 4/30/2021 (d) | | | 29,000 | | | | 28,923 | |
| | |
Natixis SA (France) | | | | | | | | |
| | |
(ICE LIBOR USD 3 Month + 0.11%),
0.44%, 9/4/2020 (b) | | | 75,000 | | | | 75,000 | |
| | |
(ICE LIBOR USD 1 Month + 0.17%),
0.33%, 9/19/2020 (b) | | | 50,000 | | | | 50,000 | |
| | |
1.40%, 10/2/2020 | | | 25,000 | | | | 25,000 | |
| | |
0.52%, 12/14/2020 | | | 80,000 | | | | 80,000 | |
| | |
0.55%, 2/17/2021 | | | 15,000 | | | | 15,000 | |
| | |
0.39%, 4/8/2021 | | | 5,000 | | | | 5,000 | |
| | |
0.29%, 5/3/2021 | | | 30,000 | | | | 30,000 | |
| | |
Nordea Bank Abp (Finland) | | | | | | | | |
| | |
(ICE LIBOR USD 3 Month + 0.10%),
0.47%, 9/1/2020 (b) | | | 50,000 | | | | 50,000 | |
| | |
(ICE LIBOR USD 3 Month + 0.10%),
0.43%, 9/8/2020 (b) | | | 100,000 | | | | 100,000 | |
| | |
(ICE LIBOR USD 3 Month + 0.12%),
0.44%, 9/17/2020 (b) | | | 40,000 | | | | 40,000 | |
| | |
(ICE LIBOR USD 3 Month + 0.10%),
0.37%, 10/13/2020 (b) | | | 25,000 | | | | 25,000 | |
| | |
1.12%, 10/15/2020 | | | 17,000 | | | | 17,000 | |
| | |
(ICE LIBOR USD 3 Month + 0.10%),
0.36%, 11/14/2020 (b) | | | 50,000 | | | | 50,000 | |
| | |
1.10%, 11/17/2020 | | | 10,000 | | | | 10,000 | |
| | |
(ICE LIBOR USD 3 Month + 0.10%),
0.35%, 11/21/2020 (b) | | | 21,000 | | | | 21,000 | |
| | |
Norinchukin Bank (The) (Japan) 0.18%, 9/22/2020 | | | 25,000 | | | | 25,000 | |
| | |
Oversea-Chinese Banking Corp. Ltd. (Singapore) | | | | | | | | |
| | |
1.08%, 9/14/2020 | | | 25,000 | | | | 25,000 | |
| | |
(ICE LIBOR USD 1 Month + 0.14%), 0.32%, 9/24/2020 (b) | | | 25,000 | | | | 25,000 | |
| | |
Rabobank International (United Kingdom) 0.26%, 2/26/2021 (d) | | | 29,000 | | | | 28,963 | |
| | |
Royal Bank of Canada (Canada) | | | | | | | | |
| | |
(US Federal Funds Effective Rate (continuous series) + 0.18%), 0.27%, 9/1/2020 (b) | | | 30,000 | | | | 30,000 | |
| | |
(ICE LIBOR USD 3 Month + 0.12%),
0.42%, 9/24/2020 (b) | | | 17,000 | | | | 17,000 | |
| | |
1.46%, 10/1/2020 | | | 15,000 | | | | 15,000 | |
| | |
(ICE LIBOR USD 3 Month + 0.11%),
0.38%, 10/9/2020 (b) | | | 15,000 | | | | 15,000 | |
| | | | | | | | |
| INVESTMENTS (a) | | PRINCIPAL
AMOUNT
($000) | | | VALUE
($000) | |
| | | | | | | | |
|
Certificates of Deposit — continued | |
| | |
(ICE LIBOR USD 3 Month + 0.07%),
0.34%, 10/29/2020 (b) | | | 22,000 | | | | 22,000 | |
| | |
(ICE LIBOR USD 3 Month + 0.30%),
0.55%, 11/4/2020 (b) | | | 15,000 | | | | 15,000 | |
| | |
(ICE LIBOR USD 3 Month + 0.21%),
0.46%, 11/5/2020 (b) | | | 13,000 | | | | 13,000 | |
| | |
1.30%, 1/7/2021 | | | 25,000 | | | | 25,000 | |
| | |
Skandinaviska Enskilda Banken AB (Sweden) | | | | | | | | |
| | |
1.35%, 10/2/2020 | | | 25,000 | | | | 25,000 | |
| | |
0.25%, 5/11/2021 | | | 75,000 | | | | 75,000 | |
| | |
Standard Chartered Bank (United Kingdom) 0.97%, 10/27/2020 | | | 100,000 | | | | 100,000 | |
| | |
Sumitomo Mitsui Banking Corp. (Japan) | | | | | | | | |
| | |
(ICE LIBOR USD 1 Month + 0.22%),
0.38%, 9/17/2020 (b) | | | 25,000 | | | | 25,000 | |
| | |
(ICE LIBOR USD 1 Month + 0.18%),
0.36%, 9/22/2020 (b) | | | 28,000 | | | | 28,000 | |
| | |
(ICE LIBOR USD 1 Month + 0.18%),
0.34%, 9/28/2020 (b) | | | 28,000 | | | | 28,000 | |
| | |
(ICE LIBOR USD 3 Month + 0.07%),
0.34%, 10/27/2020 (b) | | | 15,000 | | | | 15,000 | |
| | |
(ICE LIBOR USD 3 Month + 0.03%),
0.31%, 11/17/2020 (b) | | | 50,000 | | | | 50,000 | |
| | |
0.35%, 12/1/2020 | | | 22,000 | | | | 22,000 | |
| | |
0.30%, 1/29/2021 | | | 125,000 | | | | 125,000 | |
| | |
0.26%, 2/5/2021 | | | 40,000 | | | | 40,000 | |
| | |
0.26%, 2/24/2021 (d) | | | 25,000 | | | | 24,968 | |
| | |
Sumitomo Mitsui Trust Bank Ltd. (Japan) | | | | | | | | |
| | |
0.57%, 11/12/2020 (d) | | | 75,000 | | | | 74,915 | |
| | |
0.55%, 11/13/2020 (d) | | | 50,000 | | | | 49,944 | |
| | |
0.40%, 11/18/2020 | | | 50,000 | | | | 50,000 | |
| | |
Sumitomo Trust & Banking Japan Multi Strategy Fund (United Kingdom) 1.27%, 9/8/2020 (d) | | | 25,000 | | | | 24,994 | |
| | |
Sumitomo Trust and Banking Co. (United Kingdom) | | | | | | | | |
| | |
0.50%, 11/16/2020 (d) | | | 50,000 | | | | 49,947 | |
| | |
0.50%, 11/18/2020 (d) | | | 25,000 | | | | 24,972 | |
| | |
Svenska Handelsbanken AB (Sweden) | | | | | | | | |
| | |
(ICE LIBOR USD 3 Month + 0.11%),
0.43%, 9/16/2020 (b) | | | 17,000 | | | | 17,000 | |
| | |
(ICE LIBOR USD 3 Month + 0.12%),
0.44%, 9/16/2020 (b) | | | 9,000 | | | | 9,000 | |
| | |
(ICE LIBOR USD 3 Month + 0.12%),
0.44%, 9/19/2020 (b) | | | 12,000 | | | | 12,000 | |
SEE NOTES TO FINANCIAL STATEMENTS.
| | | | | | |
| | | |
| 42 | | | | J.P. MORGAN MONEY MARKET FUNDS | | AUGUST 31, 2020 |
| | | | | | | | |
| INVESTMENTS (a) | | PRINCIPAL
AMOUNT
($000) | | | VALUE
($000) | |
Short-Term Investments — continued | |
|
Certificates of Deposit — continued | |
| | |
(ICE LIBOR USD 3 Month + 0.07%),
0.37%, 10/2/2020 (b) | | | 17,000 | | | | 17,000 | |
| | |
1.12%, 10/14/2020 | | | 54,000 | | | | 54,000 | |
| | |
(ICE LIBOR USD 3 Month + 0.09%),
0.36%, 10/20/2020 (b) | | | 35,000 | | | | 35,000 | |
| | |
(ICE LIBOR USD 3 Month + 0.05%),
0.31%, 10/30/2020 (b) | | | 25,000 | | | | 25,000 | |
| | |
(ICE LIBOR USD 3 Month + 0.13%),
0.37%, 11/7/2020 (b) | | | 50,000 | | | | 50,000 | |
| | |
Toronto-Dominion Bank (The) (Canada) | | | | | | | | |
| | |
(US Federal Funds Effective Rate (continuous series) + 0.35%), 0.44%, 9/1/2020 (b) | | | 20,000 | | | | 20,000 | |
| | |
(ICE LIBOR USD 3 Month + 0.11%),
0.43%, 9/10/2020 (b) | | | 5,000 | | | | 5,000 | |
| | |
1.03%, 9/11/2020 | | | 25,000 | | | | 25,000 | |
| | |
(ICE LIBOR USD 1 Month + 0.18%),
0.35%, 9/21/2020 (b) | | | 25,000 | | | | 25,000 | |
| | |
(ICE LIBOR USD 3 Month + 0.19%),
0.47%, 10/7/2020 (b) | | | 30,000 | | | | 30,000 | |
| | |
(ICE LIBOR USD 3 Month + 0.07%),
0.34%, 10/28/2020 (b) | | | 30,000 | | | | 30,000 | |
| | |
(ICE LIBOR USD 3 Month + 0.09%),
0.36%, 11/19/2020 (b) | | | 26,000 | | | | 26,000 | |
| | |
1.27%, 1/28/2021 | | | 60,000 | | | | 60,000 | |
| | |
0.41%, 7/6/2021 | | | 29,000 | | | | 29,000 | |
| | |
UBS AG (Switzerland) | | | | | | | | |
| | |
1.50%, 10/2/2020 | | | 50,000 | | | | 50,000 | |
| | |
1.55%, 1/4/2021 | | | 75,000 | | | | 75,000 | |
| | |
1.55%, 1/6/2021 | | | 50,000 | | | | 50,000 | |
| | |
Wells Fargo Bank NA (ICE LIBOR USD 3 Month + 0.11%), 0.41%, 10/6/2020 (b) | | | 90,000 | | | | 90,000 | |
| | | | | | | | |
| |
Total Certificates of Deposit
(Cost $5,153,525) | | | | 5,153,525 | |
| | | | | |
|
Commercial Paper — 18.8% | |
| | |
Agricultural Bank of China Ltd. (China) 0.45%, 11/5/2020 (c) (d) | | | 25,000 | | | | 24,980 | |
| | |
Alpine Securitization LLC (Switzerland) | | | | | | | | |
| | |
(ICE LIBOR USD 3 Month + 0.08%),
0.33%, 11/20/2020 (b) (c) | | | 50,000 | | | | 50,000 | |
| | |
0.37%, 1/6/2021 (c) (d) | | | 50,000 | | | | 49,935 | |
| | |
0.31%, 5/5/2021 (c) (d) | | | 25,000 | | | | 24,947 | |
| | |
Antalis SA (France) 1.60%, 9/1/2020 (c) (d) | | | 27,440 | | | | 27,440 | |
| | |
Bank of Montreal (Canada) 1.05%, 9/14/2020 (d) | | | 17,000 | | | | 16,994 | |
| | |
Barton Capital LLC 0.36%, 1/8/2021 (c) (d) | | | 50,000 | | | | 49,936 | |
| | | | | | | | |
| INVESTMENTS (a) | | PRINCIPAL
AMOUNT
($000) | | | VALUE
($000) | |
| | | | | | | | |
|
Commercial Paper — continued | |
| | |
Bedford Row Funding Corp. | | | | | | | | |
| | |
(ICE LIBOR USD 3 Month + 0.10%),
0.42%, 9/3/2020 (b) (c) | | | 100,000 | | | | 100,000 | |
| | |
1.01%, 9/9/2020 (c) (d) | | | 25,000 | | | | 24,994 | |
| | |
1.01%, 9/14/2020 (c) (d) | | | 15,000 | | | | 14,995 | |
| | |
(ICE LIBOR USD 3 Month + 0.06%),
0.32%, 11/1/2020 (b) (c) | | | 22,000 | | | | 22,000 | |
| | |
BNG Bank NV (Netherlands) 1.20%, 9/1/2020 (c) (d) | | | 110,000 | | | | 110,000 | |
| | |
BPCE SA (France) 0.46%, 3/19/2021 (c) (d) | | | 10,000 | | | | 9,975 | |
| | |
Caisse d’Amortissement de la Dette Sociale (France) | | | | | | | | |
| | |
0.29%, 1/20/2021 (c) (d) | | | 117,000 | | | | 116,869 | |
| | |
0.40%, 3/25/2021 (c) (d) | | | 75,000 | | | | 74,829 | |
| | |
Canadian Imperial Bank of Commerce (Canada) | | | | | | | | |
| | |
(SOFR + 0.22%), 0.29%, 9/1/2020 (b) (c) | | | 75,000 | | | | 75,000 | |
| | |
1.05%, 9/10/2020 (c) (d) | | | 18,000 | | | | 17,995 | |
| | |
Cancara Asset Securitisation LLC 0.15%, 9/10/2020 (d) | | | 20,000 | | | | 19,999 | |
| | |
Concord Minutemen Capital Co. LLC Series A, 0.12%, 9/3/2020 (c) (d) | | | 70,000 | | | | 70,000 | |
| | |
Credit Suisse AG (ICE LIBOR USD 3 Month + 0.17%), 0.49%, 9/15/2020 (b) | | | 15,000 | | | | 15,000 | |
| | |
Dexia Credit Local SA (France) | | | | | | | | |
| | |
0.57%, 10/28/2020 (c) (d) | | | 25,000 | | | | 24,977 | |
| | |
0.57%, 10/30/2020 (c) (d) | | | 90,000 | | | | 89,916 | |
| | |
0.31%, 12/1/2020 (c) (d) | | | 100,000 | | | | 99,922 | |
| | |
DNB Bank ASA (Norway) (ICE LIBOR USD 3 Month + 0.07%), 0.34%, 10/22/2020 (b) (c) | | | 21,000 | | | | 21,000 | |
| | |
Fairway Finance Co. LLC 1.32%, 10/6/2020 (c) (d) | | | 25,000 | | | | 24,968 | |
| | |
First Abu Dhabi Bank PJSC (United Arab Emirates) | | | | | | | | |
| | |
0.25%, 10/16/2020 (c) (d) | | | 100,000 | | | | 99,969 | |
| | |
0.25%, 10/23/2020 (c) (d) | | | 27,000 | | | | 26,990 | |
| | |
0.24%, 11/3/2020 (c) (d) | | | 25,000 | | | | 24,990 | |
| | |
0.23%, 11/16/2020 (c) (d) | | | 75,000 | | | | 74,964 | |
| | |
0.23%, 11/20/2020 (c) (d) | | | 28,000 | | | | 27,986 | |
| | |
FMS Wertmanagement (Germany) 0.25%, 1/20/2021 (d) | | | 25,000 | | | | 24,976 | |
| | |
Honeywell International, Inc. 1.20%, 10/21/2020 (c) (d) | | | 25,000 | | | | 24,958 | |
| | |
HSBC Bank plc (United Kingdom) 1.15%, 10/15/2020 (c) (d) | | | 100,000 | | | | 99,859 | |
SEE NOTES TO FINANCIAL STATEMENTS.
| | | | | | | | |
| | | |
| AUGUST 31, 2020 | | J.P. MORGAN MONEY MARKET FUNDS | | | | | 43 | |
JPMorgan Liquid Assets Money Market Fund
SCHEDULE OF PORTFOLIO INVESTMENTS
AS OF AUGUST 31, 2020 (Unaudited) (continued)
| | | | | | | | |
| INVESTMENTS (a) | | PRINCIPAL
AMOUNT
($000) | | | VALUE
($000) | |
Short-Term Investments — continued | |
|
Commercial Paper — continued | |
| | |
LMA-Americas LLC | | | | | | | | |
| | |
0.40%, 1/15/2021 (c) (d) | | | 24,400 | | | | 24,363 | |
| | |
0.23%, 2/8/2021 (c) (d) | | | 26,400 | | | | 26,373 | |
| | |
National Australia Bank Ltd. (Australia) (ICE LIBOR USD 1 Month + 0.14%), 0.30%, 9/4/2020 (b) (c) | | | 30,000 | | | | 30,000 | |
| | |
National Bank of Canada (Canada) | | | | | | | | |
| | |
0.25%, 1/22/2021 (c) (d) | | | 30,000 | | | | 29,970 | |
| | |
0.23%, 2/4/2021 (c) (d) | | | 25,000 | | | | 24,975 | |
| | |
PSP Capital, Inc. (Canada) (SOFR + 0.18%), 0.25%, 9/1/2020 (b) (c) | | | 20,000 | | | | 20,000 | |
| | |
Royal Bank of Canada (Canada) (SOFR + 0.25%), 0.33%, 9/1/2020 (b) (c) | | | 50,000 | | | | 50,000 | |
| | |
Sheffield Receivables Co. LLC (United Kingdom) 0.29%, 9/2/2020 (c) (d) | | | 47,400 | | | | 47,400 | |
| | |
Shell International Finance BV (Netherlands) 2.15%, 1/15/2021 (c) (d) | | | 25,000 | | | | 24,797 | |
| | |
Societe Generale SA (France) 0.57%, 10/27/2020 (c) (d) | | | 15,000 | | | | 14,987 | |
| | |
Sumitomo Mitsui Trust Bank Ltd. (Japan) | | | | | | | | |
| | |
0.40%, 11/30/2020 (c) (d) | | | 25,000 | | | | 24,975 | |
| | |
0.26%, 2/4/2021 (c) (d) | | | 25,000 | | | | 24,972 | |
| | |
Svenska Handelsbanken AB (Sweden) | | | | | | | | |
| | |
(ICE LIBOR USD 1 Month + 0.10%), 0.26%, 9/10/2020 (b) (c) | | | 10,000 | | | | 10,000 | |
| | |
(ICE LIBOR USD 3 Month + 0.11%), 0.44%, 9/15/2020 (b) (c) | | | 25,000 | | | | 25,000 | |
| | |
(ICE LIBOR USD 3 Month + 0.10%), 0.38%, 10/13/2020 (b) (c) | | | 25,000 | | | | 25,000 | |
| | |
0.95%, 10/19/2020 (c) (d) | | | 10,000 | | | | 9,987 | |
| | |
(ICE LIBOR USD 3 Month + 0.08%), 0.36%, 10/27/2020 (b) (c) | | | 28,000 | | | | 28,000 | |
| | |
Toronto-Dominion Bank (The) (Canada) | | | | | | | | |
| | |
(ICE LIBOR USD 1 Month + 0.15%), 0.31%, 9/5/2020 (b) (c) | | | 30,000 | | | | 30,000 | |
| | |
(ICE LIBOR USD 3 Month + 0.19%), 0.48%, 9/27/2020 (b) (c) | | | 100,000 | | | | 100,000 | |
| | |
(ICE LIBOR USD 3 Month + 0.23%), 0.49%, 11/3/2020 (b) (c) | | | 13,000 | | | | 13,000 | |
| | |
(ICE LIBOR USD 3 Month + 0.18%), 0.44%, 11/5/2020 (b) (c) | | | 16,000 | | | | 16,000 | |
| | |
UBS AG (Switzerland) | | | | | | | | |
| | |
(ICE LIBOR USD 3 Month + 0.10%), 0.41%, 10/3/2020 (b) (c) | | | 30,000 | | | | 30,000 | |
| | |
1.14%, 1/22/2021 (c) (d) | | | 115,000 | | | | 114,478 | |
| | | | | | | | |
| INVESTMENTS (a) | | PRINCIPAL
AMOUNT
($000) | | | VALUE
($000) | |
| | | | | | | | |
|
Commercial Paper — continued | |
| | |
Westpac Banking Corp. (Australia) 0.37%, 3/4/2021 (c) (d) | | | 35,000 | | | | 34,933 | |
| | | | | | | | |
| |
Total Commercial Paper
(Cost $2,360,573) | | | | 2,360,573 | |
| | | | | |
|
U.S. Treasury Obligations — 7.1% | |
| | |
U.S. Treasury Bills | | | | | | | | |
| | |
0.15%, 9/8/2020 (d) | | | 50,000 | | | | 49,999 | |
| | |
0.10%, 9/22/2020 (d) | | | 150,000 | | | | 149,991 | |
| | |
0.15%, 9/24/2020 (d) | | | 100,000 | | | | 99,990 | |
| | |
0.17%, 9/29/2020 (d) | | | 100,000 | | | | 99,987 | |
| | |
0.31%, 10/15/2020 (d) | | | 75,000 | | | | 74,972 | |
| | |
0.15%, 10/20/2020 (d) | | | 110,000 | | | | 109,978 | |
| | |
0.12%, 11/10/2020 (d) | | | 50,000 | | | | 49,989 | |
| | |
0.10%, 11/12/2020 (d) | | | 50,000 | | | | 49,990 | |
| | |
0.12%, 11/19/2020 (d) | | | 200,000 | | | | 199,946 | |
| | | | | | | | |
| |
Total U.S. Treasury Obligations
(Cost $884,842) | | | | 884,842 | |
| | | | | |
|
Time Deposits — 6.9% | |
| | |
Australia & New Zealand Banking Group Ltd. 0.11%, 9/3/2020 | | | 200,000 | | | | 200,000 | |
| | |
Credit Agricole Corporate and Investment Bank 0.09%, 9/1/2020 | | | 475,310 | | | | 475,310 | |
| | |
Interfund Lending 0.83%, 9/1/2020 | | | 4,366 | | | | 4,366 | |
| | |
Mizuho Bank Ltd. 0.09%, 9/1/2020 | | | 180,000 | | | | 180,000 | |
| | | | | | | | |
| |
Total Time Deposits
(Cost $859,676) | | | | 859,676 | |
| | | | | |
| |
Total Short-term Investments
(Cost $9,258,616) | | | | 9,258,616 | |
| | | | | |
Total Investments — 99.9%
(Cost $12,517,130)* | | | | 12,517,130 | |
Other Assets Less Liabilities — 0.1% | | | | 17,717 | |
| | | | | |
NET ASSETS — 100.0% | | | | 12,534,847 | |
| | | | | |
Percentages indicated are based on net assets.
SEE NOTES TO FINANCIAL STATEMENTS.
| | | | | | |
| | | |
| 44 | | | | J.P. MORGAN MONEY MARKET FUNDS | | AUGUST 31, 2020 |
| | |
Abbreviations | | |
| FHLMC | | Federal Home Loan Mortgage Corp. |
| FNMA | | Federal National Mortgage Association |
| GNMA | | Government National Mortgage Association |
| ICE | | Intercontinental Exchange |
| LIBOR | | London Interbank Offered Rate |
| OBFR | | Overnight Bank Funding Rate |
| PJSC | | Public Joint Stock Company |
| RAN | | Revenue Anticipation Note |
| Rev. | | Revenue |
| SOFR | | Secured Overnight Financing Rate |
| USD | | United States Dollar |
| | |
| |
| (a) | | The date shown represents the earliest of the next put date, next demand date or final maturity date. |
| (b) | | Variable or floating rate security, linked to the referenced benchmark. The interest rate shown is the current rate as of August 31, 2020. |
| (c) | | Securities exempt from registration under Rule 144A or section 4(a)(2), of the Securities Act of 1933, as amended. |
| (d) | | The rate shown is the effective yield as of August 31, 2020. |
| * | | The cost of securities is substantially the same for federal income tax purposes. |
SEE NOTES TO FINANCIAL STATEMENTS.
| | | | | | | | |
| | | |
| AUGUST 31, 2020 | | J.P. MORGAN MONEY MARKET FUNDS | | | | | 45 | |
JPMorgan U.S. Government Money Market Fund
SCHEDULE OF PORTFOLIO INVESTMENTS
AS OF AUGUST 31, 2020 (Unaudited)
| | | | | | | | |
| INVESTMENTS (a) | | PRINCIPAL
AMOUNT
($000) | | | VALUE
($000) | |
U.S. Government Agency Securities — 37.5% | |
| | |
FFCB | | | | | | | | |
| | |
(SOFR + 0.07%), 0.14%, 9/1/2020 (b) | | | 105,000 | | | | 105,000 | |
| | |
(US Treasury 3 Month Bill Money Market Yield + 0.06%), 0.16%, 9/1/2020 (b) | | | 275,000 | | | | 275,000 | |
| | |
(US Treasury 3 Month Bill Money Market Yield + 0.09%), 0.19%, 9/1/2020 (b) | | | 200,000 | | | | 199,968 | |
| | |
(ICE LIBOR USD 1 Month + 0.04%), 0.20%, 9/1/2020 (b) | | | 450,000 | | | | 450,000 | |
| | |
(Federal Reserve Bank Prime Loan Rate US - 3.00%), 0.25%, 9/1/2020 (b) | | | 175,000 | | | | 175,000 | |
| | |
(Federal Reserve Bank Prime Loan Rate US - 2.98%), 0.28%, 9/1/2020 (b) | | | 255,000 | | | | 255,044 | |
| | |
(Federal Reserve Bank Prime Loan Rate US - 2.93%), 0.33%, 9/1/2020 (b) | | | 325,000 | | | | 325,000 | |
| | |
(SOFR + 0.30%), 0.37%, 9/1/2020 (b) | | | 1,000,000 | | | | 1,000,000 | |
| | |
(SOFR + 0.35%), 0.42%, 9/1/2020 (b) | | | 1,500,000 | | | | 1,500,000 | |
| | |
(ICE LIBOR USD 1 Month + 0.03%), 0.19%, 9/3/2020 (b) | | | 350,000 | | | | 350,000 | |
| | |
(ICE LIBOR USD 1 Month - 0.02%), 0.14%, 9/4/2020 (b) | | | 300,000 | | | | 300,000 | |
| | |
(ICE LIBOR USD 1 Month + 0.05%), 0.21%, 9/5/2020 (b) | | | 450,000 | | | | 449,998 | |
| | |
(ICE LIBOR USD 1 Month + 0.35%), 0.51%, 9/5/2020 (b) | | | 50,000 | | | | 50,065 | |
| | |
(ICE LIBOR USD 1 Month + 0.00%), 0.15%, 9/6/2020 (b) | | | 400,000 | | | | 400,000 | |
| | |
(ICE LIBOR USD 1 Month + 0.00%), 0.15%, 9/8/2020 (b) | | | 90,000 | | | | 89,998 | |
| | |
(ICE LIBOR USD 1 Month + 0.04%), 0.19%, 9/8/2020 (b) | | | 400,000 | | | | 400,000 | |
| | |
(ICE LIBOR USD 1 Month + 0.09%), 0.24%, 9/8/2020 (b) | | | 550,000 | | | | 549,997 | |
| | |
(ICE LIBOR USD 1 Month - 0.01%), 0.15%, 9/14/2020 (b) | | | 250,000 | | | | 249,992 | |
| | |
(ICE LIBOR USD 1 Month + 0.06%), 0.22%, 9/15/2020 (b) | | | 375,000 | | | | 374,998 | |
| | |
(ICE LIBOR USD 1 Month + 0.05%), 0.21%, 9/16/2020 (b) | | | 50,000 | | | | 50,000 | |
| | |
DN, 0.52%, 9/16/2020 (c) | | | 100,000 | | | | 99,978 | |
| | |
(ICE LIBOR USD 1 Month + 0.06%), 0.24%, 9/23/2020 (b) | | | 275,000 | | | | 275,003 | |
| | |
(ICE LIBOR USD 1 Month + 0.04%), 0.22%, 9/24/2020 (b) | | | 550,000 | | | | 550,000 | |
| | |
(ICE LIBOR USD 1 Month + 0.01%), 0.19%, 9/25/2020 (b) | | | 400,000 | | | | 400,000 | |
| | |
(ICE LIBOR USD 1 Month + 0.04%), 0.21%, 9/27/2020 (b) | | | 185,000 | | | | 184,999 | |
| | |
(ICE LIBOR USD 1 Month + 0.07%), 0.22%, 9/28/2020 (b) | | | 20,000 | | | | 20,000 | |
| | | | | | | | |
| INVESTMENTS (a) | | PRINCIPAL
AMOUNT
($000) | | | VALUE
($000) | |
| | | | | | | | |
| | |
(ICE LIBOR USD 1 Month + 0.03%), 0.18%, 9/30/2020 (b) | | | 250,000 | | | | 250,000 | |
| | |
DN, 0.52%, 10/16/2020 (c) | | | 50,000 | | | | 49,968 | |
| | |
FHLB | | | | | | | | |
| | |
(SOFR + 0.01%), 0.08%, 9/1/2020 (b) | | | 1,900,000 | | | | 1,900,000 | |
| | |
(SOFR + 0.03%), 0.10%, 9/1/2020 (b) | | | 1,250,000 | | | | 1,250,000 | |
| | |
(SOFR + 0.03%), 0.10%, 9/1/2020 (b) | | | 274,000 | | | | 274,000 | |
| | |
(SOFR + 0.04%), 0.11%, 9/1/2020 (b) | | | 505,000 | | | | 505,000 | |
| | |
(SOFR + 0.05%), 0.12%, 9/1/2020 (b) | | | 300,000 | | | | 300,000 | |
| | |
(SOFR + 0.06%), 0.12%, 9/1/2020 (b) | | | 500,000 | | | | 500,000 | |
| | |
(SOFR + 0.06%), 0.13%, 9/1/2020 (b) | | | 500,000 | | | | 500,000 | |
| | |
(SOFR + 0.07%), 0.14%, 9/1/2020 (b) | | | 10,000 | | | | 10,000 | |
| | |
(SOFR + 0.08%), 0.15%, 9/1/2020 (b) | | | 274,800 | | | | 274,800 | |
| | |
(SOFR + 0.09%), 0.16%, 9/1/2020 (b) | | | 1,707,750 | | | | 1,707,749 | |
| | |
(SOFR + 0.10%), 0.17%, 9/1/2020 (b) | | | 450,000 | | | | 450,000 | |
| | |
(SOFR + 0.12%), 0.19%, 9/1/2020 (b) | | | 515,000 | | | | 515,000 | |
| | |
(ICE LIBOR USD 1 Month + 0.04%), 0.20%, 9/1/2020 (b) | | | 900,000 | | | | 900,000 | |
| | |
(SOFR + 0.20%), 0.27%, 9/1/2020 (b) | | | 250,000 | | | | 250,000 | |
| | |
(SOFR + 0.24%), 0.31%, 9/1/2020 (b) | | | 200,000 | | | | 200,000 | |
| | |
(ICE LIBOR USD 1 Month - 0.01%), 0.15%, 9/5/2020 (b) | | | 62,750 | | | | 62,746 | |
| | |
DN, 0.52%, 9/9/2020 (c) | | | 1,000,000 | | | | 999,884 | |
| | |
(ICE LIBOR USD 1 Month + 0.00%), 0.16%, 9/10/2020 (b) | | | 225,000 | | | | 225,000 | |
| | |
(ICE LIBOR USD 1 Month - 0.06%), 0.11%, 9/11/2020 (b) | | | 1,408,000 | | | | 1,408,002 | |
| | |
(ICE LIBOR USD 1 Month + 0.00%), 0.17%, 9/12/2020 (b) | | | 850,000 | | | | 850,000 | |
| | |
(ICE LIBOR USD 1 Month + 0.00%), 0.17%, 9/12/2020(b) | | | 100,000 | | | | 100,000 | |
| | |
(ICE LIBOR USD 1 Month + 0.00%), 0.16%, 9/14/2020 (b) | | | 500,000 | | | | 500,000 | |
| | |
(ICE LIBOR USD 1 Month - 0.04%), 0.12%, 9/16/2020 (b) | | | 500,000 | | | | 500,000 | |
| | |
(ICE LIBOR USD 1 Month + 0.02%), 0.18%, 9/19/2020 (b) | | | 630,320 | | | | 630,387 | |
| | |
DN, 0.27%, 9/22/2020 (c) | | | 500,000 | | | | 499,921 | |
| | |
(ICE LIBOR USD 1 Month - 0.03%), 0.15%, 9/24/2020 (b) | | | 250,000 | | | | 250,000 | |
| | |
(ICE LIBOR USD 1 Month - 0.03%), 0.15%, 9/24/2020 (b) | | | 898,000 | | | | 897,946 | |
| | |
(ICE LIBOR USD 1 Month + 0.01%), 0.19%, 9/24/2020 (b) | | | 470,000 | | | | 470,003 | |
| | |
(ICE LIBOR USD 1 Month - 0.03%), 0.14%, 9/26/2020 (b) | | | 90,000 | | | | 89,982 | |
| | |
(ICE LIBOR USD 1 Month - 0.03%), 0.14%, 9/26/2020 (b) | | | 250,000 | | | | 250,000 | |
SEE NOTES TO FINANCIAL STATEMENTS.
| | | | | | |
| | | |
| 46 | | | | J.P. MORGAN MONEY MARKET FUNDS | | AUGUST 31, 2020 |
| | | | | | | | |
| INVESTMENTS (a) | | PRINCIPAL
AMOUNT
($000) | | | VALUE
($000) | |
U.S. Government Agency Securities — continued | |
| | |
(ICE LIBOR USD 1 Month - 0.03%), 0.14%, 9/26/2020 (b) | | | 500,000 | | | | 500,000 | |
| | |
(ICE LIBOR USD 1 Month - 0.01%), 0.16%, 9/26/2020 (b) | | | 279,900 | | | | 279,871 | |
| | |
(ICE LIBOR USD 1 Month - 0.02%), 0.15%, 9/27/2020 (b) | | | 1,000,000 | | | | 1,000,000 | |
| | |
(ICE LIBOR USD 1 Month - 0.01%), 0.15%, 9/28/2020 (b) | | | 1,000,000 | | | | 1,000,000 | |
| | |
DN, 0.52%, 9/30/2020 (c) | | | 1,000,000 | | | | 999,581 | |
| | |
2.63%, 10/1/2020 | | | 204,930 | | | | 205,092 | |
| | |
DN, 0.32%, 10/2/2020 (c) | | | 375,000 | | | | 374,897 | |
| | |
(ICE LIBOR USD 3 Month - 0.09%), 0.21%, 10/4/2020 (b) | | | 500,000 | | | | 500,000 | |
| | |
DN, 0.30%, 10/5/2020 (c) | | | 2,999,500 | | | | 2,998,650 | |
| | |
DN, 0.32%, 10/6/2020 (c) | | | 1,000,000 | | | | 999,689 | |
| | |
(ICE LIBOR USD 3 Month - 0.10%), 0.17%, 10/9/2020 (b) | | | 1,300,000 | | | | 1,300,000 | |
| | |
DN, 0.52%, 10/9/2020 (c) | | | 500,000 | | | | 499,726 | |
| | |
(ICE LIBOR USD 3 Month - 0.10%), 0.17%, 10/13/2020 (b) | | | 700,000 | | | | 700,000 | |
| | |
(ICE LIBOR USD 3 Month - 0.13%), 0.14%, 10/14/2020 (b) | | | 100,000 | | | | 100,000 | |
| | |
DN, 0.20%, 10/14/2020 (c) | | | 500,000 | | | | 499,881 | |
| | |
DN, 0.20%, 10/15/2020 (c) | | | 250,000 | | | | 249,939 | |
| | |
DN, 0.15%, 10/30/2020 (c) | | | 255,000 | | | | 254,937 | |
| | |
(ICE LIBOR USD 3 Month - 0.12%), 0.13%, 11/5/2020 (b) | | | 1,000,000 | | | | 1,000,000 | |
| | |
(ICE LIBOR USD 3 Month - 0.20%), 0.05%, 11/9/2020 (b) | | | 500,000 | | | | 500,029 | |
| | |
(SOFR + 0.01%), 0.08%, 11/12/2020 (b) | | | 370,000 | | | | 370,000 | |
| | |
(ICE LIBOR USD 3 Month - 0.14%), 0.13%, 11/12/2020 (b) | | | 150,000 | | | | 150,000 | |
| | |
DN, 0.11%, 11/13/2020 (c) | | | 250,000 | | | | 249,944 | |
| | |
(ICE LIBOR USD 3 Month - 0.13%), 0.14%, 11/14/2020 (b) | | | 250,000 | | | | 250,000 | |
| | |
(ICE LIBOR USD 3 Month - 0.20%), 0.09%, 11/16/2020(b) | | | 1,800,000 | | | | 1,800,000 | |
| | |
(ICE LIBOR USD 3 Month - 0.20%), 0.09%, 11/16/2020 (b) | | | 1,000,000 | | | | 1,000,000 | |
| | |
(ICE LIBOR USD 3 Month - 0.15%), 0.14%, 11/17/2020 (b) | | | 250,000 | | | | 250,000 | |
| | |
(ICE LIBOR USD 3 Month - 0.15%), 0.12%, 11/19/2020 (b) | | | 150,000 | | | | 150,000 | |
| | |
DN, 0.11%, 11/20/2020 (c) | | | 375,000 | | | | 374,908 | |
| | |
(ICE LIBOR USD 3 Month - 0.13%), 0.16%, 11/20/2020 (b) | | | 400,000 | | | | 400,000 | |
| | |
(ICE LIBOR USD 3 Month - 0.12%), 0.14%, 11/24/2020 (b) | | | 350,000 | | | | 350,000 | |
| | | | | | | | |
| INVESTMENTS (a) | | PRINCIPAL
AMOUNT
($000) | | | VALUE
($000) | |
| | | | | | | | |
| | |
(ICE LIBOR USD 3 Month - 0.12%), 0.11%, 11/26/2020 (b) | | | 400,000 | | | | 400,000 | |
| | |
DN, 0.11%, 11/27/2020 (c) | | | 150,000 | | | | 149,960 | |
| | |
0.19%, 12/10/2020 | | | 500,000 | | | | 499,982 | |
| | |
0.20%, 12/11/2020 | | | 250,000 | | | | 249,997 | |
| | |
0.14%, 5/24/2021 | | | 250,000 | | | | 249,979 | |
| | |
1.13%, 7/14/2021 | | | 290,000 | | | | 292,469 | |
| | |
FHLMC | | | | | | | | |
| | |
(SOFR + 0.03%), 0.10%, 9/1/2020 (b) | | | 127,000 | | | | 126,998 | |
| | |
(SOFR + 0.04%), 0.11%, 9/1/2020 (b) | | | 1,000,000 | | | | 1,000,000 | |
| | |
(SOFR + 0.27%), 0.34%, 9/1/2020 (b) | | | 1,250,000 | | | | 1,250,000 | |
| | |
(SOFR + 0.28%), 0.35%, 9/1/2020 (b) | | | 1,000,000 | | | | 1,000,000 | |
| | |
(SOFR + 0.30%), 0.37%, 9/1/2020 (b) | | | 2,500,000 | | | | 2,500,419 | |
| | |
FNMA | | | | | | | | |
| | |
(SOFR + 0.04%), 0.11%, 9/1/2020 (b) | | | 500,000 | | | | 500,000 | |
| | |
(SOFR + 0.05%), 0.12%, 9/1/2020 (b) | | | 349,800 | | | | 349,800 | |
| | |
(SOFR + 0.17%), 0.24%, 9/1/2020 (b) | | | 249,750 | | | | 249,750 | |
| | |
(SOFR + 0.20%), 0.27%, 9/1/2020 (b) | | | 1,950,000 | | | | 1,950,000 | |
| | |
(SOFR + 0.23%), 0.30%, 9/1/2020 (b) | | | 840,000 | | | | 840,000 | |
| | |
(SOFR + 0.24%), 0.31%, 9/1/2020 (b) | | | 1,000,000 | | | | 1,000,000 | |
| | |
(SOFR + 0.26%), 0.33%, 9/1/2020 (b) | | | 1,000,000 | | | | 1,000,000 | |
| | |
(SOFR + 0.28%), 0.35%, 9/1/2020 (b) | | | 1,000,000 | | | | 1,000,000 | |
| | |
(SOFR + 0.32%), 0.39%, 9/1/2020 (b) | | | 2,450,000 | | | | 2,450,000 | |
| | |
(SOFR + 0.35%), 0.42%, 9/1/2020 (b) | | | 2,500,000 | | | | 2,500,000 | |
| | |
(SOFR + 0.35%), 0.42%, 9/1/2020 (b) | | | 750,000 | | | | 750,000 | |
| | |
1.25%, 5/6/2021 | | | 400,375 | | | | 403,439 | |
| | |
FNMA ACES (SOFR + 0.20%), 0.27%, 9/1/2020 (b) | | | 1,200,000 | | | | 1,200,000 | |
| | | | | | | | |
| |
Total U.S. Government Agency Securities
(Cost $67,870,365) | | | | 67,870,365 | |
| | | | | |
Repurchase Agreements — 29.3% | |
| | |
Agency Joint Trading Account I, J.P. Morgan Investment Management Inc., as agent, 0.09%, dated 8/31/2020, due 9/1/20, repurchase price $2,550,006. [1] | | | 2,550,000 | | | | 2,550,000 | |
| | |
Agency Joint Trading Account II, J.P. Morgan Investment Management Inc., as agent, 0.09%, dated 8/31/2020, due 9/1/20, repurchase price $604,710. [2] | | | 604,708 | | | | 604,708 | |
| | |
Agency Joint Trading Account III, J.P. Morgan Investment Management Inc., as agent, 0.09%, dated 8/31/2020, due 9/1/20, repurchase price $92,456. [3] | | | 92,456 | | | | 92,456 | |
| | |
Bank of America NA, 0.09%, dated 8/31/2020, due 9/1/2020, repurchase price $750,002, collateralized by GNMA, 3.00%, due 9/20/2046, with a value of $765,000. | | | 750,000 | | | | 750,000 | |
SEE NOTES TO FINANCIAL STATEMENTS.
| | | | | | | | |
| | | |
| AUGUST 31, 2020 | | J.P. MORGAN MONEY MARKET FUNDS | | | | | 47 | |
JPMorgan U.S. Government Money Market Fund
SCHEDULE OF PORTFOLIO INVESTMENTS
AS OF AUGUST 31, 2020 (Unaudited) (continued)
| | | | | | | | |
| INVESTMENTS (a) | | PRINCIPAL
AMOUNT
($000) | | | VALUE
($000) | |
Repurchase Agreements — continued | |
| | |
Bank of Montreal, 0.09%, dated 8/31/2020, due 9/1/2020, repurchase price $115,000, collateralized by GNMA, 3.00%, due 6/20/2050, with a value of $117,300. | | | 115,000 | | | | 115,000 | |
| | |
Bank of Montreal, 0.12%, dated 8/31/2020, due 9/7/2020, repurchase price $500,012, collateralized by U.S. Treasury Securities, 0.25% - 3.63%, due 1/15/2028 - 2/15/2050, with a value of $510,155. | | | 500,000 | | | | 500,000 | |
| | |
Bank of Nova Scotia (The), 0.09%, dated 8/31/2020, due 9/1/2020, repurchase price $1,500,004, collateralized by FHLMC, 2.50% - 6.00%, due 5/1/2028 - 5/1/2050, FNMA, 2.22% - 5.50%, due 7/1/2028 - 5/1/2058 and U.S. Treasury Securities, 2.88%, due 10/31/2023 - 5/15/2028, with a value of $1,530,000. | | | 1,500,000 | | | | 1,500,000 | |
| | |
Bank of Nova Scotia (The), 0.08%, dated 8/31/2020, due 9/4/2020, repurchase price $1,000,009, collateralized by FHLMC, 3.00% - 6.50%, due 5/1/2021 - 5/1/2050, FNMA, 2.00% - 5.50%, due 6/1/2025 - 6/1/2050 and GNMA, 2.00% - 5.00%, due 10/20/2039 - 8/20/2050, with a value of $1,020,000. | | | 1,000,000 | | | | 1,000,000 | |
| | |
Barclays Capital, Inc., 0.07%, dated 8/31/2020, due 9/1/2020, repurchase price $106,637, collateralized by U.S. Treasury Securities, 0.00%, due 11/15/2022 - 5/15/2044, with a value of $108,770. | | | 106,637 | | | | 106,637 | |
| | |
Barclays Capital, Inc., 0.08%, dated 8/31/2020, due 9/4/2020, repurchase price $500,004, collateralized by GNMA, 2.50% - 5.50%, due 1/20/2046 - 8/20/2050, with a value of $510,000. | | | 500,000 | | | | 500,000 | |
| | |
BMO Capital Markets Corp., 0.09%, dated 8/31/2020, due 9/1/2020, repurchase price $400,001, collateralized by FFCB, 0.24%, due 7/13/2022, FHLMC, 1.50% - 6.00%, due 6/25/2027 - 9/1/2050, FNMA, 0.30% - 6.50%, due 1/1/2024 - 9/1/2050 and GNMA, 0.75% - 10.57%, due 7/15/2024 - 7/20/2070 with a value of $408,759. | | | 400,000 | | | | 400,000 | |
| | |
BMO Capital Markets Corp., 0.12%, dated 8/31/2020, due 9/7/2020, repurchase price $600,014, collateralized by FFCB, 0.24%, due 7/13/2022, FHLB, 1.38%, due 9/28/2020, FHLMC, 2.00% - 5.00%, due 9/15/2028 - 9/1/2050, FNMA, 1.50% - 6.10%, due 11/1/2030 - 8/1/2050 and GNMA, 0.66% - 8.50%, due 11/15/2021 - 7/20/2070 with a value of $612,531. | | | 600,000 | | | | 600,000 | |
| | | | | | | | |
| INVESTMENTS (a) | | PRINCIPAL
AMOUNT
($000) | | | VALUE
($000) | |
| | | | | | | | |
| | |
BMO Capital Markets Corp., 0.13%, dated 8/31/2020, due 9/7/2020, repurchase price $500,013, collateralized by FHLMC, 0.00% - 4.37%, due 6/15/2028 - 8/15/2054, FNMA, 1.21% - 6.30%, due 9/25/2027 - 9/1/2050 and GNMA, 1.15% - 5.50%, due 4/20/2034 - 7/20/2070, with a value of $512,377. | | | 500,000 | | | | 500,000 | |
| | |
BMO Capital Markets Corp., 0.13%, dated 8/31/2020, due 9/7/2020, repurchase price $500,013, collateralized by FFCB, 0.24%, due 7/13/2022, FHLB, 2.38%, due 2/8/2021, FHLMC, 1.00% - 4.50%, due 4/25/2025 - 9/25/2050, FNMA, 1.32% - 6.50%, due 5/1/2021 - 9/25/2050 and GNMA, 0.56% - 6.05%, due 2/15/2022 - 6/20/2070 with a value of $513,618. | | | 500,000 | | | | 500,000 | |
| | |
BNP Paribas SA, 0.07%, dated 8/31/2020, due 9/1/2020, repurchase price $510,001, collateralized by U.S. Treasury Securities, 0.63% - 3.00%, due 6/15/2021 - 2/15/2049, with a value of $520,201. | | | 510,000 | | | | 510,000 | |
| | |
BNP Paribas SA, 0.11%, dated 8/31/2020, due 9/7/2020, repurchase price $1,000,021, collateralized by FFCB, 2.99% - 3.54%, due 7/18/2034 - 3/9/2038, FHLB, 3.90% - 4.13%, due 10/24/2029 - 2/25/2036, FHLMC, 0.38% - 7.00%, due 5/5/2023 - 5/1/2050, FNMA, 0.00% - 9.00%, due 3/1/2022 - 7/25/2050, GNMA, 0.79% - 7.00%, due 7/15/2024 - 5/20/2050 and U.S. Treasury Securities, 0.00% - 8.13%, due 9/15/2020 - 5/15/2049, with a value of $1,020,546. | | | 1,000,000 | | | | 1,000,000 | |
| | |
BNP Paribas SA, 0.12%, dated 8/31/2020, due 9/7/2020, repurchase price $1,000,023, collateralized by FHLB, 3.54%, due 5/28/2036, FHLMC, 2.50% - 7.00%, due 3/15/2029 - 8/1/2050, FNMA, 0.00% - 6.00%, due 10/25/2020 - 10/1/2056, GNMA, 2.50% - 6.50%, due 5/15/2025 - 2/20/2069 and U.S. Treasury Securities, 0.00% - 3.38%, due 10/31/2020 - 2/15/2049 with a value of $1,020,512. | | | 1,000,000 | | | | 1,000,000 | |
| | |
BNP Paribas SA, 0.12%, dated 8/31/2020, due 9/7/2020, repurchase price $2,000,047, collateralized by FHLB, 3.90% - 4.13%, due 5/25/2035 - 2/25/2036, FHLMC, 3.00% - 7.00%, due 3/15/2029 - 3/1/2050, FNMA, 2.50% - 6.50%, due 10/25/2020 - 8/1/2050, GNMA, 2.88% - 5.50%, due 5/20/2042 - 10/20/2067 and U.S. Treasury Securities, 0.00% - 4.38%, due 9/15/2020 - 11/15/2048 with a value of $2,040,605. | | | 2,000,000 | | | | 2,000,000 | |
SEE NOTES TO FINANCIAL STATEMENTS.
| | | | | | |
| | | |
| 48 | | | | J.P. MORGAN MONEY MARKET FUNDS | | AUGUST 31, 2020 |
| | | | | | | | |
| INVESTMENTS (a) | | PRINCIPAL
AMOUNT
($000) | | | VALUE
($000) | |
Repurchase Agreements — continued | |
| | |
BNP Paribas SA, 0.14%, dated 8/31/2020, due 9/7/2020, repurchase price $2,000,054, collateralized by FHLB, 3.93%, due 7/11/2033, FHLMC, 0.00% - 7.00%, due 12/11/2025 - 7/1/2050, FNMA, 0.00% - 6.00%, due 10/25/2020 - 8/1/2050, GNMA, 2.13% - 8.00%, due 12/15/2026 - 8/20/2050 and U.S. Treasury Securities, 0.00% - 7.50%, due 9/17/2020 - 8/15/2050 with a value of $2,040,726. | | | 2,000,000 | | | | 2,000,000 | |
| | |
BNP Paribas SA, 0.12%, dated 8/31/2020, due 11/6/2020, repurchase price $1,000,223, collateralized by FFCB, 3.54%, due 1/25/2038, FHLB, 3.90% - 5.25%, due 12/9/2022 - 2/25/2036, FHLMC, 0.00% - 7.00%, due 3/15/2028 - 4/1/2050, FNMA, 0.00% - 7.50%, due 9/1/2022 - 8/1/2050, GNMA, 0.82% - 6.50%, due 5/15/2023 - 1/20/2069 and U.S. Treasury Securities, 0.00% - 7.88%, due 9/15/2020 - 11/15/2049, with a value of $1,020,344. | | | 1,000,000 | | | | 1,000,000 | |
| | |
BNP Paribas SA, 0.12%, dated 8/31/2020, due 12/1/2020, repurchase price $500,153, collateralized by FHLB, 4.00%, due 7/19/2033, FHLMC, 0.38% - 6.00%, due 5/5/2023 - 4/1/2050, FNMA, 0.00% - 7.00%, due 11/15/2030 - 8/1/2050, GNMA, 0.79% - 9.50%, due 9/15/2024 - 5/20/2050 and U.S. Treasury Securities, 0.00% - 3.13%, due 12/31/2020 - 5/15/2050 with a value of $510,180. | | | 500,000 | | | | 500,000 | |
| | |
Canadian Imperial Bank of Commerce, 0.07%, dated 8/31/2020, due 9/1/2020, repurchase price $350,001, collateralized by U.S. Treasury Securities, 0.00% - 3.63%, due 11/30/2021 - 11/15/2049, with a value of $357,001. | | | 350,000 | | | | 350,000 | |
| | |
Canadian Imperial Bank of Commerce, 0.09%, dated 8/31/2020, due 9/1/2020, repurchase price $675,002, collateralized by FHLMC, 2.90% - 4.00%, due 1/1/2029 - 7/1/2050, FNMA, 2.00% - 4.50%, due 6/1/2021 - 7/1/2050 and GNMA, 3.00% - 4.71%, due 10/20/2045 - 8/20/2069, with a value of $688,502. | | | 675,000 | | | | 675,000 | |
| | |
Citigroup Global Markets Holdings, Inc., 0.09%, dated 8/31/2020, due 9/1/2020, repurchase price $500,001, collateralized by U.S. Treasury Securities, 0.13% - 7.13%, due 7/15/2021 - 2/28/2023, with a value of $510,000. | | | 500,000 | | | | 500,000 | |
| | | | | | | | |
| INVESTMENTS (a) | | PRINCIPAL
AMOUNT
($000) | | | VALUE
($000) | |
| | | | | | | | |
| | |
Credit Agricole Corporate and Investment Bank, 0.08%, dated 8/31/2020, due 9/1/2020, repurchase price $1,000,002, collateralized by U.S. Treasury Securities, 0.25% - 0.88%, due 7/15/2021 - 7/15/2029, with a value of $1,020,000. | | | 1,000,000 | | | | 1,000,000 | |
| | |
Daiwa Capital Markets America, Inc., 0.09%, dated 8/31/2020, due 9/1/2020, repurchase price $3,000,008, collateralized by FFCB, 0.58% - 1.14%, due 6/18/2026 - 8/20/2029, FHLB, 0.13% - 3.00%, due 8/20/2021 - 10/12/2021, FHLMC, 1.00% - 5.50%, due 7/1/2024 - 9/1/2050, FNMA, 0.88% - 6.50%, due 3/1/2022 - 3/1/2052, GNMA, 2.00% - 6.00%, due 10/15/2033 - 8/20/2050 and U.S. Treasury Securities, 0.00% - 3.63%, due 9/17/2020 - 5/15/2050, with a value of $3,060,008. | | | 3,000,000 | | | | 3,000,000 | |
| | |
Goldman Sachs & Co. LLC, 0.04%, dated 8/31/2020, due 9/1/2020, repurchase price $800,001, collateralized by U.S. Treasury Securities, 0.00% - 2.75%, due 11/27/2020 - 5/15/2026, with a value of $816,000. | | | 800,000 | | | | 800,000 | |
| | |
Goldman Sachs & Co. LLC, 0.07%, dated 8/31/2020, due 9/3/2020, repurchase price $1,500,009, collateralized by U.S. Treasury Securities, 0.13% - 5.38%, due 7/31/2021 - 2/15/2048, with a value of $1,530,000. | | | 1,500,000 | | | | 1,500,000 | |
| | |
Goldman Sachs & Co. LLC, 0.08%, dated 8/31/2020, due 9/3/2020, repurchase price $1,500,010, collateralized by FHLMC, 2.50% - 5.50%, due 5/1/2027 - 2/1/2050 and FNMA, 2.50% - 6.50%, due 3/1/2027 - 2/1/2057, with a value of $1,530,000. | | | 1,500,000 | | | | 1,500,000 | |
| | |
ING Financial Markets LLC, 0.12%, dated 8/31/2020, due 9/4/2020, repurchase price $350,005, collateralized by FHLMC, 2.50% - 4.50%, due 9/1/2043 - 7/1/2050, FNMA, 2.50% - 4.50%, due 8/1/2035 - 1/1/2057 and GNMA, 3.00%, due 10/20/2049, with a value of $357,036. | | | 350,000 | | | | 350,000 | |
| | |
ING Financial Markets LLC, 0.10%, dated 8/31/2020, due 9/21/2020, repurchase price $300,018, collateralized by FHLMC, 2.78% - 4.00%, due 6/1/2047 - 1/1/2050, FNMA, 2.51% - 4.50%, due 5/1/2032 - 9/1/2057 and GNMA, 3.00%, due 10/20/2049, with a value of $306,027. | | | 300,000 | | | | 300,000 | |
SEE NOTES TO FINANCIAL STATEMENTS.
| | | | | | | | |
| | | |
| AUGUST 31, 2020 | | J.P. MORGAN MONEY MARKET FUNDS | | | | | 49 | |
JPMorgan U.S. Government Money Market Fund
SCHEDULE OF PORTFOLIO INVESTMENTS
AS OF AUGUST 31, 2020 (Unaudited) (continued)
| | | | | | | | |
| INVESTMENTS (a) | | PRINCIPAL
AMOUNT
($000) | | | VALUE
($000) | |
Repurchase Agreements — continued | |
| | |
ING Financial Markets LLC, 0.10%, dated 8/31/2020, due 9/21/2020, repurchase price $350,020, collateralized by FHLMC, 3.50% - 4.50%, due 9/1/2042 - 4/1/2049, FNMA, 3.38% - 5.00%, due 6/1/2042 - 9/1/2057 and GNMA, 5.00%, due 1/20/2049, with a value of $357,031. | | | 350,000 | | | | 350,000 | |
| | |
ING Financial Markets LLC, 0.11%, dated 8/31/2020, due 9/23/2020, repurchase price $300,021, collateralized by FHLMC, 2.50% - 4.50%, due 12/1/2042 - 7/1/2050, FNMA, 3.00% - 5.00%, due 5/1/2042 - 7/1/2056 and GNMA, 3.00%, due 10/20/2049, with a value of $306,033. | | | 300,000 | | | | 300,000 | |
| | |
Metropolitan Life Insurance Co., 0.09%, dated 8/31/2020, due 9/1/2020, repurchase price $1,000,003, collateralized by U.S. Treasury Securities, 0.00%, due 11/15/2027 - 11/15/2047, with a value of $1,020,003. | | | 1,000,000 | | | | 1,000,000 | |
| | |
Mitsubishi UFJ Trust & Banking Corp., 0.08%, dated 8/31/2020, due 9/1/2020, repurchase price $1,300,003, collateralized by GNMA, 2.50% - 5.00%, due 8/15/2038 - 7/20/2050, with a value of $1,322,995. | | | 1,300,000 | | | | 1,300,000 | |
| | |
Natixis SA, 0.07%, dated 8/31/2020, due 9/1/2020, repurchase price $850,002, collateralized by U.S. Treasury Securities, 0.00% - 6.63%, due 3/31/2021 - 8/15/2050, with a value of $867,002. | | | 850,000 | | | | 850,000 | |
| | |
Natixis SA, 0.12%, dated 8/31/2020, due 11/23/2020, repurchase price $1,000,280, collateralized by FHLB, 4.08%, due 5/25/2033, FHLMC, 0.00% - 8.00%, due 10/1/2021 - 8/1/2050, FNMA, 0.00% - 8.50%, due 12/1/2020 - 10/25/2058, GNMA, 1.75% - 8.50%, due 4/15/2022 - 7/20/2069, Tennessee Valley Authority, 4.25%, due 9/15/2065 and U.S. Treasury Securities, 0.00% - 6.50%, due 1/15/2021 - 8/15/2050, with a value of $1,023,799. | | | 1,000,000 | | | | 1,000,000 | |
| | |
Natwest Markets Securities, Inc., 0.07%, dated 8/31/2020, due 9/1/2020, repurchase price $1,000,002, collateralized by U.S. Treasury Securities, 0.00% - 3.38%, due 9/15/2020 - 11/15/2048, with a value of $1,020,002. | | | 1,000,000 | | | | 1,000,000 | |
| | |
Nomura Securities Co. Ltd., 0.07%, dated 8/31/2020, due 9/1/2020, repurchase price $500,001, collateralized by U.S. Treasury Securities, 0.00% - 2.75%, due 9/15/2020 - 8/15/2049, with a value of $510,001. | | | 500,000 | | | | 500,000 | |
| | | | | | | | |
| INVESTMENTS (a) | | PRINCIPAL
AMOUNT
($000) | | | VALUE
($000) | |
| | | | | | | | |
| | |
Nomura Securities Co. Ltd., 0.09%, dated 8/31/2020, due 9/1/2020, repurchase price $3,500,009, collateralized by FFCB, 0.00%, due 5/3/2021, FHLMC, 2.00% - 9.50%, due 9/15/2020 - 9/1/2050, FNMA, 1.50% - 9.50%, due 9/25/2020 - 2/1/2052, GNMA, 1.30% - 10.00%, due 9/15/2020 - 1/20/2070 and U.S. Treasury Securities, 2.00% - 6.13%, due 3/15/2021 - 11/15/2027 with a value of $3,570,009. | | | 3,500,000 | | | | 3,500,000 | |
| | |
Norinchukin Bank (The), 0.21%, dated 8/31/2020, due 9/4/2020, repurchase price $550,013, collateralized by U.S. Treasury Securities, 0.38% - 1.50%, due 1/15/2021 - 1/15/2027, with a value of $560,652. | | | 550,000 | | | | 550,000 | |
| | |
Norinchukin Bank (The), 0.21%, dated 8/31/2020, due 9/11/2020, repurchase price $250,016, collateralized by U.S. Treasury Securities, 0.38% - 1.50%, due 1/15/2021 - 1/15/2027, with a value of $254,842. | | | 250,000 | | | | 250,000 | |
| | |
Norinchukin Bank (The), 0.15%, dated 8/31/2020, due 10/2/2020, repurchase price $200,027, collateralized by U.S. Treasury Securities, 0.38% - 1.50%, due 1/15/2021 - 1/15/2027, with a value of $203,873. | | | 200,000 | | | | 200,000 | |
| | |
Norinchukin Bank (The), 0.15%, dated 8/31/2020, due 10/5/2020, repurchase price $500,073, collateralized by U.S. Treasury Securities, 0.38% - 1.50%, due 1/15/2021 - 1/15/2027, with a value of $509,683. | | | 500,000 | | | | 500,000 | |
| | |
Norinchukin Bank (The), 0.15%, dated 8/31/2020, due 10/16/2020, repurchase price $450,086, collateralized by U.S. Treasury Securities, 0.38% - 1.50%, due 1/15/2021 - 1/15/2027, with a value of $458,715. | | | 450,000 | | | | 450,000 | |
| | |
Norinchukin Bank (The), 0.14%, dated 8/31/2020, due 10/27/2020, repurchase price $300,067, collateralized by U.S. Treasury Securities, 0.38% - 1.50%, due 1/15/2021 - 1/15/2027, with a value of $305,810. | | | 300,000 | | | | 300,000 | |
| | |
RBC Capital Markets LLC, 0.09%, dated 8/31/2020, due 9/1/2020, repurchase price $250,001, collateralized by FHLMC, 0.52% - 2.86%, due 3/25/2023 - 1/15/2043 and U.S. Treasury Securities, 2.88%, due 5/15/2049, with a value of $257,499. | | | 250,000 | | | | 250,000 | |
SEE NOTES TO FINANCIAL STATEMENTS.
| | | | | | |
| | | |
| 50 | | | | J.P. MORGAN MONEY MARKET FUNDS | | AUGUST 31, 2020 |
| | | | | | | | |
| INVESTMENTS (a) | | PRINCIPAL
AMOUNT
($000) | | | VALUE
($000) | |
Repurchase Agreements — continued | |
| | |
RBC Capital Markets LLC, 0.15%, dated 8/31/2020, due 9/7/2020, repurchase price $2,000,058, collateralized by FHLMC, 0.34% - 5.88%, due 6/25/2022 - 1/25/2046, FNMA, 2.50% - 6.60%, due 10/1/2020 - 5/25/2050, GNMA, 0.68% - 5.50%, due 1/20/2039 - 8/20/2065 and U.S. Treasury Securities, 0.00% - 2.63%, due 10/1/2020 - 2/15/2029 with a value of $2,059,573. | | | 2,000,000 | | | | 2,000,000 | |
| | |
Royal Bank of Canada, 0.09%, dated 8/31/2020, due 9/1/2020, repurchase price $2,950,007, collateralized by U.S. Treasury Securities, 0.13% - 3.00%, due 3/31/2021 - 8/15/2048, with a value of $3,009,008. | | | 2,950,000 | | | | 2,950,000 | |
| | |
Societe Generale SA, 0.08%, dated 8/31/2020, due 9/2/2020, repurchase price $1,000,004, collateralized by U.S. Treasury Securities, 0.00% - 5.00%, due 9/10/2020 - 2/15/2050, with a value of $1,020,000. | | | 1,000,000 | | | | 1,000,000 | |
| | |
Societe Generale SA, 0.12%, dated 8/31/2020, due 9/2/2020, repurchase price $500,003, collateralized by U.S. Treasury Securities, 0.00% - 8.13%, due 9/15/2020 - 8/15/2050, with a value of $510,000. | | | 500,000 | | | | 500,000 | |
| | |
Societe Generale SA, 0.08%, dated 8/31/2020, due 9/4/2020, repurchase price $1,000,009, collateralized by U.S. Treasury Securities, 0.00% - 5.00%, due 9/3/2020 - 2/15/2050, with a value of $1,020,000. | | | 1,000,000 | | | | 1,000,000 | |
| | |
Societe Generale SA, 0.12%, dated 8/31/2020, due 9/4/2020, repurchase price $500,007, collateralized by U.S. Treasury Securities, 0.00% - 8.00%, due 9/24/2020 - 2/15/2046, with a value of $510,000. | | | 500,000 | | | | 500,000 | |
| | |
Sumitomo Mitsui Banking Corp., 0.07%, dated 8/31/2020, due 9/1/2020, repurchase price $1,100,002, collateralized by U.S. Treasury Securities, 0.50% - 3.75%, due 1/31/2025 - 8/15/2044, with a value of $1,122,002. | | | 1,100,000 | | | | 1,100,000 | |
| | |
Sumitomo Mitsui Banking Corp., 0.09%, dated 8/31/2020, due 9/1/2020, repurchase price $3,000,008, collateralized by GNMA, 3.00% - 4.50%, due 10/20/2042 - 11/20/2049, with a value of $3,060,008. | | | 3,000,000 | | | | 3,000,000 | |
| | | | | | | | |
| INVESTMENTS (a) | | PRINCIPAL
AMOUNT
($000) | | | VALUE
($000) | |
| | | | | | | | |
| | |
Treasury Joint Trading Account III, J.P. Morgan Investment Management Inc., as agent, 0.07%, dated 8/31/2020, due 9/1/20, repurchase price $902,067. [4] | | | 902,065 | | | | 902,065 | |
| | | | | | | | |
| |
Total Repurchase Agreements
(Cost $52,955,866) | | | | 52,955,866 | |
| | | | | |
U.S. Treasury Obligations — 3.1% | |
| | |
U.S. Treasury Floating Rate Notes (US Treasury 3 Month Bill Money Market Yield + 0.14%), 0.24%, 9/1/2020 (b) | | | 25,450 | | | | 25,438 | |
| | |
U.S. Treasury Notes | | | | | | | | |
| | |
1.38%, 9/15/2020 | | | 150,000 | | | | 149,986 | |
| | |
2.00%, 9/30/2020 | | | 500,000 | | | | 500,143 | |
| | |
1.63%, 10/15/2020 | | | 357,214 | | | | 357,207 | |
| | |
1.38%, 10/31/2020 | | | 691,000 | | | | 690,680 | |
| | |
1.75%, 10/31/2020 | | | 672,000 | | | | 672,098 | |
| | |
2.88%, 10/31/2020 | | | 359,000 | | | | 359,704 | |
| | |
1.75%, 11/15/2020 | | | 62,000 | | | | 62,011 | |
| | |
2.63%, 11/15/2020 | | | 645,000 | | | | 646,266 | |
| | |
1.63%, 11/30/2020 | | | 330,000 | | | | 329,984 | |
| | |
2.00%, 11/30/2020 | | | 100,000 | | | | 100,087 | |
| | |
2.75%, 11/30/2020 | | | 285,000 | | | | 285,765 | |
| | |
1.88%, 12/15/2020 | | | 395,000 | | | | 395,259 | |
| | |
2.25%, 4/30/2021 | | | 600,000 | | | | 608,419 | |
| | |
2.13%, 8/15/2021 | | | 100,000 | | | | 101,889 | |
| | |
2.75%, 8/15/2021 | | | 275,000 | | | | 281,832 | |
| | | | | | | | |
| |
Total U.S. Treasury Obligations
(Cost $5,566,768) | | | | 5,566,768 | |
| | | | | |
Short-Term Investments — 29.7% | |
|
U.S. Treasury Obligations — 29.7% | |
| | |
U.S. Treasury Bills | | | | | | | | |
| | |
0.08%, 9/1/2020 (c) | | | 200,000 | | | | 200,000 | |
| | |
0.15%, 9/3/2020 (c) | | | 1,651,500 | | | | 1,651,486 | |
| | |
0.12%, 9/8/2020 (c) | | | 5,000,000 | | | | 4,999,883 | |
| | |
0.14%, 9/10/2020 (c) | | | 2,573,050 | | | | 2,572,957 | |
| | |
0.12%, 9/15/2020 (c) | | | 1,900,000 | | | | 1,899,910 | |
| | |
0.18%, 9/17/2020 (c) | | | 4,000,000 | | | | 3,999,689 | |
| | |
0.10%, 9/22/2020 (c) | | | 1,100,000 | | | | 1,099,936 | |
| | |
0.15%, 10/1/2020 (c) | | | 6,778,000 | | | | 6,777,128 | |
| | |
0.10%, 10/13/2020 (c) | | | 1,000,000 | | | | 999,883 | |
| | |
0.16%, 10/20/2020 (c) | | | 2,500,000 | | | | 2,499,473 | |
| | |
0.15%, 10/27/2020 (c) | | | 3,000,000 | | | | 2,999,299 | |
| | |
0.17%, 11/3/2020 (c) | | | 2,775,000 | | | | 2,774,174 | |
| | |
0.18%, 11/10/2020 (c) | | | 4,000,000 | | | | 3,998,600 | |
| | |
0.19%, 11/17/2020 (c) | | | 5,000,000 | | | | 4,997,985 | |
| | |
0.11%, 12/1/2020 (c) | | | 2,000,000 | | | | 1,999,444 | |
SEE NOTES TO FINANCIAL STATEMENTS.
| | | | | | | | |
| | | |
| AUGUST 31, 2020 | | J.P. MORGAN MONEY MARKET FUNDS | | | | | 51 | |
JPMorgan U.S. Government Money Market Fund
SCHEDULE OF PORTFOLIO INVESTMENTS
AS OF AUGUST 31, 2020 (Unaudited) (continued)
| | | | | | | | |
| INVESTMENTS (a) | | PRINCIPAL
AMOUNT
($000) | | | VALUE
($000) | |
Short-Term Investments — continued | |
|
U.S. Treasury Obligations — continued | |
| | |
0.11%, 1/5/2021 (c) | | | 5,000,000 | | | | 4,998,075 | |
| | |
0.12%, 1/19/2021 (c) | | | 2,173,000 | | | | 2,171,986 | |
| | |
0.12%, 2/25/2021 (c) | | | 1,000,000 | | | | 999,410 | |
| | |
0.12%, 3/4/2021 (c) | | | 2,200,000 | | | | 2,198,716 | |
| | | | | | | | |
| |
Total U.S. Treasury Obligations
(Cost $53,838,034) | | | | 53,838,034 | |
| | | | | |
| |
Total Short-Term Investments
(Cost $53,838,034) | | | | 53,838,034 | |
| | | | | |
Total Investments — 99.6%
(Cost $180,231,033)* | | | | 180,231,033 | |
Other Assets Less Liabilities — 0.4% | | | | 687,904 | |
| | | | | |
NET ASSETS — 100.0% | | | | 180,918,937 | |
| | | | | |
| Percentages | indicated are based on net assets. |
| | |
Abbreviations |
| ACES | | Alternative Credit Enhancement Securities |
| DN | | Discount Notes |
| FFCB | | Federal Farm Credit Bank |
| FHLB | | Federal Home Loan Bank |
| FHLMC | | Federal Home Loan Mortgage Corp. |
| FNMA | | Federal National Mortgage Association |
| GNMA | | Government National Mortgage Association |
| ICE | | Intercontinental Exchange |
| LIBOR | | London Interbank Offered Rate |
| SOFR | | Secured Overnight Financing Rate |
| USD | | United States Dollar |
| |
| (a) | | The date shown represents the earliest of the next put date, next demand date or final maturity date. |
| (b) | | Variable or floating rate security, linked to the referenced benchmark. The interest rate shown is the current rate as of August 31, 2020. |
| (c) | | The rate shown is the effective yield as of August 31, 2020. |
| * | | The cost of securities is substantially the same for federal income tax purposes. |
Additional Investment Information:
[1] Agency Joint Trading Account I — At August 31, 2020, certain Funds had undivided interests in the Agency Joint Trading Account I with a maturity date of September 1, 2020, as follows (amounts in thousands):
| | | | | | | | | | |
| | | |
| Fund | | Principal
Amount | | Repurchase
Price | | | Collateral
Value
Allocation | |
JPMorgan U.S. Government Money Market Fund | | $2,550,000 | | $ | 2,550,006 | | | $ | 2,601,533 | |
Repurchase Agreements — At August 31, 2020, the Principal Amounts of certain Funds’ interests in the Agency Joint Trading Account I were as follows (amounts in thousands):
| | | | | | | | |
| | |
| Counterparty | | Interest
Rate | | | JPMorgan
U.S. Government Money
Market Fund | |
BNP Paribas SA | | | 0.09 | % | | $ | 900,000 | |
Credit Agricole Corporate and Investment Bank | | | 0.09 | % | | | 900,000 | |
TD Securities (USA) LLC | | | 0.09 | % | | | 750,000 | |
| | | | | | | | |
Total | | | | | | $ | 2,550,000 | |
| | | | | | | | |
At August 31, 2020, the Agency Joint Trading Account I was fully collateralized by:
| | | | | | | | |
| | |
| Issuer | | Interest Rates | | | Maturity Dates | |
FFCB | | | 3.98% | | | | 4/5/2038 | |
FHLB | | | 3.50% | | | | 2/22/2029 | |
FHLMC | | | 0.00% - 7.00% | | | | 4/1/2022 - 8/1/2050 | |
FNMA | | | 2.00% - 6.00% | | | | 10/25/2020 - 10/1/2056 | |
GNMA | | | 0.79% - 6.50% | | | | 9/15/2024 - 11/20/2067 | |
U.S. Treasury Securities | | | 0.00% - 3.38% | | | | 1/21/2021 - 11/15/2048 | |
[2] Agency Joint Trading Account II — At August 31, 2020, certain Funds had undivided interests in the Agency Joint Trading Account II with a maturity date of September 1, 2020, as follows (amounts in thousands):
| | | | | | | | | | |
| | | |
| Fund | | Principal
Amount | | Repurchase
Price | | | Collateral
Value
Allocation | |
JPMorgan U.S. Government Money Market Fund | | $604,708 | | $ | 604,710 | | | $ | 616,829 | |
Repurchase Agreements — At August 31, 2020, the Principal Amounts of certain Funds’ interests in the Agency Joint Trading Account II were as follows (amounts in thousands):
| | | | | | | | |
| | |
| Counterparty | | Interest
Rate | | | JPMorgan
U.S. Government Money
Market Fund | |
Bofa Securities, Inc. | | | 0.09 | % | | $ | 445,132 | |
Citibank NA | | | 0.09 | % | | | 75,589 | |
Citigroup Global Markets Holdings, Inc. | | | 0.09 | % | | | 83,987 | |
| | | | | | | | |
Total | | | | | | $ | 604,708 | |
| | | | | | | | |
At August 31, 2020, the Agency Joint Trading Account II was fully collateralized by:
| | | | | | | | |
| | |
| Issuer | | Interest Rates | | | Maturity Dates | |
FHLB | | | 2.13% - 3.60% | | | | 12/14/2029 - 5/10/2038 | |
FHLMC | | | 1.50% - 5.00% | | | | 2/1/2026 - 9/1/2050 | |
FNMA | | | 2.00% - 6.10% | | | | 4/1/2021 - 9/1/2050 | |
GNMA | | | 2.49% - 6.50% | | | | 3/20/2048 - 6/15/2049 | |
U.S. Treasury Securities | | | 1.75% | | | | 6/15/2022 | |
SEE NOTES TO FINANCIAL STATEMENTS.
| | | | | | |
| | | |
| 52 | | | | J.P. MORGAN MONEY MARKET FUNDS | | AUGUST 31, 2020 |
[3] Agency Joint Trading Account III — At August 31, 2020, certain Funds had undivided interests in the Agency Joint Trading Account III with a maturity date of September 1, 2020, as follows (amounts in thousands):
| | | | | | | | | | | | |
| | | |
| Fund | | Principal
Amount | | | Repurchase
Price | | | Collateral
Value
Allocation | |
JPMorgan U.S. Government Money Market Fund | | $ | 92,456 | | | $ | 92,456 | | | $ | 94,335 | |
Repurchase Agreements — At August 31, 2020, the Principal Amounts of certain Funds’ interests in the Agency Joint Trading Account III were as follows (amounts in thousands):
| | | | | | | | |
| | |
| Counterparty | | Interest
Rate | | | JPMorgan
U.S. Government Money
Market Fund | |
BNP Paribas SA | | | 0.09 | % | | $ | 92,456 | |
At August 31, 2020, the Agency Joint Trading Account III was fully collateralized by:
| | | | | | | | |
| | |
| Issuer | | Interest Rates | | | Maturity Dates | |
FHLMC | | | 0.66% - 7.50% | | | | 11/1/2023 - 6/1/2050 | |
FNMA | | | 0.00% - 7.50% | | | | 10/25/2020 - 8/1/2050 | |
[4] Treasury Joint Trading Account III — At August 31, 2020, certain Funds had undivided interests in the Treasury Joint Trading Account III with a maturity date of September 1, 2020, as follows (amounts in thousands):
| | | | | | | | | | | | |
| | | |
| Fund | | Principal
Amount | | | Repurchase
Price | | | Collateral
Value
Allocation | |
JPMorgan U.S. Government Money Market Fund | | $ | 902,065 | | | $ | 902,067 | | | $ | 920,106 | |
Repurchase Agreements — At August 31, 2020, the Principal Amounts of certain Funds’ interests in the Treasury Joint Trading Account III were as follows (amounts in thousands):
| | | | | | | | |
| | |
| Counterparty | | Interest
Rate | | | JPMorgan
U.S. Government Money
Market Fund | |
Credit Agricole Corporate and Investment Bank | | | 0.07 | % | | $ | 656,047 | |
Societe Generale SA | | | 0.07 | % | | | 246,018 | |
| | | | | | | | |
Total | | | | | | $ | 902,065 | |
| | | | | | | | |
At August 31, 2020, the Treasury Joint Trading Account III was fully collateralized by:
| | | | | | | | |
| | |
| Issuer | | Interest Rates | | | Maturity Dates | |
U.S. Treasury Securities | | | 0.00% - 8.00% | | | | 9/10/2020 - 2/15/2050 | |
SEE NOTES TO FINANCIAL STATEMENTS.
| | | | | | | | |
| | | |
| AUGUST 31, 2020 | | J.P. MORGAN MONEY MARKET FUNDS | | | | | 53 | |
JPMorgan U.S. Treasury Plus Money Market Fund
SCHEDULE OF PORTFOLIO INVESTMENTS
AS OF AUGUST 31, 2020 (Unaudited)
| | | | | | | | |
| INVESTMENTS (a) | | PRINCIPAL
AMOUNT
($000) | | | VALUE
($000) | |
Repurchase Agreements — 36.0% | |
| | |
Bank of Nova Scotia (The), 0.07%, dated 8/31/2020, due 9/1/2020, repurchase price $522,934, collateralized by U.S. Treasury Securities, 0.00% - 3.13%, due 1/26/2021 - 5/15/2048, with a value of $533,391. | | | 522,933 | | | | 522,933 | |
| | |
Bofa Securities, Inc., 0.07%, dated 8/31/2020, due 9/1/2020, repurchase price $500,001, collateralized by U.S. Treasury Securities, 0.13% - 3.00%, due 4/15/2021 - 8/15/2028, with a value of $510,000. | | | 500,000 | | | | 500,000 | |
| | |
Bofa Securities, Inc., 0.07%, dated 8/31/2020, due 9/1/2020, repurchase price $521,733, collateralized by U.S. Treasury Securities, 0.00% - 2.88%, due 9/30/2021 - 2/15/2048, with a value of $532,167. | | | 521,732 | | | | 521,732 | |
| | |
Deutsche Bank Securities, Inc., 0.07%, dated 8/31/2020, due 9/1/2020, repurchase price $748,222, collateralized by U.S. Treasury Securities, 0.00% - 2.25%, due 12/24/2020 - 11/15/2048, with a value of $763,186. | | | 748,221 | | | | 748,221 | |
| | |
Fixed Income Clearing Corp., 0.09%, dated 8/31/2020, due 9/1/2020, repurchase price $2,000,005, collateralized by U.S. Treasury Securities, 0.50% - 2.38%, due 5/15/2027 - 8/15/2027, with a value of $2,040,000. | | | 2,000,000 | | | | 2,000,000 | |
| | |
Goldman Sachs & Co. LLC, 0.04%, dated 8/31/2020, due 9/1/2020, repurchase price $700,001, collateralized by U.S. Treasury Securities, 0.00% - 2.00%, due 11/15/2020 - 5/15/2046, with a value of $714,000. | | | 700,000 | | | | 700,000 | |
| | |
J.P. Morgan Securities LLC, 0.07%, dated 8/31/2020, due 9/1/2020, repurchase price $250,000, collateralized by U.S. Treasury Securities, 0.00%, due 11/17/2020, with a value of $255,001. | | | 250,000 | | | | 250,000 | |
| | |
Natixis SA, 0.07%, dated 8/31/2020, due 9/1/2020, repurchase price $250,000, collateralized by U.S. Treasury Securities, 0.13% - 2.50%, due 6/30/2021 - 7/31/2026, with a value of $255,001. | | | 250,000 | | | | 250,000 | |
| | |
Nomura Securities Co. Ltd., 0.07%, dated 8/31/2020, due 9/1/2020, repurchase price $350,001, collateralized by U.S. Treasury Securities, 0.00% - 2.88%, due 9/8/2020 - 2/15/2044, with a value of $357,001. | | | 350,000 | | | | 350,000 | |
| | | | | | | | |
| INVESTMENTS (a) | | PRINCIPAL
AMOUNT
($000) | | | VALUE
($000) | |
| | | | | | | | |
| | |
Norinchukin Bank (The), 0.21%, dated 8/31/2020, due 9/11/2020, repurchase price $250,016, collateralized by U.S. Treasury Securities, 2.00% - 2.25%, due 11/15/2026 - 8/15/2049, with a value of $253,930. | | | 250,000 | | | | 250,000 | |
| | |
Norinchukin Bank (The), 0.17%, dated 8/31/2020, due 9/18/2020, repurchase price $250,021, collateralized by U.S. Treasury Securities, 2.00% - 2.25%, due 11/15/2026 - 8/15/2049, with a value of $253,930. | | | 250,000 | | | | 250,000 | |
| | |
Norinchukin Bank (The), 0.14%, dated 8/31/2020, due 10/27/2020, repurchase price $200,044, collateralized by U.S. Treasury Securities, 2.00% - 2.25%, due 11/15/2026 - 8/15/2049, with a value of $203,144. | | | 200,000 | | | | 200,000 | |
| | |
Societe Generale SA, 0.08%, dated 8/31/2020, due 9/4/2020, repurchase price $500,004, collateralized by U.S. Treasury Securities, 0.00% - 6.25%, due 9/15/2020 - 2/15/2050, with a value of $510,000. | | | 500,000 | | | | 500,000 | |
| | |
Sumitomo Mitsui Banking Corp., 0.07%, dated 8/31/2020, due 9/1/2020, repurchase price $3,250,006, collateralized by U.S. Treasury Securities, 0.00% - 2.75%, due 9/24/2020 - 11/15/2024, with a value of $3,315,007. | | | 3,250,000 | | | | 3,250,000 | |
| | |
Treasury Joint Trading Account I, J.P. Morgan Investment Management Inc., as agent, 0.07%, dated 8/31/2020, due 9/1/20, repurchase price $1,871,995. [1] | | | 1,871,991 | | | | 1,871,991 | |
| | |
Treasury Joint Trading Account III, J.P. Morgan Investment Management Inc., as agent, 0.07%, dated 8/31/2020, due 9/1/20, repurchase price $1,158,266. [3] | | | 1,158,264 | | | | 1,158,264 | |
| | | | | | | | |
| |
Total Repurchase Agreements
(Cost $13,323,141) | | | | 13,323,141 | |
| | | | | |
U.S. Treasury Obligations 16.2% | |
| | |
U.S. Treasury Floating Rate Notes | | | | | | | | |
| | |
(US Treasury 3 Month Bill Money Market Yield + 0.11%), 0.21%, 9/1/2020 (b) | | | 3,000 | | | | 3,000 | |
| | |
(US Treasury 3 Month Bill Money Market Yield + 0.12%), 0.22%, 9/1/2020 (b) | | | 800,000 | | | | 799,971 | |
| | |
(US Treasury 3 Month Bill Money Market Yield + 0.14%), 0.24%, 9/1/2020 (b) | | | 1,250,000 | | | | 1,249,808 | |
| | |
(US Treasury 3 Month Bill Money Market Yield + 0.15%), 0.25%, 9/1/2020 (b) | | | 500,000 | | | | 500,100 | |
| | |
(US Treasury 3 Month Bill Money Market Yield + 0.22%), 0.32%, 9/1/2020 (b) | | | 400,000 | | | | 399,879 | |
SEE NOTES TO FINANCIAL STATEMENTS.
| | | | | | |
| | | |
| 54 | | | | J.P. MORGAN MONEY MARKET FUNDS | | AUGUST 31, 2020 |
| | | | | | | | |
| INVESTMENTS (a) | | PRINCIPAL
AMOUNT
($000) | | | VALUE
($000) | |
U.S. Treasury Obligations — continued | |
| | |
(US Treasury 3 Month Bill Money Market Yield + 0.30%), 0.40%, 9/1/2020 (b) | | | 300,000 | | | | 300,185 | |
| | |
(US Treasury 3 Month Bill Money Market Yield + 0.06%), 0.16%, 10/31/2020 (b) | | | 350,000 | | | | 350,002 | |
| | |
U.S. Treasury Notes | | | | | | | | |
| | |
1.38%, 9/15/2020 | | | 541,000 | | | | 540,950 | |
| | |
1.63%, 10/15/2020 | | | 375,469 | | | | 375,461 | |
| | |
1.38%, 10/31/2020 | | | 171,000 | | | | 170,920 | |
| | |
1.75%, 10/31/2020 | | | 122,000 | | | | 122,020 | |
| | |
1.75%, 11/15/2020 | | | 150,000 | | | | 150,028 | |
| | |
2.63%, 11/15/2020 | | | 691,000 | | | | 692,363 | |
| | |
1.63%, 11/30/2020 | | | 28,000 | | | | 28,000 | |
| | |
2.00%, 11/30/2020 | | | 170,000 | | | | 170,141 | |
| | |
2.75%, 11/30/2020 | | | 116,000 | | | | 116,308 | |
| | | | | | | | |
| |
Total U.S. Treasury Obligations
(Cost $5,969,136) | | | | 5,969,136 | |
| | | | | |
Short-Term Investments — 50.6% | |
|
U.S. Treasury Obligations — 50.6% | |
| | |
U.S. Treasury Bills | | | | | | | | |
| | |
0.13%, 9/1/2020 (c) | | | 1,799,500 | | | | 1,799,500 | |
| | |
0.07%, 9/8/2020 (c) | | | 25,000 | | | | 25,000 | |
| | |
0.14%, 9/10/2020 (c) | | | 1,125,000 | | | | 1,124,962 | |
| | |
0.17%, 9/17/2020 (c) | | | 2,689,500 | | | | 2,689,302 | |
| | |
0.10%, 9/22/2020 (c) | | | 1,095,650 | | | | 1,095,587 | |
| | |
0.14%, 9/24/2020 (c) | | | 2,366,250 | | | | 2,366,036 | |
| | |
0.08%, 9/29/2020 (c) | | | 1,000,000 | | | | 999,938 | |
| | |
0.17%, 10/6/2020 (c) | | | 250,000 | | | | 249,959 | |
| | |
0.15%, 10/8/2020 (c) | | | 392,000 | | | | 391,940 | |
| | |
0.14%, 10/13/2020 (c) | | | 95,000 | | | | 94,984 | |
| | |
0.11%, 10/15/2020 (c) | | | 300,000 | | | | 299,958 | |
| | |
0.15%, 10/20/2020 (c) | | | 150,000 | | | | 149,970 | |
| | |
0.10%, 10/22/2020 (c) | | | 500,000 | | | | 499,933 | |
| | |
0.17%, 11/3/2020 (c) | | | 843,500 | | | | 843,249 | |
| | |
0.18%, 11/10/2020 (c) | | | 1,075,000 | | | | 1,074,628 | |
| | |
0.11%, 11/12/2020 (c) | | | 839,200 | | | | 839,011 | |
| | |
0.19%, 11/17/2020 (c) | | | 500,000 | | | | 499,797 | |
| | |
0.11%, 11/19/2020 (c) | | | 250,000 | | | | 249,942 | |
| | |
0.11%, 12/1/2020 (c) | | | 693,000 | | | | 692,807 | |
| | |
0.11%, 12/8/2020 (c) | | | 1,190,000 | | | | 1,189,660 | |
| | |
0.10%, 12/15/2020 (c) | | | 349,000 | | | | 348,898 | |
| | |
0.11%, 12/17/2020 (c) | | | 684,250 | | | | 684,036 | |
| | |
0.12%, 2/18/2021 (c) | | | 186,900 | | | | 186,794 | |
| | | | | | | | |
| INVESTMENTS (a) | | PRINCIPAL
AMOUNT
($000) | | | VALUE
($000) | |
| | | | | | | | |
| | |
0.12%, 3/4/2021 (c) | | | 323,500 | | | | 323,312 | |
| | | | | | | | |
| |
Total U.S. Treasury Obligations
(Cost $18,719,203) | | | | 18,719,203 | |
| | | | | |
| | |
Total Short-Term Investments
(Cost $18,719,203) | | | | | | | 18,719,203 | |
| | | | | | | | |
Total Investments — 102.8%
(Cost $38,011,480)* | | | | 38,011,480 | |
Liabilities in Excess of
Other Assets — (2.8)% | | | | (1,038,116 | ) |
| | | | | |
NET ASSETS — 100.0% | | | | 36,973,364 | |
| | | | | |
Percentages indicated are based on net assets.
| | |
| (a) | | The date shown represents the earliest of the next put date, next demand date or final maturity date. |
| (b) | | Variable or floating rate security, linked to the referenced benchmark. The interest rate shown is the current rate as of August 31, 2020. |
| (c) | | The rate shown is the effective yield as of August 31, 2020. |
| * | | The cost of securities is substantially the same for federal income tax purposes. |
Additional Investment Information:
[1] Treasury Joint Trading Account I — At August 31, 2020, certain Funds had undivided interests in the Treasury Joint Trading Account I with a maturity date of September 1, 2020, as follows (amounts in thousands):
| | | | | | | | | | |
| | | |
| Fund | | Principal
Amount | | Repurchase
Price | | | Collateral
Value
Allocation | |
JPMorgan U.S. Treasury Plus Money Market Fund | | $1,871,991 | | $ | 1,871,995 | | | $ | 1,909,435 | |
Repurchase Agreements — At August 31, 2020, the Principal Amounts of certain Funds’ interests in the Treasury Joint Account I were as follows (amounts in thousands):
| | | | | | | | |
| | |
| Counterparty | | Interest
Rate | | | JPMorgan
U.S. Treasury Plus Money
Market Fund | |
BNP Paribas SA | | | 0.07 | % | | $ | 813,909 | |
Citibank NA | | | 0.07 | % | | | 135,652 | |
Wells Fargo Securities LLC | | | 0.07 | % | | | 922,430 | |
| | | | | | | | |
Total | | | | | | $ | 1,871,991 | |
| | | | | | | | |
SEE NOTES TO FINANCIAL STATEMENTS.
| | | | | | | | |
| | | |
| AUGUST 31, 2020 | | J.P. MORGAN MONEY MARKET FUNDS | | | | | 55 | |
JPMorgan U.S. Treasury Plus Money Market Fund
SCHEDULE OF PORTFOLIO INVESTMENTS
AS OF AUGUST 31, 2020 (Unaudited) (continued)
At August 31, 2020, the Treasury Joint Account I was fully collateralized by:
| | | | | | | | |
| | |
| Issuer | | Interest Rates | | | Maturity Dates | |
U.S. Treasury Securities | | | 0.00% - 7.63% | | | | 9/1/2020 - 2/15/2050 | |
[3] Treasury Joint Trading Account III — At August 31, 2020, certain Funds had undivided interests in the Treasury Joint Trading Account III with a maturity date of September 1, 2020, as follows (amounts in thousands):
| | | | | | | | | | | | |
| | | |
| Fund | | Principal
Amount | | | Repurchase
Price | | | Collateral
Value
Allocation | |
JPMorgan U.S. Treasury Plus Money Market Fund | | $ | 1,158,264 | | | $ | 1,158,266 | | | $ | 1,181,429 | |
Repurchase Agreements — At August 31, 2020, the Principal Amounts of certain Funds’ interests in the Treasury Joint Account III were as follows (amounts in thousands):
| | | | | | | | |
| | |
| Counterparty | | Interest
Rate | | | JPMorgan
U.S. Treasury Plus Money
Market Fund | |
Credit Agricole Corporate and Investment Bank | | | 0.07 | % | | $ | 842,374 | |
Societe Generale SA | | | 0.07 | % | | | 315,890 | |
| | | | | | | | |
Total | | | | | | $ | 1,158,264 | |
| | | | | | | | |
At August 31, 2020, the Treasury Joint Account III was fully collateralized by:
| | | | | | | | |
| | |
| Issuer | | Interest Rates | | | Maturity Dates | |
U.S. Treasury Securities | | | 0.00% - 8.00% | | | | 9/10/2020 - 2/15/2050 | |
SEE NOTES TO FINANCIAL STATEMENTS.
| | | | | | |
| | | |
| 56 | | | | J.P. MORGAN MONEY MARKET FUNDS | | AUGUST 31, 2020 |
JPMorgan Federal Money Market Fund
SCHEDULE OF PORTFOLIO INVESTMENTS
AS OF AUGUST 31, 2020 (Unaudited)
| | | | | | | | |
| INVESTMENTS (a) | | PRINCIPAL
AMOUNT
($000) | | | VALUE
($000) | |
U.S. Government Agency Securities — 24.2% | |
| | |
FFCB | | | | | | | | |
| | |
(US Federal Funds Effective Rate (continuous series) + 0.13%), 0.22%, 9/1/2020 (b) | | | 25,000 | | | | 25,000 | |
| | |
(SOFR + 0.24%), 0.31%, 9/1/2020 (b) | | | 25,000 | | | | 24,997 | |
| | |
(Federal Reserve Bank Prime Loan Rate US - 2.93%), 0.33%, 9/1/2020 (b) | | | 25,000 | | | | 25,000 | |
| | |
(SOFR + 0.32%), 0.39%, 9/1/2020 (b) | | | 25,000 | | | | 25,000 | |
| | |
(US Treasury 3 Month Bill Money Market Yield + 0.30%), 0.40%, 9/1/2020 (b) | | | 30,000 | | | | 30,000 | |
| | |
FHLB | | | | | | | | |
| | |
(SOFR + 0.03%), 0.10%, 9/1/2020 (b) | | | 100,000 | | | | 99,999 | |
| | |
(SOFR + 0.08%), 0.15%, 9/1/2020 (b) | | | 25,000 | | | | 25,000 | |
| | |
(SOFR + 0.09%), 0.16%, 9/1/2020 (b) | | | 123,000 | | | | 123,000 | |
| | |
(SOFR + 0.10%), 0.17%, 9/1/2020 (b) | | | 25,000 | | | | 25,000 | |
| | |
(SOFR + 0.14%), 0.20%, 9/1/2020 (b) | | | 72,000 | | | | 72,000 | |
| | |
(SOFR + 0.24%), 0.31%, 9/1/2020 (b) | | | 50,000 | | | | 50,000 | |
| | |
DN, 0.26%, 9/18/2020 (c) | | | 100,000 | | | | 99,988 | |
| | |
DN, 0.26%, 9/23/2020 (c) | | | 100,000 | | | | 99,984 | |
| | |
(ICE LIBOR USD 3 Month - 0.20%), 0.09%, 11/16/2020 (b) | | | 50,000 | | | | 50,000 | |
| | | | | | | | |
| |
Total U.S. Government Agency Securities
(Cost $774,969) | | | | 774,968 | |
| | | | | |
U.S. Treasury Obligations — 12.2% | |
| | |
U.S. Treasury Floating Rate Notes | | | | | | | | |
| | |
(US Treasury 3 Month Bill Money Market Yield + 0.12%), 0.22%, 9/1/2020 (b) | | | 75,000 | | | | 74,997 | |
| | |
(US Treasury 3 Month Bill Money Market Yield + 0.14%), 0.24%, 9/1/2020 (b) | | | 100,000 | | | | 100,020 | |
| | |
(US Treasury 3 Month Bill Money Market Yield + 0.22%), 0.32%, 9/1/2020 (b) | | | 90,000 | | | | 90,011 | |
| | |
(US Treasury 3 Month Bill Money Market Yield + 0.30%), 0.40%, 9/1/2020 (b) | | | 50,000 | | | | 50,141 | |
| | |
U.S. Treasury Notes | | | | | | | | |
| | |
2.00%, 9/30/2020 | | | 25,000 | | | | 25,007 | |
| | |
2.63%, 11/15/2020 | | | 50,000 | | | | 50,099 | |
| | | | | | | | |
| |
Total U.S. Treasury Obligations
(Cost $390,275) | | | | 390,275 | |
| | | | | |
Short-Term Investments — 62.6% | |
|
U.S. Treasury Obligations — 62.6% | |
| | |
U.S. Treasury Bills | | | | | | | | |
| | |
0.11%, 9/1/2020 (c) | | | 113,000 | | | | 113,000 | |
| | |
0.17%, 9/10/2020 (c) | | | 50,000 | | | | 49,998 | |
| | |
0.14%, 9/17/2020 (c) | | | 50,000 | | | | 49,997 | |
| | |
0.12%, 9/22/2020 (c) | | | 300,000 | | | | 299,980 | |
| | |
0.10%, 9/29/2020 (c) | | | 100,000 | | | | 99,993 | |
| | |
0.16%, 10/8/2020 (c) | | | 200,000 | | | | 199,966 | |
| | | | | | | | |
| INVESTMENTS (a) | | PRINCIPAL
AMOUNT
($000) | | | VALUE
($000) | |
| | | | | | | | |
|
U.S. Treasury Obligations — continued | |
| | |
0.10%, 10/22/2020 (c) | | | 100,000 | | | | 99,986 | |
| | |
0.12%, 11/3/2020 (c) | | | 200,000 | | | | 199,958 | |
| | |
0.09%, 11/5/2020 (c) | | | 90,000 | | | | 89,986 | |
| | |
0.12%, 11/10/2020 (c) | | | 150,000 | | | | 149,965 | |
| | |
0.11%, 11/19/2020 (c) | | | 250,000 | | | | 249,939 | |
| | |
0.11%, 11/27/2020 (c) | | | 300,000 | | | | 299,921 | |
| | |
0.11%, 12/1/2020 (c) | | | 100,000 | | | | 99,972 | |
| | | | | | | | |
| |
Total U.S. Treasury Obligations
(Cost $2,002,660) | | | | 2,002,661 | |
| | | | | |
| |
Total Short-Term Investments
(Cost $2,002,660) | | | | 2,002,661 | |
| | | | | |
Total Investments — 99.0%
(Cost $3,167,904)* | | | | 3,167,904 | |
Other Assets Less Liabilities — 1.0% | | | | 32,584 | |
| | | | | |
NET ASSETS — 100.0% | | | | 3,200,488 | |
| | | | | |
Percentages indicated are based on net assets.
Abbreviations
| | |
| DN | | Discount Notes |
| FFCB | | Federal Farm Credit Bank |
| FHLB | | Federal Home Loan Bank |
| ICE | | Intercontinental Exchange |
| LIBOR | | London Interbank Offered Rate |
| SOFR | | Secured Overnight Financing Rate |
| USD | | United States Dollar |
| |
| (a) | | The date shown represents the earliest of the next put date, next demand date or final maturity date. |
| (b) | | Variable or floating rate security, linked to the referenced benchmark. The interest rate shown is the current rate as of August 31, 2020. |
| (c) | | The rate shown is the effective yield as of August 31, 2020. |
| * | | The cost of securities is substantially the same for federal income tax purposes. |
SEE NOTES TO FINANCIAL STATEMENTS.
| | | | | | | | |
| | | |
| AUGUST 31, 2020 | | J.P. MORGAN MONEY MARKET FUNDS | | | | | 57 | |
JPMorgan 100% U.S. Treasury Securities Money Market Fund
SCHEDULE OF PORTFOLIO INVESTMENTS
AS OF AUGUST 31, 2020 (Unaudited)
| | | | | | | | |
| INVESTMENTS (a) | | PRINCIPAL
AMOUNT
($000) | | | VALUE
($000) | |
U.S. Treasury Obligations — 18.6% | |
| | |
U.S. Treasury Floating Rate Notes | | | | | | | | |
| | |
(US Treasury 3 Month Bill Money Market Yield + 0.05%), 0.15%, 9/1/2020 (b) | | | 2,236,000 | | | | 2,235,902 | |
| | |
(US Treasury 3 Month Bill Money Market Yield + 0.11%), 0.21%, 9/1/2020 (b) | | | 150,000 | | | | 149,935 | |
| | |
(US Treasury 3 Month Bill Money Market Yield + 0.12%), 0.22%, 9/1/2020 (b) | | | 2,697,400 | | | | 2,697,351 | |
| | |
(US Treasury 3 Month Bill Money Market Yield + 0.14%), 0.24%, 9/1/2020 (b) | | | 4,863,000 | | | | 4,863,209 | |
| | |
(US Treasury 3 Month Bill Money Market Yield + 0.15%), 0.25%, 9/1/2020 (b) | | | 2,629,000 | | | | 2,629,478 | |
| | |
(US Treasury 3 Month Bill Money Market Yield + 0.22%), 0.32%, 9/1/2020 (b) | | | 2,461,000 | | | | 2,461,883 | |
| | |
(US Treasury 3 Month Bill Money Market Yield + 0.30%), 0.40%, 9/1/2020 (b) | | | 1,813,000 | | | | 1,816,160 | |
| | |
U.S. Treasury Notes | | | | | | | | |
| | |
1.38%, 9/30/2020 | | | 170,000 | | | | 169,964 | |
| | |
2.00%, 9/30/2020 | | | 125,000 | | | | 125,037 | |
| | |
1.38%, 10/31/2020 | | | 400,000 | | | | 399,825 | |
| | |
2.88%, 10/31/2020 | | | 835,000 | | | | 836,650 | |
| | |
1.75%, 11/15/2020 | | | 100,000 | | | | 100,021 | |
| | |
2.63%, 11/15/2020 | | | 1,330,000 | | | | 1,332,624 | |
| | |
1.63%, 11/30/2020 | | | 196,772 | | | | 196,758 | |
| | |
2.00%, 11/30/2020 | | | 522,000 | | | | 522,435 | |
| | |
1.75%, 12/31/2020 | | | 249,000 | | | | 249,089 | |
| | | | | | | | |
| |
Total U.S. Treasury Obligations
(Cost $20,786,321) | | | | 20,786,321 | |
| | | | | |
Short-Term Investments — 79.7% | |
|
U.S. Treasury Obligations — 79.7% | |
| | |
U.S. Treasury Bills | | | | | | | | |
| | |
0.09%, 9/1/2020 (c) | | | 381,000 | | | | 381,000 | |
| | |
0.11%, 9/3/2020 (c) | | | 700,000 | | | | 699,996 | |
| | |
0.12%, 9/8/2020 (c) | | | 4,570,000 | | | | 4,569,895 | |
| | |
0.16%, 9/10/2020 (c) | | | 2,350,000 | | | | 2,349,907 | |
| | |
0.09%, 9/15/2020 (c) | | | 4,350,000 | | | | 4,349,848 | |
| | |
0.13%, 9/17/2020 (c) | | | 650,000 | | | | 649,963 | |
| | |
0.15%, 9/22/2020 (c) | | | 4,950,000 | | | | 4,949,554 | |
| | |
0.09%, 9/29/2020 (c) | | | 450,000 | | | | 449,968 | |
| | |
0.14%, 10/1/2020 (c) | | | 5,180,000 | | | | 5,179,398 | |
| | |
0.15%, 10/8/2020 (c) | | | 2,450,000 | | | | 2,449,621 | |
| | |
0.15%, 10/13/2020 (c) | | | 500,000 | | | | 499,911 | |
| | |
0.16%, 10/20/2020 (c) | | | 250,000 | | | | 249,946 | |
| | |
0.09%, 10/22/2020 (c) | | | 750,000 | | | | 749,910 | |
| | |
0.15%, 10/27/2020 (c) | | | 4,500,000 | | | | 4,498,947 | |
| | |
0.15%, 10/29/2020 (c) | | | 502,115 | | | | 501,994 | |
| | |
0.14%, 11/3/2020 (c) | | | 4,900,000 | | | | 4,898,798 | |
| | | | | | | | |
| INVESTMENTS (a) | | PRINCIPAL
AMOUNT
($000) | | | VALUE
($000) | |
| | | | | | | | |
|
U.S. Treasury Obligations — continued | |
| | |
0.13%, 11/5/2020 (c) | | | 3,950,000 | | | | 3,949,103 | |
| | |
0.13%, 11/10/2020 (c) | | | 11,300,000 | | | | 11,297,048 | |
| | |
0.10%, 11/17/2020 (c) | | | 1,250,000 | | | | 1,249,731 | |
| | |
0.11%, 11/19/2020 (c) | | | 6,675,000 | | | | 6,673,347 | |
| | |
0.12%, 11/24/2020 (c) | | | 4,034,950 | | | | 4,033,822 | |
| | |
0.11%, 11/27/2020 (c) | | | 7,100,000 | | | | 7,098,169 | |
| | |
0.11%, 12/1/2020 (c) | | | 1,500,000 | | | | 1,499,578 | |
| | |
0.10%, 12/3/2020 (c) | | | 4,500,000 | | | | 4,498,837 | |
| | |
0.11%, 12/10/2020 (c) | | | 5,000,000 | | | | 4,998,533 | |
| | |
0.15%, 12/22/2020 (c) | | | 2,000,000 | | | | 1,999,098 | |
| | |
0.11%, 12/24/2020 (c) | | | 1,000,000 | | | | 999,652 | |
| | |
0.11%, 1/12/2021 (c) | | | 3,200,000 | | | | 3,198,698 | |
| | | | | | | | |
| |
Total U.S. Treasury Obligations
(Cost $88,924,272) | | | | 88,924,272 | |
| | | | | |
| |
Total Short-Term Investments
(Cost $88,924,272) | | | | 88,924,272 | |
| | | | | |
Total Investments — 98.3%
(Cost $109,710,593)* | | | | 109,710,593 | |
Other Assets Less Liabilities — 1.7% | | | | 1,880,454 | |
| | | | | |
NET ASSETS — 100.0% | | | | 111,591,047 | |
| | | | | |
Percentages indicated are based on net assets.
| | |
| (a) | | The date shown represents the earliest of the next put date, next demand date or final maturity date. |
| (b) | | Variable or floating rate security, linked to the referenced benchmark. The interest rate shown is the current rate as of August 31, 2020. |
| (c) | | The rate shown is the effective yield as of August 31, 2020. |
| * | | The cost of securities is substantially the same for federal income tax purposes. |
SEE NOTES TO FINANCIAL STATEMENTS.
| | | | | | |
| | | |
| 58 | | | | J.P. MORGAN MONEY MARKET FUNDS | | AUGUST 31, 2020 |
JPMorgan Tax Free Money Market Fund
SCHEDULE OF PORTFOLIO INVESTMENTS
AS OF AUGUST 31, 2020 (Unaudited)
| | | | | | | | |
| INVESTMENTS (a) | | PRINCIPAL
AMOUNT
($000) | | | VALUE
($000) | |
Municipal Bonds — 76.3% | |
|
Alabama — 0.1% | |
| | |
Mobile County IDA, PCR, Exxonmobil Project Rev., VRDO, 0.05%, 9/1/2020 (b) | | | 1,425 | | | | 1,425 | |
| | |
Mobile Downtown Redevelopment Authority, Gulf Opportunity Zone, Austal USA LLC Project Series 2011A, Rev., VRDO, LOC: Bank of America NA, 0.10%, 9/8/2020 (b) (c) | | | 6,970 | | | | 6,970 | |
| | | | | | | | |
| | |
| | | | | | | 8,395 | |
| | | | | | | | |
|
Alaska — 1.8% | |
| | |
Alaska Housing Finance Corp., Governmental Purpose Series 2009-A, Rev., VRDO, LIQ: FHLB, 0.08%, 9/8/2020 (b) | | | 22,065 | | | | 22,065 | |
| | |
Alaska Housing Finance Corp., Home Mortgage | | | | | | | | |
| | |
Series 2007A, Rev., VRDO, LIQ: FHLB, 0.08%, 9/8/2020 (b) | | | 13,890 | | | | 13,890 | |
| | |
Series 2007B, Rev., VRDO, LIQ: FHLB, 0.08%, 9/8/2020 (b) | | | 13,875 | | | | 13,875 | |
| | |
Series 2009B, Rev., VRDO, LIQ: Wells Fargo Bank NA, 0.08%, 9/8/2020 (b) | | | 15,105 | | | | 15,105 | |
| | |
City of Valdez, Exxon Pipeline Co. Project | | | | | | | | |
| | |
Series 1993-A, Rev., VRDO, 0.03%,
9/1/2020 (b) | | | 12,410 | | | | 12,410 | |
| | |
Series 1993-B, Rev., VRDO, 0.03%,
9/1/2020 (b) | | | 12,205 | | | | 12,205 | |
| | |
Series 1993-C, Rev., VRDO, 0.03%,
9/1/2020 (b) | | | 42,215 | | | | 42,215 | |
| | |
City of Valdez, Exxonmobil Corp. Rev., VRDO, 0.03%, 9/1/2020 (b) | | | 1,600 | | | | 1,600 | |
| | |
Municipality of Anchorage Alaska GO, TAN, 1.50%, 12/18/2020 | | | 70,000 | | | | 70,174 | |
| | | | | | | | |
| | |
| | | | | | | 203,539 | |
| | | | | | | | |
|
Arizona — 0.6% | |
| | |
Arizona Health Facilities Authority, Banner Health Series 2008E, Class E, Rev., VRDO, LOC: Bank of America NA, 0.09%, 9/8/2020 (b) | | | 3,050 | | | | 3,050 | |
| | |
Arizona Health Facilities Authority, Catholic Healthcare West Loan Program Series 2009F, Rev., VRDO, LOC: Mizuho Bank Ltd., 0.11%, 9/8/2020 (b) | | | 8,150 | | | | 8,150 | |
| | |
Arizona Industrial Development Authority, Phoenix Children’s Hospital Series 2019B, Rev., VRDO, LOC: Bank of America NA, 0.03%, 9/1/2020 (b) | | | 4,285 | | | | 4,285 | |
| | |
Arizona State University Series 2008B, Rev., VRDO, 0.08%, 9/8/2020 (b) | | | 10,505 | | | | 10,505 | |
| | |
Salt River Pima-Maricopa Indian Community Rev., VRDO, LOC: Bank of America NA, 0.13%, 9/8/2020 (b) | | | 30,330 | | | | 30,330 | |
| | | | | | | | |
| INVESTMENTS (a) | | PRINCIPAL
AMOUNT
($000) | | | VALUE
($000) | |
| | | | | | | | |
|
Arizona — continued | |
| | |
Tender Option Bond Trust Receipts/Certificates Series 2019-BAML8004, Rev., VRDO, LIQ: Bank of America NA, 0.17%, 9/8/2020 (b) (c) | | | 15,000 | | | | 15,000 | |
| | | | | | | | |
| | |
| | | | | | | 71,320 | |
| | | | | | | | |
|
California — 1.2% | |
| | |
California Municipal Finance Authority, Recovery Zone Facility, Chevron USA, Inc., Project Series 2010A, Rev., VRDO, 0.01%, 9/1/2020 (b) | | | 13,500 | | | | 13,500 | |
| | |
California Statewide Communities Development Authority, Rady Children’s Hospital Series 2008B, Rev., VRDO, LOC: Wells Fargo Bank NA, 0.02%, 9/1/2020 (b) | | | 22,330 | | | | 22,330 | |
| | |
County of Sacramento, Special Facilities Apartment, Cessna Aircraft Co., Project Rev., VRDO, LOC: Bank of America NA, 0.13%, 9/8/2020 (b) | | | 5,800 | | | | 5,800 | |
| | |
Eastern Municipal Water District Series 2018A, Rev., VRDO, LIQ: Bank of America NA, 0.02%, 9/1/2020 (b) | | | 42,395 | | | | 42,395 | |
| | |
Metropolitan Water District of Southern California Series 2018A-2, Rev., VRDO, LIQ: TD Bank NA, 0.01%, 9/1/2020 (b) | | | 31,860 | | | | 31,860 | |
| | |
Santa Clara County Housing Authority, Multi-Family Housing, Timberwood Apartments Series 2005B, Rev., VRDO, LOC: Union Bank of Canada, 0.18%, 9/8/2020 (b) | | | 9,590 | | | | 9,590 | |
| | | | | | | | |
| | |
| | | | | | | 125,475 | |
| | | | | | | | |
|
Colorado — 2.7% | |
| | |
City of Colorado Springs, Utilities System | | | | | | | | |
| | |
Series 2009C, Rev., VRDO, LIQ: Sumitomo Mitsui Banking Corp., 0.09%, 9/8/2020 (b) | | | 17,250 | | | | 17,250 | |
| | |
Series 2008-A, Rev., VRDO, LIQ: U.S. Bank NA, 0.10%, 9/8/2020 (b) | | | 11,445 | | | | 11,445 | |
| | |
Colorado Educational and Cultural Facilities Authority, Nature Conservancy Project Series 2012, Rev., VRDO, 0.11%, 9/8/2020 (b) | | | 63,280 | | | | 63,280 | |
| | |
Colorado Housing and Finance Authority, Multi-Family, Greentree Village Apartments Project Rev., VRDO, LOC: U.S. Bank NA, 0.12%, 9/8/2020 (b) | | | 12,470 | | | | 12,470 | |
| | |
Colorado Housing and Finance Authority, Single Family Mortgage Series 2019D, Class I, Rev., VRDO, AMT, LIQ: Royal Bank of Canada, 0.13%, 9/8/2020 (b) | | | 47,500 | | | | 47,500 | |
SEE NOTES TO FINANCIAL STATEMENTS.
| | | | | | | | |
| | | |
| AUGUST 31, 2020 | | J.P. MORGAN MONEY MARKET FUNDS | | | | | 59 | |
JPMorgan Tax Free Money Market Fund
SCHEDULE OF PORTFOLIO INVESTMENTS
AS OF AUGUST 31, 2020 (Unaudited) (continued)
| | | | | | | | |
| INVESTMENTS (a) | | PRINCIPAL
AMOUNT
($000) | | | VALUE
($000) | |
Municipal Bonds — continued | |
|
Colorado — continued | |
| | |
County of Arapahoe, Multi-Family Rental Housing, Hunter’s Run Rev., VRDO, LOC: FHLMC, 0.12%, 9/8/2020 (b) | | | 13,560 | | | | 13,560 | |
| | |
RBC Municipal Products, Inc. Trust, Floater Certificates Series G-24, GO, VRDO, LOC: Royal Bank of Canada, 0.12%, 9/8/2020 (b) (c) | | | 12,500 | | | | 12,500 | |
| | |
Tender Option Bond Trust Receipts/Certificates | | | | | | | | |
| | |
Series 2020-XX1130, Rev., VRDO, LIQ: Barclays Bank plc, 0.13%, 9/8/2020 (b) (c) | | | 3,880 | | | | 3,880 | |
| | |
Series 2016-ZF0467, Rev., VRDO, LOC: Royal Bank of Canada, 0.17%, 9/8/2020 (b) (c) | | | 17,700 | | | | 17,700 | |
| | |
University of Colorado Hospital Authority Series 2018 C, Rev., VRDO, LIQ: TD Bank NA, 0.09%, 9/8/2020 (b) | | | 30,000 | | | | 30,000 | |
| | |
University of Colorado Hospital Authority, Health System Series 2018 B, Rev., VRDO, LIQ: TD Bank NA, 0.09%, 9/8/2020 (b) | | | 61,610 | | | | 61,610 | |
| | | | | | | | |
| | |
| | | | | | | 291,195 | |
| | | | | | | | |
|
Connecticut — 1.9% | |
| | |
Connecticut Housing Finance Authority, Housing Mortgage Finance Program | | | | | | | | |
| | |
Series 2016A, Subseries A-3, Rev., VRDO, LIQ: Royal Bank of Canada, 0.08%, 9/8/2020 (b) | | | 10,000 | | | | 10,000 | |
| | |
Subseries B-3, Rev., VRDO, LIQ: Royal Bank of Canada, 0.08%, 9/8/2020 (b) | | | 10,000 | | | | 10,000 | |
| | |
Subseries F2, Rev., VRDO, LIQ: State Street Bank & Trust, 0.08%, 9/8/2020 (b) | | | 19,000 | | | | 19,000 | |
| | |
Subseries F-5, Rev., VRDO, LIQ: Landesbank Hessen- Thueringen, 0.08%, 9/8/2020 (b) | | | 48,200 | | | | 48,200 | |
| | |
Subseries A-2, Rev., VRDO, AMT, LIQ: U.S. Bank NA, 0.11%, 9/8/2020 (b) | | | 8,940 | | | | 8,940 | |
| | |
Series D, Subseries D-3, Rev., VRDO, AMT, LIQ: Sumitomo Mitsui Banking Corp., 0.14%, 9/8/2020 (b) | | | 32,495 | | | | 32,495 | |
| | |
State of Connecticut, Health and Educational Facilities Authority, Yale New Haven Hospital Issue Series O, Rev., VRDO, 0.09%, 9/8/2020 (b) | | | 21,000 | | | | 21,000 | |
| | |
Tender Option Bond Trust Receipts/Certificates Series G-3, GO, VRDO, LOC: Royal Bank of Canada, 0.12%, 9/8/2020 (b) (c) | | | 5,000 | | | | 5,000 | |
| | |
Town of Groton Series 2020A, GO, BAN, 2.00%, 4/29/2021 | | | 45,000 | | | | 45,263 | |
| | | | | | | | |
| | |
| | | | | | | 199,898 | |
| | | | | | | | |
| | | | | | | | |
| INVESTMENTS (a) | | PRINCIPAL
AMOUNT
($000) | | | VALUE
($000) | |
| | | | | | | | |
|
District of Columbia — 2.9% | |
| | |
District of Columbia, Medlantic/Helix Issue, Tranche II Series 1998A, Rev., VRDO, LOC: TD Bank NA, 0.09%, 9/8/2020 (b) | | | 20,785 | | | | 20,785 | |
| | |
District of Columbia, The Pew Charitable Trust Series 2008A, Rev., VRDO, LOC: PNC Bank NA, 0.09%, 9/8/2020 (b) | | | 36,205 | | | | 36,205 | |
| | |
District of Columbia, Water and Sewer Authority, Public Utility Subordinated Lien Multimodal, Weekly Rate Period Series B, Subseries B-1, Rev., VRDO, LIQ: TD Bank NA, 0.09%, 9/8/2020 (b) | | | 33,350 | | | | 33,350 | |
| | |
Metropolitan Washington Airports Authority, Airport System | | | | | | | | |
| | |
Series 2010D, Rev., VRDO, AMT, LOC: Barclays Bank plc, 0.11%, 9/8/2020 (b) | | | 56,000 | | | | 56,000 | |
| | |
Subseries A-1, Rev., VRDO, LOC: Sumitomo Mitsui Banking Corp., 0.12%, 9/8/2020 (b) | | | 56,770 | | | | 56,770 | |
| | |
Subseries A-3, Rev., VRDO, LOC: Sumitomo Mitsui Banking Corp., 0.12%, 9/8/2020 (b) | | | 14,400 | | | | 14,400 | |
| | |
RBC Municipal Products, Inc. Trust, Floater Certificates Series E-108, GO, VRDO, LOC: Royal Bank of Canada, 0.12%, 9/8/2020 (b) (c) | | | 50,000 | | | | 50,000 | |
| | |
Tender Option Bond Trust Receipts/Certificates | | | | | | | | |
| | |
Series 2019-XF0853, Rev., VRDO, LOC: TD Bank NA, 0.14%, 9/8/2020 (b) (c) | | | 23,950 | | | | 23,950 | |
| | |
Series 2019-XG0267, Rev., VRDO, LOC: Bank of America NA, 0.14%, 9/8/2020 (b) (c) | | | 18,545 | | | | 18,545 | |
| | | | | | | | |
| | |
| | | | | | | 310,005 | |
| | | | | | | | |
|
Florida — 2.8% | |
| | |
City of Jacksonville, Health Care Facilities, Baptist Health | | | | | | | | |
| | |
Series 2019C, Rev., VRDO, 0.09%, 9/8/2020 (b) | | | 47,315 | | | | 47,315 | |
| | |
Series 2019C, Rev., VRDO, 0.09%, 9/8/2020 (b) | | | 36,190 | | | | 36,190 | |
| | |
Collier County IDA, Allete, Inc. Project Rev., VRDO, LOC: Wells Fargo Bank NA, 0.12%, 9/8/2020 (b) | | | 27,800 | | | | 27,800 | |
| | |
County of Miami-Dade, Juvenile Courthouse Series 2003B, Rev., VRDO, AMBAC, LOC: TD Bank NA, 0.09%, 9/8/2020 (b) | | | 9,410 | | | | 9,410 | |
| | |
Florida Gulf Coast University Financing Corp., Housing Project Series A, Rev., VRDO, LOC: TD Bank NA, 0.08%, 9/8/2020 (b) | | | 15,465 | | | | 15,465 | |
SEE NOTES TO FINANCIAL STATEMENTS.
| | | | | | |
| | | |
| 60 | | | | J.P. MORGAN MONEY MARKET FUNDS | | AUGUST 31, 2020 |
| | | | | | | | |
| INVESTMENTS (a) | | PRINCIPAL
AMOUNT
($000) | | | VALUE
($000) | |
Municipal Bonds — continued | |
|
Florida — continued | |
| | |
Florida Housing Finance Agency, Multi-Family, Sun Pointe Cove Apartments Rev., VRDO, FNMA, LIQ: FNMA, 0.11%, 9/8/2020 (b) | | | 8,500 | | | | 8,500 | |
| | |
Highlands County Health Facilities Authority, Adventist Health System Series 2007A, Rev., VRDO, 0.09%, 9/8/2020 (b) | | | 14,350 | | | | 14,350 | |
| | |
Highlands County Health Facilities Authority, Adventist Health System/Sunbelt Obligated Group Series 2012I-2, Rev., VRDO, 0.07%, 9/8/2020 (b) | | | 41,950 | | | | 41,950 | |
| | |
Hillsborough County Industrial Development Authority, Baycare Health System | | | | | | | | |
| | |
Series 2020B, Rev., VRDO, LOC: TD Bank NA, 0.02%, 9/1/2020 (b) | | | 3,265 | | | | 3,265 | |
| | |
Series 2020D, Rev., VRDO, LOC: TD Bank NA, 0.04%, 9/1/2020 (b) | | | 2,400 | | | | 2,400 | |
| | |
Lee County Industrial Development Authority, Florida Power and Light Co., Project Series 2016B, Rev., VRDO, AMT, 0.11%, 9/1/2020 (b) | | | 19,120 | | | | 19,120 | |
| | |
Orange County Health Facilities Authority, Orlando Health, Inc. Series E, Rev., VRDO, LOC: TD Bank NA, 0.09%, 9/8/2020 (b) | | | 34,225 | | | | 34,225 | |
| | |
Palm Beach County Multi-Family Housing Finance Authority, Renaissance Apartments Series A, Rev., VRDO, AMT, LOC: FNMA, 0.13%, 9/8/2020 (b) | | | 8,235 | | | | 8,235 | |
| | |
Sunshine State Governmental Financing Commission Series 2010A, Rev., VRDO, LOC: MUFG Union Bank NA, 0.10%, 9/8/2020 (b) | | | 14,905 | | | | 14,905 | |
| | |
Tender Option Bond Trust Receipts/Certificates | | | | | | | | |
| | |
Series 2018-ZM0615, Rev., VRDO, LIQ: Citibank NA, 0.13%, 9/1/2020 (b) (c) | | | 7,500 | | | | 7,500 | |
| | |
Series 2019-XG0252, Rev., VRDO, AMBAC, LOC: Bank of America NA, 0.14%, 9/8/2020 (b) (c) | | | 9,600 | | | | 9,600 | |
| | | | | | | | |
| | |
| | | | | | | 300,230 | |
| | | | | | | | |
|
Georgia — 0.7% | |
| | |
Brookhaven Development Authority, Children’s Healthcare Series 2019D, Rev., VRDO, LIQ: PNC Bank NA, 0.10%, 9/8/2020 (b) | | | 42,140 | | | | 42,140 | |
| | |
Development Authority of Burke County (The), Oglethorpe Power Corp. Vogtle Project Series 2010-A, Rev., VRDO, LOC: Bank of America NA, 0.12%, 9/8/2020 (b) | | | 17,115 | | | | 17,115 | |
| | |
Griffin-Spaulding County Development Authority, Industrial Development, Norcom, Inc. Project Rev., VRDO, LOC: Bank of America NA, 0.19%, 9/8/2020 (b) | | | 1,490 | | | | 1,490 | |
| | | | | | | | |
| INVESTMENTS (a) | | PRINCIPAL
AMOUNT
($000) | | | VALUE
($000) | |
| | | | | | | | |
|
Georgia — continued | |
| | |
Tender Option Bond Trust Receipts/Certificates | | | | | | | | |
| | |
Series 2017-ZF0589, Rev., VRDO, LIQ: Bank of America NA, 0.13%, 9/8/2020 (b) (c) | | | 3,750 | | | | 3,750 | |
| | |
Series 2018-ZF0656, Rev., VRDO, LIQ: Bank of America NA, 0.13%, 9/8/2020 (b) (c) | | | 7,500 | | | | 7,500 | |
| | | | | | | | |
| | |
| | | | | | | 71,995 | |
| | | | | | | | |
|
Hawaii — 0.2% | |
| | |
RBC Municipal Products, Inc. Trust, Floater Certificates Series G-13, GO, VRDO, LOC: Royal Bank of Canada, 0.12%, 9/8/2020 (b) (c) | | | 20,000 | | | | 20,000 | |
| | | | | | | | |
|
Illinois — 3.3% | |
| | |
City of Galesburg, Knox College Project Series 1996, Rev., VRDO, LOC: PNC Bank NA, 0.09%, 9/8/2020 (b) | | | 4,300 | | | | 4,300 | |
| | |
County of Lake, A L Hansen Manufacturing Co. Project Rev., VRDO, LOC: BMO Harris Bank NA, 0.14%, 9/8/2020 (b) | | | 730 | | | | 730 | |
| | |
County of Lake, Multi-Family Housing, Whispering Oaks Apartments Project Rev., VRDO, LIQ: FHLMC, 0.10%, 9/8/2020 (b) | | | 21,500 | | | | 21,500 | |
| | |
County of Will, Exxonmobil Project | | | | | | | | |
| | |
Rev., VRDO, 0.05%, 9/1/2020 (b) | | | 9,625 | | | | 9,625 | |
| | |
Rev., VRDO, 0.05%, 9/1/2020 (b) | | | 1,725 | | | | 1,725 | |
| | |
Illinois Development Finance Authority, St. Ignatius College Prep, 1994 Rev., VRDO, LOC: PNC Bank NA, 0.10%, 9/8/2020 (b) | | | 4,100 | | | | 4,100 | |
| | |
Illinois Educational Facilities Authority, Columbia College Chicago Rev., VRDO, LOC: BMO Harris Bank NA, 0.10%, 9/8/2020 (b) | | | 3,890 | | | | 3,890 | |
| | |
Illinois Educational Facilities Authority, The Adler Planetarium Rev., VRDO, LOC: PNC Bank NA, 0.10%, 9/8/2020 (b) | | | 8,000 | | | | 8,000 | |
| | |
Illinois Educational Facilities Authority, University Chicago Series 2003B, Rev., VRDO, 0.09%, 9/8/2020 (b) | | | 2,198 | | | | 2,198 | |
| | |
Illinois Finance Authority, Advocate Healthcare Network Series 2008C-3A, Rev., VRDO, LIQ: Northern Trust Co., 0.10%, 9/8/2020 (b) | | | 17,150 | | | | 17,150 | |
| | |
Illinois Finance Authority, Bradley University | | | | | | | | |
| | |
Series 2008A, Rev., VRDO, LOC: PNC Bank NA, 0.09%, 9/8/2020 (b) | | | 17,660 | | | | 17,660 | |
| | |
Series 2008B, Rev., VRDO, LOC: PNC Bank NA, 0.09%, 9/8/2020 (b) | | | 12,790 | | | | 12,790 | |
| | |
Illinois Finance Authority, Chicago Symphony Orchestra Series 2008, Rev., VRDO, LOC: PNC Bank NA, 0.09%, 9/8/2020 (b) | | | 73,015 | | | | 73,015 | |
SEE NOTES TO FINANCIAL STATEMENTS.
| | | | | | | | |
| | | |
| AUGUST 31, 2020 | | J.P. MORGAN MONEY MARKET FUNDS | | | | | 61 | |
JPMorgan Tax Free Money Market Fund
SCHEDULE OF PORTFOLIO INVESTMENTS
AS OF AUGUST 31, 2020 (Unaudited) (continued)
| | | | | | | | |
| INVESTMENTS (a) | | PRINCIPAL
AMOUNT
($000) | | | VALUE
($000) | |
Municipal Bonds — continued | |
|
Illinois — continued | |
| | |
Illinois Finance Authority, College 2005 Rev., VRDO, LOC: U.S. Bank NA, 0.09%, 9/8/2020 (b) | | | 4,370 | | | | 4,370 | |
| | |
Illinois Finance Authority, Elmhurst Memorial Healthcare Series 2008D, Rev., VRDO, LOC: Bank of America NA, 0.11%, 9/8/2020 (b) | | | 22,555 | | | | 22,555 | |
| | |
Illinois Finance Authority, Hospital Sisters Services, Inc., Obligated Group Series 2012G, Rev., VRDO, LOC: Bank of Montreal, 0.09%, 9/8/2020 (b) | | | 20,945 | | | | 20,945 | |
| | |
Illinois Finance Authority, Mccormick Theological Series 2001B, Rev., VRDO, LOC: Northern Trust Co., 0.09%, 9/8/2020 (b) | | | 15,250 | | | | 15,250 | |
| | |
Illinois Finance Authority, Northwestern Memorial Hospital | | | | | | | | |
| | |
Series 2007A-2, Rev., VRDO, LIQ: U.S. Bank NA, 0.03%, 9/1/2020 (b) | | | 5,595 | | | | 5,595 | |
| | |
Series 2007A-4, Rev., VRDO, LIQ: U.S. Bank NA, 0.03%, 9/1/2020 (b) | | | 7,700 | | | | 7,700 | |
| | |
Series 2008A-1, Rev., VRDO, 0.09%, 9/8/2020 (b) | | | 13,740 | | | | 13,740 | |
| | |
Illinois Finance Authority, The University of Chicago Medical Center Series 2011B, Rev., VRDO, LOC: Sumitomo Mitsui Banking Corp., 0.14%, 9/8/2020 (b) | | | 38,820 | | | | 38,820 | |
| | |
Illinois Finance Authority, The Wbez Alliance, Inc., Project Rev., VRDO, LOC: BMO Harris Bank NA, 0.09%, 9/8/2020 (b) | | | 15,000 | | | | 15,000 | |
| | |
Illinois Housing Development Authority, Homeowner Mortgage | | | | | | | | |
| | |
Series 2018-A-2, Rev., VRDO, GNMA/FNMA/FHLMC, LIQ: FHLB, 0.09%, 9/8/2020 (b) | | | 12,500 | | | | 12,500 | |
| | |
Series C-3, Rev., VRDO, AMT, LIQ: FHLB, 0.15%, 9/8/2020 (b) | | | 5,100 | | | | 5,100 | |
| | |
Jackson-Union Counties Regional Port District, Port Facility, Enron Transportation Services Rev., VRDO, LOC: Wells Fargo Bank NA, 0.11%, 9/8/2020 (b) | | | 21,300 | | | | 21,300 | |
| | |
Village of Justice, Multi-Family Housing, Candlewood Apartments Project Rev., VRDO, LOC: FNMA, 0.15%, 9/8/2020 (b) | | | 8,900 | | | | 8,900 | |
| | | | | | | | |
| | |
| | | | | | | 368,458 | |
| | | | | | | | |
|
Indiana — 0.4% | |
| | |
Indiana Finance Authority, Ascension Health Senior Credit Group Series 2008E-8, Rev., VRDO, 0.10%, 9/8/2020 (b) | | | 22,750 | | | | 22,750 | |
| | | | | | | | |
| INVESTMENTS (a) | | PRINCIPAL
AMOUNT
($000) | | | VALUE
($000) | |
| | | | | | | | |
|
Indiana — continued | |
| | |
Indiana Finance Authority, Stadium Project Series 2005A-1, Rev., VRDO, LIQ: Bank of America NA, 0.10%, 9/8/2020 (b) | | | 21,645 | | | | 21,645 | |
| | | | | | | | |
| | |
| | | | | | | 44,395 | |
| | | | | | | | |
|
Iowa — 1.1% | |
| | |
County of Louisa, Pollution Control, Midwest Power System, Inc. Rev., VRDO, 0.11%, 9/8/2020 (b) | | | 13,400 | | | | 13,400 | |
| | |
Iowa Finance Authority, Midwestern Disaster Area, Archer-Daniels-Midland Co. Project Rev., VRDO, 0.11%, 9/8/2020 (b) | | | 63,730 | | | | 63,730 | |
| | |
Iowa Finance Authority, Midwestern Disaster Area, Chrisbro III, Inc. Project Series 2011, Rev., VRDO, LOC: Great Western Bank, 0.11%, 9/8/2020 (b) | | | 5,650 | | | | 5,650 | |
| | |
Iowa Finance Authority, Multi-Family Housing Series A, Rev., VRDO, AMT, LIQ: Wells Fargo Bank NA, 0.12%, 9/8/2020 (b) | | | 11,130 | | | | 11,130 | |
| | |
Iowa Finance Authority, Single Family Mortgage-Backed Securities Program | | | | | | | | |
| | |
Series 2019B, Rev., VRDO, GNMA/FNMA/FHLMC, LIQ: U.S. Bank NA, 0.08%, 9/8/2020 (b) | | | 10,000 | | | | 10,000 | |
| | |
Series 2020B, Rev., VRDO, GNMA/FNMA/FHLMC, LIQ: TD Bank NA, 0.08%, 9/8/2020 (b) | | | 15,500 | | | | 15,500 | |
| | |
Iowa Finance Authority, Trinity Health Series 2000D, Rev., VRDO, 0.09%, 9/8/2020 (b) | | | 11,545 | | | | 11,545 | |
| | | | | | | | |
| | |
| | | | | | | 130,955 | |
| | | | | | | | |
|
Kansas — 1.4% | |
| | |
City of Wichita Series 298, GO, 4.00%, 10/15/2020 | | | 64,390 | | | | 64,596 | |
| | |
RBC Municipal Products, Inc. Trust, Floater Certificates Series G-23, GO, VRDO, LOC: Royal Bank of Canada, 0.12%, 9/8/2020 (b) (c) | | | 12,500 | | | | 12,500 | |
| | |
University of Kansas Hospital Authority, Health System Rev., VRDO, LOC: U.S. Bank NA, 0.03%, 9/1/2020 (b) | | | 18,970 | | | | 18,970 | |
| | |
Wyandotte County-Kansas City Unified Government Series 2020-I, GO, 1.20%, 4/1/2021 | | | 50,395 | | | | 50,395 | |
| | | | | | | | |
| | |
| | | | | | | 146,461 | |
| | | | | | | | |
|
Kentucky — 1.0% | |
| | |
City of Hopkinsville Industrial Building, Riken Elastomers Corp. Project Rev., VRDO, LOC: Bank of Tokyo-Mitsubishi UFJ Ltd., 0.12%, 9/8/2020 (b) | | | 5,000 | | | | 5,000 | |
SEE NOTES TO FINANCIAL STATEMENTS.
| | | | | | |
| | | |
| 62 | | | | J.P. MORGAN MONEY MARKET FUNDS | | AUGUST 31, 2020 |
| | | | | | | | |
| INVESTMENTS (a) | | PRINCIPAL
AMOUNT
($000) | | | VALUE
($000) | |
Municipal Bonds — continued | |
|
Kentucky — continued | |
| | |
City of Shelbyville, Nifco North America Project Rev., VRDO, LOC: Bank of Tokyo-Mitsubishi UFJ Ltd., 0.12%, 9/8/2020 (b) | | | 9,525 | | | | 9,525 | |
| | |
Louisville & Jefferson County Metropolitan Government, Norton Healthcare, Inc. Series 2013C, Rev., VRDO, LOC: PNC Bank NA, 0.10%, 9/8/2020 (b) | | | 20,900 | | | | 20,900 | |
| | |
Louisville & Jefferson County Metropolitan Sewer and Drainage District Rev., BAN, 3.00%, 10/23/2020 | | | 79,225 | | | | 79,381 | |
| | | | | | | | |
| | |
| | | | | | | 114,806 | |
| | | | | | | | |
|
Louisiana — 0.3% | |
| | |
East Baton Rouge Parish Industrial Development Board, Inc., Exxonmobile Project, Gulf Opportunity Zone | | | | | | | | |
| | |
Rev., VRDO, 0.03%, 9/1/2020 (b) | | | 200 | | | | 200 | |
| | |
Series 2010B, Rev., VRDO, 0.03%, 9/1/2020 (b) | | | 29,545 | | | | 29,545 | |
| | |
Parish of East Baton Rouge, Exxonmobil Project Rev., VRDO, 0.05%, 9/1/2020 (b) | | | 5,100 | | | | 5,100 | |
| | | | | | | | |
| | |
| | | | | | | 34,845 | |
| | | | | | | | |
|
Maine — 0.6% | |
| | |
Maine State Housing Authority | | | | | | | | |
| | |
Series B2, Rev., VRDO, AMT, LIQ: Bank of America NA, 0.14%, 9/8/2020 (b) | | | 14,000 | | | | 14,000 | |
| | |
Series G, Rev., VRDO, AMT, LIQ: Bank of America NA, 0.14%, 9/8/2020 (b) | | | 10,165 | | | | 10,165 | |
| | |
Town of Yarmouth GO, BAN, 1.50%, 10/16/2020 | | | 44,000 | | | | 44,037 | |
| | | | | | | | |
| | |
| | | | | | | 68,202 | |
| | | | | | | | |
|
Maryland — 1.0% | |
| | |
County of Baltimore, Consolidated Public Improvement GO, BAN, 4.00%, 3/22/2021 | | | 30,000 | | | | 30,538 | |
| | |
Maryland Community Development Administration, Department of Housing and Community Development, Multi-Family, Monteverde Apartments Series 2008-E, Rev., VRDO, AMT, LOC: FHLMC, 0.10%, 9/8/2020 (b) | | | 6,900 | | | | 6,900 | |
| | |
Maryland Community Development Administration, Department of Housing and Community Development, Residential Series 2006G, Rev., VRDO, AMT, LIQ: State Street Bank & Trust, 0.11%, 9/8/2020 (b) | | | 19,655 | | | | 19,655 | |
| | |
Maryland Health and Higher Educational Facilities Authority, Pooled Loan Program Series 1994-D, Rev., VRDO, LOC: Bank of America NA, 0.13%, 9/8/2020 (b) | | | 1,159 | | | | 1,159 | |
| | | | | | | | |
| INVESTMENTS (a) | | PRINCIPAL
AMOUNT
($000) | | | VALUE
($000) | |
| |
|
Maryland — continued | |
| | |
Tender Option Bond Trust Receipts/Certificates | | | | | | | | |
| | |
Series 2018-XF2581, Rev., VRDO, LIQ: Morgan Stanley Bank, 0.12%, 9/8/2020 (b) (c) | | | 19,460 | | | | 19,460 | |
| | |
Series 2019-ZF2799, Rev., VRDO, LIQ: Barclays Bank plc, 0.12%, 9/8/2020 (b) (c) | | | 13,485 | | | | 13,485 | |
| | |
Series 2018-XG0177, Rev., VRDO, LOC: Barclays Bank plc, 0.13%, 9/8/2020 (b) (c) | | | 3,750 | | | | 3,750 | |
| | |
Series 2018-XF0605, Rev., VRDO, LIQ: Bank of America NA, 0.14%, 9/8/2020 (b) (c) | | | 3,300 | | | | 3,300 | |
| | |
Series 2018-ZM0596, Rev., VRDO, LIQ: Morgan Stanley Bank, 0.14%, 9/8/2020 (b) (c) | | | 7,500 | | | | 7,500 | |
| | | | | | | | |
| | |
| | | | | | | 105,747 | |
| | | | | | | | |
|
Massachusetts — 1.3% | |
| | |
City of Everett GO, BAN, 1.50%, 2/12/2021 | | | 20,367 | | | | 20,424 | |
| | |
City of Somerville Series A, GO, BAN, 2.00%, 6/4/2021 | | | 10,000 | | | | 10,120 | |
| | |
Massachusetts Development Finance Agency, First Mortgage Brookhaven Series 2005B, Rev., VRDO, LOC: Bank of America NA, 0.11%, 9/8/2020 (b) | | | 1,500 | | | | 1,500 | |
| | |
Massachusetts Health and Educational Facilities Authority, Capital Asset Program | | | | | | | | |
| | |
Series M-2, Rev., VRDO, LOC: Bank of America NA, 0.10%, 9/8/2020 (b) | | | 1,620 | | | | 1,620 | |
| | |
Series M-4A, Rev., VRDO, LOC: Bank of America NA, 0.12%, 9/8/2020 (b) | | | 1,355 | | | | 1,355 | |
| | |
Massachusetts Housing Finance Agency, Single Family Housing Series 208, Rev., VRDO, LIQ: Royal Bank of Canada, 0.09%, 9/8/2020 (b) | | | 3,400 | | | | 3,400 | |
| | |
Rib Floater Trust Various States | | | | | | | | |
| | |
Series 2018-012, Rev., VRDO, LIQ: Barclays Bank plc, 0.12%, 9/8/2020 (b) (c) | | | 23,745 | | | | 23,745 | |
| | |
Series 2019-004, Rev., VRDO, LIQ: Barclays Bank plc, 0.12%, 9/8/2020 (b) (c) | | | 46,000 | | | | 46,000 | |
| | |
Tender Option Bond Trust Receipts/Certificates Series 2018-XF2692, Rev., VRDO, LIQ: Citibank NA, 0.11%, 9/8/2020 (b) (c) | | | 4,190 | | | | 4,190 | |
| | |
Town of Acton GO, BAN, 1.25%, 3/16/2021 | | | 13,627 | | | | 13,667 | |
| | |
Town of Grafton, Unlimited Tax GO, BAN, 1.50%, 5/14/2021 | | | 17,015 | | | | 17,089 | |
| | |
Town of Scituate GO, BAN, 1.50%, 12/11/2020 | | | 12,510 | | | | 12,537 | |
| | | | | | | | |
| | |
| | | | | | | 155,647 | |
| | | | | | | | |
SEE NOTES TO FINANCIAL STATEMENTS.
| | | | | | | | |
| | | |
| AUGUST 31, 2020 | | J.P. MORGAN MONEY MARKET FUNDS | | | | | 63 | |
JPMorgan Tax Free Money Market Fund
SCHEDULE OF PORTFOLIO INVESTMENTS
AS OF AUGUST 31, 2020 (Unaudited) (continued)
| | | | | | | | |
| INVESTMENTS (a) | | PRINCIPAL
AMOUNT
($000) | | | VALUE
($000) | |
Municipal Bonds — continued | |
|
Michigan — 2.0% | |
| | |
Kent Hospital Finance Authority, Spectrum Health System Series 2008C, Rev., VRDO, LOC: Bank of New York Mellon, 0.10%, 9/8/2020 (b) | | | 6,880 | | | | 6,880 | |
| | |
Michigan State Building Authority, Multi Modal Facilities Program Series 2017-I, Rev., VRDO, LOC: Citibank NA, 0.08%, 9/8/2020 (b) | | | 16,505 | | | | 16,505 | |
| | |
Michigan State Housing Development Authority, Rental Housing | | | | | | | | |
| | |
Series 2016C, Rev., VRDO, AMT, LIQ: Royal Bank of Canada, 0.12%, 9/8/2020 (b) | | | 54,455 | | | | 54,455 | |
| | |
Series 2016D, Rev., VRDO, AMT, LOC: Bank of America NA, 0.14%, 9/8/2020 (b) | | | 9,930 | | | | 9,930 | |
| | |
Series 2018C, Rev., VRDO, AMT, LOC: Bank of America NA, 0.14%, 9/8/2020 (b) | | | 20,540 | | | | 20,540 | |
| | |
Michigan State Housing Development Authority, Single Family Mortgage Series 2007E, Rev., VRDO, AMT, LIQ: Royal Bank of Canada, 0.12%, 9/8/2020 (b) | | | 40,865 | | | | 40,865 | |
| | |
Rib Floater Trust Various States Series 2018-009, Rev., VRDO, LIQ: Barclays Bank plc, 0.13%, 9/8/2020 (b) (c) | | | 21,320 | | | | 21,320 | |
| | |
Tender Option Bond Trust Receipts/Certificates | | | | | | | | |
| | |
Series 2016-XF0394, Rev., VRDO, LIQ: Bank of America NA, 0.12%, 9/8/2020 (b) (c) | | | 11,580 | | | | 11,580 | |
| | |
Series 2017-XG0158, Rev., VRDO, LIQ: Bank of America NA, 0.12%, 9/8/2020 (b) (c) | | | 4,075 | | | | 4,075 | |
| | |
Series 2018-XG0186, Rev., VRDO, LIQ: Bank of America NA, 0.12%, 9/8/2020 (b) (c) | | | 21,540 | | | | 21,540 | |
| | | | | | | | |
| | |
| | | | | | | 207,690 | |
| | | | | | | | |
Minnesota — 1.1% | |
| | |
City of Oak Park Heights, Multi-Family Housing, Boutwells Landing Rev., VRDO, LIQ: FHLMC, 0.08%, 9/8/2020 (b) | | | 20,800 | | | | 20,800 | |
| | |
County of Hennepin Series 2018B, GO, VRDO, LIQ: TD Bank NA, 0.09%, 9/8/2020 (b) | | | 12,320 | | | | 12,320 | |
| | |
Minnesota Housing Finance Agency, Residential Housing Finance | | | | | | | | |
| | |
Series 2017F, Rev., VRDO, AMT, GNMA/FNMA/FHLMC, LIQ: Royal Bank of Canada, 0.09%, 9/8/2020 (b) | | | 37,800 | | | | 37,800 | |
| | |
Series 2019D, Rev., VRDO, GNMA/FNMA/FHLMC, LIQ: Royal Bank of Canada, 0.09%, 9/8/2020 (b) | | | 8,950 | | | | 8,950 | |
| | |
Series 2016F, Rev., VRDO, AMT, GNMA/FNMA/FHLMC COLL, LIQ: FHLB, 0.12%, 9/8/2020 (b) | | | 37,535 | | | | 37,535 | |
| | | | | | | | |
| | |
| | | | | | | 117,405 | |
| | | | | | | | |
| | | | | | | | |
| INVESTMENTS (a) | | PRINCIPAL
AMOUNT
($000) | | | VALUE
($000) | |
| | | | | | | | |
|
Mississippi — 2.6% | |
| | |
County of Jackson, Chevron USA, Inc. Project | | | | | | | | |
| | |
Rev., VRDO, 0.05%, 9/1/2020 (b) | | | 120 | | | | 120 | |
| | |
County of Jackson, Pollution Control, Chevron USA, Inc., Project Rev., VRDO, 0.03%, 9/1/2020 (b) | | | 6,955 | | | | 6,955 | |
| | |
County of Jackson, Port Facility, Chevron USA, Inc. Project Rev., VRDO, 0.03%, 9/1/2020 (b) | | | 24,900 | | | | 24,900 | |
| | |
Mississippi Business Finance Corp., Gulf Opportunity Zone Industrial Development, Chevron USA, Inc. Project | | | | | | | | |
| | |
Series 2007C, Rev., VRDO, 0.03%, 9/1/2020 (b) | | | 11,760 | | | | 11,760 | |
| | |
Series 2007E, Rev., VRDO, 0.03%, 9/1/2020 (b) | | | 11,050 | | | | 11,050 | |
| | |
Series 2009A, Rev., VRDO, 0.03%, 9/1/2020 (b) | | | 7,540 | | | | 7,540 | |
| | |
Series 2009C, Rev., VRDO, 0.03%, 9/1/2020 (b) | | | 2,680 | | | | 2,680 | |
| | |
Series 2009E, Rev., VRDO, 0.03%, 9/1/2020 (b) | | | 9,900 | | | | 9,900 | |
| | |
Series 2009F, Rev., VRDO, 0.03%, 9/1/2020 (b) | | | 530 | | | | 530 | |
| | |
Series 2009G, Rev., VRDO, 0.03%, 9/1/2020 (b) | | | 475 | | | | 475 | |
| | |
Series 2010 H, Rev., VRDO, 0.03%, 9/1/2020 (b) | | | 34,070 | | | | 34,070 | |
| | |
Series 2010 I, Rev., VRDO, 0.03%, 9/1/2020 (b) | | | 11,630 | | | | 11,630 | |
| | |
Series 2010G, Rev., VRDO, 0.03%, 9/1/2020 (b) | | | 11,255 | | | | 11,255 | |
| | |
Series 2010L, Rev., VRDO, 0.03%, 9/1/2020 (b) | | | 7,250 | | | | 7,250 | |
| | |
Series 2011 F, Rev., VRDO, 0.03%, 9/1/2020 (b) | | | 5,200 | | | | 5,200 | |
| | |
Series 2011 G, Rev., VRDO, 0.03%, 9/1/2020 (b) | | | 4,500 | | | | 4,500 | |
| | |
Series 2011A, Rev., VRDO, 0.03%, 9/1/2020 (b) | | | 29,285 | | | | 29,285 | |
| | |
Series 2011C, Rev., VRDO, 0.03%, 9/1/2020 (b) | | | 14,065 | | | | 14,065 | |
| | |
Series 2011D, Rev., VRDO, 0.03%, 9/1/2020 (b) | | | 15,925 | | | | 15,925 | |
| | |
Series 2010A, Rev., VRDO, 0.08%, 9/8/2020 (b) | | | 59,505 | | | | 59,505 | |
| | |
Mississippi Development Bank, Industrial Water System Project Series 2009, Rev., VRDO, 0.03%, 9/1/2020 (b) | | | 10,850 | | | | 10,850 | |
| | | | | | | | |
| | |
| | | | | | | 279,445 | |
| | | | | | | | |
SEE NOTES TO FINANCIAL STATEMENTS.
| | | | | | |
| | | |
| 64 | | | | J.P. MORGAN MONEY MARKET FUNDS | | AUGUST 31, 2020 |
| | | | | | | | |
| INVESTMENTS (a) | | PRINCIPAL
AMOUNT
($000) | | | VALUE
($000) | |
Municipal Bonds — continued | |
|
Missouri — 2.6% | |
| | |
City of Kansas City, Roe Bartle Convention Center Series 2008E, Rev., VRDO, LOC: Sumitomo Mitsui Banking Corp., 0.09%, 9/8/2020 (b) | | | 61,090 | | | | 61,090 | |
| | |
Health and Educational Facilities Authority of the State of Missouri, Ascension Health Senior Credit Group Series C-4, Rev., VRDO, 0.10%, 9/8/2020 (b) | | | 25,050 | | | | 25,050 | |
| | |
Health and Educational Facilities Authority of the State of Missouri, BJC Health System | | | | | | | | |
| | |
Series 2008A, Rev., VRDO, LIQ: U.S. Bank NA, 0.08%, 9/8/2020 (b) | | | 76,475 | | | | 76,475 | |
| | |
Series 2008B, Rev., VRDO, LIQ: BJC Health System, 0.08%, 9/8/2020 (b) | | | 77,675 | | | | 77,675 | |
| | |
Health and Educational Facilities Authority of the State of Missouri, SSM Health Series 2018F, Rev., VRDO, 0.04%, 9/1/2020 (b) | | | 4,180 | | | | 4,180 | |
| | |
RBC Municipal Products, Inc. Trust, Floater Certificates Rev., VRDO, LOC: Royal Bank of Canada, 0.14%, 9/8/2020 (b) (c) | | | 10,000 | | | | 10,000 | |
| | |
St. Charles County Industrial Development Authority, Remington Apartments Project Rev., VRDO, LOC: FNMA, 0.09%, 9/8/2020 (b) | | | 10,400 | | | | 10,400 | |
| | |
Tender Option Bond Trust Receipts/Certificates Rev., VRDO, LOC: Royal Bank of Canada, 0.16%, 9/8/2020 (b) (c) | | | 25,050 | | | | 25,050 | |
| | | | | | | | |
| | |
| | | | | | | 289,920 | |
| | | | | | | | |
|
Nebraska — 0.2% | |
| | |
Nebraska Investment Finance Authority, Multi-Family Housing, Irvington Heights Apartment Project Series A, Rev., VRDO, LOC: Citibank NA, 0.12%, 9/8/2020 (b) | | | 6,500 | | | | 6,500 | |
| | |
Tender Option Bond Trust Receipts/Certificates Series 2018-XF2558, Rev., VRDO, LIQ: Morgan Stanley Bank, 0.12%, 9/8/2020 (b) (c) | | | 8,000 | | | | 8,000 | |
| | | | | | | | |
| | |
| | | | | | | 14,500 | |
| | | | | | | | |
|
Nevada — 1.2% | |
| | |
City of Reno, Hospital, Renown Regional Medical Center Project Series 2008A, Rev., VRDO, LOC: Wells Fargo Bank NA, 0.08%, 9/8/2020 (b) | | | 31,475 | | | | 31,475 | |
| | |
City of Reno, Regional Medical Center Project | | | | | | | | |
| | |
Series 2008B, Rev., VRDO, LOC: Wells Fargo Bank NA, 0.08%, 9/8/2020 (b) | | | 31,945 | | | | 31,945 | |
| | |
Series 2009-B, Rev., VRDO, LOC: Wells Fargo Bank NA, 0.08%, 9/8/2020 (b) | | | 15,010 | | | | 15,010 | |
| | | | | | | | |
| INVESTMENTS (a) | | PRINCIPAL
AMOUNT
($000) | | | VALUE
($000) | |
| | | | | | | | |
|
Nevada — continued | |
| | |
Clark County, Industrial Development, Southwest Gas Corp. Project Series 2009A, Rev., VRDO, LOC: Bank of America NA, 0.10%, 9/8/2020 (b) | | | 16,555 | | | | 16,555 | |
| | |
County of Clark, Southwest Gas Corp. Project Series 2008A, Rev., VRDO, AMT, LOC: MUFG Union Bank NA, 0.10%, 9/8/2020 (b) | | | 25,000 | | | | 25,000 | |
| | |
Nevada Housing Division, Multi-Unit Housing Series A, Rev., VRDO, LOC: FNMA, 0.10%, 9/8/2020 (b) | | | 7,450 | | | | 7,450 | |
| | |
Tender Option Bond Trust Receipts/Certificates Series 2019-G98, GO, VRDO, LOC: Royal Bank of Canada, 0.12%, 9/8/2020 (b) (c) | | | 4,750 | | | | 4,750 | |
| | | | | | | | |
| | |
| | | | | | | 132,185 | |
| | | | | | | | |
|
New Jersey — 1.9% | |
| | |
Borough of Beachwood Series 2020A, GO, BAN, 2.00%, 3/4/2021 | | | 10,039 | | | | 10,094 | |
| | |
City of North Wildwood GO, BAN, 1.25%, 8/20/2021 | | | 20,326 | | | | 20,512 | |
| | |
County of Burlington Series 2020A, GO, BAN, 1.50%, 9/15/2020 | | | 23,000 | | | | 23,005 | |
| | |
County of Middlesex GO, BAN, 2.00%, 6/3/2021 | | | 6,000 | | | | 6,072 | |
| | |
County of Sussex GO, BAN, 1.75%, 6/17/2021 | | | 7,428 | | | | 7,507 | |
| | |
Rib Floater Trust Various States | | | | | | | | |
| | |
Series 2018-019, Rev., VRDO, LIQ: Barclays Bank plc, 0.12%, 9/8/2020 (b) (c) | | | 25,820 | | | | 25,820 | |
| | |
Series 2018-020, Rev., VRDO, LIQ: Barclays Bank plc, 0.16%, 9/8/2020 (b) (c) | | | 22,075 | | | | 22,075 | |
| | |
Tender Option Bond Trust Receipts/Certificates | | | | | | | | |
| | |
Series 2018-XG0168, Rev., VRDO, LOC: Barclays Bank plc, 0.12%, 9/8/2020 (b) (c) | | | 15,450 | | | | 15,450 | |
| | |
Series 2018-XX1091, Rev., VRDO, NATL-RE, LOC: Barclays Bank plc, 0.12%, 9/8/2020 (b) (c) | | | 9,000 | | | | 9,000 | |
| | |
Series 2018-XX1093, Rev., VRDO, LOC: Barclays Bank plc, 0.12%, 9/8/2020 (b) (c) | | | 3,600 | | | | 3,600 | |
| | |
Town of Dover Series 2020A, GO, BAN, 1.25%, 5/27/2021 | | | 21,090 | | | | 21,223 | |
| | |
Township of Maple Shade, General Capital, Water and Sewer System GO, BAN, 1.25%, 9/1/2021 | | | 12,000 | | | | 12,115 | |
| | |
Township of Monroe, Middlesex County, General Improvement, Water and Sewer System GO, BAN, 1.25%, 6/8/2021 | | | 12,830 | | | | 12,910 | |
SEE NOTES TO FINANCIAL STATEMENTS.
| | | | | | | | |
| | | |
| AUGUST 31, 2020 | | J.P. MORGAN MONEY MARKET FUNDS | | | | | 65 | |
JPMorgan Tax Free Money Market Fund
SCHEDULE OF PORTFOLIO INVESTMENTS
AS OF AUGUST 31, 2020 (Unaudited) (continued)
| | | | | | | | |
| INVESTMENTS (a) | | PRINCIPAL
AMOUNT
($000) | | | VALUE
($000) | |
Municipal Bonds — continued | |
|
New Jersey — continued | |
| | |
Township of Toms River GO, BAN, 1.50%, 6/16/2021 | | | 10,294 | | | | 10,375 | |
| | | | | | | | |
| | |
| | | | | | | 199,758 | |
| | | | | | | | |
|
New York — 17.1% | |
| | |
Albany City School District Series 2020B, GO, BAN, 1.25%, 7/30/2021 | | | 48,000 | | | | 48,371 | |
| | |
Amsterdam City School District GO, BAN, 1.25%, 6/25/2021 | | | 28,968 | | | | 29,137 | |
| | |
Berne-Knox-Westerlo Central School District GO, BAN, 1.25%, 7/9/2021 | | | 17,800 | | | | 17,919 | |
| | |
City of Buffalo GO, BAN, 1.50%, 4/28/2021 | | | 34,800 | | | | 34,933 | |
| | |
City of Geneva GO, BAN, 1.50%, 5/6/2021 | | | 15,213 | | | | 15,253 | |
| | |
City of New York | | | | | | | | |
| | |
Series E, Subseries E-2, GO, VRDO, LOC: Bank of America NA, 0.03%, 9/1/2020 (b) | | | 6,775 | | | | 6,775 | |
| | |
Subseries L-3, GO, VRDO, LOC: Bank of America NA, 0.03%, 9/1/2020 (b) | | | 13,840 | | | | 13,840 | |
| | |
City of New York, Fiscal Year 2006 | | | | | | | | |
| | |
Series I, Subseries I-4, GO, VRDO, LOC: TD Bank NA, 0.02%, 9/1/2020 (b) | | | 18,715 | | | | 18,715 | |
| | |
Series I, Subseries I-8, GO, VRDO, LIQ: State Street Bank & Trust, 0.03%, 9/1/2020 (b) | | | 6,960 | | | | 6,960 | |
| | |
City of New York, Fiscal Year 2008 Subseries J-6, GO, VRDO, LOC: Landesbank Hessen-Thueringen, 0.04%, 9/1/2020 (b) | | | 8,285 | | | | 8,285 | |
| | |
City of New York, Fiscal Year 2012 | | | | | | | | |
| | |
Series 2012G, Subseries G-6, GO, VRDO, LOC: Mizuho Bank Ltd., 0.02%, 9/1/2020 (b) | | | 6,980 | | | | 6,980 | |
| | |
Series D, Subseries D-3A, GO, VRDO, LIQ: Bank of New York Mellon, 0.03%, 9/1/2020 (b) | | | 8,375 | | | | 8,375 | |
| | |
Series A-3, GO, VRDO, LIQ: Landesbank Hessen-Thueringen, 0.04%, 9/1/2020 (b) | | | 19,350 | | | | 19,350 | |
| | |
City of New York, Fiscal Year 2013 | | | | | | | | |
| | |
Subseries A-2, GO, VRDO, LIQ: Mizuho Bank Ltd., 0.03%, 9/1/2020 (b) | | | 25,910 | | | | 25,910 | |
| | |
Subseries A-3, GO, VRDO, LOC: Mizuho Bank Ltd., 0.03%, 9/1/2020 (b) | | | 12,680 | | | | 12,680 | |
| | |
City of New York, Fiscal Year 2014 Subseries D-5, GO, VRDO, LOC: PNC Bank NA, 0.10%, 9/8/2020 (b) | | | 26,550 | | | | 26,550 | |
| | |
City of New York, Fiscal Year 2017 | | | | | | | | |
| | |
Series A, Subseries A-5, GO, VRDO, LIQ: Landesbank Hessen-Thueringen, 0.04%, 9/1/2020 (b) | | | 18,700 | | | | 18,700 | |
| | |
Subseries A-6, GO, VRDO, LIQ: Landesbank Hessen-Thueringen, 0.04%, 9/1/2020 (b) | | | 35,345 | | | | 35,345 | |
| | | | | | | | |
| INVESTMENTS (a) | | PRINCIPAL
AMOUNT
($000) | | | VALUE
($000) | |
| | | | | | | | |
|
New York — continued | |
| | |
City of New York, Fiscal Year 2018 Series B, Subseries B-4, GO, VRDO, LIQ: Barclays Bank plc, 0.03%, 9/1/2020 (b) | | | 3,550 | | | | 3,550 | |
| | |
City of New York, Fiscal Year 2019 Series D, Subseries D-4, GO, VRDO, LIQ: Barclays Bank plc, 0.03%, 9/1/2020 (b) | | | 20,215 | | | | 20,215 | |
| | |
County of Broome Series 2020A, GO, BAN, 3.00%, 4/30/2021 | | | 29,720 | | | | 30,069 | |
| | |
Evans-Brant Central School District Series 2020B, GO, BAN, 1.25%, 6/25/2021 | | | 21,425 | | | | 21,524 | |
| | |
Frontier Central School District GO, BAN, 1.25%, 7/22/2021 | | | 20,000 | | | | 20,147 | |
| | |
Geneva City School District GO, BAN, 1.25%, 6/25/2021 | | | 20,130 | | | | 20,249 | |
| | |
Gorham-Middlesex Central School District Series 2020A, GO, BAN, 1.25%, 6/24/2021 | | | 22,900 | | | | 23,005 | |
| | |
Highland Falls-Fort Montgomery Central School District GO, BAN, 1.25%, 6/25/2021 | | | 17,615 | | | | 17,696 | |
| | |
Metropolitan Transportation Authority | | | | | | | | |
| | |
Series 2008A-1, Rev., VRDO, LOC: TD Bank NA, 0.02%, 9/1/2020 (b) | | | 9,990 | | | | 9,990 | |
| | |
Subseries E-1, Rev., VRDO, LOC: U.S. Bank NA, 0.03%, 9/1/2020 (b) | | | 1,615 | | | | 1,615 | |
| | |
Series 2008A-2B, Rev., VRDO, LOC: PNC Bank NA, 0.10%, 9/8/2020 (b) | | | 60,455 | | | | 60,455 | |
| | |
Subseries E-1, Rev., VRDO, LOC: PNC Bank NA, 0.10%, 9/8/2020 (b) | | | 9,580 | | | | 9,580 | |
| | |
Subseries E-4, Rev., VRDO, LOC: PNC Bank NA, 0.10%, 9/8/2020 (b) | | | 25,775 | | | | 25,775 | |
| | |
Nassau Health Care Corp., Nassau County Guaranteed | | | | | | | | |
| | |
Subseries 2009B-2, Rev., VRDO, GTD, LOC: Bank of America NA, 0.09%, 9/8/2020 (b) | | | 4,420 | | | | 4,420 | |
| | |
Subseries 2009C-1, Rev., VRDO, GTD, LOC: Bank of America NA, 0.09%, 9/8/2020 (b) | | | 16,105 | | | | 16,105 | |
| | |
Subseries 2009D-1, Rev., VRDO, GTD, LOC: Bank of America NA, 0.09%, 9/8/2020 (b) | | | 9,255 | | | | 9,255 | |
| | |
Subseries 2009D-2, Rev., VRDO, GTD, LOC: Bank of America NA, 0.09%, 9/8/2020 (b) | | | 16,160 | | | | 16,160 | |
| | |
Subseries 2009B-1, Rev., VRDO, GTD, LOC: Bank of America NA, 0.10%, 9/8/2020 (b) | | | 16,760 | | | | 16,760 | |
| | |
New York City Housing Development Corp., Multi-Family Rental Housing, West 89th Street Development Series A, Rev., VRDO, LOC: FNMA, 0.10%, 9/8/2020 (b) | | | 10,630 | | | | 10,630 | |
| | |
New York City Municipal Water Finance Authority, Water and Sewer System, Fiscal Year 2008 Subseries B-1A, Rev., VRDO, LIQ: Sumitomo Mitsui Banking Corp., 0.09%, 9/8/2020 (b) | | | 71,450 | | | | 71,450 | |
SEE NOTES TO FINANCIAL STATEMENTS.
| | | | | | |
| | | |
| 66 | | | | J.P. MORGAN MONEY MARKET FUNDS | | AUGUST 31, 2020 |
| | | | | | | | |
| INVESTMENTS (a) | | PRINCIPAL
AMOUNT
($000) | | | VALUE
($000) | |
Municipal Bonds — continued | |
|
New York — continued | |
| | |
New York City Municipal Water Finance Authority, Water and Sewer System, Fiscal Year 2012 | | | | | | | | |
| | |
Series B, Subseries B-1, Rev., VRDO, LIQ: U.S. Bank NA, 0.03%, 9/1/2020 (b) | | | 11,100 | | | | 11,100 | |
| | |
Series B, Subseries B-2, Rev., VRDO, LIQ: State Street Bank & Trust, 0.03%, 9/1/2020 (b) | | | 4,205 | | | | 4,205 | |
| | |
Series B, Subseries B-4, Rev., VRDO, LIQ: State Street Bank & Trust, 0.03%, 9/1/2020 (b) | | | 5,240 | | | | 5,240 | |
| | |
Subseries A-1, Rev., VRDO, LIQ: Mizuho Bank Ltd., 0.03%, 9/1/2020 (b) | | | 13,100 | | | | 13,100 | |
| | |
New York City Municipal Water Finance Authority, Water and Sewer System, Second General Resolution | | | | | | | | |
| | |
Series BB-1B, Rev., VRDO, LIQ: State Street Bank & Trust, 0.03%, 9/1/2020 (b) | | | 7,670 | | | | 7,670 | |
| | |
Series BB-2, Rev., VRDO, LIQ: Landesbank Hessen-Thueringen, 0.05%, 9/1/2020 (b) | | | 12,655 | | | | 12,655 | |
| | |
New York City Municipal Water Finance Authority, Water and Sewer System, Second General Resolution, Fiscal Year 2001 Subseries F-1, Rev., VRDO, LIQ: Mizuho Bank Ltd., 0.03%, 9/1/2020 (b) | | | 42,440 | | | | 42,440 | |
| | |
New York City Municipal Water Finance Authority, Water and Sewer System, Second General Resolution, Fiscal Year 2014 | | | | | | | | |
| | |
Series AA, Subseries AA1, Rev., VRDO, LIQ: TD Bank NA, 0.02%, 9/1/2020 (b) | | | 28,195 | | | | 28,195 | |
| | |
Series AA, Subseries AA-5, Rev., VRDO, LIQ: Mizuho Bank Ltd., 0.02%, 9/1/2020 (b) | | | 21,530 | | | | 21,530 | |
| | |
New York City Municipal Water Finance Authority, Water and Sewer System, Second General Resolution, Fiscal Year 2015 | | | | | | | | |
| | |
Series BB, Rev., VRDO, LIQ: Mizuho Bank Ltd., 0.03%, 9/1/2020 (b) | | | 49,305 | | | | 49,305 | |
| | |
Subseries BB-1, Rev., VRDO, LIQ: Bank of America NA, 0.03%, 9/1/2020 (b) | | | 18,330 | | | | 18,330 | |
| | |
Subseries BB-4, Rev., VRDO, LIQ: Barclays Bank plc, 0.03%, 9/1/2020 (b) | | | 5,075 | | | | 5,075 | |
| | |
New York City Municipal Water Finance Authority, Water and Sewer System, Second General Resolution, Fiscal Year 2016 Series AA-1, Rev., VRDO, LIQ: Bank of America NA, 0.03%, 9/1/2020 (b) | | | 5,850 | | | | 5,850 | |
| | |
New York City Transitional Finance Authority Future Tax Secured Subseries C-5, Rev., VRDO, LIQ: Bank of America NA, 0.03%, 9/1/2020 (b) | | | 12,335 | | | | 12,335 | |
| | | | | | | | |
| INVESTMENTS (a) | | PRINCIPAL
AMOUNT
($000) | | | VALUE
($000) | |
| |
|
New York — continued | |
| | |
New York City Transitional Finance Authority, Future Tax Secured Subseries C4, Rev., VRDO, LIQ: Landesbank Hessen-Thueringen, 0.03%, 9/1/2020 (b) | | | 21,065 | | | | 21,065 | |
| | |
New York City Transitional Finance Authority, Future Tax Secured, Fiscal Year 2001 Series C, Rev., VRDO, LIQ: PNC Bank NA, 0.10%, 9/8/2020 (b) | | | 40,510 | | | | 40,510 | |
| | |
New York City Transitional Finance Authority, Future Tax Secured, Fiscal Year 2003 Subseries A-4, Rev., VRDO, LIQ: TD Bank NA, 0.02%, 9/1/2020 (b) | | | 10,200 | | | | 10,200 | |
| | |
New York City Transitional Finance Authority, Future Tax Secured, Fiscal Year 2010 Subseries 2010G-6, Rev., VRDO, LIQ: Barclays Bank plc, 0.03%, 9/1/2020 (b) | | | 16,405 | | | | 16,405 | |
| | |
New York City Transitional Finance Authority, Future Tax Secured, Fiscal Year 2013 Subseries A-6, Rev., VRDO, LIQ: State Street Bank & Trust, 0.03%, 9/1/2020 (b) | | | 8,350 | | | | 8,350 | |
| | |
New York City Transitional Finance Authority, Future Tax Secured, Fiscal Year 2014 Subseries B-3, Rev., VRDO, LIQ: Barclays Bank plc, 0.03%, 9/1/2020 (b) | | | 6,700 | | | | 6,700 | |
| | |
New York City Transitional Finance Authority, Future Tax Secured, Fiscal Year 2015 | | | | | | | | |
| | |
Subseries E-4, Rev., VRDO, LIQ: Bank of America NA, 0.03%, 9/1/2020 (b) | | | 2,625 | | | | 2,625 | |
| | |
Subseries A-3, Rev., VRDO, LIQ: Mizuho Bank Ltd., 0.04%, 9/1/2020 (b) | | | 1,675 | | | | 1,675 | |
| | |
New York City Transitional Finance Authority, Future Tax Secured, Fiscal Year 2016 Subseries A-4, Rev., VRDO, LIQ: Bank of America NA, 0.03%, 9/1/2020 (b) | | | 5,025 | | | | 5,025 | |
| | |
New York City Transitional Finance Authority, Future Tax Secured, New York City Recovery | | | | | | | | |
| | |
Series 1, Subseries 1A, Rev., VRDO, LIQ: Landesbank Hessen-Thueringen, 0.08%, 9/8/2020 (b) | | | 1,105 | | | | 1,105 | |
| | |
Subseries 2-F, Rev., VRDO, LIQ: Sumitomo Mitsui Banking Corp., 0.08%, 9/8/2020 (b) | | | 6,910 | | | | 6,910 | |
| | |
New York State Dormitory Authority, City University System, CONS Fifth General Resolution Series 2008D, Rev., VRDO, LOC: TD Bank NA, 0.07%, 9/8/2020 (b) | | | 17,380 | | | | 17,380 | |
| | |
New York State Dormitory Authority, Court Facilities Lease Series 2005B, Rev., VRDO, LOC: Mizuho Bank Ltd., 0.10%, 9/8/2020 (b) | | | 59,525 | | | | 59,525 | |
SEE NOTES TO FINANCIAL STATEMENTS.
| | | | | | | | |
| | | |
| AUGUST 31, 2020 | | J.P. MORGAN MONEY MARKET FUNDS | | | | | 67 | |
JPMorgan Tax Free Money Market Fund
SCHEDULE OF PORTFOLIO INVESTMENTS
AS OF AUGUST 31, 2020 (Unaudited) (continued)
| | | | | | | | |
| INVESTMENTS (a) | | PRINCIPAL
AMOUNT
($000) | | | VALUE
($000) | |
Municipal Bonds — continued | |
|
New York — continued | |
| | |
New York State Dormitory Authority, Remarketing Series A, Rev., VRDO, LOC: FNMA, 0.07%, 9/8/2020 (b) | | | 35 | | | | 35 | |
| | |
New York State Dormitory Authority, State Personal Income Tax, General Purpose Series 2020B, Rev., RAN, 5.00%, 3/31/2021 | | | 69,500 | | | | 71,286 | |
| | |
New York State Energy Research and Development Authority Subseries C-2, Rev., VRDO, LOC: Mizuho Bank Ltd., 0.11%, 9/8/2020 (b) | | | 1,010 | | | | 1,010 | |
| | |
New York State Energy Research and Development Authority, Consolidated Edison Co., Inc. Project Subseries A-3, Rev., VRDO, LOC: Mizuho Bank Ltd., 0.08%, 9/8/2020 (b) | | | 920 | | | | 920 | |
| | |
New York State Housing Finance Agency Series A, Rev., VRDO, LOC: FNMA, 0.10%, 9/8/2020 (b) | | | 1,600 | | | | 1,600 | |
| | |
New York State Housing Finance Agency, 160 Madison Avenue Housing Series 2013A, Rev., VRDO, LOC: Landesbank Hessen-Thueringen, 0.04%, 9/1/2020 (b) | | | 955 | | | | 955 | |
| | |
New York State Housing Finance Agency, 250 West 93rd Street Housing Series 2005A, Rev., VRDO, LOC: Landesbank Hessen-Thueringen, 0.12%, 9/8/2020 (b) | | | 33,380 | | | | 33,380 | |
| | |
New York State Housing Finance Agency, 360 West 43rd Street Series A, Rev., VRDO, LOC: FNMA, 0.10%, 9/8/2020 (b) | | | 2,400 | | | | 2,400 | |
| | |
New York State Housing Finance Agency, 455 West 37th Street Housing Series 2007A, Rev., VRDO, AMT, LOC: Landesbank Hessen-Thueringen, 0.06%, 9/1/2020 (b) | | | 17,105 | | | | 17,105 | |
| | |
New York State Housing Finance Agency, Tribeca Green Series 2003A, Rev., VRDO, LOC: Landesbank Hessen-Thueringen, 0.11%, 9/8/2020 (b) | | | 10,985 | | | | 10,985 | |
| | |
New York State Housing Finance Agency, Weyant Green Apartments Series 2007A, Rev., VRDO, LOC: FNMA, 0.10%, 9/8/2020 (b) | | | 100 | | | | 100 | |
| | |
New York State Housing Finance Agency, Worth Street | | | | | | | | |
| | |
Series A, Rev., VRDO, LOC: FNMA, 0.10%, 9/8/2020 (b) | | | 3,400 | | | | 3,400 | |
| | |
Series A, Rev., VRDO, LOC: FNMA, 0.10%, 9/8/2020 (b) | | | 2,100 | | | | 2,100 | |
| | |
North Colonie Central School District GO, BAN, 1.25%, 7/16/2021 | | | 97,710 | | | | 98,387 | |
| | |
North Rose-Wolcott Central School District GO, BAN, 1.25%, 6/29/2021 | | | 22,265 | | | | 22,387 | |
| | | | | | | | |
| INVESTMENTS (a) | | PRINCIPAL
AMOUNT
($000) | | | VALUE
($000) | |
| |
|
New York — continued | |
| | |
North Tonawanda City School District GO, BAN, 1.25%, 8/20/2021 | | | 14,940 | | | | 15,075 | |
| | |
Pearl River Union Free School District GO, BAN, 1.25%, 7/23/2021 | | | 28,345 | | | | 28,559 | |
| | |
Phoenix Central School District GO, BAN, 1.25%, 7/8/2021 | | | 32,667 | | | | 32,893 | |
| | |
RBC Municipal Products, Inc. Trust | | | | | | | | |
| | |
Series E-118, GO, VRDO, LOC: Royal Bank of Canada, 0.05%, 9/1/2020 (b) (c) | | | 10,000 | | | | 10,000 | |
| | |
Series E-24, Rev., VRDO, LOC: Royal Bank of Canada, 0.05%, 9/1/2020 (b) (c) | | | 17,605 | | | | 17,605 | |
| | |
Series E-86, GO, VRDO, LOC: Royal Bank of Canada, 0.12%, 9/8/2020 (b) (c) | | | 10,000 | | | | 10,000 | |
| | |
Series E-87, GO, VRDO, LOC: Royal Bank of Canada, 0.12%, 9/8/2020 (b) (c) | | | 14,600 | | | | 14,600 | |
| | |
Series E-88, GO, VRDO, LOC: Royal Bank of Canada, 0.12%, 9/8/2020 (b) (c) | | | 25,835 | | | | 25,835 | |
| | |
RBC Municipal Products, Inc. Trust, Floater Certificates Series E-99, Rev., VRDO, LOC: Royal Bank of Canada, 0.12%, 9/8/2020 (b) (c) | | | 27,000 | | | | 27,000 | |
| | |
Schoharie Central School District GO, BAN, 1.25%, 6/25/2021 | | | 17,335 | | | | 17,395 | |
| | |
Solvay Union Free School District GO, BAN, 1.25%, 6/30/2021 | | | 25,842 | | | | 26,012 | |
| | |
Tender Option Bond Trust Receipts/Certificates | | | | | | | | |
| | |
Series E-118, GO, VRDO, LOC: Royal Bank of Canada, 0.05%, 9/1/2020 (b) (c) | | | 4,900 | | | | 4,900 | |
| | |
Series 2018-E-129, Rev., VRDO, LOC: Royal Bank of Canada, 0.12%, 9/8/2020 (b) (c) | | | 35,000 | | | | 35,000 | |
| | |
Series 2015-XF0238, Rev., VRDO, LIQ: TD Bank NA, 0.13%, 9/8/2020 (b) (c) | | | 10,000 | | | | 10,000 | |
| | |
Series 2018-E-126, Rev., VRDO, LOC: Royal Bank of Canada, 0.14%, 9/8/2020 (b) (c) | | | 35,000 | | | | 35,000 | |
| | |
Triborough Bridge and Tunnel Authority, MTA Bridges and Tunnels | | | | | | | | |
| | |
Series 2003 B-1, Rev., VRDO, LOC: Bank of America NA, 0.03%, 9/1/2020 (b) | | | 12,090 | | | | 12,090 | |
| | |
Subseries 2005 B-3, Rev., VRDO, LOC: State Street Bank & Trust, 0.03%, 9/1/2020 (b) | | | 1,135 | | | | 1,135 | |
| | |
Union Endicott Central School District GO, BAN, 1.25%, 6/25/2021 | | | 18,079 | | | | 18,184 | |
| | |
William Floyd Union Free School District of the Mastics-Moriches-Shirley GO, BAN, 1.50%, 5/13/2021 | | | 17,600 | | | | 17,663 | |
| | | | | | | | |
| | |
| | | | | | | 1,822,229 | |
| | | | | | | | |
SEE NOTES TO FINANCIAL STATEMENTS.
| | | | | | |
| | | |
| 68 | | | | J.P. MORGAN MONEY MARKET FUNDS | | AUGUST 31, 2020 |
| | | | | | | | |
| INVESTMENTS (a) | | PRINCIPAL
AMOUNT
($000) | | | VALUE
($000) | |
Municipal Bonds — continued | |
|
North Carolina — 1.8% | |
| | |
Charlotte-Mecklenburg Hospital Authority, Health Care Series 2007E, Rev., VRDO, AGM, LOC: TD Bank NA, 0.02%, 9/1/2020 (b) | | | 27,805 | | | | 27,805 | |
| | |
City of Raleigh, Downtown Improvement Projects | | | | | | | | |
| | |
Series 2005-B-1, COP, VRDO, LIQ: Wells Fargo Bank NA, 0.08%, 9/8/2020 (b) | | | 50,000 | | | | 50,000 | |
| | |
Series 2005-B-2, COP, VRDO, LIQ: PNC Bank NA, 0.10%, 9/8/2020 (b) | | | 29,625 | | | | 29,625 | |
| | |
City of Raleigh, Enterprise System Series 2008A, Rev., VRDO, LIQ: Bank of America NA, 0.11%, 9/8/2020 (b) | | | 16,440 | | | | 16,440 | |
| | |
North Carolina Medical Care Commission, Health System, Catholic Health East Issue, Trinity Health Corp. Series 2008, Rev., VRDO, 0.10%, 9/8/2020 (b) | | | 9,725 | | | | 9,725 | |
| | |
Person County Industrial Facilities and Pollution Control Financing Authority, Recovery Zone Facility, CertainTeed Gypsum NC, Inc. Series 2010, Rev., VRDO, LOC: Credit Industriel et Commercial, 0.11%, 9/8/2020 (b) | | | 50,325 | | | | 50,325 | |
| | | | | | | | |
| | |
| | | | | | | 183,920 | |
| | | | | | | | |
|
Ohio — 1.3% | |
| | |
City of Blue Ash, Economic Development, Ursuline Academy of Cincinnati Project Series 2008, Rev., VRDO, LOC: PNC Bank NA, 0.10%, 9/8/2020 (b) | | | 200 | | | | 200 | |
| | |
Columbus Regional Airport Authority, Flightsafety International Inc., Project Series B, Rev., VRDO, AMT, 0.14%, 9/8/2020 (b) | | | 15,040 | | | | 15,040 | |
| | |
County of Hamilton, Hospital Facilities, The Elizabeth Gamble Deaconess Home Association | | | | | | | | |
| | |
Series 2002A, Rev., VRDO, LOC: Northern Trust Co., 0.09%, 9/8/2020 (b) | | | 11,750 | | | | 11,750 | |
| | |
Series 2002B, Rev., VRDO, LOC: PNC Bank NA, 0.09%, 9/8/2020 (b) | | | 8,500 | | | | 8,500 | |
| | |
County of Montgomery, Hospital Facilities, Premier Health Partners Obligated Group Series 2019B, Rev., VRDO, LOC: PNC Bank NA, 0.10%, 9/8/2020 (b) | | | 29,425 | | | | 29,425 | |
| | |
Ohio Higher Educational Facility Commission, Cleveland Clinic Health System Obligated Group Series 2013-B-1, Rev., VRDO, LIQ: Wells Fargo Bank NA, 0.03%, 9/1/2020 (b) | | | 3,700 | | | | 3,700 | |
| | |
Ohio Higher Educational Facility Commission, Hospital, Cleveland Clinic Health System Series 2013-B-2, Rev., VRDO, LIQ: Bank of New York Mellon, 0.03%, 9/1/2020 (b) | | | 6,550 | | | | 6,550 | |
| | | | | | | | |
| INVESTMENTS (a) | | PRINCIPAL
AMOUNT
($000) | | | VALUE
($000) | |
| | | | | | | | |
|
Ohio — continued | |
| | |
Ohio State University (The) Rev., VRDO, 0.08%, 9/8/2020 (b) | | | 1,500 | | | | 1,500 | |
| | |
State of Ohio, Parks and Recreation Improvement Series 2020B, Rev., VRDO, 0.08%, 9/8/2020 (b) | | | 13,150 | | | | 13,150 | |
| | |
State of Ohio, University Hospitals Health System, Inc. Series 2018 B, Rev., VRDO, LOC: PNC Bank NA, 0.09%, 9/8/2020 (b) | | | 5,470 | | | | 5,470 | |
| | |
Tender Option Bond Trust Receipts/Certificates | | | | | | | | |
| | |
Series 2019-E132, Rev., VRDO, LOC: Royal Bank of Canada, 0.12%, 9/8/2020 (b) (c) | | | 40,000 | | | | 40,000 | |
| | |
Series 2019-E-134, Rev., VRDO, LOC: Royal Bank of Canada, 0.12%, 9/8/2020 (b) (c) | | | 12,365 | | | | 12,365 | |
| | | | | | | | |
| | |
| | | | | | | 147,650 | |
| | | | | | | | |
|
Oregon — 0.1% | |
| | |
Tender Option Bond Trust Receipts/Certificates Series 2018-ZM0637, VRDO, 0.12%, 9/8/2020 (b) (c) | | | 7,500 | | | | 7,500 | |
| | | | | | | | |
|
Other — 1.0% | |
| | |
FHLMC, Multi-Family Housing | | | | | | | | |
| | |
Series M015, Class A, Rev., VRDO, LIQ: FHLMC, 0.12%, 9/8/2020 (b) (c) | | | 3,245 | | | | 3,245 | |
| | |
Series M019, Class A, Rev., VRDO, LIQ: FHLMC, 0.12%, 9/8/2020 (b) (c) | | | 32,065 | | | | 32,065 | |
| | |
Series M020, Class A, Rev., VRDO, LIQ: FHLMC, 0.12%, 9/8/2020 (b) (c) | | | 8,118 | | | | 8,118 | |
| | |
Series M021, Class A, Rev., VRDO, LIQ: FHLMC, 0.12%, 9/8/2020 (b) (c) | | | 37,970 | | | | 37,970 | |
| | |
Series M025, Class A, Rev., VRDO, LIQ: FHLMC, 0.15%, 9/8/2020 (b) (c) | | | 19,135 | | | | 19,135 | |
| | |
Series M026, Class A, Rev., VRDO, LIQ: FHLMC, 0.15%, 9/8/2020 (b) (c) | | | 10,785 | | | | 10,785 | |
| | |
SunAmerica Taxable Trust, Various States Series A-2, Class A, Rev., VRDO, LOC: FHLMC, 0.14%, 9/8/2020 (b) | | | 690 | | | | 690 | |
| | | | | | | | |
| | |
| | | | | | | 112,008 | |
| | | | | | | | |
|
Pennsylvania — 5.3% | |
| | |
Allegheny County Higher Education Building Authority, Carnegie Mellon University Series 2018A, Rev., VRDO, LIQ: Bank of New York Mellon, 0.02%, 9/1/2020 (b) | | | 3,450 | | | | 3,450 | |
| | |
Bucks County IDA, Grand View Hospital | | | | | | | | |
| | |
Series A, Rev., VRDO, LOC: TD Bank NA, 0.07%, 9/8/2020 (b) | | | 385 | | | | 385 | |
| | |
Series 2008B, Rev., VRDO, LOC: PNC Bank NA, 0.10%, 9/8/2020 (b) | | | 18,100 | | | | 18,100 | |
SEE NOTES TO FINANCIAL STATEMENTS.
| | | | | | | | |
| | | |
| AUGUST 31, 2020 | | J.P. MORGAN MONEY MARKET FUNDS | | | | | 69 | |
JPMorgan Tax Free Money Market Fund
SCHEDULE OF PORTFOLIO INVESTMENTS
AS OF AUGUST 31, 2020 (Unaudited) (continued)
| | | | | | | | |
| INVESTMENTS (a) | | PRINCIPAL
AMOUNT
($000) | | | VALUE
($000) | |
Municipal Bonds — continued | |
|
Pennsylvania — continued | |
| | |
County of Allegheny | | | | | | | | |
| | |
Series C-50, GO, VRDO, LOC: PNC Bank NA, 0.09%, 9/8/2020 (b) | | | 33,775 | | | | 33,775 | |
| | |
Series C-51, GO, VRDO, LOC: PNC Bank NA, 0.09%, 9/8/2020 (b) | | | 12,000 | | | | 12,000 | |
| | |
Fayette County Hospital Authority, Regional Health System Series A, Rev., VRDO, LOC: PNC Bank NA, 0.09%, 9/8/2020 (b) | | | 24,025 | | | | 24,025 | |
| | |
Montgomery County Redevelopment Authority, Multi-Family Housing, Brookside Manors Apartments Project Series 2001A, Rev., VRDO, LOC: FNMA, 0.09%, 9/8/2020 (b) | | | 18,710 | | | | 18,710 | |
| | |
Montgomery County Redevelopment Authority, Multi-Family Housing, Kingswood Apartments Project Series 2001A, Rev., VRDO, LOC: FNMA, 0.15%, 9/8/2020 (b) | | | 17,080 | | | | 17,080 | |
| | |
Pennsylvania Higher Educational Facilities Authority, Susquehanna University Project Series 2001 H9, Rev., VRDO, LOC: PNC Bank NA, 0.09%, 9/8/2020 (b) | | | 2,000 | | | | 2,000 | |
| | |
Pennsylvania Turnpike Commission Series 2nd, Rev., VRDO, LOC: TD Bank NA, 0.07%, 9/8/2020 (b) | | | 25,050 | | | | 25,050 | |
| | |
Philadelphia Gas Works Co., 1998 General Ordinance | | | | | | | | |
| | |
Series B, Rev., VRDO, LOC: TD Bank NA, 0.07%, 9/8/2020 (b) | | | 18,115 | | | | 18,115 | |
| | |
Series E, Rev., VRDO, LOC: TD Bank NA, 0.07%, 9/8/2020 (b) | | | 24,770 | | | | 24,770 | |
| | |
RBC Municipal Products, Inc. Trust, Floater Certificates | | | | | | | | |
| | |
Series E-110, Rev., VRDO, LOC: Royal Bank of Canada, 0.05%, 9/1/2020 (b) (c) | | | 43,700 | | | | 43,700 | |
| | |
Series E-111, Rev., VRDO, LOC: Royal Bank of Canada, 0.05%, 9/1/2020 (b) (c) | | | 121,235 | | | | 121,235 | |
| | |
Series E-101, Rev., VRDO, LOC: Royal Bank of Canada, 0.12%, 9/8/2020 (b) (c) | | | 103,050 | | | | 103,050 | |
| | |
Tender Option Bond Trust Receipts/Certificates | | | | | | | | |
| | |
Series E-111, Rev., VRDO, LOC: Royal Bank of Canada, 0.05%, 9/1/2020 (b) (c) | | | 49,370 | | | | 49,370 | |
| | |
Series 2019-ZF2779, Rev., VRDO, LIQ: Barclays Bank plc, 0.12%, 9/8/2020 (b) (c) | | | 5,070 | | | | 5,070 | |
| | |
Series 2018-XG0201, Rev., VRDO, GTD, LOC: Barclays Bank plc, 0.13%, 9/8/2020 (b) (c) | | | 45,000 | | | | 45,000 | |
| | | | | | | | |
| | |
| | | | | | | 564,885 | |
| | | | | | | | |
| | | | | | | | |
| INVESTMENTS (a) | | PRINCIPAL
AMOUNT
($000) | | | VALUE
($000) | |
| | | | | | | | |
|
Rhode Island — 0.5% | |
| | |
Rhode Island Health and Educational Building Corp., Educational Institution, International Institute of Rhode Island Rev., VRDO, LOC: Bank of America NA, 0.12%, 9/8/2020 (b) | | | 1,300 | | | | 1,300 | |
| | |
Rhode Island Health and Educational Building Corp., Higher Education Facility, Rhode Island School of Design Issue Series 2008 B, Rev., VRDO, LOC: TD Bank NA, 0.09%, 9/8/2020 (b) | | | 27,900 | | | | 27,900 | |
| | |
Rhode Island Housing and Mortgage Finance Corp., Multi-Family Housing, Sutterfield Project Rev., VRDO, AMT, LOC: FHLMC, 0.15%, 9/8/2020 (b) | | | 7,000 | | | | 7,000 | |
| | |
Rhode Island Industrial Facilities Corp., Marine Terminal, Exxonmobil Project Rev., VRDO, 0.03%, 9/1/2020 (b) | | | 450 | | | | 450 | |
| | |
Tender Option Bond Trust Receipts/Certificates Series 2018-XF2559, Rev., VRDO, LIQ: Citibank NA, 0.12%, 9/8/2020 (b) (c) | | | 9,000 | | | | 9,000 | |
| | | | | | | | |
| | |
| | | | | | | 45,650 | |
| | | | | | | | |
|
South Carolina — 2.3% | |
| | |
County of Richland GO, BAN, 3.00%, 2/25/2021 | | | 83,800 | | | | 84,632 | |
| | |
County Square Redevelopment Corp., Installment Purchase Rev., BAN, 2.00%, 3/24/2021 | | | 13,500 | | | | 13,597 | |
| | |
South Carolina Association of Governmental Organizations Series 2020A, COP, SCSDE, 1.50%, 3/1/2021 | | | 64,610 | | | | 64,829 | |
| | |
South Carolina Public Service Authority Series 2019A, Rev., VRDO, LOC: Bank of America NA, 0.20%, 9/8/2020 (b) | | | 39,950 | | | | 39,950 | |
| | |
South Carolina State Housing Finance and Development Authority, Multi-Family, Rental Housing, Rocky Creek Apartments Projects Rev., VRDO, LOC: Wells Fargo Bank NA, 0.12%, 9/8/2020 (b) | | | 5,275 | | | | 5,275 | |
| | |
Tender Option Bond Trust Receipts/Certificates Series 2019-BAML5004, Rev., VRDO, LOC: Bank of America NA, 0.14%, 9/8/2020 (b) (c) | | | 47,735 | | | | 47,735 | |
| | | | | | | | |
| | |
| | | | | | | 256,018 | |
| | | | | | | | |
|
South Dakota — 0.1% | |
| | |
South Dakota Housing Development Authority Series 2020B, Rev., VRDO, 0.08%, 9/8/2020 (b) | | | 5,800 | | | | 5,800 | |
| | | | | | | | |
SEE NOTES TO FINANCIAL STATEMENTS.
| | | | | | |
| | | |
| 70 | | | | J.P. MORGAN MONEY MARKET FUNDS | | AUGUST 31, 2020 |
| | | | | | | | |
| INVESTMENTS (a) | | PRINCIPAL
AMOUNT
($000) | | | VALUE
($000) | |
Municipal Bonds — continued | |
|
Tennessee — 0.5% | |
| | |
Clarksville Public Building Authority, Pooled Financing, Tennessee Municipal Bond Fund Rev., VRDO, LOC: Bank of America NA, 0.06%, 9/1/2020 (b) | | | 7,555 | | | | 7,555 | |
| | |
Metropolitan Government Nashville & Davidson County Health and Educational Facilities Board, Multi-Family Housing, Arbor Crest Rev., VRDO, LOC: FNMA, 0.09%, 9/8/2020 (b) | | | 12,750 | | | | 12,750 | |
| | |
Metropolitan Government Nashville & Davidson County Health and Educational Facilities Board, Multi-Family Housing, Arbor Knoll Series A, Rev., VRDO, LOC: FNMA, 0.09%, 9/8/2020 (b) | | | 13,400 | | | | 13,400 | |
| | |
Montgomery County Public Building Authority, Pooled Financing Series 2006, Rev., VRDO, LOC: Bank of America NA, 0.06%, 9/1/2020 (b) | | | 9,090 | | | | 9,090 | |
| | |
Tender Option Bond Trust Receipts/Certificates Series 2018-XF2576, Rev., VRDO, LOC: Barclays Bank plc, 0.13%, 9/8/2020 (b) (c) | | | 15,390 | | | | 15,390 | |
| | | | | | | | |
| | |
| | | | | | | 58,185 | |
| | | | | | | | |
|
Texas — 3.9% | |
| | |
Bexar County Housing Finance Authority, Multi-Family Housing, Altamonte Apartment Projects Rev., VRDO, LOC: FNMA, 0.11%, 9/8/2020 (b) | | | 9,400 | | | | 9,400 | |
| | |
City of Austin, Texas Hotel Occupancy Tax, Subordinate Lien Subseries A, Rev., VRDO, LOC: Citibank NA, 0.09%, 9/8/2020 (b) | | | 16,340 | | | | 16,340 | |
| | |
City of Houston, Airport System Subordinate Lien Rev., VRDO, LOC: Barclays Bank plc, 0.10%, 9/8/2020 (b) | | | 42,550 | | | | 42,550 | |
| | |
Gulf Coast Authority, Exxonmobil Project Rev., VRDO, 0.05%, 9/1/2020 (b) | | | 5,900 | | | | 5,900 | |
| | |
Gulf Coast Waste Disposal Authority, Environmental Facilities, American Acryl LP Project Series 2003, Rev., VRDO, AMT, LOC: Bank of Tokyo-Mitsubishi UFJ Ltd., 0.12%, 9/8/2020 (b) | | | 12,000 | | | | 12,000 | |
| | |
Gulf Coast Waste Disposal Authority, Environmental Facilities, Exxonmobil Project | | | | | | | | |
| | |
Rev., VRDO, 0.05%, 9/1/2020 (b) | | | 3,700 | | | | 3,700 | |
| | |
Series B, Rev., VRDO, 0.06%, 9/1/2020 (b) | | | 1,300 | | | | 1,300 | |
| | |
Harris County Cultural Education Facilities Finance Corp., Memorial Hermann Health System | | | | | | | | |
| | |
Series 2014D, Rev., VRDO, 0.10%, 9/8/2020 (b) | | | 35,200 | | | | 35,200 | |
| | | | | | | | |
| INVESTMENTS (a) | | PRINCIPAL
AMOUNT
($000) | | | VALUE
($000) | |
| | | | | | | | |
|
Texas — continued | |
| | |
Series 2019F, Rev., VRDO, 0.10%, 9/8/2020 (b) | | | 48,300 | | | | 48,300 | |
| | |
Harris County Housing Finance Corp., Multi-Family Housing, Baypointe Apartments Series 2006, Rev., VRDO, LOC: Citibank NA, 0.13%, 9/8/2020 (b) | | | 10,480 | | | | 10,480 | |
| | |
Harris County Industrial Development Corp., Exxonmobil Project Rev., VRDO, 0.05%, 9/1/2020 (b) | | | 11,000 | | | | 11,000 | |
| | |
Lower Neches Valley Authority Industrial Development Corp., Exxonmobil Project | | | | | | | | |
| | |
Series 2001A-2, Rev., VRDO, 0.03%, 9/1/2020 (b) | | | 2,565 | | | | 2,565 | |
| | |
Series 2002B, Rev., VRDO, 0.03%, 9/1/2020 (b) | | | 42,650 | | | | 42,650 | |
| | |
Series 2012, Rev., VRDO, 0.03%, 9/1/2020 (b) | | | 7,450 | | | | 7,450 | |
| | |
Series A-3, Rev., VRDO, 0.03%, 9/1/2020 (b) | | | 100 | | | | 100 | |
| | |
Subseries B-4, Rev., VRDO, 0.05%, 9/1/2020 (b) | | | 5,000 | | | | 5,000 | |
| | |
Subseries B-2, Rev., VRDO, 0.06%, 9/1/2020 (b) | | | 1,550 | | | | 1,550 | |
| | |
Port of Port Arthur Navigation District, Pollution Control Rev., VRDO, 0.03%, 9/1/2020 (b) | | | 5,500 | | | | 5,500 | |
| | |
RBC Municipal Products, Inc. Trust Series E141, Rev., VRDO, LOC: Royal Bank of Canada, 0.12%, 9/8/2020 (b) (c) | | | 25,000 | | | | 25,000 | |
| | |
RBC Municipal Products, Inc. Trust, Floater Certificates | | | | | | | | |
| | |
Series G-20, GO, VRDO, LOC: Royal Bank of Canada, 0.12%, 9/8/2020 (b) (c) | | | 10,000 | | | | 10,000 | |
| | |
Series G-34, GO, VRDO, PSF-GTD, LOC: Royal Bank of Canada, 0.12%, 9/8/2020 (b) (c) | | | 5,400 | | | | 5,400 | |
| | |
State of Texas, Veterans Housing Assistance Program | | | | | | | | |
| | |
Series 2001-C2, GO, VRDO, LIQ: State Street Bank & Trust, 0.14%, 9/8/2020 (b) | | | 780 | | | | 780 | |
| | |
Series 2007A, GO, VRDO, AMT, LIQ: State Street Bank & Trust, 0.14%, 9/8/2020 (b) | | | 225 | | | | 225 | |
| | |
Tarrant County Cultural Education Facilities Finance Corp., Baylor Health Care System Project Series 2011C, Rev., VRDO, LOC: TD Bank NA, 0.02%, 9/1/2020 (b) | | | 2,550 | | | | 2,550 | |
| | |
Tarrant County Cultural Education Facilities Finance Corp., Texas Health Resources System | | | | | | | | |
| | |
Series 2008 A, Rev., VRDO, 0.10%, 9/8/2020 (b) | | | 17,125 | | | | 17,125 | |
SEE NOTES TO FINANCIAL STATEMENTS.
| | | | | | | | |
| | | |
| AUGUST 31, 2020 | | J.P. MORGAN MONEY MARKET FUNDS | | | | | 71 | |
JPMorgan Tax Free Money Market Fund
SCHEDULE OF PORTFOLIO INVESTMENTS
AS OF AUGUST 31, 2020 (Unaudited) (continued)
| | | | | | | | |
| INVESTMENTS (a) | | PRINCIPAL
AMOUNT
($000) | | | VALUE
($000) | |
Municipal Bonds — continued | |
|
Texas — continued | |
| | |
Series 2012 B, Rev., VRDO, 0.10%, 9/8/2020 (b) | | | 24,000 | | | | 24,000 | |
| | |
Tender Option Bond Trust Receipts/Certificates | | | | | | | | |
| | |
Series 2018-G-84, GO, VRDO, PSF-GTD, LOC: Royal Bank of Canada, 0.12%, 9/8/2020 (b) (c) | | | 7,125 | | | | 7,125 | |
| | |
Series 2018-G-85, GO, VRDO, PSF-GTD, LOC: Royal Bank of Canada, 0.12%, 9/8/2020 (b) (c) | | | 6,175 | | | | 6,175 | |
| | |
Series 2018-XG0193, Rev., VRDO, GNMA COLL, LIQ: Royal Bank of Canada, 0.12%, 9/8/2020 (b) (c) | | | 4,000 | | | | 4,000 | |
| | |
Series G-21, GO, VRDO, LOC: Royal Bank of Canada, 0.12%, 9/8/2020 (b) (c) | | | 5,000 | | | | 5,000 | |
| | |
Texas Department of Housing and Community Affairs, Single Family Mortgage Series 2004 D, Rev., VRDO, AMT, GNMA/FNMA/FHLMC, LIQ: Texas State Comptroller of Public Accounts, 0.13%, 9/8/2020 (b) | | | 11,065 | | | | 11,065 | |
| | |
Texas Transportation Commission, State Highway Fund, First Tier Series 2014-B1, Rev., VRDO, LIQ: Sumitomo Mitsui Banking Corp., 0.09%, 9/8/2020 (b) | | | 46,660 | | | | 46,660 | |
| | | | | | | | |
| | |
| | | | | | | 426,090 | |
| | | | | | | | |
|
Utah — 0.7% | |
| | |
Central Utah Water Conservancy District, Limited Tax Series 2008A, Rev., VRDO, LIQ: Landesbank Hessen-Thueringen, 0.12%, 9/8/2020 (b) | | | 20,800 | | | | 20,800 | |
| | |
County of Utah Hospital, IHC Health Services, Inc. | | | | | | | | |
| | |
Series 2018C, Rev., VRDO, LIQ: TD Bank NA, 0.02%, 9/1/2020 (b) | | | 24,710 | | | | 24,710 | |
| | |
Series 2002B, Rev., VRDO, LIQ: U.S. Bank NA, 0.09%, 9/8/2020 (b) | | | 8,725 | | | | 8,725 | |
| | |
County of Weber, IHC Health Services, Inc. Series 2000B, Rev., VRDO, LIQ: U.S. Bank NA, 0.09%, 9/8/2020 (b) | | | 2,340 | | | | 2,340 | |
| | |
Utah Water Finance Agency Series B-2, Rev., VRDO, LIQ: Landesbank Hessen- Thueringen, 0.12%, 9/8/2020 (b) | | | 25,000 | | | | 25,000 | |
| | | | | | | | |
| | |
| | | | | | | 81,575 | |
| | | | | | | | |
|
Virginia — 1.6% | |
| | |
Albermarle County Economic Development Authority, Sentara Martha Jefferson Hospital Series 2018B, Rev., VRDO, LIQ: TD Bank NA, 0.03%, 9/1/2020 (b) | | | 7,220 | | | | 7,220 | |
| | | | | | | | |
| INVESTMENTS (a) | | PRINCIPAL
AMOUNT
($000) | | | VALUE
($000) | |
| | | | | | | | |
|
Virginia — continued | |
| | |
Albermarle County Economic Development Authority, Virginia Hospital Facilities, Sentara Martha Jefferson Hospital Series 2018B, Rev., VRDO, LIQ: TD Bank NA, 0.09%, 9/8/2020 (b) | | | 15,505 | | | | 15,505 | |
| | |
Loudoun County Economic Development Authority, Howard Hughes Medical Institute Series 2003B, Rev., VRDO, 0.09%, 9/8/2020 (b) | | | 5,695 | | | | 5,695 | |
| | |
Roanoke Economic Development Authority, Carilion Clinic Obligated Group Series 2020B, Rev., VRDO, LIQ: PNC Bank NA, 0.10%, 9/8/2020 (b) | | | 33,890 | | | | 33,890 | |
| | |
Roanoke Economic Development Authority, Health System Series 2005A, Rev., VRDO, LIQ: PNC Bank NA, 0.10%, 9/8/2020 (b) | | | 40,000 | | | | 40,000 | |
| | |
Tender Option Bond Trust Receipts/Certificates | | | | | | | | |
| | |
Series 2018-XL0069, Rev., VRDO, LIQ: Barclays Bank plc, 0.12%, 9/8/2020 (b) (c) | | | 8,170 | | | | 8,170 | |
| | |
Series 2018-ZF2713, Rev., VRDO, LIQ: Morgan Stanley Bank, 0.12%, 9/8/2020 (b) (c) | | | 5,000 | | | | 5,000 | |
| | |
Series 2018-ZF2714, Rev., VRDO, LIQ: Morgan Stanley Bank, 0.12%, 9/8/2020 (b) (c) | | | 7,000 | | | | 7,000 | |
| | |
Series 2018-XF0606, Rev., VRDO, LIQ: Bank of America NA, 0.13%, 9/8/2020 (b) (c) | | | 8,500 | | | | 8,500 | |
| | |
Series 2018-ZM0583, Rev., VRDO, LIQ: Bank of America NA, 0.13%, 9/8/2020 (b) (c) | | | 5,415 | | | | 5,415 | |
| | |
Virginia Small Business Financing Authority, Carilion Clinic Obligated Group Series 2008 B, Rev., VRDO, LOC: Wells Fargo Bank NA, 0.07%, 9/8/2020 (b) | | | 34,110 | | | | 34,110 | |
| | | | | | | | |
| | |
| | | | | | | 170,505 | |
| | | | | | | | |
|
Washington — 1.1% | |
| | |
Chelan County Public Utility District No.1 Series 2008B, Rev., VRDO, LIQ: Barclays Bank plc, 0.09%, 9/8/2020 (b) | | | 11,395 | | | | 11,395 | |
| | |
Port of Seattle, Subordinate Lien Series 1997, Rev., VRDO, LOC: Bank of America NA, 0.15%, 9/8/2020 (b) | | | 28,280 | | | | 28,280 | |
| | |
Port of Tacoma, Subordinate Lien | | | | | | | | |
| | |
Rev., VRDO, AMT, LOC: PNC Bank NA, 0.12%, 9/8/2020 (b) | | | 28,300 | | | | 28,300 | |
| | |
Series 2019A, Rev., VRDO, AMT, LOC: PNC Bank NA, 0.12%, 9/8/2020 (b) | | | 10,950 | | | | 10,950 | |
SEE NOTES TO FINANCIAL STATEMENTS.
| | | | | | |
| | | |
| 72 | | | | J.P. MORGAN MONEY MARKET FUNDS | | AUGUST 31, 2020 |
| | | | | | | | |
| INVESTMENTS (a) | | PRINCIPAL
AMOUNT
($000) | | | VALUE
($000) | |
Municipal Bonds — continued | |
|
Washington — continued | |
| | |
Tender Option Bond Trust Receipts/Certificates | | | | | | | | |
| | |
Series 2018-XF2718, Rev., VRDO, LIQ: Morgan Stanley Bank, 0.12%, 9/8/2020 (b) (c) | | | 8,800 | | | | 8,800 | |
| | |
Series 2018-ZF2682, Rev., VRDO, GTD, LIQ: Morgan Stanley Bank, 0.12%, 9/8/2020 (b) (c) | | | 7,000 | | | | 7,000 | |
| | |
Washington State Housing Finance Commission, Multi-Family Housing, Seasons Apartments Project Rev., VRDO, AMT, LOC: FNMA, 0.13%, 9/8/2020 (b) | | | 12,835 | | | | 12,835 | |
| | | | | | | | |
| | |
| | | | | | | 107,560 | |
| | | | | | | | |
|
West Virginia — 0.2% | |
| | |
West Virginia Hospital Finance Authority, United Health System Series 2018 D, Rev., VRDO, LOC: PNC Bank NA, 0.09%, 9/8/2020 (b) | | | 8,020 | | | | 8,020 | |
| | |
West Virginia Hospital Finance Authority, University Health System Series 2018 C, Rev., VRDO, LOC: TD Bank NA, 0.08%, 9/8/2020 (b) | | | 11,275 | | | | 11,275 | |
| | | | | | | | |
| | |
| | | | | | | 19,295 | |
| | | | | | | | |
|
Wisconsin — 0.8% | |
| | |
Green Bay Redevelopment Authority, Greenbay Packing Rev., VRDO, AMT, LOC: Wells Fargo Bank NA, 0.14%, 9/8/2020 (b) (c) | | | 40,000 | | | | 40,000 | |
| | |
Wisconsin Housing and Economic Development Authority Series 2007 F, Rev., VRDO, AMT, LOC: Bank of America NA, 0.14%, 9/8/2020 (b) | | | 9,035 | | | | 9,035 | |
| | |
Wisconsin Housing and Economic Development Authority, Home Ownership | | | | | | | | |
| | |
Series 2019 B, Rev., VRDO, FNMA COLL, LIQ: FHLB, 0.09%, 9/8/2020 (b) | | | 8,000 | | | | 8,000 | |
| | |
Series C, Rev., VRDO, AMT, LIQ: Royal Bank of Canada, 0.09%, 9/8/2020 (b) | | | 20,900 | | | | 20,900 | |
| | | | | | | | |
| | |
| | | | | | | 77,935 | |
| | | | | | | | |
|
Wyoming — 1.1% | |
| | |
County of Lincoln, Wyoming Pollution Control, ExxonMobile Project Series 2014, Rev., VRDO, AMT, 0.05%, 9/1/2020 (b) | | | 30,000 | | | | 30,000 | |
| | |
County of Sublette, Wyoming Pollution Control, Exxonmobile Project | | | | | | | | |
| | |
Rev., VRDO, 0.03%, 9/1/2020 (b) | | | 5,000 | | | | 5,000 | |
| | |
Rev., VRDO, AMT, 0.05%, 9/1/2020 (b) | | | 16,650 | | | | 16,650 | |
| | |
County of Uinta, Pollution Control, Chevron USA, Inc. Project Rev., VRDO, 0.03%, 9/1/2020 (b) | | | 6,000 | | | | 6,000 | |
| | | | | | | | |
| INVESTMENTS (a) | | PRINCIPAL
AMOUNT
($000) | | | VALUE
($000) | |
| | | | | | | | |
|
Wyoming — continued | |
| | |
Wyoming Community Development Authority | | | | | | | | |
| | |
Rev., VRDO, LIQ: RBC Capital Markets, 0.09%, 9/8/2020 (b) | | | 9,000 | | | | 9,000 | |
| | |
Rev., VRDO, LIQ: Royal Bank of Canada, 0.09%, 9/8/2020 (b) | | | 9,750 | | | | 9,750 | |
| | |
Series 2019-4, Rev., VRDO, LIQ: Bank of America NA, 0.09%, 9/8/2020 (b) | | | 10,000 | | | | 10,000 | |
| | |
Wyoming Community Development Authority, Composite Reoffering Housing | | | | | | | | |
| | |
Rev., VRDO, AMT, LIQ: FHLB, 0.12%, 9/8/2020 (b) | | | 6,700 | | | | 6,700 | |
| | |
Rev., VRDO, AMT, LIQ: FHLB, 0.12%, 9/8/2020 (b) | | | 6,210 | | | | 6,210 | |
| | |
Series 2007-11, Rev., VRDO, AMT, LIQ: FHLB, 0.12%, 9/8/2020 (b) | | | 5,875 | | | | 5,875 | |
| | | | | | | | |
| | |
| | | | | | | 105,185 | |
| | | | | | | | |
| |
Total Municipal Bonds
(Cost $8,204,461) | | | | 8,204,461 | |
| | | | | |
| | |
| | | SHARES
(000) | | | | |
Variable Rate Demand Preferred Shares — 10.7% | |
|
California — 2.4% | |
| | |
Nuveen California AMT-Free Quality Municipal Income Fund Series 6, LIQ: Sumitomo Mitsui Banking Corp., 0.09%, 9/8/2020 # (c) | | | 1,500 | | | | 1,500 | |
| | |
Nuveen California Quality Municipal Income Fund | | | | | | | | |
| | |
Series 3, LIQ: TD Bank NA, 0.15%, 9/8/2020 # (c) | | | 26,800 | | | | 26,800 | |
| | |
Series 2, LIQ: Citi Bank NA, 0.16%, 9/8/2020 # (c) | | | 27,500 | | | | 27,500 | |
| | |
Series 6, LIQ: Citi Bank NA, 0.16%, 9/8/2020 # (c) | | | 67,600 | | | | 67,600 | |
| | |
Series 4, LIQ: Royal Bank of Canada, 0.17%, 9/8/2020 # (c) | | | 58,500 | | | | 58,500 | |
| | |
Series 7, LIQ: Royal Bank of Canada, 0.17%, 9/8/2020 # (c) | | | 21,000 | | | | 21,000 | |
| | |
Series 1-1362, LIQ: Societe Generale, 0.21%, 9/8/2020 # (c) | | | 59,200 | | | | 59,200 | |
| | | | | | | | |
| | |
| | | | | | | 262,100 | |
| | | | | | | | |
|
New York — 0.6% | |
| | |
Nuveen New York AMT-Free Quality Municipal Income Fund | | | | | | | | |
| | |
Series 1, LIQ: Citi Bank NA, 0.12%, 9/8/2020 # (c) | | | 18,600 | | | | 18,600 | |
| | |
Series 5, LIQ: TD Bank NA, 0.12%, 9/8/2020 # (c) | | | 40,000 | | | | 40,000 | |
| | | | | | | | |
| | |
| | | | | | | 58,600 | |
| | | | | | | | |
SEE NOTES TO FINANCIAL STATEMENTS.
| | | | | | | | |
| | | |
| AUGUST 31, 2020 | | J.P. MORGAN MONEY MARKET FUNDS | | | | | 73 | |
JPMorgan Tax Free Money Market Fund
SCHEDULE OF PORTFOLIO INVESTMENTS
AS OF AUGUST 31, 2020 (Unaudited) (continued)
| | | | | | | | |
| INVESTMENTS (a) | | SHARES
(000) | | | VALUE
($000) | |
Variable Rate Demand Preferred Shares — continued | |
|
Other — 7.7% | |
| | |
BlackRock MuniYield Investment Fund LIQ: TD Bank NA, 0.18%, 9/8/2020 # (b) (c) | | | 27,400 | | | | 27,400 | |
| | |
Nuveen AMT-Free Municipal Credit Income Fund | | | | | | | | |
| | |
Series 1, LIQ: Citi Bank NA, 0.14%, 9/8/2020 # (c) | | | 24,000 | | | | 24,000 | |
| | |
Series 5, LIQ: Societe Generale, 0.14%, 9/8/2020 # (c) | | | 127,000 | | | | 127,000 | |
| | |
Series 6, LIQ: Sumitomo Mitsui Banking Corp., 0.14%, 9/8/2020 # (c) | | | 124,300 | | | | 124,300 | |
| | |
Nuveen AMT-Free Quality Municipal Income Fund | | | | | | | | |
| | |
Series 2-1309, LIQ: Citi Bank NA, 0.14%, 9/8/2020 # (c) | | | 92,000 | | | | 92,000 | |
| | |
Series 3, LIQ: TD Bank NA, 0.14%, 9/8/2020 # (c) | | | 173,500 | | | | 173,500 | |
| | |
Series 4 - 4895, LIQ: Barclays Bank plc, 0.14%, 9/8/2020 # (c) | | | 28,600 | | | | 28,600 | |
| | |
Series 5-1000, LOC: Sumitomo Mitsui Banking Corp., 0.14%, 9/8/2020 # (c) | | | 25,000 | | | | 25,000 | |
| | |
Nuveen Quality Municipal Income Fund | | | | | | | | |
| | |
Series 1-2118, LIQ: Barclays Bank plc, 0.18%, 9/8/2020 # (c) | | | 51,600 | | | | 51,600 | |
| | |
Series 2-2525, LIQ: Barclays Bank plc, 0.18%, 9/8/2020 # (b) (c) | | | 151,900 | | | | 151,900 | |
| | | | | | | | |
| | |
| | | | | | | 825,300 | |
| | | | | | | | |
| |
Total Variable Rate Demand Preferred Shares
(Cost $1,146,000) | | | | 1,146,000 | |
| | | | | |
| | |
| | | PRINCIPAL
AMOUNT
($000) | | | | |
Repurchase Agreements — 2.0% | |
| | |
Citigroup Global Markets Holdings, Inc., 0.07%, dated 8/31/2020, due 9/1/2020, repurchase price $215,110, collateralized by U.S. Treasury Securities, 0.38% - 6.50%, due 1/31/2021 - 1/15/2027, with a value of $219,412.
(Cost $215,110) | | | 215,110 | | | | 215,110 | |
| | | | | | | | |
Short-Term Investments — 11.8% | |
|
Commercial Paper — 11.8% | |
| | |
Alachua County Health Facilities Authority Series 08-A, 0.18%, 10/8/2020 | | | 26,240 | | | | 26,240 | |
| | |
Board of Regents of the University of Texas System | | | | | | | | |
| | |
Series A, 1.20%, 9/10/2020 | | | 20,000 | | | | 20,000 | |
| | |
Series A, 0.28%, 11/6/2020 | | | 25,000 | | | | 25,000 | |
| | |
Series A, 0.24%, 2/1/2021 | | | 25,000 | | | | 25,000 | |
| | |
Series A, 0.23%, 2/2/2021 | | | 20,000 | | | | 20,000 | |
| | | | | | | | |
| INVESTMENTS (a) | | PRINCIPAL
AMOUNT
($000) | | | VALUE
($000) | |
| | | | | | | | |
|
Commercial Paper — continued | |
| | |
Series A, 0.50%, 2/11/2021 | | | 25,000 | | | | 25,000 | |
| | |
Series A, 0.45%, 2/18/2021 | | | 12,000 | | | | 12,000 | |
| | |
Series A, 0.40%, 2/22/2021 | | | 20,000 | | | | 20,000 | |
| | |
California Statewide Communities Development Authority | | | | | | | | |
| | |
0.50%, 9/9/2020 | | | 50,000 | | | | 50,000 | |
| | |
0.50%, 9/9/2020 | | | 15,000 | | | | 15,000 | |
| | |
Series 08-B, 0.50%, 9/10/2020 | | | 10,000 | | | | 10,000 | |
| | |
Series 9B-4, 0.24%, 2/2/2021 | | | 20,000 | | | | 20,000 | |
| | |
City of Garland 0.23%, 9/14/2020 | | | 14,000 | | | | 14,000 | |
| | |
City of Jacksonville, Health Care Authority 0.23%, 2/4/2021 | | | 115,000 | | | | 115,000 | |
| | |
City of Rochester, Health Care Facilities | | | | | | | | |
| | |
Series 08-C, 0.18%, 10/8/2020 | | | 88,000 | | | | 88,000 | |
| | |
0.21%, 1/6/2021 | | | 25,000 | | | | 25,000 | |
| | |
0.23%, 2/4/2021 | | | 50,000 | | | | 50,000 | |
| | |
City of San Antonio, Electric and Gas System Series C, 0.89%, 9/8/2020 | | | 10,000 | | | | 10,000 | |
| | |
County of Harris, Toll Road Authority (The) | | | | | | | | |
| | |
Series E-1, 0.25%, 9/17/2020 | | | 51,975 | | | | 51,975 | |
| | |
Series E-2, 0.21%, 11/5/2020 | | | 25,245 | | | | 25,245 | |
| | |
County of York Series 00B3, 0.22%, 9/1/2020 | | | 16,275 | | | | 16,275 | |
| | |
County of York, National Rural Utilities Cooperative Finance Corp. | | | | | | | | |
| | |
Series 00B1, 0.22%, 9/1/2020 | | | 35,000 | | | | 35,000 | |
| | |
Series OOB2, 0.22%, 9/1/2020 | | | 25,000 | | | | 25,000 | |
| | |
Health and Educational Facilities Authority of the State of Missouri | | | | | | | | |
| | |
Series 14-D, 0.49%, 9/10/2020 | | | 50,000 | | | | 50,000 | |
| | |
Series 14-E, 0.49%, 9/10/2020 | | | 50,000 | | | | 50,000 | |
| | |
Series 14-C, 0.25%, 10/8/2020 | | | 50,000 | | | | 50,000 | |
| | |
Series 14-B, 0.18%, 11/3/2020 | | | 50,000 | | | | 50,000 | |
| | |
Illinois Finance Authority | | | | | | | | |
| | |
Series 12-H, 0.17%, 9/10/2020 | | | 25,600 | | | | 25,600 | |
| | |
Series 12-I, 0.26%, 9/10/2020 | | | 28,760 | | | | 28,760 | |
| | |
Indiana Finance Authority Series D-2, 0.21%, 1/5/2021 | | | 70,000 | | | | 70,000 | |
| | |
Maryland Health and Higher Educational Facilities Authority Series B, 0.16%, 10/7/2020 | | | 20,760 | | | | 20,760 | |
| | |
Michigan State Building Authority Series 7, 0.18%, 9/30/2020 | | | 67,000 | | | | 67,000 | |
| | |
Southwestern Illinois Development Authority, Health Facilities | | | | | | | | |
| | |
Series 17-B, 0.26%, 10/5/2020 | | | 45,000 | | | | 45,000 | |
| | |
Series 17-B, 0.19%, 10/16/2020 | | | 10,000 | | | | 10,000 | |
SEE NOTES TO FINANCIAL STATEMENTS.
| | | | | | |
| | | |
| 74 | | | | J.P. MORGAN MONEY MARKET FUNDS | | AUGUST 31, 2020 |
| | | | | | | | |
| INVESTMENTS (a) | | PRINCIPAL
AMOUNT
($000) | | | VALUE
($000) | |
Short-Term Investments — continued | |
|
Commercial Paper — continued | |
| | |
State of Wisconsin | | | | | | | | |
| | |
Series 06-A, 0.18%, 12/4/2020 | | | 19,574 | | | | 19,574 | |
| | |
Series 13-A, 0.18%, 12/4/2020 | | | 29,415 | | | | 29,415 | |
| | |
Series 16-A, 0.18%, 12/4/2020 | | | 24,515 | | | | 24,515 | |
| | | | | | | | |
| |
Total Commercial Paper
(Cost $1,264,359) | | | | 1,264,359 | |
| | | | | |
| |
Total Short-Term Investments
(Cost $1,264,359) | | | | 1,264,359 | |
| | | | | |
Total Investments — 100.8%
(Cost $10,829,930)* | | | | 10,829,930 | |
Liabilities in Excess of
Other Assets — (0.8)% | | | | (89,188 | ) |
| | | | | |
Net Assets — 100.0% | | | | 10,740,742 | |
| | | | | |
Percentages indicated are based on net assets.
Abbreviations
| | |
| AGM | | Insured by Assured Guaranty Municipal Corp. |
| AMBAC | | Insured by American Municipal Bond Assurance Corp. |
| AMT | | Alternative Minimum Tax |
| BAN | | Bond Anticipation Note |
| COLL | | Collateral |
| CONS | | Consolidated Bonds |
| COP | | Certificate of Participation |
| FHLB | | Federal Home Loan Bank |
| FHLMC | | Federal Home Loan Mortgage Corp. |
| FNMA | | Federal National Mortgage Association |
| GNMA | | Government National Mortgage Association |
| GO | | General Obligation |
| GTD | | Guaranteed |
| IDA | | Industrial Development Authority |
| LIQ | | Liquidity Agreement |
| LOC | | Letter of Credit |
| MTA | | Metropolitan Transportation Authority |
| NATL | | Insured by National Public Finance Guarantee Corp. |
| PCR | | Pollution Control Revenue |
| PSF-GTD | | Permanent School Fund Guaranteed |
| | |
| RAN | | Revenue Anticipation Note |
| RE | | Reinsured |
| Rev. | | Revenue |
| SCSDE | | South Carolina School District Enhancement |
| TAN | | Tax Anticipation Note |
| VRDO | | Variable Rate Demand Obligation |
| |
| (a) | | The date shown represents the earliest of the next put date, next demand date or final maturity date. |
| (b) | | Variable or floating rate security, the interest rate of which adjusts periodically based on changes in current interest rates and prepayments on the underlying pool of assets. The interest rate shown is the current rate as of August 31, 2020. |
| (c) | | Securities exempt from registration under Rule 144A or section 4(a)(2), of the Securities Act of 1933, as amended. |
| # | | Variable Rate Demand Preferred Shares of a closed-end investment company which has a weekly demand feature. The interest rate shown is the rate in effect as of August 31, 2020. |
| * | | The cost of securities is substantially the same for federal income tax purposes. |
SEE NOTES TO FINANCIAL STATEMENTS.
| | | | | | | | |
| | | |
| AUGUST 31, 2020 | | J.P. MORGAN MONEY MARKET FUNDS | | | | | 75 | |
JPMorgan Municipal Money Market Fund
SCHEDULE OF PORTFOLIO INVESTMENTS
AS OF AUGUST 31, 2020 (Unaudited)
| | | | | | | | |
| INVESTMENTS (a) | | PRINCIPAL
AMOUNT
($000) | | | VALUE
($000) | |
Municipal Bonds — 81.5% | |
|
Alabama — 0.6% | |
| | |
Alabama Housing Finance Authority, Multi-Family Housing, Alison Apartments Project Series 2007-B, Rev., VRDO, LOC: U.S. Bank NA, 0.12%, 9/8/2020 (b) | | | 7,855 | | | | 7,855 | |
| | | | | | | | |
|
California — 0.7% | |
| | |
California Health Facilities Financing Authority, Health Facility, Catholic Healthcare West Loan Program Series 2015-I, Rev., VRDO, LOC: Mizuho Bank Ltd., 0.10%, 9/8/2020 (b) | | | 5,000 | | | | 5,000 | |
| | |
Los Angeles Department of Water and Power, Power System Series 2019A-2, Rev., VRDO, LIQ: TD Bank NA, 0.02%, 9/1/2020 (b) | | | 3,050 | | | | 3,050 | |
| | | | | | | | |
| | |
| | | | | | | 8,050 | |
| | | | | | | | |
|
Colorado — 4.5% | |
| | |
County of Arapahoe, Multi-Family Rental Housing, Hunter’s Run Rev., VRDO, LOC: FHLMC, 0.12%, 9/8/2020 (b) | | | 330 | | | | 330 | |
| | |
RBC Municipal Products, Inc. Trust Series 2019-G114, Rev., VRDO, LOC: Royal Bank of Canada, 0.34%, 9/8/2020 (b) (c) | | | 3,000 | | | | 3,000 | |
| | |
Tender Option Bond Trust Receipts/Certificates | | | | | | | | |
| | |
Series 2016-ZF0467, Rev., VRDO, LOC: Royal Bank of Canada, 0.17%, 9/8/2020 (b) (c) | | | 35,195 | | | | 35,195 | |
| | |
Series 2018-XG0197, Rev., VRDO, LOC: Bank of America NA, 0.17%, 9/8/2020 (b) (c) | | | 3,250 | | | | 3,250 | |
| | |
Series 2019-XF0757, Rev., VRDO, LOC: Bank of America NA, 0.17%, 9/8/2020 (b) (c) | | | 2,895 | | | | 2,895 | |
| | |
The Regents of the University of Colorado, Enterprise System Series 2020A-1, Rev., VRDO, LIQ: TD Bank NA, 0.09%, 9/8/2020 (b) | | | 11,400 | | | | 11,400 | |
| | | | | | | | |
| | |
| | | | | | | 56,070 | |
| | | | | | | | |
|
Connecticut — 0.6% | |
| | |
Town of Oxford GO, BAN, 2.50%, 1/15/2021 | | | 6,900 | | | | 6,930 | |
| | | | | | | | |
|
District of Columbia — 0.8% | |
| | |
Metropolitan Washington Airports Authority, Airport System Series 2010D, Rev., VRDO, AMT, LOC: Barclays Bank plc, 0.11%, 9/8/2020 (b) | | | 10,000 | | | | 10,000 | |
| | | | | | | | |
|
Florida — 8.5% | |
| | |
Alachua County Housing Finance Authority, Multi-Family, Santa Fe Apartments Rev., VRDO, LOC: Citibank NA, 0.14%, 9/8/2020 (b) | | | 3,130 | | | | 3,130 | |
| | |
Collier County Housing Finance Authority, Multi-Family Housing-Sawgrass Pines Apartments Rev., VRDO, LOC: FNMA, 0.13%, 9/8/2020 (b) | | | 5,800 | | | | 5,800 | |
| | | | | | | | |
| INVESTMENTS (a) | | PRINCIPAL
AMOUNT
($000) | | | VALUE
($000) | |
| | | | | | | | |
|
Florida — continued | |
| | |
County of Broward, Florida Power and Light Co., Project Series 2018A, Rev., VRDO, AMT, 0.11%, 9/1/2020 (b) | | | 20,450 | | | | 20,450 | |
| | |
County of St. Lucie, Florida Power and Light Co., Project Rev., VRDO, 0.11%, 9/1/2020 (b) | | | 27,275 | | | | 27,275 | |
| | |
Florida Housing Finance Corp., Multi-Family Mortgage, Boynton Bay Apartments Series I, Rev., VRDO, LOC: Citibank NA, 0.14%, 9/8/2020 (b) | | | 13,845 | | | | 13,845 | |
| | |
Hillsborough County, Housing Finance Authority, Multi-Family Housing, Brandywine Apartments Rev., VRDO, LOC: Citibank NA, 0.14%, 9/8/2020 (b) | | | 5,825 | | | | 5,825 | |
| | |
Miami-Dade County Industrial Development Authority, Solid Waste Disposal, Florida Power and Light Co., Project Rev., VRDO, 0.11%, 9/1/2020 (b) | | | 1,000 | | | | 1,000 | |
| | |
Pinellas County Educational Facilities Authority, Barry University Project Rev., VRDO, LOC: Bank of America NA, 0.12%, 9/8/2020 (b) | | | 1,160 | | | | 1,160 | |
| | |
RBC Municipal Products, Inc. Trust Series G-115, Rev., VRDO, LOC: Royal Bank of Canada, 0.34%, 9/8/2020 (b) (c) | | | 6,000 | | | | 6,000 | |
| | |
Sumter County Industrial Development Authority, Solid Waste Disposal, American Cement Co., LLC Project Rev., VRDO, LOC: Bank of America NA, 0.20%, 9/8/2020 (b) | | | 15,900 | | | | 15,900 | |
| | |
Tender Option Bond Trust Receipts/Certificates Series 2019-ZF0826, Rev., VRDO, LOC: Royal Bank of Canada, 0.20%, 9/8/2020 (b) (c) | | | 2,800 | | | | 2,800 | |
| | | | | | | | |
| | |
| | | | | | | 103,185 | |
| | | | | | | | |
|
Georgia — 0.6% | |
| | |
Development Authority of Douglas County, Pandosia LLC Project Series A, Rev., VRDO, LOC: Wells Fargo Bank NA, 0.12%, 9/8/2020 (b) | | | 2,100 | | | | 2,100 | |
| | |
Development Authority of Monroe County (The), Florida Power and Light Co., Project Rev., VRDO, AMT, 0.12%, 9/1/2020 (b) | | | 3,575 | | | | 3,575 | |
| | |
Valdosta-Lowndes County Industrial Development Authority, Steeda Autosports Project Rev., VRDO, LOC: Bank of America NA, 0.18%, 9/8/2020 (b) | | | 1,705 | | | | 1,705 | |
| | | | | | | | |
| | |
| | | | | | | 7,380 | |
| | | | | | | | |
|
Illinois — 2.0% | |
| | |
County of Will, Exxonmobil Project Rev., VRDO, 0.05%, 9/1/2020 (b) | | | 13,840 | | | | 13,840 | |
SEE NOTES TO FINANCIAL STATEMENTS.
| | | | | | |
| | | |
| 76 | | | | J.P. MORGAN MONEY MARKET FUNDS | | AUGUST 31, 2020 |
| | | | | | | | |
| INVESTMENTS (a) | | PRINCIPAL
AMOUNT
($000) | | | VALUE
($000) | |
Municipal Bonds — continued | |
|
Illinois — continued | |
| | |
Illinois Development Finance Authority, Toyal America, Inc. Rev., VRDO, LOC: Bank of Tokyo-Mitsubishi UFJ Ltd., 0.18%, 9/8/2020 (b) | | | 6,000 | | | | 6,000 | |
| | |
Tender Option Bond Trust Receipts/Certificates Series 2018-XM0686, Rev., VRDO, LOC: Bank of America NA, 0.17%, 9/8/2020 (b) (c) | | | 4,680 | | | | 4,680 | |
| | | | | | | | |
| | |
| | | | | | | 24,520 | |
| | | | | | | | |
|
Indiana — 1.6% | |
| | |
City of Indianapolis, Multi-Family Housing, Nora Commons Series 2004B, Class B, Rev., VRDO, LOC: U.S. Bank NA, 0.18%, 9/8/2020 (b) | | | 615 | | | | 615 | |
| | |
Indiana Finance Authority, Solid Waste Disposal, Four-Leaf Clover Dairy LLC Rev., VRDO, LOC: Bank of America NA, 0.18%, 9/8/2020 (b) | | | 4,100 | | | | 4,100 | |
| | |
Indiana Finance Authority, Solid Waste Disposal, New Holland Dairy Leasing Rev., VRDO, LOC: Bank of America NA, 0.18%, 9/8/2020 (b) | | | 1,860 | | | | 1,860 | |
| | |
Indiana Housing and Community Development Authority | | | | | | | | |
| | |
Series 2017B-3, Rev., VRDO, LIQ: TD Bank NA, 0.02%, 9/1/2020 (b) | | | 5,750 | | | | 5,750 | |
| | |
Series 2017C, Rev., VRDO, LIQ: TD Bank NA, 0.02%, 9/1/2020 (b) | | | 5,175 | | | | 5,175 | |
| | |
Tender Option Bond Trust Receipts/Certificates Series 2016-ZF0280, Rev., VRDO, LIQ: TD Bank NA, 0.14%, 9/8/2020 (b) (c) | | | 2,500 | | | | 2,500 | |
| | | | | | | | |
| | |
| | | | | | | 20,000 | |
| | | | | | | | |
|
Iowa — 2.1% | |
| | |
Iowa Finance Authority, Multi-Family Housing Series 2008-A, Rev., VRDO, AMT, LIQ: Wells Fargo Bank NA, 0.13%, 9/8/2020 (b) | | | 3,250 | | | | 3,250 | |
| | |
Iowa Finance Authority, Solid Waste Facilities, Midamerican Energy Co. Project Rev., VRDO, AMT, 0.15%, 9/8/2020 (b) | | | 14,240 | | | | 14,240 | |
| | |
Iowa Finance Authority, Wellness Facility, Community of Marshall Town Project Rev., VRDO, LOC: Northern Trust Co., 0.12%, 9/8/2020 (b) | | | 7,350 | | | | 7,350 | |
| | | | | | | | |
| | |
| | | | | | | 24,840 | |
| | | | | | | | |
|
Kansas — 1.0% | |
| | |
City of Wichita Series 298, GO, 4.00%, 10/15/2020 | | | 12,000 | | | | 12,038 | |
| | | | | | | | |
|
Kentucky — 0.8% | |
| | |
Louisville & Jefferson County Metropolitan Sewer and Drainage District Rev., BAN, 3.00%, 10/23/2020 | | | 2,310 | | | | 2,314 | |
| | | | | | | | |
| INVESTMENTS (a) | | PRINCIPAL
AMOUNT
($000) | | | VALUE
($000) | |
| | | | | | | | |
|
Kentucky — continued | |
| | |
Maysville Industrial Building., Green Tokai Co. Ltd. Rev., VRDO, AMT, LOC: MUFG Bank Ltd., 0.12%, 9/8/2020 (b) | | | 5,740 | | | | 5,740 | |
| | |
Tender Option Bond Trust Receipts/Certificates Series 2017-XG0113, Rev., VRDO, LOC: Barclays Bank plc, 0.13%, 9/8/2020 (b) (c) | | | 1,870 | | | | 1,870 | |
| | | | | | | | |
| | |
| | | | | | | 9,924 | |
| | | | | | | | |
|
Louisiana — 3.7% | |
| | |
Parish of St. Bernard, Mobil Oil Rev., VRDO, 0.05%, 9/1/2020 (b) | | | 8,000 | | | | 8,000 | |
| | |
Parish of St. Charles, Pollution Control, Shell Oil Co., Norco Project Rev., VRDO, 0.07%, 9/1/2020 (b) | | | 12,000 | | | | 12,000 | |
| | |
Parish of St. Charles, Shell Oil Co. Project Series 1992-A, Rev., VRDO, 0.07%, 9/1/2020 (b) | | | 24,400 | | | | 24,400 | |
| | | | | | | | |
| | |
| | | | | | | 44,400 | |
| | | | | | | | |
|
Maryland — 5.2% | |
| | |
Maryland Community Development Administration, Department of Housing and Community Development, Residential | | | | | | | | |
| | |
Series 2006G, Rev., VRDO, AMT, LIQ: State Street Bank & Trust, 0.11%, 9/8/2020 (b) | | | 3,330 | | | | 3,330 | |
| | |
Series 2006J, Rev., VRDO, AMT, LIQ: State Street Bank & Trust, 0.11%, 9/8/2020 (b) | | | 45,500 | | | | 45,500 | |
| | |
Montgomery County Housing Opportunities Commission, Single Family Mortgage Series 2018B, Rev., VRDO, AMT, LOC: PNC Bank NA, 0.12%, 9/8/2020 (b) | | | 8,450 | | | | 8,450 | |
| | |
State of Maryland, Department of Transportation Rev., 4.00%, 9/1/2020 | | | 3,460 | | | | 3,460 | |
| | |
Washington Suburban Sanitary Commission Series B-3, Rev., VRDO, BAN, GTD, LIQ: State Street Bank & Trust, 0.10%, 9/8/2020 (b) | | | 2,500 | | | | 2,500 | |
| | | | | | | | |
| | |
| | | | | | | 63,240 | |
| | | | | | | | |
|
Massachusetts — 2.0% | |
| | |
City of Lynn GO, BAN, 2.00%, 9/1/2020 | | | 8,102 | | | | 8,102 | |
| | |
City of Worcester GO, BAN, 2.00%, 2/16/2021 | | | 5,000 | | | | 5,036 | |
| | |
Nashoba Valley Technical High School District GO, BAN, 2.00%, 9/11/2020 | | | 2,000 | | | | 2,000 | |
| | |
Town of North Reading GO, BAN, 2.00%, 5/28/2021 | | | 6,913 | | | | 6,980 | |
| | |
Town of Yarmouth GO, BAN, 2.00%, 2/15/2021 | | | 3,000 | | | | 3,010 | |
| | | | | | | | |
| | |
| | | | | | | 25,128 | |
| | | | | | | | |
SEE NOTES TO FINANCIAL STATEMENTS.
| | | | | | | | |
| | | |
| AUGUST 31, 2020 | | J.P. MORGAN MONEY MARKET FUNDS | | | | | 77 | |
JPMorgan Municipal Money Market Fund
SCHEDULE OF PORTFOLIO INVESTMENTS
AS OF AUGUST 31, 2020 (Unaudited) (continued)
| | | | | | | | |
| INVESTMENTS (a) | | PRINCIPAL
AMOUNT
($000) | | | VALUE
($000) | |
Municipal Bonds — continued | |
|
Michigan — 1.8% | |
| | |
Lakeview School District, School Building and Site Series B, GO, VRDO, LOC: TD Bank NA, 0.08%, 9/8/2020 (b) | | | 5,520 | | | | 5,520 | |
| | |
L’Anse Creuse Public Schools GO, VRDO, Q-SBLF, LOC: TD Bank NA, 0.08%, 9/8/2020 (b) | | | 10,910 | | | | 10,910 | |
| | |
Michigan State Housing Development Authority, Jackson Project Rev., VRDO, LOC: FHLMC, 0.10%, 9/1/2020 (b) | | | 2,725 | | | | 2,725 | |
| | |
Tender Option Bond Trust Receipts/Certificates Series 2017-XF0597, Rev., VRDO, LIQ: Royal Bank of Canada, 0.12%, 9/8/2020 (b) (c) | | | 3,000 | | | | 3,000 | |
| | | | | | | | |
| | |
| | | | | | | 22,155 | |
| | | | | | | | |
|
Minnesota — 0.5% | |
| | |
Minnesota Housing Finance Agency, Residential Housing Finance | | | | | | | | |
| | |
Series 2015D, Rev., VRDO, AMT, GNMA/FNMA/FHLMC, LIQ: Royal Bank of Canada, 0.12%, 9/8/2020 (b) | | | 3,225 | | | | 3,225 | |
| | |
Series 2016F, Rev., VRDO, AMT, GNMA/FNMA/FHLMC COLL, LIQ: FHLB, 0.12%, 9/8/2020 (b) | | | 2,345 | | | | 2,345 | |
| | | | | | | | |
| | |
| | | | | | | 5,570 | |
| | | | | | | | |
|
Mississippi — 1.4% | |
| | |
Mississippi Business Finance Corp., Gulf Opportunity Zone Industrial Development, Chevron USA, Inc. Project | | | | | | | | |
| | |
Series 2009A, Rev., VRDO, 0.03%, 9/1/2020 (b) | | | 6,170 | | | | 6,170 | |
| | |
Series 2009C, Rev., VRDO, 0.03%, 9/1/2020 (b) | | | 8,915 | | | | 8,915 | |
| | |
Series 2009G, Rev., VRDO, 0.03%, 9/1/2020 (b) | | | 1,435 | | | | 1,435 | |
| | |
Series 2010K, Rev., VRDO, 0.03%, 9/1/2020 (b) | | | 1,000 | | | | 1,000 | |
| | | | | | | | |
| | |
| | | | | | | 17,520 | |
| | | | | | | | |
|
Missouri — 1.2% | |
| | |
Rib Floater Trust Various States Series 2017-010, Rev., VRDO, LOC: Barclays Bank plc, 0.13%, 9/8/2020 (b) (c) | | | 9,845 | | | | 9,845 | |
| | |
Tender Option Bond Trust Receipts/Certificates Series 2018-XG0184, Rev., VRDO, LOC: Citibank NA, 0.14%, 9/8/2020 (b) (c) | | | 5,000 | | | | 5,000 | |
| | | | | | | | |
| | |
| | | | | | | 14,845 | |
| | | | | | | | |
| | | | | | | | |
| INVESTMENTS (a) | | PRINCIPAL
AMOUNT
($000) | | | VALUE
($000) | |
| | | | | | | | |
|
Nebraska — 0.7% | |
| | |
Douglas County Hospital Authority No. 2, Health Facilities Series 2008A, Rev., VRDO, LOC: U.S. Bank NA, 0.03%, 9/1/2020 (b) | | | 6,600 | | | | 6,600 | |
| | |
Nebraska Investment Finance Authority, Multi-Family Housing, Irvington Heights Apartment Project Series A, Rev., VRDO, LOC: Citibank NA, 0.12%, 9/8/2020 (b) | | | 2,465 | | | | 2,465 | |
| | | | | | | | |
| | |
| | | | | | | 9,065 | |
| | | | | | | | |
|
New Jersey — 11.1% | |
| | |
Bergen County Improvement Authority (The), New Bridge Medical Center Project Series 2019A, Rev., GTD, 4.00%, 9/1/2020 | | | 1,500 | | | | 1,500 | |
| | |
Borough of Butler GO, BAN, 2.00%, 9/11/2020 | | | 7,233 | | | | 7,234 | |
| | |
Borough of Palisades Park GO, BAN, 1.50%, 3/19/2021 | | | 3,972 | | | | 3,988 | |
| | |
Borough of Roselle GO, BAN, 2.00%, 11/18/2020 | | | 10,000 | | | | 10,014 | |
| | |
Borough of Somerville GO, BAN, 1.75%, 11/5/2020 | | | 4,157 | | | | 4,160 | |
| | |
Borough of Tenafly GO, BAN, 1.25%, 5/28/2021 | | | 8,910 | | | | 8,947 | |
| | |
Borough of Wood-Ridge | | | | | | | | |
| | |
GO, BAN, 2.00%, 9/11/2020 | | | 8,633 | | | | 8,637 | |
| | |
GO, BAN, 2.00%, 11/6/2020 | | | 2,149 | | | | 2,152 | |
| | |
Burlington County Bridge Commission, Governmental Leasing Program | | | | | | | | |
| | |
Series 2019C-2, Rev., 3.00%, 11/20/2020 | | | 600 | | | | 602 | |
| | |
Series 2020AB, Rev., 3.50%, 4/15/2021 | | | 6,000 | | | | 6,033 | |
| | |
City of Long Branch Series 2020A, GO, BAN, 2.00%, 2/4/2021 | | | 1,037 | | | | 1,041 | |
| | |
County of Hudson GO, BAN, 2.00%, 12/8/2020 | | | 7,000 | | | | 7,016 | |
| | |
Essex County Improvement Authority Rev., AMT, GTD, 3.00%, 11/1/2020 | | | 400 | | | | 401 | |
| | |
Rib Floater Trust Various States Series 2018-020, Rev., VRDO, LIQ: Barclays Bank plc, 0.16%, 9/8/2020 (b) (c) | | | 17,185 | | | | 17,185 | |
| | |
Tender Option Bond Trust Receipts/Certificates Series 2020-XF0957, Rev., VRDO, LOC: Royal Bank of Canada, 0.16%, 9/8/2020 (b) (c) | | | 2,500 | | | | 2,500 | |
| | |
Township of Cedar Grove GO, BAN, 2.00%, 7/14/2021 | | | 10,000 | | | | 10,125 | |
| | |
Township of East Brunswick GO, BAN, 2.00%, 2/26/2021 | | | 150 | | | | 151 | |
| | |
Township of Ewing GO, TAN, 1.25%, 12/23/2020 | | | 5,568 | | | | 5,584 | |
| | |
Township of Galloway GO, BAN, 1.25%, 8/11/2021 | | | 7,590 | | | | 7,645 | |
SEE NOTES TO FINANCIAL STATEMENTS.
| | | | | | |
| | | |
| 78 | | | | J.P. MORGAN MONEY MARKET FUNDS | | AUGUST 31, 2020 |
| | | | | | | | |
| INVESTMENTS (a) | | PRINCIPAL
AMOUNT
($000) | | | VALUE
($000) | |
Municipal Bonds — continued | |
|
New Jersey — continued | |
| | |
Township of Lyndhurst | | | | | | | | |
| | |
GO, BAN, 1.88%, 9/10/2020 | | | 1,280 | | | | 1,280 | |
| | |
GO, BAN, 2.00%, 5/6/2021 | | | 4,500 | | | | 4,512 | |
| | |
GO, BAN, 1.00%, 9/8/2021 | | | 9,000 | | | | 9,054 | |
| | |
Township of Mount Olive GO, BAN, 2.00%, 12/11/2020 | | | 3,374 | | | | 3,380 | |
| | |
Township of Tewksbury GO, 2.00%, 5/20/2021 | | | 4,722 | | | | 4,755 | |
| | |
Township of Vernon GO, BAN, 2.00%, 9/4/2020 | | | 7,366 | | | | 7,366 | |
| | | | | | | | |
| | |
| | | | | | | 135,262 | |
| | | | | | | | |
|
New York — 7.5% | |
| | |
Battery Park City Authority, Junior Series 2019D-1, Rev., VRDO, LIQ: TD Bank NA, 0.07%, 9/8/2020 (b) | | | 2,500 | | | | 2,500 | |
| | |
Binghamton City School District GO, BAN, 2.00%, 10/2/2020 | | | 6,500 | | | | 6,503 | |
| | |
City of New York, Fiscal Year 2006 Series I, Subseries I-4, GO, VRDO, LOC: TD Bank NA, 0.02%, 9/1/2020 (b) | | | 5,660 | | | | 5,660 | |
| | |
County of Westchester, Various Purpose Series 2020A, GO, BAN, 1.50%, 4/30/2021 | | | 6,500 | | | | 6,529 | |
| | |
Kenmore-Tonawanda Union Free School District GO, BAN, 1.25%, 8/13/2021 | | | 1,164 | | | | 1,173 | |
| | |
Malone Central School District GO, BAN, 1.25%, 8/13/2021 | | | 1,505 | | | | 1,517 | |
| | |
New York City Municipal Water Finance Authority, Water and Sewer System, Second General Resolution, Fiscal Year 2014 Series AA, Subseries AA-5, Rev., VRDO, LIQ: Mizuho Bank Ltd., 0.02%, 9/1/2020 (b) | | | 2,100 | | | | 2,100 | |
| | |
New York City Transitional Finance Authority, Future Tax Secured, Fiscal Year 2013 Subseries C-5, Rev., VRDO, LOC: Sumitomo Mitsui Banking Corp., 0.09%, 9/8/2020 (b) | | | 400 | | | | 400 | |
| | |
New York City Transitional Finance Authority, Future Tax Secured, Fiscal Year 2014 Subseries D-3, Rev., VRDO, LIQ: Mizuho Bank Ltd., 0.04%, 9/1/2020 (b) | | | 150 | | | | 150 | |
| | |
New York State Dormitory Authority, Court Facilities Lease Series 2005B, Rev., VRDO, LOC: Mizuho Bank Ltd., 0.10%, 9/8/2020 (b) | | | 4,500 | | | | 4,500 | |
| | |
New York State Housing Finance Agency, 350 West 43rd Street Housing | | | | | | | | |
| | |
Series 2001A, Rev., VRDO, LOC: Landesbank Hessen-Thueringen, 0.06%, 9/1/2020 (b) | | | 3,000 | | | | 3,000 | |
| | | | | | | | |
| INVESTMENTS (a) | | PRINCIPAL
AMOUNT
($000) | | | VALUE
($000) | |
| | | | | | | | |
|
New York — continued | |
| | |
Series 2002A, Rev., VRDO, LOC: Landesbank Hessen-Thueringen, 0.06%, 9/1/2020 (b) | | | 23,455 | | | | 23,455 | |
| | |
Series 2004A, Rev., VRDO, LOC: Landesbank Hessen-Thueringen, 0.06%, 9/1/2020 (b) | | | 3,800 | | | | 3,800 | |
| | |
New York State Housing Finance Agency, 455 West 37th Street Housing Series 2007A, Rev., VRDO, AMT, LOC: Landesbank Hessen-Thueringen, 0.06%, 9/1/2020 (b) | | | 9,000 | | | | 9,000 | |
| | |
Skaneateles Central School District GO, BAN, 1.25%, 8/18/2021 | | | 1,338 | | | | 1,349 | |
| | |
South Colonie Central School District GO, BAN, 1.25%, 8/13/2021 | | | 2,406 | | | | 2,423 | |
| | |
Springville-Griffith Institute Central School District GO, BAN, 1.25%, 8/20/2021 | | | 2,272 | | | | 2,290 | |
| | |
Town of Eastchester GO, BAN, 2.00%, 9/4/2020 | | | 2,183 | | | | 2,183 | |
| | |
Voorheesville Central School District GO, BAN, 1.25%, 8/20/2021 | | | 5,604 | | | | 5,650 | |
| | |
Wantagh Union Free School District GO, TAN, 1.25%, 6/25/2021 | | | 6,500 | | | | 6,545 | |
| | | | | | | | |
| | |
| | | | | | | 90,727 | |
| | | | | | | | |
|
North Carolina — 1.0% | |
| | |
Tender Option Bond Trust Receipts/Certificates Series 2018-XG0170, Rev., VRDO, LIQ: Royal Bank of Canada, 0.12%, 9/8/2020 (b) (c) | | | 3,000 | | | | 3,000 | |
| | |
Union County Industrial Facilities and Pollution Control Financing Authority, Darnel, Inc. Project Rev., VRDO, LOC: Truist Bank NA, 0.14%, 9/8/2020 (b) | | | 10,000 | | | | 10,000 | |
| | | | | | | | |
| | |
| | | | | | | 13,000 | |
| | | | | | | | |
|
Ohio — 1.1% | |
| | |
City of Brecksville, Various Purpose Improvement, Limited Tax | | | | | | | | |
| | |
GO, BAN, 2.00%, 2/25/2021 | | | 4,875 | | | | 4,896 | |
| | |
GO, BAN, 2.00%, 6/3/2021 | | | 585 | | | | 589 | |
| | |
City of Strongsville, Various Purpose Improvement, Limited Tax GO, BAN, 2.00%, 6/10/2021 | | | 1,600 | | | | 1,613 | |
| | |
City of Twinsburg, Gleneagles Clubhouse Improvements, Limited Tax GO, BAN, 2.00%, 2/25/2021 | | | 2,300 | | | | 2,308 | |
| | |
RBC Municipal Products, Inc. Trust, Floater Certificates Series G-30, GO, VRDO, LOC: Royal Bank of Canada, 0.12%, 9/8/2020 (b) (c) | | | 3,905 | | | | 3,905 | |
| | | | | | | | |
| | |
| | | | | | | 13,311 | |
| | | | | | | | |
SEE NOTES TO FINANCIAL STATEMENTS.
| | | | | | | | |
| | | |
| AUGUST 31, 2020 | | J.P. MORGAN MONEY MARKET FUNDS | | | | | 79 | |
JPMorgan Municipal Money Market Fund
SCHEDULE OF PORTFOLIO INVESTMENTS
AS OF AUGUST 31, 2020 (Unaudited) (continued)
| | | | | | | | |
| INVESTMENTS (a) | | PRINCIPAL
AMOUNT
($000) | | | VALUE
($000) | |
Municipal Bonds — continued | |
|
Oregon — 0.8% | |
| | |
Marion County Housing Authority, Residence At Marian Rev., VRDO, LOC: U.S. Bank NA, 0.15%, 9/8/2020 (b) | | | 230 | | | | 230 | |
| | |
Port of Portland, Special Obligation, Horizon Air Industries, Inc. Rev., VRDO, LOC: Bank of America NA, 0.10%, 9/1/2020 (b) | | | 9,075 | | | | 9,075 | |
| | | | | | | | |
| | |
| | | | | | | 9,305 | |
| | | | | | | | |
|
Other — 2.5% | |
| | |
FHLMC, Multi-Family Housing | | | | | | | | |
| | |
Series M015, Class A, Rev., VRDO, LIQ: FHLMC, 0.12%, 9/8/2020 (b) (c) | | | 8,785 | | | | 8,785 | |
| | |
Series M021, Class A, Rev., VRDO, LIQ: FHLMC, 0.12%, 9/8/2020 (b) (c) | | | 9,875 | | | | 9,875 | |
| | |
Series M025, Class A, Rev., VRDO, LIQ: FHLMC, 0.15%, 9/8/2020 (b) (c) | | | 4,425 | | | | 4,425 | |
| | |
Series M026, Class A, Rev., VRDO, LIQ: FHLMC, 0.15%, 9/8/2020 (b) (c) | | | 5,780 | | | | 5,780 | |
| | |
SunAmerica Taxable Trust, Various States Series A-2, Class A, Rev., VRDO, LOC: FHLMC, 0.14%, 9/8/2020 (b) | | | 1,310 | | | | 1,310 | |
| | | | | | | | |
| | |
| | | | | | | 30,175 | |
| | | | | | | | |
|
Pennsylvania — 1.8% | |
| | |
Pennsylvania Housing Finance Agency, Single Family Mortgage Series 2006-93B, Rev., VRDO, AMT, LIQ: Wells Fargo Bank NA, 0.10%, 9/8/2020 (b) | | | 3,120 | | | | 3,120 | |
| | |
Philadelphia Gas Works Co. Series D, Rev., VRDO, LOC: TD Bank NA, 0.09%, 9/8/2020 (b) | | | 13,495 | | | | 13,495 | |
| | |
Tender Option Bond Trust Receipts/Certificates Series 2018-XL0061, Rev., VRDO, LOC: Citibank NA, 0.15%, 9/8/2020 (b) (c) | | | 4,490 | | | | 4,490 | |
| | | | | | | | |
| | |
| | | | | | | 21,105 | |
| | | | | | | | |
|
South Carolina — 1.3% | |
| | |
Charleston County School District, Phase IV Projects, Sales Tax Series 2020B, GO, BAN, SCSDE, 5.00%, 5/12/2021 | | | 5,000 | | | | 5,139 | |
| | |
South Carolina Public Service Authority Series 2019A, Rev., VRDO, LOC: Bank of America NA, 0.20%, 9/8/2020 (b) | | | 5,020 | | | | 5,020 | |
| | |
Tender Option Bond Trust Receipts/Certificates Series 2019-ZF0824, Rev., VRDO, LOC: Bank of America NA, 0.17%, 9/8/2020 (b) (c) | | | 2,325 | | | | 2,325 | |
| | |
Town of Lexington, Combined Waterworks and Sewer System Rev., BAN, 2.50%, 10/27/2020 | | | 3,000 | | | | 3,006 | |
| | | | | | | | |
| | |
| | | | | | | 15,490 | |
| | | | | | | | |
| | | | | | | | |
| INVESTMENTS (a) | | PRINCIPAL
AMOUNT
($000) | | | VALUE
($000) | |
| | | | | | | | |
|
Tennessee — 0.9% | |
| | |
Tender Option Bond Trust Receipts/Certificates | | | | | | | | |
| | |
Series 2018-XL0062, Rev., VRDO, LOC: Citibank NA, 0.15%, 9/8/2020 (b) (c) | | | 4,420 | | | | 4,420 | |
| | |
Series 2019-XG0268, Rev., VRDO, LOC: Bank of America NA, 0.16%, 9/8/2020 (b) (c) | | | 3,475 | | | | 3,475 | |
| | |
Series 2020-YX1139, Rev., VRDO, LOC: Barclays Bank plc, 0.16%, 9/8/2020 (b) (c) | | | 3,795 | | | | 3,795 | |
| | | | | | | | |
| | |
| | | | | | | 11,690 | |
| | | | | | | | |
|
Texas — 9.0% | |
| | |
Collin County Housing Finance Corp., Multi-Family Housing Rev., VRDO, LOC: Northern Trust Co., 0.16%, 9/8/2020 (b) | | | 12,305 | | | | 12,305 | |
| | |
Gilmer Industrial Development Corp., Duoline Technologies LP Series 2008A, Rev., VRDO, LOC: Wells Fargo Bank NA, 0.19%, 9/8/2020 (b) | | | 6,085 | | | | 6,085 | |
| | |
Gulf Coast Authority, Exxonmobil Project Rev., VRDO, 0.05%, 9/1/2020 (b) | | | 5,300 | | | | 5,300 | |
| | |
Gulf Coast Waste Disposal Authority, Environmental Facilities, Exxonmobil Project Series B, Rev., VRDO, 0.06%, 9/1/2020 (b) | | | 5,245 | | | | 5,245 | |
| | |
Lower Neches Valley Authority Industrial Development Corp., Exempt Facilities, Mobil Oil Refining Corp. Project Rev., VRDO, 0.05%, 9/1/2020 (b) | | | 3,200 | | | | 3,200 | |
| | |
Port of Port Arthur Navigation District, Fina Oil and Chemical Co. Project Rev., VRDO, 0.17%, 9/8/2020 (b) | | | 18,425 | | | | 18,425 | |
| | |
RBC Municipal Products, Inc. Trust, Floater Certificates Series G-31, GO, VRDO, LOC: Royal Bank of Canada, 0.12%, 9/8/2020 (b) (c) | | | 3,000 | | | | 3,000 | |
| | |
State of Texas, Veterans | | | | | | | | |
| | |
Series 2010C, GO, VRDO, LIQ: State Street Bank & Trust, 0.14%, 9/8/2020 (b) | | | 165 | | | | 165 | |
| | |
GO, VRDO, AMT, LIQ: State Street Bank & Trust, 0.18%, 9/8/2020 (b) | | | 6,915 | | | | 6,915 | |
| | |
Tender Option Bond Trust Receipts/Certificates Series 2016-ZF0465, Rev., VRDO, LOC: Royal Bank of Canada, 0.17%, 9/8/2020 (b) (c) | | | 48,605 | | | | 48,605 | |
| | | | | | | | |
| | |
| | | | | | | 109,245 | |
| | | | | | | | |
|
Virginia — 1.3% | |
| | |
Arlington County Industrial Development Authority, Multi-Family, Gates Ballston Apartments Rev., VRDO, LOC: PNC Bank NA, 0.14%, 9/8/2020 (b) | | | 14,840 | | | | 14,840 | |
| | |
Prince William County Industrial Development Authority, Sewer Disposal Facilities, Dale Service Corp. Project Rev., VRDO, LOC: Wells Fargo Bank NA, 0.14%, 9/8/2020 (b) | | | 1,250 | | | | 1,250 | |
| | | | | | | | |
| | |
| | | | | | | 16,090 | |
| | | | | | | | |
SEE NOTES TO FINANCIAL STATEMENTS.
| | | | | | |
| | | |
| 80 | | | | J.P. MORGAN MONEY MARKET FUNDS | | AUGUST 31, 2020 |
| | | | | | | | |
| INVESTMENTS (a) | | PRINCIPAL
AMOUNT
($000) | | | VALUE
($000) | |
Municipal Bonds — continued | |
|
Washington — 1.0% | |
| | |
King County Housing Authority, Overlake Tod Housing LP Series 2001B, Rev., VRDO, LOC: Bank of America NA, 0.15%, 9/8/2020 (b) | | | 5,840 | | | | 5,840 | |
| | |
Port of Tacoma, Subordinate Lien Series 2019A, Rev., VRDO, AMT, LOC: PNC Bank NA, 0.12%, 9/8/2020 (b) | | | 2,550 | | | | 2,550 | |
| | |
Snohomish County Housing Authority, Ebey Arms Centerhouse Project Rev., VRDO, LOC: Bank of America NA, 0.13%, 9/8/2020 (b) | | | 1,585 | | | | 1,585 | |
| | |
Washington State Housing Finance Commission, Panorama City Project Rev., VRDO, LOC: Wells Fargo Bank NA, 0.09%, 9/8/2020 (b) | | | 2,000 | | | | 2,000 | |
| | | | | | | | |
| | |
| | | | | | | 11,975 | |
| | | | | | | | |
|
Wyoming — 1.9% | |
| | |
County of Laramie, Industrial Development, Cheyenne Light Fuel and Power Co. Project Series 2009B, Rev., VRDO, LOC: Wells Fargo Bank NA, 0.12%, 9/8/2020 (b) | | | 7,000 | | | | 7,000 | |
| | |
County of Lincoln, Wyoming Pollution Control, ExxonMobile Project Series 2014, Rev., VRDO, AMT, 0.05%, 9/1/2020 (b) | | | 15,700 | | | | 15,700 | |
| | | | | | | | |
| | |
| | | | | | | 22,700 | |
| | | | | | | | |
| |
Total Municipal Bonds
(Cost $992,790) | | | | 992,790 | |
| | | | | |
| | |
| | | SHARES
(000) | | | | |
Variable Rate Demand Preferred Shares — 9.4% | |
|
California — 0.8% | |
| | |
Nuveen California Quality Municipal Income Fund Series 4, LIQ: Royal Bank of Canada, 0.17%, 9/8/2020 # (c) | | | 10,000 | | | | 10,000 | |
| | | | | | | | |
|
Other — 8.6% | |
| | |
BlackRock MuniYield Quality Fund III, Inc. LIQ: TD Bank NA, 0.17%, 9/8/2020 # (c) | | | 30,000 | | | | 30,000 | |
| | |
Nuveen AMT-Free Municipal Credit Income Fund Series 5, LIQ: Societe Generale, 0.14%, 9/8/2020 # (c) | | | 10,000 | | | | 10,000 | |
| | |
Nuveen AMT-Free Quality Municipal Income Fund Series 4 - 4895, LIQ: Barclays Bank plc, 0.14%, 9/8/2020 # (c) | | | 20,000 | | | | 20,000 | |
| | |
Nuveen Quality Municipal Income Fund | | | | | | | | |
| | |
Series 2-2525, LIQ: Barclays Bank plc, 0.18%, 9/8/2020 # (b) (c) | | | 20,000 | | | | 20,000 | |
| | |
Series 3-1277, LIQ: Barclays Bank plc, 0.18%, 9/8/2020 # (c) | | | 24,200 | | | | 24,200 | |
| | | | | | | | |
| | |
| | | | | | | 104,200 | |
| | | | | | | | |
| |
Total Variable Rate Demand Preferred Shares
(Cost $114,200) | | | | 114,200 | |
| | | | | |
| | | | | | | | |
| INVESTMENTS (a) | | PRINCIPAL
AMOUNT
($000) | | | VALUE
($000) | |
Repurchase Agreements — 1.0% | |
| | |
Citigroup Global Markets Holdings, Inc., 0.07%, dated 8/31/2020, due 9/1/2020, repurchase price $12,543, collateralized by U.S. Treasury Securities, 0.50% - 6.13%, due 11/15/2027 - 11/15/2028, with a value of $12,794.
(Cost $12,543) | | | 12,543 | | | | 12,543 | |
| | | | | | | | |
Short-Term Investments — 8.6% | |
|
Commercial Paper — 8.6% | |
| | |
California Statewide Communities Development Authority | | | | | | | | |
| | |
0.50%, 9/9/2020 | | | 7,500 | | | | 7,500 | |
| | |
Series B-6, 0.70%, 9/10/2020 | | | 5,000 | | | | 5,000 | |
| | |
Series B-5, 0.21%, 1/6/2021 | | | 4,150 | | | | 4,150 | |
| | |
Series 9B-4, 0.24%, 2/2/2021 | | | 5,000 | | | | 5,000 | |
| | |
City of Atlanta | | | | | | | | |
| | |
Series K-2, 0.45%, 1/6/2021 | | | 5,650 | | | | 5,650 | |
| | |
Series K-4, 0.45%, 1/6/2021 | | | 2,500 | | | | 2,500 | |
| | |
City of Houston, Airport System | | | | | | | | |
| | |
Series A, 0.21%, 9/3/2020 | | | 8,000 | | | | 8,000 | |
| | |
Series A, 0.22%, 9/3/2020 | | | 16,000 | | | | 16,000 | |
| | |
Series A, 0.19%, 9/24/2020 | | | 17,000 | | | | 17,000 | |
| | |
Series A, 0.19%, 9/24/2020 | | | 5,000 | | | | 5,000 | |
| | |
City of San Antonio, Electric and Gas System | | | | | | | | |
| | |
Series C, 0.89%, 9/8/2020 | | | 3,000 | | | | 3,000 | |
| | |
Series B, 0.79%, 9/10/2020 | | | 3,800 | | | | 3,800 | |
| | |
County of Harris, Toll Road Authority (The) | | | | | | | | |
| | |
Series E-1, 0.17%, 9/17/2020 | | | 1,550 | | | | 1,550 | |
| | |
Series E-2, 0.22%, 11/5/2020 | | | 580 | | | | 580 | |
| | |
County of Miami-Dade Series A-1, 0.25%, 10/7/2020 | | | 5,750 | | | | 5,750 | |
| | |
Indiana Finance Authority Series D-2, 0.21%, 1/5/2021 | | | 4,000 | | | | 4,000 | |
| | |
Massachusetts Bay Transportation Authority Series A, 0.21%, 11/30/2020 | | | 7,000 | | | | 7,000 | |
| | |
State of California Series A-2, LOC: Royal Bank of Canada, 0.16%, 10/8/2020 | | | 3,795 | | | | 3,795 | |
| | | | | | | | |
| |
Total Commercial Paper
(Cost $105,275) | | | | 105,275 | |
| | | | | |
| |
Total Short-Term Investments
(Cost $105,275) | | | | 105,275 | |
| | | | | |
Total Investments — 100.5%
(Cost $1,224,808)* | | | | 1,224,808 | |
Liabilities in Excess of
Other Assets — (0.5)% | | | | (6,566 | ) |
| | | | | |
Net Assets — 100.0% | | | | 1,218,242 | |
| | | | | |
Percentages indicated are based on net assets.
SEE NOTES TO FINANCIAL STATEMENTS.
| | | | | | | | |
| | | |
| AUGUST 31, 2020 | | J.P. MORGAN MONEY MARKET FUNDS | | | | | 81 | |
JPMorgan Municipal Money Market Fund
SCHEDULE OF PORTFOLIO INVESTMENTS
AS OF AUGUST 31, 2020 (Unaudited) (continued)
Abbreviations
| | |
| AMT | | Alternative Minimum Tax |
| BAN | | Bond Anticipation Note |
| COLL | | Collateral |
| FHLB | | Federal Home Loan Bank |
| FHLMC | | Federal Home Loan Mortgage Corp. |
| FNMA | | Federal National Mortgage Association |
| GNMA | | Government National Mortgage Association |
| GO | | General Obligation |
| GTD | | Guaranteed |
| LIQ | | Liquidity Agreement |
| LOC | | Letter of Credit |
| Q-SBLF | | Qualified School Bond Loan Fund |
| Rev. | | Revenue |
| SCSDE | | South Carolina School District Enhancement |
| TAN | | Tax Anticipation Note |
| | |
| VRDO | | Variable Rate Demand Obligation |
| |
| (a) | | The date shown represents the earliest of the next put date, next demand date or final maturity date. |
| (b) | | Variable or floating rate security, the interest rate of which adjusts periodically based on changes in current interest rates and prepayments on the underlying pool of assets. The interest rate shown is the current rate as of August 31, 2020. |
| (c) | | Securities exempt from registration under Rule 144A or section 4(a)(2), of the Securities Act of 1933, as amended. |
| # | | Variable Rate Demand Preferred Shares of a closed-end investment company which has a weekly demand feature. The interest rate shown is the rate in effect as of August 31, 2020. |
| * | | The cost of securities is substantially the same for federal income tax purposes. |
SEE NOTES TO FINANCIAL STATEMENTS.
| | | | | | |
| | | |
| 82 | | | | J.P. MORGAN MONEY MARKET FUNDS | | AUGUST 31, 2020 |
JPMorgan California Municipal Money Market Fund
SCHEDULE OF PORTFOLIO INVESTMENTS
AS OF AUGUST 31, 2020 (Unaudited)
| | | | | | | | |
| INVESTMENTS (a) | | PRINCIPAL
AMOUNT
($000) | | | VALUE
($000) | |
Municipal Bonds — 62.8% | |
|
California — 62.8% | |
| | |
Alameda County IDA, Plyproperties Project Series 1997A, Rev., VRDO, LOC: Wells Fargo Bank NA, 0.13%, 9/8/2020 (b) | | | 3,475 | | | | 3,475 | |
| | |
Alameda Public Financing Authority, Multi-Family Housing, Eagle Village/Parrot Village Series 2005A, Rev., VRDO, LOC: FNMA, 0.09%, 9/8/2020 (b) | | | 200 | | | | 200 | |
| | |
California Economic Development Financing Authority, Industrial Development, Killion Industries, Inc. Project Rev., VRDO, LOC: MUFG Union Bank NA, 0.14%, 9/8/2020 (b) | | | 1,285 | | | | 1,285 | |
| | |
California Educational Facilities Authority, Stanford University Series U-5, Rev., 5.00%, 5/1/2021 | | | 3,670 | | | | 3,777 | |
| | |
California Health Facilities Financing Authority, Scripps Health Series 2012C, Rev., VRDO, 0.05%, 9/8/2020 (b) | | | 1,000 | | | | 1,000 | |
| | |
California Health Facilities Financing Authority, Stanford Hospital and Clinics Series 2008B-2, Rev., VRDO, 0.30%, 3/2/2021 (b) | | | 7,000 | | | | 7,000 | |
| | |
California Housing Finance, Home Mortgage Series 2005A-R, Rev., VRDO, AMT, LOC: Bank of Tokyo-Mitsubishi UFJ Ltd., 0.18%, 9/8/2020 (b) | | | 2,365 | | | | 2,365 | |
| | |
California Infrastructure and Economic Development Bank, Industrial Development, Silva Corks USA LLC Project Rev., VRDO, LOC: Bank of America NA, 0.18%, 9/8/2020 (b) | | | 1,615 | | | | 1,615 | |
| | |
California Municipal Finance Authority, Multi-Family, Pacific Meadows Apartments Series 2010A, Rev., VRDO, LIQ: FHLMC, 0.08%, 9/8/2020 (b) | | | 635 | | | | 635 | |
| | |
California Municipal Finance Authority, Recovery Zone Facility, Chevron USA, Inc., Project | | | | | | | | |
| | |
Series 2010A, Rev., VRDO, 0.01%, 9/1/2020 (b) | | | 6,950 | | | | 6,950 | |
| | |
Series 2010A, Rev., VRDO, 0.01%, 9/1/2020 (b) | | | 2,210 | | | | 2,210 | |
| | |
California State Public Works Board, Capital Projects Series 2019C, Rev., 5.00%, 11/1/2020 | | | 1,495 | | | | 1,505 | |
| | |
California Statewide Communities Development Authority, Multi-Family, Fairway Family Apartments Series 2003PP, Rev., VRDO, LOC: FNMA, 0.11%, 9/8/2020 (b) | | | 1,425 | | | | 1,425 | |
| | |
California Statewide Communities Development Authority, Multi-Family, Horizons at Indio Series 2005F, Rev., VRDO, LOC: Citibank NA, 0.12%, 9/8/2020 (b) | | | 700 | | | | 700 | |
| | | | | | | | |
| INVESTMENTS (a) | | PRINCIPAL
AMOUNT
($000) | | | VALUE
($000) | |
| |
|
California — continued | |
| | |
California Statewide Communities Development Authority, Rady Children’s Hospital | | | | | | | | |
| | |
Series 2008B, Rev., VRDO, LOC: Wells Fargo Bank NA, 0.02%, 9/1/2020 (b) | | | 4,760 | | | | 4,760 | |
| | |
Series 2008C, Rev., VRDO, LOC: Northern Trust Co., 0.04%, 9/8/2020 (b) | | | 1,000 | | | | 1,000 | |
| | |
City of Los Angeles | | | | | | | | |
| | |
Series 2017B, GO, 5.00%, 9/1/2020 | | | 400 | | | | 400 | |
| | |
Rev., TRAN, 4.00%, 6/24/2021 | | | 7,200 | | | | 7,415 | |
| | |
City of Los Angeles, Multi-Family Housing Series I, Rev., VRDO, LOC: Citibank NA, 0.12%, 9/8/2020 (b) | | | 1,100 | | | | 1,100 | |
| | |
City of San Jose, Multi-Family Housing, Almaden Lake Village Apartments | | | | | | | | |
| | |
Series 1997A, Rev., VRDO, LOC: FNMA, 0.11%, 9/8/2020 (b) | | | 8,500 | | | | 8,500 | |
| | |
Series 2000A, Rev., VRDO, LOC: FNMA, 0.11%, 9/8/2020 (b) | | | 2,000 | | | | 2,000 | |
| | |
City of Santa Rosa, Multi-Family Housing Series 2006A, Rev., VRDO, LOC: Citibank NA, 0.12%, 9/8/2020 (b) | | | 1,740 | | | | 1,740 | |
| | |
Contra Costa Water District Series T, Rev., 5.00%, 10/1/2020 | | | 125 | | | | 125 | |
| | |
County of Los Angeles Series 2020-21A, Rev., TRAN, 4.00%, 6/30/2021 | | | 4,000 | | | | 4,123 | |
| | |
County of Riverside | | | | | | | | |
| | |
Series 2019A, Rev., 1.38%, 10/22/2020 | | | 5,500 | | | | 5,502 | |
| | |
Rev., TRAN, 4.00%, 6/30/2021 | | | 8,200 | | | | 8,452 | |
| | |
County of Sacramento, Special Facilities Apartment, Cessna Aircraft Co., Project Rev., VRDO, LOC: Bank of America NA, 0.13%, 9/8/2020 (b) | | | 1,000 | | | | 1,000 | |
| | |
Daly City Housing Development Finance Agency, Multi-Family, Serramonte Del Rey Series A, Rev., VRDO, LOC: FNMA, 0.08%, 9/8/2020 (b) | | | 7,400 | | | | 7,400 | |
| | |
Fremont Public Financing Authority Rev., 5.00%, 10/1/2020 | | | 2,780 | | | | 2,789 | |
| | |
Los Angeles Department of Water and Power, Power System | | | | | | | | |
| | |
Series B, Subseries B-4, Rev., VRDO, LIQ: Citibank NA, 0.01%, 9/1/2020 (b) | | | 19,300 | | | | 19,300 | |
| | |
Subseries B-3, Rev., VRDO, LIQ: Barclays Bank plc, 0.02%, 9/1/2020 (b) | | | 8,400 | | | | 8,400 | |
| | |
Metropolitan Water District of Southern California | | | | | | | | |
| | |
Series 2018A-1, Rev., VRDO, LIQ: TD Bank NA, 0.01%, 9/1/2020 (b) | | | 1,075 | | | | 1,075 | |
| | |
Series 2018A-2, Rev., VRDO, LIQ: TD Bank NA, 0.01%, 9/1/2020 (b) | | | 1,330 | | | | 1,330 | |
SEE NOTES TO FINANCIAL STATEMENTS.
| | | | | | | | |
| | | |
| AUGUST 31, 2020 | | J.P. MORGAN MONEY MARKET FUNDS | | | | | 83 | |
JPMorgan California Municipal Money Market Fund
SCHEDULE OF PORTFOLIO INVESTMENTS
AS OF AUGUST 31, 2020 (Unaudited) (continued)
| | | | | | | | |
| INVESTMENTS (a) | | PRINCIPAL
AMOUNT
($000) | | | VALUE
($000) | |
Municipal Bonds — continued | |
|
California — continued | |
| | |
Modesto Public Financing Authority Rev., VRDO, LOC: Bank of the West, 0.08%, 9/8/2020 (b) | | | 4,155 | | | | 4,155 | |
| | |
RBC Municipal Products, Inc. Trust Series G-11806, VRDO, LOC: Royal Bank of Canada, 0.24%, 9/8/2020 (b) (c) | | | 2,000 | | | | 2,000 | |
| | |
Sacramento County Housing Authority, Multi-Family Housing, River Terrace Apartments Series 1996C, Rev., VRDO, FNMA, LIQ: FNMA, 0.07%, 9/8/2020 (b) | | | 1,770 | | | | 1,770 | |
| | |
San Diego County Water Authority | | | | | | | | |
| | |
Series 2016S-1, Rev., 3.00%, 5/1/2021 | | | 5,000 | | | | 5,067 | |
| | |
Series 2005A, COP, NATL-RE, 5.25%, 5/1/2021 | | | 6,725 | | | | 6,929 | |
| | |
San Diego Public Facilities Financing Authority, Sewer Utility Series 2016A, Rev., 5.00%, 5/15/2021 | | | 250 | | | | 257 | |
| | |
San Mateo County Community College District, Election of 2014 Series 2018B, GO, 4.00%, 9/1/2020 | | | 850 | | | | 850 | |
| | |
Santa Clara County Financing Authority, Multiple Facilities Project Series 2015P, Rev., 5.00%, 5/15/2021 | | | 5,770 | | | | 5,945 | |
| | |
State of California Department of Water Resources, Central Valley Project, Water System Series AW, Rev., 4.00%, 12/1/2020 | | | 425 | | | | 428 | |
| | |
State of California Department of Water Resources, Power Supply Series 2011N, Rev., 5.00%, 5/1/2021 | | | 325 | | | | 334 | |
| | |
Tender Option Bond Trust Receipts/Certificates | | | | | | | | |
| | |
GO, VRDO, LIQ: Royal Bank of Canada, 0.09%, 9/8/2020 (b) (c) | | | 1,600 | | | | 1,600 | |
| | |
Rev., VRDO, LIQ: Royal Bank of Canada, 0.09%, 9/8/2020 (b) (c) | | | 1,500 | | | | 1,500 | |
| | |
Series 2017-XF0607, Rev., VRDO, LIQ: TD Bank NA, 0.09%, 9/8/2020 (b) (c) | | | 3,330 | | | | 3,330 | |
| | |
Series 2018-XG0182, Rev., VRDO, LOC: Barclays Bank plc, 0.09%, 9/8/2020 (b) (c) | | | 6,030 | | | | 6,030 | |
| | |
Series 2018-XM0689, GO, VRDO, LIQ: Royal Bank of Canada, 0.09%, 9/8/2020 (b) (c) | | | 5,705 | | | | 5,705 | |
| | |
Series 2018-XM0696, Rev., VRDO, LIQ: Bank of America NA, 0.09%, 9/8/2020 (b) (c) | | | 4,590 | | | | 4,590 | |
| | |
Series 2020-XF0898, GO, VRDO, LIQ: Royal Bank of Canada, 0.09%, 9/8/2020 (b) (c) | | | 6,000 | | | | 6,000 | |
| | |
Series 2020-XG0291, Rev., VRDO, LOC: Barclays Bank plc, 0.09%, 9/8/2020 (b) (c) | | | 9,560 | | | | 9,560 | |
| | |
Series 2018-G-92, GO, VRDO, LOC: Royal Bank of Canada, 0.10%, 9/8/2020 (b) (c) | | | 1,500 | | | | 1,500 | |
| | | | | | | | |
| INVESTMENTS (a) | | PRINCIPAL
AMOUNT
($000) | | | VALUE
($000) | |
| |
|
California — continued | |
| | |
Series 2019-ZF2844, COP, VRDO, LIQ: Citibank NA, 0.10%, 9/8/2020 (b) (c) | | | 5,435 | | | | 5,435 | |
| | |
Series 2018-ZF0679, Rev., VRDO, LIQ: Bank of America NA, 0.11%, 9/8/2020 (b) (c) | | | 7,615 | | | | 7,615 | |
| | |
Series 2020-XF2867, Rev., VRDO, LIQ: Morgan Stanley Bank, 0.11%, 9/8/2020 (b) (c) | | | 4,000 | | | | 4,000 | |
| | |
Series 2020-XM0837, Rev., VRDO, LIQ: Morgan Stanley Bank, 0.11%, 9/8/2020 (b) (c) | | | 2,800 | | | | 2,800 | |
| | |
Series 2016-XF2322, Rev., VRDO, LIQ: Wells Fargo Bank NA, 0.12%, 9/8/2020 (b) (c) | | | 7,500 | | | | 7,500 | |
| | |
Series 2018-XM0712, GO, VRDO, LIQ: Morgan Stanley Bank, 0.12%, 9/8/2020 (b) (c) | | | 2,230 | | | | 2,230 | |
| | |
Series 2018-ZF2744, Rev., VRDO, LIQ: Morgan Stanley Bank, 0.12%, 9/8/2020 (b) (c) | | | 6,900 | | | | 6,900 | |
| | |
Series 2018-ZF2771, Rev., VRDO, LIQ: Morgan Stanley Bank, 0.12%, 9/8/2020 (b) (c) | | | 4,750 | | | | 4,750 | |
| | |
Series 2018-ZM0585, GO, VRDO, LIQ: Wells Fargo Bank NA, 0.12%, 9/8/2020 (b) (c) | | | 3,750 | | | | 3,750 | |
| | |
Series 2019-XM0741, Rev., VRDO, LIQ: Morgan Stanley Bank, 0.12%, 9/8/2020 (b) (c) | | | 7,785 | | | | 7,785 | |
| | |
Series 2019-XM0750, Rev., VRDO, LIQ: Bank of America NA, 0.14%, 9/8/2020 (b) (c) | | | 3,000 | | | | 3,000 | |
| | |
Series 2020-XF2876, Rev., VRDO, LOC: Barclays Bank plc, 0.14%, 9/8/2020 (b) (c) | | | 9,195 | | | | 9,195 | |
| | |
Series 2020-YX1131, Rev., VRDO, LOC: Barclays Bank plc, 0.14%, 9/8/2020 (b) (c) | | | 4,380 | | | | 4,380 | |
| | |
Western Municipal Water District Facilities Authority Series 2012A, Rev., VRDO, LOC: TD Bank NA, 0.04%, 9/8/2020 (b) | | | 1,055 | | | | 1,055 | |
| | | | | | | | |
| |
Total Municipal Bonds
(Cost $258,498) | | | | 258,498 | |
| | | | | |
| | |
| | | SHARES
(000) | | | | |
Variable Rate Demand Preferred Shares — 9.5% | |
|
California — 9.5% | |
| | |
BlackRock MuniYield California Quality Fund, Inc. Series W-7, LIQ: TD Bank NA, 0.13%, 9/8/2020 # (c) | | | 5,000 | | | | 5,000 | |
| | |
Nuveen California AMT-Free Quality Municipal Income Fund Series 3, LIQ: TD Bank NA, 0.10%, 9/8/2020 # (c) | | | 15,000 | | | | 15,000 | |
| | |
Nuveen California Quality Municipal Income Fund | | | | | | | | |
| | |
Series 6, LIQ: Citi Bank NA, 0.16%, 9/8/2020 # (c) | | | 5,100 | | | | 5,100 | |
SEE NOTES TO FINANCIAL STATEMENTS.
| | | | | | |
| | | |
| 84 | | | | J.P. MORGAN MONEY MARKET FUNDS | | AUGUST 31, 2020 |
| | | | | | | | |
| INVESTMENTS (a) | | SHARES
(000) | | | VALUE
($000) | |
Variable Rate Demand Preferred Shares — continued | |
|
California — continued | |
| | |
Series 4, LIQ: Royal Bank of Canada, 0.17%, 9/8/2020 # (c) | | | 7,000 | | | | 7,000 | |
| | |
Series 1-1362, LIQ: Societe Generale, 0.21%, 9/8/2020 # (c) | | | 7,000 | | | | 7,000 | |
| | | | | | | | |
| | |
Total Variable Rate Demand Preferred Shares
(Cost $39,100) | | | | | | | 39,100 | |
| | | | | |
| | |
| | | PRINCIPAL
AMOUNT
($000) | | | | |
Repurchase Agreements — 0.4% | |
| | |
Citigroup Global Markets Holdings, Inc., 0.07%, dated 8/31/2020, due 9/1/2020, repurchase price $1,600, collateralized by U.S. Treasury Securities, 0.38% - 6.50%, due 1/31/2021 - 1/15/2027, with a value of $1,632.
(Cost $1,600) | | | 1,600 | | | | 1,600 | |
| | | | | | | | |
Short-Term Investments — 27.1% | |
|
Commercial Paper — 27.1% | |
| | |
Alameda County Joint Powers Authority Series A, LOC: MUFG Union Bank NA, 0.15%, 9/3/2020 | | | 15,500 | | | | 15,500 | |
| | |
California Statewide Communities Development Authority | | | | | | | | |
| | |
Series 08-B, 0.50%, 9/10/2020 | | | 5,000 | | | | 5,000 | |
| | |
Series B-6, 0.70%, 9/10/2020 | | | 5,000 | | | | 5,000 | |
| | |
Series D, 0.25%, 11/4/2020 | | | 12,000 | | | | 12,000 | |
| | |
Series 08-C, 0.28%, 12/9/2020 | | | 5,000 | | | | 5,000 | |
| | |
City and County of San Francisco LOC: U.S. Bank NA, 0.24%, 11/4/2020 | | | 3,190 | | | | 3,190 | |
| | |
Los Angeles County Capital Asset Leasing Corp. LOC: Wells Fargo Bank NA, 0.17%, 10/7/2020 | | | 5,000 | | | | 5,000 | |
| | |
Municipal Improvement Corp. of Los Angeles Series A-1, LOC: BMO Harris Bank NA, 0.15%, 10/8/2020 | | | 5,600 | | | | 5,600 | |
| | | | | | | | |
| INVESTMENTS (a) | | PRINCIPAL
AMOUNT
($000) | | | VALUE
($000) | |
| |
|
Commercial Paper — continued | |
| | |
San Diego County Water Authority Series 10, LOC: Bank of the West, 0.20%, 12/9/2020 | | | 5,000 | | | | 5,000 | |
| | |
San Francisco City and County Public Utilities Commission Wastewater Series A2, LOC: Sumitomo Mitsui Banking Corp., 0.20%, 9/3/2020 | | | 17,500 | | | | 17,500 | |
| | |
State of California | | | | | | | | |
| | |
Series A-2, LOC: Royal Bank of Canada, 0.13%, 9/16/2020 | | | 5,000 | | | | 5,000 | |
| | |
Series A-2, LOC: Royal Bank of Canada, 0.16%, 10/8/2020 | | | 3,000 | | | | 3,000 | |
| | |
Series A-4, LOC: TD Bank NA, 0.22%, 10/8/2020 | | | 5,000 | | | | 5,000 | |
| | |
Series A-1, LOC: Wells Fargo Bank NA, 0.17%, 10/9/2020 | | | 2,500 | | | | 2,500 | |
| | |
University of California | | | | | | | | |
| | |
Series A, 0.35%, 9/9/2020 | | | 2,000 | | | | 2,000 | |
| | |
Series A, 0.65%, 10/26/2020 | | | 5,000 | | | | 5,000 | |
| | |
Series A, 0.35%, 2/22/2021 | | | 5,000 | | | | 5,000 | |
| | |
West Basin Municipal Water District LOC: Bank of the West, 0.20%, 10/28/2020 | | | 5,500 | | | | 5,500 | |
| | | | | | | | |
| | |
Total Commercial Paper
(Cost $111,790) | | | | | | | 111,790 | |
| | | | | | | | |
| | |
Total Short-Term Investments
(Cost $111,790) | | | | | | | 111,790 | |
| | | | | | | | |
Total Investments — 99.8%
(Cost $410,988)* | | | | | | | 410,988 | |
Other Assets Less Liabilities — 0.2% | | | | | | | 968 | |
| | | | | | | | |
Net Assets — 100.0% | | | | | | | 411,956 | |
| | | | | | | | |
Percentages indicated are based on net assets.
Abbreviations
| | |
| AMT | | Alternative Minimum Tax |
| COP | | Certificate of Participation |
| FHLMC | | Federal Home Loan Mortgage Corp. |
| FNMA | | Federal National Mortgage Association |
| GO | | General Obligation |
| IDA | | Industrial Development Authority |
| LIQ | | Liquidity Agreement |
| LOC | | Letter of Credit |
| NATL | | Insured by National Public Finance Guarantee Corp. |
| RE | | Reinsured |
| Rev. | | Revenue |
| TRAN | | Tax & Revenue Anticipation Note |
| VRDO | | Variable Rate Demand Obligation |
| | |
| (a) | | The date shown represents the earliest of the next put date, next demand date or final maturity date. |
| (b) | | Variable or floating rate security, the interest rate of which adjusts periodically based on changes in current interest rates and prepayments on the underlying pool of assets. The interest rate shown is the current rate as of August 31, 2020. |
| (c) | | Securities exempt from registration under Rule 144A or section 4(a)(2), of the Securities Act of 1933, as amended. |
| # | | Variable Rate Demand Preferred Shares of a closed-end investment company which has a weekly demand feature. The interest rate shown is the rate in effect as of August 31, 2020. |
| * | | The cost of securities is substantially the same for federal income tax purposes. |
SEE NOTES TO FINANCIAL STATEMENTS.
| | | | | | | | |
| | | |
| AUGUST 31, 2020 | | J.P. MORGAN MONEY MARKET FUNDS | | | | | 85 | |
JPMorgan New York Municipal Money Market Fund
SCHEDULE OF PORTFOLIO INVESTMENTS
AS OF AUGUST 31, 2020 (Unaudited)
| | | | | | | | |
| INVESTMENTS (a) | | PRINCIPAL
AMOUNT
($000) | | | VALUE
($000) | |
Municipal Bonds — 90.8% | |
|
New York — 90.8% | |
| | |
Albany Industrial Development Agency, Civic Facility, Living Resources Corp., Project Series 2007A, Rev., VRDO, LOC: HSBC Bank USA NA, 0.11%, 9/8/2020 (b) | | | 2,490 | | | | 2,490 | |
| | |
Amherst Development Corp., Student Housing Facility, South Lake Village Project Series 2010B, Rev., VRDO, LOC: HSBC Bank USA NA, 0.16%, 9/8/2020 (b) | | | 12,620 | | | | 12,620 | |
| | |
Baldwinsville Central School District GO, BAN, 1.25%, 6/29/2021 | | | 3,480 | | | | 3,498 | |
| | |
Battery Park City Authority, Junior Series 2019D-2, Rev., VRDO, LIQ: TD Bank NA, 0.07%, 9/8/2020 (b) | | | 5,000 | | | | 5,000 | |
| | |
Bethlehem Central School District Series 2020B, GO, BAN, 1.25%, 7/16/2021 | | | 3,705 | | | | 3,725 | |
| | |
Binghamton City School District | | | | | | | | |
| | |
GO, BAN, 2.00%, 10/2/2020 | | | 10,000 | | | | 10,005 | |
| | |
GO, BAN, 2.00%, 11/13/2020 | | | 2,410 | | | | 2,413 | |
| | |
Canajoharie Central School District GO, BAN, 1.25%, 6/29/2021 | | | 1,687 | | | | 1,696 | |
| | |
Chenango Valley Central School District GO, BAN, 1.25%, 6/25/2021 | | | 12,720 | | | | 12,787 | |
| | |
City of New York | | | | | | | | |
| | |
Series 2012G, Subseries G-3, GO, VRDO, LOC: Citibank NA, 0.08%, 9/8/2020 (b) | | | 2,855 | | | | 2,855 | |
| | |
Subseries G-4, GO, VRDO, LIQ: Barclays Bank plc, 0.08%, 9/8/2020 (b) | | | 3,055 | | | | 3,055 | |
| | |
City of New York, Fiscal Year 2012 | | | | | | | | |
| | |
Series 2012G, Subseries G-6, GO, VRDO, LOC: Mizuho Bank Ltd., 0.02%, 9/1/2020 (b) | | | 1,395 | | | | 1,395 | |
| | |
Subseries G-7, GO, VRDO, LOC: Bank of Tokyo-Mitsubishi UFJ Ltd., 0.02%, 9/1/2020 (b) | | | 11,715 | | | | 11,715 | |
| | |
Series 2012G, Subseries G-4, GO, VRDO, LOC: Citibank NA, 0.08%, 9/8/2020 (b) | | | 1,050 | | | | 1,050 | |
| | |
City of New York, Fiscal Year 2013 Subseries A-2, GO, VRDO, LIQ: Mizuho Bank Ltd., 0.03%, 9/1/2020 (b) | | | 13,465 | | | | 13,465 | |
| | |
City of New York, Fiscal Year 2017 | | | | | | | | |
| | |
Subseries A-6, GO, VRDO, LIQ: Landesbank Hessen-Thueringen, 0.04%, 9/1/2020 (b) | | | 1,475 | | | | 1,475 | |
| | |
Series 2017A, Subseries A-4, GO, VRDO, LOC: Citibank NA, 0.08%, 9/8/2020 (b) | | | 2,460 | | | | 2,460 | |
| | |
City of New York, Fiscal Year 2018 Series B, Subseries B-5, GO, VRDO, LIQ: Barclays Bank plc, 0.03%, 9/1/2020 (b) | | | 1,130 | | | | 1,130 | |
| | |
City of Peekskill GO, TAN, 1.25%, 1/15/2021 | | | 3,000 | | | | 3,007 | |
| | | | | | | | |
| INVESTMENTS (a) | | PRINCIPAL
AMOUNT
($000) | | | VALUE
($000) | |
| |
|
New York — continued | |
| | |
County of Livingston | | | | | | | | |
| | |
GO, BAN, 2.00%, 9/10/2020 | | | 2,576 | | | | 2,576 | |
| | |
County of Madison GO, BAN, 1.75%, 4/30/2021 | | | 16,000 | | | | 16,073 | |
| | |
County of Montgomery GO, BAN, 2.00%, 10/9/2020 | | | 7,470 | | | | 7,474 | |
| | |
County of Otsego GO, RAN, 1.50%, 5/28/2021 | | | 8,000 | | | | 8,032 | |
| | |
County of Westchester, Various Purpose | | | | | | | | |
| | |
Series 2020A, GO, BAN, 1.50%, 4/30/2021 | | | 27,353 | | | | 27,473 | |
| | |
Series 2020B, GO, BAN, 1.50%, 4/30/2021 | | | 9,474 | | | | 9,507 | |
| | |
Erie County Industrial Development Agency (The), Canisius High School Series 2008, Rev., VRDO, LOC: Manufacturers & Trader Trust Co., 0.13%, 9/8/2020 (b) | | | 10,820 | | | | 10,820 | |
| | |
Erie County Industrial Development Agency (The), Our Lady Victory Corp. Series 2007A, Rev., VRDO, LOC: HSBC Bank USA NA, 0.13%, 9/8/2020 (b) | | | 1,800 | | | | 1,800 | |
| | |
Franklin County Civic Development Corp., Alice Hyde Medical Center Project Series 2013A, Rev., VRDO, LOC: HSBC Bank USA NA, 0.12%, 9/8/2020 (b) | | | 11,640 | | | | 11,640 | |
| | |
Geneva City School District | | | | | | | | |
| | |
GO, RAN, 1.25%, 6/23/2021 | | | 7,000 | | | | 7,034 | |
| | |
GO, BAN, 1.25%, 6/30/2021 | | | 4,900 | | | | 4,926 | |
| | |
Lancaster Central School District Series 2020C, GO, BAN, 1.25%, 6/11/2021 | | | 6,000 | | | | 6,033 | |
| | |
Liverpool Central School District Series 2019A, GO, BAN, 2.00%, 9/25/2020 | | | 3,867 | | | | 3,868 | |
| | |
Metropolitan Transportation Authority | | | | | | | | |
| | |
Series 2008A-1, Rev., VRDO, LOC: TD Bank NA, 0.02%, 9/1/2020 (b) | | | 20,275 | | | | 20,275 | |
| | |
Series 2012G-1, Rev., VRDO, LOC: Barclays Bank plc, 0.03%, 9/1/2020 (b) | | | 4,150 | | | | 4,150 | |
| | |
Subseries E-3, Rev., VRDO, LOC: Bank of America NA, 0.03%, 9/1/2020 (b) | | | 3,045 | | | | 3,045 | |
| | |
Subseries 2005D-2, Rev., VRDO, LOC: Landesbank Hessen-Thueringen, 0.06%, 9/1/2020 (b) | | | 6,680 | | | | 6,680 | |
| | |
Subseries E-2, Rev., VRDO, LOC: Bank of America NA, 0.09%, 9/8/2020 (b) | | | 3,300 | | | | 3,300 | |
| | |
Series 2008A-2B, Rev., VRDO, LOC: PNC Bank NA, 0.10%, 9/8/2020 (b) | | | 6,135 | | | | 6,135 | |
| | |
Series 2008B-3C, Rev., VRDO, LOC: PNC Bank NA, 0.10%, 9/8/2020 (b) | | | 25,000 | | | | 25,000 | |
| | |
Subseries E-1, Rev., VRDO, LOC: PNC Bank NA, 0.10%, 9/8/2020 (b) | | | 2,000 | | | | 2,000 | |
SEE NOTES TO FINANCIAL STATEMENTS.
| | | | | | |
| | | |
| 86 | | | | J.P. MORGAN MONEY MARKET FUNDS | | AUGUST 31, 2020 |
| | | | | | | | |
| INVESTMENTS (a) | | PRINCIPAL
AMOUNT
($000) | | | VALUE
($000) | |
Municipal Bonds — continued | |
|
New York — continued | |
| | |
Monroe County Water Authority, Water System Rev., 5.00%, 3/1/2021 | | | 75 | | | | 77 | |
| | |
Monticello Central School District GO, BAN, 2.00%, 9/18/2020 | | | 10,010 | | | | 10,013 | |
| | |
Moravia Central School District GO, BAN, 1.25%, 8/6/2021 | | | 9,500 | | | | 9,561 | |
| | |
Nassau Health Care Corp., Nassau County Guaranteed | | | | | | | | |
| | |
Subseries 2009B-2, Rev., VRDO, GTD, LOC: Bank of America NA, 0.09%, 9/8/2020 (b) | | | 575 | | | | 575 | |
| | |
Subseries 2009C-1, Rev., VRDO, GTD, LOC: Bank of America NA, 0.09%, 9/8/2020 (b) | | | 6,880 | | | | 6,880 | |
| | |
Subseries 2009C-2, Rev., VRDO, GTD, LOC: Bank of America NA, 0.09%, 9/8/2020 (b) | | | 11,125 | | | | 11,125 | |
| | |
Subseries 2009D-1, Rev., VRDO, GTD, LOC: Bank of America NA, 0.09%, 9/8/2020 (b) | | | 6,885 | | | | 6,885 | |
| | |
Subseries 2009B-1, Rev., VRDO, GTD, LOC: Bank of America NA, 0.10%, 9/8/2020 (b) | | | 2,125 | | | | 2,125 | |
| | |
New York City Housing Development Corp., LaFontaine Avenue Apartments Series 2005A, Rev., VRDO, LOC: Citibank NA, 0.12%, 9/8/2020 (b) | | | 3,100 | | | | 3,100 | |
| | |
New York City Housing Development Corp., Multi-Family Housing, Ogden Avenue Apartments Series A, Rev., VRDO, LOC: FNMA, 0.12%, 9/8/2020 (b) | | | 4,760 | | | | 4,760 | |
| | |
New York City Housing Development Corp., Multi-Family Mortgage, Bathgate Avenue Apartments Series A, Rev., VRDO, LOC: FNMA, 0.12%, 9/8/2020 (b) | | | 3,225 | | | | 3,225 | |
| | |
New York City Housing Development Corp., Multi-Family Mortgage, Boricua Village Apartments Site Series C, Rev., VRDO, LOC: Citibank NA, 0.10%, 9/8/2020 (b) | | | 6,665 | | | | 6,665 | |
| | |
New York City Housing Development Corp., Multi-Family Mortgage, West 26th Street Development Series A, Rev., VRDO, LIQ: FHLMC, 0.08%, 9/8/2020 (b) | | | 270 | | | | 270 | |
| | |
New York City Housing Development Corp., Multi-Family Rental Housing, 90 Washington Street Series 2005A, Rev., VRDO, LOC: FNMA, 0.09%, 9/8/2020 (b) | | | 1,000 | | | | 1,000 | |
| | | | | | | | |
| INVESTMENTS (a) | | PRINCIPAL
AMOUNT
($000) | | | VALUE
($000) | |
| |
|
New York — continued | |
| | |
New York City Housing Development Corp., Multi-Family Rental Housing, Gold Street Series A, Rev., VRDO, LOC: FNMA, 0.08%, 9/8/2020 (b) | | | 20,000 | | | | 20,000 | |
| | |
New York City Housing Development Corp., Multi-Family Rental Housing, Lexington Courts Series A, Rev., VRDO, LIQ: FHLMC, 0.08%, 9/8/2020 (b) | | | 1,015 | | | | 1,015 | |
| | |
New York City Housing Development Corp., Multi-Family Rental Housing, Queenswood Apartments LP Series 2001A, Rev., VRDO, LOC: FHLMC, 0.07%, 9/8/2020 (b) | | | 2,600 | | | | 2,600 | |
| | |
New York City Housing Development Corp., Multi-Family Rental Housing, West 89th Street Development Series A, Rev., VRDO, LOC: FNMA, 0.10%, 9/8/2020 (b) | | | 2,300 | | | | 2,300 | |
| | |
New York City Housing Development Corp., Multi-Family, Pearl LLC Series A, Rev., VRDO, LOC: FNMA, 0.08%, 9/8/2020 (b) | | | 6,100 | | | | 6,100 | |
| | |
New York City Housing Development Corp., West 26th Street Development Series 2011B, Rev., VRDO, 0.08%, 9/8/2020 (b) | | | 1,220 | | | | 1,220 | |
| | |
New York City Industrial Development Agency, Civic Facility, New York Congregational Nursing Center Project Series A, Rev., VRDO, LOC: HSBC Bank USA NA, 0.23%, 9/8/2020 (b) | | | 300 | | | | 300 | |
| | |
New York City Municipal Water Finance Authority, Water and Sewer System, Fiscal Year 2003 Subseries F-1-A, Rev., VRDO, LIQ: Barclays Bank plc, 0.08%, 9/8/2020 (b) | | | 6,075 | | | | 6,075 | |
| | |
New York City Municipal Water Finance Authority, Water and Sewer System, Fiscal Year 2008 Series 2008-BB-5, Rev., VRDO, LIQ: Bank of America NA, 0.03%, 9/1/2020 (b) | | | 1,500 | | | | 1,500 | |
| | |
New York City Municipal Water Finance Authority, Water and Sewer System, Fiscal Year 2012 Subseries A-2, Rev., VRDO, LIQ: Mizuho Bank Ltd., 0.03%, 9/1/2020 (b) | | | 1,730 | | | | 1,730 | |
| | |
New York City Municipal Water Finance Authority, Water and Sewer System, Second General Resolution, Fiscal Year 2011 Series DD-1, Rev., VRDO, LIQ: TD Bank NA, 0.02%, 9/1/2020 (b) | | | 120 | | | | 120 | |
| | |
New York City Municipal Water Finance Authority, Water and Sewer System, Second General Resolution, Fiscal Year 2013 Series AA, Subseries AA-1, Rev., VRDO, LIQ: PNC Bank NA, 0.10%, 9/8/2020 (b) | | | 2,895 | | | | 2,895 | |
SEE NOTES TO FINANCIAL STATEMENTS.
| | | | | | | | |
| | | |
| AUGUST 31, 2020 | | J.P. MORGAN MONEY MARKET FUNDS | | | | | 87 | |
JPMorgan New York Municipal Money Market Fund
SCHEDULE OF PORTFOLIO INVESTMENTS
AS OF AUGUST 31, 2020 (Unaudited) (continued)
| | | | | | | | |
| INVESTMENTS (a) | | PRINCIPAL
AMOUNT
($000) | | | VALUE
($000) | |
Municipal Bonds — continued | |
|
New York — continued | |
| | |
New York City Municipal Water Finance Authority, Water and Sewer System, Second General Resolution, Fiscal Year 2014 | | | | | | | | |
| | |
Series AA, Subseries AA1, Rev., VRDO, LIQ: TD Bank NA, 0.02%, 9/1/2020 (b) | | | 11,485 | | | | 11,485 | |
| | |
Series AA, Subseries AA-5, Rev., VRDO, LIQ: Mizuho Bank Ltd., 0.02%, 9/1/2020 (b) | | | 2,910 | | | | 2,910 | |
| | |
New York City Municipal Water Finance Authority, Water and Sewer System, Second General Resolution, Fiscal Year 2016 Series AA-2, Rev., VRDO, LIQ: PNC Bank NA, 0.10%, 9/8/2020 (b) | | | 500 | | | | 500 | |
| | |
New York City Transitional Finance Authority, Future Tax Secured | | | | | | | | |
| | |
Subseries D-4, Rev., VRDO, LIQ: Mizuho Bank Ltd., 0.10%, 9/8/2020 (b) | | | 465 | | | | 465 | |
| | |
Series 1, Subseries 1E, Rev., VRDO, LOC: Sumitomo Mitsui Banking Corp., 0.11%, 9/8/2020 (b) | | | 1,525 | | | | 1,525 | |
| | |
New York City Transitional Finance Authority, Future Tax Secured, Fiscal Year 2001 Series C, Rev., VRDO, LIQ: PNC Bank NA, 0.10%, 9/8/2020 (b) | | | 10,000 | | | | 10,000 | |
| | |
New York City Transitional Finance Authority, Future Tax Secured, Fiscal Year 2003 Subseries A-4, Rev., VRDO, LIQ: TD Bank NA, 0.02%, 9/1/2020 (b) | | | 10,000 | | | | 10,000 | |
| | |
New York City Transitional Finance Authority, Future Tax Secured, Fiscal Year 2010 Subseries 2010G-6, Rev., VRDO, LIQ: Barclays Bank plc, 0.03%, 9/1/2020 (b) | | | 2,730 | | | | 2,730 | |
| | |
New York City Transitional Finance Authority, Future Tax Secured, Fiscal Year 2013 Subseries C-5, Rev., VRDO, LOC: Sumitomo Mitsui Banking Corp., 0.09%, 9/8/2020 (b) | | | 13,230 | | | | 13,230 | |
| | |
New York City Transitional Finance Authority, Future Tax Secured, Fiscal Year 2014 Subseries D-3, Rev., VRDO, LIQ: Mizuho Bank Ltd., 0.04%, 9/1/2020 (b) | | | 5,700 | | | | 5,700 | |
| | |
New York City Transitional Finance Authority, Future Tax Secured, Fiscal Year 2015 Subseries E-4, Rev., VRDO, LIQ: Bank of America NA, 0.03%, 9/1/2020 (b) | | | 2,300 | | | | 2,300 | |
| | |
New York City Trust for Cultural Resources, Metropolitan Museum of Art Series 2006A-1, Rev., VRDO, 0.10%, 9/8/2020 (b) | | | 40,595 | | | | 40,595 | |
| | |
New York Liberty Development Corp., 377 Greenwich LLC Rev., VRDO, LOC: Wells Fargo Bank NA, 0.09%, 9/8/2020 (b) | | | 7,750 | | | | 7,750 | |
| | | | | | | | |
| INVESTMENTS (a) | | PRINCIPAL
AMOUNT
($000) | | | VALUE
($000) | |
| |
|
New York — continued | |
| | |
New York State Dormitory Authority, Catholic Health System Series 2019B, Rev., VRDO, LOC: Manufacturers & Trader Trust Co., 0.13%, 9/8/2020 (b) | | | 18,000 | | | | 18,000 | |
| | |
New York State Dormitory Authority, Cornell University | | | | | | | | |
| | |
Series 2004A, Rev., VRDO, LIQ: Bank of New York Mellon, 0.05%, 9/8/2020 (b) | | | 700 | | | | 700 | |
| | |
Series 2004B, Rev., VRDO, LIQ: Bank of New York Mellon, 0.05%, 9/8/2020 (b) | | | 2,535 | | | | 2,535 | |
| | |
New York State Dormitory Authority, Court Facilities Lease Series 2005B, Rev., VRDO, LOC: Mizuho Bank Ltd., 0.10%, 9/8/2020 (b) | | | 10,400 | | | | 10,400 | |
| | |
New York State Dormitory Authority, Highland Community Development Corp. Series 1994B, Rev., VRDO, LOC: HSBC Bank USA NA, 0.11%, 9/8/2020 (b) | | | 2,100 | | | | 2,100 | |
| | |
New York State Dormitory Authority, Remarketing Series A, Rev., VRDO, LOC: FNMA, 0.07%, 9/8/2020 (b) | | | 14,155 | | | | 14,155 | |
| | |
New York State Dormitory Authority, St. John’s University Series 2008B-2, Rev., VRDO, LOC: U.S. Bank NA, 0.07%, 9/8/2020 (b) | | | 5,015 | | | | 5,015 | |
| | |
New York State Dormitory Authority, Teresian House Rev., VRDO, LOC: Manufacturers & Trader Trust Co., 0.13%, 9/8/2020 (b) | | | 12,465 | | | | 12,465 | |
| | |
New York State Dormitory Authority, University of Rochester Series 2006A-1, Rev., VRDO, LOC: Barclays Bank plc, 0.08%, 9/8/2020 (b) | | | 3,830 | | | | 3,830 | |
| | |
New York State Energy Research and Development Authority Subseries C-2, Rev., VRDO, LOC: Mizuho Bank Ltd., 0.11%, 9/8/2020 (b) | | | 20,000 | | | | 20,000 | |
| | |
New York State Energy Research and Development Authority, Consolidated Edison Co., Inc. Project | | | | | | | | |
| | |
Subseries A-3, Rev., VRDO, LOC: Mizuho Bank Ltd., 0.08%, 9/8/2020 (b) | | | 2,000 | | | | 2,000 | |
| | |
Subseries A-1, Rev., VRDO, LOC: Mizuho Bank Ltd., 0.09%, 9/8/2020 (b) | | | 29,600 | | | | 29,600 | |
| | |
Subseries C-1, Rev., VRDO, LOC: Mizuho Bank Ltd., 0.11%, 9/8/2020 (b) | | | 2,600 | | | | 2,600 | |
| | |
New York State Housing Finance Agency | | | | | | | | |
| | |
Series 2002A, Rev., VRDO, LOC: FNMA, 0.08%, 9/8/2020 (b) | | | 5,500 | | | | 5,500 | |
| | |
Series 2004A, Rev., VRDO, LOC: FNMA, 0.08%, 9/8/2020 (b) | | | 7,050 | | | | 7,050 | |
SEE NOTES TO FINANCIAL STATEMENTS.
| | | | | | |
| | | |
| 88 | | | | J.P. MORGAN MONEY MARKET FUNDS | | AUGUST 31, 2020 |
| | | | | | | | |
| INVESTMENTS (a) | | PRINCIPAL
AMOUNT
($000) | | | VALUE
($000) | |
Municipal Bonds — continued | |
|
New York — continued | |
| | |
Series 2009A, Rev., VRDO, LOC: FNMA, 0.08%, 9/8/2020 (b) | | | 3,190 | | | | 3,190 | |
| | |
Series 2019B, Rev., VRDO, LIQ: Barclays Bank plc, 0.14%, 9/8/2020 (b) | | | 5,765 | | | | 5,765 | |
| | |
New York State Housing Finance Agency, 10 Barclay Street Series A, Rev., VRDO, LOC: FNMA, 0.08%, 9/8/2020 (b) | | | 10,055 | | | | 10,055 | |
| | |
New York State Housing Finance Agency, 1500 Lexington Avenue Housing Series 2004A, Rev., VRDO, LOC: FNMA, 0.10%, 9/8/2020 (b) | | | 700 | | | | 700 | |
| | |
New York State Housing Finance Agency, 160 Madison Avenue Housing Series 2013A, Rev., VRDO, LOC: Landesbank Hessen-Thueringen, 0.04%, 9/1/2020 (b) | | | 3,260 | | | | 3,260 | |
| | |
New York State Housing Finance Agency, 330 Reverdale Avenue Apartments Series 2008A, Rev., VRDO, LOC: Bank of America NA, 0.10%, 9/8/2020 (b) | | | 10,750 | | | | 10,750 | |
| | |
New York State Housing Finance Agency, 42nd and 10th Housing Series 2010A, Rev., VRDO, AMT, LOC: FHLMC, 0.08%, 9/8/2020 (b) | | | 250 | | | | 250 | |
| | |
New York State Housing Finance Agency, 42nd West 10th Street Housing Series 2008A, Rev., VRDO, AMT, LIQ: FHLMC, 0.08%, 9/8/2020 (b) | | | 750 | | | | 750 | |
| | |
New York State Housing Finance Agency, 435 East 13th Street Housing Series 2016A, Rev., VRDO, LOC: Landesbank Hessen-Thueringen, 0.09%, 9/8/2020 (b) | | | 12,200 | | | | 12,200 | |
| | |
New York State Housing Finance Agency, 455 West 37th Street Housing Series 2007A, Rev., VRDO, AMT, LOC: Landesbank Hessen-Thueringen, 0.06%, 9/1/2020 (b) | | | 5,865 | | | | 5,865 | |
| | |
New York State Housing Finance Agency, Clarkstown Maplewood Gardens Housing Series 2009A, Rev., VRDO, LOC: FHLMC, 0.07%, 9/8/2020 (b) | | | 455 | �� | | | 455 | |
| | |
New York State Housing Finance Agency, Historic Front Street Series 2003A, Rev., VRDO, LOC: Landesbank Hessen-Thueringen, 0.10%, 9/8/2020 (b) | | | 9,850 | | | | 9,850 | |
| | |
New York State Housing Finance Agency, Housing, 160 Madison Avenue Series 2014A, Rev., VRDO, LOC: Landesbank Hessen-Thueringen, 0.04%, 9/1/2020 (b) | | | 18,800 | | | | 18,800 | |
| | |
New York State Housing Finance Agency, Service Contract | | | | | | | | |
| | |
Series 2003A-1, Rev., VRDO, LOC: Bank of America NA, 0.09%, 9/8/2020 (b) | | | 840 | | | | 840 | |
| | | | | | | | |
| INVESTMENTS (a) | | PRINCIPAL
AMOUNT
($000) | | | VALUE
($000) | |
| |
|
New York — continued | |
| | |
Series 2003L, Rev., VRDO, LOC: Bank of America NA, 0.09%, 9/8/2020 (b) | | | 165 | | | | 165 | |
| | |
New York State Housing Finance Agency, Tribeca Green Series 2003A, Rev., VRDO, LOC: Landesbank Hessen-Thueringen, 0.11%, 9/8/2020 (b) | | | 28,575 | | | | 28,575 | |
| | |
New York State Housing Finance Agency, Worth Street Series A, Rev., VRDO, LOC: FNMA, 0.10%, 9/8/2020 (b) | | | 1,600 | | | | 1,600 | |
| | |
New York State Urban Development Corp., Service Contract Series 2008A-1, Rev., VRDO, LOC: Wells Fargo Bank NA, 0.08%, 9/8/2020 (b) | | | 1,820 | | | | 1,820 | |
| | |
Onondaga County Industrial Development Agency, Civic Facility, Syracuse Home Association Project Series 2007, Rev., VRDO, LOC: HSBC Bank USA NA, 0.14%, 9/8/2020 (b) | | | 4,055 | | | | 4,055 | |
| | |
Orchard Park Central School District GO, BAN, 1.50%, 5/5/2021 | | | 5,700 | | | | 5,721 | |
| | |
RBC Municipal Products, Inc. Trust Series E-24, Rev., VRDO, LOC: Royal Bank of Canada, 0.05%, 9/1/2020 (b) (c) | | | 10,000 | | | | 10,000 | |
| | |
RBC Municipal Products, Inc. Trust, Floater Certificates (Canada) | | | | | | | | |
| | |
Series 2018-G5, GO, VRDO, LOC: Royal Bank of Canada, 0.12%, 9/8/2020 (b) (c) | | | 6,000 | | | | 6,000 | |
| | |
Series E-137, Rev., VRDO, LOC: Royal Bank of Canada, 0.12%, 9/8/2020 (b) (c) | | | 23,000 | | | | 23,000 | |
| | |
Schalmont Central School District GO, BAN, 2.00%, 9/3/2020 | | | 1,297 | | | | 1,297 | |
| | |
Southwestern Central School District Series 2020A, GO, BAN, 1.25%, 7/21/2021 | | | 1,249 | | | | 1,255 | |
| | |
Tender Option Bond Trust Receipts/Certificates | | | | | | | | |
| | |
Series 2018-XF2646, Rev., VRDO, LIQ: Citibank NA, 0.10%, 9/8/2020 (b) (c) | | | 4,540 | | | | 4,540 | |
| | |
Series 2016-XF2282, Rev., VRDO, LIQ: Citibank NA, 0.11%, 9/8/2020 (b) (c) | | | 7,400 | | | | 7,400 | |
| | |
Series 2018-XF2656, Rev., VRDO, LIQ: Citibank NA, 0.11%, 9/8/2020 (b) (c) | | | 2,400 | | | | 2,400 | |
| | |
Series 2018-XF2704, Rev., VRDO, LIQ: Citibank NA, 0.11%, 9/8/2020 (b) (c) | | | 4,000 | | | | 4,000 | |
| | |
Series 2019-ZF2777, Rev., VRDO, LIQ: Citibank NA, 0.11%, 9/8/2020 (b) (c) | | | 6,000 | | | | 6,000 | |
| | |
Series 2019-ZF2778, Rev., VRDO, LIQ: Citibank NA, 0.11%, 9/8/2020 (b) (c) | | | 5,000 | | | | 5,000 | |
| | |
Series 2016-XM0438, Rev., VRDO, LIQ: Barclays Bank plc, 0.12%, 9/8/2020 (b) (c) | | | 4,000 | | | | 4,000 | |
SEE NOTES TO FINANCIAL STATEMENTS.
| | | | | | | | |
| | | |
| AUGUST 31, 2020 | | J.P. MORGAN MONEY MARKET FUNDS | | | | | 89 | |
JPMorgan New York Municipal Money Market Fund
SCHEDULE OF PORTFOLIO INVESTMENTS
AS OF AUGUST 31, 2020 (Unaudited) (continued)
| | | | | | | | |
| INVESTMENTS (a) | | PRINCIPAL
AMOUNT
($000) | | | VALUE
($000) | |
Municipal Bonds — continued | |
|
New York — continued | |
| | |
Series 2016-ZM0129, Rev., VRDO, LIQ: Royal Bank of Canada, 0.12%, 9/8/2020 (b) (c) | | | 4,240 | | | | 4,240 | |
| | |
Series 2017-XG0112, Rev., VRDO, LIQ: Barclays Bank plc, 0.12%, 9/8/2020 (b) (c) | | | 5,600 | | | | 5,600 | |
| | |
Series 2017-ZM0544, Rev., VRDO, LIQ: Bank of America NA, 0.12%, 9/8/2020 (b) (c) | | | 2,220 | | | | 2,220 | |
| | |
Series 2018-XM0692, Rev., VRDO, LIQ: Royal Bank of Canada, 0.12%, 9/8/2020 (b) (c) | | | 8,000 | | | | 8,000 | |
| | |
Series 2018-ZF2740, Rev., VRDO, LIQ: Morgan Stanley Bank, 0.12%, 9/8/2020 (b) (c) | | | 2,600 | | | | 2,600 | |
| | |
Series 2018-ZM0661, Rev., VRDO, LIQ: Morgan Stanley Bank, 0.12%, 9/8/2020 (b) (c) | | | 5,000 | | | | 5,000 | |
| | |
Series 2018-ZM0682, Rev., VRDO, LIQ: Morgan Stanley Bank, 0.12%, 9/8/2020 (b) (c) | | | 5,000 | | | | 5,000 | |
| | |
Series 2019-XF0829, Rev., VRDO, LOC: Royal Bank of Canada, 0.12%, 9/8/2020 (b) (c) | | | 4,015 | | | | 4,015 | |
| | |
Series 2019-XF0838, Rev., VRDO, LIQ: Bank of America NA, 0.12%, 9/8/2020 (b) (c) | | | 1,600 | | | | 1,600 | |
| | |
Series 2019-XF0847, Rev., VRDO, LOC: Royal Bank of Canada, 0.12%, 9/8/2020 (b) (c) | | | 5,075 | | | | 5,075 | |
| | |
Series 2019-XM0724, Rev., VRDO, LIQ: Royal Bank of Canada, 0.12%, 9/8/2020 (b) (c) | | | 7,500 | | | | 7,500 | |
| | |
Series 2019-ZF0832, Rev., VRDO, LOC: Bank of America NA, 0.12%, 9/8/2020 (b) (c) | | | 945 | | | | 945 | |
| | |
Series 2020-XG0272, Rev., VRDO, LIQ: Bank of America NA, 0.12%, 9/8/2020 (b) (c) | | | 5,340 | | | | 5,340 | |
| | |
Series 2020-XG0276, Rev., VRDO, LOC: Bank of America NA, 0.12%, 9/8/2020 (b) (c) | | | 12,955 | | | | 12,955 | |
| | |
Series 2020-XG0277, Rev., VRDO, AGM, LOC: Bank of America NA, 0.12%, 9/8/2020 (b) (c) | | | 13,260 | | | | 13,260 | |
| | |
Series 2020-XM0852, Rev., VRDO, LIQ: Morgan Stanley Bank, 0.12%, 9/8/2020 (b) (c) | | | 13,500 | | | | 13,500 | |
| | |
Series 2020-ZF0929, Rev., VRDO, LOC: Bank of America NA, 0.12%, 9/8/2020 (b) (c) | | | 3,755 | | | | 3,755 | |
| | |
Series 2020-ZM0807, Rev., VRDO, LIQ: Morgan Stanley Bank, 0.12%, 9/8/2020 (b) (c) | | | 5,950 | | | | 5,950 | |
| | |
Series 2015-ZF0264, Rev., VRDO, LIQ: TD Bank NA, 0.13%, 9/8/2020 (b) (c) | | | 6,265 | | | | 6,265 | |
| | | | | | | | |
| INVESTMENTS (a) | | PRINCIPAL
AMOUNT
($000) | | | VALUE
($000) | |
| |
|
New York — continued | |
| | |
Series 2017-XF2481, Rev., VRDO, LOC: Barclays Bank plc, 0.13%, 9/8/2020 (b) (c) | | | 2,160 | | | | 2,160 | |
| | |
Series 2018-XF0634, Rev., VRDO, LIQ: TD Bank NA, 0.13%, 9/8/2020 (b) (c) | | | 7,440 | | | | 7,440 | |
| | |
Series 2018-XF0635, Rev., VRDO, LIQ: TD Bank NA, 0.13%, 9/8/2020 (b) (c) | | | 6,185 | | | | 6,185 | |
| | |
Series 2019-XF0858, Rev., VRDO, LIQ: Bank of America NA, 0.13%, 9/8/2020 (b) (c) | | | 2,800 | | | | 2,800 | |
| | |
Series 2020-XF0880, Rev., VRDO, LIQ: TD Bank NA, 0.13%, 9/8/2020 (b) (c) | | | 9,035 | | | | 9,035 | |
| | |
Series 2020-XF0947, Rev., VRDO, LIQ: TD Bank NA, 0.13%, 9/8/2020 (b) (c) | | | 7,750 | | | | 7,750 | |
| | |
Series 2020-XF2888, Rev., VRDO, LOC: Barclays Bank plc, 0.13%, 9/8/2020 (b) (c) | | | 5,000 | | | | 5,000 | |
| | |
Series 2020-XX1127, Rev., VRDO, AGM, LOC: Barclays Bank plc, 0.13%, 9/8/2020 (b) (c) | | | 5,220 | | | | 5,220 | |
| | |
Series 2017-XF0598, Rev., VRDO, LIQ: TD Bank NA, 0.14%, 9/8/2020 (b) (c) | | | 3,000 | | | | 3,000 | |
| | |
Series 2018-XF0685, Rev., VRDO, LIQ: TD Bank NA, 0.14%, 9/8/2020 (b) (c) | | | 20,000 | | | | 20,000 | |
| | |
Series 2016-ZF0464, Rev., VRDO, LOC: Royal Bank of Canada, 0.15%, 9/8/2020 (b) (c) | | | 23,000 | | | | 23,000 | |
| | |
Town of Bedford Series 2020B, GO, BAN, 1.50%, 3/15/2021 | | | 700 | | | | 702 | |
| | |
Town of Big Flats GO, BAN, 1.75%, 3/19/2021 | | | 1,760 | | | | 1,768 | |
| | |
Town of Greece GO, BAN, 2.00%, 10/16/2020 | | | 2,500 | | | | 2,502 | |
| | |
Town of Huntington GO, BAN, 2.00%, 9/24/2020 | | | 1,000 | | | | 1,000 | |
| | |
Town of Lansing GO, BAN, 2.00%, 9/10/2020 | | | 2,153 | | | | 2,154 | |
| | |
Town of North Hempstead Series 2019B, GO, BAN, 2.00%, 9/25/2020 | | | 1,013 | | | | 1,013 | |
| | |
Town of Southold GO, BAN, 2.00%, 9/24/2020 | | | 9,279 | | | | 9,283 | |
| | |
Triborough Bridge and Tunnel Authority, MTA Bridges and Tunnels Subseries 2005 B-3, Rev., VRDO, LOC: State Street Bank & Trust, 0.03%, 9/1/2020 (b) | | | 8,720 | | | | 8,720 | |
| | |
Union Endicott Central School District GO, BAN, 2.00%, 10/22/2020 | | | 1,393 | | | | 1,394 | |
| | |
Union Springs Central School District GO, RAN, 1.25%, 10/30/2020 | | | 4,500 | | | | 4,506 | |
| | |
Victor Central School District Series 2019B, GO, BAN, 2.00%, 9/18/2020 | | | 2,536 | | | | 2,537 | |
| | |
Village of Bronxville, Anticipation Notes Series 2020A, GO, BAN, 1.50%, 4/30/2021 | | | 7,198 | | | | 7,202 | |
SEE NOTES TO FINANCIAL STATEMENTS.
| | | | | | |
| | | |
| 90 | | | | J.P. MORGAN MONEY MARKET FUNDS | | AUGUST 31, 2020 |
| | | | | | | | |
| INVESTMENTS (a) | | PRINCIPAL
AMOUNT
($000) | | | VALUE
($000) | |
Municipal Bonds — continued | |
|
New York — continued | |
| | |
Village of Pelham Series 2019A, GO, BAN, 2.00%, 9/18/2020 | | | 3,265 | | | | 3,266 | |
| | |
Village of Saltaire Series 2020A, GO, BAN, 1.50%, 2/18/2021 | | | 1,750 | | | | 1,755 | |
| | |
Waterloo Central School District GO, BAN, 1.25%, 6/25/2021 | | | 11,717 | | | | 11,778 | |
| | |
West Genesee Central School District | | | | | | | | |
| | |
Series 2020A, GO, BAN, 2.00%, 6/30/2021 | | | 1,960 | | | | 1,982 | |
| | |
Series 2020B, GO, BAN, 2.00%, 7/23/2021 | | | 1,601 | | | | 1,623 | |
| | | | | | | | |
| | |
Total Municipal Bonds
(Cost $1,108,091) | | | | | | | 1,108,091 | |
| | | | | |
| | |
| | | SHARES
(000) | | | | |
Variable Rate Demand Preferred Shares — 9.8% | |
|
New York — 9.8% | |
| | |
BlackRock MuniYield New York Quality Fund, Inc. Series W-7, LIQ: TD Bank NA, 0.16%, 9/8/2020 # (c) | | | 50,000 | | | | 50,000 | |
| | | | | | | | |
| INVESTMENTS (a) | | SHARES
(000) | | | VALUE
($000) | |
| |
|
New York — continued | |
| | |
Nuveen New York AMT-Free Quality Municipal Income Fund | | | | | | | | |
| | |
Series 2, LIQ: Citi Bank NA, 0.12%, 9/8/2020 # (c) | | | 16,600 | | | | 16,600 | |
| | |
Series 3, LIQ: Citi Bank NA, 0.12%, 9/8/2020 # (c) | | | 33,200 | | | | 33,200 | |
| | |
Nuveen New York Quality Municipal Income Fund Series 1, LIQ: TD Bank NA, 0.17%, 9/8/2020 # (c) | | | 20,500 | | | | 20,500 | |
| | | | | | | | |
| | |
Total Variable Rate Demand Preferred Shares
(Cost $120,300) | | | | | | | 120,300 | |
| | | | | |
Total Investments — 100.6%
(Cost $1,228,391) * | | | | | | | 1,228,391 | |
Liabilities in Excess of Other Assets — (0.6)% | | | | | | | (7,917 | ) |
| | | | | | | | |
Net Assets — 100.0% | | | | | | | 1,220,474 | |
| | | | | | | | |
Percentages indicated are based on net assets.
Abbreviations
| | |
| AGM | | Insured by Assured Guaranty Municipal Corp. |
| AMT | | Alternative Minimum Tax |
| BAN | | Bond Anticipation Note |
| FHLMC | | Federal Home Loan Mortgage Corp. |
| FNMA | | Federal National Mortgage Association |
| GO | | General Obligation |
| GTD | | Guaranteed |
| LIQ | | Liquidity Agreement |
| LOC | | Letter of Credit |
| MTA | | Metropolitan Transportation Authority |
| RAN | | Revenue Anticipation Note |
| Rev. | | Revenue |
| TAN | | Tax Anticipation Note |
| VRDO | | Variable Rate Demand Obligation |
| | |
| (a) | | The date shown represents the earliest of the next put date, next demand date or final maturity date. |
| (b) | | Variable or floating rate security, the interest rate of which adjusts periodically based on changes in current interest rates and prepayments on the underlying pool of assets. The interest rate shown is the current rate as of August 31, 2020. |
| (c) | | Securities exempt from registration under Rule 144A or section 4(a)(2), of the Securities Act of 1933, as amended. |
| # | | Variable Rate Demand Preferred Shares of a closed-end investment company which has a weekly demand feature. The interest rate shown is the rate in effect as of August 31, 2020. |
| * | | The cost of securities is substantially the same for federal income tax purposes. |
SEE NOTES TO FINANCIAL STATEMENTS.
| | | | | | | | |
| | | |
| AUGUST 31, 2020 | | J.P. MORGAN MONEY MARKET FUNDS | | | | | 91 | |
STATEMENTS OF ASSETS AND LIABILITIES
AS OF AUGUST 31, 2020 (Unaudited)
(Amounts in thousands, except per share amounts)
| | | | | | | | | | | | |
| | | JPMorgan
Prime Money
Market Fund | | | JPMorgan
Institutional
Tax Free Money
Market Fund | | | JPMorgan
Securities
Lending Money
Market Fund | |
ASSETS: | |
Investments in non-affiliates, at value | | $ | 61,098,699 | | | $ | 1,776,421 | | | $ | 3,381,379 | |
Repurchase agreements, at value | | | 26,058,800 | | | | 99,840 | | | | 268,813 | |
Cash | | | 304,895 | | | | — | (a) | | | 1 | |
Receivables: | | | | | | | | | | | | |
Investment securities sold | | | — | | | | 14,735 | | | | — | |
Investment securities sold — delayed delivery securities | | | — | | | | 110 | | | | — | |
Interest from non-affiliates | | | 53,175 | | | | 2,107 | | | | 1,751 | |
Interest from affiliates | | | 1 | | | | — | | | | — | |
| | | | | | | | | | | | |
Total Assets | | | 87,515,570 | | | | 1,893,213 | | | | 3,651,944 | |
| | | | | | | | | | | | |
|
LIABILITIES: | |
Payables: | | | | | | | | | | | | |
Distributions | | | 9,310 | | | | 116 | | | | 1,080 | |
Investment securities purchased | | | — | | | | 56,920 | | | | — | |
Accrued liabilities: | | | | | | | | | | | | |
Investment advisory fees | | | 5,815 | | | | 114 | | | | 91 | |
Administration fees | | | 3,616 | | | | 71 | | | | 49 | |
Distribution fees | | | — | (a) | | | — | | | | — | |
Service fees | | | 4,069 | | | | 20 | | | | — | |
Custodian and accounting fees | | | 759 | | | | 53 | | | | 62 | |
Trustees’ and Chief Compliance Officer’s fees | | | 69 | | | | 2 | | | | 2 | |
Printing and mailing costs | | | 396 | | | | 4 | | | | 1 | |
Audit fees | | | 74 | | | | 32 | | | | 30 | |
Registration fees | | | 818 | | | | 15 | | | | — | |
Other | | | 359 | | | | 26 | | | | 12 | |
| | | | | | | | | | | | |
Total Liabilities | | | 25,285 | | | | 57,373 | | | | 1,327 | |
| | | | | | | | | | | | |
Net Assets | | $ | 87,490,285 | | | $ | 1,835,840 | | | $ | 3,650,617 | |
| | | | | | | | | | | | |
| (a) | Amount rounds to less than one thousand. |
SEE NOTES TO FINANCIAL STATEMENTS.
| | | | | | |
| | | |
| 92 | | | | J.P. MORGAN MONEY MARKET FUNDS | | AUGUST 31, 2020 |
| | | | | | | | | | | | |
| | | JPMorgan
Prime Money
Market Fund | | | JPMorgan
Institutional
Tax Free Money
Market Fund | | | JPMorgan
Securities
Lending Money
Market Fund | |
NET ASSETS: | |
Paid-in-Capital | | $ | 87,467,891 | | | $ | 1,835,433 | | | $ | 3,649,482 | |
Total distributable earnings (loss) | | | 22,394 | | | | 407 | | | | 1,135 | |
| | | | | | | | | | | | |
Total Net Assets | | $ | 87,490,285 | | | $ | 1,835,840 | | | $ | 3,650,617 | |
| | | | | | | | | | | | |
|
Net Assets: | |
Class C | | $ | 627 | | | $ | — | | | $ | — | |
Academy | | | 1,439,771 | | | | — | | | | — | |
Agency | | | 2,453,387 | | | | 41,193 | | | | — | |
Agency SL | | | — | | | | — | | | | 3,650,617 | |
Capital | | | 51,943,171 | | | | 213,177 | | | | — | |
IM | | | 5,543,500 | | | | 1,190,264 | | | | — | |
Institutional Class | | | 22,362,614 | | | | 391,206 | | | | — | |
Morgan | | | 1,773,331 | | | | — | | | | — | |
Premier | | | 1,972,604 | | | | — | | | | — | |
Reserve | | | 1,280 | | | | — | | | | — | |
| | | | | | | | | | | | |
Total | | $ | 87,490,285 | | | $ | 1,835,840 | | | $ | 3,650,617 | |
| | | | | | | | | | | | |
| | | |
Outstanding units of beneficial interest (shares) | | | | | | | | | | | | |
($0.0001 par value; unlimited number of shares authorized): | | | | | | | | | | | | |
Class C | | | 626 | | | | — | | | | — | |
Academy | | | 1,438,556 | | | | — | | | | — | |
Agency | | | 2,450,826 | | | | 41,163 | | | | — | |
Agency SL | | | — | | | | — | | | | 3,649,484 | |
Capital | | | 51,903,470 | | | | 213,024 | | | | — | |
IM | | | 5,539,098 | | | | 1,189,421 | | | | — | |
Institutional Class | | | 22,344,881 | | | | 390,934 | | | | — | |
Morgan | | | 1,770,978 | | | | — | | | | — | |
Premier | | | 1,970,879 | | | | — | | | | — | |
Reserve | | | 1,278 | | | | — | | | | — | |
| | | |
Net Asset Value offering and redemption price per share | | | | | | | | | | | | |
Class C | | $ | 1.0008 | | | $ | — | | | $ | — | |
Academy | | | 1.0008 | | | | — | | | | — | |
Agency | | | 1.0010 | | | | 1.0007 | | | | — | |
Agency SL | | | — | | | | — | | | | 1.0003 | |
Capital | | | 1.0008 | | | | 1.0007 | | | | — | |
IM | | | 1.0008 | | | | 1.0007 | | | | — | |
Institutional Class | | | 1.0008 | | | | 1.0007 | | | | — | |
Morgan | | | 1.0013 | | | | — | | | | — | |
Premier | | | 1.0009 | | | | — | | | | — | |
Reserve | | | 1.0011 | | | | — | | | | — | |
| | | | | | | | | | | | |
| | | |
Cost of investments in non-affiliates | | $ | 61,063,861 | | | $ | 1,776,023 | | | $ | 3,379,920 | |
Cost of repurchase agreements | | | 26,058,800 | | | | 99,840 | | | | 268,813 | |
SEE NOTES TO FINANCIAL STATEMENTS.
| | | | | | | | |
| | | |
| AUGUST 31, 2020 | | J.P. MORGAN MONEY MARKET FUNDS | | | | | 93 | |
STATEMENTS OF ASSETS AND LIABILITIES
AS OF AUGUST 31, 2020 (Unaudited) (continued)
(Amounts in thousands, except per share amounts)
| | | | | | | | | | | | |
| | | JPMorgan
Liquid
Assets Money
Market Fund | | | JPMorgan
U.S. Government
Money
Market Fund | | | JPMorgan
U.S. Treasury
Plus Money
Market Fund | |
ASSETS: | |
Investments in non-affiliates, at value | | $ | 9,369,130 | | | $ | 127,275,167 | | | $ | 24,688,339 | |
Repurchase agreements, at value | | | 3,148,000 | | | | 52,955,866 | | | | 13,323,141 | |
Cash | | | 15,001 | | | | 3,016,063 | | | | 650,001 | |
Receivables: | | | | | | | | | | | | |
Fund shares sold | | | — | | | | 1,349 | | | | — | |
Interest from non-affiliates | | | 6,878 | | | | 55,404 | | | | 16,162 | |
Interest from affiliates | | | — | (a) | | | 8 | | | | 2 | |
| | | | | | | | | | | | |
Total Assets | | | 12,539,009 | | | | 183,303,857 | | | | 38,677,645 | |
| | | | | | | | | | | | |
|
LIABILITIES: | |
Payables: | | | | | | | | | | | | |
Distributions | | | 927 | | | | 2,706 | | | | 813 | |
Investment securities purchased | | | — | | | | 2,348,676 | | | | 1,697,148 | |
Fund shares redeemed | | | — | (a) | | | 529 | | | | — | |
Accrued liabilities: | | | | | | | | | | | | |
Investment advisory fees | | | 910 | | | | 12,524 | | | | 2,342 | |
Administration fees | | | 566 | | | | 7,781 | | | | 1,455 | |
Distribution fees | | | 6 | | | | — | | | | 10 | |
Service fees | | | 1,486 | | | | 8,383 | | | | 1,889 | |
Custodian and accounting fees | | | 147 | | | | 870 | | | | 209 | |
Trustees’ and Chief Compliance Officer’s fees | | | 9 | | | | 28 | | | | 7 | |
Printing and mailing costs | | | 21 | | | | 1,030 | | | | 363 | |
Audit fees | | | 44 | | | | 25 | | | | 41 | |
Registration fees | | | — | | | | 2,163 | | | | — | |
Other | | | 46 | | | | 205 | | | | 4 | |
| | | | | | | | | | | | |
Total Liabilities | | | 4,162 | | | | 2,384,920 | | | | 1,704,281 | |
| | | | | | | | | | | | |
Net Assets | | $ | 12,534,847 | | | $ | 180,918,937 | | | $ | 36,973,364 | |
| | | | | | | | | | | | |
| (a) | Amount rounds to less than one thousand. |
SEE NOTES TO FINANCIAL STATEMENTS.
| | | | | | |
| | | |
| 94 | | | | J.P. MORGAN MONEY MARKET FUNDS | | AUGUST 31, 2020 |
| | | | | | | | | | | | |
| | | JPMorgan
Liquid
Assets Money
Market Fund | | | JPMorgan
U.S. Government
Money
Market Fund | | | JPMorgan
U.S. Treasury
Plus Money
Market Fund | |
NET ASSETS: | |
Paid-in-Capital | | $ | 12,535,159 | | | $ | 180,923,394 | | | $ | 36,974,266 | |
Total distributable earnings (loss) | | | (312 | ) | | | (4,457 | ) | | | (902 | ) |
| | | | | | | | | | | | |
Total Net Assets | | $ | 12,534,847 | | | $ | 180,918,937 | | | $ | 36,973,364 | |
| | | | | | | | | | | | |
|
Net Assets: | |
Class C | | $ | 45,233 | | | $ | — | | | $ | 329,995 | |
Academy | | | — | | | | 1,446,216 | | | | — | |
Agency | | | 1,773,635 | | | | 17,834,258 | | | | 2,368,056 | |
Capital | | | 3,146,570 | | | | 111,735,102 | | | | 17,832,959 | |
E*Trade | | | — | | | | 377,312 | | | | — | |
IM | | | — | | | | 7,353,735 | | | | 34,267 | |
Institutional Class | | | 3,716,813 | | | | 34,645,602 | | | | 14,054,803 | |
Investor | | | 3,015 | | | | 887,319 | | | | 27,686 | |
Morgan | | | 718,338 | | | | 2,196,353 | | | | 498,471 | |
Premier | | | 3,127,065 | | | | 3,802,884 | | | | 1,822,556 | |
Reserve | | | 4,178 | | | | 17,997 | | | | 4,571 | |
Service | | | — | | | | 622,159 | | | | — | |
| | | | | | | | | | | | |
Total | | $ | 12,534,847 | | | $ | 180,918,937 | | | $ | 36,973,364 | |
| | | | | | | | | | | | |
|
Outstanding units of beneficial interest (shares) | |
($0.0001 par value; unlimited number of shares authorized): | | | | | | | | | | | | |
Class C | | | 45,234 | | | | — | | | | 330,003 | |
Academy | | | — | | | | 1,446,209 | | | | — | |
Agency | | | 1,773,651 | | | | 17,834,414 | | | | 2,368,115 | |
Capital | | | 3,146,589 | | | | 111,737,602 | | | | 17,833,179 | |
E*Trade | | | — | | | | 377,316 | | | | — | |
IM | | | — | | | | 7,353,934 | | | | 34,267 | |
Institutional Class | | | 3,716,862 | | | | 34,647,044 | | | | 14,055,342 | |
Investor | | | 3,016 | | | | 887,353 | | | | 27,687 | |
Morgan | | | 718,352 | | | | 2,196,336 | | | | 498,498 | |
Premier | | | 3,127,104 | | | | 3,802,955 | | | | 1,822,601 | |
Reserve | | | 4,178 | | | | 17,997 | | | | 4,571 | |
Service | | | — | | | | 622,214 | | | | — | |
Net Asset Value offering and redemption price per share (all classes) | | $ | 1.00 | | | $ | 1.00 | | | $ | 1.00 | |
| | | | | | | | | | | | |
| | | |
Cost of investments in non-affiliates | | $ | 9,369,130 | | | $ | 127,275,167 | | | $ | 24,688,339 | |
Cost of repurchase agreements | | | 3,148,000 | | | | 52,955,866 | | | | 13,323,141 | |
SEE NOTES TO FINANCIAL STATEMENTS.
| | | | | | | | |
| | | |
| AUGUST 31, 2020 | | J.P. MORGAN MONEY MARKET FUNDS | | | | | 95 | |
STATEMENTS OF ASSETS AND LIABILITIES
AS OF AUGUST 31, 2020 (Unaudited) (continued)
(Amounts in thousands, except per share amounts)
| | | | | | | | | | | | |
| | | JPMorgan
Federal Money
Market Fund | | | JPMorgan
100% U.S.
Treasury
Securities Money
Market Fund | | | JPMorgan
Tax Free
Money
Market Fund | |
ASSETS: | |
Investments in non-affiliates, at value | | $ | 3,167,904 | | | $ | 109,710,593 | | | $ | 10,614,820 | |
Repurchase agreements, at value | | | — | | | | — | | | | 215,110 | |
Cash | | | 32,359 | | | | 1,870,303 | | | | — | (a) |
Receivables: | | | | | | | | | | | | |
Investment securities sold | | | — | | | | — | | | | 37,310 | |
Investment securities sold — delayed delivery securities | | | — | | | | — | | | | 5,165 | |
Fund shares sold | | | 2,186 | | | | — | | | | — | |
Interest from non-affiliates | | | 871 | | | | 30,894 | | | | 13,439 | |
Interest from affiliates | | | — | (a) | | | 5 | | | | — | |
Other assets | | | — | | | | 94 | | | | — | |
| | | | | | | | | | | | |
Total Assets | | | 3,203,320 | | | | 111,611,889 | | | | 10,885,844 | |
| | | | | | | | | | | | |
|
LIABILITIES: | |
Payables: | | | | | | | | | | | | |
Distributions | | | 22 | | | | 2,074 | | | | 389 | |
Investment securities purchased | | | — | | | | — | | | | 142,429 | |
Fund shares redeemed | | | 1,956 | | | | — | | | | — | |
Accrued liabilities: | | | | | | | | | | | | |
Investment advisory fees | | | 225 | | | | 7,739 | | | | 748 | |
Administration fees | | | 140 | | | | 4,808 | | | | 464 | |
Service fees | | | 177 | | | | 4,725 | | | | 759 | |
Custodian and accounting fees | | | 18 | | | | 341 | | | | 79 | |
Trustees’ and Chief Compliance Officer’s fees | | | — | | | | 11 | | | | 4 | |
Printing and mailing costs | | | 261 | | | | 49 | | | | 37 | |
Audit fees | | | 26 | | | | 20 | | | | 32 | |
Registration fees | | | — | | | | 1,068 | | | | 94 | |
Other | | | 7 | | | | 7 | | | | 67 | |
| | | | | | | | | | | | |
Total Liabilities | | | 2,832 | | | | 20,842 | | | | 145,102 | |
| | | | | | | | | | | | |
Net Assets | | $ | 3,200,488 | | | $ | 111,591,047 | | | $ | 10,740,742 | |
| | | | | | | | | | | | |
| (a) | Amount rounds to less than one thousand. |
SEE NOTES TO FINANCIAL STATEMENTS.
| | | | | | |
| | | |
| 96 | | | | J.P. MORGAN MONEY MARKET FUNDS | | AUGUST 31, 2020 |
| | | | | | | | | | | | |
| | | JPMorgan
Federal Money
Market Fund | | | JPMorgan
100% U.S.
Treasury
Securities Money
Market Fund | | | JPMorgan
Tax Free
Money
Market Fund | |
NET ASSETS: | |
Paid-in-Capital | | $ | 3,200,583 | | | $ | 111,592,243 | | | $ | 10,740,952 | |
Total distributable earnings (loss) | | | (95 | ) | | | (1,196 | ) | | | (210 | ) |
| | | | | | | | | | | | |
Total Net Assets | | $ | 3,200,488 | | | $ | 111,591,047 | | | $ | 10,740,742 | |
| | | | | | | | | | | | |
|
Net Assets: | |
Agency | | $ | 324,682 | | | $ | 4,978,340 | | | $ | 616,862 | |
Capital | | | — | | | | 69,953,404 | | | | — | |
IM | | | — | | | | 186,273 | | | | — | |
Institutional Class | | | 2,645,618 | | | | 29,171,372 | | | | 8,056,235 | |
Morgan | | | 55,726 | | | | 2,229,896 | | | | 28,341 | |
Premier | | | 174,462 | | | | 2,504,281 | | | | 676,539 | |
Reserve | | | — | | | | 2,567,481 | | | | 1,362,765 | |
| | | | | | | | | | | | |
Total | | $ | 3,200,488 | | | $ | 111,591,047 | | | $ | 10,740,742 | |
| | | | | | | | | | | | |
|
Outstanding units of beneficial interest (shares) | |
($0.0001 par value; unlimited number of shares authorized): | | | | | | | | | | | | |
Agency | | | 324,710 | | | | 4,978,399 | | | | 616,865 | |
Capital | | | — | | | | 69,954,019 | | | | — | |
IM | | | — | | | | 186,274 | | | | — | |
Institutional Class | | | 2,645,947 | | | | 29,171,752 | | | | 8,056,135 | |
Morgan | | | 55,731 | | | | 2,229,916 | | | | 28,341 | |
Premier | | | 174,489 | | | | 2,504,305 | | | | 676,481 | |
Reserve | | | — | | | | 2,567,488 | | | | 1,362,676 | |
Net Asset Value offering and redemption price per share (all classes) | | $ | 1.00 | | | $ | 1.00 | | | $ | 1.00 | |
| | | | | | | | | | | | |
| | | |
Cost of investments in non-affiliates | | $ | 3,167,904 | | | $ | 109,710,593 | | | $ | 10,614,820 | |
Cost of repurchase agreements | | | — | | | | — | | | | 215,110 | |
SEE NOTES TO FINANCIAL STATEMENTS.
| | | | | | | | |
| | | |
| AUGUST 31, 2020 | | J.P. MORGAN MONEY MARKET FUNDS | | | | | 97 | |
STATEMENTS OF ASSETS AND LIABILITIES
AS OF AUGUST 31, 2020 (Unaudited) (continued)
(Amounts in thousands, except per share amounts)
| | | | | | | | | | | | |
| | | JPMorgan
Municipal Money
Market Fund | | | JPMorgan
California
Municipal Money
Market Fund | | | JPMorgan
New York
Municipal Money
Market Fund | |
ASSETS: | |
Investments in non-affiliates, at value | | $ | 1,212,265 | | | $ | 409,388 | | | $ | 1,228,391 | |
Repurchase agreements, at value | | | 12,543 | | | | 1,600 | | | | — | |
Cash | | | — | | | | 1 | | | | 7 | |
Receivables: | | | | | | | | | | | | |
Investment securities sold | | | 5,180 | | | | 265 | | | | 2,500 | |
Investment securities sold — delayed delivery securities | | | 140 | | | | 145 | | | | 1,890 | |
Interest from non-affiliates | | | 2,988 | | | | 774 | | | | 2,102 | |
| | | | | | | | | | | | |
Total Assets | | | 1,233,116 | | | | 412,173 | | | | 1,234,890 | |
| | | | | | | | | | | | |
|
LIABILITIES: | |
Payables: | | | | | | | | | | | | |
Due to custodian | | | 4,980 | | | | — | | | | — | |
Distributions | | | 59 | | | | 4 | | | | 45 | |
Investment securities purchased | | | 9,054 | | | | — | | | | 14,070 | |
Accrued liabilities: | | | | | | | | | | | | |
Investment advisory fees | | | 83 | | | | 29 | | | | 80 | |
Administration fees | | | 52 | | | | 18 | | | | 49 | |
Service fees | | | 90 | | | | 17 | | | | 82 | |
Custodian and accounting fees | | | 29 | | | | 15 | | | | 27 | |
Trustees’ and Chief Compliance Officer’s fees | | | — | (a) | | | — | | | | — | |
Printing and mailing costs | | | 85 | | | | 74 | | | | 21 | |
Audit fees | | | 32 | | | | 28 | | | | 27 | |
Registration fees | | | 376 | | | | 19 | | | | — | |
Other | | | 34 | | | | 13 | | | | 15 | |
| | | | | | | | | | | | |
Total Liabilities | | | 14,874 | | | | 217 | | | | 14,416 | |
| | | | | | | | | | | | |
Net Assets | | $ | 1,218,242 | | | $ | 411,956 | | | $ | 1,220,474 | |
| | | | | | | | | | | | |
| (a) | Amount rounds to less than one thousand. |
SEE NOTES TO FINANCIAL STATEMENTS.
| | | | | | |
| | | |
| 98 | | | | J.P. MORGAN MONEY MARKET FUNDS | | AUGUST 31, 2020 |
| | | | | | | | | | | | |
| | | JPMorgan
Municipal Money
Market Fund | | | JPMorgan
California
Municipal Money
Market Fund | | | JPMorgan
New York
Municipal Money
Market Fund | |
NET ASSETS: | |
Paid-in-Capital | | $ | 1,218,163 | | | $ | 411,955 | | | $ | 1,220,256 | |
Total distributable earnings (loss) | | | 79 | | | | 1 | | | | 218 | |
| | | | | | | | | | | | |
Total Net Assets | | $ | 1,218,242 | | | $ | 411,956 | | | $ | 1,220,474 | |
| | | | | | | | | | | | |
|
Net Assets: | |
Agency | | $ | 93,816 | | | $ | 36,108 | | | $ | 122,454 | |
E*Trade | | | — | | | | — | | | | — | |
Institutional Class | | | 919,050 | | | | 208,247 | | | | 802,647 | |
Morgan | | | 56,077 | | | | 10,873 | | | | 65,422 | |
Premier | | | 108,341 | | | | 138,832 | | | | 224,299 | |
Reserve | | | — | | | | — | | | | 831 | |
Service | | | 40,958 | | | | 17,896 | | | | 4,821 | |
| | | | | | | | | | | | |
Total | | $ | 1,218,242 | | | $ | 411,956 | | | $ | 1,220,474 | |
| | | | | | | | | | | | |
|
Outstanding units of beneficial interest (shares) | |
($0.0001 par value; unlimited number of shares authorized): | | | | | | | | | | | | |
Agency | | | 93,808 | | | | 36,099 | | | | 122,430 | |
E*Trade | | | — | | | | — | | | | — | |
Institutional Class | | | 918,988 | | | | 208,187 | | | | 802,487 | |
Morgan | | | 56,072 | | | | 10,871 | | | | 65,409 | |
Premier | | | 108,331 | | | | 138,806 | | | | 224,255 | |
Reserve | | | — | | | | — | | | | 831 | |
Service | | | 40,955 | | | | 17,893 | | | | 4,820 | |
Net Asset Value offering and redemption price per share (all classes) | | $ | 1.00 | | | $ | 1.00 | | | $ | 1.00 | |
| | | | | | | | | | | | |
| | | |
Cost of investments in non-affiliates | | $ | 1,212,265 | | | $ | 409,388 | | | $ | 1,228,391 | |
Cost of repurchase agreements | | | 12,543 | | | | 1,600 | | | | — | |
SEE NOTES TO FINANCIAL STATEMENTS.
| | | | | | | | |
| | | |
| AUGUST 31, 2020 | | J.P. MORGAN MONEY MARKET FUNDS | | | | | 99 | |
STATEMENTS OF OPERATIONS
FOR THE SIX MONTHS ENDED AUGUST 31, 2020 (Unaudited)
(Amounts in thousands)
| | | | | | | | | | | | |
| | | JPMorgan
Prime Money
Market Fund | | | JPMorgan
Institutional
Tax Free Money
Market Fund | | | JPMorgan
Securities
Lending Money
Market Fund | |
INVESTMENT INCOME: | |
Interest income from non-affiliates | | $ | 252,542 | | | $ | 5,004 | | | $ | 13,168 | |
Interest income from affiliates | | | 270 | | | | — | | | | — | (a) |
| | | | | | | | | | | | |
Total investment income | | | 252,812 | | | | 5,004 | | | | 13,168 | |
| | | | | | | | | | | | |
|
EXPENSES: | |
Investment advisory fees | | | 27,925 | | | | 711 | | | | 1,409 | |
Administration fees | | | 16,874 | | | | 428 | | | | 855 | |
Distribution fees (See Note 4) | | | 6 | | | | — | | | | — | |
Service fees (See Note 4) | | | 27,712 | | | | 348 | | | | — | |
Custodian and accounting fees | | | 1,088 | | | | 80 | | | | 98 | |
Interest expense to affiliates | | | — | | | | 3 | | | | — | (a) |
Professional fees | | | 409 | | | | 36 | | | | 45 | |
Trustees’ and Chief Compliance Officer’s fees | | | 183 | | | | 18 | | | | 20 | |
Printing and mailing costs | | | 59 | | | | 6 | | | | 7 | |
Registration and filing fees | | | 764 | | | | 76 | | | | 32 | |
Transfer agency fees (See Note 2.F.) | | | 984 | | | | 81 | | | | 54 | |
Other | | | 285 | | | | 9 | | | | 37 | |
| | | | | | | | | | | | |
Total expenses | | | 76,289 | | | | 1,796 | | | | 2,557 | |
| | | | | | | | | | | | |
Less fees waived | | | (4,875 | ) | | | (222 | ) | | | (1,500 | ) |
Less expense reimbursements | | | (20 | ) | | | — | | | | — | |
| | | | | | | | | | | | |
Net expenses | | | 71,394 | | | | 1,574 | | | | 1,057 | |
| | | | | | | | | | | | |
Net investment income (loss) | | | 181,418 | | | | 3,430 | | | | 12,111 | |
| | | | | | | | | | | | |
| | | |
REALIZED/UNREALIZED GAINS (LOSSES): | | | | | | | | | | | | |
Net realized gain (loss) on transactions from investments in non-affiliates | | | (11,941 | ) | | | 6 | | | | (330 | ) |
Change in net unrealized appreciation/depreciation on investments in non-affiliates | | | 12,729 | | | | 317 | | | | 645 | |
| | | | | | | | | | | | |
Net realized/unrealized gains (losses) | | | 788 | | | | 323 | | | | 315 | |
| | | | | | | | | | | | |
Change in net assets resulting from operations | | $ | 182,206 | | | $ | 3,753 | | | $ | 12,426 | |
| | | | | | | | | | | | |
| (a) | Amount rounds to less than one thousand. |
SEE NOTES TO FINANCIAL STATEMENTS.
| | | | | | |
| | | |
| 100 | | | | J.P. MORGAN MONEY MARKET FUNDS | | AUGUST 31, 2020 |
| | | | | | | | | | | | |
| | | JPMorgan
Liquid
Assets Money
Market Fund | | | JPMorgan
U.S. Government
Money
Market Fund | | | JPMorgan
U.S. Treasury
Plus Money
Market Fund | |
INVESTMENT INCOME: | |
Interest income from non-affiliates | | $ | 42,992 | | | $ | 397,411 | | | $ | 68,095 | |
Interest income from affiliates | | | 10 | | | | 4,418 | | | | 690 | |
Income from interfund lending (net) | | | 62 | | | | — | | | | — | |
| | | | | | | | | | | | |
Total investment income | | | 43,064 | | | | 401,829 | | | | 68,785 | |
| | | | | | | | | | | | |
|
EXPENSES: | |
Investment advisory fees | | | 4,708 | | | | 79,403 | | | | 12,942 | |
Administration fees | | | 2,852 | | | | 48,369 | | | | 7,879 | |
Distribution fees (See Note 4) | | | 575 | | | | 4,443 | | | | 1,552 | |
Service fees (See Note 4) | | | 10,164 | | | | 77,653 | | | | 15,848 | |
Custodian and accounting fees | | | 213 | | | | 1,253 | | | | 218 | |
Interest expense to affiliates | | | 2 | | | | — | | | | — | |
Professional fees | | | 82 | | | | 819 | | | | 188 | |
Trustees’ and Chief Compliance Officer’s fees | | | 40 | | | | 344 | | | | 69 | |
Printing and mailing costs | | | 36 | | | | 247 | | | | 15 | |
Registration and filing fees | | | 381 | | | | 803 | | | | 140 | |
Transfer agency fees (See Note 2.F.) | | | 171 | | | | 1,707 | | | | 330 | |
Other | | | 2 | | | | 606 | | | | 156 | |
| | | | | | | | | | | | |
Total expenses | | | 19,226 | | | | 215,647 | | | | 39,337 | |
| | | | | | | | | | | | |
Less fees waived | | | (1,611 | ) | | | (20,364 | ) | | | (5,035 | ) |
Less expense reimbursements | | | (1 | ) | | | — | | | | — | |
| | | | | | | | | | | | |
Net expenses | | | 17,614 | | | | 195,283 | | | | 34,302 | |
| | | | | | | | | | | | |
Net investment income (loss) | | | 25,450 | | | | 206,546 | | | | 34,483 | |
| | | | | | | | | | | | |
| | | |
REALIZED/UNREALIZED GAINS (LOSSES): | | | | | | | | | | | | |
Net realized gain (loss) on transactions from investments in non-affiliates | | | (105 | ) | | | 1,217 | | | | 56 | |
| | | | | | | | | | | | |
Change in net assets resulting from operations | | $ | 25,345 | | | $ | 207,763 | | | $ | 34,539 | |
| | | | | | | | | | | | |
SEE NOTES TO FINANCIAL STATEMENTS.
| | | | | | | | |
| | | |
| AUGUST 31, 2020 | | J.P. MORGAN MONEY MARKET FUNDS | | | | | 101 | |
STATEMENTS OF OPERATIONS
FOR THE SIX MONTHS ENDED AUGUST 31, 2020 (Unaudited) (continued)
(Amounts in thousands)
| | | | | | | | | | | | |
| | | JPMorgan
Federal Money
Market Fund | | | JPMorgan
100% U.S.
Treasury
Securities Money
Market Fund | | | JPMorgan
Tax Free
Money
Market Fund | |
INVESTMENT INCOME: | |
Interest income from non-affiliates | | $ | 8,685 | | | $ | 224,457 | | | $ | 47,862 | |
Interest income from affiliates | | | 31 | | | | 1,409 | | | | — | |
| | | | | | | | | | | | |
Total investment income | | | 8,716 | | | | 225,866 | | | | 47,862 | |
| | | | | | | | | | | | |
|
EXPENSES: | |
Investment advisory fees | | | 1,562 | | | | 46,560 | | | | 4,953 | |
Administration fees | | | 959 | | | | 28,173 | | | | 3,035 | |
Distribution fees (See Note 4) | | | 27 | | | | 4,336 | | | | 1,631 | |
Service fees (See Note 4) | | | 2,340 | | | | 51,150 | | | | 8,618 | |
Custodian and accounting fees | | | 38 | | | | 678 | | | | 137 | |
Interest expense to affiliates | | | — | (a) | | | — | | | | 10 | |
Professional fees | | | 37 | | | | 449 | | | | 98 | |
Trustees’ and Chief Compliance Officer’s fees | | | 19 | | | | 197 | | | | 37 | |
Printing and mailing costs | | | 102 | | | | 122 | | | | 25 | |
Registration and filing fees | | | 62 | | | | 1,382 | | | | 71 | |
Transfer agency fees (See Note 2.F.) | | | 45 | | | | 840 | | | | 120 | |
Other | | | 36 | | | | 321 | | | | 43 | |
| | | | | | | | | | | | |
Total expenses | | | 5,227 | | | | 134,208 | | | | 18,778 | |
| | | | | | | | | | | | |
Less fees waived | | | (887 | ) | | | (15,956 | ) | | | (3,624 | ) |
| | | | | | | | | | | | |
Net expenses | | | 4,340 | | | | 118,252 | | | | 15,154 | |
| | | | | | | | | | | | |
Net investment income (loss) | | | 4,376 | | | | 107,614 | | | | 32,708 | |
| | | | | | | | | | | | |
| | | |
REALIZED/UNREALIZED GAINS (LOSSES): | | | | | | | | | | | | |
Net realized gain (loss) on transactions from investments in non-affiliates | | | 73 | | | | (389 | ) | | | 62 | |
| | | | | | | | | | | | |
Change in net assets resulting from operations | | $ | 4,449 | | | $ | 107,225 | | | $ | 32,770 | |
| | | | | | | | | | | | |
| (a) | Amount rounds to less than one thousand. |
SEE NOTES TO FINANCIAL STATEMENTS.
| | | | | | |
| | | |
| 102 | | | | J.P. MORGAN MONEY MARKET FUNDS | | AUGUST 31, 2020 |
| | | | | | | | | | | | |
| | | JPMorgan
Municipal Money
Market Fund | | | JPMorgan
California
Municipal Money
Market Fund | | | JPMorgan
New York
Municipal Money
Market Fund | |
INVESTMENT INCOME: | |
Interest income from non-affiliates | | $ | 5,928 | | | $ | 1,986 | | | $ | 7,282 | |
Interest income from affiliates | | | — | (a) | | | — | | | | — | |
| | | | | | | | | | | | |
Total investment income | | | 5,928 | | | | 1,986 | | | | 7,282 | |
| | | | | | | | | | | | |
|
EXPENSES: | |
Investment advisory fees | | | 544 | | | | 250 | | | | 675 | |
Administration fees | | | 334 | | | | 152 | | | | 418 | |
Distribution fees (See Note 4) | | | 183 | | | | 72 | | | | 54 | |
Service fees (See Note 4) | | | 985 | | | | 550 | | | | 1,390 | |
Custodian and accounting fees | | | 46 | | | | 28 | | | | 51 | |
Interest expense to affiliates | | | 4 | | | | 1 | | | | 3 | |
Professional fees | | | 37 | | | | 27 | | | | 33 | |
Trustees’ and Chief Compliance Officer’s fees | | | 15 | | | | 13 | | | | 16 | |
Printing and mailing costs | | | 49 | | | | 4 | | | | 4 | |
Registration and filing fees | | | 137 | | | | 46 | | | | 46 | |
Transfer agency fees (See Note 2.F.) | | | 35 | | | | 12 | | | | 38 | |
Other | | | 9 | | | | 5 | | | | 7 | |
| | | | | | | | | | | | |
Total expenses | | | 2,378 | | | | 1,160 | | | | 2,735 | |
| | | | | | | | | | | | |
Less fees waived | | | (603 | ) | | | (353 | ) | | | (500 | ) |
| | | | | | | | | | | | |
Net expenses | | | 1,775 | | | | 807 | | | | 2,235 | |
| | | | | | | | | | | | |
Net investment income (loss) | | | 4,153 | | | | 1,179 | | | | 5,047 | |
| | | | | | | | | | | | |
| | | |
REALIZED/UNREALIZED GAINS (LOSSES): | | | | | | | | | | | | |
Net realized gain (loss) on transactions from investments in non-affiliates | | | 87 | | | | 6 | | | | 33 | |
| | | | | | | | | | | | |
Change in net assets resulting from operations | | $ | 4,240 | | | $ | 1,185 | | | $ | 5,080 | |
| | | | | | | | | | | | |
| (a) | Amount rounds to less than one thousand. |
SEE NOTES TO FINANCIAL STATEMENTS.
| | | | | | | | |
| | | |
| AUGUST 31, 2020 | | J.P. MORGAN MONEY MARKET FUNDS | | | | | 103 | |
STATEMENTS OF CHANGES IN NET ASSETS
FOR THE PERIODS INDICATED
(Amounts in thousands)
| | | | | | | | | | | | | | | | |
| | | JPMorgan Prime Money Market Fund | | | JPMorgan Institutional Tax Free Money
Market Fund | |
| | | Six Months Ended
August 31, 2020
(Unaudited) | | | Year Ended
February 29, 2020 | | | Six Months Ended
August 31, 2020
(Unaudited) | | | Year Ended
February 29, 2020 | |
CHANGE IN NET ASSETS RESULTING FROM OPERATIONS: | | | | | | | | | | | | | | | | |
Net investment income (loss) | | $ | 181,418 | | | $ | 1,144,375 | | | $ | 3,430 | | | $ | 11,832 | |
Net realized gain (loss) | | | (11,941 | ) | | | 218 | | | | 6 | | | | 51 | |
Change in net unrealized appreciation/depreciation | | | 12,729 | | | | 13,052 | | | | 317 | | | | 114 | |
| | | | | | | | | | | | | | | | |
Change in net assets resulting from operations | | | 182,206 | | | | 1,157,645 | | | | 3,753 | | | | 11,997 | |
| | | | | | | | | | | | | | | | |
| | | | |
DISTRIBUTIONS TO SHAREHOLDERS: | | | | | | | | | | | | | | | | |
Class C | | | — | (a) | | | (13 | ) | | | — | | | | — | |
Academy (b) | | | (4,562 | ) | | | (457 | ) | | | — | | | | — | |
Agency | | | (6,261 | ) | | | (49,744 | ) | | | (108 | ) | | | (618 | ) |
Capital | | | (100,620 | ) | | | (597,060 | ) | | | (937 | ) | | | (2,326 | ) |
IM | | | (17,214 | ) | | | (117,603 | ) | | | (1,543 | ) | | | (5,287 | ) |
Institutional Class | | | (45,041 | ) | | | (289,111 | ) | | | (842 | ) | | | (3,653 | ) |
Morgan | | | (3,631 | ) | | | (48,418 | ) | | | — | | | | — | |
Premier | | | (4,081 | ) | | | (41,832 | ) | | | — | | | | — | |
Reserve | | | (7 | ) | | | (183 | ) | | | — | | | | — | |
| | | | | | | | | | | | | | | | |
Total distributions to shareholders | | | (181,417 | ) | | | (1,144,421 | ) | | | (3,430 | ) | | | (11,884 | ) |
| | | | | | | | | | | | | | | | |
|
CAPITAL TRANSACTIONS: | |
Change in net assets resulting from capital transactions | | | 24,448,368 | | | | 15,946,055 | | | | 865,149 | | | | 26,906 | |
| | | | | | | | | | | | | | | | |
|
NET ASSETS: | |
Change in net assets | | | 24,449,157 | | | | 15,959,279 | | | | 865,472 | | | | 27,019 | |
Beginning of period | | | 63,041,128 | | | | 47,081,849 | | | | 970,368 | | | | 943,349 | |
| | | | | | | | | | | | | | | | |
End of period | | $ | 87,490,285 | | | $ | 63,041,128 | | | $ | 1,835,840 | | | $ | 970,368 | |
| | | | | | | | | | | | | | | | |
| (a) | Amount rounds to less than one thousand. |
| (b) | Commencement of offering of class of shares effective May 15, 2019 for JPMorgan Prime Money Market Fund. |
SEE NOTES TO FINANCIAL STATEMENTS.
| | | | | | |
| | | |
| 104 | | | | J.P. MORGAN MONEY MARKET FUNDS | | AUGUST 31, 2020 |
| | | | | | | | | | | | | | | | |
| | | JPMorgan Securities Lending Money
Market Fund | | | JPMorgan Liquid Assets Money Market Fund | |
| | | Six Months Ended
August 31, 2020
(Unaudited) | | | Year Ended
February 29, 2020 | | | Six Months Ended
August 31, 2020
(Unaudited) | | | Year Ended
February 29, 2020 | |
CHANGE IN NET ASSETS RESULTING FROM OPERATIONS: | | | | | | | | | | | | | | | | |
Net investment income (loss) | | $ | 12,111 | | | $ | 75,333 | | | $ | 25,450 | | | $ | 154,259 | |
Net realized gain (loss) | | | (330 | ) | | | 10 | | | | (105 | ) | | | 25 | |
Change in net unrealized appreciation/depreciation | | | 645 | | | | 331 | | | | — | | | | — | |
| | | | | | | | | | | | | | | | |
Change in net assets resulting from operations | | | 12,426 | | | | 75,674 | | | | 25,345 | | | | 154,284 | |
| | | | | | | | | | | | | | | | |
| | | | |
DISTRIBUTIONS TO SHAREHOLDERS: | | | | | | | | | | | | | | | | |
Class C | | | — | | | | — | | | | (15 | ) | | | (277 | ) |
Agency | | | — | | | | — | | | | (3,728 | ) | | | (16,604 | ) |
Agency SL | | | (12,112 | ) | | | (75,337 | ) | | | — | | | | — | |
Capital | | | — | | | | — | | | | (6,523 | ) | | | (30,328 | ) |
Institutional Class | | | — | | | | — | | | | (9,047 | ) | | | (62,194 | ) |
Investor | | | — | | | | — | | | | (5 | ) | | | (127 | ) |
Morgan | | | — | | | | — | | | | (883 | ) | | | (6,659 | ) |
Premier | | | — | | | | — | | | | (5,246 | ) | | | (38,021 | ) |
Reserve | | | — | | | | — | | | | (4 | ) | | | (65 | ) |
| | | | | | | | | | | | | | | | |
Total distributions to shareholders | | | (12,112 | ) | | | (75,337 | ) | | | (25,451 | ) | | | (154,275 | ) |
| | | | | | | | | | | | | | | | |
|
CAPITAL TRANSACTIONS: | |
Change in net assets resulting from capital transactions | | | 194,479 | | | | 589,948 | | | | 1,768,293 | | | | 5,465,305 | |
| | | | | | | | | | | | | | | | |
|
NET ASSETS: | |
Change in net assets | | | 194,793 | | | | 590,285 | | | | 1,768,187 | | | | 5,465,314 | |
Beginning of period | | | 3,455,824 | | | | 2,865,539 | | | | 10,766,660 | | | | 5,301,346 | |
| | | | | | | | | | | | | | | | |
End of period | | $ | 3,650,617 | | | $ | 3,455,824 | | | $ | 12,534,847 | | | $ | 10,766,660 | |
| | | | | | | | | | | | | | | | |
SEE NOTES TO FINANCIAL STATEMENTS.
| | | | | | | | |
| | | |
| AUGUST 31, 2020 | | J.P. MORGAN MONEY MARKET FUNDS | | | | | 105 | |
STATEMENTS OF CHANGES IN NET ASSETS
FOR THE PERIODS INDICATED (continued)
(Amounts in thousands)
| | | | | | | | | | | | | | | | |
| | | JPMorgan U.S. Government Money
Market Fund | | | JPMorgan U.S. Treasury Plus Money
Market Fund | |
| | | Six Months Ended
August 31, 2020
(Unaudited) | | | Year Ended
February 29, 2020 | | | Six Months Ended
August 31, 2020
(Unaudited) | | | Year Ended
February 29, 2020 | |
CHANGE IN NET ASSETS RESULTING FROM OPERATIONS: | | | | | | | | | | | | | | | | |
Net investment income (loss) | | $ | 206,546 | | | $ | 2,820,670 | | | $ | 34,483 | | | $ | 552,404 | |
Net realized gain (loss) | | | 1,217 | | | | (82 | ) | | | 56 | | | | (198 | ) |
| | | | | | | | | | | | | | | | |
Change in net assets resulting from operations | | | 207,763 | | | | 2,820,588 | | | | 34,539 | | | | 552,206 | |
| | | | | | | | | | | | | | | | |
| | | | |
DISTRIBUTIONS TO SHAREHOLDERS: | | | | | | | | | | | | | | | | |
Class C | | | — | | | | — | | | | (49 | ) | | | (3,629 | ) |
Academy (a) | | | (732 | ) | | | (216 | ) | | | — | | | | — | |
Agency | | | (13,871 | ) | | | (230,142 | ) | | | (1,778 | ) | | | (38,568 | ) |
Capital | | | (141,319 | ) | | | (1,543,302 | ) | | | (16,456 | ) | | | (146,413 | ) |
Eagle Class (b) | | | — | | | | (16,148 | ) | | | — | | | | — | |
Eagle Private Wealth Class (c) | | | — | | | | — | (d) | | | — | | | | — | |
E*Trade | | | (69 | ) | | | (3,113 | ) | | | — | | | | — | |
IM | | | (10,406 | ) | | | (130,326 | ) | | | (52 | ) | | | (10,160 | ) |
Institutional Class | | | (36,739 | ) | | | (768,011 | ) | | | (15,180 | ) | | | (322,365 | ) |
Investor | | | (358 | ) | | | (15,053 | ) | | | (13 | ) | | | (518 | ) |
Morgan | | | (927 | ) | | | (28,533 | ) | | | (258 | ) | | | (11,478 | ) |
Premier | | | (1,959 | ) | | | (64,204 | ) | | | (695 | ) | | | (19,186 | ) |
Reserve | | | (7 | ) | | | (268 | ) | | | (2 | ) | | | (88 | ) |
Service | | | (160 | ) | | | (21,354 | ) | | | — | | | | — | |
| | | | | | | | | | | | | | | | |
Total distributions to shareholders | | | (206,547 | ) | | | (2,820,670 | ) | | | (34,483 | ) | | | (552,405 | ) |
| | | | | | | | | | | | | | | | |
|
CAPITAL TRANSACTIONS: | |
Change in net assets resulting from capital transactions | | | 21,715,629 | | | | 13,842,318 | | | | 5,855,608 | | | | 1,434,312 | |
| | | | | | | | | | | | | | | | |
|
NET ASSETS: | |
Change in net assets | | | 21,716,845 | | | | 13,842,236 | | | | 5,855,664 | | | | 1,434,113 | |
Beginning of period | | | 159,202,092 | | | | 145,359,856 | | | | 31,117,700 | | | | 29,683,587 | |
| | | | | | | | | | | | | | | | |
End of period | | $ | 180,918,937 | | | $ | 159,202,092 | | | $ | 36,973,364 | | | $ | 31,117,700 | |
| | | | | | | | | | | | | | | | |
| (a) | Commencement of offering of class of shares effective May 15, 2019 for JPMorgan U.S. Government Money Market Fund. |
| (b) | Liquidated on November 25, 2019 for JPMorgan U.S. Government Money Market Fund. |
| (c) | Liquidated on December 9, 2019 for JPMorgan U.S. Government Money Market Fund. |
| (d) | Amount rounds to less than one thousand. |
SEE NOTES TO FINANCIAL STATEMENTS.
| | | | | | |
| | | |
| 106 | | | | J.P. MORGAN MONEY MARKET FUNDS | | AUGUST 31, 2020 |
| | | | | | | | | | | | | | | | |
| | | JPMorgan Federal Money Market Fund | | | JPMorgan 100% U.S. Treasury Securities
Money Market Fund | |
| | | Six Months Ended
August 31, 2020
(Unaudited) | | | Year Ended
February 29, 2020 | | | Six Months Ended
August 31, 2020
(Unaudited) | | | Year Ended
February 29, 2020 | |
CHANGE IN NET ASSETS RESULTING FROM OPERATIONS: | | | | | | | | | | | | | | | | |
Net investment income (loss) | | $ | 4,376 | | | $ | 51,909 | | | $ | 107,614 | | | $ | 1,071,524 | |
Net realized gain (loss) | | | 73 | | | | 119 | | | | (389 | ) | | | 711 | |
| | | | | | | | | | | | | | | | |
Change in net assets resulting from operations | | | 4,449 | | | | 52,028 | | | | 107,225 | | | | 1,072,235 | |
| | | | | | | | | | | | | | | | |
| | | | |
DISTRIBUTIONS TO SHAREHOLDERS: | | | | | | | | | | | | | | | | |
Agency | | | (389 | ) | | | (3,685 | ) | | | (4,791 | ) | | | (66,255 | ) |
Capital | | | — | | | | — | | | | (65,975 | ) | | | (546,192 | ) |
IM (a) | | | — | | | | — | | | | (121 | ) | | | (25 | ) |
Institutional Class | | | (3,815 | ) | | | (45,076 | ) | | | (33,370 | ) | | | (364,514 | ) |
Morgan | | | (22 | ) | | | (515 | ) | | | (967 | ) | | | (29,187 | ) |
Premier | | | (150 | ) | | | (2,733 | ) | | | (1,615 | ) | | | (38,642 | ) |
Reserve | | | — | | | | — | | | | (774 | ) | | | (27,410 | ) |
| | | | | | | | | | | | | | | | |
Total distributions to shareholders | | | (4,376 | ) | | | (52,009 | ) | | | (107,613 | ) | | | (1,072,225 | ) |
| | | | | | | | | | | | | | | | |
|
CAPITAL TRANSACTIONS: | |
Change in net assets resulting from capital transactions | | | 131,734 | | | | (681,168 | ) | | | 45,473,766 | | | | 16,533,512 | |
| | | | | | | | | | | | | | | | |
|
NET ASSETS: | |
Change in net assets | | | 131,807 | | | | (681,149 | ) | | | 45,473,378 | | | | 16,533,522 | |
Beginning of period | | | 3,068,681 | | | | 3,749,830 | | | | 66,117,669 | | | | 49,584,147 | |
| | | | | | | | | | | | | | | | |
End of period | | $ | 3,200,488 | | | $ | 3,068,681 | | | $ | 111,591,047 | | | $ | 66,117,669 | |
| | | | | | | | | | | | | | | | |
| (a) | Commencement of offering of class of shares effective January 15, 2020 for JPMorgan 100% U.S. Treasury Securities Money Market Fund. |
SEE NOTES TO FINANCIAL STATEMENTS.
| | | | | | | | |
| | | |
| AUGUST 31, 2020 | | J.P. MORGAN MONEY MARKET FUNDS | | | | | 107 | |
STATEMENTS OF CHANGES IN NET ASSETS
FOR THE PERIODS INDICATED (continued)
(Amounts in thousands)
| | | | | | | | | | | | | | | | |
| | |
JPMorgan Tax Free Money Market Fund | | | JPMorgan Municipal Money Market Fund | |
| | | Six Months Ended
August 31, 2020
(Unaudited) | | | Year Ended
February 29, 2020 | | | Six Months Ended
August 31, 2020
(Unaudited) | | | Year Ended
February 29, 2020 | |
CHANGE IN NET ASSETS RESULTING FROM OPERATIONS: | | | | | | | | | | | | | | | | |
Net investment income (loss) | | $ | 32,708 | | | $ | 159,638 | | | $ | 4,153 | | | $ | 30,385 | |
Net realized gain (loss) | | | 62 | | | | 33 | | | | 87 | | | | 113 | |
| | | | | | | | | | | | | | | | |
Change in net assets resulting from operations | | | 32,770 | | | | 159,671 | | | | 4,240 | | | | 30,498 | |
| | | | | | | | | | | | | | | | |
| | | | |
DISTRIBUTIONS TO SHAREHOLDERS: | | | | | | | | | | | | | | | | |
Agency | | | (2,095 | ) | | | (9,975 | ) | | | (379 | ) | | | (1,494 | ) |
Eagle Class (a) | | | — | | | | — | | | | — | | | | (1,387 | ) |
Institutional Class | | | (26,628 | ) | | | (128,036 | ) | | | (3,279 | ) | | | (25,445 | ) |
Morgan | | | (37 | ) | | | (91 | ) | | | (91 | ) | | | (185 | ) |
Premier | | | (1,834 | ) | | | (9,288 | ) | | | (316 | ) | | | (1,279 | ) |
Reserve | | | (2,112 | ) | | | (12,603 | ) | | | — | | | | — | |
Service | | | — | | | | — | | | | (88 | ) | | | (749 | ) |
| | | | | | | | | | | | | | | | |
Total distributions to shareholders | | | (32,706 | ) | | | (159,993 | ) | | | (4,153 | ) | | | (30,539 | ) |
| | | | | | | | | | | | | | | | |
|
CAPITAL TRANSACTIONS: | |
Change in net assets resulting from capital transactions | | | (1,780,901 | ) | | | (4,045,909 | ) | | | (821,969 | ) | | | (1,058,068 | ) |
| | | | | | | | | | | | | | | | |
|
NET ASSETS: | |
Change in net assets | | | (1,780,837 | ) | | | (4,046,231 | ) | | | (821,882 | ) | | | (1,058,109 | ) |
Beginning of period | | | 12,521,579 | | | | 16,567,810 | | | | 2,040,124 | | | | 3,098,233 | |
| | | | | | | | | | | | | | | | |
End of period | | $ | 10,740,742 | | | $ | 12,521,579 | | | $ | 1,218,242 | | | $ | 2,040,124 | |
| | | | | | | | | | | | | | | | |
| (a) | Liquidated on November 25, 2019 for JPMorgan Municipal Money Market Fund. |
SEE NOTES TO FINANCIAL STATEMENTS.
| | | | | | |
| | | |
| 108 | | | | J.P. MORGAN MONEY MARKET FUNDS | | AUGUST 31, 2020 |
| | | | | | | | | | | | | | | | |
| | | JPMorgan California Municipal Money
Market Fund | | | JPMorgan New York Municipal Money
Market Fund | |
| | | Six Months Ended
August 31, 2020
(Unaudited) | | | Year Ended
February 29, 2020 | | | Six Months Ended
August 31, 2020
(Unaudited) | | | Year Ended
February 29, 2020 | |
CHANGE IN NET ASSETS RESULTING FROM OPERATIONS: | | | | | | | | | | | | | | | | |
Net investment income (loss) | | $ | 1,179 | | | $ | 4,781 | | | $ | 5,047 | | | $ | 21,721 | |
Net realized gain (loss) | | | 6 | | | | 248 | | | | 33 | | | | 242 | |
| | | | | | | | | | | | | | | | |
Change in net assets resulting from operations | | | 1,185 | | | | 5,029 | | | | 5,080 | | | | 21,963 | |
| | | | | | | | | | | | | | | | |
| | | | |
DISTRIBUTIONS TO SHAREHOLDERS: | | | | | | | | | | | | | | | | |
Agency (a) | | | (93 | ) | | | (124 | ) | | | (589 | ) | | | (2,365 | ) |
Eagle Class (b) | | | — | | | | (24 | ) | | | — | | | | (60 | ) |
Institutional Class (a) | | | (744 | ) | | | (2,358 | ) | | | (3,236 | ) | | | (10,243 | ) |
Morgan | | | (13 | ) | | | (18 | ) | | | (129 | ) | | | (1,002 | ) |
Premier | | | (301 | ) | | | (2,220 | ) | | | (1,078 | ) | | | (7,987 | ) |
Reserve | | | — | | | | — | | | | (2 | ) | | | (10 | ) |
Service | | | (28 | ) | | | (270 | ) | | | (11 | ) | | | (91 | ) |
| | | | | | | | | | | | | | | | |
Total distributions to shareholders | | | (1,179 | ) | | | (5,014 | ) | | | (5,045 | ) | | | (21,758 | ) |
| | | | | | | | | | | | | | | | |
|
CAPITAL TRANSACTIONS: | |
Change in net assets resulting from capital transactions | | | (164,767 | ) | | | 187,235 | | | | (1,482,088 | ) | | | 1,727,911 | |
| | | | | | | | | | | | | | | | |
|
NET ASSETS: | |
Change in net assets | | | (164,761 | ) | | | 187,250 | | | | (1,482,053 | ) | | | 1,728,116 | |
Beginning of period | | | 576,717 | | | | 389,467 | | | | 2,702,527 | | | | 974,411 | |
| | | | | | | | | | | | | | | | |
End of period | | $ | 411,956 | | | $ | 576,717 | | | $ | 1,220,474 | | | $ | 2,702,527 | |
| | | | | | | | | | | | | | | | |
| (a) | Commencement of offering of class of shares effective March 1, 2019. |
| (b) | Liquidated on November 25, 2019. |
SEE NOTES TO FINANCIAL STATEMENTS.
| | | | | | | | |
| | | |
| AUGUST 31, 2020 | | J.P. MORGAN MONEY MARKET FUNDS | | | | | 109 | |
STATEMENTS OF CHANGES IN NET ASSETS
FOR THE PERIODS INDICATED (continued)
(Amounts in thousands)
| | | | | | | | | | | | | | | | |
| | | JPMorgan Prime Money Market Fund | | | JPMorgan Institutional Tax Free Money
Market Fund | |
| | | Six Months Ended
August 31, 2020
(Unaudited) | | | Year Ended
February 29, 2020 | | | Six Months Ended
August 31, 2020
(Unaudited) | | | Year Ended
February 29, 2020 | |
CAPITAL TRANSACTIONS: | | | | | | | | | | | | | | | | |
Class C | | | | | | | | | | | | | | | | |
Proceeds from shares issued | | $ | 8 | | | $ | — | | | $ | — | | | $ | — | |
Distributions reinvested | | | — | (a) | | | 13 | | | | — | | | | — | |
Cost of shares redeemed | | | (188 | ) | | | (425 | ) | | | — | | | | — | |
| | | | | | | | | | | | | | | | |
Change in net assets resulting from Class C capital transactions | | $ | (180 | ) | | $ | (412 | ) | | $ | — | | | $ | — | |
| | | | | | | | | | | | | | | | |
Academy (b) | | | | | | | | | | | | | | | | |
Proceeds from shares issued | | $ | 9,072,213 | | | $ | 150,020 | | | $ | — | | | $ | — | |
Distributions reinvested | | | 4,515 | | | | 457 | | | | — | | | | — | |
Cost of shares redeemed | | | (7,789,816 | ) | | | — | | | | — | | | | — | |
| | | | | | | | | | | | | | | | |
Change in net assets resulting from Academy capital transactions | | $ | 1,286,912 | | | $ | 150,477 | | | $ | — | | | $ | — | |
| | | | | | | | | | | | | | | | |
Agency | | | | | | | | | | | | | | | | |
Proceeds from shares issued | | $ | 114,813,870 | | | $ | 214,440,317 | | | $ | 91,689 | | | $ | 141,665 | |
Distributions reinvested | | | 854 | | | | 6,895 | | | | — | | | | — | (a) |
Cost of shares redeemed | | | (114,878,434 | ) | | | (214,403,768 | ) | | | (92,228 | ) | | | (117,118 | ) |
| | | | | | | | | | | | | | | | |
Change in net assets resulting from Agency capital transactions | | $ | (63,710 | ) | | $ | 43,444 | | | $ | (539 | ) | | $ | 24,547 | |
| | | | | | | | | | | | | | | | |
Capital | | | | | | | | | | | | | | | | |
Proceeds from shares issued | | $ | 116,031,057 | | | $ | 203,523,806 | | | $ | 875,860 | | | $ | 1,037,579 | |
Distributions reinvested | | | 39,172 | | | | 212,739 | | | | 4 | | | | 14 | |
Cost of shares redeemed | | | (97,807,370 | ) | | | (196,787,160 | ) | | | (890,940 | ) | | | (882,404 | ) |
| | | | | | | | | | | | | | | | |
Change in net assets resulting from Capital capital transactions | | $ | 18,262,859 | | | $ | 6,949,385 | | | $ | (15,076 | ) | | $ | 155,189 | |
| | | | | | | | | | | | | | | | |
IM | | | | | | | | | | | | | | | | |
Proceeds from shares issued | | $ | 32,563,659 | | | $ | 53,762,592 | | | $ | 5,365,464 | | | $ | 5,668,758 | |
Distributions reinvested | | | 369 | | | | 2,352 | | | | — | | | | — | (a) |
Cost of shares redeemed | | | (32,564,771 | ) | | | (50,121,236 | ) | | | (4,566,684 | ) | | | (5,752,779 | ) |
| | | | | | | | | | | | | | | | |
Change in net assets resulting from IM capital transactions | | $ | (743 | ) | | $ | 3,643,708 | | | $ | 798,780 | | | $ | (84,021 | ) |
| | | | | | | | | | | | | | | | |
Institutional Class | | | | | | | | | | | | | | | | |
Proceeds from shares issued | | $ | 61,774,250 | | | $ | 85,497,068 | | | $ | 2,339,837 | | | $ | 2,757,931 | |
Distributions reinvested | | | 7,611 | | | | 48,602 | | | | 9 | | | | 1 | |
Cost of shares redeemed | | | (55,027,951 | ) | | | (81,633,030 | ) | | | (2,257,862 | ) | | | (2,826,741 | ) |
| | | | | | | | | | | | | | | | |
Change in net assets resulting from Institutional Class capital transactions | | $ | 6,753,910 | | | $ | 3,912,640 | | | $ | 81,984 | | | $ | (68,809 | ) |
| | | | | | | | | | | | | | | | |
Morgan | | | | | | | | | | | | | | | | |
Proceeds from shares issued | | $ | 229,525,238 | | | $ | 613,721,690 | | | $ | — | | | $ | — | |
Distributions reinvested | | | 267 | | | | 3,561 | | | | — | | | | — | |
Cost of shares redeemed | | | (230,631,524 | ) | | | (613,239,003 | ) | | | — | | | | — | |
| | | | | | | | | | | | | | | | |
Change in net assets resulting from Morgan capital transactions | | $ | (1,106,019 | ) | | $ | 486,248 | | | $ | — | | | $ | — | |
| | | | | | | | | | | | | | | | |
Premier | | | | | | | | | | | | | | | | |
Proceeds from shares issued | | $ | 42,087,191 | | | $ | 69,228,079 | | | $ | — | | | $ | — | |
Distributions reinvested | | | 147 | | | | 1,244 | | | | — | | | | — | |
Cost of shares redeemed | | | (42,761,266 | ) | | | (68,467,754 | ) | | | — | | | | — | |
| | | | | | | | | | | | | | | | |
Change in net assets resulting from Premier capital transactions | | $ | (673,928 | ) | | $ | 761,569 | | | $ | — | | | $ | — | |
| | | | | | | | | | | | | | | | |
Reserve | | | | | | | | | | | | | | | | |
Proceeds from shares issued | | $ | 218,218 | | | $ | 2,424,770 | | | $ | — | | | $ | — | |
Distributions reinvested | | | 1 | | | | 23 | | | | — | | | | — | |
Cost of shares redeemed | | | (228,952 | ) | | | (2,425,797 | ) | | | — | | | | — | |
| | | | | | | | | | | | | | | | |
Change in net assets resulting from Reserve capital transactions | | $ | (10,733 | ) | | $ | (1,004 | ) | | $ | — | | | $ | — | |
| | | | | | | | | | | | | | | | |
Total change in net assets resulting from capital transactions | | $ | 24,448,368 | | | $ | 15,946,055 | | | $ | 865,149 | | | $ | 26,906 | |
| | | | | | | | | | | | | | | | |
| (a) | Amount rounds to less than one thousand. |
| (b) | Commencement of offering of class of shares effective May 15, 2019 for JPMorgan Prime Money Market Fund. |
SEE NOTES TO FINANCIAL STATEMENTS.
| | | | | | |
| | | |
| 110 | | | | J.P. MORGAN MONEY MARKET FUNDS | | AUGUST 31, 2020 |
| | | | | | | | | | | | | | | | |
| | | JPMorgan Prime Money Market Fund | | | JPMorgan Institutional Tax Free
Money Market Fund | |
| | | Six Months Ended
August 31, 2020
(Unaudited) | | | Year Ended
February 29, 2020 | | | Six Months Ended
August 31, 2020
(Unaudited) | | | Year Ended
February 29, 2020 | |
SHARE TRANSACTIONS: | |
Class C | |
Issued | | | 8 | | | | — | | | | — | | | | — | |
Reinvested | | | — | (a) | | | 13 | | | | — | | | | — | |
Redeemed | | | (188 | ) | | | (425 | ) | | | — | | | | — | |
| | | | | | | | | | | | | | | | |
Change in Class C Shares | | | (180 | ) | | | (412 | ) | | | — | | | | — | |
| | | | | | | | | | | | | | | | |
Academy (b) | |
Issued | | | 9,066,614 | | | | 149,975 | | | | — | | | | — | |
Reinvested | | | 4,511 | | | | 457 | | | | — | | | | — | |
Redeemed | | | (7,783,001 | ) | | | — | | | | — | | | | — | |
| | | | | | | | | | | | | | | | |
Change in Academy Shares | | | 1,288,124 | | | | 150,432 | | | | — | | | | — | |
| | | | | | | | | | | | | | | | |
Agency | |
Issued | | | 114,701,652 | | | | 214,348,639 | | | | 91,651 | | | | 141,661 | |
Reinvested | | | 853 | | | | 6,892 | | | | — | | | | — | (a) |
Redeemed | | | (114,767,611 | ) | | | (214,312,930 | ) | | | (92,182 | ) | | | (117,115 | ) |
| | | | | | | | | | | | | | | | |
Change in Agency Shares | | | (65,106 | ) | | | 42,601 | | | | (531 | ) | | | 24,546 | |
| | | | | | | | | | | | | | | | |
Capital | |
Issued | | | 115,955,535 | | | | 203,471,472 | | | | 875,496 | | | | 1,037,557 | |
Reinvested | | | 39,146 | | | | 212,670 | | | | 4 | | | | 14 | |
Redeemed | | | (97,757,157 | ) | | | (196,736,156 | ) | | | (890,635 | ) | | | (882,346 | ) |
| | | | | | | | | | | | | | | | |
Change in Capital Shares | | | 18,237,524 | | | | 6,947,986 | | | | (15,135 | ) | | | 155,225 | |
| | | | | | | | | | | | | | | | |
IM | |
Issued | | | 32,544,409 | | | | 53,745,178 | | | | 5,362,410 | | | | 5,668,624 | |
Reinvested | | | 369 | | | | 2,351 | | | | — | | | | — | (a) |
Redeemed | | | (32,544,285 | ) | | | (50,104,592 | ) | | | (4,564,371 | ) | | | (5,752,627 | ) |
| | | | | | | | | | | | | | | | |
Change in IM Shares | | | 493 | | | | 3,642,937 | | | | 798,039 | | | | (84,003 | ) |
| | | | | | | | | | | | | | | | |
Institutional Class | |
Issued | | | 61,733,832 | | | | 85,474,302 | | | | 2,338,723 | | | | 2,757,820 | |
Reinvested | | | 7,606 | | | | 48,585 | | | | 9 | | | | 1 | |
Redeemed | | | (54,996,202 | ) | | | (81,611,351 | ) | | | (2,256,902 | ) | | | (2,826,628 | ) |
| | | | | | | | | | | | | | | | |
Change in Institutional Class Shares | | | 6,745,236 | | | | 3,911,536 | | | | 81,830 | | | | (68,807 | ) |
| | | | | | | | | | | | | | | | |
Morgan | |
Issued | | | 229,264,641 | | | | 613,432,479 | | | | — | | | | — | |
Reinvested | | | 267 | | | | 3,560 | | | | — | | | | — | |
Redeemed | | | (230,372,245 | ) | | | (612,952,228 | ) | | | — | | | | — | |
| | | | | | | | | | | | | | | | |
Change in Morgan Shares | | | (1,107,337 | ) | | | 483,811 | | | | — | | | | — | |
| | | | | | | | | | | | | | | | |
Premier | |
Issued | | | 42,051,999 | | | | 69,204,821 | | | | — | | | | — | |
Reinvested | | | 147 | | | | 1,244 | | | | — | | | | — | |
Redeemed | | | (42,726,351 | ) | | | (68,444,952 | ) | | | — | | | | — | |
| | | | | | | | | | | | | | | | |
Change in Premier Shares | | | (674,205 | ) | | | 761,113 | | | | — | | | | — | |
| | | | | | | | | | | | | | | | |
Reserve | |
Issued | | | 218,080 | | | | 2,423,689 | | | | — | | | | — | |
Reinvested | | | 1 | | | | 23 | | | | — | | | | — | |
Redeemed | | | (228,811 | ) | | | (2,424,725 | ) | | | — | | | | — | |
| | | | | | | | | | | | | | | | |
Change in Reserve Shares | | | (10,730 | ) | | | (1,013 | ) | | | — | | | | — | |
| | | | | | | | | | | | | | | | |
| (a) | Amount rounds to less than one thousand. |
| (b) | Commencement of offering of class of shares effective May 15, 2019 for JPMorgan Prime Money Market Fund. |
SEE NOTES TO FINANCIAL STATEMENTS.
| | | | | | | | |
| | | |
| AUGUST 31, 2020 | | J.P. MORGAN MONEY MARKET FUNDS | | | | | 111 | |
STATEMENTS OF CHANGES IN NET ASSETS
FOR THE PERIODS INDICATED (continued)
(Amounts in thousands)
| | | | | | | | | | | | | | | | |
| | | JPMorgan Securities Lending Money
Market Fund | | | JPMorgan Liquid Assets Money Market Fund | |
| | | Six Months Ended
August 31, 2020
(Unaudited) | | | Year Ended
February 29, 2020 | | | Six Months Ended
August 31, 2020
(Unaudited) | | | Year Ended
February 29, 2020 | |
CAPITAL TRANSACTIONS: | | | | | | | | | | | | | | | | |
Class C | | | | | | | | | | | | | | | | |
Proceeds from shares issued | | $ | — | | | $ | — | | | $ | 58,053 | | | $ | 13,606 | |
Distributions reinvested | | | — | | | | — | | | | 15 | | | | 275 | |
Cost of shares redeemed | | | — | | | | — | | | | (31,259 | ) | | | (17,530 | ) |
| | | | | | | | | | | | | | | | |
Change in net assets resulting from Class C capital transactions | | $ | — | | | $ | — | | | $ | 26,809 | | | $ | (3,649 | ) |
| | | | | | | | | | | | | | | | |
Agency | | | | | | | | | | | | | | | | |
Proceeds from shares issued | | $ | — | | | $ | — | | | $ | 2,091,104 | | | $ | 2,393,073 | |
Distributions reinvested | | | — | | | | — | | | | 1,498 | | | | 2,765 | |
Cost of shares redeemed | | | — | | | | — | | | | (1,771,698 | ) | | | (1,485,097 | ) |
| | | | | | | | | | | | | | | | |
Change in net assets resulting from Agency capital transactions | | $ | — | | | $ | — | | | $ | 320,904 | | | $ | 910,741 | |
| | | | | | | | | | | | | | | | |
Agency SL | | | | | | | | | | | | | | | | |
Proceeds from shares issued | | $ | 17,483,700 | | | $ | 24,507,300 | | | $ | — | | | $ | — | |
Distributions reinvested | | | — | | | | 1 | | | | — | | | | — | |
Cost of shares redeemed | | | (17,289,221 | ) | | | (23,917,353 | ) | | | — | | | | — | |
| | | | | | | | | | | | | | | | |
Change in net assets resulting from Agency SL capital transactions | | $ | 194,479 | | | $ | 589,948 | | | $ | — | | | $ | — | |
| | | | | | | | | | | | | | | | |
Capital | | | | | | | | | | | | | | | | |
Proceeds from shares issued | | $ | — | | | $ | — | | | $ | 3,372,483 | | | $ | 3,670,986 | |
Distributions reinvested | | | — | | | | — | | | | 2,749 | | | | 12,365 | |
Cost of shares redeemed | | | — | | | | — | | | | (2,524,516 | ) | | | (1,945,970 | ) |
| | | | | | | | | | | | | | | | |
Change in net assets resulting from Capital capital transactions | | $ | — | | | $ | — | | | $ | 850,716 | | | $ | 1,737,381 | |
| | | | | | | | | | | | | | | | |
Institutional Class | | | | | | | | | | | | | | | | |
Proceeds from shares issued | | $ | — | | | $ | — | | | $ | 3,430,600 | | | $ | 4,691,517 | |
Distributions reinvested | | | — | | | | — | | | | 2,329 | | | | 21,795 | |
Cost of shares redeemed | | | — | | | | — | | | | (3,128,836 | ) | | | (4,018,108 | ) |
| | | | | | | | | | | | | | | | |
Change in net assets resulting from Institutional Class capital transactions | | $ | — | | | $ | — | | | $ | 304,093 | | | $ | 695,204 | |
| | | | | | | | | | | | | | | | |
Investor | | | | | | | | | | | | | | | | |
Proceeds from shares issued | | $ | — | | | $ | — | | | $ | 706 | | | $ | 3,928 | |
Distributions reinvested | | | — | | | | — | | | | 4 | | | | 127 | |
Cost of shares redeemed | | | — | | | | — | | | | (5,598 | ) | | | (4,298 | ) |
| | | | | | | | | | | | | | | | |
Change in net assets resulting from Investor capital transactions | | $ | — | | | $ | — | | | $ | (4,888 | ) | | $ | (243 | ) |
| | | | | | | | | | | | | | | | |
Morgan | | | | | | | | | | | | | | | | |
Proceeds from shares issued | | $ | — | | | $ | — | | | $ | 617,651 | | | $ | 622,663 | |
Distributions reinvested | | | — | | | | — | | | | 873 | | | | 6,392 | |
Cost of shares redeemed | | | — | | | | — | | | | (443,495 | ) | | | (393,322 | ) |
| | | | | | | | | | | | | | | | |
Change in net assets resulting from Morgan capital transactions | | $ | — | | | $ | — | | | $ | 175,029 | | | $ | 235,733 | |
| | | | | | | | | | | | | | | | |
SEE NOTES TO FINANCIAL STATEMENTS.
| | | | | | |
| | | |
| 112 | | | | J.P. MORGAN MONEY MARKET FUNDS | | AUGUST 31, 2020 |
| | | | | | | | | | | | | | | | |
| | | JPMorgan Securities Lending Money
Market Fund | | | JPMorgan Liquid Assets Money Market Fund | |
| | | Six Months Ended
August 31, 2020
(Unaudited) | | | Year Ended
February 29, 2020 | | | Six Months Ended
August 31, 2020
(Unaudited) | | | Year Ended
February 29, 2020 | |
CAPITAL TRANSACTIONS: (continued) | | | | | | | | | | | | | | | | |
Premier | | | | | | | | | | | | | | | | |
Proceeds from shares issued | | $ | — | | | $ | — | | | $ | 4,395,148 | | | $ | 4,742,192 | |
Distributions reinvested | | | — | | | | — | | | | 2,356 | | | | 11,491 | |
Cost of shares redeemed | | | — | | | | — | | | | (4,302,255 | ) | | | (2,862,793 | ) |
| | | | | | | | | | | | | | | | |
Change in net assets resulting from Premier capital transactions | | $ | — | | | $ | — | | | $ | 95,249 | | | $ | 1,890,890 | |
| | | | | | | | | | | | | | | | |
Reserve | | | | | | | | | | | | | | | | |
Proceeds from shares issued | | $ | — | | | $ | — | | | $ | 1,484 | | | $ | 410 | |
Distributions reinvested | | | — | | | | — | | | | 4 | | | | 64 | |
Cost of shares redeemed | | | — | | | | — | | | | (1,107 | ) | | | (1,226 | ) |
| | | | | | | | | | | | | | | | |
Change in net assets resulting from Reserve capital transactions | | $ | — | | | $ | — | | | $ | 381 | | | $ | (752 | ) |
| | | | | | | | | | | | | | | | |
Total change in net assets resulting from capital transactions | | $ | 194,479 | | | $ | 589,948 | | | $ | 1,768,293 | | | $ | 5,465,305 | |
| | | | | | | | | | | | | | | | |
SEE NOTES TO FINANCIAL STATEMENTS.
| | | | | | | | |
| | | |
| AUGUST 31, 2020 | | J.P. MORGAN MONEY MARKET FUNDS | | | | | 113 | |
STATEMENTS OF CHANGES IN NET ASSETS
FOR THE PERIODS INDICATED (continued)
(Amounts in thousands)
| | | | | | | | | | | | | | | | |
| | | JPMorgan Securities Lending Money
Market Fund | | | JPMorgan Liquid Assets Money Market Fund | |
| | | Six Months Ended
August 31, 2020
(Unaudited) | | | Year Ended
February 29, 2020 | | | Six Months Ended
August 31, 2020
(Unaudited) | | | Year Ended
February 29, 2020 | |
SHARE TRANSACTIONS: | |
Class C | |
Issued | | | — | | | | — | | | | 58,053 | | | | 13,606 | |
Reinvested | | | — | | | | — | | | | 15 | | | | 275 | |
Redeemed | | | — | | | | — | | | | (31,259 | ) | | | (17,530 | ) |
| | | | | | | | | | | | | | | | |
Change in Class C Shares | | | — | | | | — | | | | 26,809 | | | | (3,649 | ) |
| | | | | | | | | | | | | | | | |
Agency | |
Issued | | | — | | | | — | | | | 2,091,104 | | | | 2,393,073 | |
Reinvested | | | — | | | | — | | | | 1,498 | | | | 2,765 | |
Redeemed | | | — | | | | — | | | | (1,771,698 | ) | | | (1,485,097 | ) |
| | | | | | | | | | | | | | | | |
Change in Agency Shares | | | — | | | | — | | | | 320,904 | | | | 910,741 | |
| | | | | | | | | | | | | | | | |
Agency SL | |
Issued | | | 17,480,782 | | | | 24,504,701 | | | | — | | | | — | |
Reinvested | | | — | | | | 1 | | | | — | | | | — | |
Redeemed | | | (17,286,443 | ) | | | (23,914,801 | ) | | | — | | | | — | |
| | | | | | | | | | | | | | | | |
Change in Agency SL Shares | | | 194,339 | | | | 589,901 | | | | — | | | | — | |
| | | | | | | | | | | | | | | | |
Capital | |
Issued | | | — | | | | — | | | | 3,372,483 | | | | 3,670,986 | |
Reinvested | | | — | | | | — | | | | 2,749 | | | | 12,365 | |
Redeemed | | | — | | | | — | | | | (2,524,516 | ) | | | (1,945,970 | ) |
| | | | | | | | | | | | | | | | |
Change in Capital Shares | | | — | | | | — | | | | 850,716 | | | | 1,737,381 | |
| | | | | | | | | | | | | | | | |
Institutional Class | |
Issued | | | — | | | | — | | | | 3,430,600 | | | | 4,691,517 | |
Reinvested | | | — | | | | — | | | | 2,329 | | | | 21,795 | |
Redeemed | | | — | | | | — | | | | (3,128,836 | ) | | | (4,018,108 | ) |
| | | | | | | | | | | | | | | | |
Change in Institutional Class Shares | | | — | | | | — | | | | 304,093 | | | | 695,204 | |
| | | | | | | | | | | | | | | | |
Investor | |
Issued | | | — | | | | — | | | | 706 | | | | 3,928 | |
Reinvested | | | — | | | | — | | | | 4 | | | | 127 | |
Redeemed | | | — | | | | — | | | | (5,598 | ) | | | (4,298 | ) |
| | | | | | | | | | | | | | | | |
Change in Investor Shares | | | — | | | | — | | | | (4,888 | ) | | | (243 | ) |
| | | | | | | | | | | | | | | | |
Morgan | |
Issued | | | — | | | | — | | | | 617,651 | | | | 622,661 | |
Reinvested | | | — | | | | — | | | | 873 | | | | 6,392 | |
Redeemed | | | — | | | | — | | | | (443,495 | ) | | | (393,322 | ) |
| | | | | | | | | | | | | | | | |
Change in Morgan Shares | | | — | | | | — | | | | 175,029 | | | | 235,731 | |
| | | | | | | | | | | | | | | | |
Premier | |
Issued | | | — | | | | — | | | | 4,395,148 | | | | 4,742,192 | |
Reinvested | | | — | | | | — | | | | 2,356 | | | | 11,491 | |
Redeemed | | | — | | | | — | | | | (4,302,255 | ) | | | (2,862,793 | ) |
| | | | | | | | | | | | | | | | |
Change in Premier Shares | | | — | | | | — | | | | 95,249 | | | | 1,890,890 | |
| | | | | | | | | | | | | | | | |
Reserve | |
Issued | | | — | | | | — | | | | 1,484 | | | | 410 | |
Reinvested | | | — | | | | — | | | | 4 | | | | 64 | |
Redeemed | | | — | | | | — | | | | (1,107 | ) | | | (1,226 | ) |
| | | | | | | | | | | | | | | | |
Change in Reserve Shares | | | — | | | | — | | | | 381 | | | | (752 | ) |
| | | | | | | | | | | | | | | | |
SEE NOTES TO FINANCIAL STATEMENTS.
| | | | | | |
| | | |
| 114 | | | | J.P. MORGAN MONEY MARKET FUNDS | | AUGUST 31, 2020 |
| | | | | | | | | | | | | | | | |
| | | JPMorgan U.S. Government Money
Market Fund | | | JPMorgan U.S. Treasury Plus Money
Market Fund | |
| | | Six Months Ended
August 31, 2020
(Unaudited) | | | Year Ended
February 29, 2020 | | | Six Months Ended
August 31, 2020
(Unaudited) | | | Year Ended
February 29, 2020 | |
CAPITAL TRANSACTIONS: | | | | | | | | | | | | | | | | |
Class C | | | | | | | | | | | | | | | | |
Proceeds from shares issued | | $ | — | | | $ | — | | | $ | 175,785 | | | $ | 222,137 | |
Distributions reinvested | | | — | | | | — | | | | 49 | | | | 3,629 | |
Cost of shares redeemed | | | — | | | | — | | | | (138,664 | ) | | | (308,170 | ) |
| | | | | | | | | | | | | | | | |
Change in net assets resulting from Class C capital transactions | | $ | — | | | $ | — | | | $ | 37,170 | | | $ | (82,404 | ) |
| | | | | | | | | | | | | | | | |
Academy (a) | | | | | | | | | | | | | | | | |
Proceeds from shares issued | | $ | 5,159,569 | | | $ | 85,020 | | | $ | — | | | $ | — | |
Distributions reinvested | | | 524 | | | | 6 | | | | — | | | | — | |
Cost of shares redeemed | | | (3,798,910 | ) | | | — | | | | — | | | | — | |
| | | | | | | | | | | | | | | | |
Change in net assets resulting from Academy capital transactions | | $ | 1,361,183 | | | $ | 85,026 | | | $ | — | | | $ | — | |
| | | | | | | | | | | | | | | | |
Agency | | | | | | | | | | | | | | | | |
Proceeds from shares issued | | $ | 815,259,707 | | | $ | 1,276,267,711 | | | $ | 82,378,778 | | | $ | 170,809,933 | |
Distributions reinvested | | | 483 | | | | 9,104 | | | | 230 | | | | 3,887 | |
Cost of shares redeemed | | | (811,558,180 | ) | | | (1,273,257,104 | ) | | | (81,755,245 | ) | | | (171,083,496 | ) |
| | | | | | | | | | | | | | | | |
Change in net assets resulting from Agency capital transactions | | $ | 3,702,010 | | | $ | 3,019,711 | | | $ | 623,763 | | | $ | (269,676 | ) |
| | | | | | | | | | | | | | | | |
Capital | | | | | | | | | | | | | | | | |
Proceeds from shares issued | | $ | 791,991,960 | | | $ | 1,239,463,988 | | | $ | 84,670,204 | | | $ | 76,540,607 | |
Distributions reinvested | | | 71,527 | | | | 689,238 | | | | 5,763 | | | | 33,856 | |
Cost of shares redeemed | | | (766,592,623 | ) | | | (1,227,280,092 | ) | | | (76,788,966 | ) | | | (73,053,662 | ) |
| | | | | | | | | | | | | | | | |
Change in net assets resulting from Capital capital transactions | | $ | 25,470,864 | | | $ | 12,873,134 | | | $ | 7,887,001 | | | $ | 3,520,801 | |
| | | | | | | | | | | | | | | | |
Eagle Class (b) | | | | | | | | | | | | | | | | |
Proceeds from shares issued | | $ | — | | | $ | 543,448 | | | $ | — | | | $ | — | |
Distributions reinvested | | | — | | | | 14,518 | | | | — | | | | — | |
Cost of shares redeemed | | | — | | | | (4,416,056 | ) | | | — | | | | — | |
| | | | | | | | | | | | | | | | |
Change in net assets resulting from Eagle Class capital transactions | | $ | — | | | $ | (3,858,090 | ) | | $ | — | | | $ | — | |
| | | | | | | | | | | | | | | | |
Eagle Private Wealth Class (c) | | | | | | | | | | | | | | | | |
Distributions reinvested | | $ | — | | | $ | — | (d) | | $ | — | | | $ | — | |
Cost of shares redeemed | | | — | | | | (21 | ) | | | — | | | | — | |
| | | | | | | | | | | | | | | | |
Change in net assets resulting from Eagle Private Wealth Class capital transactions | | $ | — | | | $ | (21 | ) | | $ | — | | | $ | — | |
| | | | | | | | | | | | | | | | |
E*Trade | | | | | | | | | | | | | | | | |
Proceeds from shares issued | | $ | 161,377 | | | $ | 228,719 | | | $ | — | | | $ | — | |
Distributions reinvested | | | 69 | | | | 3,113 | | | | — | | | | — | |
Cost of shares redeemed | | | (82,485 | ) | | | (208,477 | ) | | | — | | | | — | |
| | | | | | | | | | | | | | | | |
Change in net assets resulting from E*Trade capital transactions | | $ | 78,961 | | | $ | 23,355 | | | $ | — | | | $ | — | |
| | | | | | | | | | | | | | | | |
IM | | | | | | | | | | | | | | | | |
Proceeds from shares issued | | $ | 28,649,170 | | | $ | 53,182,765 | | | $ | 91,194 | | | $ | 1,226,373 | |
Distributions reinvested | | | 957 | | | | 40,503 | | | | — | | | | 6,783 | |
Cost of shares redeemed | | | (28,740,336 | ) | | | (51,888,343 | ) | | | (94,356 | ) | | | (2,647,217 | ) |
| | | | | | | | | | | | | | | | |
Change in net assets resulting from IM capital transactions | | $ | (90,209 | ) | | $ | 1,334,925 | | | $ | (3,162 | ) | | $ | (1,414,061 | ) |
| | | | | | | | | | | | | | | | |
SEE NOTES TO FINANCIAL STATEMENTS.
| | | | | | | | |
| | | |
| AUGUST 31, 2020 | | J.P. MORGAN MONEY MARKET FUNDS | | | | | 115 | |
STATEMENTS OF CHANGES IN NET ASSETS
FOR THE PERIODS INDICATED (continued)
(Amounts in thousands)
| | | | | | | | | | | | | | | | |
| | | JPMorgan U.S. Government Money
Market Fund | | | JPMorgan U.S. Treasury Plus Money
Market Fund | |
| | | Six Months Ended
August 31, 2020
(Unaudited) | | | Year Ended
February 29, 2020 | | | Six Months Ended
August 31, 2020
(Unaudited) | | | Year Ended
February 29, 2020 | |
CAPITAL TRANSACTIONS: (continued) | | | | | | | | | | | | | | | | |
Institutional Class | | | | | | | | | | | | | | | | |
Proceeds from shares issued | | $ | 257,051,935 | | | $ | 358,725,290 | | | $ | 56,711,861 | | | $ | 89,228,169 | |
Distributions reinvested | | | 9,928 | | | | 510,121 | | | | 4,394 | | | | 221,403 | |
Cost of shares redeemed | | | (265,662,510 | ) | | | (357,857,934 | ) | | | (59,548,529 | ) | | | (90,328,833 | ) |
| | | | | | | | | | | | | | | | |
Change in net assets resulting from Institutional Class capital transactions | | $ | (8,600,647 | ) | | $ | 1,377,477 | | | $ | (2,832,274 | ) | | $ | (879,261 | ) |
| | | | | | | | | | | | | | | | |
Investor | | | | | | | | | | | | | | | | |
Proceeds from shares issued | | $ | 482,811 | | | $ | 317,919 | | | $ | 188,532 | | | $ | 170,196 | |
Distributions reinvested | | | 358 | | | | 15,053 | | | | — | (d) | | | 11 | |
Cost of shares redeemed | | | (280,649 | ) | | | (775,851 | ) | | | (190,783 | ) | | | (168,853 | ) |
| | | | | | | | | | | | | | | | |
Change in net assets resulting from Investor capital transactions | | $ | 202,520 | | | $ | (442,879 | ) | | $ | (2,251 | ) | | $ | 1,354 | |
| | | | | | | | | | | | | | | | |
Morgan | | | | | | | | | | | | | | | | |
Proceeds from shares issued | | $ | 157,970,945 | | | $ | 311,978,401 | | | $ | 54,738,369 | | | $ | 166,379,043 | |
Distributions reinvested | | | 331 | | | | 7,869 | | | | 23 | | | | 855 | |
Cost of shares redeemed | | | (157,839,099 | ) | | | (311,582,589 | ) | | | (54,974,778 | ) | | | (166,279,543 | ) |
| | | | | | | | | | | | | | | | |
Change in net assets resulting from Morgan capital transactions | | $ | 132,177 | | | $ | 403,681 | | | $ | (236,386 | ) | | $ | 100,355 | |
| | | | | | | | | | | | | | | | |
Premier | | | | | | | | | | | | | | | | |
Proceeds from shares issued | | $ | 81,769,036 | | | $ | 163,482,618 | | | $ | 17,598,585 | | | $ | 27,622,521 | |
Distributions reinvested | | | 278 | | | | 5,220 | | | | 324 | | | | 6,993 | |
Cost of shares redeemed | | | (82,062,207 | ) | | | (162,337,604 | ) | | | (17,215,767 | ) | | | (27,171,290 | ) |
| | | | | | | | | | | | | | | | |
Change in net assets resulting from Premier capital transactions | | $ | (292,893 | ) | | $ | 1,150,234 | | | $ | 383,142 | | | $ | 458,224 | |
| | | | | | | | | | | | | | | | |
Reserve | | | | | | | | | | | | | | | | |
Proceeds from shares issued | | $ | 12,540 | | | $ | 13,945 | | | $ | 333,633 | | | $ | 1,498 | |
Distributions reinvested | | | 7 | | | | 268 | | | | 2 | | | | 87 | |
Cost of shares redeemed | | | (15,379 | ) | | | (12,851 | ) | | | (335,030 | ) | | | (2,605 | ) |
| | | | | | | | | | | | | | | | |
Change in net assets resulting from Reserve capital transactions | | $ | (2,832 | ) | | $ | 1,362 | | | $ | (1,395 | ) | | $ | (1,020 | ) |
| | | | | | | | | | | | | | | | |
Service | | | | | | | | | | | | | | | | |
Proceeds from shares issued | | $ | 47,503 | | | $ | 335,160 | | | $ | — | | | $ | — | |
Distributions reinvested | | | 160 | | | | 21,353 | | | | — | | | | — | |
Cost of shares redeemed | | | (293,168 | ) | | | (2,482,110 | ) | | | — | | | | — | |
| | | | | | | | | | | | | | | | |
Change in net assets resulting from Service capital transactions | | $ | (245,505 | ) | | $ | (2,125,597 | ) | | $ | — | | | $ | — | |
| | | | | | | | | | | | | | | | |
Total change in net assets resulting from capital transactions | | $ | 21,715,629 | | | $ | 13,842,318 | | | $ | 5,855,608 | | | $ | 1,434,312 | |
| | | | | | | | | | | | | | | | |
| (a) | Commencement of offering of class of shares effective May 15, 2019 for JPMorgan U.S. Government Money Market Fund. |
| (b) | Liquidated on November 25, 2019 for JPMorgan U.S. Government Money Market Fund. |
| (c) | Liquidated on December 9, 2019 for JPMorgan U.S. Government Money Market Fund. |
| (d) | Amount rounds to less than one thousand. |
SEE NOTES TO FINANCIAL STATEMENTS.
| | | | | | |
| | | |
| 116 | | | | J.P. MORGAN MONEY MARKET FUNDS | | AUGUST 31, 2020 |
| | | | | | | | | | | | | | | | |
| | | JPMorgan U.S. Government Money
Market Fund | | | JPMorgan U.S. Treasury Plus Money
Market Fund | |
| | | Six Months Ended
August 31, 2020
(Unaudited) | | | Year Ended
February 29, 2020 | | | Six Months Ended
August 31, 2020
(Unaudited) | | | Year Ended
February 29, 2020 | |
SHARE TRANSACTIONS: | |
Class C | |
Issued | | | — | | | | — | | | | 175,785 | | | | 222,129 | |
Reinvested | | | — | | | | — | | | | 49 | | | | 3,629 | |
Redeemed | | | — | | | | — | | | | (138,664 | ) | | | (308,159 | ) |
| | | | | | | | | | | | | | | | |
Change in Class C Shares | | | — | | | | — | | | | 37,170 | | | | (82,401 | ) |
| | | | | | | | | | | | | | | | |
Academy (a) | |
Issued | | | 5,159,569 | | | | 85,020 | | | | — | | | | — | |
Reinvested | | | 524 | | | | 6 | | | | — | | | | — | |
Redeemed | | | (3,798,910 | ) | | | — | | | | — | | | | — | |
| | | | | | | | | | | | | | | | |
Change in Academy Shares | | | 1,361,183 | | | | 85,026 | | | | — | | | | — | |
| | | | | | | | | | | | | | | | |
Agency | |
Issued | | | 815,259,707 | | | | 1,276,267,274 | | | | 82,378,778 | | | | 170,809,890 | |
Reinvested | | | 483 | | | | 9,104 | | | | 230 | | | | 3,887 | |
Redeemed | | | (811,558,180 | ) | | | (1,273,256,883 | ) | | | (81,755,245 | ) | | | (171,083,444 | ) |
| | | | | | | | | | | | | | | | |
Change in Agency Shares | | | 3,702,010 | | | | 3,019,495 | | | | 623,763 | | | | (269,667 | ) |
| | | | | | | | | | | | | | | | |
Capital | |
Issued | | | 791,991,960 | | | | 1,239,463,766 | | | | 84,670,204 | | | | 76,540,547 | |
Reinvested | | | 71,527 | | | | 689,238 | | | | 5,763 | | | | 33,856 | |
Redeemed | | | (766,592,623 | ) | | | (1,227,279,800 | ) | | | (76,788,966 | ) | | | (73,053,452 | ) |
| | | | | | | | | | | | | | | | |
Change in Capital Shares | | | 25,470,864 | | | | 12,873,204 | | | | 7,887,001 | | | | 3,520,951 | |
| | | | | | | | | | | | | | | | |
Eagle Class (b) | |
Issued | | | — | | | | 543,315 | | | | — | | | | — | |
Reinvested | | | — | | | | 14,518 | | | | — | | | | — | |
Redeemed | | | — | | | | (4,416,055 | ) | | | — | | | | — | |
| | | | | | | | | | | | | | | | |
Change in Eagle Class Shares | | | — | | | | (3,858,222 | ) | | | — | | | | — | |
| | | | | | | | | | | | | | | | |
Eagle Private Wealth Class (c) | |
Reinvested | | | — | | | | — | (d) | | | — | | | | — | |
Redeemed | | | — | | | | (20 | ) | | | — | | | | — | |
| | | | | | | | | | | | | | | | |
Change in Eagle Private Wealth Class Shares | | | — | | | | (20 | ) | | | — | | | | — | |
| | | | | | | | | | | | | | | | |
E*Trade | |
Issued | | | 161,377 | | | | 228,715 | | | | — | | | | — | |
Reinvested | | | 69 | | | | 3,114 | | | | — | | | | — | |
Redeemed | | | (82,485 | ) | | | (208,471 | ) | | | — | | | | — | |
| | | | | | | | | | | | | | | | |
Change in E*Trade Shares | | | 78,961 | | | | 23,358 | | | | — | | | | — | |
| | | | | | | | | | | | | | | | |
IM | |
Issued | | | 28,649,170 | | | | 53,182,729 | | | | 91,194 | | | | 1,226,280 | |
Reinvested | | | 957 | | | | 40,503 | | | | — | | | | 6,783 | |
Redeemed | | | (28,740,336 | ) | | | (51,888,257 | ) | | | (94,356 | ) | | | (2,647,216 | ) |
| | | | | | | | | | | | | | | | |
Change in IM Shares | | | (90,209 | ) | | | 1,334,975 | | | | (3,162 | ) | | | (1,414,153 | ) |
| | | | | | | | | | | | | | | | |
Institutional Class | |
Issued | | | 257,051,935 | | | | 358,725,178 | | | | 56,711,861 | | | | 89,227,998 | |
Reinvested | | | 9,928 | | | | 510,121 | | | | 4,394 | | | | 221,403 | |
Redeemed | | | (265,662,510 | ) | | | (357,857,535 | ) | | | (59,548,529 | ) | | | (90,328,769 | ) |
| | | | | | | | | | | | | | | | |
Change in Institutional Class Shares | | | (8,600,647 | ) | | | 1,377,764 | | | | (2,832,274 | ) | | | (879,368 | ) |
| | | | | | | | | | | | | | | | |
SEE NOTES TO FINANCIAL STATEMENTS.
| | | | | | | | |
| | | |
| AUGUST 31, 2020 | | J.P. MORGAN MONEY MARKET FUNDS | | | | | 117 | |
STATEMENTS OF CHANGES IN NET ASSETS
FOR THE PERIODS INDICATED (continued)
(Amounts in thousands)
| | | | | | | | | | | | | | | | |
| | | JPMorgan U.S. Government Money
Market Fund | | | JPMorgan U.S. Treasury Plus Money
Market Fund | |
| | | Six Months Ended
August 31, 2020
(Unaudited) | | | Year Ended
February 29, 2020 | | | Six Months Ended
August 31, 2020
(Unaudited) | | | Year Ended
February 29, 2020 | |
SHARE TRANSACTIONS: (continued) | |
Investor | |
Issued | | | 482,811 | | | | 317,915 | | | | 188,532 | | | | 170,195 | |
Reinvested | | | 358 | | | | 15,053 | | | | — | (d) | | | 11 | |
Redeemed | | | (280,649 | ) | | | (775,846 | ) | | | (190,783 | ) | | | (168,852 | ) |
| | | | | | | | | | | | | | | | |
Change in Investor Shares | | | 202,520 | | | | (442,878 | ) | | | (2,251 | ) | | | 1,354 | |
| | | | | | | | | | | | | | | | |
Morgan | |
Issued | | | 157,970,945 | | | | 311,978,292 | | | | 54,738,369 | | | | 166,379,004 | |
Reinvested | | | 331 | | | | 7,869 | | | | 23 | | | | 855 | |
Redeemed | | | (157,839,099 | ) | | | (311,582,523 | ) | | | (54,974,778 | ) | | | (166,279,491 | ) |
| | | | | | | | | | | | | | | | |
Change in Morgan Shares | | | 132,177 | | | | 403,638 | | | | (236,386 | ) | | | 100,368 | |
| | | | | | | | | | | | | | | | |
Premier | |
Issued | | | 81,769,036 | | | | 163,482,569 | | | | 17,598,585 | | | | 27,622,517 | |
Reinvested | | | 278 | | | | 5,220 | | | | 324 | | | | 6,993 | |
Redeemed | | | (82,062,207 | ) | | | (162,337,574 | ) | | | (17,215,767 | ) | | | (27,171,261 | ) |
| | | | | | | | | | | | | | | | |
Change in Premier Shares | | | (292,893 | ) | | | 1,150,215 | | | | 383,142 | | | | 458,249 | |
| | | | | | | | | | | | | | | | |
Reserve | |
Issued | | | 12,540 | | | | 13,945 | | | | 333,633 | | | | 1,498 | |
Reinvested | | | 7 | | | | 267 | | | | 2 | | | | 87 | |
Redeemed | | | (15,379 | ) | | | (12,851 | ) | | | (335,030 | ) | | | (2,605 | ) |
| | | | | | | | | | | | | | | | |
Change in Reserve Shares | | | (2,832 | ) | | | 1,361 | | | | (1,395 | ) | | | (1,020 | ) |
| | | | | | | | | | | | | | | | |
Service | |
Issued | | | 47,503 | | | | 335,116 | | | | — | | | | — | |
Reinvested | | | 160 | | | | 21,353 | | | | — | | | | — | |
Redeemed | | | (293,168 | ) | | | (2,482,066 | ) | | | — | | | | — | |
| | | | | | | | | | | | | | | | |
Change in Service Shares | | | (245,505 | ) | | | (2,125,597 | ) | | | — | | | | — | |
| | | | | | | | | | | | | | | | |
| (a) | Commencement of offering of class of shares effective May 15, 2019 for JPMorgan U.S. Government Money Market Fund. |
| (b) | Liquidated on November 25, 2019 for JPMorgan U.S. Government Money Market Fund. |
| (c) | Liquidated on December 9, 2019 for JPMorgan U.S. Government Money Market Fund. |
| (d) | Amount rounds to less than one thousand. |
SEE NOTES TO FINANCIAL STATEMENTS.
| | | | | | |
| | | |
| 118 | | | | J.P. MORGAN MONEY MARKET FUNDS | | AUGUST 31, 2020 |
| | | | | | | | | | | | | | | | |
| | | JPMorgan Federal Money Market Fund | | | JPMorgan 100% U.S. Treasury Securities
Money Market Fund | |
| | | Six Months Ended
August 31, 2020
(Unaudited) | | | Year Ended
February 29, 2020 | | | Six Months Ended
August 31, 2020
(Unaudited) | | | Year Ended
February 29, 2020 | |
CAPITAL TRANSACTIONS: | | | | | | | | | | | | | | | | |
Agency | | | | | | | | | | | | | | | | |
Proceeds from shares issued | | $ | 1,652,230 | | | $ | 2,960,215 | | | $ | 243,382,635 | | | $ | 388,303,998 | |
Distributions reinvested | | | 113 | | | | 686 | | | | 571 | | | | 7,638 | |
Cost of shares redeemed | | | (1,570,386 | ) | | | (2,866,309 | ) | | | (242,602,107 | ) | | | (386,681,435 | ) |
| | | | | | | | | | | | | | | | |
Change in net assets resulting from Agency capital transactions | | $ | 81,957 | | | $ | 94,592 | | | $ | 781,099 | | | $ | 1,630,201 | |
| | | | | | | | | | | | | | | | |
Capital | | | | | | | | | | | | | | | | |
Proceeds from shares issued | | $ | — | | | $ | — | | | $ | 225,184,822 | | | $ | 298,441,950 | |
Distributions reinvested | | | — | | | | — | | | | 25,652 | | | | 225,598 | |
Cost of shares redeemed | | | — | | | | — | | | | (188,220,359 | ) | | | (289,232,259 | ) |
| | | | | | | | | | | | | | | | |
Change in net assets resulting from Capital capital transactions | | $ | — | | | $ | — | | | $ | 36,990,115 | | | $ | 9,435,289 | |
| | | | | | | | | | | | | | | | |
IM (a) | | | | | | | | | | | | | | | | |
Proceeds from shares issued | | $ | — | | | $ | — | | | $ | 409,007 | | | $ | 18,801 | |
Distributions reinvested | | | — | | | | — | | | | 120 | | | | 25 | |
Cost of shares redeemed | | | — | | | | — | | | | (234,738 | ) | | | (6,941 | ) |
| | | | | | | | | | | | | | | | |
Change in net assets resulting from IM capital transactions | | $ | — | | | $ | — | | | $ | 174,389 | | | $ | 11,885 | |
| | | | | | | | | | | | | | | | |
Institutional Class | | | | | | | | | | | | | | | | |
Proceeds from shares issued | | $ | 8,291,497 | | | $ | 9,696,291 | | | $ | 65,607,648 | | | $ | 71,922,177 | |
Distributions reinvested | | | 1,288 | | | | 15,541 | | | | 7,996 | | | | 68,397 | |
Cost of shares redeemed | | | (8,219,604 | ) | | | (10,556,887 | ) | | | (58,726,630 | ) | | | (67,566,674 | ) |
| | | | | | | | | | | | | | | | |
Change in net assets resulting from Institutional Class capital transactions | | $ | 73,181 | | | $ | (845,055 | ) | | $ | 6,889,014 | | | $ | 4,423,900 | |
| | | | | | | | | | | | | | | | |
Morgan | | | | | | | | | | | | | | | | |
Proceeds from shares issued | | $ | 66,178 | | | $ | 50,871 | | | $ | 43,497,878 | | | $ | 84,584,237 | |
Distributions reinvested | | | 20 | | | | 480 | | | | 726 | | | | 21,565 | |
Cost of shares redeemed | | | (45,202 | ) | | | (45,913 | ) | | | (43,292,150 | ) | | | (84,591,494 | ) |
| | | | | | | | | | | | | | | | |
Change in net assets resulting from Morgan capital transactions | | $ | 20,996 | | | $ | 5,438 | | | $ | 206,454 | | | $ | 14,308 | |
| | | | | | | | | | | | | | | | |
Premier | | | | | | | | | | | | | | | | |
Proceeds from shares issued | | $ | 606,240 | | | $ | 1,131,836 | | | $ | 8,459,049 | | | $ | 20,764,723 | |
Distributions reinvested | | | 55 | | | | 765 | | | | 227 | | | | 7,211 | |
Cost of shares redeemed | | | (650,695 | ) | | | (1,068,744 | ) | | | (8,492,040 | ) | | | (20,294,193 | ) |
| | | | | | | | | | | | | | | | |
Change in net assets resulting from Premier capital transactions | | $ | (44,400 | ) | | $ | 63,857 | | | $ | (32,764 | ) | | $ | 477,741 | |
| | | | | | | | | | | | | | | | |
Reserve | | | | | | | | | | | | | | | | |
Proceeds from shares issued | | $ | — | | | $ | — | | | $ | 8,064,815 | | | $ | 18,891,281 | |
Distributions reinvested | | | — | | | | — | | | | 13 | | | | 437 | |
Cost of shares redeemed | | | — | | | | — | | | | (7,599,369 | ) | | | (18,351,530 | ) |
| | | | | | | | | | | | | | | | |
Change in net assets resulting from Reserve capital transactions | | $ | — | | | $ | — | | | $ | 465,459 | | | $ | 540,188 | |
| | | | | | | | | | | | | | | | |
Total change in net assets resulting from capital transactions | | $ | 131,734 | | | $ | (681,168 | ) | | $ | 45,473,766 | | | $ | 16,533,512 | |
| | | | | | | | | | | | | | | | |
| (a) | Commencement of offering of class of shares effective January 15, 2020 for JPMorgan 100% U.S. Treasury Securities Money Market Fund. |
SEE NOTES TO FINANCIAL STATEMENTS.
| | | | | | | | |
| | | |
| AUGUST 31, 2020 | | J.P. MORGAN MONEY MARKET FUNDS | | | | | 119 | |
STATEMENTS OF CHANGES IN NET ASSETS
FOR THE PERIODS INDICATED (continued)
(Amounts in thousands)
| | | | | | | | | | | | | | | | |
| | | JPMorgan Federal Money Market Fund | | | JPMorgan 100% U.S. Treasury Securities
Money Market Fund | |
| | | Six Months Ended
August 31, 2020
(Unaudited) | | | Year Ended
February 29, 2020 | | | Six Months Ended
August 31, 2020
(Unaudited) | | | Year Ended
February 29, 2020 | |
SHARE TRANSACTIONS: | |
Agency | |
Issued | | | 1,652,230 | | | | 2,960,176 | | | | 243,382,635 | | | | 388,303,998 | |
Reinvested | | | 113 | | | | 686 | | | | 571 | | | | 7,638 | |
Redeemed | | | (1,570,386 | ) | | | (2,866,254 | ) | | | (242,602,107 | ) | | | (386,681,435 | ) |
| | | | | | | | | | | | | | | | |
Change in Agency Shares | | | 81,957 | | | | 94,608 | | | | 781,099 | | | | 1,630,201 | |
| | | | | | | | | | | | | | | | |
Capital | |
Issued | | | — | | | | — | | | | 225,184,822 | | | | 298,441,950 | |
Reinvested | | | — | | | | — | | | | 25,652 | | | | 225,598 | |
Redeemed | | | — | | | | — | | | | (188,220,359 | ) | | | (289,232,259 | ) |
| | | | | | | | | | | | | | | | |
Change in Capital Shares | | | — | | | | — | | | | 36,990,115 | | | | 9,435,289 | |
| | | | | | | | | | | | | | | | |
IM (a) | |
Issued | | | — | | | | — | | | | 409,014 | | | | 18,794 | |
Reinvested | | | — | | | | — | | | | 113 | | | | 32 | |
Redeemed | | | — | | | | — | | | | (234,738 | ) | | | (6,941 | ) |
| | | | | | | | | | | | | | | | |
Change in IM Shares | | | — | | | | — | | | | 174,389 | | | | 11,885 | |
| | | | | | | | | | | | | | | | |
Institutional Class | |
Issued | | | 8,291,497 | | | | 9,696,225 | | | | 65,607,648 | | | | 71,922,177 | |
Reinvested | | | 1,288 | | | | 15,541 | | | | 7,996 | | | | 68,397 | |
Redeemed | | | (8,219,604 | ) | | | (10,556,853 | ) | | | (58,726,630 | ) | | | (67,566,674 | ) |
| | | | | | | | | | | | | | | | |
Change in Institutional Class Shares | | | 73,181 | | | | (845,087 | ) | | | 6,889,014 | | | | 4,423,900 | |
| | | | | | | | | | | | | | | | |
Morgan | |
Issued | | | 66,178 | | | | 50,870 | | | | 43,497,878 | | | | 84,584,237 | |
Reinvested | | | 20 | | | | 480 | | | | 726 | | | | 21,565 | |
Redeemed | | | (45,202 | ) | | | (45,908 | ) | | | (43,292,150 | ) | | | (84,591,494 | ) |
| | | | | | | | | | | | | | | | |
Change in Morgan Shares | | | 20,996 | | | | 5,442 | | | | 206,454 | | | | 14,308 | |
| | | | | | | | | | | | | | | | |
Premier | |
Issued | | | 606,240 | | | | 1,131,835 | | | | 8,459,049 | | | | 20,764,723 | |
Reinvested | | | 55 | | | | 765 | | | | 227 | | | | 7,211 | |
Redeemed | | | (650,695 | ) | | | (1,068,731 | ) | | | (8,492,040 | ) | | | (20,294,193 | ) |
| | | | | | | | | | | | | | | | |
Change in Premier Shares | | | (44,400 | ) | | | 63,869 | | | | (32,764 | ) | | | 477,741 | |
| | | | | | | | | | | | | | | | |
Reserve | |
Issued | | | — | | | | — | | | | 8,064,815 | | | | 18,891,281 | |
Reinvested | | | — | | | | — | | | | 13 | | | | 437 | |
Redeemed | | | — | | | | — | | | | (7,599,369 | ) | | | (18,351,530 | ) |
| | | | | | | | | | | | | | | | |
Change in Reserve Shares | | | — | | | | — | | | | 465,459 | | | | 540,188 | |
| | | | | | | | | | | | | | | | |
| (a) | Commencement of offering of class of shares effective January 15, 2020 for JPMorgan 100% U.S. Treasury Securities Money Market Fund. |
SEE NOTES TO FINANCIAL STATEMENTS.
| | | | | | |
| | | |
| 120 | | | | J.P. MORGAN MONEY MARKET FUNDS | | AUGUST 31, 2020 |
| | | | | | | | | | | | | | | | |
| | |
JPMorgan Tax Free Money Market Fund | | | JPMorgan Municipal Money Market Fund | |
| | | Six Months Ended
August 31, 2020
(Unaudited) | | | Year Ended
February 29, 2020 | | | Six Months Ended
August 31, 2020
(Unaudited) | | | Year Ended
February 29, 2020 | |
CAPITAL TRANSACTIONS: | | | | | | | | | | | | | | | | |
Agency | | | | | | | | | | | | | | | | |
Proceeds from shares issued | | $ | 801,545 | | | $ | 871,757 | | | $ | 174,777 | | | $ | 212,906 | |
Distributions reinvested | | | 251 | | | | 330 | | | | 97 | | | | 160 | |
Cost of shares redeemed | | | (967,207 | ) | | | (1,153,739 | ) | | | (193,813 | ) | | | (227,454 | ) |
| | | | | | | | | | | | | | | | |
Change in net assets resulting from Agency capital transactions | | $ | (165,411 | ) | | $ | (281,652 | ) | | $ | (18,939 | ) | | $ | (14,388 | ) |
| | | | | | | | | | | | | | | | |
Eagle Class (a) | | | | | | | | | | | | | | | | |
Proceeds from shares issued | | $ | — | | | $ | — | | | $ | — | | | $ | 142,010 | |
Distributions reinvested | | | — | | | | — | | | | — | | | | 1,270 | |
Cost of shares redeemed | | | — | | | | — | | | | — | | | | (708,765 | ) |
| | | | | | | | | | | | | | | | |
Change in net assets resulting from Eagle Class capital transactions | | $ | — | | | $ | — | | | $ | — | | | $ | (565,485 | ) |
| | | | | | | | | | | | | | | | |
Institutional Class | | | | | | | | | | | | | | | | |
Proceeds from shares issued | | $ | 19,123,134 | | | $ | 33,994,016 | | | $ | 3,681,609 | | | $ | 10,468,155 | |
Distributions reinvested | | | 1,919 | | | | 14,858 | | | | 1,965 | | | | 18,565 | |
Cost of shares redeemed | | | (20,242,326 | ) | | | (37,237,476 | ) | | | (4,452,735 | ) | | | (10,802,030 | ) |
| | | | | | | | | | | | | | | | |
Change in net assets resulting from Institutional Class capital transactions | | $ | (1,117,273 | ) | | $ | (3,228,602 | ) | | $ | (769,161 | ) | | $ | (315,310 | ) |
| | | | | | | | | | | | | | | | |
Morgan | | | | | | | | | | | | | | | | |
Proceeds from shares issued | | $ | 62,877 | | | $ | 8,331 | | | $ | 80,913 | | | $ | 34,138 | |
Distributions reinvested | | | 36 | | | | 90 | | | | 91 | | | | 185 | |
Cost of shares redeemed | | | (45,414 | ) | | | (7,463 | ) | | | (60,405 | ) | | | (14,749 | ) |
| | | | | | | | | | | | | | | | |
Change in net assets resulting from Morgan capital transactions | | $ | 17,499 | | | $ | 958 | | | $ | 20,599 | | | $ | 19,574 | |
| | | | | | | | | | | | | | | | |
Premier | | | | | | | | | | | | | | | | |
Proceeds from shares issued | | $ | 911,539 | | | $ | 1,170,039 | | | $ | 118,916 | | | $ | 167,754 | |
Distributions reinvested | | | 70 | | | | 189 | | | | 46 | | | | 95 | |
Cost of shares redeemed | | | (1,082,559 | ) | | | (1,385,434 | ) | | | (145,892 | ) | | | (161,846 | ) |
| | | | | | | | | | | | | | | | |
Change in net assets resulting from Premier capital transactions | | $ | (170,950 | ) | | $ | (215,206 | ) | | $ | (26,930 | ) | | $ | 6,003 | |
| | | | | | | | | | | | | | | | |
Reserve | | | | | | | | | | | | | | | | |
Proceeds from shares issued | | $ | 4,339,005 | | | $ | 10,411,802 | | | $ | — | | | $ | — | |
Distributions reinvested | | | 5 | | | | 17 | | | | — | | | | — | |
Cost of shares redeemed | | | (4,683,776 | ) | | | (10,733,226 | ) | | | — | | | | — | |
| | | | | | | | | | | | | | | | |
Change in net assets resulting from Reserve capital transactions | | $ | (344,766 | ) | | $ | (321,407 | ) | | $ | — | | | $ | — | |
| | | | | | | | | | | | | | | | |
Service | | | | | | | | | | | | | | | | |
Proceeds from shares issued | | $ | — | | | $ | — | | | $ | — | | | $ | 36,138 | |
Distributions reinvested | | | — | | | | — | | | | 88 | | | | 749 | |
Cost of shares redeemed | | | — | | | | — | | | | (27,626 | ) | | | (225,349 | ) |
| | | | | | | | | | | | | | | | |
Change in net assets resulting from Service capital transactions | | $ | — | | | $ | — | | | $ | (27,538 | ) | | $ | (188,462 | ) |
| | | | | | | | | | | | | | | | |
Total change in net assets resulting from capital transactions | | $ | (1,780,901 | ) | | $ | (4,045,909 | ) | | $ | (821,969 | ) | | $ | (1,058,068 | ) |
| | | | | | | | | | | | | | | | |
| (a) | Liquidated on November 25, 2019 for JPMorgan Municipal Money Market Fund. |
SEE NOTES TO FINANCIAL STATEMENTS.
| | | | | | | | |
| | | |
| AUGUST 31, 2020 | | J.P. MORGAN MONEY MARKET FUNDS | | | | | 121 | |
STATEMENTS OF CHANGES IN NET ASSETS
FOR THE PERIODS INDICATED (continued)
(Amounts in thousands)
| | | | | | | | | | | | | | | | |
| | |
JPMorgan Tax Free Money Market Fund | | | JPMorgan Municipal Money Market Fund | |
| | | Six Months Ended
August 31, 2020
(Unaudited) | | | Year Ended
February 29, 2020 | | | Six Months Ended
August 31, 2020
(Unaudited) | | | Year Ended
February 29, 2020 | |
SHARE TRANSACTIONS: | |
Agency | |
Issued | | | 801,545 | | | | 871,757 | | | | 174,777 | | | | 212,902 | |
Reinvested | | | 251 | | | | 330 | | | | 97 | | | | 160 | |
Redeemed | | | (967,207 | ) | | | (1,153,739 | ) | | | (193,812 | ) | | | (227,454 | ) |
| | | | | | | | | | | | | | | | |
Change in Agency Shares | | | (165,411 | ) | | | (281,652 | ) | | | (18,938 | ) | | | (14,392 | ) |
| | | | | | | | | | | | | | | | |
Eagle Class (a) | |
Issued | | | — | | | | — | | | | — | | | | 142,010 | |
Reinvested | | | — | | | | — | | | | — | | | | 1,270 | |
Redeemed | | | — | | | | — | | | | — | | | | (708,738 | ) |
| | | | | | | | | | | | | | | | |
Change in Eagle Class Shares | | | — | | | | — | | | | — | | | | (565,458 | ) |
| | | | | | | | | | | | | | | | |
Institutional Class | |
Issued | | | 19,123,134 | | | | 33,994,016 | | | | 3,681,603 | | | | 10,468,118 | |
Reinvested | | | 1,919 | | | | 14,858 | | | | 1,965 | | | | 18,565 | |
Redeemed | | | (20,242,326 | ) | | | (37,237,476 | ) | | | (4,452,735 | ) | | | (10,802,030 | ) |
| | | | | | | | | | | | | | | | |
Change in Institutional Class Shares | | | (1,117,273 | ) | | | (3,228,602 | ) | | | (769,167 | ) | | | (315,347 | ) |
| | | | | | | | | | | | | | | | |
Morgan | |
Issued | | | 62,877 | | | | 8,331 | | | | 80,913 | | | | 34,138 | |
Reinvested | | | 36 | | | | 90 | | | | 91 | | | | 185 | |
Redeemed | | | (45,414 | ) | | | (7,463 | ) | | | (60,405 | ) | | | (14,748 | ) |
| | | | | | | | | | | | | | | | |
Change in Morgan Shares | | | 17,499 | | | | 958 | | | | 20,599 | | | | 19,575 | |
| | | | | | | | | | | | | | | | |
Premier | |
Issued | | | 911,539 | | | | 1,170,039 | | | | 118,916 | | | | 167,753 | |
Reinvested | | | 70 | | | | 189 | | | | 46 | | | | 95 | |
Redeemed | | | (1,082,559 | ) | | | (1,385,434 | ) | | | (145,892 | ) | | | (161,846 | ) |
| | | | | | | | | | | | | | | | |
Change in Premier Shares | | | (170,950 | ) | | | (215,206 | ) | | | (26,930 | ) | | | 6,002 | |
| | | | | | | | | | | | | | | | |
Reserve | |
Issued | | | 4,339,005 | | | | 10,411,802 | | | | — | | | | — | |
Reinvested | | | 5 | | | | 17 | | | | — | | | | — | |
Redeemed | | | (4,683,776 | ) | | | (10,733,226 | ) | | | — | | | | — | |
| | | | | | | | | | | | | | | | |
Change in Reserve Shares | | | (344,766 | ) | | | (321,407 | ) | | | — | | | | — | |
| | | | | | | | | | | | | | | | |
Service | |
Issued | | | — | | | | — | | | | — | | | | 36,138 | |
Reinvested | | | — | | | | — | | | | 88 | | | | 749 | |
Redeemed | | | — | | | | — | | | | (27,621 | ) | | | (225,334 | ) |
| | | | | | | | | | | | | | | | |
Change in Service Shares | | | — | | | | — | | | | (27,533 | ) | | | (188,447 | ) |
| | | | | | | | | | | | | | | | |
| (a) | Liquidated on November 25, 2019 for JPMorgan Municipal Money Market Fund. |
SEE NOTES TO FINANCIAL STATEMENTS.
| | | | | | |
| | | |
| 122 | | | | J.P. MORGAN MONEY MARKET FUNDS | | AUGUST 31, 2020 |
| | | | | | | | | | | | | | | | |
| | | JPMorgan California Municipal Money
Market Fund | | | JPMorgan New York Municipal Money
Market Fund | |
| | | Six Months Ended
August 31, 2020
(Unaudited) | | | Year Ended
February 29, 2020 | | | Six Months Ended
August 31, 2020
(Unaudited) | | | Year Ended
February 29, 2020 | |
CAPITAL TRANSACTIONS: | | | | | | | | | | | | | | | | |
Agency (a) | | | | | | | | | | | | | | | | |
Proceeds from shares issued | | $ | 75,470 | | | $ | 66,539 | | | $ | 171,005 | | | $ | 715,020 | |
Distributions reinvested | | | — | (b) | | | — | (b) | | | — | (b) | | | — | (b) |
Cost of shares redeemed | | | (64,255 | ) | | | (41,639 | ) | | | (311,232 | ) | | | (452,366 | ) |
| | | | | | | | | | | | | | | | |
Change in net assets resulting from Agency capital transactions | | $ | 11,215 | | | $ | 24,900 | | | $ | (140,227 | ) | | $ | 262,654 | |
| | | | | | | | | | | | | | | | |
Eagle Class (c) | | | | | | | | | | | | | | | | |
Proceeds from shares issued | | $ | — | | | $ | 8,563 | | | $ | — | | | $ | 18,662 | |
Distributions reinvested | | | — | | | | 22 | | | | — | | | | 56 | |
Cost of shares redeemed | | | — | | | | (18,855 | ) | | | — | | | | (53,610 | ) |
| | | | | | | | | | | | | | | | |
Change in net assets resulting from Eagle Class capital transactions | | $ | — | | | $ | (10,270 | ) | | $ | — | | | $ | (34,892 | ) |
| | | | | | | | | | | | | | | | |
Institutional Class (a) | | | | | | | | | | | | | | | | |
Proceeds from shares issued | | $ | 304,314 | | | $ | 996,142 | | | $ | 812,166 | | | $ | 4,204,905 | |
Distributions reinvested | | | 3 | | | | — | (b) | | | 68 | | | | 145 | |
Cost of shares redeemed | | | (383,797 | ) | | | (708,396 | ) | | | (1,635,015 | ) | | | (2,579,748 | ) |
| | | | | | | | | | | | | | | | |
Change in net assets resulting from Institutional Class capital transactions | | $ | (79,480 | ) | | $ | 287,746 | | | $ | (822,781 | ) | | $ | 1,625,302 | |
| | | | | | | | | | | | | | | | |
Morgan | | | | | | | | | | | | | | | | |
Proceeds from shares issued | | $ | 33,694 | | | $ | 2,313 | | | $ | 25,221 | | | $ | 32,103 | |
Distributions reinvested | | | 13 | | | | 18 | | | | 126 | | | | 959 | |
Cost of shares redeemed | | | (25,281 | ) | | | (1,474 | ) | | | (22,104 | ) | | | (103,021 | ) |
| | | | | | | | | | | | | | | | |
Change in net assets resulting from Morgan capital transactions | | $ | 8,426 | | | $ | 857 | | | $ | 3,243 | | | $ | (69,959 | ) |
| | | | | | | | | | | | | | | | |
Premier | | | | | | | | | | | | | | | | |
Proceeds from shares issued | | $ | 315,265 | | | $ | 1,046,355 | | | $ | 775,599 | | | $ | 2,924,871 | |
Distributions reinvested | | | 75 | | | | 996 | | | | 311 | | | | 4,126 | |
Cost of shares redeemed | | | (409,758 | ) | | | (1,073,578 | ) | | | (1,294,401 | ) | | | (2,955,568 | ) |
| | | | | | | | | | | | | | | | |
Change in net assets resulting from Premier capital transactions | | $ | (94,418 | ) | | $ | (26,227 | ) | | $ | (518,491 | ) | | $ | (26,571 | ) |
| | | | | | | | | | | | | | | | |
Reserve | | | | | | | | | | | | | | | | |
Proceeds from shares issued | | $ | — | | | $ | — | | | $ | 1,805 | | | $ | 3,749 | |
Distributions reinvested | | | — | | | | — | | | | 2 | | | | 10 | |
Cost of shares redeemed | | | — | | | | — | | | | (2,098 | ) | | | (4,206 | ) |
| | | | | | | | | | | | | | | | |
Change in net assets resulting from Reserve capital transactions | | $ | — | | | $ | — | | | $ | (291 | ) | | $ | (447 | ) |
| | | | | | | | | | | | | | | | |
Service | | | | | | | | | | | | | | | | |
Proceeds from shares issued | | $ | — | | | $ | 23,376 | | | $ | — | | | $ | 21,226 | |
Distributions reinvested | | | 27 | | | | 269 | | | | 11 | | | | 91 | |
Cost of shares redeemed | | | (10,537 | ) | | | (113,416 | ) | | | (3,552 | ) | | | (49,493 | ) |
| | | | | | | | | | | | | | | | |
Change in net assets resulting from Service capital transactions | | $ | (10,510 | ) | | $ | (89,771 | ) | | $ | (3,541 | ) | | $ | (28,176 | ) |
| | | | | | | | | | | | | | | | |
Total change in net assets resulting from capital transactions | | $ | (164,767 | ) | | $ | 187,235 | | | $ | (1,482,088 | ) | | $ | 1,727,911 | |
| | | | | | | | | | | | | | | | |
| (a) | Commencement of offering of class of shares effective March 1, 2019. |
| (b) | Amount rounds to less than one thousand. |
| (c) | Liquidated on November 25, 2019. |
SEE NOTES TO FINANCIAL STATEMENTS.
| | | | | | | | |
| | | |
| AUGUST 31, 2020 | | J.P. MORGAN MONEY MARKET FUNDS | | | | | 123 | |
STATEMENTS OF CHANGES IN NET ASSETS
FOR THE PERIODS INDICATED (continued)
(Amounts in thousands)
| | | | | | | | | | | | | | | | |
| | | JPMorgan California Municipal Money
Market Fund | | | JPMorgan New York Municipal Money
Market Fund | |
| | | Six Months Ended
August 31, 2020
(Unaudited) | | | Year Ended
February 29, 2020 | | | Six Months Ended
August 31, 2020
(Unaudited) | | | Year Ended
February 29, 2020 | |
SHARE TRANSACTIONS: | |
Agency (a) | |
Issued | | | 75,465 | | | | 66,522 | | | | 171,005 | | | | 715,020 | |
Reinvested | | | — | (b) | | | — | (b) | | | — | (b) | | | — | (b) |
Redeemed | | | (64,255 | ) | | | (41,633 | ) | | | (311,229 | ) | | | (452,366 | ) |
| | | | | | | | | | | | | | | | |
Change in Agency Shares | | | 11,210 | | | | 24,889 | | | | (140,224 | ) | | | 262,654 | |
| | | | | | | | | | | | | | | | |
Eagle Class (c) | |
Issued | | | — | | | | 8,557 | | | | — | | | | 18,661 | |
Reinvested | | | — | | | | 22 | | | | — | | | | 56 | |
Redeemed | | | — | | | | (18,844 | ) | | | — | | | | (53,610 | ) |
| | | | | | | | | | | | | | | | |
Change in Eagle Class Shares | | | — | | | | (10,265 | ) | | | — | | | | (34,893 | ) |
| | | | | | | | | | | | | | | | |
Institutional Class (a) | |
Issued | | | 304,307 | | | | 995,953 | | | | 812,134 | | | | 4,204,902 | |
Reinvested | | | 3 | | | | — | (b) | | | 68 | | | | 145 | |
Redeemed | | | (383,793 | ) | | | (708,283 | ) | | | (1,635,015 | ) | | | (2,579,747 | ) |
| | | | | | | | | | | | | | | | |
Change in Institutional Class Shares | | | (79,483 | ) | | | 287,670 | | | | (822,813 | ) | | | 1,625,300 | |
| | | | | | | | | | | | | | | | |
Morgan | |
Issued | | | 33,692 | | | | 2,312 | | | | 25,218 | | | | 32,103 | |
Reinvested | | | 13 | | | | 18 | | | | 126 | | | | 959 | |
Redeemed | | | (25,281 | ) | | | (1,473 | ) | | | (22,104 | ) | | | (103,008 | ) |
| | | | | | | | | | | | | | | | |
Change in Morgan Shares | | | 8,424 | | | | 857 | | | | 3,240 | | | | (69,946 | ) |
| | | | | | | | | | | | | | | | |
Premier | |
Issued | | | 315,265 | | | | 1,046,255 | | | | 775,599 | | | | 2,924,859 | |
Reinvested | | | 75 | | | | 996 | | | | 311 | | | | 4,126 | |
Redeemed | | | (409,750 | ) | | | (1,073,445 | ) | | | (1,294,369 | ) | | | (2,955,566 | ) |
| | | | | | | | | | | | | | | | |
Change in Premier Shares | | | (94,410 | ) | | | (26,194 | ) | | | (518,459 | ) | | | (26,581 | ) |
| | | | | | | | | | | | | | | | |
Reserve | |
Issued | | | — | | | | — | | | | 1,805 | | | | 3,749 | |
Reinvested | | | — | | | | — | | | | 2 | | | | 10 | |
Redeemed | | | — | | | | — | | | | (2,098 | ) | | | (4,206 | ) |
| | | | | | | | | | | | | | | | |
Change in Reserve Shares | | | — | | | | — | | | | (291 | ) | | | (447 | ) |
| | | | | | | | | | | | | | | | |
Service | |
Issued | | | — | | | | 23,339 | | | | — | | | | 21,226 | |
Reinvested | | | 27 | | | | 269 | | | | 11 | | | | 91 | |
Redeemed | | | (10,534 | ) | | | (113,330 | ) | | | (3,552 | ) | | | (49,493 | ) |
| | | | | | | | | | | | | | | | |
Change in Service Shares | | | (10,507 | ) | | | (89,722 | ) | | | (3,541 | ) | | | (28,176 | ) |
| | | | | | | | | | | | | | | | |
| (a) | Commencement of offering of class of shares effective March 1, 2019. |
| (b) | Amount rounds to less than one thousand. |
| (c) | Liquidated on November 25, 2019. |
SEE NOTES TO FINANCIAL STATEMENTS.
| | | | | | |
| | | |
| 124 | | | | J.P. MORGAN MONEY MARKET FUNDS | | AUGUST 31, 2020 |
THIS PAGE IS INTENTIONALLY LEFT BLANK
| | | | | | | | |
| | | |
| AUGUST 31, 2020 | | J.P. MORGAN MONEY MARKET FUNDS | | | | | 125 | |
FINANCIAL HIGHLIGHTS
FOR THE PERIODS INDICATED
| | | | | | | | | | | | | | | | | | | | | | | | | | | | |
| | | Per share operating performance | |
| | | | | | Investment operations | | | Distributions | |
| | | Net asset value, beginning of period | | | Net investment income (loss) | | | Net realized and unrealized gains (losses) on investments | | | Total from investment operations | | | Net investment income | | | Net realized gain | | | Total distributions | |
JPMorgan Prime Money Market Fund* | | | | | | | | | | | | | | | | | | | | | | | | | | | | |
Class C | | | | | | | | | | | | | | | | | | | | | | | | | | | | |
Six Months Ended August 31, 2020 (Unaudited) | | $ | 1.0005 | | | $ | 0.0005 | | | $ | 0.0003 | (d) | | $ | 0.0008 | | | $ | (0.0005 | ) | | $ | — | | | $ | (0.0005 | ) |
Year Ended February 29, 2020 | | | 1.0003 | | | | 0.0134 | | | | 0.0002 | | | | 0.0136 | | | | (0.0134 | ) | | | — | (e) | | | (0.0134 | ) |
Year Ended February 28, 2019 | | | 1.0001 | | | | 0.0133 | | | | 0.0002 | | | | 0.0135 | | | | (0.0133 | ) | | | — | (e) | | | (0.0133 | ) |
Year Ended February 28, 2018 | | | 1.0004 | | | | 0.0039 | (f) | | | — | (e) | | | 0.0039 | | | | (0.0042 | ) | | | — | (e) | | | (0.0042 | ) |
Year Ended February 28, 2017 | | | 1.0000 | | | | 0.0001 | (f) | | | 0.0006 | | | | 0.0007 | | | | (0.0003 | ) | | | — | (e) | | | (0.0003 | ) |
Year Ended February 29, 2016 | | | 1.00 | | | | — | (f)(g) | | | — | (g) | | | — | (g) | | | — | (g) | | | — | (g) | | | — | (g) |
| | | | | | | |
Academy | | | | | | | | | | | | | | | | | | | | | | | | | | | | |
Six Months Ended August 31, 2020 (Unaudited) | | | 1.0006 | | | | 0.0030 | | | | 0.0002 | (d) | | | 0.0032 | | | | (0.0030 | ) | | | — | | | | (0.0030 | ) |
May 15, 2019 (h) through February 29, 2020 | | | 1.0003 | | | | 0.0162 | | | | 0.0003 | | | | 0.0165 | | | | (0.0162 | ) | | | — | | | | (0.0162 | ) |
| | | | | | | |
Agency | | | | | | | | | | | | | | | | | | | | | | | | | | | | |
Six Months Ended August 31, 2020 (Unaudited) | | | 1.0007 | | | | 0.0026 | | | | 0.0003 | (d) | | | 0.0029 | | | | (0.0026 | ) | | | — | | | | (0.0026 | ) |
Year Ended February 29, 2020 | | | 1.0003 | | | | 0.0205 | | | | 0.0004 | | | | 0.0209 | | | | (0.0205 | ) | | | — | (e) | | | (0.0205 | ) |
Year Ended February 28, 2019 | | | 1.0001 | | | | 0.0204 | | | | 0.0002 | | | | 0.0206 | | | | (0.0204 | ) | | | — | (e) | | | (0.0204 | ) |
Year Ended February 28, 2018 | | | 1.0004 | | | | 0.0114 | (f) | | | (0.0004 | ) | | | 0.0110 | | | | (0.0113 | ) | | | — | (e) | | | (0.0113 | ) |
Year Ended February 28, 2017 | | | 1.0000 | | | | 0.0036 | (f) | | | 0.0016 | | | | 0.0052 | | | | (0.0048 | ) | | | — | (e) | | | (0.0048 | ) |
Year Ended February 29, 2016 | | | 1.00 | | | | — | (f)(g) | | | — | (g) | | | — | (g) | | | — | (g) | | | — | (g) | | | — | (g) |
| | | | | | | |
Capital | | | | | | | | | | | | | | | | | | | | | | | | | | | | |
Six Months Ended August 31, 2020 (Unaudited) | | | 1.0005 | | | | 0.0030 | | | | 0.0003 | (d) | | | 0.0033 | | | | (0.0030 | ) | | | — | | | | (0.0030 | ) |
Year Ended February 29, 2020 | | | 1.0003 | | | | 0.0213 | | | | 0.0002 | | | | 0.0215 | | | | (0.0213 | ) | | | — | (e) | | | (0.0213 | ) |
Year Ended February 28, 2019 | | | 1.0001 | | | | 0.0212 | | | | 0.0002 | | | | 0.0214 | | | | (0.0212 | ) | | | — | (e) | | | (0.0212 | ) |
Year Ended February 28, 2018 | | | 1.0004 | | | | 0.0122 | (f) | | | (0.0004 | ) | | | 0.0118 | | | | (0.0121 | ) | | | — | (e) | | | (0.0121 | ) |
Year Ended February 28, 2017 | | | 1.0000 | | | | 0.0047 | (f) | | | 0.0014 | | | | 0.0061 | | | | (0.0057 | ) | | | — | (e) | | | (0.0057 | ) |
Year Ended February 29, 2016 | | | 1.00 | | | | — | (f)(g) | | | — | (g) | | | — | (g) | | | — | (g) | | | — | (g) | | | — | (g) |
| | | | | | | |
IM | | | | | | | | | | | | | | | | | | | | | | | | | | | | |
Six Months Ended August 31, 2020 (Unaudited) | | | 1.0006 | | | | 0.0032 | | | | 0.0002 | (d) | | | 0.0034 | | | | (0.0032 | ) | | | — | | | | (0.0032 | ) |
Year Ended February 29, 2020 | | | 1.0003 | | | | 0.0216 | | | | 0.0003 | | | | 0.0219 | | | | (0.0216 | ) | | | — | (e) | | | (0.0216 | ) |
Year Ended February 28, 2019 | | | 1.0001 | | | | 0.0215 | | | | 0.0002 | | | | 0.0217 | | | | (0.0215 | ) | | | — | (e) | | | (0.0215 | ) |
Year Ended February 28, 2018 | | | 1.0004 | | | | 0.0124 | (f) | | | (0.0004 | ) | | | 0.0120 | | | | (0.0123 | ) | | | — | (e) | | | (0.0123 | ) |
Year Ended February 28, 2017 | | | 1.0000 | | | | 0.0055 | (f) | | | 0.0007 | | | | 0.0062 | | | | (0.0058 | ) | | | — | (e) | | | (0.0058 | ) |
Year Ended February 29, 2016 | | | 1.00 | | | | — | (f)(g) | | | — | (g) | | | — | (g) | | | — | (g) | | | — | (g) | | | — | (g) |
| | | | | | | |
Institutional Class | | | | | | | | | | | | | | | | | | | | | | | | | | | | |
Six Months Ended August 31, 2020 (Unaudited) | | | 1.0005 | | | | 0.0029 | | | | 0.0003 | (d) | | | 0.0032 | | | | (0.0029 | ) | | | — | | | | (0.0029 | ) |
Year Ended February 29, 2020 | | | 1.0003 | | | | 0.0210 | | | | 0.0002 | | | | 0.0212 | | | | (0.0210 | ) | | | — | (e) | | | (0.0210 | ) |
Year Ended February 28, 2019 | | | 1.0001 | | | | 0.0209 | | | | 0.0002 | | | | 0.0211 | | | | (0.0209 | ) | | | — | (e) | | | (0.0209 | ) |
Year Ended February 28, 2018 | | | 1.0004 | | | | 0.0119 | (f) | | | (0.0004 | ) | | | 0.0115 | | | | (0.0118 | ) | | | — | (e) | | | (0.0118 | ) |
Year Ended February 28, 2017 | | | 1.0000 | | | | 0.0044 | (f) | | | 0.0014 | | | | 0.0058 | | | | (0.0054 | ) | | | — | (e) | | | (0.0054 | ) |
Year Ended February 29, 2016 | | | 1.00 | | | | — | (f)(g) | | | — | (g) | | | — | (g) | | | — | (g) | | | — | (g) | | | — | (g) |
| (a) | Annualized for periods less than one year, unless otherwise noted. |
| (b) | Not annualized for periods less than one year. |
| (c) | Includes earnings credits and interest expense, if applicable, each of which is less than 0.005% unless otherwise noted. |
| (d) | Net realized and unrealized gains (losses) on investments may appear disproportionate in relation to the classes due to rounding. |
| (e) | Amount rounds to less than $0.00005. |
| (f) | Calculated based upon average shares outstanding. |
| (g) | Amount rounds to less than $0.005. |
| (h) | Commencement of offering of class of shares. |
| * | The JPMorgan Prime Money Market Fund began utilizing a floating NAV calculated to four decimal places on October 3, 2016. |
SEE NOTES TO FINANCIAL STATEMENTS.
| | | | | | |
| | | |
| 126 | | | | J.P. MORGAN MONEY MARKET FUNDS | | AUGUST 31, 2020 |
| | | | | | | | | | | | | | | | | | | | | | |
| | | Ratios/Supplemental data | |
| | | | | | | | | | Ratios to average net assets (a) | |
Net asset value, end of period | | | Total return (b) | | | Net assets, end of period (000’s) | | | Net expenses (c) | | | Net investment income (loss) | | | Expenses without waivers, reimbursements and earnings credits | |
| | | | | | | | | | | | | | | | | | | | | | |
| | | | | | | | | | | | | | | | | | | | | | |
| $ | 1.0008 | | | | 0.08 | % | | $ | 627 | | | | 0.69 | % | | | 0.10 | % | | | 4.84 | % |
| | 1.0005 | | | | 1.37 | | | | 806 | | | | 0.97 | | | | 1.38 | | | | 3.88 | |
| | 1.0003 | | | | 1.36 | | | | 1,218 | | | | 0.97 | | | | 1.30 | | | | 2.80 | |
| | 1.0001 | | | | 0.39 | | | | 2,012 | | | | 0.97 | | | | 0.39 | | | | 2.27 | |
| | 1.0004 | | | | 0.07 | | | | 4,289 | | | | 0.60 | | | | 0.01 | | | | 1.20 | |
| | 1.00 | | | | 0.01 | | | | 39,558 | | | | 0.34 | | | | 0.01 | | | | 1.18 | |
| | | | | |
| | | | | | | | | | | | | | | | | | | | | | |
| | 1.0008 | | | | 0.32 | | | | 1,439,771 | | | | 0.18 | | | | 0.52 | | | | 0.19 | |
| | 1.0006 | | | | 1.66 | | | | 150,519 | | | | 0.18 | | | | 1.69 | | | | 0.26 | |
| | | | | |
| | | | | | | | | | | | | | | | | | | | | | |
| | 1.0010 | | | | 0.29 | | | | 2,453,387 | | | | 0.26 | | | | 0.50 | | | | 0.29 | |
| | 1.0007 | | | | 2.11 | | | | 2,517,667 | | | | 0.26 | | | | 2.05 | | | | 0.30 | |
| | 1.0003 | | | | 2.08 | | | | 2,474,137 | | | | 0.26 | | | | 2.09 | | | | 0.31 | |
| | 1.0001 | | | | 1.10 | | | | 1,494,001 | | | | 0.26 | | | | 1.14 | | | | 0.31 | |
| | 1.0004 | | | | 0.52 | | | | 1,002,964 | | | | 0.26 | | | | 0.36 | | | | 0.31 | |
| | 1.00 | | | | 0.07 | | | | 8,141,439 | | | | 0.26 | | | | 0.07 | | | | 0.31 | |
| | | | | |
| | | | | | | | | | | | | | | | | | | | | | |
| | 1.0008 | | | | 0.33 | | | | 51,943,171 | | | | 0.18 | | | | 0.53 | | | | 0.19 | |
| | 1.0005 | | | | 2.17 | | | | 33,683,247 | | | | 0.18 | | | | 2.09 | | | | 0.20 | |
| | 1.0003 | | | | 2.16 | | | | 26,725,832 | | | | 0.18 | | | | 2.13 | | | | 0.21 | |
| | 1.0001 | | | | 1.18 | | | | 24,654,174 | | | | 0.18 | | | | 1.22 | | | | 0.21 | |
| | 1.0004 | | | | 0.61 | | | | 20,091,103 | | | | 0.17 | | | | 0.47 | | | | 0.21 | |
| | 1.00 | | | | 0.14 | | | | 64,690,852 | | | | 0.18 | | | | 0.14 | | | | 0.21 | |
| | | | | |
| | | | | | | | | | | | | | | | | | | | | | |
| | 1.0008 | | | | 0.34 | | | | 5,543,500 | | | | 0.14 | | | | 0.62 | | | | 0.14 | |
| | 1.0006 | | | | 2.21 | | | | 5,541,728 | | | | 0.15 | | | | 2.12 | | | | 0.15 | |
| | 1.0003 | | | | 2.19 | | | | 1,896,262 | | | | 0.16 | | | | 2.13 | | | | 0.16 | |
| | 1.0001 | | | | 1.21 | | | | 2,032,079 | | | | 0.16 | | | | 1.24 | | | | 0.16 | |
| | 1.0004 | | | | 0.62 | | | | 2,010,581 | | | | 0.16 | | | | 0.55 | | | | 0.17 | |
| | 1.00 | | | | 0.17 | | | | 2,628,508 | | | | 0.16 | | | | 0.16 | | | | 0.16 | |
| | | | | |
| | | | | | | | | | | | | | | | | | | | | | |
| | 1.0008 | | | | 0.32 | | | | 22,362,614 | | | | 0.21 | | | | 0.52 | | | | 0.24 | |
| | 1.0005 | | | | 2.14 | | | | 15,607,982 | | | | 0.21 | | | | 2.07 | | | | 0.25 | |
| | 1.0003 | | | | 2.13 | | | | 11,691,618 | | | | 0.21 | | | | 2.12 | | | | 0.26 | |
| | 1.0001 | | | | 1.15 | | | | 8,567,374 | | | | 0.21 | | | | 1.19 | | | | 0.26 | |
| | 1.0004 | | | | 0.58 | | | | 6,081,787 | | | | 0.20 | | | | 0.44 | | | | 0.26 | |
| | 1.00 | | | | 0.11 | | | | 20,011,248 | | | | 0.21 | | | | 0.10 | | | | 0.26 | |
SEE NOTES TO FINANCIAL STATEMENTS.
| | | | | | | | |
| | | |
| AUGUST 31, 2020 | | J.P. MORGAN MONEY MARKET FUNDS | | | | | 127 | |
FINANCIAL HIGHLIGHTS
FOR THE PERIODS INDICATED (continued)
| | | | | | | | | | | | | | | | | | | | | | | | | | | | |
| | | Per share operating performance | |
| | | | | | Investment operations | | | Distributions | |
| | | Net asset value, beginning of period | | | Net investment income (loss) | | | Net realized and unrealized gains (losses) on investments | | | Total from investment operations | | | Net investment income | | | Net realized gain | | | Total distributions | |
JPMorgan Prime Money Market Fund* (continued) | | | | | | | | | | | | | | | | | | | | | | | | | | | | |
Morgan | | | | | | | | | | | | | | | | | | | | | | | | | | | | |
Six Months Ended August 31, 2020 (Unaudited) | | $ | 1.0008 | | | $ | 0.0015 | | | $ | 0.0005 | (d) | | $ | 0.0020 | | | $ | (0.0015 | ) | | $ | — | | | $ | (0.0015 | ) |
Year Ended February 29, 2020 | | | 1.0003 | | | | 0.0180 | | | | 0.0005 | | | | 0.0185 | | | | (0.0180 | ) | | | — | (e) | | | (0.0180 | ) |
Year Ended February 28, 2019 | | | 1.0001 | | | | 0.0179 | | | | 0.0002 | | | | 0.0181 | | | | (0.0179 | ) | | | — | (e) | | | (0.0179 | ) |
Year Ended February 28, 2018 | | | 1.0004 | | | | 0.0089 | (f) | | | (0.0005 | ) | | | 0.0084 | | | | (0.0087 | ) | | | — | (e) | | | (0.0087 | ) |
Year Ended February 28, 2017 | | | 1.0000 | | | | 0.0014 | (f) | | | 0.0012 | | | | 0.0026 | | | | (0.0022 | ) | | | — | (e) | | | (0.0022 | ) |
Year Ended February 29, 2016 | | | 1.00 | | | | — | (f)(g) | | | — | (g) | | | — | (g) | | | — | (g) | | | — | (g) | | | — | (g) |
| | | | | | | |
Premier | | | | | | | | | | | | | | | | | | | | | | | | | | | | |
Six Months Ended August 31, 2020 (Unaudited) | | | 1.0006 | | | | 0.0017 | | | | 0.0003 | (d) | | | 0.0020 | | | | (0.0017 | ) | | | — | | | | (0.0017 | ) |
Year Ended February 29, 2020 | | | 1.0003 | | | | 0.0186 | | | | 0.0003 | | | | 0.0189 | | | | (0.0186 | ) | | | — | (e) | | | (0.0186 | ) |
Year Ended February 28, 2019 | | | 1.0001 | | | | 0.0185 | | | | 0.0002 | | | | 0.0187 | | | | (0.0185 | ) | | | — | (e) | | | (0.0185 | ) |
Year Ended February 28, 2018 | | | 1.0004 | | | | 0.0096 | (f) | | | (0.0005 | ) | | | 0.0091 | | | | (0.0094 | ) | | | — | (e) | | | (0.0094 | ) |
Year Ended February 28, 2017 | | | 1.0000 | | | | 0.0020 | (f) | | | 0.0013 | | | | 0.0033 | | | | (0.0029 | ) | | | — | (e) | | | (0.0029 | ) |
Year Ended February 29, 2016 | | | 1.00 | | | | — | (f)(g) | | | — | (g) | | | — | (g) | | | — | (g) | | | — | (g) | | | — | (g) |
| | | | | | | |
Reserve | | | | | | | | | | | | | | | | | | | | | | | | | | | | |
Six Months Ended August 31, 2020 (Unaudited) | | | 1.0007 | | | | 0.0009 | | | | 0.0004 | (d) | | | 0.0013 | | | | (0.0009 | ) | | | — | | | | (0.0009 | ) |
Year Ended February 29, 2020 | | | 1.0003 | | | | 0.0161 | | | | 0.0004 | | | | 0.0165 | | | | (0.0161 | ) | | | — | (e) | | | (0.0161 | ) |
Year Ended February 28, 2019 | | | 1.0001 | | | | 0.0160 | | | | 0.0002 | | | | 0.0162 | | | | (0.0160 | ) | | | — | (e) | | | (0.0160 | ) |
Year Ended February 28, 2018 | | | 1.0004 | | | | 0.0062 | (f) | | | 0.0004 | | | | 0.0066 | | | | (0.0069 | ) | | | — | (e) | | | (0.0069 | ) |
Year Ended February 28, 2017 | | | 1.0000 | | | | 0.0003 | (f) | | | 0.0013 | | | | 0.0016 | | | | (0.0012 | ) | | | — | (e) | | | (0.0012 | ) |
Year Ended February 29, 2016 | | | 1.00 | | | | — | (f)(g) | | | — | (g) | | | — | (g) | | | — | (g) | | | — | (g) | | | — | (g) |
| (a) | Annualized for periods less than one year, unless otherwise noted. |
| (b) | Not annualized for periods less than one year. |
| (c) | Includes earnings credits and interest expense, if applicable, each of which is less than 0.005% unless otherwise noted. |
| (d) | Net realized and unrealized gains (losses) on investments may appear disproportionate in relation to the classes due to rounding. |
| (e) | Amount rounds to less than $0.00005. |
| (f) | Calculated based upon average shares outstanding. |
| (g) | Amount rounds to less than $0.005. |
| (h) | Commencement of offering of class of shares. |
| * | The JPMorgan Prime Money Market Fund began utilizing a floating NAV calculated to four decimal places on October 3, 2016. |
SEE NOTES TO FINANCIAL STATEMENTS.
| | | | | | |
| | | |
| 128 | | | | J.P. MORGAN MONEY MARKET FUNDS | | AUGUST 31, 2020 |
| | | | | | | | | | | | | | | | | | | | | | |
| | | Ratios/Supplemental data | |
| | | | | | | | | | Ratios to average net assets (a) | |
Net asset value, end of period | | | Total return (b) | | | Net assets, end of period (000’s) | | | Net expenses (c) | | | Net investment income (loss) | | | Expenses without waivers, reimbursements and earnings credits | |
| | | | | | | | | | | | | | | | | | | | | | |
| | | | | | | | | | | | | | | | | | | | | | |
| $ | 1.0013 | | | | 0.20 | % | | $ | 1,773,331 | | | | 0.48 | % | | | 0.34 | % | | | 0.50 | % |
| | 1.0008 | | | | 1.87 | | | | 2,880,586 | | | | 0.51 | | | | 1.78 | | | | 0.51 | |
| | 1.0003 | | | | 1.82 | | | | 2,395,205 | | | | 0.52 | | | | 1.88 | | | | 0.53 | |
| | 1.0001 | | | | 0.84 | | | | 739,866 | | | | 0.52 | | | | 0.89 | | | | 0.56 | |
| | 1.0004 | | | | 0.26 | | | | 534,288 | | | | 0.52 | | | | 0.14 | | | | 0.54 | |
| | 1.00 | | | | 0.01 | | | | 1,877,099 | | | | 0.31 | | | | 0.01 | | | | 0.52 | |
| | | | | |
| | | | | | | | | | | | | | | | | | | | | | |
| | 1.0009 | | | | 0.20 | | | | 1,972,604 | | | | 0.43 | | | | 0.36 | | | | 0.44 | |
| | 1.0006 | | | | 1.91 | | | | 2,646,576 | | | | 0.45 | | | | 1.83 | | | | 0.45 | |
| | 1.0003 | | | | 1.89 | | | | 1,884,553 | | | | 0.45 | | | | 1.90 | | | | 0.46 | |
| | 1.0001 | | | | 0.91 | | | | 1,093,169 | | | | 0.45 | | | | 0.96 | | | | 0.46 | |
| | 1.0004 | | | | 0.33 | | | | 687,368 | | | | 0.45 | | | | 0.20 | | | | 0.46 | |
| | 1.00 | | | | 0.02 | | | | 2,030,985 | | | | 0.30 | | | | 0.02 | | | | 0.46 | |
| | | | | |
| | | | | | | | | | | | | | | | | | | | | | |
| | 1.0011 | | | | 0.13 | | | | 1,280 | | | | 0.65 | | | | 0.45 | | | | 1.48 | |
| | 1.0007 | | | | 1.66 | | | | 12,017 | | | | 0.70 | | | | 1.59 | | | | 0.94 | |
| | 1.0003 | | | | 1.64 | | | | 13,024 | | | | 0.70 | | | | 1.57 | | | | 0.85 | |
| | 1.0001 | | | | 0.66 | | | | 15,846 | | | | 0.70 | | | | 0.62 | | | | 0.76 | |
| | 1.0004 | | | | 0.16 | | | | 99,446 | | | | 0.58 | | | | 0.03 | | | | 0.71 | |
| | 1.00 | | | | 0.01 | | | | 930,188 | | | | 0.31 | | | | 0.01 | | | | 0.71 | |
SEE NOTES TO FINANCIAL STATEMENTS.
| | | | | | | | |
| | | |
| AUGUST 31, 2020 | | J.P. MORGAN MONEY MARKET FUNDS | | | | | 129 | |
FINANCIAL HIGHLIGHTS
FOR THE PERIODS INDICATED (continued)
| | | | | | | | | | | | | | | | | | | | | | | | | | | | |
| | | Per share operating performance | |
| | | | | | Investment operations | | | Distributions | |
| | | Net asset value, beginning of period | | | Net investment income (loss) | | | Net realized and unrealized gains (losses) on investments | | | Total from investment operations | | | Net investment income | | | Net realized gain | | | Total distributions | |
JPMorgan Institutional Tax Free Money Market Fund | | | | | | | | | | | | | | | | | | | | | | | | | | | | |
Agency | | | | | | | | | | | | | | | | | | | | | | | | | | | | |
Six Months Ended August 31, 2020 (Unaudited) | | $ | 1.0001 | | | $ | 0.0022 | | | $ | 0.0006 | (d) | | $ | 0.0028 | | | $ | (0.0022 | ) | | $ | — | | | $ | (0.0022 | ) |
Year Ended February 29, 2020 | | | 1.0000 | | | | 0.0117 | | | | 0.0001 | (d) | | | 0.0118 | | | | (0.0117 | ) | | | — | (e) | | | (0.0117 | ) |
March 1, 2018 (f) through February 28, 2019 | | | 1.0000 | | | | 0.0123 | | | | — | (e) | | | 0.0123 | | | | (0.0123 | ) | | | — | (e) | | | (0.0123 | ) |
| | | | | | | |
Capital | | | | | | | | | | | | | | | | | | | | | | | | | | | | |
Six Months Ended August 31, 2020 (Unaudited) | | | 1.0000 | | | | 0.0026 | | | | 0.0007 | | | | 0.0033 | | | | (0.0026 | ) | | | — | | | | (0.0026 | ) |
Year Ended February 29, 2020 | | | 1.0000 | | | | 0.0125 | | | | — | (e) | | | 0.0125 | | | | (0.0125 | ) | | | — | (e) | | | (0.0125 | ) |
March 1, 2018 (f) through February 28, 2019 | | | 1.0000 | | | | 0.0131 | | | | — | (e) | | | 0.0131 | | | | (0.0131 | ) | | | — | (e) | | | (0.0131 | ) |
| | | | | | | |
IM | | | | | | | | | | | | | | | | | | | | | | | | | | | | |
Six Months Ended August 31, 2020 (Unaudited) | | | 1.0000 | | | | 0.0027 | | | | 0.0007 | | | | 0.0034 | | | | (0.0027 | ) | | | — | | | | (0.0027 | ) |
Year Ended February 29, 2020 | | | 1.0000 | | | | 0.0127 | | | | — | (e) | | | 0.0127 | | | | (0.0127 | ) | | | — | (e) | | | (0.0127 | ) |
March 1, 2018 (f) through February 28, 2019 | | | 1.0000 | | | | 0.0133 | | | | — | (e) | | | 0.0133 | | | | (0.0133 | ) | | | — | (e) | | | (0.0133 | ) |
| | | | | | | |
Institutional Class | | | | | | | | | | | | | | | | | | | | | | | | | | | | |
Six Months Ended August 31, 2020 (Unaudited) | | | 1.0000 | | | | 0.0025 | | | | 0.0007 | | | | 0.0032 | | | | (0.0025 | ) | | | — | | | | (0.0025 | ) |
Year Ended February 29, 2020 | | | 1.0000 | | | | 0.0122 | | | | — | (e) | | | 0.0122 | | | | (0.0122 | ) | | | — | (e) | | | (0.0122 | ) |
March 1, 2018 (f) through February 28, 2019 | | | 1.0000 | | | | 0.0128 | | | | — | (e) | | | 0.0128 | | | | (0.0128 | ) | | | — | (e) | | | (0.0128 | ) |
| (a) | Annualized for periods less than one year, unless otherwise noted. |
| (b) | Not annualized for periods less than one year. |
| (c) | Includes earnings credits and interest expense, if applicable, each of which is less than 0.005% unless otherwise noted. |
| (d) | Net realized and unrealized gains (losses) on investments may appear disproportionate in relation to the classes due to rounding. |
| (e) | Amount rounds to less than $0.00005. |
| (f) | Commencement of operations. |
| (g) | Certain non-recurring expenses incurred by the Fund were not annualized for the period indicated. |
SEE NOTES TO FINANCIAL STATEMENTS.
| | | | | | |
| | | |
| 130 | | | | J.P. MORGAN MONEY MARKET FUNDS | | AUGUST 31, 2020 |
| | | | | | | | | | | | | | | | | | | | | | |
| | | Ratios/Supplemental data | |
| | | | | | | | | | Ratios to average net assets (a) | |
Net asset value, end of period | | | Total return (b) | | | Net assets, end of period (000’s) | | | Net expenses (c) | | | Net investment income (loss) | | | Expenses without waivers, reimbursements and earnings credits | |
| | | | | | | | | | | | | | | | | | | | | | |
| | | | | | | | | | | | | | | | | | | | | | |
| $ | 1.0007 | | | | 0.28 | % | | $ | 41,193 | | | | 0.26 | % | | | 0.37 | % | | | 0.36 | % |
| | 1.0001 | | | | 1.19 | | | | 41,696 | | | | 0.26 | | | | 1.15 | | | | 0.38 | |
| | 1.0000 | | | | 1.24 | | | | 17,148 | | | | 0.26 | (g) | | | 1.36 | (g) | | | 2.96 | (g) |
| | | | | |
| | | | | | | | | | | | | | | | | | | | | | |
| | 1.0007 | | | | 0.33 | | | | 213,177 | | | | 0.18 | | | | 0.54 | | | | 0.21 | |
| | 1.0000 | | | | 1.26 | | | | 228,168 | | | | 0.18 | | | | 1.18 | | | | 0.24 | |
| | 1.0000 | | | | 1.32 | | | | 72,933 | | | | 0.18 | (g) | | | 1.42 | (g) | | | 0.40 | (g) |
| | | | | |
| | | | | | | | | | | | | | | | | | | | | | |
| | 1.0007 | | | | 0.34 | | | | 1,190,264 | | | | 0.16 | | | | 0.33 | | | | 0.16 | |
| | 1.0000 | | | | 1.28 | | | | 391,386 | | | | 0.16 | | | | 1.24 | | | | 0.18 | |
| | 1.0000 | | | | 1.34 | | | | 475,368 | | | | 0.16 | (g) | | | 1.32 | (g) | | | 0.23 | (g) |
| | | | | |
| | | | | | | | | | | | | | | | | | | | | | |
| | 1.0007 | | | | 0.32 | | | | 391,206 | | | | 0.21 | | | | 0.38 | | | | 0.26 | |
| | 1.0000 | | | | 1.23 | | | | 309,118 | | | | 0.21 | | | | 1.20 | | | | 0.28 | |
| | 1.0000 | | | | 1.29 | | | | 377,900 | | | | 0.21 | (g) | | | 1.40 | (g) | | | 0.37 | (g) |
SEE NOTES TO FINANCIAL STATEMENTS.
| | | | | | | | |
| | | |
| AUGUST 31, 2020 | | J.P. MORGAN MONEY MARKET FUNDS | | | | | 131 | |
FINANCIAL HIGHLIGHTS
FOR THE PERIODS INDICATED (continued)
| | | | | | | | | | | | | | | | | | | | | | | | | | | | |
| | | Per share operating performance | |
| | | | | | Investment operations | | | Distributions | |
| | | Net asset value, beginning of period | | | Net investment income (loss) | | | Net realized and unrealized gains (losses) on investments | | | Total from investment operations | | | Net investment income | | | Net realized gain | | | Total distributions | |
JPMorgan Securities Lending Money Market Fund | | | | | | | | | | | | | | | | | | | | | | | | | | | | |
Agency SL | | | | | | | | | | | | | | | | | | | | | | | | | | | | |
Six Months Ended August 31, 2020 (Unaudited) | | $ | 1.0002 | | | $ | 0.0036 | | �� | $ | 0.0001 | | | $ | 0.0037 | | | $ | (0.0036 | ) | | $ | — | | | $ | (0.0036 | ) |
Year Ended February 29, 2020 | | | 1.0001 | | | | 0.0222 | | | | 0.0001 | | | | 0.0223 | | | | (0.0222 | ) | | | — | (d) | | | (0.0222 | ) |
September 19, 2018 (e) through February 28, 2019 | | | 1.0000 | | | | 0.0109 | | | | 0.0001 | | | | 0.0110 | | | | (0.0109 | ) | | | — | | | | (0.0109 | ) |
| (a) | Annualized for periods less than one year, unless otherwise noted. |
| (b) | Not annualized for periods less than one year. |
| (c) | Includes earnings credits and interest expense, if applicable, each of which is less than 0.005% unless otherwise noted. |
| (d) | Amount rounds to less than $0.00005. |
| (e) | Commencement of operations. |
| (f) | Certain non-recurring expenses incurred by the Fund were not annualized for the period indicated. |
SEE NOTES TO FINANCIAL STATEMENTS.
| | | | | | |
| | | |
| 132 | | | | J.P. MORGAN MONEY MARKET FUNDS | | AUGUST 31, 2020 |
| | | | | | | | | | | | | | | | | | | | | | |
| | | Ratios/Supplemental data | |
| | | | | | | | | | Ratios to average net assets (a) | |
Net asset value, end of period | | | Total return (b) | | | Net assets, end of period (000’s) | | | Net expenses (c) | | | Net investment income (loss) | | | Expenses without waivers, reimbursements and earnings credits | |
| | | | | | | | | | | | | | | | | | | | | | |
| | | | | | | | | | | | | | | | | | | | | | |
| $ | 1.0003 | | | | 0.37 | % | | $ | 3,650,617 | | | | 0.06 | % | | | 0.69 | % | | | 0.14 | % |
| | 1.0002 | | | | 2.25 | | | | 3,455,824 | | | | 0.06 | | | | 2.20 | | | | 0.16 | |
| | 1.0001 | | | | 1.10 | | | | 2,865,539 | | | | 0.06 | (f) | | | 2.53 | (f) | | | 0.23 | (f) |
SEE NOTES TO FINANCIAL STATEMENTS.
| | | | | | | | |
| | | |
| AUGUST 31, 2020 | | J.P. MORGAN MONEY MARKET FUNDS | | | | | 133 | |
FINANCIAL HIGHLIGHTS
FOR THE PERIODS INDICATED (continued)
| | | | | | | | | | | | | | | | | | | | | | | | | | | | |
| | | Per share operating performance | |
| | | | | | Investment operations | | | Distributions | |
| | | Net asset value, beginning of period | | | Net investment income (loss) (b) | | | Net realized and unrealized gains (losses) on investments | | | Total from investment operations | | | Net investment income | | | Net realized gain | | | Total distributions | |
JPMorgan Liquid Assets Money Market Fund | | | | | | | | | | | | | | | | | | | | | | | | | | | | |
Class C | | | | | | | | | | | | | | | | | | | | | | | | | | | | |
Six Months Ended August 31, 2020 (Unaudited) | | $ | 1.00 | | | $ | — | (e) | | $ | — | (e) | | $ | — | (e) | | $ | — | (e) | | $ | — | | | $ | — | (e) |
Year Ended February 29, 2020 | | | 1.00 | | | | 0.01 | | | | — | (e) | | | 0.01 | | | | (0.01 | ) | | | — | (e) | | | (0.01 | ) |
Year Ended February 28, 2019 | | | 1.00 | | | | 0.01 | | | | — | (e) | | | 0.01 | | | | (0.01 | ) | | | — | (e) | | | (0.01 | ) |
Year Ended February 28, 2018 | | | 1.00 | | | | — | (e) | | | — | (e) | | | — | (e) | | | — | (e) | | | — | (e) | | | — | (e) |
Year Ended February 28, 2017 | | | 1.00 | | | | — | (e) | | | — | (e) | | | — | (e) | | | — | (e) | | | — | (e) | | | — | (e) |
Year Ended February 29, 2016 | | | 1.00 | | | | — | (e) | | | — | (e) | | | — | (e) | | | — | (e) | | | — | (e) | | | — | (e) |
| | | | | | | |
Agency | | | | | | | | | | | | | | | | | | | | | | | | | | | | |
Six Months Ended August 31, 2020 (Unaudited) | | | 1.00 | | | | — | (e) | | | — | (e) | | | — | (e) | | | — | (e) | | | — | | | | — | (e) |
Year Ended February 29, 2020 | | | 1.00 | | | | 0.02 | | | | — | (e) | | | 0.02 | | | | (0.02 | ) | | | — | (e) | | | (0.02 | ) |
Year Ended February 28, 2019 | | | 1.00 | | | | 0.02 | | | | — | (e) | | | 0.02 | | | | (0.02 | ) | | | — | (e) | | | (0.02 | ) |
Year Ended February 28, 2018 | | | 1.00 | | | | 0.01 | | | | — | (e) | | | 0.01 | | | | (0.01 | ) | | | — | (e) | | | (0.01 | ) |
Year Ended February 28, 2017 | | | 1.00 | | | | — | (e) | | | — | (e) | | | — | (e) | | | — | (e) | | | — | (e) | | | — | (e) |
Year Ended February 29, 2016 | | | 1.00 | | | | — | (e) | | | — | (e) | | | — | (e) | | | — | (e) | | | — | (e) | | | — | (e) |
| | | | | | | |
Capital | | | | | | | | | | | | | | | | | | | | | | | | | | | | |
Six Months Ended August 31, 2020 (Unaudited) | | | 1.00 | | | | — | (e) | | | — | (e) | | | — | (e) | | | — | (e) | | | — | | | | — | (e) |
Year Ended February 29, 2020 | | | 1.00 | | | | 0.02 | | | | — | (e) | | | 0.02 | | | | (0.02 | ) | | | — | (e) | | | (0.02 | ) |
Year Ended February 28, 2019 | | | 1.00 | | | | 0.02 | | | | — | (e) | | | 0.02 | | | | (0.02 | ) | | | — | (e) | | | (0.02 | ) |
Year Ended February 28, 2018 | | | 1.00 | | | | 0.01 | | | | — | (e) | | | 0.01 | | | | (0.01 | ) | | | — | (e) | | | (0.01 | ) |
Year Ended February 28, 2017 | | | 1.00 | | | | 0.01 | | | | — | (e) | | | 0.01 | | | | (0.01 | ) | | | — | (e) | | | (0.01 | ) |
Year Ended February 29, 2016 | | | 1.00 | | | | — | (e) | | | — | (e) | | | — | (e) | | | — | (e) | | | — | (e) | | | — | (e) |
| | | | | | | |
E*Trade (f) | | | | | | | | | | | | | | | | | | | | | | | | | | | | |
For the Period Ended October 19, 2016 | | | 1.00 | | | | — | (e) | | | — | (e) | | | — | (e) | | | — | (e) | | | — | (e) | | | — | (e) |
Year Ended February 29, 2016 | | | 1.00 | | | | — | | | | — | (e) | | | — | (e) | | | — | (e) | | | — | (e) | | | — | (e) |
| | | | | | | |
Institutional Class | | | | | | | | | | | | | | | | | | | | | | | | | | | | |
Six Months Ended August 31, 2020 (Unaudited) | | | 1.00 | | | | — | (e) | | | — | (e) | | | — | (e) | | | — | (e) | | | — | | | | — | (e) |
Year Ended February 29, 2020 | | | 1.00 | | | | 0.02 | | | | — | (e) | | | 0.02 | | | | (0.02 | ) | | | — | (e) | | | (0.02 | ) |
Year Ended February 28, 2019 | | | 1.00 | | | | 0.02 | | | | — | (e) | | | 0.02 | | | | (0.02 | ) | | | — | (e) | | | (0.02 | ) |
Year Ended February 28, 2018 | | | 1.00 | | | | 0.01 | | | | — | (e) | | | 0.01 | | | | (0.01 | ) | | | — | (e) | | | (0.01 | ) |
Year Ended February 28, 2017 | | | 1.00 | | | | — | (e) | | | — | (e) | | | — | (e) | | | — | (e) | | | — | (e) | | | — | (e) |
Year Ended February 29, 2016 | | | 1.00 | | | | — | (e) | | | — | (e) | | | — | (e) | | | — | (e) | | | — | (e) | | | — | (e) |
| | | | | | | |
Investor | | | | | | | | | | | | | | | | | | | | | | | | | | | | |
Six Months Ended August 31, 2020 (Unaudited) | | | 1.00 | | | | — | (e) | | | — | (e) | | | — | (e) | | | — | (e) | | | — | | | | — | (e) |
Year Ended February 29, 2020 | | | 1.00 | | | | 0.02 | | | | — | (e) | | | 0.02 | | | | (0.02 | ) | | | — | (e) | | | (0.02 | ) |
Year Ended February 28, 2019 | | | 1.00 | | | | 0.02 | | | | — | (e) | | | 0.02 | | | | (0.02 | ) | | | — | (e) | | | (0.02 | ) |
Year Ended February 28, 2018 | | | 1.00 | | | | 0.01 | | | | — | (e) | | | 0.01 | | | | (0.01 | ) | | | — | (e) | | | (0.01 | ) |
Year Ended February 28, 2017 | | | 1.00 | | | | — | (e) | | | — | (e) | | | — | (e) | | | (e | ) | | | — | (e) | | | — | (e) |
Year Ended February 29, 2016 | | | 1.00 | | | | — | (e) | | | — | (e) | | | — | (e) | | | — | (e) | | | — | (e) | | | — | (e) |
| (a) | Annualized for periods less than one year, unless otherwise noted. |
| (b) | Calculated based upon average shares outstanding. |
| (c) | Not annualized for periods less than one year. |
| (d) | Includes earnings credits and interest expense, if applicable, each of which is less than 0.005% unless otherwise noted. |
| (e) | Amount rounds to less than $0.005. |
| (f) | E*Trade Shares had no assets from the close of business on October 19, 2016. |
SEE NOTES TO FINANCIAL STATEMENTS.
| | | | | | |
| | | |
| 134 | | | | J.P. MORGAN MONEY MARKET FUNDS | | AUGUST 31, 2020 |
| | | | | | | | | | | | | | | | | | | | | | |
| | | Ratios/Supplemental data | |
| | | | | | | | | | Ratios to average net assets (a) | |
Net asset value, end of period | | | Total return (c) | | | Net assets, end of period (000’s) | | | Net expenses (d) | | | Net investment income (loss) | | | Expenses without waivers, reimbursements and earnings credits | |
| | | | | | | | | | | | | | | | | | | | | | |
| | | | | | | | | | | | | | | | | | | | | | |
| $ | 1.00 | | | | 0.05 | % | | $ | 45,233 | | | | 0.67 | % | | | 0.06 | % | | | 1.15 | % |
| | 1.00 | | | | 1.34 | | | | 18,423 | | | | 0.97 | | | | 1.35 | | | | 1.18 | |
| | 1.00 | | | | 1.34 | | | | 22,073 | | | | 0.97 | | | | 1.34 | | | | 1.19 | |
| | 1.00 | | | | 0.40 | | | | 22,267 | | | | 0.97 | | | | 0.38 | | | | 1.20 | |
| | 1.00 | | | | 0.04 | | | | 33,104 | | | | 0.55 | | | | 0.01 | | | | 1.18 | |
| | 1.00 | | | | 0.01 | | | | 505,609 | | | | 0.33 | | | | 0.01 | | | | 1.18 | |
| | | | | |
| | | | | | | | | | | | | | | | | | | | | | |
| | 1.00 | | | | 0.26 | | | | 1,773,635 | | | | 0.26 | | | | 0.46 | | | | 0.29 | |
| | 1.00 | | | | 2.07 | | | | 1,452,745 | | | | 0.26 | | | | 1.94 | | | | 0.31 | |
| | 1.00 | | | | 2.06 | | | | 542,003 | | | | 0.26 | | | | 2.13 | | | | 0.33 | |
| | 1.00 | | | | 1.11 | | | | 158,527 | | | | 0.26 | | | | 1.16 | | | | 0.34 | |
| | 1.00 | | | | 0.45 | | | | 36,107 | | | | 0.26 | | | | 0.39 | | | | 0.35 | |
| | 1.00 | | | | 0.08 | | | | 71,741 | | | | 0.26 | | | | 0.07 | | | | 0.33 | |
| | | | | |
| | | | | | | | | | | | | | | | | | | | | | |
| | 1.00 | | | | 0.30 | | | | 3,146,570 | | | | 0.18 | | | | 0.53 | | | | 0.19 | |
| | 1.00 | | | | 2.15 | | | | 2,295,874 | | | | 0.18 | | | | 2.01 | | | | 0.21 | |
| | 1.00 | | | | 2.14 | | | | 558,492 | | | | 0.18 | | | | 2.16 | | | | 0.23 | |
| | 1.00 | | | | 1.19 | | | | 98,814 | | | | 0.18 | | | | 1.36 | | | | 0.24 | |
| | 1.00 | | | | 0.53 | | | | 105,366 | | | | 0.18 | | | | 0.38 | | | | 0.22 | |
| | 1.00 | | | | 0.16 | | | | 2,071,483 | | | | 0.18 | | | | 0.15 | | | | 0.22 | |
| | | | | |
| | | | | | | | | | | | | | | | | | | | | | |
| | 1.00 | | | | 0.01 | | | | — | | | | 0.54 | | | | 0.01 | | | | 1.08 | |
| | 1.00 | | | | 0.01 | | | | 1,758,478 | | | | 0.30 | | | | 0.01 | | | | 1.07 | |
| | | | | |
| | | | | | | | | | | | | | | | | | | | | | |
| | 1.00 | | | | 0.28 | | | | 3,716,813 | | | | 0.21 | | | | 0.53 | | | | 0.24 | |
| | 1.00 | | | | 2.12 | | | | 3,412,753 | | | | 0.21 | | | | 2.07 | | | | 0.26 | |
| | 1.00 | | | | 2.11 | | | | 2,717,544 | | | | 0.21 | | | | 2.17 | | | | 0.28 | |
| | 1.00 | | | | 1.16 | | | | 988,333 | | | | 0.21 | | | | 1.21 | | | | 0.29 | |
| | 1.00 | | | | 0.50 | | | | 286,502 | | | | 0.21 | | | | 0.37 | | | | 0.28 | |
| | 1.00 | | | | 0.13 | | | | 6,630,618 | | | | 0.21 | | | | 0.13 | | | | 0.28 | |
| | | | | |
| | | | | | | | | | | | | | | | | | | | | | |
| | 1.00 | | | | 0.15 | | | | 3,015 | | | | 0.48 | | | | 0.29 | | | | 0.56 | |
| | 1.00 | | | | 1.81 | | | | 7,904 | | | | 0.51 | | | | 1.78 | | | | 0.52 | |
| | 1.00 | | | | 1.81 | | | | 8,147 | | | | 0.51 | | | | 1.79 | | | | 0.54 | |
| | 1.00 | | | | 0.86 | | | | 8,616 | | | | 0.51 | | | | 0.89 | | | | 0.55 | |
| | 1.00 | | | | 0.21 | | | | 3,933 | | | | 0.51 | | | | 0.07 | | | | 0.53 | |
| | 1.00 | | | | 0.02 | | | | 117,816 | | | | 0.32 | | | | 0.01 | | | | 0.53 | |
SEE NOTES TO FINANCIAL STATEMENTS.
| | | | | | | | |
| | | |
| AUGUST 31, 2020 | | J.P. MORGAN MONEY MARKET FUNDS | | | | | 135 | |
FINANCIAL HIGHLIGHTS
FOR THE PERIODS INDICATED (continued)
| | | | | | | | | | | | | | | | | | | | | | | | | | | | |
| | | Per share operating performance | |
| | | | | | Investment operations | | | Distributions | |
| | | Net asset value, beginning of period | | | Net investment income (loss) (b) | | | Net realized and unrealized gains (losses) on investments | | | Total from investment operations | | | Net investment income | | | Net realized gain | | | Total distributions | |
JPMorgan Liquid Assets Money Market Fund (continued) | | | | | | | | | | | | | | | | | |
Morgan | | | | | | | | | | | | | | | | | | | | | | | | | | | | |
Six Months Ended August 31, 2020 (Unaudited) | | $ | 1.00 | | | $ | — | (e) | | $ | — | (e) | | $ | — | (e) | | $ | — | (e) | | $ | — | | | $ | — | (e) |
Year Ended February 29, 2020 | | | 1.00 | | | | 0.02 | | | | — | (e) | | | 0.02 | | | | (0.02 | ) | | | — | (e) | | | (0.02 | ) |
Year Ended February 28, 2019 | | | 1.00 | | | | 0.02 | | | | — | (e) | | | 0.02 | | | | (0.02 | ) | | | — | (e) | | | (0.02 | ) |
Year Ended February 28, 2018 | | | 1.00 | | | | 0.01 | | | | — | (e) | | | 0.01 | | | | (0.01 | ) | | | — | (e) | | | (0.01 | ) |
Year Ended February 28, 2017 | | | 1.00 | | | | — | (e) | | | — | (e) | | | — | (e) | | | — | (e) | | | — | (e) | | | — | (e) |
Year Ended February 29, 2016 | | | 1.00 | | | | — | (e) | | | — | (e) | | | — | (e) | | | — | (e) | | | — | (e) | | | — | (e) |
| | | | | | | |
Premier | | | | | | | | | | | | | | | | | | | | | | | | | | | | |
Six Months Ended August 31, 2020 (Unaudited) | | | 1.00 | | | | — | (e) | | | — | (e) | | | — | (e) | | | — | (e) | | | — | | | | — | (e) |
Year Ended February 29, 2020 | | | 1.00 | | | | 0.02 | | | | — | (e) | | | 0.02 | | | | (0.02 | ) | | | — | (e) | | | (0.02 | ) |
Year Ended February 28, 2019 | | | 1.00 | | | | 0.02 | | | | — | (e) | | | 0.02 | | | | (0.02 | ) | | | — | (e) | | | (0.02 | ) |
Year Ended February 28, 2018 | | | 1.00 | | | | 0.01 | | | | — | (e) | | | 0.01 | | | | (0.01 | ) | | | — | (e) | | | (0.01 | ) |
Year Ended February 28, 2017 | | | 1.00 | | | | — | (e) | | | — | (e) | | | — | (e) | | | — | (e) | | | — | (e) | | | — | (e) |
Year Ended February 29, 2016 | | | 1.00 | | | | — | (e) | | | — | (e) | | | — | (e) | | | — | (e) | | | — | (e) | | | — | (e) |
| | | | | | | |
Reserve | | | | | | | | | | | | | | | | | | | | | | | | | | | | |
Six Months Ended August 31, 2020 (Unaudited) | | | 1.00 | | | | — | (e) | | | — | (e) | | | — | (e) | | | — | (e) | | | — | | | | — | (e) |
Year Ended February 29, 2020 | | | 1.00 | | | | 0.02 | | | | — | (e) | | | 0.02 | | | | (0.02 | ) | | | — | (e) | | | (0.02 | ) |
Year Ended February 28, 2019 | | | 1.00 | | | | 0.02 | | | | — | (e) | | | 0.02 | | | | (0.02 | ) | | | — | (e) | | | (0.02 | ) |
Year Ended February 28, 2018 | | | 1.00 | | | | 0.01 | | | | — | (e) | | | 0.01 | | | | (0.01 | ) | | | — | (e) | | | (0.01 | ) |
Year Ended February 28, 2017 | | | 1.00 | | | | — | (e) | | | — | (e) | | | — | (e) | | | — | (e) | | | — | (e) | | | — | (e) |
Year Ended February 29, 2016 | | | 1.00 | | | | — | (e) | | | — | (e) | | | — | (e) | | | — | (e) | | | — | (e) | | | — | (e) |
| (a) | Annualized for periods less than one year, unless otherwise noted. |
| (b) | Calculated based upon average shares outstanding. |
| (c) | Not annualized for periods less than one year. |
| (d) | Includes earnings credits and interest expense, if applicable, each of which is less than 0.005% unless otherwise noted. |
| (e) | Amount rounds to less than $0.005. |
SEE NOTES TO FINANCIAL STATEMENTS.
| | | | | | |
| | | |
| 136 | | | | J.P. MORGAN MONEY MARKET FUNDS | | AUGUST 31, 2020 |
| | | | | | | | | | | | | | | | | | | | | | |
| | | Ratios/Supplemental data | |
| | | | | | | | | | Ratios to average net assets (a) | |
Net asset value, end of period | | | Total return (c) | | | Net assets, end of period (000’s) | | | Net expenses (d) | | | Net investment income (loss) | | | Expenses without waivers, reimbursements and earnings credits | |
| | | | | | | | | | | | | | | | | | | | | | |
| | | | | | | | | | | | | | | | | | | | | | |
| $ | 1.00 | | | | 0.12 | % | | $ | 718,338 | | | | 0.54 | % | | | 0.23 | % | | | 0.60 | % |
| | 1.00 | | | | 1.73 | | | | 543,317 | | | | 0.59 | | | | 1.69 | | | | 0.63 | |
| | 1.00 | | | | 1.73 | | | | 307,584 | | | | 0.59 | | | | 1.76 | | | | 0.68 | |
| | 1.00 | | | | 0.78 | | | | 156,049 | | | | 0.59 | | | | 0.78 | | | | 0.70 | |
| | 1.00 | | | | 0.16 | | | | 144,168 | | | | 0.54 | | | | 0.04 | | | | 0.64 | |
| | 1.00 | | | | 0.01 | | | | 1,609,448 | | | | 0.33 | | | | 0.01 | | | | 0.63 | |
| | | | | |
| | | | | | | | | | | | | | | | | | | | | | |
| | 1.00 | | | | 0.17 | | | | 3,127,065 | | | | 0.43 | | | | 0.30 | | | | 0.44 | |
| | 1.00 | | | | 1.87 | | | | 3,031,847 | | | | 0.45 | | | | 1.77 | | | | 0.46 | |
| | 1.00 | | | | 1.87 | | | | 1,140,955 | | | | 0.45 | | | | 1.93 | | | | 0.48 | |
| | 1.00 | | | | 0.92 | | | | 353,810 | | | | 0.45 | | | | 0.95 | | | | 0.49 | |
| | 1.00 | | | | 0.26 | | | | 156,136 | | | | 0.45 | | | | 0.18 | | | | 0.48 | |
| | 1.00 | | | | 0.02 | | | | 132,337 | | | | 0.32 | | | | 0.02 | | | | 0.48 | |
| | | | | |
| | | | | | | | | | | | | | | | | | | | | | |
| | 1.00 | | | | 0.09 | | | | 4,178 | | | | 0.59 | | | | 0.19 | | | | 0.81 | |
| | 1.00 | | | | 1.62 | | | | 3,797 | | | | 0.70 | | | | 1.62 | | | | 0.84 | |
| | 1.00 | | | | 1.61 | | | | 4,548 | | | | 0.70 | | | | 1.59 | | | | 0.74 | |
| | 1.00 | | | | 0.67 | | | | 6,527 | | | | 0.70 | | | | 0.65 | | | | 0.74 | |
| | 1.00 | | | | 0.12 | | | | 7,672 | | | | 0.55 | | | | 0.02 | | | | 0.73 | |
| | 1.00 | | | | 0.01 | | | | 189,404 | | | | 0.33 | | | | 0.01 | | | | 0.73 | |
SEE NOTES TO FINANCIAL STATEMENTS.
| | | | | | | | |
| | | |
| AUGUST 31, 2020 | | J.P. MORGAN MONEY MARKET FUNDS | | | | | 137 | |
FINANCIAL HIGHLIGHTS
FOR THE PERIODS INDICATED (continued)
| | | | | | | | | | | | | | | | | | | | | | | | | | | | |
| | | Per share operating performance | |
| | | | | | Investment operations | | | Distributions | |
| | | Net asset value, beginning of period | | | Net investment income (loss) (b) | | | Net realized and unrealized gains (losses) on investments | | | Total from investment operations | | | Net investment income | | | Net realized gain | | | Total distributions | |
JPMorgan U.S. Government Money Market Fund | | | | | | | | | | | | | | | | | | | | | | | | | | | | |
Academy | | | | | | | | | | | | | | | | | | | | | | | | | | | | |
Six Months Ended August 31, 2020 (Unaudited) | | $ | 1.00 | | | $ | — | (e) | | $ | — | (e) | | $ | — | (e) | | $ | — | (e) | | $ | — | | | $ | — | (e) |
May 15, 2019 (f) through February 29, 2020 | | | 1.00 | | | | 0.01 | | | | — | (e) | | | 0.01 | | | | (0.01 | ) | | | — | | | | (0.01 | ) |
| | | | | | | |
Agency | | | | | | | | | | | | | | | | | | | | | | | | | | | | |
Six Months Ended August 31, 2020 (Unaudited) | | | 1.00 | | | | — | (e) | | | — | (e) | | | — | (e) | | | — | (e) | | | — | | | | — | (e) |
Year Ended February 29, 2020 | | | 1.00 | | | | 0.02 | | | | — | (e) | | | 0.02 | | | | (0.02 | ) | | | — | | | | (0.02 | ) |
Year Ended February 28, 2019 | | | 1.00 | | | | 0.02 | | | | — | (e) | | | 0.02 | | | | (0.02 | ) | | | — | | | | (0.02 | ) |
Year Ended February 28, 2018 | | | 1.00 | | | | 0.01 | | | | — | (e) | | | 0.01 | | | | (0.01 | ) | | | — | (e) | | | (0.01 | ) |
Year Ended February 28, 2017 | | | 1.00 | | | | — | (e) | | | — | (e) | | | — | (e) | | | — | (e) | | | — | (e) | | | — | (e) |
Year Ended February 29, 2016 | | | 1.00 | | | | — | (e) | | | — | (e) | | | — | (e) | | | — | (e) | | | — | (e) | | | — | (e) |
| | | | | | | |
Capital | | | | | | | | | | | | | | | | | | | | | | | | | | | | |
Six Months Ended August 31, 2020 (Unaudited) | | | 1.00 | | | | — | (e) | | | — | (e) | | | — | (e) | | | — | (e) | | | — | | | | — | (e) |
Year Ended February 29, 2020 | | | 1.00 | | | | 0.02 | | | | — | (e) | | | 0.02 | | | | (0.02 | ) | | | — | | | | (0.02 | ) |
Year Ended February 28, 2019 | | | 1.00 | | | | 0.02 | | | | — | (e) | | | 0.02 | | | | (0.02 | ) | | | — | | | | (0.02 | ) |
Year Ended February 28, 2018 | | | 1.00 | | | | 0.01 | | | | — | (e) | | | 0.01 | | | | (0.01 | ) | | | — | (e) | | | (0.01 | ) |
Year Ended February 28, 2017 | | | 1.00 | | | | — | (e) | | | — | (e) | | | — | (e) | | | — | (e) | | | — | (e) | | | — | (e) |
Year Ended February 29, 2016 | | | 1.00 | | | | — | (e) | | | — | (e) | | | — | (e) | | | — | (e) | | | — | (e) | | | — | (e) |
| | | | | | | |
E*Trade | | | | | | | | | | | | | | | | | | | | | | | | | | | | |
Six Months Ended August 31, 2020 (Unaudited) | | | 1.00 | | | | — | (e) | | | — | (e) | | | — | (e) | | | — | (e) | | | — | | | | — | (e) |
Year Ended February 29, 2020 | | | 1.00 | | | | 0.01 | | | | — | (e) | | | 0.01 | | | | (0.01 | ) | | | — | | | | (0.01 | ) |
Year Ended February 28, 2019 | | | 1.00 | | | | 0.01 | | | | — | (e) | | | 0.01 | | | | (0.01 | ) | | | — | | | | (0.01 | ) |
Year Ended February 28, 2018 | | | 1.00 | | | | — | (e) | | | — | (e) | | | — | (e) | | | — | (e) | | | — | (e) | | | — | (e) |
March 9, 2016 (f) through February 28, 2017 | | | 1.00 | | | | — | (e) | | | — | (e) | | | — | (e) | | | — | (e) | | | — | (e) | | | — | (e) |
| | | | | | | |
IM | | | | | | | | | | | | | | | | | | | | | | | | | | | | |
Six Months Ended August 31, 2020 (Unaudited) | | | 1.00 | | | | — | (e) | | | — | (e) | | | — | (e) | | | — | (e) | | | — | | | | — | (e) |
Year Ended February 29, 2020 | | | 1.00 | | | | 0.02 | | | | — | (e) | | | 0.02 | | | | (0.02 | ) | | | — | | | | (0.02 | ) |
Year Ended February 28, 2019 | | | 1.00 | | | | 0.02 | | | | — | (e) | | | 0.02 | | | | (0.02 | ) | | | — | | | | (0.02 | ) |
Year Ended February 28, 2018 | | | 1.00 | | | | 0.01 | | | | — | (e) | | | 0.01 | | | | (0.01 | ) | | | — | (e) | | | (0.01 | ) |
Year Ended February 28, 2017 | | | 1.00 | | | | — | (e) | | | — | (e) | | | — | (e) | | | — | (e) | | | — | (e) | | | — | (e) |
Year Ended February 29, 2016 | | | 1.00 | | | | — | (e) | | | — | (e) | | | — | (e) | | | — | (e) | | | — | (e) | | | — | (e) |
| | | | | | | |
Institutional Class | | | | | | | | | | | | | | | | | | | | | | | | | | | | |
Six Months Ended August 31, 2020 (Unaudited) | | | 1.00 | | | | — | (e) | | | — | (e) | | | — | (e) | | | — | (e) | | | — | | | | — | (e) |
Year Ended February 29, 2020 | | | 1.00 | | | | 0.02 | | | | — | (e) | | | 0.02 | | | | (0.02 | ) | | | — | | | | (0.02 | ) |
Year Ended February 28, 2019 | | | 1.00 | | | | 0.02 | | | | — | (e) | | | 0.02 | | | | (0.02 | ) | | | — | | | | (0.02 | ) |
Year Ended February 28, 2018 | | | 1.00 | | | | 0.01 | | | | — | (e) | | | 0.01 | | | | (0.01 | ) | | | — | (e) | | | (0.01 | ) |
Year Ended February 28, 2017 | | | 1.00 | | | | — | (e) | | | — | (e) | | | — | (e) | | | — | (e) | | | — | (e) | | | — | (e) |
Year Ended February 29, 2016 | | | 1.00 | | | | — | (e) | | | — | (e) | | | — | (e) | | | — | (e) | | | — | (e) | | | — | (e) |
| | | | | | | |
Investor | | | | | | | | | | | | | | | | | | | | | | | | | | | | |
Six Months Ended August 31, 2020 (Unaudited) | | | 1.00 | | | | — | (e) | | | — | (e) | | | — | (e) | | | — | (e) | | | — | | | | — | (e) |
Year Ended February 29, 2020 | | | 1.00 | | | | 0.02 | | | | — | (e) | | | 0.02 | | | | (0.02 | ) | | | — | | | | (0.02 | ) |
Year Ended February 28, 2019 | | | 1.00 | | | | 0.02 | | | | — | (e) | | | 0.02 | | | | (0.02 | ) | | | — | | | | (0.02 | ) |
Year Ended February 28, 2018 | | | 1.00 | | | | 0.01 | | | | — | (e) | | | 0.01 | | | | (0.01 | ) | | | — | (e) | | | (0.01 | ) |
Year Ended February 28, 2017 | | | 1.00 | | | | — | (e) | | | — | (e) | | | — | (e) | | | — | (e) | | | — | (e) | | | — | (e) |
Year Ended February 29, 2016 | | | 1.00 | | | | — | (e) | | | — | (e) | | | — | (e) | | | — | (e) | | | — | (e) | | | — | (e) |
| (a) | Annualized for periods less than one year, unless otherwise noted. |
| (b) | Calculated based upon average shares outstanding. |
| (c) | Not annualized for periods less than one year. |
| (d) | Includes earnings credits and interest expense, if applicable, each of which is less than 0.005% unless otherwise noted. |
| (e) | Amount rounds to less than $0.005. |
| (f) | Commencement of offering of class of shares. |
SEE NOTES TO FINANCIAL STATEMENTS.
| | | | | | |
| | | |
| 138 | | | | J.P. MORGAN MONEY MARKET FUNDS | | AUGUST 31, 2020 |
| | | | | | | | | | | | | | | | | | | | | | |
| | | Ratios/Supplemental data | |
| | | | | | | | | | Ratios to average net assets (a) | |
Net asset value, end of period | | | Total return (c) | | | Net assets, end of period (000’s) | | | Net expenses (d) | | | Net investment income (loss) | | | Expenses without waivers, reimbursements and earnings credits | |
| | | | | | | | | | | | | | | | | | | | | | |
| | | | | | | | | | | | | | | | | | | | | | |
| $ | 1.00 | | | | 0.12 | % | | $ | 1,446,216 | | | | 0.18 | % | | | 0.13 | % | | | 0.18 | % |
| | 1.00 | | | | 1.47 | | | | 85,026 | | | | 0.18 | | | | 1.49 | | | | 0.21 | |
| | | | | |
| | | | | | | | | | | | | | | | | | | | | | |
| | 1.00 | | | | 0.09 | | | | 17,834,258 | | | | 0.25 | | | | 0.15 | | | | 0.28 | |
| | 1.00 | | | | 1.87 | | | | 14,132,125 | | | | 0.26 | | | | 1.84 | | | | 0.30 | |
| | 1.00 | | | | 1.82 | | | | 11,112,454 | | | | 0.26 | | | | 1.79 | | | | 0.31 | |
| | 1.00 | | | | 0.81 | | | | 13,906,062 | | | | 0.26 | | | | 0.80 | | | | 0.31 | |
| | 1.00 | | | | 0.22 | | | | 12,887,975 | | | | 0.25 | | | | 0.22 | | | | 0.31 | |
| | 1.00 | | | | 0.02 | | | | 7,594,151 | | | | 0.15 | | | | 0.02 | | | | 0.31 | |
| | | | | |
| | | | | | | | | | | | | | | | | | | | | | |
| | 1.00 | | | | 0.12 | | | | 111,735,102 | | | | 0.18 | | | | 0.22 | | | | 0.18 | |
| | 1.00 | | | | 1.95 | | | | 86,263,432 | | | | 0.18 | | | | 1.91 | | | | 0.20 | |
| | 1.00 | | | | 1.90 | | | | 73,390,258 | | | | 0.18 | | | | 1.87 | | | | 0.21 | |
| | 1.00 | | | | 0.89 | | | | 92,747,537 | | | | 0.18 | | | | 0.88 | | | | 0.21 | |
| | 1.00 | | | | 0.33 | | | | 86,200,153 | | | | 0.14 | | | | 0.35 | | | | 0.21 | |
| | 1.00 | | | | 0.04 | | | | 28,046,995 | | | | 0.14 | | | | 0.04 | | | | 0.21 | |
| | | | | |
| | | | | | | | | | | | | | | | | | | | | | |
| | 1.00 | | | | 0.02 | | | | 377,312 | | | | 0.37 | | | | 0.04 | | | | 1.03 | |
| | 1.00 | | | | 1.12 | | | | 298,348 | | | | 1.00 | | | | 1.10 | | | | 1.05 | |
| | 1.00 | | | | 1.07 | | | | 274,993 | | | | 1.00 | | | | 1.04 | | | | 1.06 | |
| | 1.00 | | | | 0.13 | | | | 291,828 | | | | 0.97 | | | | 0.17 | | | | 1.06 | |
| | 1.00 | | | | 0.02 | | | | 66,010 | | | | 0.56 | | | | 0.01 | | | | 1.07 | |
| | | | | |
| | | | | | | | | | | | | | | | | | | | | | |
| | 1.00 | | | | 0.15 | | | | 7,353,735 | | | | 0.14 | | | | 0.29 | | | | 0.14 | |
| | 1.00 | | | | 1.99 | | | | 7,443,910 | | | | 0.15 | | | | 1.90 | | | | 0.15 | |
| | 1.00 | | | | 1.92 | | | | 6,108,975 | | | | 0.16 | | | | 1.95 | | | | 0.16 | |
| | 1.00 | | | | 0.91 | | | | 2,493,731 | | | | 0.16 | | | | 0.96 | | | | 0.16 | |
| | 1.00 | | | | 0.33 | | | | 589,694 | | | | 0.14 | | | | 0.34 | | | | 0.16 | |
| | 1.00 | | | | 0.05 | | | | 648,289 | | | | 0.13 | | | | 0.05 | | | | 0.16 | |
| | | | | |
| | | | | | | | | | | | | | | | | | | | | | |
| | 1.00 | | | | 0.11 | | | | 34,645,602 | | | | 0.21 | | | | 0.20 | | | | 0.23 | |
| | 1.00 | | | | 1.92 | | | | 43,246,064 | | | | 0.21 | | | | 1.89 | | | | 0.25 | |
| | 1.00 | | | | 1.87 | | | | 41,868,607 | | | | 0.21 | | | | 1.88 | | | | 0.26 | |
| | 1.00 | | | | 0.86 | | | | 32,544,047 | | | | 0.21 | | | | 0.85 | | | | 0.26 | |
| | 1.00 | | | | 0.30 | | | | 36,869,073 | | | | 0.17 | | | | 0.33 | | | | 0.26 | |
| | 1.00 | | | | 0.04 | | | | 8,704,148 | | | | 0.15 | | | | 0.03 | | | | 0.26 | |
| | | | | |
| | | | | | | | | | | | | | | | | | | | | | |
| | 1.00 | | | | 0.05 | | | | 887,319 | | | | 0.33 | | | | 0.08 | | | | 0.48 | |
| | 1.00 | | | | 1.63 | | | | 684,791 | | | | 0.50 | | | | 1.68 | | | | 0.50 | |
| | 1.00 | | | | 1.57 | | | | 1,127,675 | | | | 0.50 | | | | 1.60 | | | | 0.50 | |
| | 1.00 | | | | 0.56 | | | | 748,306 | | | | 0.51 | | | | 0.54 | | | | 0.51 | |
| | 1.00 | | | | 0.03 | | | | 919,604 | | | | 0.42 | | | | 0.02 | | | | 0.51 | |
| | 1.00 | | | | 0.01 | | | | 3,856,545 | | | | 0.18 | | | | 0.01 | | | | 0.51 | |
SEE NOTES TO FINANCIAL STATEMENTS.
| | | | | | | | |
| | | |
| AUGUST 31, 2020 | | J.P. MORGAN MONEY MARKET FUNDS | | | | | 139 | |
FINANCIAL HIGHLIGHTS
FOR THE PERIODS INDICATED (continued)
| | | | | | | | | | | | | | | | | | | | | | | | | | | | |
| | | Per share operating performance | |
| | | | | | Investment operations | | | Distributions | |
| | | Net asset value, beginning of period | | | Net investment income (loss) (b) | | | Net realized and unrealized gains (losses) on investments | | | Total from investment operations | | | Net investment income | | | Net realized gain | | | Total distributions | |
JPMorgan U.S. Government Money Market Fund (continued) | | | | | | | | | | | | | | | | | |
Morgan | | | | | | | | | | | | | | | | | | | | | | | | | | | | |
Six Months Ended August 31, 2020 (Unaudited) | | $ | 1.00 | | | $ | — | (e) | | $ | — | (e) | | $ | — | (e) | | $ | — | (e) | | $ | — | | | $ | — | (e) |
Year Ended February 29, 2020 | | | 1.00 | | | | 0.02 | | | | — | (e) | | | 0.02 | | | | (0.02 | ) | | | — | | | | (0.02 | ) |
Year Ended February 28, 2019 | | | 1.00 | | | | 0.01 | | | | — | (e) | | | 0.01 | | | | (0.01 | ) | | | — | | | | (0.01 | ) |
Year Ended February 28, 2018 | | | 1.00 | | | | — | (e) | | | — | (e) | | | — | (e) | | | — | (e) | | | — | (e) | | | — | (e) |
Year Ended February 28, 2017 | | | 1.00 | | | | — | (e) | | | — | (e) | | | — | (e) | | | — | (e) | | | — | (e) | | | — | (e) |
Year Ended February 29, 2016 | | | 1.00 | | | | — | (e) | | | — | (e) | | | — | (e) | | | — | (e) | | | — | (e) | | | — | (e) |
| | | | | | | |
Premier | | | | | | | | | | | | | | | | | | | | | | | | | | | | |
Six Months Ended August 31, 2020 (Unaudited) | | | 1.00 | | | | — | (e) | | | — | (e) | | | — | (e) | | | — | (e) | | | — | | | | — | (e) |
Year Ended February 29, 2020 | | | 1.00 | | | | 0.02 | | | | — | (e) | | | 0.02 | | | | (0.02 | ) | | | — | | | | (0.02 | ) |
Year Ended February 28, 2019 | | | 1.00 | | | | 0.02 | | | | — | (e) | | | 0.02 | | | | (0.02 | ) | | | — | | | | (0.02 | ) |
Year Ended February 28, 2018 | | | 1.00 | | | | 0.01 | | | | — | (e) | | | 0.01 | | | | (0.01 | ) | | | — | (e) | | | (0.01 | ) |
Year Ended February 28, 2017 | | | 1.00 | | | | — | (e) | | | — | (e) | | | — | (e) | | | — | (e) | | | — | (e) | | | — | (e) |
Year Ended February 29, 2016 | | | 1.00 | | | | — | (e) | | | — | (e) | | | — | (e) | | | — | (e) | | | — | (e) | | | — | (e) |
| | | | | | | |
Reserve | | | | | | | | | | | | | | | | | | | | | | | | | | | | |
Six Months Ended August 31, 2020 (Unaudited) | | | 1.00 | | | | — | (e) | | | — | (e) | | | — | (e) | | | — | (e) | | | — | | | | — | (e) |
Year Ended February 29, 2020 | | | 1.00 | | | | 0.01 | | | | — | (e) | | | 0.01 | | | | (0.01 | ) | | | — | | | | (0.01 | ) |
Year Ended February 28, 2019 | | | 1.00 | | | | 0.01 | | | | — | (e) | | | 0.01 | | | | (0.01 | ) | | | — | | | | (0.01 | ) |
Year Ended February 28, 2018 | | | 1.00 | | | | — | (e) | | | — | (e) | | | — | (e) | | | — | (e) | | | — | (e) | | | — | (e) |
Year Ended February 28, 2017 | | | 1.00 | | | | — | (e) | | | — | (e) | | | — | (e) | | | — | (e) | | | — | (e) | | | — | (e) |
Year Ended February 29, 2016 | | | 1.00 | | | | — | (e) | | | — | (e) | | | — | (e) | | | — | (e) | | | — | (e) | | | — | (e) |
| | | | | | | |
Service | | | | | | | | | | | | | | | | | | | | | | | | | | | | |
Six Months Ended August 31, 2020 (Unaudited) | | | 1.00 | | | | — | (e) | | | — | (e) | | | — | (e) | | | — | (e) | | | — | | | | — | (e) |
Year Ended February 29, 2020 | | | 1.00 | | | | 0.01 | | | | — | (e) | | | 0.01 | | | | (0.01 | ) | | | — | | | | (0.01 | ) |
Year Ended February 28, 2019 | | | 1.00 | | | | 0.01 | | | | — | (e) | | | 0.01 | | | | (0.01 | ) | | | — | | | | (0.01 | ) |
Year Ended February 28, 2018 | | | 1.00 | | | | — | (e) | | | — | (e) | | | — | (e) | | | — | (e) | | | — | (e) | | | — | (e) |
Year Ended February 28, 2017 | | | 1.00 | | | | — | (e) | | | — | (e) | | | — | (e) | | | — | (e) | | | — | (e) | | | — | (e) |
Year Ended February 29, 2016 | | | 1.00 | | | | — | (e) | | | — | (e) | | | — | (e) | | | — | (e) | | | — | (e) | | | — | (e) |
| (a) | Annualized for periods less than one year, unless otherwise noted. |
| (b) | Calculated based upon average shares outstanding. |
| (c) | Not annualized for periods less than one year. |
| (d) | Includes earnings credits and interest expense, if applicable, each of which is less than 0.005% unless otherwise noted. |
| (e) | Amount rounds to less than $0.005. |
SEE NOTES TO FINANCIAL STATEMENTS.
| | | | | | |
| | | |
| 140 | | | | J.P. MORGAN MONEY MARKET FUNDS | | AUGUST 31, 2020 |
| | | | | | | | | | | | | | | | | | | | | | |
| | | Ratios/Supplemental data | |
| | | | | | | | | | Ratios to average net assets (a) | |
Net asset value, end of period | | | Total return (c) | | | Net assets, end of period (000’s) | | | Net expenses (d) | | | Net investment income (loss) | | | Expenses without waivers, reimbursements and earnings credits | |
| | | | | | | | | | | | | | | | | | | | | | |
| | | | | | | | | | | | | | | | | | | | | | |
| $ | 1.00 | | | | 0.04 | % | | $ | 2,196,353 | | | | 0.35 | % | | | 0.08 | % | | | 0.59 | % |
| | 1.00 | | | | 1.54 | | | | 2,064,159 | | | | 0.59 | | | | 1.50 | | | | 0.60 | |
| | 1.00 | | | | 1.48 | | | | 1,660,477 | | | | 0.59 | | | | 1.49 | | | | 0.61 | |
| | 1.00 | | | | 0.48 | | | | 1,231,217 | | | | 0.59 | | | | 0.44 | | | | 0.61 | |
| | 1.00 | | | | 0.02 | | | | 2,460,361 | | | | 0.46 | | | | 0.02 | | | | 0.61 | |
| | 1.00 | | | | 0.01 | | | | 2,229,161 | | | | 0.17 | | | | 0.01 | | | | 0.61 | |
| | | | | |
| | | | | | | | | | | | | | | | | | | | | | |
| | 1.00 | | | | 0.05 | | | | 3,802,884 | | | | 0.32 | | | | 0.10 | | | | 0.43 | |
| | 1.00 | | | | 1.68 | | | | 4,095,749 | | | | 0.45 | | | | 1.64 | | | | 0.45 | |
| | 1.00 | | | | 1.62 | | | | 2,945,521 | | | | 0.45 | | | | 1.59 | | | | 0.46 | |
| | 1.00 | | | | 0.62 | | | | 5,500,002 | | | | 0.45 | | | | 0.60 | | | | 0.46 | |
| | 1.00 | | | | 0.06 | | | | 7,765,009 | | | | 0.42 | | | | 0.06 | | | | 0.46 | |
| | 1.00 | | | | 0.01 | | | | 7,570,828 | | | | 0.18 | | | | 0.01 | | | | 0.46 | |
| | | | | |
| | | | | | | | | | | | | | | | | | | | | | |
| | 1.00 | | | | 0.03 | | | | 17,997 | | | | 0.36 | | | | 0.07 | | | | 0.69 | |
| | 1.00 | | | | 1.42 | | | | 20,829 | | | | 0.70 | | | | 1.41 | | | | 0.71 | |
| | 1.00 | | | | 1.37 | | | | 19,468 | | | | 0.70 | | | | 1.28 | | | | 0.71 | |
| | 1.00 | | | | 0.37 | | | | 59,334 | | | | 0.70 | | | | 0.33 | | | | 0.71 | |
| | 1.00 | | | | 0.01 | | | | 119,542 | | | | 0.49 | | | | 0.01 | | | | 0.71 | |
| | 1.00 | | | | 0.01 | | | | 16,298 | | | | 0.12 | | | | 0.01 | | | | 0.71 | |
| | | | | |
| | | | | | | | | | | | | | | | | | | | | | |
| | 1.00 | | | | 0.02 | | | | 622,159 | | | | 0.40 | | | | 0.04 | | | | 1.03 | |
| | 1.00 | | | | 1.07 | | | | 867,659 | | | | 1.05 | | | | 1.19 | | | | 1.05 | |
| | 1.00 | | | | 1.02 | | | | 2,993,274 | | | | 1.05 | | | | 1.08 | | | | 1.05 | |
| | 1.00 | | | | 0.09 | | | | 1,649,354 | | | | 0.93 | | | | 0.08 | | | | 1.06 | |
| | 1.00 | | | | 0.01 | | | | 2,439,027 | | | | 0.50 | | | | 0.01 | | | | 1.06 | |
| | 1.00 | | | | 0.01 | | | | 395,656 | | | | 0.15 | | | | 0.01 | | | | 1.06 | |
SEE NOTES TO FINANCIAL STATEMENTS.
| | | | | | | | |
| | | |
| AUGUST 31, 2020 | | J.P. MORGAN MONEY MARKET FUNDS | | | | | 141 | |
FINANCIAL HIGHLIGHTS
FOR THE PERIODS INDICATED (continued)
| | | | | | | | | | | | | | | | | | | | | | | | | | | | |
| | | Per share operating performance | |
| | | | | | Investment operations | | | Distributions | |
| | | Net asset value, beginning of period | | | Net investment income (loss) (b) | | | Net realized and unrealized gains (losses) on investments | | | Total from investment operations | | | Net investment income | | | Net realized gain | | | Total distributions | |
JPMorgan U.S. Treasury Plus Money Market Fund | | | | | | | | | | | | | | | | | | | | | | | | | | | | |
Class C | | | | | | | | | | | | | | | | | | | | | | | | | | | | |
Six Months Ended August 31, 2020 (Unaudited) | | $ | 1.00 | | | $ | — | (e) | | $ | — | (e) | | $ | — | (e) | | $ | — | (e) | | $ | — | | | $ | — | (e) |
Year Ended February 29, 2020 | | | 1.00 | | | | 0.01 | | | | — | (e) | | | 0.01 | | | | (0.01 | ) | | | — | | | | (0.01 | ) |
Year Ended February 28, 2019 | | | 1.00 | | | | 0.01 | | | | — | (e) | | | 0.01 | | | | (0.01 | ) | | | — | | | | (0.01 | ) |
Year Ended February 28, 2018 | | | 1.00 | | | | — | (e) | | | — | (e) | | | — | (e) | | | — | (e) | | | — | (e) | | | — | (e) |
Year Ended February 28, 2017 | | | 1.00 | | | | — | (e) | | | — | (e) | | | — | (e) | | | — | (e) | | | — | (e) | | | — | (e) |
Year Ended February 29, 2016 | | | 1.00 | | | | — | (e) | | | — | (e) | | | — | (e) | | | — | (e) | | | — | (e) | | | — | (e) |
| | | | | | | |
Agency | | | | | | | | | | | | | | | | | | | | | | | | | | | | |
Six Months Ended August 31, 2020 (Unaudited) | | | 1.00 | | | | — | (e) | | | — | (e) | | | — | (e) | | | — | (e) | | | — | | | | — | (e) |
Year Ended February 29, 2020 | | | 1.00 | | | | 0.02 | | | | — | (e) | | | 0.02 | | | | (0.02 | ) | | | — | | | | (0.02 | ) |
Year Ended February 28, 2019 | | | 1.00 | | | | 0.02 | | | | — | (e) | | | 0.02 | | | | (0.02 | ) | | | — | | | | (0.02 | ) |
Year Ended February 28, 2018 | | | 1.00 | | | | 0.01 | | | | — | (e) | | | 0.01 | | | | (0.01 | ) | | | — | (e) | | | (0.01 | ) |
Year Ended February 28, 2017 | | | 1.00 | | | | — | (e) | | | — | (e) | | | — | (e) | | | — | (e) | | | — | (e) | | | — | (e) |
Year Ended February 29, 2016 | | | 1.00 | | | | — | (e) | | | — | (e) | | | — | (e) | | | — | (e) | | | — | | | | — | (e) |
| | | | | | | |
Capital | | | | | | | | | | | | | | | | | | | | | | | | | | | | |
Six Months Ended August 31, 2020 (Unaudited) | | | 1.00 | | | | — | (e) | | | — | (e) | | | — | (e) | | | — | (e) | | | — | | | | — | (e) |
Year Ended February 29, 2020 | | | 1.00 | | | | 0.02 | | | | — | (e) | | | 0.02 | | | | (0.02 | ) | | | — | | | | (0.02 | ) |
Year Ended February 28, 2019 | | | 1.00 | | | | 0.02 | | | | — | (e) | | | 0.02 | | | | (0.02 | ) | | | — | | | | (0.02 | ) |
September 22, 2017 (g) through February 28, 2018 | | | 1.00 | | | | 0.01 | | | | (0.01 | ) | | | — | (e) | | | — | (e) | | | — | (e) | | | — | (e) |
| | | | | | | |
IM | | | | | | | | | | | | | | | | | | | | | | | | | | | | |
Six Months Ended August 31, 2020 (Unaudited) | | | 1.00 | | | | — | (e) | | | — | (e) | | | — | (e) | | | — | (e) | | | — | | | | — | (e) |
Year Ended February 29, 2020 | | | 1.00 | | | | 0.02 | | | | — | (e) | | | 0.02 | | | | (0.02 | ) | | | — | | | | (0.02 | ) |
Year Ended February 28, 2019 | | | 1.00 | | | | 0.02 | | | | — | (e) | | | 0.02 | | | | (0.02 | ) | | | — | | | | (0.02 | ) |
Year Ended February 28, 2018 | | | 1.00 | | | | 0.01 | | | | — | (e) | | | 0.01 | | | | (0.01 | ) | | | — | (e) | | | (0.01 | ) |
Year Ended February 28, 2017 | | | 1.00 | | | | — | (e) | | | — | (e) | | | — | (e) | | | — | (e) | | | — | (e) | | | — | (e) |
Year Ended February 29, 2016 | | | 1.00 | | | | — | (e) | | | — | (e) | | | — | (e) | | | — | (e) | | | — | (e) | | | — | (e) |
| | | | | | | |
Institutional Class | | | | | | | | | | | | | | | | | | | | | | | | | | | | |
Six Months Ended August 31, 2020 (Unaudited) | | | 1.00 | | | | — | (e) | | | — | (e) | | | — | (e) | | | — | (e) | | | — | | | | — | (e) |
Year Ended February 29, 2020 | | | 1.00 | | | | 0.02 | | | | — | (e) | | | 0.02 | | | | (0.02 | ) | | | — | | | | (0.02 | ) |
Year Ended February 28, 2019 | | | 1.00 | | | | 0.02 | | | | — | (e) | | | 0.02 | | | | (0.02 | ) | | | — | | | | (0.02 | ) |
Year Ended February 28, 2018 | | | 1.00 | | | | 0.01 | | | | — | (e) | | | 0.01 | | | | (0.01 | ) | | | — | (e) | | | (0.01 | ) |
Year Ended February 28, 2017 | | | 1.00 | | | | — | (e) | | | — | (e) | | | — | (e) | | | — | (e) | | | — | (e) | | | — | (e) |
Year Ended February 29, 2016 | | | 1.00 | | | | — | (e) | | | — | (e) | | | — | (e) | | | — | (e) | | | — | (e) | | | — | (e) |
| | | | | | | |
Investor | | | | | | | | | | | | | | | | | | | | | | | | | | | | |
Six Months Ended August 31, 2020 (Unaudited) | | | 1.00 | | | | — | (e) | | | — | (e) | | | — | (e) | | | — | (e) | | | — | | | | — | (e) |
Year Ended February 29, 2020 | | | 1.00 | | | | 0.02 | | | | — | (e) | | | 0.02 | | | | (0.02 | ) | | | — | | | | (0.02 | ) |
Year Ended February 28, 2019 | | | 1.00 | | | | 0.02 | | | | — | (e) | | | 0.02 | | | | (0.02 | ) | | | — | | | | (0.02 | ) |
Year Ended February 28, 2018 | | | 1.00 | | | | 0.01 | | | | — | (e) | | | 0.01 | | | | (0.01 | ) | | | — | (e) | | | (0.01 | ) |
Year Ended February 28, 2017 | | | 1.00 | | | | — | (e) | | | — | (e) | | | — | (e) | | | — | (e) | | | — | (e) | | | — | (e) |
Year Ended February 29, 2016 | | | 1.00 | | | | — | (e) | | | — | (e) | | | — | (e) | | | — | (e) | | | — | (e) | | | — | (e) |
| (a) | Annualized for periods less than one year, unless otherwise noted. |
| (b) | Calculated based upon average shares outstanding. |
| (c) | Not annualized for periods less than one year. |
| (d) | Includes earnings credits and interest expense, if applicable, each of which is less than 0.005% unless otherwise noted. |
| (e) | Amount rounds to less than $0.005. |
| (f) | Amount rounds to less than 0.005%. |
| (g) | Commencement of offering of class of shares. |
SEE NOTES TO FINANCIAL STATEMENTS.
| | | | | | |
| | | |
| 142 | | | | J.P. MORGAN MONEY MARKET FUNDS | | AUGUST 31, 2020 |
| | | | | | | | | | | | | | | | | | | | | | |
| | | Ratios/Supplemental data | |
| | | | | | | | | | Ratios to average net assets (a) | |
Net asset value, end of period | | | Total return (c) | | | Net assets, end of period (000’s) | | | Net expenses (d) | | | Net investment income (loss) | | | Expenses without waivers, reimbursements and earnings credits | |
| | | | | | | | | | | | | | | | | | | | | | |
| | | | | | | | | | | | | | | | | | | | | | |
| $ | 1.00 | | | | 0.02 | % | | $ | 329,995 | | | | 0.39 | % | | | 0.03 | % | | | 1.13 | % |
| | 1.00 | | | | 1.13 | | | | 292,824 | | | | 0.97 | | | | 1.16 | | | | 1.15 | |
| | 1.00 | | | | 1.11 | | | | 375,230 | | | | 0.97 | | | | 1.09 | | | | 1.16 | |
| | 1.00 | | | | 0.15 | | | | 417,056 | | | | 0.90 | | | | 0.13 | | | | 1.16 | |
| | 1.00 | | | | 0.00 | (f) | | | 578,579 | | | | 0.48 | | | | 0.00 | (f) | | | 1.16 | |
| | 1.00 | | | | 0.00 | (f) | | | 154,988 | | | | 0.15 | | | | 0.00 | (f) | | | 1.16 | |
| | | | | |
| | | | | | | | | | | | | | | | | | | | | | |
| | 1.00 | | | | 0.09 | | | | 2,368,056 | | | | 0.26 | | | | 0.17 | | | | 0.28 | |
| | 1.00 | | | | 1.85 | | | | 1,744,289 | | | | 0.26 | | | | 1.85 | | | | 0.30 | |
| | 1.00 | | | | 1.83 | | | | 2,013,982 | | | | 0.26 | | | | 1.90 | | | | 0.30 | |
| | 1.00 | | | | 0.81 | | | | 930,654 | | | | 0.26 | | | | 0.82 | | | | 0.31 | |
| | 1.00 | | | | 0.18 | | | | 837,723 | | | | 0.26 | | | | 0.17 | | | | 0.31 | |
| | 1.00 | | | | 0.01 | | | | 956,921 | | | | 0.15 | | | | 0.01 | | | | 0.31 | |
| | | | | |
| | | | | | | | | | | | | | | | | | | | | | |
| | 1.00 | | | | 0.13 | | | | 17,832,959 | | | | 0.18 | | | | 0.22 | | | | 0.18 | |
| | 1.00 | | | | 1.94 | | | | 9,945,933 | | | | 0.18 | | | | 1.89 | | | | 0.20 | |
| | 1.00 | | | | 1.91 | | | | 6,425,187 | | | | 0.18 | | | | 1.92 | | | | 0.20 | |
| | 1.00 | | | | 0.47 | | | | 3,501,095 | | | | 0.18 | | | | 1.17 | | | | 0.21 | |
| | | | | |
| | | | | | | | | | | | | | | | | | | | | | |
| | 1.00 | | | | 0.15 | | | | 34,267 | | | | 0.14 | | | | 0.31 | | | | 0.14 | |
| | 1.00 | | | | 1.97 | | | | 37,429 | | | | 0.15 | | | | 2.26 | | | | 0.15 | |
| | 1.00 | | | | 1.93 | | | | 1,451,488 | | | | 0.15 | | | | 1.87 | | | | 0.15 | |
| | 1.00 | | | | 0.90 | | | | 3,051,574 | | | | 0.16 | | | | 0.81 | | | | 0.16 | |
| | 1.00 | | | | 0.28 | | | | 7,449,646 | | | | 0.16 | | | | 0.29 | | | | 0.16 | |
| | 1.00 | | | | 0.04 | | | | 4,788,250 | | | | 0.12 | | | | 0.04 | | | | 0.16 | |
| | | | | |
| | | | | | | | | | | | | | | | | | | | | | |
| | 1.00 | | | | 0.11 | | | | 14,054,803 | | | | 0.21 | | | | 0.24 | | | | 0.24 | |
| | 1.00 | | | | 1.90 | | | | 16,887,054 | | | | 0.21 | | | | 1.88 | | | | 0.25 | |
| | 1.00 | | | | 1.88 | | | | 17,766,429 | | | | 0.21 | | | | 1.89 | | | | 0.25 | |
| | 1.00 | | | | 0.86 | | | | 13,500,900 | | | | 0.21 | | | | 0.84 | | | | 0.26 | |
| | 1.00 | | | | 0.23 | | | | 14,813,061 | | | | 0.21 | | | | 0.24 | | | | 0.26 | |
| | 1.00 | | | | 0.02 | | | | 8,736,623 | | | | 0.13 | | | | 0.02 | | | | 0.26 | |
| | | | | |
| | | | | | | | | | | | | | | | | | | | | | |
| | 1.00 | | | | 0.04 | | | | 27,686 | | | | 0.35 | | | | 0.07 | | | | 0.58 | |
| | 1.00 | | | | 1.61 | | | | 29,937 | | | | 0.50 | | | | 1.60 | | | | 0.50 | |
| | 1.00 | | | | 1.58 | | | | 28,583 | | | | 0.51 | | | | 1.57 | | | | 0.51 | |
| | 1.00 | | | | 0.55 | | | | 48,818 | | | | 0.51 | | | | 0.52 | | | | 0.51 | |
| | 1.00 | | | | 0.02 | | | | 71,303 | | | | 0.42 | | | | 0.02 | | | | 0.51 | |
| | 1.00 | | | | 0.00 | (f) | | | 89,016 | | | | 0.14 | | | | 0.00 | (f) | | | 0.51 | |
SEE NOTES TO FINANCIAL STATEMENTS.
| | | | | | | | |
| | | |
| AUGUST 31, 2020 | | J.P. MORGAN MONEY MARKET FUNDS | | | | | 143 | |
FINANCIAL HIGHLIGHTS
FOR THE PERIODS INDICATED (continued)
| | | | | | | | | | | | | | | | | | | | | | | | | | | | |
| | | Per share operating performance | |
| | | | | | Investment operations | | | Distributions | |
| | | Net asset value, beginning of period | | | Net investment income (loss) (b) | | | Net realized and unrealized gains (losses) on investments | | | Total from investment operations | | | Net investment income | | | Net realized gain | | | Total distributions | |
JPMorgan U.S. Treasury Plus Money Market Fund (continued) | | | | | | | | | | | | | | | | | | | | | |
Morgan | | | | | | | | | | | | | | | | | | | | | | | | | | | | |
Six Months Ended August 31, 2020 (Unaudited) | | $ | 1.00 | | | $ | — | (e) | | $ | — | (e) | | $ | — | (e) | | $ | — | (e) | | $ | — | | | $ | — | (e) |
Year Ended February 29, 2020 | | | 1.00 | | | | 0.02 | | | | — | (e) | | | 0.02 | | | | (0.02 | ) | | | — | | | | (0.02 | ) |
Year Ended February 28, 2019 | | | 1.00 | | | | 0.01 | | | | — | (e) | | | 0.01 | | | | (0.01 | ) | | | — | | | | (0.01 | ) |
Year Ended February 28, 2018 | | | 1.00 | | | | — | (e) | | | — | (e) | | | — | (e) | | | — | (e) | | | — | (e) | | | — | (e) |
Year Ended February 28, 2017 | | | 1.00 | | | | — | (e) | | | — | (e) | | | — | (e) | | | — | (e) | | | — | (e) | | | — | (e) |
Year Ended February 29, 2016 | | | 1.00 | | | | — | (e) | | | — | (e) | | | — | (e) | | | — | (e) | | | — | (e) | | | — | (e) |
| | | | | | | |
Premier | | | | | | | | | | | | | | | | | | | | | | | | | | | | |
Six Months Ended August 31, 2020 (Unaudited) | | | 1.00 | | | | — | (e) | | | — | (e) | | | — | (e) | | | — | (e) | | | — | | | | — | (e) |
Year Ended February 29, 2020 | | | 1.00 | | | | 0.02 | | | | — | (e) | | | 0.02 | | | | (0.02 | ) | | | — | | | | (0.02 | ) |
Year Ended February 28, 2019 | | | 1.00 | | | | 0.02 | | | | — | (e) | | | 0.02 | | | | (0.02 | ) | | | — | | | | (0.02 | ) |
Year Ended February 28, 2018 | | | 1.00 | | | | 0.01 | | | | — | (e) | | | 0.01 | | | | (0.01 | ) | | | — | (e) | | | (0.01 | ) |
Year Ended February 28, 2017 | | | 1.00 | | | | — | (e) | | | — | (e) | | | — | (e) | | | — | (e) | | | — | (e) | | | — | (e) |
Year Ended February 29, 2016 | | | 1.00 | | | | — | (e) | | | — | (e) | | | — | (e) | | | — | (e) | | | — | (e) | | | — | (e) |
| | | | | | | |
Reserve | | | | | | | | | | | | | | | | | | | | | | | | | | | | |
Six Months Ended August 31, 2020 (Unaudited) | | | 1.00 | | | | — | (e) | | | — | (e) | | | — | (e) | | | — | (e) | | | — | | | | — | (e) |
Year Ended February 29, 2020 | | | 1.00 | | | | 0.01 | | | | — | (e) | | | 0.01 | | | | (0.01 | ) | | | — | | | | (0.01 | ) |
Year Ended February 28, 2019 | | | 1.00 | | | | 0.01 | | | | — | (e) | | | 0.01 | | | | (0.01 | ) | | | — | | | | (0.01 | ) |
Year Ended February 28, 2018 | | | 1.00 | | | | — | (e) | | | — | (e) | | | — | (e) | | | — | (e) | | | — | (e) | | | — | (e) |
Year Ended February 28, 2017 | | | 1.00 | | | | — | (e) | | | — | (e) | | | — | (e) | | | — | (e) | | | — | (e) | | | — | (e) |
Year Ended February 29, 2016 | | | 1.00 | | | | — | (e) | | | — | (e) | | | — | (e) | | | — | (e) | | | — | (e) | | | — | (e) |
| (a) | Annualized for periods less than one year, unless otherwise noted. |
| (b) | Calculated based upon average shares outstanding. |
| (c) | Not annualized for periods less than one year. |
| (d) | Includes earnings credits and interest expense, if applicable, each of which is less than 0.005% unless otherwise noted. |
| (e) | Amount rounds to less than $0.005. |
| (f) | Amount rounds to less than 0.005%. |
SEE NOTES TO FINANCIAL STATEMENTS.
| | | | | | |
| | | |
| 144 | | | | J.P. MORGAN MONEY MARKET FUNDS | | AUGUST 31, 2020 |
| | | | | | | | | | | | | | | | | | | | | | |
| | | Ratios/Supplemental data | |
| | | | | | | | | | Ratios to average net assets (a) | |
Net asset value, end of period | | | Total return (c) | | | Net assets, end of period (000’s) | | | Net expenses (d) | | | Net investment income (loss) | | | Expenses without waivers, reimbursements and earnings credits | |
| | | | | | | | | | | | | | | | | | | | | | |
| | | | | | | | | | | | | | | | | | | | | | |
| $ | 1.00 | | | | 0.03 | % | | $ | 498,471 | | | | 0.38 | % | | | 0.09 | % | | | 0.59 | % |
| | 1.00 | | | | 1.52 | | | | 734,856 | | | | 0.59 | | | | 1.49 | | | | 0.60 | |
| | 1.00 | | | | 1.49 | | | | 634,508 | | | | 0.59 | | | | 1.55 | | | | 0.61 | |
| | 1.00 | | | | 0.47 | | | | 283,619 | | | | 0.59 | | | | 0.48 | | | | 0.62 | |
| | 1.00 | | | | 0.00 | (f) | | | 244,830 | | | | 0.43 | | | | 0.00 | (f) | | | 0.61 | |
| | 1.00 | | | | 0.00 | (f) | | | 706,209 | | | | 0.15 | | | | 0.00 | (f) | | | 0.61 | |
| | | | | |
| | | | | | | | | | | | | | | | | | | | | | |
| | 1.00 | | | | 0.05 | | | | 1,822,556 | | | | 0.34 | | | | 0.08 | | | | 0.43 | |
| | 1.00 | | | | 1.66 | | | | 1,439,412 | | | | 0.45 | | | | 1.60 | | | | 0.45 | |
| | 1.00 | | | | 1.63 | | | | 981,194 | | | | 0.45 | | | | 1.68 | | | | 0.45 | |
| | 1.00 | | | | 0.61 | | | | 611,645 | | | | 0.45 | | | | 0.61 | | | | 0.46 | |
| | 1.00 | | | | 0.03 | | | | 640,584 | | | | 0.41 | | | | 0.04 | | | | 0.46 | |
| | 1.00 | | | | 0.00 | (f) | | | 244,258 | | | | 0.14 | | | | 0.00 | (f) | | | 0.46 | |
| | | | | |
| | | | | | | | | | | | | | | | | | | | | | |
| | 1.00 | | | | 0.03 | | | | 4,571 | | | | 0.44 | | | | 0.04 | | | | 0.71 | |
| | 1.00 | | | | 1.41 | | | | 5,966 | | | | 0.70 | | | | 1.41 | | | | 0.73 | |
| | 1.00 | | | | 1.38 | | | | 6,986 | | | | 0.70 | | | | 1.34 | | | | 0.71 | |
| | 1.00 | | | | 0.37 | | | | 12,246 | | | | 0.70 | | | | 0.28 | | | | 0.71 | |
| | 1.00 | | | | 0.00 | (f) | | | 109,454 | | | | 0.40 | | | | 0.00 | (f) | | | 0.71 | |
| | 1.00 | | | | 0.00 | (f) | | | 679,587 | | | | 0.15 | | | | 0.00 | (f) | | | 0.71 | |
SEE NOTES TO FINANCIAL STATEMENTS.
| | | | | | | | |
| | | |
| AUGUST 31, 2020 | | J.P. MORGAN MONEY MARKET FUNDS | | | | | 145 | |
FINANCIAL HIGHLIGHTS
FOR THE PERIODS INDICATED (continued)
| | | | | | | | | | | | | | | | | | | | | | | | | | | | |
| | | Per share operating performance | |
| | | | | | Investment operations | | | Distributions | |
| | | Net asset value, beginning of period | | | Net investment income (loss) (b) | | | Net realized and unrealized gains (losses) on investments | | | Total from investment operations | | | Net investment income | | | Net realized gain | | | Total distributions | |
JPMorgan Federal Money Market Fund | | | | | | | | | | | | | | | | | | | | | | | | | | | | |
Agency | | | | | | | | | | | | | | | | | | | | | | | | | | | | |
Six Months Ended August 31, 2020 (Unaudited) | | $ | 1.00 | | | $ | — | (e) | | $ | — | (e) | | $ | — | (e) | | $ | — | (e) | | $ | — | | | $ | — | (e) |
Year Ended February 29, 2020 | | | 1.00 | | | | 0.02 | | | | — | (e) | | | 0.02 | | | | (0.02 | ) | | | — | (e) | | | (0.02 | ) |
Year Ended February 28, 2019 | | | 1.00 | | | | 0.02 | | | | — | (e) | | | 0.02 | | | | (0.02 | ) | | | — | (e) | | | (0.02 | ) |
Year Ended February 28, 2018 | | | 1.00 | | | | 0.01 | | | | — | (e) | | | 0.01 | | | | (0.01 | ) | | | — | (e) | | | (0.01 | ) |
Year Ended February 28, 2017 | | | 1.00 | | | | — | (e) | | | — | (e) | | | — | (e) | | | — | (e) | | | — | (e) | | | — | (e) |
Year Ended February 29, 2016 | | | 1.00 | | | | — | (e) | | | — | (e) | | | — | (e) | | | — | (e) | | | — | (e) | | | — | (e) |
| | | | | | | |
Institutional Class | | | | | | | | | | | | | | | | | | | | | | | | | | | | |
Six Months Ended August 31, 2020 (Unaudited) | | | 1.00 | | | | — | (e) | | | — | (e) | | | — | (e) | | | — | (e) | | | — | | | | — | (e) |
Year Ended February 29, 2020 | | | 1.00 | | | | 0.02 | | | | — | (e) | | | 0.02 | | | | (0.02 | ) | | | — | (e) | | | (0.02 | ) |
Year Ended February 28, 2019 | | | 1.00 | | | | 0.02 | | | | — | (e) | | | 0.02 | | | | (0.02 | ) | | | — | (e) | | | (0.02 | ) |
Year Ended February 28, 2018 | | | 1.00 | | | | 0.01 | | | | — | (e) | | | 0.01 | | | | (0.01 | ) | | | — | (e) | | | (0.01 | ) |
Year Ended February 28, 2017 | | | 1.00 | | | | — | (e) | | | — | (e) | | | — | (e) | | | — | (e) | | | — | (e) | | | — | (e) |
Year Ended February 29, 2016 | | | 1.00 | | | | — | (e) | | | — | (e) | | | — | (e) | | | — | (e) | | | — | (e) | | | — | (e) |
| | | | | | | |
Morgan | | | | | | | | | | | | | | | | | | | | | | | | | | | | |
Six Months Ended August 31, 2020 (Unaudited) | | | 1.00 | | | | — | (e) | | | — | (e) | | | — | (e) | | | — | (e) | | | — | | | | — | (e) |
Year Ended February 29, 2020 | | | 1.00 | | | | 0.01 | | | | 0.01 | | | | 0.02 | | | | (0.02 | ) | | | — | (e) | | | (0.02 | ) |
Year Ended February 28, 2019 | | | 1.00 | | | | 0.01 | | | | — | (e) | | | 0.01 | | | | (0.01 | ) | | | — | (e) | | | (0.01 | ) |
Year Ended February 28, 2018 | | | 1.00 | | | | — | (e) | | | — | (e) | | | — | (e) | | | — | (e) | | | — | (e) | | | — | (e) |
Year Ended February 28, 2017 | | | 1.00 | | | | — | (e) | | | — | (e) | | | — | (e) | | | — | (e) | | | — | (e) | | | — | (e) |
Year Ended February 29, 2016 | | | 1.00 | | | | — | (e) | | | — | (e) | | | — | (e) | | | — | (e) | | | — | (e) | | | — | (e) |
| | | | | | | |
Premier | | | | | | | | | | | | | | | | | | | | | | | | | | | | |
Six Months Ended August 31, 2020 (Unaudited) | | | 1.00 | | | | — | (e) | | | — | (e) | | | — | (e) | | | — | (e) | | | — | | | | — | (e) |
Year Ended February 29, 2020 | | | 1.00 | | | | 0.02 | | | | — | (e) | | | 0.02 | | | | (0.02 | ) | | | — | (e) | | | (0.02 | ) |
Year Ended February 28, 2019 | | | 1.00 | | | | 0.02 | | | | — | (e) | | | 0.02 | | | | (0.02 | ) | | | — | (e) | | | (0.02 | ) |
Year Ended February 28, 2018 | | | 1.00 | | | | 0.01 | | | | — | (e) | | | 0.01 | | | | (0.01 | ) | | | — | (e) | | | (0.01 | ) |
Year Ended February 28, 2017 | | | 1.00 | | | | — | (e) | | | — | (e) | | | — | (e) | | | — | (e) | | | — | (e) | | | — | (e) |
Year Ended February 29, 2016 | | | 1.00 | | | | — | (e) | | | — | (e) | | | — | (e) | | | — | (e) | | | — | (e) | | | — | (e) |
| (a) | Annualized for periods less than one year, unless otherwise noted. |
| (b) | Calculated based upon average shares outstanding. |
| (c) | Not annualized for periods less than one year. |
| (d) | Includes earnings credits and interest expense, if applicable, each of which is less than 0.005% unless otherwise noted. |
| (e) | Amount rounds to less than $0.005. |
SEE NOTES TO FINANCIAL STATEMENTS.
| | | | | | |
| | | |
| 146 | | | | J.P. MORGAN MONEY MARKET FUNDS | | AUGUST 31, 2020 |
| | | | | | | | | | | | | | | | | | | | | | |
| | | Ratios/Supplemental data | |
| | | | | | | | | | Ratios to average net assets (a) | |
Net asset value, end of period | | | Total return (c) | | | Net assets, end of period (000’s) | | | Net expenses (d) | | | Net investment income (loss) | | | Expenses without waivers, reimbursements and earnings credits | |
| | | | | | | | | | | | | | | | | | | | | | |
| | | | | | | | | | | | | | | | | | | | | | |
| $ | 1.00 | | | | 0.10 | % | | $ | 324,682 | | | | 0.25 | % | | | 0.17 | % | | | 0.29 | % |
| | 1.00 | | | | 1.85 | | | | 242,716 | | | | 0.26 | | | | 1.79 | | | | 0.30 | |
| | 1.00 | | | | 1.80 | | | | 148,122 | | | | 0.26 | | | | 1.82 | | | | 0.31 | |
| | 1.00 | | | | 0.80 | | | | 127,451 | | | | 0.26 | | | | 0.77 | | | | 0.33 | |
| | 1.00 | | | | 0.20 | | | | 133,227 | | | | 0.26 | | | | 0.19 | | | | 0.35 | |
| | 1.00 | | | | 0.02 | | | | 233,955 | | | | 0.16 | | | | 0.02 | | | | 0.33 | |
| | | | | |
| | | | | | | | | | | | | | | | | | | | | | |
| | 1.00 | | | | 0.12 | | | | 2,645,618 | | | | 0.21 | | | | 0.24 | | | | 0.25 | |
| | 1.00 | | | | 1.90 | | | | 2,572,379 | | | | 0.21 | | | | 1.90 | | | | 0.25 | |
| | 1.00 | | | | 1.85 | | | | 3,417,418 | | | | 0.21 | | | | 1.85 | | | | 0.26 | |
| | 1.00 | | | | 0.85 | | | | 2,668,613 | | | | 0.21 | | | | 0.84 | | | | 0.28 | |
| | 1.00 | | | | 0.25 | | | | 2,767,271 | | | | 0.21 | | | | 0.25 | | | | 0.30 | |
| | 1.00 | | | | 0.03 | | | | 3,615,992 | | | | 0.13 | | | | 0.03 | | | | 0.28 | |
| | | | | |
| | | | | | | | | | | | | | | | | | | | | | |
| | 1.00 | | | | 0.05 | | | | 55,726 | | | | 0.33 | | | | 0.08 | | | | 0.64 | |
| | 1.00 | | | | 1.51 | | | | 34,728 | | | | 0.59 | | | | 1.48 | | | | 0.67 | |
| | 1.00 | | | | 1.46 | | | | 29,289 | | | | 0.59 | | | | 1.45 | | | | 0.70 | |
| | 1.00 | | | | 0.46 | | | | 32,224 | | | | 0.59 | | | | 0.44 | | | | 0.69 | |
| | 1.00 | | | | 0.02 | | | | 53,090 | | | | 0.42 | | | | 0.01 | | | | 0.67 | |
| | 1.00 | | | | 0.01 | | | | 131,723 | | | | 0.16 | | | | 0.01 | | | | 0.65 | |
| | | | | |
| | | | | | | | | | | | | | | | | | | | | | |
| | 1.00 | | | | 0.07 | | | | 174,462 | | | | 0.32 | | | | 0.14 | | | | 0.45 | |
| | 1.00 | | | | 1.65 | | | | 218,858 | | | | 0.45 | | | | 1.58 | | | | 0.45 | |
| | 1.00 | | | | 1.60 | | | | 155,001 | | | | 0.45 | | | | 1.54 | | | | 0.47 | |
| | 1.00 | | | | 0.60 | | | | 229,795 | | | | 0.45 | | | | 0.65 | | | | 0.48 | |
| | 1.00 | | | | 0.04 | | | | 109,282 | | | | 0.41 | | | | 0.04 | | | | 0.50 | |
| | 1.00 | | | | 0.01 | | | | 171,808 | | | | 0.14 | | | | 0.01 | | | | 0.49 | |
SEE NOTES TO FINANCIAL STATEMENTS.
| | | | | | | | |
| | | |
| AUGUST 31, 2020 | | J.P. MORGAN MONEY MARKET FUNDS | | | | | 147 | |
FINANCIAL HIGHLIGHTS
FOR THE PERIODS INDICATED (continued)
| | | | | | | | | | | | | | | | | | | | | | | | | | | | |
| | | Per share operating performance | |
| | | | | | Investment operations | | | Distributions | |
| | | Net asset
value,
beginning
of period | | | Net
investment
income
(loss) (b) | | | Net realized
and unrealized
gains
(losses) on
investments | | | Total from
investment
operations | | | Net
investment
income | | | Net
realized
gain | | | Total
distributions | |
JPMorgan 100% U.S. Treasury Securities Money Market Fund | | | | | | | | | | | | | |
Agency | | | | | | | | | | | | | | | | | | | | | | | | | | | | |
Six Months Ended August 31, 2020 (Unaudited) | | $ | 1.00 | | | $ | — | (e) | | $ | — | (e) | | $ | — | (e) | | $ | — | (e) | | $ | — | | | $ | — | (e) |
Year Ended February 29, 2020 | | | 1.00 | | | | 0.02 | | | | — | (e) | | | 0.02 | | | | (0.02 | ) | | | — | (e) | | | (0.02 | ) |
Year Ended February 28, 2019 | | | 1.00 | | | | 0.02 | | | | — | (e) | | | 0.02 | | | | (0.02 | ) | | | — | (e) | | | (0.02 | ) |
Year Ended February 28, 2018 | | | 1.00 | | | | 0.01 | | | | — | (e) | | | 0.01 | | | | (0.01 | ) | | | — | (e) | | | (0.01 | ) |
Year Ended February 28, 2017 | | | 1.00 | | | | — | (e) | | | — | (e) | | | — | (e) | | | — | (e) | | | — | (e) | | | — | (e) |
Year Ended February 29, 2016 | | | 1.00 | | | | — | (e) | | | — | (e) | | | — | (e) | | | — | (e) | | | — | (e) | | | — | (e) |
| | | | | | | |
Capital | | | | | | | | | | | | | | | | | | | | | | | | | | | | |
Six Months Ended August 31, 2020 (Unaudited) | | | 1.00 | | | | — | (e) | | | — | (e) | | | — | (e) | | | — | (e) | | | — | | | | — | (e) |
Year Ended February 29, 2020 | | | 1.00 | | | | 0.02 | | | | — | (e) | | | 0.02 | | | | (0.02 | ) | | | — | (e) | | | (0.02 | ) |
Year Ended February 28, 2019 | | | 1.00 | | | | 0.02 | | | | — | (e) | | | 0.02 | | | | (0.02 | ) | | | — | (e) | | | (0.02 | ) |
Year Ended February 28, 2018 | | | 1.00 | | | | 0.01 | | | | — | (e) | | | 0.01 | | | | (0.01 | ) | | | — | (e) | | | (0.01 | ) |
Year Ended February 28, 2017 | | | 1.00 | | | | — | (e) | | | — | (e) | | | — | (e) | | | — | (e) | | | — | (e) | | | — | (e) |
Year Ended February 29, 2016 | | | 1.00 | | | | — | (e) | | | — | (e) | | | — | (e) | | | — | (e) | | | — | (e) | | | — | (e) |
| | | | | | | |
IM | | | | | | | | | | | | | | | | | | | | | | | | | | | | |
Six Months Ended August 31, 2020 (Unaudited) | | | 1.00 | | | | — | (e) | | | — | (e) | | | — | (e) | | | — | (e) | | | — | | | | — | (e) |
January 15, 2020 (f) through February 29, 2020 | | | 1.00 | | | | — | (e) | | | — | (e) | | | — | (e) | | | — | (e) | | | — | | | | — | (e) |
| | | | | | | |
Institutional Class | | | | | | | | | | | | | | | | | | | | | | | | | | | | |
Six Months Ended August 31, 2020 (Unaudited) | | | 1.00 | | | | — | (e) | | | — | (e) | | | — | (e) | | | — | (e) | | | — | | | | — | (e) |
Year Ended February 29, 2020 | | | 1.00 | | | | 0.02 | | | | — | (e) | | | 0.02 | | | | (0.02 | ) | | | — | (e) | | | (0.02 | ) |
Year Ended February 28, 2019 | | | 1.00 | | | | 0.02 | | | | — | (e) | | | 0.02 | | | | (0.02 | ) | | | — | (e) | | | (0.02 | ) |
Year Ended February 28, 2018 | | | 1.00 | | | | 0.01 | | | | — | (e) | | | 0.01 | | | | (0.01 | ) | | | — | (e) | | | (0.01 | ) |
Year Ended February 28, 2017 | | | 1.00 | | | | — | (e) | | | — | (e) | | | — | (e) | | | — | (e) | | | — | (e) | | | — | (e) |
Year Ended February 29, 2016 | | | 1.00 | | | | — | (e) | | | — | (e) | | | — | (e) | | | — | (e) | | | — | (e) | | | — | (e) |
| | | | | | | |
Morgan | | | | | | | | | | | | | | | | | | | | | | | | | | | | |
Six Months Ended August 31, 2020 (Unaudited) | | | 1.00 | | | | — | (e) | | | — | (e) | | | — | (e) | | | — | (e) | | | — | | | | — | (e) |
Year Ended February 29, 2020 | | | 1.00 | | | | 0.01 | | | | — | (e) | | | 0.01 | | | | (0.01 | ) | | | — | (e) | | | (0.01 | ) |
Year Ended February 28, 2019 | | | 1.00 | | | | 0.01 | | | | — | (e) | | | 0.01 | | | | (0.01 | ) | | | — | (e) | | | (0.01 | ) |
Year Ended February 28, 2018 | | | 1.00 | | | | — | (e) | | | — | (e) | | | — | (e) | | | — | (e) | | | — | (e) | | | — | (e) |
Year Ended February 28, 2017 | | | 1.00 | | | | — | (e) | | | — | (e) | | | — | (e) | | | — | (e) | | | — | (e) | | | — | (e) |
Year Ended February 29, 2016 | | | 1.00 | | | | — | (e) | | | — | (e) | | | — | (e) | | | — | (e) | | | — | (e) | | | — | (e) |
| | | | | | | |
Premier | | | | | | | | | | | | | | | | | | | | | | | | | | | | |
Six Months Ended August 31, 2020 (Unaudited) | | | 1.00 | | | | — | (e) | | | — | (e) | | | — | (e) | | | — | (e) | | | — | | | | — | (e) |
Year Ended February 29, 2020 | | | 1.00 | | | | 0.02 | | | | — | (e) | | | 0.02 | | | | (0.02 | ) | | | — | (e) | | | (0.02 | ) |
Year Ended February 28, 2019 | | | 1.00 | | | | 0.02 | | | | — | (e) | | | 0.02 | | | | (0.02 | ) | | | — | (e) | | | (0.02 | ) |
Year Ended February 28, 2018 | | | 1.00 | | | | 0.01 | | | | — | (e) | | | 0.01 | | | | (0.01 | ) | | | — | (e) | | | (0.01 | ) |
Year Ended February 28, 2017 | | | 1.00 | | | | — | (e) | | | — | (e) | | | — | (e) | | | — | (e) | | | — | (e) | | | — | (e) |
Year Ended February 29, 2016 | | | 1.00 | | | | — | (e) | | | — | (e) | | | — | (e) | | | — | (e) | | | — | (e) | | | — | (e) |
| | | | | | | |
Reserve | | | | | | | | | | | | | | | | | | | | | | | | | | | | |
Six Months Ended August 31, 2020 (Unaudited) | | | 1.00 | | | | — | (e) | | | — | (e) | | | — | (e) | | | — | (e) | | | — | | | | — | (e) |
Year Ended February 29, 2020 | | | 1.00 | | | | 0.01 | | | | — | (e) | | | 0.01 | | | | (0.01 | ) | | | — | (e) | | | (0.01 | ) |
Year Ended February 28, 2019 | | | 1.00 | | | | 0.01 | | | | — | (e) | | | 0.01 | | | | (0.01 | ) | | | — | (e) | | | (0.01 | ) |
Year Ended February 28, 2018 | | | 1.00 | | | | — | (e) | | | — | (e) | | | — | (e) | | | — | (e) | | | — | (e) | | | — | (e) |
Year Ended February 28, 2017 | | | 1.00 | | | | — | (e) | | | — | (e) | | | — | (e) | | | — | (e) | | | — | (e) | | | — | (e) |
Year Ended February 29, 2016 | | | 1.00 | | | | — | (e) | | | — | (e) | | | — | (e) | | | — | (e) | | | — | (e) | | | — | (e) |
| (a) | Annualized for periods less than one year, unless otherwise noted. |
| (b) | Calculated based upon average shares outstanding. |
| (c) | Not annualized for periods less than one year. |
| (d) | Includes earnings credits and interest expense, if applicable, each of which is less than 0.005% unless otherwise noted. |
| (e) | Amount rounds to less than $0.005. |
| (f) | Commencement of offering of class of shares. |
| (g) | Amount rounds to less than 0.005%. |
SEE NOTES TO FINANCIAL STATEMENTS.
| | | | | | |
| | | |
| 148 | | | | J.P. MORGAN MONEY MARKET FUNDS | | AUGUST 31, 2020 |
| | | | | | | | | | | | | | | | | | | | | | |
| | | Ratios/Supplemental data | |
| | | | | | | | | | Ratios to average net assets (a) | |
Net asset
value,
end of
period | | | Total return (c) | | | Net assets,
end of
period
(000’s) | | | Net
expenses (d) | | |
Net
investment
income
(loss) | | | Expenses
without waivers,
reimbursements and
earnings credits | |
| | | | | | | | | | | | | | | | | | | | | | |
| | | | | | | | | | | | | | | | | | | | | | |
| $ | 1.00 | | | | 0.09 | % | | $ | 4,978,340 | | | | 0.25 | % | | | 0.16 | % | | | 0.28 | % |
| | 1.00 | | | | 1.82 | | | | 4,197,262 | | | | 0.26 | | | | 1.76 | | | | 0.30 | |
| | 1.00 | | | | 1.79 | | | | 2,567,061 | | | | 0.26 | | | | 1.81 | | | | 0.31 | |
| | 1.00 | | | | 0.79 | | | | 1,981,066 | | | | 0.26 | | | | 0.80 | | | | 0.31 | |
| | 1.00 | | | | 0.15 | | | | 1,848,739 | | | | 0.26 | | | | 0.15 | | | | 0.31 | |
| | 1.00 | | | | 0.01 | | | | 1,895,744 | | | | 0.10 | | | | 0.01 | | | | 0.31 | |
| | | | | |
| | | | | | | | | | | | | | | | | | | | | | |
| | 1.00 | | | | 0.13 | | | | 69,953,404 | | | | 0.18 | | | | 0.19 | | | | 0.18 | |
| | 1.00 | | | | 1.90 | | | | 32,963,549 | | | | 0.18 | | | | 1.85 | | | | 0.20 | |
| | 1.00 | | | | 1.88 | | | | 23,528,259 | | | | 0.18 | | | | 1.88 | | | | 0.21 | |
| | 1.00 | | | | 0.87 | | | | 19,208,530 | | | | 0.18 | | | | 0.89 | | | | 0.21 | |
| | 1.00 | | | | 0.23 | | | | 11,630,048 | | | | 0.18 | | | | 0.23 | | | | 0.21 | |
| | 1.00 | | | | 0.02 | | | | 9,678,309 | | | | 0.08 | | | | 0.01 | | | | 0.21 | |
| | | | | |
| | | | | | | | | | | | | | | | | | | | | | |
| | 1.00 | | | | 0.15 | | | | 186,273 | | | | 0.13 | | | | 0.18 | | | | 0.13 | |
| | 1.00 | | | | 0.18 | | | | 11,885 | | | | 0.15 | | | | 1.46 | | | | 0.15 | |
| | | | | |
| | | | | | | | | | | | | | | | | | | | | | |
| | 1.00 | | | | 0.11 | | | | 29,171,372 | | | | 0.21 | | | | 0.19 | | | | 0.23 | |
| | 1.00 | | | | 1.87 | | | | 22,282,460 | | | | 0.21 | | | | 1.83 | | | | 0.25 | |
| | 1.00 | | | | 1.84 | | | | 17,858,556 | | | | 0.21 | | | | 1.87 | | | | 0.26 | |
| | 1.00 | | | | 0.84 | | | | 11,098,506 | | | | 0.21 | | | | 0.83 | | | | 0.26 | |
| | 1.00 | | | | 0.20 | | | | 9,414,776 | | | | 0.21 | | | | 0.21 | | | | 0.26 | |
| | 1.00 | | | | 0.01 | | | | 7,378,773 | | | | 0.08 | | | | 0.01 | | | | 0.26 | |
| | | | | |
| | | | | | | | | | | | | | | | | | | | | | |
| | 1.00 | | | | 0.05 | | | | 2,229,896 | | | | 0.34 | | | | 0.08 | | | | 0.59 | |
| | 1.00 | | | | 1.49 | | | | 2,023,440 | | | | 0.59 | | | | 1.47 | | | | 0.60 | |
| | 1.00 | | | | 1.46 | | | | 2,009,129 | | | | 0.59 | | | | 1.45 | | | | 0.61 | |
| | 1.00 | | | | 0.45 | | | | 1,617,985 | | | | 0.59 | | | | 0.46 | | | | 0.61 | |
| | 1.00 | | | | 0.00 | (g) | | | 1,148,892 | | | | 0.40 | | | | 0.00 | (g) | | | 0.61 | |
| | 1.00 | | | | 0.00 | (g) | | | 1,990,677 | | | | 0.10 | | | | 0.00 | (g) | | | 0.61 | |
| | | | | |
| | | | | | | | | | | | | | | | | | | | | | |
| | 1.00 | | | | 0.06 | | | | 2,504,281 | | | | 0.33 | | | | 0.10 | | | | 0.43 | |
| | 1.00 | | | | 1.63 | | | | 2,537,050 | | | | 0.45 | | | | 1.62 | | | | 0.45 | |
| | 1.00 | | | | 1.60 | | | | 2,059,307 | | | | 0.45 | | | | 1.65 | | | | 0.46 | |
| | 1.00 | | | | 0.59 | | | | 848,906 | | | | 0.45 | | | | 0.59 | | | | 0.46 | |
| | 1.00 | | | | 0.02 | | | | 857,883 | | | | 0.38 | | | | 0.02 | | | | 0.46 | |
| | 1.00 | | | | 0.00 | (g) | | | 1,219,310 | | | | 0.10 | | | | 0.00 | (g) | | | 0.46 | |
| | | | | |
| | | | | | | | | | | | | | | | | | | | | | |
| | 1.00 | | | | 0.04 | | | | 2,567,481 | | | | 0.36 | | | | 0.06 | | | | 0.68 | |
| | 1.00 | | | | 1.38 | | | | 2,102,023 | | | | 0.70 | | | | 1.34 | | | | 0.70 | |
| | 1.00 | | | | 1.35 | | | | 1,561,835 | | | | 0.70 | | | | 1.42 | | | | 0.71 | |
| | 1.00 | | | | 0.35 | | | | 258,002 | | | | 0.70 | | | | 0.41 | | | | 0.71 | |
| | 1.00 | | | | 0.00 | (g) | | | 75,190 | | | | 0.41 | | | | 0.00 | | | | 0.71 | |
| | 1.00 | | | | 0.00 | (g) | | | 108,109 | | | | 0.14 | | | | 0.00 | (g) | | | 0.71 | |
SEE NOTES TO FINANCIAL STATEMENTS.
| | | | | | | | |
| | | |
| AUGUST 31, 2020 | | J.P. MORGAN MONEY MARKET FUNDS | | | | | 149 | |
FINANCIAL HIGHLIGHTS
FOR THE PERIODS INDICATED (continued)
| | | | | | | | | | | | | | | | | | | | | | | | | | | | |
| | | Per share operating performance | |
| | | | | | Investment operations | | | Distributions | |
| | | Net asset
value,
beginning
of period | | | Net
investment
income
(loss) (b) | | | Net realized
and unrealized
gains
(losses) on
investments | | | Total from
investment
operations | | | Net
investment
income | | | Net
realized
gain | | | Total
distributions | |
JPMorgan Tax Free Money Market Fund | | | | | |
Agency | | | | | |
Six Months Ended August 31, 2020 (Unaudited) | | $ | 1.00 | | | $ | — | (e) | | $ | — | (e) | | $ | — | (e) | | $ | — | (e) | | $ | — | | | $ | — | (e) |
Year Ended February 29, 2020 | | | 1.00 | | | | 0.01 | | | | — | (e) | | | 0.01 | | | | (0.01 | ) | | | — | (e) | | | (0.01 | ) |
Year Ended February 28, 2019 | | | 1.00 | | | | 0.01 | | | | — | (e) | | | 0.01 | | | | (0.01 | ) | | | — | (e) | | | (0.01 | ) |
Year Ended February 28, 2018 | | | 1.00 | | | | 0.01 | | | | — | (e) | | | 0.01 | | | | (0.01 | ) | | | — | (e) | | | (0.01 | ) |
Year Ended February 28, 2017 | | | 1.00 | | | | — | (e) | | | — | (e) | | | — | (e) | | | — | (e) | | | — | (e) | | | — | (e) |
Year Ended February 29, 2016 | | | 1.00 | | | | — | (e) | | | — | (e) | | | — | (e) | | | — | (e) | | | — | (e) | | | — | (e) |
| | | | | | | |
Institutional Class | | | | | | | | | | | | | | | | | | | | | | | | | | | | |
Six Months Ended August 31, 2020 (Unaudited) | | | 1.00 | | | | — | (e) | | | — | (e) | | | — | (e) | | | — | (e) | | | — | | | | — | (e) |
Year Ended February 29, 2020 | | | 1.00 | | | | 0.01 | | | | — | (e) | | | 0.01 | | | | (0.01 | ) | | | — | (e) | | | (0.01 | ) |
Year Ended February 28, 2019 | | | 1.00 | | | | 0.01 | | | | — | (e) | | | 0.01 | | | | (0.01 | ) | | | — | (e) | | | (0.01 | ) |
Year Ended February 28, 2018 | | | 1.00 | | | | 0.01 | | | | — | (e) | | | 0.01 | | | | (0.01 | ) | | | — | (e) | | | (0.01 | ) |
Year Ended February 28, 2017 | | | 1.00 | | | | — | (e) | | | — | (e) | | | — | (e) | | | — | (e) | | | — | (e) | | | — | (e) |
Year Ended February 29, 2016 | | | 1.00 | | | | — | (e) | | | — | (e) | | | — | (e) | | | — | (e) | | | — | (e) | | | — | (e) |
| | | | | | | |
Morgan | | | | | | | | | | | | | | | | | | | | | | | | | | | | |
Six Months Ended August 31, 2020 (Unaudited) | | | 1.00 | | | | — | (e) | | | — | (e) | | | — | (e) | | | — | (e) | | | — | | | | — | (e) |
Year Ended February 29, 2020 | | | 1.00 | | | | 0.01 | | | | — | (e) | | | 0.01 | | | | (0.01 | ) | | | — | (e) | | | (0.01 | ) |
Year Ended February 28, 2019 | | | 1.00 | | | | 0.01 | | | | — | (e) | | | 0.01 | | | | (0.01 | ) | | | — | (e) | | | (0.01 | ) |
Year Ended February 28, 2018 | | | 1.00 | | | | — | (e) | | | — | (e) | | | — | (e) | | | — | (e) | | | — | (e) | | | — | (e) |
Year Ended February 28, 2017 | | | 1.00 | | | | — | (e) | | | — | (e) | | | — | (e) | | | — | (e) | | | — | (e) | | | — | (e) |
Year Ended February 29, 2016 | | | 1.00 | | | | — | (e) | | | — | (e) | | | — | (e) | | | — | (e) | | | — | (e) | | | — | (e) |
| | | | | | | |
Premier | | | | | | | | | | | | | | | | | | | | | | | | | | | | |
Six Months Ended August 31, 2020 (Unaudited) | | | 1.00 | | | | — | (e) | | | — | (e) | | | — | (e) | | | — | (e) | | | — | | | | — | (e) |
Year Ended February 29, 2020 | | | 1.00 | | | | 0.01 | | | | — | (e) | | | 0.01 | | | | (0.01 | ) | | | — | (e) | | | (0.01 | ) |
Year Ended February 28, 2019 | | | 1.00 | | | | 0.01 | | | | — | (e) | | | 0.01 | | | | (0.01 | ) | | | — | (e) | | | (0.01 | ) |
Year Ended February 28, 2018 | | | 1.00 | | | | — | (e) | | | — | (e) | | | — | (e) | | | — | (e) | | | — | (e) | | | — | (e) |
Year Ended February 28, 2017 | | | 1.00 | | | | — | (e) | | | — | (e) | | | — | (e) | | | — | (e) | | | — | (e) | | | — | (e) |
Year Ended February 29, 2016 | | | 1.00 | | | | — | (e) | | | — | (e) | | | — | (e) | | | — | (e) | | | — | (e) | | | — | (e) |
| | | | | | | |
Reserve | | | | | | | | | | | | | | | | | | | | | | | | | | | | |
Six Months Ended August 31, 2020 (Unaudited) | | | 1.00 | | | | — | (e) | | | — | (e) | | | — | (e) | | | — | (e) | | | — | | | | — | (e) |
Year Ended February 29, 2020 | | | 1.00 | | | | 0.01 | | | | — | (e) | | | 0.01 | | | | (0.01 | ) | | | — | (e) | | | (0.01 | ) |
Year Ended February 28, 2019 | | | 1.00 | | | | 0.01 | | | | — | (e) | | | 0.01 | | | | (0.01 | ) | | | — | (e) | | | (0.01 | ) |
Year Ended February 28, 2018 | | | 1.00 | | | | — | (e) | | | — | (e) | | | — | (e) | | | — | (e) | | | — | (e) | | | — | (e) |
Year Ended February 28, 2017 | | | 1.00 | | | | — | (e) | | | — | (e) | | | — | (e) | | | — | (e) | | | — | (e) | | | — | (e) |
Year Ended February 29, 2016 | | | 1.00 | | | | — | (e) | | | — | (e) | | | — | (e) | | | — | (e) | | | — | (e) | | | — | (e) |
| (a) | Annualized for periods less than one year, unless otherwise noted. |
| (b) | Calculated based upon average shares outstanding. |
| (c) | Not annualized for periods less than one year. |
| (d) | Includes earnings credits and interest expense, if applicable, each of which is less than 0.005% unless otherwise noted. |
| (e) | Amount rounds to less than $0.005. |
SEE NOTES TO FINANCIAL STATEMENTS.
| | | | | | |
| | | |
| 150 | | | | J.P. MORGAN MONEY MARKET FUNDS | | AUGUST 31, 2020 |
| | | | | | | | | | | | | | | | | | | | | | |
| | | Ratios/Supplemental data | |
| | | | | | | | | | Ratios to average net assets (a) | |
Net asset
value,
end of
period | | | Total return (c) | | | Net assets,
end of
period
(000’s) | | | Net
expenses (d) | | | Net
investment
income
(loss) | | | Expenses
without waivers,
reimbursements and
earnings credits | |
| | | | | | | | | | | | | | | | | | | | | | |
| | | | | | | | | | | | | | | | | | | | | | |
| $ | 1.00 | | | | 0.26 | % | | $ | 616,862 | | | | 0.26 | % | | | 0.53 | % | | | 0.29 | % |
| | 1.00 | | | | 1.17 | | | | 782,269 | | | | 0.26 | | | | 1.17 | | | | 0.30 | |
| | 1.00 | | | | 1.24 | | | | 1,063,941 | | | | 0.26 | | | | 1.23 | | | | 0.31 | |
| | 1.00 | | | | 0.68 | | | | 831,137 | | | | 0.26 | | | | 0.70 | | | | 0.31 | |
| | 1.00 | | | | 0.27 | | | | 437,689 | | | | 0.25 | | | | 0.26 | | | | 0.31 | |
| | 1.00 | | | | 0.03 | | | | 344,578 | | | | 0.05 | | | | 0.01 | | | | 0.31 | |
| | | | | |
| | | | | | | | | | | | | | | | | | | | | | |
| | 1.00 | | | | 0.28 | | | | 8,056,235 | | | | 0.21 | | | | 0.57 | | | | 0.24 | |
| | 1.00 | | | | 1.22 | | | | 9,173,460 | | | | 0.21 | | | | 1.23 | | | | 0.25 | |
| | 1.00 | | | | 1.29 | | | | 12,402,297 | | | | 0.21 | | | | 1.27 | | | | 0.26 | |
| | 1.00 | | | | 0.73 | | | | 11,970,538 | | | | 0.21 | | | | 0.73 | | | | 0.26 | |
| | 1.00 | | | | 0.32 | | | | 10,567,571 | | | | 0.20 | | | | 0.31 | | | | 0.26 | |
| | 1.00 | | | | 0.03 | | | | 10,007,028 | | | | 0.04 | | | | 0.01 | | | | 0.26 | |
| | | | | |
| | | | | | | | | | | | | | | | | | | | | | |
| | 1.00 | | | | 0.19 | | | | 28,341 | | | | 0.37 | | | | 0.19 | | | | 0.62 | |
| | 1.00 | | | | 0.84 | | | | 10,842 | | | | 0.59 | | | | 0.83 | | | | 0.64 | |
| | 1.00 | | | | 0.90 | | | | 9,884 | | | | 0.59 | | | | 0.89 | | | | 0.68 | |
| | 1.00 | | | | 0.35 | | | | 9,555 | | | | 0.59 | | | | 0.34 | | | | 0.66 | |
| | 1.00 | | | | 0.05 | | | | 11,468 | | | | 0.44 | | | | 0.04 | | | | 0.62 | |
| | 1.00 | | | | 0.03 | | | | 111,381 | | | | 0.04 | | | | 0.01 | | | | 0.62 | |
| | | | | |
| | | | | | | | | | | | | | | | | | | | | | |
| | 1.00 | | | | 0.21 | | | | 676,539 | | | | 0.36 | | | | 0.41 | | | | 0.44 | |
| | 1.00 | | | | 0.98 | | | | 847,483 | | | | 0.45 | | | | 0.99 | | | | 0.45 | |
| | 1.00 | | | | 1.04 | | | | 1,062,712 | | | | 0.45 | | | | 1.03 | | | | 0.46 | |
| | 1.00 | | | | 0.49 | | | | 1,560,291 | | | | 0.45 | | | | 0.48 | | | | 0.46 | |
| | 1.00 | | | | 0.12 | | | | 1,713,414 | | | | 0.38 | | | | 0.10 | | | | 0.46 | |
| | 1.00 | | | | 0.03 | | | | 2,984,160 | | | | 0.04 | | | | 0.01 | | | | 0.46 | |
| | | | | |
| | | | | | | | | | | | | | | | | | | | | | |
| | 1.00 | | | | 0.18 | | | | 1,362,765 | | | | 0.41 | | | | 0.33 | | | | 0.69 | |
| | 1.00 | | | | 0.73 | | | | 1,707,525 | | | | 0.70 | | | | 0.72 | | | | 0.70 | |
| | 1.00 | | | | 0.79 | | | | 2,028,976 | | | | 0.70 | | | | 0.78 | | | | 0.71 | |
| | 1.00 | | | | 0.24 | | | | 2,511,847 | | | | 0.70 | | | | 0.23 | | | | 0.71 | |
| | 1.00 | | | | 0.02 | | | | 2,650,165 | | | | 0.47 | | | | 0.02 | | | | 0.71 | |
| | 1.00 | | | | 0.03 | | | | 4,220,927 | | | | 0.04 | | | | 0.01 | | | | 0.71 | |
SEE NOTES TO FINANCIAL STATEMENTS.
| | | | | | | | |
| | | |
| AUGUST 31, 2020 | | J.P. MORGAN MONEY MARKET FUNDS | | | | | 151 | |
FINANCIAL HIGHLIGHTS
FOR THE PERIODS INDICATED (continued)
| | | | | | | | | | | | | | | | | | | | | | | | | | | | |
| | | Per share operating performance | |
| | | | | | Investment operations | | | Distributions | |
| | | Net asset
value,
beginning
of period | | | Net
investment
income
(loss) (b) | | | Net realized
and unrealized
gains
(losses) on
investments | | | Total from
investment
operations | | | Net
investment
income | | | Net
realized
gain | | | Total
distributions | |
JPMorgan Municipal Money Market Fund | | | | | |
Agency | | | | | |
Six Months Ended August 31, 2020 (Unaudited) | | $ | 1.00 | | | $ | — | (e) | | $ | — | (e) | | $ | — | (e) | | $ | — | (e) | | $ | — | | | $ | — | (e) |
Year Ended February 29, 2020 | | | 1.00 | | | | 0.01 | | | | — | (e) | | | 0.01 | | | | (0.01 | ) | | | — | (e) | | | (0.01 | ) |
Year Ended February 28, 2019 | | | 1.00 | | | | 0.01 | | | | — | (e) | | | 0.01 | | | | (0.01 | ) | | | — | (e) | | | (0.01 | ) |
Year Ended February 28, 2018 | | | 1.00 | | | | 0.01 | | | | — | (e) | | | 0.01 | | | | (0.01 | ) | | | — | (e) | | | (0.01 | ) |
Year Ended February 28, 2017 | | | 1.00 | | | | — | (e) | | | — | (e) | | | — | (e) | | | — | (e) | | | — | (e) | | | — | (e) |
Year Ended February 29, 2016 | | | 1.00 | | | | — | (e) | | | — | (e) | | | — | (e) | | | — | (e) | | | — | (e) | | | — | (e) |
| | | | | | | |
E*Trade (f) | | | | | | | | | | | | | | | | | | | | | | | | | | | | |
For the Period Ended September 21, 2016 | | | 1.00 | | | | — | (e) | | | — | (e) | | | — | (e) | | | — | (e) | | | — | | | | — | (e) |
Year Ended February 29, 2016 | | | 1.00 | | | | — | (e) | | | — | (e) | | | — | (e) | | | — | (e) | | | — | (e) | | | — | (e) |
| | | | | | | |
Institutional Class | | | | | | | | | | | | | | | | | | | | | | | | | | | | |
Six Months Ended August 31, 2020 (Unaudited) | | | 1.00 | | | | — | (e) | | | — | (e) | | | — | (e) | | | — | (e) | | | — | | | | — | (e) |
Year Ended February 29, 2020 | | | 1.00 | | | | 0.01 | | | | — | (e) | | | 0.01 | | | | (0.01 | ) | | | — | (e) | | | (0.01 | ) |
Year Ended February 28, 2019 | | | 1.00 | | | | 0.01 | | | | — | (e) | | | 0.01 | | | | (0.01 | ) | | | — | (e) | | | (0.01 | ) |
Year Ended February 28, 2018 | | | 1.00 | | | | 0.01 | | | | — | (e) | | | 0.01 | | | | (0.01 | ) | | | — | (e) | | | (0.01 | ) |
Year Ended February 28, 2017 | | | 1.00 | | | | — | (e) | | | — | (e) | | | — | (e) | | | — | (e) | | | — | (e) | | | — | (e) |
Year Ended February 29, 2016 | | | 1.00 | | | | — | (e) | | | — | (e) | | | — | (e) | | | — | (e) | | | — | (e) | | | — | (e) |
| | | | | | | |
Morgan | | | | | | | | | | | | | | | | | | | | | | | | | | | | |
Six Months Ended August 31, 2020 (Unaudited) | | | 1.00 | | | | — | (e) | | | — | (e) | | | — | (e) | | | — | (e) | | | — | | | | — | (e) |
Year Ended February 29, 2020 | | | 1.00 | | | | 0.01 | | | | — | (e) | | | 0.01 | | | | (0.01 | ) | | | — | (e) | | | (0.01 | ) |
Year Ended February 28, 2019 | | | 1.00 | | | | 0.01 | | | | — | (e) | | | 0.01 | | | | (0.01 | ) | | | — | (e) | | | (0.01 | ) |
Year Ended February 28, 2018 | | | 1.00 | | | | — | (e) | | | — | (e) | | | — | (e) | | | — | (e) | | | — | (e) | | | — | (e) |
Year Ended February 28, 2017 | | | 1.00 | | | | — | (e) | | | — | (e) | | | — | (e) | | | — | (e) | | | — | (e) | | | — | (e) |
Year Ended February 29, 2016 | | | 1.00 | | | | — | (e) | | | — | (e) | | | — | (e) | | | — | (e) | | | — | (e) | | | — | (e) |
| | | | | | | |
Premier | | | | | | | | | | | | | | | | | | | | | | | | | | | | |
Six Months Ended August 31, 2020 (Unaudited) | | | 1.00 | | | | — | (e) | | | — | (e) | | | — | (e) | | | — | (e) | | | — | | | | — | (e) |
Year Ended February 29, 2020 | | | 1.00 | | | | 0.01 | | | | — | (e) | | | 0.01 | | | | (0.01 | ) | | | — | (e) | | | (0.01 | ) |
Year Ended February 28, 2019 | | | 1.00 | | | | 0.01 | | | | — | (e) | | | 0.01 | | | | (0.01 | ) | | | — | (e) | | | (0.01 | ) |
Year Ended February 28, 2018 | | | 1.00 | | | | 0.01 | | | | — | (e) | | | 0.01 | | | | (0.01 | ) | | | — | (e) | | | (0.01 | ) |
Year Ended February 28, 2017 | | | 1.00 | | | | — | (e) | | | — | (e) | | | — | (e) | | | — | (e) | | | — | (e) | | | — | (e) |
Year Ended February 29, 2016 | | | 1.00 | | | | — | (e) | | | — | (e) | | | — | (e) | | | — | (e) | | | — | (e) | | | — | (e) |
| | | | | | | |
Service | | | | | | | | | | | | | | | | | | | | | | | | | | | | |
Six Months Ended August 31, 2020 (Unaudited) | | | 1.00 | | | | — | (e) | | | — | (e) | | | — | (e) | | | — | (e) | | | — | | | | — | (e) |
Year Ended February 29, 2020 | | | 1.00 | | | | — | (e) | | | — | (e) | | | — | (e) | | | — | (e) | | | — | (e) | | | — | (e) |
Year Ended February 28, 2019 | | | 1.00 | | | | — | (e) | | | — | (e) | | | — | (e) | | | — | (e) | | | — | (e) | | | — | (e) |
Year Ended February 28, 2018 | | | 1.00 | | | | — | (e) | | | — | (e) | | | — | (e) | | | — | (e) | | | — | (e) | | | — | (e) |
Year Ended February 28, 2017 | | | 1.00 | | | | — | (e) | | | — | (e) | | | — | (e) | | | — | (e) | | | — | (e) | | | — | (e) |
Year Ended February 29, 2016 | | | 1.00 | | | | — | (e) | | | — | (e) | | | — | (e) | | | — | (e) | | | — | (e) | | | — | (e) |
| (a) | Annualized for periods less than one year, unless otherwise noted. |
| (b) | Calculated based upon average shares outstanding. |
| (c) | Not annualized for periods less than one year. |
| (d) | Includes earnings credits and interest expense, if applicable, each of which is less than 0.005% unless otherwise noted. |
| (e) | Amount rounds to less than $0.005. |
| (f) | E*Trade Shares had no assets from the close of business on September 21, 2016. |
SEE NOTES TO FINANCIAL STATEMENTS.
| | | | | | |
| | | |
| 152 | | | | J.P. MORGAN MONEY MARKET FUNDS | | AUGUST 31, 2020 |
| | | | | | | | | | | | | | | | | | | | | | |
| | | Ratios/Supplemental data | |
| | | | | | | | | | Ratios to average net assets (a) | |
Net asset
value,
end of
period | | | Total return (c) | | | Net assets,
end of
period
(000’s) | | | Net
expenses (d) | | | Net
investment
income
(loss) | | | Expenses
without waivers,
reimbursements and
earnings credits | |
| | | | | | | | | | | | | | | | | | | | | | |
| | | | | | | | | | | | | | | | | | | | | | |
| $ | 1.00 | | | | 0.30 | % | | $ | 93,816 | | | | 0.26 | % | | | 0.65 | % | | | 0.33 | % |
| | 1.00 | | | | 1.20 | | | | 112,747 | | | | 0.26 | | | | 1.20 | | | | 0.34 | |
| | 1.00 | | | | 1.26 | | | | 127,136 | | | | 0.26 | | | | 1.25 | | | | 0.33 | |
| | 1.00 | | | | 0.73 | | | | 140,809 | | | | 0.26 | | | | 0.76 | | | | 0.35 | |
| | 1.00 | | | | 0.33 | | | | 35,608 | | | | 0.23 | | | | 0.20 | | | | 0.33 | |
| | 1.00 | | | | 0.01 | | | | 193,260 | | | | 0.08 | | | | 0.01 | | | | 0.32 | |
| | | | | |
| | | | | | | | | | | | | | | | | | | | | | |
| | 1.00 | | | | 0.01 | | | | — | | | | 0.41 | | | | 0.01 | | | | 1.07 | |
| | 1.00 | | | | 0.01 | | | | 1,935,318 | | | | 0.08 | | | | 0.01 | | | | 1.07 | |
| | | | | |
| | | | | | | | | | | | | | | | | | | | | | |
| | 1.00 | | | | 0.32 | | | | 919,050 | | | | 0.21 | | | | 0.67 | | | | 0.28 | |
| | 1.00 | | | | 1.25 | | | | 1,688,150 | | | | 0.21 | | | | 1.24 | | | | 0.29 | |
| | 1.00 | | | | 1.31 | | | | 2,003,502 | | | | 0.21 | | | | 1.30 | | | | 0.28 | |
| | 1.00 | | | | 0.78 | | | | 1,575,116 | | | | 0.21 | | | | 0.83 | | | | 0.31 | |
| | 1.00 | | | | 0.37 | | | | 303,233 | | | | 0.21 | | | | 0.39 | | | | 0.30 | |
| | 1.00 | | | | 0.01 | | | | 132,605 | | | | 0.08 | | | | 0.01 | | | | 0.27 | |
| | | | | |
| | | | | | | | | | | | | | | | | | | | | | |
| | 1.00 | | | | 0.20 | | | | 56,077 | | | | 0.44 | | | | 0.28 | | | | 0.63 | |
| | 1.00 | | | | 0.87 | | | | 35,473 | | | | 0.59 | | | | 0.84 | | | | 0.66 | |
| | 1.00 | | | | 0.93 | | | | 15,899 | | | | 0.59 | | | | 0.92 | | | | 0.65 | |
| | 1.00 | | | | 0.40 | | | | 13,794 | | | | 0.59 | | | | 0.28 | | | | 0.63 | |
| | 1.00 | | | | 0.08 | | | | 312,787 | | | | 0.49 | | | | 0.07 | | | | 0.64 | |
| | 1.00 | | | | 0.01 | | | | 387,521 | | | | 0.08 | | | | 0.01 | | | | 0.62 | |
| | | | | |
| | | | | | | | | | | | | | | | | | | | | | |
| | 1.00 | | | | 0.22 | | | | 108,341 | | | | 0.41 | | | | 0.44 | | | | 0.49 | |
| | 1.00 | | | | 1.01 | | | | 135,261 | | | | 0.45 | | | | 1.00 | | | | 0.50 | |
| | 1.00 | | | | 1.07 | | | | 129,260 | | | | 0.45 | | | | 1.06 | | | | 0.48 | |
| | 1.00 | | | | 0.54 | | | | 116,319 | | | | 0.45 | | | | 0.57 | | | | 0.51 | |
| | 1.00 | | | | 0.16 | | | | 31,528 | | | | 0.41 | | | | 0.12 | | | | 0.49 | |
| | 1.00 | | | | 0.01 | | | | 28,451 | | | | 0.08 | | | | 0.01 | | | | 0.47 | |
| | | | | |
| | | | | | | | | | | | | | | | | | | | | | |
| | 1.00 | | | | 0.15 | | | | 40,958 | | | | 0.58 | | | | 0.35 | | | | 1.07 | |
| | 1.00 | | | | 0.41 | | | | 68,493 | | | | 1.05 | | | | 0.48 | | | | 1.09 | |
| | 1.00 | | | | 0.47 | | | | 256,953 | | | | 1.05 | | | | 0.46 | | | | 1.08 | |
| | 1.00 | | | | 0.07 | | | | 282,024 | | | | 0.91 | | | | 0.05 | | | | 1.09 | |
| | 1.00 | | | | 0.03 | | | | 363,754 | | | | 0.54 | | | | 0.01 | | | | 1.09 | |
| | 1.00 | | | | 0.01 | | | | 515,523 | | | | 0.08 | | | | 0.01 | | | | 1.07 | |
SEE NOTES TO FINANCIAL STATEMENTS.
| | | | | | | | |
| | | |
| AUGUST 31, 2020 | | J.P. MORGAN MONEY MARKET FUNDS | | | | | 153 | |
FINANCIAL HIGHLIGHTS
FOR THE PERIODS INDICATED (continued)
| | | | | | | | | | | | | | | | | | | | | | | | | | | | |
| | | Per share operating performance | |
| | | | | | Investment operations | | | Distributions | |
| | | Net asset
value,
beginning
of period | | | Net
investment
income
(loss) (b) | | | Net realized
and unrealized
gains
(losses) on
investments | | | Total from
investment
operations | | | Net
investment
income | | | Net
realized
gain | | | Total
distributions | |
JPMorgan California Municipal Money Market Fund | | | | | |
Agency | | | | | |
Six Months Ended August 31, 2020 (Unaudited) | | $ | 1.00 | | | $ | — | (e) | | $ | — | (e) | | $ | — | (e) | | $ | — | (e) | | $ | — | | | $ | — | (e) |
March 1, 2019 (f) through February 29, 2020 | | | 1.00 | | | | 0.01 | | | | — | (e) | | | 0.01 | | | | (0.01 | ) | | | — | (e) | | | (0.01 | ) |
| | | | | | | |
E*Trade (g) | | | | | | | | | | | | | | | | | | | | | | | | | | | | |
For the Period Ended September 21, 2016 | | | 1.00 | | | | — | (e) | | | — | | | | — | (e) | | | — | (e) | | | — | | | | — | (e) |
Year Ended February 29, 2016 | | | 1.00 | | | | — | (e) | | | — | (e) | | | — | (e) | | | — | (e) | | | — | (e) | | | — | (e) |
| | | | | | | |
Institutional Class | | | | | | | | | | | | | | | | | | | | | | | | | | | | |
Six Months Ended August 31, 2020 (Unaudited) | | | 1.00 | | | | — | (e) | | | — | (e) | | | — | (e) | | | — | (e) | | | — | | | | — | (e) |
March 1, 2019 (f) through February 29, 2020 | | | 1.00 | | | | 0.01 | | | | — | (e) | | | 0.01 | | | | (0.01 | ) | | | — | (e) | | | (0.01 | ) |
| | | | | | | |
Morgan | | | | | | | | | | | | | | | | | | | | | | | | | | | | |
Six Months Ended August 31, 2020 (Unaudited) | | | 1.00 | | | | — | (e) | | | — | (e) | | | — | (e) | | | — | (e) | | | — | | | | — | (e) |
Year Ended February 29, 2020 | | | 1.00 | | | | 0.01 | | | | — | (e) | | | 0.01 | | | | (0.01 | ) | | | — | (e) | | | (0.01 | ) |
Year Ended February 28, 2019 | | | 1.00 | | | | 0.01 | | | | — | (e) | | | 0.01 | | | | (0.01 | ) | | | — | (e) | | | (0.01 | ) |
Year Ended February 28, 2018 | | | 1.00 | | | | — | (e) | | | — | (e) | | | — | (e) | | | — | (e) | | | — | (e) | | | — | (e) |
Year Ended February 28, 2017 | | | 1.00 | | | | — | (e) | | | — | (e) | | | — | (e) | | | — | (e) | | | — | (e) | | | — | (e) |
Year Ended February 29, 2016 | | | 1.00 | | | | — | (e) | | | — | (e) | | | — | (e) | | | — | (e) | | | — | (e) | | | — | (e) |
| | | | | | | |
Premier | | | | | | | | | | | | | | | | | | | | | | | | | | | | |
Six Months Ended August 31, 2020 (Unaudited) | | | 1.00 | | | | — | (e) | | | — | (e) | | | — | (e) | | | — | (e) | | | — | | | | — | (e) |
Year Ended February 29, 2020 | | | 1.00 | | | | 0.01 | | | | — | (e) | | | 0.01 | | | | (0.01 | ) | | | — | (e) | | | (0.01 | ) |
Year Ended February 28, 2019 | | | 1.00 | | | | 0.01 | | | | — | (e) | | | 0.01 | | | | (0.01 | ) | | | — | (e) | | | (0.01 | ) |
Year Ended February 28, 2018 | | | 1.00 | | | | — | (e) | | | — | (e) | | | — | (e) | | | — | (e) | | | — | (e) | | | — | (e) |
March 9, 2016 (f) through February 28, 2017 | | | 1.00 | | | | — | (e) | | | — | (e) | | | — | (e) | | | — | (e) | | | — | (e) | | | — | (e) |
| | | | | | | |
Service | | | | | | | | | | | | | | | | | | | | | | | | | | | | |
Six Months Ended August 31, 2020 (Unaudited) | | | 1.00 | | | | — | (e) | | | — | (e) | | | — | (e) | | | — | (e) | | | — | | | | — | (e) |
Year Ended February 29, 2020 | | | 1.00 | | | | — | (e) | | | — | (e) | | | — | (e) | | | — | (e) | | | — | (e) | | | — | (e) |
Year Ended February 28, 2019 | | | 1.00 | | | | — | (e) | | | — | (e) | | | — | (e) | | | — | (e) | | | — | (e) | | | — | (e) |
Year Ended February 28, 2018 | | | 1.00 | | | | — | (e) | | | — | (e) | | | — | (e) | | | — | (e) | | | — | (e) | | | — | (e) |
Year Ended February 28, 2017 | | | 1.00 | | | | — | (e) | | | — | (e) | | | — | (e) | | | — | (e) | | | — | (e) | | | — | (e) |
Year Ended February 29, 2016 | | | 1.00 | | | | — | (e) | | | — | (e) | | | — | (e) | | | — | (e) | | | — | (e) | | | — | (e) |
| (a) | Annualized for periods less than one year, unless otherwise noted. |
| (b) | Calculated based upon average shares outstanding. |
| (c) | Not annualized for periods less than one year. |
| (d) | Includes earnings credits and interest expense, if applicable, each of which is less than 0.005% unless otherwise noted. |
| (e) | Amount rounds to less than $0.005. |
| (f) | Commencement of offering of class of shares. |
| (g) | E*Trade Shares had no assets from the close of business on September 21, 2016. |
SEE NOTES TO FINANCIAL STATEMENTS.
| | | | | | |
| | | |
| 154 | | | | J.P. MORGAN MONEY MARKET FUNDS | | AUGUST 31, 2020 |
| | | | | | | | | | | | | | | | | | | | | | |
| | | Ratios/Supplemental data | |
| | | | | | | | | | Ratios to average net assets (a) | |
Net asset
value,
end of
period | | | Total return (c) | | | Net assets,
end of
period
(000’s) | | | Net
expenses (d) | | | Net
investment
income
(loss) | | | Expenses
without waivers,
reimbursements and
earnings credits | |
| | | | | | | | | | | | | | | | | | | | | | |
| | | | | | | | | | | | | | | | | | | | | | |
| $ | 1.00 | | | | 0.22 | % | | $ | 36,108 | | | | 0.24 | % | | | 0.37 | % | | | 0.32 | % |
| | 1.00 | | | | 1.11 | | | | 24,892 | | | | 0.26 | | | | 0.87 | | | | 0.35 | |
| | | | | |
| | | | | | | | | | | | | | | | | | | | | | |
| | 1.00 | | | | 0.01 | | | | — | | | | 0.38 | | | | 0.01 | | | | 1.07 | |
| | 1.00 | | | | 0.02 | | | | 1,061,361 | | | | 0.06 | | | | 0.01 | | | | 1.07 | |
| | | | | |
| | | | | | | | | | | | | | | | | | | | | | |
| | 1.00 | | | | 0.24 | | | | 208,247 | | | | 0.21 | | | | 0.42 | | | | 0.27 | |
| | 1.00 | | | | 1.15 | | | | 287,724 | | | | 0.21 | | | | 1.03 | | | | 0.30 | |
| | | | | |
| | | | | | | | | | | | | | | | | | | | | | |
| | 1.00 | | | | 0.16 | | | | 10,873 | | | | 0.34 | | | | 0.18 | | | | 0.63 | |
| | 1.00 | | | | 0.77 | | | | 2,447 | | | | 0.59 | | | | 0.70 | | | | 0.69 | |
| | 1.00 | | | | 0.86 | | | | 1,591 | | | | 0.59 | | | | 0.85 | | | | 0.72 | |
| | 1.00 | | | | 0.38 | | | | 1,310 | | | | 0.59 | | | | 0.27 | | | | 0.75 | |
| | 1.00 | | | | 0.08 | | | | 7,314 | | | | 0.41 | | | | 0.04 | | | | 0.64 | |
| | 1.00 | | | | 0.02 | | | | 307,260 | | | | 0.06 | | | | 0.01 | | | | 0.62 | |
| | | | | |
| | | | | | | | | | | | | | | | | | | | | | |
| | 1.00 | | | | 0.18 | | | | 138,832 | | | | 0.33 | | | | 0.33 | | | | 0.47 | |
| | 1.00 | | | | 0.91 | | | | 233,249 | | | | 0.45 | | | | 0.87 | | | | 0.50 | |
| | 1.00 | | | | 1.00 | | | | 259,463 | | | | 0.45 | | | | 0.97 | | | | 0.52 | |
| | 1.00 | | | | 0.52 | | | | 166,312 | | | | 0.45 | | | | 0.49 | | | | 0.55 | |
| | 1.00 | | | | 0.15 | | | | 139,487 | | | | 0.45 | | | | 0.21 | | | | 0.57 | |
| | | | | |
| | | | | | | | | | | | | | | | | | | | | | |
| | 1.00 | | | | 0.11 | | | | 17,896 | | | | 0.50 | | | | 0.26 | | | | 1.07 | |
| | 1.00 | | | | 0.32 | | | | 28,405 | | | | 1.05 | | | | 0.37 | | | | 1.10 | |
| | 1.00 | | | | 0.41 | | | | 118,146 | | | | 1.04 | | | | 0.37 | | | | 1.12 | |
| | 1.00 | | | | 0.08 | | | | 125,615 | | | | 0.89 | | | | 0.04 | | | | 1.15 | |
| | 1.00 | | | | 0.04 | | | | 167,422 | | | | 0.50 | | | | 0.01 | | | | 1.11 | |
| | 1.00 | | | | 0.02 | | | | 229,647 | | | | 0.05 | | | | 0.01 | | | | 1.07 | |
SEE NOTES TO FINANCIAL STATEMENTS.
| | | | | | | | |
| | | |
| AUGUST 31, 2020 | | J.P. MORGAN MONEY MARKET FUNDS | | | | | 155 | |
FINANCIAL HIGHLIGHTS
FOR THE PERIODS INDICATED (continued)
| | | | | | | | | | | | | | | | | | | | | | | | | | | | |
| | | Per share operating performance | |
| | | | | | Investment operations | | | Distributions | |
| | | Net asset
value,
beginning
of period | | | Net
investment
income
(loss) (b) | | | Net realized
and unrealized
gains
(losses) on
investments | | | Total from
investment
operations | | | Net
investment
income | | | Net
realized
gain | | | Total
distributions | |
JPMorgan New York Municipal Money Market Fund | | | | | |
Agency | | | | | |
Six Months Ended August 31, 2020 (Unaudited) | | $ | 1.00 | | | $ | — | (e) | | $ | — | (e) | | $ | — | (e) | | $ | — | (e) | | $ | — | | | $ | — | (e) |
March 1, 2019 (f) through February 29, 2020 | | | 1.00 | | | | 0.01 | | | | — | (e) | | | 0.01 | | | | (0.01 | ) | | | — | (e) | | | (0.01 | ) |
| | | | | | | |
E*Trade (g) | | | | | | | | | | | | | | | | | | | | | | | | | | | | |
For the Period Ended September 21, 2016 | | | 1.00 | | | | — | (e) | | | — | | | | — | (e) | | | — | (e) | | | — | | | | — | (e) |
Year Ended February 29, 2016 | | | 1.00 | | | | — | (e) | | | — | (e) | | | — | (e) | | | — | (e) | | | — | (e) | | | — | (e) |
| | | | | | | |
Institutional Class | | | | | | | | | | | | | | | | | | | | | | | | | | | | |
Six Months Ended August 31, 2020 (Unaudited) | | | 1.00 | | | | — | (e) | | | — | (e) | | | — | (e) | | | — | (e) | | | — | | | | — | (e) |
March 1, 2019 (f) through February 29, 2020 | | | 1.00 | | | | 0.01 | | | | — | (e) | | | 0.01 | | | | (0.01 | ) | | | — | (e) | | | (0.01 | ) |
| | | | | | | |
Morgan | | | | | | | | | | | | | | | | | | | | | | | | | | | | |
Six Months Ended August 31, 2020 (Unaudited) | | | 1.00 | | | | — | (e) | | | — | (e) | | | — | (e) | | | — | (e) | | | — | | | | — | (e) |
Year Ended February 29, 2020 | | | 1.00 | | | | 0.01 | | | | — | (e) | | | 0.01 | | | | (0.01 | ) | | | — | (e) | | | (0.01 | ) |
Year Ended February 28, 2019 | | | 1.00 | | | | 0.01 | | | | — | (e) | | | 0.01 | | | | (0.01 | ) | | | — | (e) | | | (0.01 | ) |
Year Ended February 28, 2018 | | | 1.00 | | | | — | (e) | | | — | (e) | | | — | (e) | | | — | (e) | | | — | (e) | | | — | (e) |
Year Ended February 28, 2017 | | | 1.00 | | | | — | (e) | | | — | (e) | | | — | (e) | | | — | (e) | | | — | (e) | | | — | (e) |
Year Ended February 29, 2016 | | | 1.00 | | | | — | (e) | | | — | (e) | | | — | (e) | | | — | (e) | | | — | (e) | | | — | (e) |
| | | | | | | |
Premier | | | | | | | | | | | | | | | | | | | | | | | | | | | | |
Six Months Ended August 31, 2020 (Unaudited) | | | 1.00 | | | | — | (e) | | | — | (e) | | | — | (e) | | | — | (e) | | | — | | | | — | (e) |
Year Ended February 29, 2020 | | | 1.00 | | | | 0.01 | | | | — | (e) | | | 0.01 | | | | (0.01 | ) | | | — | (e) | | | (0.01 | ) |
Year Ended February 28, 2019 | | | 1.00 | | | | 0.01 | | | | — | (e) | | | 0.01 | | | | (0.01 | ) | | | — | (e) | | | (0.01 | ) |
Year Ended February 28, 2018 | | | 1.00 | | | | — | (e) | | | — | (e) | | | — | (e) | | | — | (e) | | | — | (e) | | | — | (e) |
March 9, 2016 (f) through February 28, 2017 | | | 1.00 | | | | — | (e) | | | — | (e) | | | — | (e) | | | — | (e) | | | — | (e) | | | — | (e) |
| | | | | | | |
Reserve | | | | | | | | | | | | | | | | | | | | | | | | | | | | |
Six Months Ended August 31, 2020 (Unaudited) | | | 1.00 | | | | — | (e) | | | — | (e) | | | — | (e) | | | — | (e) | | | — | | | | — | (e) |
Year Ended February 29, 2020 | | | 1.00 | | | | 0.01 | | | | — | (e) | | | 0.01 | | | | (0.01 | ) | | | — | (e) | | | (0.01 | ) |
Year Ended February 28, 2019 | | | 1.00 | | | | 0.01 | | | | — | (e) | | | 0.01 | | | | (0.01 | ) | | | — | (e) | | | (0.01 | ) |
Year Ended February 28, 2018 | | | 1.00 | | | | — | (e) | | | — | (e) | | | — | (e) | | | — | (e) | | | — | (e) | | | — | (e) |
Year Ended February 28, 2017 | | | 1.00 | | | | — | (e) | | | — | (e) | | | — | (e) | | | — | (e) | | | — | (e) | | | — | (e) |
Year Ended February 29, 2016 | | | 1.00 | | | | — | (e) | | | — | (e) | | | — | (e) | | | — | (e) | | | — | (e) | | | — | (e) |
| | | | | | | |
Service | | | | | | | | | | | | | | | | | | | | | | | | | | | | |
Six Months Ended August 31, 2020 (Unaudited) | | | 1.00 | | | | — | (e) | | | — | (e) | | | — | (e) | | | — | (e) | | | — | | | | ��� | (e) |
Year Ended February 29, 2020 | | | 1.00 | | | | — | (e) | | | — | (e) | | | — | (e) | | | — | (e) | | | — | (e) | | | — | (e) |
Year Ended February 28, 2019 | | | 1.00 | | | | — | (e) | | | — | (e) | | | — | (e) | | | — | (e) | | | — | (e) | | | — | (e) |
Year Ended February 28, 2018 | | | 1.00 | | | | — | (e) | | | — | (e) | | | — | (e) | | | — | (e) | | | — | (e) | | | — | (e) |
Year Ended February 28, 2017 | | | 1.00 | | | | — | (e) | | | — | (e) | | | — | (e) | | | — | (e) | | | — | (e) | | | — | (e) |
Year Ended February 29, 2016 | | | 1.00 | | | | — | (e) | | | — | (e) | | | — | (e) | | | — | (e) | | | — | (e) | | | — | (e) |
| (a) | Annualized for periods less than one year, unless otherwise noted. |
| (b) | Calculated based upon average shares outstanding. |
| (c) | Not annualized for periods less than one year. |
| (d) | Includes earnings credits and interest expense, if applicable, each of which is less than 0.005% unless otherwise noted. |
| (e) | Amount rounds to less than $0.005. |
| (f) | Commencement of offering of class of shares. |
| (g) | E*Trade Shares had no assets from the close of business on September 21, 2016. |
SEE NOTES TO FINANCIAL STATEMENTS.
| | | | | | |
| | | |
| 156 | | | | J.P. MORGAN MONEY MARKET FUNDS | | AUGUST 31, 2020 |
| | | | | | | | | | | | | | | | | | | | | | |
| | | Ratios/Supplemental data | |
| | | | | | | | | | Ratios to average net assets (a) | |
Net asset
value,
end of
period | | | Total return (c) | | | Net assets,
end of
period
(000’s) | | | Net
expenses (d) | | | Net
investment
income
(loss) | | | Expenses
without waivers,
reimbursements and
earnings credits | |
| | | | | | | | | | | | | | | | | | | | | | |
| | | | | | | | | | | | | | | | | | | | | | |
| $ | 1.00 | | | | 0.27 | % | | $ | 122,454 | | | | 0.26 | % | | | 0.65 | % | | | 0.30 | % |
| | 1.00 | | | | 1.15 | | | | 262,677 | | | | 0.26 | | | | 1.06 | | | | 0.31 | |
| | | | | |
| | | | | | | | | | | | | | | | | | | | | | |
| | 1.00 | | | | 0.01 | | | | — | | | | 0.40 | | | | 0.01 | | | | 1.08 | |
| | 1.00 | | | | 0.01 | | | | 395,863 | | | | 0.08 | | | | 0.01 | | | | 1.08 | |
| | | | | |
| | | | | | | | | | | | | | | | | | | | | | |
| | 1.00 | | | | 0.29 | | | | 802,647 | | | | 0.21 | | | | 0.63 | | | | 0.25 | |
| | 1.00 | | | | 1.20 | | | | 1,625,406 | | | | 0.21 | | | | 1.09 | | | | 0.26 | |
| | | | | |
| | | | | | | | | | | | | | | | | | | | | | |
| | 1.00 | | | | 0.20 | | | | 65,422 | | | | 0.40 | | | | 0.38 | | | | 0.63 | |
| | 1.00 | | | | 0.82 | | | | 62,178 | | | | 0.59 | | | | 0.84 | | | | 0.63 | |
| | 1.00 | | | | 0.89 | | | | 132,127 | | | | 0.59 | | | | 0.88 | | | | 0.66 | |
| | 1.00 | | | | 0.36 | | | | 134,395 | | | | 0.59 | | | | 0.31 | | | | 0.67 | |
| | 1.00 | | | | 0.06 | | | | 303,713 | | | | 0.47 | | | | 0.06 | | | | 0.66 | |
| | 1.00 | | | | 0.01 | | | | 491,120 | | | | 0.08 | | | | 0.01 | | | | 0.63 | |
| | | | | |
| | | | | | | | | | | | | | | | | | | | | | |
| | 1.00 | | | | 0.22 | | | | 224,299 | | | | 0.38 | | | | 0.53 | | | | 0.45 | |
| | 1.00 | | | | 0.96 | | | | 742,781 | | | | 0.45 | | | | 0.95 | | | | 0.47 | |
| | 1.00 | | | | 1.03 | | | | 769,285 | | | | 0.45 | | | | 1.03 | | | | 0.49 | |
| | 1.00 | | | | 0.50 | | | | 485,365 | | | | 0.45 | | | | 0.58 | | | | 0.51 | |
| | 1.00 | | | | 0.13 | | | | 102,091 | | | | 0.46 | | | | 0.22 | | | | 0.53 | |
| | | | | |
| | | | | | | | | | | | | | | | | | | | | | |
| | 1.00 | | | | 0.19 | | | | 831 | | | | 0.42 | | | | 0.33 | | | | 0.70 | |
| | 1.00 | | | | 0.70 | | | | 1,122 | | | | 0.70 | | | | 0.71 | | | | 0.72 | |
| | 1.00 | | | | 0.78 | | | | 1,569 | | | | 0.70 | | | | 0.75 | | | | 0.74 | |
| | 1.00 | | | | 0.25 | | | | 2,285 | | | | 0.70 | | | | 0.24 | | | | 0.78 | |
| | 1.00 | | | | 0.02 | | | | 2,607 | | | | 0.39 | | | | 0.01 | | | | 0.73 | |
| | 1.00 | | | | 0.01 | | | | 137,761 | | | | 0.08 | | | | 0.01 | | | | 0.73 | |
| | | | | |
| | | | | | | | | | | | | | | | | | | | | | |
| | 1.00 | | | | 0.15 | | | | 4,821 | | | | 0.54 | | | | 0.35 | | | | 1.14 | |
| | 1.00 | | | | 0.36 | | | | 8,363 | | | | 1.05 | | | | 0.45 | | | | 1.08 | |
| | 1.00 | | | | 0.43 | | | | 36,537 | | | | 1.04 | | | | 0.43 | | | | 1.09 | |
| | 1.00 | | | | 0.06 | | | | 49,027 | | | | 0.90 | | | | 0.05 | | | | 1.11 | |
| | 1.00 | | | | 0.02 | | | | 57,064 | | | | 0.53 | | | | 0.01 | | | | 1.10 | |
| | 1.00 | | | | 0.01 | | | | 78,992 | | | | 0.08 | | | | 0.01 | | | | 1.08 | |
SEE NOTES TO FINANCIAL STATEMENTS.
| | | | | | | | |
| | | |
| AUGUST 31, 2020 | | J.P. MORGAN MONEY MARKET FUNDS | | | | | 157 | |
NOTES TO FINANCIAL STATEMENTS
AS OF AUGUST 31, 2020 (Unaudited)
1. Organization
JPMorgan Trust I (“JPM I”), JPMorgan Trust II (“JPM II”) and JPMorgan Trust IV (“JPM IV”) (collectively, the “Trusts”) were formed on November 12, 2004, November 12, 2004 and November 11, 2015, respectively, as Delaware statutory trusts, pursuant to Declarations of Trust dated November 5, 2004, November 5, 2004 and November 11, 2015, respectively, and are registered under the Investment Company Act of 1940, as amended (the “1940 Act”), as open-end management investment companies.
The following are 12 separate funds of the Trusts (each, a “Fund” and collectively, the “Funds”) covered by this report:
| | | | | | |
| | | Classes Offered | | Trust | | Diversification Classification |
| JPMorgan Prime Money Market Fund | | Class C, Academy(1), Agency, Capital, IM, Institutional Class, Morgan, Premier and Reserve | | JPM I | | Diversified |
| JPMorgan Institutional Tax Free Money Market Fund | | Agency, Capital, IM and Institutional Class | | JPM IV | | Diversified |
| JPMorgan Securities Lending Money Market Fund | | Agency SL | | JPM IV | | Diversified |
| JPMorgan Liquid Assets Money Market Fund | | Class C, Agency, Capital, E*Trade(2), Institutional Class, Investor, Morgan, Premier and Reserve | | JPM II | | Diversified |
| JPMorgan U.S. Government Money Market Fund | | Academy(1), Agency, Capital, E*Trade, IM, Institutional Class, Investor, Morgan, Premier, Reserve and Service | | JPM II | | Diversified |
| JPMorgan U.S. Treasury Plus Money Market Fund | | Class C, Academy(3), Agency, Capital, IM, Institutional Class, Investor, Morgan, Premier and Reserve | | JPM II | | Diversified |
| JPMorgan Federal Money Market Fund | | Agency, Institutional Class, Morgan and Premier | | JPM I | | Diversified |
| JPMorgan 100% U.S. Treasury Securities Money Market Fund | | Academy(3), Agency, Capital, IM(4), Institutional Class, Morgan, Premier and Reserve | | JPM I | | Diversified |
| JPMorgan Tax Free Money Market Fund | | Agency, Institutional Class, Morgan, Premier and Reserve | | JPM I | | Diversified |
| JPMorgan Municipal Money Market Fund | | Agency, E*Trade(5), Institutional Class, Morgan, Premier and Service | | JPM II | | Diversified |
| JPMorgan California Municipal Money Market Fund | | Agency(6), E*Trade(5), Institutional Class(6), Morgan, Premier and Service | | JPM I | | Diversified |
| JPMorgan New York Municipal Money Market Fund | | Agency(6), E*Trade(5), Institutional Class(6), Morgan, Premier, Reserve and Service | | JPM I | | Diversified |
| (1) | Commenced operations on May 15, 2019. |
| (2) | E*Trade Shares of JPMorgan Liquid Assets Money Market Fund had no assets from the close of business on October 19, 2016. |
| (3) | Commenced operations on September 30, 2020. |
| (4) | Commenced operations on January 15, 2020. |
| (5) | E*Trade Shares of JPMorgan Municipal Money Market Fund, JPMorgan California Municipal Money Market Fund and JPMorgan New York Municipal Money Market Fund had no assets from the close of business on September 21, 2016. |
| (6) | Commenced operations on March 1, 2019. |
The investment objective of JPMorgan Prime Money Market Fund (“Prime Money Market Fund”) and JPMorgan Securities Lending Money Market Fund (“Securities Lending Money Market Fund”) is to seek current income while seeking to maintain liquidity and a low volatility of principal.
The investment objective of JPMorgan Institutional Tax Free Money Market Fund (“Institutional Tax Free Money Market Fund”) is to aim to provide current income, while seeking to maintain liquidity and a low volatility of principal.
The investment objective of JPMorgan Liquid Assets Money Market Fund (“Liquid Assets Money Market Fund”) and JPMorgan U.S. Treasury Plus Money Market Fund (“U.S. Treasury Plus Money Market Fund”) is to seek current income with liquidity and stability of principal.
The investment objective of JPMorgan U.S. Government Money Market Fund (“U.S. Government Money Market Fund”) is to seek high current income with liquidity and stability of principal.
The investment objective of JPMorgan Federal Money Market Fund (“Federal Money Market Fund”) is to aim to provide current income while still preserving capital and maintaining liquidity.
The investment objective of JPMorgan 100% U.S. Treasury Securities Money Market Fund (“100% U.S. Treasury Securities Money Market Fund”) is to aim to provide the highest possible level of current income while still maintaining liquidity and providing maximum safety of principal.
The investment objective of JPMorgan Tax Free Money Market Fund (“Tax Free Money Market Fund”) is to aim to provide the highest possible level of current income which is excluded from gross income, while still preserving capital and maintaining liquidity.
The investment objective of JPMorgan Municipal Money Market Fund (“Municipal Money Market Fund”) is to seek as high a level of current interest income exempt from federal income tax as is consistent with liquidity and stability of principal.
| | | | | | |
| | | |
| 158 | | | | J.P. MORGAN MONEY MARKET FUNDS | | AUGUST 31, 2020 |
The investment objective of JPMorgan California Municipal Money Market Fund (“California Municipal Money Market Fund”) is to aim to provide the highest possible level of current income which is exempt from federal and California personal income taxes, while still preserving capital and maintaining liquidity.
The investment objective of JPMorgan New York Municipal Money Market Fund (“New York Municipal Money Market Fund”) is to aim to provide the highest possible level of current income which is excluded from gross income and exempt from New York State and New York City personal income taxes, while still preserving capital and maintaining liquidity.
The Liquid Assets Money Market Fund, Tax Free Money Market Fund, Municipal Money Market Fund, California Municipal Money Market Fund and New York Municipal Money Market Fund seek to qualify as retail money market funds in accordance with criteria established by the Securities and Exchange Commission (“SEC”). Under applicable SEC rules, these Funds are ordinarily permitted to utilize amortized cost accounting to value their portfolio securities and transact at a stable $1.00 share price. These Funds have adopted policies and procedures that allow the Boards of Trustees of the Trusts (the “Boards”) to impose a liquidity fee and/or redemption gate in the event that their weekly liquid assets fall below a designated threshold.
The Prime Money Market Fund, Institutional Tax Free Money Market Fund and Securities Lending Money Market Fund do not seek to qualify as retail or government money market funds and transact utilizing a floating net asset value (“NAV”) calculated to four decimal places. The Funds have adopted policies and procedures that allow the Boards to impose a liquidity fee and/or redemption gate in the event that their weekly liquid assets fall below a designated threshold.
The U.S. Government Money Market Fund, U.S. Treasury Plus Money Market Fund, Federal Money Market Fund and 100% U.S. Treasury Securities Money Market Fund seek to qualify as government money market funds in accordance with criteria established by the SEC. Under applicable SEC rules, these Funds are ordinarily permitted to utilize amortized cost accounting to value their portfolio securities and transact at a stable $1.00 share price.
Class C Shares provide for a contingent deferred sales charge (“CDSC”). No sales charges are assessed with respect to the Academy, Agency, Agency SL, Capital, Direct, Eagle Class, Eagle Private Wealth Class, E*Trade, IM, Institutional Class, Investor, Morgan, Premier, Reserve and Service Shares. All classes of shares have equal rights as to earnings, assets and voting privileges, except that each class may bear different transfer agency, distribution and service fees and each class has exclusive voting rights with respect to its distribution plan and shareholder servicing agreements.
J.P. Morgan Investment Management Inc. (“JPMIM”), an indirect, wholly-owned subsidiary of JPMorgan Chase & Co. (“JPMorgan”), acts as Adviser (the “Adviser”) and Administrator (the “Administrator”) to the Funds.
2. Significant Accounting Policies
The following is a summary of significant accounting policies followed by the Funds in the preparation of their financial statements. The Funds are investment companies and, accordingly, follow the investment company accounting and reporting guidance of the Financial Accounting Standards Board (“FASB”) Accounting Standards Codification Topic 946 — Investment Companies, which is part of U.S. generally accepted accounting principles (“GAAP”). The preparation of financial statements in conformity with GAAP requires management to make estimates and assumptions that affect (i) the reported amounts of assets and liabilities, (ii) disclosure of contingent assets and liabilities at the date of the financial statements, and (iii) the reported amounts of increases and decreases in net assets from operations during the reporting period. Actual results could differ from those estimates.
A. Valuation of Investments — Investments are valued in accordance with GAAP and the Funds’ valuation policies set forth by, and under the supervision and responsibility of, the Boards, which established the following approach to valuation, as described more fully below: securities and other debt instruments held by money market funds pursuant to Rule 2a-7 under the 1940 Act shall be valued using the amortized cost method provided that certain conditions are met, with the exception of the Prime Money Market Fund, Institutional Tax Free Money Market Fund and Securities Lending Money Market Fund.
The amortized cost method of valuation involves valuing a security at its cost initially and thereafter assuming a constant amortization to maturity of any discount or premium, regardless of the impact of fluctuating interest rates on the market value of the security. This method may result in periods during which value, as determined by amortized cost, is higher or lower than the price each Fund would receive if it sold the security. The market value of securities in the Funds can generally be expected to vary inversely with changes in prevailing interest rates.
The Administrator has established the J.P. Morgan Asset Management Americas Valuation Committee (“AVC”) to assist the Boards with the oversight and monitoring of the valuation of the Funds’ investments. The Administrator implements the valuation policies of the Funds’ investments, as directed by the Boards. The AVC oversees and carries out the policies for the valuation of investments held in the Funds. This includes monitoring the appropriateness of fair values based on results of ongoing valuation oversight including, but not limited to, consideration of macro or security specific events, market events, and pricing vendor and broker due diligence. This includes also monitoring on a daily basis that the amortized cost valuation method fairly reflects the market-based net asset value (“NAV”) of the Funds. The Administrator is responsible for discussing and assessing the potential impacts to the fair values on an ongoing basis, and, at least on a quarterly basis, with the AVC and the Boards.
For the Prime Money Market Fund, Institutional Tax Free Money Market Fund and Securities Lending Money Market Fund, fixed income instruments for which market quotations are not readily available are fair valued based on prices received from approved affiliated and unaffiliated pricing
| | | | | | | | |
| | | |
| AUGUST 31, 2020 | | J.P. MORGAN MONEY MARKET FUNDS | | | | | 159 | |
NOTES TO FINANCIAL STATEMENTS
AS OF AUGUST 31, 2020 (Unaudited) (continued)
vendors or third party broker-dealers (collectively referred to as “Pricing Services”). The Pricing Services use multiple valuation techniques to determine the valuation of fixed income instruments. In instances where sufficient market activity exists, the Pricing Services may utilize a market based approach through which trades or quotes from market makers are used to determine the valuation of these instruments. In instances where sufficient market activity may not exist, the Pricing Services also utilize proprietary valuation models which may consider market transactions in comparable securities and the various relationships between securities in determining fair value and/or market characteristics in order to estimate the relevant cash flows, which are then discounted to calculate the fair values.
Valuations reflected in this report are as of the report date. As a result, changes in valuation due to market events and/or issuer-related events after the report date and prior to issuance of the report are not reflected herein.
The various inputs that are used in determining the valuation of the Funds’ investments are summarized into the three broad levels listed below.
| • | | Level 1 — Quoted prices in active markets for identical securities. |
| • | | Level 2 — Other significant observable inputs (including, but not limited to, quoted prices for similar securities, interest rates, prepayment speeds, credit risk, etc.). |
| • | | Level 3 — Significant unobservable inputs (including the Funds’ own assumptions in determining the fair value of investments). |
A financial instrument’s level within the fair value hierarchy is based on the lowest level of any input, both individually and in the aggregate, that is significant to the fair value measurement. The inputs or methodology used for valuing securities are not necessarily an indication of the risk associated with investing in those securities. For example, certain money market securities are valued using amortized cost, in accordance with rules under the 1940 Act. Generally, amortized cost approximates the current fair value of a security, but since the value is not obtained from a quoted price in an active market, such securities are reflected as level 2.
The following tables represent each valuation input as presented on the Schedules of Portfolio Investments (“SOIs”) (amounts in thousands):
Prime Money Market Fund
| | | | | | | | | | | | | | | | |
| | | Level 1
Quoted prices | | | Level 2
Other significant
observable inputs | | | Level 3
Significant
unobservable inputs | | | Total | |
Total Investments in Securities (a) | | $ | — | | | $ | 87,157,499 | | | $ | — | | | $ | 87,157,499 | |
| | | | | | | | | | | | | | | | |
| |
| Institutional Tax Free Money Market Fund | | | | | |
| | | Level 1
Quoted prices | | | Level 2
Other significant
observable inputs | | | Level 3
Significant
unobservable inputs | | | Total | |
Total Investments in Securities (a) | | $ | — | | | $ | 1,876,261 | | | $ | — | | | $ | 1,876,261 | |
| | | | | | | | | | | | | | | | |
| |
| Securities Lending Money Market Fund | | | | | |
| | | Level 1
Quoted prices | | | Level 2
Other significant
observable inputs | | | Level 3
Significant
unobservable inputs | | | Total | |
Total Investments in Securities (a) | | $ | — | | | $ | 3,650,192 | | | $ | — | | | $ | 3,650,192 | |
| | | | | | | | | | | | | | | | |
The following is a summary of the inputs used as of February 29, 2020, in valuing the Funds’ assets and liabilities carried at amortized cost which approximates fair value (amounts in thousands):
| | | | | | | | | | | | | | | | |
| Liquid Assets Money Market Fund | | | | | |
| | | Level 1
Quoted prices | | | Level 2
Other significant
observable inputs | | | Level 3
Significant
unobservable inputs | | | Total | |
Total Investments in Securities (a) | | $ | — | | | $ | 12,517,130 | | | $ | — | | | $ | 12,517,130 | |
| | | | | | | | | | | | | | | | |
| |
| U.S. Government Money Market Fund | | | | | |
| | | Level 1
Quoted prices | | | Level 2
Other significant
observable inputs | | | Level 3
Significant
unobservable inputs | | | Total | |
Total Investments in Securities (a) | | $ | — | | | $ | 180,231,033 | | | $ | — | | | $ | 180,231,033 | |
| | | | | | | | | | | | | | | | |
| | | | | | |
| | | |
| 160 | | | | J.P. MORGAN MONEY MARKET FUNDS | | AUGUST 31, 2020 |
| | | | | | | | | | | | | | | | |
| U.S. Treasury Plus Money Market Fund | | | | | | | | | | | | | | | | |
| | | Level 1
Quoted prices | | | Level 2
Other significant
observable inputs | | | Level 3
Significant
unobservable inputs | | | Total | |
Total Investments in Securities (a) | | $ | — | | | $ | 38,011,480 | | | $ | — | | | $ | 38,011,480 | |
| | | | | | | | | | | | | | | | |
| | | | |
| Federal Money Market Fund | | | | | | | | | | | | | | | | |
| | | Level 1
Quoted prices | | | Level 2
Other significant
observable inputs | | | Level 3
Significant
unobservable inputs | | | Total | |
Total Investments in Securities (a) | | $ | — | | | $ | 3,167,904 | | | $ | — | | | $ | 3,167,904 | |
| | | | | | | | | | | | | | | | |
| | | |
| 100% U.S. Treasury Securities Money Market Fund | | | | | | | | | | | | | |
| | | Level 1
Quoted prices | | | Level 2
Other significant
observable inputs | | | Level 3
Significant
unobservable inputs | | | Total | |
Total Investments in Securities (a) | | $ | — | | | $ | 109,710,593 | | | $ | — | | | $ | 109,710,593 | |
| | | | | | | | | | | | | | | | |
| | | | |
| Tax Free Money Market Fund | | | | | | | | | | | | | | | | |
| | | Level 1
Quoted prices | | | Level 2
Other significant
observable inputs | | | Level 3
Significant
unobservable inputs | | | Total | |
Total Investments in Securities (a) | | $ | — | | | $ | 10,829,930 | | | $ | — | | | $ | 10,829,930 | |
| | | | | | | | | | | | | | | | |
| | | | |
| Municipal Money Market Fund | | | | | | | | | | | | | | | | |
| | | Level 1
Quoted prices | | | Level 2
Other significant
observable inputs | | | Level 3
Significant
unobservable inputs | | | Total | |
Total Investments in Securities (a) | | $ | — | | | $ | 1,224,808 | | | $ | — | | | $ | 1,224,808 | |
| | | | | | | | | | | | | | | | |
| | | | |
| California Municipal Money Market Fund | | | | | | | | | | | | | | | | |
| | | Level 1
Quoted prices | | | Level 2
Other significant
observable inputs | | | Level 3
Significant
unobservable inputs | | | Total | |
Total Investments in Securities (a) | | $ | — | | | $ | 410,988 | | | $ | — | | | $ | 410,988 | |
| | | | | | | | | | | | | | | | |
| | | | |
| New York Municipal Money Market Fund | | | | | | | | | | | | | | | | |
| | | Level 1
Quoted prices | | | Level 2
Other significant
observable inputs | | | Level 3
Significant
unobservable inputs | | | Total | |
Total Investments in Securities (a) | | $ | — | | | $ | 1,228,391 | | | $ | — | | | $ | 1,228,391 | |
| | | | | | | | | | | | | | | | |
| (a) | Please refer to the SOIs for specifics of portfolio holdings. |
B. Restricted Securities — Certain securities held by the Funds may be subject to legal or contractual restrictions on resale. Restricted securities generally are resold in transactions exempt from registration under the Securities Act of 1933, as amended (the “Securities Act”). Disposal of these securities may involve time-consuming negotiations and expense. Prompt sale at the current valuation may be difficult and could adversely affect the net asset values of the Funds.
As of August 31, 2020, the Funds had no investments in restricted securities other than securities sold to the Funds under Rule 144A and/or Regulation S under the Securities Act.
C. Repurchase Agreements — The Funds may enter into repurchase agreement transactions that meet the credit guidelines of JPMIM. Repurchase agreements involve the purchase of securities subject to the seller’s agreement to repurchase the securities at a mutually agreed upon date and price. The Funds require that the collateral received in a repurchase agreement transaction be transferred to a custodian in a manner sufficient to enable the Funds to obtain collateral in the event of a counterparty default. If the counterparty defaults and the fair value of the collateral declines, realization of the collateral by the Funds may be delayed or limited. Repurchase agreement collateral may be held in segregated accounts main-
| | | | | | | | |
| | | |
| AUGUST 31, 2020 | | J.P. MORGAN MONEY MARKET FUNDS | | | | | 161 | |
NOTES TO FINANCIAL STATEMENTS
AS OF AUGUST 31, 2020 (Unaudited) (continued)
tained by JPMorgan Chase Bank, N.A. (“JPMCB”), a wholly-owned subsidiary of JPMorgan. The Prime Money Market Fund, Liquid Assets Money Market Fund, Securities Lending Money Market Fund, U.S. Government Money Market Fund and U.S. Treasury Plus Money Market Fund or their affiliates may transfer uninvested cash into joint accounts, which are utilized by multiple accounts or funds managed by the Adviser or its affiliates, the daily aggregate balance of which is invested in one or more repurchase agreements. Under these joint accounts, the Funds maintain pro-rata credit exposure to the underlying repurchase agreements’ counterparties and collateral.
The Funds’ repurchase agreements are not subject to master netting arrangements.
D. When-Issued Securities, Delayed Delivery Securities and Forward Commitments — The Institutional Tax Free Money Market Fund, Tax Free Money Market Fund, Municipal Money Market Fund, California Municipal Money Market Fund and New York Municipal Money Market Fund purchased when-issued securities, including To Be Announced (“TBA”) securities, and entered into contracts to purchase or sell securities for a fixed price that may be settled a month or more after the trade date, or purchased delayed delivery securities which generally settle seven days after the trade date. When-issued securities are securities that have been authorized, but not issued in the market. A forward commitment involves entering into a contract to purchase or sell securities for a fixed price at a future date that may be settled a month or more after the trade date. A delayed delivery security is agreed upon in advance between the buyer and the seller of the security and is generally delivered beyond seven days of the agreed upon date. The purchase of securities on a when-issued, delayed delivery or forward commitment basis involves the risk that the value of the security to be purchased declines before the settlement date. The sale of securities on a forward commitment basis involves the risk that the value of the securities sold may increase before the settlement date. The Funds may be exposed to credit risk if the counterparty fails to perform under the terms of the transaction. Interest income for securities purchased on a when-issued, delayed delivery or forward commitment basis is not accrued until the settlement date.
The Institutional Tax Free Money Market Fund, Tax Free Money Market Fund, Municipal Money Market Fund, California Municipal Money Market Fund and New York Municipal Money Market Fund had delayed delivery securities outstanding as of August 31, 2020, which are shown as a Receivable for Investment securities sold — delayed delivery securities on the Statements of Assets and Liabilities.
E. Security Transactions and Investment Income — Investment transactions are accounted for on the trade date (the date the order to buy or sell is executed). Securities gains and losses are calculated on a specifically identified cost basis. Interest income is determined on the basis of coupon interest accrued using the effective interest method, which adjusts for amortization of premiums and accretion of discounts.
F. Allocation of Income and Expenses — Expenses directly attributable to a Fund are charged directly to that Fund, while the expenses attributable to more than one fund of the Trusts are allocated among the applicable funds. Investment income, realized and unrealized gains and losses and expenses, other than class-specific expenses, are allocated daily to each class of shares based upon the proportion of net assets of each class at the beginning of each day.
Transfer agency fees are class-specific expenses. The amount of the transfer agency fees charged to each share class of the Funds for the six months ended August 31, 2020 are as follows (amounts in thousands):
| | | | | | | | | | | | | | | | | | | | | | | | | | | | | | | | | | | | | | | | | | | | | | | | |
| | | Prime
Money
Market
Fund | | | Institutional
Tax Free
Money
Market
Fund | | | Securities
Lending
Money
Market
Fund | | | Liquid
Assets
Money
Market
Fund | | | U.S.
Government
Money
Market
Fund | | | U.S.
Treasury
Plus
Money
Market
Fund | | | Federal
Money
Market
Fund | | | 100%
U.S.
Treasury
Securities
Money
Market
Fund | | | Tax
Free
Money
Market
Fund | | | Municipal
Money
Market
Fund | | | California
Municipal
Money
Market
Fund | | | New York
Municipal
Money
Market
Fund | |
Class C | | $ | 13 | | | | n/a | | | | n/a | | | $ | 2 | | | | n/a | | | $ | 5 | | | | n/a | | | | n/a | | | | n/a | | | | n/a | | | | n/a | | | | n/a | |
Academy | | | 33 | | | | n/a | | | | n/a | | | | n/a | | | $ | 2 | | | | n/a | | | | n/a | | | | n/a | | | | n/a | | | | n/a | | | | n/a | | | | n/a | |
Agency | | | 48 | | | $ | 16 | | | | n/a | | | | 16 | | | | 130 | | | | 20 | | | $ | 3 | | | $ | 47 | | | $ | 7 | | | $ | 1 | | | $ | — | (a) | | $ | 3 | |
Agency SL | | | n/a | | | | n/a | | | $ | 54 | | | | n/a | | | | n/a | | | | n/a | | | | n/a | | | | n/a | | | | n/a | | | | n/a | | | | n/a | | | | n/a | |
Capital | | | 417 | | | | 16 | | | | n/a | | | | 30 | | | | 968 | | | | 88 | | | | n/a | | | | 440 | | | | n/a | | | | n/a | | | | n/a | | | | n/a | |
E*Trade | | | n/a | | | | n/a | | | | n/a | | | | n/a | | | | 4 | | | | n/a | | | | n/a | | | | n/a | | | | n/a | | | | n/a | | | | n/a | | | | n/a | |
IM | | | 71 | | | | 29 | | | | n/a | | | | n/a | | | | 86 | | | | 1 | | | | n/a | | | | — | (a) | | | n/a | | | | n/a | | | | n/a | | | | n/a | |
Institutional Class | | | 204 | | | | 20 | | | | n/a | | | | 40 | | | | 410 | | | | 165 | | | | 25 | | | | 266 | | | | 83 | | | | 17 | | | | 7 | | | | 13 | |
Investor | | | n/a | | | | n/a | | | | n/a | | | | 1 | | | | 7 | | | | 18 | | | | n/a | | | | n/a | | | | n/a | | | | n/a | | | | n/a | | | | n/a | |
Morgan | | | 140 | | | | n/a | | | | n/a | | | | 45 | | | | 48 | | | | 15 | | | | 13 | | | | 40 | | | | 6 | | | | 4 | | | | 1 | | | | 12 | |
Premier | | | 46 | | | | n/a | | | | n/a | | | | 34 | | | | 45 | | | | 17 | | | | 4 | | | | 25 | | | | 10 | | | | 12 | | | | 3 | | | | 7 | |
Reserve | | | 12 | | | | n/a | | | | n/a | | | | 3 | | | | 1 | | | | 1 | | | | n/a | | | | 22 | | | | 14 | | | | n/a | | | | n/a | | | | — | (a) |
Service | | | n/a | | | | n/a | | | | n/a | | | | n/a | | | | 6 | | | | n/a | | | | n/a | | | | n/a | | | | n/a | | | | 1 | | | | 1 | | | | 3 | |
| | | | | | | | | | | | | | | | | | | | | | | | | | | | | | | | | | | | | | | | | | | | | | | | |
Total | | $ | 984 | | | $ | 81 | | | $ | 54 | | | $ | 171 | | | $ | 1,707 | | | $ | 330 | | | $ | 45 | | | $ | 840 | | | $ | 120 | | | $ | 35 | | | $ | 12 | | | $ | 38 | |
| | | | | | | | | | | | | | | | | | | | | | | | | | | | | | | | | | | | | | | | | | | | | | | | |
| (a) | Amount rounds to less than one thousand. |
G. Federal Income Taxes — Each Fund is treated as a separate taxable entity for Federal income tax purposes. Each Fund’s policy is to comply with the provisions of the Internal Revenue Code (the “Code”) applicable to regulated investment companies and to distribute to shareholders all of its
| | | | | | |
| | | |
| 162 | | | | J.P. MORGAN MONEY MARKET FUNDS | | AUGUST 31, 2020 |
distributable net investment income and net realized capital gains on investments. Accordingly, no provision for Federal income tax is necessary. Management has reviewed the Funds’ tax positions for all open tax years and has determined that as of August 31, 2020, no liability for Federal income tax is required in the Funds’ financial statements for net unrecognized tax benefits. However, management’s conclusions may be subject to future review based on changes in, or the interpretation of, the accounting standards or tax laws and regulations. Each Fund’s Federal tax returns for the prior three fiscal years remain subject to examination by the Internal Revenue Service.
H. Distributions to Shareholders — Distributions from net investment income, if any, are generally declared daily and paid monthly and are declared separately for each class. No class has preferential dividend rights; differences in per share rates are due to differences in separate class expenses. Net realized capital gains, if any, are distributed by each Fund at least annually. The amount of distributions from net investment income and net realized capital gains is determined in accordance with Federal income tax regulations, which may differ from GAAP. To the extent these “book/tax” differences are permanent in nature (i.e., that they result from other than timing of recognition — “temporary differences”), such amounts are reclassified within the capital accounts based on their Federal tax basis treatment.
3. Fees and Other Transactions with Affiliates
A. Investment Advisory Fee — Pursuant to Investment Advisory Agreements, the Adviser manages the investments of each Fund and for such services is paid a fee. The investment advisory fee is accrued daily and generally paid monthly at an annual rate of 0.08% of each Fund’s average daily net assets.
The Adviser waived investment advisory fees and/or reimbursed expenses as outlined in Note 3.F.
B. Administration Fee — Pursuant to Administration Agreements, the Administrator provides certain administration services to each Fund. In consideration of these services, the Administrator receives a fee accrued daily and paid monthly at an annual rate of 0.07% of the first $150 billion of the average daily net assets of all money market funds in the J.P. Morgan Funds Complex covered by the Administration Agreement, plus 0.05% of the average daily net assets between $150 billion and $300 billion, plus 0.03% of the average daily net assets between $300 billion and $400 billion, plus 0.01% of the average daily net assets in excess of $400 billion. For the six months ended August 31, 2020, the effective annualized rate was 0.05% of each Fund’s average daily net assets, notwithstanding any fee waivers and/or expense reimbursements.
The Administrator waived administration fees as outlined in Note 3.F.
JPMCB serves as the Funds’ sub-administrator (the “Sub-administrator”). For its services as Sub-administrator, JPMCB receives a portion of the fees payable to the Administrator.
C. Distribution Fees — Pursuant to a Distribution Agreement, JPMorgan Distribution Services, Inc. (“JPMDS”), an indirect, wholly-owned subsidiary of JPMorgan, serves as each Fund’s principal underwriter and promotes and arranges for the sale of each Fund’s shares.
The Boards have adopted a Distribution Plan (the “Distribution Plan”) for Class C, E*Trade, Morgan, Reserve and Service Shares of the Funds, as applicable, pursuant to Rule 12b-1 under the 1940 Act. The Academy, Agency, Agency SL, Capital, IM, Institutional Class, Investor and Premier Shares of the Funds do not participate in the Distribution Plan. The Distribution Plan provides that each Fund shall pay, with respect to the applicable share classes, distribution fees, including payments to JPMDS, at annual rates of the average daily net assets as shown in the table below:
| | | | | | | | | | | | | | | | | | | | |
| | | Class C | | | E*Trade | | | Morgan | | | Reserve | | | Service | |
Prime Money Market Fund | | | 0.75 | % | | | n/a | | | | n/a | | | | 0.25 | % | | | n/a | |
Liquid Assets Money Market Fund | | | 0.75 | | | | 0.60 | % | | | 0.10 | % | | | 0.25 | | | | n/a | |
U.S. Government Money Market Fund | | | n/a | | | | 0.60 | | | | 0.10 | | | | 0.25 | | | | 0.60 | % |
U.S. Treasury Plus Money Market Fund | | | 0.75 | | | | n/a | | | | 0.10 | | | | 0.25 | | | | n/a | |
Federal Money Market Fund | | | n/a | | | | n/a | | | | 0.10 | | | | n/a | | | | n/a | |
100% U.S. Treasury Securities Money Market Fund | | | n/a | | | | n/a | | | | 0.10 | | | | 0.25 | | | | n/a | |
Tax Free Money Market Fund | | | n/a | | | | n/a | | | | 0.10 | | | | 0.25 | | | | n/a | |
Municipal Money Market Fund | | | n/a | | | | 0.60 | | | | 0.10 | | | | n/a | | | | 0.60 | |
California Municipal Money Market Fund | | | n/a | | | | 0.60 | | | | 0.10 | | | | n/a | | | | 0.60 | |
New York Municipal Money Market Fund | | | n/a | | | | 0.60 | | | | 0.10 | | | | 0.25 | | | | 0.60 | |
JPMDS waived distribution fees as outlined in Note 3.F.
In addition, JPMDS is entitled to receive the CDSC from redemptions of Class C Shares. For the six months ended August 31, 2020, JPMDS retained the following amounts (in thousands):
| | | | |
| | | CDSC | |
Liquid Assets Money Market Fund | | $ | — | (a) |
U.S. Treasury Plus Money Market Fund | | | — | (a) |
| (a) | Amount rounds to less than one thousand. |
| | | | | | | | |
| | | |
| AUGUST 31, 2020 | | J.P. MORGAN MONEY MARKET FUNDS | | | | | 163 | |
NOTES TO FINANCIAL STATEMENTS
AS OF AUGUST 31, 2020 (Unaudited) (continued)
D. Service Fees — The Trusts, on behalf of the Funds, have entered into a Shareholder Servicing Agreement with JPMDS under which JPMDS provides certain support services to fund shareholders. For performing these services, JPMDS receives a fee with respect to all share classes, except Agency SL and IM Shares which do not charge a service fee, that is accrued daily and paid monthly equal to a percentage of the average daily net assets as shown in the table below:
| | | | | | | | | | | | | | | | |
| | | Class C | | | Academy | | | Agency | | | Capital | |
Prime Money Market Fund | | | 0.25 | % | | | 0.05 | % | | | 0.15 | % | | | 0.05 | % |
Institutional Tax Free Money Market Fund | | | n/a | | | | n/a | | | | 0.15 | | | | 0.05 | |
Liquid Assets Money Market Fund | | | 0.25 | | | | n/a | | | | 0.15 | | | | 0.05 | |
U.S. Government Money Market Fund | | | n/a | | | | 0.05 | | | | 0.15 | | | | 0.05 | |
U.S. Treasury Plus Money Market Fund | | | 0.25 | | | | n/a | | | | 0.15 | | | | 0.05 | |
Federal Money Market Fund | | | n/a | | | | n/a | | | | 0.15 | | | | n/a | |
100% U.S. Treasury Securities Money Market Fund | | | n/a | | | | n/a | | | | 0.15 | | | | 0.05 | |
Tax Free Money Market Fund | | | n/a | | | | n/a | | | | 0.15 | | | | n/a | |
Municipal Money Market Fund | | | n/a | | | | n/a | | | | 0.15 | | | | n/a | |
California Municipal Money Market Fund | | | n/a | | | | n/a | | | | 0.15 | | | | n/a | |
New York Municipal Money Market Fund | | | n/a | | | | n/a | | | | 0.15 | | | | n/a | |
| | | | | | | | | | | | | | | | | | | | | | | | | | | | |
| | | E*Trade | | | Institutional
Class | | | Investor | | | Morgan | | | Premier | | | Reserve | | | Service | |
Prime Money Market Fund | | | n/a | | | | 0.10 | % | | | n/a | | | | 0.35 | % | | | 0.30 | % | | | 0.30 | % | | | n/a | |
Institutional Tax Free Money Market Fund | | | n/a | | | | 0.10 | | | | n/a | | | | n/a | | | | n/a | | | | n/a | | | | n/a | |
Securities Lending Money Market Fund | | | n/a | | | | n/a | | | | n/a | | | | n/a | | | | n/a | | | | n/a | | | | n/a | |
Liquid Assets Money Market Fund | | | 0.30 | % | | | 0.10 | | | | 0.35 | % | | | 0.35 | | | | 0.30 | | | | 0.30 | | | | n/a | |
U.S. Government Money Market Fund | | | 0.30 | | | | 0.10 | | | | 0.35 | | | | 0.35 | | | | 0.30 | | | | 0.30 | | | | 0.30 | % |
U.S. Treasury Plus Money Market Fund | | | n/a | | | | 0.10 | | | | 0.35 | | | | 0.35 | | | | 0.30 | | | | 0.30 | | | | n/a | |
Federal Money Market Fund | | | n/a | | | | 0.10 | | | | n/a | | | | 0.35 | | | | 0.30 | | | | n/a | | | | n/a | |
100% U.S. Treasury Securities Money Market Fund | | | n/a | | | | 0.10 | | | | n/a | | | | 0.35 | | | | 0.30 | | | | 0.30 | | | | n/a | |
Tax Free Money Market Fund | | | n/a | | | | 0.10 | | | | n/a | | | | 0.35 | | | | 0.30 | | | | 0.30 | | | | n/a | |
Municipal Money Market Fund | | | 0.30 | | | | 0.10 | | | | n/a | | | | 0.35 | | | | 0.30 | | | | n/a | | | | 0.30 | |
California Municipal Money Market Fund | | | 0.30 | | | | 0.10 | | | | n/a | | | | 0.35 | | | | 0.30 | | | | n/a | | | | 0.30 | |
New York Municipal Money Market Fund | | | 0.30 | | | | 0.10 | | | | n/a | | | | 0.35 | | | | 0.30 | | | | 0.30 | | | | 0.30 | |
JPMDS has entered into shareholder services contracts with affiliated and unaffiliated financial intermediaries who provide shareholder services and other related services to their clients or customers who invest in the Funds. Pursuant to such contracts, JPMDS will pay all or a portion of such fees earned to financial intermediaries for performing such services.
JPMDS waived service fees as outlined in Note 3.F.
E. Custodian and Accounting Fees — JPMCB provides portfolio custody and accounting services to the Funds. For performing these services, the Funds pay JPMCB transaction and asset-based fees that vary according to the number of transactions and positions, plus out-of-pocket expenses. The amounts paid directly to JPMCB by the Funds for custody and accounting services are included in Custodian and accounting fees on the Statements of Operations.
Interest income earned on cash balances at the custodian, if any, is included in Interest income from affiliates on the Statements of Operations.
Interest expense paid to the custodian related to cash overdrafts, if any, is included in Interest expense to affiliates on the Statements of Operations.
F. Waivers and Reimbursements — The Adviser, Administrator and JPMDS have contractually agreed to waive fees and/or reimburse the Funds, except IM Shares of the Prime Money Market Fund, U.S. Government Money Market Fund, U.S. Treasury Plus Money Market Fund and the 100% U.S Treasury Securities Money Market Fund, to the extent that total annual operating expenses (excluding acquired fund fees and expenses, dividend
| | | | | | |
| | | |
| 164 | | | | J.P. MORGAN MONEY MARKET FUNDS | | AUGUST 31, 2020 |
and interest expenses related to short sales, interest, taxes, expenses related to litigation and potential litigation, expenses related to trustee elections and extraordinary expenses) exceed the percentages of the Funds’ respective average daily net assets as shown in the table below:
| | | | | | | | | | | | | | | | | | | | | | | | | | | | | | | | |
| | | Class C | | | Academy | | | Agency | | | Agency
SL | | | Capital | | | Direct | | | Eagle Class | | | Eagle
Private
Wealth
Class | |
Prime Money Market Fund | | | 0.97 | % | | | 0.18 | % | | | 0.26 | % | | | n/a | | | | 0.18 | % | | | n/a | | | | n/a | | | | n/a | |
Institutional Tax Free Money Market Fund | | | n/a | | | | n/a | | | | 0.26 | | | | n/a | | | | 0.18 | | | | n/a | | | | n/a | | | | n/a | |
Securities Lending Money Market Fund | | | n/a | | | | n/a | | | | n/a | | | | 0.06 | | | | n/a | | | | n/a | | | | n/a | | | | n/a | |
Liquid Assets Money Market Fund | | | 0.97 | | | | n/a | | | | 0.26 | | | | n/a | | | | 0.18 | | | | n/a | | | | n/a | | | | n/a | |
U.S. Government Money Market Fund | | | n/a | | | | 0.18 | | | | 0.26 | | | | n/a | | | | 0.18 | | | | 0.30 | % | | | 0.70 | % | | | 0.30 | % |
U.S. Treasury Plus Money Market Fund | | | 0.97 | | | | n/a | | | | 0.26 | | | | n/a | | | | 0.18 | | | | 0.30 | | | | n/a | | | | n/a | |
Federal Money Market Fund | | | n/a | | | | n/a | | | | 0.26 | | | | n/a | | | | n/a | | | | n/a | | | | n/a | | | | n/a | |
100% U.S. Treasury Securities Money Market Fund | | | n/a | | | | n/a | | | | 0.26 | | | | n/a | | | | 0.18 | | | | n/a | | | | n/a | | | | n/a | |
Tax Free Money Market Fund | | | n/a | | | | n/a | | | | 0.26 | | | | n/a | | | | n/a | | | | n/a | | | | n/a | | | | n/a | |
Municipal Money Market Fund | | | n/a | | | | n/a | | | | 0.26 | | | | n/a | | | | n/a | | | | n/a | | | | 0.70 | | | | n/a | |
California Municipal Money Market Fund | | | n/a | | | | n/a | | | | 0.26 | | | | n/a | | | | n/a | | | | n/a | | | | 0.70 | | | | n/a | |
New York Municipal Money Market Fund | | | n/a | | | | n/a | | | | 0.26 | | | | n/a | | | | n/a | | | | n/a | | | | 0.70 | | | | n/a | |
| | | | | | | | | | | | | | | | | | | | | | | | | | | | | | | | |
| | | E*Trade | | | IM | | | Institutional
Class | | | Investor | | | Morgan | | | Premier | | | Reserve | | | Service | |
Prime Money Market Fund | | | n/a | | | | n/a | | | | 0.21 | % | | | n/a | | | | 0.52 | % | | | 0.45 | % | | | 0.70 | % | | | n/a | |
Institutional Tax Free Money Market Fund | | | n/a | | | | 0.16 | % | | | 0.21 | | | | n/a | | | | n/a | | | | n/a | | | | n/a | | | | n/a | |
Securities Lending Money Market Fund | | | n/a | | | | n/a | | | | n/a | | | | n/a | | | | n/a | | | | n/a | | | | n/a | | | | n/a | |
Liquid Assets Money Market Fund | | | 1.00 | % | | | n/a | | | | 0.21 | | | | 0.51 | % | | | 0.59 | | | | 0.45 | | | | 0.70 | | | | n/a | |
U.S. Government Money Market Fund | | | 1.00 | | | | n/a | | | | 0.21 | | | | 0.51 | | | | 0.59 | | | | 0.45 | | | | 0.70 | | | | 1.05 | % |
U.S. Treasury Plus Money Market Fund | | | n/a | | | | n/a | | | | 0.21 | | | | 0.51 | | | | 0.59 | | | | 0.45 | | | | 0.70 | | | | n/a | |
Federal Money Market Fund | | | n/a | | | | n/a | | | | 0.21 | | | | n/a | | | | 0.59 | | | | 0.45 | | | | n/a | | | | n/a | |
100% U.S. Treasury Securities Money Market Fund | | | n/a | | | | n/a | | | | 0.21 | | | | n/a | | | | 0.59 | | | | 0.45 | | | | 0.70 | | | | n/a | |
Tax Free Money Market Fund | | | n/a | | | | n/a | | | | 0.21 | | | | n/a | | | | 0.59 | | | | 0.45 | | | | 0.70 | | | | n/a | |
Municipal Money Market Fund | | | 1.00 | | | | n/a | | | | 0.21 | | | | n/a | | | | 0.59 | | | | 0.45 | | | | n/a | | | | 1.05 | |
California Municipal Money Market Fund | | | 1.00 | | | | n/a | | | | 0.21 | | | | n/a | | | | 0.59 | | | | 0.45 | | | | n/a | | | | 1.05 | |
New York Municipal Money Market Fund | | | 1.00 | | | | n/a | | | | 0.21 | | | | n/a | | | | 0.59 | | | | 0.45 | | | | 0.70 | | | | 1.05 | |
The expense limitation agreements were in effect for the six months ended August 31, 2020, and are in place until at least June 30, 2021 except with respect to the Academy Shares of U.S. Treasury Plus Money Market Fund and 100% U.S. Treasury Securities Money Market Fund, for which the expense limitation agreements have been in effect since commencement of operations on September 30, 2020 and are in place until at least September 30, 2021. In addition, the Funds’ service providers have voluntarily waived fees during the six months ended August 31, 2020. However, the Funds’ service providers are under no obligation to do so and may discontinue such voluntary waivers at any time.
For the six months ended August 31, 2020, the Funds’ service providers waived fees and/or reimbursed expenses for each of the Funds as follows (amounts in thousands). None of these parties expect the Funds to repay any such waived fees and/or reimbursed expenses in future years.
| | | | | | | | | | | | | | | | | | | | |
| | | Contractual Waivers | | | | |
| | | Investment
Advisory
Fees | | | Administration
Fees | | | Service
Fees | | | Total | | | Contractual
Reimbursements | |
Prime Money Market Fund | | $ | 5 | | | $ | — | | | $ | 4,555 | | | $ | 4,560 | | | $ | 20 | |
Institutional Tax Free Money Market Fund | | | 23 | | | | 15 | | | | 181 | | | | 219 | | | | — | |
Securities Lending Money Market Fund | | | 900 | | | | 600 | | | | — | | | | 1,500 | | | | — | |
Liquid Assets Money Market Fund | | | 11 | | | | 6 | | | | 1,089 | | | | 1,106 | | | | 1 | |
U.S. Government Money Market Fund | | | 17 | | | | — | | | | 10,204 | | | | 10,221 | | | | — | |
U.S. Treasury Plus Money Market Fund | | | 2 | | | | — | | | | 2,603 | | | | 2,605 | | | | — | |
Federal Money Market Fund | | | 25 | | | | 17 | | | | 625 | | | | 667 | | | | — | |
100% U.S. Treasury Securities Money Market Fund | | | 9 | | | | — | | | | 7,084 | | | | 7,093 | | | | — | |
Tax Free Money Market Fund | | | — | | | | — | | | | 1,401 | | | | 1,401 | | | | — | |
Municipal Money Market Fund | | | 102 | | | | 68 | | | | 239 | | | | 409 | | | | — | |
California Municipal Money Market Fund | | | 39 | | | | 26 | | | | 84 | | | | 149 | | | | — | |
New York Municipal Money Market Fund | | | 28 | | | | 19 | | | | 229 | | | | 276 | | | | — | |
| | | | | | | | |
| | | |
| AUGUST 31, 2020 | | J.P. MORGAN MONEY MARKET FUNDS | | | | | 165 | |
NOTES TO FINANCIAL STATEMENTS
AS OF AUGUST 31, 2020 (Unaudited) (continued)
| | | | | | | | | | | | | | | | |
| | | Voluntary Waivers | |
| | | Distribution
Fees | | | Service
Fees | | | Transfer
Agency Fees | | | Total | |
Prime Money Market Fund | | $ | 1 | | | $ | 314 | | | $ | — | (a) | | $ | 315 | |
Institutional Tax Free Money Market Fund | | | — | | | | 3 | | | | — | (a) | | | 3 | |
Liquid Assets Money Market Fund | | | 195 | | | | 309 | | | | 1 | | | | 505 | |
U.S. Government Money Market Fund | | | 3,909 | | | | 6,234 | | | | — | | | | 10,143 | |
U.S. Treasury Plus Money Market Fund | | | 1,202 | | | | 1,228 | | | | — | (a) | | | 2,430 | |
Federal Money Market Fund | | | 22 | | | | 198 | | | | — | | | | 220 | |
100% U.S. Treasury Securities Money Market Fund | | | 3,692 | | | | 5,171 | | | | — | | | | 8,863 | |
Tax Free Money Market Fund | | | 1,233 | | | | 990 | | | | — | | | | 2,223 | |
Municipal Money Market Fund | | | 134 | | | | 60 | | | | — | | | | 194 | |
California Municipal Money Market Fund | | | 54 | | | | 150 | | | | — | | | | 204 | |
New York Municipal Money Market Fund | | | 40 | | | | 184 | | | | — | | | | 224 | |
| (a) | Amount rounds to less than one thousand. |
G. Other — Certain officers of the Trusts are affiliated with the Adviser, the Administrator and JPMDS. Such officers, with the exception of the Chief Compliance Officer, receive no compensation from the Funds for serving in their respective roles.
The Boards designated and appointed a Chief Compliance Officer to the Funds pursuant to Rule 38a-1 under the 1940 Act. Each Fund, along with affiliated funds, makes reimbursement payments, on a pro-rata basis, to the Administrator for a portion of the fees associated with the office of the Chief Compliance Officer. Such fees are included in Trustees’ and Chief Compliance Officer’s fees on the Statements of Operations.
Certain Funds earn interest on certain uninvested cash balances held at the custodian, which is included in the Interest income from affiliates on the Statements of Operations.
The Trusts adopted a Trustee Deferred Compensation Plan (the “Plan”) which allows the independent Trustees to defer the receipt of all or a portion of compensation related to performance of their duties as Trustees. The deferred fees are invested in various J.P. Morgan Funds until distribution in accordance with the Plan.
During the six months ended August 31, 2020, Prime Money Market Fund, Securities Lending Money Market Fund, Liquid Assets Money Market Fund, Tax Free Money Market Fund and California Municipal Money Market Fund purchased securities from an underwriting syndicate in which the principal underwriter or members of the syndicate were affiliated with the Adviser.
The SEC has granted an exemptive order permitting the Funds to engage in principal transactions with J.P. Morgan Securities LLC, an affiliated broker, involving taxable money market instruments, subject to certain conditions.
The Funds are permitted to effect purchase and sale transactions with affiliated Funds under procedures adopted by the Board. The procedures have been designed to seek to ensure that any such security transaction complies with certain conditions of Rule 17a-7 under the 1940 Act. Further, as defined under the procedures, each transaction is effected at the current market price. Pursuant to these procedures, for the six months ended August 31, 2020, the Funds below engaged in such transactions in the following amounts (amounts in thousands):
| | | | | | | | | | | | |
| | | Purchases | | | Sales | | | Realized
Gain
(Loss) | |
Institutional Tax Free Money Market Fund | | $ | 962,314 | | | $ | 1,017,720 | | | $ | — | |
Tax Free Money Market Fund | | | 1,343,737 | | | | 680,119 | | | | — | |
Municipal Money Market Fund | | | 238,258 | | | | 618,154 | | | | — | |
California Municipal Money Market Fund | | | 159,268 | | | | 80,775 | | | | — | |
New York Municipal Money Market Fund | | | 264,252 | | | | 571,061 | | | | — | |
| | | | | | |
| | | |
| 166 | | | | J.P. MORGAN MONEY MARKET FUNDS | | AUGUST 31, 2020 |
4. Class-Specific Expenses
The Funds’ class specific gross expenses for the six months ended August 31, 2020 were as follows (amounts in thousands):
| | | | | | | | |
| | | Distribution | | | Service | |
Prime Money Market Fund | | | | | | | | |
Class C | | $ | 2 | | | $ | 1 | |
Academy | | | — | | | | 439 | |
Agency | | | — | | | | 1,866 | |
Capital | | | — | | | | 9,555 | |
Institutional Class | | | — | | | | 8,701 | |
Morgan | | | — | | | | 3,708 | |
Premier | | | — | | | | 3,438 | |
Reserve | | | 4 | | | | 4 | |
| | | | | | | | |
| | $ | 6 | | | $ | 27,712 | |
| | | | | | | | |
Institutional Tax Free Money Market Fund | | | | | | | | |
Agency | | $ | — | | | $ | 44 | |
Capital | | | — | | | | 86 | |
Institutional Class | | | — | | | | 218 | |
| | | | | | | | |
| | $ | — | | | $ | 348 | |
| | | | | | | | |
Liquid Assets Money Market Fund | | | | | | | | |
Class C | | $ | 182 | | | $ | 61 | |
Agency | | | — | | | | 1,203 | |
Capital | | | — | | | | 615 | |
Institutional Class | | | — | | | | 1,698 | |
Investor | | | — | | | | 5 | |
Morgan | | | 387 | | | | 1,355 | |
Premier | | | — | | | | 5,220 | |
Reserve | | | 6 | | | | 7 | |
| | | | | | | | |
| | $ | 575 | | | $ | 10,164 | |
| | | | | | | | |
U.S. Government Money Market Fund | | | | | | | | |
Academy | | $ | — | | | $ | 290 | |
Agency | | | — | | | | 13,813 | |
Capital | | | — | | | | 31,681 | |
E*Trade | | | 1,075 | | | | 538 | |
Institutional Class | | | — | | | | 18,305 | |
Investor | | | — | | | | 1,621 | |
Morgan | | | 1,194 | | | | 4,178 | |
Premier | | | — | | | | 6,122 | |
Reserve | | | 27 | | | | 32 | |
Service | | | 2,147 | | | | 1,073 | |
| | | | | | | | |
| | $ | 4,443 | | | $ | 77,653 | |
| | | | | | | | |
U.S. Treasury Plus Money Market Fund | | | | | | | | |
Class C | | $ | 1,261 | | | $ | 420 | |
Agency | | | — | | | | 1,567 | |
Capital | | | — | | | | 3,671 | |
Institutional Class | | | — | | | | 6,387 | |
Investor | | | — | | | | 61 | |
Morgan | | | 279 | | | | 978 | |
Premier | | | — | | | | 2,750 | |
Reserve | | | 12 | | | | 14 | |
| | | | | | | | |
| | $ | 1,552 | | | $ | 15,848 | |
| | | | | | | | |
| | | | | | | | |
| | | |
| AUGUST 31, 2020 | | J.P. MORGAN MONEY MARKET FUNDS | | | | | 167 | |
NOTES TO FINANCIAL STATEMENTS
AS OF AUGUST 31, 2020 (Unaudited) (continued)
| | | | | | | | |
| | | Distribution | | | Service | |
Federal Money Market Fund | | | | | | | | |
Agency | | $ | — | | | $ | 334 | |
Institutional Class | | | — | | | | 1,598 | |
Morgan | | | 27 | | | | 93 | |
Premier | | | — | | | | 315 | |
| | | | | | | | |
| | $ | 27 | | | $ | 2,340 | |
| | | | | | | | |
100% U.S. Treasury Securities Money Market Fund | | | | | | | | |
Agency | | $ | — | | | $ | 4,514 | |
Capital | | | — | | | | 17,018 | |
Institutional Class | | | — | | | | 17,111 | |
Morgan | | | 1,154 | | | | 4,040 | |
Premier | | | — | | | | 4,649 | |
Reserve | | | 3,182 | | | | 3,818 | |
| | | | | | | | |
| | $ | 4,336 | | | $ | 51,150 | |
| | | | | | | | |
Tax Free Money Market Fund | | | | | | | | |
Agency | | $ | — | | | $ | 597 | |
Institutional Class | | | — | | | | 4,683 | |
Morgan | | | 19 | | | | 68 | |
Premier | | | — | | | | 1,336 | |
Reserve | | | 1,612 | | | | 1,934 | |
| | | | | | | | |
| | $ | 1,631 | | | $ | 8,618 | |
| | | | | | | | |
Municipal Money Market Fund | | | | | | | | |
Agency | | $ | — | | | $ | 88 | |
Institutional Class | | | — | | | | 491 | |
Morgan | | | 33 | | | | 115 | |
Premier | | | — | | | | 216 | |
Service | | | 150 | | | | 75 | |
| | | | | | | | |
| | $ | 183 | | | $ | 985 | |
| | | | | | | | |
California Municipal Money Market Fund | | | | | | | | |
Agency | | $ | — | | | $ | 38 | |
Institutional Class | | | — | | | | 177 | |
Morgan | | | 8 | | | | 27 | |
Premier | | | — | | | | 276 | |
Service | | | 64 | | | | 32 | |
| | | | | | | | |
| | $ | 72 | | | $ | 550 | |
| | | | | | | | |
New York Municipal Money Market Fund | | | | | | | | |
Agency | | $ | — | | | $ | 137 | |
Institutional Class | | | — | | | | 511 | |
Morgan | | | 34 | | | | 118 | |
Premier | | | — | | | | 613 | |
Reserve | | | 2 | | | | 2 | |
Service | | | 18 | | | | 9 | |
| | | | | | | | |
| | $ | 54 | | | $ | 1,390 | |
| | | | | | | | |
5. Federal Income Tax Matters
For Federal income tax purposes, the estimated cost and unrealized appreciation (depreciation) in value of investments held at August 31, 2020 were as follows (amounts in thousands):
| | | | | | | | | | | | | | | | |
| | | Aggregate
Cost | | | Gross
Unrealized
Appreciation | | | Gross
Unrealized
Depreciation | | | Net Unrealized
Appreciation
(Depreciation) | |
Prime Money Market Fund | | $ | 87,122,661 | | | $ | 35,111 | | | $ | 273 | | | $ | 34,838 | |
Institutional Tax Free Money Market Fund | | | 1,875,863 | | | | 400 | | | | 2 | | | | 398 | |
Securities Lending Money Market Fund | | | 3,648,733 | | | | 1,460 | | | | 1 | | | | 1,459 | |
| | | | | | |
| | | |
| 168 | | | | J.P. MORGAN MONEY MARKET FUNDS | | AUGUST 31, 2020 |
As of February 29, 2020, the following Funds had the following net capital loss carryforwards (amounts in thousands):
| | | | | | | | |
| | | Capital Loss
Carryforward Character | |
| | | Short-Term | | | Long-Term | |
U.S. Government Money Market Fund | | $ | 2,409 | | | $ | — | |
U.S. Treasury Plus Money Market Fund | | | 191 | | | | — | |
Net capital losses incurred after October 31 within the taxable year are deemed to arise on the first business day of the Fund’s next taxable year. As of February 29, 2020, the following Funds deferred to March 1, 2020 the following net capital losses of (amounts in thousands):
| | | | | | | | | | | | |
| | | Net Capital Losses (Gains) | | | Late Year Ordinary
Loss Deferral | |
| | | Short-Term | | | Long-Term | |
U.S. Government Money Market Fund | | $ | — | | | $ | 1,880 | | | $ | — | |
U.S. Treasury Plus Money Market Fund | | | (343 | ) | | | 406 | | | | — | |
100% U.S. Treasury Securities Money Market Fund | | | 36 | | | | 56 | | | | — | |
California Municipal Money Market Fund | | | — | | | | — | | | | — | (a) |
| (a) | Amount rounds to less than one thousand. |
During the year ended February 29, 2020, the following Funds utilized capital loss carryforwards as follows (amounts in thousands):
| | | | | | | | |
| | | Capital Loss Utilized | |
| | | Short-Term | | | Long-Term | |
U.S. Government Money Market Fund | | $ | 83 | | | $ | 9 | |
100% U.S. Treasury Securities Money Market Fund | | | 118 | | | | — | |
6. Borrowings
The Funds rely upon an exemptive order granted by the SEC (the “Order”) permitting the establishment and operation of an Interfund Lending Facility (the “Facility”). The Facility allows the Funds to directly lend and borrow money to or from any other fund relying upon the Order at rates beneficial to both the borrowing and lending funds. Advances under the Facility are taken primarily for temporary or emergency purposes, including the meeting of redemption requests that otherwise might require the untimely disposition of securities, and are subject to each Fund’s borrowing restrictions. The Interfund loan rate is determined, as specified in the Order, by averaging the current repurchase agreement rate and the current bank loan rate. The Order was granted to JPM II and may be relied upon by the Funds because the Funds and the series of JPM II are all investment companies in the same “group of investment companies” (as defined in Section 12(d)(1)(G) of the 1940 Act).
As of August 31, 2020, the Funds had no outstanding loans to another fund. Average loans made to another fund under the Facility for the six months ended August 31, 2020, were as follows (amounts in thousands, except number of days outstanding):
| | | | | | | | | | | | |
| | | Average
Loans | | | Number of
Days Outstanding | | | Interest
Earned | |
Liquid Assets Money Market Fund | | $ | 23,135 | | | | 59 | | | $ | 62 | |
Interest earned as a result of lending money to another fund for the six months ended August 31, 2020, if any, is included in Income from interfund lending (net) on the Statements of Operations.
The Trusts and JPMCB have entered into a financing arrangement. Under this arrangement, JPMCB provides an unsecured, uncommitted credit facility in the aggregate amount of $100 million to certain of the J.P. Morgan Funds, including the Funds. Advances under the arrangement are taken primarily for temporary or emergency purposes, including the meeting of redemption requests that otherwise might require the untimely disposition of securities, and are subject to each Fund’s borrowing restrictions. Interest on borrowings is payable at a rate determined by JPMCB at the time of borrowing. This agreement has been extended until November 2, 2020.
The Funds had no borrowings outstanding from the unsecured, uncommitted credit facility during the six months ended August 31, 2020.
7. Risks, Concentrations and Indemnifications
In the normal course of business, the Funds enter into contracts that contain a variety of representations which provide general indemnifications. Each Fund’s maximum exposure under these arrangements is unknown. The amount of exposure would depend on future claims that may be brought against each Fund. However, based on experience, the Funds expect the risk of loss to be remote.
| | | | | | | | |
| | | |
| AUGUST 31, 2020 | | J.P. MORGAN MONEY MARKET FUNDS | | | | | 169 | |
NOTES TO FINANCIAL STATEMENTS
AS OF AUGUST 31, 2020 (Unaudited) (continued)
As of August 31, 2020, the Funds had individual shareholder and/or omnibus accounts which owned more than 10% of the respective Fund’s outstanding shares as follows:
| | | | | | | | | | | | | | | | |
| | | Number of
individual shareholder
and/or
Affiliated Omnibus
Accounts | | | % of the Fund | | | Number of
individual shareholder
and/or
Non-Affiliated
Omnibus Accounts | | | % of the Fund | |
Prime Money Market Fund | | | 1 | | | | 48.0 | % | | | — | | | | — | |
Institutional Tax Free Money Market Fund | | | 1 | | | | 98.3 | | | | — | | | | — | |
Securities Lending Money Market Fund | | | — | | | | — | | | | 1 | | | | 100.0 | % |
Liquid Assets Money Market Fund | | | 1 | | | | 58.4 | | | | — | | | | — | |
U.S. Government Money Market Fund | | | 1 | | | | 33.5 | | | | — | | | | — | |
U.S. Treasury Plus Money Market Fund | | | 1 | | | | 25.7 | | | | 1 | | | | 14.0 | |
Federal Money Market Fund | | | 1 | | | | 58.2 | | | | 1 | | | | 21.6 | |
100% U.S. Treasury Securities Money Market Fund | | | 1 | | | | 36.7 | | | | 1 | | | | 10.3 | |
Tax Free Money Market Fund | | | 1 | | | | 43.9 | | | | 1 | | | | 48.4 | |
Municipal Money Market Fund | | | 2 | | | | 87.8 | | | | — | | | | — | |
California Municipal Money Market Fund | | | 2 | | | | 87.6 | | | | — | | | | — | |
New York Municipal Money Market Fund | | | 2 | | | | 93.3 | | | | — | | | | — | |
Significant shareholder transactions by these shareholders may impact the Funds’ performance and liquidity.
The Institutional Tax Free Money Market Fund, Tax Free Money Market Fund, Municipal Money Market Fund, California Municipal Money Market Fund and New York Municipal Money Market Fund invest primarily in a portfolio of debt obligations issued by states, territories and possessions of the United States and by the District of Columbia, and by their political subdivisions and duly constituted authorities. The California Municipal Money Market Fund and New York Municipal Money Market Fund primarily invest in issuers in the states of California and New York, respectively. An issuer’s ability to meet its payment obligations may be affected by economic or political developments in a specific state or region. These debt obligations may be insured by private insurers who guarantee the payment of principal and interest in the event of issuer default. The value of these investments may be impacted by changes to bond insurers’ ratings and the Institutional Tax Free Money Market Fund, Tax Free Money Market Fund, Municipal Money Market Fund, California Municipal Money Market Fund and New York Municipal Money Market Fund’s ability to collect principal and interest, in the event of an issuer’s default, may be limited if the private insurer does not have the wherewithal to satisfy its obligation.
The profitability of banks depends largely on the availability and cost of funds, which can change depending upon economic conditions. Banks are also exposed to losses if borrowers cannot repay their loans.
The Institutional Tax Free Money Market Fund, Tax Free Money Market Fund, Municipal Money Market Fund, California Municipal Money Market Fund and New York Municipal Money Market Fund invest in preferred securities. These securities are typically issued by corporations, generally in the form of interest bearing notes with preferred security characteristics and may include provisions that permit the issuer, in its discretion, to defer or omit distributions for a certain period of time.
The Funds are subject to interest rate and credit risk. The value of debt securities may decline as interest rates increase. The Funds could lose money if the issuer of a fixed income security is unable to pay interest or repay principal when it is due. The Funds invest variable and floating rate securities. Although these instruments are generally less sensitive to interest rate changes than fixed rate instruments, the value of floating rate and variable securities may decline if their interest rates do not rise as quickly, or as much, as general interest rates. Many factors can cause interest rates to rise. Some examples include central bank monetary policy. The Funds may face a heightened level of interest rate risk due to certain changes in monetary policy. During periods when interest rates are low or there are negative interest rates, the Funds’ yield (and total return) also may be low or the Funds may be unable to maintain positive returns. The ability of the issuers of debt to meet their obligations may be affected by economic and political developments in a specific industry or region. The value of a Fund’s investments may be adversely affected if any of the issuers or counterparties it is invested in are subject to an actual or perceived deterioration in their credit quality.
The London InterBank Offered Rate (“LIBOR”) is intended to represent the rate at which contributing banks may obtain short-term borrowings from each other in the London interbank market. The regulatory authority that oversees financial services firms and financial markets in the U.K. has announced that, after the end of 2021, it would no longer persuade or compel contributing banks to make rate submissions for purposes of determining the LIBOR rate. As a result, it is possible that commencing in 2022, LIBOR may no longer be available or no longer deemed an appropriate reference rate upon which to determine the interest rate on or impacting certain loans, notes, derivatives and other instruments or investments comprising some or all of a Fund’s portfolio. In light of this eventuality, public and private sector industry initiatives are currently underway to identify new or alternative reference rates to be used in place of LIBOR. There is no assurance that the composition or characteristics of any such alternative reference rate will be similar to or produce the same value or economic equivalence as LIBOR or that it will have the same volume or liquidity as did LIBOR prior to its discontinuance or unavailability, which may affect the value or liquidity or return on certain investments of a Fund and result in costs incurred in connection with closing out positions and entering into new trades. These risks may also apply with respect to changes in connection with other interbank offering rates (e.g., Euribor) and a wide range of other index levels, rates and values that are treated as “benchmarks” and are the subject of recent regulatory reform.
| | | | | | |
| | | |
| 170 | | | | J.P. MORGAN MONEY MARKET FUNDS | | AUGUST 31, 2020 |
The Funds are subject to infectious disease epidemics/pandemics risk. Recently, the worldwide outbreak of COVID-19, a novel coronavirus disease, has negatively affected economies, markets and individual companies throughout the world. The effects of this COVID-19 pandemic to public health, and business and market conditions, including exchange trading suspensions and closures may continue to have a significant negative impact on the performance of a Fund’s investments, increase a Fund’s volatility, exacerbate other pre-existing political, social and economic risks to the Funds and negatively impact broad segments of businesses and populations. The Funds’ operations may be interrupted as a result, which may have a significant negative impact on investment performance. In addition, governments, their regulatory agencies, or self-regulatory organizations may take actions in response to the pandemic that affect the instruments in which the Funds invest, or the issuers of such instruments, in ways that could also have a significant negative impact on a Fund’s investment performance. The full impact of this COVID-19 pandemic, or other future epidemics/pandemics, is currently unknown.
8. Subsequent Event
Subsequent to August 31, 2020, U.S. Treasury Plus Money Market Fund had net redemptions of approximately $9,437,115,000 which represented 26% of the Fund’s net assets as of August 31, 2020.
| | | | | | | | |
| | | |
| AUGUST 31, 2020 | | J.P. MORGAN MONEY MARKET FUNDS | | | | | 171 | |
SCHEDULE OF SHAREHOLDER EXPENSES
(Unaudited)
Hypothetical $1,000 Investment
As a shareholder of the Funds, you incur two types of costs: (1) transaction costs, including sales charges (loads) on purchase payments and (2) ongoing costs, including investment advisory fees, administration fees, distribution fees and other Fund expenses. The examples below are intended to help you understand your ongoing costs (in dollars) of investing in the Funds and to compare these ongoing costs with the ongoing costs of investing in other mutual funds. The examples assume that you had a $1,000 investment in each Class at the beginning of the reporting period, March 1, 2020, and continued to hold your shares at the end of the reporting period, August 31, 2020.
Actual Expenses
For each Class of each Fund in the table below, the first line provides information about actual account values and actual expenses. You may use the information in this line, together with the amount you invested, to estimate the expenses that you paid over the period. Simply divide your account value by $1,000 (for example, an $8,600 account value divided by $1,000 = 8.6), then multiply the result by the number in the first line of each Class under the heading titled “Expenses Paid During the Period” to estimate the expenses you paid on your account during this period.
Hypothetical Example for Comparison Purposes
The second line of each Class in the table below provides information about hypothetical account values and hypothetical expenses based on the Class’ actual expense ratio and an assumed rate of return of 5% per year before expenses, which is not the Class’ actual return. The hypothetical account values and expenses may not be used to estimate the actual ending account balance or expenses you paid for the period. You may use this information to compare the ongoing costs of investing in the Class of the Fund and other funds. To do so, compare this 5% hypothetical example with the 5% hypothetical examples that appear in the shareholder reports of the other funds. Please note that the expenses shown in the table are meant to highlight your ongoing costs only and do not reflect any transaction costs, such as sales charges (loads). Therefore, the second line for each Class in the table is useful in comparing ongoing costs only, and will not help you determine the relative total costs of owning different funds. In addition, if these transaction costs were included, your costs would have been higher. The examples also assume all dividends and distributions have been reinvested.
| | | | | | | | | | | | | | | | |
| | | Beginning
Account Value
March 1, 2020 | | | Ending
Account Value
August 31, 2020 | | | Expenses
Paid During
the Period* | | | Annualized
Expense
Ratio | |
JPMorgan Prime Money Market Fund | | | | | | | | | | | | | | | | |
Class C | | | | | | | | | | | | | | | | |
Actual | | $ | 1,000.00 | | | $ | 1,000.80 | | | $ | 3.48 | | | | 0.69 | % |
Hypothetical | | | 1,000.00 | | | | 1,021.73 | | | | 3.52 | | | | 0.69 | |
Academy | | | | | | | | | | | | | | | | |
Actual | | | 1,000.00 | | | | 1,003.20 | | | | 0.91 | | | | 0.18 | |
Hypothetical | | | 1,000.00 | | | | 1,024.30 | | | | 0.92 | | | | 0.18 | |
Agency | | | | | | | | | | | | | | | | |
Actual | | | 1,000.00 | | | | 1,002.90 | | | | 1.31 | | | | 0.26 | |
Hypothetical | | | 1,000.00 | | | | 1,023.89 | | | | 1.33 | | | | 0.26 | |
Capital | | | | | | | | | | | | | | | | |
Actual | | | 1,000.00 | | | | 1,003.30 | | | | 0.91 | | | | 0.18 | |
Hypothetical | | | 1,000.00 | | | | 1,024.30 | | | | 0.92 | | | | 0.18 | |
IM | | | | | | | | | | | | | | | | |
Actual | | | 1,000.00 | | | | 1,003.40 | | | | 0.71 | | | | 0.14 | |
Hypothetical | | | 1,000.00 | | | | 1,024.50 | | | | 0.71 | | | | 0.14 | |
Institutional Class | | | | | | | | | | | | | | | | |
Actual | | | 1,000.00 | | | | 1,003.20 | | | | 1.06 | | | | 0.21 | |
Hypothetical | | | 1,000.00 | | | | 1,024.15 | | | | 1.07 | | | | 0.21 | |
Morgan | | | | | | | | | | | | | | | | |
Actual | | | 1,000.00 | | | | 1,002.00 | | | | 2.42 | | | | 0.48 | |
Hypothetical | | | 1,000.00 | | | | 1,022.79 | | | | 2.45 | | | | 0.48 | |
Premier | | | | | | | | | | | | | | | | |
Actual | | | 1,000.00 | | | | 1,002.00 | | | | 2.17 | | | | 0.43 | |
Hypothetical | | | 1,000.00 | | | | 1,023.04 | | | | 2.19 | | | | 0.43 | |
Reserve | | | | | | | | | | | | | | | | |
Actual | | | 1,000.00 | | | | 1,001.30 | | | | 3.28 | | | | 0.65 | |
Hypothetical | | | 1,000.00 | | | | 1,021.93 | | | | 3.31 | | | | 0.65 | |
| | | | | | |
| | | |
| 172 | | | | J.P. MORGAN MONEY MARKET FUNDS | | AUGUST 31, 2020 |
| | | | | | | | | | | | | | | | |
| | | Beginning
Account Value
March 1, 2020 | | | Ending
Account Value
August 31, 2020 | | | Expenses
Paid During
the Period* | | | Annualized
Expense
Ratio | |
JPMorgan Institutional Tax Free Money Market Fund | | | | | | | | | | | | | | | | |
Agency | | | | | | | | | | | | | | | | |
Actual | | $ | 1,000.00 | | | $ | 1,002.80 | | | $ | 1.31 | | | | 0.26 | % |
Hypothetical | | | 1,000.00 | | | | 1,023.89 | | | | 1.33 | | | | 0.26 | |
Capital | | | | | | | | | | | | | | | | |
Actual | | | 1,000.00 | | | | 1,003.30 | | | | 0.91 | | | | 0.18 | |
Hypothetical | | | 1,000.00 | | | | 1,024.30 | | | | 0.92 | | | | 0.18 | |
IM | | | | | | | | | | | | | | | | |
Actual | | | 1,000.00 | | | | 1,003.40 | | | | 0.81 | | | | 0.16 | |
Hypothetical | | | 1,000.00 | | | | 1,024.40 | | | | 0.82 | | | | 0.16 | |
Institutional Class | | | | | | | | | | | | | | | | |
Actual | | | 1,000.00 | | | | 1,003.20 | | | | 1.06 | | | | 0.21 | |
Hypothetical | | | 1,000.00 | | | | 1,024.15 | | | | 1.07 | | | | 0.21 | |
| | | | |
JPMorgan Securities Lending Money Market Fund | | | | | | | | | | | | | | | | |
Agency SL | | | | | | | | | | | | | | | | |
Actual | | | 1,000.00 | | | | 1,003.70 | | | | 0.30 | | | | 0.06 | |
Hypothetical | | | 1,000.00 | | | | 1,024.90 | | | | 0.31 | | | | 0.06 | |
| | | | |
JPMorgan Liquid Assets Money Market Fund | | | | | | | | | | | | | | | | |
Class C | | | | | | | | | | | | | | | | |
Actual | | | 1,000.00 | | | | 1,000.50 | | | | 3.38 | | | | 0.67 | |
Hypothetical | | | 1,000.00 | | | | 1,021.83 | | | | 3.41 | | | | 0.67 | |
Agency | | | | | | | | | | | | | | | | |
Actual | | | 1,000.00 | | | | 1,002.60 | | | | 1.31 | | | | 0.26 | |
Hypothetical | | | 1,000.00 | | | | 1,023.89 | | | | 1.33 | | | | 0.26 | |
Capital | | | | | | | | | | | | | | | | |
Actual | | | 1,000.00 | | | | 1,003.00 | | | | 0.91 | | | | 0.18 | |
Hypothetical | | | 1,000.00 | | | | 1,024.30 | | | | 0.92 | | | | 0.18 | |
Institutional Class | | | | | | | | | | | | | | | | |
Actual | | | 1,000.00 | | | | 1,002.80 | | | | 1.06 | | | | 0.21 | |
Hypothetical | | | 1,000.00 | | | | 1,024.15 | | | | 1.07 | | | | 0.21 | |
Investor | | | | | | | | | | | | | | | | |
Actual | | | 1,000.00 | | | | 1,001.50 | | | | 2.42 | | | | 0.48 | |
Hypothetical | | | 1,000.00 | | | | 1,022.79 | | | | 2.45 | | | | 0.48 | |
Morgan | | | | | | | | | | | | | | | | |
Actual | | | 1,000.00 | | | | 1,001.20 | | | | 2.72 | | | | 0.54 | |
Hypothetical | | | 1,000.00 | | | | 1,022.48 | | | | 2.75 | | | | 0.54 | |
Premier | | | | | | | | | | | | | | | | |
Actual | | | 1,000.00 | | | | 1,001.70 | | | | 2.17 | | | | 0.43 | |
Hypothetical | | | 1,000.00 | | | | 1,023.04 | | | | 2.19 | | | | 0.43 | |
Reserve | | | | | | | | | | | | | | | | |
Actual | | | 1,000.00 | | | | 1,000.90 | | | | 2.98 | | | | 0.59 | |
Hypothetical | | | 1,000.00 | | | | 1,022.23 | | | | 3.01 | | | | 0.59 | |
| | | | |
JPMorgan U.S. Government Money Market Fund | | | | | | | | | | | | | | | | |
Academy | | | | | | | | | | | | | | | | |
Actual | | | 1,000.00 | | | | 1,001.20 | | | | 0.91 | | | | 0.18 | |
Hypothetical | | | 1,000.00 | | | | 1,024.30 | | | | 0.92 | | | | 0.18 | |
Agency | | | | | | | | | | | | | | | | |
Actual | | | 1,000.00 | | | | 1,000.90 | | | | 1.26 | | | | 0.25 | |
Hypothetical | | | 1,000.00 | | | | 1,023.95 | | | | 1.28 | | | | 0.25 | |
Capital | | | | | | | | | | | | | | | | |
Actual | | | 1,000.00 | | | | 1,001.20 | | | | 0.91 | | | | 0.18 | |
Hypothetical | | | 1,000.00 | | | | 1,024.30 | | | | 0.92 | | | | 0.18 | |
| | | | | | | | |
| | | |
| AUGUST 31, 2020 | | J.P. MORGAN MONEY MARKET FUNDS | | | | | 173 | |
SCHEDULE OF SHAREHOLDER EXPENSES
(Unaudited) (continued)
Hypothetical $1,000 Investment
| | | | | | | | | | | | | | | | |
| | | Beginning
Account Value
March 1, 2020 | | | Ending
Account Value
August 31, 2020 | | | Expenses
Paid During
the Period* | | | Annualized
Expense
Ratio | |
JPMorgan U.S. Government Money Market Fund (continued) | | | | | | | | | | | | | | | | |
E*Trade | | | | | | | | | | | | | | | | |
Actual | | $ | 1,000.00 | | | $ | 1,000.20 | | | $ | 1.87 | | | | 0.37 | % |
Hypothetical | | | 1,000.00 | | | | 1,023.34 | | | | 1.89 | | | | 0.37 | |
IM | | | | | | | | | | | | | | | | |
Actual | | | 1,000.00 | | | | 1,001.50 | | | | 0.71 | | | | 0.14 | |
Hypothetical | | | 1,000.00 | | | | 1,024.50 | | | | 0.71 | | | | 0.14 | |
Institutional Class | | | | | | | | | | | | | | | | |
Actual | | | 1,000.00 | | | | 1,001.10 | | | | 1.06 | | | | 0.21 | |
Hypothetical | | | 1,000.00 | | | | 1,024.15 | | | | 1.07 | | | | 0.21 | |
Investor | | | | | | | | | | | | | | | | |
Actual | | | 1,000.00 | | | | 1,000.50 | | | | 1.66 | | | | 0.33 | |
Hypothetical | | | 1,000.00 | | | | 1,023.54 | | | | 1.68 | | | | 0.33 | |
Morgan | | | | | | | | | | | | | | | | |
Actual | | | 1,000.00 | | | | 1,000.40 | | | | 1.76 | | | | 0.35 | |
Hypothetical | | | 1,000.00 | | | | 1,023.44 | | | | 1.79 | | | | 0.35 | |
Premier | | | | | | | | | | | | | | | | |
Actual | | | 1,000.00 | | | | 1,000.50 | | | | 1.61 | | | | 0.32 | |
Hypothetical | | | 1,000.00 | | | | 1,023.59 | | | | 1.63 | | | | 0.32 | |
Reserve | | | | | | | | | | | | | | | | |
Actual | | | 1,000.00 | | | | 1,000.30 | | | | 1.82 | | | | 0.36 | |
Hypothetical | | | 1,000.00 | | | | 1,023.39 | | | | 1.84 | | | | 0.36 | |
Service | | | | | | | | | | | | | | | | |
Actual | | | 1,000.00 | | | | 1,000.20 | | | | 2.02 | | | | 0.40 | |
Hypothetical | | | 1,000.00 | | | | 1,023.19 | | | | 2.04 | | | | 0.40 | |
| | | | |
JPMorgan U.S. Treasury Plus Money Market Fund | | | | | | | | | | | | | | | | |
Class C | | | | | | | | | | | | | | | | |
Actual | | | 1,000.00 | | | | 1,000.20 | | | | 1.97 | | | | 0.39 | |
Hypothetical | | | 1,000.00 | | | | 1,023.24 | | | | 1.99 | | | | 0.39 | |
Agency | | | | | | | | | | | | | | | | |
Actual | | | 1,000.00 | | | | 1,000.90 | | | | 1.31 | | | | 0.26 | |
Hypothetical | | | 1,000.00 | | | | 1,023.89 | | | | 1.33 | | | | 0.26 | |
Capital | | | | | | | | | | | | | | | | |
Actual | | | 1,000.00 | | | | 1,001.30 | | | | 0.91 | | | | 0.18 | |
Hypothetical | | | 1,000.00 | | | | 1,024.30 | | | | 0.92 | | | | 0.18 | |
IM | | | | | | | | | | | | | | | | |
Actual | | | 1,000.00 | | | | 1,001.50 | | | | 0.71 | | | | 0.14 | |
Hypothetical | | | 1,000.00 | | | | 1,024.50 | | | | 0.71 | | | | 0.14 | |
Institutional Class | | | | | | | | | | | | | | | | |
Actual | | | 1,000.00 | | | | 1,001.10 | | | | 1.06 | | | | 0.21 | |
Hypothetical | | | 1,000.00 | | | | 1,024.15 | | | | 1.07 | | | | 0.21 | |
Investor | | | | | | | | | | | | | | | | |
Actual | | | 1,000.00 | | | | 1,000.40 | | | | 1.76 | | | | 0.35 | |
Hypothetical | | | 1,000.00 | | | | 1,023.44 | | | | 1.79 | | | | 0.35 | |
Morgan | | | | | | | | | | | | | | | | |
Actual | | | 1,000.00 | | | | 1,000.30 | | | | 1.92 | | | | 0.38 | |
Hypothetical | | | 1,000.00 | | | | 1,023.29 | | | | 1.94 | | | | 0.38 | |
Premier | | | | | | | | | | | | | | | | |
Actual | | | 1,000.00 | | | | 1,000.50 | | | | 1.71 | | | | 0.34 | |
Hypothetical | | | 1,000.00 | | | | 1,023.49 | | | | 1.73 | | | | 0.34 | |
Reserve | | | | | | | | | | | | | | | | |
Actual | | | 1,000.00 | | | | 1,000.30 | | | | 2.22 | | | | 0.44 | |
Hypothetical | | | 1,000.00 | | | | 1,022.99 | | | | 2.24 | | | | 0.44 | |
| | | | | | |
| | | |
| 174 | | | | J.P. MORGAN MONEY MARKET FUNDS | | AUGUST 31, 2020 |
| | | | | | | | | | | | | | | | |
| | | Beginning
Account Value
March 1, 2020 | | | Ending
Account Value
August 31, 2020 | | | Expenses
Paid During
the Period* | | | Annualized
Expense
Ratio | |
JPMorgan Federal Money Market Fund | | | | | | | | | | | | | | | | |
Agency | | | | | | | | | | | | | | | | |
Actual | | $ | 1,000.00 | | | $ | 1,001.00 | | | $ | 1.26 | | | | 0.25 | % |
Hypothetical | | | 1,000.00 | | | | 1,023.95 | | | | 1.28 | | | | 0.25 | |
Institutional Class | | | | | | | | | | | | | | | | |
Actual | | | 1,000.00 | | | | 1,001.20 | | | | 1.06 | | | | 0.21 | |
Hypothetical | | | 1,000.00 | | | | 1,024.15 | | | | 1.07 | | | | 0.21 | |
Morgan | | | | | | | | | | | | | | | | |
Actual | | | 1,000.00 | | | | 1,000.50 | | | | 1.66 | | | | 0.33 | |
Hypothetical | | | 1,000.00 | | | | 1,023.54 | | | | 1.68 | | | | 0.33 | |
Premier | | | | | | | | | | | | | | | | |
Actual | | | 1,000.00 | | | | 1,000.70 | | | | 1.61 | | | | 0.32 | |
Hypothetical | | | 1,000.00 | | | | 1,023.59 | | | | 1.63 | | | | 0.32 | |
| | | | |
JPMorgan 100% U.S. Treasury Securities Money Market Fund | | | | | | | | | | | | | | | | |
Agency | | | | | | | | | | | | | | | | |
Actual | | | 1,000.00 | | | | 1,000.90 | | | | 1.26 | | | | 0.25 | |
Hypothetical | | | 1,000.00 | | | | 1,023.95 | | | | 1.28 | | | | 0.25 | |
Capital | | | | | | | | | | | | | | | | |
Actual | | | 1,000.00 | | | | 1,001.30 | | | | 0.91 | | | | 0.18 | |
Hypothetical | | | 1,000.00 | | | | 1,024.30 | | | | 0.92 | | | | 0.18 | |
IM | | | | | | | | | | | | | | | | |
Actual | | | 1,000.00 | | | | 1,001.50 | | | | 0.66 | | | | 0.13 | |
Hypothetical | | | 1,000.00 | | | | 1,024.55 | | | | 0.66 | | | | 0.13 | |
Institutional Class | | | | | | | | | | | | | | | | |
Actual | | | 1,000.00 | | | | 1,001.10 | | | | 1.06 | | | | 0.21 | |
Hypothetical | | | 1,000.00 | | | | 1,024.15 | | | | 1.07 | | | | 0.21 | |
Morgan | | | | | | | | | | | | | | | | |
Actual | | | 1,000.00 | | | | 1,000.50 | | | | 1.71 | | | | 0.34 | |
Hypothetical | | | 1,000.00 | | | | 1,023.49 | | | | 1.73 | | | | 0.34 | |
Premier | | | | | | | | | | | | | | | | |
Actual | | | 1,000.00 | | | | 1,000.60 | | | | 1.66 | | | | 0.33 | |
Hypothetical | | | 1,000.00 | | | | 1,023.54 | | | | 1.68 | | | | 0.33 | |
Reserve | | | | | | | | | | | | | | | | |
Actual | | | 1,000.00 | | | | 1,000.40 | | | | 1.82 | | | | 0.36 | |
Hypothetical | | | 1,000.00 | | | | 1,023.39 | | | | 1.84 | | | | 0.36 | |
| | | | |
JPMorgan Tax Free Money Market Fund | | | | | | | | | | | | | | | | |
Agency | | | | | | | | | | | | | | | | |
Actual | | | 1,000.00 | | | | 1,002.60 | | | | 1.31 | | | | 0.26 | |
Hypothetical | | | 1,000.00 | | | | 1,023.89 | | | | 1.33 | | | | 0.26 | |
Institutional Class | | | | | | | | | | | | | | | | |
Actual | | | 1,000.00 | | | | 1,002.80 | | | | 1.06 | | | | 0.21 | |
Hypothetical | | | 1,000.00 | | | | 1,024.15 | | | | 1.07 | | | | 0.21 | |
Morgan | �� | | | | | | | | | | | | | | | |
Actual | | | 1,000.00 | | | | 1,001.90 | | | | 1.87 | | | | 0.37 | |
Hypothetical | | | 1,000.00 | | | | 1,023.34 | | | | 1.89 | | | | 0.37 | |
Premier | | | | | | | | | | | | | | | | |
Actual | | | 1,000.00 | | | | 1,002.10 | | | | 1.82 | | | | 0.36 | |
Hypothetical | | | 1,000.00 | | | | 1,023.39 | | | | 1.84 | | | | 0.36 | |
Reserve | | | | | | | | | | | | | | | | |
Actual | | | 1,000.00 | | | | 1,001.80 | | | | 2.07 | | | | 0.41 | |
Hypothetical | | | 1,000.00 | | | | 1,023.14 | | | | 2.09 | | | | 0.41 | |
| | | | | | | | |
| | | |
| AUGUST 31, 2020 | | J.P. MORGAN MONEY MARKET FUNDS | | | | | 175 | |
SCHEDULE OF SHAREHOLDER EXPENSES
(Unaudited) (continued)
Hypothetical $1,000 Investment
| | | | | | | | | | | | | | | | |
| | | Beginning
Account Value
March 1, 2020 | | | Ending
Account Value
August 31, 2020 | | | Expenses
Paid During
the Period* | | | Annualized
Expense
Ratio | |
JPMorgan Municipal Money Market Fund | | | | | | | | | | | | | | | | |
Agency | | | | | | | | | | | | | | | | |
Actual | | $ | 1,000.00 | | | $ | 1,003.00 | | | $ | 1.31 | | | | 0.26 | % |
Hypothetical | | | 1,000.00 | | | | 1,023.89 | | | | 1.33 | | | | 0.26 | |
Institutional Class | | | | | | | | | | | | | | | | |
Actual | | | 1,000.00 | | | | 1,003.20 | | | | 1.06 | | | | 0.21 | |
Hypothetical | | | 1,000.00 | | | | 1,024.15 | | | | 1.07 | | | | 0.21 | |
Morgan | | | | | | | | | | | | | | | | |
Actual | | | 1,000.00 | | | | 1,002.00 | | | | 2.22 | | | | 0.44 | |
Hypothetical | | | 1,000.00 | | | | 1,022.99 | | | | 2.24 | | | | 0.44 | |
Premier | | | | | | | | | | | | | | | | |
Actual | | | 1,000.00 | | | | 1,002.20 | | | | 2.07 | | | | 0.41 | |
Hypothetical | | | 1,000.00 | | | | 1,023.14 | | | | 2.09 | | | | 0.41 | |
Service | | | | | | | | | | | | | | | | |
Actual | | | 1,000.00 | | | | 1,001.50 | | | | 2.93 | | | | 0.58 | |
Hypothetical | | | 1,000.00 | | | | 1,022.28 | | | | 2.96 | | | | 0.58 | |
| | | | |
JPMorgan California Municipal Money Market Fund | | | | | | | | | | | | | | | | |
Agency | | | | | | | | | | | | | | | | |
Actual | | | 1,000.00 | | | | 1,002.20 | | | | 1.21 | | | | 0.24 | |
Hypothetical | | | 1,000.00 | | | | 1,024.00 | | | | 1.22 | | | | 0.24 | |
Institutional Class | | | | | | | | | | | | | | | | |
Actual | | | 1,000.00 | | | | 1,002.40 | | | | 1.06 | | | | 0.21 | |
Hypothetical | | | 1,000.00 | | | | 1,024.15 | | | | 1.07 | | | | 0.21 | |
Morgan | | | | | | | | | | | | | | | | |
Actual | | | 1,000.00 | | | | 1,001.60 | | | | 1.72 | | | | 0.34 | |
Hypothetical | | | 1,000.00 | | | | 1,023.49 | | | | 1.73 | | | | 0.34 | |
Premier | | | | | | | | | | | | | | | | |
Actual | | | 1,000.00 | | | | 1,001.80 | | | | 1.67 | | | | 0.33 | |
Hypothetical | | | 1,000.00 | | | | 1,023.54 | | | | 1.68 | | | | 0.33 | |
Service | | | | | | | | | | | | | | | | |
Actual | | | 1,000.00 | | | | 1,001.10 | | | | 2.52 | | | | 0.50 | |
Hypothetical | | | 1,000.00 | | | | 1,022.68 | | | | 2.55 | | | | 0.50 | |
| | | | |
JPMorgan New York Municipal Money Market Fund | | | | | | | | | | | | | | | | |
Agency | | | | | | | | | | | | | | | | |
Actual | | | 1,000.00 | | | | 1,002.70 | | | | 1.31 | | | | 0.26 | |
Hypothetical | | | 1,000.00 | | | | 1,023.89 | | | | 1.33 | | | | 0.26 | |
Institutional Class | | | | | | | | | | | | | | | | |
Actual | | | 1,000.00 | | | | 1,002.90 | | | | 1.06 | | | | 0.21 | |
Hypothetical | | | 1,000.00 | | | | 1,024.15 | | | | 1.07 | | | | 0.21 | |
Morgan | | | | | | | | | | | | | | | | |
Actual | | | 1,000.00 | | | | 1,002.00 | | | | 2.02 | | | | 0.40 | |
Hypothetical | | | 1,000.00 | | | | 1,023.19 | | | | 2.04 | | | | 0.40 | |
Premier | | | | | | | | | | | | | | | | |
Actual | | | 1,000.00 | | | | 1,002.20 | | | | 1.92 | | | | 0.38 | |
Hypothetical | | | 1,000.00 | | | | 1,023.29 | | | | 1.94 | | | | 0.38 | |
Reserve | | | | | | | | | | | | | | | | |
Actual | | | 1,000.00 | | | | 1,001.90 | | | | 2.12 | | | | 0.42 | |
Hypothetical | | | 1,000.00 | | | | 1,023.09 | | | | 2.14 | | | | 0.42 | |
Service | | | | | | | | | | | | | | | | |
Actual | | | 1,000.00 | | | | 1,001.50 | | | | 2.72 | | | | 0.54 | |
Hypothetical | | | 1,000.00 | | | | 1,022.48 | | | | 2.75 | | | | 0.54 | |
| * | Expenses are equal to each Class’ respective annualized expense ratio, multiplied by the average account value over the period, multiplied by 184/365 (to reflect the one-half year period). |
| | | | | | |
| | | |
| 176 | | | | J.P. MORGAN MONEY MARKET FUNDS | | AUGUST 31, 2020 |
BOARD APPROVAL OF INVESTMENT ADVISORY AGREEMENTS
(Unaudited)
The Board of Trustees has established various standing committees composed of Trustees with diverse backgrounds, to which the Board of Trustees has assigned specific subject matter responsibilities to further enhance the effectiveness of the Board’s oversight and decision making. The Board of Trustees and its investment committees (money market and alternative products, equity, and fixed income) meet regularly throughout the year and consider factors that are relevant to their annual consideration of investment advisory agreements at each meeting. They also meet for the specific purpose of considering investment advisory agreement annual renewals. The Board of Trustees held meetings in June and August 2020, at which the Trustees considered the continuation of the investment advisory agreements for each Fund whose semi-annual report is contained herein (each an “Advisory Agreement” and collectively, the “Advisory Agreements”). In accordance with SEC guidance, due to the COVID-19 pandemic, the meetings were conducted through video conference. At the June meeting, the Board’s investment committees met to review and consider performance, expense and related information for the J.P. Morgan Funds. Each investment committee reported to the full Board, which then considered the investment committee’s preliminary findings. At the August meeting, the Trustees continued their review and consideration. The Trustees, including a majority of the Trustees who are not parties to an Advisory Agreement or “interested persons” (as defined in the 1940 Act) of any party to an Advisory Agreement or any of their affiliates, approved the continuation of each Advisory Agreement on August 11, 2020.
As part of their review of the Advisory Agreements, the Trustees considered and reviewed performance and other information about the Funds received from the Adviser. This information includes the Funds’ performance as compared to the performance of their peers and analyses by the Adviser of the Funds’ performance. In addition, at each of their regular meetings throughout the year, the Trustees considered reports on the performance of certain J.P. Morgan Funds provided by an independent management consulting firm (“independent consultant”). In addition, in preparation for the June and August meetings, the Trustees requested, received and evaluated extensive materials from the Adviser, including performance and expense information compiled by Broadridge, using data from Lipper Inc. and/or Morningstar, Inc., independent providers of investment company data (together, “Broadridge”). The Trustees’ independent consultant also provided additional analyses of the performance of certain J.P. Morgan Funds with greater than two years of performance history in connection with the Trustees’ review of the Advisory Agreements. Before voting on the Advisory Agreements, the Trustees reviewed the Advisory Agreements with representatives of the Adviser, counsel to the Trusts and independent legal counsel, and received a memorandum from independent legal counsel to the Trustees discussing the legal standards for
their consideration of the Advisory Agreements. The Trustees also discussed the Advisory Agreements in executive sessions with independent legal counsel at which no representatives of the Adviser were present.
A summary of the material factors evaluated by the Trustees in determining whether to approve each Advisory Agreement is provided below. Each Trustee attributed different weights to the various factors and no factor alone was considered determinative. The Trustees considered information provided with respect to the Funds throughout the year including additional reporting and information provided in connection with the market volatility caused by the COVID-19 pandemic, as well as materials furnished specifically in connection with the annual review process. From year to year, the Trustees consider and place emphasis on relevant information in light of changing circumstances in market and economic conditions.
After considering and weighing the factors and information they had received, the Trustees found that the compensation to be received by the Adviser from each Fund under the applicable Advisory Agreement was fair and reasonable under the circumstances and determined that the continuance of each Advisory Agreement was in the best interests of each Fund and its shareholders.
Nature, Extent and Quality of Services Provided by the Adviser
The Trustees received and considered information regarding the nature, extent and quality of services provided to each Fund under the applicable Advisory Agreement. The Trustees took into account information furnished throughout the year at Trustee meetings, as well as the materials furnished specifically in connection with this annual review process. The Trustees considered the background and experience of the Adviser’s senior management, personnel changes, if any, and the expertise of, and the amount of attention given to each Fund by, investment personnel of the Adviser. In addition, the Trustees reviewed the qualifications, backgrounds and responsibilities of the portfolio management team primarily responsible for the day-to-day management of each Fund and the infrastructure supporting the team, including personnel changes, if any. In addition, the Board considered its discussions with the Adviser regarding the Adviser’s business continuity plan and steps the Adviser was taking to provide ongoing services to the Funds during the COVID-19 pandemic, and the Adviser’s success in continuing to provide services to the Funds and their shareholders throughout this period. The Trustees also considered information provided by the Adviser and JPMorgan Distribution Services, Inc. (“JPMDS”) about the structure and distribution strategy of each Fund. The Trustees reviewed information relating to the Adviser’s risk governance model and reports showing the Adviser’s compliance structure and ongoing compliance processes. The Trustees also considered the quality of administration services provided by the Adviser in its role as administrator.
| | | | | | | | |
| | | |
| AUGUST 31, 2020 | | J.P. MORGAN MONEY MARKET FUNDS | | | | | 177 | |
BOARD APPROVAL OF INVESTMENT ADVISORY AGREEMENTS
(Unaudited) (continued)
The Trustees also considered their knowledge of the nature and quality of services provided by the Adviser and its affiliates to the Funds gained from their experience as Trustees of the J.P. Morgan Funds. In addition, they considered the overall reputation and capabilities of the Adviser and its affiliates, the commitment of the Adviser to provide high quality service to the Funds, their overall confidence in the Adviser’s integrity and the Adviser’s responsiveness to questions or concerns raised by them, including the Adviser’s willingness to consider and implement organizational and operational changes designed to improve investment results and the services provided to each Fund.
Based upon these considerations and other factors, the Trustees concluded that they were satisfied with the nature, extent and quality of the investment advisory services provided to the Funds by the Adviser.
Costs of Services Provided and Profitability to the Adviser and its Affiliates
The Trustees received and considered information regarding the profitability to the Adviser and its affiliates in providing services to each Fund. The Trustees reviewed and discussed this information. The Trustees recognized that this information is not audited and represents the Adviser’s determination of its and its affiliates’ revenues from the contractual services provided to the Funds, less expenses of providing such services. Expenses include direct and indirect costs and are calculated using an allocation methodology developed by the Adviser. The Trustees also recognized that it is difficult to make comparisons of profitability from fund investment advisory contracts because comparative information is not generally publicly available and is affected by numerous factors, including the structure of the particular adviser, the types of funds it manages, its business mix, numerous assumptions regarding allocations and the fact that publicly-traded fund managers’ operating profits and net income are net of distribution and marketing expenses. Based upon their review, and taking into consideration the factors noted above, the Trustees concluded that the profitability to the Adviser under each Advisory Agreement was not unreasonable in light of the services and benefits provided to each Fund.
The Trustees also considered that JPMDS, an affiliate of the Adviser, and the Adviser earn fees from the Funds for providing shareholder and administration services, respectively. These fees were shown separately in the profitability analysis presented to the Trustees. The Trustees also considered the payments of Rule 12b-1 fees to JPMDS, which also acts as the Funds’ distributor and that these fees are in turn generally paid to financial intermediaries that sell the Funds, including financial intermediaries that are affiliates of the Adviser (although they are retained by JPMDS in certain instances). The Trustees also considered the fees paid to JPMorgan Chase
Bank, N.A. (“JPMCB”) for custody and fund accounting, and other related services.
Fall-Out Benefits
The Trustees reviewed information regarding potential “fall-out” or ancillary benefits received by the Adviser and its affiliates as a result of their relationship with the Funds. The Trustees considered that the Funds’ operating accounts are held at JPMCB, which, as a result, will receive float benefits for certain J.P. Morgan Funds, as applicable. The Trustees also noted that the Adviser supports a diverse set of products and services, which benefits the Adviser by allowing it to leverage its infrastructure to serve additional clients. The Trustees also reviewed the Adviser’s allocation of fund brokerage for the J.P. Morgan Funds complex, including allocations to brokers who provide research to the Adviser.
Economies of Scale
The Trustees considered the extent to which the Funds may benefit from economies of scale. The Trustees considered that there may not be a direct relationship between economies of scale realized by the Funds and those realized by the Adviser as assets increase. The Trustees considered the extent to which the Funds were priced to scale and whether it would be appropriate to add advisory fee breakpoints. The Trustees noted certain Funds with contractual expense limitations and fee waivers (“Fee Caps”) which allow a Fund’s shareholders to share potential economies of scale from its inception, prior to reaching scale. The Trustees also noted that other Funds which had achieved scale as asset levels had increased, no longer had Fee Caps in place for some or all of their share classes, but shared economies of scale through lower average expenses. The Trustees noted that the fees remain satisfactory relative to peer funds. The Trustees considered the benefits to the Funds of the use of an affiliated distributor and custodian, including the ability to rely on existing infrastructure supporting distribution, custodial and transfer agent services and the ability to negotiate competitive fees for the Funds. The Trustees further considered the Adviser’s and JPMDS’s ongoing investments in their business in support of the Funds, including the Adviser’s and/or JPMDS’s investments in trading systems, technology (including improvements to the J.P. Morgan Funds’ website, and cybersecurity improvements), retention of key talent, and regulatory support enhancements. The Trustees concluded that the current fee structure for each Fund, including any Fee Caps the Adviser has in place that serve to limit the overall net expense ratios of a Fund at competitive levels, was reasonable. The Trustees concluded that, for Funds with expense caps in place for some or all of their share classes, the relevant Funds’ shareholders received the benefits of potential economies of scale through the Fee Caps and, for Funds that achieved scale and no longer had Fee Caps in place for some or all of their share classes, the relevant Funds’ shareholders
| | | | | | |
| | | |
| 178 | | | | J.P. MORGAN MONEY MARKET FUNDS | | AUGUST 31, 2020 |
benefited from lower average expenses resulting from increased assets. The Trustees also concluded that all Funds benefited from the Adviser’s reinvestment in its operations to serve the Funds and their shareholders. The Trustees noted that the Adviser’s reinvestment ensures sufficient resources in terms of personnel and infrastructure to support the Funds.
Independent Written Evaluation of the Funds’ Senior Officer/Chief Compliance Officer
The Trustees noted that, upon their direction, the Senior Officer for the Prime Money Market Fund, Liquid Assets Money Market Fund, U.S. Government Money Market Fund, U.S. Treasury Plus Money Market Fund, 100% U.S. Treasury Securities Money Market Fund and Municipal Money Market Fund had prepared an independent written evaluation in order to assist the Trustees in determining the reasonableness of the proposed management fees. In determining whether to continue the Advisory Agreements, the Trustees considered the Senior Officer’s report.
The Trustees noted that, upon their direction, the Chief Compliance Officer for the Institutional Tax Free Money Market Fund, Federal Money Market Fund, Tax Free Money Market Fund, California Municipal Money Market Fund, New York Municipal Money Market Fund and Securities Lending Money Market Fund had prepared an independent written evaluation in order to assist the Trustees in determining the reasonableness of the proposed management fees. The Trustees considered the written evaluation in determining whether to continue the Advisory Agreements.
Fees Relative to Adviser’s Other Clients
The Trustees received and considered information about the nature and extent of investment advisory services and fee rates offered to other clients of the Adviser, including institutional separate accounts, collective investment trusts, ETFs and/or funds sub-advised by the Adviser, for investment management styles substantially similar to that of each Fund. The Trustees considered the complexity of investment management for registered mutual funds relative to the Adviser’s other clients and noted differences, as applicable, in the regulatory, legal and other risks and responsibilities of providing services to the different clients. The Trustees considered that serving as an adviser to a registered mutual fund involves greater responsibilities and risks than acting as a sub-adviser and observed that sub-advisory fees may be lower than those charged by the Adviser to each Fund. The Trustees also noted that the adviser, not the mutual fund, pays the sub-advisory fee and that many responsibilities related to the advisory function are retained by the primary adviser. The Trustees concluded that the fee rates charged to each Fund in comparison to those charged to the Adviser’s other clients were reasonable.
Investment Performance
The Trustees received and considered absolute and/or relative performance information for the Funds in a report prepared by Broadridge. The Trustees considered the total return performance information, which included the ranking of the Funds within a performance universe made up of funds with the same Broadridge investment classification and objective (the “Universe”), as well as a subset of funds within the Universe (the “Peer Group”), by total return for applicable one-, three- and five-year periods. The Trustees reviewed a description of Broadridge’s methodology for selecting mutual funds in each Fund’s Universe and Peer Group and noted that Universe and Peer Group rankings were not calculated if the number of funds in the Universe and/or Peer Group did not meet a predetermined minimum. The Broadridge materials provided to the Trustees highlighted information with respect to certain representative share classes to assist the Trustees in their review. As part of this review, the Trustees also considered the performance information provided for the Funds at regular Board meetings by the Adviser. The Trustees also engaged with the Adviser to consider what steps might be taken to improve performance, as applicable. The Broadridge performance data noted by the Trustees as part of their review and the determinations made by the Trustees with respect to each Fund’s performance for certain representative share classes are summarized below:
The Trustees noted that the Prime Money Market Fund’s performance for the Institutional shares was in the first quintile based upon the Peer Group for each of the one-, three- and five-year periods ended December 31, 2019, and in the second, first and second quintiles based upon the Universe for the one-, three- and five-year periods ended December 31, 2019, respectively. The Trustees noted that the performance for the Morgan shares was in the third, fifth and fifth quintiles based upon the Peer Group for the one-, three- and five-year periods ended December 31, 2019 respectively, and in the fourth quintile based upon the Universe for each of the one-, three- and five-year periods ended December 31, 2019, . The Trustees discussed the performance and investment strategy of the Fund with the Adviser and, based upon this discussion and various other factors, the Trustees concluded that the Fund’s performance was satisfactory under the circumstances.
The Trustees noted that the Institutional Tax Free Money Market Fund’s performance for the Institutional shares was in the second and third quintiles based upon the Peer Group and Universe, respectively, for the one-year period ended December 31, 2019. The Trustees discussed the performance and investment strategy of the Fund with the Adviser and, based upon this discussion and various other factors, the Trustees concluded that the Fund’s performance was satisfactory.
| | | | | | | | |
| | | |
| AUGUST 31, 2020 | | J.P. MORGAN MONEY MARKET FUNDS | | | | | 179 | |
BOARD APPROVAL OF INVESTMENT ADVISORY AGREEMENTS
(Unaudited) (continued)
The Trustees noted that the Liquid Assets Money Market Fund’s performance for the Institutional shares was in the second, first and first quintiles based upon the Peer Group for the one-, three- and five- year periods ended December 31, 2019, respectively, and in the first quintile based upon the Universe for each of the one-, three- and five-year periods ended December 31, 2019. The Trustees noted that the performance for the Morgan shares was in the first quintile based on the Peer Group for each of the one-, three- and five-year periods ended December 31, 2019, and in the third quintile based upon the Universe for each of the one-, three- and five-year periods ended December 31, 2019. The Trustees discussed the performance and investment strategy of the Fund with the Adviser and, based upon this discussion and various other factors, the Trustees concluded that the Fund’s performance was satisfactory.
The Trustees noted that the U.S. Government Money Market Fund’s performance for the Institutional shares was in the second quintile based upon the Peer Group for each of the one-, three- and five-year periods ended December 31, 2019, and in the second, second and first quintiles based upon the Universe for the one-, three- and five-year periods ended December 31, 2019, respectively. The Trustees noted that the performance for the Morgan shares was in the first quintile based upon the Peer Group for each of the one-, three- and five-year periods ended December 31, 2019, and in the third quintile based upon the Universe for each of the one-, three- and five-year periods ended December 31, 2019. The Trustees noted that the performance for the Service shares was in the fifth quintile based upon both the Peer Group and Universe for each of the one-, three- and five-year periods ended December 31, 2019. The Trustees discussed the performance and investment strategy of the Fund with the Adviser and, based upon this discussion and various other factors, the Trustees concluded that the Fund’s performance was satisfactory under the circumstances.
The Trustees noted that the U.S. Treasury Plus Money Market Fund’s performance for the Institutional shares was in the second, second and first quintiles based upon both the Peer Group and Universe for the one-, three- and five-year periods ended December 31, 2019, respectively. The Trustees noted that the performance for the Morgan shares was in the second, second and first quintiles based upon the Peer Group for the one-, three- and five-year periods ended December 31, 2019, respectively, and in the third quintile based upon the Universe for each of the one-, three- and five-year periods ended December 31, 2019. The Trustees discussed the performance and investment strategy of the Fund with the Adviser and, based upon this discussion and various other factors, the Trustees concluded that the Fund’s performance was satisfactory.
The Trustees noted that the Federal Money Market Fund’s performance for the Institutional shares was in the first and second quintiles based upon the Peer Group and Universe, respectively, for each of the one-, three- and five-year periods ended December 31, 2019. The Trustees noted that the performance for the Morgan shares was in the second, first and first quintiles based upon the Peer Group for the one-, three- and five-year periods ended December 31, 2019, respectively, and in the third quintile based upon the Universe, for each of the one-, three- and five-year periods ended December 31, 2019. The Trustees discussed the performance and investment strategy of the Fund with the Adviser and, based upon this discussion and various other factors, the Trustees concluded that the Fund’s performance was satisfactory. The Trustees noted that the 100% U.S. Treasury Securities Money Market Fund’s performance for the Institutional shares was in the fourth, third and fourth quintiles based upon the Peer Group for the one-, three- and five-year periods ended December 31, 2019, respectively, and in the second quintile based upon the Universe for each of the one-, three- and five-year periods ended December 31, 2019. The Trustees noted that the performance for the Morgan shares was in the second, second and first quintiles based upon the Peer Group for the one-, three- and five-year periods ended December 31, 2019, respectively, and in the fourth, third and third quintiles based upon the Universe, for the one-, three- and five-year periods ended December 31, 2019, respectively. The Trustees discussed the performance and investment strategy of the Fund with the Adviser and, based upon this discussion and various other factors, the Trustees concluded that the Fund’s performance was satisfactory under the circumstances.
The Trustees noted that the Tax Free Money Market Fund’s performance for the Institutional shares was in the third and first quintiles based upon the Peer Group and Universe, respectively, for each of the one-, three- and five-year periods ended December 31, 2019. The Trustees noted that the performance for the Morgan shares was in the second and fourth quintiles based upon the Peer Group and Universe, respectively, for each of the one-, three- and five-year periods ended December 31, 2019. The Trustees discussed the performance and investment strategy of the Fund with the Adviser and, based upon this discussion and various other factors, the Trustees concluded that the Fund’s performance was satisfactory under the circumstances.
The Trustees noted that the California Municipal Money Market Fund’s performance for Morgan shares was in the fourth quintile based upon the Universe for each of the one-, three- and five-year periods ended December 31, 2019. The Trustees noted that the performance for Service shares was in the fifth quintile based upon the Universe for each of the one-, three- and five-year periods ended December 31, 2019. The Trustees discussed the performance and investment strategy of the Fund with the Adviser and, based upon this discussion and
| | | | | | |
| | | |
| 180 | | | | J.P. MORGAN MONEY MARKET FUNDS | | AUGUST 31, 2020 |
various other factors, the Trustees concluded that the Fund’s performance was satisfactory under the circumstances.
The Trustees noted that the Municipal Money Market Fund’s performance for the Institutional shares was in the second and first quintiles based upon the Peer Group and Universe, respectively, for each of the one-, three- and five-year periods ended December 31, 2019. The Trustees noted that the performance for the Morgan shares was in the first and fourth quintiles based upon the Peer Group and Universe, respectively, for each of the one-, three- and five-year periods ended December 31, 2019. The Trustees noted that the performance for the Service shares was in the fourth and fifth quintiles based upon the Peer Group and Universe, respectively, for each of the one-, three- and five-year periods ended December 31, 2019. The Trustees discussed the performance and investment strategy of the Fund with the Adviser and, based upon this discussion and various other factors, the Trustees concluded that the Fund’s performance was satisfactory under the circumstances.
The Trustees noted that the New York Municipal Money Market Fund’s performance for Morgan shares was in the fourth quintile based upon the Universe for each of the one-, three- and five-year periods ended December 31, 2019. The Trustees noted that the performance for Service shares was in the fifth quintile based upon the Universe for each of the one-, three- and five-year periods ended December 31, 2019. The Trustees discussed the performance and investment strategy of the Fund with the Adviser and, based upon this discussion and various other factors, the Trustees concluded that the Fund’s performance was satisfactory under the circumstances.
The Trustees noted that the Securities Lending Money Market Fund’s performance for the Agency SL shares was in the first quintile based upon both the Peer Group and Universe for the one-year period ended December 31, 2019. The Trustees discussed the performance and investment strategy of the Fund with the Adviser and, based upon this discussion and various other factors, the Trustees concluded that the performance was satisfactory.
Advisory Fees and Expense Ratios
The Trustees considered the contractual advisory fee rate and administration fee rate paid by each Fund to the Adviser and compared the combined rate to the information prepared by Broadridge concerning management fee rates paid by other funds in the same Broadridge category as each Fund. The Trustees recognized that Broadridge reported each Fund’s management fee rate as the combined contractual advisory fee and administration fee rates. The Trustees also reviewed information about other expenses and the expense ratios for each Fund and noted that Universe and Peer Group rankings were not calculated if the number of funds in the Universe and/or Peer Group did not meet a predetermined minimum. For
each Fund that had a Fee Cap in place, the Trustees considered the net advisory fee rate and net expense ratio for each share class, as applicable, taking into account any waivers and/or reimbursements. The Trustees also considered any proposed changes to a Fee Cap, and, where deemed appropriate by the Trustees, additional waivers and/or reimbursements. The Trustees recognized that it is difficult to make comparisons of advisory fees because there are variations in the services that are included in the fees paid by other funds. The Trustees’ determinations as a result of the review of each Fund’s advisory fees and expense ratios for certain representative share classes are summarized below:
The Trustees noted that the Prime Money Market Fund’s net advisory fee for the Institutional shares was in the third and fourth quintiles based upon the Peer Group and Universe, respectively, and that the actual total expenses were in the second and third quintiles based upon the Peer Group and Universe, respectively. The Trustees noted that the net advisory fee for the Morgan shares was in the third and fourth quintiles based upon the Peer Group and Universe, respectively, and that the actual total expenses were in the fifth quintile based upon both the Peer Group and Universe. After considering the factors identified above, in light of this information, the Trustees concluded that the advisory fees were satisfactory in light of the services provided to the Fund.
The Trustees noted that the Institutional Tax Free Money Market Fund’s net advisory fee for the Institutional shares was in the second and third quintiles based upon the Peer Group and Universe, respectively, and that the actual total expenses were in the second and fourth quintiles based upon the Peer Group and Universe, respectively. After considering the factors identified above, in light of this information, the Trustees concluded that the advisory fees were satisfactory in light of the services provided to the Fund.
The Trustees noted that the Liquid Assets Money Market Fund’s net advisory fee for the Institutional shares was in the first and second quintiles based upon the Peer Group and Universe, respectively, and that the actual total expenses were in the third and second quintiles based upon the Peer Group and Universe, respectively. The Trustees noted that the net advisory fee for the Morgan shares was in the second quintile based upon both the Peer Group and Universe, and that the actual total expenses were in the first quintile based upon both the Peer Group and Universe. After considering the factors identified above, in light of this information, the Trustees concluded that the advisory fees were satisfactory in light of the services provided to the Fund.
The Trustees noted that the U.S. Government Money Market Fund’s net advisory fee for Institutional shares was in the second quintile based upon both the Peer Group and Universe, and the actual total expenses were in the third and second quintiles based upon the Peer Group and Universe,
| | | | | | | | |
| | | |
| AUGUST 31, 2020 | | J.P. MORGAN MONEY MARKET FUNDS | | | | | 181 | |
BOARD APPROVAL OF INVESTMENT ADVISORY AGREEMENTS
(Unaudited) (continued)
respectively. The Trustees noted that the net advisory fee for the Morgan shares was in the first and second quintiles based upon the Peer Group and Universe, respectively, and that the actual total expenses were in the first and second quintiles based upon the Peer Group and Universe, respectively. The Trustees noted that the net advisory fee and actual total expenses for the Service shares were in the second and fifth quintiles, respectively, based upon both the Peer Group and Universe. After considering the factors identified above, in light of this information, the Trustees concluded that the advisory fees were satisfactory in light of the services provided to the Fund.
The Trustees noted that the U.S. Treasury Plus Money Market Fund’s net advisory fee and actual total expenses for the Institutional shares were both in the second quintile based upon both the Peer Group and Universe. The Trustees noted that the net advisory fee and actual total expenses for the Morgan shares were in the first and second quintiles, respectively, based upon both the Peer Group and Universe. After considering the factors identified above, in light of this information, the Trustees concluded that the advisory fees were satisfactory in light of the services provided to the Fund.
The Trustees noted that the Federal Money Market Fund’s net advisory fee for the Institutional shares was in the second quintiles based upon both the Peer Group and Universe, and that the actual total expenses were in the first and second quintiles based upon the Peer Group and Universe, respectively. The Trustees noted that the net advisory fee for the Morgan shares was in the third and first quintiles based upon the Peer Group and Universe, respectively, and that the actual total expenses were in the second quintile based upon both the Peer Group and Universe. After considering the factors identified above, in light of this information, the Trustees concluded that the advisory fees were satisfactory in light of the services provided to the Fund.
The Trustees noted that the 100% U.S. Treasury Securities Money Market Fund’s net advisory fee and the actual total expenses for the Institutional shares were both in the second quintile based upon both the Peer Group and Universe. The Trustees noted that the net advisory fee for the Morgan shares was in the first quintile based upon both the Peer Group and Universe, and that the actual total expenses were in the second quintile based upon both the Peer Group and Universe. After considering the factors identified above, in light of this information, the Trustees concluded that the advisory fees were satisfactory in light of the services provided to the Fund.
The Trustees noted that the Tax Free Money Market Fund’s net advisory fee for Institutional shares was in the second and third quintiles based upon the Peer Group and Universe, respectively, and that the actual total expenses were in the third and second quintiles based upon the Peer Group and Universe, respectively. The Trustees noted that the net advisory
fee for the Morgan shares was in the third quintile based upon both the Peer Group and Universe, and that the actual total expenses were in the second and first quintiles based upon the Peer Group and Universe, respectively. After considering the factors identified above, in light of this information, the Trustees concluded that the advisory fees were satisfactory in light of the services provided to the Fund.
The Trustees noted that the California Municipal Money Market Fund’s net advisory fee and actual total expenses for Morgan shares were in the second and first quintiles, respectively, based upon the Universe. The Trustees noted that the net advisory fee and actual total expenses for Service shares were in the second and fifth quintiles, respectively, based upon the Universe. After considering the factors identified above, the Trustees concluded that the advisory fees were satisfactory in light of the services provided to the Fund.
The Trustees noted that the Municipal Money Market Fund’s net advisory fee for the Institutional shares was in the first and second quintiles based upon the Peer Group and Universe, respectively, and that the actual total expenses were in the second quintile based upon both the Peer Group and Universe. The Trustees noted that the net advisory fee for the Morgan shares was in the second quintile based upon both the Peer Group and Universe, and that the actual total expenses were in the first quintile based upon both the Peer Group and Universe. The Trustees noted that the net advisory fee for the Service shares was in the third and second quintiles based upon the Peer Group and Universe, respectively, and that the actual total expenses were in the third and fourth quintiles based upon the Peer Group and Universe, respectively. After considering the factors identified above, in light of this information, the Trustees concluded that the advisory fees were satisfactory in light of the services provided to the Fund.
The Trustees noted that, based upon the Universe, the New York Municipal Money Market Fund’s net advisory fee and actual total expenses for Morgan shares were in the third and first quintiles, respectively, based upon the Universe. The Trustees noted that the net advisory fee and actual total expenses for the Service shares were in the third and fifth quintiles, respectively, based upon the Universe. After considering the factors identified above, the Trustees concluded that the advisory fees were satisfactory in light of the services provided to the Fund.
The Trustees noted that the Securities Lending Money Market Fund’s net advisory fee and actual total expenses for the Agency SL shares were in the first quintile based upon both the Peer Group and Universe. After considering the factors identified above, in light of this information, the Trustees concluded that the advisory fees were satisfactory in light of the services provided to the Fund.
| | | | | | |
| | | |
| 182 | | | | J.P. MORGAN MONEY MARKET FUNDS | | AUGUST 31, 2020 |
J.P. Morgan Funds are distributed by JPMorgan Distribution Services, Inc., which is an affiliate of JPMorgan Chase & Co. Affiliates of JPMorgan Chase & Co. receive fees for providing various services to the funds.
Contact JPMorgan Distribution Services, Inc. at 1-800-480-4111 (retail investors) or 1-800-766-7722 (institutional investors) for a fund prospectus. You can also visit us at www.jpmorganfunds.com. Investors should carefully consider the investment objectives and risk as well as charges and expenses of the mutual fund before investing. The prospectus contains this and other information about the mutual fund. Read the prospectus carefully before investing.
Investors may obtain information about the Securities Investor Protection Corporation (SIPC), including the SIPC brochure, by visiting www.sipc.org or by calling SIPC at 202-371-8300.
Each Fund files a complete schedule of its fund holdings for the first and third quarters of its fiscal year with the SEC as an exhibit to its report on Form N-PORT. The Funds’ Form N-PORT reports are available on the SEC’s website at http://www.sec.gov. Each Fund’s quarterly holdings can be found by visiting the J.P. Morgan Funds’ website at www.jpmorganfunds.com.
A description of each Fund’s policies and procedures with respect to the disclosure of each Fund’s holdings is available in the prospectuses and Statement of Additional Information.
A copy of proxy policies and procedures is available without charge upon request by calling 1-800-480-4111 (retail investors) or 1-800-766-7722 (institutional investors) and on the Funds’ website at www.jpmorganfunds.com. A description of such policies and procedures is on the SEC’s website at www.sec.gov. The Trustees have delegated the authority to vote proxies for securities owned by the Funds to the Adviser. A copy of the Funds’ voting record for the most recent 12-month period ended June 30 is available on the SEC’s website at www.sec.gov or at the Funds’ website at www.jpmorganfunds.com no later than August 31 of each year. The Funds’ proxy voting record will include, among other things, a brief description of the matter voted on for each fund security, and will state how each vote was cast, for example, for or against the proposal.


J.P. Morgan Asset Management is the brand name for the asset management business of JPMorgan Chase & Co. and its affiliates worldwide.
| | | | |
| | © JPMorgan Chase & Co., 2020. All rights reserved. August 2020. | | SAN-MMKT-820 |
Semi-Annual Report
J.P. Morgan SMA Funds
August 31, 2020 (Unaudited)
JPMorgan Core Focus SMA Fund

CONTENTS
Investments in the Fund are not deposits or obligations of, or guaranteed or endorsed by, any bank and are not insured or guaranteed by the FDIC, the Federal Reserve Board or any other government agency. You could lose money if you sell when the Fund’s share price is lower than when you invested.
Past performance is no guarantee of future performance. The general market views expressed in this report are opinions based on market and other conditions through the end of the reporting period and are subject to change without notice. These views are not intended to predict the future performance of the Fund or the securities markets. References to specific securities and their issuers are for illustrative purposes only and are not intended to be, and should not be interpreted as, recommendations to purchase or sell such securities. Such views are not meant as investment advice and may not be relied on as an indication of trading intent on behalf of the Fund.
Prospective investors should refer to the Fund’s prospectus for a discussion of the Fund’s investment objective, strategies and risks. Call J.P. Morgan Funds Service Center at 1-800-766-7722 for a prospectus containing more complete information about the Fund, including management fees and other expenses. Please read it carefully before investing.
LETTER TO SHAREHOLDERS
OCTOBER 23, 2020 (Unaudited)
Dear Shareholders,
Even as the U.S. economy has endured a severe contraction since the start of the pandemic, financial markets have generally rebounded from lows seen in March 2020 amid unprecedented support from the Federal Reserve (the “Fed”) and investor optimism about efforts to contain the spread of COVID-19.
| | |
 | | “Throughout this tumultuous year, J.P. Morgan Asset Management has responded to unprecedented conditions by continuing to seek to provide our clients with effective investment solutions and dependable service.” — Andrea L. Lisher |
In response to an acute sell-off in financial markets in February and March 2020, the Fed unveiled an array of lending and asset purchasing programs designed to head off a liquidity crisis in credit markets and maintain the flow of credit to the public and private sectors. The Fed also slashed interest rates in March 2020, as jobless claims spiked to record highs, which helped to bolster equity markets. In the following months, financial market volatility subsided and asset prices generally began to rebound, though global oil prices remained at historically low levels amid a steep drop off in demand and slower economic
activity. For the six months ended August 31, 2020, the S&P 500 Index returned 19.6% and the Bloomberg Barclays U.S. Aggregate Index returned 2.9%.
Our long-term view remains one of cautious optimism, but we recognize the near-term risks stemming from uncertainty surrounding additional fiscal support and efforts to contain COVID-19. The pace of economic activity looks set to slow into the end of the year as services remain under pressure, and additional stimulus may be required to keep the economy on track in 2021. That said, volatility in financial markets could begin to recede as the results of the November 3rd election provide clarity on the contours of the political landscape going forward. Throughout this tumultuous year, J.P. Morgan Asset Management has responded to unprecedented conditions by continuing to seek to provide our clients with effective investment solutions and dependable service.
On behalf of J.P. Morgan Asset Management, thank you for entrusting us to manage your investment. Should you have any questions, please visit www.jpmorganfunds.com or contact the J.P. Morgan Funds Service Center at 1-800-480-4111.
Sincerely yours,

Andrea L. Lisher
Head of Americas, Client
J.P. Morgan Asset Management
| | | | | | | | |
| | | |
| AUGUST 31, 2020 | | J.P. MORGAN SMA FUNDS | | | | | 1 | |
JPMorgan Core Focus SMA Fund
FUND COMMENTARY
SIX MONTHS ENDED AUGUST 31, 2020 (Unaudited)
| | | | |
| REPORTING PERIOD RETURN: | |
| Fund* | | | 1.40% | |
| Bloomberg Barclays U.S. Aggregate Index | | | 2.98% | |
| |
| Net Assets as of 8/31/2020 | | $ | 23,852,675 | |
| Duration as of 8/31/2020 | | | 4.1 Years | |
INVESTMENT OBJECTIVE**
The JPMorgan Core Focus SMA Fund (the “Fund”) seeks to maximize total return.
HOW DID THE MARKET PERFORM?
The reporting period began with a steep sell-off in global financial markets as COVID-19 was declared a pandemic and economic activity was sharply curtailed. However, from April through the end of August 2020, financial markets largely rebounded amid unprecedented support from leading central banks and the efforts of national governments to both provide fiscal stimulus and limit the spread of the novel coronavirus.
A potential liquidity crisis in U.S. credit markets in March 2020 was headed off by the U.S. Federal Reserve, which unleashed an array of programs to shore up financial markets. In the subsequent months, investment grade corporate credit and high yield debt (also known as “junk bonds”) rallied and yields on U.S. Treasury securities fell. For the six months ended August 31, 2020, the Bloomberg Barclays U.S. Aggregate Index (the “Benchmark”) returned 2.98%
WHAT WERE THE MAIN DRIVERS OF THE FUND’S PERFORMANCE?
For the six months ended August 31, 2020, the Fund underperformed the Benchmark.
Relative to the Benchmark, the Fund’s underweight allocation to the 20-to-30 year portion of the yield curve, which benefitted the most from falling interest rates late in the period, was a leading detractor from performance. The yield curve shows the relationship between yields and maturity dates for a set of similar bonds at a given point in time.
The Fund’s overweight allocations to asset-backed securities, non-agency mortgage-backed securities and commercial mortgage-backed securities were leading contributors to relative performance amid investor demand for asset classes with relatively attractive yields.
HOW WAS THE FUND POSITIONED?
The Fund was invested primarily in a diversified portfolio of corporate bonds, U.S. government and agency securities, asset-backed securities, and mortgage-related and mortgage-backed securities.
| | | | |
PORTFOLIO COMPOSITION*** | |
| Collateralized Mortgage Obligations | | | 30.6 | % |
| Asset-Backed Securities | | | 28.9 | |
| Corporate Bonds | | | 24.0 | |
| Commercial Mortgage-Backed Securities | | | 7.5 | |
| Mortgage-Backed Securities | | | 1.8 | |
| U.S. Treasury Obligations | | | 0.7 | |
| Short-Term Investments | | | 6.5 | |
| * | | The return shown is based on net asset values and may differ from the return shown in the financial highlights, which reflects adjustments made to the net asset values in accordance with accounting principles generally accepted in the United States of America. |
| ** | | The adviser seeks to achieve the Fund’s objective. There can be no guarantee it will be achieved. |
| *** | | Percentages indicated are based on total investments as of August 31, 2020. The Fund’s portfolio composition is subject to change. |
| | | | | | |
| | | |
| 2 | | | | J.P. MORGAN SMA FUNDS | | AUGUST 31, 2020 |
| | | | | | | | | | | | | | | | |
AVERAGE ANNUAL TOTAL RETURNS AS OF AUGUST 31, 2020 | |
| | | | |
| | | INCEPTION DATE OF
FUND | | | 6 MONTH* | | | 1 YEAR | | | SINCE INCEPTION | |
JPMORGAN CORE FOCUS SMA FUND | | | March 1, 2018 | | | | 1.40 | % | | | 4.47 | % | | | 5.96 | % |
LIFE OF FUND PERFORMANCE (3/1/18 TO 8/31/20)
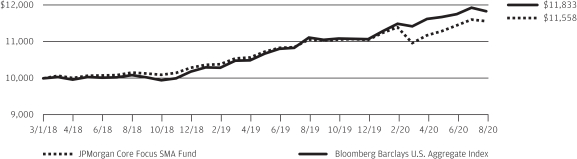
The performance quoted is past performance and is not a guarantee of future results. Mutual funds are subject to certain market risks. Investment returns and principal value of an investment will fluctuate so that an investor’s shares, when redeemed, may be worth more or less than their original cost. Current performance may be higher or lower than the performance data shown. For up-to-date, month-end performance information please call 1-800-766-7722.
The Fund commenced operations on March 1, 2018.
The graph illustrates comparative performance for $10,000 invested in the JPMorgan Core Focus SMA Fund and the Bloomberg Barclays U.S. Aggregate Index from March 1, 2018 to August 31, 2020. The performance of the Fund assumes reinvestment of all dividends and capital gain distributions, if any. The performance of the Bloomberg Barclays U.S. Aggregate Index does not reflect the deduction of expenses or a sales charge associated with a mutual fund and has been adjusted to reflect reinvestment of all dividends and capital gain distributions of securities included in the benchmark, if applicable. These expenses are not identical to the expenses incurred by the Fund. The Bloomberg Barclays U.S. Aggregate Index is an unmanaged index that represents securities that are SEC-registered, taxable and dollar denominated. The Bloomberg Barclays U.S. Aggregate Index covers the U.S. investment grade fixed rate bond market, with index components for government and corporate securities, mortgage pass-through securities, and asset-backed securities.
Fund performance may reflect the waiver of the Fund’s fees and reimbursement of expenses for certain periods since the inception date. Without these waivers and reimbursements, performance would have been lower. Also, performance shown in this section does not reflect the deduction of taxes that a shareholder would pay on Fund distributions or redemptions of Fund shares.
The returns shown are based on net asset values calculated for shareholder transactions and may differ from the returns shown in the financial highlights, which reflect adjustments made to the net asset values in accordance with accounting principles generally accepted in the United States of America.
The Fund is offered as a component of the JPMorgan Core Focus SMA Managed Account Strategy (“SMA Strategy”) to participants in separately managed account programs. The SMA Strategy consists of a separately managed account that holds both the Fund and other securities and investments directly for the SMA clients. As a result, the Fund will not hold all of the core bond investments of the SMA Strategy but rather will invest in certain securities and investments that can be traded more efficiently if held by an investment company rather than directly. Since the Fund will be used as part of a SMA Strategy, it is not intended to be a stand-alone core bond investment strategy.
| | | | | | | | |
| | | |
| AUGUST 31, 2020 | | J.P. MORGAN SMA FUNDS | | | | | 3 | |
JPMorgan Core Focus SMA Fund
SCHEDULE OF PORTFOLIO INVESTMENTS
AS OF AUGUST 31, 2020 (Unaudited)
| | | | | | | | |
| INVESTMENTS | | PRINCIPAL
AMOUNT($) | | | VALUE($) | |
Collateralized Mortgage Obligations — 30.6% | |
| | |
FHLMC, REMIC | | | | | | | | |
| | |
Series 2488, Class GM, 6.00%, 8/15/2032 | | | 27,357 | | | | 32,005 | |
| | |
Series 4151, Class YC, 2.50%, 1/15/2033 | | | 230,088 | | | | 238,021 | |
| | |
Series 2740, Class PE, 5.50%, 1/15/2034 | | | 103,684 | | | | 121,467 | |
| | |
Series 2943, Class ZC, 5.00%, 2/15/2034 | | | 38,406 | | | | 44,017 | |
| | |
Series 2768, Class PK, 5.00%, 3/15/2034 | | | 36,305 | | | | 40,207 | |
| | |
Series 3237, Class CE, 5.50%, 11/15/2036 | | | 50,000 | | | | 63,874 | |
| | |
Series 3249, Class CB, 4.25%, 12/15/2036 | | | 43,339 | | | | 46,703 | |
| | |
Series 3258, Class XX, 5.50%, 12/15/2036 | | | 53,000 | | | | 58,580 | |
| | |
Series 4031, Class AB, 5.50%, 6/15/2037 | | | 126,348 | | | | 145,562 | |
| | |
Series 3404, Class DC, 5.50%, 1/15/2038 | | | 50,000 | | | | 60,444 | |
| | |
Series 3601, Class HB, 5.00%, 11/15/2039 | | | 25,000 | | | | 29,930 | |
| | |
Series 3626, Class ME, 5.00%, 1/15/2040 | | | 29,000 | | | | 35,309 | |
| | |
Series 3680, Class ZA, 4.50%, 6/15/2040 | | | 125,102 | | | | 142,275 | |
| | |
Series 3777, Class WA, 4.00%, 12/15/2040 | | | 113,724 | | | | 127,324 | |
| | |
Series 3772, Class NE, 4.50%, 12/15/2040 | | | 180,000 | | | | 215,251 | |
| | |
Series 3939, Class AZ, 4.00%, 3/15/2041 | | | 167,695 | | | | 185,058 | |
| | |
Series 4240, Class DK, 4.00%, 11/15/2042 | | | 64,699 | | | | 72,709 | |
| | |
Series 4283, Class EW, 4.50%, 12/15/2043 (a) | | | 103,401 | | | | 115,549 | |
| | |
FNMA, REMIC | | | | | | | | |
| | |
Series 2013-17, Class YM, 4.00%, 3/25/2033 | | | 89,261 | | | | 101,638 | |
| | |
Series 2003-32, Class UJ, 5.50%, 5/25/2033 | | | 22,783 | | | | 25,544 | |
| | |
Series 2003-82, Class Z, 5.50%, 8/25/2033 | | | 40,248 | | | | 46,876 | |
| | |
Series 2004-17, Class H, 5.50%, 4/25/2034 | | | 98,108 | | | | 115,805 | |
| | |
Series 2004-31, Class MZ, 4.25%, 5/25/2034 | | | 29,992 | | | | 36,149 | |
| | |
Series 2004-36, Class CB, 5.00%, 5/25/2034 | | | 25,640 | | | | 29,458 | |
| | |
Series 2004-91, Class BR, 5.50%, 12/25/2034 | | | 33,586 | | | | 38,933 | |
| | |
Series 2009-13, Class PM, 4.00%, 4/25/2035 | | | 85,481 | | | | 89,485 | |
| | |
Series 2005-29, Class WQ, 5.50%, 4/25/2035 | | | 116,545 | | | | 137,155 | |
| | |
Series 2005-109, Class GD, 6.00%, 10/25/2035 | | | 18,750 | | | | 20,612 | |
| | | | | | | | |
| INVESTMENTS | | PRINCIPAL
AMOUNT($) | | | VALUE($) | |
| | |
| | | | | | | | |
| | |
Series 2015-65, Class LD, 3.50%, 1/25/2036 | | | 80,000 | | | | 91,523 | |
| | |
Series 2005-122, Class PY, 6.00%, 1/25/2036 | | | 71,000 | | | | 86,605 | |
| | |
Series 2006-24, Class Z, 5.50%, 4/25/2036 | | | 109,373 | | | | 125,350 | |
| | |
Series 2007-36, Class PH, 5.50%, 4/25/2037 | | | 31,516 | | | | 36,964 | |
| | |
Series 2007-60, Class ZB, 4.75%, 5/25/2037 | | | 253,769 | | | | 280,030 | |
| | |
Series 2009-42, Class TZ, 4.50%, 3/25/2039 | | | 224,587 | | | | 262,968 | |
| | |
Series 2009-66, Class KE, 4.00%, 9/25/2039 | | | 59,525 | | | | 65,383 | |
| | |
Series 2009-105, Class DB, 4.50%, 12/25/2039 | | | 25,000 | | | | 30,512 | |
| | |
Series 2010-43, Class EM, 5.00%, 5/25/2040 | | | 20,600 | | | | 26,586 | |
| | |
Series 2010-87, Class PJ, 3.50%, 6/25/2040 | | | 25,939 | | | | 26,845 | |
| | |
Series 2010-59, Class EB, 5.00%, 6/25/2040 | | | 300,000 | | | | 395,333 | |
| | |
Series 2011-146, Class LX, 3.50%, 10/25/2040 | | | 200,000 | | | | 217,760 | |
| | |
Series 2011-1, Class QA, 4.50%, 10/25/2040 | | | 53,249 | | | | 54,739 | |
| | |
Series 2010-133, Class GP, 4.00%, 11/25/2040 | | | 250,000 | | | | 296,730 | |
| | |
Series 2010-123, Class KU, 4.50%, 11/25/2040 | | | 123,589 | | | | 144,204 | |
| | |
Series 2010-129, Class PZ, 4.50%, 11/25/2040 | | | 246,287 | | | | 271,136 | |
| | |
Series 2010-136, Class CY, 4.00%, 12/25/2040 | | | 290,000 | | | | 340,216 | |
| | |
Series 2010-141, Class AL, 4.00%, 12/25/2040 | | | 159,898 | | | | 172,409 | |
| | |
Series 2010-154, Class KZ, 4.50%, 1/25/2041 | | | 45,231 | | | | 59,250 | |
| | |
Series 2011-55, Class BZ, 3.50%, 6/25/2041 | | | 172,706 | | | | 193,590 | |
| | |
Series 2011-115, Class UC, 4.00%, 11/25/2041 | | | 70,000 | | | | 83,355 | |
| | |
Series 2013-114, Class LM, 4.00%, 3/25/2042 | | | 200,000 | | | | 231,740 | |
| | |
Series 2012-120, Class PA, 3.50%, 10/25/2042 | | | 77,955 | | | | 86,307 | |
| | |
Series 2014-19, Class Z, 4.50%, 4/25/2044 | | | 266,807 | | | | 316,606 | |
| | |
Series 2015-61, Class PV, 3.50%, 5/25/2044 | | | 20,471 | | | | 22,628 | |
SEE NOTES TO FINANCIAL STATEMENTS.
| | | | | | |
| | | |
| 4 | | | | J.P. MORGAN SMA FUNDS | | AUGUST 31, 2020 |
| | | | | | | | |
| INVESTMENTS | | PRINCIPAL
AMOUNT($) | | | VALUE($) | |
Collateralized Mortgage Obligations — continued | |
| | |
Series 2016-32, Class PA, 3.00%, 12/25/2045 | | | 136,934 | | | | 146,821 | |
| | |
GNMA | | | | | | | | |
| | |
Series 2003-46, Class HA, 4.50%, 6/20/2033 | | | 84,792 | | | | 92,958 | |
| | |
Series 2004-55, Class MC, 5.50%, 7/20/2034 | | | 19,920 | | | | 22,803 | |
| | |
Series 2005-16, Class CA, 5.00%, 2/20/2035 | | | 29,000 | | | | 31,448 | |
| | |
Series 2005-17, Class GE, 5.00%, 2/20/2035 | | | 143,753 | | | | 162,830 | |
| | |
Series 2008-25, Class AD, 4.50%, 3/20/2038 | | | 103,274 | | | | 114,095 | |
| | |
Series 2009-16, Class ZD, 6.00%, 3/20/2039 | | | 135,774 | | | | 158,191 | |
| | |
Series 2009-58, Class PA, 4.50%, 7/20/2039 | | | 166,207 | | | | 183,770 | |
| | |
Series 2010-69, Class ME, 3.00%, 4/20/2040 | | | 43,045 | | | | 43,788 | |
| | | | | | | | |
| |
Total Collateralized Mortgage Obligations
(Cost $6,635,545) | | | | 7,291,413 | |
| | | | | |
Asset-Backed Securities — 28.9% | |
| | |
American Credit Acceptance Receivables Trust | | | | | | | | |
| | |
Series 2019-3, Class A, 2.44%, 12/12/2022 (b) | | | 24,585 | | | | 24,653 | |
| | |
Series 2017-1, Class D, 3.54%, 3/13/2023 (b) | | | 134,604 | | | | 135,109 | |
| | |
Series 2020-1, Class B, 2.08%, 12/13/2023 (b) | | | 94,000 | | | | 94,777 | |
| | |
B2R Mortgage Trust | | | | | | | | |
| | |
Series 2015-2, Class A, 3.34%, 11/15/2048 (b) | | | 4,584 | | | | 4,581 | |
| | |
Business Jet Securities LLC | | | | | | | | |
| | |
Series 2018-2, Class A, 4.45%, 6/15/2033 (b) | | | 130,764 | | | | 130,744 | |
| | |
Series 2018-2, Class B, 5.44%, 6/15/2033 (b) | | | 136,157 | | | | 136,948 | |
| | |
Series 2019-1, Class A, 4.21%, 7/15/2034 (b) | | | 99,077 | | | | 99,335 | |
| | |
CarMax Auto Owner Trust | | | | | | | | |
| | |
Series 2020-1, Class B, 2.21%, 9/15/2025 | | | 112,000 | | | | 116,371 | |
| | |
CoreVest American Finance Trust | | | | | | | | |
| | |
Series 2019-2, Class B, 3.42%, 6/15/2052 ‡ (b) | | | 250,000 | | | | 255,647 | |
| | |
CPS Auto Receivables Trust | | | | | | | | |
| | |
Series 2015-B, Class C, 4.20%, 5/17/2021 (b) | | | 29,653 | | | | 29,699 | |
| | |
Series 2018-B, Class B, 3.23%, 7/15/2022 (b) | | | 14,312 | | | | 14,330 | |
| | | | | | | | |
| INVESTMENTS | | PRINCIPAL
AMOUNT($) | | | VALUE($) | |
| | |
| | | | | | | | |
| | |
Series 2019-C, Class B, 2.63%, 8/15/2023 (b) | | | 130,000 | | | | 131,658 | |
| | |
Credit Acceptance Auto Loan Trust | | | | | | | | |
| | |
Series 2018-2A, Class A, 3.47%, 5/17/2027 (b) | | | 169,832 | | | | 171,595 | |
| | |
Series 2020-1A, Class A, 2.01%, 2/15/2029 (b) | | | 250,000 | | | | 256,053 | |
| | |
Drive Auto Receivables Trust | | | | | | | | |
| | |
Series 2018-5, Class B, 3.68%, 7/15/2023 | | | 117,670 | | | | 118,251 | |
| | |
DT Auto Owner Trust | | | | | | | | |
| | |
Series 2017-1A, Class D, 3.55%, 11/15/2022 (b) | | | 35,460 | | | | 35,590 | |
| | |
Series 2018-1A, Class D, 3.81%, 12/15/2023 (b) | | | 88,000 | | | | 89,452 | |
| | |
Series 2020-2A, Class A, 1.14%, 1/16/2024 (b) | | | 55,963 | | | | 56,140 | |
| | |
Series 2020-1A, Class B, 2.16%, 5/15/2024 (b) | | | 50,000 | | | | 50,577 | |
| | |
Series 2019-1A, Class C, 3.61%, 11/15/2024 (b) | | | 90,000 | | | | 91,823 | |
| | |
Series 2019-2A, Class C, 3.18%, 2/18/2025 (b) | | | 190,000 | | | | 194,172 | |
| | |
Exeter Automobile Receivables Trust | | | | | | | | |
| | |
Series 2019-4A, Class A, 2.18%, 1/17/2023 (b) | | | 63,973 | | | | 64,280 | |
| | |
Series 2019-3A, Class B, 2.58%, 8/15/2023 (b) | | | 195,000 | | | | 197,087 | |
| | |
Series 2020-1A, Class B, 2.26%, 4/15/2024 (b) | | | 40,000 | | | | 40,518 | |
| | |
First Investors Auto Owner Trust | | | | | | | | |
| | |
Series 2016-2A, Class C, 2.53%, 7/15/2022 (b) | | | 116,325 | | | | 116,729 | |
| | |
Series 2018-1A, Class A2, 3.22%, 1/17/2023 (b) | | | 6,356 | | | | 6,362 | |
| | |
Series 2019-1A, Class B, 3.02%, 3/17/2025 (b) | | | 120,000 | | | | 123,306 | |
| | |
Flagship Credit Auto Trust | | | | | | | | |
| | |
Series 2016-2, Class C, 6.22%, 9/15/2022 (b) | | | 84,906 | | | | 86,161 | |
| | |
Series 2017-2, Class B, 2.57%, 4/15/2023 (b) | | | 2,978 | | | | 2,981 | |
| | |
Series 2018-2, Class B, 3.56%, 5/15/2023 (b) | | | 150,000 | | | | 152,855 | |
| | |
Series 2019-1, Class A, 3.11%, 8/15/2023 (b) | | | 113,451 | | | | 115,101 | |
| | |
Series 2019-2, Class A, 2.83%, 10/16/2023 (b) | | | 149,009 | | | | 151,315 | |
| | |
Series 2017-4, Class C, 2.92%, 11/15/2023 (b) | | | 400,000 | | | | 405,218 | |
SEE NOTES TO FINANCIAL STATEMENTS.
| | | | | | | | |
| | | |
| AUGUST 31, 2020 | | J.P. MORGAN SMA FUNDS | | | | | 5 | |
JPMorgan Core Focus SMA Fund
SCHEDULE OF PORTFOLIO INVESTMENTS
AS OF AUGUST 31, 2020 (Unaudited) (continued)
| | | | | | | | |
| INVESTMENTS | | PRINCIPAL
AMOUNT($) | | | VALUE($) | |
Asset-Backed Securities — continued | |
| | |
Series 2019-3, Class B, 2.48%, 8/15/2024 (b) | | | 225,000 | | | | 232,988 | |
| | |
Series 2019-1, Class D, 4.08%, 2/18/2025 (b) | | | 167,000 | | | | 174,359 | |
| | |
Ford Credit Auto Lease Trust | | | | | | | | |
| | |
Series 2019-A, Class A4, 2.98%, 6/15/2022 | | | 200,000 | | | | 204,024 | |
| | |
FREED ABS Trust | | | | | | | | |
| | |
Series 2018-2, Class A, 3.99%, 10/20/2025 (b) | | | 15,527 | | | | 15,539 | |
| | |
Series 2020-FP1, Class A, 2.52%, 3/18/2027 (b) | | | 76,633 | | | | 76,648 | |
| | |
GLS Auto Receivables Issuer Trust | | | | | | | | |
| | |
Series 2019-1A, Class A, 3.37%, 1/17/2023 (b) | | | 14,423 | | | | 14,533 | |
| | |
Series 2019-2A, Class A, 3.06%, 4/17/2023 (b) | | | 28,533 | | | | 28,819 | |
| | |
Series 2019-3A, Class A, 2.58%, 7/17/2023 (b) | | | 60,773 | | | | 61,381 | |
| | |
GLS Auto Receivables Trust | | | | | | | | |
| | |
Series 2018-3A, Class A, 3.35%, 8/15/2022 (b) | | | 11,436 | | | | 11,474 | |
| | |
Series 2018-3A, Class B, 3.78%, 8/15/2023 (b) | | | 125,000 | | | | 127,251 | |
| | |
Goodgreen (Cayman Islands) | | | | | | | | |
| | |
Series 2018-1A, Class A, 3.93%, 10/15/2053 (a) (b) | | | 127,221 | | | | 134,949 | |
| | |
HERO Funding (Cayman Islands) | | | | | | | | |
| | |
Series 2017-3A, Class A2, 3.95%, 9/20/2048 (b) | | | 69,520 | | | | 72,827 | |
| | |
Hyundai Auto Lease Securitization Trust | | | | | | | | |
| | |
Series 2019-A, Class A3, 2.98%, 7/15/2022 (b) | | | 150,000 | | | | 151,828 | |
| | |
Lendmark Funding Trust | | | | | | | | |
| | |
Series 2019-1A, Class A, 3.00%, 12/20/2027 (b) | | | 175,000 | | | | 171,285 | |
| | |
Marlette Funding Trust | | | | | | | | |
| | |
Series 2019-1A, Class A, 3.44%, 4/16/2029 (b) | | | 91,572 | | | | 92,505 | |
| | |
Series 2020-1A, Class A, 2.24%, 3/15/2030 (b) | | | 125,930 | | | | 126,895 | |
| | |
OnDeck Asset Securitization Trust LLC | | | | | | | | |
| | |
Series 2018-1A, Class A, 3.50%, 4/18/2022 (b) | | | 26,076 | | | | 25,930 | |
| | |
Progress Residential Trust | | | | | | | | |
| | |
Series 2020-SFR2, Class A, 2.08%, 6/17/2037 (b) | | | 150,000 | | | | 153,193 | |
| | | | | | | | |
| INVESTMENTS | | PRINCIPAL
AMOUNT($) | | | VALUE($) | |
| | |
| | | | | | | | |
| | |
Prosper Marketplace Issuance Trust | | | | | | | | |
| | |
Series 2019-3A, Class A, 3.19%, 7/15/2025 (b) | | | 41,553 | | | | 41,757 | |
| | |
Santander Drive Auto Receivables Trust | | | | | | | | |
| | |
Series 2017-3, Class C, 2.76%, 12/15/2022 | | | 14,476 | | | | 14,522 | |
| | |
Series 2019-1, Class B, 3.21%, 9/15/2023 | | | 90,000 | | | | 90,740 | |
| | |
Santander Retail Auto Lease Trust | | | | | | | | |
| | |
Series 2018-A, Class D, 3.75%, 12/20/2022 (b) | | | 200,000 | | | | 202,206 | |
| | |
SoFi Consumer Loan Program LLC | | | | | | | | |
| | |
Series 2017-1, Class A, 3.28%, 1/26/2026 (b) | | | 7,064 | | | | 7,081 | |
| | |
Series 2017-2, Class A, 3.28%, 2/25/2026 (b) | | | 10,445 | | | | 10,469 | |
| | |
Springleaf Funding Trust | | | | | | | | |
| | |
Series 2015-BA, Class B, 3.80%, 5/15/2028 ‡ (b) | | | 100,000 | | | | 100,395 | |
| | |
Tesla Auto Lease Trust | | | | | | | | |
| | |
Series 2018-B, Class A, 3.71%, 8/20/2021 (b) | | | 36,663 | | | | 37,068 | |
| | |
Tidewater Auto Receivables Trust | | | | | | | | |
| | |
Series 2018-AA, Class C, 3.84%, 11/15/2024 (b) | | | 250,000 | | | | 254,368 | |
| | |
Towd Point Mortgage Trust | | | | | | | | |
| | |
Series 2017-6, Class A1, 2.75%, 10/25/2057 ‡ (a) (b) | | | 63,872 | | | | 66,350 | |
| | |
Vericrest Opportunity Loan Trust | | | | | | | | |
| | |
Series 2019-NPL4, Class A1A, 3.35%, 8/25/2049 ‡ (b) (c) | | | 97,626 | | | | 97,233 | |
| | |
Series 2020-NPL2, Class A1A, 2.98%, 2/25/2050 ‡ (b) (c) | | | 122,657 | | | | 121,385 | |
| | |
Westgate Resorts LLC | | | | | | | | |
| | |
Series 2018-1A, Class A, 3.38%, 12/20/2031 (b) | | | 113,321 | | | | 114,269 | |
| | |
Series 2018-1A, Class B, 3.58%, 12/20/2031 ‡ (b) | | | 113,321 | | | | 111,774 | |
| | |
World Omni Auto Receivables Trust | | | | | | | | |
| | |
Series 2017-B, Class A3, 1.95%, 2/15/2023 | | | 48,275 | | | | 48,681 | |
| | | | | | | | |
| |
Total Asset-Backed Securities
(Cost $6,799,476) | | | | 6,894,144 | |
| | | | | |
Corporate Bonds — 24.0% | |
|
Aerospace & Defense — 0.8% | |
| | |
Boeing Co. (The) 4.51%, 5/1/2023 | | | 70,000 | | | | 73,924 | |
| | |
Lockheed Martin Corp. 2.80%, 6/15/2050 | | | 15,000 | | | | 15,799 | |
SEE NOTES TO FINANCIAL STATEMENTS.
| | | | | | |
| | | |
| 6 | | | | J.P. MORGAN SMA FUNDS | | AUGUST 31, 2020 |
| | | | | | | | |
| INVESTMENTS | | PRINCIPAL
AMOUNT($) | | | VALUE($) | |
Corporate Bonds — continued | |
|
Aerospace & Defense — continued | |
| | |
Northrop Grumman Corp. | | | | | | | | |
| | |
3.20%, 2/1/2027 | | | 30,000 | | | | 33,840 | |
| | |
3.85%, 4/15/2045 | | | 20,000 | | | | 23,416 | |
| | |
Raytheon Technologies Corp. 4.63%, 11/16/2048 | | | 40,000 | | | | 52,443 | |
| | | | | | | | |
| | |
| | | | | | | 199,422 | |
| | | | | | | | |
|
Automobiles — 0.1% | |
| | |
Hyundai Capital America 3.45%, 3/12/2021 (b) | | | 30,000 | | | | 30,375 | |
| | | | | | | | |
|
Banks — 2.7% | |
| | |
Bank of America Corp. (ICE LIBOR USD
3 Month + 0.93%), | | | | | | | | |
| | |
2.82%, 7/21/2023 (d) | | | 20,000 | | | | 20,815 | |
| | |
4.20%, 8/26/2024 | | | 60,000 | | | | 67,240 | |
| | |
5.00%, 1/21/2044 | | | 55,000 | | | | 75,614 | |
| | |
(ICE LIBOR USD 3 Month + 1.19%),
3.95%, 1/23/2049 (d) | | | 15,000 | | | | 18,316 | |
| | |
Citigroup, Inc. | | | | | | | | |
| | |
3.75%, 6/16/2024 | | | 41,000 | | | | 45,546 | |
| | |
3.20%, 10/21/2026 | | | 19,000 | | | | 21,153 | |
| | |
8.13%, 7/15/2039 | | | 30,000 | | | | 52,749 | |
| | |
Fifth Third Bancorp 3.65%, 1/25/2024 | | | 25,000 | | | | 27,345 | |
| | |
Mitsubishi UFJ Financial Group, Inc. (Japan) | | | | | | | | |
| | |
3.46%, 3/2/2023 | | | 45,000 | | | | 48,101 | |
| | |
3.78%, 3/2/2025 | | | 15,000 | | | | 16,863 | |
| | |
3.74%, 3/7/2029 | | | 15,000 | | | | 17,293 | |
| | |
Santander UK Group Holdings plc (United Kingdom) 3.13%, 1/8/2021 | | | 30,000 | | | | 30,288 | |
| | |
Sumitomo Mitsui Financial Group, Inc. (Japan) 3.36%, 7/12/2027 | | | 25,000 | | | | 28,063 | |
| | |
Wells Fargo & Co. | | | | | | | | |
| | |
Series M, 3.45%, 2/13/2023 | | | 70,000 | | | | 74,420 | |
| | |
4.65%, 11/4/2044 | | | 30,000 | | | | 36,450 | |
| | |
Westpac Banking Corp. (Australia) 2.85%, 5/13/2026 | | | 65,000 | | | | 72,177 | |
| | | | | | | | |
| | |
| | | | | | | 652,433 | |
| | | | | | | | |
|
Beverages — 0.7% | |
| | |
Anheuser-Busch Cos. LLC (Belgium) | | | | | | | | |
| | |
3.65%, 2/1/2026 | | | 15,000 | | | | 16,943 | |
| | |
4.90%, 2/1/2046 | | | 25,000 | | | | 30,745 | |
| | |
Anheuser-Busch InBev Finance, Inc. (Belgium) 4.90%, 2/1/2046 | | | 10,000 | | | | 12,135 | |
| | |
Anheuser-Busch InBev Worldwide, Inc. (Belgium) | | | | | | | | |
| | |
4.00%, 4/13/2028 | | | 15,000 | | | | 17,377 | |
| | |
4.95%, 1/15/2042 | | | 30,000 | | | | 36,395 | |
| | | | | | | | |
| INVESTMENTS | | PRINCIPAL
AMOUNT($) | | | VALUE($) | |
| | |
| | | | | | | | |
|
Beverages — continued | |
| | |
Constellation Brands, Inc. | | | | | | | | |
| | |
3.70%, 12/6/2026 | | | 10,000 | | | | 11,513 | |
| | |
3.75%, 5/1/2050 | | | 5,000 | | | | 5,492 | |
| | |
Keurig Dr Pepper, Inc. | | | | | | | | |
| | |
4.60%, 5/25/2028 | | | 15,000 | | | | 18,117 | |
| | |
5.09%, 5/25/2048 | | | 5,000 | | | | 6,794 | |
| | |
Molson Coors Beverage Co. 4.20%, 7/15/2046 | | | 15,000 | | | | 15,455 | |
| | | | | | | | |
| | |
| | | | | | | 170,966 | |
| | | | | | | | |
|
Biotechnology — 0.6% | |
| | |
AbbVie, Inc. | | | | | | | | |
| | |
3.60%, 5/14/2025 | | | 50,000 | | | | 55,801 | |
| | |
4.55%, 3/15/2035 (b) | | | 10,000 | | | | 12,478 | |
| | |
4.70%, 5/14/2045 | | | 15,000 | | | | 18,708 | |
| | |
4.88%, 11/14/2048 | | | 15,000 | | | | 19,296 | |
| | |
Amgen, Inc. 2.20%, 2/21/2027 | | | 10,000 | | | | 10,583 | |
| | |
Gilead Sciences, Inc. 4.80%, 4/1/2044 | | | 15,000 | | | | 19,893 | |
| | | | | | | | |
| | |
| | | | | | | 136,759 | |
| | | | | | | | |
|
Building Products — 0.1% | |
| | |
Masco Corp. 4.45%, 4/1/2025 | | | 25,000 | | | | 28,859 | |
| | | | | | | | |
|
Capital Markets — 1.5% | |
| | |
Credit Suisse USA, Inc. (Switzerland) 7.13%, 7/15/2032 | | | 15,000 | | | | 23,172 | |
| | |
Goldman Sachs Group, Inc. (The) | | | | | | | | |
| | |
4.00%, 3/3/2024 | | | 50,000 | | | | 55,395 | |
| | |
(ICE LIBOR USD 3 Month + 1.37%),
4.02%, 10/31/2038 (d) | | | 65,000 | | | | 76,554 | |
| | |
Macquarie Group Ltd. (Australia) | | | | | | | | |
| | |
6.25%, 1/14/2021 (b) | | | 30,000 | | | | 30,649 | |
| | |
(ICE LIBOR USD 3 Month + 1.37%), 3.76%, 11/28/2028 (b) (d) | | | 20,000 | | | | 21,924 | |
| | |
Morgan Stanley | | | | | | | | |
| | |
4.00%, 7/23/2025 | | | 60,000 | | | | 68,657 | |
| | |
3.13%, 7/27/2026 | | | 35,000 | | | | 39,054 | |
| | |
3.95%, 4/23/2027 | | | 25,000 | | | | 28,364 | |
| | | | | | | | |
| | |
| | | | | | | 343,769 | |
| | | | | | | | |
|
Chemicals — 0.5% | |
| | |
DuPont de Nemours, Inc. 4.49%, 11/15/2025 | | | 50,000 | | | | 58,174 | |
| | |
Mosaic Co. (The) | | | | | | | | |
| | |
3.25%, 11/15/2022 | | | 10,000 | | | | 10,437 | |
| | |
4.05%, 11/15/2027 | | | 10,000 | | | | 11,075 | |
| | |
Nutrien Ltd. (Canada) | | | | | | | | |
| | |
3.00%, 4/1/2025 | | | 20,000 | | | | 21,737 | |
SEE NOTES TO FINANCIAL STATEMENTS.
| | | | | | | | |
| | | |
| AUGUST 31, 2020 | | J.P. MORGAN SMA FUNDS | | | | | 7 | |
JPMorgan Core Focus SMA Fund
SCHEDULE OF PORTFOLIO INVESTMENTS
AS OF AUGUST 31, 2020 (Unaudited) (continued)
| | | | | | | | |
| INVESTMENTS | | PRINCIPAL
AMOUNT($) | | | VALUE($) | |
Corporate Bonds — continued | |
|
Chemicals — continued | |
| | |
6.13%, 1/15/2041 | | | 20,000 | | | | 26,489 | |
| | | | | | | | |
| |
| | | | 127,912 | |
| | | | | | | | |
|
Construction Materials — 0.1% | |
| | |
Martin Marietta Materials, Inc. 3.45%, 6/1/2027 | | | 30,000 | | | | 33,483 | |
| | | | | | | | |
|
Consumer Finance — 0.4% | |
| | |
Capital One Financial Corp. | | | | | | | | |
| | |
4.20%, 10/29/2025 | | | 15,000 | | | | 16,795 | |
| | |
3.75%, 3/9/2027 | | | 25,000 | | | | 27,731 | |
| | |
General Motors Financial Co., Inc. 4.20%, 3/1/2021 | | | 25,000 | | | | 25,338 | |
| | |
HSBC Finance Corp. 6.68%, 1/15/2021 | | | 30,000 | | | | 30,493 | |
| | | | | | | | |
| |
| | | | 100,357 | |
| | | | | | | | |
|
Diversified Financial Services — 0.4% | |
| | |
ORIX Corp. (Japan) 3.70%, 7/18/2027 | | | 30,000 | | | | 33,787 | |
| | |
Shell International Finance BV (Netherlands) 5.50%, 3/25/2040 | | | 20,000 | | | | 27,926 | |
| | |
Voya Financial, Inc. 3.65%, 6/15/2026 | | | 20,000 | | | | 22,631 | |
| | | | | | | | |
| |
| | | | 84,344 | |
| | | | | | | | |
|
Diversified Telecommunication Services — 0.9% | |
| | |
AT&T, Inc. | | | | | | | | |
| | |
3.00%, 6/30/2022 | | | 15,000 | | | | 15,658 | |
| | |
5.35%, 9/1/2040 | | | 55,000 | | | | 70,538 | |
| | |
Telefonica Emisiones SA (Spain) 7.05%, 6/20/2036 | | | 15,000 | | | | 21,807 | |
| | |
Verizon Communications, Inc. | | | | | | | | |
| | |
4.33%, 9/21/2028 | | | 41,000 | | | | 49,668 | |
| | |
4.86%, 8/21/2046 | | | 46,000 | | | | 61,751 | |
| | | | | | | | |
| |
| | | | 219,422 | |
| | | | | | | | |
|
Electric Utilities — 1.3% | |
| | |
Cleveland Electric Illuminating Co. (The)
5.95%, 12/15/2036 | | | 20,000 | | | | 25,610 | |
| | |
Duke Energy Corp. | | | | | | | | |
| | |
2.65%, 9/1/2026 | | | 25,000 | | | | 27,289 | |
| | |
3.75%, 9/1/2046 | | | 25,000 | | | | 28,725 | |
| | |
Emera US Finance LP (Canada) | | | | | | | | |
| | |
3.55%, 6/15/2026 | | | 10,000 | | | | 11,207 | |
| | |
4.75%, 6/15/2046 | | | 20,000 | | | | 24,795 | |
| | |
Entergy Louisiana LLC 4.00%, 3/15/2033 | | | 40,000 | | | | 50,205 | |
| | |
FirstEnergy Corp. | | | | | | | | |
| | |
Series B, 2.25%, 9/1/2030 | | | 15,000 | | | | 14,915 | |
| | |
Fortis, Inc. (Canada) 3.06%, 10/4/2026 | | | 19,000 | | | | 20,762 | |
| | |
Indiana Michigan Power Co. | | | | | | | | |
| | |
Series K, 4.55%, 3/15/2046 | | | 15,000 | | | | 19,147 | |
| | | | | | | | |
| INVESTMENTS | | PRINCIPAL
AMOUNT($) | | | VALUE($) | |
| | |
| | | | | | | | |
|
Electric Utilities — continued | |
| | |
Metropolitan Edison Co. 3.50%, 3/15/2023 (b) | | | 15,000 | | | | 15,722 | |
| | |
PNM Resources, Inc. 3.25%, 3/9/2021 | | | 15,000 | | | | 15,198 | |
| | |
PPL Capital Funding, Inc. 3.10%, 5/15/2026 | | | 20,000 | | | | 22,241 | |
| | |
Southern Co. (The) 3.25%, 7/1/2026 | | | 30,000 | | | | 33,663 | |
| | | | | | | | |
| |
| | | | 309,479 | |
| | | | | | | | |
|
Electrical Equipment — 0.1% | |
| | |
Eaton Corp. 3.10%, 9/15/2027 | | | 25,000 | | | | 28,014 | |
| | | | | | | | |
|
Electronic Equipment, Instruments & Components — 0.3% | |
| | |
Arrow Electronics, Inc. | | | | | | | | |
| | |
3.25%, 9/8/2024 | | | 15,000 | | | | 16,123 | |
| | |
3.88%, 1/12/2028 | | | 15,000 | | | | 16,400 | |
| | |
Corning, Inc. | | | | | | | | |
| | |
5.35%, 11/15/2048 | | | 20,000 | | | | 26,842 | |
| | |
4.38%, 11/15/2057 | | | 15,000 | | | | 18,321 | |
| | | | | | | | |
| |
| | | | 77,686 | |
| | | | | | | | |
|
Energy Equipment & Services — 0.3% | |
| | |
Halliburton Co. | | | | | | | | |
| | |
3.80%, 11/15/2025 | | | 2,000 | | | | 2,194 | |
| | |
4.50%, 11/15/2041 | | | 10,000 | | | | 10,043 | |
| | |
Schlumberger Holdings Corp. | | | | | | | | |
| | |
4.00%, 12/21/2025 (b) | | | 15,000 | | | | 16,607 | |
| | |
4.30%, 5/1/2029 (b) | | | 30,000 | | | | 33,894 | |
| | | | | | | | |
| |
| | | | 62,738 | |
| | | | | | | | |
|
Equity Real Estate Investment Trusts (REITs) — 1.6% | |
| | |
American Tower Corp. | | | | | | | | |
| | |
5.00%, 2/15/2024 | | | 30,000 | | | | 34,206 | |
| | |
3.95%, 3/15/2029 | | | 15,000 | | | | 17,399 | |
| | |
Boston Properties LP 3.40%, 6/21/2029 | | | 25,000 | | | | 27,367 | |
| | |
Brixmor Operating Partnership LP 3.65%, 6/15/2024 | | | 25,000 | | | | 26,312 | |
| | |
Healthcare Trust of America Holdings LP 3.75%, 7/1/2027 | | | 25,000 | | | | 27,248 | |
| | |
Healthpeak Properties, Inc. 3.25%, 7/15/2026 | | | 50,000 | | | | 55,955 | |
| | |
Host Hotels & Resorts LP 3.88%, 4/1/2024 | | | 15,000 | | | | 15,589 | |
| | |
Life Storage LP 4.00%, 6/15/2029 | | | 5,000 | | | | 5,629 | |
| | |
National Retail Properties, Inc. 4.00%, 11/15/2025 | | | 20,000 | | | | 22,363 | |
| | |
Realty Income Corp. 3.65%, 1/15/2028 | | | 25,000 | | | | 27,893 | |
| | |
Simon Property Group LP 4.75%, 3/15/2042 | | | 10,000 | | | | 11,723 | |
| | |
UDR, Inc. | | | | | | | | |
| | |
4.40%, 1/26/2029 | | | 20,000 | | | | 23,795 | |
| | |
3.00%, 8/15/2031 | | | 20,000 | | | | 21,934 | |
SEE NOTES TO FINANCIAL STATEMENTS.
| | | | | | |
| | | |
| 8 | | | | J.P. MORGAN SMA FUNDS | | AUGUST 31, 2020 |
| | | | | | | | |
| INVESTMENTS | | PRINCIPAL
AMOUNT($) | | | VALUE($) | |
Corporate Bonds — continued | |
|
Equity Real Estate Investment Trusts (REITs) — continued | |
| | |
VEREIT Operating Partnership LP 4.88%, 6/1/2026 | | | 10,000 | | | | 11,159 | |
| | |
Welltower, Inc. | | | | | | | | |
| | |
4.00%, 6/1/2025 | | | 25,000 | | | | 28,154 | |
| | |
6.50%, 3/15/2041 | | | 10,000 | | | | 13,017 | |
| | | | | | | | |
| | |
| | | | | | | 369,743 | |
| | | | | | | | |
|
Food & Staples Retailing — 0.1% | |
| | |
Kroger Co. (The) 5.15%, 8/1/2043 | | | 20,000 | | | | 25,682 | |
| | | | | | | | |
|
Food Products — 0.3% | |
| | |
Campbell Soup Co. 3.65%, 3/15/2023 | | | 6,000 | | | | 6,422 | |
| | |
Conagra Brands, Inc. 5.30%, 11/1/2038 | | | 5,000 | | | | 6,429 | |
| | |
Mead Johnson Nutrition Co. (United Kingdom) 4.60%, 6/1/2044 | | | 20,000 | | | | 26,239 | |
| | |
Tyson Foods, Inc. | | | | | | | | |
| | |
3.95%, 8/15/2024 | | | 15,000 | | | | 16,698 | |
| | |
5.15%, 8/15/2044 | | | 10,000 | | | | 13,036 | |
| | | | | | | | |
| | |
| | | | | | | 68,824 | |
| | | | | | | | |
|
Health Care Equipment & Supplies — 0.5% | |
| | |
Abbott Laboratories | | | | | | | | |
| | |
3.75%, 11/30/2026 | | | 17,000 | | | | 19,887 | |
| | |
4.75%, 11/30/2036 | | | 15,000 | | | | 20,292 | |
| | |
5.30%, 5/27/2040 | | | 15,000 | | | | 21,939 | |
| | |
Becton Dickinson and Co. | | | | | | | | |
| | |
2.89%, 6/6/2022 | | | 10,000 | | | | 10,382 | |
| | |
3.70%, 6/6/2027 | | | 10,000 | | | | 11,332 | |
| | |
Boston Scientific Corp. | | | | | | | | |
| | |
3.85%, 5/15/2025 | | | 13,000 | | | | 14,765 | |
| | |
4.70%, 3/1/2049 | | | 10,000 | | | | 13,292 | |
| | | | | | | | |
| | |
| | | | | | | 111,889 | |
| | | | | | | | |
|
Health Care Providers & Services — 0.8% | |
| | |
Aetna, Inc. | | | | | | | | |
| | |
2.80%, 6/15/2023 | | | 20,000 | | | | 21,087 | |
| | |
Anthem, Inc. | | | | | | | | |
| | |
3.35%, 12/1/2024 | | | 15,000 | | | | 16,587 | |
| | |
4.63%, 5/15/2042 | | | 20,000 | | | | 25,202 | |
| | |
CVS Health Corp. | | | | | | | | |
| | |
4.30%, 3/25/2028 | | | 41,000 | | | | 48,268 | |
| | |
4.78%, 3/25/2038 | | | 27,000 | | | | 33,073 | |
| | |
HCA, Inc. | | | | | | | | |
| | |
4.50%, 2/15/2027 | | | 20,000 | | | | 22,835 | |
| | |
5.25%, 6/15/2049 | | | 15,000 | | | | 18,735 | |
| | | | | | | | |
| | |
| | | | | | | 185,787 | |
| | | | | | | | |
| | | | | | | | |
| INVESTMENTS | | PRINCIPAL
AMOUNT($) | | | VALUE($) | |
| | |
| | | | | | | | |
|
Hotels, Restaurants & Leisure — 0.3% | |
| | |
McDonald’s Corp. 3.80%, 4/1/2028 | | | 35,000 | | | | 40,671 | |
| | |
Starbucks Corp. 4.45%, 8/15/2049 | | | 15,000 | | | | 18,190 | |
| | | | | | | | |
| | |
| | | | | | | 58,861 | |
| | | | | | | | |
|
Industrial Conglomerates — 0.2% | |
| | |
General Electric Co. 6.75%, 3/15/2032 | | | 45,000 | | | | 56,362 | |
| | | | | | | | |
|
Insurance — 1.5% | |
| | |
American Financial Group, Inc. 3.50%, 8/15/2026 | | | 20,000 | | | | 21,551 | |
| | |
American International Group, Inc. | | | | | | | | |
| | |
3.75%, 7/10/2025 | | | 20,000 | | | | 22,431 | |
| | |
3.88%, 1/15/2035 | | | 25,000 | | | | 29,116 | |
| | |
4.38%, 1/15/2055 | | | 15,000 | | | | 17,549 | |
| | |
Athene Global Funding | | | | | | | | |
| | |
3.00%, 7/1/2022 (b) | | | 25,000 | | | | 25,868 | |
| | |
2.95%, 11/12/2026 (b) | | | 30,000 | | | | 31,599 | |
| | |
Athene Holding Ltd. 4.13%, 1/12/2028 | | | 10,000 | | | | 10,928 | |
| | |
Cincinnati Financial Corp. 6.92%, 5/15/2028 | | | 20,000 | | | | 26,545 | |
| | |
Lincoln National Corp. | | | | | | | | |
| | |
4.20%, 3/15/2022 | | | 15,000 | | | | 15,856 | |
| | |
3.63%, 12/12/2026 | | | 15,000 | | | | 16,808 | |
| | |
4.35%, 3/1/2048 | | | 20,000 | | | | 23,366 | |
| | |
Markel Corp. | | | | | | | | |
| | |
3.50%, 11/1/2027 | | | 20,000 | | | | 21,620 | |
| | |
5.00%, 5/20/2049 | | | 15,000 | | | | 19,631 | |
| | |
Marsh & McLennan Cos., Inc. 4.38%, 3/15/2029 | | | 30,000 | | | | 36,487 | |
| | |
Principal Financial Group, Inc. 3.70%, 5/15/2029 | | | 5,000 | | | | 5,822 | |
| | |
Prudential Financial, Inc. 3.88%, 3/27/2028 | | | 30,000 | | | | 35,476 | |
| | | | | | | | |
| | |
| | | | | | | 360,653 | |
| | | | | | | | |
|
Media — 0.9% | |
| | |
Charter Communications Operating LLC 5.75%, 4/1/2048 | | | 10,000 | | | | 12,491 | |
| | |
Comcast Corp. | | | | | | | | |
| | |
3.15%, 3/1/2026 | | | 30,000 | | | | 33,651 | |
| | |
3.20%, 7/15/2036 | | | 40,000 | | | | 44,891 | |
| | |
6.40%, 5/15/2038 | | | 30,000 | | | | 45,100 | |
| | |
4.50%, 1/15/2043 | | | 15,000 | | | | 18,961 | |
| | |
Cox Communications, Inc.
3.15%, 8/15/2024 (b) | | | 25,000 | | | | 27,106 | |
| | |
ViacomCBS, Inc. 4.95%, 1/15/2031 | | | 30,000 | | | | 35,816 | |
| | | | | | | | |
| | |
| | | | | | | 218,016 | |
| | | | | | | | |
SEE NOTES TO FINANCIAL STATEMENTS.
| | | | | | | | |
| | | |
| AUGUST 31, 2020 | | J.P. MORGAN SMA FUNDS | | | | | 9 | |
JPMorgan Core Focus SMA Fund
SCHEDULE OF PORTFOLIO INVESTMENTS
AS OF AUGUST 31, 2020 (Unaudited) (continued)
| | | | | | | | |
| INVESTMENTS | | PRINCIPAL
AMOUNT($) | | | VALUE($) | |
Corporate Bonds — continued | |
|
Metals & Mining — 0.2% | |
| | |
Glencore Funding LLC (Australia) | | | | | | | | |
| | |
4.63%, 4/29/2024 (b) | | | 15,000 | | | | 16,639 | |
| | |
1.63%, 9/1/2025 (b) | | | 20,000 | | | | 19,950 | |
| | |
Newcrest Finance Pty. Ltd. (Australia) 3.25%, 5/13/2030 (b) | | | 10,000 | | | | 11,033 | |
| | | | | | | | |
| | |
| | | | | | | 47,622 | |
| | | | | | | | |
|
Multiline Retail — 0.1% | |
| | |
Dollar General Corp. | | | | | | | | |
| | |
4.13%, 5/1/2028 | | | 5,000 | | | | 5,894 | |
| | |
3.50%, 4/3/2030 | | | 20,000 | | | | 22,945 | |
| | | | | | | | |
| | |
| | | | | | | 28,839 | |
| | | | | | | | |
|
Multi-Utilities — 0.3% | |
| | |
Dominion Energy, Inc. | | | | | | | | |
| | |
Series D, 2.85%, 8/15/2026 | | | 25,000 | | | | 27,605 | |
| | |
Series C, 4.05%, 9/15/2042 | | | 20,000 | | | | 23,642 | |
| | |
Sempra Energy 3.80%, 2/1/2038 | | | 25,000 | | | | 28,385 | |
| | | | | | | | |
| | |
| | | | | | | 79,632 | |
| | | | | | | | |
|
Oil, Gas & Consumable Fuels — 2.6% | |
| | |
APT Pipelines Ltd. (Australia) 4.25%, 7/15/2027 (b) | | | 30,000 | | | | 33,855 | |
| | |
Boardwalk Pipelines LP 5.95%, 6/1/2026 | | | 20,000 | | | | 23,300 | |
| | |
Buckeye Partners LP 5.85%, 11/15/2043 | | | 10,000 | | | | 9,706 | |
| | |
CNOOC Petroleum North America ULC (China) 5.88%, 3/10/2035 | | | 20,000 | | | | 28,700 | |
| | |
Enbridge, Inc. (Canada) | | | | | | | | |
| | |
4.25%, 12/1/2026 | | | 20,000 | | | | 23,115 | |
| | |
4.50%, 6/10/2044 | | | 15,000 | | | | 17,238 | |
| | |
Energy Transfer Operating LP 6.25%, 4/15/2049 | | | 15,000 | | | | 15,694 | |
| | |
Energy Transfer Partners LP 5.88%, 3/1/2022 | | | 15,000 | | | | 15,802 | |
| | |
Enterprise Products Operating LLC | | | | | | | | |
| | |
3.75%, 2/15/2025 | | | 20,000 | | | | 22,359 | |
| | |
3.13%, 7/31/2029 | | | 15,000 | | | | 16,367 | |
| | |
5.10%, 2/15/2045 | | | 25,000 | | | | 29,804 | |
| | |
Kinder Morgan Energy Partners LP 3.95%, 9/1/2022 | | | 25,000 | | | | 26,474 | |
| | |
Magellan Midstream Partners LP 4.20%, 10/3/2047 | | | 10,000 | | | | 10,766 | |
| | |
Marathon Petroleum Corp. 6.50%, 3/1/2041 | | | 15,000 | | | | 19,136 | |
| | |
MPLX LP | | | | | | | | |
| | |
4.13%, 3/1/2027 | | | 15,000 | | | | 16,592 | |
| | |
4.50%, 4/15/2038 | | | 10,000 | | | | 10,587 | |
| | |
5.20%, 3/1/2047 | | | 15,000 | | | | 16,970 | |
| | | | | | | | |
| INVESTMENTS | | PRINCIPAL
AMOUNT($) | | | VALUE($) | |
| | |
| | | | | | | | |
|
Oil, Gas & Consumable Fuels — continued | |
| | |
Noble Energy, Inc. | | | | | | | | |
| | |
3.85%, 1/15/2028 | | | 15,000 | | | | 17,014 | |
| | |
5.05%, 11/15/2044 | | | 30,000 | | | | 38,995 | |
| | |
ONEOK, Inc. | | | | | | | | |
| | |
3.40%, 9/1/2029 | | | 30,000 | | | | 29,491 | |
| | |
4.45%, 9/1/2049 | | | 15,000 | | | | 13,492 | |
| | |
Phillips 66 4.88%, 11/15/2044 | | | 20,000 | | | | 24,266 | |
| | |
Plains All American Pipeline LP 3.55%, 12/15/2029 | | | 30,000 | | | | 29,859 | |
| | |
Spectra Energy Partners LP 4.50%, 3/15/2045 | | | 20,000 | | | | 23,372 | |
| | |
Suncor Energy, Inc. (Canada) 5.35%, 7/15/2033 | | | 20,000 | | | | 23,347 | |
| | |
Sunoco Logistics Partners Operations LP | | | | | | | | |
| | |
4.00%, 10/1/2027 | | | 10,000 | | | | 10,277 | |
| | |
5.35%, 5/15/2045 | | | 30,000 | | | | 28,674 | |
| | |
TransCanada PipeLines Ltd. (Canada) 4.63%, 3/1/2034 | | | 15,000 | | | | 18,020 | |
| | |
Williams Cos., Inc. (The) 3.90%, 1/15/2025 | | | 20,000 | | | | 22,020 | |
| | | | | | | | |
| | |
| | | | | | | 615,292 | |
| | | | | | | | |
|
Pharmaceuticals — 0.6% | |
| | |
Bristol-Myers Squibb Co. 4.63%, 5/15/2044 | | | 10,000 | | | | 13,598 | |
| | |
Mylan NV 3.95%, 6/15/2026 | | | 10,000 | | | | 11,332 | |
| | |
Mylan, Inc. 5.20%, 4/15/2048 | | | 10,000 | | | | 12,577 | |
| | |
Shire Acquisitions Investments Ireland DAC 3.20%, 9/23/2026 | | | 50,000 | | | | 55,993 | |
| | |
Zoetis, Inc. | | | | | | | | |
| | |
4.50%, 11/13/2025 | | | 15,000 | | | | 17,677 | |
| | |
2.00%, 5/15/2030 | | | 15,000 | | | | 15,587 | |
| | |
4.70%, 2/1/2043 | | | 15,000 | | | | 19,801 | |
| | | | | | | | |
| | |
| | | | | | | 146,565 | |
| | | | | | | | |
|
Road & Rail — 0.7% | |
| | |
Burlington Northern Santa Fe LLC 4.40%, 3/15/2042 | | | 30,000 | | | | 38,045 | |
| | |
CSX Corp. | | | | | | | | |
| | |
2.40%, 2/15/2030 | | | 15,000 | | | | 15,852 | |
| | |
4.30%, 3/1/2048 | | | 20,000 | | | | 25,209 | |
| | |
ERAC USA Finance LLC 5.63%, 3/15/2042 (b) | | | 30,000 | | | | 36,808 | |
| | |
JB Hunt Transport Services, Inc. 3.88%, 3/1/2026 | | | 40,000 | | | | 46,258 | |
| | |
Norfolk Southern Corp. 4.65%, 1/15/2046 | | | 10,000 | | | | 12,984 | |
| | | | | | | | |
| | |
| | | | | | | 175,156 | |
| | | | | | | | |
SEE NOTES TO FINANCIAL STATEMENTS.
| | | | | | |
| | | |
| 10 | | | | J.P. MORGAN SMA FUNDS | | AUGUST 31, 2020 |
| | | | | | | | |
| INVESTMENTS | | PRINCIPAL
AMOUNT($) | | | VALUE($) | |
Corporate Bonds — continued | |
|
Semiconductors & Semiconductor Equipment — 0.2% | |
| | |
Broadcom Corp. | | | | | | | | |
| | |
2.65%, 1/15/2023 | | | 20,000 | | | | 20,809 | |
| | |
3.88%, 1/15/2027 | | | 25,000 | | | | 27,703 | |
| | | | | | | | |
| | |
| | | | | | | 48,512 | |
| | | | | | | | |
|
Software — 0.3% | |
| | |
Oracle Corp. 3.85%, 7/15/2036 | | | 50,000 | | | | 58,715 | |
| | | | | | | | |
|
Specialty Retail — 0.3% | |
| | |
Advance Auto Parts, Inc. 4.50%, 12/1/2023 | | | 25,000 | | | | 27,284 | |
| | |
AutoZone, Inc. | | | | | | | | |
| | |
3.63%, 4/15/2025 | | | 15,000 | | | | 16,822 | |
| | |
4.00%, 4/15/2030 | | | 10,000 | | | | 11,898 | |
| | |
Lowe’s Cos., Inc. 4.65%, 4/15/2042 | | | 10,000 | | | | 12,650 | |
| | | | | | | | |
| | |
| | | | | | | 68,654 | |
| | | | | | | | |
|
Technology Hardware, Storage & Peripherals — 0.3% | |
| | |
Apple, Inc. 4.65%, 2/23/2046 | | | 30,000 | | | | 41,062 | |
| | |
Dell International LLC 4.42%, 6/15/2021 (b) | | | 18,000 | | | | 18,466 | |
| | | | | | | | |
| | |
| | | | | | | 59,528 | |
| | | | | | | | |
|
Tobacco — 0.3% | |
| | |
Altria Group, Inc. 3.88%, 9/16/2046 | | | 15,000 | | | | 15,566 | |
| | |
BAT Capital Corp. (United Kingdom) | | | | | | | | |
| | |
3.22%, 8/15/2024 | | | 5,000 | | | | 5,392 | |
| | |
3.56%, 8/15/2027 | | | 20,000 | | | | 21,862 | |
| | |
Reynolds American, Inc. (United Kingdom) 5.85%, 8/15/2045 | | | 25,000 | | | | 30,884 | |
| | | | | | | | |
| | |
| | | | | | | 73,704 | |
| | | | | | | | |
|
Trading Companies & Distributors — 0.6% | |
| | |
Air Lease Corp. | | | | | | | | |
| | |
3.50%, 1/15/2022 | | | 25,000 | | | | 25,553 | |
| | |
3.25%, 3/1/2025 | | | 10,000 | | | | 10,161 | |
| | |
3.25%, 10/1/2029 | | | 20,000 | | | | 19,518 | |
| | |
Aviation Capital Group LLC | | | | | | | | |
| | |
2.88%, 1/20/2022 (b) | | | 30,000 | | | | 29,815 | |
| | |
3.50%, 11/1/2027 (b) | | | 20,000 | | | | 17,758 | |
| | |
International Lease Finance Corp. 4.63%, 4/15/2021 | | | 35,000 | | | | 35,639 | |
| | | | | | | | |
| | |
| | | | | | | 138,444 | |
| | | | | | | | |
|
Wireless Telecommunication Services — 0.5% | |
| | |
Rogers Communications, Inc. (Canada) | | | | | | | | |
| | |
2.90%, 11/15/2026 | | | 10,000 | | | | 11,038 | |
| | |
4.50%, 3/15/2043 | | | 10,000 | | | | 12,167 | |
| | |
T-Mobile USA, Inc. | | | | | | | | |
| | |
3.75%, 4/15/2027 (b) | | | 15,000 | | | | 16,964 | |
| | | | | | | | |
| INVESTMENTS | | PRINCIPAL
AMOUNT($) | | | VALUE($) | |
| | |
| | | | | | | | |
|
Wireless Telecommunication Services — continued | |
| | |
4.50%, 4/15/2050 (b) | | | 5,000 | | | | 6,107 | |
| | |
Vodafone Group plc (United Kingdom) | | | | | | | | |
| | |
3.75%, 1/16/2024 | | | 20,000 | | | | 21,922 | |
| | |
4.38%, 5/30/2028 | | | 25,000 | | | | 29,920 | |
| | |
5.00%, 5/30/2038 | | | 11,000 | | | | 13,770 | |
| | | | | | | | |
| | |
| | | | | | | 111,888 | |
| | | | | | | | |
| |
Total Corporate Bonds
(Cost $5,114,171) | | | | 5,714,386 | |
| | | | | |
Commercial Mortgage-Backed Securities — 7.5% | |
| | |
20 Times Square Trust | | | | | | | | |
| | |
Series 2018-20TS, Class D, 3.20%, 5/15/2035 ‡ (a) (b) | | | 100,000 | | | | 94,976 | |
| | |
Series 2018-20TS, Class E, 3.20%, 5/15/2035 ‡ (a) (b) | | | 100,000 | | | | 92,722 | |
| | |
Citigroup Commercial Mortgage Trust | | | | | | | | |
| | |
Series 2013-GC11, Class A3, 2.82%, 4/10/2046 | | | 23,593 | | | | 24,297 | |
| | |
Series 2014-GC19, Class A3, 3.75%, 3/10/2047 | | | 8,070 | | | | 8,701 | |
| | |
Series 2014-GC23, Class A3, 3.36%, 7/10/2047 | | | 11,750 | | | | 12,638 | |
| | |
Commercial Mortgage Trust | | | | | | | | |
| | |
Series 2014-UBS2, Class A4, 3.69%, 3/10/2047 | | | 15,000 | | | | 16,135 | |
| | |
Series 2014-CR17, Class A4, 3.70%, 5/10/2047 | | | 29,158 | | | | 31,524 | |
| | |
Series 2014-UBS3, Class A3, 3.55%, 6/10/2047 | | | 23,871 | | | | 25,701 | |
| | |
FHLMC, Multi-Family Structured Pass-Through Certificates | | | | | | | | |
| | |
Series K731, Class AM, 3.60%, 2/25/2025 (a) | | | 200,000 | | | | 221,104 | |
| | |
Series K090, Class A2, 3.42%, 2/25/2029 | | | 120,000 | | | | 141,948 | |
| | |
FREMF Mortgage Trust | | | | | | | | |
| | |
Series 2013-K26, Class B, 3.72%, 12/25/2045 (a) (b) | | | 99,000 | | | | 103,695 | |
| | |
GPMT Ltd. (Cayman Islands) | | | | | | | | |
| | |
Series 2018-FL1, Class AS, 1.37%, 11/21/2035 ‡ (a) (b) | | | 150,000 | | | | 145,500 | |
| | |
GS Mortgage Securities Trust | | | | | | | | |
| | |
Series 2013-GC16, Class AS, 4.65%, 11/10/2046 | | | 111,000 | | | | 120,862 | |
| | |
Series 2013-GC16, Class B, 5.16%, 11/10/2046 (a) | | | 50,000 | | | | 52,557 | |
| | |
JP Morgan Chase Commercial Mortgage Securities Trust | | | | | | | | |
| | |
Series 2013-LC11, Class A4, 2.69%, 4/15/2046 | | | 13,593 | | | | 14,082 | |
SEE NOTES TO FINANCIAL STATEMENTS.
| | | | | | | | |
| | | |
| AUGUST 31, 2020 | | J.P. MORGAN SMA FUNDS | | | | | 11 | |
JPMorgan Core Focus SMA Fund
SCHEDULE OF PORTFOLIO INVESTMENTS
AS OF AUGUST 31, 2020 (Unaudited) (continued)
| | | | | | | | |
| INVESTMENTS | | PRINCIPAL
AMOUNT($) | | | VALUE($) | |
Commercial Mortgage-Backed Securities — continued | |
| | |
Series 2011-C5, Class B, 5.61%, 8/15/2046 (a) (b) | | | 169,000 | | | | 168,500 | |
| | |
JPMBB Commercial Mortgage Securities Trust | | | | | | | | |
| | |
Series 2013-C15, Class C, 5.37%, 11/15/2045 (a) | | | 30,000 | | | | 29,445 | |
| | |
JPMCC Re-REMIC Trust | | | | | | | | |
| | |
Series 2014-FRR1, Class BK10, 1.81%, 11/27/2049 (a) (b) | | | 180,000 | | | | 177,271 | |
| | |
Morgan Stanley Bank of America Merrill Lynch Trust | | | | | | | | |
| | |
Series 2014-C18, Class A2, 3.19%, 10/15/2047 | | | 4,670 | | | | 4,668 | |
| | |
Series 2015-C27, Class A3, 3.47%, 12/15/2047 | | | 130,000 | | | | 140,296 | |
| | |
Wells Fargo Commercial Mortgage Trust | | | | | | | | |
| | |
Series 2015-NXS4, Class A3, 3.45%, 12/15/2048 | | | 130,000 | | | | 143,151 | |
| | |
WFRBS Commercial Mortgage Trust | | | | | | | | |
| | |
Series 2013-C13, Class A3, 2.75%, 5/15/2045 | | | 25,815 | | | | 26,611 | |
| | | | | | | | |
| |
Total Commercial Mortgage-Backed Securities
(Cost $1,715,272) | | | | 1,796,384 | |
| | | | | |
Mortgage-Backed Securities — 1.7% | |
| | |
FNMA, Other | | | | | | | | |
| | |
Pool # AM4660, 3.77%, 12/1/2025 | | | 131,470 | | | | 148,422 | |
| | |
Pool # AM5940, 3.24%, 6/1/2026 | | | 67,041 | | | | 74,880 | |
| | |
Pool # AM6428, 3.58%, 8/1/2029 | | | 85,781 | | | | 95,761 | |
| | |
Pool # AM6430, 3.58%, 8/1/2029 | | | 85,781 | | | | 98,810 | |
| | | | | | | | |
| |
Total Mortgage-Backed Securities
(Cost $375,368) | | | | 417,873 | |
| | | | | |
U.S. Treasury Obligations — 0.7% | |
| | |
U.S. Treasury Bonds 2.38%, 11/15/2049 | | | 65,000 | | | | 78,965 | |
| | |
2.00%, 2/15/2050 | | | 85,000 | | | | 95,665 | |
| | | | | | | | |
| |
Total U.S. Treasury Obligations
(Cost $166,249) | | | | 174,630 | |
| | | | | |
| | | | | | | | |
INVESTMENTS | |
SHARES | | | VALUE($) | |
Short-Term Investments — 6.5% | |
|
Investment Companies — 6.5% | |
| | |
JPMorgan Prime Money Market Fund Class Institutional Shares, 0.17% (e) (f)
(Cost $1,540,193) | | | 1,539,253 | | | | 1,540,485 | |
| | | | | | | | |
Total Investments — 99.9%
(Cost $22,346,274) | | | | | | | 23,829,315 | |
Other Assets Less Liabilities — 0.1% | | | | | | | 23,360 | |
| | | | | |
NET ASSETS — 100.0% | | | | 23,852,675 | |
| | | | | |
Percentages indicated are based on net assets.
| | |
Abbreviations |
| |
| ABS | | Asset-backed securities |
| FHLMC | | Federal Home Loan Mortgage Corp. |
| FNMA | | Federal National Mortgage Association |
| GNMA | | Government National Mortgage Association |
| ICE | | Intercontinental Exchange |
| LIBOR | | London Interbank Offered Rate |
| REMIC | | Real Estate Mortgage Investment Conduit |
| Re-REMIC | | Combined Real Estate Mortgage Investment Conduit |
| USD | | United States Dollar |
| |
| (a) | | Variable or floating rate security, the interest rate of which adjusts periodically based on changes in current interest rates and prepayments on the underlying pool of assets. The interest rate shown is the current rate as of August 31, 2020. |
| (b) | | Securities exempt from registration under Rule 144A or section 4(a)(2), of the Securities Act of 1933, as amended. |
| (c) | | Step bond. Interest rate is a fixed rate for an initial period that either resets at a specific date or may reset in the future contingent upon a predetermined trigger. The interest rate shown is the current rate as of August 31, 2020. |
| (d) | | Variable or floating rate security, linked to the referenced benchmark. The interest rate shown is the current rate as of August 31, 2020. |
| (e) | | Investment in an affiliated fund, which is registered under the Investment Company Act of 1940, as amended, and is advised by J.P. Morgan Investment Management Inc. |
| (f) | | The rate shown is the current yield as of August 31, 2020. |
| ‡ | | Value determined using significant unobservable inputs. |
SEE NOTES TO FINANCIAL STATEMENTS.
| | | | | | |
| | | |
| 12 | | | | J.P. MORGAN SMA FUNDS | | AUGUST 31, 2020 |
STATEMENT OF ASSETS AND LIABILITIES
AS OF AUGUST 31, 2020 (Unaudited)
| | | | |
| |
| | |
JPMorgan
Core Focus
SMA Fund | |
ASSETS: | |
Investments in non-affiliates, at value | | $ | 22,288,830 | |
Investments in affiliates, at value | | | 1,540,485 | |
Cash | | | 152 | |
Receivables: | | | | |
Interest from non-affiliates | | | 99,230 | |
Dividends from affiliates | | | 207 | |
Due from Adviser | | | 14,586 | |
| | | | |
Total Assets | | | 23,943,490 | |
| | | | |
|
LIABILITIES: | |
Payables: | | | | |
Investment securities purchased | | | 19,899 | |
Accrued liabilities: | | | | |
Custodian and accounting fees | | | 17,313 | |
Printing and mailing costs | | | 5,125 | |
Audit fees | | | 44,996 | |
Other | | | 3,482 | |
| | | | |
Total Liabilities | | | 90,815 | |
| | | | |
Net Assets | | $ | 23,852,675 | |
| | | | |
|
NET ASSETS: | |
Paid-in-Capital | | $ | 22,256,713 | |
Total distributable earnings (loss) | | | 1,595,962 | |
| | | | |
Total Net Assets | | $ | 23,852,675 | |
| | | | |
| |
Outstanding units of beneficial interest (shares) ($0.0001 par value; unlimited number of shares authorized): | | | 2,247,367 | |
| |
Net Asset Value, Offering and redemption price per share (a) | | $ | 10.61 | |
| |
Cost of investments in non-affiliates | | $ | 20,806,081 | |
Cost of investments in affiliates | | | 1,540,193 | |
| (a) | Per share amounts may not recalculate due to rounding of net assets and/or shares outstanding. |
SEE NOTES TO FINANCIAL STATEMENTS.
| | | | | | | | |
| | | |
| AUGUST 31, 2020 | | J.P. MORGAN SMA FUNDS | | | | | 13 | |
STATEMENT OF OPERATIONS
FOR THE SIX MONTHS ENDED AUGUST 31, 2020 (Unaudited)
| | | | |
| |
| | |
JPMorgan
Core Focus
SMA Fund | |
INVESTMENT INCOME: | |
Interest income from non-affiliates | | $ | 398,883 | |
Interest income from affiliates | | | 2,584 | |
Dividend income from affiliates | | | 7,725 | |
| | | | |
Total investment income | | | 409,192 | |
| | | | |
|
EXPENSES: | |
Administration fees | | | 10,004 | |
Custodian and accounting fees | | | 28,274 | |
Interest expense to affiliates | | | 18 | |
Professional fees | | | 40,325 | |
Trustees’ and Chief Compliance Officer’s fees | | | 12,487 | |
Printing and mailing costs | | | 5,144 | |
Registration and filing fees | | | 18 | |
Transfer agency fees | | | 87 | |
Other | | | 2,048 | |
| | | | |
Total expenses | | | 98,405 | |
| | | | |
Less fees waived | | | (10,020 | ) |
Less expense reimbursements | | | (88,385 | ) |
| | | | |
Net expenses | | | — | |
| | | | |
Net investment income (loss) | | | 409,192 | |
| | | | |
|
REALIZED/UNREALIZED GAINS (LOSSES): | |
Net realized gain (loss) on transactions from: | | | | |
Investments in non-affiliates | | | 102,886 | |
Investments in affiliates | | | 2,504 | |
| | | | |
Net realized gain (loss) | | | 105,390 | |
| | | | |
Change in net unrealized appreciation/depreciation on: | | | | |
Investments in non-affiliates | | | (142,895 | ) |
Investments in affiliates | | | (424 | ) |
| | | | |
Change in net unrealized appreciation/depreciation | | | (143,319 | ) |
| | | | |
Net realized/unrealized gains (losses) | | | (37,929 | ) |
| | | | |
Change in net assets resulting from operations | | $ | 371,263 | |
| | | | |
SEE NOTES TO FINANCIAL STATEMENTS.
| | | | | | |
| | | |
| 14 | | | | J.P. MORGAN SMA FUNDS | | AUGUST 31, 2020 |
STATEMENTS OF CHANGES IN NET ASSETS
FOR THE PERIODS INDICATED
| | | | | | | | |
| | | JPMorgan Core Focus SMA Fund | |
| | | Six Months Ended
August 31, 2020
(Unaudited) | | | Year Ended
February 29, 2020 | |
CHANGE IN NET ASSETS RESULTING FROM OPERATIONS: | | | | | |
Net investment income (loss) | | $ | 409,192 | | | $ | 935,007 | |
Net realized gain (loss) | | | 105,390 | | | | 55,738 | |
Change in net unrealized appreciation/depreciation | | | (143,319 | ) | | | 1,526,586 | |
| | | | | | | | |
Change in net assets resulting from operations | | | 371,263 | | | | 2,517,331 | |
| | | | | | | | |
| | |
DISTRIBUTIONS TO SHAREHOLDERS: | | | | | | | | |
Total distributions to shareholders | | | (418,806 | ) | | | (946,315 | ) |
| | | | | | | | |
| | |
CAPITAL TRANSACTIONS: | | | | | | | | |
Distributions reinvested | | | 418,806 | | | | 946,315 | |
Cost of shares redeemed | | | (5,000,000 | ) | | | — | |
| | | | | | | | |
Change in net assets resulting from capital transactions | | $ | (4,581,194 | ) | | $ | 946,315 | |
| | | | | | | | |
| |
NET ASSETS: | | | | | |
Change in net assets | | | (4,628,737 | ) | | | 2,517,331 | |
Beginning of period | | | 28,481,412 | | | | 25,964,081 | |
| | | | | | | | |
End of period | | $ | 23,852,675 | | | $ | 28,481,412 | |
| | | | | | | | |
| | |
SHARE TRANSACTIONS: | | | | | | | | |
Reinvested | | | 40,204 | | | | 91,450 | |
Redeemed | | | (473,485 | ) | | | — | |
| | | | | | | | |
Change in Shares | | | (433,281 | ) | | | 91,450 | |
| | | | | | | | |
SEE NOTES TO FINANCIAL STATEMENTS.
| | | | | | | | |
| | | |
| AUGUST 31, 2020 | | J.P. MORGAN SMA FUNDS | | | | | 15 | |
FINANCIAL HIGHLIGHTS
FOR THE PERIODS INDICATED
| | | | | | | | | | | | | | | | | | | | | | | | | | | | |
| | | | | | Per share operating performance | |
| | | | | | Investment operations | | | Distributions | |
| | | Net asset
value,
beginning
of period | | | Net
investment
income
(loss) (b) | | | Net realized
and unrealized
gains
(losses) on
investments | | | Total from
investment
operations | | | Net
investment
income | | | Net
realized
gain | | | Total
distributions | |
JPMorgan Core Focus SMA Fund | |
Six Months Ended August 31, 2020 (Unaudited) | | $ | 10.62 | | | $ | 0.16 | | | $ | (0.01 | ) | | $ | 0.15 | | | $ | (0.16 | ) | | $ | — | | | $ | (0.16 | ) |
Year Ended February 29, 2020 | | | 10.03 | | | | 0.36 | | | | 0.59 | | | | 0.95 | | | | (0.36 | ) | | | — | (g) | | | (0.36 | ) |
March 1, 2018 (h) through February 28, 2019 | | | 10.00 | | | | 0.35 | | | | 0.03 | | | | 0.38 | | | | (0.35 | ) | | | — | | | | (0.35 | ) |
| (a) | Annualized for periods less than one year, unless otherwise noted. |
| (b) | Calculated based upon average shares outstanding. |
| (c) | Not annualized for periods less than one year. |
| (d) | Includes adjustments in accordance with accounting principles generally accepted in the United States of America and as such, the net asset values for financial reporting purposes and the returns based upon those net asset values may differ from the net asset values and returns for shareholder transactions. |
| (e) | Includes earnings credits and interest expense, if applicable, each of which is less than 0.005% unless otherwise noted. |
| (f) | The Fund’s expenses have been contractually capped at 0.00%. See Note 3.E. in the Notes to Financial Statements. The Fund is an integral part of a “separately managed account” strategy offered through programs sponsored by investment advisors and/or broker-dealers, some of which are unaffiliated with the Fund and the Investment Adviser. Participants in these programs pay a fee to the sponsor of the program. |
| (g) | Amount rounds to less than $0.005. |
| (h) | Commencement of operations. |
| (i) | Certain non-recurring expenses incurred by the Fund were not annualized for the period indicated. |
SEE NOTES TO FINANCIAL STATEMENTS.
| | | | | | |
| | | |
| 16 | | | | J.P. MORGAN SMA FUNDS | | AUGUST 31, 2020 |
| | | | | | | | | | | | | | | | | | | | | | | | | | |
| | | Ratios/Supplemental data | |
| | | | | | | | | | Ratios to average net assets (a) | | | | |
Net asset
value,
end of
period | | | Total
return (c)(d) | | | Net assets,
end of
period | | | Net
expenses (e)(f) | | | Net
investment
income
(loss) | | |
Expenses
without waivers,
reimbursements and
earnings credits | | | Portfolio
turnover
rate (c) | |
| | | | | | | | | | | | | | | | | | | | | | | | | | |
| $ | 10.61 | | | | 1.49 | % | | $ | 23,852,675 | | | | — | % | | | 3.06 | % | | | 0.74 | % | | | 12 | % |
| | 10.62 | | | | 9.62 | | | | 28,481,412 | | | | — | | | | 3.43 | | | | 0.74 | | | | 25 | |
| | 10.03 | | | | 3.88 | | | | 25,964,081 | | | | — | (i) | | | 3.53 | (i) | | | 0.85 | (i) | | | 38 | |
SEE NOTES TO FINANCIAL STATEMENTS.
| | | | | | | | |
| | | |
| AUGUST 31, 2020 | | J.P. MORGAN SMA FUNDS | | | | | 17 | |
NOTES TO FINANCIAL STATEMENTS
AS OF AUGUST 31, 2020 (Unaudited)
1. Organization
JPMorgan Trust IV (the “Trust”) was formed on November 11, 2015, as a Delaware statutory trust, pursuant to a Declaration of Trust dated November 11, 2015 and is registered under the Investment Company Act of 1940, as amended (the “1940 Act”), as an open-end management investment company.
The following is a separate fund of the Trust (the “Fund”) covered by this report:
| | | | |
| | | | | Diversification Classification |
| JPMorgan Core Focus SMA Fund | | | | Diversified |
The investment objective of the Fund is to seek to maximize total return.
Shares of the Fund may be purchased only by or on behalf of separately managed accounts where J.P. Morgan Investment Management Inc. (the “Adviser” or “JPMIM”), an indirect, wholly-owned subsidiary of JPMorgan Chase & Co. (“JPMorgan”), serves as the investment adviser, sub-adviser or model portfolio provider for the account with the separately managed account sponsor or directly with the client. The Fund’s shares may not be purchased directly by individuals.
2. Significant Accounting Policies
The following is a summary of significant accounting policies followed by the Fund in the preparation of its financial statements. The Fund is an investment company and, thus, follows the investment company accounting and reporting guidance of the Financial Accounting Standards Board (“FASB”) Accounting Standards Codification Topic 946 — Investment Companies, which is part of U.S. generally accepted accounting principles (“GAAP”). The preparation of financial statements in conformity with GAAP requires management to make estimates and assumptions that affect (i) the reported amounts of assets and liabilities, (ii) disclosure of contingent assets and liabilities at the date of the financial statements, and (iii) the reported amounts of increases and decreases in net assets from operations during the reporting period. Actual results could differ from those estimates.
A. Valuation of Investments — Investments are valued in accordance with GAAP and the Fund’s valuation policies set forth by, and under the supervision and responsibility of, the Board of Trustees of the Trust (the “Board”), which established the following approach to valuation, as described more fully below: (i) investments for which market quotations are readily available shall be valued at their market value and (ii) all other investments for which market quotations are not readily available shall be valued at their fair value as determined in good faith by the Board.
The Administrator has established the J.P. Morgan Asset Management Americas Valuation Committee (“AVC”) to assist the Board with the oversight and monitoring of the valuation of the Fund’s investments. The Administrator implements the valuation policies of the Fund’s investments, as directed by the Board. The AVC oversees and carries out the policies for the valuation of investments held in the Fund. This includes monitoring the appropriateness of fair values based on results of ongoing valuation oversight including, but not limited to, consideration of macro or security specific events, market events and pricing vendor and broker due diligence. The Administrator is responsible for discussing and assessing the potential impacts to the fair values on an ongoing basis, and at least on a quarterly basis with the AVC and the Board.
A market-based approach is primarily used to value the Fund’s investments. Investments for which market quotations are not readily available are fair valued by approved affiliated and/or unaffiliated pricing vendors or third party broker-dealers (collectively referred to as “Pricing Services”) or may be internally fair valued using methods set forth by the valuation policies approved by the Board. This may include the use of related or comparable assets or liabilities, recent transactions, market multiples, book values and other relevant information for the investment. An income-based valuation approach may be used in which the anticipated future cash flows of the investment are discounted to calculate the fair value. Discounts may also be applied due to the nature or duration of any restrictions on the disposition of the investments. Valuations may be based upon current market prices of securities that are comparable in coupon, rating, maturity and industry. It is possible that the estimated values may differ significantly from the values that would have been used, had a ready market for the investments existed, and such differences could be material.
Fixed income instruments are valued based on prices received from Pricing Services. The Pricing Services use multiple valuation techniques to determine the valuation of fixed income instruments. In instances where sufficient market activity exists, the Pricing Services may utilize a market-based approach through which trades or quotes from market makers are used to determine the valuation of these instruments. In instances where sufficient market activity may not exist, the Pricing Services also utilize proprietary valuation models which may consider market transactions in comparable securities and the various relationships between securities in determining fair value and/or market characteristics in order to estimate the relevant cash flows, which are then discounted to calculate the fair values.
Investments in open-end investment companies (“Underlying Funds”) are valued at each Underlying Fund’s net asset value (“NAV”) per share as of the report date.
See the table on “Quantitative Information about Level 3 Fair Value Measurements” for information on the valuation techniques and inputs used to value level 3 securities held by the Fund at August 31, 2020.
| | | | | | |
| | | |
| 18 | | | | J.P. MORGAN SMA FUNDS | | AUGUST 31, 2020 |
Valuations reflected in this report are as of the report date. As a result, changes in valuation due to market events and/or issuer-related events after the report date and prior to issuance of the report are not reflected herein. The various inputs that are used in determining the valuation of the Fund’s investments are summarized into the three broad levels listed below.
| • | | Level 1 — Unadjusted inputs using quoted prices in active markets for identical investments. |
| • | | Level 2 — Other significant observable inputs including, but not limited to, quoted prices for similar investments, inputs other than quoted prices that are observable for investments (such as interest rates, prepayment speeds, credit risk, etc.) or other market corroborated inputs. |
| • | | Level 3 — Significant inputs based on the best information available in the circumstances, to the extent observable inputs are not available (including the Fund’s assumptions in determining the fair value of investments). |
A financial instrument’s level within the fair value hierarchy is based on the lowest level of any input, both individually and in the aggregate, that is significant to the fair value measurement. The inputs or methodology used for valuing instruments are not necessarily an indication of the risk associated with investing in those instruments.
The following table represents each valuation input by sector as presented on the Schedule of Portfolio Investments:
| | | | | | | | | | | | | | | | |
| | | Level 1
Quoted prices | | | Level 2
Other significant
observable inputs | | | Level 3
Significant
unobservable inputs | | | Total | |
Investments in Securities | | | | | | | | | | | | | | | | |
Asset-Backed Securities | | $ | — | | | $ | 6,141,360 | | | $ | 752,784 | | | $ | 6,894,144 | |
Collateralized Mortgage Obligations | | | — | | | | 7,291,413 | | | | — | | | | 7,291,413 | |
Commercial Mortgage-Backed Securities | | | — | | | | 1,463,186 | | | | 333,198 | | | | 1,796,384 | |
Corporate Bonds | | | — | | | | 5,714,386 | | | | — | | | | 5,714,386 | |
Mortgage-Backed Securities | | | — | | | | 417,873 | | | | — | | | | 417,873 | |
U.S. Treasury Obligations | | | — | | | | 174,630 | | | | — | | | | 174,630 | |
Short-Term Investments | | | | | | | | | | | | | | | | |
Investment Companies | | | 1,540,485 | | | | — | | | | — | | | | 1,540,485 | |
| | | | | | | | | | | | | | | | |
Total Investments in Securities | | $ | 1,540,485 | | | $ | 21,202,848 | | | $ | 1,085,982 | | | $ | 23,829,315 | |
| | | | | | | | | | | | | | | | |
The following is a summary of investments for which significant unobservable inputs (level 3) were used in determining fair value:
| | | | | | | | | | | | | | | | | | | | | | | | | | | | | | | | | | | | |
| | | Balance as of
February 29,
2020 | | | Realized
gain (loss) | | | Change in
net unrealized
appreciation
(depreciation) | | | Net
accretion
(amortization) | | | Purchases1 | | | Sales2 | | | Transfers
into
Level 3 | | | Transfers
out of
Level 3 | | | Balance as of
August 31,
2020 | |
Investments in Securities: | | | | | | | | | | | | | | | | | | | | | | | | | | | | | | | | | | | | |
Asset-Backed Securities | | $ | 955,903 | | | $ | — | | | $ | (23,625 | ) | | $ | 59 | | | $ | — | | | $ | (179,553 | ) | | $ | — | | | $ | — | | | $ | 752,784 | |
Commercial Mortgage-Backed Securities | | | 429,650 | | | | — | | | | (19,796 | ) | | | 259 | | | | — | | | | — | | | | 101,927 | | | | (178,842 | ) | | | 333,198 | |
| | | | | | | | | | | | | | | | | | | | | | | | | | | | | | | | | | | | |
Total | | $ | 1,385,553 | | | $ | — | | | $ | (43,421 | ) | | $ | 318 | | | $ | — | | | $ | (179,553 | ) | | $ | 101,927 | | | $ | (178,842 | ) | | $ | 1,085,982 | |
| | | | | | | | | | | | | | | | | | | | | | | | | | | | | | | | | | | | |
| 1 | Purchases include all purchases of securities and securities received in corporate actions. |
| 2 | Sales include all sales of securities, maturities, paydowns and securities tendered in corporate actions. |
The changes in net unrealized appreciation (depreciation) attributable to securities owned at August 31, 2020, which were valued using significant unobservable inputs (level 3), amounted to $(41,770). This amount is included in Change in net unrealized appreciation/ depreciation of investments in non-affiliates on the Statement of Operations.
Transfers between level 2 and level 3 are due to a decline or an increase in market activity (e.g. frequency of trades), which resulted in a lack or increase of available market inputs to determine the price for the six months ended August 31, 2020.
Quantitative Information about Level 3 Fair Value Measurements #
| | | | | | | | | | |
| | | Fair Value at
August 31, 2020 | | | Valuation Technique(s) | | Unobservable Input | | Range (Weighted Average) (a) |
| | $ | 752,784 | | | Discounted Cash Flow | | Constant Prepayment Rate | | 0.00% - 30.00% (12.92%) |
| | | | | | | | Yield (Discount Rate of Cash Flows) | | 0.96% - 5.04% (3.47%) |
| | | | | | | | | | |
| Asset-Backed Securities | | | 752,784 | | | | | | | |
|
| | | 187,698 | | | Discounted Cash Flow | | Yield (Discount Rate of Cash Flows) | | 5.13% - 6.08% (5.60%) |
| | | | | | | | | | |
| Commercial Mortgage-Backed Securities | | | 187,698 | | | | | | | |
|
| Total | | $ | 940,482 | | | | | | | |
|
| | | | | | | | |
| | | |
| AUGUST 31, 2020 | | J.P. MORGAN SMA FUNDS | | | | | 19 | |
NOTES TO FINANCIAL STATEMENTS
AS OF AUGUST 31, 2020 (Unaudited) (continued)
| # | The table above does not include certain level 3 securities that are valued by brokers and pricing services. At August 31, 2020, the value of these securities was $145,500. The inputs for these securities are not readily available or cannot be reasonably estimated and are generally those inputs described in Note 2.A. |
| (a) | Unobservable inputs were weighted by the relative fair value of the instruments. |
The significant unobservable inputs used in the fair value measurement of the Fund’s investments are listed above. Generally, a change in the assumptions used in any input in isolation may be accompanied by a change in another input. Significant changes in any of the unobservable inputs may significantly impact the fair value measurement. The impact is based on the relationship between each unobservable input and the fair value measurement. Significant increases (decreases) in the yield and default rate may decrease (increase) the fair value measurement. A significant change in the prepayment rate (Constant Prepayment Rate or PSA Prepayment Model) may decrease or increase the fair value measurement.
B. Restricted Securities — Certain securities held by the Fund may be subject to legal or contractual restrictions on resale. Restricted securities generally are resold in transactions exempt from registration under the Securities Act of 1933, as amended (the “Securities Act”). Disposal of these securities may involve time-consuming negotiations and expense. Prompt sale at the current valuation may be difficult and could adversely affect the net asset value of the Fund.
As of August 31, 2020, the Fund had no investments in restricted securities other than securities sold to the Fund under Rule 144A and/or Regulation S under the Securities Act.
C. Investment Transactions with Affiliates — The Fund invested in an Underlying Fund which is advised by the Adviser. An issuer which is under common control with the Fund may be considered an affiliate. For the purposes of the financial statements, the Fund assumes the issuer listed in the table below to be an affiliated issuer. The Underlying Fund’s distributions may be reinvested into the Underlying Fund. Reinvestment amounts are included in the purchase cost amount in the table below.
| | | | | | | | | | | | | | | | | | | | | | | | | | | | | | | | | | | | |
| | | For the six months ended August 31, 2020 | |
| Security Description | | Value at
February 29,
2020 | | | Purchases at
Cost | | | Proceeds from
Sales | | | Net
Realized
Gain (Loss) | | | Change in
Unrealized
Appreciation/
(Depreciation) | | | Value at
August 31,
2020 | | | Shares at
August 31,
2020 | | | Dividend
Income | | | Capital Gain
Distributions | |
JPMorgan Prime Money Market Fund Class Institutional Shares, 0.17% (a) (b) | | $ | 2,582,926 | | | $ | 14,389,712 | | | $ | 15,434,233 | | | $ | 2,504 | | | $ | (424 | ) | | $ | 1,540,485 | | | | 1,539,253 | | | $ | 7,725 | | | $ | — | |
| | | | | | | | | | | | | | | | | | | | | | | | | | | | | | | | | | | | |
| (a) | Investment in an affiliated fund, which is registered under the Investment Company Act of 1940, as amended, and is advised by J.P. Morgan Investment Management Inc. |
| (b) | The rate shown is the current yield as of August 31, 2020. |
D. Security Transactions and Investment Income — Investment transactions are accounted for on the trade date (the date the order to buy or sell is executed). Securities gains and losses are calculated on a specifically identified cost basis. Interest income is determined on the basis of coupon interest accrued using the effective interest method, which adjusts for amortization of premiums and accretion of discounts. Dividend income, net of foreign taxes withheld, if any, is recorded on the ex-dividend date or when the Fund first learns of the dividend.
E. Allocation of Expenses — Expenses directly attributable to a fund are charged directly to that fund, while the expenses attributable to more than one fund of the Trust are allocated among the respective funds.
F. Federal Income Taxes — The Fund is treated as a separate taxable entity for Federal income tax purposes. The Fund’s policy is to comply with the provisions of the Internal Revenue Code (the “Code”) applicable to regulated investment companies and to distribute to shareholders all of its distributable net investment income and net realized capital gains on investments. Accordingly, no provision for Federal income tax is necessary. Management has reviewed the Fund’s tax positions for all open tax years and has determined that as of August 31, 2020, no liability for Federal income tax is required in the Fund’s financial statements for net unrecognized tax benefits. However, management’s conclusions may be subject to future review based on changes in, or the interpretation of, the accounting standards or tax laws and regulations. The Fund’s Federal tax returns for the prior three fiscal years, or since inception if shorter, remain subject to examination by the Internal Revenue Service.
G. Distributions to Shareholders — Distributions from net investment income, are generally declared daily and paid monthly and are declared separately for each class. No class has preferential dividend rights; differences in per share rates are due to differences in separate class expenses. Net realized capital gains, if any, are distributed by the Fund at least annually. The amount of distributions from net investment income and net realized capital gains is determined in accordance with Federal income tax regulations, which may differ from GAAP. To the extent these “book/tax” differences are permanent in nature (i.e., that they result from other than timing of recognition — “temporary differences”), such amounts are reclassified within the capital accounts based on their Federal tax basis treatment.
| | | | | | |
| | | |
| 20 | | | | J.P. MORGAN SMA FUNDS | | AUGUST 31, 2020 |
3. Fees and Other Transactions with Affiliates
A. Investment Advisory Fee — Pursuant to an Investment Advisory Agreement, the Adviser does not charge an advisory fee to the Fund. It should be understood, however, that the Fund is an integral part of separately managed account programs. Participants in these programs pay a fee to the sponsor of the program. The Adviser is compensated by the separately managed account sponsors.
B. Administration Fee — Pursuant to an Administration Agreement, the Administrator provides certain administration services to the Fund. In consideration of these services, the Administrator receives a fee accrued daily and paid monthly at an annual rate of 0.075% of the first $10 billion of the Fund’s average daily net assets, plus 0.050% of the Fund’s average daily net assets between $10 billion and $20 billion, plus 0.025% of the Fund’s average daily net assets between $20 billion and $25 billion, plus 0.01% of the Fund’s respective average daily net assets in excess of $25 billion. For the six months ended August 31, 2020, the annualized effective rate was 0.08% of the Fund’s average daily net assets, notwithstanding any fee waivers and/or expense reimbursements.
The Administrator waived administration fees as outlined in Note 3.E. JPMorgan Chase Bank N.A. (“JPMCB”) serves as the Fund’s sub-administrator (the “Sub-administrator”). For its services as Sub-administrator, JPMCB receives a portion of the fees payable to the Administrator.
C. Distribution Fees — Pursuant to a Distribution Agreement, JPMorgan Distribution Services, Inc. (“JPMDS”), an indirect, wholly-owned subsidiary of JPMorgan, serves as the Fund’s exclusive underwriter and promotes and arranges for the sale of the Fund’s shares. JPMDS receives no compensation in its capacity as the Fund’s underwriter.
D. Custodian and Accounting Fees — JPMCB provides portfolio custody and accounting services to the Fund. For performing these services, the Fund pays JPMCB transaction and asset-based fees that vary according to the number of transactions and positions, plus out-of-pocket expenses. The amount paid directly to JPMCB by the Fund for custody and accounting services are included in Custodian and accounting fees on the Statement of Operations.
Interest income earned on cash balances at the custodian, if any, is included in Interest income from affiliates on the Statement of Operations.
Interest expense paid to the custodian related to cash overdrafts, if any, is included in Interest expense to affiliates on the Statement of Operations.
E. Waivers and Reimbursements — No expenses or fees (excluding acquired fund fees and expenses, dividend expenses related to short sales, interest expenses related to short sales, interest, taxes, expenses related to litigation and potential litigation, expenses related to trustee elections and extraordinary expenses) are borne by the Fund pursuant to contractual arrangements with the Adviser through June 30, 2021.
For the six months ended August 31, 2020, the Fund’s service providers waived fees and/or reimbursed expenses for the Fund as follows. None of these parties expect the Fund to repay any such waived fees and/or reimbursed expenses in future years.
| | | | | | | | |
| | | Contractual Waivers
Administration Fees | | | Contractual
Reimbursements | |
| | $ | 10,004 | | | $ | 88,385 | |
Additionally, the Fund may invest in one or more money market funds advised by the Adviser (affiliated money market funds). The Adviser, Administrator and JPMDS, as shareholder servicing agent, have contractually agreed to waive fees and/or reimburse expenses in an amount sufficient to offset the respective net fees each collects from the affiliated money market fund on the Fund’s investment in such affiliated money market fund. None of these parties expect the Fund to repay any such waived fees and/or reimbursed expenses in future years.
The amount of these waivers resulting from investments in these money market funds for the six months ended August 31, 2020 was $16.
F. Other — Certain officers of the Trust are affiliated with the Adviser, the Administrator and JPMDS. Such officers, with the exception of the Chief Compliance Officer, receive no compensation from the Fund for serving in their respective roles.
The Board designated and appointed a Chief Compliance Officer to the Fund pursuant to Rule 38a-1 under the 1940 Act. The Fund, along with affiliated funds, makes reimbursement payments, on a pro-rata basis, to the Administrator for a portion of the fees associated with the office of the Chief Compliance Officer. Such fees are included in Trustees’ and Chief Compliance Officer’s fees on the Statement of Operations.
The Trust adopted a Trustee Deferred Compensation Plan (the “Plan”) which allows the independent Trustees to defer the receipt of all or a portion of compensation related to performance of their duties as Trustees. The deferred fees are invested in various J.P. Morgan Funds until distribution in accordance with the Plan.
The Securities and Exchange Commission (“SEC”) has granted an exemptive order permitting the Fund to engage in principal transactions with J.P. Morgan Securities LLC, an affiliated broker, involving taxable money market instruments, subject to certain conditions.
| | | | | | | | |
| | | |
| AUGUST 31, 2020 | | J.P. MORGAN SMA FUNDS | | | | | 21 | |
NOTES TO FINANCIAL STATEMENTS
AS OF AUGUST 31, 2020 (Unaudited) (continued)
4. Investment Transactions
During the six months ended August 31, 2020, purchases and sales of investments (excluding short-term investments) were as follows:
| | | | | | | | | | | | | | | | |
| | | Purchases
(excluding
U.S. Government) | | | Sales
(excluding
U.S. Government) | | | Purchases
of U.S.
Government | | | Sales
of U.S.
Government | |
| | $ | 1,267,446 | | | $ | 4,174,851 | | | $ | 1,673,258 | | | $ | 2,228,208 | |
5. Federal Income Tax Matters
For Federal income tax purposes, the estimated cost and unrealized appreciation (depreciation) in value of investments held at August 31, 2020 were as follows:
| | | | | | | | | | | | | | | | |
| | | Aggregate
Cost | | | Gross
Unrealized
Appreciation | | | Gross
Unrealized
Depreciation | | | Net Unrealized
Appreciation
(Depreciation) | |
| | $ | 22,346,274 | | | $ | 1,514,787 | | | $ | 31,746 | | | $ | 1,483,041 | |
During the year ended February 29, 2020, the Fund utilized capital loss carryforwards as follows:
| | | | | | | | |
| | | Capital Loss Utilized | |
| | | Short-Term | | | Long-Term | |
| | $ | 6,050 | | | $ | — | |
6. Borrowings
The Fund relies upon an exemptive order granted by the SEC (the “Order”) permitting the establishment and operation of an Interfund Lending Facility (the “Facility”). The Facility allows the Fund to directly lend and borrow money to or from any other fund relying upon the Order at rates beneficial to both the borrowing and lending funds. Advances under the Facility are taken primarily for temporary or emergency purposes, including the meeting of redemption requests that otherwise might require the untimely disposition of securities, and are subject to the Fund’s borrowing restrictions. The Interfund loan rate is determined, as specified in the Order, by averaging the current repurchase agreement rate and the current bank loan rate. The Order was granted to JPMorgan Trust II and may be relied upon by the Fund because the Fund and the series of JPMorgan Trust II are both investment companies in the same “group of investment companies” (as defined in Section 12(d)(1)(G) of the 1940 Act).
The Fund had no borrowings outstanding from another fund during the six months ended August 31, 2020.
The Trust and JPMCB have entered into a financing arrangement. Under this arrangement, JPMCB provides an unsecured, uncommitted credit facility in the aggregate amount of $100 million to certain of the J.P. Morgan Funds, including the Fund. Advances under the arrangement are taken primarily for temporary or emergency purposes, including the meeting of redemption requests that otherwise might require the untimely disposition of securities, and are subject to the Fund’s borrowing restrictions. Interest on borrowings is payable at a rate determined by JPMCB at the time of borrowing. This agreement has been extended until November 2, 2020.
The Fund had no borrowings outstanding from the unsecured, uncommitted credit facility during the six months ended August 31, 2020.
The Trust, along with certain other trusts for J.P. Morgan Funds (“Borrowers”), has entered into a joint syndicated senior unsecured revolving credit facility totaling $1.5 billion (“Credit Facility”) with various lenders and The Bank of New York Mellon, as administrative agent for the lenders. This Credit Facility provides a source of funds to the Borrowers for temporary and emergency purposes, including the meeting of redemption requests that otherwise might require the untimely disposition of securities. Under the terms of the Credit Facility, a borrowing fund must have a minimum of $25,000,000 in adjusted net asset value and not exceed certain adjusted net asset coverage ratios prior to and during the time in which any borrowings are outstanding. If a fund does not comply with the aforementioned requirements, the fund must remediate within three business days with respect to the $25,000,000 minimum adjusted net asset value or within one business day with respect to certain asset coverage ratios or the administrative agent at the request of, or with the consent of, the lenders may terminate the Credit Facility and declare any outstanding borrowings to be due and payable immediately.
Interest associated with any borrowing under the Credit Facility is charged to the borrowing fund at a rate of interest equal to 1.00%, which has increased to 1.25% pursuant to the amendment referenced below, plus the greater of the federal funds effective rate or one month London InterBank Offered rate (‘LIBOR”). The annual commitment fee to maintain the Credit Facility is 0.15% and is incurred on the unused portion of the Credit Facility and is allocated to all participating funds pro rata based on their respective net assets. Effective August 11, 2020, this agreement has been amended and restated for a term of 364 days, unless extended, and to include the change to the interest rate charged for borrowing from the Credit Facility to 1.25%, as noted above, and an upfront fee of 0.075% of the Credit Facility to be charged and paid by all participating funds of the Credit Facility.
The Fund did not utilize the Credit Facility during the six months ended August 31, 2020.
| | | | | | |
| | | |
| 22 | | | | J.P. MORGAN SMA FUNDS | | AUGUST 31, 2020 |
7. Risks, Concentrations and Indemnifications
In the normal course of business, the Fund enters into contracts that contain a variety of representations which provide general indemnifications. The Fund’s maximum exposure under these arrangements is unknown. The amount of exposure would depend on future claims that may be brought against the Fund. However, based on experience, the Fund expects the risk of loss to be remote.
As of August 31, 2020 the Fund had one individual shareholder and/or affiliated omnibus account that owned 100% of the Fund’s outstanding shares.
Significant shareholder transactions by this shareholder may impact the Fund’s performance.
The Fund is subject to interest rate and credit risk. The value of debt securities may decline as interest rates increase. The Fund could lose money if the issuer of a fixed income security is unable to pay interest or repay principal when it is due. Many factors can cause interest rates to rise. Some examples include central bank monetary policy, rising inflation rates and general economic conditions. The Fund may face a heightened level of interest rate risk due to certain changes in monetary policy. During periods when interest rates are low or there are negative interest rates, the Fund’s yield (and total return) also may be low or the Fund may be unable to maintain positive returns. The ability of the issuers of debt to meet their obligations may be affected by economic and political developments in a specific industry or region. The value of a Fund’s investments may be adversely affected if any of the issuers or counterparties it is invested in are subject to an actual or perceived deterioration in their credit quality.
The Fund is subject to risks associated with securities with contractual cash flows including asset-backed securities. The value, liquidity and related income of these securities are sensitive to changes in economic conditions, including real estate value, prepayments, delinquencies and/or defaults, and may be adversely affected by shifts in the market’s perception of the issuers and changes in interest rates.
The Fund is subject to the risk that should the Fund decide to sell an illiquid investment when a ready buyer is not available at a price the Fund deems to be representative of its value, the value of the Fund’s net assets could be adversely affected.
LIBOR is intended to represent the rate at which contributing banks may obtain short-term borrowings from each other in the London interbank market. The regulatory authority that oversees financial services firms and financial markets in the U.K. has announced that, after the end of 2021, it would no longer persuade or compel contributing banks to make rate submissions for purposes of determining the LIBOR rate. As a result, it is possible that commencing in 2022, LIBOR may no longer be available or no longer deemed an appropriate reference rate upon which to determine the interest rate on or impacting certain loans, notes, derivatives and other instruments or investments comprising some or all of the Fund’s portfolio. In light of this eventuality, public and private sector industry initiatives are currently underway to identify new or alternative reference rates to be used in place of LIBOR. There is no assurance that the composition or characteristics of any such alternative reference rate will be similar to or produce the same value or economic equivalence as LIBOR or that it will have the same volume or liquidity as did LIBOR prior to its discontinuance or unavailability, which may affect the value or liquidity or return on certain investments of the Fund and result in costs incurred in connection with closing out positions and entering into new trades. These risks may also apply with respect to changes in connection with other interbank offering rates (e.g., Euribor) and a wide range of other index levels, rates and values that are treated as “benchmarks” and are the subject of recent regulatory reform.
The Fund is subject to infectious disease epidemics/pandemics risk. Recently, the worldwide outbreak of COVID-19, a novel coronavirus disease, has negatively affected economies, markets and individual companies throughout the world. The effects of this COVID-19 pandemic to public health, and business and market conditions, including exchange trading suspensions and closures may continue to have a significant negative impact on the performance of the Fund’s investments, increase the Fund’s volatility, exacerbate other pre-existing political, social and economic risks to the Fund and negatively impact broad segments of businesses and populations. The Fund’s operations may be interrupted as a result, which may have a significant negative impact on investment performance. In addition, governments, their regulatory agencies, or self-regulatory organizations may take actions in response to the pandemic that affect the instruments in which the Fund invests, or the issuers of such instruments, in ways that could also have a significant negative impact on the Fund’s investment performance. The full impact of this COVID-19 pandemic, or other future epidemics/pandemics, is currently unknown.
| | | | | | | | |
| | | |
| AUGUST 31, 2020 | | J.P. MORGAN SMA FUNDS | | | | | 23 | |
SCHEDULE OF SHAREHOLDER EXPENSES
(Unaudited)
Hypothetical $1,000 Investment
As a shareholder of the Fund, you incur two types of costs: (1) transaction costs, including sales charges (loads) on purchase payments and (2) ongoing costs, including investment advisory fees, administration fees, distribution fees and other Fund expenses. The examples below are intended to help you understand your ongoing costs (in dollars) of investing in the Fund and to compare these ongoing costs with the ongoing costs of investing in other mutual funds. The examples assume that you had a $1,000 investment in the Fund at the beginning of the reporting period, March 1, 2020, and continued to hold your shares at the end of the reporting period, August 31, 2020.
Actual Expenses
For the Fund in the table below, the first line provides information about actual account values and actual expenses. You may use the information in this line, together with the amount you invested, to estimate the expenses that you paid over the period. Simply divide your account value by $1,000 (for example, an $8,600 account value divided by $1,000 = 8.6), then multiply the result by the number in the first line of each Class under the heading titled “Expenses Paid During the Period” to estimate the expenses you paid on your account during this period.
Hypothetical Example for Comparison Purposes
The second line in the table below provides information about hypothetical account values and hypothetical expenses based on the Fund’s actual expense ratio and an assumed rate of return of 5% per year before expenses, which is not the Fund’s actual return. The hypothetical account values and expenses may not be used to estimate the actual ending account balance or expenses you paid for the period. You may use this information to compare the ongoing costs of investing in the Class of the Fund and other funds. To do so, compare this 5% hypothetical example with the 5% hypothetical examples that appear in the shareholder reports of the other funds. Please note that the expenses shown in the table are meant to highlight your ongoing costs only and do not reflect any transaction costs, such as sales charges (loads) or redemption fees. Therefore, the second line in the table is useful in comparing ongoing costs only, and will not help you determine the relative total costs of owning different funds. In addition, if these transaction costs were included, your costs would have been higher. The examples also assume all dividends and distributions have been reinvested.
| | | | | | | | | | | | | | | | |
| | | Beginning
Account Value
March 1, 2020 | | | Ending
Account Value
August 31, 2020 | | | Expenses
Paid During
the Period†* | | | Annualized
Expense
Ratio | |
JPMorgan Core Focus SMA Fund | | | | | | | | | | | | | | | | |
Actual | | $ | 1,000.00 | | | $ | 1,014.90 | | | $ | 0.00 | | | | 0.00 | % |
Hypothetical | | | 1,000.00 | | | | 1,025.21 | | | | 0.00 | | | | 0.00 | |
| † | Reflects the fact that no fees or expenses are borne by the Fund. The Fund is an integral part of “separately managed accounts” programs sponsored by investment advisers and/or broker-dealers unaffiliated with the Fund and the Adviser. Participants in these programs pay a fee to the sponsor of the program. |
| * | Expenses are equal to the Fund’s annualized expense ratio, multiplied by the average account value over the period, multiplied by 184/365 (to reflect the one-half year period). |
| | | | | | |
| | | |
| 24 | | | | J.P. MORGAN SMA FUNDS | | AUGUST 31, 2020 |
BOARD APPROVAL OF INVESTMENT ADVISORY AGREEMENT
The Board of Trustees has established various standing committees, composed of Trustees with diverse backgrounds, to which the Board of Trustees has assigned specific subject matter responsibilities to further enhance the effectiveness of the Board’s oversight and decision making. The Board of Trustees and its investment committees (money market and alternative products, equity, and fixed income) meet regularly throughout the year and consider factors that are relevant to their annual consideration of investment advisory agreements at each meeting. They also meet for the specific purpose of considering investment advisory agreement annual renewals. The Board of Trustees held meetings in June and August 2020, at which the Trustees considered the continuation of the investment advisory agreement for the Fund whose semi-annual report is contained herein (the “Advisory Agreement”). In accordance with SEC guidance, due to the COVID-19 pandemic, the meetings were conducted through video conference. At the June meeting, the Board’s investment committees met to review and consider performance, expense and related information for the J.P. Morgan Funds. Each investment committee reported to the full Board, which then considered the investment committee’s preliminary findings. At the August meeting, the Trustees continued their review and consideration. The Trustees, including a majority of the Trustees who are not parties to the Advisory Agreement or “interested persons” (as defined in the 1940 Act) of any party to the Advisory Agreement or any of their affiliates, approved the continuation of the Advisory Agreement on August 11, 2020.
As part of their review of the Advisory Agreement, the Trustees considered and reviewed performance and other information about the Fund received from the Adviser. This information includes the Fund’s performance as compared to the performance of its peers and benchmarks and analyses by the Adviser of the Fund’s performance. In addition, at each of their regular meetings throughout the year, the Trustees considered reports on the performance of certain J.P. Morgan Funds provided by an independent management consulting firm (“independent consultant”). In addition, in preparation for the June and August meetings, the Trustees requested, received and evaluated extensive materials from the Adviser, including performance and expense information compiled by Broadridge, using data from Lipper Inc. and/or Morningstar Inc., independent providers of investment company data (together “Broadridge”). The Trustees’ independent consultant also provided additional analyses of the performance of certain J.P. Morgan Funds with greater than two years of performance history in connection with the Trustees’ review of the Advisory Agreements. Before voting on the Advisory Agreement, the Trustees reviewed the Advisory Agreement with representatives of the Adviser, counsel to the Trust and independent legal counsel and received a memorandum from independent legal counsel to the Trustees discussing the legal standards for their consideration of the Advisory Agreement. The Trustees also discussed the Advisory
Agreement in executive sessions with independent legal counsel at which no representatives of the Adviser were present.
A summary of the material factors evaluated by the Trustees in determining whether to approve the Advisory Agreement is provided below. Each Trustee attributed different weights to the various factors and no factor alone was considered determinative. The Trustees considered information provided with respect to the Fund throughout the year, including additional reporting and information provided in connection with the market volatility caused by the COVID-19 pandemic, as well as materials furnished specifically in connection with the annual review process. From year to year, the Trustees consider and place emphasis on relevant information in light of changing circumstances in market and economic conditions.
After considering and weighing the factors and information they had received, the Trustees found that the overall arrangement between the Fund and the Adviser, as provided in the Advisory Agreement, was fair and reasonable under the circumstances and determined that the continuance of the Advisory Agreement was in the best interests of the Fund and its shareholders.
Nature, Extent and Quality of Services Provided by the Adviser
The Trustees received and considered information regarding the nature, extent and quality of services provided to the Fund under the Advisory Agreement. The Trustees took into account information furnished throughout the year at Trustee meetings, as well as the materials furnished specifically in connection with this annual review process. The Trustees considered the background and experience of the Adviser’s senior management, personnel changes, if any, and the expertise of, and the amount of attention given to the Fund by, investment personnel of the Adviser. In addition, the Trustees reviewed the qualifications, backgrounds and responsibilities of the portfolio management team primarily responsible for the day-to-day management of the Fund and the infrastructure supporting the team, including personnel changes, if any. In addition, the Board considered its discussions with the Adviser regarding the Adviser’s business continuity plan and steps the Adviser was taking to provide ongoing services to the Fund during the COVID-19 pandemic, and the Adviser’s success in continuing to provide services to the Fund and its shareholders throughout this period. The Trustees also considered information provided by the Adviser and JPMorgan Distribution Services, Inc. (“JPMDS”) about the structure and distribution strategy of the Fund. The Trustees reviewed information relating to the Adviser’s risk governance model and reports showing the Adviser’s compliance structure and ongoing compliance processes. The Trustees also considered the quality of the administration services provided by the Adviser in its role as administrator.
| | | | | | | | |
| | | |
| AUGUST 31, 2020 | | J.P. MORGAN SMA FUNDS | | | | | 25 | |
BOARD APPROVAL OF INVESTMENT ADVISORY AGREEMENT
(Unaudited) (continued)
The Trustees also considered their knowledge of the nature and quality of services provided by the Adviser and its affiliates to the Fund gained from their experience as Trustees of the J.P. Morgan Funds. In addition, they considered the overall reputation and capabilities of the Adviser and its affiliates, the commitment of the Adviser to provide high quality service to the Fund, their overall confidence in the Adviser’s integrity and the Adviser’s responsiveness to questions or concerns raised by them, including the Adviser’s willingness to consider and implement organizational and operational changes designed to improve investment results and the services provided to the Fund.
Based upon these considerations and other factors, the Trustees concluded that they were satisfied with the nature, extent and quality of the investment advisory services provided to the Fund by the Adviser.
Costs of Services Provided and Profitability to the Adviser and its Affiliates
The Trustees noted that there was no advisory fee charged to the Fund. The Trustees received and considered information regarding the profitability to the Adviser and its affiliates in providing services to the Fund. The Trustees reviewed and discussed this information. The Trustees recognized that this information is not audited and represents the Adviser’s determination of its and its affiliates’ revenues from the contractual services provided to the Fund, less expenses of providing such services. Expenses include direct and indirect costs and are calculated using an allocation methodology developed by the Adviser. The Trustees also recognized that it is difficult to make comparisons of profitability from fund investment advisory contracts because comparative information is not generally publicly available and is affected by numerous factors, including the structure of the particular adviser, the types of funds it manages, its business mix, numerous assumptions regarding allocations and the fact that publicly-traded fund managers’ operating profits and net income are net of distribution and marketing expenses. Based upon their review, and taking into consideration the factors noted above, the Trustees concluded that the profitability to the Adviser under the Advisory Agreement was not unreasonable in light of the services and benefits provided to the Fund.
The Trustees also considered that the Adviser did not earn fees from the Fund for providing administration services due to contractual waivers it has in place. The Trustees also considered the fees paid to JPMorgan Chase Bank, N.A. (“JPMCB”) for custody and fund accounting, and other related services. In addition, the Trustees considered that the Adviser receives fees from sponsors of, and/or investors in, separately managed accounts that are invested in the Fund.
Fall-Out Benefits
The Trustees reviewed information regarding potential “fall-out” or ancillary benefits received by the Adviser and its affiliates as a result of their relationship with the Fund. The Trustees considered that the J.P. Morgan Funds’ operating accounts are held at JPMCB, which, as a result, will receive float benefits for certain J.P. Morgan Funds, as applicable. The Trustees also noted that the Adviser supports a diverse set of products and services, which benefits the Adviser by allowing it to leverage its infrastructure to serve additional clients, including benefits that may be received by the Adviser and its affiliates in connection with the Fund’s potential investments in other funds advised by the Adviser. The Trustees also reviewed the Adviser’s allocation of fund brokerage for the J.P. Morgan Funds complex, including allocations to brokers who provide research to the Adviser.
Economies of Scale
The Trustees considered the extent to which the Fund may benefit from economies of scale. The Trustees considered that there may not be a direct relationship between economies of scale realized by the Fund and those realized by the Adviser as assets increase. The Trustees noted that there was not an investment advisory fee charged to the Fund. The Trustees also considered that the Fund has implemented fee waivers and contractual expense limitations (“Fee Caps”) which allow the Fund’s shareholders to share potential economies of scale from the Fund’s inception. The Trustees considered the benefits to the Fund of the use of an affiliated distributor and custodian, including the ability to rely on existing infrastructure supporting distribution, custodial and transfer agent services and the ability to negotiate competitive fees for the Fund. The Trustees further considered the Adviser’s and JPMDS’s ongoing investments in their business in support of the Fund, including the Adviser’s and/or JPMDS’s investments in trading systems, technology (including improvements to the J.P. Morgan Funds’ website, and cybersecurity improvements), retention of key talent, and regulatory support enhancements. The Trustees concluded that the current fee structure for the Fund, including Fee Caps that the Adviser has in place to limit the overall net expense ratio of the Fund at competitive levels, was reasonable. The Trustees concluded that the Fund’s shareholders received the benefits of potential economies of scale through the Fee Caps and the Adviser’s reinvestment in its operations to serve the Fund and its shareholders. The Trustees noted that the Adviser’s reinvestment ensures sufficient resources in terms of personnel and infrastructure to support the Fund.
Independent Written Evaluation of the Funds’ Chief Compliance Officer
The Trustees noted that, upon their direction, the Chief Compliance Officer for the Fund had prepared an independent written evaluation in order to assist the Trustees in determining the
| | | | | | |
| | | |
| 26 | | | | J.P. MORGAN SMA FUNDS | | AUGUST 31, 2020 |
reasonableness of the Advisory Agreement or management fees including administrative fees. The Trustees considered the written evaluation in determining whether to continue the Advisory Agreement.
Fees Relative to Adviser’s Other Clients
The Trustees received and considered information about the nature and extent of investment advisory services and fee rates offered to other clients of the Adviser, including institutional separate accounts, collective investment trusts, ETFs and/or funds sub-advised by the Adviser, for investment management styles substantially similar to that of the Fund. The Trustees considered the complexity of investment management for registered mutual funds relative to the Adviser’s other clients and noted differences, as applicable, in the regulatory, legal and other risks and responsibilities of providing services to the different clients. The Trustees considered that serving as an adviser to a registered mutual fund involves greater responsibilities and risks than acting as a sub-adviser and observed that sub-advisory fees may be lower than those charged by the Adviser to the Fund. The Trustees also noted that the adviser, not the mutual fund, pays the sub-advisory fee and that many responsibilities related to the advisory function are retained by the primary adviser. The Trustees concluded that the fee rates charged to the Fund in comparison to those charged to the Adviser’s other clients were reasonable.
Investment Performance
The Trustees received and considered absolute and/or relative performance information for the Fund in a report prepared by Broadridge. The Trustees considered the total return performance information, which included the ranking of the Fund within a performance universe made up of funds with the same Broadridge investment classification and objective (the “Universe ”) and a subset of funds within the Universe (the “Peer Group”), by total return for the applicable one-year period. The Trustees reviewed a description of Broadridge’s methodology for selecting mutual funds in the Fund’s Universe and Peer Group and noted that Universe and Peer Group rankings were not calculated if the number of funds in the Universe and/or Peer Group did not meet a predetermined minimum. As part of this review, the Trustees also reviewed the Fund’s performance against its benchmark and considered the performance information provided for the Fund at regular Board meetings by the Adviser. The Trustees also engaged with the Adviser to consider what steps might be taken to improve performance, as applicable. The Broadridge performance data noted by the Trustees as part of their review and the determinations made by the Trustees with respect to the Fund’s performance are summarized below:
The Trustees noted that, based upon the Universe, the Fund’s performance was in the fifth quintile for the one-year period ended December 31, 2019. The Trustees discussed the
performance and investment strategy of the Fund with the Adviser and reviewed the performance analysis and evaluation prepared by the independent consultant. Based upon these discussions and various other factors, the Trustees concluded that the performance was satisfactory, under the circumstances.
Advisory Fees and Expense Ratios
The Fund is not charged a separate investment advisory fee by the Adviser because the Fund is offered as a component of the SMA Strategy to participants in separately managed account programs that hold both the Fund and other securities and investments directly for the SMA clients. The Adviser is compensated by the separately managed account sponsors. The Trustees considered the Fund’s contractual advisory fee rate and administration fee rate and compared the combined rate to the information prepared by Broadridge concerning management fee rates paid by other funds with the same Broadridge investment classification and objective (the “Universe”), as well as a subset of funds within the Universe (the “Peer Group”) as the Fund. The Trustees reviewed a description of Broadridge’s methodology for selecting mutual funds in the Fund’s Universe and Peer Group and noted that Universe and Peer Group rankings were not calculated if the number of funds in the Universe and/or Peer Group did not meet a predetermined minimum. The Trustees recognized that Broadridge reported the Fund’s management fee rate as the combined contractual advisory fee (which is 0.00%) and administration fee rates. The Trustees also reviewed information about other expenses and the expense ratios for the Fund. The Trustees considered the Fee Caps currently in place for the Fund and considered the expenses of the Fund after taking into account any waivers and/or reimbursements, and, where deemed appropriate by the Trustee, additional waivers and/or reimbursements. The Trustees recognized that it is difficult to make comparisons of expense ratios because there are variations in the services that are included in the fees paid by other funds. The Trustees’ determination as a result of the review of the Fund’s expense ratios are summarized below:
The Trustees noted that, based upon the Universe, the Fund’s net advisory fee and the actual total expenses were in the first quintile. After considering the factors identified above, in light of this information, the Trustees concluded that the advisory fee was satisfactory in light of the services provided to the Fund.
| | | | | | | | |
| | | |
| AUGUST 31, 2020 | | J.P. MORGAN SMA FUNDS | | | | | 27 | |
FOR MORE INFORMATION:
INVESTMENT ADVISER
J.P. Morgan Investment Management Inc.
277 Park Avenue
New York, New York 10172
PLACEMENT AGENT
JPMorgan Institutional Investments, Inc.
277 Park Avenue
New York, New York 10172
This report is open and authorized for distribution only to qualified and accredited investors who have received a copy of the Fund’s Confidential Offering Memorandum. This document may not be copied, faxed or otherwise distributed to the general public.
Investors may obtain information about the Securities Investor Protection Corporation (SIPC), including the SIPC brochure, by visiting www.sipc.org or by calling SIPC at 202-371-8300.
The Fund files a complete schedule of its fund holdings for the first and third quarters of its fiscal year with the SEC as an exhibit to its report on Form N-PORT. The Fund’s Form N-PORT reports are available on the SEC’s website at http://www.sec.gov.
A copy of proxy policies and procedures is available without charge upon request by calling 1-800-343-1113 and a description of such policies and procedures is on the SEC’s website at www.sec.gov. The Trustees have delegated the authority to vote proxies for securities owned by the Fund to the Adviser. A copy of the Fund’s voting record is available on the SEC’s website at www.sec.gov. The Fund’s proxy voting record will include, among other things, a brief description of the matter voted on for each portfolio security, and will state how each vote was cast, for example, for or against the proposal.


J.P. Morgan Asset Management is the brand name for the asset management business of JPMorgan Chase & Co. and its affiliates worldwide.
| | | | |
| | © JPMorgan Chase & Co., 2020. All rights reserved. August 2020. | | SAN-CFSMA-820 |
Semi-Annual Report
J.P. Morgan Municipal Bond Funds
August 31, 2020 (Unaudited)
JPMorgan High Yield Municipal Fund
JPMorgan Short-Intermediate Municipal Bond Fund
JPMorgan Sustainable Municipal Income Fund
(formerly known as JPMorgan Municipal Income Fund)
JPMorgan Tax Free Bond Fund
JPMorgan Ultra-Short Municipal Fund
Beginning on January 1, 2021, as permitted by regulations adopted by the Securities and Exchange Commission, paper copies of the Funds’ annual and semi-annual shareholder reports will no longer be sent by mail, unless you specifically request paper copies of the reports. Instead, the reports will be made available on the Funds’ website www.jpmorganfunds.com and you will be notified by mail each time a report is posted and provided with a website to access the report. If you already elected to receive shareholder reports electronically, you will not be affected by this change and you need not take any action.
You may elect to receive shareholder reports and other communications from the Funds electronically anytime by contacting your financial intermediary (such as a broker dealer, bank, or retirement plan) or, if you are a direct investor, by going to www.jpmorganfunds.com/edelivery.
You may elect to receive paper copies of all future reports free of charge. Contact your financial intermediary or, if you invest directly with the Funds, email us at funds.website.support@jpmorganfunds.com or call 1-800-480-4111. Your election to receive paper reports will apply to all funds held within your account(s).

CONTENTS
Investments in a Fund are not deposits or obligations of, or guaranteed or endorsed by, any bank and are not insured or guaranteed by the FDIC, the Federal Reserve Board or any other government agency. You could lose money if you sell when a Fund’s share price is lower than when you invested.
Past performance is no guarantee of future performance. The general market views expressed in this report are opinions based on market and other conditions through the end of the reporting period and are subject to change without notice. These views are not intended to predict the future performance of a Fund or the securities markets. References to specific securities and their issuers are for illustrative purposes only and are not intended to be, and should not be interpreted as, recommendations to purchase or sell such securities. Such views are not meant as investment advice and may not be relied on as an indication of trading intent on behalf of any Fund.
Prospective investors should refer to the Funds’ prospectuses for a discussion of the Funds’ investment objectives, strategies and risks. Call J.P. Morgan Funds Service Center at 1-800-480-4111 for a prospectus containing more complete information about a Fund, including management fees and other expenses. Please read it carefully before investing.
LETTER TO SHAREHOLDERS
OCTOBER 23, 2020 (Unaudited)
Dear Shareholders,
Even as the U.S. economy has endured a severe contraction since the start of the pandemic, financial markets have generally rebounded from lows seen in March 2020 amid unprecedented support from the Federal Reserve (the “Fed”) and investor optimism about efforts to contain the spread of COVID-19.
| | |
 | | “Throughout this tumultuous year, J.P. Morgan Asset Management has responded to unprecedented conditions by continuing to seek to provide our clients with effective investment solutions and dependable service.” — Andrea L. Lisher |
In response to an acute sell-off in financial markets in February and March 2020, the Fed unveiled an array of lending and asset purchasing programs designed to head off a liquidity crisis in credit markets and maintain the flow of credit to the public and private sectors. The Fed also slashed interest rates in March 2020, as jobless claims spiked to record highs, which helped to bolster equity markets. In the following months, financial market volatility subsided and asset prices generally began to rebound, though global oil prices remained at historically low levels amid a steep drop off in demand and slower economic
activity. For the six months ended August 31, 2020, the S&P 500 Index returned 19.6% and the Bloomberg Barclays U.S. Aggregate Index returned 2.9%.
Our long-term view remains one of cautious optimism, but we recognize the near-term risks stemming from uncertainty surrounding additional fiscal support and efforts to contain COVID-19. The pace of economic activity looks set to slow into the end of the year as services remain under pressure, and additional stimulus may be required to keep the economy on track in 2021. That said, volatility in financial markets could begin to recede as the results of the November 3rd election provide clarity on the contours of the political landscape going forward. Throughout this tumultuous year, J.P. Morgan Asset Management has responded to unprecedented conditions by continuing to seek to provide our clients with effective investment solutions and dependable service.
On behalf of J.P. Morgan Asset Management, thank you for entrusting us to manage your investment. Should you have any questions, please visit www.jpmorganfunds.com or contact the J.P. Morgan Funds Service Center at 1-800-480-4111.
Sincerely yours,

Andrea L. Lisher
Head of Americas, Client
J.P. Morgan Asset Management
| | | | | | | | |
| | | |
| AUGUST 31, 2020 | | J.P. MORGAN MUNICIPAL BOND FUNDS | | | | | 1 | |
J.P. Morgan Municipal Bond Funds
MARKET OVERVIEW
SIX MONTHS ENDED AUGUST 31, 2020 (Unaudited)
The reporting period began amid a steep sell-off in global financial markets as COVID-19 was declared a pandemic and economic activity was sharply curtailed. However, from April through the end of August 2020, financial markets largely rebounded amid unprecedented support from leading central banks and the efforts of national governments to both provide fiscal stimulus and limit the spread of the novel coronavirus.
A potential liquidity crisis in U.S. credit markets was headed off by the U.S. Federal Reserve, which unleashed an array of programs to shore up financial markets. While new issuance in the U.S. municipal bond market was sharply curtailed in March and April 2020, the pace of new issuance bonds began to rebound in June. While state and local governments in the U.S. faced a severe decline in revenue, most entered the reporting period with solid finances following more than a decade of continuous economic expansion in the U.S.
Overall, investment grade corporate credit and high yield debt (also known as “junk bonds”) rallied as investors sought higher yields amid falling interest rates and low yields on U.S. Treasury bonds. Within the tax free bond sector, higher rated bonds generally outperformed lower rated securities and pre-refunded, local general obligation bonds and utilities sector bonds generally outperformed state general obligation and transportation bonds.
For the six months ended August 31, 2020, the Bloomberg Barclays U.S. Aggregate Index returned 2.98% and the Bloomberg Barclays U.S. Municipal Index return 0.19%.
| | | | | | |
| | | |
| 2 | | | | J.P. MORGAN MUNICIPAL BOND FUNDS | | AUGUST 31, 2020 |
JPMorgan High Yield Municipal Fund
FUND COMMENTARY
SIX MONTHS ENDED AUGUST 31, 2020 (Unaudited)
| | | | |
| REPORTING PERIOD RETURN: | |
| Fund (Class I Shares)* | | | (4.85)% | |
| Bloomberg Barclays U.S. Municipal Index | | | 0.19% | |
| Bloomberg Barclays High Yield Municipal Bond Index | | | (4.17)% | |
| |
| Net Assets as of 8/31/2020 (In Thousands) | | $ | 499,644 | |
| Duration as of 8/31/2020 | | | 8.8 years | |
INVESTMENT OBJECTIVE**
The JPMorgan High Yield Municipal Fund (the “Fund”) seeks a high level of current income exempt from federal income taxes.
WHAT WERE THE MAIN DRIVERS OF THE FUND’S PERFORMANCE?
For the six months ended August 31, 2020, the Fund’s Class I Shares underperformed the Bloomberg Barclays U.S. Municipal Index (the “Benchmark”) and the Bloomberg Barclays High Yield Municipal Bond Index.
The Fund’s out-of-Benchmark allocation to high yield bonds (also known as “junk bonds”) was a leading detractor from performance relative to the Benchmark. The Fund’s overweight allocation to education bonds and bonds rated BBB also detracted from relative performance.
The Fund’s underweight allocations to industrial development revenue/pollution control revenue bonds and transportation bonds were leading contributors to relative performance. The Fund’s underweight allocation to housing bonds also helped relative performance.
HOW WAS THE FUND POSITIONED?
During the reporting period, the Fund’s assets were invested in municipal bonds, with a small allocation to loan assignments.
The Fund’s largest allocations were to bonds rated BBB and non-rated bonds while its smallest allocations were in bonds rated AAA and single-B. At the end of the reporting period, the Fund’s overall duration was 8.8 years compared with 5.2 years for the Benchmark.
| | | | |
CREDIT QUALITY ALLOCATIONS*** | |
AAA | | | 3.6 | % |
AA | | | 10.1 | |
A | | | 11.4 | |
BBB | | | 30.1 | |
BB | | | 15.8 | |
B | | | 1.1 | |
NR | | | 27.9 | |
| * | | The return shown is based on net asset values calculated for shareholder transactions and may differ from the return shown in the financial highlights, which reflects adjustments made to the net asset values in accordance with accounting principles generally accepted in the United States of America. |
| ** | | The adviser seeks to achieve the Fund’s objective. There can be no guarantee it will be achieved. |
| *** | | Percentages indicated are based on total investments as of August 31, 2020. The Fund’s portfolio composition is subject to change. |
| | | | | | | | |
| | | |
| AUGUST 31, 2020 | | J.P. MORGAN MUNICIPAL BOND FUNDS | | | | | 3 | |
JPMorgan High Yield Municipal Fund
FUND COMMENTARY
SIX MONTHS ENDED AUGUST 31, 2020 (Unaudited) (continued)
| | | | | | | | | | | | | | | | | | |
AVERAGE ANNUAL TOTAL RETURNS AS OF AUGUST 31, 2020 | |
| | | | | |
| | | INCEPTION DATE OF
CLASS | | 6 MONTH* | | | 1 YEAR | | | 5 YEAR | | | 10 YEAR | |
CLASS A SHARES | | September 17, 2007 | | | | | | | | | | | | | | | | |
With Sales Charge** | | | | | (8.43 | )% | | | (4.92 | )% | | | 2.56 | % | | | 3.18 | % |
Without Sales Charge | | | | | (4.90 | ) | | | (1.25 | ) | | | 3.36 | | | | 3.57 | |
CLASS C SHARES | | September 17, 2007 | | | | | | | | | | | | | | | | |
With CDSC*** | | | | | (6.07 | ) | | | (2.66 | ) | | | 2.85 | | | | 3.06 | |
Without CDSC | | | | | (5.07 | ) | | | (1.66 | ) | | | 2.85 | | | | 3.06 | |
CLASS I SHARES | | September 17, 2007 | | | (4.85 | ) | | | (1.15 | ) | | | 3.47 | | | | 3.68 | |
CLASS R6 SHARES | | November 1, 2018 | | | (4.81 | ) | | | (1.06 | ) | | | 3.51 | | | | 3.70 | |
| ** | | Sales Charge for Class A Shares is 3.75%. |
| *** | | Assumes a 1% CDSC (contingent deferred sales charge) for the 6 month and one year periods and 0% CDSC thereafter. |
TEN YEAR PERFORMANCE (8/31/10 TO 8/31/20)
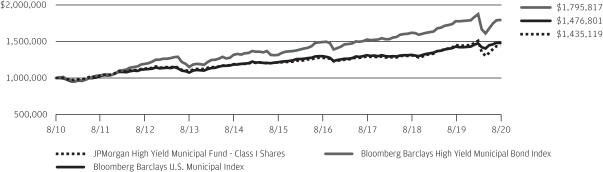
The performance quoted is past performance and is not a guarantee of future results. Mutual funds are subject to certain market risks. Investment returns and principal value of an investment will fluctuate so that an investor’s shares, when redeemed, may be worth more or less than their original cost. Current performance may be higher or lower than the performance data shown. For up-to-date month-end performance information please call 1-800-480-4111.
Returns for Class R6 Shares prior to its inception date are based on the performance of Class I Shares. The actual returns of Class R6 Shares would have been different than those shown because Class R6 Shares have different expenses than Class I Shares.
The graph illustrates comparative performance for $1,000,000 invested in Class I Shares of the JPMorgan High Yield Municipal Fund, the Bloomberg Barclays U.S. Municipal Index and the Bloomberg Barclays High Yield Municipal Bond Index from August 31, 2010 to August 31, 2020. The performance of the Fund assumes reinvestment of all dividends and capital gain distributions, if any, and does not include a sales charge. The performance of the Bloomberg Barclays U.S. Municipal Index and the Bloomberg Barclays High Yield Municipal Bond Index does not reflect the deduction of expenses or a sales charge
associated with a mutual fund and has been adjusted to reflect reinvestment of all dividends and capital gain distributions of securities included in the benchmarks, if applicable. The Bloomberg Barclays U.S. Municipal Index is a total return performance benchmark for the long-term, investment-grade tax-exempt bond market. The Bloomberg Barclays High Yield Municipal Bond Index is an unmanaged index made up of bonds that are non-investment grade, unrated, or rated below Ba1 by Moody’s Investors Service with a remaining maturity of at least one year. Investors cannot invest directly in an index.
Class I Shares have a $1,000,000 minimum initial investment.
Fund performance may reflect the waiver of the Fund’s fees and reimbursement of expenses for certain periods. Without these waivers and reimbursements, performance would have been lower. Also, performance shown in this section does not reflect the deduction of taxes that a shareholder would pay on Fund distributions or on gains resulting from redemptions of Fund shares.
The returns shown are based on net asset values calculated for shareholder transactions and may differ from the returns shown in the financial highlights, which reflect adjustments made to the net asset values in accordance with accounting principles generally accepted in the United States of America.
| | | | | | |
| | | |
| 4 | | | | J.P. MORGAN MUNICIPAL BOND FUNDS | | AUGUST 31, 2020 |
JPMorgan Short-Intermediate Municipal Bond Fund
FUND COMMENTARY
SIX MONTHS ENDED AUGUST 31, 2020 (Unaudited)
| | | | |
| REPORTING PERIOD RETURN: | |
| Fund (Class A Shares, without a sales charge)* | | | 0.37% | |
| Bloomberg Barclays U.S. 1-5 Year Blend (1-6) Municipal Bond Index | | | 1.36% | |
| |
| Net Assets as of 8/31/2020 (In Thousands) | | $ | 1,728,521 | |
| Duration as of 8/31/2020 | | | 3.7 years | |
INVESTMENT OBJECTIVE**
The JPMorgan Short-Intermediate Municipal Bond Fund (the “Fund”) seeks as high a level of current income exempt from federal income tax as is consistent with relative stability of principal.
WHAT WERE THE MAIN DRIVERS OF THE FUND’S PERFORMANCE?
For six months ended August 31, 2020, the Fund underperformed the Bloomberg Barclays U.S. 1-5 Year Blend (1-6) Municipal Bond Index (the “Benchmark”).
Relative to the Benchmark, the Fund’s overweight allocations to hospital and special tax bonds were leading detractors from performance. The Fund’s overweight allocations to bonds rated single-A and BBB and its underweight allocations to bonds rated AAA and AA, as well as its underweight allocations to the pre-refunded bonds and state general obligation bonds also detracted from relative performance.
The Fund’s overweight allocation to local general obligation bonds was a leading contributor to relative performance. The Fund’s overweight allocations to education and housing bonds, and its underweight allocation to New York State bonds also helped relative performance.
HOW WAS THE FUND POSITIONED?
During the reporting period, the Fund employed a bottom-up, security selection-based investment approach. The Fund’s portfolio managers sought to take advantage of opportunities stemming from increased volatility, supply pressures and headline credit risk while maintaining the Fund’s bias toward higher quality issuances.
| | | | |
CREDIT QUALITY ALLOCATIONS*** | |
AAA | | | 21.6 | % |
AA | | | 48.7 | |
A | | | 18.6 | |
BBB | | | 7.5 | |
| BB | | | 0.2 | |
NR | | | 3.4 | |
| * | | The return shown is based on net asset values calculated for shareholder transactions and may differ from the return shown in the financial highlights, which reflects adjustments made to the net asset values in accordance with accounting principles generally accepted in the United States of America. |
| ** | | The adviser seeks to achieve the Fund’s objective. There can be no guarantee it will be achieved. |
| *** | | Percentages indicated are based on total investments as of August 31, 2020. The Fund’s portfolio composition is subject to change. |
| | | | | | | | |
| | | |
| AUGUST 31, 2020 | | J.P. MORGAN MUNICIPAL BOND FUNDS | | | | | 5 | |
JPMorgan Short-Intermediate Municipal Bond Fund
FUND COMMENTARY
SIX MONTHS ENDED AUGUST 31, 2020 (Unaudited) (continued)
| | | | | | | | | | | | | | | | | | |
AVERAGE ANNUAL TOTAL RETURNS AS OF AUGUST 31, 2020 | |
| | | | | |
| | | INCEPTION DATE OF
CLASS | | 6 MONTH* | | | 1 YEAR | | | 5 YEAR | | | 10 YEAR | |
CLASS A SHARES | | May 4, 1998 | | | | | | | | | | | | | | | | |
With Sales Charge** | | | | | (1.89 | )% | | | (0.28 | )% | | | 1.39 | % | | | 1.02 | % |
Without Sales Charge | | | | | 0.37 | | | | 2.04 | | | | 1.85 | | | | 1.24 | |
CLASS C SHARES | | November 1, 2001 | | | | | | | | | | | | | | | | |
With CDSC*** | | | | | (0.89 | ) | | | 0.59 | | | | 1.34 | | | | 0.73 | |
Without CDSC | | | | | 0.11 | | | | 1.59 | | | | 1.34 | | | | 0.73 | |
CLASS I SHARES | | June 19, 2009 | | | 0.59 | | | | 2.57 | | | | 2.32 | | | | 1.72 | |
CLASS R6 SHARES | | October 1, 2018 | | | 0.61 | | | | 2.53 | | | | 2.33 | | | | 1.72 | |
| ** | | Sales Charge for Class A Shares is 2.25%. |
| *** | | Assumes a 1% CDSC (contingent deferred sales charge) for the 6 month and one year periods and 0% CDSC thereafter. |
TEN YEAR PERFORMANCE (8/31/10 TO 8/31/20)
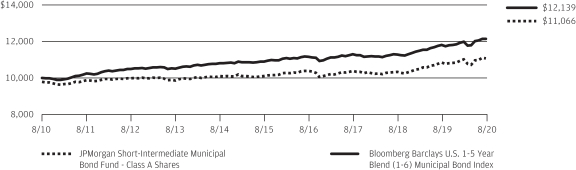
The performance quoted is past performance and is not a guarantee of future results. Mutual funds are subject to certain market risks. Investment returns and principal value of an investment will fluctuate so that an investor’s shares, when redeemed, may be worth more or less than their original cost. Current performance may be higher or lower than the performance data shown. For up-to-date, month-end performance information please call 1-800-480-4111.
Returns for Class R6 Shares prior to its inception date are based on the performance of Class I Shares. The actual returns of Class R6 Shares would have been different than those shown because Class R6 Shares have different expenses than Class I Shares.
The graph illustrates comparative performance for $10,000 invested in Class A Shares of the JPMorgan Short-Intermediate Municipal Bond Fund and the Bloomberg Barclays U.S. 1-5 Year Blend (1-6) Municipal Bond Index from August 31, 2010 to August 31, 2020. The performance of the Fund assumes reinvestment of all dividends and capital gain distributions, if any, and does not include a sales charge. The performance of the Bloomberg Barclays U.S. 1-5 Year Blend (1-6) Municipal Bond Index does not reflect the deduction of expenses or a sales charge associated with a mutual fund and has been adjusted to reflect reinvestment of all dividends and capital gain distributions of
the securities included in the benchmark, if applicable. The Bloomberg Barclays U.S. 1-5 Year Blend (1-6) Municipal Bond Index is an unmanaged index of investment grade tax-exempt municipal bonds with maturities of 1–5.999 years. Investors cannot invest directly in an index.
Capital gain distributions are subject to federal income tax; a portion of the Fund’s income distributions may be subject to the alternative minimum tax and some investors may be subject to certain state and local taxes.
Class A Shares have a $1,000 minimum initial investment and carry a 2.25% sales charge.
Fund performance may reflect the waiver of the Fund’s fees and reimbursement of expenses for certain periods. Without these waivers and reimbursements, performance would have been lower. Also, performance shown in this section does not reflect the deduction of taxes that a shareholder would pay on Fund distributions or on gains resulting from redemptions of Fund shares.
The returns shown are based on net asset values calculated for shareholder transactions and may differ from the returns shown in the financial highlights, which reflect adjustments made to the net asset values in accordance with accounting principles generally accepted in the United States of America.
| | | | | | |
| | | |
| 6 | | | | J.P. MORGAN MUNICIPAL BOND FUNDS | | AUGUST 31, 2020 |
JPMorgan Sustainable Municipal Income Fund
(formerly known as JPMorgan Municipal Income Fund)
FUND COMMENTARY
SIX MONTHS ENDED AUGUST 31, 2020 (Unaudited)
| | | | |
| REPORTING PERIOD RETURN: | |
| Fund (Class I Shares)* | | | 0.61% | |
| Bloomberg Barclays U.S. 1-15 Year Blend (1-17) Municipal Bond Index | | | 0.76% | |
| |
| Net Assets as of 8/31/2020 (In Thousands) | | $ | 302,109 | |
| Duration as of 8/31/2020 | | | 4.9 years | |
INVESTMENT OBJECTIVE**
The JPMorgan Sustainable Municipal Income Fund (the “Fund”) seeks current income exempt from federal income taxes.
WHAT WERE THE MAIN DRIVERS OF THE FUND’S PERFORMANCE?
For the six months ended August 31, 2020, the Fund’s Class I Shares underperformed the Bloomberg Barclays U.S. 1-15 Year Blend (1-17) Municipal Bond Index (the “Benchmark”).
Relative to the Benchmark, the Fund’s overweight allocation to education bonds rated single-A and BBB was a leading detractor from performance. The Fund’s underweight allocations to general obligation bonds and pre-refunded bonds also detracted from relative performance.
The Fund’s bias toward higher quality bonds within the housing and special tax bond sectors was a leading contributor to relative performance. The Fund’s overweight allocation to water & sewer bonds and its underweight allocation to industrial development revenue/pollution control revenue bonds also contributed to relative performance. The Fund’s overweight allocation to bond durations of eight years and longer also helped relative performance as interest rates fell. Generally, bonds with longer duration will experience a greater increase in price than shorter duration bonds when interest rates fall.
HOW WAS THE FUND POSITIONED?
The Fund’s portfolio managers continued to emphasize higher yielding sectors, particularly the housing sector. At the end of the six month period, the Fund’s overall duration was 4.9 years and the Benchmark’s was 4.4 years.
| | | | |
CREDIT QUALITY ALLOCATIONS*** | |
AAA | | | 24.3 | % |
AA | | | 46.4 | |
A | | | 21.7 | |
BBB | | | 6.4 | |
NR | | | 1.2 | |
| * | | The return shown is based on net asset values calculated for shareholder transactions and may differ from the return shown in the financial highlights, which reflects adjustments made to the net asset values in accordance with accounting principles generally accepted in the United States of America. |
| ** | | The adviser seeks to achieve the Fund’s objective. There can be no guarantee it will be achieved. |
| *** | | Percentages indicated are based on total investments as of August 31, 2020. The Fund’s portfolio composition is subject to change. |
| | | | | | | | |
| | | |
| AUGUST 31, 2020 | | J.P. MORGAN MUNICIPAL BOND FUNDS | | | | | 7 | |
JPMorgan Sustainable Municipal Income Fund
(formerly known as JPMorgan Municipal Income Fund)
FUND COMMENTARY
SIX MONTHS ENDED AUGUST 31, 2020 (Unaudited) (continued)
| | | | | | | | | | | | | | | | | | |
AVERAGE ANNUAL TOTAL RETURNS AS OF AUGUST 31, 2020 | |
| | | | | |
| | | INCEPTION DATE OF
CLASS | | 6 MONTH* | | | 1 YEAR | | | 5 YEAR | | | 10 YEAR | |
CLASS A SHARES | | February 23, 1993 | | | | | | | | | | | | | | | | |
With Sales Charge** | | | | | (3.19 | )% | | | (1.23 | )% | | | 2.14 | % | | | 2.43 | % |
Without Sales Charge | | | | | 0.58 | | | | 2.66 | | | | 2.92 | | | | 2.82 | |
CLASS C SHARES | | November 4, 1997 | | | | | | | | | | | | | | | | |
With CDSC*** | | | | | (0.70 | ) | | | 1.22 | | | | 2.35 | | | | 2.24 | |
Without CDSC | | | | | 0.30 | | | | 2.22 | | | | 2.35 | | | | 2.24 | |
CLASS I SHARES | | February 9, 1993 | | | 0.61 | | | | 2.93 | | | | 3.18 | | | | 3.07 | |
CLASS R6 SHARES | | November 6, 2017 | | | 0.76 | | | | 3.04 | | | | 3.24 | | | | 3.10 | |
| ** | | Sales Charge for Class A Shares is 3.75%. |
| *** | | Assumes a 1% CDSC (contingent deferred sales charge) for the 6 month and one year periods and 0% CDSC thereafter. |
TEN YEAR PERFORMANCE (8/31/10 TO 8/31/20)
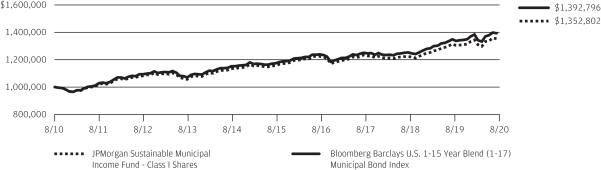
The performance quoted is past performance and is not a guarantee of future results. Mutual funds are subject to certain market risks. Investment returns and principal value of an investment will fluctuate so that an investor’s shares, when redeemed, may be worth more or less than their original cost. Current performance may be higher or lower than the performance data shown. For up-to-date, month-end performance information please call 1-800-480-4111.
Returns for Class R6 Shares prior to its inception date are based on the performance of Class I Shares. The actual returns of Class R6 Shares would have been different than those shown because Class R6 Shares have different expenses than Class I Shares.
The graph illustrates comparative performance for $1,000,000 invested in Class I Shares of the JPMorgan Sustainable Municipal Income Fund and the Bloomberg Barclays U.S. 1-15 Year Blend (1-17) Municipal Bond Index from August 31, 2010 to August 31, 2020. The performance of the Fund assumes reinvestment of all dividends and capital gain distributions, if any, and does not include a sales charge. The performance of the Bloomberg Barclays U.S. 1-15 Year Blend (1-17) Municipal Bond Index does not reflect the deduction of expenses or a sales charge associated with a mutual fund and has been adjusted to reflect reinvest-
ment of all dividends and capital gain distributions of the securities included in the benchmark, if applicable. The Bloomberg Barclays U.S. 1-15 Year Blend (1-17) Municipal Bond Index represents the performance of municipal bonds with maturities from 1 to 17 years. Investors cannot invest directly in an index.
Capital gain distributions are subject to federal income tax; a portion of the Fund’s income distributions may be subject to the alternative minimum tax and some investors may be subject to certain state and local taxes.
Class I Shares have a $1,000,000 minimum initial investment.
Fund performance may reflect the waiver of the Fund’s fees and reimbursement of expenses for certain periods. Without these waivers and reimbursements, performance would have been lower. Also, performance shown in this section does not reflect the deduction of taxes that a shareholder would pay on Fund distributions or on gains resulting from redemptions of Fund shares.
The returns shown are based on net asset values calculated for shareholder transactions and may differ from the returns shown in the financial highlights, which reflect adjustments made to the net asset values in accordance with accounting principles generally accepted in the United States of America.
| | | | | | |
| | | |
| 8 | | | | J.P. MORGAN MUNICIPAL BOND FUNDS | | AUGUST 31, 2020 |
JPMorgan Tax Free Bond Fund
FUND COMMENTARY
SIX MONTHS ENDED AUGUST 31, 2020 (Unaudited)
| | | | |
| REPORTING PERIOD RETURN: | |
| Fund (Class A Shares, without a sales charge)* | | | (0.76)% | |
| Bloomberg Barclays U.S. Municipal Index | | | 0.19% | |
| |
| Net Assets as of 8/31/2020 (In Thousands) | | | $564,398 | |
| Duration as of 8/31/2020 | | | 7.8 years | |
INVESTMENT OBJECTIVE**
The JPMorgan Tax Free Bond Fund (the “Fund”) seeks as high a level of current income exempt from federal income tax as is consistent with relative stability of principal.
WHAT WERE THE MAIN DRIVERS OF THE FUND’S PERFORMANCE?
For the six months ended August 31, 2020, the Fund underperformed the Bloomberg Barclays U.S. Municipal Index (the “Benchmark”).
Relative to the Benchmark, the Fund’s overweight allocations to bonds rated single-A and BBB was a leading detractor from performance. The Fund’s overweight allocations to bond maturities of 17+ years and to hospital bonds, and its underweight allocation to state general obligation bonds and overweight allocation to hospital bonds also detracted from relative performance. While education bonds generally provided positive returns, the Fund’s bias to education bonds rated single-A and BBB detracted from relative performance.
The Fund’s overweight allocation to local general obligation bonds and its security selection within housing bonds were leading contributors to relative performance. The Fund’s underweight allocations to transportation bonds and New York State bonds also helped relative performance.
HOW WAS THE FUND POSITIONED?
The Fund continued to employ a bottom-up, security selection-based investment approach and sought to take advantage of opportunities stemming from increased volatility, supply pressures and headline credit risk.
| | | | |
CREDIT QUALITY ALLOCATIONS*** | |
AAA | | | 12.0 | % |
AA | | | 49.5 | |
A | | | 23.5 | |
BBB | | | 11.9 | |
| BB | | | 0.8 | |
| B | | | 0.5 | |
NR | | | 1.8 | |
| * | | The return shown is based on net asset values calculated for shareholder transactions and may differ from the return shown in the financial highlights, which reflects adjustments made to the net asset values in accordance with accounting principles generally accepted in the United States of America. |
| ** | | The adviser seeks to achieve the Fund’s objective. There can be no guarantee it will be achieved. |
| *** | | Percentages indicated are based on total investments as of August 31, 2020. The Fund’s portfolio composition is subject to change. |
| | | | | | | | |
| | | |
| AUGUST 31, 2020 | | J.P. MORGAN MUNICIPAL BOND FUNDS | | | | | 9 | |
JPMorgan Tax Free Bond Fund
FUND COMMENTARY
SIX MONTHS ENDED AUGUST 31, 2020 (Unaudited) (continued)
| | | | | | | | | | |
AVERAGE ANNUAL TOTAL RETURNS AS OF AUGUST 31, 2020 |
| | | | | | | | | | | | | | | | | | |
| | | | | |
| | | INCEPTION DATE OF
CLASS | | 6 MONTH* | | | 1 YEAR | | | 5 YEAR | | | 10 YEAR | |
CLASS A SHARES | | March 1, 1988 | | | | | | | | | | | | | | | | |
With Sales Charge** | | | | | (4.46 | )% | | | (1.24 | )% | | | 2.84 | % | | | 3.22 | % |
Without Sales Charge | | | | | (0.76 | ) | | | 2.58 | | | | 3.63 | | | | 3.61 | |
CLASS C SHARES | | July 1, 2008 | | | | | | | | | | | | | | | | |
With CDSC*** | | | | | (2.06 | ) | | | 0.92 | | | | 3.01 | | | | 2.95 | |
Without CDSC | | | | | (1.06 | ) | | | 1.92 | | | | 3.01 | | | | 2.95 | |
CLASS I SHARES | | February 1, 1995 | | | (0.74 | ) | | | 2.73 | | | | 3.84 | | | | 3.81 | |
CLASS R6 SHARES | | October 1, 2018 | | | (0.71 | ) | | | 2.79 | | | | 3.86 | | | | 3.82 | |
| ** | | Sales Charge for Class A Shares is 3.75%. |
| *** | | Assumes a 1% CDSC (contingent deferred sales charge) for the 6 month and one year periods and 0% CDSC thereafter. |
TEN YEAR PERFORMANCE (8/31/10 TO 8/31/20)
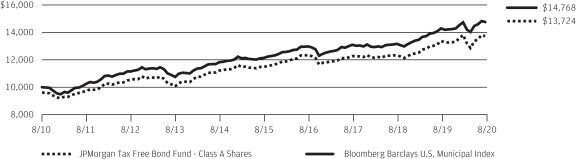
The performance quoted is past performance and is not a guarantee of future results. Mutual funds are subject to certain market risks. Investment returns and principal value of an investment will fluctuate so that an investor’s shares, when redeemed, may be worth more or less than their original cost. Current performance may be higher or lower than the performance data shown. For up-to-date, month-end performance information please call 1-800-480-4111.
Returns for Class R6 Shares prior to its inception date are based on the performance of Class I Shares. The actual returns of Class R6 Shares would have been different than those shown because Class R6 Shares have different expenses than Class I Shares.
The graph illustrates comparative performance for $10,000 invested in Class A Shares of the JPMorgan Tax Free Bond Fund and the Bloomberg Barclays U.S. Municipal Index from August 31, 2010 to August 31, 2020. The performance of the Fund assumes reinvestment of all dividends and capital gain distributions, if any, and includes a sales charge. The performance of the Bloomberg Barclays U.S. Municipal Index does not reflect the deduction of expenses or a sales charge associated with a mutual fund and has been adjusted to reflect reinvestment of all dividends and capital gain distributions of the securities included in the benchmark, if applicable. The Bloomberg Barclays
U.S. Municipal Index is a total return performance benchmark for the long-term, investment-grade tax-exempt bond market. Investors cannot invest directly in an index.
Capital gain distributions are subject to federal income tax; a portion of the Fund’s income distributions may be subject to the alternative minimum tax and some investors may be subject to certain state and local taxes.
Class A Shares have a $1,000 minimum initial investment and carry a 3.75% sales charge.
Fund performance may reflect the waiver of the Fund’s fees and reimbursement of expenses for certain periods. Without these waivers and reimbursements, performance would have been lower. Also, performance shown in this section does not reflect the deduction of taxes that a shareholder would pay on Fund distributions or on gains resulting from redemptions of Fund shares.
The returns shown are based on net asset values calculated for shareholder transactions and may differ from the returns shown in the financial highlights, which reflect adjustments made to the net asset values in accordance with accounting principles generally accepted in the United States of America.
| | | | | | |
| | | |
| 10 | | | | J.P. MORGAN MUNICIPAL BOND FUNDS | | AUGUST 31, 2020 |
JPMorgan Ultra-Short Municipal Fund
FUND COMMENTARY
SIX MONTHS ENDED AUGUST 31, 2020 (Unaudited)
| | | | |
| REPORTING PERIOD RETURN: | |
| Fund (Class I Shares)* | | | 0.45% | |
| Bloomberg Barclays 1 Year Municipal Bond Index | | | 0.98% | |
| |
| Net Assets as of 8/31/2020 (In Thousands) | | | $5,477,958 | |
| Duration as of 8/31/2020 | | | 0.9 years | |
INVESTMENT OBJECTIVE**
The JPMorgan Ultra-Short Municipal Fund (the “Fund”) seeks as high a level of current income exempt from federal income tax as is consistent with relative stability of principal.
WHAT WERE THE MAIN DRIVERS OF THE FUND’S PERFORMANCE?
For the six months ended August 31, 2020, the Fund underperformed the Bloomberg Barclays 1 Year Municipal Bond Index (the “Benchmark”).
Relative to the Benchmark, the Fund’s shorter overall duration was a leading detractor from performance as interest rates fell during the reporting period. Generally, bonds with shorter duration experience a smaller price increase compared with longer duration bonds when interest rates decline. The Fund’s security selection and overweight allocation to hospital bonds, and its out-of-Benchmark allocation to variable rate demand notes, which generally do not benefit from principal stability amid falling interest rates, also detracted from relative performance.
The Fund’s out-of-Benchmark exposure to bond durations of four-to-six years was a leading contributor to relative performance as longer duration bonds outperformed shorter duration bonds. The Fund’s underweight allocation and security selection in state general obligation bonds also contributed to relative performance.
HOW WAS THE FUND POSITIONED?
During the reporting period, the Fund sought to maintain an average weighted maturity of two years or less, and the Fund’s investment adviser used a risk/reward analysis to identify investments that it believed would perform well over market cycles.
| | | | |
CREDIT QUALITY ALLOCATIONS*** | |
AAA | | | 22.7 | % |
AA | | | 40.5 | |
A | | | 8.9 | |
BBB | | | 3.8 | |
BB | | | 0.2 | |
NR | | | 23.9 | |
| * | | The return shown is based on net asset values calculated for shareholder transactions and may differ from the return shown in the financial highlights, which reflects adjustments made to the net asset values in accordance with accounting principles generally accepted in the United States of America. |
| ** | | The adviser seeks to achieve the Fund’s objective. There can be no guarantee it will be achieved. |
| *** | | Percentages indicated are based on total investments as of August 31, 2020. The Fund’s portfolio composition is subject to change. |
| | | | | | | | |
| | | |
| AUGUST 31, 2020 | | J.P. MORGAN MUNICIPAL BOND FUNDS | | | | | 11 | |
JPMorgan Ultra-Short Municipal Fund
FUND COMMENTARY
SIX MONTHS ENDED AUGUST 31, 2020 (Unaudited) (continued)
| | | | | | | | | | | | | | |
AVERAGE ANNUAL TOTAL RETURNS AS OF AUGUST 31, 2020 | |
| | | | |
| | | INCEPTION DATE OF
CLASS | | 6 MONTH* | | | 1 YEAR | | | SINCE
INCEPTION | |
CLASS A SHARES | | May 31, 2016 | | | | | | | | | | | | |
With Sales Charge** | | | | | (1.98 | )% | | | (1.34 | )% | | | 0.48 | % |
Without Sales Charge | | | | | 0.25 | | | | 0.91 | | | | 1.02 | |
CLASS I SHARES | | May 31, 2016 | | | 0.45 | | | | 1.21 | | | | 1.24 | |
| ** | | Sales Charge for Class A Shares is 2.25%. |
LIFE OF FUND PERFORMANCE (5/31/16 TO 8/31/20)
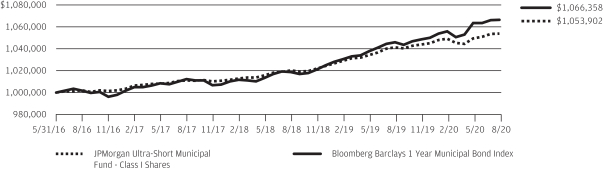
The performance quoted is past performance and is not a guarantee of future results. Mutual funds are subject to certain market risks. Investment returns and principal value of an investment will fluctuate so that an investor’s shares, when redeemed, may be worth more or less than their original cost. Current performance may be higher or lower than the performance data shown. For up-to-date, month-end performance information please call 1-800-480-4111.
The Fund commenced operations on May 31, 2016.
The graph illustrates comparative performance for $1,000,000 invested in Class I Shares of the JPMorgan Ultra-Short Municipal Fund and the Bloomberg Barclays 1 Year Municipal Bond Index from May 31, 2016 to August 31, 2020. The performance of the Fund assumes reinvestment of all dividends and capital gain distributions, if any, and does not include a sales charge. The performance of the Bloomberg Barclays 1 Year Municipal Bond Index does not reflect the deduction of expenses or a sales charge associated with a mutual fund and has been adjusted to reflect reinvestment of all dividends and capital gain distributions of securities included in the benchmark, if applicable. The Bloomberg Barclays 1 Year Municipal Bond Index is an unmanaged index that includes bonds with a minimum credit rating of BAA3, are issued as part of a deal of at least $50 million, have an amount outstanding of at least $5 million, and have maturities of 1 to 2 years. Investors cannot invest directly in an index.
Capital gain distributions are subject to federal income tax; a portion of the Fund’s income distributions may be subject to the alternative minimum tax and some investors may be subject to certain state and local taxes.
Class I Shares have a $1,000,000 minimum initial investment.
Subsequent to the inception of the Fund on May 31, 2016 until August 31, 2016, the Fund did not experience any shareholder activity. If such shareholder activity had occurred, the Fund’s performance may have been impacted.
Fund performance may reflect the waiver of the Fund’s fees and reimbursement of expenses for certain periods since the applicable inception date. Without these waivers and reimbursements, performance would have been lower. Also, performance shown in this section does not reflect the deduction of taxes that a shareholder would pay on Fund distributions or on gains resulting from redemptions of Fund shares.
The returns shown are based on net asset values calculated for shareholder transactions and may differ from the returns shown in the financial highlights, which reflect adjustments made to the net asset values in accordance with accounting principles generally accepted in the United States of America.
| | | | | | |
| | | |
| 12 | | | | J.P. MORGAN MUNICIPAL BOND FUNDS | | AUGUST 31, 2020 |
JPMorgan High Yield Municipal Fund
SCHEDULE OF PORTFOLIO INVESTMENTS
AS OF AUGUST 31, 2020 (Unaudited)
| | | | | | | | |
| INVESTMENTS | | PRINCIPAL
AMOUNT
($000) | | | VALUE
($000) | |
Municipal Bonds — 97.1% (a) | |
|
Alaska — 0.5% | |
| | |
Alaska Industrial Development and Export Authority, Providence Health and Services Series 2011A, Rev., 5.50%, 10/1/2041 | | | 325 | | | | 337 | |
| | |
Alaska Industrial Development and Export Authority, Tanana Chiefs Conference Project Series 2019A, Rev., 4.00%, 10/1/2036 | | | 2,000 | | | | 2,302 | |
| | | | | | | | |
| | |
Total Alaska | | | | | | | 2,639 | |
| | | | | | | | |
|
Arizona — 4.2% | |
| | |
Arizona Industrial Development Authority Series 2020A, Rev., 4.00%, 7/15/2040 (b) | | | 800 | | | | 776 | |
| | |
Arizona Industrial Development Authority, Academics of Math and Science Projects | | | | | | | | |
| | |
Rev., 4.00%, 7/1/2029 (b) | | | 400 | | | | 408 | |
| | |
Rev., 5.00%, 7/1/2039 (b) | | | 1,000 | | | | 1,054 | |
| | |
Arizona Industrial Development Authority, Cadence Campus Project Series 2020A, Rev., 4.00%, 7/15/2030 (b) | | | 500 | | | | 516 | |
| | |
Arizona Industrial Development Authority, Equitable School Revolving Funds Series A, Rev., 5.00%, 11/1/2044 | | | 750 | | | | 906 | |
| | |
Arizona Industrial Development Authority, Fire MESA and Red Rock Campus Projects | | | | | | | | |
| | |
Series 2019A, Rev., 3.55%, 7/15/2029 (b) | | | 1,360 | | | | 1,352 | |
| | |
Series 2019A, Rev., 5.00%, 7/15/2039 (b) | | | 1,325 | | | | 1,412 | |
| | |
Series 2019A, Rev., 5.00%, 7/15/2049 (b) | | | 1,675 | | | | 1,739 | |
| | |
Arizona Industrial Development Authority, Great Lakes Senior Living Communities LLC Project | | | | | | | | |
| | |
Series 2019A, Rev., 5.00%, 1/1/2029 | | | 1,500 | | | | 1,501 | |
| | |
Series 2019A, Rev., 5.00%, 1/1/2037 | | | 1,000 | | | | 949 | |
| | |
Series 2019A, Rev., 5.00%, 1/1/2038 | | | 1,000 | | | | 937 | |
| | |
Series 2019A, Rev., 4.25%, 1/1/2039 | | | 1,000 | | | | 844 | |
| | |
Series 2019A, Rev., 4.50%, 1/1/2049 | | | 2,000 | | | | 1,631 | |
| | |
Arizona Industrial Development Authority, Pinecrest Academy, Horizon, Inspirada and St. Rose Campus Projects | | | | | | | | |
| | |
Series 2018A, Rev., 5.00%, 7/15/2028 (b) | | | 1,000 | | | | 1,082 | |
| | |
Series 2018A, Rev., 5.75%, 7/15/2038 (b) | | | 1,000 | | | | 1,107 | |
| | |
City of Mesa, Utility System Rev., AGM, 5.25%, 7/1/2029 | | | 40 | | | | 55 | |
| | |
Glendale Industrial Development Authority, Terraces of Phoenix Project | | | | | | | | |
| | |
Series 2018A, Rev., 4.00%, 7/1/2028 | | | 450 | | | | 446 | |
| | |
Series 2018A, Rev., 5.00%, 7/1/2033 | | | 600 | | | | 618 | |
| | |
Series 2018A, Rev., 5.00%, 7/1/2038 | | | 300 | | | | 305 | |
| | |
Industrial Development Authority of The City of Phoenix, Downtown Phoenix Student Housing LLC — Arizona State University Project | | | | | | | | |
| | |
Series 2018A, Rev., 5.00%, 7/1/2032 | | | 350 | | | | 381 | |
| | | | | | | | |
| INVESTMENTS | | PRINCIPAL
AMOUNT
($000) | | | VALUE
($000) | |
| | | | | | | | |
|
Arizona — continued | |
| | |
Series 2018A, Rev., 5.00%, 7/1/2033 | | | 150 | | | | 163 | |
| | |
Series 2018A, Rev., 5.00%, 7/1/2037 | | | 200 | | | | 214 | |
| | |
La Paz County Industrial Development Authority, Charter School Solutions-Harmony Public Schools Project | | | | | | | | |
| | |
Series 2018A, Rev., 5.00%, 2/15/2028 | | | 200 | | | | 227 | |
| | |
Series 2018A, Rev., 5.00%, 2/15/2038 | | | 405 | | | | 453 | |
| | |
Maricopa County Industrial Development Authority | | | | | | | | |
| | |
Series 2020A, Rev., 4.00%, 7/1/2030 (b) | | | 320 | | | | 331 | |
| | |
Series 2020A, Rev., 5.00%, 7/1/2040 (b) | | | 620 | | | | 654 | |
| | |
Series 2020A, Rev., 5.00%, 7/1/2050 (b) | | | 780 | | | | 811 | |
| | | | | | | | |
| | |
Total Arizona | | | | | | | 20,872 | |
| | | | | | | | |
|
California — 1.7% | |
| | |
California Community College Financing Authority, Orange Coast Properties LLC — Orange Coast College Project | | | | | | | | |
| | |
Rev., 5.00%, 5/1/2037 | | | 750 | | | | 773 | |
| | |
Rev., 5.00%, 5/1/2038 | | | 400 | | | | 411 | |
| | |
California Health Facilities Financing Authority, Children’s Hospital Series 2017A, Rev., 5.00%, 8/15/2047 | | | 500 | | | | 562 | |
| | |
California Municipal Finance Authority, Eisenhower Medical Center Series 2017B, Rev., 5.00%, 7/1/2047 | | | 200 | | | | 224 | |
| | |
California Municipal Finance Authority, John Adams Academies Lincoln Project | | | | | | | | |
| | |
Series 2019A, Rev., 4.00%, 10/1/2029 (b) | | | 410 | | | | 417 | |
| | |
Series 2019A, Rev., 5.00%, 10/1/2039 (b) | | | 900 | | | | 940 | |
| | |
California Municipal Finance Authority, Linxs Apartments Project, Senior Lien | | | | | | | | |
| | |
Series 2018A, Rev., AMT, AGM, 3.25%, 12/31/2032 | | | 245 | | | | 258 | |
| | |
Series 2018A, Rev., AMT, AGM, 3.50%, 12/31/2035 | | | 240 | | | | 255 | |
| | |
California Municipal Finance Authority, San Antonio Gardens Project Rev., 5.00%, 11/15/2039 | | | 850 | | | | 925 | |
| | |
California Pollution Control Financing Authority, Solid Waste Disposal, Waste Management, Inc. Project Series 2015B-2, Rev., AMT, 3.13%, 11/3/2025 (c) | | | 250 | | | | 275 | |
| | |
California Public Finance Authority, Henry Mayo Newhall Hospital Rev., 5.00%, 10/15/2029 | | | 200 | | | | 230 | |
| | |
California Public Finance Authority, Laverne Elementary Preparatory Academy | | | | | | | | |
| | |
Series 2019A, Rev., 4.25%, 6/15/2029 (b) | | | 795 | | | | 808 | |
SEE NOTES TO FINANCIAL STATEMENTS.
| | | | | | | | |
| | | |
| AUGUST 31, 2020 | | J.P. MORGAN MUNICIPAL BOND FUNDS | | | | | 13 | |
JPMorgan High Yield Municipal Fund
SCHEDULE OF PORTFOLIO INVESTMENTS
AS OF AUGUST 31, 2020 (Unaudited) (continued)
| | | | | | | | |
| INVESTMENTS | | PRINCIPAL
AMOUNT
($000) | | | VALUE
($000) | |
Municipal Bonds — continued | |
|
California — continued | |
| | |
Series 2019A, Rev., 5.00%, 6/15/2039 (b) | | | 785 | | | | 802 | |
| | |
California School Facilities Financing Authority, Capital Appreciation, Azusa Unified School District Series 2018A, Rev., AGM, Zero Coupon, 8/1/2030 | | | 200 | | | | 171 | |
| | |
California School Finance Authority Series 2015A, Rev., 5.00%, 7/1/2035 (b) | | | 100 | | | | 113 | |
| | |
Eastern Municipal Water District Financing Authority Series 2020A, Rev., 5.00%, 7/1/2037 | | | 80 | | | | 108 | |
| | |
Palomar Health Rev., 5.00%, 11/1/2039 | | | 500 | | | | 568 | |
| | |
Pomona Unified School District Series C, GO, 6.00%, 8/1/2029 (d) | | | 160 | | | | 233 | |
| | |
San Mateo Union High School District, Capital Appreciation, Election of 2006 Series A, GO, Zero Coupon, 9/1/2028 | | | 100 | | | | 73 | |
| | |
Sunnyvale Elementary School District, Election 2004 Series C, GO, 5.50%, 9/1/2034 | | | 175 | | | | 259 | |
| | | | | | | | |
| | |
Total California | | | | | | | 8,405 | |
| | | | | | | | |
|
Colorado — 8.6% | |
| | |
Aviation Station, North Metropolitan District No. 2 Series A, GO, 5.00%, 12/1/2039 | | | 750 | | | | 766 | |
| | |
Bradburn Metropolitan District No. 2 | | | | | | | | |
| | |
Series 2018A, GO, 5.00%, 12/1/2038 | | | 500 | | | | 536 | |
| | |
Series 2018B, GO, 7.25%, 12/15/2047 | | | 500 | | | | 509 | |
| | |
Colorado Educational and Cultural Facilities Authority, Stargate Charter School Project | | | | | | | | |
| | |
Series 2018A, Rev., 5.00%, 12/1/2032 | | | 500 | | | | 615 | |
| | |
Series 2018A, Rev., 5.00%, 12/1/2033 | | | 500 | | | | 610 | |
| | |
Series 2018A, Rev., 4.00%, 12/1/2048 | | | 500 | | | | 541 | |
| | |
Colorado Health Facilities Authority Series 2017A, Rev., 5.00%, 5/15/2022 | | | 280 | | | | 291 | |
| | |
Colorado Health Facilities Authority, Christian Living Neighborhoods | | | | | | | | |
| | |
Rev., 4.00%, 1/1/2028 | | | 500 | | | | 520 | |
| | |
Rev., 4.00%, 1/1/2038 | | | 550 | | | | 526 | |
| | |
Rev., 5.00%, 1/1/2038 | | | 1,550 | | | | 1,659 | |
| | |
Colorado Health Facilities Authority, Commonspirit Health Series A-1, Rev., 4.00%, 8/1/2044 | | | 2,000 | | | | 2,216 | |
| | |
Colorado Health Facilities Authority, Frasier Meadows Retirement Community Project Series A, Rev., 5.25%, 5/15/2028 | | | 1,000 | | | | 1,142 | |
| | |
Colorado Health Facilities Authority, Parkview Medical Center, Inc. Project Series 2020A, Rev., 4.00%, 9/1/2050 | | | 675 | | | | 735 | |
| | | | | | | | |
| INVESTMENTS | | PRINCIPAL
AMOUNT
($000) | | | VALUE
($000) | |
| | | | | | | | |
|
Colorado — continued | |
| | |
Copper Ridge Metropolitan District | | | | | | | | |
| | |
Rev., 4.00%, 12/1/2029 | | | 1,000 | | | | 946 | |
| | |
Rev., 5.00%, 12/1/2039 | | | 1,000 | | | | 947 | |
| | |
Copperleaf Metropolitan District No. 4 | | | | | | | | |
| | |
Series 2020A, GO, 5.00%, 12/1/2039 | | | 775 | | | | 796 | |
| | |
Series 2020A, GO, 5.00%, 12/1/2049 | | | 1,000 | | | | 1,009 | |
| | |
Cottonwood Highlands Metropolitan District No. 1 Series 2019A, GO, 5.00%, 12/1/2049 | | | 900 | | | | 911 | |
| | |
Cross Creek Metropolitan District No. 2, Unlimited Tax GO, AGM, 4.00%, 12/1/2045 | | | 1,000 | | | | 1,121 | |
| | |
Denver Health & Hospital Authority Series 2019A, Rev., 4.00%, 12/1/2037 | | | 1,250 | | | | 1,343 | |
| | |
DIATC Metropolitan District | | | | | | | | |
| | |
GO, 3.25%, 12/1/2029 (b) | | | 590 | | | | 569 | |
| | |
GO, 5.00%, 12/1/2039 (b) | | | 1,240 | | | | 1,277 | |
| | |
Jefferson Center Metropolitan District No. 1 | | | | | | | | |
| | |
Series 2020A-2, Rev., 4.13%, 12/1/2040 | | | 285 | | | | 286 | |
| | |
Series 2020B, Rev., 5.75%, 12/15/2050 | | | 2,500 | | | | 2,508 | |
| | |
Lanterns Metropolitan District No. 1 Series A, GO, 5.00%, 12/1/2039 | | | 1,375 | | | | 1,417 | |
| | |
Mirabelle Metropolitan District No. 2 | | | | | | | | |
| | |
Series 2020A, GO, 5.00%, 12/1/2039 | | | 700 | | | | 715 | |
| | |
Series 2020A, GO, 5.00%, 12/1/2049 | | | 1,250 | | | | 1,258 | |
| | |
Painted Prairie Metropolitain District No. 2 GO, 5.25%, 12/1/2048 | | | 2,000 | | | | 2,042 | |
| | |
Painted Prairie Public Improvement Authority | | | | | | | | |
| | |
Rev., 4.00%, 12/1/2029 | | | 1,000 | | | | 1,021 | |
| | |
Rev., 5.00%, 12/1/2039 | | | 2,500 | | | | 2,626 | |
| | |
Public Authority for Colorado Energy, Natural Gas Purchase Series 2008, Rev., 6.13%, 11/15/2023 | | | 90 | | | | 98 | |
| | |
Raindance Metropolitan District No. 1 Non-Potable Water System Rev., 5.00%, 12/1/2040 | | | 750 | | | | 753 | |
| | |
South Suburban Park & Recreation District | | | | | | | | |
| | |
COP, 4.00%, 12/15/2036 | | | 1,350 | | | | 1,553 | |
| | |
COP, 4.00%, 12/15/2037 | | | 500 | | | | 574 | |
| | |
STC Metropolitan District No. 2 | | | | | | | | |
| | |
Series 2019A, GO, 3.00%, 12/1/2025 | | | 555 | | | | 539 | |
| | |
Series 2019A, GO, 4.00%, 12/1/2029 | | | 1,000 | | | | 1,001 | |
| | |
Series 2019A, GO, 5.00%, 12/1/2038 | | | 1,700 | | | | 1,738 | |
| | |
Thompson Crossing Metropolitan District No. 4 | | | | | | | | |
| | |
GO, 5.00%, 12/1/2039 | | | 1,400 | | | | 1,466 | |
| | |
GO, 5.00%, 12/1/2049 | | | 1,500 | | | | 1,526 | |
SEE NOTES TO FINANCIAL STATEMENTS.
| | | | | | |
| | | |
| 14 | | | | J.P. MORGAN MUNICIPAL BOND FUNDS | | AUGUST 31, 2020 |
| | | | | | | | |
| INVESTMENTS | | PRINCIPAL
AMOUNT
($000) | | | VALUE
($000) | |
Municipal Bonds — continued | |
|
Colorado — continued | |
| | |
Trails at Crowfoot Metropolitan District No. 3 | | | | | | | | |
| | |
Series A, GO, 4.38%, 12/1/2030 | | | 620 | | | | 624 | |
| | |
Series A, GO, 5.00%, 12/1/2039 | | | 1,000 | | | | 1,020 | |
| | |
Willow Bend Metropolitan District Series A, GO, 5.00%, 12/1/2039 | | | 600 | | | | 616 | |
| | | | | | | | |
| | |
Total Colorado | | | | | | | 42,966 | |
| | | | | | | | |
|
Connecticut — 1.8% | |
| | |
Connecticut State Health & Educational Facilities Authority | | | | | | | | |
| | |
Series A-1, Rev., 5.00%, 10/1/2029 (b) | | | 400 | | | | 426 | |
| | |
Series G-1, Rev., 5.00%, 7/1/2034 (b) | | | 225 | | | | 254 | |
| | |
Series A-1, Rev., 4.50%, 10/1/2034 (b) | | | 2,350 | | | | 2,351 | |
| | |
Series A-1, Rev., 5.00%, 10/1/2039 (b) | | | 1,000 | | | | 1,020 | |
| | |
Connecticut State Health and Educational Facilities Authority, McLean Issue | | | | | | | | |
| | |
Series 2020B-2, Rev., 2.75%, 1/1/2026 (b) | | | 650 | | | | 653 | |
| | |
Series 2020B-1, Rev., 3.25%, 1/1/2027 (b) | | | 700 | | | | 704 | |
| | |
Series 2020A, Rev., 5.00%, 1/1/2030 (b) | | | 250 | | | | 275 | |
| | |
Series 2020A, Rev., 5.00%, 1/1/2045 (b) | | | 500 | | | | 530 | |
| | |
Connecticut State Higher Education Supplemental Loan Authority, CHESLA Loan Program Series A, Rev., 5.25%, 11/15/2020 | | | 200 | | | | 202 | |
| | |
State of Connecticut Series A, GO, 5.00%, 4/15/2037 | | | 1,000 | | | | 1,232 | |
| | |
Town of Hamden Rev., 5.00%, 1/1/2030 | | | 1,500 | | | | 1,545 | |
| | | | | | | | |
| | |
Total Connecticut | | | | | | | 9,192 | |
| | | | | | | | |
|
Delaware — 0.2% | |
| | |
Delaware Economic Development Authority, Acts Retirement-Life Communities, Inc. Obligated Group Series 2018-B, Rev., 5.00%, 11/15/2048 | | | 700 | | | | 798 | |
| | |
Delaware State Housing Authority, Senior Single Family Mortgage Series A-1, Rev., AMT, 4.90%, 7/1/2029 | | | 125 | | | | 127 | |
| | | | | | | | |
| | |
Total Delaware | | | | | | | 925 | |
| | | | | | | | |
|
District of Columbia — 0.3% | |
| | |
District of Columbia | | | | | | | | |
| | |
Series 2017B, Rev., 5.00%, 7/1/2037 | | | 500 | | | | 584 | |
| | |
Rev., 4.00%, 7/1/2039 | | | 200 | | | | 217 | |
| | |
District of Columbia, International School Issue Rev., 5.00%, 7/1/2039 | | | 650 | | | | 750 | |
| | | | | | | | |
| | |
Total District of Columbia | | | | | | | 1,551 | |
| | | | | | | | |
|
Florida — 10.2% | |
| | |
Capital Trust Agency, Inc., Advantage Academy of Hillsborough Project | | | | | | | | |
| | |
Series A, Rev., 5.00%, 12/15/2029 | | | 405 | | | | 458 | |
| | | | | | | | |
| INVESTMENTS | | PRINCIPAL
AMOUNT
($000) | | | VALUE
($000) | |
| | | | | | | | |
|
Florida — continued | |
| | |
Series A, Rev., 5.00%, 12/15/2039 | | | 1,775 | | | | 1,939 | |
| | |
Capital Trust Agency, Inc., Franklin Academy Project | | | | | | | | |
| | |
Rev., 4.00%, 12/15/2025 (b) | | | 300 | | | | 315 | |
| | |
Rev., 5.00%, 12/15/2026 (b) | | | 300 | | | | 332 | |
| | |
Rev., 5.00%, 12/15/2027 (b) | | | 330 | | | | 363 | |
| | |
Rev., 5.00%, 12/15/2028 (b) | | | 345 | | | | 379 | |
| | |
Rev., 5.00%, 12/15/2029 (b) | | | 365 | | | | 399 | |
| | |
Rev., 5.00%, 12/15/2030 (b) | | | 510 | | | | 556 | |
| | |
Rev., 5.00%, 12/15/2035 (b) | | | 1,080 | | | | 1,159 | |
| | |
Rev., 5.00%, 12/15/2040 (b) | | | 1,200 | | | | 1,274 | |
| | |
Capital Trust Agency, Inc., Imagine School at Land O’Lakes Project | | | | | | | | |
| | |
Series 2020A, Rev., 3.00%, 12/15/2029 (b) | | | 420 | | | | 397 | |
| | |
Series 2020A, Rev., 5.00%, 12/15/2039 (b) | | | 640 | | | | 684 | |
| | |
Capital Trust Agency, Inc., Liza Jackson Preparatory School, Inc. Project | | | | | | | | |
| | |
Series 2020A, Rev., 4.00%, 8/1/2030 | | | 200 | | | | 227 | |
| | |
Series 2020A, Rev., 5.00%, 8/1/2040 | | | 300 | | | | 349 | |
| | |
Charlotte County, Utility System | | | | | | | | |
| | |
Rev., AGM, 5.25%, 10/1/2021 (d) | | | 70 | | | | 74 | |
| | |
Rev., AGM, 5.25%, 10/1/2024 | | | 130 | | | | 137 | |
| | |
City of Tampa, H. Lee Moffitt Cancer Center Project | | | | | | | | |
| | |
Series 2020B, Rev., 4.00%, 7/1/2038 | | | 190 | | | | 217 | |
| | |
Series 2020B, Rev., 4.00%, 7/1/2039 | | | 250 | | | | 285 | |
| | |
Series 2020B, Rev., 5.00%, 7/1/2040 | | | 390 | | | | 482 | |
| | |
Series 2020B, Rev., 4.00%, 7/1/2045 | | | 750 | | | | 842 | |
| | |
Series 2020B, Rev., 5.00%, 7/1/2050 | | | 1,785 | | | | 2,185 | |
| | |
City of Venice, Village on the Isle Project | | | | | | | | |
| | |
Rev., 5.00%, 1/1/2037 | | | 1,000 | | | | 1,058 | |
| | |
Rev., 5.00%, 1/1/2047 | | | 1,000 | | | | 1,037 | |
| | |
County of Broward Series 2019A, Rev., AMT, 4.00%, 10/1/2044 | | | 2,475 | | | | 2,743 | |
| | |
County of Lake, Imagine South Lake Charter School Project | | | | | | | | |
| | |
Series A, Rev., 5.00%, 1/15/2029 (b) | | | 500 | | | | 536 | |
| | |
Series A, Rev., 5.00%, 1/15/2039 (b) | | | 550 | | | | 579 | |
| | |
Series A, Rev., 5.00%, 1/15/2049 (b) | | | 825 | | | | 854 | |
| | |
County of Palm Beach, Atlantic University | | | | | | | | |
| | |
Rev., 5.00%, 4/1/2029 (b) | | | 400 | | | | 417 | |
| | |
Rev., 5.00%, 4/1/2039 (b) | | | 900 | | | | 896 | |
| | |
County of Palm Beach, Tuscan Gardens of Delray Beach Project | | | | | | | | |
| | |
Series 2018-A, Rev., 4.25%, 10/1/2029 (c) | | | 1,000 | | | | 900 | |
| | |
Series 2018C, Rev., 6.25%, 10/1/2029 (c) | | | 1,000 | | | | 850 | |
SEE NOTES TO FINANCIAL STATEMENTS.
| | | | | | | | |
| | | |
| AUGUST 31, 2020 | | J.P. MORGAN MUNICIPAL BOND FUNDS | | | | | 15 | |
JPMorgan High Yield Municipal Fund
SCHEDULE OF PORTFOLIO INVESTMENTS
AS OF AUGUST 31, 2020 (Unaudited) (continued)
| | | | | | | | |
| INVESTMENTS | | PRINCIPAL
AMOUNT
($000) | | | VALUE
($000) | |
Municipal Bonds — continued | |
|
Florida — continued | |
| | |
Florida Development Finance Corp. Series 2020A, Rev., 5.00%, 1/1/2040 (b) | | | 2,430 | | | | 2,468 | |
| | |
Florida Development Finance Corp., Educational Facilities, Renaissance Charter School Inc. Project | | | | | | | | |
| | |
Series 2020C, Rev., 4.00%, 9/15/2030 (b) | | | 235 | | | | 243 | |
| | |
Series 2020C, Rev., 5.00%, 9/15/2040 (b) | | | 525 | | | | 559 | |
| | |
Florida Development Finance Corp., Educational Facilities, Social Bonds — UCP Charter Schools Project | | | | | | | | |
| | |
Series 2020A, Rev., 4.00%, 6/1/2030 (b) | | | 500 | | | | 500 | |
| | |
Series 2020A, Rev., 5.00%, 6/1/2040 (b) | | | 830 | | | | 854 | |
| | |
Florida Development Finance Corp., Imagine School at Broward Project | | | | | | | | |
| | |
Series A, Rev., 4.00%, 12/15/2029 (b) | | | 260 | | | | 289 | |
| | |
Series A, Rev., 5.00%, 12/15/2034 (b) | | | 525 | | | | 613 | |
| | |
Series A, Rev., 5.00%, 12/15/2039 (b) | | | 305 | | | | 352 | |
| | |
Florida Higher Educational Facilities Financial Authority, Ringling College Project | | | | | | | | |
| | |
Rev., 5.00%, 3/1/2034 | | | 385 | | | | 424 | |
| | |
Rev., 5.00%, 3/1/2035 | | | 1,165 | | | | 1,281 | |
| | |
Rev., 5.00%, 3/1/2036 | | | 1,230 | | | | 1,349 | |
| | |
Rev., 5.00%, 3/1/2037 | | | 1,130 | | | | 1,236 | |
| | |
Rev., 5.00%, 3/1/2044 | | | 2,000 | | | | 2,149 | |
| | |
Florida Higher Educational Facilities Financial Authority, St. Leo University Project Series 2019, Rev., 5.00%, 3/1/2039 | | | 750 | | | | 803 | |
| | |
JEA Electric System Series B, Rev., 5.00%, 10/1/2034 | | | 25 | | | | 26 | |
| | |
Lakeland Educational Facilities, Southern College Project Series 2012A, Rev., 5.00%, 9/1/2025 | | | 500 | | | | 534 | |
| | |
Lee County Industrial Development Authority, Shell Point/Waterside Health Project Rev., 5.00%, 11/15/2039 | | | 1,340 | | | | 1,463 | |
| | |
Miami Beach Health Facilities Authority, Mount Sinai Medical Center Rev., 5.00%, 11/15/2029 | | | 545 | | | | 618 | |
| | |
Palm Beach County Health Facilities Authority, Acts Retirement Life Communities, Inc., Obligated Group | | | | | | | | |
| | |
Series 2020B, Rev., 4.00%, 11/15/2041 | | | 250 | | | | 275 | |
| | |
Series 2020B, Rev., 5.00%, 11/15/2042 | | | 500 | | | | 592 | |
| | |
Pinellas County Educational Facilities Authority, Pinellas Academy of Math and Science Project Series 2018A, Rev., 4.13%, 12/15/2028 (b) | | | 1,060 | | | | 1,153 | |
| | |
Pinellas County Industrial Development Authority, Drs. Kiran & Pallavi Patel 2017 Foundation For Global Understanding, Inc., Project Rev., 5.00%, 7/1/2029 | | | 625 | | | | 692 | |
| | | | | | | | |
| INVESTMENTS | | PRINCIPAL
AMOUNT
($000) | | | VALUE
($000) | |
| | | | | | | | |
|
Florida — continued | |
| | |
Polk County Industrial Development Authority, Retirement Facilities, Carpenter’s Home Estates | | | | | | | | |
| | |
Series 2019A, Rev., 5.00%, 1/1/2029 | | | 440 | | | | 475 | |
| | |
Series 2019A, Rev., 5.00%, 1/1/2039 | | | 400 | | | | 419 | |
| | |
Sarasota County Health Facilities Authority, Sunnyside Village Project Rev., 5.00%, 5/15/2038 | | | 1,050 | | | | 1,132 | |
| | |
Seminole County Industrial Development Authority | | | | | | | | |
| | |
Series 2019B-2, Rev., 3.75%, 11/15/2025 | | | 2,000 | | | | 1,866 | |
| | |
Series 2019B-1, Rev., 4.25%, 11/15/2026 | | | 2,000 | | | | 1,881 | |
| | |
Series 2019A, Rev., 5.00%, 11/15/2029 | | | 1,000 | | | | 978 | |
| | |
Series 2019A, Rev., 5.25%, 11/15/2039 | | | 2,000 | | | | 1,847 | |
| | |
Tampa Bay Water Utility System, Revenue Refunding and Improvement Series A, Rev., NATL-RE, 6.00%, 10/1/2029 | | | 500 | | | | 720 | |
| | | | | | | | |
| | |
Total Florida | | | | | | | 50,714 | |
| | | | | | | | |
|
Georgia — 0.3% | |
| | |
City of Atlanta, Airport Series 2012C, Rev., 5.00%, 1/1/2042 | | | 500 | | | | 522 | |
| | |
Cobb County, Kennestone Hospital Authority, Wellstar Health System, Inc. Project Series 2020A, Rev., 5.00%, 4/1/2050 | | | 230 | | | | 284 | |
| | |
Downtown Smyrna Development Authority Rev., 5.25%, 2/1/2028 | | | 240 | | | | 284 | |
| | |
Georgia Housing and Finance Authority, Single Family Mortgage Series B, Rev., AMT, 4.00%, 12/1/2029 | | | 5 | | | | 5 | |
| | |
Glynn-Brunswick Memorial Hospital Authority Rev., 4.00%, 8/1/2036 | | | 375 | | | | 424 | |
| | | | | | | | |
| | |
Total Georgia | | | | | | | 1,519 | |
| | | | | | | | |
|
Idaho — 0.0% (e) | |
| | |
Idaho Housing and Finance Association, Compass Public Charter School, Inc. Project Series A, Rev., 4.63%, 7/1/2029 (b) | | | 180 | | | | 189 | |
| | | | | | | | |
|
Illinois — 4.8% | |
| | |
Chicago O’Hare International Airport, Transportation Infrastructure Properties LLC (TRIPS) Obligated Group Rev., AMT, 5.00%, 7/1/2038 | | | 500 | | | | 575 | |
| | |
City of Chicago, Waterworks, Second Lien Rev., AMBAC, BHAC-CR, 5.75%, 11/1/2030 | | | 150 | | | | 192 | |
| | |
County of Du Page, The Morton Abroretum Project Rev., 3.00%, 5/15/2047 | | | 1,265 | | | | 1,273 | |
| | |
Grundy & Will Counties Community Unit School District No. 1 Coal City GO, 5.00%, 2/1/2027 | | | 600 | | | | 734 | |
SEE NOTES TO FINANCIAL STATEMENTS.
| | | | | | |
| | | |
| 16 | | | | J.P. MORGAN MUNICIPAL BOND FUNDS | | AUGUST 31, 2020 |
| | | | | | | | |
| INVESTMENTS | | PRINCIPAL
AMOUNT
($000) | | | VALUE
($000) | |
Municipal Bonds — continued | |
|
Illinois — continued | |
| | |
Illinois Finance Authority, University of Illinois, Champaign Project | | | | | | | | |
| | |
Series 2019A, Rev., 5.00%, 10/1/2036 | | | 300 | | | | 368 | |
| | |
Series 2019A, Rev., 5.00%, 10/1/2037 | | | 400 | | | | 489 | |
| | |
Series 2019A, Rev., 5.00%, 10/1/2038 | | | 400 | | | | 488 | |
| | |
Series 2019A, Rev., 5.00%, 10/1/2039 | | | 350 | | | | 425 | |
| | |
Series 2019A, Rev., 5.00%, 10/1/2044 | | | 1,000 | | | | 1,198 | |
| | |
Lake County Community Consolidated School District No. 50 Woodland Series C, GO, 5.25%, 1/1/2021 (d) | | | 150 | | | | 153 | |
| | |
Metropolitan Pier and Exposition Authority, Mccormick Place Expansion Project Series 2012B, Rev., 5.00%, 12/15/2028 | | | 1,610 | | | | 1,687 | |
| | |
Metropolitan Water Reclamation District of Greater Chicago Series C, GO, 5.25%, 12/1/2027 | | | 50 | | | | 64 | |
| | |
Northern Illinois University | | | | | | | | |
| | |
Series 2020B, Rev., 4.00%, 4/1/2039 | | | 650 | | | | 727 | |
| | |
Series 2020B, Rev., 4.00%, 4/1/2041 | | | 1,450 | | | | 1,612 | |
| | |
Regional Transportation Authority Series A, Rev., NATL-RE, 6.00%, 7/1/2024 | | | 250 | | | | 299 | |
| | |
Sales Tax Securitization Corp. Series 2020A, Rev., 5.00%, 1/1/2037 | | | 1,050 | | | | 1,267 | |
| | |
State of Illinois | | | | | | | | |
| | |
GO, 4.88%, 5/1/2021 | | | 750 | | | | 766 | |
| | |
Series 2018A, GO, 5.00%, 10/1/2021 | | | 750 | | | | 777 | |
| | |
GO, 5.13%, 5/1/2022 | | | 250 | | | | 264 | |
| | |
GO, 5.38%, 5/1/2023 | | | 250 | | | | 271 | |
| | |
GO, 5.50%, 5/1/2024 | | | 750 | | | | 834 | |
| | |
Series 2012, GO, 4.13%, 3/1/2028 | | | 170 | | | | 173 | |
| | |
GO, 4.00%, 6/1/2035 | | | 5,000 | | | | 5,121 | |
| | |
Upper Illinois River Valley Development Authority, Morris Hospital | | | | | | | | |
| | |
Series 2018, Rev., 5.00%, 12/1/2027 | | | 1,145 | | | | 1,415 | |
| | |
Series 2018, Rev., 5.00%, 12/1/2028 | | | 1,050 | | | | 1,318 | |
| | |
Series 2018, Rev., 5.00%, 12/1/2029 | | | 875 | | | | 1,092 | |
| | |
Series 2018, Rev., 5.00%, 12/1/2033 | | | 250 | | | | 301 | |
| | |
Series 2018, Rev., 5.00%, 12/1/2034 | | | 20 | | | | 24 | |
| | | | | | | | |
| | |
Total Illinois | | | | | | | 23,907 | |
| | | | | | | | |
|
Indiana — 2.0% | |
| | |
City of Franklin, Otterbeit Homes | | | | | | | | |
| | |
Series B, Rev., 4.00%, 7/1/2036 | | | 870 | | | | 965 | |
| | |
Series B, Rev., 4.00%, 7/1/2037 | | | 905 | | | | 1,001 | |
| | |
Series B, Rev., 4.00%, 7/1/2038 | | | 940 | | | | 1,038 | |
| | |
Series B, Rev., 4.00%, 7/1/2039 | | | 750 | | | | 824 | |
| | | | | | | | |
| INVESTMENTS | | PRINCIPAL
AMOUNT
($000) | | | VALUE
($000) | |
| | | | | | | | |
|
Indiana — continued | |
| | |
Series B, Rev., 4.00%, 7/1/2040 | | | 500 | | | | 548 | |
| | |
Indiana Finance Authority, Educational Facilities, Kipp Indianapolis, Inc. Project | | | | | | | | |
| | |
Series 2020A, Rev., 4.00%, 7/1/2030 | | | 105 | | | | 110 | |
| | |
Series 2020A, Rev., 5.00%, 7/1/2040 | | | 170 | | | | 184 | |
| | |
Series 2020A, Rev., 5.00%, 7/1/2055 | | | 455 | | | | 484 | |
| | |
Indiana Finance Authority, Goshen Health | | | | | | | | |
| | |
Series A, Rev., 5.00%, 11/1/2035 | | | 665 | | | | 812 | |
| | |
Series A, Rev., 4.00%, 11/1/2036 | | | 235 | | | | 267 | |
| | |
Series A, Rev., 4.00%, 11/1/2037 | | | 330 | | | | 373 | |
| | |
Series A, Rev., 4.00%, 11/1/2038 | | | 340 | | | | 383 | |
| | |
Series A, Rev., 4.00%, 11/1/2039 | | | 360 | | | | 405 | |
| | |
Indiana Finance Authority, Marian University Project Series A, Rev., 4.00%, 9/15/2044 | | | 1,090 | | | | 1,113 | |
| | |
Indiana Finance Authority, Marquette Project Series A, Rev., 5.00%, 3/1/2030 | | | 1,000 | | | | 1,074 | |
| | |
Indiana Housing and Community Development Authority, Home First Mortgage | | | | | | | | |
| | |
Series A, Rev., GNMA/FNMA/FHLMC, 4.50%, 9/1/2020 | | | 10 | | | | 10 | |
| | |
Series C, Rev., GNMA/FNMA/FHLMC, 4.50%, 12/1/2027 | | | 15 | | | | 15 | |
| | |
Indiana State Finance Authority, Wastewater Utility, First Lien Series 2101A, Rev., 5.25%, 10/1/2031 | | | 250 | | | | 263 | |
| | | | | | | | |
| | |
Total Indiana | | | | | | | 9,869 | |
| | | | | | | | |
|
Iowa — 0.5% | |
| | |
Iowa Finance Authority, Northcrest Inc. Project | | | | | | | | |
| | |
Series 2018A, Rev., 5.00%, 3/1/2028 | | | 890 | | | | 961 | |
| | |
Series 2018A, Rev., 5.00%, 3/1/2038 | | | 250 | | | | 263 | |
| | |
Iowa Finance Authority, Phs Council Bluffs, Inc. Project | | | | | | | | |
| | |
Rev., 3.95%, 8/1/2023 | | | 150 | | | | 150 | |
| | |
Rev., 4.45%, 8/1/2028 | | | 250 | | | | 254 | |
| | |
Rev., 5.00%, 8/1/2033 | | | 485 | | | | 493 | |
| | |
Rev., 5.00%, 8/1/2038 | | | 370 | | | | 374 | |
| | | | | | | | |
| | |
Total Iowa | | | | | | | 2,495 | |
| | | | | | | | |
|
Kansas — 0.5% | |
| | |
City of Lenexa, Kansas Health Care Facility, Lakeview Village, Inc. | | | | | | | | |
| | |
Series A, Rev., 5.00%, 5/15/2032 | | | 500 | | | | 541 | |
| | |
Series A, Rev., 5.00%, 5/15/2039 | | | 850 | | | | 911 | |
| | |
City of Wichita, Health Care Facilities, Presbyterian Manors, Inc. | | | | | | | | |
| | |
Series 2018 I, Rev., 5.00%, 5/15/2033 | | | 500 | | | | 510 | |
SEE NOTES TO FINANCIAL STATEMENTS.
| | | | | | | | |
| | | |
| AUGUST 31, 2020 | | J.P. MORGAN MUNICIPAL BOND FUNDS | | | | | 17 | |
JPMorgan High Yield Municipal Fund
SCHEDULE OF PORTFOLIO INVESTMENTS
AS OF AUGUST 31, 2020 (Unaudited) (continued)
| | | | | | | | |
| INVESTMENTS | | PRINCIPAL
AMOUNT
($000) | | | VALUE
($000) | |
Municipal Bonds — continued | |
|
Kansas — continued | |
| | |
Series I, Rev., 5.00%, 5/15/2038 | | | 500 | | | | 503 | |
| | | | | | | | |
| | |
Total Kansas | | | | | | | 2,465 | |
| | | | | | | | |
|
Kentucky — 0.3% | |
| | |
City of Ashland, Kings Daughters Medical Center | | | | | | | | |
| | |
Series 2016A, Rev., 4.00%, 2/1/2036 | | | 1,000 | | | | 1,032 | |
| | |
Series 2016A, Rev., 5.00%, 2/1/2040 | | | 500 | | | | 549 | |
| | | | | | | | |
| | |
Total Kentucky | | | | | | | 1,581 | |
| | | | | | | | |
|
Louisiana — 0.8% | |
| | |
East Baton Rouge Mortgage Finance Authority, Single Family Mortgage, Mortgage-Backed Securities Program Series 2009A-2, Rev., GNMA/FNMA/FHLMC, 4.75%, 10/1/2029 | | | 40 | | | | 40 | |
| | |
Louisiana Public Facilities Authority, Ochsner Clinic Foundation Project Rev., 5.00%, 5/15/2042 | | | 500 | | | | 576 | |
| | |
Louisiana Public Facilities Authority, Young Audiences Charter School Project | | | | | | | | |
| | |
Series A, Rev., 5.00%, 4/1/2030 (b) | | | 525 | | | | 548 | |
| | |
Series A, Rev., 5.00%, 4/1/2039 (b) | | | 1,425 | | | | 1,427 | |
| | |
Series A, Rev., 5.00%, 4/1/2049 (b) | | | 1,135 | | | | 1,105 | |
| | |
New Orleans Aviation Board, General Airport, North Terminal Project Series B, Rev., AMT, 5.00%, 1/1/2048 | | | 250 | | | | 285 | |
| | | | | | | | |
| | |
Total Louisiana | | | | | | | 3,981 | |
| | | | | | | | |
|
Maine — 0.0% (e) | |
| | |
Maine Health and Higher Educational Facilities Authority Series A, Rev., 5.00%, 7/1/2023 (d) | | | 25 | | | | 28 | |
| | | | | | | | |
|
Maryland — 0.8% | |
| | |
County of Frederick, Educational Facilities, Mount St. Mary’s University Series A, Rev., 5.00%, 9/1/2037 (b) | | | 1,500 | | | | 1,582 | |
| | |
Maryland Economic Development Corp. | | | | | | | | |
| | |
Rev., 4.00%, 7/1/2040 | | | 300 | | | | 302 | |
| | |
Rev., 4.00%, 7/1/2050 | | | 1,500 | | | | 1,468 | |
| | |
Maryland Health and Higher Educational Facilities Authority, Frederick Health System Issue | | | | | | | | |
| | |
Rev., 3.25%, 7/1/2039 | | | 175 | | | | 175 | |
| | |
Rev., 4.00%, 7/1/2040 | | | 215 | | | | 241 | |
| | | | | | | | |
| | |
Total Maryland | | | | | | | 3,768 | |
| | | | | | | | |
|
Massachusetts — 2.0% | |
| | |
Massachusetts Bay Transportation Authority Series B, Rev., NATL-RE, 5.50%, 7/1/2028 | | | 300 | | | | 408 | |
| | |
Massachusetts Development Finance Agency, Emerson College | | | | | | | | |
| | |
Rev., 5.00%, 1/1/2037 | | | 500 | | | | 577 | |
| | | | | | | | |
| INVESTMENTS | | PRINCIPAL
AMOUNT
($000) | | | VALUE
($000) | |
| | | | | | | | |
|
Massachusetts — continued | |
| | |
Rev., 5.00%, 1/1/2038 | | | 405 | | | | 465 | |
| | |
Rev., 5.00%, 1/1/2043 | | | 500 | | | | 567 | |
| | |
Massachusetts Development Finance Agency, Emmanuel College Series 2016A, Rev., 5.00%, 10/1/2043 | | | 500 | | | | 555 | |
| | |
Massachusetts Development Finance Agency, Newbridge On the Charles, Inc. Rev., 4.13%, 10/1/2042 (b) | | | 2,000 | | | | 2,018 | |
| | |
Massachusetts Development Finance Agency, Orchid Cove, Inc. | | | | | | | | |
| | |
Rev., 4.00%, 10/1/2029 | | | 925 | | | | 977 | |
| | |
Rev., 4.00%, 10/1/2039 | | | 500 | | | | 509 | |
| | |
Rev., 5.00%, 10/1/2039 | | | 250 | | | | 270 | |
| | |
Massachusetts Development Finance Agency, Suffolk University | | | | | | | | |
| | |
Rev., 5.00%, 7/1/2036 | | | 450 | | | | 532 | |
| | |
Rev., 5.00%, 7/1/2037 | | | 605 | | | | 712 | |
| | |
Massachusetts Development Finance Agency, Wellforce Issue Series 2020C, Rev., AGM, 3.00%, 10/1/2045 | | | 1,280 | | | | 1,310 | |
| | |
Massachusetts Port Authority Series A, Rev., 5.00%, 7/1/2044 | | | 500 | | | | 565 | |
| | |
Massachusetts State College Building Authority Series B, Rev., AGC, 5.50%, 5/1/2028 | | | 350 | | | | 444 | |
| | |
Massachusetts Water Resources Authority Series B, Rev., AGM, 5.25%, 8/1/2032 | | | 100 | | | | 146 | |
| | | | | | | | |
| | |
Total Massachusetts | | | | | | | 10,055 | |
| | | | | | | | |
|
Michigan — 3.6% | |
| | |
City of Detroit | | | | | | | | |
| | |
GO, 5.00%, 4/1/2035 | | | 500 | | | | 526 | |
| | |
GO, 5.00%, 4/1/2036 | | | 500 | | | | 524 | |
| | |
GO, 5.00%, 4/1/2037 | | | 500 | | | | 523 | |
| | |
Flint Hospital Building Authority Rev., 4.00%, 7/1/2038 | | | 1,800 | | | | 1,892 | |
| | |
Kalamazoo Economic Development Corp., Heritage Community of Kalamazoo Project | | | | | | | | |
| | |
Rev., 5.00%, 5/15/2032 | | | 1,915 | | | | 1,987 | |
| | |
Rev., 5.00%, 5/15/2037 | | | 1,230 | | | | 1,271 | |
| | |
Kentwood Economic Development Corp., Holland Home Obligated Group Rev., 5.00%, 11/15/2032 | | | 1,390 | | | | 1,506 | |
| | |
Michigan Finance Authority, Kettering University Project | | | | | | | | |
| | |
Rev., 4.00%, 9/1/2045 | | | 500 | | | | 545 | |
| | |
Rev., 4.00%, 9/1/2050 | | | 1,000 | | | | 1,085 | |
SEE NOTES TO FINANCIAL STATEMENTS.
| | | | | | |
| | | |
| 18 | | | | J.P. MORGAN MUNICIPAL BOND FUNDS | | AUGUST 31, 2020 |
| | | | | | | | |
| INVESTMENTS | | PRINCIPAL
AMOUNT
($000) | | | VALUE
($000) | |
Municipal Bonds — continued | |
|
Michigan — continued | |
| | |
Michigan Finance Authority, Universal Learning Academy Rev., 6.00%, 11/1/2032 | | | 750 | | | | 841 | |
| | |
Michigan Strategic Fund, Holland Home Obligated Group | | | | | | | | |
| | |
Rev., 5.00%, 11/15/2034 | | | 1,900 | | | | 2,040 | |
| | |
Rev., 5.00%, 11/15/2043 | | | 750 | | | | 784 | |
| | |
Michigan Strategic Fund, I-75 Improvement Project Rev., AMT, AGM, 4.13%, 6/30/2035 | | | 2,500 | | | | 2,808 | |
| | |
Michigan Strategic Fund, United Methodist Retirement Communities, Inc. Project Rev., 5.00%, 11/15/2034 | | | 1,280 | | | | 1,380 | |
| | |
Saginaw County Economic Development Corp., BGI South LLC-Recovery Zone Rev., 5.00%, 12/1/2020 | | | 40 | | | | 40 | |
| | |
Wayne County Airport Authority, Detroit Metropolitan Airport Series B, Rev., AMT, 5.00%, 12/1/2021 | | | 400 | | | | 422 | |
| | | | | | | | |
| | |
Total Michigan | | | | | | | 18,174 | |
| | | | | | | | |
|
Minnesota — 0.7% | |
| | |
City of Apple Valley, Minnesota Senior Housing, Orchard Path Project Rev., 4.25%, 9/1/2038 | | | 750 | | | | 755 | |
| | |
City of Minneapolis, Health Care System, Fairview Health Services Series A, Rev., 4.00%, 11/15/2038 | | | 750 | | | | 854 | |
| | |
City of Wayzata, Folkestone Senior Living Community | | | | | | | | |
| | |
Rev., 5.00%, 8/1/2032 | | | 100 | | | | 106 | |
| | |
Rev., 5.00%, 8/1/2033 | | | 200 | | | | 212 | |
| | |
Rev., 5.00%, 8/1/2035 | | | 200 | | | | 212 | |
| | |
Rev., 3.75%, 8/1/2036 | | | 250 | | | | 246 | |
| | |
Rev., 3.75%, 8/1/2037 | | | 500 | | | | 488 | |
| | |
Rev., 4.00%, 8/1/2038 | | | 350 | | | | 350 | |
| | |
Rev., 4.00%, 8/1/2039 | | | 250 | | | | 250 | |
| | |
Minneapolis/St. Paul Housing Finance Board, Single Family Mortgage, Mortgage-Backed Securities Program, City Living Home Programs | | | | | | | | |
| | |
Series A-1, Rev., GNMA/FNMA/FHLMC, 5.25%, 12/1/2040 | | | 2 | | | | 2 | |
| | |
Series 2007A-2, Rev., GNMA/FNMA/FHLMC, 5.52%, 3/1/2041 | | | 55 | | | | 55 | |
| | |
Minnesota Housing Finance Agency, Residential Housing Finance Series D, Rev., AMT, GNMA/FNMA/FHLMC, 4.00%, 7/1/2040 | | | 5 | | | | 5 | |
| | | | | | | | |
| | |
Total Minnesota | | | | | | | 3,535 | |
| | | | | | | | |
|
Mississippi — 0.6% | |
| | |
Mississippi Development Bank, Harrison County, Coliseum and Convention Center | | | | | | | | |
| | |
Series A, Rev., GTD, 5.25%, 1/1/2030 | | | 160 | | | | 213 | |
| | | | | | | | |
| INVESTMENTS | | PRINCIPAL
AMOUNT
($000) | | | VALUE
($000) | |
| | | | | | | | |
|
Mississippi — continued | |
| | |
Series 2010A, Rev., GTD, 5.25%, 1/1/2034 | | | 100 | | | | 137 | |
| | |
Mississippi Hospital Equipment & Facilities Authority, Forrest County General Hospital Refunding Project | | | | | | | | |
| | |
Series A, Rev., 4.00%, 1/1/2039 | | | 1,250 | | | | 1,433 | |
| | |
Series A, Rev., 4.00%, 1/1/2040 | | | 1,000 | | | | 1,143 | |
| | | | | | | | |
| | |
Total Mississippi | | | | | | | 2,926 | |
| | | | | | | | |
|
Missouri — 1.8% | |
| | |
Bi-State Development Agency, Metropolitan District, St. Clair County Metrolink Project Rev., AGM, 5.25%, 7/1/2025 | | | 400 | | | | 491 | |
| | |
Health and Educational Facilities Authority of the State of Missouri | | | | | | | | |
| | |
Series 2019C, Rev., 4.00%, 2/1/2032 | | | 390 | | | | 415 | |
| | |
Series 2019C, Rev., 4.00%, 2/1/2033 | | | 865 | | | | 914 | |
| | |
Series 2019C, Rev., 4.00%, 2/1/2034 | | | 1,000 | | | | 1,050 | |
| | |
Series 2016A, Rev., 5.00%, 2/1/2036 | | | 2,500 | | | | 2,710 | |
| | |
Health and Educational Facilities Authority of the State of Missouri, Lutheran Senior Services Projects | | | | | | | | |
| | |
Series 2019A, Rev., 5.00%, 2/1/2029 | | | 550 | | | | 611 | |
| | |
Series 2019A, Rev., 5.00%, 2/1/2034 | | | 1,010 | | | | 1,104 | |
| | |
Series 2019A, Rev., 5.00%, 2/1/2042 | | | 1,000 | | | | 1,083 | |
| | |
Missouri Housing Development Commission, Single Family Mortgage, Special Homeownership Loan Program | | | | | | | | |
| | |
Series E-3, Rev., GNMA/FNMA/FHLMC, 4.63%, 11/1/2020 (d) | | | 30 | | | | 31 | |
| | |
Series E-4, Rev., AMT, GNMA/FNMA/FHLMC, 4.25%, 5/1/2021 (d) | | | 15 | | | | 15 | |
| | |
St. Louis County Industrial Development Authority, Friendship Village Series 2018A, Rev., 5.00%, 9/1/2028 | | | 630 | | | | 692 | |
| | | | | | | | |
| | |
Total Missouri | | | | | | | 9,116 | |
| | | | | | | | |
|
Montana — 0.1% | |
| | |
Cascade County Elementary School District No. 1 Great Falls, School Building GO, 3.63%, 7/1/2038 | | | 335 | | | | 372 | |
| | |
Montana Board of Housing, Single Family Homeownership Series A-2, Rev., AMT, 4.00%, 12/1/2038 | | | 90 | | | | 94 | |
| | | | | | | | |
| | |
Total Montana | | | | | | | 466 | |
| | | | | | | | |
|
Nebraska — 0.4% | |
| | |
Nebraska Educational Health Cultural & Social Services Finance Authority | | | | | | | | |
| | |
Series 2019A, Rev., 4.00%, 1/1/2034 | | | 1,000 | | | | 1,126 | |
SEE NOTES TO FINANCIAL STATEMENTS.
| | | | | | | | |
| | | |
| AUGUST 31, 2020 | | J.P. MORGAN MUNICIPAL BOND FUNDS | | | | | 19 | |
JPMorgan High Yield Municipal Fund
SCHEDULE OF PORTFOLIO INVESTMENTS
AS OF AUGUST 31, 2020 (Unaudited) (continued)
| | | | | | | | |
| INVESTMENTS | | PRINCIPAL
AMOUNT
($000) | | | VALUE
($000) | |
Municipal Bonds — continued | |
|
Nebraska — continued | |
| | |
Series 2019A, Rev., 4.00%, 1/1/2037 | | | 1,000 | | | | 1,118 | |
| | | | | | | | |
| | |
Total Nebraska | | | | | | | 2,244 | |
| | | | | | | | |
|
Nevada — 0.2% | |
| | |
City of Reno, Sales Tax, Senior Lien, ReTrac-Reno Transportation Rail Access Corridor Project Series B, Rev., AGM, 4.00%, 6/1/2048 | | | 375 | | | | 407 | |
| | |
City of Sparks, Senior Sales Tax Series 2019A, Rev., 2.50%, 6/15/2024 (b) | | | 190 | | | | 189 | |
| | |
County of Clark NV Passenger Facility Charge Series 2019E, Rev., 5.00%, 7/1/2033 | | | 200 | | | | 254 | |
| | | | | | | | |
| | |
Total Nevada | | | | | | | 850 | |
| | | | | | | | |
|
New Hampshire — 0.3% | |
| | |
City of Manchester, School Facilities Rev., NATL-RE, 5.50%, 6/1/2027 | | | 100 | | | | 131 | |
| | |
New Hampshire Business Finance Authority, The Vista Project | | | | | | | | |
| | |
Series A, Rev., 5.25%, 7/1/2039 (b) | | | 200 | | | | 203 | |
| | |
Series A, Rev., 5.63%, 7/1/2046 (b) | | | 1,000 | | | | 1,024 | |
| | |
New Hampshire Housing Finance Authority, Single Family Mortgage Series 2011A, Rev., AMT, 5.25%, 7/1/2028 | | | 5 | | | | 5 | |
| | | | | | | | |
| | |
Total New Hampshire | | | | | | | 1,363 | |
| | | | | | | | |
|
New Jersey — 5.0% | |
| | |
New Jersey Economic Development Authority | | | | | | | | |
| | |
Series 2020A, Rev., 4.00%, 11/1/2037 | | | 1,500 | | | | 1,616 | |
| | |
Series 2020A, Rev., 4.00%, 11/1/2038 | | | 750 | | | | 807 | |
| | |
Series 2019A, Rev., 5.00%, 10/1/2039 (b) | | | 2,000 | | | | 1,915 | |
| | |
Series 2020A, Rev., 4.00%, 11/1/2039 | | | 2,000 | | | | 2,151 | |
| | |
Rev., 5.00%, 1/1/2040 (b) | | | 3,000 | | | | 2,853 | |
| | |
Series 2017DDD, Rev., 5.00%, 6/15/2042 | | | 4,585 | | | | 5,191 | |
| | |
New Jersey Economic Development Authority, Charter School, Golden Door Charter School Project | | | | | | | | |
| | |
Series 2018A, Rev., 5.13%, 11/1/2029 (b) | | | 210 | | | | 223 | |
| | |
Series 2018-A, Rev., 6.25%, 11/1/2038 (b) | | | 525 | | | | 589 | |
| | |
New Jersey Economic Development Authority, Charter School, Marion P. Thomas Charter School, Inc. Project Series 2018-A, Rev., 5.00%, 10/1/2033 (b) | | | 1,000 | | | | 1,043 | |
| | |
New Jersey Economic Development Authority, Motor Vehicle Surplus Series A, Rev., NATL-RE, 5.25%, 7/1/2024 | | | 380 | | | | 434 | |
| | |
New Jersey Economic Development Authority, State House Project Series 2017B, Rev., 4.13%, 6/15/2039 | | | 1,200 | | | | 1,366 | |
| | | | | | | | |
| INVESTMENTS | | PRINCIPAL
AMOUNT
($000) | | | VALUE
($000) | |
| | | | | | | | |
|
New Jersey — continued | |
| | |
New Jersey Educational Facilities Authority, Seton Hall University Issue, Tax-Exempt | | | | | | | | |
| | |
Series 2020C, Rev., AGM, 3.25%, 7/1/2049 | | | 700 | | | | 723 | |
| | |
Series 2020C, Rev., AGM, 4.00%, 7/1/2050 | | | 725 | | | | 814 | |
| | |
New Jersey Health Care Facilities Financing Authority, St. Josephs Healthcare System Rev., 5.00%, 7/1/2041 | | | 1,500 | | | | 1,666 | |
| | |
New Jersey Higher Education Student Assistance Authority, Senior Student Loan | | | | | | | | |
| | |
Series 2018A, Rev., AMT, 3.75%, 12/1/2031 | | | 750 | | | | 793 | |
| | |
Series 2018A, Rev., AMT, 4.00%, 12/1/2032 | | | 400 | | | | 429 | |
| | |
Series A, Rev., AMT, 4.00%, 12/1/2033 | | | 500 | | | | 534 | |
| | |
Series 2018A, Rev., AMT, 4.00%, 12/1/2034 | | | 300 | | | | 320 | |
| | |
Series A, Rev., AMT, 4.00%, 12/1/2035 | | | 200 | | | | 212 | |
| | |
New Jersey Transportation Trust Fund Authority Series 2019BB, Rev., 4.00%, 6/15/2036 | | | 1,000 | | | | 1,073 | |
| | | | | | | | |
| | |
Total New Jersey | | | | | | | 24,752 | |
| | | | | | | | |
|
New Mexico — 0.6% | |
| | |
City of Santa Fe, El Castillo Retirement Residences Project Series 2019A, Rev., 5.00%, 5/15/2034 | | | 650 | | | | 700 | |
| | |
New Mexico Hospital Equipment Loan Council, Haverland Carter Lifestyle Group — La Vida Llena Expansion Project | | | | | | | | |
| | |
Series A, Rev., 5.00%, 7/1/2033 | | | 360 | | | | 384 | |
| | |
Series A, Rev., 5.00%, 7/1/2034 | | | 375 | | | | 398 | |
| | |
Series A, Rev., 5.00%, 7/1/2039 | | | 1,225 | | | | 1,283 | |
| | |
New Mexico Mortgage Finance Authority, Single Family Mortgage Program Series 2011B, Class I, Rev., GNMA/FNMA/FHLMC, 5.00%, 3/1/2028 | | | 55 | | | | 56 | |
| | | | | | | | |
| | |
Total New Mexico | | | | | | | 2,821 | |
| | | | | | | | |
|
New York — 4.5% | |
| | |
Build Resource Corp., Inwood Academy for Leadership Charter School Project | | | | | | | | |
| | |
Series 2018A, Rev., 4.88%, 5/1/2031 (b) | | | 500 | | | | 538 | |
| | |
Series 2018A, Rev., 5.13%, 5/1/2038 (b) | | | 250 | | | | 266 | |
| | |
Jefferson County Civic Facility Development Corp., Samaritan Medical Center Project Series 2017A, Rev., 4.00%, 11/1/2042 | | | 1,000 | | | | 989 | |
| | |
Metropolitan Transportation Authority | | | | | | | | |
| | |
Series 2018C, Subseries C-1, Rev., BAN, 5.00%, 9/1/2020 | | | 2,400 | | | | 2,400 | |
| | |
Series 2014B, Rev., 5.00%, 11/15/2020 | | | 300 | | | | 302 | |
| | |
Series 2019B-1, Rev., BAN, 5.00%, 5/15/2022 | | | 200 | | | | 208 | |
SEE NOTES TO FINANCIAL STATEMENTS.
| | | | | | |
| | | |
| 20 | | | | J.P. MORGAN MUNICIPAL BOND FUNDS | | AUGUST 31, 2020 |
| | | | | | | | |
| INVESTMENTS | | PRINCIPAL
AMOUNT
($000) | | | VALUE
($000) | |
Municipal Bonds — continued | |
|
New York — continued | |
| | |
Series 2020A-1, Rev., BAN, 5.00%, 2/1/2023 | | | 500 | | | | 525 | |
| | |
Monroe County Industrial Development Corp. | | | | | | | | |
| | |
Rev., 4.00%, 1/1/2030 | | | 2,000 | | | | 2,001 | |
| | |
Rev., 5.00%, 1/1/2040 | | | 2,145 | | | | 2,232 | |
| | |
Monroe County Industrial Development Corp., True North Rochester Preparatory Charter School Project | | | | | | | | |
| | |
Series 2020A, Rev., 5.00%, 6/1/2040 (b) | | | 630 | | | | 737 | |
| | |
Series 2020A, Rev., 5.00%, 6/1/2059 (b) | | | 540 | | | | 618 | |
| | |
New York Liberty Development Corp., Goldman Sachs Headquarters Rev., 5.25%, 10/1/2035 | | | 525 | | | | 731 | |
| | |
New York State Dormitory Authority Series 2020A, Rev., AGM, 3.00%, 9/1/2050 | | | 1,850 | | | | 1,910 | |
| | |
New York Transportation Development Corp. Rev., AMT, 5.00%, 1/1/2028 | | | 500 | | | | 557 | |
| | |
New York Transportation Development Corp., Delta Air Lines, Inc., LaGuardia Airport Terminals C&D Redevelopment Project | | | | | | | | |
| | |
Rev., AMT, 5.00%, 1/1/2022 | | | 1,000 | | | | 1,031 | |
| | |
Rev., AMT, 5.00%, 1/1/2025 | | | 3,250 | | | | 3,517 | |
| | |
Rev., AMT, 4.00%, 1/1/2036 | | | 500 | | | | 505 | |
| | |
Rev., AMT, 5.00%, 1/1/2036 | | | 375 | | | | 404 | |
| | |
Onondaga Civic Development Corp., Le Moyne College Project | | | | | | | | |
| | |
Rev., 5.00%, 1/1/2037 | | | 300 | | | | 341 | |
| | |
Rev., 5.00%, 1/1/2038 | | | 200 | | | | 227 | |
| | |
Rev., 5.00%, 1/1/2043 | | | 500 | | | | 559 | |
| | |
Suffolk County Economic Development Corp. Rev., 5.00%, 12/1/2029 (f) | | | 750 | | | | 833 | |
| | |
Westchester County Local Development Corp., Miriam Osborn Memorial Home Association Project Series 2019, Rev., 5.00%, 7/1/2042 | | | 365 | | | | 404 | |
| | |
Yonkers Economic Development Corp., Charter School of Educational Excellence Project | | | | | | | | |
| | |
Series 2019A, Rev., 4.00%, 10/15/2029 | | | 200 | | | | 205 | |
| | |
Series 2019A, Rev., 5.00%, 10/15/2039 | | | 315 | | | | 333 | |
| | | | | | | | |
| | |
Total New York | | | | | | | 22,373 | |
| | | | | | | | |
|
North Carolina — 0.4% | |
| | |
North Carolina Medical Care Commission Series 2019A, Rev., 5.00%, 1/1/2031 | | | 625 | | | | 678 | |
| | |
North Carolina Medical Care Commission, Retirement Facilities First Mortgage, Davidson Project Series 2019A, Rev., 5.00%, 1/1/2034 | | | 1,000 | | | | 1,084 | |
| | |
North Carolina Medical Care Commission, Retirement Facilities, Pennybyrn at Maryfield Project Series 2020A, Rev., 5.00%, 10/1/2040 (f) | | | 355 | | | | 389 | |
| | | | | | | | |
| | |
Total North Carolina | | | | | | | 2,151 | |
| | | | | | | | |
| | | | | | | | |
| INVESTMENTS | | PRINCIPAL
AMOUNT
($000) | | | VALUE
($000) | |
| | | | | | | | |
|
North Dakota — 0.0% (e) | |
| | |
North Dakota Housing Finance Agency, Home Mortgage Finance Program Series 2012A, Rev., 3.75%, 7/1/2042 | | | 40 | | | | 41 | |
| | | | | | | | |
|
Ohio — 4.4% | |
| | |
Buckeye Tobacco Settlement Financing Authority Series 2020A-2, Class I, Rev., 4.00%, 6/1/2048 | | | 3,210 | | | | 3,546 | |
| | |
City of Centerville, Graceworks Lutheran Services Rev., 5.00%, 11/1/2027 | | | 380 | | | | 406 | |
| | |
City of Middleburg Heights, Southwest General Health Center Project, Tax-Exempt Series 2020A, Rev., 4.00%, 8/1/2041 | | | 550 | | | | 630 | |
| | |
Cleveland-Cuyahoga County, Port Authority Cultural Facility, Playhouse Square Foundation Project | | | | | | | | |
| | |
Rev., 5.00%, 12/1/2033 | | | 1,000 | | | | 1,058 | |
| | |
Rev., 5.25%, 12/1/2038 | | | 500 | | | | 527 | |
| | |
Rev., 5.50%, 12/1/2043 | | | 500 | | | | 526 | |
| | |
County of Hamilton, Cincinnati City School District, Board of Education, Classroom Facilities Construction and Improvement GO, NATL-RE, 5.25%, 12/1/2025 | | | 185 | | | | 231 | |
| | |
County of Ross, Adena Health System Rev., 5.00%, 12/1/2039 | | | 1,000 | | | | 1,225 | |
| | |
County of Warren, Otterbein Homes | | | | | | | | |
| | |
Series A, Rev., 4.00%, 7/1/2037 | | | 1,000 | | | | 1,106 | |
| | |
Series A, Rev., 4.00%, 7/1/2039 | | | 500 | | | | 550 | |
| | |
Greene County Series 2007A, GO, AMBAC, 5.25%, 12/1/2028 | | | 45 | | | | 58 | |
| | |
Ohio Higher Educational Facility Commission | | | | | | | | |
| | |
Rev., 5.00%, 11/1/2034 | | | 2,875 | | | | 3,185 | |
| | |
Rev., 5.00%, 11/1/2039 | | | 4,890 | | | | 5,322 | |
| | |
Ohio Higher Educational Facility Commission, The Cleveland Institute of Art 2018 Project | | | | | | | | |
| | |
Rev., 5.00%, 12/1/2028 | | | 500 | | | | 539 | |
| | |
Rev., 5.00%, 12/1/2033 | | | 270 | | | | 278 | |
| | |
Rev., 5.00%, 12/1/2038 | | | 685 | | | | 690 | |
| | |
Ohio Higher Educational Facility Commission, University of Findlay 2019 Project Rev., 5.00%, 3/1/2034 | | | 2,000 | | | | 2,174 | |
| | |
Ohio Housing Finance Agency, Single Family Mortgage Series 2011 2, Rev., GNMA/FNMA/FHLMC, 4.50%, 11/1/2028 | | | 15 | | | | 15 | |
| | | | | | | | |
| | |
Total Ohio | | | | | | | 22,066 | |
| | | | | | | | |
|
Oklahoma — 0.4% | |
| | |
Oklahoma City Water Utilities Trust, Water and Sewer System Rev., 5.38%, 7/1/2040 | | | 220 | | | | 228 | |
SEE NOTES TO FINANCIAL STATEMENTS.
| | | | | | | | |
| | | |
| AUGUST 31, 2020 | | J.P. MORGAN MUNICIPAL BOND FUNDS | | | | | 21 | |
JPMorgan High Yield Municipal Fund
SCHEDULE OF PORTFOLIO INVESTMENTS
AS OF AUGUST 31, 2020 (Unaudited) (continued)
| | | | | | | | |
| INVESTMENTS | | PRINCIPAL
AMOUNT
($000) | | | VALUE
($000) | |
Municipal Bonds — continued | |
|
Oklahoma — continued | |
| | |
Oklahoma Development Finance Authority, Health System, Ou Medicine Project Series B, Rev., 5.00%, 8/15/2038 | | | 1,000 | | | | 1,165 | |
| | |
Tulsa Airports Improvement Trust | | | | | | | | |
| | |
Series A, Rev., AMT, 5.00%, 6/1/2024 | | | 300 | | | | 344 | |
| | |
Series A, Rev., AMT, 5.00%, 6/1/2025 | | | 420 | | | | 481 | |
| | | | | | | | |
| | |
Total Oklahoma | | | | | | | 2,218 | |
| | | | | | | | |
|
Oregon — 0.6% | |
| | |
Clackamas County Hospital Facility Authority, Mary’s Woods at Marylhurst Project | | | | | | | | |
| | |
Series 2018A, Rev., 5.00%, 5/15/2038 | | | 220 | | | | 231 | |
| | |
Series 2018A, Rev., 5.00%, 5/15/2043 | | | 310 | | | | 323 | |
| | |
Clackamas County School District No. 7J, Lake Oswego GO, AGM, 5.25%, 6/1/2025 | | | 165 | | | | 202 | |
| | |
Linn County Community School District No. 9 Lebanon GO, NATL-RE, 5.50%, 6/15/2030 | | | 20 | | | | 28 | |
| | |
Oregon State Facilities Authority, Samaritan Health Services Project, Tax-Exempt | | | | | | | | |
| | |
Series 2020A, Rev., 5.00%, 10/1/2035 | | | 135 | | | | 167 | |
| | |
Series 2020A, Rev., 5.00%, 10/1/2040 | | | 585 | | | | 717 | |
| | |
Oregon State Housing and Community Services Department, Single Family Mortgage Program Series B, Rev., AMT, 5.00%, 7/1/2030 | | | 20 | | | | 21 | |
| | |
Salem Hospital Facility Authority, Capital Manor Project Rev., 5.00%, 5/15/2038 | | | 1,000 | | | | 1,079 | |
| | |
State of Oregon, University Systems Projects Series G, GO, 5.25%, 8/2/2021 (d) | | | 105 | | | | 110 | |
| | | | | | | | |
| | |
Total Oregon | | | | | | | 2,878 | |
| | | | | | | | |
|
Pennsylvania — 9.1% | |
| | |
Aliquippa School District | | | | | | | | |
| | |
GO, 3.75%, 12/1/2033 | | | 2,000 | | | | 2,274 | |
| | |
GO, 3.88%, 12/1/2037 | | | 1,250 | | | | 1,408 | |
| | |
Allegheny County Airport Authority, Pittsburgh International Airport Series 2012A-1, Rev., 5.00%, 1/1/2022 (d) | | | 350 | | | | 371 | |
| | |
Allegheny County Hospital Development Authority, Allegheny Health Network Obligated Group Series 2018A, Rev., 4.00%, 4/1/2038 | | | 500 | | | | 562 | |
| | |
Allentown City School District | | | | | | | | |
| | |
Series C, GO, 4.00%, 2/1/2034 | | | 1,580 | | | | 1,847 | |
| | |
Series B, GO, 5.00%, 2/1/2034 | | | 1,300 | | | | 1,654 | |
| | |
Series C, GO, 4.00%, 2/1/2035 | | | 1,000 | | | | 1,165 | |
| | |
Allentown Neighborhood Improvement Zone Development Authority, City Center Project | | | | | | | | |
| | |
Rev., 5.00%, 5/1/2033 (b) | | | 250 | | | | 266 | |
| | |
Rev., 5.00%, 5/1/2042 (b) | | | 250 | | | | 262 | |
| | | | | | | | |
| INVESTMENTS | | PRINCIPAL
AMOUNT
($000) | | | VALUE
($000) | |
| | | | | | | | |
|
Pennsylvania — continued | |
| | |
Berks County Industrial Development Authority, Healthcare Facilities | | | | | | | | |
| | |
Rev., 5.00%, 5/15/2033 | | | 500 | | | | 538 | |
| | |
Series 2017A, Rev., 5.00%, 5/15/2037 | | | 250 | | | | 268 | |
| | |
Rev., 5.00%, 5/15/2038 | | | 500 | | | | 534 | |
| | |
Berks County Industrial Development Authority, Tower Health Project Rev., 5.00%, 11/1/2037 | | | 1,000 | | | | 1,091 | |
| | |
Bucks County Industrial Development Authority, St. Luke’s University Health Network Project Rev., 4.00%, 8/15/2044 | | | 2,475 | | | | 2,703 | |
| | |
Cumberland County Municipal Authority | | | | | | | | |
| | |
Rev., 3.00%, 1/1/2024 | | | 1,000 | | | | 953 | |
| | |
Rev., 3.38%, 1/1/2029 | | | 4,545 | | | | 4,072 | |
| | |
Dallas Area Municipal Authority, Misericordia University Project | | | | | | | | |
| | |
Rev., 3.25%, 5/1/2023 | | | 150 | | | | 152 | |
| | |
Rev., 5.00%, 5/1/2029 | | | 650 | | | | 731 | |
| | |
Rev., 5.00%, 5/1/2039 | | | 1,100 | | | | 1,217 | |
| | |
Franklin County Industrial Development Authority, Haven Inc. Project | | | | | | | | |
| | |
Rev., 5.00%, 12/1/2029 | | | 195 | | | | 207 | |
| | |
Rev., 5.00%, 12/1/2039 | | | 385 | | | | 393 | |
| | |
Rev., 5.00%, 12/1/2049 | | | 500 | | | | 502 | |
| | |
Lancaster County Hospital Authority | | | | | | | | |
| | |
Rev., 5.00%, 3/1/2040 | | | 250 | | | | 258 | |
| | |
Rev., 5.00%, 3/1/2045 | | | 500 | | | | 511 | |
| | |
Rev., 5.00%, 3/1/2050 | | | 500 | | | | 509 | |
| | |
Lancaster County Hospital Authority, Health Care Facilities, Moravian Manors, Inc. Project | | | | | | | | |
| | |
Series 2019B, Rev., 2.88%, 12/15/2023 | | | 1,000 | | | | 984 | |
| | |
Series 2019A, Rev., 5.00%, 6/15/2032 | | | 545 | | | | 580 | |
| | |
Series 2019A, Rev., 5.00%, 6/15/2033 | | | 570 | | | | 602 | |
| | |
Series 2019A, Rev., 5.00%, 6/15/2038 | | | 1,110 | | | | 1,154 | |
| | |
Lancaster Industrial Development Authority, Willow Valley Communities Project Rev., 5.00%, 12/1/2044 | | | 1,425 | | | | 1,614 | |
| | |
Luzerne County Industrial Development Authority Rev., AGM, 5.00%, 12/15/2024 | | | 70 | | | | 82 | |
| | |
Montgomery County Higher Education and Health Authority, Arcadia University | | | | | | | | |
| | |
Rev., 5.00%, 4/1/2034 | | | 275 | | | | 308 | |
| | |
Rev., 4.00%, 4/1/2035 | | | 205 | | | | 210 | |
| | |
Rev., 4.00%, 4/1/2036 | | | 520 | | | | 529 | |
| | |
Rev., 4.00%, 4/1/2037 | | | 545 | | | | 553 | |
| | |
Rev., 4.00%, 4/1/2038 | | | 695 | | | | 703 | |
| | |
Rev., 4.00%, 4/1/2039 | | | 725 | | | | 729 | |
SEE NOTES TO FINANCIAL STATEMENTS.
| | | | | | |
| | | |
| 22 | | | | J.P. MORGAN MUNICIPAL BOND FUNDS | | AUGUST 31, 2020 |
| | | | | | | | |
| INVESTMENTS | | PRINCIPAL
AMOUNT
($000) | | | VALUE
($000) | |
Municipal Bonds — continued | |
|
Pennsylvania — continued | |
| | |
Montgomery County Industrial Development Authority, Acts Retirement Life Communities, Inc., Obligated Group | | | | | | | | |
| | |
Series 2020C, Rev., 4.00%, 11/15/2043 | | | 300 | | | | 329 | |
| | |
Series 2020C, Rev., 5.00%, 11/15/2045 | | | 730 | | | | 862 | |
| | |
Montgomery County Industrial Development Authority, Waverly Heights Ltd. Project | | | | | | | | |
| | |
Series 2019, Rev., 4.00%, 12/1/2034 | | | 170 | | | | 183 | |
| | |
Series 2019, Rev., 4.00%, 12/1/2035 | | | 175 | | | | 188 | |
| | |
Series 2019, Rev., 4.00%, 12/1/2036 | | | 175 | | | | 188 | |
| | |
Series 2019, Rev., 4.00%, 12/1/2037 | | | 100 | | | | 107 | |
| | |
Series 2019, Rev., 4.00%, 12/1/2038 | | | 100 | | | | 107 | |
| | |
Series 2019, Rev., 5.00%, 12/1/2044 | | | 350 | | | | 387 | |
| | |
Series 2019, Rev., 5.00%, 12/1/2049 | | | 500 | | | | 552 | |
| | |
Northampton County Industrial Development Authority Rev., 5.00%, 11/1/2039 | | | 1,000 | | | | 1,036 | |
| | |
Pennsylvania Housing Finance Agency, Single Family Mortgage Series 2011- 112, Rev., AMT, 5.00%, 4/1/2028 | | | 20 | | | | 20 | |
| | |
Philadelphia Authority for Industrial Development | | | | | | | | |
| | |
Rev., 4.00%, 6/15/2029 | | | 360 | | | | 367 | |
| | |
Rev., 5.00%, 6/15/2039 | | | 500 | | | | 515 | |
| | |
Philadelphia Authority for Industrial Development, International Education and Community Initiatives Project Series 2018-A, Rev., 4.50%, 6/1/2029 (b) | | | 700 | | | | 731 | |
| | |
Philadelphia Authority for Industrial Development, MAST Community Charter School II Project | | | | | | | | |
| | |
Series 2020A, Rev., 5.00%, 8/1/2030 | | | 265 | | | | 317 | |
| | |
Series 2020A, Rev., 5.00%, 8/1/2040 | | | 315 | | | | 364 | |
| | |
School District of Philadelphia (The) Series B, GO, AGM, 4.00%, 9/1/2043 | | | 1,250 | | | | 1,442 | |
| | |
West Cornwall Township Municipal Authority, Pleasant View Retirement Community Project Rev., 5.00%, 12/15/2038 | | | 750 | | | | 776 | |
| | |
West Mifflin School District | | | | | | | | |
| | |
GO, 3.00%, 4/1/2034 | | | 1,000 | | | | 1,106 | |
| | |
GO, 3.00%, 4/1/2038 | | | 1,400 | | | | 1,524 | |
| | |
Wilkes-Barre Area School District | | | | | | | | |
| | |
Series 2019, GO, 3.50%, 4/15/2038 | | | 370 | | | | 419 | |
| | |
Series 2019, GO, 3.50%, 4/15/2039 | | | 230 | | | | 260 | |
| | |
Series 2019, GO, 3.75%, 4/15/2044 | | | 1,000 | | | | 1,135 | |
| | | | | | | | |
| | |
Total Pennsylvania | | | | | | | 45,411 | |
| | | | | | | | |
|
Rhode Island — 0.1% | |
| | |
Rhode Island Commerce Corp. Series B, Rev., 5.00%, 7/1/2022 | | | 250 | | | | 269 | |
| | | | | | | | |
| INVESTMENTS | | PRINCIPAL
AMOUNT
($000) | | | VALUE
($000) | |
| | | | | | | | |
|
Rhode Island — continued | |
| | |
Rhode Island Student Loan Authority, Senior Series 2017A, Rev., AMT, 5.00%, 12/1/2024 | | | 100 | | | | 113 | |
| | | | | | | | |
| | |
Total Rhode Island | | | | | | | 382 | |
| | | | | | | | |
|
South Carolina — 1.6% | |
| | |
South Carolina Jobs-Economic Development Authority | | | | | | | | |
| | |
Series 2020A, Rev., 5.00%, 11/15/2028 | | | 210 | | | | 226 | |
| | |
Series 2020A, Rev., 5.00%, 11/15/2029 | | | 110 | | | | 119 | |
| | |
Series 2019A, Rev., 4.00%, 4/1/2034 | | | 605 | | | | 635 | |
| | |
Series 2020A, Rev., 5.00%, 11/15/2042 | | | 580 | | | | 597 | |
| | |
South Carolina Jobs-Economic Development Authority, Lowcountry Leadership Charter School Project | | | | | | | | |
| | |
Series A, Rev., 4.00%, 12/1/2029 (b) | | | 1,130 | | | | 1,248 | |
| | |
Series A, Rev., 5.00%, 12/1/2034 (b) | | | 1,405 | | | | 1,629 | |
| | |
Series A, Rev., 5.00%, 12/1/2039 (b) | | | 1,795 | | | | 2,040 | |
| | |
South Carolina Jobs-Economic Development Authority, South Carolina Episcopal Home at Still Homes Series 2018A, Rev., 5.00%, 4/1/2033 | | | 1,485 | | | | 1,596 | |
| | | | | | | | |
| | |
Total South Carolina | | | | | | | 8,090 | |
| | | | | | | | |
|
South Dakota — 0.1% | |
| | |
South Dakota Health and Educational Facilities Authority, Sanford Health Rev., 5.00%, 11/1/2045 | | | 500 | | | | 568 | |
| | |
South Dakota Housing Development Authority, Homeownership Mortgage Series 2012A, Rev., AMT, 4.50%, 5/1/2031 | | | 35 | | | | 36 | |
| | | | | | | | |
| | |
Total South Dakota | | | | | | | 604 | |
| | | | | | | | |
|
Tennessee — 2.5% | |
| | |
Chattanooga Health Educational & Housing Facility Board, CommonSpirit Health Series A-1, Rev., 4.00%, 8/1/2044 | | | 1,000 | | | | 1,108 | |
| | |
Metropolitan Nashville Airport Authority (The), Subordinate Airport Series 2019B, Rev., AMT, 5.00%, 7/1/2039 | | | 625 | | | | 778 | |
| | |
Nashville Metropolitan Development and Housing Agency, Tax Increment, Fifth Broadway Development Project | | | | | | | | |
| | |
Rev., 4.50%, 6/1/2028 (b) | | | 500 | | | | 521 | |
| | |
Rev., 5.13%, 6/1/2036 (b) | | | 425 | | | | 445 | |
| | |
Shelby County Health Educational & Housing Facilities Board | | | | | | | | |
| | |
Series 2019A, Rev., 5.00%, 10/1/2029 | | | 1,350 | | | | 1,351 | |
| | |
Series 2019A, Rev., 5.50%, 10/1/2034 | | | 2,850 | | | | 2,842 | |
SEE NOTES TO FINANCIAL STATEMENTS.
| | | | | | | | |
| | | |
| AUGUST 31, 2020 | | J.P. MORGAN MUNICIPAL BOND FUNDS | | | | | 23 | |
JPMorgan High Yield Municipal Fund
SCHEDULE OF PORTFOLIO INVESTMENTS
AS OF AUGUST 31, 2020 (Unaudited) (continued)
| | | | | | | | |
| INVESTMENTS | | PRINCIPAL
AMOUNT
($000) | | | VALUE
($000) | |
Municipal Bonds — continued | |
|
Tennessee — continued | |
| | |
Shelby County Health Educational and Housing Facilities Board | | | | | | | | |
| | |
Series 2019A, Rev., 5.75%, 10/1/2049 | | | 1,000 | | | | 956 | |
| | |
Series 2019A, Rev., 5.75%, 10/1/2054 | | | 1,500 | | | | 1,421 | |
| | |
Series 2019A, Rev., 5.75%, 10/1/2059 | | | 3,350 | | | | 3,143 | |
| | |
Tennessee Housing Development Agency, Homeownership Program | | | | | | | | |
| | |
Series A, Rev., AMT, 4.50%, 1/1/2021 (d) | | | 20 | | | | 20 | |
| | |
Series 1A, Rev., AMT, 4.50%, 1/1/2038 | | | 45 | | | | 46 | |
| | | | | | | | |
| | |
Total Tennessee | | | | | | | 12,631 | |
| | | | | | | | |
|
Texas — 6.1% | |
| | |
Arlington Higher Education Finance Corp. Series 2020A, Rev., 4.00%, 6/15/2040 (b) | | | 1,810 | | | | 1,762 | |
| | |
Arlington Higher Education Finance Corp., Winfree Academy Charter Schools | | | | | | | | |
| | |
Series 2019A, Rev., 5.15%, 8/15/2029 | | | 435 | | | | 467 | |
| | |
Series 2019A, Rev., 5.75%, 8/15/2043 | | | 1,000 | | | | 1,089 | |
| | |
Bexar County Health Facilities Development Corp., Army Retirement Residence Foundation Project Rev., 4.00%, 7/15/2045 | | | 940 | | | | 878 | |
| | |
City of Houston | | | | | | | | |
| | |
Series 2018D, Rev., 5.00%, 7/1/2028 | | | 355 | | | | 453 | |
| | |
Rev., AMT, 5.00%, 7/1/2029 | | | 2,500 | | | | 2,588 | |
| | |
City of Houston, Combined Utility System, Capital Appreciation Series A, Rev., AGM, Zero Coupon, 12/1/2027 (d) | | | 30 | | | | 29 | |
| | |
City of Temple, Reinvestment Zone Series A, Rev., 5.00%, 8/1/2028 (b) | | | 915 | | | | 1,032 | |
| | |
Dallas Area Rapid Transit, Senior Lien Rev., AMBAC, 5.25%, 12/1/2029 | | | 130 | | | | 179 | |
| | |
Danbury Higher Education Authority, Inc. Series 2019A, Rev., 5.00%, 8/15/2039 | | | 3,000 | | | | 3,125 | |
| | |
Matagorda County Navigation District No. 1, Central Power and Light Co. Project Rev., 2.60%, 11/1/2029 | | | 1,000 | | | | 1,033 | |
| | |
New Hope Cultural Education Facilities Finance Corp. | | | | | | | | |
| | |
Rev., 4.00%, 1/1/2029 | | | 300 | | | | 290 | |
| | |
Series 2020A, Rev., 5.00%, 1/1/2030 | | | 1,075 | | | | 1,149 | |
| | |
Series 2020A, Rev., 5.00%, 1/1/2035 | | | 865 | | | | 904 | |
| | |
Rev., 5.00%, 1/1/2039 | | | 205 | | | | 205 | |
| | |
Series A-1, Rev., 5.00%, 12/1/2039 | | | 1,420 | | | | 1,546 | |
| | |
Series 2020A, Rev., 5.00%, 1/1/2040 | | | 790 | | | | 814 | |
| | |
Series 2020A, Rev., 5.00%, 1/1/2055 | | | 2,000 | | | | 2,029 | |
| | |
New Hope Cultural Education Facilities Finance Corp., Beta Academy | | | | | | | | |
| | |
Series A, Rev., 3.38%, 8/15/2029 (b) | | | 300 | | | | 298 | |
| | | | | | | | |
| INVESTMENTS | | PRINCIPAL
AMOUNT
($000) | | | VALUE
($000) | |
| | | | | | | | |
|
Texas — continued | |
| | |
Series A, Rev., 4.00%, 8/15/2029 (b) | | | 330 | | | | 342 | |
| | |
Series A, Rev., 5.00%, 8/15/2039 (b) | | | 1,035 | | | | 1,082 | |
| | |
Series A, Rev., 5.00%, 8/15/2049 (b) | | | 670 | | | | 689 | |
| | |
New Hope Cultural Education Facilities Finance Corp., Legacy Midtown Park Project Series A, Rev., 5.50%, 7/1/2054 | | | 1,000 | | | | 946 | |
| | |
New Hope Cultural Education Facilities Finance Corp., Children’s Presbyterian Village North Project Rev., 5.00%, 10/1/2039 | | | 1,000 | | | | 1,009 | |
| | |
Newark Higher Education Finance Corp., Austin Achieve Public Schools, Inc. | | | | | | | | |
| | |
Rev., 4.25%, 6/15/2028 | | | 140 | | | | 142 | |
| | |
Rev., 5.00%, 6/15/2033 | | | 150 | | | | 154 | |
| | |
Rev., 5.00%, 6/15/2038 | | | 250 | | | | 256 | |
| | |
Permanent University Fund — Texas A&M University System Series B, Rev., 5.25%, 7/1/2028 | | | 140 | | | | 188 | |
| | |
Tarrant County Cultural Education Facilities Finance Corp., Hospital, Cook Children’s Medical Center Series A, Rev., 5.25%, 12/1/2039 | | | 170 | | | | 188 | |
| | |
Tarrant County Cultural Education Facilities Finance Corp., Retirement Facility, MRC Stevenson Oaks Project | | | | | | | | |
| | |
Series 2020A, Rev., 6.25%, 11/15/2031 | | | 500 | | | | 500 | |
| | |
Series 2020A, Rev., 6.63%, 11/15/2041 | | | 1,455 | | | | 1,455 | |
| | |
Tarrant County Cultural Education Facilities Finance Corp., Retirement Facility, MRC Stevenson Oaks Project, Tax Exempt | | | | | | | | |
| | |
Series 2020B-2, Rev., 3.00%, 11/15/2026 | | | 1,660 | | | | 1,660 | |
| | |
Series 2020B-1, Rev., 4.00%, 11/15/2027 | | | 2,100 | | | | 2,100 | |
| | |
Texas Department of Housing and Community Affairs, Residential Mortgage Series A, Rev., GNMA/FNMA/FHLMC, 5.00%, 7/1/2029 | | | 10 | | | | 10 | |
| | | | | | | | |
| | |
Total Texas | | | | | | | 30,591 | |
| | | | | | | | |
|
Utah — 1.7% | |
| | |
Mida Mountain Village Public Infrastructure District | | | | | | | | |
| | |
Series 2020B, 6.25%, 8/1/2030 (b) | | | 1,000 | | | | 968 | |
| | |
Series 2020A, 4.50%, 8/1/2040 | | | 1,000 | | | | 1,001 | |
| | |
Utah Charter School Finance Authority | | | | | | | | |
| | |
Series 2020A, Rev., 3.13%, 6/15/2029 (b) | | | 750 | | | | 725 | |
| | |
Series A, Rev., 4.00%, 4/15/2032 | | | 250 | | | | 295 | |
| | |
Series A, Rev., 4.00%, 4/15/2033 | | | 260 | | | | 304 | |
| | |
Series A, Rev., 5.00%, 4/15/2034 | | | 235 | | | | 292 | |
| | |
Series A, Rev., 5.00%, 4/15/2039 | | | 700 | | | | 855 | |
| | |
Series 2020A, Rev., 5.00%, 6/15/2039 (b) | | | 475 | | | | 498 | |
SEE NOTES TO FINANCIAL STATEMENTS.
| | | | | | |
| | | |
| 24 | | | | J.P. MORGAN MUNICIPAL BOND FUNDS | | AUGUST 31, 2020 |
| | | | | | | | |
| INVESTMENTS | | PRINCIPAL
AMOUNT
($000) | | | VALUE
($000) | |
Municipal Bonds — continued | |
|
Utah — continued | |
| | |
Series 2020A, Rev., 5.00%, 6/15/2049 (b) | | | 825 | | | | 852 | |
| | |
Utah Infrastructure Agency | | | | | | | | |
| | |
Rev., 4.00%, 10/15/2033 | | | 500 | | | | 531 | |
| | |
Rev., 4.00%, 10/15/2036 | | | 500 | | | | 526 | |
| | |
Rev., 4.00%, 10/15/2039 | | | 700 | | | | 731 | |
| | |
Rev., 4.00%, 10/15/2042 | | | 475 | | | | 490 | |
| | |
Utah Transit Authority, Sales Tax | | | | | | | | |
| | |
Series C, Rev., AGM, 5.25%, 6/15/2025 | | | 40 | | | | 48 | |
| | |
Series 2006C, Rev., AGM, 5.25%, 6/15/2032 | | | 450 | | | | 627 | |
| | | | | | | | |
| | |
Total Utah | | | | | | | 8,743 | |
| | | | | | | | |
|
Vermont — 0.1% | |
| | |
Vermont Student Assistance Corp., Education Loan | | | | | | | | |
| | |
Series A, Rev., AMT, 4.00%, 6/15/2032 | | | 165 | | | | 175 | |
| | |
Series A, Rev., AMT, 4.00%, 6/15/2033 | | | 210 | | | | 221 | |
| | |
Series 2018A, Rev., AMT, 4.00%, 6/15/2034 | | | 170 | | | | 179 | |
| | | | | | | | |
| | |
Total Vermont | | | | | | | 575 | |
| | | | | | | | |
|
Virginia — 3.6% | |
| | |
Chesapeake Hospital Authority, Regional Medical Center | | | | | | | | |
| | |
Rev., 4.00%, 7/1/2035 | | | 1,000 | | | | 1,154 | |
| | |
Rev., 4.00%, 7/1/2036 | | | 1,175 | | | | 1,350 | |
| | |
Rev., 4.00%, 7/1/2037 | | | 1,205 | | | | 1,378 | |
| | |
Danville Industrial Development Authority, Averett University Series A, Rev., 4.75%, 10/1/2032 | | | 760 | | | | 765 | |
| | |
Fredericksburg Economic Development Authority, Stadium Project | | | | | | | | |
| | |
Series B, Rev., 6.13%, 9/1/2029 (b) | | | 2,000 | | | | 1,968 | |
| | |
Series B, Rev., 7.00%, 9/1/2044 (b) | | | 1,000 | | | | 926 | |
| | |
Norfolk Redevelopment and Housing Authority, Harbors Edge Project | | | | | | | | |
| | |
Series 2019A, Rev., 5.00%, 1/1/2034 | | | 1,000 | | | | 1,054 | |
| | |
Series 2019A, Rev., 4.38%, 1/1/2039 | | | 1,400 | | | | 1,403 | |
| | |
Roanoke County Economic Development Authority, Residential Care Facility, Richfield Living | | | | | | | | |
| | |
Series 2019A, Rev., 4.75%, 9/1/2029 | | | 1,000 | | | | 1,014 | |
| | |
Series 2019A, Rev., 5.00%, 9/1/2034 | | | 2,000 | | | | 2,040 | |
| | |
Roanoke Economic Development Authority | | | | | | | | |
| | |
Rev., 4.30%, 9/1/2030 | | | 770 | | | | 750 | |
| | |
Rev., 5.00%, 9/1/2040 | | | 1,640 | | | | 1,646 | |
| | |
Series 2020A, Rev., 5.00%, 7/1/2047 | | | 1,550 | | | | 2,427 | |
| | |
Virginia Resources Authority, Infrastructure, Pooled Financing Program Series 2011A, Rev., 5.00%, 11/1/2021 (d) | | | 70 | | | | 74 | |
| | | | | | | | |
| | |
Total Virginia | | | | | | | 17,949 | |
| | | | | | | | |
| | | | | | | | |
| INVESTMENTS | | PRINCIPAL
AMOUNT
($000) | | | VALUE
($000) | |
| | | | | | | | |
|
Washington — 2.8% | |
| | |
Pend Oreille County, Public Hospital District No. 1 | | | | | | | | |
| | |
GO, 5.00%, 12/1/2033 | | | 1,000 | | | | 1,167 | |
| | |
GO, 5.00%, 12/1/2038 | | | 1,255 | | | | 1,443 | |
| | |
Pend Oreille County, Public Utility District No. 1, Box Canyon Production System Rev., 5.00%, 1/1/2039 | | | 2,605 | | | | 2,890 | |
| | |
Washington Health Care Facilities Authority, Commonspirit Health Series A-1, Rev., 4.00%, 8/1/2044 | | | 1,000 | | | | 1,108 | |
| | |
Washington Higher Education Facilities Authority, Seattle University Project | | | | | | | | |
| | |
Rev., 3.50%, 5/1/2039 | | | 300 | | | | 312 | |
| | |
Rev., 3.63%, 5/1/2040 | | | 800 | | | | 836 | |
| | |
Rev., 4.00%, 5/1/2045 | | | 500 | | | | 552 | |
| | |
Washington State Housing Finance Commission, Homeownership Program Series A, Rev., AMT, GNMA/FNMA/FHLMC, 4.50%, 4/1/2029 | | | 10 | | | | 10 | |
| | |
Washington State Housing Finance Commission, Judson Park Project | | | | | | | | |
| | |
Rev., 4.00%, 7/1/2028 (b) | | | 535 | | | | 555 | |
| | |
Rev., 5.00%, 7/1/2033 (b) | | | 535 | | | | 575 | |
| | |
Rev., 5.00%, 7/1/2038 (b) | | | 300 | | | | 320 | |
| | |
Washington State Housing Finance Commission, The Heart Stone Project | | | | | | | | |
| | |
Series 2018A, Rev., 4.50%, 7/1/2028 (b) | | | 965 | | | | 989 | |
| | |
Series 2018A, Rev., 5.00%, 7/1/2038 (b) | | | 825 | | | | 840 | |
| | |
Washington State Housing Finance Commission, Transforming Age Projects | | | | | | | | |
| | |
Series 2019A, Rev., 5.00%, 1/1/2034 (b) | | | 745 | | | | 775 | |
| | |
Series 2019A, Rev., 5.00%, 1/1/2039 (b) | | | 1,495 | | | | 1,529 | |
| | | | | | | | |
| | |
Total Washington | | | | | | | 13,901 | |
| | | | | | | | |
|
West Virginia — 0.6% | |
| | |
West Virginia Hospital Finance Authority, Charleston Area Medical Center, Inc. | | | | | | | | |
| | |
Series 2019A, Rev., 5.00%, 9/1/2038 | | | 1,250 | | | | 1,474 | |
| | |
Series 2019A, Rev., 5.00%, 9/1/2039 | | | 1,400 | | | | 1,646 | |
| | | | | | | | |
| | |
Total West Virginia | | | | | | | 3,120 | |
| | | | | | | | |
|
Wisconsin — 5.7% | |
| | |
Public Finance Authority | | | | | | | | |
| | |
Series 2019A, Rev., 5.00%, 10/1/2028 (b) | | | 2,000 | | | | 2,182 | |
| | |
Series 2019A, Rev., 5.00%, 6/1/2029 (b) | | | 370 | | | | 399 | |
| | |
Series 2019A, Rev., 5.00%, 10/1/2029 (b) | | | 1,850 | | | | 2,022 | |
| | |
Rev., 5.00%, 4/1/2030 (b) | | | 500 | | | | 548 | |
| | |
Series 2019A, Rev., 5.00%, 10/1/2034 (b) | | | 500 | | | | 532 | |
| | |
Rev., 4.25%, 10/1/2038 (b) | | | 2,000 | | | | 1,859 | |
SEE NOTES TO FINANCIAL STATEMENTS.
| | | | | | | | |
| | | |
| AUGUST 31, 2020 | | J.P. MORGAN MUNICIPAL BOND FUNDS | | | | | 25 | |
JPMorgan High Yield Municipal Fund
SCHEDULE OF PORTFOLIO INVESTMENTS
AS OF AUGUST 31, 2020 (Unaudited) (continued)
| | | | | | | | |
| INVESTMENTS | | PRINCIPAL
AMOUNT
($000) | | | VALUE
($000) | |
Municipal Bonds — continued | |
|
Wisconsin — continued | |
| | |
Series 2019A, Rev., 5.00%, 6/1/2039 (b) | | | 710 | | | | 734 | |
| | |
Rev., 5.00%, 4/1/2040 (b) | | | 2,155 | | | | 2,306 | |
| | |
Public Finance Authority, Acts Retirement Life Communities, Inc., Obligated Group Series 2020A, Rev., 5.00%, 11/15/2041 | | | 555 | | | | 656 | |
| | |
Public Finance Authority, Blue Ridge Healthcare Facilities | | | | | | | | |
| | |
Series 2020A, Rev., 4.00%, 1/1/2045 | | | 750 | | | | 837 | |
| | |
Series 2020A, Rev., 3.00%, 1/1/2050 | | | 750 | | | | 736 | |
| | |
Public Finance Authority, Cedars Obligated Group Rev., 4.25%, 5/1/2029 (b) | | | 1,000 | | | | 955 | |
| | |
Public Finance Authority, Community School of Davidson Project | | | | | | | | |
| | |
Rev., 3.75%, 10/1/2023 | | | 230 | | | | 232 | |
| | |
Rev., 5.00%, 10/1/2033 | | | 775 | | | | 833 | |
| | |
Public Finance Authority, ENO River Academy Project | | | | | | | | |
| | |
Series 2020A, Rev., 4.00%, 6/15/2030 (b) | | | 235 | | | | 243 | |
| | |
Series 2020A, Rev., 5.00%, 6/15/2040 (b) | | | 410 | | | | 439 | |
| | |
Series 2020A, Rev., 5.00%, 6/15/2054 (b) | | | 685 | | | | 721 | |
| | |
Public Finance Authority, Minnesota College of Osteopathic Medicine | | | | | | | | |
| | |
Series 2019A-1, Rev., 5.50%, 12/1/2048 (b) (g) | | | 17 | | | | 9 | |
| | |
Series 2019A-2, Rev., 7.25%, 12/1/2048 (b) (g) | | | 46 | | | | 23 | |
| | |
Public Finance Authority, Piedmont Community Charter School | | | | | | | | |
| | |
Rev., 5.00%, 6/15/2027 | | | 160 | | | | 190 | |
| | |
Rev., 5.00%, 6/15/2028 | | | 505 | | | | 606 | |
| | |
Rev., 5.00%, 6/15/2034 | | | 215 | | | | 253 | |
| | |
Rev., 5.00%, 6/15/2039 | | | 390 | | | | 450 | |
| | |
Rev., 5.00%, 6/15/2049 | | | 1,000 | | | | 1,132 | |
| | |
Public Finance Authority, The Evergreens Obligated Group Rev., 5.00%, 11/15/2044 | | | 1,565 | | | | 1,688 | |
| | |
Public Finance Authority, Wilson Preparatory Academy | | | | | | | | |
| | |
Series 2019A, Rev., 4.13%, 6/15/2029 (b) | | | 510 | | | | 516 | |
| | |
Series 2019A, Rev., 5.00%, 6/15/2039 (b) | | | 500 | | | | 510 | |
| | |
Series 2019A, Rev., 5.00%, 6/15/2049 (b) | | | 1,100 | | | | 1,109 | |
| | |
Wisconsin Health & Educational Facilities Authority Rev., 4.00%, 2/1/2045 | | | 575 | | | | 607 | |
| | |
Wisconsin Health and Educational Facilities Authority, Rogers Memorial Hospital, Inc. | | | | | | | | |
| | |
Series B, Rev., 5.00%, 7/1/2038 | | | 150 | | | | 174 | |
| | |
Series A, Rev., 5.00%, 7/1/2044 | | | 210 | | | | 241 | |
| | | | | | | | |
| INVESTMENTS | | PRINCIPAL
AMOUNT
($000) | | | VALUE
($000) | |
| | | | | | | | |
|
Wisconsin — continued | |
| | |
Series A, Rev., 5.00%, 7/1/2049 | | | 750 | | | | 856 | |
| | |
Wisconsin Health and Educational Facilities Authority, St. Camillus Health System | | | | | | | | |
| | |
Series 2019A, Rev., 5.00%, 11/1/2026 | | | 355 | | | | 386 | |
| | |
Series 2019A, Rev., 5.00%, 11/1/2027 | | | 370 | | | | 405 | |
| | |
Series 2019A, Rev., 5.00%, 11/1/2028 | | | 470 | | | | 518 | |
| | |
Series 2019A, Rev., 5.00%, 11/1/2029 | | | 315 | | | | 346 | |
| | |
Series 2019A, Rev., 5.00%, 11/1/2030 | | | 515 | | | | 563 | |
| | |
Wisconsin Health and Educational Facilities Authority, St. John’s Communities, Inc. Project Series A, Rev., 4.25%, 9/15/2035 | | | 1,500 | | | | 1,508 | |
| | | | | | | | |
| | |
Total Wisconsin | | | | | | | 28,324 | |
| | | | | | | | |
| | |
Total Municipal Bonds
(Cost $482,329) | | | | | | | 485,416 | |
| | | | | | | | |
Collateralized Mortgage Obligations — 0.0% | |
| | |
Southcross Holdco Equity 0.00%, 7/9/2070 ‡
(Cost $11) | | | 3 | | | | — | |
| | | | | | | | |
| | | SHARES
(000) | | | | |
Short-Term Investments — 3.5% | |
|
Investment Companies — 3.5% | |
| | |
JPMorgan Institutional Tax Free Money Market Fund Class IM Shares, 0.04% (h) (i)
(Cost $17,242) | | | 17,230 | | | | 17,242 | |
| | | | | | | | |
Total Investments — 100.6%
(Cost $499,582) | | | | | | | 502,658 | |
Liabilities in Excess of Other Assets — (0.6)% | | | | | | | (3,014 | ) |
| | | | | | | | |
NET ASSETS — 100.0% | | | | | | | 499,644 | |
| | | | | | | | |
Percentages indicated are based on net assets.
SEE NOTES TO FINANCIAL STATEMENTS.
| | | | | | |
| | | |
| 26 | | | | J.P. MORGAN MUNICIPAL BOND FUNDS | | AUGUST 31, 2020 |
| | |
Abbreviations | | |
| AGC | | Insured by Assured Guaranty Corp. |
| AGM | | Insured by Assured Guaranty Municipal Corp. |
| AMBAC | | Insured by American Municipal Bond Assurance Corp. |
| AMT | | Alternative Minimum Tax |
| BAN | | Bond Anticipation Note |
| BHAC | | Insured by Berkshire Hathaway Assurance Corp. |
| CHESLA | | Connecticut Higher Education Supplemental Loan Authority |
| COP | | Certificate of Participation |
| CR | | Custodial Receipts |
| FHLMC | | Federal Home Loan Mortgage Corp. |
| FNMA | | Federal National Mortgage Association |
| GNMA | | Government National Mortgage Association |
| GO | | General Obligation |
| GTD | | Guaranteed |
| NATL | | Insured by National Public Finance Guarantee Corp. |
| RE | | Reinsured |
| Rev. | | Revenue |
| | |
| (a) | | The date shown represents the earliest of the prerefunded date, next put date or final maturity date. |
| (b) | | Securities exempt from registration under Rule 144A or section 4(a)(2), of the Securities Act of 1933, as amended. |
| (c) | | Variable or floating rate security, the interest rate of which adjusts periodically based on changes in current interest rates and prepayments on the underlying pool of assets. The interest rate shown is the current rate as of August 31, 2020. |
| (d) | | Security is prerefunded or escrowed to maturity. |
| (e) | | Amount rounds to less than 0.1% of net assets. |
| (f) | | All or a portion of the security is a when-issued security, delayed delivery security, or forward commitment. |
| (g) | | Defaulted security. |
| (h) | | Investment in an affiliated fund, which is registered under the Investment Company Act of 1940, as amended, and is advised by J.P. Morgan Investment Management Inc. |
| (i) | | The rate shown is the current yield as of August 31, 2020. |
| ‡ | | Value determined using significant unobservable inputs. |
SEE NOTES TO FINANCIAL STATEMENTS.
| | | | | | | | |
| | | |
| AUGUST 31, 2020 | | J.P. MORGAN MUNICIPAL BOND FUNDS | | | | | 27 | |
JPMorgan Short-Intermediate Municipal Bond Fund
SCHEDULE OF PORTFOLIO INVESTMENTS
AS OF AUGUST 31, 2020 (Unaudited)
| | | | | | | | |
| INVESTMENTS | | PRINCIPAL
AMOUNT
($000) | | | VALUE
($000) | |
Municipal Bonds — 90.4% (a) | |
|
Alabama — 1.7% | |
| | |
Birmingham Airport Authority | | | | | | | | |
| | |
Rev., 5.00%, 7/1/2027 | | | 250 | | | | 311 | |
| | |
Rev., 5.00%, 7/1/2028 | | | 350 | | | | 444 | |
| | |
Rev., 5.00%, 7/1/2029 | | | 375 | | | | 485 | |
| | |
Rev., 5.00%, 7/1/2030 | | | 250 | | | | 327 | |
| | |
Rev., 5.00%, 7/1/2031 | | | 175 | | | | 227 | |
| | |
Rev., 5.00%, 7/1/2032 | | | 150 | | | | 193 | |
| | |
Rev., 5.00%, 7/1/2033 | | | 325 | | | | 417 | |
| | |
Rev., 5.00%, 7/1/2034 | | | 375 | | | | 479 | |
| | |
Black Belt Energy Gas District, Gas Prepay Series 2018B-2, Rev., (SIFMA Municipal Swap Index Yield + 0.62%), 0.71%, 9/10/2020 (b) | | | 7,500 | | | | 7,456 | |
| | |
Black Belt Energy Gas District, Gas Supply Series 2016A, Rev., LIQ: Royal Bank of Canada, 4.00%, 6/1/2021 (c) | | | 8,320 | | | | 8,513 | |
| | |
Montgomery County Public Building Authority, Warrants, Facilities Project Rev., 5.00%, 3/1/2023 | | | 500 | | | | 554 | |
| | |
Selma Industrial Development Board, International Paper Company Project Series 2019A, Rev., 2.00%, 10/1/2024 (c) | | | 3,625 | | | | 3,780 | |
| | |
Southeast Alabama Gas Supply District (The), Project No. 1 | | | | | | | | |
| | |
Series A, Rev., 5.00%, 4/1/2021 | | | 2,865 | | | | 2,938 | |
| | |
Series A, Rev., 5.00%, 4/1/2022 | | | 3,220 | | | | 3,443 | |
| | | | | | | | |
| | |
Total Alabama | | | | | | | 29,567 | |
| | | | | | | | |
|
Alaska — 0.5% | |
| | |
Alaska Municipal Bond Bank Authority | | | | | | | | |
| | |
Series 1, Rev., 5.00%, 12/1/2027 | | | 1,945 | | | | 2,447 | |
| | |
Series 1, Rev., 5.00%, 12/1/2028 | | | 1,230 | | | | 1,573 | |
| | |
Series 1, Rev., 5.00%, 12/1/2029 | | | 1,275 | | | | 1,660 | |
| | |
Series 1, Rev., 5.00%, 12/1/2030 | | | 875 | | | | 1,158 | |
| | |
City of Anchorage, Electric Utilities, Senior Lien Series 2014A, Rev., 5.00%, 12/1/2023 | | | 500 | | | | 572 | |
| | |
State of Alaska Series A, GO, 5.00%, 8/1/2029 | | | 1,300 | | | | 1,573 | |
| | | | | | | | |
| | |
Total Alaska | | | | | | | 8,983 | |
| | | | | | | | |
|
Arizona — 1.8% | |
| | |
Arizona Health Facilities Authority, Scottsdale Lincoln Hospitals Series 2014A, Rev., 5.00%, 12/1/2025 | | | 3,540 | | | | 4,128 | |
| | |
Arizona Industrial Development Authority, Phoenix Children’s Hospital Series 2020A, Rev., 5.00%, 2/1/2027 | | | 125 | | | | 157 | |
| | |
City of Scottsdale GO, 5.00%, 7/1/2022 | | | 2,550 | | | | 2,775 | |
| | | | | | | | |
| INVESTMENTS | | PRINCIPAL
AMOUNT
($000) | | | VALUE
($000) | |
| | | | | | | | |
| | |
Arizona — continued | | | | | | | | |
| | |
Maricopa County Elementary School District No. 6 Washington, School Improvement, Project of 2016 Series 2019B, GO, 5.00%, 7/1/2029 | | | 3,950 | | | | 5,171 | |
| | |
Maricopa County Industrial Development Authority, Banner Health | | | | | | | | |
| | |
Series B, Rev., 5.00%, 10/18/2022 (c) | | | 7,370 | | | | 8,062 | |
| | |
Series C, Rev., 5.00%, 10/18/2024 (c) | | | 9,000 | | | | 10,578 | |
| | |
Town of Marana, Excise Tax Series 2017B, Rev., 5.00%, 7/1/2021 | | | 100 | | | | 104 | |
| | | | | | | | |
| | |
Total Arizona | | | | | | | 30,975 | |
| | | | | | | | |
|
Arkansas — 0.7% | |
| | |
Arkansas Development Finance Authority, Department of Community Correction Project Rev., 5.00%, 11/1/2026 | | | 325 | | | | 409 | |
| | |
City of Rogers Series B, Rev., 5.00%, 11/1/2027 | | | 3,855 | | | | 4,821 | |
| | |
County of Sharp | | | | | | | | |
| | |
Rev., 5.00%, 3/1/2024 | | | 595 | | | | 681 | |
| | |
Rev., 5.00%, 3/1/2025 | | | 600 | | | | 708 | |
| | |
Rev., 5.00%, 3/1/2026 | | | 685 | | | | 829 | |
| | |
University of Arkansas, UAMS Campus | | | | | | | | |
| | |
Rev., 5.00%, 3/1/2025 | | | 500 | | | | 599 | |
| | |
Rev., 5.00%, 3/1/2026 | | | 1,000 | | | | 1,185 | |
| | |
University of Central Arkansas, Student Housing System | | | | | | | | |
| | |
Series 2017A, Rev., 5.00%, 11/1/2021 | | | 1,600 | | | | 1,684 | |
| | |
Series 2019C, Rev., AGM, 4.00%, 11/1/2025 | | | 110 | | | | 127 | |
| | |
Series 2019C, Rev., AGM, 4.00%, 11/1/2026 | | | 240 | | | | 277 | |
| | |
Series 2019C, Rev., AGM, 4.00%, 11/1/2027 | | | 180 | | | | 206 | |
| | | | | | | | |
| | |
Total Arkansas | | | | | | | 11,526 | |
| | | | | | | | |
|
California — 14.1% | |
| | |
Alameda County Transport Authority, Sales Tax Rev., 4.00%, 3/1/2022 | | | 5,000 | | | | 5,289 | |
| | |
Allan Hancock Joint Community College District GO, 5.00%, 8/1/2022 | | | 1,050 | | | | 1,148 | |
| | |
Anaheim Housing and Public Improvements Authority, Electric Utility Distribution System Series 2016A, Rev., 5.00%, 10/1/2021 (d) | | | 1,275 | | | | 1,338 | |
| | |
Bay Area Toll Authority, Toll Bridge, San Francisco Bay Area Series S-7, Rev., 4.00%, 4/1/2029 | | | 20,000 | | | | 23,654 | |
SEE NOTES TO FINANCIAL STATEMENTS.
| | | | | | |
| | | |
| 28 | | | | J.P. MORGAN MUNICIPAL BOND FUNDS | | AUGUST 31, 2020 |
| | | | | | | | |
| INVESTMENTS | | PRINCIPAL
AMOUNT
($000) | | | VALUE
($000) | |
Municipal Bonds — continued | |
|
California — continued | |
| | |
California Educational Facilities Authority, Claremont McKenna College Series 2015A, Rev., 4.00%, 1/1/2024 | | | 1,675 | | | | 1,888 | |
| | |
California Health Facilities Financing Authority, Adventist Health System Series 2011A, Rev., 3.00%, 3/1/2024 (c) | | | 8,465 | | | | 8,888 | |
| | |
California Health Facilities Financing Authority, Cedars-Sinai Medical Center Rev., 5.00%, 11/15/2025 | | | 1,850 | | | | 2,273 | |
| | |
California Health Facilities Financing Authority, Providence Health and Services | | | | | | | | |
| | |
Series 2014A, Rev., 5.00%, 10/1/2021 | | | 750 | | | | 787 | |
| | |
Series 2014A, Rev., 5.00%, 10/1/2022 | | | 1,500 | | | | 1,644 | |
| | |
California Health Facilities Financing Authority, St. Joseph Health System Series 2013D, Rev., 5.00%, 10/15/2020 (c) | | | 12,870 | | | | 12,943 | |
| | |
California Infrastructure and Economic Development Bank, The J. Paul Getty Trust Series 2013A-2, Rev., (ICE LIBOR USD 1 Month + 0.33%), 0.44%, 10/1/2020 (b) | | | 3,250 | | | | 3,241 | |
| | |
California Municipal Finance Authority, Biola University Rev., 5.00%, 10/1/2021 | | | 370 | | | | 381 | |
| | |
California Municipal Finance Authority, California Lutheran University | | | | | | | | |
| | |
Rev., 5.00%, 10/1/2025 | | | 275 | | | | 317 | |
| | |
Rev., 5.00%, 10/1/2026 | | | 150 | | | | 176 | |
| | |
Rev., 5.00%, 10/1/2027 | | | 150 | | | | 179 | |
| | |
California Municipal Finance Authority, NorthBay Healthcare Group | | | | | | | | |
| | |
Series 2017A, Rev., 5.00%, 11/1/2023 | | | 500 | | | | 549 | |
| | |
Series 2017A, Rev., 5.00%, 11/1/2024 | | | 800 | | | | 899 | |
| | |
California State Public Works Board, California State University, Davidson Library at Santa Barbara Series 2013C, Rev., 5.00%, 3/1/2023 (d) | | | 2,820 | | | | 3,155 | |
| | |
California Statewide Communities Development Authority, Marin General Hospital Project Series 2018A, Rev., 5.00%, 8/1/2028 | | | 250 | | | | 314 | |
| | |
City and County of San Francisco Series 2014A, GO, 5.00%, 6/15/2025 | | | 5,310 | | | | 5,758 | |
| | |
City of Chula Vista, Police Facility Project | | | | | | | | |
| | |
COP, 5.00%, 10/1/2021 | | | 360 | | | | 378 | |
| | |
COP, 5.00%, 10/1/2022 | | | 465 | | | | 512 | |
| | |
COP, 5.00%, 10/1/2023 | | | 1,000 | | | | 1,147 | |
| | |
City of Los Angeles, Department of Airports | | | | | | | | |
| | |
Series A, Rev., AMT, 5.00%, 5/15/2021 | | | 1,590 | | | | 1,638 | |
| | | | | | | | |
| INVESTMENTS | | PRINCIPAL
AMOUNT
($000) | | | VALUE
($000) | |
| |
|
California — continued | |
| | |
Series C, Rev., 5.00%, 5/15/2022 | | | 750 | | | | 808 | |
| | |
Series D, Rev., AMT, 5.00%, 5/15/2022 | | | 3,380 | | | | 3,624 | |
| | |
Series B, Rev., 4.00%, 5/15/2024 | | | 365 | | | | 412 | |
| | |
Series C, Rev., 5.00%, 5/15/2024 | | | 700 | | | | 816 | |
| | |
Series D, Rev., AMT, 5.00%, 5/15/2027 | | | 2,700 | | | | 3,187 | |
| | |
Series D, Rev., AMT, 5.00%, 5/15/2028 | | | 1,950 | | | | 2,295 | |
| | |
Series D, Rev., AMT, 5.00%, 5/15/2029 | | | 2,550 | | | | 2,993 | |
| | |
City of Los Angeles, Wastewater System Series 2015-A, Rev., 5.00%, 6/1/2022 | | | 2,750 | | | | 2,984 | |
| | |
Contra Costa County Transportation Authority, Sales Tax | | | | | | | | |
| | |
Series A, Rev., 5.00%, 3/1/2023 | | | 2,420 | | | | 2,697 | |
| | |
Series A, Rev., 5.00%, 3/1/2024 | | | 2,000 | | | | 2,316 | |
| | |
County of Santa Clara, Moreland School District GO, 5.00%, 8/1/2021 | | | 1,000 | | | | 1,044 | |
| | |
Eastern Municipal Water District, Water and Wastewater | | | | | | | | |
| | |
Series C, Rev., 5.00%, 7/1/2021 | | | 2,530 | | | | 2,633 | |
| | |
Series C, Rev., 5.00%, 7/1/2022 | | | 1,700 | | | | 1,851 | |
| | |
Golden State Tobacco Securitization Corp., Tobacco Settlement Series 2015A, Rev., 5.00%, 6/1/2021 | | | 1,000 | | | | 1,036 | |
| | |
Goleta Water District Series A, COP, AGM, 5.00%, 12/1/2020 | | | 140 | | | | 142 | |
| | |
Grossmont Healthcare District Series D, GO, 5.00%, 7/15/2026 | | | 1,225 | | | | 1,483 | |
| | |
Grossmont Healthcare District, Election of 2006 Series 2015C, GO, 5.00%, 7/15/2026 | | | 1,000 | | | | 1,211 | |
| | |
Los Angeles Community College District Series C, GO, 5.00%, 6/1/2026 | | | 5,000 | | | | 6,338 | |
| | |
Los Angeles Department of Water and Power, Water System Series A, Rev., 5.00%, 7/1/2025 | | | 100 | | | | 123 | |
| | |
Novato Unified School District | | | | | | | | |
| | |
Series A, GO, 4.00%, 2/1/2022 | | | 535 | | | | 564 | |
| | |
Series A, GO, 5.00%, 2/1/2023 | | | 685 | | | | 765 | |
| | |
Series A, GO, 5.00%, 8/1/2025 | | | 1,500 | | | | 1,779 | |
| | |
Series A, GO, 5.00%, 8/1/2026 | | | 1,800 | | | | 2,126 | |
| | |
Oak Grove School District GO, 5.00%, 8/1/2023 | | | 1,200 | | | | 1,368 | |
| | |
Placentia-Yorba Linda Unified School District GO, 5.00%, 8/1/2025 | | | 1,770 | | | | 2,181 | |
| | |
Regents of the University of California Series AK, Rev., 5.00%, 5/15/2023 (c) | | | 11,505 | | | | 12,951 | |
| | |
Sacramento Municipal Utility District, Electric | | | | | | | | |
| | |
Series E, Rev., 5.00%, 8/15/2022 | | | 2,740 | | | | 3,001 | |
SEE NOTES TO FINANCIAL STATEMENTS.
| | | | | | | | |
| | | |
| AUGUST 31, 2020 | | J.P. MORGAN MUNICIPAL BOND FUNDS | | | | | 29 | |
JPMorgan Short-Intermediate Municipal Bond Fund
SCHEDULE OF PORTFOLIO INVESTMENTS
AS OF AUGUST 31, 2020 (Unaudited) (continued)
| | | | | | | | |
| INVESTMENTS | | PRINCIPAL
AMOUNT
($000) | | | VALUE
($000) | |
Municipal Bonds — continued | |
|
California — continued | |
| | |
Series E, Rev., 5.00%, 8/15/2027 | | | 105 | | | | 137 | |
| | |
San Diego County Regional Transportation Commission, Sales Tax | | | | | | | | |
| | |
Series A, Rev., 5.00%, 4/1/2021 | | | 250 | | | | 257 | |
| | |
Series A, Rev., 5.00%, 4/1/2022 | | | 100 | | | | 108 | |
| | |
San Diego Public Facilities Financing Authority Series 2020A, Rev., 5.00%, 8/1/2027 | | | 250 | | | | 325 | |
| | |
San Francisco Bay Area Rapid Transit District, Election of 2004 | | | | | | | | |
| | |
Series D, GO, 3.00%, 8/1/2022 | | | 2,735 | | | | 2,888 | |
| | |
Series 2015D, GO, 5.00%, 8/1/2028 | | | 1,685 | | | | 2,070 | |
| | |
San Francisco City and County Public Utilities Commission Water, Green Bonds Series 2018C, Rev., 2.13%, 10/1/2023 (c) | | | 10,000 | | | | 10,337 | |
| | |
San Francisco State Building Authority and Oakland State Building Authority, Elihu M. Harris State Office Building Series A, Rev., 5.00%, 12/1/2022 | | | 1,700 | | | | 1,884 | |
| | |
San Francisco Unified School District, Proposition A, Election of 2011 Series B, GO, 5.00%, 6/15/2024 | | | 5,190 | | | | 5,635 | |
| | |
Santa Barbara Unified School District | | | | | | | | |
| | |
Series A, GO, 4.00%, 8/1/2022 | | | 30 | | | | 32 | |
| | |
Series B, GO, 5.00%, 8/1/2026 | | | 50 | | | | 64 | |
| | |
Sonoma County Transportation Authority, Sales Tax Rev., 5.00%, 12/1/2024 | | | 1,000 | | | | 1,200 | |
| | |
Southern California Public Power Authority, Canyon Power Project Series 2016A, Rev., 5.00%, 7/1/2026 | | | 1,000 | | | | 1,040 | |
| | |
State of California, Various Purpose | | | | | | | | |
| | |
Series B, GO, 5.00%, 9/1/2023 | | | 2,810 | | | | 3,213 | |
| | |
GO, 5.00%, 11/1/2023 | | | 3,560 | | | | 4,098 | |
| | |
GO, 5.00%, 3/1/2026 | | | 13,210 | | | | 15,919 | |
| | |
GO, 5.00%, 9/1/2026 | | | 4,900 | | | | 6,203 | |
| | |
GO, 4.00%, 8/1/2028 | | | 4,000 | | | | 4,790 | |
| | |
GO, 4.00%, 8/1/2029 | | | 4,180 | | | | 4,983 | |
| | |
GO, 5.00%, 8/1/2029 | | | 7,830 | | | | 9,806 | |
| | |
GO, 4.00%, 8/1/2030 | | | 10,000 | | | | 11,864 | |
| | |
Stockton Public Financing Authority | | | | | | | | |
| | |
Rev., 5.00%, 3/1/2027 | | | 630 | | | | 748 | |
| | |
Rev., 5.00%, 3/1/2029 | | | 465 | | | | 563 | |
| | |
Walnut Energy Center Authority Series A, Rev., 5.00%, 1/1/2023 | | | 400 | | | | 445 | |
| | |
Whittier Union School District GO, 5.00%, 8/1/2023 | | | 10,495 | | | | 11,964 | |
| | | | | | | | |
| | |
Total California | | | | | | | 241,797 | |
| | | | | | | | |
| | | | | | | | |
| INVESTMENTS | | PRINCIPAL
AMOUNT
($000) | | | VALUE
($000) | |
| | | | | | | | |
|
Colorado — 3.1% | |
| | |
Arapahoe County School District No. 5 Cherry Creek GO, 5.00%, 12/15/2029 | | | 17,575 | | | | 24,276 | |
| | |
City of Aurora | | | | | | | | |
| | |
COP, 3.00%, 12/1/2020 | | | 125 | | | | 126 | |
| | |
COP, 4.00%, 12/1/2022 | | | 375 | | | | 406 | |
| | |
City of Longmont | | | | | | | | |
| | |
Series A, COP, 5.00%, 12/1/2021 | | | 100 | | | | 106 | |
| | |
Series A, COP, 5.00%, 12/1/2022 | | | 100 | | | | 110 | |
| | |
Series A, COP, 5.00%, 12/1/2024 | | | 100 | | | | 115 | |
| | |
Colorado Bridge Enterprise Series 2019A, Rev., 4.00%, 12/1/2027 | | | 5,000 | | | | 6,024 | |
| | |
Colorado Department of Transportation Headquarters Facilities, Headquarters Facilities Lease Purchase Agreement COP, 3.00%, 6/15/2021 | | | 1,000 | | | | 1,022 | |
| | |
Colorado Health Facilities Authority, Commonspirit Health Series B-2, Rev., 5.00%, 8/1/2026 (c) | | | 10,000 | | | | 11,785 | |
| | |
Colorado Health Facilities Authority, Parkview Medical Center, Inc. Project Rev., 5.00%, 9/1/2022 | | | 150 | | | | 162 | |
| | |
Colorado Health Facilities Authority, Valley View Hospital Association Project Rev., 2.80%, 5/15/2023 (c) | | | 1,090 | | | | 1,139 | |
| | |
Counties of Gunnison, Watershed School District No. 1 | | | | | | | | |
| | |
Series 2014A, GO, 4.00%, 12/1/2022 | | | 300 | | | | 326 | |
| | |
Series 2014A, GO, 5.00%, 12/1/2026 | | | 500 | | | | 596 | |
| | |
County of Boulder, Flood Reconstruction Projects | | | | | | | | |
| | |
COP, 5.00%, 12/1/2022 | | | 720 | | | | 727 | |
| | |
COP, 5.00%, 12/1/2023 | | | 500 | | | | 506 | |
| | |
COP, 5.00%, 12/1/2025 | | | 500 | | | | 506 | |
| | |
County of Eagle COP, 5.00%, 12/1/2022 | | | 200 | | | | 221 | |
| | |
Denver Convention Center Hotel Authority Rev., 4.00%, 12/1/2020 | | | 500 | | | | 504 | |
| | |
The Regents of the University of Colorado, Enterprise System | | | | | | | | |
| | |
Series 2017A-2, Rev., 5.00%, 6/1/2022 (d) | | | 820 | | | | 887 | |
| | |
Series 2017A-2, Rev., 5.00%, 6/1/2022 | | | 260 | | | | 282 | |
| | |
Series A, Rev., 5.00%, 6/1/2022 (d) | | | 2,590 | | | | 2,805 | |
| | |
Series A, Rev., 5.00%, 6/1/2022 | | | 560 | | | | 606 | |
| | | | | | | | |
| | |
Total Colorado | | | | | | | 53,237 | |
| | | | | | | | |
|
Connecticut — 1.4% | |
| | |
Connecticut Housing Finance Authority Series E, Subseries E-3, Rev., 1.63%, 11/15/2022 (c) | | | 750 | | | | 752 | |
SEE NOTES TO FINANCIAL STATEMENTS.
| | | | | | |
| | | |
| 30 | | | | J.P. MORGAN MUNICIPAL BOND FUNDS | | AUGUST 31, 2020 |
| | | | | | | | |
| INVESTMENTS | | PRINCIPAL
AMOUNT
($000) | | | VALUE
($000) | |
Municipal Bonds — continued | |
|
Connecticut — continued | |
| | |
Connecticut State Health & Educational Facilities Authority Series 2020B-2, Rev., 5.00%, 1/1/2027 (c) | | | 7,750 | | | | 9,668 | |
| | |
State of Connecticut Series 2020C, GO, 4.00%, 6/1/2032 | | | 1,000 | | | | 1,209 | |
| | |
State of Connecticut, Special Tax Transportation Infrastructure Purposes Series C, Rev., 5.00%, 10/1/2026 | | | 10,000 | | | | 12,507 | |
| | | | | | | | |
| | |
Total Connecticut | | | | | | | 24,136 | |
| | | | | | | | |
|
District of Columbia — 0.2% | |
| | |
District of Columbia Children’s Hospital Rev., 5.00%, 7/15/2021 | | | 500 | | | | 519 | |
| | |
Metropolitan Washington Airports Authority, Airport System Series 2013C, Rev., 5.00%, 10/1/2021 | | | 1,475 | | | | 1,550 | |
| | |
Washington Metropolitan Area Transit Authority Series B, Rev., 5.00%, 7/1/2029 | | | 1,120 | | | | 1,419 | |
| | | | | | | | |
| | |
Total District of Columbia | | | | | | | 3,488 | |
| | | | | | | | |
|
Florida — 1.8% | |
| | |
County of Miami-Dade, Stormwater Project | | | | | | | | |
| | |
Rev., 5.00%, 4/1/2028 | | | 2,840 | | | | 3,737 | |
| | |
Rev., 5.00%, 4/1/2029 | | | 1,350 | | | | 1,813 | |
| | |
Florida Higher Educational Facilities Financial Authority | | | | | | | | |
| | |
Rev., 5.00%, 10/1/2022 | | | 115 | | | | 120 | |
| | |
Rev., 5.00%, 10/1/2023 | | | 125 | | | | 134 | |
| | |
JEA Water and Sewer System Series A, Rev., 5.00%, 10/1/2025 | | | 250 | | | | 307 | |
| | |
Miami-Dade County Expressway Authority, Toll System Series 2014A, Rev., 5.00%, 7/1/2022 | | | 625 | | | | 669 | |
| | |
Orlando Utilities Commission Series 2020A, Rev., 5.00%, 10/1/2026 (e) | | | 10,000 | | | | 12,637 | |
| | |
School Board of Duval County Series B, COP, 5.00%, 7/1/2021 | | | 750 | | | | 779 | |
| | |
State of Florida, State Board of Education, Lottery Series B, Rev., 5.00%, 7/1/2027 | | | 8,540 | | | | 10,761 | |
| | | | | | | | |
| | |
Total Florida | | | | | | | 30,957 | |
| | | | | | | | |
|
Georgia — 2.7% | |
| | |
Atlanta Development Authority, New Downtown Atlanta Stadium Project, Senior Lien | | | | | | | | |
| | |
Series 2015A-1, Rev., 5.00%, 7/1/2027 | | | 1,000 | | | | 1,131 | |
| | |
Series 2015A-1, Rev., 5.00%, 7/1/2028 | | | 1,000 | | | | 1,127 | |
| | |
Cook County School District, Sales Tax GO, 5.00%, 10/1/2021 | | | 1,495 | | | | 1,572 | |
| | | | | | | | |
| INVESTMENTS | | PRINCIPAL
AMOUNT
($000) | | | VALUE
($000) | |
| | | | | | | | |
|
Georgia — continued | |
| | |
Dahlonega Downtown Development Authority, North Georgia MAC, LLC Project | | | | | | | | |
| | |
Series 2017, Rev., 5.00%, 7/1/2023 | | | 325 | | | | 365 | |
| | |
Series 2017, Rev., 5.00%, 7/1/2025 | | | 250 | | | | 301 | |
| | |
Series 2017, Rev., 5.00%, 7/1/2026 | | | 275 | | | | 339 | |
| | |
Series 2017, Rev., 5.00%, 7/1/2028 | | | 375 | | | | 470 | |
| | |
Series 2017, Rev., 4.00%, 7/1/2032 | | | 1,000 | | | | 1,151 | |
| | |
Development Authority for Fulton County | | | | | | | | |
| | |
Rev., 5.00%, 10/1/2022 (d) | | | 4,855 | | | | 5,326 | |
| | |
Rev., 5.00%, 10/1/2022 | | | 145 | | | | 157 | |
| | |
Private Colleges & Universities Authority Series 2020B, Rev., 5.00%, 9/1/2030 | | | 10,755 | | | | 14,856 | |
| | |
State of Georgia | | | | | | | | |
| | |
Series I, GO, 5.00%, 7/1/2021 | | | 8,165 | | | | 8,495 | |
| | |
Series 2016E, GO, 5.00%, 12/1/2025 | | | 6,750 | | | | 8,382 | |
| | |
Series F, GO, 5.00%, 7/1/2028 | | | 2,000 | | | | 2,543 | |
| | | | | | | | |
| | |
Total Georgia | | | | | | | 46,215 | |
| | | | | | | | |
|
Hawaii — 0.5% | |
| | |
State of Hawaii Series EF, GO, 5.00%, 11/1/2021 | | | 7,640 | | | | 8,067 | |
| | | | | | | | |
|
Illinois — 8.8% | |
| | |
Carol Stream Park District | | | | | | | | |
| | |
Series 2020C, GO, 4.00%, 11/1/2027 | | | 200 | | | | 239 | |
| | |
Series 2020C, GO, 4.00%, 11/1/2031 | | | 880 | | | | 1,059 | |
| | |
Series 2020C, GO, 3.00%, 11/1/2032 | | | 1,250 | | | | 1,368 | |
| | |
Carol Stream Park District, Limited Tax Series 2020A, GO, 4.00%, 11/1/2028 | | | 145 | | | | 174 | |
| | |
Champaign County Community Unit School District No. 4 Champaign | | | | | | | | |
| | |
Series 2020A, GO, Zero Coupon, 1/1/2025 | | | 960 | | | | 928 | |
| | |
Series 2020A, GO, Zero Coupon, 1/1/2027 | | | 385 | | | | 359 | |
| | |
Series 2020A, GO, Zero Coupon, 1/1/2028 | | | 570 | | | | 521 | |
| | |
GO, 4.00%, 6/1/2028 | | | 1,255 | | | | 1,527 | |
| | |
GO, 4.00%, 6/1/2029 | | | 1,000 | | | | 1,234 | |
| | |
GO, 4.00%, 6/1/2030 | | | 1,285 | | | | 1,564 | |
| | |
GO, 4.00%, 6/1/2031 | | | 1,250 | | | | 1,500 | |
| | |
GO, 4.00%, 6/1/2032 | | | 1,000 | | | | 1,190 | |
| | |
City of Chicago | | | | | | | | |
| | |
Series 2015C, GO, 5.00%, 1/1/2022 (d) | | | 3,335 | | | | 3,543 | |
| | |
Series 2015C, GO, 5.00%, 1/1/2022 | | | 1,665 | | | | 1,716 | |
| | |
City of Waukegan | | | | | | | | |
| | |
Series B, GO, AGM, 5.00%, 12/30/2025 | | | 1,075 | | | | 1,300 | |
| | |
Series B, GO, AGM, 5.00%, 12/30/2026 | | | 1,125 | | | | 1,391 | |
| | |
Series B, GO, AGM, 5.00%, 12/30/2027 | | | 1,185 | | | | 1,483 | |
SEE NOTES TO FINANCIAL STATEMENTS.
| | | | | | | | |
| | | |
| AUGUST 31, 2020 | | J.P. MORGAN MUNICIPAL BOND FUNDS | | | | | 31 | |
JPMorgan Short-Intermediate Municipal Bond Fund
SCHEDULE OF PORTFOLIO INVESTMENTS
AS OF AUGUST 31, 2020 (Unaudited) (continued)
| | | | | | | | |
| INVESTMENTS | | PRINCIPAL
AMOUNT
($000) | | | VALUE
($000) | |
Municipal Bonds — continued | |
|
Illinois — continued | |
| | |
City of Waukegan, First Lien, Water and Sewer System | | | | | | | | |
| | |
Series C, Rev., AGM, 5.00%, 12/30/2023 | | | 535 | | | | 612 | |
| | |
Series C, Rev., AGM, 5.00%, 12/30/2026 | | | 680 | | | | 843 | |
| | |
Series C, Rev., AGM, 5.00%, 12/30/2027 | | | 710 | | | | 888 | |
| | |
Cook County Community Consolidated School District No. 65 Evanston GO, 4.00%, 12/1/2030 | | | 1,225 | | | | 1,472 | |
| | |
Cook County Community School District No. 97 Oak Park | | | | | | | | |
| | |
GO, 4.00%, 1/1/2028 | | | 500 | | | | 610 | |
| | |
GO, 4.00%, 1/1/2029 | | | 375 | | | | 455 | |
| | |
GO, 4.00%, 1/1/2030 | | | 285 | | | | 343 | |
| | |
Cook County High School District No. 207 Maine Township | | | | | | | | |
| | |
Series 2019A, GO, 5.00%, 12/1/2027 | | | 1,915 | | | | 2,462 | |
| | |
Series 2019A, GO, 5.00%, 12/1/2028 | | | 1,930 | | | | 2,527 | |
| | |
Series 2019A, GO, 4.00%, 12/1/2029 | | | 1,945 | | | | 2,378 | |
| | |
Cook County School District No. 69 Skokie | | | | | | | | |
| | |
GO, 4.00%, 12/1/2026 | | | 470 | | | | 561 | |
| | |
GO, 4.00%, 12/1/2027 | | | 490 | | | | 595 | |
| | |
GO, 4.00%, 12/1/2028 | | | 545 | | | | 670 | |
| | |
GO, 4.00%, 12/1/2029 | | | 515 | | | | 629 | |
| | |
GO, 4.00%, 12/1/2030 | | | 200 | | | | 243 | |
| | |
GO, 4.00%, 12/1/2031 | | | 820 | | | | 986 | |
| | |
GO, 4.00%, 12/1/2033 | | | 1,530 | | | | 1,812 | |
| | |
Cook County School District No. 99 Cicero | | | | | | | | |
| | |
Series 2019B, GO, 5.00%, 12/1/2024 | | | 505 | | | | 592 | |
| | |
Series 2019B, GO, 5.00%, 12/1/2025 | | | 515 | | | | 619 | |
| | |
Cook County, Proviso Township High School District No. 209 | | | | | | | | |
| | |
GO, 5.00%, 12/1/2022 | | | 2,975 | | | | 3,262 | |
| | |
GO, 5.00%, 12/1/2023 | | | 2,350 | | | | 2,669 | |
| | |
County of Cook, Township High School District No. 225 Series 2016A, GO, 5.00%, 12/1/2023 | | | 5 | | | | 6 | |
| | |
County of DuPage, Courthouse Project GO, 5.00%, 1/1/2024 | | | 335 | | | | 385 | |
| | |
DeKalb County Community Unit School District No. 428 DeKalb | | | | | | | | |
| | |
GO, 4.00%, 1/1/2028 | | | 1,265 | | | | 1,541 | |
| | |
GO, 4.00%, 1/1/2029 | | | 650 | | | | 787 | |
| | |
GO, 4.00%, 1/1/2030 | | | 600 | | | | 722 | |
| | |
GO, 4.00%, 1/1/2031 | | | 1,000 | | | | 1,195 | |
| | |
GO, 4.00%, 1/1/2032 | | | 500 | | | | 592 | |
| | | | | | | | |
| INVESTMENTS | | PRINCIPAL
AMOUNT
($000) | | | VALUE
($000) | |
| | | | | | | | |
|
Illinois — continued | |
| | |
DuPage County School District No. 2 Bensenville | | | | | | | | |
| | |
GO, 4.00%, 5/1/2032 | | | 615 | | | | 738 | |
| | |
GO, 4.00%, 5/1/2033 | | | 1,280 | | | | 1,528 | |
| | |
Effingham Community Unit School District No. 40 Series 2019A, GO, 4.00%, 12/1/2028 | | | 565 | | | | 663 | |
| | |
Glenview Park District | | | | | | | | |
| | |
GO, 5.00%, 12/1/2026 | | | 300 | | | | 376 | |
| | |
GO, 5.00%, 12/1/2029 | | | 350 | | | | 446 | |
| | |
Grundy & Kendall Counties Consolidated Grade School District No. 60-C | | | | | | | | |
| | |
GO, 4.00%, 2/1/2030 | | | 1,145 | | | | 1,362 | |
| | |
GO, 4.00%, 2/1/2031 | | | 1,190 | | | | 1,405 | |
| | |
GO, 4.00%, 2/1/2032 | | | 620 | | | | 726 | |
| | |
Illinois Finance Authority | | | | | | | | |
| | |
Series 2020A, Rev., 4.00%, 12/15/2032 | | | 1,300 | | | | 1,592 | |
| | |
Series 2020A, Rev., 4.00%, 12/15/2033 | | | 3,740 | | | | 4,519 | |
| | |
Series 2020A, Rev., 4.00%, 12/15/2034 | | | 1,700 | | | | 2,043 | |
| | |
Series 2020A, Rev., 4.00%, 12/15/2035 | | | 1,340 | | | | 1,598 | |
| | |
Illinois Finance Authority, Ascension Health Alliance Senior Credit Group Series E-2, Rev., 1.75%, 4/1/2021 (c) | | | 3,750 | | | | 3,776 | |
| | |
Illinois Finance Authority, DePaul University | | | | | | | | |
| | |
Rev., 5.00%, 10/1/2023 | | | 200 | | | | 223 | |
| | |
Rev., 5.00%, 10/1/2025 | | | 300 | | | | 353 | |
| | |
Rev., 5.00%, 10/1/2028 | | | 250 | | | | 298 | |
| | |
Illinois Finance Authority, Lake Zurich Community Unit School District No. 95 Project | | | | | | | | |
| | |
Series 2019, Rev., 4.00%, 1/15/2030 | | | 1,960 | | | | 2,366 | |
| | |
Series 2019, Rev., 4.00%, 1/15/2032 | | | 2,120 | | | | 2,514 | |
| | |
Illinois Finance Authority, Silver Cross Hospital and Medical Centers | | | | | | | | |
| | |
Series C, Rev., 5.00%, 8/15/2021 | | | 150 | | | | 156 | |
| | |
Series 2015C, Rev., 5.00%, 8/15/2022 | | | 500 | | | | 540 | |
| | |
Illinois Finance Authority, State Clean Water Revolving Funds Series 1998B, Rev., 5.00%, 1/1/2029 | | | 4,000 | | | | 4,949 | |
| | |
Kane and DeKalb Counties Community Unit School District No. 301 | | | | | | | | |
| | |
GO, 5.00%, 1/1/2027 | | | 355 | | | | 443 | |
| | |
Kane County School District No. 131 Aurora East Side | | | | | | | | |
| | |
Series 2020A, GO, AGM, 5.00%, 12/1/2026 | | | 115 | | | | 138 | |
| | |
Series 2020B, GO, AGM, 5.00%, 12/1/2026 | | | 210 | | | | 254 | |
| | |
Series 2020A, GO, AGM, 4.00%, 12/1/2027 | | | 105 | | | | 121 | |
SEE NOTES TO FINANCIAL STATEMENTS.
| | | | | | |
| | | |
| 32 | | | | J.P. MORGAN MUNICIPAL BOND FUNDS | | AUGUST 31, 2020 |
| | | | | | | | |
| INVESTMENTS | | PRINCIPAL
AMOUNT
($000) | | | VALUE
($000) | |
Municipal Bonds — continued | | | | | | | | |
|
Illinois — continued | |
| | |
Series 2020A, GO, AGM, 4.00%, 12/1/2028 | | | 65 | | | | 76 | |
| | |
Series 2020B, GO, AGM, 4.00%, 12/1/2028 | | | 135 | | | | 158 | |
| | |
Series 2020A, GO, AGM, 4.00%, 12/1/2029 | | | 65 | | | | 75 | |
| | |
Series 2020B, GO, AGM, 4.00%, 12/1/2029 | | | 40 | | | | 46 | |
| | |
Series 2020A, GO, AGM, 4.00%, 12/1/2030 | | | 80 | | | | 92 | |
| | |
Series 2020A, GO, AGM, 4.00%, 12/1/2031 | | | 100 | | | | 114 | |
| | |
Series 2020A, GO, AGM, 4.00%, 12/1/2032 | | | 110 | | | | 125 | |
| | |
Series 2020A, GO, AGM, 4.00%, 12/1/2033 | | | 125 | | | | 142 | |
| | |
Lincoln Land Community College District No. 526 | | | | | | | | |
| | |
GO, 5.00%, 12/15/2021 | | | 305 | | | | 324 | |
| | |
GO, 4.00%, 12/15/2022 | | | 440 | | | | 460 | |
| | |
Madison-Macoupin Etc Counties Community College District No. 536, Lewis and Clark Community | | | | | | | | |
| | |
GO, AGM, 4.00%, 5/1/2025 | | | 400 | | | | 456 | |
| | |
GO, AGM, 4.00%, 5/1/2026 | | | 200 | | | | 232 | |
| | |
GO, AGM, 4.00%, 5/1/2028 | | | 350 | | | | 408 | |
| | |
GO, AGM, 4.00%, 5/1/2029 | | | 1,000 | | | | 1,161 | |
| | |
McHenry County, Woodstock Community Unit School District No. 200 | | | | | | | | |
| | |
GO, 5.00%, 1/15/2021 | | | 300 | | | | 305 | |
| | |
Peoria County Community Unit School District No. 309 Brimfield | | | | | | | | |
| | |
GO, AGM, 4.00%, 4/1/2026 | | | 750 | | | | 866 | |
| | |
GO, AGM, 4.00%, 4/1/2027 | | | 780 | | | | 915 | |
| | |
GO, AGM, 4.00%, 4/1/2028 | | | 410 | | | | 489 | |
| | |
GO, AGM, 4.00%, 4/1/2029 | | | 240 | | | | 290 | |
| | |
GO, AGM, 4.00%, 4/1/2030 | | | 375 | | | | 450 | |
| | |
GO, AGM, 4.00%, 4/1/2031 | | | 410 | | | | 489 | |
| | |
Peoria Public Building Commission | | | | | | | | |
| | |
Series A, Rev., AGM, 4.00%, 12/1/2025 | | | 700 | | | | 812 | |
| | |
Series A, Rev., AGM, 4.00%, 12/1/2026 | | | 1,000 | | | | 1,174 | |
| | |
Series A, Rev., AGM, 4.00%, 12/1/2027 | | | 1,270 | | | | 1,516 | |
| | |
Series A, Rev., AGM, 5.00%, 12/1/2028 | | | 1,200 | | | | 1,527 | |
| | |
Series A, Rev., AGM, 5.00%, 12/1/2029 | | | 2,400 | | | | 3,038 | |
| | |
Sales Tax Securitization Corp. | | | | | | | | |
| | |
Series C, Rev., 5.00%, 1/1/2024 | | | 3,000 | | | | 3,353 | |
| | |
Series C, Rev., 5.00%, 1/1/2025 | | | 4,250 | | | | 4,879 | |
| | |
Southwestern Illinois Development Authority, Hospital Sisters Services, Inc. Obligated Group | | | | | | | | |
| | |
Series A, Rev., 5.00%, 2/15/2027 | | | 2,000 | | | | 2,487 | |
| | |
State of Illinois | | | | | | | | |
| | |
Series D, GO, 5.00%, 11/1/2020 | | | 10,000 | | | | 10,058 | |
| | | | | | | | |
| INVESTMENTS | | PRINCIPAL
AMOUNT
($000) | | | VALUE
($000) | |
| | | | | | | | |
|
Illinois — continued | |
| | |
Series D, GO, 5.00%, 11/1/2023 | | | 5,000 | | | | 5,364 | |
| | |
State of Illinois, Sales Tax, Junior Obligation | | | | | | | | |
| | |
Series 2018A, Rev., 5.00%, 6/15/2021 | | | 4,600 | | | | 4,743 | |
| | |
Series A, Rev., 5.00%, 6/15/2022 | | | 4,600 | | | | 4,921 | |
| | |
Series A, Rev., 5.00%, 6/15/2023 | | | 4,600 | | | | 5,058 | |
| | |
University of Illinois, Auxiliary Facilities System Series A, Rev., 5.00%, 4/1/2024 | | | 2,500 | | | | 2,764 | |
| | |
Village of Arlington Heights | | | | | | | | |
| | |
GO, 4.00%, 12/1/2028 | | | 1,890 | | | | 2,354 | |
| | |
GO, 4.00%, 12/1/2029 | | | 1,000 | | | | 1,234 | |
| | |
GO, 4.00%, 12/1/2030 | | | 500 | | | | 612 | |
| | |
Will County Forest Preservation District GO, 5.00%, 12/15/2027 | | | 805 | | | | 1,043 | |
| | |
Will County Township High School District No. 204 Joliet GO, 4.00%, 1/1/2029 | | | 250 | | | | 288 | |
| | | | | | | | |
| | |
Total Illinois | | | | | | | 149,577 | |
| | | | | | | | |
|
Indiana — 1.1% | |
| | |
City of Evansville, Waterworks District | | | | | | | | |
| | |
Rev., 4.00%, 7/1/2027 | | | 985 | | | | 1,195 | |
| | |
Rev., 4.00%, 7/1/2028 | | | 1,015 | | | | 1,248 | |
| | |
City of Rockport, Indiana Michigan Power Company Project Series 2009B, Rev., 3.05%, 6/1/2025 | | | 5,000 | | | | 5,478 | |
| | |
Fort Wayne Redevelopment Authority Lease Rental, Harrison Square Project Rev., 5.00%, 8/1/2023 | | | 1,000 | | | | 1,137 | |
| | |
Indiana Finance Authority, Health Obligation | | | | | | | | |
| | |
Series C, Rev., 5.00%, 12/1/2021 | | | 2,355 | | | | 2,491 | |
| | |
Series B, Rev., 2.25%, 7/1/2025 (c) | | | 5,000 | | | | 5,258 | |
| | |
New Albany Floyd County School Building Corp. | | | | | | | | |
| | |
Rev., 5.00%, 7/15/2021 | | | 700 | | | | 729 | |
| | |
Rev., 5.00%, 7/15/2022 | | | 835 | | | | 908 | |
| | |
Purdue University, Student Fee | | | | | | | | |
| | |
Series DD, Rev., 5.00%, 7/1/2025 | | | 870 | | | | 1,066 | |
| | |
Series DD, Rev., 5.00%, 7/1/2027 | | | 10 | | | | 13 | |
| | | | | | | | |
| | |
Total Indiana | | | | | | | 19,523 | |
| | | | | | | | |
|
Iowa — 0.8% | |
| | |
Iowa Finance Authority, Health Systems Rev., (SIFMA Municipal Swap Index Yield + 0.58%), 0.67%, 9/10/2020 (b) (f) | | | 13,100 | | | | 13,004 | |
| | | | | | | | |
|
Kansas — 1.1% | |
| | |
Butler County, Unified School District No. 375 GO, 4.00%, 9/1/2024 | | | 200 | | | | 214 | |
SEE NOTES TO FINANCIAL STATEMENTS.
| | | | | | | | |
| | | |
| AUGUST 31, 2020 | | J.P. MORGAN MUNICIPAL BOND FUNDS | | | | | 33 | |
JPMorgan Short-Intermediate Municipal Bond Fund
SCHEDULE OF PORTFOLIO INVESTMENTS
AS OF AUGUST 31, 2020 (Unaudited) (continued)
| | | | | | | | |
| INVESTMENTS | | PRINCIPAL
AMOUNT
($000) | | | VALUE
($000) | |
Municipal Bonds — continued | | | | | | | | |
| |
Kansas — continued | | | | | |
| | |
City of Wichita, Sales Tax, River District Stadium Star Bond Project | | | | | | | | |
| | |
Rev., 5.00%, 9/1/2025 | | | 300 | | | | 361 | |
| | |
Rev., 5.00%, 9/1/2026 | | | 465 | | | | 570 | |
| | |
City of Wichita, Water and Sewer Utility Series 2014A, Rev., 5.00%, 10/1/2022 | | | 2,200 | | | | 2,417 | |
| | |
Kansas Development Finance Authority, State of Kansas Project Series F, Rev., 4.00%, 11/1/2029 | | | 6,820 | | | | 8,152 | |
| | |
Overland Park Development Corp. | | | | | | | | |
| | |
Rev., 4.00%, 3/1/2022 | | | 1,455 | | | | 1,464 | |
| | |
Rev., 5.00%, 3/1/2023 | | | 1,520 | | | | 1,570 | |
| | |
Seward County Unified School District No. 480 Series 2017-B, GO, 5.00%, 9/1/2025 | | | 1,750 | | | | 2,143 | |
| | |
University of Kansas Hospital Authority, Health System Series 2017A, Rev., 5.00%, 3/1/2024 | | | 275 | | | | 317 | |
| | |
Wyandotte County Unified School District No. 202 | | | | | | | | |
| | |
Series 2019A, GO, AGM, 5.00%, 9/1/2025 | | | 400 | | | | 485 | |
| | |
Series 2019A, GO, AGM, 5.00%, 9/1/2026 | | | 220 | | | | 274 | |
| | |
Series 2019A, GO, AGM, 5.00%, 9/1/2027 | | | 325 | | | | 415 | |
| | |
Series 2019A, GO, AGM, 5.00%, 9/1/2028 | | | 400 | | | | 513 | |
| | |
Series 2019A, GO, AGM, 5.00%, 9/1/2029 | | | 375 | | | | 479 | |
| | | | | | | | |
| | |
Total Kansas | | | | | | | 19,374 | |
| | | | | | | | |
|
Kentucky — 1.1% | |
| | |
Carter County Kentucky School District Finance Corp. Rev., 4.50%, 2/1/2021 (d) | | | 250 | | | | 254 | |
| | |
Kentucky Municipal Power Agency, Prairie State Project Series 2015A, Rev., NATL-RE, 5.00%, 9/1/2023 | | | 240 | | | | 271 | |
| | |
Kentucky Public Energy Authority, Gas Supply Series A, Rev., 4.00%, 4/1/2024 (c) | | | 2,500 | | | | 2,759 | |
| | |
Louisville & Jefferson County Metropolitan Government, Kentucky Pollution Control, Louisville Gas and Electric Co. Project Series B, Rev., AMT, 2.55%, 5/3/2021 (c) | | | 2,250 | | | | 2,277 | |
| | |
Louisville & Jefferson County Metropolitan Government, Norton Healthcare, Inc. Series 2020D, Rev., 5.00%, 10/1/2029 (c) | | | 10,500 | | | | 12,721 | |
| | |
Northern Kentucky University Series A, Rev., 5.00%, 9/1/2024 | | | 1,310 | | | | 1,484 | |
| | | | | | | | |
| | |
Total Kentucky | | | | | | | 19,766 | |
| | | | | | | | |
|
Louisiana — 1.4% | |
| | |
City of Shreveport, Water and Sewer, Junior Lien | | | | | | | | |
| | |
Series C, Rev., 3.00%, 12/1/2021 | | | 175 | | | | 181 | |
| | | | | | | | |
| INVESTMENTS | | PRINCIPAL
AMOUNT
($000) | | | VALUE
($000) | |
| | | | | | | | |
| |
Louisiana — continued | | | | | |
| | |
Series C, Rev., 5.00%, 12/1/2022 | | | 270 | | | | 294 | |
| | |
Series 2018C, Rev., 5.00%, 12/1/2023 | | | 365 | | | | 411 | |
| | |
Series 2019B, Rev., AGM, 4.00%, 12/1/2025 | | | 400 | | | | 467 | |
| | |
Series 2018C, Rev., 5.00%, 12/1/2025 | | | 915 | | | | 1,092 | |
| | |
Series 2018C, Rev., 5.00%, 12/1/2026 | | | 500 | | | | 611 | |
| | |
Series 2019B, Rev., AGM, 5.00%, 12/1/2026 | | | 360 | | | | 449 | |
| | |
Series 2019B, Rev., AGM, 5.00%, 12/1/2027 | | | 600 | | | | 763 | |
| | |
Series 2019B, Rev., AGM, 5.00%, 12/1/2028 | | | 500 | | | | 648 | |
| | |
Series 2019B, Rev., AGM, 5.00%, 12/1/2029 | | | 300 | | | | 387 | |
| | |
Jefferson Sales Tax District Series 2019B, Rev., AGM, 4.00%, 12/1/2032 | | | 5,815 | | | | 6,944 | |
| | |
Louisiana Public Facilities Authority, Louisiana Children’s Medical Center Project Rev., (SIFMA Municipal Swap Index Yield + 0.65%), 0.74%, 9/10/2020 (b) | | | 10,000 | | | | 9,915 | |
| | |
Louisiana Public Facilities Authority, Tulane University of Louisiana Project | | | | | | | | |
| | |
Rev., 5.00%, 12/15/2022 | | | 230 | | | | 254 | |
| | |
Rev., 5.00%, 12/15/2025 | | | 250 | | | | 308 | |
| | |
Series 2020A, Rev., 5.00%, 4/1/2027 | | | 150 | | | | 190 | |
| | |
Series 2020A, Rev., 5.00%, 4/1/2028 | | | 165 | | | | 213 | |
| | |
Series 2020A, Rev., 5.00%, 4/1/2029 | | | 220 | | | | 291 | |
| | |
Series 2020A, Rev., 5.00%, 4/1/2030 | | | 130 | | | | 175 | |
| | |
Series 2020A, Rev., 5.00%, 4/1/2031 | | | 150 | | | | 200 | |
| | |
Series 2020A, Rev., 5.00%, 4/1/2032 | | | 150 | | | | 198 | |
| | | | | | | | |
| | |
Total Louisiana | | | | | | | 23,991 | |
| | | | | | | | |
|
Maryland — 0.4% | |
| | |
State of Maryland Department of Transportation Rev., 5.00%, 10/1/2025 | | | 6,100 | | | | 7,529 | |
| | | | | | | | |
|
Massachusetts — 3.1% | |
| | |
City of Boston Series 2014A, GO, 5.00%, 3/1/2023 | | | 7,360 | | | | 8,246 | |
| | |
Commonwealth of Massachusetts | | | | | | | | |
| | |
Series A, GO, (ICE LIBOR USD 3 Month + 0.55%), 0.72%, 11/1/2020 (b) | | | 3,000 | | | | 2,985 | |
| | |
Series D, GO, 4.00%, 9/1/2030 | | | 8,290 | | | | 9,528 | |
| | |
Massachusetts Clean Water Trust (The), Revolving Funds Rev., 5.00%, 8/1/2025 | | | 6,775 | | | | 8,288 | |
| | |
Massachusetts Development Finance Agency, Northeastern University Issue | | | | | | | | |
| | |
Series 2020A, Rev., 5.00%, 10/1/2027 | | | 1,000 | | | | 1,287 | |
SEE NOTES TO FINANCIAL STATEMENTS.
| | | | | | |
| | | |
| 34 | | | | J.P. MORGAN MUNICIPAL BOND FUNDS | | AUGUST 31, 2020 |
| | | | | | | | |
| INVESTMENTS | | PRINCIPAL
AMOUNT
($000) | | | VALUE
($000) | |
Municipal Bonds — continued | | | | | | | | |
| |
Massachusetts — continued | | | | | |
| | |
Series 2020A, Rev., 5.00%, 10/1/2028 | | | 1,000 | | | | 1,313 | |
| | |
Series 2020A, Rev., 5.00%, 10/1/2030 | | | 660 | | | | 901 | |
| | |
Series 2020A, Rev., 5.00%, 10/1/2031 | | | 585 | | | | 793 | |
| | |
Series 2020A, Rev., 5.00%, 10/1/2032 | | | 425 | | | | 571 | |
| | |
Series 2020A, Rev., 5.00%, 10/1/2033 | | | 450 | | | | 601 | |
| | |
Series 2020A, Rev., 5.00%, 10/1/2034 | | | 500 | | | | 665 | |
| | |
Series 2020A, Rev., 5.00%, 10/1/2035 | | | 1,000 | | | | 1,323 | |
| | |
Massachusetts Development Finance Agency, Partners Healthcare System Series 2017S, Rev., (SIFMA Municipal Swap Index Yield + 0.50%), 0.59%, 9/10/2020 (b) | | | 10,000 | | | | 9,967 | |
| | |
Massachusetts Development Finance Agency, Suffolk University | | | | | | | | |
| | |
Rev., 5.00%, 7/1/2025 | | | 525 | | | | 609 | |
| | |
Rev., 5.00%, 7/1/2026 | | | 435 | | | | 514 | |
| | |
Rev., 5.00%, 7/1/2027 | | | 420 | | | | 505 | |
| | |
Rev., 5.00%, 7/1/2028 | | | 525 | | | | 640 | |
| | |
Massachusetts Port Authority Series 2019-A, Rev., AMT, 5.00%, 7/1/2023 | | | 4,840 | | | | 5,424 | |
| | | | | | | | |
| | |
Total Massachusetts | | | | | | | 54,160 | |
| | | | | | | | |
|
Michigan — 2.0% | |
| | |
Avondale School District Series 2020A, GO, Q-SBLF, 5.00%, 5/1/2029 | | | 1,835 | | | | 2,447 | |
| | |
City of Grand Rapids, Sanitary Sewer System Improvement Rev., 5.00%, 1/1/2022 | | | 350 | | | | 372 | |
| | |
City of Royal Oak, Capital Improvement | | | | | | | | |
| | |
GO, 5.00%, 4/1/2027 | | | 625 | | | | 795 | |
| | |
GO, 5.00%, 4/1/2028 | | | 245 | | | | 319 | |
| | |
Gerald R Ford International Airport Authority, Limited Tax | | | | | | | | |
| | |
Rev., GTD, 5.00%, 1/1/2023 | | | 1,560 | | | | 1,718 | |
| | |
Rev., GTD, 5.00%, 1/1/2024 | | | 1,400 | | | | 1,598 | |
| | |
Grosse Pointe Public School System GO, 4.00%, 5/1/2027 | | | 765 | | | | 925 | |
| | |
Jackson Public Schools | | | | | | | | |
| | |
GO, Q-SBLF, 4.00%, 5/1/2025 | | | 570 | | | | 664 | |
| | |
GO, Q-SBLF, 4.00%, 5/1/2026 | | | 885 | | | | 1,052 | |
| | |
GO, Q-SBLF, 4.00%, 5/1/2027 | | | 1,090 | | | | 1,311 | |
| | |
Kalamazoo Public Schools GO, 5.00%, 5/1/2022 | | | 1,000 | | | | 1,080 | |
| | |
Michigan Finance Authority, Clean Water Revolving Fund Rev., 5.00%, 10/1/2021 | | | 2,250 | | | | 2,368 | |
| | |
Michigan Finance Authority, Local Government Loan Program Series B, Rev., 4.00%, 11/1/2020 | | | 455 | | | | 458 | |
| | | | | | | | |
| INVESTMENTS | | PRINCIPAL
AMOUNT
($000) | | | VALUE
($000) | |
| | | | | | | | |
| |
Michigan — continued | | | | | |
| | |
Michigan State Hospital Finance Authority, Ascension Health Credit Group Series B-4, Rev., 5.00%, 11/15/2027 | | | 2,250 | | | | 2,690 | |
| | |
Michigan Strategic Fund, The Detroit Edison Company Pollution Control Bonds Project Series CC, Rev., 1.45%, 9/1/2021 (c) | | | 2,600 | | | | 2,612 | |
| | |
Northville Public Schools, School Building and Site | | | | | | | | |
| | |
Series II, GO, 5.00%, 5/1/2027 | | | 375 | | | | 479 | |
| | |
Series II, GO, 5.00%, 5/1/2028 | | | 600 | | | | 784 | |
| | |
Series II, GO, 5.00%, 5/1/2029 | | | 250 | | | | 334 | |
| | |
Troy School District, School Building and Site | | | | | | | | |
| | |
GO, Q-SBLF, 5.00%, 5/1/2021 | | | 550 | | | | 568 | |
| | |
GO, Q-SBLF, 5.00%, 5/1/2022 | | | 500 | | | | 540 | |
| | |
University of Michigan Series 2019C, Rev., 4.00%, 4/1/2024 (c) | | | 10,650 | | | | 11,773 | |
| | | | | | | | |
| | |
Total Michigan | | | | | | | 34,887 | |
| | | | | | | | |
|
Minnesota — 0.4% | |
| | |
Duluth Independent School District No. 709 | | | | | | | | |
| | |
Series 2019B, COP, 5.00%, 2/1/2024 | | | 210 | | | | 240 | |
| | |
Series 2019C, COP, 5.00%, 2/1/2024 | | | 295 | | | | 337 | |
| | |
Series 2019B, COP, 5.00%, 2/1/2025 | | | 185 | | | | 218 | |
| | |
Series 2019C, COP, 5.00%, 2/1/2025 | | | 310 | | | | 366 | |
| | |
Series 2019B, COP, 5.00%, 2/1/2026 | | | 195 | | | | 237 | |
| | |
Series 2019C, COP, 5.00%, 2/1/2026 | | | 320 | | | | 388 | |
| | |
Series 2019B, COP, 5.00%, 2/1/2027 | | | 185 | | | | 230 | |
| | |
Series 2019B, COP, 5.00%, 2/1/2028 | | | 175 | | | | 223 | |
| | |
Series 2019C, COP, 5.00%, 2/1/2028 | | | 350 | | | | 444 | |
| | |
Minneapolis-St. Paul Metropolitan Airports Commission, Subordinate Airport Series A, Rev., 5.00%, 1/1/2022 | | | 1,000 | | | | 1,057 | |
| | |
Minnesota Higher Education Facilities Authority, College of St. Scholastica, Inc. | | | | | | | | |
| | |
Rev., 4.00%, 12/1/2024 | | | 100 | | | | 108 | |
| | |
Rev., 4.00%, 12/1/2025 | | | 185 | | | | 202 | |
| | |
Rev., 4.00%, 12/1/2026 | | | 185 | | | | 202 | |
| | |
Rev., 4.00%, 12/1/2027 | | | 195 | | | | 214 | |
| | |
Rev., 4.00%, 12/1/2028 | | | 240 | | | | 265 | |
| | |
Western Minnesota Municipal Power Agency, Power Supply | | | | | | | | |
| | |
Series A, Rev., 5.00%, 1/1/2023 | | | 1,500 | | | | 1,664 | |
| | |
Series 2014A, Rev., 5.00%, 1/1/2024 | | | 1,000 | | | | 1,154 | |
| | | | | | | | |
| | |
Total Minnesota | | | | | | | 7,549 | |
| | | | | | | | |
SEE NOTES TO FINANCIAL STATEMENTS.
| | | | | | | | |
| | | |
| AUGUST 31, 2020 | | J.P. MORGAN MUNICIPAL BOND FUNDS | | | | | 35 | |
JPMorgan Short-Intermediate Municipal Bond Fund
SCHEDULE OF PORTFOLIO INVESTMENTS
AS OF AUGUST 31, 2020 (Unaudited) (continued)
| | | | | | | | |
| INVESTMENTS | | PRINCIPAL
AMOUNT
($000) | | | VALUE
($000) | |
Municipal Bonds — continued | | | | | | | | |
|
Mississippi — 0.7% | |
| | |
County of Harrison | | | | | | | | |
| | |
Series A, GO, 5.00%, 10/1/2027 | | | 800 | | | | 1,028 | |
| | |
Series A, GO, 5.00%, 10/1/2028 | | | 345 | | | | 453 | |
| | |
Medical Center Educational Building Corp. Rev., 5.00%, 6/1/2031 | | | 3,105 | | | | 4,023 | |
| | |
Mississippi Business Finance Corp., Pollution Control Series 2002, Rev., 3.20%, 9/1/2028 | | | 4,000 | | | | 4,194 | |
| | |
State of Mississippi Series 2019A, Rev., 5.00%, 10/15/2028 | | | 1,400 | | | | 1,767 | |
| | | | | | | | |
| | |
Total Mississippi | | | | | | | 11,465 | |
| | | | | | | | |
|
Missouri — 0.7% | |
| | |
City of Chesterfield COP, 5.00%, 12/1/2021 | | | 1,000 | | | | 1,060 | |
| | |
City of St. Peters | | | | | | | | |
| | |
COP, 4.00%, 5/1/2026 | | | 705 | | | | 834 | |
| | |
COP, 4.00%, 5/1/2027 | | | 730 | | | | 882 | |
| | |
COP, 4.00%, 5/1/2028 | | | 760 | | | | 933 | |
| | |
COP, 4.00%, 5/1/2029 | | | 760 | | | | 945 | |
| | |
COP, 4.00%, 5/1/2030 | | | 545 | | | | 686 | |
| | |
COP, 4.00%, 5/1/2031 | | | 550 | | | | 699 | |
| | |
County of Clay, North Kansas City School District 74, Refunding and Improvement, Missouri Direct Deposit Program GO, 5.00%, 3/1/2022 | | | 350 | | | | 375 | |
| | |
County of Greene | | | | | | | | |
| | |
Rev., 4.00%, 12/1/2028 | | | 300 | | | | 369 | |
| | |
Rev., 4.00%, 12/1/2029 | | | 200 | | | | 250 | |
| | |
Health and Educational Facilities Authority of the State of Missouri | | | | | | | | |
| | |
Rev., 4.00%, 10/1/2020 | | | 300 | | | | 301 | |
| | |
Rev., 4.00%, 10/1/2021 | | | 300 | | | | 310 | |
| | |
Health and Educational Facilities Authority of the State of Missouri, BJC Health System Rev., 5.00%, 1/1/2021 | | | 225 | | | | 228 | |
| | |
Missouri State Environmental Improvement and Energy Resources Authority, Water Pollution Control and Drinking Water Series B, Rev., 5.00%, 7/1/2023 | | | 550 | | | | 559 | |
| | |
St. Louis Lambert International Airport | | | | | | | | |
| | |
Rev., 5.00%, 7/1/2021 | | | 1,575 | | | | 1,629 | |
| | |
Rev., 5.00%, 7/1/2022 | | | 1,000 | | | | 1,075 | |
| | |
Rev., 5.00%, 7/1/2023 | | | 1,080 | | | | 1,200 | |
| | | | | | | | |
| | |
Total Missouri | | | | | | | 12,335 | |
| | | | | | | | |
| | | | | | | | |
| INVESTMENTS | | PRINCIPAL
AMOUNT
($000) | | | VALUE
($000) | |
| | | | | | | | |
|
Montana — 0.2% | |
| | |
Gallatin County High School District No. 7 Bozeman Series 2017A, GO, 5.00%, 12/1/2023 | | | 515 | | | | 593 | |
| | |
Missoula County Elementary School District No. 1 GO, 5.00%, 7/1/2024 | | | 520 | | | | 613 | |
| | |
State of Montana, Long-Range Building Program | | | | | | | | |
| | |
GO, 5.00%, 8/1/2021 | | | 690 | | | | 721 | |
| | |
GO, 5.00%, 8/1/2022 | | | 1,000 | | | | 1,092 | |
| | | | | | | | |
| | |
Total Montana | | | | | | | 3,019 | |
| | | | | | | | |
|
Nebraska — 0.1% | |
| | |
Southeast Community College | | | | | | | | |
| | |
COP, 5.00%, 12/15/2021 | | | 200 | | | | 212 | |
| | |
COP, 5.00%, 12/15/2026 | | | 275 | | | | 351 | |
| | |
COP, 5.00%, 12/15/2027 | | | 495 | | | | 646 | |
| | |
COP, 5.00%, 12/15/2028 | | | 540 | | | | 715 | |
| | | | | | | | |
| | |
Total Nebraska | | | | | | | 1,924 | |
| | | | | | | | |
|
New Hampshire — 0.5% | |
| | |
New Hampshire Municipal Bond Bank | | | | | | | | |
| | |
Series 2020A, Rev., 5.00%, 2/15/2029 | | | 1,870 | | | | 2,513 | |
| | |
Series 2020A, Rev., 4.00%, 2/15/2031 | | | 1,240 | | | | 1,538 | |
| | |
Series 2020A, Rev., 4.00%, 2/15/2032 | | | 1,300 | | | | 1,602 | |
| | |
State of New Hampshire Series A, GO, 5.00%, 3/1/2026 | | | 2,880 | | | | 3,472 | |
| | | | | | | | |
| | |
Total New Hampshire | | | | | | | 9,125 | |
| | | | | | | | |
|
New Jersey — 4.2% | |
| | |
Bergen County Improvement Authority (The), Fort Lee Project Rev., GTD, 4.00%, 10/15/2030 | | | 475 | | | | 595 | |
| | |
City of Newark | | | | | | | | |
| | |
Series 2020A, GO, AGM, 5.00%, 10/1/2027 | | | 1,000 | | | | 1,257 | |
| | |
Series 2020A, GO, AGM, 5.00%, 10/1/2028 | | | 750 | | | | 957 | |
| | |
County of Passaic | | | | | | | | |
| | |
GO, 5.00%, 2/1/2021 | | | 90 | | | | 92 | |
| | |
Monmouth County Improvement Authority (The) Series 2019B, Rev., GTD, 4.00%, 12/1/2034 | | | 790 | | | | 965 | |
| | |
New Jersey Economic Development Authority, School Facilities Construction | | | | | | | | |
| | |
Series DDD, Rev., 5.00%, 6/15/2025 | | | 1,500 | | | | 1,731 | |
| | |
Series DDD, Rev., 5.00%, 6/15/2026 | | | 1,840 | | | | 2,157 | |
| | |
New Jersey Housing and Mortgage Finance Agency, Multifamily Conduit, Georgia King Village Project Series 2018-E, Rev., 2.45%, 10/1/2020 (c) | | | 3,000 | | | | 3,005 | |
SEE NOTES TO FINANCIAL STATEMENTS.
| | | | | | |
| | | |
| 36 | | | | J.P. MORGAN MUNICIPAL BOND FUNDS | | AUGUST 31, 2020 |
| | | | | | | | |
| INVESTMENTS | | PRINCIPAL
AMOUNT
($000) | | | VALUE
($000) | |
Municipal Bonds — continued | | | | | | | | |
|
New Jersey — continued | |
| | |
New Jersey Institute of Technology | | | | | | | | |
| | |
Series 2020A, Rev., 5.00%, 7/1/2027 | | | 175 | | | | 217 | |
| | |
Series 2020A, Rev., 5.00%, 7/1/2028 | | | 200 | | | | 252 | |
| | |
Series 2020A, Rev., 5.00%, 7/1/2029 | | | 270 | | | | 347 | |
| | |
Series 2020A, Rev., 5.00%, 7/1/2030 | | | 415 | | | | 530 | |
| | |
Series 2020A, Rev., 5.00%, 7/1/2032 | | | 725 | | | | 914 | |
| | |
New Jersey Transportation Trust Fund Authority, Federal Highway Reimbursement | | | | | | | | |
| | |
Series A, Rev., 5.00%, 6/15/2028 | | | 3,000 | | | | 3,508 | |
| | |
Series A, Rev., 5.00%, 6/15/2029 | | | 5,350 | | | | 6,217 | |
| | |
Series A, Rev., 5.00%, 6/15/2031 | | | 4,750 | | | | 5,458 | |
| | |
New Jersey Turnpike Authority Series C-6, Rev., (ICE LIBOR USD 1 Month + 0.75%), 0.86%, 10/1/2020 (b) | | | 10,000 | | | | 9,981 | |
| | |
Passaic Valley Sewerage Commissioners, New Jersey Sewer System | | | | | | | | |
| | |
Series J, Rev., AGM, 3.00%, 12/1/2027 | | | 6,370 | | | | 7,222 | |
| | |
Series J, Rev., AGM, 3.00%, 12/1/2028 | | | 6,465 | | | | 7,357 | |
| | |
Series J, Rev., AGM, 3.00%, 12/1/2029 | | | 6,555 | | | | 7,413 | |
| | |
Series J, Rev., AGM, 3.00%, 12/1/2030 | | | 6,665 | | | | 7,490 | |
| | |
State of New Jersey, Various Purpose GO, 4.00%, 6/1/2026 | | | 3,870 | | | | 4,191 | |
| | |
Township of South Brunswick GO, 5.00%, 9/1/2022 | | | 425 | | | | 466 | |
| | | | | | | | |
| | |
Total New Jersey | | | | | | | 72,322 | |
| | | | | | | | |
|
New Mexico — 0.2% | |
| | |
County of Sandoval | | | | | | | | |
| | |
GO, 5.00%, 8/1/2024 | | | 1,100 | | | | 1,299 | |
| | |
GO, 5.00%, 8/1/2025 | | | 500 | | | | 612 | |
| | |
GO, 5.00%, 8/1/2026 | | | 650 | | | | 817 | |
| | |
New Mexico Finance Authority, Senior Lien Public Project Series 2103B, Rev., 5.00%, 6/1/2021 | | | 800 | | | | 829 | |
| | | | | | | | |
| | |
Total New Mexico | | | | | | | 3,557 | |
| | | | | | | | |
|
New York — 8.4% | |
| | |
Bedford Central School District GO, 5.00%, 11/15/2022 | | | 2,410 | | | | 2,665 | |
| | |
Buffalo and Fort Erie Public Bridge Authority, Toll Bridge System Rev., 5.00%, 1/1/2021 | | | 815 | | | | 828 | |
| | |
Build Resource Corp., The New York Methodist Hospital Project Rev., 5.00%, 7/1/2021 | | | 550 | | | | 569 | |
| | |
City of Jamestown, Public Improvement GO, 5.00%, 6/1/2025 | | | 540 | | | | 652 | |
| | | | | | | | |
| INVESTMENTS | | PRINCIPAL
AMOUNT
($000) | | | VALUE
($000) | |
| | | | | | | | |
|
New York — continued | |
| | |
City of New York | | | | | | | | |
| | |
Series 2012A-1, GO, 5.00%, 8/1/2021 (d) | | | 2,190 | | | | 2,287 | |
| | |
Series 2020-1, GO, 4.00%, 8/1/2027 | | | 2,450 | | | | 2,931 | |
| | |
County of Orange, Public Improvement | | | | | | | | |
| | |
Series B, GO, 5.00%, 3/1/2021 | | | 1,510 | | | | 1,547 | |
| | |
GO, 5.00%, 2/1/2023 | | | 1,000 | | | | 1,113 | |
| | |
County of Suffolk, Longwood Central School District GO, 5.00%, 6/15/2026 | | | 365 | | | | 462 | |
| | |
Floral Park-Bellerose Union Free School District | | | | | | | | |
| | |
GO, 5.00%, 12/1/2028 | | | 640 | | | | 861 | |
| | |
GO, 4.00%, 12/1/2029 | | | 670 | | | | 841 | |
| | |
GO, 4.00%, 12/1/2030 | | | 695 | | | | 862 | |
| | |
Hampton Bays Union Free School District GO, 5.00%, 9/15/2022 | | | 2,025 | | | | 2,224 | |
| | |
Long Island Power Authority, Electric System | | | | | | | | |
| | |
Series 2017, Rev., 5.00%, 9/1/2025 | | | 500 | | | | 614 | |
| | |
Series 2017, Rev., 5.00%, 9/1/2027 | | | 500 | | | | 646 | |
| | |
Series 2017, Rev., 5.00%, 9/1/2028 | | | 750 | | | | 961 | |
| | |
Metropolitan Transportation Authority | | | | | | | | |
| | |
Series D-1, Rev., (ICE LIBOR USD 1 Month + 0.65%), 0.75%, 10/1/2020 (b) | | | 4,790 | | | | 4,698 | |
| | |
Subseries A-1, Rev., 5.00%, 11/15/2020 | | | 1,435 | | | | 1,443 | |
| | |
Subseries C-1, Rev., 5.00%, 11/15/2024 | | | 3,000 | | | | 3,232 | |
| | |
Metropolitan Transportation Authority, Green Bonds Series B-2, Rev., 4.00%, 11/15/2032 | | | 4,000 | | | | 4,525 | |
| | |
Nassau County Local Economic Assistance Corp., Catholic Health Services, Long Island Obligated Group Project Series 2014B, Rev., 5.00%, 7/1/2023 | | | 800 | | | | 893 | |
| | |
New York City Transitional Finance Authority, Future Tax Secured, Fiscal Year 2014 Series A, Subseries A-1, Rev., 5.00%, 11/1/2020 | | | 3,700 | | | | 3,729 | |
| | |
New York Convention Center Development Corp., Hotel Unit fee Secured Rev., 5.00%, 11/15/2026 | | | 5,000 | | | | 5,724 | |
| | |
New York State Dormitory Authority Series 2019A, Rev., 5.00%, 7/1/2027 | | | 4,630 | | | | 5,907 | |
| | |
New York State Dormitory Authority, Memorial Sloan-Kettering Cancer Center | | | | | | | | |
| | |
Series 2017-1, Rev., 5.00%, 7/1/2026 | | | 1,000 | | | | 1,251 | |
| | |
Series 1, Rev., 4.00%, 7/1/2031 | | | 4,255 | | | | 5,290 | |
| | |
New York State Dormitory Authority, Montefiore Obligated Group Series 2018A, Rev., 5.00%, 8/1/2027 | | | 3,225 | | | | 3,920 | |
| | |
New York State Dormitory Authority, Personal Income Tax Series 2011G, Rev., 5.00%, 8/15/2021 | | | 1,110 | | | | 1,161 | |
SEE NOTES TO FINANCIAL STATEMENTS.
| | | | | | | | |
| | | |
| AUGUST 31, 2020 | | J.P. MORGAN MUNICIPAL BOND FUNDS | | | | | 37 | |
JPMorgan Short-Intermediate Municipal Bond Fund
SCHEDULE OF PORTFOLIO INVESTMENTS
AS OF AUGUST 31, 2020 (Unaudited) (continued)
| | | | | | | | |
| INVESTMENTS | | PRINCIPAL
AMOUNT
($000) | | | VALUE
($000) | |
Municipal Bonds — continued | | | | | | | | |
|
New York — continued | |
| | |
New York State Dormitory Authority, State Personal Income Tax, General Purpose Series 2020B, Rev., RAN, 5.00%, 3/31/2021 | | | 13,925 | | | | 14,317 | |
| | |
New York State Dormitory Authority, State Sales Tax | | | | | | | | |
| | |
Series A, Rev., 5.00%, 3/15/2021 | | | 2,000 | | | | 2,052 | |
| | |
Series 2017A, Rev., 5.00%, 3/15/2024 | | | 6,135 | | | | 7,134 | |
| | |
New York State Dormitory Authority, The New School Series 2015A, Rev., 5.00%, 7/1/2024 | | | 1,100 | | | | 1,245 | |
| | |
New York Transportation Development Corp., Delta Air Lines, Inc., LaGuardia Airport Terminals C&D Redevelopment Project Rev., AMT, 5.00%, 1/1/2023 | | | 9,200 | | | | 9,635 | |
| | |
Niagara Frontier Transportation Authority, Buffalo Niagara International Airport | | | | | | | | |
| | |
Series 2019A, Rev., AMT, 5.00%, 4/1/2028 | | | 265 | | | | 329 | |
| | |
Series 2019A, Rev., AMT, 5.00%, 4/1/2029 | | | 265 | | | | 335 | |
| | |
Port Authority of New York and New Jersey, Consolidated Series 207, Rev., AMT, 5.00%, 9/15/2023 | | | 4,325 | | | | 4,900 | |
| | |
Sales Tax Asset Receivable Corp., Fiscal Year 2015 | | | | | | | | |
| | |
Series 2015A, Rev., 5.00%, 10/15/2022 | | | 4,800 | | | | 5,292 | |
| | |
Series 2015A, Rev., 5.00%, 10/15/2025 | | | 4,500 | | | | 5,354 | |
| | |
Schenectady County Capital Resource Corp., Union College Project Rev., 5.00%, 1/1/2025 | | | 400 | | | | 474 | |
| | |
State of New York Series 2019A, GO, 5.00%, 3/1/2026 | | | 3,250 | | | | 4,065 | |
| | |
Town of East Hampton | | | | | | | | |
| | |
GO, 5.00%, 5/15/2021 | | | 1,000 | | | | 1,034 | |
| | |
GO, 5.00%, 5/15/2023 | | | 1,000 | | | | 1,131 | |
| | |
Town of Oyster Bay | | | | | | | | |
| | |
GO, 4.00%, 11/1/2026 | | | 800 | | | | 950 | |
| | |
GO, 4.00%, 11/1/2027 | | | 675 | | | | 814 | |
|
Triborough Bridge and Tunnel Authority | |
|
Subseries 2005B-2, Rev., VRDO, LOC: | |
| | |
Citibank NA, 0.02%, 9/1/2020 (c) | | | 19,400 | | | | 19,400 | |
| | |
Series A, Rev., 5.00%, 11/15/2024 | | | 3,290 | | | | 3,658 | |
| | |
White Plains City School District GO, 5.00%, 5/15/2024 | | | 1,550 | | | | 1,829 | |
| | | | | | | | |
| | |
Total New York | | | | | | | 145,784 | |
| | | | | | | | |
| | | | | | | | |
| INVESTMENTS | | PRINCIPAL
AMOUNT
($000) | | | VALUE
($000) | |
| | | | | | | | |
|
North Carolina — 1.2% | |
| | |
North Carolina Medical Care Commission, Wake Forest Baptist Obligated Group Series 2019C, Rev., 2.55%, 6/1/2026 (c) | | | 13,805 | | | | 14,508 | |
| | |
State of North Carolina Series 2017B, Rev., 5.00%, 5/1/2022 | | | 700 | | | | 757 | |
| | |
University of North Carolina, Chapel Hill Series B, Rev., (ICE LIBOR USD 1 Month + 0.40%), 0.50%, 10/1/2020 (b) | | | 5,750 | | | | 5,750 | |
| | |
Winston-Salem State University Foundation LLC, The Board of Governors of The University of North Carolina Rev., AGM, 5.00%, 10/1/2023 | | | 445 | | | | 493 | |
| | | | | | | | |
| | |
Total North Carolina | | | | | | | 21,508 | |
| | | | | | | | |
|
Ohio — 1.4% | |
| | |
Akron, Bath and Copley Joint Township Hospital District, Summa Health Obligated Group Rev., 5.00%, 11/15/2021 | | | 375 | | | | 395 | |
| | |
American Municipal Power, Inc. Series 2019A, Rev., 2.30%, 2/15/2022 (c) | | | 5,000 | | | | 5,068 | |
| | |
City of Cleveland, Subordinate Lien, Public Facilities Improvements | | | | | | | | |
| | |
Series 2018A, Rev., 5.00%, 10/1/2025 | | | 150 | | | | 182 | |
| | |
Series 2018A, Rev., 5.00%, 10/1/2027 | | | 250 | | | | 320 | |
| | |
Series 2018A, Rev., 5.00%, 10/1/2028 | | | 250 | | | | 323 | |
| | |
City of Dublin, Various Purpose GO, 4.00%, 12/1/2028 | | | 200 | | | | 232 | |
| | |
County of Lake, Hospital Facilities, Lake Hospital System, Inc. | | | | | | | | |
| | |
Rev., 5.00%, 8/15/2023 | | | 1,445 | | | | 1,626 | |
| | |
Rev., 5.00%, 8/15/2024 | | | 1,655 | | | | 1,923 | |
| | |
Cuyahoga Ohio Community College District, Facilities Construction and Improvement Bonds GO, 5.00%, 12/1/2028 | | | 2,300 | | | | 2,860 | |
| | |
Franklin County Convention Facilities Authority | | | | | | | | |
| | |
Rev., 5.00%, 12/1/2025 | | | 250 | | | | 256 | |
| | |
Rev., 5.00%, 12/1/2026 | | | 625 | | | | 639 | |
| | |
Rev., 5.00%, 12/1/2029 | | | 800 | | | | 801 | |
| | |
Franklin County, Hospital Facilities, OhioHealth Corp. Series B, Rev., (SIFMA Municipal Swap Index Yield + 0.43%), 0.52%, 9/10/2020 (b) | | | 4,000 | | | | 3,992 | |
| | |
Hamilton County, Sewer System, Metropolitan Sewer District of Greater Cincinnati Series A, Rev., 5.00%, 12/1/2021 | | | 1,375 | | | | 1,458 | |
| | |
Lexington Local School District, School Facilities Construction and Improvement Series A, GO, 4.00%, 10/1/2031 | | | 1,050 | | | | 1,280 | |
SEE NOTES TO FINANCIAL STATEMENTS.
| | | | | | |
| | | |
| 38 | | | | J.P. MORGAN MUNICIPAL BOND FUNDS | | AUGUST 31, 2020 |
| | | | | | | | |
| INVESTMENTS | | PRINCIPAL
AMOUNT
($000) | | | VALUE
($000) | |
Municipal Bonds — continued | | | | | | | | |
|
Ohio — continued | |
| | |
Ohio Higher Educational Facility Commission, Oberlin College Rev., 5.00%, 10/1/2020 | | | 1,000 | | | | 1,004 | |
| | |
State of Ohio, University Hospitals Health System, Inc. Series B, Rev., VRDO, 0.45%, 9/1/2020 (c) | | | 2,500 | | | | 2,500 | |
| | | | | | | | |
| | |
Total Ohio | | | | | | | 24,859 | |
| | | | | | | | |
|
Oklahoma — 1.6% | |
| | |
Bryan County School Finance Authority, Durant Public Schools Project | | | | | | | | |
| | |
Rev., 4.00%, 12/1/2028 | | | 385 | | | | 470 | |
| | |
Rev., 4.00%, 12/1/2029 | | | 415 | | | | 512 | |
| | |
Rev., 4.00%, 12/1/2030 | | | 435 | | | | 531 | |
| | |
Carter County Public Facilities Authority, Educational Facilities Lease, Ardmore City Schools Project | | | | | | | | |
| | |
Rev., 5.00%, 9/1/2025 | | | 365 | | | | 422 | |
| | |
Rev., 5.00%, 9/1/2026 | | | 820 | | | | 965 | |
| | |
Rev., 5.00%, 9/1/2027 | | | 1,250 | | | | 1,497 | |
| | |
Cleveland County Educational Facilities Authority, Norman Public Schools Project Series 2019, Rev., 5.00%, 6/1/2025 | | | 3,050 | | | | 3,631 | |
| | |
Custer County Economic Development Authority, Thomas Fay Public Schools | | | | | | | | |
| | |
Rev., 4.00%, 12/1/2025 | | | 700 | | | | 815 | |
| | |
Rev., 4.00%, 12/1/2027 | | | 1,255 | | | | 1,497 | |
| | |
Grady County School Finance Authority, Educational Facilities Lease, Minco Public Schools Project | | | | | | | | |
| | |
Rev., 5.00%, 9/1/2028 | | | 375 | | | | 486 | |
| | |
Rev., 5.00%, 9/1/2029 | | | 1,175 | | | | 1,517 | |
| | |
Grady County School Finance Authority, Tuttle Public Schools Project | | | | | | | | |
| | |
Rev., 4.00%, 9/1/2029 | | | 300 | | | | 367 | |
| | |
Rev., 4.00%, 9/1/2030 | | | 430 | | | | 522 | |
| | |
Muskogee Industrial Trust | | | | | | | | |
| | |
Rev., 5.00%, 9/1/2024 | | | 890 | | | | 1,035 | |
| | |
Rev., 5.00%, 9/1/2025 | | | 850 | | | | 1,016 | |
| | |
Rev., 5.00%, 9/1/2026 | | | 1,800 | | | | 2,195 | |
| | |
Rev., 5.00%, 9/1/2027 | | | 480 | | | | 599 | |
| | |
Rev., 4.00%, 9/1/2028 | | | 2,500 | | | | 2,980 | |
| | |
Oklahoma County Finance Authority, Educational Facilities, Lease Midwest City-Del City Public Schools Project | | | | | | | | |
| | |
Rev., 5.00%, 10/1/2022 | | | 500 | | | | 547 | |
| | |
Rev., 5.00%, 10/1/2023 | | | 355 | | | | 404 | |
| | |
Rev., 5.00%, 10/1/2025 | | | 1,000 | | | | 1,219 | |
| | | | | | | | |
| INVESTMENTS | | PRINCIPAL
AMOUNT
($000) | | | VALUE
($000) | |
| | | | | | | | |
|
Oklahoma — continued | |
| | |
Tulsa County Industrial Authority Educational Facilities Lease, Jenks Public Schools Project Rev., 5.00%, 9/1/2021 | | | 2,000 | | | | 2,095 | |
| | |
Wagoner County School Development Authority, Wagoner Public Schools Project | | | | | | | | |
| | |
Rev., 4.00%, 9/1/2025 | | | 625 | | | | 713 | |
| | |
Rev., 4.00%, 9/1/2027 | | | 725 | | | | 849 | |
| | |
Rev., 4.00%, 9/1/2028 | | | 300 | | | | 355 | |
| | | | | | | | |
| | |
Total Oklahoma | | | | | | | 27,239 | |
| | | | | | | | |
|
Oregon — 0.2% | |
| | |
City of Portland, Sewer System, First Lien Series 2014A, Rev., 5.00%, 10/1/2023 | | | 40 | | | | 46 | |
| | |
Port of Portland, International Airport | | | | | | | | |
| | |
Series 23, Rev., 5.00%, 7/1/2023 | | | 1,000 | | | | 1,121 | |
| | |
Series 23, Rev., 5.00%, 7/1/2024 | | | 1,595 | | | | 1,852 | |
| | | | | | | | |
| | |
Total Oregon | | | | | | | 3,019 | |
| | | | | | | | |
|
Pennsylvania — 7.9% | |
| | |
Allegheny County Sanitary Authority, Sewer | | | | | | | | |
| | |
Rev., 5.00%, 12/1/2021 | | | 3,500 | | | | 3,698 | |
| | |
Rev., 5.00%, 12/1/2022 | | | 3,000 | | | | 3,303 | |
| | |
Rev., 5.00%, 12/1/2023 | | | 4,000 | | | | 4,577 | |
| | |
Berks County Industrial Development Authority, Tower Health Project | | | | | | | | |
| | |
Rev., 5.00%, 11/1/2023 | | | 1,000 | | | | 1,077 | |
| | |
Rev., 5.00%, 11/1/2024 | | | 1,000 | | | | 1,097 | |
| | |
Charleroi Borough Authority, Water System | | | | | | | | |
| | |
Rev., AGM, 4.00%, 12/1/2024 | | | 175 | | | | 199 | |
| | |
Rev., AGM, 4.00%, 12/1/2025 | | | 150 | | | | 175 | |
| | |
Rev., AGM, 4.00%, 12/1/2026 | | | 100 | | | | 119 | |
| | |
Rev., AGM, 4.00%, 12/1/2027 | | | 125 | | | | 151 | |
| | |
Chester County Health and Education Facilities Authority, Main Line Health System | | | | | | | | |
| | |
Series 2020A, Rev., 5.00%, 9/1/2026 | | | 250 | | | | 308 | |
| | |
Series 2020A, Rev., 5.00%, 9/1/2027 | | | 200 | | | | 253 | |
| | |
Series 2020A, Rev., 5.00%, 9/1/2028 | | | 175 | | | | 226 | |
| | |
Series 2020A, Rev., 5.00%, 9/1/2029 | | | 175 | | | | 231 | |
| | |
City of Philadelphia, Water and Wastewater | | | | | | | | |
| | |
Series A, Rev., 5.00%, 7/1/2022 | | | 1,510 | | | | 1,635 | |
| | |
Series 2014A, Rev., 5.00%, 7/1/2024 | | | 2,595 | | | | 3,053 | |
| | |
City of Pittsburgh | | | | | | | | |
| | |
Series 2020A, GO, 5.00%, 9/1/2027 | | | 350 | | | | 451 | |
| | |
Series 2020A, GO, 5.00%, 9/1/2028 | | | 385 | | | | 504 | |
| | |
Series 2020A, GO, 4.00%, 9/1/2029 | | | 350 | | | | 426 | |
| | |
Series 2020A, GO, 4.00%, 9/1/2030 | | | 500 | | | | 604 | |
SEE NOTES TO FINANCIAL STATEMENTS.
| | | | | | | | |
| | | |
| AUGUST 31, 2020 | | J.P. MORGAN MUNICIPAL BOND FUNDS | | | | | 39 | |
JPMorgan Short-Intermediate Municipal Bond Fund
SCHEDULE OF PORTFOLIO INVESTMENTS
AS OF AUGUST 31, 2020 (Unaudited) (continued)
| | | | | | | | |
| INVESTMENTS | | PRINCIPAL
AMOUNT
($000) | | | VALUE
($000) | |
Municipal Bonds — continued | | | | | | | | |
|
Pennsylvania — continued | |
| | |
Commonwealth Financing Authority, Tobacco Master Settlement Payment Series 2018, Rev., 5.00%, 6/1/2022 | | | 555 | | | | 597 | |
| | |
Commonwealth of Pennsylvania Series 2011, GO, 4.00%, 11/15/2028 | | | 5,000 | | | | 5,203 | |
| | |
County of Chester GO, 4.00%, 7/15/2028 | | | 2,500 | | | | 3,132 | |
| | |
County of Lackawanna | | | | | | | | |
| | |
Series 2020B, GO, 4.00%, 9/1/2027 | | | 1,480 | | | | 1,778 | |
| | |
Series 2020B, GO, 4.00%, 9/1/2028 | | | 1,495 | | | | 1,809 | |
| | |
Series 2020B, GO, 4.00%, 9/1/2029 | | | 1,525 | | | | 1,828 | |
| | |
Series 2020B, GO, 4.00%, 9/1/2030 | | | 1,690 | | | | 2,000 | |
| | |
County of Northampton | | | | | | | | |
| | |
Series A, GO, 4.00%, 10/1/2026 | | | 750 | | | | 887 | |
| | |
Series A, GO, 4.00%, 10/1/2027 | | | 1,565 | | | | 1,843 | |
| | |
Series A, GO, 4.00%, 10/1/2028 | | | 920 | | | | 1,079 | |
| | |
County of Westmoreland Series A, GO, 5.00%, 8/15/2028 | | | 3,000 | | | | 3,867 | |
| | |
Lehigh County Industrial Development Authority, Pollution Control | | | | | | | | |
| | |
Series 2016B, Rev., 1.80%, 8/15/2022 (c) | | | 4,000 | | | | 4,052 | |
| | |
Series 2016A, Rev., 1.80%, 9/1/2022 (c) | | | 2,500 | | | | 2,531 | |
| | |
Montgomery County Higher Education and Health Authority, Thomas Jefferson University Series 2018A, Rev., 5.00%, 9/1/2024 | | | 1,000 | | | | 1,164 | |
| | |
Panther Valley School District | | | | | | | | |
| | |
GO, 2.00%, 10/15/2026 | | | 750 | | | | 778 | |
| | |
GO, 2.00%, 10/15/2027 | | | 680 | | | | 701 | |
| | |
GO, 2.00%, 10/15/2028 | | | 300 | | | | 307 | |
| | |
GO, 2.00%, 10/15/2029 | | | 300 | | | | 306 | |
| | |
Penn Hills School District | | | | | | | | |
| | |
GO, 5.00%, 10/1/2026 | | | 4,845 | | | | 6,016 | |
| | |
GO, 5.00%, 10/1/2027 | | | 3,585 | | | | 4,566 | |
| | |
GO, 5.00%, 10/1/2028 | | | 3,585 | | | | 4,666 | |
| | |
GO, 5.00%, 10/1/2029 | | | 3,815 | | | | 5,068 | |
| | |
Pennsylvania Higher Educational Facilities Authority, Trustees of the University Series 2015C, Rev., 5.00%, 10/1/2022 | | | 5,055 | | | | 5,552 | |
| | |
Pennsylvania Turnpike Commission | | | | | | | | |
| | |
Series A-1, Rev., (SIFMA Municipal Swap Index Yield + 0.60%), 0.69%, 9/10/2020 (b) | | | 13,000 | | | | 12,943 | |
| | |
Series A, Rev., 5.00%, 12/1/2021 | | | 655 | | | | 691 | |
| | |
Pittsburgh Water & Sewer Authority Series A, Rev., 5.00%, 9/1/2023 | | | 270 | | | | 307 | |
| | |
Quaker Valley School District | | | | | | | | |
| | |
GO, 5.00%, 10/1/2028 | | | 350 | | | | 464 | |
| | | | | | | | |
| INVESTMENTS | | PRINCIPAL
AMOUNT
($000) | | | VALUE
($000) | |
| | | | | | | | |
|
Pennsylvania — continued | |
| | |
GO, 5.00%, 10/1/2029 | | | 425 | | | | 576 | |
| | |
GO, 5.00%, 10/1/2030 | | | 250 | | | | 341 | |
| | |
GO, 5.00%, 10/1/2031 | | | 325 | | | | 440 | |
| | |
School District of Philadelphia (The) Rev., TRAN, 4.00%, 6/30/2021 | | | 15,000 | | | | 15,457 | |
| | |
Schuylkill Valley School District GO, 5.00%, 4/1/2022 | | | 350 | | | | 377 | |
| | |
Southcentral General Authority, Hanover Hospital, Inc. Rev., 5.00%, 12/1/2026 | | | 1,400 | | | | 1,676 | |
| | |
Southcentral General Authority, Wellspan Health Obligation Group Series 2014A, Rev., 5.00%, 6/1/2024 | | | 380 | | | | 440 | |
| | |
Southeastern Pennsylvania Transportation Authority | | | | | | | | |
| | |
Rev., 5.00%, 6/1/2027 | | | 635 | | | | 803 | |
| | |
Rev., 5.00%, 6/1/2028 | | | 2,265 | | | | 2,912 | |
| | |
Rev., 5.00%, 6/1/2029 | | | 3,115 | | | | 4,080 | |
| | |
Rev., 5.00%, 6/1/2030 | | | 1,740 | | | | 2,319 | |
| | |
Rev., 5.00%, 6/1/2031 | | | 2,125 | | | | 2,821 | |
| | |
Rev., 5.00%, 6/1/2032 | | | 1,105 | | | | 1,461 | |
| | |
State Public School Building Authority, Community College of Philadelphia Project | | | | | | | | |
| | |
Rev., 5.00%, 6/15/2021 | | | 2,760 | | | | 2,847 | |
| | |
Rev., 5.00%, 6/15/2024 | | | 2,625 | | | | 2,965 | |
| | |
Upper St. Clair Township School District | | | | | | | | |
| | |
Series 2019B, GO, 4.00%, 10/1/2028 | | | 575 | | | | 683 | |
| | |
Series 2019B, GO, 4.00%, 10/1/2029 | | | 420 | | | | 497 | |
| | | | | | | | |
| | |
Total Pennsylvania | | | | | | | 136,917 | |
| | | | | | | | |
|
Rhode Island — 0.0% (g) | |
| | |
Rhode Island Commerce Corp., Department of Transportation Series 2016-A, Rev., GAN, 5.00%, 6/15/2022 | | | 25 | | | | 27 | |
| | | | | | | | |
|
South Dakota — 0.1% | |
| | |
South Dakota Health and Educational Facilities Authority | | | | | | | | |
| | |
Series B, Rev., 4.00%, 11/1/2020 | | | 625 | | | | 629 | |
| | |
Series B, Rev., 4.00%, 11/1/2021 | | | 500 | | | | 520 | |
| | |
Series B, Rev., 5.00%, 11/1/2022 | | | 375 | | | | 411 | |
| | |
South Dakota State Building Authority Series B, Rev., 5.00%, 6/1/2021 | | | 485 | | | | 502 | |
| | | | | | | | |
| | |
Total South Dakota | | | | | | | 2,062 | |
| | | | | | | | |
|
Tennessee — 0.7% | |
| | |
County of Rutherford Series A, GO, 5.00%, 4/1/2026 | | | 1,165 | | | | 1,410 | |
SEE NOTES TO FINANCIAL STATEMENTS.
| | | | | | |
| | | |
| 40 | | | | J.P. MORGAN MUNICIPAL BOND FUNDS | | AUGUST 31, 2020 |
| | | | | | | | |
| INVESTMENTS | | PRINCIPAL
AMOUNT
($000) | | | VALUE
($000) | |
Municipal Bonds — continued | | | | | | | | |
|
Tennessee — continued | |
| | |
State of Tennessee Series A, GO, 4.00%, 8/1/2025 | | | 7,000 | | | | 7,494 | |
| | |
Tennessee Energy Acquisition Corp., Gas Project | | | | | | | | |
| | |
Series A, Rev., 4.00%, 5/1/2022 | | | 1,460 | | | | 1,542 | |
| | |
Series A, Rev., 4.00%, 5/1/2023 | | | 1,400 | | | | 1,523 | |
| | | | | | | | |
| | |
Total Tennessee | | | | | | | 11,969 | |
| | | | | | | | |
|
Texas — 6.7% | |
| | |
Abilene Independent School District, Unlimited Tax School Building GO, PSF-GTD, 4.00%, 2/15/2029 | | | 2,000 | | | | 2,463 | |
| | |
Arlington Higher Education Finance Corp., Uplift Education Series 2017A, Rev., PSF-GTD, 4.00%, 12/1/2029 | | | 1,000 | | | | 1,185 | |
| | |
Austin Community College District Public Facility Corp., Lease, Highland Campus Parking Garage Project | | | | | | | | |
| | |
Series 2018C, Rev., 5.00%, 8/1/2026 | | | 250 | | | | 313 | |
| | |
Series 2018C, Rev., 5.00%, 8/1/2027 | | | 200 | | | | 258 | |
| | |
Series 2018C, Rev., 5.00%, 8/1/2029 | | | 325 | | | | 414 | |
| | |
Austin Community College District, Combined Fee Series 2014A, Rev., 5.00%, 2/1/2021 | | | 790 | | | | 806 | |
| | |
Austin Convention Enterprises, Inc., Convention Center Hotel First Tier | | | | | | | | |
| | |
Series 2017A, Rev., 5.00%, 1/1/2021 | | | 500 | | | | 505 | |
| | |
Series 2017A, Rev., 5.00%, 1/1/2022 | | | 750 | | | | 771 | |
| | |
Austin Convention Enterprises, Inc., Convention Center Hotel Second Tier Series 2017B, Rev., 5.00%, 1/1/2021 | | | 800 | | | | 788 | |
| | |
Central Texas Regional Mobility Authority, Subordinated Lien Rev., BAN, 4.00%, 1/1/2022 | | | 1,545 | | | | 1,585 | |
| | |
City of Abilene, Taylor and Jones Counties GO, 5.00%, 2/15/2021 | | | 475 | | | | 485 | |
| | |
City of Austin, Airport System | | | | | | | | |
| | |
Series 2017B, Rev., AMT, 5.00%, 11/15/2026 | | | 1,095 | | | | 1,345 | |
| | |
Series 2017B, Rev., AMT, 5.00%, 11/15/2027 | | | 585 | | | | 713 | |
| | |
Series 2017B, Rev., AMT, 5.00%, 11/15/2028 | | | 630 | | | | 762 | |
| | |
City of Cedar Park, Utility System Rev., 5.00%, 8/15/2022 | | | 560 | | | | 612 | |
| | |
City of Coppell, Combination Limited Tax GO, 4.00%, 2/1/2030 (e) | | | 1,010 | | | | 1,247 | |
| | |
City of Denton GO, 5.00%, 2/15/2023 | | | 1,045 | | | | 1,166 | |
| | |
City of El Paso, Refunding and Improvement | | | | | | | | |
| | |
GO, 5.00%, 8/15/2021 | | | 530 | | | | 554 | |
| | | | | | | | |
| INVESTMENTS | | PRINCIPAL
AMOUNT
($000) | | | VALUE
($000) | |
| | | | | | | | |
|
Texas — continued | |
| | |
GO, 5.00%, 8/15/2025 | | | 4,035 | | | | 4,947 | |
| | |
City of Galveston GO, 4.00%, 5/1/2024 | | | 635 | | | | 716 | |
| | |
City of Galveston, Waterworks and Sewer System Rev., 5.00%, 5/1/2021 | | | 265 | | | | 273 | |
| | |
City of Garland, Water and Sewer System Series 2018A, Rev., 5.00%, 3/1/2026 | | | 1,030 | | | | 1,272 | |
| | |
City of Houston, Public Improvement | | | | | | | | |
| | |
Series A, GO, 5.00%, 3/1/2021 | | | 3,000 | | | | 3,071 | |
| | |
Series A, GO, 5.00%, 3/1/2025 | | | 1,195 | | | | 1,435 | |
| | |
City of San Antonio, Electric and Gas Systems Series B, Rev., 2.00%, 12/1/2021 (c) | | | 6,480 | | | | 6,556 | |
| | |
College of the Mainland GO, 4.00%, 8/15/2034 | | | 2,860 | | | | 3,339 | |
| | |
Counties of Harris and Fort Bend, Houston Community College System, Limited Tax GO, 5.00%, 2/15/2026 | | | 1,000 | | | | 1,112 | |
| | |
County of Kaufman | | | | | | | | |
| | |
Series 2020A, GO, 5.00%, 2/15/2028 | | | 270 | | | | 351 | |
| | |
Series 2020A, GO, 5.00%, 2/15/2029 | | | 285 | | | | 378 | |
| | |
GO, 5.00%, 2/15/2030 | | | 665 | | | | 880 | |
| | |
Series 2020A, GO, 5.00%, 2/15/2030 | | | 300 | | | | 396 | |
| | |
Series 2020A, GO, 5.00%, 2/15/2031 | | | 630 | | | | 827 | |
| | |
GO, 5.00%, 2/15/2032 | | | 425 | | | | 554 | |
| | |
Series 2020A, GO, 5.00%, 2/15/2032 | | | 660 | | | | 861 | |
| | |
Series 2020A, GO, 4.00%, 2/15/2033 | | | 345 | | | | 416 | |
| | |
GO, 4.00%, 2/15/2034 | | | 465 | | | | 558 | |
| | |
GO, 4.00%, 2/15/2035 | | | 300 | | | | 359 | |
| | |
Series 2020A, GO, 4.00%, 2/15/2035 | | | 375 | | | | 448 | |
| | |
Forney Independent School District, School Building GO, PSF-GTD, 5.00%, 8/15/2024 | | | 1,310 | | | | 1,552 | |
| | |
Galveston County, Unlimited Tax Road | | | | | | | | |
| | |
Series 2017, GO, 4.00%, 2/1/2024 | | | 980 | | | | 1,099 | |
| | |
Series 2017, GO, 4.00%, 2/1/2025 | | | 800 | | | | 924 | |
| | |
Georgetown Independent School District Series C, GO, PSF-GTD, 4.00%, 8/15/2032 | | | 2,165 | | | | 2,600 | |
| | |
Grand Parkway Transportation Corp. Rev., BAN, 5.00%, 2/1/2023 | | | 10,000 | | | | 10,994 | |
| | |
Harris County Cultural Education Facilities Finance Corp., Memorial Hermann Health System Series 2014A, Rev., 5.00%, 12/1/2026 | | | 1,910 | | | | 2,226 | |
| | |
Harris County Fresh Water Supply District No. 61 Series 2019, GO, AGM, 3.00%, 9/1/2025 | | | 530 | | | | 585 | |
| | |
Hereford Independent School District, School Building | | | | | | | | |
| | |
GO, PSF-GTD, 4.00%, 2/15/2028 | | | 1,420 | | | | 1,697 | |
SEE NOTES TO FINANCIAL STATEMENTS.
| | | | | | | | |
| | | |
| AUGUST 31, 2020 | | J.P. MORGAN MUNICIPAL BOND FUNDS | | | | | 41 | |
JPMorgan Short-Intermediate Municipal Bond Fund
SCHEDULE OF PORTFOLIO INVESTMENTS
AS OF AUGUST 31, 2020 (Unaudited) (continued)
| | | | | | | | |
| INVESTMENTS | | PRINCIPAL
AMOUNT
($000) | | | VALUE
($000) | |
Municipal Bonds — continued | | | | | | | | |
|
Texas — continued | |
| | |
GO, PSF-GTD, 4.00%, 2/15/2029 | | | 1,480 | | | | 1,766 | |
| | |
GO, PSF-GTD, 4.00%, 2/15/2030 | | | 1,000 | | | | 1,180 | |
| | |
GO, PSF-GTD, 4.00%, 2/15/2031 | | | 700 | | | | 819 | |
| | |
Irving Hospital Authority, Baylor Scott and White Medical Center | | | | | | | | |
| | |
Series 2017B, Rev., (SIFMA Municipal Swap Index Yield + 1.10%), 1.19%, 9/10/2020 (b) | | | 1,750 | | | | 1,708 | |
| | |
Series 2017A, Rev., 5.00%, 10/15/2022 | | | 250 | | | | 273 | |
| | |
Series 2017A, Rev., 5.00%, 10/15/2028 | | | 250 | | | | 302 | |
| | |
Series 2017A, Rev., 5.00%, 10/15/2029 | | | 500 | | | | 601 | |
| | |
Katy Independent School District, School Building GO, PSF-GTD, 4.00%, 2/15/2027 | | | 290 | | | | 315 | |
| | |
Klein Independent School District Series B, GO, 5.00%, 8/1/2029 | | | 525 | | | | 636 | |
| | |
Lewisville Independent School District, School Building | | | | | | | | |
| | |
GO, PSF-GTD, 5.00%, 8/15/2025 | | | 750 | | | | 853 | |
| | |
GO, PSF-GTD, 5.00%, 8/15/2026 | | | 750 | | | | 852 | |
| | |
GO, PSF-GTD, 5.00%, 8/15/2027 | | | 650 | | | | 737 | |
| | |
Lower Colorado River Authority | | | | | | | | |
| | |
Series B, Rev., 5.00%, 5/15/2022 (d) | | | 60 | | | | 65 | |
| | |
Series B, Rev., 5.00%, 5/15/2023 | | | 4,700 | | | | 5,067 | |
| | |
New Braunfels Independent School District GO, PSF-GTD, 4.00%, 2/1/2034 | | | 1,000 | | | | 1,177 | |
| | |
North Texas Tollway Authority System, First Tier Series A, Rev., 4.00%, 1/1/2033 | | | 2,500 | | | | 2,875 | |
| | |
Pasadena Independent School District Series A, GO, PSF-GTD, 5.00%, 2/15/2028 | | | 1,000 | | | | 1,155 | |
| | |
Richardson Independent School District Series 2019, GO, PSF-GTD, 5.00%, 2/15/2029 | | | 3,165 | | | | 4,121 | |
| | |
S & S Consolidated Independent School District GO, PSF-GTD, 4.00%, 2/15/2028 | | | 580 | | | | 709 | |
| | |
Southside Independent School District, School Building GO, PSF-GTD, 5.00%, 8/15/2022 | | | 250 | | | | 273 | |
| | |
Southwest Higher Education Authority, Inc., Southern Methodist University Project | | | | | | | | |
| | |
Series 2017, Rev., 5.00%, 10/1/2021 | | | 425 | | | | 447 | |
| | |
Series 2017, Rev., 5.00%, 10/1/2022 | | | 400 | | | | 436 | |
| | |
Series 2017, Rev., 5.00%, 10/1/2023 | | | 400 | | | | 454 | |
| | |
State of Texas Rev., TRAN, 4.00%, 8/26/2021 | | | 12,480 | | | | 12,945 | |
| | |
Texas Municipal Gas Acquisition and Supply Corp. I Series D, Rev., 6.25%, 12/15/2026 | | | 1,705 | | | | 2,017 | |
| | |
University of Texas System (The) Series 2020C, Rev., 5.00%, 8/15/2031 | | | 5,000 | | | | 7,011 | |
| | | | | | | | |
| INVESTMENTS | | PRINCIPAL
AMOUNT
($000) | | | VALUE
($000) | |
| | | | | | | | |
|
Texas — continued | |
| | |
West Travis County Public Utility Agency | | | | | | | | |
| | |
Series 2017, Rev., 5.00%, 8/15/2022 | | | 545 | | | | 595 | |
| | |
Series 2017, Rev., 5.00%, 8/15/2023 | | | 325 | | | | 368 | |
| | |
Series 2017, Rev., 5.00%, 8/15/2027 | | | 350 | | | | 447 | |
| | | | | | | | |
| | |
Total Texas | | | | | | | 116,602 | |
| | | | | | | | |
|
Utah — 1.2% | |
| | |
Salt Lake City Corp. Airport Series A, Rev., AMT, 5.00%, 7/1/2022 | | | 1,000 | | | | 1,077 | |
| | |
State of Utah GO, 5.00%, 7/1/2021 | | | 4,925 | | | | 5,123 | |
| | |
Utah Infrastructure Agency, Telecommunication Series A, Rev., 5.00%, 10/15/2025 | | | 10,380 | | | | 11,667 | |
| | |
West Valley City Municipal Building Authority | | | | | | | | |
| | |
Rev., AGM, 4.00%, 2/1/2024 | | | 500 | | | | 559 | |
| | |
Rev., AGM, 5.00%, 2/1/2025 | | | 250 | | | | 298 | |
| | |
Rev., AGM, 5.00%, 2/1/2027 | | | 720 | | | | 907 | |
| | |
Rev., AGM, 5.00%, 2/1/2029 | | | 1,070 | | | | 1,334 | |
| | | | | | | | |
| | |
Total Utah | | | | | | | 20,965 | |
| | | | | | | | |
|
Vermont — 0.1% | |
| | |
University of Vermont and State Agricultural College | | | | | | | | |
| | |
Rev., 5.00%, 10/1/2021 | | | 750 | | | | 789 | |
| | |
Rev., 5.00%, 10/1/2022 | | | 855 | | | | 931 | |
| | |
Vermont Municipal Bond Bank Series 3, Rev., 5.00%, 12/1/2021 | | | 400 | | | | 424 | |
| | | | | | | | |
| | |
Total Vermont | | | | | | | 2,144 | |
| | | | | | | | |
|
Virginia — 2.7% | |
| | |
County of Fairfax, Public Improvement Series 2019A, GO, 4.00%, 10/1/2026 | | | 7,715 | | | | 9,365 | |
| | |
Fairfax County Water Authority, Water Series B, Rev., 5.25%, 4/1/2024 | | | 5,615 | | | | 6,624 | |
| | |
Loudoun County, Public Improvement Series A, GO, 5.00%, 12/1/2026 | | | 1,930 | | | | 2,406 | |
| | |
Virginia College Building Authority, 21st Century College and Equipment Programs | | | | | | | | |
| | |
Series 2017E, Rev., 5.00%, 2/1/2027 | | | 20,000 | | | | 25,629 | |
| | |
Series 2017C, Rev., 5.00%, 2/1/2028 | | | 1,000 | | | | 1,275 | |
| | |
Virginia Resources Authority, Infrastructure Series C, Rev., 5.00%, 11/1/2027 | | | 1,235 | | | | 1,575 | |
| | | | | | | | |
| | |
Total Virginia | | | | | | | 46,874 | |
| | | | | | | | |
|
Washington — 1.2% | |
| | |
Snohomish County Public Utility District No. 1 Rev., 5.00%, 12/1/2025 | | | 500 | | | | 618 | |
SEE NOTES TO FINANCIAL STATEMENTS.
| | | | | | |
| | | |
| 42 | | | | J.P. MORGAN MUNICIPAL BOND FUNDS | | AUGUST 31, 2020 |
| | | | | | | | |
| INVESTMENTS | | PRINCIPAL
AMOUNT
($000) | | | VALUE
($000) | |
Municipal Bonds — continued | | | | | | | | |
|
Washington — continued | |
| | |
Washington Health Care Facilities Authority, Commonspirit Health Series B-3, Rev., 5.00%, 8/1/2026 (c) | | | 17,000 | | | | 20,035 | |
| | | | | | | | |
| | |
Total Washington | | | | | | | 20,653 | |
| | | | | | | | |
|
West Virginia — 0.2% | |
| | |
West Virginia Economic Development Authority, Appalachian Power Co. — AMOS Project Series 2009A, Rev., 2.63%, 6/1/2022 (c) | | | 2,905 | | | | 2,994 | |
| | | | | | | | |
|
Wisconsin — 1.5% | |
| | |
Pewaukee School District Series 2019B, GO, 5.00%, 9/1/2027 | | | 200 | | | | 259 | |
| | |
State of Wisconsin | | | | | | | | |
| | |
Series A, GO, 5.00%, 5/1/2026 | | | 5,050 | | | | 6,149 | |
| | |
Series 1, GO, 5.00%, 11/1/2026 | | | 1,135 | | | | 1,447 | |
| | |
Sun Prairie Area School District GO, 4.00%, 3/1/2028 | | | 2,500 | | | | 3,003 | |
| | |
Wauwatosa School District, School Building and Improvement | | | | | | | | |
| | |
Series 2019A, GO, 5.00%, 3/1/2027 | | | 5,025 | | | | 6,440 | |
| | |
Series 2019A, GO, 5.00%, 3/1/2029 | | | 6,025 | | | | 7,661 | |
| | |
Wisconsin Health and Educational Facilities Authority, Aspirus, Inc., Obligated Group Rev., 5.00%, 8/15/2025 | | | 325 | | | | 391 | |
| | | | | | | | |
| INVESTMENTS | | PRINCIPAL
AMOUNT
($000) | | | VALUE
($000) | |
| | | | | | | | |
| | |
Wisconsin — continued | | | | | | | | |
| | |
Wisconsin Health and Educational Facilities Authority, Thedacare, Inc. Rev., 5.00%, 12/15/2020 | | | 1,250 | | | | 1,266 | |
| | | | | | | | |
| | |
Total Wisconsin | | | | | | | 26,616 | |
| | | | | | | | |
| | |
Total Municipal Bonds
(Cost $1,501,888) | | | | | | | 1,562,287 | |
| | | | | | | | |
Collateralized Mortgage Obligations — 0.0% (g) | |
| | |
FNMA, REMIC Series 2002-36, Class FS, 0.68%, 6/25/2032 (c)
(Cost $116) | | | 116 | | | | 116 | |
| | | | | | | | |
| | |
| | | SHARES
(000) | | | | |
Short-Term Investments — 10.8% | |
|
Investment Companies — 10.8% | |
| | |
JPMorgan Institutional Tax Free Money Market Fund Class IM Shares, 0.04% (h) (i)
(Cost $186,178) | | | 186,063 | | | | 186,193 | |
| | | | | | | | |
Total Investments — 101.2%
(Cost $1,688,182) | | | | | | | 1,748,596 | |
Liabilities in Excess of
Other Assets — (1.2)% | | | | | | | (20,075 | ) |
| | | | | | | | |
NET ASSETS — 100.0% | | | | | | | 1,728,521 | |
| | | | | | | | |
Percentages indicated are based on net assets.
Abbreviations
| | |
| AGM | | Insured by Assured Guaranty Municipal Corp. |
| AMT | | Alternative Minimum Tax |
| BAN | | Bond Anticipation Note |
| COP | | Certificate of Participation |
| FNMA | | Federal National Mortgage Association |
| GAN | | Grant Anticipation Note |
| GO | | General Obligation |
| GTD | | Guaranteed |
| ICE | | Intercontinental Exchange |
| LIBOR | | London Interbank Offered Rate |
| LIQ | | Liquidity Agreement |
| LOC | | Letter of Credit |
| NATL | | Insured by National Public Finance Guarantee Corp. |
| PSF-GTD | | Permanent School Fund Guaranteed |
| Q-SBLF | | Qualified School Bond Loan Fund |
| RAN | | Revenue Anticipation Note |
| RE | | Reinsured |
| REMIC | | Real Estate Mortgage Investment Conduit |
| Rev. | | Revenue |
| SIFMA | | The Securities Industry and Financial Markets Association |
| TRAN | | Tax & Revenue Anticipation Note |
| | |
| USD | | United States Dollar |
| VRDO | | Variable Rate Demand Obligation |
| |
| (a) | | The date shown represents the earliest of the prerefunded date, next put date or final maturity date. |
| (b) | | Variable or floating rate security, linked to the referenced benchmark. The interest rate shown is the current rate as of August 31, 2020. |
| (c) | | Variable or floating rate security, the interest rate of which adjusts periodically based on changes in current interest rates and prepayments on the underlying pool of assets. The interest rate shown is the current rate as of August 31, 2020. |
| (d) | | Security is prerefunded or escrowed to maturity. |
| (e) | | All or a portion of the security is a when-issued security, delayed delivery security, or forward commitment. |
| (f) | | Securities exempt from registration under Rule 144A or section 4(a)(2), of the Securities Act of 1933, as amended. |
| (g) | | Amount rounds to less than 0.1% of net assets. |
| (h) | | Investment in an affiliated fund, which is registered under the Investment Company Act of 1940, as amended, and is advised by J.P. Morgan Investment Management Inc. |
| (i) | | The rate shown is the current yield as of August 31, 2020. |
SEE NOTES TO FINANCIAL STATEMENTS.
| | | | | | | | |
| | | |
| AUGUST 31, 2020 | | J.P. MORGAN MUNICIPAL BOND FUNDS | | | | | 43 | |
JPMorgan Sustainable Municipal Income Fund
(formerly known as JPMorgan Municipal Income Fund)
SCHEDULE OF PORTFOLIO INVESTMENTS
AS OF AUGUST 31, 2020 (Unaudited)
| | | | | | | | |
| INVESTMENTS | | PRINCIPAL
AMOUNT
($000) | | | VALUE
($000) | |
Municipal Bonds — 92.8% (a) | |
|
Alabama — 0.4% | |
| | |
The Lower Alabama Gas District, Gas Project Series 2016A, Rev., 5.00%, 9/1/2031 | | | 1,000 | | | | 1,300 | |
| | | | | | | | |
|
Alaska — 0.2% | |
| | |
Alaska Housing Finance Corp., General Mortgage Series 2016A, Rev., 3.50%, 6/1/2046 | | | 625 | | | | 664 | |
| | | | | | | | |
|
Arizona — 1.6% | |
| | |
City of Tucson, Water System Rev., 5.00%, 7/1/2024 | | | 2,150 | | | | 2,540 | |
| | |
Maricopa County Industrial Development Authority, HonorHealth Series 2019A, Rev., 5.00%, 9/1/2032 | | | 200 | | | | 248 | |
| | |
University of Arizona (The) | | | | | | | | |
| | |
Series 2020A, Rev., 5.00%, 8/1/2025 | | | 250 | | | | 301 | |
| | |
Series 2020A, Rev., 5.00%, 8/1/2026 | | | 700 | | | | 866 | |
| | |
Series 2020A, Rev., 5.00%, 8/1/2027 | | | 750 | | | | 951 | |
| | | | | | | | |
| | |
Total Arizona | | | | | | | 4,906 | |
| | | | | | | | |
|
California — 2.8% | |
| | |
California Municipal Finance Authority, Eisenhower Medical Center Series 2017B, Rev., 5.00%, 7/1/2026 | | | 410 | | | | 491 | |
| | |
California Statewide Communities Development Authority, Emanate Health, Tax Exempt Series 2020A, Rev., 3.00%, 4/1/2050 | | | 2,645 | | | | 2,701 | |
| | |
Eastern Municipal Water District Financing Authority, Water and Wastewater System | | | | | | | | |
| | |
Series 2020A, Rev., 5.00%, 7/1/2035 | | | 500 | | | | 679 | |
| | |
Series 2020A, Rev., 5.00%, 7/1/2036 | | | 500 | | | | 676 | |
| | |
Middle Fork Project Finance Authority Rev., 5.00%, 4/1/2027 | | | 3,000 | | | | 3,520 | |
| | |
State of California, Department of Veterans Affairs Series B, Rev., 3.50%, 12/1/2045 | | | 490 | | | | 522 | |
| | | | | | | | |
| | |
Total California | | | | | | | 8,589 | |
| | | | | | | | |
|
Colorado — 3.2% | |
| | |
Aspen Fire Protection District | | | | | | | | |
| | |
COP, 4.00%, 12/1/2034 | | | 200 | | | | 237 | |
| | |
COP, 4.00%, 12/1/2035 | | | 225 | | | | 266 | |
| | |
COP, 4.00%, 12/1/2036 | | | 350 | | | | 412 | |
| | |
Colorado Educational and Cultural Facilities Authority, University Corp. for Atmospheric Research Project | | | | | | | | |
| | |
Rev., 4.00%, 9/1/2020 | | | 450 | | | | 450 | |
| | |
Rev., 5.00%, 9/1/2022 | | | 470 | | | | 507 | |
| | |
Colorado Housing and Finance Authority, Single Family Mortgage | | | | | | | | |
| | |
Series 2019F, Rev., GNMA COLL, 4.25%, 11/1/2049 | | | 290 | | | | 326 | |
| | | | | | | | |
| INVESTMENTS | | PRINCIPAL
AMOUNT
($000) | | | VALUE
($000) | |
| | | | | | | | |
| | |
Colorado — continued | | | | | | | | |
| | |
Series 2020B, Rev., 3.75%, 5/1/2050 | | | 2,100 | | | | 2,325 | |
| | |
Colorado School of Mines Series A, Rev., (ICE LIBOR USD 1 Month + 0.50%), 0.60%, 10/1/2020 (b) | | | 970 | | | | 956 | |
| | |
IDK PARTNERS III Trust, Mortgage Pass-Through Certificates Series 1999A, Class A, Rev., 5.10%, 8/1/2023 ‡ | | | 5 | | | | 5 | |
| | |
Pueblo City Schools GO, 5.00%, 12/15/2031 | | | 3,000 | | | | 4,041 | |
| | | | | | | | |
| | |
Total Colorado | | | | | | | 9,525 | |
| | | | | | | | |
|
Connecticut — 3.6% | |
| | |
Connecticut Housing Finance Authority, Housing Mortgage Finance Program | | | | | | | | |
| | |
Series D-1, Rev., 1.35%, 5/15/2022 | | | 175 | | | | 178 | |
| | |
Series D-1, Rev., 1.45%, 5/15/2023 | | | 1,020 | | | | 1,043 | |
| | |
Series D-1, Rev., 1.50%, 11/15/2023 | | | 1,220 | | | | 1,252 | |
| | |
Series 2020A-1, Rev., 3.50%, 11/15/2045 | | | 1,315 | | | | 1,469 | |
| | |
Series A-1, Rev., 4.00%, 11/15/2045 | | | 260 | | | | 275 | |
| | |
Series D, Subseries D-1, Rev., GNMA/FNMA/FHLMC, 4.00%, 11/15/2047 | | | 920 | | | | 996 | |
| | |
Subseries A-1, Rev., 4.00%, 11/15/2047 | | | 315 | | | | 341 | |
| | |
Connecticut State Health & Educational Facilities Authority, Yale New Haven Series B, Rev., 1.80%, 7/1/2024 (c) | | | 225 | | | | 234 | |
| | |
Connecticut State Higher Education Supplemental Loan Authority, CHESLA Loan Program | | | | | | | | |
| | |
Series 2010A, Rev., 5.25%, 11/15/2020 | | | 1,560 | | | | 1,577 | |
| | |
Series A, Rev., 5.25%, 11/15/2020 | | | 1,500 | | | | 1,515 | |
| | |
Series 2019B, Rev., AMT, 5.00%, 11/15/2027 | | | 250 | | | | 295 | |
| | |
University of Connecticut Series 2019A, Rev., 5.00%, 11/1/2035 | | | 1,250 | | | | 1,558 | |
| | | | | | | | |
| | |
Total Connecticut | | | | | | | 10,733 | |
| | | | | | | | |
|
Delaware — 0.9% | |
| | |
Delaware State Health Facilities Authority, Beebe Medical Center Project Rev., 5.00%, 6/1/2034 | | | 2,200 | | | | 2,620 | |
| | |
Delaware State Housing Authority, Senior Single Family Mortgage Series A-1, Rev., AMT, 4.90%, 7/1/2029 | | | 145 | | | | 147 | |
| | | | | | | | |
| | |
Total Delaware | | | | | | | 2,767 | |
| | | | | | | | |
|
District of Columbia — 3.4% | |
| | |
District of Columbia, Water and Sewer Authority, Public Utility, Subordinate Lien, Green Bonds Series A, Rev., 5.00%, 10/1/2045 | | | 1,500 | | | | 1,777 | |
SEE NOTES TO FINANCIAL STATEMENTS.
| | | | | | |
| | | |
| 44 | | | | J.P. MORGAN MUNICIPAL BOND FUNDS | | AUGUST 31, 2020 |
| | | | | | | | |
| INVESTMENTS | | PRINCIPAL
AMOUNT
($000) | | | VALUE
($000) | |
Municipal Bonds — continued | | | | | | | | |
| | |
District of Columbia — continued | | | | | | | | |
| | |
Washington Metropolitan Area Transit Authority | | | | | | | | |
| | |
Series 2020A, Rev., 5.00%, 7/15/2031 | | | 1,500 | | | | 2,037 | |
| | |
Series 2020A, Rev., 5.00%, 7/15/2032 | | | 3,885 | | | | 5,224 | |
| | |
Washington Metropolitan Area Transit Authority, Gross Transit Bonds Series 2017B, Rev., 5.00%, 7/1/2025 | | | 1,000 | | | | 1,212 | |
| | | | | | | | |
| | |
Total District of Columbia | | | | | | | 10,250 | |
| | | | | | | | |
|
Florida — 7.8% | |
| | |
Broward County Series 2019A, Rev., 5.00%, 10/1/2038 | | | 3,000 | | | | 3,914 | |
| | |
Broward County Fuel System, Fort Lauderdale Fuel Facilities LLC Project Series A, Rev., AMT, AGM, 5.00%, 4/1/2024 | | | 835 | | | | 923 | |
| | |
City of Port St. Lucie, Utility Systems Rev., NATL-RE, 5.25%, 9/1/2024 | | | 5,000 | | | | 5,954 | |
| | |
Florida Housing Finance Corp., Homeowner Mortgage, Special Program Series B, Rev., GNMA/FNMA/FHLMC, 4.50%, 1/1/2029 | | | 30 | | | | 30 | |
| | |
Lee Memorial Health System Series 2019A-1, Rev., 5.00%, 4/1/2036 | | | 1,000 | | | | 1,247 | |
| | |
Miami Beach Redevelopment Agency, Historic Convention Village Series A, Rev., 5.00%, 2/1/2027 | | | 2,000 | | | | 2,292 | |
| | |
Palm Beach County Health Facilities Authority, Hospital, BRRH Corp. Obligated Group Rev., 5.00%, 12/1/2021 (d) | | | 1,100 | | | | 1,164 | |
| | |
Polk County School District Series 2019B, COP, 5.00%, 1/1/2026 | | | 515 | | | | 629 | |
| | |
School Board of Miami-Dade County (The) Series 2015D, COP, 5.00%, 2/1/2027 | | | 3,000 | | | | 3,671 | |
| | |
South Florida Water Management District COP, 5.00%, 10/1/2032 | | | 2,250 | | | | 2,699 | |
| | |
St. Johns County School Board Series 2019A, COP, 5.00%, 7/1/2031 | | | 570 | | | | 741 | |
| | | | | | | | |
| | |
Total Florida | | | | | | | 23,264 | |
| | | | | | | | |
|
Georgia — 1.0% | |
| | |
Columbus Medical Center Hospital Authority, Piedmont Healthcare Series 2019B, Rev., 5.00%, 7/1/2029 (c) | | | 500 | | | | 606 | |
| | |
Gainesville and Hall County Hospital Authority, Northeast Georgia Health System, Inc. Project Series A, Rev., 5.00%, 2/15/2026 | | | 860 | | | | 1,041 | |
| | |
Georgia Housing and Finance Authority, Single Family Mortgage | | | | | | | | |
| | |
Series A, Rev., 4.00%, 12/1/2047 | | | 470 | | | | 506 | |
| | |
Series B, Rev., 4.00%, 12/1/2047 | | | 890 | | | | 964 | |
| | | | | | | | |
| | |
Total Georgia | | | | | | | 3,117 | |
| | | | | | | | |
| | | | | | | | |
| INVESTMENTS | | PRINCIPAL
AMOUNT
($000) | | | VALUE
($000) | |
| | | | | | | | |
|
Guam — 0.3% | |
| | |
Guam Government Waterworks Authority, Water and Wastewater System (Guam) | | | | | | | | |
| | |
Rev., 5.00%, 7/1/2023 | | | 375 | | | | 415 | |
| | |
Rev., 5.00%, 7/1/2024 | | | 300 | | | | 342 | |
| | | | | | | | |
| | |
Total Guam | | | | | | | 757 | |
| | | | | | | | |
|
Illinois — 3.4% | |
| | |
City of Aurora, Single Family Mortgage | | | | | | | | |
| | |
Series B, Rev., GNMA/FNMA/FHLMC, 5.45%, 12/1/2039 | | | 87 | | | | 87 | |
| | |
Series A, Rev., AMT, GNMA/FNMA/FHLMC, 5.50%, 12/1/2039 | | | 103 | | | | 105 | |
| | |
Illinois Finance Authority, Healthcare Enterprises, Inc. Series C, Rev., 5.00%, 3/1/2033 | | | 365 | | | | 438 | |
| | |
Illinois Housing Development Authority Series C, Rev., GNMA/FNMA/FHLMC COLL, 4.00%, 10/1/2049 | | | 1,860 | | | | 2,076 | |
| | |
Illinois Housing Development Authority, Homeowner Mortgage Series C, Rev., 3.50%, 8/1/2046 | | | 755 | | | | 812 | |
| | |
Peoria City School District No. 150 Series 2020A, GO, AGM, 4.00%, 12/1/2027 | | | 505 | | | | 598 | |
| | |
Southwestern Illinois Development Authority | | | | | | | | |
| | |
Rev., 5.00%, 4/15/2026 | | | 250 | | | | 307 | |
| | |
Rev., 5.00%, 4/15/2027 | | | 365 | | | | 460 | |
| | |
Rev., 5.00%, 4/15/2028 | | | 390 | | | | 503 | |
| | |
Rev., 5.00%, 4/15/2029 | | | 290 | | | | 380 | |
| | |
Will County Forest Preserve District | | | | | | | | |
| | |
GO, 5.00%, 12/15/2035 | | | 1,170 | | | | 1,499 | |
| | |
GO, 5.00%, 12/15/2036 | | | 1,460 | | | | 1,848 | |
| | |
GO, 4.00%, 12/15/2037 | | | 1,000 | | | | 1,168 | |
| | | | | | | | |
| | |
Total Illinois | | | | | | | 10,281 | |
| | | | | | | | |
|
Indiana — 3.3% | |
| | |
County of St. Joseph, Economic Development, St. Mary’s College Project Series A, Rev., 5.00%, 4/1/2026 | | | 1,880 | | | | 2,221 | |
| | |
Indiana Finance Authority, First Lien Wastewater Utility, CWA Authority Project Series 2012A, Rev., 5.00%, 10/1/2030 | | | 1,250 | | | | 1,367 | |
| | |
Indiana Health Facility Financing Authority, Ascension Health Credit Group Series A-1, Rev., 5.00%, 11/15/2034 | | | 1,670 | | | | 1,979 | |
| | |
Indiana Housing and Community Development Authority Series 2020A, Rev., 3.75%, 1/1/2049 | | | 1,000 | | | | 1,118 | |
| | |
Indiana Housing and Community Development Authority, Home First Mortgage | | | | | | | | |
SEE NOTES TO FINANCIAL STATEMENTS.
| | | | | | | | |
| | | |
| AUGUST 31, 2020 | | J.P. MORGAN MUNICIPAL BOND FUNDS | | | | | 45 | |
JPMorgan Sustainable Municipal Income Fund
(formerly known as JPMorgan Municipal Income Fund)
SCHEDULE OF PORTFOLIO INVESTMENTS
AS OF AUGUST 31, 2020 (Unaudited) (continued)
| | | | | | | | |
| INVESTMENTS | | PRINCIPAL
AMOUNT
($000) | | | VALUE
($000) | |
Municipal Bonds — continued | | | | | | | | |
| | |
Indiana — continued | | | | | | | | |
| | |
Series A, Rev., GNMA/FNMA/FHLMC, 4.50%, 9/1/2020 | | | 50 | | | | 51 | |
| | |
Series A, Rev., GNMA/FNMA/FHLMC, 4.50%, 6/1/2028 | | | 20 | | | | 20 | |
| | |
Indianapolis Local Public Improvement Bond Bank Series 2019F, Rev., 5.00%, 1/1/2037 | | | 2,500 | | | | 3,207 | |
| | | | | | | | |
| | |
Total Indiana | | | | | | | 9,963 | |
| | | | | | | | |
|
Iowa — 1.0% | |
| | |
Iowa Finance Authority, Single Family Mortgage-Backed Securities Program Series C, Rev., GNMA/FNMA/FHLMC, 3.50%, 1/1/2047 | | | 1,400 | | | | 1,499 | |
| | |
Iowa Student Loan Liquidity Corp., Student Loan | | | | | | | | |
| | |
Series A, Rev., AMT, 5.00%, 12/1/2025 | | | 1,000 | | | | 1,142 | |
| | |
Series 2019B, Rev., AMT, 5.00%, 12/1/2029 | | | 300 | | | | 363 | |
| | | | | | | | |
| | |
Total Iowa | | | | | | | 3,004 | |
| | | | | | | | |
|
Kentucky — 0.8% | |
| | |
Louisville & Jefferson County Metropolitan Government Series 2020C, Rev., 5.00%, 10/1/2026 (c) | | | 2,000 | | | | 2,337 | |
| | | | | | | | |
|
Louisiana — 0.3% | |
| | |
East Baton Rouge Mortgage Finance Authority, Single Family Mortgage, Mortgage-Backed Securities Program Series 2009A-2, Rev., GNMA/FNMA/FHLMC, 5.25%, 9/1/2020 | | | 8 | | | | 8 | |
| | |
Louisiana Local Government Environmental Facilities and Community Development Authority, LCTCS Act 391 Project Rev., 5.00%, 10/1/2028 | | | 670 | | | | 867 | |
| | | | | | | | |
| | |
Total Louisiana | | | | | | | 875 | |
| | | | | | | | |
|
Maine — 0.8% | |
| | |
City of Portland Rev., 5.00%, 1/1/2031 | | | 370 | | | | 467 | |
| | |
Maine Health and Higher Educational Facilities Authority | | | | | | | | |
| | |
Series 2020A, Rev., 4.00%, 7/1/2024 | | | 250 | | | | 281 | |
| | |
Series 2020A, Rev., 4.00%, 7/1/2028 | | | 860 | | | | 1,034 | |
| | |
Maine State Housing Authority | | | | | | | | |
| | |
Series A-1, Rev., AMT, 4.50%, 11/15/2028 | | | 80 | | | | 83 | |
| | |
Series B, Rev., AMT, 4.00%, 11/15/2043 | | | 75 | | | | 77 | |
| | |
Series A, Rev., 4.00%, 11/15/2045 | | | 525 | | | | 556 | |
| | | | | | | | |
| | |
Total Maine | | | | | | | 2,498 | |
| | | | | | | | |
|
Maryland — 1.1% | |
| | |
County of Baltimore | | | | | | | | |
| | |
Series 2019B, Rev., 3.00%, 9/1/2024 | | | 320 | | | | 334 | |
| | |
Series 2019B, Rev., 3.00%, 9/1/2025 | | | 475 | | | | 495 | |
| | | | | | | | |
| INVESTMENTS | | PRINCIPAL
AMOUNT
($000) | | | VALUE
($000) | |
| | | | | | | | |
| | |
Maryland — continued | | | | | | | | |
| | |
Rev., 4.00%, 1/1/2032 | | | 475 | | | | 537 | |
| | |
Rev., 4.00%, 1/1/2033 | | | 600 | | | | 675 | |
| | |
Montgomery County Housing Opportunities Commission, Single Family Mortgage Series 2017A, Rev., 4.00%, 7/1/2048 | | | 1,045 | | | | 1,137 | |
| | | | | | | | |
| | |
Total Maryland | | | | | | | 3,178 | |
| | | | | | | | |
|
Massachusetts — 6.8% | |
| | |
Massachusetts Bay Transportation Authority, Mass Sales Tax | | | | | | | | |
| | |
Series 2012B-1, Rev., 5.00%, 7/1/2032 | | | 1,600 | | | | 2,161 | |
| | |
Series 2012B-1, Rev., 5.00%, 7/1/2033 | | | 3,015 | | | | 4,048 | |
| | |
Massachusetts Clean Water Trust (The), Pool Program Rev., 5.25%, 8/1/2024 | | | 3,000 | | | | 3,580 | |
| | |
Massachusetts Educational Financing Authority, Education Loan Rev., AMT, 5.00%, 7/1/2021 | | | 1,000 | | | | 1,030 | |
| | |
Massachusetts Health and Educational Facilities Authority, Massachusetts Institute of Technology Series L, Rev., 5.25%, 7/1/2033 | | | 820 | | | | 1,211 | |
| | |
Massachusetts Housing Finance Agency, Single Family Housing | | | | | | | | |
| | |
Series 169, Rev., 4.00%, 12/1/2044 | | | 125 | | | | 131 | |
| | |
Series 183, Rev., 3.50%, 12/1/2046 | | | 245 | | | | 258 | |
| | |
Series 214, Rev., GNMA/FNMA/FHLMC, 3.75%, 12/1/2049 | | | 1,250 | | | | 1,394 | |
| | |
Massachusetts Water Resources Authority | | | | | | | | |
| | |
Series B, Rev., AGM, 5.25%, 8/1/2028 | | | 3,000 | | | | 4,062 | |
| | |
Series B, Rev., AGM, 5.25%, 8/1/2029 | | | 2,000 | | | | 2,772 | |
| | | | | | | | |
| | |
Total Massachusetts | | | | | | | 20,647 | |
| | | | | | | | |
|
Michigan — 0.8% | |
| | |
Eastern Michigan University Series A, Rev., 5.00%, 3/1/2030 | | | 575 | | | | 700 | |
| | |
Michigan State Housing Development Authority, Single Family Mortgage Series B, Rev., AMT, 3.50%, 6/1/2047 | | | 760 | | | | 812 | |
| | |
Michigan Strategic Fund, The Detroit Edison Company Pollution Control Bonds Project Series CC, Rev., 1.45%, 9/1/2021 (c) | | | 570 | | | | 573 | |
| | |
Saginaw County Economic Development Corp., BGI South LLC-Recovery Zone Rev., 5.00%, 12/1/2020 | | | 380 | | | | 381 | |
| | | | | | | | |
| | |
Total Michigan | | | | | | | 2,466 | |
| | | | | | | | |
|
Minnesota — 1.9% | |
| | |
City of Rochester, Health Care Facilities, Mayo Clinic Series B, Rev., 5.00%, 11/15/2029 | | | 965 | | | | 1,287 | |
SEE NOTES TO FINANCIAL STATEMENTS.
| | | | | | |
| | | |
| 46 | | | | J.P. MORGAN MUNICIPAL BOND FUNDS | | AUGUST 31, 2020 |
| | | | | | | | |
| INVESTMENTS | | PRINCIPAL
AMOUNT
($000) | | | VALUE
($000) | |
Municipal Bonds — continued | | | | | | | | |
| | |
Minnesota — continued | | | | | | | | |
| | |
Dakota County Community Development Agency, Single Family Mortgage, Mortgage-Backed Securities Program | | | | | | | | |
| | |
Series A, Rev., GNMA/FNMA/FHLMC, 4.50%, 6/1/2035 | | | 100 | | | | 101 | |
| | |
Series A, Rev., GNMA/FNMA/FHLMC, 5.13%, 12/1/2040 | | | 90 | | | | 90 | |
| | |
Minneapolis/St. Paul Housing Finance Board, Single Family Mortgage, Mortgage-Backed Securities Program, City Living Home Programs | | | | | | | | |
| | |
Series A-1, Rev., GNMA/FNMA/FHLMC, 5.25%, 12/1/2040 | | | 18 | | | | 18 | |
| | |
Series 2007A-2, Rev., GNMA/FNMA/FHLMC, 5.52%, 3/1/2041 | | | 200 | | | | 201 | |
| | |
Minnesota Housing Finance Agency, Homeownership Finance, Mortgage-Backed Securities Program Series D, Rev., AMT, GNMA/FNMA/FHLMC, 4.50%, 7/1/2034 | | | 40 | | | | 41 | |
| | |
Minnesota Housing Finance Agency, Non Profit Housing, State Appropriation | | | | | | | | |
| | |
Rev., 5.25%, 8/1/2024 | | | 1,015 | | | | 1,061 | |
| | |
Rev., 5.25%, 8/1/2025 | | | 1,070 | | | | 1,117 | |
| | |
Rev., 5.25%, 8/1/2026 | | | 825 | | | | 862 | |
| | |
Minnesota Housing Finance Agency, Residential Housing Finance | | | | | | | | |
| | |
Series D, Rev., AMT, GNMA/FNMA/FHLMC, 4.00%, 7/1/2040 | | | 35 | | | | 36 | |
| | |
Series B, Rev., AMT, GNMA/FNMA/FHLMC COLL, 4.00%, 7/1/2047 | | | 610 | | | | 658 | |
| | |
Minnesota Office of Higher Education Rev., AMT, 5.00%, 11/1/2027 | | | 300 | | | | 371 | |
| | |
State of Minnesota Series A, GO, 5.00%, 10/1/2021 (d) | | | 35 | | | | 37 | |
| | | | | | | | |
| | |
Total Minnesota | | | | | | | 5,880 | |
| | | | | | | | |
|
Mississippi — 0.5% | |
| | |
Mississippi Home Corp., Single Family Mortgage Series 2019A, Rev., GNMA/FNMA/FHLMC, 4.00%, 12/1/2048 | | | 1,470 | | | | 1,628 | |
| | | | | | | | |
|
Missouri — 1.5% | |
| | |
Health and Educational Facilities Authority of the State of Missouri, Mercy Health Series A, Rev., 5.00%, 6/1/2031 | | | 1,000 | | | | 1,269 | |
| | |
Missouri Housing Development Commission, Single Family Mortgage, First Place Homeownership Loan Program | | | | | | | | |
| | |
Series 2106B, Rev., AMT, GNMA/FNMA/FHLMC COLL, 3.50%, 5/1/2041 | | | 1,135 | | | | 1,198 | |
| | | | | | | | |
| INVESTMENTS | | PRINCIPAL
AMOUNT
($000) | | | VALUE
($000) | |
| | | | | | | | |
| | |
Missouri — continued | | | | | | | | |
| | |
Series 2020A, Rev., GNMA/FNMA/FHLMC, 3.50%, 11/1/2050 | | | 1,970 | | | | 2,183 | |
| | | | | | | | |
| | |
Total Missouri | | | | | | | 4,650 | |
| | | | | | | | |
|
Nebraska — 0.7% | |
| | |
Madison County Hospital Authority No. 1, Faith Regional Health Services Project | | | | | | | | |
| | |
Rev., 5.00%, 7/1/2030 | | | 1,020 | | | | 1,160 | |
| | |
Rev., 5.00%, 7/1/2031 | | | 720 | | | | 815 | |
| | | | | | | | |
| | |
Total Nebraska | | | | | | | 1,975 | |
| | | | | | | | |
|
Nevada — 0.5% | |
| | |
City of Carson, Carson Tahoe Regional Healthcare Project | | | | | | | | |
| | |
Rev., 5.00%, 9/1/2026 | | | 555 | | | | 664 | |
| | |
Rev., 5.00%, 9/1/2029 | | | 620 | | | | 747 | |
| | | | | | | | |
| | |
Total Nevada | | | | | | | 1,411 | |
| | | | | | | | |
|
New Hampshire — 1.8% | |
| | |
City of Manchester, School Facilities | | | | | | | | |
| | |
Rev., NATL-RE, 5.50%, 6/1/2024 | | | 3,545 | | | | 4,218 | |
| | |
Rev., NATL-RE, 5.50%, 6/1/2027 | | | 900 | | | | 1,175 | |
| | | | | | | | |
| | |
Total New Hampshire | | | | | | | 5,393 | |
| | | | | | | | |
|
New Jersey — 3.6% | |
| | |
Egg Harbor Township School District GO, AGM, 5.75%, 7/15/2024 | | | 1,215 | | | | 1,465 | |
| | |
New Jersey Educational Facilities Authority | | | | | | | | |
| | |
Series 2020A, Rev., 5.00%, 7/1/2033 | | | 350 | | | | 435 | |
| | |
Series 2020A, Rev., 5.00%, 7/1/2034 | | | 280 | | | | 347 | |
| | |
New Jersey Health Care Facilities Financing Authority, University Hospital Issue | | | | | | | | |
| | |
Series A, Rev., AGM, 5.00%, 7/1/2022 | | | 1,000 | | | | 1,074 | |
| | |
Series A, Rev., AGM, 5.00%, 7/1/2023 | | | 820 | | | | 911 | |
| | |
Series A, Rev., AGM, 5.00%, 7/1/2026 | | | 1,095 | | | | 1,275 | |
| | |
New Jersey Higher Education Student Assistance Authority, Senior Student Loan | | | | | | | | |
| | |
Series 1A, Rev., AMT, 5.00%, 12/1/2024 | | | 1,750 | | | | 1,999 | |
| | |
Series A, Rev., 5.00%, 12/1/2024 | | | 1,100 | | | | 1,271 | |
| | |
New Jersey Housing and Mortgage Finance Agency Series 2019D, Rev., 1.35%, 6/1/2022 (c) | | | 1,000 | | | | 1,014 | |
| | |
New Jersey Housing and Mortgage Finance Agency, Single Family Housing Series 2018A, Rev., 4.50%, 10/1/2048 | | | 1,035 | | | | 1,164 | |
| | | | | | | | |
| | |
Total New Jersey | | | | | | | 10,955 | |
| | | | | | | | |
SEE NOTES TO FINANCIAL STATEMENTS.
| | | | | | | | |
| | | |
| AUGUST 31, 2020 | | J.P. MORGAN MUNICIPAL BOND FUNDS | | | | | 47 | |
JPMorgan Sustainable Municipal Income Fund
(formerly known as JPMorgan Municipal Income Fund)
SCHEDULE OF PORTFOLIO INVESTMENTS
AS OF AUGUST 31, 2020 (Unaudited) (continued)
| | | | | | | | |
| INVESTMENTS | | PRINCIPAL
AMOUNT
($000) | | | VALUE
($000) | |
Municipal Bonds — continued | | | | | | | | |
|
New Mexico — 0.4% | |
| | |
New Mexico Mortgage Finance Authority, Single Family Mortgage Program Series 2019C, Class I, Rev., GNMA/FNMA/FHLMC, 4.00%, 1/1/2050 | | | 1,190 | | | | 1,328 | |
| | | | | | | | |
|
New York — 4.6% | |
| | |
Metropolitan Transportation Authority Series 2017B, Rev., 5.00%, 11/15/2021 | | | 1,300 | | | | 1,336 | |
| | |
Metropolitan Transportation Authority, Dedicated Tax Fund Series A, Rev., 5.00%, 11/15/2029 | | | 1,000 | | | | 1,072 | |
| | |
New York City Municipal Water Finance Authority, Water and Sewer System, Second General Resolution, Fiscal Year 2015 Series FF, Rev., 5.00%, 6/15/2031 | | | 1,000 | | | | 1,199 | |
| | |
New York Mortgage Agency Rev., AMT, 5.00%, 4/1/2028 | | | 35 | | | | 35 | |
| | |
New York Mortgage Agency, Homeowner Mortgage | | | | | | | | |
| | |
Series 197, Rev., 3.50%, 10/1/2044 | | | 1,015 | | | | 1,077 | |
| | |
Series 195, Rev., 4.00%, 10/1/2046 | | | 985 | | | | 1,051 | |
| | |
New York State Dormitory Authority Series 2020A, Rev., 5.00%, 9/1/2027 | | | 1,325 | | | | 1,613 | |
| | |
New York State Dormitory Authority, Cornell University Series 2020A, Rev., 5.00%, 7/1/2031 | | | 1,500 | | | | 2,118 | |
| | |
New York Transportation Development Corp., Delta Air Lines, Inc., LaGuardia Airport Terminals C&D Redevelopment Project Rev., AMT, 5.00%, 1/1/2025 | | | 1,750 | | | | 1,894 | |
| | |
Port Authority of New York and New Jersey, Consolidated Series 194, Rev., 5.00%, 10/15/2030 | | | 2,000 | | | | 2,388 | |
| | | | | | | | |
| | |
Total New York | | | | | | | 13,783 | |
| | | | | | | | |
|
North Carolina — 1.0% | |
| | |
County of Randolph, Limited Obligation Series B, Rev., 5.00%, 10/1/2026 | | | 1,000 | | | | 1,258 | |
| | |
North Carolina Housing Finance Agency Series 43, Rev., GNMA/FNMA/FHLMC, 4.00%, 7/1/2050 | | | 670 | | | | 756 | |
| | |
University of North Carolina at Charlotte (The) | | | | | | | | |
| | |
Series 2020A, Rev., 5.00%, 10/1/2025 | | | 85 | | | | 103 | |
| | |
Series 2020A, Rev., 5.00%, 10/1/2026 | | | 500 | | | | 622 | |
| | |
Series 2020A, Rev., 5.00%, 10/1/2027 | | | 200 | | | | 257 | |
| | | | | | | | |
| | |
Total North Carolina | | | | | | | 2,996 | |
| | | | | | | | |
|
North Dakota — 0.9% | |
| | |
North Dakota Housing Finance Agency, Home Mortgage Finance Program | | | | | | | | |
| | |
Series 2016D, Rev., 3.50%, 7/1/2046 | | | 350 | | | | 376 | |
| | | | | | | | |
| INVESTMENTS | | PRINCIPAL
AMOUNT
($000) | | | VALUE
($000) | |
| | | | | | | | |
| | |
North Dakota — continued | | | | | | | | |
| | |
Series D, Rev., 4.00%, 7/1/2046 | | | 1,015 | | | | 1,081 | |
| | |
Series 2017D, Rev., FHA, 4.00%, 1/1/2048 | | | 1,090 | | | | 1,187 | |
| | | | | | | | |
| | |
Total North Dakota | | | | | | | 2,644 | |
| | | | | | | | |
|
Ohio — 4.4% | |
| | |
American Municipal Power, Inc., Combined Hydroelectric Projects Series 2020A, Rev., 5.00%, 2/15/2026 | | | 855 | | | | 1,056 | |
| | |
American Municipal Power, Inc., Solar Electricity Prepayment Project Series 2019A, Rev., 5.00%, 2/15/2035 | | | 825 | | | | 1,045 | |
| | |
Lakota Local School District Series A, GO, NATL-RE, 5.25%, 12/1/2025 | | | 1,500 | | | | 1,872 | |
| | |
Ohio Higher Educational Facility Commission | | | | | | | | |
| | |
Series 2019C, Rev., 1.63%, 12/1/2026 (c) | | | 500 | | | | 513 | |
| | |
Series 2019B, Rev., 5.00%, 12/1/2031 | | | 750 | | | | 964 | |
| | |
Ohio Housing Finance Agency Series 2020A, Rev., GNMA/FNMA/FHLMC, 3.75%, 9/1/2050 | | | 995 | | | | 1,124 | |
| | |
Ohio Housing Finance Agency, Single Family Mortgage Series 2016D, Rev., GNMA/FNMA/FHLMC, 4.00%, 3/1/2047 | | | 755 | | | | 817 | |
| | |
Ohio Water Development Authority, Water Pollution Control Loan Fund | | | | | | | | |
| | |
Series 2019A, Rev., 5.00%, 6/1/2029 | | | 2,645 | | | | 3,562 | |
| | |
Series B, Rev., 5.00%, 12/1/2029 | | | 1,615 | | | | 1,988 | |
| | |
University of Akron (The), General Receipts Series 2019A, Rev., 5.00%, 1/1/2030 | | | 310 | | | | 407 | |
| | | | | | | | |
| | |
Total Ohio | | | | | | | 13,348 | |
| | | | | | | | |
|
Oklahoma — 0.1% | |
| | |
Oklahoma Housing Finance Agency Rev., 1.60%, 1/1/2022 (c) | | | 200 | | | | 202 | |
| | | | | | | | |
|
Oregon — 0.1% | |
| | |
Oregon State Housing and Community Services Department, Single Family Mortgage Program Series B, Rev., AMT, 5.00%, 7/1/2030 | | | 265 | | | | 273 | |
| | | | | | | | |
|
Pennsylvania — 5.5% | |
| | |
Allegheny County Hospital Development Authority, Medical Center Series 2019A, Rev., 5.00%, 7/15/2033 | | | 600 | | | | 760 | |
| | |
Chester County Industrial Development Authority, Longwood Gardens Project | | | | | | | | |
| | |
Rev., 4.00%, 12/1/2023 | | | 500 | | | | 562 | |
| | |
Rev., 4.00%, 12/1/2024 | | | 345 | | | | 399 | |
| | |
Rev., 4.00%, 12/1/2025 | | | 250 | | | | 296 | |
| | |
Rev., 4.00%, 12/1/2026 | | | 250 | | | | 302 | |
| | |
Rev., 5.00%, 12/1/2027 | | | 200 | | | | 261 | |
SEE NOTES TO FINANCIAL STATEMENTS.
| | | | | | |
| | | |
| 48 | | | | J.P. MORGAN MUNICIPAL BOND FUNDS | | AUGUST 31, 2020 |
| | | | | | | | |
| INVESTMENTS | | PRINCIPAL
AMOUNT
($000) | | | VALUE
($000) | |
Municipal Bonds — continued | | | | | | | | |
| | |
Pennsylvania — continued | | | | | | | | |
| | |
Rev., 5.00%, 12/1/2035 | | | 175 | | | | 225 | |
| | |
Rev., 5.00%, 12/1/2036 | | | 185 | | | | 237 | |
| | |
Rev., 5.00%, 12/1/2037 | | | 200 | | | | 256 | |
| | |
Geisinger Authority, Health System Series 2020B, Rev., 5.00%, 2/15/2027 (c) | | | 3,350 | | | | 4,110 | |
| | |
Pennsylvania Higher Educational Facilities Authority Rev., 4.00%, 8/15/2034 | | | 175 | | | | 207 | |
| | |
Pennsylvania Housing Finance Agency, Single Family Mortgage | | | | | | | | |
| | |
Series 121, Rev., 3.50%, 10/1/2046 | | | 1,085 | | | | 1,145 | |
| | |
Series 122, Rev., AMT, 4.00%, 10/1/2046 | | | 335 | | | | 360 | |
| | |
Pennsylvania State University (The) | | | | | | | | |
| | |
Series 2020E, Rev., 5.00%, 3/1/2029 | | | 710 | | | | 949 | |
| | |
Series 2020E, Rev., 5.00%, 3/1/2030 | | | 290 | | | | 396 | |
| | |
Series 2020E, Rev., 5.00%, 3/1/2031 | | | 710 | | | | 962 | |
| | |
Philadelphia Authority for Industrial Development, City Service Agreement, Affordable Housing Preservation Programs Project | | | | | | | | |
| | |
Rev., 5.00%, 12/1/2023 | | | 2,020 | | | | 2,309 | |
| | |
Rev., AGM, 5.00%, 12/1/2026 | | | 1,550 | | | | 1,944 | |
| | |
Rev., AGM, 5.00%, 12/1/2027 | | | 680 | | | | 860 | |
| | | | | | | | |
| | |
Total Pennsylvania | | | | | | | 16,540 | |
| | | | | | | | |
|
South Carolina — 0.7% | |
| | |
South Carolina State Housing Finance and Development Authority | | | | | | | | |
| | |
Series A, Rev., 4.00%, 1/1/2047 | | | 275 | | | | 295 | |
| | |
Series B, Rev., FHA, GNMA/FNMA/FHLMC, 4.00%, 7/1/2047 | | | 680 | | | | 737 | |
| | |
Town of Hilton Head Island, Beach Preservation Fee Pledge Rev., 5.00%, 8/1/2026 | | | 1,000 | | | | 1,214 | |
| | | | | | | | |
| | |
Total South Carolina | | | | | | | 2,246 | |
| | | | | | | | |
|
South Dakota — 1.1% | |
| | |
South Dakota Housing Development Authority, Homeownership Mortgage | | | | | | | | |
| | |
Series 2015D, Rev., 4.00%, 11/1/2045 | | | 1,155 | | | | 1,231 | |
| | |
Series A, Rev., 4.00%, 5/1/2049 | | | 1,930 | | | | 2,138 | |
| | | | | | | | |
| | |
Total South Dakota | | | | | | | 3,369 | |
| | | | | | | | |
|
Tennessee — 0.9% | |
| | |
Shelby County Health Educational and Housing Facilities Board Series 2019A, Rev., 5.75%, 10/1/2049 | | | 1,000 | | | | 956 | |
| | |
Tennessee Housing Development Agency, Residential Finance Program | | | | | | | | |
| | |
Series 2B, Rev., AMT, 4.00%, 7/1/2043 | | | 140 | | | | 147 | |
| | | | | | | | |
| INVESTMENTS | | PRINCIPAL
AMOUNT
($000) | | | VALUE
($000) | |
| | | | | | | | |
| | |
Tennessee — continued | | | | | | | | |
| | |
Rev., 3.50%, 1/1/2048 | | | 1,380 | | | | 1,481 | |
| | | | | | | | |
| | |
Total Tennessee | | | | | | | 2,584 | |
| | | | | | | | |
|
Texas — 6.8% | |
| | |
Arlington Higher Education Finance Corp. | | | | | | | | |
| | |
Rev., PSF-GTD, 5.00%, 8/15/2023 (e) | | | 150 | | | | 170 | |
| | |
Rev., PSF-GTD, 5.00%, 8/15/2024 (e) | | | 140 | | | | 165 | |
| | |
Rev., PSF-GTD, 5.00%, 8/15/2025 (e) | | | 200 | | | | 244 | |
| | |
Rev., PSF-GTD, 5.00%, 8/15/2026 (e) | | | 220 | | | | 276 | |
| | |
Rev., PSF-GTD, 5.00%, 8/15/2027 (e) | | | 250 | | | | 321 | |
| | |
Rev., PSF-GTD, 5.00%, 8/15/2028 (e) | | | 300 | | | | 392 | |
| | |
Rev., PSF-GTD, 5.00%, 8/15/2029 (e) | | | 500 | | | | 665 | |
| | |
Rev., PSF-GTD, 5.00%, 8/15/2030 (e) | | | 400 | | | | 542 | |
| | |
Boerne School District GO, PSF-GTD, 5.00%, 2/1/2029 | | | 1,000 | | | | 1,342 | |
| | |
Brazos Higher Education Authority, Inc. | | | | | | | | |
| | |
Series 2020-1A, Rev., AMT, 5.00%, 4/1/2025 | | | 350 | | | | 402 | |
| | |
Series 2020-1A, Rev., AMT, 5.00%, 4/1/2026 | | | 500 | | | | 586 | |
| | |
Central Texas Regional Mobility Authority Rev., 5.00%, 1/1/2046 | | | 1,000 | | | | 1,146 | |
| | |
City of Austin, Water and Wastewater System Rev., 5.00%, 11/15/2027 | | | 665 | | | | 865 | |
| | |
Clear Creek Independent School District Series B, GO, PSF-GTD, 1.35%, 8/15/2022 (c) | | | 500 | | | | 509 | |
| | |
Clifton Higher Education Finance Corp., Idea Public Schools Rev., PSF-GTD, 4.00%, 8/15/2030 | | | 1,300 | | | | 1,604 | |
| | |
Clifton Higher Education Finance Corp., Yes Prep Public Schools, Inc. Rev., PSF-GTD, 5.00%, 4/1/2029 | | | 130 | | | | 172 | |
| | |
Dallas Area Rapid Transit, Senior Lien Series A, Rev., 5.00%, 12/1/2032 | | | 2,800 | | | | 3,416 | |
| | |
Irving Hospital Authority, Baylor Scott and White Medical Center | | | | | | | | |
| | |
Series 2017A, Rev., 5.00%, 10/15/2026 | | | 250 | | | | 306 | |
| | |
Series 2017A, Rev., 5.00%, 10/15/2027 | | | 500 | | | | 609 | |
| | |
Midtown Redevelopment Authority | | | | | | | | |
| | |
Rev., 4.00%, 1/1/2031 | | | 365 | | | | 444 | |
| | |
Rev., 4.00%, 1/1/2032 | | | 500 | | | | 599 | |
| | |
Northside Independent School District GO, PSF-GTD, 1.60%, 8/1/2024 (c) | | | 345 | | | | 357 | |
| | |
Pasadena Independent School District Series B, GO, PSF-GTD, 1.50%, 8/15/2024 (c) | | | 750 | | | | 781 | |
| | |
Pflugerville Independent School District Series A, GO, PSF-GTD, 2.25%, 8/15/2022 (c) | | | 1,200 | | | | 1,245 | |
| | |
State of Texas, Water Financial Assistance Series 2015D, GO, 5.00%, 5/15/2033 | | | 450 | | | | 537 | |
SEE NOTES TO FINANCIAL STATEMENTS.
| | | | | | | | |
| | | |
| AUGUST 31, 2020 | | J.P. MORGAN MUNICIPAL BOND FUNDS | | | | | 49 | |
JPMorgan Sustainable Municipal Income Fund
(formerly known as JPMorgan Municipal Income Fund)
SCHEDULE OF PORTFOLIO INVESTMENTS
AS OF AUGUST 31, 2020 (Unaudited) (continued)
| | | | | | | | |
| INVESTMENTS | | PRINCIPAL
AMOUNT
($000) | | | VALUE
($000) | |
Municipal Bonds — continued | | | | | | | | |
| | |
Texas — continued | | | | | | | | |
| | |
Texas Department of Housing and Community Affairs, Residential Mortgage Series A, Rev., GNMA/FNMA/FHLMC, 5.00%, 7/1/2029 | | | 115 | | | | 117 | |
| | |
Texas State Affordable Housing Corp., Single Family Mortgage, Heroes Home Loan Program Series 2019A, Rev., GNMA COLL, 4.25%, 3/1/2049 | | | 1,180 | | | | 1,322 | |
| | |
Texas Water Development Board Series 2019A, Rev., 5.00%, 4/15/2023 | | | 1,300 | | | | 1,461 | |
| | | | | | | | |
| | |
Total Texas | | | | | | | 20,595 | |
| | | | | | | | |
|
Utah — 2.7% | |
| | |
Utah Associated Municipal Power System, Horse Butte Wind Project Series 2017B, Rev., 5.00%, 9/1/2033 | | | 1,700 | | | | 2,127 | |
| | |
Utah Housing Corp., Single Family Mortgage Series D-2, Class III, Rev., FHA, 4.00%, 1/1/2045 | | | 1,005 | | | | 1,083 | |
| | |
Utah State Board of Regents, Student Fee and Housing System Rev., NATL-RE, 5.25%, 4/1/2023 | | | 3,245 | | | | 3,568 | |
| | |
Utah Transit Authority, Sales Tax Series C, Rev., AGM, 5.25%, 6/15/2029 | | | 970 | | | | 1,302 | |
| | | | | | | | |
| | |
Total Utah | | | | | | | 8,080 | |
| | | | | | | | |
|
Vermont — 2.0% | |
| | |
Vermont Housing Finance Agency, Multiple Purpose | | | | | | | | |
| | |
Series B, Rev., AMT, 4.13%, 11/1/2042 | | | 35 | | | | 35 | |
| | |
Series B, Rev., AMT, 3.75%, 11/1/2045 | | | 920 | | | | 963 | |
| | |
Vermont Student Assistance Corp., Education Loan | | | | | | | | |
| | |
Series A, Rev., AMT, 5.00%, 6/15/2023 | | | 1,000 | | | | 1,092 | |
| | |
Series 2016A, Rev., AMT, 5.00%, 6/15/2024 | | | 1,400 | | | | 1,570 | |
| | |
Series A, Rev., AMT, 5.00%, 6/15/2025 | | | 2,150 | | | | 2,466 | |
| | | | | | | | |
| | |
Total Vermont | | | | | | | 6,126 | |
| | | | | | | | |
|
Washington — 4.3% | |
| | |
FYI Properties, State of Washington District Project — Green Bonds Rev., 5.00%, 6/1/2039 | | | 5,000 | | | | 6,064 | |
| | |
King County Housing Authority, Highland Village Project | | | | | | | | |
| | |
Rev., 5.00%, 1/1/2027 | | | 125 | | | | 155 | |
| | |
Rev., 5.00%, 1/1/2028 | | | 125 | | | | 159 | |
| | |
Rev., 5.00%, 1/1/2029 | | | 125 | | | | 161 | |
| | |
Rev., 4.00%, 1/1/2031 | | | 330 | | | | 397 | |
| | |
Rev., 4.00%, 1/1/2034 | | | 500 | | | | 589 | |
| | |
Washington Health Care Facilities Authority, Multicare Health System Series B, Rev., 5.00%, 8/15/2035 | | | 1,850 | | | | 2,262 | |
| | | | | | | | |
| INVESTMENTS | | PRINCIPAL
AMOUNT
($000) | | | VALUE
($000) | |
| | | | | | | | |
| | |
Washington — continued | | | | | | | | |
| | |
Washington Higher Education Facilities Authority, Seattle Pacific University Project Series 2020A, Rev., 5.00%, 10/1/2035 | | | 710 | | | | 862 | |
| | |
Washington State Housing Finance Commission, Single Family Program | | | | | | | | |
| | |
Series 2A-R, Rev., AMT, 3.50%, 12/1/2046 | | | 240 | | | | 251 | |
| | |
Series 2N, Rev., GNMA/FNMA/FHLMC, 3.50%, 6/1/2047 | | | 2,060 | | | | 2,193 | |
| | | | | | | | |
| | |
Total Washington | | | | | | | 13,093 | |
| | | | | | | | |
|
Wisconsin — 3.0% | |
| | |
Multi-Family Housing, Bond Pass-Through Certificates, Grand Reserve Apartments Series 8, Rev., 5.95%, 11/1/2023 (c) | | | 965 | | | | 966 | |
| | |
Wisconsin Health and Educational Facilities Authority | | | | | | | | |
| | |
Rev., 4.00%, 2/1/2021 | | | 425 | | | | 429 | |
| | |
Rev., 4.00%, 2/1/2022 | | | 280 | | | | 289 | |
| | |
Rev., 4.00%, 2/1/2023 | | | 280 | | | | 295 | |
| | |
Wisconsin Health and Educational Facilities Authority, Agnesian Healthcare, Inc. | | | | | | | | |
| | |
Rev., 5.00%, 7/1/2024 | | | 250 | | | | 290 | |
| | |
Rev., 5.00%, 7/1/2025 | | | 250 | | | | 300 | |
| | |
Wisconsin Health and Educational Facilities Authority, Franciscan Sisters of Christian Charity Sponsored Ministries, Inc. | | | | | | | | |
| | |
Series 2017A, Rev., 5.00%, 9/1/2022 | | | 520 | | | | 556 | |
| | |
Series 2017A, Rev., 5.00%, 9/1/2023 | | | 550 | | | | 605 | |
| | |
Series 2017A, Rev., 5.00%, 9/1/2024 | | | 580 | | | | 656 | |
| | |
Series 2017A, Rev., 5.00%, 9/1/2025 | | | 235 | | | | 272 | |
| | |
Series 2017A, Rev., 5.00%, 9/1/2026 | | | 385 | | | | 454 | |
| | |
Series 2017A, Rev., 5.00%, 9/1/2027 | | | 785 | | | | 944 | |
| | |
Wisconsin Health and Educational Facilities Authority, Marshfield Clinic Health System, Inc. | | | | | | | | |
| | |
Series C, Rev., 5.00%, 2/15/2027 | | | 400 | | | | 486 | |
| | |
Series C, Rev., 5.00%, 2/15/2028 | | | 575 | | | | 692 | |
| | |
Series C, Rev., 5.00%, 2/15/2029 | | | 375 | | | | 449 | |
| | |
Wisconsin Health and Educational Facilities Authority, Milwaukee Regional Medical Center Thermal Service Rev., 5.00%, 4/1/2035 | | | 1,165 | | | | 1,452 | |
| | | | | | | | |
| | |
Total Wisconsin | | | | | | | 9,135 | |
| | | | | | | | |
|
Wyoming — 0.3% | |
| | |
Wyoming Community Development Authority Series 5, Rev., 4.00%, 12/1/2046 | | | 765 | | | | 828 | |
| | | | | | | | |
| | |
Total Municipal Bonds
(Cost $266,408) | | | | | | | 280,183 | |
| | | | | | | | |
SEE NOTES TO FINANCIAL STATEMENTS.
| | | | | | |
| | | |
| 50 | | | | J.P. MORGAN MUNICIPAL BOND FUNDS | | AUGUST 31, 2020 |
| | | | | | | | |
| | |
| INVESTMENTS | | SHARES
(000) | | | VALUE
($000) | |
Short-Term Investments — 7.1% | |
|
Investment Companies — 7.1% | |
| | |
JPMorgan Institutional Tax Free Money Market Fund Class IM Shares, 0.04% (f) (g)
(Cost $21,510) | | | 21,497 | | | | 21,512 | |
| | | | | | | | |
Total Investments — 99.9%
(Cost $287,918) | | | | | | | 301,695 | |
Other Assets Less Liabilities — 0.1% | | | | | | | 414 | |
| | | | | | | | |
NET ASSETS — 100.0% | | | | | | | 302,109 | |
| | | | | | | | |
Percentages indicated are based on net assets.
Abbreviations
| | |
| AGM | | Insured by Assured Guaranty Municipal Corp. |
| AMT | | Alternative Minimum Tax |
| BRRH | | Boca Raton Regional Hospital |
| CHESLA | | Connecticut Higher Education Supplemental Loan Authority |
| COLL | | Collateral |
| COP | | Certificate of Participation |
| FHA | | Federal Housing Administration |
| FHLMC | | Federal Home Loan Mortgage Corp. |
| FNMA | | Federal National Mortgage Association |
| GNMA | | Government National Mortgage Association |
| GO | | General Obligation |
| ICE | | Intercontinental Exchange |
| LIBOR | | London Interbank Offered Rate |
| NATL | | Insured by National Public Finance Guarantee Corp. |
| PSF-GTD | | Permanent School Fund Guaranteed |
| RE | | Reinsured |
| Rev. | | Revenue |
| USD | | United States Dollar |
| | |
| (a) | | The date shown represents the earliest of the prerefunded date, next put date or final maturity date. |
| (b) | | Variable or floating rate security, linked to the referenced benchmark. The interest rate shown is the current rate as of August 31, 2020. |
| (c) | | Variable or floating rate security, the interest rate of which adjusts periodically based on changes in current interest rates and prepayments on the underlying pool of assets. The interest rate shown is the current rate as of August 31, 2020. |
| (d) | | Security is prerefunded or escrowed to maturity. |
| (e) | | All or a portion of the security is a when-issued security, delayed delivery security, or forward commitment. |
| (f) | | Investment in an affiliated fund, which is registered under the Investment Company Act of 1940, as amended, and is advised by J.P. Morgan Investment Management Inc. |
| (g) | | The rate shown is the current yield as of August 31, 2020. |
| ‡ | | Value determined using significant unobservable inputs. |
SEE NOTES TO FINANCIAL STATEMENTS.
| | | | | | | | |
| | | |
| AUGUST 31, 2020 | | J.P. MORGAN MUNICIPAL BOND FUNDS | | | | | 51 | |
JPMorgan Tax Free Bond Fund
SCHEDULE OF PORTFOLIO INVESTMENTS
AS OF AUGUST 31, 2020 (Unaudited)
| | | | | | | | |
| INVESTMENTS | | PRINCIPAL
AMOUNT
($000) | | | VALUE
($000) | |
| | | | | | | | |
Municipal Bonds — 96.5% (a) | |
|
Alabama — 1.0% | |
| | |
City of Trussville Series 2018A, GO, 4.00%, 8/1/2032 | | | 25 | | | | 30 | |
| | |
Montgomery County Public Building Authority, Warrants, Facilities Project Rev., 5.00%, 3/1/2029 | | | 1,000 | | | | 1,156 | |
| | |
Montgomery Water Works and Sanitary Sewer Board | | | | | | | | |
| | |
Series 2019A, Rev., 4.00%, 9/1/2036 | | | 515 | | | | 625 | |
| | |
Series 2019A, Rev., 4.00%, 9/1/2037 | | | 800 | | | | 968 | |
| | |
Series 2019A, Rev., 4.00%, 9/1/2038 | | | 830 | | | | 1,001 | |
| | |
Southeast Alabama Gas Supply District (The), Project No. 1 Series 2018A, Rev., 4.00%, 4/1/2024 (b) | | | 500 | | | | 552 | |
| | |
Southeast Alabama Gas Supply District (The), Project No. 2 Series 2018A, Rev., 4.00%, 6/1/2024 (b) | | | 835 | | | | 924 | |
| | |
UAB Medicine Finance Authority | | | | | | | | |
| | |
Series B-2, Rev., 3.50%, 9/1/2035 | | | 160 | | | | 176 | |
| | |
Series B-2, Rev., 5.00%, 9/1/2037 | | | 30 | | | | 36 | |
| | | | | | | | |
| | |
Total Alabama | | | | | | | 5,468 | |
| | | | | | | | |
|
Alaska — 0.4% | |
| | |
Alaska Housing Finance Corp., General Mortgage Series 2016A, Rev., 3.50%, 6/1/2046 | | | 620 | | | | 658 | |
| | |
Alaska Industrial Development and Export Authority, Tanana Chiefs Conference Project Series 2019A, Rev., 4.00%, 10/1/2044 | | | 1,500 | | | | 1,689 | |
| | |
University of Alaska Series S, Rev., 4.00%, 10/1/2021 | | | 70 | | | | 71 | |
| | | | | | | | |
| | |
Total Alaska | | | | | | | 2,418 | |
| | | | | | | | |
|
Arizona — 1.4% | |
| | |
Arizona Industrial Development Authority, Equitable School Revolving Fund | | | | | | | | |
| | |
Series 2020A, Rev., 4.00%, 11/1/2045 | | | 1,000 | | | | 1,145 | |
| | |
Series 2020A, Rev., 4.00%, 11/1/2050 | | | 1,300 | | | | 1,483 | |
| | |
Arizona Industrial Development Authority, Great Lakes Senior Living Communities LLC Project Series 2019A, Rev., 4.50%, 1/1/2049 | | | 4,000 | | | | 3,263 | |
| | |
Arizona Industrial Development Authority, Phoenix Children’s Hospital Series 2020A, Rev., 3.00%, 2/1/2045 | | | 1,000 | | | | 1,035 | |
| | |
City of Chandler Rev., 5.00%, 7/1/2028 | | | 25 | | | | 31 | |
| | |
City of Phoenix Civic Improvement Corp. Series 2005B, Rev., BHAC-CR, FGIC, 5.50%, 7/1/2036 | | | 125 | | | | 187 | |
| | |
County of Pinal Rev., 4.00%, 8/1/2036 | | | 50 | | | | 58 | |
| | | | | | | | |
| INVESTMENTS | | PRINCIPAL
AMOUNT
($000) | | | VALUE
($000) | |
| | | | | | | | |
| | | | | | | | |
|
Arizona — continued | |
| | |
Industrial Development Authority of The City of Phoenix, Downtown Phoenix Student Housing LLC — Arizona State University Project | | | | | | | | |
| | |
Series 2018A, Rev., 5.00%, 7/1/2032 | | | 350 | | | | 381 | |
| | |
Series 2018A, Rev., 5.00%, 7/1/2033 | | | 150 | | | | 163 | |
| | |
Series 2018A, Rev., 5.00%, 7/1/2037 | | | 200 | | | | 214 | |
| | |
Maricopa County Special Health Care District Series 2018C, GO, 5.00%, 7/1/2033 | | | 10 | | | | 12 | |
| | |
Maricopa County Unified School District No. 11-Peoria GO, 4.00%, 7/1/2034 | | | 10 | | | | 12 | |
| | |
University of Arizona (The) Rev., 5.00%, 6/1/2033 | | | 40 | | | | 48 | |
| | | | | | | | |
| | |
Total Arizona | | | | | | | 8,032 | |
| | | | | | | | |
|
Arkansas — 0.2% | |
| | |
Board of Trustees of the University of Arkansas, Various Facility, Fayetteville Campus Series A, Rev., 5.00%, 11/1/2037 | | | 185 | | | | 224 | |
| | |
County of Pulaski, Arkansas Children’s Hospital Rev., 5.00%, 3/1/2029 | | | 350 | | | | 424 | |
| | |
State of Arkansas, Four-Lane Highway Construction and Improvement Series 2013, GO, 5.00%, 6/15/2021 | | | 60 | | | | 62 | |
| | |
University of Arkansas, Monticello Campus Series 2017A, Rev., 5.00%, 12/1/2027 | | | 100 | | | | 127 | |
| | |
University of Arkansas, Student Fee, UALR Campus Rev., 5.00%, 10/1/2029 | | | 100 | | | | 122 | |
| | | | | | | | |
| | |
Total Arkansas | | | | | | | 959 | |
| | | | | | | | |
|
California — 7.2% | |
| | |
Alta Loma School District, Election of 2016 Series 2017A, GO, 5.00%, 8/1/2032 | | | 60 | | | | 76 | |
| | |
Bay Area Toll Authority, Toll Bridge, San Francisco Bay Area Series S-7, Rev., 4.00%, 4/1/2032 | | | 35 | | | | 41 | |
| | |
California Educational Facilities Authority Series T-1, Rev., 5.00%, 3/15/2039 | | | 350 | | | | 527 | |
| | |
California Educational Facilities Authority, Claremont McKenna College Series 2015A, Rev., 4.00%, 1/1/2039 | | | 500 | | | | 559 | |
| | |
California Health Facilities Financing Authority, Sutter Health Series 2016A, Rev., 5.00%, 11/15/2041 | | | 250 | | | | 292 | |
| | |
California Public Finance Authority, Henry Mayo Newhall Hospital | | | | | | | | |
| | |
Rev., 5.00%, 10/15/2037 | | | 500 | | | | 560 | |
| | |
Rev., 5.00%, 10/15/2047 | | | 1,000 | | | | 1,100 | |
SEE NOTES TO FINANCIAL STATEMENTS.
| | | | | | |
| | | |
| 52 | | | | J.P. MORGAN MUNICIPAL BOND FUNDS | | AUGUST 31, 2020 |
| | | | | | | | |
| INVESTMENTS | | PRINCIPAL
AMOUNT
($000) | | | VALUE
($000) | |
| | | | | | | | |
Municipal Bonds — continued | | | | | | | | |
| | |
California continued | | | | | | | | |
| | |
California School Finance Authority, Green Dot Public School Projects | | | | | | | | |
| | |
Series 2018A, Rev., 5.00%, 8/1/2021 (c) | | | 50 | | | | 51 | |
| | |
Series 2018A, Rev., 5.00%, 8/1/2022 (c) | | | 80 | | | | 85 | |
| | |
Series 2018A, Rev., 5.00%, 8/1/2023 (c) | | | 175 | | | | 193 | |
| | |
Series 2018A, Rev., 5.00%, 8/1/2024 (c) | | | 160 | | | | 181 | |
| | |
Series 2018A, Rev., 5.00%, 8/1/2025 (c) | | | 150 | | | | 174 | |
| | |
Series 2018A, Rev., 5.00%, 8/1/2026 (c) | | | 150 | | | | 178 | |
| | |
Series 2018A, Rev., 5.00%, 8/1/2027 (c) | | | 150 | | | | 181 | |
| | |
Series 2018A, Rev., 5.00%, 8/1/2028 (c) | | | 190 | | | | 232 | |
| | |
California State Public Works Board, Riverside Campus Series 2017H, Rev., 5.00%, 4/1/2027 | | | 10 | | | | 13 | |
| | |
California State University | | | | | | | | |
| | |
Series 2019A, Rev., 5.00%, 11/1/2036 | | | 30 | | | | 40 | |
| | |
Series 2016A, Rev., 5.00%, 11/1/2041 | | | 45 | | | | 55 | |
| | |
Series 2017A, Rev., 5.00%, 11/1/2042 | | | 30 | | | | 37 | |
| | |
Series 2016A, Rev., 5.00%, 11/1/2045 | | | 25 | | | | 30 | |
| | |
California Statewide Communities Development Authority, Marin General Hospital Project Series 2018A, Rev., 4.00%, 8/1/2045 | | | 1,500 | | | | 1,567 | |
| | |
City of Los Angeles Department of Airports Series 2019E, Rev., AMT, 5.00%, 5/15/2039 | | | 155 | | | | 193 | |
| | |
City of Los Angeles, Department of Airports Series A, Rev., AMT, 5.00%, 5/15/2038 | | | 1,250 | | | | 1,367 | |
| | |
City of Palm Springs Series B, COP, Zero Coupon, 4/15/2021 (d) | | | 100 | | | | 100 | |
| | |
County of Santa Clara, Campbell Union High School District | | | | | | | | |
| | |
GO, 3.00%, 8/1/2030 | | | 620 | | | | 677 | |
| | |
GO, 3.00%, 8/1/2031 | | | 30 | | | | 33 | |
| | |
East Bay Municipal Utility District, Wastewater System Series 2015A-1, Rev., 5.00%, 6/1/2036 | | | 2,450 | | | | 2,924 | |
| | |
East Bay Municipal Utility District, Water System, Green Bonds Series B, Rev., 5.00%, 6/1/2033 | | | 515 | | | | 619 | |
| | |
Eastern Municipal Water District Financing Authority | | | | | | | | |
| | |
Series 2020A, Rev., 4.00%, 7/1/2037 | | | 450 | | | | 559 | |
| | |
Series 2020A, Rev., 5.00%, 7/1/2037 | | | 2,405 | | | | 3,233 | |
| | |
Series 2020A, Rev., 4.00%, 7/1/2038 | | | 1,000 | | | | 1,237 | |
| | |
Eastern Municipal Water District Financing Authority, Water and Wastewater System Series 2020A, Rev., 5.00%, 7/1/2036 | | | 1,500 | | | | 2,028 | |
| | |
El Monte City School District GO, BAN, Zero Coupon, 4/1/2023 | | | 900 | | | | 885 | |
| | | | | | | | |
| INVESTMENTS | | PRINCIPAL
AMOUNT
($000) | | | VALUE
($000) | |
| | | | | | | | |
| | | | | | | | |
|
California — continued | |
| | |
Franklin-Mckinley School District, Election of 2020 Series A, GO, 4.00%, 8/1/2049 | | | 1,415 | | | | 1,629 | |
| | |
Long Beach Bond Finance Authority, Natural Gas Series 2007A, Rev., 5.25%, 11/15/2021 | | | 2,000 | | | | 2,109 | |
| | |
Los Angeles Community College District, Election of 2008 Series F, GO, 5.00%, 8/1/2024 | | | 60 | | | | 68 | |
| | |
Los Angeles County Metropolitan Transportation Authority, Green Bond Series 2020A, Rev., 5.00%, 6/1/2030 | | | 20 | | | | 27 | |
| | |
Los Angeles Department of Water and Power, Power System | | | | | | | | |
| | |
Series 2019D, Rev., 5.00%, 7/1/2038 | | | 35 | | | | 46 | |
| | |
Series 2014D, Rev., 5.00%, 7/1/2044 | | | 60 | | | | 69 | |
| | |
Los Angeles Unified School District Series 2018B-1, GO, 5.00%, 7/1/2037 | | | 30 | | | | 38 | |
| | |
Millbrae Redevelopment Agency Successor Agency 4.00%, 8/1/2035 | | | 150 | | | | 164 | |
| | |
Moulton-Niguel Water District Rev., 5.00%, 9/1/2038 | | | 35 | | | | 46 | |
| | |
Mount San Antonio Community College District, Election of 2008 Series A, GO, 0.00%, 8/1/2043 | | | 7,150 | | | | 7,693 | |
| | |
Mountain View Shoreline Regional Park Community Series 2018A, Rev., AGM, 5.00%, 8/1/2034 | | | 25 | | | | 32 | |
| | |
Orange County Water District Series A, Rev., 5.00%, 8/15/2034 | | | 650 | | | | 808 | |
| | |
Riverside County Transportation Commission Series 2017A, Rev., 5.00%, 6/1/2039 | | | 150 | | | | 187 | |
| | |
Riverside Public Financing Authority, Riverside Pavement Rehabilitation Project COP, AGM, 5.00%, 6/1/2033 | | | 1,500 | | | | 1,672 | |
| | |
San Diego Unified School District Series 2012E, GO, Zero Coupon, 7/1/2049 | | | 1,000 | | | | 462 | |
| | |
San Lorenzo Valley Unified School District | | | | | | | | |
| | |
Series 2020A, GO, 4.00%, 8/1/2045 | | | 1,000 | | | | 1,159 | |
| | |
Series 2020A, GO, 5.00%, 8/1/2050 | | | 2,505 | | | | 3,106 | |
| | |
Santa Clara Valley Transportation Authority Series 2018A, Rev., 5.00%, 6/1/2024 | | | 30 | | | | 35 | |
| | |
Santa Maria Joint Union High School District, Santa Barbara and San Luis Obispo GO, Zero Coupon, 8/1/2037 | | | 2,450 | | | | 1,135 | |
| | |
South Monterey County Joint Union High School District, Election of 2018 Series A-1, GO, AGM, 5.00%, 8/1/2035 | | | 15 | | | | 19 | |
| | | | | | | | |
| | |
Total California | | | | | | | 40,531 | |
| | | | | | | | |
SEE NOTES TO FINANCIAL STATEMENTS.
| | | | | | | | |
| | | |
| AUGUST 31, 2020 | | J.P. MORGAN MUNICIPAL BOND FUNDS | | | | | 53 | |
JPMorgan Tax Free Bond Fund
SCHEDULE OF PORTFOLIO INVESTMENTS
AS OF AUGUST 31, 2020 (Unaudited) (continued)
| | | | | | | | |
| INVESTMENTS | | PRINCIPAL
AMOUNT
($000) | | | VALUE
($000) | |
| | | | | | | | |
Municipal Bonds — continued | | | | | | | | |
|
Colorado — 3.0% | |
| | |
Adams County, Colorado Refunding and Improvement COP, 4.00%, 12/1/2040 | | | 2,815 | | | | 3,112 | |
| | |
Colorado Department of Transportation Headquarters Facilities COP, 5.00%, 6/15/2041 | | | 1,000 | | | | 1,200 | |
| | |
Colorado Health Facilities Authority, Commonspirit Health Series A-2, Rev., 4.00%, 8/1/2049 | | | 2,500 | | | | 2,752 | |
| | |
Colorado Health Facilities Authority, Parkview Medical Center, Inc. Project Series 2020A, Rev., 4.00%, 9/1/2050 | | | 675 | | | | 735 | |
| | |
Colorado Health Facilities Authority, Vail Valley Medical Centre Project Rev., 4.00%, 1/15/2045 | | | 1,095 | | | | 1,188 | |
| | |
Denver Health and Hospital Authority | | | | | | | | |
| | |
Series 2019A, Rev., 4.00%, 12/1/2040 | | | 1,635 | | | | 1,741 | |
| | |
Series A, Rev., 5.25%, 12/1/2045 | | | 1,000 | | | | 1,069 | |
| | |
Larimer County School District No. R-1 Poudre GO, 5.00%, 12/15/2037 | | | 1,000 | | | | 1,280 | |
| | |
Raindance Metropolitan District No. 1 Non-Potable Water System Rev., 5.25%, 12/1/2050 | | | 1,000 | | | | 1,004 | |
| | |
State of Colorado Series 2018A, COP, 5.00%, 9/1/2031 | | | 20 | | | | 26 | |
| | |
State of Colorado, Building Excellent Schools Today Series G, COP, 5.00%, 3/15/2021 (d) | | | 2,000 | | | | 2,051 | |
| | |
Vauxmont Metropolitan District | | | | | | | | |
| | |
GO, AGM, 5.00%, 12/15/2024 | | | 265 | | | | 310 | |
| | |
GO, AGM, 5.00%, 12/15/2025 | | | 250 | | | | 300 | |
| | | | | | | | |
| | |
Total Colorado | | | | | | | 16,768 | |
| | | | | | | | |
|
Connecticut — 0.9% | |
| | |
Connecticut Housing Finance Authority, Housing Mortgage Finance Program | | | | | | | | |
| | |
Series B-2, Rev., 4.00%, 11/15/2032 | | | 240 | | | | 246 | |
| | |
Series A-1, Rev., 4.00%, 11/15/2045 | | | 85 | | | | 90 | |
| | |
Subseries A-1, Rev., 4.00%, 11/15/2047 | | | 305 | | | | 330 | |
| | |
Connecticut State Health and Educational Facilities Authority | | | | | | | | |
| | |
Series K-1, Rev., 5.00%, 7/1/2034 | | | 725 | | | | 790 | |
| | |
Series K-1, Rev., 5.00%, 7/1/2036 | | | 450 | | | | 488 | |
| | |
Series K-1, Rev., 5.00%, 7/1/2039 | | | 490 | | | | 527 | |
| | |
Connecticut State Health and Educational Facilities Authority, Covenant Home, Inc. Series B, Rev., 5.00%, 12/1/2025 | | | 1,000 | | | | 1,126 | |
| | |
Connecticut State Higher Education Supplemental Loan Authority, CHESLA Loan Program Series A, Rev., AMT, 5.00%, 11/15/2020 | | | 300 | | | | 302 | |
| | | | | | | | |
| INVESTMENTS | | PRINCIPAL
AMOUNT
($000) | | | VALUE
($000) | |
| | | | | | | | |
| | | | | | | | |
|
Connecticut — continued | |
| | |
State of Connecticut | | | | | | | | |
| | |
Series 2016D, GO, 5.00%, 8/15/2026 | | | 25 | | | | 31 | |
| | |
Series 2012G, GO, 4.00%, 10/15/2027 | | | 45 | | | | 48 | |
| | |
Series A, GO, 5.00%, 4/15/2029 | | | 150 | | | | 187 | |
| | |
State of Connecticut Special Tax Series 2014B, Rev., 5.00%, 9/1/2020 | | | 20 | | | | 20 | |
| | |
State of Connecticut, Special Tax Transportation Infrastructure Purposes | | | | | | | | |
| | |
Series 2016A, Rev., 5.00%, 9/1/2027 | | | 25 | | | | 31 | |
| | |
Series 2018B, Rev., 5.00%, 10/1/2033 | | | 55 | | | | 69 | |
| | |
Town of New Canaan | | | | | | | | |
| | |
GO, 4.00%, 10/1/2036 | | | 240 | | | | 289 | |
| | |
GO, 4.00%, 10/1/2037 | | | 370 | | | | 445 | |
| | |
GO, 4.00%, 10/1/2039 | | | 100 | | | | 119 | |
| | |
Town of Stonington Series 2012A, GO, 4.00%, 9/1/2020 | | | 15 | | | | 15 | |
| | |
Town of Wallingford GO, 4.00%, 3/15/2021 | | | 20 | | | | 20 | |
| | |
University of Connecticut Series A, Rev., 5.00%, 2/15/2028 | | | 15 | | | | 18 | |
| | | | | | | | |
| | |
Total Connecticut | | | | | | | 5,191 | |
| | | | | | | | |
|
Delaware — 2.2% | |
| | |
County of New Castle GO, 5.00%, 4/1/2027 | | | 25 | | | | 32 | |
| | |
Delaware Economic Development Authority, Acts Retirement-Life Communities, Inc. Obligated Group Series 2018-B, Rev., 5.00%, 11/15/2048 | | | 1,000 | | | | 1,140 | |
| | |
Delaware Economic Development Authority, Newark Charter School, Inc. Project | | | | | | | | |
| | |
Series A, Rev., 5.00%, 9/1/2036 | | | 500 | | | | 566 | |
| | |
Series A, Rev., 5.00%, 9/1/2046 | | | 500 | | | | 555 | |
| | |
Delaware State Economic Development Authority | | | | | | | | |
| | |
Rev., 4.00%, 7/1/2041 | | | 5,000 | | | | 5,850 | |
| | |
Rev., 5.00%, 9/1/2050 | | | 1,500 | | | | 1,756 | |
| | |
Delaware State Health Facilities Authority Series 2017A, Rev., 4.00%, 7/1/2033 | | | 25 | | | | 28 | |
| | |
Delaware State Health Facilities Authority, Bayhealth Medical Center Project Series 2017A, Rev., 4.00%, 7/1/2043 | | | 1,275 | | | | 1,415 | |
| | |
Delaware State Housing Authority, Senior Single Family Mortgage Series A-1, Rev., AMT, 4.90%, 7/1/2029 | | | 245 | | | | 249 | |
| | |
University of Delaware Series 2019A, Rev., 5.00%, 11/1/2045 | | | 500 | | | | 783 | |
| | | | | | | | |
| | |
Total Delaware | | | | | | | 12,374 | |
| | | | | | | | |
SEE NOTES TO FINANCIAL STATEMENTS.
| | | | | | |
| | | |
| 54 | | | | J.P. MORGAN MUNICIPAL BOND FUNDS | | AUGUST 31, 2020 |
| | | | | | | | |
| INVESTMENTS | | PRINCIPAL
AMOUNT
($000) | | | VALUE
($000) | |
| | | | | | | | |
Municipal Bonds — continued | | | | | | | | |
|
District of Columbia — 1.8% | |
| | |
District of Columbia | | | | | | | | |
| | |
Series A, Rev., 6.00%, 7/1/2023 (d) | | | 1,000 | | | | 1,160 | |
| | |
Series 2017B, Rev., 5.00%, 7/1/2037 | | | 25 | | | | 29 | |
| | |
Rev., 4.00%, 7/1/2039 | | | 600 | | | | 651 | |
| | |
Rev., 4.00%, 7/1/2044 | | | 1,240 | | | | 1,329 | |
| | |
District of Columbia, Kipp DC Project Series 2017B, Rev., 5.00%, 7/1/2027 | | | 30 | | | | 36 | |
| | |
District of Columbia, National Public Radio, Inc. Series 2016, Rev., 5.00%, 4/1/2024 (d) | | | 25 | | | | 29 | |
| | |
Metropolitan Washington Airports Authority, Airport System | | | | | | | | |
| | |
Series A, Rev., AMT, 5.00%, 10/1/2030 | | | 50 | | | | 60 | |
| | |
Series 2017A, Rev., AMT, 5.00%, 10/1/2032 | | | 415 | | | | 507 | |
| | |
Washington Metropolitan Area Transit Authority Series B, Rev., 5.00%, 7/1/2042 | | | 5,010 | | | | 6,078 | |
| | | | | | | | |
| | |
Total District of Columbia | | | | | | | 9,879 | |
| | | | | | | | |
|
Florida — 2.9% | |
| | |
City of Jacksonville Series B, Rev., 5.00%, 10/1/2024 | | | 20 | | | | 24 | |
| | |
City of Lauderhill, Water and Sewer System Rev., 4.00%, 10/1/2027 | | | 15 | | | | 18 | |
| | |
City of Leesburg, Electric System Rev., 5.00%, 10/1/2031 | | | 15 | | | | 19 | |
| | |
City of Miami Beach Rev., 4.00%, 9/1/2045 | | | 25 | | | | 27 | |
| | |
City of Palm Coast Rev., 5.00%, 10/1/2020 | | | 25 | | | | 25 | |
| | |
City of Port St. Lucie, Utility Systems Series 2018, Rev., 5.00%, 9/1/2028 | | | 25 | | | | 32 | |
| | |
City of South Miami Health Facilities Authority, Inc., Baptist Health Rev., 4.00%, 8/15/2042 | | | 20 | | | | 22 | |
| | |
City of Tallahassee, Utility System Series 2017, Rev., 5.00%, 10/1/2023 | | | 10 | | | | 11 | |
| | |
City of Tampa Series 2020A, Rev., 4.00%, 4/1/2050 | | | 2,000 | | | | 2,241 | |
| | |
City of Tampa, H. Lee Moffitt Cancer Center Project Series 2020B, Rev., 5.00%, 7/1/2050 | | | 2,790 | | | | 3,415 | |
| | |
County of Miami-Dade | | | | | | | | |
| | |
Series A, GO, 5.00%, 7/1/2036 | | | 1,545 | | | | 2,003 | |
| | |
Series 2016, Rev., 4.00%, 10/1/2040 | | | 105 | | | | 113 | |
| | |
County of Sarasota Series 2019A, Rev., 5.00%, 10/1/2038 | | | 25 | | | | 32 | |
| | |
County of Sarasota, Utility System Series 2016A, Rev., 4.00%, 10/1/2043 | | | 65 | | | | 72 | |
| | |
East Central Regional Wastewater Treatment Facilities Operation Board Rev., 5.00%, 10/1/2028 | | | 30 | | | | 39 | |
| | | | | | | | |
| INVESTMENTS | | PRINCIPAL
AMOUNT
($000) | | | VALUE
($000) | |
| | | | | | | | |
| | | | | | | | |
| | |
Florida — continued | | | | | | | | |
| | |
Florida Atlantic University Finance Corp. | | | | | | | | |
| | |
Series 2019A, Rev., 5.00%, 7/1/2031 | | | 15 | | | | 19 | |
| | |
Series 2019B, Rev., 5.00%, 7/1/2034 | | | 120 | | | | 146 | |
| | |
Florida Governmental Utility Authority | | | | | | | | |
| | |
Rev., AGM, 4.00%, 10/1/2034 | | | 600 | | | | 731 | |
| | |
Rev., AGM, 4.00%, 10/1/2035 | | | 1,000 | | | | 1,210 | |
| | |
Rev., AGM, 4.00%, 10/1/2036 | | | 370 | | | | 445 | |
| | |
Florida Housing Finance Corp., Homeowner Mortgage, Special Program Series B, Rev., GNMA/FNMA/FHLMC, 4.50%, 1/1/2029 | | | 10 | | | | 10 | |
| | |
Florida State University Housing Facility Series 2015A, Rev., 4.00%, 5/1/2034 | | | 30 | | | | 34 | |
| | |
Florida’s Turnpike Enterprise, Department of Transportation Series 2018A, Rev., 5.00%, 7/1/2033 | | | 55 | | | | 70 | |
| | |
Hillsborough County, Parks and Recreation Program GO, NATL-RE, 5.25%, 7/1/2025 | | | 2,415 | | | | 2,835 | |
| | |
JEA Water and Sewer System Series 2017A, Rev., 5.00%, 10/1/2020 (d) | | | 20 | | | | 20 | |
| | |
Monroe County School District | | | | | | | | |
| | |
Series A, COP, 5.00%, 6/1/2032 | | | 100 | | | | 125 | |
| | |
Series A, COP, 5.00%, 6/1/2034 | | | 40 | | | | 49 | |
| | |
Orange County Convention Center Series 2016A, Rev., 4.00%, 10/1/2036 | | | 40 | | | | 44 | |
| | |
Orange County Health Facilities Authority Series B, Rev., 4.00%, 10/1/2045 | | | 215 | | | | 235 | |
| | |
School Board of Miami-Dade County (The) Series 2006D, COP, AMBAC, 5.00%, 10/1/2020 | | | 20 | | | | 20 | |
| | |
South Broward Hospital District, Memorial Healthcare System Series 2016, Rev., 5.00%, 5/1/2023 | | | 10 | | | | 11 | |
| | |
Volusia County Educational Facility Authority, Embry-Riddle Aeronautical | | | | | | | | |
| | |
Series 2020A, Rev., 4.00%, 10/15/2037 | | | 725 | | | | 834 | |
| | |
Series 2020A, Rev., 4.00%, 10/15/2038 | | | 750 | | | | 860 | |
| | |
Series 2020A, Rev., 4.00%, 10/15/2039 | | | 350 | | | | 400 | |
| | | | | | | | |
| | |
Total Florida | | | | | | | 16,191 | |
| | | | | | | | |
|
Georgia — 4.9% | |
| | |
Carroll City-County Hospital Authority, Tanner Medical Center Project Rev., GTD, 4.00%, 7/1/2050 | | | 1,450 | | | | 1,670 | |
| | |
Dalton Development Authority, Hamilton Health Care System Rev., NATL-RE, 5.50%, 8/15/2026 | | | 2,450 | | | | 2,797 | |
| | |
Dalton Whitfield County Joint Development Authority, Hamilton Health Care System Series 2017, Rev., 4.00%, 8/15/2041 | | | 1,000 | | | | 1,123 | |
SEE NOTES TO FINANCIAL STATEMENTS.
| | | | | | | | |
| | | |
| AUGUST 31, 2020 | | J.P. MORGAN MUNICIPAL BOND FUNDS | | | | | 55 | |
JPMorgan Tax Free Bond Fund
SCHEDULE OF PORTFOLIO INVESTMENTS
AS OF AUGUST 31, 2020 (Unaudited) (continued)
| | | | | | | | |
| INVESTMENTS | | PRINCIPAL
AMOUNT
($000) | | | VALUE
($000) | |
| | | | | | | | |
Municipal Bonds — continued | | | | | | | | |
| | |
Georgia — continued | | | | | | | | |
| | |
Development Authority for Fulton County, Wellstar Health System, Inc. Project Series 2020A, Rev., 4.00%, 4/1/2050 | | | 2,080 | | | | 2,372 | |
| | |
Georgia Higher Education Facilities Authority USG Real Estate Foundation II LLC Projects Rev., 4.00%, 6/15/2038 | | | 2,000 | | | | 2,275 | |
| | |
Georgia Housing and Finance Authority, Single Family Mortgage | | | | | | | | |
| | |
Series A, Rev., AMT, 5.00%, 6/1/2029 | | | 5 | | | | 5 | |
| | |
Subseries A-1, Rev., AMT, 4.00%, 6/1/2044 | | | 115 | | | | 120 | |
| | |
Glynn-Brunswick Memorial Hospital Authority Rev., 4.00%, 8/1/2038 | | | 1,000 | | | | 1,126 | |
| | |
Main Street Natural Gas, Inc., Gas Supply | | | | | | | | |
| | |
Series A, Rev., LIQ: Royal Bank of Canada, 4.00%, 9/1/2023 (b) | | | 5,000 | | | | 5,487 | |
| | |
Series 2019B, Rev., 4.00%, 12/2/2024 (b) | | | 8,600 | | | | 9,764 | |
| | |
Metropolitan Atlanta Rapid Transit Authority Series A, Rev., NATL-RE, 5.25%, 7/1/2028 | | | 110 | | | | 147 | |
| | |
Private Colleges and Universities Authority Series 2020B, Rev., 4.00%, 9/1/2041 | | | 750 | | | | 904 | |
| | | | | | | | |
| | |
Total Georgia | | | | | | | 27,790 | |
| | | | | | | | |
|
Hawaii — 0.4% | |
| | |
City and County of Honolulu | | | | | | | | |
| | |
Series A, GO, 5.00%, 10/1/2037 | | | 1,970 | | | | 2,344 | |
| | |
Series 2019B, Rev., 5.00%, 7/1/2040 | | | 35 | | | | 45 | |
| | | | | | | | |
| | |
Total Hawaii | | | | | | | 2,389 | |
| | | | | | | | |
|
Idaho — 0.0% (e) | |
| | |
Idaho Health Facilities Authority Series 2016ID, Rev., 5.00%, 12/1/2045 | | | 75 | | | | 88 | |
| | |
University of Idaho Series 2018A, Rev., 5.00%, 4/1/2035 | | | 25 | | | | 30 | |
| | | | | | | | |
| | |
Total Idaho | | | | | | | 118 | |
| | | | | | | | |
|
Illinois — 5.2% | |
| | |
Chicago O’Hare International Airport, Third Lien | | | | | | | | |
| | |
Series 2011A, Rev., 5.75%, 1/1/2021 (d) | | | 1,260 | | | | 1,283 | |
| | |
Series 2011A, Rev., 5.75%, 1/1/2039 | | | 240 | | | | 244 | |
| | |
City of Rockford, Waterworks System Series 2018B, GO, 4.00%, 12/15/2022 | | | 105 | | | | 113 | |
| | |
Cook County Forest Preserve District, Limited Tax Project Series B, GO, 5.00%, 12/15/2037 | | | 295 | | | | 314 | |
| | |
County of Cook GO, 5.00%, 11/15/2034 | | | 700 | | | | 824 | |
| | |
County of Du Page, The Morton Abroretum Project Rev., 3.00%, 5/15/2047 | | | 3,335 | | | | 3,355 | |
| | |
DuPage and Cook Counties Township High School District No. 86 Hinsdale GO, 4.00%, 1/15/2039 | | | 800 | | | | 930 | |
| | | | | | | | |
| INVESTMENTS | | PRINCIPAL
AMOUNT
($000) | | | VALUE
($000) | |
| | | | | | | | |
| | | | | | | | |
| | |
Illinois — continued | | | | | | | | |
| | |
Hoffman Estates Park District GO, 4.00%, 12/1/2044 | | | 25 | | | | 27 | |
| | |
Illinois Finance Authority | | | | | | | | |
| | |
Series 2016C, Rev., 4.00%, 2/15/2027 (d) | | | 20 | | | | 24 | |
| | |
Series 2016A, Rev., 5.00%, 11/1/2031 | | | 10 | | | | 11 | |
| | |
Rev., 5.00%, 7/1/2040 | | | 105 | | | | 135 | |
| | |
Series 2016C, Rev., 4.00%, 2/15/2041 | | | 930 | | | | 1,032 | |
| | |
Illinois Finance Authority, Healthcare Enterprises, Inc. | | | | | | | | |
| | |
Series C, Rev., 5.00%, 3/1/2033 | | | 305 | | | | 367 | |
| | |
Series 2017C, Rev., 5.00%, 3/1/2034 | | | 205 | | | | 245 | |
| | |
Illinois State Toll Highway Authority | | | | | | | | |
| | |
Series 2019C, Rev., 5.00%, 1/1/2031 | | | 3,000 | | | | 3,947 | |
| | |
Series 2019A, Rev., 4.00%, 1/1/2044 | | | 65 | | | | 73 | |
| | |
Lake County Community Consolidated School District No. 3 Beach Park | | | | | | | | |
| | |
GO, AGM, 4.00%, 2/1/2034 | | | 620 | | | | 695 | |
| | |
GO, AGM, 4.00%, 2/1/2035 | | | 500 | | | | 558 | |
| | |
Metropolitan Pier and Exposition Authority, MC Cormik Expansion Project Series 2002A, Rev., AGM-CR, NATL-RE, Zero Coupon, 12/15/2040 | | | 5,000 | | | | 2,546 | |
| | |
Railsplitter Tobacco Settlement Authority Rev., 5.25%, 6/1/2021 | | | 200 | | | | 207 | |
| | |
Sales Tax Securitization Corp. | | | | | | | | |
| | |
Series C, Rev., 5.00%, 1/1/2026 | | | 3,500 | | | | 4,102 | |
| | |
Series C, Rev., 5.25%, 1/1/2043 | | | 1,500 | | | | 1,757 | |
| | |
State of Illinois | | | | | | | | |
| | |
Series 2018A, GO, 5.00%, 10/1/2021 | | | 50 | | | | 52 | |
| | |
Series 2016C, Rev., 5.00%, 6/15/2022 | | | 25 | | | | 27 | |
| | |
Series 2012A, GO, 4.00%, 1/1/2024 | | | 15 | | | | 15 | |
| | |
GO, 5.00%, 5/1/2024 | | | 205 | | | | 224 | |
| | |
Series D, GO, 5.00%, 11/1/2024 | | | 325 | | | | 354 | |
| | |
Series 2012, GO, 4.00%, 8/1/2025 | | | 25 | | | | 26 | |
| | |
Series 2012, GO, 4.00%, 3/1/2026 | | | 10 | | | | 10 | |
| | |
Series 2012A, GO, 5.00%, 1/1/2027 | | | 25 | | | | 26 | |
| | |
GO, 5.00%, 5/1/2027 | | | 175 | | | | 189 | |
| | |
GO, 5.00%, 6/1/2027 | | | 25 | | | | 28 | |
| | |
Series 2009A, GO, 4.00%, 9/1/2027 | | | 115 | | | | 115 | |
| | |
Series 2016, GO, 5.00%, 11/1/2028 | | | 20 | | | | 22 | |
| | |
Series 2012A, GO, 4.00%, 1/1/2029 | | | 45 | | | | 46 | |
| | |
GO, 5.50%, 1/1/2030 | | | 20 | | | | 24 | |
| | |
GO, 4.13%, 11/1/2031 | | | 20 | | | | 21 | |
| | |
Series 2016, GO, 4.00%, 6/1/2033 | | | 15 | | | | 15 | |
| | |
Series 2016, GO, 4.00%, 6/1/2036 | | | 25 | | | | 26 | |
| | |
GO, 4.00%, 6/1/2037 | | | 45 | | | | 46 | |
| | |
GO, 5.50%, 7/1/2038 | | | 3,000 | | | | 3,169 | |
SEE NOTES TO FINANCIAL STATEMENTS.
| | | | | | |
| | | |
| 56 | | | | J.P. MORGAN MUNICIPAL BOND FUNDS | | AUGUST 31, 2020 |
| | | | | | | | |
| INVESTMENTS | | PRINCIPAL
AMOUNT
($000) | | | VALUE
($000) | |
| | | | | | | | |
Municipal Bonds — continued | | | | | | | | |
| | |
Illinois — continued | | | | | | | | |
| | |
State of Illinois, Sales Tax Series D, Rev., 5.00%, 6/15/2027 | | | 15 | | | | 18 | |
| | |
Village of Arlington Heights GO, 4.00%, 12/1/2034 | | | 130 | | | | 147 | |
| | |
Village of Bolingbrook Series A, GO, AGM, 5.00%, 1/1/2033 | | | 1,000 | | | | 1,237 | |
| | |
Village of Hoffman Estates GO, 5.00%, 12/1/2033 | | | 80 | | | | 102 | |
| | |
Village of Midlothian | | | | | | | | |
| | |
GO, AGM, 4.00%, 1/1/2022 | | | 10 | | | | 10 | |
| | |
GO, AGM, 4.00%, 1/1/2023 | | | 10 | | | | 11 | |
| | |
GO, AGM, 4.00%, 1/1/2024 | | | 75 | | | | 83 | |
| | |
GO, AGM, 4.00%, 1/1/2025 | | | 40 | | | | 45 | |
| | |
GO, AGM, 4.00%, 1/1/2026 | | | 65 | | | | 75 | |
| | |
GO, AGM, 4.00%, 1/1/2027 | | | 85 | | | | 100 | |
| | |
GO, AGM, 4.00%, 1/1/2028 | | | 65 | | | | 77 | |
| | |
GO, AGM, 4.00%, 1/1/2029 | | | 95 | | | | 114 | |
| | |
Will County School District No. 86 Joliet Series A, GO, 4.00%, 3/1/2024 | | | 220 | | | | 245 | |
| | |
Winnebago and Boone Counties School District No. 205 Rockford Series B, GO, 3.75%, 2/1/2033 | | | 35 | | | | 37 | |
| | | | | | | | |
| | |
Total Illinois | | | | | | | 29,525 | |
| | | | | | | | |
|
Indiana — 1.6% | |
| | |
City of Lafayette, Local Income Tax Rev., 4.00%, 6/30/2028 | | | 180 | | | | 212 | |
| | |
Clarksville Redevelopment Authority Rev., 5.00%, 1/15/2031 | | | 30 | | | | 39 | |
| | |
Gary Community School Corp. GO, 4.00%, 7/15/2023 | | | 230 | | | | 250 | |
| | |
Greenfield Middle School Building Corp. | | | | | | | | |
| | |
Rev., 4.00%, 7/15/2031 | | | 240 | | | | 279 | |
| | |
Rev., 4.00%, 7/15/2032 | | | 350 | | | | 404 | |
| | |
Greenfield Middle School Building Corp., Ad Valorem Property Tax First Mortgage Refunding Rev., 5.00%, 1/15/2023 | | | 10 | | | | 11 | |
| | |
Indiana Finance Authority Rev., 4.00%, 2/1/2040 | | | 25 | | | | 27 | |
| | |
Indiana Finance Authority, Educational Facilities, Kipp Indianapolis, Inc. Project | | | | | | | | |
| | |
Series 2020A, Rev., 5.00%, 7/1/2040 | | | 170 | | | | 184 | |
| | |
Series 2020A, Rev., 5.00%, 7/1/2055 | | | 460 | | | | 489 | |
| | |
Indiana Finance Authority, Goshen Health | | | | | | | | |
| | |
Series A, Rev., 5.00%, 11/1/2032 | | | 15 | | | | 19 | |
| | |
Series A, Rev., 4.00%, 11/1/2043 | | | 1,125 | | | | 1,244 | |
| | |
Indiana Finance Authority, Marian University Project Series A, Rev., 5.00%, 9/15/2034 | | | 1,100 | | | | 1,267 | |
| | | | | | | | |
| INVESTMENTS | | PRINCIPAL
AMOUNT
($000) | | | VALUE
($000) | |
| | | | | | | | |
| | | | | | | | |
| | |
Indiana — continued | | | | | | | | |
| | |
Indiana Finance Authority, Parkview Health Series A, Rev., 4.00%, 11/1/2048 | | | 50 | | | | 56 | |
| | |
Indiana Finance Authority, State Revolving Fund Program Series 2011A, Rev., 5.00%, 2/1/2022 (d) | | | 4,000 | | | | 4,269 | |
| | |
Indiana Health and Educational Facilities Financing Authority, Ascension Senior Credit Group Series 2006 B-1, Rev., 4.00%, 11/15/2046 | | | 15 | | | | 17 | |
| | |
Indiana Municipal Power Agency, Power Supply System Series 2016A, Rev., 5.00%, 1/1/2042 | | | 30 | | | | 35 | |
| | |
Merrillville Building Corp. Rev., 4.00%, 7/15/2034 | | | 35 | | | | 41 | |
| | |
University of Southern Indiana, Student Fee Series M, Rev., 5.00%, 10/1/2029 | | | 25 | | | | 32 | |
| | | | | | | | |
| | |
Total Indiana | | | | | | | 8,875 | |
| | | | | | | | |
|
Iowa — 0.1% | |
| | |
Iowa Finance Authority Rev., 5.00%, 8/1/2034 | | | 15 | | | | 19 | |
| | |
Iowa Finance Authority, Single Family Mortgage-Backed Securities Program Series 2016D, Rev., AMT, GNMA/FNMA/FHLMC COLL, 3.50%, 7/1/2046 | | | 405 | | | | 431 | |
| | | | | | | | |
| | |
Total Iowa | | | | | | | 450 | |
| | | | | | | | |
|
Kansas — 0.0% (e) | |
| | |
Leavenworth County Unified School District No. 464 Series B, GO, 4.00%, 9/1/2022 | | | 50 | | | | 54 | |
| | | | | | | | |
|
Kentucky — 0.3% | |
| | |
City of Ashland, Kings Daughters Medical Center Series 2016A, Rev., 4.00%, 2/1/2036 | | | 1,750 | | | | 1,807 | |
| | |
Commonwealth of Kentucky COP, 4.00%, 6/15/2032 | | | 30 | | | | 33 | |
| | |
Kentucky Housing Corp. Series A, Rev., 5.00%, 1/1/2028 | | | 10 | | | | 10 | |
| | |
Kentucky Turnpike Authority, Revitalization Projects Series B, Rev., 5.00%, 7/1/2023 | | | 30 | | | | 33 | |
| | |
Pike County School District Finance Corp., School Building Rev., 4.00%, 2/1/2028 | | | 20 | | | | 23 | |
| | | | | | | | |
| | |
Total Kentucky | | | | | | | 1,906 | |
| | | | | | | | |
|
Louisiana — 0.9% | |
| | |
City of Ruston Rev., AGM, 5.00%, 6/1/2024 | | | 10 | | | | 12 | |
| | |
Louisiana Local Government Environmental Facilities and Community Development Authority, Jefferson Parish Projects Rev., 5.00%, 4/1/2029 | | | 100 | | | | 124 | |
| | |
Louisiana Public Facilities Authority, Louisiana Children’s Medical Center Series 2015A1, Rev., 5.00%, 6/1/2039 | | | 25 | | | | 30 | |
SEE NOTES TO FINANCIAL STATEMENTS.
| | | | | | | | |
| | | |
| AUGUST 31, 2020 | | J.P. MORGAN MUNICIPAL BOND FUNDS | | | | | 57 | |
JPMorgan Tax Free Bond Fund
SCHEDULE OF PORTFOLIO INVESTMENTS
AS OF AUGUST 31, 2020 (Unaudited) (continued)
| | | | | | | | |
| INVESTMENTS | | PRINCIPAL
AMOUNT
($000) | | | VALUE
($000) | |
| | | | | | | | |
Municipal Bonds — continued | | | | | | | | |
| | |
Louisiana — continued | | | | | | | | |
| | |
Louisiana Public Facilities Authority, Ochsner Clinic Foundation Project Rev., 5.00%, 5/15/2047 | | | 1,055 | | | | 1,173 | |
| | |
St. Tammany Parish Hospital Service District No. 1, St. Tammany Parish Hospital Project Series A, Rev., 4.00%, 7/1/2043 | | | 50 | | | | 56 | |
| | |
State of Louisiana Series 2019A, GO, 5.00%, 3/1/2035 | | | 2,000 | | | | 2,587 | |
| | |
Tobacco Settlement Financing Corp., Asset-Backed Series 2013A, Rev., 5.25%, 5/15/2035 | | | 1,000 | | | | 1,077 | |
| | | | | | | | |
| | |
Total Louisiana | | | | | | | 5,059 | |
| | | | | | | | |
|
Maine — 0.5% | |
| | |
Maine Health and Higher Educational Facilities Authority, Mainehealth Series 2020A, Rev., 4.00%, 7/1/2050 | | | 2,000 | | | | 2,272 | |
| | |
Maine Municipal Bond Bank Series E, Rev., 4.00%, 11/1/2021 | | | 100 | | | | 104 | |
| | |
Maine State Housing Authority Series A, Rev., 4.00%, 11/15/2045 | | | 315 | | | | 334 | |
| | | | | | | | |
| | |
Total Maine | | | | | | | 2,710 | |
| | | | | | | | |
|
Maryland — 2.5% | |
| | |
Baltimore County, Equipment Acquisition Program Series 2019, COP, 5.00%, 3/1/2029 | | | 5,735 | | | | 7,657 | |
| | |
City of Baltimore Series 2019A, Rev., 4.00%, 7/1/2044 | | | 50 | | | | 59 | |
| | |
City of Baltimore, Water Projects Series B, Rev., 4.00%, 7/1/2033 | | | 270 | | | | 324 | |
| | |
Maryland Health and Higher Educational Facilities Authority Series 2017A, Rev., 5.00%, 5/15/2045 | | | 5,000 | | | | 5,829 | |
| | |
Maryland Health and Higher Educational Facilities Authority, Broadmead Issue Series A, Rev., 5.00%, 7/1/2023 | | | 115 | | | | 123 | |
| | |
Maryland State Transportation Authority Series 2017, Rev., 5.00%, 7/1/2028 | | | 10 | | | | 13 | |
| | |
Montgomery County Housing Opportunities Commission, Single Family Mortgage Series A, Rev., 4.00%, 1/1/2031 | | | 195 | | | | 206 | |
| | | | | | | | |
| | |
Total Maryland | | | | | | | 14,211 | |
| | | | | | | | |
|
Massachusetts — 2.9% | |
| | |
City of Lowell, Municipal Purpose Loan Series 2018, GO, 5.00%, 3/1/2028 | | | 90 | | | | 118 | |
| | |
Commonwealth of Massachusetts Series E, GO, 5.00%, 9/1/2020 | | | 25 | | | | 25 | |
| | | | | | | | |
| INVESTMENTS | | PRINCIPAL
AMOUNT
($000) | | | VALUE
($000) | |
| | | | | | | | |
| | | | | | | | |
| | |
Massachusetts — continued | | | | | | | | |
| | |
Commonwealth of Massachusetts Transportation Fund, Rail Enhancement and Accelerated Bridge Programs Series B, Rev., 4.00%, 6/1/2046 | | | 2,480 | | | | 2,750 | |
| | |
Commonwealth of Massachusetts, Consolidated Loan of 2016 Series J, GO, 4.00%, 12/1/2039 | | | 3,690 | | | | 4,218 | |
| | |
Massachusetts Development Finance Agency | | | | | | | | |
| | |
Series 2020U, Rev., 5.00%, 7/1/2038 | | | 755 | | | | 1,147 | |
| | |
Series 2020U, Rev., 5.00%, 7/1/2039 | | | 665 | | | | 1,021 | |
| | |
Series 2020U, Rev., 5.00%, 7/1/2040 | | | 535 | | | | 830 | |
| | |
Series 2017T, Rev., 4.00%, 7/1/2042 | | | 35 | | | | 40 | |
| | |
Massachusetts Development Finance Agency, Emerson College | | | | | | | | |
| | |
Rev., 5.00%, 1/1/2036 | | | 825 | | | | 953 | |
| | |
Rev., 5.00%, 1/1/2037 | | | 315 | | | | 363 | |
| | |
Massachusetts Development Finance Agency, Wellforce Issue Series 2020C, Rev., AGM, 3.00%, 10/1/2045 | | | 1,000 | | | | 1,024 | |
| | |
Massachusetts Housing Finance Agency, Single Family Housing | | | | | | | | |
| | |
Series 177, Rev., AMT, 4.00%, 6/1/2039 | | | 410 | | | | 434 | |
| | |
Series 167, Rev., 4.00%, 12/1/2043 | | | 260 | | | | 270 | |
| | |
Series 169, Rev., 4.00%, 12/1/2044 | | | 485 | | | | 507 | |
| | |
Town of Bellingham GO, 4.00%, 6/15/2032 | | | 10 | | | | 12 | |
| | |
University of Massachusetts Building Authority | | | | | | | | |
| | |
Series 1, Rev., 5.00%, 11/1/2020 | | | 10 | | | | 10 | |
| | |
Series 2020-1, Rev., 5.00%, 11/1/2034 | | | 2,000 | | | | 2,623 | |
| | |
Series 2017-1, Rev., 5.25%, 11/1/2042 | | | 50 | | | | 62 | |
| | | | | | | | |
| | |
Total Massachusetts | | | | | | | 16,407 | |
| | | | | | | | |
|
Michigan — 1.4% | |
| | |
Berkley School District GO, Q-SBLF, 4.00%, 5/1/2040 | | | 30 | | | | 32 | |
| | |
City of Grand Rapids Rev., 5.00%, 1/1/2045 | | | 600 | | | | 766 | |
| | |
Grand Rapids Public Schools Series 2019, GO, AGM, 5.00%, 11/1/2043 | | | 1,000 | | | | 1,251 | |
| | |
Michigan Finance Authority Series 2016MI, Rev., 5.25%, 12/1/2041 | | | 1,000 | | | | 1,178 | |
| | |
Michigan Finance Authority, Bronson Healthcare Group, Inc. Series A, Rev., 5.00%, 5/15/2054 | | | 1,525 | | | | 1,732 | |
| | |
Michigan State Building Authority Series 2016 I, Rev., 4.00%, 10/15/2036 | | | 50 | | | | 56 | |
| | |
Michigan State Building Authority, Facilities Program Series 2015I, Rev., 4.00%, 4/15/2040 | | | 120 | | | | 132 | |
SEE NOTES TO FINANCIAL STATEMENTS.
| | | | | | |
| | | |
| 58 | | | | J.P. MORGAN MUNICIPAL BOND FUNDS | | AUGUST 31, 2020 |
| | | | | | | | |
| INVESTMENTS | | PRINCIPAL
AMOUNT
($000) | | | VALUE
($000) | |
| | | | | | | | |
Municipal Bonds — continued | | | | | | | | |
| | |
Michigan — continued | | | | | | | | |
| | |
Michigan State Housing Development Authority, Single Family Mortgage Series 2015A, Rev., AMT, 4.00%, 6/1/2046 | | | 105 | | | | 111 | |
| | |
Michigan Strategic Fund, Holland Home Obligated Group Rev., 5.00%, 11/15/2043 | | | 750 | | | | 785 | |
| | |
Niles Community Schools GO, Q-SBLF, 4.00%, 5/1/2041 | | | 25 | | | | 27 | |
| | |
State of Michigan, Trunk Line Fund Rev., 5.00%, 11/15/2036 | | | 1,500 | | | | 1,580 | |
| | |
University of Michigan Rev., 4.00%, 4/1/2034 | | | 50 | | | | 58 | |
| | |
Walled Lake Consolidated School District GO, Q-SBLF, 5.00%, 5/1/2033 | | | 10 | | | | 13 | |
| | |
West Ottawa Public Schools Series 2014-1, GO, 4.00%, 5/1/2039 | | | 25 | | | | 27 | |
| | |
Whitehall District Schools GO, AGM, 5.00%, 5/1/2033 | | | 25 | | | | 31 | |
| | | | | | | | |
| | |
Total Michigan | | | | | | | 7,779 | |
| | | | | | | | |
|
Minnesota — 2.5% | |
| | |
Aurora Independent School District No. 2711, School Building, Capital Appreciation | | | | | | | | |
| | |
Series 2017B, GO, Zero Coupon, 2/1/2026 | | | 150 | | | | 136 | |
| | |
Series 2017B, GO, Zero Coupon, 2/1/2027 | | | 400 | | | | 349 | |
| | |
Series 2017B, GO, Zero Coupon, 2/1/2028 | | | 225 | | | | 189 | |
| | |
Series 2017B, GO, Zero Coupon, 2/1/2030 | | | 880 | | | | 676 | |
| | |
City of Hopkins Series 2017B, GO, 4.00%, 2/1/2026 | | | 25 | | | | 30 | |
| | |
City of Minneapolis, Health Care System, Fairview Health Services Series 2018A, Rev., 4.00%, 11/15/2048 | | | 3,000 | | | | 3,352 | |
| | |
City of Rochester Series 2016B, Rev., 5.00%, 11/15/2036 | | | 30 | | | | 44 | |
| | |
Dakota County Community Development Agency, Single Family Mortgage, Mortgage-Backed Securities Program Series A, Rev., GNMA/FNMA/FHLMC, 4.50%, 6/1/2035 | | | 20 | | | | 20 | |
| | |
Duluth Independent School District No. 709 | | | | | | | | |
| | |
Series 2019B, COP, 5.00%, 2/1/2021 | | | 150 | | | | 153 | |
| | |
Series 2019B, COP, 5.00%, 2/1/2022 | | | 160 | | | | 169 | |
| | |
East Grand Forks Independent School District No. 595 Series A, GO, 4.00%, 2/1/2027 | | | 15 | | | | 18 | |
| | |
Greenway Independent School District No. 316 | | | | | | | | |
| | |
Series 2019F, GO, Zero Coupon, 2/1/2029 | | | 1,320 | | | | 1,153 | |
| | |
Series 2019F, GO, Zero Coupon, 2/1/2030 | | | 700 | | | | 592 | |
| | |
Series 2019F, GO, Zero Coupon, 2/1/2031 | | | 545 | | | | 445 | |
| | |
Lakeville Independent School District No. 194, Credit Enhancement Program Series 2018A, GO, 5.00%, 2/1/2028 | | | 25 | | | | 32 | |
| | | | | | | | |
| INVESTMENTS | | PRINCIPAL
AMOUNT
($000) | | | VALUE
($000) | |
| | | | | | | | |
| | | | | | | | |
| | |
Minnesota — continued | | | | | | | | |
| | |
Minneapolis/St. Paul Housing Finance Board, Single Family Mortgage, Mortgage-Backed Securities Program, City Living Home Programs | | | | | | | | |
| | |
Series A, Rev., GNMA COLL, 4.50%, 9/1/2020 | | | 5 | | | | 5 | |
| | |
Series A-1, Rev., GNMA/FNMA/FHLMC, 5.25%, 12/1/2040 | | | 5 | | | | 5 | |
| | |
Series 2007A-2, Rev., GNMA/FNMA/FHLMC, 5.52%, 3/1/2041 | | | 55 | | | | 55 | |
| | |
Minnesota Higher Education Facilities Authority, Carleton College | | | | | | | | |
| | |
Rev., 4.00%, 3/1/2032 | | | 1,000 | | | | 1,166 | |
| | |
Rev., 4.00%, 3/1/2033 | | | 500 | | | | 581 | |
| | |
Minnesota Housing Finance Agency, Homeownership Finance, Mortgage-Backed Securities Program | | | | | | | | |
| | |
Series B, Rev., AMT, GNMA/FNMA/FHLMC, 4.50%, 1/1/2031 | | | 10 | | | | 10 | |
| | |
Series D, Rev., AMT, GNMA/FNMA/FHLMC, 4.50%, 7/1/2034 | | | 20 | | | | 21 | |
| | |
Series E, Rev., GNMA/FNMA/FHLMC, 4.00%, 1/1/2035 | | | 20 | | | | 20 | |
| | |
Minnesota Housing Finance Agency, Residential Housing Finance | | | | | | | | |
| | |
Series 2014A, Rev., AMT, 4.00%, 7/1/2038 | | | 190 | | | | 201 | |
| | |
Series D, Rev., AMT, GNMA/FNMA/FHLMC, 4.00%, 7/1/2040 | | | 35 | | | | 36 | |
| | |
Series C, Rev., AMT, GNMA/FNMA/FHLMC, 4.00%, 1/1/2045 | | | 520 | | | | 554 | |
| | |
Series B, Rev., AMT, GNMA/FNMA/FHLMC COLL, 4.00%, 7/1/2047 | | | 315 | | | | 340 | |
| | |
Virginia Independent School District No. 706 Series A, GO, 5.00%, 2/1/2030 | | | 3,000 | | | | 3,879 | |
| | | | | | | | |
| | |
Total Minnesota | | | | | | | 14,231 | |
| | | | | | | | |
|
Mississippi — 0.7% | |
| | |
Lowndes County School District GO, 4.00%, 9/1/2020 | | | 10 | | | | 10 | |
| | |
Mississippi Development Bank | | | | | | | | |
| | |
Rev., 4.00%, 4/1/2033 | | | 20 | | | | 24 | |
| | |
Rev., 4.00%, 3/1/2050 | | | 2,335 | | | | 2,615 | |
| | |
Mississippi Development Bank, Water and Sewer System Project, Special Obligation Rev., AGM, 6.88%, 12/1/2040 | | | 1,000 | | | | 1,170 | |
| | | | | | | | |
| | |
Total Mississippi | | | | | | | 3,819 | |
| | | | | | | | |
|
Missouri — 1.0% | |
| | |
City of Sedalia COP, 4.00%, 7/15/2035 | | | 205 | | | | 230 | |
| | |
Health and Educational Facilities Authority of the State of Missouri Rev., 4.00%, 10/1/2036 | | | 100 | | | | 116 | |
SEE NOTES TO FINANCIAL STATEMENTS.
| | | | | | | | |
| | | |
| AUGUST 31, 2020 | | J.P. MORGAN MUNICIPAL BOND FUNDS | | | | | 59 | |
JPMorgan Tax Free Bond Fund
SCHEDULE OF PORTFOLIO INVESTMENTS
AS OF AUGUST 31, 2020 (Unaudited) (continued)
| | | | | | | | |
| INVESTMENTS | | PRINCIPAL
AMOUNT
($000) | | | VALUE
($000) | |
| | | | | | | | |
Municipal Bonds — continued | | | | | | | | |
| | |
Missouri — continued | | | | | | | | |
| | |
Health and Educational Facilities Authority of the State of Missouri, Lutheran Senior Services Projects | | | | | | | | |
| | |
Series 2019A, Rev., 5.00%, 2/1/2034 | | | 1,000 | | | | 1,092 | |
| | |
Series 2019A, Rev., 5.00%, 2/1/2042 | | | 1,000 | | | | 1,083 | |
| | |
Health and Educational Facilities Authority of the State of Missouri, SSM Health Series A, Rev., 4.00%, 6/1/2048 | | | 2,160 | | | | 2,402 | |
| | |
Metropolitan St. Louis Sewer District, Wastewater System Improvement Series 2017A, Rev., 5.00%, 5/1/2034 | | | 10 | | | | 13 | |
| | |
Missouri Housing Development Commission, Single Family Mortgage, First Place Homeownership Loan Program | | | | | | | | |
| | |
Series 2106B, Rev., AMT, GNMA/FNMA/FHLMC COLL, 3.50%, 5/1/2041 | | | 340 | | | | 359 | |
| | |
Series 2015B-2, Rev., GNMA/FNMA/FHLMC, 4.00%, 11/1/2045 | | | 425 | | | | 456 | |
| | |
Missouri Housing Development Commission, Single Family Mortgage, Special Homeownership Loan Program | | | | | | | | |
| | |
Series E-3, Rev., GNMA/FNMA/FHLMC, 4.63%, 11/1/2020 (d) | | | 5 | | | | 5 | |
| | |
Series E-4, Rev., AMT, GNMA/FNMA/FHLMC, 4.25%, 5/1/2021 (d) | | | 30 | | | | 31 | |
| | |
Missouri State Environmental Improvement and Energy Resources Authority, Water Pollution Control and Drinking Water Series 2010B, Rev., 5.00%, 7/1/2025 | | | 35 | | | | 36 | |
| | |
St. Louis County Reorganized School District No. R-6 Series 2017, GO, 5.00%, 2/1/2023 | | | 10 | | | | 11 | |
| | | | | | | | |
| | |
Total Missouri | | | | | | | 5,834 | |
| | | | | | | | |
|
Montana — 0.3% | |
| | |
Montana Board of Housing, Single Family Homeownership | | | | | | | | |
| | |
Series B2, Rev., AMT, 5.00%, 12/1/2027 | | | 125 | | | | 129 | |
| | |
Series A-2, Rev., AMT, 4.00%, 12/1/2038 | | | 85 | | | | 89 | |
| | |
Montana Facility Finance Authority, SCL Health System Series A, Rev., 4.00%, 1/1/2038 | | | 1,200 | | | | 1,396 | |
| | | | | | | | |
| | |
Total Montana | | | | | | | 1,614 | |
| | | | | | | | |
|
Nebraska — 0.9% | |
| | |
Central Plains Energy Project, Gas Project No. 3 | | | | | | | | |
| | |
Series 2017A, Rev., 5.00%, 9/1/2034 | | | 1,000 | | | | 1,339 | |
| | |
Series 2017A, Rev., 5.00%, 9/1/2037 | | | 1,500 | | | | 2,047 | |
| | |
Douglas County Hospital Authority No. 2 | | | | | | | | |
| | |
Series 2020A, Rev., 4.00%, 11/15/2040 | | | 575 | | | | 668 | |
| | |
Series 2020A, Rev., 4.00%, 11/15/2041 | | | 300 | | | | 347 | |
| | | | | | | | |
| INVESTMENTS | | PRINCIPAL
AMOUNT
($000) | | | VALUE
($000) | |
| | | | | | | | |
| | | | | | | | |
| | |
Nebraska — continued | | | | | | | | |
| | |
Douglas County Hospital Authority No. 2, Health Facilities Series 2016, Rev., 5.00%, 5/15/2030 | | | 10 | | | | 12 | |
| | |
Douglas County Hospital Authority No. 3 Rev., 5.00%, 11/1/2020 | | | 25 | | | | 25 | |
| | |
Public Power Generation Agency, Whelan Energy Center Unit 2 | | | | | | | | |
| | |
Series 2015A, Rev., 5.00%, 1/1/2026 | | | 100 | | | | 119 | |
| | |
Series A, Rev., 5.00%, 1/1/2034 | | | 185 | | | | 223 | |
| | |
Series 2016A, Rev., 5.00%, 1/1/2035 | | | 25 | | | | 30 | |
| | | | | | | | |
| | |
Total Nebraska | | | | | | | 4,810 | |
| | | | | | | | |
|
Nevada — 0.5% | |
| | |
City of Reno, Sales Tax, Senior Lien, ReTrac-Reno Transportation Rail Access Corridor Project Series B, Rev., AGM, 4.00%, 6/1/2048 | | | 375 | | | | 408 | |
| | |
Las Vegas Convention and Visitors Authority, Convention Center Expansion Series B, Rev., 4.00%, 7/1/2049 | | | 2,500 | | | | 2,649 | |
| | |
Truckee Meadows Water Authority Series 2016, Rev., 5.00%, 7/1/2031 | | | 15 | | | | 18 | |
| | | | | | | | |
| | |
Total Nevada | | | | | | | 3,075 | |
| | | | | | | | |
|
New Hampshire — 0.0% (e) | |
| | |
New Hampshire Housing Finance Authority, Single Family Mortgage | | | | | | | | |
| | |
Series C, Rev., AMT, 4.00%, 1/1/2028 | | | 5 | | | | 5 | |
| | |
Series 2011A, Rev., AMT, 5.25%, 7/1/2028 | | | 5 | | | | 5 | |
| | | | | | | | |
| | |
Total New Hampshire | | | | | | | 10 | |
| | | | | | | | |
|
New Jersey — 4.1% | |
| | |
County of Middlesex COP, 4.00%, 6/15/2022 | | | 110 | | | | 117 | |
| | |
Monmouth County Improvement Authority Rev., GTD, 5.00%, 12/1/2020 | | | 60 | | | | 61 | |
| | |
New Jersey Economic Development Authority, Biomedical Research Facilities Series 2016A, Rev., 5.00%, 7/15/2027 | | | 240 | | | | 280 | |
| | |
New Jersey Economic Development Authority, School Facilities Construction Series NN, Rev., 5.00%, 3/1/2024 | | | 150 | | | | 163 | |
| | |
New Jersey Economic Development Authority, State House Project Series 2017B, Rev., 4.13%, 6/15/2039 | | | 2,800 | | | | 3,187 | |
| | |
New Jersey Educational Facilities Authority Series 2016B, Rev., 5.00%, 9/1/2036 | | | 105 | | | | 118 | |
| | |
New Jersey Housing and Mortgage Finance Agency, Single Family Housing Series 2018A, Rev., 4.50%, 10/1/2048 | | | 825 | | | | 928 | |
SEE NOTES TO FINANCIAL STATEMENTS.
| | | | | | |
| | | |
| 60 | | | | J.P. MORGAN MUNICIPAL BOND FUNDS | | AUGUST 31, 2020 |
| | | | | | | | |
| INVESTMENTS | | PRINCIPAL
AMOUNT
($000) | | | VALUE
($000) | |
| | | | | | | | |
Municipal Bonds — continued | | | | | | | | |
| | |
New Jersey — continued | | | | | | | | |
| | |
New Jersey Transportation Trust Fund Authority Series BB, Rev., 4.00%, 6/15/2038 | | | 1,500 | | | | 1,607 | |
| | |
New Jersey Transportation Trust Fund Authority, Capital Appreciation, Transportation Systems Series A, Rev., Zero Coupon, 12/15/2036 | | | 10,355 | | | | 5,954 | |
| | |
New Jersey Transportation Trust Fund Authority, Federal Highway Reimbursement | | | | | | | | |
| | |
Series A-1, Rev., 5.00%, 6/15/2027 | | | 2,670 | | | | 3,144 | |
| | |
Series A, Rev., 5.00%, 6/15/2031 | | | 3,000 | | | | 3,448 | |
| | |
Tobacco Settlement Financing Corp. | | | | | | | | |
| | |
Series A, Rev., 4.00%, 6/1/2037 | | | 1,000 | | | | 1,132 | |
| | |
Series A, Rev., 5.00%, 6/1/2046 | | | 1,000 | | | | 1,166 | |
| | |
Series A, Rev., 5.25%, 6/1/2046 | | | 1,500 | | | | 1,775 | |
| | | | | | | | |
| | |
Total New Jersey | | | | | | | 23,080 | |
| | | | | | | | |
|
New Mexico — 0.1% | |
| | |
New Mexico Finance Authority, State Transportation, Senior Lien Series 2010B, Rev., 5.00%, 6/15/2024 | | | 100 | | | | 100 | |
| | |
New Mexico Mortgage Finance Authority, Single Family Mortgage Program | | | | | | | | |
| | |
Series 2012, Class I, Rev., GNMA/FNMA/FHLMC, 4.25%, 3/1/2043 | | | 60 | | | | 61 | |
| | |
Series B-1, Rev., AMT, GNMA/FNMA/FHLMC, 3.75%, 3/1/2048 | | | 480 | | | | 526 | |
| | | | | | | | |
| | |
Total New Mexico | | | | | | | 687 | |
| | | | | | | | |
|
New York — 9.5% | |
| | |
City of New York Series 2018E-1, GO, 5.00%, 3/1/2041 | | | 225 | | | | 272 | |
| | |
County of Rockland Series B, GO, AGM, 5.00%, 9/1/2027 | | | 10 | | | | 13 | |
| | |
Metropolitan Transportation Authority | | | | | | | | |
| | |
Series H, Rev., 5.00%, 11/15/2022 (d) | | | 70 | | | | 77 | |
| | |
Series 2012A, Rev., 5.00%, 11/15/2026 | | | 25 | | | | 27 | |
| | |
Subseries B-3B, Rev., 5.00%, 11/15/2028 | | | 25 | | | | 30 | |
| | |
Series 2016B-1, Rev., 5.00%, 11/15/2029 | | | 25 | | | | 30 | |
| | |
Series D, Rev., 5.00%, 11/15/2031 | | | 400 | | | | 437 | |
| | |
Series 2017B-1, Rev., 5.00%, 11/15/2035 | | | 95 | | | | 113 | |
| | |
Monroe County Industrial Development Corp., True North Rochester Preparatory Charter School Project Series 2020A, Rev., 5.00%, 6/1/2059 (c) | | | 540 | | | | 618 | |
| | |
Monroe County Industrial Development Corp., University of Rochester Series 2017C, Rev., 4.00%, 7/1/2033 | | | 60 | | | | 69 | |
| | |
New York City Municipal Water Finance Authority, Water and Sewer System, Second General Resolution, Fiscal Year 2020 Series 2020BB1, Rev., 5.00%, 6/15/2049 | | | 10,000 | | | | 12,738 | |
| | | | | | | | |
| INVESTMENTS | | PRINCIPAL
AMOUNT
($000) | | | VALUE
($000) | |
| | | | | | | | |
| | | | | | | | |
| | |
New York — continued | | | | | | | | |
| | |
New York City Transitional Finance Authority, Future Tax Secured | | | | | | | | |
| | |
Series 2019C-1, Rev., 5.00%, 11/1/2034 | | | 100 | | | | 128 | |
| | |
Series A, Subseries A-2, Rev., 5.00%, 5/1/2035 | | | 50 | | | | 64 | |
| | |
Series C-3, Rev., 5.00%, 5/1/2039 | | | 25 | | | | 31 | |
| | |
Series 2017F-1, Rev., 4.00%, 5/1/2044 | | | 375 | | | | 416 | |
| | |
New York City Transitional Finance Authority, Future Tax Secured, Fiscal Year 2011 Series C, Rev., 5.00%, 11/1/2021 | | | 170 | | | | 171 | |
| | |
New York City Transitional Finance Authority, Future Tax Secured, Fiscal Year 2019 Series A, Subseries A-1, Rev., 5.00%, 8/1/2040 | | | 5,000 | | | | 6,159 | |
| | |
New York City Water and Sewer System | | | | | | | | |
| | |
Subseries 2019FF-2, Rev., 5.00%, 6/15/2038 | | | 30 | | | | 39 | |
| | |
Series 2012EE, Rev., 4.00%, 6/15/2039 | | | 35 | | | | 37 | |
| | |
Series 2020AA, Rev., 5.00%, 6/15/2040 | | | 55 | | | | 71 | |
| | |
New York Mortgage Agency, Homeowner Mortgage Series 197, Rev., 3.50%, 10/1/2044 | | | 305 | | | | 323 | |
| | |
New York State Dormitory Authority | | | | | | | | |
| | |
Series 2015B, Rev., 5.00%, 7/1/2026 | | | 15 | | | | 18 | |
| | |
Series 2018A, Rev., 5.00%, 10/1/2031 | | | 50 | | | | 60 | |
| | |
Series 2016A, Rev., 5.00%, 10/1/2032 | | | 35 | | | | 42 | |
| | |
Series 2017A, Rev., 5.00%, 3/15/2036 | | | 100 | | | | 122 | |
| | |
Series 2019D, Rev., 5.00%, 7/1/2036 | | | 640 | | | | 967 | |
| | |
Series 2018A, Rev., 5.00%, 3/15/2037 | | | 40 | | | | 50 | |
| | |
Series 2018C, Rev., 5.00%, 3/15/2038 | | | 1,250 | | | | 1,544 | |
| | |
Series 2019A, Rev., 4.00%, 7/1/2045 | | | 2,000 | | | | 2,304 | |
| | |
New York State Environmental Facilities Corp. Series B, Rev., 5.50%, 10/15/2020 (d) | | | 30 | | | | 30 | |
| | |
New York State Environmental Facilities Corp., State Clean Water and Drinking Water Revolving Funds, Municipal Water Finance Authority Projects Series 2017A, Rev., 5.00%, 6/15/2037 | | | 1,750 | | | | 2,186 | |
| | |
New York State Urban Development Corp. | | | | | | | | |
| | |
Series 2019A, Rev., 5.00%, 3/15/2039 | | | 25 | | | | 31 | |
| | |
Series 2019A, Rev., 5.00%, 3/15/2041 | | | 2,000 | | | | 2,519 | |
| | |
New York State Urban Development Corp., State Personal Income Tax, General Purpose Series 2019A, Rev., 5.00%, 3/15/2042 | | | 3,500 | | | | 4,292 | |
| | |
New York Transportation Development Corp., Delta Air Lines, Inc., LaGuardia Airport Terminals C&D Redevelopment Project | | | | | | | | |
| | |
Rev., AMT, 4.00%, 1/1/2036 | | | 1,500 | | | | 1,515 | |
| | |
Rev., AMT, 5.00%, 1/1/2036 | | | 1,125 | | | | 1,213 | |
SEE NOTES TO FINANCIAL STATEMENTS.
| | | | | | | | |
| | | |
| AUGUST 31, 2020 | | J.P. MORGAN MUNICIPAL BOND FUNDS | | | | | 61 | |
JPMorgan Tax Free Bond Fund
SCHEDULE OF PORTFOLIO INVESTMENTS
AS OF AUGUST 31, 2020 (Unaudited) (continued)
| | | | | | | | |
| INVESTMENTS | | PRINCIPAL
AMOUNT
($000) | | | VALUE
($000) | |
| | | | | | | | |
Municipal Bonds — continued | | | | | | | | |
| | |
New York — continued | | | | | | | | |
| | |
Port Authority of New York and New Jersey, Consolidated | | | | | | | | |
| | |
Series 188, Rev., AMT, 5.00%, 5/1/2024 | | | 50 | | | | 58 | |
| | |
Series 93, Rev., 6.13%, 6/1/2094 | | | 7,470 | | | | 8,583 | |
| | |
Springville-Griffith Institute Central School District GO, 3.00%, 6/15/2021 | | | 25 | | | | 26 | |
| | |
Tompkins County Development Corp., Ithaca College Rev., 5.00%, 7/1/2032 | | | 80 | | | | 97 | |
| | |
Town of Orangetown, Rockland County, Sparkill-Palisades Fire District | | | | | | | | |
| | |
GO, AGM, 4.00%, 11/15/2040 | | | 220 | | | | 242 | |
| | |
GO, AGM, 4.00%, 11/15/2041 | | | 205 | | | | 225 | |
| | |
GO, AGM, 4.00%, 11/15/2042 | | | 315 | | | | 345 | |
| | |
GO, AGM, 4.00%, 11/15/2043 | | | 325 | | | | 356 | |
| | |
Triborough Bridge and Tunnel Authority, MTA Bridges and Tunnels | | | | | | | | |
| | |
Series 2018B, Rev., 5.00%, 11/15/2031 | | | 75 | | | | 102 | |
| | |
Series 2018C, Rev., 5.00%, 11/15/2038 | | | 35 | | | | 44 | |
| | |
Series 2018A, Rev., 5.00%, 11/15/2045 | | | 105 | | | | 128 | |
| | |
Utility Debt Securitization Authority Series 2013TE, Rev., 5.00%, 12/15/2041 | | | 4,250 | | | | 4,804 | |
| | |
Village of Tuxedo Park GO, 4.00%, 8/1/2031 | | | 45 | | | | 53 | |
| | |
Westchester Tobacco Asset Securitization Series 2016B, Rev., 5.00%, 6/1/2025 | | | 130 | | | | 152 | |
| | | | | | | | |
| | |
Total New York | | | | | | | 53,971 | |
| | | | | | | | |
|
North Carolina — 2.8% | |
| | |
City of Charlotte Rev., 5.00%, 7/1/2029 | | | 10 | | | | 12 | |
| | |
City of Greensborough, Combined Water and Sewer System Rev., 5.00%, 6/1/2027 | | | 10 | | | | 13 | |
| | |
City of Raleigh Series A, Rev., 4.00%, 10/1/2022 | | | 30 | | | | 32 | |
| | |
City of Winston-Salem Series B, GO, 4.00%, 6/1/2030 | | | 10 | | | | 12 | |
| | |
County of Burke | | | | | | | | |
| | |
Series 2017, Rev., 5.00%, 4/1/2025 | | | 15 | | | | 18 | |
| | |
Series 2018, Rev., 5.00%, 4/1/2031 | | | 25 | | | | 31 | |
| | |
North Carolina Capital Facilities Finance Agency, Meredith College | | | | | | | | |
| | |
Rev., 5.00%, 6/1/2027 | | | 1,060 | | | | 1,211 | |
| | |
Rev., 5.00%, 6/1/2028 | | | 805 | | | | 915 | |
| | |
Rev., 5.00%, 6/1/2029 | | | 350 | | | | 396 | |
| | |
Rev., 5.00%, 6/1/2030 | | | 400 | | | | 449 | |
| | |
North Carolina Housing Finance Agency, Homeownership | | | | | | | | |
| | |
Series 2, Rev., 4.25%, 1/1/2028 | | | 5 | | | | 5 | |
| | |
Series 1, Rev., AMT, 4.50%, 7/1/2028 | | | 10 | | | | 10 | |
| | |
Series A, Rev., AMT, 3.50%, 7/1/2039 | | | 220 | | | | 232 | |
| | | | | | | | |
| INVESTMENTS | | PRINCIPAL
AMOUNT
($000) | | | VALUE
($000) | |
| | | | | | | | |
| | | | | | | | |
| | |
North Carolina — continued | | | | | | | | |
| | |
North Carolina Turnpike Authority Rev., 5.00%, 7/1/2021 | | | 35 | | | | 36 | |
| | |
Raleigh Durham Airport Authority Series 2020A, Rev., AMT, 5.00%, 5/1/2033 | | | 1,645 | | | | 2,107 | |
| | |
State of North Carolina Rev., GAN, 5.00%, 3/1/2033 | | | 7,735 | | | | 10,040 | |
| | |
Town of Fuquay-Varina Rev., 5.00%, 11/1/2030 | | | 10 | | | | 13 | |
| | | | | | | | |
| | |
Total North Carolina | | | | | | | 15,532 | |
| | | | | | | | |
|
North Dakota — 0.1% | |
| | |
North Dakota Housing Finance Agency, Home Mortgage Finance Program | | | | | | | | |
| | |
Series B, Rev., 4.50%, 1/1/2028 | | | 60 | | | | 61 | |
| | |
Series 2011D, Rev., 4.25%, 7/1/2028 | | | 25 | | | | 25 | |
| | |
Series A, Rev., 4.00%, 7/1/2034 | | | 195 | | | | 205 | |
| | |
Series 2016D, Rev., 3.50%, 7/1/2046 | | | 360 | | | | 387 | |
| | | | | | | | |
| | |
Total North Dakota | | | | | | | 678 | |
| | | | | | | | |
|
Ohio — 2.1% | |
| | |
American Municipal Power, Inc. Series 2019A, Rev., 2.30%, 2/15/2022 (b) | | | 100 | | | | 101 | |
| | |
Athens City School District Series 2019A, GO, 4.00%, 12/1/2040 | | | 460 | | | | 536 | |
| | |
Buckeye Tobacco Settlement Financing Authority Series 2020A-2, Class I, Rev., 4.00%, 6/1/2048 | | | 3,210 | | | | 3,545 | |
| | |
County of Union, Memorial Hospital GO, 4.00%, 12/1/2041 | | | 1,825 | | | | 2,071 | |
| | |
County of Warren Series 2016A, Rev., 5.00%, 7/1/2032 | | | 35 | | | | 40 | |
| | |
County of Warren, Healthcare Facilities, Otterbein Homes Obligated Group Series A, Rev., 5.50%, 7/1/2039 | | | 1,000 | | | | 1,075 | |
| | |
County of Warren, Otterbein Homes Series A, Rev., 5.00%, 7/1/2031 | | | 115 | | | | 132 | |
| | |
Delaware City School District GO, 4.00%, 12/1/2039 | | | 160 | | | | 190 | |
| | |
Greenville City School District, School Improvement GO, 5.25%, 1/1/2022 (d) | | | 2,000 | | | | 2,133 | |
| | |
Licking Heights Local School District, School Facilities Construction and Improvement Series A, GO, 4.00%, 10/1/2034 | | | 10 | | | | 12 | |
| | |
Miami University, A State University of Ohio Rev., 5.00%, 9/1/2029 | | | 25 | | | | 31 | |
| | |
Ohio Higher Educational Facility Commission Series 2012A, Rev., 5.00%, 12/1/2020 | | | 10 | | | | 10 | |
| | |
Ohio Housing Finance Agency, Single Family Mortgage | | | | | | | | |
| | |
Series 1, Rev., GNMA/FNMA/FHLMC, 4.80%, 11/1/2028 | | | 10 | | | | 10 | |
| | |
Series 3, Rev., GNMA/FNMA/FHLMC, 4.50%, 11/1/2029 | | | 40 | | | | 41 | |
SEE NOTES TO FINANCIAL STATEMENTS.
| | | | | | |
| | | |
| 62 | | | | J.P. MORGAN MUNICIPAL BOND FUNDS | | AUGUST 31, 2020 |
| | | | | | | | |
| INVESTMENTS | | PRINCIPAL
AMOUNT
($000) | | | VALUE
($000) | |
| | | | | | | | |
Municipal Bonds — continued | | | | | | | | |
| | |
Ohio — continued | | | | | | | | |
| | |
State of Ohio Series A, GO, 5.00%, 5/1/2033 | | | 1,500 | | | | 1,877 | |
| | |
State of Ohio, Higher Education Series B, GO, 5.00%, 8/1/2023 | | | 110 | | | | 120 | |
| | |
Streetsboro City School District Series A, GO, 4.00%, 12/1/2020 (d) | | | 5 | | | | 5 | |
| | |
University of Cincinnati Series 2017A, Rev., 5.00%, 6/1/2045 | | | 25 | | | | 30 | |
| | | | | | | | |
| | |
Total Ohio | | | | | | | 11,959 | |
| | | | | | | | |
|
Oklahoma — 0.8% | |
| | |
Grand River Dam Authority Series A, Rev., 4.00%, 6/1/2022 | | | 10 | | | | 11 | |
| | |
Oklahoma Development Finance Authority Rev., AMT, 1.63%, 7/6/2023 | | | 2,000 | | | | 1,994 | |
| | |
Oklahoma Development Finance Authority, Health System, OU Medicine Project Series 2018B, Rev., AGM, 4.00%, 8/15/2048 | | | 700 | | | | 775 | |
| | |
Oklahoma Housing Finance Agency, Single Family Mortgage, Homeownership Loan Program | | | | | | | | |
| | |
Series 2011B, Rev., GNMA COLL, 4.50%, 9/1/2027 | | | 20 | | | | 21 | |
| | |
Series A, Rev., GNMA COLL, 4.75%, 3/1/2028 | | | 10 | | | | 10 | |
| | |
Oklahoma Turnpike Authority, Turnpike System, Second Senior Series 2017A, Rev., 5.00%, 1/1/2037 | | | 1,665 | | | | 1,977 | |
| | | | | | | | |
| | |
Total Oklahoma | | | | | | | 4,788 | |
| | | | | | | | |
|
Oregon — 0.7% | |
| | |
City of Eugene, Electric Utility System Series 2016A, Rev., 4.00%, 8/1/2031 | | | 325 | | | | 377 | |
| | |
City of Portland, Water System, Second Lien Series 2020A, Rev., 5.00%, 5/1/2035 | | | 2,635 | | | | 3,486 | |
| | |
City of Sheridan GO, 4.00%, 12/1/2027 | | | 10 | | | | 12 | |
| | |
State of Oregon, Department of Transportation Series 2019A, Rev., 5.00%, 11/15/2042 | | | 35 | | | | 45 | |
| | |
State of Oregon, Department of Transportation, User Tax Series 2013A, Rev., 5.00%, 11/15/2022 | | | 5 | | | | 6 | |
| | |
Yamhill County School District No. 40 McMinnville GO, 4.00%, 6/15/2037 | | | 30 | | | | 34 | |
| | | | | | | | |
| | |
Total Oregon | | | | | | | 3,960 | |
| | | | | | | | |
|
Pennsylvania — 9.7% | |
| | |
Abington School District Series 2017A, GO, 4.00%, 10/1/2037 | | | 15 | | | | 17 | |
| | |
Allegheny County Hospital Development Authority, Allegheny Health Network Obligated Group Series 2018A, Rev., 4.00%, 4/1/2044 | | | 2,000 | | | | 2,215 | |
| | | | | | | | |
| INVESTMENTS | | PRINCIPAL
AMOUNT
($000) | | | VALUE
($000) | |
| | | | | | | | |
| | | | | | | | |
| | |
Pennsylvania — continued | | | | | | | | |
| | |
Berks County Industrial Development Authority, Tower Health Project | | | | | | | | |
| | |
Rev., 5.00%, 11/1/2036 | | | 50 | | | | 55 | |
| | |
Rev., 5.00%, 11/1/2037 | | | 430 | | | | 469 | |
| | |
Berks County Municipal Authority (The), Tower Health Project Series 2020B-3, Rev., 5.00%, 2/1/2030 (b) | | | 2,000 | | | | 2,264 | |
| | |
Central Dauphin School District GO, 4.00%, 2/1/2030 | | | 25 | | | | 29 | |
| | |
Chester County Health and Education Facilities Authority, Main Line Health System Series 2017A, Rev., 4.00%, 10/1/2036 | | | 25 | | | | 29 | |
| | |
Chester County Industrial Development Authority, Longwood Gardens Project Rev., 4.00%, 12/1/2049 | | | 3,345 | | | | 3,835 | |
| | |
City of Pittsburgh GO, 4.00%, 9/1/2031 | | | 1,155 | | | | 1,360 | |
| | |
Commonwealth Financing Authority, Tobacco Master Settlement Payment Rev., AGM, 4.00%, 6/1/2039 | | | 9,950 | | | | 11,282 | |
| | |
Commonwealth of Pennsylvania Series A, COP, 4.00%, 7/1/2046 | | | 1,200 | | | | 1,351 | |
| | |
County of Cambria Series 2020B, GO, AGM, 4.00%, 8/1/2035 | | | 700 | | | | 788 | |
| | |
DuBois Hospital Authority, Penn Highlands Healthcare Rev., 4.00%, 7/15/2048 | | | 1,200 | | | | 1,304 | |
| | |
Erie City Water Authority Series A, Rev., AGM, 5.00%, 12/1/2043 | | | 1,500 | | | | 1,864 | |
| | |
Lancaster County Hospital Authority, Health Center, Masonic Villages Project | | | | | | | | |
| | |
Rev., 5.00%, 11/1/2034 | | | 35 | | | | 41 | |
| | |
Rev., 5.00%, 11/1/2036 | | | 510 | | | | 587 | |
| | |
Rev., 5.00%, 11/1/2037 | | | 250 | | | | 287 | |
| | |
Mifflinburg Area School District Series 2020A, GO, 4.00%, 6/15/2039 | | | 335 | | | | 384 | |
| | |
Montgomery County Higher Education and Health Authority, Arcadia University Rev., 4.00%, 9/1/2036 | | | 1,655 | | | | 1,860 | |
| | |
Montgomery County Higher Education and Health Authority, Thomas Jefferson University | | | | | | | | |
| | |
Series 2018A, Rev., 4.00%, 9/1/2038 | | | 3,725 | | | | 4,116 | |
| | |
Series 2018A, Rev., 4.00%, 9/1/2043 | | | 3,740 | | | | 4,082 | |
| | |
Montgomery County Industrial Development Authority, ACTS Retirement-Life Communities, Inc. Obligated Group | | | | | | | | |
| | |
Rev., 5.00%, 5/15/2022 (d) | | | 510 | | | | 551 | |
| | |
Series 2020C, Rev., 5.00%, 11/15/2045 | | | 1,770 | | | | 2,091 | |
| | |
Montgomery County Industrial Development Authority, Waverly Heights Ltd. Project | | | | | | | | |
| | |
Series 2019, Rev., 5.00%, 12/1/2044 | | | 350 | | | | 387 | |
SEE NOTES TO FINANCIAL STATEMENTS.
| | | | | | | | |
| | | |
| AUGUST 31, 2020 | | J.P. MORGAN MUNICIPAL BOND FUNDS | | | | | 63 | |
JPMorgan Tax Free Bond Fund
SCHEDULE OF PORTFOLIO INVESTMENTS
AS OF AUGUST 31, 2020 (Unaudited) (continued)
| | | | | | | | |
| INVESTMENTS | | PRINCIPAL
AMOUNT
($000) | | | VALUE
($000) | |
| | | | | | | | |
Municipal Bonds — continued | | | | | | | | |
| | |
Pennsylvania — continued | | | | | | | | |
| | |
Series 2019, Rev., 5.00%, 12/1/2049 | | | 500 | | | | 552 | |
| | |
Northampton County General Purpose Authority, Moravian College Project Rev., 5.00%, 10/1/2036 | | | 100 | | | | 106 | |
| | |
Pennsylvania Economic Development Financing Authority, Waste Management, Inc. Project Rev., 2.80%, 12/1/2021 (b) | | | 2,950 | | | | 3,040 | |
| | |
Pennsylvania Housing Finance Agency, Single Family Mortgage | | | | | | | | |
| | |
Series 2011- 112, Rev., AMT, 5.00%, 4/1/2028 | | | 20 | | | | 20 | |
| | |
Series 118A, Rev., AMT, 3.50%, 4/1/2040 | | | 530 | | | | 548 | |
| | |
Series 122, Rev., AMT, 4.00%, 10/1/2046 | | | 335 | | | | 360 | |
| | |
Philadelphia Authority for Industrial Development, MAST Community Charter School II Project Series 2020A, Rev., 5.00%, 8/1/2040 | | | 315 | | | | 364 | |
| | |
Pittsburgh Water and Sewer Authority Series B, Rev., AGM, 5.00%, 9/1/2032 | | | 1,000 | | | | 1,385 | |
| | |
School District of Philadelphia (The) Series B, GO, AGM, 4.00%, 9/1/2043 | | | 1,250 | | | | 1,442 | |
| | |
Swarthmore Borough Authority, Swarthmore College | | | | | | | | |
| | |
Rev., 5.00%, 9/15/2023 | | | 25 | | | | 29 | |
| | |
Series 2016B, Rev., 4.00%, 9/15/2041 | | | 15 | | | | 17 | |
| | |
Township of Tredyffrin GO, 2.00%, 11/15/2020 | | | 25 | | | | 25 | |
| | |
Township of West Bradford | | | | | | | | |
| | |
GO, 4.00%, 12/15/2040 | | | 600 | | | | 700 | |
| | |
GO, 4.00%, 12/15/2045 | | | 1,100 | | | | 1,271 | |
| | |
Upper Merion Area School District GO, 5.00%, 1/15/2036 | | | 250 | | | | 302 | |
| | |
West Cornwall Township Municipal Authority, Pleasant View Retirement Community Project | | | | | | | | |
| | |
Rev., 3.00%, 12/15/2023 | | | 445 | | | | 440 | |
| | |
Rev., 4.00%, 12/15/2028 | | | 1,000 | | | | 1,020 | |
| | |
Rev., 5.00%, 12/15/2038 | | | 750 | | | | 776 | |
| | |
West Mifflin School District GO, 3.00%, 4/1/2038 | | | 1,400 | | | | 1,524 | |
| | | | | | | | |
| | |
Total Pennsylvania | | | | | | | 55,169 | |
| | | | | | | | |
|
Rhode Island — 0.1% | |
| | |
City of Pawtucket Series D, GO, AGM, 5.00%, 7/15/2028 | | | 200 | | | | 260 | |
| | |
Rhode Island Health and Educational Building Corp., Public Schools Series A, Rev., AGM, 5.00%, 5/15/2032 | | | 25 | | | | 32 | |
| | | | | | | | |
| | |
Total Rhode Island | | | | | | | 292 | |
| | | | | | | | |
| | | | | | | | |
| INVESTMENTS | | PRINCIPAL
AMOUNT
($000) | | | VALUE
($000) | |
| | | | | | | | |
| | | | | | | | |
|
South Carolina — 1.1% | |
| | |
City of Greenwood, Combined Public Utility | | | | | | | | |
| | |
Rev., 5.00%, 12/1/2023 | | | 220 | | | | 252 | |
| | |
Rev., 5.00%, 12/1/2026 | | | 340 | | | | 426 | |
| | |
Rev., 5.00%, 12/1/2028 | | | 250 | | | | 328 | |
| | |
Rev., 5.00%, 12/1/2030 | | | 675 | | | | 895 | |
| | |
City of North Charleston 4.00%, 10/1/2040 | | | 90 | | | | 104 | |
| | |
Greenwood Metropolitan District Rev., 5.00%, 10/1/2027 | | | 10 | | | | 13 | |
| | |
South Carolina State Housing Finance and Development Authority Series A, Rev., 4.00%, 1/1/2047 | | | 265 | | | | 284 | |
| | |
South Carolina State Ports Authority Rev., AMT, 4.00%, 7/1/2040 | | | 1,095 | | | | 1,177 | |
| | |
Spartanburg County School District No. 7 Series 2019D, GO, SCSDE, 5.00%, 3/1/2044 | | | 1,970 | | | | 2,484 | |
| | | | | | | | |
| | |
Total South Carolina | | | | | | | 5,963 | |
| | | | | | | | |
|
South Dakota — 0.6% | |
| | |
Rapid City Area School District No. 51-4/SD, Go Limited Tax Capital Outlay Refunding Certificate | | | | | | | | |
| | |
GO, 4.00%, 8/1/2029 | | | 1,165 | | | | 1,372 | |
| | |
GO, 4.00%, 8/1/2030 | | | 610 | | | | 715 | |
| | |
GO, 4.00%, 8/1/2031 | | | 420 | | | | 489 | |
| | |
South Dakota Board of Regents Housing and Auxiliary Facilities System Series 2019A, Rev., 4.00%, 4/1/2036 | | | 65 | | | | 75 | |
| | |
South Dakota Housing Development Authority, Homeownership Mortgage | | | | | | | | |
| | |
Series D, Rev., AMT, 4.00%, 11/1/2029 | | | 150 | | | | 154 | |
| | |
Series 2012A, Rev., AMT, 4.50%, 5/1/2031 | | | 30 | | | | 31 | |
| | |
Series 2015D, Rev., 4.00%, 11/1/2045 | | | 350 | | | | 373 | |
| | |
South Dakota Housing Development Authority, Single Family Mortgage Series 2011 2, Rev., 4.25%, 5/1/2032 | | | 25 | | | | 25 | |
| | | | | | | | |
| | |
Total South Dakota | | | | | | | 3,234 | |
| | | | | | | | |
|
Tennessee — 5.9% | |
| | |
City of Cleveland | | | | | | | | |
| | |
Series 2018B, GO, 5.00%, 6/1/2022 | | | 205 | | | | 222 | |
| | |
Series 2018B, GO, 5.00%, 6/1/2027 | | | 245 | | | | 314 | |
| | |
Series 2018B, GO, 5.00%, 6/1/2028 | | | 260 | | | | 341 | |
| | |
Series 2018B, GO, 5.00%, 6/1/2030 | | | 285 | | | | 369 | |
| | |
Series 2018B, GO, 4.00%, 6/1/2031 | | | 300 | | | | 362 | |
| | |
Series 2018B, GO, 4.00%, 6/1/2032 | | | 310 | | | | 371 | |
| | |
Series 2018B, GO, 4.00%, 6/1/2038 | | | 395 | | | | 460 | |
| | |
Series 2018B, GO, 4.00%, 6/1/2039 | | | 410 | | | | 476 | |
SEE NOTES TO FINANCIAL STATEMENTS.
| | | | | | |
| | | |
| 64 | | | | J.P. MORGAN MUNICIPAL BOND FUNDS | | AUGUST 31, 2020 |
| | | | | | | | |
| INVESTMENTS | | PRINCIPAL
AMOUNT
($000) | | | VALUE
($000) | |
| | | | | | | | |
Municipal Bonds — continued | | | | | | | | |
| | |
Tennessee — continued | | | | | | | | |
| | |
City of Oak Ridge | | | | | | | | |
| | |
GO, 4.00%, 6/1/2037 | | | 695 | | | | 792 | |
| | |
GO, 4.00%, 6/1/2038 | | | 720 | | | | 819 | |
| | |
GO, 4.00%, 6/1/2039 | | | 750 | | | | 847 | |
| | |
County of Blount Series 2016B, GO, 5.00%, 6/1/2029 | | | 4,610 | | | | 5,684 | |
| | |
County of Hamilton Series 2018A, GO, 5.00%, 4/1/2028 | | | 25 | | | | 33 | |
| | |
County of Williamson | | | | | | | | |
| | |
GO, 4.00%, 4/1/2033 | | | 1,490 | | | | 1,841 | |
| | |
GO, 4.00%, 4/1/2034 | | | 1,485 | | | | 1,827 | |
| | |
County of Wilson | | | | | | | | |
| | |
GO, 5.00%, 4/1/2030 | | | 3,625 | | | | 4,843 | |
| | |
Series 2017A, GO, 4.00%, 4/1/2039 | | | 25 | | | | 28 | |
| | |
Greeneville Health and Educational Facilities Board, Ballad Health Obligated Group Series 2018A, Rev., 4.00%, 7/1/2040 | | | 4,000 | | | | 4,437 | |
| | |
Jackson Energy Authority Rev., 5.00%, 12/1/2020 | | | 10 | | | | 10 | |
| | |
Knox County Health Educational and Housing Facility Board, East Tennessee Children’s Hospital | | | | | | | | |
| | |
Rev., 5.00%, 11/15/2024 | | | 800 | | | | 936 | |
| | |
Rev., 4.00%, 11/15/2043 | | | 105 | | | | 118 | |
| | |
Metropolitan Government Nashville & Davidson County Health and Educational Facilities Board Series A, Rev., 5.00%, 7/1/2035 | | | 100 | | | | 117 | |
| | |
Metropolitan Nashville Airport Authority (The) | | | | | | | | |
| | |
Series 2019A, Rev., 5.00%, 7/1/2044 | | | 1,000 | | | | 1,235 | |
| | |
Series 2019A, Rev., 5.00%, 7/1/2049 | | | 1,000 | | | | 1,225 | |
| | |
Metropolitan Nashville Airport Authority (The), Airport Improvement Series 2015A, Rev., 5.00%, 7/1/2035 | | | 20 | | | | 23 | |
| | |
Shelby County Health Educational and Housing Facilities Board Series 2019A, Rev., 5.75%, 10/1/2054 | | | 1,000 | | | | 947 | |
| | |
Tennessee Energy Acquisition Corp., Gas Project Rev., 4.00%, 11/1/2025 (b) | | | 4,000 | | | | 4,572 | |
| | |
Tennessee Housing Development Agency, Homeownership Program | | | | | | | | |
| | |
Series A, Rev., AMT, 4.50%, 1/1/2021 (d) | | | 60 | | | | 61 | |
| | |
Series 1A, Rev., AMT, 4.50%, 1/1/2038 | | | 40 | | | | 41 | |
| | |
Tennessee State School Bond Authority Series B, Rev., 5.00%, 11/1/2040 | | | 35 | | | | 42 | |
| | | | | | | | |
| | |
Total Tennessee | | | | | | | 33,393 | |
| | | | | | | | |
| | | | | | | | |
| INVESTMENTS | | PRINCIPAL
AMOUNT
($000) | | | VALUE
($000) | |
| | | | | | | | |
| | | | | | | | |
| | |
Texas — 5.8% | | | | | | | | |
| | |
Calallen Independent School District, School Building Series 2018, GO, PSF-GTD, 5.00%, 2/15/2028 | | | 10 | | | | 13 | |
| | |
Carrollton-Farmers Branch Independent School District Series B, GO, 4.00%, 2/15/2021 | | | 25 | | | | 25 | |
| | |
City of Abilene GO, 5.00%, 2/15/2024 | | | 10 | | | | 12 | |
| | |
City of Austin, Public Improvement Series 2019, GO, 5.00%, 9/1/2033 | | | 2,000 | | | | 2,651 | |
| | |
City of Bryan, Electric System Rev., AGM, 4.00%, 7/1/2031 | | | 50 | | | | 58 | |
| | |
City of Conroe Series 2018A, GO, 5.00%, 3/1/2032 | | | 10 | | | | 13 | |
| | |
City of El Paso | | | | | | | | |
| | |
GO, 4.00%, 8/15/2040 | | | 475 | | | | 526 | |
| | |
GO, 4.00%, 8/15/2042 | | | 25 | | | | 28 | |
| | |
City of Garland Series 2018, GO, 5.00%, 2/15/2027 | | | 10 | | | | 13 | |
| | |
City of Houston Rev., AMT, 5.00%, 7/1/2029 | | | 2,500 | | | | 2,588 | |
| | |
City of Houston, Airport System, Subordinate Lien Series 2012A, Rev., AMT, 5.00%, 7/1/2028 | | | 35 | | | | 37 | |
| | |
City of Houston, Combined Utility System, Junior Lien Series A, Rev., AGM, 5.75%, 12/1/2032 (d) | | | 2,500 | | | | 3,807 | |
| | |
City of Laredo | | | | | | | | |
| | |
GO, 5.00%, 2/15/2027 | | | 30 | | | | 36 | |
| | |
GO, 5.00%, 2/15/2032 | | | 40 | | | | 50 | |
| | |
City of Lucas GO, 5.00%, 2/1/2028 | | | 170 | | | | 222 | |
| | |
City of Mission GO, AGM, 5.00%, 2/15/2031 | | | 575 | | | | 725 | |
| | |
City of Pearland GO, 4.00%, 3/1/2032 | | | 35 | | | | 42 | |
| | |
City of San Antonio, Electric and Gas Systems | | | | | | | | |
| | |
Rev., 4.00%, 2/1/2028 | | | 45 | | | | 56 | |
| | |
Rev., 5.00%, 2/1/2031 | | | 230 | | | | 285 | |
| | |
Rev., 5.00%, 2/1/2032 | | | 35 | | | | 43 | |
| | |
City of San Marcos GO, 5.00%, 8/15/2031 | | | 25 | | | | 32 | |
| | |
City of Temple Series 2016A, GO, 5.00%, 8/1/2031 | | | 50 | | | | 60 | |
| | |
City of Waxahachie Series A, GO, 5.00%, 8/1/2025 | | | 45 | | | | 55 | |
| | |
Clifton Higher Education Finance Corp., Idea Public Schools | | | | | | | | |
| | |
Series B, Rev., 4.00%, 8/15/2023 | | | 500 | | | | 540 | |
| | |
Series B, Rev., 5.00%, 8/15/2024 | | | 345 | | | | 395 | |
| | |
Series 2016B, Rev., 5.00%, 8/15/2025 | | | 460 | | | | 541 | |
| | |
Rev., 6.00%, 8/15/2033 | | | 1,250 | | | | 1,401 | |
SEE NOTES TO FINANCIAL STATEMENTS.
| | | | | | | | |
| | | |
| AUGUST 31, 2020 | | J.P. MORGAN MUNICIPAL BOND FUNDS | | | | | 65 | |
JPMorgan Tax Free Bond Fund
SCHEDULE OF PORTFOLIO INVESTMENTS
AS OF AUGUST 31, 2020 (Unaudited) (continued)
| | | | | | | | |
| INVESTMENTS | | PRINCIPAL
AMOUNT
($000) | | | VALUE
($000) | |
| | | | | | | | |
Municipal Bonds — continued | | | | | | | | |
| | |
Texas — continued | | | | | | | | |
| | |
Clifton Higher Education Finance Corp., Yes Prep Public Schools, Inc. | | | | | | | | |
| | |
Rev., PSF-GTD, 4.00%, 4/1/2035 | | | 400 | | | | 479 | |
| | |
Rev., PSF-GTD, 4.00%, 4/1/2036 | | | 500 | | | | 596 | |
| | |
County of Galveston GO, 4.00%, 2/1/2039 | | | 10 | | | | 12 | |
| | |
County of Hidalgo | | | | | | | | |
| | |
Series 2016, GO, 5.00%, 8/15/2028 | | | 10 | | | | 12 | |
| | |
GO, 4.00%, 8/15/2035 | | | 85 | | | | 99 | |
| | |
Series 2018B, GO, 4.00%, 8/15/2038 | | | 40 | | | | 46 | |
| | |
County of Victoria GO, 4.00%, 2/15/2030 | | | 15 | | | | 18 | |
| | |
Cypress-Fairbanks Independent School District Series 2013, GO, PSF-GTD, 5.00%, 2/15/2022 | | | 10 | | | | 11 | |
| | |
Dallas/Fort Worth International Airport | | | | | | | | |
| | |
Series 2012B, Rev., 5.00%, 11/1/2020 | | | 445 | | | | 449 | |
| | |
Series 2013B, Rev., 5.00%, 11/1/2044 | | | 25 | | | | 27 | |
| | |
El Paso County Hospital District GO, AGM-CR, 5.00%, 8/15/2023 | | | 510 | | | | 561 | |
| | |
Ennis Independent School District GO, PSF-GTD, 5.00%, 8/15/2028 | | | 30 | | | | 38 | |
| | |
Harris County, Senior Lien Series 2016A, Rev., 5.00%, 8/15/2022 | | | 10 | | | | 11 | |
| | |
Harris Montgomery Counties Municipal Utility District No. 386 | | | | | | | | |
| | |
GO, 2.00%, 9/1/2020 | | | 10 | | | | 10 | |
| | |
GO, 4.00%, 9/1/2023 | | | 15 | | | | 16 | |
| | |
Highland Park Independent School District GO, PSF-GTD, 5.00%, 2/15/2024 | | | 30 | | | | 35 | |
| | |
Ingleside Independent School District GO, PSF-GTD, 5.00%, 8/15/2028 | | | 35 | | | | 44 | |
| | |
Killeen Independent School District GO, PSF-GTD, 5.00%, 2/15/2026 | | | 25 | | | | 31 | |
| | |
Metropolitan Transit Authority of Harris County, Sales & Use Tax Series 2011A, Rev., 5.00%, 11/1/2020 | | | 10 | | | | 10 | |
| | |
Metropolitan Transit Authority of Harris County, Vanderbilt University Medical Center Rev., 5.00%, 11/1/2024 (d) | | | 15 | | | | 18 | |
| | |
Midlothian Independent School District Series 2017A, GO, PSF-GTD, 4.00%, 2/15/2037 | | | 25 | | | | 29 | |
| | |
North Texas Municipal Water District, Upper East Fork Wastewater Interceptor System Series 2017, Rev., 5.00%, 6/1/2031 | | | 10 | | | | 13 | |
| | |
North Texas Municipal Water District, Wastewater System Rev., 4.00%, 6/1/2028 | | | 15 | | | | 18 | |
| | |
North Texas Tollway Authority System, Second Tier Rev., 4.00%, 1/1/2038 | | | 200 | | | | 225 | |
| | |
North Texas Tollway Authority System, Special Projects System Series A, Rev., 6.00%, 9/1/2021 (d) | | | 2,000 | | | | 2,115 | |
| | | | | | | | |
| INVESTMENTS | | PRINCIPAL
AMOUNT
($000) | | | VALUE
($000) | |
| | | | | | | | |
| | | | | | | | |
| | |
Texas — continued | | | | | | | | |
| | |
Palestine Independent School District Series 2016, GO, PSF-GTD, 5.00%, 2/15/2026 | | | 30 | | | | 37 | |
| | |
Pasadena Independent School District, School Building Series 2018, GO, PSF-GTD, 5.00%, 2/15/2028 | | | 15 | | | | 20 | |
| | |
Permanent University Fund, A&M University System Series A, Rev., 5.00%, 7/1/2031 | | | 210 | | | | 250 | |
| | |
Plano Independent School District GO, PSF-GTD, 5.00%, 2/15/2026 | | | 40 | | | | 50 | |
| | |
Red Oak Independent School District GO, PSF-GTD, 5.00%, 8/15/2030 | | | 20 | | | | 25 | |
| | |
Round Rock Independent School District GO, PSF-GTD, 4.00%, 8/1/2032 | | | 170 | | | | 198 | |
| | |
San Antonio Water System Series 2017A, Rev., 4.00%, 5/15/2034 | | | 60 | | | | 70 | |
| | |
Socorro Independent School District, Unlimited Tax GO, PSF-GTD, 5.00%, 2/15/2026 | | | 45 | | | | 56 | |
| | |
Southwest Higher Education Authority, Inc. Rev., 5.00%, 10/1/2020 | | | 30 | | | | 30 | |
| | |
Stafford Municipal School District, School Building Series 2018, GO, PSF-GTD, 5.00%, 8/15/2029 | | | 35 | | | | 46 | |
| | |
Tarrant County Cultural Education Facilities Finance Corp., Hendrick Medical Center, Hospital Rev., 5.50%, 9/1/2043 | | | 2,300 | | | | 2,523 | |
| | |
Tarrant County Cultural Education Facilities Finance Corp., Retirement Facility, MRC Stevenson Oaks Project Series 2020A, Rev., 6.75%, 11/15/2051 | | | 3,000 | | | | 3,000 | |
| | |
Texas Department of Housing and Community Affairs, Residential Mortgage Series 2011B, Rev., GNMA COLL, 4.25%, 1/1/2034 | | | 85 | | | | 86 | |
| | |
Texas Public Finance Authority Rev., 4.00%, 2/1/2035 | | | 2,315 | | | | 2,809 | |
| | |
Texas Water Development Board | | | | | | | | |
| | |
Series 2019A, Rev., 4.00%, 10/15/2037 | | | 500 | | | | 608 | |
| | |
Series 2019A, Rev., 4.00%, 10/15/2044 | | | 2,100 | | | | 2,498 | |
| | |
Texas Water Development Board, Water Implementation Series B, Rev., 5.00%, 4/15/2026 | | | 25 | | | | 31 | |
| | |
Texas Woman’s University, Financing System Series 2016, Rev., 4.00%, 7/1/2030 | | | 10 | | | | 12 | |
| | |
West Harris County Regional Water Authority Rev., 4.00%, 12/15/2045 | | | 1,000 | | | | 1,186 | |
| | | | | | | | |
| | |
Total Texas | | | | | | | 32,712 | |
| | | | | | | | |
|
Utah — 0.2% | |
| | |
City of Lehi, Sales Tax Rev., 4.00%, 6/1/2039 | | | 480 | | | | 558 | |
| | |
City of Provo GO, 5.00%, 1/1/2032 | | | 10 | | | | 13 | |
SEE NOTES TO FINANCIAL STATEMENTS.
| | | | | | |
| | | |
| 66 | | | | J.P. MORGAN MUNICIPAL BOND FUNDS | | AUGUST 31, 2020 |
| | | | | | | | |
| INVESTMENTS | | PRINCIPAL
AMOUNT
($000) | | | VALUE
($000) | |
| | | | | | | | |
Municipal Bonds — continued | | | | | | | | |
| | |
Utah — continued | | | | | | | | |
| | |
City of South Jordan Rev., 5.00%, 8/15/2038 | | | 25 | | | | 32 | |
| | |
Salt Lake City Corp. Airport Series 2017B, Rev., 5.00%, 7/1/2042 | | | 260 | | | | 309 | |
| | |
Tooele County Municipal Building Authority Series 2017, Rev., 4.00%, 12/15/2042 | | | 25 | | | | 28 | |
| | |
University of Utah (The) Series 2018A, Rev., 5.00%, 8/1/2044 | | | 60 | | | | 75 | |
| | | | | | | | |
| | |
Total Utah | | | | | | | 1,015 | |
| | | | | | | | |
|
Vermont — 1.0% | |
| | |
City of Burlington, Public Improvement | | | | | | | | |
| | |
Series 2019A, GO, 4.00%, 11/1/2037 | | | 500 | | | | 589 | |
| | |
Series 2019A, GO, 4.00%, 11/1/2039 | | | 435 | | | | 510 | |
| | |
Vermont Housing Finance Agency, Mortgage-Backed Securities Series A, Rev., AMT, GNMA/FNMA/FHLMC, 4.50%, 2/1/2026 | | | 30 | | | | 31 | |
| | |
Vermont Housing Finance Agency, Multiple Purpose | | | | | | | | |
| | |
Series B, Rev., AMT, 4.13%, 11/1/2042 | | | 120 | | | | 120 | |
| | |
Series A, Rev., AMT, 4.00%, 11/1/2046 | | | 220 | | | | 236 | |
| | |
Vermont Municipal Bond Bank Series 1, Rev., 5.00%, 12/1/2034 | | | 30 | | | | 37 | |
| | |
Vermont Student Assistance Corp., Education Loan | | | | | | | | |
| | |
Series A, Rev., AMT, 5.00%, 6/15/2022 | | | 725 | | | | 769 | |
| | |
Series 2018A, Rev., AMT, 3.63%, 6/15/2029 | | | 835 | | | | 887 | |
| | |
Series A, Rev., AMT, 3.75%, 6/15/2030 | | | 1,170 | | | | 1,234 | |
| | |
Series A, Rev., AMT, 4.00%, 6/15/2031 | | | 415 | | | | 442 | |
| | |
Series A, Rev., AMT, 4.00%, 6/15/2032 | | | 165 | | | | 175 | |
| | |
Series A, Rev., AMT, 4.00%, 6/15/2033 | | | 210 | | | | 222 | |
| | |
Series 2018A, Rev., AMT, 4.00%, 6/15/2034 | | | 165 | | | | 174 | |
| | | | | | | | |
| | |
Total Vermont | | | | | | | 5,426 | |
| | | | | | | | |
|
Virginia — 1.1% | |
| | |
Capital Region Airport Commission (Richmond International Airport) | | | | | | | | |
| | |
Series 2016A, Rev., 4.00%, 7/1/2035 | | | 350 | | | | 388 | |
| | |
Series 2016A, Rev., 4.00%, 7/1/2036 | | | 320 | | | | 354 | |
| | |
City of Portsmouth Series 2015A, GO, 5.00%, 8/1/2025 | | | 20 | | | | 24 | |
| | |
City of Richmond, Public Improvement Series 2018A, GO, 5.00%, 3/1/2029 | | | 5 | | | | 7 | |
| | |
County of Loudoun, Public Improvement Series A, GO, 4.00%, 12/1/2020 (d) | | | 5 | | | | 5 | |
| | |
Norfolk Economic Development Authority, Sentara Healthcare Series B, Rev., 4.00%, 11/1/2048 | | | 4,375 | | | | 4,946 | |
| | | | | | | | |
| INVESTMENTS | | PRINCIPAL
AMOUNT
($000) | | | VALUE
($000) | |
| | | | | | | | |
| | | | | | | | |
| | |
Virginia — continued | | | | | | | | |
| | |
Virginia College Building Authority, Virginia Educational Facilities Revenue 21st Century College and Equipment Project Series 2017E, Rev., 5.00%, 2/1/2029 | | | 10 | | | | 13 | |
| | |
Virginia Resources Authority, Infrastructure Series 2017B, Rev., 5.00%, 11/1/2028 | | | 10 | | | | 13 | |
| | |
Virginia Resources Authority, Infrastructure and State Moral Obligation | | | | | | | | |
| | |
Series B, Rev., 5.00%, 11/1/2021 (d) | | | 130 | | | | 137 | |
| | |
Series 2011B, Rev., 5.00%, 11/1/2023 | | | 25 | | | | 26 | |
| | |
Series B, Rev., 5.00%, 11/1/2026 | | | 15 | | | | 16 | |
| | | | | | | | |
| | |
Total Virginia | | | | | | | 5,929 | |
| | | | | | | | |
|
Washington — 1.1% | |
| | |
Chelan County Public Utility District No. 1 Series 2011A, Rev., AMT, 5.50%, 7/1/2026 | | | 350 | | | | 364 | |
| | |
City of Lynnwood, Utility System Series 2018, Rev., 5.00%, 12/1/2028 | | | 25 | | | | 33 | |
| | |
County of King, Sewer | | | | | | | | |
| | |
Series 2102C, Rev., 5.00%, 1/1/2023 | | | 40 | | | | 43 | |
| | |
Series 2018B, Rev., 5.00%, 7/1/2031 | | | 10 | | | | 13 | |
| | |
Energy Northwest, Project 3 Electric System Series C, Rev., 5.00%, 7/1/2023 | | | 25 | | | | 28 | |
| | |
King County School District No. 414 Lake Washington Series 2017, GO, 5.00%, 12/1/2028 | | | 15 | | | | 19 | |
| | |
Pierce and Lewis Counties School District No. 404 GO, 4.00%, 12/1/2025 | | | 5 | | | | 6 | |
| | |
Pierce County School District No. 416 White River GO, 4.00%, 12/1/2030 | | | 10 | | | | 12 | |
| | |
Washington Health Care Facilities Authority, Commonspirit Health Series A-1, Rev., 5.00%, 8/1/2031 | | | 1,000 | | | | 1,261 | |
| | |
Washington Health Care Facilities Authority, Seattle Cancer Care Alliance Rev., 4.00%, 9/1/2045 | | | 2,500 | | | | 2,844 | |
| | |
Washington State Housing Finance Commission, Homeownership Program Series B, Rev., GNMA/FNMA/FHLMC, 4.25%, 10/1/2032 | | | 130 | | | | 131 | |
| | |
Washington State Housing Finance Commission, Single Family Program Series 2A-R, Rev., AMT, 3.50%, 12/1/2046 | | | 235 | | | | 246 | |
| | |
Western Washington University, Housing and Dining System, Junior Lien Series A, Rev., AMBAC, 5.50%, 10/1/2022 | | | 1,365 | | | | 1,422 | |
| | | | | | | | |
| | |
Total Washington | | | | | | | 6,422 | |
| | | | | | | | |
|
West Virginia — 0.2% | |
| | |
West Virginia Hospital Finance Authority, University Health System Series A, Rev., 4.00%, 6/1/2051 | | | 1,000 | | | | 1,101 | |
| | | | | | | | |
SEE NOTES TO FINANCIAL STATEMENTS.
| | | | | | | | |
| | | |
| AUGUST 31, 2020 | | J.P. MORGAN MUNICIPAL BOND FUNDS | | | | | 67 | |
JPMorgan Tax Free Bond Fund
SCHEDULE OF PORTFOLIO INVESTMENTS
AS OF AUGUST 31, 2020 (Unaudited) (continued)
| | | | | | | | |
| INVESTMENTS | | PRINCIPAL
AMOUNT
($000) | | | VALUE
($000) | |
Municipal Bonds — continued | | | | | | | | |
|
Wisconsin — 1.9% | |
| | |
Public Finance Authority, Blue Ridge Healthcare Facilities Series 2020A, Rev., 3.00%, 1/1/2050 | | | 1,000 | | | | 982 | |
| | |
Public Finance Authority, Central District Development Project Rev., 5.00%, 3/1/2027 | | | 280 | | | | 336 | |
| | |
Public Finance Authority, ENO River Academy Project Series 2020A, Rev., 5.00%, 6/15/2054 (c) | | | 690 | | | | 727 | |
| | |
Wisconsin Health and Educational Facilities Authority Series 2018A, Rev., 5.00%, 8/15/2033 | | | 55 | | | | 68 | |
| | |
Rev., 4.00%, 12/15/2039 | | | 500 | | | | 537 | |
| | |
Wisconsin Health and Educational Facilities Authority, Beloit Health System, Inc. Rev., 4.00%, 7/1/2046 | | | 15 | | | | 16 | |
| | |
Wisconsin Health and Educational Facilities Authority, Children’s Hospital of Wisconsin, Inc. Rev., 4.00%, 8/15/2047 | | | 4,800 | | | | 5,313 | |
| | |
Wisconsin Health and Educational Facilities Authority, Rogers Memorial Hospital, Inc. | | | | | | | | |
| | |
Series B, Rev., 5.00%, 7/1/2038 | | | 150 | | | | 174 | |
| | |
Series A, Rev., 5.00%, 7/1/2044 | | | 210 | | | | 241 | |
| | |
Series A, Rev., 5.00%, 7/1/2049 | | | 750 | | | | 856 | |
| | | | | | | | |
| INVESTMENTS | | PRINCIPAL
AMOUNT
($000) | | | VALUE
($000) | |
| | | | | | | | |
| | |
Wisconsin — continued | | | | | | | | |
| | |
Wisconsin Health and Educational Facilities Authority, St. John’s Communities, Inc. Project Series 2018A, Rev., 5.00%, 9/15/2040 | | | 665 | | | | 678 | |
| | |
Wisconsin Housing and Economic Development Authority, Home Ownership Series B, Rev., 4.00%, 3/1/2048 | | | 760 | | | | 828 | |
| | | | | | | | |
| | |
Total Wisconsin | | | | | | | 10,756 | |
| | | | | | | | |
| | |
Total Municipal Bonds
(Cost $507,902) | | | | | | | 544,544 | |
| | | | | | | | |
| | | SHARES (000) | | | | |
Short-Term Investments — 2.7% | |
|
Investment Companies — 2.7% | |
| | |
JPMorgan Institutional Tax Free Money Market Fund Class IM Shares, 0.04% (f) (g)
(Cost $15,276) | | | 15,271 | | | | 15,282 | |
| | | | | | | | |
Total Investments — 99.2%
(Cost $523,178) | | | | | | | 559,826 | |
Other Assets Less Liabilities — 0.8% | | | | | | | 4,572 | |
| | | | | | | | |
NET ASSETS — 100.0% | | | | | | | 564,398 | |
| | | | | | | | |
Percentages indicated are based on net assets.
Abbreviations
| | |
| AGM | | Insured by Assured Guaranty Municipal Corp. |
| AMBAC | | Insured by American Municipal Bond Assurance Corp. |
| AMT | | Alternative Minimum Tax |
| BAN | | Bond Anticipation Note |
| BHAC | | Insured by Berkshire Hathaway Assurance Corp. |
| CHESLA | | Connecticut Higher Education Supplemental Loan Authority |
| COLL | | Collateral |
| COP | | Certificate of Participation |
| CR | | Custodial Receipts |
| FGIC | | Insured by Financial Guaranty Insurance Co. |
| FHLMC | | Federal Home Loan Mortgage Corp. |
| FNMA | | Federal National Mortgage Association |
| GAN | | Grant Anticipation Note |
| GNMA | | Government National Mortgage Association |
| GO | | General Obligation |
| GTD | | Guaranteed |
| LIQ | | Liquidity Agreement |
| MTA | | Metropolitan Transportation Authority |
| NATL | | Insured by National Public Finance Guarantee Corp. |
| PSF-GTD | | Permanent School Fund Guaranteed |
| | |
| Q-SBLF | | Qualified School Bond Loan Fund |
| RE | | Reinsured |
| Rev. | | Revenue |
| SCSDE | | South Carolina School District Enhancement |
| |
| (a) | | The date shown represents the earliest of the prerefunded date, next put date or final maturity date. |
| (b) | | Variable or floating rate security, the interest rate of which adjusts periodically based on changes in current interest rates and prepayments on the underlying pool of assets. The interest rate shown is the current rate as of August 31, 2020. |
| (c) | | Securities exempt from registration under Rule 144A or section 4(a)(2), of the Securities Act of 1933, as amended. |
| (d) | | Security is prerefunded or escrowed to maturity. |
| (e) | | Amount rounds to less than 0.1% of net assets. |
| (f) | | Investment in an affiliated fund, which is registered under the Investment Company Act of 1940, as amended, and is advised by J.P. Morgan Investment Management Inc. |
| (g) | | The rate shown is the current yield as of August 31, 2020. |
SEE NOTES TO FINANCIAL STATEMENTS.
| | | | | | |
| | | |
| 68 | | | | J.P. MORGAN MUNICIPAL BOND FUNDS | | AUGUST 31, 2020 |
| | | | | | | | | | | | | | | | | | | | |
| Futures contracts outstanding as of August 31, 2020 (amounts in thousands, except number of contracts): | |
| DESCRIPTION | | NUMBER OF
CONTRACTS | | | EXPIRATION
DATE | | | TRADING
CURRENCY | | | NOTIONAL
AMOUNT ($) | | | VALUE AND
UNREALIZED
APPRECIATION
(DEPRECIATION) ($) | |
Short Contracts | | | | | | | | | | | | | | | | | | | | |
U.S. Treasury 10 Year Note | | | (48 | ) | | | 12/2020 | | | | USD | | | | (6,680 | ) | | | (4 | ) |
| | | | | | | | | | | | | | | | | | | | |
Abbreviations
SEE NOTES TO FINANCIAL STATEMENTS.
| | | | | | | | |
| | | |
| AUGUST 31, 2020 | | J.P. MORGAN MUNICIPAL BOND FUNDS | | | | | 69 | |
JPMorgan Ultra-Short Municipal Fund
SCHEDULE OF PORTFOLIO INVESTMENTS
AS OF AUGUST 31, 2020 (Unaudited)
| | | | | | | | |
| INVESTMENTS | | PRINCIPAL
AMOUNT
($000) | | | VALUE
($000) | |
Municipal Bonds — 93.0% (a) | |
|
Alabama — 1.0% | |
| | |
Alabama Public School and College Authority, Capital Improvement Series 2014-B, Rev., 5.00%, 1/1/2021 | | | 20 | | | | 20 | |
| | |
Birmingham Airport Authority | | | | | | | | |
| | |
Rev., 5.00%, 7/1/2023 | | | 125 | | | | 139 | |
| | |
Rev., 5.00%, 7/1/2024 | | | 150 | | | | 173 | |
| | |
Rev., 5.00%, 7/1/2025 | | | 250 | | | | 298 | |
| | |
Rev., 5.00%, 7/1/2026 | | | 225 | | | | 274 | |
| | |
Black Belt Energy Gas District, Gas Prepay Series 2018B-2, Rev., (SIFMA Municipal Swap Index Yield + 0.62%), 0.71%, 9/10/2020 (b) | | | 30,000 | | | | 29,824 | |
| | |
Black Belt Energy Gas District, Gas Supply Series 2016A, Rev., LIQ: Royal Bank of Canada, 4.00%, 6/1/2021 (c) | | | 11,450 | | | | 11,715 | |
| | |
City of Centre | | | | | | | | |
| | |
GO, 3.00%, 9/1/2021 | | | 100 | | | | 103 | |
| | |
GO, 3.00%, 9/1/2022 | | | 110 | | | | 115 | |
| | |
GO, 4.00%, 9/1/2023 | | | 215 | | | | 237 | |
| | |
City of Hamilton | | | | | | | | |
| | |
GO, 3.00%, 8/1/2021 | | | 365 | | | | 374 | |
| | |
GO, 2.00%, 8/1/2022 | | | 370 | | | | 382 | |
| | |
GO, 5.00%, 8/1/2023 | | | 240 | | | | 271 | |
| | |
City of Mobile, Industrial Development Board, Pollution Control, Alabama Power Co., Barry Plant Project Series 2007A, Rev., 1.00%, 6/26/2025 (c) | | | 4,750 | | | | 4,759 | |
| | |
Prattville Industrial Development Board | | | | | | | | |
| | |
Series 2019B, Rev., 2.00%, 10/1/2024 (c) | | | 450 | | | | 470 | |
| | |
Series 2019C, Rev., 2.00%, 10/1/2024 (c) | | | 430 | | | | 448 | |
| | |
Selma Industrial Development Board, International Paper Company Project Series 2020A, Rev., 1.37%, 6/16/2025 (c) | | | 2,670 | | | | 2,718 | |
| | |
State of Alabama Series 2013A, GO, 4.00%, 8/1/2023 | | | 1,250 | | | | 1,385 | |
| | |
University of West Alabama | | | | | | | | |
| | |
Rev., AGM, 4.00%, 1/1/2022 | | | 150 | | | | 155 | |
| | |
Rev., AGM, 4.00%, 1/1/2023 | | | 120 | | | | 127 | |
| | |
Rev., AGM, 4.00%, 1/1/2024 | | | 125 | | | | 135 | |
| | |
Rev., AGM, 4.00%, 1/1/2025 | | | 150 | | | | 167 | |
| | | | | | | | |
| | |
Total Alabama | | | | | | | 54,289 | |
| | | | | | | | |
|
Alaska — 0.5% | |
| | |
Alaska Municipal Bond Bank Authority | | | | | | | | |
| | |
Series 1, Rev., 5.00%, 12/1/2020 | | | 200 | | | | 202 | |
| | |
Series 2019 1, Rev., 5.00%, 5/1/2021 | | | 215 | | | | 221 | |
| | |
Series 1, Rev., 5.00%, 12/1/2021 | | | 450 | | | | 475 | |
| | | | | | | | |
| INVESTMENTS | | PRINCIPAL
AMOUNT
($000) | | | VALUE
($000) | |
| | | | | | | | |
|
Alaska — continued | |
| | |
Series 2019 1, Rev., 5.00%, 5/1/2022 | | | 200 | | | | 215 | |
| | |
Series 1, Rev., 5.00%, 12/1/2022 | | | 500 | | | | 549 | |
| | |
Series 1, Rev., 5.00%, 12/1/2023 | | | 960 | | | | 1,096 | |
| | |
Series 1, Rev., 5.00%, 12/1/2024 | | | 870 | | | | 1,027 | |
| | |
Series 1, Rev., 5.00%, 12/1/2025 | | | 750 | | | | 907 | |
| | |
Series 1, Rev., 5.00%, 12/1/2026 | | | 675 | | | | 833 | |
| | |
City of Valdez, Exxon Pipeline Co. Project | | | | | | | | |
| | |
Series 1993-A, Rev., VRDO, 0.03%, 9/1/2020 (c) | | | 10,580 | | | | 10,580 | |
| | |
Series 1993-B, Rev., VRDO, 0.03%, 9/1/2020 (c) | | | 6,840 | | | | 6,840 | |
| | |
State of Alaska Series 2020A, GO, 5.00%, 8/1/2026 | | | 3,585 | | | | 4,511 | |
| | | | | | | | |
| | |
Total Alaska | | | | | | | 27,456 | |
| | | | | | | | |
|
Arizona — 0.3% | |
| | |
Arizona Industrial Development Authority, Phoenix Children’s Hospital Series 2020A, Rev., 5.00%, 2/1/2026 | | | 130 | | | | 160 | |
| | |
Arizona Water Infrastructure Finance Authority, Water Quality Rev., 4.00%, 10/1/2020 (d) | | | 540 | | | | 542 | |
| | |
City of Tucson Series 2018-A, GO, 5.00%, 7/1/2026 | | | 325 | | | | 409 | |
| | |
Industrial Development Authority of The City of Phoenix, Downtown Phoenix Student Housing LLC — Arizona State University Project | | | | | | | | |
| | |
Series 2018A, Rev., 5.00%, 7/1/2023 | | | 140 | | | | 148 | |
| | |
Series 2018A, Rev., 5.00%, 7/1/2024 | | | 200 | | | | 215 | |
| | |
Industrial Development Authority of the County of Yavapai (The), Regional Medical Center | | | | | | | | |
| | |
Rev., 5.00%, 8/1/2021 | | | 225 | | | | 234 | |
| | |
Rev., 5.00%, 8/1/2022 | | | 380 | | | | 411 | |
| | |
Industrial Development Authority of the County of Yavapai (The), Yavapai Regional Medical Center Rev., 5.00%, 8/1/2023 | | | 325 | | | | 365 | |
| | |
Maricopa County School District No. 24-Gila Bend, School Improvement | | | | | | | | |
| | |
Series 2019, GO, AGM, 3.00%, 7/1/2021 | | | 575 | | | | 589 | |
| | |
Series 2019, GO, AGM, 4.00%, 7/1/2022 | | | 300 | | | | 321 | |
| | |
Series 2019, GO, AGM, 5.00%, 7/1/2023 | | | 700 | | | | 790 | |
| | |
Maricopa County School District No. 66, Roosevelt Elementary GO, 5.00%, 7/1/2021 | | | 1,520 | | | | 1,579 | |
| | |
Maricopa County School District No. 66, Roosevelt Elementary, Arizona School Improvement Series 2017-A, GO, 5.00%, 7/1/2021 | | | 1,150 | | | | 1,194 | |
| | |
Maricopa County Unified School District No. 95 Queen Creek GO, 3.00%, 7/1/2024 | | | 525 | | | | 576 | |
SEE NOTES TO FINANCIAL STATEMENTS.
| | | | | | |
| | | |
| 70 | | | | J.P. MORGAN MUNICIPAL BOND FUNDS | | AUGUST 31, 2020 |
| | | | | | | | |
| INVESTMENTS | | PRINCIPAL
AMOUNT
($000) | | | VALUE
($000) | |
Municipal Bonds — continued | | | | | | | | |
|
Arizona — continued | |
| | |
Salt River Project Agricultural Improvement & Power District, Arizona Salt River Project Series 2015-XF2192, Rev., VRDO, LIQ: Morgan Stanley Bank, 0.12%, 9/10/2020 (c) (e) | | | 7,845 | | | | 7,845 | |
| | | | | | | | |
| | |
Total Arizona | | | | | | | 15,378 | |
| | | | | | | | |
|
Arkansas — 0.1% | |
| | |
Arkansas Development Finance Authority, 900 West Capitol Building Project Rev., 3.00%, 4/1/2021 | | | 500 | | | | 507 | |
| | |
Arkansas Development Finance Authority, Department of Community Correction Project | | | | | | | | |
| | |
Rev., 5.00%, 11/1/2021 | | | 310 | | | | 326 | |
| | |
Rev., 5.00%, 11/1/2022 | | | 410 | | | | 452 | |
| | |
Board of Trustees of the University of Arkansas, Various Facility, Fayetteville Campus Series 2018A, Rev., 5.00%, 11/1/2021 | | | 330 | | | | 349 | |
| | |
City of Centerton Rev., 3.00%, 12/1/2021 | | | 125 | | | | 129 | |
| | |
City of Heber Springs, Greenstar | | | | | | | | |
| | |
Rev., 3.00%, 11/1/2021 | | | 50 | | | | 52 | |
| | |
Rev., 3.00%, 11/1/2023 | | | 100 | | | | 106 | |
| | |
County of Sharp | | | | | | | | |
| | |
Rev., 5.00%, 3/1/2021 | | | 270 | | | | 276 | |
| | |
Rev., 5.00%, 3/1/2022 | | | 495 | | | | 530 | |
| | |
Rev., 5.00%, 3/1/2023 | | | 540 | | | | 598 | |
| | |
University of Central Arkansas | | | | | | | | |
| | |
Series 2020A, Rev., 5.00%, 11/1/2021 | | | 150 | | | | 158 | |
| | |
Series 2020A, Rev., 5.00%, 11/1/2022 | | | 200 | | | | 219 | |
| | |
Series 2020A, Rev., 5.00%, 11/1/2023 | | | 205 | | | | 232 | |
| | |
Series 2020A, Rev., 5.00%, 11/1/2024 | | | 160 | | | | 187 | |
| | |
Series 2020A, Rev., 5.00%, 11/1/2025 | | | 230 | | | | 277 | |
| | |
Series 2020A, Rev., 5.00%, 11/1/2026 | | | 220 | | | | 270 | |
| | |
Series 2020A, Rev., 5.00%, 11/1/2027 | | | 200 | | | | 250 | |
| | |
University of Central Arkansas, Student Housing System | | | | | | | | |
| | |
Series 2019C, Rev., AGM, 3.00%, 11/1/2021 | | | 75 | | | | 77 | |
| | |
Series 2019C, Rev., AGM, 3.00%, 11/1/2022 | | | 85 | | | | 89 | |
| | |
Series 2019C, Rev., AGM, 3.00%, 11/1/2023 | | | 135 | | | | 145 | |
| | | | | | | | |
| | |
Total Arkansas | | | | | | | 5,229 | |
| | | | | | | | |
|
California — 2.6% | |
| | |
Bay Area Toll Authority Rev., VRDO, LOC: Bank of America NA, 0.04%, 9/10/2020 (c) | | | 1,200 | | | | 1,200 | |
| | | | | | | | |
| INVESTMENTS | | PRINCIPAL
AMOUNT
($000) | | | VALUE
($000) | |
| | | | | | | | |
|
California — continued | |
| | |
California Educational Facilities Authority, Art Center College of Design Series 2018A, Rev., 5.00%, 12/1/2020 | | | 180 | | | | 181 | |
| | |
California Educational Facilities Authority, Institute of Technology Rev., VRDO, 0.11%, 9/10/2020 (c) | | | 10,000 | | | | 10,000 | |
| | |
California Enterprise Development Authority, Riverside County, Library Facility | | | | | | | | |
| | |
Rev., 4.00%, 11/1/2022 | | | 100 | | | | 108 | |
| | |
Rev., 4.00%, 11/1/2023 | | | 200 | | | | 224 | |
| | |
California Health Facilities Financing Authority, Adventist Health System Series 2011A, Rev., 3.00%, 3/1/2024 (c) | | | 1,690 | | | | 1,775 | |
| | |
California Health Facilities Financing Authority, Stanford Hospital Series B-1, Rev., VRDO, 0.10%, 9/10/2020 (c) | | | 16,650 | | | | 16,650 | |
| | |
California Infrastructure and Economic Development Bank, California Academy of Sciences Series 2018D, Rev., (ICE LIBOR USD 1 Month + 0.38%), 0.50%, 9/10/2020 (b) | | | 17,010 | | | | 16,945 | |
| | |
California Infrastructure and Economic Development Bank, The J. Paul Getty Trust | | | | | | | | |
| | |
Series 2012B-2, Rev., (ICE LIBOR USD 1 Month + 0.20%), 0.31%, 10/1/2020 (b) | | | 11,615 | | | | 11,603 | |
| | |
Series 2013A-2, Rev., (ICE LIBOR USD 1 Month + 0.33%), 0.44%, 10/1/2020 (b) | | | 6,750 | | | | 6,732 | |
| | |
California Municipal Finance Authority, California Lutheran University | | | | | | | | |
| | |
Rev., 5.00%, 10/1/2020 | | | 325 | | | | 326 | |
| | |
Rev., 5.00%, 10/1/2021 | | | 250 | | | | 258 | |
| | |
California Municipal Finance Authority, Hollywood El Centro Apartments Series 2019A, Rev., 1.40%, 5/1/2021 (c) | | | 1,750 | | | | 1,762 | |
| | |
California Municipal Finance Authority, San Antonio Gardens Project | | | | | | | | |
| | |
Rev., 4.00%, 11/15/2021 | | | 270 | | | | 275 | |
| | |
Rev., 4.00%, 11/15/2022 | | | 280 | | | | 288 | |
| | |
Rev., 4.00%, 11/15/2023 | | | 290 | | | | 301 | |
| | |
California Municipal Finance Authority, UCR North District, Phase 1 Student Housing Project | | | | | | | | |
| | |
Rev., 5.00%, 5/15/2023 | | | 360 | | | | 395 | |
| | |
Rev., 5.00%, 5/15/2024 | | | 300 | | | | 338 | |
| | |
Rev., 5.00%, 5/15/2025 | | | 425 | | | | 492 | |
| | |
Rev., 5.00%, 5/15/2026 | | | 500 | | | | 591 | |
| | |
Rev., 5.00%, 5/15/2027 | | | 725 | | | | 874 | |
| | |
California Pollution Control Financing Authority Rev., 0.60%, 9/1/2023 (c) | | | 1,850 | | | | 1,845 | |
SEE NOTES TO FINANCIAL STATEMENTS.
| | | | | | | | |
| | | |
| AUGUST 31, 2020 | | J.P. MORGAN MUNICIPAL BOND FUNDS | | | | | 71 | |
JPMorgan Ultra-Short Municipal Fund
SCHEDULE OF PORTFOLIO INVESTMENTS
AS OF AUGUST 31, 2020 (Unaudited) (continued)
| | | | | | | | |
| INVESTMENTS | | PRINCIPAL
AMOUNT
($000) | | | VALUE
($000) | |
Municipal Bonds — continued | | | | | | | | |
|
California — continued | |
| | |
California Public Finance Authority, Henry Mayo Newhall Hospital Rev., 5.00%, 10/15/2020 | | | 100 | | | | 100 | |
| | |
California School Finance Authority, Green Dot Public School Projects | | | | | | | | |
| | |
Series 2018A, Rev., 5.00%, 8/1/2021 (e) | | | 50 | | | | 51 | |
| | |
Series 2018A, Rev., 5.00%, 8/1/2022 (e) | | | 85 | | | | 91 | |
| | |
California School Finance Authority, Kipp Socal Project | | | | | | | | |
| | |
Series 2019A, Rev., 5.00%, 7/1/2022 (e) | | | 100 | | | | 107 | |
| | |
Series 2019A, Rev., 5.00%, 7/1/2023 (e) | | | 100 | | | | 110 | |
| | |
California Statewide Communities Development Authority, Western University of Health Sciences Series 2007A, Rev., VRDO, LOC: Wells Fargo Bank NA, 0.04%, 9/10/2020 (c) | | | 23,370 | | | | 23,370 | |
| | |
Chula Vista Elementary School District Rev., BAN, Zero Coupon, 8/1/2023 | | | 5,500 | | | | 5,438 | |
| | |
Los Angeles Department of Water and Power, Power System Subseries B-8, Rev., VRDO, LIQ: TD Bank NA, 0.03%, 9/10/2020 (c) | | | 5,300 | | | | 5,300 | |
| | |
Metropolitan Water District of Southern California Series 2018A-1, Rev., VRDO, LIQ: TD Bank NA, 0.01%, 9/1/2020 (c) | | | 5,500 | | | | 5,500 | |
| | |
Mount San Antonio Community College District GO, BAN, Zero Coupon, 4/1/2022 (d) | | | 250 | | | | 249 | |
| | |
Orange County Water District Series 2003 A, COP, VRDO, LOC: | | | | | | | | |
| | |
Citibank NA, 0.07%, 9/10/2020 (c) | | | 5,680 | | | | 5,680 | |
| | |
Pioneers Memorial Healthcare District Rev., 3.00%, 10/1/2020 | | | 265 | | | | 265 | |
| | |
Sacramento City Unified School District Series 2019D, GO, 4.00%, 8/1/2021 | | | 4,475 | | | | 4,628 | |
| | |
Santa Clara County Financing Authority, El Camino Hospital Series 2009A, Rev., VRDO, LOC: Wells Fargo Bank NA, 0.08%, 9/10/2020 (c) | | | 6,605 | | | | 6,605 | |
| | |
South Bay Union School District/San Diego County GO, BAN, Zero Coupon, 8/1/2022 | | | 2,000 | | | | 1,980 | |
| | |
State of California Series B4, GO, VRDO, LOC: Citibank NA, 0.03%, 9/10/2020 (c) | | | 1,970 | | | | 1,970 | |
| | |
Stockton Public Financing Authority | | | | | | | | |
| | |
Rev., 5.00%, 3/1/2023 | | | 360 | | | | 390 | |
| | |
Rev., 5.00%, 3/1/2025 | | | 570 | | | | 652 | |
| | |
Stockton Public Financing Authority, Green Bonds | | | | | | | | |
| | |
Series 2018A, Rev., 5.00%, 10/1/2020 | | | 500 | | | | 501 | |
| | |
Series 2018A, Rev., 5.00%, 10/1/2021 | | | 450 | | | | 473 | |
| | | | | | | | |
| INVESTMENTS | | PRINCIPAL
AMOUNT
($000) | | | VALUE
($000) | |
| | | | | | | | |
|
California — continued | |
| | |
Tender Option Bond Trust Receipts/Certificates Series 2018-XF2615, Rev., VRDO, LOC: Barclays Bank plc, 0.29%, 9/10/2020 (c) (e) | | | 5,230 | | | | 5,230 | |
| | | | | | | | |
| | |
Total California | | | | | | | 141,853 | |
| | | | | | | | |
|
Colorado — 3.4% | |
| | |
Arapahoe County School District No. 5 Cherry Creek | | | | | | | | |
| | |
GO, 5.00%, 12/15/2020 | | | 17,515 | | | | 17,757 | |
| | |
GO, 5.00%, 12/15/2025 | | | 9,930 | | | | 12,346 | |
| | |
GO, 5.00%, 12/15/2026 | | | 5,655 | | | | 7,240 | |
| | |
GO, 5.00%, 12/15/2028 | | | 6,460 | | | | 8,712 | |
| | |
Arapahoe County School District No. 6 Littleton | | | | | | | | |
| | |
Series 2019A, GO, 5.00%, 12/1/2021 | | | 2,585 | | | | 2,741 | |
| | |
Series 2019A, GO, 5.00%, 12/1/2022 | | | 1,370 | | | | 1,516 | |
| | |
City of Aurora Rev., 5.00%, 8/1/2023 | | | 2,355 | | | | 2,680 | |
| | |
City of Aurora, Sterling Hills West Metropolitan District GO, 5.00%, 12/1/2020 | | | 100 | | | | 101 | |
| | |
City of Colorado Springs | | | | | | | | |
| | |
COP, 5.00%, 12/1/2020 | | | 120 | | | | 121 | |
| | |
COP, 5.00%, 12/1/2021 | | | 145 | | | | 153 | |
| | |
COP, 5.00%, 12/1/2022 | | | 155 | | | | 172 | |
| | |
COP, 5.00%, 12/1/2023 | | | 100 | | | | 115 | |
| | |
City of Colorado Springs, Utilities System Improvement Series 2012A, Rev., VRDO, LIQ: U.S. Bank NA, 0.08%, 9/10/2020 (c) | | | 3,500 | | | | 3,500 | |
| | |
City of Grand Junction Rev., 5.00%, 3/1/2021 (d) | | | 35 | | | | 36 | |
| | |
Colorado Health Facilities Authority, Frasier Meadows Retirement Community Project Series 2017B, Rev., 5.00%, 5/15/2021 | | | 395 | | | | 408 | |
| | |
Colorado Health Facilities Authority, Valley View Hospital Association Project Rev., 2.80%, 5/15/2023 (c) | | | 1,515 | | | | 1,583 | |
| | |
Colorado State Education Loan Program Series 2020A, Rev., TRAN, 3.00%, 6/29/2021 | | | 25,000 | | | | 25,578 | |
| | |
Denver Health and Hospital Authority, 550 Acoma, Inc. | | | | | | | | |
| | |
COP, 5.00%, 12/1/2020 | | | 110 | | | | 111 | |
| | |
COP, 5.00%, 12/1/2021 | | | 220 | | | | 230 | |
| | |
COP, 5.00%, 12/1/2022 | | | 295 | | | | 318 | |
| | |
E-470 Public Highway Authority, Senior LIBOR Index Series 2019A, Rev., (ICE LIBOR USD 1 Month + 0.42%), 0.52%, 9/10/2020 (b) | | | 8,000 | | | | 7,954 | |
| | |
Interlocken Metropolitan District Series A-1, GO, AGM, 5.00%, 12/1/2020 | | | 175 | | | | 177 | |
SEE NOTES TO FINANCIAL STATEMENTS.
| | | | | | |
| | | |
| 72 | | | | J.P. MORGAN MUNICIPAL BOND FUNDS | | AUGUST 31, 2020 |
| | | | | | | | |
| INVESTMENTS | | PRINCIPAL
AMOUNT
($000) | | | VALUE
($000) | |
Municipal Bonds — continued | | | | | | | | |
|
Colorado — continued | |
| | |
State of Colorado | | | | | | | | |
| | |
Rev., TRAN, 4.00%, 6/25/2021 | | | 23,000 | | | | 23,713 | |
| | |
Series 2020A, COP, 5.00%, 12/15/2023 | | | 2,500 | | | | 2,885 | |
| | |
Series 2020A, COP, 5.00%, 12/15/2024 | | | 2,085 | | | | 2,495 | |
| | |
The Regents of the University of Colorado, Enterprise System | | | | | | | | |
| | |
Series 2020A-2, Rev., VRDO, LIQ: TD Bank NA, 0.02%, 9/1/2020 (c) | | | 5,380 | | | | 5,380 | |
| | |
Series 2020A-1, Rev., VRDO, LIQ: TD Bank NA, 0.09%, 9/10/2020 (c) | | | 24,000 | | | | 24,000 | |
| | |
Town of Milliken, Water Activity Enterprise Rev., 3.00%, 12/1/2020 | | | 195 | | | | 196 | |
| | |
University of Colorado Hospital Authority Series 2018 C, Rev., VRDO, LIQ: TD Bank NA, 0.09%, 9/10/2020 (c) | | | 33,100 | | | | 33,100 | |
| | | | | | | | |
| | |
Total Colorado | | | | | | | 185,318 | |
| | | | | | | | |
|
Connecticut — 1.8% | |
| | |
City of Bridgeport Series C, GO, GAN, 2.00%, 12/10/2020 | | | 21,000 | | | | 21,095 | |
| | |
City of Derby | | | | | | | | |
| | |
Series A, GO, 5.00%, 8/1/2021 | | | 220 | | | | 229 | |
| | |
Series A, GO, 5.00%, 8/1/2022 | | | 75 | | | | 82 | |
| | |
Series A, GO, 5.00%, 8/1/2023 | | | 150 | | | | 169 | |
| | |
Series A, GO, 5.00%, 8/1/2024 | | | 85 | | | | 99 | |
| | |
City of New Britain | | | | | | | | |
| | |
GO, 5.00%, 9/1/2022 (d) | | | 50 | | | | 55 | |
| | |
GO, 5.00%, 9/1/2023 (d) | | | 110 | | | | 125 | |
| | |
City of New Haven | | | | | | | | |
| | |
Series 2019A, GO, 5.00%, 8/1/2021 | | | 1,300 | | | | 1,343 | |
| | |
Series 2019B, GO, 5.00%, 2/1/2022 | | | 700 | | | | 736 | |
| | |
Series 2019A, GO, 5.00%, 8/1/2022 | | | 1,000 | | | | 1,063 | |
| | |
Connecticut Housing Finance Authority Series E, Subseries E-3, Rev., 1.63%, 11/15/2022 (c) | | | 1,750 | | | | 1,754 | |
| | |
Connecticut State Health & Educational Facilities Authority Series 2020B-1, Rev., 5.00%, 1/1/2025 (c) | | | 8,500 | | | | 10,048 | |
| | |
Connecticut State Health and Educational Facilities Authority | | | | | | | | |
| | |
Series K-1, Rev., 5.00%, 7/1/2021 | | | 665 | | | | 679 | |
| | |
Series K-1, Rev., 5.00%, 7/1/2022 | | | 675 | | | | 705 | |
| | |
Connecticut State Health and Educational Facilities Authority, Covenant Home, Inc. Series 2018B, Rev., 5.00%, 12/1/2021 | | | 1,000 | | | | 1,034 | |
| | |
Connecticut State Health and Educational Facilities Authority, Wesleyan University Issue Series H, Rev., VRDO, 0.07%, 9/10/2020 (c) | | | 9,825 | | | | 9,825 | |
| | | | | | | | |
| INVESTMENTS | | PRINCIPAL
AMOUNT
($000) | | | VALUE
($000) | |
| | | | | | | | |
|
Connecticut — continued | |
| | |
New Canaan Housing Authority, Multi-Family Housing, Parish Project Rev., 0.44%, 3/1/2023 (c) | | | 12,475 | | | | 12,460 | |
| | |
State of Connecticut | | | | | | | | |
| | |
Series 2020C, GO, 3.00%, 6/1/2021 | | | 1,150 | | | | 1,174 | |
| | |
Series G, GO, 5.00%, 11/1/2021 | | | 200 | | | | 211 | |
| | |
Series 2020C, GO, 3.00%, 6/1/2022 | | | 1,000 | | | | 1,048 | |
| | |
Series 2020C, GO, 3.00%, 6/1/2023 | | | 600 | | | | 644 | |
| | |
Series 2020C, GO, 4.00%, 6/1/2023 | | | 400 | | | | 440 | |
| | |
Series 2020C, GO, 3.00%, 6/1/2024 | | | 1,065 | | | | 1,165 | |
| | |
Series 2020C, GO, 4.00%, 6/1/2024 | | | 500 | | | | 565 | |
| | |
Series 2020C, GO, 2.00%, 6/1/2025 | | | 3,350 | | | | 3,559 | |
| | |
Series 2020C, GO, 4.00%, 6/1/2025 | | | 850 | | | | 982 | |
| | |
State of Connecticut, Health and Educational Facility Authority Series 2000A, Rev., VRDO, LIQ: TD Bank NA, 0.08%, 9/10/2020 (c) | | | 23,140 | | | | 23,140 | |
| | |
Town of Windham GO, BAN, 3.00%, 10/1/2020 | | | 6,250 | | | | 6,262 | |
| | | | | | | | |
| | |
Total Connecticut | | | | | | | 100,691 | |
| | | | | | | | |
|
Delaware — 0.2% | |
| | |
Delaware Municipal Electric Corp. (The), Middletown and Seaford Project | | | | | | | | |
| | |
Series 2019A, Rev., 5.00%, 10/1/2020 | | | 195 | | | | 196 | |
| | |
Series 2019A, Rev., 5.00%, 10/1/2021 | | | 145 | | | | 152 | |
| | |
Series 2019A, Rev., 5.00%, 10/1/2022 | | | 150 | | | | 164 | |
| | |
Series 2019A, Rev., 5.00%, 10/1/2023 | | | 220 | | | | 249 | |
| | |
Delaware State Economic Development Authority, Delmarva Power and Light Co. Project Series 2020A, Rev., 1.05%, 7/1/2025 (c) | | | 3,000 | | | | 3,025 | |
| | |
University of Delaware Series 2004B, Rev., VRDO, LIQ: Bank of America NA, 0.06%, 9/1/2020 (c) | | | 7,835 | | | | 7,835 | |
| | | | | | | | |
| | |
Total Delaware | | | | | | | 11,621 | |
| | | | | | | | |
|
District of Columbia — 0.5% | |
| | |
District of Columbia Rev., 5.00%, 7/1/2023 | | | 100 | | | | 110 | |
| | |
District of Columbia, Georgetown University Series C, Rev., VRDO, LOC: Bank of Tokyo-Mitsubishi UFJ Ltd., 0.08%, 9/10/2020 (c) | | | 14,330 | | | | 14,330 | |
| | |
District of Columbia, International School Issue Rev., 5.00%, 7/1/2022 | | | 500 | | | | 526 | |
| | |
Metropolitan Washington Airports Authority, Airport System | | | | | | | | |
|
Subseries C-2, Rev., VRDO, LOC: | |
| | |
Sumitomo Mitsui Banking Corp., 0.08%, 9/10/2020 (c) | | | 9,930 | | | | 9,930 | |
| | | | | | | | |
| | |
Total District of Columbia | | | | | | | 24,896 | |
| | | | | | | | |
SEE NOTES TO FINANCIAL STATEMENTS.
| | | | | | | | |
| | | |
| AUGUST 31, 2020 | | J.P. MORGAN MUNICIPAL BOND FUNDS | | | | | 73 | |
JPMorgan Ultra-Short Municipal Fund
SCHEDULE OF PORTFOLIO INVESTMENTS
AS OF AUGUST 31, 2020 (Unaudited) (continued)
| | | | | | | | |
| INVESTMENTS | | PRINCIPAL
AMOUNT
($000) | | | VALUE
($000) | |
Municipal Bonds — continued | | | | | | | | |
|
Florida — 2.8% | |
| | |
Broward County, Water and Sewer Utility Series 2012B, Rev., 5.00%, 10/1/2020 | | | 20 | | | | 20 | |
| | |
City of Fort Myers | | | | | | | | |
| | |
Series 2020B, Rev., AGM, 5.00%, 10/1/2021 | | | 2,000 | | | | 2,100 | |
| | |
Series 2020B, Rev., AGM, 5.00%, 10/1/2022 | | | 2,000 | | | | 2,186 | |
| | |
Series 2020B, Rev., AGM, 5.00%, 10/1/2023 | | | 2,125 | | | | 2,412 | |
| | |
Series 2020B, Rev., AGM, 5.00%, 10/1/2024 | | | 2,355 | | | | 2,772 | |
| | |
Series 2020B, Rev., AGM, 5.00%, 10/1/2025 | | | 5,100 | | | | 6,198 | |
| | |
Series 2020B, Rev., AGM, 5.00%, 10/1/2026 | | | 2,225 | | | | 2,779 | |
| | |
City of Gainesville, Utilities System Series B, Rev., VRDO, LIQ: Barclays Bank plc, 0.12%, 9/10/2020 (c) | | | 7,700 | | | | 7,700 | |
| | |
City of Lauderhill GO, 3.00%, 1/1/2021 | | | 425 | | | | 429 | |
| | |
City of Tallahassee, Utility System | | | | | | | | |
| | |
Rev., 5.00%, 10/1/2023 | | | 2,430 | | | | 2,786 | |
| | |
Rev., 5.00%, 10/1/2024 | | | 2,550 | | | | 3,040 | |
| | |
County of Escambia Series 2019B, Rev., 2.00%, 10/1/2024 (c) | | | 775 | | | | 808 | |
| | |
County of Hillsborough, Capital Improvement Program Rev., 5.00%, 8/1/2021 | | | 30 | | | | 31 | |
| | |
County of Martin, Utilities System Series A, Rev., 5.00%, 10/1/2020 | | | 90 | | | | 90 | |
| | |
County of Miami-Dade, Seaport Department Series A, Rev., VRDO, LOC: PNC Bank NA, 0.09%, 9/10/2020 (c) | | | 2,400 | | | | 2,400 | |
| | |
County of Miami-Dade, Stormwater Project Rev., 5.00%, 4/1/2026 | | | 2,000 | | | | 2,499 | |
| | |
Escambia County School Board Series 2020A, COP, 5.00%, 2/1/2026 | | | 1,895 | | | | 2,327 | |
| | |
Florida Development Finance Corp., Virgin Trains USA Passenger Rail Project 0.55%, 1/1/2049 (c) (d) | | | 50,000 | | | | 49,996 | |
| | |
Florida Higher Educational Facilities Financial Authority | | | | | | | | |
| | |
Rev., 5.00%, 10/1/2020 | | | 115 | | | | 115 | |
| | |
Rev., 5.00%, 10/1/2021 | | | 115 | | | | 118 | |
| | |
Florida Higher Educational Facilities Financial Authority, Ringling College Project | | | | | | | | |
| | |
Rev., 4.00%, 3/1/2021 | | | 60 | | | | 60 | |
| | |
Rev., 4.00%, 3/1/2022 | | | 55 | | | | 56 | |
| | |
Rev., 5.00%, 3/1/2023 | | | 185 | | | | 197 | |
| | |
Rev., 5.00%, 3/1/2024 | | | 110 | | | | 118 | |
| | | | | | | | |
| INVESTMENTS | | PRINCIPAL
AMOUNT
($000) | | | VALUE
($000) | |
| | | | | | | | |
|
Florida — continued | |
| | |
Florida Higher Educational Facilities Financial Authority, St. Leo University Project | | | | | | | | |
| | |
Series 2019, Rev., 5.00%, 3/1/2021 | | | 350 | | | | 355 | |
| | |
Series 2019, Rev., 5.00%, 3/1/2022 | | | 355 | | | | 370 | |
| | |
Series 2019, Rev., 5.00%, 3/1/2023 | | | 410 | | | | 432 | |
| | |
JEA, Water and Sewer System Series A-2, Rev., VRDO, LOC: Sumitomo Mitsui Banking Corp., 0.07%, 9/10/2020 (c) | | | 38,670 | | | | 38,670 | |
| | |
Lee Memorial Health System | | | | | | | | |
| | |
Series 2019A-1, Rev., 5.00%, 4/1/2022 | | | 750 | | | | 802 | |
| | |
Series 2019A-1, Rev., 5.00%, 4/1/2023 | | | 400 | | | | 445 | |
| | |
Series 2019A-1, Rev., 5.00%, 4/1/2024 | | | 575 | | | | 662 | |
| | |
Orange County Health Facilities Authority, The Nemours Foundation Project Series B, Rev., VRDO, LOC: Northern Trust Co., 0.08%, 9/10/2020 (c) | | | 880 | | | | 880 | |
| | |
Orlando Utilities Commission Series B, Rev., VRDO, LIQ: TD Bank NA, 0.10%, 9/10/2020 (c) | | | 17,400 | | | | 17,400 | |
| | |
Village Community Development District No. 13 Rev., 2.63%, 5/1/2024 | | | 500 | | | | 501 | |
| | |
West Palm Beach Community Redevelopment Agency, City Center Community Redevelopment Area | | | | | | | | |
| | |
5.00%, 3/1/2023 | | | 1,335 | | | | 1,491 | |
| | |
5.00%, 3/1/2024 | | | 1,160 | | | | 1,342 | |
| | | | | | | | |
| | |
Total Florida | | | | | | | 154,587 | |
| | | | | | | | |
|
Georgia — 0.6% | |
| | |
Clarke County School District, Sales Tax GO, 5.00%, 9/1/2021 | | | 30 | | | | 31 | |
| | |
Dahlonega Downtown Development Authority, North Georgia MAC, LLC Project | | | | | | | | |
| | |
Series 2017, Rev., 5.00%, 7/1/2021 | | | 370 | | | | 383 | |
| | |
Series 2017, Rev., 5.00%, 7/1/2022 | | | 300 | | | | 323 | |
| | |
Dougherty County School District, Sales Tax Series 2018, GO, 4.00%, 12/1/2020 | | | 1,250 | | | | 1,262 | |
| | |
Georgia Municipal Electric Authority, Project One Series 2008-B, Rev., VRDO, LOC: PNC Bank NA, 0.08%, 9/10/2020 (c) | | | 4,255 | | | | 4,255 | |
| | |
Hall County School District Series 2018, GO, 5.00%, 11/1/2020 | | | 1,250 | | | | 1,260 | |
| | |
Metropolitan Atlanta Rapid Transit Authority Series A, Rev., 3.75%, 7/1/2021 | | | 5,585 | | | | 5,751 | |
| | |
Pike County School District GO, 4.00%, 10/1/2020 | | | 400 | | | | 401 | |
| | |
Private Colleges & Universities Authority Series 2020B, Rev., 5.00%, 9/1/2025 | | | 13,345 | | | | 16,430 | |
SEE NOTES TO FINANCIAL STATEMENTS.
| | | | | | |
| | | |
| 74 | | | | J.P. MORGAN MUNICIPAL BOND FUNDS | | AUGUST 31, 2020 |
| | | | | | | | |
| INVESTMENTS | | PRINCIPAL
AMOUNT
($000) | | | VALUE
($000) | |
Municipal Bonds — continued | | | | | | | | |
|
Georgia — continued | |
| | |
Richmond County Hospital Authority, University Health Services, Inc. Project Rev., RAN, 5.00%, 1/1/2022 | | | 100 | | | | 106 | |
| | |
Savannah Economic Development Authority Series 2019A, Rev., 2.00%, 10/1/2024 (c) | | | 1,675 | | | | 1,747 | |
| | | | | | | | |
| | |
Total Georgia | | | | | | | 31,949 | |
| | | | | | | | |
|
Idaho — 0.0% (f) | |
| | |
Idaho Housing and Finance Association, Federal Highway Trust Series A, Rev., GRAN, 5.00%, 7/15/2021 | | | 25 | | | | 26 | |
| | |
University of Idaho | | | | | | | | |
| | |
Series 2020A, Rev., 5.00%, 4/1/2021 | | | 390 | | | | 401 | |
| | |
Series 2020A, Rev., 5.00%, 4/1/2022 | | | 165 | | | | 177 | |
| | |
Series 2020A, Rev., 5.00%, 4/1/2023 | | | 355 | | | | 390 | |
| | |
Series 2020A, Rev., 5.00%, 4/1/2024 | | | 315 | | | | 363 | |
| | |
Series 2020A, Rev., 5.00%, 4/1/2025 | | | 330 | | | | 393 | |
| | | | | | | | |
| | |
Total Idaho | | | | | | | 1,750 | |
| | | | | | | | |
|
Illinois — 4.2% | |
| | |
Adams County School District No. 172 GO, AGM, 4.00%, 2/1/2021 | | | 300 | | | | 305 | |
| | |
Buffalo Grove Park District, Lake and Cook Counties GO, 2.00%, 12/30/2020 | | | 330 | | | | 332 | |
| | |
Carol Stream Park District | | | | | | | | |
| | |
Series 2020C, GO, 2.00%, 11/1/2020 | | | 135 | | | | 135 | |
| | |
Series 2020C, GO, 4.00%, 11/1/2024 | | | 210 | | | | 238 | |
| | |
Series 2020C, GO, 4.00%, 11/1/2025 | | | 405 | | | | 470 | |
| | |
Series 2020C, GO, 4.00%, 11/1/2026 | | | 535 | | | | 632 | |
| | |
Champaign Coles Et Al Counties Community College District No. 505 | | | | | | | | |
| | |
Series 2018B, GO, 4.00%, 12/1/2020 | | | 1,250 | | | | 1,262 | |
| | |
Series 2018B, GO, 4.00%, 12/1/2021 | | | 2,500 | | | | 2,618 | |
| | |
Series 2018C, GO, 4.00%, 12/1/2021 | | | 465 | | | | 487 | |
| | |
Champaign County Community Unit School District No. 4 Champaign | | | | | | | | |
| | |
Series 2020A, GO, Zero Coupon, 1/1/2022 | | | 200 | | | | 199 | |
| | |
Series 2020A, GO, Zero Coupon, 1/1/2023 | | | 200 | | | | 197 | |
| | |
Series 2020A, GO, Zero Coupon, 1/1/2024 | | | 385 | | | | 376 | |
| | |
Chicago Midway International Airport, Second Lien | | | | | | | | |
| | |
Series 2014A, Rev., AMT, 5.00%, 1/1/2021 | | | 1,000 | | | | 1,013 | |
| | |
Series 2014B, Rev., 5.00%, 1/1/2023 | | | 150 | | | | 164 | |
| | |
Chicago O’Hare International Airport, General Airport, Senior Lien Series 2016G, Rev., AMT, 5.00%, 1/1/2021 | | | 200 | | | | 203 | |
| | | | | | | | |
| INVESTMENTS | | PRINCIPAL
AMOUNT
($000) | | | VALUE
($000) | |
| | | | | | | | |
|
Illinois — continued | |
| | |
Chicago Park District, Limited Tax | | | | | | | | |
| | |
Series 2011B, GO, 4.00%, 1/1/2021 | | | 100 | | | | 101 | |
| | |
Series 2013B, GO, 5.00%, 1/1/2021 | | | 100 | | | | 101 | |
| | |
Chicago Park District, Unlimited Tax Series 2011C, GO, 5.00%, 1/1/2022 | | | 175 | | | | 183 | |
| | |
Chicago Park District, Unlimited Tax, Special Recreation Activity Series 2018E, GO, 5.00%, 11/15/2021 | | | 300 | | | | 313 | |
| | |
Chicago Transit Authority, Federal Transit Administration Section 5307 Urbanized Area Formula Funds Rev., 5.00%, 6/1/2021 | | | 270 | | | | 278 | |
| | |
City of Aurora | | | | | | | | |
| | |
Series 2019A, GO, 4.00%, 12/30/2021 | | | 470 | | | | 494 | |
| | |
Series 2019A, GO, 4.00%, 12/30/2022 | | | 1,525 | | | | 1,649 | |
| | |
Series 2019A, GO, 4.00%, 12/30/2023 | | | 1,595 | | | | 1,778 | |
| | |
Series 2019A, GO, 4.00%, 12/30/2024 | | | 1,655 | | | | 1,894 | |
| | |
City of Danville | | | | | | | | |
| | |
GO, 2.00%, 12/1/2020 | | | 170 | | | | 171 | |
| | |
GO, 2.00%, 12/1/2021 | | | 255 | | | | 259 | |
| | |
GO, 3.00%, 12/1/2022 | | | 140 | | | | 146 | |
| | |
GO, 4.00%, 12/1/2023 | | | 145 | | | | 159 | |
| | |
City of Elgin | | | | | | | | |
| | |
Series 2020A, GO, 2.00%, 12/15/2021 | | | 230 | | | | 235 | |
| | |
Series 2020A, GO, 3.00%, 12/15/2022 | | | 1,480 | | | | 1,564 | |
| | |
Series 2020A, GO, 3.00%, 12/15/2023 | | | 1,025 | | | | 1,106 | |
| | |
City of Kankakee Series 2011A, GO, AGM, 4.30%, 1/1/2021 | | | 1,040 | | | | 1,053 | |
| | |
City of Rock Island | | | | | | | | |
| | |
Series B, GO, AGM, 3.00%, 12/1/2020 | | | 200 | | | | 201 | |
| | |
Series A, GO, AGM, 3.00%, 12/1/2021 | | | 130 | | | | 134 | |
| | |
Series B, GO, AGM, 3.00%, 12/1/2021 | | | 200 | | | | 206 | |
| | |
City of Rockford, Sales Tax | | | | | | | | |
| | |
Series 2019A, GO, AGM, 4.00%, 12/15/2020 | | | 100 | | | | 101 | |
| | |
Series 2019A, GO, AGM, 4.00%, 12/15/2021 | | | 130 | | | | 136 | |
| | |
Series 2019A, GO, AGM, 4.00%, 12/15/2022 | | | 135 | | | | 145 | |
| | |
Series 2019A, GO, AGM, 4.00%, 12/15/2023 | | | 140 | | | | 154 | |
| | |
City of Waukegan | | | | | | | | |
| | |
Series A, GO, AGM, 3.00%, 12/30/2020 | | | 590 | | | | 595 | |
| | |
Series A, GO, AGM, 4.00%, 12/30/2023 | | | 525 | | | | 581 | |
| | |
Clay Wayne and Marion Counties Community Unit School District No. 35 | | | | | | | | |
| | |
Series 2019, GO, AGM, 5.00%, 12/1/2020 | | | 145 | | | | 147 | |
| | |
Series 2019, GO, AGM, 5.00%, 12/1/2021 | | | 205 | | | | 216 | |
SEE NOTES TO FINANCIAL STATEMENTS.
| | | | | | | | |
| | | |
| AUGUST 31, 2020 | | J.P. MORGAN MUNICIPAL BOND FUNDS | | | | | 75 | |
JPMorgan Ultra-Short Municipal Fund
SCHEDULE OF PORTFOLIO INVESTMENTS
AS OF AUGUST 31, 2020 (Unaudited) (continued)
| | | | | | | | |
| INVESTMENTS | | PRINCIPAL
AMOUNT
($000) | | | VALUE
($000) | |
Municipal Bonds — continued | | | | | | | | |
|
Illinois — continued | |
| | |
Series 2019, GO, AGM, 5.00%, 12/1/2022 | | | 165 | | | | 181 | |
| | |
Series 2019, GO, AGM, 5.00%, 12/1/2023 | | | 175 | | | | 198 | |
| | |
Cook County Community College District No. 508 GO, 5.25%, 12/1/2029 | | | 250 | | | | 283 | |
| | |
Cook County Community Consolidated School District No. 34 Glenview | | | | | | | | |
| | |
GO, 4.00%, 12/1/2020 | | | 100 | | | | 101 | |
| | |
GO, 4.00%, 12/1/2021 | | | 175 | | | | 183 | |
| | |
GO, 4.00%, 12/1/2022 | | | 150 | | | | 162 | |
| | |
GO, 4.00%, 12/1/2023 | | | 150 | | | | 167 | |
| | |
Cook County Community Consolidated School District No. 65 Evanston GO, 5.00%, 12/1/2020 | | | 270 | | | | 273 | |
| | |
Cook County Community School District No. 97 Oak Park | | | | | | | | |
| | |
GO, 4.00%, 1/1/2021 | | | 550 | | | | 557 | |
| | |
GO, 4.00%, 1/1/2022 | | | 400 | | | | 420 | |
| | |
GO, 4.00%, 1/1/2023 | | | 300 | | | | 326 | |
| | |
GO, 4.00%, 1/1/2024 | | | 275 | | | | 307 | |
| | |
Cook County Community Unit School District No. 401 Elmwood Park Series 2013, GO, 4.00%, 12/1/2023 | | | 3,440 | | | | 3,574 | |
| | |
Cook County High School District No. 207 Maine Township | | | | | | | | |
| | |
Series 2019A, GO, 4.00%, 12/1/2021 | | | 8,330 | | | | 8,718 | |
| | |
Series 2019B, GO, 3.50%, 12/1/2022 | | | 325 | | | | 347 | |
| | |
Cook County School District No. 100 South Berwyn | | | | | | | | |
| | |
Series 2019A, GO, 3.00%, 12/1/2020 | | | 100 | | | | 101 | |
| | |
Series 2019C, GO, 3.00%, 12/1/2020 | | | 100 | | | | 101 | |
| | |
Series 2019A, GO, 4.00%, 12/1/2021 | | | 100 | | | | 104 | |
| | |
Series 2019C, GO, 4.00%, 12/1/2021 | | | 165 | | | | 172 | |
| | |
Series 2019A, GO, 4.00%, 12/1/2022 | | | 235 | | | | 252 | |
| | |
Series 2019C, GO, 4.00%, 12/1/2022 | | | 605 | | | | 650 | |
| | |
Series 2019A, GO, 5.00%, 12/1/2023 | | | 345 | | | | 391 | |
| | |
Series 2019C, GO, 5.00%, 12/1/2023 | | | 660 | | | | 748 | |
| | |
Cook County School District No. 102 La Grange | | | | | | | | |
| | |
GO, AGM, 4.00%, 12/15/2020 | | | 400 | | | | 404 | |
| | |
GO, AGM, 4.00%, 12/15/2021 | | | 840 | | | | 879 | |
| | |
GO, AGM, 4.00%, 12/15/2022 | | | 825 | | | | 891 | |
| | |
GO, AGM, 4.00%, 12/15/2023 | | | 825 | | | | 919 | |
| | |
GO, AGM, 4.00%, 12/15/2024 | | | 930 | | | | 1,065 | |
| | |
GO, AGM, 4.00%, 12/15/2025 | | | 985 | | | | 1,150 | |
| | |
Cook County School District No. 109 Indian Springs | | | | | | | | |
| | |
Series 2020A, GO, 4.00%, 12/1/2023 | | | 125 | | | | 138 | |
| | |
Series 2020A, GO, 4.00%, 12/1/2024 | | | 400 | | | | 454 | |
| | | | | | | | |
| INVESTMENTS | | PRINCIPAL
AMOUNT
($000) | | | VALUE
($000) | |
| | | | | | | | |
|
Illinois — continued | |
| | |
Cook County School District No. 145 | | | | | | | | |
| | |
Series 2019B, GO, 4.00%, 12/1/2021 | | | 150 | | | | 157 | |
| | |
Series 2019D, GO, 4.00%, 12/1/2023 | | | 110 | | | | 121 | |
| | |
Cook County School District No. 148 Dolton | | | | | | | | |
| | |
Series 2018A, GO, 5.00%, 12/1/2021 | | | 450 | | | | 473 | |
| | |
Series 2018A, GO, 5.00%, 12/1/2022 | | | 725 | | | | 792 | |
| | |
Cook County School District No. 151 South Holland | | | | | | | | |
| | |
GO, 4.00%, 4/1/2021 | | | 175 | | | | 179 | |
| | |
GO, 4.00%, 4/1/2022 | | | 190 | | | | 201 | |
| | |
Cook County School District No. 160 Country Club Hills | | | | | | | | |
| | |
Series 2020A, GO, 4.00%, 12/1/2021 | | | 250 | | | | 261 | |
| | |
Series 2020A, GO, 4.00%, 12/1/2022 | | | 510 | | | | 547 | |
| | |
Series 2020B, GO, 4.00%, 12/1/2022 | | | 180 | | | | 193 | |
| | |
Series 2020A, GO, 4.00%, 12/1/2023 | | | 285 | | | | 314 | |
| | |
Series 2020B, GO, 4.00%, 12/1/2023 | | | 100 | | | | 110 | |
| | |
Series 2020A, GO, 4.00%, 12/1/2024 | | | 255 | | | | 288 | |
| | |
Series 2020B, GO, 4.00%, 12/1/2024 | | | 100 | | | | 113 | |
|
Cook County School District No. 63 | |
| | |
East Maine GO, 5.00%, 12/1/2020 | | | 2,170 | | | | 2,196 | |
| | |
GO, 5.00%, 12/1/2021 | | | 1,845 | | | | 1,954 | |
| | |
GO, 5.00%, 12/1/2022 | | | 1,935 | | | | 2,115 | |
| | |
Cook County School District No. 69 Skokie | | | | | | | | |
| | |
GO, 4.00%, 12/1/2024 | | | 315 | | | | 362 | |
| | |
GO, 4.00%, 12/1/2025 | | | 460 | | | | 539 | |
| | |
Cook County School District No. 89 Maywood | | | | | | | | |
| | |
Rev., AGM, 4.00%, 12/15/2020 | | | 415 | | | | 419 | |
| | |
Rev., AGM, 4.00%, 12/15/2021 | | | 515 | | | | 538 | |
| | |
Rev., AGM, 4.00%, 12/15/2022 | | | 535 | | | | 573 | |
| | |
Rev., AGM, 4.00%, 12/15/2023 | | | 555 | | | | 609 | |
| | |
Rev., AGM, 4.00%, 12/15/2024 | | | 580 | | | | 650 | |
| | |
Cook County School District No. 99 Cicero | | | | | | | | |
| | |
Series 2019B, GO, 5.00%, 12/1/2022 | | | 350 | | | | 384 | |
| | |
Series 2019B, GO, 5.00%, 12/1/2023 | | | 575 | | | | 653 | |
| | |
Cook County, Community Consolidated School District No. 146 Tinley Park | | | | | | | | |
| | |
GO, 4.00%, 12/1/2020 | | | 200 | | | | 202 | |
| | |
GO, 4.00%, 12/1/2021 | | | 200 | | | | 209 | |
| | |
Cook County, Proviso Township High School District No. 209 GO, 5.00%, 12/1/2021 | | | 2,825 | | | | 2,987 | |
| | |
Cook County, Township High School District No. 225 | | | | | | | | |
| | |
GO, 5.00%, 12/1/2025 (g) | | | 2,795 | | | | 3,443 | |
| | |
GO, 5.00%, 12/1/2026 (g) | | | 2,565 | | | | 3,258 | |
SEE NOTES TO FINANCIAL STATEMENTS.
| | | | | | |
| | | |
| 76 | | | | J.P. MORGAN MUNICIPAL BOND FUNDS | | AUGUST 31, 2020 |
| | | | | | | | |
| INVESTMENTS | | PRINCIPAL
AMOUNT
($000) | | | VALUE
($000) | |
Municipal Bonds — continued | | | | | | | | |
|
Illinois — continued | |
| | |
County of Cook | | | | | | | | |
| | |
Series 2018, GO, 5.00%, 11/15/2020 | | | 900 | | | | 908 | |
| | |
Series 2018, GO, 5.00%, 11/15/2021 | | | 700 | | | | 736 | |
| | |
Series A, GO, 5.00%, 11/15/2021 | | | 355 | | | | 373 | |
| | |
Series C, GO, 5.00%, 11/15/2022 | | | 180 | | | | 195 | |
| | |
County of Will | | | | | | | | |
| | |
Series 2019, GO, 5.00%, 11/15/2020 | | | 810 | | | | 818 | |
| | |
Series 2019, GO, 5.00%, 11/15/2021 | | | 270 | | | | 286 | |
| | |
Series 2019, GO, 5.00%, 11/15/2022 | | | 475 | | | | 524 | |
| | |
Series 2019, GO, 5.00%, 11/15/2023 | | | 525 | | | | 602 | |
| | |
DuPage County Community High School District No. 94 GO, 4.00%, 1/1/2021 | | | 200 | | | | 202 | |
| | |
DuPage County Community High School District No. 94 West Chicago GO, 4.00%, 1/1/2033 | | | 10 | | | | 11 | |
| | |
DuPage County High School District No. 87 Glenbard GO, 3.00%, 10/1/2022 | | | 1,500 | | | | 1,580 | |
| | |
Flagg-Rochelle Community Park District | | | | | | | | |
| | |
Series A, GO, AGM, 4.00%, 1/1/2021 | | | 100 | | | | 101 | |
| | |
Series A, GO, AGM, 4.00%, 1/1/2022 | | | 210 | | | | 220 | |
| | |
Series A, GO, AGM, 4.00%, 1/1/2023 | | | 220 | | | | 236 | |
| | |
Series A, GO, AGM, 4.00%, 1/1/2024 | | | 225 | | | | 249 | |
| | |
Grundy County School District No. 54 Series 2011A, GO, AGM, 7.25%, 12/1/2021 | | | 710 | | | | 770 | |
| | |
Hoffman Estates Park District | | | | | | | | |
| | |
Series 2019A, GO, 4.00%, 12/1/2020 | | | 1,300 | | | | 1,312 | |
| | |
Series 2019A, GO, 4.00%, 12/1/2021 | | | 135 | | | | 141 | |
| | |
Series 2019B, GO, 4.00%, 12/1/2023 | | | 245 | | | | 273 | |
| | |
Illinois Finance Authority | | | | | | | | |
| | |
Series 2020A, Rev., 5.00%, 8/15/2021 | | | 1,000 | | | | 1,042 | |
| | |
Series 2020A, Rev., 5.00%, 8/15/2022 | | | 750 | | | | 812 | |
| | |
Series 2020A, Rev., 5.00%, 8/15/2023 | | | 500 | | | | 566 | |
| | |
Series 2020A, Rev., 5.00%, 8/15/2024 | | | 1,000 | | | | 1,176 | |
| | |
Series 2020A, Rev., 5.00%, 8/15/2025 | | | 1,250 | | | | 1,521 | |
| | |
Illinois Finance Authority, Ascension Health Alliance Senior Credit Group Series E-2, Rev., 1.75%, 4/1/2021 (c) | | | 250 | | | | 252 | |
| | |
Illinois Finance Authority, Carle Foundation | | | | | | | | |
| | |
Series B, Rev., VRDO, LOC: Northern Trust Co., 0.07%, 9/10/2020 (c) | | | 6,080 | | | | 6,080 | |
|
Series 2009-C, Rev., VRDO, LOC: | |
| | |
Northern Trust Co., 0.08%, 9/10/2020 (c) | | | 6,335 | | | | 6,335 | |
| | |
Illinois Finance Authority, Local Government Program, East Prairie School District Number 73 Project | | | | | | | | |
| | |
Rev., 4.00%, 12/1/2020 | | | 230 | | | | 232 | |
| | |
Rev., 5.00%, 12/1/2021 | | | 250 | | | | 265 | |
| | | | | | | | |
| INVESTMENTS | | PRINCIPAL
AMOUNT
($000) | | | VALUE
($000) | |
| | | | | | | | |
|
Illinois — continued | |
| | |
Illinois Finance Authority, Northwestern University Subseries 2008-B, Rev., VRDO, 0.08%, 9/10/2020 (c) | | | 3,425 | | | | 3,425 | |
| | |
Illinois Finance Authority, University of Chicago | | | | | | | | |
| | |
Rev., VRDO, 0.08%, 9/10/2020 (c) | | | 30,000 | | | | 30,000 | |
| | |
Series 2004B, Rev., VRDO, 0.09%, 9/10/2020 (c) | | | 14,000 | | | | 14,000 | |
| | |
Illinois Finance Authority, Water Facilities, American Water Capital Corp. Project Rev., 0.70%, 9/1/2023 (c) | | | 2,800 | | | | 2,794 | |
| | |
Illinois Finance Authority, Wesleyan University Rev., 5.00%, 9/1/2022 | | | 560 | | | | 597 | |
| | |
Illinois Housing Development Authority Series 2019A, Rev., FHA, 1.60%, 1/1/2023 (c) | | | 5,600 | | | | 5,662 | |
| | |
Jackson County Community Unit School District No. 186 GO, AGM, 4.00%, 12/1/2020 | | | 265 | | | | 267 | |
| | |
Joliet Park District GO, 4.00%, 2/1/2021 | | | 830 | | | | 842 | |
| | |
Kane County School District No. 131 Aurora East Side | | | | | | | | |
| | |
Series 2020A, GO, AGM, 2.00%, 12/1/2020 | | | 185 | | | | 186 | |
| | |
Series 2020B, GO, AGM, 2.00%, 12/1/2020 | | | 220 | | | | 221 | |
| | |
Series 2020A, GO, AGM, 3.00%, 12/1/2021 | | | 175 | | | | 180 | |
| | |
Series 2020B, GO, AGM, 3.00%, 12/1/2021 | | | 255 | | | | 263 | |
| | |
Series 2020A, GO, AGM, 4.00%, 12/1/2022 | | | 120 | | | | 128 | |
| | |
Series 2020B, GO, AGM, 4.00%, 12/1/2022 | | | 220 | | | | 235 | |
| | |
Series 2020A, GO, AGM, 5.00%, 12/1/2023 | | | 145 | | | | 163 | |
| | |
Series 2020B, GO, AGM, 5.00%, 12/1/2023 | | | 235 | | | | 264 | |
| | |
Series 2020A, GO, AGM, 5.00%, 12/1/2024 | | | 240 | | | | 278 | |
| | |
Series 2020A, GO, AGM, 5.00%, 12/1/2025 | | | 55 | | | | 65 | |
| | |
Series 2020B, GO, AGM, 5.00%, 12/1/2025 | | | 115 | | | | 136 | |
| | |
Kendall Kane and Will Counties Community Unit School District No. 308 | | | | | | | | |
| | |
Series B, GO, 4.00%, 10/1/2020 | | | 225 | | | | 225 | |
| | |
Series B, GO, 4.00%, 10/1/2021 | | | 255 | | | | 261 | |
| | |
Series B, GO, 5.00%, 10/1/2022 | | | 1,375 | | | | 1,496 | |
| | |
La Grange Park District Series 2012B, GO, 5.00%, 12/1/2021 | | | 415 | | | | 439 | |
| | |
Lake County School District No. 70 Libertyville Series 2019, Rev., 4.00%, 1/1/2023 | | | 300 | | | | 325 | |
| | |
Lee & Ogle Counties School District No. 170 Dixon | | | | | | | | |
| | |
Series 2019A, GO, AGM, 3.00%, 1/30/2021 | | | 50 | | | | 51 | |
| | |
Series 2019B, GO, AGM, 3.00%, 1/30/2021 | | | 120 | | | | 121 | |
| | |
Series 2019A, GO, AGM, 3.00%, 1/30/2022 | | | 160 | | | | 166 | |
| | |
Series 2019B, GO, AGM, 3.00%, 1/30/2022 | | | 245 | | | | 254 | |
SEE NOTES TO FINANCIAL STATEMENTS.
| | | | | | | | |
| | | |
| AUGUST 31, 2020 | | J.P. MORGAN MUNICIPAL BOND FUNDS | | | | | 77 | |
JPMorgan Ultra-Short Municipal Fund
SCHEDULE OF PORTFOLIO INVESTMENTS
AS OF AUGUST 31, 2020 (Unaudited) (continued)
| | | | | | | | |
| INVESTMENTS | | PRINCIPAL
AMOUNT
($000) | | | VALUE
($000) | |
Municipal Bonds — continued | | | | | | | | |
|
Illinois — continued | |
| | |
Series 2019A, GO, AGM, 3.00%, 1/30/2023 | | | 170 | | | | 179 | |
| | |
Series 2019B, GO, AGM, 3.00%, 1/30/2023 | | | 255 | | | | 267 | |
| | |
Lincoln Land Community College District No. 526 GO, 5.00%, 12/15/2021 | | | 125 | | | | 133 | |
| | |
Madison-Macoupin Etc Counties Community College District No. 536, Lewis and Clark Community | | | | | | | | |
| | |
GO, AGM, 4.00%, 5/1/2022 | | | 750 | | | | 793 | |
| | |
GO, AGM, 4.00%, 5/1/2023 | | | 700 | | | | 763 | |
| | |
Peoria Public Building Commission | | | | | | | | |
| | |
Series A, Rev., AGM, 3.00%, 12/1/2022 | | | 75 | | | | 79 | |
| | |
Series A, Rev., AGM, 4.00%, 12/1/2024 | | | 655 | | | | 743 | |
| | |
Sangamon County Community Unit School District No. 5 Series B, GO, 5.00%, 1/1/2022 | | | 1,650 | | | | 1,754 | |
| | |
Sangamon County Community Unit School District No. 5 Ball-Chatham GO, 4.00%, 2/1/2023 | | | 2,015 | | | | 2,176 | |
| | |
Sangamon Menard Etc Counties Community School District No. 8 Pleasant Plains | | | | | | | | |
| | |
Series 2019C, GO, 4.00%, 1/1/2022 | | | 165 | | | | 173 | |
| | |
Series 2019C, GO, 4.00%, 1/1/2023 | | | 310 | | | | 334 | |
| | |
Series 2019C, GO, 4.00%, 1/1/2024 | | | 370 | | | | 410 | |
| | |
St. Charles Public Library District | | | | | | | | |
| | |
Series 2019, Rev., 3.00%, 11/1/2020 | | | 100 | | | | 100 | |
| | |
Series 2019, Rev., 3.00%, 11/1/2021 | | | 85 | | | | 88 | |
| | |
Series 2019, Rev., 4.00%, 11/1/2022 | | | 100 | | | | 107 | |
| | |
State of Illinois | | | | | | | | |
| | |
Series D, GO, 5.00%, 11/1/2020 | | | 5,000 | | | | 5,029 | |
| | |
GO, 5.00%, 2/1/2024 | | | 3,370 | | | | 3,660 | |
| | |
GO, 5.50%, 5/1/2025 | | | 2,500 | | | | 2,839 | |
| | |
GO, 5.50%, 5/1/2026 | | | 5,000 | | | | 5,763 | |
| | |
State of Illinois, Sales Tax, Junior Obligation | | | | | | | | |
| | |
Rev., 5.00%, 6/15/2021 | | | 110 | | | | 113 | |
| | |
Series 2018B, Rev., 5.00%, 6/15/2021 | | | 5,000 | | | | 5,140 | |
| | |
Rev., 5.00%, 6/15/2023 | | | 990 | | | | 1,084 | |
| | |
University of Illinois, Auxiliary Facilities System Series A, Rev., 5.00%, 4/1/2024 | | | 2,500 | | | | 2,764 | |
| | |
University of Illinois, Health Services System Series 2008, Rev., VRDO, LOC: Wells Fargo Bank NA, 0.11%, 9/10/2020 (c) | | | 2,850 | | | | 2,850 | |
| | |
Village of Antioch GO, 3.00%, 12/1/2020 | | | 290 | | | | 292 | |
| | |
Village of Arlington Heights | | | | | | | | |
| | |
GO, 4.00%, 12/1/2023 | | | 1,130 | | | | 1,263 | |
| | |
GO, 4.00%, 12/1/2024 | | | 1,175 | | | | 1,352 | |
| | |
GO, 4.00%, 12/1/2025 | | | 695 | | | | 822 | |
| | | | | | | | |
| INVESTMENTS | | PRINCIPAL
AMOUNT
($000) | | | VALUE
($000) | |
| | | | | | | | |
|
Illinois — continued | |
| | |
Village of Bartlett | | | | | | | | |
| | |
GO, 5.00%, 12/1/2021 | | | 980 | | | | 1,039 | |
| | |
GO, 5.00%, 12/1/2022 | | | 1,065 | | | | 1,173 | |
| | |
GO, 5.00%, 12/1/2023 | | | 1,130 | | | | 1,292 | |
| | |
Village of Bolingbrook Series A, GO, AGM, 4.00%, 1/1/2021 | | | 185 | | | | 187 | |
| | |
Village of Flossmoor | | | | | | | | |
| | |
GO, 3.00%, 12/1/2020 | | | 585 | | | | 589 | |
| | |
GO, 3.00%, 12/1/2021 | | | 605 | | | | 625 | |
| | |
Village of Franklin Park GO, 4.00%, 1/1/2021 | | | 500 | | | | 506 | |
| | |
Village of Gilberts Series 2011, GO, 4.00%, 12/1/2021 | | | 440 | | | | 450 | |
| | |
Village of Hoffman Estates | | | | | | | | |
| | |
Series A, GO, 3.00%, 12/1/2020 | | | 110 | | | | 111 | |
| | |
GO, 5.00%, 12/1/2020 | | | 270 | | | | 273 | |
| | |
GO, 5.00%, 12/1/2021 | | | 210 | | | | 223 | |
| | |
Village of Midlothian | | | | | | | | |
| | |
Series 2019A, GO, 4.00%, 1/1/2023 | | | 190 | | | | 204 | |
| | |
Series 2019A, GO, 4.00%, 1/1/2024 | | | 120 | | | | 133 | |
| | |
Village of Villa Park | | | | | | | | |
| | |
Series B, GO, 4.00%, 12/15/2020 | | | 125 | | | | 126 | |
| | |
Series B, GO, 4.00%, 12/15/2021 | | | 190 | | | | 199 | |
| | |
Series B, GO, 4.00%, 12/15/2022 | | | 200 | | | | 216 | |
| | |
Series B, GO, 4.00%, 12/15/2023 | | | 205 | | | | 227 | |
| | |
Village of Villa Park, Illinois Alternate Source | | | | | | | | |
| | |
Series 2018C, GO, 3.00%, 12/15/2020 | | | 415 | | | | 418 | |
| | |
Series 2018C, GO, 4.00%, 12/15/2021 | | | 505 | | | | 529 | |
| | |
Village of Villa Park, Sales Tax Series A, GO, 4.00%, 12/15/2023 | | | 125 | | | | 139 | |
| | |
Village of Woodridge Series 2017, GO, 3.00%, 2/1/2021 | | | 250 | | | | 253 | |
| | |
Washington County Community Unit School Dist No. 10 West Washington | | | | | | | | |
| | |
GO, 4.00%, 1/15/2021 | | | 740 | | | | 750 | |
| | |
GO, 4.00%, 1/15/2022 | | | 575 | | | | 603 | |
| | |
GO, 4.00%, 1/15/2023 | | | 685 | | | | 738 | |
| | |
Whiteside and Lee Counties, Sterling Community Unit School District No. 5 GO, AGM, 4.00%, 12/1/2020 | | | 320 | | | | 323 | |
| | |
Whiteside County Community Unit School District No. 6 Morrison | | | | | | | | |
| | |
Series A, GO, AGM, 4.00%, 12/1/2020 | | | 205 | | | | 207 | |
| | |
Series A, GO, AGM, 4.00%, 12/1/2021 | | | 745 | | | | 779 | |
| | |
Will County Community High School District No. 210 Lincoln-Way | | | | | | | | |
| | |
GO, AGM, 4.00%, 1/1/2021 | | | 100 | | | | 101 | |
| | |
GO, AGM, 4.00%, 1/1/2022 | | | 1,000 | | | | 1,029 | |
SEE NOTES TO FINANCIAL STATEMENTS.
| | | | | | |
| | | |
| 78 | | | | J.P. MORGAN MUNICIPAL BOND FUNDS | | AUGUST 31, 2020 |
| | | | | | | | |
| INVESTMENTS | | PRINCIPAL
AMOUNT
($000) | | | VALUE
($000) | |
Municipal Bonds — continued | | | | | | | | |
|
Illinois — continued | |
| | |
Will County Township High School District No. 204 Joliet | | | | | | | | |
| | |
GO, 4.00%, 1/1/2021 | | | 75 | | | | 76 | |
| | |
GO, 4.00%, 1/1/2023 | | | 125 | | | | 133 | |
| | |
Will County, Community Consolidated School District No. 70-C Laraway, Lease Certificates | | | | | | | | |
| | |
Series A, Rev., AGM, 4.00%, 12/1/2020 | | | 385 | | | | 388 | |
| | |
Series A, Rev., AGM, 4.00%, 12/1/2021 | | | 400 | | | | 418 | |
| | |
Will Grundy Etc Counties Community College District No. 525 | | | | | | | | |
| | |
GO, 5.00%, 1/1/2022 | | | 5,275 | | | | 5,600 | |
| | |
GO, 5.00%, 1/1/2023 | | | 5,495 | | | | 6,076 | |
| | |
GO, 5.00%, 1/1/2024 | | | 2,600 | | | | 2,987 | |
| | |
Winnebago and Stephenson Counties School District No. 323, School Building GO, 5.00%, 11/1/2020 | | | 100 | | | | 101 | |
| | | | | | | | |
| | |
Total Illinois | | | | | | | 232,940 | |
| | | | | | | | |
|
Indiana — 2.6% | |
| | |
City of Evansville, Waterworks District | | | | | | | | |
| | |
Rev., 4.00%, 7/1/2021 | | | 2,800 | | | | 2,884 | |
| | |
Rev., 4.00%, 7/1/2026 | | | 3,710 | | | | 4,406 | |
| | |
City of Rockport, AEP Generating Company Project | | | | | | | | |
| | |
Series A, Rev., 1.35%, 9/1/2022 (c) | | | 2,000 | | | | 2,018 | |
| | |
Series B, Rev., 1.35%, 9/1/2022 (c) | | | 2,250 | | | | 2,271 | |
| | |
City of Rockport, Indiana Michigan Power Company Project Series 2009B, Rev., 3.05%, 6/1/2025 | | | 6,500 | | | | 7,122 | |
| | |
Fort Wayne Community School Building Corp. | | | | | | | | |
| | |
Rev., 4.00%, 1/15/2021 | | | 100 | | | | 101 | |
| | |
Rev., 4.00%, 7/15/2021 | | | 250 | | | | 258 | |
| | |
Rev., 4.00%, 1/15/2022 | | | 250 | | | | 263 | |
| | |
Rev., 4.00%, 7/15/2022 | | | 125 | | | | 134 | |
| | |
Fort Wayne Community Schools | | | | | | | | |
| | |
GO, 4.00%, 1/15/2021 | | | 455 | | | | 461 | |
| | |
GO, 4.00%, 7/15/2021 | | | 630 | | | | 650 | |
| | |
GO, 4.00%, 1/15/2022 | | | 755 | | | | 794 | |
| | |
Franklin Township Community School Corp. GO, 4.00%, 1/15/2021 | | | 1,465 | | | | 1,484 | |
| | |
Gary Community School Building Corp., Ad Valorem Property Tax First Mortgage | | | | | | | | |
| | |
Series 2020B, Rev., 4.00%, 1/15/2021 | | | 205 | | | | 208 | |
| | |
Series 2020B, Rev., 4.00%, 1/15/2022 | | | 150 | | | | 156 | |
| | |
Series 2020B, Rev., 4.00%, 7/15/2022 | | | 165 | | | | 174 | |
| | |
Series 2020B, Rev., 4.00%, 1/15/2023 | | | 165 | | | | 176 | |
| | | | | | | | |
| INVESTMENTS | | PRINCIPAL
AMOUNT
($000) | | | VALUE
($000) | |
| | | | | | | | |
|
Indiana — continued | |
| | |
Series 2020B, Rev., 4.00%, 7/15/2023 | | | 185 | | | | 200 | |
| | |
Series 2020B, Rev., 4.00%, 7/15/2025 | | | 215 | | | | 242 | |
| | |
Series 2020B, Rev., 4.00%, 1/15/2026 | | | 220 | | | | 249 | |
| | |
Series 2020B, Rev., 4.00%, 7/15/2026 | | | 235 | | | | 269 | |
| | |
Hammond Local Public Improvement Bond Bank Series 2020A, Rev., 2.38%, 12/31/2020 | | | 2,000 | | | | 2,009 | |
| | |
Hammond Multi-School Building Corp., First Mortgage Rev., 4.00%, 7/15/2021 | | | 670 | | | | 689 | |
| | |
Indiana Finance Authority Rev., VRDO, 0.08%, 9/10/2020 (c) | | | 25,875 | | | | 25,875 | |
| | |
Indiana Finance Authority, Ascension Health Senior Credit Group Series 2008E-4, Rev., VRDO, 0.08%, 9/10/2020 (c) | | | 10,720 | | | | 10,720 | |
| | |
Indiana Finance Authority, Butler University Project | | | | | | | | |
| | |
Rev., 3.00%, 2/1/2021 | | | 140 | | | | 141 | |
| | |
Rev., 3.00%, 2/1/2022 | | | 210 | | | | 217 | |
| | |
Rev., 3.00%, 2/1/2023 | | | 225 | | | | 232 | |
| | |
Indiana Finance Authority, Goshen Health Series B, Rev., 2.10%, 11/1/2026 (c) | | | 2,700 | | | | 2,849 | |
| | |
Indiana Finance Authority, Health Obligation Series L, Rev., (SIFMA Municipal Swap Index Yield + 0.28%), 0.37%, 9/10/2020 (b) | | | 10,000 | | | | 9,977 | |
| | |
Indiana Finance Authority, Lease Appropriation, Stadium Project Series 2007A-2, Rev., VRDO, LIQ: Wells Fargo Bank NA, 0.02%, 9/1/2020 (c) | | | 15,555 | | | | 15,555 | |
| | |
Indiana Finance Authority, Marian University Project | | | | | | | | |
| | |
Series A, Rev., 5.00%, 9/15/2020 | | | 50 | | | | 50 | |
| | |
Series A, Rev., 5.00%, 9/15/2021 | | | 60 | | | | 62 | |
| | |
Series A, Rev., 5.00%, 9/15/2022 | | | 50 | | | | 53 | |
| | |
Series A, Rev., 5.00%, 9/15/2023 | | | 75 | | | | 82 | |
| | |
Series A, Rev., 5.00%, 9/15/2024 | | | 155 | | | | 174 | |
| | |
Indiana Finance Authority, University Health Obligated Group Series E, Rev., VRDO, LOC: Bank of America NA, 0.10%, 9/10/2020 (c) | | | 1,055 | | | | 1,055 | |
| | |
Indiana Health Facility Financing Authority | | | | | | | | |
| | |
Series E-6, Rev., VRDO, 0.08%, 9/10/2020 (c) | | | 3,000 | | | | 3,000 | |
| | |
Series 2001A-2, Rev., 2.00%, 2/1/2023 (c) | | | 24,875 | | | | 25,741 | |
| | |
Series 2001A-2, Rev., 2.00%, 2/1/2023 (c) (d) | | | 125 | | | | 129 | |
| | |
Indiana State Finance Authority, Lease Appropriation, Stadium Project Series A, Rev., VRDO, 0.09%, 9/10/2020 (c) | | | 6,820 | | | | 6,820 | |
SEE NOTES TO FINANCIAL STATEMENTS.
| | | | | | | | |
| | | |
| AUGUST 31, 2020 | | J.P. MORGAN MUNICIPAL BOND FUNDS | | | | | 79 | |
JPMorgan Ultra-Short Municipal Fund
SCHEDULE OF PORTFOLIO INVESTMENTS
AS OF AUGUST 31, 2020 (Unaudited) (continued)
| | | | | | | | |
| INVESTMENTS | | PRINCIPAL
AMOUNT
($000) | | | VALUE
($000) | |
Municipal Bonds — continued | | | | | | | | |
|
Indiana — continued | |
| | |
Metropolitan School District of Southwest Allen County | | | | | | | | |
| | |
Series 2019B, GO, 4.00%, 1/15/2021 | | | 110 | | | | 112 | |
| | |
Series 2019B, GO, 4.00%, 7/15/2021 | | | 100 | | | | 103 | |
| | |
Series 2019B, GO, 4.00%, 1/15/2022 | | | 100 | | | | 105 | |
| | |
Series 2019B, GO, 4.00%, 7/15/2022 | | | 590 | | | | 623 | |
| | |
Series 2019B, GO, 4.00%, 1/15/2023 | | | 520 | | | | 556 | |
| | |
Series 2019B, GO, 4.00%, 7/15/2023 | | | 485 | | | | 525 | |
| | |
Series 2019B, GO, 4.00%, 1/15/2024 | | | 575 | | | | 631 | |
| | |
Metropolitan School District Washington Township | | | | | | | | |
| | |
GO, 4.00%, 7/15/2021 | | | 250 | | | | 258 | |
| | |
GO, 4.00%, 1/15/2022 | | | 590 | | | | 621 | |
| | |
North Putnam Middle School Building Corp., Property Tax, First Mortgage | | | | | | | | |
| | |
Series 2019, Rev., 3.00%, 1/15/2021 | | | 170 | | | | 172 | |
| | |
Series 2019, Rev., 3.00%, 7/15/2021 | | | 190 | | | | 195 | |
| | |
Series 2019, Rev., 3.00%, 1/15/2022 | | | 250 | | | | 258 | |
| | |
Series 2019, Rev., 3.00%, 7/15/2022 | | | 150 | | | | 158 | |
| | |
Purdue University, Student Facilities System Series 2007C, Rev., VRDO, 0.07%, 9/10/2020 (c) | | | 6,575 | | | | 6,575 | |
| | |
South Madison Elementary School Building Corp., Indiana Ad Valorem Property Tax | | | | | | | | |
| | |
Rev., 4.00%, 1/15/2021 | | | 100 | | | | 101 | |
| | |
Rev., 4.00%, 7/15/2021 | | | 80 | | | | 83 | |
| | |
Tippecanoe County School Building Corp. | | | | | | | | |
| | |
Rev., 4.00%, 1/15/2021 | | | 300 | | | | 304 | |
| | |
Rev., 4.00%, 7/15/2021 | | | 200 | | | | 207 | |
| | |
Rev., 4.00%, 1/15/2022 | | | 365 | | | | 384 | |
| | |
Rev., 4.00%, 7/15/2022 | | | 275 | | | | 295 | |
| | |
Rev., 4.00%, 1/15/2023 | | | 300 | | | | 326 | |
| | |
Rev., 4.00%, 7/15/2023 | | | 380 | | | | 419 | |
| | |
Town of Schererville, Sewage Works | | | | | | | | |
| | |
Rev., 4.00%, 3/1/2021 | | | 50 | | | | 51 | |
| | |
Rev., 4.00%, 3/1/2022 | | | 75 | | | | 79 | |
| | |
Rev., 4.00%, 3/1/2023 | | | 75 | | | | 81 | |
| | |
Rev., 4.00%, 3/1/2024 | | | 110 | | | | 123 | |
| | | | | | | | |
| | |
Total Indiana | | | | | | | 143,295 | |
| | | | | | | | |
|
Iowa — 0.4% | |
| | |
City of Altoona | | | | | | | | |
| | |
Series 2020A, COP, 4.00%, 6/1/2022 | | | 225 | | | | 239 | |
| | |
Series 2020A, COP, 4.00%, 6/1/2023 | | | 275 | | | | 301 | |
| | |
City of Coralville Series 2016E, COP, 4.00%, 6/1/2023 | | | 325 | | | | 319 | |
| | | | | | | | |
| INVESTMENTS | | PRINCIPAL
AMOUNT
($000) | | | VALUE
($000) | |
| | | | | | | | |
|
Iowa — continued | |
| | |
City of Iowa Falls GO, 3.00%, 6/1/2023 | | | 230 | | | | 245 | |
| | |
City of Sac City GO, 5.00%, 6/1/2021 | | | 160 | | | | 166 | |
| | |
County of Plymouth | | | | | | | | |
| | |
GO, AGM, 3.00%, 6/1/2021 | | | 565 | | | | 576 | |
| | |
GO, AGM, 3.00%, 6/1/2022 | | | 290 | | | | 303 | |
| | |
Iowa Finance Authority, Health Systems Rev., (SIFMA Municipal Swap Index Yield + 0.58%), 0.67%, 9/10/2020 (b) (e) | | | 19,650 | | | | 19,507 | |
| | |
North Polk Community School District Series 2020B, Rev., 4.00%, 6/1/2022 | | | 450 | | | | 479 | |
| | |
State of Iowa, Ijobs Program Series A, Rev., 5.00%, 6/1/2021 | | | 400 | | | | 414 | |
| | | | | | | | |
| | |
Total Iowa | | | | | | | 22,549 | |
| | | | | | | | |
|
Kansas — 0.3% | |
| | |
Butler County Unified School District No. 385, Temporary Notes GO, 3.00%, 12/1/2020 | | | 815 | | | | 820 | |
| | |
City of Manhattan, Temporary Notes GO, 1.50%, 6/15/2022 | | | 5,865 | | | | 5,868 | |
| | |
County of Reno GO, 3.00%, 12/1/2021 | | | 4,605 | | | | 4,635 | |
| | |
Johnson County Park & Recreation District | | | | | | | | |
| | |
Series 2019B, COP, 3.00%, 9/1/2020 | | | 340 | | | | 340 | |
| | |
Series 2019A, COP, 5.00%, 9/1/2020 | | | 200 | | | | 200 | |
| | |
Series 2019B, COP, 3.00%, 9/1/2021 | | | 255 | | | | 262 | |
| | |
Series 2019A, COP, 5.00%, 9/1/2021 | | | 240 | | | | 251 | |
| | |
Series 2019B, COP, 3.00%, 9/1/2022 | | | 200 | | | | 205 | |
| | |
Series 2019A, COP, 5.00%, 9/1/2022 | | | 250 | | | | 266 | |
| | |
Series 2019B, COP, 3.00%, 9/1/2023 | | | 200 | | | | 208 | |
| | |
Series 2019A, COP, 5.00%, 9/1/2023 | | | 125 | | | | 137 | |
| | |
Kansas City Kansas Community College | | | | | | | | |
| | |
Series 2020A, COP, 4.00%, 4/1/2022 | | | 600 | | | | 635 | |
| | |
Series 2020A, COP, 4.00%, 4/1/2023 | | | 800 | | | | 871 | |
| | |
Series 2020A, COP, 4.00%, 4/1/2024 | | | 500 | | | | 561 | |
| | |
Kansas City Kansas Community College District Series 2020A, COP, 4.00%, 4/1/2021 | | | 450 | | | | 460 | |
| | |
Overland Park Development Corp. Rev., 4.00%, 3/1/2021 | | | 1,400 | | | | 1,403 | |
| | |
Sedgwick County Unified School District No. 267 Renwick | | | | | | | | |
| | |
Series 2019A, GO, 3.00%, 11/1/2022 | | | 100 | | | | 106 | |
| | |
Series 2019A, GO, 3.00%, 11/1/2023 | | | 100 | | | | 107 | |
| | |
Wyandotte County Unified School District No. 202 Turner | | | | | | | | |
| | |
Series 2019A, GO, AGM, 2.00%, 9/1/2021 | | | 200 | | | | 203 | |
| | |
Series 2019A, GO, AGM, 3.00%, 9/1/2022 | | | 125 | | | | 132 | |
| | |
Series 2019A, GO, AGM, 3.00%, 9/1/2023 | | | 400 | | | | 429 | |
| | |
Series 2019A, GO, AGM, 3.00%, 9/1/2024 | | | 400 | | | | 438 | |
| | | | | | | | |
| | |
Total Kansas | | | | | | | 18,537 | |
| | | | | | | | |
SEE NOTES TO FINANCIAL STATEMENTS.
| | | | | | |
| | | |
| 80 | | | | J.P. MORGAN MUNICIPAL BOND FUNDS | | AUGUST 31, 2020 |
| | | | | | | | |
| INVESTMENTS | | PRINCIPAL
AMOUNT
($000) | | | VALUE
($000) | |
Municipal Bonds — continued | | | | | | | | |
|
Kentucky — 0.9% | |
| | |
City of Ashland, Ashland Hospital Corp. DBA King’s Daughters Medical Center | | | | | | | | |
| | |
Rev., 5.00%, 2/1/2021 | | | 385 | | | | 390 | |
| | |
Rev., 5.00%, 2/1/2022 | | | 500 | | | | 524 | |
| | |
Rev., 5.00%, 2/1/2023 | | | 600 | | | | 647 | |
| | |
Rev., 5.00%, 2/1/2024 | | | 575 | | | | 637 | |
| | |
County of Owen, Kentucky-American Water Co. Project Rev., 0.70%, 9/1/2023 (c) | | | 2,500 | | | | 2,493 | |
| | |
Franklin County Public Properties Corp., Justice Center Project Series A, Rev., 4.50%, 4/1/2021 (d) | | | 40 | | | | 41 | |
| | |
Kentucky Housing Corp., BTT Development III Portfolio Rev., 1.40%, 6/1/2022 (c) | | | 3,315 | | | | 3,363 | |
| | |
Kentucky Housing Corp., Henry Greene Apartments Project Rev., VRDO, 2.00%, 9/1/2020 (c) | | | 7,200 | | | | 7,200 | |
| | |
Kentucky Public Energy Authority, Gas Supply | | | | | | | | |
| | |
Series 2018A, Rev., 4.00%, 4/1/2021 | | | 775 | | | | 790 | |
| | |
Series A, Rev., 4.00%, 4/1/2022 | | | 1,210 | | | | 1,275 | |
| | |
Kentucky State Property and Buildings Commission, Project No. 110 Rev., 5.00%, 8/1/2024 | | | 85 | | | | 99 | |
| | |
Kentucky State Property and Buildings Commission, Project No. 99 Series A, Rev., 5.00%, 11/1/2021 | | | 1,540 | | | | 1,552 | |
| | |
Lexington-Fayette Urban County Government, Various Purpose Series 2014A, GO, 5.00%, 9/1/2020 | | | 20 | | | | 20 | |
| | |
Louisville & Jefferson County Metropolitan Government, Kentucky Pollution Control, Louisville Gas and Electric Co. Project Series B, Rev., AMT, 2.55%, 5/3/2021 (c) | | | 2,750 | | | | 2,783 | |
| | |
Louisville & Jefferson County Metropolitan Government, Louisville Gas and Electric Co. Project | | | | | | | | |
| | |
Series 2003A, Rev., 1.85%, 4/1/2021 (c) | | | 10,000 | | | | 10,064 | |
| | |
Series 2020A, Rev., 0.90%, 9/1/2026 | | | 5,000 | | | | 4,984 | |
| | |
Louisville Regional Airport Authority, Airport System Series A, Rev., AMT, 5.00%, 7/1/2022 | | | 1,000 | | | | 1,076 | |
| | |
Paducah Electric Plant Board | | | | | | | | |
| | |
Rev., 5.00%, 10/1/2020 | | | 2,250 | | | | 2,258 | |
| | |
Rev., 5.00%, 10/1/2021 | | | 2,300 | | | | 2,412 | |
| | |
Rev., 5.00%, 10/1/2022 | | | 2,000 | | | | 2,183 | |
| | |
Rev., 5.00%, 10/1/2023 | | | 2,000 | | | | 2,266 | |
| | | | | | | | |
| | |
Total Kentucky | | | | | | | 47,057 | |
| | | | | | | | |
| | | | | | | | |
| INVESTMENTS | | PRINCIPAL
AMOUNT
($000) | | | VALUE
($000) | |
| | | | | | | | |
|
Louisiana — 1.4% | |
| | |
Calcasieu Parish School District No. 23 | | | | | | | | |
| | |
GO, 5.00%, 9/1/2023 | | | 180 | | | | 205 | |
| | |
GO, 5.00%, 9/1/2024 | | | 250 | | | | 294 | |
| | |
Calcasieu Parish School District No. 34 GO, 3.00%, 1/15/2022 | | | 520 | | | | 540 | |
| | |
City of Shreveport, Water and Sewer GO, 5.00%, 9/1/2021 | | | 145 | | | | 151 | |
| | |
City of Shreveport, Water and Sewer, Junior Lien | | | | | | | | |
| | |
Series 2019B, Rev., AGM, 4.00%, 12/1/2023 | | | 310 | | | | 345 | |
| | |
Series 2019B, Rev., AGM, 5.00%, 12/1/2024 | | | 225 | | | | 266 | |
| | |
City of Youngsville LA | | | | | | | | |
| | |
Rev., 3.00%, 12/1/2020 | | | 250 | | | | 252 | |
| | |
Rev., 3.00%, 12/1/2021 | | | 255 | | | | 263 | |
| | |
Iberia Parishwide School District GO, 2.00%, 3/1/2021 | | | 150 | | | | 151 | |
| | |
Louisiana Local Government Environmental Facilities and Community Development Authority, East Ascension Consolidated Gravity Drainage District No. 1 Project | | | | | | | | |
| | |
Series 2015, Rev., 5.00%, 12/1/2025 | | | 715 | | | | 877 | |
| | |
Louisiana Local Government Environmental Facilities and Community Development Authority, LCTCS Act 391 Project Rev., 5.00%, 10/1/2021 | | | 1,500 | | | | 1,575 | |
| | |
Louisiana Public Facilities Authority, Louisiana Children’s Medical Center Project Rev., (SIFMA Municipal Swap Index Yield + 0.65%), 0.74%, 9/10/2020 (b) | | | 40,000 | | | | 39,661 | |
| | |
Louisiana Public Facilities Authority, Tulane University of Louisiana Project | | | | | | | | |
| | |
Series 2020A, Rev., 5.00%, 4/1/2025 | | | 60 | | | | 72 | |
| | |
Series 2020A, Rev., 5.00%, 4/1/2026 | | | 100 | | | | 124 | |
| | |
Parish of St. Charles, Pollution Control, Shell Oil Co., Norco Project Series B, Rev., VRDO, 0.03%, 9/1/2020 (c) | | | 150 | | | | 150 | |
| | |
Parish of St. John the Baptist LA, Marathon Oil Corp. Project | | | | | | | | |
| | |
Subseries 2017B-1, Rev., 2.13%, 7/1/2024 (c) | | | 18,000 | | | | 18,089 | |
| | |
Subseries 2017B-2, Rev., 2.37%, 7/1/2026 (c) | | | 12,800 | | | | 12,957 | |
| | |
St. Martin Parish School Board GO, 3.00%, 3/1/2021 | | | 335 | | | | 339 | |
SEE NOTES TO FINANCIAL STATEMENTS.
| | | | | | | | |
| | | |
| AUGUST 31, 2020 | | J.P. MORGAN MUNICIPAL BOND FUNDS | | | | | 81 | |
JPMorgan Ultra-Short Municipal Fund
SCHEDULE OF PORTFOLIO INVESTMENTS
AS OF AUGUST 31, 2020 (Unaudited) (continued)
| | | | | | | | |
| INVESTMENTS | | PRINCIPAL
AMOUNT
($000) | | | VALUE
($000) | |
Municipal Bonds — continued | | | | | | | | |
|
Louisiana — continued | |
| | |
Zachary Community School District No. 1 | | | | | | | | |
| | |
GO, 3.00%, 3/1/2021 | | | 200 | | | | 203 | |
| | |
GO, 3.00%, 3/1/2022 | | | 685 | | | | 714 | |
| | |
GO, 3.00%, 3/1/2023 | | | 715 | | | | 758 | |
| | | | | | | | |
| | |
Total Louisiana | | | | | | | 77,986 | |
| | | | | | | | |
|
Maine — 0.0% (f) | |
| | |
Maine Health and Higher Educational Facilities Authority, Mainehealth Series 2020A, Rev., 5.00%, 7/1/2026 | | | 250 | | | | 309 | |
| | | | | | | | |
|
Maryland — 1.1% | |
| | |
County of Montgomery, CHE Trinity Health Credit Group Series MD, Rev., VRDO, 0.18%, 12/1/2020 (c) | | | 20,000 | | | | 20,000 | |
| | |
Maryland Health and Higher Educational Facilities Authority Series 2013C, Rev., 5.00%, 5/15/2023 (d) | | | 12,255 | | | | 13,815 | |
| | |
Maryland Stadium Authority, Construction and Revitalization Program Series 2018A, Rev., 5.00%, 5/1/2021 | | | 1,215 | | | | 1,254 | |
| | |
Maryland Stadium Authority, Sports Facilities, Football Stadium Issue Series 2007, Rev., VRDO, LIQ: | | | | | | | | |
| | |
Sumitomo Mitsui Banking Corp., 0.08%, 9/10/2020 (c) | | | 22,630 | | | | 22,630 | |
| | |
State of Maryland Series 2017B, GO, 5.00%, 8/1/2025 | | | 2,825 | | | | 3,474 | |
| | | | | | | | |
| | |
Total Maryland | | | | | | | 61,173 | |
| | | | | | | | |
|
Massachusetts — 2.8% | |
| | |
City of Fall River GO, BAN, 1.50%, 2/5/2021 | | | 14,094 | | | | 14,166 | |
| | |
City of Greenfield GO, BAN, 2.00%, 10/1/2020 | | | 4,853 | | | | 4,860 | |
| | |
City of Lowell GO, BAN, 2.00%, 9/25/2020 | | | 4,389 | | | | 4,393 | |
| | |
Commonwealth of Massachusetts Series A, GO, (ICE LIBOR USD 3 Month + 0.55%), 0.72%, 11/1/2020 (b) | | | 30,000 | | | | 29,856 | |
| | |
Commonwealth of Massachusetts, Consolidated Loan of 2011 Series 2011A, GO, 5.00%, 4/1/2021 (d) | | | 20 | | | | 21 | |
| | |
Commonwealth of Massachusetts, Consolidated Loan of 2014 | | | | | | | | |
| | |
Subseries D-2, GO, 1.70%, 8/1/2022 (c) | | | 5,500 | | | | 5,639 | |
| | |
Massachusetts Development Finance Agency, Northeastern University Issue | | | | | | | | |
| | |
Series 2020A, Rev., 5.00%, 10/1/2022 | | | 3,600 | | | | 3,952 | |
| | |
Series 2020A, Rev., 5.00%, 10/1/2023 | | | 2,900 | | | | 3,316 | |
| | |
Series 2020A, Rev., 5.00%, 10/1/2024 | | | 1,580 | | | | 1,878 | |
| | |
Series 2020A, Rev., 5.00%, 10/1/2025 | | | 975 | | | | 1,198 | |
| | |
Series 2020A, Rev., 5.00%, 10/1/2026 | | | 895 | | | | 1,127 | |
| | | | | | | | |
| INVESTMENTS | | PRINCIPAL
AMOUNT
($000) | | | VALUE
($000) | |
| | | | | | | | |
|
Massachusetts — continued | |
| | |
Massachusetts Development Finance Agency, Partners Healthcare System | | | | | | | | |
| | |
Series 2017S-5, Rev., (SIFMA Municipal Swap Index Yield + 0.42%), 0.51%, 9/10/2020 (b) | | | 10,000 | | | | 9,974 | |
| | |
Series 2017S, Rev., (SIFMA Municipal Swap Index Yield + 0.50%), 0.59%, 9/10/2020 (b) | | | 1,500 | | | | 1,495 | |
| | |
Massachusetts Development Finance Agency, Suffolk University | | | | | | | | |
| | |
Rev., 5.00%, 7/1/2021 | | | 500 | | | | 515 | |
| | |
Rev., 5.00%, 7/1/2022 | | | 390 | | | | 417 | |
| | |
Rev., 5.00%, 7/1/2024 | | | 350 | | | | 396 | |
| | |
Massachusetts Development Finance Agency, Wellforce Issue | | | | | | | | |
| | |
Series 2020C, Rev., AGM, 5.00%, 10/1/2021 | | | 120 | | | | 126 | |
| | |
Series 2020C, Rev., AGM, 5.00%, 10/1/2022 | | | 150 | | | | 163 | |
| | |
Series 2020C, Rev., AGM, 5.00%, 10/1/2023 | | | 100 | | | | 113 | |
| | |
Series 2020C, Rev., AGM, 5.00%, 10/1/2024 | | | 115 | | | | 134 | |
| | |
Series 2020C, Rev., AGM, 5.00%, 10/1/2025 | | | 175 | | | | 210 | |
| | |
Series 2020C, Rev., AGM, 5.00%, 10/1/2026 | | | 175 | | | | 214 | |
| | |
Massachusetts Development Finance Agency, Western New England University | | | | | | | | |
| | |
Rev., 5.00%, 9/1/2020 | | | 300 | | | | 300 | |
| | |
Rev., 5.00%, 9/1/2021 | | | 265 | | | | 275 | |
| | |
Massachusetts Port Authority | | | | | | | | |
| | |
Series 2019-A, Rev., AMT, 5.00%, 7/1/2021 | | | 3,000 | | | | 3,111 | |
| | |
Series 2019-A, Rev., AMT, 5.00%, 7/1/2022 | | | 2,500 | | | | 2,698 | |
| | |
Massachusetts Transportation Trust Fund Metropolitan Highway System, Commonwealth Contract Assistance Secured Series A, Rev., 5.00%, 1/1/2023 (c) | | | 10,000 | | | | 11,028 | |
| | |
Massachusetts Water Resources Authority Series A-3, Rev., VRDO, LIQ: Wells Fargo Bank NA, 0.10%, 9/10/2020 (c) | | | 22,790 | | | | 22,790 | |
| | |
Metrowest Regional Transit Authority Rev., RAN, 2.00%, 9/18/2020 | | | 9,657 | | | | 9,665 | |
| | |
Southeastern Massachusetts Regional 911 District GO, BAN, 2.00%, 11/4/2020 | | | 7,000 | | | | 7,019 | |
SEE NOTES TO FINANCIAL STATEMENTS.
| | | | | | |
| | | |
| 82 | | | | J.P. MORGAN MUNICIPAL BOND FUNDS | | AUGUST 31, 2020 |
| | | | | | | | |
| INVESTMENTS | | PRINCIPAL
AMOUNT
($000) | | | VALUE
($000) | |
Municipal Bonds — continued | | | | | | | | |
|
Massachusetts — continued | |
| | |
University of Massachusetts Building Authority Series 2008A, Rev., VRDO, GTD, LIQ: | | | | | | | | |
| | |
Barclays Bank plc, 0.08%, 9/10/2020 (c) | | | 9,760 | | | | 9,760 | |
| | | | | | | | |
| | |
Total Massachusetts | | | | | | | 150,809 | |
| | | | | | | | |
|
Michigan — 1.6% | |
| | |
City of Charlevoix | | | | | | | | |
| | |
Rev., 4.00%, 10/1/2020 | | | 165 | | | | 165 | |
| | |
Rev., 4.00%, 10/1/2021 | | | 215 | | | | 223 | |
| | |
Rev., 4.00%, 10/1/2022 | | | 175 | | | | 188 | |
| | |
Rev., 4.00%, 10/1/2023 | | | 110 | | | | 122 | |
| | |
City of Garden, Capital Improvement GO, 4.00%, 10/1/2020 | | | 795 | | | | 797 | |
| | |
City of Gladstone | | | | | | | | |
| | |
GO, AGM, 3.00%, 3/1/2021 | | | 250 | | | | 253 | |
| | |
GO, AGM, 3.00%, 3/1/2022 | | | 250 | | | | 260 | |
| | |
GO, AGM, 3.00%, 3/1/2023 | | | 260 | | | | 276 | |
| | |
GO, AGM, 3.00%, 3/1/2024 | | | 265 | | | | 288 | |
| | |
GO, AGM, 3.00%, 3/1/2025 | | | 275 | | | | 305 | |
| | |
City of Marquette, Capital Improvement GO, 4.00%, 5/1/2021 | | | 150 | | | | 154 | |
| | |
City of Marquette, Limited Tax GO, 3.00%, 5/1/2021 | | | 125 | | | | 127 | |
| | |
Detroit Downtown Development Authority, Tax Increment Series 2018A, Rev., AGM, 5.00%, 7/1/2021 | | | 500 | | | | 518 | |
| | |
Frankenmuth School District GO, Q-SBLF, 4.00%, 5/1/2023 | | | 200 | | | | 219 | |
| | |
Gerald R Ford International Airport Authority, Limited Tax Rev., GTD, 5.00%, 1/1/2021 | | | 815 | | | | 827 | |
| | |
Grand Rapids Public Schools | | | | | | | | |
| | |
Series 2019, GO, AGM, 5.00%, 11/1/2020 | | | 2,075 | | | | 2,091 | |
| | |
Series 2019, GO, AGM, 5.00%, 11/1/2021 | | | 2,225 | | | | 2,345 | |
| | |
Grosse Pointe Public School System GO, 4.00%, 5/1/2021 | | | 240 | | | | 246 | |
| | |
Hopkins Public Schools | | | | | | | | |
| | |
Series 2019A, GO, Q-SBLF, 4.00%, 5/1/2021 | | | 180 | | | | 184 | |
| | |
Series 2019A, GO, Q-SBLF, 4.00%, 5/1/2022 | | | 160 | | | | 170 | |
| | |
Series 2019A, GO, Q-SBLF, 4.00%, 5/1/2023 | | | 365 | | | | 399 | |
| | |
Jackson Public Schools | | | | | | | | |
| | |
GO, Q-SBLF, 4.00%, 5/1/2023 | | | 605 | | | | 665 | |
| | |
GO, Q-SBLF, 4.00%, 5/1/2024 | | | 690 | | | | 783 | |
| | |
Kalamazoo Public Schools, School Building and Site GO, 4.00%, 5/1/2021 | | | 775 | | | | 795 | |
| | | | | | | | |
| INVESTMENTS | | PRINCIPAL
AMOUNT
($000) | | | VALUE
($000) | |
| | | | | | | | |
|
Michigan — continued | |
| | |
Kelloggsville Public Schools, School Building and Site | | | | | | | | |
| | |
GO, AGM, 4.00%, 5/1/2021 | | | 360 | | | | 369 | |
| | |
GO, AGM, 4.00%, 5/1/2022 | | | 380 | | | | 403 | |
| | |
Kent Hospital Finance Authority Series 2008B-3, Rev., VRDO, LIQ: | | | | | | | | |
| | |
Wells Fargo Bank NA, 0.10%, 9/10/2020 (c) | | | 34,040 | | | | 34,040 | |
| | |
Leland Public School District | | | | | | | | |
| | |
GO, AGM, 4.00%, 5/1/2022 | | | 510 | | | | 541 | |
| | |
GO, AGM, 4.00%, 5/1/2023 | | | 785 | | | | 856 | |
| | |
Michigan Finance Authority, Bronson Healthcare Group, Inc. Series B, Rev., 3.50%, 11/15/2022 (c) | | | 4,165 | | | | 4,415 | |
| | |
Michigan Finance Authority, CHE Trinity Health Credit Group Series MI-1, Rev., VRDO, 0.18%, 12/1/2020 (c) | | | 13,550 | | | | 13,550 | |
| | |
Michigan State Hospital Finance Authority, Ascension Health Credit Group Series 2010F-3, Rev., 4.00%, 7/1/2024 (c) | | | 1,000 | | | | 1,128 | |
| | |
Michigan State Housing Development Authority, Single-Family Mortgage Series D, Rev., VRDO, LIQ: | | | | | | | | |
| | |
Industrial & Commercial Bank of China, 0.17%, 9/10/2020 (c) | | | 8,360 | | | | 8,360 | |
| | |
Michigan Strategic Fund, Holland Home Obligated Group | | | | | | | | |
| | |
Rev., 4.00%, 11/15/2020 | | | 200 | | | | 201 | |
| | |
Rev., 4.00%, 11/15/2021 | | | 180 | | | | 182 | |
| | |
Rev., 4.00%, 11/15/2022 | | | 180 | | | | 183 | |
| | |
Rev., 4.00%, 11/15/2023 | | | 190 | | | | 194 | |
| | |
South Haven Township & Casco Township Water & Sewage Treatment Authority | | | | | | | | |
| | |
Rev., 4.00%, 5/1/2021 | | | 280 | | | | 287 | |
| | |
Rev., 4.00%, 5/1/2022 | | | 285 | | | | 302 | |
| | |
Rev., 4.00%, 5/1/2023 | | | 480 | | | | 525 | |
| | |
Rev., 4.00%, 5/1/2024 | | | 720 | | | | 811 | |
| | |
Waterford School District | | | | | | | | |
| | |
GO, Q-SBLF, 4.00%, 5/1/2021 | | | 265 | | | | 271 | |
| | |
GO, Q-SBLF, 4.00%, 5/1/2022 | | | 650 | | | | 689 | |
| | |
GO, Q-SBLF, 4.00%, 5/1/2023 | | | 1,340 | | | | 1,469 | |
| | |
GO, Q-SBLF, 4.00%, 5/1/2024 | | | 1,360 | | | | 1,536 | |
| | |
Wayne County Airport Authority, Junior Lien Series B, Rev., AMT, 5.00%, 12/1/2020 | | | 550 | | | | 556 | |
| | |
Wayne-Westland Community Schools, Building and Site | | | | | | | | |
| | |
Series 2019, GO, Q-SBLF, 4.00%, 11/1/2020 | | | 875 | | | | 879 | |
SEE NOTES TO FINANCIAL STATEMENTS.
| | | | | | | | |
| | | |
| AUGUST 31, 2020 | | J.P. MORGAN MUNICIPAL BOND FUNDS | | | | | 83 | |
JPMorgan Ultra-Short Municipal Fund
SCHEDULE OF PORTFOLIO INVESTMENTS
AS OF AUGUST 31, 2020 (Unaudited) (continued)
| | | | | | | | |
| INVESTMENTS | | PRINCIPAL
AMOUNT
($000) | | | VALUE
($000) | |
Municipal Bonds — continued | | | | | | | | |
|
Michigan — continued | |
| | |
Series 2019, GO, Q-SBLF, 4.00%, 5/1/2021 | | | 200 | | | | 205 | |
| | |
Series 2019, GO, Q-SBLF, 4.00%, 11/1/2021 | | | 785 | | | | 818 | |
| | |
Series 2019, GO, Q-SBLF, 4.00%, 5/1/2022 | | | 160 | | | | 170 | |
| | |
Series 2019, GO, Q-SBLF, 5.00%, 11/1/2022 | | | 290 | | | | 319 | |
| | | | | | | | |
| | |
Total Michigan | | | | | | | 85,659 | |
| | | | | | | | |
|
Minnesota — 0.5% | |
| | |
City of Glencoe Series 2018-A, GO, 3.00%, 8/1/2021 | | | 80 | | | | 82 | |
| | |
City of Minneapolis and St. Paul Housing and Redevelopment Authority, Health Care, Allina Health System Series 2007C-2, Rev., VRDO, LOC: Wells Fargo Bank NA, 0.09%, 9/10/2020 (c) | | | 6,500 | | | | 6,500 | |
| | |
City of Wayzata, Folkestone Senior Living Community | | | | | | | | |
| | |
Rev., 3.00%, 8/1/2022 | | | 200 | | | | 199 | |
| | |
Rev., 3.00%, 8/1/2023 | | | 100 | | | | 99 | |
| | |
Rev., 3.00%, 8/1/2024 | | | 100 | | | | 99 | |
| | |
Duluth Housing and Redevelopment Authority, Public Schools Academy Project | | | | | | | | |
| | |
Series 2018-A, Rev., 3.38%, 11/1/2021 | | | 330 | | | | 334 | |
| | |
Series 2018-A, Rev., 3.63%, 11/1/2022 | | | 345 | | | | 355 | |
| | |
Series 2018-A, Rev., 3.88%, 11/1/2023 | | | 325 | | | | 339 | |
| | |
Duluth Independent School District No. 709 | | | | | | | | |
| | |
Series 2019B, COP, 5.00%, 2/1/2021 | | | 145 | | | | 148 | |
| | |
Series 2019B, COP, 5.00%, 2/1/2022 | | | 160 | | | | 170 | |
| | |
Series 2019C, COP, 5.00%, 2/1/2022 | | | 135 | | | | 143 | |
| | |
Series 2019B, COP, 5.00%, 2/1/2023 | | | 185 | | | | 203 | |
| | |
Housing and Redevelopment Authority of The City of St. Paul Minnesota | | | | | | | | |
| | |
Series 2009C, Rev., VRDO, LOC: | | | | | | | | |
| | |
Wells Fargo Bank NA, 0.09%, 9/10/2020 (c) | | | 10,280 | | | | 10,280 | |
| | |
Series 2015A, Rev., 5.00%, 11/15/2020 (d) | | | 4,825 | | | | 4,870 | |
| | |
Minnesota Higher Education Facilities Authority, College of St. Scholastica, Inc. | | | | | | | | |
| | |
Rev., 3.00%, 12/1/2020 | | | 75 | | | | 75 | |
| | |
Rev., 3.00%, 12/1/2021 | | | 75 | | | | 76 | |
| | |
Rev., 3.00%, 12/1/2022 | | | 100 | | | | 103 | |
| | |
Rev., 3.00%, 12/1/2023 | | | 100 | | | | 103 | |
| | |
Minnesota Higher Education Facilities Authority, Trustees of the Hamline University Series 2017B, Rev., 4.00%, 10/1/2020 | | | 780 | | | | 781 | |
| | | | | | | | |
| INVESTMENTS | | PRINCIPAL
AMOUNT
($000) | | | VALUE
($000) | |
| | | | | | | | |
|
Minnesota — continued | |
| | |
St. Paul Independent School District No. 625 Series B, COP, 5.00%, 2/1/2021 | | | 930 | | | | 948 | |
| | |
State of Minnesota, Trunk Highway Series B, GO, 5.00%, 8/1/2021 | | | 1,765 | | | | 1,843 | |
| | | | | | | | |
| | |
Total Minnesota | | | | | | | 27,750 | |
| | | | | | | | |
|
Mississippi — 0.5% | |
| | |
City of Tupelo | | | | | | | | |
| | |
Series 2019, GO, 4.00%, 12/1/2020 | | | 360 | | | | 363 | |
| | |
Series 2019, GO, 4.00%, 12/1/2021 | | | 125 | | | | 131 | |
| | |
Series 2019, GO, 4.00%, 12/1/2022 | | | 245 | | | | 265 | |
| | |
Series 2019, GO, 4.00%, 12/1/2023 | | | 315 | | | | 351 | |
| | |
County of Jackson, Port Facility, Chevron USA, Inc. Project Rev., VRDO, 0.03%, 9/1/2020 (c) | | | 5,000 | | | | 5,000 | |
| | |
County of Warren, Gulf Opportunity Zone, International Paper Co. Project | | | | | | | | |
| | |
Series 2020A, Rev., 1.37%, 6/16/2025 (c) | | | 1,750 | | | | 1,782 | |
| | |
Series 2020C, Rev., 1.37%, 6/16/2025 (c) | | | 1,500 | | | | 1,527 | |
| | |
Mississippi Business Finance Corp., Gulf Opportunity Zone Industrial Development, Chevron USA, Inc. Project Series 2010 H, Rev., VRDO, 0.03%, 9/1/2020 (c) | | | 11,335 | | | | 11,335 | |
| | |
Mississippi Development Bank, Rankin County Project Rev., 3.00%, 3/1/2022 | | | 100 | | | | 104 | |
| | |
Mississippi Development Bank, Special Obligation, Biloxi project | | | | | | | | |
| | |
Rev., 3.00%, 3/1/2021 | | | 130 | | | | 132 | |
| | |
Rev., 3.00%, 3/1/2022 | | | 175 | | | | 181 | |
| | |
Mississippi Hospital Equipment & Facilities Authority Series 2020A-2, Rev., VRDO, 0.65%, 9/1/2021 (c) | | | 4,500 | | | | 4,500 | |
| | |
Mississippi Hospital Equipment & Facilities Authority, Forrest County General Hospital Refunding Project | | | | | | | | |
| | |
Series B, Rev., 5.00%, 1/1/2021 | | | 270 | | | | 274 | |
| | |
Series B, Rev., 5.00%, 1/1/2022 | | | 320 | | | | 338 | |
| | |
Series B, Rev., 5.00%, 1/1/2023 | | | 370 | | | | 407 | |
| | |
Series B, Rev., 5.00%, 1/1/2024 | | | 370 | | | | 421 | |
| | |
State of Mississippi Series E, Rev., 5.00%, 10/15/2020 | | | 100 | | | | 100 | |
| | |
State of Mississippi, Capital Improvements Project Series 2011A, GO, 5.00%, 10/1/2021 (d) | | | 25 | | | | 26 | |
| | |
State of Mississippi, Gaming Tax Series 2019A, Rev., 5.00%, 10/15/2021 | | | 700 | | | | 730 | |
| | | | | | | | |
| | |
Total Mississippi | | | | | | | 27,967 | |
| | | | | | | | |
SEE NOTES TO FINANCIAL STATEMENTS.
| | | | | | |
| | | |
| 84 | | | | J.P. MORGAN MUNICIPAL BOND FUNDS | | AUGUST 31, 2020 |
| | | | | | | | |
| INVESTMENTS | | PRINCIPAL
AMOUNT
($000) | | | VALUE
($000) | |
Municipal Bonds — continued | | | | | | | | |
|
Missouri — 1.5% | |
| | |
Belton School District No. 124 Series 2019, COP, AGM, 4.00%, 1/15/2022 (d) | | | 100 | | | | 105 | |
| | |
Blue Eye R-V School District | | | | | | | | |
| | |
COP, 4.00%, 4/1/2021 | | | 75 | | | | 77 | |
| | |
City of Kansas City, Roe Bartle Convention Center Series 2008F, Rev., VRDO, LOC: | | | | | | | | |
| | |
Sumitomo Mitsui Banking Corp., 0.09%, 9/10/2020 (c) | | | 4,490 | | | | 4,490 | |
| | |
City of St. Peters | | | | | | | | |
| | |
COP, 4.00%, 5/1/2021 | | | 530 | | | | 543 | |
| | |
COP, 4.00%, 5/1/2022 | | | 605 | | | | 642 | |
| | |
COP, 4.00%, 5/1/2023 | | | 625 | | | | 684 | |
| | |
COP, 4.00%, 5/1/2024 | | | 650 | | | | 733 | |
| | |
COP, 4.00%, 5/1/2025 | | | 425 | | | | 493 | |
| | |
County of Greene | | | | | | | | |
| | |
Rev., 4.00%, 12/1/2021 | | | 205 | | | | 215 | |
| | |
Rev., 4.00%, 12/1/2022 | | | 260 | | | | 281 | |
| | |
Rev., 4.00%, 12/1/2023 | | | 520 | | | | 579 | |
| | |
Rev., 4.00%, 12/1/2024 | | | 540 | | | | 618 | |
| | |
County of Jackson, Harry S. Truman Sports Complex Project Rev., 5.00%, 12/1/2022 | | | 4,000 | | | | 4,345 | |
| | |
County of Stone COP, 3.00%, 12/1/2020 | | | 145 | | | | 146 | |
| | |
Greene County Reorganized School District No. R-8 | | | | | | | | |
| | |
Series 2019B, GO, 3.00%, 3/1/2022 | | | 500 | | | | 521 | |
| | |
Series 2019B, GO, 3.00%, 3/1/2023 | | | 595 | | | | 634 | |
| | |
Hannibal IDA, Healthcare Facilities Rev., 5.00%, 10/1/2020 | | | 300 | | | | 300 | |
| | |
Health and Educational Facilities Authority of the State of Missouri, BJC Health System Series C, Rev., VRDO, LIQ: BJC Health System, 0.07%, 9/10/2020 (c) | | | 39,475 | | | | 39,475 | |
| | |
Health and Educational Facilities Authority of the State of Missouri, Lutheran Senior Services Projects Series 2019B, Rev., 2.88%, 2/1/2022 | | | 3,270 | | | | 3,255 | |
| | |
Missouri State Health & Educational Facilities Authority, Educational Facilities, The Washington University of St. Louis 1996 Series 1996-C, Rev., VRDO, LIQ: | | | | | | | | |
| | |
Wells Fargo Bank NA, 0.02%, 9/1/2020 (c) | | | 10,500 | | | | 10,500 | |
| | |
Missouri Western State University, Auxiliary System Rev., 2.80%, 10/1/2022 | | | 50 | | | | 50 | |
| | |
Nixa Public Schools | | | | | | | | |
| | |
Series 2019B, GO, 4.00%, 3/1/2021 | | | 100 | | | | 102 | |
| | |
Series 2019B, GO, 4.00%, 3/1/2022 | | | 175 | | | | 185 | |
| | |
Series 2019B, GO, 5.00%, 3/1/2023 | | | 200 | | | | 223 | |
| | | | | | | | |
| INVESTMENTS | | PRINCIPAL
AMOUNT
($000) | | | VALUE
($000) | |
| | | | | | | | |
|
Missouri — continued | |
| | |
St. Louis County Special School District | | | | | | | | |
| | |
COP, 4.00%, 4/1/2021 | | | 355 | | | | 363 | |
| | |
COP, 4.00%, 4/1/2022 | | | 395 | | | | 418 | |
| | |
COP, 4.00%, 4/1/2023 | | | 410 | | | | 447 | |
| | |
COP, 4.00%, 4/1/2024 | | | 605 | | | | 680 | |
| | |
St. Louis Lambert International Airport Series B, Rev., AMT, AGM, 5.00%, 7/1/2021 | | | 1,305 | | | | 1,351 | |
| | |
Tender Option Bond Trust Receipts/Certificates Series 2018-XG0176, Rev., VRDO, LIQ: Royal Bank of Canada, 0.34%, 9/10/2020 (c) (e) | | | 8,200 | | | | 8,200 | |
| | |
Village of Country Club COP, AGM, 3.00%, 4/1/2021 | | | 165 | | | | 168 | |
| | | | | | | | |
| | |
Total Missouri | | | | | | | 80,823 | |
| | | | | | | | |
|
Montana — 0.1% | |
| | |
Montana State Board of Regents, Montana State University Series F, Rev., (SIFMA Municipal Swap Index Yield + 0.45%), 0.54%, 9/10/2020 (b) | | | 3,225 | | | | 3,185 | |
| | | | | | | | |
|
Nebraska — 0.2% | |
| | |
City of Omaha | | | | | | | | |
| | |
Series A, Rev., 2.20%, 1/15/2021 | | | 125 | | | | 126 | |
| | |
Series A, Rev., 5.00%, 1/15/2022 | | | 125 | | | | 133 | |
| | |
County of Saunders | | | | | | | | |
| | |
GO, 1.00%, 11/1/2021 | | | 100 | | | | 101 | |
| | |
GO, 2.00%, 11/1/2022 | | | 300 | | | | 311 | |
| | |
GO, 3.00%, 11/1/2023 | | | 325 | | | | 351 | |
| | |
GO, 3.00%, 11/1/2024 | | | 415 | | | | 459 | |
| | |
County of Washington, Wastewater and Solid Waste Disposal Facilities, Cargill Incorporated Projects Rev., AMT, 0.90%, 9/1/2025 (c) | | | 6,800 | | | | 6,802 | |
| | |
Papio-Missouri River Natural Resource District GO, 4.00%, 12/15/2020 | | | 405 | | | | 409 | |
| | |
Upper Republican Natural Resource District, Limited Obligation, Occupation Tax Supported, River Flow Enhancement Series 2017B, Rev., AGM, 3.00%, 12/15/2020 | | | 250 | | | | 252 | |
| | | | | | | | |
| | |
Total Nebraska | | | | | | | 8,944 | |
| | | | | | | | |
|
Nevada — 0.6% | |
| | |
City of Carson, Carson Tahoe Regional Healthcare Project | | | | | | | | |
| | |
Rev., 5.00%, 9/1/2020 | | | 250 | | | | 250 | |
| | |
Rev., 5.00%, 9/1/2027 | | | 610 | | | | 744 | |
| | |
City of Sparks, Senior Sales Tax Series 2019A, Rev., 2.50%, 6/15/2024 (e) | | | 795 | | | | 789 | |
SEE NOTES TO FINANCIAL STATEMENTS.
| | | | | | | | |
| | | |
| AUGUST 31, 2020 | | J.P. MORGAN MUNICIPAL BOND FUNDS | | | | | 85 | |
JPMorgan Ultra-Short Municipal Fund
SCHEDULE OF PORTFOLIO INVESTMENTS
AS OF AUGUST 31, 2020 (Unaudited) (continued)
| | | | | | | | |
| INVESTMENTS | | PRINCIPAL
AMOUNT
($000) | | | VALUE
($000) | |
Municipal Bonds — continued | | | | | | | | |
|
Nevada — continued | |
| | |
Clark County School District Series C, GO, 5.00%, 6/15/2023 | | | 2,000 | | | | 2,234 | |
| | |
Clark County, Department of Aviation, Nevada Airport System, Junior Subordinate Lien Series A, Rev., 5.00%, 7/1/2021 | | | 18,500 | | | | 19,173 | |
| | |
County of Humboldt, Sierra Pacific Power Company Project Series 2016B, Rev., 1.85%, 4/15/2022 (c) | | | 4,550 | | | | 4,608 | |
| | |
County of Washoe, Sierra Pacific Power Company Project Series 2016G, Rev., 1.85%, 4/15/2022 (c) | | | 5,000 | | | | 5,063 | |
| | | | | | | | |
| | |
Total Nevada | | | | | | | 32,861 | |
| | | | | | | | |
|
New Hampshire — 0.3% | |
| | |
New Hampshire Health and Education Facilities Authority, University System | | | | | | | | |
| | |
Series 2005B-1, Rev., VRDO, LIQ: Wells Fargo Bank NA, 0.03%, 9/1/2020 (c) | | | 10,730 | | | | 10,730 | |
| | |
Series 2011B, Rev., VRDO, LIQ: State Street Bank & Trust, 0.03%, 9/1/2020 (c) | | | 6,410 | | | | 6,410 | |
| | | | | | | | |
| | |
Total New Hampshire | | | | | | | 17,140 | |
| | | | | | | | |
|
New Jersey — 3.3% | |
| | |
Borough of Carteret GO, BAN, 1.75%, 1/29/2021 | | | 7,147 | | | | 7,189 | |
| | |
Borough of East Rutherford GO, AGM, 5.00%, 12/1/2020 | | | 290 | | | | 293 | |
| | |
Borough of Haledon GO, BAN, 2.00%, 10/30/2020 | | | 3,650 | | | | 3,660 | |
| | |
Borough of Paramus GO, TAN, 2.00%, 4/30/2021 | | | 20,000 | | | | 20,184 | |
| | |
Borough of Sussex GO, BAN, 2.00%, 10/23/2020 | | | 2,027 | | | | 2,031 | |
| | |
City of Newark | | | | | | | | |
| | |
GO, 2.00%, 10/7/2020 | | | 49,420 | | | | 49,496 | |
| | |
Series 2020A, GO, 5.00%, 10/1/2021 | | | 110 | | | | 115 | |
| | |
Series 2020B, GO, 5.00%, 10/1/2021 | | | 250 | | | | 261 | |
| | |
Series 2020A, GO, 5.00%, 10/1/2022 | | | 750 | | | | 814 | |
| | |
Series 2020B, GO, 5.00%, 10/1/2022 | | | 500 | | | | 543 | |
| | |
Series 2020A, GO, AGM, 5.00%, 10/1/2023 | | | 1,000 | | | | 1,132 | |
| | |
Series 2020B, GO, AGM, 5.00%, 10/1/2023 | | | 525 | | | | 594 | |
| | |
Series 2020A, GO, AGM, 5.00%, 10/1/2024 | | | 1,000 | | | | 1,170 | |
| | |
Series 2020B, GO, AGM, 5.00%, 10/1/2024 | | | 650 | | | | 760 | |
| | |
Series 2020A, GO, AGM, 5.00%, 10/1/2025 | | | 850 | | | | 1,023 | |
| | |
Series 2020B, GO, AGM, 5.00%, 10/1/2025 | | | 595 | | | | 716 | |
| | |
Series 2020A, GO, AGM, 5.00%, 10/1/2026 | | | 750 | | | | 924 | |
| | | | | | | | |
| INVESTMENTS | | PRINCIPAL
AMOUNT
($000) | | | VALUE
($000) | |
| | | | | | | | |
|
New Jersey — continued | |
| | |
East Brunswick Township Board of Education, School Energy Savings | | | | | | | | |
| | |
GO, 5.00%, 8/1/2021 | | | 55 | | | | 57 | |
| | |
GO, 5.00%, 8/1/2022 | | | 110 | | | | 120 | |
| | |
Garden State Preservation Trust | | | | | | | | |
| | |
Series A, Rev., 5.00%, 11/1/2020 | | | 25 | | | | 25 | |
| | |
Series 2005C, Rev., AGM, 5.25%, 11/1/2020 | | | 1,725 | | | | 1,739 | |
| | |
Monmouth County Improvement Authority (The), Governmental Pooled Loan Project | | | | | | | | |
| | |
Series 2020B, Rev., GTD, 2.00%, 2/15/2021 | | | 9,000 | | | | 9,071 | |
| | |
Series 2020A, Rev., GTD, 2.00%, 7/12/2021 | | | 6,900 | | | | 7,001 | |
| | |
New Jersey Economic Development Authority, School Facilities Construction Series XX, Rev., 5.00%, 6/15/2021 | | | 5,000 | | | | 5,158 | |
| | |
New Jersey Educational Facilities Authority Series C, Rev., 5.00%, 7/1/2021 | | | 150 | | | | 155 | |
| | |
New Jersey Health Care Facilities Financing Authority, Virtua Health Series 2009D, Class D, Rev., VRDO, LOC: TD Bank NA, 0.01%, 9/10/2020 (c) | | | 15,900 | | | | 15,900 | |
| | |
New Jersey Housing and Mortgage Finance Agency, Multifamily Conduit, Georgia King Village Project Series 2018-E, Rev., 2.45%, 10/1/2020 (c) | | | 4,500 | | | | 4,508 | |
| | |
New Jersey Transportation Trust Fund Authority, Federal Highway Reimbursement Series A, Rev., 5.00%, 6/15/2021 | | | 6,000 | | | | 6,175 | |
| | |
New Jersey Turnpike Authority Series C-1, Rev., (ICE LIBOR USD 1 Month + 0.34%), 0.45%, 10/1/2020 (b) (d) | | | 4,000 | | | | 3,997 | |
| | |
Passaic County Improvement Authority (The), City Of Paterson Project Rev., GTD, 5.00%, 8/15/2026 | | | 350 | | | | 442 | |
| | |
Passaic County Utilities Authority, Solid Waste Disposal Series 2018, Rev., GTD, 4.38%, 3/1/2021 | | | 255 | | | | 260 | |
| | |
Passaic Valley Sewerage Commissioners, New Jersey Sewer System | | | | | | | | |
| | |
Series J, Rev., AGM, 3.00%, 12/1/2025 | | | 1,825 | | | | 2,035 | |
| | |
Series J, Rev., AGM, 3.00%, 12/1/2026 | | | 6,285 | | | | 7,079 | |
| | |
The Cumberland County Improvement Authority, Vineland Public Safety Building Project Series 2017, Rev., 5.00%, 12/15/2021 | | | 340 | | | | 361 | |
SEE NOTES TO FINANCIAL STATEMENTS.
| | | | | | |
| | | |
| 86 | | | | J.P. MORGAN MUNICIPAL BOND FUNDS | | AUGUST 31, 2020 |
| | | | | | | | |
| INVESTMENTS | | PRINCIPAL
AMOUNT
($000) | | | VALUE
($000) | |
Municipal Bonds — continued | | | | | | | | |
|
New Jersey — continued | |
| | |
Township of Haddon Series 2019A, GO, BAN, 2.00%, 10/29/2020 | | | 15,758 | | | | 15,802 | |
| | |
Township of Logan GO, BAN, 1.75%, 10/21/2020 | | | 2,360 | | | | 2,365 | |
| | |
Township of Lyndhurst GO, BAN, 1.50%, 2/5/2021 | | | 4,065 | | | | 4,086 | |
| | |
Township of Waterford Series 2019A, GO, BAN, 2.00%, 12/1/2020 | | | 2,718 | | | | 2,730 | |
| | | | | | | | |
| | |
Total New Jersey | | | | | | | 179,971 | |
| | | | | | | | |
|
New Mexico — 0.2% | |
| | |
City of Rio Rancho NM Water and Wastewater System | | | | | | | | |
| | |
Rev., 5.00%, 5/15/2021 | | | 720 | | | | 744 | |
| | |
Rev., 5.00%, 5/15/2022 | | | 1,250 | | | | 1,353 | |
| | |
City of Santa Fe, El Castillo Retirement Residences Project Series 2019B-2, Rev., 2.25%, 5/15/2024 | | | 600 | | | | 582 | |
| | |
County of Sandoval | | | | | | | | |
| | |
GO, 5.00%, 8/1/2021 | | | 535 | | | | 558 | |
| | |
GO, 5.00%, 8/1/2022 | | | 560 | | | | 611 | |
| | |
New Mexico Hospital Equipment Loan Council, Haverland Carter Lifestyle Group La Vida Llena Expansion Project | | | | | | | | |
| | |
Series C, Rev., 2.25%, 7/1/2023 | | | 1,525 | | | | 1,482 | |
| | |
Series C, Rev., 2.38%, 7/1/2024 | | | 1,525 | | | | 1,471 | |
| | |
Regents Of The University of New Mexico, Subordinate Lien System Series 2002B, Rev., VRDO, LIQ: U.S. Bank NA, 0.09%, 9/10/2020 (c) | | | 2,765 | | | | 2,765 | |
| | |
University of New Mexico, Gallup Branch Community College District Series 2012, GO, 2.00%, 10/15/2022 | | | 1,500 | | | | 1,502 | |
| | | | | | | | |
| | |
Total New Mexico | | | | | | | 11,068 | |
| | | | | | | | |
|
New York — 26.1% | |
| | |
Battery Park City Authority, Junior | | | | | | | | |
| | |
Series 2019D-1, Rev., VRDO, LIQ: TD Bank NA, 0.07%, 9/10/2020 (c) | | | 15,000 | | | | 15,000 | |
| | |
Series 2019D-2, Rev., VRDO, LIQ: TD Bank NA, 0.07%, 9/10/2020 (c) | | | 10,000 | | | | 10,000 | |
| | |
Bay Shore Union Free School District GO, TAN, 1.25%, 6/25/2021 | | | 40,000 | | | | 40,291 | |
| | |
Broome County Local Development Corp., United Health Services Hospitals, Inc. Project | | | | | | | | |
| | |
Rev., AGM, 5.00%, 4/1/2024 | | | 500 | | | | 578 | |
| | |
Rev., AGM, 5.00%, 4/1/2025 | | | 500 | | | | 597 | |
| | |
Rev., AGM, 5.00%, 4/1/2026 | | | 500 | | | | 615 | |
| | | | | | | | |
| INVESTMENTS | | PRINCIPAL
AMOUNT
($000) | | | VALUE
($000) | |
| | | | | | | | |
|
New York — continued | |
| | |
Cazenovia Central School District GO, BAN, 1.25%, 7/16/2021 | | | 13,000 | | | | 13,087 | |
| | |
Chittenango Central School District Series 2020A, GO, BAN, 1.25%, 6/25/2021 | | | 13,400 | | | | 13,484 | |
| | |
City of Jamestown, Public Improvement | | | | | | | | |
| | |
GO, 5.00%, 6/1/2021 | | | 475 | | | | 491 | |
| | |
GO, 5.00%, 6/1/2022 | | | 500 | | | | 540 | |
| | |
GO, 5.00%, 6/1/2023 | | | 525 | | | | 590 | |
| | |
GO, 5.00%, 6/1/2024 | | | 545 | | | | 637 | |
| | |
City of Long Beach Series 2020A, GO, BAN, 1.50%, 9/4/2020 | | | 21,645 | | | | 21,647 | |
| | |
City of New York | | | | | | | | |
| | |
Subseries F-5, GO, VRDO, LIQ: | | | | | | | | |
| | |
Barclays Bank plc, 0.03%, 9/1/2020 (c) | | | 8,425 | | | | 8,425 | |
| | |
Subseries G-4, GO, VRDO, LIQ: | | | | | | | | |
| | |
Barclays Bank plc, 0.08%, 9/10/2020 (c) | | | 20,000 | | | | 20,000 | |
| | |
Subseries B-3, GO, VRDO, LOC: TD Bank NA, 0.09%, 9/10/2020 (c) | | | 10,520 | | | | 10,520 | |
| | |
Series 2020-1, GO, 5.00%, 8/1/2026 | | | 1,300 | | | | 1,607 | |
| | |
City of New York, Fiscal Year 2012 Series A, Subseries A-4, GO, VRDO, LOC: Bank of Tokyo-Mitsubishi UFJ Ltd., 0.08%, 9/10/2020 (c) | | | 2,300 | | | | 2,300 | |
| | |
City of New York, Fiscal Year 2014 Series D, Subseries D-4, GO, VRDO, LOC: TD Bank NA, 0.02%, 9/1/2020 (c) | | | 6,100 | | | | 6,100 | |
| | |
City of New York, Fiscal Year 2015 Series F, Subseries F-7, GO, VRDO, LOC: Bank of Tokyo-Mitsubishi UFJ Ltd., 0.08%, 9/10/2020 (c) | | | 10,900 | | | | 10,900 | |
| | |
City of New York, Fiscal Year 2021 Series A, Subseries A-1, GO, 5.00%, 8/1/2024 | | | 15,000 | | | | 17,542 | |
| | |
City of Rochester Series I, GO, BAN, 2.50%, 3/4/2021 | | | 26,095 | | | | 26,369 | |
| | |
Copenhagen Central School District GO, BAN, 2.00%, 7/9/2021 | | | 5,700 | | | | 5,770 | |
| | |
County of Cattaraugus GO, 2.00%, 5/15/2021 | | | 100 | | | | 101 | |
| | |
County of Erie GO, RAN, 3.00%, 6/24/2021 | | | 5,000 | | | | 5,106 | |
| | |
County of Suffolk, Longwood Central School District GO, 5.00%, 6/15/2021 | | | 300 | | | | 311 | |
| | |
County of Sullivan GO, TAN, 2.00%, 5/28/2021 | | | 9,500 | | | | 9,607 | |
| | |
Floral Park-Bellerose Union Free School District | | | | | | | | |
| | |
GO, 5.00%, 12/1/2021 | | | 450 | | | | 477 | |
| | |
GO, 5.00%, 12/1/2022 | | | 475 | | | | 526 | |
| | |
GO, 5.00%, 12/1/2023 | | | 495 | | | | 572 | |
| | |
GO, 5.00%, 12/1/2024 | | | 525 | | | | 631 | |
| | |
GO, 5.00%, 12/1/2025 | | | 550 | | | | 684 | |
SEE NOTES TO FINANCIAL STATEMENTS.
| | | | | | | | |
| | | |
| AUGUST 31, 2020 | | J.P. MORGAN MUNICIPAL BOND FUNDS | | | | | 87 | |
JPMorgan Ultra-Short Municipal Fund
SCHEDULE OF PORTFOLIO INVESTMENTS
AS OF AUGUST 31, 2020 (Unaudited) (continued)
| | | | | | | | |
| INVESTMENTS | | PRINCIPAL
AMOUNT
($000) | | | VALUE
($000) | |
Municipal Bonds — continued | | | | | | | | |
|
New York — continued | |
| | |
Forestville Central School District Series 2020B, GO, BAN, 2.00%, 6/17/2021 | | | 3,061 | | | | 3,098 | |
| | |
Franklinville Central School District GO, BAN, 1.25%, 7/23/2021 | | | 5,100 | | | | 5,133 | |
| | |
Frewsburg Central School District GO, BAN, 1.25%, 7/13/2021 | | | 6,177 | | | | 6,215 | |
| | |
Hampton Bays Union Free School District GO, TAN, 2.00%, 6/24/2021 | | | 11,000 | | | | 11,147 | |
| | |
Hempstead Town Local Development Corp., Adelphi University Project | | | | | | | | |
| | |
Series 2019, Rev., 4.00%, 2/1/2021 | | | 75 | | | | 76 | |
| | |
Series 2019, Rev., 4.00%, 2/1/2022 | | | 50 | | | | 52 | |
| | |
Series 2019, Rev., 4.00%, 2/1/2023 | | | 100 | | | | 105 | |
| | |
Series 2019, Rev., 4.00%, 2/1/2024 | | | 200 | | | | 214 | |
| | |
Hempstead Union Free School District | | | | | | | | |
| | |
GO, RAN, 1.50%, 6/30/2021 | | | 39,000 | | | | 39,216 | |
| | |
GO, BAN, 1.50%, 7/14/2021 | | | 25,900 | | | | 26,050 | |
| | |
Horseheads Central School District GO, BAN, 1.00%, 6/24/2021 | | | 61,695 | | | | 62,005 | |
| | |
Jefferson County Civic Facility Development Corp., Samaritan Medical Center Project Series A, Rev., 3.00%, 11/1/2020 | | | 575 | | | | 576 | |
| | |
Kinderhook Central School District GO, BAN, 1.25%, 7/23/2021 | | | 14,500 | | | | 14,601 | |
| | |
Little Falls City School District GO, BAN, 1.25%, 2/5/2021 | | | 6,500 | | | | 6,517 | |
| | |
Long Island Power Authority, Electric System Series 2020A, Rev., 5.00%, 9/1/2026 | | | 680 | | | | 858 | |
| | |
Maine-Endwell Central School District GO, RAN, 1.25%, 7/28/2021 | | | 8,000 | | | | 8,054 | |
| | |
Manchester-Shortsville Central School District GO, BAN, 1.25%, 6/29/2021 | | | 9,925 | | | | 9,984 | |
| | |
Marcellus Central School District GO, BAN, 2.00%, 7/16/2021 | | | 8,000 | | | | 8,104 | |
| | |
Metropolitan Transportation Authority Series 2019A, Rev., BAN, 5.00%, 3/1/2022 | | | 20,000 | | | | 20,952 | |
| | |
Middleburgh Central School District GO, BAN, 1.25%, 7/16/2021 | | | 10,620 | | | | 10,688 | |
| | |
Morrisville-Eaton Central School District Series 2020B, GO, BAN, 1.50%, 6/25/2021 | | | 8,508 | | | | 8,584 | |
| | |
Mount Vernon City School District | | | | | | | | |
| | |
GO, 5.00%, 12/1/2020 | | | 815 | | | | 825 | |
| | |
GO, 5.00%, 12/1/2021 | | | 885 | | | | 939 | |
| | |
GO, 5.00%, 12/1/2022 | | | 1,965 | | | | 2,172 | |
| | |
Nassau County Interim Finance Authority, Sales Tax Secured Series B, Rev., VRDO, LIQ: Sumitomo Mitsui Banking Corp., 0.07%, 9/10/2020 (c) | | | 11,015 | | | | 11,015 | |
| | | | | | | | |
| INVESTMENTS | | PRINCIPAL
AMOUNT
($000) | | | VALUE
($000) | |
| | | | | | | | |
|
New York — continued | |
| | |
New York City Housing Development Corp., West 26th Street Development Series 2011B, Rev., VRDO, 0.08%, 9/10/2020 (c) | | | 2,570 | | | | 2,570 | |
| | |
New York City Municipal Water Finance Authority, Fiscal Year 2008 | | | | | | | | |
| | |
Subseries BB-1, Rev., VRDO, LIQ: | | | | | | | | |
| | |
Bank of Tokyo-Mitsubishi UFJ Ltd., 0.07%, 9/10/2020 (c) | | | 11,390 | | | | 11,390 | |
| | |
New York City Municipal Water Finance Authority, Water and Sewer System, Fiscal Year 2003 | | | | | | | | |
| | |
Subseries F-1-A, Rev., VRDO, LIQ: | | | | | | | | |
| | |
Barclays Bank plc, 0.08%, 9/10/2020 (c) | | | 3,450 | | | | 3,450 | |
| | |
New York City Municipal Water Finance Authority, Water and Sewer System, Second General Resolution Series BB-1A, Rev., VRDO, LIQ: | | | | | | | | |
| | |
State Street Bank & Trust, 0.03%, 9/1/2020 (c) | | | 14,600 | | | | 14,600 | |
| | |
New York City Municipal Water Finance Authority, Water and Sewer System, Second General Resolution, Fiscal Year 2011 Series DD-1, Rev., VRDO, LIQ: TD Bank NA, 0.02%, 9/1/2020 (c) | | | 11,200 | | | | 11,200 | |
| | |
New York City Municipal Water Finance Authority, Water and Sewer System, Second General Resolution, Fiscal Year 2013 Subseries AA-2, Rev., VRDO, LIQ: | | | | | | | | |
| | |
Bank of Tokyo-Mitsubishi UFJ Ltd., 0.08%, 9/10/2020 (c) | | | 12,560 | | | | 12,560 | |
| | |
New York City Municipal Water Finance Authority, Water and Sewer System, Second General Resolution, Fiscal Year 2014 Series AA, Subseries AA-5, Rev., VRDO, LIQ: Mizuho Bank Ltd., 0.02%, 9/1/2020 (c) | | | 23,600 | | | | 23,600 | |
| | |
New York City Municipal Water Finance Authority, Water and Sewer System, Second General Resolution, Fiscal Year 2015 | | | | | | | | |
| | |
Subseries BB-4, Rev., VRDO, LIQ: Barclays Bank plc, 0.03%, 9/1/2020 (c) | | | 18,865 | | | | 18,865 | |
| | |
Series BB-3, Rev., VRDO, LIQ: Sumitomo Mitsui Banking Corp., 0.09%, 9/10/2020 (c) | | | 5,680 | | | | 5,680 | |
| | |
New York City Transitional Finance Authority Future Tax Secured Series 1999A-1, Rev., VRDO, LIQ: TD Bank NA, 0.08%, 9/10/2020 (c) | | | 26,200 | | | | 26,200 | |
SEE NOTES TO FINANCIAL STATEMENTS.
| | | | | | |
| | | |
| 88 | | | | J.P. MORGAN MUNICIPAL BOND FUNDS | | AUGUST 31, 2020 |
| | | | | | | | |
| INVESTMENTS | | PRINCIPAL
AMOUNT
($000) | | | VALUE
($000) | |
Municipal Bonds — continued | | | | | | | | |
|
New York — continued | |
| | |
New York City Transitional Finance Authority, Future Tax Secured, Fiscal Year 2011 Subseries 2011A-4, Rev., VRDO, LIQ: | | | | | | | | |
| | |
Barclays Bank plc, 0.03%, 9/1/2020 (c) | | | 13,300 | | | | 13,300 | |
| | |
New York City Transitional Finance Authority, Future Tax Secured, Fiscal Year 2014 Subseries B-3, Rev., VRDO, LIQ: | | | | | | | | |
| | |
Barclays Bank plc, 0.03%, 9/1/2020 (c) | | | 8,985 | | | | 8,985 | |
| | |
New York City Transitional Finance Authority, New York City Recovery Series 3, Subseries 3-G, Rev., VRDO, LIQ: Bank of New York Mellon, 0.09%, 9/10/2020 (c) | | | 2,495 | | | | 2,495 | |
| | |
New York City Water and Sewer System Series 2010CC, Rev., VRDO, LIQ: | | | | | | | | |
| | |
Barclays Bank plc, 0.08%, 9/10/2020 (c) | | | 55,090 | | | | 55,090 | |
| | |
New York State Dormitory Authority Series 2019A, Rev., 5.00%, 10/1/2022 | | | 7,490 | | | | 8,191 | |
| | |
New York State Dormitory Authority, City University System, CONS Fifth General Resolution Series 2008D, Rev., VRDO, LOC: TD Bank NA, 0.07%, 9/10/2020 (c) | | | 9,470 | | | | 9,470 | |
| | |
New York State Dormitory Authority, Court Facilities Lease Series 2005B, Rev., VRDO, LOC: Mizuho Bank Ltd., 0.10%, 9/10/2020 (c) | | | 22,000 | | | | 22,000 | |
| | |
New York State Dormitory Authority, Fordham University Rev., 5.00%, 7/1/2023 | | | 920 | | | | 1,035 | |
| | |
New York State Dormitory Authority, Sales Tax Series 2018C, Rev., 5.00%, 3/15/2025 | | | 400 | | | | 482 | |
| | |
New York State Dormitory Authority, State Personal Income Tax, General Purpose | | | | | | | | |
| | |
Series 2014A, Rev., 5.00%, 2/15/2021 | | | 200 | | | | 204 | |
| | |
Series 2020B, Rev., RAN, 5.00%, 3/31/2021 | | | 83,695 | | | | 86,052 | |
| | |
New York State Dormitory Authority, University of Rochester Series 2006A-1, Rev., VRDO, LOC: | | | | | | | | |
| | |
Barclays Bank plc, 0.08%, 9/10/2020 (c) | | | 7,745 | | | | 7,745 | |
| | |
New York State Housing Finance Agency Series 2009A, Rev., VRDO, LOC: | | | | | | | | |
| | |
FNMA, 0.08%, 9/10/2020 (c) | | | 55,255 | | | | 55,255 | |
| | |
New York State Housing Finance Agency, 330 West 39th Street Housing Series A, Rev., VRDO, LOC: | | | | | | | | |
| | |
Landesbank Hessen-Thueringen, 0.09%, 9/10/2020 (c) | | | 50,000 | | | | 50,000 | |
| | |
New York State Housing Finance Agency, 8 East 102nd Street Housing Series 2010A, Rev., VRDO, LOC: TD Bank NA, 0.09%, 9/10/2020 (c) | | | 40,445 | | | | 40,445 | |
| | | | | | | | |
| INVESTMENTS | | PRINCIPAL
AMOUNT
($000) | | | VALUE
($000) | |
| | | | | | | | |
|
New York — continued | |
| | |
New York State Thruway Authority Series L, Rev., 5.00%, 1/1/2021 | | | 50 | | | | 51 | |
| | |
New York Transportation Development Corp., Delta Air Lines, Inc., LaGuardia Airport Terminals C&D Redevelopment Project Rev., AMT, 5.00%, 1/1/2022 | | | 14,650 | | | | 15,108 | |
| | |
Niagara Falls City School District Series 2020B, GO, BAN, 1.25%, 7/9/2021 | | | 29,000 | | | | 29,193 | |
| | |
Niagara Frontier Transportation Authority, Buffalo Niagara International Airport | | | | | | | | |
| | |
Series 2019A, Rev., AMT, 5.00%, 4/1/2021 | | | 1,540 | | | | 1,578 | |
| | |
Series 2019A, Rev., AMT, 5.00%, 4/1/2022 | | | 845 | | | | 902 | |
| | |
Niagara-Wheatfield Central School District GO, BAN, 2.00%, 6/29/2021 | | | 10,000 | | | | 10,135 | |
| | |
North Collins Central School District GO, BAN, 2.00%, 6/25/2021 | | | 7,880 | | | | 7,963 | |
| | |
Palmyra Macedon Central School District GO, BAN, 1.25%, 7/20/2021 | | | 12,500 | | | | 12,585 | |
| | |
Penn Yan Central School District Series 2020B, GO, BAN, 1.25%, 7/16/2021 | | | 13,183 | | | | 13,268 | |
| | |
Port Authority of New York and New Jersey, Consolidated Series 207, Rev., AMT, 5.00%, 9/15/2023 | | | 10,000 | | | | 11,330 | |
| | |
Putnam Valley Central School District Series 2020B, GO, BAN, 1.25%, 7/16/2021 | | | 14,185 | | | | 14,291 | |
| | |
Rhinebeck Central School District GO, BAN, 1.25%, 6/25/2021 | | | 12,152 | | | | 12,213 | |
| | |
Rome City School District GO, RAN, 2.00%, 2/3/2021 | | | 8,000 | | | | 8,040 | |
| | |
Rondout Valley Central School District Accord GO, BAN, 2.00%, 6/30/2021 | | | 12,000 | | | | 12,156 | |
| | |
Scotia-Glenville Central School District GO, BAN, 1.25%, 6/30/2021 | | | 14,000 | | | | 14,093 | |
| | |
Silver Creek Central School District GO, BAN, 1.25%, 6/30/2021 | | | 14,825 | | | | 14,919 | |
| | |
South Jefferson Central School District GO, BAN, 2.00%, 6/30/2021 | | | 8,530 | | | | 8,639 | |
| | |
Town of Oyster Bay | | | | | | | | |
| | |
Series 2020A, GO, BAN, 2.00%, 3/12/2021 | | | 80,695 | | | | 81,400 | |
| | |
Series B, GO, 2.00%, 3/12/2021 | | | 49,190 | | | | 49,614 | |
| | |
GO, 2.00%, 11/1/2021 | | | 415 | | | | 422 | |
| | |
GO, 4.00%, 11/1/2022 | | | 410 | | | | 440 | |
| | |
GO, 4.00%, 11/1/2023 | | | 1,000 | | | | 1,110 | |
| | |
GO, 4.00%, 11/1/2024 | | | 950 | | | | 1,084 | |
| | |
GO, 4.00%, 11/1/2025 | | | 495 | | | | 578 | |
SEE NOTES TO FINANCIAL STATEMENTS.
| | | | | | | | |
| | | |
| AUGUST 31, 2020 | | J.P. MORGAN MUNICIPAL BOND FUNDS | | | | | 89 | |
JPMorgan Ultra-Short Municipal Fund
SCHEDULE OF PORTFOLIO INVESTMENTS
AS OF AUGUST 31, 2020 (Unaudited) (continued)
| | | | | | | | |
| INVESTMENTS | | PRINCIPAL
AMOUNT
($000) | | | VALUE
($000) | |
Municipal Bonds — continued | | | | | | | | |
|
New York — continued | |
| | |
Triborough Bridge and Tunnel Authority, MTA Bridges and Tunnels | | | | | | | | |
| | |
Series D, Rev., (SOFR + 0.50%), 0.55%, 9/1/2020 (b) | | | 10,000 | | | | 9,998 | |
| | |
Rev., VRDO, LOC: Barclays Bank plc, 0.08%, 9/10/2020 (c) | | | 21,445 | | | | 21,445 | |
| | |
Unadilla Valley Central School District GO, BAN, 2.00%, 7/9/2021 | | | 8,700 | | | | 8,814 | |
| | |
Watertown Enlarged City School District GO, BAN, 1.50%, 6/29/2021 | | | 10,598 | | | | 10,694 | |
| | |
Webster Central School District GO, BAN, 1.00%, 6/30/2021 | | | 23,539 | | | | 23,650 | |
| | |
Wheatland Chili Central School District GO, BAN, 1.25%, 6/23/2021 | | | 9,080 | | | | 9,113 | |
| | |
Williamson Central School District GO, BAN, 1.25%, 7/16/2021 | | | 10,097 | | | | 10,160 | |
| | |
Wyandanch Union Free School District GO, TAN, 1.25%, 6/25/2021 | | | 15,000 | | | | 15,084 | |
| | |
Yorkshire-Pioneer Central School District GO, BAN, 1.25%, 6/29/2021 | | | 9,303 | | | | 9,357 | |
| | | | | | | | |
| | |
Total New York | | | | | | | 1,432,576 | |
| | | | | | | | |
|
North Carolina — 3.1% | |
| | |
Buncombe County Metropolitan Sewerage District Series A, Rev., VRDO, LIQ: Wells Fargo Bank NA, 0.06%, 9/10/2020 (c) | | | 21,420 | | | | 21,420 | |
| | |
City of Charlotte Series B, Rev., VRDO, LIQ: Wells Fargo Bank NA, 0.08%, 9/10/2020 (c) | | | 8,300 | | | | 8,300 | |
| | |
City of Charlotte, 2003 Governmental Facilities Projects Series 2013G, COP, VRDO, LIQ: Wells Fargo Bank NA, 0.08%, 9/10/2020 (c) | | | 51,905 | | | | 51,905 | |
| | |
City of Raleigh, Downtown Improvement Projects Series 2004A, COP, VRDO, LIQ: Wells Fargo Bank NA, 0.08%, 9/10/2020 (c) | | | 47,010 | | | | 47,010 | |
| | |
Columbus County Industrial Facilities and Pollution Control Financing Authority, International Paper Co. Project | | | | | | | | |
| | |
Series 2019A, Rev., 2.00%, 10/1/2024 (c) | | | 825 | | | | 860 | |
| | |
Series 2019B, Rev., 2.00%, 10/1/2024 (c) | | | 825 | | | | 860 | |
| | |
Series 2020A, Rev., 1.37%, 6/16/2025 (c) | | | 1,780 | | | | 1,812 | |
| | |
County of Buncombe, Limited Obligation Series 2014A, Rev., 5.00%, 6/1/2021 | | | 20 | | | | 21 | |
| | |
North Carolina Medical Care Commission, Moses Cone Health System Series 2001A, Rev., VRDO, LIQ: BMO Harris Bank NA, 0.09%, 9/10/2020 (c) | | | 26,170 | | | | 26,170 | |
| | |
Tender Option Bond Trust Receipts/Certificates Series 2016-XX1003, Rev., VRDO, LIQ: Barclays Bank plc, 0.14%, 9/10/2020 (c) (e) | | | 9,185 | | | | 9,185 | |
| | | | | | | | |
| INVESTMENTS | | PRINCIPAL
AMOUNT
($000) | | | VALUE
($000) | |
| | | | | | | | |
|
North Carolina — continued | |
| | |
University of North Carolina, Chapel Hill Series B, Rev., (ICE LIBOR USD 1 Month + 0.40%), 0.50%, 10/1/2020 (b) | | | 3,750 | | | | 3,750 | |
| | |
Winston-Salem State University Foundation LLC, The Board of Governors of The University of North Carolina Rev., AGM, 4.00%, 10/1/2020 | | | 120 | | | | 120 | |
| | | | | | | | |
| | |
Total North Carolina | | | | | | | 171,413 | |
| | | | | | | | |
|
North Dakota — 0.1% | |
| | |
County of Burleigh Series 2014A, Rev., 5.00%, 7/1/2021 (d) | | | 3,895 | | | | 4,037 | |
| | | | | | | | |
|
Ohio — 4.0% | |
| | |
Akron, Bath and Copley Joint Township Hospital District, Summa Health Obligated Group Rev., 5.00%, 11/15/2021 | | | 125 | | | | 132 | |
| | |
American Municipal Power, Inc. Series 2019A, Rev., 2.30%, 2/15/2022 (c) | | | 10,000 | | | | 10,136 | |
| | |
Avon Local School District GO, BAN, 2.00%, 9/30/2020 | | | 3,015 | | | | 3,019 | |
| | |
City of Brecksville, Various Purpose Improvement, Limited Tax GO, BAN, 2.00%, 2/25/2021 | | | 4,875 | | | | 4,915 | |
| | |
City of Centerville, Graceworks Lutheran Services | | | | | | | | |
| | |
Rev., 5.00%, 11/1/2020 | | | 275 | | | | 276 | |
| | |
Rev., 5.00%, 11/1/2021 | | | 285 | | | | 290 | |
| | |
City of Cleveland, Subordinate Lien, Public Facilities Improvements Series 2018A, Rev., 5.00%, 10/1/2022 | | | 265 | | | | 291 | |
| | |
City of Elyria | | | | | | | | |
| | |
Series 2019-2, GO, 4.00%, 12/1/2021 | | | 1,010 | | | | 1,057 | |
| | |
Series 2019-2, GO, 4.00%, 12/1/2022 | | | 935 | | | | 1,011 | |
| | |
City of Napoleon GO, BAN, 2.00%, 2/25/2021 | | | 5,852 | | | | 5,899 | |
| | |
City of Rocky River GO, BAN, 2.00%, 9/24/2020 | | | 3,375 | | | | 3,379 | |
| | |
City of Toledo GO, AGM, 4.00%, 12/1/2020 | | | 100 | | | | 101 | |
| | |
City of Toledo, Capital Improvement | | | | | | | | |
| | |
GO, AGM, 5.00%, 12/1/2020 | | | 615 | | | | 622 | |
| | |
GO, AGM, 5.00%, 12/1/2021 | | | 1,275 | | | | 1,349 | |
| | |
GO, AGM, 5.00%, 12/1/2022 | | | 1,305 | | | | 1,440 | |
| | |
City of Twinsburg, Gleneagles Clubhouse Improvements, Limited Tax GO, BAN, 2.00%, 2/25/2021 | | | 2,300 | | | | 2,309 | |
| | |
City of Whitehall Rev., 2.25%, 12/9/2020 | | | 3,810 | | | | 3,829 | |
| | |
County of Allen, Hospital Facilities, Catholic Health Partners Series 2012B, Rev., VRDO, 0.13%, 9/10/2020 (c) | | | 37,565 | | | | 37,565 | |
SEE NOTES TO FINANCIAL STATEMENTS.
| | | | | | |
| | | |
| 90 | | | | J.P. MORGAN MUNICIPAL BOND FUNDS | | AUGUST 31, 2020 |
| | | | | | | | |
| INVESTMENTS | | PRINCIPAL
AMOUNT
($000) | | | VALUE
($000) | |
Municipal Bonds — continued | | | | | | | | |
|
Ohio — continued | |
| | |
County of Allen, Hospital Facilities, Mercy Health Series B, Rev., 5.00%, 5/5/2022 (c) | | | 2,000 | | | | 2,137 | |
| | |
County of Franklin, Nationwide Children’s Hospital Project Series 2009A, Rev., VRDO, LIQ: Barclays Bank plc, 0.08%, 9/10/2020 (c) | | | 38,030 | | | | 38,030 | |
| | |
County of Lorain | | | | | | | | |
| | |
Series B, GO, BAN, 1.30%, 2/6/2021 | | | 500 | | | | 500 | |
| | |
Series A, GO, BAN, 3.00%, 2/6/2021 | | | 5,010 | | | | 5,060 | |
| | |
County of Mahoning, Various Purpose Notes GO, 3.00%, 9/16/2020 | | | 3,100 | | | | 3,104 | |
| | |
County of Mahoning, Various Purpose Sales Tax Supported Improvement Notes Rev., 3.00%, 9/16/2020 | | | 750 | | | | 751 | |
| | |
County of Ross, Adena Health System | | | | | | | | |
| | |
Rev., 5.00%, 12/1/2020 | | | 1,000 | | | | 1,010 | |
| | |
Rev., 5.00%, 12/1/2021 | | | 335 | | | | 353 | |
| | |
Rev., 5.00%, 12/1/2022 | | | 355 | | | | 388 | |
| | |
Rev., 5.00%, 12/1/2023 | | | 490 | | | | 556 | |
| | |
County of Union GO, BAN, 2.00%, 9/9/2020 | | | 1,500 | | | | 1,501 | |
| | |
County of Warren, Healthcare Facilities, Otterbein Homes Obligated Group Series 2016A, Rev., 5.00%, 7/1/2021 | | | 50 | | | | 51 | |
| | |
Euclid City School District | | | | | | | | |
| | |
COP, 4.00%, 12/1/2023 | | | 70 | | | | 77 | |
| | |
COP, 4.00%, 12/1/2024 | | | 70 | | | | 80 | |
| | |
Franklin County, Hospital Facilities, OhioHealth Corp. Series B, Rev., (SIFMA Municipal Swap Index Yield + 0.43%), 0.52%, 9/10/2020 (b) | | | 5,000 | | | | 4,991 | |
| | |
Goshen Local School District, School Facilities Project COP, 1.50%, 12/15/2020 | | | 280 | | | | 281 | |
| | |
Ohio Water Development Authority, Water Pollution Control Loan Fund Series 2016A, Rev., VRDO, LIQ: TD Bank NA, 0.07%, 9/10/2020 (c) | | | 73,645 | | | | 73,645 | |
| | |
Rev., 5.25%, 12/1/2020 | | | 35 | | | | 35 | |
| | |
State of Ohio, University Hospitals Health System, Inc. Series A, Rev., VRDO, 0.45%, 9/1/2020 (c) | | | 8,250 | | | | 8,250 | |
| | |
Village of Obetz | | | | | | | | |
| | |
Rev., 5.00%, 12/1/2020 | | | 185 | | | | 188 | |
| | |
Rev., 5.00%, 12/1/2021 | | | 125 | | | | 132 | |
| | |
Zanesville City School District GO, 4.00%, 12/1/2021 | | | 595 | | | | 622 | |
| | | | | | | | |
| | |
Total Ohio | | | | | | | 219,362 | |
| | | | | | | | |
| | | | | | | | |
| INVESTMENTS | | PRINCIPAL
AMOUNT
($000) | | | VALUE
($000) | |
| | | | | | | | |
|
Oklahoma — 0.4% | |
| | |
Bryan County School Finance Authority, Durant Public Schools Project | | | | | | | | |
| | |
Rev., 1.15%, 12/1/2020 | | | 270 | | | | 272 | |
| | |
Rev., 4.00%, 12/1/2021 | | | 140 | | | | 146 | |
| | |
Rev., 4.00%, 12/1/2022 | | | 190 | | | | 205 | |
| | |
Rev., 4.00%, 12/1/2023 | | | 155 | | | | 172 | |
| | |
Rev., 4.00%, 12/1/2024 | | | 165 | | | | 188 | |
| | |
Canadian County Educational Facilities Authority, Yukon Public Schools Project Series 2019, Rev., 5.00%, 12/1/2020 | | | 3,400 | | | | 3,430 | |
| | |
City of Moore GO, 1.25%, 4/1/2022 | | | 1,550 | | | | 1,573 | |
| | |
Cleveland County Educational Facilities Authority, Lexington Public Schools Project | | | | | | | | |
| | |
Series 2019, Rev., 4.00%, 9/1/2020 | | | 110 | | | | 110 | |
| | |
Series 2019, Rev., 4.00%, 9/1/2021 | | | 150 | | | | 155 | |
| | |
Series 2019, Rev., 4.00%, 9/1/2022 | | | 125 | | | | 133 | |
| | |
Series 2019, Rev., 4.00%, 9/1/2023 | | | 270 | | | | 296 | |
| | |
Cushing Educational Facilities Authority, Public Schools Project Rev., 5.00%, 9/1/2020 | | | 50 | | | | 50 | |
| | |
Custer County Economic Development Authority, Thomas Fay Public Schools | | | | | | | | |
| | |
Rev., 4.00%, 12/1/2021 | | | 410 | | | | 428 | |
| | |
Rev., 4.00%, 12/1/2023 | | | 450 | | | | 499 | |
| | |
Elk City Industrial Authority Rev., 2.00%, 5/1/2023 | | | 140 | | | | 145 | |
| | |
Ellis County Educational Facilities Authority | | | | | | | | |
| | |
Rev., 3.00%, 3/1/2022 | | | 725 | | | | 753 | |
| | |
Rev., 3.00%, 3/1/2023 | | | 730 | | | | 773 | |
| | |
Garvin County Educational Facilities Authority | | | | | | | | |
| | |
Rev., 4.00%, 9/1/2021 | | | 125 | | | | 129 | |
| | |
Rev., 4.00%, 9/1/2022 | | | 135 | | | | 144 | |
| | |
Rev., 4.00%, 9/1/2023 | | | 110 | | | | 121 | |
| | |
Rev., 4.00%, 9/1/2024 | | | 160 | | | | 181 | |
| | |
Grady County School Finance Authority, Tuttle Public Schools Project | | | | | | | | |
| | |
Rev., 4.00%, 9/1/2021 | | | 250 | | | | 259 | |
| | |
Rev., 4.00%, 9/1/2022 | | | 200 | | | | 214 | |
| | |
Rev., 4.00%, 9/1/2023 | | | 300 | | | | 330 | |
| | |
Rev., 4.00%, 9/1/2024 | | | 245 | | | | 276 | |
| | |
Kingfisher County Educational Facilities Authority, Lomega Public Schools Project | | | | | | | | |
| | |
Rev., 3.00%, 3/1/2022 | | | 165 | | | | 171 | |
| | |
Rev., 3.00%, 3/1/2023 | | | 385 | | | | 407 | |
| | |
Rev., 3.00%, 3/1/2024 | | | 270 | | | | 292 | |
| | |
Muskogee Industrial Trust Rev., 5.00%, 9/1/2023 | | | 900 | | | | 1,013 | |
SEE NOTES TO FINANCIAL STATEMENTS.
| | | | | | | | |
| | | |
| AUGUST 31, 2020 | | J.P. MORGAN MUNICIPAL BOND FUNDS | | | | | 91 | |
JPMorgan Ultra-Short Municipal Fund
SCHEDULE OF PORTFOLIO INVESTMENTS
AS OF AUGUST 31, 2020 (Unaudited) (continued)
| | | | | | | | |
| INVESTMENTS | | PRINCIPAL
AMOUNT
($000) | | | VALUE
($000) | |
Municipal Bonds — continued | | | | | | | | |
|
Oklahoma — continued | |
| | |
Oklahoma Development Finance Authority Rev., AMT, 1.63%, 7/6/2023 | | | 4,885 | | | | 4,872 | |
| | |
Oklahoma Housing Finance Agency, Sooner Haven Apartments Rev., 2.37%, 10/1/2020 (c) | | | 2,375 | | | | 2,379 | |
| | |
Oklahoma Turnpike Authority, Turnpike System, Second Senior Series B, Rev., 5.00%, 1/1/2021 (d) | | | 20 | | | | 20 | |
| | |
Tulsa County Industrial Authority, Sand Springs Public Schools Project | | | | | | | | |
| | |
Rev., 2.00%, 9/1/2020 | | | 70 | | | | 70 | |
| | |
Rev., 5.00%, 9/1/2021 | | | 325 | | | | 340 | |
| | |
Rev., 2.00%, 9/1/2022 | | | 125 | | | | 128 | |
| | |
Rev., 4.00%, 9/1/2023 | | | 175 | | | | 191 | |
| | |
Rev., 4.00%, 9/1/2024 | | | 435 | | | | 488 | |
| | |
Wagoner County School Development Authority, Wagoner Public Schools Project | | | | | | | | |
| | |
Rev., 4.00%, 9/1/2021 | | | 225 | | | | 233 | |
| | |
Rev., 4.00%, 9/1/2023 | | | 525 | | | | 573 | |
| | | | | | | | |
| | |
Total Oklahoma | | | | | | | 22,159 | |
| | | | | | | | |
|
Oregon — 0.8% | |
| | |
City of Portland GO, TAN, 3.00%, 1/6/2021 | | | 31,290 | | | | 31,595 | |
| | |
County of Washington Series 2016, GO, 5.00%, 6/1/2021 | | | 1,875 | | | | 1,943 | |
| | |
Salem-Keizer School District No. 24J | | | | | | | | |
| | |
GO, 4.00%, 6/15/2021 | | | 175 | | | | 180 | |
| | |
GO, 5.00%, 6/15/2021 | | | 500 | | | | 519 | |
| | |
State of Oregon Series 2015P, GO, VRDO, LIQ: U.S. Bank NA, 0.09%, 9/10/2020 (c) | | | 3,500 | | | | 3,500 | |
| | |
State of Oregon Housing & Community Services Department Rev., 1.45%, 6/1/2022 (c) | | | 3,350 | | | | 3,422 | |
| | | | | | | | |
| | |
Total Oregon | | | | | | | 41,159 | |
| | | | | | | | |
|
Pennsylvania — 6.9% | |
| | |
Allentown City School District, Limited Tax GO, TRAN, 2.38%, 3/31/2021 | | | 3,150 | | | | 3,150 | |
| | |
Allentown Neighborhood Improvement Zone Development Authority, City Center Project Rev., 5.00%, 5/1/2023 (e) | | | 200 | | | | 211 | |
| | |
Ambridge Borough Water Authority | | | | | | | | |
| | |
Rev., 3.00%, 11/15/2020 | | | 195 | | | | 197 | |
| | |
Rev., 4.00%, 11/15/2021 | | | 160 | | | | 167 | |
| | |
Rev., 4.00%, 11/15/2022 | | | 175 | | | | 188 | |
| | |
Rev., 4.00%, 11/15/2023 | | | 175 | | | | 194 | |
| | |
Apollo-Ridge School District | | | | | | | | |
| | |
Series 2019A, GO, 2.00%, 9/1/2022 | | | 375 | | | | 388 | |
| | |
Series 2019A, GO, 4.00%, 9/1/2023 | | | 385 | | | | 424 | |
| | |
Series 2019A, GO, 4.00%, 9/1/2024 | | | 450 | | | | 510 | |
| | | | | | | | |
| INVESTMENTS | | PRINCIPAL
AMOUNT
($000) | | | VALUE
($000) | |
| | | | | | | | |
|
Pennsylvania — continued | |
| | |
Armstrong School District | | | | | | | | |
| | |
Series A, GO, 3.00%, 3/15/2021 | | | 230 | | | | 233 | |
| | |
Series B, GO, 3.00%, 3/15/2021 | | | 105 | | | | 106 | |
| | |
Series A, GO, 3.00%, 3/15/2022 | | | 235 | | | | 244 | |
| | |
Series B, GO, 3.00%, 3/15/2022 | | | 300 | | | | 312 | |
| | |
Series A, GO, 3.00%, 3/15/2023 | | | 240 | | | | 255 | |
| | |
Series B, GO, 3.00%, 3/15/2023 | | | 400 | | | | 425 | |
| | |
Berks County Municipal Authority (The), Tower Health Project | | | | | | | | |
| | |
Series 2020A, Rev., 5.00%, 2/1/2021 | | | 400 | | | | 405 | |
| | |
Series 2020A, Rev., 5.00%, 2/1/2022 | | | 500 | | | | 519 | |
| | |
Series 2020A, Rev., 5.00%, 2/1/2023 | | | 1,300 | | | | 1,377 | |
| | |
Series 2020A, Rev., 5.00%, 2/1/2024 | | | 425 | | | | 459 | |
| | |
Series 2020A, Rev., 5.00%, 2/1/2025 | | | 600 | | | | 661 | |
| | |
Series 2020A, Rev., 5.00%, 2/1/2026 | | | 1,015 | | | | 1,134 | |
| | |
Bethlehem Area School District GO, 5.00%, 10/15/2021 | | | 13,155 | | | | 13,843 | |
| | |
Big Beaver Falls Area School District | | | | | | | | |
| | |
GO, 4.00%, 3/15/2022 | | | 1,155 | | | | 1,217 | |
| | |
GO, 5.00%, 3/15/2023 | | | 1,200 | | | | 1,329 | |
| | |
Burgettstown Area School District | | | | | | | | |
| | |
Series A, GO, 3.00%, 3/15/2022 | | | 100 | | | | 103 | |
| | |
Series A, GO, 4.00%, 3/15/2023 | | | 200 | | | | 216 | |
| | |
Butler Area School District GO, AGM, 4.00%, 10/1/2020 | | | 865 | | | | 868 | |
| | |
Carmichaels Area School District | | | | | | | | |
| | |
GO, 4.00%, 9/1/2022 | | | 190 | | | | 203 | |
| | |
GO, 4.00%, 9/1/2023 | | | 150 | | | | 164 | |
| | |
Charleroi Borough Authority, Water System | | | | | | | | |
| | |
Rev., AGM, 3.00%, 12/1/2020 | | | 305 | | | | 307 | |
| | |
Rev., AGM, 4.00%, 12/1/2021 | | | 225 | | | | 235 | |
| | |
Rev., AGM, 4.00%, 12/1/2022 | | | 165 | | | | 178 | |
| | |
Rev., AGM, 4.00%, 12/1/2023 | | | 225 | | | | 250 | |
| | |
Chester County Health and Education Facilities Authority, Main Line Health System | | | | | | | | |
| | |
Series 2020A, Rev., 3.00%, 9/1/2023 | | | 230 | | | | 246 | |
| | |
Series 2020A, Rev., 3.00%, 9/1/2024 | | | 215 | | | | 234 | |
| | |
Series 2020A, Rev., 5.00%, 9/1/2025 | | | 250 | | | | 301 | |
| | |
City of Altoona, Guaranteed Sewer | | | | | | | | |
| | |
GO, AGM, 5.00%, 12/1/2020 | | | 315 | | | | 318 | |
| | |
GO, AGM, 5.00%, 12/1/2021 | | | 265 | | | | 280 | |
| | |
GO, AGM, 5.00%, 12/1/2022 | | | 200 | | | | 220 | |
| | |
GO, AGM, 5.00%, 12/1/2023 | | | 300 | | | | 342 | |
SEE NOTES TO FINANCIAL STATEMENTS.
| | | | | | |
| | | |
| 92 | | | | J.P. MORGAN MUNICIPAL BOND FUNDS | | AUGUST 31, 2020 |
| | | | | | | | |
| INVESTMENTS | | PRINCIPAL
AMOUNT
($000) | | | VALUE
($000) | |
Municipal Bonds — continued | | | | | | | | |
|
Pennsylvania — continued | |
| | |
City of Lebanon Authority | | | | | | | | |
| | |
Rev., 4.00%, 12/15/2020 | | | 405 | | | | 409 | |
| | |
Rev., 4.00%, 12/15/2021 | | | 240 | | | | 251 | |
| | |
Rev., 4.00%, 12/15/2022 | | | 275 | | | | 298 | |
| | |
Rev., 4.00%, 12/15/2023 | | | 360 | | | | 402 | |
| | |
City of Philadelphia
Series 2009B, GO, VRDO, LOC: Barclays Bank plc, 0.07%, 9/10/2020 (c) | | | 15,940 | | | | 15,940 | |
| | |
Series 2012A, GO, 5.00%, 9/15/2021 | | | 45 | | | | 47 | |
| | |
Series 2019A, GO, 5.00%, 8/1/2022 | | | 4,755 | | | | 5,150 | |
| | |
City of Philadelphia, Water and Wastewater Rev., 5.00%, 11/1/2022 (d) | | | 1,465 | | | | 1,614 | |
| | |
City of Pittsburgh Series 2020A, GO, 5.00%, 9/1/2026 | | | 300 | | | | 377 | |
| | |
Commonwealth Financing Authority, Tobacco Master Settlement Payment Series 2018, Rev., 5.00%, 6/1/2021 | | | 535 | | | | 552 | |
| | |
Conewago Valley School District Series 2013A, GO, 2.00%, 9/1/2022 | | | 570 | | | | 571 | |
| | |
Connellsville Area School District | | | | | | | | |
| | |
Series A, GO, AGM, 2.00%, 5/15/2021 | | | 70 | | | | 71 | |
| | |
Series A, GO, AGM, 2.00%, 5/15/2022 | | | 70 | | | | 72 | |
| | |
Series A, GO, AGM, 2.00%, 5/15/2023 | | | 70 | | | | 73 | |
| | |
Cornell School District | | | | | | | | |
| | |
GO, AGM, 2.00%, 9/1/2020 | | | 200 | | | | 200 | |
| | |
GO, AGM, 2.00%, 9/1/2021 | | | 200 | | | | 203 | |
| | |
GO, AGM, 4.00%, 9/1/2022 | | | 200 | | | | 214 | |
| | |
County of Armstrong | | | | | | | | |
| | |
GO, AGM, 3.00%, 6/1/2021 | | | 370 | | | | 377 | |
| | |
Series A, GO, 4.00%, 6/1/2021 | | | 230 | | | | 236 | |
| | |
GO, AGM, 4.00%, 6/1/2022 | | | 380 | | | | 405 | |
| | |
Series A, GO, 4.00%, 6/1/2022 | | | 430 | | | | 458 | |
| | |
GO, AGM, 4.00%, 6/1/2023 | | | 225 | | | | 246 | |
| | |
Series A, GO, 5.00%, 6/1/2023 | | | 225 | | | | 253 | |
| | |
GO, AGM, 4.00%, 6/1/2024 | | | 230 | | | | 259 | |
| | |
GO, AGM, 4.00%, 6/1/2025 | | | 240 | | | | 277 | |
| | |
County of Lackawanna | | | | | | | | |
| | |
Series 2020A, GO, 1.00%, 9/15/2020 | | | 300 | | | | 300 | |
| | |
Series 2020A, GO, 3.00%, 3/15/2021 | | | 200 | | | | 203 | |
| | |
Series 2020A, GO, 4.00%, 3/15/2022 | | | 200 | | | | 211 | |
| | |
Series 2020B, GO, 4.00%, 9/1/2022 | | | 135 | | | | 145 | |
| | |
Series 2020A, GO, 4.00%, 3/15/2023 | | | 200 | | | | 218 | |
| | |
Series 2020B, GO, 4.00%, 9/1/2023 | | | 305 | | | | 337 | |
| | |
Series 2020A, GO, 4.00%, 3/15/2024 | | | 300 | | | | 336 | |
| | |
Series 2020B, GO, 4.00%, 9/1/2024 | | | 680 | | | | 772 | |
| | | | | | | | |
| INVESTMENTS | | PRINCIPAL
AMOUNT
($000) | | | VALUE
($000) | |
| | | | | | | | |
|
Pennsylvania — continued | |
| | |
Series 2020A, GO, 4.00%, 3/15/2025 | | | 300 | | | | 345 | |
| | |
Series 2020B, GO, 4.00%, 9/1/2025 | | | 685 | | | | 796 | |
| | |
Series 2020B, GO, 4.00%, 9/1/2026 | | | 1,445 | | | | 1,708 | |
| | |
County of Somerset | | | | | | | | |
| | |
GO, 2.00%, 10/1/2020 | | | 225 | | | | 225 | |
| | |
GO, 2.00%, 10/1/2021 | | | 285 | | | | 289 | |
| | |
GO, 2.00%, 10/1/2022 | | | 340 | | | | 351 | |
| | |
GO, 2.00%, 10/1/2023 | | | 335 | | | | 349 | |
| | |
GO, 2.00%, 10/1/2024 | | | 300 | | | | 316 | |
| | |
County of York Series 2020A, GO, 5.00%, 6/1/2026 | | | 1,305 | | | | 1,631 | |
| | |
Dallas School District | | | | | | | | |
| | |
Series 2019, GO, AGM, 4.00%, 10/15/2020 | | | 290 | | | | 291 | |
| | |
Series 2019, GO, AGM, 4.00%, 10/15/2021 | | | 275 | | | | 285 | |
| | |
Series 2019, GO, AGM, 4.00%, 10/15/2022 | | | 300 | | | | 319 | |
| | |
Series 2019, GO, AGM, 5.00%, 10/15/2023 | | | 175 | | | | 197 | |
| | |
Series 2019, GO, AGM, 5.00%, 10/15/2024 | | | 325 | | | | 377 | |
| | |
Emmaus General Authority Rev., VRDO, AGM, LIQ: Wells Fargo Bank NA, 0.09%, 9/10/2020 (c) | | | 4,990 | | | | 4,990 | |
| | |
Franklin County Industrial Development Authority, Menno-Haven, Inc., Project Rev., 4.00%, 12/1/2020 | | | 520 | | | | 521 | |
| | |
General Authority of Southcentral, Wellspan Health Obligation Series C, Rev., VRDO, LIQ: Bank of America NA, 0.14%, 9/10/2020 (c) | | | 16,000 | | | | 16,000 | |
| | |
Iroquois School District | | | | | | | | |
| | |
GO, 3.00%, 10/1/2020 | | | 185 | | | | 185 | |
| | |
GO, 4.00%, 10/1/2021 | | | 300 | | | | 312 | |
| | |
GO, 4.00%, 10/1/2022 | | | 390 | | | | 419 | |
| | |
GO, 4.00%, 10/1/2023 | | | 200 | | | | 221 | |
| | |
Juniata County School District GO, AGM, 5.00%, 11/15/2021 | | | 185 | | | | 196 | |
| | |
Lackawanna County Industrial Development Authority, University of Scranton | | | | | | | | |
| | |
Rev., 4.00%, 11/1/2020 | | | 100 | | | | 101 | |
| | |
Rev., 5.00%, 11/1/2021 | | | 1,000 | | | | 1,049 | |
| | |
Lancaster County Hospital Authority, Health Care Facilities, Moravian Manors, Inc. Project Series 2019B, Rev., 2.88%, 12/15/2023 | | | 1,000 | | | | 984 | |
| | |
Lycoming County Water & Sewer Authority | | | | | | | | |
| | |
Rev., AGM, 2.00%, 11/15/2020 | | | 225 | | | | 226 | |
| | |
Rev., AGM, 4.00%, 11/15/2021 | | | 245 | | | | 255 | |
| | |
Rev., AGM, 4.00%, 11/15/2022 | | | 200 | | | | 215 | |
| | |
Rev., AGM, 4.00%, 11/15/2023 | | | 150 | | | | 166 | |
SEE NOTES TO FINANCIAL STATEMENTS.
| | | | | | | | |
| | | |
| AUGUST 31, 2020 | | J.P. MORGAN MUNICIPAL BOND FUNDS | | | | | 93 | |
JPMorgan Ultra-Short Municipal Fund
SCHEDULE OF PORTFOLIO INVESTMENTS
AS OF AUGUST 31, 2020 (Unaudited) (continued)
| | | | | | | | |
| INVESTMENTS | | PRINCIPAL
AMOUNT
($000) | | | VALUE
($000) | |
Municipal Bonds — continued | | | | | | | | |
|
Pennsylvania — continued | |
| | |
Mars Area School District | | | | | | | | |
| | |
Series 2019B, GO, AGM, 5.00%, 9/1/2020 | | | 145 | | | | 145 | |
| | |
Series 2019B, GO, AGM, 5.00%, 9/1/2021 | | | 120 | | | | 126 | |
| | |
Series 2019B, GO, AGM, 5.00%, 9/1/2023 | | | 115 | | | | 129 | |
| | |
Middletown Township Sewer Authority | | | | | | | | |
| | |
Rev., 3.00%, 10/1/2020 | | | 270 | | | | 271 | |
| | |
Rev., 4.00%, 10/1/2021 | | | 330 | | | | 343 | |
| | |
Rev., 4.00%, 10/1/2022 | | | 265 | | | | 284 | |
| | |
Rev., 4.00%, 10/1/2023 | | | 210 | | | | 232 | |
| | |
Montgomery County Higher Education and Health Authority, Arcadia University | | | | | | | | |
| | |
Rev., 5.00%, 4/1/2022 | | | 300 | | | | 311 | |
| | |
Rev., 5.00%, 4/1/2023 | | | 300 | | | | 317 | |
| | |
Rev., 5.00%, 4/1/2024 | | | 300 | | | | 323 | |
| | |
Rev., 5.00%, 4/1/2025 | | | 250 | | | | 273 | |
| | |
Rev., 5.00%, 4/1/2026 | | | 165 | | | | 183 | |
| | |
Montgomery County Industrial Development Authority, Meadowood Senior Living Project | | | | | | | | |
| | |
Series A, Rev., 3.00%, 12/1/2020 | | | 250 | | | | 250 | |
| | |
Series A, Rev., 3.00%, 12/1/2021 | | | 250 | | | | 252 | |
| | |
Montour School District GO, 3.00%, 10/1/2023 | | | 200 | | | | 215 | |
| | |
Muncy School District GO, 4.00%, 5/15/2023 | | | 345 | | | | 377 | |
| | |
Municipality of Norristown Series 2020A, GO, 4.00%, 5/1/2023 | | | 6,000 | | | | 6,335 | |
| | |
Municipality of Penn Hills | | | | | | | | |
| | |
Series A, GO, 3.00%, 12/1/2020 | | | 275 | | | | 277 | |
| | |
Series A, GO, 3.00%, 12/1/2021 | | | 340 | | | | 352 | |
| | |
Series A, GO, 3.00%, 12/1/2022 | | | 345 | | | | 363 | |
| | |
Series A, GO, 3.00%, 12/1/2023 | | | 305 | | | | 329 | |
| | |
Neshannock Township School District | | | | | | | | |
| | |
Series 2019AA, GO, 4.00%, 9/1/2021 | | | 100 | | | | 104 | |
| | |
Series 2019AA, GO, 4.00%, 9/1/2022 | | | 150 | | | | 161 | |
| | |
Series 2019AA, GO, 4.00%, 9/1/2023 | | | 200 | | | | 220 | |
| | |
Northeast Bradford School District | | | | | | | | |
| | |
GO, AGM, 2.00%, 6/1/2021 | | | 150 | | | | 152 | |
| | |
GO, AGM, 2.00%, 6/1/2022 | | | 320 | | | | 329 | |
| | |
GO, AGM, 3.00%, 6/1/2023 | | | 330 | | | | 351 | |
| | |
Northwestern Lehigh School District | | | | | | | | |
| | |
Series 2019, GO, 5.00%, 2/15/2021 | | | 155 | | | | 158 | |
| | |
Series 2019, GO, 5.00%, 2/15/2023 | | | 680 | | | | 756 | |
| | |
Penn Hills School District | | | | | | | | |
| | |
GO, 3.00%, 10/1/2022 | | | 1,725 | | | | 1,814 | |
| | |
GO, 4.00%, 10/1/2023 | | | 1,790 | | | | 1,978 | |
| | |
GO, 4.00%, 10/1/2024 | | | 1,855 | | | | 2,106 | |
| | |
GO, 5.00%, 10/1/2025 | | | 4,615 | | | | 5,585 | |
| | | | | | | | |
| INVESTMENTS | | PRINCIPAL
AMOUNT
($000) | | | VALUE
($000) | |
| | | | | | | | |
|
Pennsylvania — continued | |
| | |
Pennsylvania Higher Educational Facilities Authority | | | | | | | | |
| | |
Series AX, Rev., AGM, 5.00%, 6/15/2021 | | | 5,935 | | | | 6,153 | |
| | |
Series AX, Rev., AGM, 5.00%, 6/15/2022 | | | 1,375 | | | | 1,488 | |
| | |
Pennsylvania Higher Educational Facilities Authority, Associates Independent Colleges Rev., 2.72%, 5/1/2021 (c) (d) | | | 2,500 | | | | 2,541 | |
| | |
Pennsylvania Turnpike Commission | | | | | | | | |
| | |
Rev., VRDO, LOC: TD Bank NA, 0.07%, 9/10/2020 (c) | | | 20,000 | | | | 20,000 | |
| | |
Series 2nd, Rev., VRDO, LOC: TD Bank NA, 0.07%, 9/10/2020 (c) | | | 22,940 | | | | 22,940 | |
| | |
Series A-1, Rev., (SIFMA Municipal Swap Index Yield + 0.60%), 0.69%, 9/10/2020 (b) | | | 18,000 | | | | 17,922 | |
| | |
Series A, Rev., 5.00%, 12/1/2022 | | | 1,000 | | | | 1,099 | |
| | |
Series A, Rev., 5.00%, 12/1/2023 | | | 1,000 | | | | 1,142 | |
| | |
Pennsylvania Turnpike Commission, Convertible Capital Appreciation Series B2, Rev., 5.35%, 12/1/2020 (d) | | | 30 | | | | 30 | |
| | |
Pennsylvania Turnpike Commission, Senior Lien Series A, Rev., 5.00%, 12/1/2020 | | | 110 | | | | 111 | |
| | |
Philadelphia Authority for Industrial Development Series B-2, Rev., VRDO, LOC: TD Bank NA, 0.07%, 9/10/2020 (c) | | | 8,395 | | | | 8,395 | |
| | |
Philadelphia Gas Works Co. Series A-2, Rev., VRDO, LOC: TD Bank NA, 0.07%, 9/10/2020 (c) | | | 20,300 | | | | 20,300 | |
| | |
Pittsburgh School District | | | | | | | | |
| | |
Series 2019, GO, 5.00%, 9/1/2022 | | | 1,690 | | | | 1,853 | |
| | |
Series 2019, GO, 5.00%, 9/1/2023 | | | 1,810 | | | | 2,060 | |
| | |
Pittsburgh Water & Sewer Authority Series A, Rev., 5.00%, 9/1/2022 | | | 250 | | | | 273 | |
| | |
Punxsutawney Area School District | | | | | | | | |
| | |
Series 2020A, GO, AGM, 4.00%, 10/15/2020 | | | 215 | | | | 216 | |
| | |
Series 2020A, GO, AGM, 4.00%, 10/15/2021 | | | 315 | | | | 327 | |
| | |
Series 2020A, GO, AGM, 5.00%, 10/15/2022 | | | 290 | | | | 319 | |
| | |
Series 2020A, GO, AGM, 5.00%, 10/15/2023 | | | 250 | | | | 286 | |
| | |
Series 2020A, GO, AGM, 5.00%, 10/15/2024 | | | 150 | | | | 178 | |
| | |
School District of Philadelphia (The) | | | | | | | | |
| | |
Series 2019A, GO, 5.00%, 9/1/2020 | | | 600 | | | | 600 | |
| | |
Rev., TRAN, 4.00%, 6/30/2021 | | | 71,120 | | | | 73,282 | |
SEE NOTES TO FINANCIAL STATEMENTS.
| | | | | | |
| | | |
| 94 | | | | J.P. MORGAN MUNICIPAL BOND FUNDS | | AUGUST 31, 2020 |
| | | | | | | | |
| INVESTMENTS | | PRINCIPAL
AMOUNT
($000) | | | VALUE
($000) | |
Municipal Bonds — continued | | | | | | | | |
|
Pennsylvania — continued | |
| | |
Series 2019A, GO, 5.00%, 9/1/2021 | | | 800 | | | | 834 | |
| | |
Series 2019A, GO, 5.00%, 9/1/2022 | | | 1,050 | | | | 1,141 | |
| | |
Series 2019A, GO, 5.00%, 9/1/2023 | | | 1,050 | | | | 1,186 | |
| | |
School District of the City of Erie (The) | | | | | | | | |
| | |
Series 2019B, GO, AGM, 5.00%, 4/1/2021 | | | 400 | | | | 410 | |
| | |
Series 2019B, GO, AGM, 5.00%, 4/1/2022 | | | 325 | | | | 348 | |
| | |
Series 2019B, GO, AGM, 5.00%, 4/1/2023 | | | 315 | | | | 350 | |
| | |
Selinsgrove Area School District | | | | | | | | |
| | |
Series A, GO, 2.00%, 9/1/2020 | | | 100 | | | | 100 | |
| | |
Series A, GO, 2.00%, 3/1/2021 | | | 5 | | | | 5 | |
| | |
Series B, GO, 3.00%, 3/1/2021 | | | 110 | | | | 111 | |
| | |
Series A, GO, 2.00%, 9/1/2021 | | | 125 | | | | 127 | |
| | |
Series A, GO, 2.00%, 3/1/2022 | | | 5 | | | | 5 | |
| | |
Series B, GO, 3.00%, 3/1/2022 | | | 130 | | | | 135 | |
| | |
Series A, GO, 2.00%, 9/1/2022 | | | 400 | | | | 414 | |
| | |
Series A, GO, 2.00%, 3/1/2023 | | | 5 | | | | 5 | |
| | |
Series B, GO, 3.00%, 3/1/2023 | | | 95 | | | | 101 | |
| | |
Series A, GO, 2.00%, 9/1/2023 | | | 585 | | | | 614 | |
| | |
Southeastern Pennsylvania Transportation Authority | | | | | | | | |
| | |
Rev., 5.00%, 6/1/2021 | | | 500 | | | | 517 | |
| | |
Rev., 5.00%, 6/1/2022 | | | 500 | | | | 540 | |
| | |
Rev., 5.00%, 6/1/2023 | | | 750 | | | | 842 | |
| | |
Rev., 5.00%, 6/1/2024 | | | 755 | | | | 879 | |
| | |
Rev., 5.00%, 6/1/2025 | | | 1,250 | | | | 1,504 | |
| | |
Rev., 5.00%, 6/1/2026 | | | 750 | | | | 927 | |
| | |
Spring-Benner-Walker Joint Authority Rev., 4.00%, 9/1/2024 | | | 440 | | | | 496 | |
| | |
State Public School Building Authority, Community College of Philadelphia Project | | | | | | | | |
| | |
Series 2019A, Rev., AGM, 5.00%, 6/15/2021 | | | 295 | | | | 305 | |
| | |
Series 2019A, Rev., AGM, 5.00%, 6/15/2022 | | | 310 | | | | 334 | |
| | |
Steel Valley School District | | | | | | | | |
| | |
Series 2019B, GO, 3.00%, 11/1/2021 | | | 230 | | | | 236 | |
| | |
Series 2019B, GO, 4.00%, 11/1/2022 | | | 240 | | | | 257 | |
| | |
Series 2019B, GO, 4.00%, 11/1/2023 | | | 250 | | | | 275 | |
| | |
Steelton-Highspire School District | | | | | | | | |
| | |
GO, 4.00%, 11/15/2022 | | | 60 | | | | 64 | |
| | |
GO, 4.00%, 11/15/2023 | | | 85 | | | | 94 | |
| | |
Township of Butler PA/Luzerne County | | | | | | | | |
| | |
GO, 1.10%, 10/1/2020 | | | 1,100 | | | | 1,101 | |
| | |
GO, 4.00%, 10/1/2021 | | | 475 | | | | 493 | |
| | |
GO, 5.00%, 10/1/2022 | | | 250 | | | | 273 | |
| | | | | | | | |
| INVESTMENTS | | PRINCIPAL
AMOUNT
($000) | | | VALUE
($000) | |
| | | | | | | | |
|
Pennsylvania — continued | |
| | |
GO, 5.00%, 10/1/2023 | | | 260 | | | | 296 | |
| | |
GO, 5.00%, 10/1/2024 | | | 275 | | | | 324 | |
| | |
Township of East Pennsboro, Cumberland County | | | | | | | | |
| | |
Series 2019, GO, 3.00%, 9/1/2020 | | | 150 | | | | 150 | |
| | |
Series 2019, GO, 3.00%, 9/1/2021 | | | 190 | | | | 196 | |
| | |
Series 2019, GO, 3.00%, 9/1/2022 | | | 175 | | | | 184 | |
| | |
Township of Rostraver | | | | | | | | |
| | |
GO, AGM, 3.00%, 9/1/2020 | | | 140 | | | | 140 | |
| | |
GO, AGM, 4.00%, 9/1/2021 | | | 100 | | | | 104 | |
| | |
University of Pittsburgh of the Commonwealth System of Higher Education Rev., (SIFMA Municipal Swap Index Yield + 0.24%), 0.33%, 9/10/2020 (b) | | | 11,510 | | | | 11,496 | |
| | |
University of Pittsburgh-of the Commonwealth System of Higher Education Rev., (SIFMA Municipal Swap Index Yield + 0.36%), 0.45%, 9/10/2020 (b) | | | 47,000 | | | | 46,885 | |
| | |
Upper Allegheny Joint Sanitary Authority | | | | | | | | |
| | |
Series 2019A, Rev., AGM, 3.00%, 9/1/2020 | | | 125 | | | | 125 | |
| | |
Series 2019A, Rev., AGM, 3.00%, 9/1/2021 | | | 285 | | | | 293 | |
| | |
Series 2019A, Rev., AGM, 4.00%, 9/1/2022 | | | 200 | | | | 214 | |
| | |
Series 2019A, Rev., AGM, 4.00%, 9/1/2023 | | | 215 | | | | 237 | |
| | |
Waynesboro Area School District, Franklin County | | | | | | | | |
| | |
Series 2019, GO, 5.00%, 10/1/2020 | | | 485 | | | | 487 | |
| | |
Series 2019, GO, 5.00%, 10/1/2021 | | | 580 | | | | 608 | |
| | |
Series 2019, GO, 5.00%, 10/1/2022 | | | 305 | | | | 334 | |
| | |
Series 2019, GO, 5.00%, 10/1/2023 | | | 320 | | | | 365 | |
| | |
Wilkes-Barre Area School District Series 2019, GO, 5.00%, 4/15/2023 | | | 115 | | | | 128 | |
| | |
Wyalusing Area School District, Bradford and Wyoming Counties | | | | | | | | |
| | |
Series 2019, GO, AGM, 4.00%, 4/1/2021 | | | 375 | | | | 383 | |
| | |
Series 2019, GO, AGM, 4.00%, 4/1/2022 | | | 315 | | | | 332 | |
| | |
Series 2019, GO, AGM, 4.00%, 4/1/2023 | | | 400 | | | | 436 | |
| | | | | | | | |
| | |
Total Pennsylvania | | | | | | | 382,865 | |
| | | | | | | | |
|
Rhode Island — 0.3% | |
| | |
City of Pawtucket | | | | | | | | |
| | |
Series 2019D, GO, AGM, 3.00%, 7/15/2021 | | | 125 | | | | 128 | |
| | |
Series 2019C, GO, AGM, 4.00%, 7/15/2021 | | | 185 | | | | 191 | |
| | |
Series 2019D, GO, AGM, 3.00%, 7/15/2022 | | | 210 | | | | 221 | |
| | |
Series 2019C, GO, AGM, 4.00%, 7/15/2022 | | | 210 | | | | 225 | |
| | |
Series 2019D, GO, AGM, 3.00%, 7/15/2023 | | | 70 | | | | 75 | |
| | |
Series 2019C, GO, AGM, 4.00%, 7/15/2023 | | | 380 | | | | 418 | |
SEE NOTES TO FINANCIAL STATEMENTS.
| | | | | | | | |
| | | |
| AUGUST 31, 2020 | | J.P. MORGAN MUNICIPAL BOND FUNDS | | | | | 95 | |
JPMorgan Ultra-Short Municipal Fund
SCHEDULE OF PORTFOLIO INVESTMENTS
AS OF AUGUST 31, 2020 (Unaudited) (continued)
| | | | | | | | |
| INVESTMENTS | | PRINCIPAL
AMOUNT
($000) | | | VALUE
($000) | |
Municipal Bonds — continued | | | | | | | | |
|
Rhode Island — continued | |
| | |
Providence Public Building Authority, Capital Improvement Series A, Rev., 5.00%, 9/15/2020 | | | 200 | | | | 200 | |
| | |
Rhode Island Health and Educational Building Corp., Higher Education Facilities, Brown University Series 2005A, Rev., VRDO, LIQ: HSBC Bank USA NA, 0.08%, 9/10/2020 (c) | | | 3,560 | | | | 3,560 | |
| | |
Rhode Island Health and Educational Building Corp., Public School Program, Providence Public Building Authority Series 2013A, Rev., 5.00%, 5/15/2022 | | | 15 | | | | 16 | |
| | |
Rhode Island Industrial Facilities Corp., Marine Terminal, Exxonmobil Project Rev., VRDO, 0.03%, 9/1/2020 (c) | | | 12,105 | | | | 12,105 | |
| | |
Rhode Island Turnpike & Bridge Authority | | | | | | | | |
| | |
Series 2019A, Rev., 5.00%, 10/1/2021 | | | 300 | | | | 313 | |
| | |
Series 2019A, Rev., 5.00%, 10/1/2023 | | | 125 | | | | 140 | |
| | | | | | | | |
| | |
Total Rhode Island | | | | | | | 17,592 | |
| | | | | | | | |
|
South Carolina — 0.3% | |
| | |
Chester Sewer District | | | | | | | | |
| | |
Rev., 3.00%, 6/1/2021 | | | 110 | | | | 112 | |
| | |
Rev., 4.00%, 6/1/2023 | | | 75 | | | | 82 | |
| | |
Educational Facilities Authority, Wofford College Series B, Rev., 2.37%, 4/1/2022 (c) | | | 500 | | | | 514 | |
| | |
Laurens County Water & Sewer Commission Rev., BAN, 1.38%, 2/1/2022 | | | 7,000 | | | | 7,052 | |
| | |
South Carolina Jobs-Economic Development Authority Series 2020A, Rev., 4.00%, 11/15/2023 | | | 130 | | | | 131 | |
| | |
South Carolina Jobs-Economic Development Authority, Episcopal Home At Still Hopes Series 2018A, Rev., 5.00%, 4/1/2021 | | | 500 | | | | 507 | |
| | |
South Carolina Jobs-Economic Development Authority, Lowcountry Leadership Charter School Project Series A, Rev., 2.38%, 12/1/2024 (e) | | | 600 | | | | 608 | |
| | |
South Carolina Transportation Infrastructure Bank Series 2003B, Rev., (ICE LIBOR USD 1 Month + 0.45%), 0.55%, 10/1/2020 (b) | | | 9,950 | | | | 9,880 | |
| | | | | | | | |
| | |
Total South Carolina | | | | | | | 18,886 | |
| | | | | | | | |
|
South Dakota — 0.0% (f) | |
| | |
South Dakota Board of Regents, Housing and Auxiliary Facility System Series 2017, Rev., 5.00%, 4/1/2022 | | | 375 | | | | 400 | |
| | | | | | | | |
|
Tennessee — 1.0% | |
| | |
Highlands Residential Services, Walnut Village Project Series 2019, Rev., GNMA COLL, 1.80%, 4/1/2021 (c) | | | 1,000 | | | | 1,008 | |
| | | | | | | | |
| INVESTMENTS | | PRINCIPAL
AMOUNT
($000) | | | VALUE
($000) | |
| | | | | | | | |
|
Tennessee — continued | |
| | |
Knox County Health Educational & Housing Facility Board, Meadowbrook Apartments Project Rev., 1.50%, 7/1/2021 (c) | | | 650 | | | | 656 | |
| | |
Knox County Health Educational and Housing Facility Board, Clear Springs Apartments Project Series 2019, Rev., 1.80%, 5/1/2021 (c) | | | 800 | | | | 807 | |
| | |
Lewisburg Industrial Development Board, Lewisburg Summit Apartments Rev., 1.55%, 3/1/2022 (c) | | | 1,900 | | | | 1,940 | |
| | |
Metropolitan Government Nashville & Davidson County Health and Educational Facilities Board, Multifamily Housing, Trevecca Towers I/East Project Rev., 2.00%, 1/1/2021 (c) | | | 10,000 | | | | 10,051 | |
| | |
Metropolitan Government Nashville & Davidson County Health and Educational Facilities Board, Multifamily Housing, Trevecca Towers II Project Rev., 2.00%, 1/1/2021 (c) | | | 5,000 | | | | 5,026 | |
| | |
Metropolitan Government Nashville & Davidson County Health and Educational Facilities Board, Oakwood Flats Apartments Project Rev., 2.10%, 10/1/2020 (c) | | | 6,500 | | | | 6,509 | |
| | |
Metropolitan Government Nashville & Davidson County Health and Educational Facilities Board, Trevecca Nazarene University Project Series 2019, Rev., 3.00%, 10/1/2024 | | | 425 | | | | 428 | |
| | |
Rutherford County Health and Educational Facilities Board Rev., 2.50%, 11/1/2020 (c) | | | 3,500 | | | | 3,512 | |
| | |
Shelby County Health Educational & Housing Facilities Board Series 2019B-1, Rev., 4.00%, 12/1/2026 | | | 10,000 | | | | 9,907 | |
| | |
Tennergy Corp. Series 2019A, Rev., LIQ: Royal Bank of Canada, 5.00%, 10/1/2024 (c) | | | 10,000 | | | | 11,701 | |
| | |
Tennessee Energy Acquisition Corp., Gas Project Series 2017A, Rev., 4.00%, 5/1/2021 | | | 730 | | | | 747 | |
| | | | | | | | |
| | |
Total Tennessee | | | | | | | 52,292 | |
| | | | | | | | |
|
Texas — 7.5% | |
| | |
Arlington Higher Education Finance Corp., Trinity Basin Preparatory, Inc. | | | | | | | | |
| | |
Rev., PSF-GTD, 3.00%, 8/15/2022 | | | 635 | | | | 666 | |
| | |
Rev., PSF-GTD, 3.00%, 8/15/2023 | | | 655 | | | | 702 | |
| | |
Austin Community College District Public Facility Corp., Lease, Highland Campus Parking Garage Project | | | | | | | | |
| | |
Series 2018C, Rev., 5.00%, 8/1/2024 | | | 200 | | | | 236 | |
| | |
Series 2018C, Rev., 5.00%, 8/1/2025 | | | 200 | | | | 243 | |
SEE NOTES TO FINANCIAL STATEMENTS.
| | | | | | |
| | | |
| 96 | | | | J.P. MORGAN MUNICIPAL BOND FUNDS | | AUGUST 31, 2020 |
| | | | | | | | |
| INVESTMENTS | | PRINCIPAL
AMOUNT
($000) | | | VALUE
($000) | |
Municipal Bonds — continued | | | | | | | | |
|
Texas — continued | |
| | |
Austin Community College District, Combined Fee | | | | | | | | |
| | |
Rev., 5.00%, 2/1/2021 | | | 160 | | | | 163 | |
| | |
Rev., 5.00%, 2/1/2022 | | | 165 | | | | 176 | |
| | |
Rev., 5.00%, 2/1/2023 | | | 170 | | | | 190 | |
| | |
Austin Independent School District Series 2013A, GO, PSF-GTD, 5.00%, 8/1/2021 (d) | | | 30 | | | | 31 | |
| | |
Avery Ranch Road District No. 1 | | | | | | | | |
| | |
Series 2019, GO, 3.00%, 8/15/2022 | | | 615 | | | | 647 | |
| | |
Series 2019, GO, 3.00%, 8/15/2023 | | | 810 | | | | 871 | |
| | |
Big Oaks Municipal Utility District, Waterworks & Sewer System | | | | | | | | |
| | |
GO, AGM, 3.00%, 3/1/2021 | | | 335 | | | | 339 | |
| | |
GO, AGM, 3.00%, 3/1/2022 | | | 345 | | | | 359 | |
| | |
GO, AGM, 3.00%, 3/1/2023 | | | 905 | | | | 959 | |
| | |
Bridgestone Municipal Utility District | | | | | | | | |
| | |
Series A, GO, AGM, 2.00%, 5/1/2021 | | | 1,480 | | | | 1,497 | |
| | |
Series A, GO, AGM, 2.00%, 5/1/2022 | | | 110 | | | | 113 | |
| | |
Series A, GO, AGM, 3.00%, 5/1/2023 | | | 85 | | | | 90 | |
| | |
Brushy Creek Municipal Utility District | | | | | | | | |
| | |
GO, 3.00%, 6/1/2021 | | | 200 | | | | 204 | |
| | |
GO, 3.00%, 6/1/2022 | | | 235 | | | | 246 | |
| | |
GO, 3.00%, 6/1/2023 | | | 250 | | | | 265 | |
| | |
Central Texas Regional Mobility Authority, Subordinated Lien Rev., BAN, 4.00%, 1/1/2022 | | | 2,455 | | | | 2,519 | |
| | |
City of Austin, Airport System Series 2019, Rev., AMT, 5.00%, 11/15/2022 | | | 4,250 | | | | 4,657 | |
| | |
City of El Paso Series 2020A, GO, 5.00%, 8/15/2021 | | | 600 | | | | 627 | |
| | |
GO, 5.00%, 8/15/2022 | | | 400 | | | | 437 | |
| | |
GO, 5.00%, 8/15/2023 | | | 515 | | | | 587 | |
| | |
GO, 5.00%, 8/15/2024 | | | 700 | | | | 829 | |
| | |
Series 2020A, GO, 5.00%, 8/15/2024 | | | 275 | | | | 326 | |
| | |
City of Galveston | | | | | | | | |
| | |
GO, 3.00%, 5/1/2021 | | | 130 | | | | 132 | |
| | |
GO, 4.00%, 5/1/2022 | | | 590 | | | | 628 | |
| | |
City of Grand Prairie GO, 5.00%, 2/15/2021 | | | 20 | | | | 20 | |
| | |
City of Houston Series 2012A, Rev., VRDO, LIQ: TD Bank NA, 0.09%, 9/10/2020 (c) | | | 12,500 | | | | 12,500 | |
| | |
City of Houston, Combined Utility System, First Lien Series B-2, Rev., VRDO, LOC: | | | | | | | | |
| | |
Citibank NA, 0.09%, 9/10/2020 (c) | | | 22,500 | | | | 22,500 | |
| | | | | | | | |
| INVESTMENTS | | PRINCIPAL
AMOUNT
($000) | | | VALUE
($000) | |
| | | | | | | | |
|
Texas — continued | |
| | |
City of Irving, Hotel Occupancy | | | | | | | | |
| | |
Rev., 5.00%, 8/15/2021 | | | 25 | | | | 25 | |
| | |
Rev., 5.00%, 8/15/2022 | | | 50 | | | | 52 | |
| | |
Rev., 5.00%, 8/15/2023 | | | 50 | | | | 52 | |
| | |
City of Kenedy, Certificates of Obligation | | | | | | | | |
| | |
GO, 4.00%, 5/1/2021 | | | 130 | | | | 133 | |
| | |
GO, 4.00%, 5/1/2022 | | | 120 | | | | 127 | |
| | |
GO, 4.00%, 5/1/2023 | | | 125 | | | | 137 | |
| | |
City of Laredo GO, 5.00%, 2/15/2021 | | | 725 | | | | 741 | |
| | |
City of Laredo, Waterworks & Sewer System Rev., 5.00%, 3/1/2021 | | | 125 | | | | 128 | |
| | |
City of Port Arthur | | | | | | | | |
| | |
GO, AGM, 3.00%, 2/15/2021 | | | 350 | | | | 354 | |
| | |
Series 2020A, GO, AGM, 3.00%, 2/15/2021 | | | 970 | | | | 982 | |
| | |
GO, AGM, 3.00%, 2/15/2022 | | | 765 | | | | 796 | |
| | |
Series 2020A, GO, AGM, 4.00%, 2/15/2022 | | | 350 | | | | 369 | |
| | |
Series 2020A, GO, AGM, 4.00%, 2/15/2023 | | | 365 | | | | 396 | |
| | |
GO, AGM, 5.00%, 2/15/2023 | | | 910 | | | | 1,011 | |
| | |
Series 2020A, GO, AGM, 5.00%, 2/15/2024 | | | 380 | | | | 438 | |
| | |
Series 2020A, GO, AGM, 5.00%, 2/15/2025 | | | 400 | | | | 476 | |
| | |
City of Sulphur Springs | | | | | | | | |
| | |
Series 2019, GO, AGM, 3.00%, 9/1/2020 | | | 100 | | | | 100 | |
| | |
Series 2019, GO, AGM, 3.00%, 9/1/2021 | | | 100 | | | | 103 | |
| | |
Series 2019, GO, AGM, 3.00%, 9/1/2022 | | | 520 | | | | 548 | |
| | |
City of Universal City | | | | | | | | |
| | |
GO, 4.00%, 8/15/2021 | | | 140 | | | | 145 | |
| | |
GO, 4.00%, 8/15/2022 | | | 145 | | | | 156 | |
| | |
GO, 2.00%, 8/15/2023 | | | 230 | | | | 240 | |
| | |
Clear Brook City Municipal Utility District Series 2019, GO, AGM, 2.10%, 2/1/2023 | | | 450 | | | | 465 | |
| | |
Counties of Travis, Williamson and Hays, City of Austin, Public Improvement GO, 5.00%, 9/1/2021 | | | 30 | | | | 31 | |
| | |
County of Bexar, Tax Exempt Revenue Project | | | | | | | | |
| | |
Rev., 5.00%, 8/15/2022 | | | 275 | | | | 295 | |
| | |
Rev., 5.00%, 8/15/2023 | | | 275 | | | | 305 | |
| | |
County of Kaufman | | | | | | | | |
| | |
Series 2020A, GO, 5.00%, 2/15/2022 | | | 250 | | | | 267 | |
| | |
GO, 5.00%, 2/15/2023 | | | 155 | | | | 173 | |
| | |
Series 2020A, GO, 5.00%, 2/15/2023 | | | 110 | | | | 123 | |
| | |
GO, 5.00%, 2/15/2024 | | | 210 | | | | 243 | |
| | |
Series 2020A, GO, 5.00%, 2/15/2024 | | | 125 | | | | 145 | |
| | |
GO, 5.00%, 2/15/2025 | | | 255 | | | | 306 | |
| | |
Series 2020A, GO, 5.00%, 2/15/2025 | | | 130 | | | | 156 | |
SEE NOTES TO FINANCIAL STATEMENTS.
| | | | | | | | |
| | | |
| AUGUST 31, 2020 | | J.P. MORGAN MUNICIPAL BOND FUNDS | | | | | 97 | |
JPMorgan Ultra-Short Municipal Fund
SCHEDULE OF PORTFOLIO INVESTMENTS
AS OF AUGUST 31, 2020 (Unaudited) (continued)
| | | | | | | | |
| INVESTMENTS | | PRINCIPAL
AMOUNT
($000) | | | VALUE
($000) | |
Municipal Bonds — continued | | | | | | | | |
|
Texas — continued | |
| | |
County of La Salle GO, AGM, 5.00%, 3/1/2021 | | | 345 | | | | 353 | |
| | |
County of La Salle, Unlimited Tax GO, AGM, 5.00%, 3/1/2021 | | | 2,135 | | | | 2,186 | |
| | |
Cuero Independent School District, School Building Series 2014, GO, PSF-GTD, 5.00%, 8/15/2021 | | | 100 | | | | 105 | |
| | |
Cypress Hill Municipal Utility District No. 1 | | | | | | | | |
| | |
GO, 2.00%, 9/1/2020 | | | 30 | | | | 30 | |
| | |
GO, 2.00%, 9/1/2021 | | | 290 | | | | 295 | |
| | |
GO, 2.00%, 9/1/2022 | | | 190 | | | | 196 | |
| | |
GO, 3.00%, 9/1/2023 | | | 270 | | | | 289 | |
| | |
Duncanville Independent School District, Unlimited Tax | | | | | | | | |
| | |
GO, PSF-GTD, 4.00%, 2/15/2026 | | | 8,335 | | | | 9,909 | |
| | |
Florence Independent School District | | | | | | | | |
| | |
GO, PSF-GTD, 3.00%, 8/15/2026 | | | 230 | | | | 240 | |
| | |
GO, PSF-GTD, 3.00%, 8/15/2027 | | | 115 | | | | 120 | |
| | |
Fort Bend County Levee Improvement District No. 11 GO, AGM, 3.00%, 9/1/2023 | | | 400 | | | | 428 | |
| | |
Fort Bend County Municipal Utility District No. 116 | | | | | | | | |
| | |
Series 2019, GO, 3.00%, 9/1/2021 | | | 330 | | | | 339 | |
| | |
Series 2019, GO, 3.00%, 9/1/2022 | | | 460 | | | | 483 | |
| | |
Series 2019, GO, 3.00%, 9/1/2023 | | | 450 | | | | 482 | |
| | |
Fort Bend County Municipal Utility District No. 151, Unlimited Tax GO, 3.00%, 9/1/2021 | | | 190 | | | | 195 | |
| | |
Grand Parkway Transportation Corp. Series 2013B, Rev., 5.00%, 10/1/2023 (d) | | | 21,060 | | | | 24,100 | |
| | |
Greenhawe Water Control & Improvement District No. 2 | | | | | | | | |
| | |
GO, AGM, 3.00%, 9/1/2022 | | | 190 | | | | 200 | |
| | |
GO, AGM, 3.00%, 9/1/2023 | | | 200 | | | | 214 | |
| | |
Harris County Cultural Education Facilities Finance Corp. | | | | | | | | |
| | |
Series 2019C, Rev., (SIFMA Municipal Swap Index Yield + 0.42%), 0.51%, 9/10/2020 (b) | | | 10,000 | | | | 9,938 | |
| | |
Series 2019C-2, Rev., (SIFMA Municipal Swap Index Yield + 0.57%), 0.66%, 9/10/2020 (b) | | | 9,000 | | | | 8,947 | |
| | |
Series 2019A, Rev., 5.00%, 12/1/2021 | | | 1,750 | | | | 1,847 | |
| | |
Series 2019A, Rev., 5.00%, 12/1/2022 | | | 1,700 | | | | 1,868 | |
| | |
Series 2019A, Rev., 5.00%, 12/1/2023 | | | 2,230 | | | | 2,544 | |
| | |
Harris County Cultural Education Facilities Finance Corp., Children’s Hospital Series A, Rev., 5.00%, 10/1/2020 | | | 3,255 | | | | 3,267 | |
| | | | | | | | |
| INVESTMENTS | | PRINCIPAL
AMOUNT
($000) | | | VALUE
($000) | |
| | | | | | | | |
|
Texas — continued | |
| | |
Harris County Cultural Education Facilities Finance Corp., Memorial Hermann Health System Series 2020C-3, Rev., 5.00%, 12/1/2026 (c) | | | 5,000 | | | | 6,251 | |
| | |
Harris County Fresh Water Supply District No. 61 | | | | | | | | |
| | |
Series 2019, GO, AGM, 4.00%, 9/1/2023 | | | 445 | | | | 490 | |
| | |
Series 2019, GO, AGM, 3.00%, 9/1/2024 | | | 695 | | | | 758 | |
| | |
Harris County Municipal Utility District No. 096 | | | | | | | | |
| | |
Series 2019, GO, 2.00%, 9/1/2021 | | | 185 | | | | 188 | |
| | |
Series 2019, GO, 2.00%, 9/1/2023 | | | 195 | | | | 203 | |
| | |
Harris County Municipal Utility District No. 152 | | | | | | | | |
| | |
GO, AGM, 3.00%, 8/1/2022 | | | 280 | | | | 293 | |
| | |
GO, AGM, 3.00%, 8/1/2023 | | | 400 | | | | 426 | |
| | |
Harris County Municipal Utility District No. 157 GO, AGM, 3.00%, 3/1/2023 | | | 425 | | | | 451 | |
| | |
Harris County Municipal Utility District No. 276 | | | | | | | | |
| | |
GO, 3.00%, 9/1/2022 | | | 365 | | | | 384 | |
| | |
GO, 3.00%, 9/1/2023 | | | 745 | | | | 796 | |
| | |
Harris County Municipal Utility District No. 281 | | | | | | | | |
| | |
Series 2019, GO, 2.00%, 9/1/2020 | | | 135 | | | | 135 | |
| | |
Series 2019, GO, 2.00%, 9/1/2021 | | | 130 | | | | 132 | |
| | |
Series 2019, GO, 2.00%, 9/1/2022 | | | 300 | | | | 309 | |
| | |
Series 2019, GO, 2.00%, 9/1/2023 | | | 305 | | | | 319 | |
| | |
Harris County Municipal Utility District No. 374 | | | | | | | | |
| | |
Series 2019, GO, 3.00%, 9/1/2021 | | | 100 | | | | 103 | |
| | |
Series 2019, GO, 3.00%, 9/1/2022 | | | 145 | | | | 152 | |
| | |
Series 2019, GO, 3.00%, 9/1/2023 | | | 115 | | | | 123 | |
| | |
Harris County Municipal Utility District No. 391 | | | | | | | | |
| | |
GO, 3.00%, 9/1/2020 | | | 95 | | | | 95 | |
| | |
GO, 3.00%, 9/1/2021 | | | 375 | | | | 385 | |
| | |
GO, 3.00%, 9/1/2023 | | | 400 | | | | 425 | |
| | |
Harris County Municipal Utility District No. 419 | | | | | | | | |
| | |
GO, 3.00%, 9/1/2020 | | | 75 | | | | 75 | |
| | |
GO, 3.00%, 9/1/2021 | | | 70 | | | | 72 | |
| | |
GO, 3.00%, 9/1/2022 | | | 175 | | | | 184 | |
| | |
GO, 3.00%, 9/1/2023 | | | 455 | | | | 486 | |
| | |
Harris County Municipal Utility District No. 55 | | | | | | | | |
| | |
GO, 2.00%, 2/1/2021 | | | 470 | | | | 473 | |
| | |
GO, 3.00%, 2/1/2022 | | | 260 | | | | 270 | |
| | |
GO, 3.00%, 2/1/2023 | | | 785 | | | | 831 | |
| | |
Harris County Toll Road Authority (The) Series A, Rev., 5.00%, 8/15/2021 | | | 1,500 | | | | 1,568 | |
SEE NOTES TO FINANCIAL STATEMENTS.
| | | | | | |
| | | |
| 98 | | | | J.P. MORGAN MUNICIPAL BOND FUNDS | | AUGUST 31, 2020 |
| | | | | | | | |
| INVESTMENTS | | PRINCIPAL
AMOUNT
($000) | | | VALUE
($000) | |
Municipal Bonds — continued | | | | | | | | |
|
Texas — continued | |
| | |
Harris County Water Control & Improvement District No. 119 | | | | | | | | |
| | |
GO, AGM, 2.00%, 10/1/2021 | | | 835 | | | | 849 | |
| | |
GO, AGM, 3.00%, 10/1/2022 | | | 365 | | | | 384 | |
| | |
GO, AGM, 3.00%, 10/1/2023 | | | 375 | | | | 403 | |
| | |
Hunters Glen Municipal Utility District, Waterworks & Sewer System | | | | | | | | |
| | |
Series 2019A, GO, AGM, 2.00%, 4/1/2021 | | | 110 | | | | 111 | |
| | |
Series 2019A, GO, AGM, 2.00%, 4/1/2022 | | | 330 | | | | 336 | |
| | |
Series 2019A, GO, AGM, 2.00%, 4/1/2023 | | | 595 | | | | 617 | |
| | |
La Joya Independent School District | | | | | | | | |
| | |
GO, AGM, 4.00%, 2/15/2021 | | | 380 | | | | 387 | |
| | |
GO, AGM, 4.00%, 2/15/2022 | | | 390 | | | | 411 | |
| | |
GO, AGM, 4.00%, 2/15/2023 | | | 420 | | | | 456 | |
| | |
Love Field Airport Modernization Corp. Rev., AMT, 5.00%, 11/1/2021 | | | 125 | | | | 131 | |
| | |
Lower Neches Valley Authority Industrial Development Corp., Exxonmobil Project Rev., VRDO, 0.03%, 9/1/2020 (c) | | | 1,300 | | | | 1,300 | |
| | |
Lower Neches Valley Authority Industrial Development Corp., ExxonMobil Project Series 2011, Rev., VRDO, 0.03%, 9/1/2020 (c) | | | 5,900 | | | | 5,900 | |
| | |
Lytle Independent School District GO, PSF-GTD, 4.00%, 2/15/2028 | | | 255 | | | | 310 | |
| | |
Matagorda County Navigation District No. 1, Pollution Control Rev., VRDO, AMT, 1.75%, 5/1/2030 (c) | | | 4,000 | | | | 4,000 | |
| | |
Matagorda County Navigation District No. 1, Pollution Control, Central Power and Light Co. Project. Rev., AMT, 0.90%, 9/1/2023 (c) | | | 3,750 | | | | 3,737 | |
| | |
McLennan County Junior College District | | | | | | | | |
| | |
Rev., AGM, 3.00%, 4/15/2021 | | | 350 | | | | 356 | |
| | |
Rev., AGM, 3.00%, 4/15/2022 | | | 100 | | | | 104 | |
| | |
Montgomery County Municipal Utility District No. 94 | | | | | | | | |
| | |
GO, 2.00%, 10/1/2020 | | | 20 | | | | 20 | |
| | |
GO, 2.00%, 10/1/2021 | | | 60 | | | | 61 | |
| | |
GO, 2.00%, 10/1/2022 | | | 185 | | | | 191 | |
| | |
GO, 2.00%, 10/1/2023 | | | 185 | | | | 194 | |
| | |
New Caney Independent School District, School Building GO, PSF-GTD, 3.00%, 8/15/2021 (c) | | | 1,500 | | | | 1,537 | |
| | |
New Hope Cultural Education Facilities Finance Corp. | | | | | | | | |
| | |
Series 2020A, Rev., 2.10%, 1/1/2023 | | | 90 | | | | 87 | |
| | |
Series 2020A, Rev., 2.20%, 1/1/2024 | | | 180 | | | | 173 | |
| | |
Series 2020A, Rev., 2.25%, 1/1/2025 | | | 315 | | | | 299 | |
| | | | | | | | |
| INVESTMENTS | | PRINCIPAL
AMOUNT
($000) | | | VALUE
($000) | |
| | | | | | | | |
|
Texas — continued | |
| | |
New Hope Cultural Education Facilities Finance Corp., Presbyterian Village North Project | | | | | | | | |
| | |
Rev., 5.00%, 10/1/2020 | | | 675 | | | | 676 | |
| | |
Rev., 5.00%, 10/1/2021 | | | 1,425 | | | | 1,448 | |
| | |
Rev., 5.00%, 10/1/2022 | | | 1,495 | | | | 1,538 | |
| | |
North Texas Tollway Authority | | | | | | | | |
| | |
Series B, Rev., 4.00%, 1/1/2022 | | | 800 | | | | 839 | |
| | |
Series B, Rev., 5.00%, 1/1/2023 | | | 5,000 | | | | 5,534 | |
| | |
Series B, Rev., 5.00%, 1/1/2024 | | | 5,500 | | | | 6,293 | |
| | |
Northside Independent School District, School Building GO, PSF-GTD, 2.00%, 6/1/2021 (c) | | | 3,035 | | | | 3,072 | |
| | |
Northwest Harris County Municipal Utility District No. 19 | | | | | | | | |
| | |
GO, AGM, 2.00%, 10/1/2020 | | | 40 | | | | 40 | |
| | |
GO, AGM, 2.00%, 10/1/2021 | | | 100 | | | | 102 | |
| | |
GO, AGM, 2.00%, 10/1/2022 | | | 100 | | | | 103 | |
| | |
GO, AGM, 2.00%, 10/1/2023 | | | 105 | | | | 109 | |
| | |
Pecan Grove Municipal Utility District | | | | | | | | |
| | |
Series 2019, GO, 4.00%, 9/1/2021 | | | 560 | | | | 581 | |
| | |
GO, AGM, 3.00%, 9/1/2022 | | | 195 | | | | 205 | |
| | |
Series 2019, GO, 4.00%, 9/1/2022 | | | 710 | | | | 762 | |
| | |
GO, AGM, 3.00%, 9/1/2023 | | | 345 | | | | 371 | |
| | |
Series 2019, GO, 4.00%, 9/1/2023 | | | 740 | | | | 818 | |
| | |
GO, AGM, 3.00%, 9/1/2024 | | | 600 | | | | 659 | |
| | |
Permanent University Fund — University of Texas System | | | | | | | | |
| | |
Series 2008A, Rev., VRDO, 0.06%, 9/10/2020 (c) | | | 26,230 | | | | 26,230 | |
| | |
Series 2008A, Rev., VRDO, LIQ: University of Texas Investment Management Co. (The), 0.06%, 9/10/2020 (c) | | | 24,100 | | | | 24,100 | |
| | |
Plano Independent School District, Unlimited Tax School Building GO, PSF-GTD, 5.00%, 2/15/2025 | | | 1,140 | | | | 1,375 | |
| | |
Port Beaumont Navigation District Rev., 4.00%, 9/1/2020 | | | 155 | | | | 155 | |
| | |
Robstown Independent School District | | | | | | | | |
| | |
GO, PSF-GTD, 2.00%, 2/15/2021 | | | 325 | | | | 328 | |
| | |
GO, PSF-GTD, 2.00%, 2/15/2022 | | | 325 | | | | 333 | |
| | |
GO, PSF-GTD, 3.00%, 2/15/2023 | | | 650 | | | | 692 | |
| | |
GO, PSF-GTD, 3.00%, 2/15/2024 | | | 360 | | | | 391 | |
| | |
Sienna Plantation Municipal Utility District No. 3 | | | | | | | | |
| | |
GO, 2.00%, 3/1/2021 | | | 200 | | | | 202 | |
| | |
GO, 2.00%, 3/1/2022 | | | 225 | | | | 230 | |
| | |
GO, 2.00%, 3/1/2023 | | | 185 | | | | 192 | |
SEE NOTES TO FINANCIAL STATEMENTS.
| | | | | | | | |
| | | |
| AUGUST 31, 2020 | | J.P. MORGAN MUNICIPAL BOND FUNDS | | | | | 99 | |
JPMorgan Ultra-Short Municipal Fund
SCHEDULE OF PORTFOLIO INVESTMENTS
AS OF AUGUST 31, 2020 (Unaudited) (continued)
| | | | | | | | |
| INVESTMENTS | | PRINCIPAL
AMOUNT
($000) | | | VALUE
($000) | |
Municipal Bonds — continued | | | | | | | | |
|
Texas — continued | |
| | |
State of Texas Series A, GO, VRDO, LIQ: State Street Bank & Trust, 0.14%, 9/10/2020 (c) | | | 12,050 | | | | 12,050 | |
| | |
Rev., TRAN, 4.00%, 8/26/2021 | | | 119,090 | | | | 123,534 | |
| | |
State of Texas, Veterans GO, VRDO, LIQ: Sumitomo Mitsui Banking Corp., 0.13%, 9/10/2020 (c) | | | 18,550 | | | | 18,550 | |
| | |
State of Texas, Veterans Housing Assistance Program Series 2008 B, GO, VRDO, LIQ: State Street Bank & Trust, 0.14%, 9/10/2020 (c) | | | 5,985 | | | | 5,985 | |
| | |
Tarrant County Cultural Education Facilities Finance Corp., Texas Health Resources System Series 2008-C, Rev., VRDO, 0.10%, 9/10/2020 (c) | | | 1,175 | | | | 1,175 | |
| | |
Town of Horizon City | | | | | | | | |
| | |
Series 2019, GO, AGM, 3.00%, 8/15/2021 | | | 300 | | | | 308 | |
| | |
Series 2019, GO, AGM, 3.00%, 8/15/2022 | | | 170 | | | | 179 | |
| | |
Series 2019, GO, AGM, 4.00%, 8/15/2023 | | | 230 | | | | 254 | |
| | |
Travis County Municipal Utility District No. 4 | | | | | | | | |
| | |
Series 2019A, GO, AGM, 2.00%, 9/1/2022 | | | 410 | | | | 424 | |
| | |
Series 2019A, GO, AGM, 3.00%, 9/1/2023 | | | 650 | | | | 695 | |
| | |
Travis County Water Control & Improvement District No. 17, Texas Steiner Ranch Defined Area Unlimited Tax | | | | | | | | |
| | |
GO, 3.00%, 5/1/2024 (g) | | | 400 | | | | 434 | |
| | |
GO, 4.00%, 5/1/2025 (g) | | | 300 | | | | 345 | |
| | |
GO, 4.00%, 5/1/2026 (g) | | | 280 | | | | 327 | |
| | |
University of Texas (The), Board of Regents, Financing System Series 2016D, Rev., 5.00%, 8/15/2021 | | | 25 | | | | 26 | |
| | |
University of Texas System (The) Series 2008B, Rev., VRDO, LIQ: | | | | | | | | |
| | |
University of Texas Investment Management Co. (The), 0.06%, 9/10/2020 (c) | | | 1,495 | | | | 1,495 | |
| | |
Williamson County Municipal Utility District No. 11 | | | | | | | | |
| | |
GO, AGM, 4.00%, 8/1/2021 | | | 140 | | | | 145 | |
| | |
GO, AGM, 4.00%, 8/1/2022 | | | 110 | | | | 117 | |
| | | | | | | | |
| | |
Total Texas | | | | | | | 414,504 | |
| | | | | | | | |
|
Utah — 0.1% | |
| | |
City of Lehi, Electric Utility Series 2018, Rev., 5.00%, 6/1/2021 | | | 75 | | | | 78 | |
| | |
City of Murray, Sales Tax | | | | | | | | |
| | |
Series 2018, Rev., 3.00%, 11/15/2020 | | | 235 | | | | 236 | |
| | |
Series 2018, Rev., 4.00%, 11/15/2021 | | | 150 | | | | 157 | |
| | | | | | | | |
| INVESTMENTS | | PRINCIPAL
AMOUNT
($000) | | | VALUE
($000) | |
| | | | | | | | |
|
Utah — continued | |
| | |
County of Utah, IHC Health Services, Inc. Series 2016D, Rev., VRDO, LIQ: U.S. Bank NA, 0.10%, 9/10/2020 (c) | | | 5,000 | | | | 5,000 | |
| | |
Utah Charter School Finance Authority | | | | | | | | |
| | |
Series A, Rev., 5.00%, 4/15/2021 | | | 40 | | | | 41 | |
| | |
Series A, Rev., 5.00%, 4/15/2022 | | | 35 | | | | 38 | |
| | |
Series A, Rev., 5.00%, 4/15/2023 | | | 85 | | | | 94 | |
| | |
Utah Charter School Finance Authority, Utah Charter Academies Project | | | | | | | | |
| | |
Rev., 3.00%, 10/15/2020 | | | 220 | | | | 221 | |
| | |
Rev., 4.00%, 10/15/2021 | | | 305 | | | | 316 | |
| | |
West Valley City Municipal Building Authority Series 2019, Rev., AGM, 5.00%, 2/1/2021 | | | 90 | | | | 92 | |
| | | | | | | | |
| | |
Total Utah | | | | | | | 6,273 | |
| | | | | | | | |
|
Vermont — 0.2% | |
| | |
Vermont Educational and Health Buildings Financing Agency, Fletcher Allen Health Series A, Rev., VRDO, LOC: TD Bank NA, 0.10%, 9/10/2020 (c) | | | 10,000 | | | | 10,000 | |
| | | | | | | | |
|
Virginia — 3.1% | |
| | |
Chesapeake Economic Development Authority, Virginia Electric and Power Co. Project Series 2008A, Rev., 1.90%, 6/1/2023 (c) | | | 4,250 | | | | 4,397 | |
| | |
Chesapeake Hospital Authority, Regional Medical Center | | | | | | | | |
| | |
Rev., 5.00%, 7/1/2023 | | | 925 | | | | 1,034 | |
| | |
Rev., 5.00%, 7/1/2024 | | | 885 | | | | 1,024 | |
| | |
Commonwealth of Virginia Series A, GO, 5.00%, 6/1/2021 | | | 1,480 | | | | 1,534 | |
| | |
Fairfax County EDA, Smithsonian Institution Issue Series A, Rev., VRDO, LIQ: Northern Trust Co., 0.08%, 9/10/2020 (c) | | | 22,425 | | | | 22,425 | |
| | |
Fairfax County Industrial Development Authority, Health Care System Series 2016C, Rev., VRDO, 0.09%, 9/10/2020 (c) | | | 9,500 | | | | 9,500 | |
| | |
Fairfax County Industrial Development Authority, Virginia Health Care, Inova Health System Project Series 2018C, Rev., VRDO, 0.09%, 9/10/2020 (c) | | | 49,305 | | | | 49,305 | |
| | |
Halifax County Industrial Development Authority, Virginia Electric and Power Company Project Series 2010A, Rev., 0.45%, 4/1/2022 (c) | | | 8,000 | | | | 7,997 | |
| | |
Loudoun County Economic Development Authority, Howard Hughes Medical Institute Series 2003B, Rev., VRDO, 0.09%, 9/10/2020 (c) | | | 18,650 | | | | 18,650 | |
SEE NOTES TO FINANCIAL STATEMENTS.
| | | | | | |
| | | |
| 100 | | | | J.P. MORGAN MUNICIPAL BOND FUNDS | | AUGUST 31, 2020 |
| | | | | | | | |
| INVESTMENTS | | PRINCIPAL
AMOUNT
($000) | | | VALUE
($000) | |
Municipal Bonds — continued | | | | | | | | |
|
Virginia — continued | |
| | |
Peninsula Ports Authority Rev., 1.70%, 10/1/2022 (c) | | | 1,550 | | | | 1,567 | |
| | |
Rockingham County Economic Development Authority | | | | | | | | |
| | |
Series 2020A, Rev., 4.00%, 12/1/2020 | | | 280 | | | | 281 | |
| | |
Series 2020A, Rev., 4.00%, 12/1/2021 | | | 270 | | | | 275 | |
| | |
Series 2020A, Rev., 4.00%, 12/1/2022 | | | 295 | | | | 305 | |
| | |
Series 2020A, Rev., 4.00%, 12/1/2023 | | | 100 | | | | 105 | |
| | |
Virginia College Building Authority, Public Higher Education Financing Program Series 2014B, Rev., 5.00%, 9/1/2020 | | | 7,685 | | | | 7,685 | |
| | |
Virginia Commonwealth Transportation Board Rev., 5.00%, 5/15/2021 | | | 5,000 | | | | 5,170 | |
| | |
Virginia Commonwealth Transportation Board, Federal Transportation Series B-G, Rev., GAN, 5.00%, 3/15/2021 | | | 25 | | | | 26 | |
| | |
Wise County Industrial Development Authority Series 2009-A, Rev., VRDO, 2.15%, 9/1/2020 (c) | | | 7,500 | | | | 7,500 | |
| | |
Wise County Industrial Development Authority, Virginia Electric And Power Company Project Series 2009A, Rev., 0.75%, 9/2/2025 (c) | | | 21,000 | | | | 20,931 | |
| | |
York County Economic Development Authority, Electric and Power Company Project Series 2009A, Rev., 1.90%, 6/1/2023 (c) | | | 8,000 | | | | 8,261 | |
| | | | | | | | |
| | |
Total Virginia | | | | | | | 167,972 | |
| | | | | | | | |
|
Washington — 1.4% | |
| | |
Cascade Water Alliance Rev., 5.00%, 1/1/2021 | | | 20 | | | | 20 | |
| | |
City of Seattle, Municipal Light and Power Improvement Rev., 5.00%, 9/1/2021 | | | 20 | | | | 21 | |
| | |
City of Seattle, Wastewater System Improvement Rev., 5.00%, 9/1/2020 | | | 25 | | | | 25 | |
| | |
Douglas County Public Utility District No. 1 Series B, Rev., 4.00%, 9/1/2021 | | | 25 | | | | 26 | |
| | |
King County Housing Authority, Highland Village Project | | | | | | | | |
| | |
Rev., 4.00%, 1/1/2022 | | | 120 | | | | 125 | |
| | |
Rev., 4.00%, 1/1/2023 | | | 100 | | | | 108 | |
| | |
Rev., 5.00%, 1/1/2024 | | | 120 | | | | 137 | |
| | |
King County School District No. 407 Riverview GO, 4.00%, 12/1/2023 | | | 500 | | | | 559 | |
| | |
Kitsap County School District No. 401 Central Kitsap, Unlimited Tax GO, 4.00%, 12/1/2021 | | | 75 | �� | | | 79 | |
| | |
Pend Oreille County, Public Hospital District No. 1 GO, 3.00%, 12/1/2020 | | | 155 | | | | 156 | |
| | | | | | | | |
| INVESTMENTS | | PRINCIPAL
AMOUNT
($000) | | | VALUE
($000) | |
| | | | | | | | |
|
Washington — continued | |
| | |
Port of Tacoma, Subordinate Lien Rev., VRDO, LOC: Bank of America NA, 0.08%, 9/10/2020 (c) | | | 29,980 | | | | 29,980 | |
| | |
Snohomish County School District No. 15 Edmonds GO, 5.00%, 12/1/2021 | | | 330 | | | | 350 | |
| | |
Snohomish County, Everett School District No. 2 GO, 5.00%, 12/1/2020 | | | 25 | | | | 25 | |
| | |
Snohomish County, School District No. 25, Marysville GO, 5.00%, 12/1/2020 | | | 170 | | | | 172 | |
| | |
State of Washington Series 2012C, GO, 5.00%, 6/1/2041 | | | 12,455 | | | | 12,879 | |
| | |
Washington Biomedical Research Properties Series 2015A, Rev., 5.00%, 1/1/2021 | | | 25 | | | | 25 | |
| | |
Washington Health Care Facilities Authority, Catholic Health Initiatives | | | | | | | | |
| | |
Series 2013B, Rev., (SIFMA Municipal Swap Index Yield + 1.00%), 1.09%, 9/10/2020 (b) | | | 5,000 | | | | 4,988 | |
| | |
Series 2013B, Rev., (SIFMA Municipal Swap Index Yield + 1.40%), 1.49%, 9/10/2020 (b) | | | 10,000 | | | | 9,862 | |
| | |
Washington Health Care Facilities Authority, Commonspirit Health Series B-1, Rev., 5.00%, 8/1/2024 (c) | | | 11,000 | | | | 12,383 | |
| | |
Washington Health Care Facilities Authority, Overlake Hospital Medical Center Series 2017B, Rev., 5.00%, 7/1/2022 | | | 1,210 | | | | 1,305 | |
| | |
Washington State Housing Finance Commission, Transforming Age Projects Series 2019B, Rev., 2.38%, 1/1/2026 (e) | | | 3,500 | | | | 3,265 | |
| | | | | | | | |
| | |
Total Washington | | | | | | | 76,490 | |
| | | | | | | | |
|
West Virginia — 0.2% | |
| | |
Berkeley County Board of Education | | | | | | | | |
| | |
GO, 3.00%, 5/1/2021 | | | 395 | | | | 402 | |
| | |
GO, 4.00%, 5/1/2022 | | | 600 | | | | 635 | |
| | |
GO, 5.00%, 5/1/2025 | | | 360 | | | | 432 | |
| | |
West Virginia Economic Development Authority, Appalachian Power Co. — Amos Project Series 2009A, Rev., 2.63%, 6/1/2022 (c) | | | 3,805 | | | | 3,921 | |
| | |
West Virginia Economic Development Authority, Solid Waste Disposal Facilities, Appalachian Power Company — Amos Project Series 2011A, Rev., AMT, 1.00%, 9/1/2025 (c) | | | 5,650 | | | | 5,629 | |
| | | | | | | | |
| | |
Total West Virginia | | | | | | | 11,019 | |
| | | | | | | | |
SEE NOTES TO FINANCIAL STATEMENTS.
| | | | | | | | |
| | | |
| AUGUST 31, 2020 | | J.P. MORGAN MUNICIPAL BOND FUNDS | | | | | 101 | |
JPMorgan Ultra-Short Municipal Fund
SCHEDULE OF PORTFOLIO INVESTMENTS
AS OF AUGUST 31, 2020 (Unaudited) (continued)
| | | | | | | | |
| INVESTMENTS | | PRINCIPAL
AMOUNT
($000) | | | VALUE
($000) | |
Municipal Bonds — continued | | | | | | | | |
|
Wisconsin — 1.2% | |
| | |
Big Foot Union High School District | | | | | | | | |
| | |
Series 2019, GO, 4.00%, 3/1/2021 | | | 130 | | | | 133 | |
| | |
Series 2019, GO, 4.00%, 3/1/2022 | | | 100 | | | | 105 | |
| | |
Series 2019, GO, 4.00%, 3/1/2023 | | | 115 | | | | 125 | |
| | |
City of Fort Atkinson | | | | | | | | |
| | |
GO, 3.00%, 2/1/2021 | | | 115 | | | | 116 | |
| | |
GO, 3.00%, 2/1/2022 | | | 120 | | | | 124 | |
| | |
GO, 4.00%, 2/1/2023 | | | 230 | | | | 251 | |
| | |
City of Kaukauna, Sanitary Sewer System Series 2019C, Rev., BAN, 2.63%, 9/1/2024 | | | 510 | | | | 530 | |
| | |
City of Kaukauna, Storm Water System Series 2019D, Rev., BAN, 2.63%, 9/1/2024 | | | 660 | | | | 685 | |
| | |
City of Kenosha GO, 3.00%, 2/1/2021 | | | 1,000 | | | | 1,012 | |
| | |
City of Middletown GO, 3.00%, 3/1/2021 | | | 355 | | | | 360 | |
| | |
City of Oak Creek | | | | | | | | |
| | |
GO, 3.00%, 4/1/2021 | | | 335 | | | | 340 | |
| | |
GO, 3.00%, 4/1/2022 | | | 135 | | | | 141 | |
| | |
GO, 3.00%, 4/1/2023 | | | 180 | | | | 192 | |
| | |
City of Racine | | | | | | | | |
| | |
Series 2019B, GO, 4.00%, 6/1/2021 | | | 120 | | | | 123 | |
| | |
Series 2019B, GO, 4.00%, 12/1/2021 | | | 165 | | | | 174 | |
| | |
Series 2019B, GO, 4.00%, 12/1/2022 | | | 145 | | | | 156 | |
| | |
Series 2019B, GO, 5.00%, 12/1/2023 | | | 125 | | | | 142 | |
| | |
City of Shawano, Promissory Notes | | | | | | | | |
| | |
Series 2019, GO, 3.00%, 4/1/2021 | | | 250 | | | | 255 | |
| | |
Series 2019, GO, 3.00%, 4/1/2022 | | | 140 | | | | 146 | |
| | |
Series 2019, GO, 3.00%, 4/1/2023 | | | 150 | | | | 159 | |
| | |
City of Watertown | | | | | | | | |
| | |
GO, 3.00%, 6/1/2023 | | | 125 | | | | 134 | |
| | |
GO, 3.00%, 6/1/2024 | | | 425 | | | | 464 | |
| | |
City of Waukesha | | | | | | | | |
| | |
Series 2019C, GO, 3.00%, 10/1/2020 | | | 575 | | | | 575 | |
| | |
Series 2019C, GO, 3.00%, 10/1/2021 | | | 450 | | | | 464 | |
| | |
Series 2019C, GO, 3.00%, 10/1/2022 | | | 425 | | | | 449 | |
| | |
Series 2019C, GO, 3.00%, 10/1/2023 | | | 350 | | | | 378 | |
| | |
County of Douglas | | | | | | | | |
| | |
GO, 5.00%, 2/1/2021 | | | 350 | | | | 357 | |
| | |
GO, 5.00%, 2/1/2022 | | | 520 | | | | 555 | |
| | |
County of Manitowoc | | | | | | | | |
| | |
GO, AGM, 3.00%, 4/1/2021 | | | 350 | | | | 355 | |
| | |
GO, AGM, 3.00%, 4/1/2022 | | | 875 | | | | 911 | |
| | |
GO, AGM, 3.00%, 11/1/2022 | | | 50 | | | | 53 | |
| | |
GO, AGM, 3.00%, 4/1/2023 | | | 895 | | | | 951 | |
| | |
GO, AGM, 3.00%, 11/1/2023 | | | 150 | | | | 161 | |
| | |
GO, AGM, 4.00%, 4/1/2024 | | | 680 | | | | 763 | |
| | | | | | | | |
| INVESTMENTS | | PRINCIPAL
AMOUNT
($000) | | | VALUE
($000) | |
| | | | | | | | |
|
Wisconsin — continued | |
| | |
County of Rusk | | | | | | | | |
| | |
GO, 3.00%, 3/1/2021 | | | 200 | | | | 203 | |
| | |
GO, 3.00%, 3/1/2022 | | | 130 | | | | 135 | |
| | |
GO, 3.00%, 3/1/2023 | | | 260 | | | | 276 | |
| | |
GO, 3.00%, 3/1/2024 | | | 270 | | | | 292 | |
| | |
Eleva-Strum School District GO, 3.00%, 4/1/2021 | | | 450 | | | | 457 | |
| | |
Gale-Ettrick-Trempealeau School District | | | | | | | | |
| | |
GO, 2.00%, 4/1/2021 | | | 50 | | | | 50 | |
| | |
GO, 2.00%, 4/1/2022 | | | 105 | | | | 108 | |
| | |
GO, 2.00%, 4/1/2023 | | | 130 | | | | 135 | |
| | |
Gibraltar Area School District | | | | | | | | |
| | |
GO, 4.00%, 3/1/2021 | | | 700 | | | | 713 | |
| | |
GO, 4.00%, 3/1/2022 | | | 315 | | | | 333 | |
| | |
Lakeshore Technical College District | | | | | | | | |
| | |
Series 2019A, GO, 3.00%, 3/1/2022 | | | 75 | | | | 78 | |
| | |
Series 2019A, GO, 3.00%, 3/1/2023 | | | 110 | | | | 116 | |
| | |
Series 2019A, GO, 3.00%, 3/1/2024 | | | 405 | | | | 437 | |
| | |
Milwaukee Redevelopment Authority, Milwaukee Public Schools Rev., 4.00%, 11/15/2021 | | | 55 | | | | 57 | |
| | |
Pewaukee School District Series 2019A, GO, 5.00%, 3/1/2024 | | | 375 | | | | 435 | |
| | |
Poynette School District | | | | | | | | |
| | |
GO, 3.00%, 4/1/2021 | | | 100 | | | | 102 | |
| | |
GO, 3.00%, 4/1/2022 | | | 340 | | | | 355 | |
| | |
GO, 3.00%, 4/1/2023 | | | 265 | | | | 282 | |
| | |
Randall Consolidated School Joint No. 1 GO, 4.00%, 3/1/2021 | | | 175 | | | | 178 | |
| | |
Village of DeForest Series C, Rev., RAN, 3.00%, 5/1/2023 | | | 4,865 | | | | 4,953 | |
| | |
Village of Howard Rev., RAN, 2.00%, 12/1/2021 | | | 6,965 | | | | 6,993 | |
| | |
Village of Menomonee Falls, Promissory Note Series A, GO, 3.00%, 6/1/2021 | | | 270 | | | | 276 | |
| | |
Village of Mount Pleasant | | | | | | | | |
| | |
Series 2019A, GO, 3.00%, 3/1/2021 | | | 285 | | | | 289 | |
| | |
Series 2019A, GO, 3.00%, 3/1/2022 | | | 265 | | | | 274 | |
| | |
Series 2019A, GO, 5.00%, 3/1/2023 | | | 380 | | | | 423 | |
| | |
Wisconsin Department of Transportation Series 1, Rev., 5.00%, 7/1/2021 | | | 25 | | | | 26 | |
| | |
Wisconsin Health and Educational Facilities Authority, Advocate Aurora Health Credit Group | | | | | | | | |
| | |
Series 2018C-1, Rev., (SIFMA Municipal Swap Index Yield + 0.35%), 0.44%, 9/10/2020 (b) | | | 21,865 | | | | 21,823 | |
| | |
Series 2018B-2, Rev., 5.00%, 1/25/2023 (c) | | | 5,750 | | | | 6,358 | |
SEE NOTES TO FINANCIAL STATEMENTS.
| | | | | | |
| | | |
| 102 | | | | J.P. MORGAN MUNICIPAL BOND FUNDS | | AUGUST 31, 2020 |
| | | | | | | | |
| INVESTMENTS | | PRINCIPAL
AMOUNT
($000) | | | VALUE
($000) | |
Municipal Bonds — continued | | | | | | | | |
|
Wisconsin — continued | |
| | |
Wisconsin Health and Educational Facilities Authority, Franciscan Sisters of Christian Charity Sponsored Ministries, Inc. | | | | | | | | |
| | |
Series 2017A, Rev., 5.00%, 9/1/2020 | | | 155 | | | | 155 | |
| | |
Series 2017A, Rev., 5.00%, 9/1/2021 | | | 160 | | | | 165 | |
| | |
Wisconsin Health and Educational Facilities Authority, Hmong American Peace Academy | | | | | | | | |
| | |
Rev., 4.00%, 3/15/2022 | | | 110 | | | | 115 | |
| | |
Rev., 4.00%, 3/15/2023 | | | 120 | | | | 126 | |
| | |
Rev., 4.00%, 3/15/2024 | | | 120 | | | | 129 | |
| | |
Rev., 4.00%, 3/15/2025 | | | 125 | | | | 137 | |
| | |
Wisconsin Health and Educational Facilities Authority, St. Camillus Health System Series 2019B-3, Rev., 2.25%, 11/1/2026 | | | 4,000 | | | | 3,907 | |
| | |
Wittenberg Birnamwood School District | | | | | | | | |
| | |
GO, AGM, 4.00%, 3/1/2021 | | | 130 | | | | 132 | |
| | |
GO, AGM, 4.00%, 3/1/2022 | | | 260 | | | | 274 | |
| | |
GO, AGM, 4.00%, 3/1/2023 | | | 280 | | | | 306 | |
| | | | | | | | |
| | |
Total Wisconsin | | | | | | | 63,442 | |
| | | | | | | | |
| | |
Total Municipal Bonds
(Cost $5,080,639) | | | | | | | 5,097,481 | |
| | | | | | | | |
| | | | | | | | |
| INVESTMENTS | | PRINCIPAL
AMOUNT
($000) | | | VALUE
($000) | |
U.S. Treasury Obligations — 1.9% | |
| | |
U.S. Treasury Notes | | | | | | | | |
| | |
1.13%, 2/28/2022
(Cost $100,702) | | | 100,000 | | | | 101,457 | |
| | | | | | | | |
| | |
| | | SHARES
(000) | | | | |
Short-Term Investments — 13.0% | |
|
Investment Companies — 13.0% | |
| | |
JPMorgan Institutional Tax Free Money Market Fund Class IM Shares, 0.04% (h) (i)
(Cost $713,341) | | | 712,915 | | | | 713,414 | |
| | | | | | | | |
Total Investments — 107.9%
(Cost $5,894,682) | | | | | | | 5,912,352 | |
Liabilities in Excess of
Other Assets — (7.9)% | | | | | | | (434,394 | ) |
| | | | | | | | |
NET ASSETS — 100.0% | | | | | | | 5,477,958 | |
| | | | | | | | |
Percentages indicated are based on net assets.
Abbreviations
| | |
| AGM | | Insured by Assured Guaranty Municipal Corp. |
| AMT | | Alternative Minimum Tax |
| BAN | | Bond Anticipation Note |
| COLL | | Collateral |
| CONS | | Consolidated Bonds |
| COP | | Certificate of Participation |
| EDA | | Economic Development Authority |
| FHA | | Federal Housing Administration |
| FNMA | | Federal National Mortgage Association |
| GAN | | Grant Anticipation Note |
| GNMA | | Government National Mortgage Association |
| GO | | General Obligation |
| GRAN | | Grant Revenue Anticipation Note |
| GTD | | Guaranteed |
| ICE | | Intercontinental Exchange |
| IDA | | Industrial Development Authority |
| LIBOR | | London Interbank Offered Rate |
| LIQ | | Liquidity Agreement |
| LOC | | Letter of Credit |
| MTA | | Metropolitan Transportation Authority |
| PSF-GTD | | Permanent School Fund Guaranteed |
| Q-SBLF | | Qualified School Bond Loan Fund |
| RAN | | Revenue Anticipation Note |
| Rev. | | Revenue |
| SIFMA | | The Securities Industry and Financial Markets Association |
| | |
| SOFR | | Secured Overnight Financing Rate |
| TAN | | Tax Anticipation Note |
| TRAN | | Tax & Revenue Anticipation Note |
| USD | | United States Dollar |
| VRDO | | Variable Rate Demand Obligation |
| |
| (a) | | The date shown represents the earliest of the prerefunded date, next put date or final maturity date. |
| (b) | | Variable or floating rate security, linked to the referenced benchmark. The interest rate shown is the current rate as of August 31, 2020. |
| (c) | | Variable or floating rate security, the interest rate of which adjusts periodically based on changes in current interest rates and prepayments on the underlying pool of assets. The interest rate shown is the current rate as of August 31, 2020. |
| (d) | | Security is prerefunded or escrowed to maturity. |
| (e) | | Securities exempt from registration under Rule 144A or section 4(a)(2), of the Securities Act of 1933, as amended. |
| (f) | | Amount rounds to less than 0.1% of net assets. |
| (g) | | All or a portion of the security is a when-issued security, delayed delivery security, or forward commitment. |
| (h) | | Investment in an affiliated fund, which is registered under the Investment Company Act of 1940, as amended, and is advised by J.P. Morgan Investment Management Inc. |
| (i) | | The rate shown is the current yield as of August 31, 2020. |
SEE NOTES TO FINANCIAL STATEMENTS.
| | | | | | | | |
| | | |
| AUGUST 31, 2020 | | J.P. MORGAN MUNICIPAL BOND FUNDS | | | | | 103 | |
STATEMENTS OF ASSETS AND LIABILITIES
AS OF AUGUST 31, 2020 (Unaudited)
(Amounts in thousands, except per share amounts)
| | | | | | | | | | | | |
| | | JPMorgan
High Yield
Municipal
Fund | | | JPMorgan
Short- Intermediate
Municipal
Bond Fund | | | JPMorgan
Sustainable
Municipal Income
Fund (formerly
known as
JPMorgan
Municipal
Income Fund) | |
ASSETS: | |
Investments in non-affiliates, at value | | $ | 485,416 | | | $ | 1,562,403 | | | $ | 280,183 | |
Investments in affiliates, at value | | | 17,242 | | | | 186,193 | | | | 21,512 | |
Receivables: | | | | | | | | | | | | |
Investment securities sold | | | 1,851 | | | | 2 | | | | 453 | |
Investment securities sold — delayed delivery securities | | | 3,398 | | | | 1,385 | | | | 175 | |
Fund shares sold | | | 1,430 | | | | 6,902 | | | | 276 | |
Interest from non-affiliates | | | 5,448 | | | | 14,534 | | | | 2,862 | |
Dividends from affiliates | | | 1 | | | | 9 | | | | 1 | |
| | | | | | | | | | | | |
Total Assets | | | 514,786 | | | | 1,771,428 | | | | 305,462 | |
| | | | | | | | | | | | |
|
LIABILITIES: | |
Payables: | | | | | | | | | | | | |
Due to custodian | | | — | | | | — | (a) | | | 6 | |
Investment securities purchased | | | 8,788 | | | | 25,633 | | | | — | |
Investment securities purchased — delayed delivery securities | | | 4,532 | | | | 13,932 | | | | 2,780 | |
Fund shares redeemed | | | 1,493 | | | | 2,928 | | | | 372 | |
Accrued liabilities: | | | | | | | | | | | | |
Investment advisory fees | | | 117 | | | | 219 | | | | 58 | |
Administration fees | | | 19 | | | | 21 | | | | 7 | |
Distribution fees | | | 60 | | | | 17 | | | | 32 | |
Service fees | | | 23 | | | | 46 | | | | 20 | |
Custodian and accounting fees | | | 26 | | | | 33 | | | | 17 | |
Trustees’ and Chief Compliance Officer’s fees | | | — | (a) | | | 1 | | | | 1 | |
Other | | | 84 | | | | 77 | | | | 60 | |
| | | | | | | | | | | | |
Total Liabilities | | | 15,142 | | | | 42,907 | | | | 3,353 | |
| | | | | | | | | | | | |
Net Assets | | $ | 499,644 | | | $ | 1,728,521 | | | $ | 302,109 | |
| | | | | | | | | | | | |
| (a) | Amount rounds to less than one thousand. |
SEE NOTES TO FINANCIAL STATEMENTS.
| | | | | | |
| | | |
| 104 | | | | J.P. MORGAN MUNICIPAL BOND FUNDS | | AUGUST 31, 2020 |
| | | | | | | | | | | | |
| | | JPMorgan
High Yield
Municipal
Fund | | | JPMorgan
Short- Intermediate
Municipal
Bond Fund | | | JPMorgan
Sustainable
Municipal Income
Fund (formerly
known as
JPMorgan
Municipal
Income Fund) | |
NET ASSETS: | |
Paid-in-Capital | | $ | 501,685 | | | $ | 1,681,983 | | | $ | 288,983 | |
Total distributable earnings (loss) | | | (2,041 | ) | | | 46,538 | | | | 13,126 | |
| | | | | | | | | | | | |
Total Net Assets | | $ | 499,644 | | | $ | 1,728,521 | | | $ | 302,109 | |
| | | | | | | | | | | | |
|
Net Assets: | |
Class A | | $ | 169,070 | | | $ | 71,587 | | | $ | 115,463 | |
Class C | | | 36,667 | | | | 4,955 | | | | 11,659 | |
Class I | | | 274,219 | | | | 747,249 | | | | 108,647 | |
Class R6 | | | 19,688 | | | | 904,730 | | | | 66,340 | |
| | | | | | | | | | | | |
Total | | $ | 499,644 | | | $ | 1,728,521 | | | $ | 302,109 | |
| | | | | | | | | | | | |
|
Outstanding units of beneficial interest (shares) | |
($0.0001 par value; unlimited number of shares authorized): | | | | | | | | | | | | |
Class A | | | 15,135 | | | | 6,610 | | | | 11,559 | |
Class C | | | 3,290 | | | | 453 | | | | 1,179 | |
Class I | | | 24,552 | | | | 68,627 | | | | 10,959 | |
Class R6 | | | 1,762 | | | | 83,123 | | | | 6,694 | |
Net Asset Value (a): | | | | | | | | | | | | |
Class A — Redemption price per share | | $ | 11.17 | | | $ | 10.83 | | | $ | 9.99 | |
Class C — Offering price per share (b) | | | 11.15 | | | | 10.93 | | | | 9.89 | |
Class I — Offering and redemption price per share | | | 11.17 | | | | 10.89 | | | | 9.91 | |
Class R6 — Offering and redemption price per share | | | 11.17 | | | | 10.88 | | | | 9.91 | |
Class A maximum sales charge | | | 3.75 | % | | | 2.25 | % | | | 3.75 | % |
Class A maximum public offering price per share
[net asset value per share/(100% — maximum sales charge)] | | $ | 11.61 | | | $ | 11.08 | | | $ | 10.38 | |
| | | | | | | | | | | | |
| | | |
Cost of investments in non-affiliates | | $ | 482,340 | | | $ | 1,502,004 | | | $ | 266,408 | |
Cost of investments in affiliates | | | 17,242 | | | | 186,178 | | | | 21,510 | |
| (a) | Per share amounts may not recalculate due to rounding of net assets and/or shares outstanding. |
| (b) | Redemption price for Class C Shares varies based upon length of time the shares are held. |
SEE NOTES TO FINANCIAL STATEMENTS.
| | | | | | | | |
| | | |
| AUGUST 31, 2020 | | J.P. MORGAN MUNICIPAL BOND FUNDS | | | | | 105 | |
STATEMENTS OF ASSETS AND LIABILITIES
AS OF AUGUST 31, 2020 (Unaudited) (continued)
(Amounts in thousands, except per share amounts)
| | | | | | | | |
| | | JPMorgan
Tax Free
Bond Fund | | | JPMorgan
Ultra-Short
Municipal Fund | |
ASSETS: | |
Investments in non-affiliates, at value | | $ | 544,544 | | | $ | 5,198,938 | |
Investments in affiliates, at value | | | 15,282 | | | | 713,414 | |
Deposits at broker for futures contracts | | | 239 | | | | — | |
Receivables: | | | | | | | | |
Investment securities sold | | | 317 | | | | 921 | |
Investment securities sold — delayed delivery securities | | | 895 | | | | 380 | |
Fund shares sold | | | 1,508 | | | | 35,949 | |
Interest from non-affiliates | | | 5,250 | | | | 20,248 | |
Dividends from affiliates | | | 1 | | | | 50 | |
Due from adviser | | | — | | | | 58 | |
| | | | | | | | |
Total Assets | | | 568,036 | | | | 5,969,958 | |
| | | | | | | | |
|
LIABILITIES: | |
Payables: | |
Due to custodian | | | — | | | | 49,989 | |
Investment securities purchased | | | 3,000 | | | | 362,203 | |
Investment securities purchased — delayed delivery securities | | | — | | | | 7,815 | |
Fund shares redeemed | | | 318 | | | | 70,722 | |
Variation margin on futures contracts | | | 3 | | | | — | |
Accrued liabilities: | | | | | | | | |
Investment advisory fees | | | 126 | | | | — | |
Administration fees | | | 26 | | | | — | |
Distribution fees | | | 69 | | | | 40 | |
Service fees | | | 12 | | | | 1,043 | |
Custodian and accounting fees | | | 28 | | | | 78 | |
Trustees’ and Chief Compliance Officer’s fees | | | — | (a) | | | 4 | |
Other | | | 56 | | | | 106 | |
| | | | | | | | |
Total Liabilities | | | 3,638 | | | | 492,000 | |
| | | | | | | | |
Net Assets | | $ | 564,398 | | | $ | 5,477,958 | |
| | | | | | | | |
| (a) | Amount rounds to less than one thousand. |
SEE NOTES TO FINANCIAL STATEMENTS.
| | | | | | |
| | | |
| 106 | | | | J.P. MORGAN MUNICIPAL BOND FUNDS | | AUGUST 31, 2020 |
| | | | | | | | |
| | | JPMorgan
Tax Free
Bond Fund | | | JPMorgan
Ultra-Short
Municipal Fund | |
NET ASSETS: | |
Paid-in-Capital | | $ | 539,195 | | | $ | 5,467,704 | |
Total distributable earnings (loss) | | | 25,203 | | | | 10,254 | |
| | | | | | | | |
Total Net Assets | | $ | 564,398 | | | $ | 5,477,958 | |
| | | | | | | | |
|
Net Assets: | |
Class A | | $ | 255,242 | | | $ | 193,026 | |
Class C | | | 24,062 | | | | — | |
Class I | | | 168,187 | | | | 5,284,932 | |
Class R6 | | | 116,907 | | | | — | |
| | | | | | | | |
Total | | $ | 564,398 | | | $ | 5,477,958 | |
| | | | | | | | |
|
Outstanding units of beneficial interest (shares) | |
($0.0001 par value; unlimited number of shares authorized): | | | | | | | | |
Class A | | | 20,552 | | | | 19,164 | |
Class C | | | 1,955 | | | | — | |
Class I | | | 13,602 | | | | 525,064 | |
Class R6 | | | 9,457 | | | | — | |
| | |
Net Asset Value (a): | | | | | | | | |
Class A — Redemption price per share | | $ | 12.42 | | | $ | 10.07 | |
Class C — Offering price per share (b) | | | 12.31 | | | | — | |
Class I — Offering and redemption price per share | | | 12.36 | | | | 10.07 | |
Class R6 — Offering and redemption price per share | | | 12.36 | | | | — | |
Class A maximum sales charge | | | 3.75 | % | | | 2.25 | % |
Class A maximum public offering price per share
[net asset value per share/(100% — maximum sales charge)] | | $ | 12.90 | | | $ | 10.30 | |
| | | | | | | | |
| | |
Cost of investments in non-affiliates | | $ | 507,902 | | | $ | 5,181,341 | |
Cost of investments in affiliates | | | 15,276 | | | | 713,341 | |
| (a) | Per share amounts may not recalculate due to rounding of net assets and/or shares outstanding. |
| (b) | Redemption price for Class C Shares varies based upon length of time the shares are held. |
SEE NOTES TO FINANCIAL STATEMENTS.
| | | | | | | | |
| | | |
| AUGUST 31, 2020 | | J.P. MORGAN MUNICIPAL BOND FUNDS | | | | | 107 | |
STATEMENTS OF OPERATIONS
FOR THE SIX MONTHS ENDED AUGUST 31, 2020 (Unaudited)
(Amounts in thousands)
| | | | | | | | | | | | |
| | | JPMorgan
High Yield
Municipal
Fund | | | JPMorgan
Short- Intermediate
Municipal
Bond Fund | | | JPMorgan
Sustainable
Municipal Income
Fund (formerly
known as
JPMorgan
Municipal
Income Fund) | |
INVESTMENT INCOME: | |
Interest income from non-affiliates | | $ | 8,722 | | | $ | 16,835 | | | $ | 3,419 | |
Interest income from affiliates | | | — | | | | — | (a) | | | — | |
Dividend income from non-affiliates | | | 2 | | | | — | | | | — | |
Dividend income from affiliates | | | 48 | | | | 105 | | | | 18 | |
| | | | | | | | | | | | |
Total investment income | | | 8,772 | | | | 16,940 | | | | 3,437 | |
| | | | | | | | | | | | |
|
EXPENSES: | |
Investment advisory fees | | | 830 | | | | 2,046 | | | | 425 | |
Administration fees | | | 178 | | | | 614 | | | | 106 | |
Distribution fees: | | | | | | | | | | | | |
Class A | | | 204 | | | | 71 | | | | 129 | |
Class C | | | 134 | | | | 20 | | | | 45 | |
Service fees: | | | | | | | | | | | | |
Class A | | | 204 | | | | 71 | | | | 129 | |
Class C | | | 45 | | | | 7 | | | | 15 | |
Class I | | | 336 | | | | 816 | | | | 133 | |
Custodian and accounting fees | | | 66 | | | | 91 | | | | 32 | |
Interest expense to affiliates | | | — | (a) | | | — | (a) | | | — | (a) |
Professional fees | | | 46 | | | | 42 | | | | 28 | |
Trustees’ and Chief Compliance Officer’s fees | | | 14 | | | | 16 | | | | 14 | |
Printing and mailing costs | | | 10 | | | | 41 | | | | 9 | |
Registration and filing fees | | | 74 | | | | 48 | | | | 45 | |
Transfer agency fees (See Note 2.I.) | | | 4 | | | | 12 | | | | 3 | |
Other | | | 3 | | | | 12 | | | | 5 | |
| | | | | | | | | | | | |
Total expenses | | | 2,148 | | | | 3,907 | | | | 1,118 | |
| | | | | | | | | | | | |
Less fees waived | | | (617 | ) | | | (1,976 | ) | | | (341 | ) |
Less expense reimbursements | | | (51 | ) | | | (1 | ) | | | — | |
| | | | | | | | | | | | |
Net expenses | | | 1,480 | | | | 1,930 | | | | 777 | |
| | | | | | | | | | | | |
Net investment income (loss) | | | 7,292 | | | | 15,010 | | | | 2,660 | |
| | | | | | | | | | | | |
| | | |
REALIZED/UNREALIZED GAINS (LOSSES): | | | | | | | | | | | | |
Net realized gain (loss) on transactions from: | | | | | | | | | | | | |
Investments in non-affiliates | | | (5,576 | ) | | | (1,231 | ) | | | (130 | ) |
Investments in affiliates | | | — | (a) | | | — | (a) | | | (1 | ) |
| | | | | | | | | | | | |
Net realized gain (loss) | | | (5,576 | ) | | | (1,231 | ) | | | (131 | ) |
| | | | | | | | | | | | |
Change in net unrealized appreciation/depreciation on: | | | | | | | | | | | | |
Investments in non-affiliates | | | (28,084 | ) | | | (6,214 | ) | | | (1,411 | ) |
Investments in affiliates | | | — | (a) | | | 14 | | | | 2 | |
| | | | | | | | | | | | |
Change in net unrealized appreciation/depreciation | | | (28,084 | ) | | | (6,200 | ) | | | (1,409 | ) |
| | | | | | | | | | | | |
Net realized/unrealized gains (losses) | | | (33,660 | ) | | | (7,431 | ) | | | (1,540 | ) |
| | | | | | | | | | | | |
Change in net assets resulting from operations | | $ | (26,368 | ) | | $ | 7,579 | | | $ | 1,120 | |
| | | | | | | | | | | | |
| (a) | Amount rounds to less than one thousand. |
SEE NOTES TO FINANCIAL STATEMENTS.
| | | | | | |
| | | |
| 108 | | | | J.P. MORGAN MUNICIPAL BOND FUNDS | | AUGUST 31, 2020 |
| | | | | | | | |
| | | JPMorgan
Tax Free
Bond Fund | | |
JPMorgan
Ultra-Short
Municipal Fund | |
INVESTMENT INCOME: | |
Interest income from non-affiliates | | $ | 7,771 | | | $ | 21,883 | |
Interest income from affiliates | | | — | | | | — | (a) |
Dividend income from affiliates | | | 43 | | | | 593 | |
| | | | | | | | |
Total investment income | | | 7,814 | | | | 22,476 | |
| | | | | | | | |
|
EXPENSES: | |
Investment advisory fees | | | 793 | | | | 3,145 | |
Administration fees | | | 198 | | | | 1,572 | |
Distribution fees: | | | | | | | | |
Class A | | | 287 | | | | 185 | |
Class C | | | 93 | | | | — | |
Service fees: | | | | | | | | |
Class A | | | 287 | | | | 185 | |
Class C | | | 31 | | | | — | |
Class I | | | 205 | | | | 5,057 | |
Custodian and accounting fees | | | 77 | | | | 216 | |
Interest expense to affiliates | | | — | (a) | | | 8 | |
Professional fees | | | 24 | | | | 60 | |
Trustees’ and Chief Compliance Officer’s fees | | | 14 | | | | 23 | |
Printing and mailing costs | | | 15 | | | | 25 | |
Registration and filing fees | | | 62 | | | | 27 | |
Transfer agency fees (See Note 2.I.) | | | 10 | | | | 14 | |
Other | | | 6 | | | | 46 | |
| | | | | | | | |
Total expenses | | | 2,102 | | | | 10,563 | |
| | | | | | | | |
Less fees waived | | | (598 | ) | | | (5,378 | ) |
| | | | | | | | |
Net expenses | | | 1,504 | | | | 5,185 | |
| | | | | | | | |
Net investment income (loss) | | | 6,310 | | | | 17,291 | |
| | | | | | | | |
| | |
REALIZED/UNREALIZED GAINS (LOSSES): | | | | | | | | |
Net realized gain (loss) on transactions from: | |
Investments in non-affiliates | | | (2,050 | ) | | | (6,147 | ) |
Investments in affiliates | | | 10 | | | | (81 | ) |
Futures contracts | | | (760 | ) | | | — | |
| | | | | | | | |
Net realized gain (loss) | | | (2,800 | ) | | | (6,228 | ) |
| | | | | | | | |
Change in net unrealized appreciation/depreciation on: | |
Investments in non-affiliates | | | (10,195 | ) | | | (2,986 | ) |
Investments in affiliates | | | 5 | | | | 73 | |
Futures contracts | | | 255 | | | | — | |
| | | | | | | | |
Change in net unrealized appreciation/depreciation | | | (9,935 | ) | | | (2,913 | ) |
| | | | | | | | |
Net realized/unrealized gains (losses) | | | (12,735 | ) | | | (9,141 | ) |
| | | | | | | | |
Change in net assets resulting from operations | | $ | (6,425 | ) | | $ | 8,150 | |
| | | | | | | | |
| (a) | Amount rounds to less than one thousand. |
SEE NOTES TO FINANCIAL STATEMENTS.
| | | | | | | | |
| | | |
| AUGUST 31, 2020 | | J.P. MORGAN MUNICIPAL BOND FUNDS | | | | | 109 | |
STATEMENTS OF CHANGES IN NET ASSETS
FOR THE PERIODS INDICATED
(Amounts in thousands)
| | | | | | | | | | | | | | | | |
| | | JPMorgan High Yield Municipal Fund | | | JPMorgan Short-Intermediate
Municipal Bond Fund | |
| | | Six Months
Ended
August 31, 2020
(Unaudited) | | | Year Ended
February 29, 2020 | | | Six Months
Ended
August 31, 2020
(Unaudited) | | | Year Ended
February 29, 2020 | |
CHANGE IN NET ASSETS RESULTING FROM OPERATIONS: | | | | | | | | | | | | | | | | |
Net investment income (loss) | | $ | 7,292 | | | $ | 9,327 | | | $ | 15,010 | | | $ | 30,983 | |
Net realized gain (loss) | | | (5,576 | ) | | | 1,187 | | | | (1,231 | ) | | | 5,377 | |
Change in net unrealized appreciation/depreciation | | | (28,084 | ) | | | 28,740 | | | | (6,200 | ) | | | 49,005 | |
| | | | | | | | | | | | | | | | |
Change in net assets resulting from operations | | | (26,368 | ) | | | 39,254 | | | | 7,579 | | | | 85,365 | |
| | | | | | | | | | | | | | | | |
| | | | |
DISTRIBUTIONS TO SHAREHOLDERS: | | | | | | | | | | | | | | | | |
Class A | | | (2,483 | ) | | | (3,137 | ) | | | (369 | ) | | | (652 | ) |
Class C | | | (462 | ) | | | (644 | ) | | | (20 | ) | | | (41 | ) |
Class I | | | (4,277 | ) | | | (5,749 | ) | | | (5,601 | ) | | | (12,180 | ) |
Class R6 | | | (109 | ) | | | (103 | ) | | | (8,097 | ) | | | (18,526 | ) |
| | | | | | | | | | | | | | | | |
Total distributions to shareholders | | | (7,331 | ) | | | (9,633 | ) | | | (14,087 | ) | | | (31,399 | ) |
| | | | | | | | | | | | | | | | |
| | | | |
CAPITAL TRANSACTIONS: | | | | | | | | | | | | | | | | |
Change in net assets resulting from capital transactions | | | (1,413 | ) | | | 346,641 | | | | 73,662 | | | | 129,277 | |
| | | | | | | | | | | | | | | | |
| | | | |
NET ASSETS: | | | | | | | | | | | | | | | | |
Change in net assets | | | (35,112 | ) | | | 376,262 | | | | 67,154 | | | | 183,243 | |
Beginning of period | | | 534,756 | | | | 158,494 | | | | 1,661,367 | | | | 1,478,124 | |
| | | | | | | | | | | | | | | | |
End of period | | $ | 499,644 | | | $ | 534,756 | | | $ | 1,728,521 | | | $ | 1,661,367 | |
| | | | | | | | | | | | | | | | |
SEE NOTES TO FINANCIAL STATEMENTS.
| | | | | | |
| | | |
| 110 | | | | J.P. MORGAN MUNICIPAL BOND FUNDS | | AUGUST 31, 2020 |
| | | | | | | | | | | | | | | | |
| | | JPMorgan Sustainable Municipal Income Fund
(formerly known as JPMorgan Municipal
Income Fund) | | | JPMorgan Tax Free Bond Fund | |
| | | Six Months
Ended
August 31, 2020
(Unaudited) | | | Year Ended
February 29, 2020 | | | Six Months
Ended
August 31, 2020
(Unaudited) | | | Year Ended
February 29, 2020 | |
CHANGE IN NET ASSETS RESULTING FROM OPERATIONS: | | | | | | | | | | | | | | | | |
Net investment income (loss) | | $ | 2,660 | | | $ | 5,026 | | | $ | 6,310 | | | $ | 12,273 | |
Net realized gain (loss) | | | (131 | ) | | | (362 | ) | | | (2,800 | ) | | | (522 | ) |
Change in net unrealized appreciation/depreciation | | | (1,409 | ) | | | 11,661 | | | | (9,935 | ) | | | 33,879 | |
| | | | | | | | | | | | | | | | |
Change in net assets resulting from operations | | | 1,120 | | | | 16,325 | | | | (6,425 | ) | | | 45,630 | |
| | | | | | | | | | | | | | | | |
| | | | |
DISTRIBUTIONS TO SHAREHOLDERS: | | | | | | | | | | | | | | | | |
Class A | | | (908 | ) | | | (1,506 | ) | | | (2,638 | ) | | | (4,479 | ) |
Class C | | | (71 | ) | | | (188 | ) | | | (210 | ) | | | (558 | ) |
Class I | | | (1,051 | ) | | | (2,040 | ) | | | (2,065 | ) | | | (4,385 | ) |
Class R6 | | | (654 | ) | | | (1,287 | ) | | | (1,423 | ) | | | (2,816 | ) |
| | | | | | | | | | | | | | | | |
Total distributions to shareholders | | | (2,684 | ) | | | (5,021 | ) | | | (6,336 | ) | | | (12,238 | ) |
| | | | | | | | | | | | | | | | |
| | | | |
CAPITAL TRANSACTIONS: | | | | | | | | | | | | | | | | |
Change in net assets resulting from capital transactions | | | 18,253 | | | | 75,558 | | | | 25,381 | | | | 135,787 | |
| | | | | | | | | | | | | | | | |
| | | | |
NET ASSETS: | | | | | | | | | | | | | | | | |
Change in net assets | | | 16,689 | | | | 86,862 | | | | 12,620 | | | | 169,179 | |
Beginning of period | | | 285,420 | | | | 198,558 | | | | 551,778 | | | | 382,599 | |
| | | | | | | | | | | | | | | | |
End of period | | $ | 302,109 | | | $ | 285,420 | | | $ | 564,398 | | | $ | 551,778 | |
| | | | | | | | | | | | | | | | |
SEE NOTES TO FINANCIAL STATEMENTS.
| | | | | | | | |
| | | |
| AUGUST 31, 2020 | | J.P. MORGAN MUNICIPAL BOND FUNDS | | | | | 111 | |
STATEMENTS OF CHANGES IN NET ASSETS
FOR THE PERIODS INDICATED (continued)
(Amounts in thousands)
| | | | | | | | |
| | |
JPMorgan Ultra-Short Municipal Fund | |
| | | Six Months
Ended
August 31, 2020
(Unaudited) | | | Year Ended
February 29, 2020 | |
CHANGE IN NET ASSETS RESULTING FROM OPERATIONS: | | | | | | | | |
Net investment income (loss) | | $ | 17,291 | | | $ | 47,954 | |
Net realized gain (loss) | | | (6,228 | ) | | | (635 | ) |
Change in net unrealized appreciation/depreciation | | | (2,913 | ) | | | 17,937 | |
| | | | | | | | |
Change in net assets resulting from operations | | | 8,150 | | | | 65,256 | |
| | | | | | | | |
| | |
DISTRIBUTIONS TO SHAREHOLDERS: | | | | | | | | |
Class A | | | (432 | ) | | | (694 | ) |
Class I | | | (16,611 | ) | | | (47,204 | ) |
| | | | | | | | |
Total distributions to shareholders | | | (17,043 | ) | | | (47,898 | ) |
| | | | | | | | |
| | |
CAPITAL TRANSACTIONS: | | | | | | | | |
Change in net assets resulting from capital transactions | | | 1,329,340 | | | | 1,051,707 | |
| | | | | | | | |
| | |
NET ASSETS: | | | | | | | | |
Change in net assets | | | 1,320,447 | | | | 1,069,065 | |
Beginning of period | | | 4,157,511 | | | | 3,088,446 | |
| | | | | | | | |
End of period | | $ | 5,477,958 | | | $ | 4,157,511 | |
| | | | | | | | |
SEE NOTES TO FINANCIAL STATEMENTS.
| | | | | | |
| | | |
| 112 | | | | J.P. MORGAN MUNICIPAL BOND FUNDS | | AUGUST 31, 2020 |
| | | | | | | | | | | | | | | | |
| | | JPMorgan High Yield Municipal Fund | | | JPMorgan Short-Intermediate
Municipal Bond Fund | |
| | | Six Months
Ended
August 31, 2020
(Unaudited) | | | Year Ended
February 29, 2020 | | | Six Months
Ended
August 31, 2020
(Unaudited) | | | Year Ended
February 29, 2020 | |
CAPITAL TRANSACTIONS: | | | | | | | | | | | | | | | | |
Class A | | | | | | | | | | | | | | | | |
Proceeds from shares issued | | $ | 34,084 | | | $ | 157,088 | | | $ | 31,699 | | | $ | 32,090 | |
Distributions reinvested | | | 2,447 | | | | 3,085 | | | | 366 | | | | 648 | |
Cost of shares redeemed | | | (48,411 | ) | | | (18,889 | ) | | | (13,747 | ) | | | (14,332 | ) |
| | | | | | | | | | | | | | | | |
Change in net assets resulting from Class A capital transactions | | $ | (11,880 | ) | | $ | 141,284 | | | $ | 18,318 | | | $ | 18,406 | |
| | | | | | | | | | | | | | | | |
Class C | | | | | | | | | | | | | | | | |
Proceeds from shares issued | | $ | 9,707 | | | $ | 22,062 | | | $ | 2,557 | | | $ | 2,099 | |
Distributions reinvested | | | 452 | | | | 619 | | | | 19 | | | | 34 | |
Cost of shares redeemed | | | (8,774 | ) | | | (5,415 | ) | | | (1,964 | ) | | | (2,564 | ) |
| | | | | | | | | | | | | | | | |
Change in net assets resulting from Class C capital transactions | | $ | 1,385 | | | $ | 17,266 | | | $ | 612 | | | $ | (431 | ) |
| | | | | | | | | | | | | | | | |
Class I | | | | | | | | | | | | | | | | |
Proceeds from shares issued | | $ | 113,181 | | | $ | 221,490 | | | $ | 313,068 | | | $ | 310,487 | |
Distributions reinvested | | | 4,247 | | | | 5,733 | | | | 5,456 | | | | 11,873 | |
Cost of shares redeemed | | | (122,252 | ) | | | (43,564 | ) | | | (210,375 | ) | | | (275,025 | ) |
| | | | | | | | | | | | | | | | |
Change in net assets resulting from Class I capital transactions | | $ | (4,824 | ) | | $ | 183,659 | | | $ | 108,149 | | | $ | 47,335 | |
| | | | | | | | | | | | | | | | |
Class R6 | | | | | | | | | | | | | | | | |
Proceeds from shares issued | | $ | 15,831 | | | $ | 5,577 | | | $ | 75,064 | | | $ | 300,185 | |
Distributions reinvested | | | 109 | | | | 102 | | | | 8,015 | | | | 18,420 | |
Cost of shares redeemed | | | (2,034 | ) | | | (1,247 | ) | | | (136,496 | ) | | | (254,638 | ) |
| | | | | | | | | | | | | | | | |
Change in net assets resulting from Class R6 capital transactions | | $ | 13,906 | | | $ | 4,432 | | | $ | (53,417 | ) | | $ | 63,967 | |
| | | | | | | | | | | | | | | | |
Total change in net assets resulting from capital transactions | | $ | (1,413 | ) | | $ | 346,641 | | | $ | 73,662 | | | $ | 129,277 | |
| | | | | | | | | | | | | | | | |
SEE NOTES TO FINANCIAL STATEMENTS.
| | | | | | | | |
| | | |
| AUGUST 31, 2020 | | J.P. MORGAN MUNICIPAL BOND FUNDS | | | | | 113 | |
STATEMENTS OF CHANGES IN NET ASSETS
FOR THE PERIODS INDICATED (continued)
(Amounts in thousands)
| | | | | | | | | | | | | | | | |
| | | JPMorgan High Yield Municipal Fund | | | JPMorgan Short-Intermediate
Municipal Bond Fund | |
| | | Six Months
Ended
August 31, 2020
(Unaudited) | | | Year Ended
February 29, 2020 | | | Six Months
Ended
August 31, 2020
(Unaudited) | | | Year Ended
February 29, 2020 | |
SHARE TRANSACTIONS: | | | | | | | | | | | | | | | | |
Class A | | | | | | | | | | | | | | | | |
Issued | | | 3,115 | | | | 13,674 | | | | 2,949 | | | | 3,003 | |
Reinvested | | | 227 | | | | 268 | | | | 34 | | | | 60 | |
Redeemed | | | (4,522 | ) | | | (1,633 | ) | | | (1,292 | ) | | | (1,341 | ) |
| | | | | | | | | | | | | | | | |
Change in Class A Shares | | | (1,180 | ) | | | 12,309 | | | | 1,691 | | | | 1,722 | |
| | | | | | | | | | | | | | | | |
Class C | | | | | | | | | | | | | | | | |
Issued | | | 902 | | | | 1,928 | | | | 240 | | | | 194 | |
Reinvested | | | 42 | | | | 54 | | | | 2 | | | | 3 | |
Redeemed | | | (815 | ) | | | (473 | ) | | | (182 | ) | | | (238 | ) |
| | | | | | | | | | | | | | | | |
Change in Class C Shares | | | 129 | | | | 1,509 | | | | 60 | | | | (41 | ) |
| | | | | | | | | | | | | | | | |
Class I | | | | | | | | | | | | | | | | |
Issued | | | 10,626 | | | | 19,345 | | | | 28,908 | | | | 28,928 | |
Reinvested | | | 394 | | | | 498 | | | | 506 | | | | 1,106 | |
Redeemed | | | (11,322 | ) | | | (3,786 | ) | | | (19,585 | ) | | | (25,587 | ) |
| | | | | | | | | | | | | | | | |
Change in Class I Shares | | | (302 | ) | | | 16,057 | | | | 9,829 | | | | 4,447 | |
| | | | | | | | | | | | | | | | |
Class R6 | | | | | | | | | | | | | | | | |
Issued | | | 1,431 | | | | 485 | | | | 6,991 | | | | 27,999 | |
Reinvested | | | 10 | | | | 9 | | | | 744 | | | | 1,717 | |
Redeemed | | | (187 | ) | | | (109 | ) | | | (12,761 | ) | | | (23,752 | ) |
| | | | | | | | | | | | | | | | |
Change in Class R6 Shares | | | 1,254 | | | | 385 | | | | (5,026 | ) | | | 5,964 | |
| | | | | | | | | | | | | | | | |
SEE NOTES TO FINANCIAL STATEMENTS.
| | | | | | |
| | | |
| 114 | | | | J.P. MORGAN MUNICIPAL BOND FUNDS | | AUGUST 31, 2020 |
| | | | | | | | | | | | | | | | |
| | | JPMorgan Sustainable Municipal Income Fund
(formerly known as JPMorgan Municipal
Income Fund) | | | JPMorgan Tax Free Bond Fund | |
| | | Six Months
Ended
August 31, 2020
(Unaudited) | | | Year Ended
February 29, 2020 | | | Six Months
Ended
August 31, 2020
(Unaudited) | | | Year Ended
February 29, 2020 | |
CAPITAL TRANSACTIONS: | | | | | | | | | | | | | | | | |
Class A | | | | | | | | | | | | | | | | |
Proceeds from shares issued | | $ | 28,610 | | | $ | 44,590 | | | $ | 61,013 | | | $ | 122,167 | |
Distributions reinvested | | | 895 | | | | 1,476 | | | | 2,578 | | | | 4,347 | |
Cost of shares redeemed | | | (10,672 | ) | | | (12,912 | ) | | | (35,423 | ) | | | (40,378 | ) |
| | | | | | | | | | | | | | | | |
Change in net assets resulting from Class A capital transactions | | $ | 18,833 | | | $ | 33,154 | | | $ | 28,168 | | | $ | 86,136 | |
| | | | | | | | | | | | | | | | |
Class C | | | | | | | | | | | | | | | | |
Proceeds from shares issued | | $ | 1,702 | | | $ | 4,262 | | | $ | 2,009 | | | $ | 6,842 | |
Distributions reinvested | | | 69 | | | | 176 | | | | 203 | | | | 539 | |
Cost of shares redeemed | | | (2,890 | ) | | | (5,022 | ) | | | (4,477 | ) | | | (10,107 | ) |
| | | | | | | | | | | | | | | | |
Change in net assets resulting from Class C capital transactions | | $ | (1,119 | ) | | $ | (584 | ) | | $ | (2,265 | ) | | $ | (2,726 | ) |
| | | | | | | | | | | | | | | | |
Class I | | | | | | | | | | | | | | | | |
Proceeds from shares issued | | $ | 28,526 | | | $ | 49,981 | | | $ | 39,167 | | | $ | 56,040 | |
Distributions reinvested | | | 1,026 | | | | 1,971 | | | | 1,895 | | | | 4,060 | |
Cost of shares redeemed | | | (34,695 | ) | | | (15,978 | ) | | | (45,742 | ) | | | (29,103 | ) |
| | | | | | | | | | | | | | | | |
Change in net assets resulting from Class I capital transactions | | $ | (5,143 | ) | | $ | 35,974 | | | $ | (4,680 | ) | | $ | 30,997 | |
| | | | | | | | | | | | | | | | |
Class R6 | | | | | | | | | | | | | | | | |
Proceeds from shares issued | | $ | 8,680 | | | $ | 14,651 | | | $ | 24,749 | | | $ | 37,282 | |
Distributions reinvested | | | 643 | | | | 1,269 | | | | 1,422 | | | | 2,816 | |
Cost of shares redeemed | | | (3,641 | ) | | | (8,906 | ) | | | (22,013 | ) | | | (18,718 | ) |
| | | | | | | | | | | | | | | | |
Change in net assets resulting from Class R6 capital transactions | | $ | 5,682 | | | $ | 7,014 | | | $ | 4,158 | | | $ | 21,380 | |
| | | | | | | | | | | | | | | | |
Total change in net assets resulting from capital transactions | | $ | 18,253 | | | $ | 75,558 | | | $ | 25,381 | | | $ | 135,787 | |
| | | | | | | | | | | | | | | | |
SEE NOTES TO FINANCIAL STATEMENTS.
| | | | | | | | |
| | | |
| AUGUST 31, 2020 | | J.P. MORGAN MUNICIPAL BOND FUNDS | | | | | 115 | |
STATEMENTS OF CHANGES IN NET ASSETS
FOR THE PERIODS INDICATED (continued)
(Amounts in thousands)
| | | | | | | | | | | | | | | | |
| | | JPMorgan Sustainable Municipal Income Fund
(formerly known as JPMorgan Municipal
Income Fund) | | | JPMorgan Tax Free Bond Fund | |
| | | Six Months
Ended
August 31, 2020
(Unaudited) | | | Year Ended
February 29, 2020 | | | Six Months
Ended
August 31, 2020
(Unaudited) | | | Year Ended
February 29, 2020 | |
SHARE TRANSACTIONS: | | | | | | | | | | | | | | | | |
Class A | | | | | | | | | | | | | | | | |
Issued | | | 2,894 | | | | 4,540 | | | | 4,980 | | | | 9,980 | |
Reinvested | | | 91 | | | | 151 | | | | 211 | | | | 355 | |
Redeemed | | | (1,090 | ) | | | (1,318 | ) | | | (2,946 | ) | | | (3,309 | ) |
| | | | | | | | | | | | | | | | |
Change in Class A Shares | | | 1,895 | | | | 3,373 | | | | 2,245 | | | | 7,026 | |
| | | | | | | | | | | | | | | | |
Class C | | | | | | | | | | | | | | | | |
Issued | | | 173 | | | | 441 | | | | 166 | | | | 565 | |
Reinvested | | | 7 | | | | 18 | | | | 17 | | | | 45 | |
Redeemed | | | (299 | ) | | | (518 | ) | | | (376 | ) | | | (835 | ) |
| | | | | | | | | | | | | | | | |
Change in Class C Shares | | | (119 | ) | | | (59 | ) | | | (193 | ) | | | (225 | ) |
| | | | | | | | | | | | | | | | |
Class I | | | | | | | | | | | | | | | | |
Issued | | | 2,921 | | | | 5,130 | | | | 3,211 | | | | 4,611 | |
Reinvested | | | 105 | | | | 202 | | | | 156 | | | | 334 | |
Redeemed | | | (3,607 | ) | | | (1,639 | ) | | | (3,851 | ) | | | (2,400 | ) |
| | | | | | | | | | | | | | | | |
Change in Class I Shares | | | (581 | ) | | | 3,693 | | | | (484 | ) | | | 2,545 | |
| | | | | | | | | | | | | | | | |
Class R6 | | | | | | | | | | | | | | | | |
Issued | | | 877 | | | | 1,508 | | | | 2,038 | | | | 3,067 | |
Reinvested | | | 65 | | | | 131 | | | | 117 | | | | 231 | |
Redeemed | | | (377 | ) | | | (920 | ) | | | (1,855 | ) | | | (1,547 | ) |
| | | | | | | | | | | | | | | | |
Change in Class R6 Shares | | | 565 | | | | 719 | | | | 300 | | | | 1,751 | |
| | | | | | | | | | | | | | | | |
SEE NOTES TO FINANCIAL STATEMENTS.
| | | | | | |
| | | |
| 116 | | | | J.P. MORGAN MUNICIPAL BOND FUNDS | | AUGUST 31, 2020 |
| | | | | | | | |
| | | JPMorgan Ultra-Short Municipal Fund | |
| | | Six Months
Ended
August 31, 2020
(Unaudited) | | | Year Ended
February 29, 2020 | |
CAPITAL TRANSACTIONS: | | | | | | | | |
Class A | | | | | | | | |
Proceeds from shares issued | | $ | 210,297 | | | $ | 117,084 | |
Distributions reinvested | | | 432 | | | | 694 | |
Cost of shares redeemed | | | (124,160 | ) | | | (78,616 | ) |
| | | | | | | | |
Change in net assets resulting from Class A capital transactions | | $ | 86,569 | | | $ | 39,162 | |
| | | | | | | | |
Class I | | | | | | | | |
Proceeds from shares issued | | $ | 4,012,017 | | | $ | 3,458,713 | |
Distributions reinvested | | | 16,610 | | | | 47,013 | |
Cost of shares redeemed | | | (2,785,856 | ) | | | (2,493,181 | ) |
| | | | | | | | |
Change in net assets resulting from Class I capital transactions | | $ | 1,242,771 | | | $ | 1,012,545 | |
| | | | | | | | |
Total change in net assets resulting from capital transactions | | $ | 1,329,340 | | | $ | 1,051,707 | |
| | | | | | | | |
| | |
SHARE TRANSACTIONS: | | | | | | | | |
Class A | | | | | | | | |
Issued | | | 20,923 | | | | 11,622 | |
Reinvested | | | 43 | | | | 69 | |
Redeemed | | | (12,379 | ) | | | (7,822 | ) |
| | | | | | | | |
Change in Class A Shares | | | 8,587 | | | | 3,869 | |
| | | | | | | | |
Class I | | | | | | | | |
Issued | | | 399,190 | | | | 344,011 | |
Reinvested | | | 1,656 | | | | 4,680 | |
Redeemed | | | (277,954 | ) | | | (248,088 | ) |
| | | | | | | | |
Change in Class I Shares | | | 122,892 | | | | 100,603 | |
| | | | | | | | |
SEE NOTES TO FINANCIAL STATEMENTS.
| | | | | | | | |
| | | |
| AUGUST 31, 2020 | | J.P. MORGAN MUNICIPAL BOND FUNDS | | | | | 117 | |
FINANCIAL HIGHLIGHTS
FOR THE PERIODS INDICATED
| | | | | | | | | | | | | | | | | | | | | | | | | | | | |
| | | Per share operating performance | |
| | | | | | Investment operations | | | Distributions | |
| | | Net asset
value,
beginning
of period | | | Net
investment
income
(loss) (b) | | | Net realized
and unrealized
gains
(losses) on
investments | | | Total from
investment
operations | | | Net
investment
income | | | Net
realized
gain | | | Total
distributions | |
JPMorgan High Yield Municipal Fund | | | | | | | | | | | | | |
Class A | | | | | | | | | | | | | | | | | | | | | | | | | | | | |
Six Months Ended August 31, 2020 (Unaudited) | | $ | 11.93 | | | $ | 0.17 | | | $ | (0.76 | ) | | $ | (0.59 | ) | | $ | (0.17 | ) | | $ | — | | | $ | (0.17 | ) |
Year Ended February 29, 2020 | | | 10.88 | | | | 0.32 | | | | 1.05 | | | | 1.37 | | | | (0.31 | ) | | | (0.01 | ) | | | (0.32 | ) |
Year Ended February 28, 2019 | | | 10.78 | | | | 0.36 | | | | 0.09 | | | | 0.45 | | | | (0.35 | ) | | | — | | | | (0.35 | ) |
Year Ended February 28, 2018 | | | 10.82 | | | | 0.28 | | | | (0.04 | ) | | | 0.24 | | | | (0.28 | ) | | | — | | | | (0.28 | ) |
Year Ended February 28, 2017 | | | 10.99 | | | | 0.29 | | | | (0.17 | ) | | | 0.12 | | | | (0.29 | ) | | | — | | | | (0.29 | ) |
Year Ended February 29, 2016 | | | 11.03 | | | | 0.29 | | | | (0.04 | ) | | | 0.25 | | | | (0.29 | ) | | | — | | | | (0.29 | ) |
| | | | | | | |
Class C | | | | | | | | | | | | | | | | | | | | | | | | | | | | |
Six Months Ended August 31, 2020 (Unaudited) | | | 11.90 | | | | 0.14 | | | | (0.75 | ) | | | (0.61 | ) | | | (0.14 | ) | | | — | | | | (0.14 | ) |
Year Ended February 29, 2020 | | | 10.85 | | | | 0.27 | | | | 1.05 | | | | 1.32 | | | | (0.26 | ) | | | (0.01 | ) | | | (0.27 | ) |
Year Ended February 28, 2019 | | | 10.76 | | | | 0.30 | | | | 0.09 | | | | 0.39 | | | | (0.30 | ) | | | — | | | | (0.30 | ) |
Year Ended��February 28, 2018 | | | 10.80 | | | | 0.22 | | | | (0.03 | ) | | | 0.19 | | | | (0.23 | ) | | | — | | | | (0.23 | ) |
Year Ended February 28, 2017 | | | 10.97 | | | | 0.23 | | | | (0.17 | ) | | | 0.06 | | | | (0.23 | ) | | | — | | | | (0.23 | ) |
Year Ended February 29, 2016 | | | 11.01 | | | | 0.23 | | | | (0.03 | ) | | | 0.20 | | | | (0.24 | ) | | | — | | | | (0.24 | ) |
| | | | | | | |
Class I | | | | | | | | | | | | | | | | | | | | | | | | | | | | |
Six Months Ended August 31, 2020 (Unaudited) | | | 11.93 | | | | 0.17 | | | | (0.76 | ) | | | (0.59 | ) | | | (0.17 | ) | | | — | | | | (0.17 | ) |
Year Ended February 29, 2020 | | | 10.87 | | | | 0.34 | | | | 1.06 | | | | 1.40 | | | | (0.33 | ) | | | (0.01 | ) | | | (0.34 | ) |
Year Ended February 28, 2019 | | | 10.78 | | | | 0.37 | | | | 0.08 | | | | 0.45 | | | | (0.36 | ) | | | — | | | | (0.36 | ) |
Year Ended February 28, 2018 | | | 10.82 | | | | 0.29 | | | | (0.03 | ) | | | 0.26 | | | | (0.30 | ) | | | — | | | | (0.30 | ) |
Year Ended February 28, 2017 | | | 10.99 | | | | 0.30 | | | | (0.17 | ) | | | 0.13 | | | | (0.30 | ) | | | — | | | | (0.30 | ) |
Year Ended February 29, 2016 | | | 11.03 | | | | 0.30 | | | | (0.04 | ) | | | 0.26 | | | | (0.30 | ) | | | — | | | | (0.30 | ) |
| | | | | | | |
Class R6 | | | | | | | | | | | | | | | | | | | | | | | | | | | | |
Six Months Ended August 31, 2020 (Unaudited) | | | 11.93 | | | | 0.18 | | | | (0.76 | ) | | | (0.58 | ) | | | (0.18 | ) | | | — | | | | (0.18 | ) |
Year Ended February 29, 2020 | | | 10.87 | | | | 0.35 | | | | 1.06 | | | | 1.41 | | | | (0.34 | ) | | | (0.01 | ) | | | (0.35 | ) |
November 1, 2018 (f) through February 28, 2019 | | | 10.53 | | | | 0.14 | | | | 0.33 | | | | 0.47 | | | | (0.13 | ) | | | — | | | | (0.13 | ) |
| (a) | Annualized for periods less than one year, unless otherwise noted. |
| (b) | Calculated based upon average shares outstanding. |
| (c) | Not annualized for periods less than one year. |
| (d) | Includes adjustments in accordance with accounting principles generally accepted in the United States of America and as such, the net asset values for financial reporting purposes and the returns based upon those net asset values may differ from the net asset values and returns for shareholder transactions. |
| (e) | Includes earnings credits and interest expense, if applicable, each of which is less than 0.005% unless otherwise noted. |
| (f) | Commencement of offering of class of shares. |
SEE NOTES TO FINANCIAL STATEMENTS.
| | | | | | |
| | | |
| 118 | | | | J.P. MORGAN MUNICIPAL BOND FUNDS | | AUGUST 31, 2020 |
| | | | | | | | | | | | | | | | | | | | | | | | | | |
| | | Ratios/Supplemental data | |
| | | | | | | | | | Ratios to average net assets (a) | | | | |
Net asset
value,
end of
period | | | Total return
(excludes
sales charge) (c)(d) | | | Net assets,
end of
period
(000’s) | | | Net
expenses (e) | | | Net
investment
income
(loss) | | |
Expenses
without waivers,
reimbursements and
earnings credits | | | Portfolio
turnover
rate (c) | |
| | | | | | | | | | | | | | | | | | | | | | | | | | |
| | | | | | | | | | | | | | | | | | | | | | | | | | |
| $ | 11.17 | | | | (4.90 | )% | | $ | 169,070 | | | | 0.64 | % | | | 3.05 | % | | | 1.01 | % | | | 19 | % |
| | 11.93 | | | | 12.81 | | | | 194,623 | | | | 0.64 | | | | 2.80 | | | | 1.06 | | | | 18 | |
| | 10.88 | | | | 4.28 | | | | 43,565 | | | | 0.64 | | | | 3.32 | | | | 1.22 | | | | 130 | |
| | 10.78 | | | | 2.25 | | | | 35,071 | | | | 0.64 | | | | 2.56 | | | | 1.20 | | | | 17 | |
| | 10.82 | | | | 1.07 | | | | 43,639 | | | | 0.64 | | | | 2.59 | | | | 1.23 | | | | 16 | |
| | 10.99 | | | | 2.32 | | | | 48,716 | | | | 0.65 | | | | 2.61 | | | | 1.18 | | | | 19 | |
| | | | | | |
| | | | | | | | | | | | | | | | | | | | | | | | | | |
| | 11.15 | | | | (5.07 | ) | | | 36,667 | | | | 1.14 | | | | 2.55 | | | | 1.51 | | | | 19 | |
| | 11.90 | | | | 12.29 | | | | 37,623 | | | | 1.14 | | | | 2.34 | | | | 1.57 | | | | 18 | |
| | 10.85 | | | | 3.67 | | | | 17,929 | | | | 1.14 | | | | 2.82 | | | | 1.71 | | | | 130 | |
| | 10.76 | | | | 1.74 | | | | 18,675 | | | | 1.14 | | | | 2.06 | | | | 1.70 | | | | 17 | |
| | 10.80 | | | | 0.58 | | | | 20,864 | | | | 1.14 | | | | 2.09 | | | | 1.73 | | | | 16 | |
| | 10.97 | | | | 1.80 | | | | 24,452 | | | | 1.15 | | | | 2.11 | | | | 1.70 | | | | 19 | |
| | | | | | |
| | | | | | | | | | | | | | | | | | | | | | | | | | |
| | 11.17 | | | | (4.85 | ) | | | 274,219 | | | | 0.54 | | | | 3.15 | | | | 0.76 | | | | 19 | |
| | 11.93 | | | | 13.02 | | | | 296,450 | | | | 0.54 | | | | 2.92 | | | | 0.81 | | | | 18 | |
| | 10.87 | | | | 4.29 | | | | 95,662 | | | | 0.54 | | | | 3.45 | | | | 0.97 | | | | 130 | |
| | 10.78 | | | | 2.36 | | | | 51,274 | | | | 0.54 | | | | 2.66 | | | | 0.95 | | | | 17 | |
| | 10.82 | | | | 1.17 | | | | 35,502 | | | | 0.54 | | | | 2.68 | | | | 0.97 | | | | 16 | |
| | 10.99 | | | | 2.42 | | | | 47,524 | | | | 0.55 | | | | 2.71 | | | | 0.93 | | | | 19 | |
| | | | | | |
| | | | | | | | | | | | | | | | | | | | | | | | | | |
| | 11.17 | | | | (4.81 | ) | | | 19,688 | | | | 0.44 | | | | 3.20 | | | | 0.51 | | | | 19 | |
| | 11.93 | | | | 13.12 | | | | 6,060 | | | | 0.44 | | | | 3.01 | | | | 0.56 | | | | 18 | |
| | 10.87 | | | | 4.46 | | | | 1,338 | | | | 0.39 | | | | 4.09 | | | | 1.23 | | | | 130 | |
SEE NOTES TO FINANCIAL STATEMENTS.
| | | | | | | | |
| | | |
| AUGUST 31, 2020 | | J.P. MORGAN MUNICIPAL BOND FUNDS | | | | | 119 | |
FINANCIAL HIGHLIGHTS
FOR THE PERIODS INDICATED (continued)
| | | | | | | | | | | | | | | | | | | | | | | | | | | | |
| | | Per share operating performance | |
| | | | | | Investment operations | | | Distributions | |
| | | Net asset
value,
beginning
of period | | | Net
investment
income
(loss) (b) | | | Net realized
and unrealized
gains
(losses) on
investments | | | Total from
investment
operations | | | Net
investment
income | | | Net
realized
gain | | | Total
distributions | |
JPMorgan Short-Intermediate Municipal Bond Fund | | | | | | | | | | | | | |
Class A | | | | | | | | | | | | | | | | | | | | | | | | | | | | |
Six Months Ended August 31, 2020 (Unaudited) | | $ | 10.86 | | | $ | 0.07 | | | $ | (0.03 | ) | | $ | 0.04 | | | $ | (0.07 | ) | | $ | — | | | $ | (0.07 | ) |
Year Ended February 29, 2020 | | | 10.49 | | | | 0.16 | | | | 0.37 | | | | 0.53 | | | | (0.16 | ) | | | — | | | | (0.16 | ) |
Year Ended February 28, 2019 | | | 10.39 | | | | 0.16 | | | | 0.10 | | | | 0.26 | | | | (0.16 | ) | | | — | | | | (0.16 | ) |
Year Ended February 28, 2018 | | | 10.48 | | | | 0.12 | | | | (0.09 | ) | | | 0.03 | | | | (0.12 | ) | | | — | | | | (0.12 | ) |
Year Ended February 28, 2017 | | | 10.71 | | | | 0.10 | | | | (0.17 | ) | | | (0.07 | ) | | | (0.10 | ) | | | (0.06 | ) | | | (0.16 | ) |
Year Ended February 29, 2016 | | | 10.62 | | | | 0.08 | | | | 0.09 | | | | 0.17 | | | | (0.08 | ) | | | — | | | | (0.08 | ) |
| | | | | | | |
Class C | | | | | | | | | | | | | | | | | | | | | | | | | | | | |
Six Months Ended August 31, 2020 (Unaudited) | | | 10.96 | | | | 0.05 | | | | (0.04 | ) | | | 0.01 | | | | (0.04 | ) | | | — | | | | (0.04 | ) |
Year Ended February 29, 2020 | | | 10.59 | | | | 0.11 | | | | 0.37 | | | | 0.48 | | | | (0.11 | ) | | | — | | | | (0.11 | ) |
Year Ended February 28, 2019 | | | 10.48 | | | | 0.11 | | | | 0.11 | | | | 0.22 | | | | (0.11 | ) | | | — | | | | (0.11 | ) |
Year Ended February 28, 2018 | | | 10.56 | | | | 0.06 | | | | (0.08 | ) | | | (0.02 | ) | | | (0.06 | ) | | | — | | | | (0.06 | ) |
Year Ended February 28, 2017 | | | 10.80 | | | | 0.04 | | | | (0.17 | ) | | | (0.13 | ) | | | (0.05 | ) | | | (0.06 | ) | | | (0.11 | ) |
Year Ended February 29, 2016 | | | 10.70 | | | | 0.02 | | | | 0.10 | | | | 0.12 | | | | (0.02 | ) | | | — | | | | (0.02 | ) |
| | | | | | | |
Class I | | | | | | | | | | | | | | | | | | | | | | | | | | | | |
Six Months Ended August 31, 2020 (Unaudited) | | | 10.92 | | | | 0.10 | | | | (0.04 | ) | | | 0.06 | | | | (0.09 | ) | | | — | | | | (0.09 | ) |
Year Ended February 29, 2020 | | | 10.55 | | | | 0.21 | | | | 0.37 | | | | 0.58 | | | | (0.21 | ) | | | — | | | | (0.21 | ) |
Year Ended February 28, 2019 | | | 10.44 | | | | 0.21 | | | | 0.11 | | | | 0.32 | | | | (0.21 | ) | | | — | | | | (0.21 | ) |
Year Ended February 28, 2018 | | | 10.53 | | | | 0.16 | | | | (0.09 | ) | | | 0.07 | | | | (0.16 | ) | | | — | | | | (0.16 | ) |
Year Ended February 28, 2017 | | | 10.76 | | | | 0.15 | | | | (0.17 | ) | | | (0.02 | ) | | | (0.15 | ) | | | (0.06 | ) | | | (0.21 | ) |
Year Ended February 29, 2016 | | | 10.67 | | | | 0.13 | | | | 0.09 | | | | 0.22 | | | | (0.13 | ) | | | — | | | | (0.13 | ) |
| | | | | | | |
Class R6 | | | | | | | | | | | | | | | | | | | | | | | | | | | | |
Six Months Ended August 31, 2020 (Unaudited) | | | 10.91 | | | | 0.10 | | | | (0.03 | ) | | | 0.07 | | | | (0.10 | ) | | | — | | | | (0.10 | ) |
Year Ended February 29, 2020 | | | 10.54 | | | | 0.21 | | | | 0.38 | | | | 0.59 | | | | (0.22 | ) | | | — | | | | (0.22 | ) |
October 1, 2018 (f) through February 28, 2019 | | | 10.39 | | | | 0.09 | | | | 0.15 | | | | 0.24 | | | | (0.09 | ) | | | — | | | | (0.09 | ) |
| (a) | Annualized for periods less than one year, unless otherwise noted. |
| (b) | Calculated based upon average shares outstanding. |
| (c) | Not annualized for periods less than one year. |
| (d) | Includes adjustments in accordance with accounting principles generally accepted in the United States of America and as such, the net asset values for financial reporting purposes and the returns based upon those net asset values may differ from the net asset values and returns for shareholder transactions. |
| (e) | Includes earnings credits and interest expense, if applicable, each of which is less than 0.005% unless otherwise noted. |
| (f) | Commencement of offering of class of shares. |
SEE NOTES TO FINANCIAL STATEMENTS.
| | | | | | |
| | | |
| 120 | | | | J.P. MORGAN MUNICIPAL BOND FUNDS | | AUGUST 31, 2020 |
| | | | | | | | | | | | | | | | | | | | | | | | | | |
| | | Ratios/Supplemental data | |
| | | | | | | | | | Ratios to average net assets (a) | | | | |
Net asset
value,
end of
period | | | Total return
(excludes
sales charge) (c)(d) | | | Net assets,
end of
period
(000’s) | | | Net
expenses (e) | | | Net
investment
income
(loss) | | |
Expenses
without waivers,
reimbursements and
earnings credits | | | Portfolio
turnover
rate (c) | |
| | | | | | | | | | | | | | | | | | | | | | | | | | |
| | | | | | | | | | | | | | | | | | | | | | | | | | |
| $ | 10.83 | | | | 0.37 | % | | $ | 71,587 | | | | 0.69 | % | | | 1.36 | % | | | 0.87 | % | | | 12 | % |
| | 10.86 | | | | 5.12 | | | | 53,408 | | | | 0.70 | | | | 1.48 | | | | 0.86 | | | | 24 | |
| | 10.49 | | | | 2.55 | | | | 33,554 | | | | 0.70 | | | | 1.54 | | | | 0.86 | | | | 42 | |
| | 10.39 | | | | 0.26 | | | | 32,373 | | | | 0.69 | | | | 1.10 | | | | 0.86 | | | | 73 | |
| | 10.48 | | | | (0.69 | ) | | | 30,535 | | | | 0.73 | | | | 0.91 | | | | 0.88 | | | | 31 | |
| | 10.71 | | | | 1.58 | | | | 38,345 | | | | 0.75 | | | | 0.71 | | | | 0.87 | | | | 39 | |
| | | | | | |
| | | | | | | | | | | | | | | | | | | | | | | | | | |
| | 10.93 | | | | 0.11 | | | | 4,955 | | | | 1.19 | | | | 0.87 | | | | 1.38 | | | | 12 | |
| | 10.96 | | | | 4.52 | | | | 4,303 | | | | 1.20 | | | | 0.99 | | | | 1.36 | | | | 24 | |
| | 10.59 | | | | 2.10 | | | | 4,590 | | | | 1.20 | | | | 1.03 | | | | 1.38 | | | | 42 | |
| | 10.48 | | | | (0.19 | ) | | | 6,406 | | | | 1.19 | | | | 0.56 | | | | 1.37 | | | | 73 | |
| | 10.56 | | | | (1.27 | ) | | | 14,013 | | | | 1.23 | | | | 0.41 | | | | 1.40 | | | | 31 | |
| | 10.80 | | | | 1.14 | | | | 17,709 | | | | 1.25 | | | | 0.21 | | | | 1.40 | | | | 39 | |
| | | | | | |
| | | | | | | | | | | | | | | | | | | | | | | | | | |
| | 10.89 | | | | 0.59 | | | | 747,249 | | | | 0.24 | | | | 1.81 | | | | 0.60 | | | | 12 | |
| | 10.92 | | | | 5.56 | | | | 641,836 | | | | 0.24 | | | | 1.94 | | | | 0.61 | | | | 24 | |
| | 10.55 | | | | 3.09 | | | | 573,350 | | | | 0.25 | | | | 1.97 | | | | 0.61 | | | | 42 | |
| | 10.44 | | | | 0.70 | | | | 1,680,807 | | | | 0.24 | | | | 1.53 | | | | 0.60 | | | | 73 | |
| | 10.53 | | | | (0.20 | ) | | | 1,887,149 | | | | 0.25 | | | | 1.40 | | | | 0.48 | | | | 31 | |
| | 10.76 | | | | 2.09 | | | | 2,453,419 | | | | 0.25 | | | | 1.21 | | | | 0.47 | | | | 39 | |
| | | | | | |
| | | | | | | | | | | | | | | | | | | | | | | | | | |
| | 10.88 | | | | 0.61 | | | | 904,730 | | | | 0.19 | | | | 1.88 | | | | 0.36 | | | | 12 | |
| | 10.91 | | | | 5.61 | | | | 961,820 | | | | 0.19 | | | | 1.99 | | | | 0.36 | | | | 24 | |
| | 10.54 | | | | 2.31 | | | | 866,630 | | | | 0.19 | | | | 2.19 | | | | 0.37 | | | | 42 | |
SEE NOTES TO FINANCIAL STATEMENTS.
| | | | | | | | |
| | | |
| AUGUST 31, 2020 | | J.P. MORGAN MUNICIPAL BOND FUNDS | | | | | 121 | |
FINANCIAL HIGHLIGHTS
FOR THE PERIODS INDICATED (continued)
| | | | | | | | | | | | | | | | | | | | | | | | | | | | |
| | | Per share operating performance | |
| | | | | | Investment operations | | | Distributions | |
| | | Net asset
value,
beginning
of period | | | Net
investment
income
(loss) (b) | | | Net realized
and unrealized
gains
(losses) on
investments | | | Total from
investment
operations | | | Net
investment
income | | | Net
realized
gain | | | Total
distributions | |
JPMorgan Sustainable Municipal Income Fund (formerly known as JPMorgan Municipal Income Fund) | | | | | | | | | | | | | |
Class A | | | | | | | | | | | | | | | | | | | | | | | | | | | | |
Six Months Ended August 31, 2020 (Unaudited) | | $ | 10.02 | | | $ | 0.09 | | | $ | (0.03 | ) | | $ | 0.06 | | | $ | (0.09 | ) | | $ | — | | | $ | (0.09 | ) |
Year Ended February 29, 2020 | | | 9.55 | | | | 0.20 | | | | 0.47 | | | | 0.67 | | | | (0.20 | ) | | | — | | | | (0.20 | ) |
Year Ended February 28, 2019 | | | 9.52 | | | | 0.21 | | | | 0.08 | | | | 0.29 | | | | (0.21 | ) | | | (0.05 | ) | | | (0.26 | ) |
Year Ended February 28, 2018 | | | 9.70 | | | | 0.23 | (f) | | | (0.11 | ) | | | 0.12 | | | | (0.23 | ) | | | (0.07 | ) | | | (0.30 | ) |
Year Ended February 28, 2017 | | | 10.10 | | | | 0.24 | | | | (0.28 | ) | | | (0.04 | ) | | | (0.24 | ) | | | (0.12 | ) | | | (0.36 | ) |
Year Ended February 29, 2016 | | | 10.11 | | | | 0.25 | | | | 0.08 | | | | 0.33 | | | | (0.26 | ) | | | (0.08 | ) | | | (0.34 | ) |
| | | | | | | |
Class C | | | | | | | | | | | | | | | | | | | | | | | | | | | | |
Six Months Ended August 31, 2020 (Unaudited) | | | 9.92 | | | | 0.06 | | | | (0.03 | ) | | | 0.03 | | | | (0.06 | ) | | | — | | | | (0.06 | ) |
Year Ended February 29, 2020 | | | 9.45 | | | | 0.14 | | | | 0.47 | | | | 0.61 | | | | (0.14 | ) | | | — | | | | (0.14 | ) |
Year Ended February 28, 2019 | | | 9.42 | | | | 0.16 | | | | 0.08 | | | | 0.24 | | | | (0.16 | ) | | | (0.05 | ) | | | (0.21 | ) |
Year Ended February 28, 2018 | | | 9.61 | | | | 0.17 | (f) | | | (0.12 | ) | | | 0.05 | | | | (0.17 | ) | | | (0.07 | ) | | | (0.24 | ) |
Year Ended February 28, 2017 | | | 10.00 | | | | 0.18 | | | | (0.26 | ) | | | (0.08 | ) | | | (0.19 | ) | | | (0.12 | ) | | | (0.31 | ) |
Year Ended February 29, 2016 | | | 10.02 | | | | 0.19 | | | | 0.07 | | | | 0.26 | | | | (0.20 | ) | | | (0.08 | ) | | | (0.28 | ) |
| | | | | | | |
Class I | | | | | | | | | | | | | | | | | | | | | | | | | | | | |
Six Months Ended August 31, 2020 (Unaudited) | | | 9.95 | | | | 0.10 | | | | (0.04 | ) | | | 0.06 | | | | (0.10 | ) | | | — | | | | (0.10 | ) |
Year Ended February 29, 2020 | | | 9.48 | | | | 0.22 | | | | 0.47 | | | | 0.69 | | | | (0.22 | ) | | | — | | | | (0.22 | ) |
Year Ended February 28, 2019 | | | 9.45 | | | | 0.24 | | | | 0.08 | | | | 0.32 | | | | (0.24 | ) | | | (0.05 | ) | | | (0.29 | ) |
Year Ended February 28, 2018 | | | 9.63 | | | | 0.25 | (f) | | | (0.11 | ) | | | 0.14 | | | | (0.25 | ) | | | (0.07 | ) | | | (0.32 | ) |
Year Ended February 28, 2017 | | | 10.03 | | | | 0.26 | | | | (0.27 | ) | | | (0.01 | ) | | | (0.27 | ) | | | (0.12 | ) | | | (0.39 | ) |
Year Ended February 29, 2016 | | | 10.04 | | | | 0.28 | | | | 0.07 | | | | 0.35 | | | | (0.28 | ) | | | (0.08 | ) | | | (0.36 | ) |
| | | | | | | |
Class R6 | | | | | | | | | | | | | | | | | | | | | | | | | | | | |
Six Months Ended August 31, 2020 (Unaudited) | | | 9.94 | | | | 0.10 | | | | (0.03 | ) | | | 0.07 | | | | (0.10 | ) | | | — | | | | (0.10 | ) |
Year Ended February 29, 2020 | | | 9.48 | | | | 0.23 | | | | 0.46 | | | | 0.69 | | | | (0.23 | ) | | | — | | | | (0.23 | ) |
Year Ended February 28, 2019 | | | 9.45 | | | | 0.25 | | | | 0.08 | | | | 0.33 | | | | (0.25 | ) | | | (0.05 | ) | | | (0.30 | ) |
November 6, 2017 (g) through February 28, 2018 | | | 9.74 | | | | 0.08 | (f) | | | (0.21 | ) | | | (0.13 | ) | | | (0.09 | ) | | | (0.07 | ) | | | (0.16 | ) |
| (a) | Annualized for periods less than one year, unless otherwise noted. |
| (b) | Calculated based upon average shares outstanding. |
| (c) | Not annualized for periods less than one year. |
| (d) | Includes adjustments in accordance with accounting principles generally accepted in the United States of America and as such, the net asset values for financial reporting purposes and the returns based upon those net asset values may differ from the net asset values and returns for shareholder transactions. |
| (e) | Includes earnings credits and interest expense, if applicable, each of which is less than 0.005% unless otherwise noted. |
| (f) | Net investment income (loss) may appear disproportionate among the classes due to the timing of recognition of income and changes in the relative size of the classes. |
| (g) | Commencement of offering of class of shares. |
SEE NOTES TO FINANCIAL STATEMENTS.
| | | | | | |
| | | |
| 122 | | | | J.P. MORGAN MUNICIPAL BOND FUNDS | | AUGUST 31, 2020 |
| | | | | | | | | | | | | | | | | | | | | | | | | | |
| | | Ratios/Supplemental data | |
| | | | | | | | | | Ratios to average net assets (a) | | | | |
Net asset
value,
end of
period | | | Total return
(excludes
sales charge) (c)(d) | | | Net assets,
end of
period
(000’s) | | | Net
expenses (e) | | | Net
investment
income
(loss) | | |
Expenses without
waivers,
reimbursements and
earnings credits | | | Portfolio
turnover
rate (c) | |
| | | | | | | | | | | | | | | | | | | | | | | | | | |
| | | | | | | | | | | | | | | | | | | | | | | | | | |
| $ | 9.99 | | | | 0.58 | % | | $ | 115,463 | | | | 0.69 | % | | | 1.72 | % | | | 0.97 | % | | | 12 | % |
| | 10.02 | | | | 7.04 | | | | 96,844 | | | | 0.70 | | | | 2.02 | | | | 0.99 | | | | 7 | |
| | 9.55 | | | | 3.15 | | | | 60,078 | | | | 0.70 | | | | 2.26 | | | | 1.01 | | | | 13 | |
| | 9.52 | | | | 1.16 | | | | 66,258 | | | | 0.69 | | | | 2.33 | (f) | | | 1.01 | | | | 21 | |
| | 9.70 | | | | (0.40 | ) | | | 76,684 | | | | 0.77 | | | | 2.39 | | | | 1.00 | | | | 15 | |
| | 10.10 | | | | 3.26 | | | | 73,120 | | | | 0.82 | | | | 2.52 | | | | 0.97 | | | | 22 | |
| | | | | | |
| | | | | | | | | | | | | | | | | | | | | | | | | | |
| | 9.89 | | | | 0.30 | | | | 11,659 | | | | 1.24 | | | | 1.19 | | | | 1.47 | | | | 12 | |
| | 9.92 | | | | 6.52 | | | | 12,868 | | | | 1.25 | | | | 1.49 | | | | 1.51 | | | | 7 | |
| | 9.45 | | | | 2.61 | | | | 12,833 | | | | 1.25 | | | | 1.71 | | | | 1.51 | | | | 13 | |
| | 9.42 | | | | 0.51 | | | | 15,138 | | | | 1.24 | | | | 1.78 | (f) | | | 1.51 | | | | 21 | |
| | 9.61 | | | | (0.87 | ) | | | 17,137 | | | | 1.34 | | | | 1.83 | | | | 1.50 | | | | 15 | |
| | 10.00 | | | | 2.61 | | | | 15,950 | | | | 1.39 | | | | 1.95 | | | | 1.48 | | | | 22 | |
| | | | | | |
| | | | | | | | | | | | | | | | | | | | | | | | | | |
| | 9.91 | | | | 0.61 | | | | 108,647 | | | | 0.44 | | | | 1.98 | | | | 0.72 | | | | 12 | |
| | 9.95 | | | | 7.36 | | | | 114,772 | | | | 0.44 | | | | 2.28 | | | | 0.74 | | | | 7 | |
| | 9.48 | | | | 3.43 | | | | 74,386 | | | | 0.45 | | | | 2.51 | | | | 0.76 | | | | 13 | |
| | 9.45 | | | | 1.42 | | | | 71,161 | | | | 0.44 | | | | 2.57 | (f) | | | 0.74 | | | | 21 | |
| | 9.63 | | | | (0.16 | ) | | | 176,990 | | | | 0.53 | | | | 2.64 | | | | 0.72 | | | | 15 | |
| | 10.03 | | | | 3.56 | | | | 245,864 | | | | 0.57 | | | | 2.77 | | | | 0.70 | | | | 22 | |
| | | | | | |
| | | | | | | | | | | | | | | | | | | | | | | | | | |
| | 9.91 | | | | 0.76 | | | | 66,340 | | | | 0.34 | | | | 2.08 | | | | 0.47 | | | | 12 | |
| | 9.94 | | | | 7.36 | | | | 60,936 | | | | 0.34 | | | | 2.38 | | | | 0.49 | | | | 7 | |
| | 9.48 | | | | 3.54 | | | | 51,261 | | | | 0.35 | | | | 2.61 | | | | 0.50 | | | | 13 | |
| | 9.45 | | | | (1.42 | ) | | | 64,738 | | | | 0.34 | | | | 2.67 | (f) | | | 0.57 | | | | 21 | |
SEE NOTES TO FINANCIAL STATEMENTS.
| | | | | | | | |
| | | |
| AUGUST 31, 2020 | | J.P. MORGAN MUNICIPAL BOND FUNDS | | | | | 123 | |
FINANCIAL HIGHLIGHTS
FOR THE PERIODS INDICATED (continued)
| | | | | | | | | | | | | | | | | | | | | | | | | | | | |
| | | Per share operating performance | |
| | | | | | Investment operations | | | Distributions | |
| | | Net asset
value,
beginning
of period | | | Net
investment
income
(loss) (b) | | | Net realized
and unrealized
gains (losses) on
investments | | | Total from
investment
operations | | | Net
investment
income | | | Net
realized
gain | | | Total
distributions | |
JPMorgan Tax Free Bond Fund | | | | | | | | | | | | | |
Class A | | | | | | | | | | | | | | | | | | | | | | | | | | | | |
Six Months Ended August 31, 2020 (Unaudited) | | $ | 12.66 | | | $ | 0.14 | | | $ | (0.24 | ) | | $ | (0.10 | ) | | $ | (0.14 | ) | | $ | — | | | $ | (0.14 | ) |
Year Ended February 29, 2020 | | | 11.77 | | | | 0.32 | | | | 0.89 | | | | 1.21 | | | | (0.32 | ) | | | — | | | | (0.32 | ) |
Year Ended February 28, 2019 | | | 11.82 | | | | 0.40 | | | | (0.05 | ) | | | 0.35 | | | | (0.40 | ) | | | — | | | | (0.40 | ) |
Year Ended February 28, 2018 | | | 11.93 | | | | 0.39 | | | | (0.11 | ) | | | 0.28 | | | | (0.39 | ) | | | — | | | | (0.39 | ) |
Year Ended February 28, 2017 | | | 12.57 | | | | 0.40 | | | | (0.40 | ) | | | — | (f) | | | (0.39 | ) | | | (0.25 | ) | | | (0.64 | ) |
Year Ended February 29, 2016 | | | 12.70 | | | | 0.45 | | | | (0.01 | ) | | | 0.44 | | | | (0.47 | ) | | | (0.10 | ) | | | (0.57 | ) |
| | | | | | | |
Class C | | | | | | | | | | | | | | | | | | | | | | | | | | | | |
Six Months Ended August 31, 2020 (Unaudited) | | | 12.55 | | | | 0.10 | | | | (0.24 | ) | | | (0.14 | ) | | | (0.10 | ) | | | — | | | | (0.10 | ) |
Year Ended February 29, 2020 | | | 11.67 | | | | 0.25 | | | | 0.87 | | | | 1.12 | | | | (0.24 | ) | | | — | | | | (0.24 | ) |
Year Ended February 28, 2019 | | | 11.72 | | | | 0.33 | | | | (0.05 | ) | | | 0.28 | | | | (0.33 | ) | | | — | | | | (0.33 | ) |
Year Ended February 28, 2018 | | | 11.84 | | | | 0.32 | | | | (0.12 | ) | | | 0.20 | | | | (0.32 | ) | | | — | | | | (0.32 | ) |
Year Ended February 28, 2017 | | | 12.48 | | | | 0.31 | | | | (0.39 | ) | | | (0.08 | ) | | | (0.31 | ) | | | (0.25 | ) | | | (0.56 | ) |
Year Ended February 29, 2016 | | | 12.60 | | | | 0.37 | | | | (0.01 | ) | | | 0.36 | | | | (0.38 | ) | | | (0.10 | ) | | | (0.48 | ) |
| | | | | | | |
Class I | | | | | | | | | | | | | | | | | | | | | | | | | | | | |
Six Months Ended August 31, 2020 (Unaudited) | | | 12.61 | | | | 0.15 | | | | (0.25 | ) | | | (0.10 | ) | | | (0.15 | ) | | | — | | | | (0.15 | ) |
Year Ended February 29, 2020 | | | 11.72 | | | | 0.34 | | | | 0.89 | | | | 1.23 | | | | (0.34 | ) | | | — | | | | (0.34 | ) |
Year Ended February 28, 2019 | | | 11.77 | | | | 0.42 | | | | (0.05 | ) | | | 0.37 | | | | (0.42 | ) | | | — | | | | (0.42 | ) |
Year Ended February 28, 2018 | | | 11.88 | | | | 0.42 | | | | (0.11 | ) | | | 0.31 | | | | (0.42 | ) | | | — | | | | (0.42 | ) |
Year Ended February 28, 2017 | | | 12.53 | | | | 0.42 | | | | (0.40 | ) | | | 0.02 | | | | (0.42 | ) | | | (0.25 | ) | | | (0.67 | ) |
Year Ended February 29, 2016 | | | 12.65 | | | | 0.47 | | | | — | (f) | | | 0.47 | | | | (0.49 | ) | | | (0.10 | ) | | | (0.59 | ) |
| | | | | | | |
Class R6 | | | | | | | | | | | | | | | | | | | | | | | | | | | | |
Six Months Ended August 31, 2020 (Unaudited) | | | 12.60 | | | | 0.16 | | | | (0.24 | ) | | | (0.08 | ) | | | (0.16 | ) | | | — | | | | (0.16 | ) |
Year Ended February 29, 2020 | | | 11.72 | | | | 0.35 | | | | 0.88 | | | | 1.23 | | | | (0.35 | ) | | | — | | | | (0.35 | ) |
October 1, 2018 (g) through February 28, 2019 | | | 11.61 | | | | 0.17 | | | | 0.11 | | | | 0.28 | | | | (0.17 | ) | | | — | | | | (0.17 | ) |
| (a) | Annualized for periods less than one year, unless otherwise noted. |
| (b) | Calculated based upon average shares outstanding. |
| (c) | Not annualized for periods less than one year. |
| (d) | Includes adjustments in accordance with accounting principles generally accepted in the United States of America and as such, the net asset values for financial reporting purposes and the returns based upon those net asset values may differ from the net asset values and returns for shareholder transactions. |
| (e) | Includes earnings credits and interest expense, if applicable, each of which is less than 0.005% unless otherwise noted. |
| (f) | Amount rounds to less than $0.005. |
| (g) | Commencement of offering of class of shares. |
SEE NOTES TO FINANCIAL STATEMENTS.
| | | | | | |
| | | |
| 124 | | | | J.P. MORGAN MUNICIPAL BOND FUNDS | | AUGUST 31, 2020 |
| | | | | | | | | | | | | | | | | | | | | | | | | | |
| | | Ratios/Supplemental data | |
| | | | | | | | | | Ratios to average net assets (a) | | | | |
Net asset
value,
end of
period | | | Total return
(excludes
sales charge) (c)(d) | | | Net assets,
end of
period
(000’s) | | | Net
expenses (e) | | | Net
investment
income
(loss) | | |
Expenses
without waivers,
reimbursements and
earnings credits | | | Portfolio
turnover
rate (c) | |
| | | | | | | | | | | | | | | | | | | | | | | | | | |
| | | | | | | | | | | | | | | | | | | | | | | | | | |
| $ | 12.42 | | | | (0.76 | )% | | $ | 255,242 | | | | 0.66 | % | | | 2.28 | % | | | 0.95 | % | | | 17 | % |
| | 12.66 | | | | 10.37 | | | | 231,815 | | | | 0.67 | | | | 2.58 | | | | 0.97 | | | | 31 | |
| | 11.77 | | | | 3.00 | | | | 132,813 | | | | 0.67 | | | | 3.40 | | | | 1.00 | | | | 53 | |
| | 11.82 | | | | 2.36 | | | | 130,462 | | | | 0.66 | | | | 3.27 | | | | 0.98 | | | | 39 | |
| | 11.93 | | | | (0.03 | ) | | | 148,987 | | | | 0.66 | | | | 3.16 | | | | 1.00 | | | | 73 | |
| | 12.57 | | | | 3.53 | | | | 152,207 | | | | 0.67 | | | | 3.62 | | | | 0.97 | | | | 94 | |
| | | | | | |
| | | | | | | | | | | | | | | | | | | | | | | | | | |
| | 12.31 | | | | (1.06 | ) | | | 24,062 | | | | 1.24 | | | | 1.71 | | | | 1.46 | | | | 17 | |
| | 12.55 | | | | 9.73 | | | | 26,965 | | | | 1.25 | | | | 2.05 | | | | 1.48 | | | | 31 | |
| | 11.67 | | | | 2.43 | | | | 27,701 | | | | 1.25 | | | | 2.81 | | | | 1.49 | | | | 53 | |
| | 11.72 | | | | 1.70 | | | | 25,172 | | | | 1.24 | | | | 2.69 | | | | 1.48 | | | | 39 | |
| | 11.84 | | | | (0.66 | ) | | | 32,052 | | | | 1.31 | | | | 2.50 | | | | 1.50 | | | | 73 | |
| | 12.48 | | | | 2.92 | | | | 26,715 | | | | 1.36 | | | | 2.93 | | | | 1.47 | | | | 94 | |
| | | | | | |
| | | | | | | | | | | | | | | | | | | | | | | | | | |
| | 12.36 | | | | (0.74 | ) | | | 168,187 | | | | 0.45 | | | | 2.50 | | | | 0.70 | | | | 17 | |
| | 12.61 | | | | 10.66 | | | | 177,584 | | | | 0.45 | | | | 2.82 | | | | 0.72 | | | | 31 | |
| | 11.72 | | | | 3.24 | | | | 135,295 | | | | 0.45 | | | | 3.61 | | | | 0.74 | | | | 53 | |
| | 11.77 | | | | 2.60 | | | | 160,391 | | | | 0.44 | | | | 3.49 | | | | 0.72 | | | | 39 | |
| | 11.88 | | | | 0.09 | | | | 141,356 | | | | 0.47 | | | | 3.34 | | | | 0.74 | | | | 73 | |
| | 12.53 | | | | 3.82 | | | | 126,091 | | | | 0.50 | | | | 3.79 | | | | 0.71 | | | | 94 | |
| | | | | | |
| | | | | | | | | | | | | | | | | | | | | | | | | | |
| | 12.36 | | | | (0.63 | ) | | | 116,907 | | | | 0.40 | | | | 2.55 | | | | 0.45 | | | | 17 | |
| | 12.60 | | | | 10.63 | | | | 115,414 | | | | 0.40 | | | | 2.87 | | | | 0.47 | | | | 31 | |
| | 11.72 | | | | 2.44 | | | | 86,790 | | | | 0.40 | | | | 3.61 | | | | 0.51 | | | | 53 | |
SEE NOTES TO FINANCIAL STATEMENTS.
| | | | | | | | |
| | | |
| AUGUST 31, 2020 | | J.P. MORGAN MUNICIPAL BOND FUNDS | | | | | 125 | |
FINANCIAL HIGHLIGHTS
FOR THE PERIODS INDICATED (continued)
| | | | | | | | | | | | | | | | | | | | |
| | | Per share operating performance | |
| | | | | | Investment operations | | | Distributions | |
| | | Net asset
value,
beginning
of period | | | Net
investment
income
(loss) (b) | | | Net realized
and unrealized
gains (losses) on
investments | | | Total from
investment
operations | | | Net
investment
income | |
JPMorgan Ultra-Short Municipal Fund | |
Class A | |
Six Months Ended August 31, 2020 (Unaudited) | | $ | 10.08 | | | $ | 0.03 | | | $ | — | (f)(g) | | $ | 0.03 | | | $ | (0.04 | ) |
Year Ended February 29, 2020 | | | 10.03 | | | | 0.12 | | | | 0.06 | | | | 0.18 | | | | (0.13 | ) |
Year Ended February 28, 2019 | | | 10.01 | | | | 0.13 | | | | — | (f) | | | 0.13 | | | | (0.11 | ) |
Year Ended February 28, 2018 | | | 10.02 | | | | 0.07 | | | | (0.02 | ) | | | 0.05 | | | | (0.06 | ) |
May 31, 2016 (i) through February 28, 2017 | | | 10.00 | | | | 0.06 | | | | (0.01 | ) | | | 0.05 | | | | (0.03 | ) |
|
Class I | |
Six Months Ended August 31, 2020 (Unaudited) | | | 10.07 | | | | 0.04 | | | | 0.01 | (g) | | | 0.05 | | | | (0.05 | ) |
Year Ended February 29, 2020 | | | 10.02 | | | | 0.14 | | | | 0.05 | | | | 0.19 | | | | (0.14 | ) |
Year Ended February 28, 2019 | | | 10.00 | | | | 0.14 | | | | 0.02 | | | | 0.16 | | | | (0.14 | ) |
Year Ended February 28, 2018 | | | 10.02 | | | | 0.09 | | | | (0.03 | ) | | | 0.06 | | | | (0.08 | ) |
May 31, 2016 (i) through February 28, 2017 | | | 10.00 | | | | 0.06 | | | | — | (f) | | | 0.06 | | | | (0.04 | ) |
| (a) | Annualized for periods less than one year, unless otherwise noted. |
| (b) | Calculated based upon average shares outstanding. |
| (c) | Not annualized for periods less than one year. |
| (d) | Includes adjustments in accordance with accounting principles generally accepted in the United States of America and as such, the net asset values for financial reporting purposes and the returns based upon those net asset values may differ from the net asset values and returns for shareholder transactions. |
| (e) | Includes earnings credits and interest expense, if applicable, each of which is less than 0.005% unless otherwise noted. |
| (f) | Amount rounds to less than $0.005. |
| (g) | Calculation of the net realized and unrealized gains (losses) per share do not correlate with the Fund’s net realized and unrealized gains (losses) presented in the Statement of Operations due to rounding. |
| (h) | Certain non-recurring expenses incurred by the Fund were not annualized for the period indicated. |
| (i) | Commencement of operations. |
SEE NOTES TO FINANCIAL STATEMENTS.
| | | | | | |
| | | |
| 126 | | | | J.P. MORGAN MUNICIPAL BOND FUNDS | | AUGUST 31, 2020 |
| | | | | | | | | | | | | | | | | | | | | | | | | | |
| | | Ratios/Supplemental data | |
| | | | | | | | | | Ratios to average net assets (a) | | | | |
Net asset
value,
end of
period | | | Total return
(excludes
sales charge) (c)(d) | | | Net assets,
end of
period
(000’s) | | | Net
expenses (e) | | | Net
investment
income
(loss) | | |
Expenses
without waivers,
reimbursements and
earnings credits | | | Portfolio
turnover
rate (c) | |
| | | | | | | | | | | | | | | | | | | | | | | | | | |
| | | | | | | | | | | | | | | | | | | | | | | | | | |
| $ | 10.07 | | | | 0.25 | % | | $ | 193,026 | | | | 0.44 | % | | | 0.57 | % | | | 0.74 | % | | | 66 | % |
| | 10.08 | | | | 1.76 | | | | 106,625 | | | | 0.45 | | | | 1.23 | | | | 0.76 | | | | 48 | |
| | 10.03 | | | | 1.33 | | | | 67,256 | | | | 0.44 | | | | 1.32 | | | | 0.77 | | | | 50 | |
| | 10.01 | | | | 0.47 | | | | 772 | | | | 0.44 | (h) | | | 0.67 | (h) | | | 0.85 | (h) | | | 71 | |
| | 10.02 | | | | 0.52 | | | | 519 | | | | 0.44 | (h) | | | 0.81 | (h) | | | 2.56 | (h) | | | 80 | |
| | | | | | |
| | | | | | | | | | | | | | | | | | | | | | | | | | |
| | 10.07 | | | | 0.45 | | | | 5,284,932 | | | | 0.24 | | | | 0.83 | | | | 0.49 | | | | 66 | |
| | 10.07 | | | | 1.96 | | | | 4,050,886 | | | | 0.25 | | | | 1.43 | | | | 0.50 | | | | 48 | |
| | 10.02 | | | | 1.60 | | | | 3,021,190 | | | | 0.24 | | | | 1.42 | | | | 0.52 | | | | 50 | |
| | 10.00 | | | | 0.63 | | | | 2,064,297 | | | | 0.24 | (h) | | | 0.90 | (h) | | | 0.56 | (h) | | | 71 | |
| | 10.02 | | | | 0.65 | | | | 31,656 | | | | 0.27 | (h) | | | 0.74 | (h) | | | 2.00 | (h) | | | 80 | |
SEE NOTES TO FINANCIAL STATEMENTS.
| | | | | | | | |
| | | |
| AUGUST 31, 2020 | | J.P. MORGAN MUNICIPAL BOND FUNDS | | | | | 127 | |
NOTES TO FINANCIAL STATEMENTS
AS OF AUGUST 31, 2020 (Unaudited)
1. Organization
JPMorgan Trust I (“JPM I”), JPMorgan Trust II (“JPM II”) and JPMorgan Trust IV (“JPM IV”) (collectively, the “Trusts”) were formed on November 12, 2004, November 12, 2004 and November 11, 2015, respectively, as Delaware statutory trusts, pursuant to Declarations of Trust dated November 5, 2004, November 5, 2004 and November 11, 2015, respectively, and are registered under the Investment Company Act of 1940, as amended (the “1940 Act”), as open-end management investment companies.
The following are 5 separate funds of the Trusts (each, a “Fund” and collectively, the “Funds”) covered by this report:
| | | | | | |
| | | Classes Offered | | Trust | | Diversification Classification |
| JPMorgan High Yield Municipal Fund | | Class A, Class C, Class I and Class R6 | | JPM I | | Diversified |
| JPMorgan Short-Intermediate Municipal Bond Fund | | Class A, Class C, Class I and Class R6 | | JPM II | | Diversified |
| JPMorgan Sustainable Municipal Income Fund(1) | | Class A, Class C, Class I and Class R6 | | JPM II | | Diversified |
| JPMorgan Tax Free Bond Fund | | Class A, Class C, Class I and Class R6 | | JPM II | | Diversified |
| JPMorgan Ultra-Short Municipal Fund | | Class A and Class I | | JPM IV | | Diversified |
| (1) | Effective September 15, 2020, JPMorgan Municipal Income Fund changed its name to JPMorgan Sustainable Municipal Income Fund. |
The investment objective of JPMorgan High Yield Municipal Fund (“High Yield Municipal Fund”) is to seek a high level of current income exempt from federal income taxes.
The investment objective of JPMorgan Sustainable Municipal Income Fund (“Sustainable Municipal Income Fund”) is to seek current income exempt from federal income taxes.
The investment objective of JPMorgan Short-Intermediate Municipal Bond Fund (“Short-Intermediate Bond Fund”), JPMorgan Tax Free Bond Fund (“Tax Free Bond Fund”) and JPMorgan Ultra-Short Municipal Fund (“Ultra-Short Municipal Fund”) is to seek as high a level of current income exempt from federal income tax as is consistent with relative stability of principal.
Class A Shares generally provide for a front-end sales charge while Class C Shares provide for a contingent deferred sales charge (“CDSC”). No sales charges are assessed with respect to Class I and Class R6 Shares. Certain Class A Shares, for which front-end sales charges have been waived, may be subject to a CDSC as described in the Funds’ prospectuses. Beginning on November 14, 2017, Class C Shares automatically convert to Class A Shares after ten years. Effective October 1, 2020, Class C Shares automatically convert to Class A Shares after eight years. All classes of shares have equal rights as to earnings, assets and voting privileges, except that each class may bear different transfer agency, distribution and service fees and each class has exclusive voting rights with respect to its distribution plan and shareholder servicing agreements.
J.P. Morgan Investment Management Inc. (“JPMIM”), an indirect, wholly-owned subsidiary of JPMorgan Chase & Co. (“JPMorgan”), acts as Adviser (the “Adviser”) and Administrator (the “Administrator”) to the Funds.
2. Significant Accounting Policies
The following is a summary of significant accounting policies followed by the Funds in the preparation of their financial statements. The Funds are investment companies and, accordingly, follow the investment company accounting and reporting guidance of the Financial Accounting Standards Board (“FASB”) Accounting Standards Codification Topic 946 — Investment Companies, which is part of U.S. generally accepted accounting principles (“GAAP”). The preparation of financial statements in conformity with GAAP requires management to make estimates and assumptions that affect (i) the reported amounts of assets and liabilities, (ii) disclosure of contingent assets and liabilities at the date of the financial statements, and (iii) the reported amounts of increases and decreases in net assets from operations during the reporting period. Actual results could differ from those estimates.
A. Valuation of Investments — Investments are valued in accordance with GAAP and the Funds’ valuation policies set forth by, and under the supervision and responsibility of, the Boards of Trustees of the Trusts (the “Boards”), which established the following approach to valuation, as described more fully below: (i) investments for which market quotations are readily available shall be valued at their market value and (ii) all other investments for which market quotations are not readily available shall be valued at their fair value as determined in good faith by the Boards.
The Administrator has established the J.P. Morgan Asset Management Americas Valuation Committee (“AVC”) to assist the Boards with the oversight and monitoring of the valuation of the Funds’ investments. The Administrator implements the valuation policies of the Funds’ investments, as directed by the Boards. The AVC oversees and carries out the policies for the valuation of investments held in the Funds. This includes monitoring the appropriateness of fair values based on results of ongoing valuation oversight including, but not limited to, consideration of macro or security specific events, market events, and pricing vendor and broker due diligence. The Administrator is responsible for discussing and assessing the potential impacts to the fair values on an ongoing basis, and, at least on a quarterly basis, with the AVC and the Boards.
A market-based approach is primarily used to value the Funds’ investments. Investments for which market quotations are not readily available are fair valued by approved affiliated and/or unaffiliated pricing vendors or third party broker-dealers (collectively referred to as “Pricing Services”) or may be internally fair valued using methods set forth by the valuation policies approved by the Boards. This may include the use of related or comparable assets or liabilities, recent transactions, market multiples, book values and other relevant information for the investment. An income-based valuation approach may be used in which the anticipated future cash flows of the investment are discounted to calculate the fair value. Discounts
| | | | | | |
| | | |
| 128 | | | | J.P. MORGAN MUNICIPAL BOND FUNDS | | AUGUST 31, 2020 |
may also be applied due to the nature or duration of any restrictions on the disposition of the investments. Valuations may be based upon current market prices of securities that are comparable in coupon, rating, maturity and industry. It is possible that the estimated values may differ significantly from the values that would have been used had a ready market for the investments existed, and such differences could be material.
Fixed income instruments are valued based on prices received from Pricing Services. The Pricing Services use multiple valuation techniques to determine the valuation of fixed income instruments. In instances where sufficient market activity exists, the Pricing Services may utilize a market-based approach through which trades or quotes from market makers are used to determine the valuation of these instruments. In instances where sufficient market activity may not exist, the Pricing Services also utilize proprietary valuation models which may consider market transactions in comparable securities and the various relationships between securities in determining fair value and/or market characteristics in order to estimate the relevant cash flows, which are then discounted to calculate the fair values.
Equities and other exchange-traded instruments are valued at the last sale price or official market closing price on the primary exchange on which the instrument is traded before the net asset values (“NAV”) of the Funds are calculated on a valuation date.
Investments in open-end investment companies (“Underlying Funds”) are valued at each Underlying Fund’s NAV per share as of the report date.
Futures contracts are generally valued on the basis of available market quotations.
Valuations reflected in this report are as of the report date. As a result, changes in valuation due to market events and/or issuer-related events after the report date and prior to issuance of the report are not reflected herein.
The various inputs that are used in determining the valuation of the Funds’ investments are summarized into the three broad levels listed below.
| • | | Level 1 — Unadjusted inputs using quoted prices in active markets for identical investments. |
| • | | Level 2 — Other significant observable inputs including, but not limited to, quoted prices for similar investments, inputs other than quoted prices that are observable for investments (such as interest rates, prepayment speeds, credit risk, etc.) or other market corroborated inputs. |
| • | | Level 3 — Significant inputs based on the best information available in the circumstances, to the extent observable inputs are not available (including the Funds’ assumptions in determining the fair value of investments). |
A financial instrument’s level within the fair value hierarchy is based on the lowest level of any input, both individually and in the aggregate, that is significant to the fair value measurement. The inputs or methodology used for valuing instruments are not necessarily an indication of the risk associated with investing in those instruments.
The following tables represent each valuation input as presented on the Schedules of Portfolio Investments (“SOIs”) (amounts in thousands):
High Yield Municipal Fund
| | | | | | | | | | | | | | | | |
| | | Level 1
Quoted prices | | | Level 2
Other significant
observable inputs | | | Level 3
Significant
unobservable inputs | | | Total | |
Investments in Securities | | | | | | | | | | | | | | | | |
Collateralized Mortgage Obligations | | $ | — | | | $ | — | | | $ | — | (a) | | $ | — | (a) |
Municipal Bonds | | | — | | | | 485,416 | | | | — | | | | 485,416 | |
Short-Term Investments | | | | | | | | | | | | | | | | |
Investment Companies | | | 17,242 | | | | — | | | | — | | | | 17,242 | |
| | | | | | | | | | | | | | | | |
Total Investments in Securities | | $ | 17,242 | | | $ | 485,416 | | | $ | — | (a) | | $ | 502,658 | |
| | | | | | | | | | | | | | | | |
Short-Intermediate Municipal Bond Fund
| | | | | | | | | | | | | | | | |
| | | Level 1
Quoted prices | | | Level 2
Other significant
observable inputs | | | Level 3
Significant
unobservable inputs | | | Total | |
Investments in Securities | | | | | | | | | | | | | | | | |
Collateralized Mortgage Obligations | | $ | — | | | $ | 116 | | | $ | — | | | $ | 116 | |
Municipal Bonds | | | — | | | | 1,562,287 | | | | — | | | | 1,562,287 | |
Short-Term Investments | | | | | | | | | | | | | | | | |
Investment Companies | | | 186,193 | | | | — | | | | — | | | | 186,193 | |
| | | | | | | | | | | | | | | | |
Total Investments in Securities | | $ | 186,193 | | | $ | 1,562,403 | | | $ | — | | | $ | 1,748,596 | |
| | | | | | | | | | | | | | | | |
| | | | | | | | |
| | | |
| AUGUST 31, 2020 | | J.P. MORGAN MUNICIPAL BOND FUNDS | | | | | 129 | |
NOTES TO FINANCIAL STATEMENTS
AS OF AUGUST 31, 2020 (continued)
Sustainable Municipal Income Fund
| | | | | | | | | | | | | | | | |
| | | Level 1
Quoted prices | | | Level 2
Other significant
observable inputs | | | Level 3
Significant
unobservable inputs | | | Total | |
Investments in Securities | | | | | | | | | | | | | | | | |
Municipal Bonds | | | | | | | | | | | | | | | | |
Alabama | | $ | — | | | $ | 1,300 | | | $ | — | | | $ | 1,300 | |
Alaska | | | — | | | | 664 | | | | — | | | | 664 | |
Arizona | | | — | | | | 4,906 | | | | — | | | | 4,906 | |
California | | | — | | | | 8,589 | | | | — | | | | 8,589 | |
Colorado | | | — | | | | 9,520 | | | | 5 | | | | 9,525 | |
Connecticut | | | — | | | | 10,733 | | | | — | | | | 10,733 | |
Delaware | | | — | | | | 2,767 | | | | — | | | | 2,767 | |
District of Columbia | | | — | | | | 10,250 | | | | — | | | | 10,250 | |
Florida | | | — | | | | 23,264 | | | | — | | | | 23,264 | |
Georgia | | | — | | | | 3,117 | | | | — | | | | 3,117 | |
Guam | | | — | | | | 757 | | | | — | | | | 757 | |
Illinois | | | — | | | | 10,281 | | | | — | | | | 10,281 | |
Indiana | | | — | | | | 9,963 | | | | — | | | | 9,963 | |
Iowa | | | — | | | | 3,004 | | | | — | | | | 3,004 | |
Kentucky | | | — | | | | 2,337 | | | | — | | | | 2,337 | |
Louisiana | | | — | | | | 875 | | | | — | | | | 875 | |
Maine | | | — | | | | 2,498 | | | | — | | | | 2,498 | |
Maryland | | | — | | | | 3,178 | | | | — | | | | 3,178 | |
Massachusetts | | | — | | | | 20,647 | | | | — | | | | 20,647 | |
Michigan | | | — | | | | 2,466 | | | | — | | | | 2,466 | |
Minnesota | | | — | | | | 5,880 | | | | — | | | | 5,880 | |
Mississippi | | | — | | | | 1,628 | | | | — | | | | 1,628 | |
Missouri | | | — | | | | 4,650 | | | | — | | | | 4,650 | |
Nebraska | | | — | | | | 1,975 | | | | — | | | | 1,975 | |
Nevada | | | — | | | | 1,411 | | | | — | | | | 1,411 | |
New Hampshire | | | — | | | | 5,393 | | | | — | | | | 5,393 | |
New Jersey | | | — | | | | 10,955 | | | | — | | | | 10,955 | |
New Mexico | | | — | | | | 1,328 | | | | — | | | | 1,328 | |
New York | | | — | | | | 13,783 | | | | — | | | | 13,783 | |
North Carolina | | | — | | | | 2,996 | | | | — | | | | 2,996 | |
North Dakota | | | — | | | | 2,644 | | | | — | | | | 2,644 | |
Ohio | | | — | | | | 13,348 | | | | — | | | | 13,348 | |
Oklahoma | | | — | | | | 202 | | | | — | | | | 202 | |
Oregon | | | — | | | | 273 | | | | — | | | | 273 | |
Pennsylvania | | | — | | | | 16,540 | | | | — | | | | 16,540 | |
South Carolina | | | — | | | | 2,246 | | | | — | | | | 2,246 | |
South Dakota | | | — | | | | 3,369 | | | | — | | | | 3,369 | |
Tennessee | | | — | | | | 2,584 | | | | — | | | | 2,584 | |
Texas | | | — | | | | 20,595 | | | | — | | | | 20,595 | |
Utah | | | — | | | | 8,080 | | | | — | | | | 8,080 | |
Vermont | | | — | | | | 6,126 | | | | — | | | | 6,126 | |
Washington | | | — | | | | 13,093 | | | | — | | | | 13,093 | |
Wisconsin | | | — | | | | 9,135 | | | | — | | | | 9,135 | |
Wyoming | | | — | | | | 828 | | | | — | | | | 828 | |
| | | | | | | | | | | | | | | | |
Total Municipal Bonds | | | — | | | | 280,178 | | | | 5 | | | | 280,183 | |
| | | | | | | | | | | | | | | | |
Short-Term Investments | | | | | | | | | | | | | | | | |
Investment Companies | | | 21,512 | | | | — | | | | — | | | | 21,512 | |
| | | | | | | | | | | | | | | | |
Total Investments in Securities | | $ | 21,512 | | | $ | 280,178 | | | $ | 5 | | | $ | 301,695 | |
| | | | | | | | | | | | | | | | |
| | | | | | |
| | | |
| 130 | | | | J.P. MORGAN MUNICIPAL BOND FUNDS | | AUGUST 31, 2020 |
Tax Free Bond Fund
| | | | | | | | | | | | | | | | |
| | | Level 1
Quoted prices | | | Level 2
Other significant
observable inputs | | | Level 3
Significant
unobservable inputs | | | Total | |
Investments in Securities | | | | | | | | | | | | | | | | |
Municipal Bonds | | $ | — | | | $ | 544,544 | | | $ | — | | | $ | 544,544 | |
Short-Term Investments | | | | | | | | | | | | | | | | |
Investment Companies | | | 15,282 | | | | — | | | | — | | | | 15,282 | |
| | | | | | | | | | | | | | | | |
Total Investments in Securities | | $ | 15,282 | | | $ | 544,544 | | | $ | — | | | $ | 559,826 | |
| | | | | | | | | | | | | | | | |
Depreciation in Other Financial Instruments | | | | | | | | | | | | | | | | |
Futures Contracts | | $ | (4 | ) | | $ | — | | | $ | — | | | $ | (4 | ) |
| | | | | | | | | | | | | | | | |
Ultra-Short Municipal Fund
��
| | | | | | | | | | | | | | | | |
| | | Level 1
Quoted prices | | | Level 2
Other significant
observable inputs | | | Level 3
Significant
unobservable inputs | | | Total | |
Investments in Securities | | | | | | | | | | | | | | | | |
Municipal Bonds | | $ | — | | | $ | 5,097,481 | | | $ | — | | | $ | 5,097,481 | |
U.S. Treasury Obligations | | | — | | | | 101,457 | | | | — | | | | 101,457 | |
Short-Term Investments | | | | | | | | | | | | | | | | |
Investment Companies | | | 713,414 | | | | — | | | | — | | | | 713,414 | |
| | | | | | | | | | | | | | | | |
Total Investments in Securities | | $ | 713,414 | | | $ | 5,198,938 | | | $ | — | | | $ | 5,912,352 | |
| | | | | | | | | | | | | | | | |
B. Restricted Securities — Certain securities held by the Funds may be subject to legal or contractual restrictions on resale. Restricted securities generally are resold in transactions exempt from registration under the Securities Act of 1933, as amended (the “Securities Act”). Disposal of these securities may involve time-consuming negotiations and expense. Prompt sale at the current valuation may be difficult and could adversely affect the net asset value of the Funds.
As of August 31, 2020, the Funds had no investments in restricted securities other than securities sold to the Funds under Rule 144A and/or Regulation S under the Securities Act.
C. Loan Assignments — High Yield Municipal Fund invested in debt instruments that are interests in amounts owed to lenders or lending syndicates (a “Lender”) by corporate, governmental or other borrowers (a “Borrower”). A loan is often administered by a bank or other financial institution (the “Agent”) that acts as agent for all holders. The Agent administers the terms of the loan, as specified in the loan agreement. The Fund invests in loan assignments of all or a portion of the loans. When the Fund purchases a loan assignment, the fund has direct rights against the Borrower on a loan, provided, however, the fund’s rights may be more limited than the Lender from which they acquired the assignment and the funds may be able to enforce their rights only through the Agent. As a result, the Fund assumes the credit risk of the Borrower as well as any other persons interpositioned between the fund and the Borrower (“Intermediate Participants”). The Fund may incur certain costs and delays in realizing payment on a loan assignment or suffer a loss of principal and/or interest if assets or interests held by the Agent or other Intermediate Participants are determined to be subject to the claims of the Agent’s or other Intermediate Participant’s creditors. In addition, it is unclear whether loan assignments and other forms of direct indebtedness offer securities law protections against fraud and misrepresentation. Also, because JPMIM may wish to invest in publicly traded securities of a Borrower, it may not have access to material non-public information regarding the Borrower to which other investors have access. Although certain loan assignments are secured by collateral, the Fund could experience delays or limitations in realizing the value on such collateral or have its interest subordinated to other indebtedness of the Borrower.
Loan assignments are vulnerable to market conditions such that economic conditions or other events may reduce the demand for assignments and certain assignments which were liquid, when purchased, may become illiquid and they may be difficult to value. In addition, the settlement period for loans is uncertain as there is no standardized settlement schedule applicable to such investments. Therefore, the Fund may not receive the proceeds from a sale of such investments for a period after the sale.
At August 31, 2020, the Fund did not have any loan assignments.
D. When-Issued Securities, Delayed Delivery Securities and Forward Commitments — The Funds purchased when-issued securities, including To Be Announced (“TBA”) securities, and entered into contracts to purchase or sell securities for a fixed price that may be settled a month or more after the trade date, or purchased delayed delivery securities which generally settle seven days after the trade date. When-issued securities are securities that have been authorized, but not issued in the market. A forward commitment involves entering into a contract to purchase or sell securities for a fixed price at a future date that may be settled a month or more after the trade date. A delayed delivery security is agreed upon in advance between the buyer and the seller of the security and is generally delivered beyond seven days of the agreed upon date. The purchase of
| | | | | | | | |
| | | |
| AUGUST 31, 2020 | | J.P. MORGAN MUNICIPAL BOND FUNDS | | | | | 131 | |
NOTES TO FINANCIAL STATEMENTS
AS OF AUGUST 31, 2020 (continued)
securities on a when-issued, delayed delivery or forward commitment basis involves the risk that the value of the security to be purchased declines before settlement date. The sale of securities on a forward commitment basis involves the risk that the value of the securities sold may increase before the settlement date. The Funds may be exposed to credit risk if the counterparty fails to perform under the terms of the transaction. Interest income for securities purchased on a when-issued, delayed delivery or forward commitment basis is not accrued until settlement date.
The Funds had when-issued securities, forward commitments or delayed delivery securities outstanding as of August 31, 2020, which are shown as a Receivable for Investment securities sold — delayed delivery securities and Payable for Investment securities purchased — delayed delivery securities, respectively, on the Statements of Assets and Liabilities. The values of these securities held at August 31, 2020 are detailed on the SOIs.
E. Securities Lending —The Funds are authorized to engage in securities lending in order to generate additional income. The Funds are able to lend to approved borrowers. Citibank N.A. (“Citibank”) serves as lending agent for the Funds, pursuant to a Securities Lending Agency Agreement (the “Securities Lending Agency Agreement”). Securities loaned are collateralized by cash equal to at least 100% of the market value plus accrued interest on the securities lent, which is invested in an affiliated money market fund. The Funds retain loan fees and the interest on cash collateral investments but are required to pay the borrower a rebate for the use of cash collateral. In cases where the lent security is of high value to borrowers, there may be a negative rebate (i.e., a net payment from the borrower to the Funds). Upon termination of a loan, the Funds are required to return to the borrower an amount equal to the cash collateral, plus any rebate owed to the borrowers. The remaining maturities of the securities lending transactions are considered overnight and continuous. Loans are subject to termination by the Funds or the borrower at any time.
The net income earned on the securities lending (after payment of rebates and Citibank’s fee) is included on the Statements of Operations as Income from securities lending (net). The Funds also receive payments from the borrower during the period of the loan, equivalent to dividends and interest earned on the securities loaned, which are recorded as Dividend or Interest income, respectively, on the Statements of Operations.
Under the Securities Lending Agency Agreement, Citibank marks to market the loaned securities on a daily basis. In the event the cash received from the borrower is less than 102% of the value of the loaned securities (105% for loans of non-U.S. securities), Citibank requests additional cash from the borrower so as to maintain a collateralization level of at least 102% of the value of the loaned securities plus accrued interest (105% for loans of non-U.S. securities), subject to certain de minimis amounts.
The value of securities out on loan is recorded as an asset on the Statements of Assets and Liabilities. The value of the cash collateral received is recorded as a liability on the Statements of Assets and Liabilities and details of collateral investments are disclosed on the SOIs.
The Funds bear the risk of loss associated with the collateral investments and are not entitled to additional collateral from the borrower to cover any such losses. To the extent that the value of the collateral investments declines below the amount owed to a borrower, the Funds may incur losses that exceed the amount they earned on lending the security. Upon termination of a loan, the Funds may use leverage (borrow money) to repay the borrower for cash collateral posted if the Adviser does not believe that it is prudent to sell the collateral investments to fund the payment of this liability. Securities lending activity is subject to master netting arrangements.
Securities lending also involves counterparty risks, including the risk that the loaned securities may not be returned in a timely manner or at all. Subject to certain conditions, Citibank has agreed to indemnify the Funds from losses resulting from a borrower’s failure to return a loaned security.
The Funds did not lend out any securities during the six months ended August 31, 2020.
F. Investment Transactions with Affiliates — The Funds invested in Underlying Funds which are advised by the Adviser. An issuer which is under common control with the Funds may be considered an affiliate. For the purposes of the financial statements, the Funds assume the issuers listed in the table below to be affiliated issuers. Underlying Funds’ distributions may be reinvested into the Underlying Funds. Reinvestment amounts are included in the purchase cost amounts in the table below. Amounts in the tables below are in thousands.
High Yield Municipal Fund
| | | | | | | | | | | | | | | | | | | | | | | | | | | | | | | | | | | | |
| For the six months ended August 31, 2020 | |
| Security Description | | Value at
February 29,
2020 | | | Purchases
at Cost | | | Proceeds
from Sales | | | Net
Realized
Gain
(Loss) | | | Change
in Unrealized
Appreciation/
(Depreciation) | | | Value at
August 31,
2020 | | | Shares at
August 31,
2020 | | | Dividend
Income | | | Capital Gain
Distributions | |
JPMorgan Institutional Tax Free Money Market Fund Class IM Shares, 0.04% (a) (b) | | $ | 44,883 | | | $ | 126,509 | | | $ | 154,150 | | | $ | — | (c) | | $ | — | (c) | | $ | 17,242 | | | | 17,230 | | | $ | 48 | | | $ | — | |
| | | | | | | | | | | | | | | | | | | | | | | | | | | | | | | | | | | | |
| | | | | | |
| | | |
| 132 | | | | J.P. MORGAN MUNICIPAL BOND FUNDS | | AUGUST 31, 2020 |
Short-Intermediate Municipal Bond Fund
| | | | | | | | | | | | | | | | | | | | | | | | | | | | | | | | | | | | |
| For the six months ended August 31, 2020 | |
| Security Description | | Value at
February 29,
2020 | | | Purchases
at Cost | | | Proceeds
from Sales | | | Net
Realized
Gain
(Loss) | | | Change in
Unrealized
Appreciation/
(Depreciation) | | | Value at
August 31,
2020 | | | Shares at
August 31,
2020 | | | Dividend
Income | | | Capital Gain
Distributions | |
JPMorgan Institutional Tax Free Money Market Fund Class IM Shares, 0.04% (a) (b) | | $ | 48,403 | | | $ | 541,106 | | | $ | 403,330 | | | $ | — | (c) | | $ | 14 | | | $ | 186,193 | | | | 186,063 | | | $ | 105 | | | $ | — | |
| | | | | | | | | | | | | | | | | | | | | | | | | | | | | | | | | | | | |
Sustainable Municipal Income Fund
| | | | | | | | | | | | | | | | | | | | | | | | | | | | | | | | | | | | |
| For the six months ended August 31, 2020 | |
| Security Description | | Value at
February 29,
2020 | | | Purchases
at Cost | | | Proceeds
from Sales | | | Net
Realized
Gain
(Loss) | | | Change in
Unrealized
Appreciation/
(Depreciation) | | | Value at
August 31,
2020 | | | Shares at
August 31,
2020 | | | Dividend
Income | | | Capital Gain
Distributions | |
JPMorgan Institutional Tax Free Money Market Fund Class IM Shares, 0.04% (a) (b) | | $ | 13,683 | | | $ | 57,697 | | | $ | 49,869 | | | $ | (1 | ) | | $ | 2 | | | $ | 21,512 | | | | 21,497 | | | $ | 18 | | | $ | — | |
| | | | | | | | | | | | | | | | | | | | | | | | | | | | | | | | | | | | |
Tax Free Bond Fund
| | | | | | | | | | | | | | | | | | | | | | | | | | | | | | | | | | | | |
| For the six months ended August 31, 2020 | |
| Security Description | | Value at
February 29,
2020 | | | Purchases
at Cost | | | Proceeds
from Sales | | | Net
Realized
Gain
(Loss) | | | Change in
Unrealized
Appreciation/
(Depreciation) | | | Value at
August 31,
2020 | | | Shares at
August 31,
2020 | | | Dividend
Income | | | Capital Gain
Distributions | |
JPMorgan Institutional Tax Free Money Market Fund Class IM Shares, 0.04% (a) (b) | | $ | 27,433 | | | $ | 124,120 | | | $ | 136,286 | | | $ | 10 | | | $ | 5 | | | $ | 15,282 | | | | 15,271 | | | $ | 43 | | | $ | — | |
| | | | | | | | | | | | | | | | | | | | | | | | | | | | | | | | | | | | |
Ultra-Short Municipal Fund
| | | | | | | | | | | | | | | | | | | | | | | | | | | | | | | | | | | | |
| For the six months ended August 31, 2020 | |
| Security Description | | Value at
February 29,
2020 | | | Purchases
at Cost | | | Proceeds
from Sales | | | Net
Realized
Gain
(Loss) | | | Change in
Unrealized
Appreciation/
(Depreciation) | | | Value at
August 31,
2020 | | | Shares at
August 31,
2020 | | | Dividend
Income | | | Capital Gain
Distributions | |
JPMorgan Institutional Tax Free Money Market Fund Class IM Shares, 0.04% (a) (b) | | $ | 50,592 | | | $ | 4,532,928 | | | $ | 3,870,098 | | | $ | (81 | ) | | $ | 73 | | | $ | 713,414 | | | | 712,915 | | | $ | 593 | | | $ | — | |
| | | | | | | | | | | | | | | | | | | | | | | | | | | | | | | | | | | | |
| (a) | Investment in an affiliated fund, which is registered under the Investment Company Act of 1940, as amended, and is advised by J.P. Morgan Investment Management Inc. |
| (b) | The rate shown is the current yield as of August 31, 2020. |
| (c) | Amount rounds to less than one thousand. |
G. Futures Contracts — Tax Free Bond Fund used interest rate and treasury futures contracts to manage and hedge interest rate risk associated with portfolio investments. The Fund also used futures contracts to lengthen or shorten the duration of the overall investment portfolio.
Futures contracts provide for the delayed delivery of the underlying instrument at a fixed price or are settled for a cash amount based on the change in the value of the underlying instrument at a specific date in the future. Upon entering into a futures contract, the Fund is required to deposit with the broker, cash or securities in an amount equal to a certain percentage of the contract amount, which is referred to as the initial margin deposit. Subsequent payments, referred to as variation margin, are made or received by the Fund periodically and are based on changes in the market value of open futures contracts. Changes in the market value of open futures contracts are recorded as Change in net unrealized appreciation/depreciation on the Statements of Operations. Realized gains or losses, representing the difference between the value of the contract at the time it was opened and the value at the time it was closed, are reported on the Statements of Operations at the closing or expiration of the
| | | | | | | | |
| | | |
| AUGUST 31, 2020 | | J.P. MORGAN MUNICIPAL BOND FUNDS | | | | | 133 | |
NOTES TO FINANCIAL STATEMENTS
AS OF AUGUST 31, 2020 (continued)
futures contract. Securities deposited as initial margin are designated on the SOIs, while cash deposited, which is considered restricted, is recorded on the Statements of Assets and Liabilities. A receivable from and/or a payable to brokers for the daily variation margin is also recorded on the Statements of Assets and Liabilities.
The use of futures contracts exposes the Fund to interest rate risk. The Fund may be subject to the risk that the change in the value of the futures contract may not correlate perfectly with the underlying instrument. Use of long futures contracts subjects the Fund to risk of loss in excess of the amounts shown on the Statements of Assets and Liabilities, up to the notional amount of the futures contracts. Use of short futures contracts subjects the Fund to unlimited risk of loss. The Fund may enter into futures contracts only on exchanges or boards of trade. The exchange or board of trade acts as the counterparty to each futures transaction; therefore, the Fund’s credit risk is limited to failure of the exchange or board of trade. Under some circumstances, futures exchanges may establish daily limits on the amount that the price of a futures contract can vary from the previous day’s settlement price, which could effectively prevent liquidation of positions.
The table below discloses the volume of the Fund’s futures contracts activity during the six months ended August 31, 2020 (amounts in thousands):
| | | | |
| | | Tax Free
Bond Fund | |
Futures Contracts — Interest: | | | | |
Average Notional Balance Short | | $ | 11,309 | |
Ending Notional Balance Short | | | 6,680 | |
The Fund’s futures contracts are not subject to master netting arrangements (the right to close out all transactions traded with a counterparty and net amounts owed or due across transactions).
H. Security Transactions and Investment Income — Investment transactions are accounted for on the trade date (the date the order to buy or sell is executed). Securities gains and losses are calculated on a specifically identified cost basis. Interest income is determined on the basis of coupon interest accrued using the effective interest method, which adjusts for amortization of premiums and accretion of discounts. Dividend income net of foreign taxes withheld, if any, is recorded on the ex-dividend date or when a Fund first learns of the dividend.
I. Allocation of Income and Expenses — Expenses directly attributable to a Fund are charged directly to that Fund, while the expenses attributable to more than one fund of the Trusts are allocated among the applicable funds. Investment income, realized and unrealized gains and losses and expenses, other than class-specific expenses, are allocated daily to each class of shares based upon the proportion of net assets of each class at the beginning of each day.
Transfer agency fees are class-specific expenses. The amount of transfer agency fees charged to each share class of the Funds for the six months ended August 31, 2020 are as follows (amounts in thousands):
| | | | | | | | | | | | | | | | | | | | |
| | | Class A | | | Class C | | | Class I | | | Class R6 | | | Total | |
High Yield Municipal Fund | | | | | | | | | | | | | | | | | | | | |
Transfer agency fees | | $ | 2 | | | $ | — | (a) | | $ | 2 | | | $ | — | (a) | | $ | 4 | |
| | | | | |
Short-Intermediate Municipal Bond Fund | | | | | | | | | | | | | | | | | | | | |
Transfer agency fees | | | 5 | | | | 1 | | | | 3 | | | | 3 | | | | 12 | |
| | | | | |
Sustainable Municipal Income Fund | | | | | | | | | | | | | | | | | | | | |
Transfer agency fees | | | 2 | | | | — | (a) | | | 1 | | | | — | (a) | | | 3 | |
| | | | | |
Tax Free Bond Fund | | | | | | | | | | | | | | | | | | | | |
Transfer agency fees | | | 7 | | | | 1 | | | | 2 | | | | — | (a) | | | 10 | |
| | | | | |
Ultra-Short Municipal Fund | | | | | | | | | | | | | | | | | | | | |
Transfer agency fees | | | — | (a) | | | n/a | | | | 14 | | | | n/a | | | | 14 | |
| (a) | Amount rounds to less than one thousand. |
J. Federal Income Taxes — Each Fund is treated as a separate taxable entity for Federal income tax purposes. Each Fund’s policy is to comply with the provisions of the Internal Revenue Code (the “Code”) applicable to regulated investment companies and to distribute to shareholders all of its distributable net investment income and net realized capital gains on investments. Accordingly, no provision for Federal income tax is necessary. Management has reviewed the Funds’ tax positions for all open tax years and has determined that as of August 31, 2020, no liability for Federal income tax is required in the Funds’ financial statements for net unrecognized tax benefits. However, management’s conclusions may be subject to future review based on changes in, or the interpretation of, the accounting standards or tax laws and regulations. Each Fund’s Federal tax returns for the prior three fiscal years remain subject to examination by the Internal Revenue Service.
K. Distributions to Shareholders — Distributions from net investment income, if any, are generally declared and paid monthly and are declared separately for each class. No class has preferential dividend rights; differences in per share rates are due to differences in separate class expenses. Net realized capital gains, if any, are distributed by each Fund at least annually. The amount of distributions from net investment income and net
| | | | | | |
| | | |
| 134 | | | | J.P. MORGAN MUNICIPAL BOND FUNDS | | AUGUST 31, 2020 |
realized capital gains is determined in accordance with Federal income tax regulations, which may differ from GAAP. To the extent these “book/tax” differences are permanent in nature (i.e., that they result from other than timing of recognition — “temporary differences”), such amounts are reclassified within the capital accounts based on their Federal tax-basis treatment.
3. Fees and Other Transactions with Affiliates
A. Investment Advisory Fee — Pursuant to Investment Advisory Agreements, the Adviser manages the investments of each Fund and for such services is paid a fee. The investment advisory fee is accrued daily and paid monthly based on each Fund’s respective average daily net assets. The annual rate for each Fund is as follows:
| | | | |
High Yield Municipal Fund | | | 0.35 | % |
Short-Intermediate Municipal Bond Fund | | | 0.25 | |
Sustainable Municipal Income Fund | | | 0.30 | |
Tax Free Bond Fund | | | 0.30 | |
Ultra-Short Municipal Fund | | | 0.15 | |
The Adviser waived investment advisory fees and/or reimbursed expenses as outlined in Note 3.F.
B. Administration Fee — Pursuant to Administration Agreements, the Administrator provides certain administration services to each Fund. In consideration of these services, the Administrator receives a fee accrued daily and paid monthly at an annual rate of 0.075% of the first $10 billion of each Fund’s respective average daily net assets, plus 0.050% of each Fund’s respective average daily net assets between $10 billion and $20 billion, plus 0.025% of each Fund’s respective average daily net assets between $20 billion and $25 billion, plus 0.01% of each Fund’s respective average daily net assets in excess of $25 billion. For the six months ended August 31, 2020, the effective annualized rate was 0.07% of each Fund’s average daily net assets, notwithstanding any fee waivers and/or expense reimbursements.
The Administrator waived administration fees as outlined in Note 3.F.
JPMorgan Chase Bank, N.A. (“JPMCB”), a wholly-owned subsidiary of JPMorgan, serves as the Funds’ sub-administrator (the “Sub-administrator”). For its services as Sub-administrator, JPMCB receives a portion of the fees payable to the Administrator.
C. Distribution Fees — Pursuant to a Distribution Agreement, JPMorgan Distribution Services, Inc. (“JPMDS”), an indirect, wholly-owned subsidiary of JPMorgan, serves as each Fund’s principal underwriter and promotes and arranges for the sale of each Fund’s shares.
The Boards have adopted a Distribution Plan (the “Distribution Plan”) for Class A and Class C Shares of the Funds pursuant to Rule 12b-1 under the 1940 Act. Class I Shares and Class R6 Shares of the Funds do not charge a distribution fee. The Distribution Plan provides that each Fund shall pay, with respect to the applicable share classes, distribution fees, including payments to JPMDS, at annual rates of the average daily net assets as shown in the table below:
| | | | |
| Class A | | Class C | |
| 0.25% | | | 0.75 | % |
In addition, JPMDS is entitled to receive the front-end sales charges from purchases of Class A Shares and the CDSC from redemptions of Class C Shares and certain Class A Shares for which front-end sales charges have been waived. For the six months ended August 31, 2020, JPMDS retained the following (amounts in thousands):
| | | | | | | | |
| | | Front-End
Sales Charge | | | CDSC | |
High Yield Municipal Fund | | | $5 | | | $ | 2 | |
Short-Intermediate Municipal Bond Fund | | | 4 | | | | — | |
Sustainable Municipal Income Fund | | | 2 | | | | — | |
Tax Free Bond Fund | | | 8 | | | | 2 | |
Ultra-Short Municipal Fund | | | 1 | | | | — | |
D. Service Fees — The Trusts, on behalf of the Funds, have entered into a Shareholder Servicing Agreement with JPMDS under which JPMDS provides certain support services to fund shareholders. For performing these services, JPMDS receives a fee with respect to all share classes, except Class R6 Shares which do not charge a service fee, that is accrued daily and paid monthly equal to a percentage of the average daily net assets as shown in the table below:
| | | | | | | | | | |
| | | Class A | | Class C | | | Class I | |
High Yield Municipal Fund | | 0.25% | | | 0.25 | % | | | 0.25 | % |
Short-Intermediate Municipal Bond Fund | | 0.25 | | | 0.25 | | | | 0.25 | |
Sustainable Municipal Income Fund | | 0.25 | | | 0.25 | | | | 0.25 | |
Tax Free Bond Fund | | 0.25 | | | 0.25 | | | | 0.25 | |
Ultra-Short Municipal Fund | | 0.25 | | | n/a | | | | 0.25 | |
| | | | | | | | |
| | | |
| AUGUST 31, 2020 | | J.P. MORGAN MUNICIPAL BOND FUNDS | | | | | 135 | |
NOTES TO FINANCIAL STATEMENTS
AS OF AUGUST 31, 2020 (continued)
JPMDS has entered into shareholder services contracts with affiliated and unaffiliated financial intermediaries who provide shareholder services and other related services to their clients or customers who invest in the Funds. Pursuant to such contracts, JPMDS will pay all or a portion of such fees earned to financial intermediaries for performing such services.
JPMDS waived service fees as outlined in Note 3.F.
E. Custodian and Accounting Fees — JPMCB provides portfolio custody and accounting services to the Funds. For performing these services, the Funds pay JPMCB transaction and asset-based fees that vary according to the number of transactions and positions, plus out-of-pocket expenses. The amounts paid directly to JPMCB by the Funds for custody and accounting services are included in Custodian and accounting fees on the Statements of Operations.
Interest income earned on cash balances at the custodian, if any, is included in Interest income from affiliates on the Statements of Operations.
Interest expense paid to the custodian related to cash overdrafts, if any, is included in Interest expense to affiliates on the Statements of Operations.
F. Waivers and Reimbursements — The Adviser, Administrator and/or JPMDS have contractually agreed to waive fees and/or reimburse the Funds to the extent that total annual operating expenses (excluding acquired fund fees and expenses other than certain money market fund fees as described below, dividend and interest expenses related to short sales, interest, taxes, expenses related to litigation and potential litigation, expenses related to trustee elections and extraordinary expenses) exceed the percentages of the Funds’ respective average daily net assets as shown in the table below:
| | | | | | | | | | | | | | |
| | | Class A | | Class C | | | Class I | | | Class R6 | |
High Yield Municipal Fund | | 0.65% | | | 1.15 | % | | | 0.55 | % | | | 0.45 | % |
Short-Intermediate Municipal Bond Fund | | 0.70 | | | 1.20 | | | | 0.25 | | | | 0.20 | |
Sustainable Municipal Income Fund | | 0.70 | | | 1.25 | | | | 0.45 | | | | 0.35 | |
Tax Free Bond Fund | | 0.67 | | | 1.25 | | | | 0.45 | | | | 0.40 | |
Ultra-Short Municipal Fund | | 0.45 | | | n/a | | | | 0.25 | | | | n/a | |
The expense limitation agreements were in effect for the six months ended August 31, 2020 and are in place until at least June 30, 2021. For the six months ended August 31, 2020, the Funds’ service providers waived fees and/or reimbursed expenses for each of the Funds as follows (amounts in thousands). None of these parties expect the Funds to repay any such waived fees and/or reimbursed expenses in future years.
| | | | | | | | | | | | | | | | | | | | |
| | | Contractual Waivers | | | | |
| | | Investment
Advisory
Fees | | | Administration
Fees | | | Service
Fees | | | Total | | | Contractual
Reimbursement | |
High Yield Municipal Fund | | $ | 93 | | | $ | 62 | | | $ | 451 | | | $ | 606 | | | $ | 51 | |
Short-Intermediate Municipal Bond Fund | | | 766 | | | | 511 | | | | 659 | | | | 1,936 | | | | 1 | |
Sustainable Municipal Income Fund | | | 102 | | | | 68 | | | | 164 | | | | 334 | | | | — | |
Tax Free Bond Fund | | | 80 | | | | 53 | | | | 455 | | | | 588 | | | | — | |
Ultra-Short Municipal Fund | | | 3,145 | | | | 1,572 | | | | 449 | | | | 5,166 | | | | — | |
Additionally, the Funds may invest in one or more money market funds advised by the Adviser (affiliated money market funds). The Adviser, Administrator and/or JPMDS, as shareholder servicing agent, have contractually agreed to waive fees and/or reimburse expenses in an amount sufficient to offset the respective net fees each collects from the affiliated money market fund on the applicable Fund’s investment in such affiliated money market fund, except for investments of securities lending cash collateral. None of these parties expect the Funds to repay any such waived fees and/or reimbursed expenses in future years.
The amounts of these waivers/reimbursements resulting from investments in these money market funds for the six months ended August 31, 2020 were as follows (amounts in thousands):
| | | | |
High Yield Municipal Fund | | $ | 11 | |
Short-Intermediate Municipal Bond Fund | | | 40 | |
Sustainable Municipal Income Fund | | | 7 | |
Tax Free Bond Fund | | | 10 | |
Ultra-Short Municipal Fund | | | 212 | |
G. Other — Certain officers of the Trusts are affiliated with the Adviser, the Administrator and JPMDS. Such officers, with the exception of the Chief Compliance Officer, receive no compensation from the Funds for serving in their respective roles.
The Boards designated and appointed a Chief Compliance Officer to the Funds pursuant to Rule 38a-1 under the 1940 Act. Each Fund, along with affiliated funds, makes reimbursement payments, on a pro-rata basis, to the Administrator for a portion of the fees associated with the office of the Chief Compliance Officer. Such fees are included in Trustees’ and Chief Compliance Officer’s fees on the Statements of Operations.
| | | | | | |
| | | |
| 136 | | | | J.P. MORGAN MUNICIPAL BOND FUNDS | | AUGUST 31, 2020 |
The Trusts adopted a Trustee Deferred Compensation Plan (the “Plan”) which allows the independent Trustees to defer the receipt of all or a portion of compensation related to performance of their duties as Trustees. The deferred fees are invested in various J.P. Morgan Funds until distribution in accordance with the Plan.
During the six months ended August 31, 2020, the Funds purchased securities from an underwriting syndicate in which the principal underwriter or members of the syndicate were affiliated with the Adviser.
The Securities and Exchange Commission (“SEC”) has granted an exemptive order permitting the Funds to engage in principal transactions with J.P. Morgan Securities LLC, an affiliated broker, involving taxable money market instruments, subject to certain conditions.
4. Investment Transactions
During the six months ended August 31, 2020, purchases and sales of investments (excluding short-term investments) were as follows (amounts in thousands):
| | | | | | | | | | | | | | | | |
| | | Purchases
(excluding U.S.
Government) | | | Sales
(excluding U.S.
Government) | | | Purchases
of U.S.
Government | | | Sales
of U.S.
Government | |
High Yield Municipal Fund | | $ | 97,363 | | | $ | 86,917 | | | $ | — | | | $ | — | |
Short-Intermediate Municipal Bond Fund | | | 190,102 | | | | 275,573 | | | | — | | | | — | |
Sustainable Municipal Income Fund | | | 40,203 | | | | 32,650 | | | | — | | | | — | |
Tax Free Bond Fund | | | 114,367 | | | | 89,474 | | | | — | | | | — | |
Ultra-Short Municipal Fund | | | 2,787,489 | | | | 2,343,502 | | | | 100,930 | | | | — | |
5. Federal Income Tax Matters
For Federal income tax purposes, the estimated cost and unrealized appreciation (depreciation) in value of investments held at August 31, 2020 were as follows (amounts in thousands):
| | | | | | | | | | | | | | | | |
| | | Aggregate
Cost | | | Gross
Unrealized
Appreciation | | | Gross
Unrealized
Depreciation | | | Net
Unrealized
Appreciation
(Depreciation) | |
High Yield Municipal Fund | | $ | 499,582 | | | $ | 13,447 | | | $ | 10,371 | | | $ | 3,076 | |
Short-Intermediate Municipal Bond Fund | | | 1,688,182 | | | | 63,208 | | | | 2,794 | | | | 60,414 | |
Sustainable Municipal Income Fund | | | 287,918 | | | | 14,304 | | | | 527 | | | | 13,777 | |
Tax Free Bond Fund | | | 523,178 | | | | 37,907 | | | | 1,263 | | | | 36,644 | |
Ultra-Short Municipal Fund | | | 5,894,682 | | | | 20,743 | | | | 3,073 | | | | 17,670 | |
As of February 29, 2020, the following Funds had the following net capital loss carryforwards (amounts in thousands):
| | | | | | | | |
| | | Capital Loss Carryforward Character | |
| | | Short-Term | | | Long-Term | |
Sustainable Municipal Income Fund | | $ | 11 | | | $ | 327 | |
Short-Intermediate Municipal Bond Fund | | | 10,296 | | | | 1,209 | |
Tax Free Bond Fund | | | 4,612 | | | | 3,864 | |
Ultra-Short Municipal Fund | | | 554 | | | | 351 | |
Net capital losses incurred after October 31, and within the taxable year are deemed to arise on the first business day of the Funds’ next taxable year. For the year ended February 29, 2020, the Funds deferred to March 1, 2020 the following net capital losses and specified ordinary losses of (amounts in thousands):
| | | | | | | | |
| | | Net Capital Losses (Gains) | |
| | | Short-Term | | | Long-Term | |
Sustainable Municipal Income Fund | | $ | 7 | | | $ | 129 | |
Tax Free Bond Fund | | | 108 | | | | 275 | |
Ultra-Short Municipal Fund | | | 93 | | | | (11 | ) |
During the year ended February 29, 2020, the following Funds utilized capital loss carryforwards as follows (amounts in thousands):
| | | | | | | | |
| | | Capital Loss Utilized | |
| | | Short-Term | | | Long-Term | |
High Yield Municipal Fund | | $ | 159 | | | $ | 221 | |
Short-Intermediate Municipal Bond Fund | | | 4,157 | | | | — | |
| | | | | | | | |
| | | |
| AUGUST 31, 2020 | | J.P. MORGAN MUNICIPAL BOND FUNDS | | | | | 137 | |
NOTES TO FINANCIAL STATEMENTS
AS OF AUGUST 31, 2020 (continued)
6. Borrowings
The Funds rely upon an exemptive order granted by the SEC (the “Order”) permitting the establishment and operation of an Interfund Lending Facility (the “Facility”). The Facility allows the Funds to directly lend and borrow money to or from any other fund relying upon the Order at rates beneficial to both the borrowing and lending funds. Advances under the Facility are taken primarily for temporary or emergency purposes, including the meeting of redemption requests that otherwise might require the untimely disposition of securities, and are subject to each Fund’s borrowing restrictions. The Interfund loan rate is determined, as specified in the Order, by averaging the current repurchase agreement rate and the current bank loan rate. The Order was granted to JPM II and may be relied upon by the Funds because the Funds and the series of JPM II are all investment companies in the same “group of investment companies” (as defined in Section 12(d)(1)(G) of the 1940 Act).
The Funds had no borrowings outstanding from another fund during the six months ended August 31, 2020.
The Trusts and JPMCB have entered into a financing arrangement. Under this arrangement, JPMCB provides an unsecured, uncommitted credit facility in the aggregate amount of $100 million to certain of the J.P. Morgan Funds, including the Funds. Advances under the arrangement are taken primarily for temporary or emergency purposes, including the meeting of redemption requests that otherwise might require the untimely disposition of securities, and are subject to each Fund’s borrowing restrictions. Interest on borrowings is payable at a rate determined by JPMCB at the time of borrowing. This agreement has been extended until November 2, 2020.
The Funds had no borrowings outstanding from the unsecured, uncommitted credit facility during the six months ended August 31, 2020.
The Trusts, along with certain other trusts for J.P. Morgan Funds (“Borrowers”), have entered into a joint syndicated senior unsecured revolving credit facility totaling $1.5 billion (“Credit Facility”) with various lenders and The Bank of New York Mellon, as administrative agent for the lenders. This Credit Facility provides a source of funds to the Borrowers for temporary and emergency purposes, including the meeting of redemption requests that otherwise might require the untimely disposition of securities. Under the terms of the Credit Facility, a borrowing fund must have a minimum of $25,000,000 in adjusted net asset value and not exceed certain adjusted net asset coverage ratios prior to and during the time in which any borrowings are outstanding. If a fund does not comply with the aforementioned requirements, the fund must remediate within three business days with respect to the $25,000,000 minimum adjusted net asset value or within one business day with respect to certain asset coverage ratios or the administrative agent at the request of, or with the consent of, the lenders may terminate the Credit Facility and declare any outstanding borrowings to be due and payable immediately.
Interest associated with any borrowing under the Credit Facility is charged to the borrowing fund at a rate of interest equal to 1.00%, which has increased to 1.25% pursuant to the amendment referenced below, plus the greater of the federal funds effective rate or one month London InterBank Offered Rate (“LIBOR”). The annual commitment fee to maintain the Credit Facility is 0.15% and is incurred on the unused portion of the Credit Facility and is allocated to all participating funds pro rata based on their respective net assets. Effective August 11, 2020, this agreement has been amended and restated for a term of 364 days, unless extended, and to include the change to the interest rate charged for borrowing from the Credit Facility to 1.25%, as noted above, and an upfront fee of 0.075% of the Credit Facility to be charged and paid by all participating funds of the Credit Facility.
The Funds did not utilize the Credit Facility during the six months ended August 31, 2020.
7. Risks, Concentrations and Indemnifications
In the normal course of business, the Funds enter into contracts that contain a variety of representations which provide general indemnifications. Each Fund’s maximum exposure under these arrangements is unknown. The amount of exposure would depend on future claims that may be brought against each Fund. However, based on experience, the Funds expect the risk of loss to be remote.
As of August 31, 2020, the Funds had individual shareholder and/or omnibus accounts which owned more than 10% of the respective Fund’s outstanding shares as follows:
| | | | | | | | | | | | | | | | |
| | | Number of
individual
shareholder
and/or Affiliated
Omnibus Accounts | | | % of the
Fund | | | Number of
individual
shareholder and/
or Non-Affiliated
Omnibus Accounts | | | % of the
Fund | |
High Yield Municipal Fund | | | 1 | | | | 15.7 | % | | | 4 | | | | 50.2 | % |
Short-Intermediate Municipal Bond Fund | | | 1 | | | | 81.6 | | | | — | | | | — | |
Sustainable Municipal Income Fund | | | 1 | | | | 50.2 | | | | 2 | | | | 28.8 | |
Tax Free Bond Fund | | | 1 | | | | 50.6 | | | | 1 | | | | 20.9 | |
Ultra-Short Municipal Fund | | | 1 | | | | 90.0 | | | | — | | | | — | |
Significant shareholder transactions by these shareholders may impact the Funds’ performance and liquidity.
Derivatives may be riskier than other types of investments because they may be more sensitive to changes in economic and market conditions and could result in losses that significantly exceed the Funds’ original investment. Many derivatives create leverage thereby causing the Funds to be more volatile than they would have been if they had not used derivatives. Derivatives also expose the Funds to counterparty risk (the risk that the
| | | | | | |
| | | |
| 138 | | | | J.P. MORGAN MUNICIPAL BOND FUNDS | | AUGUST 31, 2020 |
derivative counterparty will not fulfill its contractual obligations), including credit risk of the derivative counterparty. The possible lack of a liquid secondary market for derivatives and the resulting inability of the Funds to sell or otherwise close a derivatives position could expose the Funds to losses.
The Funds are also subject to counterparty credit risk, which is the risk that a counterparty fails to perform on agreements with the Funds such as swap and option contracts, forward foreign currency exchange contracts, TBA securities and insurance linked securities.
The Funds are subject to interest rate and credit risk. The value of debt securities may decline as interest rates increase. The Funds could lose money if the issuer of a fixed income security is unable to pay interest or repay principal when it is due. The Funds invest in floating rate loans and other floating rate debt securities. Although these investments are generally less sensitive to interest rate changes than other fixed rate instruments, the value of floating rate loans and other floating rate investments may decline if their interest rates do not rise as quickly, or as much, as general interest rates. Many factors can cause interest rates to rise. Some examples include central bank monetary policy, rising inflation rates and general economic conditions. The Funds may face a heightened level of interest rate risk due to certain changes in monetary policy. During periods when interest rates are low or there are negative interest rates, the Funds’ yield (and total return) also may be low or the Funds may be unable to maintain positive returns. The ability of the issuers of debt to meet their obligations may be affected by economic and political developments in a specific industry or region. The value of a Fund’s investments may be adversely affected if any of the issuers or counterparties it is invested in are subject to an actual or perceived deterioration in their credit quality.
Specific risks and concentrations present in the Underlying Funds are disclosed within their individual financial statements and registration statements, as appropriate.
The Funds invest primarily in a portfolio of debt obligations issued by states, territories and possessions of the United States and by the District of Columbia, and by their political subdivisions and duly constituted authorities. An issuer’s ability to meet its payment obligations may be affected by economic or political developments in a specific state or region. These debt obligations may be insured by private insurers who guarantee the payment of principal and interest in the event of issuer default. The value of these investments may be impacted by changes to bond insurers’ ratings and the Fund’s ability to collect principal and interest in the event of an issuer’s default may be limited if the private insurer does not have the wherewithal to satisfy its obligation.
LIBOR is intended to represent the rate at which contributing banks may obtain short-term borrowings from each other in the London interbank market. The regulatory authority that oversees financial services firms and financial markets in the U.K. has announced that, after the end of 2021, it would no longer persuade or compel contributing banks to make rate submissions for purposes of determining the LIBOR rate. As a result, it is possible that commencing in 2022, LIBOR may no longer be available or no longer deemed an appropriate reference rate upon which to determine the interest rate on or impacting certain loans, notes, derivatives and other instruments or investments comprising some or all of the Fund’s portfolio. In light of this eventuality, public and private sector industry initiatives are currently underway to identify new or alternative reference rates to be used in place of LIBOR. There is no assurance that the composition or characteristics of any such alternative reference rate will be similar to or produce the same value or economic equivalence as LIBOR or that it will have the same volume or liquidity as did LIBOR prior to its discontinuance or unavailability, which may affect the value or liquidity or return on certain investments of the Fund and result in costs incurred in connection with closing out positions and entering into new trades. These risks may also apply with respect to changes in connection with other interbank offering rates (e.g., Euribor) and a wide range of other index levels, rates and values that are treated as “benchmarks” and are the subject of recent regulatory reform.
The Funds are subject to infectious disease epidemics/pandemics risk. Recently, the worldwide outbreak of COVID-19, a novel coronavirus disease, has negatively affected economies, markets and individual companies throughout the world. The effects of this COVID-19 pandemic to public health, and business and market conditions, including exchange trading suspensions and closures may continue to have a significant negative impact on the performance of a Fund’s investments, increase a Fund’s volatility, exacerbate other pre-existing political, social and economic risks to the Funds and negatively impact broad segments of businesses and populations. The Funds’ operations may be interrupted as a result, which may have a significant negative impact on investment performance. In addition, governments, their regulatory agencies, or self-regulatory organizations may take actions in response to the pandemic that affect the instruments in which the Funds invest, or the issuers of such instruments, in ways that could also have a significant negative impact on a Fund’s investment performance. The full impact of this COVID-19 pandemic, or other future epidemics/pandemics, is currently unknown.
| | | | | | | | |
| | | |
| AUGUST 31, 2020 | | J.P. MORGAN MUNICIPAL BOND FUNDS | | | | | 139 | |
SCHEDULE OF SHAREHOLDER EXPENSES
(Unaudited)
Hypothetical $1,000 Investment
As a shareholder of the Funds, you incur two types of costs: (1) transaction costs, including sales charges (loads) on purchase payments and (2) ongoing costs, including investment advisory, fees, administration fees, distribution fees and other Fund expenses. The examples below are intended to help you understand your ongoing costs (in dollars) of investing in the Funds and to compare these ongoing costs with the ongoing costs of investing in other mutual funds. The examples assume that you had a $1,000 investment in each Class at the beginning of the reporting period, March 1, 2020, and continued to hold your shares at the end of the reporting period, August 31, 2020.
Actual Expenses
For each Class of each Fund in the table below, the first line provides information about actual account values and actual expenses. You may use the information in this line, together with the amount you invested, to estimate the expenses that you paid over the period. Simply divide your account value by $1,000 (for example, an $8,600 account value divided by $1,000 = 8.6), then multiply the result by the number in the first line of each Class under the heading titled “Expenses Paid During the Period” to estimate the expenses you paid on your account during this period.
Hypothetical Example for Comparison Purposes
The second line of each Class in the table below provides information about hypothetical account values and hypothetical expenses based on the Class’ actual expense ratio and an assumed rate of return of 5% per year before expenses, which is not the Class’ actual return. The hypothetical account values and expenses may not be used to estimate the actual ending account balance or expenses you paid for the period. You may use this information to compare the ongoing costs of investing in the Class of the Fund and other funds. To do so, compare this 5% hypothetical example with the 5% hypothetical examples that appear in the shareholder reports of the other funds. Please note that the expenses shown in the table are meant to highlight your ongoing costs only and do not reflect any transaction costs, such as sales charges (loads) or redemption fees. Therefore, the second line for each Class in the table is useful in comparing ongoing costs only, and will not help you determine the relative total costs of owning different funds. In addition, if these transaction costs were included, your costs would have been higher. The examples also assume all dividends and distributions have been reinvested.
| | | | | | | | | | | | | | | | |
| | | Beginning
Account Value
March 1, 2020 | | | Ending
Account Value
August 31, 2020 | | | Expenses
Paid During
the Period* | | | Annualized
Expense
Ratio | |
JPMorgan High Yield Municipal Fund | | | | | | | | | | | | | | | | |
Class A | | | | | | | | | | | | | | | | |
Actual | | $ | 1,000.00 | | | $ | 951.00 | | | $ | 3.15 | | | | 0.64 | % |
Hypothetical | | | 1,000.00 | | | | 1,021.98 | | | | 3.26 | | | | 0.64 | |
Class C | | | | | | | | | | | | | | | | |
Actual | | | 1,000.00 | | | | 949.30 | | | | 5.60 | | | | 1.14 | |
Hypothetical | | | 1,000.00 | | | | 1,019.46 | | | | 5.80 | | | | 1.14 | |
Class I | | | | | | | | | | | | | | | | |
Actual | | | 1,000.00 | | | | 951.50 | | | | 2.66 | | | | 0.54 | |
Hypothetical | | | 1,000.00 | | | | 1,022.48 | | | | 2.75 | | | | 0.54 | |
Class R6 | | | | | | | | | | | | | | | | |
Actual | | | 1,000.00 | | | | 951.90 | | | | 2.16 | | | | 0.44 | |
Hypothetical | | | 1,000.00 | | | | 1,022.99 | | | | 2.24 | | | | 0.44 | |
| | | | |
JPMorgan Short-Intermediate Municipal Bond Fund | | | | | | | | | | | | | | | | |
Class A | | | | | | | | | | | | | | | | |
Actual | | | 1,000.00 | | | | 1,003.70 | | | | 3.48 | | | | 0.69 | |
Hypothetical | | | 1,000.00 | | | | 1,021.73 | | | | 3.52 | | | | 0.69 | |
Class C | | | | | | | | | | | | | | | | |
Actual | | | 1,000.00 | | | | 1,001.10 | | | | 6.00 | | | | 1.19 | |
Hypothetical | | | 1,000.00 | | | | 1,019.21 | | | | 6.06 | | | | 1.19 | |
Class I | | | | | | | | | | | | | | | | |
Actual | | | 1,000.00 | | | | 1,005.90 | | | | 1.21 | | | | 0.24 | |
Hypothetical | | | 1,000.00 | | | | 1,024.00 | | | | 1.22 | | | | 0.24 | |
Class R6 | | | | | | | | | | | | | | | | |
Actual | | | 1,000.00 | | | | 1,006.10 | | | | 0.96 | | | | 0.19 | |
Hypothetical | | | 1,000.00 | | | | 1,024.25 | | | | 0.97 | | | | 0.19 | |
| | | | | | |
| | | |
| 140 | | | | J.P. MORGAN MUNICIPAL BOND FUNDS | | AUGUST 31, 2020 |
| | | | | | | | | | | | | | | | |
| | | Beginning
Account Value
March 1, 2020 | | | Ending
Account Value
August 31, 2020 | | | Expenses
Paid During
the Period* | | | Annualized
Expense
Ratio | |
| | | | |
JPMorgan Sustainable Municipal Income Fund (formerly known as JPMorgan Municipal Income Fund) | | | | | | | | | | | | | | | | |
Class A | | | | | | | | | | | | | | | | |
Actual | | $ | 1,000.00 | | | $ | 1,005.80 | | | $ | 3.49 | | | | 0.69 | % |
Hypothetical | | | 1,000.00 | | | | 1,021.73 | | | | 3.52 | | | | 0.69 | |
Class C | | | | | | | | | | | | | | | | |
Actual | | | 1,000.00 | | | | 1,003.00 | | | | 6.26 | | | | 1.24 | |
Hypothetical | | | 1,000.00 | | | | 1,018.95 | | | | 6.31 | | | | 1.24 | |
Class I | | | | | | | | | | | | | | | | |
Actual | | | 1,000.00 | | | | 1,006.10 | | | | 2.22 | | | | 0.44 | |
Hypothetical | | | 1,000.00 | | | | 1,022.99 | | | | 2.24 | | | | 0.44 | |
Class R6 | | | | | | | | | | | | | | | | |
Actual | | | 1,000.00 | | | | 1,007.60 | | | | 1.72 | | | | 0.34 | |
Hypothetical | | | 1,000.00 | | | | 1,023.49 | | | | 1.73 | | | | 0.34 | |
| | | | |
JPMorgan Tax Free Bond Fund | | | | | | | | | | | | | | | | |
Class A | | | | | | | | | | | | | | | | |
Actual | | | 1,000.00 | | | | 992.40 | | | | 3.31 | | | | 0.66 | |
Hypothetical | | | 1,000.00 | | | | 1,021.88 | | | | 3.36 | | | | 0.66 | |
Class C | | | | | | | | | | | | | | | | |
Actual | | | 1,000.00 | | | | 989.40 | | | | 6.22 | | | | 1.24 | |
Hypothetical | | | 1,000.00 | | | | 1,018.95 | | | | 6.31 | | | | 1.24 | |
Class I | | | | | | | | | | | | | | | | |
Actual | | | 1,000.00 | | | | 992.60 | | | | 2.26 | | | | 0.45 | |
Hypothetical | | | 1,000.00 | | | | 1,022.94 | | | | 2.29 | | | | 0.45 | |
Class R6 | | | | | | | | | | | | | | | | |
Actual | | | 1,000.00 | | | | 993.70 | | | | 2.01 | | | | 0.40 | |
Hypothetical | | | 1,000.00 | | | | 1,023.19 | | | | 2.04 | | | | 0.40 | |
| | | | |
JPMorgan Ultra-Short Municipal Fund | | | | | | | | | | | | | | | | |
Class A | | | | | | | | | | | | | | | | |
Actual | | | 1,000.00 | | | | 1,002.50 | | | | 2.22 | | | | 0.44 | |
Hypothetical | | | 1,000.00 | | | | 1,022.99 | | | | 2.24 | | | | 0.44 | |
Class I | | | | | | | | | | | | | | | | |
Actual | | | 1,000.00 | | | | 1,004.50 | | | | 1.21 | | | | 0.24 | |
Hypothetical | | | 1,000.00 | | | | 1,024.00 | | | | 1.22 | | | | 0.24 | |
| * | Expenses are equal to each Class’ respective annualized expense ratio, multiplied by the average account value over the period, multiplied by 184/365 (to reflect the one-half year period). |
| | | | | | | | |
| | | |
| AUGUST 31, 2020 | | J.P. MORGAN MUNICIPAL BOND FUNDS | | | | | 141 | |
BOARD APPROVAL OF INVESTMENT ADVISORY AGREEMENTS
(Unaudited)
The Board of Trustees has established various standing committees composed of Trustees with diverse backgrounds, to which the Board of Trustees has assigned specific subject matter responsibilities to further enhance the effectiveness of the Board’s oversight and decision making. The Board of Trustees and its investment committees (money market and alternative products, equity, and fixed income) meet regularly throughout the year and consider factors that are relevant to their annual consideration of investment advisory agreements at each meeting. They also meet for the specific purpose of considering investment advisory agreement annual renewals. The Board of Trustees held meetings in June and August 2020, at which the Trustees considered the continuation of the investment advisory agreements for each Fund whose semi-annual report is contained herein (each an “Advisory Agreement” and collectively, the “Advisory Agreements”). In accordance with SEC guidance, due to the COVID-19 pandemic, the meetings were conducted through video conference. At the June meeting, the Board’s investment committees met to review and consider performance, expense and related information for the J.P. Morgan Funds. Each investment committee reported to the full Board, which then considered the investment committee’s preliminary findings. At the August meeting, the Trustees continued their review and consideration. The Trustees, including a majority of the Trustees who are not parties to an Advisory Agreement or “interested persons” (as defined in the 1940 Act) of any party to an Advisory Agreement or any of their affiliates, approved the continuation of each Advisory Agreement on August 11 2020.
As part of their review of the Advisory Agreements, the Trustees considered and reviewed performance and other information about the Funds received from the Adviser. This information includes the Funds’ performance as compared to the performance of their peers and benchmarks and analyses by the Adviser of the Funds’ performance. In addition, at each of their regular meetings throughout the year, the Trustees considered reports on the performance of certain J.P. Morgan Funds provided by an independent management consulting firm (“independent consultant”). In addition, in preparation for the June and August meetings, the Trustees requested, received and evaluated extensive materials from the Adviser, including performance and expense information compiled by Broadridge, using data from Lipper Inc. and/or Morningstar Inc., independent providers of investment company data (together, “Broadridge”). The Trustees’ independent consultant also provided additional analyses of the performance of the Funds, as well as a risk/return assessment of certain Funds as compared to the Funds’ objectives and peers. Before voting on the Advisory Agreements, the Trustees reviewed the Advisory Agreements with representatives of the Adviser, counsel to the Trusts and independent legal counsel and received a memorandum from independent legal counsel to the Trustees discussing the legal standards for their consideration of the Advisory Agreements. The Trustees also discussed the
Advisory Agreements in executive sessions with independent legal counsel at which no representatives of the Adviser were present.
A summary of the material factors evaluated by the Trustees in determining whether to approve each Advisory Agreement is provided below. Each Trustee attributed different weights to the various factors and no factor alone was considered determinative. The Trustees considered information provided with respect to the Funds throughout the year including additional reporting and information provided in connection with the market volatility caused by the COVID-19 pandemic, as well as materials furnished specifically in connection with the annual review process. From year to year, the Trustees consider and place emphasis on relevant information in light of changing circumstances in market and economic conditions.
After considering and weighing the factors and information they had received, the Trustees found that the compensation to be received by the Adviser from each Fund under the applicable Advisory Agreement was fair and reasonable under the circumstances and determined that the continuance of each Advisory Agreement was in the best interests of each Fund and its shareholders.
Nature, Extent and Quality of Services Provided by the Adviser
The Trustees received and considered information regarding the nature, extent and quality of services provided to each Fund under the applicable Advisory Agreement. The Trustees took into account information furnished throughout the year at Trustee meetings, as well as the materials furnished specifically in connection with this annual review process. The Trustees considered the background and experience of the Adviser’s senior management, personnel changes, if any, and the expertise of, and the amount of attention given to each Fund by, investment personnel of the Adviser. In addition, the Trustees reviewed the qualifications, backgrounds and responsibilities of the portfolio management team primarily responsible for the day-to-day management of each Fund and the infrastructure supporting the team, including personnel changes, if any. In addition, the Board considered its discussions with the Adviser regarding the Adviser’s business continuity plan and steps the Adviser was taking to provide ongoing services to the Funds during the COVID-19 pandemic, and the Adviser’s success in continuing to provide services to the Funds and their shareholders throughout this period. The Trustees also considered information provided by the Adviser and JPMorgan Distribution Services, Inc. (“JPMDS”) about the structure and distribution strategy of each Fund. The Trustees reviewed information relating to the Adviser’s risk governance model and reports showing the Adviser’s compliance structure and ongoing compliance processes. The Trustees also considered the quality of administration services provided by the Adviser in its role as administrator.
| | | | | | |
| | | |
| 142 | | | | J.P. MORGAN MUNICIPAL BOND FUNDS | | AUGUST 31, 2020 |
The Trustees also considered their knowledge of the nature and quality of services provided by the Adviser and its affiliates to the Funds gained from their experience as Trustees of the J.P. Morgan Funds. In addition, they considered the overall reputation and capabilities of the Adviser and its affiliates, the commitment of the Adviser to provide high quality service to the Funds, their overall confidence in the Adviser’s integrity and the Adviser’s responsiveness to questions or concerns raised by them, including the Adviser’s willingness to consider and implement organizational and operational changes designed to improve investment results and the services provided to each Fund.
Based upon these considerations and other factors, the Trustees concluded that they were satisfied with the nature, extent and quality of the investment advisory services provided to the Funds by the Adviser.
Costs of Services Provided and Profitability to the Adviser and its Affiliates
The Trustees received and considered information regarding the profitability to the Adviser and its affiliates in providing services to each Fund. The Trustees reviewed and discussed this information. The Trustees recognized that this information is not audited and represents the Adviser’s determination of its and its affiliates’ revenues from the contractual services provided to the Funds, less expenses of providing such services. Expenses include direct and indirect costs and are calculated using an allocation methodology developed by the Adviser. The Trustees also recognized that it is difficult to make comparisons of profitability from fund investment advisory contracts because comparative information is not generally publicly available and is affected by numerous factors, including the structure of the particular adviser, the types of funds it manages, its business mix, numerous assumptions regarding allocations and the fact that publicly-traded fund managers’ operating profits and net income are net of distribution and marketing expenses. Based upon their review, and taking into consideration the factors noted above, the Trustees concluded that the profitability to the Adviser under each Advisory Agreement was not unreasonable in light of the services and benefits provided to each Fund.
The Trustees also considered that JPMDS, an affiliate of the Adviser, and the Adviser earn fees from the Funds for providing shareholder and administration services, respectively. These fees were shown separately in the profitability analysis presented to the Trustees. The Trustees also considered the payments of Rule 12b-1 fees to JPMDS, which also acts as the Funds’ distributor and that these fees are in turn generally paid to financial intermediaries that sell the Funds, including financial intermediaries that are affiliates of the Adviser (although they are retained by JPMDS in certain instances). The Trustees also considered the fees paid to JPMorgan Chase Bank, N.A.
(“JPMCB”) for custody and fund accounting, and other related services.
Fall-Out Benefits
The Trustees reviewed information regarding potential “fall-out” or ancillary benefits received by the Adviser and its affiliates as a result of their relationship with the Funds. The Trustees considered that the J.P. Morgan Funds’ operating accounts are held at JPMCB, which as a result, will receive float benefits for certain J.P. Morgan Funds, as applicable. The Trustees also noted that the Adviser supports a diverse set of products and services, which benefits the Adviser by allowing it to leverage its infrastructure to serve additional clients, including benefits that may be received by the Adviser and its affiliates in connection with the Fund’s potential investments in other funds advised by the Adviser. The Trustees also reviewed the Adviser’s allocation of fund brokerage for the J.P. Morgan Funds complex, including allocations to brokers who provide research to the Adviser.
Economies of Scale
The Trustees considered the extent to which the Funds may benefit from economies of scale. The Trustees considered that there may not be a direct relationship between economies of scale realized by the Funds and those realized by the Adviser as assets increase. The Trustees considered the extent to which the Funds were priced to scale and whether it would be appropriate to add advisory fee breakpoints. The Trustees noted certain Funds with contractual expense limitations and fee waivers (“Fee Caps”) which allow a Fund’s shareholders to share potential economies of scale from a Fund’s inception, prior to reaching scale. The Trustees also noted that other Funds which had achieved scale as asset levels had increased, no longer had Fee Caps in place for some or all of their share classes, but shared economies of scale through lower average expenses. The Trustees noted that the fees remain satisfactory relative to peer funds. The Trustees considered the benefits to the Funds of the use of an affiliated distributor and custodian, including the ability to rely on existing infrastructure supporting distribution, custodial and transfer agent services and the ability to negotiate competitive fees for the Funds. The Trustees further considered the Adviser’s and JPMDS’s ongoing investments in their business in support of the Funds, including the Adviser’s and/or JPMDS’s investments in trading systems, technology (including improvements to the J.P. Morgan Funds’ website, and cybersecurity improvements), retention of key talent, and regulatory support enhancements. The Trustees concluded that the current fee structure for each Fund, including any Fee Caps the Adviser has in place that serve to limit the overall net expense ratios of each Fund at competitive levels, was reasonable. The Trustees concluded that, for Funds with expense caps in place for some or all of their share classes, the relevant Fund’s shareholders received the benefits of potential
| | | | | | | | |
| | | |
| AUGUST 31, 2020 | | J.P. MORGAN MUNICIPAL BOND FUNDS | | | | | 143 | |
BOARD APPROVAL OF INVESTMENT ADVISORY AGREEMENTS
(Unaudited) (continued)
economies of scale through the Fee Caps and for Funds that achieved scale and no longer had Fee Caps in place for some or all of their share classes, the relevant Fund’s shareholders benefitted from lower average expenses resulting from increased assets. The Trustees also concluded that all Funds benefitted from the Adviser’s reinvestment in its operations to serve the Funds and their shareholders. The Trustees noted that the Adviser’s reinvestment ensures sufficient resources in terms of personnel and infrastructure to support the Funds.
Independent Written Evaluation of the Funds’ Senior /Chief Compliance Officer
The Trustees noted that, upon their direction, the Senior Officer for the Municipal Income Fund, Short-Intermediate Municipal Bond Fund and Tax Free Bond Fund had prepared an independent written evaluation in order to assist the Trustees in determining the reasonableness of the proposed management fees. In determining whether to continue the Advisory Agreements, the Trustees considered the Senior Officer’s report.
The Trustees noted that, upon their direction, the Chief Compliance Officer for the High Yield Municipal Fund and Ultra-Short Municipal Fund had prepared an independent written evaluation in order to assist the Trustees in determining the reasonableness of the proposed management fees. The Trustees considered the written evaluation in determining whether to continue the Advisory Agreements.
Fees Relative to Adviser’s Other Clients
The Trustees received and considered information about the nature and extent of investment advisory services and fee rates offered to other clients of the Adviser, including institutional separate accounts, collective investment trusts, ETFs and/or funds sub-advised by the Adviser, and for investment management styles substantially similar to that of each Fund. The Trustees considered the complexity of investment management for registered mutual funds relative to the Adviser’s other clients and noted differences, as applicable, in the regulatory, legal and other risks and responsibilities of providing services to the different clients. The Trustees considered that serving as an adviser to a registered mutual fund involves greater responsibilities and risks than acting as a sub-adviser and observed that sub-advisory fees may be lower than those charged by the Adviser to each Fund. The Trustees also noted that the adviser, not the mutual fund, pays the sub-advisory fee and that many responsibilities related to the advisory function are retained by the primary adviser. The Trustees concluded that the fee rates charged to each Fund in comparison to those charged to the Adviser’s other clients were reasonable.
Investment Performance
The Trustees received and considered absolute and/or relative performance information for the Funds in a report prepared by
Broadridge. The Trustees considered the total return performance information, which included the ranking of the Funds within a performance universe made up of funds with the same Broadridge investment classification and objective (the “Universe”), as well as a subset of funds within the Universe (the “Peer Group”), by total return for applicable one-, three- and five-year periods. The Trustees reviewed a description of Broadridge’s methodology for selecting mutual funds in each Fund’s Universe and Peer Group, and noted that Universe and Peer Group rankings were not calculated if the number of funds in the Universe and/or Peer Group did not meet a predetermined minimum. The Broadridge materials provided to the Trustees highlighted information with respect to certain representative classes to assist the Trustees in their review. As part of this review, the Trustees also reviewed each Fund’s performance against its benchmark and considered the performance information provided for the Funds at regular Board meetings by the Adviser and the Trustees’ independent consultant and also considered the special analysis prepared by the Trustees’ independent consultant. For certain Funds, the Trustees and Adviser determined that the Peer Group and/or Universe were less meaningful and the independent consultant prepared an analysis of those Funds across various risk and return metrics including standard deviation, Sharpe ratio, credit quality, and duration compared to customized peer groups of funds with similar portfolio objectives (as selected by the independent consultant). The Trustees also engaged with the Adviser to consider what steps might be taken to improve performance, as applicable. The Broadridge performance data noted by the Trustees as part of their review and the determinations made by the Trustees with respect to each Fund’s performance for certain representative classes are summarized below:
The Trustees noted that the High Yield Municipal Fund’s performance for Class A shares was in the first, fifth and fifth quintiles based upon the Peer Group, and in the second, fourth and fourth quintiles based upon the Universe, for the one-, three-, and five-year periods ended December 31, 2019, respectively. The Trustees noted that the performance for Class I shares was in the first, fourth, and fourth quintiles based upon the Universe, for the one-, three-, and five-year periods ended December 31, 2019, respectively. The Trustees noted that the performance for Class R6 shares was in the second and first quintiles based upon the Peer Group and Universe, respectively, for the one-year period ended December 31, 2019. The Trustees discussed the performance and investment strategy of the Fund with the Adviser, including changes to the investment strategy that went into effect on November 1, 2018, and reviewed the performance analysis and evaluation prepared by the independent consultant. Based upon these discussions and various other factors, the Trustees concluded that the Fund’s performance was satisfactory, under the circumstances. The Trustees requested, however, that the Adviser
| | | | | | |
| | | |
| 144 | | | | J.P. MORGAN MUNICIPAL BOND FUNDS | | AUGUST 31, 2020 |
provide additional Fund performance information to be reviewed with the members of the Board’s fixed income committee at each of their regular meetings over the course of next year.
The Trustees noted that the Municipal Income Fund’s performance for Class A shares was in the fifth, fourth and fourth quintiles based upon the Peer Group, for the one-, three, and five-year periods ended December 31, 2019, respectively, and in the fourth quintile based upon the Universe, for each of the one-, three-, and five-year periods ended December 31, 2019. The Trustees noted that the performance for Class I shares was in the fourth quintile based upon the Peer Group, for each of the one-, three-, and five-year periods ended December 31, 2019, and in the fourth, fourth and third quintiles based upon the Universe, for the one-, three-, and five-year periods ended December 31, 2019, respectively. The Trustees noted that the performance for Class R6 shares was in the fifth and fourth quintiles based upon the Peer Group and Universe, respectively, for the one-year period ended December 31, 2019. The Trustees discussed the performance and investment strategy of the Fund with the Adviser and reviewed the performance analysis and evaluation prepared by the independent consultant. Based upon these discussions and various other factors, the Trustees concluded that the Fund’s performance was satisfactory, under the circumstances. The Trustees requested, however, that the Adviser provide additional Fund performance information to be reviewed with the members of the Board’s fixed income committee at each of their regular meetings over the course of next year.
The Trustees noted that the Short-Intermediate Municipal Bond Fund’s performance for Class A shares was in the third, fourth and fifth quintiles based upon the Peer Group, for the one-, three-, and five-year periods ended December 31, 2019, respectively, and in the third, fourth and fourth quintiles based upon the Universe, for the one-, three-, and five-year periods ended December 31, 2019, respectively. The Trustees noted that the performance for Class I shares was in the second quintile based upon the Universe, for each of the one-, three-, and five-year periods ended December 31, 2019. The Trustees noted that the performance for Class R6 shares was in the first quintile based upon the Universe, for the one-year period ended December 31, 2019. The Trustees discussed the performance and investment strategy of the Fund with the Adviser and reviewed the performance analysis and evaluation prepared by the independent consultant. Based upon these discussions and various other factors, the Trustees concluded that the Fund’s performance was satisfactory, under the circumstances.
The Trustees noted that the Tax Free Bond Fund’s performance for Class A shares was in the fourth quintile based upon the Peer Group, for each of the one-, three, and five-year periods ended December 31, 2019, and in the third, fourth and fourth quintiles based upon the Universe, for the one-, three-, and five-year periods ended December 31, 2019, respectively. The
Trustees noted that the performance for Class I shares was in the third quintile based upon the Universe, for each of the one-, three- and five-year periods ended December 31, 2019. The Trustees noted that the performance for Class R6 shares was in the fourth and third quintiles based upon the Peer Group and Universe, respectively, for the one-year period ended December 31, 2019. The Trustees discussed the performance and investment strategy of the Fund with the Adviser and reviewed the performance analysis and evaluation prepared by the independent consultant. Based upon these discussions and various other factors, the Trustees concluded that the Fund’s performance was satisfactory, under the circumstances.
The Trustees noted that the Ultra-Short Municipal Fund’s performance for Class A shares was in the fourth and fifth quintiles based upon the Peer Group, for the one- and three-year periods ended December 31, 2019, respectively, and in the fifth quintile based upon the Universe, for each of the one- and three-year periods ended December 31, 2019. The Trustees notes that the performance for Class I shares was in the fourth quintile based upon the Universe, for the one- and three-year periods ended December 31, 2019. The Trustees discussed the performance and investment strategy of the Fund with the Advisor and reviewed the performance analysis and evaluation prepared by the independent consultant. Based upon these discussions and various other factors, concluded that the performance was satisfactory, under the circumstances.
Advisory Fees and Expense Ratios
The Trustees considered the contractual advisory fee rate and administration fee rate paid by each Fund to the Adviser and compared the combined rate to the information prepared by Broadridge concerning management fee rates paid by other funds in the same Broadridge category as each Fund. The Trustees recognized that Broadridge reported each Fund’s management fee rate as the combined contractual advisory fee and administration fee rates. The Trustees also reviewed information about other expenses and the expense ratios for each Fund and noted that Universe and Peer Group rankings were not calculated if the number of funds in the Universe and/or Peer Group did not meet a predetermined minimum. For each Fund that had a Fee Cap in place, the Trustees considered, the net advisory fee rate and net expense ratio for each class, as applicable, taking into account any waivers and/or reimbursements. The Trustees also considered any proposed changes to a Fee Cap, and, where deemed appropriate by the Trustees, additional waivers and/or reimbursements. The Trustees recognized that it is difficult to make comparisons of advisory fees because there are variations in the services that are included in the fees paid by other funds. The Trustees’ determinations as a result of the review of each Fund’s advisory fees and expense ratios for certain representative classes are summarized below:
| | | | | | | | |
| | | |
| AUGUST 31, 2020 | | J.P. MORGAN MUNICIPAL BOND FUNDS | | | | | 145 | |
BOARD APPROVAL OF INVESTMENT ADVISORY AGREEMENTS
(Unaudited) (continued)
The Trustees noted that the High Yield Municipal Fund’s net advisory fee and actual total expenses for Class A shares were in the first quintile based upon both the Peer Group and Universe. The Trustees noted that the net advisory fee and actual total expenses for Class I shares were in the first and second quintiles, respectively, based upon the Universe. The Trustees noted that the net advisory fee and actual total expenses for Class R6 shares were in the first quintile based upon both the Peer Group and Universe. After considering the factors identified above, in light of this information, the Trustees concluded that the advisory fee was satisfactory in light of the services provided to the Fund.
The Trustees noted that the Municipal Income Fund’s net advisory fee for Class A shares was in the first quintile based upon both the Peer Group and Universe, and that the actual total expenses for Class A shares were in the second and third quintiles based upon the Peer Group and Universe, respectively. The Trustees noted that the net advisory fee for Class I shares was in the first quintile based upon both the Peer Group and Universe, and actual total expenses for Class I shares were in the first and third quintiles, based upon the Peer Group and Universe, respectively. The Trustees noted that the net advisory fee for Class R6 shares was in the third and first quintiles based upon the Peer Group and Universe, respectively, and the actual total expenses were in the first quintile based upon both the Peer Group and Universe. After considering the factors identified above, in light of this information, the Trustees concluded that the advisory fee was satisfactory in light of the services provided to the Fund.
The Trustees noted that the Short-Intermediate Municipal Bond Fund’s net advisory fee for Class A shares was in the first quintile
based upon both the Peer Group and Universe, and that the actual total expenses for Class A shares were in the fourth and third quintiles based upon the Peer Group and Universe, respectively. The Trustees noted that the net advisory fee and actual total expenses for Class I shares and Class R6 shares were in the first quintile based upon both the Peer Group and Universe. After considering the factors identified above, in light of this information, the Trustees concluded that the advisory fee was satisfactory in light of the services provided to the Fund.
The Trustees noted that the Tax Free Bond Fund’s net advisory fee and actual total expenses for Class A shares were in the first quintile based upon both the Peer Group and Universe. The Trustees noted that the net advisory fee for Class I shares was in the first quintile, and the actual total expenses for Class I shares were in the second quintile based upon the Universe. The Trustees noted that the net advisory fee and actual total expenses for Class R6 shares were in the first quintile for both the Peer Group and the Universe. After considering the factors identified above, in light of this information, the Trustees concluded that the advisory fee was satisfactory in light of the services provided to the Fund.
The Trustees noted that the Ultra-Short Municipal Fund’s net advisory fee and actual total expenses for Class A shares were in the first quintile based upon both the Peer Group and Universe. The Trustees noted that the net advisory fee and actual total expenses for Class I shares were in the first quintile based upon the Universe. After considering the factors identified above, in light of this information, the Trustees concluded that the advisory fee was satisfactory in light of the services provided to the Fund.
| | | | | | |
| | | |
| 146 | | | | J.P. MORGAN MUNICIPAL BOND FUNDS | | AUGUST 31, 2020 |
J.P. Morgan Funds are distributed by JPMorgan Distribution Services, Inc., which is an affiliate of JPMorgan Chase & Co. Affiliates of JPMorgan Chase & Co. receive fees for providing various services to the funds.
Contact JPMorgan Distribution Services, Inc. at 1-800-480-4111 for a fund prospectus. You can also visit us at www.jpmorganfunds.com. Investors should carefully consider the investment objectives and risk as well as charges and expenses of the mutual fund before investing. The prospectus contains this and other information about the mutual fund. Read the prospectus carefully before investing.
Investors may obtain information about the Securities Investor Protection Corporation (SIPC), including the SIPC brochure, by visiting www.sipc.org or by calling SIPC at 202-371-8300.
Each Fund files a complete schedule of its fund holdings for the first and third quarters of its fiscal year with the SEC as an exhibit to its report on Form N-PORT. The Funds’ Form N-PORT reports are available on the SEC’s website at http://www.sec.gov. Each Fund’s quarterly holdings can be found by visiting the J.P. Morgan Funds’ website at www.jpmorganfunds.com.
A description of each Fund’s policies and procedures with respect to the disclosure of each Fund’s holdings is available in the prospectuses and Statement of Additional Information.
A copy of proxy policies and procedures is available without charge upon request by calling 1-800-480-4111 and on the Funds’ website at www.jpmorganfunds.com. A description of such policies and procedures is on the SEC’s website at www.sec.gov. The Trustees have delegated the authority to vote proxies for securities owned by the Funds to the Adviser. A copy of the Funds’ voting record for the most recent 12-month period ended June 30 is available on the SEC’s website at www.sec.gov or at the Funds’ website at www.jpmorganfunds.com no later than August 31 of each year. The Funds’ proxy voting record will include, among other things, a brief description of the matter voted on for each fund security, and will state how each vote was cast, for example, for or against the proposal.

J.P. Morgan Asset Management is the brand name for the asset management business of JPMorgan Chase & Co. and its affiliates worldwide.
| | | | |
| | © JPMorgan Chase & Co., 2020. All rights reserved. August 2020. | | SAN-MUNIBOND-820 |
ITEM 2. CODE OF ETHICS.
Disclose whether, as of the end of the period covered by the report, the registrant has adopted a code of ethics that applies to the registrant’s principal executive officer, principal financial officer, principal accounting officer or controller, or persons performing similar functions, regardless of whether these individuals are employed by the registrant or a third party. If the registrant has not adopted such a code of ethics, explain why it has not done so.
The registrant must briefly describe the nature of any amendment, during the period covered by the report, to a provision of its code of ethics that applies to the registrant’s principal executive officer, principal financial officer, principal accounting officer or controller, or persons performing similar functions, regardless of whether these individuals are employed by the registrant or a third party, and that relates to any element of the code of ethics definition enumerated in paragraph (b) of this Item. The registrant must file a copy of any such amendment as an exhibit pursuant to Item 13(a)(1), unless the registrant has elected to satisfy paragraph (f) of this Item by positing its code of ethics on its website pursuant to paragraph (f)(2) of this Item, or by undertaking to provide its code of ethics to any person without charge, upon request, pursuant to paragraph (f)(3) of this Item.
If the registrant has, during the period covered by the report, granted a waiver, including an implicit waiver, from a provision of the code of ethics that applies to the registrant’s principal executive officer, principal financial officer, principal accounting officer or controller, or persons performing similar functions, regardless of whether these individuals are employed by the registrant or third party, that relates to one or more items set forth in paragraph (b) of this Item, the registrant must briefly describe the nature of the waiver, the name of the person to whom the waiver was granted, and the date of the waiver.
Not applicable to a semi-annual report.
ITEM 3. AUDIT COMMITTEE FINANCIAL EXPERT.
(a) (1) Disclose that the registrant’s board of directors has determined that the registrant either:
(i) Has at least one audit committee financial expert serving on its audit committee; or
(ii) Does not have an audit committee financial expert serving on its audit committee.
(2) If the registrant provides the disclosure required by paragraph (a)(1)(i) of this Item, it must disclose the name of the audit committee financial expert and whether that person is “independent.” In order to be considered “independent” for purposes of this Item, a member of an audit committee may not, other than in his or her capacity as a member of the audit committee, the board of directors, or any other board committee:
(i) Accept directly or indirectly any consulting, advisory, or other compensatory fee from the issuer; or
(ii) Be an “interested person” of the investment company as defined in Section 2(a)(19) of the Act (15 U.S.C. 80a-2(a)(19)).
(3) If the registrant provides the disclosure required by paragraph (a)(1)(ii) of this Item, it must explain why it does not have an audit committee financial expert.
Not applicable to a semi-annual report.
ITEM 4. PRINCIPAL ACCOUNTANT FEES AND SERVICES.
(a) Disclose, under the caption Audit Fees, the aggregate fees billed for each of the last two fiscal years for professional
services rendered by the principal accountant for the audit of the registrant’s annual financial statements or services that are normally provided by the accountant in connection with statutory and regulatory filings or engagements for those fiscal years.
(b) Disclose, under the caption Audit-Related Fees, the aggregate fees billed in each of the last two fiscal years for assurance and related services by the principal accountant that are reasonably related to the performance of the audit of the registrant’s financial statements and are not reported under paragraph (a) of this Item. Registrants shall describe the nature of the services comprising the fees disclosed under this category.
(c) Disclose, under the caption Tax Fees, the aggregate fees billed in each of the last two fiscal years for professional services rendered by the principal accountant for tax compliance, tax advice, and tax planning. Registrants shall describe the nature of the services comprising the fees disclosed under this category.
(d) Disclose, under the caption All Other Fees, the aggregate fees billed in each of the last two fiscal years for products and services provided by the principal accountant, other than the services reported in paragraphs (a) through (c) of this Item. Registrants shall describe the nature of the services comprising the fees disclosed under this category.
(e) (1) Disclose the audit committee’s pre-approval policies and procedures described in paragraph (c)(7) of Rule 2-01 of Regulation S-X.
(2) Disclose the percentage of services described in each of paragraphs (b) through (d) of this Item that were approved by the audit committee pursuant to paragraph (c)(7)(i)(C) of Rule 2-01 of Regulation S-X.
(f) If greater than 50 percent, disclose the percentage of hours expended on the principal accountant’s engagement to audit the registrant’s financial statements for the most recent fiscal year that were attributed to work performed by persons other than the principal accountant’s full-time, permanent employees.
(g) Disclose the aggregate non-audit fees billed by the registrant’s accountant for services rendered to the registrant, and rendered to the registrant’s investment adviser (not including any sub-adviser whose role is primarily portfolio management and is subcontracted with or overseen by another investment adviser), and any entity controlling, controlled by, or under common control with the adviser that provides ongoing services to the registrant for each of the last two fiscal years of the registrant.
(h) Disclose whether the registrant’s audit committee of the board of directors has considered whether the provision of non-audit services that were rendered to the registrant’s investment adviser (not including any subadviser whose role is primarily portfolio management and is subcontracted with or overseen by another investment adviser), and any entity controlling, controlled by, or under common control with the investment adviser that provides ongoing services to the registrant that were not pre-approved pursuant to paragraph (c)(7)(ii) of Rule 2-01 of Regulation S-X is compatible with maintaining the principal accountant’s independence.
Not applicable to a semi-annual report.
ITEM 5. AUDIT COMMITTEE OF LISTED REGISTRANTS.
(a) If the registrant is a listed issuer as defined in Rule 10A-3 under the Exchange Act (17CFR 240.10A-3), state whether or not the registrant has a separately-designated standing audit committee established in accordance with Section 3(a)(58)(A) of the Exchange Act (15 U.S.C. 78c(a)(58)(A)). If the registrant has such a committee, however designated, identify each committee member. If the entire board of directors is acting as the registrant’s audit committee as specified in Section 3(a)(58)(B) of the Exchange Act (15 U.S.C. 78c(a)(58)(B)), so state.
(b) If applicable, provide the disclosure required by Rule 10A-3(d) under the Exchange Act (17CFR 240.10A-3(d)) regarding an exemption from the listing standards for all audit committees.
Not applicable to a semi-annual report.
ITEM 6. INVESTMENTS.
File Schedule I – Investments in securities of unaffiliated issuers as of the close of the reporting period as set forth in Section 210.12-12 of Regulation S-X, unless the schedule is included as part of the report to shareholders filed under Item 1 of this Form.
Included in Item 1.
ITEM 7. DISCLOSURE OF PROXY VOTING POLICIES AND PROCEDURES FOR CLOSED-END MANAGEMENT INVESTMENT COMPANIES.
Not applicable.
ITEM 8. PORTFOLIO MANAGERS OF CLOSED-END MANAGEMENT INVESTMENT COMPANIES.
Not applicable.
ITEM 9. PURCHASE OF EQUITY SECURITIES BY CLOSED-END MANAGEMENT INVESTMENT COMPANY AND AFFILIATED PURCHASERS.
Not applicable.
ITEM 10. SUBMISSION OF MATTERS TO A VOTE OF SECURITY HOLDERS.
Describe any material changes to the procedures by which shareholders may recommend nominees to the registrant’s board of directors, where those changes were implemented after the registrant last provided disclosure in response to the requirements of Item 7(d)(2)(ii)(G) of Schedule 14A (17 CFR 240.14a-101), or this Item.
No material changes to report.
ITEM 11. CONTROLS AND PROCEDURES.
(a) Disclose the conclusions of the registrant’s principal executive and principal financial officers, or persons performing similar functions, regarding the effectiveness of the registrant’s disclosure controls and procedures (as defined in Rule 30a-3(c) under the Act (17 CFR 270.30a-3(c))) as of a date within 90 days of the filing date of the report that includes the disclosure required by this paragraph, based on the evaluation of these controls and procedures required by Rule 30a-3(b) under the Act (17 CFR 270.30a-3(b)) and Rules 13a-15(b) or 15d-15(b) under the Exchange Act (17 CFR 240.13a-15(b) or 240.15d-15(b)).
The Registrant’s principal executive and principal financial officers have concluded, based on their evaluation of the Registrant’s disclosure controls and procedures as of a date within 90 days of the filing date of this report, that the Registrant’s disclosure controls and procedures are reasonably designed to ensure that information required to be disclosed by the Registrant on Form N-CSR is recorded, processed, summarized and reported within the required time periods and that information required to be disclosed by the Registrant in the reports that it files or submits on Form N-CSR is accumulated and communicated to the Registrant’s management, including its principal executive and principal financial officers, as appropriate to allow timely decisions regarding required disclosure.
(b) Disclose any change in the registrant’s internal control over financial reporting (as defined in Rule 30a-3(d) under the Act (17 CFR 270.30a-3(d)) that occurred during the registrant’s second fiscal quarter of the period covered by this report that has materially affected, or is reasonably likely to materially affect, the registrant’s internal control over financial reporting.
There were no changes in the Registrant’s internal control over financial reporting that occurred during the last fiscal quarter covered by this report that have materially affected, or are reasonably likely to materially affect, the Registrant’s internal control over financial reporting.
ITEM 12. DISCLOSURE OF SECURITIES LENDING ACTIVITIES FOR CLOSED-END MANAGEMENT INVESTMENT COMPANIES.
Not applicable.
ITEM 13. EXHIBITS.
| | (a) | File the exhibits listed below as part of this Form. Letter or number the exhibits in the sequence indicated. |
(1) Any code of ethics, or amendment thereto, that is the subject of the disclosure required by Item 2, to the extent that the registrant intends to satisfy the Item 2 requirements through filing of an exhibit.
Not applicable.
(2) A separate certification for each principal executive officer and principal financial officer of the registrant as required by Rule 30a-2(a) under the Act (17 CFR 270.30a-2).
Certifications pursuant to Rule 30a-2(a) under the Investment Company Act of 1940 are attached hereto.
(3) Any written solicitation to purchase securities under Rule 23c-1 under the Act (17 CFR 270.23c-1) sent or given during the period covered by the report by or on behalf of the registrant to 10 or more persons.
Not applicable.
| | (b) | A separate or combined certification for each principal executive officer and principal officer of the registrant as required by Rule 30a-2(b) under the Act of 1940. |
Certifications pursuant to Rule 30a-2(b) under the Investment Company Act of 1940 are attached hereto.
SIGNATURES
Pursuant to the requirements of the Securities Exchange Act of 1934 and the Investment Company Act of 1940, the registrant has duly caused this report to be signed on its behalf by the undersigned, thereunto duly authorized.
| | |
| JPMorgan Trust IV |
| |
| By: | | /s/ Brian S. Shlissel |
| | Brian S. Shlissel |
| | President and Principal Executive Officer |
| | November 2, 2020 |
Pursuant to the requirements of the Securities Exchange Act of 1934 and the Investment Company Act of 1940, this report has been signed below by the following persons on behalf of the registrant and in the capacities and on the dates indicated.
| | |
| By: | | /s/ Brian S. Shlissel |
| | Brian S. Shlissel |
| | President and Principal Executive Officer |
| | November 2, 2020 |
| |
| By: | | /s/ Timothy J. Clemens |
| | Timothy J. Clemens |
| | Treasurer and Principal Financial Officer |
| | November 2, 2020 |