Wells Fargo Commercial Mortgage Trust 2015-P2
Filed: 2 Dec 15, 12:00am
| FREE WRITING PROSPECTUS | ||
| FILED PURSUANT TO RULE 433 | ||
| REGISTRATION FILE NO.: 333-206677-01 | ||
 |  |  |
Free Writing Prospectus
Structural and Collateral Term Sheet
$1,002,201,025
(Approximate Initial Pool Balance)
$860,640,000
(Approximate Aggregate Certificate Principal Balance of Offered Certificates)
Wells Fargo Commercial Mortgage Trust 2015-P2
as Issuing Entity
Wells Fargo Commercial Mortgage Securities, Inc.
as Depositor
Principal Commercial Capital
Ladder Capital Finance LLC
Citigroup Global Markets Realty Corp.
Wells Fargo Bank, National Association
Société Générale
as Sponsors and Mortgage Loan Sellers
Commercial Mortgage Pass-Through Certificates
Series 2015-P2
December 2, 2015
| WELLS FARGO SECURITIES | CITIGROUP | SOCIETE GENERALE |
| Co-Lead Manager and Joint Bookrunner | Co-Lead Manager and Joint Bookrunner | Co-Lead Manager and Joint Bookrunner |
Deutsche Bank Securities Co-Manager |
STATEMENT REGARDING THIS FREE WRITING PROSPECTUS
The depositor has filed a registration statement (including a prospectus) with the Securities and Exchange Commission (“SEC”) (SEC File No. 333-206677) for the offering to which this communication relates. Before you invest, you should read the prospectus in the registration statement and other documents the depositor has filed with the SEC for more complete information about the depositor, the issuing entity and this offering. You may get these documents for free by visiting EDGAR on the SEC Web site at www.sec.gov. Alternatively, the depositor, any underwriter, or any dealer participating in the offering will arrange to send you the prospectus after filing if you request it by calling toll free 1-800-745-2063 (8 a.m. – 5 p.m. EST) or by emailing wfs.cmbs@wellsfargo.com.
Nothing in this document constitutes an offer of securities for sale in any jurisdiction where the offer or sale is not permitted. The information contained herein is preliminary as of the date hereof, supersedes any such information previously delivered to you and will be superseded by any such information subsequently delivered and ultimately by the final prospectus relating to the securities. These materials are subject to change, completion, supplement or amendment from time to time.
This free writing prospectus has been prepared by the underwriters for information purposes only and does not constitute, in whole or in part, a prospectus for the purposes of Directive 2003/71/EC (as amended) and/or Part VI of the Financial Services and Markets Act 2000, as amended, or other offering document.
STATEMENT REGARDING ASSUMPTIONS AS TO SECURITIES, PRICING ESTIMATES AND OTHER INFORMATION
The attached information contains certain tables and other statistical analyses (the “Computational Materials”) which have been prepared in reliance upon information furnished by the Mortgage Loan Sellers. Numerous assumptions were used in preparing the Computational Materials, which may or may not be reflected herein. As such, no assurance can be given as to the Computational Materials’ accuracy, appropriateness or completeness in any particular context; or as to whether the Computational Materials and/or the assumptions upon which they are based reflect present market conditions or future market performance. The Computational Materials should not be construed as either projections or predictions or as legal, tax, financial or accounting advice. You should consult your own counsel, accountant and other advisors as to the legal, tax, business, financial and related aspects of a purchase of these securities. Any weighted average lives, yields and principal payment periods shown in the Computational Materials are based on prepayment and/or loss assumptions, and changes in such prepayment and/or loss assumptions may dramatically affect such weighted average lives, yields and principal payment periods. In addition, it is possible that prepayments or losses on the underlying assets will occur at rates higher or lower than the rates shown in the attached Computational Materials. The specific characteristics of the securities may differ from those shown in the Computational Materials due to differences between the final underlying assets and the preliminary underlying assets used in preparing the Computational Materials. The principal amount and designation of any security described in the Computational Materials are subject to change prior to issuance. None of Wells Fargo Securities, LLC, Citigroup Global Markets Inc., SG Americas Securities, LLC, or Deutsche Bank Securities Inc., or any of their respective affiliates, make any representation or warranty as to the actual rate or timing of payments or losses on any of the underlying assets or the payments or yield on the securities. The information in this presentation is based upon management forecasts and reflects prevailing conditions and management’s views as of this date, all of which are subject to change. In preparing this presentation, we have relied upon and assumed, without independent verification, the accuracy and completeness of all information available from public sources or which was provided to us by or on behalf of the Mortgage Loan Sellers or which was otherwise reviewed by us.
This free writing prospectus contains certain forward-looking statements. If and when included in this free writing prospectus, the words “expects”, “intends”, “anticipates”, “estimates” and analogous expressions and all statements that are not historical facts, including statements about our beliefs or expectations, are intended to identify forward-looking statements. Any forward-looking statements are made subject to risks and uncertainties which could cause actual results to differ materially from those stated. Those risks and uncertainties include, among other things, declines in general economic and business conditions, increased competition, changes in demographics, changes in political and social conditions, regulatory initiatives and changes in customer preferences, many of which are beyond our control and the control of any other person or entity related to this offering. The forward-looking statements made in this free writing prospectus are made as of the date stated on the cover. We have no obligation to update or revise any forward-looking statement.
Wells Fargo Securities is the trade name for the capital markets and investment banking services of Wells Fargo & Company and its subsidiaries, including but not limited to Wells Fargo Securities, LLC, a member of NYSE, FINRA, NFA and SIPC, Wells Fargo Prime Services, LLC, a member of FINRA, NFA and SIPC, and Wells Fargo Bank, N.A. Wells Fargo Securities, LLC and Wells Fargo Prime Services, LLC are distinct entities from affiliated banks and thrifts.
IMPORTANT NOTICE REGARDING THE OFFERED CERTIFICATES
The information herein is preliminary and may be supplemented or amended prior to the time of sale. Prospective investors should understand that, when considering the purchase of the Offered Certificates, a contract of sale will come into being no sooner than the date on which the relevant class of certificates has been priced and the investor has otherwise taken all actions the investor must take to become committed to purchase the Offered Certificates, and the investor has therefore entered into a contract of sale. Any “indications of interest” expressed by any prospective investor, and any “soft circles” generated by the underwriters, prior to the time of sale, will not create binding contractual obligations for such prospective investors, on the one hand, or the underwriters, the depositor or any of their respective agents or affiliates, on the other hand.
In addition, the Offered Certificates referred to in these materials and the asset pool backing them are subject to modification or revision (including the possibility that one or more classes of certificates may be split, combined or eliminated at any time prior to issuance or availability of a final prospectus) and are offered on a “when, as and if issued” basis. As a result of the foregoing, a prospective investor may commit to purchase certificates that have characteristics that may change, and each prospective investor is advised that all or a portion of the certificates referred to in these materials may be issued without all or certain of the characteristics described in these materials. The underwriters’ obligation to sell certificates to any prospective investor is conditioned on the certificates and the transaction having the characteristics described in these materials. If the underwriters determine that a condition is not satisfied in any material respect, such prospective investor will be notified, and neither the depositor nor the underwriters will have any obligation to such prospective investor to deliver any portion of the Offered Certificates which such prospective investor has committed to purchase, and there will be no liability between the underwriters, the depositor or any of their respective agents or affiliates, on the one hand, and such prospective investor, on the other hand, as a consequence of the non-delivery.
The underwriters described in these materials may from time to time perform investment banking services for, or solicit investment banking business from, any company named in these materials. The underwriters and/or their affiliates or respective employees may from time to time have a long or short position in any security or contract discussed in these materials.
The information contained herein supersedes any previous such information delivered to any prospective investor and will be superseded by information delivered to such prospective investor prior to the time of sale.
IMPORTANT NOTICE RELATING TO AUTOMATICALLY-GENERATED EMAIL DISCLAIMERS
Any legends, disclaimers or other notices that may appear at the bottom of any email communication to which this free writing prospectus is attached relating to (1) these materials not constituting an offer (or a solicitation of an offer), (2) no representation that these materials are accurate or complete and may not be updated or (3) these materials possibly being confidential, are not applicable to these materials and should be disregarded. Such legends, disclaimers or other notices have been automatically generated as a result of these materials having been sent via Bloomberg or another system.
THE INFORMATION IN THIS STRUCTURAL AND COLLATERAL TERM SHEET IS NOT COMPLETE AND MAY BE AMENDED PRIOR TO THE TIME OF SALE. THIS TERM SHEET IS NOT AN OFFER TO SELL THESE SECURITIES AND IT IS NOT A SOLICITATION OF AN OFFER TO BUY THESE SECURITIES IN ANY JURISDICTION WHERE THE OFFER OR SALE IS NOT PERMITTED.
| 2 |
| Wells Fargo Commercial Mortgage Trust 2015-P2 | Certificate Structure |
| I. | Certificate Structure |
| Class | Expected Ratings (Fitch/KBRA/Moody’s)(1) | Approximate Initial Certificate Principal Balance or Notional Amount(2) |
Approx. | Pass-Through Rate Description | Weighted Average Life (Years)(4) | Expected Principal Window(4) | Certificate Principal to Value Ratio(5) | Certificate Principal U/W NOI Debt Yield(6) | |||
| Offered Certificates | |||||||||||
| A-1 | AAAsf/AAA(sf)/Aaa(sf) | $28,655,000 | 30.000% | (7) | 2.90 | 1/16 – 10/20 | 44.0% | 14.6% | |||
| A-2A | AAAsf/AAA(sf)/Aaa(sf) | $70,000,000 | 30.000% | (7) | 4.86 | 10/20 – 12/20 | 44.0% | 14.6% | |||
| A-2B | AAAsf/AAA(sf)/Aaa(sf) | $82,513,000 | 30.000% | (7) | 4.98 | 12/20 – 12/20 | 44.0% | 14.6% | |||
| A-3 | AAAsf/AAA(sf)/Aaa(sf) | $170,000,000 | 30.000% | (7) | 9.73 | 8/25 – 10/25 | 44.0% | 14.6% | |||
| A-4 | AAAsf/AAA(sf)/Aaa(sf) | $292,790,000 | 30.000% | (7) | 9.90 | 10/25 – 12/25 | 44.0% | 14.6% | |||
| A-SB | AAAsf/AAA(sf)/Aaa(sf) | $57,582,000 | 30.000% | (7) | 7.45 | 12/20 – 8/25 | 44.0% | 14.6% | |||
| A-S | AAAsf/AAA(sf)/Aa1(sf) | $47,605,000 | 25.250% | (7) | 9.98 | 12/25 – 12/25 | 46.9% | 13.7% | |||
| X-A | AAAsf/AAA(sf)/NR | $749,145,000 | (8) | N/A | Variable(9) | N/A | N/A | N/A | N/A | ||
| X-B | AA-sf/AAA(sf)/NR | $61,385,000 | (10) | N/A | Variable(11) | N/A | N/A | N/A | N/A | ||
| B | AA-sf/AA-(sf)/A1(sf) | $61,385,000 | 19.125% | (7) | 9.98 | 12/25 – 12/25 | 50.8% | 12.7% | |||
| C | A-sf/A-(sf)/NR | $50,110,000 | 14.125% | (7) | 9.98 | 12/25 – 12/25 | 53.9% | 11.9% | |||
| Non-Offered Certificates | |||||||||||
| X-D | BBB-sf/BBB-(sf)/NR | $56,373,000 | (12) | N/A | Variable(13) | N/A | N/A | N/A | N/A | ||
| D | BBB-sf/BBB-(sf)/NR | $56,373,000 | 8.500% | (7) | 9.98 | 12/25 – 12/25 | 57.5% | 11.2% | |||
| E | BBsf/BB(sf)/NR | $22,550,000 | 6.250% | (7) | 9.98 | 12/25 – 12/25 | 58.9% | 10.9% | |||
| F | Bsf/B(sf)/NR | $11,275,000 | 5.125% | (7) | 9.98 | 12/25 – 12/25 | 59.6% | 10.8% | |||
| G | NR/NR/NR | $51,363,025 | 0.000% | (7) | 9.98 | 12/25 – 12/25 | 62.8% | 10.2% | |||
| Notes: | |||||||||||||||
| (1) | The expected ratings presented are those of Fitch Ratings, Inc. (“Fitch”), Kroll Bond Rating Agency, Inc. (“KBRA”) and Moody’s Investors Service, Inc. (“Moody’s”) which the depositor hired to rate the offered certificates. One or more other nationally recognized statistical rating organizations that were not hired by the depositor may use information they receive pursuant to Rule 17g-5 under the Securities Exchange Act of 1934, as amended (the “Exchange Act”) or otherwise, to rate or provide market reports and/or published commentary related to the offered certificates. We cannot assure you as to what ratings a non-hired nationally recognized statistical rating organization would assign or that its reports will not express differing, possibly negative, views of the mortgage loans and/or the offered certificates. The ratings of each class of offered certificates address the likelihood of the timely distribution of interest and, except in the case of the Class X-A and X-B certificates, the ultimate distribution of principal due on those classes on or before the Rated Final Distribution Date. See “Risk Factors—Other Risks Relating to the Certificates—Nationally Recognized Statistical Rating Organizations May Assign Different Ratings to the Certificates; Ratings of the Certificates Reflect Only the Views of the Applicable Rating Agencies as of the Dates Such Ratings Were Issued; Ratings May Affect ERISA Eligibility; Ratings May Be Downgraded” and “Ratings” in the Preliminary Prospectus, expected to be dated December 2, 2015 (the “Preliminary Prospectus”). Fitch, KBRA and Moody’s have informed us that the “sf” designation in their ratings represents an identifier for structured finance product ratings. |
| (2) | The principal balances and notional amounts set forth in the table are approximate. The actual initial principal balances and notional amounts may be larger or smaller depending on the initial pool balance of the mortgage loans definitively included in the pool of mortgage loans, which aggregate cut-off date principal balance may be as much as 5% larger or smaller than the amount presented in the Preliminary Prospectus. |
| (3) | The approximate initial credit support with respect to the Class A-1, A-2A, A-2B, A-3, A-4 and A-SB Certificates represents the approximate credit enhancement for the Class A-1, A-2A, A-2B, A-3, A-4 and A-SB Certificates in the aggregate. |
| (4) | Weighted Average Lives and Expected Principal Windows are calculated based on an assumed prepayment rate of 0% CPR and the “Structuring Assumptions” described under “Yield and Maturity Considerations—Weighted Average Life” in the Preliminary Prospectus. |
| (5) | The Certificate Principal to Value Ratio for each Class of Certificates (other than the Class A-1, A-2A, A-2B, A-3, A-4 and A-SB Certificates) is calculated as the product of (a) the weighted average Cut-off Date LTV Ratio for the mortgage loans and (b) a fraction, the numerator of which is the total initial Certificate Balance of such Class of Certificates and all Classes of Principal Balance Certificates senior to such Class of Certificates and the denominator of which is the total initial Certificate Balance of all of the Principal Balance Certificates. The Certificate Principal to Value Ratio for each of the Class A-1, A-2A, A-2B, A-3, A-4 and A-SB Certificates is calculated in the aggregate for those Classes as if they were a single Class and is calculated as the product of (a) the weighted average Cut-off Date LTV Ratio for the mortgage loans and (b) a fraction, the numerator of which is the total initial aggregate Certificate Balances of such Classes of Certificates and the denominator of which is the total initial Certificate Balance of all of the Principal Balance Certificates. In any event, however, excess mortgaged property value associated with a mortgage loan will not be available to offset losses on any other mortgage loan. |
| (6) | The Certificate Principal U/W NOI Debt Yield for each Class of Certificates (other than the Class A-1, A-2A, A-2B, A-3, A-4 and A-SB Certificates) is calculated as the product of (a) the weighted average U/W NOI Debt Yield for the mortgage loans and (b) a fraction, the numerator of which is the total initial Certificate Balance of all of the Classes of Principal Balance Certificates and the denominator of which is the total initial Certificate Balance for such Class of Certificates and all Classes of Principal Balance Certificates senior to such Class of Certificates. The Certificate Principal U/W NOI Debt Yield for each of the Class A-1, A-2A, A-2B, A-3, A-4 and A-SB Certificates is calculated in the aggregate for those Classes as if they were a single Class and is calculated as the product of (a) the weighted average U/W NOI Debt Yield for the mortgage loans and (b) a fraction, the numerator of which is the total initial Certificate Balance of all of the Classes of Principal Balance Certificates and the denominator of which is the total aggregate initial Certificate Balances for the Class A-1, A-2A, A-2B, A-3, A-4 and A-SB Certificates. In any event, however, cash flow from each mortgaged property supports only the related mortgage loan and will not be available to support any other mortgage loan. |
| (7) | The pass-through rates for the Class A-1, A-2A, A-2B, A-3, A-4, A-SB, A-S, B, C, D, E, F and G Certificates in each case will be one of the following: (i) a fixed rateper annum, (ii) a variable rate per annum equal to the weighted average of the net mortgage interest rates on the mortgage loans for the related distribution date, (iii) a variable rateper annum equal to the lesser of (a) a fixed rate and (b) the weighted average of the net mortgage interest rates on the mortgage loans for the related distribution date or (iv) a variable rateper annum equal to the weighted average of the net mortgage interest rates on the mortgage loans for the related distribution date minus a specified percentage. For purposes of the calculation of the weighted average of the net mortgage interest rates on the mortgage loans for each distribution date, the mortgage interest rates will be adjusted as necessary to a 30/360 basis. |
| (8) | The Class X-A Certificates are notional amount certificates. The Notional Amount of the Class X-A Certificates will be equal to the aggregate principal balance of the Class A-1, A-2A, A-2B, A-3, A-4, A-SB and A-S Certificates outstanding from time to time. The Class X-A Certificates will not be entitled to distributions of principal. |
THE INFORMATION IN THIS STRUCTURAL AND COLLATERAL TERM SHEET IS NOT COMPLETE AND MAY BE AMENDED PRIOR TO THE TIME OF SALE. THIS TERM SHEET IS NOT AN OFFER TO SELL THESE SECURITIES AND IT IS NOT A SOLICITATION OF AN OFFER TO BUY THESE SECURITIES IN ANY JURISDICTION WHERE THE OFFER OR SALE IS NOT PERMITTED.
| 3 |
| Wells Fargo Commercial Mortgage Trust 2015-P2 | Certificate Structure |
| (9) | The pass-through rate for the Class X-A Certificates for any distribution date will be aper annum rate equal to the excess, if any, of (a) the weighted average of the net mortgage interest rates on the mortgage loans for the related distribution date, over (b) the weighted average of the pass-through rates on the Class A-1, A-2A, A-2B, A-3, A-4, A-SB and A-S Certificates for the related distribution date, weighted on the basis of their respective aggregate principal balances outstanding immediately prior to that distribution date. For purposes of the calculation of the weighted average of the net mortgage interest rates on the mortgage loans for each distribution date, the mortgage interest rates will be adjusted as necessary to a 30/360 basis. |
| (10) | The Class X-B Certificates are notional amount certificates. The Notional Amount of the Class X-B Certificates will be equal to the principal balance of the Class B Certificates outstanding from time to time. The Class X-B Certificates will not be entitled to distributions of principal. |
| (11) | The pass-through rate for the Class X-B Certificates for any distribution date will be aper annum rate equal to the excess, if any, of (a) the weighted average of the net mortgage interest rates on the mortgage loans for the related distribution date, over (b) the pass-through rate on the Class B Certificates for the related distribution date. For purposes of the calculation of the weighted average of the net mortgage interest rates on the mortgage loans for each distribution date, the mortgage interest rates will be adjusted as necessary to a 30/360 basis. |
| (12) | The Class X-D Certificates are notional amount certificates. The Notional Amount of the Class X-D Certificates will be equal to the principal balance of the Class D Certificates outstanding from time to time. The Class X-D Certificates will not be entitled to distributions of principal. |
| (13) | The pass-through rate for the Class X-D Certificates for any distribution date will be aper annum rate equal to the excess, if any, of (a) the weighted average of the net mortgage interest rates on the mortgage loans for the related distribution date, over (b) the pass-through rate on the Class D Certificates for the related distribution date. For purposes of the calculation of the weighted average of the net mortgage interest rates on the mortgage loans for each distribution date, the mortgage interest rates will be adjusted as necessary to a 30/360 basis. |
THE INFORMATION IN THIS STRUCTURAL AND COLLATERAL TERM SHEET IS NOT COMPLETE AND MAY BE AMENDED PRIOR TO THE TIME OF SALE. THIS TERM SHEET IS NOT AN OFFER TO SELL THESE SECURITIES AND IT IS NOT A SOLICITATION OF AN OFFER TO BUY THESE SECURITIES IN ANY JURISDICTION WHERE THE OFFER OR SALE IS NOT PERMITTED.
| 4 |
| Wells Fargo Commercial Mortgage Trust 2015-P2 | Issue Characteristics |
| II. | Transaction Highlights |
Mortgage Loan Sellers:
Mortgage Loan Seller | Number of | Number of | Aggregate Cut-off | % of Initial | ||||
| Principal Commercial Capital(1) | 9 | 22 | $255,000,000 | 25.4% | ||||
| Ladder Capital Finance LLC | 23 | 52 | 243,814,257 | 24.3 | ||||
| Citigroup Global Markets Realty Corp. | 10 | 12 | 208,388,821 | 20.8 | ||||
| Wells Fargo Bank, National Association | 21 | 21 | 167,826,195 | 16.7 | ||||
| Société Générale | 8 | 8 | 127,171,753 | 12.7 | ||||
Total | 71 | 115 | $1,002,201,025 | 100.0% |
| (1) | Principal Commercial Capital is the lending platform jointly formed by Macquarie US Trading LLC and Principal Real Estate Investors, LLC to originate and securitize commercial mortgage loans. The mortgage loans to be transferred to the depositor by Macquarie US Trading LLC d/b/a Principal Commercial Capital were originated by either (i) Macquarie Investments US Inc. d/b/a Principal Commercial Capital, in the case of one mortgage loan, secured by the mortgaged property identified on Annex A 1 to the Preliminary Prospectus as Hawthorne Business Center, representing approximately 1.2% of the Initial Pool Balance, which will transfer such mortgage loan to Macquarie US Trading LLC d/b/a Principal Commercial Capital on or prior to the closing date, or (ii) Macquarie US Trading LLC d/b/a Principal Commercial Capital, in the case of all other mortgage loans to be transferred to the depositor by Macquarie US Trading LLC d/b/a Principal Commercial Capital. |
Loan Pool:
| Initial Pool Balance: | $1,002,201,025 |
| Number of Mortgage Loans: | 71 |
| Average Cut-off Date Balance per Mortgage Loan: | $14,115,507 |
| Number of Mortgaged Properties: | 115 |
| Average Cut-off Date Balance per Mortgaged Property(1): | $8,714,792 |
| Weighted Average Mortgage Interest Rate: | 4.763% |
| Ten Largest Mortgage Loans as % of Initial Pool Balance(2): | 50.4% |
| Weighted Average Original Term to Maturity or ARD (months): | 111 |
| Weighted Average Remaining Term to Maturity or ARD (months): | 110 |
| Weighted Average Original Amortization Term (months)(3): | 359 |
| Weighted Average Remaining Amortization Term (months)(3): | 359 |
| Weighted Average Seasoning (months): | 1 |
| (1) | Information regarding mortgage loans secured by multiple properties is based on an allocation according to relative appraised values or the allocated loan amounts or property-specific release prices set forth in the related loan documents or such other allocation as the related mortgage loan seller deemed appropriate. |
| (2) | Includes the ten largest mortgage loans or group of cross-collateralized underlying mortgage loans. |
| (3) | Excludes any mortgage loan that does not amortize. |
Credit Statistics:
| Weighted Average U/W Net Cash Flow DSCR(1): | 1.64x |
| Weighted Average U/W Net Operating Income Debt Yield(1): | 10.2% |
| Weighted Average Cut-off Date Loan-to-Value Ratio(1): | 62.8% |
| Weighted Average Balloon or ARD Loan-to-Value Ratio(1): | 56.8% |
| % of Mortgage Loans with Additional Subordinate Debt(2): | 14.3% |
| % of Mortgage Loans with Single Tenants(3): | 11.3% |
| (1) | With respect to the Empire Mall mortgage loan, the Harbor Pointe Apartments mortgage loan, the Heritage Industrial Portfolio mortgage loan, the Anchorage Marriott Downtown mortgage loan, the Harvey Building Products Portfolio mortgage loan and the JW Marriott Santa Monica Le Merigot mortgage loan, each of which is part of a whole loan, loan-to-value ratio, debt service coverage ratio and debt yield calculations include the relatedpari passu companion loan(s) (unless otherwise stated). The debt service coverage ratio, debt yield and loan-to-value ratio information do not take into account any subordinate debt (whether or not secured by the related mortgaged property), that currently exists or is allowed under the terms of any mortgage loan. The information for each mortgaged property that relates to a mortgage loan that is cross-collateralized or cross-defaulted with one or more other mortgage loans is based upon the principal balance of that mortgage loan, except that the applicable loan-to-value ratio, debt service coverage ratio, and debt yield for each such mortgage loan is based upon the ratio or yield (as applicable) for the aggregate indebtedness evidenced by all loans in the group. On an individual basis, without regard to the cross-collateralization feature, any mortgage loan that is part of a cross-collateralized group of mortgage loans may have a higher loan-to-value ratio, lower debt service coverage ratio and/or lower debt yield than is presented herein. See “Description of the Mortgage Pool—Mortgage Pool Characteristics—Cross-Collateralized Mortgage Loans; Multi-Property Mortgage Loans and Related Borrower Mortgage Loans” in the Preliminary Prospectus and Annex A-1 to the Preliminary Prospectus. |
| (2) | The percentage figure expressed as “% of Mortgage Loans with Additional Subordinate Debt” is determined as a percentage of the initial pool balance and does not take into account any future subordinate debt (whether or not secured by the mortgaged property), that may be permitted under the terms of any mortgage loan or the pooling and servicing agreement. See “Description of the Mortgage Pool—Additional Indebtedness—Other Secured Indebtedness” and “—Other Unsecured Indebtedness”. |
| (3) | Excludes mortgage loans that are secured by multiple single tenant properties and includes mortgage loans secured by multiple single tenant properties where each property is occupied by the same tenant or tenants that are affiliates of one another. |
THE INFORMATION IN THIS STRUCTURAL AND COLLATERAL TERM SHEET IS NOT COMPLETE AND MAY BE AMENDED PRIOR TO THE TIME OF SALE. THIS TERM SHEET IS NOT AN OFFER TO SELL THESE SECURITIES AND IT IS NOT A SOLICITATION OF AN OFFER TO BUY THESE SECURITIES IN ANY JURISDICTION WHERE THE OFFER OR SALE IS NOT PERMITTED.
| 5 |
| Wells Fargo Commercial Mortgage Trust 2015-P2 | Issue Characteristics |
Loan Structural Features:
Amortization:Based on the Initial Pool Balance, 71.6% of the mortgage pool (52 mortgage loans) has scheduled amortization, as follows:
48.0% (27 mortgage loans) provides for an interest-only period followed by an amortization period; and
23.6% (25 mortgage loans) requires amortization during the entire loan term.
Interest-Only:Based on the Initial Pool Balance, 28.4% of the mortgage pool (19 mortgage loans) provides for interest-only payments during the entire loan term. The Weighted Average Cut-off Date Loan-to-Value Ratio and Weighted Average U/W Net Cash Flow DSCR for those mortgage loans are 61.1% and 1.69x, respectively.
Hard Lockboxes: Based on the Initial Pool Balance, 38.7% of the mortgage pool (21 mortgage loans) have hard lockboxes in place.
Reserves:The mortgage loans require amounts to be escrowed monthly as follows (excluding any mortgage loans with springing provisions):
| Real Estate Taxes: | 79.1% of the pool | |
| Insurance: | 60.7% of the pool | |
| Capital Replacements: | 72.9% of the pool | |
| TI/LC: | 56.5% of the pool(1) | |
| (1) The percentage of Initial Pool Balance for mortgage loans with TI/LC reserves is based on the aggregate principal balance allocable to loans that include retail, office, industrial and mixed use properties. | ||
Call Protection/Defeasance: Based on the Initial Pool Balance, the mortgage pool has the following call protection and defeasance features:
81.3% of the mortgage pool (52 mortgage loans) features a lockout period, then defeasance only until an open period;
8.7% of the mortgage pool (six mortgage loans) features a lockout period, then the greater of a prepayment premium or yield maintenance until an open period;
5.3% of the mortgage pool (five mortgage loans) features a lockout period, then the greater of a prepayment premium or yield maintenance or defeasance until an open period;
3.1% of the mortgage pool (one mortgage loan) features a lockout period, then the greater of a prepayment premium or yield maintenance, then the greater of a prepayment premium or yield maintenance or defeasance until an open period; and
1.5% of the mortgage pool (seven mortgage loans) features no lockout period, but requires yield maintenance, then yield maintenance or defeasance until an open period.
Please refer to Annex A-1 to the Preliminary Prospectus for further information regarding individual loan call protection.
THE INFORMATION IN THIS STRUCTURAL AND COLLATERAL TERM SHEET IS NOT COMPLETE AND MAY BE AMENDED PRIOR TO THE TIME OF SALE. THIS TERM SHEET IS NOT AN OFFER TO SELL THESE SECURITIES AND IT IS NOT A SOLICITATION OF AN OFFER TO BUY THESE SECURITIES IN ANY JURISDICTION WHERE THE OFFER OR SALE IS NOT PERMITTED.
| 6 |
| Wells Fargo Commercial Mortgage Trust 2015-P2 | Issue Characteristics |
| III. | Issue Characteristics |
| Securities Offered: | $860,640,000 approximate monthly pay, multi-class, commercial mortgage REMIC pass-through certificates consisting of eleven classes (Classes A-1, A-2A, A-2B, A-3, A-4, A-SB, A-S, B, C, X-A and X-B), which are offered pursuant to a registration statement filed with the SEC (such classes of certificates, the “Offered Certificates”). | ||
| Mortgage Loan Sellers: | Macquarie US Trading LLC d/b/a Principal Commercial Capital (“PCC”), Ladder Capital Finance LLC (“LCF”), Citigroup Global Markets Realty Corp. (“CGMRC”), Wells Fargo Bank, National Association (“WFB”) and Société Générale (“SG”). | ||
| Co-Lead Managers and Joint Bookrunners: | Wells Fargo Securities, LLC, Citigroup Global Markets Inc. and SG Americas Securities, LLC | ||
| Co-Managers: | Deutsche Bank Securities Inc. | ||
| Rating Agencies: | Fitch Ratings, Inc., Kroll Bond Rating Agency, Inc. and Moody’s Investors Service, Inc. | ||
| Master Servicer: | Wells Fargo Bank, National Association | ||
| Special Servicer: | C-III Asset Management LLC | ||
| Additional Primary Servicer: | Principal Global Investors, LLC | ||
| Certificate Administrator: | Wells Fargo Bank, National Association | ||
| Trustee: | Wilmington Trust, National Association | ||
| Operating Advisor: | Pentalpha Surveillance LLC | ||
| Asset Representations Reviewer: | Pentalpha Surveillance LLC | ||
| Initial Majority Controlling Class Certificateholder: | Raith Capital Partners, LLC or an affiliate thereof. | ||
| Cut-off Date: | The Cut-off Date with respect to each mortgage loan is the due date for the monthly debt service payment that is due in December 2015 (or, in the case of any mortgage loan that has its first due date in January 2016, the date that would have been its due date in December 2015 under the terms of that mortgage loan if a monthly debt service payment were scheduled to be due in that month). | ||
| Expected Closing Date: | On or about December 23, 2015. | ||
| Determination Dates: | The 11th day of each month (or if that day is not a business day, the next succeeding business day), commencing in January 2016. | ||
| Distribution Dates: | The fourth business day following the Determination Date in each month, commencing in January 2016. | ||
| Rated Final Distribution Date: | The Distribution Date in December 2048. | ||
| Interest Accrual Period: | With respect to any Distribution Date, the calendar month immediately preceding the month in which such Distribution Date occurs. | ||
| Day Count: | The Offered Certificates will accrue interest on a 30/360 basis. | ||
| Minimum Denominations: | $10,000 for each Class of Offered Certificates (other than the Class X-A and X-B Certificates) and $1,000,000 for the Class X-A and X-B Certificates. Investments may also be made in any whole dollar denomination in excess of the applicable minimum denomination. | ||
| Clean-up Call: | 1% | ||
| Delivery: | DTC, Euroclear and Clearstream Banking | ||
| ERISA/SMMEA Status: | Each Class of Offered Certificates is expected to be eligible for exemptive relief under ERISA. No Class of Offered Certificates will be SMMEA eligible. | ||
| Risk Factors: | THE CERTIFICATES INVOLVE CERTAIN RISKS AND MAY NOT BE SUITABLE FOR ALL INVESTORS. SEE THE “RISK FACTORS” SECTION OF THE PRELIMINARY PROSPECTUS. | ||
| Bond Analytics Information: | The Certificate Administrator will be authorized to make distribution date statements, CREFC® reports and certain supplemental reports (other than confidential information) available to certain financial modeling and data provision services, including Bloomberg, L.P., Trepp, LLC, Intex Solutions, Inc., Markit Group Limited, Interactive Data Corp., BlackRock Financial Management, Inc., CMBS.com, Inc. and Thomson Reuters Corporation. |
THE INFORMATION IN THIS STRUCTURAL AND COLLATERAL TERM SHEET IS NOT COMPLETE AND MAY BE AMENDED PRIOR TO THE TIME OF SALE. THIS TERM SHEET IS NOT AN OFFER TO SELL THESE SECURITIES AND IT IS NOT A SOLICITATION OF AN OFFER TO BUY THESE SECURITIES IN ANY JURISDICTION WHERE THE OFFER OR SALE IS NOT PERMITTED.
| 7 |
| Wells Fargo Commercial Mortgage Trust 2015-P2 | Characteristics of the Mortgage Pool |
| IV. | Characteristics of the Mortgage Pool(1) |
| A. | Ten Largest Mortgage Loans or Groups of Cross-Collateralized Underlying Mortgage Loans |
| Mortgage Loan Seller | Mortgage Loan Name | City | State | Number of Mortgage Loans / Mortgaged Properties | Mortgage Loan Cut-off Date Balance ($) | % of Initial Pool Balance (%) | Property Type | Number of Units/ SF/ Rooms | Cut-off Date Balance Per Unit/ SF/Room | Cut-off Date LTV Ratio (%) | Balloon or ARD LTV Ratio (%) | U/W NCF DSCR (x) | U/W NOI Debt Yield (%) | |||||||||||||||||
| LCF | Rolling Brook Village | Woodbridge | VA | 1 / 1 | $88,000,000 | 8.8 | % | Multifamily | 732 | $120,219 | 62.0 | % | 62.0 | % | 1.48x | 8.1 | % | |||||||||||||
| SG | Empire Mall | Sioux Falls | SD | 1 / 1 | 75,000,000 | 7.5 | Retail | 1,124,451 | 169 | 54.3 | 47.3 | 1.80 | 11.2 | |||||||||||||||||
| PCC | Pineapple Hotel Portfolio | Seattle | WA | 1 / 3 | 61,500,000 | 6.1 | Hospitality | 318 | 193,396 | 60.0 | 51.8 | 1.96 | 13.6 | |||||||||||||||||
| PCC | Adler Office(2) | Doral | FL | 1 / 1 | 40,200,000 | 4.0 | Office | 388,305 | 98 | 63.3 | 58.3 | 1.29 | 9.0 | |||||||||||||||||
| PCC | Adler Industrial(2) | Doral | FL | 1 / 1 | 16,800,000 | 1.7 | Industrial | 196,267 | 98 | 63.3 | 58.3 | 1.29 | 9.0 | |||||||||||||||||
| CGMRC | Harbor Pointe Apartments | Bayonne | NJ | 1 / 1 | 50,000,000 | 5.0 | Multifamily | 544 | 202,206 | 71.0 | 71.0 | 1.48 | 7.2 | |||||||||||||||||
| PCC | Heritage Industrial Portfolio | Various | Various | 1 / 12 | 41,000,000 | 4.1 | Industrial | 2,578,919 | 32 | 69.8 | 61.3 | 1.36 | 9.2 | |||||||||||||||||
| CGMRC | Anchorage Marriott Downtown | Anchorage | AK | 1 / 1 | 37,926,518 | 3.8 | Hospitality | 392 | 193,503 | 69.9 | 51.7 | 1.76 | 12.3 | |||||||||||||||||
| LCF | Harvey Building Products Portfolio | Various | Various | 1 / 30 | 32,922,772 | 3.3 | Various | 2,046,119 | 54 | 53.4 | 49.3 | 1.96 | 12.8 | |||||||||||||||||
| CGMRC | JW Marriott Santa Monica Le Merigot | Santa Monica | CA | 1 / 1 | 31,162,303 | 3.1 | Hospitality | 175 | 356,141 | 59.9 | 55.3 | 1.77 | 13.5 | |||||||||||||||||
| CGMRC | Keeper’s Self Storage Manhattan | New York | NY | 1 / 1 | 31,000,000 | 3.1 | Self Storage | 61,575 | 503 | 57.5 | 57.5 | 1.45 | 7.3 | |||||||||||||||||
| Top Three Total/Weighted Average | 3 / 5 | $224,500,000 | 22.4 | % | 58.9 | % | 54.3 | % | 1.72x | 10.6 | % | |||||||||||||||||||
| Top Five Total/Weighted Average(3) | 6 / 8 | $331,500,000 | 33.1 | % | 61.5 | % | 57.5 | % | 1.61x | 9.8 | % | |||||||||||||||||||
| Top Ten Total/Weighted Average(4) | 11 / 53 | $505,511,593 | 50.4 | % | 61.9 | % | 56.7 | % | 1.62x | 10.2 | % | |||||||||||||||||||
| Non-Top Ten Total/Weighted Average(5) | 60 / 62 | $496,689,432 | 49.6 | % | 63.7 | % | 56.9 | % | 1.66x | 10.2 | % | |||||||||||||||||||
| (1) | With respect to the Empire Mall mortgage loan, the Harbor Pointe Apartments mortgage loan, the Heritage Industrial Portfolio mortgage loan, the Anchorage Marriott Downtown mortgage loan, the Harvey Building Products Portfolio mortgage loan and the JW Marriott Santa Monica Le Merigot mortgage loan, each of which is part of a whole loan, Cut-off Date Balance Per Unit/SF/Room, loan-to-value ratio, debt service coverage ratio and debt yield calculations include the relatedpari passu companion loan(s) (unless otherwise stated). With respect to each mortgage loan, debt service coverage ratio, debt yield and loan-to-value ratio information do not take into account of subordinate debt (whether or not secured by the related mortgaged property), if any, that currently exists or is allowed under the terms of such mortgage loan. |
| (2) | The Adler Office mortgage loan and the Adler Industrial mortgage loan are cross-collateralized and cross-defaulted with one another. With respect to each of the Adler Office and Adler Industrial mortgage loans, the applicable loan-to-value ratios, debt service coverage ratios and debt yields for each such mortgage loan is based upon the ratio or yield (as applicable) for the aggregate indebtedness evidenced by both mortgage loans. On an individual basis, without regard to the cross-collateralization feature, a related mortgage loan may have a higher loan-to-value ratio, lower debt service coverage ratio and/or lower debt yield than is presented herein. |
| (3) | Includes the five largest mortgage loans or group of cross-collateralized underlying mortgage loans. |
| (4) | Includes the ten largest mortgage loans or group of cross-collateralized underlying mortgage loans. |
| (5) | Excludes the ten largest mortgage loans or group of cross-collateralized underlying mortgage loans. |
THE INFORMATION IN THIS STRUCTURAL AND COLLATERAL TERM SHEET IS NOT COMPLETE AND MAY BE AMENDED PRIOR TO THE TIME OF SALE. THIS TERM SHEET IS NOT AN OFFER TO SELL THESE SECURITIES AND IT IS NOT A SOLICITATION OF AN OFFER TO BUY THESE SECURITIES IN ANY JURISDICTION WHERE THE OFFER OR SALE IS NOT PERMITTED.
| 8 |
| Wells Fargo Commercial Mortgage Trust 2015-P2 | Characteristics of the Mortgage Pool |
| B. | Summary ofPari PassuWhole Loans |
| Property Name | Mortgage Loan Seller | Related Notes in Loan Group (Original Balance) | Holder of Note | Lead Servicer for Whole loan | Current Master Servicer Under Related Securitization Servicing Agreement | Current Special Servicer Under Related Securitization Servicing Agreement |
| Empire Mall | SG | $75,000,000 | WFCM 2015-P2 | No(2) | Wells Fargo Bank, National Association | C-III Asset Management LLC |
| SG | $40,000,000 | (1) | Yes(2) | TBD | TBD | |
| SG | $40,000,000 | (1) | No(2) | TBD | TBD | |
| SG | $25,000,000 | (1) | No(2) | TBD | TBD | |
| SG | $10,000,000 | (1) | No(2) | TBD | TBD | |
| Harbor Pointe Apartments | CGMRC | $60,000,000 | CGCMT 2015-GC35 | Yes | Midland Loan Services, a Division of PNC Bank, National Association | C-III Asset Management LLC |
| CGMRC | $50,000,000 | WFCM 2015-P2 | No | Wells Fargo Bank, National Association | C-III Asset Management LLC | |
| Heritage Industrial Portfolio | PCC | $41,000,000 | WFCM 2015-P2 | Yes | Wells Fargo Bank, National Association | C-III Asset Management LLC |
| PCC | $40,375,000 | (3) | No | TBD | TBD | |
| Anchorage Marriott Downtown | CGMRC | $37,975,000 | CGCMT 2015-GC35 | Yes | Midland Loan Services, a Division of PNC Bank, National Association | C-III Asset Management LLC |
| CGMRC | $37,975,000 | WFCM 2015-P2 | No | Wells Fargo Bank, National Association | C-III Asset Management LLC | |
| Harvey Building Products Portfolio | LCF | $42,000,000 | COMM 2015-LC23 | Yes | Wells Fargo Bank, National Association | LNR Partners LLC |
| LCF | $33,000,000 | WFCM 2015-P2 | No | Wells Fargo Bank, National Association | C-III Asset Management LLC | |
| LCF | $25,000,000 | (4) | No | TBD | TBD | |
| LCF | $10,000,000 | (4) | No | TBD | TBD | |
| JW Marriott Santa Monica Le Merigot | CGMRC | $31,200,000 | CGCMT 2015-GC35 | Yes | Midland Loan Services, a Division of PNC Bank, National Association | C-III Asset Management LLC |
| CGMRC | $31,200,000 | WFCM 2015-P2 | No | Wells Fargo Bank, National Association | C-III Asset Management LLC | |
| (1) | The relatedpari passu companion loans designated Note A-1, Note A-3, Note A-4 and Note A-5 are currently held by SG or an affiliate. Note A-1 represents the controlling note. Note A-1, Note A-3, Note A-4 and Note A-5 are expected to be contributed to one or more future securitizations. No assurance can be provided that Note A-1, Note A-3, Note A-4 and Note A-5 will not be split further. |
| (2) | The Empire Mall whole loan will be serviced under the WFCM 2015-P2 pooling and servicing agreement until the securitization of the related controllingpari passu companion loan (evidenced by Note A-1), after which the Empire Mall whole loan will be serviced under the pooling and servicing agreement related to the securitization of the related controllingpari passu companion loan. The master servicer and special servicer under that pooling and servicing agreement will be identified in a notice, report or statement to holders of the WFCM 2015-P2 certificates after the securitization of the related controllingpari passu companion loan. |
| (3) | The relatedpari passu companion loan designated Note A-2 is currently held by PCC or an affiliate. Note A-2 represents the non-controlling note and is expected to be contributed to one or more future securitizations. No assurance can be provided that Note A-2 will not be split further. |
| (4) | The relatedpari passu companion loans designated Note A-2-A and Note A-2-B are currently held by LCF or an affiliate. Note A-2-A and Note A-2-B represent non-controlling notes and are expected to be contributed to one or more future securitizations. No assurance can be provided that Note A-2-A and Note A-2-B will not be split further. |
THE INFORMATION IN THIS STRUCTURAL AND COLLATERAL TERM SHEET IS NOT COMPLETE AND MAY BE AMENDED PRIOR TO THE TIME OF SALE. THIS TERM SHEET IS NOT AN OFFER TO SELL THESE SECURITIES AND IT IS NOT A SOLICITATION OF AN OFFER TO BUY THESE SECURITIES IN ANY JURISDICTION WHERE THE OFFER OR SALE IS NOT PERMITTED.
| 9 |
| Wells Fargo Commercial Mortgage Trust 2015-P2 | Characteristics of the Mortgage Pool |
| C. | Mortgage Loans with Additional Secured and Mezzanine Financing |
| Loan No. | Mortgage Loan Seller | Mortgage Loan Name | Mortgage Loan Cut-off Date Balance ($) | % of Initial Pool Balance (%) | Sub Debt Cut-off Date Balance ($) | Mezzanine Debt Cut-off Date Balance ($) | Total Debt | Mortgage Loan U/W NCF DSCR (x)(2) | Total Debt U/W NCF DSCR (x)(2) | Mortgage Loan Cut-off Date U/W NOI Debt Yield (%)(2) | Total Debt Cut-off Date U/W NOI Debt Yield (%)(2) | Mortgage Loan Cut-off Date LTV Ratio (%)(2) | Total Debt Cut-off Date LTV Ratio (%)(2) | |||||||||||||
| 1 | LCF | Rolling Brook Village | $88,000,000 | 8.8% | $0 | $20,200,000 | 6.018% | 1.48x | 1.05x | 8.1% | 6.6% | 62.0% | 76.2% | |||||||||||||
| 10 | CGMRC | JW Marriott Santa Monica Le Merigot | 31,162,303 | 3.1 | 0 | 17,000,000 | 5.941 | 1.77 | 1.26 | 13.5 | 10.6 | 59.9 | 76.3 | |||||||||||||
| Total/Weighted Average | $119,162,303 | 11.9% | $0 | $37,200,000 | 5.998% | 1.56x | 1.10x | 9.5% | 7.6% | 61.5% | 76.2% | |||||||||||||||
| (1) | Total Debt Interest Rate for any specified mortgage loan reflects the weighted average of the interest rates on the respective components of the total debt. |
| (2) | With respect to the JW Marriott Santa Monica Le Merigot mortgage loan, which is part of a whole loan, debt service coverage ratio, debt yield and loan-to-value ratio calculations include the related pari passu companion loan. |
THE INFORMATION IN THIS STRUCTURAL AND COLLATERAL TERM SHEET IS NOT COMPLETE AND MAY BE AMENDED PRIOR TO THE TIME OF SALE. THIS TERM SHEET IS NOT AN OFFER TO SELL THESE SECURITIES AND IT IS NOT A SOLICITATION OF AN OFFER TO BUY THESE SECURITIES IN ANY JURISDICTION WHERE THE OFFER OR SALE IS NOT PERMITTED.
| 10 |
| Wells Fargo Commercial Mortgage Trust 2015-P2 | Characteristics of the Mortgage Pool |
| D. | Previous Securitization History(1) |
| Loan No. | Mortgage Loan Seller | Mortgage Loan or Mortgaged Property Name | City | State | Property Type | Mortgage Loan or Mortgaged Property Cut- off Date Balance ($) | % of Initial Pool Balance (%) | Previous Securitization | ||||||||
| 2 | SG | Empire Mall | Sioux Falls | SD | Retail | $75,000,000 | 7.5 | % | BACM 2006-6 | |||||||
| 7 | PCC | Heritage Industrial Portfolio | Various | Various | Industrial | 41,000,000 | 4.1 | CD 2007-CD4 | ||||||||
| 8 | CGMRC | Anchorage Marriott Downtown | Anchorage | AK | Hospitality | 37,926,518 | 3.8 | DBUBS 2011-LC3A | ||||||||
| 10 | CGMRC | JW Marriott Santa Monica Le Merigot | Santa Monica | CA | Hospitality | 31,162,303 | 3.1 | DBUBS 2011-LC3A | ||||||||
| 13 | PCC | Home Depot Jamaica | Jamaica | NY | Other | 25,000,000 | 2.5 | MSC 2006-IQ11 | ||||||||
| 16 | CGMRC | Westgate Shopping Center | Ann Arbor | MI | Retail | 22,000,000 | 2.2 | BACM 2006-5 | ||||||||
| 17 | LCF | Green Caye | Dickinson | TX | Mixed Use | 19,000,000 | 1.9 | LBUBS 2006-C3 | ||||||||
| 18 | WFB | Huntington Park Shopping Center | Huntington Park | CA | Retail | 18,500,000 | 1.8 | BSCMS 2006-PW11 | ||||||||
| 20 | WFB | 2200 Harbor Boulevard | Costa Mesa | CA | Retail | 14,000,000 | 1.4 | BSCMS 2005-T20 | ||||||||
| 23 | CGMRC | Amsdell Michigan Pool | Various | MI | Self Storage | 12,500,000 | 1.2 | WFRBS 2011-C5 | ||||||||
| 26 | PCC | Hawthorne Business Center | Hawthorne | CA | Industrial | 11,800,000 | 1.2 | WBCMT 2005-C22 | ||||||||
| 27 | WFB | Valley View Business Center | Las Vegas | NV | Industrial | 11,185,358 | 1.1 | JPMCC 2006-CB14 | ||||||||
| 29 | WFB | Security Public Storage - Salinas | Salinas | CA | Self Storage | 9,925,000 | 1.0 | BSCMS 2006-T22 | ||||||||
| 30 | SG | Dollar Self Storage | Henderson | NV | Self Storage | 9,150,000 | 0.9 | GSMS 2012-GC6 | ||||||||
| 31 | CGMRC | Sunset Plaza | San Angelo | TX | Retail | 9,150,000 | 0.9 | GSMS 2006-GG6 | ||||||||
| 32 | LCF | Tally Ho | Wilmington | DE | Retail | 8,988,677 | 0.9 | CD 2006-CD2 | ||||||||
| 33 | WFB | Parkway Commons | Franklin | TN | Mixed Use | 8,050,000 | 0.8 | LBUBS 2006-C3 | ||||||||
| 36 | WFB | ClimaStor 6 | Baton Rouge | LA | Self Storage | 7,620,134 | 0.8 | BACM 2006-1 | ||||||||
| 37 | WFB | Joiner Parkway Self Storage | Lincoln | CA | Self Storage | 7,350,000 | 0.7 | BSCMS 2006-PW11 | ||||||||
| 38 | LCF | Fairfield Inn & Suites Lumberton | Lumberton | NC | Hospitality | 6,988,368 | 0.7 | CSMC 2006-C1 | ||||||||
| 39 | SG | LA Fitness - Euless | Euless | TX | Retail | 6,700,000 | 0.7 | JPMCC 2007-LD12 | ||||||||
| 41 | CGMRC | CSS Lafayette | Lafayette | CA | Self Storage | 6,300,000 | 0.6 | BACM 2007-3 | ||||||||
| 42 | SG | LA Fitness - Grand Prairie | Grand Prairie | TX | Retail | 6,300,000 | 0.6 | JPMCC 2007-LDPX | ||||||||
| 43 | SG | LA Fitness - Pearland | Pearland | TX | Retail | 6,125,000 | 0.6 | MSC 2007-HQ13 | ||||||||
| 44 | WFB | Security Public Storage - Pittsburg | Pittsburg | CA | Self Storage | 6,050,000 | 0.6 | MSC 2006-T23 | ||||||||
| 49 | LCF | Dover Downs | Dover | DE | Retail | 4,993,835 | 0.5 | CSMC 2006-C1 | ||||||||
| 54 | WFB | Security Public Storage - Manteca | Manteca | CA | Self Storage | 4,225,000 | 0.4 | BSCMS 2006-T22 | ||||||||
| 55 | WFB | Storage Depot Fossil Creek | Fort Worth | TX | Self Storage | 4,015,000 | 0.4 | BACM 2006-1 | ||||||||
| 56 | WFB | ClimaStor 7 | Baton Rouge | LA | Self Storage | 3,795,086 | 0.4 | JPMCC 2006-LDP9 | ||||||||
| 60 | WFB | University Center South | Jacksonville | FL | Retail | 3,080,983 | 0.3 | MLMT 2005-CIP1 | ||||||||
| 63 | WFB | Security Public Storage - Sacramento III | Sacramento | CA | Self Storage | 2,600,000 | 0.3 | BSCMS 2006-PW11 | ||||||||
| Total | $440,481,261 | 44.0 | % | |||||||||||||
| (1) | The table above represents the most recent securitization with respect to the mortgaged property securing the related mortgage loan, based on information provided by the related borrower or obtained through searches of a third-party database. While loans secured by the above mortgaged properties may have been securitized multiple times in prior transactions, mortgage loans in this securitization are only listed in the above chart if the mortgage loan paid off a loan in another securitization. The information has not otherwise been confirmed by the mortgage loan sellers. |
THE INFORMATION IN THIS STRUCTURAL AND COLLATERAL TERM SHEET IS NOT COMPLETE AND MAY BE AMENDED PRIOR TO THE TIME OF SALE. THIS TERM SHEET IS NOT AN OFFER TO SELL THESE SECURITIES AND IT IS NOT A SOLICITATION OF AN OFFER TO BUY THESE SECURITIES IN ANY JURISDICTION WHERE THE OFFER OR SALE IS NOT PERMITTED.
| 11 |
| Wells Fargo Commercial Mortgage Trust 2015-P2 | Characteristics of the Mortgage Pool |
| E. | Mortgage Loans with Scheduled Balloon Payments and Related Classes |
| Class A-2A and Class A-2B(1) |
| Loan No. | Mortgage Loan Seller | Mortgage Loan Name | State | Property Type | Mortgage Loan Cut-off Date Balance ($) | % of Initial Pool Balance (%) | Balloon Balance ($) | % of Class A-2A and A-2B Certificate Principal Balance (%)(2) | Units/ SF/ Rooms | Loan per Unit/SF/ Room ($) | U/W NCF DSCR (x) | U/W NOI Debt Yield (%) | Cut-off Date LTV Ratio (%) | Balloon or ARD LTV Ratio (%) | Rem. IO Period (mos.) | Rem. Term to Maturity (mos.) | |||||||||||||||||||
| 1 | LCF | Rolling Brook Village | VA | Multifamily | $88,000,000 | 8.8 | % | $88,000,000 | 57.7 | % | 732 | $120,219 | 1.48x | 8.1 | % | 62.0 | % | 62.0% | 60 | 60 | |||||||||||||||
| 9 | LCF | Harvey Building Products Portfolio | Various | Various | 32,922,772 | 3.3 | 30,369,128 | 19.9 | 2,046,119 | 54 | 1.96 | 12.8 | 53.4 | 49.3 | 0 | 58 | |||||||||||||||||||
| 10 | CGMRC | JW Marriott Santa Monica Le Merigot | CA | Hospitality | 31,162,303 | 3.1 | 28,764,615 | 18.9 | 175 | 356,141 | 1.77 | 13.5 | 59.9 | 55.3 | 0 | 59 | |||||||||||||||||||
| 61 | SG | Baymont Inn & Suites Las Vegas | NV | Hospitality | 2,946,753 | 0.3 | 2,739,852 | 1.8 | 111 | 26,547 | 1.69 | 13.9 | 54.6 | 50.7 | 0 | 59 | |||||||||||||||||||
| Total/Weighted Average | $155,031,828 | 15.5 | % | $149,873,595 | 98.3 | % | 1.64x | 10.3 | % | 59.6 | % | 57.7% | 34 | 59 | |||||||||||||||||||||
| (1) | The table above presents the mortgage loan(s) whose balloon payments would be applied to pay down the principal balance of the Class A-2A and A-2B Certificates, assuming a 0% CPR and applying the “Structuring Assumptions” described in the Preliminary Prospectus, including the assumptions that (i) none of the mortgage loans in the pool experience prepayments prior to maturity (or, in the case of an ARD loan, its anticipated repayment date), defaults or losses; (ii) there are no extensions of maturity dates of any mortgage loans in the pool; and (iii) each mortgage loan in the pool is paid in full on its stated maturity date (or, in the case of an ARD loan, its anticipated repayment date). Each Class of Certificates, including the Class A-2A and A-2B Certificates, evidences undivided ownership interests in the entire pool of mortgage loans. Debt service coverage ratio, debt yield and loan-to-value ratio information do not take into account subordinate debt (whether or not secured by the related mortgaged property), if any, that currently exists or is allowed under the terms of any mortgage loan. See Annex A-1 to the Preliminary Prospectus. |
| (2) | Reflects the percentage equal to the Balloon Balance divided by the initial Class A-2A and A-2B Certificate Principal Balance. |
THE INFORMATION IN THIS STRUCTURAL AND COLLATERAL TERM SHEET IS NOT COMPLETE AND MAY BE AMENDED PRIOR TO THE TIME OF SALE. THIS TERM SHEET IS NOT AN OFFER TO SELL THESE SECURITIES AND IT IS NOT A SOLICITATION OF AN OFFER TO BUY THESE SECURITIES IN ANY JURISDICTION WHERE THE OFFER OR SALE IS NOT PERMITTED.
| 12 |
(THIS PAGE INTENTIONALLY LEFT BLANK)
THE INFORMATION IN THIS STRUCTURAL AND COLLATERAL TERM SHEET IS NOT COMPLETE AND MAY BE AMENDED PRIOR TO THE TIME OF SALE. THIS TERM SHEET IS NOT AN OFFER TO SELL THESE SECURITIES AND IT IS NOT A SOLICITATION OF AN OFFER TO BUY THESE SECURITIES IN ANY JURISDICTION WHERE THE OFFER OR SALE IS NOT PERMITTED.
| 13 |
| Wells Fargo Commercial Mortgage Trust 2015-P2 | Characteristics of the Mortgage Pool |
| F. | Property Type Distribution(1) |
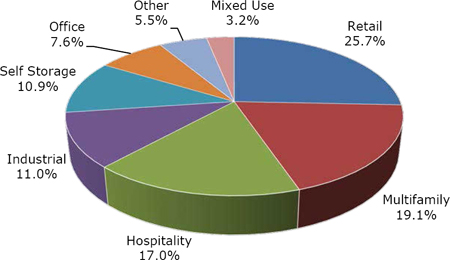
| Property Type | Number of Mortgaged Properties | Aggregate Cut-off Date Balance ($) | % of Initial Pool Balance (%) | Weighted Average Cut-off Date LTV Ratio (%) | Weighted Average Balloon or ARD LTV Ratio (%) | Weighted Average U/W NCF DSCR (x) | Weighted Average U/W NOI Debt Yield (%) | Weighted Average U/W NCF Debt Yield (%) | Weighted Average Mortgage Rate (%) | |||||||||||
| Retail | 27 | $257,287,731 | 25.7% | 62.4% | 55.2% | 1.61x | 10.3% | 9.7% | 4.672 | % | ||||||||||
| Anchored | 8 | 107,132,512 | 10.7 | 65.7 | 57.6 | 1.51 | 10.3 | 9.5 | 4.764 | |||||||||||
| Regional Mall | 1 | 75,000,000 | 7.5 | 54.3 | 47.3 | 1.80 | 11.2 | 10.7 | 4.314 | |||||||||||
| Single Tenant | 14 | 54,907,000 | 5.5 | 64.9 | 59.5 | 1.53 | 9.1 | 8.8 | 4.921 | |||||||||||
| Unanchored | 3 | 11,098,220 | 1.1 | 63.3 | 57.7 | 1.86 | 10.6 | 9.8 | 4.664 | |||||||||||
| Shadow Anchored | 1 | 9,150,000 | 0.9 | 75.0 | 61.7 | 1.43 | 9.9 | 9.3 | 5.040 | |||||||||||
| Multifamily | 9 | 191,325,000 | 19.1 | 65.5 | 63.8 | 1.53 | 8.4 | 8.1 | 4.938 | |||||||||||
| Garden | 7 | 127,775,000 | 12.7 | 62.4 | 60.9 | 1.58 | 8.9 | 8.5 | 5.028 | |||||||||||
| High Rise | 1 | 13,550,000 | 1.4 | 75.3 | 64.7 | 1.28 | 8.2 | 8.0 | 4.750 | |||||||||||
| Mid Rise | 1 | 50,000,000 | 5.0 | 71.0 | 71.0 | 1.48 | 7.2 | 7.1 | 4.760 | |||||||||||
| Hospitality | 9 | 170,615,310 | 17.0 | 61.8 | 52.1 | 1.87 | 13.4 | 11.9 | 4.884 | |||||||||||
| Limited Service | 6 | 96,035,120 | 9.6 | 59.3 | 51.6 | 1.96 | 13.8 | 12.5 | 4.908 | |||||||||||
| Full Service | 2 | 69,088,821 | 6.9 | 65.4 | 53.3 | 1.76 | 12.8 | 11.1 | 4.805 | |||||||||||
| Extended Stay | 1 | 5,491,368 | 0.5 | 59.0 | 44.9 | 1.59 | 14.0 | 11.6 | 5.450 | |||||||||||
| Industrial | 44 | 110,451,769 | 11.0 | 62.1 | 55.8 | 1.63 | 10.5 | 9.8 | 4.710 | |||||||||||
| Warehouse | 38 | 60,474,908 | 6.0 | 64.3 | 57.3 | 1.56 | 10.4 | 9.8 | 4.710 | |||||||||||
| Light Industrial | 2 | 28,600,000 | 2.9 | 58.8 | 55.9 | 1.67 | 9.8 | 9.0 | 4.732 | |||||||||||
| Flex | 2 | 11,978,906 | 1.2 | 65.3 | 53.3 | 1.63 | 10.7 | 10.0 | 4.547 | |||||||||||
| Manufacturing | 2 | 9,397,955 | 0.9 | 53.4 | 49.3 | 1.96 | 12.8 | 12.5 | 4.850 | |||||||||||
| Self Storage | 16 | 109,226,854 | 10.9 | 63.7 | 56.4 | 1.49 | 8.9 | 8.7 | 4.731 | |||||||||||
| Self Storage | 16 | 109,226,854 | 10.9 | 63.7 | 56.4 | 1.49 | 8.9 | 8.7 | 4.731 | |||||||||||
| Office | 5 | 76,644,361 | 7.6 | 64.0 | 60.0 | 1.50 | 9.5 | 8.5 | 4.741 | |||||||||||
| Suburban | 4 | 61,144,361 | 6.1 | 65.2 | 60.2 | 1.36 | 9.3 | 8.4 | 4.850 | |||||||||||
| CBD | 1 | 15,500,000 | 1.5 | 59.2 | 59.2 | 2.06 | 10.3 | 9.0 | 4.310 | |||||||||||
| Other | 2 | 55,000,000 | 5.5 | 57.1 | 54.5 | 1.73 | 9.1 | 9.1 | 4.482 | |||||||||||
| Leased Fee | 2 | 55,000,000 | 5.5 | 57.1 | 54.5 | 1.73 | 9.1 | 9.1 | 4.482 | |||||||||||
| Mixed Use | 3 | 31,650,000 | 3.2 | 61.6 | 54.6 | 2.02 | 11.4 | 10.9 | 4.616 | |||||||||||
| Manufactured Housing Community/Multifamily/Self Storage | 1 | 19,000,000 | 1.9 | 63.3 | 51.6 | 1.71 | 11.1 | 10.7 | 4.751 | |||||||||||
| Retail/Office | 1 | 8,050,000 | 0.8 | 64.4 | 64.4 | 2.03 | 10.1 | 9.3 | 4.490 | |||||||||||
| Office/Retail | 1 | 4,600,000 | 0.5 | 50.0 | 50.0 | 3.28 | 15.2 | 14.3 | 4.280 | |||||||||||
| Total/Weighted Average: | 115 | $1,002,201,025 | 100.0% | 62.8% | 56.8% | 1.64x | 10.2% | 9.6% | 4.763 | % | ||||||||||
| (1) | Because this table presents information relating to the mortgaged properties and not the mortgage loans, (a) the information for mortgage loans secured by more than one mortgaged property (other than through cross-collateralization with other mortgage loans) is based on allocated amounts (allocating the mortgage loan principal balance to each of those properties according to the relative appraised values of the mortgaged properties or the allocated loan amounts or property-specific release prices set forth in the related mortgage loan documents or such other allocation as the related mortgage loan seller deemed appropriate), and (b) the information for each mortgaged property that relates to a mortgage loan that is cross-collateralized or cross-defaulted with other mortgage loans is based upon the principal balance of that mortgage loan, except that the applicable loan-to-value ratio, debt service coverage ratio and debt yield for each such mortgage loan is based upon the ratio or yield (as applicable) for the aggregate indebtedness evidenced by all loans in the group. On an individual basis, without regard to the cross-collateralization feature, any mortgage loan that is part of a cross-collateralized group of mortgage loans may have a higher loan-to-value ratio, lower debt service coverage ratio and/or lower debt yield than is presented herein. With respect to the Empire Mall mortgage loan, the Harbor Pointe Apartments mortgage loan, the Heritage Industrial Portfolio mortgage loan, the Anchorage Marriott Downtown mortgage loan, the Harvey Building Products Portfolio mortgage loan and the JW Marriott Santa Monica Le Merigot mortgage loan, each of which is part of a whole loan, the loan-to-value ratio, debt service coverage ratio and debt yield calculations include the relatedpari passu companion loan(s) (unless otherwise stated). With respect to each mortgage loan, debt service coverage ratio, debt yield and loan-to-value ratio information do not take into account of any subordinate debt (whether or not secured by the related mortgaged property) that currently exists or is allowed under the terms of such mortgage loan. See Annex A-1 to the Preliminary Prospectus. |
THE INFORMATION IN THIS STRUCTURAL AND COLLATERAL TERM SHEET IS NOT COMPLETE AND MAY BE AMENDED PRIOR TO THE TIME OF SALE. THIS TERM SHEET IS NOT AN OFFER TO SELL THESE SECURITIES AND IT IS NOT A SOLICITATION OF AN OFFER TO BUY THESE SECURITIES IN ANY JURISDICTION WHERE THE OFFER OR SALE IS NOT PERMITTED.
| 14 |
| Wells Fargo Commercial Mortgage Trust 2015-P2 | Characteristics of the Mortgage Pool |
G. Geographic Distribution(1)(2)
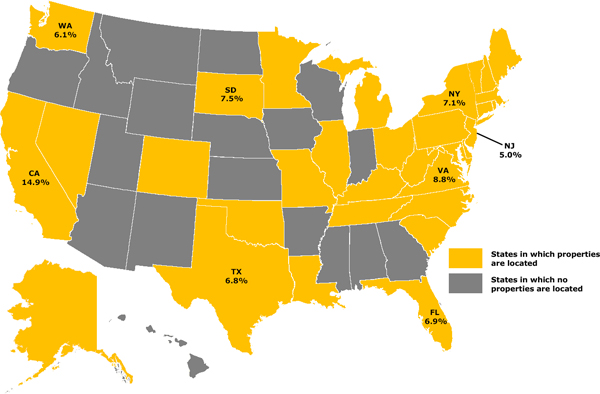
| Location | Number of Mortgaged Properties | Aggregate Cut-off Date Balance ($) | % of Initial Pool Balance (%) | Weighted Average Cut-off Date LTV Ratio (%) | Weighted Average Balloon or ARD LTV Ratio (%) | Weighted Average U/W NCF DSCR (x) | Weighted Average U/W NOI Debt Yield (%) | Weighted Average U/W NCF Debt Yield (%) | Weighted Average Mortgage Rate (%) | |||||||||||
| California | 12 | $149,562,303 | 14.9% | 56.9% | 52.8% | 1.75x | 10.7% | 10.0% | 4.683 | % | ||||||||||
| Southern California(3) | 5 | 105,462,303 | 10.5 | 55.9 | 53.1 | 1.79 | 11.1 | 10.1 | 4.737 | |||||||||||
| Northern California(3) | 7 | 44,100,000 | 4.4 | 59.3 | 52.1 | 1.65 | 9.8 | 9.6 | 4.554 | |||||||||||
| Virginia | 1 | 88,000,000 | 8.8 | 62.0 | 62.0 | 1.48 | 8.1 | 7.9 | 5.247 | |||||||||||
| South Dakota | 1 | 75,000,000 | 7.5 | 54.3 | 47.3 | 1.80 | 11.2 | 10.7 | 4.314 | |||||||||||
| New York | 10 | 70,964,055 | 7.1 | 62.4 | 58.6 | 1.50 | 8.6 | 8.4 | 4.627 | |||||||||||
| Florida | 5 | 69,580,983 | 6.9 | 62.7 | 58.1 | 1.47 | 9.6 | 8.7 | 4.809 | |||||||||||
| Texas | 9 | 67,986,634 | 6.8 | 62.7 | 54.4 | 1.63 | 10.0 | 9.6 | 4.752 | |||||||||||
| Washington | 3 | 61,500,000 | 6.1 | 60.0 | 51.8 | 1.96 | 13.6 | 12.5 | 4.950 | |||||||||||
| New Jersey | 1 | 50,000,000 | 5.0 | 71.0 | 71.0 | 1.48 | 7.2 | 7.1 | 4.760 | |||||||||||
| Other(4) | 73 | 369,607,049 | 36.9 | 66.6 | 57.9 | 1.63 | 10.7 | 9.9 | 4.759 | |||||||||||
| Total/Weighted Average | 115 | $1,002,201,025 | 100.0% | 62.8% | 56.8% | 1.64x | 10.2% | 9.6% | 4.763 | % | ||||||||||
| (1) | The mortgaged properties are located in 32 states. |
| (2) | Because this table presents information relating to the mortgaged properties and not the mortgage loans, (a) the information for mortgage loans secured by more than one mortgaged property (other than through cross-collateralization with other mortgage loans) is based on allocated amounts (allocating the mortgage loan principal balance to each of those properties according to the relative appraised values of the mortgaged properties or the allocated loan amounts or property-specific release prices set forth in the related mortgage loan documents or such other allocation as the related mortgage loan seller deemed appropriate), and (b) the information for each mortgaged property that relates to a mortgage loan that is cross-collateralized or cross-defaulted with other mortgage loans is based upon the principal balance of that mortgage loan, except that the applicable loan-to-value ratio, debt service coverage ratio and debt yield for each such mortgage loan is based upon the ratio or yield (as applicable) for the aggregate indebtedness evidenced by all loans in the group. On an individual basis, without regard to the cross-collateralization feature, any mortgage loan that is part of a cross-collateralized group of mortgage loans may have a higher loan-to-value ratio, lower debt service coverage ratio and/or lower debt yield than is presented herein. With respect to the Empire Mall mortgage loan, the Harbor Pointe Apartments mortgage loan, the Heritage Industrial Portfolio mortgage loan, the Anchorage Marriott Downtown mortgage loan, the Harvey Building Products Portfolio mortgage loan and the JW Marriott Santa Monica Le Merigot mortgage loan, each of which is part of a whole loan, the loan-to-value ratio, debt service coverage ratio and debt yield calculations include the relatedpari passu companion loan(s) (unless otherwise stated). With respect to each mortgage loan, debt service coverage ratio, debt yield and loan-to-value ratio information do not take into account of any subordinate debt (whether or not secured by the related mortgaged property) that currently exists or is allowed under the terms of such mortgage loan. See Annex A-1 to the Preliminary Prospectus. |
| (3) | For purposes of determining whether a mortgaged property is in Northern California or Southern California, Northern California includes areas with zip codes above 93600 and Southern California includes areas with zip codes of 93600 and below. |
| (4) | Includes 24 other states. |
THE INFORMATION IN THIS STRUCTURAL AND COLLATERAL TERM SHEET IS NOT COMPLETE AND MAY BE AMENDED PRIOR TO THE TIME OF SALE. THIS TERM SHEET IS NOT AN OFFER TO SELL THESE SECURITIES AND IT IS NOT A SOLICITATION OF AN OFFER TO BUY THESE SECURITIES IN ANY JURISDICTION WHERE THE OFFER OR SALE IS NOT PERMITTED.
| 15 |
| Wells Fargo Commercial Mortgage Trust 2015-P2 | Characteristics of the Mortgage Pool |
| H. | Characteristics of the Mortgage Pool(1) |
| CUT-OFF DATE BALANCE | |||
| Range of Cut-off Date Balances ($) | Number of Mortgage Loans | Aggregate Cut- off Date Balance | % of Initial Pool Balance |
| 734,500 - 1,000,000 | 5 | $4,017,000 | 0.4% |
| 1,000,001 - 2,000,000 | 1 | 1,375,000 | 0.1 |
| 2,000,001 - 3,000,000 | 5 | 12,440,623 | 1.2 |
| 3,000,001 - 4,000,000 | 5 | 17,381,070 | 1.7 |
| 4,000,001 - 5,000,000 | 7 | 32,183,835 | 3.2 |
| 5,000,001 - 6,000,000 | 4 | 21,861,368 | 2.2 |
| 6,000,001 - 7,000,000 | 7 | 44,963,368 | 4.5 |
| 7,000,001 - 8,000,000 | 4 | 30,530,134 | 3.0 |
| 8,000,001 - 9,000,000 | 2 | 17,038,677 | 1.7 |
| 9,000,001 - 10,000,000 | 3 | 28,225,000 | 2.8 |
| 10,000,001 - 15,000,000 | 9 | 110,073,358 | 11.0 |
| 15,000,001 - 20,000,000 | 4 | 69,800,000 | 7.0 |
| 20,000,001 - 30,000,000 | 5 | 123,600,000 | 12.3 |
| 30,000,001 - 50,000,000 | 7 | 264,211,593 | 26.4 |
| 50,000,001 - 70,000,000 | 1 | 61,500,000 | 6.1 |
| 70,000,001 - 80,000,000 | 1 | 75,000,000 | 7.5 |
| 80,000,001 - 88,000,000 | 1 | 88,000,000 | 8.8 |
| Total: | 71 | $1,002,201,025 | 100.0% |
| Weighted Average: | $14,115,507 | ||
| UNDERWRITTEN NOI DEBT SERVICE COVERAGE RATIO | |||
| Range of U/W NOI DSCRs (x) | Number of Mortgage Loans | Aggregate Cut- off Date Balance | % of Initial Pool Balance |
| 1.27 - 1.30 | 1 | $4,970,000 | 0.5% |
| 1.31 - 1.40 | 9 | 63,797,322 | 6.4 |
| 1.41 - 1.50 | 15 | 286,019,768 | 28.5 |
| 1.51 - 1.60 | 5 | 120,950,000 | 12.1 |
| 1.61 - 1.70 | 7 | 59,735,000 | 6.0 |
| 1.71 - 1.80 | 8 | 88,385,018 | 8.8 |
| 1.81 - 1.90 | 9 | 99,146,736 | 9.9 |
| 1.91 - 2.00 | 1 | 37,926,518 | 3.8 |
| 2.01 - 2.50 | 14 | 231,570,664 | 23.1 |
| 2.51 - 3.00 | 1 | 5,100,000 | 0.5 |
| 3.01 - 3.50 | 1 | 4,600,000 | 0.5 |
| Total: | 71 | $1,002,201,025 | 100.0% |
| Weighted Average: | 1.75x | ||
| UNDERWRITTEN NCF DEBT SERVICE COVERAGE RATIO | |||
| Range of U/W NCF DSCRs (x) | Number of Mortgage Loans | Aggregate Cut- off Date Balance | % of Initial Pool Balance |
| 1.27 - 1.30 | 6 | $106,808,000 | 10.7% |
| 1.31 - 1.40 | 15 | 157,672,322 | 15.7 |
| 1.41 - 1.50 | 11 | 221,506,768 | 22.1 |
| 1.51 - 1.60 | 3 | 14,872,352 | 1.5 |
| 1.61 - 1.70 | 10 | 85,819,155 | 8.6 |
| 1.71 - 1.80 | 8 | 206,587,656 | 20.6 |
| 1.81 - 1.90 | 6 | 11,667,000 | 1.2 |
| 1.91 - 2.00 | 2 | 94,422,772 | 9.4 |
| 2.01 - 2.25 | 8 | 93,145,000 | 9.3 |
| 2.26 - 2.75 | 1 | 5,100,000 | 0.5 |
| 2.76 - 3.28 | 1 | 4,600,000 | 0.5 |
| Total: | 71 | $1,002,201,025 | 100.0% |
| Weighted Average: | 1.64x | ||
| LOAN PURPOSE | |||
| Loan Purpose | Number of Mortgage Loans | Aggregate Cut- off Date Balance | % of Initial Pool Balance |
| Refinance | 55 | $751,908,253 | 75.0% |
| Acquisition | 16 | 250,292,772 | 25.0 |
| Total: | 71 | $1,002,201,025 | 100.0% |
| MORTGAGE RATE | |||
| Range of Mortgage Rates (%) | Number of Mortgage Loans | Aggregate Cut- off Date Balance | % of Initial Pool Balance |
| 4.220 - 4.250 | 1 | $5,100,000 | 0.5% |
| 4.251 - 4.500 | 8 | 164,075,000 | 16.4 |
| 4.501 - 4.750 | 24 | 291,935,772 | 29.1 |
| 4.751 - 5.000 | 25 | 409,231,764 | 40.8 |
| 5.001 - 5.250 | 9 | 111,905,368 | 11.2 |
| 5.251 - 5.470 | 4 | 19,953,121 | 2.0 |
| Total: | 71 | $1,002,201,025 | 100.0% |
| Weighted Average: | 4.763% | ||
| UNDERWRITTEN NOI DEBT YIELD | |||
| Range of U/W NOI Debt Yields (%) | Number of Mortgage Loans | Aggregate Cut- off Date Balance | % of Initial Pool Balance |
| 7.2 - 8.0 | 2 | $81,000,000 | 8.1% |
| 8.1 - 9.0 | 16 | 260,567,322 | 26.0 |
| 9.1 - 10.0 | 24 | 223,551,768 | 22.3 |
| 10.1 - 11.0 | 13 | 106,394,035 | 10.6 |
| 11.1 - 12.0 | 3 | 97,080,983 | 9.7 |
| 12.1 - 13.0 | 4 | 82,831,493 | 8.3 |
| 13.1 - 14.0 | 5 | 102,475,424 | 10.2 |
| 14.1 - 15.0 | 2 | 38,600,000 | 3.9 |
| 15.1 - 17.0 | 1 | 4,600,000 | 0.5 |
| 17.1 - 17.4 | 1 | 5,100,000 | 0.5 |
| Total: | 71 | $1,002,201,025 | 100.0% |
| Weighted Average: | 10.2% | ||
| UNDERWRITTEN NCF DEBT YIELD | |||
| Range of U/W NCF Debt Yields (%) | Number of Mortgage Loans | Aggregate Cut- off Date Balance | % of Initial Pool Balance |
| 7.1 - 8.0 | 6 | $206,020,000 | 20.6% |
| 8.1 - 9.0 | 26 | 312,877,090 | 31.2 |
| 9.1 - 10.0 | 16 | 96,247,000 | 9.6 |
| 10.1 - 11.0 | 11 | 191,376,536 | 19.1 |
| 11.1 - 12.0 | 5 | 51,582,627 | 5.1 |
| 12.1 - 13.0 | 4 | 120,397,772 | 12.0 |
| 13.1 - 14.0 | 1 | 14,000,000 | 1.4 |
| 14.1 - 15.0 | 1 | 4,600,000 | 0.5 |
| 15.1 - 15.9 | 1 | 5,100,000 | 0.5 |
| Total: | 71 | $1,002,201,025 | 100.0% |
| Weighted Average: | 9.6% | ||
| (1) | Information regarding mortgage loans that are cross-collateralized or cross-defaulted with other mortgage loans is based upon the individual loan balances, except that the applicable loan-to-value ratio, debt service coverage ratio and debt yield for each such mortgage loan is based upon the ratio or yield (as applicable) for the aggregate indebtedness evidenced by all loans in the group. On an individual basis, without regard to the cross-collateralization feature, any mortgage loan that is part of a cross-collateralized group of mortgage loans may have a higher loan-to-value ratio, lower debt service coverage ratio and/or lower debt yield than is presented herein. With respect to the Empire Mall mortgage loan, the Harbor Pointe Apartments mortgage loan, the Heritage Industrial Portfolio mortgage loan, the Anchorage Marriott Downtown mortgage loan, the Harvey Building Products Portfolio mortgage loan and the JW Marriott Santa Monica Le Merigot mortgage loan, each of which is part of apari passu whole loan, loan-to-value ratio, debt service coverage ratio and debt yield calculations include the relatedpari passu companion loan(s) (unless otherwise stated). With respect to each mortgage loan, debt service coverage ratio, debt yield and loan-to-value ratio information do not take into account any subordinate debt (whether or not secured by the related mortgaged property), that currently exists or is allowed under the terms of such mortgage loan. See Annex A-1 to the Preliminary Prospectus. Prepayment provisions for each mortgage loan reflects the entire life of the loan (from origination to maturity or ARD). |
THE INFORMATION IN THIS STRUCTURAL AND COLLATERAL TERM SHEET IS NOT COMPLETE AND MAY BE AMENDED PRIOR TO THE TIME OF SALE. THIS TERM SHEET IS NOT AN OFFER TO SELL THESE SECURITIES AND IT IS NOT A SOLICITATION OF AN OFFER TO BUY THESE SECURITIES IN ANY JURISDICTION WHERE THE OFFER OR SALE IS NOT PERMITTED.
| 16 |
| Wells Fargo Commercial Mortgage Trust 2015-P2 | Characteristics of the Mortgage Pool |
| ORIGINAL TERM TO MATURITY OR ARD | ||||
| Original Terms to Maturity or ARD (months) | Number of Mortgage Loans | Aggregate Cut- off Date Balance | % of Initial Pool Balance | |
| 60 | 4 | $155,031,828 | 15.5% | |
| 120 | 67 | 847,169,197 | 84.5 | |
| Total: | 71 | $1,002,201,025 | 100.0% | |
| Weighted Average: | 111 months | |||
| REMAINING TERM TO MATURITY OR ARD | ||||
| Range of Remaining Terms to Maturity or ARD (months) | Number of Mortgage Loans | Aggregate Cut- off Date Balance | % of Initial Pool Balance | |
| 58 - 60 | 4 | $155,031,828 | 15.5% | |
| 102 - 120 | 67 | 847,169,197 | 84.5 | |
| Total: | 71 | $1,002,201,025 | 100.0% | |
| Weighted Average: | 110 months | |||
| ORIGINAL AMORTIZATION TERM(2) | ||||
| Original Amortization Terms (months) | Number of Mortgage Loans | Aggregate Cut- off Date Balance | % of Initial Pool Balance | |
| Non-Amortizing | 19 | $284,852,000 | 28.4% | |
| 300 | 2 | 12,479,736 | 1.2 | |
| 360 | 50 | 704,869,289 | 70.3 | |
| Total: | 71 | $1,002,201,025 | 100.0% | |
| Weighted Average(3): | 359 months | |||
(2) The original amortization term shown for any mortgage loan that is interest-only for part of its term does not include the number of months in its interest-only period and reflects only the number of months as of the commencement of amortization remaining from the end of such interest-only period. (3) Excludes the non-amortizing mortgage loans.
| ||||
| REMAINING AMORTIZATION TERM(4) | ||||
| Range of Remaining Amortization Terms (months) | Number of Mortgage Loans | Aggregate Cut- off Date Balance | % of Initial Pool Balance | |
| Non-Amortizing | 19 | $284,852,000 | 28.4% | |
| 299 | 2 | 12,479,736 | 1.2 | |
| 342 - 360 | 50 | 704,869,289 | 70.3 | |
| Total: | 71 | $1,002,201,025 | 100.0% | |
| Weighted Average(5): | 359 months | |||
(4) The remaining amortization term shown for any mortgage loan that is interest-only for part of its term does not include the number of months in its interest-only period and reflects only the number of months as of the commencement of amortization remaining from the end of such interest-only period. (5) Excludes the non-amortizing mortgage loans.
| ||||
| LOCKBOXES | ||||
| Type of Lockbox | Number of Mortgage Loans | Aggregate Cut- off Date Balance | % of Initial Pool Balance | |
| Springing | 33 | $419,448,106 | 41.9% | |
| Hard/Springing Cash Management | 12 | 308,103,006 | 30.7 | |
| Soft/Upfront Cash Management | 1 | 88,000,000 | 8.8 | |
| Hard/Upfront Cash Management | 9 | 79,617,076 | 7.9 | |
| None | 15 | 77,032,837 | 7.7 | |
| Soft/Springing Cash Management | 1 | 30,000,000 | 3.0 | |
| Total: | 71 | $1,002,201,025 | 100.0% | |
| PREPAYMENT PROVISION SUMMARY | ||||
| Prepayment Provision | Number of Mortgage Loans | Aggregate Cut- off Date Balance | % of Initial Pool Balance | |
| Lockout / Def / Open | 52 | $815,081,722 | 81.3% | |
| Lockout / GRTR 1% or YM / Open | 6 | 87,625,000 | 8.7 | |
| Lockout / GRTR 1% or YM or Def / Open | 5 | 52,800,000 | 5.3 | |
| Lockout / GRTR 1% or YM / GRTR 1% or YM or Def / Open | 1 | 31,162,303 | 3.1 | |
| YM / YM or Def / Open | 7 | 15,532,000 | 1.5 | |
| Total: | 71 | $1,002,201,025 | 100.0% | |
| CUT-OFF DATE LOAN-TO-VALUE RATIO | ||||
| Range of Cut-off Date LTV Ratios (%) | Number of Mortgage Loans | Aggregate Cut- off Date Balance | % of Initial Pool Balance | |
| 42.4 - 45.0 | 1 | $14,000,000 | 1.4% | |
| 45.1 - 50.0 | 3 | 11,075,000 | 1.1 | |
| 50.1 - 55.0 | 8 | 175,713,360 | 17.5 | |
| 55.1 - 60.0 | 12 | 202,622,348 | 20.2 | |
| 60.1 - 65.0 | 20 | 261,792,358 | 26.1 | |
| 65.1 - 70.0 | 13 | 142,994,739 | 14.3 | |
| 70.1 - 75.0 | 12 | 170,303,220 | 17.0 | |
| 75.1 - 75.5 | 2 | 23,700,000 | 2.4 | |
| Total: | 71 | $1,002,201,025 | 100.0% | |
| Weighted Average: | 62.8% | |||
| BALLOON OR ARD LOAN-TO-VALUE RATIO | |||
| Range of Balloon or ARD LTV Ratios (%) | Number of Mortgage Loans | Aggregate Cut- off Date Balance | % of Initial Pool Balance |
| 38.8 - 40.0 | 2 | $15,375,000 | 1.5% |
| 40.1 - 45.0 | 4 | 21,635,203 | 2.2 |
| 45.1 - 50.0 | 6 | 131,099,817 | 13.1 |
| 50.1 - 55.0 | 17 | 249,570,263 | 24.9 |
| 55.1 - 60.0 | 16 | 214,535,523 | 21.4 |
| 60.1 - 65.0 | 19 | 267,332,220 | 26.7 |
| 65.1 - 70.0 | 6 | 52,653,000 | 5.3 |
| 70.1 - 71.0 | 1 | 50,000,000 | 5.0 |
| Total: | 71 | $1,002,201,025 | 100.0% |
| Weighted Average: | 56.8% | ||
| AMORTIZATION TYPE | |||||
| Type of Amortization | Number of Mortgage Loans | Aggregate Cut- off Date Balance | % of Initial Pool Balance | ||
| Interest-only, Amortizing Balloon | 27 | $481,288,000 | 48.0% | ||
| Interest-only, Balloon | 12 | 269,320,000 | 26.9 | ||
| Amortizing Balloon | 25 | 236,061,025 | 23.6 | ||
| Interest-only, ARD | 7 | 15,532,000 | 1.5 | ||
| Total: | 71 | $1,002,201,025 | 100.0% | ||
ORIGINAL TERM OF INTEREST-ONLY PERIOD FOR PARTIAL IO LOANS | |||||
| IO Term (months) | Number of Mortgage Loans | Aggregate Cut- off Date Balance | % of Initial Pool Balance | ||
| 24 | 6 | $113,225,000 | 11.3% | ||
| 36 | 10 | 184,975,000 | 18.5 | ||
| 48 | 2 | 19,088,000 | 1.9 | ||
| 60 | 8 | 156,650,000 | 15.6 | ||
| 84 | 1 | 7,350,000 | 0.7 | ||
| Total: | 27 | $481,288,000 | 48.0% | ||
| Weighted Average: | 42 months | ||||
SEASONING | |||||
| Seasoning (months) | Number of Mortgage Loans | Aggregate Cut- off Date Balance | % of Initial Pool Balance | ||
| 0 | 28 | $467,867,500 | 46.7% | ||
| 1 | 33 | 313,929,770 | 31.3 | ||
| 2 | 3 | 70,422,772 | 7.0 | ||
| 3 | 5 | 105,900,000 | 10.6 | ||
| 4 | 1 | 41,000,000 | 4.1 | ||
| 18 | 1 | 3,080,983 | 0.3 | ||
| Total: | 71 | $1,002,201,025 | 100.0% | ||
| Weighted Average: | 1 month | ||||
THE INFORMATION IN THIS STRUCTURAL AND COLLATERAL TERM SHEET IS NOT COMPLETE AND MAY BE AMENDED PRIOR TO THE TIME OF SALE. THIS TERM SHEET IS NOT AN OFFER TO SELL THESE SECURITIES AND IT IS NOT A SOLICITATION OF AN OFFER TO BUY THESE SECURITIES IN ANY JURISDICTION WHERE THE OFFER OR SALE IS NOT PERMITTED.
| 17 |
| Wells Fargo Commercial Mortgage Trust 2015-P2 | Certain Terms and Conditions |
V. Certain Terms and Conditions
| Interest Entitlements: | The interest entitlement of each Class of Offered Certificates on each Distribution Date generally will be the interest accrued during the related Interest Accrual Period on the related Certificate Principal Balance or Notional Amount at the related pass-through rate, net of any prepayment interest shortfalls allocated to that Class for such Distribution Date as described below. If prepayment interest shortfalls arise from voluntary prepayments (without Master Servicer consent) on particular non-specially serviced mortgage loans during any collection period, the Master Servicer is required to make a compensating interest payment to offset those shortfalls, generally up to an amount equal to the portion of its master servicing fees that accrue at 0.25 basis pointsper annum. The remaining amount of prepayment interest shortfalls will be allocated to reduce the interest entitlement on all Classes of Certificates,pro rata, based on their respective amounts of accrued interest for the related Distribution Date. If a Class receives less than the entirety of its interest entitlement on any Distribution Date, then the shortfall, excluding any shortfall due to prepayment interest shortfalls, will be added to its interest entitlement for the next succeeding Distribution Date. | |||
| Principal Distribution Amount: | The Principal Distribution Amount for each Distribution Date generally will be the aggregate amount of principal received or advanced in respect of the mortgage loans, net of any non-recoverable advances and interest thereon that are reimbursed to the Master Servicer, the Special Servicer or the Trustee during the related collection period. Non-recoverable advances and interest thereon are reimbursable from principal collections and advances before reimbursement from other amounts. | |||
| Distributions: | On each Distribution Date, funds available for distribution from the mortgage loans, net of specified trust fees, expenses and reimbursements will generally be distributed in the following amounts and order of priority (in each case to the extent of remaining available funds): | |||
| 1. | Class A-1, A-2A, A-2B, A-3, A-4, A-SB, X-A, X-B and X-D Certificates: To interest on the Class A-1, A-2A, A-2B, A-3, A-4, A-SB, X-A, X-B and X-D Certificates,pro rata, according to their respective interest entitlements. | |||
| 2. | Class A-1, A-2A, A-2B, A-3, A-4 and A-SB Certificates: To principal on the Class A-1, A-2A, A-2B, A-3, A-4 and A-SB Certificates in the following amounts and order of priority: (i) first, to principal on the Class A-SB Certificates, in an amount up to the Principal Distribution Amount for such Distribution Date until their Certificate Principal Balance is reduced to the Class A-SB Planned Principal Balance for such Distribution Date; (ii) second, to principal on the Class A-1 Certificates until their Certificate Principal Balance is reduced to zero, up to the remainder of the Principal Distribution Amount for such Distribution Date; (iii) third, to principal on the Class A-2A Certificates until their Certificate Principal Balance is reduced to zero, up to the remainder of the Principal Distribution Amount for such Distribution Date; (iv) fourth, to principal on the Class A-2B Certificates until their Certificate Principal Balance is reduced to zero, up to the remainder of the Principal Distribution Amount for such Distribution Date; (v) fifth, to principal on the Class A-3 Certificates until their Certificate Principal Balance is reduced to zero, up to the remainder of the Principal Distribution Amount for such Distribution Date; (vi) sixth, to principal on the Class A-4 Certificates until their Certificate Principal Balance is reduced to zero, up to the remainder of the Principal Distribution Amount for such Distribution Date; and (vii) seventh, to principal on the Class A-SB Certificates until their Certificate Principal Balance is reduced to zero, up to the remainder of the Principal Distribution Amount for such Distribution Date. However, if the Certificate Principal Balance of each and every Class of Principal Balance Certificates, other than the Class A-1, A-2A, A-2B, A-3, A-4 and A-SB Certificates, has been reduced to zero as a result of the allocation of Mortgage Loan losses and expenses and any of the Class A-1, A-2A, A-2B, A-3, A-4 and A-SB Certificates remains outstanding, then the Principal Distribution Amount will be distributed to the Class A-1, A-2A, A-2B, A-3, A-4 and A-SB Certificates,pro rata, based on their respective outstanding Certificate Principal Balances, until their Certificate Principal Balances have been reduced to zero. | |||
| 3. | Class A-1, A-2A, A-2B, A-3, A-4 and A-SB Certificates: To reimburse the holders of the Class A-1, A-2A, A-2B, A-3, A-4 and A-SB Certificates,pro rata, for any previously unreimbursed losses (plus interest thereon) on the mortgage loans that were previously allocated in reduction of the Certificate Principal Balances of such Classes. | |||
THE INFORMATION IN THIS STRUCTURAL AND COLLATERAL TERM SHEET IS NOT COMPLETE AND MAY BE AMENDED PRIOR TO THE TIME OF SALE. THIS TERM SHEET IS NOT AN OFFER TO SELL THESE SECURITIES AND IT IS NOT A SOLICITATION OF AN OFFER TO BUY THESE SECURITIES IN ANY JURISDICTION WHERE THE OFFER OR SALE IS NOT PERMITTED.
| 18 |
| Wells Fargo Commercial Mortgage Trust 2015-P2 | Certain Terms and Conditions |
| 4. | Class A-S Certificates: To make distributions on the Class A-S Certificates as follows: (a) first, to interest on the Class A-S Certificates in the amount of the interest entitlement for that Class; (b) next, to the extent of the portion of the Principal Distribution Amount remaining after distributions in respect of principal to each Class with a higher distribution priority (in this case, the Class A-1, A-2A, A-2B, A-3, A-4 and A-SB Certificates), to principal on the Class A-S Certificates until their Certificate Principal Balance is reduced to zero; and (c) next, to reimburse the holders of the Class A-S Certificates for any previously unreimbursed losses (plus interest thereon) on the mortgage loans that were previously allocated to that Class in reduction of their Certificate Principal Balance. | |||
| 5. | Class B Certificates: To make distributions on the Class B Certificates as follows: (a) first, to interest on the Class B Certificates in the amount of the interest entitlement for that Class; (b) next, to the extent of the portion of the Principal Distribution Amount remaining after distributions in respect of principal to each Class with a higher distribution priority (in this case, the Class A-1, A-2A, A-2B, A-3, A-4, A-SB and A-S Certificates), to principal on the Class B Certificates until their Certificate Principal Balance is reduced to zero; and (c) next, to reimburse the holders of the Class B Certificates for any previously unreimbursed losses (plus interest thereon) on the mortgage loans that were previously allocated to that Class in reduction of their Certificate Principal Balance. | |||
| 6. | Class C Certificates: To make distributions on the Class C Certificates as follows: (a) first, to interest on the Class C Certificates in the amount of the interest entitlement for that Class; (b) next, to the extent of the portion of the Principal Distribution Amount remaining after distributions in respect of principal to each Class with a higher distribution priority (in this case, the Class A-1, A-2A, A-2B, A-3, A-4, A-SB, A-S and B Certificates), to principal on the Class C Certificates until their Certificate Principal Balance is reduced to zero; and (c) next, to reimburse the holders of the Class C Certificates for any previously unreimbursed losses (plus interest thereon) on the mortgage loans that were previously allocated to that Class in reduction of their Certificate Principal Balance. | |||
| 7. | After the Class A-1, A-2A, A-2B, A-3, A-4, A-SB, A-S, B and C Certificates are paid all amounts to which they are entitled, the remaining funds available for distribution will be used to pay interest, principal and loss reimbursement amounts on the Class D, E, F and G Certificates sequentially in that order in a manner analogous to the Class C Certificates. | |||
| Allocation of Yield Maintenance and Prepayment Premiums: | If any yield maintenance charge or prepayment premium is collected during any particular collection period with respect to any mortgage loan, then on the Distribution Date corresponding to that collection period, the certificate administrator will pay that yield maintenance charge or prepayment premium (net of liquidation fees payable therefrom) in the following manner: (1) to each of the Class A-1, A-2A, A-2B, A-3, A-4, A-SB, A-S, B, C and D Certificates, the product of (a) such yield maintenance charge or prepayment premium, (b) the related Base Interest Fraction (as defined in the Preliminary Prospectus) for such Class, and (c) a fraction, the numerator of which is equal to the amount of principal distributed to such Class for that distribution date, and the denominator of which is the total amount of principal distributed to all Principal Balance Certificates for that distribution date, and (2) to the Class X-A Certificates, the excess, if any, of (a) the product of (i) such yield maintenance charge or prepayment premium and (ii) a fraction, the numerator of which is equal to the amount of principal distributed to the Class A-1, A-2A, A-2B, A-3, A-4, A-SB and A-S Certificates for that distribution date, and the denominator of which is the total amount of principal distributed to all Principal Balance Certificates for that distribution date, over (b) the amount of such yield maintenance charge or prepayment premium distributed to the Class A-1, A-2A, A-2B, A-3, A-4, A-SB and A-S Certificates as described above, and (3) to the Class X-B Certificates, any remaining yield maintenance charge or prepayment premium not distributed as described above. No prepayment premiums or yield maintenance charges will be distributed to the holders of the Class X-D, E, F, G, V or R Certificates. For a description of when prepayment premiums and yield maintenance charges are generally required on the mortgage loans, see Annex A-1 to the Preliminary Prospectus. See also “Risk Factors—Risks Relating to the Mortgage Loans— Risks Relating to Enforceability of Yield Maintenance Charges, Prepayment Premiums or Defeasance Provisions” and “Risk Factors—Other Risks Relating to the Certificates—Your Yield May Be Affected by Defaults, Prepayments and Other Factors” in the Preliminary Prospectus. Prepayment premiums and yield maintenance charges will be distributed on each Distribution Date only to the extent they are actually received on the mortgage loans as of the related Determination Date. | |||
THE INFORMATION IN THIS STRUCTURAL AND COLLATERAL TERM SHEET IS NOT COMPLETE AND MAY BE AMENDED PRIOR TO THE TIME OF SALE. THIS TERM SHEET IS NOT AN OFFER TO SELL THESE SECURITIES AND IT IS NOT A SOLICITATION OF AN OFFER TO BUY THESE SECURITIES IN ANY JURISDICTION WHERE THE OFFER OR SALE IS NOT PERMITTED.
| 19 |
| Wells Fargo Commercial Mortgage Trust 2015-P2 | Certain Terms and Conditions |
| Realized Losses: | The Certificate Principal Balances of the Class A-1, A-2A, A-2B, A-3, A-4, A-SB, A-S, B, C, D, E, F, and G Certificates, will be reduced without distribution on any Distribution Date as a write-off to the extent of any losses realized on the mortgage loans allocated to such Class on such Distribution Date. Such losses will be applied in the following order, in each case until the related Certificate Principal Balance is reduced to zero: first, to the Class G Certificates; second, to the Class F Certificates; third, to the Class E Certificates; fourth, to the Class D Certificates; fifth, to the Class C Certificates; sixth, to Class B Certificates; seventh, to Class A-S Certificates; and, finally,pro rata, to the Class A-1, A-2A, A-2B, A-3, A-4 and A-SB Certificates based on their outstanding Certificate Principal Balances.
The notional amount of the Class X-A Certificates will be reduced by the amount of all losses that are allocated to the Class A-1, A-2A, A-2B, A-3, A-4, A-SB or A-S Certificates as write-offs in reduction of their Certificate Principal Balances. The notional amount of the Class X-B Certificates will be reduced by the amount of all losses that are allocated to the Class B Certificates as write-offs in reduction of its Certificate Principal Balance. The notional amount of the Class X-D Certificates will be reduced by the amount of all losses that are allocated to the Class D Certificates as write-offs in reduction of its Certificate Principal Balance. | |||
| P&I Advances: | The Master Servicer or, if the Master Servicer fails to do so, the Trustee, will be obligated to advance delinquent debt service payments (other than balloon payments, excess interest and default interest) and assumed debt service payments on mortgage loans with delinquent balloon payments (including each of the Non-Serviced Mortgage Loans(as defined in the Preliminary Prospectus) but not the related companion loans), except to the extent any such advance is deemed non-recoverable from collections on the related mortgage loan. In addition, if an Appraisal Reduction Amount exists for a given mortgage loan, the interest portion of any P&I advance for such mortgage loan will be reduced, which will have the effect of reducing the amount of interest available for distribution to the Certificates in reverse alphabetical order of their Class designations (except that interest payments on the Class A-1, A-2A, A-2B, A-3, A-4, A-SB, X-A, X-B and X-D Certificates would be affected on apari passu basis). | |||
| Servicing Advances: | The Master Servicer or, if the Master Servicer fails to do so, the Trustee, will be obligated to make servicing advances with respect to each mortgage loan it services, including the payment of delinquent property taxes, insurance premiums and ground rent, except to the extent that those advances are deemed non-recoverable from collections on the related mortgage loan. The special servicer will have no obligation to make servicing advances but may do so in an emergency situation. Prior to the securitization of the Empire Mall controllingpari passu companion loan (designated as Note A-1), the Master Servicer is expected to have the primary obligation to make any servicing advances with respect to the Empire Mall whole loan. After the securitization of the Empire Mall controllingpari passu companion loan, the master servicer under such related securitization will have the primary obligation to make any servicing advances with respect to the Empire Mall whole loan. The master servicer under the CGCMT 2015-GC35 securitization will have the primary obligation to make any servicing advances with respect to the Harbor Pointe Apartments whole loan, the Anchorage Marriott Downtown whole loan and the JW Marriott Santa Monica Le Merigot whole loan. The master servicer under the COMM 2015-LC23 securitization will have the primary obligation to make any servicing advances with respect to the Harvey Building Products Portfolio whole loan. | |||
| Appraisal Reduction Amounts: | An Appraisal Reduction Amount generally will be created in the amount, if any, by which the principal balance of a required appraisal loan (which is a mortgage loan with respect to which certain defaults, modifications or insolvency events have occurred as further described in the Preliminary Prospectus) plus other amounts overdue or advanced in connection with such mortgage loan exceeds 90% of the appraised value of the related mortgaged property plus certain escrows and reserves (including letters of credit) held with respect to the mortgage loan.
A mortgage loan will cease to be a required appraisal loan when the same has ceased to be a specially serviced mortgage loan (if applicable), has been brought current for at least three consecutive months and no other circumstances exist that would cause such mortgage loan to be a required appraisal loan.
Appraisal Reduction Amounts will affect the amount of debt service advances in respect of the related mortgage loan. Appraisal Reduction Amounts will also be taken into account in the determination of the identity of the Class whose majority constitutes the “majority controlling certificateholder” and is entitled to appoint the directing certificateholder.
| |||
THE INFORMATION IN THIS STRUCTURAL AND COLLATERAL TERM SHEET IS NOT COMPLETE AND MAY BE AMENDED PRIOR TO THE TIME OF SALE. THIS TERM SHEET IS NOT AN OFFER TO SELL THESE SECURITIES AND IT IS NOT A SOLICITATION OF AN OFFER TO BUY THESE SECURITIES IN ANY JURISDICTION WHERE THE OFFER OR SALE IS NOT PERMITTED.
| 20 |
| Wells Fargo Commercial Mortgage Trust 2015-P2 | Certain Terms and Conditions |
| Clean-Up Call and Exchange Termination: | On each Distribution Date occurring after the aggregate unpaid principal balance of the mortgage loans is reduced below 1% of the initial aggregate principal balance of the mortgage loans as of the Cut-off Date, certain specified persons will have the option to purchase all of the remaining mortgage loans (and the trust’s interest in all property acquired through exercise of remedies in respect of any mortgage loan) at the price specified in the Preliminary Prospectus. Exercise of the option will terminate the trust and retire the then-outstanding certificates.
If the aggregate Certificate Principal Balances of each of the Class A-1, A-2A, A-2B, A-3, A-4, A-SB, A-S, B, C and D Certificates have been reduced to zero, the trust may also be terminated in connection with an exchange of all the then-outstanding certificates for the mortgage loans and REO properties then remaining in the issuing entity, but all of the holders of those Classes of outstanding certificates would have to voluntarily participate in the exchange. | |||
| Liquidation Loan Waterfall: | Following the liquidation of any loan or property, the net liquidation proceeds generally will be applied (after reimbursement of advances and certain trust fund expenses), first, as a recovery of accrued interest, other than delinquent interest that was not advanced as a result of Appraisal Reduction Amounts, second, as a recovery of principal until all principal has been recovered, and then as a recovery of delinquent interest that was not advanced as a result of Appraisal Reduction Amounts. Please see “Description of the Certificates—Distributions—Application Priority of Mortgage Loan Collections or Whole Loan Collections” in the Preliminary Prospectus. | |||
| Majority Controlling Class Certificateholder and Directing Certificateholder: | A directing certificateholder may be appointed by the “majority controlling class certificate-holder”, which will be the holder(s) of a majority of the “controlling class”, which means: (a) before a Control Termination Event, the most subordinate class among the Class E, F and G Certificates that has a Certificate Principal Balance, as notionally reduced by any Appraisal Reduction Amounts allocable to that class, that is at least equal to 25% of its total initial Certificate Principal Balance and (b) before a Consultation Termination Event, the most subordinate class among the Class E, F and G Certificates that has a total Certificate Principal Balance, without regard to Appraisal Reduction Amounts, that is at least equal to 25% of its initial Certificate Principal Balance. The majority controlling certificateholder will have a continuing right to appoint, remove or replace the directing certificateholder in its sole discretion. This right may be exercised at any time and from time to time. See “The Pooling and Servicing Agreement—The Directing Certificateholder” in the Preliminary Prospectus.
A “Control Termination Event” occurs if the Class E Certificates have a Certificate Principal Balance, net of any Appraisal Reduction Amounts allocable to that Class, that is less than 25% of the initial principal balance of that Class or, while the Class E Certificates are the controlling Class, the majority (by Certificate Principal Balance) of the holders of the Class E Certificates irrevocably waived its right, in writing, to exercise any of the rights of the Controlling Class Certificateholder and such rights have not been reinstated to a successor Controlling Class Certificateholder.
A “Consultation Termination Event” occurs if the Class E Certificates have a Certificate Balance, without regard to any Appraisal Reduction Amounts allocable to that Class, that is less than 25% of the initial Certificate Principal Balance of that Class or, while the Class E Certificates are the controlling Class, the majority (by Certificate Principal Balance) of the holders of the Class E Certificates irrevocably waived its right, in writing, to exercise any of the rights of the Controlling Class Certificateholder and such rights have not been reinstated to a successor Controlling Class Certificateholder. | |||
| Control and Consultation: | The rights of various parties to replace the Special Servicer and approve or consult with respect to major actions of the Special Servicer will vary according to defined periods.
If no Control Termination Event has occurred and is continuing, except with respect to the Non-Serviced Mortgage Loans and Excluded Loans (as defined below), (i) the directing certificateholder will be entitled to grant or withhold approval of asset status reports prepared, and material servicing actions proposed, by the Special Servicer, and (ii) the directing certificateholder will be entitled to terminate and replace the Special Servicer with or without cause, and appoint itself or another person as the successor special servicer. It will be a condition to such appointment that Fitch, KBRA and Moody’s confirm that the appointment would not result in a qualification, downgrade or withdrawal of any of their then-current ratings of certificates.
If a Control Termination Event has occurred and is continuing but no Consultation Termination Event has occurred and is continuing, the Special Servicer will be required to consult with the directing certificateholder (other than with respect to Excluded Loans) and the Operating Advisor in connection with asset status reports and material special servicing actions (other than with respect to the Non-Serviced Mortgage Loans). | |||
THE INFORMATION IN THIS STRUCTURAL AND COLLATERAL TERM SHEET IS NOT COMPLETE AND MAY BE AMENDED PRIOR TO THE TIME OF SALE. THIS TERM SHEET IS NOT AN OFFER TO SELL THESE SECURITIES AND IT IS NOT A SOLICITATION OF AN OFFER TO BUY THESE SECURITIES IN ANY JURISDICTION WHERE THE OFFER OR SALE IS NOT PERMITTED.
| 21 |
| Wells Fargo Commercial Mortgage Trust 2015-P2 | Certain Terms and Conditions |
If a Consultation Termination Event has occurred and is continuing, the Special Servicer must seek to consult with the Operating Advisor in connection with asset status reports and material special servicing actions (other than with respect to the Non-Serviced Mortgage Loans), and, in general, no directing certificateholder will be recognized or have any right to terminate the Special Servicer or approve, direct or consult with respect to servicing matters.
With respect to the Heritage Industrial Portfolio mortgage loan, the rights of the directing certificateholder described above will be subject to the consultation rights of the holder of the relatedpari passu companion loans as described below.
Notwithstanding any contrary description set forth above, with respect to the Empire Mall mortgage loan, in general the related whole loan will be serviced (i) prior to the securitization of the related controllingpari passu companion loan, under the WFCM 2015-P2 pooling and servicing agreement and, with respect to the Empire Mall whole loan, the holder of the Empire Mall controllingpari passu companion loan will have the control and consultation rights provided to the directing certificateholder described above and (ii) after the securitization of the related controllingpari passu companion loan, under the pooling and servicing agreement related to that securitization, of which is expected to grant to the related directing certificateholder control rights that include the right to approve or disapprove various material servicing actions involving the related whole loan but the directing certificateholder for this securitization will nonetheless have the right to be consulted on a non-binding basis with respect to such actions. For purposes of the servicing of the Empire Mall whole loan, the occurrence and continuance of a Control Termination Event or Consultation Termination Event under this securitization will not limit the control or other rights of the holder of the Empire Mall controllingpari passu companion loan or the directing certificateholder designated under the securitization of the related controllingpari passu companion loan.
Also, notwithstanding any contrary description set forth above, with respect to the Harbor Pointe Apartments mortgage loan, the Anchorage Marriott Downtown mortgage loan and the JW Marriott Santa Monica Le Merigot mortgage loan, in general the related whole loan will be serviced under the CGCMT 2015-GC35 pooling and servicing agreement, which grants the related directing certificateholder control rights that may include the right to approve or disapprove various material servicing actions involving the related whole loan but the directing certificateholder for this securitization will nonetheless have the right to be consulted on a non-binding basis with respect to such actions. For purposes of the servicing of the Harbor Pointe Apartments whole loan, the Anchorage Marriott Downtown whole loan and the JW Marriott Santa Monica Le Merigot whole loan, the occurrence and continuance of a Control Termination Event or Consultation Termination Event under this securitization will not limit the control or other rights of the directing certificateholder under the CGCMT 2015-GC35 securitization.
Also, notwithstanding any contrary description set forth above, with respect to the Heritage Industrial Portfolio mortgage loan, the holder of thepari passu companion loan in the related whole loan (or its representative, including any directing certificateholder under any securitization of suchpari passu companion loan) will have consultation rights with respect to asset status reports and material special servicing actions involving the related whole loan, as provided for in the related intercreditor agreement and as described in the Preliminary Prospectus, and those rights will be in addition to the rights of the directing certificateholder in this transaction described above.
Also, notwithstanding any contrary description set forth above, with respect to the Harvey Building Products Portfolio mortgage loan, in general the related whole loan will be serviced under the COMM 2015-LC23 pooling and servicing agreement which grants the related directing certificateholder control rights that include the right to approve or disapprove various material servicing actions involving the related whole loan but the directing certificateholder for this securitization will nonetheless have the right to be consulted on a non-binding basis with respect to such actions. For purposes of the servicing of the Harvey Building Products Portfolio whole loan, the occurrence and continuance of a Control Termination Event or Consultation Termination Event under this securitization will not limit the control or other rights of the directing certificateholder under the COMM 2015-LC23.
In general, whole loan control rights also include the right, in certain circumstances, to direct the replacement of the special servicer for the related whole loan only.
Notwithstanding any contrary description set forth above, in the event that, with respect to any mortgage loan, the majority controlling class certificateholder or the directing certificateholder is (i) a borrower, a mortgagor or a manager of a mortgaged property or any affiliate thereof, (ii) any person that owns, directly or indirectly, 25% or more of a borrower, mortgagor or manager of a mortgaged property, (iii) any person that owns, directly or indirectly, 25% or more of the beneficial interests in any mezzanine lender of any mezzanine loan related to a mortgage loan that has accelerated such mezzanine loan or commenced foreclosure proceedings as set forth in clause (iv) or (iv) a mezzanine lender (or any affiliate thereof) of any mezzanine loan related to a Mortgage |
THE INFORMATION IN THIS STRUCTURAL AND COLLATERAL TERM SHEET IS NOT COMPLETE AND MAY BE AMENDED PRIOR TO THE TIME OF SALE. THIS TERM SHEET IS NOT AN OFFER TO SELL THESE SECURITIES AND IT IS NOT A SOLICITATION OF AN OFFER TO BUY THESE SECURITIES IN ANY JURISDICTION WHERE THE OFFER OR SALE IS NOT PERMITTED.
| 22 |
| Wells Fargo Commercial Mortgage Trust 2015-P2 | Certain Terms and Conditions |
| Loan that has accelerated such mezzanine loan (unless (a) acceleration was automatic under such mezzanine loan, (b) the event directly giving rise to the automatic acceleration under such mezzanine loan was not initiated by such mezzanine lender or an affiliate of such mezzanine lender and (c) such mezzanine lender is stayed from exercising and has not commenced the exercise of remedies associated with foreclosure of the equity collateral under such mezzanine loan) or commenced foreclosure proceedings with respect to such mezzanine loan against the equity interests in the borrower(s) of such mortgage loan (each, a “borrower party”), the majority controlling class certificateholder and the directing certificateholder will have no right to receive asset status reports or such other information as may be specified in the pooling and servicing agreement, to grant or withhold approval of, or consult with respect to, asset status reports prepared, and material servicing actions proposed, by the Special Servicer, with respect to such mortgage loan, and such mortgage loan will be referred to as an “Excluded Loan”. | ||||
| In addition, notwithstanding any contrary description set forth above, in the event that, with respect to any mortgage loan, a controlling class certificateholder is a borrower party, such controlling class certificateholder will have no right to receive asset status reports or such other information as may be specified in the pooling and servicing agreement with respect to such mortgage loan, and such controlling class certificateholder will be referred to as an “excluded controlling class holder”. | ||||
| Replacement of Special Servicer by General Vote of Certificateholders: | If a Control Termination Event has occurred and is continuing, the Special Servicer may be removed and replaced without cause upon the affirmative direction of certificates owners holding not less than 75% of a Certificateholder quorum, following a proposal from certificate owners holding not less than 25% of the appraisal-reduced voting rights of all Certificates. The Certificateholders who initiate a vote on a termination and replacement of the Special Servicer without cause must cause Fitch, KBRA and Moody’s to confirm the then-current ratings of the certificates (or decline to review the matter) and cause the payment of the fees and expenses incurred in the replacement. If no Control Termination Event has occurred and is continuing, the Special Servicer may be replaced by the directing certificateholder, subject to Fitch, KBRA and Moody’s confirming the then-current ratings of the Certificates (or declining to review the matter). | |||
| Excluded Special Servicer: | In the event that, with respect to any mortgage loan, the Special Servicer is a borrower party, the Special Servicer will be required to resign as special servicer of such mortgage loan (referred to as an “excluded special servicer loan”). If no Control Termination Event has occurred and is continuing, the directing certificateholder will be entitled to appoint (and may replace with or without cause) a separate special servicer that is not a borrower party (referred to as an “excluded special servicer”) with respect to such excluded special servicer loan unless such excluded special servicer loan is also an excluded loan. Otherwise, upon resignation of the Special Servicer with respect to an excluded special servicer loan, such resigning Special Servicer will be required to appoint the excluded special servicer. | |||
| Appraisal Remedy: | If the Class of certificates comprising the controlling class loses its status as controlling class because of the application of an Appraisal Reduction Amount, the holders of a majority of the Voting Rights of such Class may require the Special Servicer to order a second appraisal for any mortgage loan in respect of which an Appraisal Reduction Amount has been applied. The Special Servicer must thereafter determine whether, based on its assessment of such second appraisal, any recalculation of the Appraisal Reduction Amount is warranted. Such Class will not be able to exercise any direction, control consent and/or similar rights of the controlling class unless and until reinstated as the controlling class through such determination; and pending such determination, the rights of the controlling class will be exercised by the most senior control eligible certificates (which may only be any one of Class E, Class F or Class G), if any. | |||
THE INFORMATION IN THIS STRUCTURAL AND COLLATERAL TERM SHEET IS NOT COMPLETE AND MAY BE AMENDED PRIOR TO THE TIME OF SALE. THIS TERM SHEET IS NOT AN OFFER TO SELL THESE SECURITIES AND IT IS NOT A SOLICITATION OF AN OFFER TO BUY THESE SECURITIES IN ANY JURISDICTION WHERE THE OFFER OR SALE IS NOT PERMITTED.
| 23 |
| Wells Fargo Commercial Mortgage Trust 2015-P2 | Certain Terms and Conditions |
| Sale of Defaulted Assets: | There will be no “fair value” purchase option. Instead, the pooling and servicing agreement will authorize the Special Servicer to sell defaulted mortgage loans serviced by the Special Servicer to the highest bidder in a manner generally similar to sales of REO properties.
The sale of a defaulted loan (other than with respect to the Empire Mall whole loan, the Harbor Pointe Apartments whole loan, the Anchorage Marriott Downtown whole loan, the Harvey Building Products Portfolio whole loan and the JW Marriott Santa Monica Le Merigot whole loan) for less than par plus accrued interest and certain other fees and expenses owed on the loan will be subject to consent or consultation rights of the directing certificateholder and/or Operating Advisor and, in the case of the Heritage Industrial Portfolio mortgage loan, consultation rights of the holders of the relatedpari passu companion loan, as described in the Preliminary Prospectus.
In the case of the Heritage Industrial Portfolio whole loan, pursuant to the related intercreditor agreement and the pooling and servicing agreement, if the special servicer offers to sell to any person (or offers to purchase) for cash such mortgage loan during such time as the related whole loan constitutes a defaulted mortgage loan, then in connection with any such sale, the special servicer is required to sell both the mortgage loan and the relatedpari passu companion loan as a single whole loan.
In the case of the Empire Mall mortgage loan, prior to the securitization of the related controllingpari passucompanion loan, pursuant to the related intercreditor agreement and the WFCM 2015-P2 pooling and servicing agreement, the WFCM 2015-P2 special servicer may offer to sell to any person (or may offer to purchase) for cash the related whole loan during such time as the relatedpari passu companion loan constitutes a defaulted mortgage loan, and, in connection with any such sale, the WFCM 2015-P2 special servicer will be required to sell both the applicable mortgage loan and the relatedpari passucompanion loans as a whole loan. After the securitization of the Empire Mall controllingpari passucompanion loan pursuant to the related intercreditor agreement, the party acting as special servicer with respect to the Empire Mall whole loan pursuant to the pooling and servicing agreement for the related securitization may offer to sell to any person (or may offer to purchase) for cash such loan, and, in connection with any such sale, such special servicer is required to sell both the Empire Mall mortgage loan and the relatedpari passucompanion loans as a whole loan. The directing certificateholder for this securitization will have consultation rights as the holder of an interest in the relatedpari passumortgage loan, as described in the Preliminary Prospectus.
In the case of the Harbor Pointe Apartments mortgage loan, the Anchorage Marriott Downtown mortgage loan and the JW Marriott Santa Monica Le Merigot mortgage loan, pursuant to the related intercreditor agreement and the CGCMT 2015-GC35 pooling and servicing agreement, the related special servicer may offer to sell to any person (or may offer to purchase) for cash the related whole loan during such time as the relatedpari passu companion loan constitutes a defaulted mortgage loan, and, in connection with any such sale, the related special servicer is required to sell both the applicable mortgage loan and the relatedpari passu companion loan as a whole loan. The sale of such whole loan will be subject to the consent of the directing certificateholder for this securitization unless the related special servicer satisfies certain notice and information delivery requirements.
In the case of the Harvey Building Products Portfolio mortgage loan, pursuant to the related intercreditor agreement and the COMM 2015-LC23 pooling and servicing agreement, the related special servicer may offer to sell to any person (or may offer to purchase) for cash the related whole loan during such time as the related whole loan constitutes a defaulted mortgage loan, and, in connection with any such sale, the related special servicer is required to sell both the applicable mortgage loan and the relatedpari passu companion loan(s) as a whole loan. The sale of the Harvey Building Products Portfolio whole loan will be subject to the consent of the directing certificateholder for this securitization unless the related special servicer satisfies certain notice and information delivery requirements. | |||
| “As-Is” Appraisals: | Appraisals must be conducted on an “as-is” basis, and must be no more than 9 months old, for purposes of determining Appraisal Reduction Amounts, market value in connection with REO sales, etc. Required appraisals may consist of updates of prior appraisals. Internal valuations by the Special Servicer are permitted if the principal balance of a mortgage loan is less than $2,000,000. | |||
| Operating Advisor: | The Operating Advisor will perform certain review duties if a Control Termination Event has occurred and is continuing, which will generally include a limited annual review of, and the delivery of a report regarding, certain actions of the Special Servicer with respect to the resolution and/or liquidation of specially serviced mortgage loans to the Certificate Administrator. The review and report generally will be based on any asset status reports and additional information delivered to the Operating Advisor by the Special Servicer. In addition, if a Control Termination Event has occurred and is continuing, the Special Servicer must seek to consult with the Operating Advisor (in addition to the directing certificateholder if no Consultation Termination Event has occurred and | |||
THE INFORMATION IN THIS STRUCTURAL AND COLLATERAL TERM SHEET IS NOT COMPLETE AND MAY BE AMENDED PRIOR TO THE TIME OF SALE. THIS TERM SHEET IS NOT AN OFFER TO SELL THESE SECURITIES AND IT IS NOT A SOLICITATION OF AN OFFER TO BUY THESE SECURITIES IN ANY JURISDICTION WHERE THE OFFER OR SALE IS NOT PERMITTED.
| 24 |
| Wells Fargo Commercial Mortgage Trust 2015-P2 | Certain Terms and Conditions |
| is continuing) in connection with material special servicing actions with respect to specially serviced mortgage loans serviced by the Special Servicer. Furthermore, under certain circumstances, but only if a Consultation Termination Event has occurred and is continuing, the Operating Advisor may recommend the replacement of the Special Servicer, in which case the Certificate Administrator will deliver notice of such recommendation to the certificateholders, and certificateholders with specified percentages of the voting rights may direct the replacement of the Special Servicer at their expense. | ||||
| If a Consultation Termination Event has occurred and is continuing, the Operating Advisor may be removed and replaced without cause upon the affirmative direction of certificates owners holding not less than 75% of the appraisal-reduced voting rights of all Principal Balance Certificates, following a proposal from certificate owners holding not less than 25% of the appraisal-reduced voting rights of all certificates. The certificateholders who initiate a vote on a termination and replacement of the Operating Advisor without cause must cause Fitch, KBRA and Moody’s to confirm the then-current ratings of the certificates (or decline to review the matter) and cause the payment of the fees and expenses incurred in the replacement. The Operating Advisor generally may be discharged from its duties if and when the Class A-1, A-2A, A-2B, A-3, A-4, A-SB, A-S, B, C and D Certificates are retired. | ||||
| Asset Representations Reviewer: | The Asset Representations Reviewer will be required to review certain delinquent mortgage loans after a specified delinquency threshold has been exceeded and the required percentage of certificateholders vote to direct a review of such delinquent mortgage loans. An asset review will occur when either (1) mortgage loans with an aggregate outstanding principal balance of 25.0% or more of the aggregate outstanding principal balance of all of the Mortgage Loans (including any REO loans (or a portion of any REO loan in the case of a whole loan) held by the issuing entity as of the end of the applicable collection period are delinquent loans or (2) at least 15 mortgage loans are delinquent loans as of the end of the applicable collection period and the outstanding principal balance of such delinquent loans in the aggregate constitutes at least 20.0% of the aggregate outstanding principal balance of all of the mortgage loans (including any REO loans (or a portion of any REO loan in the case of a whole loan)) held by the issuing entity as of the end of the applicable collection period.
The Asset Representations Reviewer may be terminated and replaced without cause. Upon (i) the written direction of Certificateholders evidencing not less than 25% of the voting rights requesting a vote to terminate and replace the Asset Representations Reviewer with a proposed successor Asset Representations Reviewer that is an eligible asset reviewer, and (ii) payment by such holders to the certificate administrator of the reasonable fees and expenses to be incurred by the certificate administrator in connection with administering such vote, the certificate administrator will promptly provide notice to all Certificateholders and the Asset Representations Reviewer of such request by posting such notice on its internet website, and by mailing such notice to all Certificateholders and the Asset Representations Reviewer. Upon the written direction of Certificateholders evidencing at least 75% of a Certificateholder quorum, the trustee will terminate all of the rights and obligations of the Asset Representations Reviewer under the pooling and servicing agreement by written notice to the Asset Representations Reviewer, and the proposed successor Asset Representations Reviewer will be appointed. See “The Pooling and Servicing Agreement—The Asset Representations Reviewer” in the Preliminary Prospectus. | |||
| Dispute Resolution Provisions: | The mortgage loan sellers will be subject to the dispute resolution provisions set forth in the pooling and servicing agreement to the extent those provisions are triggered with respect to any mortgage loan sold to the depositor by a mortgage loan seller and such mortgage loan seller will be obligated under the related mortgage loan purchase agreement to comply with all applicable provisions and to take part in any mediation or arbitration proceedings that may result.
Generally, in the event that a Repurchase Request (as defined in the Preliminary Prospectus) is not “Resolved” (as defined below) within 180 days after the related mortgage loan seller receives such Repurchase Request, then the enforcing servicer will be required to send a notice to the “Initial Requesting Certificateholder” (if any) indicating the enforcing servicer’s intended course of action with respect to the Repurchase Request. If (a) the enforcing servicer’s intended course of action with respect to the Repurchase Request does not involve pursuing further action to exercise rights against the related mortgage loan seller with respect to the Repurchase Request and the Initial Requesting Certificateholder, if any, or any other Certificateholder or Certificate Owner wishes to exercise its right to refer the matter to mediation (including nonbinding arbitration) or arbitration, or (b) the enforcing servicer’s intended course of action is to pursue further action to exercise rights against the related mortgage loan seller with respect to the Repurchase Request but the Initial Requesting Certificateholder, if any, or any other Certificateholder or Certificate Owner does not agree with the dispute resolution method selected by the enforcing servicer, then the Initial Requesting Certificateholder, if any, or such other Certificateholder or Certificate Owner may deliver a written notice to the special servicer indicating its intent to exercise its right to refer the matter to either mediation or arbitration. | |||
THE INFORMATION IN THIS STRUCTURAL AND COLLATERAL TERM SHEET IS NOT COMPLETE AND MAY BE AMENDED PRIOR TO THE TIME OF SALE. THIS TERM SHEET IS NOT AN OFFER TO SELL THESE SECURITIES AND IT IS NOT A SOLICITATION OF AN OFFER TO BUY THESE SECURITIES IN ANY JURISDICTION WHERE THE OFFER OR SALE IS NOT PERMITTED.
| 25 |
| Wells Fargo Commercial Mortgage Trust 2015-P2 | Certain Terms and Conditions |
| “Resolved” means, with respect to a Repurchase Request, (i) that any Material Defect has been cured, (ii) the related mortgage loan has been repurchased in accordance with the related mortgage loan purchase agreement, (iii) a mortgage loan has been substituted for the related mortgage loan in accordance with the related mortgage loan purchase agreement, (iv) the applicable mortgage loan seller makes a Loss of Value Payment, (v) a contractually binding agreement is entered into between the enforcing servicer, on behalf of the issuing entity, and the related mortgage loan seller that settles the related mortgage loan seller’s obligations under the related mortgage loan purchase agreement, or (vi) the related mortgage loan is no longer property of the issuing entity as a result of a sale or other disposition in accordance with the pooling and servicing agreement. See “The Pooling and Servicing Agreement—Dispute Resolution Provisions” in the Preliminary Prospectus. | ||||
| Investor Communications: | The certificate administrator is required to include on any Form 10–D any request received from a Certificateholder to communicate with other Certificateholders related to Certificateholders exercising their rights under the terms of the pooling and servicing agreement. Any Certificateholder wishing to communicate with other Certificateholders regarding the exercise of its rights under the terms of the Pooling and Servicing Agreement will be able to deliver a written request signed by an authorized representative of the requesting investor to the certificate administrator. | |||
| Certain Fee Offsets: | If a workout fee is earned by the Special Servicer following a loan default with respect to any mortgage loan that it services, then certain limitations will apply based on modification fees paid by the borrower. The modification fee generally must not exceed 1% of the principal balance of the loan as modified in any 12-month period. In addition, if the loan re-defaults, any subsequent workout fee on that loan must be reduced by a portion of the modification fees paid by the borrower in the previous 12-months. Likewise, liquidation fees collected in connection with a liquidation or partial liquidation of a mortgage loan must be reduced by a portion of the modification fees paid by the borrower in the previous 12 months. | |||
| Deal Website: | The Certificate Administrator will be required to maintain a deal website which will include, among other items: (a) summaries of asset status reports prepared by the Special Servicer, (b) inspection reports, (c) appraisals, (d) various “special notices” described in the Preliminary Prospectus, (e) the “Investor Q&A Forum” and (f) a voluntary “Investor Registry”. Investors may access the deal website following execution of a certification and confidentiality agreement. | |||
| Initial Majority Controlling Class Certificateholder: | It is expected that Raith Capital Partners, LLC or an affiliate thereof will be the initial majority controlling class certificateholder. | |||
| Whole Loans: | Each of the mortgaged properties identified on Annex A-1 to the Preliminary Prospectus as Empire Mall, Harbor Pointe Apartments, Heritage Industrial Portfolio, Anchorage Marriott Downtown, Harvey Building Products Portfolio and JW Marriott Santa Monica Le Merigot secures both a mortgage loan to be included in the trust fund and one or more other mortgage loans that will not be included in the trust fund, which will bepari passu in right of payment with the mortgage loan included in the trust fund.We refer to each such group of mortgage loans as a “whole loan”. It is expected that prior to the securitization of the Empire Mall controllingpari passu companion loan, the Empire Mall whole loan will be serviced under the pooling and servicing agreement, and, with respect to the Empire Mall whole loan, the holder of the Empire Mall controllingpari passu companion loan will have the control and consultation rights of the directing certificateholder under the pooling and servicing agreement as described under “—Control and Consultation” above. After the securitization of the Empire Mall controllingpari passu companion loan, the Empire Mall whole loan will be serviced under the pooling and servicing agreement related to the securitization of such controllingpari passu companion loan. TheHarbor Pointe Apartments whole loan will be principally serviced under the CGCMT 2015-GC35 pooling and servicing agreement. The Heritage Industrial Portfolio whole loan will be principally serviced under the pooling and servicing agreement for this WFCM 2015-P2 securitization. TheAnchorage Marriott Downtownwhole loan will be principally serviced under the CGCMT 2015-GC35 pooling and servicing agreement. TheHarvey Building Productswhole loan will be principally serviced under the COMM 2015-LC23 pooling and servicing agreement. TheJW Marriott Santa Monica Le Merigotwhole loan will be principally serviced under the CGCMT 2015-GC35 pooling and servicing agreement.
As of the closing date, the companion loans in such whole loans will be held by the parties identified above under “IV. Characteristics of the Mortgage Pool—B. Summary ofPari Passu Whole Loans”.
| |||
THE INFORMATION IN THIS STRUCTURAL AND COLLATERAL TERM SHEET IS NOT COMPLETE AND MAY BE AMENDED PRIOR TO THE TIME OF SALE. THIS TERM SHEET IS NOT AN OFFER TO SELL THESE SECURITIES AND IT IS NOT A SOLICITATION OF AN OFFER TO BUY THESE SECURITIES IN ANY JURISDICTION WHERE THE OFFER OR SALE IS NOT PERMITTED.
| 26 |
(THIS PAGE INTENTIONALLY LEFT BLANK)
THE INFORMATION IN THIS STRUCTURAL AND COLLATERAL TERM SHEET IS NOT COMPLETE AND MAY BE AMENDED PRIOR TO THE TIME OF SALE. THIS TERM SHEET IS NOT AN OFFER TO SELL THESE SECURITIES AND IT IS NOT A SOLICITATION OF AN OFFER TO BUY THESE SECURITIES IN ANY JURISDICTION WHERE THE OFFER OR SALE IS NOT PERMITTED.
| 27 |
| ROLLING BROOK VILLAGE |
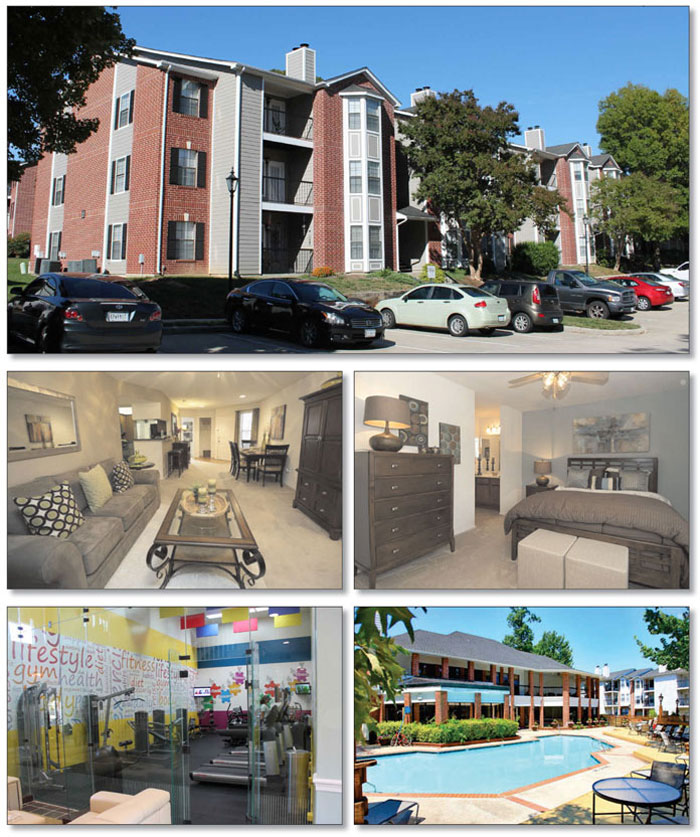
THE INFORMATION IN THIS STRUCTURAL AND COLLATERAL TERM SHEET IS NOT COMPLETE AND MAY BE AMENDED PRIOR TO THE TIME OF SALE. THIS TERM SHEET IS NOT AN OFFER TO SELL THESE SECURITIES AND IT IS NOT A SOLICITATION OF AN OFFER TO BUY THESE SECURITIES IN ANY JURISDICTION WHERE THE OFFER OR SALE IS NOT PERMITTED.
| 28 |
| ROLLING BROOK VILLAGE |

THE INFORMATION IN THIS STRUCTURAL AND COLLATERAL TERM SHEET IS NOT COMPLETE AND MAY BE AMENDED PRIOR TO THE TIME OF SALE. THIS TERM SHEET IS NOT AN OFFER TO SELL THESE SECURITIES AND IT IS NOT A SOLICITATION OF AN OFFER TO BUY THESE SECURITIES IN ANY JURISDICTION WHERE THE OFFER OR SALE IS NOT PERMITTED.
| 29 |
| No. 1 – Rolling Brook Village | ||||||||
| Loan Information | Property Information | |||||||
| Mortgage Loan Seller: | Ladder Capital Finance LLC | Single Asset/Portfolio: | Single Asset | |||||
Credit Assessment (Fitch/KBRA/Moody’s): | NR/NR/NR | Property Type: | Multifamily | |||||
| Original Principal Balance: | $88,000,000 | Specific Property Type: | Garden | |||||
| Cut-off Date Principal Balance: | $88,000,000 | Location: | Woodbridge, VA | |||||
| % of Initial Pool Balance: | 8.8% | Size: | 732 Units | |||||
| Loan Purpose: | Acquisition | Cut-off Date Principal Balance Per Unit: | $120,219 | |||||
| Borrower Names(1): | Various | Year Built/Renovated: | 1987/2015 | |||||
| Sponsor: | Ralph S. Dweck | Title Vesting: | Fee | |||||
| Mortgage Rate: | 5.247% | Property Manager: | Gates, Hudson & Associates, Inc. | |||||
| Note Date: | November 17, 2015 | 3rdMost Recent Occupancy (As of)(4): | NAV | |||||
| Anticipated Repayment Date: | NAP | 2ndMost Recent Occupancy (As of): | 93.8% (12/31/2013) | |||||
| Maturity Date: | December 6, 2020 | Most Recent Occupancy (As of): | 93.4% (12/31/2014) | |||||
| IO Period: | 60 months | Current Occupancy (As of): | 93.2% (11/2/2015) | |||||
| Loan Term (Original): | 60 Months | |||||||
| Seasoning: | 0 months | Underwriting and Financial Information: | ||||||
| Amortization Term (Original): | NAP | |||||||
| Loan Amortization Type: | Interest-only, Balloon | 3rdMost Recent NOI (As of): | $6,809,589 (12/31/2013) | |||||
| Interest Accrual Method: | Actual/360 | 2ndMost Recent NOI (As of): | $6,976,764 (12/31/2014) | |||||
| Call Protection: | L(24),D(33),O(3) | Most Recent NOI (As of): | $7,190,256 (TTM 9/30/2015) | |||||
| Lockbox Type: | Soft/Upfront Cash Management | |||||||
| Additional Debt(2): | Yes | U/W Revenues: | $11,497,238 | |||||
| Additional Debt Type(2): | Mezzanine | U/W Expenses: | $4,381,484 | |||||
| U/W NOI: | $7,115,754 | |||||||
| U/W NCF: | $6,932,754 | |||||||
| U/W NOI DSCR: | 1.52x | |||||||
| Escrows and Reserves(3): | U/W NCF DSCR(2): | 1.48x | ||||||
| U/W NOI Debt Yield: | 8.1% | |||||||
| Type: | Initial | Monthly | Cap (If Any) | U/W NCF Debt Yield(2): | 7.9% | |||
| Taxes | $217,610 | $108,805 | NAP | As-Is Appraised Value: | $142,000,000 | |||
| Insurance | $42,938 | $14,313 | NAP | As-Is Appraisal Valuation Date: | October 8, 2015 | |||
| Replacement Reserves | $0 | $15,250 | NAP | Cut-off Date LTV Ratio(2): | 62.0% | |||
| Deferred Maintenance | $37,500 | $0 | NAP | LTV Ratio at Maturity or ARD: | 62.0% | |||
| (1) | See “The Borrowers” section. |
| (2) | See “Subordinate and Mezzanine Indebtedness” section. The equity interest in the borrowers have been pledged to secure mezzanine indebtedness with a principal balance of $20,200,000. As of the Cut-off Date, the combined U/W NCF DSCR, Cut-off Date LTV Ratio and U/W NCF Debt Yield were 1.05x, 76.2% and 6.4%, respectively. |
| (3) | See “Escrows” section. |
| (4) | See “Historical Occupancy” section. |
The Mortgage Loan. The mortgage loan (the “Rolling Brook Village Mortgage Loan”) is evidenced by a single promissory note that is secured by a first mortgage encumbering a garden-style multifamily property located in Woodbridge, Virginia (the “Rolling Brook Village Property”). The Rolling Brook Village Mortgage Loan was originated on November 17, 2015 by Ladder Capital Finance LLC. The Rolling Brook Village Mortgage Loan had an original principal balance of $88,000,000, has an outstanding principal balance as of the Cut-off Date of $88,000,000 and accrues interest at an interest rate of 5.247%per annum. The Rolling Brook Village Mortgage Loan had an initial term of 60 months, has a remaining term of 60 months as of the Cut-off Date and requires interest-only payments through the term of the Rolling Brook Village Mortgage Loan. The Rolling Brook Village Mortgage Loan matures on December 6, 2020.
Following the lockout period, the borrowers have the right to defease the Rolling Brook Village Mortgage Loan in whole, but not in part, on any date before October 6, 2020. In addition, the Rolling Brook Village Mortgage Loan is prepayable without penalty on or after October 6, 2020.
THE INFORMATION IN THIS STRUCTURAL AND COLLATERAL TERM SHEET IS NOT COMPLETE AND MAY BE AMENDED PRIOR TO THE TIME OF SALE. THIS TERM SHEET IS NOT AN OFFER TO SELL THESE SECURITIES AND IT IS NOT A SOLICITATION OF AN OFFER TO BUY THESE SECURITIES IN ANY JURISDICTION WHERE THE OFFER OR SALE IS NOT PERMITTED.
| 30 |
| ROLLING BROOK VILLAGE |
Sources and Uses
| Sources | Uses | |||||||||
| Original loan amount | $88,000,000 | 62.6 | % | Purchase price | $138,500,000 | 98.6 | % | |||
| Mezzanine loan | 20,200,000 | 14.4 | Closing costs | 1,722,299 | 1.2 | |||||
| Sponsor’s new cash contribution | 32,320,346 | 23.0 | Reserves | 298,047 | 0.2 | |||||
| Total Sources | $140,520,346 | 100.0 | % | Total Uses | $140,520,346 | 100.0 | % | |||
The Property.The Rolling Brook Village Property is a 732-unit, garden-style multifamily property located in Woodbridge, Virginia, approximately 20.0 miles southwest of the Washington D.C. central business district. Constructed in 1987 and 1991, and renovated in 2015, the Rolling Brook Village Property consists of 53 three-story residential buildings situated on a 54.9-acre parcel. Community amenities include two swimming pools, media center, fitness center, community room and conference room. Unit amenities include fully equipped kitchens and in-unit washer/dryers. The Rolling Brook Village Property contains 1,326 surface parking spaces resulting in a parking ratio of 1.8 spaces per unit. As of November 2, 2015, the Rolling Brook Village Property was 93.2% occupied.
The following table presents certain information relating to the unit mix of the Rolling Brook Village Property:
Unit Mix Summary(1)
| Unit Type | No. of Units | % of Total Units | Average Unit Size (SF) | Average Monthly Rent per Unit |
| 1 Bedroom / 1 Bath | 244 | 33.3% | 697 | $1,165 |
| 1 Bedroom / 1 Bath + Den | 48 | 6.6% | 797 | $1,246 |
| 2 Bedroom / 1 Bath | 112 | 15.3% | 854 | $1,289 |
| 2 Bedroom / 2 Bath | 328 | 44.8% | 978 | $1,407 |
| Total/Weighted Average | 732 | 100.0% | 853 | $1,298 |
| (1) | Information obtained from the appraisal. |
The following table presents historical occupancy percentages at the Rolling Brook Village Property:
Historical Occupancy
12/31/2012(1) | 12/31/2013(2) | 12/31/2014(2) | 11/2/2015(2) | |||
| NAV | 93.8% | 93.4% | 93.2% |
| (1) | Historical occupancy prior to 2013 is unavailable, as the sponsor recently acquired the Rolling Brook Village Property, and it was not provided by the seller. |
| (2) | Information obtained from the borrower. |
Operating History and Underwritten Net Cash Flow.The following table presents certain information relating to the historical operating performance and underwritten net cash flow at the Rolling Brook Village Property:
Cash Flow Analysis
| 2013 | 2014 | TTM 9/30/2015 | U/W | % of U/W Effective Gross Income | U/W $ per Unit | ||||||
| Base Rent | $11,080,404 | $11,244,434 | $11,296,625 | $10,518,267 | 91.5% | $14,369 | |||||
| Grossed Up Vacant Space | 0 | 0 | 0 | 778,358 | 6.8 | 1,063 | |||||
| Concessions | 0 | 0 | 0 | 0 | 0.0 | 0 | |||||
| Other Income | 802,104 | 930,015 | 979,604 | 979,604 | 8.5 | 1,338 | |||||
| Less Vacancy & Credit Loss | (931,640) | (831,849) | (778,991) | (778,991)(1) | (6.8) | (1,064) | |||||
| Effective Gross Income | $10,950,868 | $11,342,600 | $11,497,238 | $11,497,238 | 100.0% | $15,707 | |||||
| Total Operating Expenses | $4,141,279 | $4,365,836 | $4,306,982 | $4,381,484 | 38.1% | $5,986 | |||||
| Net Operating Income | $6,809,589 | $6,976,764 | $7,190,256 | $7,115,754 | 61.9% | $9,721 | |||||
| Capital Expenditures | 0 | 0 | 0 | 183,000 | 1.6 | 250 | |||||
| Net Cash Flow | $6,809,589 | $6,976,764 | $7,190,256 | $6,932,754 | 60.3% | $9,471 | |||||
| NOI DSCR | 1.45x | 1.49x | 1.53x | 1.52x | |||||||
| NCF DSCR | 1.45x | 1.49x | 1.53x | 1.48x | |||||||
| NOI DY | 7.7% | 7.9% | 8.2% | 8.1% | |||||||
| NCF DY | 7.7% | 7.9% | 8.2% | 7.9% |
| (1) | The underwritten economic vacancy is 6.9%. The Rolling Brook Village Property was 93.2% physically occupied as of November 2, 2015. |
Appraisal.As of the appraisal valuation date of October 8, 2015, the Rolling Brook Village Property had an “as-is” appraised value of $142,000,000.
THE INFORMATION IN THIS STRUCTURAL AND COLLATERAL TERM SHEET IS NOT COMPLETE AND MAY BE AMENDED PRIOR TO THE TIME OF SALE. THIS TERM SHEET IS NOT AN OFFER TO SELL THESE SECURITIES AND IT IS NOT A SOLICITATION OF AN OFFER TO BUY THESE SECURITIES IN ANY JURISDICTION WHERE THE OFFER OR SALE IS NOT PERMITTED.
| 31 |
| ROLLING BROOK VILLAGE |
Environmental Matters.According to a Phase I environmental assessment dated October 13, 2015, there was no evidence of any recognized environmental conditions at the Rolling Brook Village Property.
Market Overview and Competition.The Rolling Brook Village Property is located in Woodbridge, Virginia, approximately 20.0 miles southwest of the Washington D.C. central business district. The Rolling Brook Village Property is located near Interstate 95 and Jefferson David Highway, both providing north/south access to the property. Jefferson Davis Highway is a major retail hub for the area and is comprised of a mix of power centers, big box retailers and neighborhood centers. Large retail draws include Potomac Town Center, a 550,000 square foot power center anchored by Wegmans and whose major tenants include Sport & Health, DSW, REI, Old Navy, and an Apple Store. The nearest regional mall is Potomac Mills, a Simon Property Group mall with a 97% occupancy, which is located four miles south of the Rolling Brook Village Property. The estimated 2015 population within a one-, three- and five-mile radius of the Rolling Brook Village Property was 15,336, 72,780 and 203,912, respectively, and the estimated 2015 average annual household income within the same radii was $99,854, $108,949 and $120,537, respectively.
According to a third party market research report, the Rolling Brook Village Property is located in the Northern Virginia multifamily market and the East Prince William County multifamily submarket. As of third quarter 2015, the Northern Virginia multifamily market contained 59,952 units, with an 8.4% vacancy rate and average monthly asking rent of $1,784 per unit per month. As of the third quarter of 2015, the East Prince William County had a 4.2% vacancy rate and average monthly asking rent of $1,542 per unit per month.
The following table presents certain information relating to comparable multifamily properties for the Rolling Brook Village Property:
Competitive Set(1)
| Rolling Brook Village (Subject) | Windsor at Potomac Vista | Dominion Lake Ridge | Dominion Middle Ridge | Springwoods at Lake Ridge | Misty Ridge | Windsor Park | |
| Location | Woodbridge, VA | Woodbridge, VA | Woodbridge, VA | Woodbridge, VA | Woodbridge, VA | Woodbridge, VA | Woodbridge, VA |
| Distance to Subject | -- | 2.8 miles | 2.9 miles | 3.7 miles | 4.0 miles | 4.3 miles | 4.5 miles |
| Property Type | Garden | Garden | Garden | Garden | Garden | Garden | Garden |
| Number of Units | 732 | 408 | 192 | 280 | 180 | 409 | 220 |
| Average Rent (per unit) | $1,298 | $1,347 | $1,379 | $1,437 | $1,317 | $1,243 | $1,330 |
| Total Occupancy | 93% | 96% | 97% | 95% | 97% | 95% | 96% |
| (1) | Information obtained from the appraisal. |
The Borrowers.The borrowers comprise three tenants-in-common: Rolling Brook Park Center, LLC, Rolling Brook Stratford, LLC and Rolling Brook Windsor, LLC. Each tenant-in-common is a Delaware limited liability company and single purpose entity with two independent directors. Legal counsel to the borrowers delivered a non-consolidation opinion in connection with the origination of the Rolling Brook Village Mortgage Loan. Ralph S. Dweck is the guarantor of certain nonrecourse carveouts under the Rolling Brook Village Mortgage Loan.
The Sponsor.The sponsor, Ralph S. Dweck, currently owns 16 multifamily properties in Washington D.C. and Virginia with a total of 5,332 units in addition to a 224,300 square foot office building in Arlington, Virginia. As of October 2015, Mr. Dweck’s real estate holdings are valued at approximately $1.9 billion. See “Description of the Mortgage Pool — Loan Purpose; Default History, Bankruptcy Issues and Other Proceedings” in the Preliminary Prospectus.
Escrows.The loan documents provide for upfront escrows in the amount of $217,610 for real estate taxes, $42,938 for insurance premiums and $37,500 for deferred maintenance. The loan documents also provide for ongoing monthly reserves in the amount of $108,805 for real estate taxes, $14,313 for insurance premiums and $15,250 for replacement reserves.
Lockbox and Cash Management.The loan documents require a soft lockbox into which the borrowers or the property manager are required to deposit all revenues within one business day of receipt. Funds deposited into the lockbox account are required to be swept on a daily basis into a cash management account controlled by the lender and applied and disbursed in accordance with the loan documents. Upon the occurrence of a Cash Management Trigger Event (as defined below), all excess cash flow will be held as additional collateral for the Rolling Brook Village Mortgage Loan.
A “Cash Management Trigger Event” will commence upon the occurrence of (i) an event of default; (ii) any event of default under the management agreement; or (iii) the debt service coverage ratio falling below 1.42x as of any date of determination by the lender. A Cash Management Trigger Event will end with respect to clause (i), upon the cure of such event of default; with respect to clause (ii), upon the cure of such default under the management agreement; and with respect to clause (iii), the debt service coverage ratio being at least 1.48x for two consecutive calendar quarters.
Property Management.The Rolling Brook Village Property is managed by Gates, Hudson & Associates, Inc.
Assumption.The borrowers have a one-time right to transfer the Rolling Brook Village Property provided that certain conditions are satisfied, including (i) no event of default has occurred and is continuing; (ii) the lender’s reasonable determination that the proposed transferee and guarantor satisfy the lender’s credit review and underwriting standards, taking into consideration transferee experience, financial strength and general business standing; (iii) execution of a recourse guaranty and an environmental indemnity by an affiliate of the transferee; (iv) the mezzanine borrower will have satisfied all of the terms set forth in the mezzanine loan agreement regarding an assumption of the Rolling Brook Village Mezzanine Loan (see “Subordinate and Mezzanine Indebtedness” section);(v) borrower pays the lender an assumption fee equal to 0.5% of the outstanding principal balance of the Rolling Brook Village Mortgage Loan; and (vi) if requested by the lender, a rating agency confirmation from Fitch, KBRA and Moody’s that the
THE INFORMATION IN THIS STRUCTURAL AND COLLATERAL TERM SHEET IS NOT COMPLETE AND MAY BE AMENDED PRIOR TO THE TIME OF SALE. THIS TERM SHEET IS NOT AN OFFER TO SELL THESE SECURITIES AND IT IS NOT A SOLICITATION OF AN OFFER TO BUY THESE SECURITIES IN ANY JURISDICTION WHERE THE OFFER OR SALE IS NOT PERMITTED.
| 32 |
| ROLLING BROOK VILLAGE |
transfer will not result in a downgrade, withdrawal or qualification of the respective ratings assigned to the Series 2015-P2 Certificates.
Partial Release.Not permitted.
Real Estate Substitution.Not permitted.
Ground Lease.None.
Subordinate and Mezzanine Indebtedness.SMHF Cayman Hotel, LLC is the holder of a mezzanine loan in the original amount of $20,200,000 (the “Rolling Brook Village Mezzanine Loan”) from Rolling Brook Park Center Mezzco, LLC, Rolling Brook Stratford Mezzco, LLC and Rolling Brook Windsor Mezzco, LLC, each a Delaware limited liability company that directly owns 100.0% of the related individual borrower. The Rolling Brook Village Mezzanine Loan accrues interest at an interest rate of 9.375%per annum. The Rolling Brook Village Mezzanine Loan matures on December 6, 2020. The rights of the Rolling Brook Village Mezzanine Loan lender are further described under “Description of the Mortgage Pool—Additional Indebtedness—Mezzanine Indebtedness” in the Preliminary Prospectus.
Terrorism Insurance.The loan documents require that the “all risk” insurance policy required to be maintained by the borrowers provide coverage for terrorism in an amount equal to the full replacement cost of the Rolling Brook Village Property, as well as business interruption insurance covering no less than the 18-month period following the occurrence of a casualty event, together with a 12-month extended period of indemnity.
THE INFORMATION IN THIS STRUCTURAL AND COLLATERAL TERM SHEET IS NOT COMPLETE AND MAY BE AMENDED PRIOR TO THE TIME OF SALE. THIS TERM SHEET IS NOT AN OFFER TO SELL THESE SECURITIES AND IT IS NOT A SOLICITATION OF AN OFFER TO BUY THESE SECURITIES IN ANY JURISDICTION WHERE THE OFFER OR SALE IS NOT PERMITTED.
| 33 |
EMPIRE MALL |
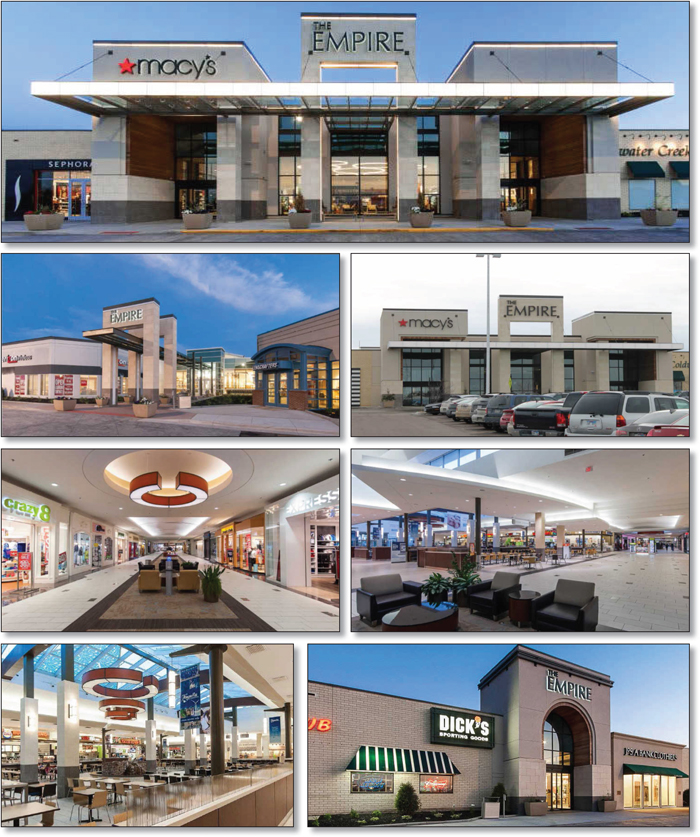
THE INFORMATION IN THIS STRUCTURAL AND COLLATERAL TERM SHEET IS NOT COMPLETE AND MAY BE AMENDED PRIOR TO THE TIME OF SALE. THIS TERM SHEET IS NOT AN OFFER TO SELL THESE SECURITIES AND IT IS NOT A SOLICITATION OF AN OFFER TO BUY THESE SECURITIES IN ANY JURISDICTION WHERE THE OFFER OR SALE IS NOT PERMITTED.
| 34 |
EMPIRE MALL |

THE INFORMATION IN THIS STRUCTURAL AND COLLATERAL TERM SHEET IS NOT COMPLETE AND MAY BE AMENDED PRIOR TO THE TIME OF SALE. THIS TERM SHEET IS NOT AN OFFER TO SELL THESE SECURITIES AND IT IS NOT A SOLICITATION OF AN OFFER TO BUY THESE SECURITIES IN ANY JURISDICTION WHERE THE OFFER OR SALE IS NOT PERMITTED.
| 35 |
| No. 2 – Empire Mall | ||||||||
| Loan Information | Property Information | |||||||
| Mortgage Loan Seller: | Société Générale | Single Asset/Portfolio: | Single Asset | |||||
| Credit Assessment (Fitch/KBRA/Moody’s): | NR/NR/NR | Property Type: | Retail | |||||
| Original Principal Balance(1): | $75,000,000 | Specific Property Type: | Regional Mall | |||||
| Cut-off Date Principal Balance(1): | $75,000,000 | Location: | Sioux Falls, SD | |||||
| % of Initial Pool Balance: | 7.5% | Size: | 1,124,451 SF | |||||
| Loan Purpose: | Refinance | Cut-off Date Principal Balance Per SF(1): | $168.97 | |||||
| Borrower Name: | Empire Mall, LLC | Year Built/Renovated: | 1974/2013 | |||||
| Sponsor: | Simon Property Group, Inc. | Title Vesting: | Fee/Leasehold | |||||
| Mortgage Rate: | 4.314% | Property Manager: | Self-managed | |||||
| Note Date: | November 24, 2015 | 3rdMost Recent Occupancy (As of): | 94.6% (12/31/2012) | |||||
| Anticipated Repayment Date: | NAP | 2ndMost Recent Occupancy (As of): | 98.0% (12/31/2013) | |||||
| Maturity Date: | December 1, 2025 | Most Recent Occupancy (As of): | 97.2% (12/31/2014) | |||||
| IO Period: | 36 months | Current Occupancy (As of): | 97.1% (10/23/2015) | |||||
| Loan Term (Original): | 120 months | |||||||
| Seasoning: | 0 months | Underwriting and Financial Information: | ||||||
| Amortization Term (Original): | 360 months | |||||||
| Loan Amortization Type: | Interest-only, Amortizing Balloon | 3rdMost Recent NOI (As of): | $19,090,493 (12/31/2013) | |||||
| Interest Accrual Method: | Actual/360 | 2ndMost Recent NOI (As of): | $20,677,771 (12/31/2014) | |||||
| Call Protection: | L(24),D(89),O(7) | Most Recent NOI (As of): | $21,505,710 (TTM 9/30/2015) | |||||
| Lockbox Type: | Hard/Springing Cash Management | |||||||
| Additional Debt(1): | Yes | |||||||
| Additional Debt Type(1): | Pari Passu | U/W Revenues: | $28,697,242 | |||||
| U/W Expenses: | $7,478,959 | |||||||
| U/W NOI: | $21,218,283 | |||||||
| U/W NCF: | $20,386,359 | |||||||
| Escrows and Reserves(2): | U/W NOI DSCR(1): | 1.88x | ||||||
| U/W NCF DSCR(1): | 1.80x | |||||||
| Type: | Initial | Monthly | Cap (If Any) | U/W NOI Debt Yield(1): | 11.2% | |||
| Taxes | $0 | Springing | NAP | U/W NCF Debt Yield(1): | 10.7% | |||
| Insurance | $0 | Springing | NAP | As-Is Appraised Value: | $350,000,000 | |||
| Replacement Reserves | $0 | Springing | NAP | As-Is Appraisal Valuation Date: | October 15, 2015 | |||
| TI/LC Reserve | $75,000 | Springing | NAP | Cut-off Date LTV Ratio(1): | 54.3% | |||
| Ground Rent | $0 | Springing | NAP | LTV Ratio at Maturity or ARD(1): | 47.3% | |||
| (1) | The Empire Mall Whole Loan, with an original principal balance of $190,000,000, is comprised of fivepari passu notes (Note A-1, Note A-2, Note A-3, Note A-4, and Note A-5). The non-controlling Note A-2 had an original principal balance of $75,000,000, has an outstanding principal balance as of the Cut-Off Date of $75,000,000 and will be contributed to the WFCM 2015-P2 Trust. The controlling note A-1 and non-controlling notes A-3, A-4 and A-5 have a combined original principal balance of $115,000,000, and are expected to be contributed to future trusts. All statistical financial information related to the balances per square foot, loan-to-value ratios, debt service coverage ratios and debt yields are based on the Empire Mall Whole Loan. |
| (2) | See “Escrows” section. |
The Mortgage Loan.The mortgage loan is part of a whole loan (the “Empire Mall Whole Loan”) which is evidenced by fivepari passu promissory notes that are secured by a first mortgage encumbering the fee simple and leasehold interests in a regional mall which is located in Sioux Falls, South Dakota (the “Empire Mall Property”). The Empire Mall Whole Loan was originated on November 24th, 2015 by Société Générale. The Empire Mall Whole Loan had an original principal balance of $190,000,000, has an outstanding principal balance as of the Cut-off Date of $190,000,000 and accrues interest at an interest rate of 4.314%per annum. The Empire Mall Whole Loan had an initial term of 120 months, has a remaining term of 120 months as of the Cut-off Date and requires interest only payments for the first 36 months following origination, and, thereafter, requires payments of principal and interest based on a 30-year amortization schedule. The Empire Mall Whole Loan matures on December 1, 2025.
Note A-2, which will be contributed to the WFCM 2015-P2 Trust, had an original principal balance of $75,000,000, has an outstanding principal balance as of the Cut-off Date of $75,000,000 and represents a non-controlling interest in the Empire Mall Whole Loan. The related Note A-1, Note A-3, Note A-4 and Note A-5 (the “Empire Mall Companion Loans”) are expected to be contributed to future trusts and have an aggregate original principal balance of $115,000,000. Note A-1 represents the controlling interest in the Empire Mall Whole Loan. The Mortgage Loan Seller provides no assurances that any non-securitized notes will not be split further. See “Description of the Mortgage Pool — The Whole Loans — The Serviced Pari Passu Whole Loans — The Empire Mall Whole Loan” in the Preliminary Prospectus.
THE INFORMATION IN THIS STRUCTURAL AND COLLATERAL TERM SHEET IS NOT COMPLETE AND MAY BE AMENDED PRIOR TO THE TIME OF SALE. THIS TERM SHEET IS NOT AN OFFER TO SELL THESE SECURITIES AND IT IS NOT A SOLICITATION OF AN OFFER TO BUY THESE SECURITIES IN ANY JURISDICTION WHERE THE OFFER OR SALE IS NOT PERMITTED.
| 36 |
EMPIRE MALL |
Following the lockout period, the borrower has the right to defease the Empire Mall Whole Loan in whole, but not in part (see “Free Release” section), on any date before June 1, 2025. In addition, the Empire Mall Whole Loan is prepayable without penalty on or after June 1, 2025.
Sources and Uses
| Sources | Uses | |||||||
| Original whole loan amount | $190,000,000 | 100.0% | Loan payoff | $176,300,000 | 92.8% | |||
| Reserves | 75,000 | 0.0 | ||||||
| Closing costs | 1,685,311 | 0.9 | ||||||
| Return of equity | 11,939,689 | 6.3 | ||||||
| Total Sources | $190,000,000 | 100.0% | Total Uses | $190,000,000 | 100.0% |
The Property.The Empire Mall Property is a regional mall located in Sioux Falls, South Dakota. The Empire Mall Property contains approximately 1,124,451 square feet of retail space, inclusive of several ground leased outparcels. Built in 1974, the Empire Mall Property is comprised of one main building and five outparcel buildings situated on an approximately 121.7 acre parcel. The Empire Mall Property is anchored by Dick’s Clothing & Sport, Sears, J.C. Penney, Younkers, and Macys (on a ground lease). Other major tenants include a Hy-Vee grocery store, Richman Gordman and standalone outparcels including large tenants such as The District, Toys R Us/Babies R Us and T.J. Maxx. Two of the outparcels, totaling 13,450 square feet of rentable area, are subject to an underlying ground lease from a third party.
The Empire Mall Property underwent an approximately $17.0 million renovation in 2013, which included upgrades to the building entrances, replacement of floor finishes, ceiling and lighting retrofits, replacement of furniture, fixtures and equipment and the construction of a flagship Dick’s Clothing & Sport. The Empire Mall Property contains 6,470 surface parking spaces, resulting in a parking ratio of 5.8 spaces per 1,000 square feet of rentable area. As of October 23, 2015, the Empire Mall Property was 97.1% occupied by 127 tenants.
THE INFORMATION IN THIS STRUCTURAL AND COLLATERAL TERM SHEET IS NOT COMPLETE AND MAY BE AMENDED PRIOR TO THE TIME OF SALE. THIS TERM SHEET IS NOT AN OFFER TO SELL THESE SECURITIES AND IT IS NOT A SOLICITATION OF AN OFFER TO BUY THESE SECURITIES IN ANY JURISDICTION WHERE THE OFFER OR SALE IS NOT PERMITTED.
| 37 |
EMPIRE MALL |
The following table presents certain information relating to the tenancy at the Empire Mall Property:
Major Tenants
| Tenant Name | Credit Rating (Fitch/ Moody’s/ S&P)(1) | Tenant NRSF | % of NRSF | Annual U/W Base Rent PSF(2) | Annual U/W Base Rent(2) | % of Total Annual U/W Base Rent | Sales PSF(3) | Occupancy Cost(3) | Lease Expiration Date | ||||||||
| Anchor Tenant | |||||||||||||||||
| Dick’s Clothing & Sport | NR/NR/NR | 50,300 | 4.5% | $14.00 | $704,200 | 4.3% | $158 | 11.4% | 1/31/2024(4) | ||||||||
| Sears | C/Caa3/CCC+ | 100,709 | 9.0% | $3.77 | $379,691 | 2.3% | $132 | 3.3% | 6/30/2018(5) | ||||||||
| J.C. Penney | B-/Caa1/CCC+ | 134,209 | 11.9% | $2.66 | $356,931 | 2.2% | $153 | 2.1% | 4/30/2021(6) | ||||||||
| Younkers | NR/NR/NR | 101,151 | 9.0% | $2.76 | $279,122 | 1.7% | $211 | 3.5% | 1/31/2026(7) | ||||||||
| Macy’s (Ground Lease) | BBB+/Baa2/BBB+ | 100,790 | 9.0% | $0.35 | $35,000 | 0.2% | NAV | NAV | 1/31/2019(8) | ||||||||
| Total Anchor Tenants | 487,159 | 43.3% | $3.60 | $1,754,944 | 10.7% | ||||||||||||
| Major Tenants | |||||||||||||||||
| Hy-Vee | NR/NR/NR | 89,044 | 7.9% | $6.41 | $570,683 | 3.5% | NAV | NAV | 12/31/2026(9) | ||||||||
| Gap/Gap Kids/Baby Gap | BBB-/Baa2/BBB- | 15,004 | 1.3% | $31.81 | $477,352 | 2.9% | $153 | 26.6% | 1/31/2019(10) | ||||||||
| Richman Gordman | NR/NR/NR | 60,000 | 5.3% | $7.03 | $421,885 | 2.6% | $203 | 4.0% | 1/31/2017(11) | ||||||||
| T.J. Maxx | NR/A2/A+ | 25,818 | 2.3% | $11.50 | $296,907 | 1.8% | $438 | 3.0% | 1/31/2022(6) | ||||||||
| Old Navy | BBB-/Baa2/BBB- | 16,489 | 1.5% | $16.94 | $279,293 | 1.7% | $377 | 6.0% | 2/29/2020 | ||||||||
| The District (Ground Lease) | NR/NR/NR | 37,000 | 3.3% | $4.46 | $165,000 | 1.0% | NAV | NAV | 1/31/2024 | ||||||||
| Toys R Us/Babies R Us | NR/NR/NR | 30,625 | 2.7% | $2.87 | $87,846 | 0.5% | NAV | NAV | 1/31/2020 | ||||||||
| Total Other Major Tenants | 273,980 | 24.4% | $8.39 | $2,298,966 | 14.1% | ||||||||||||
| Non-Major Tenants | 330,858 | 29.4% | $37.14 | $12,289,190 | 75.2% | ||||||||||||
| Occupied Total | 1,091,997 | 97.1% | $14.97 | $16,343,100 | 100.0% | ||||||||||||
| Vacant Space | 32,454 | 2.9% | |||||||||||||||
| Collateral Total | 1,124,451 | 100.0% | |||||||||||||||
| (1) | Certain ratings are those of the parent company whether or not the parent guarantees the lease. |
| (2) | Annual U/W Base Rent PSF and Annual U/W Base Rent include contractual rent steps through July 2016, totaling $157,653. |
| (3) | Some tenants at the Empire Mall Property are not required to report sales and in such cases, Sales PSF and Occupancy Costs are not available. Sales PSF and Occupancy Cost are for the trailing 12-month period ending September 30, 2015. |
| (4) | Dick’s Clothing & Sport has three, five-year lease renewal options. |
| (5) | Sears has two, five-year lease renewal options. |
| (6) | J.C. Penney and T.J. Maxx each have one, five-year lease renewal option. |
| (7) | Younkers has three, ten-year lease renewal options. |
| (8) | Macy’s has three, ten-year lease renewal options. Macy’s may terminate its lease at anytime with 180 days notice. |
| (9) | Hy-Vee has four, five-year lease renewal options. |
| (10) | Gap/Gap Kids/Baby Gap has two, four-year lease renewal options. |
| (11) | Richman Gordman has one, five-year lease renewal option. |
THE INFORMATION IN THIS STRUCTURAL AND COLLATERAL TERM SHEET IS NOT COMPLETE AND MAY BE AMENDED PRIOR TO THE TIME OF SALE. THIS TERM SHEET IS NOT AN OFFER TO SELL THESE SECURITIES AND IT IS NOT A SOLICITATION OF AN OFFER TO BUY THESE SECURITIES IN ANY JURISDICTION WHERE THE OFFER OR SALE IS NOT PERMITTED.
| 38 |
EMPIRE MALL |
The following table presents certain information relating to the historical sales and occupancy costs at the Empire Mall Property:
Historical Sales (PSF) and Occupancy Costs(1)(2)(3)
| Tenant Name | 2012 | 2013 | 2014 | TTM 9/30/2015 | TTM 9/30/2015 Occupancy Cost |
| Younkers | $221 | $218 | $212 | $211 | 3.5% |
| Dick’s Clothing & Sport | NAP | NAP | $160 | $158 | 11.4% |
| Richman Gordman | $225 | $215 | $204 | $203 | 4.0% |
| J.C. Penney | $225 | $136 | $144 | $153 | 2.1% |
| Sears | $153 | $153 | $137 | $132 | 3.3% |
| Aeropostale | $594 | $474 | $419 | $382 | 10.1% |
| T.J. Maxx | $327 | $417 | $391 | $438 | 3.0% |
| Old Navy Clothing Company | $357 | $355 | $366 | $377 | 6.0% |
| Banana Republic | $241 | $216 | $205 | $214 | 12.3% |
| Express / Express Men | $223 | $226 | $201 | $205 | 23.1% |
| Rue 21 | $255 | $241 | $262 | $266 | 8.0% |
| Gap/Gap Kids/Baby Gap | $233 | $217 | $174 | $153 | 26.6% |
| Maurices | $523 | $510 | $517 | $564 | 13.6% |
| American Eagle Outfitters | $639 | $565 | $561 | $639 | 9.3% |
| Charlotte Russe | $301 | $288 | $265 | $235 | 23.7% |
| Buckle | NAP | NAP | $1,227 | $1,162 | 7.6% |
| Victoria’s Secret | $782 | $735 | $626 | $652 | 9.2% |
| Pink | NAP | $928 | $772 | $973 | 7.6% |
| Eddie Bauer | $234 | $245 | $217 | $229 | 24.1% |
| Zales Jewelers | $1,142 | $1,367 | $1,374 | $1,542 | 8.6% |
| Sephora | NAP | $536 | $702 | $832 | 6.6% |
| Yankee Candle | $392 | $416 | $402 | $385 | 20.5% |
| Men’s Warehouse | $366 | $405 | $432 | $451 | 3.8% |
| Bath & Body Works | $766 | $983 | $1,005 | $1,007 | 7.6% |
| Champs Sports | $414 | $421 | $398 | $397 | 13.6% |
| GameStop | $1,236 | $1,227 | $1,265 | $1,331 | 8.2% |
| Journeys | $697 | $654 | $664 | $630 | 16.5% |
| Gymboree | $544 | $538 | $456 | $461 | 16.8% |
| Famous Footwear | $278 | $377 | $351 | $387 | 11.2% |
| Foot Locker | $471 | $472 | $467 | $396(4) | 14.5% |
| Verizon Wireless | $406 | $435 | $667 | $1,232 | 10.0% |
| Things Remembered | $1,394 | $1,361 | $1,323 | $1,250 | 24.3% |
| Total In-Line (<10,000 square feet) | $436 | $435 | $423 | $451 | 14.5% |
| Total In-Line Occupancy Costs | 13.3% | 14.0% | 14.7% | 14.5% |
| (1) | Historical Sales (PSF) and Occupancy Costs were provided by the borrower. |
| (2) | Historical Sales (PSF) are based on lease net rentable square footage during each given period as some tenants listed may have expanded or reduced their lease net rentable square footage during such given period. |
| (3) | Historical Sales (PSF) and Occupancy Costs reflect those tenants who reported sales during the given period. |
| (4) | Foot Locker increased its net rentable area from 3,409 square feet to 4,103 square feet in April 2015. |
THE INFORMATION IN THIS STRUCTURAL AND COLLATERAL TERM SHEET IS NOT COMPLETE AND MAY BE AMENDED PRIOR TO THE TIME OF SALE. THIS TERM SHEET IS NOT AN OFFER TO SELL THESE SECURITIES AND IT IS NOT A SOLICITATION OF AN OFFER TO BUY THESE SECURITIES IN ANY JURISDICTION WHERE THE OFFER OR SALE IS NOT PERMITTED.
| 39 |
EMPIRE MALL |
The following table presents certain information relating to the lease rollover schedule at the Empire Mall Property:
Lease Expiration Schedule(1)(2)
| Year Ending December 31, | No. of Leases Expiring | Expiring NRSF | % of Total NRSF | Cumulative Expiring NRSF | Cumulative % of Total NRSF | Annual U/W Base Rent | Annual U/W Base Rent PSF(3) |
| MTM | 1 | 2,093 | 0.2% | 2,093 | 0.2% | $24,028 | $11.48 |
| 2015 | 2 | 3,860 | 0.3% | 5,953 | 0.5% | $126,149 | $32.68 |
| 2016 | 20 | 50,929 | 4.5% | 56,882 | 5.1% | $1,786,498 | $35.08 |
| 2017 | 16 | 100,880 | 9.0% | 157,762 | 14.0% | $2,177,184 | $21.58 |
| 2018 | 15 | 138,287 | 12.3% | 296,049 | 26.3% | $1,618,732 | $11.71 |
| 2019 | 14 | 144,754 | 12.9% | 440,803 | 39.2% | $1,792,019 | $12.38 |
| 2020 | 11 | 76,813 | 6.8% | 517,616 | 46.0% | $1,443,603 | $18.79 |
| 2021 | 9 | 152,721 | 13.6% | 670,337 | 59.6% | $1,056,743 | $6.92 |
| 2022 | 8 | 46,315 | 4.1% | 716,652 | 63.7% | $1,012,761 | $21.87 |
| 2023 | 11 | 32,051 | 2.9% | 748,703 | 66.6% | $1,368,805 | $42.71 |
| 2024 | 10 | 115,285 | 10.3% | 863,988 | 76.8% | $2,058,191 | $17.85 |
| 2025 | 4 | 17,256 | 1.5% | 881,244 | 78.4% | $713,891 | $41.37 |
| Thereafter | 6 | 210,753 | 18.7% | 1,091,997 | 97.1% | $1,164,497 | $5.53 |
| Vacant | 0 | 32,454 | 2.9% | 1,124,451 | 100.0% | $0 | $0.00 |
| Total/Weighted Average | 127 | 1,124,451 | 100.0% | $16,343,100 | $14.97 |
| (1) | Information obtained from the underwritten rent roll. |
| (2) | Certain tenants may have lease termination options that are exercisable prior to the originally stated expiration date of the subject lease and that are not considered in the Lease Expiration Schedule. |
| (3) | Annual U/W Base Rent PSF excludes vacant space. |
The following table presents historical occupancy percentages at the Empire Mall Property:
Historical Occupancy
12/31/2012(1)(2) | 12/31/2013(1)(2) | 12/31/2014(1)(2) | 10/23/2015(2)(3) | |||
| 94.6% | 98.0% | 97.2% | 97.1% |
| (1) | Information obtained from the borrower. |
| (2) | The occupancy excludes temporary tenants. |
| (3) | Information obtained from the underwritten rent roll. |
Operating History and Underwritten Net Cash Flow.The following table presents certain information relating to the historical operating performance and underwritten net cash flow at the Empire Mall Property:
Cash Flow Analysis
| 2013 | 2014 | TTM 9/30/2015 | U/W | % of U/W Effective Gross Income | U/W $ per SF | ||||||||
| Base Rent | $14,567,944 | $16,007,670 | $16,236,415 | $16,343,100(1) | 57.0% | $14.53 | |||||||
| Grossed Up Vacant Space | 0 | 0 | 0 | 1,659,860 | 5.8 | 1.48 | |||||||
| Percentage Rent | 465,506 | 366,503 | 639,664 | 809,257 | 2.8 | 0.72 | |||||||
| Total Reimbursables | 9,002,626 | 9,523,412 | 9,382,685 | 9,614,895 | 33.5 | 8.55 | |||||||
| Other Income | 1,864,173 | 1,816,492 | 1,962,852 | 1,962,852 | 6.8 | 1.75 | |||||||
| Less Vacancy & Credit Loss | 28,986 | (60,879) | 64,125 | (1,692,721)(2) | (5.9) | (1.51) | |||||||
| Effective Gross Income | $25,929,235 | $27,653,198 | $28,285,741 | $28,697,242 | 100% | $25.52 | |||||||
| Total Operating Expenses | $6,838,742 | $6,975,427 | $6,780,031 | $7,478,959 | 26.1% | $6.65 | |||||||
|
|
|
|
|
| ||||||||
| Net Operating Income | $19,090,493 | $20,677,771 | $21,505,710 | $21,218,283 | 73.9% | $18.87 | |||||||
| TI/LC | 0 | 0 | 0 | 589,189 | 2.1 | 0.52 | |||||||
| Capital Expenditures | 0 | 0 | 0 | 242,735 | 0.8 | 0.22 | |||||||
| Net Cash Flow | $19,090,493 | $20,677,771 | $21,505,710 | $20,386,359 | 71.0% | $18.13 | |||||||
| NOI DSCR(3) | 1.69x | 1.83x | 1.90x | 1.88x | |||||||||
| NCF DSCR(3) | 1.69x | 1.83x | 1.90x | 1.80x | |||||||||
| NOI DY(3) | 10.0% | 10.9% | 11.3% | 11.2% | |||||||||
| NCF DY(3) | 10.0% | 10.9% | 11.3% | 10.7% |
| (1) | U/W Base Rent includes contractual rent steps through May 2016, totaling $157,763. |
| (2) | The underwritten economic vacancy is 5.6%. The Empire Mall Property was 97.1% physically occupied as of October 23, 2015. |
| (3) | The debt service coverage ratios and debt yields are based on the Empire Mall Whole Loan. |
THE INFORMATION IN THIS STRUCTURAL AND COLLATERAL TERM SHEET IS NOT COMPLETE AND MAY BE AMENDED PRIOR TO THE TIME OF SALE. THIS TERM SHEET IS NOT AN OFFER TO SELL THESE SECURITIES AND IT IS NOT A SOLICITATION OF AN OFFER TO BUY THESE SECURITIES IN ANY JURISDICTION WHERE THE OFFER OR SALE IS NOT PERMITTED.
| 40 |
EMPIRE MALL |
Appraisal.As of the appraisal valuation date of October 15, 2015, the Empire Mall Property had an “as-is” appraised value of $350,000,000.
Environmental Matters.According to the Phase I environmental site assessment dated October 19, 2015, 11 non-active in-ground hydraulic lifts were observed at the Empire Mall Property. The status of these in-ground hydraulic cylinders and hydraulic reservoirs are unknown at this time and as such, they represent a recognized environmental condition. Sears has been identified as the responsible party for liability and costs associated with groundwater monitoring and remediation, if required. The Phase I Environmental Site Assessment recommends obtaining documentation regarding the decommissioning of the hydraulic lifts. If not available, it was recommended by the Phase I environmental assessment that the lifts be decommissioned.
Market Overview and Competition. The Empire Mall Property is located in the southeast quadrant of Interstate 29 and 41st Street in Sioux Falls, South Dakota. The Empire Mall Property is bounded by 41st Street to the north, 49th Street to the south, I-29 to the west, and Louise Avenue to the east. According to a third-party market research provider, daily traffic counts are approximately 29,000 to 35,000 vehicles along 41st Street and 44,000 vehicles along I-29. As of August 2015, Sioux Falls had a population of approximately 244,000 and has one of the lowest unemployment rates in the United States at 2.5%. Sioux Falls’ population grew at an average rate of 2.1% annually between 2004 and 2014, well above the statewide population growth rate of 1.0% annually and the average national growth rate of 0.9% annually over the same time period. Sioux Falls is a regional hub for education and health services and boasts the highest education attainment of any metropolitan area within the Midwest, with 30.9% of adult residents holding a bachelor’s or advanced college degree. The city was listed as one of the top 10 small places for business and careers for each of the past 10 years. The trade, transportation, utilities, education and health services sectors account for more than 40% of total employment in the metropolitan area, with Sanford Health and Avera Health, health care companies, and John Morrell & Co. being the top three employers. The Empire Mall Property’s trade area has a radius of 30.0 miles and includes approximately 253,225 people with average annual household income of $72,873. The closest regional mall competitor to the Empire Mall Property is located 77.0 miles south in Sioux City, Iowa.
According to a third-party research report, as of the third quarter of 2015, the Sioux Falls retail market reported a total retail inventory of 9.5 million square feet with a 2.2% vacancy rate and average asking rents of $11.94 per square foot, on a triple-net basis.
The following table presents certain information relating to comparable retail properties for the Empire Mall Property:
Competitive Set(1)
Empire Mall | Meadows on the River | Western Mall | Dawley Farm Village | Southern Hills Mall | River Hills Mall | |
| Location | Sioux Falls, SD | Sioux Falls, SD | Sioux Falls, SD | Sioux Falls, SD | Sioux City, IA | Mankato, MN |
| Distance from Subject | -- | 0.2 miles | 0.8 miles | 6.0 miles | 77.0 miles | 150.0 miles |
| Property Type | Regional Mall | Power Center | Community Center | Power Center | Regional Mall | Regional Mall |
| Year Built/Renovated | 1974/2013 | 1990/2008 | 1968/2003 | 2002/2013 | 1980/2000 | 1991/2007 |
| Anchors | Sears, Macy’s, J.C. Penney, Dick’s Clothing & Sport, Younkers | Home Depot, Michael’s, Walmart, PetSmart, Century Theatre, World Market | Scheels, Best Buy, Hancock Fabrics, SD Furniture Mart, West Mall 7 | Target, Kohl’s, Walmart Supercenter, Burlington Coat Factory | Sears, J.C. Penney, Scheels, Younkers, Carmike Cinema, Hy-Vee | J.C. Penney, Herberger’s, Sears, Target, Scheels, Barnes & Noble |
| Total GLA | 1,124,451 SF | 1,081,095 SF | 418,141 SF | 603,870 SF | 950,897 SF | 792,810 SF |
| Total Occupancy | 97% | 96% | 97% | 99% | 84% | 92% |
| (1) | Information obtained from the appraisal and underwritten rent roll. |
The Borrower.The borrower is Empire Mall, LLC, a Delaware limited liability company and single purpose entity with two independent directors. Legal counsel to the borrower delivered a non-consolidation opinion in connection with the origination of the Empire Mall Whole Loan. Simon Property Group, Inc. (“Simon”) is the guarantor of certain nonrecourse carveouts under the Empire Mall Whole Loan, in which liability is limited to $38,000,000 pursuant to a guaranty agreement.
The Sponsor.The sponsor, Simon (NYSE: SPG), is an S&P 100 company, owning or holding interests in 230 commercial properties totaling approximately 190.0 million square feet with total market capitalization of $66.5 billion as of September 30, 2015. Simon is a publicly traded real estate investment trust that was established in 1993 and operates a fully integrated real estate company from five retail real estate platforms: regional malls, Premium Outlet Centers, The Mills, community/lifestyle centers and international properties. Simon’s 2014 revenue was reported to be approximately $4.9 billion. See “Description of the Mortgage Pool — Non-Recourse Carveout Limitations” and “Description of the Mortgage Pool — Loan Purpose; Default History, Bankruptcy Issues and Other Proceedings” in the Preliminary Prospectus.
Escrows.The loan documents provide for an upfront escrow of $75,000 for outstanding tenant improvement and leasing obligations for J.C. Penney. The loan documents do not require monthly escrows for real estate taxes, insurance, replacement reserves or tenant improvements and leasing commissions reserves, provided no Debt Service Coverage Ratio Trigger Period (as defined below) has occurred and is continuing under the Empire Mall Whole Loan. In the event that a Debt Service Coverage Ratio Trigger Period has occurred, the borrower is required to make monthly deposits: (i) for the payment of real estate taxes in an amount equal to one-twelfth of the estimated annual taxes payable and for the payment of insurance in an amount equal to one-twelfth of the estimated annual insurance premiums payable; provided that so long as no event of default has occurred and is continuing, the borrower will
THE INFORMATION IN THIS STRUCTURAL AND COLLATERAL TERM SHEET IS NOT COMPLETE AND MAY BE AMENDED PRIOR TO THE TIME OF SALE. THIS TERM SHEET IS NOT AN OFFER TO SELL THESE SECURITIES AND IT IS NOT A SOLICITATION OF AN OFFER TO BUY THESE SECURITIES IN ANY JURISDICTION WHERE THE OFFER OR SALE IS NOT PERMITTED.
| 41 |
EMPIRE MALL |
not be required to make such deposits for so long as the borrower provides satisfactory evidence to the lender that the taxes have been paid prior to delinquency and the insurance policies are being maintained as part of a reasonably acceptable blanket insurance policy providing coverage to substantially all of the other properties managed by the property manager or its affiliates; (ii) for replacements and repairs in an amount equal to $20,228 (subject to a cap of $485,473); and (iii) for tenant improvements and leasing commissions in an amount equal to $49,099 (subject to a cap of $1,000,000).Monthly reserves for ground lease funds are required during the continuance of a Lockbox Event (see “Lockbox and Cash Management” section).
A “Debt Service Coverage Ratio Trigger Period” will commence if, as of the date of determination, the amortizing debt service coverage ratio based on the trailing four-calendar quarter period immediately preceding the date of such determination falls below 1.20x.
Lockbox and Cash Management.The Empire Mall Whole Loan requires a lender-controlled lockbox account, which is already in place, and that the borrower direct tenants to deposit all rents directly into the lockbox account and that the borrower and the property manager deposit all rents received into the lockbox account within two business days of receipt. Prior to the occurrence of a Lockbox Event (as defined below), all funds on deposit in the lockbox account will be released to the borrower on a weekly basis. Upon the occurrence and continuance of a Lockbox Event, funds on deposit in the lockbox account will be swept on a weekly basis and on the 30th day of each calendar month (or on each business day, during the continuance of an event of default) into a lender controlled cash management account.
A “Lockbox Event” will commence upon the occurrence of: (i) an event of default; (ii) any bankruptcy or insolvency proceeding of the borrower or the property manager (if the property manager is an affiliate of the borrower); (iii) if, as of the date of determination, the debt service coverage ratio based on the trailing four-calendar quarter period immediately preceding the date of such determination falls below 1.20x for two consecutive calendar quarters; or (iv) an Anchor Tenant Trigger Event (as defined below). A Lockbox Event will end with respect to clause (i), upon the acceptance by the lender of a cure of such event of default; with respect to clause (ii), if the borrower replaces the property manager with a qualified property manager pursuant to a replacement management agreement or such bankruptcy action is discharged or dismissed within 90 days; with respect to clause (iii), when the amortizing debt service coverage ratio based on the trailing four-calendar quarters of at least 1.20x has been achieved for two consecutive calendar quarters; or with respect to clause (iv), if such Anchor Tenants (as defined below) re-commence operations at the applicable premises and the borrower has delivered certification of such to the lender; provided, however, that (x) no event of default has occurred and is continuing under the loan agreement or any of the other Empire Mall Whole Loan documents; (y) the borrower has paid all of the lender’s reasonable out-of-pocket expenses actually incurred in connection with such Lockbox Event, including reasonable attorney’s fees and expenses; and (z) a Lockbox Event may not be cured more than five times in the aggregate during the term of the Empire Mall Whole Loan.
An “Anchor Tenant Trigger Event” will commence if two or more anchor tenants (i) go dark, vacate or cease to occupy their respective premises, (ii) reject their respective leases at the Empire Mall Property in a bankruptcy action or proceeding, or (iii) otherwise give notice to vacate during the term of the loan.
“Anchor Tenants” include J.C. Penney, Younkers, Sears, Hy-Vee, Dick’s Clothing and Sport, Macy’s and any replacement tenant occupying all or substantially all of the space previously demised to any of such Anchor Tenants.
Property Management. The Empire Mall Property is managed by an affiliate of the borrower.
Assumption.The borrower also has the right to transfer the Empire Mall Property or 100% of the aggregate interests in the borrower to a transferee that is not a Qualified Transferee (as defined below), provided that no event of default has occurred and is continuing, the conditions with respect to transfers to a transferee that is not a Qualified Transferee and certain additional conditions are satisfied, including, but not limited to receipt of a rating agency confirmation from Fitch, KBRA and Moody’s that the transfer will not result in a downgrade, withdrawal or qualification of the respective ratings assigned to the Series WFCM 2015-P2 Certificates and similar confirmations with respect to the ratings of any securities backed by the Empire Mall Companion Loans.
The borrower has the right to transfer the Empire Mall Property, or greater than 50% of the aggregate interests in the borrower, in one, or a series of, related transactions to one or more Qualified Transferees (as defined below) (other than a transfer to a Key Principal (as defined below) or any person wholly owned by one or more Key Principals, so long as such Key Principals owned 49% of the aggregate interests in the borrower prior to such transfer), 60 days after the WFCM 2015-P2 Trust closing date, provided that no event of default has occurred and is continuing and certain other conditions are satisfied, including, but not limited to delivery of an additional insolvency opinion.
A “Qualified Transferee” is: (a) any person or its affiliate (provided such person owns, directly or indirectly, not less than 51% of such affiliate) who owns and operates (i) at least five shopping centers and (ii) retail properties and shopping centers totaling in the aggregate at least 3,000,000 square feet of gross area; (b) any person or its affiliate (provided such person owns, directly or indirectly, not less than 51% of such affiliate) who has a net worth in excess of $250,000,000; or (c) any person, provided the lender has received written confirmation from each of Fitch, KBRA and Moody’s that the transfer to such person will not, in and of itself, cause a downgrade, withdrawal or qualification of the then current ratings of the Series WFCM 2015-P2 Certificates and similar confirmations with respect to ratings of any securities backed by the Empire Mall Companion Loans; provided, however, that no person will be deemed to be a Qualified Transferee if such person (x) is an embargoed person, (y) except for General Growth Properties or its affiliates, is or has during the previous seven years been the subject of a bankruptcy or insolvency proceeding or (z) has been convicted in a criminal proceeding for a felony or any crime involving moral turpitude or is an organized crime figure or is reputed to have substantial business or other affiliations with any organized crime figure.
“Key Principal” means any of SPG LP or Simon.
THE INFORMATION IN THIS STRUCTURAL AND COLLATERAL TERM SHEET IS NOT COMPLETE AND MAY BE AMENDED PRIOR TO THE TIME OF SALE. THIS TERM SHEET IS NOT AN OFFER TO SELL THESE SECURITIES AND IT IS NOT A SOLICITATION OF AN OFFER TO BUY THESE SECURITIES IN ANY JURISDICTION WHERE THE OFFER OR SALE IS NOT PERMITTED.
| 42 |
EMPIRE MALL |
Free Release. Provided that no event of default has occurred and is continuing, the borrower may: (i) make transfers of immaterial or non-income producing portions of the Empire Mall Property in connection with takings or condemnations of any portion of the Empire Mall Property; (ii) make transfers of non-income producing portions of the Empire Mall Property to third parties or affiliates of the borrower; and (iii) dedicate portions of the Empire Mall Property or grant easements, restrictions, covenants, reservations and rights of way in the ordinary course of business; subject to certain conditions, including, with respect to any of the transfers described in (ii) and (iii), delivery of an officer’s certificate evidencing that such transfer, conveyance or encumbrance will not result in a material adverse effect on the value of the Empire Mall Property, the business operations or financial condition of the borrower or the ability of the borrower to repay the Empire Mall Whole Loan.
Real Estate Substitution.Not permitted.
Subordinate and Mezzanine Indebtedness. None.
Ground Lease.The Empire Mall Property is subject to a ground lease encompassing a 13,450 square foot outparcel, which commenced on October 1, 1973 between Judson S. Berry and General Growth Properties. The outparcel is leased to two tenants, Red Lobster and Men’s Wearhouse. The second of two 10-year renewal options was exercised on October 27, 2015, extending the term to expire on September 30, 2033 with no remaining renewal options. The current monthly rental amount of $5,257 is adjusted every five years according to the increase in the consumer price index. For each percentage of increase in the annual index over that of the previous year, there will be a corresponding percentage increase in the monthly rental amount.
Terrorism Insurance. The loan documents require that the “all risk” insurance policy required to be maintained by the borrower provide coverage for terrorism in an amount equal to the full replacement cost of the Empire Mall Property, or if the Terrorism Risk Insurance Program Reauthorization Act is no longer in effect, the borrower will be required to obtain a standalone policy providing the same coverage for terrorism; provided, however (a) that the borrower will not be required to pay annual premiums in excess of two times the then-current annual premiums for the “all risk” insurance policy (excluding the catastrophic coverage of flood, earthquake and wind) and (b) that such stand-alone policy may have a deductible that is reasonable for such stand-alone policies with respect to properties similar to and reasonable for the geographic region where the Empire Mall Property is located, so long as in no event will such deductible exceed 5% of the total insured values. The loan documents also require business interruption insurance covering no less than the 18-month period following the occurrence of a casualty event, together with an extended period of indemnity, which will continue for the lesser of (i) the period of time until income returns to the same level as it was prior to loss and (ii) 365 days from the date that the Empire Mall Property is repaired or replaced and operations are resumed.
Windstorm Insurance.The loan documents require windstorm insurance covering the full replacement cost of the Empire Mall Property. At the time of loan closing, the Empire Mall Property had insurance for windstorms.
THE INFORMATION IN THIS STRUCTURAL AND COLLATERAL TERM SHEET IS NOT COMPLETE AND MAY BE AMENDED PRIOR TO THE TIME OF SALE. THIS TERM SHEET IS NOT AN OFFER TO SELL THESE SECURITIES AND IT IS NOT A SOLICITATION OF AN OFFER TO BUY THESE SECURITIES IN ANY JURISDICTION WHERE THE OFFER OR SALE IS NOT PERMITTED.
| 43 |
| PINEAPPLE HOTEL PORTFOLIO |
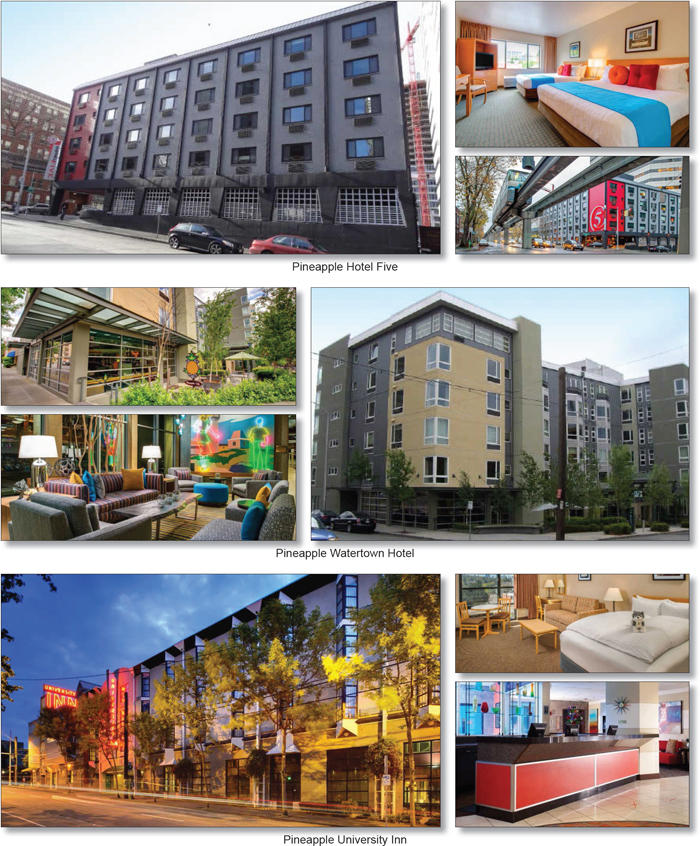
THE INFORMATION IN THIS STRUCTURAL AND COLLATERAL TERM SHEET IS NOT COMPLETE AND MAY BE AMENDED PRIOR TO THE TIME OF SALE. THIS TERM SHEET IS NOT AN OFFER TO SELL THESE SECURITIES AND IT IS NOT A SOLICITATION OF AN OFFER TO BUY THESE SECURITIES IN ANY JURISDICTION WHERE THE OFFER OR SALE IS NOT PERMITTED.
| 44 |
| PINEAPPLE HOTEL PORTFOLIO |
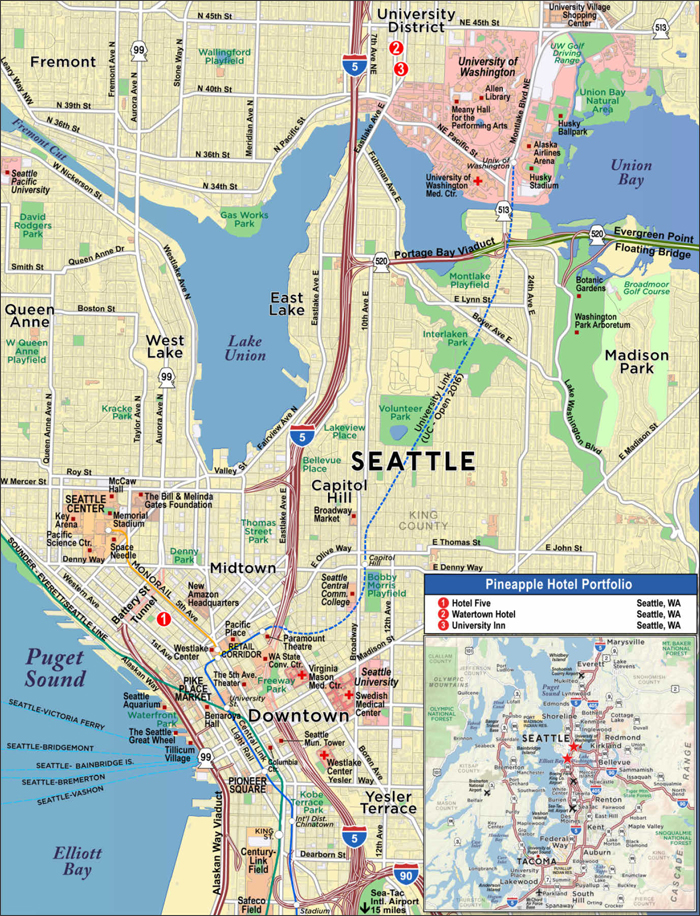
THE INFORMATION IN THIS STRUCTURAL AND COLLATERAL TERM SHEET IS NOT COMPLETE AND MAY BE AMENDED PRIOR TO THE TIME OF SALE. THIS TERM SHEET IS NOT AN OFFER TO SELL THESE SECURITIES AND IT IS NOT A SOLICITATION OF AN OFFER TO BUY THESE SECURITIES IN ANY JURISDICTION WHERE THE OFFER OR SALE IS NOT PERMITTED.
| 45 |
| No. 3 – Pineapple Hotel Portfolio | |||||||
| Loan Information | Property Information | ||||||
| Mortgage Loan Seller: | Principal Commercial Capital | Single Asset/Portfolio: | Portfolio | ||||
Credit Assessment (Fitch/KBRA/Moody’s): | NR/NR/NR | Property Type: | Hospitality | ||||
| Original Principal Balance: | $61,500,000 | Specific Property Type: | Limited Service | ||||
| Cut-off Date Principal Balance: | $61,500,000 | Location: | Seattle, WA | ||||
| % of Initial Pool Balance: | 6.1% | Size: | 318 rooms | ||||
| Loan Purpose: | Refinance | Cut-off Date Principal Balance Per Room: | $193,396 | ||||
| Borrower Names: | Dream Legacy PRU SPE LLC; PHC PRU SPE LLC | Year Built/Renovated: | Various – See Table | ||||
| Sponsor: | Michelle Foreman Barnet | Title Vesting:(4) | Fee | ||||
| Mortgage Rate: | 4.950% | Property Manager: | Self-managed | ||||
| Note Date: | November 6, 2015 | 3rd Most Recent Occupancy: | NAV | ||||
| Anticipated Repayment Date: | NAP | 2nd Most Recent Occupancy (As of): | 81.8% (12/31/2013) | ||||
| Maturity Date: | December 1, 2025 | Most Recent Occupancy (As of): | 87.6% (12/31/2014) | ||||
| IO Period: | 24 months | Current Occupancy (As of): | 89.1% (8/31/2015) | ||||
| Loan Term (Original): | 120 months | ||||||
| Seasoning: | 0 months | Underwriting and Financial Information: | |||||
| Amortization Term (Original): | 360 months | ||||||
| Loan Amortization Type: | Interest-only, Amortizing Balloon | 3rd Most Recent NOI(As of) (5): | $5,637,809 (12/31/2013) | ||||
| Interest Accrual Method: | Actual/360 | 2nd Most Recent NOI(As of) (5): | $7,759,364 (12/31/2014) | ||||
| Call Protection(1): | L(24),D(92),O(4) | Most Recent NOI(As of) (5): | $8,511,617 (TTM 8/31/2015) | ||||
| Lockbox Type: | Springing | ||||||
| Additional Debt(2): | None | ||||||
| Additional Debt Type: | NAP | U/W Revenues: | $16,980,118 | ||||
| U/W Expenses: | $8,589,520 | ||||||
| U/W NOI: | $8,390,598 | ||||||
| U/W NCF: | $7,711,393 | ||||||
| Escrows and Reserves(3): | U/W NOI DSCR: | 2.13x | |||||
| U/W NCF DSCR: | 1.96x | ||||||
| Type: | Initial | Monthly | Cap (If Any) | U/W NOI Debt Yield: | 13.6% | ||
| Taxes | $87,785 | $43,892 | NAP | U/W NCF Debt Yield: | 12.5% | ||
| Insurance | $0 | Springing | NAP | As-Is Appraised Value: | $102,500,000 | ||
| Deferred Maintenance | $67,625 | $0 | NAP | As-Is Appraisal Valuation Date: | July 29, 2015 | ||
| FF&E Reserve | $0 | $56,600 | $2,500,000 | Cut-Off Date LTV Ratio: | 60.0% | ||
| Seasonality Reserve | $200,000 | $50,000 | $400,000 | LTV Ratio at Maturity or ARD: | 51.8% | ||
| (1) | Partial releases of individual properties are allowed subject to either partial defeasance or prepayment with greater of yield maintenance or prepayment premium of 1% of the applicable release amount. See “Partial Release” section. |
| (2) | See “The Borrowers” section regarding pledge of an indirect ownership interest in the fee borrower to secure a promissory note between certain indirect owners. |
| (3) | See “Escrows” section. |
| (4) | See “The Borrowers” section |
| (5) | See “Cash Flow Analysis” section. |
The Mortgage Loan.The mortgage loan (the “Pineapple Hotel Portfolio Mortgage Loan”) is evidenced by a single promissory note that is secured by a first mortgage encumbering three limited service hotels located in Seattle, Washington (the “Pineapple Hotel Portfolio Properties”). The Pineapple Hotel Portfolio Mortgage Loan was originated on November 6, 2015 by Principal Commercial Capital. The Pineapple Hotel Portfolio Mortgage Loan had an original principal balance of $61,500,000, has an outstanding principal balance as of the Cut-off Date of $61,500,000 and accrues interest at an interest rate of 4.950%perannum. The Pineapple Hotel Portfolio Mortgage Loan had an initial term of 120 months, has a remaining term of 120 months as of the Cut-off Date and requires interest-only payments for the first 24 payments following origination and, thereafter, requires payments of principal and interest based on a 30-year amortization schedule. The Pineapple Hotel Portfolio Mortgage Loan matures on December 1, 2025.
Following the lockout period, the borrowers have the right to defease the Pineapple Hotel Portfolio Mortgage Loan in whole, or in part, and to prepay the Pineapple Hotel Portfolio Mortgage Loan in part (subject to payment of the greater of (i) a 1% prepayment premium or (ii) a yield maintenance premium, in each case based on the amount of principal balance being prepaid) in connection with a partial release (see “Partial Release” section), on any date before September 1, 2025. In addition, the Pineapple Hotel Portfolio Mortgage Loan is prepayable without penalty on or after September 1, 2025.
THE INFORMATION IN THIS STRUCTURAL AND COLLATERAL TERM SHEET IS NOT COMPLETE AND MAY BE AMENDED PRIOR TO THE TIME OF SALE. THIS TERM SHEET IS NOT AN OFFER TO SELL THESE SECURITIES AND IT IS NOT A SOLICITATION OF AN OFFER TO BUY THESE SECURITIES IN ANY JURISDICTION WHERE THE OFFER OR SALE IS NOT PERMITTED.
| 46 |
| PINEAPPLE HOTEL PORTFOLIO |
Sources and Uses
| Sources | Uses | |||||||
| Original loan amount | $61,500,000 | 100.0% | Loan payoff | $48,714,234 | 79.2% | |||
| Reserves | $355,410 | 0.6 | ||||||
| Closing costs | $724,825 | 1.2 | ||||||
| Return of Equity | $11,705,531 | 19.0 | ||||||
| Total Sources | $61,500,000 | 100.0% | Total Uses | $61,500,000 | 100.0% |
The Properties. The Pineapple Hotel Portfolio Properties comprise three unflagged hotel properties: the Hotel Five (the “Hotel Five Property”), the Watertown Hotel (the “Watertown Hotel Property”) and the University Inn (the “University Inn Property”).
The Hotel Five Property is a 116-room, five-story, limited service hotel built in 1973 and located in the central business district of Seattle, Washington. Situated on a 0.4 acre parcel, the Hotel Five Property features 64 queen guestrooms, 8 king guestrooms, 40 double queen guestrooms and 4 suites. Guestrooms feature a flat panel television, desk with chair, and complimentary internet. Amenities at the Hotel Five Property include a 300 square foot boardroom, fitness room, business desk, shuttle service, bicycle checkout program and a hotel restaurant/café. The hotel underwent an extensive interior renovation in 2012 and 2013 totaling approximately $5.5 million ($47,414 per room). In addition, the borrowers reported capital expenditures totaling over $220,000 between 2014 and 2015.
The Watertown Hotel Property is a 100-room, six-story, limited service hotel built in 2001 and located in Seattle, Washington. Situated on a 0.4 acre parcel, the Watertown Hotel Property features 58 double queen guestrooms, 22 king guestrooms and 20 suites. Guestrooms feature a desk with chair, coffee maker, microwave, refrigerator, and complimentary internet. Amenities at the Watertown Hotel Property include 1,304 square feet of meeting space, a fitness center, coffee shop/café, complimentary bike rentals, business center, shuttle service, guest laundry and secured underground parking for 74 vehicles. Since 2012, the borrowers reported capital expenditures of approximately $390,000.
The University Inn Property is a 102-room, four-story, limited service hotel built in 1962, expanded in 1992 and located in Seattle, Washington. Situated on a 0.9 acre parcel, the University Inn Property features 29 single queen guestrooms, 58 double queen rooms and 15 king guestrooms. Guestrooms feature a desk with chair, flat panel television, coffee maker, microwave, refrigerator, and complimentary internet. Amenities at the University Inn Property include on-site parking, full-service restaurant, complimentary breakfast, an outdoor pool, complimentary bike rentals, guest laundry and shuttle services. Since 2014, the borrowers reported capital expenditures of approximately $435,000. In addition, an approximately $800,000 renovation, including but not limited to new manufactured hardwood floors, flat panel televisions, bathroom vanity tops and bedding and furniture, will reportedly commence shortly after the Thanksgiving holiday on the University Inn Property’s original wing, which contains 42 guest rooms. Such renovation was not reserved for at origination.
The following table presents certain information relating to the Pineapple Hotel Portfolio Properties:
| Property Name – Location | Property Sub-Type | Allocated Cut-off Date Principal Balance | % of Portfolio Cut-off Date Principal Balance | Rooms | Cut-off Date Balance Per Room | Year Built/ Renovated | Appraised Value | Allocated Cut-off Date LTV | ||||||||||
| Hotel Five – Seattle, WA | Limited Service | $23,820,000 | 38.7% | 116 | $205,345 | 1973/2013 | $39,700,000 | 60.0% | ||||||||||
| Watertown Hotel – Seattle, WA | Limited Service | $19,980,000 | 32.5% | 100 | $199,800 | 2001/NAP | $33,300,000 | 60.0% | ||||||||||
| University Inn – Seattle, WA | Limited Service | $17,700,000 | 28.8% | 102 | $173,529 | 1962/NAP | $29,500,000 | 60.0% | ||||||||||
| Total/Weighted Average | $61,500,000 | 100.0% | 318 | $193,396 | $102,500,000 | 60.0% | ||||||||||||
THE INFORMATION IN THIS STRUCTURAL AND COLLATERAL TERM SHEET IS NOT COMPLETE AND MAY BE AMENDED PRIOR TO THE TIME OF SALE. THIS TERM SHEET IS NOT AN OFFER TO SELL THESE SECURITIES AND IT IS NOT A SOLICITATION OF AN OFFER TO BUY THESE SECURITIES IN ANY JURISDICTION WHERE THE OFFER OR SALE IS NOT PERMITTED.
| 47 |
| PINEAPPLE HOTEL PORTFOLIO |
Operating History and Underwritten Net Cash Flow. The following table presents certain information relating to the historical operating performance and the underwritten net cash flow of the Pineapple Hotel Portfolio Properties:
Cash Flow Analysis
| 2013 | 2014 | TTM 8/31/2015 | U/W | % of Gross Revenues | U/W $ per Room | ||||||||
| Occupancy | 81.8% | 87.6% | 89.1% | 89.1% | |||||||||
| ADR | $132.55 | $144.56 | $155.73 | $155.73 | |||||||||
| RevPAR | $108.37 | $126.65 | $138.76 | $138.76 | |||||||||
| Total Gross Revenues | $13,067,766 | $15,525,946 | $16,980,117 | $16,980,118 | 100.0 | % | $53,397 | ||||||
| Total Department Expenses | 3,601,233 | 3,742,731 | 4,106,832 | 4,106,833 | 24.2 | 12,915 | |||||||
| Gross Operating Profit | $9,466,533 | $11,783,215 | $12,873,285 | $12,873,285 | 75.8 | % | $40,482 | ||||||
| Total Undistributed Expenses | 3,162,945 | 3,325,397 | 3,640,641 | 3,652,415 | 21.5 | 11,486 | |||||||
| Profit Before Fixed Charges | $6,303,588 | $8,457,818 | $9,232,644 | $9,220,870 | 54.3 | % | $28,996 | ||||||
| Total Fixed Charges | 665,779 | 698,454 | 721,027 | 830,272 | 4.9 | 2,611 | |||||||
| Net Operating Income | $5,637,809(1) | $7,759,364 | $8,511,617 | $8,390,598 | 49.4 | % | $26,386 | ||||||
FF&E | 522,710 | 621,037 | 679,205 | 679,205 | 4.0 | 2,136 | |||||||
| Net Cash Flow | $5,115,099 | $7,138,326 | $7,832,412 | $7,711,393 | 45.4 | % | $24,250 | ||||||
| NOI DSCR | 1.43x | 1.97x | 2.16x | 2.13x | |||||||||
| NCF DSCR | 1.30x | 1.81x | 1.99x | 1.96x | |||||||||
| NOI DY | 9.2% | 12.6% | 13.8% | 13.6% | |||||||||
| NCF DY | 8.3% | 11.6% | 12.7% | 12.5% | |||||||||
| (1) | During 2013 the Hotel Five Property underwent a major renovation and the University Inn Property underwent elevator repairs. Subsequently, performance improved as an increased number of rooms were available for occupancy. |
Appraisal.As of the appraisal valuation dates of July 29, 2015, the Pineapple Hotel Portfolio Properties had an aggregate “as-is” appraised value of $102,500,000.
Environmental Matters.According to the Phase I environmental assessments dated August 5, 2015 and August 6, 2015, there was no evidence of any recognized environmental conditions at the Pineapple Hotel Portfolio Properties.
Market Overview and Competition.The Pineapple Hotel Portfolio Properties are located in Seattle, Washington. According to the appraisal, the Hotel Five Property is located in downtown Seattle, within one block of Amazon.com’s new 4.1 million square foot world headquarters (which is currently under construction) and walking distance to the Washington State Convention Center, Puget Sound Central Waterfront, Pike Place Market and several other major institutions and corporations. The Watertown Hotel Property and the University Inn Property are each located in the University District Neighborhood of Seattle within walking distance to the University of Washington, University of Washington Medical Center, and the Children’s Hospital and Regional Medical Center. The University of Washington is one of the oldest and largest state-assisted universities on the west coast with over 40,000 undergraduate and graduate students, and contributes approximately $12.5 billion to the economy of the State of Washington annually.
According to the appraisal, corporate demand for the Pineapple Hotel Portfolio Properties is driven by the University of Washington, healthcare, retail, technology, and finance traffic. Major employers in the Seattle area include Boeing (85,000 employees), Microsoft (41,664 employees), University of Washington (29,800 employees), Providence Health & Services (20,240 employees), Amazon.com (>10,000 employees), Starbucks (10,837 employees) and Nordstrom (9,281 employees). Leisure demand is generated by tourism, University of Washington Pacific 12 Conference collegiate events, professional sporting events at Safeco Field (home of the Seattle Mariners major league baseball team) and Century Link Field (home of the Seattle Seahawks), Pike Place Market and the Seattle Center. Meeting and group demand is generated by a number of sources, most notably the Washington State Convention and Trade Center. The Washington State Convention and Trade Center comprises 102,201 square feet of dedicated meeting space and 205,700 square feet of heavy load exhibit space. The Washington State Convention and Trade Center has planned a $1.4 billion expansion slated to begin in early 2017 that is expected to double its current capacity which is anticipated to create significant hotel demand for the Seattle market.
Demand segmentation at the Hotel Five Property is 56% commercial, 40% leisure and 4% meeting and group, compared to its competitive set of 35% commercial, 31% meeting and group and 34% leisure. Demand segmentation for the Watertown Hotel Property is 60% commercial/university, 26% leisure and 14% meeting and group, compared to its competitive set of 56% commercial/university, 23% leisure and 21% meeting and group. Demand segmentation for the University Inn Property is 75% commercial/university, 15% meeting and group and 10% leisure, compared to its competitive set of 56% commercial/university, 23% leisure and 21% meeting and group.
THE INFORMATION IN THIS STRUCTURAL AND COLLATERAL TERM SHEET IS NOT COMPLETE AND MAY BE AMENDED PRIOR TO THE TIME OF SALE. THIS TERM SHEET IS NOT AN OFFER TO SELL THESE SECURITIES AND IT IS NOT A SOLICITATION OF AN OFFER TO BUY THESE SECURITIES IN ANY JURISDICTION WHERE THE OFFER OR SALE IS NOT PERMITTED.
| 48 |
| PINEAPPLE HOTEL PORTFOLIO |
The following table presents certain information relating to the Pineapple Hotel Portfolio Properties’ competitive set:
Subject and Market Historical Occupancy, ADR and RevPAR
(Hotel Five Property)(1)
| Competitive Set | Hotel Five Hotel | Penetration Factor | |||||||||||||||||
| Year | Occupancy | ADR | RevPAR | Occupancy | ADR | RevPAR | Occupancy | ADR | RevPAR | ||||||||||
| 8/31/2015 TTM | 84.5% | $174.55 | $147.51 | 89.2% | $155.25 | $138.53 | 105.6% | 88.9% | 93.9% | ||||||||||
| 8/31/2014 TTM | 80.6% | $156.28 | $125.93 | 83.2% | $139.20 | $115.82 | 103.3% | 89.1% | 92.0% | ||||||||||
| 8/31/2013 TTM | 79.8% | $140.68 | $112.31 | 75.4% | $124.98 | $94.29 | 94.5% | 88.8% | 84.0% | ||||||||||
| (1) | Information obtained from a third party hospitality research report dated September 17, 2015. The competitive set includes the following hotels: Crowne Plaza Seattle Downtown, Hotel Max, Warwick Hotel Seattle, Roosevelt Hotel Seattle, The Paramount Hotel Seattle, Motif Seattle and Kimpton Hotel Monaco Seattle. |
Subject and Market Historical Occupancy, ADR and RevPAR
(Watertown Hotel Property)(1)
| Competitive Set | Watertown | Penetration Factor | |||||||||||||||||
| Year | Occupancy | ADR | RevPAR | Occupancy | ADR | RevPAR | Occupancy | ADR | RevPAR | ||||||||||
| 8/31/2015 TTM | 80.0% | $165.40 | $132.31 | 90.2% | $162.48 | $146.50 | 112.7% | 98.2% | 110.7% | ||||||||||
| 8/31/2014 TTM | 76.9% | $152.16 | $116.95 | 85.9% | $146.69 | $126.07 | 111.8% | 96.4% | 107.8% | ||||||||||
| 8/31/2013 TTM | 73.7% | $141.25 | $104.10 | 82.8% | $136.49 | $112.96 | 112.3% | 96.6% | 108.5% | ||||||||||
| (1) | Information obtained from a third party hospitality research report dated September 17, 2015. The competitive set includes the following hotels: Hotel Nexus, Hotel Deca, Silver Cloud Inn Seattle University, Courtyard Seattle Downtown Lake Union and Silver Cloud Inn Seattle Lake Union. |
Subject and Market Historical Occupancy, ADR and RevPAR
(University Inn Property)(1)
| Competitive Set | University Inn | Penetration Factor | |||||||||||||||||
| Year | Occupancy | ADR | RevPAR | Occupancy | ADR | RevPAR | Occupancy | ADR | RevPAR | ||||||||||
| 8/31/2015 TTM | 80.0% | $165.40 | $132.31 | 90.3% | $148.16 | $133.80 | 112.9% | 89.6% | 101.1% | ||||||||||
| 12/31/2014 YE | 77.8% | $156.35 | $121.63 | 88.0% | $140.04 | $123.24 | 113.1% | 89.6% | 101.3% | ||||||||||
| 12/31/2013 YE | 74.8% | $143.32 | $107.24 | 81.5% | $129.13 | $105.22 | 109.0% | 90.1% | 98.1% | ||||||||||
| (1) | The sponsor does not submit data from the University Inn Property to the provider of the third party hospitality research reports described above given the University Inn Property’s proximity to the Watertown Hotel Property. Information in the table above was derived by using third party hospitality reports dated September 17, 2015, January 16, 2015 and January 17, 2014, the borrowers’ provided trailing 12-month operating statement as of August 31, 2015, and year-end 2014 and year-end 2013 operating statements. In the appraisal of the University Inn Property dated October 28, 2015, the appraiser concluded the competitive set is identical to the Watertown Hotel Property and includes the following hotels: Hotel Nexus, Hotel Deca, Silver Cloud Inn Seattle University, Courtyard Seattle Downtown Lake Union and Silver Cloud Inn Seattle Lake Union. |
The Borrowers.The borrowers are Dream Legacy PRU SPE LLC and PHC PRU SPE LLC, each of which is a single purpose entity and Delaware limited liability company with two independent directors. Dream Legacy PRU SPE LLC, as landlord, leases the hotels to PHC PRU SPE LLC, as tenant under three separate master operating leases. Legal counsel to the borrowers delivered a non-consolidation opinion in connection with the origination of the Pineapple Hotel Portfolio Mortgage Loan. Michelle Foreman Barnet is the guarantor of certain non-recourse carveouts under the Pineapple Hotel Portfolio Mortgage Loan. Michelle Foreman Barnet is the indirect owner of 100% of PHC Pru SPE LLC, the master operating lessee borrower, and a family trust of which Michelle Foreman Barnet is a trustee (“the MFB Family Trust”) owns a 49% interest in Dream Legacy LLC, which owns 100% of Dream Legacy PRU SPE LLC, the fee borrower. The remaining 51% interest in Dream Legacy LLC, is owned by a family trust of which Ms. Barnet’s mother, Diane Foreman, is a trustee. A pledge of an indirect ownership interest in the fee borrower has been permitted as follows: the MFB Family Trust obtained its 49% equity ownership interest in Dream Legacy LLC from Diane Foreman and, in connection therewith, executed a promissory note in favor of Diane Foreman, and the MFB Family Trust has pledged its equity ownership interest in Dream Legacy LLC to Diane Foreman to secure such promissory note.
The Sponsor.The sponsor is Michelle Foreman Barnet. Since 1996, Ms. Barnet has served as president of Columbia West Properties (“Columbia West”), a company established in 1988 to manage a family-owned portfolio of commercial and hospitality real estate holdings. As of June 18, 2015, Columbia West managed real estate assets valued at approximately $350.0 million. In 2010, Pineapple Hospitality Company was formed specifically to manage the operational aspects of all portfolio hospitality assets, and Ms. Barnet also serves as its president. Presently, Columbia West and Pineapple Hospitality Company own and manage seven hotels, including four in Seattle (inclusive of the Pineapple Hotel Portfolio Properties), one in Portland, Oregon, one in San Francisco and one in San Diego.
Escrows.The loan documents provide for upfront escrows of $87,785 for real estate taxes, $67,625 for deferred maintenance and $200,000 for a seasonality reserve. The loan documents provide for ongoing monthly deposits in an amount determined by the lender (currently $43,892) for real estate taxes, $50,000 for seasonality reserves (during the months of March through October only; capped at $400,000), and FF&E reserves in an amount equal to one-twelfth of the greater of (i) 4.0% of the estimated total annual gross revenues (as set forth in the borrowers’ current fiscal year budget approved by the lender) and (ii) the amount required to be reserved for capital expenses and FF&E expenses under any future franchise agreement (or in the management agreement) (initially
THE INFORMATION IN THIS STRUCTURAL AND COLLATERAL TERM SHEET IS NOT COMPLETE AND MAY BE AMENDED PRIOR TO THE TIME OF SALE. THIS TERM SHEET IS NOT AN OFFER TO SELL THESE SECURITIES AND IT IS NOT A SOLICITATION OF AN OFFER TO BUY THESE SECURITIES IN ANY JURISDICTION WHERE THE OFFER OR SALE IS NOT PERMITTED.
| 49 |
| PINEAPPLE HOTEL PORTFOLIO |
$56,600 per month and capped at $2,500,000, subject to the borrowers providing evidence reasonably acceptable to the lender indicating a minimum of $750,000 has been spent to renovate the 42 rooms located in the original wing of the University Inn Property on or prior to June 30, 2016). No reserve for insurance premiums is required so long as the borrowers maintain insurance under an acceptable blanket insurance policy, provide proof of payment of renewal premiums and no event of default exists.
Lockbox and Cash Management.Upon the occurrence and during the continuance of a Cash Sweep Trigger Event (as defined below), the Pineapple Hotel Portfolio Mortgage Loan requires that the borrowers or property manager establish a lockbox account and direct all rents to be deposited directly into such lockbox account. Documents relating to the establishment of the lockbox account were signed at closing. During the continuance of a Cash Sweep Trigger Event, all cash flow is required to be swept from the lockbox account to a lender-controlled cash management account. If a Cash Sweep Cure occurs, funds in the lockbox account will be swept to a borrower-controlled operating account
A “Cash Sweep Trigger Event” will occur upon the earlier of (i) the occurrence and continuance of an event of default; or (ii) the amortizing debt service coverage ratio falling below 1.20x at the end of any calendar quarter.
A “Cash Sweep Cure” will occur, with respect to clause (i) above, upon the cure of such event of default; and with respect to clause (ii) above, upon the amortizing debt service coverage ratio being equal to or greater than 1.25x for two consecutive calendar quarters.
Property Management.The Pineapple Hotel Portfolio Properties are managed by an affiliate of the borrowers.
Assumption.The borrowers have the ongoing right to transfer the Pineapple Hotel Portfolio Properties provided that certain conditions are satisfied, including (i) no event of default has occurred and is continuing; (ii) approval of the proposed transferee and transfer by the lender, in its commercially reasonable discretion, including but not limited to the transferee’s creditworthiness, financial strength and real estate management, hotel management and leasing expertise; (iii) if the original guarantor is released (from and after the date of the transfer) in connection with the transfer, then any guarantor’s obligations are assumed by a person acceptable to the lender in its reasonable discretion; and (iv) at the lender’s option, and if required by the procedures of Fitch, KBRA or Moody’s, a confirmation from such rating agency that such assumption will not result in a downgrade, withdrawal or qualification of its ratings assigned to the Series 2015-P2 Certificates.
Partial Release.Following the lockout period, the borrowers may obtain the release of any individual property from the lien on the Pineapple Hotel Portfolio Mortgage Loan upon a third-party sale of such property provided that certain requirements are satisfied, including: (i) defeasance or prepayment of 120% of the allocated loan amount for such property being sold and, in the case of a prepayment, payment of the greater of (i) a 1% prepayment premium and (ii) a yield maintenance premium, in each case based on the amount of principal balance being prepaid; (ii) no event of default then exists under the loan documents; (iii) after giving effect to such release, the amortizing debt service coverage ratio for the remaining properties shall be no less than the greater of (x) the amortizing debt service coverage ratio immediately preceding such release and (y) 1.95x; (iv) after giving effect to such release, the loan-to-value ratio of the remaining properties shall not be greater than the lesser of (a) the loan-to-value ratio of the properties immediately preceding such release and (b) 60.0% (v) receipt of a REMIC opinion and (vi) at the lender’s option, receipt of a rating confirmation from Fitch, KBRA and Moody’s that such partial release will not result in a requalification, reduction or withdrawal of the rating assigned to the Series 2015-P2 Certificates by such rating agency. In the event of a prepayment in connection with a partial release, the loan documents provide that the monthly debt service payment will be reamortized based on the then remaining portion of the original 30-year amortization period.
Real Estate Substitution.Not permitted.
Subordinate and Mezzanine Indebtedness.Not permitted. See “The Borrowers” section above regarding pledge of an indirect ownership interest in the fee borrower to secure a promissory note between certain indirect owners.
Ground Lease.None.
Terrorism Insurance.The loan documents require that the “all risk” insurance policy required to be maintained by the borrowers provides coverage for terrorism in an amount equal to the full replacement cost of the Pineapple Hotel Portfolio Properties, as well as business interruption insurance covering no less than the 12-month period following the occurrence of a casualty event, together with a 6-month extended period of indemnity; provided that if the policies contain an exclusion for loss or damage incurred as a result of an act of terrorism or similar acts of sabotage, the borrowers are required to maintain separate insurance against such loss or damage provided such insurance (a) is commercially available and (b) can be obtained at a commercially reasonable cost as reasonably determined by lender.
Earthquake Insurance. The loan documents do not require earthquake insurance. Seismic reports prepared in connection with the origination of the Pineapple Hotel Portfolio Mortgage Loan indicated a probable maximum loss of 10.0% for the Hotel Five Property, 7.0% for the Watertown Hotel Property and 11.0% for the University Inn Property.
THE INFORMATION IN THIS STRUCTURAL AND COLLATERAL TERM SHEET IS NOT COMPLETE AND MAY BE AMENDED PRIOR TO THE TIME OF SALE. THIS TERM SHEET IS NOT AN OFFER TO SELL THESE SECURITIES AND IT IS NOT A SOLICITATION OF AN OFFER TO BUY THESE SECURITIES IN ANY JURISDICTION WHERE THE OFFER OR SALE IS NOT PERMITTED.
| 50 |
(THIS PAGE INTENTIONALLY LEFT BLANK)
THE INFORMATION IN THIS STRUCTURAL AND COLLATERAL TERM SHEET IS NOT COMPLETE AND MAY BE AMENDED PRIOR TO THE TIME OF SALE. THIS TERM SHEET IS NOT AN OFFER TO SELL THESE SECURITIES AND IT IS NOT A SOLICITATION OF AN OFFER TO BUY THESE SECURITIES IN ANY JURISDICTION WHERE THE OFFER OR SALE IS NOT PERMITTED.
| 51 |
ADLER OFFICE AND ADLER INDUSTRIAL |
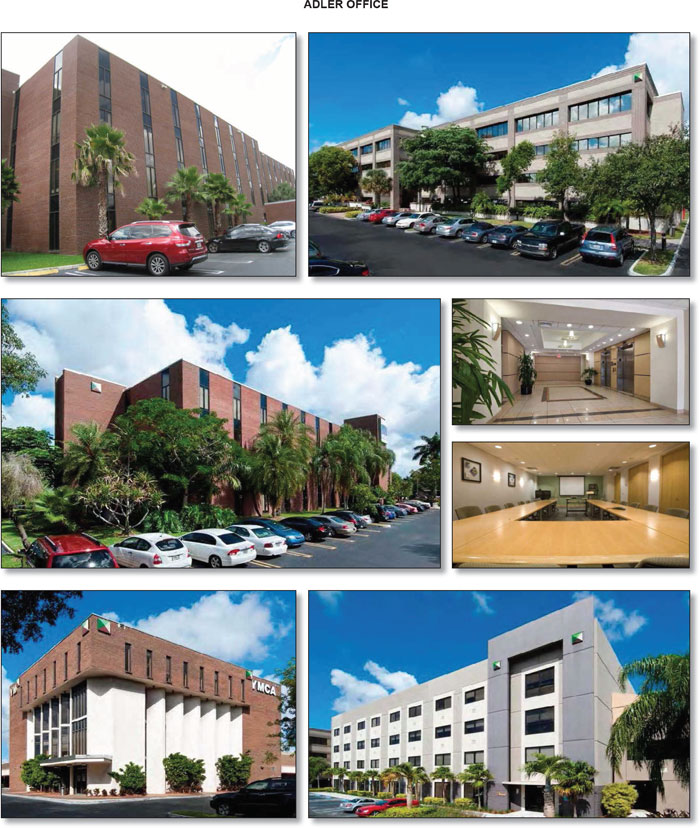
THE INFORMATION IN THIS STRUCTURAL AND COLLATERAL TERM SHEET IS NOT COMPLETE AND MAY BE AMENDED PRIOR TO THE TIME OF SALE. THIS TERM SHEET IS NOT AN OFFER TO SELL THESE SECURITIES AND IT IS NOT A SOLICITATION OF AN OFFER TO BUY THESE SECURITIES IN ANY JURISDICTION WHERE THE OFFER OR SALE IS NOT PERMITTED.
| 52 |
ADLER OFFICE AND ADLER INDUSTRIAL |
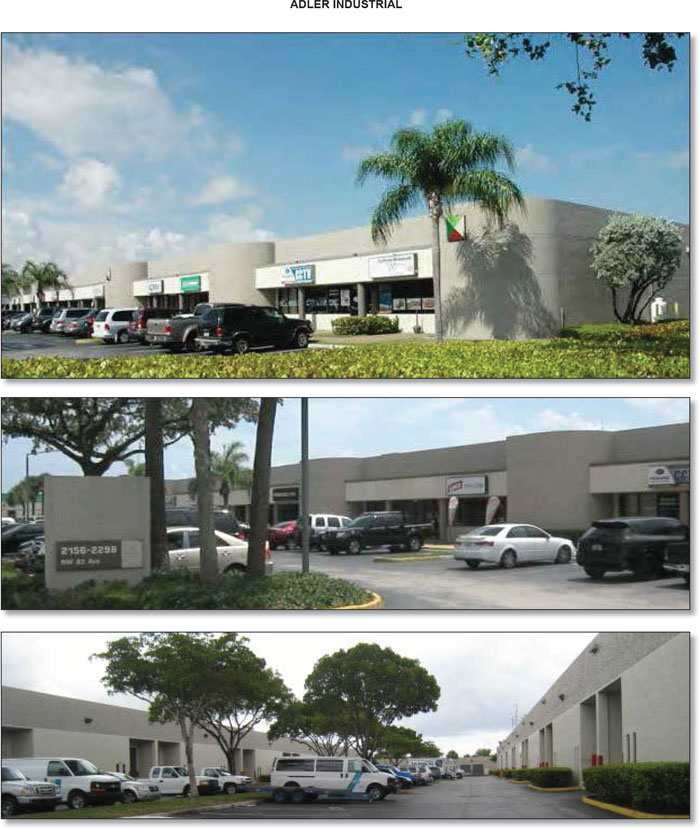
THE INFORMATION IN THIS STRUCTURAL AND COLLATERAL TERM SHEET IS NOT COMPLETE AND MAY BE AMENDED PRIOR TO THE TIME OF SALE. THIS TERM SHEET IS NOT AN OFFER TO SELL THESE SECURITIES AND IT IS NOT A SOLICITATION OF AN OFFER TO BUY THESE SECURITIES IN ANY JURISDICTION WHERE THE OFFER OR SALE IS NOT PERMITTED.
| 53 |
ADLER OFFICE AND ADLER INDUSTRIAL |
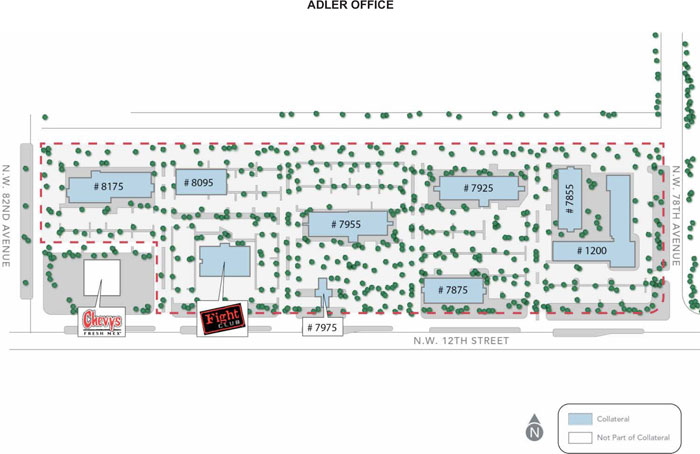
THE INFORMATION IN THIS STRUCTURAL AND COLLATERAL TERM SHEET IS NOT COMPLETE AND MAY BE AMENDED PRIOR TO THE TIME OF SALE. THIS TERM SHEET IS NOT AN OFFER TO SELL THESE SECURITIES AND IT IS NOT A SOLICITATION OF AN OFFER TO BUY THESE SECURITIES IN ANY JURISDICTION WHERE THE OFFER OR SALE IS NOT PERMITTED.
| 54 |
ADLER OFFICE AND ADLER INDUSTRIAL |
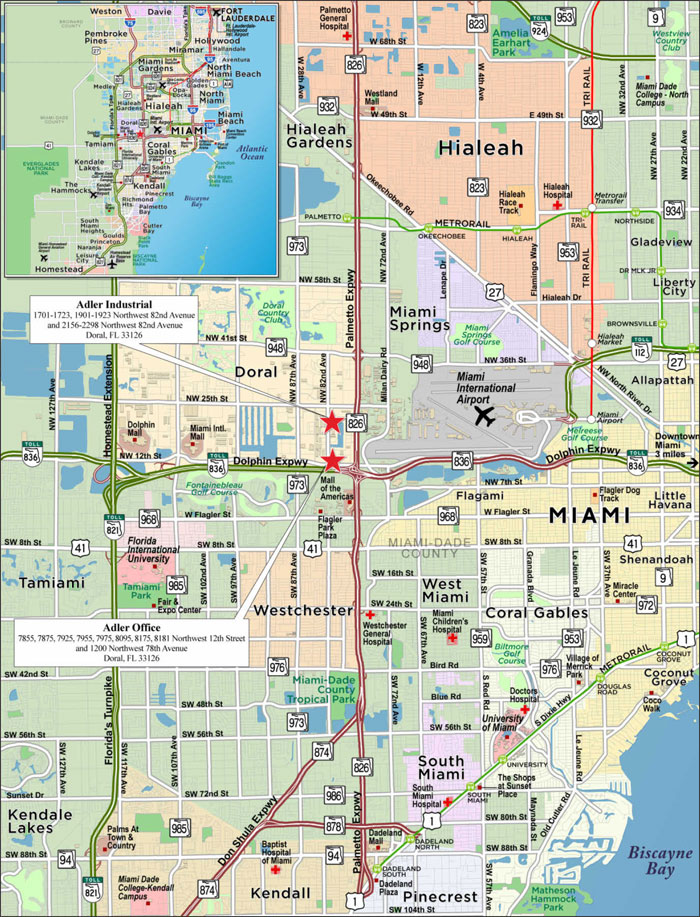
THE INFORMATION IN THIS STRUCTURAL AND COLLATERAL TERM SHEET IS NOT COMPLETE AND MAY BE AMENDED PRIOR TO THE TIME OF SALE. THIS TERM SHEET IS NOT AN OFFER TO SELL THESE SECURITIES AND IT IS NOT A SOLICITATION OF AN OFFER TO BUY THESE SECURITIES IN ANY JURISDICTION WHERE THE OFFER OR SALE IS NOT PERMITTED.
| 55 |
| No. 4 & 5 – Adler Office and Adler Industrial(1) | ||||||||
| Loan Information | Property Information | |||||||
| Mortgage Loan Seller: | Principal Commercial Capital | Single Asset/Portfolio: | Portfolio | |||||
Credit Assessment (Fitch/KBRA/Moody’s): | NR/NR/NR | Property Type: | Office; Industrial | |||||
| Original Principal Balance: | $57,000,000 | Specific Property Type: | Suburban; Light Industrial | |||||
| Cut-off Date Principal Balance: | $57,000,000 | Location: | Doral, FL | |||||
| % of Initial Pool Balance: | 5.7% | Size: | Various(4) | |||||
| Loan Purpose: | Refinance | Cut-off Date Principal Balance Per SF: | $97.51 | |||||
| Borrower Names: | AOA Office, LLC; AOA Flexx, LLC | Year Built/Renovated: | Various(4) | |||||
| Sponsor: | Michael M. Adler | Title Vesting: | Fee | |||||
| Mortgage Rate: | 4.860% | Property Manager: | Self-managed | |||||
| Note Date: | August 5, 2015 | 3rdMost Recent Occupancy (As of)(5): | 90.5% (12/31/2012) | |||||
| Anticipated Repayment Date: | NAP | 2nd Most Recent Occupancy (As of)(5: | 85.6% (12/31/2013) | |||||
| Maturity Date: | September 1, 2025 | Most Recent Occupancy (As of)(5): | 81.2% (12/31/2014) | |||||
| IO Period: | 60 months | Current Occupancy (As of)(5): | 86.8% (11/03/2015) | |||||
| Loan Term (Original): | 120 months | |||||||
| Seasoning: | 3 months | Underwriting and Financial Information: | ||||||
| Amortization Term (Original): | 360 months | |||||||
| Loan Amortization Type: | Interest-only, Amortizing Balloon | 3rd Most Recent NOI (As of)(6): | $5,070,543 (12/31/2013) | |||||
| Interest Accrual Method: | Actual/360 | 2nd Most Recent NOI (As of)(6): | $4,398,664 (12/31/2014) | |||||
| Call Protection: | L(27),D(89),O(4) | Most Recent NOI (As of)(6): | $4,023,195 (TTM 9/30/2015) | |||||
| Lockbox Type: | Hard/Springing Cash Management | |||||||
| Additional Debt(2): | Yes | |||||||
| Additional Debt Type(2): | Future Mezzanine | |||||||
| U/W Revenues: | $9,334,092 | |||||||
| U/W Expenses: | $4,177,565 | |||||||
| U/W NOI(6): | $5,156,527 | |||||||
| Escrows and Reserves(3): | U/W NCF: | $4,653,278 | ||||||
| U/W NOI DSCR: | 1.43x | |||||||
| Type: | Initial | Monthly | Cap (If Any) | U/W NCF DSCR: | 1.29x | |||
| Taxes | $746,233 | $74,623 | NAP | U/W NOI Debt Yield: | 9.0% | |||
| Insurance | $302,691 | $50,449 | NAP | U/W NCF Debt Yield: | 8.2% | |||
| Replacement Reserve | $0 | $13,079 | NAP | As-Is Appraised Value: | $90,000,000 | |||
| TI/LC Reserve | $1,500,000 | $48,715 | $1,169,144 | As-Is Appraisal Valuation Date: | August 4, 2015 | |||
| Outstanding TI Allowance | $116,677 | $0 | NAP | Cut-off Date LTV Ratio: | 63.3% | |||
| Rent Escrow | $426,134 | $0 | NAP | LTV Ratio at Maturity or ARD: | 58.3% | |||
| (1) | The Adler Office mortgage loan and the Adler Industrial mortgage loan (collectively, the “Adler Office and Adler Industrial Crossed Mortgage Loans”) are cross-collateralized and cross-defaulted with one another. All information herein represents the Adler Office mortgage loan and the Adler Industrial mortgage loan presented as one mortgage loan, except as otherwise specified below. With respect to each of the Adler Office and Adler Industrial mortgage loans, the applicable loan-to-value ratios, debt service coverage ratios and debt yields for each such mortgage loan is based upon the ratio or yield (as applicable) for the aggregate indebtedness evidenced by both mortgage loans. On an individual basis, without regard to the cross-collateralization feature, a related mortgage loan may have a higher loan-to-value ratio, lower debt service coverage ratio and/or lower debt yield than is presented herein. |
| (2) | See “Subordinate and Mezzanine Indebtedness” section. |
| (3) | See “Escrows” section. |
| (4) | See table set forth in “The Properties” section. |
| (5) | See “Historical Occupancy” section. |
| (6) | See “Cash Flow Analysis” section. |
The Mortgage Loan. The Adler Office mortgage loan and the Adler Industrial mortgage loan (collectively, the “Adler Office and Adler Industrial Crossed Mortgage Loans”) are cross-collateralized and cross-defaulted with one another and are each evidenced by a single promissory note that is secured by a first mortgage encumbering a 388,305 square foot office property and a 196,267 square foot industrial property, respectively, located in Doral, Florida (collectively, the “Adler Office and Adler Industrial Properties”). The Adler Office and Adler Industrial Crossed Mortgage Loans were originated on August 5, 2015 by Principal Commercial Capital. The Adler Office and Adler Industrial Crossed Mortgage Loans had an original principal balance of $57,000,000, have an outstanding principal balance as of the Cut-off Date of $57,000,000 and accrue interest at an interest rate of 4.860%per annum. The Adler Office and Adler Industrial Crossed Mortgage Loans had an initial term of 120 months, have a remaining term of 117 months as of the Cut-off Date and require interest-only payments for the first 60 payments following origination and, thereafter, require payments of principal and interest based on a 30-year amortization schedule. The Adler Office and Adler Industrial Crossed Mortgage Loans mature on September 1, 2025.
THE INFORMATION IN THIS STRUCTURAL AND COLLATERAL TERM SHEET IS NOT COMPLETE AND MAY BE AMENDED PRIOR TO THE TIME OF SALE. THIS TERM SHEET IS NOT AN OFFER TO SELL THESE SECURITIES AND IT IS NOT A SOLICITATION OF AN OFFER TO BUY THESE SECURITIES IN ANY JURISDICTION WHERE THE OFFER OR SALE IS NOT PERMITTED.
| 56 |
ADLER OFFICE AND ADLER INDUSTRIAL |
Following the lockout period, the borrowers have the right to defease either of the Adler Office and Adler Industrial Mortgage Loans in whole, or in part (see “Partial Release” section), onany date before June 1, 2025. In addition, each of the Adler Office and Adler Industrial Crossed Mortgage Loans are prepayable without penalty on or after June 1, 2025.
Sources and Uses – Adler Office
| Sources | Uses | |||||||
| Original loan amount | $40,200,000 | 100.0% | Loan payoff | $34,551,355 | 85.9% | |||
| Reserves | 2,589,671 | 6.4 | ||||||
| Closing costs | 710,713 | 1.8 | ||||||
| Return of equity | 2,348,261 | 5.8 | ||||||
| Total Sources | $40,200,000 | 100.0% | Total Uses | $40,200,000 | 100.0% |
Sources and Uses – Adler Industrial
| Sources | Uses | |||||||
| Original loan amount | $16,800,000 | 100.0% | Loan payoff | $13,953,899 | 83.1% | |||
| Reserves | 502,064 | 3.0 | ||||||
| Closing costs | 155,388 | 0.9 | ||||||
| Return of equity | 2,188,649 | 13.0 | ||||||
| Total Sources | $16,800,000 | 100.0% | Total Uses | $16,800,000 | 100.0% |
The Properties. The Adler Office and Adler Industrial Properties are comprised of a 388,305 square foot office property and a 196,267 square foot industrial property located in Doral, Florida, approximately 13.3 miles west of Miami.
Adler Office
The Adler Office property is comprised of nine adjacent one-, two- and four-story office buildings containing 388,305 square feet and situated on 20.4 acres in Doral, Florida. The Adler Office property features seven multi-story office buildings, a single story bank drive-through building and a stand-alone fitness center building which were built between 1979 and 1999. The Adler Office property contains 1,155 surface parking spaces and 195 spaces within a parking garage for a total of 1,350 parking spaces, resulting in a parking ratio of 3.5 spaces per 1,000 square feet of rentable area. As of November 3, 2015, the Adler Office property was 85.6% occupied by 104 tenants.
Adler Industrial
The Adler Industrial property consists of two proximate, non-contiguous, industrial/office/warehouse developments comprised of five buildings containing 196,267 square feet and situated on 12.1 acres in Doral, Florida. The parcel located at 1701 NW 82nd Avenue is improved with two buildings with an estimated office finish of 60.0% of the net rentable area and the parcel located at 2210 NW 82nd Avenue is improved with three buildings with an estimated office finish of 25.0% of the net rentable area. The buildings were constructed in 1988 and 1991. The Adler Industrial property contains 441 surface parking spaces, resulting in a parking ratio of 2.2 per 1,000 square feet of rentable area. As of November 3, 2015, the Adler Industrial property was 89.3% occupied by 52 tenants.
The following table presents certain information relating to the Adler Office and Adler Industrial Properties:
| Property Name - Location | Allocated Cut-off Date Principal Balance | % of Cut- off Date Principal Balance(1) | % of Crossed Cut- off Date Principal Balance% | Year Built/ Renovated | Net Rentable Area (SF) | Appraised Value | Allocated LTV | |||||||
| Adler Office | $40,200,000 | 100.0% | 70.5% | 1979/NAP | 388,305 | $63,000,000 | 63.8% | |||||||
| 1200 NW 78th Avenue – Doral, FL | 5,168,571 | 12.9 | 9.1 | 1980/NAP | 59,047 | 8,100,000 | 63.8 | |||||||
| 7855 NW 12th Street – Doral, FL | 2,233,333 | 5.6 | 3.9 | 1980/NAP | 25,400 | 3,500,000 | 63.8 | |||||||
| 7875 NW 12th Street – Doral, FL | 2,297,143 | 5.7 | 4.0 | 1979/NAP | 25,400 | 3,600,000 | 63.8 | |||||||
| 7925 NW 12th Street – Doral, FL | 8,295,238 | 20.6 | 14.6 | 1979/NAP | 71,189 | 13,000,000 | 63.8 | |||||||
| 7955 NW 12th Street – Doral, FL | 5,487,619 | 13.7 | 9.6 | 1982/NAP | 69,990 | 8,600,000 | 63.8 | |||||||
| 7975 NW 12th Street – Doral, FL | 510,476 | 1.3 | 0.9 | 1982/NAP | 1,900 | 800,000 | 63.8 | |||||||
| 8095 NW 12th Street – Doral, FL | 4,594,286 | 11.4 | 8.1 | 1999/NAP | 41,878 | 7,200,000 | 63.8 | |||||||
| 8175 NW 12th Street – Doral, FL | 8,167,620 | 20.3 | 14.3 | 1987/NAP | 65,921 | 12,800,000 | 63.8 | |||||||
| 8181 NW 12th Street – Doral, FL | 3,445,714 | 8.6 | 6.0 | 1986/NAP | 27,580 | 5,400,000 | 63.8 | |||||||
| Adler Industrial | $16,800,000 | 100.0% | 29.5% | 1988/NAP | 196,267 | 27,000,000 | 62.2% | |||||||
| 1701-1901 NW 82nd Avenue – Doral, FL(2) | 6,844,444 | 40.7 | 12.0 | 1991/NAP | 62,832 | 11,000,000 | 62.2 | |||||||
| 2156-2298 NW 82nd Avenue – Doral, FL(3) | 9,955,556 | 59.3 | 17.5 | 1988/NAP | 133,435 | 16,000,000 | 62.2 | |||||||
| Total/Weighted Average | $57,000,000 | 100.0% | 100.0% | 584,572 | $90,000,000 | 63.3% |
| (1) | The % of Cut-off Date Principal Balance is split out separately for each of the Adler Office and Adler Industrial Crossed Mortgage Loans. |
| (2) | The 1701-1901 NW 82nd Avenue property consists of two industrial buildings. |
| (3) | The 2156-2298 NW 82nd Avenue property consists of three industrial buildings. |
THE INFORMATION IN THIS STRUCTURAL AND COLLATERAL TERM SHEET IS NOT COMPLETE AND MAY BE AMENDED PRIOR TO THE TIME OF SALE. THIS TERM SHEET IS NOT AN OFFER TO SELL THESE SECURITIES AND IT IS NOT A SOLICITATION OF AN OFFER TO BUY THESE SECURITIES IN ANY JURISDICTION WHERE THE OFFER OR SALE IS NOT PERMITTED.
| 57 |
ADLER OFFICE AND ADLER INDUSTRIAL |
The following table presents certain information relating to the tenancy at the Adler Office and Adler Industrial Properties:
Major Tenants
| Tenant Name | Credit Rating (Fitch/Moody’s/ S&P) | Tenant NRSF | % of NRSF(1) | Annual U/W Base Rent PSF(2) | Annual U/W Base Rent(2) | % of Total Annual U/W Base Rent(1) | Lease Expiration Date |
| Adler Office Major Tenants | |||||||
| Florida Department of Revenue | NR/NR/NR | 37,750 | 6.5% | $22.53 | $850,339 | 9.4% | 3/31/2023(3) |
| Fight Club America, Inc. | NR/NR/NR | 27,580 | 4.7% | $23.00 | $634,340(4) | 7.0% | 11/30/2024 |
| FCNH, Inc. | NR/NR/NR | 14,280 | 2.4% | $28.95 | $413,413 | 4.6% | 10/31/2016 |
| Miami-Dade County | NR/NR/NR | 17,225 | 2.9% | $20.69 | $356,343 | 4.0% | 4/01/2018(5) |
| P.K. Management Group, Inc. | NR/NR/NR | 15,887(6) | 2.7% | $19.17 | $304,582(6) | 3.4% | Various(6) |
| Total Major Office Tenants | 112,722 | 19.3% | $22.70 | $2,559,017 | 28.4% | ||
| Non-Major Office Tenants | 219,635 | 37.6% | $19.12 | $4,199,345 | 46.6% | ||
| Total Occupied Office Tenants | 332,357 | 56.9% | $20.33 | $6,758,362 | 75.0% | ||
| Vacant Office | 55,948 | 9.6% | |||||
| Total Adler Office | 388,305 | 66.4% | |||||
| Adler Industrial Major Tenants | |||||||
| Miami Behavioral Health Center, Inc. | NR/NR/NR | 10,773 | 1.8% | $16.88 | $181,848 | 2.0% | 8/31/2020(7) |
| Miami-Dade County | NR/NR/NR | 11,900(8) | 2.0% | $14.54 | $173,067(8) | 1.9% | Various(8) |
| Capillus, LLC | NR/NR/NR | 8,418 | 1.4% | $14.00 | $117,852 | 1.3% | 10/31/2020(9) |
| J&K Mechanical LLC | NR/NR/NR | 11,900 | 2.0% | $8.24 | $98,056 | 1.1% | 10/31/2019 |
| Brown Y USA, Inc | NR/NR/NR | 5,515 | 0.9% | $16.00 | $88,240 | 1.0% | 2/28/2018 |
| Total Major Industrial Tenants | 48,506 | 8.3% | $13.59 | $659,063 | 7.3% | ||
| Non-Major Industrial Tenants | 126,680 | 21.7% | $12.54 | $1,588,592 | 17.6% | ||
| Total Occupied Industrial Tenants | 175,186 | 30.0% | $12.83 | $2,247,655 | 25.0% | ||
| Vacant Industrial | 21,081 | 3.6% | |||||
| Total Adler Industrial | 196,267 | 33.6% | |||||
| Combined Occupied Total | 507,543 | 86.8% | $17.74 | $9,006,017 | 100.0% | ||
| Combined Vacant Total | 77,029 | 13.2% | |||||
| Combined Collateral Total | 584,572 | 100.0% | |||||
| (1) | The % of NRSF and % of Total Annual U/W Base Rent are based upon the Combined Collateral Total Tenant NRSF and the Combined Occupied Total Annual U/W Base Rent, respectively. |
| (2) | Annual U/W Base Rent PSF and Annual U/W Base Rent include contractual rent steps through June 2016 totaling $85,006. |
| (3) | Florida Department of Revenue has the right to terminate its lease upon six months’ notice in the event a state-owned building becomes available to such tenant for occupancy. The obligations of the tenant under its lease are contingent upon annual appropriations. |
| (4) | Fight Club America, Inc. recently took occupancy and is currently paying an annual rent of $317,170 ($11.50 per square foot) through January 31, 2016. Beginning on February 1, 2016, the tenant is required to pay an annual rent of $634,340. An escrow was collected at closing for such tenant’s free/reduced rent. |
| (5) | Miami-Dade County has the right to terminate its lease at the Adler Office property with 90 days’ notice. The obligations of the tenant under its lease are contingent upon annual appropriations. |
| (6) | P.K. Management Group, Inc. occupies a 10,843 square foot space and a 5,044 square foot space with an annual underwritten rent of $22.50 per square foot and $12.02 per square foot, respectively, and lease expirations of December 31, 2017 and September 30, 2016, respectively. P.K. Management Group, Inc. has the right to terminate its 10,843 square foot space on December 31, 2016 with 120 days’ notice and payment of a $49,484 termination fee. |
| (7) | Miami Behavioral Health Center, Inc. may terminate its lease at any time upon 120 days’ notice if the tenant’s funding from state and federal sources has been reduced by at least 20% from that established on September 1, 2012. |
| (8) | Miami-Dade County occupies a 5,100 square foot space, a 3,400 square foot space, and two 1,700 square foot spaces at the Adler Industrial property with annual underwritten rents of $15.79 per square foot, $14.48 per square foot, $13.11 per square foot and $12.36 per square foot, respectively, and lease expirations of April 30, 2019, April 30, 2017, June 30, 2016, and February 28, 2019, respectively. Miami-Dade County has the right to terminate at any time with 90 days’ notice the lease on the 5,100 square foot space and on the 1,700 square foot space which expires June 30, 2016 and the right to terminate with 120 days’ notice the lease on the 3,400 square foot space. The obligations of the tenant under its leases are contingent upon annual appropriations. |
| (9) | Capillus, LLC has a one-time termination option effective August 31, 2018 with 90 days’ notice and payment of a $20,000 termination fee. |
THE INFORMATION IN THIS STRUCTURAL AND COLLATERAL TERM SHEET IS NOT COMPLETE AND MAY BE AMENDED PRIOR TO THE TIME OF SALE. THIS TERM SHEET IS NOT AN OFFER TO SELL THESE SECURITIES AND IT IS NOT A SOLICITATION OF AN OFFER TO BUY THESE SECURITIES IN ANY JURISDICTION WHERE THE OFFER OR SALE IS NOT PERMITTED.
| 58 |
ADLER OFFICE AND ADLER INDUSTRIAL |
The following tables present certain information relating to the lease rollover schedule at the Adler Office and Adler Industrial Properties:
Lease Expiration Schedule – Adler Office Property(1)(2)
Year Ending December 31, | No. of Leases Expiring | Expiring NRSF | % of Total NRSF | Cumulative Expiring NRSF | Cumulative % of Total NRSF | Annual U/W Base Rent(3) | Annual U/W Base Rent PSF(3) |
| MTM | 0 | 0 | 0.0% | 0 | 0.0% | $0 | $0.00 |
| 2015 | 3 | 3,186 | 0.8% | 3,186 | 0.8% | $65,515 | $20.56 |
| 2016 | 39 | 91,041 | 23.4% | 94,227 | 24.3% | $1,881,615 | $20.67 |
| 2017 | 25 | 42,663 | 11.0% | 136,890 | 35.3% | $839,707 | $19.68 |
| 2018 | 23 | 71,241 | 18.3% | 208,131 | 53.6% | $1,418,148 | $19.91 |
| 2019 | 4 | 10,567 | 2.7% | 218,698 | 56.3% | $203,272 | $19.24 |
| 2020 | 9 | 43,113 | 11.1% | 261,811 | 67.4% | $787,186 | $18.26 |
| 2021 | 0 | 0 | 0.0% | 261,811 | 67.4% | $0 | $0.00 |
| 2022 | 0 | 0 | 0.0% | 261,811 | 67.4% | $0 | $0.00 |
| 2023 | 1 | 37,750 | 9.7% | 299,561 | 77.1% | $850,339 | $22.53 |
| 2024 | 1 | 27,580 | 7.1% | 327,141 | 84.2% | $634,340 | $23.00 |
| 2025 | 1 | 5,216 | 1.3% | 332,357 | 85.6% | $78,240 | $15.00 |
| Thereafter | 0 | 0 | 0.0% | 332,357 | 85.6% | $0 | $0.00 |
| Vacant | 0 | 55,948 | 14.4% | 388,305 | 100.0% | $0 | $0.00 |
| Total/Weighted Average | 106 | 388,305 | 100.0% | $6,758,362 | $20.33 |
| (1) | Information obtained from the underwritten aggregate rent roll. |
| (2) | Certain tenants may have lease termination options that are exercisable prior to the originally stated expiration date of the subject lease and that are not considered in the Lease Expiration Schedule. |
| (3) | Weighted Average Annual U/W Base Rent and Annual U/W Base Rent PSF excludes vacant space. |
Lease Expiration Schedule – Adler Industrial Property(1)(2)
Year Ending December 31, | No. of Leases Expiring | Expiring NRSF | % of Total NRSF | Cumulative Expiring NRSF | Cumulative % of Total NRSF | Annual U/W Base Rent(3) | Annual U/W Base Rent PSF(3) |
| MTM | 0 | 0 | 0.0% | 0 | 0.0% | $0 | $0.00 |
| 2015 | 2 | 3,400 | 1.7% | 3,400 | 1.7% | $41,450 | $12.19 |
| 2016 | 26 | 66,021 | 33.6% | 69,421 | 35.4% | $787,334 | $11.93 |
| 2017 | 11 | 25,427 | 13.0% | 94,848 | 48.3% | $349,147 | $13.73 |
| 2018 | 9 | 24,887 | 12.7% | 119,735 | 61.0% | $411,342 | $16.53 |
| 2019 | 4 | 26,200 | 13.3% | 145,935 | 74.4% | $283,154 | $10.81 |
| 2020 | 6 | 29,251 | 14.9% | 175,186 | 89.3% | $375,228 | $12.83 |
| 2021 | 0 | 0 | 0.0% | 175,186 | 89.3% | $0 | $0.00 |
| 2022 | 0 | 0 | 0.0% | 175,186 | 89.3% | $0 | $0.00 |
| 2023 | 0 | 0 | 0.0% | 175,186 | 89.3% | $0 | $0.00 |
| 2024 | 0 | 0 | 0.0% | 175,186 | 89.3% | $0 | $0.00 |
| 2025 | 0 | 0 | 0.0% | 175,186 | 89.3% | $0 | $0.00 |
| Thereafter | 0 | 0 | 0.0% | 175,186 | 89.3% | $0 | $0.00 |
| Vacant | 0 | 21,081 | 10.7% | 196,267 | 100.0% | $0 | $0.00 |
| Total/Weighted Average | 58 | 196,267 | 100.0% | $2,247,655 | $12.83 |
| (1) | Information obtained from the underwritten aggregate rent roll. |
| (2) | Certain tenants may have lease termination options that are exercisable prior to the originally stated expiration date of the subject lease and that are not considered in the Lease Expiration Schedule. |
| (3) | Weighted Average Annual U/W Base Rent and Annual U/W Base Rent PSF excludes vacant space. |
The following table presents historical occupancy percentages at the Adler Office and Adler Industrial Properties:
Historical Occupancy
Property | 12/31/2012(1) | 12/31/2013(1) | 12/31/2014(1) | 11/3/2015(2)(3) | ||||
| Adler Office property | 89.3% | 84.6% | 80.1% | 85.6% | ||||
| Adler Industrial property | 92.9% | 87.7% | 83.4% | 89.3% | ||||
| Weighted Average | 90.5% | 85.6% | 81.2% | 86.8% |
| (1) | Information provided by the borrowers. |
| (2) | Information obtained from the underwritten rent roll. |
| (3) | The increase in occupancy at the Adler Office property from December 31, 2014 to November 3, 2015 is largely due to four new leases (totaling 50,165 square feet of net rentable area) being executed. The increase in occupancy at the Adler Industrial property from December 31, 2014 to November 3, 2015 is largely due to one new lease (Capillus, LLC representing 8,418 square feet of net rentable area) being executed. |
THE INFORMATION IN THIS STRUCTURAL AND COLLATERAL TERM SHEET IS NOT COMPLETE AND MAY BE AMENDED PRIOR TO THE TIME OF SALE. THIS TERM SHEET IS NOT AN OFFER TO SELL THESE SECURITIES AND IT IS NOT A SOLICITATION OF AN OFFER TO BUY THESE SECURITIES IN ANY JURISDICTION WHERE THE OFFER OR SALE IS NOT PERMITTED.
| 59 |
ADLER OFFICE AND ADLER INDUSTRIAL |
Operating History and Underwritten Net Cash Flow.The following tables present certain information relating to the historical operating performance and underwritten net cash flow at the Adler Office and Adler Industrial Properties on an individual basis:
Cash Flow Analysis – Adler Office Property(1)
| 2013 | 2014 | TTM 9/30/2015 | U/W | % of U/W Effective Gross Income | U/W $ per SF | |||||||
| Base Rent | $6,440,393 | $5,958,977 | $5,677,046 | $6,758,362(2) | 96.9% | $17.40 | ||||||
| Grossed Up Vacant Space | 0 | 0 | 0 | 1,164,552 | 16.7 | 3.00 | ||||||
| Total Reimbursables | 222,909 | 150,489 | 65,755 | 65,742 | 0.9 | 0.17 | ||||||
| Other Income | 179,016 | 148,682 | 124,577 | 161,029 | 2.2 | 0.41 | ||||||
| Less Vacancy &Credit Loss | 0 | 0 | 0 | (1,174,332)(3) | (16.8) | (3.02) | ||||||
| Effective Gross Income | $6,842,318 | $6,258,148 | $5,867,378 | $6,975,353 | 100% | $17.96 | ||||||
| Total Operating Expenses | $3,181,713 | $3,313,718 | $3,368,935 | $3,350,978 | 48.0% | $8.63 | ||||||
| Net Operating Income | $3,660,605 | $2,944,430 | $2,498,443 | $3,624,375(4) | 52.0% | $9.33 | ||||||
| TI/LC | 0 | 0 | 0 | 253,330 | 3.6 | 0.65 | ||||||
| Capital Expenditures | 0 | 0 | 0 | 97,076 | 1.4 | 0.25 | ||||||
| Net Cash Flow | $3,660,605 | $2,944,430 | $2,498,443 | $3,273,969 | 46.9% | $8.43 | ||||||
| NOI DSCR | 1.44x | 1.16x | .98x | 1.42x | ||||||||
| NCF DSCR | 1.44x | 1.16x | .98x | 1.28x | ||||||||
| NOI DY | 9.1% | 7.3% | 6.2% | 9.0% | ||||||||
| NCF DY | 9.1% | 7.3% | 6.2% | 8.1% |
| (1) | The downward trend in historical operating performance occurred during the construction of a $600.0 million road and infrastructure improvement project that has been underway directly east and south of the subject property since 2013. These improvements are scheduled to be completed by early 2016; however, there can be no assurance as to the effect of such completion or as to future occupancy or rental or reimbursement income. |
| (2) | U/W Base Rent includes rent steps through June 2016 totalling $57,492 and income from four new leases (50,165 square feet of net rentable area and $1,067,082 in annual base rent) that are required to commence paying full rent by February 1, 2016. Escrows for all new leases were collected at closing for free rent and outstanding tenant improvements and leasing commissions (see “Escrows” section). |
| (3) | The underwritten economic vacancy is 14.7%. The Adler Office property was 85.6% physically occupied as of November 3, 2015. |
| (4) | The increase in U/W Net Operating Income from TTM 9/30/2015 is largely due to new leasing which includes four new leases that are required to commence paying full rent by February 1, 2016. The full base rent amounts for all tenants have been included in the underwritten cash flow (differential of approximately $749,912 from the current combined annual base rent amount for such four tenants of $317,170 (which represents the current annual base rent required to be paid by Fight Club America, Inc.)). |
Cash Flow Analysis – Adler Industrial Property
| 2013 | 2014 | TTM 9/30/2015 | U/W | % of U/W Effective Gross Income | U/W $ per SF | |||||||
| Base Rent | $2,131,803 | $2,187,761 | $2,240,607 | $2,247,655(1) | 95.3% | $11.45 | ||||||
| Grossed Up Vacant Space | 0 | 0 | 0 | 299,046 | 12.7 | 1.52 | ||||||
| Total Reimbursables | 25,012 | 24,474 | 28,055 | 29,205 | 1.2 | 0.15 | ||||||
| Other Income | 82,219 | 78,964 | 81,234 | 85,244 | 3.6 | 0.43 | ||||||
| Less Vacancy &Credit Loss | 0 | 0 | 0 | (302,411)(2) | (12.8) | (1.54) | ||||||
| Effective Gross Income | $2,239,034 | $2,291,199 | $2,349,896 | $2,358,739 | 100% | $12.02 | ||||||
| Total Operating Expenses | $829,096 | $836,965 | $825,144 | $826,587 | 35.0% | $4.21 | ||||||
| Net Operating Income | $1,409,938 | $1,454,234 | $1,524,752 | $1,532,152 | 65.0% | $7.81 | ||||||
| TI/LC | 0 | 0 | 0 | 103,776 | 4.4 | 0.53 | ||||||
| Capital Expenditures | 0 | 0 | 0 | 49,067 | 2.1 | 0.25 | ||||||
| Net Cash Flow | $1,409,938 | $1,454,234 | $1,524,752 | $1,379,309 | 58.5% | $7.03 | ||||||
| NOI DSCR | 1.32x | 1.37x | 1.43x | 1.44x | ||||||||
| NCF DSCR | 1.32x | 1.37x | 1.43x | 1.30x | ||||||||
| NOI DY | 8.4% | 8.7% | 9.1% | 9.1% | ||||||||
| NCF DY | 8.4% | 8.7% | 9.1% | 8.2% |
| (1) | U/W Base Rent includes rent steps through June 2016 totalling $27,514. |
| (2) | The underwritten economic vacancy is 11.7%. The Adler Industrial property was 89.3% physically occupied as of November 3, 2015. |
Appraisal. As of the appraisal valuation date of August 4, 2015, the Adler Office and Adler Industrial Properties had an aggregate “as-is” appraised value of $90,000,000 ($63,000,000 for the Adler Office property and $27,000,000 for the Adler Industrial property).
Environmental Matters.According to the Phase I environmental site assessments dated June 18, 2015, there was no evidence of any recognized environmental conditions at the Adler Office and Adler Industrial Properties.
Market Overview and Competition.The Adler Office and Adler Industrial Properties are located within the Miami International Commerce Center, which is situated immediately west of the Palmetto Expressway (SR 826) and north of the Dolphin Expressway (SR 836). The Adler Office and Adler Industrial Properties benefit from direct access to Miami International Airport via ingress and egress on NW 12th Street. Miami International Airport serves over 80 airlines to approximately 150 destinations and handled
THE INFORMATION IN THIS STRUCTURAL AND COLLATERAL TERM SHEET IS NOT COMPLETE AND MAY BE AMENDED PRIOR TO THE TIME OF SALE. THIS TERM SHEET IS NOT AN OFFER TO SELL THESE SECURITIES AND IT IS NOT A SOLICITATION OF AN OFFER TO BUY THESE SECURITIES IN ANY JURISDICTION WHERE THE OFFER OR SALE IS NOT PERMITTED.
| 60 |
ADLER OFFICE AND ADLER INDUSTRIAL |
approximately 40.6 million domestic and international passengers in 2014. International trade supports over 105,000 jobs and is a key industry in Miami. Miami International Mall is located in the northeast quadrant of the intersection of NW 12th Street and NW 107th Avenue. This regional mall contains more than 1,000,000 square feet and anchor tenants include Macy’s, H&M, J.C. Penney, Sears and Kohl’s. The Dolphin Mall, located in the northeast quadrant of the intersection of SR 836 and Florida’s Turnpike, includes more than 240 value oriented stores such as Bloomingdale’s The Outlet Store, Coach Factory Store, Last Call by Neiman Marcus and Saks Fifth Avenue OFF 5th. The neighborhood surrounding the Adler Office and Adler Industrial Properties has a large concentration of commercial and industrial development. The neighborhood is well established with limited land available to support new development. The Adler Office and Adler Industrial Properties are expected to benefit from over $600.0 million in road improvements, as a number of projects are currently being completed which are expected to facilitate the tenants’ ability to access the Adler Office and Adler Industrial Properties. These projects, scheduled for completion by early 2016, are expected to improve connectivity of the area as well as alleviate traffic congestion within the immediate area along Milam Dairy Road and NW 12th Street.
Adler Office
According to the appraisal, the Adler Office property is located within the Miami Airport office submarket of the Miami-Dade County office market. As of the first quarter of 2015, the Miami Airport office submarket had a vacancy rate of 10.7% and average asking rents of $24.89 per square foot full service. Additionally, according to a third-party market report, as of the first quarter of 2015, the Miami Airport office submarket is the largest office market in Miami-Dade, comprising 349 buildings with a total inventory of 16.1 million square feet. The appraiser concluded market rent of $20.00-$23.50 per square foot with base year stops for office, $20.00 per square foot triple net for the health club and $40.00 per square foot triple net for the bank.
Adler Industrial
According to the appraisal, the Adler Industrial property is located within the Miami Airport industrial submarket. As of the first quarter of 2015, the Miami Airport industrial submarket had a vacancy rate of 6.4% and average asking rents of $9.48 per square foot triple net. Additionally, according to a third-party market report, as of the first quarter of 2015, the Miami Airport industrial submarket is the largest industrial market in Miami-Dade, comprising 2,066 buildings with a total inventory of 77.6 million square feet. The appraiser concluded market rent of $15.00-$16.00 per square foot for the 1701 NW 82nd Avenue buildings and $11.50 per square foot for the 2210 NW 82nd Avenue buildings, both with base year stops.
The Borrowers. The borrowers are AOA Office, LLC and AOA Flexx, LLC, each of which is a single purpose entity and Delaware limited liability company with two independent directors. Legal counsel to the borrowers provided a non-consolidation opinion in connection with the origination of each of theAdler Office and Adler Industrial Crossed MortgageLoans. Michael M. Adler is the nonrecourse carve-out guarantor under theAdler Office and Adler Industrial Crossed MortgageLoans. Mr. Adler owns approximately 24.5% of each borrower (72.6% when including Mr. Adler and his family members).
The Sponsor.The sponsor for theAdler Office and Adler Industrial Crossed MortgageLoans is Michael M. Adler. Mr. Adler is the chairman and chief executive officer of The Adler Group. The Adler Group was formed in 1978, and including its affiliates, has over 50 years of experience in leasing, property management, acquisitions, investment, development and construction. Throughout its history, The Adler Group has developed and acquired in excess of 18.0 million square feet of industrial, office, retail, and residential real estate. The company owns and manages an extensive real estate portfolio comprised primarily of multi-tenant industrial and office properties located throughout Miami, South Florida, Central Florida, Nashville, Charlotte, Houston, and Washington D.C.Mr. Adler disclosed prior foreclosures, deeds-in-lieu of foreclosure, and receiverships with respect to seven properties in which Mr. Adler and/or his affiliates was a sponsor or investor, all of which took place during the period from 2013 to the present.See “Description of the Mortgage Pool—Loan Purpose; Default History, Bankruptcy Issues and Other Proceedings” in the Preliminary Prospectus.
Escrows. The following are brief summaries of upfront and monthly reserves for the Adler Office and Adler Industrial Crossed Mortgage Loans:
Adler Office
The loan documents for the Adler Office mortgage loan require upfront reserves in an amount determined by the lender for payment of real estate taxes and insurance (currently $536,561 for real estate taxes and $213,437 for insurance premiums), $1,350,000 for general tenant improvements and leasing commissions, $100,370 for outstanding tenant improvement allowances and leasing commissions related to three tenants ($57,510 for United States Conference of Catholic Bishops, Inc., $25,862 for Community/Condotte/De Moya JV and $16,998 for Coastal Care Services, Inc.) and $389,303 for a free rent escrow related to seven tenants ($158,585 for Fight Club America Inc., $107,421 for Coastal Care Services, Inc., $63,779 for A1 Commercial Associates Group, LLC, $38,340 for United States Conference of Catholic Bishops, Inc., $14,976 for Community/Condotte/De Moya JV, $4,403 for CTS Engineering, Inc. and $1,799 for Blue Guard Insurance Group, Inc.).
The loan documents for the Adler Office mortgage loan require monthly deposits in an amount determined by the lender for payment of real estate taxes and insurance (currently $53,656 for real estate taxes and $35,573 for insurance premiums); $32,359 for general tenant improvements and leasing commissions (subject to a cap of $776,610); and $8,990 for replacement reserves.
Adler Industrial
The loan documents for the Adler Industrial mortgage loan require upfront reserves in an amount determined by the lender for payment of real estate taxes and insurance (currently $209,672 for real estate taxes and $89,254 for insurance premiums), $150,000 for general tenant improvements and leasing commissions, $16,307 for outstanding leasing commissions for Capillus, LLC and $36,831 for a free rent escrow related to three tenants ($33,672 for Capillus, LLC, $1,700 for Liquors USA Corp. and $1,459 for Van Son Holland Ink Corporate of America).
THE INFORMATION IN THIS STRUCTURAL AND COLLATERAL TERM SHEET IS NOT COMPLETE AND MAY BE AMENDED PRIOR TO THE TIME OF SALE. THIS TERM SHEET IS NOT AN OFFER TO SELL THESE SECURITIES AND IT IS NOT A SOLICITATION OF AN OFFER TO BUY THESE SECURITIES IN ANY JURISDICTION WHERE THE OFFER OR SALE IS NOT PERMITTED.
| 61 |
ADLER OFFICE AND ADLER INDUSTRIAL |
The loan documents for the Adler Industrial mortgage loan require monthly deposits in an amount determined by the lender for payment of real estate taxes and insurance (currently $20,967 for real estate taxes and $14,876 for insurance premiums); $16,356 for general tenant improvements and leasing commissions (subject to a cap of $392,534); and $4,089 for replacement reserves.
Lockbox and Cash Management. TheAdler Office and Adler Industrial Crossed MortgageLoans are structured with a hard lockbox and springing cash management. TheAdler Office and Adler Industrial Crossed MortgageLoans require all rents to be directly deposited by tenants of theAdler Office and Adler IndustrialProperties into the lockbox account. The loan documents also require that all rents received by the borrowers or the property manager be deposited into the lockbox account within two business days of receipt. With respect to each of the Adler Office and Adler Industrial mortgage loan, prior to the occurrence of a Cash Sweep Trigger Event (as defined below), all funds from the related lockbox account are swept into the respective borrower’s operating account. Upon the occurrence of a Cash Sweep Trigger Event with respect to the respective mortgage loan, all cash flow is required to be swept from the related lockbox account into a lender-controlled cash management account.
With respect to each of the Adler Office and Adler Industrial mortgage loans, a “Cash Sweep Trigger Event”shall occur upon the earlier of: (i) the occurrence and continuance of an event of default or (ii) the amortizing debt service coverage ratio falling below 1.15x at the end of any calendar quarter. With respect to each of the Adler Office and Adler Industrial mortgage loans, a Cash Sweep Trigger Event will expire,with respect to clause (i), upon the cure of such event of default, and with respect to clause (ii), upon the amortizing debt service coverage ratio being at least 1.15x for two consecutive calendar quarters.
Property Management. TheAdler Office and Adler IndustrialProperties are managed by an affiliate of the borrowers.
Assumption.The borrowers have the right to transfer theAdler Office and Adler IndustrialProperties, in whole but not in part, provided that certain conditions are satisfied, including(i) no event of default has occurred and is continuing; (ii) approval of the proposed transferee and transfer by the lender, in its commercially reasonable discretion, including, but not limited to, the proposed transferee’s creditworthiness, financial strength, and real estate management and leasing expertise; (iii) if the original guarantor is released (from and after the date of the transfer) in connectionwith the transfer, then any guarantor’s obligations are assumed by a person acceptable to the lender in its reasonable discretion; and (iv) at the lender’s option, and if required by the procedures of Fitch, KBRA or Moody’s, a confirmation from such rating agency that the transfer will not result in a downgrade, withdrawal or qualification of the respective ratings assigned to the Series 2015-P2 Certificates by such rating agency.
Partial Release.At any time following the lockout date and prior to the open period, the respective borrowers have the right to obtain the release of any release parcel within the Adler Office and Adler Industrial Properties (see “The Properties” section above for a table identifying the release parcels) from the lien of the Adler Office and Adler Industrial Crossed Mortgage Loans in connection with a bona fide sale to a third party and subject to the terms and conditions of the loan documents, which include but are not limited to: (i) the amortizing debt service coverage ratio for the Adler Office and Adler Industrial Crossed Mortgage Loans (on a combined basis) after the release is no less than the greater of (a) the amortizing debt service coverage ratio (on a combined basis) immediately preceding the release and (b) 1.25x; (ii) the loan-to-value ratio for the Adler Office and Adler Industrial Crossed Mortgage Loans (on a combined basis) after the release does not exceed the lesser of (1) the loan-to-value ratio (on a combined basis) immediately preceding the release and (2) 64.0%; (iii) rollover for the remaining Adler Office or Adler Industrial Properties, as applicable, in any given year of the remainder of the loan term shall not be greater than 30% of net rentable area; (iv) defeasance of a portion of the loan equal to the greater of (A) 115% of the allocated loan amount of the property being released, and (b) 100% of the net proceeds received in connection with the related sale; (v) receipt of a REMIC opinion; and (vi) at the lender’s option, a confirmation from Fitch, KBRA and Moody’s that the transfer will not result in a downgrade, withdrawal or qualification of the rating assigned to the Series 2015-P2 Certificates by such rating agency.
In addition, each of the Adler Office and Adler Industrial Crossed Mortgage Loans may be separately defeased in full, without full defeasance of the other such mortgage loan upon satisfaction of conditions similar to those set forth above. Upon the full defeasance of either the Adler Office mortgage loan or Adler Industrial mortgage loan, the related Mortgaged Properties securing the defeased mortgage loan will be released. In addition, the related loan documents provide that any funds remaining in the upfront reserve for future tenant improvement and leasing commissions under the defeased mortgage loan are to be retained by the lender as security for the remaining mortgage loan and deposited into the related reserve under the remaining mortgage loan and held and disbursed in accordance with the remaining mortgage loan’s documents.
Real Estate Substitution.Not permitted.
Subordinate and Mezzanine Indebtedness.No additional financing was in place at the time of loan closing for the Adler Office and Adler Industrial Crossed Mortgage Loans. Mezzanine financing secured by a pledge of the direct or indirect ownership interests in the related borrower is permitted for each of the Adler Office and Adler Industrial Crossed Mortgage Loans subject to the lender’s standard requirements for mezzanine financing, which include among other items: (i) a maximum loan-to-value ratio of 75.0% for the combined outstanding indebtedness of the respective loan and proposed mezzanine financing; (ii) a minimum amortizing debt service coverage ratio of 1.20x for the respective loan and any proposed mezzanine financing; (iii) lease rollover in any given year of the remainder of the loan term of the respective loan shall not be greater than 30.0% of net rentable area; (iv) a satisfactory intercreditor agreement; (v) the lender’s reasonable approval of the mezzanine financing loan documents; and (vi) the mezzanine lender must be an institutional lender. The loan documents provide that an affiliate of the lender or an affiliate of Principal Real Estate Investors, LLC shall have the first opportunity to provide the mezzanine financing, which election is required to be made within ten days of delivery of all requested information.
THE INFORMATION IN THIS STRUCTURAL AND COLLATERAL TERM SHEET IS NOT COMPLETE AND MAY BE AMENDED PRIOR TO THE TIME OF SALE. THIS TERM SHEET IS NOT AN OFFER TO SELL THESE SECURITIES AND IT IS NOT A SOLICITATION OF AN OFFER TO BUY THESE SECURITIES IN ANY JURISDICTION WHERE THE OFFER OR SALE IS NOT PERMITTED.
| 62 |
ADLER OFFICE AND ADLER INDUSTRIAL |
Ground Lease.None.
Terrorism Insurance.The loan documents require that the “all risk” insurance policy required to be maintained by the borrowers provides coverage for terrorism in an amount equal to the full replacement cost of theAdler Office and Adler IndustrialProperties, as well as business interruption insurance covering no less than the 12-month period following the occurrence of a casualty event, together with a six-month extended period of indemnity; provided that if the policies contain an exclusion for loss or damage incurred as a result of an act of terrorism or similar acts of sabotage, the borrowers are required to maintain separate insurance against such loss or damage provided such insurance (a) is commercially available and (b) can be obtained at a commercially reasonable cost as reasonably determined by the lender.
Windstorm Insurance.The loan documents require windstorm insurance covering the full replacement cost of the Adler Office and Adler Industrial Properties (which may have a deductible not to exceed 5.0% of the total insured value of the premises) during the loan term. At the time of closing, the Adler Office and Adler Industrial Properties had insurance coverage for windstorms.
THE INFORMATION IN THIS STRUCTURAL AND COLLATERAL TERM SHEET IS NOT COMPLETE AND MAY BE AMENDED PRIOR TO THE TIME OF SALE. THIS TERM SHEET IS NOT AN OFFER TO SELL THESE SECURITIES AND IT IS NOT A SOLICITATION OF AN OFFER TO BUY THESE SECURITIES IN ANY JURISDICTION WHERE THE OFFER OR SALE IS NOT PERMITTED.
| 63 |
| HARBOR POINTE APARTMENTS |
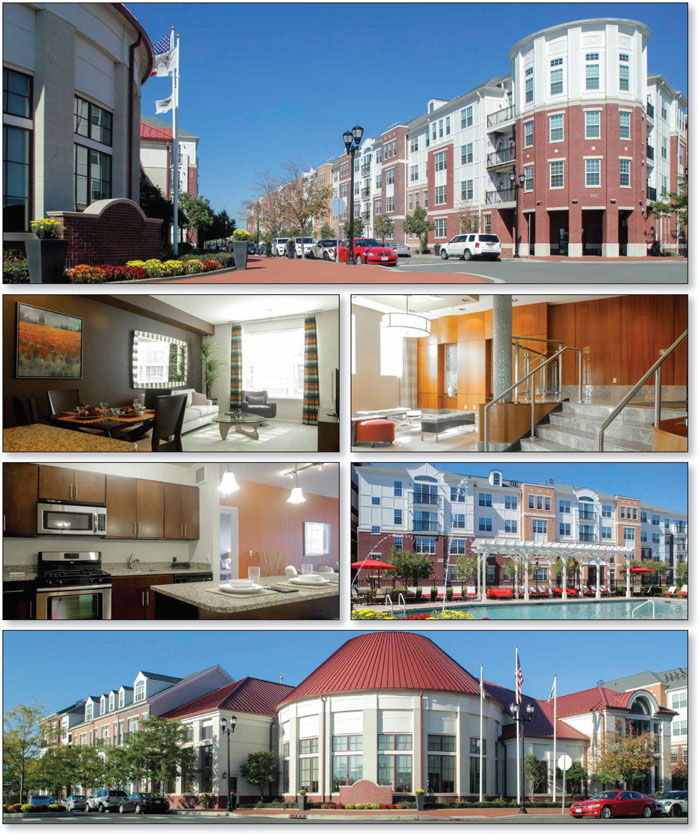
THE INFORMATION IN THIS STRUCTURAL AND COLLATERAL TERM SHEET IS NOT COMPLETE AND MAY BE AMENDED PRIOR TO THE TIME OF SALE. THIS TERM SHEET IS NOT AN OFFER TO SELL THESE SECURITIES AND IT IS NOT A SOLICITATION OF AN OFFER TO BUY THESE SECURITIES IN ANY JURISDICTION WHERE THE OFFER OR SALE IS NOT PERMITTED.
| 64 |
| HARBOR POINTE APARTMENTS |
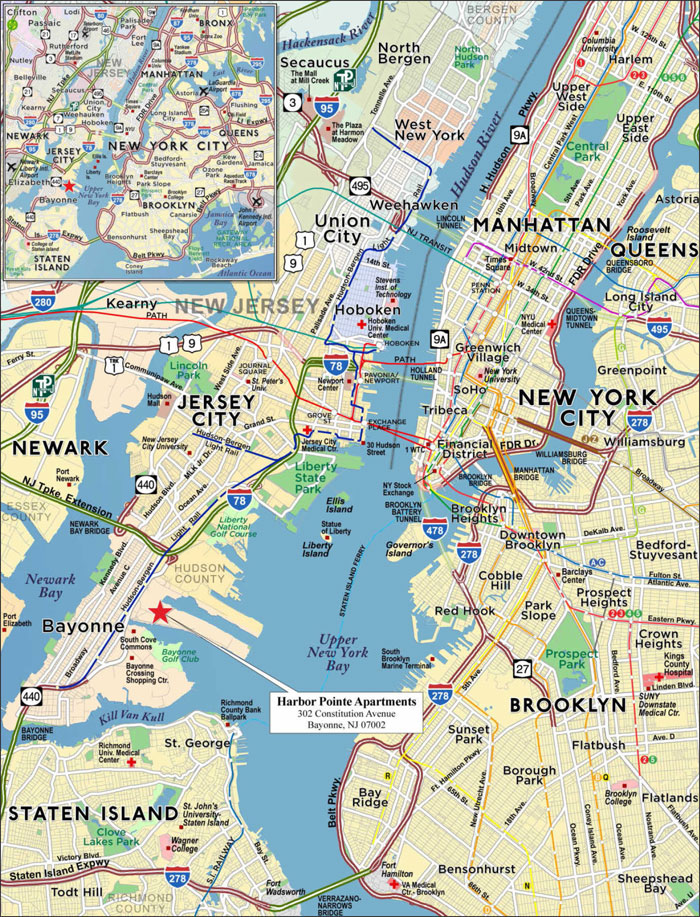
THE INFORMATION IN THIS STRUCTURAL AND COLLATERAL TERM SHEET IS NOT COMPLETE AND MAY BE AMENDED PRIOR TO THE TIME OF SALE. THIS TERM SHEET IS NOT AN OFFER TO SELL THESE SECURITIES AND IT IS NOT A SOLICITATION OF AN OFFER TO BUY THESE SECURITIES IN ANY JURISDICTION WHERE THE OFFER OR SALE IS NOT PERMITTED.
| 65 |
| No. 6 – Harbor Pointe Apartments |
| Loan Information | Property Information | ||||||
| Mortgage Loan Seller: | Citigroup Global Markets Realty Corp. | Single Asset/Portfolio: | Single Asset | ||||
| Credit Assessment (Fitch/KBRA/Moody’s): | NR/NR/NR | Property Type: | Multifamily | ||||
| Original Principal Balance(1): | $50,000,000 | Specific Property Type: | Mid-Rise | ||||
| Cut-off Date Principal Balance(1): | $50,000,000 | Location: | Bayonne, NJ | ||||
| % of Initial Pool Balance: | 5.0% | Size: | 544 Units | ||||
| Loan Purpose: | Acquisition | Cut-off Date Principal Balance Per Unit(1): | $202,206 | ||||
| Borrower Names(2): | Various | Year Built/Renovated: | 2009/NAP | ||||
| Sponsor: | Elie Rieder | Title Vesting: | Fee | ||||
| Mortgage Rate: | 4.760% | Property Manager: | Alliance Southwest, LLC | ||||
| Note Date: | October 21, 2015 | 3rdMost Recent Occupancy (As of): | 92.7% (12/31/2012) | ||||
| Anticipated Repayment Date: | NAP | 2ndMost Recent Occupancy (As of): | 92.3% (12/31/2013) | ||||
| Maturity Date: | November 6, 2025 | Most Recent Occupancy (As of): | 92.9% (12/31/2014) | ||||
| IO Period: | 120 months | Current Occupancy (As of): | 91.2% (8/10/2015) | ||||
| Loan Term (Original): | 120 months | ||||||
| Seasoning: | 1 month | Underwriting and Financial Information: | |||||
| Amortization Term (Original): | NAP | ||||||
| Loan Amortization Type: | Interest Only, Balloon | 3rdMost Recent NOI (As of): | $7,456,491 (12/31/2013) | ||||
| Interest Accrual Method: | Actual/360 | 2ndMost Recent NOI (As of): | $6,648,287 (12/31/2014) | ||||
| Call Protection(3): | L(25),D(91),O(4) | Most Recent NOI (As of): | $7,528,110 (TTM 8/31/2015) | ||||
| Lockbox Type: | Springing | ||||||
| Additional Debt(1): | Yes | ||||||
| Additional Debt Type(1): | Pari Passu | U/W Revenues: | $12,490,995 | ||||
| U/W Expenses: | $4,518,686 | ||||||
| U/W NOI: | $7,972,309 | ||||||
| U/W NCF: | $7,863,509 | ||||||
| U/W NOI DSCR(1): | 1.50x | ||||||
| Escrows and Reserves(4): | U/W NCF DSCR(1): | 1.48x | |||||
| U/W NOI Debt Yield(1): | 7.2% | ||||||
| Type: | Initial | Monthly | Cap (If Any) | U/W NCF Debt Yield(1): | 7.1% | ||
| PILOT(5) | $178,371 | $89,186 | NAP | As-Is Appraised Value: | $154,000,000 | ||
| Insurance | $33,867 | $16,934 | NAP | As-Is Appraisal Valuation Date: | July 16, 2015 | ||
| Replacement Reserves | $0 | $9,067 | NAP | Cut-off Date LTV Ratio(1)(6): | 71.0% | ||
| Deferred Maintenance | $54,835 | $0 | NAP | LTV Ratio at Maturity or ARD(1)(6): | 71.0% | ||
| (1) | The Harbor Pointe Apartments Whole Loan (as defined below), with an original principal balance totaling $110,000,000, is comprised of two pari passu notes (Notes A-1 and A-2). The non-controlling Note A-2 had an original principal balance of $50,000,000, has an outstanding principal balance as of the Cut-off Date of $50,000,000 and will be contributed to the WFCM 2015-P2 Trust. The controlling Note A-1 had an original balance of $60,000,000, has an outstanding principal balance as of the Cut-off Date of $60,000,000 and is expected to be contributed to the CGCMT 2015-GC35 trust. All statistical information related to the balance per unit, loan-to-value ratios, debt service coverage ratios and debt yields are based on the Harbor Pointe Apartments Whole Loan. |
| (2) | See “The Borrowers” section. |
| (3) | Defeasance of the Harbor Pointe Apartments Whole Loan is permitted on or after the date that is the earlier to occur of (i) 24 months after the closing date of the securitization that includes the final portion of the Harbor Pointe Apartments Whole Loan, and (ii) thirty-six months following origination of the Harbor Pointe Apartments Whole Loan. |
| (4) | See “Escrows” section. |
| (5) | See “PILOT Program” section. |
| (6) | Cut-off Date LTV Ratio and LTV Ratio at Maturity or ARD are calculated based on the As-stabilized appraised value of $155,000,000. The As-Is appraised value is $154,000,000 resulting in a Cut-off Date LTV Ratio and LTV Ratio at Maturity or ARD of 71.4%. |
The Mortgage Loan. The mortgage loan is part of a whole loan (the “Harbor Pointe Apartments Whole Loan”) that is evidenced by twopari passu notes (Notes A-1 and A-2) secured by a first mortgage encumbering the fee interest in a multifamily apartment complex located in Bayonne, New Jersey (the “Harbor Pointe Apartments Property”). The Harbor Pointe Apartments Whole Loan was originated on October 21, 2015 by Citigroup Global Markets Realty Corp. The Harbor Pointe Apartments Whole Loan had an original principal balance of $110,000,000, has an outstanding principal balance as of the Cut-off Date of $110,000,000 and accrues interest at an interest rate of 4.760%per annum. The Harbor Pointe Apartments Whole Loan had an initial term of 120 months, has a remaining term of 119 months as of the Cut-off Date and requires interest-only payments through the term of the Harbor Pointe Apartments Whole Loan. The Harbor Pointe Apartments Whole Loan matures on November 6, 2025. See “Description of the Mortgage Pool — The Whole Loans — The Non-Serviced Pari Passu Whole Loans — The Harbor Pointe Apartments Whole Loan” in the Preliminary Prospectus.
Note A-2, which will be contributed to the WFCM 2015-P2 Trust, had an original principal balance of $50,000,000, has an outstanding principal balance as of the Cut-off Date of $50,000,000 and represents the non-controlling interest in the Harbor Pointe Apartments
THE INFORMATION IN THIS STRUCTURAL AND COLLATERAL TERM SHEET IS NOT COMPLETE AND MAY BE AMENDED PRIOR TO THE TIME OF SALE. THIS TERM SHEET IS NOT AN OFFER TO SELL THESE SECURITIES AND IT IS NOT A SOLICITATION OF AN OFFER TO BUY THESE SECURITIES IN ANY JURISDICTION WHERE THE OFFER OR SALE IS NOT PERMITTED.
| 66 |
| HARBOR POINTE APARTMENTS |
Whole Loan. Note A-1 (the “Harbor Pointe Apartments Companion Loan”), some or all of which is expected to be contributed to the CGCMT 2015-GC35 Trust, had an original principal balance of $60,000,000, has an outstanding principal balance as of the Cut-off Date of $60,000,000, and represents the controlling interest in the Harbor Pointe Apartments Whole Loan.
Following the lockout period, the borrowers have the right to defease the Harbor Pointe Apartments Whole Loan, in whole, but not in part, on any date before August 6, 2025. In addition, the Harbor Pointe Apartments Whole Loan is prepayable without payment of a prepayment premium on or after August 6, 2025.
Sources and Uses
| Sources | Uses | |||||||||
| Original loan amount | $110,000,000 | 73.3 | % | Purchase price | $147,500,000 | 98.4 | % | |||
| Sponsor’s new cash contribution | 38,916,309 | 25.9 | Reserves | 2,207,295 | 1.5 | |||||
| Other sources | 1,058,059 | 0.7 | Closing costs | 267,073 | 0.2 | |||||
| Total Sources | $149,974,368 | 100.0 | % | Total Uses | $149,974,368 | 100.0 | % |
The Property. The Harbor Pointe Apartments Property consists of a certified LEED Silver mid-rise apartment complex containing 544 residential units located in Bayonne, New Jersey, approximately 9.0 miles southwest of Manhattan. The Harbor Pointe Apartments Property was built in 2009 and contains 521,102 square feet of rentable area and approximately 9,000 square feet of amenity space. Each unit offers, full-sized washer and dryer, walk-in closets and open layout kitchens with stainless steel appliances. The Harbor Pointe Apartments Property features amenities such as concierge service, a 9,000 square foot clubhouse with an indoor basketball court, a resort-style outdoor salt-water swimming pool, computer/media lounge, business center and full fitness studio. In addition, the Harbor Pointe Apartments Property offers shuttle service to local mass transportation stations and amenities. The Harbor Pointe Apartments Property features 756 parking spaces, resulting in a parking ratio of 1.4 spaces per unit. As of August 10, 2015, the Harbor Pointe Apartments Property was 91.2% occupied.
There are currently six employee units and 13 affordable units which are offered at below market rents. The Payment in Lieu of Taxes (“PILOT”) Program agreement (see “PILOT Program” section), requires the borrower to provide the 13 units currently designated as affordable rental units at below-market rents.
The following table presents certain information relating to the unit mix of the Harbor Pointe Apartments Property:
Unit Mix Summary(1)
| Unit Type | No. of Units | % of Total Units | Average Unit Size (SF) | Average U/W Monthly Rent per Unit(2) | ||
| Studio / 1 Bath | 12 | 2.2 | % | 556 | $1,587 | |
| 1 Bed / 1 Bath | 282 | 51.8 | % | 756 | $1,719 | |
| 2 Bed / 2 Bath | 213 | 39.2 | % | 1,137 | $2,207 | |
| 3 Bed / 2 Bath | 15 | 2.8 | % | 1,488 | $1,935 | |
| 3 Bed / 3 Bath | 22 | 4.0 | % | 1,664 | $3,090 | |
| Total/Weighted Average | 544 | 100.0 | % | 958 | $1,969 | |
| (1) | Information obtained from the underwritten rent roll. |
| (2) | There are currently 6 employee units and 13 affordable units which are offered at a discount to current rents (see “Property” and “PILOT Program” sections). |
The following table presents historical occupancy percentages at the Harbor Pointe Apartments Property:
Historical Occupancy
12/31/2012(1) | 12/31/2013(1) | 12/31/2014(1) | 8/10/2015(2) | |||
| 92.7% | 92.3% | 92.9% | 91.2% |
| (1) | Information obtained from the borrowers. |
| (2) | Information obtained from the underwritten rent roll. |
THE INFORMATION IN THIS STRUCTURAL AND COLLATERAL TERM SHEET IS NOT COMPLETE AND MAY BE AMENDED PRIOR TO THE TIME OF SALE. THIS TERM SHEET IS NOT AN OFFER TO SELL THESE SECURITIES AND IT IS NOT A SOLICITATION OF AN OFFER TO BUY THESE SECURITIES IN ANY JURISDICTION WHERE THE OFFER OR SALE IS NOT PERMITTED.
| 67 |
| HARBOR POINTE APARTMENTS |
Operating History and Underwritten Net Cash Flow.The following table presents certain information relating to the historical operating performance and underwritten net cash flow at the Harbor Pointe Apartments Property:
Cash Flow Analysis
| 2013 | 2014 | TTM 8/31/2015 | U/W | % of U/W Effective Gross Income | U/W $ per Unit | ||||||||||||
| Base Rent | $11,900,626 | $11,632,684 | $11,501,478 | $11,666,000 | 93.4 | % | $21,445 | ||||||||||
| Grossed Up Vacant Space | 0 | 0 | 0 | 1,335,840 | 10.7 | 2,456 | |||||||||||
| Reimbursement Income(1) | 358,151 | 429,658 | 453,566 | 453,566 | 3.6 | 834 | |||||||||||
| Other Income(2) | 587,662 | 609,016 | 718,238 | 707,814 | 5.7 | 1,301 | |||||||||||
| Less Vacancy & Credit Loss | (135,850) | (331,921) | (181,017) | (1,672,225)(3) | (13.4 | ) | (3,074 | ) | |||||||||
| Effective Gross Income | $12,710,589 | $12,339,437 | $12,492,265 | $12,490,995 | 100.0 | % | $22,961 | ||||||||||
| Total Operating Expenses | $5,254,098 | $5,691,150 | $4,964,156 | $4,518,686 | 36.2 | % | $8,306 | ||||||||||
| Net Operating Income | $7,456,491 | $6,648,287 | $7,528,110 | $7,972,309 | 63.8 | % | $14,655 | ||||||||||
| Capital Expenditures | 0 | 0 | 0 | 108,800 | 0.9 | 200 | |||||||||||
| Net Cash Flow | $7,456,491 | $6,648,287 | $7,528,110 | $7,863,509 | 63.0 | % | $14,455 | ||||||||||
| NOI DSCR | 1.40x | 1.25x | 1.41x | 1.50x | |||||||||||||
| NCF DSCR | 1.40x | 1.25x | 1.41x | 1.48x | |||||||||||||
| NOI DY | 6.8% | 6.0% | 6.8% | 7.2% | |||||||||||||
| NCF DY | 6.8% | 6.0% | 6.8% | 7.1% | |||||||||||||
| (1) | Reimbursement Income includes water/sewer reimbursements, electric and gas rebill, administrative fees on water/sewer and trash reimbursements. |
| (2) | Other Income includes late charges, lease termination fees, pet rent, parking fees, administrative fees and other miscellaneous income. |
| (3) | The underwritten economic vacancy is 13.4% of U/W Effective Gross Income. The Harbor Pointe Apartments Property was 91.2% occupied as of August 10, 2015. |
Appraisal.As of the appraisal valuation date of July 16, 2015, the Harbor Pointe Apartments Property had an “as-is” appraised value of $154,000,000. The appraiser also concluded to an “as-stabilized” value of $155,000,000 with an “as-stabilized” valuation date of December 15, 2015.
Environmental Matters.According to the Phase I environmental report dated July 3, 2015, there was no evidence of any recognized environmental conditions at the Harbor Pointe Apartments Property.
Market Overview and Competition.The Harbor Pointe Apartments Property is located within the Hudson Waterfront of Northern New Jersey. The Hudson Waterfront is an 18-mile shoreline stretching from Bayonne to Fort Lee, New Jersey. There are currently 19 Fortune 500 Companies that are headquartered in Northern New Jersey. Major employers in the area include Barnabas Health, Verizon Communications, United Airlines and New Jersey Transit. According to the appraisal, the average 2014 household income and population in the city of Bayonne was $73,514 and 65,713, respectively.
The Harbor Pointe Apartments Property is situated within the Peninsula at Bayonne Harbor redevelopment area, a 420-acre man-made peninsula. The immediate area has undergone significant redevelopment in the last decade through the extension of transportation services to the Bayonne area including the construction of the Hudson Bergen Light Rail. The construction of the Hudson Bergen Light Rail has resulted in a reduced commute time into Manhattan totaling approximately 30 minutes. South Cove Commons, a 225,000 square foot retail power center, and Bayonne Crossing, a 350,000 square foot retail power center, are both located within one mile of the Harbor Pointe Apartments Property. Retailers at these centers include Stop & Shop, Walmart, Lowes, T.J. Maxx, and New York Sports Club.
According to a third party report, the Harbor Pointe Apartments Property is located in the Northern New Jersey multifamily market which consists of approximately 216,216 rental units across 994 buildings with a 4.0% vacancy rate and an average rent of $1,671 per unit per month. Within the Northern New Jersey multifamily market, the Harbor Pointe Apartments Property is located in the Hudson County submarket, which consists of 172 buildings totaling 45,071 units with a 6.4% vacancy rate and an average asking rent of $2,842 as of August 2015.
THE INFORMATION IN THIS STRUCTURAL AND COLLATERAL TERM SHEET IS NOT COMPLETE AND MAY BE AMENDED PRIOR TO THE TIME OF SALE. THIS TERM SHEET IS NOT AN OFFER TO SELL THESE SECURITIES AND IT IS NOT A SOLICITATION OF AN OFFER TO BUY THESE SECURITIES IN ANY JURISDICTION WHERE THE OFFER OR SALE IS NOT PERMITTED.
| 68 |
| HARBOR POINTE APARTMENTS |
The following table presents certain information relating to some comparable multifamily properties for the Harbor Pointe Apartments Property:
Competitive Set(1)
| Harbor Pointe Apartments (Subject) | Osprey Cove | Peninsula Court | Camelot at Bayonne | SilkLofts | Xchange at Secaucus Junction | ||||||
| Location | Bayonne, NJ | Secaucus, NJ | Bayonne, NJ | Bayonne, NJ | Bayonne, NJ | Secaucus, NJ | |||||
| Property Type | Mid Rise | Garden | Garden | Garden | Garden | Garden | |||||
| Number of Units | 544 | 116 | 52 | 96 | 84 | 799 | |||||
| Total Occupancy | 91.2% | 96.6% | 96.2% | 75.0% | 96.5% | 96.5% | |||||
| Studio | 556 | 598 | 550 | NAP | 935 | NAP | |||||
| 1 Bedroom | 756 | 756 | 1,130 | 716 | 829 | 849 | |||||
| 2 Bedroom | 1,137 | 1,090 | 1,200 | 1,022 | 1,210 | 1,185 | |||||
| 3 Bedroom | 1,593 | NAP | NAP | NAP | NAP | 1,542 |
| (1) | Information obtained from the appraisal and underwritten rent roll. |
The Borrowers.The borrowers are three tenants-in-common, each of which is a single purpose entity and Delaware limited liability company: CL Cityview Urban Renewal LLC, RS Bayonne Urban Renewal LLC and Verbena Bayonne Urban Renewal LLC. Pursuant to the Harbor Pointe Apartments Whole Loan documents, the borrowers have waived their rights to partition the Harbor Pointe Apartments Property. Legal counsel to the borrower delivered a non-consolidation opinion in connection with the origination of the Harbor Pointe Apartments Whole Loan. The guarantors of the non-recourse carveouts are Elie Rieder and Sol Werdiger.
The Sponsor.The sponsor is Elie Rieder. Mr. Rieder is the founder and Chief Executive Officer of Castle Lanterra Equity and Castle Lanterra Properties, and has been an active real estate investor, owner, and manager since 1998. Mr. Rieder was directly involved in acquiring over 10,000 multifamily units and has invested in residential, office, hospitality, retail, and parking assets. Castle Lanterra Properties is a leading real estate investment firm founded in 2009. Based in New York, Castle Lanterra Properties acquires, owns, and manages targeted multifamily properties in major metropolitan areas of the United States, including Chicago, Washington D.C., Baltimore, and Austin.
Escrows.The loan documents provide for upfront reserves in an amount of $178,371 for payment-in-lieu of real estate taxes, $33,867 for insurance and $54,835 for deferred maintenance.
On each due date, the borrowers are required to pay to deposit: (i) one-twelfth of the taxes (or payment-in-lieu thereof) that the lender estimates will be payable over the then succeeding 12-month period (initially $89,186), (ii) an insurance reserve in an amount equal to one-twelfth of the amount that the lender estimates will be necessary to pay insurance premiums over the then succeeding 12-month period, (initially $16,934) and (iii) a replacement reserve in the amount of $9,067.
Lockbox and Cash Management.The Harbor Pointe Apartments Whole Loan documents require a springing lockbox with springing cash management. The Harbor Pointe Apartments Whole Loan documents require the borrowers, upon the first occurrence of a Trigger Period, to (or to direct the property manager to) deposit within two business days following receipt of all revenue derived from the Harbor Pointe Apartments Property and all other money payable to the borrowers with respect to the Harbor Pointe Apartments Property directly to a lender-controlled lockbox account and to send a notice to all commercial tenants directing them to pay all rents directly into the lender controlled lockbox account. So long as a Trigger Period is not in effect, all funds in the lockbox account are required to be swept and remitted on each business day to the borrowers’ operating account. During the continuance of a Trigger Period, all funds in the lockbox account are required to be transferred on each business day to a lender-controlled cash management account. If no event of default under the loan documents is continuing, applied to pay debt service and operating expenses of the Harbor Pointe Apartments Property and to fund required reserves in accordance with the loan documents. After the foregoing disbursements are made and so long as a Harbor Pointe Apartments Trigger Period is continuing, all excess cash is trapped in an excess cash account and held as additional collateral for the Harbor Pointe Apartments Whole Loan. During the continuance of an event of default under the loan documents, the lender may apply any funds in the cash management account to amounts payable under the Harbor Pointe Apartments Loan or toward the payment of expenses of the Harbor Pointe Apartments Property, in such order of priority as the lender may determine.
A “Trigger Period” means a period commencing upon the earliest of (i) the occurrence and continuance of an event of default or (ii) the trailing 12-month debt service coverage ratio being less than 1.25x and ending, with respect to a Harbor Pointe Apartments Trigger Period clause by (i) above, upon the cure of such event of default; and with respect to a Trigger Period caused by (ii) above, upon the debt service coverage ratio being equal to or greater than 1.30x for two consecutive calendar quarters.
Property Management.The Harbor Pointe Apartments Property is currently managed by Alliance Southwest, LLC.
PILOT Program. The Harbor Pointe Apartments Property is operating under a PILOT Program that expires in 2039 under which the borrowers do not pay real estate taxes and instead make quarterly payments to the city of Bayonne. From January 2016 through December 2021 the annual charge will be the greater of the Base Amount (as defined below) or 20% of the taxes otherwise due on the land and improvements; and from January 2022 through December 2027, the greater of the Base Amount or 40% of the taxes otherwise due on the land and improvements. In addition to the annual charge, a 2% administrative fee based on the annual charge is payable to the city of Bayonne. The payments under the PILOT Program (“Base Amount”) are calculated as 10% of 80% of annual gross revenue of the Harbor Pointe Apartments Property through December 2025 and 10% of the full annual gross revenue of the Harbor Pointe Apartments Property thereafter and until the expiration of the program. The borrowers’ interest in the PILOT Agreement may be transferred to a successor owner (including a mortgagee in foreclosure) upon the satisfaction of certain conditions, including,
THE INFORMATION IN THIS STRUCTURAL AND COLLATERAL TERM SHEET IS NOT COMPLETE AND MAY BE AMENDED PRIOR TO THE TIME OF SALE. THIS TERM SHEET IS NOT AN OFFER TO SELL THESE SECURITIES AND IT IS NOT A SOLICITATION OF AN OFFER TO BUY THESE SECURITIES IN ANY JURISDICTION WHERE THE OFFER OR SALE IS NOT PERMITTED.
| 69 |
| HARBOR POINTE APARTMENTS |
without limitation, that the transferee forms an urban renewal entity in accordance with the New Jersey Long Term Tax Exemption Law and that the transferee agrees to abide by all terms and conditions of the PILOT Program.
Assumption.The borrowers have a right to transfer the Harbor Pointe Apartments Property at any time other than the 60 days prior to and following any secondary market transaction, provided that no event of default has occurred and is continuing and certain other conditions are satisfied, including (i) the lender’s reasonable determination that the proposed transferee and guarantor satisfy the lender’s credit review and underwriting standards, taking into consideration transferee experience, financial strength and general business standing; (ii) execution of a recourse guaranty and an environmental indemnity by an affiliate of the transferee; (iii) if requested by the lender, delivery of a rating agency confirmation; and (iv) payment of an assumption fee.
Partial Release.Not permitted.
Real Estate Substitution.Not permitted.
Subordinate and Mezzanine Indebtedness.Not permitted.
Ground Lease.None
Terrorism Insurance.The borrowers are required to maintain an “all-risk” insurance policy that provides coverage for terrorism in an amount equal to the full replacement cost of the Harbor Pointe Apartments Property and provides for a deductible no greater than $10,000 (except with respect to earthquakes and windstorms), as well as business interruption insurance covering no less than the 18-month period following the occurrence of a casualty event, plus a 6-month extended period of indemnity.
THE INFORMATION IN THIS STRUCTURAL AND COLLATERAL TERM SHEET IS NOT COMPLETE AND MAY BE AMENDED PRIOR TO THE TIME OF SALE. THIS TERM SHEET IS NOT AN OFFER TO SELL THESE SECURITIES AND IT IS NOT A SOLICITATION OF AN OFFER TO BUY THESE SECURITIES IN ANY JURISDICTION WHERE THE OFFER OR SALE IS NOT PERMITTED.
| 70 |
(THIS PAGE INTENTIONALLY LEFT BLANK)
THE INFORMATION IN THIS STRUCTURAL AND COLLATERAL TERM SHEET IS NOT COMPLETE AND MAY BE AMENDED PRIOR TO THE TIME OF SALE. THIS TERM SHEET IS NOT AN OFFER TO SELL THESE SECURITIES AND IT IS NOT A SOLICITATION OF AN OFFER TO BUY THESE SECURITIES IN ANY JURISDICTION WHERE THE OFFER OR SALE IS NOT PERMITTED.
| 71 |
HERITAGE INDUSTRIAL PORTFOLIO |
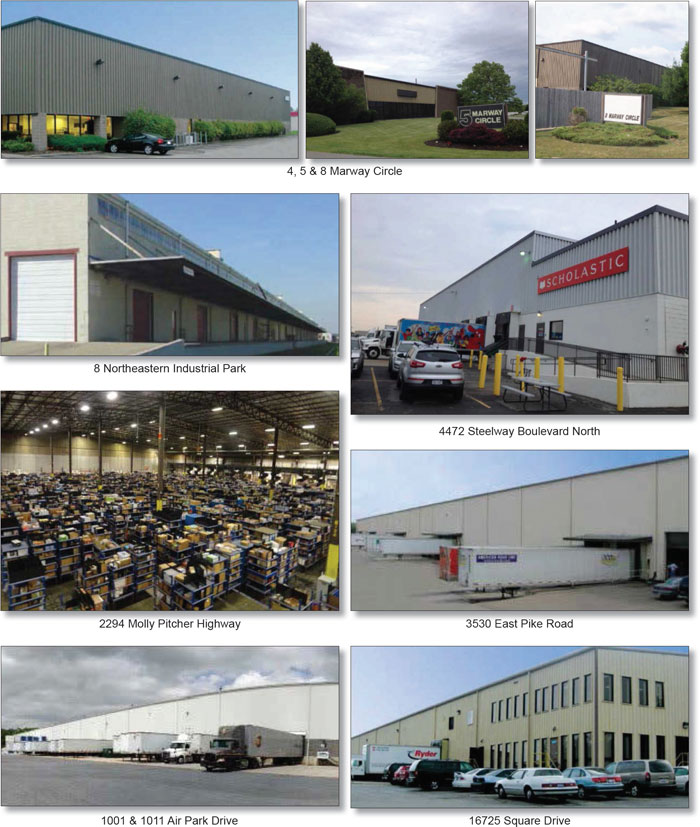
THE INFORMATION IN THIS STRUCTURAL AND COLLATERAL TERM SHEET IS NOT COMPLETE AND MAY BE AMENDED PRIOR TO THE TIME OF SALE. THIS TERM SHEET IS NOT AN OFFER TO SELL THESE SECURITIES AND IT IS NOT A SOLICITATION OF AN OFFER TO BUY THESE SECURITIES IN ANY JURISDICTION WHERE THE OFFER OR SALE IS NOT PERMITTED.
| 72 |
HERITAGE INDUSTRIAL PORTFOLIO |
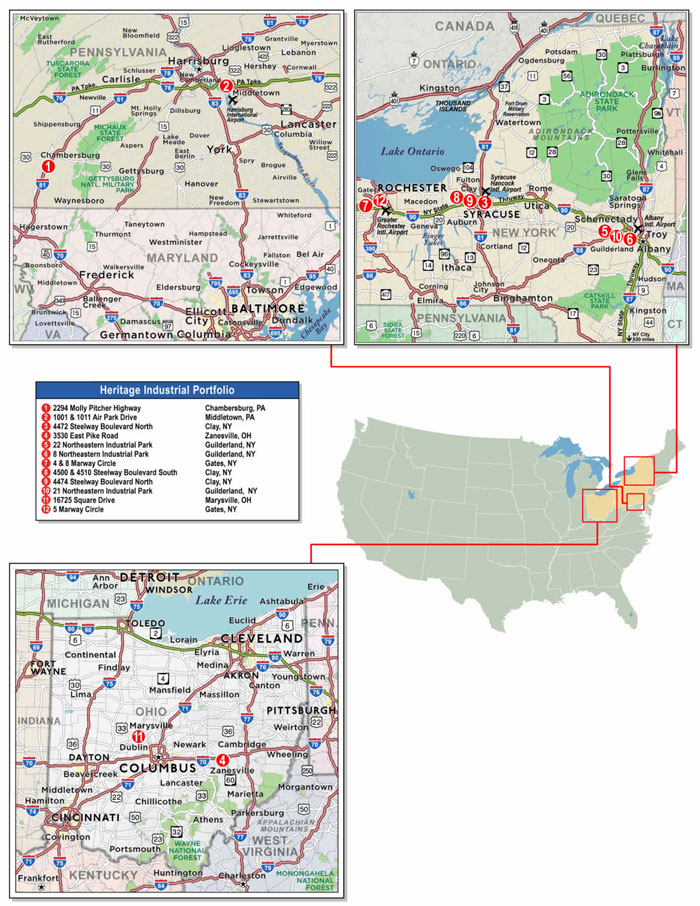
THE INFORMATION IN THIS STRUCTURAL AND COLLATERAL TERM SHEET IS NOT COMPLETE AND MAY BE AMENDED PRIOR TO THE TIME OF SALE. THIS TERM SHEET IS NOT AN OFFER TO SELL THESE SECURITIES AND IT IS NOT A SOLICITATION OF AN OFFER TO BUY THESE SECURITIES IN ANY JURISDICTION WHERE THE OFFER OR SALE IS NOT PERMITTED.
| 73 |
| No. 7 – Heritage Industrial Portfolio | ||||||||||
| Loan Information | Property Information | |||||||||
| Mortgage Loan Seller: | Principal Commercial Capital | Single Asset/Portfolio: | Portfolio | |||||||
Credit Assessment (Fitch/KBRA/Moody’s): | NR/NR/NR | Property Type: | Industrial | |||||||
| Original Principal Balance(1): | $41,000,000 | Specific Property Type: | Various | |||||||
| Cut-off Date Principal Balance(1): | $41,000,000 | Location: | Various – See Table | |||||||
| % of Initial Pool Balance: | 4.1% | Size: | 2,578,919 SF | |||||||
| Loan Purpose: | Refinance | Cut-off Date Principal Balance Per SF:(1) | $31.55 | |||||||
| Borrower Names: | 550BSA III, LLC; Tri-Martin IV, LLC | Year Built/Renovated: | Various – See Table | |||||||
| Sponsors: | Steven Greenberg; Jeffrey Greenberg | Title Vesting: | Fee | |||||||
| Mortgage Rate: | 4.640% | Property Manager: | Self-managed | |||||||
| Note Date: | July 29, 2015 | 3rd Most Recent Occupancy (As of): | 90.2% (12/31/2012) | |||||||
| Anticipated Repayment Date: | NAP | 2nd Most Recent Occupancy (As of): | 93.9% (12/31/2013) | |||||||
| Maturity Date: | August 1, 2025 | Most Recent Occupancy (As of): | 94.3% (12/31/2014) | |||||||
| IO Period: | 36 months | Current Occupancy (As of): | 95.1% (11/1/2015) | |||||||
| Loan Term (Original): | 120 months | |||||||||
| Seasoning: | 4 months | Underwriting and Financial Information: | ||||||||
| Amortization Term (Original): | 360 months | |||||||||
| Loan Amortization Type: | Interest-only, Amortizing Balloon | 3rd Most Recent NOI(As of): | $7,204,620 (12/31/2013) | |||||||
| Interest Accrual Method: | Actual/360 | 2nd Most Recent NOI(As of): | $7,419,548 (12/31/2014) | |||||||
| Call Protection(2):: | L(28),D(88),O(4) | Most Recent NOI(As of): | $7,140,060 (TTM 9/30/2015) | |||||||
| Lockbox Type: | Hard/Springing Cash Management | |||||||||
| Additional Debt(1): | Yes | |||||||||
| Additional Debt Type(1): | Pari Passu | |||||||||
| U/W Revenues: | $10,495,223 | |||||||||
| U/W Expenses: | $3,004,642 | |||||||||
| U/W NOI: | $7,490,582 | |||||||||
| Escrows and Reserves(3): | U/W NCF: | $6,818,695 | ||||||||
| U/W NOI DSCR(1): | 1.49x | |||||||||
| Type: | Initial | Monthly | Cap (If Any) | U/W NCF DSCR(1): | 1.36x | |||||
| Taxes | $694,723 | $141,872 | NAP | U/W NOI Debt Yield(1): | 9.2% | |||||
| Insurance | $64,203 | $16,051 | NAP | U/W NCF Debt Yield(1): | 8.4% | |||||
| Replacement Reserves | $0 | $21,517 | NAP | As-Is Appraised Value(4): | $116,500,000 | |||||
| Deferred Maintenance | $88,889 | $0 | NAP | As-Is Appraisal Valuation Date(4): | July 1, 2015 | |||||
| General TI/LC Reserve | $800,000 | $32,250 | $500,000 | Cut-Off Date LTV Ratio(1): | 69.8% | |||||
| Staples Space TI/LC Reserve | $0 | $33,333 | $1,500,000 | LTV Ratio at Maturity or ARD(1): | 61.3% | |||||
| (1) | The Heritage Industrial Portfolio Whole Loan (as defined below) totaling $81,375,000, is comprised of twopari passu notes (Notes A-1 and A-2), Note A-1 had an original principal balance of $41,000,000, has an outstanding principal balance of $41,000,000 as of the Cut-Off Date and will be contributed to the WFCM 2015-P2 Trust. Note A-2 had an original principal balance of $40,375,000 and is expected to be contributed to a future trust.All statistical financial information related to balances per square foot, loan-to-value ratios, debt service coverage ratios and debt yield are based on the Heritage Industrial Portfolio Whole Loan. |
| (2) | The lockout period will be at least 28 payments beginning with and including the first payment date of September 1, 2015. Defeasance of the Heritage Industrial Portfolio Whole Loan is permitted on or after the date that is the earlier to occur of (i) the 25th payment date after the closing date of the securitization that includes the final portion of the Heritage Industrial Portfolio Whole Loan, and (ii) forty-eight months following the first payment date under the Heritage Industrial Portfolio Whole Loan. The assumed lockout period of 28 payments is based on the expected WFCM 2015-P2 Trust closing date in December 2015. |
| (3) | See “Escrows” section. |
| (4) | The “As-Is Appraised Value” reflects a premium attributed to the value of the Heritage Industrial Portfolio Properties (as defined below) as a whole. The sum of the individual appraised values of each of the Heritage Industrial Portfolio Properties is $108,500,000, which results in a Cut-Off Date LTV Ratio of 75.0%. See “Appraisal” section. |
The Mortgage Loan.The mortgage loan is part of a whole loan (the “Heritage Industrial Portfolio Whole Loan”) that is evidenced by twopari passu notes (A-1 and A-2) secured by a first mortgage encumbering 12 industrial/warehouse/flex properties located in Pennsylvania, New York and Ohio (the “Heritage Industrial Portfolio Properties”). The Heritage Industrial Portfolio Whole Loan was originated on July 29, 2015 by Principal Commercial Capital. The Heritage Industrial Portfolio Whole Loan had an original principal balance of $81,375,000, has an outstanding principal balance as of the Cut-off Date of $81,375,000 and accrues interest at an interest rate of 4.640%perannum. The Heritage Industrial Portfolio Whole Loan had an initial term of 120 months, has a remaining term of 116 months as of the Cut-off Date and requires interest-only payments for the first 36 payments following origination and, thereafter, requires payments of principal and interest based on a 30-year amortization schedule. The Heritage Industrial Portfolio Whole Loan matures on August 1, 2025.
Note A-1, which will be contributed to the WFCM 2015-P2 securitization, had an original principal balance of $41,000,000, has an outstanding principal balance as of the Cut-Off Date of $41,000,000 and individually represents the controlling interest in the
THE INFORMATION IN THIS STRUCTURAL AND COLLATERAL TERM SHEET IS NOT COMPLETE AND MAY BE AMENDED PRIOR TO THE TIME OF SALE. THIS TERM SHEET IS NOT AN OFFER TO SELL THESE SECURITIES AND IT IS NOT A SOLICITATION OF AN OFFER TO BUY THESE SECURITIES IN ANY JURISDICTION WHERE THE OFFER OR SALE IS NOT PERMITTED.
| 74 |
HERITAGE INDUSTRIAL PORTFOLIO |
Heritage Industrial Portfolio Whole Loan. Note A-2 (the “Heritage Industrial Portfolio Companion Loan”), which is currently held by Principal Commercial Capital and is expected to be contributed to a future trust or trusts, had an original principal balance of $40,375,000 and represents a non-controlling interest in the Heritage Industrial Portfolio Whole Loan. See “Description of the Mortgage Pool — The Whole Loans — The Serviced Pari Passu Whole Loans — The Heritage Industrial Portfolio Whole Loan” in the Preliminary Prospectus. The lender provides no assurances that Note A-2 will not be split further.
Following the lockout period, the borrowers have the right to defease the Heritage Industrial Portfolio Whole Loan in whole, or in part (see “Partial Release” section), on any date before May 1, 2025. In addition, the Heritage Industrial Portfolio Whole Loan is prepayable without penalty on or after May 1, 2025.
Sources and Uses
| Sources | Uses | |||||||
| Original loan amount | $81,375,000 | 97.1 | % | Loan payoff(1) | $80,854,476 | 96.5% | ||
| Sponsor’s new cash contribution | 2,416,629 | 2.9 | Reserves | 1,647,816 | 2.0 | |||
| Closing costs | 1,289,338 | 1.5 | ||||||
| Total Sources | $83,791,629 | 100.0 | % | Total Uses | $83,791,629 | 100.0% |
| (1) | All properties were previously securitized in the CD 2007-CD4 securitization. |
The Properties. The Heritage Industrial Portfolio Properties comprise 12 industrial/warehouse properties totaling 2,578,919 square feet located in New York, Ohio and Pennsylvania. Built between 1953 and 1991, the Heritage Industrial Portfolio Properties were 95.1% physically occupied by 28 tenants as of November 1, 2015. The borrowers acquired the Heritage Industrial Portfolio Properties in 2007, and occupancy has reportedly averaged approximately 91.1% since the time of acquisition.
The largest tenant at the Heritage Industrial Portfolio Properties is Staples Contract & Commercial, Inc. (“Staples”), which comprises 24.1% of the net rentable area. Staples has occupied its space at the 2294 Molly Pitcher Highway property for 20 years and utilizes the spaces as its fulfillment center for online orders in the Northeast and Mid-Atlantic regions. The second largest tenant is Owens-Brockway Glass Container, Inc. (“Owens-Brockway”), which comprises 11.6% of the net rentable area, Owens-Brockway has leased its space at the 3530 East Pike Road property for 23 years and is a glass manufacturer.
The following table presents certain information relating to the Heritage Industrial Portfolio Properties:
| Property Name - Location | Allocated Cut-off Date Principal Balance | % of Portfolio Cut-off Date Principal Balance | Current Occupancy | Year Built/ Renovated | Net Rentable Area (SF) | Loading Docks/ Drive-In Doors | Clear Height (Feet) | Appraised Value | Allocated Cut-off Date LTV Ratio |
2294 Molly Pitcher Highway Chambersburg, PA | $28,200,000 | 34.7% | 100.0% | 1960/1991 | 621,400 | 62/17 | 24-32 | $37,600,000 | 75.0% |
1001 & 1011 Air Park Drive Middletown, PA | $14,400,000 | 17.7% | 100.0% | 1991/NAP | 286,203 | 55/1 | 30 | 19,200,000 | 75.0% |
4472 Steelway Boulevard North Clay, NY | $6,750,000 | 8.3% | 90.7% | 1977/NAP | 378,500 | 29/3 | 20 | 9,000,000 | 75.0% |
3530 East Pike Road Zanesville, OH
| $6,427,500 | 7.9% | 100.0% | 1991/NAP | 300,000 | 13/1 | 30 eave 36 peak | 8,570,000 | 75.0% |
22 Northeastern Industrial Park Guilderland, NY | $4,350,000 | 5.3% | 100.0% | 1989/NAP | 104,000 | 22/1 | 30 | 5,800,000 | 75.0% |
8 Northeastern Industrial Park Guilderland, NY | $4,275,000 | 5.3% | 93.1% | 1953/NAP | 199,045 | 38/4 | 24 | 5,700,000 | 75.0% |
4 & 8 Marway Circle Gates, NY | $3,825,000 | 4.7% | 100.0% | 1980/NAP | 124,696 | 14/1 | 22 | 5,100,000 | 75.0% |
| 4500 & 4510 Steelway Boulevard South Clay, NY | $3,075,000 | 3.8% | 100.0% | 1970/NAP | 123,000 | 26/1 | 28 | 4,100,000 | 75.0% |
21 Northeastern Industrial Park Guilderland, NY | $2,925,000 | 3.6% | 100.0% | 1987/NAP | 100,065 | 16/2 | 36 | 3,900,000 | 75.0% |
4474 Steelway Boulevard North Clay, NY | $2,925,000 | 3.6% | 100.0% | 1977/NAP | 160,000 | 16/0 | 28 | 3,900,000 | 75.0% |
16725 Square Drive Marysville, OH | $2,647,500 | 3.3% | 50.0% | 1987/NAP | 130,735 | 18/1 | 20.2 eave 25.4 peak | 3,530,000 | 75.0% |
5 Marway Circle Gates, NY | $1,575,000 | 1.9% | 76.6% | 1976/NAP | 51,275 | 13/2 | 22 | 2,100,000 | 75.0% |
| Total/Weighted Average | $81,375,000 | 100.0% | 95.1% | 2,578,919 | $116,500,000(1) | 69.8%(1) |
| (1) | The Portfolio Appraised Value of $116,500,000 reflects a premium attributed to the aggregate value of the Heritage Industrial Portfolio as a whole. The sum of the appraised values of each of the individual Heritage Industrial Portfolio Properties is $108.5 million. |
THE INFORMATION IN THIS STRUCTURAL AND COLLATERAL TERM SHEET IS NOT COMPLETE AND MAY BE AMENDED PRIOR TO THE TIME OF SALE. THIS TERM SHEET IS NOT AN OFFER TO SELL THESE SECURITIES AND IT IS NOT A SOLICITATION OF AN OFFER TO BUY THESE SECURITIES IN ANY JURISDICTION WHERE THE OFFER OR SALE IS NOT PERMITTED.
| 75 |
HERITAGE INDUSTRIAL PORTFOLIO |
The following table presents certain information relating to the tenancy at the Heritage Industrial Portfolio Properties:
Major Tenants
| Tenant Name | Credit Rating (Fitch/Moody’s /S&P)(1) | Tenant NRSF | % of NRSF | Annual U/W Base Rent PSF(2) | Annual U/W Base Rent(2) | % of Total Annual U/W Base Rent | Lease Expiration Date |
| Major Tenants | |||||||
| Staples Contract & Commercial, Inc.(3) | BBB-/Baa2/BBB- | 621,400 | 24.1% | $4.20 | $2,609,880 | 30.4% | 3/31/2018 |
| Owens-Brockway Glass Container Inc.(4) | NR/Ba3/BB | 300,000 | 11.6% | $2.60 | $780,000 | 9.1% | 4/30/2017 |
| Victory Packaging, L.P.(5) | NR/NR/NR | 195,949 | 7.6% | $3.35 | $655,991 | 7.6% | 9/30/2017 |
| Iron Mountain Information Management, Inc.(6) | NR/Ba3/B+ | 149,881 | 5.8% | $4.25 | $636,297 | 7.4% | Various |
| McLane Foodservice, Inc. (7) | A+/Aa2/AA | 104,000 | 4.0% | $4.50 | $468,000 | 5.4% | 8/31/2018 |
| Total Major Tenants | 1,371,230 | 53.2% | $3.76 | $5,150,168 | 59.9% | ||
| Non-Major Tenants | 1,081,301 | 41.9% | $3.19 | $3,447,527 | 40.1% | ||
| Occupied Collateral Total | 2,452,531 | 95.1% | $3.51 | $8,597,695 | 100.0% | ||
| Vacant Space | 126,388 | 4.9% | |||||
| Collateral Total | 2,578,919 | 100.0% | |||||
| (1) | Certain ratings are those of the parent company whether or not the parent guarantees the lease. |
| (2) | Annual U/W Base Rent PSF and Annual U/W Base Rent include contractual rent increases through June 2016 totaling approximately $74,545. |
| (3) | Located at the 2294 Molly Pitcher Highway property. |
| (4) | Located at the 3530 East Pike Road property. |
| (5) | Located at the 4472 Steelway Boulevard North property. |
| (6) | Iron Mountain Information Management, Inc. (“Iron Mountain”) leases 109,237 square feet in the 1001 Air Park Drive property with an Annual U/W Base Rent of $506,985 ($4.64 per square foot) on a lease that expires January 31, 2021 with two, 5-year renewal options and 40,644 square feet in the 4500 Steelway Boulevard South property with an Annual U/W Base Rent of $129,312 ($3.18 per square foot) on a lease that expires September 30, 2022 with two, 5-year renewal options. Iron Mountain subleases approximately 4,900 square feet to an affiliate, Iron Mountain Information Management Services, Inc., in the 1001 Air Park Drive property with an annual base rent of approximately $38,583 ($7.87 per square foot) and an expiration date of June 30, 2018. Iron Mountain has a right of first refusal to purchase the 4500 Steelway Boulevard South property. |
| (7) | Located at the 22 Northeastern Industrial Park property. |
The following table presents certain information relating to the lease rollover schedule of the Heritage Industrial Portfolio Properties:
Lease Expiration Schedule(1)(2)
| Year Ending December 31, | No. of Leases Expiring | Expiring NRSF | % of Total NRSF | Cumulative Expiring NRSF | Cumulative % of Total NRSF | Annual U/W Base Rent | Annual U/W Base Rent PSF(3) |
| MTM | 0 | 0 | 0.0% | 0 | 0.0% | $0 | $0.00 |
| 2015 | 4 | 193,315 | 7.5% | 193,315 | 7.5% | $447,827 | $2.32 |
| 2016 | 4 | 78,321 | 3.0% | 271,636 | 10.5% | $240,606 | $3.07 |
| 2017 | 7 | 812,831 | 31.5% | 1,084,467 | 42.1% | $2,546,120 | $3.13 |
| 2018 | 7 | 911,449 | 35.3% | 1,995,916 | 77.4% | $3,756,434 | $4.12 |
| 2019 | 3 | 152,294 | 5.9% | 2,148,210 | 83.3% | $501,280 | $3.29 |
| 2020 | 1 | 2,750 | 0.1% | 2,150,960 | 83.4% | $9,625 | $3.50 |
| 2021 | 3 | 252,677 | 9.8% | 2,403,637 | 93.2% | $921,528 | $3.65 |
| 2022 | 2 | 48,894 | 1.9% | 2,452,531 | 95.1% | $174,275 | $3.56 |
| 2023 | 0 | 0 | 0.0% | 2,452,531 | 95.1% | $0 | $0.00 |
| 2024 | 0 | 0 | 0.0% | 2,452,531 | 95.1% | $0 | $0.00 |
| 2025 | 0 | 0 | 0.0% | 2,452,531 | 95.1% | $0 | $0.00 |
| Thereafter | 0 | 0 | 0.0% | 2,452,531 | 95.1% | $0 | $0.00 |
| Vacant | 0 | 126,388 | 4.9% | 2,578,919 | 100.0% | $0 | $0.00 |
| Total/Weighted Average | 31 | 2,578,919 | 100.0% | $8,597,695 | $3.51 |
| (1) | Information was obtained from the underwritten rent roll. |
| (2) | Certain tenants may have lease termination options that are exercisable prior to the originally stated expiration date of the subject lease and that are not considered in the Lease Expiration Schedule. |
| (3) | Weighted Average Annual U/W Base Rent PSF excludes vacant space. |
THE INFORMATION IN THIS STRUCTURAL AND COLLATERAL TERM SHEET IS NOT COMPLETE AND MAY BE AMENDED PRIOR TO THE TIME OF SALE. THIS TERM SHEET IS NOT AN OFFER TO SELL THESE SECURITIES AND IT IS NOT A SOLICITATION OF AN OFFER TO BUY THESE SECURITIES IN ANY JURISDICTION WHERE THE OFFER OR SALE IS NOT PERMITTED.
| 76 |
HERITAGE INDUSTRIAL PORTFOLIO |
The following table presents historical occupancy percentages of the Heritage Industrial Portfolio Properties:
Historical Occupancy
12/31/2011(1) | 12/31/2012(1) | 12/31/2013(1) | 12/31/2014(1) | 11/1/2015(2) | ||||
| 94.0% | 90.2% | 93.9% | 94.3% | 95.1% |
| (1) | Information obtained from the borrowers. |
| (2) | Information obtained from the underwritten rent roll. |
Operating History and Underwritten Net Cash Flow. The following table presents certain information relating to the historical operating performance and the underwritten net cash flow of the Heritage Industrial Portfolio Properties:
Cash Flow Analysis
| 2012 | 2013 | 2014 | TTM 9/30/2015 | U/W(1) | % of U/W Effective Gross Income | U/W $ per SF | |||||||||
| Base Rent | $8,239,034 | $8,316,139 | $8,500,363 | $8,285,316 | $8,597,695(2) | 81.9% | $3.33 | ||||||||
| Grossed Up Vacant Space | 0 | 0 | 0 | 0 | 403,941 | 3.8 | 0.16 | ||||||||
| Total Reimbursables | 1,730,488 | 1,766,020 | 1,916,629 | 1,851,957 | 2,045,968 | 19.5 | 0.79 | ||||||||
| Other Income | 0 | 0 | 0 | 0 | 0 | 0.0 | 0.00 | ||||||||
| Less Vacancy & Credit Loss | 0 | 0 | 0 | 0 | (552,380)(3) | (5.3) | (0.21) | ||||||||
| Effective Gross Income | $9,969,522 | $10,082,159 | $10,416,992 | $10,137,273 | $10,495,223 | 100.0% | $4.07 | ||||||||
| Total Operating Expenses | $2,844,648 | $2,877,539 | $2,997,444 | $2,997,213 | $3,004,642 | 28.6% | $1.17 | ||||||||
| Net Operating Income | $7,124,874 | $7,204,620 | $7,419,548 | $7,140,060 | $7,490,582 | 71.4% | $2.90 | ||||||||
| TI/LC | 0 | 0 | 0 | 0 | 413,995 | 3.9 | 0.16 | ||||||||
| Capital Expenditures | 0 | 0 | 0 | 0 | 257,892 | 2.5 | 0.10 | ||||||||
| Net Cash Flow | $7,124,874 | $7,204,620 | $7,419,548 | $7,140,060 | $6,818,695 | 65.0% | $2.64 | ||||||||
| NOI DSCR | 1.42x | 1.43x | 1.48x | 1.42x | 1.49x | ||||||||||
| NCF DSCR | 1.42x | 1.43x | 1.48x | 1.42x | 1.36x | ||||||||||
| NOI DY | 8.8% | 8.9% | 9.1% | 8.8% | 9.2% | ||||||||||
| NCF DY | 8.8% | 8.9% | 9.1% | 8.8% | 8.4% |
| (1) | The Heritage Industrial Portfolio Properties were underwritten on a portfolio basis. |
| (2) | The U/W Base Rent includes contractual rent increases through June 2016 totaling approximately $74,545. |
| (3) | The underwritten physical vacancy is 5.0%. The Heritage Industrial Portfolio Properties were 95.1% physically occupied as of November 1, 2015. |
Appraisal.As of the appraisal valuation dates ranging from June 4, 2015 to June 10, 2015, the Heritage Industrial Portfolio Properties had an aggregate “as-is” appraised value of $108,500,000. The appraiser also concluded to a portfolio value for the Heritage Industrial Portfolio Properties of $116,500,000 with a valuation date of July 1, 2015.
Environmental Matters.According to Phase I environmental assessments dated from May 27, 2015 to June 4, 2015, there was no evidence of any recognized environmental conditions at the Heritage Industrial Portfolio Properties.
Market Overview and Competition.The Heritage Industrial Portfolio Properties are located in five markets.
Harrisburg, Pennsylvania MSA (2 properties totaling 907,603 sq. ft., 35.2% of NRA, 44.4% of U/W Base Rent) 2294 Molly Pitcher Highway is located in Chambersburg, Pennsylvania, less than two miles west of an I-81 interchange via Kriner Road. Interstate 81 provides access to the Pennsylvania Turnpike (I-76) to the subject’s northeast, which is one of Pennsylvania’s primary east/west, limited access highways. The Chambersburg Terminal (CSX) is just 1.5 miles east of the subject and Greencastle Terminal (Norfolk Southern) is 12 miles south via I-81. According to the appraisal, the subject is located in the Harrisburg West Industrial submarket, which has an overall inventory of 74.6 million square feet. As of Q1 2015, the vacancy rate for the submarket was 4.2% with an average quoted rental rate of $4.08 per square foot, triple net.
The 1001 & 1011 Air Park Drive property is located within the Airport Industrial Park in Middletown, Pennsylvania, situated approximately two miles from the Pennsylvania Turnpike (I-76), offering access points to the east and west, and is also just off I-283, which offers access to the north and south via I-83 and I-81. According to the appraisal, the property is located in the Harrisburg East Industrial submarket, which is comprised of 585 buildings with nearly 44.6 million square feet of space. As of Q1 2015, the vacancy rate in the submarket was 8.9% and the average quoted rental rate was $3.39 per square foot, triple net. The appraisal reports roughly 8.8 million square feet of industrial properties within a 3 mile radius of the 1001 & 1011 Air Park Drive property.
Syracuse, New York MSA (3 properties totaling 661,500 sq. ft., 25.7% of NRA, 22.6% of U/W Base Rent) The 4472 Steelway Boulevard North, 4474 Steelway Boulevard North and 4500 & 4510 Steelway Boulevard South properties are located in an industrial park in Clay, New York, in suburban Syracuse, approximately 1.5 miles north of the New York State Thruway (I-90), 4 miles west of I-81 and 8 miles west of the Syracuse Hancock International Airport. According to the appraisal, each property is located in the NE Outer Onondaga County Warehouse submarket. As of the first quarter of 2015, the submarket included nearly 9.3 million square feet of space in 144 buildings, with a 2.4% vacancy rate and an average quoted rental rate of $3.97 per square foot, triple net.
THE INFORMATION IN THIS STRUCTURAL AND COLLATERAL TERM SHEET IS NOT COMPLETE AND MAY BE AMENDED PRIOR TO THE TIME OF SALE. THIS TERM SHEET IS NOT AN OFFER TO SELL THESE SECURITIES AND IT IS NOT A SOLICITATION OF AN OFFER TO BUY THESE SECURITIES IN ANY JURISDICTION WHERE THE OFFER OR SALE IS NOT PERMITTED.
| 77 |
HERITAGE INDUSTRIAL PORTFOLIO |
Albany, New York MSA (3 properties totaling 403,110 sq. ft., 15.6% of NRA, 14.0% of U/W Base Rent) The 8, 21 and 22 Northeastern Industrial Park properties are located in the Northeastern Industrial Park in Guilderland, New York, within the Albany MSA, immediately adjacent to the New York State Thruway (I-90). The Northeastern Industrial Park consists of 29 buildings totaling 3.0 million square foot on 586 acres, served by three rail lines (CSX, Canadian Pacific and Norfolk Southern). According to the appraisal, the properties are located in the West Outer Albany County submarket. As of Q1 2015, the submarket included just over 6.1 million square feet of space in 102 buildings, with a 13.2% vacancy rate and an average quoted rental rate of $4.27 per square foot, triple net.
Rochester, New York MSA (2 properties totaling 175,971 sq. ft., 6.8% of NRA, 7.6% of U/W Base Rent) The properties located at 4 & 8 Marway Circle and 5 Marway Circle in Gates, New York are located within an industrial park situated less than one mile east of I-490, within close proximity to the I-490 Expressway Buffalo Road Entrance and approximately two miles west of I-390, both of which access the New York State Thruway (I-90). Marway Circle is approximately four miles northwest of the Greater Rochester International Airport and six miles west of the Rochester central business district. According to the related appraisal, the 4 & 8 Marway Circle property was noted as being located in the Southwest Rochester Warehouse Industrial submarket. As of Q1 2015, the submarket included 234 buildings totaling just less than 9.9 million square feet of space, with a 12.9% vacancy rate and an average quoted rental rate of $7.58 psf/year. The appraisal for 5 Marway Circle indicated the property was located in the Southwest Rochester Flex submarket. As of Q1 2015, the submarket included 25 buildings totaling just under 3.5 million square feet of space, with a 31.8% vacancy rate and an average quoted rental rate of $8.03 per square foot, triple net.
Columbus, Ohio MSA (2 properties totaling 430,735 sq. ft., 16.7% of NRA, 11.5% of U/W Base Rent) 16725 Square Drive is located in Marysville, Ohio, near the junction of US Highway 36 and US Highway 33, which provides expressway access to I-270 and the Columbus outer-belt expressway, approximately 20 miles to the southeast. According to the appraisal, the subject is located in the Union County Warehouse submarket. As of Q1 2015, the submarket was comprised of 114 buildings totaling nearly 5.9 million square feet of space, with a 7.5% vacancy rate and an average quoted rental rate of $3.67 per square foot, triple net.
3530 East Pike Road is located in Zanesville, Ohio, immediately south of I-70 with access to the interstate approximately one mile to the west, providing access to Columbus and I-77 via I-70. According to the appraisal, the subject is located in the Muskingum and Surrounding Counties Warehouse/Distribution submarket. The submarket includes 73 buildings ranging in size from 50,000 to 500,000 square feet with just over 11 million square feet in total. As of Q1 2015, the vacancy rate for the submarket was 13.3% with an average quoted rental rate of $3.84 per square foot, triple net.
The Borrowers.The borrowers are a two TIC structure, comprised of 550BSA III, LLC and Tri-Martin IV, LLC, each of which is a single purpose entity and Delaware limited liability company with two independent directors. Legal counsel to the borrowers delivered a non-consolidation opinion in connection with the origination of the Heritage Industrial Portfolio Whole Loan. Steven Greenberg and Jeffrey Greenberg are the guarantors of certain non-recourse carveouts under the Heritage Industrial Portfolio Whole Loan. Combined, the guarantors own 62.2% of 550BSA, LLC and 36.4% of Tri-Martin IV, LLC and are the managing members of both borrowing entities.
The Sponsors.The sponsors are Steven Greenberg and Jeffrey Greenberg. Steven and Jeffrey Greenberg are the principals of Heritage Capital Group (“Heritage”), a private, family-owned real estate firm founded over 75 years ago. Heritage has invested in office, industrial and retail properties totaling more than six million square feet in 20 states in the U.S. as well as over 7,000 apartment units. Heritage currently owns and manages a portfolio consisting of 21 properties, (inclusive of the Heritage Industrial Portfolio Properties) totaling approximately 3.4 million square feet, four office properties comprising 473,000 square feet, two retail properties comprising 22,200 square feet, and an industrial property comprising 250,000 square feet. Additionally, Heritage owns and manages seven apartment properties totaling 2,055 units. The assets in Heritage’s portfolio are located in NJ, SC and NC, in addition to the locations of the Heritage Industrial Portfolio Properties. As of May 1, 2015, the reported average occupancy of Heritage’s total commercial portfolio was 92.5% excluding the seven apartment units and an unimproved land asset located in New Jersey. The sponsor disclosed three loans in which it was a sponsor (in one case) or minority investor (in the other two cases) in the related properties, as to which a deed-in-lieu of foreclosure, an uncontested foreclosure or a discounted payoff was effected, during the period between 2007 through 2012. See “Description of the Mortgage Pool — Loan Purpose; Default History, Bankruptcy Issues and Other Proceedings” in the Preliminary Prospectus.
Escrows.The loan documents provide for upfront escrows in the amount of $88,889 for deferred maintenance, $800,000 for tenant improvements and leasing commissions for space other than Staples (the “General TI/LC Reserve”), $694,723 for real estate taxes and $64,203 for insurance premiums. The loan documents require ongoing monthly deposits in the amount determined by the lender for real estate taxes and insurance (currently $141,872 for real estate taxes and $16,051 for insurance premiums), $21,517 for replacement reserves and $32,250 into the General TI/LC Reserve (subject to a cap of $500,000).
The loan documents require escrows to cover the costs of tenant improvements and leasing commissions for the Staples space (the “Staples TI/LC Reserve”) consisting of monthly deposits of $33,333 for the first 15 months of the loan term and $83,333 beginning on the first payment date 12 months prior to Staples’ lease expiration (subject to a combined cap of $1,500,000). In lieu of the $83,333 monthly deposits, a $1,000,000 letter of credit may be provided by the borrowers no later than 13 months prior to Staples lease expiration. The loan documents also require monthly deposits of $100,000 starting on the first payment date on or after the date that is 18 months prior to a subsequent lease expiration for Staples (or for any replacement tenant that leases all of Staples’ space) until such time as funds have accumulated to $1,800,000 for the reimbursement of tenant improvements and leasing commissions for the Staples space; provided that in lieu of such deposits an $1,800,000 letter of credit may be provided by the borrowers. In addition, if only a portion of the Staples space has been leased to a replacement tenant(s), monthly deposits are required starting 18 months prior to the then-scheduled expiration date of such lease in an amount equal to $0.16 per square foot for such tenant’s space (provided that if such replacement lease is for less than five years, the required deposit will be equal to the foregoing amount multiplied by the number of years for such lease divided by five). If a Cash Sweep Trigger Event is continuing, and funds in the cash management account are insufficient to pay monthly debt service payments on the Heritage Industrial Portfolio
THE INFORMATION IN THIS STRUCTURAL AND COLLATERAL TERM SHEET IS NOT COMPLETE AND MAY BE AMENDED PRIOR TO THE TIME OF SALE. THIS TERM SHEET IS NOT AN OFFER TO SELL THESE SECURITIES AND IT IS NOT A SOLICITATION OF AN OFFER TO BUY THESE SECURITIES IN ANY JURISDICTION WHERE THE OFFER OR SALE IS NOT PERMITTED.
| 78 |
HERITAGE INDUSTRIAL PORTFOLIO |
Whole Loan, and no event of default exists, at the borrowers’ request, the lender is required to apply funds in the Staples TI/LC Reserve to pay monthly debt service payments; provided that the maximum aggregate amount of such reserve permitted to be applied for such purpose is $480,000.
Lockbox and Cash Management.The Heritage Industrial Portfolio Whole Loan is structured with a hard lockbox and springing cash management. The Heritage Industrial Portfolio Whole Loan requires all rents to be directly deposited by tenants of the Heritage Industrial Portfolio Properties into the lockbox account. The loan documents also require that, the borrowers or property manager deposit all rents into the lockbox account within three business days of receipt. Prior to the occurrence of a Cash Sweep Trigger Event (as defined below), all funds in the lockbox account are swept into the borrowers’ operating account. Upon the occurrence and during the continuance of a Cash Sweep Trigger Event, all cash flow is required to be swept from the lockbox account into a lender-controlled cash management account.
A “Cash Sweep Trigger Event” means the occurrence of any one or more of the following as determined by lender in its sole discretion: (a) an event of default, (b) the amortizing debt service coverage ratio is less than 1.10x as of the last day of any calendar quarter for such quarter, or (c) Staples (i) ceases to operate its business from all or any material portion of the Staples space for more than 30 consecutive days, (ii) becomes the subject of any proceeding or action relating to its bankruptcy, reorganization or other arrangement pursuant to federal bankruptcy law or any similar federal or state law or files for bankruptcy or other insolvency proceedings, (iii) provides notice of its intent to terminate the Staples lease, or (iv) defaults under any monetary or material non-monetary term of the Staples lease and such monetary or material non-monetary default continues after any applicable notice and cure period and such monetary or material non-monetary default would allow the borrowers to terminate the Staples lease.
A “Cash Sweep Cure” will occur, with respect to clause (a) above, upon the cure of such event of default; with respect to clause (b) above, upon the amortizing debt service coverage ratio being equal to or greater than 1.15x for two consecutive calendar quarters; with respect to clause (c) above, upon the amortizing debt service coverage ratio being equal to or greater than 1.20x for two consecutive calendar quarters; provided, however, that, such Cash Sweep Cure set forth in this definition shall be subject to the following conditions, (x) no event of default shall have occurred and be continuing under the cash management agreement or any of the loan documents, (y) no other Cash Sweep Trigger Event shall have occurred and be continuing, and (z) the borrowers shall have paid all of the lender’s expenses in connection with such Cash Sweep Cure including, without limitation, reasonable attorney’s fees and expenses.
Property Management.The Heritage Industrial Portfolio Properties are managed by affiliates of the sponsors.
Assumption.The borrowers have the ongoing right to transfer the Heritage Industrial Portfolio Properties provided that certain conditions are satisfied, including (i) no event of default has occurred and is continuing; (ii) approval of the proposed transferee and transfer by the lender, in its commercially reasonable discretion, including but not limited to the transferee’s creditworthiness, financial strength and real estate management and leasing expertise; (iii) if the original guarantor is released (from and after the date of the transfer) in connection with the transfer, then any guarantor’s obligations are assumed by a person acceptable to lender in its reasonable discretion; and (iv) at the lender’s option, and if required by the procedures of Fitch, KBRA or Moody’s, a confirmation from such rating agency that such assumption will not result in a downgrade, withdrawal or qualification of the ratings assigned by it to the Series 2015-P2 Certificates, along with similar confirmations from each applicable rating agency rating any securities backed by the Heritage Industrial Portfolio Companion Loan.
Purchase Option. Midwest Express Inc., the sole tenant at the 16725 Square Drive property, has the right to purchase such property at any time after the 25th payment date after the securitization of the Heritage Industrial Portfolio Whole Loan, for a purchase price equal to $4,000,000 plus all applicable defeasance costs.
Partial Release.Following the lockout period, the borrowers are permitted to obtain the partial release of any of the Heritage Industrial Portfolio Properties in connection with a partial defeasance, subject to certain conditions including: (i) the principal balance defeased equals the greater of (a) 120% of the allocated loan amount for the mortgaged properties located in Pennsylvania (2294 Molly Pitcher Highway; 1001 & 1011 Air Park Drive) and Guilderland, New York (8 Northeastern Industrial Park; 21 Northeastern Industrial Park and 22 Northeastern Industrial Park) or 110% of the allocated loan amount for all other mortgaged properties; and (b) an amount equal to 100% of the net proceeds of the sale of the released property; (ii) the remaining portfolio, following release, would have (x) an amortizing debt service coverage ratio utilizing annual net operating income (without deduction for tenant improvements, leasing commissions or replacement reserves) from leases on the remaining premises that have remaining terms of at least 18 months of at least 1.25x and (y) a loan-to-value ratio of not more than 75.0%; (iv) at the lender’s option, the lender has received confirmation from Fitch, KBRA and Moody’s that such release will not result in a downgrade, withdrawal or qualification of the respective ratings assigned to the Series 2015-P2 Certificates, along with similar confirmations from each rating agency rating any securities backed by the Heritage Industrial Portfolio Companion Loan; and (v) receipt of a REMIC opinion.
Real Estate Substitution.Not permitted.
Subordinate and Mezzanine Indebtedness.Not permitted.
Ground Lease.None.
Terrorism Insurance.The loan documents require that the “all risk” insurance policy required to be maintained by the borrowers provide coverage for terrorism in an amount equal to the full replacement cost of the Heritage Industrial Portfolio Properties and business interruption insurance covering no less than the 12-month period following the occurrence of a casualty event, together with a six-month extended period of indemnity; provided that if the policies contain an exclusion for loss or damage incurred as a result of an act of terrorism or similar acts of sabotage, the borrowers are required to maintain separate insurance against such loss or damage provided such insurance (a) is commercially available and (b) can be obtained at a commercially reasonable cost as reasonably determined by lender.
THE INFORMATION IN THIS STRUCTURAL AND COLLATERAL TERM SHEET IS NOT COMPLETE AND MAY BE AMENDED PRIOR TO THE TIME OF SALE. THIS TERM SHEET IS NOT AN OFFER TO SELL THESE SECURITIES AND IT IS NOT A SOLICITATION OF AN OFFER TO BUY THESE SECURITIES IN ANY JURISDICTION WHERE THE OFFER OR SALE IS NOT PERMITTED.
| 79 |
ANCHORAGE MARRIOTT DOWNTOWN |

THE INFORMATION IN THIS STRUCTURAL AND COLLATERAL TERM SHEET IS NOT COMPLETE AND MAY BE AMENDED PRIOR TO THE TIME OF SALE. THIS TERM SHEET IS NOT AN OFFER TO SELL THESE SECURITIES AND IT IS NOT A SOLICITATION OF AN OFFER TO BUY THESE SECURITIES IN ANY JURISDICTION WHERE THE OFFER OR SALE IS NOT PERMITTED.
| 80 |
ANCHORAGE MARRIOTT DOWNTOWN |
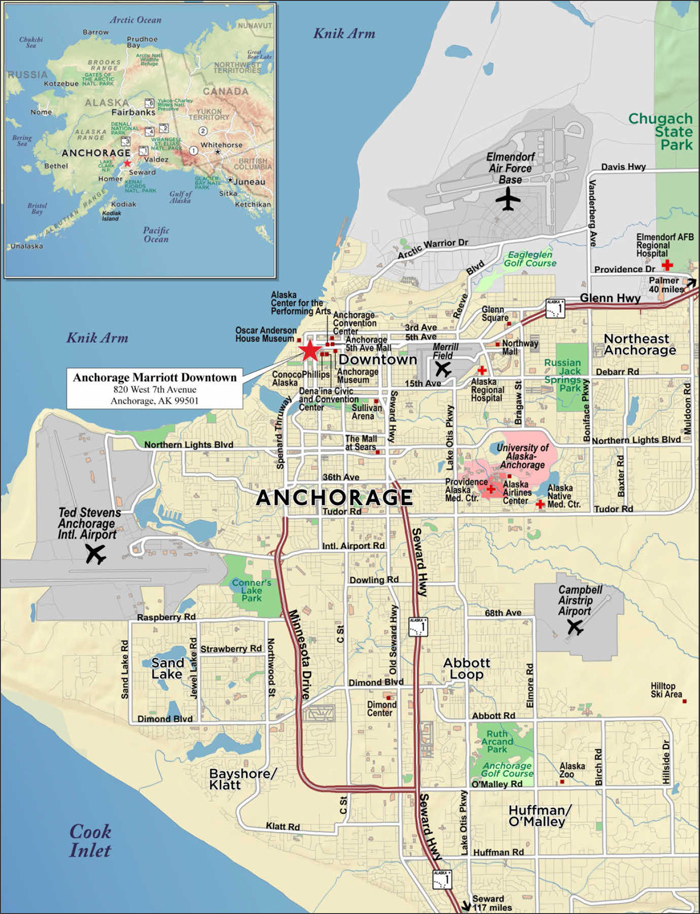
THE INFORMATION IN THIS STRUCTURAL AND COLLATERAL TERM SHEET IS NOT COMPLETE AND MAY BE AMENDED PRIOR TO THE TIME OF SALE. THIS TERM SHEET IS NOT AN OFFER TO SELL THESE SECURITIES AND IT IS NOT A SOLICITATION OF AN OFFER TO BUY THESE SECURITIES IN ANY JURISDICTION WHERE THE OFFER OR SALE IS NOT PERMITTED.
| 81 |
| No. 8 – Anchorage Marriott Downtown | |||||||
| Loan Information | Property Information | ||||||
| Mortgage Loan Seller: | Citigroup Global Markets Realty Corp. | Single Asset/Portfolio: | Single Asset | ||||
Credit Assessment (Fitch/KBRA/Moody’s): | NR/NR/NR | Property Type: | Hospitality | ||||
| Original Principal Balance(1): | $37,975,000 | Specific Property Type: | Full Service | ||||
| Cut-off Date Principal Balance(1): | $37,926,518 | Location: | Anchorage, AK | ||||
| % of Initial Pool Balance: | 3.8% | Size: | 392 Rooms | ||||
| Loan Purpose: | Refinance | Cut-off Date Principal Balance Per Room(1): | $193,503 | ||||
| Borrower Name: | Columbia Properties Anchorage, L.P. | Year Built/Renovated: | 2000/2012 | ||||
| Sponsor: | William J. Yung III | Title Vesting: | Fee | ||||
| Mortgage Rate: | 4.670% | Property Manager: | Self-managed | ||||
| Note Date: | October 7, 2015 | 3rd Most Recent Occupancy (As of): | 65.7% (12/31/2012) | ||||
| Anticipated Repayment Date: | NAP | 2nd Most Recent Occupancy (As of): | 66.3% (12/31/2013) | ||||
| Maturity Date: | November 6, 2025 | Most Recent Occupancy (As of): | 68.2% (12/31/2014) | ||||
| IO Period: | None | Current Occupancy (As of): | 68.5% (TTM 8/31/2015) | ||||
| Loan Term (Original): | 120 months | ||||||
| Seasoning: | 1 month | Underwriting and Financial Information: | |||||
| Amortization Term (Original): | 360 months | ||||||
| Loan Amortization Type: | Amortizing Balloon | 3rd Most Recent NOI (As of): | $9,511,675 (12/31/2013) | ||||
| Interest Accrual Method: | Actual/360 | 2nd Most Recent NOI (As of): | $9,789,531 (12/31/2014) | ||||
| Call Protection(2): | L(25),D(92),O(3) | Most Recent NOI (As of): | $10,560,305 (TTM 8/31/2015) | ||||
| Lockbox Type: | Hard/Springing Cash Management | ||||||
| Additional Debt(1): | Yes | ||||||
| Additional Debt Type(1): | Pari Passu | ||||||
| U/W Revenues: | $21,884,808 | ||||||
| U/W Expenses: | $12,519,868 | ||||||
| Escrows and Reserves(3): | U/W NOI: | $9,364,940 | |||||
| U/W NCF: | $8,270,700 | ||||||
| Type: | Initial | Monthly | Cap (If Any) | U/W NOI DSCR(1): | 1.99x | ||
| Taxes | $245,311 | $61,328 | NAP | U/W NCF DSCR(1): | 1.76x | ||
| Insurance | $58,129 | $29,064 | NAP | U/W NOI Debt Yield(1): | 12.3% | ||
| FF&E Reserve | $0 | $91,187 | NAP | U/W NCF Debt Yield(1): | 10.9% | ||
| Deferred Maintenance | $1,875 | $0 | NAP | As-Is Appraised Value: | $108,500,000 | ||
| Comfort Letter Reserve | $2,500 | $0 | NAP | As-Is Appraisal Valuation Date: | September 1, 2015 | ||
| Seasonality Reserve | $362,604 | Springing | NAP | Cut-off Date LTV Ratio(1): | 69.9% | ||
| PIP Reserve | $0 | Springing | NAP | LTV Ratio at Maturity or ARD(4): | 51.7% | ||
| (1) | The Anchorage Marriott Downtown Whole Loan, with an original principal balance totaling $75,950,000, is comprised of two pari passu notes (Notes A-1 and A-2). The non-controlling Note A-2 had an original principal balance of $37,975,000, has an outstanding principal balance as of the Cut-off Date of $37,926,518 and will be contributed to the WFCM 2015-P2 Trust. The controlling Note A-1 had an original balance of $37,975,000, has an outstanding principal balance as of the Cut-off Date of $37,926,518 and is expected to be contributed to the CGCMT 2015-GC35 Trust. All statistical information related to the balance per room, loan-to-value ratios, debt service coverage ratios and debt yields are based on the Anchorage Marriott Downtown Whole Loan. |
| (2) | Defeasance of the Anchorage Marriott Downtown Mortgage Loan is permitted on or after the date that is the earlier to occur of (i) 24 months after the closing date of the securitization that includes the final portion of the Anchorage Marriott Downtown Mortgage Loan, and (ii) forty-eight months following origination of the Anchorage Marriott Downtown Mortgage Loan. |
| (3) | See “Escrows” section. |
| (4) | LTV Ratio at Maturity or ARD is calculated based on the as-stabilized appraised value of $119,500,000 based on an as-stabilized valuation date of September 1, 2017. Based on the as-is value of $108,500,000, the LTV Ratio at Maturity or ARD is 56.9%. |
The Mortgage Loan. The mortgage loan (the “Anchorage Marriott Downtown Mortgage Loan”) is part of a whole loan (the “Anchorage Marriott Downtown Whole Loan”) evidenced by twopari passu notes that are secured by a first mortgage encumbering the borrower’s fee simple interest in a 392-room full service hotel located in Anchorage, Alaska (the “Anchorage Marriott Downtown Property”). The Anchorage Marriott Downtown Whole Loan was originated on October 7, 2015 by Citigroup Global Markets Realty Corp. The Anchorage Marriott Downtown Whole Loan had an original principal balance of $75,950,000, has an outstanding principal balance as of the Cut-off Date of $75,853,035 and accrues interest at an interest rate of 4.670%per annum. The Anchorage Marriott Downtown Whole Loan had an initial term of 120 months, has a remaining term of 119 months as of the Cut-off Date and requires payments of interest and principal based on a 30-year amortization schedule. The Anchorage Marriott Downtown Whole Loan matures on November 6, 2025. See “Description of the Mortgage Pool — The Whole Loans — The Non-Serviced Pari Passu Whole Loans - The Anchorage Marriott Downtown Whole Loan” in the Preliminary Prospectus.
Note A-2, which will be contributed to the WFCM 2015-P2 Trust, had an original principal balance of $37,975,000, has an outstanding principal balance as of the Cut-off Date of $37,926,518 and represents the non-controlling interest in the Anchorage Marriott
THE INFORMATION IN THIS STRUCTURAL AND COLLATERAL TERM SHEET IS NOT COMPLETE AND MAY BE AMENDED PRIOR TO THE TIME OF SALE. THIS TERM SHEET IS NOT AN OFFER TO SELL THESE SECURITIES AND IT IS NOT A SOLICITATION OF AN OFFER TO BUY THESE SECURITIES IN ANY JURISDICTION WHERE THE OFFER OR SALE IS NOT PERMITTED.
| 82 |
ANCHORAGE MARRIOTT DOWNTOWN |
Downtown Whole Loan. Note A-1 (the “Anchorage Marriott Downtown Companion Loan”), some or all of which is expected to be contributed to the CGCMT 2015-GC35 Trust, had an original principal balance of $37,975,000 and represents the controlling interest in the Anchorage Marriott Downtown Whole Loan.
Following the second anniversary of the Closing Date, the borrower may defease the Anchorage Marriott Downtown Whole Loan, in whole, but not in part, on any date before September 6, 2025. In addition, the Anchorage Marriott Downtown Whole Loan is prepayable without payment of a prepayment premium on or after September 6, 2025.
Sources and Uses
| Sources | Uses | |||||||
| Original whole loan amount | $75,950,000 | 100.0% | Loan payoff | $46,113,190 | 60.7% | |||
| Reserves | 670,419 | 0.9 | ||||||
| Closing costs | 627,362 | 0.8 | ||||||
| Return of equity | 28,539,029 | 37.6 | ||||||
| Total Sources | $75,950,000 | 100.0% | Total Uses | $75,950,000 | 100.0% |
The Property. The Anchorage Marriott Downtown Property is a 20-story, 392-room, full service hotel located in the central business district of Anchorage, Alaska. The Anchorage Marriott Downtown Property was constructed in 2000 and renovated in 2012 and is situated near the Dena’ina Civic and Convention Center and Delaney Park. Guestrooms at the Anchorage Marriott Downtown Property are located on floors three through twenty and comprise 173 king rooms, 219 double-double rooms and 3 parlor suites (not included in the guestroom count). The Anchorage Marriott Downtown Property offers a variety of amenities including a business center, fitness center, indoor swimming pool, 2 restaurants, lounge and approximately 10,334 square feet of meeting space. The Anchorage Marriott Downtown Property currently has use of 10 parking spaces in an adjacent third-party parking garage pursuant to an agreement with Anchorage Community Development Authority – EasyPark (the “Parking Agreement”). The Parking Agreement is scheduled to expire on December 31, 2016. Additionally, per the appraisal, there are multiple surface and structured parking options in close proximity to the Anchorage Marriott Downtown Property. The Anchorage Marriott Downtown Property operates under a franchise agreement with Marriott International, Inc., that expires in December 2020.
Operating History and Underwritten Net Cash Flow.The following table presents certain information relating to the historical operating performance and the underwritten net cash flow at the Anchorage Marriott Downtown Property:
Cash Flow Analysis
| 2013 | 2014 | TTM 8/31/2015 | U/W | % of U/W Total Revenue | U/W $ per Room | ||||||||
| Occupancy | 66.3% | 68.2% | 68.5% | 68.5% | |||||||||
| ADR | $156.22 | $163.94 | $171.98 | $171.98 | |||||||||
| RevPAR | $103.64 | $111.75 | $117.73 | $117.73 | |||||||||
| Total Revenue | $20,142,514 | $20,819,085 | $21,884,808 | $21,884,808 | 100.0% | $55,829 | |||||||
| Total Department Expenses | 5,145,255 | 5,235,787 | 5,260,177 | 5,935,692 | 27.1 | 15,142 | |||||||
| Gross Operating Profit | $14,997,259 | $15,583,298 | $16,624,631 | $15,949,116 | 72.9% | $40,687 | |||||||
| Total Undistributed Expenses | 4,429,213 | 4,662,437 | 4,942,270 | 5,531,236 | 25.3 | 14,110 | |||||||
| Profit Before Fixed Charges | $10,568,045 | $10,920,862 | $11,682,361 | $10,417,880 | 47.6% | $26,576 | |||||||
| Total Fixed Charges | 1,056,371 | 1,131,331 | 1,122,056 | 1,052,940 | 4.8 | 2,686 | |||||||
| Net Operating Income | $9,511,675 | $9,789,531 | $10,560,305 | $9,364,940 | 42.8% | $23,890 | |||||||
| FF&E | 0 | 0 | 874,247 | 1,094,240 | 5.0 | 2,791 | |||||||
| Net Cash Flow | $9,511,675 | $9,789,531 | $9,686,058 | $8,270,700 | 37.8% | $21,099 | |||||||
| NOI DSCR | 2.02x | 2.08x | 2.24x | 1.99x | |||||||||
| NCF DSCR | 2.02x | 2.08x | 2.06x | 1.76x | |||||||||
| NOI DY | 12.5% | 12.9% | 13.9% | 12.3% | |||||||||
| NCF DY | 12.5% | 12.9% | 12.8% | 10.9% | |||||||||
Appraisal.As of the appraisal valuation date of September 1, 2015, the Anchorage Marriott Downtown Property had an “as-is” appraised value of $108,500,000. The appraiser also concluded to an “as stabilized” appraised value of $119,500,000 with an “as stabilized” valuation date of September 1, 2017. The “as stabilized” value assumes occupancy, average daily rate and RevPAR of 69.0%, $188.66 and $130.18, respectively.
Environmental Matters.According to the Phase I environmental report, dated July 22, 2015, there was no evidence of any recognized environmental conditions at the Anchorage Marriott Downtown Property.
Market Overview and Competition.According to the appraisal, Anchorage is home to over 50 parks and recreational facilities and numerous museums. The Ted Stevens Anchorage International Airport serves approximately 5,000,000 passengers annually. According to the appraisal, one million tourists came through Anchorage in 2014 with industry projections indicating a 2%-3% growth in visitors statewide in 2015. Anchorage has major roads and routes that run through the city, including Alaska State Route 1, Glenn Highway and Seward Highway; public transportation is provided by People Mover Bus System throughout the city.
THE INFORMATION IN THIS STRUCTURAL AND COLLATERAL TERM SHEET IS NOT COMPLETE AND MAY BE AMENDED PRIOR TO THE TIME OF SALE. THIS TERM SHEET IS NOT AN OFFER TO SELL THESE SECURITIES AND IT IS NOT A SOLICITATION OF AN OFFER TO BUY THESE SECURITIES IN ANY JURISDICTION WHERE THE OFFER OR SALE IS NOT PERMITTED.
| 83 |
ANCHORAGE MARRIOTT DOWNTOWN |
According to the appraisal, the Anchorage Metropolitan Statistical Area (“MSA”) had an estimated 2014 population of approximately 399,000, which is expected to grow by 2.9% to 420,000 by 2019. The top employers are in health services, grocery and merchandise, oil services, airline and financial services industries. The largest employers in the area include: Providence Health & Services, Walmart/Sam’s Club, Carrs/Safeway, Fred Meyer, ASRC Energy Services and BP Exploration Alaska. According to the appraisal, the leisure and hospitality sector is anticipated to account for 16,900 jobs in 2015.
The following table presents certain information relating to the Anchorage Marriott Downtown Property’s competitive set:
Subject and Market Historical Occupancy, ADR and RevPAR(1)
Competitive Set | Anchorage Marriott Downtown | Penetration Factor | |||||||||||||||
Year | Occupancy | ADR | RevPAR | Occupancy | ADR | RevPAR | Occupancy | ADR | RevPAR | ||||||||
| TTM 7/31/2015 | 66.2% | $146.16 | $96.71 | 68.0% | $171.01 | $116.30 | 102.8% | 117.0% | 120.3% | ||||||||
| YTD 7/31/2014 | 68.3% | $141.72 | $96.83 | 67.3% | $163.03 | $109.73 | 98.5% | 115.0% | 113.3% | ||||||||
| YTD 7/31/2013 | 65.5% | $139.57 | $91.47 | 67.3% | $158.16 | $106.40 | 102.6% | 113.3% | 116.3% | ||||||||
| (1) | Information obtained from a third party hospitality research report dated August 2015. The competitive set includes the following hotels: Sheraton Hotel & Spa Anchorage, Hilton Anchorage, Millennium The Lakefront Anchorage, Courtyard Anchorage Airport, and Hilton Garden Inn Anchorage. |
The Borrower.The borrower is Columbia Properties Anchorage, L.P., a single-purpose entity and limited partnership with two independent directors. Legal counsel to the borrower delivered a non-consolidation opinion in connection with the origination of the Anchorage Marriott Downtown Whole Loan. Columbia Sussex Corporation and CSC Holdings, LLC are the guarantors of certain non-recourse carveouts under the Anchorage Marriott Downtown Whole Loan. The guarantors are required to maintain a combined net worth of $85.0 million and combined liquidity of $10.0 million through the term of the Anchorage Marriott Downtown Whole Loan.
The Sponsor.The sponsor is William J. Yung III. The sponsor is an experienced developer, owner and operator of hotel properties. William J. Yung founded Columbia Sussex Corporation in 1972. Columbia Sussex Corporation is a large private hotel company with a portfolio that primarily consists of 35 hotels (11,502 keys), 27 (8,318 keys) of which are Marriott flags, and is the largest domestic full-service Marriott franchisee. Columbia Sussex Corporation is currently a defendant in litigation pertaining to an unrelated transaction. See also “Description of the Mortgage Pool — Litigation and Other Considerations” in the Preliminary Prospectus.
Escrows.The loan documents provide for upfront reserves of $362,604 for a seasonality reserve, $245,311 for: real estate taxes, $58,129 for insurance premiums, $1,875 for deferred maintenance and $2,500 for expenses related to the transfer of the comfort letter.
The loan documents also provide for monthly escrows for real estate taxes in an amount equal to one-twelfth of the amount the lender estimates will be necessary to pay taxes over the then succeeding 12-month period; insurance premiums in an amount equal to one-twelfth of the amount the lender estimates will be necessary to pay insurance over the then succeeding 12-month period; a reserve for FF&E in an amount equal to the greater of (a) the FF&E Payment (as defined below) and (b) the amount of the deposit (if any) then required by the franchisor on account of FF&E under the franchise agreement; and a seasonality reserve in an amount equal to the applicable Seasonality Reserve Monthly Deposit (as defined below).
No property improvement plan (“PIP”) was required under the franchise agreement at origination. In the event that a PIP is required by a franchisor, the borrower will be required to deposit an amount equal to 120% of the costs of the related PIP work (as estimated by the lender in its reasonable discretion) (A) in the case of any existing or renewal franchise agreement, prior to the required commencement date of any PIP imposed thereunder and (B) in the case of any new franchise agreement, on or prior to the date such new franchise agreement is executed and delivered. Additionally, if 18 months prior to the expiration of the franchise agreement (“Franchise Renewal Date”) a Franchise Renewal Event (as defined below) has not occurred, within 12 months of the Franchise Renewal Date, the borrower is required to post a letter of credit or cash in amount equal to 120% of the estimated PIP costs, less any sums then on deposit in the FF&E escrow and the PIP escrow.
An “FF&E Payment” means, with respect to the monthly payment date, an amount equal to (1) during the continuance of an Anchorage Marriott Downtown Trigger Period (see “Lockbox and Cash Management” section) where an approved annual budget exists as of the date of determination, one-twelfth of 5% of the greater of (x) the annual gross revenues for the hotel related operations at the Anchorage Marriott Downtown Property for the immediately preceding calendar year as reasonably determined by the lender and (y) the projected annual gross revenues for the hotel related operations at the Anchorage Marriott Downtown Property for the calendar year in which such monthly payment date occurs as set forth in the approved annual budget, or (2) if no Anchorage Marriott Downtown Trigger Period is continuing or during the continuance of an Anchorage Marriott Downtown Trigger Period where no approved annual budget exists as of the date of determination, one-twelfth of 5% of the annual gross revenues for the hotel related operations at the Anchorage Marriott Downtown Property for the immediately preceding calendar year as reasonably determined by the lender. The FF&E reserve monthly deposit must (A) initially be determined for the balance of the 2015 calendar year as of the origination date and (B) thereafter be adjusted and determined by the lender annually on the monthly payment date in April 2016 and on each monthly payment date falling in each subsequent April thereafter. Notwithstanding anything herein to the contrary, the lender may require the borrower to increase the monthly deposits required pursuant to the loan documents upon 30 days’ notice to the borrower if (1) an Anchorage Marriott Downtown Trigger Period is continuing and the lender determines in its reasonable discretion that an increase is necessary to maintain proper maintenance and operation of the Anchorage Marriott Downtown Property and/or (2) the lender determines in its reasonable discretion that an increase is necessary to reflect increased FF&E expenditures required under the franchise agreement and/or set forth in any amendment to the most recently determined approved annual budget.
THE INFORMATION IN THIS STRUCTURAL AND COLLATERAL TERM SHEET IS NOT COMPLETE AND MAY BE AMENDED PRIOR TO THE TIME OF SALE. THIS TERM SHEET IS NOT AN OFFER TO SELL THESE SECURITIES AND IT IS NOT A SOLICITATION OF AN OFFER TO BUY THESE SECURITIES IN ANY JURISDICTION WHERE THE OFFER OR SALE IS NOT PERMITTED.
| 84 |
ANCHORAGE MARRIOTT DOWNTOWN |
A “Franchise Renewal Event” means the lender’s receipt of evidence reasonably acceptable to the lender (which such evidence must include, without limitation, a duly executed estoppel certificate from the applicable franchisor) that (i) the related franchise agreement has not been extended or replaced by a new franchise agreement in accordance with the terms of the Anchorage Marriott Downtown Whole Loan documents, in each case, for a term expiring no earlier than three years after the maturity date of the Anchorage Marriott Downtown Whole Loan, (ii) such franchise agreement (as so extended) or such replacement franchise agreement, as applicable, is in full force and effect with no defaults thereunder, and (iii) to the extent a PIP is required in connection with the foregoing, a deposit has been made to the PIP escrow in accordance with the terms of the Anchorage Marriott Downtown Whole Loan documents.
The “Seasonality Reserve Monthly Deposit” is equal to 110% of the quotient of (x) the aggregate amount by which operating income at the Anchorage Marriott Downtown Property for the calendar month is insufficient to establish a debt service coverage ratio of 1.00x based on the then-current annual budget (“Negative Monthly Amount”) for the 12-month period divided by (y) the number of months for which there is no Negative Monthly Amount, based on the then-current seasonality annual budget.
Lockbox and Cash Management.The Anchorage Marriott Downtown Loan is structured with a lender-controlled lockbox in place at origination and springing cash management. The borrower sent letters to all credit card companies directing such companies to pay rent directly to the lender-controlled lockbox account, and the borrower is required to deposit all revenue generated by the Anchorage Marriott Downtown Property in the lockbox account. Prior to the occurrence of an Anchorage Marriott Downtown Trigger Period, funds in the lockbox account are disbursed to the borrower’s operating account. Upon the occurrence of an Anchorage Marriott Downtown Trigger Period, all sums on deposit in the lockbox account are required to be swept on a daily basis into a cash management account for the payment of, among other things, debt service and property operating expenses, and for the funding of monthly escrows, with any excess (i) to the extent the Anchorage Marriott Downtown Trigger Period was caused solely by the failure of a Franchise Renewal Event to occur on or before the Franchise Renewal Date, deposited to the PIP escrow and (ii) to the extent the Anchorage Marriott Downtown Trigger Period was caused by any event other than as described in the preceding clause (i), held as additional collateral by the lender until the expiration of the applicable Anchorage Marriott Downtown Trigger Period after which it is returned to the borrower.
An “Anchorage Marriott Downtown Trigger Period” means a period (a) commencing upon the occurrence of an event of default and continuing until the cure or the lender’s waiver of such event of default; (b) commencing upon the occurrence of the debt service coverage ratio being less than 1.30x, and continuing until the debt service coverage ratio is equal to or greater than 1.35x for two consecutive calendar quarters; (c) commencing upon the occurrence of a Franchise Agreement Trigger Event (as defined below) and continuing until the borrower has cured all defaults under the franchise agreement, the borrower and the franchisor have reaffirmed the franchise agreement, the Anchorage Marriott Downtown Property continues to be operated pursuant to the franchise agreement and all permits applicable to the franchise agreement are in full force and effect; (d) commencing upon the non-delivery of an estoppel attesting to an extension of the franchise agreement or its replacement with a qualifying agreement for a term no shorter than expiring three years after the maturity date of the Anchorage Marriott Downtown Whole Loan, which franchise agreement or qualified replacement is in full force and effect without defaults thereunder, and for which any required renovation reserve has been deposited, on or before eighteen months prior to the expiration of the franchise agreement, and continuing until the delivery of such estoppel; (e) commencing upon the occurrence of a bankruptcy action of the property manager and continuing until such property manager is replaced in accordance with the loan documents; or (f) commencing upon the occurrence of the debt yield falling below 8.25% and continuing until the debt yield is 8.50% for two consecutive calendar quarters.
A “Franchise Agreement Trigger Event” means the occurrence of any of the following: (i) the borrower being in default under the franchise agreement beyond any applicable notice and cure periods; (ii) the borrower or franchisor giving notice that it is terminating the franchise agreement; and (iii) any termination or cancellation of the franchise agreement and/or the franchise agreement expiring or otherwise failing to otherwise be in full force and effect.
Property Management.The Anchorage Marriott Downtown Property is managed by an affiliate of the borrower.
Assumption.The borrower has a one-time right to transfer the Anchorage Marriott Downtown Property at any time other than the 60 days prior to and following any secondary market transaction, provided that no event of default has occurred and is continuing and certain other conditions are satisfied, including: (i) the lender’s reasonable determination that the proposed transferee and guarantor satisfy the lender’s credit review and underwriting standards, taking into consideration transferee experience, financial strength and general business standing; (ii) execution of a recourse guaranty and an environmental indemnity by an affiliate of the transferee; (iii) if requested by the lender, delivery of a rating agency confirmation from Fitch, KBRA and Moody’s that the transfer will not result in a downgrade, withdrawal or qualification of the respective ratings assigned to the Series WFCM 2015-P2 Certificates; and (iv) payment of an assumption fee.
Partial Release.Not permitted.
Real Estate Substitution.Not permitted.
Subordinate and Mezzanine Indebtedness.Not permitted.
THE INFORMATION IN THIS STRUCTURAL AND COLLATERAL TERM SHEET IS NOT COMPLETE AND MAY BE AMENDED PRIOR TO THE TIME OF SALE. THIS TERM SHEET IS NOT AN OFFER TO SELL THESE SECURITIES AND IT IS NOT A SOLICITATION OF AN OFFER TO BUY THESE SECURITIES IN ANY JURISDICTION WHERE THE OFFER OR SALE IS NOT PERMITTED.
| 85 |
ANCHORAGE MARRIOTT DOWNTOWN |
Ground Lease.None.
Terrorism Insurance. The borrower is required to maintain an “all-risk” insurance policy with a deductible no greater than $100,000 (except with respect to earthquake and windstorm coverage) that provides coverage for terrorism in an amount equal to the full replacement cost of the Anchorage Marriott Downtown Property, as well as business interruption insurance covering no less than the 18-month period following the occurrence of a casualty event, together with a six-month extended period of indemnity.
THE INFORMATION IN THIS STRUCTURAL AND COLLATERAL TERM SHEET IS NOT COMPLETE AND MAY BE AMENDED PRIOR TO THE TIME OF SALE. THIS TERM SHEET IS NOT AN OFFER TO SELL THESE SECURITIES AND IT IS NOT A SOLICITATION OF AN OFFER TO BUY THESE SECURITIES IN ANY JURISDICTION WHERE THE OFFER OR SALE IS NOT PERMITTED.
| 86 |
(THIS PAGE INTENTIONALLY LEFT BLANK)
THE INFORMATION IN THIS STRUCTURAL AND COLLATERAL TERM SHEET IS NOT COMPLETE AND MAY BE AMENDED PRIOR TO THE TIME OF SALE. THIS TERM SHEET IS NOT AN OFFER TO SELL THESE SECURITIES AND IT IS NOT A SOLICITATION OF AN OFFER TO BUY THESE SECURITIES IN ANY JURISDICTION WHERE THE OFFER OR SALE IS NOT PERMITTED.
| 87 |
| HARVEY BUILDING PRODUCTS PORTFOLIO |
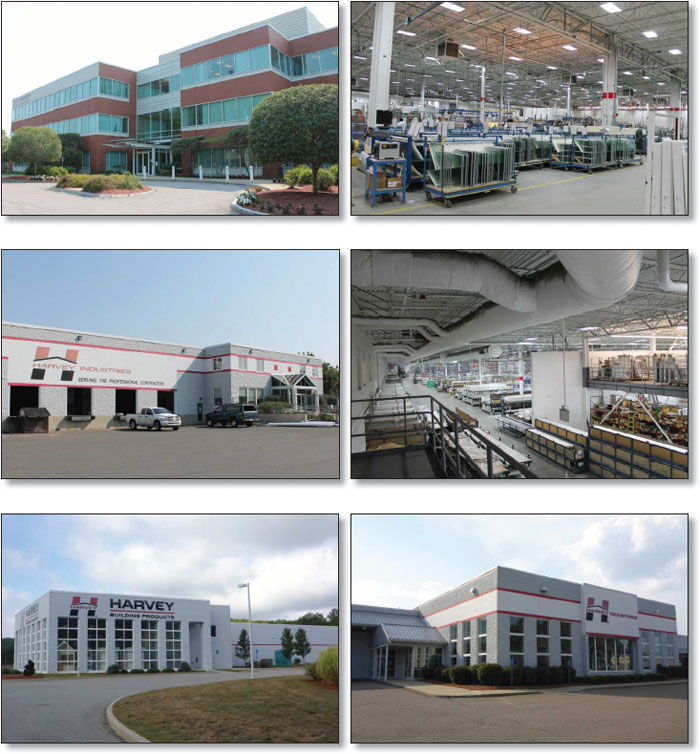
THE INFORMATION IN THIS STRUCTURAL AND COLLATERAL TERM SHEET IS NOT COMPLETE AND MAY BE AMENDED PRIOR TO THE TIME OF SALE. THIS TERM SHEET IS NOT AN OFFER TO SELL THESE SECURITIES AND IT IS NOT A SOLICITATION OF AN OFFER TO BUY THESE SECURITIES IN ANY JURISDICTION WHERE THE OFFER OR SALE IS NOT PERMITTED.
| 88 |
| HARVEY BUILDING PRODUCTS PORTFOLIO |
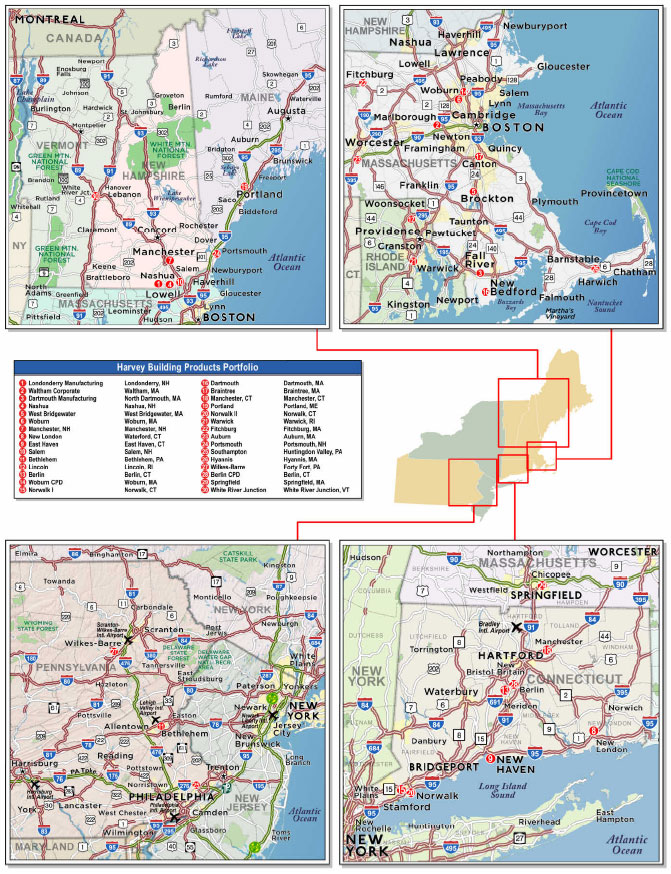
THE INFORMATION IN THIS STRUCTURAL AND COLLATERAL TERM SHEET IS NOT COMPLETE AND MAY BE AMENDED PRIOR TO THE TIME OF SALE. THIS TERM SHEET IS NOT AN OFFER TO SELL THESE SECURITIES AND IT IS NOT A SOLICITATION OF AN OFFER TO BUY THESE SECURITIES IN ANY JURISDICTION WHERE THE OFFER OR SALE IS NOT PERMITTED.
| 89 |
| No. 9 – Harvey Building Products Portfolio | ||||||
| Loan Information | Property Information | |||||
| Mortgage Loan Seller: | Ladder Capital Finance LLC | Single Asset/Portfolio: | Portfolio | |||
Credit Assessment (Fitch/KBRA/Moody’s): | NR/NR/NR | Property Type: | Various | |||
| Original Principal Balance(1): | $33,000,000 | Specific Property Type: | Various | |||
| Cut-off Date Principal Balance(1): | $32,922,772 | Location: | Various – See Table | |||
| % of Initial Pool Balance: | 3.3% | Size: | 2,046,119 SF | |||
| Loan Purpose: | Acquisition | Cut-off Date Principal Balance Per SF(1): | $53.63 | |||
| Borrower Name: | Harvey Propco, LLC | Year Built/Renovated: | Various – See Table | |||
| Sponsor: | Dunes Point Capital LLC | Title Vesting: | Fee | |||
| Mortgage Rate: | 4.850% | Property Manager: | Self-managed | |||
| Note Date: | October 1, 2015 | 3rd Most Recent Occupancy(4): | NAV | |||
| Anticipated Repayment Date: | NAP | 2nd Most Recent Occupancy(4): | NAV | |||
| Maturity Date: | October 6, 2020 | Most Recent Occupancy(4): | NAV | |||
| IO Period: | None | Current Occupancy: | 100.0% (12/1/2015) | |||
| Loan Term (Original): | 60 months | |||||
| Seasoning: | 2 months | Underwriting and Financial Information: | ||||
| Amortization Term (Original): | 360 months | |||||
| Loan Amortization Type: | Amortizing Balloon | 3rd Most Recent NOI(4): | NAV | |||
| Interest Accrual Method: | Actual/360 | 2nd Most Recent NOI(4): | NAV | |||
| Call Protection(2): | L(26),D(30),O(4) | Most Recent NOI(4): | NAV | |||
| Lockbox Type: | Hard/Upfront Cash Management | |||||
| Additional Debt(1): | Yes | U/W Revenues: | $14,531,091 | |||
| Additional Debt Type(1): | Pari Passu | U/W Expenses: | $435,933 | |||
| U/W NOI: | $14,095,158 | |||||
| U/W NCF: | $13,683,832 | |||||
| U/W NOI DSCR(1): | 2.02x | |||||
| U/W7 NCF DSCR(1): | 1.96x | |||||
| Escrows and Reserves(3): | U/W NOI Debt Yield(1): | 12.8% | ||||
| U/W NCF Debt Yield(1): | 12.5% | |||||
| Type: | Initial | Monthly | Cap (If Any) | As-Is Appraised Value(5): | $205,460,000 | |
| Taxes | $1,207,022 | $199,837 | NAP | As-Is Appraisal Valuation Date(5): | Various | |
| Insurance | $594,489 | $78,692 | NAP | Cut-off Date LTV Ratio(1): | 53.4% | |
| Deferred Maintenance | $500,000 | NAP | NAP | LTV Ratio at Maturity or ARD(1): | 49.3% | |
| (1) | The Harvey Building Products Whole Loan (as defined below), with an original principal balance of $110,000,000, is comprised of four pari passu notes (Notes A-1, A-2-A, A-2-B and A-3). The non-controlling Note A-3 has an original balance of $33,000,000, has an outstanding principal balance of $32,922,772 as of the Cut-off Date and will be contributed to the WFCM 2015-P2 Trust. The controlling Note A-1 had an original principal balance of $42,000,000 and was contributed to the COMM 2015-LC23 Trust. The non-controlling Note A-2-A and Note A-2-B, had an aggregate original principal balance of $35,000,000 and are expected to be contributed to a future trust. All statistical information related to balances per square foot, loan-to-value ratios, debt service coverage ratios and debt yields are based on the Harvey Building Products Whole Loan. |
| (2) | The lockout period will be at least 26 payment dates beginning with and including the first payment date of November 6, 2015. Defeasance of the Harvey Building Products Portfolio Whole Loan is permitted on or after the date that is earlier to occur of (i) two years after the closing date of the securitization that includes the last pari passu note to be securitized, and (ii) October 1, 2018. The assumed lockout period of 26 payments (and assumed defeasance period of 30 payments) is based on the expected WFCM 2015-P2 Trust closing date in December 2015. |
| (3) | See “Escrows” section. |
| (4) | Historical NOI and Historical Occupancy are unavailable as the borrower entered into a new 20-year master lease with an affiliate of the borrower at closing of the Harvey Building Products Portfolio Loan. |
| (5) | See “Appraisals” section. |
The Mortgage Loan. The mortgage loan is part of a whole loan (the “Harvey Building Products Portfolio Whole Loan”) that is evidenced by fourpari passu promissory notes (Notes A-1, A-2-A, A-2-B and A-3) secured by a first mortgage encumbering the fee interest in a portfolio of 27 warehouse properties, two manufacturing properties, and one office property located across seven states, totaling 2,046,119 square feet (the “Harvey Building Products Portfolio” or the “Harvey Building Products Portfolio Properties”). The Harvey Building Products Portfolio Whole Loan was originated on October 1, 2015 by Ladder Capital Finance LLC. The Harvey Building Products Portfolio Whole Loan had an original principal balance of $110,000,000, has an outstanding principal balance as of the Cut-off Date of $109,742,575 and accrues interest at an interest rate of 4.850%per annum. The Harvey Building Products Portfolio Whole Loan had an initial term of 60 months, has a remaining term of 58 months as of the Cut-off Date and requires payments of principal and interest based on a 30-year amortization schedule. The Harvey Building Products Portfolio Whole Loan matures on October 6, 2020. See “Description of the Mortgage Pool — The Whole Loans — The Non-Serviced Pari Passu Whole Loans — The Harvey Building Products Portfolio Whole Loan” in the Preliminary Prospectus.
The non-controlling Note A-3, which will be contributed to the WFCM 2015-P2 Trust, had an original principal balance of $33,000,000 and had an outstanding principal balance as of the Cut-off Date of $32,922,772. The controlling Note A-1, which had an original
THE INFORMATION IN THIS STRUCTURAL AND COLLATERAL TERM SHEET IS NOT COMPLETE AND MAY BE AMENDED PRIOR TO THE TIME OF SALE. THIS TERM SHEET IS NOT AN OFFER TO SELL THESE SECURITIES AND IT IS NOT A SOLICITATION OF AN OFFER TO BUY THESE SECURITIES IN ANY JURISDICTION WHERE THE OFFER OR SALE IS NOT PERMITTED.
| 90 |
| HARVEY BUILDING PRODUCTS PORTFOLIO |
principal balance of $42,000,000, was contributed to the COMM 2015-LC23 Trust. The non-controlling Note A-2-A and Note A-2-B have an aggregate original principal balance of $35,000,000 and are expected to be contributed to a future trust. Note A-1, Note A-2-A and A-2-B are referred to herein as the “Harvey Building Products Companion Loans”. The lender provides no assurances that any non-securitized notes will not be split further.
Following the lockout period, which is based on the last securitization of the four pari passu notes, the borrower has the right to defease the Harvey Building Products Portfolio Whole Loan in whole or in part (see “Partial Release” section) on any date before July 6, 2020. In addition, the Harvey Building Products Portfolio Whole Loan is prepayable without penalty on or after July 6, 2020.
Pari Passu Note Summary
| Original Balance | Cut-off Date Balance | Note Holder | Controlling Piece | ||
| Note A-1 | $42,000,000 | $41,901,710 | COMM 2015-LC23 | Yes | |
| Note A-2-A | $25,000,000 | $24,941,494 | Ladder Capital Finance LLC(1) | No | |
| Note A-2-B | $10,000,000 | $9,976,598 | Ladder Capital Finance LLC(1) | No | |
| Note A-3 | $33,000,000 | $32,922,772 | WFCM 2015-P2 | No | |
| Total | $110,000,000 | $109,742,575 |
| (1) | The Notes A-2-A and A-2-B are expected to be contributed to a future trust. |
Sources and Uses
| Sources | Uses | |||||||
| Original whole loan amount | $110,000,000 | 36.7% | Purchase price(2) | $295,000,000 | 98.4% | |||
| Equity | 113,000,000 | 37.7 | Reserves | 500,000 | 0.2 | |||
| Opco Term Loan(1) | 70,000,000 | 23.4 | Closing costs(3) | 4,250,000 | 1.4 | |||
| Seller Preferred Shares(1) | 5,000,000 | 1.7 | ||||||
| Opco Revolver(1) | 1,750,000 | 0.6 | ||||||
| Total Sources | $299,750,000 | 100.0% | Total Uses | $299,750,000 | 100.0% |
| (1) | Dunes Point Capital acquired Harvey Building Products for a total purchase price of $295.0 million and a total cost basis of $299.8 million inclusive of closing costs. |
| (2) | The purchase price reflects the acquisition of both the Harvey Building Products Portfolio Opco and Propco. The appraised value for the Harvey Building Products Portfolio Properties is $205.5 million. |
| (3) | The closing costs reflect the closing costs incurred as a result of the acquisition of the Harvey Building Products Portfolio Opco and Propco. The closing costs for the Harvey Building Products Portfolio Properties were approximately $1.1 million. |
The Properties. The Harvey Building Products Portfolio Whole Loan is secured by a first mortgage encumbering the fee interest in a portfolio of 27 warehouse properties, two manufacturing properties and one office property located across seven states, totaling 2,046,119 square feet. The Harvey Building Products Portfolio warehouse properties are located in Massachusetts, Connecticut, Maine, Rhode Island, Pennsylvania, New Hampshire and Vermont and serve as distribution and sales centers for the Harvey Building Products Portfolio. The Harvey Building Products Portfolio manufacturing properties are located in Massachusetts and New Hampshire and are where the company produces all of its windows and doors. The Harvey Building Products Portfolio office property is located in Waltham, Massachusetts and serves as the corporate headquarters for Harvey Industries, Inc., housing its finance, accounting, sales, and senior management teams.
27 of the 30 properties are located in New England (93.2% square feet, 94.9% allocated loan amount), with the largest concentration by state located in Massachusetts, where 11 properties representing 35.6% of property square feet and 39.5% of allocated loan amount are located. The Harvey Building Products Portfolio Properties were built between 1950 and 2009, with an average age of 19 years.
The Harvey Building Products Portfolio Properties consist of a blend of office, warehouse, and manufacturing space and range from approximately 13,736 square feet to 376,294 square feet in size.
Harvey Industries, Inc. (“Harvey Building Products” or “Opco”) executed a single 20 year absolute net unitary master lease (“Master Lease”) for the 30 properties at an initial yearly base rent of $14,950,000 ($7.31 per square foot). The Master Lease represents an absolute net lease, with Harvey Building Products responsible for the direct payment of all real estate taxes, insurance premiums and capital expenditures. The Master Lease has no termination options except with respect to substantial condemnation of an affected property and termination options tied to casualty or changes in law during the last two years of the initial term of the Master Lease or any option period. There are contractual rent steps of a 10.0% increase every six years and there are two, five-year renewal options with 360 days’ notice required.
Harvey Building Products offers a broad base of exterior products including: vinyl windows, exterior doors, vinyl siding, shutters, PVC trim, and decking. The company’s revenue streams are split approximately 40.0% in the manufacture and direct to contractor sale of Harvey-branded windows and doors, and approximately 60.0% in the distribution of third party building products to contractors. Harvey Building Products reported total revenues of $403.9 million over the trailing twelve month period ended May 31, 2015.
Harvey Building Products is a leading manufacturer and marketer of premium vinyl windows, as well as a wholesale distributor of a broad range of exterior building products, and has been in continuous operation since 1961. They currently have the leading market position for vinyl windows in its core Northeastern markets and have installed over 10 million windows since 1990. Harvey Building Products is consistently ranked in the top 15 manufacturers onWindows & Door’s Top 100 Manufacturers list.
THE INFORMATION IN THIS STRUCTURAL AND COLLATERAL TERM SHEET IS NOT COMPLETE AND MAY BE AMENDED PRIOR TO THE TIME OF SALE. THIS TERM SHEET IS NOT AN OFFER TO SELL THESE SECURITIES AND IT IS NOT A SOLICITATION OF AN OFFER TO BUY THESE SECURITIES IN ANY JURISDICTION WHERE THE OFFER OR SALE IS NOT PERMITTED.
| 91 |
| HARVEY BUILDING PRODUCTS PORTFOLIO |
According to the company’s trailing 12-month financial statements ended July 2015, the warehouse locations that will serve as collateral for the Harvey Building Products Portfolio Whole Loan generated total sales of $324,852,851, representing a 2.8% occupancy cost on the their allocated rental rate of $9,077,888. Overall, the collateral locations represent a majority of Harvey Building Products’ sales.
| Historical Harvey Building Products Portfolio Properties EBITDAR | ||||||||
| State | 2009 | 2010 | 2011 | 2012 | 2013 | 2014 | 2015 | T-12 7/30/2015 |
| EBITDAR | 30,400,000 | 36,725,000 | 32,102,000 | 32,441,000 | 33,300,000 | 31,877,000 | 33,470,000 | 36,238,000 |
| Rent Coverage Ratio | 2.0x | 2.5x | 2.1x | 2.2x | 2.2x | 2.1x | 2.2x | 2.4x |
The following table presents certain information relating to the Harvey Building Products Portfolio Properties:
| Property Name – Location | Allocated Cut-off Date Principal Balance(1) | % of Portfolio Cut-off Date Principal Balance | Occupancy | Year Built/ Renovated | Net Rentable Area (SF) | Allocated LTV | Appraised Value | |||||||
| Londonderry Manufacturing - Londonderry, NH | $21,200,270 | 19.3% | 100.0% | 2007/NAP | 376,294 | 53.0% | $40,000,000 | |||||||
| Waltham Corporate - Waltham, MA | $10,854,538 | 9.9% | 100.0% | 2000/2015 | 54,400 | 45.4% | $23,900,000 | |||||||
| Dartmouth Manufacturing - North Dartmouth, MA | $10,126,247 | 9.2% | 100.0% | 1998/NAP | 235,239 | 56.9% | $17,800,000 | |||||||
| Nashua - Nashua, NH | $5,108,018 | 4.7% | 100.0% | 2006/NAP | 111,594 | 53.8% | $9,500,000 | |||||||
| West Bridgewater - West Bridgewater, MA | $4,738,884 | 4.3% | 100.0% | 2005/NAP | 81,776 | 60.0% | $7,900,000 | |||||||
| Woburn - Woburn, MA | $4,689,001 | 4.3% | 100.0% | 1989/NAP | 76,054 | 63.4% | $7,400,000 | |||||||
| Manchester, NH - Manchester, NH | $3,873,913 | 3.5% | 100.0% | 2003/NAP | 81,747 | 53.8% | $7,200,000 | |||||||
| New London - Waterford, CT | $3,641,458 | 3.3% | 100.0% | 2008/NAP | 70,642 | 55.0% | $6,620,000 | |||||||
| East Haven - East Haven, CT | $3,392,043 | 3.1% | 100.0% | 2005/NAP | 70,089 | 53.8% | $6,300,000 | |||||||
| Salem - Salem, NH | $3,392,043 | 3.1% | 100.0% | 2001/NAP | 58,286 | 61.7% | $5,500,000 | |||||||
| Bethlehem - Bethlehem, PA | $3,292,277 | 3.0% | 100.0% | 1973/NAP | 71,091 | 59.9% | $5,500,000 | |||||||
| Lincoln - Lincoln, RI | $3,167,570 | 2.9% | 100.0% | 2003/NAP | 80,240 | 53.7% | $5,900,000 | |||||||
| Berlin - Berlin, CT | $3,042,862 | 2.8% | 100.0% | 1995/NAP | 43,796 | 56.5% | $5,390,000 | |||||||
| Woburn CPD - Woburn, MA | $2,992,979 | 2.7% | 100.0% | 1984/NAP | 59,800 | 46.8% | $6,400,000 | |||||||
| Norwalk I - Norwalk, CT | $2,494,149 | 2.3% | 100.0% | 1972/NAP | 40,232 | 47.0% | $5,310,000 | |||||||
| Dartmouth - Dartmouth, MA | $2,394,383 | 2.2% | 100.0% | 1974/NAP | 63,117 | 48.9% | $4,900,000 | |||||||
| Braintree - Braintree, MA | $2,244,735 | 2.0% | 100.0% | 1986/NAP | 32,531 | 60.7% | $3,700,000 | |||||||
| Manchester, CT - Manchester, CT | $2,095,086 | 1.9% | 100.0% | 1996/NAP | 49,175 | 53.4% | $3,920,000 | |||||||
| Portland - Portland , ME | $2,095,086 | 1.9% | 100.0% | 1976/NAP | 48,145 | 53.7% | $3,900,000 | |||||||
| Norwalk II - Norwalk, CT | $1,895,554 | 1.7% | 100.0% | 1974/NAP | 30,000 | 44.5% | $4,260,000 | |||||||
| Warwick - Warwick, RI | $1,883,582 | 1.7% | 100.0% | 1997/NAP | 43,899 | 53.8% | $3,500,000 | |||||||
| Fitchburg - Fitchburg, MA | $1,614,214 | 1.5% | 100.0% | 2002/NAP | 39,433 | 53.8% | $3,000,000 | |||||||
| Auburn - Auburn , MA | $1,560,340 | 1.4% | 100.0% | 1983/NAP | 37,132 | 53.8% | $2,900,000 | |||||||
| Portsmouth - Portsmouth, NH | $1,506,466 | 1.4% | 100.0% | 1993/NAP | 31,470 | 53.8% | $2,800,000 | |||||||
| Southampton - Huntingdon Valley, PA | $1,247,075 | 1.1% | 100.0% | 2009/NAP | 36,421 | 53.1% | $2,350,000 | |||||||
| Hyannis - Hyannis, MA | $1,184,222 | 1.1% | 100.0% | 1986/NAP | 24,070 | 53.8% | $2,200,000 | |||||||
| Wilkes-Barre - Forty Fort, PA | $1,097,426 | 1.0% | 100.0% | 1950/1999 | 32,200 | 57.8% | $1,900,000 | |||||||
| Berlin CPD - Berlin, CT | $1,072,484 | 1.0% | 100.0% | 1977/2002 | 28,163 | 56.2% | $1,910,000 | |||||||
| Springfield - Springfield, MA | $997,660 | 0.9% | 100.0% | 1989/NAP | 25,347 | 47.5% | $2,100,000 | |||||||
| White River Junction - White River Junction, VT | $848,011 | 0.8% | 100.0% | 1981/NAP | 13,736 | 56.5% | $1,500,000 | |||||||
| Total/Weighted Average | $109,742,575 | 100.0% | 100.0% | 2,046,119 | $205,460,000 |
| (1) | Based on the entire Harvey Building Products Portfolio Whole Loan. |
THE INFORMATION IN THIS STRUCTURAL AND COLLATERAL TERM SHEET IS NOT COMPLETE AND MAY BE AMENDED PRIOR TO THE TIME OF SALE. THIS TERM SHEET IS NOT AN OFFER TO SELL THESE SECURITIES AND IT IS NOT A SOLICITATION OF AN OFFER TO BUY THESE SECURITIES IN ANY JURISDICTION WHERE THE OFFER OR SALE IS NOT PERMITTED.
| 92 |
| HARVEY BUILDING PRODUCTS PORTFOLIO |
The following table presents certain information relating to the tenant at the Harvey Building Products Portfolio Properties:
Major Tenant
| Tenant Name | Credit Rating (Fitch/Moody’s /S&P) | Tenant NRSF | % of NRSF | Annual U/W Base Rent PSF | Annual U/W Base Rent | % of Total Annual U/W Base Rent | Sales PSF(1) | Occupancy Cost(1) | Lease Expiration Date |
| Major Tenant | |||||||||
| Harvey Industries, Inc.(2) | NR/NR/NR | 2,046,119 | 100.0% | $7.31 | $14,947,405 | 100.0% | $172 | 4.2% | 10/31/2035(3) |
| Total Major Tenant | 2,046,119 | 100.0% | $7.31 | $14,947,405 | 100.0% | ||||
| (1) | Sales PSF and Occupancy Costs are for the trailing 12-months period ending July 31, 2015. |
| (2) | Harvey Industries, Inc., the master tenant, currently subleases 18,648 square feet (0.9% of the net rentable area) to three separate tenants: Massachusetts Association of Realtors, Inc. (10,251 square feet), B4 Consulting, Inc. (4,947 square feet) and Delphi Building Services, Inc. (3,450 square feet). |
| (3) | Harvey Industries, Inc. has two, 5-year lease extension options. |
The following table presents certain information relating to the lease rollover schedule at the Harvey Building Products Portfolio Properties:
Lease Expiration Schedule(1)
Year Ending December 31, | No. of Leases Expiring | Expiring NRSF | % of Total NRSF | Cumulative Expiring NRSF | Cumulative % of Total NRSF | Annual U/W Base Rent | Annual U/W Base Rent PSF | |||||||
| MTM | 0 | 0 | 0.0% | 0 | 0.0% | $0 | $0.00 | |||||||
| 2015 | 0 | 0 | 0.0% | 0 | 0.0% | $0 | $0.00 | |||||||
| 2016 | 0 | 0 | 0.0% | 0 | 0.0% | $0 | $0.00 | |||||||
| 2017 | 0 | 0 | 0.0% | 0 | 0.0% | $0 | $0.00 | |||||||
| 2018 | 0 | 0 | 0.0% | 0 | 0.0% | $0 | $0.00 | |||||||
| 2019 | 0 | 0 | 0.0% | 0 | 0.0% | $0 | $0.00 | |||||||
| 2020 | 0 | 0 | 0.0% | 0 | 0.0% | $0 | $0.00 | |||||||
| 2021 | 0 | 0 | 0.0% | 0 | 0.0% | $0 | $0.00 | |||||||
| 2022 | 0 | 0 | 0.0% | 0 | 0.0% | $0 | $0.00 | |||||||
| 2023 | 0 | 0 | 0.0% | 0 | 0.0% | $0 | $0.00 | |||||||
| 2024 | 0 | 0 | 0.0% | 0 | 0.0% | $0 | $0.00 | |||||||
| 2025 | 0 | 0 | 0.0% | 0 | 0.0% | $0 | $0.00 | |||||||
| Thereafter | 1 | 2,046,119 | 100.0% | 2,046,119 | 100.0% | $14,947,405 | $7.31 | |||||||
| Vacant | 0 | 0 | 0.0% | 2,046,119 | 100.0% | $0 | $0.00 | |||||||
| Total/Weighted Average | 1 | 2,046,119 | 100.0% | $14,947,405 | $7.31 |
| (1) | Information obtained from the underwritten rent roll. |
The following table presents historical occupancy percentages at the Harvey Building Products Portfolio Properties:
Historical Occupancy
12/31/2012(1) | 12/31/2013(1) | 12/31/2014(1) | 12/1/2015(2) | |||
| NAV | NAV | NAV | 100.0% |
| (1) | Historical NOI and Historical Occupancy are unavailable as the borrower entered into a new 20-year master lease with an affiliate of the borrower at closing of the Harvey Building Products Portfolio Whole Loan. |
| (2) | Information obtained from the underwritten rent roll. |
THE INFORMATION IN THIS STRUCTURAL AND COLLATERAL TERM SHEET IS NOT COMPLETE AND MAY BE AMENDED PRIOR TO THE TIME OF SALE. THIS TERM SHEET IS NOT AN OFFER TO SELL THESE SECURITIES AND IT IS NOT A SOLICITATION OF AN OFFER TO BUY THESE SECURITIES IN ANY JURISDICTION WHERE THE OFFER OR SALE IS NOT PERMITTED.
| 93 |
| HARVEY BUILDING PRODUCTS PORTFOLIO |
Operating History and Underwritten Net Cash Flow. The following table presents certain information relating to the underwritten net cash flow at the Harvey Building Products Portfolio Properties:
Cash Flow Analysis
| U/W | % of U/W Effective Gross Income | U/W $ per SF | |||||
| Base Rent(1) | $14,947,405 | 102.9% | $7.31 | ||||
| Rent Steps | $0 | 0.0 | 0.00 | ||||
| Grossed Up Vacant Space | $0 | 0.0 | 0.00 | ||||
| Total Reimbursables(2) | 847,259 | 5.8 | 0.41 | ||||
| Other Income | 0 | 0.0 | 0.00 | ||||
| Less Vacancy & Credit Loss | (1,263,573)(3) | (8.7) | (0.62) | ||||
| Effective Gross Income | $14,531,091 | 100% | $7.10 | ||||
| Total Operating Expenses(2) | $435,933 | 3.0% | $0.21 | ||||
| Net Operating Income | $14,095,158 | 97.0% | $6.89 | ||||
| TI/LC | 0 | 0.0 | 0.00 | ||||
| Capital Expenditures(2) | 411,326 | 2.8 | 0.20 | ||||
| Net Cash Flow | $13,683,832
| 94.2% | $6.69 | ||||
| NOI DSCR | 2.02x | ||||||
| NCF DSCR | 1.96x | ||||||
| NOI DY | 12.8% | ||||||
| NCF DY | 12.5% |
| (1) | Lease between the borrower and Harvey Industries, Inc. covering all of the Harvey Building Products Portfolio Properties (the “Master Lease”) commenced on October 1, 2015 and extends to October 31, 2035, at which time Harvey Industries, Inc. has two, 5-year options to extend the term. The base rent is currently $14,950,000 and has rent steps of 10% every six years. |
| (2) | The Master Lease is an absolute-NNN lease with the tenant responsible for all costs of operations and maintenance. |
| (3) | The underwritten economic vacancy is 8%. The Harvey Building Products Portfolio was 100% leased as of December 1, 2015. |
Appraisals. As of the appraisal valuation dates ranging from September 1, 2015 to October 1, 2015, the Harvey Building Products Portfolio Properties had an aggregate “as-is” appraised value of $205,460,000.
Environmental Matters. According to the Phase I environmental site assessments dated from September 9, 2015 to September 16, 2015, Phase II reports were recommended for the following properties: with respect to the Waltham Corporate property, to rule out groundwater contamination; with respect to the Woburn property, to rule out groundwater contamination and ensure containment of existing aboveground storage tanks; with respect to the Woburn CPD property, to ensure that the underground storage tanks have been removed and to rule out groundwater contamination; with respect to the Bethlehem property, to rule out groundwater contamination; and with respect to the Fitchburg property, to rule out groundwater contamination. The borrower agreed to undertake mitigating actions under the environmental indemnity and environmental insurance was obtained for the portfolio in lieu of obtaining Phase II reports. See “Description of the Mortgage Pool — Environmental Considerations” in the Preliminary Prospectus.
The Borrower. The borrower is Harvey Propco, LLC, a limited liability company and single purpose entity whose managing member has two independent directors. Legal counsel to the borrower delivered a non-consolidation opinion in connection with the origination of the Harvey Building Products Portfolio. Dunes Point Capital LLC is the sponsor of the borrower and Harvey Parent Corporation is the guarantor of certain nonrecourse carveouts under the Harvey Building Products Portfolio Whole Loan.
The Sponsor. The sponsor is Dunes Point Capital LLC (“Dunes Point Capital”). Dunes Point Capital is a family office and private investment firm founded in 2013 by former Blackstone Group LP executive, Timothy White. Dunes Point Capital invests in industrial and energy companies. Dunes Point Capital is a wholly owned subsidiary of White Group Holdings. The Dunes Point Capital team has invested or overseen the investment of over $5 billion in transactions over the last 20 years.
Escrows. The loan documents provide for upfront reserves in the amount of $1,207,022 for real estate taxes, $594,489 for insurance premiums and $500,000 for required repairs. The loan documents also require ongoing monthly reserves of $199,837 for real estate taxes and $78,692 for insurance premiums.
Lockbox and Cash Management.The Harvey Building Products Portfolio Whole Loan requires a lender-controlled lockbox account, which is already in place, and that the borrower cause all receipts payable with respect to the Harvey Building Products Portfolio Properties to be transmitted directly into such lockbox account. Prior to the occurrence of a Cash Sweep Event Period (as defined below), all excess cash flow on deposit in the lockbox account will be disbursed to the borrower. During a Cash Sweep Event Period, all excess cash flow is required to be swept to a lender-controlled cash management account.
A Cash Sweep Event Period will commence upon the earlier of (i) the occurrence and continuance of an event of default; (ii) Opco ceases to conduct its normal business operations in at least 80% of the total square footage at the Harvey Building Products Portfolio (it being understood that one or more subtenants conducting normal business operations in up to 10% of the total square feet at the property in the aggregate may count towards the 80% requirement); (iii) Opco (or its parent) being adjudicated insolvent or filing for bankruptcy; (iv) either (a) the Opco (or its successor) failing to satisfy the 4.5x EBITDA leverage ratio under Opco’s existing term
THE INFORMATION IN THIS STRUCTURAL AND COLLATERAL TERM SHEET IS NOT COMPLETE AND MAY BE AMENDED PRIOR TO THE TIME OF SALE. THIS TERM SHEET IS NOT AN OFFER TO SELL THESE SECURITIES AND IT IS NOT A SOLICITATION OF AN OFFER TO BUY THESE SECURITIES IN ANY JURISDICTION WHERE THE OFFER OR SALE IS NOT PERMITTED.
| 94 |
| HARVEY BUILDING PRODUCTS PORTFOLIO |
loan or (b) the borrower failing to deliver the financial information required to be delivered under the lease or under any term loan or credit facility of Opco (“Opco Debt”) (including, without limitation, a calculation of EBITDA and adjusted EBITDA and a calculation of the leverage covenant under such term loan) and/or; (v) a default in the payment of principal or interest under the Opco Debt after applicable notice and cure periods.
A Cash Sweep Event Period will expire with respect to (i), once the event of default has been cured and such cure is accepted by the lender; with respect to (ii), once the Opco or another qualified tenant has reopened for business and is conducting normal business operations in at least 85% of the total square footage at the Harvey Building Products Portfolio and is paying full unabated rent for two consecutive quarters or a Re-tenanting Event (as defined below) has occurred; with respect to (iii), such adjudication has been vacated, withdrawn, reversed on appeal, or determined to be incorrect or no longer the case in a final non-appealable judgment or a Re-tenanting Event has occurred; with respect to (iv)(a), once the EBITDA leverage ratio under Opco’s existing term loan is at or below 4.5x, with respect to (iv)(b), the date on which the borrower delivers financial information; with respect to (v), the date on which the payment default is cured.
A “Re-tenanting Event” means that the borrower has entered into one or more replacement leases acceptable to the lender with a tenant reasonably acceptable to the lender for the portion of the property which had previously been occupied by Opco, and (i) that each tenant has accepted possession and is in occupancy of, and is open for business and conducting normal business operations at, all of the space demised under the lease and is paying full, unabated rent in accordance with the lease, (ii) that the rents payable under any such replacement lease(s) are comparable to existing local market rates for similar properties and, in the aggregate, no less than the rent payable under the Opco lease, (iii) that all landlord obligations under any such replacement lease(s) with respect to required landlord and tenant improvement obligations and leasing commission obligations and all other landlord obligations have been duly performed, completed and paid for, such evidence to include, without limitation, a fully-executed lease and an acceptable estoppel certificate from each such tenant, (iv) each tenant under any such replacement lease has entered into attornment agreement reasonably satisfactory to the lender, and (v) after taking into account any new lease(s) with any such replacement tenant(s), at least eighty percent (80%) of the square footage of the premises demised under the Opco lease is occupied by Opco and/or such replacement tenant(s).
Property Management.The Harvey Building Products Portfolio Properties is managed by an affiliate of the borrower.
Assumption. The borrower has the right to transfer the Harvey Building Products Portfolio Properties in whole, but not in part, provided that no event of default has occurred and is continuing and certain other conditions are satisfied, including (i) the lender’s reasonable determination that the proposed transferee and guarantor satisfy the lender’s credit review and underwriting standards; (ii) execution of recourse guaranty and an environmental indemnity by an acceptable substitute guarantor; and (iii) if requested by the lender (and provided the rating agency responds and considers such event), rating agency confirmation from Fitch, KBRA and Moody’s that the transfer will not result in a downgrade, withdrawal or qualification of the respective ratings assigned to the Series 2015-P2 Certificates.
Partial Release.Following the lockout period, the borrower is permitted to release any constituent properties in connection with a partial defeasance, subject to certain conditions, among other things, (i) no event of default has occurred and is continuing; (ii) partial defeasance of the greater of (a) net sales proceeds of released property and (b) 125% of the allocated loan amount of such released property; (iii) if, after such release, at least $11,000,000 of the principal amount of the Harvey Building Products Portfolio Whole Loan has been prepaid or defeased, the loan-to-value ratio for the remaining Harvey Building Products Portfolio Properties is no greater than 60.0%.
Real Estate Substitution.None.
Subordinate and Mezzanine Indebtedness.None; howeverthe Harvey Building Products Portfolio Whole Loan documents allow for the pledge of direct or indirect interests in the guarantor of the mortgage loan to secure corporate level financing, provided that the aggregate value of the Harvey Building Products Portfolio Properties is not more than 25% of the value of all security for such financing. There is no requirement for an intercreditor agreement in connection with such pledges.
Ground Lease. None.
Terrorism Insurance. The loan documents require that the “all risk” insurance policy required to be maintained by the borrower provides coverage from terrorism in an amount equal to the full replacement cost of the Harvey Building Products Portfolio Properties. The loan documents also require business interruption insurance covering no less than the 18-month period following the occurrence of a casualty event.
THE INFORMATION IN THIS STRUCTURAL AND COLLATERAL TERM SHEET IS NOT COMPLETE AND MAY BE AMENDED PRIOR TO THE TIME OF SALE. THIS TERM SHEET IS NOT AN OFFER TO SELL THESE SECURITIES AND IT IS NOT A SOLICITATION OF AN OFFER TO BUY THESE SECURITIES IN ANY JURISDICTION WHERE THE OFFER OR SALE IS NOT PERMITTED.
| 95 |
| JW MARRIOTT SANTA MONICA LE MERIGOT |

THE INFORMATION IN THIS STRUCTURAL AND COLLATERAL TERM SHEET IS NOT COMPLETE AND MAY BE AMENDED PRIOR TO THE TIME OF SALE. THIS TERM SHEET IS NOT AN OFFER TO SELL THESE SECURITIES AND IT IS NOT A SOLICITATION OF AN OFFER TO BUY THESE SECURITIES IN ANY JURISDICTION WHERE THE OFFER OR SALE IS NOT PERMITTED.
| 96 |
| JW MARRIOTT SANTA MONICA LE MERIGOT |
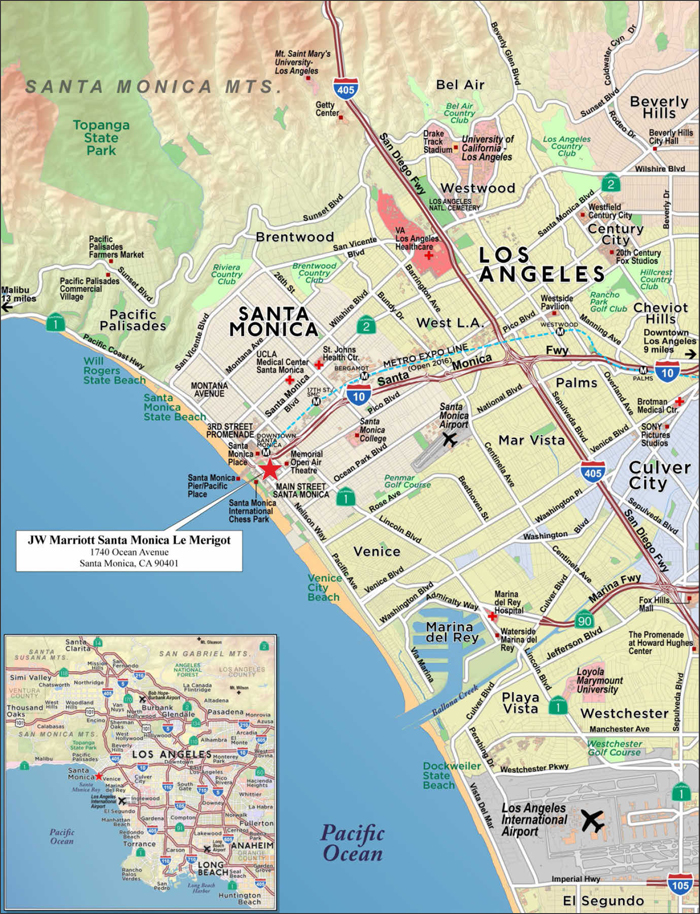
THE INFORMATION IN THIS STRUCTURAL AND COLLATERAL TERM SHEET IS NOT COMPLETE AND MAY BE AMENDED PRIOR TO THE TIME OF SALE. THIS TERM SHEET IS NOT AN OFFER TO SELL THESE SECURITIES AND IT IS NOT A SOLICITATION OF AN OFFER TO BUY THESE SECURITIES IN ANY JURISDICTION WHERE THE OFFER OR SALE IS NOT PERMITTED.
| 97 |
| No. 10 – JW Marriott Santa Monica Le Merigot |
| Loan Information | Property Information | ||||||
| Mortgage Loan Seller: | Citigroup Global Markets Realty Corp. | Single Asset/Portfolio: | Single Asset | ||||
Credit Assessment (Fitch/KBRA/Moody’s): | NR/NR/NR | Property Type: | Hospitality | ||||
| Original Principal Balance(1): | $31,200,000 | Specific Property Type: | Full Service | ||||
| Cut-off Date Principal Balance(1): | $31,162,303 | Location: | Santa Monica, CA | ||||
| % of Initial Pool Balance: | 3.1% | Size: | 175 Rooms | ||||
| Loan Purpose: | Refinance | Cut-off Date Principal Balance Per Room(1): | $356,141 | ||||
| Borrower Name: | CW Hotel Limited Partnership | Year Built/Renovated: | 1999/2014 | ||||
| Sponsor: | William J. Yung III | Title Vesting: | Leasehold | ||||
| Mortgage Rate: | 4.970% | Property Manager: | Self-managed | ||||
| Note Date: | October 7, 2015 | 3rd Most Recent Occupancy (As of): | 85.1% (12/31/2012) | ||||
| Anticipated Repayment Date: | NAP | 2nd Most Recent Occupancy (As of): | 97.3% (12/31/2013) | ||||
| Maturity Date: | November 6, 2020 | Most Recent Occupancy (As of): | 99.2% (12/31/2014) | ||||
| IO Period: | None | Current Occupancy (As of): | 97.5% (8/31/2015) | ||||
| Loan Term (Original): | 60 months | ||||||
| Seasoning: | 1 month | Underwriting and Financial Information: | |||||
| Amortization Term (Original): | 360 months | ||||||
| Loan Amortization Type: | Amortizing Balloon | 3rd Most Recent NOI (As of): | $8,335,496 (12/31/2013) | ||||
| Interest Accrual Method: | Actual/360 | 2nd Most Recent NOI (As of): | $9,528,195 (12/31/2014) | ||||
| Call Protection(2): | L(23),GRTR 1% or YM(2), GRTR 1% or YM or D(32),O(3) | Most Recent NOI (As of): | $9,737,032 (TTM 8/31/2015) | ||||
| Lockbox Type: | Hard/ Upfront Cash Management | ||||||
| Additional Debt(1): | Yes | ||||||
| Additional Debt Type(1)(3): | Pari Passu; Mezzanine | ||||||
| U/W Revenues: | $25,647,276 | ||||||
| U/W Expenses: | $17,260,703 | ||||||
| Escrows and Reserves(4): | U/W NOI: | $8,386,572 | |||||
| U/W NCF: | $7,104,208 | ||||||
| Type: | Initial | Monthly | Cap (If Any) | U/W NOI DSCR(1): | 2.09x | ||
| Taxes | $533,964 | $66,746 | NAP | U/W NCF DSCR(1): | 1.77x | ||
| Insurance | $70,120 | $23,373 | NAP | U/W NOI Debt Yield(1): | 13.5% | ||
| FF&E | $0 | $106,864 | NAP | U/W NCF Debt Yield(1): | 11.4% | ||
| Seasonality Reserve | $389,819 | $0 | NAP | As-Is Appraised Value: | $104,000,000 | ||
| Ground Lease Reserve | $272,250 | $136,125 | NAP | As-Is Appraisal Valuation Date: | September 1, 2015 | ||
| Ground Rent Adjustment Reserve | $9,881,593 | $0 | NAP | Cut-off Date LTV Ratio(1): | 59.9% | ||
| Comfort Letter Reserve | $2,500 | $0 | NAP | LTV Ratio at Maturity or ARD(1): | 55.3% | ||
| (1) | The JW Marriott Santa Monica Le Merigot Whole Loan, with an original principal balance totaling $62,400,000, is comprised of twopari passu notes (Notes A-1 and A-2). The non-controlling Note A-2 had an original principal balance of $31,200,000, has an outstanding principal balance as of the Cut-off Date of $31,162,303 and will be contributed to the WFCM 2015-P2 Trust. The controlling Note A-1 had an original balance of $31,200,000, has an outstanding principal balance as of the Cut-off Date of $31,162,303 and is expected to be contributed to the CGCMT 2015-GC35 Trust. All statistical information related to the balance per room, loan-to-value ratios, debt service coverage ratios and debt yields are based on the JW Marriott Santa Monica Le Merigot Whole Loan. |
| (2) | Defeasance of the JW Marriott Santa Monica Le Merigot Whole Loan is permitted on or after the date that is the earlier of (i) 24 months after the closing date of the securitization that includes the final portion of the JW Marriott Santa Monica Le Merigot Whole Loan and (ii) 48 months following origination of the JW Marriott Santa Monica Le Merigot Whole Loan. |
| (3) | A Mezzanine loan of $17,000,000 was funded at closing. As of the Cut-off Date, the total debt U/W NCF DSCR, total debt Cut-off Date LTV Ratio and total debt U/W NOI Debt Yield are 1.26x, 76.3% and 10.6%, respectively. See “Subordinate and Mezzanine Indebtedness” section |
| (4) | See “Escrows” section. |
The Mortgage Loan. The mortgage loan is part of a whole loan (the “JW Marriott Santa Monica Le Merigot Whole Loan”) evidenced by twopari passu notes (Notes A-1 and A-2) that are secured by a first mortgage encumbering the borrower’s leasehold interest in a 175-room full service hotel located in Santa Monica, California (the “JW Marriott Santa Monica Le Merigot Property”). The JW Marriott Santa Monica Le Merigot Whole Loan was originated on October 7, 2015 by Citigroup Global Markets Realty Corp. The JW Marriott Santa Monica Le Merigot Whole Loan had an original principal balance of $62,400,000, has an outstanding principal balance as of the Cut-off Date of $62,324,606 and accrues interest at an interest rate of 4.970%per annum. The JW Marriott Santa Monica Le Merigot Whole Loan had an initial term of 60 months, has a remaining term of 59 months as of the Cut-off Date and requires payments of principal and interest based on a 30-year amortization schedule. The JW Marriott Santa Monica Le Merigot Whole Loan matures on November 6, 2020.
THE INFORMATION IN THIS STRUCTURAL AND COLLATERAL TERM SHEET IS NOT COMPLETE AND MAY BE AMENDED PRIOR TO THE TIME OF SALE. THIS TERM SHEET IS NOT AN OFFER TO SELL THESE SECURITIES AND IT IS NOT A SOLICITATION OF AN OFFER TO BUY THESE SECURITIES IN ANY JURISDICTION WHERE THE OFFER OR SALE IS NOT PERMITTED.
| 98 |
| JW MARRIOTT SANTA MONICA LE MERIGOT |
Note A-2, which will be contributed to the WFCM 2015-P2 Trust, had an original principal balance of $31,200,000, has an outstanding balance as of the Cut-off Date of $31,162,303 and represents the non-controlling interest in the JW Marriott Santa Monica Le Merigot Whole Loan. Note A-1 (the “JW Marriott Santa Monica Le Merigot Mortgage Companion Loan”), which represents the controlling interest in the JW Marriott Santa Monica Le Merigot Whole Loan, had an original principal balance of $31,200,000, has an outstanding principal balance as of the Cut-off Date of $31,162,303 and is expected to be contributed to CGCMT 2015-GC35 Trust.
Following the lockout period, and on any date before September 6, 2020, the borrower has the right to either (i) prepay the JW Marriott Santa Monica Le Merigot Whole Loan in whole, but not in part, provided that the borrower pays the greater of a yield maintenance premium or a prepayment premium equal to 1.0% of the principal amount being prepaid or (ii) defease the JW Marriott Santa Monica Le Merigot Whole Loan in whole, but not in part. In addition, the JW Marriott Santa Monica Le Merigot Whole Loan is prepayable without penalty on or after September 6, 2020. If the mezzanine loan is outstanding, simultaneously with any defeasance, the borrower is required to prepay the mezzanine loan in full. Following the determination of the fair market value of the JW Marriott Santa Monica Le Merigot Property, the lender may elect to apply any ground rent adjustment reserve funds remaining after the deduction of the Rent Adjustment Reserve Surplus (see “Escrows” section) as prepayment of the debt in accordance with the loan documents.
Sources and Uses
| Sources | Uses | |||||||
| Original whole loan amount | $62,400,000 | 78.6% | Loan payoff | $34,658,321 | 43.7% | |||
| Mezzanine debt | 17,000,000 | 21.4 | Reserves | 11,150,246 | 14.0 | |||
| Closing costs | 776,615 | 1.0 | ||||||
| Return of equity | 32,814,818 | 41.3 | ||||||
| Total Sources | $79,400,000 | 100.0% | Total Uses | $79,400,000 | 100.0% |
The Property. The JW Marriott Santa Monica Le Merigot Property is a 175-room, six-story, full service hotel located in Santa Monica, California. Built in 1999 and renovated in 2014, the JW Marriott Santa Monica Le Merigot Property is situated on a 1.5-acre site on Ocean Avenue with guestrooms comprising of 173 standard rooms and 2 suites. Amenities at the JW Marriott Santa Monica Le Merigot Property include 11 event rooms totaling 10,552 square feet of meeting space; Cezanne (a full-service restaurant open for breakfast, lunch and dinner) and Le Troquet Patio, a cocktail/dinner lounge; a business center; Spa Le Merigot; an outdoor swimming pool and whirlpool; and a fitness center. Additionally, the JW Marriott Santa Monica Le Merigot Property features an underground parking garage with 208 spaces, resulting in a parking ratio of 1.2 spaces per room. The JW Marriott Santa Monica Le Merigot Property operates under a franchise agreement with Marriott International, Inc. that expires in December 2020.
Operating History and Underwritten Net Cash Flow.The following table presents certain information relating to the historical operating performance and the underwritten net cash flow at the JW Marriott Santa Monica Le Merigot Property:
Cash Flow Analysis
| 2013 | 2014 | TTM 8/31/2015 | U/W | % of U/W Total Revenue | U/W $ per Room | ||||||||
| Occupancy | 97.3% | 99.2% | 97.5% | 97.5% | |||||||||
| ADR | $285.89 | $307.09 | $316.92 | $316.92 | |||||||||
| RevPAR | $278.30 | $304.59 | $309.02 | $309.02 | |||||||||
| Total Revenue | $23,679,978 | $25,589,767 | $25,647,276 | $25,647,276 | 100.0% | $146,556 | |||||||
| Total Department Expenses | 6,838,077 | 7,238,099 | 7,116,335 | 7,368,733 | 28.7 | 42,107 | |||||||
| Gross Operating Profit | $16,841,901 | $18,351,668 | $18,530,940 | $18,278,543 | 71.3% | $104,449 | |||||||
| Total Undistributed Expenses | 5,569,687 | 5,947,675 | 5,926,291 | 6,443,272 | 25.1 | 36,819 | |||||||
| Profit Before Fixed Charges | $11,272,214 | $12,403,993 | $12,604,649 | $11,835,271 | 46.1% | $67,630 | |||||||
| Ground Rent | 1,633,500 | 1,633,500 | 1,633,500 | 2,376,000(1) | 9.3 | 13,577 | |||||||
| Other Fixed Charges | 1,303,218 | 1,242,298 | 1,234,117 | 1,072,699 | 4.2 | 6,130 | |||||||
| Net Operating Income | $8,335,496 | $9,528,195 | $9,737,032 | $8,386,572 | 32.7% | $47,923 | |||||||
| FF&E | 1,183,999 | 1,279,488 | 1,282,364 | 1,282,364 | 5.0 | 7,328 | |||||||
| Net Cash Flow | $7,151,498 | $8,248,707 | $8,454,668 | $7,104,208 | 27.7% | $40,595 | |||||||
| NOI DSCR | 2.08x | 2.38x | 2.43x | 2.09x | |||||||||
| NCF DSCR | 1.79x | 2.06x | 2.11x | 1.77x | |||||||||
| NOI DY | 13.4% | 15.3% | 15.6% | 13.5% | |||||||||
| NCF DY | 11.5% | 13.2% | 13.6% | 11.4% | |||||||||
(1) The U/W Ground Rent is calculated as 9% of the appraiser’s concluded unencumbered land value of $26,400,000 for the JW Marriott Santa Monica Le Merigot Property. See “Ground Lease” section.
Appraisal.As of the appraisal valuation date of September 1, 2015, the JW Marriott Santa Monica Le Merigot Property had an “as-is” appraised value of $104,000,000.
THE INFORMATION IN THIS STRUCTURAL AND COLLATERAL TERM SHEET IS NOT COMPLETE AND MAY BE AMENDED PRIOR TO THE TIME OF SALE. THIS TERM SHEET IS NOT AN OFFER TO SELL THESE SECURITIES AND IT IS NOT A SOLICITATION OF AN OFFER TO BUY THESE SECURITIES IN ANY JURISDICTION WHERE THE OFFER OR SALE IS NOT PERMITTED.
| 99 |
| JW MARRIOTT SANTA MONICA LE MERIGOT |
Environmental Matters.According to the Phase I environmental site assessment dated July 20, 2015, there was no evidence of any recognized environmental conditions at the JW Marriott Santa Monica Le Merigot Property.
Market Overview and Competition.The JW Marriott Santa Monica Le Merigot Property is located in Santa Monica, California, directly off of Ocean Avenue, a four-lane thoroughfare and one of the central arteries of both Santa Monica and neighboring Venice. The JW Marriott Santa Monica Le Merigot Property is accessible from the Pacific Coast Highway, which is approximately one half-mile from the JW Marriott Santa Monica Le Merigot Property, and the I-10 Freeway, which is located approximately one mile northeast. Additionally, the JW Marriott Santa Monica Le Merigot Property is located approximately eight miles northwest of Los Angeles International Airport. The JW Marriott Santa Monica Le Merigot Property is within one mile of the Santa Monica State Beach, a three-mile long stretch covering 245 acres along Santa Monica Bay; Santa Monica Pier, a double-jointed pier with amusement rides, restaurants and street performers; and the Third Street Promenade, an outdoor pedestrian-only shopping district that includes retail stores, restaurants, bars and movie theaters. Recently redeveloped in 2010 and located at the south end of the Third Street Promenade, Santa Monica Place is an indoor/outdoor shopping mall that spans three levels and is anchored by Nordstrom, Bloomingdale’s and ArcLight Cinema. Additional retailers at Santa Monica Place include Louis Vuitton, Burberry, Armani and Tiffany & Co.
The following table presents certain information relating to the JW Marriott Santa Monica Le Merigot Mortgage Property’s competitive set:
Subject and Market Historical Occupancy, ADR and RevPAR(1)
| Competitive Set | JW Marriott Santa Monica Le Merigot | Penetration Factor | |||||||||||||||||
| Year | Occupancy | ADR | RevPAR | Occupancy | ADR | RevPAR | Occupancy | ADR | RevPAR | ||||||||||
| 8/31/2015 TTM | 81.1% | $373.90 | $303.18 | 97.5% | $317.79 | $309.86 | 120.2% | 85.0% | 102.2% | ||||||||||
| 8/31/2014 TTM | 82.4% | $350.05 | $288.56 | 98.0% | $303.72 | $297.54 | 118.8% | 86.8% | 103.1% | ||||||||||
| 8/31/2013 TTM | 83.9% | $321.26 | $269.56 | 96.2% | $284.22 | $273.38 | 114.6% | 88.5% | 101.4% | ||||||||||
| (1) | Information obtained from a third party hospitality report as of August 31, 2015. The competitive set includes the following hotels: Fairmont Miramar, Viceroy Santa Monica, Shutters On The Beach, Loews Santa Monica Beach Hotel, DoubleTree Suites Santa Monica, Marriott Marina Del Rey, Ritz-Carlton Marina Del Rey and Casa Del Mar. |
The Borrower.The borrower is CW Hotel Limited Partnership, an Ohio limited partnership and single purpose entity with two independent directors. Legal counsel to the borrower delivered a non-consolidation opinion in connection with the origination of the JW Marriott Santa Monica Le Merigot Whole Loan. Columbia Sussex Corporation and CSC Holdings, LLC are the guarantors of certain nonrecourse carveouts under the JW Marriott Santa Monica Le Merigot Whole Loan. The guarantors are required to maintain a combined net worth of $85.0 million and combined liquidity of $10.0 million through the term of the JW Marriott Santa Monica Le Merigot Whole Loan.
The Sponsor.The sponsor is William J. Yung III. The sponsor is an experienced developer, owner and operator of hotel properties. William J. Yung founded Columbia Sussex Corporation in 1972. Columbia Sussex Corporation is a large privately owned hotel company and the largest domestic full-service Marriott franchisee with a portfolio that consisting of 35 total hotels (11,502 keys), 27 (8,318 keys) of which are Marriott flags. See also “Description of the Mortgage Pool — Loan Purpose; Default History, Bankruptcy Issues and Other Proceedings” in the Preliminary Prospectus.
Escrows.The loan documents provide for upfront escrows in the amount of $533,964 for real estate taxes, $70,120 for insurance premiums, $272,250 for current ground rent payments and $2,500 to be paid to any franchisor for fees related to the issuance of a replacement comfort letter with respect to the JW Marriott Santa Monica Le Merigot Property. The loan documents also provide for monthly escrows in an amount equal to $66,746 for real estate taxes, $23,373 for insurance premiums and $136,125 for current ground rent payments. The loan documents provide for an upfront escrow in the amount of $389,819 for a seasonality reserve and an ongoing amount which is equal to 110% of the quotient of (x) the aggregate amount by which operating income at the JW Marriott Santa Monica Le Merigot Property for the calendar month is insufficient to establish a debt service coverage ratio of 1.00x based on the then-current annual budget (“Negative Monthly Amount”) for the 12-month period divided by (y) the number of months for which there is no Negative Monthly Amount, based on the then-current seasonality annual budget.
The loan documents also provide for an upfront escrow in the amount of $9,881,593 for a rent adjustment reserve which is held as additional cash collateral for the JW Marriott Santa Monica Le Merigot Whole Loan until the determination of the new annual base rent pursuant to the terms of the ground lease (see “Ground Lease” section). After the ground rent determination date and provided that no event of default exists under the loan documents (i) the Rent Adjustment Reserve Surplus (as defined below) may be disbursed to the borrower, provided that, in the event that an event of default exists under the mezzanine loan documents, the Rent Adjustment Reserve Surplus will instead be paid to the mezzanine lender, and (ii) at the lender’s election, rent adjustment reserves remaining after deduction of the Rent Adjustment Reserve Surplus may be used to pay down the JW Marriott Santa Monica Le Merigot Whole Loan rather than be held as additional collateral. If a portion of the reserve is used to pay down the JW Marriott Santa Monica Le Merigot Whole Loan, the mezzanine borrower is required to simultaneously proportionately pay down the mezzanine loan.
“Rent Adjustment Reserve Surplus” is defined as 9.0% multiplied by the difference between the $37,200,000 (a value deemed to be the maximum probable reset value of the land underlying the JW Marriott Santa Monica Le Merigot Property) and the fair market value of the JW Marriott Santa Monica Le Merigot Property at the time of the next ground rent reset, divided by 9.29% (representing the closing debt yield for the JW Marriott Santa Monica Le Merigot Whole Loan and Mezzanine Loan); provided that, if the fair market
THE INFORMATION IN THIS STRUCTURAL AND COLLATERAL TERM SHEET IS NOT COMPLETE AND MAY BE AMENDED PRIOR TO THE TIME OF SALE. THIS TERM SHEET IS NOT AN OFFER TO SELL THESE SECURITIES AND IT IS NOT A SOLICITATION OF AN OFFER TO BUY THESE SECURITIES IN ANY JURISDICTION WHERE THE OFFER OR SALE IS NOT PERMITTED.
| 100 |
| JW MARRIOTT SANTA MONICA LE MERIGOT |
value of the JW Marriott Santa Monica Le Merigot Property at the ground rent reset is equal to or less than $27,000,000, the entire rent adjustment reserve constitutes Rent Adjustment Reserve Surplus.
No property improvement plan (“PIP”) was required under the franchise agreement at origination. In the event that a PIP is required by a franchisor, the borrower will be required to deposit an amount equal to 120% of the costs of the related PIP work (as estimated by the lender in its reasonable discretion) (A) in the case of any existing or renewal franchise agreement, prior to the required commencement date of any PIP imposed thereunder and (B) in the case of any new franchise agreement on or prior to the date such new franchise agreement is executed and delivered. Additionally, if 18 months prior to the expiration of the franchise agreement (“Franchise Renewal Date”) a Franchise Renewal Event (as defined below) has not occurred, within 12 months of the Franchise Renewal Date, the borrower is required to post a letter of credit or cash in amount equal to 120% of the estimated PIP costs, less any sums then on deposit in the FF&E escrow and the PIP escrow.
The loan documents require an ongoing monthly FF&E reserve in an amount equal to the greater of (a) the FF&E Payment (as defined below) and (b) the amount of the deposit (if any) then required by the franchisor on account of FF&E under the franchise agreement.
“FF&E Payment” means, with respect to the monthly payment date, an amount equal to one-twelfth of 5% of the greater (x) the annual gross revenues for the hotel related operations at the JW Marriott Santa Monica Le Merigot Property for the immediately preceding calendar year as reasonably determined by the lender and (y) the projected annual gross revenues for the hotel related operations at the JW Marriott Santa Monica Le Merigot Property for the calendar year in which such monthly payment date occurs as set forth in, generally, (i) during the continuance of a JW Marriott Santa Monica Le Merigot Trigger Period or JW Marriott Santa Monica Le Merigot Mezzanine Trigger Period (see “Lockbox and Cash Management” section), the approved annual budget or (ii) otherwise, the annual budget approved for such calendar year by the mezzanine lender pursuant to the mezzanine loan documents, in each case as more particularly set for in the JW Marriott Santa Monica Le Merigot Loan documents. The FF&E reserve monthly deposit is initially determined for the balance of the 2015 calendar year as of the origination date and thereafter adjusted annually. The lender may require the borrower to increase the monthly deposits required if (1) an JW Marriott Santa Monica Le Merigot Trigger Period is continuing and the lender determines in its reasonable discretion that an increase is necessary to maintain proper maintenance and operation of the JW Marriott Santa Monica Le Merigot Property and/or (2) the lender determines in its reasonable discretion that an increase is necessary to reflect increased FF&E expenditures required under the franchise agreement and/or set forth in any amendment to the most recently determined approved annual budget.
A “Franchise Renewal Event” means the lender’s receipt of evidence reasonably acceptable to the lender (which such evidence must include, without limitation, a duly executed estoppel certificate from the applicable franchisor) that (i) the related franchise agreement has not been extended or replaced by a new franchise agreement in accordance with the terms of the loan documents, in each case, for a term expiring no earlier than three years after the maturity date of the JW Marriott Santa Monica Le Merigot Whole Loan, (ii) such franchise agreement (as so extended) or such replacement franchise agreement, as applicable, is in full force and effect with no defaults thereunder, and (iii) to the extent a PIP is required in connection with the foregoing, a deposit has been made to the PIP escrow in accordance with the terms of the loan documents.
Lockbox and Cash Management.The JW Marriott Santa Monica Le Merigot Whole Loan requires a lender-controlled lockbox, which is already in place, and that the borrower directs all credit card companies to pay all sums directly into such lockbox account. The loan documents also require that all funds received by the borrower be deposited into such lockbox account, and all funds in the lockbox account are swept directly into the cash management account for the payment of debt service and property operating expenses and funding of reserves. Prior to the occurrence of a JW Marriott Santa Monica Le Merigot Trigger Period or a JW Marriott Santa Monica Le Merigot Mezzanine Trigger Period (as defined below), any excess is released to the borrower. During a JW Marriott Santa Monica Le Merigot Trigger Period, (i) to the extent the JW Marriott Santa Monica Le Merigot Trigger Period was caused solely by the failure of a Franchise Renewal Event to occur on or before eighteen months prior to the expiration of the franchise agreement, excess cash flow will be deposited into the PIP reserve and, (ii) to the extent the JW Marriott Santa Monica Le Merigot Trigger Period was caused by any event other than as described in the preceding clause (i), excess cash flow will be held as additional collateral by the lender. To the extent a JW Marriott Santa Monica Le Merigot Mezzanine Trigger Period has occurred and is then continuing and no JW Marriott Santa Monica Le Merigot Trigger Period exists, excess cash flow will be deposited an account which is distributed to the mezzanine lender for the purpose of paying monthly debt service on the mezzanine loan.
A “JW Marriott Santa Monica Le Merigot Trigger Period” will commence upon the earlier of any of the following: (a) an event of default; (b) the debt yield falling below 8.25%; (c) the borrower defaulting under, providing notice of termination of, or the cancellation or expiration of the franchise agreement; (d) the borrower failing to deliver evidence (including an estoppel from the franchisor) relating to the extension of the franchise agreement or its replacement with a qualifying agreement for a term no shorter than expiring three years after the maturity date of the JW Marriott Santa Monica Le Merigot Whole Loan, which franchise agreement or qualified replacement is in full force and effect without defaults thereunder, and for which any required renovation reserve has been deposited, on or before eighteen months prior to the expiration of the franchise agreement; (e) a bankruptcy action of the manager.
A JW Marriott Santa Monica Le Merigot Trigger Period will cease with respect to clause (a) above, upon the cure or the lender’s waiver of such event of default; with respect to clause (b), upon the achievement of a debt yield equal to or greater than 8.5% for two consecutive calendar quarters; with respect to clause (c), if the borrower (i) has cured all defaults under the franchise agreement, the borrower and the franchisor have reaffirmed the franchise agreement, the JW Marriott Santa Monica Le Merigot Property continues to be operated pursuant to the franchise agreement and all permits applicable to the franchise agreement are in full force and effect or (ii) has flagged the JW Marriott Santa Monica Le Merigot Property pursuant to a replacement franchise
THE INFORMATION IN THIS STRUCTURAL AND COLLATERAL TERM SHEET IS NOT COMPLETE AND MAY BE AMENDED PRIOR TO THE TIME OF SALE. THIS TERM SHEET IS NOT AN OFFER TO SELL THESE SECURITIES AND IT IS NOT A SOLICITATION OF AN OFFER TO BUY THESE SECURITIES IN ANY JURISDICTION WHERE THE OFFER OR SALE IS NOT PERMITTED.
| 101 |
| JW MARRIOTT SANTA MONICA LE MERIGOT |
agreement in accordance with the loan documents; with respect to clause (d), upon the delivery of such evidence; and with respect to clause (e), if the manager is replaced in accordance with the loan documents.
A “JW Marriott Santa Monica Le Merigot Mezzanine Trigger Period” commences upon the date that the lender has received written notice from the mezzanine lender that an event of default exists under the mezzanine loan documents.
Property Management. The JW Marriott Santa Monica Le Merigot Property is managed by an affiliate of the borrower.
Assumption.The borrower has a one-time right to transfer the JW Marriott Santa Monica Le Merigot Property provided that certain conditions are satisfied, including (i) no event of default has occurred and is continuing; (ii) if requested by the lender, rating agency confirmation from Fitch, KBRA and Moody’s that the transfer will not result in a downgrade, withdrawal or qualification of the respective ratings assigned to the Series WFCM 2015-P2 Certificates, along with similar confirmations from each rating agency rating any securities backed by the JW Marriott Santa Monica Le Merigot Companion Loan; (iii) the borrower pays a non-refundable fee of one percent of the then outstanding principal balance of the JW Marriott Santa Monica Le Merigot Whole Loan; (iv) after the applicable transfer, the JW Marriott Santa Monica Le Merigot Property will continue to be operated pursuant to a franchise agreement permitted under the loan documents; and (v) if the mezzanine loan is outstanding, the mezzanine lender has confirmed the mezzanine borrower has complied with related requirements of the mezzanine loan agreement.
Partial Release.Not permitted.
Real Estate Substitution.Not permitted.
Subordinate and Mezzanine Indebtedness.Concurrently with the funding of the JW Marriott Santa Monica Le Merigot Whole Loan, SMHF Cayman Hotel, LLC, a Delaware limited liability company, funded a mezzanine loan in the amount of $17,000,000 to CP Santa Monica Mezz, LLC, as mezzanine borrower, which is the direct owner of 99% of the limited liability company interests in the borrower. The mezzanine loan is secured by a pledge of the mezzanine borrower’s 99% limited liability company interests in the borrower and 100% of the limited liability company interests in the general partner of the borrower (which owns a 1% limited liability company interest in the borrower). The mezzanine loan carries an interest rate of 9.500% per annum and is co-terminus with the JW Marriott Santa Monica Le Merigot Whole Loan. The mezzanine loan is interest only for the term of the loan and is subject to a customary intercreditor agreement with the lender.
Ground Lease.The borrower for the JW Marriott Santa Monica Le Merigot Property is a tenant under a ground lease underlying the entire JW Marriott Santa Monica Le Merigot Property. The current term of the ground lease expires on October 15, 2086, without any option to renew. The annual ground rent for the five year period ending on October 31, 2015 was $1,316,000. The annual rent to be paid by the lessee equals 9.0% of the fair market value of the JW Marriott Santa Monica Le Merigot Property with rent resets to occur every five years. The next reset is to be effective as of November 1, 2015. As of the date of origination, the annual ground rent to be paid pursuant to the aforementioned rent reset had not yet been determined. The lender has taken a reserve in the amount of $9,881,593 (see “Escrows” section), a portion of which may, at the lender’s option, be used to partially prepay the JW Marriott Santa Monica Le Merigot Whole Loan in the event that the fair market value used for the purpose of determining the annual ground rent exceeds the underwritten fair market value of the JW Marriott Santa Monica Le Merigot Property.
Terrorism Insurance. The borrower is required to maintain an “all-risk” insurance policy that provides coverage for terrorism in an amount equal to the full replacement cost of the JW Marriott Santa Monica Le Merigot Property. The loan documents also require business interruption coverage no less than the 18–month period following the occurrence of a casualty event, together with a six-month extended period of indemnity. The “all-risk” policy containing terrorism insurance is required to contain a deductible that is acceptable to the lender and is no larger than $100,000.
Earthquake Insurance. The loan documents do not require earthquake insurance. Seismic reports prepared in connection with the origination of the JW Marriott Santa Monica Le Merigot Whole Loan indicated a probable maximum loss of 12.0% with respect to the JW Marriott Santa Monica Le Merigot Property.
THE INFORMATION IN THIS STRUCTURAL AND COLLATERAL TERM SHEET IS NOT COMPLETE AND MAY BE AMENDED PRIOR TO THE TIME OF SALE. THIS TERM SHEET IS NOT AN OFFER TO SELL THESE SECURITIES AND IT IS NOT A SOLICITATION OF AN OFFER TO BUY THESE SECURITIES IN ANY JURISDICTION WHERE THE OFFER OR SALE IS NOT PERMITTED.
| 102 |
(THIS PAGE INTENTIONALLY LEFT BLANK)
THE INFORMATION IN THIS STRUCTURAL AND COLLATERAL TERM SHEET IS NOT COMPLETE AND MAY BE AMENDED PRIOR TO THE TIME OF SALE. THIS TERM SHEET IS NOT AN OFFER TO SELL THESE SECURITIES AND IT IS NOT A SOLICITATION OF AN OFFER TO BUY THESE SECURITIES IN ANY JURISDICTION WHERE THE OFFER OR SALE IS NOT PERMITTED.
| 103 |
KEEPER’S SELF STORAGE MANHATTAN |
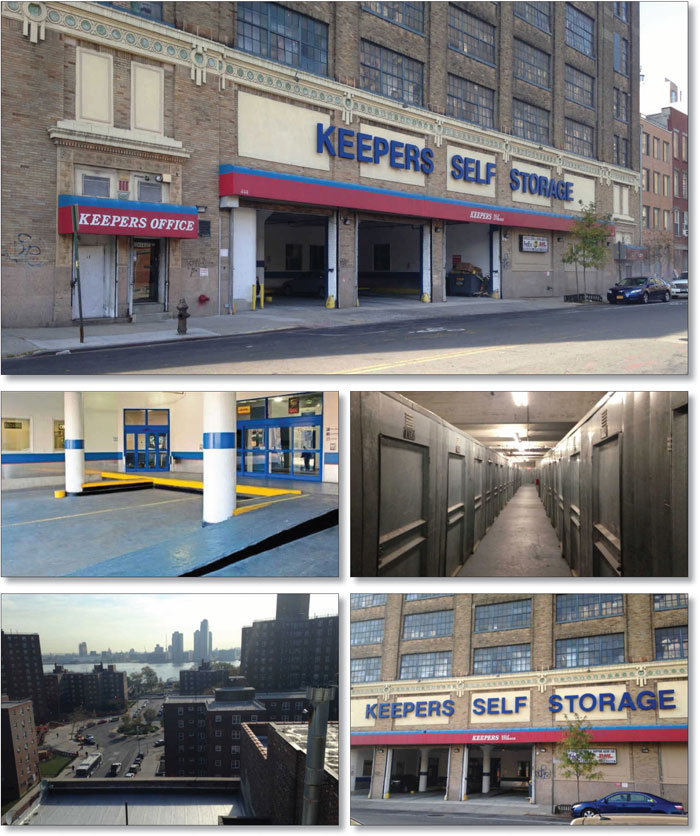
THE INFORMATION IN THIS STRUCTURAL AND COLLATERAL TERM SHEET IS NOT COMPLETE AND MAY BE AMENDED PRIOR TO THE TIME OF SALE. THIS TERM SHEET IS NOT AN OFFER TO SELL THESE SECURITIES AND IT IS NOT A SOLICITATION OF AN OFFER TO BUY THESE SECURITIES IN ANY JURISDICTION WHERE THE OFFER OR SALE IS NOT PERMITTED.
| 104 |
KEEPER’S SELF STORAGE MANHATTAN |
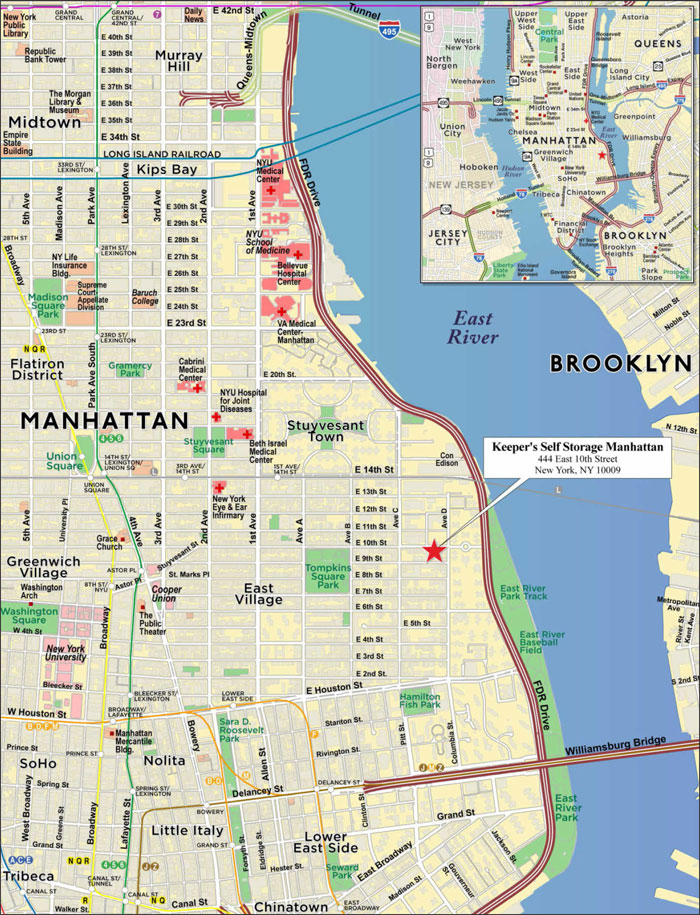
THE INFORMATION IN THIS STRUCTURAL AND COLLATERAL TERM SHEET IS NOT COMPLETE AND MAY BE AMENDED PRIOR TO THE TIME OF SALE. THIS TERM SHEET IS NOT AN OFFER TO SELL THESE SECURITIES AND IT IS NOT A SOLICITATION OF AN OFFER TO BUY THESE SECURITIES IN ANY JURISDICTION WHERE THE OFFER OR SALE IS NOT PERMITTED.
| 105 |
| No. 11 – Keeper’s Self Storage Manhattan | ||||||
| Loan Information | Property Information | |||||
| Mortgage Loan Seller: | Citigroup Global Markets Realty Corp. | Single Asset/Portfolio: | Single Asset | |||
| Credit Assessment (Fitch/KBRA/Moody’s): | NR/NR/NR | Property Type: | Self Storage | |||
| Original Principal Balance: | $31,000,000 | Specific Property Type: | Self Storage | |||
| Cut-off Date Principal Balance: | $31,000,000 | Location: | New York, NY | |||
| % of Initial Pool Balance: | 3.1% | Size: | 61,575 SF | |||
| Loan Purpose: | Refinance | Cut-off Date Principal Balance Per SF: | $503.45 | |||
| Borrower Name: | 444 Warehouse Associates, L.P. | Year Built/Renovated: | 1928/1984 | |||
| Sponsors: | David Haver; David Haver 2007 GRAT | Title Vesting: | Fee | |||
| Mortgage Rate: | 4.900% | Property Manager: | Self-managed | |||
| Note Date: | November 13, 2015 | 3rdMost Recent Occupancy (As of): | 87.0% (12/31/2012) | |||
| Anticipated Repayment Date: | NAP | 2ndMost Recent Occupancy (As of): | 89.1% (12/31/2013) | |||
| Maturity Date: | December 6, 2025 | Most Recent Occupancy (As of): | 89.8% (12/31/2014) | |||
| IO Period: | 120 months | Current Occupancy (As of): | 91.0% (10/21/2015) | |||
| Loan Term (Original): | 120 months | |||||
| Seasoning: | 0 months | Underwriting and Financial Information: | ||||
| Amortization Term (Original): | NAP | |||||
| Loan Amortization Type: | Interest-only, Balloon | 3rdMost Recent NOI (As of): | $2,109,700 (12/31/2013) | |||
| Interest Accrual Method: | Actual/360 | 2ndMost Recent NOI (As of): | $2,168,010 (12/31/2014) | |||
| Call Protection: | L(24),GRTR 1% or YM(92),O(4) | Most Recent NOI (As of): | $2,267,453 (TTM 10/31/2015) | |||
| Lockbox Type: | Springing | |||||
| Additional Debt: | None | U/W Revenues: | $3,343,768 | |||
| Additional Debt Type: | NAP | U/W Expenses: | $1,084,330 | |||
| U/W NOI: | $2,259,438 | |||||
| U/W NCF: | $2,246,013 | |||||
| U/W NOI DSCR: | 1.46x | |||||
| Escrows and Reserves(1): | U/W NCF DSCR: | 1.45x | ||||
| U/W NOI Debt Yield: | 7.3% | |||||
| Type: | Initial | Monthly | Cap (If Any) | U/W NCF Debt Yield: | 7.2% | |
| Taxes | $31,109 | $31,109 | NAP | As-Is Appraised Value(2): | $53,880,000 | |
| Insurance | $0 | Springing | NAP | As-Is Appraisal Valuation Date: | October 21, 2015 | |
| Replacement Reserves | $0 | $1,119 | $67,125 | Cut-off Date LTV Ratio(2): | 57.5% | |
| Deferred Maintenance | $181,750 | $0 | NAP | LTV Ratio at Maturity or ARD(2): | 57.5% | |
| (1) | See “Escrows” section. |
| (2) | The appraiser also concluded to an appraised value of $62,110,000 based on the property’s highest and best use as vacant land for development to a mixed-use property with commercial use on the 1st floor and residential uses above. The Cut-off Date LTV Ratio and LTV Ratio at Maturity or ARD, based on the highest and best use value, are both 49.9%. See “Appraisal” section. |
The Mortgage Loan. The mortgage loan (the “Keeper’s Self Storage Manhattan Mortgage Loan”) is evidenced by a single promissory note that is secured by a first mortgage encumbering a seven-story self storage property located in the East Village neighborhood of Manhattan, New York (the “Keeper’s Self Storage Manhattan Property”). The Keeper’s Self Storage Manhattan Mortgage Loan was originated on November 13, 2015 by Citigroup Global Markets Realty Corp. The Keeper’s Self Storage Manhattan Mortgage Loan had an original principal balance of $31,000,000, has an outstanding principal balance as of the Cut-off Date of $31,000,000 and accrues interest at an interest rate of 4.900%per annum. The Keeper’s Self Storage Manhattan Mortgage Loan had an initial term of 120 months, has a remaining term of 120 months as of the Cut-off Date and requires interest-only payments through the term of the Keeper’s Self Storage Manhattan Mortgage Loan. The Keeper’s Self Storage Manhattan Mortgage Loan matures on December 6, 2025.
Following the lockout period, the borrower has the right to prepay the Keeper’s Self Storage Manhattan Mortgage Loan in whole, but not in part, on any day before September 6, 2025, provided that the borrower pays the greater of a yield maintenance premium or a prepayment premium equal to 1.0% of the principal amount being prepaid. In addition, the Keeper’s Self Storage Manhattan Mortgage Loan is prepayable without penalty on or after September 6, 2025.
THE INFORMATION IN THIS STRUCTURAL AND COLLATERAL TERM SHEET IS NOT COMPLETE AND MAY BE AMENDED PRIOR TO THE TIME OF SALE. THIS TERM SHEET IS NOT AN OFFER TO SELL THESE SECURITIES AND IT IS NOT A SOLICITATION OF AN OFFER TO BUY THESE SECURITIES IN ANY JURISDICTION WHERE THE OFFER OR SALE IS NOT PERMITTED.
| 106 |
KEEPER’S SELF STORAGE MANHATTAN |
Sources and Uses
| Sources | Uses | |||||||
| Original loan amount | $31,000,000 | 100.0% | Loan payoff | $10,334,013 | 33.3% | |||
| Reserves | 212,859 | 0.7 | ||||||
| Closing costs | 1,193,039 | 3.8 | ||||||
| Return of equity | 19,260,089 | 62.1 | ||||||
| Total Sources | $31,000,000 | 100.0% | Total Uses | $31,000,000 | 100.0% |
The Property.The Keeper’s Self Storage Manhattan Property is a self storage facility totaling 61,575 rentable square feet located in the East Village neighborhood of Manhattan, New York. Built in 1928 and renovated in 1984, the Keeper’s Self Storage Manhattan Property contains a total of 1,478 interior self-storage units and 24 P.O. Boxes located on a 0.3-acre site at 444 East 10th Street. The Keeper’s Self Storage Manhattan Property offers traditional storage amenities, including interior loading docks, 24-hour security monitoring, on-site property management, and a retail center. As of October 21, 2015, the Keeper’s Self Storage Manhattan Property was 91.0% occupied.
The following table presents historical occupancy percentages at the Keeper’s Self Storage Manhattan Property:
Historical Occupancy
12/31/2012(1) | 12/31/2013(1) | 12/31/2014(1) | 10/21/2015(2) | |||
| 87.0% | 89.1% | 89.8% | 91.0% |
| (1) | Information obtained from the borrower. |
| (2) | Information obtained from the underwritten rent roll. |
Operating History and Underwritten Net Cash Flow. The following table presents certain information relating to the historical operating performance and the underwritten net cash flow at the Keeper’s Self Storage Manhattan Property:
Cash Flow Analysis
| 2013 | 2014 | TTM 10/31/2015 | U/W | % of U/W Effective Gross Income | U/W $ per SF | ||||||||
| Base Rent | $2,980,804 | $3,124,468 | $3,180,223 | $3,227,448 | 96.5% | $52.41 | |||||||
| Grossed Up Vacant Space | 0 | 0 | 0 | 326,880 | 9.8 | 5.31 | |||||||
| Other Income | 278,596 | 278,067 | 288,096 | 288,096 | 8.6 | 4.68 | |||||||
| Less Vacancy, Concession & Credit Loss | (111,877) | (154,790) | (124,551) | (498,656)(1) | (14.9) | (8.10) | |||||||
| Effective Gross Income | $3,147,523 | $3,247,745 | $3,343,768 | $3,343,768 | 100.0% | $54.30 | |||||||
| Total Operating Expenses | 1,037,823 | 1,079,735 | 1,076,315 | 1,084,330 | 32.4 | 17.61 | |||||||
|
|
|
|
|
| ||||||||
| Net Operating Income | $2,109,700 | $2,168,010 | $2,267,453 | $2,259,438 | 67.6% | $36.69 | |||||||
| Capital Expenditures | 0 | 0 | 0 | 13,425 | 0.4 | 0.22 | |||||||
| Net Cash Flow | $2,109,700 | $2,168,010 | $2,267,453 | $2,246,013 | 67.2% | $36.48 | |||||||
| NOI DSCR | 1.37x | 1.40x | 1.47x | 1.46x | |||||||||
| NCF DSCR | 1.37x | 1.40x | 1.47x | 1.45x | |||||||||
| NOI DY | 6.8% | 7.0% | 7.3% | 7.3% | |||||||||
| NCF DY | 6.8% | 7.0% | 7.3% | 7.2% |
| (1) | The underwritten economic vacancy is 14.0%. The Keeper’s Self Storage Manhattan Property was 91.0% physically occupied as of October 21, 2015. |
Appraisal.As of the appraisal valuation date of October 21, 2015, the Keeper’s Self Storage Manhattan Property had an “as-is” value of $53,880,000 which is based on its current use as a self storage facility. As of the Appraisal Date the mortgaged property has an “as-is” value based on the property’s highest and best use as vacant land for development to a mixed-use property with commercial use on the 1st floor and residential uses above, of $62,110,000. The Cut-Off Date LTV Ratio and LTV Ratio at Maturity or ARD based on the $62,110,000 appraised value is 49.9% and 49.9%, respectively.
Environmental Matters. According to Phase I environmental assessment dated October 21, 2015, there was no evidence of any recognized environmental conditions at the Keeper’s Self Storage Manhattan Property.
Market Overview and Competition. The Keeper’s Self Storage Manhattan Property is located on East 10th Street between Avenue D and Avenue C in Manhattan’s East Village. The East Village is known for its diverse community and contains neighborhoods such as Alphabet City and Bowery. According to a third party market research report, in 2015, the average household income and population within one mile radius of the Keeper’s Self Storage Manhattan Property was $89,862 and 183,977, respectively. A third-party industry report forecasts 3.5% rent growth for the New York metropolitan statistical area over the next five years. New York’s rentable storage square footage per person is 3.8, which is substantially lower than the national average ratio of 8.3 rentable storage square feet per person.
The appraiser surveyed four comparable properties within 1.6 miles of the Keeper’s Self Storage Manhattan Property. All four comparable properties were of the Manhattan Mini Storage brand, originally constructed between 1922 and 1927 and totaled 596,764 square feet. The Manhattan self-storage market is highly competitive, and occupancy levels are treated as proprietary information; however, according to a third party market research survey of self-storage properties within five miles of the Keeper’s
THE INFORMATION IN THIS STRUCTURAL AND COLLATERAL TERM SHEET IS NOT COMPLETE AND MAY BE AMENDED PRIOR TO THE TIME OF SALE. THIS TERM SHEET IS NOT AN OFFER TO SELL THESE SECURITIES AND IT IS NOT A SOLICITATION OF AN OFFER TO BUY THESE SECURITIES IN ANY JURISDICTION WHERE THE OFFER OR SALE IS NOT PERMITTED.
| 107 |
KEEPER’S SELF STORAGE MANHATTAN |
Self Storage Manhattan Property, the average vacancy was approximately 7.0%. The appraiser concluded to a monthly rent of $5.18 per square foot, which is higher than the weighted average in-place rent at the Keeper’s Self Storage Manhattan Property of $4.80 per square foot.
The following table presents certain information relating to comparable self storage properties for the Keeper’s Self Storage Manhattan Property:
Competitive Set(1)
| Keeper’s Self Storage Manhattan (Subject) | Manhattan Mini-Storage | Manhattan Mini-Storage | Manhattan Mini-Storage | Manhattan Mini- Storage | |
| Location | New York, NY | New York, NY | New York, NY | New York, NY | New York, NY |
| Distance to Subject | -- | 1.5 miles | 1.6 miles | 0.8 miles | 1.6 miles |
| Property Type | Self Storage | Self Storage | Self Storage | Self Storage | Self Storage |
| Year Built/Renovated | 1928 /1984 | 1927 / NAP | 1924 / NAP | 1923 / NAP | 1922 / NAP |
| Net Rentable Area | 61,575 | 206,064 | 225,110 | 41,997 | 123,593 |
| Total Occupancy | 91.0% | NAV(2) | NAV(2) | NAV(2) | NAV(2) |
| (1) | Information obtained from the appraisal and underwritten rent roll. |
| (2) | Per the appraisal, the Manhattan self-storage market is highly competitive. Occupancy levels are treated as propriety information and therefore not available. |
The Borrower. The borrower is 444 Warehouse Associates, L.P., a single purpose entity and New York limited partnership. Legal counsel to the borrower provided a non-consolidation opinion in connection with the origination of the Keeper’s Self Storage Manhattan Mortgage Loan. David Haver is the guarantor of certain nonrecourse carveouts under the Keeper’s Self Storage Manhattan Mortgage Loan.
The Sponsors. The sponsors are David Haver and David Haver 2007 GRAT. Mr. Haver has been involved in the self-storage business since the 1980s, having built, converted, bought, and sold numerous properties over the years. Mr. Haver’s schedule of real estate owned includes commercial properties located in New York, New Jersey, and Florida. His company, Keepers Storage, owns and operates facilities in New York, Staten Island, Nyack, Jersey City, and Bergenfield with total estimated market value of $86 million.
Escrows.The loan documents provide for upfront escrows in the amount of $181,750 for deferred maintenance. The loan documents also provide for ongoing monthly reserves in the amount of $31,109 for real estate taxes and $1,119 for replacement reserves (subject to a cap of $67,125). At the option of the lender, if the liability or casualty policy maintained by the borrower does not constitute an approved blanket or umbrella insurance policy under the loan documents, the borrower will fund an insurance reserve in an amount equal to one-twelfth of the amount that the lender estimates will be necessary to pay insurance premiums over the then succeeding 12-month period.
Lockbox and Cash Management.Upon the occurrence of a Cash Trap Event Period (as defined below), the borrower will be required to establish a lender-controlled lockbox account and direct all credit card companies and banks to deposit all rents directly into such lockbox account and direct the manager to deposit all revenue derived from the Keeper’s Self Storage Manhattan Property in the lockbox account. During a Cash Trap Event Period, all funds on deposit in the lockbox account are swept daily to a lender-controlled cash management account, where the funds are used to pay debt service and operating expenses and to fund required reserves. Excess funds in the lender-controlled cash management account are disbursed to the borrower if no Cash Trap Event Period exists or held by the lender as an excess cash flow reserve for so long as a Cash Trap Event Period exists.
A “Cash Trap Event Period” will commence upon the earlier of (i) the occurrence and continuance of an event of default; and (ii) the debt service coverage ratio for the trailing 12-month period falling below 1.20x at the end of any calendar month. A Cash Trap Event Period will expire, with regard to clause (i), upon the cure of such event of default; and with regard to clause, (ii) upon the debt service coverage ratio being equal to or greater than 1.25x for two consecutive calendar quarters.
Property Management. The Keeper’s Self Storage Manhattan Property is managed by an affiliate of the borrower.
Assumption.The borrower has the right to transfer the Keeper’s Self Storage Manhattan Property at any time other than the 60 days prior to and following any secondary market transaction, provided that no event of default has occurred and is continuing and certain other conditions are satisfied, including (i) the lender’s reasonable determination that the proposed transferee and guarantor satisfy the lender’s credit review and underwriting standards, taking into consideration transferee experience, financial strength and general business standing; (ii) execution of a recourse guaranty with respect to such transfer and an environmental indemnity by an affiliate of the transferee; (iii) if requested by the lender, rating agency confirmation; and (iv) payment of an assumption fee.
Partial Release.Not permitted.
Real Estate Substitution.Not permitted.
Subordinate and Mezzanine Indebtedness.Not permitted.
Ground Lease. None.
Terrorism Insurance. The loan documents require that the “all risk” insurance policy required to be maintained by the borrower provide coverage for terrorism in an amount equal to the full replacement cost of Keeper’s Self Storage Manhattan Property, as well
THE INFORMATION IN THIS STRUCTURAL AND COLLATERAL TERM SHEET IS NOT COMPLETE AND MAY BE AMENDED PRIOR TO THE TIME OF SALE. THIS TERM SHEET IS NOT AN OFFER TO SELL THESE SECURITIES AND IT IS NOT A SOLICITATION OF AN OFFER TO BUY THESE SECURITIES IN ANY JURISDICTION WHERE THE OFFER OR SALE IS NOT PERMITTED.
| 108 |
KEEPER’S SELF STORAGE MANHATTAN |
as business interruption insurance covering no less than the 18-month period following the occurrence of a casualty event, together with a six-month extended period of indemnity.
THE INFORMATION IN THIS STRUCTURAL AND COLLATERAL TERM SHEET IS NOT COMPLETE AND MAY BE AMENDED PRIOR TO THE TIME OF SALE. THIS TERM SHEET IS NOT AN OFFER TO SELL THESE SECURITIES AND IT IS NOT A SOLICITATION OF AN OFFER TO BUY THESE SECURITIES IN ANY JURISDICTION WHERE THE OFFER OR SALE IS NOT PERMITTED.
| 109 |
| No. 12 – 2052 Century Park East | ||||||
| Loan Information | Property Information | |||||
| Mortgage Loan Seller: | Wells Fargo Bank, National Association | Single Asset/Portfolio: | Single Asset | |||
Credit Assessment (Fitch/KBRA/Moody’s): | NR/NR/NR | Property Type: | Other | |||
| Original Principal Balance: | $30,000,000 | Specific Property Type: | Leased Fee | |||
| Cut-off Date Principal Balance: | $30,000,000 | Location: | Los Angeles, CA | |||
| % of Initial Pool Balance: | 3.0% | Size: | 63,000 SF | |||
| Loan Purpose: | Refinance | Cut-off Date Principal Balance Per SF: | $476.19 | |||
| Borrower Name: | CC Plant Fee LLC | Year Built/Renovated: | NAP/NAP | |||
| Sponsors: | Steven Gordon; Stephen Massman | Title Vesting: | Fee | |||
| Mortgage Rate: | 4.650% | Property Manager: | Self-managed | |||
| Note Date: | November 18, 2015 | 3rd Most Recent Occupancy (As of): | 100.0% (12/31/2012) | |||
| Anticipated Repayment Date: | NAP | 2nd Most Recent Occupancy (As of): | 100.0% (12/31/2013) | |||
| Maturity Date: | December 11, 2025 | Most Recent Occupancy (As of): | 100.0% (12/31/2014) | |||
| IO Period: | 120 months | Current Occupancy (As of): | 100.0% (10/19/2015) | |||
| Loan Term (Original): | 120 months | |||||
| Seasoning: | 0 months | Underwriting and Financial Information: | ||||
| Amortization Term (Original): | NAP | |||||
| Loan Amortization Type: | Interest-only, Balloon | 3rdMost Recent NOI (As of)(3): | $1,922,148 (12/31/2013) | |||
| Interest Accrual Method: | Actual/360 | 2ndMost Recent NOI (As of)(3): | $2,640,956 (12/31/2014) | |||
| Call Protection: | L(24),GRTR 1% or YM or D(92),O(4) | Most Recent NOI (As of): | $2,639,376 (TTM 9/30/2015) | |||
| Lockbox Type: | Soft/Springing Cash Management | |||||
| Additional Debt: | None | |||||
| Additional Debt Type: | NAP | |||||
| U/W Revenues: | $2,735,995 | |||||
| U/W Expenses: | $200,803 | |||||
| U/W NOI: | $2,535,192 | |||||
| U/W NCF: | $2,535,192 | |||||
| U/W NOI DSCR: | 1.79x | |||||
| Escrows and Reserves: | U/W NCF DSCR: | 1.79x | ||||
| U/W NOI Debt Yield: | 8.5% | |||||
| Type: | Initial | Monthly | Cap (If Any) | U/W NCF Debt Yield: | 8.5% | |
| Taxes(1) | $0 | Springing | NAP | As-Is Appraised Value(4): | $58,600,000 | |
| Insurance(2) | $0 | Springing | NAP | As-Is Appraisal Valuation Date: | June 23, 2015 | |
| Replacement Reserves | $0 | $0 | NAP | Cut-off Date LTV Ratio(4): | 51.2% | |
| TI/LC Reserve | $0 | $0 | NAP | LTV Ratio at Maturity or ARD(4): | 51.2% | |
| (1) | Ongoing reserves for taxes are not required as long as (i) no event of default has occurred and is continuing; (ii) Veolia pays taxes prior to delinquency; (iii) no event of default under the Veolia lease has occurred; and (iv) the borrower provides the lender with acceptable evidence that taxes have been paid. |
| (2) | Ongoing reserves for insurance premiums are not required as long as (i) no event of default has occurred and is continuing; (ii) Veolia maintains insurance as required by the lender; (iii) no event of default under the Veolia lease has occurred; and (iv) the borrower provides the lender with evidence of renewal and timely proof of payment of insurance premiums. |
| (3) | See “Cash Flow Analysis” section. |
| (4) | The appraiser also concluded to an unencumbered land value of $59.6 million, which assumes the highest and best use of a multifamily residential development, which value would be subject to obtaining necessary public and private approvals. Assuming this land value, the Cut-off Date LTV Ratio and the LTV Ratio at Maturity or ARD would be 50.3%. |
The 2052 Century Park East mortgage loan is evidenced by a single promissory note that is secured by a first mortgage encumbering an approximate 1.6-acre parcel of land that is improved with the Century City Central Plant located in Los Angeles, California (the “2052 Century Park East Property”). The 2052 Century Park East Property is ground leased to two tenants: Trigen-LA Energy Corporation (99.98% of the underwritten base rent) and Century City Medical Plaza Land Co. (“Century City Medical”) (0.02% of the underwritten base rent), which have ground lease expirations in 2041 and 2039, respectively. Built in 1965 and 1973 and last renovated in 2007, the Century City Central Plant is operated by Trigen-LA Energy Corporation, which was acquired by Veolia Energy North America in 2007. The Century City Central Plant has a 22,000 ton capacity and supplies chilled water, hot water and/or steam to eight properties. Unlike typical commercial properties, the customers of the Century City Central Plant do not have the on-site equipment required to provide to their tenants the steam, hot water and chilled water necessary for heating, ventilation and air conditioning. The Century City Central Plant provides those properties with hot water and chilled water through an underground pipeline network with rates set through customer contracts. Century City Medical also ground leases a narrow strip of land along the shared access driveway to store equipment including a fuel tank, emergency generator, oxygen tanks and other tanks for medical gases. The 2052 Century Park East Property benefits from strong demographics with an estimated 2015 population within a one-, three- and five-mile radius of the 2052 Century Park East Property of 25,809, 286,616 and 691,364, respectively; while the 2015
THE INFORMATION IN THIS STRUCTURAL AND COLLATERAL TERM SHEET IS NOT COMPLETE AND MAY BE AMENDED PRIOR TO THE TIME OF SALE. THIS TERM SHEET IS NOT AN OFFER TO SELL THESE SECURITIES AND IT IS NOT A SOLICITATION OF AN OFFER TO BUY THESE SECURITIES IN ANY JURISDICTION WHERE THE OFFER OR SALE IS NOT PERMITTED.
| 110 |
| 2052 CENTURY PARK EAST |
estimated average household income within the same radii was $128,176, $100,357 and $96,185, respectively. As of October 19, 2015, the 2052 Century Park East Property was 100.0% ground leased to two tenants.
Sources and Uses
| Sources | Uses | ||||||||
| Original loan amount | $30,000,000 | 100.0% | Loan payoff(1) | $7,400,000 | 24.7 | % | |||
| Closing costs | 440,275 | 1.5 | |||||||
| Return of equity | 22,159,725 | 73.9 | |||||||
| Total Sources | $30,000,000 | 100.0% | Total Uses | $30,000,000 | 100.0 | % | |||
| (1) | The 2052 Century Park East Property was previously securitized in the CD 2006-CD3 transaction. |
The following table presents certain information relating to the tenancy at the 2052 Century Park East Property:
Major Tenants
| Tenant Name | Credit Rating (Fitch/Moody’s/ S&P)(1) | Tenant NRSF | % of NRSF | Annual U/W Base Rent PSF | Annual U/W Base Rent | % of Total Annual U/W Base Rent | Lease Expiration Date | ||||||
| �� | |||||||||||||
| Major Tenants | |||||||||||||
| Trigen-LA Energy Corporation | BBB/Baa1/BBB | 59,000 | 93.7% | $44.89 | $2,648,560 | 100.0% | 10/31/2041 | ||||||
| Century City Medical Plaza Land Co. | NR/NR/NR | 4,000 | 6.3% | $0.15 | $600 | 0.0% | 9/30/2039 | ||||||
| Total Major Tenants | 63,000 | 100.0% | $42.05 | $2,649,160 | 100.0% | ||||||||
| Occupied Collateral Total | 63,000 | 100.0% | $42.05 | $2,649,160 | 100.0% | ||||||||
| Vacant Space | 0 | 0.0% | |||||||||||
| Collateral Total | 63,000 | 100.0% | |||||||||||
| (1) | Certain ratings are those of the parent company whether or not the parent company guarantees the lease. |
The following table presents certain information relating to the lease rollover schedule at the 2052 Century Park East Property:
Lease Expiration Schedule(1)
| Year Ending December 31, | No. of Leases Expiring | Expiring NRSF | % of Total NRSF | Cumulative Expiring NRSF | Cumulative % of Total NRSF | Annual U/W Base Rent | Annual U/W Base Rent PSF |
| MTM | 0 | 0 | 0.0% | 0 | 0.0% | $0 | $0.00 |
| 2015 | 0 | 0 | 0.0% | 0 | 0.0% | $0 | $0.00 |
| 2016 | 0 | 0 | 0.0% | 0 | 0.0% | $0 | $0.00 |
| 2017 | 0 | 0 | 0.0% | 0 | 0.0% | $0 | $0.00 |
| 2018 | 0 | 0 | 0.0% | 0 | 0.0% | $0 | $0.00 |
| 2019 | 0 | 0 | 0.0% | 0 | 0.0% | $0 | $0.00 |
| 2020 | 0 | 0 | 0.0% | 0 | 0.0% | $0 | $0.00 |
| 2021 | 0 | 0 | 0.0% | 0 | 0.0% | $0 | $0.00 |
| 2022 | 0 | 0 | 0.0% | 0 | 0.0% | $0 | $0.00 |
| 2023 | 0 | 0 | 0.0% | 0 | 0.0% | $0 | $0.00 |
| 2024 | 0 | 0 | 0.0% | 0 | 0.0% | $0 | $0.00 |
| 2025 | 0 | 0 | 0.0% | 0 | 0.0% | $0 | $0.00 |
| Thereafter | 2 | 63,000 | 100.0% | 63,000 | 100.0% | $2,649,160 | $42.05 |
| Vacant | 0 | 0 | 0.0% | 63,000 | 100.0% | $0 | $0.00 |
| Total/Weighted Average | 2 | 63,000 | 100.0% | $2,649,160 | $42.05 |
| (1) | Information obtained from the underwritten rent roll. |
THE INFORMATION IN THIS STRUCTURAL AND COLLATERAL TERM SHEET IS NOT COMPLETE AND MAY BE AMENDED PRIOR TO THE TIME OF SALE. THIS TERM SHEET IS NOT AN OFFER TO SELL THESE SECURITIES AND IT IS NOT A SOLICITATION OF AN OFFER TO BUY THESE SECURITIES IN ANY JURISDICTION WHERE THE OFFER OR SALE IS NOT PERMITTED.
| 111 |
| 2052 CENTURY PARK EAST |
The following table presents historical occupancy percentages at the 2052 Century Park East Property:
Historical Occupancy
12/31/2012(1) | 12/31/2013(1) | 12/31/2014(1) | 10/19/2015(2) | |||
| 100.0% | 100.0% | 100.0% | 100.0% | |||
| (1) | Information obtained from the leases. |
| (2) | Information obtained from the underwritten rent roll. |
Operating History and Underwritten Net Cash Flow. The following table presents certain information relating to the historical operating performance and underwritten net cash flow at the 2052 Century Park East Property:
Cash Flow Analysis
| 2013(1) | 2014(1) | TTM 9/30/2015 | U/W | % of U/W Effective Gross Income | U/W $ per SF | ||||||||||
| Base Rent | $1,930,292 | $2,649,160 | $2,663,579 | $2,649,160 | 96.8 | % | $42.05 | ||||||||
| Grossed Up Vacant Space | 0 | 0 | 0 | 0 | 0.0 | 0.00 | |||||||||
| Total Reimbursables | 172,510 | 171,418 | 167,317 | 166,310 | 6.1 | 2.64 | |||||||||
| Other Income | 0 | 0 | 0 | 0 | 0.0 | 0.00 | |||||||||
| Less Vacancy & Credit Loss | 0 | 0 | 0 | (79,475)(2) | (2.9 | ) | (1.26) | ||||||||
| Effective Gross Income | $2,102,802 | $2,820,578 | $2,830,896 | $2,735,995 | 100.0 | % | $43.43 | ||||||||
| Total Operating Expenses | $180,654 | $179,621 | $191,520 | $200,803 | 7.3 | % | $3.19 | ||||||||
|
|
|
|
|
| ||||||||||
| Net Operating Income | $1,922,148 | $2,640,956 | $2,639,376 | $2,535,192 | 92.7 | % | $40.24 | ||||||||
| TI/LC | 0 | 0 | 0 | 0 | 0.0 | 0.00 | |||||||||
| Capital Expenditures | 0 | 0 | 0 | 0 | 0.0 | 0.00 | |||||||||
| Net Cash Flow | $1,922,148 | $2,640,956 | $2,639,376 | $2,535,192 | 92.7 | % | $40.24 | ||||||||
| NOI DSCR | 1.36x | 1.86x | 1.86x | 1.79x | |||||||||||
| NCF DSCR | 1.36x | 1.86x | 1.86x | 1.79x | |||||||||||
| NOI DY | 6.4% | 8.8% | 8.8% | 8.5% | |||||||||||
| NCF DY | 6.4% | 8.8% | 8.8% | 8.5% | |||||||||||
| (1) | The increase in Net Operating Income from 2013 to 2014 was due primarily to a contractual rent increase for Trigan-LA Energy Corporation. |
| (2) | The underwritten economic vacancy is 3.0%. The 2052 Century Park East Property was 100.0% physically occupied as of October 19, 2015. |
THE INFORMATION IN THIS STRUCTURAL AND COLLATERAL TERM SHEET IS NOT COMPLETE AND MAY BE AMENDED PRIOR TO THE TIME OF SALE. THIS TERM SHEET IS NOT AN OFFER TO SELL THESE SECURITIES AND IT IS NOT A SOLICITATION OF AN OFFER TO BUY THESE SECURITIES IN ANY JURISDICTION WHERE THE OFFER OR SALE IS NOT PERMITTED.
| 112 |
(THIS PAGE INTENTIONALLY LEFT BLANK)
THE INFORMATION IN THIS STRUCTURAL AND COLLATERAL TERM SHEET IS NOT COMPLETE AND MAY BE AMENDED PRIOR TO THE TIME OF SALE. THIS TERM SHEET IS NOT AN OFFER TO SELL THESE SECURITIES AND IT IS NOT A SOLICITATION OF AN OFFER TO BUY THESE SECURITIES IN ANY JURISDICTION WHERE THE OFFER OR SALE IS NOT PERMITTED.
| 113 |
| No. 13 – Home Depot Jamaica | ||||||
| Loan Information | Property Information | |||||
| Mortgage Loan Seller: | Principal Commercial Capital | Single Asset/Portfolio: | Single Asset | |||
Credit Assessment (Fitch/KBRA/Moody’s): | A/A/A2 (sca.pd) | Property Type: | Other | |||
| Original Principal Balance: | $25,000,000 | Specific Property Type: | Leased Fee | |||
| Cut-off Date Principal Balance: | $25,000,000 | Location: | Jamaica, NY | |||
| % of Initial Pool Balance: | 2.5% | Size: | 105,196 SF | |||
| Loan Purpose: | Refinance | Cut-off Date Principal Balance Per SF: | $237.65 | |||
| Borrower Name: | 168thStreet Jamaica, LLC | Year Built/Renovated: | 2007/NAP | |||
| Sponsors: | Louis L. Ceruzzi, Jr., Joseph Mattone, Sr. | Title Vesting: | Fee/Leasehold | |||
| Mortgage Rate: | 4.280% | Property Manager: | Self-managed | |||
| Note Date: | August 13, 2015 | 3rd Most Recent Occupancy (As of): | 100.0% (12/31/2012) | |||
| Anticipated Repayment Date: | NAP | 2nd Most Recent Occupancy (As of): | 100.0% (12/31/2013) | |||
| Maturity Date: | September 1, 2025 | Most Recent Occupancy (As of): | 100.0% (12/31/2014) | |||
| IO Period: | 60 months | Current Occupancy (As of): | 100.0% (12/1/2015) | |||
| Loan Term (Original): | 120 months | |||||
| Seasoning: | 3 months | Underwriting and Financial Information: | ||||
| Amortization Term (Original): | 360 months | |||||
| Loan Amortization Type: | Interest-only, Amortizing Balloon | 3rd Most Recent NOI (As of)(4): | $2,114,929 (12/31/2012) | |||
| Interest Accrual Method: | Actual/360 | 2nd Most Recent NOI (As of)(4): | $2,111,693 (12/31/2013) | |||
| Call Protection: | L(27),D(89),O(4) | Most Recent NOI: (As of)(4): | $2,107,586 (12/31/2014) | |||
| Lockbox Type: | Hard/Springing Cash Management | |||||
| Additional Debt: | None | |||||
| Additional Debt Type: | NAP | |||||
| U/W Revenues: | $3,026,100 | |||||
| U/W Expenses: | $586,998 | |||||
| U/W NOI: | $2,439,102 | |||||
| U/W NCF: | $2,439,102 | |||||
| Escrows and Reserves: | U/W NOI DSCR(4): | 1.65x | ||||
| U/W NCF DSCR(4): | 1.65x | |||||
| Type: | Initial | Monthly | Cap (If Any) | U/W NOI Debt Yield(4): | 9.8% | |
| Taxes(1) | $0 | Springing | NAP | U/W NCF Debt Yield(4): | 9.8% | |
| Insurance(2) | $0 | Springing | NAP | As-Is Appraised Value: | $39,000,000 | |
| Replacement Reserves(3) | $0 | Springing | NAP | As-Is Appraisal Valuation Date: | June 16, 2015 | |
| TI/LC Reserves(3) | $0 | Springing | NAP | Cut-off Date LTV Ratio: | 64.1% | |
| Other (Ground Rent Escrow) | $46,363 | $46,363 | NAP | LTV Ratio at Maturity or ARD: | 58.4% | |
| (1) | The loan documents do not require monthly escrows for real estate taxes so long as (i) there is no cancelation, termination or expiration of the Ground Sublease (as defined below) between the borrower and Home Depot USA, Inc. (“Home Depot”), (ii) there is no continuing monetary or other material event of default by Home Depot under the Ground Sublease, and (iii) Home Depot continues to be obligated under the Ground Sublease to maintain and pay taxes and assessments directly. |
| (2) | Ongoing monthly reserves for insurance are waived so long as (i) there is no cancelation, termination or expiration of the Ground Sublease, (ii) there is no continuing monetary or other material event of default by Home Depot under the Ground Sublease, and (iii) Home Depot continues to be obligated under the Ground Sublease to maintain property insurance. In addition Home Depot may self insure if it (i) maintains a minimum net worth of $100.0 million; (ii) is in compliance with the self-insurance requirements of, and is not in default under, the Ground Sublease; and (iii) provides lender written evidence confirming its agreement to self-insure. In such event no insurance premiums would be due, and therefore no insurance reserve required. |
| (3) | Ongoing TI/LC reserves or capital improvements reserves are not required unless there is a continuing “Cash Sweep Trigger Event,” which means (i) Home Depot goes dark; (ii) subleases substantially all its premises; (iii) is downgraded below BBB-/Baa3 (collectively, the “Partial Sweep Events”); (iv) fails to rebuild after a casualty; (v) is bankrupt/insolvent; (vi) defaults under, terminates its lease; (vii) fails to renew its lease nine months prior to expiration; or (viii) an event of default. Partial Sweep Events require a sweep of $81,250 during the interest only period, and $52,000 thereafter (each capped at $30.00 per square foot) into a lender controlled cash management account; all other Cash Sweep Trigger Events require a full sweep. |
| (4) | See “Cash Flow Analysis” section. |
The Home Depot Jamaica mortgage loan is evidenced by a single promissory note that is secured by a first mortgage encumbering a fee and leasehold interest in land located in Jamaica, New York (the “Home Depot Jamaica Property”), in the central section of the Borough of Queens. The land consists of 3.0 acres within nine contiguous parcels. Six parcels are owned fee simple (2.3 acres or approximately 76.0% of the net rentable area) and three parcels (0.7 acres or approximately 24.0% of the net rentable area), which are located under the Home Depot parking garage, loading docks and access drives are ground leased parcels. Each ground lease has an initial term that expires September 1, 2025 with five five-year extension options (provided, that in the case of one ground lease, the final extension option is for four years and 364 days). See “Description of the Mortgage Pool — Mortgage Pool Characteristics — Fee & Leasehold Estates; Ground Leases” in the Preliminary Prospectus. The entire site is ground sub-leased (“Ground Sublease”) to Home Depot U.S.A, Inc. (“Home Depot”) through June 28, 2025, which owns a 105,196 square foot single tenant retail building on the site. Home Depot has four five-year extension options, as well as a final option through June 17, 2053. Constructed in 2007, the improvements at the Home Depot Jamaica Property have three secured loading docks that are fully
THE INFORMATION IN THIS STRUCTURAL AND COLLATERAL TERM SHEET IS NOT COMPLETE AND MAY BE AMENDED PRIOR TO THE TIME OF SALE. THIS TERM SHEET IS NOT AN OFFER TO SELL THESE SECURITIES AND IT IS NOT A SOLICITATION OF AN OFFER TO BUY THESE SECURITIES IN ANY JURISDICTION WHERE THE OFFER OR SALE IS NOT PERMITTED.
| 114 |
| HOME DEPOT JAMAICA |
|---|
enclosed/covered, a separate contractor pick-up area, two entrances/exits, and a roof level containing a garden center and outdoor product sales area. The Home Depot Jamaica Property features 250 parking spaces resulting in a parking ratio of 2.4 spaces per 1,000 square feet of net rentable area. The building and other improvements are owned by Home Depot. The tenant’s parent company, The Home Depot, Inc., is the world’s largest home improvement specialty retailer with 2,273 stores, of which 1,977 stores are located in the United States. The Home Depot, Inc. (NYSE: HD) is rated A, A2, and A by Fitch, Moody’s and S&P, respectively. As of the third quarter of 2015, The Home Depot, Inc. reported revenues of $21.8 billion, a 6.4% increase over the third quarter of 2014. The Home Depot, Inc. does not guarantee the lease.
The 2015 population within a one-, three-, and five-mile radius of the Home Depot Jamaica Property was 92,854, 661,479, and 1,634,812, respectively, while the estimated 2015 average household income within the same radii was $65,475, $76,688, and $76,726, respectively. According to the appraisal, the Home Depot Jamaica Property is located in the South Queens retail market which, as of the second quarter of 2015, was comprised of 2,101 buildings totaling 15,637,006 square feet. As of the first quarter of 2015, the South Queens retail market reported a vacancy rate of 5.2% and an average annual rental rate of $31.50 per square foot, triple-net.
Sources and Uses
| Sources | Uses | ||||||||
| Original loan amount | $25,000,000 | 100.0% | Loan payoff(1) | $24,099,392 | 96.4 | % | |||
| Reserves | 46,363 | 0.2 | |||||||
| Closing costs | 469,280 | 1.9 | |||||||
| Return of equity | 384,965 | 1.5 | |||||||
| Total Sources | $25,000,000 | 100.0% | Total Uses | $25,000,000 | 100.0 | % | |||
| (1) | The Home Depot Jamaica Property was securitized in MSC 2006-IQ11. |
The following table presents certain information relating to the tenant at the Home Depot Jamaica Property:
Major Tenants
| Tenant Name | Credit Rating (Fitch/ Moody’s/ S&P)(1) | Tenant NRSF | % of NRSF | Annual U/W Base Rent PSF | Annual U/W Base Rent | % of Total Annual U/W Base Rent | Sales PSF | Occupancy Cost | Lease Expiration Date |
| Major Tenant | |||||||||
| Home Depot | A/A2/A | 105,196 | 100.0% | $27.40(2) | $2,882,000(2) | 100.0% | NAV(3) | NAV(3) | 6/28/2025(4) |
| Total Major Tenant | 105,196 | 100.0% | $27.40 | $2,882,000 | 100.0% | ||||
| Vacant Space | 0 | 0.0% | |||||||
| Collateral Total | 105,196 | 100.0% | |||||||
| (1) | Rating is of tenant’s parent company, The Home Depot, Inc. The Home Depot, Inc. does not guarantee the lease. |
| (2) | Annual U/W Base Rent and Annual U/W Base Rent PSF reflect Home Depot’s contractual rent increase that occurs in January 2016. Home Depot’s in-place annual rent is $2,620,000 ($24.91 per square foot). In addition, $144,100 of straight-lined rent increases were underwritten (see “Cash Flow Analysis” section) as other income. |
| (3) | Home Depot is not required to report sales. |
| (4) | Home Depot has four, five-year lease extension options, and one, 7.8-year renewal option to extend the lease to June 17, 2053. All renewal options require nine months’ notice; provided that if the tenant fails to give notice within such time limit, its right to renew continues until the earlier of (x) 95 days prior to the expiration of the current term and (y) 30 days after the borrower gives the tenant notice of its election to terminate the renewal option. Home Depot has the right to terminate in the last two years of the term, if greater than 25% of the building is damaged; however, the borrower or Home Depot is required to obtain 24 months of rent loss insurance under the loan documents (provided that Home Depot may self-insure for such insurance if the conditions in the loan documents are satisfied). In addition, Home Depot has the option to either rebuild the improvements or to raze such improvements and place the premises in a safe condition. While Home Depot has the general right to raze the improvements at any time, Home Depot will remain obligated under its lease except in the circumstance of a casualty as described in the prior sentence. |
THE INFORMATION IN THIS STRUCTURAL AND COLLATERAL TERM SHEET IS NOT COMPLETE AND MAY BE AMENDED PRIOR TO THE TIME OF SALE. THIS TERM SHEET IS NOT AN OFFER TO SELL THESE SECURITIES AND IT IS NOT A SOLICITATION OF AN OFFER TO BUY THESE SECURITIES IN ANY JURISDICTION WHERE THE OFFER OR SALE IS NOT PERMITTED.
| 115 |
| HOME DEPOT JAMAICA |
|---|
The following table presents certain information relating to the lease rollover schedule at the Home Depot Jamaica Property:
Lease Expiration Schedule(1)
| Year Ending December 31, | No. of Leases Expiring | Expiring NRSF | % of Total NRSF | Cumulative Expiring NRSF | Cumulative % of Total NRSF | Annual U/W Base Rent | Annual U/W Base Rent PSF |
| MTM | 0 | 0 | 0.0% | 0 | 0.0% | $0 | $0.00 |
| 2015 | 0 | 0 | 0.0% | 0 | 0.0% | $0 | $0.00 |
| 2016 | 0 | 0 | 0.0% | 0 | 0.0% | $0 | $0.00 |
| 2017 | 0 | 0 | 0.0% | 0 | 0.0% | $0 | $0.00 |
| 2018 | 0 | 0 | 0.0% | 0 | 0.0% | $0 | $0.00 |
| 2019 | 0 | 0 | 0.0% | 0 | 0.0% | $0 | $0.00 |
| 2020 | 0 | 0 | 0.0% | 0 | 0.0% | $0 | $0.00 |
| 2021 | 0 | 0 | 0.0% | 0 | 0.0% | $0 | $0.00 |
| 2022 | 0 | 0 | 0.0% | 0 | 0.0% | $0 | $0.00 |
| 2023 | 0 | 0 | 0.0% | 0 | 0.0% | $0 | $0.00 |
| 2024 | 0 | 0 | 0.0% | 0 | 0.0% | $0 | $0.00 |
| 2025 | 1 | 105,196 | 100.0% | 105,196 | 100.0% | $2,882,000 | $27.40 |
| Thereafter | 0 | 0 | 0.0% | 105,196 | 100.0% | $0 | $0.00 |
| Vacant | 0 | 0 | 0.0% | 105,196 | 100.0% | $0 | $0.00 |
| Total/Weighted Average | 1 | 105,196 | 100.0% | $2,882,000 | $27.40 |
| (1) | Information obtained from the underwritten rent roll. |
The following table presents historical occupancy percentages at the Home Depot Jamaica Property:
Historical Occupancy
12/31/2012(1) | 12/31/2013(1) | 12/31/2014(1) | 12/1/2015(2) | |||
| 100.0% | 100.0% | 100.0% | 100.0% |
| (1) | Information based on the lease. |
| (2) | Information obtained from the underwritten rent roll. |
Operating History and Underwritten Net Cash Flow.The following table presents certain information relating to the historical operating performance and underwritten net cash flow at the Home Depot Jamaica Property:
Cash Flow Analysis
| 2012 | 2013 | 2014 | U/W | % of U/W Effective Gross Income | U/W $ per SF | ||||||||
| Base Rent | $2,620,000 | $2,620,000 | $2,620,000 | $2,882,000(1) | 95.2 | % | $27.40 | ||||||
| Grossed Up Vacant Space | 0 | 0 | 0 | 0 | 0.0 | 0.00 | |||||||
| Total Reimbursables | 32,724 | 32,384 | 29,718 | 0 | 0.0 | 0.00 | |||||||
| Other Income | 2,481 | 0 | 576 | 144,100(2) | 4.8 | 1.37 | |||||||
| Less Vacancy & Credit Loss | 0 | 0 | 0 | 0(3) | 0.0 | 0.00 | |||||||
| Effective Gross Income | $2,655,205 | $2,652,384 | $2,650,294 | $3,026,100 | 100.0 | % | $28.77 | ||||||
| Total Operating Expenses | $540,276 | $540,691 | $542,708 | $586,998 | 19.4 | % | $5.58 | ||||||
|
|
|
|
|
| ||||||||
| Net Operating Income | $2,114,929 | $2,111,693 | $2,107,586 | $2,439,102 | 80.6 | % | $23.19 | ||||||
| TI/LC | 0 | 0 | 0 | 0 | 0.0 | 0.00 | |||||||
| Capital Expenditures | 0 | 0 | 0 | 0 | 0.0 | 0.00 | |||||||
| Net Cash Flow | $2,114,929 | $2,111,693 | $2,107,586 | $2,439,102 | 80.6 | % | $23.19 | ||||||
| NOI DSCR | 1.43x | 1.43x | 1.42x | 1.65x(1) | |||||||||
| NCF DSCR | 1.43x | 1.43x | 1.42x | 1.65x(1) | |||||||||
| NOI DY | 8.5% | 8.4% | 8.4% | 9.8%(1) | |||||||||
| NCF DY | 8.5% | 8.4% | 8.4% | 9.8%(1) | |||||||||
| (1) | U/W Base Rent represents Home Depot’s contractual rent increase that occurs in January 2016. Home Depot’s current rent is $2,620,000. Based on the in-place rent, the U/W NOI DSCR is 1.47x, U/W NCF DSCR is 1.47x, U/W NOI DY is 8.7% and U/W NCF DY is 8.7%. |
| (2) | Other Income represents the straight-line rent steps for the remaining original lease term of the Home Depot lease. |
| (3) | The underwritten economic vacancy is 0.0%. A vacancy factor has not been applied given the credit nature of the tenant’s parent, The Home Depot, Inc., which is rated A/A2/A by Fitch/Moody’s/S&P. |
THE INFORMATION IN THIS STRUCTURAL AND COLLATERAL TERM SHEET IS NOT COMPLETE AND MAY BE AMENDED PRIOR TO THE TIME OF SALE. THIS TERM SHEET IS NOT AN OFFER TO SELL THESE SECURITIES AND IT IS NOT A SOLICITATION OF AN OFFER TO BUY THESE SECURITIES IN ANY JURISDICTION WHERE THE OFFER OR SALE IS NOT PERMITTED.
| 116 |
(THIS PAGE INTENTIONALLY LEFT BLANK)
THE INFORMATION IN THIS STRUCTURAL AND COLLATERAL TERM SHEET IS NOT COMPLETE AND MAY BE AMENDED PRIOR TO THE TIME OF SALE. THIS TERM SHEET IS NOT AN OFFER TO SELL THESE SECURITIES AND IT IS NOT A SOLICITATION OF AN OFFER TO BUY THESE SECURITIES IN ANY JURISDICTION WHERE THE OFFER OR SALE IS NOT PERMITTED.
| 117 |
| No. 14 – Aloft Nashville West End | ||||||||
| Loan Information | Property Information | |||||||
| Mortgage Loan Seller: | Principal Commercial Capital | Single Asset/Portfolio: | Single Asset | |||||
Credit Assessment (Fitch/KBRA/Moody’s): | NR/NR/NR | Property Type: | Hospitality | |||||
| Original Principal Balance: | $24,600,000 | Specific Property Type: | Limited Service | |||||
| Cut-off Date Principal Balance: | $24,600,000 | Location: | Nashville, TN | |||||
| % of Initial Pool Balance: | 2.5% | Size: | 139 Rooms | |||||
| Loan Purpose: | Acquisition | Cut-off Date Principal Balance Per Room: | $176,978 | |||||
| Borrower Name: | AIGGRE Nashville Hotel Investor LLC | Year Built/Renovated: | 1956/2015 | |||||
| Sponsor: | AIG Global Real Estate Investment Corp. | Title Vesting: | Fee | |||||
| Mortgage Rate: | 4.690% | Property Manager: | Aimbridge Hospitality, LLC | |||||
| Note Date: | November 19, 2015 | 3rdMost Recent Occupancy: | NAV | |||||
| Anticipated Repayment Date: | NAP | 2ndMost Recent Occupancy (As of): | 71.2% (12/31/2013) | |||||
| Maturity Date: | December 1, 2025 | Most Recent Occupancy (As of): | 83.2% (12/31/2014) | |||||
| IO Period: | 60 months | Current Occupancy (As of): | 83.6% (8/31/2015) | |||||
| Loan Term (Original): | 120 months | |||||||
| Seasoning: | 0 months | |||||||
| Amortization Term (Original): | 360 months | Underwriting and Financial Information: | ||||||
| Loan Amortization Type: | Interest-only, Amortizing Balloon | |||||||
| Interest Accrual Method: | Actual/360 | 3rdMost Recent NOI(As of)(5): | $2,078,304 (12/31/2013) | |||||
| Call Protection: | L(24),D(89),O(7) | 2ndMost Recent NOI(As of): | $3,077,048 (12/31/2014) | |||||
| Lockbox Type: | Hard/Springing Cash Management | Most Recent NOI(As of): | $3,548,280 (TTM 8/31/2015) | |||||
| Additional Debt(1): | Yes | |||||||
| Additional Debt Type(1): | Unsecured Debt | |||||||
| U/W Revenues: | $8,745,233 | |||||||
| U/W Expenses: | $5,194,791 | |||||||
| U/W NOI: | $3,550,442 | |||||||
| U/W NCF: | $3,200,633 | |||||||
| U/W NOI DSCR: | 2.32x | |||||||
| Escrows and Reserves: | U/W NCF DSCR: | 2.09x | ||||||
| U/W NOI Debt Yield: | 14.4% | |||||||
| Type: | Initial | Monthly | Cap (If Any) | U/W NCF Debt Yield: | 13.0% | |||
| Taxes | $224,536 | $22,454 | NAP | Appraised Value(6): | $43,800,000 | |||
| Insurance(2) | $0 | Springing | NAP | Appraisal Valuation Date(6): | October 9, 2015 | |||
| FF&E Reserves(3) | $300,000 | $29,151 | NAP | Cut-Off Date LTV Ratio(6): | 56.2% | |||
| PIP Reserve(4) | $1,800,000 | $0 | NAP | LTV Ratio at Maturity or ARD(6): | 51.5% | |||
| (1) | The franchisor or an affiliate previously funded to the ERGS HI Nashville REO, L.L.C (the “Seller”) of the Aloft Nashville West End Property (as defined below) key money in the amount of $1,250,000 pursuant to the terms of the prior license agreement between the franchisor and the Seller dated August 29, 2012. The Sheraton LLC (“Starwood”), in connection with the new franchise agreement with the borrower, transferred to the borrower the obligation to pay the balance of the unamortized key money if the franchise agreement is terminated prior to its stated expiration date. The borrower’s obligation to repay these funds, if any, is unsecured and no ongoing payments are required to be made by the borrower to Starwood. If the obligation to repay the financing is triggered, the unamortized portion of the key money financing will be payable to Starwood. The amortization is calculated on a straight-line basis over the 20 year term of the franchise agreement. The current balance of the unamortized portion of the key money is $1,104,167. The parent company of the borrower has guaranteed the obligation to repay the unamortized portion of the key money. No subordination and standstill agreement or intercreditor agreement has been entered into in connection with this financing. The loan documents include a nonrecourse carve-out to the borrower and guarantor of the Aloft Nashville West End mortgage loan for any losses associated with this financing. |
| (2) | Ongoing monthly reserves for insurance are waived as long as (i) the Aloft Nashville West End Property is insured via an acceptable blanket insurance policy; (ii) no event of default has occurred and is continuing; and (iii) the borrower provides timely proof of payment of insurance premiums. |
| (3) | Ongoing monthly reserves for FF&E are required in an amount equal to one-twelfth of 4.0% of gross revenues based on the annual budget (initially estimated to be $29,151). An upfront FF&E Reserve in the amount of $300,000 was collected for planned capital expenditures at the Aloft Nashville West End Property for the first half of 2016 in addition to immediate repairs identified in the property condition report. |
| (4) | An upfront PIP Reserve of $1,800,000 for the Aloft Nashville West End Property was required for renovations planned in 2016. |
| (5) | See “Cash Flow Analysis” section. |
| (6) | The Appraised Value, Cut-Off Date LTV Ratio and LTV Ratio at Maturity or ARD are calculated based on the “as if complete” value, which assumes the PIP renovations to the Aloft Nashville West End Property scheduled to be performed in 2016, as well as certain capital expenditures and immediate repairs, have been completed. At closing, the borrower reserved an aggregate of $2,100,000 for the PIP renovations and immediate repairs/capital expenditures. The “as-is” value as of October 9, 2015 is $40,800,000 which results in a Cut-Off Date LTV and LTV Ratio at Maturity or ARD of 60.3% and 55.3%, respectively. |
The Aloft Nashville West End mortgage loan is evidenced by a single promissory note that is secured by a first mortgage encumbering the borrower’s fee interest in a 139-room limited service hotel located in the West End district of Nashville, Tennessee (the “Aloft Nashville West End Property”), which is within walking distance to Music Row and Vanderbilt University. The Aloft Nashville West End Property was originally built in 1956, converted from an office to a hotel in 2007, and rebranded in 2012 as an Aloft brand of Starwood Hotels & Resorts. The franchise agreement with Starwood Hotels & Resorts expires in November 2035. The Aloft Nashville West End Property is situated on a 0.8-acre site and comprises 139 guestrooms, which include 54 king rooms, 76
THE INFORMATION IN THIS STRUCTURAL AND COLLATERAL TERM SHEET IS NOT COMPLETE AND MAY BE AMENDED PRIOR TO THE TIME OF SALE. THIS TERM SHEET IS NOT AN OFFER TO SELL THESE SECURITIES AND IT IS NOT A SOLICITATION OF AN OFFER TO BUY THESE SECURITIES IN ANY JURISDICTION WHERE THE OFFER OR SALE IS NOT PERMITTED.
| 118 |
ALOFT NASHVILLE WEST END |
double queen rooms, 8 suites and a 2,500 square foot penthouse suite. Each guestroom features a flat screen television, workspace with ergonomic desk chair, mini-refrigerator, coffee maker, luxury bed, and walk-in shower. Amenities at the Aloft Nashville West End Property include an on-site parking garage providing 249 spaces, w xyz Bar (a self-serve eatery), a restaurant leased to Goten Japanese Restaurant, 24-hour business center, fitness center, outdoor terrace, and 2,502 square feet of meeting and event space. Guestrooms are located on levels two through eleven of the 11-story building.
A reported total of $3,300,000 ($23,741 per room) has been invested in the property since 2013 including a comprehensive room and lobby renovation in 2013 and recent upgrades to guestrooms in the second quarter 2015. An upfront reserve of $1,800,000 or $12,950 per room was required for the Property Improvement Plan (“PIP”) planned for the first half of 2016. The PIP includes renovations to a portion of guestrooms, facilities, common areas, meeting space, recreational amenities, and plans to streamline management operations. An additional $300,000 or $2,158 per room FF&E reserve was established at closing for planned capital expenditures for the first half of 2016, in addition to the immediate repair items ($43,650) identified in the property condition report.
Sources and Uses
| Sources | Uses | |||||||
| Original loan amount | $24,600,000 | 65.2% | Purchase price | $34,750,000 | 92.1% | |||
| Sponsor’s new cash contribution | 12,799,444 | 33.9 | Reserves | 2,324,536 | 6.2 | |||
| Other | 321,060 | 0.9 | Closing costs | 645,967 | 1.7 | |||
| Total Sources | $37,720,503 | 100.0% | Total Uses | $37,720,503 | 100.0% |
The following table presents certain information relating to the Aloft Nashville West End Property’s competitive set.
Subject and Market Historical Occupancy, ADR and RevPAR(1)
Competitive Set |
| Penetration Factor | |||||||||||||||
Year | Occupancy | ADR | RevPAR | Occupancy | ADR | RevPAR | Occupancy | ADR | RevPAR | ||||||||
| TTM 8/31/2015 | 82.3% | $174.71 | $143.70 | 83.6% | $176.89 | $147.81 | 101.6% | 101.2% | 102.9% | ||||||||
| TTM 8/31/2014 | 84.7% | $159.15 | $134.76 | 79.4% | $157.93 | $125.45 | 93.8% | 99.2% | 93.1% | ||||||||
| TTM 8/31/2013 | 81.5% | $142.46 | $116.15 | 67.6% | $138.61 | $93.73 | 82.9% | 97.3% | 80.7% | ||||||||
| (1) | Information obtained from a third party hospitality report dated September 17, 2015. The competitive set includes the following hotels: Holiday Inn Nashville Vanderbilt Downtown, Courtyard Nashville Vanderbilt West End, Embassy Suites Nashville at Vanderbilt University and Hilton Garden Inn Nashville Vanderbilt. |
Operating History and Underwritten Net Cash Flow. The following table presents certain information relating to the historical operating performance and the underwritten net cash flow at the Aloft Nashville West End Property:
Cash Flow Analysis
| 2013 | 2014 | TTM 8/31/2015 | U/W | % of U/W Total Revenue | U/W $ per Room | |||||||
| Occupancy | 71.2% | 83.2% | 83.6% | 83.6% | ||||||||
| ADR | $141.25 | $161.07 | $176.81 | $176.81 | ||||||||
| RevPAR | $100.56 | $133.93 | $147.81 | $147.81 | ||||||||
| Total Revenue | $6,041,103 | $7,974,002 | $8,745,233 | $8,745,233 | 100.0% | $62,915 | ||||||
| Total Department Expenses | 1,652,389 | 2,015,875 | 2,199,059 | 2,199,059 | 25.1 | 15,821 | ||||||
| Gross Operating Profit | $4,388,714 | $5,958,127 | $6,546,174 | $6,546,174 | 74.9% | $47,095 | ||||||
| Total Undistributed Expenses | 2,007,813 | 2,564,977 | 2,659,485 | 2,659,485 | 30.4 | 19,133 | ||||||
| Profit Before Fixed Charges | $2,380,901 | $3,393,150 | $3,886,689 | $3,886,689 | 44.4% | $27,962 | ||||||
| Total Fixed Charges | 302,597 | 316,102 | 338,409 | 336,247 | 3.8 | 2,419 | ||||||
| Net Operating Income | $2,078,304 | $3,077,048 | $3,548,280 | $3,550,442 | 40.6% | $25,543 | ||||||
| FF&E | 241,644 | 318,960 | 349,809 | 349,809 | 4.0 | 2,517 | ||||||
| Net Cash Flow | $1,836,660(1) | $2,758,088 | $3,198,471 | $3,200,633 | 36.6% | $23,026 | ||||||
| NOI DSCR | 1.36x | 2.01x | 2.32x | 2.32x | ||||||||
| NCF DSCR | 1.20x | 1.80x | 2.09x | 2.09x | ||||||||
| NOI DY | 8.4% | 12.5% | 14.4% | 14.4% | ||||||||
| NCF DY | 7.5% | 11.2% | 13.0% | 13.0% |
| (1) | The 2013 Net Cash Flow reflects extensive renovations at the Aloft Nashville West End Property as well as rebranding, which left a portion of the rooms offline. |
THE INFORMATION IN THIS STRUCTURAL AND COLLATERAL TERM SHEET IS NOT COMPLETE AND MAY BE AMENDED PRIOR TO THE TIME OF SALE. THIS TERM SHEET IS NOT AN OFFER TO SELL THESE SECURITIES AND IT IS NOT A SOLICITATION OF AN OFFER TO BUY THESE SECURITIES IN ANY JURISDICTION WHERE THE OFFER OR SALE IS NOT PERMITTED.
| 119 |
| No. 15 – Merritt Creek Farm Shopping Center | ||||||
| Loan Information | Property Information | |||||
| Mortgage Loan Seller: | Principal Commercial Capital | Single Asset/Portfolio: | Single Asset | |||
Credit Assessment (Fitch/KBRA/Moody’s): | NR/NR/NR | Property Type: | Retail | |||
| Original Principal Balance: | $22,000,000 | Specific Property Type: | Anchored | |||
| Cut-off Date Principal Balance: | $22,000,000 | Location: | Barboursville, WV | |||
| % of Initial Pool Balance: | 2.2% | Size: | 265,070 SF | |||
| Loan Purpose: | Refinance | Cut-off Date Principal Balance Per SF: | $83.00 | |||
| Borrower Name: | THD, LP | Year Built/Renovated: | 2002/NAP | |||
| Sponsors(1): | J. Brent Roswall; J. Michael Nidiffer | Title Vesting: | Fee | |||
| Mortgage Rate: | 4.730% | Property Manager: | Interstate Management L.L.C. | |||
| Note Date: | September 08, 2015 | 3rdMost Recent Occupancy (As of): | 100.0% (12/31/2012) | |||
| Anticipated Repayment Date: | NAP | 2ndMost Recent Occupancy (As of): | 98.9% (12/31/2013) | |||
| Maturity Date: | October 1, 2025 | Most Recent Occupancy (As of): | 98.9% (12/31/2014) | |||
| IO Period: | 24 months | Current Occupancy (As of): | 98.9% (9/8/2015) | |||
| Loan Term (Original): | 120 months | |||||
| Seasoning: | 2 months | Underwriting and Financial Information: | ||||
| Amortization Term (Original): | 360 months | |||||
| Loan Amortization Type: | Interest-only, Amortizing Balloon | 3rdMost Recent NOI(As of): | $1,897,459 (12/31/2013) | |||
| Interest Accrual Method: | Actual/360 | 2ndMost Recent NOI(As of): | $2,098,755 (12/31/2014) | |||
| Call Protection: | L(26),D(90),O(4) | Most Recent NOI(As of)(4): | $2,065,035 (T-9 Annualized 9/30/2015) | |||
| Lockbox Type: | Hard/Springing Cash Management | |||||
| Additional Debt: | None | |||||
| Additional Debt Type: | NAP | |||||
| U/W Revenues: | $2,572,107 | |||||
| U/W Expenses: | $543,938 | |||||
| U/W NOI: | $2,028,169 | |||||
| U/W NCF: | $1,898,618 | |||||
| Escrows and Reserves: | U/W NOI DSCR: | 1.48x | ||||
| U/W NCF DSCR: | 1.38x | |||||
| Type: | Initial | Monthly | Cap (If Any) | U/W NOI Debt Yield: | 9.2% | |
| Taxes | $42,978 | $14,326 | NAP | U/W NCF Debt Yield: | 8.6% | |
| Insurance | $35,868 | $3,587 | NAP | As-Is Appraised Value: | $30,900,000 | |
| Replacement Reserves | $0 | $5,068 | NAP | As-Is Appraisal Valuation Date: | July 29, 2015 | |
| TI/LC Reserves(2) | $8,400 | $6,002 | $144,047 | Cut-off Date LTV Ratio: | 71.2% | |
| Other Reserves(3) | $31,602 | Springing | NAP | LTV Ratio at Maturity or ARD: | 61.2% | |
| (1) | The Merritt Creek Farm Shopping Center mortgage loan refinanced a bank loan, which in turn refinanced a prior securitized loan to an affiliate of the borrower, which was secured by a portion of the Merritt Creek Farm Shopping Center Property and by adjacent parcels, and experienced a maturity default in 2014. The borrower also reported two prior foreclosures and a prior deed-in-lieu of foreclosure. See “Description of the Mortgage Pool — Loan Purpose; Default History, Bankruptcy Issues and Other Proceedings” in the Preliminary Prospectus. |
| (2) | The lender collected $8,400 upfront for remaining landlord obligations to pay leasing commissions on the Massage Envy Spa lease. |
| (3) | Other Reserves consist of (i) initial reserves representing six months’ free rent for Massage Envy Spa and (ii) ongoing monthly reserves required upon the occurrence of (a) an event of default is continuing; (b) the debt service coverage ratio being less than 1.10x as of the last day of the quarter; (c) Home Depot fails to renew its lease twelve months prior to expiration, goes dark, files bankruptcy or other insolvency proceedings, provides notice of termination, or materially defaults (subject to a $1,200,000 cap); or (d) Target (a shadow anchor) goes dark or the borrower receives notice or gains public information of Target’s intent to go dark or Target files bankruptcy or insolvency proceedings (subject to a $2,000,000 cap). |
| (4) | See “Cash Flow Analysis” section. |
The Merritt Creek Farm Shopping Center mortgage loan is evidenced by a single promissory note that is secured by a first mortgage encumbering a 265,070 square foot community shopping center located in Barboursville, West Virginia (the “Merritt Creek Farm Shopping Center Property”). Bourboursville is located ten miles east of Huntington, and 50 miles west of Charleston, West Virginia. Constructed between 2002 and 2005, the Merritt Creek Farm Shopping Center Property is situated on 49.3 acres of land and is anchored by Home Depot U.S.A., Inc. (subject to a ground lease), and shadow anchored by Target (not part of the collateral). Junior anchors consist of Marshall’s, A.C. Moore, Office Depot, Petco, Shoe Show, Dollar Tree and Dress Barn. The Merritt Creek Farm Shopping Center Property provides 1,366 parking spaces resulting in a parking ratio of 5.2 spaces per 1,000 square feet of rentable area.
The Merritt Creek Farm Shopping Center Property is located one mile west of the Huntington Mall, the largest retail center in West Virginia. Shoppers coming from the Huntington-Ashland area pass the Merritt Creek Farm Shopping Center Property to reach the mall. The Merritt Creek Farm Shopping Center Property also benefits from its proximity to Marshall University (13,500 students),
THE INFORMATION IN THIS STRUCTURAL AND COLLATERAL TERM SHEET IS NOT COMPLETE AND MAY BE AMENDED PRIOR TO THE TIME OF SALE. THIS TERM SHEET IS NOT AN OFFER TO SELL THESE SECURITIES AND IT IS NOT A SOLICITATION OF AN OFFER TO BUY THESE SECURITIES IN ANY JURISDICTION WHERE THE OFFER OR SALE IS NOT PERMITTED.
| 120 |
MERRITT CREEK FARM SHOPPING CENTER |
located approximately five miles west of the Merritt Creek Farm Shopping Center Property. Since its completion in 2002, the Merritt Creek Farm Shopping Center has reportedly consistently maintained occupancy above 95.0%. Historic occupancy data provided back to 2010 reflects average occupancy over the last 5-years of 99.0%. As of September 8, 2015, the Merritt Creek Farm Shopping Center Property was 98.9% occupied by 17 tenants.
Sources and Uses
| Sources | Uses | |||||||
| Original loan amount | $22,000,000 | 100.0% | Loan payoff | $20,769,422 | 94.4% | |||
| Reserves | 118,848 | 0.5 | ||||||
| Closing costs | 288,196 | 1.3 | ||||||
| Return of equity | 823,534 | 3.7 | ||||||
| Total Sources | $22,000,000 | 100.0% | Total Uses | $22,000,000 | 100.0% | |||
The following table presents certain information relating to the tenants at the Merritt Creek Farm Shopping Center Property:
Major Tenants
| Tenant Name |
Credit Rating (Fitch/ Moody’s/ S&P)(1) | Tenant NRSF |
% of NRSF | Annual U/W Base Rent PSF |
Annual | % of Total Annual U/W Base Rent | Sales PSF(2) | Occupancy Cost(2) |
Lease Expiration Date |
| Anchor Tenants | |||||||||
| Home Depot U.S.A., Inc. (Ground Lease)(3) | A/A2/A | 121,039 | 45.7% | $2.48 | $300,000 | 13.5% | NAV | NAV | 1/31/2024 |
| Total Anchor Tenants | 121,039 | 45.7% | $2.48 | $300,000 | 13.5% | ||||
Major Tenants | |||||||||
| Marshalls | NR/A2/A+ | 30,000 | 11.3% | $8.75 | $262,500 | 11.8% | $345 | 2.5% | 1/31/2023 |
| A.C. Moore | NR/NR/NR | 21,306 | 8.0% | $12.00 | $255,672 | 11.5% | NAV | NAV | 10/31/2024 |
| Office Depot | NR/B2/NR | 18,448 | 7.0% | $13.50 | $249,048 | 11.2% | NAV | NAV | 2/28/2025 |
| Petco Animal Supplies Stores | NR/B2/B | 12,500 | 4.7% | $17.50 | $218,750 | 9.8% | NAV | NAV | 1/31/2024 |
| Shoe Show | NR/NR/NR | 10,075 | 3.8% | $16.00 | $161,200 | 7.2% | NAV | NAV | 11/30/2017 |
| Dollar Tree Stores | NR/Ba2/BB | 10,020 | 3.8% | $13.41 | $134,368 | 6.0% | NAV | NAV | 2/28/2019 |
| The Dress Barn | NR/Ba2/NR | 8,400 | 3.2% | $18.00 | $151,200 | 6.8% | $193 | 9.3% | 12/31/2017 |
| Total Major Tenants | 110,749 | 41.8% | $12.94 | $1,432,738 | 63.4% | ||||
| Other Tenants(4) | 30,395 | 11.5% | $16.23 | $493,250 | 22.2% | ||||
| Occupied Total | 262,183 | 98.9% | $8.49 | $2,225,988 | 100.0% | ||||
| Vacant Space | 2,887 | 1.1% | |||||||
| Total | 265,070 | 100.0% | |||||||
| (1) | Certain ratings are those of the parent company whether or not the parent guarantees the lease. |
| (2) | Marshall’s, Dress Barn and Catherines (included in Other Tenants) are the only tenants required to formally report store sales. |
| (3) | Home Depot U.S.A, Inc. has a right of first refusal to purchase its leased parcel at the Merritt Creek Farm Shopping Center Property. |
| (4) | Other Tenants includes Massage Envy Spa (1.1% net rentable square feet), which executed a lease on September 1, 2015 with the tenant expected to take possession of its space on December 1, 2015 and commence rent payments of $57,740 on March 1, 2016. All outstanding landlord obligations related to the tenant and six months free rent were reserved upfront. |
THE INFORMATION IN THIS STRUCTURAL AND COLLATERAL TERM SHEET IS NOT COMPLETE AND MAY BE AMENDED PRIOR TO THE TIME OF SALE. THIS TERM SHEET IS NOT AN OFFER TO SELL THESE SECURITIES AND IT IS NOT A SOLICITATION OF AN OFFER TO BUY THESE SECURITIES IN ANY JURISDICTION WHERE THE OFFER OR SALE IS NOT PERMITTED.
| 121 |
MERRITT CREEK FARM SHOPPING CENTER |
The following table presents certain information relating to the lease rollover schedule at the Merritt Creek Farm Shopping Center Property:
Lease Expiration Schedule(1)(2)
Year Ending December 31, | No. of Leases Expiring | Expiring NRSF | % of Total NRSF | Cumulative Expiring NRSF | Cumulative % of Total NRSF | Annual U/W Base | Annual U/W Base Rent PSF(3) |
| MTM | 2 | 4,400 | 1.7% | 4,400 | 1.7% | $64,800 | $14.73 |
| 2015 | 1 | 3,600 | 1.4% | 8,000 | 3.0% | $74,052 | $20.57 |
| 2016 | 0 | 0 | 0.0% | 8,000 | 3.0% | $0 | $0.00 |
| 2017 | 4 | 29,598 | 11.2% | 37,598 | 14.2% | $475,600 | $16.07 |
| 2018 | 0 | 0 | 0.0% | 37,598 | 14.2% | $0 | $0.00 |
| 2019 | 1 | 10,020 | 3.8% | 47,618 | 18.0% | $134,368 | $13.41 |
| 2020 | 3 | 9,600 | 3.6% | 57,218 | 21.6% | $150,736 | $15.70 |
| 2021 | 0 | 0 | 0.0% | 57,218 | 21.6% | $0 | $0.00 |
| 2022 | 0 | 0 | 0.0% | 57,218 | 21.6% | $0 | $0.00 |
| 2023 | 1 | 30000 | 11.3% | 87,218 | 32.9% | $262,500 | $8.75 |
| 2024 | 4 | 156,517 | 59.0% | 243,735 | 92.0% | $814,884 | $5.21 |
| 2025 | 1 | 18,448 | 7.0% | 262,183 | 98.9% | $249,048 | $13.50 |
| Thereafter | 0 | 0 | 0.0% | 262,183 | 98.9% | $0 | $0.00 |
| Vacant | 0 | 2,887 | 1.1% | 265,070 | 100.0% | $0 | $0.00 |
| Total/Weighted Average | 17 | 265,070 | 100.0% | $2,225,988 | $8.49 |
| (1) | Information obtained from the underwritten rent roll. |
| (2) | Certain tenants may have lease termination options that are exercisable prior to the originally stated lease expiration date of the subject lease and that are not considered in the Lease Expiration Schedule. |
| (3) | Weighted Average Annual U/W Base Rent and Annual U/W Base Rent PSF excludes vacant space. |
The following table presents historical occupancy percentages at the Merritt Creek Farm Shopping Center Property:
Historical Occupancy
12/31/2012(1) | 12/31/2013(1) | 12/31/2014(1) | 9/8/2015(2) |
| 100.0% | 98.9% | 98.9% | 98.9% |
| (1) | Information obtained from the borrower. |
| (2) | Information obtained from the underwritten rent roll. |
THE INFORMATION IN THIS STRUCTURAL AND COLLATERAL TERM SHEET IS NOT COMPLETE AND MAY BE AMENDED PRIOR TO THE TIME OF SALE. THIS TERM SHEET IS NOT AN OFFER TO SELL THESE SECURITIES AND IT IS NOT A SOLICITATION OF AN OFFER TO BUY THESE SECURITIES IN ANY JURISDICTION WHERE THE OFFER OR SALE IS NOT PERMITTED.
| 122 |
MERRITT CREEK FARM SHOPPING CENTER |
Operating History and Underwritten Net Cash Flow.The following table presents certain information relating to the historical operating performance and underwritten net cash flow at the Merritt Creek Farm Shopping Center Property:
Cash Flow Analysis
| 2013 | 2014 | Annualized September | U/W | % of U/W Effective Gross Income | U/W $ per SF | |
| Base Rent | $2,092,824 | $2,253,166 | $2,175,393 | $2,276,511(1) | 88.5% | $8.59 |
| Grossed Up Vacant Space | 0 | 0 | 0 | 0 | 0.0 | 0.00 |
| Total Reimbursables | 310,217 | 380,006 | 385,611 | 402,767 | 15.7 | 1.52 |
| Other Income | 0 | 0 | 0 | 0 | 0.0 | 0.00 |
| Less Vacancy & Credit Loss | 0 | 0 | 0 | 107,171(2) | 4.2 | 0.40 |
| Effective Gross Income | $2,403,041 | $2,633,172 | $2,561,004 | $2,572,107 | 100.0% | $9.70 |
| Total Operating Expenses | $505,581 | $534,416 | $495,969 | $543,938 | 21.1% | $2.05 |
|
|
|
|
|
| |
| Net Operating Income | $1,897,459 | $2,098,755 | $2,065,035 | $2,028,169 | 78.9% | $7.65 |
| TI/LC | 0 | 0 | 0 | 68,733 | 2.7 | 0.26 |
| Capital Expenditures | 0 | 0 | 0 | 60,818 | 2.4 | 0.23 |
| Net Cash Flow | $1,897,459 | $2,098,755 | $2,065,035 | $1,898,618 | 73.8% | $7.16 |
| NOI DSCR | 1.38x | 1.53x | 1.50x | 1.48x | ||
| NCF DSCR | 1.38x | 1.53x | 1.50x | 1.38x | ||
| NOI DY | 8.6% | 9.5% | 9.4% | 9.2% | ||
| NCF DY | 8.6% | 9.5% | 9.4% | 8.6% |
| (1) | U/W Base Rent includes a new lease with Massage Envy (1.1% of the net rentable area), executed on September 1, 2015 with the tenant expected to take possession of its space on December 1, 2015 and annual rent of $57,740 commencing on March 1, 2016. The outstanding landlord obligations and six months free rent related to the lease were reserved upfront. |
| (2) | The underwritten economic vacancy is 4.0%. The Merritt Creek Farm Shopping Center Property was 98.9% occupied as of September 8, 2015. There are currently two month to month tenants (Guiding Light Christian and Renee’s Birkenstock) which account for 1.7% of the net rentable square feet. If such tenants’ space were treated as vacant, vacancy would increase to 2.8%, which remains lower than the 4.0% underwritten vacancy. |
THE INFORMATION IN THIS STRUCTURAL AND COLLATERAL TERM SHEET IS NOT COMPLETE AND MAY BE AMENDED PRIOR TO THE TIME OF SALE. THIS TERM SHEET IS NOT AN OFFER TO SELL THESE SECURITIES AND IT IS NOT A SOLICITATION OF AN OFFER TO BUY THESE SECURITIES IN ANY JURISDICTION WHERE THE OFFER OR SALE IS NOT PERMITTED.
| 123 |
| No. 16 – Westgate Shopping Center | |||||||
| Loan Information | Property Information | ||||||
| Mortgage Loan Seller: | Citigroup Global Markets Realty Corp. | Single Asset/Portfolio: | Single Asset | ||||
Credit Assessment (Fitch/KBRA/Moody's): | NR/NR/NR | Property Type: | Retail | ||||
| Original Principal Balance: | $22,000,000 | Specific Property Type: | Anchored | ||||
| Cut-off Date Principal Balance: | $22,000,000 | Location: | Ann Arbor, MI | ||||
| % of Initial Pool Balance: | 2.2% | Size: | 174,426 SF | ||||
| Loan Purpose: | Refinance | Cut-off Date Principal Balance Per SF: | $126.13 | ||||
| Borrower Name: | Westgate Enterprises, L.L.C. | Year Built/Renovated: | 1960/2004 | ||||
| Sponsors: | Sam Berman, Gerald Byer, James Chaconas and Barry Margolis | Title Vesting: | Fee | ||||
| Mortgage Rate: | 4.930% | Property Manager: | JDP Management, L.L.C. | ||||
| Note Date: | November 17, 2015 | 3rd Most Recent Occupancy (As of): | 99.0% (12/31/2012) | ||||
| Anticipated Repayment Date: | NAP | 2nd Most Recent Occupancy (As of): | 100.0% (12/31/2013) | ||||
| Maturity Date: | December 6, 2025 | Most Recent Occupancy (As of): | 100.0% (12/31/2014) | ||||
| IO Period: | 36 months | Current Occupancy (As of): | 100.0% (10/1/2015) | ||||
| Loan Term (Original): | 120 months | ||||||
| Seasoning: | 0 months | Underwriting and Financial Information: | |||||
| Amortization Term (Original): | 360 months | ||||||
| Loan Amortization Type: | Interest Only, Amortizing Balloon | 3rd Most Recent NOI(As of): | $1,722,876 (12/31/2013) | ||||
| Interest Accrual Method: | Actual/360 | 2nd Most Recent NOI(As of): | $1,881,660 (12/31/2014) | ||||
| Call Protection: | L(24),GRTR 1% or YM(92),O(4) | Most Recent NOI(As of): | $1,844,184 (TTM 9/30/2015) | ||||
| Lockbox Type: | Springing | ||||||
| Additional Debt(1): | Yes | ||||||
| Additional Debt Type(1): | Future Mezzanine | ||||||
| U/W Revenues: | $2,983,239 | ||||||
| U/W Expenses: | $959,325 | ||||||
| Escrows and Reserves: | U/W NOI: | $2,023,914 | |||||
| U/W NCF: | $1,905,985 | ||||||
| Type: | Initial | Monthly | Cap (If Any) | U/W NOI DSCR: | 1.44x | ||
| Taxes | $270,773 | $38,682 | NAP | U/W NCF DSCR: | 1.36x | ||
| Insurance | $33,218 | $2,555 | NAP | U/W NOI Debt Yield: | 9.2% | ||
| Replacement Reserves | $0 | $2,180 | $78,492 | U/W NCF Debt Yield: | 8.7% | ||
| TI/LC | $175,000 | $9,448 | $350,000 | As-Is Appraised Value: | $28,600,000 | ||
| Outstanding TI/LC(2) | $1,732,311 | $0 | NAP | As-Is Appraisal Valuation Date: | October 26, 2015 | ||
| Gap Rent Holdback(3) | $304,960 | $0 | NAP | Cut-off Date LTV Ratio(5): | 72.8% | ||
| Specified Tenant Leasing Reserve(4) | $261,874 | $0 | NAP | LTV Ratio at Maturity or ARD(5): | 64.4% | ||
| (1) | The borrower is permitted to incur future mezzanine debt provided that an intercreditor agreement is obtained and the combined debt service coverage ratio is at least 1.30x, the combined loan to value ratio is not greater than 75%, and the combined debt yield is at least 8.0%. |
| (2) | The Outstanding TI/LC reserve consists of Tenant Improvement allowances for the Ann Arbor Public Library ($1,600,000), Leasing Commissions for the Ann Arbor Public Library ($69,311), Picture Plus ($60,000) and Expo Kitchen ($3,000). |
| (3) | The Gap Rent Holdback reserve consists of 7 months of gap rent for the Ann Arbor Public Library ($302,860) while the tenant expands its space and one month of gap rent for the Pictures Plus ($2,100) as it relocates within the center. |
| (4) | The Specified Tenant Leasing Reserve will be released upon receipt of the Rite Aid Estoppel. |
| (5) | The Cut-off Date LTV Ratio and LTV Ratio at Maturity or ARD are calculated based on the Westgate Shopping Center Property’s “as stabilized” appraised value of $30,200,000 with an “as-stabalized” valuation date of July 1, 2016. The “as stabilized” appraised value assumes the Ann Arbor Public Library tenant’s improvements are completed and the lease has commenced. Ann Arbor Public library has been a tenant at the property since 1983 and executed a lease in September 2015 to expand its space from 5,536 square feet to 21,914 square feet (12.6% of the net rentable area). The Cut-Off Date LTV Ratio and LTV Ratio at Maturity or ARD based on the “as is” appraised value are 76.9% and 68.0%, respectively. |
The Westgate Shopping Center mortgage loan is evidenced by a single promissory note that is secured by a first mortgage encumbering an anchored retail center comprising 174,426 square feet and located in Ann Arbor, Michigan (the “Westgate Shopping Center Property”). The Westgate Shopping Center Property was built in 1960 and is anchored by TJ Maxx. The Westgate Shopping Center Property is situated on the southwest corner of the intersection between West Stadium Boulevard and Jackson Avenue. Parking at the Westgate Shopping Center Property is provided by 766 surface spaces, resulting in a parking ratio of 4.5 spaces per 1,000 square feet of rentable area. As of October 1, 2015, the Westgate Shopping Center Property was 100.0% occupied by 28 tenants.
THE INFORMATION IN THIS STRUCTURAL AND COLLATERAL TERM SHEET IS NOT COMPLETE AND MAY BE AMENDED PRIOR TO THE TIME OF SALE. THIS TERM SHEET IS NOT AN OFFER TO SELL THESE SECURITIES AND IT IS NOT A SOLICITATION OF AN OFFER TO BUY THESE SECURITIES IN ANY JURISDICTION WHERE THE OFFER OR SALE IS NOT PERMITTED.
| 124 |
| WESTGATE SHOPPING CENTER |
Sources and Uses
| Sources | Uses | ||||||
| Original loan amount | $22,000,000 | 99.8% | Loan payoff | $17,474,540 | 79.3% | ||
| Other sources | 37,500 | 0.2% | Reserves | 2,778,136 | 12.6% | ||
| Return of equity | 1,349,874 | 6.1% | |||||
| Closing costs | 434,950 | 2.0% | |||||
| Total Sources | $22,037,500 | 100.0% | Total Uses | $22,037,500 | 100.0% | ||
The following table presents certain information relating to the tenancy at the Westgate Shopping Center Property:
Major Tenants
| Tenant Name | Credit Rating (Fitch/ Moody’s/ S&P)(1) | Tenant NRSF | % of NRSF | Annual U/W Base Rent PSF | Annual U/W Base Rent(2) | % of Total Annual U/W Base Rent | Sales PSF(3) | Occupancy Cost(3) | Lease Expiration Date | |
| Major Tenants | ||||||||||
| Ann Arbor Public Library | NR/NR/NR | 21,914 | 12.6% | $19.26 | $422,050 | 17.6% | NAV | NAV | 6/30/2024(4) | |
| TJ Maxx | NR/A2/A+ | 34,746 | 19.9% | $8.00 | $277,968 | 11.6% | $392 | 3.4% | 1/31/2017(5) | |
| Rite Aid | B/B2/B | 34,803 | 20.0% | $7.52 | $261,874 | 10.9% | NAV | NAV | 12/31/2018 | |
| Schuler’s Books | NR/NR/NR | 9,804 | 5.6% | $17.21 | $168,766 | 7.0% | NAV | NAV | 6/16/2019(6) | |
| Happy House | NR/NR/NR | 8,300 | 4.8% | $14.88 | $123,504 | 5.1% | NAV | NAV | 10/31/2016(7) | |
| Total Major Tenants | 109,567 | 62.8% | $11.45 | $1,254,162 | 52.2% | |||||
| Non-Major Tenants | 64,859 | 37.2% | $17.74 | $1,150,466 | 47.8% | |||||
| Occupied Collateral Total | 174,426 | 100.0% | $13.79 | $2,404,628 | 100.0% | |||||
| Vacant Space | 0 | 0.0% | ||||||||
| Collateral Total | 174,426 | 100.0% | ||||||||
| (1) | Credit Ratings are those of the parent company whether or not the parent guarantees the lease. |
| (2) | Annual U/W Base Rent includes rent steps through June 2016 totaling $20,431. |
| (3) | Sales PSF and Occupancy Costs are for the trailing 12-month period ending December 31, 2014. |
| (4) | Ann Arbor Public Library has two, five-year lease renewal options. |
| (5) | TJ Maxx has three, five-year lease renewal options. |
| (6) | Schuler’s Books has three, three-year lease renewal options. |
| (7) | Happy House has one, five-year lease renewal option. |
THE INFORMATION IN THIS STRUCTURAL AND COLLATERAL TERM SHEET IS NOT COMPLETE AND MAY BE AMENDED PRIOR TO THE TIME OF SALE. THIS TERM SHEET IS NOT AN OFFER TO SELL THESE SECURITIES AND IT IS NOT A SOLICITATION OF AN OFFER TO BUY THESE SECURITIES IN ANY JURISDICTION WHERE THE OFFER OR SALE IS NOT PERMITTED.
| 125 |
| WESTGATE SHOPPING CENTER |
The following table presents certain information relating to the lease rollover schedule at the Westgate Shopping Center Property:
Lease Expiration Schedule(1)(2)
| Year Ending December 31, | No. of Leases Expiring | Expiring NRSF | % of Total NRSF | Cumulative Expiring NRSF | Cumulative % of Total NRSF | Annual U/W Base Rent | Annual U/W Base Rent PSF(3) | |||||||
| MTM | 0 | 0 | 0.0% | 0 | 0.0% | $0 | $0.00 | |||||||
| 2015 | 0 | 0 | 0.0% | 0 | 0.0% | $0 | $0.00 | |||||||
| 2016 | 3 | 11,721 | 6.7% | 11,721 | 6.7% | $191,952 | $16.38 | |||||||
| 2017 | 10 | 57,910 | 33.2% | 69,631 | 39.9% | $682,712 | $11.79 | |||||||
| 2018 | 7 | 54,907 | 31.5% | 124,538 | 71.4% | $588,142 | $10.71 | |||||||
| 2019 | 3 | 17,574 | 10.1% | 142,112 | 81.5% | $308,643 | $17.56 | |||||||
| 2020 | 1 | 1,350 | 0.8% | 143,462 | 82.2% | $28,111 | $20.82 | |||||||
| 2021 | 1 | 5,500 | 3.2% | 148,962 | 85.4% | $107,947 | $19.63 | |||||||
| 2022 | 1 | 2,000 | 1.1% | 150,962 | 86.5% | $39,265 | $19.63 | |||||||
| 2023 | 1 | 1,550 | 0.9% | 152,512 | 87.4% | $35,805 | $23.10 | |||||||
| 2024 | 1 | 21,914 | 12.6% | 174,426 | 100.0% | $422,050 | $19.26 | |||||||
| 2025 | 0 | 0 | 0.0% | 174,426 | 100.0% | $0 | $0.00 | |||||||
| Thereafter | 0 | 0 | 0.0% | 174,426 | 100.0% | $0 | $0.00 | |||||||
| Vacant | 0 | 0 | 0.0% | 174,426 | 100.0% | $0 | $0.00 | |||||||
| Total/Weighted Average | 28 | 174,426 | 100.0% | $2,404,627 | $13.79 |
| (1) | Information obtained from the underwritten rent roll. |
| (2) | Certain tenants may have lease termination options that are exercisable prior to the originally stated expiration date of the subject lease and that are not considered in the Lease Expiration Schedule. |
| (3) | Weighted Average Annual U/W Base Rent and Annual U/W Base Rent PSF excludes vacant space. |
The following table presents historical occupancy percentages at the Westgate Shopping Center Property:
Historical Occupancy
12/31/2012(1) | 12/31/2013(1) | 12/31/2014(1) | 10/1/2015(2) | |||
| 99.0% | 100.0% | 100.0% | 100.0% |
| (1) | Information obtained from a third-party market research provider. |
| (2) | Information obtained from the underwritten rent roll. |
Operating History and Underwritten Net Cash Flow. The following table presents certain information relating to the historical operating performance and underwritten net cash flow at the Westgate Shopping Center Property:
Cash Flow Analysis
| 2013 | 2014 | TTM 9/30/2015 | U/W | % of U/W Effective Gross Income | U/W $ per SF | |||||||||||
| Base Rent | $1,991,240 | $2,121,854 | $2,138,723 | $2,404,628(1) | 80.6% | $13.79 | ||||||||||
| Grossed Up Vacant Space | 0 | 0 | 0 | 0 | 0.0 | 0.00 | ||||||||||
| Total Reimbursables | 592,742 | 631,956 | 581,969 | 681,300 | 22.8 | 3.91 | ||||||||||
| Other Income | 53,522 | 51,101 | 54,119 | 54,119 | 1.8 | 0.31 | ||||||||||
| Less Vacancy & Credit Loss | (5,769) | (29,447) | (178) | (156,809)(2) | (5.3) | (0.90) | ||||||||||
| Effective Gross Income | $2,631,735 | $2,775,464 | $2,774,634 | $2,983,239 | 100.0% | $17.10 | ||||||||||
| Total Operating Expenses | $908,858 | $963,804 | $930,450 | $959,325 | 32.2% | $5.50 | ||||||||||
| Net Operating Income | $1,722,876 | $1,811,660 | $1,844,184 | $2,023,914 | 67.8% | $11.60 | ||||||||||
| TI/LC | 0 | 0 | 0 | 91,765 | 3.1 | 0.53 | ||||||||||
| Capital Expenditures | 0 | 0 | 0 | 26,164 | 0.9 | 0.15 | ||||||||||
| Net Cash Flow | $1,722,876 | $1,811,660 | $1,844,184 | $1,905,985 | 63.9% | $10.93 | ||||||||||
| NOI DSCR | 1.23x | 1.29x | 1.31x | 1.44x | ||||||||||||
| NCF DSCR | 1.23x | 1.29x | 1.31x | 1.36x | ||||||||||||
| NOI DY | 7.8% | 8.2% | 8.4% | 9.2% | ||||||||||||
| NCF DY | 7.8% | 8.2% | 8.4% | 8.7% | ||||||||||||
| (1) | The U/W Base Rent includes rent steps through June 2016 totaling $20,431. |
| (2) | The underwritten economic vacancy is 5.1%. The Westgate Shopping Center Property was 100.0% physically occupied as of October 1, 2015. |
THE INFORMATION IN THIS STRUCTURAL AND COLLATERAL TERM SHEET IS NOT COMPLETE AND MAY BE AMENDED PRIOR TO THE TIME OF SALE. THIS TERM SHEET IS NOT AN OFFER TO SELL THESE SECURITIES AND IT IS NOT A SOLICITATION OF AN OFFER TO BUY THESE SECURITIES IN ANY JURISDICTION WHERE THE OFFER OR SALE IS NOT PERMITTED.
| 126 |
| Wells Fargo Commercial Mortgage Trust 2015-P2 | Transaction Contact Information |
| VI. | Transaction Contact Information |
Questions regarding this Structural and Collateral Term Sheet may be directed to any of the following individuals:
| Wells Fargo Securities, LLC | |
| Brigid Mattingly | Tel. (312) 269-3062 |
| A.J. Sfarra | Tel. (212) 214-5613 |
| Alex Wong | Tel. (212) 214-5615 |
| Citigroup Global Markets Inc. | |
| Paul Vanderslice | Tel. (212) 723-1295 |
| Raul Orozco | Tel. (212) 723-1295 |
| Richard Simpson | Tel. (212) 816-5343 |
| Michael Steele | Tel. (952) 525-2248 |
| Wendy Yam | Tel. (212) 816-5314 |
| Matt Perry | Tel. (212) 723-1295 |
| SG Americas Securities, LLC | |
| Adam Ansaldi | Tel. (212) 278-6126 |
| Jim Barnard | Tel. (212) 278-6263 |
| John Caputo | Tel. (212) 278-5086 |
| Warren Geiger | Tel. (212) 278-5692 |
THE INFORMATION IN THIS STRUCTURAL AND COLLATERAL TERM SHEET IS NOT COMPLETE AND MAY BE AMENDED PRIOR TO THE TIME OF SALE. THIS TERM SHEET IS NOT AN OFFER TO SELL THESE SECURITIES AND IT IS NOT A SOLICITATION OF AN OFFER TO BUY THESE SECURITIES IN ANY JURISDICTION WHERE THE OFFER OR SALE IS NOT PERMITTED.
| 127 |