Table of Contents
CONFIDENTIAL SUBMISSION – DRAFT DATED DECEMBER 4, 2015
UNITED STATES
SECURITIES AND EXCHANGE COMMISSION
WASHINGTON, D.C. 20549
FORM 20-F
| x | REGISTRATION STATEMENT PURSUANT TO SECTION 12(b) OR 12(g) OF THE SECURITIES EXCHANGE ACT OF 1934 |
OR
| ¨ | ANNUAL REPORT PURSUANT TO SECTION 13 OR 15(d) OF THE SECURITIES EXCHANGE ACT OF 1934 |
For the fiscal year ended
OR
| ¨ | TRANSITION REPORT PURSUANT TO SECTION 13 OR 15(d) OF THE SECURITIES EXCHANGE ACT OF 1934 |
OR
| ¨ | SHELL COMPANY REPORT PURSUANT TO SECTION 13 OR 15(d) OF THE SECURITIES EXCHANGE ACT OF 1934 |
Date of event requiring this shell company report,
For the transition period from to
Commission file number:
ENERSIS CHILE S.A.
(Exact name of Registrant as specified in its charter)
ENERSIS CHILE S.A.
(Translation of Registrant’s name into English)
CHILE
(Jurisdiction of incorporation or organization)
Santa Rosa 76, Santiago, Chile
(Address of principal executive offices)
Nicolás Billikopf, phone: (56-2) 2353-4639, Nicolas.Billikopf@enel.com, Santa Rosa 76, Piso 15, Santiago, Chile
(Name, Telephone, E-mail and/or Facsimile number and Address of Company Contact Person)
Securities registered or to be registered pursuant to Section 12(b) of the Act:
Title of Each Class | Name of Each Exchange on Which Registered | |
American Depositary Shares Representing Common Stock Common Stock, no par value * | New York Stock Exchange |
| * | Listed, not for trading, but only in connection with the registration of American Depositary Shares, pursuant to the requirements of the Securities and Exchange Commission. |
Securities registered or to be registered pursuant to Section 12(g) of the Act: None
Securities for which there is a reporting obligation pursuant to Section 15(d) of the Act: None
Indicate the number of outstanding shares of each of the issuer’s classes of capital or common stock as of the close of the period covered by the annual report Shares of Common Stock:
Indicate by check mark if the registrant is a well-known seasoned issuer, as defined in Rule 405 of the Securities Act. ¨ Yes x No
If this report is an annual or transition report, indicate by check mark if the registrant is not required to file reports pursuant to Section 13 or 15(d) of the Securities Exchange Act of 1934. ¨ Yes ¨ No
Indicate by check mark whether the registrant (1) has filed all reports required to be filed by Section 13 or 15(d) of the Securities Exchange Act of 1934 during the preceding 12 months (or for such shorter period that the registrant was required to file such reports), and (2) has been subject to such filing requirements for the past 90 days. ¨ Yes ¨ No
Indicate by check mark whether the registrant has submitted electronically and posted on its corporate Web site, if any, every Interactive Data File required to be submitted and posted pursuant to Rule 405 of Regulation S-T (§232.405 of this chapter) during the preceding 12 months (or for such shorter period that the registrant was required to submit and post such files). ¨ Yes ¨ No
Indicate by check mark whether the registrant is a large accelerated filer, an accelerated filer, or a non-accelerated filer. See definition of “accelerated filer and large accelerated filer” in Rule 12b-2 of the Exchange Act.
Large accelerated filer ¨ Accelerated filer ¨ Non-accelerated filer x
Indicate by check mark which basis of accounting the registrant has used to prepare the financial statements included in this filing:
| U.S. GAAP ¨ | International Financial Reporting Standards as issued by the International Accounting Standards Board x | Other ¨ |
If “Other” has been checked in response to the previous question, indicate by check mark which financial statement item the registrant has elected to follow. ¨ Item 17 ¨ Item 18
If this is an annual report, indicate by check mark whether the registrant is a shell company (as defined in Rule 12b-2 of the Exchange Act). ¨ Yes ¨ No
Table of Contents
SUBJECT TO COMPLETION, DATED DECEMBER 4, 2015 — FOR INFORMATION ONLY
INFORMATION STATEMENT
ENERSIS CHILE S.A.
Shares of Common Stock
American Depositary Shares
This information statement is being furnished to shareholders of Enersis S.A., or Enersis, in connection with the “división”,or “demerger”, under Chilean corporate law, of Enersis, which involves (i) the separation of the non-Chilean electricity generation and distribution businesses and assets of Enersis, (ii) the creation of Enersis Chile S.A., as part of the demerger, and (iii) the distribution by Enersis to its shareholders of all outstanding shares of common stock of Enersis Chile. The transactions described above are referred to collectively, as the “Spin-Off”. Following the Spin-Off, Enersis Chile will own and operate the Chilean electricity generation and distribution businesses and assets of Enersis.
Each holder of record of Enersis common stock as of the close of business on [●], 2016, or the record date, will receive one share of Enersis Chile common stock for each share of Enersis common stock held.
Enersis shareholders will vote to approve the Spin-Off at an Extraordinary Shareholders Meeting to be held on December 18, 2015. Enersis shareholders will not be required (i) to pay for the shares of Enersis Chile common stock to be received by them in the Spin-Off, (ii) to surrender or exchange shares of Enersis common stock in order to receive Enersis Chile common stock, or (iii) to take any other action in connection with the Spin-Off. There is currently no trading market for Enersis Chile common stock, [although a “when-issued” trading market may develop prior to the effective date of the Spin-Off.] Enersis Chile will apply to list the common stock on the Santiago Stock Exchange, the Electronic Stock Exchange and the Valparaíso Stock Exchange (collectively, the “Chilean Stock Exchanges”) and American Depositary Shares (“ADSs”), representing shares of Enersis Chile common stock, on the New York Stock Exchange.
In reviewing this information statement, you should carefully consider the matters described under the caption “Risk Factors” beginning on page 24.
Enersis Chile and shares of Enersis Chile common stock are being registered with the Chilean Superintendence of Securities and Insurance (Superintendencia de Valores y Seguros, or the SVS). The SVS has not approved or disapproved of the securities (including in the form of ADSs), or determined if this information statement or any Spanish language document(s) that will be used in Chile are truthful or complete.
Neither the U.S. Securities and Exchange Commission nor any state securities commission has approved or disapproved these securities or determined if this information statement is truthful or complete. Any representation to the contrary is a criminal offense.
This information statement does not constitute an offer to sell or the solicitation of an offer to buy any securities.
The date of this information statement is , 2016.
Table of Contents
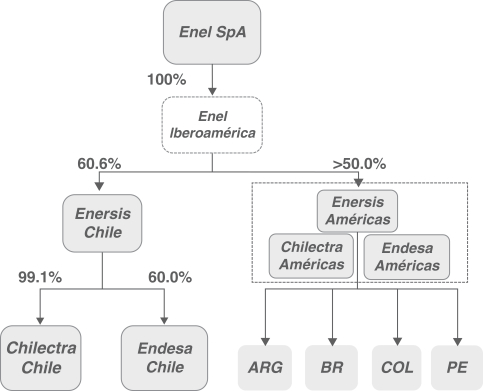
Enersis Chile’s Simplified Organizational Structure After Giving Effect to the Spin-Off(1)
As of September 30, 2015

| (1) | Only principal operating combined entities are presented here. The percentage listed for each of our combined entities represents our post-Spin-Off economic interest in such combined entity. |
| (2) | Certain organizational charts contained in this information statement do not show Enel Latinoamérica because it is a wholly-owned subsidiary of Enel and Enel Iberoamérica. |
Table of Contents
| Page | ||||||||
| 2 | ||||||||
| 6 | ||||||||
| 12 | ||||||||
| 14 | ||||||||
| 17 | ||||||||
| PART I | ||||||||
| Item 1. | 19 | |||||||
| Item 2. | 19 | |||||||
| Item 3. | 19 | |||||||
| Item 4. | 35 | |||||||
| Item 4A. | 67 | |||||||
| Item 5. | 67 | |||||||
| Item 6. | 91 | |||||||
| Item 7. | 97 | |||||||
| Item 8. | 99 | |||||||
| Item 9. | 106 | |||||||
| Item 10. | 112 | |||||||
| Item 11. | 130 | |||||||
| Item 12. | 137 | |||||||
| PART II | ||||||||
| Item 13. | 146 | |||||||
| Item 14. | Material Modifications to the Rights of Security Holders and Use of Proceeds | 146 | ||||||
| Item 15. | 146 | |||||||
| Item 16. | 146 | |||||||
| Item 16A. | 146 | |||||||
| Item 16B. | 146 | |||||||
| Item 16C. | 146 | |||||||
| Item 16D. | 146 | |||||||
| Item 16E. | Purchases of Equity Securities by the Issuer and Affiliated Purchasers | 146 | ||||||
| Item 16F. | 146 | |||||||
| Item 16G. | 146 | |||||||
| Item 16H. | 146 | |||||||
| PART III | ||||||||
| Item 17. | 147 | |||||||
| Item 18. | 147 | |||||||
| Item 19. | 147 | |||||||
Table of Contents
| AFP | Administradora de Fondos de Pensiones | A legal entity that manages a Chilean pension fund. | ||
| CDEC | Centro de Despacho Económico de Carga | Autonomous entity in two Chilean electric systems in charge of coordinating the efficient operation and dispatch of generation units to satisfy demand. | ||
| Celta | Compañía Eléctrica Tarapacá S.A. | Chilean generation subsidiary of Endesa Chile that operates plants in the SING and SIC. Celta merged with Endesa Eco in November 2013 and currently operates several plants in northern Chile including Pangue, San Isidro, and those previously held by Endesa Eco. | ||
| Chilean Stock Exchanges | Chilean Stock Exchanges | The three principal stock exchanges located within Chile: the Santiago Stock Exchange, the Electronic Stock Exchange and the Valparaíso Stock Exchange. | ||
| Chilectra Américas | Chilectra Américas S.A. | A newly formed electricity company to be spun-off by Chilectra to hold minority interests in Argentina, Brazil, Colombia and Peru. | ||
| Chilectra Chile | Chilectra S.A. | Chilean electricity distribution company operating in the Santiago metropolitan area and our combined entity. | ||
| CNE | Comisión Nacional de Energía | Chilean National Energy Commission, governmental entity with responsibilities under the Chilean regulatory framework. | ||
| DCV | Depósito Central de Valores S.A. | Chilean Central Securities Depositary. | ||
| Endesa Américas | Endesa Américas S.A. | A newly formed related company to be spun-off by Endesa Chile with operations in Argentina, Brazil, Colombia and Peru. | ||
| Endesa Chile | Empresa Nacional de Electricidad S.A. | A publicly held limited liability stock corporation incorporated under the laws of the Republic of Chile that, following our Spin-Off from Enersis Américas, will be our combined entity with electricity generation operations in Chile. | ||
| Endesa Eco | Endesa Eco S.A. | A former Chilean subsidiary of Endesa Chile and owner of Central Eólica Canela S.A. and Ojos de Agua mini hydroelectric plant. Endesa Eco merged with Celta in November 2013. | ||
2
Table of Contents
| Enel | Enel S.p.A. | An Italian power company that will hold a 60.6% beneficial interest in us and be our ultimate parent company. | ||
| Enel Iberoamérica | Enel Iberoamérica, S.R.L. | A wholly-owned subsidiary of Enel and owner of 20.3% of us, which it acquired from Endesa Spain in October 2014. Enel Iberoamérica was formerly known as Enel Energy Europe S.R.L. | ||
| Enel Latinoamérica | Enel Latinoamérica, S.A. | A wholly-owned subsidiary of Enel Iberoamérica and owner of 40.3% of us. | ||
| Enersis | Enersis S.A. (before the Spin-Off) | A publicly held limited liability stock corporation incorporated under the laws of the Republic of Chile, with subsidiaries engaged primarily in the generation, transmission and distribution of electricity in Chile, Argentina, Brazil, Colombia, and Peru. The company from which our company is being spun-off. | ||
| Enersis Américas | Enersis Américas S.A. | A related publicly held limited liability stock corporation incorporated under the laws of the Republic of Chile, with combined entities engaged primarily in the generation, transmission and distribution of electricity in Argentina, Brazil, Colombia, and Peru. This will be the continuing Enersis, after giving effect to the Spin-Off. | ||
| Enersis Chile | Enersis Chile S.A. | Our company, a limited liability stock corporation incorporated under the laws of the Republic of Chile, with combined entities engaged primarily in the generation and distribution of electricity in Chile that, following our Spin-Off from Enersis Américas, will be publicly held. | ||
| ESM | Extraordinary Shareholders’ Meeting | Extraordinary Shareholders’ Meeting. | ||
| GasAtacama | GasAtacama S.A. | Company involved in gas transportation and electricity generation in northern Chile that is a subsidiary of Endesa Chile. | ||
| GasAtacama Holding | Inversiones GasAtacama Holding Ltda. | A holding company which owns GasAtacama and is a subsidiary of Endesa Chile following the acquisition of an additional 50% interest from Southern Cross Latin America Private Equity Fund III, L.P. in April 2014. | ||
| Gener | AES Gener S.A. | Chilean generation company and our competitor in Chile. | ||
3
Table of Contents
| GNL Quintero | GNL Quintero S.A. | Company created to develop, build, finance, own and operate a LNG regasification facility at Quintero Bay (Chile) in which LNG is unloaded, stored and regasified. | ||
| IFRS | International Financial Reporting Standards | International Financial Reporting Standards as issued by the International Accounting Standards Board (IASB). | ||
| IMV | Inmobiliaria Manso de Velasco Ltda. | Our former, wholly-owned real estate subsidiary which merged into ICT in December 2014. As a result, IMV is now included in SIEI. | ||
| LNG | Liquefied Natural Gas. | Liquefied natural gas. | ||
| NCRE | Non-Conventional Renewable Energy | Energy sources which are continuously replenished by natural processes, such as wind, biomass, mini-hydro, geothermal, wave, or tidal energy. | ||
| NIS | Sistema Interconectado Nacional | Chilean national interconnected electric system. | ||
| OSM | Ordinary Shareholders’ Meeting | Ordinary Shareholders’ Meeting. | ||
| Pangue | Empresa Eléctrica Pangue S.A. | A former Chilean subsidiary of Endesa Chile and former owner of the Pangue power station. Pangue merged with San Isidro, which merged with Endesa Eco, which then merged with Celta. As a result, Pangue is now included in Celta. | ||
| Pehuenche | Empresa Eléctrica Pehuenche S.A. | A publicly held Chilean electricity company, owner of three power stations in the Maule River basin and a subsidiary of Endesa Chile. | ||
| San Isidro | Compañía Eléctrica San Isidro S.A. | A former Chilean subsidiary of Endesa Chile. San Isidro merged with Pangue in May 2012 and Endesa Eco merged with San Isidro in September 2013. Celta merged with Endesa Eco in November 2013. As a result, San Isidro is now included in Celta. | ||
| SEF | Superintendencia de Electricidad y Combustible | Chilean Superintendence of Electricity and Fuels, a governmental entity in charge of supervising the Chilean electricity industry. | ||
| SIC | Sistema Interconectado Central | Chilean central interconnected electric system covering all of Chile except the north and the extreme south. | ||
4
Table of Contents
| SIEI | Servicios Informáticos e Inmobiliarios Ltda. | A business consultancy in technology, information and computer science, telecommunications, data transmission and real estate which was formed following the merger of ICT Servicios Informáticos Ltda. (“ICT”) with Inmobiliaria Manso de Velasco Ltda. (“IMV”). | ||
| SING | Sistema Interconectado del Norte Grande | Chilean interconnected electric system operating in northern Chile. | ||
| SVS | Superintendencia de Valores y Seguros | Chilean Superintendence of Securities and Insurance, the authority in charge of supervising public companies, securities and the insurance business. | ||
| UF | Unidad de Fomento | Chilean inflation-indexed, Chilean peso-denominated monetary unit. | ||
| UTA | Unidad Tributaria Anual | Chilean annual tax unit. One UTA equals 12Unidad Tributaria Mensual (“UTM”), which is a Chilean inflation-indexed monthly tax unit used to define fines, among other purposes. | ||
| VAD | Valor Agregado de Distribución | Value added from distribution of electricity. | ||
5
Table of Contents
Unless the context otherwise requires, all references in this information statement to:
| • | “we”, “us”, “our”, “the Company” and “Enersis Chile” refer to the Chilean Business (as defined below) prior to the Spin-Off and to Enersis Chile S.A. following the Spin-Off; |
| • | “Enersis” refers to Enersis S.A. prior to the Spin-Off; |
| • | “Enersis Américas” refers to Enersis Américas S.A. (formerly named Enersis S.A.) following the Spin-Off, which will continue to hold the Non-Chilean Business as defined below; |
| • | “Chilean Business” refers to the Chilean electricity generation and distribution businesses and assets held by Enersis S.A. prior to the Spin-Off and to be held by Enersis Chile after the Spin-Off; and |
| • | “Non-Chilean Business” refers to the non-Chilean electricity generation, transmission and distribution businesses and assets comprised exclusively of the ownership interests in shares of companies with operations outside of Chile, in Argentina, Brazil, Colombia and Peru, held by Enersis S.A. prior to the Spin-Off and continued to be held by Enersis Américas after the Spin-Off. |
This information statement is part of a Registration Statement on Form 20-F (the “Registration Statement”) filed with the U.S. Securities and Exchange Commission in connection with the spin-off by Enersis, a Chilean company engaged in the electricity generation, transmission and distribution, to its shareholders of the shares of Enersis Chile, a Chilean corporation to be formed, that will hold the Chilean electricity generation and distribution businesses and assets.
6
Table of Contents
Overview of the Spin-Off and Reorganization
The Spin-Off is part of a reorganization (the “Reorganization”) of certain companies ultimately controlled by Enel S.p.A., an Italian electricity generation company (“Enel”), which beneficially owns 60.6% of Enersis. The Reorganization is intended to separate the electricity generation and distribution businesses and assets of Enersis and its combined entities in Chile from the generation, transmission and distribution businesses in Argentina, Brazil, Colombia and Peru as shown in the following chart.
The Spin-Offs
First, each of Empresa Nacional de Electricidad S.A. (“Endesa Chile”), a Chilean electricity generation company and combined entity of Enersis, and Chilectra S.A. (“Chilectra”), a Chilean electricity distribution company and subsidiary of Enersis, will spin-off to their respective shareholders pro rata the shares of two new Chilean entities Endesa Américas S.A. (“Endesa Américas”) and Chilectra Américas S.A. (“Chilectra Américas”), that will hold the Non-Chilean Business, comprised exclusively of their respective ownership interests in shares of companies domiciled outside of Chile, formerly held by Endesa Chile and Chilectra, respectively (the “Endesa/Chilectra Spin-Offs”). Each of the Endesa/Chilectra Spin-Offs will be effected by means of a procedure under Chilean corporate law called a “división” or “demerger.” Following the Endesa/Chilectra Spin-Offs, Endesa Chile will continue to hold the Chilean businesses and assets of Endesa Chile and Chilectra Chile will continue to hold the Chilean businesses and assets of Chilectra (“Chilectra Chile”). Enersis, as the 60.0% owner of Endesa Chile and the 99.1% owner of Chilectra, will own 60.0% of Endesa Américas and 99.1% of Chilectra Américas as a result of the Endesa/Chilectra Spin-Offs and the minority shareholders of
7
Table of Contents
Endesa Chile and Chilectra will own their respective percentage interests in Endesa Américas and Chilectra Américas, respectively, based on a pro rata distribution of the spin-off company shares. The shares of Endesa Américas and Chilectra Américas will be listed and traded on the Chilean Stock Exchanges and the American Depositary Receipts (“ADRs”) of Endesa Américas will be listed and traded on the New York Stock Exchange (“NYSE”).
Second, following the Endesa/Chilectra Spin-Offs, Enersis will conduct a “demerger” to separate Enersis into two companies. The new company, Enersis Chile S.A. (“Enersis Chile”) will be established as a separate company and will be assigned the equity interests, assets and associated liabilities of Enersis’ businesses in Chile, including the equity interests in each of Endesa Chile and Chilectra Chile after giving effects to the Endesa/Chilectra Spin-Offs (the “Separation”). Upon the completion of the Separation, Enersis Chile will register its shares with the Securities Registry of the SVS under Chilean law and the SEC under applicable U.S. federal securities laws, and subject to the receipt of necessary authorizations, the completion of legal formalities and the satisfaction of the conditions precedent, Enersis will distribute to its shareholders shares of Enersis Chile in proportion to their share ownership in Enersis based on a ratio of one share of Enersis Chile for each outstanding share of Enersis (the “Distribution,” and together with the Separation, the “Spin-Off”).
Enel will beneficially own 60.6% of Enersis Chile as a result of the Spin-Off, and the minority shareholders of Enersis will own their respective percentage interest in Enersis Chile. Upon the effectiveness of the Spin-Off, Enersis will change its name to Enersis Américas S.A. (“Enersis Américas”). The shares of Enersis Chile will be listed and traded on the Chilean Stock Exchanges and the ADRs of Enersis Chile will be listed and traded on the NYSE.
8
Table of Contents
Each of the Endesa/Chilectra Spin-Offs is conditioned on the approval by Enersis shareholders of the Spin-Off, and the Spin-Off is conditioned on the approval by the respective shareholders of Endesa Chile and Chilectra of the Endesa/Chilectra Spin-Offs. For further details, see Item 9. The Offer and Listing — B. Plan of Distribution — Background and Description of the Spin-Off Conditions Precedents.
The Tender Offer
Upon the completion of the Endesa/Chilectra Spin-Offs and the Spin-Off, Enersis Américas will conduct a public cash tender offer (oferta pública de adquisición de valores) for the shares and ADSs of Endesa Américas under Chilean law and applicable U.S. securities laws (the “Tender Offer”).
The Tender Offer is contingent on (i) the completion of the Endesa/Chilectra Spin-Offs and the Spin-Off, (ii) the approval of the Merger by the respective shareholders of Enersis Américas, Endesa Américas and Chilectra Américas at separate extraordinary shareholders’ meetings of Enersis Américas, Endesa Américas and Chilectra Américas as described in “—The Merger,” (iii) less than 6.73% of the outstanding shares of Enersis Américas and 7.72% of the outstanding shares of Endesa Américas exercising the right of withdrawal in connection with the Merger, and (iv) the absence of any significant adverse supervening events that would make the Tender Offer not in the best interest of Enersis Américas.
The Tender Offer will be for all shares, including in the form of ADSs represented by ADRs of Endesa Américas (other than those held by Enersis Américas), for a price of Ch$ 236.00 per share (or the equivalent in U.S. dollars at the date of payment in the case of ADSs), and will be subject to other terms and conditions which will be provided at the appropriate time. The Tender Offer is expected to occur by the third quarter of 2016.
9
Table of Contents
This information statement is for informational purposes only and is not an offer to buy or the solicitation of an offer to sell any securities of Enersis, Enersis Américas, Endesa Chile or Endesa Américas. When and if the Tender Offer is commenced, Enersis Américas will make available the tender offer materials to the shareholders of Endesa Américas and file such materials with the SEC in accordance with applicable U.S. federal securities laws and SEC rules. In that event, shareholders and investors are urged to read the tender offer materials because they will contain important information, including the full details of the Tender Offer. Shareholders and investors may obtain free copies of the tender offer materials that Enersis Américas files with the SEC at the SEC’s website at http://www.sec.gov and will receive information at an appropriate time on how to obtain tender offer materials for free from Enersis Américas. These documents are not currently available and their availability is subject to the determination to commence the Tender Offer. The consummation of the Spin-Offs is not conditioned on the Tender Offer.
The Merger
Following the completion of the Endesa/Chilectra Spin-Offs and the Spin-Off described above, each of Enersis Américas, Endesa Américas and Chilectra Américas (then holding the non-Chilean assets of their respective businesses), and subject to approval by shareholders holding at least two-thirds of the outstanding shares of the relevant companies, intend to merge together (the “Merger”), with Enersis Américas continuing as the surviving company under the name Enersis Américas S.A. (the “Surviving Company”). Following completion of the Merger, the Surviving Company will continue to have its shares publicly traded and listed in Chile on the Chilean Stock Exchanges and its ADRs traded on the NYSE. In the Merger, the shares of Endesa Américas and Chilectra Américas will be converted into shares of the Surviving Company and Endesa Américas and Chilectra Américas shares will cease trading on the Chilean Stock Exchanges and ADRs of Endesa Américas will cease to trade on the NYSE. Following the Merger, Enel is expected to continue to be the ultimate controlling shareholder, through its beneficial ownership, of the Surviving Company and the former minority shareholders of Enersis Américas, Endesa Américas and Chilectra Américas will own the minority interest in the Surviving Company.
Based on the valuation reports received by the Board of Directors and the Directors’ Committee of Enersis, a majority of the Board of Directors of Enersis has determined that the number of shares of Enersis Américas to be paid by Enersis Américas as consideration for each share of Endesa Américas and Chilectra Américas in connection with the Merger, if approved by the respective shareholders of Enersis Américas, Endesa Américas and Chilectra Américas, will be as follows:
| Number of shares of Enersis Américas for each | ||||
Endesa Américas share | 2.8 | |||
Chilectra Américas share | 5.0 | |||
10
Table of Contents
In connection with the Merger, each of Enersis Américas, Endesa Américas and Chilectra Américas will hold an extraordinary shareholders’ meeting to approve the Merger. Prior to such extraordinary shareholders’ meetings, Enersis Américas will register the shares of the Surviving Company to be issued in the Merger with the SEC under the Securities Act. In connection with their respective extraordinary shareholders’ meetings to approve the Merger, which are expected to be held in mid-2016, Enersis Américas will distribute to the shareholders of each of Enersis Américas, Endesa Américas and, if necessary, Chilectra Américas a proxy statement/prospectus containing information about the Merger and the Surviving Company.
11
Table of Contents
This information statement is being furnished in connection with the Spin-Off and the following is a summary of the material terms of the Spin-Off. See “Item 9. The Offer and Listing — B. Plan of Distribution — Description of the Spin-Off” for a more detailed description of the matters below.
| Distributing Company | Enersis S.A., a publicly held limited liability stock company organized under the laws of the Republic of Chile. After the completion of the Spin-Off, Enersis Américas will not own any capital stock of Enersis Chile and Enersis Chile will not own any capital stock of Enersis Américas. | |
| Issuer Company | Enersis Chile S.A., a corporation that will be incorporated for the first time as a publicly held limited liability stock corporation under the laws of the Republic of Chile and that will hold the Chilean electricity generation and distribution businesses and assets formerly held by Enersis.
Immediately after the effectiveness of the Spin-Off, the share capital of Enersis Chile will be Ch$ 2,229,108,974,538 and the capital structure of Enersis Chile will be identical to that of Enersis immediately prior to the Spin-Off. Enersis Américas and Enersis Chile will initially have the same shareholders, including controlling shareholders. | |
| Conditions Precedent | The Spin-Off is contingent upon the satisfaction of specific conditions precedent. See “Item 9. The Offer and Listing — B. Plan of Distribution — Conditions Precedent.” | |
| Share Record Date | [●], 2016 | |
| Share Distribution Date | [●], 2016 | |
| ADS Record Date | [●], 2016 | |
| ADS Distribution Date | [●], 2016 | |
| Use of Proceeds | Neither Enersis nor Enersis Chile will receive any proceeds in connection with the Spin-Off. | |
| Distribution Ratio | Holders of Enersis common stock (“Enersis Shares”) as of the Share Record Date will have the right to receive one share of Enersis Chile common stock (“Enersis Chile Shares”) for each Enersis Share on the Share Distribution Date.
Holders of Enersis American Depositary Shares (“Enersis ADSs”) as of the ADS Record Date will have the right to receive one Enersis Chile American Depositary Share (“Enersis Chile ADSs”) for each Enersis ADS on the ADS Distribution Date. | |
| Distribution Method | Distribution of Enersis Chile Shares that are not deposited with the Chilean Central Securities Depositary (DCV Registros, S.A., Depósito Central de Valores, or the “DCV”), which is the clearing system for securities traded on the Chilean Stock Exchanges, will be made against the presentation of Enersis share certificates. For Enersis Chile Shares deposited with the DCV, distribution will generally be made by book-entry annotation in the shareholder list maintained by the DCV. | |
12
Table of Contents
Persons holding Enersis ADSs through the facilities of The Depository Trust Company (“DTC”) will receive the distribution of Enersis Chile ADSs by book-entry only, through the facilities of DTC. Persons holding Enersis ADSs directly will receive the distribution of Enersis Chile ADSs in the form of certificated American Depositary Receipts (“ADRs”), representing Enersis Chile ADSs.
Enersis share certificates and certificated ADRs will continue to represent the shares and ADSs of Enersis Américas after the Spin-Off without any need to exchange or surrender those certificates. | ||
| Risk Factors | The Spin-Off and the Chilean Business that will be held by Enersis Chile following the Spin-Off are subject to both general and specific risks. See “Item 3. Key Information—D. Risk Factors.” | |
13
Table of Contents
Financial Information
In this information statement, unless otherwise specified, references to “U.S. dollars” or “US$”, are to dollars of the United States of America; references to “pesos” or “Ch$” are to Chilean pesos, the legal currency of Chile; references to “€” or “Euros” are to the legal currency of the European Union; and references to “UF” are to Development Units (Unidades de Fomento).
TheUnidad de Fomento is a Chilean inflation-indexed, peso-denominated monetary unit that is adjusted daily to reflect changes in the official Consumer Price Index (“CPI”) of the Chilean National Institute of Statistics (Instituto Nacional de Estadísticasor “INE”). The UF is adjusted in monthly cycles. Each day in the period beginning on the tenth day of the current month through the ninth day of the succeeding month, the nominal peso value of the UF is indexed in order to reflect a proportionate amount of the change in the Chilean CPI during the prior calendar month. As of September 30, 2015, one UF was equivalent to Ch$ 25,346.69. The U.S. dollar equivalent of one UF was US$ 36.28 as of September 30, 2015, using the Observed Exchange Rate reported by the Central Bank of Chile (Banco Central de Chile) as of September 30, 2015 of Ch$ 698.72 per US$ 1.00. The U.S. dollar observed exchange rate (dólar observado) (the “Observed Exchange Rate”), which is reported by the Central Bank of Chile and published daily on its webpage, is the weighted average exchange rate of the previous business day’s transactions in the Formal Exchange Market
The Central Bank of Chile may intervene by buying or selling foreign currency on the Formal Exchange Market to maintain the Observed Exchange Rate within a desired range.
As of November 30, 2015, one UF was equivalent to Ch$ 25,598.41. The U.S. dollar equivalent of one UF was US$ 35.99 on November 30, 2015, using the Observed Exchange Rate reported by the Central Bank of Chile as of such date of Ch$ 711.20 per US$ 1.00.
Our combined financial statements and, unless otherwise indicated, other financial information concerning us included in this information statement are presented in Chilean pesos. We have prepared our combined financial statements in accordance with International Financial Reporting Standards (“IFRS”), as issued by the International Accounting Standard Board (“IASB”).
All of our combined entities are integrated and all their assets, liabilities, income, expenses and cash flows are included in the combined financial statements after making the adjustments and eliminations related to intra-group transactions. References in this information statement to combined entities refer to entities that are controlled, either directly or indirectly, by Enersis Chile. Control is achieved when Enersis Chile (i) has power over the entity, (ii) is exposed, or has rights, to variable returns from its involvement with the entity and (iii) has the ability to use its power to effect its returns. Enersis Chile has power over its combined entities when it holds the majority of the substantive voting rights or, when it has less than a majority of the voting rights, and those rights are sufficient to give it the practical ability to direct the relevant activities of the entity unilaterally.
Investments in associated companies over which we exercise significant influence are included in our combined financial statements using the equity method. For detailed information regarding combined entities, jointly-controlled entities and associated companies, see Appendices 1, 2 and 3 to the combined financial statements.
For the convenience of the reader, this information statement contains translations of certain Chilean peso amounts into U.S. dollars at specified rates. Unless otherwise indicated, the U.S. dollar equivalent for information in Chilean pesos is based on the Observed Exchange Rate for September 30, 2015, as defined in “Item 3. Key Information — A. Selected Financial Data — Exchange Rates”. The Federal Reserve Bank of New York does not report a noon buying rate for Chilean pesos. No representation is made that the Chilean peso or
14
Table of Contents
U.S. dollar amounts shown in this information statement could have been or could be converted into U.S. dollars or Chilean pesos, as the case may be, at such rate or at any other rate. See “Item 3. Key Information — A. Selected Financial Data — Exchange Rates”.
Unaudited Pro Forma Combined Financial Information
The pro forma information is based on the historical combined financial statements of the Chilean Business of Enersis after giving effect to the transactions and applying the estimates, assumptions and adjustments described in the accompanying notes to the unaudited pro forma combined financial information. The historical column in the unaudited pro forma combined statement of financial position is derived from the historical combined statement of financial position of the Chilean Business of Enersis as of September 30, 2015 included in this information statement. The historical columns in the unaudited pro forma combined statements of income for the year ended December 31, 2014 and the nine months ended September 30, 2015 are derived from the historical combined statements of income of the Chilean Business of Enersis for the year ended December 31, 2014 and the nine months ended September 30, 2015 included in this information statement.
The unaudited pro forma combined financial information has been prepared by Enersis’ management for illustrative purposes and is not intended to represent the combined financial position or combined results of operations in future periods or what the results actually would have been had Enersis completed the proposed spin-off transactions during the specified periods.
Technical Terms
References to “TW” are to terawatts; references to “GW” and “GWh” are to gigawatts and gigawatt hours, respectively; references to “MW” and “MWh” are to megawatts and megawatt hours, respectively; references to “kW” and “kWh” are to kilowatts and kilowatt hours, respectively; references to “kV” are to kilovolts, and references to “MVA” are to megavolt amperes. References to “BTU” and “MBTU” are to British thermal unit and million British thermal units, respectively. A “BTU” is an energy unit equal to approximately 1055 joules. References to “Hz” are to hertz; and references to “mtpa” are to metric tons per annum. Unless otherwise indicated, statistics provided in this information statement with respect to the installed capacity of electricity generation facilities are expressed in MW. One TW equals 1,000 GW, one GW equals 1,000 MW, and one MW equals 1,000 kW.
Statistics relating to aggregate annual electricity production are expressed in GWh and based on a year of 8,760 hours, except for leap years, which are based on 8,784 hours. Statistics relating to installed capacity and production of the electricity industry do not include electricity of self-generators. Statistics relating to our production do not include electricity consumed by us by our own generation units.
Energy losses experienced by generation companies during transmission are calculated by subtracting the number of GWh of energy sold from the number of GWh of energy generated (excluding their own energy consumption and losses on the part of the power plant), within a given period. Losses are expressed as a percentage of total energy generated.
Energy losses during distribution are calculated as the difference between total energy purchased (GWh of electricity demand, including own generation) and the energy sold (also measured in GWh), within a given period. Distribution losses are expressed as a percentage of total energy purchased. Losses in distribution arise from illegally tapped energy as well as technical losses.
Calculation of Economic Interest
References are made in this information statement to the “economic interest” of Enersis Chile in its related companies. In circumstances where we do not directly own an interest in a related company, our economic
15
Table of Contents
interest in such ultimate related company is calculated by multiplying the percentage of economic interest in a directly held related company by the percentage of economic interest of any entity in the ownership chain of such related company. For example, if we own 60% of a directly held combined entity and that combined entity owns 40% of an associate, our economic interest in such associate would be 60% times 40%, or 24%.
Rounding
Certain figures included in our combined financial statements have been rounded for ease of presentation. Percentages expressed in this information statement may not have been calculated using rounded figures, but by using amounts prior to rounding. For this reason, percentages expressed in this information statement may vary from those obtained by performing the same calculations using figures in our combined financial statements. Certain other amounts that appear in the tables in this information statement may not total exactly due to rounding.
16
Table of Contents
This information statement contains statements that are or may constitute forward-looking statements within the meaning of Section 27A of the Securities Act of 1933, as amended, and Section 21E of the Securities Exchange Act of 1934, as amended (the “Exchange Act”). These statements appear throughout this information statement and include statements regarding our intent, belief or current expectations, including but not limited to any statements concerning:
| • | our capital investment program; |
| • | trends affecting our financial condition or results from operations; |
| • | our dividend policy; |
| • | the future impact of competition and regulation; |
| • | political and economic conditions in the countries in which we or our related companies operate or may operate in the future; |
| • | any statements preceded by, followed by or that include the words “believes”, “expects”, “predicts”, “anticipates”, “intends”, “estimates”, “should”, “may” or similar expressions; and |
| • | other statements contained or incorporated by reference in this information statement regarding matters that are not historical facts. |
Because such statements are subject to risks and uncertainties, actual results may differ materially from those expressed or implied by such forward-looking statements. Factors that could cause actual results to differ materially include, but are not limited to:
| • | changes in the Chilean regulatory framework of the electricity industry; |
| • | our ability to implement proposed capital expenditures, including our ability to arrange financing where required; |
| • | the nature and extent of future competition in our principal markets; |
| • | the factors discussed below under “Risk Factors.” |
You should not place undue reliance on such statements, which speak only as of the date that they were made. Our independent registered public accounting firm has not examined or compiled the forward-looking statements and, accordingly, does not provide any assurance with respect to such statements. You should consider these cautionary statements together with any written or oral forward-looking statements that we may issue in the future. We do not undertake any obligation to release publicly any revisions to forward-looking statements contained in this information statement to reflect later events or circumstances or to reflect the occurrence of unanticipated events.
For all these forward-looking statements, we claim the protection of the safe harbor for forward-looking statements contained in the Private Securities Litigation Reform Act of 1995.
17
Table of Contents
RECENT DEVELOPMENTS
[●]
18
Table of Contents
| Item 1. | Identity of Directors, Senior Management and Advisers |
A. Directors and Senior Management
For information regarding our directors and senior management, see “Item 6. Directors, Senior Management and Employees—A. Directors and Senior Management.”
B. Advisors
Not applicable.
C. Auditors
Our combined financial statements as of September 30, 2015, December 31, 2014 and 2013, and as of January 1, 2013 and for the nine months ended September 30, 2015 and the years ended December 31, 2014 and 2013 were audited by Ernst & Young Servicios Profesionales de Auditoría y Asesorías Limitada (“EY Ltda.”), with offices at Avenida Presidente Riesco 5435, 4th floor, Santiago, Chile. EY is a member of Ernst & Young Global Limited and is an independent registered public accounting firm registered with the Public Company Accounting Oversight Board (“PCAOB”).
| Item 2. | Offer Statistics and Expected Timetable |
Not applicable.
| Item 3. | Key Information |
A. Selected Financial Data
The following combined financial data should be read in conjunction with our combined financial statements included in this information statement. The selected combined financial data as of September 30, 2015, December 31, 2014 and 2013 and January 1, 2013 and for the nine months ended September 30, 2015 and 2014 (unaudited) and for the years ended December 31, 2014 and 2013 are derived from our combined financial statements included in this information statement. The audited combined financial statements represent Enersis Chile’s first publication of financial statements prepared in accordance with IFRS, as issued by the IASB.
Amounts are expressed in millions, except for operating data. For the convenience of the reader, all data presented in U.S. dollars, as of and for the nine months ended September 30, 2015 and as of and for the year ended December 31, 2014, has been converted at the U.S. dollar Observed Exchange Rate (dólar observado) for September 30, 2015 of Ch$ 698.72 per US$ 1.00. The Observed Exchange Rate, which is reported and published daily on the Central Bank of Chile’s web page, corresponds to the weighted average exchange rate of the previous business day’s transactions in the Formal Exchange Market.
For more information concerning historical exchange rates, see “ — Exchange Rates” below.
19
Table of Contents
The following tables set forth our selected combined financial and other operating data for the periods indicated:
| Nine months ended September 30, | Year ended December 31, | |||||||||||||||||||||||
| 2015(1) | 2015 | 2014 | 2014(1) | 2014 | 2013 | |||||||||||||||||||
| (US$ millions) | (Ch$ millions) | (US$ millions) | (Ch$ millions) | |||||||||||||||||||||
| (unaudited) | ||||||||||||||||||||||||
COMBINED STATEMENT OF INCOME DATA | ||||||||||||||||||||||||
Revenues and other operating income | 2,522 | 1,762,199 | 1,498,862 | 2,933 | 2,049,065 | 1,738,083 | ||||||||||||||||||
Operating expenses(2) | (2,058 | ) | (1,437,826 | ) | (1,272,427 | ) | (2,385 | ) | (1,666,315 | ) | (1,346,460 | ) | ||||||||||||
Operating income | 464 | 324,373 | 226,435 | 548 | 382,750 | 391,623 | ||||||||||||||||||
Financial income (expense), net | (120 | ) | (83,785 | ) | (59,542 | ) | (96 | ) | (67,045 | ) | (56,363 | ) | ||||||||||||
Total gain on sale of non-current assets not held for sale | 10 | 6,694 | 47,755 | 101 | 70,893 | 14,528 | ||||||||||||||||||
Other non-operating income | 11 | 7,483 | 7,729 | (78 | ) | (54,353 | ) | 24,309 | ||||||||||||||||
Income before income tax | 365 | 254,765 | 222,377 | 476 | 332,247 | 374,097 | ||||||||||||||||||
Income tax | (82 | ) | (57,497 | ) | (102,595 | ) | (190 | ) | (132,687 | ) | (61,712 | ) | ||||||||||||
Net income | 282 | 197,268 | 119,782 | 286 | 199,559 | 312,385 | ||||||||||||||||||
Net income attributable to the parent company | 214 | 149,907 | 96,244 | 233 | 162,459 | 229,527 | ||||||||||||||||||
Net income attributable to non-controlling interests | 68 | 47,361 | 23,538 | 53 | 37,100 | 82,858 | ||||||||||||||||||
| As of September 30, | As of December 31, | As of January 1, | ||||||||||||||||||||||
| 2015(1) | 2015 | 2014(1) | 2014 | 2013 | 2013 | |||||||||||||||||||
| (US$ millions) | (Ch$ millions) | (US$ millions) | (Ch$ millions) | |||||||||||||||||||||
COMBINED STATEMENT OF FINANCIAL POSITION DATA | ||||||||||||||||||||||||
Total assets | 7,370 | 5,149,298 | 7,337 | 5,126,735 | 4,820,392 | 4,618,431 | ||||||||||||||||||
Non-current liabilities | 1,793 | 1,252,992 | 1,607 | 1,122,585 | 826,478 | 922,191 | ||||||||||||||||||
Equity attributable to the parent company | 3,618 | 2,527,956 | 3,538 | 2,472,201 | 2,438,837 | 2,457,765 | ||||||||||||||||||
Equity attributable to non-controlling interests | 843 | 589,113 | 876 | 611,864 | 626,947 | 605,552 | ||||||||||||||||||
Total equity | 4,461 | 3,117,070 | 4,414 | 3,084,066 | 3,065,784 | 3,063,317 | ||||||||||||||||||
OTHER COMBINED FINANCIAL DATA | ||||||||||||||||||||||||
Capital expenditures (CAPEX)(3) | 362 | 252,814 | 281 | 196,932 | 128,239 | 143,880 | ||||||||||||||||||
Depreciation, amortization and impairment losses(4) | 168 | 117,309 | 203 | 141,623 | 127,720 | 126,265 | ||||||||||||||||||
| (1) | Solely for the convenience of the reader, Chilean peso amounts have been converted into U.S. dollars at the exchange rate of Ch$ 698.72 per U.S. dollar, as of September 30, 2015. |
| (2) | Operating expenses include selling and administration expense. |
| (3) | CAPEX figures represent effective payments for each year. |
| (4) | For further detail please refer to Notes 9C and 30 of the Notes to our interim combined financial statements. |
The nine months ended September 30, 2014 and the year ended December 31, 2014 net income presented above are based on our combined financial statements, which were prepared in accordance with IFRS as issued by the IASB. These figures would differ from the net income that would have been included in our statutory combined financial statements, if they had been filed with the SVS. This is due to the fact that our statutory combined financial statements would have been prepared in accordance with the SVS guidelines and instructions, which are composed of the IFRS as issued by the IASB and supplemental instructions from the SVS, which require that the effects of the enacted Chilean tax reform on deferred taxes to be recognized in retained earnings
20
Table of Contents
instead of the income statement as required under IFRS. As of December 31, 2014, the only SVS instruction that conflicts with IFRS is related to the effects of the Chilean tax reform that consisted in an increase in net deferred tax liabilities. This conflict has one-time effect during the year of its application, 2014, in which the net income differs depending on their preparation guidance (IFRS as issued by the IASB or SVS guidelines).
The following table sets forth the main differences in net income attributable to the parent company for the year ended December 31, 2014 and the nine months ended September 30, 2014 that were recorded:
| Year ended December 31, 2014 | Nine months ended September 30, 2014 | |||||||
| (unaudited) | ||||||||
| (Ch$ millions) | (Ch$ millions) | |||||||
Combined Financial Statements under IFRS | 162,459 | 96,244 | ||||||
Statutory Financial Statements (SVS) | 205,377 | 134,677 | ||||||
| As of and for the nine months ended September 30, | As of and for the year ended December 31, | |||||||||||||||||||||||||||
| 2015 | 2014 | 2014 | 2013 | 2012 | 2011 | 2010 | ||||||||||||||||||||||
OPERATING DATA OF COMBINED ENTITIES | ||||||||||||||||||||||||||||
Chilectra | ||||||||||||||||||||||||||||
Electricity sold (GWh) | 11,943 | 11,783 | 15,690 | 15,140 | 14,433 | 13,685 | 13,086 | |||||||||||||||||||||
Number of customers (thousands) | 1,772 | 1,727 | 1,737 | 1,694 | 1,659 | 1,638 | 1,610 | |||||||||||||||||||||
Total energy losses (%)(1) | 5.5 | % | 5.5 | % | 5.3 | % | 5.3 | % | 5.4 | % | 5.5 | % | 5.8 | % | ||||||||||||||
Endesa Chile | ||||||||||||||||||||||||||||
Installed capacity (MW)(2) | 6,351 | 6,351 | 6,351 | 5,571 | 5,571 | 5,221 | 5,221 | |||||||||||||||||||||
Generation (GWh)(2) | 13,382 | 12,995 | 18,063 | 19,438 | 19,194 | 19,296 | 19,096 | |||||||||||||||||||||
| (1) | Energy losses are calculated as the difference between total energy purchased (GWh of electricity demand, including own generation) and the energy sold (GWh), within a given period. Losses are expressed as a percentage of total energy purchased. Losses in distribution arise from illegally tapped energy as well as technical losses. |
| (2) | The 2014 and 2015 data includes the capacity and generation of GasAtacama, as a result of its combination. Prior to 2014, GasAtacama was excluded. |
Exchange Rates
Fluctuations in the exchange rate between the Chilean peso and the U.S. dollar will affect the U.S. dollar equivalent of the peso price of our shares of common stock on the Santiago Stock Exchange(Bolsa de Comercio de Santiago), the Chilean Electronic Stock Exchange (Bolsa Electrónica de Chile) and the Valparaíso Stock Exchange (Bolsa de Corredores de Valparaíso). These exchange rate fluctuations will likely affect the price of our future ADSs and the conversion of cash dividends relating to the common shares represented by future ADSs from Chilean pesos to U.S. dollars. In addition, to the extent that significant financial liabilities of the Company are denominated in foreign currencies, exchange rate fluctuations may have a significant impact on earnings.
In Chile, there are two currency markets, the Formal Exchange Market (Mercado Cambiario Formal) and the Informal Exchange Market (Mercado Cambiario Informal). The Formal Exchange Market is comprised of banks and other entities authorized by the Central Bank of Chile. The Informal Exchange Market is comprised of entities that are not expressly authorized to operate in the Formal Exchange Market, such as certain foreign exchange houses and travel agencies, among others. The Central Bank of Chile has the authority to require that certain purchases and sales of foreign currencies be carried out on the Formal Exchange Market. Both the Formal
21
Table of Contents
and Informal Exchange Markets are driven by free market forces. Current regulations require that the Central Bank of Chile be informed of certain transactions and they must be carried out through the Formal Exchange Market.
The U.S. dollar Observed Exchange Rate, which is reported by the Central Bank of Chile and published daily on its web page, is the weighted average exchange rate of the previous business day’s transactions in the Formal Exchange Market. Nevertheless, the Central Bank of Chile may intervene by buying or selling foreign currency on the Formal Exchange Market to attempt to maintain the Observed Exchange Rate within a desired range.
The Informal Exchange Market reflects transactions carried out at an informal exchange rate (the “Informal Exchange Rate”). There are no limits imposed on the extent to which the rate of exchange in the Informal Exchange Market can fluctuate above or below the Observed Exchange Rate. Foreign currency for payments and distributions with respect to the ADSs may be purchased either in the Formal or the Informal Exchange Market, but such payments and distributions must be remitted through the Formal Exchange Market.
The Federal Reserve Bank of New York does not report a noon buying rate for Chilean pesos. As of November 30, 2015, the U.S. dollar Observed Exchange Rate was Ch$ 711.20 per US$ 1.00.
The following table sets forth the low, high, average and period-end Observed Exchange Rate for U.S. dollars for the periods set forth below, as reported by the Central Bank of Chile:
| Daily Observed Exchange Rate (Ch$ per US$)(1) | ||||||||||||||||
| Low(2) | High(2) | Average(3) | Period-end | |||||||||||||
Year ended December 31, | ||||||||||||||||
2014 | 527.53 | 621.41 | 573.70 | 606.75 | ||||||||||||
2013 | 466.50 | 533.95 | 498.83 | 524.61 | ||||||||||||
2012 | 469.65 | 519.69 | 486.31 | 479.96 | ||||||||||||
2011 | 455.91 | 533.74 | 483.45 | 519.20 | ||||||||||||
2010 | 468.01 | 549.17 | 510.38 | 468.01 | ||||||||||||
Month ended | ||||||||||||||||
November 2015 | 688.94 | 715.66 | n.a. | 711.20 | ||||||||||||
October 2015 | 673.91 | 695.53 | n.a. | 690.32 | ||||||||||||
September 2015 | 676.74 | 705.92 | n.a. | 698.72 | ||||||||||||
August 2015 | 676.43 | 706.24 | n.a. | 695.25 | ||||||||||||
July 2015 | 636.39 | 672.19 | n.a. | 671.11 | ||||||||||||
June 2015 | 621.69 | 639.04 | n.a. | 639.04 | ||||||||||||
Source: Central Bank of Chile.
| (1) | Nominal figures. |
| (2) | Exchange rates are the actual low and high, on a day-by-day basis for each period. |
| (3) | The average of the exchange rates on the last day of each month during the period. |
Calculation of the appreciation or devaluation of the Chilean peso against the U.S. dollar in any given period is made by determining the percent change between the reciprocals of the Chilean peso equivalent of US$ 1.00 at the end of the preceding period and the end of the period for which the calculation is being made. For example, to calculate the devaluation of the Chilean peso for 2015, through September 30, one determines the percent change between the reciprocal of Ch$ 606.75 (the value of one U.S. dollar as of December 31, 2014) and the reciprocal of Ch$ 698.72 (the value of one U.S. dollar as of September 30, 2015). In this example, the percentage change between��0.001648 (the reciprocal of Ch$ 606.75) and 0.001431 (the reciprocal of Ch$ 698.72) is negative 13.2%, which represents the nine-month 2015 devaluation of the Chilean peso against the 2014 year-end U.S. dollar. A positive percentage change means that the Chilean peso appreciated against the U.S. dollar, while a negative percentage change means that the Chilean peso devaluated against the U.S. dollar.
22
Table of Contents
The following table sets forth the period-end rates for U.S. dollars for the nine months ended September 30, 2015 and 2014 and the years ended December 31, 2010 through 2014, based on information published by the Central Bank of Chile.
| Ch$ per US$(1) | ||||||||
| Period End | Appreciation (Devaluation) | |||||||
| (in Ch$) | (in %) | |||||||
Nine months ended September 30, | ||||||||
2015 | 698.72 | (13.2 | ) | |||||
2014 | 599.22 | (12.5 | ) | |||||
Year ended December 31, | ||||||||
2014 | 606.75 | (13.5 | ) | |||||
2013 | 524.61 | (8.5 | ) | |||||
2012 | 479.96 | 8.2 | ||||||
2011 | 519.20 | (9.9 | ) | |||||
2010 | 468.01 | 8.4 | ||||||
Source: Central Bank of Chile.
| (1) | Calculated based on the variation of period-end exchange rates. |
| B. | Capitalization and Indebtedness. |
The following table sets forth our combined capitalization and indebtedness as of September 30, 2015 on an actual basis, and as adjusted to give effect to the completion of the Spin-Off. This information should be read in conjunction with our combined financial statements and the related notes thereto as of September 30, 2015, as well as information included elsewhere in this information statement, including information in “Item 5A. Operating Results” and “Item 5B. Liquidity and Capital Resources.”
The information below is not necessarily indicative of Enersis Chile’s future capitalization or indebtedness.
| As of September 30, 2015 | ||||||||
| Enersis Chile | As Adjusted | |||||||
| (in millions of Ch$) | ||||||||
Short term debt(1): | ||||||||
Bank loans | 589 | 589 | ||||||
Unsecured liabilities | 19,020 | 19,020 | ||||||
Finance leases | 1,775 | 1,775 | ||||||
|
|
|
| |||||
Total | 21,385 | 21,385 | ||||||
Long term debt(1): | ||||||||
Unsecured liabilities | 798,286 | 798,286 | ||||||
Finance leases | 18,987 | 18,987 | ||||||
|
|
|
| |||||
Total | 817,273 | 817,273 | ||||||
Total Debt | 838,657 | 838,657 | ||||||
Equity attributable to the parent company | 2,527,956 | 2,433,803 | ||||||
Non-controlling interest | 589,113 | 535,641 | ||||||
|
|
|
| |||||
Total Capitalization | 3,955,726 | 3,808,101 | ||||||
|
|
|
| |||||
| (1) | Includes debt payable to third parties before the effect of derivatives. For further detail please refer to Note 20 of the Notes to our interim combined financial statements. |
23
Table of Contents
| C. | Reasons for the Offer and Use of Proceeds. |
Not applicable.
| D. | Risk Factors. |
Risks Related to Our Business
A financial or other crisis in any region worldwide can have a significant impact in Chile, and consequently, may adversely affect our operations as well as our liquidity.
Chile is vulnerable to external shocks, including financial and political events, which could cause significant economic difficulties and affect its growth. If the Chilean economy experiences lower than expected economic growth or a recession, it is likely that some of our customers may experience difficulties paying their electric bills, possibly increasing our uncollectible accounts. Any of these situations could adversely affect our results of operations and financial condition.
Financial and political crises in other parts of the world could also adversely affect our business. For example, instability in the Middle East or in other oil producing regions could result in higher fuel prices worldwide, which in turn could increase the cost of fuel for our thermal generation plants and adversely affect our results of operations and financial condition.
In addition, an international financial crisis and its disruptive effects on the financial industry could adversely impact our ability to obtain new bank financings on the same historical terms and conditions. A financial crisis could also diminish our ability to access the capital markets in Chile, as well as the international capital markets, for other sources of liquidity, or increase the interest rates available to us. Reduced liquidity could, in turn, adversely affect our capital expenditures, our long-term investments and acquisitions, our growth prospects and our dividend payout policy.
Chilean economic fluctuations could affect our results of operations and financial condition as well as the value of our securities.
All of our operations are located in Chile. Accordingly, our combined revenues may be affected by the performance of the Chilean economy. If local, regional or worldwide economic trends adversely affect the Chilean economy, our financial condition and results from operations could be adversely affected. Moreover, insufficient cash flows for our combined entities could result in their inability to meet debt obligations and the need to seek waivers to comply with restrictive debt covenants.
Considering that we only have investments in Chile and the electricity business closely tracks GDP fluctuations, our financial condition and results of operations are strictly dependent on the Chilean economic performance. According to the Latin American Consensus Forecast published by Consensus Economics Inc. on September 14, 2015, in 2014, Chilean GDP increased by 1.9% compared to a 4.2% in 2013, while in 2015, it is forecasted to grow by 2.2% and in 2016 by 2.6%.
During 2015, the Chilean economy has been affected mainly by the economic uncertainty derived from the global contraction in several commodities markets, such as copper, which has affected the exchange rate evolution, as well as the several law reforms still under discussion by the Chilean authorities (tax, labor, education, among others), and the possibility of a reform to the Chilean Constitution.
Future adverse developments in Chile may impair our ability to execute our strategic plans, which could adversely affect our results of operations and financial condition. In addition, Chilean financial and securities markets are influenced by economic and market conditions in other countries and may be adversely affected by events in other countries, which could adversely affect the value of our securities.
24
Table of Contents
To a certain degree, Chile has registered certain economic interventionist measures by governmental authorities, which may adversely affect our business and financial results.
The Chilean government has exercised in the past, and continues to exercise, a substantial influence over many aspects of the private sector, which may result in changes to economic or other policies. For example, in September 2014, the Chilean government approved the progressive increase of the corporate income tax and a change in the tax system, which may have an additional negative effect upon non-Chilean holders of shares or ADSs. In addition, taxes may be due on accrued dividends prior to their payments depending on the tax mechanism elected. Recently, different social and economic agents in the country have pressed for a more simple taxation system. As a consequence, there are currently internal discussions on whether to amend some of the taxation rules in force. Governmental actions could involve wage, price and tariff rate controls and other interventionist measures, such as expropriation or nationalization.
Changes in the policies of these governmental and monetary authorities regarding tariffs, exchange controls, regulations and taxation could reduce our profitability. Inflation, devaluation, social instability and other political, economic or diplomatic developments, including the response by governments in the region to these circumstances, could also reduce our profitability. Any of these scenarios could adversely affect our results of operations and financial condition.
Our electricity business is subject to risks arising from natural disasters, catastrophic accidents and acts of terrorism, which could adversely affect our operations, earnings and cash flow.
Our primary facilities include power plants and distribution assets, pipelines, liquefied natural gas (“LNG”) terminals and re-gasification plants, storage and chartered LNG tankers. Our facilities may be damaged by earthquakes, flooding, fires, and other catastrophic disasters arising from natural or accidental human causes, as well as acts of terrorism. A catastrophic event could cause disruptions in our business, significant decreases in revenues due to lower demand or significant additional costs to us not covered by our business interruption insurance. There may be lags between a major accident or catastrophic event and the final reimbursement from our insurance policies, which typically carry a deductible and are subject to per event policy maximums.
As an example, on February 27, 2010, Chile experienced a major earthquake in the Bío-Bío region, with a magnitude of 8.8 on the Richter scale, followed by a very destructive tsunami. Our Bocamina I and Bocamina II thermal generation units, which are located near the epicenter, sustained significant damage as a result of the earthquake. More recently, on September 16, 2015, Chile experienced an 8.3-magnitude earthquake in the Coquimbo region, followed by a tsunami, though there was no significant damage to any of our power facilities.
We are subject to financing risks, such as those associated with funding our new projects and capital expenditures, and risks related to refinancing our maturing debt; we are also subject to debt covenant compliance, all of which could adversely affect our liquidity.
As of September 30, 2015, our combined debt totaled Ch$ 942 billion (net of currency hedging instruments).
Our debt had the following maturity profile:
| • | Ch$ 31 billion in 2016; |
| • | Ch$ 109 billion from 2017 to 2018; |
| • | Ch$ 49 billion from 2019 to 2020; and |
| • | Ch$ 752 billion thereafter. |
Some of our debt agreements are subject to (1) financial covenants, (2) affirmative and negative covenants, (3) events of default, (4) mandatory prepayments for contractual breaches, and (5) certain change of control
25
Table of Contents
clauses for material mergers and divestments, among other provisions. A significant portion of our combined entities’ financial indebtedness is subject to cross default provisions, which have varying definitions, criteria, materiality thresholds and applicability with respect to combined entities that could give rise to such a cross default.
In the event that we or our combined entities breach any of these material contractual provisions, our creditors and bondholders may demand immediate repayment, and a significant portion of our indebtedness could become due and payable. We may be unable to refinance our indebtedness or obtain such refinancing on terms acceptable to us. In the absence of such refinancing, we could be forced to dispose of assets in order to make the payments due on our indebtedness under circumstances that might not be favorable to obtaining the best price for such assets. Furthermore, we may be unable to sell our assets quickly enough, or at sufficiently high prices, to enable us to make such payments.
We may also be unable to raise the necessary funds required to finish our projects under development or under construction. Market conditions prevailing at the moment we require these funds or other unforeseen project costs can compromise our ability to finance these projects and expenditures.
Our inability to finance new projects or capital expenditures or to refinance our existing debt could adversely affect our results of operation and financial condition.
We may be unable to enter into suitable investments, alliances and acquisitions.
On an ongoing basis, we review acquisition prospects that may increase our market coverage or supplement our existing businesses, though there can be no assurance that we will be able to identify and consummate suitable acquisition transactions in the future. The acquisition and integration of independent companies that we do not control is generally a complex, costly and time-consuming process and requires significant efforts and expenditures. If we consummate an acquisition, it could result in the incurrence of substantial debt and assumption of unknown liabilities, the potential loss of key employees, amortization expenses related to tangible assets and the diversion of management’s attention from other business concerns. In addition, any delays or difficulties encountered in connection with acquisitions and the integration of multiple operations could have a material adverse effect on our business, financial condition or results of operations.
Because our generation business depends heavily on hydrological conditions, droughts and climate change may adversely affect our operations and profitability.
Approximately 54.6% of our combined installed generation capacity as of September 30, 2015 was hydroelectric. Accordingly, extreme hydrological conditions and climate change could adversely affect our business, results of operations and financial condition. In the last few years before 2015, Chilean hydrological conditions have been affected by the La Niña climate phenomenon that influences rainfall, resulting in droughts. In addition, the ongoing drought in Chile not only reduced our ability to operate our hydroelectric plants at full capacity, but also resulted in increased number of disputes with both the Chilean government and local farmers over water use. As a result of such disputes, Endesa Chile has entered into agreements with both the Chilean government and the farmers that further restrict its ability to use water for hydroelectric generation. If drought conditions persist or become worse, we may face increased pressure by the Chilean government or other third parties to further restrict our water use.
Droughts also affect the operation of our thermal plants, including our facilities that use natural gas, fuel oil or coal as fuel, in the following manner:
| • | During drought periods, thermal plants are used more frequently. Thermal plant operating costs can be considerably higher than those of hydroelectric plants. Our operating expenses increase during these periods. In addition depending on our commercial obligations, we may have to buy electricity at spot |
26
Table of Contents
prices in order to meet our contractual supply obligations and the cost of these electricity purchases may exceed the price at which we sell contracted electricity, thus potentially producing losses from those contracts. |
| • | Our thermal plants require water for cooling and droughts not only reduce the availability of water, but also increase the concentration of chemicals, such as sulfates in the water. The high concentration of chemicals in the water we use for cooling increases the risk of damaging the equipment at our thermal plants as well as the risk of violating environmental regulations. As a result, we have had to purchase water from agricultural areas that are also experiencing shortages of water. These water purchases may increase our operating costs and also require us to further negotiate with the local communities. |
| • | Thermal power plants burning gas generate emissions such as sulfur dioxide (SO2) and nitrogen oxide (NOx) gases. When operating with diesel, they also release particulate matter into the atmosphere. Coal fired plants generate emissions of SO2 and NO2. Therefore, greater use of thermal plants during periods of drought increases the risk of producing a higher level of pollutants. |
In addition, according to certain weather forecast models, the drought that is affecting the regions where most of our hydroelectric plants are located may last for an extended period and may recur in the future. A prolonged drought will exacerbate the risks described above and have a further adverse effect upon our business, results of operations and financial condition.
Governmental regulations may adversely affect our business.
We are subject to extensive regulation on the tariffs we charge to our customers and on other aspects of our business, and these regulations may adversely affect our profitability. For example, the Chilean government can impose electricity rationing during droughts or prolonged failures of power facilities. During rationing, if we are unable to generate enough electricity to comply with our contractual obligations, we may be forced to buy electricity at the spot price, as even a severe drought does not release us from our contractual obligations as aforce majeure event. The spot price may be significantly higher than our costs to generate the electricity and can be as high as the “cost of failure” set by the Chilean National Energy Commission (Comisión Nacional de Energíaor “CNE”). This “cost of failure,” which is updated semiannually by the CNE, is a measurement of how much final users would pay for one extra MWh under rationing conditions. If we are unable to buy enough electricity at the spot price to comply with our contractual obligations, we would have to compensate our regulated customers for the electricity we failed to provide at the rationed price. Rationing periods have occurred in the past and may occur in the future. Our generation combined entities may be required to pay regulatory penalties if they fail to provide adequate service under their contractual obligations. Material rationing policies imposed by Chilean regulatory authorities could adversely affect our business, results of operations and financial condition.
The distribution tariff review process, or tariff adjustments determined by Chilean governmental authorities may be insufficient to pass through our costs. Similarly, electricity regulations issued by governmental authorities in Chile may affect the ability of our generation companies to collect revenues sufficient to offset their operating costs.
The inability of any company in our combined group to collect revenues sufficient to cover operating costs may affect the ability of that company to operate as a going concern and may otherwise have an adverse effect on our business, financial results and operations.
In addition, changes in the regulatory framework are often submitted to the legislators and administrative authorities and, some of these changes could have a material adverse impact on our business and affect our results. For instance, in 2005 there was a change in the water rights’ law in Chile that requires us to pay for unused water rights. In addition, the Chilean government is initiating a review of the current energy policies through an energy agenda presented in May 2014. These changes could adversely affect our business, results of operations and financial condition.
27
Table of Contents
Our business and profitability could be adversely affected if water rights are denied or if water concessions are granted with limited duration.
Approximately 54.6% of our installed capacity is hydroelectric. We own water rights granted by the Chilean Water Authority (Dirección General de Aguas or “DGA”) for the supply of water from rivers and lakes near our production facilities. Under current law, these water rights are (i) for unlimited duration, (ii) absolute and unconditional property rights and (iii) not subject to further challenge. Chilean generation companies must pay an annual license fee for unused water rights. New hydroelectric facilities are required to obtain water rights, the conditions of which may impact design, timing or profitability of a project.
In addition, the Chilean Congress is currently discussing amendments to the Water Code in order to prioritize the use of water by defining its access as a human right that must be guaranteed by the State. The amendment will establish that water use for human consumption, domestic subsistence and sanitation will always take precedence, in both the granting and limiting the exercise of rights of exploitation. Under the proposal: (i) water use concessions would be limited to 30 years, which would be extendable with respect to water rights actually used during the 30-year period, unless the Chilean Water Authority demonstrates the water rights have not been used effectively; (ii) new non-consumptive water rights would expire if the holder does not exercise the rights within eight years; and (iii) existing non-consumptive water rights and have not been used would expire within 8 years from the date of enactment of the new Water Code. Any limitations on our current water rights, our need for additional water rights, or our current unlimited duration of water concessions could have a material adverse effect on our hydroelectric development projects and our profitability.
Regulatory authorities may impose fines on our combined entities, which could adversely affect our results of operations and financial condition.
Our electricity businesses may be subject to regulatory fines for any breach of current regulations, including energy supply failures. In Chile, such fines may be imposed for a maximum of 10,000 Annual Tax Units (Unidades Tributarias Anuales or “UTA”), or Ch$ 5.3 billion using the UTA and foreign exchange rate as of September 30, 2015. Our electricity generation combined entities are supervised by local regulatory entities and may be subject to these fines in cases where, in the opinion of the regulatory entity, operational failures affecting the regular energy supply to the system are the fault of the company such as when agents are not coordinated with the system operator. In addition, our combined entities may be required to pay fines or compensate customers if those combined entities are unable to deliver electricity, even if such failure is due to forces outside of the combined entities’ control.
For example, in 2011, the Chilean Superintendence of Electricity and Fuels (Superintendencia de Electricidad y Combustibles or “SEF”) imposed 1,947 UTA (approximately Ch$ 1,033 million) in fines on Endesa Chile, Pehuenche and Chilectra due to a blackout that occurred in the Santiago metropolitan region in March 2010. More recently, and as of the date of this information statement, Chilectra has been fined in three different occasions by the electricity authority for a total amount of Ch$ 2,549 million, mainly due to regulatory breaches in relation to safety procedures and delay in the replenishment of supply and attention to users’ calls during a front of bad weather that occurred in July 2015. Those penalties have not been paid yet, since they were claimed before the electricity authority and courts of justice. For further information on fines, please refer to Note 37 of the Notes to our interim combined financial statements.
We depend in part on payments from our combined entities, jointly-controlled entities and associates to meet our payment obligations.
In order to pay our obligations, we rely partly on cash from dividends, loans, interest payments, capital reductions and other distributions from our combined entities. The ability of our combined entities to pay dividends, interest payments, loans and other distributions to us is subject to legal constraints such as dividend restrictions, fiduciary duties and contractual limitations that may be imposed by local authorities.
28
Table of Contents
Historically, we have been able to access the cash flows of our combined entities, but future economic and political uncertainties, such as government regulations, economic conditions and credit restrictions, could affect our future results from operations, and therefore we may not be able to rely on cash flows from operations in those entities to repay our debt.
Dividend Limits and Other Legal Restrictions. The ability of any of our combined entities that are not wholly-owned to distribute cash to us may be limited by the directors’ fiduciary duties of such combined entities to their minority shareholders. Furthermore, some of our combined entities may be forced by law, in accordance with applicable regulation, to diminish or eliminate dividend payments. As a consequence of such restrictions, our combined entities could, under certain circumstances, be impeded from distributing cash to us.
Contractual Constraints. Distribution restrictions included in certain credit agreements of our combined entities may prevent dividends and other distributions to shareholders if they are not in compliance with certain financial ratios. Generally, our credit agreements prohibit any type of distribution if there is an ongoing default.
Operating Results of Our Combined Entities. The ability of our combined entities to pay dividends or make loan payments or other distributions to us is limited by their operating results. To the extent that the cash requirements of any of our combined entities exceed their available cash, the combined entity will not be able to make cash available to us.
Any of the situations described above could adversely affect our business, results of operations and financial condition.
Foreign exchange risks may adversely affect our results and the U.S. dollar value of dividends payable to ADS holders.
The Chilean peso has been subject to devaluations and appreciations against the U.S. dollar and may be subject to significant fluctuations in the future. Historically, a significant portion of our combined indebtedness has been denominated in U.S. dollars. Although a substantial portion of our operating cash flows is linked to U.S. dollars (primarily coming from the generation business), we generally have been and will continue to be materially exposed to fluctuations of the Chilean peso against the U.S. dollar because of time lags and other limitations to peg our tariffs to the U.S. dollar.
A substantial portion of our operating cash flows is linked to U.S. dollars, and we seek to maintain debt in the same currency, but due to market conditions it may not be possible to do so. Because of this exposure, the cash generated by our combined entities can decrease substantially due to devaluations against the U.S. dollar. Future volatility in the exchange rate of the currency in which we receive revenues or incur expenditures may adversely affect our business, results of operations and financial condition.
We are involved in litigation proceedings.
We are currently involved in various litigation proceedings, which could result in unfavorable decisions or financial penalties against us. We will continue to be subject to future litigation proceedings, which could cause material adverse consequences to our business.
For example, in August 2014, the Chilean Superintendence of Environment (“SMA” in its Spanish acronym) fined Endesa Chile 8,640 UTAs (approximately Ch$ 4.6 billion) for alleged environmental violations related to the Bocamina II power plant. Endesa Chile appealed the fine and in March 2015, the Environmental Court of Valdivia partially voided the fine, but ordered the SMA to consider additional aggravating circumstances in re-calculating the amount of the fine. Endesa Chile appealed that decision to the Supreme Court, which appeal is currently pending. Nevertheless, a provision for this fine was included in our combined financial statements since the beginning of this litigation proceeding. Our financial condition or results of
29
Table of Contents
operations could be adversely affected if we are unsuccessful in defending this litigation or other lawsuits and proceedings against us. For further information on litigation proceedings, please see Note 36.3 of the Notes to our interim combined financial statements.
The values of our generation business’s combined entities’ long-term energy supply contracts are subject to fluctuations in the market prices of certain commodities and other factors.
We have economic exposure to fluctuations in the market prices of certain commodities as a result of the long-term energy sales contracts into which we have entered. We and our combined entities have material obligations as selling parties under long-term fixed-price electricity sales contracts. Prices in these contracts are indexed according to different commodities, the exchange rate, inflation, and the market price of electricity. Adverse changes to these indices would reduce the rates we charge under our long-term fixed-price electricity sales contracts, which could adversely affect our business, results of operations and financial condition.
Our controlling shareholder will exert a substantial influence over us and may have a strategic view for our development different from that of our minority shareholders.
After the completion of the Spin-Off, Enel will beneficially own 60.6% of our share capital. Our controlling shareholder will have the power to determine the outcome of substantially all material matters that require shareholder votes, such as the election of the majority of our board members and, subject to contractual and legal restrictions, our dividend policy. Enel will also exercise decisive influence over our business strategy and operations. Its interests may in some cases differ from those of our minority shareholders. For example, Enel conducts its renewable energies business in South America through Enel Green Power S.p.A. (“EGP”) and the Argentine, Brazilian, Colombian and Peruvian electricity business through Enersis Américas, in neither of which we will have equity interests. Enel currently owns 68% of EGP and eventually could increase its ownership up to 100% according to recent announcements. Enel may prefer to grow in the renewable energies through EGP and not through us, especially after increasing its ownership stake. Enel has recently committed that if the Reorganization is completed in all respects, it will, or will direct one or more of its subsidiaries, to negotiate an agreement with Endesa Chile for joint investments in renewable energy projects in Chile. However, we do not know whether such initiatives will prosper, and even if they do prosper, whether NCRE growth will be channeled to a greater degree through other vehicles and not through us. Any present or future conflict of interest affecting Enel may be resolved against our best interests in these matters. As a consequence, our growth may be potentially limited, and our business and results of operations may be adversely affected.
Environmental regulations and other factors may cause delays, impede the development of new projects or increase the costs of operations and capital expenditures.
Our operating combined entities are subject to environmental regulations which, among other things, require us to perform environmental impact studies for future projects and obtain permits from both local and national regulators. The approval of these environmental impact studies may take longer than planned and may be withheld by governmental authorities. Local communities and ethnic and environmental activists, among others, may intervene in the approval process to delay or prevent a project’s development. They may also seek injunctive or other relief, which could negatively impact us if they are successful.
Environmental regulations for existing and future generation capacity may become stricter, requiring increased capital investments. For example, Decree 13 of the Chilean Ministry of the Environment, promulgated in January 2011 and published in June 2011, defined stricter emission standards for thermoelectric plants that must be met between 2014 and 2016, and stricter standards for new facilities or additional capacity. This regulation also requires the establishment of a system of continuous emission monitoring, pursuant to which thermoelectric plants must implement a monitoring system in accordance with the guidelines and protocols issued by the Chilean Superintendence of the Environment. Failure to certify the implementation of such monitoring system may result in penalties and sanctions. In September 2014, the Chilean government enacted
30
Table of Contents
Law 20,780 (a tax reform law), which established an annual tax on stationary power generators, such as thermal generators, tied to their emission of pollutants for the previous year. When this provision of the law enters into force in 2018, it will apply to generators with a capacity of at least 50 MW. In compliance with these Chilean environmental regulations, all thermal plants are expected to incur in incremental investments so as to comply with the new regulations by installing abatement systems to control pollutant emissions. Any delay in the filing may constitute a violation of the regulations which established emission limits effective on June 23, 2015 or June 23, 2016 depending on the plant’s location.
In 2009, we presented our 740 MW coal-fueled Punta Alcalde project for environmental approval in Chile. In 2012, the regional environmental authority rejected the project and we appealed to the Council of Ministers. The Council unanimously reversed the decision of the environmental authority, and issued an environmental qualification resolution (“RCA” in its Spanish acronym) in December 2012. However, the Court of Appeals accepted four injunctions against us in early 2013. In January 2014, the Chilean Supreme Court ruled that the project could proceed but imposed several conditions in the RCA, including steps to improve air quality in the nearby town of Huasco. In addition, the Chilean Supreme Court requested certain environmental evaluations (including an evaluation for the transmission line). In light of the changes requested by the Chilean Supreme Court, we concluded that major modifications to the approved RCA were needed in order to make the Punta Alcalde project economically sustainable. On January 29, 2015, we decided to stop the development of the project and the associated Punta Alcalde - Maitencillo transmission project. As a consequence, we recorded a Ch$ 12,582 million impairment loss that affected Endesa Chile’s 2014 net income by Ch$ 9,184 million.
In addition to environmental matters, there are other factors that may adversely affect our ability to build new facilities or to complete projects currently under development on time, including delays in obtaining regulatory approvals, shortages or increases in the price of equipment, materials or labor, strikes, adverse weather conditions, natural disasters, civil unrest, accidents, or other unforeseen events. Any such event could adversely impact our results of operations and financial condition.
Delays or modifications to any proposed project and laws or regulations may change or be interpreted in a manner that could adversely affect our operations or our plans for companies in which we hold investments, which could adversely affect our business, results of operations and financial condition.
Our business may be adversely affected by judicial decisions on environmental qualification resolutions for electricity projects in Chile.
The amount of time necessary to obtain an environmental qualification resolution for electricity generation or transmission projects in Chile has materially increased, primarily due to judicial decisions against such projects, environmental opposition, social criticism and government delays. This can cast doubt on the ability of a project to obtain such approval and increase the uncertainty for investing in electricity generation and transmission projects in Chile. The uncertainty is forcing companies to reassess their business strategies as the delay in the construction of electricity generation and transmission projects may result in a supply constraints over the next five or six years. If any plant within the system ceases operation unexpectedly, we could experience supply shortages in our system, which could lead to power cuts. Any such event could adversely affect our business, results of operations and financial condition.
Our power plant projects may encounter significant opposition from different groups that may delay their development, increase costs, damage our reputation and potentially result in impairment of our goodwill with stakeholders.
Our reputation is the foundation of our relationship with key stakeholders and other constituencies. If we are unable to effectively manage real or perceived issues that could negatively impact sentiments toward us, our business, results of operations and financial condition could be adversely affected.
31
Table of Contents
The development of new and existing power plants may face opposition from several stakeholders, such as ethnic groups, environmental groups, land owners, farmers, local communities and political parties, among others, all of which may impact the sponsoring company’s reputation and goodwill. For example, since December 2013, the Bocamina II power plant has encountered substantial opposition from local fishermen’s unions that claim that our facility negatively affects marine life and causes pollution, which resulted in the interruption of the operation of the power plant for more than a year. On July 1, 2015, the Bocamina II power plant resumed operations, after the approval of a new RCA in March 2015. Such groups are sometimes financed internationally and may receive global attention. The operation of our current thermal power plants may also affect our goodwill with stakeholders, due to emissions such as particulate matter, sulfur dioxide and nitrogen oxides, which could adversely affect the environment.
Damage to our reputation may exert considerable pressure on regulators, creditors, and other stakeholders and ultimately lead to projects and operations that may not be optimal, causing our share prices to drop and hindering our ability to attract or retain valuable employees, all of which could result in an impairment of our goodwill with stakeholders.
We may be exposed to asbestos liability and additional expense related to asbestos.
Several of our facilities have asbestos present in them. We have a policy regarding asbestos control and sanitation, which includes a detailed action plan regarding the detecting the presence of asbestos, measuring air quality, ensuring the compliance with safety requirements, as well as a plan to monitor the health of workers.
In April 2015, Endesa Chile completed the removal of the identifiable asbestos from the Bocamina I power plant. However, some Akeron Caf employees, working for the contractor removing asbestos in the power plant, reported to the regional Health Ministerial Office (“Seremi” in its Spanish acronym) that their health had beem affected subsequently. According to Chilean regulations, any company that removes asbestos must present a work plan, which must be approved by the Seremi and supervised by the Workers Safety Association (“Mutal de Seguridad”) to avoid workers being contaminated with asbestos. After an investigation, in September 2015, the Seremi of the Bio-Bío region fined Endesa Chile for Ch$ 22 million because it did not record the delivery of security materials to remove asbestos on an individual basis. Endesa Chile appealed the decision, which is still pending. In addition, Endesa Chile is implementing asbestos removal plans in the Tarapacá, Huasco and Ralco power plants, which processes could also be affected by similar problems.
We may have to incur in additional costs to remediate and implement our asbestos control and sanitation policy, or be subject to legal actions against us, which in turn may have a material adverse effect on our business, results of operation and financial condition as well as our reputation.
Our business may experience adverse consequences if we are unable to reach satisfactory collective bargaining agreements with our unionized employees.
A large percentage of our employees are members of unions and have collective bargaining agreements that must be renewed on a regular basis. Our business, financial condition and results of operations could be adversely affected by a failure to reach agreement with any labor union representing such employees or by an agreement with a labor union that contains terms we view as unfavorable. Chilean law provides legal mechanisms for judicial authorities to impose a collective agreement if the parties are unable to come to an agreement, which may increase our costs beyond what we have budgeted.
In addition, we employ many highly-specialized employees, and certain actions such as strikes, walk-outs or work stoppages by these employees, could adversely impact our business, results of operations and financial condition.
32
Table of Contents
Interruption or failure of our information technology and communications systems or external attacks to or breaches of these systems could have an adverse effect on our operations and results.
We depend on information technology, communication and processing systems (“IT Systems”) to operate our businesses, the failure of which could adversely affect our business, results of operations and financial condition.
IT Systems are all vital to our generation combined entities’ ability to monitor our power plants’ operations, maintain generation and network performance, adequately generate invoices to customers, achieve operating efficiencies and meet our service targets and standards. Our distribution combined entities could also be affected adversely because they rely heavily on IT Systems to monitor their grids, billing processes for millions of customers and customer service platforms. Temporary or long-lasting operational failures of any of these IT Systems could have a material adverse effect on our results of operations. Additionally, cyber attacks can have an adverse effect on the company’s image and its relationship with the community. In the last few years, global cyber attacks on security systems, treasury operations, and IT Systems have intensified. We are exposed to cyber-terrorist attacks aimed at damaging our assets through computer networks, cyber spying involving strategic information that may be beneficial for third parties and cyber-theft of proprietary and confidential information, including information of our customers. During 2014, we suffered two cyber attacks perpetrated by a cyber-terrorist group, which impacted our websites. In one case, the attack resulted in a service interruption of 90 minutes. Further cyber attacks may occur and may affect us in the future.
We rely on electricity transmission facilities that we do not own or control. If these facilities do not provide us with an adequate transmission service, we may not be able to deliver the power we sell to our final customers.
We depend on transmission facilities owned and operated by other unaffiliated power companies to deliver the electricity we sell. This dependence exposes us to several risks. If transmission is disrupted, or transmission capacity is inadequate, we may be unable to sell and deliver our electricity. If a region’s power transmission infrastructure is inadequate, our recovery of sales costs and profits may be insufficient. If restrictive transmission price regulation is imposed, transmission companies upon whom we rely may not have sufficient incentives to invest in expansion of their transmission infrastructure, which could adversely affect our operations and financial results. Currently, the construction of new transmission lines is taking longer than in the past, mainly because of new social and environmental requirements that are creating uncertainty about the probability of completing the projects. In addition, the increase of new non-conventional renewable energy (“NCRE”) projects is congesting the current transmission system as these projects can be built relatively quickly, while new transmission projects can take as long as seven years to be built.
On September 24, 2011, nearly 10 million people located in central Chile experienced a blackout (affecting more than half of the Chilean population), due to the failure of Transelec’s 220 kV Ancoa substation. The failure led to the disruption of two 500 kV transmission lines in the Chilean Central Interconnected System (“SIC” in its Spanish acronym) and the subsequent failure of the remote recovery computer software used by the independent entity that coordinates generators, transmission companies and large customers (“CDEC” in its Spanish acronym) to operate the grid. This blackout, which lasted two hours, exposed weaknesses in the transmission grid and its need for expansion and technological improvements to increase the reliability of the transmission grid.
Any such disruption or failure of transmission facilities could interrupt our business, which could adversely affect our results of operations and financial condition.
Lawsuits against us brought outside Chile or complaints against us based on foreign legal concepts may be unsuccessful.
All of our assets are located outside of the United States. All of our directors and officers are expected to reside outside of the United States and most of their assets are expected to be located outside the United States as
33
Table of Contents
well. If any investor were to bring a lawsuit against our directors, officers or experts in the United States, it may be difficult for them to effect service of legal process within the United States upon these persons, or to enforce against them, in United States or Chilean courts, judgments obtained in United States courts based upon the civil liability provisions of the federal securities laws of the United States. In addition, there is doubt as to whether an action could be brought successfully in Chile on the basis of liability based solely upon the civil liability provisions of the United States federal securities laws.
Risks Related to the Spin-Off
There may not be a liquid market for our shares.
There is currently no public market for our shares. It is expected that our shares will be listed on the Chilean Stock Exchanges and our ADSs will be listed on the NYSE after the effectiveness of the Spin-Off. There can be no assurance as to the liquidity of any markets that may develop for our shares or ADSs or the price at which our shares or ADSs may trade. Also, the liquidity and the market for our shares or ADSs may be affected by a number of factors including variations in exchange and interest rates, the deterioration and volatility of the markets for similar securities and any changes in our liquidity, financial condition, creditworthiness, results and profitability and uncertainty with respect to the consummation of the Merger. As a result, the initial trading prices of our shares and ADSs may not be indicative of future trading prices. In addition, trading volumes of our shares and ADSs, in the aggregate, may be significantly less liquid than trading volumes of Enersis’ shares and ADSs before theSpin-Off.
Enersis’ historical performance may not be representative of our performance as a separate company.
Our combined financial statements are based on the historical results of operations and historical bases of the assets and liabilities of the former Chilean businesses of Enersis. Our historical performance might have been different if it had been a separate, entity during the periods presented. The historical carve-out financial information included in this information statement is not necessarily indicative of what our results of operations, financial position and cash flows will be in the future. There may be changes that will occur in our cost structure, funding and operations as a result of our separation from Enersis, including increased costs associated with reduced economies of scale, and increased costs associated with being a stand-alone publicly traded company.
We may face difficulty in financing our operations and capital expenditures following the Spin-Off, which could have an adverse impact on our business and results.
We may need to incur debt or issue additional equity in order to fund working capital and capital expenditures or to make acquisitions and other investments following the Spin-Off. There can be no assurance that debt or equity financing will be available to us on acceptable terms, if at all. As a result of the Spin-Off, it may also become more expensive for us to raise funds through the issuance of debt than it was prior to the consummation of the Spin-Off. If we are not able to obtain sufficient financing on attractive terms, it could have a material adverse effect on our business, results of operations and financial condition.
There is no guarantee that the conditions precedent to the Spin-Off will be satisfied.
The Spin-Off will not become effective unless the conditions precedent are satisfied, including the receipt of certain regulatory approvals and the absence of any order or injunction prohibiting the consummation of the Spin-Off. The conditions precedent include matters beyond the control of Enersis Américas, such as approval of the concurrent spin-off of Endesa Américas by the shareholders of Endesa Chile. There can be no assurance that such conditions precedent will be satisfied. Any delay or the inability to satisfy the conditions precedent may prevent the effectiveness of the Spin-Off.
34
Table of Contents
The Spin-Off and the Reorganization may be subject to judicial or administrative injunctions.
AFP Habitat and AFP Capital, which are shareholders of Enersis and Endesa Chile, brought action in the Santiago Court of Appeals in order to block the Reorganization. The matter is pending resolution. It is possible that additional actions may be brought by shareholders, bondholders, regulators or others seeking to enjoin the Spin-Off or the Reorganization. Any litigation may delay the Spin-Off and the Reorganization, distract management, divert resources, result in negative publicity or otherwise negatively affect the Spin-Off and the Reorganization.
| Item 4. | Information on the Company |
| A. | History and Development of the Company. |
In this “History and Development of the Company” section, references (i) to “we”, “us” and “our” are to the Chilean Business of Enersis prior to the Spin-Off, and to Enersis Chile after the Spin-Off, (ii) to Endesa Chile are to the Chilean business of Endesa Chile prior to the spin-off of Endesa Américas by Endesa Chile, and to Endesa Chile after such spin-off, and (iii) to Chilectra are to the Chilean business of Chilectra prior to the spin-off of Chilectra Américas by Chilectra, and to Chilectra Chile after such spin-off.
History
We expect that we will register our common stock in Chile with the SVS and in the United States with the SEC during the first quarter of 2016.
Our contact information in Chile is:
| Street Address: | Santa Rosa 76, Santiago, Código Postal 8330099, Chile | |
| Telephone: | (56-2) 2353-4639 | |
| Web site: | www. enersischile.cl |
We are primarily engaged in the generation and distribution of electricity in Chile. We trace our origins to Compañía Chilena de Electricidad Ltda. (“CCE”), which was formed in 1921 as a result of the merger of Chilean Electric Tramway and Light Co., founded in 1889, and Compañía Nacional de Fuerza Eléctrica (“CONAFE”), with operations dating back to 1919. In 1970, the Chilean government nationalized CCE. During the 1980s, the sector was reorganized through the Chilean Electricity Law, CCE’s operations were divided into one generation company, a currently unrelated company, and two distribution companies, one with a concession in the Valparaíso Region, and the other, our predecessor company, with a concession in the Santiago metropolitan region. From 1982 to 1987, the Chilean electric utility sector went through a process of re-privatization. In August 1988, our predecessor company changed its name to Enersis S.A. and became the new parent company of Distribuidora Chilectra Metropolitana S.A., later renamed Chilectra S.A. In the 1990s, we diversified into electricity generation and transmission through our increasing equity stakes in Endesa Chile.
As of September 30, 2015, we had 6,351 MW of installed capacity with 111 generation units in Chile, combined assets of Ch$ 5,149.3 billion and operating revenues of Ch$ 1,762.2 billion.
Capital Investments, Capital Expenditures and Divestitures
We coordinate our overall financing strategy, including the terms and conditions of loans and intercompany advances entered into by our combined entities, in order to optimize debt and liquidity management. Generally, our operating combined entities independently plan capital expenditures financed by internally generated funds or direct financings. One of our goals is to focus on investments that will provide long-term benefits, such as energy loss reduction projects. Although we have considered how these investments will be financed as part of our budget process, we have not committed to any particular financing structure, and investments will depend on the prevailing market conditions at the time the cash flows are needed.
35
Table of Contents
Our investment plan is flexible enough to adapt to changing circumstances by giving different priorities to each project in accordance with profitability and strategic fit. Investment priorities are currently focused on developing additional hydroelectric and thermal capacity to guarantee adequate levels of reliable supply while remaining focused on the environment.
For the 2016-2020 period, we expect to make capital expenditures of Ch$ 1,298 billion in our combined entities, related to investments currently in progress, maintenance of our distribution network, maintenance of existing generation plants and in the studies required to develop other potential generation projects. For further detail regarding these projects please see “Item 4. Information on the Company— D. Property, Plant and Equipment— Projects Under Development.”
The table below sets forth the expected capital expenditures for the 2016-2020 period and the capital expenditures incurred by our combined entities for the nine months ended September 30, 2015 and for the years ended December 31, 2014 and 2013:
| Estimated 2016-2020 | September 2015 | December 2014 | December 2013 | |||||||||||||
| (in millions of Ch$) | ||||||||||||||||
Capital Expenditure(1) | 1,297,938 | 252,814 | 196,932 | 128,239 | ||||||||||||
|
|
|
|
|
|
|
| |||||||||
| (1) | Capex amounts represent effective payments for each year, except for future projections. |
Capital Expenditures for the nine months ended September 30, 2015 and the years ended December 31, 2014 and 2013
Our capital expenditures in the last three years were related principally to the 350 MW Bocamina II power plant and and the 150 MW Los Cóndores power plant. Bocamina II began commercial operations in October 2012. Subsequently, Bocamina II suspended operations in December 2013 due to environmental injunctions and reassumed operations in July 2015. Los Cóndores is a hydroelectric project, which began construction in 2014 with completion expected in 2018.
Investments currently in progress
Our material plans in progress include the 150 MW Los Cóndores project described above. Finally, we plan to continue to expand distribution services and reduce energy losses to improve the efficiency and profitability of our distribution operations in all the countries in which we operate.
Projects in progress will be financed with resources provided by external financing as well as internally generated funds for each of the projects described.
| B. | Business Overview. |
In this “Business Overview” section, references to “we”, “us” and “our” are to the Chilean Business of Enersis prior to the Spin-Off, and to Enersis Chile after the Spin-Off.
We have combined operations in Chile. Our core businesses are electricity generation and distribution. We also participate in other activities which are not part of our core business. Since these non-core activities represent less than 1% of our 2015 revenues, we do not report them as separate business in this information statement or in our combined financial statements.
36
Table of Contents
The table below presents our revenues by operating segment:
| Nine months ended September 30, | Year ended December 31, | |||||||||||||||||||||||
Revenues | 2015 | 2014 | Change 2015 vs. 2014 | 2014 | 2013 | Change 2014 vs. 2013 | ||||||||||||||||||
| (unaudited) | ||||||||||||||||||||||||
| (in millions of Ch$) | (in %) | (in millions of Ch$) | (in %) | |||||||||||||||||||||
Generation | 1,131,407 | 876,113 | 29.14 | 1,220,566 | 959,787 | 27.17 | ||||||||||||||||||
Distribution | 930,399 | 830,888 | 11.98 | 1,127,893 | 975,024 | 15.68 | ||||||||||||||||||
Other businesses and intercompany transaction adjustments | (299,607 | ) | (208,138 | ) | 43.95 | (299,393 | ) | (196,728 | ) | 52.19 | ||||||||||||||
|
|
|
|
|
|
|
|
|
|
|
| |||||||||||||
Total net revenues | 1,762,199 | 1,498,862 | 17.57 | 2,049,065 | 1,738,083 | 17.89 | ||||||||||||||||||
|
|
|
|
|
|
|
|
|
|
|
| |||||||||||||
For further financial information related to our businesses, see “Item 5. Operating and Financial Review and Prospects — A. Operating Results” and Note 35 of the Notes to our interim combined financial statements.
Electricity Generation Business Segment
For the nine months ended September 30, 2015, electricity generation represented 55% of our operating revenues and 67% of our operating income before combination adjustments. For the year 2014, electricity generation represented 52% of our operating revenues and 61% of our operating income before combination adjustments.
Our total installed capacity as of both September 30, 2015 and December 31, 2014, was 6,351MW, a 781 MW increase compared to December 31, 2013, due to the additional 781 MW of capacity of GasAtacama.
Our combined electricity sales for the nine months ended September 30, 2015 were 17,311 GWh and our production was 13,382 GWh, a 14.9% increase and a 2.9% increase, respectively, compared to the same period of 2014. Our combined electricity sales in 2014 were 21,157 GWh and our production was 18,063 GWh, a 3.7% increase and a 7.0% decrease, respectively, compared to 2013.
The following tables summarize the information relating to our electricity generation:
ELECTRICITY DATA(1)
| Nine months ended September 30, | Year ended December 31, | |||||||||||||||
| 2015 | 2014 | 2014 | 2013 | |||||||||||||
Number of generating units(2)(3) | 111 | 111 | 111 | 105 | ||||||||||||
Installed capacity (MW)(3)(4) | 6,351 | 6,351 | 6,351 | 5,571 | ||||||||||||
Electricity generation (GWh) | 13,382 | 12,995 | 18,063 | 19,438 | ||||||||||||
Energy sales (GWh) | 17,311 | 15,063 | 21,157 | 20,406 | ||||||||||||
| (1) | The 2014 and 2015 data includes GasAtacama, which has been combined since May 2014. |
| (2) | For details on generation facilities, see “Item 4. Information on the Company — D. Property, Plant and Equipment — Property, Plant and Equipment of Generating Companies.” |
| (3) | The Bocamina II TV2 generation unit in Chile has been combined since April 2012. |
| (4) | Total installed capacity is defined as the maximum capacity (MW), under specific technical conditions and characteristics. In most cases, installed capacity is confirmed by satisfaction guarantee tests performed by equipment suppliers. Figures may differ from installed capacity declared to governmental authorities and customers, according to criteria defined by such authorities and relevant contracts. |
37
Table of Contents
In the electricity industry, it is common to segment the business into hydroelectric and thermoelectric generation, because each type of generation has significantly different variable costs. Thermoelectric generation requires the purchase of fuel, which leads to a high variable costs compared with hydro generation from reservoirs or rivers that have no marginal costs. Of our total combined generation in 2014, 64.0% was from hydroelectric sources, 35.1% from thermal sources, and less than 1% from wind energy, which is generated by the Canela I and Canela II wind farms, subsidiaries of Celta.
Of our total combined generation during the nine months ended September 30, 2015, 57.5% was from hydroelectric sources, 41.5% from thermal sources, and 1% from wind energy.
The following table summarizes our combined generation by type of energy:
COMBINED GENERATION BY TYPE OF ENERGY (GWh)
| Nine months ended September 30, | Year ended December 31, | |||||||||||||||||||||||||||||||
| 2015 | 2014 | 2014 | 2013 | |||||||||||||||||||||||||||||
| Generation | % | Generation | % | Generation | % | Generation | % | |||||||||||||||||||||||||
Hydroelectric | 7,699 | 57.5 | 7,831 | 60.5 | 11,561 | 64.0 | 9,889 | 50.9 | ||||||||||||||||||||||||
Thermal(1) | 5,552 | 41.5 | 5,021 | 38.6 | 6,344 | 35.1 | 9,404 | 48.4 | ||||||||||||||||||||||||
Other generation(2) | 130 | 1.0 | 143 | 0.8 | 158 | 0.9 | 145 | 0.7 | ||||||||||||||||||||||||
|
|
|
|
|
|
|
|
|
|
|
|
|
|
|
| |||||||||||||||||
Total generation | 13,382 | 100 | 12,995 | 100 | 18,063 | 100 | 19,438 | 100 | ||||||||||||||||||||||||
|
|
|
|
|
|
|
|
|
|
|
|
|
|
|
| |||||||||||||||||
| (1) | The 2014 and 2015 data includes GasAtacama, which has been combined since May 2014. |
| (2) | Other generation refers to the generation from the Canela and Canela II wind farms. |
The potential for contracting electricity is generally related to electricity demand. Customers identified as small volume regulated customers, including residential customers, are subject to government regulated electricity tariffs, and must purchase electricity directly from a distribution company. These distribution companies, which purchase large amounts of electricity for small volume residential customers, generally enter into contractual agreements with generators at a regulated tariff price. Those identified as large volume industrial customers also enter into contractual agreements with energy suppliers. However, such large volume industrial customers are not subject to the regulated tariff price. Instead, these customers are allowed to negotiate the energy price with generators based on the characteristics of the service required. Finally, the pool market, where energy is normally sold at the spot price, is not carried out through contracted pricing.
The following table contains information regarding our combined sales of electricity by type of customer for each of the periods indicated:
ELECTRICITY SALES BY CUSTOMER TYPE (GWh)(1)
| Nine months ended September 30, | Year ended December 31, | |||||||||||||||||||||||||||||||
| 2015 | 2014 | 2014 | 2013 | |||||||||||||||||||||||||||||
| Sales | % | Sales | % | Sales | % | Sales | % | |||||||||||||||||||||||||
Regulated customers | 13,053 | 75.4 | 11,753 | 78.0 | 15,838 | 74.9 | 14,796 | 72.5 | ||||||||||||||||||||||||
Unregulated customers | 3,103 | 17.9 | 2,858 | 19.0 | 4,065 | 19.2 | 4,185 | 20.5 | ||||||||||||||||||||||||
|
|
|
|
|
|
|
|
|
|
|
|
|
|
|
| |||||||||||||||||
Total contracted sales(2) | 16,156 | 93.3 | 14,611 | 97.0 | 19,903 | 94.1 | 18,981 | 93.0 | ||||||||||||||||||||||||
Electricity pool market sales | 1,155 | 6.7 | 452 | 3.0 | 1,254 | 5.9 | 1,425 | 7.0 | ||||||||||||||||||||||||
|
|
|
|
|
|
|
|
|
|
|
|
|
|
|
| |||||||||||||||||
Total electricity sales | 17,311 | 100 | 15,063 | 100 | 21,157 | 100 | 20,406 | 100 | ||||||||||||||||||||||||
|
|
|
|
|
|
|
|
|
|
|
|
|
|
|
| |||||||||||||||||
| (1) | The 2014 and 2015 data includes GasAtacama, which has been combined since May 2014. |
| (2) | Includes the sales to distribution companies not backed by contracts. |
38
Table of Contents
Specific energy consumption limits (measured in GWh) for regulated and unregulated customers are established. Moreover, regulatory frameworks often require that regulated distribution companies have contracts to support their commitments to small volume customers and also determine which customers can purchase energy in electricity pool markets.
In terms of expenses, the primary variable costs involved in the electricity generation business, in addition to the direct variable cost of generating hydroelectric or thermal electricity such as fuel costs, are energy purchases and transportation costs. During periods of relatively low rainfall conditions, the amount of our thermal generation increases. This involves an increase of the total fuel cost and the costs of its transportation to the thermal generation power plants. Under drought conditions, electricity that we have contractually agreed to provide may exceed the amount of electricity that we are able to generate, which requires us to purchase electricity in the pool market at spot prices in order to satisfy our contractual commitments. The cost of these purchases at spot prices may, under certain circumstances, exceed the price at which we sell electricity under contracts and, therefore, may result in a loss. We attempt to minimize the effect of poor hydrological conditions on our operations in any year by limiting our contractual sales requirements to a quantity that does not exceed the estimated production in a dry year. To determine an estimated production in a dry year, we take into consideration the available statistical information concerning rainfall, hydrological levels, and the capacity of key reservoirs. In addition to limiting contracted sales, we may adopt other strategies including installing temporary thermal capacity, negotiating lower consumption levels with unregulated customers, negotiating with other water users and including pass-through cost clauses in contracts with customers.
Operations
We own and operate a total of 111 generation units through Endesa Chile, Pehuenche, Celta and GasAtacama. Of these generation units, 38 are hydroelectric, with a total installed capacity of 3,456 MW. This represents 54.4% of our total installed capacity. There are 22 thermal generation units that operate with gas, coal or oil with a total installed capacity of 2,808 MW, representing 44.2% of our total installed capacity. There are 51 wind powered generation units with an aggregate installed capacity of 87 MW representing 1.4% of our total installed capacity. All of our generation units are connected to the SIC except for two of Celta’s thermoelectric generation units and six of GasAtacama’s thermoelectric generation units which are connected to the Northern Interconnected System (“SING”) in northern Chile.
For information on the installed generation capacity for each of our combined entities, see “Item 4. Information on the Company — D. Property, Plant and Equipment.”
Our total electricity generation (including the SIC and the SING) accounted for 25.8% of total gross electricity production in Chile during 2014, 25.0% during the first nine months of 2015, and 25.8% for the first nine months of 2014.
39
Table of Contents
The following table sets forth the electricity generation for each of our Chilean generation companies:
ELECTRICITY GENERATION BY COMPANIES (GWh)
| Nine months ended September 30, | Year ended December 31, | |||||||||||||||
| 2015 | 2014 | 2014 | 2013 | |||||||||||||
Endesa Chile | 7,890 | 7,565 | 10,092 | 11,967 | ||||||||||||
Pehuenche | 1,766 | 1,772 | 2,902 | 2,565 | ||||||||||||
San Isidro(1) | — | — | — | 2,546 | ||||||||||||
Celta(1) | 2,738 | 3,405 | 4,553 | 1,564 | ||||||||||||
Endesa Eco(1) | — | — | — | 796 | ||||||||||||
GasAtacama(2) | 988 | 253 | 516 | — | ||||||||||||
|
|
|
|
|
|
|
| |||||||||
Total | 13,382 | 12,995 | 18,063 | 19,438 | ||||||||||||
|
|
|
|
|
|
|
| |||||||||
| (1) | The electricity generation difference from 2013to 2014 was primarily due to the merger of San Isidro into Endesa Eco on September 1, 2013, as well as the subsequent merger of Endesa Eco into Celta on November 1, 2013. |
| (2) | GasAtacama has been combined by Endesa Chile since May 2014. |
The energy equivalent in reservoirs reached 3,886 GWh in 2014, an increase of 659 GWh, or 20%, compared to 2013 (3,227 GWh).
The energy equivalent in reservoirs reached 3,721 GWh for the nine months ended September 30, 2015, an increase of 554 GWh, or 18%, compared to the same period in 2014 (3,167 GWh).
Generation by type is shown in the following table:
ELECTRICITY GENERATION BY TYPE (GWh)
| Nine months ended September 30, | Year ended December 31, | |||||||||||||||||||||||||||||||
| 2015 | 2014 | 2014 | 2013 | |||||||||||||||||||||||||||||
| Generation | % | Generation | % | Generation | % | Generation | % | |||||||||||||||||||||||||
Hydroelectric generation | 7,529 | 56.3 | 7,653 | 58.9 | 11,272 | 62.4 | 9,617 | 49.5 | ||||||||||||||||||||||||
Thermal generation(1) | 5,552 | 41.5 | 5,021 | 38.6 | 6,344 | 35.1 | 9,404 | 48.4 | ||||||||||||||||||||||||
Wind generation–NCRE(2) | 93 | 0.7 | 109 | 0.8 | 158 | 0.9 | 145 | 0.7 | ||||||||||||||||||||||||
Mini-hydro generation – NCRE (3) | 209 | 1.6 | 211 | 1.6 | 289 | 1.6 | 272 | 1.4 | ||||||||||||||||||||||||
|
|
|
|
|
|
|
|
|
|
|
|
|
|
|
| |||||||||||||||||
Total generation | 13,382 | 100 | 12,995 | 100 | 18,063 | 100 | 19,438 | 100 | ||||||||||||||||||||||||
|
|
|
|
|
|
|
|
|
|
|
|
|
|
|
| |||||||||||||||||
| (1) | The 2014 and 2015 data includes GasAtacama, which has been combined since May 2014. |
| (2) | Refers to the generation from the Canela and Canela II wind farms. |
| (3) | Refers to the generation from Palmucho and the Ojos de Agua mini-hydroelectric plants. |
Our thermal electric generation facilities use LNG, coal and to a lesser extent, diesel.
The LNG supply is the most relevant and it is based on long term agreements with the Quintero LNG Terminal (“GNLQ”), for regasification services, and British Gas for supply.
In July 2013, Endesa Chile and British Gas successfully ended the renegotiation of their LNG sale and purchase agreement. This renegotiation modified some conditions of the original contract, allowing Endesa Chile to secure its long term LNG supply at competitive prices, with significant flexibility and the addition of new capacity sufficient for its current and potential needs.
40
Table of Contents
Endesa Chile also exercised a priority right to purchase additional regasification capacity as part of an expansion of GNLQ. This has allowed Endesa Chile to increase its regasification capacity from 3.2 million cubic meters per day to 5.4 million cubic meters per day as of the date of this information statement. This additional capacity will allow Endesa Chile’s San Isidro and Quintero facilities to provide additional thermal generation, to secure the regasification for future power plants, as well as develop new businesses, such as the tolling agreement signed with Gener during 2015, which has allowed Endesa Chile to utilize Gener’s Nueva Renca combined-cycle power plant to generate electricity with its LNG.
Endesa Chile has also contracted capacity in the LNG truck loading facility (“TLF”) in GNLQ, allowing it to sell natural gas to industrial customers. In August 2014, the first load of LNG was successfully delivered to MAERSK’s satellite regasification facility. During 2014, a 20-year sale and purchase agreement was signed with GasValpo (a gas distribution company) to distribute natural gas using the TLF for new customers in various cities in Chile. The first stage started its operations during August 2015, supplying the city of Talca (270 km south of Santiago). Other plants are currently in advanced construction and will begin operation before the end of 2015.
In January 2015 an agreement with Intergas (gas distribution company) was signed to supply LNG by trucks to the city of Temuco (700 km south of Santiago). This supply arrangement will start during first quarter of 2016.
During the nine months ended September 30, 2015, 560 kilotons of coal were consumed by the Tarapacá and Bocamina thermal power plants. Bocamina units I and II were stopped for 8 and 18 months, respectively, due to judicial issues. During this time the supply of coal from Endesa Generación S.A., Enel’s Spanish subsidiary, was deferred. The current agreement is in effect and will run through the end of 2015.
Under Chilean law, power generation companies must demonstrate that a minimum amount of their energy sales are from NCRE. Currently, our Canela wind farm, Ojos de Agua mini-hydroelectric plant and 40% of the installed capacity of our Palmucho mini-hydroelectric plant qualify as NCRE facilities. We fully complied with this obligation during 2014. The additional cost of generating electricity using NCRE facilities is being charged as a pass-through in our new contracts, which mitigates the impact to our operating income.
Total industry electricity sales in Chile increased 2.6% during 2014, with a sales increase of 2.6% in the SIC and of 2.5% in the SING, as detailed in the following table and 2.7% during the first nine months of 2015, with a sales increase of 1.3% in the SIC and of 6.9% in the SING, as detailed in the following table:
ELECTRICITY SALES PER SYSTEM (GWh)
| Nine months ended September 30, | Year ended December 31, | |||||||||||||||
| 2015 | 2014 | 2014 | 2013 | |||||||||||||
Electricity sales in the SIC | 37,119 | 36,628 | 49,066 | 47,831 | ||||||||||||
Electricity sales in the SING | 12,491 | 11,683 | 15,785 | 15,399 | ||||||||||||
|
|
|
|
|
|
|
| |||||||||
Total electricity sales | 49,609 | 48,311 | 64,851 | 63,230 | ||||||||||||
|
|
|
|
|
|
|
| |||||||||
For the nine months ended September 30, 2015, our electricity sales reached 17,311 GWh compared to 15,063 GWh during the same period of 2014, which represented 34.9% and 31.2% market shares, respectively. The percentage of the energy purchases needed to comply with our contractual obligations to third parties increased from 13.7% as of September 30, 2014 to 22.7% as of September 30, 2015, as a consequence of the decrease of our electricity generation.
Our electricity sales reached 21,157 GWh in 2014 and 20,406 GWh in 2013, which represented 32.6% and 32.2% market shares, respectively. The percentage of energy purchases needed to comply with our contractual obligations to third parties increased from 4.7% in 2013 to 14.6% in 2014 as a consequence of the decrease of our electricity generation.
41
Table of Contents
The following table sets forth our electricity generation and purchases:
ELECTRICITY GENERATION AND PURCHASES (GWh)(1)
| Nine months ended September 30, | Year ended December 31, | |||||||||||||||||||||||||||||||
| 2015 | 2014 | 2014 | 2013 | |||||||||||||||||||||||||||||
| (GWh) | % of Volume | (GWh) | % of Volume | (GWh) | % of Volume | (GWh) | % of Volume | |||||||||||||||||||||||||
Electricity generation | 13,382 | 77.3 | 12,995 | 86.3 | 18,063 | 85.4 | 19,438 | 95.3 | ||||||||||||||||||||||||
Electricity purchases | 3,929 | 22.7 | 2,069 | 13.7 | 3,094 | 14.6 | 968 | 4.7 | ||||||||||||||||||||||||
|
|
|
|
|
|
|
|
|
|
|
|
|
|
|
| |||||||||||||||||
Total | 17,311 | 100 | 15,063 | 100 | 21,157 | 100 | 20,406 | 100 | ||||||||||||||||||||||||
|
|
|
|
|
|
|
|
|
|
|
|
|
|
|
| |||||||||||||||||
| (1) | The 2014 and 2015 data includes GasAtacama, which has been combined since May 2014. |
We supply electricity to the major regulated electricity distribution companies, large unregulated industrial firms (primarily in the mining, pulp and steel sectors) and the pool market. Commercial relationships with our customers are usually governed by contracts. Supply contracts with distribution companies must be auctioned, and are generally standardized with an average term of ten years.
Supply contracts with unregulated customers (large industrial customers) are specific to the needs of each customer, and the conditions are agreed between both parties, reflecting competitive market conditions.
During the nine months ended September 30, 2015, Endesa Chile had 41 customers, including 18 distribution companies in the SIC and 23 unregulated customers.
In 2014, our customers included 18 distribution companies in the SIC and 28 unregulated customers. Endesa Chile had 46 customers in 2014 and 50 customers in 2013.
The following table sets forth information regarding our electricity sales by type of customer:
ELECTRICITY SALES PER CUSTOMER SEGMENT (GWh)(1)
| Nine months ended September 30, | Year ended December 31, | |||||||||||||||||||||||||||||||
| 2015 | 2014 | 2014 | 2013 | |||||||||||||||||||||||||||||
| Sales | % of Sales Volume | Sales | % of Sales Volume | Sales | % of Sales Volume | Sales | % of Sales Volume | |||||||||||||||||||||||||
Regulated customers | 13,053 | 75.4 | 11,753 | 78.0 | 15,838 | 74.9 | 14,796 | 72.5 | ||||||||||||||||||||||||
Unregulated customers | 3,103 | 17.9 | 2,858 | 19.0 | 4,065 | 19.2 | 4,185 | 20.5 | ||||||||||||||||||||||||
|
|
|
|
|
|
|
|
|
|
|
|
|
|
|
| |||||||||||||||||
Total contract sales | 16,156 | 93.3 | 14,611 | 97.0 | 19,903 | 94.1 | 18,981 | 93.0 | ||||||||||||||||||||||||
Electricity pool market sales | 1,115 | 6.7 | 452 | 3.0 | 1,254 | 5.9 | 1,425 | 7.0 | ||||||||||||||||||||||||
|
|
|
|
|
|
|
|
|
|
|
|
|
|
|
| |||||||||||||||||
Total electricity sales | 17,311 | 100 | 15,063 | 100 | 21,157 | 100 | 20,406 | 100 | ||||||||||||||||||||||||
|
|
|
|
|
|
|
|
|
|
|
|
|
|
|
| |||||||||||||||||
| (1) | The 2014 and 2015 data includes GasAtacama, which has been combined since May 2014. |
The most significant supply contracts with regulated customers are with our combined entity Chilectra S.A. and with Compañía General de Electricidad S.A. (“CGE”), an unaffiliated entity. These are the two largest distribution companies in Chile in terms of sales.
42
Table of Contents
The following table sets forth Endesa Chile’s public contracts with electricity distribution companies in the SIC for their regulated customers as of December 31, 2014:
| Year ended December 31, | ||||||||||||||||||||||||||||||||||||||||||||||||||||
| (in GWh) | ||||||||||||||||||||||||||||||||||||||||||||||||||||
Company | 2015 | 2016 | 2017 | 2018 | 2019 | 2020 | 2021 | 2022 | 2023 | 2024 | 2025 | 2026 | 2027 | |||||||||||||||||||||||||||||||||||||||
Chilectra | 6,498 | 7,009 | 7,384 | 7,733 | 7,743 | 7,743 | 6,772 | 5,086 | 3,838 | 3,838 | 3,103 | 1,485 | 1,485 | |||||||||||||||||||||||||||||||||||||||
CGE | 6,003 | 7,144 | 7,083 | 7,039 | 7,092 | 6,223 | 6,200 | 4,746 | 4,644 | 4,611 | 423 | — | — | |||||||||||||||||||||||||||||||||||||||
Chilquinta | 1,507 | 1,564 | 1,662 | 1,747 | 1,810 | 1,815 | 1,817 | 1,820 | 1,822 | 1,097 | 340 | 324 | — | |||||||||||||||||||||||||||||||||||||||
Saesa | 3,006 | 2,451 | 2,421 | 2,365 | 2,299 | 798 | 798 | 798 | 798 | 798 | 159 | — | — | |||||||||||||||||||||||||||||||||||||||
|
|
|
|
|
|
|
|
|
|
|
|
|
|
|
|
|
|
|
|
|
|
|
|
|
| |||||||||||||||||||||||||||
Total | 17,013 | 18,167 | 18,550 | 18,885 | 18,944 | 16,580 | 15,588 | 12,450 | 11,102 | 10,344 | 4,026 | 1,809 | 1,485 | |||||||||||||||||||||||||||||||||||||||
|
|
|
|
|
|
|
|
|
|
|
|
|
|
|
|
|
|
|
|
|
|
|
|
|
| |||||||||||||||||||||||||||
Our generation contracts with unregulated customers are generally on a long-term basis and typically range from five to fifteen years. Such contracts are usually automatically extended at the end of the applicable term, unless terminated by either party upon prior notice. Some include a price adjustment mechanism in the case of high marginal costs, and therefore, reduces the hydrological risk. Contracts with unregulated customers may also include specifications regarding power sources and equipment, which may be provided at special rates, as well as provisions for technical assistance to the customer. We have not experienced any supply interruptions under our contracts. If we experienced a force majeure event, as defined in the contract, we are allowed to reject purchases and we have no obligation to supply electricity to our unregulated customers. Disputes are typically subject to binding arbitration between the parties, with limited exceptions.
For both the nine months ended September 30, 2015 and the year ended December 31, 2014, Endesa Chile’s principal distribution customers were (ordered alphabetically): CGE, Chilectra, Chilquinta, Emel group and Saesa group, and Endesa Chile’s principal unregulated customers were (ordered alphabetically): Caserones, Compañia Minera Carmen de Andacollo, Compañia Minera Collahuasi, Grupo CAP-Companía Minera de Pacifico and Minera Valle Central.
We compete in the SIC primarily with two generation companies, Colbún S.A. (“Colbún”) and Gener. According to the CDEC-SIC in 2014, in the SIC, Colbún had an installed capacity of 3,305 MW, of which 52.0% was thermoelectric and Gener and its subsidiaries had an installed capacity of 2,632 MW, of which 89.2% was thermoelectric, and in addition, there were a number of smaller entities with an aggregate installed capacity of 3,857 MW that generate electricity in the SIC. According to the CDEC-SIC, as of September 30, 2015, Colbún and Gener’s capacity and electricity type data were substantially the same as for December 2014. In addition, there are a number of smaller entities with an aggregate installed capacity of 4,480 MW that generate electricity in the SIC.
As of December 31, 2014, our primary competitors in the SING were E-CL (GDF Suez Group) and Gener, which have 2,147 MW and 1,465 MW of installed capacity, respectively. As of September 30, 2015, our primary competitors in the SING wereE-CL (GDF Suez Group) and Gener, which have 2,147 MW and 822 MW of installed capacity, respectively. Our direct participation in the SING includes our 182 MW Tarapacá thermal plant, owned by our combined entity Celta, and the 781 MW GasAtacama thermal plant.
Electricity generation companies compete largely on the basis of price, technical experience and reliability. In addition, because 64.3% of our installed capacity in the SIC is from hydroelectric power plants, we have lower marginal production costs than companies generating electricity through thermal plants. Our installed thermal capacity benefits from access to gas from GNLQ. However, during periods of extended droughts, we may be forced to buy more expensive electricity from thermoelectric generators at spot prices in order to comply with our contractual obligations.
Directly and through our combined entities, we are the principal generation operator in the SIC, with 35.0% of the total installed capacity and 40.0% of the electricity energy sales of this system in 2014. As of September 30, 2015, we had 34.2% of the total installed capacity and represented 41.6% of the electricity energy sales in the system.
43
Table of Contents
In the SING, our combined entities, Celta and GasAtacama, accounted for 20.4% of the total installed capacity and 10.0% of the electricity energy sales of this system in 2014. As of September 30, 2015, Celta and GasAtacama, accounted for 23.2% of the total installed capacity and 14.9% of the electricity energy sales in the system.
Electricity Distribution Business Segment
Our electricity distribution business is conducted through Chilectra. For the nine months ended September 30, 2015, electricity sales increased by 1.3% compared to the same period of 2014, totaling 11,943 GWh. For more information on energy sales by our distribution businesses for the last five fiscal years, see “Item 3. Key Information — A. Selected Financial Data”.
Chilectra
Chilectra is one of the largest electricity distribution companies in Chile in terms of the number of regulated customers, distribution assets and energy sales. Our economic interest in Chilectra is 99.1%. Chilectra operates in a concession area of 2,105 square kilometers, under an indefinite concession granted by the Chilean government. Chilectra transmits and distributes electricity in 33 municipalities of the Santiago metropolitan region. Its service area is primarily defined as a densely populated area under the Chilean tariff regulations, which govern electricity distribution companies and includes all residential, commercial, industrial, governmental, and toll customers. The Santiago metropolitan region, the capital of Chile, is the country’s most densely populated area and has the highest concentration of industries, industrial parks and office facilities in the country. As of September 30, 2015, Chilectra distributed electricity to approximately 1.8 million customers. Its energy losses were 5.5% during the first nine months of both 2015 and 2014.
For the first nine months of 2015, residential, commercial, industrial and other customers, who are primarily public and municipal, represented 28%, 32%, 17% and 24%, respectively, of Chilectra’s total energy sales of 11,943 GWh, which is an increase of 1.3% in comparison with the first nine months of 2014.
The following table sets forth Chilectra’s principal operating data for each of the periods indicated:
| Nine months period ended September 30, | Year ended December 31, | |||||||||||||||
| 2015 | 2014 | 2014 | 2013 | |||||||||||||
Electricity sales (GWh) | 11,943 | 11,783 | 15,690 | 15,140 | ||||||||||||
Residential | 3,290 | 3,224 | 4,256 | 4,048 | ||||||||||||
Commercial | 3,850 | 3,694 | 4,983 | 4,627 | ||||||||||||
Industrial | 1,986 | 2,100 | 2,818 | 2,903 | ||||||||||||
Other customers(1) | 2,816 | 2,765 | 3,633 | 3,563 | ||||||||||||
Number of customers (thousands) | 1,772 | 1,727 | 1,737 | 1,694 | ||||||||||||
Residential | 1,585 | 1,545 | 1,555 | 1,516 | ||||||||||||
Commercial | 138 | 135 | 135 | 132 | ||||||||||||
Industrial | 12 | 12 | 12 | 12 | ||||||||||||
Other customers | 37 | 35 | 35 | 34 | ||||||||||||
Energy purchased (GWh)(2) | 12,630 | 12,469 | 16,572 | 15,990 | ||||||||||||
Total energy losses (%)(3) | 5.5 | % | 5.5 | % | 5.3 | % | 5.3 | % | ||||||||
| (1) | The data for other customers includes tolls. |
| (2) | During 2014, 49% of electricity purchased was acquired from Endesa Chile, and 29.4% in 2013. |
| (3) | Energy losses are calculated as the percent difference between energy purchased and energy sold (GWh) within a given period. Losses in distribution arise from illegally tapped lines as well as technical losses. |
44
Table of Contents
For the nine months ended September 30, 2015, Chilectra’s principal unregulated customers were (ordered alphabetically): Aguas Andinas S.A., Cencosud, El Mercurio S.A, Esco Elecmetal, Gerdau Aza S.A., Goodyear Chile S.A.C.I., Linde Gas Chile S.A. (formerly Aga S.A.), Mall Plaza S.A., Metro S.A., Nestlé Chile S.A, Papeles Cordillera S.A. (CMPC), Praxair Chile S.A., Sca Chile S.A. (formerly Papeles Industriales S.A.), SCL Terminal Aéreo Santiago, Telefónica Chile S.A., Walmart Chile S.A. and Watt’s S.A.
For the nine months ended September 30, 2015, the collection rate was 96.7%, compared to 99.6% during the same period in 2014.
For the supply to regulated distribution customers, Chilectra has entered into contracts with the following generation companies: Endesa Chile, Gener, Colbún, Guacolda S.A. and Panguipulli S.A. In 2014, the distribution companies of the SIC jointly submitted a 5,000 GWh/year bid for the period of 2014 through 2025. In August 2014, Chilectra was awarded 15% of the electricity supply in the bidding process held by Endesa Chile. Additionally, the distribution companies of the SIC jointly submitted a second bid with energy requirements of 11,000 GWh/year for the period of 2016 through 2033. In December 2014, Chilectra was awarded 92% of the electricity supply in the bidding process held by the following companies: E.E Carén S.A., Santiago Solar S.A., Acciona Energía Chile SpA, E-CL S.A., Central El Campesino S.A., Norvind S.A. and Abengoa Chile S.A.
For the supply to unregulated distribution customers, Chilectra has contracts with the following generation companies: Duke Energy International Duqueco SpA, Colbún , Hidroeléctrica La Higuera S.A., Hidroeléctrica La Confluencia S.A., Guacolda S.A., Pacific Hydro Chacayes S.A. and Enel Green Power Chile Ltda, a subsidiary of our controlling company.
Non-Electricity Businesses
Servicios Informáticos e Inmobiliarios Ltda.
Servicios Informáticos e Inmobiliarios Ltda. (“SIEI”), a wholly-owned combined entity, is a business consultancy in technology, information and computer services, telecommunications, data transmission and develops real estate projects in Chile. It accounts for less than 1% of our revenues, income and assets.
45
Table of Contents
CHILEAN ELECTRICITY INDUSTRY REGULATORY FRAMEWORK
The following chart shows a summary of the main characteristics of the Chilean electricity regulatory framework by business.
Gx | Unregulated Market | Spot markets with costs audited by the regulator | ||
| Regulated | Node Price public auction up to 20 years | |||
| Capacity | Income based on contributions during peak demand | |||
| Tx | Features | Public - Open Access Regulated Tariff Monopoly Regime for Transmission System Operators (“TSOs”) | ||
| Dx | Law | Administrative Concession (indefinite) | ||
| Expansion | Undefined | |||
| Tariff review | 4 years | |||
| Cx | Unregulated Agents | > 0.5 MW | ||
| Liberalized (%) | ≈ 30% |
| Gx: Generation | Tx: Transmission | Dx: Distribution | Cx: Trading |
Industry Overview
Industry Structure
The Chilean electricity industry is divided into three business segments: generation, transmission and distribution. These business segments are carried out by publicly-owned private sector companies. The state’s role is circumscribed to regulation, supervision and indicative investment planning through non-binding recommendations in the case of the generation and transmission businesses, with the exception of the main transmission system in which indicative planning is binding as well as part of the bidding processes for its construction.
The following chart shows the relationships among the various participants in the Chilean electricity market:
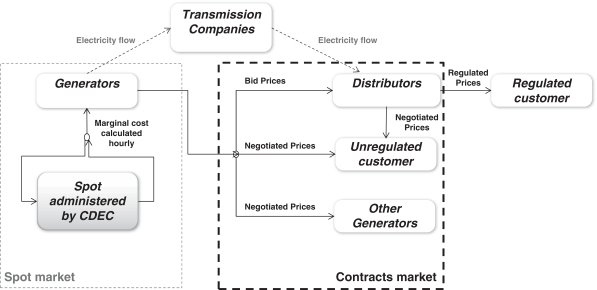
46
Table of Contents
The generation segment comprises a group of electricity companies that own generating plants, whose energy is transmitted and distributed to end customers. This segment is characterized by being a competitive market which operates under market-driven conditions. Generation plants sell their production to distribution companies, unregulated customers and other generation companies, and their surpluses on the spot market.
The transmission system is comprised of a combination of lines, substations and equipment for the transmission of electricity from the production points (generators) to the centers of consumption or distribution. Transmission in Chile is defined as lines or substations with a voltage or tension higher than 23 kV. The transmission system is open access, and transmission companies may impose rights of way over the available transmission capacity through the payment of tolls.
The distribution segment is defined for regulatory purposes as all electricity supplied to end customers at a voltage no higher than 23 kV. Distribution companies operate under a distribution public utility concession regime, with service obligations and regulated tariffs for supplying regulated customers.
Customers are classified according to their amount of demand, as follows: (i) unregulated customers with connected capacity of over 2,000 kW; (ii) regulated customers with connected capacity of no more than 500 kW; and (iii) customers that choose either a regulated-tariff or an unregulated regime, for a minimum period of four years in each regime, available to customers whose connected capacity falls in the range of 500 kW to 2,000 kW. In January 2015, the Chilean Congress approved a reform of the procurement system contained in the Chilean Electricity Law (described below), which becomes effective in 2019 and raises the capacity limit for unregulated customers and customers with the option to choose their regime from the former 2,000 kW to a new 5,000 kW threshold.
The distribution companies supply regulated customers, a segment for which the price and supply conditions are the result of tender processes regulated by the CNE), and unregulated customers, with bilateral agreements between generators, whose conditions are freely negotiated and agreed upon.
In Chile, there are four separate interconnected electricity systems. The main systems that cover the most populated Chilean areas are the SIC, which services the central and south central part of the country, where 92.2% of the Chilean population lives, and the SING, which operates in the northern part of the country, where most of the mining industry is located and where 6.3% of the Chilean population lives (2014 CDEC-SIC annual report). In addition to the SIC and the SING, there are two isolated systems in southern Chile that provide electricity to remote areas, where 1.5% of the population lives.
In 2013, the Chilean government sent a proposal to modify the Chilean Electricity Law to allow the state to promote the interconnection project between the SIC and the SING. In January 2014, the proposal was approved and signed into law by the Chilean President as Law No. 20,726. The interconnection is expected to be completed in 2018 or 2019.
In May 2014, the Chilean government announced the Energy Agenda in which a plan is established to create and execute a long-term energy policy. The Energy Agenda presents several courses of action and goals to achieve in the short, medium and long term. These objectives are: lower energy prices, facilitating the incorporation of non-conventional renewable energy sources and promoting the efficient use of energy.
The Energy Agenda includes a program of legal initiatives to realize those goals. Among the subjects to be addressed by this program are: “Amendments to the legal framework for procurement of electricity for regulated customers” (approved and published in theDiario Oficial in January 2015), “Amendments to the legal framework of the electricity transmission systems” (presented to Congress in August 2015, and currently under analysis ), “Energy Efficiency Law” (expected for the second quarter of 2016) and “Law to promote geothermal energy” (expected for the second quarter of 2016).
47
Table of Contents
For more information about the amendments, see “—The Electricity Law - General” below.
The operation of electricity generation companies in each of the two major interconnected electricity systems is coordinated by their respective dispatch centers, known as a CDEC, an independent entity that coordinates generators, transmission companies and large customers. CDEC coordinates the operation of its system with an efficiency criterion in which the lowest cost producer available is usually required to satisfy demand at any moment in time. As a result, at any specific level of demand, the appropriate supply will be provided at the lowest possible production cost available in the system. The marginal cost used is the price at which generators trade energy on an hourly basis, involving both their injections into the system and their withdrawals or purchases for supplying their customers.
Principal Regulatory Authorities
The Chilean Ministry of Energy develops and coordinates plans, policies and standards for the proper operation of the sector, approves tariffs and node prices set by the CNE, and regulates the granting of concessions to electricity generation, transmission and distribution companies. The CNE is the technical entity in charge of defining prices, technical standards and regulatory requirements.
The SEF monitors the proper operation of electricity, gas and fuel sectors in compliance with the law in terms of safety, quality, and technical standards.
The Chilean Ministry of Environment is responsible for the development and application of regulatory and policy instruments that provide for the protection of natural resources, the promotion of environmental education and the control of pollution, among other matters. It is also responsible for administering the environmental impact assessment system at the national level, coordinating the preparation of environmental standards and establishing the programs for compliance with the standards.
Chilean antitrust authorities are responsible for preventing, investigating and correcting any threats to free market competition and any anti-competitive practices by potentially monopolistic companies. These authorities include:
| • | Free Market Competition Tribunal (“TDLC” in its Spanish acronym). This is a special and independent jurisdictional entity, subject to the directive, correctional and economic authority of the Chilean Supreme Court, which functions to prevent, correct and sanction threats to free market competition. |
| • | National Economic Prosecutor (“FNE” in its Spanish acronym). This is the attorney general responsible for economic matters and for investigating and prosecuting all antitrust conduct before the FNE’s regulatory commission and other tribunals. |
The Panel of Experts acts as a tribunal in electricity matters arising from disputes between participants in the electricity market and between participants in the electricity market and the regulatory authority in certain tariff processes. It issues enforceable resolutions and is composed of experts in industry matters, five engineers or economists and two lawyers, all of whom are elected every six years by the TDLC.
There are also other entities related to the energy sector: the Chilean Nuclear Energy Commission is in charge of research, development, use and control of nuclear energy, and the Chilean Energy Efficiency Agency is in charge of promoting energy efficiency.
48
Table of Contents
The Electricity Law
General
Since its inception, the Chilean electricity industry has been developed by private sector companies. Nationalization was carried out during the period 1970-1973. During the 1980s, the sector was reorganized through the Chilean Electricity Law, known as DFL 1, allowing participation of private capital in the electricity sector. By the end of the 1990s, foreign companies had a majority participation in the Chilean electricity system.
The goal of the Chilean Electricity Law is to provide incentives to maximize efficiency and to provide a simplified regulatory scheme and tariff-setting process that limits the discretionary role of the government by establishing objective criteria for setting prices. The goal is an economically efficient allocation of resources. The regulatory system is designed to provide a competitive rate of return on investment to stimulate private investment, while ensuring the availability of electricity to all who request it.
DFL 1 was published in 1982 and has had few important changes since then. In 1999, a reform was applied to it due to the drought. The first important change took place in 2004 to encourage investments in transmission lines. Another took place in 2005 to create long-term contracts between generation and distribution companies as part of a bid process. The present text of the law was restated as DFL 4 of 2006, and has been supplemented with a series of regulations and standards.
In January 2015, the Chilean Congress approved amendments to the legal framework for procurement of electricity by regulated customers. Among the principal changes introduced in these amendments, were:
| • | Increased CNE participation in the development of tenders. |
| • | Additional time to call for tenders: five years in advance. |
| • | Allocation mechanism: Will be awarded to the lowest prices offered. These prices will be limited by a capped price that will be deemed as a reserve price and keep private until the bid price is public. |
| • | Reduced risk: Providers of electricity have the ability to postpone delivery of electricity in the event there are delays due to a well-founded reasons, not attributable to the tenderer and to request a price review, indexed to the conditions prevalent at the time which the supply is delivered. |
| • | Short-term contracts: Short-term procurement contracts (up to three years), with an advance of one year, have a minimum price equal to the average market price plus 50%. Additionally, within specified ranges from the average marginal cost price, marginal cost will be used. |
| • | Uncontracted energy: All generators within a particular system will be required to offset energy supply contract deficits in proportion to the energy they inject into the system. Each generator will receive the higher of the short-term node price or variable cost of the plant. When energy without contracts exceeds 5% of the total regulated supply, the excess will be paid by distribution companies at a price equal to marginal cost. In turn, these marginal costs will be passed on to end customers. |
| • | Unregulated customers: Unregulated customers capacity limit increased from 2,000 kW to 5,000 kW beginning 2019. |
Currently, a new modification is under study by the Chilean Congress which is intended to address two relevant issues:
| • | Planning, expansion and remuneration of the Chilean transmission systems. |
| • | Long-term energy planning for terms of at least 40 years by the Chilean Ministry of Energy. |
| • | Annual transmission system planning by the CNE. |
| • | Transmission network valuation process every four years. |
| • | Transmission network cost to be financed by unregulated and regulated consumers. |
49
Table of Contents
| • | New entity to coordinate the power plant operations and the transmission facilities of the Chilean electricity system (Comité Independiente del Sistema Eléctrico Nacional,“CISEN” in its Spanish acronym) |
| • | Independent power plant directory. |
| • | Attributions and resources |
| • | In the middle-term, due to the SING-SIC interconnection, there will be only one new operator of the Chilean electricity system. |
Limits and Restrictions
The owners of the main transmission system must be constituted as limited liability stock corporations and cannot take part in the electricity generation or distribution businesses.
Individual interest in the Main Transmission System (“STT” in its Spanish acronym) by companies operating in another electricity or unregulated customer segment cannot exceed, directly or indirectly, 8% of the total investment value of the STT. The aggregate interest of all such agents in the STT must never exceed 40% of the investment value.
According to the Chilean Electricity Law, there are no restrictions on market concentration for generation and distribution activities. However, Chilean antitrust authorities have imposed certain measures to increase the transparency within the different companies within the group of Enersis and its subsidiaries. The TDLC’s Resolution No. 667/2002 requires:
| • | board members of Enersis, Endesa Chile and Chilectra be elected from different and independent groups; |
| • | the external auditors of Enersis, Endesa Chile and Chilectra be different for local statutory purposes; |
| • | Enersis, Endesa Chile and Chilectra may not merge companies within the group which operate in electricity generation and distribution; instead, Enersis must continue to maintain both business segments separately through companies that are independent business units; and |
| • | Enersis, Endesa Chile and Chilectra must remain subject to the regulatory authority of the SVS and comply with the regulations applicable to publicly held stock corporations, even if they should lose such designation. |
Resolution No. 667/2002 will apply to Enersis Chile, as its by-laws will include provisions regarding to being subject to this resolution, with the understanding that the restrictions shall not apply to Enersis Américas with respect to the spin-off of Enersis Chile and considering that Enersis Américas shall not participate in any way in the relevant markets within Chile, it may merge with Endesa Américas and Chilectra Américas.
Additionally, in October 2012, FNE Official Letter No. 1479 imposed additional restrictions on Endesa Chile stating that:
(i) the controlling shareholders should refrain from designating those persons who had been directors of Chilectra the prior term, as Endesa Chile directors; and
(ii) Endesa Chile’s management should refrain from designating employees in first and second level positions that had held the same positions in Chilectra during the six months prior to their designation.
In addition, the Water Utility Services Law also sets restrictions on the overlapping of concessions in the same area, setting restrictions on the ownership of the property between sewage services concessions and utilities that are natural monopolies, such as electricity distribution, gas or home telephone networks.
50
Table of Contents
Regulation of Generation Companies
Concessions
Chilean law permits generation activity without a concession. However, companies may apply for a concession to facilitate access to third-party properties. Third-party property owners are entitled to compensation, which may be agreed to by the parties or, if there is no agreement, it may be determined by an administrative proceeding that may be appealed in the Chilean courts.
Dispatch and Pricing
In each of the two major electric systems, the pertinent CDEC coordinates the operations of generation companies, in order to minimize the operating costs in the electricity system and monitor the quality of service provided by the generation and transmission companies. Generation companies satisfy their contractual sales requirements with dispatched electricity, whether produced by them or purchased from other generation companies in the spot market.
Sales by Generation Companies to Unregulated Customers
Sales by generation companies may be made to unregulated end customers or to other generation companies under freely negotiated contracts. To balance their contractual obligations with their dispatch, generators have to trade deficit and surplus electricity at the spot market price, which is set hourly by each CDEC, based on the lowest cost of production of the last kWh dispatched.
Sales to Distribution Companies and Certain Regulated Customers
Under Law No. 20,018 (Ley Corta II), enacted on May 19, 2005, all new contracts between generation and distribution companies to supply electricity to regulated customers must arise from international bids. In January 2015, theDiario Oficialpublished Law No. 20,805, which amended the bidding process for supplying electricity to regulated customers. These amendments, among others, changed the anticipation required for the bidding process from three to five years; the extension of the maximum contract period from 15 to 20 years; new procedures to assign energies without contracts; new procedures to regulate the short-term bidding process; the adoption of a capped price known as “reserve price,” that is kept private until the bid price is made public; and the possibility to review the price awarded during the supply period.
Sales of Capacity to Other Generation Companies
Each CDEC determines a firm capacity for each power plant on an annual basis. Firm capacity is the highest capacity which a generator may supply to the system at certain peak hours, taking into consideration statistical information and accounting for time out of service for maintenance purposes and for extremely dry conditions in the case of hydroelectric plants.
A generation company may be required to purchase or sell capacity in the spot market, depending upon its contractual requirements in relation to the amount of electricity to be dispatched from such company and to its firm capacity.
Promotion of Generation from Renewable Energy Sources
On April 1, 2008, Law No. 20,257 amended the General Electric Services Law. The purpose of the amendment was to promote the development of NCRE. This law defines the different types of technologies that qualify as NCRE and establishes the obligation for generators, between 2010 and 2014, to supply at least 5% of the total energy contracted as of August 31, 2007, to be of a certain type, and to progressively increase this percentage by 0.5 percentage points annually up to a minimum of 10% by 2024.
51
Table of Contents
On October 22, 2013, Law No. 20,698 (known as the “20/25 Law”) supported renewable energy sources and modified the previously defined NCRE minimum requirements. This law establishes a mandatory share of renewable energy sources in 2025, calculated as a percentage of the total contracted energy of each generator. For contracts signed between 2007 and 2013, the target is 10% by 2024, while for contracts beyond 2013 the target is 20% by 2025.
Incentives and Penalties
If a rationing decree is enacted in response to prolonged periods of electricity shortages, strict penalties may be imposed on generation companies that contravene the decree. A severe drought is not considered a force majeure event under our service agreements.
Generation companies may also be required to pay fines to the regulatory authorities, as well as to make compensatory payments to electricity customers affected by shortages of electricity. The fines are related to system blackouts due to an electricity generator’s operational problems, including failures related to the coordination duties of all system agents. If generation companies cannot satisfy their contractual commitments to deliver electricity during periods when a rationing decree is in effect and there is no energy available to purchase in the system, the generation company must compensate the customers at a rate known as the “failure cost” determined by the authority in each node price setting. This failure cost, which is updated semiannually by the CNE, is a measurement of how many end customers would pay for one extra MWh under rationing conditions.
Water Rights
Companies in Chile must pay an annual fee for unused water rights. License fees already paid may be recovered through monthly tax credits commencing on the start-up date of the project associated with the water right. The maximum license fees that may be recovered are those paid during the eight years before the start-up date.
The Chilean Constitution considers water as a national public good on which real utilization rights are defined. That is similar to holding the private property rights over water, as set forth in article 19, paragraph 24: “The rights of individuals over water, recognized or constituted in accordance with the law, grant their holders ownership over such rights.” Notwithstanding the foregoing, paragraph 24 also specifies legal limitations to those water rights.
The Chilean Congress is currently discussing amendments to the Water Code with the objective of making water use related to human consumption, household subsistence and sanitation a priority, both in the granting and limiting the exercise of rights of use, including:
| • | Granting of water rights which would be limited to a maximum period of 30 years and extendable, unless the Chilean Water Authority proves the ineffective use of resources. The extension shall be effective only for used water rights. |
| • | The expiration of non-consumptive water rights, that were granted by law, if the holder does not exercise the right of use within eight years. |
| • | The expiration of non-consumptive water rights already granted, if the user does not effectively use the rights within a period of eight years from the date of enactment of the new Water Code. Only in justified cases, such asdelays in obtaining permits or environmental approvals, can the term be extended for up to four years. |
52
Table of Contents
Regulation of Distribution Companies
Concessions
Distribution service concessions give the right to use public areas for building distribution lines. The concessions are given by the Chilean Ministry of Energy for an undefined period. Distribution companies have the obligation to serve and connect the customers that make the requirement in the concession area. The Chilean President can declare a concession expired if the quality of service does not meet certain minimum standards.
Energy Purchases
Since 2005, with the enactment of the law “Ley Corta II,” energy sales between generation and distribution companies have been made by an international auction process. After the last modification of the law (Law 20.805 – 2015), the auctions of all distribution companies are managed by the CNE. The auctions are based on distribution companies’ projections of energy demand for the coming years. The result of the process is a “pay as bid” contract, with an extension up to 20 years. In addition, the modifications of the law establish a mechanism to supply the excess demand that is not covered by the contract.
Distribution Tariffs to End Customers
Tariffs charged by distribution companies to end customers are determined by the sum of the cost of electricity purchased by the distribution company, a transmission charge, and the value added from distribution of electricity (“VAD”), which allows distribution companies to recover their investment and operating costs, including a return on investment which is set by law. The price for both generation and distribution capacity sold to customers includes a factor which reflects the simultaneous contribution of each customer to peak capacity demand of the system as a whole. The transmission charge reflects the cost paid for electricity transmission and transformation.
The VAD is based on a so-called “efficient model company,” which considers the cost of building and operating the company at the minimum cost, fulfilling quality and safety standards. It includes the annualized investment in distribution assets, the company’s operation, administration, and maintenance costs, and an expected return on investment, before taxes of 10% per year in real terms, based on the replacement cost of assets used for the distribution business.
Regulatory Charges and Subsidies
The Chilean law deems that transitory subsidies can be granted, if the residential customers tariff increased by at least 5% within a six-month period. The application of this subsidy is optional and the last one was granted in 2009.
Distribution Tariff-Setting Process
The VAD is set every four years. The CNE classifies companies into groups called Typical Distribution Areas (“TDA”) based on economic factors that group companies with similar distribution costs, which in turn determines the equipment requirements of the network. The CNE selects one distribution company for every group and estimates its cost under the concept of an efficient model company. At the same time, distribution companies also carry out their own studies, which are based on the same one company selected by the CNE for each TDA. The VAD of each TDA is determined in a weighted manner with one third of the value estimated by the study of the companies and two thirds by the CNE. Preliminary tariffs, as a result of the VAD, are tested to ensure that they provide a rate of return between 6% and 14% on distribution assets.
The real return on investment for a distribution company depends on its actual performance relative to the standards chosen by the CNE for the efficient model company. The tariff system allows for a greater return to distribution companies that are more efficient than the model company.
53
Table of Contents
Associated Electrical Services
In 2013, the CNE concluded the tariff setting process for 25 regulated associated services (which include meter rental, disconnection and reconnection of service, among others). These new prices were applied starting March 14, 2014 and will remain in effect until 2016.
Incentives and Penalties
Distribution companies may be required to compensate end customers in the case of electricity shortages that exceed the authorized standards. These compensatory payments are equal to double the amount of electricity the distribution company failed to provide, using a rate equal to the failure cost.
Regulation in Transmission
The main transmission system consists of 220 kV or higher voltage lines that are used by generators and customers. Every four years, a study is carried out to evaluate the existing system and to define the expansion plan. On December 31, 2010, the last study was delivered to the CNE. In November 2011, the CNE promulgated Decree 61, which defines the current value of the existing lines to be remunerated for the 2011 to 2014 period. The main transmission system is paid for by generators and customers.
According to the General Electricity Services Law, the transportation of electricity by main transmission systems and sub-transmission systems are defined as a public service. Therefore, the transmitter has a service obligation and is responsible for the maintenance and improvement of its facilities.
On October 14, 2013, the Electricity Concessions Law was approved, which law seeks to streamline the processing of electrical concessions, including, among other things, compensation, taxation and notifications.
During 2014, studies were developed to set tolls of major transmission systems. The results of these studies should have been applied beginning in 2015. However, the authority ruled that the current values will remain in effect until December 2015.
Regulation in Subtransmission
Subtransmission systems are defined as voltage lines exceeding 23 kV. There are six subtransmission systems defined by decree. The subtransmission systems are paid mainly by customers according to the tariffs fixed by decree of the Chilean Ministry of Energy. Subtransmissions tariffs remunerate the Subtransmission Annual Value (“VASTx” in its Spanish acronym). The VASTx is estimated every four years in a process carried out by the government. Each subtransmission system develops a study where investment, operation, maintenance, and administration costs are estimated. Investments are economically adapted to the government’s energy projections. Therefore, tariffs only pay for investments in utilized capacity and not for overcapacity. The discount rate established by law is 10%. Operation, maintenance, and administrative costs are estimated under the “efficient model company” methodology, as described above. The CNE’s consultants examine the studies and develop a report that includes CNE considerations. If major discrepancies are discovered, an expert panel will resolve them based on technical aspects.
Generators and unregulated customers pay only for the lines they use in each system. In April 2013, Decree 14 was promulgated, which established a tariff schedule for 2011 through 2014.
During 2014, studies were developed to set tolls of subtransmission systems. The results of these studies should have been applied beginning in 2015. However, the authority ruled that the current values will remain in force for an additional year.
54
Table of Contents
Environmental Regulation
The Chilean constitution grants citizens the right to live in a pollution-free environment. It further provides that certain other constitutional rights may be limited in order to protect the environment. Chile has numerous laws, regulations, decrees and municipal ordinances that address environmental considerations. Among them are regulations relating to waste disposal (including the discharge of liquid industrial wastes), the establishment of industries in areas that may affect public health, and the protection of water for human consumption.
Environmental Law No. 19,300 was enacted in 1994 and has been amended by several regulations, including the Environmental Impact Assessment System Rule issued in 1997 and modified in 2001. This law requires companies to conduct an environmental impact study and a declaration of any future generation or transmission projects.
In January 2010, Law No. 19,300 was modified by Law No. 20,417, which introduced changes in the environmental assessment process and in the public institutions involved, principally creating the Chilean Ministry of Environment and the Superintendence of Environment. Environmental assessment processes are coordinated by this entity and the Environmental Assessment Service. In June 2011, the Ministry of Environment published Decree 13, emission standards for thermoelectric plants applicable to generation units of at least 50 MW. The objective of this regulation is to control atmospheric emissions of particulate matter (MP), nitrogen oxides (NOx), sulfur dioxide (SO2) and mercury (Hg), in order to prevent and protect the health of the population and protect the environment. Existing emission sources will have to meet emission limits as established in the regulation for MP emissions within two and a half years from the date this decree was published (December 2013) and for SO2and NOx emissions, within four years in highly polluted areas and within five years elsewhere.
In June 2012, Law No. 20,600 created the Environmental Courts, special jurisdictional courts subject to the control of the Chilean Supreme Court. Their primary function is to resolve environmental disputes within their jurisdiction and look into other matters that are submitted for their attention under the law. The law created three such courts, all of which are in operation.
On December 28, 2012, the Superintendence of Environment was formally created and began to exercise its powers of enforcement and sanctions pursuant to Chilean environmental regulations.
On September 10, 2014, Law No. 20,780 was enacted and included charges for the emission of particles (MP), nitrogen oxides (NOx), sulfur dioxide (SO2) and carbon dioxide (CO2) into the atmosphere. For CO2 emissions, the charge is US$ 5 per emitted ton (not applicable to renewable biomass generation). MP, NOx and SO2 emissions will be charged the equivalent of US$ 0.10 per emitted ton, multiplied by the result of a formula based on the population of the municipality where the generation plant is located and an additional fee of US$ 0.90 per ton of MP emitted, US$ 0.01 per ton of SO2 emitted and US$ 0.025 per ton of NOx emitted. This tax will be in effect beginning in 2018, taking into account the previous year’s emissions.
Raw Materials
For information regarding our raw materials, please see “Item 11. Quantitative and Qualitative Disclosures About Market Risk — Commodity Price Risk.”
55
Table of Contents
| C. | Organizational Structure. |
In this “Organizational Structure” section, references (i) to “we,” “us” and “our” are to the Chilean Business of Enersis prior to the Spin-Off, and to Enersis Chile after the Spin-Off, (ii) to Endesa Chile are to the Chilean business of Endesa Chile prior to the spin-off of Endesa Américas by Endesa Chile, and to Endesa Chile after such spin-off, and (iii) to Chilectra are to the Chilean business of Chilectra prior to the spin-off of Chilectra Américas by Chilectra, and to Chilectra Chile after such spin-off.
Principal Combined Entities and Affiliates
We are part of an electricity group controlled by the Italian company, Enel, which after giving effect to theSpin-Off, will beneficially own 60.6% of our shares through wholly-owned Spanish combined entities. Enel publicly trades on the Milan Stock Exchange. It is headquartered in Italy and is primarily engaged in the energy sector, with a presence in 30 countries across five continents, mainly in Europe and Latin America, and generating power from power plants with over 89 GW of net installed capacity. Enel provides service to more than 61 million customers through its electricity and gas businesses through distribution networks of 1.9 million kilometers.
56
Table of Contents
Enersis Chile’s Simplified Organizational Structure After Giving Effect to the Spin-Off(1)
As of September 30, 2015
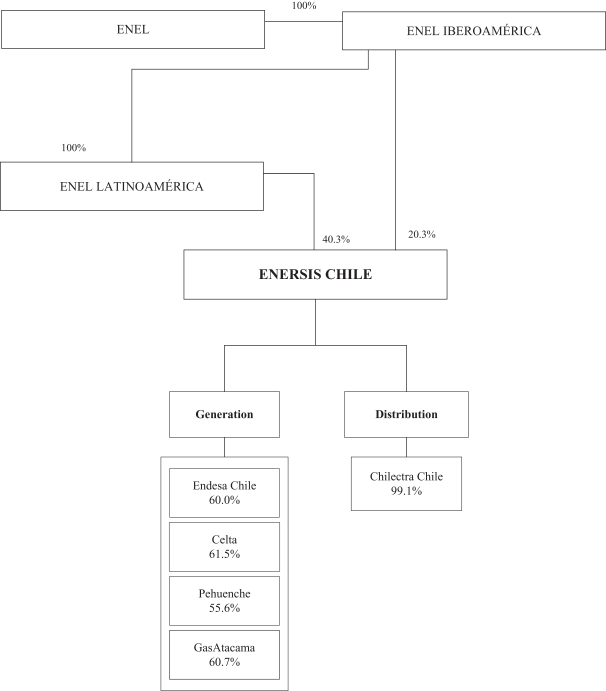
| (1) | Only principal operating combined entities are presented here. The percentage listed for each of our combined entities represents our post-Spin-Off economic interest in such combined entity. |
57
Table of Contents
The companies listed in the following table were combined by us as of September 30, 2015. In the case of combined entities, economic interest is calculated by multiplying our post-Spin-Off percentage of economic interest in a directly held combined entity by the percentage economic interest of any entity in the chain of ownership of such ultimate combined entity.
Principal Combined Entities and Country of | % Economic Ownership of Main Combined Entity by Enersis | Combined Assets of Each Main Combined Entity | Operating Income of Each Main Combined Entity | |||||||||
| (in %) | (in billions of Ch$) | |||||||||||
Electricity Generation | ||||||||||||
Endesa Chile (Chile)(1) | 60.0 | 3,275.0 | 229 | |||||||||
Electricity Distribution | ||||||||||||
Chilectra (Chile) | 99.1 | 994.6 | 112 | |||||||||
Other non-electricity businesses | ||||||||||||
SIEI (Chile)(2) | 100 | 61.2 | (1 | ) | ||||||||
| (1) | Endesa Chile consolidates all generation facilities in Chile. |
| (2) | In December 2014, Inmobiliaria Manso de Velasco Ltda. merged into ICT Servicios Informáticos Ltda. This resulting company was renamed Servicios Informáticos e Inmobiliarios Ltda. (SIEI). |
Generation Business
Celta
Celta was formed in 1995 in order to build and operate two thermoelectric plants in the SING: a coal-fired plant with an installed capacity of 158 MW, and a gas/fuel oil power plant with 24 MW of installed capacity. On November 1, 2013, Endesa Eco (which had previously merged with San Isidro and Pangue) was merged into Celta. Endesa Chile holds a 96.2% equity interest and we hold a 61.5% economic interest in Celta.
Endesa Chile
Endesa Chile is a Chilean electricity generation business, which has a total installed capacity of 6,351 MW as of September 30, 2015, with 17 generation facilities. Of the total installed capacity, 62% is from hydroelectric power plants and includes, among others, Ralco with 690 MW, El Toro with 450 MW, Rapel with 377 MW, and Antuco with 320 MW. Nearly 67% of its thermoelectric facilities are gas/fuel oil power plants, and the remaining are coal-fired steam power plants. Our economic interest in Endesa Chile is 60.0%.
GasAtacama
GasAtacama is a generation company located in the northern region of Chile. It consists of a four-unit combined-cycle power plant of with a capacity of 780 MW and a gas pipeline, which allows the import of gas from Argentina. Since March 31, 2014, and after completing the purchase of a 50% ownership interest in GasAtacama Holding, Endesa Chile beneficially owns 98.1% of GasAtacama’s shares and the remaining 1.9% is beneficially owned by Enersis. Since May 1, 2014, Endesa Chile has fully combined GasAtacama Holding and GasAtacama in its combined financial statements. We beneficially own a 60.7% economic interest in GasAtacama.
Pehuenche
Pehuenche, a generation company connected to the SIC, owns three hydroelectric facilities located in the hydrological basin of the Maule River, south of Santiago, with a total installed capacity of 699 MW. The 570 MW Pehuenche plant began operations in 1991, the 89 MW Curillinque plant began operations in 1993, and the 40 MW Loma Alta plant began operations in 1997. Endesa Chile holds 92.7% of Pehuenche and our economic interest in Pehuenche is 55.6%.
58
Table of Contents
Distribution Business
Chilectra
Chilectra is one of the largest electricity distribution businesses in Chile as measured by the number of regulated customers, distribution assets and energy sales. Chilectra operates in a concession area of 2,105 square kilometers in the Santiago metropolitan area, serving approximately 1.8 million customers. Our shareholding is 99.1%.
Selected Related and Jointly-Controlled Companies
Transquillota
Transquillota was formed by San Isidro and Colbún for the joint development of a 220 kV transmission line to dispatch the energy produced and to connect both the San Isidro (which is now merged with Celta, one of Endesa Chile’s combined entities) and Nehuenco (a combined entity of Colbún) plants to the SIC. The 220 kV transmission line is 8 kilometers long. The property is equally divided between Celta and Nehuenco (an unrelated company). Endesa Chile’s economic interest is 48.1% and our economic interest is 30.7%.
Non-Electricity Businesses
SIEI
SIEI is a company that provides consulting, management, administration and contract operations related to information systems, technological information, telecommunications, and control systems in South America, as well as real estate projects in Chile. SIEI was formed in December 2014, as a result of the merger of ICT Servicios Informáticos Ltda. with Inmobiliaria Manso de Velasco Ltda.
For additional information on all of our combined entities and jointly-controlled companies, please refer to Appendix 1 of our combined financial statements.
| D. | Property, Plant and Equipment. |
In this “Property, Plant and Equipment” section, references (i) to “we,” “us” and “our” are to the Chilean Business of Enersis prior to the Spin-Off, and to Enersis Chile after the Spin-Off, (ii) to Endesa Chile are to the Chilean business of Endesa Chile prior to the spin-off of Endesa Américas by Endesa Chile, and to Endesa Chile after such spin-off, and (iii) to Chilectra are to the Chilean business of Chilectra prior to the spin-off of Chilectra Américas by Chilectra, and to Chilectra Chile after such spin-off.
Our property, plant and equipment are concentrated on electricity generation and distribution assets in Chile.
Property, Plant and Equipment of Generating Companies
We conduct our generation businesses through Endesa Chile, which owns 28 generation power plants in Chile.
A substantial portion of our generating combined entities’ cash flow and net income is derived from the sale of electricity produced by our electricity generation facilities. Significant damage to one or more of our main electricity generation facilities or interruption in the production of electricity, whether as a result of an earthquake, flood, volcanic activity or any other such cause, could have a material adverse effect on our operations. Our electricity generation facilities are insured against damage due to earthquakes, fires, floods, other acts of god (but not for prolonged droughts, which are notforce majeure risks, and are not covered by insurance) and from damage due to third-party actions, based on the appraised value of the facilities as determined from time to time by an independent appraiser. Based on geological, hydrological and engineering studies,
59
Table of Contents
management believes that the risk of an event with a material adverse effect is remote. Claims under our generating combined entities’ insurance policies are subject to customary deductibles and other conditions. We also maintain business interruption insurance providing coverage for the failure of any of our facilities for a period of up to 24 months, including the deductible period.
The insurance coverage taken for our property is approved by each company’s management, taking into account the quality of the insurance companies and the needs, conditions and risk evaluations of each generating facility, and is based on general corporate guidelines.
All insurance policies are purchased from reputable international insurers. We continuously monitor and meet with the insurance companies in order to obtain what we believe is the most commercially reasonable insurance coverage.
60
Table of Contents
The following table identifies the power plants that we own, all in Chile, at the end of each period indicated, by company and their basic characteristics:
| As of September 30, | As of December 31, | |||||||||||||||||||
Company | Power Plant Name | Power Plant Type(1) | 2015 | 2014 | 2014 | 2013 | ||||||||||||||
| (in MW) | ||||||||||||||||||||
Endesa Chile | Rapel | Reservoir | 377 | 377 | 377 | 377 | ||||||||||||||
Cipreses | Reservoir | 106 | 106 | 106 | 106 | |||||||||||||||
El Toro | Reservoir | 450 | 450 | 450 | 450 | |||||||||||||||
Los Molles | Pass-through | 18 | 18 | 18 | 18 | |||||||||||||||
Sauzal | Pass-through | 77 | 77 | 77 | 77 | |||||||||||||||
Sauzalito | Pass-through | 12 | 12 | 12 | 12 | |||||||||||||||
Isla | Pass-through | 70 | 70 | 70 | 70 | |||||||||||||||
Antuco | Pass-through | 320 | 320 | 320 | 320 | |||||||||||||||
Abanico | Pass-through | 136 | 136 | 136 | 136 | |||||||||||||||
Ralco | Reservoir | 690 | 690 | 690 | 690 | |||||||||||||||
Palmucho | Pass-through | 34 | 34 | 34 | 34 | |||||||||||||||
|
|
|
|
|
|
|
| |||||||||||||
Total hydroelectric | 2,290 | 2,290 | 2,290 | 2,290 | ||||||||||||||||
Bocamina | Steam Turbine/Coal | 478 | 478 | 478 | 478 | |||||||||||||||
Diego de Almagro | Gas Turbine/ Diesel Oil | 24 | 24 | 24 | 24 | |||||||||||||||
Huasco | Gas Turbine/IFO 180 Oil | 64 | 64 | 64 | 64 | |||||||||||||||
Taltal | Gas Turbine/Natural Gas+Diesel Oil | 245 | 245 | 245 | 245 | |||||||||||||||
San Isidro 2 | Combined Cycle /Natural Gas+Diesel Oil | 399 | 399 | 399 | 399 | |||||||||||||||
Quintero | Gas Turbine/Natural Gas+Diesel Oil | 257 | 257 | 257 | 257 | |||||||||||||||
|
|
|
|
|
|
|
| |||||||||||||
Total thermal | 1,467 | 1,467 | 1,467 | 1,467 | ||||||||||||||||
|
|
|
|
|
|
|
| |||||||||||||
Total | 3,757 | 3,757 | 3,757 | 3,757 | ||||||||||||||||
Pehuenche | Pehuenche | Reservoir | 570 | 570 | 570 | 570 | ||||||||||||||
Curillinque | Pass-through | 89 | 89 | 89 | 89 | |||||||||||||||
Loma Alta | Pass-through | 40 | 40 | 40 | 40 | |||||||||||||||
|
|
|
|
|
|
|
| |||||||||||||
Total | 699 | 699 | 699 | 699 | ||||||||||||||||
Celta(2) | Tarapacá | Steam Turbine/Coal | 158 | 158 | 158 | 158 | ||||||||||||||
Tarapacá | Gas Turbine/Diesel Oil | 24 | 24 | 24 | 24 | |||||||||||||||
San Isidro | Combined Cycle /Natural Gas+Diesel Oil | 379 | 379 | 379 | 379 | |||||||||||||||
Pangue | Reservoir | 467 | 467 | 467 | 467 | |||||||||||||||
Canela | Wind Farm | 18 | 18 | 18 | 18 | |||||||||||||||
Canela II | Wind Farm | 60 | 60 | 60 | 60 | |||||||||||||||
Ojos de Agua | Pass-through | 9 | 9 | 9 | 9 | |||||||||||||||
|
|
|
|
|
|
|
| |||||||||||||
Total | 1,115 | 1,115 | 1,115 | 1,115 | ||||||||||||||||
GasAtacama(3) | Atacama | Combined Cycle /Natural Gas+Diesel Oil | 781 | 781 | 781 | — | ||||||||||||||
|
|
|
|
|
|
|
| |||||||||||||
Total | 781 | 781 | 781 | — | ||||||||||||||||
|
|
|
|
|
|
|
| |||||||||||||
Total capacity | 6,351 | 6,351 | 6,351 | 5,571 | ||||||||||||||||
|
|
|
|
|
|
|
| |||||||||||||
| (1) | “Reservoir” and “pass-through” refer to hydroelectric plants that use the force of a dam or a river, respectively, to move the turbines which generate electricity. “Steam” refers to thermal power plants fueled with natural gas, coal, diesel or fuel oil to produce steam that moves the turbines. “Gas Turbine” (“GT”) or “Open Cycle” refer to thermal power that uses either diesel or natural gas to produce gas that moves the turbines. “Combined-Cycle” refers to a thermal power plant fueled with natural gas, diesel oil, or fuel oil to generate gas that first moves a turbine and then recovers the gas from that process to generate steam to move a second turbine. |
| (2) | San Isidro. merged into Endesa Eco. on September 1, 2013, and the latter remained the surviving company. Subsequently, Endesa Eco merged into Celta on November 1, 2013, and Celta. was the surviving company. |
| (3) | GasAtacama was accounted for using the equity method and its installed capacity was not included in 2013 and for a portion of 2014. Since May 1, 2014, GasAtacama has been fully combined following Endesa Chile’s purchase of an additional 50% interest in GasAtacama Holding. |
61
Table of Contents
As of September 30, 2015, we received the ISO 14,001 certification for 94.5% of our installed capacity in Chile, which included our generation facilities that produced 96.4% of the total annual generation, in accordance with this standard.
Property, Plant and Equipment of Distribution Companies
We also have significant interests or investments in electricity distribution. The description for our distribution company is included in this “Item 4. Information on the Company.” The table below describes our main equipment used for our distribution business, such as transmission lines, substations, distribution networks and transformers.
We are insured against damage to substations, transformers that are within the substations, the distribution network that is less one kilometer from the substations and administrative buildings. Risks covered include damages caused by fires, explosions, earthquakes, floods, lightning, damage to machinery and other such events. Insurance policies include liability clauses, which protect our companies from claims made by third parties.
TABLE OF DISTRIBUTION FACILITIES
General Characteristics
| Transmission Lines(1) | ||||||||||||||||||||||||
| As of September 30, | As of December 31, | |||||||||||||||||||||||
| Location | Concession Area | 2015 | 2014 | 2014 | 2013 | |||||||||||||||||||
| (in km2) | (in kilometers) | |||||||||||||||||||||||
Chilectra | Chile | 2,105 | 361 | 355 | 355 | 355 | ||||||||||||||||||
| (1) | The transmission lines consist of circuits with voltages in the 27-220 kV range. |
Power and Interconnection Substations and Transformers(1)
| As of September 30, | ||||||||||||||||||||||||
| 2015 | 2014 | |||||||||||||||||||||||
| Number of Substations | Number of Transformers | Capacity (in MVA) | Number of Substations | Number of Transformers | Capacity (in MVA) | |||||||||||||||||||
Chilectra | 55 | 164 | 8,123 | 54 | 161 | 7,673 | ||||||||||||||||||
| (1) | Voltage of these transformers is in the range of 500 kV (high voltage) and 7 kV (medium voltage). |
| As of December 31, | ||||||||||||||||||||||||
| 2014 | 2013 | |||||||||||||||||||||||
| Number of Substations | Number of Transformers | Capacity (in MVA) | Number of Substations | Number of Transformers | Capacity (in MVA) | |||||||||||||||||||
Chilectra | 54 | 161 | 7,673 | 54 | 160 | 7,598 | ||||||||||||||||||
| (1) | Voltage of these transformers is in the range of 500 kV (high voltage) and 7 kV (medium voltage). |
62
Table of Contents
Distribution Network - Medium and Low Voltage Lines(1)
| As of September 30, | As of December 31, | |||||||||||||||||||||||||||||||
| 2015 | 2014 | 2014 | 2013 | |||||||||||||||||||||||||||||
| Medium Voltage | Low Voltage | Medium Voltage | Low Voltage | Medium Voltage | Low Voltage | Medium Voltage | Low Voltage | |||||||||||||||||||||||||
| (in kilometers) | ||||||||||||||||||||||||||||||||
Chilectra | 5,218 | 11,154 | 5,145 | 10,956 | 5,152 | 11,016 | 5,111 | 10,838 | ||||||||||||||||||||||||
| (1) | Medium voltage lines: 7 kV - 34.5 kV; low voltage lines: 380-110 V. |
Transformers for Distribution(1)
| As of September 30, | As of December 31, | |||||||||||||||||||||||||||||||
| 2015 | 2014 | 2014 | 2013 | |||||||||||||||||||||||||||||
| Number | Capacity (in MVA) | Number | Capacity (in MVA) | Number | Capacity (in MVA) | Number | Capacity (in MVA) | |||||||||||||||||||||||||
Chilectra | 28,972 | 7,774 | 29,013 | 7,535 | 28,995 | 7,621 | 28,893 | 7,313 | ||||||||||||||||||||||||
| (1) | Voltage of these transformers is in the range of 34.5 kV (medium voltage) and 110 V (low voltage). |
Project Investments
The total investment for each project described below was translated into Chilean pesos at the exchange rate of Ch$ 698.72 per U.S. dollar, the U.S. dollar Observed Exchange Rate as of September 30, 2015. Budgeted amounts include connecting lines that could eventually be owned by third parties and paid as tolls, unless otherwise indicated.
Projects under Construction
Los Cóndores Hydroelectric Project
Los Cóndores project will be located in the Maule region, in the San Clemente area. It consists of a 150 MW run-of-the river hydroelectric power plant, which will use water from the Maule Lake reservoir through a 12 km penstock. The power plant will be connected to the SIC at the Ancoa substation (220 kV) through an 87 km transmission line and will consist of two Units.
The basic engineering and the Environmental Impact Statement (“DIA”, in its Spanish acronym) of the Los Cóndores optimized project were concluded in early 2011. The RCA was obtained in November 2011 and the RCA of the Transmission Line project was granted in May 2012. Finally, in November 2014, the General Water Authority approved the waterworks permit.
During July 2015, we conducted scale model tests of the turbines in the laboratory owned by Voith Hydro located in Heidenheim, Germany. The results were satisfactory and enabled a hydraulic design, giving rise to the detailed design of the main generating equipment, a process that will take approximately eight months.
During August 2015, we participated in the assembling tests of the Tunnel Boring Machine (“TBM”), which will be used to build a 12 km connecting tunnel.
The main advances in construction in 2015 were:
| • | In January 2015, we finished phase 1 of civil works by executing (digging and sustenance) the first 10 meters of the tunnel Ventana Lo Aguirre. |
| • | In April 2015, we completed the digging of the access tunnel to the underground powerhouse (390 meters in length). |
63
Table of Contents
| • | In August 2015, we completed the digging of the auxiliary tunnel to the discharge tunnel (141 meters in length). |
| • | In September 2015, we completed the digging of the discharge tunnel of both Units that connect the underground powerhouse with the principal discharge tunnel of the power plant. |
Construction is expected to be completed in 2018. This project is being financed primarily with internally generated funds. The estimated total investment is Ch$ 409,795 million, of which Ch$ 80,553 million was accrued as of September 30, 2015.
Projects Under Development
We continuously analyze different growth opportunities in Chile. During 2015, our projects’ portfolio has been modified to permit flexibility in the investment decision. The focus is to have a portfolio with projects that are sustainable from a technical, environmental, social and economic perspective. Expected dates of commissioning of each of the projects are constantly reviewed and are defined based on commercial opportunities and on our financial capacity to undertake these projects. The most important projects under development are as follows:
Generation Business
Neltume Hydroelectric Project
The Neltume project is located in Los Ríos region, on the upper part of the Valdivia River basin. The Neltume project consists of a 490 MW installed capacity run-of-the-river hydro power plant. It will be connected to the SIC through a 42 kilometer 220 kV transmission line from Neltume to Pullinque.
In 2007, we started an early process of social integration in the local territory, which is still in place. Due to this process and to the engineering studies required, the Environmental Impact Study was submitted in December 2010. The environmental assessment process was suspended during its fourth round of questions and answers by the Environmental Evaluation Authority (“SEA,” in its Spanish acronym) of Los Ríos. This suspension is part of the Indigenous Inquiry process that the SEA is carrying out.
During the second half of 2013, the SEA initiated the Indigenous Inquiry process for the local inhabitants in the area, to ascertain their position on the project and to comply with Convention No. 169, “Indigenous and Tribal Peoples Convention” of the International Labor Organization (“ILO”). There is no legal deadline to complete the Indigenous Inquiry and the environmental assessment process is suspended until it is concluded.
We expect construction to start during 2018 and completion in 2023. This project is being financed primarily with internally generated funds. The estimated total investment is Ch$ 880,340 million, of which Ch$ 39,140 million was accrued as of September 30, 2015.
Piruquina Hydroelectric Project
The Piruquina Hydroelectric project is located in Los Lagos region, on Chiloé Island, and will use water from the Carihueico river. The Piruquina project consists of a 8 MW installed capacity mini hydroelectric power plant. Its architecture provides a small connecting tunnel of approximately 200 meters. It will be connected to the SIC at the Pid-Pid substation, through a 6 kilometer 23 kV transmission line.
This project has all the engineering studies and principal permits required, as well as the favorable environmental qualification resolution (“RCA” in its Spanish acronym) issued on November 10, 2009 and the Hydraulic Work Permit (“PHO” in its Spanish acronym) granted on August 6, 2014 that approves and authorizes the construction of hydraulic works for the power plant.
64
Table of Contents
Currently, we expect construction to start during 2016 and completion in 2018. This project is being financed primarily with internally generated funds. The estimated total investment is Ch$ 25,950 million, of which Ch$ 39 million was accrued as of September 30, 2015.
Ttanti Combined-Cycle Project
The Ttanti project is located in Antofagasta región, in an adjacent land to the existing Atacama power plant, in the industrial zone of Mejillones city. In its first phase, the project consists of the construction of a natural gas combined-cycle power plant with an installed capacity of approximately 400 MW, which would be able to use diesel oil as a backup. The power plant would be connected to SING through a 0.5 km 220 kV double circuit transmission line to the Atacama substation, which will required to be expanded for this purpose.
Currently, the project is in the environment assessment phase. Nevertheless, we agreed to suspend the process until the end of 2015, in order to prepare and complete Addendum No. 1, to respond to the first round of observations formulated by the SEA.
We expect construction to start during 2018 and its commissioning is expected in 2022. The estimated total investment is Ch$ 209,319 million, of which Ch$ 335 million was accrued as of September 30, 2015.
Taltal Combined-Cycle Project
The project consists of the construction of a steam turbine for converting the existing Taltal gas-fired open cycle plant to a combined-cycle plant by adding a turbine in the vapor phase, which would use the steam generated by the gas turbines’ heat emissions to produce energy, which will considerably improve its efficiency. The Taltal power plant is located in the Antofagasta region. Currently, the existing Taltal power plant has two gas turbines of 120 MW each. The extra power to be added by the steam turbine would be approximately 130 MW and therefore, the Taltal power plant would achieve a total capacity of 370 MW and an efficiency increase. The energy produced will be supplied to the SIC through the existing 220 kV double circuit Diego de Almagro – Paposo transmission line.
In December 2013, an Environmental Impact Statement (“DIA” in its Spanish acronym) was submitted for approval to the SEA, in order to optimize the project. The main modification relates to a change in the cooling system, which was originally designed as a wet system (using sea water) and is being modified to a dry cooling system. During 2014, we progressed on drafting Addendum No. 1 of the DIA responding to the first round of observations formulated by the SEA, which was submitted during the first quarter of 2015. During the second quarter of 2015, Addendum No. 2 was submitted, responding to the second round of observations formulated by the SEA. During the third quarter of 2015, the SEA formulated its third round of observations and we decided to postpone sending a response until the end of the year. This decision was made to create opportunities for dialogue and work in partnership with the local community and thus, build a collaborative, transparent and constructive relationship, enabling us to benefit mutually.
We expect construction to start during 2018 and its commissioning is expected for 2021. This project is being financed primarily with internally generated funds. The estimated total investment is Ch$ 186,474 million. The amount invested as of September 30, 2015 was Ch$ 2,776 million.
Distribution Business
As of September 30, 2015, Chilectra has invested Ch$ 55.8 billion, mainly in projects focused on satisfying the increase of energy demand, quality of service, safety and information systems.
During May 2015, the new Chicureo Substation was commissioned, with the energization of Transformer No. 1 and the Chamisero and Piedra Roja feeders. The new 220/23 kV Chicureo Substation, which has an initial capacity of 25 MVA, equivalent of supplying approximately 30,000 homes, includes the construction of a new 6.2 km extension of High Voltage Supply Line.
65
Table of Contents
During August 2015, the 220 kV Transmission Line Alto Jahuel – Los Almendros was purchased for an amount of Ch$ 17.7 billion.
Major Encumbrances
As of September 30, 2015, we have full ownership of our assets and they are not subject to material encumbrances.
Climate Change
In recent years, Chile and the region have seen an increase of developments related to NCRE and strategies to combat climate change. This has required both the public and private sectors to adopt strategies in order to comply with the new environmental requirements, as evidenced by legal obligations at the local level, commitments assumed by countries at the international level, and the demanding requirements of the international markets.
NCREs provide energy with minimal environmental impact and without CO2 emissions. They are therefore considered technological options that strengthen sustainable energy development as they supplement the production of traditional generators.
The Canela wind farm (18 MW, in operation since 2007) and Canela II wind farm (60 MW, in operation since 2009) are the NCRE facilities owned by Endesa Chile which have contributed clean and renewable energy to the SIC. Regarding the development of CO2 emission reduction mechanisms, the projects in the Clean Development Mechanism (“CDM”) circuit were as follows:
Canela Wind Farm: On April 3, 2009, the United Nations Framework Convention on Climate Change (“UNFCCC”) approved the registration of the Canela project as a CDM project, which recognizes that this wind farm may verify and trade credits for greenhouse gas emissions that it will avoid during its useful life. On February 24, 2014, the UNFCCC approved the issuance of credits for 44,919 tons of CO2 emissions for the operational period of 2009 through 2011. Certified Emission Reductions (“CERs”) of subsequent periods have not yet been verified.
On August 8, 2013, the Canela wind farm achieved registration under the Gold Standard (“GS”). This allowed Endesa Chile to apply for the GS verification process, which would provide GS Voluntary Emission Reductions (“VER”).
Canela II Wind Farm: On August 12, 2012, the UNFCCC approved the registration of the Canela II project as a CDM project, which recognizes that this wind farm may verify and trade the greenhouse gas emissions that it will avoid during its useful life.
66
Table of Contents
Detail of CDM Projects Processed in the Nine Months ended September 30, 2015 by Endesa Chile
CDM project | Company/country | Position as of September 30, 2015 | Emission factor | Approximate | ||||
| Canela Wind Farm | Central Eólica Canela S.A. (Chile) | Registered with the Executive Authority of the UNFCCC since April 2009. Issuance of 44,919 CERs(2) during the period from 2009 to 2011. Subsequent periods are not yet verified. | 0.5713 | 27,251 | ||||
| Canela Wind Farm | Central Eólica Canela S.A. (Chile) | Registered with the Gold Standard (Voluntary Standard) since August 2013. | 0.5713 | 27,251 (VER not yet verified)(3) | ||||
| Canela II Wind Farm | Central Eólica Canela S.A. (Chile) | Registered with the Executive Authority of the UNFCCC since August 2012. CDM procedure implemented. | 0.6541 | 89,990 | ||||
| (1) | Obtained from the PDD (Project Design Document) of each project. |
| (2) | CER: Certified Emission Reductions. |
| (3) | VER: Voluntary Emission Reductions. |
In compliance with the group climate change guidelines, we have secured the certification of our carbon footprint for a fourth time. The Spanish Association of Standards and Certification (Asociación Española de Normalización y Certificación or “AENOR”), an independent certification authority, acknowledged the validity of the methodology. Acknowledgement by AENOR includes verification of the group’s carbon footprint reports from 2009 to 2014. A carbon footprint is the sum of all greenhouse gases (“GHGs”) produced by a company in the course of its business activity. We are striving to reduce our emissions as part of our commitment to combat climate change. The first step involves measuring our carbon footprint.
As part of the process of calculating our carbon footprint, we plan to obtain a GHG inventory, including direct emissions associated with activities controlled by us. We also plan to obtain a GHG inventory of indirect emissions, which are not generated through sources we control but are consequences of our activities.
The tools used to calculate emissions include audits and checks at all of our facilities. This enables us to monitor our carbon footprint throughout the entire electricity supply chain. Calculating the carbon footprint also enables us to identify phases of our activities with the greatest potential to boost energy efficiency and reduce emissions.
Item 4A. Unresolved Staff Comments
None
| Item 5. | Operating and Financial Review and Prospects |
| A. | Operating Results. |
General
The following discussion should be read in conjunction with our combined financial statements and the notes thereto, included in this information statement, and “Selected Financial Data,” included in Item 3 herein. Our audited combined financial statements as of September 30, 2015 and for the nine month then ended have
67
Table of Contents
been prepared in accordance with IAS 34, Interim Financial Reporting, as issued by the IASB. Our audited combined financial statements as of December 31, 2014 and 2013 and January 1, 2013 and for the years ended December 31, 2014 and 2013 have been prepared in accordance with IFRS, as issued by the IASB.
| 1. | Discussion of Main Factors Affecting Operating Results and Financial Condition |
We own and operate power generation and distribution companies in Chile. Our revenues, income and cash flows come from the operations of the combined companies and associates.
Factors such as (i) hydrological conditions, (ii) fuel prices, (iii) regulatory developments, (iv) exceptional actions adopted by governmental authorities and (v) changes to the economic conditions may materially affect our financial results. In addition, our results from operations and financial condition are affected by variations in the exchange rates between the Chilean peso and the U.S. dollar. We have certain critical accounting policies that affect our combined operating results. The impact of these factors on us, for the periods covered by this information statement, is discussed below.
Since May 2014, we have fully combined GasAtacama Holding and its subsidiaries, including GasAtacama, in our combined financial statements, as a result of Endesa Chile’s purchase of an additional 50% of GasAtacama Holding’s shares from Southern Cross Latin America Private Equity Fund III, L.P., which increased our economic interest in GasAtacama to 60.7%. Before this transaction, the companies were recognized as jointly-controlled companies.
| a. | Generation Business |
A substantial part of our generation capacity depends on the hydrological conditions, although generally only extreme hydrological conditions materially affect our operating results and financial condition. Our installed capacity as of September 30, 2015, September 30, 2014 and December 31, 2014 was 6,351 MW and as of December 2013 amounted to 5,571 MW, of which 54.6% and 62.2%, respectively, was hydroelectric. The 781 MW increase in installed capacity between December 2013 and 2014 is due to the inclusion of GasAtacama since May 2014. See “Item 4. Information on the Company – D. Property, Plant and Equipment.”
Hydroelectric generation was 7,699 GWh and 7,831 GWh in the nine months ended September 30, 2015 and 2014, respectively, a decrease of 132 GWh due to slightly the less favorable hydrological conditions and a higher accumulation of reservoirs. Hydroelectric generation was 11,561 GWh and 9,889 GWh in 2014 and 2013, an increase of 1,672 GWh mainly due to more favorable hydrological conditions. Some important reservoirs are still at low levels due to droughts since 2010, characterized by low rainfalls and a poor snowmelt. Several years of good hydrological conditions are needed to reach historical normal levels.
In order to mitigate hydrological risk, hydroelectric generation had to be substituted with thermal generation (natural gas, LNG, coal or diesel) and energy purchases on the spot market, both of which resulted in higher costs, in order to meet our obligations under contracts with both regulated and unregulated customers.
Our thermal generators burn natural gas, LNG, coal or diesel. We can offset the effect of poor hydrological conditions (reservoir levels, rain and snow) with thermal generation and electricity purchases. Our thermal installed capacity and the ability to purchase electricity from other generators allow us to increase thermal generation and/or purchase electricity from competitors to meet our energy commitments. In addition, given the industry structure and the percentage of hydroelectric generation capacity, when hydrological conditions are poor, electricity prices generally increase. Under certain circumstances, poor hydrological conditions can potentially lead to higher revenues and sometimes, higher operating income.
Operating costs in connection with thermal generation and energy purchases are higher than the variable cost of hydroelectric generation in normal hydrological conditions. The cost of thermal generation does not
68
Table of Contents
depend on hydrology but instead on global commodity prices for natural gas, coal, LNG and diesel. However, the cost of electricity purchases in the spot market does depend on hydrology and commodity prices.
The impact of poor hydrological conditions on our operating results depends on the effects of such conditions on the electricity market prices, on our hydroelectric generation, our cost of thermal generation, and our need for energy purchases. The effect of poor hydrological conditions on market prices may increase or decrease our operating margin, depending on several relevant market factors. In recent years, additional thermal capacity has helped to offset poor hydrology, resulting in better operating margins.
For additional information on the effects of hydrological conditions on our operating results, see “Item 3. Key Information — D. Risk Factors — Risks Related to Our Business—Because our generation business depends heavily on hydrological conditions, droughts may adversely affect our profitability.”
Our operating income had been negatively affected by the temporary shutdown of the Bocamina II power plant, which reduced our thermal generation. On December 17, 2013, the local Court of Concepción ordered the shutdown of the power plant in response to claims by some local fishermen’s unions. Bocamina II remained closed until July 1, 2015, when the plant became available to dispatch, after obtaining the required authorization.
| b. | Distribution Business |
Our electricity distribution business is conducted through Chilectra. For the nine months ended September 30, 2015, electricity sales amounted to 11,943 GWh, increasing by 1.4% compared to the same period of 2014. For the year ended December 31, 2014, electricity sales totaled 15,690 GWh, increasing by 3.6% compared to 2013. Currently Chilectra operates in the Santiago metropolitan area, providing electricity to over 1.8 million customers. Santiago is the country’s most densely populated area and has the highest concentration of industries, industrial parks and office facilities in the country. Chilectra faces growing electricity demand, because of organic growth in demand, which obliges it to continually invest in its facilities.
Among the key factors that impact our financial results are regulations. This is especially true when the actions adopted by government authorities define or intervene with directly regulated customer tariffs, or affect the price at which distributors can buy their energy. Our ability to buy electricity relies highly on generation availability and in a lesser degree on government regulation. In the past, we focused on reducing the losses, especially those due to illegally tapped energy, currently at a 5.5% level. We are working on improving our collectability indices and to improve our efficiency.
| c. | Selective Regulatory Developments |
The regulatory framework governing our businesses has a material effect on our results of operations. In particular, regulators set (i) energy prices in the generation business, taking into consideration factors such as fuel costs, reservoir levels, exchange rates, future investments in installed capacity and demand growth, and (ii) distribution tariffs taking into account the costs of energy purchases paid by distribution companies (which distribution companies pass on to their customers) and the “Value Added from Distribution,” or VAD, all of which are intended to reflect investment and operating costs incurred by distribution and generation companies and to allow our companies to earn a regulated level of return on their investments and guarantee service quality and reliability. Our earnings are determined to a large degree by government regulators, mainly through the tariff setting process.
Chilectra’s tariffs will be reviewed in 2016, which presents its own particularities and challenges since tariff reviews seek to capture economies of scale based on economic growth.
For additional information relating to the Chilean regulatory framework, see “Item 4. Information on the Company — B. Business Overview — Chilean Electricity Industry Regulatory Framework.”
69
Table of Contents
| d. | Economic Conditions |
Macroeconomic conditions, such as changes in employment levels and inflation or deflation may have a significant effect on our operating results. Macroeconomic factors, such as the variation of the Chilean peso against the U.S. dollar, may impact our operating results, as well as our assets and liabilities, depending on the percentage denominated in U.S. dollars. For example, a devaluation of the Chilean peso against the U.S. dollar increases the cost of capital expenditure plans. For additional information, see “Item 3. Key Information — D. Risk Factors — Risks Related to Our Business—Foreign exchange risks may adversely affect our results and the U.S. dollar value of dividends payable to ADS holders.” and “— Risks Related to Our Business —Chilean economic fluctuations could affect our results from of operations and financial condition as well as the value of our securities.”
Local Currency Exchange Rate
Variations in the parity of the U.S. dollar and the Chilean peso may have an impact on our operating results and overall financial position. The impact will depend on the level at which tariffs are pegged to the U.S. dollar, U.S. dollar-denominated assets and liabilities.
The following table sets forth the closing and average Chilean pesos per U.S. dollar exchange rates for the periods indicated:
| Local Currency U.S. Dollar Exchange Rates | ||||||||||||||||||||||||||||||||
| Nine months ended September 30, | Year ended December 31, | |||||||||||||||||||||||||||||||
| 2015 | 2014 | 2014 | 2013 | |||||||||||||||||||||||||||||
| Average | Period End | Average | Period End | Average | Year End | Average | Year End | |||||||||||||||||||||||||
Chile (Chilean pesos per U.S. dollar) | 640.39 | 698.72 | 561.10 | 599.22 | 570.40 | 606.75 | 495.18 | 524.61 | ||||||||||||||||||||||||
Source: Chilean Central Bank
| e. | Critical Accounting Policies |
Critical accounting policies are defined as those that reflect significant judgments and uncertainties which would potentially result in materially different results under different assumptions and conditions. We believe that our critical accounting policies are limited to those described below with reference to the preparation of our combined financial statements under IFRS.
For further detail of the accounting policies and the methods used in the preparation of the combined financial statements, see Notes 2 and 3 of the Notes to our interim combined financial statements
Impairment of Long-Lived Assets
During the year, and principally at the end of each reporting period, we evaluate whether there is any indication that an asset has been impaired. Should any such indication exist, we estimate the recoverable amount of that asset to determine, where appropriate, the amount of impairment. In the case of identifiable assets that do not generate cash flows independently, we estimate the recoverability of the cash generating unit to which the asset belongs, which is understood to be the smallest identifiable group of assets that generates independent cash inflows.
Notwithstanding the preceding paragraph, in the case of cash generating units to which goodwill or intangible assets with an indefinite useful life have been allocated, a recoverability analysis is performed routinely at each period end.
70
Table of Contents
The recoverable amount is the greater of (i) the fair value less the cost needed to sell and (ii) the value in use. Value in use” is defined as the present value of the estimated future cash flows. In order to calculate the recoverable value of property, plant and equipment, goodwill and intangible assets, we use value in use criteria in nearly all cases.
To estimate the value in use, we prepare future pre-tax cash flow projections based on the most recent budgets available. These budgets incorporate management’s best estimates of cash generating units, revenues and costs using sector projections, past experience and future expectations.
In general, these projections cover the next five years, estimating cash flows for subsequent years by applying reasonable growth rates, between 4.1% and 5.1%, which in no case are increasing nor exceed the average long-term growth rates for the particular sector.
These cash flows are discounted at a given pre-tax rate in order to calculate their present value. This rate reflects the cost of capital of the business in Chile. The discount rate is calculated taking into account the current time value of money and the risk premiums generally used by market participants for the specific business activity.
The pre-tax nominal discount rates applied as of September 30, 2015 and 2014 and December 31, 2014 and 2013 are as follows:
| Nine months ended September 30, | Year ended December 31, | |||||||||||||||||||||||||||||||||
| 2015 | 2014 | 2014 | 2013 | |||||||||||||||||||||||||||||||
Country | Currency | Minimum | Maximum | Minimum | Maximum | Minimum | Maximum | Minimum | Maximum | |||||||||||||||||||||||||
Chile | Chilean peso | 8.7 | % | 13.1 | % | 7.8 | % | 16.3 | % | 7.9 | % | 13.0 | % | 7.8 | % | 16.3 | % | |||||||||||||||||
Source: Chilean Central Bank
If the recoverable amount is less than the net carrying amount of the asset, the corresponding impairment loss provision is recognized for the difference, and charged to “Reversal of impairment loss (impairment loss) recognized in profit or loss” in the combined statement of comprehensive income.
Impairment losses recognized for an asset in prior periods are reversed when its estimated recoverable amount changes, increasing the asset’s value with a credit to earnings, limited to the asset’s carrying amount if no adjustment had occurred. In the case of goodwill, any adjustments made are not reversible.
Litigation and Contingencies
We are currently involved in certain legal and tax proceedings. As discussed in Note 24 of the Notes to our interim combined financial statements as of September 30, 2015, we have estimated the probable outflows of resources for resolving these claims to be Ch$16.3 billion. We have reached this estimate after consulting our legal and tax advisors who are carrying out our defense in these matters and an analysis of potential results, assuming a combination of litigation and settlement strategies.
Hedge Revenues Directly Linked to the U.S. Dollar
We have established a policy to hedge the portion of our revenues directly linked to the U.S. dollar by obtaining financing in U.S. dollars. Exchange differences related to this debt, as they are cash flow hedge transactions, are charged net of taxes to an equity reserve account and recorded as income during the period in which the hedged cash flows are realized. This term has been estimated at ten years.
This policy reflects a detailed analysis of our future U.S. dollar revenue streams. Such analysis may change in the future due to new electricity regulations limiting the amount of revenues tied to the U.S. dollar.
71
Table of Contents
Pension and Post-Employment Benefit Liabilities
We have various defined benefit plans for our employees. These plans pay benefits to employees at retirement and use formulas based on years of service and employee compensations. We also offer certain additional benefits for some retired employees in particular.
The liabilities shown for the pension and post-employment benefits reflect our best estimate of the future cost of meeting our obligations under these plans. The accounting applied to these defined benefit plans involves actuarial calculations which contain key assumptions that include employee turnover, life expectancy, retirement age, discount rates, the future level of employee compensations and benefits, the claims rate under medical plans and future medical costs. These assumptions change as economic and market conditions vary and any change in any of these assumptions could have a material effect on the reported results from operations.
The effect of an increase of one percentage point in the discount rate used to determine the present value of the post-employment defined benefits would decrease the liability by Ch$ 3.9 billion as of September 30, 2015, and Ch$ 3.9 billion and Ch$ 3.2 billion as of December 31, 2014 and 2013, respectively, and the effect of a decrease of one percentage point in the rate used to determine the present value of the post-employment defined benefits would increase the liability by Ch$ 4.6 billion as of September 30, 2015, and Ch$ 4.6 billion and Ch$ 3.7 billion as of December 31, 2014 and 2013, respectively.
Recent Accounting Pronouncements
Please see Note 2.2 of the Notes to our interim combined financial statements for additional information regarding recent accounting pronouncements.
2. Analysis of Results of Operations for the Nine Months Ended September 30, 2015 and 2014
Revenues
Generation Business
The following table sets forth the electricity sales of Endesa Chile and its subsidiaries and the corresponding changes for the nine months ended September 30, 2015 and 2014.
| Nine months ended September 30, | ||||||||||||||||
| 2015 | 2014 | Change | Change | |||||||||||||
| (in GWh) | (in %) | |||||||||||||||
Endesa Chile and subsidiaries | 17,311 | 15,063 | 2,248 | 14.9 | ||||||||||||
|
|
|
|
|
|
|
| |||||||||
Distribution Business
Distribution revenues are mainly derived from the resale of electricity purchased from generators. Revenues associated with distribution include the recovery of the cost of electricity purchased and the resulting revenue from the VAD, which is associated with the recovery of costs and the return on the investment with respect to the distribution assets, plus the physical energy losses permitted by the regulator. Other revenues derived from our distribution business consist of charges for new connections and the maintenance and rental of meters, among others.
The following table sets forth the electricity sales of Chilectra Chile and the corresponding changes for the nine months ended September 30, 2015 and 2014.
| Nine months ended September 30, | ||||||||||||||||
| 2015 | 2014 | Change | Change | |||||||||||||
| (in GWh) | (in %) | |||||||||||||||
Chilectra Chile | 11,943 | 11,783 | 160 | 1.4 | ||||||||||||
|
|
|
|
|
|
|
| |||||||||
72
Table of Contents
The table below presents our revenues by business for the nine months ended September 30, 2015 and 2014
| Nine months ended September 30, | ||||||||||||||||
| 2015 | 2014 | Change | Change | |||||||||||||
| (unaudited) | ||||||||||||||||
| (in millions of Ch$) | (in %) | |||||||||||||||
Generation Business | ||||||||||||||||
Endesa Chile and subsidiaries | 1,131,407 | 876,113 | 255,294 | 29.1 | ||||||||||||
|
|
|
|
|
|
|
| |||||||||
Distribution Business | ||||||||||||||||
Chilectra Chile and subsidiaries | 930,399 | 830,888 | 99,511 | 12.0 | ||||||||||||
|
|
|
|
|
|
|
| |||||||||
Non-electricity business and combination adjustments | (299,607 | ) | (208,139 | ) | (91,468 | ) | 43.9 | |||||||||
|
|
|
|
|
|
|
| |||||||||
Total | 1,762,199 | 1,498,862 | 263,337 | 17.6 | ||||||||||||
|
|
|
|
|
|
|
| |||||||||
Generation Business: Revenues
Revenues increased by Ch$ 255.3 billion, or 29.1%, for the first nine months of 2015, mainly due to (i) Ch$ 174.7 billion as a consequence of an 2,248 GWh increase in physical sales, equivalent to a 14.9%, and a higher average energy sale prices of US$ 4/MWh, and (ii) operating revenue contributed for the full 2015 period by our GasAtacama combined entity of Ch$ 80.6 billion, a combined entity, which has been combined only since May 2014.
Distribution Business: Revenues
Revenues from our Chilectra Chile combined entity, increased by Ch$ 99.5 billion, or 12.0%, in the first nine months of 2015 compared to the same period of 2014. This increase is a result of better energy sales of Ch$ 87.3 billion, mainly due to the increase of the tariff to regulated clients and the recognition of prior years’, tariff increases not previously applied, which was reflected in a Ch$ 6.5/MWh (10.3%) increase in the average sale prices, and, to a lesser extent, 160 MWh in higher physical sales.
The number of customers rose by 45,663, compared to the same period last year, totaling 1.7 million.
Operating Costs
Operating costs consist primarily of electricity purchases from third parties, fuel purchases, depreciation, amortization and impairment losses, maintenance costs, tolls paid to transportation expenses and employee salaries. Operating costs also include administrative and selling expenses.
The following table shows the breakdown of our combined operating costs, as a percentage of total combined operating costs, for the nine months ended September 30, 2015 and 2014.
| Nine months ended September 30, | ||||||||
| 2015 | 2014 | |||||||
| (unaudited) | ||||||||
| (in %) | ||||||||
Operating Costs as a Percentage of Total Operating Costs | ||||||||
Electricity purchases | 44.7 | 48.1 | ||||||
Fuel purchases | 20.1 | 18.2 | ||||||
Other variable cost | 6.3 | 2.0 | ||||||
Other fixed costs | 5.7 | 7.3 | ||||||
Depreciation, amortization and impairment losses | 8.2 | 7.4 | ||||||
Transmission tolls | 9.0 | 10.6 | ||||||
Staff benefit costs | 6.0 | 6.4 | ||||||
|
|
|
| |||||
Total | 100.0 | 100.0 | ||||||
|
|
|
| |||||
73
Table of Contents
Our operating cost structure for the first nine months of 2015 remained similar to that for the same period in 2014, except for the combined electricity purchase expenses that grew less than the total operating cost, 5.1% versus 13.0%, due to a higher average purchase price in the distribution business and the other variable costs that increased as a percentage of total combined operating costs mainly due to the agreement with Gener allowing Endesa Chile to use its available LNG in Gener’s Nueva Renca combined-cycle power plant.
The table below sets forth the breakdown of operating costs (excluding selling and administrative expenses) by business for the nine months ended September 30, 2015 and 2014.
| Nine months ended September 30, | ||||||||||||||||
| 2015 | 2014 | Change | Change | |||||||||||||
| (unaudited) | ||||||||||||||||
| (in millions of Ch$) | (in %) | |||||||||||||||
Generation Business | ||||||||||||||||
Endesa Chile and subsidiaries | 712,864 | 588,935 | 123,929 | 21.0 | ||||||||||||
|
|
|
|
|
|
|
| |||||||||
Distribution Business | ||||||||||||||||
Chilectra Chile and subsidiaries | 725,894 | 628,679 | 97,215 | 15.5 | ||||||||||||
|
|
|
|
|
|
|
| |||||||||
Non-electricity business activities and combination adjustments | (286,931 | ) | (213,773 | ) | (73,158 | ) | 34.2 | |||||||||
|
|
|
|
|
|
|
| |||||||||
Total | 1,151,827 | 1,003,841 | 147,986 | 14.7 | ||||||||||||
|
|
|
|
|
|
|
| |||||||||
Generation Business: Operating Costs
Operating costs increased by Ch$ 123.9 billion, or 21.0%, in the first nine months of 2015, mainly due to higher fuel consumption costs of Ch$ 57.4 billion, mostly as a consequence of the full combination of GasAtacama since May 2014, higher other variable procurement and services of Ch$ 44.3 billion mostly attributable to the Ch$ 25.0 billion cost related to the agreement with Gener that allows Endesa Chile to use its available LNG in Gener’s Nueva Renca combined-cycle power plant, higher transportation costs of Ch$ 16.1 billion, higher water transportation costs for the operation of the San Isidro power plant of Ch$ 9.4 billion and greater purchases of energy on the spot market of Ch$ 6.1 billion.
Distribution Business: Operating Costs
Operating costs of Chilectra Chile increased by Ch$ 97.2 billion, or 15.5%, for the first nine months of September 30, 2015, mainly due to greater energy purchases of Ch$ 84.6 billion to cover energy sales, primarily due to a higher average purchase price (Ch$6.1 /GWh) and also because of a 160 GWh increase in the physical purchases compared to the previous period. In addition, the operation costs increase was impacted by the higher expenses on account of variable procurement and services costs of Ch$ 10.7 billion.
Selling and Administrative Expenses
Selling and administrative expenses relate to salaries, compensation, administrative expenses, depreciation, amortization and impairment losses, and office materials and supplies.
74
Table of Contents
The following table shows the breakdown of our combined selling and administrative expenses, as a percentage of total combined selling and administrative expenses, for the nine months ended September 30, 2015 and 2014.
| Nine months ended September 30, | ||||||||
| 2015 | 2014 | |||||||
| (unaudited) | ||||||||
| (in %) | ||||||||
Selling and Administrative Expenses as a Percentage of Total Selling and Administrative Expenses | ||||||||
Other fixed costs | 28.9 | 34.8 | ||||||
Staff benefit costs | 30.1 | 30.0 | ||||||
Depreciation, amortization and impairment losses | 41.0 | 35.2 | ||||||
|
|
|
| |||||
Total | 100.0 | 100.0 | ||||||
|
|
|
| |||||
The table below sets forth the breakdown of selling and administrative expenses by business for the nine months ended September 30, 2015 and 2014:
| Nine months ended September 30, | ||||||||||||||||
| 2015 | 2014 | Change | Change | |||||||||||||
| (unaudited) | ||||||||||||||||
| (in millions of Ch$) | (in %) | |||||||||||||||
Generation Business | ||||||||||||||||
Endesa Chile and subsidiaries | 189,191 | 161,080 | 28,111 | 17.5 | ||||||||||||
|
|
|
|
|
|
|
| |||||||||
Distribution Business | ||||||||||||||||
Chilectra Chile and subsidiaries | 92,424 | 91,649 | 775 | 0.8 | ||||||||||||
|
|
|
|
|
|
|
| |||||||||
Non-electricity business and combination adjustments | 4,384 | 15,857 | (11,473 | ) | (72.4 | ) | ||||||||||
|
|
|
|
|
|
|
| |||||||||
Total | 285,999 | 268,586 | 17,413 | 6.5 | ||||||||||||
|
|
|
|
|
|
|
| |||||||||
Selling and administrative expenses increased by Ch$ 17.4 billion, or 6.5%, in the first nine month of 2015, mainly due to higher charges for depreciation of Ch$ 20.1 billion in the generation business from the inclusion of GasAtacama and from higher expense capitalization carried out during the second half of 2014 in San Isidro II, Bocamina II and Tal Tal.
Operating Income
The following table summarizes operating income by business for the nine months ended September 30, 2015 and 2014.
| Nine months ended September 30, | ||||||||||||||||
| 2015 | 2014 | Change | Change | |||||||||||||
| (unaudited) | ||||||||||||||||
| (in millions of Ch$) | (in %) | |||||||||||||||
Generation Business | ||||||||||||||||
Endesa Chile and subsidiaries | 229,352 | 126,098 | 103,254 | 81.9 | ||||||||||||
|
|
|
|
|
|
|
| |||||||||
Distribution Business | ||||||||||||||||
Chilectra Chile and subsidiaries | 112,081 | 110,560 | 1,521 | 1.4 | ||||||||||||
|
|
|
|
|
|
|
| |||||||||
Non-electricity business and combination adjustments | (17,060 | ) | (10,223 | ) | (6,837 | ) | (66.9 | ) | ||||||||
|
|
|
|
|
|
|
| |||||||||
Total | 324,373 | 226,435 | 97,938 | 43.2 | ||||||||||||
|
|
|
|
|
|
|
| |||||||||
75
Table of Contents
Other Results
The following table shows the other results for the nine months ended September 30, 2015 and 2014.
| Nine months ended September 30, | ||||||||||||||||
| 2015 | 2014 | Change | Change | |||||||||||||
| (unaudited) | ||||||||||||||||
| (in millions of Ch$) | (in %) | |||||||||||||||
Financial results | ||||||||||||||||
Financial income | 11,075 | 9,125 | 1,950 | 21.4 | ||||||||||||
Financial costs | (52,291 | ) | (58,022 | ) | 5,731 | 9.9 | ||||||||||
Gain for indexed assets and liabilities | 3,320 | 3,089 | 231 | 7.5 | ||||||||||||
Net foreign currency exchange differences | (45,890 | ) | (13,734 | ) | (32,156 | ) | (234.1 | ) | ||||||||
|
|
|
|
|
|
|
| |||||||||
Total | (83,785 | ) | (59,542 | ) | (24,243 | ) | (40.7 | ) | ||||||||
Other | ||||||||||||||||
Gain on sale of non-current assets not held for sale | 6,694 | 47,755 | (41,061 | ) | (86.0 | ) | ||||||||||
Share of the profit of associates accounted for using the equity method | 7,483 | 7,729 | (246 | ) | (3.3 | ) | ||||||||||
|
|
|
|
|
|
|
| |||||||||
Total | 14,177 | 55,484 | (41,307 | ) | (25.6 | ) | ||||||||||
|
|
|
|
|
|
|
| |||||||||
Other results | (69,609 | ) | (4,058 | ) | (65,551 | ) | (94.2 | ) | ||||||||
|
|
|
|
|
|
|
| |||||||||
Financial Results
The net financial results for the first nine months of 2015 was an expense of Ch$ 83.8 billion, an increase of Ch$ 24.2 billion, or 40.7%, in comparison to the same period in 2014. This increase was due to increased charges for foreign currency exchange differences of Ch$ 32.2 billion, as a result of an increase in the exchange rate between the Chilean peso against the US dollar that affects the valuation of financial debt and derivative instruments.
Gain on sale of non-current assets not held for sale (Other gains)
The gain on asset sales for the first nine months of 2015 was Ch$ 6.7 billion, a decrease of Ch$ 41.1 billion from the same period in 2014. The primary reason for the reduction in thesenon-operating results is thenon-recurring gain of Ch$ 42.6 billion recorded in the first nine months of 2014 arising from the revaluation of the 50% pre-existing investments in Gas Atacama and as a result of the recognition of its accumulated currency exchange differences, as explained in Notes 5 and 32 of the Notes to our interim combined financial statements. In January 2015, we recorded an income of Ch$ 4.2 billion net result from the sale of Túnel El Melón that partially offset the negative variation in comparison with the same period in 2014.
Corporate Income Tax
Corporate income tax decreased Ch$ 45.1 billion, for the first nine month of 2015 or 44.0%, to Ch$ 82.9 billion, compared to the same period in 2014. The effective tax rate was 22.6% for the first nine months of 2015 and 46.1% for the same period in 2014. The decrease in corporate income tax expenses was mainly due to the lower recognition of net deferred tax liabilities of the Chilean companies following the tax reform enacted in Chile on September 29, 2014, which established a gradual increase in the taxation rate. For more information see Note 34 of the Notes to our interim combined financial statements and “Item 10. Additional Information —E. Taxation — Chilean Tax Considerations.”
76
Table of Contents
Net Income
The following table sets forth our combined net income before tax, income tax and net income for the periods indicated.
| Nine months ended September 30, | ||||||||||||||||
| 2015 | 2014 | Change | Change | |||||||||||||
| (unaudited) | ||||||||||||||||
| (in millions of Ch$) | (in %) | |||||||||||||||
Operating income | 324,373 | 226,435 | 97,938 | 43.3 | ||||||||||||
Other results | (69,608 | ) | (4,058 | ) | (65,551 | ) | n.a. | |||||||||
|
|
|
|
|
|
|
| |||||||||
Net income before taxes | 254,765 | 222,377 | 32,288 | 14.6 | ||||||||||||
Income tax | (57,497 | ) | (102,595 | ) | 45,098 | 44.0 | ||||||||||
|
|
|
|
|
|
|
| |||||||||
Net income | 197,268 | 119,782 | 77,486 | 64.7 | ||||||||||||
Net income attributable to the Parent Company Chile | 149,907 | 96,244 | 53,663 | 55.8 | ||||||||||||
Net income attributable to non-controlling interests | 47,361 | 23,538 | 23,823 | 101.2 | ||||||||||||
For a breakdown of the net income by business, see Note 35.2 of the Notes to our interim combined financial statements.
3. Analysis of Results of Operations for the Years Ended December 31, 2014 and 2013.
Revenues
Generation Business
The following table sets forth the electricity sales of Endesa Chile and its subsidiaries and the corresponding changes for the years ended December 31, 2014 and 2013.
| Years ended December 31, | ||||||||||||||||
| 2014 | 2013 | Change | Change | |||||||||||||
| (in GWh) | (in %) | |||||||||||||||
Endesa Chile and subsidiaries | 21,157 | 20,406 | 751 | 3.7 | % | |||||||||||
|
|
|
|
|
|
|
| |||||||||
Distribution Business
The following table sets forth the electricity sales of Chilectra and the corresponding changes for the years ended December 31, 2014 and 2013.
| Years ended December 31, | ||||||||||||||||
| 2014 | 2013 | Change | Change | |||||||||||||
| (in GWh) | (in %) | |||||||||||||||
Chilectra Chile | 15,690 | 15,140 | 550 | 3.6 | % | |||||||||||
|
|
|
|
|
|
|
| |||||||||
77
Table of Contents
The table below presents our revenues by business segment for the years ended December 31, 2014 and 2013.
| Years ended December 31, | ||||||||||||||||
| 2014 | 2013 | Change | Change | |||||||||||||
| (in millions of Ch$) | (in %) | |||||||||||||||
Generation Business | ||||||||||||||||
Endesa Chile and subsidiaries | 1,220,566 | 959,787 | 260,779 | 27.2 | ||||||||||||
|
|
|
|
|
|
|
| |||||||||
Distribution Business | ||||||||||||||||
Chilectra Chile and subsidiaries | 1,127,893 | 975,024 | 152,869 | 15.7 | ||||||||||||
|
|
|
|
|
|
|
| |||||||||
Non-electricity business and combination adjustments | (299,394 | ) | (196,728 | ) | (102,666 | ) | 52.2 | |||||||||
|
|
|
|
|
|
|
| |||||||||
Total | 2,049,065 | 1,738,083 | 310,982 | 17.9 | ||||||||||||
|
|
|
|
|
|
|
| |||||||||
Generation Business: Revenues
Revenues increased by Ch$ 260.8 billion, or 27.2% in 2014, mainly due (i) Ch$ 147.8 billion as a consequence of an increase in physical sales of 3.7% and a 29.5% increase in average energy sales prices, and (ii) operating revenue contributed by our GasAtacama subsidiary of Ch$ 113.0 billion, a combined entity which has been combined since May 2014.
Distribution Business: Revenues
Revenues from our Chilectra Chile combined entity increased by Ch$ 152.9 billion, or 15.7%, in 2014 as a result of greater physical energy sales of 550 GWh due to lower temperatures than the previous year. Sales in 2014 amounted to 15,690 GWh. The number of customers rose by 43,375, totaling 1.7 million.
Operating Costs
Operating costs consist primarily of electricity purchases from third parties, fuel purchases, depreciation, amortization and impairment losses, maintenance costs, tolls paid to transmission companies, and employee salaries. Operating costs also include administrative and selling expenses.
The following table shows the breakdown of our operating costs, as a percentage of total operating costs, for the years ended December 31, 2014 and 2013.
| Years ended December 31, | ||||||||
| 2014 | 2013 | |||||||
| (in %) | ||||||||
Operating Costs as a Percentage of Total Operating Costs | ||||||||
Electricity purchases | 47.3 | 42.2 | ||||||
Fuel purchases | 18.3 | 15.7 | ||||||
Other variable cost | 3.8 | 2.7 | ||||||
Other fixed costs | 6.7 | 8.5 | ||||||
Depreciation, amortization and impairment losses | 8.5 | 9.5 | ||||||
Transmission tolls | 9.1 | 13.6 | ||||||
Staff benefit costs | 6.3 | 7.8 | ||||||
|
|
|
| |||||
Total | 100.0 | 100.0 | ||||||
|
|
|
| |||||
Our 2014 operating cost structure remained similar to our 2013 operating cost structure, except for the electricity purchases that increased due to the stoppage of Bocamina II since December 2013.
78
Table of Contents
The table below sets forth the breakdown of operating costs (excluding selling and administrative expenses) by business for the years ended December 31, 2014 and 2013:
| Years ended December 31, | ||||||||||||||||
| 2014 | 2013 | Change | Change | |||||||||||||
| (in millions of Ch$) | (in %) | |||||||||||||||
Generation Business | ||||||||||||||||
Endesa Chile and subsidiaries | 750,213 | 494,892 | 255,321 | 51.6 | ||||||||||||
|
|
|
|
|
|
|
| |||||||||
Distribution Business | ||||||||||||||||
Chilectra Chile and subsidiaries | 855,758 | 712,458 | 143,300 | 20.1 | ||||||||||||
|
|
|
|
|
|
|
| |||||||||
Non-electricity business and combination adjustments | (296,569 | ) | (208,446 | ) | (88,123 | ) | (42.3 | ) | ||||||||
|
|
|
|
|
|
|
| |||||||||
Total | 1,309,402 | 998,904 | 310,498 | 31.1 | ||||||||||||
|
|
|
|
|
|
|
| |||||||||
Generation Business: Operating Costs
Operating costs of Endesa Chile increased by Ch$ 255.3 billion, or 51.6%, in 2014, mainly due to greater purchases of energy on the spot market of Ch$ 164.0 billion, principally as a consequence of the stoppage of Bocamina II coal fired power plant since December 2013, and higher fuel consumption costs of Ch$ 93.9 billion mainly as a consequence of the full inclusion of GasAtacama since May 2014, which added Ch$ 53.9 billion of fuel consumption costs and higher other variable procurement and services of Ch$ 4.0 billion, partially compensated by lower transportation costs of Ch$ 6.6 billion.
Distribution Business: Operating Costs
Operating costs of Chilectra Chile increased by Ch$ 143.3 billion, or 20.1%, in 2014, mainly due to greater energy purchases of Ch$ 137.9 billion to cover the physical energy sales, explained by Ch$ 6.9/GWh higher average purchase price as well as 589 GWh higher physical purchases in comparison to 2013.
Selling and Administrative Expenses
Selling and administrative expenses relate to salaries, compensation, administrative expenses, depreciation, amortization and impairment losses, and office materials and supplies.
The following table shows the breakdown of our combined selling and administrative expenses, as a percentage of total combined selling and administrative expenses, for the years ended December 31, 2014 and 2013:
| Years ended December 31, | ||||||||
| 2014 | 2013 | |||||||
| (in %) | ||||||||
Selling and Administrative Expenses as a Percentage of Selling and Administrative Expenses | ||||||||
Other fixed costs | 30.9 | 32.9 | ||||||
Staff benefit costs | 29.4 | 30.3 | ||||||
Depreciation, amortization and impairment losses | 39.7 | 36.8 | ||||||
|
|
|
| |||||
Total | 100.0 | 100.0 | ||||||
|
|
|
| |||||
79
Table of Contents
The table below sets forth the breakdown of selling and administrative expenses by business for the years ended December 31, 2014 and 2013:
| Years ended December 31, | ||||||||||||||||
| 2014 | 2013 | Change | Change | |||||||||||||
| (in millions of Ch$) | (in %) | |||||||||||||||
Generation Business | ||||||||||||||||
Endesa Chile and subsidiaries | 224,627 | 202,030 | 22,597 | 11.2 | ||||||||||||
|
|
|
|
|
|
|
| |||||||||
Distribution Business | ||||||||||||||||
Chilectra Chile and subsidiaries | 118,028 | 122,503 | (4,475 | ) | (3.7 | ) | ||||||||||
|
|
|
|
|
|
|
| |||||||||
Non-electricity business and combination adjustments | 14,258 | 23,023 | (8,765 | ) | (61.9 | ) | ||||||||||
|
|
|
|
|
|
|
| |||||||||
Total | 356,913 | 347,556 | 9,357 | 2.7 | ||||||||||||
|
|
|
|
|
|
|
| |||||||||
Selling and administrative expenses increased by Ch$ 9.4 billion, or 2.7%, in 2014, mainly due to higher charges for depreciation and impairment of Ch$ 21.2 billion in the generation business, which includes Ch$ 12.6 billion of impairment losses with respect to the Punta Alcalde project. On January 29, 2015, we halted development of the power plant and the related transmission project, in light of the changes requested by the Chilean Court, which may require major modifications to the approved RCA in order to make the project economically and technologically more sustainable. The above was offset by lower depreciation and impairment losses in Chilectra of Ch$ 7.2 billion.
Operating Income
The following table summarizes operating income by business for the years ended December 31, 2014 and 2013.
| Years ended December 31, | ||||||||||||||||
| 2014 | 2013 | Change | Change | |||||||||||||
| (in millions of Ch$) | (in %) | |||||||||||||||
Generation Business | ||||||||||||||||
Endesa Chile and subsidiaries | 245,726 | 262,865 | (17,139 | ) | (6.5 | ) | ||||||||||
|
|
|
|
|
|
|
| |||||||||
Distribution Business | ||||||||||||||||
Chilectra Chile and subsidiaries | 154,107 | 140,063 | 14,044 | 10.0 | ||||||||||||
|
|
|
|
|
|
|
| |||||||||
Non-electricity business and combination adjustments | (17,083 | ) | (11,305 | ) | (5,778 | ) | (51.1 | ) | ||||||||
|
|
|
|
|
|
|
| |||||||||
Total | 382,750 | 391,623 | (8,873 | ) | (2.3 | ) | ||||||||||
|
|
|
|
|
|
|
| |||||||||
80
Table of Contents
Other Results
The following table shows the other results for the years ended December 31, 2014 and 2013.
| Years ended December 31, | ||||||||||||||||
| 2014 | 2013 | Change | Change | |||||||||||||
| (in millions of Ch$) | (in %) | |||||||||||||||
Financial results | ||||||||||||||||
Financial income | 14,763 | 13,651 | 1,112 | 8.1 | ||||||||||||
Financial costs | (75,626 | ) | (69,769 | ) | (5,857 | ) | (8.4 | ) | ||||||||
Gain for indexed assets and liabilities | 15,264 | 1,593 | 13,671 | n.a. | ||||||||||||
Net foreign currency exchange differences | (21,444 | ) | (1,838 | ) | (19,606 | ) | n.a. | |||||||||
|
|
|
|
|
|
|
| |||||||||
Total | (67,045 | ) | (56,363 | ) | (10,682 | ) | 19.0 | |||||||||
Other | ||||||||||||||||
Total gain on sale of non-current assets not held for sale | 70,893 | 14,528 | 56,365 | n.a. | ||||||||||||
Share of the profit (loss) of associates and joint ventures accounted for using the equity method | (54,353 | ) | 24,309 | (78,661 | ) | n.a. | ||||||||||
|
|
|
|
|
|
|
| |||||||||
Total | 16,540 | 38,837 | (22,297 | ) | (57.6 | ) | ||||||||||
|
|
|
|
|
|
|
| |||||||||
Other results | (50,504 | ) | (17,526 | ) | (32,978 | ) | (188.5 | ) | ||||||||
|
|
|
|
|
|
|
| |||||||||
Financial Results
The net financial results for 2014 was an expense of Ch$ 67.0 billion. The expense increased Ch$ 10.7 billion, or 19.0%, in comparison to 2013. This is mainly explained by: (i) increased charges for foreign currency exchange differences of Ch$ 19.6 billion, as a result of an increase in the exchange rate between the Chilean peso against the US dollar, that affects the valuation of financial debt and derivative instruments, (ii) higher financial cost of Ch$ 5.9 billion, mainly due the increase in the financial debt. This was partially offset by a gain for indexation adjustments of Ch$ 13.7 billion mainly due to the positive variation of financial derivatives asset position over the UF.
Gain on sale of non-current assets not held for sale (Other gains)
Gains from non-current assets not held for sale increased by Ch$ 56.4 billion, mainly due to the recognition of a Ch$ 42.5 billion gain arising from the revaluation of the 50% pre-existing investment participation in GasAtacama and as a result of the recognition of its accumulated currency exchange differences, as explained in Notes 5 and 32 of the Notes to our combined financial statements, and a Ch$ 21.1 billion gain on the sale of Los Maitenes and Aguas Santiago Poniente (Enea Project in former Manso de Velasco), partially offset by reduced sales of investment properties and transmission lines of Ch$ 11.0 billion.
Results of Associates and Joint Ventures Accounted for Using the Equity Method
The share of profits of associates accounted for using the equity method decreased by Ch$ 78.7 billion, mainly as a result of the impairment in the HidroAysén project of Ch$ 69.1 billion due to Endesa Chile’s decision not to proceed with this project. This decision was based on the uncertainty of recovering the investment made in the project, mainly as a consequence of the long judicial process in order to obtain environmental approvals. This result also decreased Ch$13.9 billion as a result of combination of GasAtacama Holding. Such decreases were partially offset by an increase of Ch$ 4.4 billion relating to Electrogas.
As a result of all the foregoing, total non-operating results for 2014 amounted to an expense of Ch$ 50.5 billion.
81
Table of Contents
Corporate Income Tax
Corporate income tax increased by Ch$ 71.0 billion mainly due to (i) increased charges of Ch$ 62.0 billion resulting from the recognition of net deferred tax liabilities of the Chilean companies mainly following the tax reform enacted in Chile on September 29, 2014, which establishes a gradual increase in the taxation rate, (ii) the additional net income due to the combination of GasAtacama that implied additional income tax by Ch$ 10.2 billion.
The effective tax rate was 39.9% in 2014 and 16.5% for the same period in 2013. For more information see Note 34 of the Notes to our combined financial statements and “Item 10. Additional Information —E. Taxation — Chilean Tax Considerations.”
Net Income
The following table sets forth our combined net income before tax, income tax and net income for the periods indicated.
| Years ended December 31, | ||||||||||||||||
| 2014 | 2013 | Change | Change | |||||||||||||
| (in millions of Ch$) | (in %) | |||||||||||||||
Operating income | 382,750 | 391,623 | (8,873 | ) | (2,3 | ) | ||||||||||
Other results | (50,504 | ) | (17,526 | ) | (32,978 | ) | (188.5 | ) | ||||||||
|
|
|
|
|
|
|
| |||||||||
Net income before taxes | 332,246 | 374,097 | (41,851 | ) | (11.2 | ) | ||||||||||
Income tax | (132,687 | ) | (61,712 | ) | (70,975 | ) | (115.0 | ) | ||||||||
|
|
|
|
|
|
|
| |||||||||
Net income | 199,559 | 312,385 | (112,826 | ) | (36.1 | ) | ||||||||||
Net income attributable to the Parent Company | 162,459 | 229,527 | (67,068 | ) | (29.2 | ) | ||||||||||
Net income attributable to non-controlling interests | 37,100 | 82,858 | (45,758 | ) | (55.2 | ) | ||||||||||
For a breakdown of the net income by business, see Note 35.2 of the Notes to our combined financial statements.
| B. | Liquidity and Capital Resources. |
We will have no significant assets other than the stock of our Chilean combined entities. The following discussion of cash sources and uses reflects the key drivers of our cash flow.
We, on a stand-alone basis, will receive cash inflows from our Chilean combined entities, as well as from related companies in Chile. Cash flows of our associates may not be available to satisfy our own liquidity needs, mainly because they are not wholly-owned, and because there is a time lag before we have effective access to those funds through dividends or capital reductions. However, we believe that cash flow generated from our business operations, as well as cash balances, borrowings from commercial banks, and ample access to both Chilean and foreign capital markets will be sufficient to satisfy all our needs for working capital, expected debt service, dividends and planned capital expenditures in the foreseeable future.
We have a direct ownership in Endesa Chile (60.0%) and Chilectra Chile (99.1%), our main combined combined entities.
82
Table of Contents
Set forth below is a summary of our combined cash flow information for the periods indicated:
| Nine months ended September 30, | Year ended December 31, | |||||||||||||||
| 2015 | 2014 | 2014 | 2013 | |||||||||||||
| (unaudited) | ||||||||||||||||
| (in billions of Ch$) | ||||||||||||||||
Net cash flows from (used in) operating activities | 334 | 77 | 265 | 443 | ||||||||||||
Net cash flows from (used in) investing activities | (468 | ) | (177 | ) | (189 | ) | (106 | ) | ||||||||
Net cash flows from (used in) financing activities | 83 | (54 | ) | (159 | ) | (216 | ) | |||||||||
|
|
|
|
|
|
|
| |||||||||
Net increase (decrease) in cash and cash equivalents before effect of exchange rates changes | (52 | ) | (154 | ) | (83 | ) | 120 | |||||||||
Effects of exchange rate changes on cash and cash equivalents | 4 | 7 | 1 | 0.4 | ||||||||||||
Cash and cash equivalents at beginning of period | 133 | 215 | 215 | 94 | ||||||||||||
|
|
|
|
|
|
|
| |||||||||
Cash and cash equivalents at end of period | 85 | 68 | 133 | 215 | ||||||||||||
|
|
|
|
|
|
|
| |||||||||
For the nine months ended September 30, 2015, net cash flow from operating activities was Ch$ 334 billion, an increase of Ch$ 258 billion, or 335.4%, compared to Ch$ 77 billion for the same period of 2014, primarily as a consequence of an increase in collections from the sale of goods and services of Ch$ 525 billion, which was partially offset by an increase in payments to suppliers for goods and services of Ch$ 127 billion, an increase in income tax payments of Ch$ 86 billion, an increase in payments to and on behalf of employees of Ch$ 15 billion and an increase in other payments for operating activities of Ch$ 34 billion.
For the year ended December 31, 2014, net cash flow from operating activities was Ch$ 265 billion, a decrease of Ch$ 178 billion, or 48.8%, compared to net cash flow from operating activities of Ch$ 443 billion for 2013, primarily as a consequence of an increase in payments to suppliers for goods and services of Ch$ 392 billion, a decrease in collections from insurance policies and services, annual payments, and other benefits from policies held of Ch$ 74 billion, an increase in payments to and on behalf of employees of Ch$ 12 billion and a decrease in other collections for operating activities of Ch$ 16 billion, all of which were partially offset by the increase in collections from the sale of goods and services of Ch$ 282 billion and a decrease in income tax payments of Ch$ 34 billion.
For the nine months ended September 30, 2015, net cash used in investing activities was Ch$ 468 billion, compared to net cash used in investing activities of Ch$ 177 billion for the same period of 2014. The increase was mainly due to the acquisition of fixed assets totaling Ch$ 253 billion (see “Item 4. Information of the Company — A. History and Development of the Company — Investment, Capital Expenditures and Divestitures”), collections of loans of related entities for Ch$ 228 billion, all of which were partially offset by proceeds from dividends classified as investment cash flow of Ch$ 9 billion, loss of control of combined entities for Ch$ 7 billion, due to the sale of all of our shareholdings in Túnel El Melon, and interest received of Ch$ 1 billion.
For the year ended December 31, 2014, net cash used in investing activities was Ch$ 189 billion, compared to net cash used in investing activities of Ch$ 106 billion for 2013. The increase was mostly due to the acquisition of fixed assets totaling Ch$ 197 billion (see “Item 4. Information of the Company — A. History and Development of the Company — Investment, Capital Expenditures and Divestitures”), the inclusion of GasAtacama, after the purchase of an additional 50% participation, of Ch$ 38 billion, a decrease of collections from derivatives contracts of Ch$ 17 billion and investments in time deposits with a maturity greater than 90 days of Ch$ 16 billion, all of which were partially offset by the loss of control of combined entities for Ch$ 41 billion, due to the sale of all the shareholdings in Maitenes and Aguas Santiago Poniente, proceeds from dividends classified as investment cash flow of Ch$ 13 billion and interest received of Ch$ 4 billion.
For the nine months ended September 30, 2015, net cash from financing activities was Ch$ 83 billion. The main drivers of this change are described below.
83
Table of Contents
The aggregate cash inflows from financing activities were primarily due to Ch$ 409 billion in loans from related entities, mainly to Endesa Chile, offset by cash outflows primarily due to:
| • | Ch$ 137 billion of payments of bonds for Endesa Chile on a stand-alone basis. |
| • | Ch$ 133 billion in dividend payments (including Ch$ 102 billion for Enersis on a stand-alone basis, Ch$ 22 billion for Endesa Chile on a stand-alone basis, excluding dividends paid to Enersis and Ch$ 8 billion for Pehuenche, among others). |
| • | Ch$ 44 billion of interest expense, mainly for Endesa Chile on a stand-alone basis. |
| • | Ch$ 8 billion of net investment of parent companies |
For the nine months ended September 30, 2014, net cash used in financing activities was Ch$ 54 billion. The main drivers of this change are described below.
The aggregate cash outflows from financing activities were primarily due to:
| • | Ch$ 158 billion in dividend payments (including Ch$ 114 billion for Enersis on a stand-alone basis, Ch$ 35 billion for Endesa Chile on a stand-alone basis, excluding dividends paid to Enersis and Ch 6 billion for Pehuenche, among others). |
| • | Ch$ 115 billion of payments of loans and bonds for Endesa Chile on a stand-alone basis. |
| • | Ch$ 42 billion of interest expense, mainly for Endesa Chile on a stand-alone basis. |
| • | Ch$ 10 billion of net investment of parent companies |
These outflows were offset by cash inflows primarily due to:
| • | Ch$ 222 billion in bond issuances carried out by Endesa Chile. |
| • | Ch$ 56 billion in loans from related entities. |
For the year ended December 31, 2014, net cash used in financing activities was Ch$ 159 billion. The main drivers of this change are described below.
The aggregate cash outflows from financing activities were primarily due to:
| • | Ch$ 161 billion in dividend payments (including Ch$ 115 billion for Enersis on a stand-alone basis, Ch$ 35 billion for Endesa Chile on a stand-alone basis and Ch$ 8 billion for Pehuenche, among others, excluding dividends paid to Enersis). |
| • | Ch$ 159 billion of payments of loans from related entities. |
| • | Ch$ 118 billion of payments of loans, bonds for Endesa Chile on a stand-alone basis. |
| • | Ch$ 63 billion of interest expense mainly in Endesa Chile on a stand-alone basis. |
These outflows were offset by cash inflows primarily due to:
| • | Ch$ 222 billion in bond issuances carried out by Endesa Chile. |
| • | Ch$ 131 billion of net investment of parent companies. |
For the year ended December 31, 2013, net cash used in financing activities was Ch$ 216 billion. The main drivers of this change are described below.
84
Table of Contents
The aggregate cash outflows from financing activities were primarily due to:
| • | Ch$ 213 billion of payments of loans, bonds and other and other financial instruments for Endesa Chile on a stand-alone basis. |
| • | Ch$ 101 billion in dividend payments (including Ch$ 79 billion for Enersis Chile on a stand-alone basis, Ch$ 13 billion for Endesa Chile on a stand-alone basis, excluding dividends paid to Enersis and Ch$ 7 billion for Pehuenche, among others). |
| • | Ch$ 59 billion of interest expense mainly for Endesa Chile on a stand-alone basis. |
| • | Ch$ 37 billion of net investment of parent companies. |
These outflows were offset by cash inflows primarily due to Ch$ 199 billion in loans from related entities.
For a description of liquidity risks resulting from the inability of our combined entities to transfer funds, please see “Item 3. Key Information — D. Risk Factors — Risks Related to Our Business — We depend in part on payments from our combined entities, jointly-controlled entities and associates to meet our payment obligations.”
We coordinate the overall financing strategy of our controlled combined entities. Our operating combined entities independently develop their capital expenditure plans and finance their capital expansion programs through internally generated funds or direct financings. We have no legal obligations or other commitments to financially support our combined entities. We currently have no debt obligations and are therefore not affected by any cross default provisions that could be triggered by combined entity defaults. Our combined entities are financed by us through intercompany loans. For information regarding our commitments for capital expenditures, see “Item 4. Information on the Company — A. History and Development of the Company — Investments, Capital Expenditures and Divestitures” and our contractual obligations table set forth below.
After completion of theSpin-Off, we will have American Depositary Shares, which we intend to list and trade on the NYSE and may in the future access the international equity capital markets (including SEC-registered ADS offerings) while our combined entity Endesa Chile has accessed the international equity capital markets, with an SEC-registered ADS offering on August 3, 1994. Endesa Chile has also issued bonds in the United States (“Yankee Bonds”) and we and Endesa Chile may issue Yankee Bonds depending on liquidity needs in the future. Since 1996, Endesa Chile and its subsidiary Pehuenche have issued a total of US$ 2,770 million in Yankee Bonds.
The following table lists the Yankee Bonds issued by our combined entity Endesa Chile and the aggregate principal amount outstanding as of September 30, 2015. The weighted average annual coupon interest rate for such bonds is 5.8%, without giving effect to each bond’s duration, or put options.
| Aggregate Principal Amount | ||||||||||||||||
Issuer | Term | Maturity | Coupon | Issued | Outstanding | |||||||||||
| (%) | (in millions of US$) | |||||||||||||||
Endesa Chile | 10 years | April 2024 | 4.250 | 400 | 400 | |||||||||||
Endesa Chile(1) | 30 years | February 2027 | 7.875 | 230 | 206 | |||||||||||
Endesa Chile(2) | 40 years | February 2037 | 7.325 | 220 | 71 | |||||||||||
Endesa Chile(1) | 100 years | February 2097 | 8.125 | 200 | 40 | |||||||||||
|
|
|
|
|
| |||||||||||
Total | 6.426 | (3) | 1,250 | 717 | ||||||||||||
|
|
|
|
|
| |||||||||||
| (1) | Endesa Chile repurchased some of these bonds in 2001. |
| (2) | Holders of the Endesa Chile 7.325% Yankee Bonds due 2037 exercised a put option on February 1, 2009 for a total amount of US$ 149.2 million. The remaining US$ 70.8 million principal amount of the Yankee Bonds mature in February 2037. |
| (3) | Weighted-average coupon. |
85
Table of Contents
We will have access to the Chilean domestic capital markets. Endesa Chile has issued debt instruments in Chile, including commercial paper and medium and long-term bonds that are primarily sold to Chilean pension funds, life insurance companies and other institutional investors.
The following table lists UF-denominated Chilean bonds issued by Endesa Chile that are outstanding as of September 30, 2015.
Issuer | Term | Maturity | Coupon (inflation adjusted rate) | Aggregate Principal Amount | ||||||||||||||||||
| Issued | Outstanding | |||||||||||||||||||||
| (%) | (in millions of UF) | (in millions of UF) | (in billions of Ch$) | |||||||||||||||||||
Endesa Chile Series H | 25 years | October 2028 | 6.20 | 4.0 | 2.9 | 72 | ||||||||||||||||
Endesa Chile Series M | 21 years | December 2029 | 4.75 | 10.0 | 10.0 | 254 | ||||||||||||||||
|
|
|
|
|
|
|
| |||||||||||||||
Total | 5.07 | (1) | 14.0 | 12.9 | 326 | |||||||||||||||||
|
|
|
|
|
|
|
| |||||||||||||||
| (1) | Weighted-average coupon. |
For a full description of local bonds issued by Endesa Chile, see “Unsecured liabilities detailed by currency and maturity” in Note 20 of the Notes to our interim combined financial statements.
We may also participate in the international commercial bank markets through syndicated senior unsecured loans, including both fixed term and revolving credit facilities. As of September 30, 2015, the amount outstanding or available for these bank loans is listed below:
Borrower | Type | Maturity | Facility Amount | Amount Drawn | ||||||||||
| (in millions of US$) | (in millions of US$) | |||||||||||||
Endesa Chile | Syndicated revolving loan | July 2019 | 200 | — | ||||||||||
The Endesa Chile revolving credit facility due July 2019 does not contain a condition precedent requirement regarding the non-occurrence of a “Material Adverse Effect” (or MAE, as defined contractually) prior to a disbursement, allowing us full flexibility to draw on up to US$ 200 million in the aggregate from such committed revolving facility under any circumstances, including situations involving an MAE.
We and Endesa Chile also borrow from banks in Chile under fully committed facilities in which a potential MAE would not be an impediment to this source of liquidity. In early 2013, Endesa Chile entered into 3-year bilateral revolving loans for an aggregate of UF 2.4 million (Ch$ 86 billion as of September 30, 2015) as described below.
Borrower | Type | Maturity | Facility Amount | Amount Drawn | ||||||||||
| (in millions of UF$) | (in billions of UF$) | |||||||||||||
Endesa Chile | Bilateral revolving loan | February 2016 | 2.4 | — | ||||||||||
We and Endesa Chile also borrow routinely from uncommitted Chilean bank facilities with approved lines of credit for approximately Ch$ 113 billion in the aggregate, of which Ch$ 578,311 are drawn. Unlike the committed lines described above, which are not subject to MAE conditions precedent prior to disbursements, these facilities are not guaranteed , and therefore could limit our liquidity under certain circumstances. Our combined entities also have access to uncommitted local bank facilities, for a total amount of Ch$ 97 billion, of which Ch$ 30,000 are drawn.
Both we and Endesa Chile may also access the Chilean commercial paper market under programs that need to be registered with the SVS. Endesa Chile has an outstanding program for a maximum of US$ 200 million. Finally, we can also have access to other types of financing, including supplier credits, leasing, among others.
86
Table of Contents
As of September 30, 2015, we had no debt obligations and are therefore not affected by any covenants or events of default. Endesa Chile’s outstanding debt facilities, with the exception of their Yankee Bonds, include financial covenants. The types of financial covenants, and their respective limits, vary from one type of debt to another. As of September 30, 2015, the most restrictive financial covenant affecting Endesa Chile was the leverage ratio in connection with the bilateral revolving loan facility that matures in February 2016. Under such covenant, the maximum additional debt that could be incurred without a breach is Ch$ 1,167 billion. As of September 30, 2015 and as of the date of this information statement, our combined entities are in compliance with the financial covenants contained in our combined debt instruments.
As is customary for certain credit and capital market debt facilities, a significant portion of Endesa Chile’s financial indebtedness is subject to cross default provisions. Each of the revolving credit facilities described above, as well as all of Endesa Chile’s Yankee Bonds, have cross default provisions with different definitions, criteria, materiality thresholds, and applicability as to the combined entities that could give rise to a cross default.
The cross default provision for the Endesa Chile revolving credit facilities due in July 2019, governed by the laws of the State of New York, refers to defaults of the borrower, without reference to any combined entity. Under such credit facilities, only matured defaults of the borrower exceeding US$ 50 million qualify for a potential cross default when the principal exceeds US$ 50 million, or its equivalent in other currencies. In the case of a matured default above the materiality threshold, the revolving credit facility’s lenders would have the option to accelerate if lenders representing more than 50% of the aggregate debt of a particular outstanding facility choose to do so.
Endesa Chile local facilities due in February 2016 do not have cross default provisions to debt other than the respective borrower’s own indebtedness.
Cross default provisions of Endesa Chile’s Yankee Bonds may be triggered by its Chilean subsidiaries’ debt. A matured default of Endesa Chile or one of its subsidiaries could result in a cross default to Endesa Chile’s Yankee Bonds if such matured default, on an individual basis, has a principal exceeding US$ 30 million, or its equivalent in other currencies. In the specific case of the Endesa Chile’s Yankee Bond issued in April 2014, maturing in 2024, the threshold is US$ 50 million, or its equivalent in other currencies. In the case of a matured default above the materiality threshold, Yankee bondholders would have the option to accelerate if either the trustee or bondholders representing at least 25% of the aggregate debt of a particular series then outstanding choose to do so. Finally, Endesa Chile’s local bonds do not have cross default provisions arising from its subsidiaries.
All of Endesa Chile’s Yankee Bonds, including those registered with the United States Securities and Exchange Commission, are unsecured and not subject to any guarantees by any of our combined entities or parent companies.
Payment of dividends and distributions by our combined entities and affiliates represent an important source of funds for us. The payment of dividends and distributions by certain combined entities and affiliates are subject to legal restrictions, such as legal reserve requirements, and capital and retained earnings criteria, and other contractual restrictions. Legal counsel in the countries where our combined entities and affiliates operate have informed us of the current legal restrictions regarding the payment of dividends or distributions to us in the jurisdictions where such combined entities or affiliates are incorporated. We are currently in compliance with the legal restrictions, and therefore, they currently do not affect the payment of dividends or distributions to us. Certain credit facilities and investment agreements of our combined entities restrict the payment of dividends or distributions in certain special circumstances. For instance, one of Endesa Chile’s UF-denominated Chilean bonds restricts the amount of intercompany loans that Endesa Chile and its subsidiaries are allowed to lend to us. The threshold for such restriction of intercompany loans is US$ 100 million equal to approximately Ch$ 70 billion. For a description of liquidity risks resulting from our company status, please see “Item 3. Key Information — D. Risk factors — Risks Related to Our Business — We depend in part on payments from our combined entities, jointly-controlled entities and associates to meet our payment obligations.”
87
Table of Contents
Our estimated capital expenditures for 2016 through 2020 amount to Ch$ 1,298 billion, of which Ch$ 1,238 billion are considered non-discretionary investments. We include maintenance capital expenditures as non-discretionary because it is important for us to maintain the quality and operation standards required for our facilities, but we do have some flexibility regarding the timing for these investments. We consider the investment in expansion projects under execution as non-discretionary expenditures, such as those for Los Cóndores and Bocamina II, as well as water rights. We consider the remaining Ch$ 60 billion as discretionary capital expenditures. The latter includes expansion projects that are still under evaluation, in which case we would undertake them only if deemed profitable.
We do not currently anticipate liquidity shortfalls affecting our ability to satisfy the material obligations described in this information statement. We expect to be able to refinance our combined indebtedness as it becomes due, fund our purchase obligations outlined previously with internally generated cash and fund capital expenditures with a mixture of internally generated cash and borrowings.
| C. | Research and Development, Patents and Licenses, etc. |
None.
| D. | Trend Information. |
Our combined entities are engaged in the generation and distribution of electricity in Chile. Our businesses are subject to a wide range of conditions that may result in significant variability in our earnings and cash flows from year to year.
Our net income is a result of our operating income from our generation and distribution businesses and other inputs such as income from uncombined related companies and tax expense. In our generation business, our operating income for the nine months ended September 30, 2015 increased by 81.9 % as compared to 2014. This percent change in the generation segment’s operating income during the nine-month period ended as of September 30, 2015 varies due to numerous factors, including hydrological conditions, the price of fuel used to generate thermal electricity, and the prevailing regulated and spot market prices for electricity.
We expect reasonably good operating performance during the coming years given the favorable macroeconomic perspective for Chile. Despite current uncertainties concerning the global economy, there is favorable expectation for Chile’s growth during the next five years, including an expected 2.2% growth in gross domestic product in 2015, based on Latin American Consensus Forecasts published by Consensus Economics Inc. on September 14, 2015, and a stable electricity demand growth.
On the other hand, development of new generation facilities in Chile has always lagged behind demand growth. However, due to growing environmental restrictions, transmission line saturation, obstacles for fuel transportation, and scarcity of places where to locate plants, these new projects involve higher development costs than in the past. Enel, our ultimate controller both before and after the Spin-Off, has announced that it will no longer build coal power plants because it considers the technology to be obsolete, and the company expects to be carbon neutral by 2050. Eventually, Enel would like to also eliminate natural gas power plants because of the CO2 costs and current carbon capture and storage technology is not economically viable.
We expect that average electricity prices will rise to recognize these higher costs. This could increase the value of our assets, especially in the case of hydroelectric power plants, which have lower production costs, and thus have greater profitability in scenarios of increasing prices to end users. We expect this situation will also impact long term spot prices positively. Long term contracts awarded to our combined entities in different bids have already incorporated these expected price levels. Currently, 15.3% of our expected annual generation is sold under contracts with terms of at least ten years and an additional 77.8% under contracts with terms of at least five years.
88
Table of Contents
However, spot prices are subject to great volatility, affecting our forecasted income. In order to address this risk in the generation business, we have implemented commercial policies to control relevant variables and provide stability to the profit margins. Our commercial policy establishes a global framework to conduct energy trading operations, setting responsibilities, guidelines and acceptable risk limits aligned with our objectives. Therefore, we define contractual volumes that minimize the risk of supply in adverse hydrological conditions and include risk mitigation clauses, where necessary, with some unregulated customers.
In order to mitigate the risk of increasing fuel costs, we have entered into supply contracts to cover part of the fuel needed to operate the thermal generation units, which operate with coal, natural gas, diesel, and fuel oil. Through an equity interest in GNL Quintero and GNL Chile, and a Long Term Gas Supply Agreement with GNL Chile, we are the only electricity company in Chile with direct access to the LNG terminal at Quintero Bay (the only facility of its kind in the SIC market). This enhances our position to manage fuel supply risks, especially when facing increasing fuel costs scenarios. This is becoming more important as there is an increasing trend to penalize fuel intensive technologies, such as coal and diesel, which have greater environmental impacts.
In July 2013, Endesa Chile successfully renegotiated a LNG sale and purchase agreement with British Gas. This renegotiation modified some conditions of the original contract, allowing Endesa Chile to secure its long-term LNG supply at competitive prices, with significant flexibility and at capacities sufficient for its current and future needs.
Endesa Chile has also contracted capacity in the LNG truck loading facility (TLF) in the Quintero LNG Terminal, allowing it to sell natural gas to industrial customers. In August 2014, the first load of LNG was successfully delivered to MAERSK’s satellite regasification facility. During 2014, a 20-year sale and purchase agreement was signed with GasValpo (a gas distribution company) to distribute natural gas using the TLF for new customers in various cities in Chile. The first stage started its operations during August 2015, supplying the city of Talca (270 km south of Santiago). Other plants are currently in advanced construction and will begin operation before the end of 2015.
In January 2015, Endesa Chile entered into an agreement with Intergas (gas distribution company) to supply LNG by trucks to the city of Temuco (700 km south of Santiago). This supply arrangement will start during first quarter of 2016.
Endesa Chile also exercised a priority option to purchase additional regasification capacity as part of an expansion at the Quintero LNG Terminal. This allows us to increase our regasification capacity from 3.2 million cubic meters per day to 5.4 million cubic meters per day, as of the first quarter of 2015. This expansion will allow our San Isidro and Quintero power plants to generate additional thermal electricity and also allow Endesa Chile to secure the LNG supply necessary for potential new power plants.
With respect to our distribution business, our operating income for the nine months ended September 30, 2015 increased by 15.5% as compared to the same period of 2014. We believe that electricity demand will grow approximately 3.7% annually, on average, over the next five years.
In connection with the distribution segment tariffs, and taking into account the future periodic review process in Chile, we expect that the regulator will continue to recognize investments, encourage efficiency, and establish prices that will allow for an appropriate return on our investment. We also anticipate that our distribution company will maintain its profitability during the period between periodic tariff setting processes, according to price cap tariff model, due to growth and economies of scale. After tariffs have been set, the companies have the opportunity to increase their efficiency, and obtain extra profits associated with such efficiencies, during the period subsequent to each new tariff setting.
Although the price at which a distribution company purchases electricity has an impact on the price at which it is sold to end users, it does not have an impact on our profitability since the cost of electricity purchased is passed to end users through tariffs. Regulation dictates that purchase contracts must be made through long-term contracts and are the result of a regulated tender.
89
Table of Contents
There can be no assurance that past performance will be indicative of future performance with respect to our businesses. Any significant change with respect to hydrological conditions, fuel or electricity prices, among other factors, could affect our operating income in the generation business. More broadly, any significant change with respect to economic or population growth, as well as changes in the regulatory regimes in Chile, among other factors, could affect our operating income. Variability in our earnings and cash flows can also arise from non-operating factors as well, such as foreign currency exchange rates. For further information regarding our 2015 results compared with those recorded in previous periods, please see “— A. Operating Results — Results of Operations for the nine months ended September 30, 2015 and 2014” and “— A. Operating Results — Results of Operations for the Years Ended December 31, 2014 and 2013.” Investors should not look at our past performance as indicative of future performance.
We expect that we will continue generating substantial operating cash, which can be used to finance a significant part of our capital expenditure plan. If needed, our shareholders can also decrease the dividend payout ratio, subject to certain minimum legal restrictions, in order to finance our investment plan and future growth.
In order to be more responsive to the concerns of the residents living in the surrounding areas of prospective new sites, we have shifted our focus to building smaller, less invasive power plants. These plants are constructed faster, allow greater flexibility to activate or deactivate according to system needs, and are generally more acceptable to residents. The local population will be involved in the planning stages of any future projects.
| E. | Off-balance Sheet Arrangements. |
We are not a party to any off-balance sheet arrangements.
| F. | Tabular Disclosure of Contractual Obligations. |
The table below sets forth the Company’s cash payment obligations as of December 31, 2014:
| Payments due by Period | ||||||||||||||||||||
Ch$ billion | Total | 2015 | 2016-2017 | 2018-2019 | After 2019 | |||||||||||||||
Bank debt | 1 | 1 | — | — | — | |||||||||||||||
Local bonds(1) | 333 | 5 | 10 | 36 | 282 | |||||||||||||||
Yankee bonds(1) | 556 | 121 | — | — | 435 | |||||||||||||||
Other debt(2) | — | — | — | — | — | |||||||||||||||
Interest expense(3) | 513 | 82 | 145 | 120 | 167 | |||||||||||||||
Pension and post-retirement obligations(4) | 54 | 7 | 8 | 7 | 32 | |||||||||||||||
Purchase obligations(5) | 13,787 | 880 | 1,557 | 1,768 | 9,582 | |||||||||||||||
Financial leases | 24 | 2 | 10 | 12 | — | |||||||||||||||
|
|
|
|
|
|
|
|
|
| |||||||||||
Total contractual obligations | 15,268 | 1,098 | 1,730 | 1,943 | 10,498 | |||||||||||||||
|
|
|
|
|
|
|
|
|
| |||||||||||
| (1) | Net value, hedging instruments included substantially modify the principal amount of debt. |
| (2) | Other debt includes governmental loan facilities, supplier credits and short-term commercial paper among others. |
| (3) | Interest expenses are the interest payments for all outstanding financial obligations, calculated as principal multiplied by the interest rate, presented according to when the interest payment comes due. |
| (4) | We have funded and unfunded pension and post-retirement benefit plans. Our funded plans have contractual annual commitments for contributions, which do not change based on funding status. Cash flow estimates in the table are based on such annual contractual commitments including certain estimable variable factors such as interest. Cash flow estimates in the table relating to our unfunded plans are based on future discounted payments necessary to meet all of our pension and post-retirement obligations. |
| (5) | Includes generation and distribution business purchase obligations which are comprised mainly of energy purchases, operating and maintenance contracts, and other services. Of the total contractual obligations of Ch$ 13,787 billion, 65% corresponds to energy purchased for distribution, 23% corresponds primarily to fuel supply, maintenance of medium and low voltage lines, supplies of cable and utility poles, and energy purchased for generation. The remaining 12% corresponds to miscellaneous services, such as LNG regasification, fuel transport and coal handling. |
90
Table of Contents
| G. | Safe Harbor. |
The information contained in the Items 5.E and 5.F contains statements that may constitute forward-looking statements. See “Forward-Looking Statements” in the “Introduction” of this information statement, for safe harbor provisions.
| Item 6. | Directors, Senior Management and Employees |
| A. | Directors and Senior Management. |
Our Board of Directors will initially consist of seven members who will be elected for an interim term at the Extraordinary Shareholders’ Meeting (“ESM”) of the shareholders of Enersis to be held on December 18, 2015 to hold office until the first Ordinary Shareholders’ Meeting (“OSM”) of the shareholders of Enersis Chile to be held in April 2016 (the “2016 OSM”). At the 2016 OSM, the entire Board of Directors consisting of seven members will be elected to a three-year term. Following the end of their term, they may be re-elected or replaced. If a vacancy occurs in the interim, the Board of Directors will elect a temporary director to fill the vacancy until the next OSM, at which time the entire Board of Directors will be elected to new three-year term. Our Executive Officers will be appointed and hold office at the discretion of the Board of Directors.
| B. | Compensation. |
At the ESM to be held on December 18, 2015, the shareholders of Enersis will approve the compensation policy for our Board of Directors. Directors are expected to be paid an annual variable fee equivalent to 0.1% of the net earnings of Enersis Chile for the current year based on the statutory combined financial statements filed with the SVS. Directors are also expected to be paid a monthly fee, in advance, depending on their attendance at Board meetings and their participation as director of any combined entities of Enersis Chile. Director compensation is expected to be similar to the current Enersis’ compensation policy, which consists of a monthly fixed compensation of UF 180 per month and an additional fee of UF 66 per meeting, depending on attendance to Board meetings. Enersis also pays an annual fee to its directors. The monthly fixed fees are considered as advances on the annual variable fee and creditable against that amount. It is expected that once our net earnings are approved at the OSM of the following year, the difference between the accrued annual variable fee and the total fees paid in advance will be paid to directors, but only if the resulting amount is positive. The Chairman of the Board will typically be entitled to double the compensation compared to other directors under this policy, while the Vice Chairman would receive fixed compensation higher than the directors but lower than the Chairman. It is expected that the members of the Directors’ Committee of Enersis Chile will be paid a variable annual fee, equivalent to a percentage of the net earnings of Enersis Chile for the current year. This compensation scheme has been estimated based on the latest Enersis information prior to the Spin-Off and may be different when applied to Enersis Chile.
Enersis Chile will not disclose, to its shareholders or otherwise, any information about an individual Executive Officer’s compensation. Executive Officers will be eligible for variable compensation under a bonus plan. The annual bonus plan will be paid to Executive Officers for achieving company-wide objectives and for their individual contribution to Enersis Chile’s results and objectives. The annual bonus plan will provide for a range of bonus amounts according to seniority level. The bonuses that will be paid to Executive Officers will consist of a certain multiple of gross monthly salaries.
Enersis Chile expects to enter into severance indemnity agreements with all of its Executive Officers, pursuant to which it will pay severance indemnity in the event of voluntary resignation, termination by mutual agreement among the parties, or death. The severance indemnity will not apply if the termination is due to willful misconduct, prohibited negotiations, unjustified absences, abandonment of duties, among other causes, as defined in Article 160 of the Chilean Labor Code. All of Enersis Chile’s employees will be entitled to legal severance pay if terminated due to the needs of Enersis Chile, as defined in Article 161 of the Chilean Labor Code.
91
Table of Contents
| C. | Board Practices. |
Corporate Governance
Enersis Chile will be managed by a Board of Directors in accordance with its by-laws. The Board will initially consist of seven directors who will be elected by shareholders of Enersis at the ESM to be held on December 18, 2015 to hold office until the first OSM of the shareholders of Enersis Chile to be held in April 2016. At the 2016 OSM, the entire Board of Directors consisting of seven members will be elected to a three-year term. Following the end of their term, they may be re-elected or replaced. At the end of the three-year term, each director will be either re-elected or replaced. Directors can be re-elected indefinitely. Staggered terms are not permitted under Chilean law. If a vacancy occurs on the board during the three-year term, the Board of Directors may appoint a temporary director to fill the vacancy. Any vacancy triggers an election for every seat on the Board of Directors at the next OSM. Members of the Board of Directors will not have service contracts with Enersis Chile or with any of its combined entities that will provide them benefits upon termination of their service.
Chilean corporate law provides that a company’s Board of Directors is responsible for the management and representation of a company in all matters concerning its corporate purpose, subject to the provisions of the company’s bylaws and the stockholders’ resolutions.
Corporate governance policies of Enersis Chile are expected to be similar to the current Enersis policies. Additionally, the Charter Governing Executives and the Employee Code of Conduct will be approved by the Board of Directors. The Employee Code of Conduct will explain Enersis Chile’s principles and ethical values, establish the rules governing Enersis Chile’s contact with customers and suppliers, and establish the principles that should be followed by employees, including ethical conduct, professionalism and confidentiality. Limitations on the activities that Enersis Chile’s executives and other employees may undertake outside the scope of their employment with us may also be imposed.
In order to ensure compliance with Securities Market Law No. 18,045 and SVS regulations, it is expected that the Board of Directors will approve the “Manual for the Management of Information of Interest to the Market” (the “Manual”). This document will address applicable standards regarding the information in connection with transactions of Enersis Chile’s securities and those of its affiliates, entered into by directors, management, principal executives, employees and other related parties, the existence of blackout periods for such transactions undertaken by directors, principal executives and other related parties, the existence of mechanisms for the continuous disclosure of information that is of interest to the market and mechanisms that provide protection for confidential information. The Manual will be posted on Enersis Chile’s website at www. enersischile.cl. The provisions of this Manual will apply to the members of the Board, as well as executives and employees who have access to confidential information, and especially those who work in areas related to the securities markets.
In order to supplement the aforementioned corporate governance regulations, it is expected that the Board of Directors will approve a Code of Ethics and a Zero Tolerance Anti-Corruption Plan (“ZTAC Plan”), which will be similar to the ZTAC Plan of Enersis. The Code of Ethics will be based on general principles such as impartiality, honesty, integrity and other ethical standards of similar importance, all of which are expected from employees. The ZTAC Plan will reinforce the principles included in the Code of Ethics, but with special emphasis on avoiding corruption in the form of bribes, preferential treatment, and other similar matters.
In order to comply with Law 20,393 enacted on December 2, 2009, it is expected that the Board of Directors will approve the Penal Risk Prevention Model, which imposes criminal responsibility on legal entities for the crimes of asset laundering, financing of terrorism and bribing of public officials. The law encourages companies to adopt this model, whose implementation involves compliance with managerial and supervision duties. The adoption of the Penal Risk Prevention Model will mitigate, and in some cases relieve, the effects of criminal responsibility even when a crime is committed. One of the elements of this model is the appointment of the Penal Risk Prevention Officer, who will be appointed by the Board.
92
Table of Contents
It is expected that the Board of Directors will approve the “Guidelines 231: Guidelines applicable to non-Italian subsidiaries in accordance with Legislative Decree 231 of June 8, 2001.” Given that Enersis Chile’s ultimate parent company, Enel, has to comply with Italian Legislative Decree 231, which establishes management responsibility for Italian companies as a consequence of certain crimes committed in Italy or abroad, in the name of or for the benefit of such entities, including those crimes described in Chilean Law 20,393, these guidelines set a group of measures, with standards of behavior expected from all employees, advisers, auditors, officials, directors as well as consultants, contractors, commercial partners, agents and suppliers. Legislative Decree 231 includes various activities of a preventive nature that are coherent with and integral to the requirements and compliance with Chilean Law No. 20,393, which deals with the criminal responsibility of legal entities. These guidelines are supplementary to the standards included in the Code of Ethics and the ZTAC Plan.
On November 29, 2012, the SVS issued General Regulation No. 341 which established regulations for the disclosure of information with respect to the standards of corporate governance compliance adopted by publicly held limited liability corporations and sets the procedures, mechanisms and policies that are indicated in the Appendix to the regulation. The objective of this regulation is to provide credible information to investors with respect to good corporate governance policies and practices adopted by publicly held limited liability corporations, which include us, and permit entities like stock exchanges to produce their own analyses to help the various market participants to understand and evaluate the commitment of companies. The Appendix is divided into the following five sections with respect to which companies must report the corporate practices that have been adopted: (i) the functioning of the board, (ii) relations between the company, shareholders and the general public, (iii) the replacement and compensation of senior executives, (iv) the definition, implementation and supervision of the company’s internal control and risk management policies and procedures, and (v) other practices adopted by the company that do not refer to the above matters. Publicly held limited liability corporations should send the information with respect to corporate governance practices to the SVS, no later than March 31 of each year, using the contents of the Appendix to this regulation as criteria. If none of them is adopted, the company must explain its reasons to the SVS. The information should refer to December 31 of the calendar year prior to its dispatch. At the same time, such information should also be at the public’s disposal on the company’s website and must be sent to the stock exchanges.
Compliance with the New York Stock Exchange Listing Standards on Corporate Governance
The following is a summary of the significant differences between Enersis Chile’s expected corporate governance practices and those applicable to U.S. domestic issuers under the corporate governance rules of the NYSE:
Independence and Functions of the Directors’ Committee (Audit Committee)
Chilean law requires that at least two thirds of the Directors’ Committee be independent directors. According to Chilean law, a member would not be considered independent if, at any time, within the last 18 months he: (i) maintained any relationship of a relevant nature and amount with the company, with other companies of the same group, with its controlling shareholder or with the principal officers of any of them or has been a director, manager, administrator or officer of any of them; (ii) maintained a family relationship with any of the members described in (i) above; (iii) has been a director, manager, administrator or principal officer of a non-profit organization that has received contributions from (i) above; (iv) has been a partner or a shareholder that has controlled, directly or indirectly, 10% or more of the capital stock or has been a director, manager, administrator or principal officer of an entity that has provided consulting or legal services for a relevant consideration or external audit services to the persons listed in (i) above; and (v) has been a partner or a shareholder that has controlled, directly or indirectly, 10% or more of the capital stock or has been a director, manager, administrator or principal officer of the principal competitors, suppliers or customers. In case there are not sufficient independent directors on the Board to serve on the Directors’ Committee, Chilean law determines that the independent director nominates the rest of the members of the Directors’ Committee among the remaining Board members that do not meet the Chilean law independence requirements. Chilean law also
93
Table of Contents
requires that all publicly held limited liability stock corporations that have a market capitalization of at least UF 1,500,000 (Ch$ 38 billion as of September 30, 2015) and at least 12.5% of its voting shares are held by shareholders that individually control or own less than 10% of such shares, must have at least one independent director and a Directors’ Committee.
Under the NYSE corporate governance rules, all members of the Audit Committee must be independent, subject to a phase-in period for compliance for spin-off companies. The Audit Committee of a U.S. company must perform the functions detailed in, and otherwise comply with the requirements of NYSE Listed Company Manual Rules 303A.06 and 303A.07. As of July 31, 2005, non-U.S. companies have been required to comply with Rule 303A.06, but not with Rule 303A.07. Once the Spin-Off is effective, it is expected that Enersis Chile will comply with the independence and the functional requirement of Rule 303A.06.
Pursuant to Enersis Chile’s by-laws that are expected to be approved by the shareholders of Enersis at the ESM to be held on December 18, 2015, all members of the Directors’ Committee must satisfy the requirements of independence, as stipulated by the NYSE. The members of the Director’s Committee will be composed of three members of the Board and will comply with Chilean law, as well as with the criteria and requirements of independence prescribed by the Sarbanes-Oxley Act (“SOX”), the SEC and the NYSE. Therefore, the Director’s Committee will comply with the conditions of the Audit Committee as required by the SOX, the SEC and the NYSE corporate governance rules. As a result, the Company will have a single Committee, the Directors’ Committee, which will include among its functions the duties perform by the Audit Committee.
Enersis Chile’s Directors’ Committee is expected to be composed of three independent directors, all of whom will meet the independence criteria of Chilean law, SOX, the SEC and the NYSE.
The Enersis Chile Directors’ Committee will perform the following functions:
| • | review of financial statements and the reports of the external auditors prior to their submission for shareholders’ approval; |
| • | formulate proposals to the Board of Directors, which will make its own proposals to shareholders’ meetings, for the selection of external auditors and private rating agencies; |
| • | review of information related to transactions of Enersis Chile with related parties and reports the opinion of the Directors’ Committee to the Board of Directors; |
| • | the examination of the compensation framework and plans for managers, executive officers and employees; |
| • | the preparation of an Annual Management Report, including its main recommendations to shareholders; |
| • | provide information to the Board of Directors about the convenience of recruiting external auditors to provide non-auditing services, when such services are not prohibited by law, depending on whether such services might affect the external auditors’ independence; |
| • | oversee the work of external auditors; |
| • | review and approval of the annual auditing plan by the external auditors; |
| • | evaluate the qualifications, independence and quality of the auditing services; |
| • | elaborate on policies regarding employment of former members of the external auditing firm; |
| • | review and discuss problems or disagreements between management and external auditors regarding the auditing process; |
| • | establish procedures for receiving and dealing with complaints regarding accounting, internal control and auditing matters; |
| • | any other function mandated to the committee by the bylaws, the Board of Directors or the shareholders. |
94
Table of Contents
Corporate Governance Guidelines
The NYSE’s corporate governance rules require U.S.-listed companies to adopt and disclose corporate governance guidelines. Although Chilean law does not provide for this practice (except for the Manual), Enersis Chile expects to adopt the codes of conduct and its by-laws will include provisions that govern the creation, composition, attributions, functions and compensation of both Director’s and Audit Committees described above.
| D. | Employees. |
The following table provides the total number of personnel (both permanent and temporary employees) and the number of personnel (both permanent and temporary employees) of each of our combined entities as of the dates indicated.
| As of September 30, | As of December 31, | |||||||||||||||
Company | 2015 | 2014 | 2014 | 2013 | ||||||||||||
Endesa Chile | 925 | 1,128 | 1,137 | 1,137 | ||||||||||||
Pehuenche | 2 | 3 | 3 | 3 | ||||||||||||
Celta | — | 1 | 1 | 1 | ||||||||||||
Ingendesa | — | — | — | — | ||||||||||||
Túnel El Melón(1) | — | 15 | 15 | 16 | ||||||||||||
Enersis | 391 | 446 | 445 | 357 | ||||||||||||
Chilectra(2) | 682 | 695 | 690 | 745 | ||||||||||||
Servicios Informáticos e Inmobiliarios Ltda.(3) | 110 | 107 | 128 | 153 | ||||||||||||
GasAtacama(4) | 71 | 156 | 105 | — | ||||||||||||
|
|
|
|
|
|
|
| |||||||||
Total personnel | 2,181 | 2,551 | 2,524 | 2,412 | ||||||||||||
|
|
|
|
|
|
|
| |||||||||
| (1) | This company was sold by Endesa Chile in January 2015. |
| (2) | Includes Luz Andes S.A. and Empresa Eléctrica de Colina S.A. |
| (3) | In December 2014, IMV was merged into ICT. The resulting company was renamed Servicios Informáticos e Inmobiliarios Ltda. 2013 includes ICT, IMV, Los Maitenes and Aguas Santiago Poniente. The 2014 data only includes ICT and IMV, since the other two companies were sold in December 2014. |
| (4) | As a result of Endesa Chile’s purchase of an additional 50% interest in GasAtacama Holding, we began accounting for GasAtacama Holding and its subsidiaries on a combined basis since May 2014. |
95
Table of Contents
The following table provides the total number of temporary employees and the number of temporary employees of each of our combined entities as of the dates indicated and the average during the most recent financial year:
| As of September 30, | Average | As of December 31, | ||||||||||||||||||
Company | 2015 | 2014 | 2014 | 2014 | 2013 | |||||||||||||||
Endesa Chile | 91 | 118 | 108.2 | 119 | 96 | |||||||||||||||
Pehuenche | — | — | — | — | — | |||||||||||||||
Celta | — | — | — | — | — | |||||||||||||||
Ingendesa | — | — | — | — | — | |||||||||||||||
Túnel El Melón(1) | — | — | — | — | — | |||||||||||||||
Enersis | — | 4.0 | 4.0 | 4 | 4 | |||||||||||||||
Chilectra(2) | — | — | 0.1 | — | 1 | |||||||||||||||
Servicios Informáticos e Inmobiliarios Ltda.(3) | — | — | — | — | — | |||||||||||||||
GasAtacama(4) | — | — | 0.9 | 1 | — | |||||||||||||||
|
|
|
|
|
|
|
|
|
| |||||||||||
Total temporary personnel | 91 | 122 | 113.2 | 124 | 101 | |||||||||||||||
|
|
|
|
|
|
|
|
|
| |||||||||||
| (1) | This company was sold by Endesa Chile in January 2015. |
| (2) | Includes Luz Andes S.A. and Empresa Eléctrica de Colina S.A. |
| (3) | In December 2014, IMV was merged into ICT. The resulting company was renamed Servicios Informáticos e Inmobiliarios Ltda. 2013 includes ICT, IMV, Los Maitenes and Aguas Santiago Poniente. The 2014 data only includes ICT and IMV, since the other two companies were sold in December 2014. |
| (4) | As a result of Endesa Chile’s purchase of an additional 50% interest in GasAtacama Holding, we began accounting for GasAtacama Holding and its subsidiaries on a combined basis since May 2014. |
All Chilean employees who are dismissed for reasons other than misconduct are entitled by law to a severance payment. According to Chilean law, permanent employees are entitled to a basic payment of one-month’s salary for each year (or a six-month portion thereof) worked, subject to a limit of a total payment of no more than 11 months’ pay for employees hired after August 14, 1981. Severance payments to employees hired prior to that date consist of one-month’s salary for each full year worked, not subject to any limitation on the total amount payable. Under our collective bargaining agreements, we are obligated to make severance payments to all covered employees in cases of voluntary resignation or death in specified amounts that increase according to seniority and may exceed the amounts required under Chilean law.
Enersis currently has two collective bargaining agreements in Chile, which are expected to be transferred to Enersis Chile once the separation is effective. The first one was signed in July 2015 and it will be in force until July 2019. The second one was signed in December 2011 and will expire in December 2015. Chilectra has five collective bargaining agreements, all of them signed in 2012, which expire in December 2016. Empresa Eléctrica de Colina has one collective bargaining agreement signed in 2015, which expires in October 2019. SIEI has one agreement which expires in December 2015. Endesa Chile has four collective bargaining agreements in Chile, which will expire between 2015 and 2017.
| E. | Share Ownership. |
At the 2016 OSM, the Board of Directors will be elected. None of the directors or officers of Enersis Chile is expected to own more than 0.1% of the shares of Enersis Chile or any stock options after the Spin-Off.
96
Table of Contents
| Item 7. | Major Shareholders and Related Party Transactions |
| A. | Major Shareholders. |
Based on the distribution ratio in the Spin-Off of one share of Enersis Chile common stock for every one share of Enersis common stock, immediately after the Spin-Off, Enersis Chile’s shareholders and their holdings of Enersis Chile common stock will be identical to the shareholders of Enersis and their holdings of Enersis common stock immediately prior to the Spin-Off. Following the Spin-Off, Enersis Chile will have only one class of capital stock and Enel, the ultimate controlling stockholder of Enersis, will also be the ultimate controlling shareholder of Enersis Chile after the Spin-Off and will have no different voting rights than the other shareholders of Enersis Chile.
The following discussion has been prepared based on information available to us concerning ownership of Enersis common stock and ADSs as of September 30, 2015 and describes the expected ownership of Enersis Chile common stock and ADSs immediately following the Spin-Off.
Immediately following the Spin-Off, Enersis Chile is expected to have 49,092,772,762 shares of common stock outstanding, held by 6,891 stockholders of record and five record holders of Enersis Chile ADSs. It is not practicable for us to determine the number of Enersis Chile ADSs or Enersis Chile common stock that will be beneficially owned in the United States, as the depositary for Enersis’ ADSs only has knowledge of the record holders, including the Depositary Trust Company and its nominees. As a result, we are not able to ascertain the domicile of the expected final beneficial holders represented by Enersis Chile ADS record holders. Likewise, we cannot readily determine the domicile of any of the expected foreign stockholders who will hold Enersis Chile common stock, either directly or indirectly.
Immediately following the Spin-Off, we expect that: Enel will beneficially own 60.6% of Enersis Chile; AFPs in the aggregate will own 12.1% of Enersis Chile; Chilean stockbrokers, mutual funds, insurance companies, foreign equity funds, and other Chilean institutional investors collectively will own 14.5% of Enersis Chile; ADS holders will beneficially own 10.8% of Enersis Chile; and the remaining 2.0% of Enersis Chile will be held by over 6000 minority shareholders, based on available information as of September 30, 2015.
The following table sets forth certain information concerning the expected ownership of Enersis Chile common stock immediately following the Spin-Off, with respect to each stockholder known by us that is expected to own more than 5% of the outstanding shares of Enersis Chile common stock:
| Number of Shares Owned | Percentage of Shares Outstanding | |||||||
Enel Latinoamérica(1) | 19,794,583,473 | 40.3 | % | |||||
Enel Iberoamérica | 9,967,630,058 | 20.3 | % | |||||
| (1) | Enel Latinoamérica is wholly-owned by Enel Iberoamérica, which in turn is wholly-owned by Enel. |
Enel, an Italian generation and distribution company which is publicly traded on the Milan Stock Exchange, is primarily engaged in the energy sector, with a presence in 30 countries worldwide, and approximately 89 GW of net installed capacity. It provides service to more than 61 million customers through its electricity and gas businesses.
| B. | Related Party Transactions. |
Article 146 of Law No. 18,046 (the “Chilean Companies Act”) defines related-party transactions as all transactions involving a company and any entity belonging to the corporate group, its parent companies, controlling companies, subsidiaries or related companies, board members, managers, administrators, senior officers or company liquidators, including their spouses, some of their relatives and all entities controlled by them, in addition to individuals who may appoint at least one member of the company’s board of directors or who control 10% or more of voting capital, or companies in which a board member, manager, administrator,
97
Table of Contents
senior officer or company liquidator has been serving in the same position within the last 18 months. The law establishes that in the event that these persons fulfill the requirements established by Article 146, such persons must immediately inform the Board of Directors of their related-party nature or such other group as the Board may appoint for that purpose. As required by law, “related-party transactions” must comply with corporate interests, as well as prices, terms and conditions prevailing in the market at the time of their approval. They must also meet all legal requirements, including acknowledgement and approval of the transaction by the board (excluding the affected directors), by the ESM (in some cases, with requisite majority approval) and by any applicable regulatory procedures.
The aforementioned law, which also applies to Enersis Chile’s affiliates, also provides for some exceptions, stating that in certain cases, Board approval would suffice for “related-party transactions, “ pursuant to certain related-party transaction thresholds and when such transactions are conducted in compliance with the related-party policies defined by the company’s board. Accordingly, during 2016, Enersis Chile’s Board of Directors will adopt a related-party transaction policy (política de habitualidad) which, when approved, will be available on Enersis Chile’s website.
If a transaction is not in compliance with Article 146, this would not affect the transaction’s validity, but we or our shareholders may demand compensation from the individual associated with the infringement as provided under law, and reparation for damages.
It is Enersis’ policy that all cash inflows and outflows of its Chilean combined entities be managed through its centralized cash management policy. It is a common practice in Chile to transfer surplus funds from one company to another affiliate that has a cash deficit. These transfers are carried out through either short-term loans or through structured inter-company loans. Under Chilean laws and regulations, such transactions must be carried out on an arm’s-length basis. Enersis’ centralized cash management is more efficient for both financial and tax reasons and Enersis Chile is expected to continue such policy. All of these transactions will be subject to the supervision of Enersis Chile’s Directors’ Committee. As of September 30, 2015, these transactions were priced at TIP (a Chilean variable interest rate) plus 0.05% per month.
Endesa Chile, has received three structured loans from Enersis, primarily to satisfy working capital needs/finance projects. As of September 30, 2015, the outstanding balance for such loans was US$ 377 million comprised of a US$ 150 million loan at a fixed annual interest rate of 0.77%, a second loan of US$ 150 million at a fixed annual interest rate of 0.72% and a third annual loan of US$ 77 million with a fixed annual interest rate of 0.66%.
Endesa Chile, has also received a short-term loan from Enersis, primarily to satisfy working capital needs/finance projects. As of September 30, 2015, the outstanding balance for such loan was US$ 35 million.
Enersis granted a short-term loan to Endesa Chile, primarily to satisfy working capital needs/finance projects. As of September 30, 2015, the outstanding balance for such loan was US$ 25 million.
Chilectra, has received a short-term loan from Enersis, primarily to satisfy working capital needs/finance projects. As of September 30, 2015, the outstanding net balance for such loan was US$ 7 million.
Enersis granted a short-term loan to Chilectra, primarily to satisfy working capital needs/finance projects. As of September 30, 2015, the outstanding net balance for such loan was US$ 5 million
During the three-year period ended December 31, 2014, Endesa Chile granted only one loan to its subsidiary as of that date, Costanera, at a spread of 6.0% over LIBOR. This loan matured in November 2013, because it was contributed to Costanera in connection with its capital increase.
As of the date of this information statement, the abovementioned transactions have not experienced material changes. For more information regarding transactions with related parties, refer to Note 10 of the Notes to our interim combined financial statements.
98
Table of Contents
| C. | Interests of Experts and Counsel. |
Not applicable.
| Item 8. | Financial Information |
| A. | Combined Statements and Other Financial Information. |
See “Item 18. Financial Statements.”
Legal Proceedings
We and our combined entities are parties to legal proceedings arising in the ordinary course of business. We believe it is unlikely that any loss associated with pending lawsuits will significantly affect the normal development of our business.
For detailed information as of September 30, 2015 on the status of the material pending lawsuits that have been filed against Enersis and its subsidiaries, please refer to Note 36.3 of the Notes to our interim combined financial statements. Please note that once the Spin-Off is effective, we will be the defendant instead of Enersis for all legal proceeding originating from our Chilean Business.
In relation to the legal proceedings reported in the Notes to our interim combined financial statements, we use the criteria of disclosing lawsuits above a minimum threshold of US$ 9 million of potential impact to us, and, in some cases, qualitative criteria according to the materiality of the impact in the conduct of our business. The lawsuit status includes a general description, the process status and the estimate of the amount involved in each lawsuit.
Dividend Policy
It is expected that the Board of Directors will establish a definitive dividend payable each year. The dividend policy has not been defined yet.
It is expected that the interim Board of Directors of Enersis Chile will be elected at the ESM of the shareholders of Enersis to be held on December 18, 2015 and will establish a definitive dividend payable each year, accrued in the prior year, which cannot be less than the legal minimum of 30% of annual net income before negative goodwill amortization. Additionally, it is expected that shareholders of Enersis will agree to consider a percentage of Enersis’ 2015 annual net income as Enersis Chile’s 2015 annual net income at the ESM. The exact proportion has to be determined and this definition will be applied only for the first dividend distribution.
It is expected that our dividend policy will be similar to Enersis’ current dividend policy and therefore, the interim dividend will correspond to 15% of liquid net income as of a specific, yet to be determined period, of the combined statements of financial position. Additionally, it is expected that our Board of Directors will propose a definitive dividend payout equal to 50% of the annual net income for fiscal year 2016. Dividend payments will be subject to net profits obtained in each period, as well as to expectations of future profit levels and other conditions that may exist at the time of such dividend declaration. The fulfillment of the aforementioned dividend policy will depend on the net income. The proposed dividend policy will be subject to our Board of Director’s right to change the amount and timing of the dividends under the circumstances at the time of the payment. The payment of dividends for fiscal year 2015 will be based on the net income filed with the SVS. For further details, see “Item 3. Key Information — A. Selected Financial Data.”
The payments of dividends are subject to legal restrictions, such as legal reserve requirements, capital and retained earnings criteria, and other contractual restrictions such as the non-default on credit agreements. However, these legal restrictions will not affect our ability or any of our combined entities to pay dividends. (See “Item 5. Operating and Financial Review and Prospects — B. Liquidity and Capital Resources” for further detail on our debt instruments).
99
Table of Contents
Stockholders set dividend policies at each subsidiary and affiliate. Dividends will be paid to shareholders of record as of midnight of the fifth business day prior to the payment date. Holders of ADS on the applicable record dates will be entitled to participate in dividends.
Dividends
Dividends have not been paid to date.
For a discussion of Chilean withholding taxes and access to the formal currency market in Chile in connection with the payment of dividends and sales of ADSs and the underlying common stock, see “Item 10. Additional Information — E. Taxation” and “Item 10. Additional Information — D. Exchange Controls.”
100
Table of Contents
| B. | Significant Changes. |
UNAUDITED PRO FORMA COMBINED FINANCIAL INFORMATION
The following unaudited pro forma combined statement of financial position as of September 30, 2015 and the unaudited pro forma combined statements of income for the year ended December 31, 2014 and the nine months ended September 30, 2015 give effect to (1) the Endesa/Chilectra Spin-Offs and (2) Spin-Off. The pro forma information is based on the combined financial statements of the Chilean Businesses of Enersis after giving effect to the transactions and applying the estimates, assumptions and adjustments described in the accompanying notes to the unaudited pro forma combined financial information.
For pro forma purposes, the unaudited pro forma combined statement of financial position as of September 30, 2015 is presented as if the spin-off transactions had occurred on September 30, 2015. The unaudited pro forma combined statements of income for the year ended December 31, 2014 and the nine months ended September 30, 2015, in each case, are presented as if the spin-off transactions had occurred on January 1, 2014.
The unaudited pro forma combined financial information has been prepared by Enersis’ management for illustrative purposes and is not intended to represent the combined financial position or combined results of operations in future periods or what the results actually would have been had Enersis completed the proposed spin-off transactions during the specified periods. The unaudited pro forma combined financial information and accompanying notes should be read in conjunction with the following information presented in this information statement: (1) the historical combined financial statements of the Chilean Businesses of Enersis for the year ended December 31, 2014 and notes thereto, (2) the historical combined financial statements of the Chilean Businesses for the nine months ended September 30, 2015 and notes thereto and (3) Part I, Item 5.A. “Operating Results” of this information statement.
101
Table of Contents
Unaudited Pro Forma Combined Statement of Financial Position as of September 30, 2015
| Combined Historical | Combined Pro forma Adjustment | Combined Pro forma | ||||||||||
| (in thousands of Ch$) | ||||||||||||
| ASSETS | ||||||||||||
CURRENT ASSETS | ||||||||||||
Cash and cash equivalents | 85,160,333 | — | 85,160,333 | |||||||||
Other current financial assets | 1,580,176 | — | 1,580,176 | |||||||||
Other current non-financial assets | 17,526,512 | — | 17,526,512 | |||||||||
Trade and other current receivables | 580,410,561 | — | 580,410,561 | |||||||||
Current accounts receivable from related companies | 21,954,154 | — | 21,954,154 | |||||||||
Inventories | 35,549,475 | — | 35,549,475 | |||||||||
Current tax assets | 22,652,733 | — | 22,652,733 | |||||||||
|
|
|
|
|
| |||||||
Total current assets other than assets or groups of assets for disposal classified as held for sale or as held for distribution to owners | 764,833,944 | — | 764,833,944 | |||||||||
|
|
|
|
|
| |||||||
Non-current assets or groups of assets for disposal classified as held for sale | — | — | — | |||||||||
Non-current assets or groups of assets for disposal classified as held for sale or as held for distribution to owners | — | — | — | |||||||||
|
|
|
|
|
| |||||||
TOTAL CURRENT ASSETS | 764,833,944 | — | 764,833,944 | |||||||||
|
|
|
|
|
| |||||||
NON-CURRENT ASSETS | ||||||||||||
Other non-current financial assets | 22,823,374 | — | 22,823,374 | |||||||||
Other non-current non-financial assets | 4,517,717 | — | 4,517,717 | |||||||||
Trade and other non-current receivables | 6,929,938 | — | 6,929,938 | |||||||||
Investments accounted for using the equity method | 47,687,926 | — | 47,687,926 | |||||||||
Intangible assets other than goodwill | 37,725,489 | — | 37,725,489 | |||||||||
Goodwill | 887,257,655 | — | 887,257,655 | |||||||||
Property, plant and equipment | 3,349,115,618 | — | 3,349,115,618 | |||||||||
Investment property | 8,156,603 | — | 8,156,603 | |||||||||
Deferred tax assets | 20,249,553 | — | 20,249,553 | |||||||||
|
|
|
|
|
| |||||||
TOTAL NON-CURRENT ASSETS | 4,384,463,873 | — | 4,384,463,873 | |||||||||
|
|
|
|
|
| |||||||
TOTAL ASSETS | 5,149,297,817 | — | 5,149,297,817 | |||||||||
|
|
|
|
|
| |||||||
See Notes to the unaudited pro forma combined financial statements
102
Table of Contents
| Combined Historical | Combined Pro forma Adjustment | Combined Pro forma | ||||||||||
| (in thousands of Ch$) | ||||||||||||
| LIABILITIES AND EQUITY | ||||||||||||
CURRENT LIABILITIES | ||||||||||||
Other current financial liabilities | 31,465,056 | — | 31,465,056 | |||||||||
Trade and other current payables | 360,768,802 | 194,244,000 | (A) | 555,012,802 | ||||||||
Current accounts payable to related companies | 335,484,506 | — | 335,484,506 | |||||||||
Other current provisions | 19,554,817 | — | 19,554,817 | |||||||||
Current tax liabilities | 3,926,861 | — | 3,926,861 | |||||||||
Other current non-financial liabilities | 28,036,115 | — | 28,036,115 | |||||||||
|
|
|
|
|
| |||||||
Total current liabilities other than those associated with groups of assets for disposal classified as held for sale | 779,236,157 | 194,244,000 | 973,480,157 | |||||||||
|
|
|
|
|
| |||||||
Liabilities associated with groups of assets for disposal classified as held for sale | — | — | — | |||||||||
|
|
|
|
|
| |||||||
TOTAL CURRENT LIABILITIES | 779,236,157 | 194,244,000 | 973,480,157 | |||||||||
|
|
|
|
|
| |||||||
NON-CURRENT LIABILITIES | ||||||||||||
Other non-current financial liabilities | 910,216,082 | — | 910,216,082 | |||||||||
Trade and other non-current payables | — | — | — | |||||||||
Other long-term provisions | 61,064,768 | — | 61,064,768 | |||||||||
Deferred tax liabilities | 227,628,896 | (46,618,560 | )(B) | 181,010,336 | ||||||||
Non-current provisions for employee benefits | 50,819,635 | — | 50,819,635 | |||||||||
Other non-current non-financial liabilities | 3,262,507 | — | 3,262,507 | |||||||||
|
|
|
|
|
| |||||||
TOTAL NON-CURRENT LIABILITIES | 1,252,991,888 | (46,618,560 | ) | 1,206,373,328 | ||||||||
|
|
|
|
|
| |||||||
TOTAL LIABILITIES | 2,032,228,045 | 147,625,440 | 2,179,853,485 | |||||||||
EQUITY | ||||||||||||
Allocated Capital | 2,229,108,975 | — | 2,229,108,975 | |||||||||
Retained earnings | 1,278,364,066 | — | 1,278,364,066 | |||||||||
Other reserves | (979,516,732 | ) | (94,153,185 | )(C) | 1,073,669,917 | ) | ||||||
Equity attributable to Parent Company | 2,527,956,309 | (94,153,185 | ) | 2,433,803,124 | ||||||||
Non-controlling interests | 589,113,463 | (53,472,255 | )(D) | 535,641,208 | ||||||||
|
|
|
|
|
| |||||||
TOTAL EQUITY | 3,117,069,772 | (147,625,440 | ) | 2,969,444,332 | ||||||||
|
|
|
|
|
| |||||||
TOTAL LIABILITIES AND EQUITY | 5,149,297,817 | — | 5,149,297,817 | |||||||||
|
|
|
|
|
| |||||||
See Notes to the unaudited pro forma combined financial statements
103
Table of Contents
Unaudited Pro Forma Combined Statement of Income
for the Nine Months ended September 30, 2015
| Combined Historical | Combined Pro forma Adjustment | Combined Pro forma | ||||||||||
| (in thousands of Ch$) | ||||||||||||
| STATEMENTS OF COMPREHENSIVE INCOME Profit (loss) | ||||||||||||
Revenues | 1,753,899,975 | — | 1,753,899,975 | |||||||||
Other operating income | 8,298,934 | — | 8,298,934 | |||||||||
Revenues and other operating income | 1,762,198,909 | — | 1,762,198,909 | |||||||||
Raw materials and consumables used | (1,151,827,225 | ) | — | (1,151,827,225 | ) | |||||||
Contribution Margin | 610,371,684 | — | 610,371,684 | |||||||||
Other work performed by the entity and capitalized | 16,076,024 | — | 16,076,024 | |||||||||
Employee benefits expense | (102,295,695 | ) | — | (102,295,695 | ) | |||||||
Depreciation and amortization expense | (112,391,453 | ) | — | (112,391,453 | ) | |||||||
Impairment loss recognized in the period’s profit or loss | (4,917,537 | ) | — | (4,917,537 | ) | |||||||
Other expenses | (82,469,879 | ) | — | (82,469,879 | ) | |||||||
Operating Income | 324,373,144 | — | 324,373,144 | |||||||||
Other gains (losses) | 6,694,174 | — | 6,694,174 | |||||||||
Financial income | 11,075,425 | — | 11,075,425 | |||||||||
Financial costs | (52,290,795 | ) | — | (52,290,795 | ) | |||||||
Share of profit (loss) of associates and joint ventures accounted for using the equity method | 7,482,890 | — | 7,482,890 | |||||||||
Foreign currency exchange differences | (45,890,221 | ) | — | (45,890,221 | ) | |||||||
Profit (loss) from indexed assets and liabilities | 3,320,149 | — | 3,320,149 | |||||||||
Income before taxes | 254,764,766 | — | 254,764,766 | |||||||||
Income tax expense | (57,496,655 | ) | — | (57,496,655 | ) | |||||||
NET INCOME | 197,268,111 | — | 197,268,111 | |||||||||
Net income attributable to: | ||||||||||||
Enersis Chile | 149,907,188 | — | 149,907,188 | |||||||||
Non-controlling interests | 47,360,923 | — | 47,360,923 | |||||||||
NET INCOME | 197,268,111 | — | 197,268,111 | |||||||||
See Notes to the unaudited pro forma combined financial statements
104
Table of Contents
Unaudited Pro Forma Combined Statement of Income for the Year ended December 31, 2014
| Combined Historical | Combined Pro forma Adjustment | Combined Pro forma | ||||||||||
| (in thousands of Ch$) | ||||||||||||
| STATEMENTS OF COMPREHENSIVE INCOME Profit (loss) | ||||||||||||
Revenues | 1,477,407,687 | — | 1,477,407,687 | |||||||||
Other operating income | 21,454,312 | — | 21,454,312 | |||||||||
Revenues and other operating income | 1,498,861,999 | — | 1,498,861,999 | |||||||||
Raw materials and consumables used | (1,003,840,694 | ) | — | (1,003,840,694 | ) | |||||||
Contribution Margin | 495,021,305 | — | 495,021,305 | |||||||||
Other work performed by the entity and capitalized | 15,904,921 | — | 15,904,921 | |||||||||
Employee benefits expense | (96,504,075 | ) | — | (96,504,075 | ) | |||||||
Depreciation and amortization expense | (93,389,860 | ) | — | (93,389,860 | ) | |||||||
Impairment losses recognized in the year’s profit or loss | (1,075,487 | ) | — | (1,075,487 | ) | |||||||
Other expenses by nature | (93,521,920 | ) | — | (93,521,920 | ) | |||||||
Operating Income | 226,434,884 | — | 226,434,884 | |||||||||
Other gains (losses) | 47,755,054 | — | 47,755,054 | |||||||||
Financial income | 9,124,834 | — | 9,124,834 | |||||||||
Financial costs | (58,021,595 | ) | — | (58,021,595 | ) | |||||||
Share of profit (loss) of associates and joint ventures accounted for using the equity method | 7,728,915 | — | 7,728,915 | |||||||||
Foreign currency exchange differences | (13,734,131 | ) | — | (13,734,131 | ) | |||||||
Profit (loss) from indexed assets and liabilities | 3,088,893 | — | 3,088,893 | |||||||||
Income before taxes | 222,376,854 | — | 222,376,854 | |||||||||
Income tax expense | (102,595,091 | ) | — | (102,595,091 | ) | |||||||
NET INCOME | 119,781,763 | — | 119,781,763 | |||||||||
Net income attributable to: | ||||||||||||
Enersis Chile | 96,243,582 | — | 96,243,582 | |||||||||
Non-controlling interests | 23,538,181 | — | 23,538,181 | |||||||||
NET INCOME | 119,781,763 | — | 119,781,763 | |||||||||
See Notes to the unaudited pro forma combined financial statements
105
Table of Contents
Notes to the Unaudited Pro Forma Combined Financial Statements
| A. | Basis of Presentation |
Capital Gains Taxes
In connection with the Endesa /Chilectra Spin-Offs, it is expected that Endesa Chile and Chilectra will be subject to capital gains taxes in Peru and Argentina under applicable tax laws (Ley del Impuesto a la Renta in Peru andLey de Impuesto a las Ganancias in Argentina) with respect to the transfer of investments that Endesa Chile and Chilectra have in entities in these countries to Endesa Américas and Chilectra Américas, respectively, in the Endesa/Chilectra Spin-Offs.
These taxes are preliminarily estimated to be approximately Ch$ 194 billion (Ch$ 175 billion to be paid by Endesa Chile and Ch$ 19 billion to be paid by Chilectra Chile) and will be a result of the capital gains generated by the difference between the value of these investments at the time of transfer to Endesa Américas and Chilectra Américas and the cost of acquisition of these investments in accordance with the applicable laws.
The applicable capital gain tax rates are expected to be 30% in Peru and 15% in Argentina. These taxes would be considered deductible expenses for purposes of determining Endesa Chile’s and Chilectra Chile’s income taxable in Chile, and would result in a tax benefit estimated to be approximately Ch$ 46.6 billion (Ch$ 42.1 billion for Endesa Chile and Ch$ 4.5 billion for Chilectra Chile), provided all the corresponding local tax requirements are met and assuming a Chilean income tax rate of 24%, which would be the tax rate applicable for the year 2016, after giving effect to the Endesa/Chilectra Spin-Offs and the Spin-Off. The capital gains taxes will become payable upon the completion of the Spin-Off, in the year in which the Spin-Off is completed.
The Spin-Off has tax consequences that will arise when it is legally completed; therefore, these effects are not accounted for as part of the spin-off accounting itself, but will rather be recorded in Endesa Américas and Chilectra Américas, as soon as these entities are legally established and the transaction has been consummated.
As these tax consequences are expected to be non-recurring and will not have a continuing impact, no adjustments were provided in the combined statements of income and they have been given effect in the combined statement of financial position as of September 30, 2015, as described below.
| B. | Pro Forma Adjustments |
| (A) | Represents the aggregate estimated capital gains tax payable in Peru and Argentina in the amounts of Ch$ 175 billion to be paid by Endesa Chile and Ch$ 19 billion to be paid by Chilectra Chile with respect to the transfer of investments that Endesa Chile and Chilectra have in entities in these countries to Endesa Américas and Chilectra Américas, respectively, in the Endesa/Chilectra Spin-Offs. |
| (B) | Represents the aggregate estimated tax benefit in the amounts of Ch$ 42.1 billion for Endesa Chile and Ch$ 4.5 billion for Chilectra Chile (assuming a Chilean income tax rate of 24%) arising from the tax deductibility in Chile of a portion of the capital gains tax payable in Peru and Argentina. |
| (C) | Represents the impact of Ch$ 94.2 billion on the equity attributable to the Parent Company in relation to the additional net liability, reflected as an adjustment to “Other reserves.” |
| (D) | Represents the impact of Ch$ 53.5 billion of the additional net liability on the non-controlling interests. |
| Item 9. | The Offer and Listing |
| A. | Offer and Listing Details. |
Market Price Information
We expect that the shares of our common stock and our ADS will be traded on the Chilean Stock Exchanges and NYSE, respectively, upon the completion of the Spin-Off.
106
Table of Contents
| B. | Plan of Distribution. |
Background and Description of the Spin-Off
Overview
The Spin-Off will establish us as a new Chilean corporation, independent of Enersis Américas. Enersis Chile will be a holding company focused on providing the Chilean Business through its combined entities and jointly controlled entities in Chile. Neither Enersis Américas nor Enersis Chile will own any capital stock of the other. The relationships between the two companies will be limited to:
| • | Agreements relating to the implementation of the Spin-Off; and |
| • | Intercompany agreements for staff and support services as well as financial arrangements, among others. |
Enersis Chile and Enersis Américas may also have certain intercompany arrangements with Endesa Chile, Endesa Américas, Chilectra Chile and Chilectra Américas following the Spin-Off and the Endesa/Chilectra Spin-Offs.
Description of the Spin-Off
The Spin-Off will be implemented using a procedure under Chilean corporate law calleddivisión or “demerger.” In adivisión, an existing company is divided, creating a new company to which specified assets and liabilities are assigned. The shares of the new company are issued to the shareholders of the existing company, pro rata in proportion to their share ownership in the existing company.
The Spin-Off will be presented to the shareholders of Enersis for approval at the extraordinary shareholders’ meeting to be held on December 18, 2015 (the “Enersis Meeting”). Upon approval of the Spin-Off, holders of Enersis’s common stock (“Enersis Shares”) will have the right to receive one share of common stock of Enersis Chile (“Enersis Chile Shares”) for each Enersis Share.
Following the approval of the Spin-Off by the shareholders of Enersis at the Enersis Meeting (the date of such approval, the “Approval Date”), subject to the receipt of necessary authorizations, the completion of legal formalities and the satisfaction of the conditions precedent, the following actions will occur:
| • | Enersis Chile will be established as a separate company, with a fully independent legal existence and full capacity to own and dispose of its assets. Our initial interim Board of Directors will be elected at the Enersis Meeting to serve until the first annual ordinary shareholders’ meeting of Enersis Chile expected to be held in April 2016. |
| • | Specified assets and liabilities of Enersis relating to the Chilean Business, including the shares of specified combined entities and jointly controlled entities, will be transferred to Enersis Chile. All of the Chilean Business to be conveyed to Enersis Chile are conducted by separate operating entities, and the continuity of existence of those entities will be undisturbed by the Separation. |
| • | Certain agreements to accomplish the separation of Enersis’ businesses in the Spin-Off and to provide for ongoing relationships between Enersis and Enersis Chile will take effect. |
Based on the unaudited pro forma condensed combined statements of financial position prepared in connection with the Separation, Enersis will convey to Enersis Chile, and Enersis Chile will be formed with, assets amounting to Ch$ 5,149,298 million, liabilities amounting to Ch$ 2,179,853 million and stockholders’ equity of Ch$ 2,969,444 million. These figures will be adjusted to reflect amounts as of the effective date of the Separation.
Promptly following the Approval Date, Enersis shareholders’ resolution from the Enersis Meeting approving the Spin-Off will be notarized and registered with the Chilean Commerce Registry (Registro de Comercio del Conservador de Bienes Raíces de Santiago) and a notice of the Separation will be published in theDiario Oficial.
107
Table of Contents
The Board of Directors of Enersis must grant the necessary powers-of-attorney to execute one or more documents necessary or convenient to certify compliance with the conditions precedent to which the Spin-Off is subject, certify that the assets subject to registration are assigned to Enersis Chile, and grant the Public Deed certifying the satisfaction of the conditions precedent for the Spin-Off (the “Public Deed”) within 10 calendar days of the satisfaction of all of the conditions precedent. The Separation will be fully effective as of the first calendar day of the month following the date on which the Public Deed is granted. However, until the registration of the Enersis Chile Shares with the SVS and the SEC is completed, Enersis Chile Shares and ADS will not be delivered or traded separately.
Conditions Precedent
In addition to the receipt of Enersis’ shareholder approval at the Meeting and the completion of legal formalities, the effectiveness of the Separation is subject to the following conditions precedent:
| • | Shareholders of Endesa Chile must have approved the spin-off of Endesa Américas at an extraordinary shareholders’ meeting of Endesa Chile, the minutes of such meeting must have been duly recorded as a public deed and the extracts of such minutes must have been duly registered and published pursuant to Chilean law; and |
| • | Shareholders of Chilectra must have approved the spin-off of Chilectra Américas at an extraordinary shareholders’ meeting of Chilectra, the minutes of such meeting must have been duly recorded as a public deed and the extracts of such minutes must have been duly registered and published pursuant to Chilean law. |
As described above, the Public Deed must be executed within 10 calendar days of the satisfaction of all of the conditions precedent.
Share Capital and Capital Structure of Enersis Chile
Immediately after the effectiveness of the Spin-Off the share capital of Enersis Chile will be Ch$ 2,229,108,974,538. Enersis and Enersis Chile will initially have the same shareholders, and they will continue to be controlled by the same group of shareholders.
Shareholder Approval
On November 5, 2015, a majority of the Board of Directors of Enersis determined that the Reorganization, including the Spin-Off and the Merger, was in the best interest of Enersis. On November 10, 2015, the Board of Directors of Enersis resolved to summon the Enersis Meeting to approve the Spin-Off.
At the Enersis Meeting, the shareholders of Enersis will vote to approve the Spin-Off, which includes the Separation establishing Enersis Chile and allocating certain assets and liabilities of Enersis relating to the Chilean Business to Enersis Chile. The approval of the Spin-Off requires the affirmative vote of holders of at least two-thirds of Enersis’ outstanding common stock. Enel Iberoamérica, S.R.L., a wholly owned subsidiary of Enel, both directly and through its wholly owned subsidiary, Enel Latinoamérica, S.A., owns 60.6% of Enersis’ common stock and intends to vote all of its shares in favor of the Spin-Off at the extraordinary shareholders’ meeting.
Costs Associated with the Spin-Off
Enersis will assume the notary fees, duties and other costs incurred in connection with the Spin-Off, except for those fees, duties and other costs that by their nature are incurred by any combined entity of Enersis, which shall be assumed by that entity.
Enersis may also enter into a tax indemnity agreement with Endesa Chile pursuant to which Enersis will indemnify Endesa Chile for net tax costs paid by Endesa Chile in connection with Endesa Chile’s spin-off of
108
Table of Contents
Endesa Américas. This indemnification would be applicable only if the Merger is not approved before December 31, 2017 due to reasons not attributable to Endesa Américas or Endesa Chile or an event of force majeure has occurred.
Third Party Approvals and Consents
With respect to any obligation of Enersis that will be assigned to Enersis Chile, consent of the relevant creditor may be required in order for Enersis Chile to succeed to the rights and obligations of Enersis. In these cases, failure to obtain consent from the creditor may require that Enersis remain liable for such obligation of Enersis Chile. Enersis Chile will agree to indemnify Enersis against liabilities of this kind.
Description of Distribution
Distribution of Enersis Chile Shares
Once the Separation is effective, we will apply to register the Enersis Chile Shares in the Securities Registry of the SVS and to list them for trading on the Chilean Stock Exchanges. Once the SVS has authorized the registration of our shares, they will be distributed to their legal holders. Distribution of shares that are not deposited with the Chilean Central Securities Depositary (DCV Registros, S.A., Depósito Central de Valores, or the “DCV”), the clearing system for securities traded on the Chilean Stock Exchanges, will be made against the presentation of the Enersis share certificates. For shares deposited with the DCV, distribution will generally be made by book-entry annotation in the shareholder list maintained by the DCV, by which holders of outstanding Enersis Shares will receive one Enersis Chile Share for each Enersis Share.
Holders of Enersis Shares as of a specified record date, referred to as the Share Record Date, will receive Enersis Chile Shares on the “Share Distribution Date.” Enersis will advise shareholders at a later time of the Share Record Date and the Share Distribution Date. The Share Distribution Date will not occur until the registration of Enersis Chile Shares under Chilean and U.S. securities laws is effective. We cannot be certain when this will occur, but we expect it will be during the first quarter of 2016.
Following the Separation but prior to the Share Distribution Date, there will be no separate certificates for Enersis Chile Shares, and the right to receive Enersis Chile Shares will trade and be transferred together with Enersis Shares. Investors will not be able to buy or otherwise acquire, or sell or otherwise transfer or deliver, Enersis Shares or Enersis Chile Shares separately.
After the Spin-Off has become effective, distribution to shareholders of Enersis will take place on the Share Distribution Date in the following manner:
| • | Each holder of Enersis Shares will receive one Enersis Chile Share for each Enersis Share held; and |
| • | Holders of Enersis Shares will continue to own the same number of Enersis Shares. |
Beginning on the Share Distribution Date, it is expected that:
| • | Enersis Chile Shares will commence trading on the Chilean Stock Exchanges; |
| • | Enersis Shares will trade on the Chilean Stock Exchanges separately from Enersis Chile Shares; and |
| • | Shareholders will be able to trade Enersis Shares and Enersis Chile Shares separately. |
Distribution of Enersis Chile ADSs
Upon the completion of the Spin-Off, each American Depositary Share (“ADS”) of Enersis (“Enersis ADS”) will represent, in addition to 50 Enersis Shares, the right to receive 50 Enersis Chile Shares. Enersis Chile will arrange with a U.S. depositary bank to issue ADSs of Enersis Chile (“Enersis Chile ADSs”), each representing 50 Enersis Chile Shares. Applications will be made to list the Enersis Chile ADSs on the NYSE.
109
Table of Contents
On a date, referred to as the “ADS Distribution Date,” as promptly as practicable after the Share Distribution Date, each record holder of Enersis ADSs as of a specified date, referred to as the “ADS Record Date,” will receive one Enersis Chile ADS for each Enersis ADS.
Enersis Chile ADSs will be issued and distributed to each record holder of Enersis ADSs at the close of business (New York time) on the ADS Record Date. Enersis expects that the Depositary of the Enersis ADSs will announce the ADS Record Date and the ADS Distribution Date on or about the same date on which Enersis announces the Share Record Date and the Share Distribution Date, although no assurances can be given that such an announcement will be made concurrently.
Persons holding Enersis ADSs through the facilities of The Depository Trust Company, or DTC, will receive the distribution of Enersis Chile ADSs by book entry only, through the facilities of DTC. Persons holding Enersis ADSs directly will receive the distribution of Enersis Chile ADSs in the form of certificated American Depositary Receipts, representing Enersis Chile ADSs. These ADRs will be sent to direct holders of Enersis ADSs on or as soon as practicable after the ADS Distribution Date. Persons holding Enersis ADSs through a broker or other securities intermediary should consult such broker or other securities intermediary concerning distribution of the Enersis Chile ADSs.
Beginning on the ADS Distribution Date, it is expected that:
| • | Enersis Chile ADSs will commence trading on the NYSE; |
| • | Enersis ADSs will trade on the NYSE separately from the Enersis Chile ADSs; and |
| • | ADS holders will be able to trade Enersis ADSs and Enersis Chile ADSs separately. |
Intercompany Arrangements
Immediately after the Spin-Off, Enersis Américas will not own any Enersis Chile Shares or Enersis Chile ADSs and Enersis Chile will not own any Enersis Shares or Enersis ADSs. Under Chilean law, Enersis Américas will remain jointly and severally liable for the obligations of Enersis assumed by Enersis Chile pursuant to the Spin-Off. Such liability, however, will not extend to any obligation to a person or entity that has given its express consent relieving Enersis Américas of such liability and approving the Spin-Off.
Following the Spin-Off, there will be a variety of contractual relationships between Enersis Américas and Enersis Chile, both to accomplish the Spin-Off and to provide for ongoing relationships. They fall into two broad categories:
Arrangements Related to the Approval of the Spin-Off.The separation of the two companies and the transfer of certain assets and liabilities of Enersis to Enersis Chile will be effected by the action of the shareholders of Enersis at the Meeting.
Intercompany Services. Enersis Américas and Enersis Chile will enter into intercompany agreements under which Enersis Chile will provide a variety of services to Enersis Américas and possibly vice versa. These services will include certain legal, financial, accounting, investor relations, data processing and other corporate support and administrative services. They will generally be provided at cost plus a specified percentage.
In addition, following the Spin-Off and the Endesa/Chilectra Spin-Offs, Enersis Chile and Enersis Américas may also have certain intercompany financial arrangements with Endesa Chile, Endesa Américas, Chilectra Chile and Chilectra Américas.
| C. | Markets. |
In Chile, we will apply for Enersis Chile common stock to be traded on three stock exchanges: the Santiago Stock Exchange, the Electronic Stock Exchange and the Valparaíso Stock Exchange. The largest exchange in the
110
Table of Contents
country, the Santiago Stock Exchange, was established in 1893 as a private company. Its equity consists of 48 shares as of the date of this information statement. As of December 31, 2014, 230 companies had shares listed on the Santiago Stock Exchange Equities, closed-end funds, fixed-income securities, short-term and money market securities, gold and U.S. dollars are traded on the Santiago Stock Exchange. The Santiago Stock Exchange also trades U.S. dollar futures and stock index futures. Securities are traded primarily through an open voice auction system; a firm offers system or the daily auction. Trading through the open voice system occurs on each business day from 9:30 a.m. to 4:00 p.m., during local standard time, and from 9:30 a.m. to 5:00 p.m. during daylight savings time (usually from November to March), which differs from New York City time by up to two hours, depending on the season. The Santiago Stock Exchange has an electronic trading system calledTelepregón, which operates continuously from 9:30 a.m. to 4:00 p.m. during local standard time, and from 9:00 a.m. to 5:00 p.m. during daylight savings time, on each business day. During local standard time, electronic auctions may be conducted four times a day, at 10:30 a.m., 11:30 a.m., 1:30 p.m., and 3:30 p.m. During daylight savings time there is an additional electronic auction at 4:30 p.m. More than 99% of the auctions and transactions take place electronically.
There are two share price indexes on the Santiago Stock Exchange, the General Shares Price Index, or IGPA, and the Selected Shares Price Index, or IPSA. The IGPA is calculated using the prices of shares that are traded at least 5% of the trading days of a year, with a total annual transactions exceeding UF 10,000 (Ch$ 253 million as of September 30, 2015, equivalent to US$ 0.36 million) and a free float representing at least 5% of the capital. The IPSA is calculated using the prices of the 40 shares with highest amounts traded, on a quarterly basis, and with a market capitalization above US$ 200 million. The shares included in the IPSA and IGPA are weighted according to the weighted value of the shares traded.
We will apply for Enersis Chile common stock to be traded in the United States, in the form of ADSs on the NYSE under a yet to be determined ticker symbol. Each ADS will represent 50 shares of common stock, with the ADSs in turn evidenced by American Depositary Receipts (“ADRs”). The ADRs will be issued under a Deposit Agreement among us, with Citibank, N.A. acting as Depositary, and the holders and beneficial owners from time to time of ADRs issued thereunder. Only persons in whose names ADRs are registered on the books of the Depositary will be treated by the Depositary as owners of ADRs.
The NYSE is open for trading Monday through Friday from 9:30 am to 4:00 pm, with the exception of holidays declared by the NYSE in advance. On the trading floor, the NYSE trades in a continuous auction format, where traders can execute stock transactions on behalf of investors. Specialist brokers act as auctioneers in an open outcry auction market to bring buyers and sellers together and to manage the actual auction. Customers can also send orders for immediate electronic execution or route orders to the floor for trade in the auction market. The NYSE works with U.S. regulators like the SEC and the Commodity Futures Trading Commission (“CFTC”) to coordinate risk management measures in the electronic trading environment through the implementation of mechanisms like circuit breakers and liquidity replenishment points.
| D. | Selling Shareholders. |
Not applicable.
| E. | Dilution. |
Not applicable.
| F. | Expense of the Issue. |
Not applicable.
111
Table of Contents
| Item 10. | Additional Information |
| A. | Share Capital. |
Immediately following the effectiveness of the Spin-Off, Enersis Chile’s authorized share capital will be Ch$2,229,108,975,438 divided into 49,092,772,762 common shares with no par value. For more information regarding the share capital of Enersis Chile, see “Item 3. Key Information—B. Capitalization and Indebtedness” and “—B. Memorandum and Articles of Association—Capitalization.”
| B. | Memorandum and Articles of Association. |
Description of Share Capital
Set forth below is certain information concerning our share capital and a brief summary of certain significant provisions of Chilean law and the expected provisions of our by-laws, which will be substantially the same as the current by-laws of Enersis, except:
| • | Article Five will provide that the authorized capital of Enersis Chile will be Ch$ 2,229,108,974,538 divided into 49,092,772,762 registered ordinary shares, all of the same series and with no par value; |
| • | Article Nine bis will not be included given that it refers to a regulation that has been repealed; |
| • | Article Twenty-Four bis will not include references to Articles Nine bis and Thirty-Seven bis, which will not exist in the Enersis Chile by-laws; |
| • | New Article Forty-Four will state that Enersis Chile will be subject to Resolution No. 667 issued by the Honorable Comisión Resolutiva (the former antitrust authority) dated October 30, 2002, provided that the restrictions under such resolution shall not apply to Enersis Chile in respect of the spin-off from Enersis Américas; |
| • | A new Transitory Article Three will be added to confirm that Enersis Chile, from its incorporation, will voluntarily submit in advance to the rules established in Article 50 of the Chilean Companies Act relating to the election of independent directors and creation of a Directors’ Committee; and |
| • | Other transitory articles that specifically apply to Enersis Chile in connection with the Spin-Off. |
General
Shareholders’ rights in Chilean companies are governed by the company’s by-laws (Estatutos), which have the same purpose as the articles or the certificate of incorporation and the by-laws of a company incorporated in the United States, and by the Chilean Companies Act, Law No. 18,046. In addition, D.L. 3500, or the Pension Funds’ System Law, which permits the investment by Chilean pension funds in stock of qualified companies, indirectly affects corporate governance and prescribes certain rights of shareholders. In accordance with the Chilean Companies Act, legal actions by shareholders to enforce their rights as shareholders of the company must be brought in Chile in arbitration proceedings or, at the option of the plaintiff, before Chilean courts. Members of the Board of Directors, managers, officers and principal executives of the company, or shareholders that individually own shares with a book value or stock value higher that UF 5,000 (Ch$ 127 million as of September 30, 2015) do not have the option to bring the procedure to the courts.
The Chilean securities markets are principally regulated by the SVS under Securities Market Law, Law No. 18,045 and the Chilean Companies Act. These two laws state the disclosure requirements, restrictions on insider trading and price manipulation, and provide protection to minority shareholders. The Securities Market
112
Table of Contents
Law sets forth requirements for public offerings, stock exchanges and brokers, and outlines disclosure requirements for companies that issue publicly offered securities. The Chilean Companies Act and the Securities Market Law, both as amended, state rules regarding takeovers, tender offers, transactions with related parties, qualified majorities, share repurchases, directors’ committee, independent directors, stock options and derivative actions.
Public Register
Once the Spin-Off is effective, we will be a publicly held stock corporation incorporated under the laws of Chile. We will be constituted by a public deed issued by a Santiago Notary Public. In connection with the Spin-Off, we will also register in Chile with the SVS and the Commercial Registrar (Registro de Comercio del Conservador de Bienes Raíces y Comercio de Santiago), as well as with the U.S. SEC.
Reporting Requirements Regarding Acquisition or Sale of Shares
Under Article 12 of the Securities Market Law and General Rule 269 of the SVS, certain information regarding transactions in shares of a publicly held stock corporation or in contracts or securities whose price or results depend on, or are conditioned in whole or in part on the price of such shares, must be reported to the SVS and the Chilean stock exchanges. Since ADSs are deemed to represent the shares of common stock underlying the ADRs, transactions in ADRs will be subject to these reporting requirements and those established in Circular 1375 of the SVS. Shareholders of publicly held stock corporations are required to report to the SVS and the Chilean stock exchanges:
| • | any direct or indirect acquisition or sale of shares made by a holder who owns, directly or indirectly, at least 10% of a publicly held stock corporation’s subscribed capital; |
| • | any direct or indirect acquisition or sale of contracts or securities whose price or results depend on or are conditioned in whole or in part on the price of shares made by a holder who owns, directly or indirectly, at least 10% of a publicly held stock corporation’s subscribed capital; |
| • | any direct or indirect acquisition or sale of shares made by a holder who, due to an acquisition of shares of such publicly held stock company, results in the holder acquiring, directly or indirectly, at least 10% of a publicly held stock company’s subscribed capital; and |
| • | any direct or indirect acquisition or sale of shares in any amount, made by a director, receiver, principal executive, general manager or manager of a publicly held stock company. |
In addition, majority shareholders of a publicly held stock corporation must inform the SVS and the Chilean stock exchanges if such transactions are entered into with the intention of acquiring control of the company or if they are making a passive financial investment instead.
Under Article 54 of the Securities Market Law and General Rule 104 enacted by the SVS, any person who directly or indirectly intends to take control of a publicly held stock corporation must disclose this intent to the market at least ten business days in advance of the proposed change of control and, in any event, as soon as the negotiations for the change of control have taken place or reserved information of the publicly held stock corporation has been provided.
Corporate Objectives and Purposes
Article 4 of our by-laws is expected to provide that our corporate objectives and purposes are, among other things, to conduct the exploration, development, operation, generation, distribution, transformation, or sale of energy in any form, directly or through other companies, as well as to provide engineering-consultancy services related to these objectives, to make loans to related companies, susidaries and affiliates and to participate in the telecommunications business, all restricted to Chile.
113
Table of Contents
Board of Directors
Our Board of Directors will initially consist of seven members who will be elected for an interim term at the ESM of the shareholders of Enersis to be held on December 18, 2015 to hold office until the first OSM of the shareholders of Enersis Chile to be held in April 2016. At the 2016 OSM, the entire Board of Directors consisting of seven members will be elected to a three-year term. Following the end of their term, they may be either re-elected or replaced.
The seven directors that will be elected at the OSM will be the seven individual nominees who receive the highest number of votes. Each shareholder may vote his shares in favor of one nominee or may apportion his shares among any number of nominees.
The effect of these voting provisions is to ensure that a shareholder owning more than 12.5% of our shares is able to secure the election of a member of the Board. A majority of the Board of Directors, four members, can be secured with more than 50% of the shares.
Normally, the compensation of the directors is established annually at the OSM. Initially, the compensation of the interim Board of Directors will be established at the ESM of the shareholders of Enersis to be held on December 18, 2015 which is expected to be similar to the current Enersis’ director compensations. See “Item 6. Directors, Senior Management and Employees —B. Compensation.”
Future agreements that will be entered into by us with related parties can only be executed when such agreements serve our interest, and their price, terms and conditions are consistent with prevailing market conditions at the time of their approval and comply with all the requirements and procedures indicated in Article 147 of the Chilean Companies Act.
Certain Powers of the Board of Directors
Our by-laws will provide that every agreement or contract that we enter into with our controlling shareholder, our directors or executives, or with our related parties, must be previously approved by two thirds of the Board of Directors and be included in the Board meetings, and must comply with the provisions of the Chilean Companies Act.
Our by-laws will not contain provisions relating to:
| • | the directors’ power, in the absence of an independent quorum, to vote on compensation for themselves or any members of their body; |
| • | borrowing powers exercisable by the directors and how such borrowing powers can be varied; |
| • | retirement or non-retirement of directors under an age limit requirement; or |
| • | number of shares, if any, required for directors’ qualification. |
Certain Provisions Regarding Shareholder Rights
Our capital will be comprised of only one class of shares, all of which will be ordinary shares and have the same rights.
Our by-laws will not contain any provisions relating to:
| • | redemption provisions; |
| • | sinking funds; or |
| • | liability for capital reductions by us. |
114
Table of Contents
Under Chilean law, the rights of our stockholders may only be modified by an amendment to the by-laws that complies with the requirements explained below under “Item 10. Additional Information — B. Memorandum and Articles of Association. — Shareholders’ Meetings and Voting Rights.”
Capitalization
Under Chilean law, only the shareholders of a company acting at an ESM have the power to authorize a capital increase. When an investor subscribes for shares, these are officially issued and registered under his name, and the subscriber is treated as a shareholder for all purposes, except receipt of dividends and for return of capital in the event that the shares have been subscribed but not paid for. The subscriber becomes eligible to receive dividends only for the shares that he has actually paid for or, if the subscriber has paid for only a portion of such shares, the pro rata portion of the dividends declared with respect to such shares unless the company’s by-laws provide otherwise. If a subscriber does not fully pay for shares for which the subscriber has subscribed on or prior to the date agreed upon for payment, notwithstanding the actions intended by the company to collect payment, the company is entitled to auction the shares on the stock exchange where such shares are traded, for the account and risk of the debtor, the number of shares held by the debtor necessary for the company to pay the outstanding balances and disposal expenses. However, until such shares are sold at auction, the subscriber continues to hold all the rights of a shareholder, except the right to receive dividends and return of capital. The Chief Executive Officer, or the person replacing him, will reduce in the shareholders’ register the number of shares in the name of the debtor shareholder to the number of shares that remain, deducting the shares sold by the company and settling the debt in the amount necessary to cover the result of such disposal after the corresponding expenses. When there are authorized and issued shares for which full payment has not been made within the period fixed by shareholders at the same ESM at which the subscription was authorized (which in no case may exceed three years from the date of such meeting), these shall be reduced in the non-subscribed amount until that date. With respect to the shares subscribed and not paid following the term mentioned above, the Board must proceed to collect payment, unless the shareholders’ meeting authorizes (by two thirds of the voting shares) a reduction of the company’s capital to the amount effectively collected, in which case the capital shall be reduced by force of law to the amount effectively paid. Once collection actions have been exhausted, the Board should propose to the shareholders’ meeting the approval by simple majority of the write-off of the outstanding balance and the reduction of capital to the amount effectively recovered.
Our subscribed and fully paid capital is expected to total Ch$ 2,229 billion and to consist of 49,092,772,762 shares.
Preemptive Rights and Increases of Share Capital
The Chilean Companies Act requires Chilean companies to grant shareholders preemptive rights to purchase a sufficient number of shares to maintain their existing ownership percentage of such company whenever such company issues new shares.
Under Chilean law, preemptive rights are exercisable or freely transferable by shareholders during a 30-day period. The options to subscribe for shares in capital increases of the company or of any other securities convertible into shares or that confer future rights over these shares, should be offered, at least once, to the shareholders pro rata to the shares held registered in their name at midnight on the fifth business day prior to the date of the start of the preemptive rights period. The preemptive rights offering and the start of the 30-day period for exercising them shall be communicated through the publication of a prominent notice, at least once, in the newspaper that should be used for notifications of shareholders’ meetings. During such 30-day period, and for an additional period of up to 30-days immediately following the initial 30-day period, publicly held stock corporations are not permitted to offer any unsubscribed shares to third parties on terms which are more favorable than those offered to their shareholders. At the end of the second 30-day period, a Chilean publicly held stock corporation is authorized to sell non-subscribed shares to third parties on any terms, provided they are sold on one of the Chilean stock exchanges.
115
Table of Contents
Shareholders’ Meetings and Voting Rights
An OSM must be held within the first four months following the end of our fiscal year. An ESM may be called by the Board of Directors when deemed appropriate, or when requested by shareholders representing at least 10% of the issued shares with voting rights, or by the SVS. To convene an OSM or an ESM, notice must be given three times in a newspaper located in our corporate domicile. The newspaper designated by our shareholders is El Mercurio de Santiago. The first notice must be published not less than 15-days and no more than 20-days in advance of the scheduled meeting. Notice must also be mailed to each shareholder, to the SVS and to the Chilean stock exchanges.
The OSM shall be held on the day stated in the notice and should remain in session until having exhausted all the matters stated in the notice. However, once constituted, upon the proposal of the chairman or shareholders representing at least 10% of the shares with voting rights, the majority of the shareholders present may agree to suspend it and to continue it within the same day and place, with no new constitution of the meeting or qualification of powers being necessary, recorded in one set of minutes. Only those shareholders who were present or represented may attend the recommencement of the meeting with voting rights.
Under Chilean law, a quorum for a shareholders’ meeting is established by the presence, in person or by proxy, of shareholders representing at least a majority of the issued shares with voting rights of a company. If a quorum is not present at the first meeting, a reconvened meeting can take place at which the shareholders present are deemed to constitute a quorum regardless of the percentage of the shares represented. This second meeting must take place within 45-days following the scheduled date for the first meeting. Shareholders’ meetings adopt resolutions by the affirmative vote of a majority of those shares present or represented at the meeting. An ESM must be called to take the following actions:
| • | a transformation of the company into a form other than a publicly held stock corporation under the Chilean Companies Act, a merger or split-up of the company; |
| • | an amendment to the term of duration or early dissolution of the company; |
| • | a change in the company’s domicile; |
| • | a decrease of corporate capital; |
| • | an approval of capital contributions in kind and non-monetary assessments; |
| • | a modification of the authority reserved to shareholders or limitations on the Board of Directors; |
| • | a reduction in the number of members of the Board of Directors; |
| • | a disposition of 50% or more of the assets of the company, whether it includes disposition of liabilities or not, as well as the approval or the amendment of the business plan which contemplates the disposition of assets in an amount greater that such percentage; |
| • | the disposition of 50% or more of the assets of a combined entity, as long as such combined entity represents at least 20% of the assets of the corporation, as well as any disposition of its shares that results in the parent company losing its position as controller; |
| • | the form of distributing corporate benefits; |
| • | issue of guarantees for third-party liabilities which exceed 50% of the assets, except when the third party is a combined entity of the company, in which case approval of the Board of Directors is deemed sufficient; |
| • | the purchase of the company’s own shares; |
| • | other actions established by the by-laws or the laws; |
| • | certain remedies for the nullification of the company’s by-laws; |
116
Table of Contents
| • | inclusion in the by-laws of the right to purchase shares from minority shareholders, when the controlling shareholders reaches 95% of the company’s shares by means of a tender offer for all of the company’s shares, where at least 15% of the shares have been acquired from unrelated shareholders; and |
| • | approval or ratification of acts or contracts with related parties. |
Regardless of the quorum present, the vote required for any of the actions above is at least two-thirds of the outstanding shares with voting rights.
By-law amendments for the creation of a new class of shares, or an amendment to or an elimination of those classes of shares that already exist, must be approved by at least two-thirds of the outstanding shares of the affected series.
Chilean law does not require a publicly held stock corporation to provide its shareholders the same level and type of information required by the securities laws regarding the solicitation of proxies. However, shareholders are entitled to examine the financial statements of a publicly held stock corporation within the 15-day period before its scheduled OSM. Under Chilean law, a notice of a shareholders meeting listing matters to be addressed at the meeting must be mailed at least 15 days prior to the date of such meeting, and, an indication of the way complete copies of the documents that support the matters submitted for voting can be obtained, which must also be made available to shareholders on our website. In the case of an OSM, our annual report of activities, which will include audited financial statements, must also be made available to shareholders and published on our website at: www.enersischile.cl.
The Chilean Companies Act provides that, upon the request by the Directors’ Committee or by shareholders representing at least 10% of the issued shares with voting rights, a Chilean company’s annual report must include, in addition to the materials provided by the Board of Directors to shareholders, such shareholders’ comments and proposals in relation to the company’s affairs. In accordance with Article 136 of the Chilean Companies Regulation (“Reglamento de Sociedades Anónimas”), the shareholder(s) holding or representing 10% or more of the shares issued with voting rights, may:
| • | make comments and proposals relating to the progress of the corporate businesses in the corresponding year, no shareholder being able to make individually or jointly more than one presentation. These observations should be presented in writing to the company concisely, responsibly and respectfully, and the respective shareholder(s) should state their willingness for these to be included as an appendix to the annual report. The board shall include in an appendix to the annual report of the year a faithful summary of the pertinent comments and proposals the interested parties had made, provided they are presented during the year or within 30-days after its ending; or |
| • | make comments and proposals on matters that the board submits for the knowledge or voting of the shareholders. The board shall include a faithful summary of those comments and proposals in all information it sends to shareholders, provided the shareholders’ proposal is received at the offices of the company at least 10-days prior to the date of dispatch of the information by the company. The shareholders should present their comments and proposals to the company, expressing their willingness for these to be included in the appendix to the respective annual report or in information sent to shareholders, as the case may be. The observations referred to in this Article may be made separately by each shareholder holding 10% or more of the shares issued with voting rights or shareholders who together hold that percentage, who should act as one. |
Similarly, the Chilean Companies Act provides that whenever the Board of Directors of a publicly held stock corporation convenes an OSM and solicits proxies for the meeting, or circulates information supporting its decisions or other similar material, it is obligated to include the pertinent comments and proposals that may have been made by the Directors’ Committee or by shareholders owning 10% or more of the shares with voting rights who request that such comments and proposals be so included.
117
Table of Contents
Only shareholders registered as such with us, as of 11:59 p.m. on the fifth business day prior to the date of a meeting, will be entitled to attend and vote their shares. A shareholder may appoint another individual, who does not need to be a shareholder, as his proxy to attend the meeting and vote on his behalf. Proxies for such representation shall be given for all the shares held by the owner. The proxy may contain specific instructions to approve, reject, or abstain with respect to any of the matters submitted for voting at the meeting and which were included in the notice. Every shareholder entitled to attend and vote at a shareholders’ meeting shall have one vote for every share subscribed.
There are no limitations imposed by Chilean law or our expected by-laws on the right of nonresidents or foreigners to hold or vote shares of common stock. However, the registered holder of the shares of common stock represented by ADSs, and evidenced by outstanding ADSs, is the custodian of the depositary. Accordingly, holders of ADSs will not be entitled to receive notice of meetings of shareholders directly or to vote the underlying shares of common stock represented by ADS directly. A deposit agreement will contain provisions pursuant to which the depositary will agree to solicit instructions from registered holders of ADSs as to the exercise of the voting rights pertaining to the shares of common stock represented by the ADSs. Subject to compliance with the requirements of the deposit agreement and receipt of such instructions, the depositary will agree to endeavor, insofar as practicable and permitted under Chilean law and the provisions of the by-laws, to vote or cause to be voted (or grant a discretionary proxy to the Chairman of the Board of Directors or to a person designated by the Chairman of the Board of Directors to vote) the shares of common stock represented by the ADSs in accordance with any such instruction. The depositary shall not itself exercise any voting discretion over any shares of common stock underlying ADSs. If no voting instructions are received by the depositary from a holder of ADSs with respect to the shares of common stock represented by the ADSs, on or before the date established by the depositary for such purpose, the shares of common stock represented by the ADS, may be voted in the manner directed by the Chairman of the Board, or by a person designated by the Chairman of the Board, subject to limitations set forth in the deposit agreement.
Dividends and Liquidation Rights
According to the Chilean Companies Act, unless otherwise decided by unanimous vote of its issued shares eligible to vote, all companies must distribute a cash dividend in an amount equal to at least 30% of their combined net income, before amortization and negative goodwill for each year (calculated according to the local accounting rules that will apply to us when preparing financial statements to be submitted to the SVS), unless and except to the extent we have carried forward losses. The law provides that the Board of Directors must agree to the dividend policy and inform such policy to the shareholders at the OSM.
Any dividend in excess of 30% of net income may be paid, at the election of the shareholder, in cash, or in our shares, or in shares of publicly held corporations owned by us. Shareholders who do not expressly elect to receive a dividend other than in cash are legally presumed to have decided to receive the dividend in cash.
Dividends which are declared but not paid within the appropriate time period set forth in the Chilean Companies Act (as to minimum dividends, 30-days after declaration; as to additional dividends, the date set for payment at the time of declaration) are adjusted to reflect the change in the value of UF, from the date set for payment to the date such dividends are actually paid. Such dividends also accrue interest at the then-prevailing rate for UF-denominated deposits during such period. The right to receive a dividend lapses if it is not claimed within five years from the date such dividend is payable. Payments not collected in such period are transferred to the volunteer fire department.
In the event of our liquidation, the shareholders would participate in the assets available in proportion to the number of paid-in shares held by them, after payment to all creditors.
Approval of Financial Statements
The Board of Directors will be required to submit our financial statements to the shareholders annually for their approval. If the shareholders by a vote of a majority of shares present (in person or by proxy) at the
118
Table of Contents
shareholders’ meeting reject the financial statements, the Board of Directors must submit new financial statements no later than 60-days from the date of such meeting. If the shareholders reject the new financial statements, the entire Board of Directors is deemed removed from office and a new board is elected at the same meeting. Directors who individually approved such financial statements are disqualified for reelection for the following period.
Change of Control
The Capital Markets Law establishes a comprehensive regulation related to tender offers. The law defines a tender offer as the offer to purchase shares of companies which publicly offer their shares or securities convertibles into shares and which offer is made to shareholders to purchase their shares under conditions which allow the bidder to reach a certain percentage of ownership of the company within a fixed period of time. These provisions apply to both voluntary and hostile tender offers.
Acquisition of Shares
No provision in our by-laws will discriminate against any existing or prospective holder of shares as a result of such shareholder owning a substantial number of shares. However, no person may directly or indirectly own more than 65% of the outstanding shares of our stock. The foregoing restriction will not apply to the depositary as record owner of shares represented by ADRs, but it will apply to each beneficial ADS holder. Additionally, our by-laws will prohibit any shareholder from exercising voting power with respect to more than 65% of the common stock owned by such shareholder or on behalf of others representing more than 65% of the outstanding issued shares with voting rights.
Right of Dissenting Shareholders to Tender Their Shares
The Chilean Companies Act provides that upon the adoption of any of the resolutions enumerated below at a meeting of shareholders, dissenting shareholders acquire the right to withdraw from the company and to compel the company to repurchase their shares, subject to the fulfillment of certain terms and conditions. In order to exercise such withdrawal rights, holders of ADRs must first withdraw the shares represented by their ADRs pursuant to the terms of the deposit agreement.
“Dissenting” shareholders are defined as those who at a shareholders’ meeting vote against a resolution that results in the withdrawal right, or who if absent from such meeting, state in writing their opposition to the respective resolution, within the 30-days following the shareholders’ meeting. Shareholders present or represented at the meeting and who abstain in exercising their voting rights shall not be considered as dissenting. The right to withdraw should be exercised for all the shares that the dissenting shareholder had registered in their name on the date on which the right is determined to participate in the meeting at which the resolution is adopted that motivates the withdrawal and which remains on the date on which their intention to withdraw is communicated to the company.
The price paid to a dissenting shareholder of a publicly held stock corporation whose shares are quoted and actively traded on one of the Chilean stock exchanges is the weighted average of the sales prices for the shares as reported on the Chilean stock exchanges on which the shares are quoted for the two-month period between the ninetieth and the thirtieth day before the shareholders’ meeting giving rise to the withdrawal right. If, because of the volume, frequency, number and diversity of the buyers and sellers, the SVS determines that the shares are not actively traded on a stock exchange, the price paid to the dissenting shareholder shall be the book value. Book value for this purpose shall equal paid capital plus reserves and profits, less losses, divided by the total number of subscribed shares, whether entirely or partially paid. For the purpose of making this calculation, the last combined statements of financial position is used, as adjusted to reflect inflation up to the date of the shareholders’ meeting which gave rise to the withdrawal right.
119
Table of Contents
Article 126 of the Chilean Companies Act Regulations establishes that in cases where the right to withdraw arises, the company shall be obliged to inform the shareholders of this situation, the value per share that will be paid to shareholders exercising their right to withdraw and the term for exercising it. Such information should be given to shareholders at the same meeting at which the resolutions are adopted giving rise to the right of withdrawal, prior to its voting. A special communication should be given to the shareholders with rights, within two days following the date on which the rights to withdraw are born. In the case of publicly held companies, such information shall be communicated by a prominent notice in a newspaper with a wide national circulation and on its website, plus a written communication addressed to the shareholders with rights at the address they have registered with the company. The notice of the shareholders meeting that should pronounce on a matter that could originate withdrawal rights should mention this circumstance.
The resolutions that result in a shareholder’s right to withdraw include, among others, the following:
| • | the transformation of the company into an entity which is not a publicly held stock corporation governed by Chilean Companies Act; |
| • | the merger of the company with another company; |
| • | disposition of 50% or more of the assets of the company, whether it includes disposition of liabilities or not, as well as the approval or the amendment of the business plan which contemplates the disposition of assets in an amount greater than such percentage; |
| • | the disposition of 50% or more of the assets of a combined entity, as long as such combined entity represents at least 20% of the assets of the company, as well as any disposition of its shares that results in the parent company losing its position of controller; |
| • | issue of guarantees for third parties’ liabilities which exceed 50% of the assets (if the third party is a combined entity of the company, the approval of the Board of Directors is sufficient); |
| • | the creation of preferential rights for a class of shares or an amendment to the existing ones. In this case the right to withdraw only accrues to the dissenting shareholders of the class or classes of shares adversely affected; |
| • | certain remedies for the nullification of the corporate by-laws; and |
| • | such other causes as may be established by the law or by the company’s by-laws. |
Investments by AFPs
The Pension Funds’ System Law permits AFPs to invest their funds in companies that are subject to Title XII and, subject to greater restrictions than other companies. The determination of which stocks may be purchased by AFPs is made by the Risk Classification Committee. The Risk Classification Committee establishes investment guidelines and is empowered to approve or disapprove those companies that are eligible for AFP investments. We expect that after the Spin-Off, we will be a Title XII company and we will be approved by the Risk Classification Committee.
Title XII companies are required to have by-laws that
| • | limit the ownership of any shareholder to a specified maximum percentage, |
| • | require that certain actions be taken only at a meeting of the shareholders, and |
| • | give the shareholders the right to approve certain investment and financing policies. |
Registrations and Transfers
Shares issued by us will be registered with an administrative agent, which we expect to beDCV Registros S.A. This entity will also be responsible for our shareholders registry. In case of jointly-owned shares, an attorney-in-fact must be appointed to represent the joint owners in dealing with us.
120
Table of Contents
| C. | Material Contracts. |
None.
| D. | Exchange Controls. |
The Central Bank of Chile is responsible for, among other things, monetary policies and exchange controls in Chile. Currently applicable foreign exchange regulations are set forth in the Compendium of Foreign Exchange Regulations (the “Compendium”) approved by the Central Bank of Chile in 2002. Appropriate registration of a foreign investment in Chile permits the investor access to the Formal Exchange Market. Foreign investments can be registered with the Foreign Investment Committee under D.L. 600 of 1974 or can be registered with the Central Bank of Chile under the Central Bank Act, Law 18840 of October 1989.
a) Foreign Investments Contracts and Chapter XIV
The following is a summary of certain provisions of Chapter XIV that will be applicable to all shareholders (and ADS holders). This summary does not purport to be complete and is qualified in its entirety by reference to Chapter XIV. Chapter XIV regulates the following type of investments: credits, deposits, investments and equity contributions. A Chapter XIV investor may at any time repatriate an investment made in us upon sale of our shares, and the profits derived therefrom, with no monetary ceiling, subject to the then effective regulations, which must be reported to the Central Bank of Chile.
Except for compliance with tax regulations and some reporting requirements, currently there are no rules in Chile affecting repatriation rights, except that the remittance of foreign currency must be made through a Formal Exchange Market entity. However, the Central Bank of Chile has the authority to change such rules and impose exchange controls.
The Compendium and International Bond Issuances
Chilean issuers may offer bonds issued by the Central Bank of Chile internationally under Chapter XIV, as amended, of the Compendium.
| E. | Taxation. |
Chilean Tax Considerations
The following discussion summarizes material Chilean income and withholding tax consequences to foreign holders arising from the ownership and disposition of shares and ADSs and, to the extent any are issued, rights and ADS rights. The summary that follows does not purport to be a comprehensive description of all of the tax considerations that may be relevant to a decision to purchase, own or dispose of shares or ADSs and rights or ADS rights, if any, and does not purport to deal with the tax consequences applicable to all categories of investors, some of which may be subject to special rules. Holders of shares and ADSs are advised to consult their own tax advisors concerning the Chilean and other tax consequences of the ownership of shares or ADSs.
The summary that follows is based on Chilean law, in effect on the date hereof, and is subject to any changes in these or other laws occurring after such date, possibly with retroactive effect. Under Chilean law, provisions contained in statutes such as tax rates applicable to foreign investors, the computation of taxable income for Chilean purposes and the manner in which Chilean taxes are imposed and collected may be amended only by another law. In addition, the Chilean tax authorities enact rulings and regulations of either general or specific application and interpret the provisions of the Chilean Income Tax Law. Chilean tax may not be assessed retroactively against taxpayers who act in good faith relying on such rulings, regulations and interpretations, but Chilean tax authorities may change their rulings, regulations and interpretations in the future. The discussion that follows is also based, in part, on representations of the depositary, and assumes that each obligation in the
121
Table of Contents
Deposit Agreement and any related agreements will be performed in accordance with its terms. As of this date, there is currently no applicable income tax treaty in effect between the United States and Chile. However, in 2010 the United States and Chile signed an income tax treaty that will enter into force once the treaty is ratified by both countries. There can be no assurance that the treaty will be ratified by either country. The following summary assumes that there is no applicable income tax treaty in effect between the United States and Chile. As used in this information statement, the term “foreign holder” means either:
| • | in the case of an individual holder, a person who is not a resident of Chile; for purposes of Chilean taxation, an individual is resident of Chile if he or she has resided in Chile for more than six months in one calendar year, or a total of more than six months in two consecutive fiscal years; or |
| • | in the case of a legal entity holder, an entity that is not organized under the laws of Chile, unless the shares or ADSs are assigned to a branch, agent, representative or permanent establishment of such entity in Chile. |
Taxation of Shares and ADSs
Taxation of Cash Dividends and Property Distributions
General Rule: The following taxation of cash dividends and property distributions applies until 2016. Cash dividends paid with respect to the shares or ADSs held by a foreign holder will be subject to Chilean withholding tax, which is withheld and paid by the company. As described in the example below, the amount of the Chilean withholding tax is determined by applying a 35% rate to a “grossed-up” distribution amount (such amount equal to the sum of the actual distribution amount and the correlative Chilean corporate income tax paid by the issuer), and then subtracting as a credit such correlative Chilean corporate income tax paid by the issuer. For years 2004 through 2010, the Chilean corporate income tax rate was 17%; for 2011 and until 2014 the rate was 20%. In September 2014, a tax reform was enacted (Law 20,780), which, among other topics, progressively increased the corporate income tax (“CIT”). The CIT rate will be adjusted as follows: in 2014 it increased from 20% to 21%; in 2015 it increased to 22.5%; in 2016 it increases to 24%; in 2017, depending on which of the two new alternative systems enacted as part of the 2014 tax reform (discussed below) is chosen, the rate increases to 25% for companies electing the accrued income basis and 25.5% for companies electing the cash basis for shareholders and as of 2018 it will remain at 25% for companies that elect the accrued income basis and it will increase to 27% for companies that elect the cash basis for shareholders.
The example below illustrates the effective Chilean withholding tax burden on a cash dividend received by a foreign holder, assuming a Chilean withholding tax base rate of 35%, an effective Chilean corporate income tax rate of 22.5 % (CIT rate for 2015) and a distribution of 50% of the net income of the company distributable after payment of the Chilean corporate income tax:
Line | Concept and calculation assumptions | Amount | ||||
1 | Company taxable income (based on Line 1 = 100) | 100.0 | ||||
2 | Chilean corporate income tax: 22.5% x Line 1 | 22.5 | ||||
3 | Net distributable income: Line 1 — Line 2 | 77.5 | ||||
4 | Dividend distributed (50% of net distributable income): 50% of Line 3 | 38.75 | ||||
5 | Withholding tax: (35% of (the sum of Line 4 and 50% of Line 2)) | (17.5 | ) | |||
6 | Credit for 50% of Chilean corporate income tax: 50% of Line 2 | 11.25 | ||||
7 | Net withholding tax: Line 5 + Line 6 | (6.25 | ) | |||
8 | Net dividend received: Line 4 - Line 7 | 32.5 | ||||
9 | Effective dividend withholding rate: Line 7 / Line 4 | 16.13 | % | |||
122
Table of Contents
In general, the effective Chilean dividend withholding tax rate, after giving effect to the credit for the Chilean corporate income tax paid by the company, can be computed using the following formula:
| Effective Dividend | = | (Withholding tax rate) - (Chilean corporate income tax rate) | ||||||
| Withholding Tax Rate | 1 - (Chilean corporate income tax rate) |
Using the rates prevailing until 2015, the Effective Dividend Withholding Rate is
(35%-22.5%) / (100%-22.5%) = 16.13%
Dividends are generally assumed to have been paid out of our oldest retained profits for purposes of determining the level of Chilean corporate income tax that was paid by us. For information as to our retained earnings for tax purposes and the tax credit available on the distribution of such retained earnings, see Note 19 of the Notes to our interim combined financial statements.
Under Chilean Income Tax Law, dividend distributions made in property are subject to the same Chilean tax rules as cash dividends. Stock dividends that represent free shares distributed to foreign shareholders as a consequence of a capitalization made on the same corporation are not subject to Chilean taxation.
Exceptions: Despite the aforementioned general rule, there are special circumstances under which a different tax treatment would apply depending on the source of the income or due to special circumstances existing at the date of the dividend distribution. The most common special cases are briefly described below:
1) Circumstances where there is no CIT credit against the Chilean withholding tax: These cases are when: (i) profits paid as dividends (following the seniority rule indicated above) exceed a company’s taxable income (such dividend distributions in excess of a company’s taxable income determined as of December 31 of the distribution’s year will be subject to the Chilean withholding tax rate of 35%, without the CIT credit; in relation to the provisional withholding rule applicable on the date of the dividend payment, please see number 3 below); or (ii) the income was not subject to CIT due to an exemption of the Chilean corporate income tax, in which case the foreign holder will be also subject to the Chilean withholding tax rate of 35% without the CIT credit.
2) Circumstances where dividends have been attributed to income exempted from all the Chilean income taxes: In these cases, dividends distributed by a company to the foreign holder will not be subject to Chilean withholding tax. Income exempted from Chilean income tax is expressly listed in the Chilean Income Tax Law.
3) Circumstances where dividends are subject to a provisional withholding tax: In the event that on the date of the dividend distribution there are no earnings on which income tax has been paid and there are no tax-exempt earnings, a 35% Chilean withholding tax with a provisional 22.5% Chilean CIT credit is applicable. This provisional 22.5% Chilean corporate income tax credit must be confirmed with the information of a company’s taxable income as of December 31 of the year in which the dividend was paid. A company can agree with the foreign holders to withhold a higher amount in order to avoid under withholding of the Chilean withholding tax.
4) Circumstances when it is possible to use certain credits in Chile against income taxes paid abroad, or “foreign tax credit”: This occurs when dividends distributed by the Chilean company have income generated by companies domiciled in third countries as their source. If that income was subject to withholding tax or corporate income tax in those third countries, such income will have a credit or “foreign tax credit” against corresponding Chilean taxes, which can be proportionally transferred to the shareholders of a Chilean company.
New System in effect starting in 2017
The tax reform released in September 2014 created two alternative mechanisms of shareholder-level income taxation beginning on January 1, 2017: a) accrued income basis (known as attributed-income system in Chile)
123
Table of Contents
shareholder taxation and b) cash basis (known as partially-integrated system in Chile) shareholder taxation. One of these two alternative mechanisms must be chosen by companies in an ESM with a minimum vote of 2/3. The selection should be made before the end of 2016. Once the election is made, it will remain in effect for five years. If no regime is selected by the taxpayer, the law states that the default mechanism for foreign shareholders will be the cash basis mechanism (the most similar to the current system).
a) Accrued income basis
Shareholders would be taxed in Chile on income attributed to them as of the end of the tax year in which the income is generated, eliminating the taxable profits fund ledger (“FUT” in its Spanish acronym). These profits would be taxed at the shareholder level whether or not they are distributed. The underlying CIT paid at the entity level may be used by shareholders as a credit to reduce the Chilean shareholder tax. Therefore, the combined total company and shareholder Chilean income tax burden remains at 35%. Future distributions are not subject to taxation.
Taxpayers will be taxed on the income of companies in which they have an interest in the year such income is recognized, regardless of whether actual distributions are made, with the corresponding credit.
Taxation in two stages
• Company: | 25% of accrued profits (using the maximum CIT applicable as of 2018). | |
• Shareholder: | 35% of accrued profits (whether or not distributions are received, with 100% credit of the CIT paid, resulting in an effective tax rate to the shareholder of 10%). | |
Total Tax Burden: 35%
Progressive CIT tax rate increase: 21% in 2014, 22.5% in 2015, 24% in 2016 and 25% as of 2017.
Advantages to accrued income tax basis:
| • | CIT Rate of 25% vs. 27% for the cash basis. |
| • | Shareholders are granted 100% credit of taxes paid by a company. |
Disadvantages to accrued income tax basis:
| • | Shareholders are taxed on undistributed profits. |
| • | Shareholders of record must pay tax by December 31st (regardless of having received dividends). |
| • | Complex management for companies. |
b) Cash basis
A company pays CIT on its annual result. Foreign and local individual shareholders will only pay in Chile the relevant tax on effective profit distributions and will be allowed to use the tax paid by the distributing company as credit, with certain limitations. Only 65% of the CIT is creditable against the 35% shareholder-level tax (as opposed to 100% under the current FUT regime and under the accrued income basis). However, if there is a tax treaty in effect with Chile, the CIT is fully creditable against the 35% shareholder tax.
Taxation in two stages
• Company: | 27% of accrued profits (using the maximum CIT applicable from 2018 and forward). | |
• Shareholder: | 35% of cash disbursement (65% of CIT tax is creditable against the shareholder level tax, resulting in an effective tax rate to the shareholder of 17.5%. However, if the shareholder is a resident of a country with an effective tax treaty with Chile, CIT tax is fully creditable, resulting in an effective tax rate to the shareholder of 8%). | |
124
Table of Contents
Total Tax Burden: 44.45% (35% for residents of countries with tax treaties)
Advantages to cash basis:
| • | Shareholders are only taxed on actual distributions. |
| • | Shareholders must pay taxes only if they hold the share on the dividend distribution date. |
Disadvantages to cash basis:
| • | CIT Rate of 27% versus 25% for the accrued income basis. |
| • | Only shareholders residing in countries with a tax treaty are granted full CIT credit (others 65%). |
Taxation on sale or exchange of ADSs, outside of Chile
Gains obtained by a foreign holder from the sale or exchange of ADSs outside Chile will not be subject to Chilean taxation.
Taxation on sale or exchange of Shares
The Chilean Income Tax Law includes a tax exemption on capital gains arising from the sale of shares of listed companies traded in the stock markets. Although there are certain restrictions, in general terms, the amendment provides that in order to qualify for the capital gain exemption: (i) the shares must be of a publicly held stock corporation with a certain minimum level of trading on a stock exchange; (ii) the sale must be carried out in a Chilean stock exchange, or in a tender offer subject to Chapter XXV of the Chilean Securities Market Law; (iii) the shares which are being sold must have been acquired on a Chilean stock exchange, or in a tender offer subject to Chapter XXV of the Chilean Securities Market Law, or in an initial public offering (due to the creation of a company or to a capital increase), or due to the exchange of convertible bonds; and (iv) the shares must have been acquired after April 19, 2001.
If the shares do not qualify for the above exemption, capital gains on their sale or exchange of shares (as distinguished from sales or exchanges of ADSs representing such shares of common stock) could be subject to two alternative tax regimes: (a) the general tax regime, with a 22.5% Chilean corporate income tax and a 35% Chilean withholding tax, the former being creditable against the latter; or (b) a 22.5% Chilean corporate income tax as sole tax regime, when all the following circumstances are met: (i) the sale is made between unrelated parties, (ii) the sale of shares is not a recurrent or habitual activity for the seller and (iii) at least one year has elapsed between the acquisition and the sale of the shares.
The date of acquisition of the ADSs is considered to be the date of acquisition of the shares for which the ADSs are exchanged.
Taxation of Rights and ADS Rights
For Chilean tax purposes and to the extent we issue any rights or ADS rights, the receipt of rights or ADS rights by a foreign holder of shares or ADSs pursuant to a rights offering is a nontaxable event. In addition, there are no Chilean income tax consequences to foreign holders upon the exercise or the lapse of the rights or the ADS rights.
Any gain on the sale, exchange or transfer of any ADS rights by a foreign holder is not subject to taxes in Chile.
Any gain on the sale, exchange or transfer of the rights by a foreign holder is subject to a 35% Chilean withholding tax.
Currently, there are no rights that are outstanding.
125
Table of Contents
Other Chilean Taxes
There is no gift, inheritance or succession tax applicable to the ownership, transfer or disposition of ADSs by foreign holders, but such taxes will generally apply to the transfer at death or by gift of the shares by a foreign holder. There is no Chilean stamp, issue, registration or similar taxes or duties payable by holders of shares or ADSs.
Material U.S. Income Tax Considerations
This discussion is based on the Internal Revenue Code of 1986, as amended (the “Code”), administrative pronouncements, judicial decisions and final, temporary and proposed Treasury regulations, all as of the date hereof. These authorities are subject to change, possibly with retroactive effect. This discussion assumes that the depositary’s activities are clearly and appropriately defined so as to ensure that the tax treatment of ADSs will be identical to the tax treatment of the underlying shares.
The following are the material U.S. federal income tax consequences to U.S. Holders (as defined herein) of receiving, owning, and disposing of shares or ADSs, but it does not purport to be a comprehensive description of all of the tax considerations that may be relevant to a particular person’s decision to hold such securities and is based on the assumption stated above under “Chilean Tax Considerations” that there is no applicable income tax treaty in effect between the United States and Chile. The discussion applies only if the beneficial owner holds shares or ADSs as capital assets for U.S. federal income tax purposes and it does not describe all of the tax consequences that may be relevant in light of the beneficial owner’s particular circumstances. For instance, it does not describe all the tax consequences that may be relevant to:
| • | certain financial institutions; |
| • | insurance companies; |
| • | dealers and traders in securities who use a mark-to-market method of tax accounting; |
| • | persons holding shares or ADSs as part of a “straddle” integrated transaction or similar transaction; |
| • | persons whose functional currency for U.S. federal income tax purposes is not the U.S. dollar; |
| • | partnerships or other entities classified as partnerships for U.S. federal income tax purposes; |
| • | persons liable for the alternative minimum tax; |
| • | tax-exempt organizations; |
| • | persons holding shares or ADSs that own or are deemed to own ten percent or more of our stock; or |
| • | persons holding shares or ADSs in connection with a trade or business conducted outside of the United States. |
If an entity classified as a partnership for U.S. federal income tax purposes holds shares or ADSs, the U.S. federal income tax treatment of a partner will generally depend on the status of the partner and upon the activities of the partnership. Partnerships holding shares or ADSs and partners in such partnerships should consult their tax advisors as to the particular U.S. federal income tax consequences of holding and disposing of the shares or ADSs.
You will be a “U.S. Holder” for purposes of this discussion if you become a beneficial owner of our shares or ADSs and if you are, for U.S. federal income tax purposes:
| • | a citizen or individual resident of the United States; or |
| • | a corporation, or other entity taxable as a corporation, created or organized in or under the laws of the United States or any political subdivision thereof; or |
126
Table of Contents
| • | an estate, the income of which is subject to U.S. federal income taxation regardless of its source; or |
| • | a trust (i) that validly elects to be treated as a U.S. person for U.S. federal income tax purposes or (ii) if (A) a court within the United States is able to exercise primary supervision over the administration of the trust and (B) one or more U.S. persons have the authority to control all substantial decisions of the trust. |
In general, if a beneficial owner owns ADSs, such owner will be treated as the owner of the shares represented by those ADSs for U.S. federal income tax purposes. Accordingly, no gain or loss will be recognized if a beneficial owner exchanges ADSs for the underlying shares represented by those ADSs.
The U.S. Treasury has expressed concerns that parties to whom ADSs are released before shares are delivered to the depositary (pre-release) or intermediaries in the chain of ownership between beneficial owners and the issuer of the security underlying the ADSs may be taking actions that are inconsistent with the claiming of foreign tax credits for beneficial owners of depositary shares. Such actions would also be inconsistent with the claiming of the reduced tax rate, described below, applicable to dividends received by certain non-corporate beneficial owners. Accordingly, the analysis of the creditability of Chilean taxes, and the availability of the reduced tax rate for dividends received by certain non-corporate holders, each described below, could be affected by actions taken by such parties or intermediaries.
This discussion assumes we will not be a passive foreign investment company, as described below.
Beneficial owners should consult their tax advisors with respect to their particular tax consequences of owning or disposing of shares or ADSs, including the applicability and effect of state, local, non-U.S. and other tax laws and the possibility of changes in tax laws.
Taxation of Distributions
The following discussion is based on the current regime for taxation of cash dividends and distributions applicable in Chile until 2016. For 2017 and later, the U.S. federal income tax treatment will depend on which of the two regimes we elect to adopt. See “— Chilean Tax Considerations — Taxation of shares and ADSs — Taxation of Cash Dividends and Property Distributions” above.
Distributions paid on shares or ADSs other than certain pro rata distributions of shares of common stock will be treated as dividends taxable as ordinary income to the extent paid out of our current or accumulated earnings and profits (as determined under U.S. federal income tax principles). Because we do not maintain calculations of our earnings and profits under U.S. federal income tax principles, it is expected that distributions generally will be reported as dividends.
If a beneficial owner is a U.S. Holder, subject to applicable limitations and the discussion above regarding concerns expressed by the U.S. Treasury, dividends paid by qualified foreign corporations to the beneficial owner that is not a corporation are taxable at a maximum rate of 20%. A foreign company is treated as a qualified foreign corporation with respect to dividends paid on stock that is readily tradable on an established securities market in the United States, such as the New York Stock Exchange where our ADSs are traded. Beneficial owners should consult their tax advisors to determine whether the favorable rate will apply to dividends they receive and whether they are subject to any special rules that limit their ability to be taxed at this favorable rate.
The amount of a dividend will include the net amount withheld by us in respect of Chilean withholding taxes on the distribution. The amount of the dividend will be treated as foreign-source dividend income to a beneficial owner and will not be eligible for the dividends-received deduction generally allowed to U.S. corporations under the Code. Dividends will be included in a beneficial owner’s income on the date of the beneficial owner’s, or in the case of ADSs, the Depositary’s receipt of the dividend. The amount of any dividend paid in Chilean pesos will be a U.S. dollar amount calculated by reference to the exchange rate for converting
127
Table of Contents
Chilean pesos into U.S. dollars in effect on the date of such receipt regardless of whether the payment is in fact converted into U.S. dollars. If the dividend is converted into U.S. dollars on the date of receipt, a beneficial owner generally should not be required to recognize foreign currency gain or loss in respect of the dividend income. A beneficial owner may have foreign currency gain or loss if the dividend is converted into U.S. dollars on a date after the date of receipt.
Subject to applicable limitations that may vary depending upon a beneficial owner’s circumstances and subject to the discussion above regarding concerns expressed by the U.S. Treasury, the net amount of Chilean withholding tax (after reduction for the credit for Chilean corporate income tax, as discussed above under
“— Chilean Tax Considerations — Taxation of Shares and ADSs — Taxation of Cash Dividends and Property Distributions” above) withheld from dividends on shares or ADSs will be creditable against a beneficial owner’s U.S. federal income tax liability. The rules governing foreign tax credits are complex and, therefore, a beneficial owner should consult the beneficial owner’s tax advisor regarding the availability of foreign tax credits in the beneficial owner’s particular circumstances. Instead of claiming a credit, a beneficial owner may, at the beneficial owner’s election, deduct such Chilean taxes in computing the beneficial owner’s taxable income, subject to generally applicable limitations under U.S. law. An election to deduct foreign taxes instead of claiming foreign tax credits applies to all taxes paid or accrued in the taxable year to foreign countries and possessions of the United States.
Sale or Other Disposition of Shares or ADSs
If a beneficial owner is a U.S. Holder, for U.S. federal income tax purposes, the gain or loss a beneficial owner realizes on the sale or other disposition of shares or ADSs will be a capital gain or loss, and will be a long-term capital gain or loss if the beneficial holder has held the shares or ADSs for more than one year. The amount of a beneficial owner’s gain or loss will equal the difference between the beneficial owner’s tax basis in the shares or ADSs disposed of and the amount realized on the disposition, in each case as determined in U.S. dollars. Such gain or loss will generally be U.S.-source gain or loss for foreign tax credit purposes. In addition, certain limitations exist on the deductibility of capital losses by both corporate and individual taxpayers.
In certain circumstances, Chilean taxes may be imposed upon the sale of shares. See “— Chilean Tax Considerations — Taxation of Shares and ADSs.” If a Chilean tax is imposed on the sale or disposition of shares, and a beneficial owner that is a U.S. Holder does not receive significant foreign source income from other sources, such beneficial owner may not be able to credit such Chilean tax against the beneficial owner’s U.S. federal income tax liability.
Passive Foreign Investment Company Rules
We believe that we will not be a “passive foreign investment company” (“PFIC”) for U.S. federal income tax purposes for our 2016 taxable year or for the foreseeable future. However, because PFIC status depends upon the composition of a company’s income and assets and the market value of its assets from time to time, and because it is unclear whether certain types of our income constitute passive income for PFIC purposes, there can be no assurance that we will not be considered a PFIC for any taxable year. If we were to become a PFIC for any taxable year during which a beneficial owner held shares or ADSs, certain adverse consequences could apply to the beneficial owner, including the imposition of higher amounts of tax than would otherwise apply, and additional filing requirements. Beneficial owners should consult their tax advisors regarding the consequences to them if we were a PFIC, as well as the availability and advisability of making any election that might mitigate the adverse consequences of PFIC status.
Information Reporting and Backup Withholding
Payments of dividends and sales proceeds that are made within the United States or through certain U.S.-related financial intermediaries generally are subject to information reporting and to backup withholding unless
128
Table of Contents
(i) the beneficial owner is an exempt recipient or (ii) in the case of backup withholding, the beneficial owner provides a correct taxpayer identification number and certifies that the beneficial owner is not subject to backup withholding.
The amount of any backup withholding from a payment to a beneficial owner will be allowed as a credit against the beneficial owner’s U.S. federal income tax liability and may entitle the beneficial owner to a refund, provided that the required information is furnished in a timely fashion to the Internal Revenue Service.
Medicare Contribution Tax
Legislation enacted in 2010 generally imposes a tax of 3.8% on the “net investment income” of certain individuals, trusts and estates. Among other items, net investment income generally includes gross income from dividends and net gain attributable to the disposition of certain property, like the shares or ADSs, less certain deductions. A beneficial owner should consult the beneficial owner’s tax advisor regarding the possible application of this legislation in the beneficial owner’s particular circumstances.
Beneficial owners should consult their tax advisors with respect to the particular consequences to them of receiving, owning or disposing of shares or ADSs.
| F. | Dividends and Paying Agents. |
The paying agent for shareholders is expected to be DCV. The paying agent for holders of Enersis Chile ADRs listed on the NYSE is expected to be Citibank N.A.
| G. | Statement by Experts. |
EY Ltda., a Member of Ernst & Young Global Limited, independent registered public accounting firm, as set forth in their reports thereon, included therein, and incorporated herein, has audited both the interim combined financial statements of Enersis Chile as of September 30, 2015 and for the nine-month period then ended, and the combined financial statements of Enersis Chile as of December 31, 2014, 2013 and January 1, 2013, and for the years ended December 31, 2014 and 2013.
The interim combined financial statements and the combined financial statements referred to above, both appearing in this registration statement, are included in reliance upon such reports given on the authority of such firms as experts in accounting and auditing.
| H. | Documents on Display. |
We will be subject to the information requirements of the Exchange Act, except that as a foreign issuer, we are not subject to SEC proxy rules (other than general anti-fraud rules) or the short-swing profit disclosure rules of the Exchange Act. In accordance with these statutory requirements, we will file or furnish reports and other information with the SEC. Reports and other information that we will file or furnish with the SEC may be inspected and copied at the public reference facilities maintained by the SEC at Room 1024, 100 F Street, N.E., Washington, D.C. 20549. Copies of such material may also be inspected at the offices of the New York Stock Exchange, at 11 Wall Street, New York, New York 10005, on which our ADSs are expected to be listed. In addition, the SEC maintains a website that contains electronically filed information, which can be accessed at http://www.sec.gov.
| I. | Combined Entity Information. |
Not applicable.
129
Table of Contents
Item 11. Quantitative and Qualitative Disclosures About Market Risk
We are exposed to risks arising from changes in commodity prices, interest rates and foreign exchange rates. Enersis’ Board of Directors approves risk management policies at all levels and the Board of Directors of Enersis Chile will continue to do so with respect to the Chilean Business after the Spin-Off.
Commodity Price Risk
In our electricity generation business, we are exposed to market risks arising from the price volatility of electricity, natural gas, diesel oil, and coal. Natural gas is used in some of our power plants. We seek to ensure our fuel supply by securing long-term contracts with our suppliers for periods that are expected to match the lifetime of our generation assets. These contracts generally have provisions that allow us to purchase natural gas with a pricing formula that combines Henry Hub natural gas and Brent diesel oil at market prices prevailing at the time the purchase occurs. As of September 30, 2015 and 2014, and December 31, 2014 and 2013, we did not hold contracts classified as derivative financial instruments or financial instruments related to natural gas. However, during 2015 and 2014, we entered into contracts classified as derivative commodity instruments related to natural gas for the period between January and September 2015 (10.3 million of MMBTU and 1.69 million barrels of Brent diesel oil) and for the period between January and December 2014 (17.1 million MMBTU and 3.3 million barrels of Brent diesel oil). As of December 31, 2014, we held contracts classified as a derivative commodity instruments related to natural gas (350,000 MMBTU and 266,000 barrels of Brent diesel oil).
In our power plants which use coal or diesel oil, the dispatch mechanism allows the thermal power plants to cover their operational costs. However, under certain circumstances, fuel price fluctuations might affect marginal costs. Due to the continuing drought in Chile and the price volatility of coal and petroleum, we hedged this risk with commodity instruments available in the international markets. As of September 30, 2015 and 2014, and December 31, 2014 and 2013, we did not hold any contracts classified as either derivative financial instruments or financial instruments related either to coal or petroleum-based liquid fuel. However, during 2015, we entered into contracts classified as derivative commodity instruments related to coal, for the period between January and September 2015 (65,000 tons of type API2 coal).
Additionally, through adequate commercial risk mitigation policies, and a hydro-thermal power plant mix, we seek to protect our operating income from electricity price volatility. As of September 30, 2015 and December 31, 2014, we did not hold electricity price-sensitive instruments.
We are continually analyzing ways to hedge commodity price risk, like transferring commodity price variations to the customer’s contract prices and permanently adjusting the commodity indexed price formulas for new Power Purchase Agreements (“PPAs”) according to our exposure and/or analyzing ways to mitigate risk through hydrological insurance in dry years. In the future we may use price-sensitive instruments.
130
Table of Contents
Interest Rate and Foreign Currency Risk
The recorded values of our debt as of September 30, 2015, are detailed below, according to maturity. Total values do not include the effect of derivatives.
| Expected maturity date | ||||||||||||||||||||||||||||||||
For the year ended December 31, | 2015 | 2016 | 2017 | 2018 | 2019 | Thereafter | Total | Fair Value(2) | ||||||||||||||||||||||||
| (in millions of Ch$)(1) | ||||||||||||||||||||||||||||||||
Fixed Rate | ||||||||||||||||||||||||||||||||
Ch$/UF | 0.61 | — | — | — | — | — | 0.61 | 0.61 | ||||||||||||||||||||||||
Weighted average interest rate | 6.7 | % | — | — | — | — | — | 6.7 | % | — | ||||||||||||||||||||||
US$ | 1,005 | 1,804 | 1,921 | 2,046 | 2,179 | 513,416 | 522,370 | 606,155 | ||||||||||||||||||||||||
Weighted average interest rate | 5.7 | % | 5.4 | % | 5.4 | % | 5.4 | % | 5.4 | % | 5.8 | % | 5.8 | % | — | |||||||||||||||||
|
|
|
|
|
|
|
|
|
|
|
|
|
|
|
| |||||||||||||||||
Total fixed rate | 1,006 | 1,804 | 1,921 | 2,046 | 2,179 | 513,416 | 522,370 | 606,156 | ||||||||||||||||||||||||
Weighted average interest rate | 5.7 | % | 5.4 | % | 5.4 | % | 5.4 | % | 5.4 | % | 5.8 | % | 5.8 | % | — | |||||||||||||||||
Variable Rate | ||||||||||||||||||||||||||||||||
Ch$/UF | 2,636 | 5,272 | 5,272 | 5,272 | 28,315 | 279,092 | 325,860 | 413,078 | ||||||||||||||||||||||||
Weighted average interest rate | 10.4 | % | 10.4 | % | 10.4 | % | 10.4 | % | 7.6 | % | 7.6 | % | 7.8 | % | — | |||||||||||||||||
US$ | — | — | — | — | — | — | — | — | ||||||||||||||||||||||||
Weighted average interest rate | — | — | — | — | — | — | — | — | ||||||||||||||||||||||||
|
|
|
|
|
|
|
|
|
|
|
|
|
|
|
| |||||||||||||||||
Total variable rate | 2,636 | 5,272 | 5,272 | 5,272 | 28,315 | 279,092 | 325,860 | 413,078 | ||||||||||||||||||||||||
Weighted average interest rate | 10.4 | % | 10.4 | % | 10.4 | % | 10.4 | % | 7.6 | % | 7.6 | % | 7.8 | % | — | |||||||||||||||||
|
|
|
|
|
|
|
|
|
|
|
|
|
|
|
| |||||||||||||||||
Total | 3,642 | 7,076 | 7,193 | 7,318 | 30,493 | 792,509 | 848,230 | 1,019,234 | ||||||||||||||||||||||||
|
|
|
|
|
|
|
|
|
|
|
|
|
|
|
| |||||||||||||||||
| (1) | Calculated based on the Observed Exchange Rate as of September 30, 2015, which was Ch$ 698.72 per US$ 1.00. |
| (2) | As of September 30, 2015, fair value was calculated based on the discounted value of future cash flows expected to be paid (or received), considering current discount rates that reflect the different risks involved. |
131
Table of Contents
The recorded values of our debt as of September 30, 2014, are detailed below, according to maturity. Total values do not include the effect of derivatives.
| Expected maturity date | ||||||||||||||||||||||||||||||||
For the year ended December 31, | 2014 | 2015 | 2016 | 2017 | 2018 | Thereafter | Total | Fair Value(2) | ||||||||||||||||||||||||
| (in millions of Ch$)(1) | ||||||||||||||||||||||||||||||||
Fixed Rate | ||||||||||||||||||||||||||||||||
Ch$/UF | 1.31 | — | — | — | — | — | 1.31 | 1.31 | ||||||||||||||||||||||||
Weighted average interest rate | 4.6 | % | — | — | — | — | — | 4.6 | % | — | ||||||||||||||||||||||
US$ | 839 | 122,277 | 1,547 | 1,647 | 1,754 | 442,172 | 570,237 | 683,201 | ||||||||||||||||||||||||
Weighted average interest rate | 6.2 | % | 8.4 | % | 6.2 | % | 6.2 | % | 6.2 | % | 5.8 | % | 6.4 | % | — | |||||||||||||||||
|
|
|
|
|
|
|
|
|
|
|
|
|
|
|
| |||||||||||||||||
Total fixed rate | 841 | 122,277 | 1,547 | 1,647 | 1,754 | 442,172 | 570,238 | 683,202 | ||||||||||||||||||||||||
Weighted average interest rate | 6.2 | % | 8.4 | % | 6.2 | % | 6.2 | % | 6.2 | % | 5.8 | % | 6.4 | % | — | |||||||||||||||||
Variable Rate | ||||||||||||||||||||||||||||||||
Ch$/UF | 5,305 | 8,042 | 6,656 | 5,027 | 5,027 | 293,110 | 323,167 | 408,693 | ||||||||||||||||||||||||
Weighted average interest rate | 11.9 | % | 11.7 | % | 11.5 | % | 11.1 | % | 11.1 | % | 8.9 | % | 10.0 | % | — | |||||||||||||||||
US$ | — | — | — | — | — | — | — | — | ||||||||||||||||||||||||
Weighted average interest rate | — | — | — | — | — | — | — | — | ||||||||||||||||||||||||
|
|
|
|
|
|
|
|
|
|
|
|
|
|
|
| |||||||||||||||||
Total variable rate | 5,305 | 8,042 | 6,656 | 5,027 | 5,027 | 293,110 | 323,167 | 408,693 | ||||||||||||||||||||||||
Weighted average interest rate | 11.9 | % | 11.7 | % | 11.5 | % | 11.1 | % | 11.1 | % | 8.9 | % | 10.0 | % | — | |||||||||||||||||
|
|
|
|
|
|
|
|
|
|
|
|
|
|
|
| |||||||||||||||||
Total | 6,146 | 130,319 | 8,203 | 6,674 | 6,781 | 735,282 | 893,405 | 1,091,895 | ||||||||||||||||||||||||
|
|
|
|
|
|
|
|
|
|
|
|
|
|
|
| |||||||||||||||||
| (1) | Calculated based on the Observed Exchange Rate as of September 30, 2014, which was Ch$ 599.22 per US$ 1.00. |
| (2) | As of September 30, 2014, fair value was calculated based on the discounted value of future cash flows expected to be paid (or received), considering current discount rates that reflect the different risks involved. |
132
Table of Contents
The recorded values of our debt as of December 31, 2014, are detailed below, according to maturity. Total values do not include the effect of derivatives.
| Expected maturity date | ||||||||||||||||||||||||||||||||
For the year ended December 31, | 2015 | 2016 | 2017 | 2018 | 2019 | Thereafter | Total | Fair Value(2) | ||||||||||||||||||||||||
| (in millions of Ch$)(1) | ||||||||||||||||||||||||||||||||
Fixed Rate | ||||||||||||||||||||||||||||||||
Ch$/UF | 0.71 | — | — | — | — | — | 0.71 | 0.71 | ||||||||||||||||||||||||
Weighted average interest rate | 1.3 | % | — | — | — | — | — | 1.3 | % | — | ||||||||||||||||||||||
US$ | 123,813 | 1,566 | 1,668 | 1,776 | 1,892 | 445,837 | 576,553 | 685,462 | ||||||||||||||||||||||||
Weighted average interest rate | 8.7 | % | 6.2 | % | 6.2 | % | 6.2 | % | 6.2 | % | 5.9 | % | 6.5 | % | — | |||||||||||||||||
|
|
|
|
|
|
|
|
|
|
|
|
|
|
|
| |||||||||||||||||
Total fixed rate | 123,814 | 1,566 | 1,668 | 1,776 | 1,892 | 445,837 | 576,553 | 685,463 | ||||||||||||||||||||||||
Weighted average interest rate | 8.7 | % | 6.2 | % | 6.2 | % | 6.2 | % | 6.2 | % | 5.9 | % | 6.5 | % | — | |||||||||||||||||
Variable Rate | ||||||||||||||||||||||||||||||||
Ch$/UF | 5,122 | 5,122 | 5,122 | 5,122 | 16,317 | 282,361 | 319,167 | 424,956 | ||||||||||||||||||||||||
Weighted average interest rate | 11.9 | % | 11.9 | % | 11.9 | % | 11.9 | % | 10.6 | % | 10.4 | % | 10.5 | % | — | |||||||||||||||||
US$ | — | — | — | — | — | — | — | — | ||||||||||||||||||||||||
Weighted average interest rate | — | — | — | — | — | — | — | — | ||||||||||||||||||||||||
|
|
|
|
|
|
|
|
|
|
|
|
|
|
|
| |||||||||||||||||
Total variable rate | 5,122 | 5,122 | 5,122 | 5,122 | 16,317 | 282,361 | 319,167 | 424,956 | ||||||||||||||||||||||||
Weighted average interest rate | 11.9 | % | 11.9 | % | 11.9 | % | 11.9 | % | 10.6 | % | 10.4 | % | 10.5 | % | — | |||||||||||||||||
|
|
|
|
|
|
|
|
|
|
|
|
|
|
|
| |||||||||||||||||
Total | 128,936 | 6,689 | 6,790 | 6,899 | 18,208 | 728,198 | 895,721 | 1,110,419 | ||||||||||||||||||||||||
|
|
|
|
|
|
|
|
|
|
|
|
|
|
|
| |||||||||||||||||
| (1) | Calculated based on the Observed Exchange Rate as of December 31, 2014, which was Ch$ 606.75 per US$ 1.00. |
| (2) | As of December 31, 2014, fair value was calculated based on the discounted value of future cash flows expected to be paid (or received), considering current discount rates that reflect the different risks involved. |
133
Table of Contents
The recorded values of our debt as of December 31, 2013, are detailed below, according to maturity. Total values do not include the effect of derivatives.
| Expected maturity date | ||||||||||||||||||||||||||||||||
For the year ended December 31, | 2014 | 2015 | 2016 | 2017 | 2018 | Thereafter | Total | Fair Value(2) | ||||||||||||||||||||||||
| (in millions of Ch$)(1) | ||||||||||||||||||||||||||||||||
Fixed Rate | ||||||||||||||||||||||||||||||||
Ch$/UF | 0.11 | — | — | — | — | — | 0.11 | 0.11 | ||||||||||||||||||||||||
Weighted average interest rate | 6.8 | % | — | — | — | — | — | 6.8 | % | — | ||||||||||||||||||||||
US$ | 2,052 | 107,052 | 1,354 | 1,442 | 1,536 | 177,273 | 290,709 | 358,571 | ||||||||||||||||||||||||
Weighted average interest rate | 6.6 | % | 8.9 | % | 6.5 | % | 6.5 | % | 6.5 | % | 8.0 | % | 8.3 | % | — | |||||||||||||||||
|
|
|
|
|
|
|
|
|
|
|
|
|
|
|
| |||||||||||||||||
Total fixed rate | 2,052 | 107,052 | 1,354 | 1,442 | 1,536 | 177,273 | 290,709 | 358,571 | ||||||||||||||||||||||||
Weighted average interest rate | 6.6 | % | 8.9 | % | 6.5 | % | 6.5 | % | 6.5 | % | 8.0 | % | 8.3 | % | — | |||||||||||||||||
Variable Rate | ||||||||||||||||||||||||||||||||
Ch$/UF | 7,541 | 7,756 | 6,420 | 4,848 | 4,848 | 282,698 | 314,112 | 390,790 | ||||||||||||||||||||||||
Weighted average interest rate | 10.1 | % | 10.2 | % | 9.5 | % | 8.3 | % | 8.3 | % | 7.0 | % | 7.2 | % | — | |||||||||||||||||
US$ | 105,673 | — | — | — | — | — | 105,673 | 105,673 | ||||||||||||||||||||||||
Weighted average interest rate | 1.7 | % | — | — | — | — | — | 1.7 | % | — | ||||||||||||||||||||||
|
|
|
|
|
|
|
|
|
|
|
|
|
|
|
| |||||||||||||||||
Total variable rate | 113,214 | 7,756 | 6,420 | 4,848 | 4,848 | 282,698 | 419,785 | 496,463 | ||||||||||||||||||||||||
Weighted average interest rate | 2.2 | % | 10.2 | % | 9.5 | % | 8.3 | % | 8.3 | % | 7.0 | % | 5.8 | % | — | |||||||||||||||||
|
|
|
|
|
|
|
|
|
|
|
|
|
|
|
| |||||||||||||||||
Total | 115,266 | 114,808 | 7,774 | 6,291 | 6,384 | 459,971 | 710,494 | 855,034 | ||||||||||||||||||||||||
|
|
|
|
|
|
|
|
|
|
|
|
|
|
|
| |||||||||||||||||
| (1) | Calculated based on the Observed Exchange Rate as of December 31, 2013, which was Ch$ 524.61 per US$ 1.00. |
| (2) | As of December 31, 2013, fair value was calculated based on the discounted value of future cash flows expected to be paid (or received), considering current discount rates that reflect the different risks involved. |
Interest Rate Risk
At September 30, 2015 and 2014, 25% and 23%, respectively, of our outstanding net debt obligations were subject to variable interest rates.
At December 31, 2014 and 2013, 20% and 40%, respectively, of our outstanding net debt obligations were subject to variable interest rates.
We manage interest rate risk by maintaining a mixture of both variable and fixed rate debt, according to a policy that will be approved by our Board of Directors after the completion of the Spin-Sff. Additionally, we manage interest rate risk through the use of interest rate derivatives.
As of September 30, 2015, 2014 and December 31, 2014 we did not hold derivatives to hedge our interest rate risk.
134
Table of Contents
As of December 31, 2013, the recorded values for financial accounting purposes and the corresponding fair value of the instruments that hedge our interest rate risk exposure were as follows:
| Expected Maturity Date | ||||||||||||||||||||||||||||||||
For the year ended December 31, | 2014 | 2015 | 2016 | 2017 | 2018 | Thereafter | Total | Fair Value(2) | ||||||||||||||||||||||||
| (in millions of Ch$)(1) | ||||||||||||||||||||||||||||||||
Variable to fixed rates | 104,922 | — | — | — | — | — | 104,922 | (1,197 | ) | |||||||||||||||||||||||
Fixed to variable rates | — | — | — | — | — | — | — | — | ||||||||||||||||||||||||
|
|
|
|
|
|
|
|
|
|
|
|
|
|
|
| |||||||||||||||||
Total | 104,922 | �� | — | — | — | — | — | 104,922 | (1,197 | ) | ||||||||||||||||||||||
|
|
|
|
|
|
|
|
|
|
|
|
|
|
|
| |||||||||||||||||
| (1) | Calculated based on the Observed Exchange Rate as of December 31, 2013, which was Ch$ 524.61 per US$ 1.00. |
| (2) | Fair values were calculated based on the discounted value of future cash flows expected to be paid (or received), considering current discount rates that reflect the different risks involved. |
Foreign Currency Risk
Our corporate currency risk policy will be approved by our Board of Directors, after the completion of the Spin-Off. This policy will seek to hedge cash flows of each company that is indexed to the U.S. dollar with liabilities in the same currency.
We are exposed to foreign currency risk arising from debt denominated in U.S. dollars. Some of our combined entities have a natural hedge between their revenues and the currency of their debt. In some other cases, we do not have this natural hedge, and therefore, we try to manage this exposure with currency derivatives, such as U.S. dollar/UF exchange and U.S. dollar/Chilean peso derivatives. However, this could not always be possible due to market conditions.
As of September 30, 2015, the recorded values for financial accounting purposes and the corresponding fair value of the instruments that hedge our foreign exchange risk were as follows:
| Expected Maturity Date | ||||||||||||||||||||||||||||||||
For the year ended December 31, | 2015 | 2016 | 2017 | 2018 | 2019 | Thereafter | Total | Fair Value(2) | ||||||||||||||||||||||||
| (in millions of Ch$)(1) | ||||||||||||||||||||||||||||||||
UF to US$ | — | — | — | — | 536,243 | — | 536,243 | (61,418 | ) | |||||||||||||||||||||||
US$ to Ch$/UF | — | — | — | — | — | — | — | — | ||||||||||||||||||||||||
Ch$ to US$ | — | — | — | — | — | — | — | — | ||||||||||||||||||||||||
|
|
|
|
|
|
|
|
|
|
|
|
|
|
|
| |||||||||||||||||
Total | — | — | — | — | 536,243 | — | 536,243 | (61,418 | ) | |||||||||||||||||||||||
|
|
|
|
|
|
|
|
|
|
|
|
|
|
|
| |||||||||||||||||
| (1) | Calculated based on the Observed Exchange Rate as of September 30, 2015, which was Ch$ 698.72 per US$ 1.00. |
| (2) | Fair values were calculated based on the discounted value of future cash flows expected to be paid (or received), considering current discount rates that reflect the different risks involved. |
135
Table of Contents
By comparison, as of September 30, 2014, the recorded values for financial accounting purposes and the corresponding fair value of the instruments that hedge our foreign exchange risk were as follows:
| Expected Maturity Date | ||||||||||||||||||||||||||||||||
For the year ended December 31, | 2014 | 2015 | 2016 | 2017 | 2018 | Thereafter | Total | Fair Value(2) | ||||||||||||||||||||||||
| (in millions of Ch$)(1) | ||||||||||||||||||||||||||||||||
UF to US$ | 237,079 | — | — | — | — | 257,219 | 494,298 | (3,894 | ) | |||||||||||||||||||||||
US$ to Ch$/UF | — | — | — | — | — | — | — | — | ||||||||||||||||||||||||
Ch$ to US$ | — | — | — | — | — | — | — | — | ||||||||||||||||||||||||
|
|
|
|
|
|
|
|
|
|
|
|
|
|
|
| |||||||||||||||||
Total | 237,079 | — | — | — | — | 257,219 | 494,298 | (3,894 | ) | |||||||||||||||||||||||
|
|
|
|
|
|
|
|
|
|
|
|
|
|
|
| |||||||||||||||||
| (1) | Calculated based on the Observed Exchange Rate as of September 30, 2014, which was Ch$ 599.22 per US$ 1.00. |
| (2) | Fair values were calculated based on the discounted value of future cash flows expected to be paid (or received), considering current discount rates that reflect the different risks involved. |
As of December 31, 2014, the recorded values for financial accounting purposes and the corresponding fair value of the instruments that hedge our foreign exchange risk were as follows:
| Expected Maturity Date | ||||||||||||||||||||||||||||||||
For the year ended December 31, | 2015 | 2016 | 2017 | 2018 | 2019 | Thereafter | Total | Fair Value(2) | ||||||||||||||||||||||||
| (in millions of Ch$)(1) | ||||||||||||||||||||||||||||||||
UF to US$ | — | — | — | — | 260,451 | — | 260,451 | (24,639 | ) | |||||||||||||||||||||||
US$ to Ch$/UF | — | — | — | — | — | — | — | — | ||||||||||||||||||||||||
Ch$ to US$ | — | — | — | — | — | — | — | — | ||||||||||||||||||||||||
|
|
|
|
|
|
|
|
|
|
|
|
|
|
|
| |||||||||||||||||
Total | — | — | — | — | 260,451 | — | 260,451 | (24,639 | ) | |||||||||||||||||||||||
|
|
|
|
|
|
|
|
|
|
|
|
|
|
|
| |||||||||||||||||
| (1) | Calculated based on the Observed Exchange Rate as of December 31, 2014, which was Ch$ 606.75 per US$ 1.00. |
| (2) | Fair values were calculated based on the discounted value of future cash flows expected to be paid (or received), considering current discount rates that reflect the different risks involved. |
By comparison, as of December 31, 2013 the recorded values for financial accounting purposes and the corresponding fair value of the instruments that hedge for our interest rate risk were as follows:
| Expected Maturity Date | ||||||||||||||||||||||||||||||||
For the year ended December 31, | 2014 | 2015 | 2016 | 2017 | 2018 | Thereafter | Total | Fair Value(2) | ||||||||||||||||||||||||
| (in millions of Ch$)(1) | ||||||||||||||||||||||||||||||||
UF to US$ | — | — | — | — | — | — | — | — | ||||||||||||||||||||||||
US$ to Ch$/UF | — | — | — | — | — | — | — | — | ||||||||||||||||||||||||
Ch$ to US$ | 207,560 | — | — | — | — | — | 207,560 | 20,865 | ||||||||||||||||||||||||
|
|
|
|
|
|
|
|
|
|
|
|
|
|
|
| |||||||||||||||||
Total | 207,560 | — | — | — | — | — | 207,560 | 20,865 | ||||||||||||||||||||||||
|
|
|
|
|
|
|
|
|
|
|
|
|
|
|
| |||||||||||||||||
| (1) | Calculated based on the Observed Exchange Rate as of December 31, 2013, which was Ch$ 524.61 per US$ 1.00. |
| (2) | Fair values were calculated based on the discounted value of future cash flows expected to be paid (or received), considering current discount rates that reflect the different risks involved. |
136
Table of Contents
(d) Safe Harbor
The information in this “Item 11. Quantitative and Qualitative Disclosures About Market Risk,” contains information that may constitute forward-looking statements. See “Forward-Looking Statements” in the Introduction of this information statement for safe harbor provisions.
| Item 12. | Description of Securities Other Than Equity Securities |
| A. | Debt Securities. |
Not applicable.
| B. | Warrants and Rights. |
Not applicable.
| C. | Other Securities. |
Not applicable.
| D. | American Depositary Shares. |
Enersis Chile is expected to appoint Citibank, N.A. as depositary pursuant to a deposit agreement (“Deposit Agreement”). Citibank, N.A.’s depositary offices are located at 388 Greenwich Street, New York, New York 10013. The terms and provisions of the Deposit Agreement are expected to be substantially the same as the Deposit Agreement entered into by Enersis for its ADR program. Upon the execution of the Deposit Agreement, Enersis Chile will file the Deposit Agreement with the SEC and a copy of the Deposit Agreement will be obtainable from the SEC’s Public Reference Room at 100 F Street, N.E., Washington, D.C. 20549 and from the SEC’s website (www.sec.gov). The depositary typically appoints a custodian to safekeep the securities on deposit. In the case of Enersis Chile, the custodian is expected to be Banco Santander (Chile), located at Bandera 140, Santiago, Chile.
The following is a summary description of the material terms of the Deposit Agreement to be entered into by Enersis Chile and the Enersis Chile ADSs to be issued thereunder. This summary is based on the terms of the Deposit Agreement expected to be entered into by Enersis Chile and the actual terms of the Deposit Agreement by Enersis Chile may be different. Please remember that summaries by their nature lack the precision of the information summarized and that rights and obligations as an owner of Enersis Chile ADSs will be determined by reference to the terms of the Deposit Agreement and not by this summary.
Each Enersis Chile ADS will represent 50 shares of common stock of Enersis Chile on deposit with the custodian. An ADS will also represent any other property received by the depositary or the custodian on behalf of the owner of the ADS but that has not been distributed to the owners of ADSs because of legal restrictions or practical considerations.
If you become an owner of ADSs, you will become a party to the Deposit Agreement and therefore will be bound to its terms and to the terms of the ADR that represents your ADSs. The Deposit Agreement and the ADR will specify the rights and obligations of Enersis Chile as well as your rights and obligations as owner of ADSs and those of the depositary. As an ADS holder you will be appointing the depositary to act on your behalf in certain circumstances. The Deposit Agreement and the ADRs will be governed by New York law. However, Enersis Chile’s obligations to the holders of shares of Enersis Chile common stock will continue to be governed by the laws of Chile, which are different from New York law.
As an owner of ADSs, you may hold your ADSs either by means of an ADR registered in your name, through a brokerage or safekeeping account, or through an account established by the depositary in your name
137
Table of Contents
reflecting the registration of uncertificated ADSs directly on the books of the depositary (commonly referred to as the “direct registration system” or “DRS”). The direct registration system reflects the uncertificated (book-entry) registration of ownership of ADSs by the depositary. Under the direct registration system, ownership of ADSs is evidenced by periodic statements issued by the depositary to the holders of the ADSs. The direct registration system includes automated transfers between the depositary and the Depository Trust Company, or DTC, the central book-entry clearing and settlement system for equity securities in the United States. If you decide to hold your ADSs through your brokerage or safekeeping account, you must rely on the procedures of your broker or bank to assert your rights as an ADS owner. Banks and brokers typically hold securities such as the ADSs through clearing and settlement systems such as DTC. The procedures of such clearing and settlement systems may limit your ability to exercise your rights as an owner of ADSs. All ADSs held through DTC will be registered in the name of a nominee of DTC. This summary description assumes you have opted to own the ADSs directly by means of an ADR registered in your name and, as such, we will refer to you as the “holder.” When we refer to “you,” we assume the reader owns ADSs and will own ADSs at the relevant time.
Dividends and Distributions
As a holder, you will generally have the right to receive the distributions made by Enersis Chile on the securities deposited with the custodian. Your receipt of these distributions may be limited, however, by practical considerations and legal limitations. Holders will receive such distributions under the terms of the Deposit Agreement in proportion to the number of ADSs held as of a specified record date.
Distributions of Cash
Upon receipt by the custodian of a cash distribution for the securities on deposit, the depositary will arrange for the funds to be converted into U.S. dollars and for the distribution of the U.S. dollars to the holders. The conversion into U.S. dollars will take place only if reasonable, in the judgment of the depositary, if the U.S. dollars are transferable to the United States and if permitted by Chilean law and regulations and, if in effect, the foreign exchange agreements among the Central Bank of Chile, the depositary and Enersis Chile. The amounts distributed to holders will be net of the fees, expenses, taxes and governmental charges payable by holders under the terms of the Deposit Agreement. The depositary will apply the same method for distributing the proceeds of the sale of any property, such as undistributed rights, held by the custodian in respect of securities on deposit.
Distributions of Shares
Upon receipt of a dividend or free distribution of shares, the depositary may and will, at the request of Enersis Chile, distribute to holders, in proportion to the number of ADSs held, new ADSs representing the shares of common stock deposited. Only whole new ADSs will be distributed. Fractional entitlements will be sold and the proceeds of such sale will be distributed as in the case of a cash distribution.
The distribution of new ADSs upon a distribution of shares of common stock will be made net of the fees, expenses, taxes and governmental charges payable by holders under the terms of the Deposit Agreement. In order to pay such taxes or governmental charges, the depositary may sell all or a portion of the new shares of common stock so distributed.
No such distribution of new ADSs will be made if it would violate a law, including the U.S. securities laws. If the depositary does not distribute new ADSs as described above, it will sell the shares of common stock received and will distribute the proceeds of the sale as in the case of a distribution of cash.
138
Table of Contents
Distributions of Rights
If Enersis Chile offers to its holders of shares rights to purchase additional ADSs, the depositary will have discretion as to the procedures to follow in making such rights available to the holders of ADSs or selling such rights on behalf of holders and making the net proceeds available in U.S. dollars to such holders. If requested by Enersis Chile, the depositary will take the following actions:
| • | If at the time of the offering the depositary determines that it is lawful and feasible to make such rights available to holders, the depositary will distribute such rights to holders in proportion to the number of ADSs held, or the depositary will employ such other method as it may deem feasible in order to facilitate the exercise, sale or transfer of rights by such holders; |
| • | If at the time of the offering the depositary determines that it is not lawful or not feasible to make such rights available to holders, or if the rights are not exercised and appear about to lapse, the depositary in its discretion may sell such rights at public or private sale, and may allocate the net proceeds of any such sale, upon an averaged or other practicable basis; or |
| • | If by the terms of the offering or for any other reason the depositary cannot make those rights available to the holders, then the depositary may allow those rights to lapse. |
If the distribution of rights requires the rights to be registered under the Securities Act, the depositary will not distribute such rights unless and until such registration statement is in effect, or unless the transaction is exempt from registration under the provisions of the Securities Act.
If the depositary has distributed the rights to holders of ADSs, the depositary will exercise such rights on behalf of the holders upon receipt of the following:
| • | payment of the purchase price for the share to be purchased upon the exercise of the right; |
| • | a duly completed and signed exercise instruction; and |
| • | payment of the applicable fee and charges. |
The depositary will sell the rights that are not exercised or not distributed if such sale is lawful. The proceeds of such sale will be distributed to holders as in the case of a cash distribution. If the depositary is unable to sell the rights, it will allow the rights to lapse.
Elective Distributions
Whenever Enersis Chile intends to distribute a dividend payable at the election of shareholders either in cash or in additional shares, Enersis Chile will give prior notice thereof to the depositary and will indicate whether Enersis Chile wishes the elective distribution to be made available to you. In such case, Enersis Chile will assist the depositary in determining whether such distribution is lawful and reasonably practicable.
The depositary will make the election available to you only if it is reasonably practicable and if Enersis Chile provides all of the documentation contemplated in the Deposit Agreement. In such case, the depositary will establish procedures to enable you to elect to receive either cash or additional ADSs, in each case as described in the Deposit Agreement.
If the election is not made available to you, you will receive either cash or additional ADSs, depending on what a shareholder in Chile would receive upon failing to make an election, as more fully described in the Deposit Agreement.
Other Distributions
Whenever Enersis Chile distributes property other than cash, shares of common stock or rights to purchase additional shares of Enersis Chile common stock, the depositary will consult with Enersis Chile to the extent
139
Table of Contents
practicable and distribute such property to holders of ADSs in proportion to the number of ADSs held, in any manner that the depositary, with consent of Enersis Chile, deems equitable and practicable for accomplishing the distribution.
If the depositary determines that such distribution cannot be made proportionately among the holders of ADRs, or for any other reason the depositary deems such distribution not to be reasonably practicable, the depositary may, with our approval, adopt such distribution method, including a sale, as it deems equitable and practicable.
If the depositary sells such property, the net proceeds of such sale will be distributed to holders as in the case of a cash distribution, net of fees, expenses, taxes or governmental charges payable by holders under the Deposit Agreement.
The proceeds of such a sale will be distributed to holders as in the case of a cash distribution.
Changes Affecting Shares of Common Stock
The shares of common stock held on deposit for ADSs may change from time to time. For example, there may be a change in nominal or par value, a split-up, cancellation, consolidation or classification of such shares of common stock or a recapitalization, reorganization, merger, consolidation or sale of assets.
If any such change were to occur, your ADSs would, to the extent permitted by law, represent the right to receive the property received or exchanged in respect of the shares of common stock held on deposit. The depositary may, with our approval, or at the request of Enersis Chile, in such circumstances deliver new ADSs to you or call for the exchange of your existing ADSs for new ADSs. If the depositary may not lawfully distribute such property to you, the depositary may sell such property and distribute the net proceeds to you as in the case of a cash distribution.
Redemption
To the extent permitted by applicable law, whenever Enersis Chile decides to redeem any of the securities on deposit with the custodian, Enersis Chile will notify the depositary in advance. If it is practicable and if Enersis Chile provides all of the documentation contemplated in the Deposit Agreement, the depositary will provide notice of the redemption to the holders of ADSs.
The custodian will be instructed to surrender the shares being redeemed against payment of the applicable redemption price. The depositary will convert the redemption funds received into U.S. dollars upon the terms of the Deposit Agreement and will establish procedures to enable holders of ADSs to receive the net proceeds from the redemption upon surrender of their ADSs to the depositary. You may have to pay fees, expenses, taxes and other governmental charges upon the redemption of your ADSs. If less than all ADSs are being redeemed, the ADSs to be retired will be selected by lot or on a pro rata basis, as the depositary may determine.
Issuance of ADSs Upon Deposit of Shares of Common Stock
The depositary may create ADSs on your behalf if you or your broker deposits shares of common stock with the custodian. The depositary will deliver these ADSs to the person you indicate only after you pay any applicable issuance fees and any charges and taxes payable for the transfer of the shares of common stock to the custodian.
The issuance of ADSs may be delayed until the depositary or the custodian receives confirmation that all required approvals have been given and that the shares of common stock have been duly transferred to the custodian. The depositary will only issue ADSs in whole numbers.
140
Table of Contents
When you make a deposit of shares of common stock, you will be responsible for transferring good and valid title to the depositary. As such, you will be deemed to represent and warrant that:
| • | The shares are duly authorized, validly issued, fully paid, non assessable and legally obtained. |
| • | All preemptive (and similar) rights, if any, with respect to such shares have been validly waived or exercised. |
| • | You are duly authorized to deposit the shares. |
| • | The shares presented for deposit are free and clear of any lien, encumbrance, security interest, charge, mortgage or adverse claim, and are not, and the ADSs issuable upon such deposit will not be, “restricted securities” (as defined in the Deposit Agreement). |
| • | The shares presented for deposit have not been stripped of any rights or entitlements. |
If any of the representations or warranties is incorrect in any way, Enersis Chile and the depositary may, at your cost and expense, take any and all actions necessary to attempt to correct the consequences of the misrepresentations.
Transfer, Combination and Split Up of ADRs
As an ADR holder, you will be entitled to transfer, combine or split up your ADRs and the ADSs evidenced thereby. For transfers of ADRs, you will have to surrender the ADRs to be transferred to the depositary and also must:
| • | duly deliver the ADRs to the depositary at its principal office, and |
| • | ensure that the surrendered ADR certificate is properly endorsed or otherwise in proper form for transfer. |
Withdrawal of Shares Upon Cancellation of ADSs
As a holder, you will be entitled to present your ADSs to the depositary for cancellation and then receive the underlying shares of common stock at the custodian’s offices. In order to withdraw the shares of common stock represented by your ADSs, you will be required to pay to the depositary the fees for cancellation of ADSs and any charges and taxes payable upon the transfer of the shares of common stock being withdrawn. You assume the risk for delivery of all funds and securities upon withdrawal. Once canceled, the ADSs will not have any rights under the Deposit Agreement.
If you hold an ADS registered in your name, the depositary may ask you to provide proof of identity and genuineness of any signature and certain other documents as the depositary may deem appropriate before it will cancel your ADSs. The withdrawal of the shares of common stock represented by your ADSs may be delayed until the depositary receives satisfactory evidence of compliance with all applicable laws and regulations. Please keep in mind that the depositary will only accept ADSs for cancellation that represent a whole number of securities on deposit.
You will have the right to withdraw the securities represented by your ADSs at any time except for:
| • | Temporary delays that are caused by clearing of the transfer books for the shares of common stock or the ADSs or the payment of dividends. |
| • | Obligations to pay fees, taxes and similar charges. |
| • | Restrictions imposed due to laws or regulations applicable to ADSs or the withdrawal of deposited securities. |
The Deposit Agreement may not be modified to impair your right to withdraw the securities represented by your ADSs except to comply with mandatory provisions of law.
141
Table of Contents
Voting Rights
As a holder, you will generally have the right under the Deposit Agreement to instruct the depositary to exercise the voting rights for the shares of common stock represented by your ADSs. The voting rights of holders of shares of common stock are described in “Item 10. Additional Information—B. Memorandum and Articles of Association—Description of Share Capital—Shareholders’ Meetings and Voting Rights.”
The depositary will mail to you any notice of a shareholders’ meeting received from Enersis Chile together with information explaining how to instruct the depositary to exercise the voting rights of the securities represented by ADSs.
If the depositary timely receives voting instructions from a holder of ADSs, it will endeavor insofar as practicable to vote the securities represented by the holder’s ADSs in accordance with such voting instructions.
Please note that the ability of the depositary to carry out voting instructions may be limited by practical and legal limitations and the terms of the securities on deposit. There will be no assurance that you will receive voting materials in time to enable you to return voting instructions to the depositary in a timely manner.
If the depositary does not receive your voting instructions in a timely manner you will nevertheless be treated as having instructed the depositary to give a discretionary proxy with full power of substitution to our Chairman of the Board or to a person designated by him to vote the shares represented by your ADSs in his/her discretion. The depositary will deliver such discretionary proxy to vote on any matter other than:
| • | substantial opposition exists by holders of ADSs, it being understood that an election of directors at an annual or extraordinary meeting of shareholders is not a contested matter involving substantial opposition; |
| • | matters that materially and adversely affect the rights of holders of ADSs; |
| • | any matter as to which the Chairman of the Board directs the depositary that he or she does not wish such proxy to be given. |
Fees and Charges
The holders of Enersis Chile ADSs are expected to be required to pay the following fees of the depositary.
Service Fees | Fees | |
| Issuance of ADS upon deposit of shares | Up to US$[●] per 100 ADS (or fraction thereof) issued. | |
| Delivery of deposited securities against surrender of ADS | Up to US$[●] per 100 ADS (or fraction thereof) surrendered. | |
| Distribution of cash dividends or other cash distributions (i.e., sale of rights and other entitlements) | Up to US$[●] per 100 ADS (or fraction thereof) held. | |
| Distribution of ADS pursuant to (i) stock dividends or other free stock distributions, or (ii) exercise of rights to purchase additional ADS | Up to US$[●] per 100 ADS (or fraction thereof) held. | |
| Distribution of securities other than ADS or rights to purchase additional ADS (i.e., spin-off of shares) | Up to US$[●] per 100 ADS (or fraction thereof) held. | |
| Depositary services | Up to US$[●] per 100 ADS (or fraction thereof) held on the applicable record date(s) established by the depositary. | |
142
Table of Contents
As an ADS holder you will also be responsible to pay certain fees and expenses incurred by the depositary and certain taxes and governmental charges such as:
| • | Fees for the transfer, exchange or registration of shares of common stock, such as upon deposit and withdrawal of shares of common stock. |
| • | Expenses incurred for converting foreign currency into U.S. dollars. |
| • | Expenses for cable, telex and fax transmissions and for delivery of securities. |
| • | Taxes and other governmental charges upon the transfer of securities, such as when shares of common stock are deposited or withdrawn from deposit. |
| • | Fees and expenses incurred in connection with the delivery or servicing of shares of common stock on deposit. |
Enersis Chile will agree to pay certain other charges and expenses of the depositary. Note that the fees and charges you may be required to pay may vary over time and may be changed by us and by the depositary. You will receive prior notice of such changes.
Amendments and Termination
Enersis Chile may agree with the depositary to modify the Deposit Agreement at any time without your consent. Enersis Chile will undertake to give holders 30 days’ prior notice of any modifications that increase any fees or charges or that would materially prejudice any of their existing substantial rights under the Deposit Agreement, except in very limited circumstances enumerated in the Deposit Agreement.
You will be bound by the modifications to the Deposit Agreement if you continue to hold your ADSs after the modifications to the Deposit Agreement become effective. The Deposit Agreement cannot be amended to prevent you from withdrawing the shares of common stock represented by your ADSs, except as permitted by law.
Enersis Chile will have the right to direct the depositary to terminate the Deposit Agreement. Similarly, the depositary may in certain circumstances on its own initiative terminate the Deposit Agreement. In either case, the depositary must give notice to the holders at least 30 days before termination. Until termination, your rights under the Deposit Agreement will be unaffected.
After termination, the depositary will continue to collect distributions received (but will not distribute any such property until you request the cancellation of your ADSs) and may sell the securities held on deposit. After the sale, the depositary will hold the proceeds from such sale and any other funds then held for the holders of ADSs in a non-interest bearing account. At that point, the depositary will have no further obligations to holders other than to account for the funds then held for the holders of ADSs still outstanding (after deduction of applicable fees, taxes and expenses).
Books of Depositary
The depositary will maintain ADS holder records at its depositary office. You may inspect such records at such office at all reasonable times but solely for the purpose of communicating with other holders in the interest of matters relating to the ADSs, the Deposit Agreement or our business.
The depositary will maintain in New York facilities to record and process the issuance, cancellation, combination, split-up and transfer of ADRs. These facilities may be closed from time to time, to the extent not prohibited by law.
143
Table of Contents
Limitations on Obligations and Liabilities
The Deposit Agreement will limit Enersis Chile’s obligations and the depositary’s obligations to you. Please note the following:
| • | Enersis Chile and the depositary will be obligated only to take the actions specifically stated in the Deposit Agreement without negligence or bad faith. |
| • | The depositary disclaims any liability for any failure to carry out voting instructions, for any manner in which a vote is cast or for the effect of any vote, provided it acts in good faith and in accordance with the terms of the Deposit Agreement. |
| • | Enersis Chile and the depositary will not be obligated to perform any act that is inconsistent with the terms of the Deposit Agreement. |
| • | Enersis Chile and the depositary disclaim any liability if we or the depositary are prevented or forbidden from, or delayed in, doing or performing any act or thing required by the terms of the Deposit Agreement, by reason of any provision, present or future of any law or regulation, or by reason of any present or future provision of foreign exchange contract or our by-laws, or any provision of or governing the securities on deposit, or by reason of any act of God or war or other circumstances beyond our control. |
| • | We and the depositary disclaim any liability by reason of the performance or non-performance or delay in the performance of any act or thing that may be done in their discretion. |
| • | We and the depositary disclaim any liability by reason of any exercise or failure to exercise discretion contemplated in the Deposit Agreement. |
| • | We and the depositary also disclaim liability for the inability by a holder to benefit from any distribution, offering, right or other benefit that is made available to holders of shares but is not, under the terms of the Deposit Agreement, made available to you. |
| • | We and the depositary may rely without any liability upon any written notice, request or other document believed to be genuine and to have been signed or presented by the proper parties. |
| • | We and the depositary also disclaim liability for any consequential or punitive damages resulting from any breach of the terms of the Deposit Agreement. |
Pre-Release Transactions
The depositary may, in certain circumstances, issue ADSs before receiving a deposit of shares or release shares of common stock before receiving ADSs. These transactions are commonly referred to as “pre-release transactions.” The Deposit Agreement limits the aggregate size of pre-release transactions and imposes a number of conditions on such transactions, including the need to receive collateral, the type of collateral required and the representations required from brokers. The depositary may retain the compensation received from the pre-release transactions.
Taxes
You will be responsible for the taxes and other governmental charges payable on the ADSs and the securities represented by the ADSs. We, the depositary and the custodian may deduct from any distribution the taxes and governmental charges payable by holders and may sell any and all property on deposit to pay the taxes and governmental charges payable by holders. You will be liable for any deficiency if the sale proceeds do not cover the taxes that are due.
The depositary may refuse to issue ADSs, to deliver transfer, split and combine ADRs or to release securities on deposit until all taxes and charges are paid by the applicable holder. The depositary and the
144
Table of Contents
custodian may take reasonable administrative actions to obtain tax refunds and reduce tax withholding for any distribution on behalf of holders of ADSs. However, you may be required to provide to the depositary and to the custodian proof of taxpayer status and residence and such other information as the depositary and the custodian may require to fulfill legal obligations. You are required to indemnify us, the depositary and the custodian for any claims with respect to taxes based on any tax benefit obtained for you.
Foreign Currency Conversion
The depositary will arrange for the conversion of all foreign currency received into U.S. dollars if such conversion can be done on a practicable basis and will distribute the U.S. dollars in accordance with the terms of the Deposit Agreement. You may have to pay fees and expenses incurred in converting foreign currency, such as fees and expenses incurred in complying with currency exchange controls and other governmental requirements.
If the conversion of foreign currency cannot be done on a practicable basis, or if any required approvals are denied or not obtainable at a reasonable cost or within a reasonable period, the depositary may take the following actions in its discretion:
| • | Convert the foreign currency to the extent permissible and distribute the U.S. dollars to the holders for whom the conversion and distribution is practicable. |
| • | Distribute the foreign currency to holders for whom the distribution is lawful and practicable. |
| • | Hold the foreign currency, without liability for interest, for the applicable holders. |
145
Table of Contents
| Item 13. | Defaults, Dividend Arrearages and Delinquencies |
Not applicable.
| Item 14. | Material Modifications to the Rights of Security Holders and Use of Proceeds |
Not applicable.
| Item 15. | Controls and Procedures |
Not applicable.
| Item 16. | Reserved |
| Item 16A. | Audit Committee Financial Expert |
Not applicable.
| Item 16B. | Code of Ethics |
Not applicable.
| Item 16C. | Principal Accountant Fees and Services |
Not applicable.
| Item 16D. | Exemptions from the Listing Standards for Audit Committees |
Not applicable.
| Item 16E. | Purchases of Equity Securities by the Issuer and Affiliated Purchasers |
Not applicable.
| Item 16F. | Change in Registrant’s Certifying Accountant |
Not applicable.
| Item 16G. | Corporate Governance |
Not applicable.
| Item 16H. | Mine Safety Disclosure |
Not applicable.
146
Table of Contents
| Item 17. | Financial Statements |
None.
| Item 18. | Financial Statements |
Enersis Chile
Index to the Combined Financial Statements
Report of Independent Registered Public Accounting Firm:
Report of Ernst & Young Servicios Profesionales de Auditoría y Asesorías Limitada (EY Ldta.) — Enersis Chile at September 30, 2015 and December 31, 2014 | F-1 | |||
Interim Combined Financial Statements: | ||||
Interim Combined Statements of Financial Position at September 30, 2015 and December 31, 2014 | F-2 | |||
Interim Combined Statements of Comprehensive Income for the nine months ended September 30, 2015 and 2014 | F-4 | |||
Interim Combined Statements of Changes in Equity for the nine months ended September 30, 2015 and 2014 | F-6 | |||
Interim Combined Statements of Cash Flows for the nine months ended September 30, 2015 and 2014 | F-8 | |||
Notes to the Interim Combined Financial Statements | F-12 | |||
Report of Independent Registered Public Accounting Firm: | ||||
Report of Ernst & Young Servicios Profesionales de Auditoría y Asesorías Limitada — Enersis Chile at December 31, 2014 and 2013 and January 1, 2013 | F-121 | |||
Audited Combined Financial Statements: | ||||
Combined Statements of Financial Position at December 31, 2014 and 2013 and January 1, 2013 | F-122 | |||
Combined Statements of Comprehensive Income for the years ended December 31, 2014 and 2013 | F-124 | |||
Combined Statements of Changes in Equity for the years ended December 31, 2014 and 2013 | F-126 | |||
Combined Statements of Cash Flows — Direct Method for the years ended December 31, 2014 and 2013 | F-127 | |||
Notes to the Audited Combined Financial Statements | F-128 | |||
| Ch$ | Chilean pesos | |
| US$ | U.S. dollars | |
| UF | The UF is a Chilean inflation-indexed, peso-denominated monetary unit that is set daily in advance based on the previous month’s inflation rate. | |
| ThCh$ | Thousands of Chilean pesos | |
| ThUS$ | Thousands of U.S. dollars |
| Item 19. | Exhibits |
Exhibit | Description | |
| 1.1 | By-laws (Estatutos) of Enersis Chile S.A. | |
| 2.1 | Form of Specimen Share Certificate for Enersis Chile S.A. Common Stock | |
| 8.1 | List of Principal Combined Entities as of September 30, 2015 | |
| 15.1 | Consent of Ernst & Young Servicios Profesionales de Auditoría y Asesorías Limitada, an independent registered public accounting firm | |
| 99.1* | Item 8.A.4 of Form 20-F Waiver Request and Representation | |
| * | To be included in subsequent submission. |
We will furnish to the Securities and Exchange Commission, upon request, copies of any not filed instruments that define the rights of stakeholders of Enersis Chile.
147
Table of Contents
SIGNATURES
The registrant hereby certifies that it meets all of the requirements for filing on Form 20-F and that it has duly caused and authorized the undersigned to sign this Registration Statement on its behalf.
| ENERSIS CHILE S.A. | ||
| By: |
| |
| Name: | ||
| Title: | ||
Date:
Table of Contents
Enersis Chile
Interim Combined Financial Statements as of September 30, 2015 and December 31, 2014, and for the nine months ended September 30, 2015 and 2014
Table of Contents
Index to the Audited Interim Combined Financial Statements
Reports of Independent Registered Public Accounting Firms:
Ch$ | Chilean pesos | |
US$ | U.S. dollars | |
UF | The UF is a Chilean inflation-indexed, peso-denominated monetary unit that is set daily in advance based on the previous month’s inflation rate. | |
ThCh$ | Thousand of Chilean pesos | |
ThUS$ | Thousand of U.S. dollars |
Table of Contents
|
EY Chile Avda. Presidente Riesco 5435, piso 4, Santiago |
Tel: +56 (2) 2676 1000 www.eychile.cl |

Report of Independent Registered Public Accounting Firm
To Shareholders and Directors of
Enersis S.A.
We have audited the accompanying interim combined statements of financial position of Enersis Chile (the “Combined Group,” as described in Note 2 to the combined financial statements) as of September 30, 2015, and the related interim combined statements of comprehensive income, shareholders’ equity and cash flows for the nine month period then ended. These financial statements are the responsibility of Enersis S.A.’s management. Our responsibility is to express an opinion on these financial statements based on our audit.
We conducted our audit in accordance with the standards of the Public Company Accounting Oversight Board (United States). Those standards require that we plan and perform the audit to obtain reasonable assurance about whether the financial statements are free of material misstatement. We were not engaged to perform an audit of the Combined Group’s internal control over financial reporting. Our audit included consideration of internal control over financial reporting as a basis for designing audit procedures that are appropriate in the circumstances, but not for the purpose of expressing an opinion on the effectiveness of the Combined Group’s internal control over financial reporting. Accordingly, we express no such opinion. An audit also includes examining, on a test basis, evidence supporting the amounts and disclosures in the financial statements, assessing the accounting principles used and significant estimates made by management, and evaluating the overall financial statement presentation. We believe that our audit provide a reasonable basis for our opinion.
In our opinion, the financial statements referred to above present fairly, in all material respects, the interim combined financial position of Enersis Chile at September 30, 2015, and the interim combined results of their operations and their cash flows for the nine month period then ended, in accordance with International Accounting Standard No. 34, “Interim Financial Reporting”, as issued by the International Accounting Standards Board.
We have separately audited, in accordance with the standards of the Public Company Accounting Oversight Board (United States), the combined statement of financial position of Enersis Chile as of December 31, 2014, and the related combined statements of comprehensive income, shareholders’ equity and cash flows for the year then ended (not presented herein) and we expressed an unqualified audit opinion on those combined financial statements in our report dated December 4, 2015.
/s/ EY Ltda |
EY Ltda.
Santiago, Chile December 4, 2015 |
F-1
Table of Contents
ENERSIS CHILE
Interim Combined Statements of Financial Position
At September 30, 2015 and December 31, 2014
(In thousands of Chilean pesos)
| Note | 9-30-2015 ThCh$ | 12-31-2014 ThCh$ | ||||||||||
| ASSETS | ||||||||||||
CURRENT ASSETS | ||||||||||||
Cash and cash equivalents | 7 | 85,160,333 | 132,985,927 | |||||||||
Other current financial assets | 8 | 1,580,176 | 1,491,129 | |||||||||
Other current non-financial assets | 17,526,512 | 16,047,607 | ||||||||||
Trade and other current receivables | 9 | 580,410,561 | 578,081,205 | |||||||||
Current accounts receivable from related companies | 10 | 21,954,154 | 16,952,650 | |||||||||
Inventories | 11 | 35,549,475 | 43,677,878 | |||||||||
Current tax assets | 12 | 22,652,733 | 45,648,139 | |||||||||
|
|
|
| |||||||||
Total current assets other than assets or groups of assets for disposal classified as held for sale or as held for distribution to owners | 764,833,944 | 834,884,535 | ||||||||||
|
|
|
| |||||||||
Non-current assets or groups of assets for disposal classified as held for sale | 13 | — | 7,978,963 | |||||||||
Non-current assets or groups of assets for disposal classified as held for sale or as held for distribution to owners | — | 7,978,963 | ||||||||||
|
|
|
| |||||||||
TOTAL CURRENT ASSETS | 764,833,944 | 842,863,498 | ||||||||||
|
|
|
| |||||||||
NON-CURRENT ASSETS | ||||||||||||
Other non-current financial assets | 8 | 22,823,374 | 6,750,472 | |||||||||
Other non-current non-financial assets | 4,517,717 | 235,430 | ||||||||||
Trade and other non-current receivables | 9 | 6,929,938 | 7,496,412 | |||||||||
Investments accounted for using the equity method | 14 | 47,687,926 | 40,365,323 | |||||||||
Intangible assets other than goodwill | 15 | 37,725,489 | 36,525,522 | |||||||||
Goodwill | 16 | 887,257,655 | 887,257,655 | |||||||||
Property, plant and equipment | 17 | 3,349,115,618 | 3,283,760,776 | |||||||||
Investment property | 18 | 8,156,603 | 8,514,562 | |||||||||
Deferred tax assets | 19 | 20,249,553 | 12,965,095 | |||||||||
|
|
|
| |||||||||
TOTAL NON-CURRENT ASSETS | 4,384,463,873 | 4,283,871,247 | ||||||||||
|
|
|
| |||||||||
TOTAL ASSETS | 5,149,297,817 | 5,126,734,745 | ||||||||||
|
|
|
| |||||||||
F-2
Table of Contents
ENERSIS CHILE
Interim Combined Statements of Financial Position
At September 30, 2015 and December 31, 2014
(In thousands of Chilean pesos)
| Note | 9-30-2015 ThCh$ | 12-31-2014 ThCh$ | ||||||||||
| LIABILITIES AND EQUITY | ||||||||||||
CURRENT LIABILITIES | ||||||||||||
Other current financial liabilities | 20 | 31,465,056 | 146,364,359 | |||||||||
Trade and other current payables | 23 | 360,768,802 | 495,361,355 | |||||||||
Current accounts payable to related companies | 10 | 335,484,506 | 187,185,193 | |||||||||
Other current provisions | 24 | 19,554,817 | 11,623,514 | |||||||||
Current tax liabilities | 12 | 3,926,861 | 38,357,866 | |||||||||
Other current non-financial liabilities | 28,036,115 | 35,703,261 | ||||||||||
|
|
|
| |||||||||
Total current liabilities other than those associated with groups of assets for disposal classified as held for sale | 779,236,157 | 914,595,548 | ||||||||||
|
|
|
| |||||||||
Liabilities associated with groups of assets for disposal classified as held for sale | 13 | — | 5,488,147 | |||||||||
|
|
|
| |||||||||
TOTAL CURRENT LIABILITIES | 779,236,157 | 920,083,695 | ||||||||||
|
|
|
| |||||||||
NON-CURRENT LIABILITIES | ||||||||||||
Other non-current financial liabilities | 20 | 910,216,082 | 778,135,167 | |||||||||
Trade and other non-current payables | 23 | — | 3,711,078 | |||||||||
Other long-term provisions | 24 | 61,064,768 | 27,969,935 | |||||||||
Deferred tax liabilities | 19 | 227,628,896 | 255,222,666 | |||||||||
Non-current provisions for employee benefits | 25 | 50,819,635 | 53,937,842 | |||||||||
Other non-current non-financial liabilities | 3,262,507 | 3,608,571 | ||||||||||
|
|
|
| |||||||||
TOTAL NON-CURRENT LIABILITIES | 1,252,991,888 | 1,122,585,259 | ||||||||||
|
|
|
| |||||||||
TOTAL LIABILITIES | 2,032,228,045 | 2,042,668,954 | ||||||||||
|
|
|
| |||||||||
EQUITY | ||||||||||||
Allocated capital | 26.1 | 2,229,108,975 | 2,229,108,975 | |||||||||
Retained earnings | 1,278,364,066 | 1,171,971,677 | ||||||||||
Other reserves | 26.5 | (979,516,732 | ) | (928,879,218 | ) | |||||||
|
|
|
| |||||||||
Equity attributable to Enersis Chile | 2,527,956,309 | 2,472,201,434 | ||||||||||
Non-controlling interests | 26.6 | 589,113,463 | 611,864,357 | |||||||||
|
|
|
| |||||||||
TOTAL EQUITY | 3,117,069,772 | 3,084,065,791 | ||||||||||
|
|
|
| |||||||||
TOTAL LIABILITIES AND EQUITY | 5,149,297,817 | 5,126,734,745 | ||||||||||
|
|
|
| |||||||||
F-3
Table of Contents
Interim Combined Statements of Comprehensive Income, by Nature
For the nine months ended September 30, 2015 and 2014
(In thousands of Chilean pesos)
| For the nine months ended September 30, | ||||||||||
COMBINED STATEMENTS OF COMPREHENSIVE INCOME | Note | 2015 ThCh$ | 2014 (Unaudited) ThCh$ | |||||||
Revenues | 27 | 1,753,899,975 | 1,477,407,687 | |||||||
Other operating income | 27 | 8,298,934 | 21,454,312 | |||||||
|
|
|
| |||||||
Revenues and other operating income | 1,762,198,909 | 1,498,861,999 | ||||||||
Raw materials and consumables used | 28 | (1,151,827,225 | ) | (1,003,840,694 | ) | |||||
|
|
|
| |||||||
Contribution Margin | 610,371,684 | 495,021,305 | ||||||||
|
|
|
| |||||||
Other work performed by the entity and capitalized | 3 a. – 3 d.1 | 16,076,024 | 15,904,921 | |||||||
Employee benefits expense | 29 | (102,295,695 | ) | (96,504,075 | ) | |||||
Depreciation and amortization expense | 30 | (112,391,453 | ) | (93,389,860 | ) | |||||
Impairment loss recognized in the period’s profit or loss | 30 | (4,917,537 | ) | (1,075,487 | ) | |||||
Other expenses | 31 | (82,469,879 | ) | (93,521,920 | ) | |||||
|
|
|
| |||||||
Operating Income | 324,373,144 | 226,434,884 | ||||||||
|
|
|
| |||||||
Other gains | 32 | 6,694,174 | 47,755,054 | |||||||
Financial income | 33 | 11,075,425 | 9,124,834 | |||||||
Financial costs | 33 | (52,290,795 | ) | (58,021,595 | ) | |||||
Share of profit (loss) of associates and joint ventures accounted for using the equity method | 14 | 7,482,890 | 7,728,915 | |||||||
Foreign currency exchange differences | 33 | (45,890,221 | ) | (13,734,131 | ) | |||||
Profit from indexed assets and liabilities | 33 | 3,320,149 | 3,088,893 | |||||||
|
|
|
| |||||||
Income before taxes | 254,764,766 | 222,376,854 | ||||||||
Income tax expense | 34 | (57,496,655 | ) | (102,595,091 | ) | |||||
|
|
|
| |||||||
NET INCOME | 197,268,111 | 119,781,763 | ||||||||
|
|
|
| |||||||
Net income attributable to: | ||||||||||
Enersis Chile | 149,907,188 | 96,243,582 | ||||||||
Non-controlling interests | 26.5 | 47,360,923 | 23,538,181 | |||||||
|
|
|
| |||||||
NET INCOME | 197,268,111 | 119,781,763 | ||||||||
|
|
|
| |||||||
F-4
Table of Contents
ENERSIS CHILE
Interim Combined Statements of Comprehensive Income, by Nature (continued)
For the nine months ended September 30, 2015 and 2014
(In thousands of Chilean pesos)
| For the nine months ended September 30, | ||||||||||
COMBINED STATEMENTS OF COMPREHENSIVE INCOME | Note | 2015 ThCh$ | 2014 (Unaudited) ThCh$ | |||||||
Net Income | 197,268,111 | 119,781,763 | ||||||||
Components of other comprehensive income that will not be reclassified subsequently to profit or loss, before taxes | ||||||||||
Losses from defined benefit plans | 25.2.b | (2,332,333 | ) | — | ||||||
Other comprehensive income that will not be reclassified subsequently to profit or loss | (2,332,333 | ) | — | |||||||
Components of other comprehensive income (loss) that will be reclassified subsequently to profit or loss, before taxes | ||||||||||
Foreign currency translation gains | 2,952,588 | 8,617,612 | ||||||||
Gains (losses) from available-for-sale financial assets | 3,314 | 6,296 | ||||||||
Share of other comprehensive income from associates and joint ventures accounted for using the equity method | 151,687 | 13,239,7 66 | ||||||||
Losses from cash flow hedges | (125,039,969 | ) | (99,441,280 | ) | ||||||
Adjustments from reclassification of cash flow hedges, transferred to profit or loss | 9,120,241 | (8,428,439 | ) | |||||||
Other comprehensive income (loss) that will be reclassified subsequently to profit or loss | (112,812,139 | ) | (86,006,045 | ) | ||||||
Components of other comprehensive income (loss), before taxes | (115,144,472 | ) | (86,006,045 | ) | ||||||
Income tax related to components of other comprehensive income that will not be reclassified subsequently to profit or loss | ||||||||||
Income tax related to defined benefit plans | 629,730 | 1,100,658 | ||||||||
Income tax related to components of other comprehensive income that will not be reclassified subsequently to profit or loss | 629,730 | 1,100,658 | ||||||||
Income tax related to components of other comprehensive income that will be reclassified subsequently to profit or loss | ||||||||||
Income tax related to cash flow hedge | 30,136,391 | 24,111,073 | ||||||||
Income tax related to available-for-sale financial assets | (895 | ) | (2,663 | ) | ||||||
|
|
|
| |||||||
Income tax related to components of other comprehensive income that will be reclassified subsequently to profit or loss | 30,135,496 | 24,108,410 | ||||||||
|
|
|
| |||||||
Total Other Comprehensive Income (Loss) | (84,379,246 | ) | (60,796,977 | ) | ||||||
|
|
|
| |||||||
TOTAL COMPREHENSIVE INCOME | 112,888,865 | 58,984,786 | ||||||||
|
|
|
| |||||||
Comprehensive income attributable to: | ||||||||||
Enersis Chile | 99,000,493 | 59,396,843 | ||||||||
Non-controlling interests | 13,888,372 | (412,057 | ) | |||||||
|
|
|
| |||||||
TOTAL COMPREHENSIVE INCOME | 112,888,865 | 58,984,786 | ||||||||
|
|
|
| |||||||
F-5
Table of Contents
Interim Combined Statements of Changes in Equity
For the nine months ended September 30, 2015 and 2014
(In thousands of Chilean pesos)
Statements of Changes in | Allocated Capital | Changes in Other Reserves | Retained Earnings | Equity Attributable to Enersis Chile | Non-controlling Interests | Total Equity | ||||||||||||||||||||||||||||||||||||||
| Reserve for Exchange Differences in Translation | Reserve for Cash Flow Hedges | Reserve for Gains and Losses for Defined Benefit Plans | Reserve for Gains and Losses on Remeasuring Available- for-Sale Financial Assets | Other Miscellaneous Reserves | Other Reserves | |||||||||||||||||||||||||||||||||||||||
Equity at beginning of period 1/1/2015 | 2,229,108,975 | 11,443,966 | (66,850,863 | ) | — | 14,046 | (873,486,367 | ) | (928,879,218 | ) | 1,171,971,677 | 2,472,201,434 | 611,864,357 | 3,084,065,791 | ||||||||||||||||||||||||||||||
Changes in equity | ||||||||||||||||||||||||||||||||||||||||||||
Comprehensive income | ||||||||||||||||||||||||||||||||||||||||||||
Profit (loss) | 149,907,188 | 149,907,188 | 47,360,923 | 197,268,111 | ||||||||||||||||||||||||||||||||||||||||
Other comprehensive income | 2,279,919 | (51,708,486 | ) | (1,571,523 | ) | 2,414 | 90,981 | (50,906,695 | ) | (50,906,695 | ) | (33,472,551 | ) | (84,379,246 | ) | |||||||||||||||||||||||||||||
Comprehensive income | 99,000,493 | 13,888,372 | 112,888,865 | |||||||||||||||||||||||||||||||||||||||||
Dividends | (41,075,392 | ) | (41,075,392 | ) | (17,681,737 | ) | (58,757,129 | ) | ||||||||||||||||||||||||||||||||||||
Increase (decrease) from other changes | — | — | — | 1,571,523 | — | (1,302,342 | ) | 269,181 | (2,439,407 | ) | (2,170,226 | ) | (18,957,529 | ) | (21,127,755 | ) | ||||||||||||||||||||||||||||
Total changes in equity | — | 2,279,919 | (51,708,486 | ) | — | 2,414 | (1,211,361 | ) | (50,637,514 | ) | 106,392,389 | 55,754,875 | (22,750,894 | ) | 33,003,981 | |||||||||||||||||||||||||||||
Equity at end of period 9/30/2015 | 2,229,108,975 | 13,723,885 | (118,559,349 | ) | — | 16,460 | (874,697,728 | ) | (979,516,732 | ) | 1,278,364,066 | 2,527,956,309 | 589,113,463 | 3,117,069,772 | ||||||||||||||||||||||||||||||
F-6
Table of Contents
| Changes in Other Reserves | ||||||||||||||||||||||||||||||||||||||||||||
Statement of Changes in | Allocated Capital | Reserve for Exchange Differences in Translation | Reserve for Cash Flow Hedges | Reserve for Gains and Losses for Defined Benefit Plans | Reserve for Gains and Losses on Remeasuring Available- for-Sale Financial Assets | Other Miscellaneous Reserves | Other Reserves | Retained Earnings | Equity Attributable to Enersis Chile | Non-controlling Interests | Total Equity | |||||||||||||||||||||||||||||||||
Equity at beginning of period 1/1/2014 | 2,229,108,975 | 3,628,184 | (6,258,379 | ) | — | 11,811 | (877,246,493 | ) | (879,864,877 | ) | 1,080,532,977 | 2,438,837,368 | 626,946,621 | 3,065,783,989 | ||||||||||||||||||||||||||||||
Changes in equity (Unaudited) | ||||||||||||||||||||||||||||||||||||||||||||
Comprehensive income (Unaudited) | ||||||||||||||||||||||||||||||||||||||||||||
Profit (loss) (Unaudited) | 96,243,583 | 96,243,583 | 23,538,180 | 119,781,763 | ||||||||||||||||||||||||||||||||||||||||
Other comprehensive income (Unaudited) | 5,252,261 | (50,905,635 | ) | 861,672 | 3,751 | 7,941,211 | (36,846,740 | ) | (36,846,740 | ) | (23,950,237 | ) | (60,796,977 | ) | ||||||||||||||||||||||||||||||
Comprehensive income (Unaudited) | 59,396,843 | (412,057 | ) | 58,984,786 | ||||||||||||||||||||||||||||||||||||||||
Dividends (Unaudited) | (45,905,332 | ) | (45,905,332 | ) | (20,838,639 | ) | (66,743,971 | ) | ||||||||||||||||||||||||||||||||||||
Increase (decrease) from other changes (Unaudited) | — | — | — | (861,672 | ) | — | (38,067,193 | ) | (38,928,865 | ) | (11,257,992 | ) | (50,186,857 | ) | 10,204,860 | (39,981,997 | ) | |||||||||||||||||||||||||||
Increase (decrease) from changes in stakes of combined entities including loss of control (Note 2.4.1) (Unaudited) | — | 917,513 | 917,513 | — | 917,513 | 577,393 | 1,494,906 | |||||||||||||||||||||||||||||||||||||
Total changes in equity (Unaudited) | — | 5,252,261 | (50,905,635 | ) | — | 3,751 | (29,208,469 | ) | (74,858,092 | ) | 39,080,259 | (35,777,833 | ) | (10,468,443 | ) | (46,246,276 | ) | |||||||||||||||||||||||||||
Equity at end of period 9/30/2014 (Unaudited) | 2,229,108,975 | 8,880,445 | (57,164,014 | ) | — | 15,562 | (906,454,962 | ) | (954,722,969 | ) | 1,119,613,236 | 2,403,059,535 | 616,478,178 | 3,019,537,713 | ||||||||||||||||||||||||||||||
F-7
Table of Contents
Interim Combined Statements of Cash Flow, Direct
For the nine months ended September 30, 2015 and 2014
(In thousands of Chilean pesos)
| January - September | ||||||||||
Statements of Direct Cash Flow | Note | 2015 ThCh$ | 2014 (Unaudited) ThCh$ | |||||||
Cash flow provided by (used in) operating activities | ||||||||||
Types of collection from operating activities | ||||||||||
Collections from the sale of goods and services | 2,258,841,320 | 1,733,644,468 | ||||||||
Other collections from operating activities | 2,265,599 | 7,448,681 | ||||||||
Types of payment in cash from operating activities | ||||||||||
Payments to suppliers for goods and services | (1,600,390,531 | ) | (1,473,341,315 | ) | ||||||
Payments to and on behalf of employees | (104,787,077 | ) | (89,489,009 | ) | ||||||
Payments on premiums and services, annual payments, and other obligations from policies held | (7,542,437 | ) | (6,672,429 | ) | ||||||
Other payments for operating activities | (94,171,212 | ) | (69,711,350 | ) | ||||||
Cash flows from operating activities | ||||||||||
Income taxes paid | (107,913,797 | ) | (22,403,648 | ) | ||||||
Other outflows of cash, net | (12,009,073 | ) | (2,693,191 | ) | ||||||
|
|
|
| |||||||
Net cash flows provided by operating activities | 334,292,792 | 76,782,207 | ||||||||
|
|
|
| |||||||
Cash flow provided by (used in) investing activities | ||||||||||
Cash flows from the loss of control of combined entities or other businesses | 7.e | 6,639,653 | — | |||||||
Cash flows used to obtain control of combined entities or other businesses | 7.c | — | (37,654,762 | ) | ||||||
Other payments to acquire equity or debt instruments belonging to other entities | — | (15,894,195 | ) | |||||||
Other payments to acquire stakes in joint ventures | (2,295,000 | ) | (2,805,000 | ) | ||||||
Proceeds from the sale of property, plant and equipment | 28,732 | 59,655 | ||||||||
Purchases of property, plant and equipment | (252,813,573 | ) | (136,852,106 | ) | ||||||
Proceeds from the sale of other long-term assets | 1,729,727 | 2,037,930 | ||||||||
Purchases of other long-term assets | — | (2,059,014 | ) | |||||||
Payments from future, forward, option and swap contracts | (3,878,518 | ) | (383,231 | ) | ||||||
Collections from future, forward, option and swap contracts | 156,295 | 2,708,854 | ||||||||
Collections from related companies | (227,962,795 | ) | — | |||||||
Dividends received | 8,687,772 | 10,503,945 | ||||||||
Interest received | 1,277,630 | 3,770,109 | ||||||||
|
|
|
| |||||||
Net cash flows used in investing activities | (468,430,077 | ) | (176,567,815 | ) | ||||||
|
|
|
| |||||||
Cash flows provided by (used in) financing activities | ||||||||||
Total proceeds from loans | — | 221,932,163 | ||||||||
Proceeds from long-term loans | — | 221,932,163 | ||||||||
Loans from related companies | 495,451,692 | 488,921,142 | ||||||||
Payment on borrowings | (137,503,915 | ) | (114,652,781 | ) | ||||||
Payments on financial lease liabilities | (1,164,709 | ) | — | |||||||
Payment of loans to related companies | (86,919,438 | ) | (432,290,266 | ) | ||||||
Dividends paid | (132,737,594 | ) | (158,040,343 | ) | ||||||
Interest paid | (43,865,807 | ) | (41,716,609 | ) | ||||||
Change in parent company investment | (8,343,688 | ) | (9,763,348 | ) | ||||||
Other outflows of cash, net | (2,407,021 | ) | (8,457,175 | ) | ||||||
|
|
|
| |||||||
Net cash flows provided by (used in) financing activities | 82,509,520 | (54,067,217 | ) | |||||||
|
|
|
| |||||||
Net increase (decrease) in cash and cash equivalents before effect of exchange rate changes | (51,627,765 | ) | (153,852,825 | ) | ||||||
|
|
|
| |||||||
Effect of exchange rate changes on cash and cash equivalents | ||||||||||
Effect of exchange rate changes on cash and cash equivalents | 3,772,469 | 6,546,576 | ||||||||
Net increase (decrease) in cash and cash equivalents | (47,855,296 | ) | (147,306,249 | ) | ||||||
Cash and cash equivalents at beginning of period | 7 | 133,015,629 | 214,907,097 | |||||||
Cash and cash equivalents at end of period | 7. d | 85,160,333 | 67,600,848 | |||||||
F-8
Table of Contents
ENERSIS CHILE
NOTES TO THE INTERIM COMBINED FINANCIAL STATEMENTS
F-9
Table of Contents
F-10
Table of Contents
Contents | Page | |||||||
34. | INCOME TAXES | F-89 | ||||||
35. | INFORMATION BY SEGMENT | F-90 | ||||||
36. | THIRD PARTY GUARANTEES, OTHER CONTINGENT ASSETS AND LIABILITIES, AND OTHER COMMITMENTS. | F-94 | ||||||
37. | SANCTIONS | F-100 | ||||||
38. | ENVIRONMENT | F-103 | ||||||
39. | FINANCIAL INFORMATION ON ENTITIES IN THE COMBINED GROUP, SUMMARIZED | F-104 | ||||||
40. | SUBSEQUENT EVENTS | F-105 | ||||||
APPENDIX 1 | ENERSIS CHILE COMBINED GROUP ENTITIES | F-106 | ||||
APPENDIX 2 | CHANGES IN SCOPE OF COMBINATION | F-107 | ||||
APPENDIX 3 | ASSOCIATED COMPANIES AND JOINT VENTURE ENTITIES | F-108 | ||||
APPENDIX 4 | ADDITIONAL INFORMATION ON FINANCIAL DEBT | F-109 | ||||
APPENDIX 5 | DETAILS OF ASSETS AND LIABILITIES IN FOREIGN CURRENCY | F-111 | ||||
APPENDIX 6 | ADDITIONAL INFORMATION TRADE AND OTHER RECEIVABLES | F-112 | ||||
APPENDIX 6.1 | COMPLEMENTARY INFORMATION ON TRADE RECEIVABLES | F-115 | ||||
APPENDIX 6.2 | ESTIMATED SALES AND PURCHASES OF ENERGY AND CAPACITY | F-119 | ||||
APPENDIX 7 | DETAILS OF DUE DATES OF PAYMENTS TO SUPPLIERS | F-120 | ||||
F-11
Table of Contents
ENERSIS CHILE
COMBINED FINANCIAL STATEMENTS AS OF SEPTEMBER 30, 2015 AND DECEMBER 31, 2014
(In thousands of Chilean pesos)
| 1. | BACKGROUND |
On April 28, 2015, Enersis S.A. (“Enersis”) informed the Superintendence of Securities and Insurance (hereinafter “SVS”) through a significant event, that the Board of Directors of the company decided by unanimous vote to initiate an analysis of a corporate reorganization (“reorganization”) aimed at the separation of the activities of generation and distribution of electricity in Chile from activities outside of Chile. The objective of this would be to resolve certain duplications and redundancies that arise from Enersis’ complex corporate structure today and generate value for all its shareholders, maintaining its inclusion in the Enel S.p.A. group.
On July 27, 2015, pursuant to the provisions of Articles 9 and 10 of the Securities Market Law No. 18,045 and the provisions of General Norm No. 30 of the SVS, Enersis informed the SVS, by means of a significant event, that the Board of Directors of the company had decided unanimously that if the separation of power generation and distribution activities in Chile from the rest of the activities of the Enersis group outside of Chile were approved, the reorganization would be carried out through the following corporate transactions:
Steps to carry out the corporate reorganization:
a) Related to the preparation of the Combined Financial Statements
| • | Each of the direct and indirect subsidiaries of Enersis, Chilectra S.A. and Empresa Nacional de Electricidad S.A. (“Endesa S.A.”) would effect spin-offs, resulting in the formation of a new company from the spin-off by Chilectra S.A. (“Chilectra Américas”) and a new company from the spin-off by Endesa S.A. (“Endesa Américas”), which would be allocated equity interests and other assets that both Chilectra S.A. and Endesa S.A. hold outside of Chile, as well as certain other assets and liabilities related to them. |
The continuing companies of Endesa S.A. and Chilectra S.A. are to be called Empresa Nacional de Electricidad S.A. (“Endesa Chile”) and Chilectra Chile S.A. (“Chilectra Chile”) after the spin-offs.
| • | At the same time, Enersis will be spun-off and, resulting from this spin-off, will form a new company (“Enersis Chile”), which will hold the equity interests and assets of Enersis in Chile allocated to it, including equity interests in Chilectra Chile and Endesa Chile (after the spin-off of these companies described above), and certain other assets and liabilities related to them. Remaining in continuing Enersis (to be called “Enersis Américas” after the spin-off) are the equity interests and corresponding liabilities of Enersis outside Chile, as well as those held by each of the new companies “Chilectra Américas” and “Endesa Américas”, created as a result of the spin-offs of Chilectra Américas and Endesa Américas mentioned above, and the liabilities related to them. |
b) Related to the subsequent processes of the division phase.
| • | Once the previously mentioned spin-offs are completed, “Enersis Américas” would absorb by merger “Chilectra Américas” and “Endesa Américas”, and would dissolve them without liquidation, thus grouping all international shares of the Enersis group outside Chile in “Enersis Américas”. The merger involving “Endesa Américas” and “Chilectra Américas” would take place as soon as legally possible and in accordance with the applicable regulations. |
The preparation of these combined financial statements of Enersis Chile (the “Combined Group”), do not include effects that could potentially arise as a result of the previously mentioned merger.
The resulting companies would be based in Chile and their shares would be listed in the same markets that Enersis group companies are currently listed. As stated earlier, none of the transactions described above require the contribution of additional financial resources.
F-12
Table of Contents
On November 10, 2015, in the Enersis’ Extraordinary Board of Directors’ Meeting, the majority of the Board of Directors of the company agreed to summon an Extraordinary Shareholders’ Meeting (“ESM”), on December 18, 2015. The purpose of this meeting is for the shareholders to acknowledge and rule on, among others, the proposed corporate reorganization and all supporting information related to it.
1.1 THE COMBINED GROUP’S ACTIVITIES
Enersis Chile comprises the combination of Endesa Chile S.A. and Chilectra Chile S.A. and their combined entities and investments in associates and joint ventures (hereinafter “the Combined Group”).
Enersis Chile S.A. will be a publicly traded corporation with registered address and head office located at Avenida Santa Rosa, No. 76, in Santiago, Chile. The company will be registered in the securities register of the Superintendency of Securities and Insurance of Chile (Superintendencia de Valores y Seguros or SVS) under number 175. In addition, the company will be registered with the Securities and Exchange Commission of the United States of America (hereinafter U.S. SEC) and with Spain’sComisión Nacional del Mercado de Valores.
Enersis Chile’s corporate purpose consists of generating, transporting, producing, and distributing electrical energy. The Combined Group’s corporate purpose also includes investing in financial assets, developing projects, carrying out activities in the energy industry and in other fields in which electrical energy is essential, and participating in public civil or hydroelectric infrastructure concessions in which it may participate directly or through subsidiaries or associate companies in Chile.
Enersis Chile S.A. will be a subsidiary of Enel Iberoamérica S.R.L., a company controlled by Enel S.p.A. (hereinafter Enel).
| 2. | BASIS OF PRESENTATION OF THE COMBINED FINANCIAL STATEMENTS |
The combined financial statements as of September 30, 2015 and December 31, 2014 of Enersis Chile have been prepared in accordance with International Financial Reporting Standards (IFRS) as issued by the International Accounting Standards Board (IASB). They were approved by the Enersis’ Board Directors at its meeting held on December 2, 2015.
As of September 30, 2015, the Enersis Chile Combined Group does not represent a group for consolidated financial statement reporting purposes in accordance with IFRS 10Consolidated Financial Statements.
These combined financial statements are the first financial statements of the Combined Group in accordance with paragraph 3 of IFRS 1First-time Adoption of International Financial Reporting Standards(“IFRS 1”). The Combined Group prepared the combined financial statements using IFRS 1.D16 (a) (“parent’s accounting method”). The accompanying combined financial statements reflect the combined operations of the Combined Group as it would have been incorporated following the spin-off, assuming date would have been January 1, 2013. The combined financial statements may not be indicative of the Combined Group’s future performance and do not necessarily reflect what the results of operations, financial position and cash flows would have been had it operated, since January 1, 2013 as an independent Combined Group during the periods presented.
The Combined Group used the same accounting policies and valuation methods for the preparation of these combined financial statements, as those used by Enersis for the preparation of its Consolidated Financial Statements, unless such accounting policies and valuation methods are not in accordance with IFRS when presenting the Combined Group as a group of companies independent of Enersis. These accounting policies have been disclosed under this note and Note 3 Accounting policies. The entities and associates are included in these combined financial statements using their respective historical carrying values and amounts as included in Enersis’ Consolidated Financial Statements.
F-13
Table of Contents
Since IFRS does not provide any guidance for the preparation of combined financial statements, paragraph 12 of IAS 8Accounting Policies, Changes in Accounting Estimates and Errors has been used for the preparation of the combined financial statements. This paragraph requires that the latest pronouncements of other standard setters, other accounting literature and accepted industry practice should be considered. The combined financial statements of Enersis Chile have been derived from the aggregation of the net assets of the Chilean business of Enersis. All intra-group balances, revenues, expenses and unrealized gains and losses arising from transactions between companies belonging to Combined Group were eliminated when preparing the combined financial statements. In addition, the investments of Enersis in the Combined Group were eliminated against the equity of the respective combined entities. Transactions with Enersis group companies, which do not belong to the Combined Group, have been disclosed as transactions with related parties.
The Combined Financial Statements have been prepared and published in thousands of Chilean peso (ThCh$), as the Chilean peso is the functional currency of Enersis Chile. Chilean operations with functional currencies other than the Chilean peso are reported in accordance with the accounting policies stated in Note 3.k. Rounding differences may occur in respect of individual amounts or percentages.
Principles applied in preparing the Combined Financial Statements
The following summarizes the accounting and other principles applied in preparing the combined financial statements. Enersis Management considers that the allocations described below have been made on a reasonable basis, but are not necessarily indicative of the costs that would have been incurred if the Combined Group had been a stand-alone entity.
Net assets of the Parent (equity)
The Combined Group has not previously formed a separate legal group nor presented any stand-alone financial statements, and accordingly it is not conceivable to present share capital or an analysis of equity reserves. The net assets of the Combined Group are represented by capital invested in the Combined Group and are shown as “Equity” using the same captions as those used by Enersis. Issued capital, share premium and retained earnings of Enersis have been allocated to Enersis Chile based on net assets value ratio assigned to it. Other reserves (which are primarily composed of the equity effects of past reorganizations, business combinations under common control, residual effects of first-time adoption of IFRS and the equity effects of the current spin-off process) have been allocated considering the transaction and circumstances that led to creation of these reserves.
Cash and cash equivalents
Cash and cash equivalents of the foreign subsidiaries of Enersis are excluded from these Combined Financial Statements. In addition, based on the exercise carried out by Enersis’ management, the ratios obtained for the division of the cash and cash equivalents of Enersis on a stand-alone basis, are as follows:
| Proportion of Economic Assets | ||||||||
Entity | Chile | Américas | ||||||
Enersis | 42 | % | 58 | % | ||||
Endesa S.A. (Chile) | 66 | % | 34 | % | ||||
Chilectra S.A. | 63 | % | 37 | % | ||||
Intercompany balances and transactions with related parties
Intercompany balances with successors of Enersis were allocated by identifying the entity that provided/received the service as well as the nature of it. Intercompany balances with Enersis Chile were eliminated in full for the purpose of these combined financial statements. Intercompany balances with Enersis Americas are included in these combined financial statements and disclosed as accounts with related parties.
F-14
Table of Contents
Debt instruments and related interest expenses, exchange differences and effects of hedge accounting strategies
Financial debt and related interest expenses and exchange rate differences of the Chilean subsidiaries of Enersis are included in these combined financial statements. Financial debt and related interest expenses and exchange rate differences of Enersis stand-alone have been 100% allocated to Enersis Americas and are not included in these combined financial statements.
In relation to derivative instruments designated as hedging instruments for the Chilean subsidiaries of Enersis have been included in these combined financial statements. Enersis’ management has adopted as a criterion to keep the strategies of hedge accounting. Therefore, all effects on the statement of financial position, income and other comprehensive income are assigned to the specific companies to which the hedged items were assigned. In the case of Enersis on a stand-alone basis, the main items covered by the hedging strategies are related to debt (hedging exposure to foreign currency debt and variability in interest rates). Therefore, the main derivative instruments associated with such hedging strategies have been assigned according to Enersis Américas, an entity that will assume 100% of the debt of Enersis stand-alone.
Personnel, salary expenses other employee benefits
For purposes of properly distributing the accounting effect of personnel from Enersis on a stand-alone basis between Enersis Chile and Enersis Américas, the Enersis’ Management defined as a criterion to identify those personnel whose main activities are related 100% with the operations based in Chile under Enersis. This group of employees was assigned to Enersis Chile. On the other hand, Management also identified those employees whose main activities relate 100% to foreign operations. This group of employees was assigned to Enersis Américas.
All remaining personnel, who divide their main activities between the Chilean operations of Enersis and foreign operations, were assigned to Enersis Chile, meaning that as of the date of the spin-off, those employees would identify the activities offered to foreign operations of Enersis and vice-versa. This should lead to contracts of the inter-company provision of services between Enersis Chile and Enersis Américas. Accordingly, the costs of thes employees have been allocated based on the expected ratio of time devoted to activities offered to Enersis Chile companies and the total available time.
Below is a summary table presenting the breakdown of the employees to be allocated to Enersis Chile and Enersis Américas:
| Employee Allocation | ||||||||
Entity | Chile | Américas | ||||||
Enersis | 391 | 87 | ||||||
Endesa S.A. | 925 | 7 | ||||||
Chilectra S.A. | 668 | 2 | ||||||
|
|
|
| |||||
Total | 1,984 | 96 | ||||||
|
|
|
| |||||
Once the allocation of personnel was determined Enersis management applied the same criteria to the division of all accounts of the statements of financial position, income and other comprehensive income that were affected by this criterion.
Dividends receivable and payable
The criterion defined by Enersis’ Management to allocate to both Enersis Chile as well as to Enersis Américas a portion of dividends receivable accounts from Enersis stand-alone as of the date of the corporate spin-off, has been based mainly on identifying the origin of each one of those dividends. If the dividends come directly from a Chilean subsidiary, these dividends have been allocated 100% to Enersis Chile.
F-15
Table of Contents
Income tax
The tax effect (income statement and income tax provision) related to the Chilean subsidiaries of Enersis are included in these combined financial statements and was calculated using the statutory corporate tax rates according to the jurisdiction where the pre-tax income was originated.
In addition, for the tax effect in the income statement of Enersis on a stand-alone basis it has been allocated to these combined financial statements by determining a hypothetical taxable income as if Enersis Chile and Enersis Americas had operated as separate taxpayers. However, and from a tax point of view, there is currently only one taxpaying company, which is Enersis, and whose successor entity would be Enersis Americas, if the corporate reorganization is finally approved. Accordingly, income tax payable by Enersis has not been allocated to the combined financial statements.
In relation to deferred tax assets and liabilities, these have been assigned to Enersis Chile and Enersis Américas, taking into account the underlying assets and liabilities, whose respective temporary differences have originated such deferred taxes.
Other working capital accounts
Working capital items such as accounts receivable, accounts payable and inventories that are directly attributable to the Chilean operations of the Combined Group are included in the combined financial statements.
2.2 New accounting pronouncements
a) Accounting pronouncements effective from January 1, 2015:
Standards, Interpretations and Amendments | Mandatory Application for: | |
Amendment to IAS 19: Employee Benefits
The purpose of this amendment is to simplify the accounting for contributions from employees or third parties that are not determined on the basis of an employee’s years of service, such as employee contributions calculated according to a fixed percentage of salary.
|
Annual periods beginning on or after July 1, 2014. | |
Improvements to IFRS (2010-2012 and 2011-2013 Cycles)
These are a set of improvements that were necessary, but not urgent, and that amend the following standards: IFRS 2, IFRS 3, IFRS 8, IFRS 13, IAS 16, IAS 24, IAS 38 and IAS 40. |
Annual periods beginning on or after July 1, 2014. |
The new interpretation and amendments adopted, which became effective on January 1, 2015, had no effect on the interim combined financial statements.
F-16
Table of Contents
b) Accounting pronouncements effective from January 1, 2016 and subsequent periods:
As of the date of issue of these combined financial statements, the following accounting pronouncements had been issued by the IASB, but their application was not yet mandatory:
Standards, Interpretations and Amendments | Mandatory Application for: | |
Amendment to IFRS 11: Joint Arrangements
This amendment states that the accounting standards contained in IFRS 3 and other standards that are pertinent to business combinations accounting must be applied to the accounting for acquiring an interest in a joint operation in which the activities constitutes a business. |
Annual periods beginning on or after January 1, 2016. | |
Amendment to IAS 16 and IAS 38: Clarification of Acceptable Methods of Depreciation and Amortization
The amendment to IAS 16 explicitly forbids the use of revenue-based depreciation for property, plant and equipment. The amendment to IAS 38 introduces the rebuttable presumption that, for intangible assets, the revenue-based amortization method is inappropriate and establishes two limited exceptions. | Annual periods beginning on or after January 1, 2016. | |
Improvements to IFRS (2012-2014 Cycles)
These are a set of improvements that were necessary, but not urgent, and that amend the following standards IFRS 5, IFRS7, IAS19 and IAS 34. |
Annual periods beginning on or after January 1, 2016. | |
Amendment to IFRS 10 and IAS 28: Sale or Contribution of Assets
The amendment corrects an inconsistency between IFRS 10 and IAS 28 relating to the accounting treatment of the sale or contributions of assets between an Investor and its Associate or Joint Venture. |
Annual periods beginning on or after January 1, 2016. | |
Amendment to IAS 27: Equity Method in Separate Financial Statements
This improvement allows entities to use the equity method to account for investments in subsidiaries, joint ventures and associates in their separate financial statements. The objective of the improvement is to minimize the costs associated with complying with the IFRS, particularly for those entities applying IFRS for the first time, without reducing the information available to investors. |
Annual periods beginning on or after January 1, 2016. | |
Amendment to IAS 1: Disclosure Initiative
The IASB has issued amendments to IAS 1 as part of its principal initiative to improve the presentation and disclosure of information in financial statements. These amendments are designed to assist companies in applying professional judgment to determine the disclosures that should be included in their financial statements. |
Annual periods beginning on or after January 1, 2016. | |
F-17
Table of Contents
Standards, Interpretations and Amendments | Mandatory application for: | |
Amendment to IFRS 10, IFRS 12 and IAS 28: Investment Entities, Application of the Consolidation Exception
The amendments, which have a restricted scope, introduce clarifications to the requirements for the accounting of investment entities. The modifications also provide relief in some circumstances, which will reduce the costs of applying the Standards. |
Annual periods beginning on or after January 1, 2016. | |
IFRS 9: Financial Instruments
This is the final version of the standard issued in July 2014 and which completes the IASB project to replace IAS 39 “Financial Instruments: Recognition and Measurement.” This project was divided into 3 phases:
Phase 1 – Classification and measurement of financial assets and financial liabilities. This introduces a logical focus for the classification of financial assets driven by cash flow characteristics and the business model. This new model also results in a single impairment model being applied to all financial instruments.
Phase 2 – Impairment methodology. The objective is a more timely recognition of expected credit losses. The standard requires entities to account for expected credit losses from the time when financial instruments are first recognized in the financial statements.
Phase 3 – Hedge accounting. This establishes a new model aimed at reflecting better alignment between hedge accounting and risk management activity. Also included are enhancements to required disclosures.
This final version of IFRS 9 replaces the previous versions of the Standard. |
Annual periods beginning on or after January 1, 2018. | |
IFRS 15: Revenue from Contracts with Customers
This new standard applies to all contracts with customers except leases, financial instruments and insurance contracts. Its purpose is to make financial information more comparable, and it provides a new model for revenue recognition and more detailed requirements for contracts with multiple obligations. It also requires more itemized information. This standard will replace IAS 11 and IAS 18 as well as their interpretations (IFRIC 13, IFRIC 15, IFRIC 18 and SIC 31). | Annual periods beginning on or after January 1, 2018. | |
The Combined Group is currently assessing the impact of applying IFRS 9 and IFRS 15, however, it is not practicable to provide a reasonable estimate of the effects that these IFRSs will have until the Combined Group performs a detail review. In Enersis management’s opinion, the future application of the other standards and amendments is not expected to have a significant effect on the interim combined financial statements of the Combined Group.
2.3 Responsibility for the information, judgments and estimates provided
Management is responsible for the information contained in these interim combined financial statements and expressly states that all IFRS principles and standards, as issued by the IASB, have been fully implemented.
F-18
Table of Contents
In preparing the interim combined financial statements, certain judgments and estimates made by the Enersis management have been used to quantify some of the assets, liabilities, income, expenses and commitments recorded in the statements.
The most important areas were critical judgment is required are:
| • | The identification of Cash Generating Units (CGU) for impairment testing (see Note 3.e). |
| • | The hierarchy of information used to measure assets and liabilities at fair value (see Note 3.h) |
The estimates refer basically to:
| • | The valuations performed to determine the existence of impairment losses among tangible and intangible assets and goodwill (see Note 3.e). |
| • | The assumptions used to calculate the actuarial liabilities and obligations to employees, such as discount rates, mortality tables, salary raises, etc. (see Notes 3.m.1 and 25). |
| • | The useful life of property, plant and equipment, and intangible assets (see Notes 3.a and 3.d). |
| • | The assumptions used to calculate the fair value of financial instruments (see Notes 3.g.5 and 22). |
| • | Energy supplied to customers whose meter readings are pending. |
| • | Certain assumptions inherent in the electricity system affecting transactions with other companies, such as production, customer billings, energy consumption, etc. that allow for estimating electricity system settlements that must occur on the corresponding final settlement dates, but that are pending as of the date of issuance of the interim combined financial statements and could affect the balances of assets, liabilities, income and expenses recorded in the statements (see appendix 6.2). |
| • | The probability that uncertain or contingent liabilities will be incurred and their related amounts (see Note 3.m). |
| • | Future disbursements for the closure of facilities and restoration of land, as well as the discount rates to be used (see Note 3.a). |
| • | The tax results of the various combined entities of the Combined Group that will be reported to the respective tax authorities in the future, and that have served as the basis for recording different balances related to income taxes in these interim combined financial statements (see Note 3.o). |
| • | The fair values of assets acquired and liabilities assumed, and any pre-existing interest in an entity acquired in a business combination. |
Although these judgments and estimates have been based on the best information available on the issuance date of these combined financial statements, future events may occur that would require a change (increase or decrease) to these estimates in subsequent periods. This change would be made prospectively, recognizing the effects in the corresponding future combined financial statements.
Combined entities are defined as those entities controlled, either directly or indirectly, by the Combined Group. Control is achieved when Enersis has i) power over the combined entity; ii) is exposed, or has rights, to variable returns from its involvement with the combined entity; and iii) has the ability to use its power to affect its returns.
Enersis Chile has power over its combined entities when it holds the majority of the substantive voting rights or, when it has less than a majority of the voting rights, and those rights are sufficient to give it the practical ability to direct the relevant activities of the combined entity unilaterally.
The Combined Group reassesses whether or not it controls a combined entity if facts and circumstances indicate that there are changes to one or more of the three elements of control listed above.
F-19
Table of Contents
Appendix 1 – Enersis Combined Entities to these combined financial statements describes the relationship of Enersis Chile with each of its combined entities.
2.4.1 Changes in the scope of combination
On January 9, 2015, our combined entity Empresa Nacional de Electricidad S.A. (Endesa Chile S.A.), sold all the shares owned in Sociedad Concesionaria Túnel El Melón S.A. for ThCh$25,000,000 (see Note 32).
The elimination of Sociedad Concesionaria Túnel El Melón S.A. from Enersis Combined Group’s scope of combination caused a decrease in the combined statement of financial position of ThCh$871,022 in current assets, ThCh$7,107,941 in non-current assets, ThCh$3,698,444 in current liabilities and ThCh$1,789,703 in non-current liabilities.
On December 30, 2014, Inmobiliaria Manso de Velasco Ltda, a combined entity of Enersis, completed the sale of all of its direct and indirect ownership interest in the companies Construcciones y Proyectos Los Maitenes S.A. and Aguas Santiago Poniente S.A. The selling price of these shares was ThCh$57,173,142, which was received in cash on the same date (see note 32).
The elimination of Maitenes S.A. and Aguas Santiago Poniente S.A. from the Enersis Combined Group’s scope of combination caused a decrease in the combined statement of financial position of ThCh$54,845,853 in current assets, ThCh$12,822,077 in non-current assets, and ThCh$1,393,348 in current liabilities; there was no effect on non-current liabilities.
During the first half of 2014, the company Inversiones GasAtacama Holding Limitada was incorporated to the Enersis Combined Group’s scope of combination as a result of Endesa Chile S.A.’s acquisition of a 50% interest in that company on April 22, 2014 (see Note 5).
By virtue of this operation, the following companies became combined entities of the Combined Group: Inversiones GasAtacama Holding Limitada, GasAtacama S.A., GasAtacama Chile S.A., Gasoducto TalTal S.A., Progas S.A., Gasoducto Atacama Argentina S.A., Atacama Finance Co., GNL Norte S.A. and Energex Co.
The incorporation of GasAtacama Holding Limitada to the Enersis Combined Group’s scope of combination resulted in an increase in the in the interim combinated statement of financial position of ThCh$198,924,289 in current assets, ThCh$221,471,415 in non-current assets, ThCh$69,989,919 in current liabilities, and ThCh$35,672,488 in non-current liabilities.
2.4.2 Uncombined companies with an ownership interest of more than 50%
Although the Combined Group holds more than a 50% ownership interest in Centrales Hidroeléctricas de Aysén S.A. (Aysén), it is considered a “joint venture” since the Combined Group, through contracts or agreements with shareholders, exercises joint control of the company.
2.5 Investment in associates and joint arrangements
Associates are those in which the Combined Group, either directly or indirectly, exercises significant influence.
Significant influence is the power to participate in the financial and operational policy decisions of the associate but does not control or have joint control over those policies. In general, significant influence is presumed to be those cases in which the Combined Group has an ownership interest of more than 20% (see Note 3.i).
Joint arrangements are defined as those entities in which the Combined Group exercises control under an agreement with other shareholders and jointly with them, in other words, when decisions on the entities’
F-20
Table of Contents
relevant activities require the unanimous consent of the parties sharing control. Joint arrangements are classified as:
| • | Joint ventures: an agreement whereby the parties exercising joint control have rights to the entity’s net assets. |
| • | Joint operation: an agreement whereby the parties exercising joint control have rights to the assets and obligations with respect to the liabilities relating to the arrangement. Currently, Enersis Chile does not have any joint arrangements that qualify as joint operations. |
Appendix 3 – “Associated Companies and Joint Ventures” to these combined financial statements describes the relationship of Enersis Chile with each of these companies.
The combined entities are combined and all their assets, liabilities, revenues, expenses, and cash flows are included in the combined financial statements once the adjustments and eliminations from intercompany transactions have been made.
The comprehensive income of combined entities is included in the combined statement of comprehensive income from the date when Enersis Chile obtains control of the combined entity and until the date on which it loses control of the combined entity.
The operations of Enersis Chile and its combined entities have been combined under the following principles:
| 1. | At the date Enersis Chile obtains control, the combined entity’s assets acquired and its liabilities assumed are recorded at fair value, except for certain assets and liabilities that are recorded using valuation principles established in other IFRS standards. If the fair value of the consideration transferred plus the fair value of any non-controlling interest exceeds the fair value of the net assets acquired, this difference is recorded as goodwill. In the case of a bargain purchase, the resulting gain is recognized in profit or loss for the period after reassessing whether all of the assets acquired and the liabilities assumed have been properly identified and following a review of the procedures used to measure the fair value of these amounts. |
For each business combination, the Combined Group chooses whether to measure the non-controlling interests in an acquired company at fair value or at the proportional share of the net identifiable assets acquired.
If the fair value of assets acquired and liabilities assumed at the acquisition date it has not been completed, the Combined Group reports the provisional values recorded. During the measurement period, which shall not exceed one year from the acquisition date, the provisional values recognized will be adjusted retrospectively and additional assets or liabilities will be recognized to reflect new information obtained on events and circumstances that existed on the acquisition date, but which were unknown to management at that time.
For business combinations achieved in stages, the fair value of the equity interest previously held in the acquired company is measured on the date of acquisition and any profit or loss is recognized in the results for that fiscal year.
| 2. | Non-controlling interests in equity and in the comprehensive income of the combined entities are presented, respectively, under the line items “Total Equity: Non-controlling interests” in the combined statement of financial position and “Net Income attributable to non-controlling interests” and “Comprehensive income attributable to non-controlling interests” in the combined statement of comprehensive income. |
F-21
Table of Contents
| 3. | The financial statements of combined entities with functional currencies other than the Chilean peso are translated as follows: |
| a. | For assets and liabilities, the prevailing exchange rate on the closing date of the financial statements is used. |
| b. | For items in the comprehensive income statement, the average exchange rate for the period is used (unless this average is not a reasonable approximation of the cumulative effect of the exchange rates in effect on the dates of the transactions, in which case the exchange rate in effect on the date of each transaction is used). |
| c. | Equity remains at the historical exchange rate from the date of acquisition or contribution, and retained earnings at the average exchange rate at the date of origination. |
| d. | Exchange differences arising in translation of financial statements are recognized in the item “Foreign currency translation gains (losses)” in other comprehensive income (see Note 26.2). |
| 4. | Balances and transactions between combined entities were fully eliminated in the combination process. |
| 5. | Changes in interests in combined entities that do not result in taking or losing control are recorded as equity transactions, and the book value of the controlling and non-controlling interests is adjusted to reflect the change in relative interest in the combined entity. Any difference that may exist, between the value for which a non-controlling interest is adjusted and the fair value of a compensation paid or received, is recognized directly in Equity attributable to Enersis Chile. |
| 6. | Business combinations under common control are recorded using, as a reference, the ‘pooling of interest’ method. Under this method, the assets and liabilities involved in the transaction remain reflected at the same book value at which they were recorded in the ultimate controlling company, although subsequent accounting adjustments may need to be made to align the accounting policies of the companies involved. |
Any difference between the assets and liabilities contributed to the combination and the compensation given is recorded directly in Net equity as a debit or credit to other reserves. The Combined Group does not apply retrospective accounting records of business combinations under common control.
| 3. | ACCOUNTING POLICIES APPLIED |
The main accounting policies used in preparing the accompanying combined financial statements are the following:
a) Property, plant and equipment
Property, plant and equipment are measured at acquisition cost, net of accumulated depreciation and any impairment losses they may have experienced. In addition to the price paid to acquire each item, the cost also includes, where applicable, the following concepts:
| • | Financing expenses accrued during the construction period that are directly attributable to the acquisition, construction, or production of qualified assets, which require a substantial period of time before being ready for use such as, for example, electricity generation or distribution facilities. The Combined Group defines “substantial period” as one that exceeds twelve months. The interest rate used is that of the specific financing or, if none exists, the weighted average financing rate of the company carrying out the investment. The weighted average financing rate was 5.10% as of September 30, 2015 and 8.8% as of September 30, 2014. The amount capitalized for this concept amounted to ThCh$1,354,490 and ThCh$1,022,024 during the periods ended September 30, 2015 and 2014, respectively (see Note 33). |
| • | Employee expenses directly related to construction in progress. The amounts capitalized under this concept for the periods ended September 30, 2015 and 2014 were ThCh$16,076,024 and ThCh$15,904,921, respectively. |
F-22
Table of Contents
| • | Future disbursements that the Combined Group will have to incur to close its facilities are added to the cost of the asset, recognizing the corresponding provision for dismantling or restoration. The Combined Group reviews its estimates on an annual basis, increasing or decreasing the value of the asset and the liability based on the results of this estimate (see Note 24). |
Items for construction work in progress are transferred to operating assets once the testing period has been completed and they are available for use, at which time depreciation begins.
Expansion, modernization or improvement costs that represent an increase in productivity, capacity or efficiency, or a longer useful life are capitalized as increasing the cost of the corresponding assets.
The replacement or overhaul of entire components that increase the asset’s useful life or economic capacity are recorded as an increase in cost for the respective assets, derecognizing the replaced or overhauled components.
Expenditures for periodic maintenance, conservation and repair are recognized directly as an expense for the year in which they are incurred.
The Combined Group, based on the outcome of impairment testing performed as explained in Note 3.e), considers that the carrying amount of assets does not exceed their recoverable amount.
Property, plant and equipment, net of its residual value, is depreciated by distributing the cost of the different items that comprise it on a straight-line basis over its estimated useful life, which is the period during which the Combined Group expects to use the assets. Useful life estimates and residual values are reviewed on an annual basis and if appropriate adjusted prospectively.
The following table sets forth the main categories of property, plant and equipment with their respective estimated useful lives:
Categories of Property, plant and equipment | Years of estimated useful lives | |
Buildings | 22 - 100 | |
Plant and equipment | 3 - 85 | |
IT equipment | 3 - 15 | |
Fixtures and fittings | 5 - 21 | |
Motor vehicles | 5 - 10 | |
Other | 2 - 33 |
Additionally, the following table sets forth more details on the useful lives of plant and equipment items:
| Years of estimated useful lives | ||
Generating facilities: | ||
Hydroelectric plants | ||
Civil engineering works | 35-65 | |
Electromechanical equipment | 10-85 | |
Fuel oil/coal-fired power plants | 25-40 | |
Combined cycle plants | 10-35 | |
Renewable energy power plants | 35 | |
Transmission and distribution facilities: | ||
High-voltage network | 10-80 | |
Low- and medium-voltage network | 7-62 | |
Measuring and remote control equipment | 3-76 | |
Other facilities | 4-25 | |
Natural gas transport facilities | ||
Pipelines | 35 |
F-23
Table of Contents
Land is not depreciated since it has an indefinite useful life.
Gains or losses that arise from the sale or disposal of items of Property, plant and equipment are recognized as “Other gains (losses)” in the comprehensive income statement and are calculated by deducting the net book value of the asset and any sales expenses from the amount received in the sale.
Investment property includes land and buildings held for the purpose of earning rentals and/or for capital appreciation.
Investment property is measured at acquisition cost less any accumulated depreciation and impairment losses that have been incurred. Investment property, excluding land, is depreciated on a straight-line basis over the useful lives of the related assets.
An investment property is derecognized upon disposal or when no future economic benefits are expected from its use or disposal.
Gains or losses on derecognition of the investment property is calculated as the difference between the net disposal proceeds and the carrying amount of the asset.
The breakdown of the fair value of investment property is detailed in Note 18.
Goodwill arising from business combinations represents the excess of the consideration paid plus the amount of any non-controlling interests over the Combined Group’s share of the net value of the assets acquired and liabilities assumed, measured at fair value at the acquisition date. If the accounting for a business combination is completed, as well as the determination of goodwill, after the end of the reporting period in which the combination occurs, the amounts previously reported presented are adjusted, for comparative purposes to include the value of the assets acquired and liabilities assumed and the value of the final goodwill as of acquisition date.
Goodwill arising from acquisition of entities with functional currencies other than the Chilean peso is measured in the functional currency of the acquired company and translated to Chilean pesos using the closing exchange rate.
Goodwill is not amortized; instead, at the end of each reporting period or when there are indicators that an impairment might have occurred, the Combined Group estimates whether any impairment loss has reduced its recoverable amount to an amount less than the carrying amount and, if so, it impairment loss is immediately recognized in profit or loss (see Note 3.e).
d) Intangible assets other than goodwill
Intangible assets are initially recognized at their acquisition cost or production cost, and are subsequently measured at their cost, net of their accumulated amortization and impairment losses they may have experienced.
Intangible assets are amortized on a straight line basis during their useful lives, starting from the date when they are ready for use, except for those with an indefinite useful life, which are not amortized. As of September 30, 2015 and December 31, 2014, there are no significant intangible assets with an indefinite useful life.
An intangible asset is derecognized on disposal, or when no future economic benefits are expected from use or disposal. Gains or losses arising from derecognition of an intangible asset, measured as the difference between the net disposal proceeds and de carrying amount of the asset are recognized in profit or loss when the asset is derecognized.
The criteria for recognizing these assets’ impairment losses and, if applicable, recovery of impairment losses recorded in previous fiscal years are explained in Note 3.e below.
F-24
Table of Contents
d.1) Research and development expenses
The Combined Group recognizes the costs incurred in a project’s development phase as intangible assets in the statement of financial position as long as the project’s technical feasibility and future economic benefits have been demonstrated.
Other intangible assets correspond to computer software, water rights, and easements. They are initially recognized at acquisition or production cost and are subsequently measured at cost less accumulated amortization and impairment losses, if any.
Computer software is amortized (on average) over five years. Certain easements and water rights have indefinite useful lives and, therefore, are not amortized, while others have useful lives ranging from 40 to 60 years, depending on their characteristics, and they are amortized over that term.
e) Impairment of non-financial assets
During the year, and principally at the end of each reporting period, the Combined Group evaluates whether there is any indication that an asset has been impaired. If any such indication exist, the Combined Group estimates the recoverable amount of that asset to determine the amount of the impairment loss. In the case of identifiable assets that do not generate cash flows independently, the Combined Group estimates the recoverable amount of the Cash Generating Unit (CGU) to which the asset belongs, which is understood to be the smallest identifiable group of assets that generates independent cash inflows.
Notwithstanding the preceding paragraph, in the case of CGUs to which goodwill or intangible assets with an indefinite useful lives have been allocated, a recoverability analysis is performed routinely at each period end.
Recoverable amount is the higher of fair value less costs of disposal and value in use, which is defined as the present value of the estimated future cash flows. In order to calculate the recoverable amount of Property, plant, and equipment, as well as of goodwill, and intangible assets, the Combined Group uses value in use criteria in practically all cases.
To estimate value in use, the Combined Group prepares future pre-tax cash flow projections based on the most recent budgets available. These budgets incorporate management’s best estimates of a CGUs’ revenue and costs using sector projections, past experience and future expectations.
In general, these projections cover the next five years, estimating cash flows for subsequent years by applying reasonable growth rates which, in no case, are increasing rates nor exceed the average long-term growth rates for the particular sector and country in which the Combined Group operates. As of September 30, 2105 and December 31, 2014, projections were extrapolated from the following rates:
Growth Rates (g) | ||||
9-30-2015 | 12-31-2014 | |||
4.1% - 5.1% | 2.2% - 5.0% | |||
Future cash flows are discounted to calculate their present value at a pre-tax rate that covers the cost of capital for the business activity and the geographic area in which it is being carried out. The time value of money and risk premiums generally used among analysts for the business activity and the geographic zone are taken into account to calculate the pre-tax rate.
The following are the pre-tax discount rates applied in 2015 and 2014 expressed in nominal terms:
September 2015 | December 2014 | |||||||||||
Minimum | Maximum | Minimum | Maximum | |||||||||
8.7% | 13.1 | % | 7.9 | % | 13.0 | % | ||||||
F-25
Table of Contents
If the recoverable amount of the CGU is estimated to be less than its carrying amount, an impairment loss is recognized in the combined statement of comprehensive income. The impairment is first allocated to reduce the carrying amount of any goodwill allocated to the CGU, and then to the other assets of the unit pro rata on the basis of the carrying amount of each asset in the unit. The carrying amount of an asset is not reduced below the highest of fair value less costs of disposal, its value in use; or zero.
Impairment losses recognized for an asset in prior periods are reversed when there are indications that the impairment loss no longer exists or may have decreased, thus increasing the asset’s carrying amount with a credit to earnings. The increase in the asset’s carrying amount shall not exceed that carrying amount that would have been determined had no impairment loss been recognized for the asset. Goodwill impairment losses are not reversed in subsequent periods.
In order to determine whether an arrangement is, or contains, a lease, the Combined Group assesses the economic substance of the agreement, in order to determine whether fulfillment of the arrangement depends on the use of a specific asset and whether the agreement conveys the right to use an asset. If both conditions are met, at the inception of the arrangement the Combined Group separates the payments and other considerations relating to the lease, at their fair values, from those corresponding to other components of the agreement.
Leases that substantially transfer all the risks and rewards of ownership to the Combined Group are classified as finance leases. All others leases are classified as operating leases.
Finance leases in which the Combined Group acts as a lessee are recognized at the inception of the arrangement. At that time, the Combined Group records an asset based on the nature of the lease and a liability for the same amount, equal to the fair value of the leased asset or the present value of the minimum lease payments, if the latter is lower. Subsequently, the minimum lease payments are apportioned between finance expenses and reduction of the lease obligation. Finance expenses are recognized immediately in the income statement and allocated over the lease term, so as to achieve a constant interest rate on the remaining balance of the liability. Leased assets are depreciated on the same terms as other similar depreciable assets, as long as there is reasonable certainty that the lessee will acquire ownership of the asset at the end of the lease. If no such certainty exists, the leased assets are depreciated over the shorter of the useful lives of the assets and their lease term.
In the case of operating leases, payments are recognized as an expense in the case of the lessee and as income in the case of the lessor, both on a straight-line basis, over the term of the lease unless another type of systematic basis of distribution is deemed more representative.
Financial instruments are contracts that give rise to both a financial asset in one entity and a financial liability or equity instrument in another entity.
Purchases and sales of financial assets are accounted for using their trade date.
g.1) Financial assets other than derivatives
The Combined Group classifies its financial assets other than derivatives, whether permanent or temporary, except for investments accounted for using equity method (See Note 14) and those held for sale, into four categories:
| • | Loans and account receivables: Trade and other receivables and accounts receivable from related companies are recognized at amortized cost, which is the initial fair value less principal repayments made, plus accrued and uncollected interest, calculated using the effective interest method. |
F-26
Table of Contents
The effective interest method is used to calculate the amortized cost of a financial asset or liability (or group of financial assets or financial liabilities) and of allocating finance income or cost over the relevant period. The effective interest rate is the rate that exactly discounts estimated future cash flows to be received or paid over the expected life of the financial instrument or, when appropriate, a shorter period to the net carrying amount of the financial asset or financial liability.
| • | Held-to-maturity investments: Investments that the Combined Group intends to hold and is capable of holding until their maturity are accounted for at amortized cost as defined in the preceding paragraph. |
| • | Financial assets at fair value with changes in net income: This category includes the trading portfolio and those financial assets that have been designated as such upon initial recognition and that are managed and evaluated on a fair value basis. They are measured in the combined statement of financial position at fair value, with changes in value recorded directly in income when they occur. |
| • | Available-for-sale financial assets: These are financial assets specifically designated as available-for-sale or are not classify within any of the three preceding categories. |
These investments are recognized in the combined statement of financial position at fair value when it can be reliably determined. For investments in equity instruments in unlisted companies or companies with lower levels of liquidity, normally the fair value cannot be reliably measured. When this occurs, those investments in equity instruments are measured at cost less impairment losses, if any.
Changes in fair value, net of taxes, are recognized in other comprehensive income, until the investments are disposed of, at which time the amount accumulated in other comprehensive income is reclassified to profit or loss.
If the fair value is lower than cost, and if there is objective evidence that the asset has been more than temporarily impaired, the difference is recognized directly in profit or loss.
Purchases and sales of financial assets are accounted for using their trade date.
g.2) Cash and cash equivalents
This item within the interim combined statement of financial position includes cash and bank balances, time deposits, and other highly liquid investments (with original maturity of less than or equal to 90 days) that are readily convertible to cash and are subject to insignificant risk of changes in value.
g.3) Impairment of financial assets
The following criteria are used to determine if a financial assets has been impaired:
| • | For trade receivables in the electricity generation, transmission and distribution segments, the Combined Group’s policy is to recognized impairment losses when there is objective evidence that the balance will not be recoverable. In general terms, the Combined Group’s entities has a defined policy to recognize an allowance for impairment losses based on the aging of past-due balances, except in those cases where a specific collective basis analysis is recommended, such as in the case of receivables from government-owned companies (see Note 9). |
| • | In the case of receivables of a financial nature, that are included in the “Loan and receivables” and “Investment held-to-maturity”, impairment is determined on case-by-case basis and is measured as the difference between the carrying amount and the present value of the future estimated cash flows discounted at the original effective interest rate (see Notes 8 and 22). |
| • | For financial investments available-for-sale, the criteria for impairment applied are described in Note 3.g.1 |
F-27
Table of Contents
g.4) Financial liabilities other than derivatives
Financial liabilities are recognized based on cash received, net of any costs incurred in the transaction. In subsequent periods, these obligations are measured at their amortized cost using the effective interest rate method (see Note 3.g.1).
In the particular case that a liability is the hedged item in a fair value hedge, as an exception, such liability is measured at its fair value for the portion of the hedged risk.
In order to calculate the fair value of debt, both when it is recorded in the statement of financial position and for fair value disclosure purposes as shown in Note 22, debt has been divided into fixed interest rate debt (hereinafter “fixed-rate debt”) and variable interest rate debt (hereinafter “floating-rate debt”). Fixed-rate debt is that on which fixed-interest coupons established at the beginning of the transaction are paid explicitly or implicitly over its term. Floating-rate debt is that debt issued at a variable interest rate, i.e., each coupon is established at the beginning of each period based on the reference interest rate. All debt has been measured by discounting expected future cash flows with a market interest rate curve based on the payment currency.
g.5) Derivative financial instruments and hedge accounting
Derivatives held by the Combined Group are transactions entered into to hedge interest and/or exchange rate risk, intended to eliminate or significantly reduce these risks in the underlying transactions being hedged.
Derivatives are recorded at fair value at the end of each reporting period as follows: if their fair value is positive, they are recorded within “Other financial assets”; and if their fair value is negative, they are recorded within “Other financial liabilities.” For derivatives on commodities, the positive fair value is recorded in “Trade and other receivables,” and negative fair values are recorded in “Trade and other liabilities.”
Changes in fair value are recorded directly in profit or loss, except when the derivative has been designated for hedge accounting purposes as a hedge instrument (in a cash flow hedge) and all of the conditions for applying hedge accounting are met, including that the hedge be highly effective. In this case, changes are recorded as follows:
| • | Fair value hedges: The underlying portion for which the risk is being hedged (hedged risk) and the hedge instrument are measured at fair value, and any changes in value of both items are recognized in the combined statement of comprehensive income by offsetting the effects in the same comprehensive income statement account. |
| • | Cash flow hedges: Changes in fair value of the effective portion of the hedged item and hedge instrument are recorded in other comprehensive income an accumulated in an equity reserve known as “Reserve for cash flow hedges.” The cumulative gain or loss in in this reserve is reclassified to the combined statement of comprehensive income to the extent that the hedged item impacts the combined statement of comprehensive income offsetting the effect in the same comprehensive income statement account. Gains or losses from the ineffective portion of the hedging relationship are recorded directly in the combined statement of comprehensive income. |
A hedge relationship is considered highly effective when changes in fair value or in cash flows of the underlying item directly attributable to the hedged risk are offset by changes in fair value or cash flows of the hedging instrument, with an effectiveness ranging from 80% to 125%.
As a general rule, long-term commodity purchase or sale agreements are recorded in the combined statement of financial position at their fair value at the end of each reporting period, recognizing any differences in value directly in profit or loss, except for, when all of the following conditions are met:
| • | The sole purpose of the agreement is for the Combined Group’s own use, which is understood as: (i) in the case of fuel purchase agreements its used to generate electricity; (ii) in the case of electrical energy purchased for sale, its sale to the end-customers; and, (i) in the case of electricity sales its sale to the end-customers. |
F-28
Table of Contents
| • | The Combined Group’s future projections evidence the existence of these agreements for its own use. |
| • | Past experience with agreements evidence that they have been utilized for the Combined Group’s own use, except in certain isolated cases when for exceptional reasons or reasons associated with logistical issues have been used beyond the control and projection of the Combined Group. |
| • | The agreement does not stipulate settlement by differences and the parties have not made it a practice to settle similar contracts with differences in the past. |
The long-term commodity purchase or sale agreements maintained by the Combined Group, which are mainly for electricity, fuel, and other supplies, meet the conditions described above. Thus, the purpose of fuel purchase agreements is to use them to generate electricity, electricity purchase contracts are used to sell to end-customers, and electricity sale contracts are used to sell the Combined Group’s own products.
The Combined Group also evaluates the existence of derivatives embedded in contracts or financial instruments to determine if their characteristics and risk are closely related to the principal contract, provided that when taken as a whole they are not being accounted for at fair value. If they are not closely related, they are recorded separately and changes in value are accounted for directly in the comprehensive income statement.
The fair value of financial derivatives is determined using the following procedures:
| • | For derivatives quoted in an organized market, its quoted price at the end of each reporting period. |
| • | For derivatives non-quoted in an organized market, the Combined Group measures derivatives not traded on active markets by using the discounted cash flow method and generally accepted options valuation models, based on current and future market conditions as of year-end. It also adjusts the value according to its own credit risk (Debt Valuation Adjustment, DVA), and the counterparty risk (Credit Valuation Adjustment, CVA). These CVA and DVA adjustments are measured on the basis of the potential future exposure of the instrument (creditor or borrower position) and the risk profile of both the counterparties and the Combined Group itself. |
g.6) Derecognition of financial assets and liabilities
Financial assets are derecognized when:
| • | The contractual rights to receive cash flows from the financial asset expire or have been transferred or, if the contractual rights are retained, the Combined Group has assumed a contractual obligation to pay these cash flows to one or more recipients. |
| • | The Combined Group has substantially transferred all the risks and rewards of ownership of the financial asset, or, if it has neither transferred nor retained substantially all the risks and rewards, when it does not retain control of the financial asset. |
Transactions in which the Combined Group retains substantially all the inherent risks and rewards of ownership of the transferred asset, it continues recognizing the transferred asset in its entirety and recognizes a financial liability for the consideration received. Transactions costs are recognized in profit and loss by using the effective interest method (see Note 3.g.1).
Financial liabilities are derecognized when they are extinguished, that is, when the obligation arising from the liability has been paid or cancelled, or has expired.
g.7) Offsetting financial assets and liabilities.
The Combined Group offsets financial assets and liabilities and the net amount is presented in the statement of financial position when, and only when:
| • | There is a legally enforceable right to set off the recognized amounts; and |
F-29
Table of Contents
| • | There is an intention to settle on a net basis, or to realize the asset and settle the liability simultaneously. |
g.8) Financial guarantee contracts
Financial guarantee contracts, such as guarantees given by the Combined Group to third parties, are initially recognized at fair value, adjusting the transaction costs that are directly attributable to the issuance of the guarantee.
Subsequently to initial recognition, financial guarantee contracts are measured at the higher of:
| • | the amount determined under accounting policy describe in Note 3.m; and |
| • | the amount initially recognized less, if appropriate, any accumulated amortization. |
The fair value of an asset or liability is defined as the price that would be received from the sale of an asset or paid to transfer a liability in an orderly transaction between market participants at the measurement date.
Fair value measurement assumes that the transaction to sell an asset or transfer a liability occurs in the principal market, namely, the market with the greatest volume and level of activity for that asset or liability. In the absence of a principal market, it is assumed that the transaction is carried out in the most advantageous market available to the entity, namely, the market that maximizes the amount that would be received to sell the asset or minimizes the amount that would be paid to transfer the liability.
In estimating fair value, the Combined Group uses valuation techniques that are appropriate for the circumstances and for which there are sufficient data to conduct the measurement. The Combined Group maximizes the use of relevant observable data and minimizes the use of unobservable data.
Considering the hierarchy of the data used in these valuation techniques, the assets and liabilities measured at fair value can be classified into the following levels:
| Level 1: | Quoted prices (unadjusted) in active markets for identical assets or liabilities; | |
| Level 2: | Inputs other than quoted prices included within Level 1 that are observable for the assets or liabilities, either directly (i.e. as prices) or indirectly (i.e. derived from prices). The methods and assumptions used to determine the fair values at Level 2 by type of financial asset or financial liability take into consideration estimated future cash flows discounted at zero coupon interest rate curves for each currency. All the valuations described are carried out using external tools, such as “Bloomberg”. | |
| Level 3: | Inputs for assets or liabilities that are not based on observable market data (unobservable inputs). | |
The Combined Group takes into account the characteristics of the asset or liability when measuring fair value, in particular:
| • | For non-financial assets, fair value measurement takes into account the ability of a market participant to generate economic benefits by using the asset in its highest and best use or by selling it to another market participant that would use the asset in its highest and best use; |
| • | For liabilities and equity instruments, the fair value measurement assumes that the liability would not be settled and an equity instrument would not be cancelled or otherwise extinguished on the measurement date. The fair value of the liability reflects the effect of non-performance risk, namely, the risk that an entity will not fulfill the obligation, which includes, but is not limited to, the Combined Group’s own credit risk; |
F-30
Table of Contents
| • | In the case of financial assets and financial liabilities with offsetting positions in market risks or counterparty credit risks, it is permitted to measure the fair value on a net basis. However, this must be consistent with the manner in which market participants would price the net risk exposure at the measurement date. |
i) Investments accounted for using the equity method
The Combined Group’s interests in joint ventures and associates are recognized using the equity method.
Under the equity method, an investment in an associate or joint venture is initially recognized at cost. As of the acquisition date, the investment is recognized in the statement of financial position based on the share of its equity that the Combined Group’s interest represents in its capital, adjusted for, if appropriate, the effect of transactions with Combined Group’s entities, plus any goodwill generated in acquiring the entity. If the resulting amount is negative, zero is recorded for that investment in the statement of financial position, unless the Combined Group has a present obligation (either legal or constructive) to support the investee’s negative equity situation, in which case a provision is recognized.
Goodwill from associates or joint ventures is included in the carrying amount of the investment. It is not amortized but is subject to impairment testing as part of the overall investment carrying amount when impairment indicators exist.
Dividends received from these investments are deducted from the carrying amount of the investment, and any profit or loss obtained from them to which the Combined Group is entitled based on its ownership interest is recognized under “Share of profit (loss) of associates accounted for using equity method.”
Appendix No. 3, “Enersis Chile Combined Group Associated Companies and Joint Ventures,” to these combined interim financial statements, provides information about the relationship of Enersis with each of these entities.
Inventories are measured at their weighted average acquisition cost or the net realizable value, whichever is lower.
k) Non-current assets held for sale and discontinued operations
The Combined Group classifies property, plant and equipment; intangible assets; investments accounted for using the equity method, joint ventures, and disposal groups (a group of assets to be disposed of and the liabilities directly associated with those assets) as non-current assets held for sale, if, as of the date of the combined financial statements, the Combined Group has taken active measures for their sale and estimates that such sale is highly probable.
Non-current assets held-for-sale or disposal groups are measured at the lower of their carrying amount and fair value less costs of disposal. Depreciation and amortization on these assets cease when they meet the criteria to be classified as non-current assets held for sale.
Assets that are no longer classified as held for sale, or are no longer part of a disposal group, are measured at the lower of their carrying amounts before being classified as held for sale less any depreciations, amortizations or revaluations that would have been recognized if they had not been classified as held for sale and their recoverable amount at the date of subsequent decision where would be reclassified as non-current assets.
Non-current assets and the components of the disposal groups classified as held for sale are presented in the combined statement of financial position as a single line item within assets called “Non-current assets or disposal groups classified as held for sale,” and the respective liabilities are presented as a single line item within liabilities called “Liabilities included in disposal groups classified as held for sale.”
F-31
Table of Contents
The Combined Group classifies as discontinued operations those separate major lines of business that have been sold or disposed of, or are classified as held for sale, including other assets that are part of the same coordinated sales or disposal plan. Similarly, entities that have been acquired exclusively with a view to resale are also considered discontinued operations.
The components of profit or loss after taxes from discontinued operations are presented as a single line item in the combined comprehensive income statement as “Net income from discontinued operations”.
Provisions are recognized when the Combined Group has a present obligation (legal or constructive) as a result of a past event, it is probable that the Combined Group will be required to settle the obligation, and a reliable estimate can be made of the amount of the obligation. The amount recognized as a provision is the best estimate of the consideration required to settle the present obligation at the end of the reporting period, taking into account the risks and uncertainties surrounding the obligation. When a provision is measured using the cash flows estimated to settle the present obligation, its carrying amount is the present value of those cash flows (when the effect of the time value of money is material).
Provisions are measured using the best information available as of the date of issuance of the combined financial statements considering the consequences of the event causing the provision and are re-estimated at the end of each subsequent reporting period.
l.1) Provisions for post-employment benefits and similar obligations
Some of the combined entities have pension and similar obligations with their employees. These obligations, which can be defined benefits and defined contributions, are basically formalized through pension plans, except for certain non-monetary benefits, mainly electricity supply commitments, which, due to their nature, have not been externalized and are covered by the related in-house provisions.
For defined benefit plans, the cost of providing benefits is determined using the Projected Unit Credit Method, with actuarial valuations being carried out at the end of each reporting period. Past service costs relating to changes in benefits are recognized immediately.
The defined benefit plan obligations in the statement of financial position represent the present value of the accrued obligations, adjusted, once the fair value of the different plans’ assets has been deducted, if any.
For each of the defined benefit plans, any deficit between the actuarial liability and the plan assets (if any) is recognized under line item “Provisions for employee benefits” within current and non-current liabilities in the combined statement of financial position.
Actuarial gains and losses arising in measurement of both the plan liabilities and the plan assets (if any, and excluding interest) are recognized directly in other comprehensive income.
Contributions to defined contribution benefit plans are recognized as an expense in the combined statement of comprehensive income when the employees have rendered their services.
m) Translation of foreign currency balances
Transactions carried out by each entity in a currency other than its functional currency are recognized using the exchange rates prevailing as of the date of the transactions. During the year, any differences that arise between the prevailing exchange rate at the date of the transaction and the exchange rate as of the date of collection or payment are recognized as “Foreign currency exchange differences” in the combined statement of comprehensive income.
Likewise, at the end of each reporting period, receivable or payable balances denominated in a currency other than each entity’s functional currency are translated using the closing exchange rate. Any differences
F-32
Table of Contents
are recorded as “Foreign currency exchange differences” in the combined statement of comprehensive income.
The Combined Group has established a policy to hedge the portion of revenue from its combined entities that is directly linked to variations in the U.S. dollar, through obtaining financing in such currency. Exchange differences related to this debt, which is regarded as the hedging instrument in cash flow hedge transactions, are recognized, net of taxes, in other comprehensive income and are accumulated in an equity reserve and reclassified to profit or loss when the hedged cash flows impact profit or loss. This term has been estimated at five years.
n) Current/non-current classification
In these combined statements of financial position, assets and liabilities expected to be recovered or settled within twelve months are presented as current items, except for post-employment and other similar obligations. Those assets and liabilities expected to be recovered or settled in more than twelve months are presented as non-current items. Deferred income tax assets and liabilities are classified as non-current.
When the Combined Group have any obligations that mature in less than twelve months but can be refinanced over the long term at the Combined Group’s discretion, through unconditionally available credit agreements with long-term maturities, such obligations are classified as long-term liabilities.
Income tax expense for the period is determined as the sum of current taxes from the Combined Group’s different combined entities and results from applying the tax rate to the taxable income for the period, after permitted deductions have been made, plus any changes in deferred tax assets and liabilities and tax credits, both for tax losses and deductions. Differences between the carrying amount and tax basis of assets and liabilities generate deferred tax assets and liabilities, which are calculated using the tax rates expected to apply when the assets and liabilities are realized or settled, based on tax rates that have been enacted or substantively enacted by the end of the reporting period.
Deferred tax assets are recognized for all deductible temporary differences, tax losses and unused tax credits to the extent that it is probable that sufficient future taxable profits exist to recover the deductible temporary differences and make use of the tax credits. Such deferred tax asset is not recognized if the deductible temporary difference arises from the initial recognition of an asset or liability that:
| • | Did not arise from a business combination, and |
| • | At initial recognition affected neither accounting profit nor taxable profit (loss). |
With respect to deductible temporary differences associated with investments in combined entities, associates and joint arrangements, deferred tax assets are recognized only to the extent that it is probable that the temporary differences will reverse in the foreseeable future and taxable profits will be available against which the temporary differences can be utilized.
Deferred tax liabilities are recognized for all temporary differences, except those derived from the initial recognition of goodwill and those that arose from investments in combined entities, associates and joint ventures in which the Combined Group can control their reversal and where it is probable that they will not be reversed in the foreseeable future.
Current tax and changes in deferred tax assets or liabilities are recorded in profit or loss or in equity, depending on where the gains or losses that triggered these tax entries have been recognized.
Any tax deductions that can be applied to current tax liabilities are credited to earnings within the line item “Income tax expenses”, except when doubts exist about their tax realization, in which case they are not recognized until they are effectively realized, or when they correspond to specific tax incentives, in which case they are recorded as government grants.
F-33
Table of Contents
At the end of each reporting period, the Combined Group reviews the deferred taxes assets and liabilities recognized, and makes, if any, necessary corrections based on the results of this analysis.
Deferred tax assets and deferred tax liabilities are offset in the combined statement of financial position if has a legally enforceable right to set off current tax assets against current tax liabilities, and only when the deferred taxes relate to income taxes levied by the same taxation authority.
p) Revenue and expense recognition
Revenue is recognized when the gross inflow of economic benefits arising in the course of the Combined Group’s ordinary activities in the period occurs, provided that this inflow of economic benefits results in an increase in total equity other than increases relating to contributions from equity participants and such benefits can be measured reliably.
Revenues and expenses are recognized on an accrual basis and depending on the type of transaction; the following criteria for recognition are taken:
| • | Generation of electricity: Revenue is recognized based on physical delivery of energy and power, at prices established in the respective contracts, at prices stipulated in the electricity market by applicable regulations or at marginal cost determined on the spot market, as the case. This revenue includes an estimate of the service provided and not billed until the closing date (see Note 2.3). |
| • | Distribution of electricity: Revenue is recognized based on the amount of energy supplied to customers during the period, at prices established in the respective contracts or at prices stipulated in the electricity market by applicable regulations, as appropriate. This revenue includes an estimate of the energy supplied not yet read the meters customer (see Note 2.3). |
Revenue is recognized based on the economic substance of the transaction and are recognized when all and each of the following conditions are met:
| • | the entity has transferred to the buyer the significant risks and rewards of ownership of the goods; |
| • | the entity retains neither continuing managerial involvement to the degree usually associated with ownership nor effective control over the goods sold; |
| • | the amount of revenue can be measured reliably; |
| • | it is probable that the economic benefits associated with the transaction will flow to the entity; and |
| • | the costs incurred or to be incurred in respect of the transaction can be measured reliably. |
Revenue is measured at the fair value of the consideration received or receivable that gives rise to the revenue.
In arrangements under which the Combined Group will perform multiple revenue-generating activities (multiple-element arrangement), the recognition criteria are applied to the separately identifiable components of the transaction in order to reflect the substance of the transaction or to two or more transactions together when they are linked in such a way that the commercial effect cannot be understood without reference to the series of transactions as a whole.
Revenue from rendering of services is only recognized when it can be estimated reliably, by reference to the stage of completion of the service rendered at the date of the statement of financial position. When the outcome of a transaction involving the rendering of services cannot be estimated reliably, revenue is recognized only to the extent of the expenses recognized that are recoverable.
The Combined Group excludes from revenue those gross inflows of economic benefits it receives when it acts as an agent or commission agent on behalf of third parties, and only recognizes as revenue economic benefits received for its own activity.
F-34
Table of Contents
When goods or services are exchanged or swapped for goods or services of a similar nature and value, the exchange is not regarded as a revenue-generating transaction.
The Combined Group recognizes the net amount of non-financial asset purchases or sale contracts that are settled for a net amount of cash or through some other financial instruments. Contracts entered into and maintained for the purpose of receiving or delivering these non-financial assets are recognized on the basis of the contractual terms of the purchase, sale, or usage requirements expected by the entity.
Financial income (expense) is recognized using the effective interest rate applicable to the outstanding principal over the repayment period.
Expenses are recognized on an accruals basis, immediately in the event of expenditures that do not generate future economic benefits or when they do not meet the requirements for recording them as assets.
Article 79 of the Chilean Companies Act establishes that, unless unanimously agreed otherwise by the shareholders of all issued shares, listed corporations must distribute a cash dividend to shareholders on an annual basis, pro rata to the shares owned or the proportion established in the company’s by-laws if there are preferred shares, of at least 30% of net income for each year, except when accumulated losses from prior years must be absorbed.
As it is practically impossible to achieve a unanimous agreement not to approve the mandatory dividend, given Enersis’ highly fragmented share capital. At the end of each reporting period the amount of the minimum statutory dividend obligation to its shareholders is determined, net of interim dividends approved during the fiscal year, and then accounted for in “Trade and other current payables” and “Accounts payable to related companies,” as appropriate, and recognized in Equity.
Interim and final dividends are deducted from Equity when approved by the competent body, which in the first case is normally the Board of Directors and in the second case is the shareholders as agreed at an Ordinary Shareholders’ Meeting.
Capital issuance costs, only when represents incremental expenses directly attributable to the transaction, are recognized directly in equity as a deduction from “Allocated capital”, net of any applicable taxes. If the allocated capital account has a zero balance or if the costs described exceed the balance, they are recognized in “Other reserves.”
s) Interim financial statements
The accompanying interim financial statements of the Combined Group as of September 30, 2015 and for the nine months ended September 30, 2015 and 2014 have been prepared in accordance with International Accounting Standards 34, Interim Financial Reporting.
| 4. | SECTOR REGULATION AND ELECTRICITY SYSTEM OPERATIONS |
The electricity sector is regulated by the General Law of Electrical Services (Chilean Electricity Law), also known as DFL No. 1 of 1982, of the Ministry of Mining, whose compiled and coordinated text was established in DFL No. 4 issued in 2006 by the Ministry of Economy (the Electricity Law), as well as by an associated Regulation (D.S. No. 327 issued in 1998). Three government bodies are primarily responsible for enforcing this law: the National Energy Commission (CNE), which has the authority to propose regulated tariffs (node prices) and to draw up indicative plans for the construction of new generating units; the
F-35
Table of Contents
Superintendency of Electricity and Fuels (SEF), which supervises and oversees compliance with the laws, regulations, and technical standards that govern the generation, transmission, and distribution of electricity, as well as liquid fuels, and gas; and the Ministry of Energy, which is responsible for proposing and guiding public policies on energy matters. It also oversees the SEF, the CNE, and the Chilean Commission for Nuclear Energy (ChCNE), thus strengthening coordination and allowing for an integrated view of the energy sector. The Ministry of Energy also includes the Agency for Energy Efficiency and the Center for Renewable Energy, (Centro de Energías Renovables –CER), which in November 2014 was replaced by the National Center for Innovation and Development of Sustainable Energy (Centro Nacional para la Innovación y Fomento de las Energías Sustentables –CIFES). The Chilean Electricity Law has also established a Panel of Experts whose main task is to resolve potential discrepancies among the players in the electricity market, including electricity companies, system operators, regulators, etc.
From a physical viewpoint, the Chilean electrical sector is divided into four electrical grids: theSistema Interconectado Central (SIC), theSistema Interconectado del Norte Grande (SING), and two separate medium-size grids located in southern Chile, one in Aysén and the other in Magallanes. The SIC, the main electrical grid, runs 2,400 km longitudinally and connects the country from Taltal in the north to Quellon, on the island of Chiloe in the south. The SING covers the northern part of the country, from Arica down to Coloso, covering a length of some 700 km. A law was passed on January 8, 2014, which will allow the SIC to be connected to the SING.
The electricity industry is organized into three business segments: generation, transmission, and distribution, all operating in an interconnected and coordinated manner, and whose main purpose is to supply electrical energy to the market at minimum cost while maintaining the quality and safety service standards required by the electrical regulations. As essential services, the power transmission and distribution businesses are natural monopolies; these segments are regulated as such by the electricity law, which requires free access to networks and regulates rates.
Under the Chilean Electricity Law, companies engaged in generation and transmission on an interconnected electrical grid must coordinate their operations through a centralizing operating agent, the Centro de Despacho Económico de Carga (CDEC), in order to operate the system at minimum cost while maintaining a reliable service. For this reason, the CDEC plans and operates the system, including the calculation of the so-called “marginal cost,” which is the price assigned to energy transfers among power generating companies.
Therefore, a company’s decision to generate electricity is subject to the CDEC’s operation plan. On the other hand, each company is free to decide whether to sell its energy to regulated or unregulated customers. Any surplus or deficit between a company’s sales to its customers and its energy supply is sold to, or purchased from, other generators at the spot market price.
A power generating company may have the following types of customers:
(i)Distribution companies that supply power to regulated customers: This distribution is to residential and commercial consumers and small and medium-size businesses with a connected capacity equal to or less than 500 kW located in the concession area of a distribution company. Until January 2015, customers consuming between 500kW and 2,000 kW may choose to be regulated or unregulated customers. On January 29, 2015, it was published in the Official Gazzette an amendment to the law increasing the upper threshold from 2,000kW to 5,000kW. A summarized description of the scope of the amendments to the law are described below.
Until 2009, the transfer prices between generators and distribution companies for supplying power to regulated customers were capped at a maximum value called the node price, which is regulated by the Ministry of Energy. Node prices are set every six months, in April and October, based on a report prepared by the CNE that takes into account projections of expected marginal costs in the system over the next 48 months for the SIC and 24 months for the SING. Beginning in 2010, and as the node price contracts begin to expire, the transfer prices between generators and distributors are being replaced by the results of regulated bidding processes, with a price cap set by the authority every six months.
F-36
Table of Contents
(ii)Unregulated customers: Those customers, mainly industrial and mining companies, with a connected capacity of over 5,000 kW. These consumers can freely negotiate prices for electrical supply with generators and/or distributors. Customers with capacity between 500 and 5,000 kW, have the option to contract energy at prices agreed upon with their suppliers or be subject to regulated prices, with a minimum term of at least four years under each pricing system. As previously discussed, the 5,000 kW threshold became effective beginning on January 30, 2015.
(iii)Spot market: This represents energy and capacity transactions among generating companies that result from the CDEC’s coordination to keep the system running as economically as possible, where the surpluses (deficits) between a generator’s energy supply and the energy it needs to comply with business commitments are transferred through sales (purchases) to (from) other generators in the CDEC. In the case of energy, transfers are valued at the marginal cost, while node prices for capacity are set every semester by the regulators.
In Chile, the capacity that must be paid to each generator depends on an annual calculation performed by the CDEC to determine the firm capacity of each power plant, which is not the same as the dispatched capacity.
Beginning in 2010 with the enactment of Law 20,018, distribution companies must have sufficient supply permanently available to cover their entire demand projected for a period of three years; to do so, they must carry out long-term public bidding processes. This period of three years has been changed to five years, following the legislative amendment published in January 2015.
On May 15, 2014, the Minister of Energy presented the “Energy Agenda,” a document outlining general guidelines for the energy policy of the new government. On July 31, 2014, the Ministry of Energy launched “Energy 2050” Project, in order to define long-term energy goals. On September 29, 2015, the Timetable of Energy 2050 was released, and on November 4, 2015 opened for Public Consultation Energy 2050 until December 8, 2015.
On September 29, 2014 a Tax Reform was published in the Official Gazzette, which emphasizes the creation of so-called green tax to be levied on air emissions of particulate matter (PM), nitrogen oxides (NOx), sulfur dioxide (SO2) and carbon dioxide (CO2). The tax will be US$5/ton for CO2 emissions.
On January 29, 2015, Law 20,805 was published in the Official Gazzette, incorporating a legal amendment to the energy bidding processes for consumption of regulated customers. Among the main changes incorporated through this amendment are the increased participation of the CNE in the bidding processes; the increase from three to five years for the anticipated bidding announcements; the incorporation of a reserved price as a limit price for each bid; the chance for a bidder to delay the energy supply in case of force majeure; the increase of the duration of the supply contract up to 20 years; the incorporation of short-term biddings; the treatment for energy without contract; and the increase in the upper threshold to qualify as regulated customer from 2,000 to 5,000 kW.
Non-Conventional Renewable Energy
In Chile, Law 20,257 was enacted in April of 2008 to encourage the use of Non-Conventional Renewable Energy (NCRE). The principal aspect of this law is that at least 5% of the energy sold by generation companies to their customers must come from renewable sources between years 2010 and 2014. This requirement progressively increases by 0.5% from year 2015 until 2024, when a 10% renewable energy requirement will be reached. This law was amended in 2013 by Law 20,698, dubbed the “20/25 law,” as it establishes that by 2025, 20% of power supplied will be generated by NCRE. It does not change the previous law’s plan for supplying power under agreements in effect in July 2013.
Limits on integration and concentration
Chile has legislation in effect that defends free competition and, together with specific regulations that apply to the electricity market, defines criteria to avoid certain levels of economic concentration and/or abusive market practices.
F-37
Table of Contents
In principle, the regulators allow the participation of companies in different activities (e.g. generation, distribution, and commercialization) as long as there is an adequate separation of each activity, for both accounting and company purposes. Nevertheless, most of the restrictions imposed involve the transmission sector mainly due to its nature and to the need to guarantee adequate access to all agents. In Chile, there are specific restrictions if generation or distribution companies want to become majority shareholders in transmission companies.
Regarding concentration in a specific sector, while there are regulations on free competition, there are no specific quantitative limits on vertical or horizontal integration. However, the General Law on Electrical Services provides that companies that operate on or have ownership in the Trunk Transmission Systems cannot engage in, either directly or indirectly, activities that are in any way involved in the business of power generation or distribution.
Market for unregulated customers
In Chile, distributing companies can supply their customers under regulated or freely-agreed conditions. For clients purchasing more than 500kW and less than 5,000 Kw may choose between the regulated and unregulated markets. Clients purchasing more than 5,000 kW are required to be categorized as unregulated customers. The 5,000 kW threshold became effective beginning on January 30, 2015. Clients purchasing less than 500 kW are regulated customers and such threshold is applied if energy is purchased from renewable sources, for which the government provide incentives through a discount on tolls.
General Aspects
In Chile, selling prices charged to clients are based on the purchase price paid to generators plus a component associated with the value added in distribution. Regulators set this value periodically through reviews of distribution tariffs. As a result, distribution is essentially a regulated activity.
The Distribution Value Added (VAD) is established every four years. For this, the local regulator, (the CNE) classifies companies by typical areas that group together companies with similar distribution costs. A distribution company’s return on investment depends on the company’s performance compared to model company standards defined by the regulator. On April 2, 2013, the Energy Ministry published Tariff Decree No. 1T in the Official Gazette. This was made retrospectively to November 4, 2012 and will remain in effect until November 3, 2016. The next tariff-setting process will take place in 2016 and will cover the period November 2016 to November 2020.
On June 23, 2015, the Energy Ministry published in the Official Gazette, Decree No.12T, which established the node prices for energy supply that will be retrospectively applied beginning on January 1, 2015.
On May 12, 2015, the Energy Ministry published in the Official Gazette, Decrees No.2T and 3T, which established the node prices for energy supply that will be retrospectively applied beginning on September 1 and October 1, 2014, respectively.
On May 22, 2015, the Energy Ministry published in the Official Gazette, Decree No. 9T, which established the node prices for energy supply that will be retrospectively applied beginning on October 1, 2014.
Decree No. 14, which established the subtransmission tolls for this segment for 2011-2014 was published in the Official Gazette on April 9, 2013. On January 29, 2015, the Energy Ministry extends the term of the Decree until 2015, as it is state on transitory articles on Law 20.805. The Average Node Price Decrees transfer these tolls to final customers, as they are part of distribution company’s costs.
Our combined entity, Chilectra S.A. during the first nine months of 2015, had recognized provisions for sale and purchase of energy and capacity, from the application of the Average Node Price decrees (PNP), which generated a net gain of ThCh$30,399,644 (A net gain for ThCh$75,313,324 in 2014).
F-38
Table of Contents
| 5. | BUSINESS COMBINATION – ACQUISITION OF GASATACAMA |
On April 22, 2014, the Combined Group through its combined entity Endesa Chile acquired the remaining 50% ownership interest in Inversiones GasAtacama Holding Limitada (hereinafter “GasAtacama”) that was owned by Southern Cross Latin America Private Equity Fund III L.P. (hereinafter “Southern Cross”) at that time.
Consequently, the Combined Group now holds 100% of control over GasAtacama which at the same time is the owner of (i) the Atacama Plant, a 780 MW capacity combined cycle thermal power plant fired by natural gas or diesel oil located in the north of Chile; (ii) the 940 km Atacama Pipeline that runs between Coronel Cornejo in Argentina and Mejillones in Chile; and (iii) the 223 km Taltal Pipeline between Mejillones and Paposo.
Upon obtaining control of GasAtacama, the Combined Group’s total generation capacity in Chile’s northern grid (theSistema Interconectado del Norte Grande, or SING) reached 1,000 MW, and it is expected to enable us to satisfy greater industrial, residential and mining demand through a competitively priced energy supply with a low environmental impact.
GasAtacama acquisition was recognized using the accounting criteria for business combinations achieved in stages as detailed in Note 2.6.1.
Since the date of acquisition, GasAtacama has contributed ThCh$113,074,006 in revenues and ThCh$33,443,547 in income before tax to the Combined Group’s results. Had the acquisition taken place on January 1, 2014, it is estimated that these amounts would have been ThCh$179,474,707 in revenues and ThCh$41,772,291 in income before tax for the year ended December 31, 2014.
a) Consideration transferred
The following table summarizes the fair value of each type of consideration transferred in connection with the GasAtacama acquisition:
| ThCh$ | ||||
Total price paid | 174,028,622 | |||
Transaction recorded separately from the assets acquired and liabilities assumed (i) | (16,070,521 | ) | ||
|
| |||
Total consideration paid in cash (Note 7) | 157,958,101 | |||
|
| |||
| (i) | The total consideration transferred was ThCh$174,028,622 and included the assignment of rights to collect on an outstanding loan of ThCh$16,070,521 owed by Pacific Energy Sub Co. (a subsidiary of Southern Cross) to Atacama Finance Co. (a subsidiary of GasAtacama). |
b) Acquisition-related costs
Endesa Chile incurred costs for ThCh$23,543 in financial advisory fees related to the acquisition of Inversiones GasAtacama Holding Limitada. These costs have been recognized under the line item “Other expenses” in the combined statements of comprehensive income.
F-39
Table of Contents
c) Identifiable assets acquired and liabilities assumed
The following table summarizes the fair values recognized for identifiable assets acquired and liabilities assumed in connection with the acquisition:
| Fair Value | ||||
Identifiable assets acquired, net | ThCh$ | |||
Cash and cash equivalents | 120,303,339 | |||
Trade and other current receivables | 34,465,552 | |||
Current accounts receivable from related companies | 5,692,257 | |||
Inventories | 15,009,265 | |||
Property, plant and equipment | 199,660,391 | |||
Deferred tax assets | 2,392,531 | |||
Other assets | 23,906,126 | |||
Trade and other current payables | (30,818,836 | ) | ||
Current accounts payable to related companies | (34,445,277 | ) | ||
Deferred tax liabilities | (28,923,167 | ) | ||
Other liabilities | (10,874,817 | ) | ||
|
| |||
Total | 296,367,364 | |||
|
| |||
No risk of default is expected for the gross amount of trade and other receivables.
Given the nature of GasAtacama’s business and assets, the fair value of the assets acquired and liabilities assumed was measured using the following valuation approaches:
i. The market approach using the comparison method, based on quoted market prices for identical or comparable items when available.
ii. The cost approach or depreciated replacement cost, which reflects adjustments for physical deterioration and functional and economic obsolescence.
iii. The income approach, which uses valuation techniques that convert future amounts (such as cash flows or income and expenses) into a single current amount (that is, discounted). The fair value measurement reflects current market expectations for those future amounts.
Reconciliation of values
Finally, the fair values were determined from an assessment and reconciliation of the results obtained from the methods selected, based on the nature of each asset acquired and liability assumed.
d) Goodwill
| ThCh$ | ||||
Total consideration paid | 157,958,101 | |||
Fair value of pre-existing interest in the acquiree | 157,147,000 | |||
Fair value of identifiable net assets acquired | (296,367,364 | ) | ||
Goodwill (See Note 16) | 18,737,737 | |||
The goodwill is attributable primarily to the value of the synergies expected to be obtained by integrating GasAtacama into the Combined Group. These synergies include reduced administrative, research and structure costs, which could be absorbed by Endesa Chile.
e) Remeasurement of pre-existing interest and currency translation differences
The remeasurement of the fair value of Endesa Chile’s pre-existing 50% equity interest in GasAtacama resulted in a gain of ThCh$21,546,320. The gain recognized was the positive difference between the acquisition-date fair value of the pre-existing equity interest of ThCh$157,147,000, and the carrying amount of the investment accounted for using the equity method at the acquisition date of ThCh$135,600,682.
F-40
Table of Contents
In addition, the exchange differences on translation of the pre-existing equity interest accumulated in the equity of the Combined Group at the acquisition date, were reclassified to profit or loss resulting in a gain of ThCh$21,006,456.
Both amounts have been recorded in the caption “Other gains (losses)” in the interim combined statement of comprehensive income (see Note 32).
| 6. | CAPITAL INCREASE |
The Enersis allocated capital increase approved by the Extraordinary Shareholders’ Meeting on December 20, 2012 was completed in the first quarter of 2013; all of the allocated shares were subscribed (see Note 26.1.1).
This capital increase amounted to ThCh$2,845,858,393. Of this, 60.62% of the shares were subscribed by Endesa S.A., Enersis’ parent company located in Spain, and were paid for with its investments in Latin America valued at ThCh$1,724,400,000. The remaining shares were subscribed and paid with non-controlling interests of Enersis via cash payments of ThCh$1,121,458,393, which included a Allocated capital of ThCh$1,460,503. This capital increase has been reflected in these combined financial statements to the extent of the contributions in kind of additional interests of Endesa S.A.’s in certain entities in Chile.
| 7. | CASH AND CASH EQUIVALENTS |
| a) | The detail of cash and cash equivalents as of September 30, 2015 and December 31, 2014, is as follows: |
Cash and Cash Equivalents | Balance at | |||||||
| 9-30-2015 ThCh$ | 12-31-2014 ThCh$ | |||||||
Cash balances | 464,185 | 634,059 | ||||||
Bank balances | 16,865,200 | 17,765,485 | ||||||
Time deposits | 14,811,059 | 83,326,061 | ||||||
Other fixed-income instruments | 53,019,889 | 31,260,322 | ||||||
|
|
|
| |||||
Total | 85,160,333 | 132,985,927 | ||||||
|
|
|
| |||||
Time deposits have a maturity of three months or less from their date of acquisition and accrue the market interest for this type of short-term investment. Other fixed-income investments are mainly comprised of repurchase agreements with original maturities of less than or equal to 90 days.
| b) | The detail of cash and cash equivalents by currency is as follows: |
Currency | 9-30-2015 ThCh$ | 12-31-2014 ThCh$ | ||||||
Chilean peso | 71,981,322 | 44,863,907 | ||||||
Argentine peso | 6,915,499 | 4,206,734 | ||||||
U.S. dollar | 6,263,512 | 83,915,286 | ||||||
|
|
|
| |||||
Total | 85,160,333 | 132,985,927 | ||||||
|
|
|
| |||||
| c) | The following table shows the amounts paid to obtain control of combined entities as of September 30, 2015 and December 31, 2014: |
Acquisition of Combined Entities | 9-30-2015 ThCh$ | 12-31-2014 ThCh$ | ||||||
Acquisitions paid in cash and cash equivalents | — | (157,958,101 | ) | |||||
Cash and cash equivalents in entities acquired | — | 120,303,339 | ||||||
|
|
|
| |||||
Total, net (*) | — | (37,654,762 | ) | |||||
|
|
|
| |||||
| (*) | See Note 5. |
F-41
Table of Contents
| d) | The following table shows a reconciliation of cash and cash equivalents presented in the statement of financial position with cash and cash equivalents in the cash flow statement as of September 30, 2015 and December 31, 2014: |
| Balance at | ||||||||
| 9-30-2015 ThCh$ | 12-31-2014 ThCh$ | |||||||
Cash and cash equivalents (statement of financial position) | 85,160,333 | 132,985,927 | ||||||
Cash and cash equivalents attributable to assets held for sale (*) | — | 29,702 | ||||||
|
|
|
| |||||
Cash and cash equivalents (statement of cash flow) | 85,160,333 | 133,015,629 | ||||||
|
|
|
| |||||
| (*) | See Note 13. |
| e) | The following table sets forth cash and cash equivalents that have been received from the sale of shares in combined entities: |
Loss of control at Combined Entities | 9-30-2015 ThCh$ | 12-31-2014 ThCh$ | ||||||
Amounts received for the sale of Combined Entities (*) | 25,000,000 | 57,173,142 | ||||||
Amounts in cash and cash equivalents in entities sold | (18,360,347 | ) | (16,311,571 | ) | ||||
|
|
|
| |||||
Total net | 6,639,653 | 40,861,571 | ||||||
|
|
|
| |||||
| (*) | See Note 2.4.1 and Note 32. |
| 8. | OTHER FINANCIAL ASSETS |
The detail of other financial assets as of September 30, 2015 and December 31, 2014, is as follows:
Other Financial Assets | Balance at | |||||||||||||||
| Current | Non-current | |||||||||||||||
| 9-30-2015 ThCh$ | 12-31-2014 ThCh$ | 9-30-2015 ThCh$ | 12-31-2014 ThCh$ | |||||||||||||
Available-for-sale financial investments – unquoted equity securities or with limited liquidity | — | — | 3,001,868 | 2,670,665 | ||||||||||||
Available-for-sale financial investments – quoted equity securities | — | — | 34,358 | 362,169 | ||||||||||||
Financial assets held to maturity (*) | 989,104 | 948,789 | — | — | ||||||||||||
Hedging derivatives (*) | 585,915 | 508,458 | 19,787,148 | 3,695,636 | ||||||||||||
Non-hedging derivatives (*) | 5,157 | 33,882 | — | 22,002 | ||||||||||||
|
|
|
|
|
|
|
| |||||||||
Total | 1,580,176 | 1,491,129 | 22,823,374 | 6,750,472 | ||||||||||||
|
|
|
|
|
|
|
| |||||||||
| (*) | See Note 22.1.a |
The amounts included in “financial assets held to maturity” and “financial assets at fair value with change in profit or loss” correspond mainly to time deposits and other highly liquid investments that are readily convertible to cash and subject to a low risk of changes in value, but that do not fulfill the definition of cash equivalent as defined in Note 3.g.2 (e.g. with maturity over 90 days from time of investment).
F-42
Table of Contents
| 9. | TRADE AND OTHER RECEIVABLES |
a) The detail of trade and other receivables as of September 30, 2015 and December 31, 2014 is as follows:
Trade and Other Receivables, Gross | Balance at | |||||||||||||||
| 9-30-2015 | 12-31-2014 | |||||||||||||||
| Current ThCh$ | Non-current ThCh$ | Current ThCh$ | Non-current ThCh$ | |||||||||||||
Trade and other receivables, gross | 614,873,292 | 6,929,938 | 607,916,372 | 7,496,412 | ||||||||||||
Trade receivables, gross | 483,889,499 | 3,153,282 | 490,553,898 | 3,318,126 | ||||||||||||
Other receivables, gross | 130,983,793 | 3,776,656 | 117,362,474 | 4,178,286 | ||||||||||||
| Balance at | ||||||||||||||||
| 9-30-2015 | 12-31-2014 | |||||||||||||||
Trade and Other Receivables, Net | Current ThCh$ | Non-current ThCh$ | Current ThCh$ | Non-current ThCh$ | ||||||||||||
Trade and other receivables, net | 580,410,561 | 6,929,938 | 578,081,205 | 7,496,412 | ||||||||||||
Trade and other receivables, net | 457,589,590 | 3,153,282 | 466,647,454 | 3,318,126 | ||||||||||||
Other receivables, net | 122,820,971 | 3,776,656 | 111,433,751 | 4,178,286 | ||||||||||||
There are no significant trade and other receivables balances held by the Combined Group that are not available for its use.
The Combined Group does not have customers with sales representing 10% or more of its total combined revenues for the nine month periods ended September 30, 2015 and 2014.
Refer to Note 10.1 for detailed information on amounts, terms and conditions associated with accounts receivable from related companies.
b) As of September 30, 2015 and December 31, 2014, the balance of past due but not impaired trade receivables is as follows
Trade Receivables Past Due But Not Impaired | Balance at | |||||||
| 9-30-2015 | 12-31-2014 | |||||||
| ThCh$ | ThCh$ | |||||||
Less than three months | 41,436,022 | 39,058,318 | ||||||
Between three and six months | 5,799,244 | 2,624,968 | ||||||
Between six and twelve months | 6,805,631 | 3,693,880 | ||||||
More than twelve months | 19,446,795 | 12,957,133 | ||||||
|
|
|
| |||||
Total | 73,487,692 | 58,334,299 | ||||||
|
|
|
| |||||
F-43
Table of Contents
c) The reconciliation of changes in the allowance for impairment of trade receivables is as follows:
Trade Receivables Past Due and Impaired | Current and Non-current ThCh$ | |||
Balance at January 1, 2014 | 30,886,147 | |||
Increases (decreases) for the year (*) | 655,600 | |||
Amounts written off | (1,706,580 | ) | ||
Balance at December 31, 2014 | 29,835,167 | |||
Increases (decreases) for the year (*) | 5,027,094 | |||
Amounts written off | (399,530 | ) | ||
Balance at September 30, 2015 | 34,462,731 | |||
| (*) | See Note 30 for impairment of financial assets. |
Write-offs for past due receivables
Past due receivables are written off once all collection procedures and legal proceedings have been exhausted and the debtors’ insolvency has been demonstrated. In our power generation business, this process normally takes at least one year. In our distribution business the process takes at least twenty four months. Overall, the risk of writing off our trade receivables, is limited (see Notes 3.g.3 and 21.5).
| 10. | BALANCES AND TRANSACTIONS WITH RELATED COMPANIES |
Related party transactions are performed at current market conditions.
Transactions between the Combined Group and its combined entities and joint ventures have been eliminated on combination and are not itemized in this note.
As of the date of these financial statements, no guarantees have been given or received nor has any allowance for bad or doubtful accounts been recorded with respect to receivable balances for related party transactions.
The controlling shareholder of Enersis Chile is the Italian corporation Enel S.p.A.
F-44
Table of Contents
10.1 Balances and transactions with related companies
The balances of accounts receivable and payable between the Combined Group and its non-combined related companies are as follows:
a) Receivables from related companies
| Balance at | ||||||||||||||||||||||||||||
| Current | Non-current | |||||||||||||||||||||||||||
Taxpayer ID | Company | Country | Relationship | Currency | Description of transaction | Term of | 9-30-2015 ThCh$ | 12-31-2014 ThCh$ | 9-30-2015 ThCh$ | 12-31-2014 ThCh$ | ||||||||||||||||||
Foreign | Enel Latinoamérica S.A | Spain | Related to Immediate Parent | CH$ | Other services | Less than 90 days | 47,244 | 26,165 | — | — | ||||||||||||||||||
Foreign | Endesa España | Spain | Related to Immediate Parent | CH$ | Other services | More than 90 days | 87,417 | 61,852 | — | — | ||||||||||||||||||
96.524.140-K | Empresa Electrica Panguipulli S.A. | Chile | Common Immediate Parent | CH$ | Energy sales | Less than 90 days | 2,062 | 273,705 | — | — | ||||||||||||||||||
96.524.140-K | Empresa Electrica Panguipulli S.A. | Chile | Common Immediate Parent | CH$ | Tolls | Less than 90 days | 66,902 | — | — | — | ||||||||||||||||||
96.880.800-1 | Empresa Electrica Puyehue S.A. | Chile | Common Immediate Parent | CH$ | Energy sales | Less than 90 days | 64 | 64 | — | — | ||||||||||||||||||
Foreign | Endesa Energía S.A. | Chile | Common Immediate Parent | CH$ | Gas sales | Less than 90 days | 14,604,841 | — | — | — | ||||||||||||||||||
96.806.130-5 | Electrogas S.A. | Chile | Associate | CH$ | Dividends | Less than 90 days | — | 1,477,177 | — | — | ||||||||||||||||||
76.788.080-4 | GNL Quintero S.A. | Chile | Associate | CH$ | Energy sales | Less than 90 days | 426,240 | 649,986 | — | — | ||||||||||||||||||
76.418.940-k | GNL Chile S.A. | Chile | Associate | US$ | Advance natural gas purchase | Less than 90 days | 2,171,745 | 11,845,926 | — | — | ||||||||||||||||||
76.418.940-k | GNL Chile S.A. | Chile | Associate | US$ | Other services | Less than 90 days | — | 1,644,650 | — | — | ||||||||||||||||||
76.418.940-k | GNL Chile S.A. | Chile | Associate | US$ | Loan | Less than 90 days | 1,460,231 | 549,359 | — | — | ||||||||||||||||||
Foreign | Endesa Generación | Spain | Common Immediate Parent | CH$ | Commodity derivatives | Less than 90 days | 1,858,367 | 99,662 | — | — | ||||||||||||||||||
Foreign | Enel Ingegneria e Innovazione | Italy | Common Immediate Parent | CH$ | Other services | Less than 90 days | 17,974 | 10,299 | — | — | ||||||||||||||||||
Foreign | Enel Trade S.p.A. | Italy | Common Immediate Parent | CH$ | Commodity derivatives | Less than 90 days | 42,290 | — | — | — | ||||||||||||||||||
76.126.507-5 | Parque Eolico Talinay Oriente SA | Chile | Common Immediate Parent | CH$ | Energy sales | Less than 90 days | 45,376 | 21,647 | — | — | ||||||||||||||||||
76.321.458-3 | Sociedad Almeyda Solar SpA | Chile | Common Immediate Parent | CH$ | Energy sales | Less than 90 days | 48,618 | — | — | — | ||||||||||||||||||
76.179.024-2 | Parque Eolico Tal Tal S.A. | Chile | Common Immediate Parent | CH$ | Energy sales | Less than 90 days | 1,750 | — | — | — | ||||||||||||||||||
Foreign | Enel S.p.A. | Italy | Ultimate Parent | CH$ | Other services | Less than 90 days | 69,389 | — | — | — | ||||||||||||||||||
Foreign | Enel S.p.A. | Italy | Ultimate Parent | Euros | Other services | Less than 90 days | 120,040 | — | — | — | ||||||||||||||||||
76.052.206-6 | Parque Eolico Valle de los Vientos S.A. | Chile | Common Immediate Parent | CH$ | Other services | Less than 90 days | 95,355 | — | — | — | ||||||||||||||||||
Foreign | Distrilec | Argentina | Common Immediate Parent | CH$ | Other services | Less than 90 days | 1,305 | 1,305 | — | — | ||||||||||||||||||
Foreign | Compañía Distribuidora y Comercializadora de Energía S.A. | Colombia | Common Immediate Parent | CH$ | Other services | Less than 90 days | 9,380 | — | — | — | ||||||||||||||||||
TBD | Chilectra Américas | Chile | Common Immediate Parent | CH$ | Other services | Less than 90 days | 60,823 | 2,394 | — | — | ||||||||||||||||||
F-45
Table of Contents
| Balance at | ||||||||||||||||||||||||||||
| Current | Non-current | |||||||||||||||||||||||||||
Taxpayer ID | Company | Country | Relationship | Currency | Description of transaction | Term of | 9-30-2015 ThCh$ | 12-31-2014 ThCh$ | 9-30-2015 ThCh$ | 12-31-2014 ThCh$ | ||||||||||||||||||
TBD | Endesa Américas | Chile | Common Immediate Parent | CH$ | Other services | Less than 90 days | 23,669 | 57,775 | — | — | ||||||||||||||||||
Foreign | Emgesa S.A. E.S.P. | Colombia | Common Immediate Parent | CH$ | Other services | Less than 90 days | 72,560 | — | — | — | ||||||||||||||||||
Foreign | Edegel S.A.A | Peru | Common Immediate Parent | CH$ | Other services | Less than 90 days | 24,452 | — | — | — | ||||||||||||||||||
Foreign | Empresa de Distribución Eléctrica de Lima Norte S.A.A | Peru | Common Immediate Parent | CH$ | Other services | Less than 90 days | 73,173 | 42,355 | — | — | ||||||||||||||||||
99.573.910-0 | Chilectra Inversud S.A. | Chile | Common Immediate Parent | CH$ | Other services | Less than 90 days | 149,609 | 149,609 | — | — | ||||||||||||||||||
99.573.910-0 | Chilectra Inversud S.A. | Chile | Common Immediate Parent | CH$ | Mercantile Current Account | Less than 90 days | 74,880 | — | — | — | ||||||||||||||||||
TBD | Enersis Américas | Chile | Common Immediate Parent | CH$ | Other services | Less than 90 days | 123,858 | 38,720 | — | — | ||||||||||||||||||
Foreign | Enel Italia Servizi SRL | Italy | Common Immediate Parent | CH$ | Other services | Less than 90 days | 8,144 | — | — | — | ||||||||||||||||||
Foreign | Enel Italia Servizi SRL | Italy | Common Immediate Parent | CH$ | Other services | Less than 90 days | 166,396 | — | — | — | ||||||||||||||||||
|
|
|
|
|
|
|
| |||||||||||||||||||||
| Total | 21,954,154 | 16,952,650 | — | — | ||||||||||||||||||||||||
|
|
|
|
|
|
|
| |||||||||||||||||||||
b) Accounts payable to related companies
| Balance at | ||||||||||||||||||||||||||||
| Current | Non-current | |||||||||||||||||||||||||||
Taxpayer ID | Company | Country | Relationship | Currency | Description of transaction | Term of | 9-30-2015 ThCh$ | 12-31-2014 ThCh$ | 9-30-2015 ThCh$ | 12-31-2014 ThCh$ | ||||||||||||||||||
Foreign | Enel Latinoamérica S.A | Spain | Related to Immediate Parent | CH$ | Dividends | Less than 90 days | — | 24,842,818 | — | — | ||||||||||||||||||
Foreign | Enel Latinoamérica S.A | Spain | Related to Immediate Parent | CH$ | Other services | Less than 90 days | 41,794 | — | — | — | ||||||||||||||||||
96.524.140-K | Empresa Electrica Panguipulli S.A. | Chile | Common Immediate Parent | CH$ | Energy purchases | Less than 90 days | 1,645,457 | 1,708,804 | — | — | ||||||||||||||||||
96.524.140-K | Empresa Electrica Panguipulli S.A. | Chile | Common Immediate Parent | CH$ | Tolls | Less than 90 days | 62,988 | — | — | — | ||||||||||||||||||
96.806.130-5 | Electrogas S.A. | Chile | Associate | CH$ | Tolls | Less than 90 days | 75,499 | — | — | — | ||||||||||||||||||
96.806.130-5 | Electrogas S.A. | Chile | Associate | CH$ | Other services | Less than 90 days | 296,865 | 335,962 | — | — | ||||||||||||||||||
76.418.940-k | GNL Chile S.A. | Chile | Associate | US$ | Gas purchases | Less than 90 days | 8,536,047 | 19,808,375 | — | — | ||||||||||||||||||
Foreign | Endesa Generación | Spain | Common Immediate Parent | CH$ | Fuel purchases | Less than 90 days | 238,981 | 2,881,032 | — | — | ||||||||||||||||||
Foreign | Endesa Generación | Spain | Common Immediate Parent | CH$ | Coal purchases | Less than 90 days | 362,432 | — | — | — | ||||||||||||||||||
Foreign | Endesa Generación | Spain | Common Immediate Parent | CH$ | Other services | Less than 90 days | 22,831 | — | — | — | ||||||||||||||||||
Foreign | Endesa Generación | Spain | Common Immediate Parent | CH$ | Commodity derivatives | Less than 90 days | — | 1,102,253 | — | — | ||||||||||||||||||
Foreign | Enel Iberoamérica S.R.L | Spain | Parent | CH$ | Dividends | Less than 90 days | — | 12,509,673 | — | — | ||||||||||||||||||
F-46
Table of Contents
| Balance at | ||||||||||||||||||||||||||||
| Current | Non-current | |||||||||||||||||||||||||||
Taxpayer ID | Company | Country | Relationship | Currency | Description of transaction | Term of | 9-30-2015 ThCh$ | 12-31-2014 ThCh$ | 9-30-2015 ThCh$ | 12-31-2014 ThCh$ | ||||||||||||||||||
Foreign | Enel Iberoamérica S.R.L | Spain | Parent | CH$ | Other services | Less than 90 days | 237,390 | �� | 382,893 | — | — | |||||||||||||||||
Foreign | Enel Distribuzione | Italy | Common Immediate Parent | CH$ | Other services | Less than 90 days | — | 73,730 | — | — | ||||||||||||||||||
Foreign | Enel Produzione | Italy | Common Immediate Parent | CH$ | Other services | Less than 90 days | — | 99,837 | — | — | ||||||||||||||||||
Foreign | Enel Produzione | Italy | Common Immediate Parent | Euros | Other services | Less than 90 days | 70,999 | — | — | — | ||||||||||||||||||
Foreign | Enel Produzione | Italy | Common Immediate Parent | CH$ | Other services | Less than 90 days | 250,861 | — | — | — | ||||||||||||||||||
Foreign | Enel Ingegneria e Innovazione | Italy | Common Immediate Parent | CH$ | Other services | Less than 90 days | 2,489,027 | 2,024,190 | — | — | ||||||||||||||||||
76.321.458-3 | Sociedad Almeyda Solar Spa | Chile | Common Immediate Parent | CH$ | Energy purchases | Less than 90 days | 417,236 | — | — | — | ||||||||||||||||||
77.017.930-0 | Transmisora Eléctrica de Quillota Ltda. | Chile | Joint Venture | CH$ | Other services | Less than 90 days | 165,981 | 157,762 | — | — | ||||||||||||||||||
Foreign | Enel Green Power España SL | Spain | Common Immediate Parent | CH$ | Other services | Less than 90 days | — | 23,982 | — | — | ||||||||||||||||||
Foreign | Endesa España | Spain | Common Immediate Parent | CH$ | Other services | Less than 90 days | 303,587 | 129,492 | — | — | ||||||||||||||||||
76.126.507-5 | Parque Eolico Talinay Oriente SA | Chile | Common Immediate Parent | CH$ | Energy purchases | Less than 90 days | 180 | — | — | — | ||||||||||||||||||
Foreign | Enel Trade S.p.A. | Italy | Common Immediate Parent | CH$ | Other services | Less than 90 days | 157,301 | — | — | — | ||||||||||||||||||
Foreign | Enel Trade S.p.A. | Italy | Common Immediate Parent | CH$ | Commodity derivatives | Less than 90 days | 957,995 | — | — | — | ||||||||||||||||||
76.179.024-2 | Parque Eolico Tal Tal S.A. | Chile | Common Immediate Parent | CH$ | Energy purchases | Less than 90 days | 2,081,997 | — | — | — | ||||||||||||||||||
Foreign | Enel S.p.A. | Italy | Ultimate Parent | Euros | Other services | Less than 90 days | 787,436 | — | — | — | ||||||||||||||||||
76.052.206-6 | Parque Eolico Valle de los Vientos S.A. | Chile | Common Immediate Parent | CH$ | Other services | Less than 90 days | 1,170,359 | — | — | — | ||||||||||||||||||
Foreign | Emgesa S.A. E.S.P. | Colombia | Common Immediate Parent | CH$ | Other services | Less than 90 days | 1,478 | — | — | — | ||||||||||||||||||
Foreign | Empresa de Distribución Eléctrica de Lima Norte S.A.A | Peru | Common Immediate Parent | CH$ | Other services | Less than 90 days | 2,240 | — | — | — | ||||||||||||||||||
Foreign | Endesa Cemsa S.A. | Argentina | Common Immediate Parent | CH$ | Other services | Less than 90 days | 67,131 | 58,720 | — | — | ||||||||||||||||||
TBD | Enersis Américas | Chile | Common Immediate Parent | CH$ | Loans | Less than 90 days | 264,083,578 | 60,858,956 | — | — | ||||||||||||||||||
TBD | Enersis Américas | Chile | Common Immediate Parent | CH$ | Mercantile Current Account | Less than 90 days | 50,845,829 | 39,315,938 | — | — | ||||||||||||||||||
99.573.910-0 | Chilectra Inversud S.A. | Chile | Common Immediate Parent | CH$ | Mercantile Current Account | Less than 90 days | — | 20,775,085 | — | — | ||||||||||||||||||
Foreign | Enel Brasil | Brazil | Common Immediate Parent | CH$ | Other services | Less than 90 days | 73,065 | 95,691 | — | — | ||||||||||||||||||
Foreign | Enel Italia Servizi SRL | Italy | Common Immediate Parent | CH$ | Other services | Less than 90 days | 12,690 | — | — | — | ||||||||||||||||||
Foreign | Enel Italia Servizi SRL | Italy | Common Immediate Parent | Euros | Other services | Less than 90 days | 25,252 | — | — | — | ||||||||||||||||||
|
|
|
|
|
|
|
| |||||||||||||||||||||
| Total | 335,484,506 | 187,185,193 | — | — | ||||||||||||||||||||||||
|
|
|
|
|
|
|
| |||||||||||||||||||||
F-47
Table of Contents
c) Significant transactions and effects on income/expenses:
Transactions with related companies that are not combined and their effects on profit or loss are as follows:
Taxpayer ID Number | Company | Country | Relationship | Description of transaction | 9-30-2015 ThCh$ | 9-30-2014 (Unaudited) ThCh$ | ||||||||||
Foreign | Endesa Energía S.A. | Spain | Common Immediate Parent | Natural gas sales | 14,604,841 | — | ||||||||||
Foreign | Enel Latinoamérica S.A | Spain | Common Immediate Parent | Other fixed operating expenses | (18,684 | ) | — | |||||||||
Foreign | Endesa Generación | Spain | Common Immediate Parent | Fuel consumption | (11,641,643 | ) | (23,300,577 | ) | ||||||||
Foreign | Endesa Generación | Spain | Common Immediate Parent | Other fixed operating expenses | (23,329 | ) | — | |||||||||
Foreign | Endesa Generación | Spain | Common Immediate Parent | Commodity derivatives | (2,144,063 | ) | (974,481 | ) | ||||||||
76.418.940-k | GNL Chile S.A. | Chile | Associate | Gas consumption | (120,255,826 | ) | (92,507,654 | ) | ||||||||
76.418.940-k | GNL Chile S.A. | Chile | Associate | Gas transportation | (39,104,820 | ) | (29,275,499 | ) | ||||||||
76.418.940-k | GNL Chile S.A. | Chile | Associate | Other services rendered | 54,377 | 56,042 | ||||||||||
76.418.940-k | GNL Chile S.A. | Chile | Associate | Other financial income | 63,105 | 46,820 | ||||||||||
76.788.080-4 | GNL Quintero S.A. | Chile | Associate | Energy sales | 2,554,154 | 2,040,026 | ||||||||||
76.788.080-4 | GNL Quintero S.A. | Chile | Associate | Electricity tolls | (57,354 | ) | — | |||||||||
76.788.080-4 | GNL Quintero S.A. | Chile | Associate | Other services rendered | 563,204 | 588,752 | ||||||||||
96.880.800-1 | Empresa Eléctrica Puyehue S.A. | Chile | Common Immediate Parent | Energy purchases | — | (3,805 | ) | |||||||||
96.880.800-1 | Empresa Eléctrica Puyehue S.A. | Chile | Common Immediate Parent | Electricity tolls | — | (12,399 | ) | |||||||||
96.880.800-1 | Empresa Eléctrica Puyehue S.A. | Chile | Common Immediate Parent | Energy sales | — | 34,253 | ||||||||||
96.524.140-K | Empresa Eléctrica Panguipulli S.A. | Chile | Common Immediate Parent | Energy purchases | (7,052,938 | ) | (6,368,804 | ) | ||||||||
96.524.140-K | Empresa Eléctrica Panguipulli S.A. | Chile | Common Immediate Parent | Electricity tolls | (215,823 | ) | (142,361 | ) | ||||||||
96.524.140-K | Empresa Eléctrica Panguipulli S.A. | Chile | Common Immediate Parent | Other services rendered | 285,452 | 116,012 | ||||||||||
96.524.140-K | Empresa Eléctrica Panguipulli S.A. | Chile | Common Immediate Parent | Energy sales | 200,469 | 883,600 | ||||||||||
Foreign | Enel Iberoamérica S.R.L | Spain | Parent | Other fixed operating expenses | — | (743,029 | ) | |||||||||
Foreign | Enel Iberoamérica S.R.L | Spain | Parent | Other operating income | 150,534 | — | ||||||||||
96.806.130-5 | Electrogas S.A. | Chile | Associate | Gas tolls | (2,644,008 | ) | (2,547,228 | ) | ||||||||
96.806.130-5 | Electrogas S.A. | Chile | Associate | Fuel consumption | (529,741 | ) | (257,797 | ) | ||||||||
Foreign | Enel Ingegneria e Innovazione | Italy | Common Immediate Parent | Other services rendered | 26,723 | 25,316 | ||||||||||
Foreign | Enel Ingegneria e Innovazione | Italy | Common Immediate Parent | Other fixed operating expenses | (394,261 | ) | (274,444 | ) | ||||||||
76.652.400-1 | Centrales Hidroeléctricas De Aysén S.A. | Chile | Joint Venture | Other services rendered | — | 23,891 | ||||||||||
77.017.930-0 | Transmisora Eléctrica de Quillota Ltda. | Chile | Joint Venture | Electricity tolls | (1,083,945 | ) | (1,021,152 | ) | ||||||||
Foreign | Endesa España | Spain | Common Immediate Parent | Other operating income | 8,811 | 57,623 | ||||||||||
Foreign | Endesa España | Spain | Common Immediate Parent | Other fixed operating expenses | (123,819 | ) | — | |||||||||
Foreign | Enel Trade S.p.A | Italy | Common Immediate Parent | Other fixed operating expenses | (216,437 | ) | — | |||||||||
Foreign | Enel Trade S.p.A | Italy | Common Immediate Parent | Commodity derivatives | (790,547 | ) | — | |||||||||
76.321.458-3 | Sociedad Almeyda Solar Spa | Chile | Common Immediate Parent | Energy purchases | (2,059,681 | ) | — | |||||||||
76.321.458-3 | Sociedad Almeyda Solar Spa | Chile | Common Immediate Parent | Electricity tolls | (79,566 | ) | — | |||||||||
76.321.458-3 | Sociedad Almeyda Solar Spa | Chile | Common Immediate Parent | Other services rendered | 43,983 | — | ||||||||||
76.321.458-3 | Sociedad Almeyda Solar Spa | Chile | Common Immediate Parent | Energy sales | 24,526 | — | ||||||||||
76.052.206-6 | Parque Eolico Valle de los Vientos S.A. | Chile | Common Immediate Parent | Energy purchases | (10,919,822 | ) | — | |||||||||
76.052.206-6 | Parque Eolico Valle de los Vientos S.A. | Chile | Common Immediate Parent | Energy sales | 360,506 | — | ||||||||||
76.179.024-2 | Parque Eolico Tal Tal S.A. | Chile | Common Immediate Parent | Energy purchases | (19,806,382 | ) | — | |||||||||
76.179.024-2 | Parque Eolico Tal Tal S.A. | Chile | Common Immediate Parent | Energy sales | 1,471 | — | ||||||||||
TBD | Endesa Américas | Chile | Common Immediate Parent | Other services rendered | 274,710 | 247,659 | ||||||||||
TBD | Chilectra Américas | Chile | Common Immediate Parent | Other services rendered | 514,555 | 491,877 | ||||||||||
TBD | Enersis Américas | Chile | Common Immediate Parent | Other services rendered | 249,703 | 243,155 | ||||||||||
TBD | Enersis Américas | Chile | Common Immediate Parent | Other financial expense | (3,911,790 | ) | (12,827,660 | ) | ||||||||
Foreign | Empresa de Distribución Eléctrica de Lima Norte S.A.A | Peru | Common Immediate Parent | Other services rendered | 197,989 | 176,935 | ||||||||||
99.573.910-0 | Chilectra Inversud S.A. | Chile | Common Immediate Parent | Other financial income | 652 | — | ||||||||||
99.573.910-0 | Chilectra Inversud S.A. | Chile | Common Immediate Parent | Other financial expense | (374,900 | ) | (580,770 | ) | ||||||||
Foreign | Endesa Cemsa S.A. | Argentina | Common Immediate Parent | Other fixed operating expenses | — | (129,974 | ) | |||||||||
Foreign | Enel Produzione | Italia | Common Immediate Parent | Other fixed operating expenses | (206,911 | ) | — | |||||||||
76.126.507-5 | Parque Eolico Talinay Oriente SA | Chile | Common Immediate Parent | Energy sales | 93,698 | — | ||||||||||
76.126.507-5 | Parque Eolico Talinay Oriente SA | Chile | Common Immediate Parent | Energy purchases | (383,631 | ) | (5,028,122 | ) | ||||||||
|
|
|
| |||||||||||||
| Total | (203,766,458 | ) | (170,963,795 | ) | ||||||||||||
|
|
|
| |||||||||||||
Transfers of short-term funds between related companies are treated as current accounts changes, with variable interest rates based on market conditions used for the monthly balance. The resulting receivable or payable balances are usually at 30 days term, with automatic rollover for the same periods and amortization in line with cash flows.
F-48
Table of Contents
10.2 Board of Directors and Key management personnel
Once Enersis Chile S.A. is formed, its Board of Directors will initially consist of seven members who will be elected for an interim term at an Extraordinary Shareholders’ Meeting (“ESM”) to be held on December 18, 2015 to hold office until the first Ordinary Shareholders’ Meeting (“OSM”) to be held in April 2016. At the 2016 OSM, the entire Board of Directors consisting of seven members will be elected to a three-year term. Following the end of their term, they may be re-elected or replaced. If a vacancy occurs in the interim, the Board of Directors will elect a temporary director to fill the vacancy until the next OSM, at which time the entire Board of Directors will be elected to new three-year terms. Its Executive Officers will be appointed by the Board of Directors and hold office at the discretion of the Board.
10.3 Compensation plans linked to share price
There are no compensation plans linked to share price
| 11. | INVENTORIES |
The detail of inventories as of September 30, 2015 and December 31, 2014 is as follows:
Classes of Inventories | Balance at | |||||||
| 9-30-2015 ThCh$ | 12-31-2014 ThCh$ | |||||||
Supplies for Production | 17,701,744 | 22,295,598 | ||||||
Gas | 2,925,803 | 1,407,284 | ||||||
Oil | 4,132,420 | 3,734,834 | ||||||
Coal | 10,643,521 | 17,153,480 | ||||||
Other inventories (*) | 17,847,731 | 21,382,280 | ||||||
|
|
|
| |||||
Total | 35,549,475 | 43,677,878 | ||||||
|
|
|
| |||||
Detail of other inventories | ||||||||
(*) Other inventories | 17,847,731 | 21,382,280 | ||||||
Supplies for projects and spare parts | 9,573,903 | 16,747,706 | ||||||
Electrical materials | 8,273,828 | 4,634,574 | ||||||
There are no inventories pledged as security for liabilities.
For the nine months ended September 30, 2015 and 2014, raw materials and consumables recognized as fuel expenses were ThCh$289,424,648 and ThCh$232,011,290, respectively. See Note 28.
As of September 30, 2015 and December 31, 2014, no inventories have been written down due to obsolescence.
| 12. | TAX RECEIVABLES AND PAYABLES |
The detail of current tax receivables as of September 30, 2015 and December 31, 2014 is as follows:
Tax Receivables | Balance at | |||||||
| 9-30-2015 ThCh$ | 12-31-2014 ThCh$ | |||||||
Monthly provisional tax payments | 18,439,659 | 14,510,732 | ||||||
Tax credit for absorbed profits | 851,232 | 9,993,425 | ||||||
Tax credit for training expenses | 249,500 | 240,800 | ||||||
Tax credits from dividends received abroad | — | 20,903,182 | ||||||
Other | 3,112,342 | — | ||||||
|
|
|
| |||||
Total | 22,652,733 | 45,648,139 | ||||||
|
|
|
| |||||
F-49
Table of Contents
The detail of current tax payables as of September 30, 2015 and December 31, 2014 is as follows:
Tax Payables | Balance at | |||||||
| 9-30-2015 ThCh$ | 12-31-2014 ThCh$ | |||||||
Income tax | 3,926,861 | 38,357,866 | ||||||
|
|
|
| |||||
Total | 3,926,861 | 38,357,866 | ||||||
|
|
|
| |||||
| 13. | NON-CURRENT ASSETS OR GROUPS OF ASSETS FOR DISPOSAL CLASSIFIED AS HELD FOR SALE |
In December 2014, Empresa Nacional de Electricidad S.A. and its combined entity Compañía Eléctrica de Tarapacá SA signed a contract to sell all their shares in Sociedad Concesionaria Túnel El Melón S.A. to Temsa Private Investment Fund. Such contract established a number of conditions, which were not fulfilled at the end of 2014, preventing the closure of the sale. The sale was finalized on January 9, 2015.
Túnel El Melón S.A is a private corporation whose purpose is the construction, maintenance and operation of the public work called the El Melón Tunnel and the provision of ancillary services authorized by the Ministry of Public Works (MOP).
El Melón Tunnel is an alternative route to the road that climbs the El Melon pass, which is located between 126 and 132 kilometers north of Santiago on Route 5. This is the main highway linking the country from Arica to Puerto Montt.
As described in Note 3.k), non-current assets and groups of assets held for sale have been recorded at the lower of their carrying amount and fair value less costs of disposal.
The main items of assets, liabilities and cash flows held for sale as of December 31, 2014 are as follows:
| Balance 12/31/2014 | ||||
| ThCh$ | ||||
CURRENT ASSETS | ||||
Cash and cash equivalents | 29,702 | |||
Other current non-financial assets | 81,275 | |||
Trade and other current receivables | 758,645 | |||
Current tax assets | 1,400 | |||
|
| |||
TOTAL CURRENT ASSETS | 871,022 | |||
|
| |||
NON-CURRENT ASSETS | ||||
Intangible assets other than goodwill | 4,404,615 | |||
Property, plant and equipment | 81,432 | |||
Deferred tax assets | 2,621,894 | |||
|
| |||
TOTAL NON-CURRENT ASSETS | 7,107,941 | |||
|
| |||
TOTAL ASSETS | 7,978,963 | |||
|
| |||
CURRENT LIABILITIES | ||||
Other current financial liabilities | 3,072,179 | |||
Trade and other current payables | 495,235 | |||
Other current non-financial liabilities | 131,030 | |||
|
| |||
TOTAL CURRENT LIABILITIES | 3,698,444 | |||
|
| |||
NON-CURRENT LIABILITIES | ||||
Other non-current financial liabilities | 1,660,254 | |||
Non-current provisions for employee benefits | 102,423 | |||
Other non-current non-financial liabilities | 27,026 | |||
|
| |||
TOTAL NON-CURRENT LIABILITIES | 1,789,703 | |||
|
| |||
TOTAL LIABILITIES | 5,488,147 | |||
|
| |||
F-50
Table of Contents
| Balance 12/31/2014 | ||||
| ThCh$ | ||||
Summary of net cash flow | ||||
Net cash flows from (used in) operating activities | 9,045,775 | |||
Net cash flows from (used in) investment activities | (5,604,740 | ) | ||
Net cash flows from (used in) financing activities | (3,450,774 | ) | ||
Net increase (decrease) in cash and cash equivalents before effect of exchange rate changes | (9,739 | ) | ||
Effect of exchange rate changes on cash and cash equivalents | — | |||
Net increase (decrease) in cash and cash equivalents | (9,739 | ) | ||
Cash and cash equivalents at beginning of period | 39,440 | |||
Cash and cash equivalents at end of period | 29,702 | |||
F-51
Table of Contents
| 14. | INVESTMENTS ACCOUNTED FOR USING THE EQUITY METHOD |
14.1. Investments accounted for using the equity method
| a. | The following tables present the changes in investments in combined associates and joint ventures accounted for using the equity method as of September 30, 2015 and December 31, 2014: |
Taxpayer ID | Changes in Investments | Relationship | Country | Functional Currency | Ownership interest | Balance at 01/01/2015 ThCh$ | Additions ThCh$ | Share of Profit (Loss) ThCh$ | Dividends declared ThCh$ | Foreign Currency Translation ThCh$ | Other comprehensive income ThCh$ | Other increases (decreases) ThCh$ | Balance at 9/30/2015 ThCh$ | |||||||||||||||||||||||||||||||
96,806,130-5 | Electrogas S.A. | Associate | Chile | U.S. dollar | 42.50 | % | 10,777,659 | — | 3,874,850 | (2,914,348 | ) | 1,337,643 | 151,687 | — | 13,227,491 | |||||||||||||||||||||||||||||
76,788,080-4 | GNL Quintero S.A. | Associate | Chile | U.S. dollar | 20.00 | % | 15,198,935 | — | 3,450,923 | (3,262,701 | ) | 1,874,549 | — | — | 17,261,706 | |||||||||||||||||||||||||||||
76,418,940-k | GNL Chile S.A. | Associate | Chile | U.S. dollar | 33.33 | % | 1,818,168 | — | 903,889 | 357,883 | — | — | 3,079,940 | |||||||||||||||||||||||||||||||
76,652,400-1 | Centrales Hidroeléctricas De Aysén S.A. | Joint Venture | Chile | Chilean Peso | 51.00 | % | 6,144,557 | 2,295,000 | (1,800,997 | ) | — | — | — | — | 6,638,560 | |||||||||||||||||||||||||||||
77,017,930-0 | Transmisora Eléctrica de Quillota Ltda. | Joint Venture | Chile | Chilean Peso | 50.00 | % | 6,426,004 | — | 1,054,225 | — | — | — | — | 7,480,229 | ||||||||||||||||||||||||||||||
|
|
|
|
|
|
|
|
|
|
|
|
|
|
|
| |||||||||||||||||||||||||||||
| TOTAL | 40,365,323 | 2,295,000 | 7,482,890 | (6,177,049 | ) | 3,570,075 | 151,687 | — | 47,687,926 | |||||||||||||||||||||||||||||||||||
|
|
|
|
|
|
|
|
|
|
|
|
|
|
|
| |||||||||||||||||||||||||||||
Taxpayer ID | Changes in Investments | Relationship | Country | Functional Currency | Ownership interest | Balance at 01/01/2014 ThCh$ | Additions ThCh$ | Share of Profit (Loss) ThCh$ | Dividends declared ThCh$ | Foreign Currency Translation ThCh$ | Other comprehensive income ThCh$ | Other increases (decreases) ThCh$ | Balance at 12/31/2014 ThCh$ | |||||||||||||||||||||||||||||||
96,806,130-5 | Electrogas S.A. | Associate | Chile | U.S. dollar | 42.50 | % | 9,682,324 | — | 4,456,124 | (4,239,280 | ) | 847,016 | 31,475 | — | 10,777,659 | |||||||||||||||||||||||||||||
76,788,080-4 | GNL Quintero S.A. | Associate | Chile | U.S. dollar | 20.00 | % | 4,797,508 | — | 3,541,883 | (6,897,599 | ) | 311,747 | 13,445,396 | — | 15,198,935 | |||||||||||||||||||||||||||||
76,418,940-k | GNL Chile S.A. | Associate | Chile | U.S. dollar | 33.33 | % | 559,615 | — | 1,099,143 | — | 159,410 | — | — | 1,818,168 | ||||||||||||||||||||||||||||||
76,652,400-1 | Centrales Hidroeléctricas De Aysén S.A. (2) | Joint Venture | Chile | Chilean Peso | 51.00 | % | 69,684,864 | 3,315,000 | (66,855,307 | ) | — | — | — | — | 6,144,557 | |||||||||||||||||||||||||||||
77,017,930-0 | Transmisora Eléctrica de Quillota Ltda. | Joint Venture | Chile | Chilean Peso | 50.00 | % | 6,073,897 | — | 352,107 | — | — | — | — | 6,426,004 | ||||||||||||||||||||||||||||||
76,014,570-k | Inversiones GasAtacama Holding Ltda. (1) | Joint Venture | Chile | U.S. dollar | 50.00 | % | 123,627,968 | — | 3,053,468 | — | 8,919,246 | — | (135,600,682 | ) | — | |||||||||||||||||||||||||||||
|
|
|
|
|
|
|
|
|
|
|
|
|
|
|
| |||||||||||||||||||||||||||||
| TOTAL | 214,426,176 | 3,315,000 | (54,352,582 | ) | (11,136,879 | ) | 10,237,419 | 13,476,871 | (135,600,682 | ) | 40,365,323 | |||||||||||||||||||||||||||||||||
|
|
|
|
|
|
|
|
|
|
|
|
|
|
|
| |||||||||||||||||||||||||||||
| (1) | In April 2014, the company Inversiones GasAtacama Holding Ltda. became a combined entity of the Combined Group using the global integration method (see Notes 2.4.1 and 5). |
| (2) | The loss recognized during 2014 includes a provision for impairment of ThCh$69,066,857 as a result of uncertainty about the recoverability of this investment (see Note 36.5). |
F-52
Table of Contents
| b. | Additional financial information on investments in associated companies and joint ventures |
14.2. Investments with significant influence
The following tables show financial information as of September 30, 2015 and December 31, 2014 from the financial statements of the investments in associates where the Combined Group has significant influence:
Investments with Significant | September 30, 2015 | |||||||||||||||||||||||||||||||||||||||
| % Ownership interest Direct/ Indirect | Current assets ThCh$ | Non- current assets ThCh$ | Current liabilities ThCh$ | Non- current liabilities ThCh$ | Revenue ThCh$ | Expenses ThCh$ | Profit (Loss) ThCh$ | Other Comprehensive Income ThCh$ | Comprehensive income ThCh$ | |||||||||||||||||||||||||||||||
GNL Chile S.A | 33.33 | % | 83,308,612 | 78,426 | 69,765,943 | 4,380,353 | 545,158,354 | (542,446,416 | ) | 2,711,938 | 1,073,757 | 3,785,695 | ||||||||||||||||||||||||||||
GNL Quintero S.A | 20.00 | % | 133,435,149 | 674,630,034 | 11,800,730 | 709,955,923 | 97,683,633 | (80,429,018 | ) | 17,254,615 | 9,372,746 | 26,627,361 | ||||||||||||||||||||||||||||
Electrogas S.A. | 42.50 | % | 6,414,662 | 47,054,671 | 5,058,199 | 17,287,627 | 17,800,953 | (7,831,263 | ) | 9,969,690 | 3,504,305 | 13,473,995 | ||||||||||||||||||||||||||||
Investments with Significant | December 31, 2014 | |||||||||||||||||||||||||||||||||||||||
| % Ownership interest Direct/ Indirect | Current assets ThCh$ | Non- current assets ThCh$ | Current liabilities ThCh$ | Non- current liabilities ThCh$ | Revenue ThCh$ | Expenses ThCh$ | Profit (Loss) ThCh$ | Other Comprehensive Income ThCh$ | Comprehensive income ThCh$ | |||||||||||||||||||||||||||||||
GNL Chile S.A | 33.33 | % | 73,425,419 | 81,983 | 64,329,604 | 3,723,224 | 732,138,386 | (728,840,589 | ) | 3,297,797 | 478,277 | 3,776,074 | ||||||||||||||||||||||||||||
GNL Quintero S.A | 20.00 | % | 98,325,654 | 597,812,711 | 20,036,542 | 600,107,009 | 117,435,890 | (99,726,467 | ) | 17,709,423 | 68,785,714 | 86,495,137 | ||||||||||||||||||||||||||||
Electrogas S.A. | 42.50 | % | 6,085,889 | 43,289,210 | 10,076,915 | 13,938,983 | 19,635,597 | (9,150,599 | ) | 10,484,998 | 2,067,038 | 12,552,036 | ||||||||||||||||||||||||||||
Appendix 3 to these combined financial statements provides information on the main activities of our associates and the ownership interest that the Combined Group holds in them.
None of our associates have published price quotations.
14.3. Joint ventures
The following tables present information from the financial statements as of September 30, 2015 and December 31, 2014 on the main joint ventures:
| Centrales Hidroeléctricas de Aysén S.A. | Transmisora Eléctrica de Quillota Ltda. | |||||||||||||||
% Ownership | 51.0% 9-30-2015 ThCh$ | 51.0% 12-31-2014 ThCh$ | 50.0% 9-30-2015 ThCh$ | 50.0% 12-31-2014 ThCh$ | ||||||||||||
Total current assets | 365,973 | 485,966 | 4,870,520 | 4,426,445 | ||||||||||||
Total non-current assets | 15,159,321 | 15,026,706 | 12,228,334 | 11,420,593 | ||||||||||||
Total current liabilities | 2,451,497 | 3,419,214 | 463,983 | 1,159,095 | ||||||||||||
Total non-current liabilities | 56,685 | 45,348 | 1,674,416 | 1,835,937 | ||||||||||||
Cash and cash equivalent | 251,506 | 319,670 | 4,457,803 | 3,930,814 | ||||||||||||
Revenues | — | — | 2,099,517 | 2,672,950 | ||||||||||||
Depreciation and amortization expense | — | (52,978 | ) | (529,169 | ) | (738,927 | ) | |||||||||
Impairment losses | — | (126,657,707 | ) | — | — | |||||||||||
Interest income | 16,068 | 479,518 | 1,652,413 | 88,597 | ||||||||||||
Income tax expense | — | — | (496,978 | ) | (671,727 | ) | ||||||||||
Profit (loss) | (3,530,997 | ) | (131,088,876 | ) | 2,108,449 | 704,214 | ||||||||||
Other comprehensive income | — | — | — | — | ||||||||||||
Comprehensive income | (3,530,997 | ) | (131,088,876 | ) | 2,108,449 | 704,214 | ||||||||||
| c. | There are no significant commitments and contingencies, or restrictions on funds transfers to its owners in associates and joint ventures. |
F-53
Table of Contents
| 15. | INTANGIBLE ASSETS OTHER THAN GOODWILL |
The following table presents intangible assets as of September 30, 2015 and December 31, 2014:
Intangible Assets, Net | 9-30-2015 ThCh$ | 12-31-2014 ThCh$ | ||||||
Intangible Assets, Net | 37,725,489 | 36,525,522 | ||||||
Easements and water rights | 14,476,100 | 14,692,984 | ||||||
Computer software | 22,781,572 | 21,651,862 | ||||||
Other identifiable intangible assets | 467,817 | 180,676 | ||||||
Intangible Assets, Gross | 9-30-2015 ThCh$ | 12-31-2014 ThCh$ | ||||||
Intangible Assets, Gross | 86,950,083 | 82,119,207 | ||||||
Easements and water rights | 16,465,850 | 17,106,353 | ||||||
Computer software | 63,554,771 | 58,579,846 | ||||||
Other identifiable intangible assets | 6,929,462 | 6,433,008 | ||||||
Intangible Assets, Amortization and Impairment | 9-30-2015 ThCh$ | 12-31-2014 ThCh$ | ||||||
Accumulated Amortization and Impairment, Total | (49,224,594 | ) | (45,593,685 | ) | ||||
Identifiable intangible assets | (49,224,594 | ) | (45,593,685 | ) | ||||
Easements and water rights | (1,989,750 | ) | (2,413,369 | ) | ||||
Computer software | (40,773,199 | ) | (36,927,984 | ) | ||||
Other identifiable intangible assets | (6,461,645 | ) | (6,252,332 | ) | ||||
The reconciliations of the carrying amounts of intangible assets at September 30, 2015 and December 31, 2014 are as follows:
September 30, 2015
Changes in Intangible Assets | Easements ThCh$ | Concessions ThCh$ | Computer Software ThCh$ | Other Identifiable Assets, Net ThCh$ | Intangible Assets, Net ThCh$ | |||||||||||||||
Opening balance 01/01/2015 | 14,692,984 | — | 21,651,862 | 180,676 | 36,525,522 | |||||||||||||||
Changes in identifiable intangible assets | ||||||||||||||||||||
Increases other than from business combinations | 109,691 | — | 3,850,728 | — | 3,960,419 | |||||||||||||||
Increase (decrease) from exchange differences, net | — | — | 359,401 | (51,402 | ) | 307,999 | ||||||||||||||
Amortization (1) | — | — | (3,255,339 | ) | (19,300 | ) | (3,274,639 | ) | ||||||||||||
Increases (decreases) from transfers and other changes | (246,573 | ) | — | 174,920 | 357,843 | 286,190 | ||||||||||||||
Increases (decreases) from transfers | — | — | 55,625 | — | 55,625 | |||||||||||||||
Increases (decreases) from other changes | (246,573 | ) | — | 119,295 | 357,843 | 230,565 | ||||||||||||||
Disposals and removals from service | (80,002 | ) | — | — | — | (80,002 | ) | |||||||||||||
Disposals | (80,002 | ) | — | — | — | (80,002 | ) | |||||||||||||
Removal from service | — | — | — | — | — | |||||||||||||||
Decreases classified as held for sale | — | — | — | — | — | |||||||||||||||
Total changes in identified intangible assets | (216,884 | ) | — | 1,129,710 | 287,141 | 1,199,967 | ||||||||||||||
|
|
|
|
|
|
|
|
|
| |||||||||||
Closing balance 9/30/2015 | 14,476,100 | — | 22,781,572 | 467,817 | 37,725,489 | |||||||||||||||
|
|
|
|
|
|
|
|
|
| |||||||||||
F-54
Table of Contents
December 31, 2014
Changes in Intangible Assets | Easements ThCh$ | Concessions ThCh$ | Computer Software ThCh$ | Other Identifiable Assets, Net ThCh$ | Intangible Assets, Net ThCh$ | |||||||||||||||
Opening balance 01/01/2014 | 14,517,212 | 6,951,508 | 15,991,138 | 110,947 | 37,570,805 | |||||||||||||||
Changes in identifiable intangible assets | ||||||||||||||||||||
Increases (decreases) other than from business combinations | (19,567 | ) | — | 8,568,249 | — | 8,548,682 | ||||||||||||||
Increase (decrease) from exchange differences, net | — | — | 6,303 | 4,577 | 10,880 | |||||||||||||||
Amortization (1) | — | (2,546,894 | ) | (3,336,876 | ) | (7,207 | ) | (5,890,977 | ) | |||||||||||
Increases (decreases) from transfers and other changes | 195,339 | 1 | 425,897 | 72,359 | 693,596 | |||||||||||||||
Increases (decreases) from transfers | — | 1 | — | (1 | ) | — | ||||||||||||||
Increases (decreases) from other changes | 195,339 | — | 426,897 | 72,360 | 693,596 | |||||||||||||||
Disposals and removals from service | — | — | (2,849 | ) | — | (2,849 | ) | |||||||||||||
Disposals | — | — | — | — | — | |||||||||||||||
Removal from service | — | — | (2,849 | ) | — | (2,849 | ) | |||||||||||||
Decreases classified as held for sale (2) | — | (4,404,615 | ) | — | — | (4,404,615 | ) | |||||||||||||
Total changes in identified intangible assets | 175,772 | (6,951,508 | ) | 5,660,724 | 69,729 | (1,045,283 | ) | |||||||||||||
|
|
|
|
|
|
|
|
|
| |||||||||||
Closing balance 12/31/2014 | 14,692,984 | — | 21,651,862 | 180,676 | 36,525,522 | |||||||||||||||
|
|
|
|
|
|
|
|
|
| |||||||||||
| (1) | See Note 30. |
| (2) | See Note 13. |
According to the Combined Group’s management estimates and projections, the expected future cash flows attributable to intangible assets allow the recovery of the carrying amount of these assets recorded as of September 30, 2015 (See Note 3.e).
F-55
Table of Contents
| 16. | GOODWILL |
The following table shows goodwill by the Cash-Generating Unit or group of Cash-Generating Units to which it belongs and changes as of September 30, 2015 and December 31, 2014:
Company | Cash Generating Unit | Opening Balance 1/1/2014 ThCh$ | Increase/ (Decrease) ThCh$ | Foreign Currency Translation ThCh$ | Closing Balance 12/31/2014 ThCh$ | Foreign Currency Translation ThCh$ | Closing Balance 9/30/2015 ThCh$ | |||||||||||||||||||
Empresa Eléctrica de Colina Ltda. | Empresa Eléctrica de Colina Ltda. | 2,240,478 | — | — | 2,240,478 | — | 2,240,478 | |||||||||||||||||||
Compañía Eléctrica Tarapaca S.A. | Generación Chile—SING | 4,656,105 | — | — | 4,656,105 | — | 4,656,105 | |||||||||||||||||||
Chilectra S.A. | Chilectra S.A. | 128,374,362 | — | — | 128,374,362 | — | 128,374,362 | |||||||||||||||||||
Empresa Nacional de Electricidad S.A | Generación Chile—SIC | 731,782,459 | — | — | 731,782,459 | — | 731,782,459 | |||||||||||||||||||
Inversiones GasAtacama Holding Ltda. (1) | Inversiones GasAtacama Holding | — | 18,737,737 | 1,466,514 | 20,204,251 | — | 20,204,251 | |||||||||||||||||||
|
|
|
|
|
|
|
|
|
|
|
| |||||||||||||||
Total | 867,053,404 | 18,737,737 | 1,466,514 | 887,257,655 | — | 887,257,655 | ||||||||||||||||||||
|
|
|
|
|
|
|
|
|
|
|
| |||||||||||||||
| (1) | See Notes 2.4.1 and 5. |
According to the Enersis management’s estimates and projections, the expected future cash flows projections attributable to the Cash-Generating Units or groups of Cash-Generating Units, to which the acquired goodwill has been allocated, allow recovery of its carrying amount as of September 30, 2015 (See Note 3.e).
The origin of the goodwill is detailed below:
1.- Empresa Eléctrica de Colina Ltda.
On September 30, 1996, Chilectra S.A. acquired 100% of the company Empresa Eléctrica de Colina Ltda. from the investment company Saint Thomas S.A., which is neither directly nor indirectly related to Chilectra S.A.
2.- Empresa Eléctrica Pangue S.A.
On July 12, 2002, Endesa Chile acquired 2.51% of the shares of Empresa Eléctrica Pangue S.A. through a put option held by the minority shareholder Internacional Finance Corporation (IFC).
On May 2, 2012, Empresa Eléctrica Pangue S.A. merged with Compañía Eléctrica San Isidro S.A.; with the latter company being the surviving entity.
3.- Compañía Eléctrica San Isidro S.A.
On August 11, 2005, Endesa Chile acquired the shares of company Inversiones Lo Venecia Ltda., whose only asset was a 25% interest in the company San Isidro S.A. (minority shareholder purchase). On September 1, 2013, Compañía Eléctrica San Isidro S.A. was merged with Endesa Eco S.A., being the latter the surviving entity. Subsequently, on November 1, 2013, Endesa Eco S.A. was merged with Compañía Eléctrica Tarapacá, being the latter the surviving entity.
F-56
Table of Contents
4.- Chilectra S.A.
In November 2000, Enersis S.A. acquired an additional 25.4% interest in Chilectra S.A. through a purchasing power of attorney in a public bidding process, reaching a 99.99% stake in the company.
5.- Empresa Nacional de Electricidad S.A.
On May 11, 1999, Enersis S.A. acquired an additional 35% in Endesa Chile in a public bidding process on the Santiago Stock Exchange and by buying shares in the U.S. (30% and 5%, respectively), reaching a 60% interest in the generation company.
6.- Inversiones GasAtacama Holding Limitada.
On April 22, 2014, Endesa Chile acquired the remaining 50% equity interest in Inversiones GasAtacama Holding Limitada that was owned at that time by Southern Cross Latin America Private Equity Fund III L.P (see Notes 2.4.1 and 5).
| 17. | PROPERTY, PLANT AND EQUIPMENT - |
The following table shows property, plant and equipment as of September 30, 2015 and December 31, 2014:
Classes of Property, Plant and Equipment, Net | 9-30-2015 ThCh$ | 12-31-2014 ThCh$ | ||||||
Property, Plant and Equipment, Net | 3,349,115,618 | 3,283,760,776 | ||||||
Construction in progress | 524,171,727 | 526,367,579 | ||||||
Land | 71,363,995 | 61,050,488 | ||||||
Buildings | 13,827,814 | 10,149,650 | ||||||
Plant and equipment | 2,701,054,113 | 2,626,471,521 | ||||||
Fixtures and fittings | 18,266,957 | 38,649,832 | ||||||
Other property, plant and equipment under financial lease | 20,431,012 | 21,071,706 | ||||||
Classes of Property, Plant and Equipment, Gross | 9-30-2015 ThCh$ | 12-31-2014 ThCh$ | ||||||
Property, Plant and Equipment, Gross | 6,234,020,347 | 6,080,079,331 | ||||||
Construction in progress | 524,171,727 | 526,367,579 | ||||||
Land | 71,363,995 | 61,050,488 | ||||||
Buildings | 27,516,555 | 20,219,104 | ||||||
Plant and equipment | 5,524,917,539 | 5,362,568,352 | ||||||
Fixtures and fittings | 57,290,500 | 81,113,777 | ||||||
Other property, plant and equipment under financial lease | 28,760,031 | 28,760,031 | ||||||
Classes of Accumulated Depreciation and Impairment in Property, Plant and Equipment | 9-30-2015 ThCh$ | 12-31-2014 ThCh$ | ||||||
Total Accumulated Depreciation and Impairment in Property, Plant and Equipment | (2,884,904,729 | ) | (2,796,318,555 | ) | ||||
Buildings | (13,688,741 | ) | (10,069,454 | ) | ||||
Plant and equipment | (2,823,863,426 | ) | (2,736,096,831 | ) | ||||
Fixtures and fittings | (39,023,543 | ) | (42,463,945 | ) | ||||
Other property, plant and equipment under financial lease | (8,329,019 | ) | (7,688,325 | ) | ||||
F-57
Table of Contents
The detail and changes in property, plant, and equipment during the nine months ended September 30, 2015 and year ended December 31, 2014 are as follows:
Changes in 2015 | Construction in progress ThCh$ | Land ThCh$ | Buildings, net ThCh$ | Plant and Equipment, net ThCh$ | Fixtures and Fittings, net ThCh$ | Other Property, Plant and Equipment under Financial Lease, Net ThCh$ | Property, Plant and Equipment, Net ThCh$ | |||||||||||||||||||||||
Opening balance January 1, 2015 | 526,367,579 | 61,050,488 | 10,149,650 | 2,626,471,521 | 38,649,832 | 21,071,706 | 3,283,760,776 | |||||||||||||||||||||||
 | Increases other than from business combinations | 155,261,350 | — | — | — | 1,829,737 | — | 157,091,087 | ||||||||||||||||||||||
Increases (decreases) from exchange differences, net | (197,568 | ) | 9,404 | 17,962 | 1,844,662 | (388,011 | ) | — | 1,286,449 | |||||||||||||||||||||
| Depreciation (2) | — | — | (536,429 | ) | (105,366,952 | ) | (2,518,423 | ) | (695,010 | ) | (109,116,814 | ) | ||||||||||||||||||
Reversals of impairment losses recognized in profit or loss (2) | — | — | — | 109,557 | — | — | 109,557 | |||||||||||||||||||||||
Increases (decreases) from transfers and other changes | (153,405,336 | ) | 317,427 | 22,987 | 154,980,041 | 1,235,243 | (3,150,362 | ) | — | |||||||||||||||||||||
Increases (decreases) for transfers | (153,405,336 | ) | 317,427 | 22,987 | 154,980,041 | 1,235,243 | (3,150,362 | ) | — | |||||||||||||||||||||
Increases (decreases) from transfers from constructions in progress | (153,405,336 | ) | 317,427 | 22,987 | 154,980,041 | 1,235,243 | (3,150,362 | ) | — | |||||||||||||||||||||
Increases (decreases) from other changes | — | — | — | — | — | — | — | |||||||||||||||||||||||
| Disposals and removals of service | (289,393 | ) | (59,737 | ) | — | (3,495,241 | ) | (165,783 | ) | — | (4,010,154 | ) | ||||||||||||||||||
| Disposals | — | — | — | — | — | — | — | |||||||||||||||||||||||
| Removals | (289,393 | ) | (59,737 | ) | — | (3,495,241 | ) | (165,783 | ) | — | (4,010,154 | ) | ||||||||||||||||||
| Other increases (decreases) | (3,564,905 | ) | 10,046,413 | 4,173,644 | 26,510,525 | (20,375,638 | ) | 3,204,678 | 19,994,717 | |||||||||||||||||||||
|
|
|
|
|
|
|
|
|
|
|
|
|
| |||||||||||||||||
| Total changes | (2,195,852 | ) | 10,313,507 | 3,678,164 | 74,582,592 | (20,382,875 | ) | (640,694 | ) | 65,354,842 | ||||||||||||||||||||
|
|
|
|
|
|
|
|
|
|
|
|
|
| |||||||||||||||||
Closing balance September 30, 2015 | 524,171,727 | 71,363,995 | 13,827,814 | 2,701,054,113 | 18,266,957 | 20,431,012 | 3,349,115,618 | |||||||||||||||||||||||
|
|
|
|
|
|
|
|
|
|
|
|
|
| |||||||||||||||||
F-58
Table of Contents
Changes in 2014 | Construction in progress ThCh$ | Land ThCh$ | Buildings, net ThCh$ | Plant and Equipment, net ThCh$ | Fixtures and Fittings, net ThCh$ | Other Property, Plant and Equipment under Financial Lease, Net ThCh$ | Property, Plant and Equipment, Net ThCh$ | |||||||||||||||||||||||
Opening balance January 1, 2014 | 425,836,637 | 57,582,247 | 9,971,705 | 2,348,545,639 | 16,608,442 | 21,925,965 | 2,880,470,635 | |||||||||||||||||||||||
| Increases other than from business combinations | 318,751,963 | — | — | 3,988 | 1,796,610 | — | 320,552,561 | ||||||||||||||||||||||
Acquisitions through business combinations (1) | 10,802,165 | 3,216,432 | — | 171,934,310 | 13,707,484 | — | 199,660,391 | |||||||||||||||||||||||
Increases (decreases) from exchange differences, net | 1,690,772 | 466,822 | — | 33,352,192 | 1,553,738 | — | 37,063,524 | |||||||||||||||||||||||
| Depreciation (2) | — | — | (481,737 | ) | (137,325,080 | ) | (2,324,987 | ) | (854,258 | ) | (140,986,062 | ) | ||||||||||||||||||
Impairment losses recognized in profit or loss (2) | — | — | — | (13,769,033 | ) | — | — | (13,769,033 | ) | |||||||||||||||||||||
Increases (decreases) from transfers and other changes | (227,696,726 | ) | 74 | 659,682 | 224,759,203 | 2,277,767 | — | — | ||||||||||||||||||||||
Increases (decreases) for transfers | (227,696,726 | ) | 74 | 659,682 | 224,759,203 | 2,277,767 | — | — | ||||||||||||||||||||||
Increases (decreases) from transfers from constructions in progress | (227,696,726 | ) | 74 | 659,682 | 224,759,203 | 2,277,767 | — | — | ||||||||||||||||||||||
Increases (decreases) from other changes | — | |||||||||||||||||||||||||||||
Disposals and removals of service | — | — | — | (392,778 | ) | (35,900 | ) | — | (428,678 | ) | ||||||||||||||||||||
Disposals | — | — | — | — | — | — | — | |||||||||||||||||||||||
Removals | — | — | — | (392,778 | ) | (35,900 | ) | — | (428,678 | ) | ||||||||||||||||||||
Other increases (decreases) | (3,017,232 | ) | (215,087 | ) | — | (636,920 | ) | 5,066,678 | (1 | ) | 1,197,438 | |||||||||||||||||||
|
|
|
|
|
|
|
|
|
|
|
|
|
| |||||||||||||||||
Total changes | 100,530,942 | 3,468,241 | 177,945 | 277,925,882 | 22,041,390 | (854,259 | ) | 403,290,141 | ||||||||||||||||||||||
|
|
|
|
|
|
|
|
|
|
|
|
|
| |||||||||||||||||
Closing balance December 31, 2014 | 526,367,579 | 61,050,488 | 10,149,650 | 2,626,471,521 | 38,649,832 | 21,071,706 | 3,283,760,776 | |||||||||||||||||||||||
|
|
|
|
|
|
|
|
|
|
|
|
|
| |||||||||||||||||
| (1) | See Note 2.4.1 and 5. |
| (2) | See Note 30. |
Additional information on property, plant and equipment, net
a) Main investments
Major additions to property, plant and equipment are investments in operating plants and new projects amounting to ThCh$157,091,087 and ThCh$320,552,561 as of September 30, 2015 and December 31, 2014, respectively. In the generation business the main investments include maintenance to plants of ThCh$101,148,732 and ThCh$253,740,453 as of September 30, 2015 and December 31, 2014, respectively. In the distribution business, major investments are network extensions and investments to optimize their operation, in order to improve the efficiency and quality of service, amounting to ThCh$43,206,709 and ThCh$62,680,946 as of September 30, 2015 and December 31, 2014, respectively.
F-59
Table of Contents
b) Finance leases
As of September 30, 2015 and December 31, 2014, property, plant and equipment includes ThCh$20,431,012 and ThCh$21,071,706, respectively, in leased assets classified as finance leases.
The present value of future lease payments derived from these finance leases is as follows:
| 9-30-2015 | 12-31-2014 | |||||||||||||||||||||||
| Gross ThCh$ | Interest ThCh$ | Present Value ThCh$ | Gross ThCh$ | Interest ThCh$ | Present Value ThCh$ | |||||||||||||||||||
Less than one year | 2,794,878 | 1,019,508 | 1,775,370 | 2,427,000 | 956,437 | 1,470,563 | ||||||||||||||||||
From one to five years | 16,769,280 | 2,951,463 | 13,817,817 | 9,708,000 | 2,270,533 | 7,437,467 | ||||||||||||||||||
More than five years | 5,674,204 | 505,280 | 5,168,924 | 11,601,579 | 1,386,143 | 10,215,436 | ||||||||||||||||||
|
|
|
|
|
|
|
|
|
|
|
| |||||||||||||
Total | 25,238,362 | 4,476,251 | 20,762,111 | 23,736,579 | 4,613,113 | 19,123,466 | ||||||||||||||||||
|
|
|
|
|
|
|
|
|
|
|
| |||||||||||||
Leased assets primarily relate to a lease agreement for Electric Transmission Lines and Installations (Ralco-Charrúa 2X220 KV) entered into between Endesa Chile and Abengoa Chile S.A. The lease agreement has a 20-year maturity and bears interest at an annual rate of 6.5%.
c) Operating leases
The combined statements of income for the nine months ended September 30, 2015 and 2014 include ThCh$2,760,267 and ThCh$6,466,979, respectively, corresponding to operating lease contracts for material assets in operation.
As of September 30, 2015 and December 31, 2014, the total future lease payments under those contracts are as follows:
| 9-30-2015 ThCh$ | 12-31-2014 ThCh$ | |||||||
Less than one year | 6,856,644 | 8,566,303 | ||||||
From one to five years | 17,178,624 | 16,634,394 | ||||||
More than five years | 10,498,589 | 10,064,425 | ||||||
|
|
|
| |||||
Total | 34,533,857 | 35,265,122 | ||||||
|
|
|
| |||||
d) Other information
i) As of September 30, 2015 and December 31, 2014, the Combined Group had contractual commitments for the acquisition of property, plant and equipment amounting to ThCh$257,258,029 and ThCh$170,911,479, respectively.
ii) As of September 30, 2015 and December 31, 2014, the Combined Group does not have property, plant and equipment pledged as security for liabilities.
iii) The Combined Group and its combined entities have insurance policies for all risks, earthquake and machinery breakdown and damages for business interruption with a €1,000 million limit in the case of generating companies and a €50 million limit for distribution companies, including business interruption coverage. Additionally, the Combined Group has Civil Liability insurance to meet claims from third parties with a €500 million limit. The insurance premiums associated with these policies are presented proportionally for each company in the caption “Prepaid expenses”.
iv) The situation of certain assets of our combined entity Endesa Chile has changed, primarily works and infrastructure for facilities built to support power generation in the SIC grid in 1998, due primarily to the installation in the SIC of new thermoelectric plants, the arrival of LNG, and new projects that will be
F-60
Table of Contents
starting up soon. This has resulted in a new supply configuration for the upcoming years, in which it is expected that these facilities will not need to be used. Accordingly, in 2009, an impairment loss of ThCh$43,999,600 was recognized for these assets, which is still in effect.
v) On October 16, 2012, Endesa Chile began the collection process on all of the bank performance bonds guaranteeing compliance with the works and correct, timely execution of these works as specified in the agreement “Bocamina Thermal Plant Expansion Project”, contract ACP-003.06. This is a turnkey project for a 350 MW coal-fired thermal generation plant (“the contract”) signed on July 25, 2007 between Empresa Nacional de Electricidad S.A. (“the owner”) and the consortium consisting of (i) the Chilean company Ingeniería y Construcción Tecnimont Chile y Compañía Limitada; (ii) the Italian company Tecnimont SpA; (iii) the Brazilian company Tecnimont do Brasil Construcao e Administracao de Projetos Ltda; (iv) the Slovakian company Slovenske Energeticke Strojarne a.s. (“SES”); and (v) the Chilean company Ingeniería y Construcción SES Chile Limitada; (all referred to collectively as “the Contractor” or “the Consortium”).
These performance bonds amounted to US$74,795,164.44 and UF 796,594.29 (approximately US$38,200,000). As of December 31, 2012 it was collected US$93,992,554 of these bonds and currently it is still pending to collect US$18,940,295, equivalent to ThCh$11,492,024.
Collection made on these bank performance bonds reduced the cost overruns incurred by the company due to breach of contract; they were capitalized into the Project.
On October 17, 2012, Endesa Chile filed an arbitration request with the International Chamber of Arbitration of Paris in order to enforce the rights conferred upon it under the Contract. On December 29, 2014, Endesa’s Board of Directors accepted and approved an agreement with the consortium that finalizes the arbitration process and grants full reciprocal settlement of the obligations. Consequently, at the end of 2014, Endesa Chile recognized a provision for US$125 million (ThCh$75,843,750 approximately) that represents an increase investment in property, plant and equipment. Finally, the payment was made on April 6, 2015.
vi) At the end of 2012, our combined entity Compañía Eléctrica Tarapacá S.A. recognized an impairment loss for ThCh$12,578,098, an amount still in effect, to adjust the carrying amount of its Property, plant and equipment to their recoverable amount (see Note 3.e).
vii) At the end of 2014, our combined entity Endesa Chile SA, recognized an impairment loss provision for ThCh$12,581,947 related to the Punta Alcalde project. This impairment loss arises because the current definition of the project is not fully aligned with the strategy that the Combined Group is reformulating, particularly with regard to technological leadership, and to community and environmental sustainability. Endesa Chile has decided to suspend the project as its profitability is still unclear (see Note 3.e).
F-61
Table of Contents
| 18. | INVESTMENT PROPERTY |
The detail and changes in investment property during the nine months ended September 30, 2015 and year ended December 31, 2014, are as follows:
| Investment Properties, Gross | Accumulated Depreciation, Amortization and Impairment | Investment Properties, Net | ||||||||||
Investment Properties | ThCh$ | ThCh$ | ThCh$ | |||||||||
Balance at January 1, 2014 | 47,047,605 | (2,170,556 | ) | 44,877,049 | ||||||||
|
|
|
|
|
| |||||||
Additions | 1,463,242 | — | 1,463,242 | |||||||||
Disposals | (1,806,675 | ) | — | (1,806,675 | ) | |||||||
Disposals related to the sale of combined entities (1) | (36,040,698 | ) | — | (36,040,698 | ) | |||||||
Depreciation expense | — | (30,483 | ) | (30,483 | ) | |||||||
Impairment losses recognized in income statement | — | 52,127 | 52,127 | |||||||||
|
|
|
|
|
| |||||||
Balance at December 31, 2014 | 10,663,474 | (2,148,912 | ) | 8,514,562 | ||||||||
|
|
|
|
|
| |||||||
Disposals | (1,724,812 | ) | 1,387,042 | (337,770 | ) | |||||||
Depreciation expense | — | (20,189 | ) | (20,189 | ) | |||||||
Impairment reversals recognized in income statement | — | — | — | |||||||||
|
|
|
|
|
| |||||||
Balance at September 30, 2015 | 8,938,662 | (782,059 | ) | 8,156,603 | ||||||||
|
|
|
|
|
| |||||||
| (1) | See Note 32. |
The sale prices of investment properties disposed of during the nine months ended September 30, 2015 and 2014 were ThCh$1,800,933 and ThCh$6,665,449, respectively.
-Fair value measurement and hierarchy
As of September 30, 2015, the fair value of the Combined Group’s investment properties was ThCh$12,272,521 which was determined using independent appraisals.
The fair value measurement for these investment properties was categorized as Level 2. (See Note 3h)
For the nine months ended September 30, 2015 and 2014, the detail of income and expenses from investment properties is as follows:
| Balance at | ||||||||
| 9-30-2015 | 9-30-2014 (Unaudited) | |||||||
Income and expense from investment properties | ThCh$ | ThCh$ | ||||||
Rental income from investment properties | 121,919 | 223,750 | ||||||
Income from the sale of investment properties (*) | 1,800,933 | 6,665,448 | ||||||
Direct operating expense from investment properties generating rental income | (118,283 | ) | (166,924 | ) | ||||
Direct operating expense from investment properties not generating rental income (*) | (337,770 | ) | (1,378,073 | ) | ||||
|
|
|
| |||||
Total | 1,466,799 | 5,344,201 | ||||||
|
|
|
| |||||
| (*) | See Note 32. |
The Combined Group has no repair, maintenance, acquisition, construction or development agreements that represent future obligations for the Combined Group as of September 30, 2015 and December 31, 2014.
F-62
Table of Contents
The Combined Group has insurance policies to cover operational risks of its investment properties, as well as to cover legal claims against the Combined Group that could potentially arise from exercising its business activity. Management considers that the insurance policy coverage is sufficient against the risks involved.
| 19. | DEFERRED TAXES |
a. The origination and changes in deferred tax assets and liabilities as of September 30, 2015 and December 31, 2014 are as follows:
Deferred Tax Assets | Deferred Tax Assets Relating To | Deferred Tax Assets | ||||||||||||||||||||||||||||
| Accumulated depreciation | Provisions | Post- employment benefit obligations | Revaluation of financial instruments | Tax loss carryforwards | Other | |||||||||||||||||||||||||
| ThCh$ | ThCh$ | ThCh$ | ThCh$ | ThCh$ | ThCh$ | ThCh$ | ||||||||||||||||||||||||
Opening balance January 1, 2015 | 190,823 | 5,798,306 | 162,365 | — | 4,851,839 | 1,961,762 | 12,965,095 | |||||||||||||||||||||||
| Increase (decrease) in profit or loss | 4,395,198 | 7,233,099 | (570,699 | ) | — | 6,900,373 | (2,410,942 | ) | 15,547,029 | ||||||||||||||||||||
Increase (decrease) in other comprehensive income | — | — | 628,836 | — | — | — | 628,836 | |||||||||||||||||||||||
Foreign currency translation | — | — | — | — | — | — | — | |||||||||||||||||||||||
Other increases (decreases) | 462,024 | (10,170,118 | ) | 73,354 | — | (191,991 | ) | 935,324 | (8,891,407 | ) | ||||||||||||||||||||
|
|
|
|
|
|
|
|
|
|
|
|
|
| |||||||||||||||||
Closing balance September 30, 2015 | 5,048,045 | 2,861,287 | 293,856 | — | 11,560,221 | 486,144 | 20,249,553 | |||||||||||||||||||||||
|
|
|
|
|
|
|
|
|
|
|
|
|
| |||||||||||||||||
Deferred Tax Assets | Deferred Tax Assets Relating To | Deferred Tax Assets | ||||||||||||||||||||||||||||
| Accumulated depreciation | Provisions | Post- employment benefit obligations | Revaluation of financial instruments | Tax loss carryforwards | Other | |||||||||||||||||||||||||
| ThCh$ | ThCh$ | ThCh$ | ThCh$ | ThCh$ | ThCh$ | ThCh$ | ||||||||||||||||||||||||
Opening balance January 1, 2014 | 1,409,000 | 2,471,333 | — | — | 1,710,288 | 5,660,926 | 11,251,547 | |||||||||||||||||||||||
| Increase (decrease) in profit or loss | (1,110,934 | ) | 3,894,698 | (1,218,281 | ) | (1,716 | ) | 6,297,437 | 6,750,316 | 14,611,520 | |||||||||||||||||||
Increase (decrease) in other comprehensive income | — | — | 4,488,450 | 1,716 | — | (1,084 | ) | 4,489,082 | ||||||||||||||||||||||
Acquisitions through business combinations under common control (1) | — | 879,716 | — | — | 537,932 | 974,883 | 2,392,531 | |||||||||||||||||||||||
Disinvestment through selling businesses | (107,241 | ) | (34,403 | ) | — | — | (329,845 | ) | (5,816,292 | ) | (6,287,781 | ) | ||||||||||||||||||
Foreign currency translation | — | 361,135 | — | — | — | 155,705 | 516,840 | |||||||||||||||||||||||
Transfers to (from) Non-current assets and disposals group held for sale | — | (29,583 | ) | (1,761 | ) | — | (1,448,281 | ) | (1,142,270 | ) | (2,621,895 | ) | ||||||||||||||||||
Other increases (decreases) | (2 | ) | (1,744,590 | ) | (3,106,043 | ) | — | (1,915,692 | ) | (4,620,422 | ) | (11,386,749 | ) | |||||||||||||||||
|
|
|
|
|
|
|
|
|
|
|
|
|
| |||||||||||||||||
Closing balance December 31, 2014 | 190,823 | 5,798,306 | 162,365 | — | 4,851,839 | 1,961,762 | 12,965,095 | |||||||||||||||||||||||
|
|
|
|
|
|
|
|
|
|
|
|
|
| |||||||||||||||||
Deferred Tax Liabilities | Deferred Tax Liabilities Relating to | Deferred Tax Liabilities | ||||||||||||||||||||||||
| Accumulated depreciation | Provisions | Post- employment benefit obligations | Revaluation of financial instruments | Other | ||||||||||||||||||||||
| ThCh$ | ThCh$ | ThCh$ | ThCh$ | ThCh$ | ThCh$ | |||||||||||||||||||||
Opening balance January 1, 2015 | 252,995,247 | 379 | 16,498 | — | 2,210,542 | 255,222,666 | ||||||||||||||||||||
| Increase (decrease) in profit or loss | (1,711,840 | ) | (264 | ) | 3,019 | — | (1,499,107 | ) | (3,208,192 | ) | |||||||||||||||
Increase (decrease) in other comprehensive income | — | — | (894 | ) | — | (199,530 | ) | (200,424 | ) | |||||||||||||||||
Foreign currency translation | 20,571 | — | — | — | — | 20,571 | ||||||||||||||||||||
Other increases (decreases) | (24,550,391 | ) | — | (18,466 | ) | — | 363,132 | (24,205,725 | ) | |||||||||||||||||
|
|
|
|
|
|
|
|
|
|
|
| |||||||||||||||
Closing balance September 30, 2015 | 226,753,587 | 115 | 157 | — | 875,037 | 227,628,896 | ||||||||||||||||||||
|
|
|
|
|
|
|
|
|
|
|
| |||||||||||||||
F-63
Table of Contents
Deferred Tax Liabilities | Deferred Tax Liabilities Relating to | Deferred Tax Liabilities | ||||||||||||||||||||||||
| Accumulated depreciation | Provisions | Post- employment benefit obligations | Revaluation of financial instruments | Other | ||||||||||||||||||||||
| ThCh$ | ThCh$ | ThCh$ | ThCh$ | ThCh$ | ThCh$ | |||||||||||||||||||||
Opening balance January 1, 2014 | 172,945,228 | — | 20,818 | 3,933,526 | 1,649 | 176,901,221 | ||||||||||||||||||||
| Increase (decrease) in profit or loss | 60,395,908 | 379 | (457,558 | ) | (4,490,773 | ) | 1,399,160 | 56,847,116 | |||||||||||||||||
Increase (decrease) in other comprehensive income | — | — | (20,511 | ) | 557,247 | 378 | 537,114 | |||||||||||||||||||
Acquisitions through business combinations under common control (1) | 27,088,856 | — | — | — | 1,834,311 | 28,923,167 | ||||||||||||||||||||
Disinvestment through selling businesses | — | — | — | — | — | — | ||||||||||||||||||||
Foreign currency translation | 3,324,089 | — | — | — | 77,065 | 3,401,154 | ||||||||||||||||||||
Transfers to (from) Non-current assets and disposals group held for sale | — | — | ||||||||||||||||||||||||
Other increases (decreases) | (10,758,834 | ) | — | 473,749 | — | (1,102,021 | ) | (11,387,106 | ) | |||||||||||||||||
|
|
|
|
|
|
|
|
|
|
|
| �� | ||||||||||||||
Closing balance December 31, 2014 | 252,995,247 | 379 | 16,498 | — | 2,210,542 | 255,222,666 | ||||||||||||||||||||
|
|
|
|
|
|
|
|
|
|
|
| |||||||||||||||
| (1) | See Note 2.4.1 and 5. |
Recovery of deferred tax assets will depend on whether sufficient tax profits will be obtained in the future. The Combined Group believes that the future profit projections for its combined entities will allow these assets to be recovered.
b. As of September 30, 2015, the Combined Group does not have unrecognized deferred tax assets related to tax loss carryforwards. As of December 31, 2014, the Combined Group has unrecognized deferred tax assets related to tax loss carryforwards totaling ThCh$351,900, respectively. See Note 3.o.
The Combined Group has not recognized deferred tax liabilities for taxable temporary differences associated with investment in combined entities and joint ventures, as it is able to control the timing of the reversal of the temporary differences and considers that it is probable that such temporary differences will not reverse in the foreseeable future. As of September 30, 2015 and December 31, 2014, the aggregate of taxable temporary differences associated with investments in combined entities and joint ventures for which deferred tax liabilities have not been recognized totaled ThCh$547,222,564 and ThCh$426,167,022, respectively.
Additionally, the Combined Group has not recognized deferred tax asset for deductible temporary differences which as of September 30, 2015 and December 31, 2014, totaled ThCh$1,167,394,420 and ThCh$966,314,793, respectively, as it is not probable that sufficient future taxable profits exist to recover such temporary differences.
The Combined Group companies are potentially subject to income tax audits by the Chilean tax regulator and are limited to three tax years after which tax audits over those years can no longer be performed. Tax audits by nature are often complex and can require several years to complete. The tax years potentially subject to examination are 2012 through 2014.
Given the range of possible interpretations of tax standards, the results of any future inspections carried out by Chilean tax authority for the years subject to audit can give rise to tax liabilities that cannot currently be quantified objectively. Nevertheless, management estimates that the liabilities, if any, that may arise from such tax audits, would not significantly impact the Combined Group’s future results.
F-64
Table of Contents
The effects of deferred tax on the components of other comprehensive income for the nine months ended September 30, 2015 and 2014 are as follows:
Effects of Deferred Tax on the Comprehensive Income | 9/30/2015 | 9/30/2014 (Unaudited) | ||||||||||||||||||||||
| Amount Before Tax | Income Tax Expense (Benefit) | Amount After Tax | Amount Before Tax | Income Tax Expense (Benefit) | Amount After Tax | |||||||||||||||||||
| ThCh$ | ThCh$ | ThCh$ | ThCh$ | ThCh$ | ThCh$ | |||||||||||||||||||
Available-for-sale financial assets | 3,314 | (895 | ) | 2,419 | 6,296 | (2,663 | ) | 3,633 | ||||||||||||||||
Cash flow hedge | (115,919,728 | ) | 30,136,391 | (85,783,337 | ) | (107,869,719 | ) | 24,111,073 | (83,758,646 | ) | ||||||||||||||
Share of other comprehensive income from associates and joint ventures accounted for using the equity method | 151,687 | — | 151,687 | 13,239,766 | — | 13,239,766 | ||||||||||||||||||
Foreign currency translation | 2,952,588 | — | 2,952,588 | 8,617,612 | — | 8,617,612 | ||||||||||||||||||
Actuarial gains(losses) on defined-benefit pension plans | (2,332,333 | ) | 629,730 | (1,702,603 | ) | — | 1,100,658 | 1,100,658 | ||||||||||||||||
|
|
|
|
|
|
|
|
|
|
|
| |||||||||||||
Income tax related to components of other comprehensive income | (115,144,472 | ) | 30,765,226 | (84,379,246 | ) | (86,006,045 | ) | 25,209,068 | (60,796,977 | ) | ||||||||||||||
|
|
|
|
|
|
|
|
|
|
|
| |||||||||||||
c. In Chile, Law No. 20,780 was published in the Official Gazette on September 29, 2014. It changes the income tax system and other taxes, by replacing the current tax system in 2017 with two alternative tax systems: the attributed income system and partially integrated system.
This Law gradually increases the rate of income tax on corporate income. Thus, it will increase to 21% in 2014, to 22.5% in 2015 and to 24% in 2016. As from 2017 taxpayers choosing the attributed income system will be subject to a rate of 25%, while companies choosing the partially integrated system will be subject to a rate of 25.5% in 2017 and 27% in 2018.
Furthermore, this Law establishes that the partially integrated system will apply by default to open stock companies, unless a future Extraordinary Shareholders’ Meeting agrees to adopt the attributed income system.
The Combined Group assumes that, since an Extraordinary Shareholders’ Meeting has not agreed to adopt the alternative system, the partially integrated system applies by default. Therefore, changes in deferred tax assets and liabilities as a direct effect of the increase in the corporate income tax rate have been recognized in profit or loss. Specifically, for the year ended December 31, 2014 the net charge against income was a loss of ThCh$66,669,816.
| 20. | OTHER FINANCIAL LIABILITIES |
The balances of other financial liabilities as of September 30, 2015 and December 31, 2014, are as follows:
Other Financial Liabilities | 9-30-2015 | 12-31-2014 | ||||||||||||||
| Current ThCh$ | Non-current ThCh$ | Current ThCh$ | Non-current ThCh$ | |||||||||||||
Interest-bearing borrowings | 21,384,656 | 817,272,530 | 143,170,408 | 743,672,174 | ||||||||||||
Hedging derivatives (*) | 2,173,667 | 79,617,049 | 667,153 | 28,176,011 | ||||||||||||
Non-hedging derivatives (**) | 7,906,733 | 13,326,503 | 2,526,798 | 6,286,982 | ||||||||||||
|
|
|
|
|
|
|
| |||||||||
Total | 31,465,056 | 910,216,082 | 146,364,359 | 778,135,167 | ||||||||||||
|
|
|
|
|
|
|
| |||||||||
| (*) | See Note 22.2.a |
| (**) | See Note 22.2.b |
F-65
Table of Contents
20.1 Interest-bearing borrowings
The detail of current and non-current interest-bearing borrowings as of September 30, 2015 and December 31, 2014, is as follows:
Classes of Loans that Accrue Interest | 9-30-2015 | 12-31-2014 | ||||||||||||||
| Current ThCh$ | Non-current ThCh$ | Current ThCh$ | Non-current ThCh$ | |||||||||||||
Bank loans | 588,902 | — | 1,008,956 | — | ||||||||||||
Unsecured obligations | 19,020,384 | 798,285,789 | 140,690,889 | 726,019,271 | ||||||||||||
Financial leases | 1,775,370 | 18,986,741 | 1,470,563 | 17,652,903 | ||||||||||||
|
|
|
|
|
|
|
| |||||||||
Total | 21,384,656 | 817,272,530 | 143,170,408 | 743,672,174 | ||||||||||||
|
|
|
|
|
|
|
| |||||||||
Bank loans by currency and contractual maturity as of September 30, 2015 and December 31, 2014, are as follows:
Summary of bank loans by currency and maturity
Country | Currency | Nominal Interest Rate | Secured/ Unsecured | Current | Non-current | |||||||||||||||||||||||||||||||||||||||||||
| Maturity | Total Current at 9/30/2015 | Maturity | Total Non- current at 9/30/2015 | |||||||||||||||||||||||||||||||||||||||||||||
| One to three months | Three to twelve months | One to two years | Two to three years | Three to four years | Four to five years | Over five years | ||||||||||||||||||||||||||||||||||||||||||
| ThCh$ | ThCh$ | ThCh$ | ThCh$ | ThCh$ | ThCh$ | ThCh$ | ThCh$ | ThCh$ | ||||||||||||||||||||||||||||||||||||||||
Chile | US$ | 5.98 | % | Unsecured | 588,288 | — | 588,288 | — | — | — | — | — | — | |||||||||||||||||||||||||||||||||||
Chile | Ch$ | 5.50 | % | Unsecured | 614 | — | 614 | — | — | — | — | — | — | |||||||||||||||||||||||||||||||||||
|
|
|
|
|
|
|
|
|
|
|
|
|
|
|
|
|
| |||||||||||||||||||||||||||||||
Total |
| 588,902 | — | 588,902 | — | — | — | — | — | — | ||||||||||||||||||||||||||||||||||||||
|
|
|
|
|
|
|
|
|
|
|
|
|
|
|
|
|
| |||||||||||||||||||||||||||||||
Country | Currency | Nominal Interest Rate | Secured/ Unsecured | Current | Non-current | |||||||||||||||||||||||||||||||||||||||||||
| Maturity | Total Current at 12/31/2014 | Maturity | Total Non- current at 12/31/2014 | |||||||||||||||||||||||||||||||||||||||||||||
| One to three months | Three to twelve months | One to two years | Two to three years | Three to four years | Four to five years | Over five years | ||||||||||||||||||||||||||||||||||||||||||
| ThCh$ | ThCh$ | ThCh$ | ThCh$ | ThCh$ | ThCh$ | ThCh$ | ThCh$ | ThCh$ | ||||||||||||||||||||||||||||||||||||||||
Chile | US$ | 5.98 | % | Unsecured | — | 1,007,362 | 1,007,362 | — | — | — | — | — | — | |||||||||||||||||||||||||||||||||||
Chile | Ch$ | 5.47 | % | Unsecured | 1,594 | — | 1,594 | — | — | — | — | — | — | |||||||||||||||||||||||||||||||||||
|
|
|
|
|
|
|
|
|
|
|
|
|
|
|
|
|
| |||||||||||||||||||||||||||||||
Total |
| 1,594 | 1,007,362 | 1,008,956 | — | — | — | — | — | — | ||||||||||||||||||||||||||||||||||||||
|
|
|
|
|
|
|
|
|
|
|
|
|
|
|
|
|
| |||||||||||||||||||||||||||||||
Fair value measurement and hierarchy
The fair value of current and non-current bank borrowings as of September 30, 2015 and December 31, 2014, totaled ThCh$572,498 and ThCh$1,027,794, respectively. The fair value measurement of borrowings have been categorized as Level 2 (see Note 3.h).
F-66
Table of Contents
– Identification of bank borrowings by company
Taxpayer | Company | Country | Taxpayer ID number | Financial Institution | Country | Currency | Effective interest rate | Nominal interest rate | Amortization | September 30, 2015 | ||||||||||||||||||||||||||||||||||||||||||||||||
| Current ThCh$ | Non-current ThCh$ | |||||||||||||||||||||||||||||||||||||||||||||||||||||||||
| Less than 90 days | More than 90 days | Total Current | One to two years | Two to three years | Three to four years | Four to five years | More than five years | Total Non- Current | ||||||||||||||||||||||||||||||||||||||||||||||||||
96.800.570-7 | Chilectra S.A. | Chile | 97.004.000-5 | Lines of Credit | Chile | Ch$ | 6.00 | % | 6.00 | % | Other | 29 | — | 29 | — | — | — | — | — | — | ||||||||||||||||||||||||||||||||||||||
91.081.000-6 | Endesa Chile S.A. | Chile | Foreign | B.N.P. Paribas | U.S.A | US$ | 6.32 | % | 5.98 | % | Semi-annually | 588,288 | — | 588,288 | — | — | — | — | — | — | ||||||||||||||||||||||||||||||||||||||
91.081.000-6 | Endesa Chile S.A. | Chile | 97.004.000-5 | Banco Santander | Chile | Ch$ | 6.00 | % | 6.00 | % | Monthly | 581 | — | 581 | — | — | — | — | — | — | ||||||||||||||||||||||||||||||||||||||
94.271.00-3 | Enersis S.A. | Chile | 97.004.000-5 | Banco Santander Chile | Chile | Ch$ | 4.50 | % | 4.50 | % | At maturity | 4 | — | 4 | — | — | — | — | — | — | ||||||||||||||||||||||||||||||||||||||
|
|
|
|
|
|
|
|
|
|
|
|
|
|
|
|
|
| |||||||||||||||||||||||||||||||||||||||||
Total | 588,902 | — | 588,902 | — | — | — | — | — | — | |||||||||||||||||||||||||||||||||||||||||||||||||
|
|
|
|
|
|
|
|
|
|
|
|
|
|
|
|
|
| |||||||||||||||||||||||||||||||||||||||||
Taxpayer | Company | Country | Taxpayer ID number | Financial Institution | Country | Currency | Effective interest rate | Nominal interest rate | Amortization | December 31, 2014 | ||||||||||||||||||||||||||||||||||||||||||||||||
| Current ThCh$ | Non-current ThCh$ | |||||||||||||||||||||||||||||||||||||||||||||||||||||||||
| Less than 90 days | More than 90 days | Total Current | One to two years | Two to three years | Three to four years | Four to five years | More than five years | Total Non- Current | ||||||||||||||||||||||||||||||||||||||||||||||||||
96.800.570-7 | Chilectra S.A. | Chile | 97.004.000-5 | Lines of Credit | Chile | Ch$ | 6.00 | % | 6.00 | % | Other | 133 | — | 133 | — | — | — | — | — | — | ||||||||||||||||||||||||||||||||||||||
91.081.000-6 | Endesa Chile S.A. | Chile | Foreign | B.N.P. Paribas | U.S.A | US$ | 6.32 | % | 5.98 | % | Semi-annually | — | 1,007,362 | 1,007,362 | — | — | — | — | — | — | ||||||||||||||||||||||||||||||||||||||
91.081.000-6 | Endesa Chile S.A. | Chile | 97.004.000-5 | Banco Santander | Chile | Ch$ | 6.00 | % | 6.00 | % | Monthly | 1,338 | — | 1,338 | — | — | — | — | — | — | ||||||||||||||||||||||||||||||||||||||
94.271.00-3 | Enersis S.A. | Chile | 97.004.000-5 | Banco Santander Chile | Chile | Ch$ | 4.50 | % | 4.50 | % | At maturity | 123 | — | 123 | — | — | — | — | — | — | ||||||||||||||||||||||||||||||||||||||
|
|
|
|
|
|
|
|
|
|
|
|
|
|
|
|
|
| |||||||||||||||||||||||||||||||||||||||||
Total | 1,594 | 1,007,362 | 1,008,956 | — | — | — | — | — | — | |||||||||||||||||||||||||||||||||||||||||||||||||
|
|
|
|
|
|
|
|
|
|
|
|
|
|
|
|
|
| |||||||||||||||||||||||||||||||||||||||||
Appendix No.4, letter a), presents details of estimated future cash flows (undiscounted) that the Combined Group will have to disburse to settle the bank loans detailed above.
F-67
Table of Contents
20.2 Unsecured liabilities
The detail of Unsecured Liabilities by currency and maturity as of September 30, 2015 and December 31, 2014, is as follows:
Summary of unsecured liabilities by currency and maturity
Country | Currency | Nominal Annual Rate | Secured/ Unsecured | Non-Current | ||||||||||||||||||||||||||||||||||||||||||||
| Maturity | Total | Maturity | Total Non- Current 9/30/2015 | |||||||||||||||||||||||||||||||||||||||||||||
One to three | Three to Twelve | One to two years | Two to three years | Three to four years | Four to five years | More than five years | ||||||||||||||||||||||||||||||||||||||||||
| ThCh$ | ThCh$ | ThCh$ | ThCh$ | ThCh$ | ThCh$ | ThCh$ | ThCh$ | ThCh$ | ||||||||||||||||||||||||||||||||||||||||
Chile | US$ | 7.24 | % | Unsecured | 4,659,697 | 8,270,539 | 12,930,236 | — | 11,521,315 | 23,042,627 | 477,429,312 | 511,993,254 | ||||||||||||||||||||||||||||||||||||
Chile | U.F. | 6.34 | % | Unsecured | 6,090,148 | 6,090,148 | 5,272,153 | 5,272,153 | 5,272,153 | 5,272,153 | 265,203,923 | 286,292,535 | ||||||||||||||||||||||||||||||||||||
|
|
|
|
|
|
|
|
|
|
|
|
|
|
|
|
|
| |||||||||||||||||||||||||||||||
Total |
| 4,659,697 | 14,360,687 | 19,020,384 | 5,272,153 | 5,272,153 | 16,793,468 | 28,314,780 | 742,633,235 | 798,285,789 | ||||||||||||||||||||||||||||||||||||||
|
|
|
|
|
|
|
|
|
|
|
|
|
|
|
|
|
| |||||||||||||||||||||||||||||||
Country | Currency | Nominal Annual Rate | Secured/ Unsecured | Non-Current | ||||||||||||||||||||||||||||||||||||||||||||
| Maturity | Total | Maturity | Total Non- Current | |||||||||||||||||||||||||||||||||||||||||||||
| One to three months | Three to Twelve months | One to two years | Two to three | Three to four years | Four to five years | More than five years | ||||||||||||||||||||||||||||||||||||||||||
| ThCh$ | ThCh$ | ThCh$ | ThCh$ | ThCh$ | ThCh$ | ThCh$ | ThCh$ | ThCh$ | ||||||||||||||||||||||||||||||||||||||||
Chile | US$ | 7.17 | % | Unsecured | 10,600,825 | 123,527,558 | 134,128,383 | — | — | — | — | 419,950,580 | 419,950,580 | |||||||||||||||||||||||||||||||||||
Chile | U.F. | 5.57 | % | Unsecured | — | 6,562,506 | 6,562,506 | 5,122,437 | 5,122,437 | 5,122,437 | 27,510,710 | 263,190,670 | 306,068,691 | |||||||||||||||||||||||||||||||||||
|
|
|
|
|
|
|
|
|
|
|
|
|
|
|
|
|
| |||||||||||||||||||||||||||||||
Total |
| 10,600,825 | 130,090,064 | 140,690,889 | 5,122,437 | 5,122,437 | 5,122,437 | 27,510,710 | 683,141,250 | 726,019,271 | ||||||||||||||||||||||||||||||||||||||
|
|
|
|
|
|
|
|
|
|
|
|
|
|
|
|
|
| |||||||||||||||||||||||||||||||
20.3 Secured liabilities
As of September 30, 2015 and December 31, 2014, there were no secured liabilities.
Fair value measurement and hierarchy
The fair value of current and non-current unsecured liabilities as of September 30, 2015 and December 31, 2014, totaled ThCh$996,314,917 and ThCh$1,088,491,056, respectively. The fair value measurement of these liabilities have been categorized as Level 2 (see Note 3.h).
F-68
Table of Contents
- Unsecured liabilities by company
Taxpayer ID | Company | Country | Taxpayer ID Number | Financial Institution | Country | Currency | Effective Interest Rate | Nominal Interest Rate | Secured | September 30, 2015 | ||||||||||||||||||||||||||||||||||||||||||||||||||
| Current ThCh$ | Non-Current ThCh$ | |||||||||||||||||||||||||||||||||||||||||||||||||||||||||||
| Less than 90 days | More than 90 days | Total Current | One to two years | Two to three years | Three to four years | Four to five years | More than five years | Total Non- Current | ||||||||||||||||||||||||||||||||||||||||||||||||||||
91.081.000-6 | Endesa Chile S.A. | Chile | 97.004.000-5 | Banco Santander 522 Serie-M | Chile | U.F. | 4.82 | % | 4.75 | % | No | — | 3,454,071 | 3,454,071 | — | — | 11,521,315 | 23,042,627 | 215,329,906 | 249,893,848 | ||||||||||||||||||||||||||||||||||||||||
91.081.000-6 | Endesa Chile S.A. | Chile | 97.004.000-5 | Banco Santander -317 Serie-H | Chile | U.F. | 7.17 | % | 6.20 | % | No | 4,659,697 | 2,636,077 | 7,295,774 | 5,272,153 | 5,272,153 | 5,272,153 | 5,272,153 | 41,790,675 | 62,879,287 | ||||||||||||||||||||||||||||||||||||||||
91.081.000-6 | Endesa Chile S.A. | Chile | Foreign | BNY Mellon- 144 - A | USA | US$ | 8.83 | % | 8.63 | % | No | — | — | — | — | — | — | — | — | — | ||||||||||||||||||||||||||||||||||||||||
91.081.000-6 | Endesa Chile S.A. | Chile | Foreign | BNY Mellon - Primera Emisión S-2 | USA | US$ | 7.40 | % | 7.33 | % | No | — | 593,705 | 593,705 | — | — | — | — | 48,885,654 | 48,885,654 | ||||||||||||||||||||||||||||||||||||||||
91.081.000-6 | Endesa Chile S.A. | Chile | Foreign | BNY Mellon - Primera Emisión S-3 | USA | US$ | 8.26 | % | 8.13 | % | No | — | 376,036 | 376,036 | — | — | — | — | 22,789,356 | 22,789,356 | ||||||||||||||||||||||||||||||||||||||||
91.081.000-6 | Endesa Chile S.A. | Chile | Foreign | BNY Mellon - Unica 24296 | USA | US$ | 4.32 | % | 4.25 | % | No | — | 5,444,193 | 5,444,193 | — | — | — | — | 271,141,327 | 271,141,327 | ||||||||||||||||||||||||||||||||||||||||
91.081.000-6 | Endesa Chile S.A. | Chile | Foreign | BNY Mellon - Primera Emisión S-1 | USA | US$ | 7.96 | % | 7.88 | % | No | — | 1,856,605 | 1,856,605 | — | — | — | — | 142,696,317 | 142,696,317 | ||||||||||||||||||||||||||||||||||||||||
|
|
|
|
|
|
|
|
|
|
|
|
|
|
|
|
|
| |||||||||||||||||||||||||||||||||||||||||||
| Total Unsecured Bonds | 4,659,697 | 14,360,687 | 19,020,384 | 5,272,153 | 5,272,153 | 16,793,468 | 28,314,780 | 742,633,235 | 798,285,789 | |||||||||||||||||||||||||||||||||||||||||||||||||||
|
|
|
|
|
|
|
|
|
|
|
|
|
|
|
|
|
| |||||||||||||||||||||||||||||||||||||||||||
Taxpayer | Company | Country | Taxpayer ID Number | Financial Institution | Country | Currency | Effective Interest Rate | Nominal Interest Rate | Secured | December 31, 2014 | ||||||||||||||||||||||||||||||||||||||||||||||||||
| Current ThCh$ | Non-Current ThCh$ | |||||||||||||||||||||||||||||||||||||||||||||||||||||||||||
| Less than 90 days | More than 90 days | Total Current | One to two years | Two to three years | Three to four years | Four to five years | More than five years | Total Non- Current | ||||||||||||||||||||||||||||||||||||||||||||||||||||
91.081.000-6 | Endesa Chile S.A. | Chile | 97.004.000-5 | Banco Santander 522 Serie-M | Chile | U.F. | 4.82 | % | 4.75 | % | No | 4,098,882 | — | 4,098,882 | — | — | — | 22,388,273 | 220,251,255 | 242,639,528 | ||||||||||||||||||||||||||||||||||||||||
91.081.000-6 | Endesa Chile S.A. | Chile | 97.004.000-5 | Banco Santander -317 Serie-H | Chile | U.F. | 7.17 | % | 6.20 | % | No | 1,310,741 | — | 1,310,741 | 5,122,437 | 5,122,437 | 5,122,437 | 5,122,437 | 42,939,415 | 63,429,163 | ||||||||||||||||||||||||||||||||||||||||
91.081.000-6 | Endesa Chile S.A. | Chile | Foreign | BNY Mellon - 144 - A | USA | US$ | 8.83 | % | 8.63 | % | No | 830,186 | — | 830,186 | — | — | — | — | — | — | ||||||||||||||||||||||||||||||||||||||||
91.081.000-6 | Endesa Chile S.A. | Chile | Foreign | BNY Mellon - Primera Emisión S-2 | USA | US$ | 7.40 | % | 7.33 | % | No | 4,361,016 | 121,350,000 | 125,711,016 | — | — | — | — | 42,390,409 | 42,390,409 | ||||||||||||||||||||||||||||||||||||||||
91.081.000-6 | Endesa Chile S.A. | Chile | Foreign | BNY Mellon - Primera Emisión S-3 | USA | US$ | 8.26 | % | 8.13 | % | No | — | 2,177,558 | 2,177,558 | — | — | — | — | 18,905,448 | 18,905,448 | ||||||||||||||||||||||||||||||||||||||||
91.081.000-6 | Endesa Chile S.A. | Chile | Foreign | BNY Mellon - Unica 24296 | USA | US$ | 4.32 | % | 4.25 | % | No | — | 6,054,055 | 6,054,055 | — | — | — | — | 234,941,377 | 234,941,377 | ||||||||||||||||||||||||||||||||||||||||
91.081.000-6 | Endesa Chile S.A. | Chile | Foreign | BNY Mellon - Primera Emisión S-1 | USA | US$ | 7.96 | % | 7.88 | % | No | — | 508,451 | 508,451 | — | — | — | — | 123,713,346 | 123,713,346 | ||||||||||||||||||||||||||||||||||||||||
|
|
|
|
|
|
|
|
|
|
|
|
|
|
|
|
|
| |||||||||||||||||||||||||||||||||||||||||||
| Total Unsecured Bonds | 10,600,825 | 130,090,064 | 140,690,889 | 5,122,437 | 5,122,437 | 5,122,437 | 27,510,710 | 683,141,250 | 726,019,271 | |||||||||||||||||||||||||||||||||||||||||||||||||||
|
|
|
|
|
|
|
|
|
|
|
|
|
|
|
|
|
| |||||||||||||||||||||||||||||||||||||||||||
Appendix No. 4, letter b) presents details of estimated future cash flows (undiscounted) that the Combined Group will have to disburse to settle the secured and unsecured liabilities detailed above.
F-69
Table of Contents
- Detail of finance lease obligations
Taxpayer ID | Company | Country | Taxpayer ID Number | Financial Institution | Country | Currency | Nominal Interest Rate | September 30, 2015 | ||||||||||||||||||||||||||||||||||||||||||||||||
| Current | Non-Current ThCh$ | |||||||||||||||||||||||||||||||||||||||||||||||||||||||
| Less than 90 days | More than 90 days | Total Current | One to two years | Two to three years | Three to four years | Four to five years | More than five years | Total Non- Current | ||||||||||||||||||||||||||||||||||||||||||||||||
91.081.000-6 | Endesa Chile S.A. | Chile | 87.509.100-K | Abengoa Chile | Chile | US$ | 6.50 | % | — | 1,775,370 | 1,775,370 | 2,794,880 | 2,557,749 | 1,920,774 | 2,045,625 | 9,667,713 | 18,986,741 | |||||||||||||||||||||||||||||||||||||||
|
|
|
|
|
|
|
|
|
|
|
|
|
|
|
|
|
| |||||||||||||||||||||||||||||||||||||||
| Total Leasing | — | 1,775,370 | 1,775,370 | 2,794,880 | 2,557,749 | 1,920,774 | 2,045,625 | 9,667,713 | 18,986,741 | |||||||||||||||||||||||||||||||||||||||||||||||
|
|
|
|
|
|
|
|
|
|
|
|
|
|
|
|
|
| |||||||||||||||||||||||||||||||||||||||
Taxpayer ID | Company | Country | Taxpayer ID Number | Financial Institution | Country | Currency | Nominal Interest Rate | December 31, 2014 | ||||||||||||||||||||||||||||||||||||||||||||||||
| Current | Non-Current | |||||||||||||||||||||||||||||||||||||||||||||||||||||||
| Less than 90 days | More than 90 days | Total Current | One to two years | Two to three years | Three to four years | Four to five years | More than five years | Total Non- Current | ||||||||||||||||||||||||||||||||||||||||||||||||
91.081.000-6 | Endesa Chile S.A. | Chile | 87.509.100-K | Abengoa Chile | Chile | US$ | 6.50 | % | — | 1,470,563 | 1,470,563 | 2,427,000 | 1,566,150 | 1,667,950 | 1,776,367 | 10,215,436 | 17,652,903 | |||||||||||||||||||||||||||||||||||||||
|
|
|
|
|
|
|
|
|
|
|
|
|
|
|
|
|
| |||||||||||||||||||||||||||||||||||||||
| Total Leasing | — | 1,470,563 | 1,470,563 | 2,427,000 | 1,566,150 | 1,667,950 | 1,776,367 | 10,215,436 | 17,652,903 | |||||||||||||||||||||||||||||||||||||||||||||||
|
|
|
|
|
|
|
|
|
|
|
|
|
|
|
|
|
| |||||||||||||||||||||||||||||||||||||||
Appendix No. 4 letter c) presents details of estimated future cash flows (undiscounted) that the Combined Group will have to disburse to settle the finance lease obligations detailed above.
20.4 Hedged debt
The U.S. dollar denominated debt of the Combined Group that is designated as cash flow hedge, as referenced in Note 3.m, was ThCh$801,537,707 and ThCh$608,113,125 as of September 30, 2015 and December 31, 2014.
The following table details changes in “Reserve for cash flow hedges” as of September 30, 2015 and December 31, 2014, due to exchange differences of this debt:
| 9-30-2015 | 12-31-2014 | |||||||
Balance in hedging reserves (hedging income) at the beginning of the period, net | (39,805,097 | ) | (217,636 | ) | ||||
Foreign currency exchange differences recorded in equity, net | (34,972,812 | ) | (30,045,776 | ) | ||||
Recognition of foreign currency exchange differences in profit and loss, net | 1,344,138 | (9,541,685 | ) | |||||
Foreign currency translation differences | — | — | ||||||
|
|
|
| |||||
Balance in hedging reserves (hedging income) at the end of the period, net | (74,433,772 | ) | (39,805,097 | ) | ||||
|
|
|
| |||||
20.5 Other information
As of September 30, 2015 and December 31, 2014, the Combined Group has undrawn borrowing Facilities available for use amounting to ThCh$139,744,000 and ThCh$238,502,592, respectively.
F-70
Table of Contents
| 21. | RISK MANAGEMENT POLICY |
The Combined Group’s companies are exposed to certain risks that are managed by systems that identify, measure, limit concentration of, and monitor these risks.
The main principles in the Combined Group’s risk management policy include the following:
| • | Compliance with good corporate governance standards. |
| • | Strict compliance with all the Combined Group’s internal policies. |
| • | Each business and corporate area determines: |
| I. | The markets in which it can operate based on its knowledge and ability to ensure effective risk management; |
| II. | Criteria regarding counterparts; |
| III. | Authorized operators. |
| • | Business and corporate areas establish their risk tolerance in a manner consistent with the defined strategy for each market in which they operate. |
| • | All of the operations of the businesses and corporate areas are conducted within the limits approved for each case. |
| • | Businesses, corporate areas, lines of business and companies design the risk management controls necessary to ensure that transactions in the markets are conducted in accordance with the Enersis policies, standards, and procedures. |
21.1 Interest rate risk
Changes in interest rates affect the fair value of assets and liabilities bearing fixed interest rates, as well as the expected future cash flows of assets and liabilities subject to floating interest rates.
The objective of managing interest rate risk exposure is to achieve a balance in the debt structure to minimize the cost of debt with reduced volatility in profit or loss.
In compliance with the current interest rate hedging policy, the proportion of fixed debt and/or hedged debt over the net total debt was 100% as of September 30, 2015.
Depending on the Combined Group’s estimates and on the objectives of the debt structure, hedging transactions are performed by entering into derivatives contracts that mitigate interest rate risk. Derivative instruments currently used to comply with the risk management policy are interest rate swaps to set floating rate at fixed rate.
The financial debt structure of the Combined Group detailed by the mostly strongly hedged fixed and floating interest rates on total net debt, net of hedging derivative instruments, is as follows:
Net position:
| 9-30-2015 % | 12-31-2014 % | |||||||
Fixed interest rate | 100 | % | 100 | % | ||||
Floating interest rate | — | — | ||||||
Total | 100 | % | 100 | % | ||||
F-71
Table of Contents
21.2 Exchange rate risk
Exchange rate risks involve basically the following transactions:
| • | Debt taken on by the Combined Group’s companies that is denominated in a currency other than that in which its cash flows are indexed. |
| • | Payments to be made for the acquisition of project-related materials and for corporate insurance policies in a currency other than that in which its cash flows are indexed. |
| • | Income in the Combined Group companies directly linked to changes in currencies other than that of its cash flows. |
In order to mitigate foreign currency risk, the Combined Group’s foreign currency risk management policy is based on cash flows and includes maintaining a balance between U.S. dollar flows and the levels of assets and liabilities denominated in this currency. The objective is to minimize the exposure to variability in cash flows that are attributable to foreign exchange risk.
The hedging instruments currently being used to comply with the policy are currency swaps and forward exchange contracts. In addition, the policy seeks to refinance debt in the functional currency of each of the Combined Group’s companies.
21.3 Commodities risk
The Combined Group has a risk exposure to price fluctuations in certain commodities, basically due to:
| • | Purchases of fuel used to generate electricity. |
| • | Energy purchase/sale transactions that take place in local markets. |
In order to reduce the risk in situations of extreme drought, the Combined Group has designed a commercial policy that defines the levels of sales commitments in line with the capacity of its generating power plants in a dry year. It also includes risk mitigation terms in certain contracts with unregulated customers and with regulated customers subject to long-term tender processes, establishing indexation polynomials that allow for reducing commodities exposure risk.
Considering the operating conditions faced by the power generation market in Chile, with drought and highly volatile commodity prices on international markets, the Combined Group is constantly verifying the advisability of using hedging to lessen the impacts that these price swings have on its results. As of September 30, 2015, there are no commodity derivatives transactions. As of December 31, 2014, the Combined Group had swap hedges for 266,000 barrels of Brent oil for January 2015 and 350,000 MMBTU of Henry Hub gas for February 2015.
Depending on operating conditions, which are constantly being updated, these hedges may be modified or may cover other commodities.
21.4 Liquidity risk
The Combined Group maintains a liquidity risk management policy that consists of entering into long-term committed banking facilities and temporary financial investments for amounts that cover the projected needs over a period of time that is determined based on the situation and expectations for debt and capital markets.
The projected needs mentioned above include maturities of financial debt, net of financial derivatives. For further details regarding the features and conditions of financial obligations and financial derivatives, See Notes 20 and 22, and Appendix No. 4.
As of September 30, 2015 and December 31, 2014, the Combined Group has cash and cash equivalent totaling ThCh$85,160,333 and ThCh$132,985,927, respectively, and unconditionally available lines of long-term credit totaling ThCh$139,744,000 and ThCh$238,502,592, respectively.
F-72
Table of Contents
21.5 Credit risk
The Combined Group closely monitors its credit risk.
Trade receivables:
The credit risk for receivables from the Combined Group’s commercial activity has historically been very low, due to the short term period of collections from customers, resulting in non-significant cumulative receivables amounts. This situation applies to both the electricity generating and distribution lines of business.
In our electricity generating business, Chilean regulations allow the suspension of energy service to customers with outstanding payments, and most contracts have termination clauses for payment default. The Combined Group monitors its credit risk on an ongoing basis and measures quantitatively its maximum exposure to payment default risk, which, as stated above, is very low.
In our electricity distribution companies, the suspension of energy service for customers in payment default is permitted in all cases, in accordance with current regulations. This facilitates our credit risk management, which is also low in this line of business.
Financial assets:
Cash surpluses are invested in the highest-rated local and foreign financial entities (with risk rating equivalent to investment grade where possible) with thresholds established for each entity.
Banks that have received investment grade ratings from the three major international rating agencies (Moody’s, S&P, and Fitch) are selected for making investments.
Investments may be backed with treasury bonds from the countries in which the Combined Group operates and/or with commercial papers issued by the highest rated banks; the latter are preferred, as they offer higher returns (always in line with current investment policies).
Derivative instruments are entered into with entities with solid creditworthiness; all derivative transactions are performed with entities with investment grade ratings.
21.6 Risk measurement
The Combined Group measures the Value at Risk (VaR) of its debt positions and financial derivatives in order to monitor the risk assumed by the Combined Group, thereby reducing volatility in the income statement.
The VaR determined represents the potential variation in value of the portfolio of positions described above in one quarter with a 95% confidence level. To determine the VaR, we take into account the volatility of the risk variables affecting the value of the portfolio of positions including:
| • | U.S. dollar Libor interest rate. |
| • | The exchange rates of the various currencies used in the calculation. |
The calculation of VaR is based on generating possible future scenarios (at one quarter) of market values (both spot and term) for the risk variables based on the scenarios with observable inputs for a same period (quarter) during five years.
The one-quarter 95%-confidence VaR number is calculated as the 5% percentile of the potential variations in the fair value of the portfolio in one quarter.
Taking into account the assumptions described above, the one-quarter VaR was ThCh$14,191,075. This amount represent the potential increase of the Debt and Derivatives’ Portfolio, thus these Values at Risk are inherently related, among other factors, to the Portfolio’s value at each quarter’ end.
F-73
Table of Contents
| 22. | FINANCIAL INSTRUMENTS |
22.1 Financial instruments, classified by type and category
a) The detail of financial assets, classified by type and category, as of September 30, 2015 and December 31, 2014, is as follows:
| 9-30-2015 | ||||||||||||||||||||||||
| Financial assets held for trading | Financial assets at fair value with change in profit or loss | Held-to-maturity investments | Loans and receivables | Available-for-sale financial assets | Financial derivatives for hedging | |||||||||||||||||||
| ThCh$ | ThCh$ | ThCh$ | ThCh$ | ThCh$ | ThCh$ | |||||||||||||||||||
Derivative instruments | 5,157 | — | — | — | — | 585,915 | ||||||||||||||||||
Other financial assets | — | — | 989,104 | 506,572,421 | — | — | ||||||||||||||||||
|
|
|
|
|
|
|
|
|
|
|
| |||||||||||||
Total Current | 5,157 | — | 989,104 | 506,572,421 | — | 585,915 | ||||||||||||||||||
|
|
|
|
|
|
|
|
|
|
|
| |||||||||||||
Equity instruments | — | — | — | — | 3,036,226 | — | ||||||||||||||||||
Derivative instruments | — | — | — | — | — | 19,787,148 | ||||||||||||||||||
Other financial assets | — | — | — | 6,929,938 | — | — | ||||||||||||||||||
|
|
|
|
|
|
|
|
|
|
|
| |||||||||||||
Total Non-current | — | — | — | 6,929,938 | 3,036,226 | 19,787,148 | ||||||||||||||||||
|
|
|
|
|
|
|
|
|
|
|
| |||||||||||||
Total | 5,157 | — | 989,104 | 513,502,359 | 3,036,226 | 20,373,063 | ||||||||||||||||||
|
|
|
|
|
|
|
|
|
|
|
| |||||||||||||
| 12-31-2014 | ||||||||||||||||||||||||
| Financial assets held for trading | Financial assets at fair value with change in profit or loss | Held-to-maturity investments | Loans and receivables | Available-for-sale financial assets | Financial derivatives for hedging | |||||||||||||||||||
| ThCh$ | ThCh$ | ThCh$ | ThCh$ | ThCh$ | ThCh$ | |||||||||||||||||||
Derivative instruments | 33,882 | — | — | — | — | 508,458 | ||||||||||||||||||
Other financial assets | — | — | 948,788 | 595,033,855 | — | — | ||||||||||||||||||
|
|
|
|
|
|
|
|
|
|
|
| |||||||||||||
Total Current | 33,882 | — | 948,788 | 595,033,855 | — | 508,458 | ||||||||||||||||||
|
|
|
|
|
|
|
|
|
|
|
| |||||||||||||
Equity instruments | — | — | — | — | 3,032,834 | — | ||||||||||||||||||
Derivative instruments | 22,002 | — | — | — | — | 3,695,636 | ||||||||||||||||||
Other financial assets | — | — | — | 7,496,412 | — | — | ||||||||||||||||||
|
|
|
|
|
|
|
|
|
|
|
| |||||||||||||
Total Non-current | 22,002 | — | — | 7,496,412 | 3,032,834 | 3,695,636 | ||||||||||||||||||
|
|
|
|
|
|
|
|
|
|
|
| |||||||||||||
Total | 55,884 | — | 948,788 | 602,530,267 | 3,032,834 | 4,204,094 | ||||||||||||||||||
|
|
|
|
|
|
|
|
|
|
|
| |||||||||||||
F-74
Table of Contents
b)The detail of financial liabilities, classified by type and category, as of September 30, 2015 and December 31, 2014, is as follows:
| 9-30-2015 | ||||||||||||
| Financial liabilities held for trading ThCh$ | Loans and payables ThCh$ | Financial derivatives for hedging ThCh$ | ||||||||||
Interest-bearing loans | — | 21,384,656 | — | |||||||||
Derivative instruments | 7,906,733 | — | 2,173,667 | |||||||||
Other financial liabilities | — | 672,189,662 | — | |||||||||
|
|
|
|
|
| |||||||
Total Current | 7,906,733 | 693,574,318 | 2,173,667 | |||||||||
|
|
|
|
|
| |||||||
Interest-bearing loans | — | 817,272,530 | — | |||||||||
Derivative instruments | 13,326,503 | — | 79,617,049 | |||||||||
Other financial liabilities | — | — | — | |||||||||
|
|
|
|
|
| |||||||
Total Non-current | 13,326,503 | 817,272,530 | 79,617,049 | |||||||||
|
|
|
|
|
| |||||||
Total | 21,233,236 | 1,510,846,848 | 81,790,716 | |||||||||
|
|
|
|
|
| |||||||
| 12-31-2014 | ||||||||||||
| Financial liabilities held for trading ThCh$ | Loans and payables ThCh$ | Financial derivatives for hedging ThCh$ | ||||||||||
Interest-bearing loans | — | 143,170,408 | — | |||||||||
Derivative instruments | 2,526,798 | — | 667,153 | |||||||||
Other financial liabilities | — | 682,546,548 | — | |||||||||
|
|
|
|
|
| |||||||
Total Current | 2,526,798 | 825,716,956 | 667,153 | |||||||||
|
|
|
|
|
| |||||||
Interest-bearing loans | — | 743,672,174 | — | |||||||||
Derivative instruments | 6,286,982 | — | 28,176,011 | |||||||||
Other financial liabilities | — | 3,711,078 | — | |||||||||
|
|
|
|
|
| |||||||
Total Non-current | 6,286,982 | 747,383,252 | 28,176,011 | |||||||||
|
|
|
|
|
| |||||||
Total | 8,813,780 | 1,573,100,208 | 28,843,164 | |||||||||
|
|
|
|
|
| |||||||
22.2 Derivative instruments
The risk management policy of the Combined Group uses primarily interest rate and foreign exchange rate derivatives to hedge its exposure to interest rate and foreign currency risks.
The Combined Group classifies its derivatives as follows:
| • | Cash flow hedges: Those that hedge the cash flows of the underlying hedged item. |
| • | Fair value hedges: Those that hedge the fair value of the underlying hedged item. |
| • | Non-hedge derivatives: Financial derivatives that do not meet the requirements established by IFRS to be designated as hedge instruments are recorded at fair value with changes in net income (assets held for trading). |
F-75
Table of Contents
a) Assets and liabilities for hedge derivative instruments
As of September 30, 2015 and December 31, 2014, financial derivative transactions qualifying as hedge instruments resulted in recognition of the following assets and liabilities in the combined statement of financial position:
| September 30, 2015 | ||||||||||||||||
| Assets | Liabilities | |||||||||||||||
| Current ThCh$ | Non-current ThCh$ | Current ThCh$ | Non-current ThCh$ | |||||||||||||
Exchange rate hedge: | 585,915 | 19,787,148 | 2,173,667 | 79,617,049 | ||||||||||||
Cash flow hedge | 585,915 | 19,787,148 | 2,173,667 | 79,617,049 | ||||||||||||
|
|
|
|
|
|
|
| |||||||||
Total | 585,915 | 19,787,148 | 2,173,667 | 79,617,049 | ||||||||||||
|
|
|
|
|
|
|
| |||||||||
| December 31, 2014 | ||||||||||||||||
| Assets | Liabilities | |||||||||||||||
| Current ThCh$ | Non-current ThCh$ | Current ThCh$ | Non-current ThCh$ | |||||||||||||
Exchange rate hedge: | 508,458 | 3,695,636 | 667,153 | 28,176,011 | ||||||||||||
Cash flow hedge | 508,458 | 3,695,636 | 667,153 | 28,176,011 | ||||||||||||
|
|
|
|
|
|
|
| |||||||||
Total | 508,458 | 3,695,636 | 667,153 | 28,176,011 | ||||||||||||
|
|
|
|
|
|
|
| |||||||||
General information on hedge derivative instruments
Hedge derivative instruments and their corresponding hedged instruments are shown in the following table:
Detail of hedge instruments | Description of hedge instrument | Description of instrument | Fair value of instruments hedged 9-30-2015 ThCh$ | Fair value of instruments hedged 12-31-2014 ThCh$ | ||||||||
SWAP | Exchange rate | Unsecured obligations (bonds) | (61,417,653 | ) | (24,639,070 | ) | ||||||
For the nine months ended September 30, 2015 and 2014, the Combined Group has not recognized gains or losses for ineffective cash flow hedges.
The Combined Group has not entered into any fair value hedges for any of the periods reported.
b) Financial derivative instrument assets and liabilities at fair value through profit or loss
As of September 30, 2015 and December 31, 2014, financial derivative transactions recorded at fair value through profit or loss, resulted in the recognition of the following assets and liabilities in the statement of financial position:
| 9-30-2015 | 12-31-2014 | |||||||||||||||||||||||||||||||
| Current Assets ThCh$ | Current Liabilities ThCh$ | Non-Current Assets ThCh$ | Non-Current Liabilities ThCh$ | Current Assets ThCh$ | Current Liabilities ThCh$ | Non-Current Assets ThCh$ | Non-Current Liabilities ThCh$ | |||||||||||||||||||||||||
Non-hedging derivative instrument | 5,157 | 7,906,733 | — | 13,326,503 | 33,882 | 2,526,798 | 22,002 | 6,286,982 | ||||||||||||||||||||||||
F-76
Table of Contents
c) Other information on derivatives
The following tables present the fair value of hedging and non-hedging derivatives entered into by the Combined Group as well as the remaining contractual maturities as of September 30, 2015 and December 31, 2014:
Financial derivatives | September 30, 2015 | |||||||||||||||||||||||||||
| Fair value ThCh$ | Notional Amount | |||||||||||||||||||||||||||
| Less than 1 year ThCh$ | 1-2 years ThCh$ | 2-3 years ThCh$ | 3-4 years ThCh$ | 4-5 years ThCh$ | Total ThCh$ | |||||||||||||||||||||||
Interest rate hedge: | — | — | — | — | — | — | — | |||||||||||||||||||||
Cash flow hedge | — | — | — | — | — | — | — | |||||||||||||||||||||
Exchange rate hedge: | (61,417,653 | ) | — | — | — | — | 536,242,718 | 536,242,718 | ||||||||||||||||||||
Cash flow hedge | (61,417,653 | ) | — | — | — | — | 536,242,718 | 536,242,718 | ||||||||||||||||||||
Derivatives not designated for hedge accounting | (21,228,079 | ) | 51,894,501 | 51,987,038 | 37,442,611 | — | — | 141,324,149 | ||||||||||||||||||||
|
|
|
|
|
|
|
|
|
|
|
|
|
| |||||||||||||||
Total | (82,645,732 | ) | 51,894,501 | 51,987,038 | 37,442,611 | — | 536,242,718 | 677,566,867 | ||||||||||||||||||||
|
|
|
|
|
|
|
|
|
|
|
|
|
| |||||||||||||||
Financial derivatives | December 31, 2014 | |||||||||||||||||||||||||||
| Fair value ThCh$ | Notional Amount | |||||||||||||||||||||||||||
| Less than 1 year ThCh$ | 1-2 years ThCh$ | 2-3 years ThCh$ | 3-4 years ThCh$ | 4-5 years ThCh$ | Total ThCh$ | |||||||||||||||||||||||
Interest rate hedge: | — | — | — | — | — | — | — | |||||||||||||||||||||
Cash flow hedge | — | — | — | — | — | — | — | |||||||||||||||||||||
Exchange rate hedge: | (24,639,070 | ) | — | — | — | — | 260,451,370 | 260,451,370 | ||||||||||||||||||||
Cash flow hedge | (24,639,070 | ) | — | — | — | — | 260,451,370 | 260,451,370 | ||||||||||||||||||||
Derivatives not designated for hedge accounting | (8,757,896 | ) | 65,572,071 | 46,908,791 | 45,078,924 | 19,426,499 | — | 176,986,285 | ||||||||||||||||||||
|
|
|
|
|
|
|
|
|
|
|
|
|
| |||||||||||||||
Total | (33,396,966 | ) | 65,572,071 | 46,908,791 | 45,078,924 | 19,426,499 | 260,451,370 | 437,437,655 | ||||||||||||||||||||
|
|
|
|
|
|
|
|
|
|
|
|
|
| |||||||||||||||
The hedging and non-hedging derivatives contractual maturities do not represent the Combined Group’s total risk exposure, as the amounts presented in the above tables have been drawn up based on undiscounted contractual cash inflows and outflows for their settlement.
F-77
Table of Contents
22.3 Fair value hierarchy
Financial instruments recognized at fair value in the combined statement of financial position are classified based on the hierarchy described in Note 3.h.
The following table presents financial assets and liabilities measured at fair value as of September 30, 2015 and December 31, 2014:
Financial Instruments Measured at Fair Value | Fair Value Measured at End of Reporting Period Using: | |||||||||||||||
| 9-30-2015 ThCh$ | Level 1 ThCh$ | Level 2 ThCh$ | Level 3 ThCh$ | |||||||||||||
Financial Assets | ||||||||||||||||
Financial derivatives designated as cash flow hedges | 20,373,063 | — | 20,373,063 | — | ||||||||||||
Financial derivatives not designated for hedge accounting | 5,157 | — | 5,157 | — | ||||||||||||
Available-for-sale financial assets, non-current | 34,358 | 34,358 | — | — | ||||||||||||
|
|
|
|
|
|
|
| |||||||||
Total | 20,412,578 | 34,358 | 20,378,220 | — | ||||||||||||
|
|
|
|
|
|
|
| |||||||||
Financial Liabilities | ||||||||||||||||
Financial derivatives designated as cash flow hedges | 81,790,716 | — | 81,790,716 | — | ||||||||||||
Financial derivatives not designated for hedge accounting | 21,233,236 | — | 21,233,236 | — | ||||||||||||
|
|
|
|
|
|
|
| |||||||||
Total | 103,023,952 | — | 103,023,952 | — | ||||||||||||
|
|
|
|
|
|
|
| |||||||||
Financial Instruments Measured at Fair Value | Fair Value Measured at End of Reporting Period Using: | |||||||||||||||
| 12-31-2014 ThCh$ | Level 1 ThCh$ | Level 2 ThCh$ | Level 3 ThCh$ | |||||||||||||
Financial Assets | ||||||||||||||||
Financial derivatives designated as cash flow hedges | 4,204,094 | — | 4,204,094 | — | ||||||||||||
Financial derivatives not designated for hedge accounting | 55,884 | — | 55,884 | — | ||||||||||||
Available-for-sale financial assets, non-current | 362,169 | 362,169 | — | — | ||||||||||||
|
|
|
|
|
|
|
| |||||||||
Total | 4,622,147 | 362,169 | 4,259,978 | — | ||||||||||||
|
|
|
|
|
|
|
| |||||||||
Financial Liabilities | ||||||||||||||||
Financial derivatives designated as cash flow hedges | 28,843,164 | — | 28,843,164 | — | ||||||||||||
Financial derivatives not designated for hedge accounting | 8,813,780 | — | 8,813,780 | — | ||||||||||||
|
|
|
|
|
|
|
| |||||||||
Total | 37,656,944 | — | 37,656,944 | — | ||||||||||||
|
|
|
|
|
|
|
| |||||||||
22.3.1 Financial instruments whose fair value measurement is classified as Level 3:
The Level 3 fair value is calculated by applying a traditional discounted cash flow method. These projected cash flows include assumptions internally developed by the company that are primarily based on estimates for prices and levels of energy production and firm capacity, as well as the costs of operating and maintaining some of our plants.
F-78
Table of Contents
None of the possible reasonable scenarios foreseeable in the assumptions mentioned in the above paragraph would result in a significant change in the fair value of the financial instruments included at this level. As of September 30, 2015 and December 31, 2014, there are no financial instruments whose fair value measurement is classified as Level 3.
| 23. | TRADE AND OTHER CURRENT PAYABLES |
The breakdown of Trade and Other Payables as of September 30, 2015 and December 31, 2014 is as follows:
| Current | Non-current | |||||||||||||||
Trade and other payables | 9-30-2015 ThCh$ | 12-31-2014 ThCh$ | 9-30-2015 ThCh$ | 12-31-2014 ThCh$ | ||||||||||||
Trade payables | 172,464,331 | 141,406,478 | — | — | ||||||||||||
Other payables | 188,304,471 | 353,954,877 | — | 3,711,078 | ||||||||||||
|
|
|
|
|
|
|
| |||||||||
Total | 360,768,802 | 495,361,355 | — | 3,711,078 | ||||||||||||
|
|
|
|
|
|
|
| |||||||||
The detail of Trade and Other Current Payables as of September 30, 2015 and December 31, 2014, is as follows:
| Current | Non-current | |||||||||||||||
| One to five years | ||||||||||||||||
Trade and other payables | 9-30-2015 ThCh$ | 12-31-2014 ThCh$ | 9-30-2015 ThCh$ | 12-31-2014 ThCh$ | ||||||||||||
Energy suppliers | 133,447,103 | 117,406,230 | — | — | ||||||||||||
Fuel and gas suppliers | 39,017,228 | 24,000,248 | — | — | ||||||||||||
Payables for goods and services | 151,095,688 | 239,620,155 | — | — | ||||||||||||
Dividends payable to non-controlling interests | 3,326,312 | 52,514,644 | — | — | ||||||||||||
Taxes payables other than income tax | 11,231,770 | 9,151,384 | — | 3,711,078 | ||||||||||||
VAT debit | 12,831,876 | 13,615,918 | — | — | ||||||||||||
Mitsubishi contract (LTSA) | 8,192,276 | 34,214,611 | — | — | ||||||||||||
Other payables | 1,626,549 | 4,838,165 | — | — | ||||||||||||
|
|
|
|
|
|
|
| |||||||||
Total | 360,768,802 | 495,361,355 | — | 3,711,078 | ||||||||||||
|
|
|
|
|
|
|
| |||||||||
See Note 21.4 for the description of the liquidity risk management policy.
The detail of trade payables, both non-past due and past due as of September 30, 2015 and December 31, 2014, are presented in Appendix 7.
| 24. | PROVISIONS |
| a) | The breakdown of provisions as of September 30, 2015 and December 31, 2014, is as follows: |
Provisions | Current | Non-current | ||||||||||||||
| 9-30-2015 ThCh$ | 12-31-2014 ThCh$ | 9-30-2015 ThCh$ | 12-31-2014 ThCh$ | |||||||||||||
Provision for legal proceedings | 13,038,463 | 5,113,728 | 3,241,846 | 2,397,507 | ||||||||||||
Decommissioning or restoration (1) | — | — | 57,822,922 | 25,572,428 | ||||||||||||
Other provisions | 6,516,354 | 6,509,786 | — | — | ||||||||||||
|
|
|
|
|
|
|
| |||||||||
Total | 19,554,817 | 11,623,514 | 61,064,768 | 27,969,935 | ||||||||||||
|
|
|
|
|
|
|
| |||||||||
| (1) | See Note 3a |
The expected timing and amount of any cash outflows related to the above provisions is uncertain and depends on the final resolution of the provisioned matters (See note 3.l)
F-79
Table of Contents
The management of Enersis Chile considers that the provisions recorded in the combined financial statements are adequate to cover the risks resulting from litigation.
| b) | Changes in provisions as of September 30, 2015 and December 31, 2014, are as follows: |
Changes in Provisions | Legal Proceedings ThCh$ | Decommissioning or Restoration ThCh$ | Other Provisions ThCh$ | Total ThCh$ | ||||||||||||
Balance at January 1, 2015 | 7,511,235 | 25,572,428 | 6,509,786 | 39,593,449 | ||||||||||||
Additional provisions | — | — | — | — | ||||||||||||
Increase (decrease) in existing provisions | 9,738,885 | 31,036,569 | 6,568 | 40,782,022 | ||||||||||||
Provisions used | — | — | — | — | ||||||||||||
Increase from adjustment to time value of money | — | 1,213,925 | — | 1,213,925 | ||||||||||||
Foreign currency translation | (969,811 | ) | — | — | (969,811 | ) | ||||||||||
Other increase (decrease) | — | — | — | — | ||||||||||||
|
|
|
|
|
|
|
| |||||||||
Total changes in provisions | 8,769,074 | 32,250,494 | 6,568 | 41,026,136 | ||||||||||||
|
|
|
|
|
|
|
| |||||||||
Balance at September 30, 2015 | 16,280,309 | 57,822,922 | 6,516,354 | 80,619,585 | ||||||||||||
|
|
|
|
|
|
|
| |||||||||
Changes in Provisions | Legal Proceedings ThCh$ | Decommissioning or Restoration ThCh$ | Other Provisions ThCh$ | Total ThCh$ | ||||||||||||
Balance at January 1, 2014 | 13,364,904 | 17,691,002 | 37,566,817 | 68,622,723 | ||||||||||||
Additional provisions | — | 6,815,580 | — | 6,815,580 | ||||||||||||
Increase (decrease) in existing provisions | (925,600 | ) | 15,850 | (31,043,430 | ) | (31,953,180 | ) | |||||||||
Provisions used | (4,928,069 | ) | — | (13,601 | ) | (4,941,670 | ) | |||||||||
Increase from adjustment to time value of money | — | 1,049,996 | — | 1,049,996 | ||||||||||||
Foreign currency translation | — | — | — | — | ||||||||||||
Other increase (decrease) | — | — | — | — | ||||||||||||
|
|
|
|
|
|
|
| |||||||||
Total changes in provisions | (5,853,669 | ) | 7,881,426 | (31,057,031 | ) | (29,029,274 | ) | |||||||||
|
|
|
|
|
|
|
| |||||||||
Balance at December 31, 2014 | 7,511,235 | 25,572,428 | 6,509,786 | 39,593,449 | ||||||||||||
|
|
|
|
|
|
|
| |||||||||
| 25. | EMPLOYEE BENEFIT OBLIGATIONS |
25.1 General information
The Combined Group provides various post-employment benefits for all or some of their active or retired employees. These benefits are calculated and recorded in the financial statements according to the criteria described in Note 3.l.1, and include primarily the following:
Defined benefit plans:
| • | Complementary pension: The beneficiary is entitled to receive a monthly amount that supplements the pension obtained from the respective social security system. |
| • | Employee severance indemnities: The beneficiary receives a certain number of contractual salaries upon retirement. Such benefit is subject to a vesting minimum service requirement period, which depending on the Combined Group, varies within a range from 5 to 15 years. |
| • | Electricity: The beneficiary receives a monthly bonus to cover a portion of their billed residential electricity consumption. |
| • | Health benefit: The beneficiary receives health coverage in addition to that to which they are entitled to under applicable social security regime. |
F-80
Table of Contents
| 25.2 | Details, changes and presentation in financial statements |
| a) | The post-employment obligations associated with the defined benefits plan as of September 30, 2015 and December 31, 2014, are as follows: |
General ledger accounts:
| 9-30-2015 ThCh$ | 12-31-2014 ThCh$ | |||||||
Post-employment obligations | 50,819,635 | 53,937,842 | ||||||
|
|
|
| |||||
Total | 50,819,635 | 53,937,842 | ||||||
|
|
|
| |||||
Total post-employment obligations, net | 50,819,635 | 53,937,842 | ||||||
|
|
|
| |||||
| b) | The following amounts were recognized in the combined statement of comprehensive income for the nine months ended September 30, 2015 and 2014: |
Expense Recognized in the Statement of Comprehensive Income | 9-30-2015 ThCh$ | 9-30-2014 (Unaudited) ThCh$ | ||||||
Current service cost for defined benefits plan | 1,539,535 | 1,365,665 | ||||||
Interest cost for defined benefits plan | 1,734,791 | 1,562,832 | ||||||
Past service costs | — | 331,581 | ||||||
|
|
|
| |||||
Expenses recognized in the Statement of Income | 3,274,326 | 3,260,078 | ||||||
|
|
|
| |||||
Gains (losses) from remeasurement of defined benefit plans | 2,332,333 | — | ||||||
|
|
|
| |||||
Total expense recognized in the Statement of Comprehensive Income | 5,606,659 | 3,260,078 | ||||||
|
|
|
| |||||
| c) | The balance and changes in post-employment defined benefit obligations as of September 30, 2015 and December 31, 2014, are as follows: |
Actuarial Value of Post-employment Obligations | ThCh$ | |||
Balance at January 1, 2014 | 41,495,612 | |||
|
| |||
Current service cost | 1,642,846 | |||
Net Interest cost | 2,139,043 | |||
Actuarial (gains) losses from changes in financial assumptions | 6,190,052 | |||
Actuarial (gains) losses from changes in experience adjustments | 6,502,804 | |||
Foreign currency translation | (273,590 | ) | ||
Benefits paid | (5,007,250 | ) | ||
Past service cost | 667,153 | |||
Defined benefit plan obligations from business combinations | 1,297,048 | |||
Transfers of employees | (102,423 | ) | ||
Other | (613,453 | ) | ||
|
| |||
Balance at December 31, 2014 | 53,937,842 | |||
|
| |||
Current service cost | 1,539,535 | |||
Net Interest cost | 1,734,791 | |||
Actuarial (gains) losses from changes in experience adjustments | 2,332,333 | |||
Foreign currency translation | (697 | ) | ||
Benefits paid | (8,328,124 | ) | ||
Other | (396,045 | ) | ||
|
| |||
Balance at September 30, 2015 | 50,819,635 | |||
|
| |||
The Combined Group companies make no contributions to funds for financing the payment of these benefits.
F-81
Table of Contents
Other disclosures:
| • | Actuarial assumptions: |
As of September 30, 2015 and December 31, 2014, the following assumptions were used in the actuarial calculation of defined benefits:
| 9-30-2015 | 12-31-2014 | |||||||
Discount rates used | 4.60 | % | 4.60 | % | ||||
Expected rate of salary increases | 3.00 | % | 4.00 | % | ||||
Mortality tables | RV -2009 | RV -2009 | ||||||
| • | Sensitivity |
As of September 30, 2015 and December 31, 2014, the sensitivity value of the actuarial liability for post-employment benefits to variations of 100 basis points in the discount rate assumes a decrease of ThCh$3,903,525, and ThCh$3,886,938, respectively, if the rate rises, and an increase of ThCh$4,590,001 and ThCh$4,559,332, respectively, if the rate falls.
| • | Future disbursements |
The estimates available indicate that ThCh$8,573,738 will be disbursed for defined benefit plans in the next year.
| • | Term of commitments |
The Combined Group’s obligations have a weighted average length of 6.35 years, and the flow for benefits for the next five years and more is expected to be as follows:
Years | ThCh$ | |||
1 | 8,573,738 | |||
2 | 4,881,554 | |||
3 | 4,423,747 | |||
4 | 4,989,801 | |||
5 | 4,388,053 | |||
Over 5 | 25,464,149 | |||
| 26. | EQUITY |
26.1 Net assets (Combined financial statements)
As stated in Note 2.1 “Basis of preparation” Enersis Chile was not a group for Consolidated Financial Statements reporting purposes in accordance with IFRS 10Consolidated Financial Statements and was presented on the basis of the aggregation of the net assets of the legal entities of Enersis group located in Chile. Since the combined group does not have any subscribed capital, a presentation of earnings per share in accordance with IAS 33Earnings per Share, it is not applicable.
F-82
Table of Contents
26.2 Foreign currency translation reserves
The following table details currency translation adjustments attributable to Enersis Chile, for the nine months ended September 30, 2015 and 2014:
Reserves for Accumulated | 9-30-2015 ThCh$ | 9-30-2014 (Unaudited) ThCh$ | ||||||
Inversiones GasAtacama Holding Ltda. | 11,125,888 | 9,018,476 | ||||||
GNL Quinteros | 477,445 | (913,587 | ) | |||||
GNL Chile | 334,093 | 80,497 | ||||||
Electrogas | 1,786,459 | 695,059 | ||||||
|
|
|
| |||||
TOTAL | 13,723,885 | 8,880,445 | ||||||
|
|
|
| |||||
26.3 Restrictions on combined companies transferring funds to the parent
Certain of the companies included in the Combined Group must comply with financial ratio covenants which require them to have a minimum level of equity or other requirements that restrict the transferring of assets to Enersis Chile. The Combined Group’s restricted net assets as of September 30, 2015 from its combined entity Endesa Chile totaled ThCh$ 497,184,293.
26.4 Other reserves
Other reserves within Equity attributable to Enersis Chile for the nine months ended September 30, 2015 and 2014 are as follows:
| Balance at January 1, 2015 ThCh$ | 2015 Changes ThCh$ | Balance at September 30, 2015 ThCh$ | ||||||||||
Exchange differences on translation | 11,443,966 | 2,279,919 | 13,723,885 | |||||||||
Cash flow hedges | (66,850,863 | ) | (51,708,486 | ) | (118,559,349 | ) | ||||||
Available-for-sale financial assets | 14,046 | 2,414 | 16,460 | |||||||||
Other miscellaneous reserves | (873,486,367 | ) | (1,211,361 | ) | (874,697,728 | ) | ||||||
|
|
|
|
|
| |||||||
TOTAL | (928,879,218 | ) | (50,637,514 | ) | (979,516,732 | ) | ||||||
|
|
|
|
|
| |||||||
| Balance at January 1, 2014 ThCh$ | 2014 Changes ThCh$ | Balance at September 30, 2014 (Unaudited) ThCh$ | ||||||||||
Exchange differences on translation | 3,628,184 | 5,252,261 | 8,880,445 | |||||||||
Cash flow hedges | (6,258,379 | ) | (50,905,635 | ) | (57,164,014 | ) | ||||||
Available-for-sale financial assets | 11,811 | 3,751 | 15,562 | |||||||||
Other miscellaneous reserves | (877,246,493 | ) | (29,208,469 | ) | (906,454,962 | ) | ||||||
|
|
|
|
|
| |||||||
TOTAL | (879,864,877 | ) | (74,858,092 | ) | (954,722,969 | ) | ||||||
|
|
|
|
|
| |||||||
| a) | Reserves for exchange difference on translation arise from: |
| • | Translation of the financial statements of our Chilean operations from their functional currencies to our presentation currency (i.e. Chilean peso) (see Note 2.6.3); and |
| • | Translation of goodwill arising from the acquisition of Chilean operations with a functional currency other than the Chilean peso (see Note 3.c). |
| b) | Cash flow hedging reserves:These represent the cumulative portion of effective gains and losses recognized in cash flow hedges (see Note 3.g.5). |
F-83
Table of Contents
| c) | Other reserves |
The main items and their effects are the following:
i) In accordance with Official Bulletin No. 456 from the SVS (Superintendencia de Valores y Seguros de Chile), included in this line item is the monetary correction corresponding to the accumulated paid-up capital from the date of our transition to IFRS, January 1, 2004, to December 31, 2008.
Please note that, while the Combined Group adopted the IFRS as its statutory accounting standards on January 1, 2013, the date of transition to that international standard used was the same as that used by its parent company, Endesa, S.A. (Spain), January 1, 2004. This results from applying the exemption for that purpose in IFRS 1, “First Time Adoption”.
ii) Foreign currency translation differences existing at the time of transition to IFRS (IFRS 1 exemption, First Time Adoption).
26.5 Non-controlling Interests
26.5.1 The detail of non-controlling interests
| Non-controlling financial interests | ||||||||||||||||||
| 9-30-2015 % | Equity | Profit (Loss) | ||||||||||||||||
Companies | 9-30-2015 ThCh$ | 12-31-2014 ThCh$ | 9-30-2015 ThCh$ | 9-30-2014 (Unaudited) ThCh$ | ||||||||||||||
Chilectra S.A. | 0.91% | 6,919,775 | 6,096,609 | 918,471 | 770,118 | |||||||||||||
Empresa Nacional de Electricidad S.A | 40.02% | 567,536,292 | 590,523,470 | 40,288,011 | 13,748,187 | |||||||||||||
Empresa Eléctrica Pehuenche S.A. | 7.35% | 12,368,213 | 12,597,077 | 6,183,061 | 5,964,933 | |||||||||||||
Constructora y Proyectos Los Maitenes S.A. | 0.00% | — | — | — | 2,878,558 | |||||||||||||
Sociedad Agrícola de Cameros Ltda. | 42.50% | 2,455,754 | 2,483,339 | (27,585 | ) | (35,408 | ) | |||||||||||
Others | (166,571 | ) | 163,862 | (1,035 | ) | 211,793 | ||||||||||||
|
|
|
|
|
|
|
| |||||||||||
Total | 589,113,463 | 611,864,357 | 47,360,923 | 23,538,181 | ||||||||||||||
|
|
|
|
|
|
|
| |||||||||||
F-84
Table of Contents
| 27. | REVENUE AND OTHER INCOME |
The detail of revenues presented in the combined statement of comprehensive income for the nine months ended September 30, 2015 and 2014, is as follows:
Revenues | For the nine months ended | |||||||
| 9-30-2015 ThCh$ | 9-30-2014 (Unaudited) ThCh$ | |||||||
Energy sales | 1,650,442,562 | 1,367,941,145 | ||||||
|
|
|
| |||||
Generation | 822,300,521 | 626,980,501 | ||||||
Regulated customers | 529,634,192 | 294,895,384 | ||||||
Non-regulated customers | 188,137,634 | 269,237,640 | ||||||
Spot market sales | 88,013,239 | 49,329,089 | ||||||
Other customers | 16,515,456 | 13,518,388 | ||||||
Distribution | 828,142,041 | 740,960,644 | ||||||
Residential | 279,600,726 | 248,915,051 | ||||||
Business | 234,704,933 | 209,921,548 | ||||||
Industrial | 163,323,036 | 145,437,149 | ||||||
Other consumers (1) | 150,513,346 | 136,686,896 | ||||||
|
|
|
| |||||
Other sales | 26,966,253 | 14,516,552 | ||||||
Natural Gas sales | 13,819,660 | 4,125,174 | ||||||
Sales of products and services | 13,146,593 | 10,391,378 | ||||||
|
|
|
| |||||
Revenue from other services | 76,491,160 | 94,949,990 | ||||||
Tolls and transmission | 32,876,545 | 44,791,152 | ||||||
Metering equipment leases | 3,266,019 | 3,132,696 | ||||||
Public lighting | 8,220,190 | 6,220,583 | ||||||
Other services (2) | 32,128,406 | 40,805,559 | ||||||
|
|
|
| |||||
Total operating income | 1,753,899,975 | 1,477,407,687 | ||||||
|
|
|
| |||||
| For the nine months ended | ||||||||
Other Operating Income | 9-30-2015 ThCh$ | 9-30-2014 (Unaudited) ThCh$ | ||||||
Other income (3) | 8,298,934 | 21,454,312 | ||||||
|
|
|
| |||||
Total other income | 8,298,934 | 21,454,312 | ||||||
|
|
|
| |||||
| (1) | For the nine months ended September 30, 2015, includes revenues from energy sales to municipalities for ThCh$66,363,345; government entities ThCh$32,054,705; hospitals and other related public health entities for ThCh$4,072,058; distribution companies for ThCh$34,578,458; agricultural sector entities for ThCh$7,369,069; and other for ThCh$4,748,326. For the nine months ended September 30, 2014, includes revenues from energy sales to municipalities for ThCh$49,769,397; government entities ThCh$23,961,279; hospitals and other related public health entities for ThCh$20,371,444; distribution companies for ThCh$31,030,858; agricultural sector entities for ThCh$5,478,091; and other for ThCh$5,903,629. |
| (2) | For the nine months ended September 30, 2015, includes services for construction of junctions for ThCh$12,336,330; works in specific facilities and networks for ThCh$16,706,596; and other services for ThCh$3,085,480. For the nine months ended September 30, 2014, includes services for construction of junctions for ThCh$11,445,324; tolls from concessions for ThCh$8,061,362; works in specific facilities and networks for ThCh$13,066,129; and other services for ThCh$8,232,744. |
F-85
Table of Contents
| (3) | Mainly related to indemnifications received from third-party for breach of contracts of ThCh$3,109,539 for the nine months ended September 30, 2015 (ThCh$15,153,482 for the nine months ended September 30, 2014); revenues from trading commodity derivatives for ThCh$1,800,995 for the nine months ended September 30, 2015 (ThCh$2,346,301 for the nine months ended September 30, 2014); and revenues from water sales of ThCh$1,184,961 for the nine months ended September 30, 2015. |
| 28. | RAW MATERIALS AND CONSUMABLES USED |
The detail of raw materials and consumables used presented in profit or loss for the nine months ended September 30, 2015 and 2014, is as follows:
Raw Materials and Consumables Used | For the nine months ended | |||||||
| 9-30-2015 ThCh$ | 9-30-2014 (Unaudited) ThCh$ | |||||||
Energy purchases | (642,367,505 | ) | (611,229,791 | ) | ||||
Fuel consumption | (289,424,648 | ) | (232,011,290 | ) | ||||
Transportation costs | (129,577,583 | ) | (135,080,966 | ) | ||||
Other raw materials and consumables | (90,457,489 | ) | (25,518,647 | ) | ||||
|
|
|
| |||||
Total | (1,151,827,225 | ) | (1,003,840,694 | ) | ||||
|
|
|
| |||||
| 29. | EMPLOYEE BENEFITS EXPENSE |
Employee expenses recognized in profit or loss for the nine months ended September 30, 2015 and 2014, are as follows:
Employee Benefits Expense | For the nine months ended | |||||||
| 9-30-2015 ThCh$ | 9-30-2014 (Unaudited) ThCh$ | |||||||
Wages and salaries | (86,419,365 | ) | (86,333,458 | ) | ||||
Post-employment benefit obligations expense | (1,539,535 | ) | (1,697,246 | ) | ||||
Social security and other contributions | (14,336,795 | ) | (8,473,371 | ) | ||||
|
|
|
| |||||
Total | (102,295,695 | ) | (96,504,075 | ) | ||||
|
|
|
| |||||
| 30. | DEPRECIATION, AMORTIZATION AND IMPAIRMENT LOSSES |
The detail of depreciation, amortization and impairment losses recognized for the nine months ended September 30, 2015 and 2014 are as follows:
| For the nine months ended | ||||||||
| 9-30-2015 ThCh$ | 9-30-2014 (Unaudited) ThCh$ | |||||||
Depreciation | (109,116,814 | ) | (89,164,852 | ) | ||||
Amortization | (3,274,639 | ) | (4,225,008 | ) | ||||
|
|
|
| |||||
Subtotal | (112,391,453 | ) | (93,389,860 | ) | ||||
Reversal (losses) from impairment (*) | (4,917,537 | ) | (1,075,487 | ) | ||||
|
|
|
| |||||
Total | (117,308,990 | ) | (94,465,347 | ) | ||||
|
|
|
| |||||
F-86
Table of Contents
(*) Information on Impairment | Generation | Distribution | Other | Balance at | ||||||||||||||||||||||||||||
| 9-30-2015 ThCh$ | 9-30-2014 (Unaudited) ThCh$ | 9-30-2015 ThCh$ | 9-30-2014 (Unaudited) ThCh$ | 9-30-2015 ThCh$ | 9-30-2014 (Unaudited) ThCh$ | 9-30-2015 ThCh$ | 9-30-2014 (Unaudited) ThCh$ | |||||||||||||||||||||||||
Financial assets (see Note 9c) | — | 189,544 | (5,027,094 | ) | (1,265,031 | ) | — | — | (5,027,094 | ) | (1,075,487 | ) | ||||||||||||||||||||
Property, plant and equipment (see note 17) | 109,557 | — | — | — | — | — | 109,557 | — | ||||||||||||||||||||||||
|
|
|
|
|
|
|
|
|
|
|
|
|
|
|
| |||||||||||||||||
Total | 109,557 | 189,544 | (5,027,094 | ) | (1,265,031 | ) | — | — | (4,917,537 | ) | (1,075,487 | ) | ||||||||||||||||||||
|
|
|
|
|
|
|
|
|
|
|
|
|
|
|
| |||||||||||||||||
| 31. | OTHER EXPENSES |
Other miscellaneous operating expenses for the nine months ended September 30, 2015 and 2014, are as follows:
Other Expenses | For the nine months ended | |||||||
| 9-30-2015 ThCh$ | 9-30-2014 (Unaudited) ThCh$ | |||||||
Other supplies and services | (12,366,153 | ) | (12,018,022 | ) | ||||
Professional, outsourced and other services | (31,322,930 | ) | (43,439,737 | ) | ||||
Repairs and maintenance | (10,381,239 | ) | (9,070,052 | ) | ||||
Indemnities and fines | (1,303,521 | ) | (378,752 | ) | ||||
Taxes and charges | (5,320,780 | ) | (4,998,379 | ) | ||||
Insurance premiums | (11,011,670 | ) | (9,749,791 | ) | ||||
Leases and rental costs | (2,760,267 | ) | (6,466,979 | ) | ||||
Marketing, public relations and advertising | (2,072,615 | ) | (2,275,848 | ) | ||||
Other supplies | (1,260,610 | ) | (585,078 | ) | ||||
Travel expenses | (3,015,247 | ) | (2,878,701 | ) | ||||
Environmental expenses | (1,654,847 | ) | (1,660,581 | ) | ||||
|
|
|
| |||||
Total | (82,469,879 | ) | (93,521,920 | ) | ||||
|
|
|
| |||||
| 32. | OTHER GAINS (LOSSES) |
Other gains (losses) for the nine months ended September 30, 2015 and 2014, are as follows:
Other Gains (Losses) | For the nine months ended | |||||||
| 9-30-2015 ThCh$ | 9-30-2014 (Unaudited) ThCh$ | |||||||
Gain on sale of Tunel El Melón (1) | 4,207,167 | — | ||||||
Gain on sale of investment properties (2) | 1,463,163 | 5,287,375 | ||||||
Gain on sale of land | 1,661,915 | — | ||||||
Gain on remeasuring pre-existing interest held in Inversiones GasAtacama Holding Ltda. (3) | — | 21,546,320 | ||||||
Reclassification of translation difference reserve on the pre-existing interest held in Inversiones GasAtacama Holding Ltda. (3) | — | 21,006,456 | ||||||
Other | (638,071 | ) | (85,097 | ) | ||||
|
|
|
| |||||
Total | 6,694,174 | 47,755,054 | ||||||
|
|
|
| |||||
| (1) | See Note 2.4.1 and 13 |
| (2) | See Note 18 |
| (3) | See Note 5.d |
F-87
Table of Contents
| 33. | FINANCIAL RESULTS |
Financial income and costs for the nine months ended September 30, 2015 and 2014, are as follows:
Financial Income | For the nine months ended | |||||||
| 9-30-2015 ThCh$ | 9-30-2014 (Unaudited) ThCh$ | |||||||
Income from deposits and other financial instruments | 1,307,305 | 2,577,320 | ||||||
Other financial income | 9,768,120 | 6,547,514 | ||||||
|
|
|
| |||||
Total | 11,075,425 | 9,124,834 | ||||||
|
|
|
| |||||
Financial Costs | For the nine months ended | |||||||
| 9-30-2015 ThCh$ | 9-30-2014 (Unaudited) ThCh$ | |||||||
Financial costs | (52,290,795 | ) | (58,021,595 | ) | ||||
Bank loans | (35,197 | ) | (600,141 | ) | ||||
Secured and unsecured obligations | (40,124,564 | ) | (34,915,556 | ) | ||||
Financial leasing | (771,767 | ) | (740,356 | ) | ||||
Valuation of financial derivatives | (1,373,503 | ) | (2,365,853 | ) | ||||
Financial provisions | (1,228,035 | ) | (770,668 | ) | ||||
Post-employment benefit obligations | (1,734,791 | ) | (1,562,832 | ) | ||||
Capitalized borrowing costs | 1,354,490 | 1,022,024 | ||||||
Other financial costs | (8,377,428 | ) | (18,088,213 | ) | ||||
Loss from indexed assets and liabilities (*) | 3,320,149 | 3,088,893 | ||||||
Foreign currency exchange differences (**) | (45,890,221 | ) | (13,734,131 | ) | ||||
|
|
|
| |||||
Total financial costs | (94,860,867 | ) | (68,666,833 | ) | ||||
|
|
|
| |||||
Total financial results | (83,785,442 | ) | (59,541,999 | ) | ||||
|
|
|
| |||||
The effects on financial results from exchange differences and the application of indexed assets and liabilities originated from the following:
Profit (losses) from Indexed Assets and Liabilities (*) | For the nine months ended | |||||||
| 9-30-2015 ThCh$ | 9-30-2014 (Unaudited) ThCh$ | |||||||
Other financial assets | 7,197,900 | 9,110,374 | ||||||
Other non-financial assets | 7,503 | 26,934 | ||||||
Trade and other receivables | 481,056 | 79,409 | ||||||
Current tax assets and liabilities | 4,935,479 | 5,467,588 | ||||||
Other financial liabilities (financial debt and derivative instruments) | (9,162,838 | ) | (11,517,401 | ) | ||||
Trade and other payables | (138,951 | ) | (11,988 | ) | ||||
Other provisions | — | (65,390 | ) | |||||
Other non-financial liabilities | — | (633 | ) | |||||
|
|
|
| |||||
Total | 3,320,149 | 3,088,893 | ||||||
|
|
|
| |||||
F-88
Table of Contents
Foreign Currency Exchange Differences (**) | For the nine months ended | |||||||
| 9-30-2015 ThCh$ | 9-30-2014 (Unaudited) ThCh$ | |||||||
Cash and cash equivalents | 3,397,749 | 348,047 | ||||||
Other financial assets | 9,092,030 | (17,491,765 | ) | |||||
Other non-financial assets | — | 162,075 | ||||||
Trade and other receivables | 12,865,234 | 14,969,151 | ||||||
Current tax assets and liabilities | — | (488,988 | ) | |||||
Other financial liabilities (financial debt and derivative instruments) | (26,639,853 | ) | (2,459,182 | ) | ||||
Trade and other payables | (44,605,381 | ) | (8,214,886 | ) | ||||
Other non-financial liabilities | — | (558,583 | ) | |||||
|
|
|
| |||||
Total | (45,890,221 | ) | (13,734,131 | ) | ||||
|
|
|
| |||||
| 34. | INCOME TAXES |
The following table presents the components of the income tax expense/(benefit) for the nine months ended September 30, 2015 and 2014:
Current Income Tax and Adjustments | For the nine months ended | |||||||
| 9-30-2015 ThCh$ | 9-30-2014 (Unaudited) ThCh$ | |||||||
Current income tax | (36,702,361 | ) | (18,829,519 | ) | ||||
Adjustments to current tax from the previous period | (7,277,572 | ) | (6,459,975 | ) | ||||
Benefit / (expense) for current income tax due to changes in tax rates or the introduction of new taxes | — | (4,747,995 | ) | |||||
Other current tax benefit / (expense) | (32,271,943 | ) | (13,511,752 | ) | ||||
|
|
|
| |||||
Current tax expense, net | (76,251,876 | ) | (43,549,242 | ) | ||||
Benefit / (expense) from deferred taxes for origination and reversal of temporary differences | 19,020,203 | 7,623,968 | ||||||
Benefit / (expense) from deferred taxes due to changes in tax rates or the introduction of new taxes | — | (66,669,816 | ) | |||||
Other components of deferred tax (benefit) /expense | — | — | ||||||
Adjustments from prior periods deferred taxes | (264,982 | ) | — | |||||
Total deferred tax benefit / (expense) | 18,755,221 | (59,045,849 | ) | |||||
|
|
|
| |||||
Income tax expense | (57,496,655 | ) | (102,595,091 | ) | ||||
|
|
|
| |||||
F-89
Table of Contents
The following table reconciles income taxes resulting from applying the local current tax rate to “Net income before taxes” and the actual income tax expense recorded in the accompanying Combined Statement of Comprehensive Income for the nine months ended September 30, 2015 and 2014:
Reconciliation of Tax Expense | Rate | 9-30-2015 ThCh$ | Rate | 9-30-2014 (Unaudited) ThCh$ | ||||||||||||
ACCOUNTING INCOME BEFORE TAX | 254,764,766 | 222,376,854 | ||||||||||||||
Total tax income (expense) using statutory rate | (22.50 | %) | (57,322,071 | ) | (21.00 | %) | (46,699,138 | ) | ||||||||
Tax effect of non-taxable revenues | 2.10 | % | 5,344,840 | 7.19 | % | 15,991,967 | ||||||||||
Tax effect of non-tax-deductible expenses | (2.78 | %) | (7,084,019 | ) | (1.76 | %) | (3,909,877 | ) | ||||||||
Tax effect of changes in income tax rates (*) | — | — | (32.04 | %) | (71,247,160 | ) | ||||||||||
Tax effect of adjustments to taxes in previous periods | (2.86 | %) | (7,277,572 | ) | (2.90 | %) | (6,459,975 | ) | ||||||||
Adjustments from prior periods deferred taxes | (0.10 | %) | (264,982 | ) | — | — | ||||||||||
Price level restatement for tax purposes (investments and equity) | 3.57 | % | 9,107,149 | 4.38 | % | 9,729,092 | ||||||||||
Total adjustments to tax expense using statutory rate | (0.07 | %) | (174,584 | ) | (25.14 | %) | (55,895,953 | ) | ||||||||
|
|
|
|
|
|
|
| |||||||||
Income tax expense | (22.57 | %) | (57,496,655 | ) | (46.14 | %) | (102,595,091 | ) | ||||||||
|
|
|
|
|
|
|
| |||||||||
| (*) | The principal temporary differences are detailed in Note 19a. |
| 35. | INFORMATION BY SEGMENT |
35.1 Basis of segmentation criteria
Since Enersis Chile S.A. has not yet been established as a legal entity, no chief operating decision maker existed for this Combined Group. Consequently, the Combined Group does not yet have any operating segments as the term is defined under IFRS 8 Operating Segments. Information provided in this note includes segments as they are supposed to be analyzed by the chief operating decision maker upon appointment of the latter.
The Combined Group’s activities will be organized primarily around its core businesses: electric energy generation and distribution. On that basis, the Combined Group has established two major business lines.
Considering that the differentiated information will be analyzed by the Combined Group’s chief operating decision maker, segment information has been organized by its core businesses.
Given that the Combined Group’s corporate organization basically matches its future business organization and, therefore, the segments, the following information is based on the financial information of the companies forming each segment. The accounting policies used to determine the segment information are the same as those used in the preparation of the Combined Group’s combined financial statements.
F-90
Table of Contents
The following tables present details of this information by segment:
35.2 Generation, distribution and others
Line of Business | Generation | Distribution | Eliminations and others | Total | ||||||||||||||||||||||||||||
ASSETS | 9-30-2015 ThCh$ | 12-31-2014 ThCh$ | 9-30-2015 ThCh$ | 12-31-2014 ThCh$ | 9-30-2015 ThCh$ | 12-31-2014 ThCh$ | 9-30-2015 ThCh$ | 12-31-2014 ThCh$ | ||||||||||||||||||||||||
CURRENT ASSETS | 473,803,232 | 514,223,177 | 259,773,656 | 283,754,811 | 31,257,056 | 44,885,510 | 764,833,944 | 842,863,498 | ||||||||||||||||||||||||
Cash and cash equivalents | 14,145,358 | 38,186,573 | 2,482,732 | 4,867,106 | 68,532,243 | 89,932,248 | 85,160,333 | 132,985,927 | ||||||||||||||||||||||||
Other current financial assets | 1,518,027 | 1,464,821 | 24,663 | 13,483 | 37,486 | 12,825 | 1,580,176 | 1,491,129 | ||||||||||||||||||||||||
Other current non-financial assets | 10,600,736 | 10,766,654 | 6,332,551 | 4,837,555 | 593,225 | 443,398 | 17,526,512 | 16,047,607 | ||||||||||||||||||||||||
Trade and other current receivables | 337,190,608 | 317,250,689 | 238,459,538 | 257,567,489 | 4,760,415 | 3,263,027 | 580,410,561 | 578,081,205 | ||||||||||||||||||||||||
Current accounts receivable from related companies | 59,977,672 | 54,976,444 | 7,912,464 | 12,867,310 | (45,935,982 | ) | (50,891,104 | ) | 21,954,154 | 16,952,650 | ||||||||||||||||||||||
Inventories | 31,648,641 | 36,871,184 | 1,406,309 | 3,542,452 | 2,494,525 | 3,264,242 | 35,549,475 | 43,677,878 | ||||||||||||||||||||||||
Current tax assets | 18,722,190 | 44,701,760 | 3,155,399 | 59,416 | 775,144 | 886,963 | 22,652,733 | 45,648,139 | ||||||||||||||||||||||||
Non-current assets classified as held for sale and discontinued operations | — | 10,005,052 | — | — | — | (2,026,089 | ) | — | 7,978,963 | |||||||||||||||||||||||
NON-CURRENT ASSETS | 2,800,901,615 | 2,722,809,246 | 734,777,028 | 698,940,269 | 848,785,230 | 862,121,732 | 4,384,463,873 | 4,283,871,247 | ||||||||||||||||||||||||
Other non-current financial assets | 22,789,384 | 6,719,853 | 33,990 | 30,619 | — | — | 22,823,374 | 6,750,472 | ||||||||||||||||||||||||
Other non-current non-financial assets | 3,387,708 | 42,847 | 1,131,351 | 188,156 | (1,342 | ) | 4,427 | 4,517,717 | 235,430 | |||||||||||||||||||||||
Trade and other non-current receivables | 48,635 | — | 6,741,484 | 7,364,934 | 139,819 | 131,478 | 6,929,938 | 7,496,412 | ||||||||||||||||||||||||
Non-current accounts receivable from related companies | — | — | — | — | — | — | — | — | ||||||||||||||||||||||||
Investments accounted for using the equity method | 47,687,925 | 40,365,323 | 55,748 | 53,525 | (55,747 | ) | (53,525 | ) | 47,687,926 | 40,365,323 | ||||||||||||||||||||||
Intangible assets other than goodwill | 19,383,824 | 18,851,913 | 20,135,627 | 14,613,951 | (1,793,962 | ) | 3,059,658 | 37,725,489 | 36,525,522 | |||||||||||||||||||||||
Goodwill | 24,860,356 | 24,860,356 | 2,240,478 | 2,240,478 | 860,156,821 | 860,156,821 | 887,257,655 | 887,257,655 | ||||||||||||||||||||||||
Property, plant and equipment | 2,664,655,189 | 2,621,113,892 | 704,048,512 | 674,156,508 | (19,588,083 | ) | (11,509,624 | ) | 3,349,115,618 | 3,283,760,776 | ||||||||||||||||||||||
Investment property | — | — | — | — | 8,156,603 | 8,514,562 | 8,156,603 | 8,514,562 | ||||||||||||||||||||||||
Deferred tax assets | 18,088,594 | 10,855,062 | 389,838 | 292,098 | 1,771,121 | 1,817,935 | 20,249,553 | 12,965,095 | ||||||||||||||||||||||||
|
|
|
|
|
|
|
|
|
|
|
|
|
|
|
| |||||||||||||||||
TOTAL ASSETS | 3,274,704,847 | 3,237,032,423 | 994,550,684 | 982,695,080 | 880,042,286 | 907,007,242 | 5,149,297,817 | 5,126,734,745 | ||||||||||||||||||||||||
|
|
|
|
|
|
|
|
|
|
|
|
|
|
|
| |||||||||||||||||
F-91
Table of Contents
Line of Business | Generation | Distribution | Eliminations and others | Total | ||||||||||||||||||||||||||||
LIABILITIES AND EQUITY | 9-30-2015 ThCh$ | 12-31-2014 ThCh$ | 9-30-2015 ThCh$ | 12-31-2014 ThCh$ | 9-30-2015 ThCh$ | 12-31-2014 ThCh$ | 9-30-2015 ThCh$ | 12-31-2014 ThCh$ | ||||||||||||||||||||||||
CURRENT LIABILITIES | 804,375,101 | 680,402,981 | 202,670,567 | 261,250,997 | (227,809,511 | ) | (21,570,283 | ) | 779,236,157 | 920,083,695 | ||||||||||||||||||||||
Other current financial liabilities | 31,465,023 | 146,364,103 | 29 | 133 | 4 | 123 | 31,465,056 | 146,364,359 | ||||||||||||||||||||||||
Trade and other current payables | 403,455,239 | 332,677,495 | 140,584,856 | 116,345,087 | (183,271,293 | ) | 46,338,773 | 360,768,802 | 495,361,355 | |||||||||||||||||||||||
Current accounts payable to related companies | 334,348,933 | 142,780,113 | 52,687,066 | 128,880,543 | (51,551,493 | ) | (84,475,463 | ) | 335,484,506 | 187,185,193 | ||||||||||||||||||||||
Other current provisions | 18,857,312 | 10,932,577 | 36,140 | 68,028 | 661,365 | 622,909 | 19,554,817 | 11,623,514 | ||||||||||||||||||||||||
Current tax liabilities | 3,862,956 | 31,480,257 | 15,419 | 4,501,006 | 48,486 | 2,376,603 | 3,926,861 | 38,357,866 | ||||||||||||||||||||||||
Current provisions for employee benefits | — | — | — | — | — | — | — | — | ||||||||||||||||||||||||
Other current non-financial liabilities | 12,385,638 | 16,168,436 | 9,347,057 | 11,456,200 | 6,303,420 | 8,078,625 | 28,036,115 | 35,703,261 | ||||||||||||||||||||||||
Liabilities associated with current assets classified as held for sale and discontinued operations | — | — | — | — | — | 5,488,147 | — | 5,488,147 | ||||||||||||||||||||||||
NON-CURRENT LIABILITIES | 1,152,529,885 | 1,060,586,955 | 45,279,044 | 51,025,398 | 55,182,959 | 10,972,906 | 1,252,991,888 | 1,122,585,259 | ||||||||||||||||||||||||
Other non-current financial liabilities | 910,216,082 | 778,135,167 | — | — | — | — | 910,216,082 | 778,135,167 | ||||||||||||||||||||||||
Trade and other non-current payables | — | 3,711,078 | — | — | — | — | — | 3,711,078 | ||||||||||||||||||||||||
Non-current accounts payable to related companies | — | — | — | — | — | — | — | — | ||||||||||||||||||||||||
Other long-term provisions | 57,397,502 | 25,161,118 | 3,667,266 | 2,808,817 | — | — | 61,064,768 | 27,969,935 | ||||||||||||||||||||||||
Deferred tax liabilities | 167,576,824 | 232,085,097 | 17,041,118 | 23,069,096 | 43,010,954 | 68,473 | 227,628,896 | 255,222,666 | ||||||||||||||||||||||||
Non-current provisions for employee benefits | 14,717,530 | 18,537,036 | 23,934,191 | 24,497,162 | 12,167,914 | 10,903,644 | 50,819,635 | 53,937,842 | ||||||||||||||||||||||||
Other non-current non-financial liabilities | 2,621,947 | 2,957,459 | 636,469 | 650,323 | 4,091 | 789 | 3,262,507 | 3,608,571 | ||||||||||||||||||||||||
EQUITY | 1,317,799,861 | 1,496,042,487 | 746,601,073 | 670,418,685 | 1,052,668,838 | 917,604,619 | 3,117,069,772 | 3,084,065,791 | ||||||||||||||||||||||||
Equity attributable to Enersis Chile | 1,317,799,861 | 1,496,042,487 | 746,601,073 | 670,418,685 | 1,052,668,838 | 917,604,619 | 2,527,956,309 | 2,472,201,434 | ||||||||||||||||||||||||
Allocated capital | 638,288,813 | 619,260,333 | 230,492,200 | 230,492,200 | 1,360,327,962 | 1,379,356,442 | 2,229,108,975 | 2,229,108,975 | ||||||||||||||||||||||||
Retained earnings | 887,494,564 | 829,887,035 | 832,340,258 | 767,602,864 | (441,470,756 | ) | (425,518,222 | ) | 1,278,364,066 | 1,171,971,677 | ||||||||||||||||||||||
Other reserves | (207,983,516 | ) | 46,895,119 | (316,231,385 | ) | (327,676,379 | ) | 133,811,632 | (36,233,601 | ) | (979,516,732 | ) | (928,879,218 | ) | ||||||||||||||||||
Non-controlling interests | — | — | — | — | — | — | 589,113,463 | 611,864,357 | ||||||||||||||||||||||||
|
|
|
|
|
|
|
|
|
|
|
|
|
|
|
| |||||||||||||||||
Total Liabilities and Equity | 3,274,704,847 | 3,237,032,423 | 994,550,684 | 982,695,080 | 880,042,286 | 907,007,242 | 5,149,297,817 | 5,126,734,745 | ||||||||||||||||||||||||
|
|
|
|
|
|
|
|
|
|
|
|
|
|
|
| |||||||||||||||||
The eliminations column corresponds to transactions between companies in different lines of business and country, primarily purchases and sales of energy and services.
F-92
Table of Contents
Line of Business | Generation | Distribution | Eliminations and others | Total | ||||||||||||||||||||||||||||
STATEMENT OF COMPREHENSIVE INCOME | 9-30-2015 ThCh$ | 9-30-2014 (Unaudited) ThCh$ | 9-30-2015 ThCh$ | 9-30-2014 (Unaudited) ThCh$ | 9-30-2015 ThCh$ | 9-30-2014 (Unaudited) ThCh$ | 9-30-2015 ThCh$ | 9-30-2014 (Unaudited) ThCh$ | ||||||||||||||||||||||||
REVENUES AND OTHER OPERATING INCOME | 1,131,407,459 | 876,112,867 | 930,399,001 | 830,887,781 | (299,607,551 | ) | (208,138,649 | ) | 1,762,198,909 | 1,498,861,999 | ||||||||||||||||||||||
Revenues | 1,127,922,248 | 860,266,754 | 925,989,796 | 826,230,486 | (300,012,069 | ) | (209,089,553 | ) | 1,753,899,975 | 1,477,407,687 | ||||||||||||||||||||||
Energy sales | 1,077,215,296 | 824,541,995 | 826,814,655 | 739,503,643 | (253,587,389 | ) | (196,104,493 | ) | 1,650,442,562 | 1,367,941,145 | ||||||||||||||||||||||
Other sales | 21,415,581 | 8,312,010 | 5,555,897 | 4,774,745 | (5,224 | ) | 1,429,797 | 26,966,254 | 14,516,552 | |||||||||||||||||||||||
Other services rendered | 29,291,371 | 27,412,749 | 93,619,244 | 81,952,098 | (46,419,456 | ) | (14,414,857 | ) | 76,491,159 | 94,949,990 | ||||||||||||||||||||||
Other operating income | 3,485,211 | 15,846,113 | 4,409,205 | 4,657,295 | 404,518 | 950,904 | 8,298,934 | 21,454,312 | ||||||||||||||||||||||||
RAW MATERIALS AND CONSUMABLES USED | (712,863,643 | ) | (588,934,880 | ) | (725,894,546 | ) | (628,678,985 | ) | 286,930,964 | 213,773,171 | (1,151,827,225 | ) | (1,003,840,694 | ) | ||||||||||||||||||
Energy purchases | (246,551,238 | ) | (240,490,204 | ) | (650,588,590 | ) | (566,025,134 | ) | 254,772,323 | 195,285,547 | (642,367,505 | ) | (611,229,791 | ) | ||||||||||||||||||
Fuel consumption | (289,424,648 | ) | (232,007,925 | ) | — | — | — | (3,365 | ) | (289,424,648 | ) | (232,011,290 | ) | |||||||||||||||||||
Transportation expenses | (126,196,302 | ) | (110,084,940 | ) | (45,803,557 | ) | (43,876,183 | ) | 42,422,276 | 18,880,157 | (129,577,583 | ) | (135,080,966 | ) | ||||||||||||||||||
Other miscellaneous supplies and services | (50,691,455 | ) | (6,351,811 | ) | (29,502,399 | ) | (18,777,668 | ) | (10,263,635 | ) | (389,168 | ) | (90,457,489 | ) | (25,518,647 | ) | ||||||||||||||||
CONTRIBUTION MARGIN | 418,543,816 | 287,177,987 | 204,504,455 | 202,208,796 | (12,676,587 | ) | 5,634,522 | 610,371,684 | 495,021,305 | |||||||||||||||||||||||
Other work performed by the entity and capitalized | 11,759,208 | 12,203,142 | 4,316,816 | 3,701,779 | — | — | 16,076,024 | 15,904,921 | ||||||||||||||||||||||||
Employee benefits expense | (54,486,923 | ) | (49,112,666 | ) | (24,305,937 | ) | (24,085,760 | ) | (23,502,835 | ) | (23,305,649 | ) | (102,295,695 | ) | (96,504,075 | ) | ||||||||||||||||
Other expenses | (55,279,562 | ) | (53,073,741 | ) | (45,894,872 | ) | (49,732,889 | ) | 18,704,555 | 9,284,710 | (82,469,879 | ) | (93,521,920 | ) | ||||||||||||||||||
GROSS OPERATING INCOME | 320,536,539 | 197,194,722 | 138,620,462 | 132,091,926 | (17,474,867 | ) | (8,386,417 | ) | 441,682,134 | 320,900,231 | ||||||||||||||||||||||
Depreciation and amortization expense | (91,294,436 | ) | (71,286,205 | ) | (21,512,049 | ) | (20,267,434 | ) | 415,032 | (1,836,221 | ) | (112,391,453 | ) | (93,389,860 | ) | |||||||||||||||||
Impairment losses (reversal of impairment losses) recognized in profit or loss | 109,557 | 189,544 | (5,027,094 | ) | (1,265,031 | ) | — | — | (4,917,537 | ) | (1,075,487 | ) | ||||||||||||||||||||
OPERATING INCOME | 229,351,660 | 126,098,061 | 112,081,319 | 110,559,461 | (17,059,835 | ) | (10,222,638 | ) | 324,373,144 | 226,434,884 | ||||||||||||||||||||||
FINANCIAL RESULT | (95,288,055 | ) | (63,027,659 | ) | 8,728,350 | 3,426,000 | 2,774,263 | 59,660 | (83,785,442 | ) | (59,541,999 | ) | ||||||||||||||||||||
Financial income | 158,430 | 1,404,413 | 10,097,477 | 6,214,397 | 819,518 | 1,506,024 | 11,075,425 | 9,124,834 | ||||||||||||||||||||||||
Financial costs | (50,224,176 | ) | (54,736,875 | ) | (1,712,043 | ) | (3,095,714 | ) | (354,576 | ) | (189,006 | ) | (52,290,795 | ) | (58,021,595 | ) | ||||||||||||||||
Profit (loss) from indexed assets and liabilities | 2,915,547 | 2,688,098 | 392,726 | 246,352 | 11,876 | 154,443 | 3,320,149 | 3,088,893 | ||||||||||||||||||||||||
Foreign currency exchange differences | (48,137,856 | ) | (12,383,295 | ) | (49,810 | ) | 60,965 | 2,297,445 | (1,411,801 | ) | (45,890,221 | ) | (13,734,131 | ) | ||||||||||||||||||
Positive | 24,095,968 | 17,211,246 | 420,956 | 130,653 | 2,715,808 | 2,363,022 | 27,232,732 | 19,704,921 | ||||||||||||||||||||||||
Negative | (72,233,824 | ) | (29,594,541 | ) | (470,766 | ) | (69,688 | ) | (418,363 | ) | (3,774,823 | ) | (73,122,953 | ) | (33,439,052 | ) | ||||||||||||||||
Share of profit of associates accounted for using the equity method | 7,482,890 | 7,728,915 | — | — | — | — | 7,482,890 | 7,728,915 | ||||||||||||||||||||||||
Other gains (losses) | 4,013,381 | 42,651,210 | 1,300,454 | (183,531 | ) | 1,380,339 | 5,287,375 | 6,694,174 | 47,755,054 | |||||||||||||||||||||||
Gain (loss) from other investments | 4,308,859 | 42,651,210 | — | — | — | — | 4,308,859 | 42,651,210 | ||||||||||||||||||||||||
Gain (loss) from the sale of property, plant and equipment | (295,478 | ) | — | 1,300,454 | (183,531 | ) | 1,380,339 | 5,287,375 | 2,385,315 | 5,103,844 | ||||||||||||||||||||||
Income before tax | 145,559,876 | 113,450,527 | 122,110,123 | 113,801,930 | (12,905,233 | ) | (4,875,603 | ) | 254,764,766 | 222,376,854 | ||||||||||||||||||||||
Income tax | (36,779,295 | ) | (75,388,994 | ) | (23,209,179 | ) | (29,108,484 | ) | 2,491,819 | 1,902,387 | (57,496,655 | ) | (102,595,091 | ) | ||||||||||||||||||
NET INCOME | 108,780,581 | 38,061,533 | 98,900,944 | 84,693,446 | (10,413,414 | ) | (2,973,216 | ) | 197,268,111 | 119,781,763 | ||||||||||||||||||||||
Net income attributable to: | — | — | — | — | — | — | 197,268,111 | 119,781,763 | ||||||||||||||||||||||||
Enersis Chile | — | — | — | — | — | — | 149,907,188 | 96,243,583 | ||||||||||||||||||||||||
Non-controlling interests | — | — | — | — | — | — | 47,360,923 | 23,538,180 | ||||||||||||||||||||||||
F-93
Table of Contents
Line of Business | Generation | Distribution | Eliminations and others | Total | ||||||||||||||||||||||||||||
STATEMENT OF CASH FLOW | 9-30-2015 ThCh$ | 9-30-2014 (Unaudited) ThCh$ | 9-30-2015 ThCh$ | 9-30-2014 (Unaudited) ThCh$ | 9-30-2015 ThCh$ | 9-30-2014 (Unaudited) ThCh$ | 9-30-2015 ThCh$ | 9-30-2014 (Unaudited) ThCh$ | ||||||||||||||||||||||||
Cash flow from (used in) operating activities | 254,363,734 | 66,830,007 | 132,690,580 | 25,775,118 | (52,761,522 | ) | (15,822,918 | ) | 334,292,792 | 76,782,207 | ||||||||||||||||||||||
Cash flow from (used in) investment activities | (209,997,941 | ) | (153,370,861 | ) | (62,200,758 | ) | (34,275,206 | ) | (196,231,378 | ) | 11,078,252 | (468,430,077 | ) | (176,567,815 | ) | |||||||||||||||||
Cash flows from (used in) financing activities | (70,272,532 | ) | 84,417,014 | (72,937,961 | ) | (882,542 | ) | 225,720,013 | (137,601,689 | ) | 82,509,520 | (54,067,217 | ) | |||||||||||||||||||
The eliminations column corresponds to transactions between companies in different lines of business and country, primarily purchases and sales of energy and services.
| 36. | THIRD PARTY GUARANTEES, OTHER CONTINGENT ASSETS AND LIABILITIES, AND OTHER COMMITMENTS |
36.1 Direct guarantees
Creditor Of Guarantee | Debtor | Type of Guarantee | Assets Committed | Outstanding balance as of | Guarantees Released | |||||||||||||||||||||||||||||||||||||||||||||||||||
| Company | Relationship | Type | Currency | Carrying amount | Currency | 9-30-2015 | 12-31-2014 | 2015 | Assets | 2016 | Assets | 2017 | Assets | |||||||||||||||||||||||||||||||||||||||||||
Deutsche Bank / Santander Benelux | Enersis S.A. | Creditor | Deposit account | Deposit account | ThCh$ | 12,711,681 | ThCh$ | 41,191,324 | 50,509,024 | — | — | — | — | — | — | |||||||||||||||||||||||||||||||||||||||||
Citibank N.A. | Endesa Chile | Creditor | Pledge | Deposit account | ThCh$ | 593,267 | ThCh$ | 593,267 | 702,470 | — | — | — | — | — | — | |||||||||||||||||||||||||||||||||||||||||
For the nine-months periods ended September 30, 2015 and 2014, the Combined Group had future energy purchase commitments amounting to ThCh$7,713,710,525, and ThCh$4,120,859,843, respectively.
36.2 Indirect guarantees
As of September 30, 2015 and December 31, 2014, there are no indirect guarantees.
F-94
Table of Contents
36.3 Lawsuits and Arbitration Proceedings
As of the date of these Interim Combined Financial Statements, the most relevant contingent liabilities, for which no provision have been recognized, involving Enersis Chile and its combined entities are as follows:
1. Law 25,561 on Public Emergency and Reform to the Currency System, enacted on January 6, 2002 by the Argentine authorities, voided certain provisions of the concession agreement of Enersis Chile’s combined entity Edesur. Law 25,561 also required that utility concession agreements be renegotiated within a reasonable timeframe to adjust them to the new conditions. However, the failure to renegotiate Edesur’s concession agreement prompted Enersis S.A., Chilectra S.A., Endesa Chile and Elesur S.A. (now Chilectra S.A.) (collectively, the “Claimants”) to file an arbitration petition in 2003 under the Treaty for the Promotion and Protection of Chilean-Argentine Investments before the International Center for Settlement of Investment Disputes (ICSID). The statement of claim principally requested that the ICSID declare the investment expropriated for an amount of US$1,306,875,960 (approximately ThCh$913,140,371), and seeking for the damages caused to the investment due to lack of fair and equitable treatment, in the amount of US$318,780,600 (approximately ThCh$222,738,381). The Claimants also seek, with respect to both claims, compounded annual interest of 6.9% per annum. The Claimants also claimed the sums resulting from the damages caused as from July 1, 2004. Finally, the Claimants also demanded US$ 102,164,683 (approximately ThCh$71,384,507) for Elesur S.A. (now Chilectra S.A.) due to a lower price received on the sale of its shares. In 2005, the Argentine authorities and Edesur signed a Letter of Understanding, in which the terms and conditions are established for amendments and supplements to the Concession Agreement, forecasting tariff modifications, first during a transitional period and then under an Integral Tariff Review, in which the conditions for an ordinary tariff period of 5 years will be set. The arbitration has been suspended since March 2006 in accordance with the terms of the Letter of Understanding, and the appointment of one of the arbitrators, to replace an arbitrator who resigned in 2010 has been suspended. As of December 31, 2014, the parties informed ICSID of their agreement to extend the suspension of the arbitration procedure for 12 months starting on the same date, informing also that any of the parties can request the renewal of the arbitration procedure with 30 calendar days prior notice.
2. In 2005, three lawsuits were filed against Endesa Chile, the Chilean Treasury and the Chilean Water Authority (DGA, in its Spanish acronym), which are currently being treated as a single proceeding, requesting that DGA Resolution No. 134, which established non-consumptive water rights in favor of Endesa Chile to build the Neltume hydroelectric power plant project be declared null as a matter of public policy, with compensation for damages. Alternatively, the lawsuits request the compensation for damages for the losses allegedly sustained by the plaintiffs due to the loss of their status as riparian owners along Pirihueico Lake, as well as due to the devaluation of their properties. The defendants have rejected these allegations, contending that the DGA Resolution complies with all legal requirements, and that the exercise of this right does not cause any detriment to the plaintiffs, among other arguments. The sums involved in these suits are undetermined. This case was joined with two other cases: the first one is captioned “Arrieta v. the State and Others” in the 9th Civil Court, docket 15279-2005 and the second is captioned “Jordán v. the State and Others,” in the 10th Civil Court, docket 1608-2005. With regard to these cases, an injunction has been ordered against entering into any acts and contracts concerning Endesa Chile’s water rights related to the Neltume project. On September 25, 2014, the Court of Law issued an unfavorable ruling against Endesa Chile that in essence declared the right to use water established by DGA Resolution No. 134 illegal and orders its cancellation in the corresponding Water Rights Register of the correspondent Real Estate Registrar. Endesa Chile filed an appeal and cassation resources with the Santiago Court of Appeals, which are still pending.
3. During 2010, three lawsuits for damages were filed against Endesa Chile by plaintiffs who alleged they were affected by the flooding of the Bio-Bio River in Region VIII of Chile. The plaintiffs sued Endesa Chile for losses caused by its deficient operation of the Ralco hydroelectric power plant during the flood. These three cases were joined, and a first instance ruling has been issued which denies the claim filed in all its parts. The ruling was appealed and such appeal has not yet been reviewed by the court. The plaintiffs are required to produce legal evidence proving the causal link between the operation of the Ralco hydroelectric
F-95
Table of Contents
power plant during the floods and the damages that the plaintiffs claim they sustained as a result of deficient facility operation. On March 27, 2012, there was a first instance judgment filed, which rejected the claim filed in all its parts. The plaintiff filed an appeal on March 12, 2013, and the Court of Appeals ordered proceedings to supplement the judgment, since there were exceptions and defenses that were not resolved in the first instance judgment. On May 2, 2013, the first instance Court of Law filed a supplementary judgment, referring to the exceptions and defenses that were not resolved in the first initial judgment. On July 14, 2014, the Court of Appeals of Concepción rejected the appeal filed by the plaintiffs and confirmed the first ruling denying relief in the lawsuit. The plaintiffs filed an appeal with the Chilean Supreme Court, which on June 22, 2015, accepted the appeal and revoked the first and second instance rulings, and issued an unfavorable ruling against Endesa Chile to pay U.F. 65,679 (approximately ThCh$1,638,358). Endesa Chile paid the amount in September 2015 in the First Instance Court, and was reimbursed by insurance.Closed.
4. In July and September 2010, Ingeniería y Construcción Madrid S.A. and Transportes Silva y Silva Limitada, respectively, filed separate lawsuits against Endesa Chile and the DGA seeking to declare the annulment of DGA Resolution No. 134 that granted Endesa Chile’s water rights for the Neltume hydroelectric station. Similarly, Ingeniería y Construcción Madrid S.A. and Transportes Silva y Silva Limitada, respectively, each filed suits against DGA Resolution No. 732 that authorized the relocation of the collection point of such water rights, arguing its invalidity as a violation of public policy. Ultimately, the plaintiffs attempted to demand payment for their water rights located in the area of influence of the hydraulic works for the future Neltume hydroelectric station. Endesa Chile has rejected these claims, contending that the plaintiffs are engaging in wrongful prosecution to prevent the construction of the power plant in order to obtain monetary compensation. The evidentiary period of the complaint filed by Ingeniería y Construcción Madrid S.A. (Case No. 7036-2010) has expired, and the parties have been summoned to hear judgment. Regarding the other lawsuit (Case No. 6705-2010), requesting the annulment of DGA Resolution No. 732, on March 12, 2012 a ruling was issued that declared the proceeding as abandoned. On June 27, 2012, Ingeniería y Construcción Madrid, filed a similar claim before another Court of Law (Case C-15156-2012). On July 10, 2015, the Court issued a ruling that rejected entirely the claims of the lawsuit and required the plaintiff to pay expenses. The plaintiff filed a recourse of appeal which is pending in the Santiago Court of Appeals.
5. On May 24, 2011, Endesa Chile was served with a lawsuit filed by 19 riparian owners along the Pirihueico Lake, seeking to nullify DGA Resolution No. 732, which authorized the relocation of water rights collection for the Neltume power plant, from the Pirihueico Lake drainage 900 meters downstream along Fui River. The plaintiffs seek to have this annulment annotated at the margin of the notarized instrument that memorialized DGA Resolution No. 732, which approved the transfer of the collection. The plaintiffs also seek to have the recording of the deed struck from the Water Rights Registry, if entered, and to require the Chilean Treasury, the DGA and Endesa Chile to pay damages to the plaintiffs as a result of the challenged DGA Resolution. The plaintiffs seek to reserve their right to indicate the type and amount of damages in a subsequent legal proceeding. The claim is for an undetermined amount because the plaintiffs have requested that damages be determined in another suit, once the DGA Resolution is nullified. The discussion period has ended and the evidence action has been determined, which after notification was subject to a motion of reversal filed by the plaintiff, and to a nullity incidental plea filed by Endesa Chile, which were rejected. The proceeding was suspended by mutual agreement until March 9, 2013, after which it was immediately restarted. On August 20, 2013 the pending conciliation hearing took place without success. After the end of the ordinary, extraordinary and special periods of evidence on January 22, 2015, the parties were summoned to acknowledge the ruling, and on April 23, 2015, the Court issued a ruling accepting the complaint, declaring DGA Resolution N° 732 null of public legislation. Endesa Chile, in turn, filed a writ of appeal and reversal in the form before the Santiago Court of Appeals, which are still pending of resolution.
6. On August 22, 2013, Endesa Chile, Pehuenche and San Isidro filed before the Santiago Court of Appeals a claim against the Chilean Superintendence of Electricity and Fuels (SEF). The claim asserts the illegality of Resolution ORD No. 7230, dated August 7, 2013, in which the SEF, relying on its interpretative and
F-96
Table of Contents
supervisory authority, decreed that consumption by distributing companies in excess of the contracted supply, with respect to electricity generators that are forced by means of a bid to supply electricity, must be covered by electricity surpluses generated by other companies. The distributors with surplus electricity can assign their surpluses to distributors with deficits, irrespective of the will of the respective generator. The claim asserts this is contrary to the law and exceeds SEF’s powers and authority, resulting in an illegal resolution.
An injunction was requested, which was denied in the San Isidro and Pehuenche suits but was granted in the Endesa Chile suit. As a result, the effects of the decree are suspended. The three claims were heard one after the other and the result were communicated to all the companies. On April 10, 2014, the claims were dismissed as having been filed outside of the period allowed by law. An appeal was filed against such resolution before the Chilean Supreme Court, which accepted the appeal on July 8, 2014 and found the claim was filed in a timely manner. The cases were remanded to the Santiago Court of Appeals to determine the validity of the claim, and on January 29, 2015 the Court rejected the claims filed. The company filed a writ of appeal to the resolution before the Supreme Court, which finally rejected the writ filed and confirmed the ruling of the Santiago Court of Appeals, which did not accept the electric complaint attempted.
7. In August 2013, the Chilean Superintendence of the Environment (SMA) filed charges against Endesa Chile alleging several violations of Exempt Resolution No. 206, dated August 2, 2007 and its supplementary and explanatory resolutions that environmentally certified the Bocamina Thermal Power Plant Extension Project. These alleged violations are related to the cooling system discharge channel, an inoperative Bocamina I desulphurizer, non-compliance with information delivery obligations, surpassing CO limits, failures in the acoustic perimeter fence of Bocamina I, excessive noise levels and having no technological barriers that prevent the massive entry of biomass in the intake of the central power plant. Endesa Chile submitted a compliance program that was not approved. On November 27, 2013, SMA added two additional violations to its charges. Endesa Chile presented its defense in December 2013, partially recognizing some of these violations (which could reduce the fine by 25% in case of recognition) and contesting the remainder. On August 11, 2014, SMA passed Resolution No. 421 that fined Endesa Chile 8,640.4 UTA for environmental non-compliances that are the subject matter of the sanctioning proceeding. Endesa Chile filed an illegality claim against the SMA before the Third Environmental Court of Valdivia, which on March 27, 2015 issued a ruling that partially annulled the sanctions imposed of by the SMA, instructing it to consider aggravating circumstances evidenced in connection with the calculation of the fine imposed. The company filed a writ of reversal in substance before the Chilean Supreme Court, which is pending resolution.Closed.
8. On May 12, 2014, Compañía Eléctrica Tarapacá S.A., (Celta) formally filed an arbitration claim against Compañía Minera Doña Inés de Collahuasi, requesting that the Arbitration Court of Law declare that through the contracts entered into in 1995 and 2001, the parties have established a long-term contractual relation, characterized by the economic balance that there must be in their reciprocal services supplied and that, due to the above, greater costs corresponding to the investment that must be made to comply with the emission standard contained in DS (Supreme Decree) (MMA) No. 13, 2011 must be shared by the parties. Based on this, the defendant should start paying up to the maturity of the contract, a fixed monthly charge that as of March 31, 2020 amounts to US$72,275,000 (approximately ThCh$50,499,988) for the proportional part of the investments that the defendant must pay due to the Supreme Decree mentioned above.
The claim was notified on July 3, 2014. On August 8, 2014 Collahuasi contested Celta’s claim and filed a counterclaim against Celta requesting that the Court declare that Celta has violated the prohibition to call on as precedent what was agreed to in the modifications of the 2009 supply contracts, reserving the right to discuss and prove the amount of damages. On August 26, 2014, Celta filed its response to the main claim and contested the counterclaim. On September 11, 2014, Collahuasi filed its rejoinder to the main claim and its response to the counterclaim. On October 1, 2014, Celta filed its response to the counterclaim. Additionally, the Arbitration Judge formulated a questionnaire with questions separately to each one of the parties and also with common questions for both.
F-97
Table of Contents
Once these were responded, the arbitrator gave the parties a deadline of January 16, 2015 to contest or observe the answers provided and the documents attached specifying the contrary. Afterwards, several conciliation meetings were held between the parties, chaired by the Arbitrating Judge which did not succeed. The evidence action is pending in order to start the evidentiary stage.
The management of Enersis Chile considers that the provisions recorded in the Interim Combined Financial Statements are adequate to cover the risks resulting from litigation described in this Note. It does not consider there to be any additional liabilities other than those specified.
Given the characteristics of the risks covered by these provisions, it is not possible to determine a reasonable schedule of payment dates if there are any.
36.4 Financial restrictions
As of September 30, 2015, we had no debt obligations and are therefore not affected by any covenants or events of default. However, a number of the Combined Group’s combined companies’ loan agreements, include the obligation to comply with certain financial ratios, which is normal in contracts of this nature. There are also affirmative and negative covenants requiring the monitoring of these commitments. In addition, there are restrictions in the events-of-default clauses of the agreements which require compliance.
| 1. | Cross Default |
Some of the financial debt contracts of Endesa Chile contain cross default clauses. The credit line agreements governed by Chilean law, which Endesa Chile signed in February 2013, stipulate that cross default arises only in the event of non-compliance by the borrower itself, with no reference made to its subsidiaries. In order to accelerate payment of the debt in these credit lines due to cross default originating from other debt, the amount overdue of a debt must exceed US$50 million, or the equivalent in other currencies, and other additional conditions must be met such as the expiry of grace periods. Since being signed, these credit lines have not been disbursed. They mature in February 2016. Endesa Chile’s international credit line governed by New York State law, which was signed in July 2014 and expires in July 2019, also makes no reference to its subsidiaries, so cross default arises only in the event of non-compliance by the borrower itself. For the repayment of debt to be accelerated under this facility due to cross default on another debt, the amount in default should exceed US$50 million or its equivalent in other currencies. It must also meet other conditions, including the expiration of any grace periods, and a formal notice of intent to accelerate the debt repayment must have been served by creditors representing more than 50% of the amount owed or committed in the contract. This line of credit has not currently been utilized.
Regarding the bond issues of Endesa Chile registered with the United States Securities and Exchange Commission (the SEC), commonly called “Yankee bonds”, a cross default can be triggered by another debt of the same company or of any of their subsidiaries, for any amount overdue provided that the principal of the debt giving rise to the cross default exceeds US$30 million or its equivalent in other currencies. Debt acceleration due to cross default does not occur automatically but has to be demanded by the holders of at least 25% of the bonds of a certain series of Yankee bonds. The Endesa Yankee bonds mature in 2024, 2027, 2037 and 2097. For the specific Yankee Bond that was issued in April 2014 and matures in 2024, the threshold for triggering cross default increased to US$50 million or its equivalent in other currencies.
The Endesa Chile bonds issued in Chile state that cross default can be triggered only by the default of the issuer when the amount in default exceeds US$50 million or its equivalent in other currencies. Debt acceleration requires the agreement of at least 50% of the holders of the bonds of a certain series.
| 2. | Financial covenants |
Financial covenants are contractual commitments with respect to minimum or maximum financial ratios that a company is obliged to meet at certain periods of time (quarterly, annually, etc.). Most of the financial covenants of the Combined Group limit the level of indebtedness and evaluate the ability to generate cash flows in order to service the companies’ debts. Various companies are also required to certify these covenants periodically. The types of covenants and their respective limits vary according to the type of debt.
F-98
Table of Contents
The Endesa Chile bonds issued in Chile include the following financial covenants whose definitions and calculation formulas are established in the respective indentures:
Series H
| • | Consolidated Debt Ratio: The consolidated debt ratio, which is Financial debt to Capitalization, must be no more than 0.64. Financial debt is the sum of interest-bearing loans, current; Interest-bearing loans, non-current; Other financial liabilities, current; Other financial liabilities, non-current; and Other obligations guaranteed by the issuer or its subsidiaries; while Capitalization is the sum of Financial liabilities, Equity attributable to the shareholders of Endesa Chile and Non-controlling interests. As of September 30, 2015, the ratio was 0.37. |
| • | Consolidated Equity: A minimum Equity of Ch$760,468 million must be maintained; this limit is adjusted at the end of each year as established in the indenture. Equity corresponds to Equity attributable to the shareholders of Endesa Chile. As of September 30, 2015, the equity of Endesa Chile was Ch$1,418,132 million. |
| • | Financial Expense Coverage: A financial expense coverage ratio of at least 1.85 must be maintained. Financial expense coverage is the quotient between i) the gross margin plus Financial income and dividends received from associated companies, and ii) Financial expenses; both items refer to the period of four consecutive quarters ending on the quarter being reported. For the period ended September 30, 2015, this ratio was 7.32. |
| • | Net Asset Position with Related Companies: A Net asset position must be maintained with related companies of no more than a hundred million dollars. The Net asset position with related companies is the difference between i) the sum of Accounts receivable from related entities, current, Accounts receivable from related entities, non-current, less transactions in the ordinary course of business at less than 180 days term, short-term transactions of associates of Endesa Chile in which Enersis Chile has no participation, and long-term transactions of associates of Endesa Chile in which Enersis Chile has no participation; and ii) the sum of Accounts payable to related entities, current; Accounts payable to related entities, non-current, less transactions in the ordinary course of business at less than 180 days term; short-term transactions of associates of Endesa Chile in which Enersis Chile has no participation; and long-term transactions of associates of Endesa Chile in which Enersis Chile has no participation. As of September 30, 2015, using the exchange rate prevailing on that date, the Net asset position with related companies was a negative US$418.87 million, indicating that Enersis Chile is a net creditor of Endesa Chile rather than a net debtor. |
Series M
| • | Consolidated Debt Ratio: The consolidated debt ratio, which is Financial debt to Capitalization, must be no more than 0.64. Financial debt is the sum of Interest-bearing loans, current; Interest-bearing loans, non-current; Other financial liabilities, current; and Other financial liabilities, non-current; while Capitalization is the sum of Financial liabilities, Equity attributable to the shareholders of Enersis and Non-controlling interests. As of As of September 30, 2015, the debt ratio was 0.37. |
| • | Consolidated Equity: Same as for Series H. |
| • | Financial Expense Coverage Ratio: Same as for Series H. |
The rest of Endesa Chile’s debt and the undisbursed credit lines include other covenants such as leverage and debt coverage ratios (debt/EBITDA ratio), while the Yankee bonds are not subject to financial covenants.
The most restrictive financial covenant for Endesa Chile as of September 30, 2015 was the Debt Ratio requirement for the credit line under Chilean law, which expires in February 2016.
Lastly, in most of the contracts, debt acceleration for non-compliance with these covenants does not occur automatically but is subject to certain conditions, such as a cure period.
F-99
Table of Contents
As of September 30, 2015 and December 31, 2014, none of combined entities were in default under their financial obligations summarized here or other financial obligations whose defaults might trigger the acceleration of their financial commitments.
36.5 Other Information
Centrales Hidroeléctricas de Aysén, S.A.
In May, 2014, the Committee of Ministers revoked the Environmental Qualification Resolution (RCA) of Hidroaysén project in which our combined entity, Endesa Chile, participates by accepting some of the claims filed against this project. It is of public knowledge that this decision was reported before the environmental courts of Valdivia and Santiago. On January 28, 2015, it was made public that the water rights request made by Centrales Hidroeléctricas de Aysén S.A. (hereinafter “Hidroaysén”) had been partially denied in 2008. Endesa Chile has expressed its intention to thrive at Hidroaysén the defense for water rights and the environmental qualification granted to the project in the corresponding instances, continuing with the judicial actions already started or implementing new administrative or judicial actions that are necessary to this end, and it maintains the belief that hydric resources of Aysén region are important for the energy development of the country. Nevertheless, given the current situation, there is uncertainty on the recovery of the investment made so far at Hidroaysén, since it depends both from judicial decisions and from definitions in the energy agenda which cannot be foreseen at present, consequently the investment is not included in the portfolio of Endesa Chile’s immediate projects. Consequently, at closing of Fiscal Year 2014, Endesa Chile recorded a provision for impairment of its participation in Hidroaysén S.A. amounting to Ch$ 69,066 million (approximately US$ 121 million). See note 14.1.a). The financial and accounting effects for Enersis Chile of the impairment provision at Endesa Chile for its participation in Hidroaysén resulted into a charge against net results attributable to the shareholders of Enersis Chile by Ch$ 41,426 million (approximately US$ 73 million).
| 37. | SANCTIONS |
The following companies belonging to the Combined Group have received sanctions from the administrative authorities:
a) Pending lawsuits of the combined entities
1. Endesa Chile
| • | In January 2013, Endesa Chile was notified of Superintendence of Electricity and Fuels (SEF) Exempt Resolution 2496 fining the company 10 UTA (approximately ThCh$4,952) for violating Article 123 of Decree Law (DFL) 4/20,018 of 2006 due to its failure to report to the SEF the commissioning of its electricity facilities by the deadline provided for in that law. To clear the charges, Endesa Chile paid the fine in full. |
Closed and paid.
| • | In the first quarter of 2013, Endesa Chile was notified of three resolutions issued by the Health SEREMI (Regional Ministerial Office) of the Maule Region, Resolutions 1057, 085, and 970, which ruled on health summary proceedings RIT Nos. 355/2011, 354/2011, and 256/2011, respectively, imposing a 20 UTM fine for each of the proceedings. The fines were imposed for the following violations: Resolution 1057 penalizes a health violation of Decree 594 of 1999, Regulations on Basic Health and Environmental Conditions in the Workplace, specifically, at the Cipreses Plant facilities; this fine has been paid in full. Resolution 085 penalizes a violation of Executive Decree 90/2011, which requires a statement of the emissions made in 2009 and 2010 by a 20.8-kW-capacity Siemens-Schukertwerke A6 power generator located at the Bocatoma Maule Isla facility. This resolution is currently being challenged. Resolution 970 penalizes a violation of Executive Decree 90/2011, which requires a statement of the emissions made in 2009 and 2010 by a 34 kW Conex generator located at the Bocatoma Maule Isla facility. This resolution is currently being challenged. Total: 60 UTA (approximately ThCh$2,626). |
F-100
Table of Contents
| • | Endesa Chile received notification in September 2013 of ORD No. 603 issued by the Superintendence of the Environment (SMA) initiating sanction proceedings and filing charges against Endesa Chile as Holder of the Expansion Project for Unit Two of the Bocamina Plant for a number of violations against environmental regulations and the RCA environmental regulation instrument. The sanction proceedings are the result of inspections conducted by SMA personnel on February 13 and 14 and on March 19, 26, and 27, 2013, at the Bocamina thermoelectric facilities. The inspections found a number of violations of Exempt Resolution 206 of August 2, 2007 (RCA 206/2007), which was clarified by Exempt Resolutions 229 of August 21, 2007 (RCA 229/2007) and 285 of October 8, 2007 (RCA 285/2007) giving environmental approval to this expansion project. The infractions consist primarily of (i) not having a discharge channel for the cooling system that extends 30 meters into the ocean from the edge of the beach; (ii) not having the Bocamina I desulfurization unit in operation; (iii) not submitting the information requested by the SMA’s official on past records of on-line emissions reports (CEM reports) from the startup of operations until the present time; (iv) exceeding the CO limit for Bocamina I set in the RCA for Bocamina II in January 2013; (v) defects and gaps between panels in the Bocamina I perimeter acoustic enclosure; (vi) noise emissions that exceed regulatory limits; and (vii) not having technological barriers that prevent biomass from pouring into the plant’s intake. |
Endesa Chile submitted a compliance schedule within the time frame allotted, that was rejected. On November 27, 2013, the SMA reformulated the charges filed, adding two new charges (failure to comply with RCA 206/2007, considered a grave violation, and failure to comply with the information requirement issued in Ord UIPS 603, which is also considered a grave violation).
On August 11, 2014, the SMA issued Resolution No. 421 which penalized Endesa Chile for these environmental breaches applying a fine of 8,640.4 UTA (approximately ThCh$4,537,247). Endesa Chile filed a counter-claim of illegality before the Third Environmental Court of Valdivia, which on March 27, 2015, resolved to partially annul the fines imposed by the SMA and order it to consider the aggravated circumstances in relation to the calculation of the fine. The parties, against such resolution, filed a writ of reversal with the Chilean Supreme Court, which is currently pending.
| • | The Labor Directorate (Inspección del Trabajo) of the Bío Bío Region fined Endesa Chile ThCh$2,523 for failure to fulfill its duties as the operating company after confirming, on June 12, 2014, an accident suffered by a worker employed by the contractor Metalcav at the Bocamina II worksite. Payment of the fine is in process at this time. |
Closed and paid.
| • | On May 20, 2014, the Valparaíso Court of Appeals confirmed the fine of ThCh$2,646 imposed by the Quintero Local Police Court (Juzgado de Policía Local) upholding CONAF’s claim that Endesa Chile cut trees without first having a forestry management plan approved by CONAF. The trees were cut in the Valle Alegre area in lot 22, site 3 in the municipality of Quintero in order to clear trees from the high voltage wires. The fine was paid through the appropriate court. |
Closed and paid.
| • | On June 23, 2014, the SISS (Sanitary Services Superintendence) fined Endesa Chile 13 UTA (approximately ThCh$6,599) for discharging liquid waste from the San Isidro II thermal plant during the cooling process in excess of the amount permitted under D.S. 90 on sulfate concentration. |
Closed and paid.
| • | In July 2014 the Coronel Labor Directorate fined Endesa Chile for labor legislation violations relating to staff serving at the Bocamina plant. The infringements are: i) exceeding the maximum of two hours overtime per day; ii) not allowing staff to rest on Sundays; iii) incorrectly recording attendance; iv) exceeding the maximum 10-hour working day. The fine imposed for these offenses totaled Ch$10,122,720, which the company has paid in full. |
Closed and paid.
F-101
Table of Contents
| • | The Labor Directorate, through resolution No.1209/15/16, fined Endesa Chile Ch$2,594,400 for failure to fulfill labor resolutions authorizing an exceptional distribution of the working day. The fine is in process of payment. |
| • | On September 25, 2015, the Health SEREMI of the Bio Bío Region, through resolution No. 158s3890 fined Endesa Chile 500 UTM (approximately ThCh$22,122) for failure to supervise the personal delivery of safety materials for asbestos management to each worker and instead doing it through group discussion. The claim it is not supported by any legal regulation, as such Endesa Chile filed an administrative proceeding, which is currently pending. |
2. Pehuenche
| • | On October 2, 2013, the Superintendence of Securities and Insurance (SVS) fined Empresa Eléctrica Pehuenche S.A. and its Chief Executive Officer for alleged violations of Article 54 of Law 18,046 “over the right of all shareholders to examine the annual report, balance sheet, inventory, minutes, ledgers, and external auditors’ reports during the 15 days prior to a company’s ordinary shareholders’ meeting.” It resolved the following: |
“To impose on Empresa Eléctrica Pehuenche S.A. and its Chief Executive Officer, Lucio Castro Márquez, a fine of 150 UF each for violation of Article 54 of Law 18,046 and Article 61 of the Regulations on Corporations in effect at the time the events penalized occurred.”
The fine was applied as a result of a claim made by Tricahue Inversiones S.A. against Pehuenche based on the fact that, on April 24, 2012, the Tricahue S.A. Chief Executive Officer went to Pehuenche’s offices to examine the minute books of the company’s Board of Directors and stated that he was first required to sign a statement of confidentiality and indemnity in Pehuenche’s favor, which he considered illegal and arbitrary.
On August 24, 2012, Tricahue Inversiones S.A. withdrew its complaint filed against Empresa Eléctrica Pehuenche S.A.
The company and its Chief Executive Officer, respectively, exercised the action provided for under Article 30 of Decree Law 3,538, within the conditions and time frame required, to file a claim against the SVS resolution with the ordinary courts of law to have the resolution revoked.
Finally, on May 20, 2014, the Court recognized the claim filed and revoked the sanction applied as groundless.
Closed.
3. Chilectra
| • | During the fiscal year 2013, Chilectra S.A. was sanctioned by the SEF with 7 fines amounting to ThCh$227,507. |
| • | During the fiscal year 2014, Chilectra S.A. was sanctioned by the SEF with 8 fines amounting to ThCh$459,453. |
| • | During the third quarter of 2015, Chilectra S.A. was sanctioned by the SEF with 3 fines amounting to (i) ThCh$778,320; (ii) ThCh$1,327; and (iii) ThCh$1,769,720. All sanctions have been appeal to the authorities and the courts of justice. |
The Combined Group has not received any other fines from the SVS or from any other administrative authorities.
F-102
Table of Contents
| 38. | ENVIRONMENT |
Environmental expenses for the nine months ended September 30, 2015 and 2014, are as follows:
Company Incurring the | Project | Description | 9-30-2015 ThCh$ | 9-30-2014 (Unaudited) ThCh$ | ||||||||||||||||||||||||||||
| Costs incurred | Capitalized Cost | Expense amount | Costs to be incurred in the future | Estimate date of incurring cost | Total Expenditures | Costs incurred prior period | ||||||||||||||||||||||||||
Pehuenche | Environmental costs CC.HH. | Studies, monitoring, laboratory analysis, removal and final disposal of solid waste in hydro electrical plants (C.H.) | 2,666 | — | 2,666 | — | — | 2,666 | 522 | |||||||||||||||||||||||
Endesa Chile | Plants environmental costs | Waste treatment, sanitation | 1,396,926 | — | 1,396,926 | — | — | 1,396,926 | 744,298 | |||||||||||||||||||||||
| Emissions monitoring, CEMS project, demolition NOX | 1,855 | 1,855 | — | — | — | 1,855 | 6,804,120 | |||||||||||||||||||||||||
| CEMS project | 61 | 61 | — | — | — | 61 | 8,203 | |||||||||||||||||||||||||
Celta | Environmental costs in Thermal Plants | Environmental costs in Thermal Plants | 118,417 | — | 118,417 | — | — | 118,417 | 10,706,540 | |||||||||||||||||||||||
Canela | Plants environmental costs | Water quality monitoring and analysis and Canela’s sanitation | 4,713 | — | 4,713 | — | — | 4,713 | 10,488 | |||||||||||||||||||||||
Chilectra | Vegetation control in high voltage networks | Pruning of trees and vegetation near high voltage | 42,570 | — | 42,570 | — | — | 42,570 | 8,878 | |||||||||||||||||||||||
| Improvements to MT/BT network | Space Cab (4,285 mts network) / Preliminary assembly (78,578 mts network) | 1,841,766 | 1,841,766 | — | 1,205,829 | 12-31-2015 | 3,047,595 | 2,547,219 | ||||||||||||||||||||||||
| Vegetation control in MT/BT network | Garden maintenance/Weed removal at substations | 85,080 | — | 85,080 | — | — | 85,080 | 163,675 | ||||||||||||||||||||||||
| Noise control | Noise mitigation | 4,475 | — | 4,475 | — | — | 4,475 | 4,559 | ||||||||||||||||||||||||
|
|
|
|
|
|
|
|
|
|
|
| |||||||||||||||||||||
Total | 3,498,529 | 1,843,682 | 1,654,847 | 1,205,829 | 4,704,358 | 20,998,502 | ||||||||||||||||||||||||||
|
|
|
|
|
|
|
|
|
|
|
| |||||||||||||||||||||
F-103
Table of Contents
| 39. | SUMMARIZED FINANCIAL INFORMATION OF COMBINED ENTITIES |
As of September 30, 2015 and December 31, 2014, summarized financial information of our principal combined entities is as follows:
| 9-30-2015 | ||||||||||||||||||||||||||||||||||||||||||||||||||||||||||||||||||||||||||||
| Type of financial statements | Current Assets ThCh$ | Non- Current Assets ThCh$ | Total Assets ThCh$ | Current Liabilities ThCh$ | Non- Current Liabilities ThCh$ | Equity ThCh$ | Total Equity and Liabilities ThCh$ | Revenues ThCh$ | Raw Materials and Consumable Used ThCh$ | Contribution Margin ThCh$ | Gross Operating Income ThCh$ | Operating Income ThCh$ | Financial Results ThCh$ | Income before Taxes ThCh$ | Income Taxes ThCh$ | Profit (Loss) ThCh$ | Other Comprehensive Income ThCh$ | Total Comprehensive Income ThCh$ | ||||||||||||||||||||||||||||||||||||||||||||||||||||||||||
Chilectra S.A. | Consolidated | 259,773,656 | 734,777,028 | 994,550,684 | 202,670,567 | 45,279,044 | 746,601,073 | 994,550,684 | 930,399,001 | (725,894,545 | ) | 204,504,456 | 138,620,462 | 112,081,319 | 8,728,350 | 122,112,442 | (23,209,179 | ) | 98,903,263 | (183,808 | ) | 98,719,455 | ||||||||||||||||||||||||||||||||||||||||||||||||||||||
Grupo Servicios Informaticos e Inmobiliarios Ltda. | Consolidated | 49,330,094 | 11,951,903 | 61,281,997 | 3,577,392 | 1,290,616 | 56,413,989 | 61,281,997 | 5,682,890 | — | 5,682,890 | (699,249 | ) | (787,753 | ) | 1,651,896 | 2,338,004 | (116,699 | ) | 2,221,305 | (80,206 | ) | 2,141,099 | |||||||||||||||||||||||||||||||||||||||||||||||||||||
Empresa Eléctrica Pehuenche S.A. | Separate | 51,331,739 | 202,860,528 | 254,192,267 | 33,492,198 | 52,425,061 | 168,275,008 | 254,192,267 | 141,602,768 | (23,762,784 | ) | 117,839,984 | 113,801,316 | 107,338,530 | 1,414,749 | 108,753,279 | (24,629,993 | ) | 84,123,286 | 31,487 | 84,154,773 | |||||||||||||||||||||||||||||||||||||||||||||||||||||||
Compañĺa Eléctrica Tarapacá S.A. | Separate | 68,286,167 | 473,689,974 | 541,976,141 | 88,211,994 | 41,975,664 | 411,788,483 | 541,976,141 | 186,150,897 | (119,758,064 | ) | 66,392,833 | 55,259,003 | 40,739,684 | 20,853,310 | 61,304,173 | (11,884,703 | ) | 49,419,470 | (2,494 | ) | 49,416,976 | ||||||||||||||||||||||||||||||||||||||||||||||||||||||
Grupo Endesa Chile | Consolidated | 473,803,232 | 2,800,901,616 | 3,274,704,848 | 804,375,100 | 1,152,529,886 | 1,317,799,862 | 3,274,704,848 | 1,131,407,459 | (712,863,644 | ) | 418,543,815 | 320,536,537 | 229,351,659 | (95,288,053 | ) | 145,559,919 | (36,779,295 | ) | 108,780,581 | (82,350,586 | ) | 26,429,995 | |||||||||||||||||||||||||||||||||||||||||||||||||||||
Grupo Inversiones GasAtacama Holding Ltda. | | Consolidated | | 235,346,168 | 209,103,678 | 444,449,846 | 28,289,221 | 46,454,388 | 369,706,237 | 444,449,846 | 145,193,316 | (89,693,906 | ) | 55,499,410 | 45,213,282 | 36,456,581 | 8,334,235 | 44,783,031 | (10,021,277 | ) | 34,761,754 | (584,097 | ) | 34,177,657 | ||||||||||||||||||||||||||||||||||||||||||||||||||||
| 12-31-2014 | ||||||||||||||||||||||||||||||||||||||||||||||||||||||||||||||||||||||||||||
| Type of financial statements | Current Assets ThCh$ | Non- Current Assets ThCh$ | Total Assets ThCh$ | Current Liabilities ThCh$ | Non- Current Liabilities ThCh$ | Equity ThCh$ | Total Equity and Liabilities ThCh$ | Revenues ThCh$ | Raw Materials and Consumable Used ThCh$ | Contribution Margin ThCh$ | Gross Operating Income ThCh$ | Operating Income ThCh$ | Financial Results ThCh$ | Income before Taxes ThCh$ | Income Taxes ThCh$ | Profit (Loss) ThCh$ | Other Comprehensive Income ThCh$ | Total Comprehensive Income ThCh$ | ||||||||||||||||||||||||||||||||||||||||||||||||||||||||||
Chilectra S.A. | Consolidated | 283,754,811 | 698,940,269 | 982,695,080 | 261,250,997 | 51,025,398 | 670,418,685 | 982,695,080 | 1,127,892,544 | (855,757,752 | ) | 272,134,792 | 182,260,785 | 154,106,769 | 8,282,495 | 161,984,048 | (37,256,549 | ) | 124,727,499 | (4,520,678 | ) | 120,206,821 | ||||||||||||||||||||||||||||||||||||||||||||||||||||||
Inmobiliaria Manso de Velasco Ltda. | Consolidated | 47,631,734 | 12,103,210 | 59,734,944 | 3,605,662 | 526,608 | 55,602,674 | 59,734,944 | 12,596,339 | (2,146,800 | ) | 10,449,539 | 5,567,964 | 5,359,685 | 587,792 | 27,044,615 | (3,029,840 | ) | 24,014,775 | (39,600 | ) | 23,975,175 | ||||||||||||||||||||||||||||||||||||||||||||||||||||||
ICT Servicios Informáticos Ltda. | Separate | 2,214,084 | 555,542 | 2,769,626 | 3,005,476 | 1,069,158 | (1,305,008 | ) | 2,769,626 | 4,978,226 | — | 4,978,226 | (1,498,309 | ) | (1,541,569 | ) | 68,519 | (1,473,050 | ) | 105,583 | (1,367,466 | ) | (162,551 | ) | (1,530,017 | ) | ||||||||||||||||||||||||||||||||||||||||||||||||||
Empresa Eléctrica Pehuenche S.A. | Separate | 75,414,557 | 209,069,274 | 284,483,831 | 59,142,217 | 53,952,811 | 171,388,803 | 284,483,831 | 227,886,302 | (34,362,209 | ) | 193,524,093 | 188,824,599 | 180,521,784 | 955,150 | 181,476,935 | (38,314,654 | ) | 143,162,280 | (51,043 | ) | 143,111,237 | ||||||||||||||||||||||||||||||||||||||||||||||||||||||
Compañĺa Eléctrica Tarapacá S.A. | Separate | 77,067,775 | 450,573,978 | 527,641,753 | 110,849,007 | 30,918,614 | 385,874,132 | 527,641,753 | 318,959,142 | (196,105,061 | ) | 122,854,082 | 107,687,954 | 91,702,959 | 18,891,133 | 110,594,093 | (20,693,726 | ) | 89,900,366 | (604 | ) | 89,899,762 | ||||||||||||||||||||||||||||||||||||||||||||||||||||||
Soc. Concesionaria Túnel El Melón S.A. | Separate | 19,183,735 | 7,107,942 | 26,291,677 | 3,709,123 | 1,789,703 | 20,792,851 | 26,291,677 | 10,484,435 | (3,751 | ) | 10,480,684 | 9,152,206 | 6,547,832 | 82,925 | 6,630,757 | (800,038 | ) | 5,830,719 | (12,156 | ) | 5,818,563 | ||||||||||||||||||||||||||||||||||||||||||||||||||||||
Grupo Endesa Chile | Consolidated | 512,188,512 | 2,722,809,245 | 3,234,997,757 | 667,580,516 | 1,060,586,957 | 1,506,830,284 | 3,234,997,757 | 1,230,985,755 | (750,216,671 | ) | 480,769,084 | 366,039,750 | 252,273,385 | (77,345,373 | ) | 163,166,269 | (34,098,106 | ) | 129,068,163 | (73,959,262 | ) | 55,108,901 | |||||||||||||||||||||||||||||||||||||||||||||||||||||
Grupo Inversiones GasAtacama Holding Ltda. | Consolidated | 197,276,197 | 216,893,717 | 414,169,914 | 29,892,670 | 48,748,663 | 335,528,581 | 414,169,914 | 179,474,707 | (99,313,387 | ) | 80,161,320 | 59,020,205 | 46,178,851 | (4,406,559 | ) | 41,772,291 | (12,407,764 | ) | 29,364,528 | 51,288,697 | 80,653,225 | ||||||||||||||||||||||||||||||||||||||||||||||||||||||
F-104
Table of Contents
| 40. | SUBSEQUENT EVENTS |
The combined financial statements reflect our evaluation of all events that have occurred subsequent to September 30, 2015 through November 30, 2015, which is the date that the combined financial statements are available to be issued.
F-105
Table of Contents
APPENDIX 1. ENERSIS CHILE COMBINED GROUP COMBINED ENTITIES
This appendix is part of Note 2.4, “Combined Entities”.
It presents the Combined Group’s percentage of control in each company.
Taxpayer ID | Company (in alphabetical order) | Currency | Percentage of control at 9/30/2015 | Percentage of control at 12/31/2014 | Country | Activity | ||||||||||||||||||||||||||||
| Direct | Indirect | Total | Direct | Indirect | Total | |||||||||||||||||||||||||||||
| 96,773,290-7 | Aguas Santiago Poniente S.A. (3) | Chilean peso | 0.00 | % | 0.00 | % | 0.00 | % | 0.00 | % | 0.00 | % | 00.00 | % | Chile | Sanitation services | ||||||||||||||||||
| 76,003,204-2 | Central Eólica Canela S.A. | Chilean peso | 0.00 | % | 75.00 | % | 75.00 | % | 0.00 | % | 75.00 | % | 75.00 | % | Chile | Promotion and development of renewable energy projects | ||||||||||||||||||
| 99,573,910-0 | Chilectra Inversud S.A. | Chilean peso | 0.00 | % | 100.00 | % | 100.00 | % | 0.00 | % | 100.00 | % | 100.00 | % | Chile | Portfolio company | ||||||||||||||||||
| 96,800,570-7 | Chilectra S.A. | Chilean peso | 99.08 | % | 0.01 | % | 99.09 | % | 99.08 | % | 0.01 | % | 99.09 | % | Chile | Ownership interest in companies of any nature | ||||||||||||||||||
| 96,770,940-9 | Compañía Eléctrica Tarapacá S.A. | Chilean peso | 3.78 | % | 96.21 | % | 99.99 | % | 3.78 | % | 96.21 | % | 99.99 | % | Chile | Complete electric energy cycle | ||||||||||||||||||
| 96,764,840-K | Constructora y Proyectos Los Maitenes S.A. (3) | Chilean peso | 0.00 | % | 0.00 | % | 0.00 | % | 0.00 | % | 0.00 | % | 0.00 | % | Chile | Construction and facilities | ||||||||||||||||||
| 96,783,910-8 | Empresa Eléctrica de Colina Ltda. | Chilean peso | 0.00 | % | 100.00 | % | 100.00 | % | 0.00 | % | 100.00 | % | 100.00 | % | Chile | Complete energy cycle and related supplies | ||||||||||||||||||
| 96,504,980-0 | Empresa Eléctrica Pehuenche S.A. | Chilean peso | 0.00 | % | 92.65 | % | 92.65 | % | 0.00 | % | 92.65 | % | 92.65 | % | Chile | Complete electric energy cycle | ||||||||||||||||||
| 91,081,000-6 | Empresa Nacional de Electricidad S.A | Chilean peso | 59.98 | % | 0.00 | % | 59.98 | % | 59.98 | % | 0.00 | % | 59.98 | % | Chile | Complete electric energy cycle | ||||||||||||||||||
| 76,014,570-K | Inversiones GasAtacama Holding Ltda. (1) | U.S. dollar | 0.00 | % | 100.00 | % | 100.00 | % | 0.00 | % | 100.00 | % | 100.00 | % | Chile | Natural gas transportation | ||||||||||||||||||
| 96,830,980-3 | GasAtacama S.A. | U.S. dollar | 0.00 | % | 100.00 | % | 100.00 | % | 0.00 | % | 100.00 | % | 100.00 | % | Chile | Exploitation, generation, transmission and distribution of electric energy and natural gas | ||||||||||||||||||
| 78,932,860-9 | GasAtacama Chile S.A. | U.S. dollar | 0.00 | % | 100.00 | % | 100.00 | % | 0.00 | % | 100.00 | % | 100.00 | % | Chile | Company management | ||||||||||||||||||
| 77,032,280-4 | Gasoducto TalTal S.A. | Chilean peso | 0.00 | % | 100.00 | % | 100.00 | % | 0.00 | % | 100.00 | % | 100.00 | % | Chile | Natural gas transportation, sale and distribution | ||||||||||||||||||
| 78,952,420-3 | Gasoducto Atacama Argentina S.A. | U.S. dollar | 0.00 | % | 100.00 | % | 100.00 | % | 0.00 | % | 100.00 | % | 100.00 | % | Chile | Natural gas exploitation and transportation | ||||||||||||||||||
| 76,676,750-8 | GNL Norte S.A. | Chilean peso | 0.00 | % | 100.00 | % | 100.00 | % | 0.00 | % | 100.00 | % | 100.00 | % | Chile | Energy and fuel production, transportation and distribution | ||||||||||||||||||
| 76,107,186-6 | Servicios Informáticos e Inmobiliarios Ltda. (2) | Chilean peso | 99.00 | % | 1.00 | % | 100.00 | % | 99.00 | % | 1.00 | % | 100.00 | % | Chile | Information Technology services | ||||||||||||||||||
| 79,913,810-7 | Inmobiliaria Manso de Velasco Ltda. (2) | Chilean peso | 99.99 | % | 0.00 | % | 99.99 | % | 99.99 | % | 0.00 | % | 99.99 | % | Chile | Construction and works | ||||||||||||||||||
| 96,800,460-3 | Luz Andes Ltda. | Chilean peso | 0.00 | % | 100.00 | % | 100.00 | % | 0.00 | % | 100.00 | % | 100.00 | % | Chile | Energy and fuel transportation, distribution and sales | ||||||||||||||||||
| 96,905,700-K | Progas S.A. | Chilean peso | 0.00 | % | 100.00 | % | 100.00 | % | 0.00 | % | 100.00 | % | 100.00 | % | Chile | Purchase, production, transportation and commercial distribution of natural gas | ||||||||||||||||||
| 77,047,280-6 | Sociedad Agrícola de Cameros Ltda. | Chilean peso | 0.00 | % | 57.50 | % | 57.50 | % | 0.00 | % | 57.50 | % | 57.50 | % | Chile | Financial investments | ||||||||||||||||||
| 96,671,360-7 | Sociedad Concesionaria Túnel El Melón S.A.(4) | Chilean peso | 0.00 | % | 0.00 | % | 0.00 | % | 0.00 | % | 100.00 | % | 100.00 | % | Chile | Execution, construction and operation of the El Melón tunnel | ||||||||||||||||||
| (1) | On April 22, 2014, Endesa Chile acquired the remaining 50% equity interest in Inversiones GasAtacama Holding Limitada, (See Note 5). |
| (2) | On December 31, 2014, Inmobiliaria Manso de Velasco was merged with ICT, the latter being the legal successor company under the name of Servicios Informáticos e Inmobiliarios Ltda. |
| (3) | On December 30, 2014, the companies Aguas Santiago Poniente SA and Constructora y Proyectos los Maitenes SA were sold. |
| (4) | On January 9, 2015, Sociedad Concesionaria Túnel El Melón was sold. (See Note 2.41.) |
F-106
Table of Contents
APPENDIX 2. CHANGES IN THE SCOPE OF COMBINATION
This appendix is part of Note 2.4.1 “Changes in the scope of combination”.
Incorporation into the scope of combination:
Company | Ownership Interest | Ownership Interest | ||||||||||||||||||||||||||||||
| September 30, 2015 | December 31, 2014 | |||||||||||||||||||||||||||||||
| Direct | Indirect | Total | Consolidation Method | Direct | Indirect | Total | Consolidation Method | |||||||||||||||||||||||||
Inversiones GasAtacama Holding Ltda. | — | — | — | — | — | 100.00 | % | 100.00 | % | Full integration | ||||||||||||||||||||||
Atacama Finance Co. (1) | — | — | — | — | — | — | — | Full integration | ||||||||||||||||||||||||
Energex Co. (1) | — | — | — | — | — | — | — | Full integration | ||||||||||||||||||||||||
GasAtacama S.A. | — | — | — | — | — | 100.00 | % | 100.00 | % | Full integration | ||||||||||||||||||||||
GasAtacama Chile S.A. | — | — | — | — | — | 100.00 | % | 100.00 | % | Full integration | ||||||||||||||||||||||
Gasoducto TalTal S.A. | — | — | — | — | — | 100.00 | % | 100.00 | % | Full integration | ||||||||||||||||||||||
Gasoducto Atacama Argentina S.A. | — | — | — | — | — | 100.00 | % | 100.00 | % | Full integration | ||||||||||||||||||||||
GNL Norte S.A. | — | — | — | — | — | 100.00 | % | 100.00 | % | Full integration | ||||||||||||||||||||||
Progas S.A. | — | — | — | — | — | 100.00 | % | 100.00 | % | Full integration | ||||||||||||||||||||||
See Note 2.4.1.
| (1) | On 17 September 2014 the companies Atacama Finance Co and Energex Co were dissolved. |
Companies eliminated from the scope of combination:
Company | Ownership Interest | Ownership Interest | ||||||||||||||||||||||||||||||
| September 30, 2015 | December 31, 2014 | |||||||||||||||||||||||||||||||
| Direct | Indirect | Total | Consolidation Method | Direct | Indirect | Total | Consolidation Method | |||||||||||||||||||||||||
Aguas Santiago Poniente S.A. | — | — | — | — | — | 78.88 | % | 78.88 | % | Full integration | ||||||||||||||||||||||
Constructora y Proyectos Los Maitenes S.A. | — | — | — | — | — | 55.00 | % | 55.00 | % | Full integration | ||||||||||||||||||||||
Sociedad Concesionaria Túnel El Melón S.A. | 0.00 | % | 100.00 | % | 100.00 | % | Full integration | — | — | — | — | |||||||||||||||||||||
F-107
Table of Contents
APPENDIX 3. ASSOCIATED COMPANIES AND JOINT VENTURES
This appendix is part of Note 3.i, “Investments accounted for using the equity method”.
Taxpayer ID | Company (in alphabetical order) | Currency | Ownership Interest at 9/30/2015 | Ownership Interest at 12/31/2014 | Type of Relationship | Country | Activity | |||||||||||||||||||||||||||||
| Direct | Indirect | Total | Direct | Indirect | Total | |||||||||||||||||||||||||||||||
96,806,130-5 | Electrogas S.A. | U.S. dollar | 0.00 | % | 42.50 | % | 42.50 | % | 0.00 | % | 42.50 | % | 42.50 | % | Associate | Chile | Portfolio company | |||||||||||||||||||
76,418,940-K | GNL Chile S.A. | Chilean peso | 0.00 | % | 33.33 | % | 33.33 | % | 0.00 | % | 33.33 | % | 33.33 | % | Associate | Chile | Promotion of liquefied natural gas supply project | |||||||||||||||||||
76,788,080-4 | GNL Quintero S.A. | U.S. dollar | 0.00 | % | 20.00 | % | 20.00 | % | 0.00 | % | 20.00 | % | 20.00 | % | Associate | Chile | Development, design and supply of liquid natural gas regasifying terminal | |||||||||||||||||||
76,652,400-1 | Centrales Hidroeléctricas De Aysén S.A. | Chilean peso | 0.00 | % | 51.00 | % | 51.00 | % | 0.00 | % | 51.00 | % | 51.00 | % | Joint venture | Chile | Development and operation of a hydroelectric plant | |||||||||||||||||||
76,041,891-9 | Aysén Transmisión S.A. | Chilean peso | 0.00 | % | 51.00 | % | 51.00 | % | 0.00 | % | 51.00 | % | 51.00 | % | Joint venture | Chile | Development and operation of a hydroelectric plant | |||||||||||||||||||
76,091,595-5 | Aysén Energía S.A. | Chilean peso | 0.00 | % | 51.00 | % | 51.00 | % | 0.00 | % | 51.00 | % | 51.00 | % | Joint venture | Chile | Development and operation of a hydroelectric plant | |||||||||||||||||||
77,017,930-0 | Transmisora Eléctrica de Quillota Ltda. | Chilean peso | 0.00 | % | 50.00 | % | 50.00 | % | 0.00 | % | 50.00 | % | 50.00 | % | Joint venture | Chile | Electric energy transportation and distribution | |||||||||||||||||||
F-108
Table of Contents
APPENDIX 4. ADDITIONAL INFORMATION ON FINANCIAL DEBT
This appendix is part of Note 20, “Other financial liabilities.” The following tables present the contractual undiscounted cash flows by type of financial debt:
a) Bank borrowings
Summary of bank borrowings by currency and maturity
Country | Currency | Nominal Interest Rate | Current | Non-current | Current | Non-current | ||||||||||||||||||||||||||||||||||||||||||||||||||||||||||||||||||||||||||
| Maturity | Total Current at 12/31/2014 | Maturity | Total Non- current at 9/30/2015 | Maturity | Total Current at 12/31/2013 | Maturity | Total Non-current at 12/31/2014 | |||||||||||||||||||||||||||||||||||||||||||||||||||||||||||||||||||||||||
| One to three months | Three to twelve months | One to two years | Two to three years | Three to four years | Four to five years | More than five years | One to three months | Three to twelve months | One to two years | Two to three years | Three to four years | Four to five years | More than five years | |||||||||||||||||||||||||||||||||||||||||||||||||||||||||||||||||||
| ThCh$ | ThCh$ | ThCh$ | ThCh$ | ThCh$ | ThCh$ | ThCh$ | ThCh$ | ThCh$ | ThCh$ | ThCh$ | ThCh$ | ThCh$ | ThCh$ | ThCh$ | ThCh$ | ThCh$ | ThCh$ | |||||||||||||||||||||||||||||||||||||||||||||||||||||||||||||||
Chile | US$ | 5.98 | % | 574,764 | — | 574,764 | — | — | — | — | — | — | 20,269 | 1,020,576 | 1,040,845 | — | — | — | — | — | — | |||||||||||||||||||||||||||||||||||||||||||||||||||||||||||
Chile | Ch$ | 5.50 | % | 615 | — | 615 | — | — | — | — | — | — | 714 | — | 714 | — | — | — | — | — | — | |||||||||||||||||||||||||||||||||||||||||||||||||||||||||||
| 575,379 | — | 575,379 | — | — | — | — | — | — | 20,983 | 1,020,576 | 1,041,559 | — | — | — | — | — | — | |||||||||||||||||||||||||||||||||||||||||||||||||||||||||||||||
Identification of bank borrowings by company
Taxpayer | Company | Country | Financial Institution | Currency | Effective Interest Rate | Nominal Interest Rate | 9-30-2015 | 12-31-2014 | ||||||||||||||||||||||||||||||||||||||||||||||||||||||||||||||||||||||||||||||||||||
| Current | Non-current | Current | Non-current | |||||||||||||||||||||||||||||||||||||||||||||||||||||||||||||||||||||||||||||||||||||||||
| Less than 90 days | More than 90 days | Total Current | One to two years | Two to three years | Three to four years | Four to five years | More than five years | Total Non- current | Less than 90 days | More than 90 days | Total Current | One to two years | Two to three years | Three to four years | Four to five years | More than five years | Total Non- current | |||||||||||||||||||||||||||||||||||||||||||||||||||||||||||||||||||||||||||
96.800.570-7 | Chilectra S.A. | Chile | Credit lines | Ch$ | 6.00 | % | 6.00 | % | 29 | — | 29 | — | — | — | — | — | — | — | — | — | — | — | — | — | — | — | ||||||||||||||||||||||||||||||||||||||||||||||||||||||||||||||||||
91.081.000-6 | Endesa Chile S.A. | Chile | B.N.P. Paribas | US$ | 6.32 | % | 5.98 | % | 574,764 | — | 574,764 | — | — | — | — | — | — | 20,269 | 1,020,576 | 1,040,845 | — | — | — | — | — | — | ||||||||||||||||||||||||||||||||||||||||||||||||||||||||||||||||||
91.081.000-6 | Endesa Chile S.A. | Chile | Banco Santander | Ch$ | 6.00 | % | 6.00 | % | 582 | — | 582 | — | — | — | — | — | — | 714 | — | 714 | — | — | — | — | — | — | ||||||||||||||||||||||||||||||||||||||||||||||||||||||||||||||||||
94.271.00-3 | Enersis S.A. | Chile | Banco Santander Chile | Ch$ | 4.50 | % | 4.50 | % | 4 | — | 4 | — | — | — | — | — | — | — | — | — | — | — | — | — | — | — | ||||||||||||||||||||||||||||||||||||||||||||||||||||||||||||||||||
|
|
|
|
|
|
|
|
|
|
|
|
|
|
|
|
|
|
|
|
|
|
|
|
|
|
|
|
|
|
|
|
|
|
|
| |||||||||||||||||||||||||||||||||||||||||||||||||||||||||
| Total | 575,379 | — | 575,379 | — | — | — | — | — | — | 20,983 | 1,020,576 | 1,041,559 | — | — | — | — | — | — | ||||||||||||||||||||||||||||||||||||||||||||||||||||||||||||||||||||||||||
|
|
|
|
|
|
|
|
|
|
|
|
|
|
|
|
|
|
|
|
|
|
|
|
|
|
|
|
|
|
|
|
|
|
|
| |||||||||||||||||||||||||||||||||||||||||||||||||||||||||
F-109
Table of Contents
b) Secured and unsecured liabilities
Summary of secured and unsecured liabilities by currency and maturity
Country | Currency | Nominal Interest Rate | Current | Non-current | Current | Non-current | ||||||||||||||||||||||||||||||||||||||||||||||||||||||||||||||||||||||||
| Maturity | Total Current at 9/30/2015 | Maturity | Total Non- current at 9/30/2015 | Maturity | Total Current at 12/31/2014 | Maturity | Total Non- current at 12/31/2014 | |||||||||||||||||||||||||||||||||||||||||||||||||||||||||||||||||||||||
| One to three months | Three to twelve months | One to two years | Two to three years | Three to four years | Four to five years | More than five years | One to three months | Three to twelve months | One to two years | Two to three years | Three to four years | Four to five years | More than five years | |||||||||||||||||||||||||||||||||||||||||||||||||||||||||||||||||
| ThCh$ | ThCh$ | ThCh$ | ThCh$ | ThCh$ | ThCh$ | ThCh$ | ThCh$ | ThCh$ | ThCh$ | ThCh$ | ThCh$ | ThCh$ | ThCh$ | ThCh$ | ThCh$ | ThCh$ | ThCh$ | |||||||||||||||||||||||||||||||||||||||||||||||||||||||||||||
Chile | US$ | 6.93 | % | 8,926,299 | 21,319,934 | 30,246,233 | 29,695,239 | 29,144,247 | 39,919,478 | 49,482,933 | 358,153,297 | 506,395,194 | 9,028,616 | 144,138,509 | 153,167,125 | 25,547,239 | 25,547,239 | 25,547,239 | 25,547,239 | 733,419,902 | 835,608,858 | |||||||||||||||||||||||||||||||||||||||||||||||||||||||||
Chile | U.F. | 5.57 | % | 7,251,762 | 21,755,288 | 29,007,050 | 29,007,049 | 29,007,049 | 29,007,049 | 29,007,049 | 821,248,858 | 937,277,054 | 8,377,677 | 30,005,314 | 38,382,991 | 37,771,918 | 37,160,846 | 36,549,774 | 46,672,611 | 429,466,743 | 587,621,892 | |||||||||||||||||||||||||||||||||||||||||||||||||||||||||
|
|
|
|
|
|
|
|
|
|
|
|
|
|
|
|
|
|
|
|
|
|
|
|
|
|
|
|
|
|
|
|
|
|
|
| |||||||||||||||||||||||||||||||||||||||||||
| Total | 16,178,061 | 43,075,222 | 59,253,283 | 58,702,288 | 58,151,296 | 68,926,527 | 78,489,982 | 1,179,402,155 | 1,443,672,248 | 17,406,293 | 174,143,823 | 191,550,116 | 63,319,157 | 62,708,085 | 62,097,013 | 72,219,850 | 1,162,886,645 | 1,423,230,750 | ||||||||||||||||||||||||||||||||||||||||||||||||||||||||||||
|
|
|
|
|
|
|
|
|
|
|
|
|
|
|
|
|
|
|
|
|
|
|
|
|
|
|
|
|
|
|
|
|
|
|
| |||||||||||||||||||||||||||||||||||||||||||
Secured and unsecured liabilities by company
Taxpayer | Company | Country | Financial Institution | Country | Currency | Effective Interest Rate | Nominal Interest Rate | September 30, 2015 | December 31, 2014 | |||||||||||||||||||||||||||||||||||||||||||||||||||||||||||||||||||||||||||||||||||
| Current ThCh$ | Non-Current ThCh$ | Current ThCh$ | Non-Current ThCh$ | |||||||||||||||||||||||||||||||||||||||||||||||||||||||||||||||||||||||||||||||||||||||||
| Less than 90 days | More than 90 days | Total Current | One to two years | Two to three years | Three to four years | Four to five years | More than five years | Total Non- Current | Less than 90 days | More than 90 days | Total Current | One to two years | Two to three years | Three to four years | Four to five years | More than five years | Total Non- Current | |||||||||||||||||||||||||||||||||||||||||||||||||||||||||||||||||||||||||||
91.081.000-6 | Endesa Chile S.A. | Chile | Banco Santander 522 Serie- M | Chile | U.F. | 4.82 | % | 4.75 | % | 4,443,178 | 13,329,534 | 17,772,712 | 17,772,711 | 17,772,711 | 29,098,935 | 39,213,382 | 291,944,043 | 395,801,782 | 2,474,039 | 7,422,118 | 9,896,157 | 9,896,157 | 9,896,157 | 9,896,157 | 9,896,157 | 195,949,534 | 235,534,162 | |||||||||||||||||||||||||||||||||||||||||||||||||||||||||||||||||
91.081.000-6 | Endesa Chile S.A. | Chile | Banco Santander -317 Serie-H | Chile | U.F. | 7.17 | % | 6.20 | % | 4,483,121 | 7,990,400 | 12,473,521 | 11,922,528 | 11,371,536 | 10,820,543 | 10,269,551 | 66,209,254 | 110,593,412 | 789,495 | 2,368,484 | 3,157,979 | 3,157,979 | 3,157,979 | 3,157,979 | 3,157,979 | 77,747,246 | 90,379,162 | |||||||||||||||||||||||||||||||||||||||||||||||||||||||||||||||||
91.081.000-6 | Endesa Chile S.A. | Chile | BNY Mellon — 144—A | E.E.U.U. | US$ | 8.83 | % | 8.63 | % | — | — | — | — | — | — | — | — | — | 502,137 | 1,506,412 | 2,008,549 | 2,008,549 | 2,008,549 | 2,008,549 | 2,008,549 | 168,757,572 | 176,791,768 | |||||||||||||||||||||||||||||||||||||||||||||||||||||||||||||||||
91.081.000-6 | Endesa Chile S.A. | Chile | BNY Mellon — Primera Emisión S-2 | E.E.U.U. | US$ | 7.40 | % | 7.33 | % | 905,024 | 2,715,073 | 3,620,097 | 3,620,097 | 3,620,097 | 3,620,097 | 3,620,097 | 89,336,140 | 103,816,528 | 2,641,806 | 124,978,079 | 127,619,885 | — | — | — | — | — | — | |||||||||||||||||||||||||||||||||||||||||||||||||||||||||||||||||
91.081.000-6 | Endesa Chile S.A. | Chile | BNY Mellon — Primera Emisión S-3 | E.E.U.U. | US$ | 8.26 | % | 8.13 | % | 575,238 | 1,725,715 | 2,300,953 | 2,300,953 | 2,300,953 | 2,300,953 | 2,300,953 | 193,464,771 | 202,668,583 | 2,621,139 | 7,863,416 | 10,484,555 | 10,484,554 | 10,484,554 | 10,484,554 | 10,484,554 | 290,965,550 | 332,903,766 | |||||||||||||||||||||||||||||||||||||||||||||||||||||||||||||||||
91.081.000-6 | Endesa Chile S.A. | Chile | BNY Mellon — Unica 24296 | E.E.U.U. | US$ | 4.32 | % | 4.25 | % | 2,936,551 | 8,809,652 | 11,746,203 | 11,746,202 | 11,746,202 | 11,746,202 | 11,746,202 | 321,745,270 | 368,730,078 | 2,174,007 | 11,394,304 | 13,568,311 | 12,957,238 | 12,346,166 | 11,735,094 | 11,124,022 | 73,777,578 | 121,940,098 | |||||||||||||||||||||||||||||||||||||||||||||||||||||||||||||||||
91.081.000-6 | Endesa Chile S.A. | Chile | BNY Mellon— Primera Emisión S-1 | E.E.U.U. | US$ | 7.96 | % | 7.88 | % | 2,834,949 | 8,504,848 | 11,339,797 | 11,339,797 | 11,339,797 | 11,339,797 | 11,339,797 | 216,702,677 | 262,061,865 | 6,203,670 | 18,611,010 | 24,814,680 | 24,814,680 | 24,814,680 | 24,814,680 | 35,548,589 | 355,689,165 | 465,681,794 | |||||||||||||||||||||||||||||||||||||||||||||||||||||||||||||||||
|
|
|
|
|
|
|
|
|
|
|
|
|
|
|
|
|
|
|
|
|
|
|
|
|
|
|
|
|
|
|
|
|
|
|
| |||||||||||||||||||||||||||||||||||||||||||||||||||||||||
| Total | 16,178,061 | 43,075,222 | 59,253,283 | 58,702,288 | 58,151,296 | 68,926,527 | 78,489,982 | 1,179,402,155 | 1,443,672,248 | 17,406,293 | 174,143,823 | 191,550,116 | 63,319,157 | 62,708,085 | 62,097,013 | 72,219,850 | 1,162,886,645 | 1,423,230,750 | ||||||||||||||||||||||||||||||||||||||||||||||||||||||||||||||||||||||||||
|
|
|
|
|
|
|
|
|
|
|
|
|
|
|
|
|
|
|
|
|
|
|
|
|
|
|
|
|
|
|
|
|
|
|
| |||||||||||||||||||||||||||||||||||||||||||||||||||||||||
F-110
Table of Contents
c) Financial lease obligations
Financial lease obligations by company
Taxpayer ID | Company | Country | Taxpayer ID Number | Financial Institution | Country | Currency | Nominal Interest Rate | September 30, 2015 | December 31, 2014 | |||||||||||||||||||||||||||||||||||||||||||||||||||||||||||||||||||||||||||||||||||||||
| Current ThCh$ | Non-Current ThCh$ | Current ThCh$ | Non-Current ThCh$ | |||||||||||||||||||||||||||||||||||||||||||||||||||||||||||||||||||||||||||||||||||||||||||||
| Less than 90 days | More than 90 days | Total Current | One to two years | Two to three years | Three to four years | Four to five years | More than five years | Total Non- Current | Less than 90 days | More than 90 days | Total Current | One to two years | Two to three years | Three to four years | Four to five years | More than five years | Total Non- Current | |||||||||||||||||||||||||||||||||||||||||||||||||||||||||||||||||||||||||||||||
91.081.000-6 | Endesa Chile S.A. | Chile | 87.509.100-K | Abengoa Chile | Chile | US$ | 6.50 | % | 711,183 | 2,139,718 | 2,850,901 | 2,867,972 | 2,886,153 | 2,905,515 | 2,926,137 | 11,727,541 | 23,313,318 | 652,199 | 1,957,446 | 2,609,645 | 2,611,991 | 2,614,490 | 2,617,151 | 2,619,984 | 12,287,815 | 22,751,431 | ||||||||||||||||||||||||||||||||||||||||||||||||||||||||||||||||||||||
|
|
|
|
|
|
|
|
|
|
|
|
|
|
|
|
|
|
|
|
|
|
|
|
|
|
|
|
|
|
|
|
|
|
|
| |||||||||||||||||||||||||||||||||||||||||||||||||||||||||||||
| Totals | 711,183 | 2,139,718 | 2,850,901 | 2,867,972 | 2,886,153 | 2,905,515 | 2,926,137 | 11,727,541 | 23,313,318 | 652,199 | 1,957,446 | 2,609,645 | 2,611,991 | 2,614,490 | 2,617,151 | 2,619,984 | 12,287,815 | 22,751,431 | ||||||||||||||||||||||||||||||||||||||||||||||||||||||||||||||||||||||||||||||
|
|
|
|
|
|
|
|
|
|
|
|
|
|
|
|
|
|
|
|
|
|
|
|
|
|
|
|
|
|
|
|
|
|
|
| |||||||||||||||||||||||||||||||||||||||||||||||||||||||||||||
APPENDIX 5. DETAILS OF ASSETS AND LIABILITIES IN FOREIGN CURRENCY
This appendix forms an integral part of the Enersis Chile’s financial statements.
The detail of assets and liabilities denominated in foreign currencies is the following:
ASSETS | Foreign Currency | Functional Currency | 9-30-2015 ThCh$ | 9-30-2014 (Unaudited) ThCh$ | ||||||||
CURRENT ASSETS | ||||||||||||
Cash and cash equivalents | 13,179,011 | 91,039,422 | ||||||||||
| U.S. dollar | Chilean peso | 6,263,512 | 80,722,128 | |||||||||
| Argentine peso | U.S. dollar | 6,915,499 | 6,110,560 | |||||||||
| Chilean peso | U.S. dollar | — | 4,206,734 | |||||||||
Current accounts receivable from related companies | 3,631,976 | 14,039,935 | ||||||||||
| U.S. dollar | Chilean peso | 3,631,976 | 14,039,935 | |||||||||
|
|
|
| |||||||||
Total current assets other than assets classified as held for sale and discontinued operations | 16,810,987 | 105,079,357 | ||||||||||
|
|
|
| |||||||||
TOTAL CURRENT ASSETS | 16,810,987 | 105,079,357 | ||||||||||
|
|
|
| |||||||||
NON- CURRENT ASSETS | ||||||||||||
Investments accounted for using the equity method | 33,569,137 | 27,794,762 | ||||||||||
| U.S. dollar | Chilean peso | 33,569,137 | 27,794,762 | |||||||||
|
|
|
| |||||||||
TOTAL NON-CURRENT ASSETS | 33,569,137 | 27,794,762 | ||||||||||
|
|
|
| |||||||||
TOTAL ASSETS | 46,222,403 | 132,874,119 | ||||||||||
|
|
|
| |||||||||
| 9-30-2015 | 12-31-2014 | |||||||||||||||||||||||||||||||||||||||||||||||||||||||||||||||||||||||||||
| Current Liabilities | Non-current Liabilities | Current Liabilities | Non-current Liabilities | |||||||||||||||||||||||||||||||||||||||||||||||||||||||||||||||||||||||||
| 90 days or less | 91 days to 1 year | Total Current | One to two years | Two to three years | Three to four years | Four to five years | More than five years | Total Non-current | 90 days or less | 91 days to 1 year | Total | One to two years | Two to three years | Three to four years | Four to five years | More than five years | Total Non-current | |||||||||||||||||||||||||||||||||||||||||||||||||||||||||||
| Foreign Currency | Functional Currency | ThCh$ | ThCh$ | ThCh$ | ThCh$ | ThCh$ | ThCh$ | ThCh$ | ThCh$ | ThCh$ | Current | ThCh$ | ThCh$ | ThCh$ | ThCh$ | ThCh$ | ||||||||||||||||||||||||||||||||||||||||||||||||||||||||||||
LIABILITIES | ||||||||||||||||||||||||||||||||||||||||||||||||||||||||||||||||||||||||||||
Other current financial liabilities | U.S. dollar | 8,537,709 | 23,895,006 | 32,432,715 | 209,524,014 | 31,931,516 | 31,950,878 | 31,971,500 | 833,815,723 | 1,139,193,631 | 9,701,084 | 147,116,531 | 156,817,615 | 28,159,230 | 28,161,729 | 28,164,390 | 28,167,223 | 745,707,717 | 858,360,289 | |||||||||||||||||||||||||||||||||||||||||||||||||||||||||
| U.S. dollar | Chilean peso | 8,537,709 | 23,895,006 | 32,432,715 | 209,524,014 | 31,931,516 | 31,950,878 | 31,971,500 | 833,815,723 | 1,139,193,631 | 9,701,084 | 147,116,531 | 156,817,615 | 28,159,230 | 28,161,729 | 28,164,390 | 28,167,223 | 745,707,717 | 858,360,289 | |||||||||||||||||||||||||||||||||||||||||||||||||||||||||
|
|
|
|
|
|
|
|
|
|
|
|
|
|
|
|
|
|
|
|
|
|
|
|
|
|
|
|
|
|
|
|
|
|
|
| |||||||||||||||||||||||||||||||||||||||||
TOTAL LIABILITIES | 8,537,709 | 23,895,006 | 32,432,715 | 209,524,014 | 31,931,516 | 31,950,878 | 31,971,500 | 833,815,723 | 1,139,193,631 | 9,701,084 | 147,116,531 | 156,817,615 | 28,159,230 | 28,161,729 | 28,164,390 | 28,167,223 | 745,707,717 | 858,360,289 | ||||||||||||||||||||||||||||||||||||||||||||||||||||||||||
|
|
|
|
|
|
|
|
|
|
|
|
|
|
|
|
|
|
|
|
|
|
|
|
|
|
|
|
|
|
|
|
|
|
|
| |||||||||||||||||||||||||||||||||||||||||
F-111
Table of Contents
APPENDIX 6. ADDITIONAL INFORMATIONOFICIO CIRCULAR (OFFICIAL BULLETIN) No. 715 OF FEBRUARY 3, 2012
This appendix forms an integral part of the Enersis Chile’s financial statements.
a ) Portfolio stratification
| • | Trade and other receivables by aging: |
| Balance at | ||||||||||||||||||||||||||||||||||||||||||||||||
| 9-30-2015 | ||||||||||||||||||||||||||||||||||||||||||||||||
Trade and Other | Current portfolio ThCh$ | 1-30 days ThCh$ | 31-60 days ThCh$ | 61-90 days ThCh$ | 91-120 days ThCh$ | 121-150 days ThCh$ | 151-180 days ThCh$ | 181-210 days ThCh$ | 211-250 days ThCh$ | More than 251 days ThCh$ | Total Current ThCh$ | Total Non- Current ThCh$ | ||||||||||||||||||||||||||||||||||||
Trade receivables, gross | 384,552,394 | 27,807,115 | 12,228,969 | 1,880,821 | 3,041,144 | 1,324,434 | 1,731,692 | 1,313,697 | 362,431 | 49,646,802 | 483,889,499 | 3,153,282 | ||||||||||||||||||||||||||||||||||||
Allowance for doubtful accounts | (450,496 | ) | (191,679 | ) | (190,538 | ) | (98,666 | ) | (105,063 | ) | (86,706 | ) | (106,257 | ) | (410,876 | ) | (64,170 | ) | (24,595,458 | ) | (26,299,909 | ) | — | |||||||||||||||||||||||||
Other receivables, gross | 130,983,793 | — | — | — | — | — | — | — | — | — | 130,983,793 | 3,776,656 | ||||||||||||||||||||||||||||||||||||
Allowance for doubtful accounts | (8,162,822 | ) | — | — | — | — | — | — | — | — | — | (8,162,822 | ) | — | ||||||||||||||||||||||||||||||||||
|
|
|
|
|
|
|
|
|
|
|
|
|
|
|
|
|
|
|
|
|
|
|
| |||||||||||||||||||||||||
Total | 506,922,869 | 27,615,436 | 12,038,431 | 1,782,155 | 2,936,081 | 1,237,728 | 1,625,435 | 902,821 | 298,261 | 25,051,344 | 580,410,561 | 6,929,938 | ||||||||||||||||||||||||||||||||||||
|
|
|
|
|
|
|
|
|
|
|
|
|
|
|
|
|
|
|
|
|
|
|
| |||||||||||||||||||||||||
| Balance at | ||||||||||||||||||||||||||||||||||||||||||||||||
| 12-31-2014 | ||||||||||||||||||||||||||||||||||||||||||||||||
Trade and Other | Current portfolio ThCh$ | 1-30 days ThCh$ | 31-60 days ThCh$ | 61-90 days ThCh$ | 91-120 days ThCh$ | 121-150 days ThCh$ | 151-180 days ThCh$ | 181-210 days ThCh$ | 211-250 days ThCh$ | More than 251 days ThCh$ | Total Current ThCh$ | Total Non- Current ThCh$ | ||||||||||||||||||||||||||||||||||||
Trade receivables, gross | 408,553,659 | 24,895,938 | 11,368,415 | 3,524,410 | 780,369 | 1,529,776 | 724,073 | 1,364,913 | 683,993 | 37,128,352 | 490,553,898 | 3,318,126 | ||||||||||||||||||||||||||||||||||||
Allowance for doubtful accounts | (240,504 | ) | (206,494 | ) | (284,757 | ) | (239,194 | ) | (169,479 | ) | (143,664 | ) | (96,107 | ) | (381,988 | ) | (113,699 | ) | (22,030,558 | ) | (23,906,444 | ) | — | |||||||||||||||||||||||||
Other receivables, gross | 117,462,574 | — | — | — | — | — | — | — | — | — | 117,462,574 | 4,178,286 | ||||||||||||||||||||||||||||||||||||
Allowance for doubtful accounts | (5,928,723 | ) | — | — | — | — | — | — | — | — | — | (5,928,723 | ) | — | ||||||||||||||||||||||||||||||||||
|
|
|
|
|
|
|
|
|
|
|
|
|
|
|
|
|
|
|
|
|
|
|
| |||||||||||||||||||||||||
Total | 519,847,006 | 24,689,444 | 11,083,658 | 3,285,216 | 610,890 | 1,386,112 | 627,966 | 982,925 | 570,294 | 15,097,794 | 578,181,305 | 7,496,412 | ||||||||||||||||||||||||||||||||||||
|
|
|
|
|
|
|
|
|
|
|
|
|
|
|
|
|
|
|
|
|
|
|
| |||||||||||||||||||||||||
F-112
Table of Contents
| • | By type of portfolio: |
Aging of balances | Balance at | Balance at | ||||||||||||||||||||||||||||||||||||||||||||||
| 9-30-2015 | 12-31-2014 | |||||||||||||||||||||||||||||||||||||||||||||||
| Non-renegotiated Portfolio | Renegotiated Portfolio | Total Gross Portfolio | Non-renegotiated Portfolio | Renegotiated Portfolio | Total Gross Portfolio | |||||||||||||||||||||||||||||||||||||||||||
| Number of customers | Gross amount ThCh$ | Number of customers | Gross amount ThCh$ | Number of customers | Gross amount ThCh$ | Number of customers | Gross amount ThCh$ | Number of customers | Gross amount ThCh$ | Number of customers | Gross amount ThCh$ | |||||||||||||||||||||||||||||||||||||
Current | 1,312,094 | 381,450,931 | 55,738 | 6,254,745 | 1,367,832 | 387,705,676 | 1,120,913 | 408,973,803 | 44,355 | 2,897,982 | 10,337,947 | 411,871,785 | ||||||||||||||||||||||||||||||||||||
1 to 30 days | 345,763 | 24,337,479 | 22,255 | 3,469,636 | 368,018 | 27,807,115 | 394,849 | 22,455,423 | 20,378 | 2,440,515 | 2,187,327 | 24,895,938 | ||||||||||||||||||||||||||||||||||||
31 to 60 days | 91,710 | 10,860,335 | 7,545 | 1,368,634 | 99,255 | 12,228,969 | 107,014 | 10,431,423 | 6,632 | 936,992 | 438,222 | 11,368,415 | ||||||||||||||||||||||||||||||||||||
61 to 90 days | 12,792 | 1,507,068 | 1,540 | 373,753 | 14,332 | 1,880,821 | 16,019 | 3,237,896 | 1,335 | 286,514 | 111,278 | 3,524,410 | ||||||||||||||||||||||||||||||||||||
91 to 120 days | 6,603 | 2,832,153 | 824 | 208,991 | 7,427 | 3,041,144 | 6,699 | 617,720 | 672 | 162,649 | 72,724 | 780,369 | ||||||||||||||||||||||||||||||||||||
121 to 150 days | 5,054 | 1,156,470 | 492 | 167,964 | 5,546 | 1,324,434 | 5,401 | 1,403,115 | 468 | 126,661 | 66,295 | 1,529,776 | ||||||||||||||||||||||||||||||||||||
151 to 180 days | 4,153 | 1,334,114 | 293 | 397,578 | 4,446 | 1,731,692 | 4,457 | 650,259 | 272 | 73,814 | 48,729 | 724,073 | ||||||||||||||||||||||||||||||||||||
181 to 210 days | 6,445 | 1,256,374 | 163 | 57,323 | 6,608 | 1,313,697 | 5,433 | 1,299,677 | 183 | 65,236 | 39,593 | 1,364,913 | ||||||||||||||||||||||||||||||||||||
211 to 250 days | 3,246 | 178,185 | 140 | 184,246 | 3,386 | 362,431 | 3,731 | 644,648 | 158 | 39,345 | 31,399 | 683,993 | ||||||||||||||||||||||||||||||||||||
More than 251 days | 9,735 | 46,333,879 | 470 | 3,312,923 | 10,205 | 49,646,802 | 91,978 | 29,615,862 | 4,650 | 7,512,490 | 426,902 | 37,128,352 | ||||||||||||||||||||||||||||||||||||
|
|
|
|
|
|
|
|
|
|
|
|
|
|
|
|
|
|
|
|
|
|
|
| |||||||||||||||||||||||||
Total | 1,797,595 | 471,246,988 | 89,460 | 15,795,793 | 1,887,055 | 487,042,781 | 1,756,494 | 479,329,826 | 79,103 | 14,542,198 | 13,760,416 | 493,872,024 | ||||||||||||||||||||||||||||||||||||
|
|
|
|
|
|
|
|
|
|
|
|
|
|
|
|
|
|
|
|
|
|
|
| |||||||||||||||||||||||||
b ) Portfolio in default and in legal collection process
| Balance at | Balance at | |||||||||||||||
| 9-30-2015 | 12-31-2014 | |||||||||||||||
Portfolio in Default and in Legal Collection Process | Number of Customers | Amount ThCh$ | Number of Customers | Amount ThCh$ | ||||||||||||
Notes receivable in default | 2,013 | 267,573 | 2,039 | 269,934 | ||||||||||||
Notes receivable in legal collection process (*) | 3,923 | 7,093,235 | 3,898 | 6,983,415 | ||||||||||||
|
|
|
|
|
|
|
| |||||||||
Total | 5,936 | 7,360,808 | 5,937 | 7,253,349 | ||||||||||||
|
|
|
|
|
|
|
| |||||||||
| (*) | Legal collections are included in the portfolio in arrears. |
F-113
Table of Contents
c ) Provisions and write-offs
| Balance at | ||||||||
Provisions and Write-offs | 9-30-2015 ThCh$ | 9-30-2014 (Unaudited) ThCh$ | ||||||
Provision for non-renegotiated portfolio | 10,291,284 | 1,463,785 | ||||||
Provision for renegotiated portfolio | (5,264,190 | ) | (388,298 | ) | ||||
Write-offs during the period | — | — | ||||||
Recoveries during the period | — | — | ||||||
|
|
|
| |||||
Total | 5,027,094 | 1,075,487 | ||||||
|
|
|
| |||||
d ) Number and value of operations
| Balance at | ||||||||||||||||
| 9-30-2015 | 9-30-2014 (Unaudited) | |||||||||||||||
Number and Value of Operations | Total detail by type of operation Last Quarter | Total detail by type of operation Annual Accumulation | Total detail by type of operation Last Quarter | Total detail by type of operation Annual Accumulation | ||||||||||||
Impairment provisions and recoveries: | ||||||||||||||||
Number of operations | 1,886,563 | 1,886,563 | 1,798,642 | 1,798,642 | ||||||||||||
Value of operations, in ThCh$ | 5,027,094 | 5,027,094 | 830,164 | 1,075,487 | ||||||||||||
F-114
Table of Contents
APPENDIX 6.1. SUPPLEMENTARY INFORMATION ON TRADE RECEIVABLES
This appendix forms an integral part of the Enersis Chile’s financial statements.
a) Portfolio stratification
| • | Trade receivables by aging: |
| Balance at | ||||||||||||||||||||||||||||||||||||||||||||||||
| 9-30-2015 | ||||||||||||||||||||||||||||||||||||||||||||||||
Trade and other current | Current portfolio ThCh$ | 1-30 days ThCh$ | 31-60 days ThCh$ | 61-90 days ThCh$ | 91-120 days ThCh$ | 121-150 days ThCh$ | 151-180 days ThCh$ | 181-210 days ThCh$ | 211-250 days ThCh$ | More than 251 days ThCh$ | Total Current ThCh$ | Total Non- Current ThCh$ | ||||||||||||||||||||||||||||||||||||
Trade receivables, generation | 233,991,291 | 353 | 2,551 | 2 | 6,642 | 39,764 | — | 181,591 | 5 | 1,305,310 | 235,527,509 | 48,635 | ||||||||||||||||||||||||||||||||||||
- Large customers | 233,566,869 | 353 | 2,551 | 2 | 6,642 | 39,764 | — | 181,591 | 5 | 1,305,310 | 235,103,087 | — | ||||||||||||||||||||||||||||||||||||
- Institutional customers | — | — | — | — | — | — | — | — | — | — | — | — | ||||||||||||||||||||||||||||||||||||
- Others | 424,422 | — | — | — | — | — | — | — | — | — | 424,422 | 48,635 | ||||||||||||||||||||||||||||||||||||
Allowance for doubtful accounts | (55,494 | ) | — | — | — | — | — | — | — | — | (1,122,141 | ) | (1,177,635 | ) | — | |||||||||||||||||||||||||||||||||
Unbilled services | 137,217,470 | — | — | — | — | — | — | — | — | 19,055 | 137,236,525 | — | ||||||||||||||||||||||||||||||||||||
Services billed | 96,773,821 | 353 | 2,551 | 2 | 6,642 | 39,764 | — | 181,591 | 5 | 1,286,255 | 98,290,984 | 48,635 | ||||||||||||||||||||||||||||||||||||
Trade receivables, distribution | 150,561,103 | 27,806,762 | 12,226,418 | 1,880,819 | 3,034,502 | 1,284,670 | 1,731,692 | 1,132,106 | 362,426 | 48,341,492 | 248,361,990 | 3,104,647 | ||||||||||||||||||||||||||||||||||||
- Large customers | 123,789,696 | 21,282,497 | 8,947,027 | 1,098,549 | 636,590 | 442,677 | 330,588 | 566,630 | 191,192 | 19,042,751 | 176,328,197 | 2,801,608 | ||||||||||||||||||||||||||||||||||||
- Institutional customers | 24,821,623 | 5,094,054 | 2,274,170 | 539,140 | 279,490 | 120,368 | 522,234 | 245,807 | 17,242 | 15,032,846 | 48,946,974 | 278,424 | ||||||||||||||||||||||||||||||||||||
- Others | 1,949,784 | 1,430,211 | 1,005,221 | 243,130 | 2,118,422 | 721,625 | 878,870 | 319,669 | 153,992 | 14,265,895 | 23,086,819 | 24,615 | ||||||||||||||||||||||||||||||||||||
Allowance for doubtful accounts | (395,002 | ) | (191,679 | ) | (190,538 | ) | (98,666 | ) | (105,063 | ) | (86,706 | ) | (106,257 | ) | (410,876 | ) | (64,170 | ) | (23,473,317 | ) | (25,122,274 | ) | — | |||||||||||||||||||||||||
Unbilled services | 101,512,439 | — | — | — | — | — | — | — | — | — | 101,512,439 | — | ||||||||||||||||||||||||||||||||||||
Services billed | 49,048,664 | 27,806,762 | 12,226,418 | 1,880,819 | 3,034,502 | 1,284,670 | 1,731,692 | 1,132,106 | 362,426 | 48,341,492 | 146,849,551 | 3,104,647 | ||||||||||||||||||||||||||||||||||||
Total Trade Receivables, Gross | 384,552,394 | 27,807,115 | 12,228,969 | 1,880,821 | 3,041,144 | 1,324,434 | 1,731,692 | 1,313,697 | 362,431 | 49,646,802 | 483,889,499 | 3,153,282 | ||||||||||||||||||||||||||||||||||||
Total Allowance for Doubtful Accounts | (450,496 | ) | (191,679 | ) | (190,538 | ) | (98,666 | ) | (105,063 | ) | (86,706 | ) | (106,257 | ) | (410,876 | ) | (64,170 | ) | (24,595,458 | ) | (26,299,909 | ) | — | |||||||||||||||||||||||||
|
|
|
|
|
|
|
|
|
|
|
|
|
|
|
|
|
|
|
|
|
|
|
| |||||||||||||||||||||||||
Total Trade Receivables, Net | 384,101,898 | 27,615,436 | 12,038,431 | 1,782,155 | 2,936,081 | 1,237,728 | 1,625,435 | 902,821 | 298,261 | 25,051,344 | 457,589,590 | 3,153,282 | ||||||||||||||||||||||||||||||||||||
|
|
|
|
|
|
|
|
|
|
|
|
|
|
|
|
|
|
|
|
|
|
|
| |||||||||||||||||||||||||
F-115
Table of Contents
Since not all of our commercial databases in our Combined Group’s different combined entities distinguish whether the final electricity service consumer is a natural or legal person, the main management segmentation used by all the combined entities to monitor and follow up on trade receivables is the following:
| • | Mass-market customers |
| • | Large customers |
| • | Institutional customers |
| Balance at | ||||||||||||||||||||||||||||||||||||||||||||||||
| 12-31-2014 | ||||||||||||||||||||||||||||||||||||||||||||||||
Trade and other current | Current portfolio ThCh$ | 1-30 days ThCh$ | 31-60 days ThCh$ | 61-90 days ThCh$ | 91-120 days ThCh$ | 121-150 days ThCh$ | 151-180 days ThCh$ | 181-210 days ThCh$ | 211-250 days ThCh$ | More than 251 days ThCh$ | Total Current ThCh$ | Total Non- Current ThCh$ | ||||||||||||||||||||||||||||||||||||
Trade receivables, generation | 215,515,564 | 1,126,379 | 2,211,459 | 549,240 | 165,805 | 16,224 | 203,213 | 4,742 | 11,386 | 1,475,172 | 221,279,184 | — | ||||||||||||||||||||||||||||||||||||
- Large customers | 215,515,564 | 1,126,379 | 2,211,459 | 498,757 | 165,805 | 16,224 | 203,213 | 4,742 | 11,386 | 1,475,172 | 221,228,701 | — | ||||||||||||||||||||||||||||||||||||
- Institutional customers | — | — | — | — | — | — | — | — | — | — | — | — | ||||||||||||||||||||||||||||||||||||
- Others | — | — | — | 50,483 | — | — | — | — | — | — | 50,483 | — | ||||||||||||||||||||||||||||||||||||
Allowance for doubtful accounts | — | — | — | — | — | — | — | — | — | (1,177,635 | ) | (1,177,635 | ) | — | ||||||||||||||||||||||||||||||||||
Unbilled services | 129,288,778 | — | — | — | — | — | — | — | — | — | 129,288,778 | — | ||||||||||||||||||||||||||||||||||||
Services billed | 86,226,786 | 1,126,379 | 2,211,459 | 549,240 | 165,805 | 16,224 | 203,213 | 4,742 | 11,386 | 1,475,172 | 91,990,406 | — | ||||||||||||||||||||||||||||||||||||
Trade receivables, distribution | 193,038,095 | 23,769,559 | 9,156,956 | 2,975,170 | 614,564 | 1,513,552 | 520,860 | 1,360,171 | 672,607 | 35,653,180 | 269,274,714 | 3,318,126 | ||||||||||||||||||||||||||||||||||||
- Large customers | 148,429,749 | 16,970,890 | 6,872,321 | 1,012,684 | 474,373 | 337,101 | 258,211 | 486,833 | 154,843 | 17,153,968 | 192,150,973 | 2,358,478 | ||||||||||||||||||||||||||||||||||||
- Institutional Clients | 39,530,019 | 6,327,489 | 1,561,755 | 1,708,259 | 6,617 | 357,959 | 231,579 | 662,941 | 217,543 | 8,790,763 | 59,394,924 | 550,439 | ||||||||||||||||||||||||||||||||||||
- Others | 5,078,327 | 471,180 | 722,880 | 254,227 | 133,574 | 818,492 | 31,070 | 210,397 | 300,221 | 9,708,449 | 17,728,817 | 409,209 | ||||||||||||||||||||||||||||||||||||
Allowance for doubtful accounts | (240,504 | ) | (206,494 | ) | (284,757 | ) | (239,194 | ) | (169,479 | ) | (143,664 | ) | (96,107 | ) | (381,988 | ) | (113,699 | ) | (20,852,923 | ) | (22,728,809 | ) | — | |||||||||||||||||||||||||
Unbilled services | 159,974,872 | — | — | — | — | — | — | — | — | — | 159,974,872 | — | ||||||||||||||||||||||||||||||||||||
Services billed | 33,063,222 | 23,769,559 | 9,156,956 | 2,975,170 | 614,564 | 1,513,552 | 520,860 | 1,360,171 | 672,607 | 35,653,180 | 109,299,841 | 3,318,126 | ||||||||||||||||||||||||||||||||||||
Total Trade Receivables, Gross | 408,553,659 | 24,895,938 | 11,368,415 | 3,524,410 | 780,369 | 1,529,776 | 724,073 | 1,364,913 | 683,993 | 37,128,352 | 490,553,898 | 3,318,126 | ||||||||||||||||||||||||||||||||||||
Total Allowance for Doubtful Accounts | (240,504 | ) | (206,494 | ) | (284,757 | ) | (239,194 | ) | (169,479 | ) | (143,664 | ) | (96,107 | ) | (381,988 | ) | (113,699 | ) | (22,030,558 | ) | (23,906,444 | ) | — | |||||||||||||||||||||||||
|
|
|
|
|
|
|
|
|
|
|
|
|
|
|
|
|
|
|
|
|
|
|
| |||||||||||||||||||||||||
Total Trade Receivables, Net | 408,313,155 | 24,689,444 | 11,083,658 | 3,285,216 | 610,890 | 1,386,112 | 627,966 | 982,925 | 570,294 | 15,097,794 | 466,647,454 | 3,318,126 | ||||||||||||||||||||||||||||||||||||
|
|
|
|
|
|
|
|
|
|
|
|
|
|
|
|
|
|
|
|
|
|
|
| |||||||||||||||||||||||||
F-116
Table of Contents
- By type of portfolio:
| Balance at | ||||||||||||||||||||||||||||||||||||||||||||
| 9-30-2015 | ||||||||||||||||||||||||||||||||||||||||||||
Type of Portfolio | Current portfolio ThCh$ | 1-30 days ThCh$ | 31-60 days ThCh$ | 61-90 days ThCh$ | 91-120 days ThCh$ | 121-150 days ThCh$ | 151-180 days ThCh$ | 181-210 days ThCh$ | 211-250 days ThCh$ | More than 251 days ThCh$ | Total Gross Portfolio ThCh$ | |||||||||||||||||||||||||||||||||
GENERATION | ||||||||||||||||||||||||||||||||||||||||||||
Non-renegotiated portfolio | 233,991,291 | 353 | 2,551 | 2 | 6,642 | 39,764 | — | 181,591 | 5 | 1,305,310 | 235,527,509 | |||||||||||||||||||||||||||||||||
- Large customers | 233,566,869 | 353 | 2,551 | 2 | 6,642 | 39,764 | — | 181,591 | 5 | 1,305,310 | 235,103,087 | |||||||||||||||||||||||||||||||||
- Institutional customers | — | — | — | — | — | — | — | — | — | — | — | |||||||||||||||||||||||||||||||||
- Others | 424,422 | — | — | — | — | — | — | — | — | — | 424,422 | |||||||||||||||||||||||||||||||||
Renegotiated portfolio | — | — | — | — | — | — | — | — | — | — | — | |||||||||||||||||||||||||||||||||
- Large customers | — | — | — | — | — | — | — | — | — | — | — | |||||||||||||||||||||||||||||||||
- Institutional customers | — | — | — | — | — | — | — | — | — | — | — | |||||||||||||||||||||||||||||||||
- Others | — | — | — | — | — | — | — | — | — | — | — | |||||||||||||||||||||||||||||||||
Distribution | ||||||||||||||||||||||||||||||||||||||||||||
Non-renegotiated portfolio | 146,628,735 | 24,337,126 | 10,857,784 | 1,507,066 | 2,825,511 | 1,116,706 | 1,334,114 | 1,074,783 | 178,180 | 45,028,569 | 234,888,574 | |||||||||||||||||||||||||||||||||
-Mass-market customers | 120,061,055 | 18,052,132 | 7,589,249 | 725,207 | 427,749 | 275,039 | 227,123 | 509,559 | 149,022 | 17,135,794 | 165,151,929 | |||||||||||||||||||||||||||||||||
- Large customers | 24,619,392 | 4,856,107 | 2,264,524 | 539,140 | 279,490 | 120,368 | 522,234 | 245,807 | 17,242 | 15,032,846 | 48,497,150 | |||||||||||||||||||||||||||||||||
- Institutional customers | 1,948,288 | 1,428,887 | 1,004,011 | 242,719 | 2,118,272 | 721,299 | 584,757 | 319,417 | 11,916 | 12,859,929 | 21,239,495 | |||||||||||||||||||||||||||||||||
Renegotiated portfolio | 3,932,368 | 3,469,636 | 1,368,634 | 373,753 | 208,991 | 167,964 | 397,578 | 57,323 | 184,246 | 3,312,923 | 13,473,416 | |||||||||||||||||||||||||||||||||
-Mass-market customers | 3,728,640 | 3,230,366 | 1,357,779 | 373,342 | 208,841 | 167,638 | 103,465 | 57,071 | 42,170 | 1,906,957 | 11,176,269 | |||||||||||||||||||||||||||||||||
- Large Customers | 202,231 | 237,947 | 9,645 | — | — | — | — | — | — | — | 449,823 | |||||||||||||||||||||||||||||||||
- Institutional Customers | 1,497 | 1,323 | 1,210 | 411 | 150 | 326 | 294,113 | 252 | 142,076 | 1,405,966 | 1,847,324 | |||||||||||||||||||||||||||||||||
|
|
|
|
|
|
|
|
|
|
|
|
|
|
|
|
|
|
|
|
|
| |||||||||||||||||||||||
Total Gross Portfolio | 384,552,394 | 27,807,115 | 12,228,969 | 1,880,821 | 3,041,144 | 1,324,434 | 1,731,692 | 1,313,697 | 362,431 | 49,646,802 | 483,889,499 | |||||||||||||||||||||||||||||||||
|
|
|
|
|
|
|
|
|
|
|
|
|
|
|
|
|
|
|
|
|
| |||||||||||||||||||||||
F-117
Table of Contents
| Balance at | ||||||||||||||||||||||||||||||||||||||||||||
| 12-31-2014 | ||||||||||||||||||||||||||||||||||||||||||||
Type of Portfolio | Current portfolio ThCh$ | 1-30 days ThCh$ | 31-60 days ThCh$ | 61-90 days ThCh$ | 91-120 days ThCh$ | 121-150 days ThCh$ | 151-180 days ThCh$ | 181-210 days ThCh$ | 211-250 days ThCh$ | More than 251 days ThCh$ | Total Gross Portfolio ThCh$ | |||||||||||||||||||||||||||||||||
GENERATION | ||||||||||||||||||||||||||||||||||||||||||||
Non-renegotiated portfolio | 215,515,564 | 1,126,379 | 2,211,459 | 549,240 | 165,805 | 16,224 | 203,213 | 4,742 | 11,386 | 1,475,172 | 221,279,184 | |||||||||||||||||||||||||||||||||
- Large customers | 215,515,564 | 1,126,379 | 2,211,459 | 498,757 | 165,805 | 16,224 | 203,213 | 4,742 | 11,386 | 1,475,172 | 221,228,701 | |||||||||||||||||||||||||||||||||
- Institutional customers | — | — | — | — | — | — | — | — | — | — | — | |||||||||||||||||||||||||||||||||
- Others | — | — | — | 50,483 | — | — | — | — | — | — | 50,483 | |||||||||||||||||||||||||||||||||
Renegotiated portfolio | — | — | — | — | — | — | — | — | — | — | — | |||||||||||||||||||||||||||||||||
- Large customers | — | — | — | — | — | — | — | — | — | — | — | |||||||||||||||||||||||||||||||||
- Institutional customers | — | — | — | — | — | — | — | — | — | — | — | |||||||||||||||||||||||||||||||||
- Others | — | — | — | — | — | — | — | — | — | — | — | |||||||||||||||||||||||||||||||||
Distribution | ||||||||||||||||||||||||||||||||||||||||||||
Non-renegotiated portfolio | 190,140,113 | 21,329,044 | 8,219,964 | 2,688,656 | 451,915 | 1,386,891 | 447,046 | 1,294,935 | 633,262 | 28,140,690 | 254,732,516 | |||||||||||||||||||||||||||||||||
-Mass-market customers | 146,243,855 | 14,632,805 | 5,935,329 | 736,267 | 311,815 | 210,642 | 184,854 | 421,774 | 115,498 | 9,683,090 | 178,475,929 | |||||||||||||||||||||||||||||||||
- Large customers | 39,239,436 | 6,240,396 | 1,561,755 | 1,698,236 | 6,617 | 357,959 | 231,579 | 662,941 | 217,543 | 8,774,211 | 58,990,673 | |||||||||||||||||||||||||||||||||
- Institutional customers | 4,656,822 | 455,843 | 722,880 | 254,153 | 133,483 | 818,290 | 30,613 | 210,220 | 300,221 | 9,683,389 | 17,265,914 | |||||||||||||||||||||||||||||||||
Renegotiated portfolio | 2,897,982 | 2,440,515 | 936,992 | 286,514 | 162,649 | 126,661 | 73,814 | 65,236 | 39,345 | 7,512,490 | 14,542,198 | |||||||||||||||||||||||||||||||||
-Mass-market customers | 2,185,893 | 2,338,085 | 936,992 | 276,417 | 162,558 | 126,459 | 73,357 | 65,059 | 39,345 | 7,470,878 | 13,675,043 | |||||||||||||||||||||||||||||||||
- Large customers | 290,583 | 87,093 | — | 10,023 | — | — | — | — | — | 16,552 | 404,251 | |||||||||||||||||||||||||||||||||
- Institutional customers | 421,506 | 15,337 | — | 74 | 91 | 202 | 457 | 177 | — | 25,060 | 462,904 | |||||||||||||||||||||||||||||||||
|
|
|
|
|
|
|
|
|
|
|
|
|
|
|
|
|
|
|
|
|
| |||||||||||||||||||||||
Total Gross Portfolio | 408,553,659 | 24,895,938 | 11,368,415 | 3,524,410 | 780,369 | 1,529,776 | 724,073 | 1,364,913 | 683,993 | 37,128,352 | 490,553,898 | |||||||||||||||||||||||||||||||||
|
|
|
|
|
|
|
|
|
|
|
|
|
|
|
|
|
|
|
|
|
| |||||||||||||||||||||||
F-118
Table of Contents
APPENDIX 6.2. ESTIMATED SALES AND PURCHASES OF ENERGY AND CAPACITY
This appendix forms an integral part of the Enersis Chile’s financial statements.
| CHILE | TOTAL | |||||||||||||||||||||||||||||||
| 9-30-2015 | 12-31-2014 | 9-30-2015 | 12-31-2014 | |||||||||||||||||||||||||||||
BALANCE | Energy and Tolls | Capacity | Energy and Tolls | Capacity | Energy and Tolls | Capacity | Energy and Tolls | Capacity | ||||||||||||||||||||||||
Current accounts receivable from related companies | 250,149 | 141,414 | 212,000 | 109,588 | 250,149 | 141,414 | 212,000 | 109,588 | ||||||||||||||||||||||||
Trade and other current receivables | 197,511,306 | 24,040,822 | 245,764,182 | 14,741,243 | 197,511,306 | 24,040,822 | 245,764,182 | 14,741,243 | ||||||||||||||||||||||||
Total Estimated Assets | 197,761,455 | 24,182,236 | 245,976,182 | 14,850,831 | 197,761,455 | 24,182,236 | 245,976,182 | 14,850,831 | ||||||||||||||||||||||||
Current accounts payable to related companies | 5,240,630 | 215,966 | 1,547,416 | 71,570 | 5,240,630 | 215,966 | 1,547,416 | 71,570 | ||||||||||||||||||||||||
Trade and other current payables | 95,143,645 | 45,852,222 | 75,929,064 | 26,185,456 | 95,143,645 | 45,852,222 | 75,929,064 | 26,185,456 | ||||||||||||||||||||||||
Total Estimated Liabilities | 100,384,275 | 46,068,188 | 77,476,480 | 26,257,026 | 100,384,275 | 46,068,188 | 77,476,480 | 26,257,026 | ||||||||||||||||||||||||
| 9-30-2015 | 12-31-2014 | 9-30-2015 | 12-31-2014 | |||||||||||||||||||||||||||||
INCOME STATEMENT | Energy and Tolls | Capacity | Energy and Tolls | Capacity | Energy and Tolls | Capacity | Energy and Tolls | Capacity | ||||||||||||||||||||||||
Energy Sales | 197,761,455 | 24,182,236 | 212,420,675 | 10,496,376 | 197,761,455 | 24,182,236 | 212,420,675 | 10,496,376 | ||||||||||||||||||||||||
Energy Purchases | 100,384,275 | 46,068,188 | 38,827,589 | 10,873,645 | 100,384,275 | 46,068,188 | 38,827,589 | 10,873,645 | ||||||||||||||||||||||||
F-119
Table of Contents
APPENDIX 7. DETAILS OF DUE DATES OF PAYMENTS TO SUPPLIERS
This appendix forms an integral part of the Enersis Chile’s financial statements.
Suppliers with Current | Balance at | Balance at | ||||||||||||||||||||||||||||||
| 9-30-2015 | 12-31-2014 | |||||||||||||||||||||||||||||||
| Goods ThCh$ | Services ThCh$ | Other ThCh$ | Total ThCh$ | Goods ThCh$ | Services ThCh$ | Other ThCh$ | Total ThCh$ | |||||||||||||||||||||||||
Up to 30 days | — | 103,053,544 | 69,410,787 | 172,464,331 | — | 80,138,994 | 60,130,466 | 140,269,460 | ||||||||||||||||||||||||
From 31 to 60 days | — | — | — | — | — | — | — | — | ||||||||||||||||||||||||
From 61 to 90 days | — | — | — | — | — | — | — | — | ||||||||||||||||||||||||
From 91 to 120 days | — | — | — | — | — | — | — | — | ||||||||||||||||||||||||
From 121 to 365 days | — | — | — | — | — | — | — | — | ||||||||||||||||||||||||
More than 365 days | — | — | — | — | — | — | — | — | ||||||||||||||||||||||||
|
|
|
|
|
|
|
|
|
|
|
|
|
|
|
| |||||||||||||||||
Total | — | 103,053,544 | 69,410,787 | 172,464,331 | — | 80,138,994 | 60,130,466 | 140,269,460 | ||||||||||||||||||||||||
|
|
|
|
|
|
|
|
|
|
|
|
|
|
|
| |||||||||||||||||
Suppliers with Current | Balance at | Balance at | ||||||||||||||||||||||||||||||
| 9-30-2015 | 12-31-2014 | |||||||||||||||||||||||||||||||
| Goods ThCh$ | Services ThCh$ | Other ThCh$ | Total ThCh$ | Goods ThCh$ | Services ThCh$ | Other ThCh$ | Total ThCh$ | |||||||||||||||||||||||||
Up to 30 days | — | — | — | — | — | — | — | — | ||||||||||||||||||||||||
From 31 to 60 days | — | — | — | — | — | — | — | — | ||||||||||||||||||||||||
From 61 to 90 days | — | — | — | — | — | — | — | — | ||||||||||||||||||||||||
From 91 to 120 days | — | — | — | — | — | — | — | — | ||||||||||||||||||||||||
From 121 to 180 days | — | — | — | — | — | — | — | — | ||||||||||||||||||||||||
More than 180 days | — | — | — | — | — | 1,137,018 | — | 1,137,018 | ||||||||||||||||||||||||
|
|
|
|
|
|
|
|
|
|
|
|
|
|
|
| |||||||||||||||||
Total | — | — | — | — | — | 1,137,018 | — | 1,137,018 | ||||||||||||||||||||||||
|
|
|
|
|
|
|
|
|
|
|
|
|
|
|
| |||||||||||||||||
F-120
Table of Contents
Enersis Chile
Audited Combined Financial Statements as of December 31, 2014 and 2013 and January 1, 2013, and for the years ended December 31, 2014 and 2013 together with the Report of Independent Registered Public Accounting Firms
F-121
Table of Contents
Index to the Audited Combined Financial Statements
Report of Independent Registered Public Accounting Firm:
Ch$ | Chilean pesos | |
US$ | U.S. dollars | |
UF | The UF is a Chilean inflation-indexed, peso-denominated monetary unit that is set daily in advance based on the previous month’s inflation rate. | |
ThCh$ | Thousands of Chilean pesos | |
ThUS$ | Thousands of U.S. dollars |
F-122
Table of Contents
|
EY Chile Avda. Presidente Riesco 5435, piso 4, Santiago |
Tel: +56 (2) 2676 1000 www.eychile.cl |
Report of Independent Registered Public Accounting Firm
To Shareholders and Directors of
Enersis S.A.
We have audited the accompanying combined statements of financial position of Enersis Chile (the “Combined Group”, as described in Note 2 to the combined financial statements) as of December 31, 2014 and 2013 and January 1, 2013, and the related combined statements of comprehensive income, equity and cash flows for the each of the two years in the period ended December 31, 2014. These financial statements are the responsibility of Enersis S.A.’s management. Our responsibility is to express an opinion on these financial statements based on our audits.
We conducted our audits in accordance with the standards of the Public Company Accounting Oversight Board (United States). Those standards require that we plan and perform the audit to obtain reasonable assurance about whether the financial statements are free of material misstatement. We were not engaged to perform an audit of the Combined Group’s internal control over financial reporting. Our audits included consideration of internal control over financial reporting as a basis for designing audit procedures that are appropriate in the circumstances, but not for the purpose of expressing an opinion on the effectiveness of the Combined Group’s internal control over financial reporting. Accordingly, we express no such opinion. An audit also includes examining, on a test basis, evidence supporting the amounts and disclosures in the financial statements, assessing the accounting principles used and significant estimates made by management, and evaluating the overall financial statement presentation. We believe that our audits provide a reasonable basis for our opinion.
In our opinion, the financial statements referred to above present fairly, in all material respects, the combined financial position of Enersis Chile at December 31, 2014 and 2013 and January 1, 2013, and the combined results of their operations and their cash flows for each of the two years in the period ended December 31, 2014, in conformity with International Financial Reporting Standards (IFRS), as issued by the International Accounting Standards Board.
| /s/ EY Ltda |
EY Ltda.
Santiago, Chile December 4, 2015 |
F-123
Table of Contents
ENERSIS CHILE
Combined Statements of Financial Position
At December 31, 2014, 2013 and January 1, 2013
(In thousands of Chilean pesos)
| Note | 12-31-2014 ThCh$ | 12-31-2013 ThCh$ | 1-1-2013 ThCh$ | |||||||||||
| ASSETS | ||||||||||||||
CURRENT ASSETS | ||||||||||||||
Cash and cash equivalents | 7 | 132,985,927 | 214,907,097 | 94,093,760 | ||||||||||
Other current financial assets | 8 | 1,491,129 | 22,263,951 | 3,864 | ||||||||||
Other current non-financial assets | 16,047,607 | 4,819,090 | 8,544,045 | |||||||||||
Trade and other current receivables | 9 | 578,081,205 | 302,980,633 | 302,204,856 | ||||||||||
Current accounts receivable from related companies | 10 | 16,952,650 | 34,348,893 | 25,418,867 | ||||||||||
Inventories | 11 | 43,677,878 | 22,015,024 | 35,822,895 | ||||||||||
Current tax assets | 12 | 45,648,139 | 153,383,498 | 148,174,175 | ||||||||||
|
|
|
|
|
| |||||||||
Total current assets other than assets or groups of assets for disposal classified as held for sale | 834,884,535 | 754,718,186 | 614,262,462 | |||||||||||
|
|
|
|
|
| |||||||||
Non-current assets or groups of assets for disposal classified as held for sale | 13 | 7,978,963 | — | — | ||||||||||
Non-current assets or groups of assets for disposal classified as held for sale | 7,978,963 | — | — | |||||||||||
|
|
|
|
|
| |||||||||
TOTAL CURRENT ASSETS | 842,863,498 | 754,718,186 | 614,262,462 | |||||||||||
|
|
|
|
|
| |||||||||
NON-CURRENT ASSETS | ||||||||||||||
Other non-current financial assets | 8 | 6,750,472 | 2,782,608 | 31,575,533 | ||||||||||
Other non-current non-financial assets | 235,430 | 366,777 | 380,917 | |||||||||||
Trade and other non-current receivables | 9 | 7,496,412 | 6,875,034 | 7,548,389 | ||||||||||
Non-current accounts receivable from related companies | 10 | — | — | 5,712,830 | ||||||||||
Investments accounted for using the equity method | 14 | 40,365,323 | 214,426,176 | 178,220,751 | ||||||||||
Intangible assets other than goodwill | 15 | 36,525,522 | 37,570,805 | 37,962,229 | ||||||||||
Goodwill | 16 | 887,257,655 | 867,053,404 | 867,053,404 | ||||||||||
Property, plant and equipment | 17 | 3,283,760,776 | 2,880,470,635 | 2,810,746,294 | ||||||||||
Investment property | 18 | 8,514,562 | 44,877,049 | 46,922,970 | ||||||||||
Deferred tax assets | 19 | 12,965,095 | 11,251,547 | 18,044,936 | ||||||||||
|
|
|
|
|
| |||||||||
TOTAL NON-CURRENT ASSETS | 4,283,871,247 | 4,065,674,035 | 4,004,168,253 | |||||||||||
|
|
|
|
|
| |||||||||
TOTAL ASSETS | 5,126,734,745 | 4,820,392,221 | 4,618,430,715 | |||||||||||
|
|
|
|
|
| |||||||||
F-124
Table of Contents
ENERSIS CHILE
Combined Statements of Financial Position
At December 31, 2014, 2013 and January 1, 2013
(In thousands of Chilean pesos)
| Note | 12-31-2014 ThCh$ | 12-31-2013 ThCh$ | 1-1-2013 ThCh$ | |||||||||||
| LIABILITIES AND EQUITY | ||||||||||||||
CURRENT LIABILITIES | ||||||||||||||
Other current financial liabilities | 20 | 146,364,359 | 127,263,854 | 220,356,909 | ||||||||||
Trade and other current payables | 23 | 495,361,355 | 358,330,996 | 274,359,131 | ||||||||||
Current accounts payable to related companies | 10 | 187,185,193 | 337,171,936 | 66,891,664 | ||||||||||
Other current provisions | 24 | 11,623,514 | 44,639,072 | 38,652,787 | ||||||||||
Current tax liabilities | 12 | 38,357,866 | 59,433,519 | 30,073,926 | ||||||||||
Other current non-financial liabilities | 35,703,261 | 1,291,094 | 2,587,960 | |||||||||||
|
|
|
|
|
| |||||||||
Total current liabilities other than those associated with groups of assets for disposal classified as held for sale | 914,595,548 | 928,130,471 | 632,922,377 | |||||||||||
|
|
|
|
|
| |||||||||
Liabilities associated with groups of assets for disposal classified as held for sale | 13 | 5,488,147 | — | — | ||||||||||
|
|
|
|
|
| |||||||||
TOTAL CURRENT LIABILITIES | 920,083,695 | 928,130,471 | 632,922,377 | |||||||||||
|
|
|
|
|
| |||||||||
NON-CURRENT LIABILITIES | ||||||||||||||
Other non-current financial liabilities | 20 | 778,135,167 | 579,403,606 | 656,681,229 | ||||||||||
Trade and other non-current payables | 23 | 3,711,078 | — | — | ||||||||||
Other long-term provisions | 24 | 27,969,935 | 23,983,651 | 25,283,772 | ||||||||||
Deferred tax liabilities | 19 | 255,222,666 | 176,901,221 | 187,311,744 | ||||||||||
Non-current provisions for employee benefits | 25 | 53,937,842 | 41,495,612 | 38,842,337 | ||||||||||
Other non-current non-financial liabilities | 3,608,571 | 4,693,671 | 14,071,787 | |||||||||||
|
|
|
|
|
| |||||||||
TOTAL NON-CURRENT LIABILITIES | 1,122,585,259 | 826,477,761 | 922,190,869 | |||||||||||
|
|
|
|
|
| |||||||||
TOTAL LIABILITIES | 2,042,668,954 | 1,754,608,232 | 1,555,113,246 | |||||||||||
|
|
|
|
|
| |||||||||
EQUITY | ||||||||||||||
Allocated Capital | 26.1 | 2,229,108,975 | 2,238,169,268 | 1,145,822,006 | ||||||||||
Retained earnings | 1,171,971,677 | 1,080,532,977 | 929,854,899 | |||||||||||
Other reserves | 26.5 | (928,879,218 | ) | (879,864,877 | ) | 382,088,337 | ||||||||
Equity attributable to Enersis Chile | 2,472,201,434 | 2,438,837,368 | 2,457,765,242 | |||||||||||
|
|
|
|
|
| |||||||||
Non-controlling interests | 26.6 | 611,864,357 | 626,946,621 | 605,552,227 | ||||||||||
|
|
|
|
|
| |||||||||
TOTAL EQUITY | 3,084,065,791 | 3,065,783,989 | 3,063,317,469 | |||||||||||
|
|
|
|
|
| |||||||||
TOTAL LIABILITIES AND EQUITY | 5,126,734,745 | 4,820,392,221 | 4,618,430,715 | |||||||||||
|
|
|
|
|
| |||||||||
F-125
Table of Contents
ENERSIS CHILE
Combined Statements of Comprehensive Income, by Nature
For the years ended December 31, 2014 and 2013
(In thousands of Chilean pesos)
COMBINED STATEMENTS OF COMPREHENSIVE INCOME Profit | Note | 2014 ThCh$ | 2013 ThCh$ | |||||||
Revenues | 27 | 2,014,863,898 | 1,719,566,716 | |||||||
Other operating income | 27 | 34,201,387 | 18,516,161 | |||||||
|
|
|
| |||||||
Revenues and other operating income | 2,049,065,285 | 1,738,082,877 | ||||||||
|
|
|
| |||||||
Raw materials and consumables used | 28 | (1,309,402,283 | ) | (998,903,978 | ) | |||||
|
|
|
| |||||||
Contribution Margin | 739,663,002 | 739,178,899 | ||||||||
|
|
|
| |||||||
Other work performed by the entity and capitalized | 3 a. – 3 d.1 | 21,505,568 | 14,831,058 | |||||||
Employee benefits expense | 29 | (126,341,363 | ) | (120,113,902 | ) | |||||
Depreciation and amortization expense | 30 | (128,437,154 | ) | (119,507,118 | ) | |||||
Impairment losses recognized in the year’s profit or loss | 30 | (13,185,420 | ) | (8,212,948 | ) | |||||
Other expenses by nature | 31 | (110,454,215 | ) | (114,552,727 | ) | |||||
|
|
|
| |||||||
Operating Income | 382,750,418 | 391,623,262 | ||||||||
|
|
|
| |||||||
Other gains | 32 | 70,893,263 | 14,527,737 | |||||||
Financial income | 33 | 14,762,515 | 13,650,531 | |||||||
Financial costs | 33 | (75,626,489 | ) | (69,768,634 | ) | |||||
Share of profit (loss) of associates and joint ventures accounted for using the equity method | 14 | (54,352,582 | ) | 24,309,344 | ||||||
Foreign currency exchange differences | 33 | (21,444,198 | ) | (1,838,329 | ) | |||||
Profit from indexed assets and liabilities | 33 | 15,263,623 | 1,593,046 | |||||||
|
|
|
| |||||||
Income before taxes | 332,246,550 | 374,096,957 | ||||||||
|
|
|
| |||||||
Income tax expense | 34 | (132,687,133 | ) | (61,712,442 | ) | |||||
|
|
|
| |||||||
NET INCOME | 199,559,417 | 312,384,515 | ||||||||
|
|
|
| |||||||
Net income attributable to: | ||||||||||
Enersis Chile | 162,459,039 | 229,526,660 | ||||||||
Non-controlling interests | 26.5 | 37,100,378 | 82,857,855 | |||||||
|
|
|
| |||||||
NET INCOME | 199,559,417 | 312,384,515 | ||||||||
|
|
|
| |||||||
F-126
Table of Contents
ENERSIS CHILE
Combined Statements of Comprehensive Income, by Nature (continued)
For the years ended December 31, 2014 and 2013
(In thousands of Chilean pesos)
COMBINED STATEMENTS OF COMPREHENSIVE INCOME | Note | 2014 ThCh$ | 2013 ThCh$ | |||||||
Net Income | 199,559,417 | 312,384,515 | ||||||||
Components of other comprehensive income that will not be reclassified subsequently to profit or loss, before taxes | ||||||||||
Losses from defined benefit plans | 25.2.b | (12,692,856 | ) | (3,260,244 | ) | |||||
Other comprehensive income that will not be reclassified subsequently to profit or loss | (12,692,856 | ) | (3,260,244 | ) | ||||||
Components of other comprehensive income (loss) that will be reclassified subsequently to profit or loss, before taxes | ||||||||||
Foreign currency translation gains | 12,473,950 | 12,286,748 | ||||||||
Gains (losses) from available-for-sale financial assets | 1,849 | (2,273 | ) | |||||||
Share of other comprehensive income (loss) from associates and joint ventures accounted for using the equity method | 13,476,871 | 8,699,592 | ||||||||
Losses from cash flow hedges | (122,590,463 | ) | (61,087,792 | ) | ||||||
Adjustments from reclassification of cash flow hedges, transferred to profit or loss | (8,765,418 | ) | (9,840,931 | ) | ||||||
Other comprehensive income (loss) that will be reclassified subsequently to profit or loss | (105,403,211 | ) | (49,944,656 | ) | ||||||
Components of other comprehensive income (loss), before taxes | (118,096,067 | ) | (53,204,900 | ) | ||||||
Income tax related to components of other comprehensive income that will not be reclassified subsequently to profit or loss | ||||||||||
Income tax related to defined benefit plans | 4,527,209 | 652,049 | ||||||||
Income tax related to components of other comprehensive income that will not be reclassified subsequently to profit or loss | 4,527,209 | 652,049 | ||||||||
Income tax related to components of other comprehensive income that will be reclassified subsequently to profit or loss | ||||||||||
Income tax related to cash flow hedge | 31,585,153 | 10,955,996 | ||||||||
Income tax related to available-for-sale financial assets | (1,462 | ) | 455 | |||||||
Income tax related to components of other comprehensive income that will be reclassified subsequently to profit or loss | 31,583,691 | 10,956,451 | ||||||||
|
|
|
| |||||||
Total Other Comprehensive Income (Loss) | (81,985,167 | ) | (41,596,400 | ) | ||||||
|
|
|
| |||||||
TOTAL COMPREHENSIVE INCOME | 117,574,250 | 270,788,115 | ||||||||
|
|
|
| |||||||
Comprehensive income attributable to: | ||||||||||
Enersis Chile | 110,466,754 | 203,106,403 | ||||||||
Non-controlling interests | 7,107,496 | 67,681,712 | ||||||||
|
|
|
| |||||||
TOTAL COMPREHENSIVE INCOME | 117,574,250 | 270,788,115 | ||||||||
|
|
|
| |||||||
F-127
Table of Contents
ENERSIS CHILE
Combined Statements of Changes in Equity
For the years ended December 31, 2014, 2013 and January 1, 2013
(In thousands of Chilean pesos)
Statements of Changes in Equity | Allocated Capital | Changes in Other Reserves | Retained Earnings | Equity Attributable to Enersis Chile | Non-controlling Interests | Total Equity | ||||||||||||||||||||||||||||||||||||||
| Reserve for Exchange Differences in Translation | Reserve for Cash Flow Hedges | Reserve for Gains and Losses for Defined Benefit Plans | Reserve for Gains and Losses on Remeasuring Available- for-Sale Financial Assets | Other Miscellaneous Reserves | Other Reserves | |||||||||||||||||||||||||||||||||||||||
Equity at beginning of period 1/1/2014 | 2,238,169,268 | 3,628,184 | (6,258,379 | ) | — | 11,811 | (877,246,493 | ) | (879,864,877 | ) | 1,080,532,977 | 2,438,837,368 | 626,946,621 | 3,065,783,989 | ||||||||||||||||||||||||||||||
Changes in equity | ||||||||||||||||||||||||||||||||||||||||||||
Comprehensive income | ||||||||||||||||||||||||||||||||||||||||||||
Profit (loss) | 162,459,039 | 162,459,039 | 37,100,378 | 199,559,417 | ||||||||||||||||||||||||||||||||||||||||
Other comprehensive income | 7,815,782 | (60,592,484 | ) | (7,301,245 | ) | 2,235 | 8,083,427 | (51,992,285 | ) | (51,992,285 | ) | (29,992,882 | ) | (81,985,167 | ) | |||||||||||||||||||||||||||||
Comprehensive income | 110,466,754 | 7,107,496 | 117,574,250 | |||||||||||||||||||||||||||||||||||||||||
Dividends | (109,706,921 | ) | (109,706,921 | ) | (40,621,604 | ) | (150,328,525 | ) | ||||||||||||||||||||||||||||||||||||
Increase (decrease) from other changes | (9,060,293 | ) | — | — | 7,301,245 | — | (5,224,276 | ) | 2,076,969 | 38,686,582 | 31,703,258 | 48,255,408 | 79,958,666 | |||||||||||||||||||||||||||||||
Increase (decrease) from changes in stakes of combined entities including loss of control (Note 2.4.1) | — | 900,975 | 900,975 | — | 900,975 | (29,823,564 | ) | (28,922,589 | ) | |||||||||||||||||||||||||||||||||||
Total changes in equity | (9,060,293 | ) | 7,815,782 | (60,592,484 | ) | — | 2,235 | 3,760,126 | (49,014,341 | ) | 91,438,700 | 33,364,066 | (15,082,264 | ) | 18,281,802 | |||||||||||||||||||||||||||||
|
|
|
|
|
|
|
|
|
|
|
|
|
|
|
|
|
|
|
|
|
| |||||||||||||||||||||||
Equity at end of period 12/31/2014 | 2,229,108,975 | 11,443,966 | (66,850,863 | ) | — | 14,046 | (873,486,367 | ) | (928,879,218 | ) | 1,171,971,677 | 2,472,201,434 | 611,864,357 | 3,084,065,791 | ||||||||||||||||||||||||||||||
|
|
|
|
|
|
|
|
|
|
|
|
|
|
|
|
|
|
|
|
|
| |||||||||||||||||||||||
Statement of Changes in Equity | Changes in Other Reserves | |||||||||||||||||||||||||||||||||||||||||||
| Allocated Capital | Reserve for Exchange Differences in Translation | Reserve for Cash Flow Hedges | Reserve for Gains and Losses for Defined Benefit Plans | Reserve for Gains and Losses on Remeasuring Available- for-Sale Financial Assets | Other Miscellaneous Reserves | Other Reserves | Retained Earnings | Equity Attributable to Enersis Chile | Non-controlling Interests | Total Equity | ||||||||||||||||||||||||||||||||||
Equity at beginning of period 1/1/2013 | 1,145,822,006 | (3,488,610 | ) | 25,228,578 | — | 13,647 | 360,334,722 | 382,088,337 | 929,854,899 | 2,457,765,242 | 605,552,227 | 3,063,317,469 | ||||||||||||||||||||||||||||||||
Changes in equity | ||||||||||||||||||||||||||||||||||||||||||||
Comprehensive income | ||||||||||||||||||||||||||||||||||||||||||||
Profit (loss) | 229,526,660 | 229,526,660 | 82,857,855 | 312,384,515 | ||||||||||||||||||||||||||||||||||||||||
Other comprehensive income | 7,116,794 | (31,486,957 | ) | (2,048,258 | ) | (1,836 | ) | — | (26,420,257 | ) | (26,420,257 | ) | (15,176,143 | ) | (41,596,400 | ) | ||||||||||||||||||||||||||||
Comprehensive income | 203,106,403 | 67,681,712 | 270,788,115 | |||||||||||||||||||||||||||||||||||||||||
Dividends | (131,159,522 | ) | (131,159,522 | ) | (36,354,383 | ) | (167,513,905 | ) | ||||||||||||||||||||||||||||||||||||
Increase (decrease) from other changes | 1,092,347,262 | — | — | 2,048,258 | — | (1,243,494,764 | ) | (1,241,446,506 | ) | 52,310,940 | (96,788,304 | ) | (4,019,386 | ) | (100,807,690 | ) | ||||||||||||||||||||||||||||
Increase (decrease) from changes in stakes of combined entities that do not entail a loss of control | — | 5,913,549 | 5,913,549 | — | 5,913,549 | (5,913,549 | ) | — | ||||||||||||||||||||||||||||||||||||
Total changes in equity | 1,092,347,262 | 7,116,794 | (31,486,957 | ) | — | (1,836 | ) | (1,237,581,215 | ) | (1,261,953,214 | ) | 150,678,078 | (18,927,874 | ) | 21,394,394 | 2,466,520 | ||||||||||||||||||||||||||||
|
|
|
|
|
|
|
|
|
|
|
|
|
|
|
|
|
|
|
|
|
| |||||||||||||||||||||||
Equity at end of period 12/31/2013 | 2,238,169,268 | 3,628,184 | (6,258,379 | ) | — | 11,811 | (877,246,493 | ) | (879,864,877 | ) | 1,080,532,977 | 2,438,837,368 | 626,946,621 | 3,065,783,989 | ||||||||||||||||||||||||||||||
|
|
|
|
|
|
|
|
|
|
|
|
|
|
|
|
|
|
|
|
|
| |||||||||||||||||||||||
F-128
Table of Contents
ENERSIS CHILE
Combined Statements of Cash Flow, Direct
For the years ended December 31, 2014 and 2013
(In thousands of Chilean pesos)
Statements of Direct Cash Flow | Note | 2014 ThCh$ | 2013 ThCh$ | |||||||||
Cash flow from (used in) operating activities | ||||||||||||
Types of collection from operating activities | ||||||||||||
Collections from the sale of goods and services | 2,387,905,862 | 2,105,444,082 | ||||||||||
Collections from royalties, payments, commissions, and other income from ordinary activities | — | — | ||||||||||
Collections from premiums and services, annual payments, and other benefits from policies held | — | 73,618,168 | ||||||||||
Other collections from operating activities | 15,244,642 | 31,272,875 | ||||||||||
Types of payment in cash from operating activities | ||||||||||||
Payments to suppliers for goods and services | (1,875,922,724 | ) | (1,483,888,195 | ) | ||||||||
Payments to and on behalf of employees | (118,058,522 | ) | (106,465,885 | ) | ||||||||
Payments on premiums and services, annual payments, and other obligations from policies held | (8,060,258 | ) | (5,468,607 | ) | ||||||||
Other payments for operating activities | (92,292,159 | ) | (81,340,651 | ) | ||||||||
Cash flows from operating activities | ||||||||||||
Income taxes paid | (33,916,694 | ) | (67,815,894 | ) | ||||||||
Other outflows of cash, net | (9,953,266 | ) | (22,395,362 | ) | ||||||||
|
|
|
| |||||||||
Net cash flows from operating activities | 264,946,881 | 442,960,531 | ||||||||||
|
|
|
| |||||||||
Cash flow from (used in) investing activities | ||||||||||||
Cash flows from the loss of control of combined entities or other businesses | 7.e | 40,861,571 | — | |||||||||
Cash flows used to obtain control of combined entities or other businesses | 7.c | (37,654,763 | ) | (5,084,700 | ) | |||||||
Other collections from the sale of equity or debt instruments belonging to other entities | — | — | ||||||||||
Other payments to acquire equity or debt instruments belonging to other entities | (15,894,195 | ) | — | |||||||||
Other payments to acquire interests in joint ventures | (3,315,000 | ) | — | |||||||||
Loans to related companies | — | (4,844,707 | ) | |||||||||
Proceeds from the sale of property, plant and equipment | 167,486 | 5,462,527 | ||||||||||
Purchases of property, plant and equipment | (193,980,458 | ) | (128,239,374 | ) | ||||||||
Purchases of intangible assets | — | — | ||||||||||
Proceeds from the sale of other long-term assets | 2,037,930 | 1,987,002 | ||||||||||
Purchases of other long-term assets | (2,952,035 | ) | — | |||||||||
Cash advances and loans made to other parties | — | — | ||||||||||
Payments from future, forward, option and swap contracts | (17,364,789 | ) | (134,614 | ) | ||||||||
Collections from future, forward, option and swap contracts | 22,536,125 | 1,214,705 | ||||||||||
Collections from related companies | — | 4,895,411 | ||||||||||
Dividends received | 12,857,184 | 7,134,121 | ||||||||||
Interest received | 3,952,768 | 11,487,763 | ||||||||||
Other inflows (outflows) of cash, net | 9,704 | (3,192 | ) | |||||||||
|
|
|
| |||||||||
Net cash flows used in investing activities | (188,738,471 | ) | (106,125,058 | ) | ||||||||
|
|
|
| |||||||||
Cash flows from (used in) financing activities | ||||||||||||
Proceeds from share issuance | — | — | ||||||||||
Payments for changes in ownership interest in combined entities that do not entail loss of control | — | 3,192 | ||||||||||
Total proceeds from loans | 221,932,163 | 615,868 | ||||||||||
Proceeds from long-term loans | 221,932,163 | — | ||||||||||
Proceeds from short-term loans | — | 615,868 | ||||||||||
Loans from related companies | 475,737,765 | 373,106,833 | ||||||||||
Payment on borrowings | (117,659,358 | ) | (212,530,770 | ) | ||||||||
Payments on financial lease liabilities | ||||||||||||
Payment on loans to related companies | (633,824,523 | ) | (173,958,103 | ) | ||||||||
Dividends paid | (161,129,816 | ) | (101,334,995 | ) | ||||||||
Interest paid | (63,291,514 | ) | (58,595,534 | ) | ||||||||
Change in parent combined group investment | 131,304,205 | (37,143,350 | ) | |||||||||
Other outflows of cash, net | (12,213,403 | ) | (6,574,206 | ) | ||||||||
|
|
|
| |||||||||
Net cash flows from (used in) financing activities | (159,144,481 | ) | (216,411,065 | ) | ||||||||
|
|
|
| |||||||||
Net increase (decrease) in cash and cash equivalents before effect of exchange rate changes | (82,936,071 | ) | 120,424,408 | |||||||||
|
|
|
| |||||||||
Effect of exchange rate changes on cash and cash equivalents | ||||||||||||
Effect of exchange rate changes on cash and cash equivalents | 1,044,602 | 388,929 | ||||||||||
Net increase (decrease) in cash and cash equivalents | (81,891,469 | ) | 120,813,337 | |||||||||
Cash and cash equivalents at beginning of period | 7 | 214,907,097 | 94,093,760 | |||||||||
Cash and cash equivalents at end of year | 7. d | 133,015,629 | 214,907,097 | |||||||||
F-129
Table of Contents
ENERSIS CHILE
NOTES TO THE COMBINED FINANCIAL STATEMENTS
Contents | Page | |||
| F-131 | ||||
| F-132 | ||||
2. BASIS OF PRESENTATION OF THE COMBINED FINANCIAL STATEMENTS | F-132 | |||
| F-132 | ||||
| F-135 | ||||
2.3. Responsibility for the information, judgment and estimates provided | F-138 | |||
| F-139 | ||||
| F-139 | ||||
2.4.2 Uncombined companies with an ownership interest of more than 50% | F-139 | |||
| F-139 | ||||
| F-140 | ||||
| F-141 | ||||
| F-141 | ||||
| F-143 | ||||
| F-143 | ||||
| F-143 | ||||
| F-144 | ||||
| F-144 | ||||
| F-144 | ||||
| F-145 | ||||
| F-145 | ||||
| F-146 | ||||
| F-146 | ||||
| F-146 | ||||
| F-147 | ||||
| F-147 | ||||
| F-148 | ||||
| F-149 | ||||
| F-149 | ||||
| F-149 | ||||
| F-150 | ||||
| F-150 | ||||
| F-150 | ||||
| F-151 | ||||
l.1) Provision for post-employment benefits and similar obligations | F-151 | |||
| F-151 | ||||
| F-152 | ||||
| F-152 | ||||
| F-153 | ||||
| F-154 | ||||
| F-154 | ||||
| F-154 | ||||
| F-154 | ||||
| F-157 | ||||
5. BUSINESS COMBINATION – ACQUISITION OF GAS ATACAMA | F-157 | |||
F-130
Table of Contents
Contents | Page | |||
| F-159 | ||||
| F-160 | ||||
| F-161 | ||||
| F-161 | ||||
| F-163 | ||||
| F-163 | ||||
| F-163 | ||||
| F-164 | ||||
| F-165 | ||||
| F-166 | ||||
| F-166 | ||||
| F-166 | ||||
| F-167 | ||||
13. NON-CURRENT ASSETS OR GOUPS OF ASSETS FOR DISPOSAL CLASSIFIED AS HELD FOR SALE | F-167 | |||
| F-169 | ||||
| F-170 | ||||
| F-172 | ||||
| F-174 | ||||
| F-177 | ||||
| F-178 | ||||
| F-180 | ||||
| F-186 | ||||
| F-189 | ||||
| F-195 | ||||
| F-196 | ||||
| F-197 | ||||
| F-199 | ||||
| F-202 | ||||
| F-203 | ||||
| F-203 | ||||
| F-203 | ||||
| F-204 | ||||
| F-204 | ||||
| F-204 | ||||
| F-206 | ||||
F-131
Table of Contents
Contents | Page | |||
| F-209 | ||||
36. THIRD PARTY GUARANTEES, OTHER CONTINGENT ASSETS AND LIABILITIES, AND OTHER COMMITMENTS. | F-212 | |||
| F-219 | ||||
| F-223 | ||||
39. FINANCIAL INFORMATION ON ENTITIES IN THE COMBINED GROUP, SUMMARIZED | F-224 | |||
| F-224 | ||||
| F-225 | ||||
| F-226 | ||||
| F-227 | ||||
| F-228 | ||||
APPENDIX 5 DETAILS OF ASSETS AND LIABILITIES IN FOREIGN CURRENCY | F-234 | |||
APPENDIX 6 ADDITIONAL INFORMATION TRADE AND OTHER RECEIVABLES | F-236 | |||
| F-240 | ||||
APPENDIX 6.2 ESTIMATED SALES AND PURCHASES OF ENERGY AND CAPACITY | F-244 | |||
| F-245 | ||||
F-132
Table of Contents
ENERSIS CHILE
COMBINED FINANCIAL STATEMENTS FOR THE YEAR ENDED DECEMBER 31, 2014 AND 2013
(In thousands of Chilean pesos)
| 1. | BACKGROUND |
On April 28, 2015, Enersis S.A. (“Enersis”) informed the Chilean Superintendence of Securities and Insurance (hereinafter “SVS”) through a significant event, that the Board of Directors of the company decided by unanimous vote to initiate an analysis of a corporate reorganization (“reorganization”) aimed at the separation of the activities of generation and distribution of electricity in Chile from activities outside of Chile. The objective of this would be to resolve certain duplications and redundancies that arise from Enersis’ complex corporate structure today and generate value for all its shareholders, maintaining its inclusion in the Enel S.p.A. group.
On July 27, 2015, pursuant to the provisions of Articles 9 and 10 of the Securities Market Law No. 18,045 and the provisions of General Norm No. 30 of the SVS, Enersis informed the SVS, by means of a significant event, that the Board of Directors of the company had decided unanimously that if the separation of power generation and distribution activities in Chile from the rest of the activities of the Enersis group outside of Chile were approved, the reorganization would be carried out through the following corporate transactions:
Steps to carry out the corporate reorganization:
a) Related to the preparation of the Combined Financial Statements
| • | Each of the direct and indirect subsidiaries of Enersis, Chilectra S.A. and Empresa Nacional de Electricidad S.A. (“Endesa S.A.”) would effect spin-offs, resulting in the formation of a new company from the spin-off by Chilectra S.A. (“Chilectra Américas”) and a new company from the spin-off by Endesa S.A. (“Endesa Américas”), which would be allocated equity interests and other assets that both Chilectra S.A. and Endesa S.A. hold outside of Chile, as well as certain other assets and liabilities related to them. |
The continuing companies of Endesa and Chilectra S.A. are to be called Empresa Nacional de Electricidad S.A. (“Endesa Chile”) and Chilectra Chile S.A. (“Chilectra Chile”) after the spin-off.
| • | At the same time, Enersis will be spun-off and, resulting from this spin-off, will form a new company (“Enersis Chile”), which will hold the equity interests and assets of Enersis in Chile allocated to it, including equity interests in Chilectra Chile and Endesa Chile (after the spin-off of these companies described above), and certain other assets and liabilities related to them. Remaining in continuing Enersis (to be called “Enersis Américas” after the spin-off) are the equity interests and corresponding liabilities of Enersis outside Chile, as well as those held by each of the new companies “Chilectra Américas” and “Endesa Américas”, created as a result of the spin-offs of Chilectra Américas and Endesa Américas mentioned above, and the liabilities related to them. |
b) Related to the subsequent processes of the division phase.
| • | Once the previously mentioned spin-offs are completed, “Enersis Américas” would absorb by merger “Chilectra Américas” and “Endesa Américas”, and would dissolve them without liquidation, thus grouping all international shares of the Enersis group outside Chile in “Enersis Américas”. The merger involving “Endesa Américas” and “Chilectra Américas” would take place as soon as legally possible and in accordance with the applicable regulations. |
The preparation of these combined financial statements of Enersis Chile (the “Combined Group”), do not include effects that could potentially arise as a result of the previously mentioned merger.
The resulting companies would be based in Chile and their shares would be listed in the same markets that Enersis group companies are currently listed. As stated earlier, none of the transactions described above require the contribution of additional financial resources.
F-133
Table of Contents
On November 10, 2015, in the Enersis’ Extraordinary Board of Directors’ Meeting, the majority of the Board of Directors of the company agreed to summon an Extraordinary Shareholders’ Meeting (“ESM”), on December 18, 2015. The purpose of this meeting is for the shareholders to acknowledge and rule on, among others, the proposed corporate reorganization and all supporting information related to it.
1.1 THE COMBINED GROUP’S ACTIVITIES
Enersis Chile comprises the combination of Endesa Chile S.A. and Chilectra Chile S.A. and their entities and investments in associates and joint ventures (hereinafter “the Combined Group”).
Enersis Chile will be a publicly traded corporation with registered address and head office located at Avenida Santa Rosa, No. 76, in Santiago, Chile. Enersis Chile will be registered in the securities register of the Superintendency of Securities and Insurance of Chile (Superintendencia de Valores y Seguros or SVS). In addition, Enersis Chile will be registered with the Securities and Exchange Commission of the United States of America (hereinafter U.S. SEC) and with Spain’sComisión Nacional del Mercado de Valores.
Enersis Chile’s corporate purpose consists of generating, transporting, producing, and distributing electrical energy. The Combined Group’s corporate purpose also includes investing in financial assets, developing projects, carrying out activities in the energy industry and in other fields in which electrical energy is essential, and participating in public civil or hydroelectric infrastructure concessions in which it may participate directly or through combined entities or associate companies in Chile.
Enersis Chile will be a subsidiary of Enel Iberoamérica S.R.L., a company controlled by Enel S.p.A. (hereinafter Enel).
| 2. | BASIS OF PREPARATION OF THE COMBINED FINANCIAL STATEMENTS |
The combined financial statements as of December 31, 2014 and 2013 and January 1, 2013 of Enersis Chile have been prepared in accordance with International Financial Reporting Standards (IFRS) as issued by the International Accounting Standards Board (IASB). They were approved by the Enersis’ Board Directors at its meeting held on December 2, 2015.
As of December 31, 2014, the Enersis Chile Combined Group does not represent a group for consolidated financial statement reporting purposes in accordance with IFRS 10Consolidated Financial Statements.
These combined financial statements are the first financial statements of the Combined Group in accordance with paragraph 3 of IFRS 1First-time Adoption of International Financial Reporting Standards(“IFRS 1”). The Combined Group prepared the combined financial statements using IFRS 1.D16 (a) (“parent’s accounting method”). The accompanying combined financial statements reflect the combined operations of the Combined Group as it would have been incorporated following the spin-off, assuming date would have been January 1, 2013. The combined financial statements may not be indicative of the Combined Group’s future performance and do not necessarily reflect what the results of operations, financial position and cash flows would have been had it operated, since January 1, 2013 as an independent Combined Group during the periods presented.
The Combined Group used the same accounting policies and valuation methods for the preparation of these combined financial statements, as those used by Enersis for the preparation of its Consolidated Financial Statements, unless such accounting policies and valuation methods are not in accordance with IFRS when presenting the Combined Group as a group of companies independent of Enersis. These accounting policies have been disclosed under this note and Note 3 Accounting policies. The entities and associates are included in these combined financial statements using their respective historical carrying values and amounts as included in Enersis’ Consolidated Financial Statements.
F-134
Table of Contents
Since IFRS does not provide any guidance for the preparation of combined financial statements, paragraph 12 of IAS 8Accounting Policies, Changes in Accounting Estimates and Errors has been used for the preparation of the combined financial statements. This paragraph requires that the latest pronouncements of other standard setters, other accounting literature and accepted industry practice should be considered. The combined financial statements of Enersis Chile have been derived from the aggregation of the net assets of the Chilean business of Enersis. All intra-group balances, revenues, expenses and unrealized gains and losses arising from transactions between companies belonging to Combined Group were eliminated when preparing the combined financial statements. In addition, the investments of Enersis in the Combined Group were eliminated against the equity of the respective combined entities. Transactions with Enersis group companies, which do not belong to the Combined Group, have been disclosed as transactions with related companies.
The Combined Financial Statements have been prepared and published in thousands of Chilean peso (ThCh$), as the Chilean peso is the functional currency of Enersis Chile. Chilean operations with functional currencies other than the Chilean peso are reported in accordance with the accounting policies stated in Note 3.k. Rounding differences may occur in respect of individual amounts or percentages.
Principles applied in preparing the Combined Financial Statements
The following summarizes the accounting and other principles applied in preparing the combined financial statements. Enersis management considers that the allocations described below have been made on a reasonable basis, but are not necessarily indicative of the costs that would have been incurred if the Combined Group had been a stand-alone entity.
Net assets of the Parent (equity)
The Combined Group has not previously formed a separate legal group nor presented any stand-alone financial statements, and accordingly it is not conceivable to present share capital or an analysis of equity reserves. The net assets of the Combined Group are represented by capital invested in the Combined Group and are shown as “Equity” using the same captions as those used by Enersis. Issued capital, share premium and retained earnings of Enersis have been allocated to Enersis Chile based on net assets book value ratio assigned to it. Other reserves (which are primarily composed of the equity effects of past reorganizations, business combinations under common control, residual effects of first-time adoption of IFRS and the equity effects of the current spin-off process) have been allocated considering the transaction and circumstances that led to creation of these reserves.
Cash and cash equivalents
Cash and cash equivalents of the foreign subsidiaries of Enersis are excluded from these Combined Financial Statements. In addition, based on the exercise carried out by Enersis management, the ratios obtained for the division of the cash and cash equivalents of Enersis on a stand-alone basis, are as follows:
| Proportion of Economic Assets | ||||||||
Entity | Chile | Américas | ||||||
Enersis S.A. | 42 | % | 58 | % | ||||
Endesa S.A. | 66 | % | 34 | % | ||||
Chilectra S.A. | 63 | % | 37 | % | ||||
Intercompany balances and transactions with related companies
Intercompany balances with successors of Enersis were allocated by identifying the entity that provided/received the service as well as the nature of it. Intercompany balances with Enersis Chile were eliminated in full for the purpose of these combined financial statements. Intercompany balances with Enersis Americas are included in these combined financial statements and disclosed as accounts with related companies.
F-135
Table of Contents
Debt instruments and related interest expenses, exchange differences and effects of hedge accounting strategies
Financial debt and related interest expenses and exchange rate differences of the Chilean subsidiaries of Enersis are included in these combined financial statements. Financial debt and related interest expenses and exchange rate differences of Enersis stand-alone have been 100% allocated to Enersis Americas and are not included in these combined financial statements.
In relation to derivative instruments designated as hedging instruments for the Chilean subsidiaries of Enersis have been included in these combined financial statements. Enersis’ management has adopted as a criterion to keep the strategies of hedge accounting. Therefore, all effects on the statement of financial position, income and other comprehensive income are assigned to the specific companies to which the hedged items were assigned. In the case of Enersis on a stand-alone basis, the main items covered by the hedging strategies are related to debt (hedging exposure to foreign currency debt and variability in interest rates). Therefore, the derivative financial instruments were associated with their corresponding hedged item and, as such, have been assigned accordingly to Enersis Américas, an entity that will assume 100% of the debt of Enersis stand-alone entity, or Enersis Chile, as applicable.
Personnel, salary expenses other employee benefits
For purposes of properly distributing the accounting effect of personnel from Enersis on a stand-alone basis between Enersis Chile and Enersis Américas, the Enersis’ Management defined as a criterion to identify those personnel whose main activities are related 100% with the operations based in Chile under Enersis. This group of employees was assigned to Enersis Chile. On the other hand, Management also identified those employees whose main activities relate 100% to foreign operations. This group of employees was assigned to Enersis Américas.
All remaining personnel, who divide their main activities between the Chilean operations of Enersis and foreign operations, were assigned to Enersis Chile, meaning that as of the date of the spin-off, those employees would identify and the activities offered to foreign operations of Enersis and vice-versa. This should lead to contracts of the inter-company provision of services between Enersis Chile and Enersis Américas. Accordingly, the costs of thes employees have been allocated based on the expected ratio of time devoted to activities offered to Enersis Chile companies and the total available time.
Below is a summary table presenting the breakdown of the employees to be allocated to Enersis Chile and Enersis Américas:
| Employee Allocation | ||||||||
Entity | Chile | Américas | ||||||
Enersis S.A. | 391 | 87 | ||||||
Endesa S.A. | 925 | 7 | ||||||
Chilectra S.A. | 668 | 2 | ||||||
|
|
|
| |||||
Total | 1,984 | 96 | ||||||
|
|
|
| |||||
Once the allocation of personnel was determined Enersis management applied the same criteria to the division of all accounts of the statements of financial position, income and other comprehensive income that were affected by this criterion.
Dividends receivable and payable
The criterion defined by Enersis’ Management to allocate to both Enersis Chile as well as to Enersis Américas a portion of dividends receivable accounts from Enersis stand-alone as of the date of the corporate spin-off, has been based mainly on identifying the origin of each one of those dividends. If the dividends come directly from a Chilean subsidiary, these dividends have been allocated 100% to Enersis Chile.
F-136
Table of Contents
Income tax
The tax effect (income statement and income tax provision) related to the Chilean subsidiaries of Enersis are included in these combined financial statements and was calculated using the statutory corporate tax rates according to the jurisdiction where the pre-tax income was originated.
In addition, for the tax effect in the income statement of Enersis on a stand-alone basis it has been allocated to these combined financial statements by determining a hypothetical taxable income as if Enersis Chile and Enersis Americas had operated as separate taxpayers. However, and from a tax point of view, there is currently only one taxpaying company, which is Enersis, and whose successor entity would be Enersis Americas, if the corporate reorganization is finally approved. Accordingly, income tax payable by Enersis has not been allocated to the combined financial statements.
In relation to deferred tax assets and liabilities, these have been assigned to Enersis Chile and Enersis Américas, taking into account the underlying assets and liabilities, whose respective temporary differences have originated such deferred taxes.
Other working capital accounts
Working capital items such as accounts receivable, accounts payable and inventories that are directly attributable to the Chilean operations of the Combined Group are included in the combined financial statements.
2.2 New accounting pronouncements
a) Accounting pronouncements effective from January 1, 2014:
Standards, Interpretations and Amendments | Mandatory Application for: | |
Amendment to IAS 32: Financial Instruments: Presentation
Clarifies the requirements for offsetting financial assets and financial liabilities in order to eliminate inconsistencies from the application of the current IAS 32 offsetting criteria. | Annual periods beginning on or after January 1, 2014. | |
Amendments to IFRS 10 and 12, and IAS 27: Investment Entities
Under IFRS 10 requirements, the reporting entities must consolidate all of the companies over which they have control. The amendment establishes an exception to these requirements, allowing the Investment Entities to measure their investments at fair value with changes in income as per IFRS 9 instead of consolidating them. | Annual periods beginning on or after January 1, 2014. | |
IFRIC 21: Levies
This interpretation of IAS 37, “Provisions, Contingent Liabilities and Contingent Assets” outlines when an entity must recognize a government-imposed levy other than income tax as a liability in its financial statements. | Annual periods beginning on or after January 1, 2014. | |
Amendment to IAS 36: Impairment of Assets
This amendment remove the unintended consequences of IFRS 13 on the disclosures required under IAS 36. In addition, the amendment require disclosure of the recoverable amounts for the assets or CGUs for which impairment loss has been recognized or reversed during the period. | Annual periods beginning on or after January 1, 2014. | |
F-137
Table of Contents
Standards, Interpretations and Amendments | Mandatory Application for: | |
Amendment to IAS 39: Financial Instruments: Recognition and Measurement (Novation of derivatives)
This amendment incorporates into the Standard the criteria that must be met in order not to discontinue hedge accounting in circumstances when a hedging instrument is novated. | Annual periods beginning on or after January 1, 2014. |
The new interpretation and amendments adopted, which became effective on January 1, 2014, had no effect on the combined financial statements.
b) Accounting pronouncements effective from January 1, 2015 and subsequent periods:
As of the date of issue of these combined financial statements, the following accounting pronouncements had been issued by the IASB, but their application was not yet mandatory:
Standards, Interpretations and Amendments | Mandatory Application for: | |
| IFRS 9: Financial Instruments | ||
This is the final version of the standard issued in July 2014 and which completes the IASB project to replace IAS 39 “Financial Instruments: Recognition and Measurement.” This project was divided into 3 phases:
Phase 1 – Classification and measurement of financial assets and financial liabilities. This introduces a logical focus for the classification of financial assets driven by cash flow characteristics and the business model. This new model also results in a single impairment model being applied to all financial instruments.
Phase 2 – Impairment methodology. The objective is a more timely recognition of expected credit losses. The standard requires entities to account for expected credit losses from the time when financial instruments are first recognized in the financial statements.
Phase 3 – Hedge accounting. This establishes a new model aimed at reflecting better alignment between hedge accounting and risk management activity. Also included are enhancements to required disclosures.
This final version of IFRS 9 replaces the previous versions of the Standard. | Annual periods beginning on or after January 1, 2018. | |
| IFRS 15: Revenue from Contracts with Customers | ||
| This new standard applies to all contracts with customers except leases, financial instruments and insurance contracts. Its purpose is to make financial information more comparable, and it provides a new model for revenue recognition and more detailed requirements for contracts with multiple obligations. It also requires more itemized information. This standard will replace IAS 11 and IAS 18 as well as their interpretations (IFRIC 13, IFRIC 15, IFRIC 18 and SIC 31). | Annual periods beginning on or after January 1, 2018. | |
Amendment to IAS 19: Employee Benefits
The purpose of this amendment is to simplify the accounting for contributions from employees or third parties that are not determined on the basis of an employee’s years of service, such as employee contributions calculated according to a fixed percentage of salary. | Annual periods beginning on or after July 1, 2014. | |
F-138
Table of Contents
Standards, Interpretations and Amendments | Mandatory Application for: | |
Improvements to IFRS (2010-2012 and 2011-2013 Cycles)
These are a set of improvements that were necessary, but not urgent, and that amend the following standards: IFRS 2, IFRS 3, IFRS 8, IFRS 13, IAS 16, IAS 24, IAS 38 and IAS 40. | Annual periods beginning on or after July 1, 2014. | |
Amendment to IFRS 11: Joint Arrangements
This amendment states that the accounting standards contained in IFRS 3 and other standards that are pertinent to business combinations accounting must be applied to the accounting for acquiring an interest in a joint operation in which the activities constitutes a business. | Annual periods beginning on or after January 1, 2016. | |
Amendment to IAS 16 and IAS 38: Clarification of Acceptable Methods of Depreciation and Amortization
The amendment to IAS 16 explicitly forbids the use of revenue-based depreciation for property, plant and equipment. The amendment to IAS 38 introduces the rebuttable presumption that, for intangible assets, the revenue-based amortization method is inappropriate and establishes two limited exceptions. | Annual periods beginning on or after January 1, 2016. | |
Improvements to IFRS (2012-2014 Cycles)
These are a set of improvements that were necessary, but not urgent, and that amend the following standards IFRS 5, IFRS7, IAS19 and IAS 34. | Annual periods beginning on or after January 1, 2016. | |
Amendment to IFRS 10 and IAS 28: Sale or Contribution of Assets
The amendment corrects an inconsistency between IFRS 10 and IAS 28 relating to the accounting treatment of the sale or contributions of assets between an Investor and its Associate or Joint Venture. | Annual periods beginning on or after January 1, 2016. | |
Amendment to IAS 27: Equity Method in Separate Financial Statements
This improvement allows entities to use the equity method to account for investments in subsidiaries, joint ventures and associates in their separate financial statements. The objective of the improvement is to minimize the costs associated with complying with the IFRS, particularly for those entities applying IFRS for the first time, without reducing the information available to investors. | Annual periods beginning on or after January 1, 2016. | |
Amendment to IAS 1: Disclosure Initiative
The IASB has issued amendments to IAS 1 as part of its principal initiative to improve the presentation and disclosure of information in financial statements. These amendments are designed to assist companies in applying professional judgment to determine the disclosures that should be included in their financial statements. | Annual periods beginning on or after January 1, 2016. | |
Amendment to IFRS 10, IFRS 12 and IAS 28: Investment Entities, Application of the Consolidation Exception
The amendments, which have a restricted scope, introduce clarifications to the requirements for the accounting of investment entities. The modifications also provide relief in some circumstances, which will reduce the costs of applying the Standards. | Annual periods beginning on or after January 1, 2016. | |
F-139
Table of Contents
The Combined Group is assessing the impact of applying IFRS 9 and IFRS 15, however, it is not practicable to provide a reasonable estimate of the effects that these IFRSs will have until the Combined Group performs a detail review. In Enersis management’s opinion, the future application of the other standards and amendments is not expected to have a significant effect on the combined financial statements of the Combined Group.
2.3 Responsibility for the information, judgments and estimates provided
Management is responsible for the information contained in these combined financial statements and expressly states that all IFRS principles and standards, as issued by the IASB, have been fully implemented.
In preparing the combined financial statements, certain judgments and estimates made by Enersis management have been used to quantify some of the assets, liabilities, income, expenses and commitments recorded in the statements.
The most important areas were critical judgment is required are:
| • | The identification of Cash Generating Units (CGU) for impairment testing (see Note 3.e). |
| • | The hierarchy of information used to measure assets and liabilities at fair value (see Note 3.h) |
The estimates refer basically to:
| • | The valuations performed to determine the existence of impairment losses among tangible and intangible assets and goodwill (see Note 3.e). |
| • | The assumptions used to calculate the actuarial liabilities and obligations to employees, such as discount rates, mortality tables, salary raises, etc. (see Notes 3.m.1 and 25). |
| • | The useful life of property, plant and equipment, and intangible assets (see Notes 3.a and 3.d). |
| • | The assumptions used to calculate the fair value of financial instruments (see Notes 3.g.5 and 22). |
| • | Energy supplied to customers whose meter readings are pending. |
| • | Certain assumptions inherent in the electricity system affecting transactions with other companies, such as production, customer billings, energy consumption, etc. that allow for estimating electricity system settlements that must occur on the corresponding final settlement dates, but that are pending as of the date of issuance of the combined financial statements and could affect the balances of assets, liabilities, income and expenses recorded in the statements (see appendix 6.2). |
| • | The probability that uncertain or contingent liabilities will be incurred and their related amounts (see Note 3.l). |
| • | Future disbursements for the closure of facilities and restoration of land, as well as the discount rates to be used (see Note 3.a). |
| • | The tax results of the various combined entities of the Combined Group that will be reported to the respective tax authorities in the future, and that have served as the basis for recording different balances related to income taxes in these combined financial statements (see Note 3.o). |
| • | The fair values of assets acquired and liabilities assumed, and any pre-existing interest in an entity acquired in a business combination. |
Although these judgments and estimates have been based on the best information available on the issuance date of these combined financial statements, future events may occur that would require a change (increase or decrease) to these estimates in subsequent periods. This change would be made prospectively, recognizing the effects in the corresponding future combined financial statements.
F-140
Table of Contents
Combined entities are defined as those entities controlled, either directly or indirectly, by the Combined Group. Control is achieved when the Combined Group has i) power over the combined entity; ii) is exposed, or has rights, to variable returns from its involvement with the combined entity; and iii) has the ability to use its power to affect its returns.
Enersis Chile has power over its combined entities when it holds the majority of the substantive voting rights or, when it has less than a majority of the voting rights, and those rights are sufficient to give it the practical ability to direct the relevant activities of the combined entity unilaterally.
The Combined Group reassesses whether or not it controls a combined entity if facts and circumstances indicate that there are changes to one or more of the three elements of control listed above.
Appendix 1 – Enersis Combined Entities to these combined financial statements describes the relationship of Enersis Chile with each of its combined entities.
2.4.1 Changes in the scope of combination
On December 30, 2014, Inmobiliaria Manso de Velasco Ltda, a combined entity of Enersis Chile, completed the sale of all of its direct and indirect ownership interest in the companies Construcciones y Proyectos Los Maitenes S.A. and Aguas Santiago Poniente S.A. The selling price of these shares was ThCh$57,173,142, which was received in cash on the same date (see note 32).
The sale of Maitenes S.A. and Aguas Santiago Poniente S.A. from the Enersis Chile Combined Group’s scope of combination caused a decrease in the combined statement of financial position of ThCh$54,845,853 in current assets, ThCh$12,822,077 in non-current assets, and ThCh$1,393,348 in current liabilities; there was no effect on non-current liabilities.
The Combined Group acquired 50% interest of Inversiones GasAtacama Holding Limitada on April 22, 2014 (see Note 5). The acquisition resulted in an increase in the combined statement of financial position of ThCh$198,924,289 in current assets, ThCh$221,471,415 in non-current assets, ThCh$69,989,919 in current liabilities, and ThCh$35,672,488 in non-current liabilities.
By virtue of this operation, the following companies became combined entities of the Combined Group: Inversiones GasAtacama Holding Limitada, GasAtacama S.A., GasAtacama Chile S.A., Gasoducto TalTal S.A., Progas S.A., Gasoducto Atacama Argentina S.A., Atacama Finance Co., GNL Norte S.A. and Energex Co.
2.4.2 Uncombined companies with an ownership interest of more than 50%
Although the Combined Group holds more than a 50% ownership interest in Centrales Hidroeléctricas de Aysén S.A. (Aysén), it is considered a “joint venture” since the Combined Group, through contracts or agreements with shareholders, exercises joint control of the company.
2.5 Investment in associates and joint arrangements
Associates are those entities in which the Combined Group, either directly or indirectly, exercises significant influence.
Significant influence is the power to participate in the financial and operational policy decisions of the investee but does not control or have joint control over these policies. In general, if the Combined Group holds 20% or more of the voting power of an investee, it is presumed that the Combined Group has significant influence over an investee (see Note 3.i).
F-141
Table of Contents
Joint arrangements are those agreements in which the Combined Group exercises joint control. Joint control is the contractually agreed sharing of control of an arrangement, which exists only when decisions about the entities’ relevant activities require the unanimous consent of the parties sharing control. Joint arrangements are classified as:
| • | Joint ventures: an agreement whereby the parties exercising joint control have rights to the net assets of the arrangement. |
| • | Joint operations: an agreement whereby the parties exercising joint control have rights to the assets, and obligations for the liabilities, relating to the arrangement. At the end of the reporting period, the Combined Group does not have any joint arrangements that qualify as joint operations. |
Appendix 3 – “Associated Companies and Joint Ventures” to these combined financial statements describes the relationship of Enersis Chile with each of these companies.
The combined entities are combined and all their assets, liabilities, revenues, expenses, and cash flows are included in the combined financial statements once the adjustments and eliminations from intercompany transactions have been made.
The comprehensive income of combined entities is included in the combined statement of comprehensive income from the date when the Combined Group obtains control of the combined entity and until the date on which it loses control of the combined entity.
The operations of the Combined Group entities have been combined under the following principles:
| 1. | At the date Enersis Chile obtains control, the combined entity’s assets acquired and its liabilities assumed are recorded at fair value, except for certain assets and liabilities that are recorded using valuation principles established in other IFRS standards. If the fair value of the consideration transferred plus the fair value of any non-controlling interest exceeds the fair value of the net assets acquired, this difference is recorded as goodwill. In the case of a bargain purchase, the resulting gain is recognized in profit or loss for the period after reassessing whether all of the assets acquired and the liabilities assumed have been properly identified and following a review of the procedures used to measure the fair value of these amounts. |
For each business combination, the Combined Group chooses whether to measure the non-controlling interests in an acquired company at fair value or at the proportional share of the net identifiable assets acquired.
If the fair value of assets acquired and liabilities assumed at the acquisition date it has not been completed, the Combined Group reports the provisional values recorded. During the measurement period, which shall not exceed one year from the acquisition date, the provisional values recognized will be adjusted retrospectively and additional assets or liabilities will be recognized to reflect new information obtained on events and circumstances that existed on the acquisition date, but which were unknown to management at that time.
For business combinations achieved in stages, the fair value of the equity interest previously held in the acquired company is measured on the date of acquisition and any profit or loss is recognized in the results for that fiscal year.
| 2. | Non-controlling interests in equity and in the comprehensive income of the combined entities are presented, respectively, under the line items “Total Equity: Non-controlling interests” in the combined statement of financial position and “Net Income attributable to non-controlling interests” and “Comprehensive income attributable to non-controlling interests” in the combined statement of comprehensive income. |
F-142
Table of Contents
| 3. | The financial statements of combined entities with functional currencies other than the Chilean peso are translated as follows: |
| a. | For assets and liabilities, the prevailing exchange rate on the closing date of the financial statements is used. |
| b. | For items in the comprehensive income statement, the average exchange rate for the period is used (unless this average is not a reasonable approximation of the cumulative effect of the exchange rates in effect on the dates of the transactions, in which case the exchange rate in effect on the date of each transaction is used). |
| c. | Equity remains at the historical exchange rate from the date of acquisition or contribution, and retained earnings at the average exchange rate at the date of origination. |
| d. | Exchange differences arising in translation of financial statements are recognized in the item “Foreign currency translation gains (losses)” in other comprehensive income (see Note 26.2). |
| 4. | Balances and transactions between combined entities were fully eliminated in the combination process. |
| 5. | Changes in interests in combined entities that do not result in taking or losing control are recorded as equity transactions, and the book value of the controlling and non-controlling interests is adjusted to reflect the change in relative interest in the combined entity. Any difference that may exist, between the value for which a non-controlling interest is adjusted and the fair value of a compensation paid or received, is recognized directly in Equity attributable to Enersis Chile. |
| 6. | Business combinations under common control are recorded using, as a reference, the ‘pooling of interest’ method. Under this method, the assets and liabilities involved in the transaction remain reflected at the same book value at which they were recorded in the ultimate controlling entity, although subsequent accounting adjustments may need to be made to align the accounting policies of the companies involved. |
Any difference between the assets and liabilities contributed to the combination and the compensation given is recorded directly in Net equity as a debit or credit to other reserves. The Combined Group does not apply retrospective accounting records of business combinations under common control.
| 3. | ACCOUNTING POLICIES APPLIED |
The main accounting policies used in preparing the accompanying combined financial statements are the following:
a) Property, plant and equipment
Property, plant and equipment are measured at acquisition cost, net of accumulated depreciation and any impairment losses they may have experienced. In addition to the price paid to acquire each item, the cost also includes, where applicable, the following concepts:
| • | Financing expenses accrued during the construction period that are directly attributable to the acquisition, construction, or production of qualified assets, which require a substantial period of time before being ready for use such as, for example, electricity generation or distribution facilities. The Combined Group defines “substantial period” as one that exceeds twelve months. The interest rate used is that of the specific financing or, if none exists, the weighted average financing rate of the company carrying out the investment. The weighted average financing rate was 8.8% as of December 31, 2014 and December 31, 2013. The finance expenses capitalized were ThCh$1,817,283 and ThCh$998,984 during the years ended December 31, 2014 and 2013, respectively (see Note 33). |
| • | Employee expenses directly related to construction in progress. The amounts capitalized under this concept for the years ended December 31, 2014 and 2013 were ThCh$21,505,568 and ThCh$14,831,058, respectively. |
F-143
Table of Contents
| • | Future disbursements that the Combined Group will have to incur to close its facilities are added to the cost of the asset at fair value, recognizing the corresponding provision for dismantling or restoration. The Combined Group reviews its estimates on an annual basis, increasing or decreasing the value of the asset and the liability based on the results of this estimate (see Note 24). |
Items for construction work in progress are transferred to operating assets once the testing period has been completed and they are available for use, at which time depreciation begins.
Expansion, modernization or improvement costs that represent an increase in productivity, capacity or efficiency, or a longer useful life are capitalized as increasing the cost of the corresponding assets.
The replacement or overhaul of entire components that increase the asset’s useful life or economic capacity are recorded as an increase in cost for the respective assets, derecognizing the replaced or overhauled components.
Expenditures for periodic maintenance, conservation and repair are recognized directly as an expense for the year in which they are incurred.
The Combined Group, based on the outcome of impairment testing performed as explained in Note 3.e), considers that the carrying amount of assets does not exceed their recoverable amount.
Property, plant and equipment, net of its residual value, is depreciated by distributing the cost of the different items that comprise it on a straight-line basis over its estimated useful life, which is the period during which the Combined Group expects to use the assets. Useful life estimates and residual values are reviewed on an annual basis and if appropriate adjusted prospectively.
The following table sets forth the main categories of property, plant and equipment with their respective estimated useful lives:
Categories of Property, plant and equipment | Years of estimated useful lives | |
Buildings | 22 – 100 | |
Plant and equipment | 3 – 85 | |
IT equipment | 3 – 15 | |
Fixtures and fittings | 5 – 21 | |
Motor vehicles | 5 – 10 | |
Other | 2 – 33 |
Additionally, the following table sets forth more details on the useful lives of plant and equipment items:
| Years of Estimated useful lives | ||
Generating facilities: | ||
Hydroelectric plants | ||
Civil engineering works | 35 – 65 | |
Electromechanical equipment | 10 – 85 | |
Fuel oil/coal-fired power plants | 25 – 40 | |
Combined cycle plants | 10 – 35 | |
Renewable energy power plants | 35 | |
Transmission and distribution facilities: | ||
High-voltage network | 10 – 80 | |
Low- and medium-voltage network | 7 – 62 | |
Measuring and remote control equipment | 3 – 76 | |
Other facilities | 4 – 25 | |
Natural gas transport facilities | ||
Pipelines | 35 |
Land is not depreciated since it has an indefinite useful life.
F-144
Table of Contents
Gains or losses that arise from the sale or disposal of items of Property, plant and equipment are recognized as “Other gains (losses)” in the comprehensive income statement and are calculated by deducting the net book value of the asset and any sales expenses from the amount received in the sale.
Investment property includes land and buildings held for the purpose of earning rentals and/or for capital appreciation.
Investment property is measured at acquisition cost less any accumulated depreciation and impairment losses that have been incurred. Investment property, excluding land, is depreciated on a straight-line basis over the estimated useful lives of the related assets.
An investment property is derecognized upon disposal or when no future economic benefits are expected from its use or disposal.
Gains or losses on derecognition of the investment property is calculated as the difference between the net disposal proceeds and the carrying amount of the asset.
The breakdown of the fair value of investment property is detailed in Note 18.
Goodwill arising from business combinations represents the excess of the consideration paid plus the amount of any non-controlling interests over the Combined Group’s share of the net value of the assets acquired and liabilities assumed, measured at fair value at the acquisition date. If the accounting for a business combination is completed, as well as the determination of goodwill, after the end of the reporting period in which the combination occurs, the amounts previously reported presented are adjusted, for comparative purposes to include the value of the assets acquired and liabilities assumed and the value of the final goodwill as of acquisition date.
Goodwill arising from acquisition of entities with functional currencies other than the Chilean peso is measured in the functional currency of the acquired company and translated to Chilean pesos using the closing exchange rate.
Goodwill is not amortized; instead, at the end of each reporting period or when there are indicators, the Combined Group estimates whether any impairment loss has reduced its recoverable amount to an amount less than the carrying amount and, if so, it is immediately adjusted for impairment (see Note 3.e).
d) Intangible assets other than goodwill
Intangible assets are initially recognized at their acquisition cost or production cost, and are subsequently measured at their cost, net of their accumulated amortization and impairment losses they may have experienced.
Intangible assets are amortized on a straight line basis during their useful lives, starting from the date when they are ready for use, except for those with an indefinite useful life, which are not amortized. As of December 31, 2014 and 2013 and January 1, 2013, there are no significant intangible assets with an indefinite useful life.
The criteria for recognizing these assets’ impairment losses and, if applicable, recovery of impairment losses recorded in previous fiscal years are explained in Note 3.e below.
An intangible asset is derecognized on disposal, or when no future economic benefits are expected from use or disposal.
F-145
Table of Contents
Gains or losses arising from derecognition of an intangible asset, measured as the difference between the net disposal proceeds and the carrying amount of the asset are recognized in profit or loss when the asset is derecognized.
d.1) Research and development expenses
The Combined Group recognizes the costs incurred in a project’s development phase as intangible assets in the statement of financial position as long as the project’s technical feasibility and future economic benefits have been demonstrated.
Other intangible assets correspond primarily to computer software, water rights, and easements. They are initially recognized at acquisition or production cost and are subsequently measured at cost less accumulated amortization and impairment losses, if any.
Computer software is amortized (on average) over five years. Certain easements and water rights have indefinite useful lives and, therefore, are not amortized, while others have useful lives ranging from 40 to 60 years, depending on their characteristics, and they are amortized over that term.
e) Impairment of non-financial assets
During the year, and principally at the end of each reporting period, the Combined Group evaluates whether there is any indication that an asset has been impaired. If any such indication exist, the Combined Group estimates the recoverable amount of that asset to determine the amount of the impairment loss. In the case of identifiable assets that do not generate cash flows independently, the Combined Group estimates the recoverable amount of the Cash Generating Unit (CGU) to which the asset belongs, which is understood to be the smallest identifiable group of assets that generates independent cash inflows.
Notwithstanding the preceding paragraph, in the case of CGUs to which goodwill or intangible assets with an indefinite useful lives have been allocated, a recoverability analysis is performed routinely at each period end.
Recoverable amount is the higher of fair value less costs of disposal and value in use, which is defined as the present value of the estimated future cash flows. In order to calculate the recoverable amount of Property, plant, and equipment, as well as of goodwill, and intangible assets, the Combined Group uses value in use criteria in practically all cases.
To estimate value in use, the Combined Group prepares future pre-tax cash flow projections based on the most recent budgets available. These budgets incorporate management’s best estimates of a CGUs’ revenue and costs using sector projections, past experience and future expectations.
In general, these projections cover the next five years, estimating cash flows for subsequent years by applying reasonable growth rates which, in no case, are increasing rates nor exceed the average long-term growth rates for the particular sector and country in which the Combined Group operates. At the end of 2014, 2013 and 2012, future cash flows projections were extrapolated from the following rates:
| Growth rates (g) | ||||
| 2014 | 2013 | 2012 | ||
| 2.2% – 5.0% | 2.2% – 5.3% | 2.3% – 5.2% | ||
Future cash flows are discounted to calculate their present value at a pre-tax rate that covers the cost of capital for the business activity and the geographic area in which it is being carried out. The time value of money and risk premiums generally used among analysts for the business activity and the geographic zone are taken into account to calculate the pre-tax rate.
F-146
Table of Contents
The following sets forth the pre-tax discount rates applied in 2014, 2013 and 2012 expressed in nominal terms:
2014 | 2013 | 2012 | ||||||||
Minimum | Maximum | Minimum | Maximum | Minimum | Maximum | |||||
7.9% | 13.0% | 7.8% | 16.3% | 8.0% | 14.6% | |||||
If the recoverable amount of the CGU is less than the net carrying amount of the asset, the corresponding impairment loss is recognized for the difference, and charged to “Reversal of impairment loss (impairment loss) recognized in profit or loss” in the combined statement of comprehensive income. The impairment is first allocated to the CGU’s goodwill carrying amount, if any, and then to the other assets comprising it, prorated on the basis of the carrying amount of each one, limited to its fair value less costs of disposal, or its value in use; a negative amount may not be obtained.
Impairment losses recognized for an asset in prior periods are reversed when there are indications that the impairment loss no longer exists or may have decreased, thus increasing the asset’s carrying amount with a credit to earnings, limited to the asset’s carrying amount if no impairment had occurred. In the case of goodwill, impairment losses are not reversed.
In order to determine whether an arrangement is, or contains, a lease, the Combined Group assesses the economic substance of the agreement, in order to determine whether fulfillment of the arrangement depends on the use of a specific asset and whether the agreement conveys the right to use an asset. If both conditions are met, at the inception of the arrangement the Combined Group separates the payments and other considerations relating to the lease, at their fair values, from those corresponding to other components of the agreement.
Leases that substantially transfer all the risks and rewards of ownership to the Combined Group are classified as finance leases. All others leases are classified as operating leases.
Finance leases in which the Combined Group acts as a lessee are recognized at the inception of the arrangement. At that time, the Combined Group records an asset based on the nature of the lease and a liability for the same amount, equal to the fair value of the leased asset or the present value of the minimum lease payments, if the latter is lower. Subsequently, the minimum lease payments are apportioned between finance expenses and reduction of the lease obligation. Finance expenses are recognized immediately in the income statement and allocated over the lease term, so as to achieve a constant interest rate on the remaining balance of the liability. Leased assets are depreciated on the same terms as other similar depreciable assets, as long as there is reasonable certainty that the lessee will acquire ownership of the asset at the end of the lease. If no such certainty exists, the leased assets are depreciated over the shorter of the useful lives of the assets and their lease term.
In the case of operating leases, payments are recognized as an expense in the case of the lessee and as income in the case of the lessor, both on a straight-line basis, over the term of the lease unless another type of systematic basis of distribution is deemed more representative.
Financial instruments are contracts that give rise to both a financial asset in one entity and a financial liability or equity instrument in another entity.
F-147
Table of Contents
g.1) Financial assets other than derivatives
The Combined Group classifies its financial assets other than derivatives, whether permanent or temporary, except for investments accounted for using equity method (See Note 14) and those held for sale, into four categories:
| • | Loans and account receivables: Trade and other receivables and accounts receivable from related companies are recognized at amortized cost, which is the initial fair value less principal repayments made, plus accrued and uncollected interest, calculated using the effective interest method. |
The effective interest method is used to calculate the amortized cost of a financial asset or liability (or group of financial assets or financial liabilities) and of allocating finance income or cost over the relevant period. The effective interest rate is the rate that exactly discounts estimated future cash flows to be received or paid over the expected life of the financial instrument (or, when appropriate, over a shorter period) to the net carrying amount of the financial asset or financial liability.
| • | Held-to-maturity investments: Investments that the Combined Group intends to hold and is capable of holding until their maturity are accounted for at amortized cost as defined in the preceding paragraph. |
| • | Financial assets at fair value through profit or loss: This includes the trading portfolio and those financial assets that have been designated as such upon initial recognition and that are managed and evaluated on a fair value basis. They are measured in the combined statement of financial position at fair value, with changes in value recognized directly in profit or loss when they occur. |
| • | Available-for-sale financial assets: These are financial assets specifically designated as available-for-sale or are not classify within any of the three preceding categories. |
These investments are recognized in the combined statement of financial position at fair value when it can be reliably determined. For investments in equity instruments in unlisted companies or companies with lower levels of liquidity, normally the fair value cannot be reliably measured. When this occurs, those investments in equity instruments are measured at cost less impairment losses, if any.
Changes in fair value, net of taxes, are recognized in other comprehensive income, until the investments are disposed of, at which time the amount accumulated in other comprehensive income is reclassified to profit or loss.
If the fair value is lower than cost, and if there is objective evidence that the asset has been more than temporarily impaired, the difference is recognized directly in profit or loss.
Purchases and sales of financial assets are accounted for using their trade date.
g.2) Cash and cash equivalents
This item within the interim combined statement of financial position includes cash and bank balances, time deposits, and other highly liquid investments (with a maturity of 90 days or less from the time of investment) that are readily convertible to cash and are subject to insignificant risk of changes in value.
g.3) Impairment of financial assets
The following criteria are used to determine if a financial assets has been impaired:
| • | For trade receivables in the electricity generation and distribution segments, the Combined Group’s policy is to recognized impairment losses when there is objective evidence that the balance will not be recoverable. In general terms, the Combined Group’s entities has a defined policy to recognize an allowance for impairment losses based on the aging of past-due balances, except in those cases where a specific collective basis analysis is recommended, such as in the case of receivables from government-owned companies (see Note 9). |
F-148
Table of Contents
| • | In the case of receivables of a financial nature, that are included in the “Loan and receivables” and “Investment held-to-maturity”, impairment is determined on case-by-case basis and is measured as the difference between the carrying amount and the present value of the future estimated cash flows discounted at the original effective interest rate (see Notes 8 and 22). |
| • | For financial investments available-for-sale, the criteria for impairment applied are described in Note 3.g.1 |
g.4) Financial liabilities other than derivatives
Financial liabilities are recognized based on cash received, net of any costs incurred in the transaction. In subsequent periods, these obligations are measured at their amortized cost using the effective interest rate method (see Note 3.g.1).
In the particular case that a liability is the hedged item in a fair value hedge, as an exception, such liability is measured at its fair value for the portion of the hedged risk.
In order to calculate the fair value of debt, both when it is recorded in the statement of financial position and for fair value disclosure purposes as shown in Note 22, debt has been divided into fixed interest rate debt (hereinafter “fixed-rate debt”) and variable interest rate debt (hereinafter “floating-rate debt”). Fixed-rate debt is that on which fixed-interest coupons established at the beginning of the transaction are paid explicitly or implicitly over its term. Floating-rate debt is that issued at a variable interest rate, i.e., each coupon is established at the beginning of each period based on the reference interest rate. All debt has been measured by discounting expected future cash flows with a market interest rate curve based on the payment currency.
g.5) Derivative financial instruments and hedge accounting
Derivatives held by the Combined Group are transactions entered into to hedge interest and/or exchange rate risk, intended to eliminate or significantly reduce these risks in the underlying transactions being hedged.
Derivatives are recorded at fair value at the end of each reporting period as follows: if their fair value is positive, they are recorded within “Other financial assets”; and if their fair value is negative, they are recorded within “Other financial liabilities.” For derivatives on commodities, the positive fair value is recorded in “Trade and other receivables,” and negative fair values are recorded in “Trade and other liabilities.”
Changes in fair value are recorded directly in profit or loss, except when the derivative has been designated for hedge accounting purposes as a hedge instrument (in a cash flow hedge) and all of the conditions for applying hedge accounting are met, including that the hedge be highly effective. In this case, changes are recorded as follows:
| • | Fair value hedges: The underlying portion for which the risk is being hedged (hedged risk) and the hedge instrument are measured at fair value, and any changes in value of both items are recognized in the combined statement of comprehensive income by offsetting the effects in the same comprehensive income statement account. |
| • | Cash flow hedges: Changes in fair value of the effective portion of the hedged item and hedge instrument are recorded in other comprehensive income an accumulated in an equity reserve known as “Reserve for cash flow hedges.” The cumulative gain or loss in in this reserve is reclassified to the combined statement of comprehensive income to the extent that the hedged item impacts the combined statement of comprehensive income offsetting the effect in the same comprehensive income statement account. Gains or losses from the ineffective portion of the hedging relationship are recorded directly in the combined statement of comprehensive income. |
A hedge relationship is considered highly effective when changes in fair value or in cash flows of the underlying item directly attributable to the hedged risk are offset by changes in fair value or cash flows of the hedging instrument, with an effectiveness ranging from 80% to 125%.
F-149
Table of Contents
As a general rule, long-term commodity purchase or sale agreements are recorded in the combined statement of financial position at their fair value at the end of each reporting period, recognizing any differences in value directly in profit or loss, except for, when all of the following conditions are met:
| • | The sole purpose of the agreement is for the Combined Group’s own use, which is understood as: (i) in the case of fuel purchase agreements its used to generate electricity; (ii) in the case of electrical energy purchased for sale, its sale to the end-customers; and, (i) in the case of electricity sales its sale to the end-customers. |
| • | The Combined Group’s future projections evidence the existence of these agreements for its own use. |
| • | Past experience with agreements evidence that they have been utilized for the Combined Group’s own use, except in certain isolated cases when for exceptional reasons or reasons associated with logistical issues have been used beyond the control and projection of the Combined Group. |
| • | The agreement does not stipulate settlement by differences and the parties have not made it a practice to settle similar contracts with differences in the past. |
The long-term commodity purchase or sale agreements maintained by the Combined Group, which are mainly for electricity, fuel, and other supplies, meet the conditions described above. Thus, the purpose of fuel purchase agreements is to use them to generate electricity, electricity purchase contracts are used to sell to end-customers, and electricity sale contracts are used to sell the Combined Group’s own products.
The Combined Group also evaluates the existence of derivatives embedded in contracts or financial instruments to determine if their characteristics and risk are closely related to the principal contract, provided that when taken as a whole they are not being accounted for at fair value. If they are not closely related, they are recorded separately and changes in value are accounted for directly in the comprehensive income statement.
The fair value of financial derivatives is determined using the following procedures:
| • | For derivatives quoted in an organized market, its quoted price at the end of each reporting period. |
| • | For derivatives non-quoted in an organized market, the Combined Group measures derivatives not traded on active markets by using the discounted cash flow method and generally accepted options valuation models, based on current and future market conditions as of year-end. It also adjusts the value according to its own credit risk (Debt Valuation Adjustment, DVA), and the counterparty risk (Credit Valuation Adjustment, CVA). These CVA and DVA adjustments are measured on the basis of the potential future exposure of the instrument (creditor or borrower position) and the risk profile of both the counterparties and the Combined Group itself. |
g.6) Derecognition of financial assets and liabilities
Financial assets are derecognized when:
| • | The contractual rights to receive cash flows from the financial asset expire or have been transferred or, if the contractual rights are retained, the Combined Group has assumed a contractual obligation to pay these cash flows to one or more recipients. |
| • | The Combined Group has substantially transferred all the risks and rewards of ownership of the financial asset, or, if it has neither transferred nor retained substantially all the risks and rewards, when it does not retain control of the financial asset. |
Transactions in which the Combined Group retains substantially all the inherent risks and rewards of ownership of the transferred asset, it continues recognizing the transferred asset in its entirety and recognizes a financial liability for the consideration received. Transactions costs are recognized in profit and loss by using the effective interest method (see Note 3.g.1).
Financial liabilities are derecognized when they are extinguished, that is, when the obligation arising from the liability has been paid or cancelled, or has expired.
F-150
Table of Contents
g.7) Offsetting financial assets and liabilities.
The Combined Group offsets financial assets and liabilities and the net amount is presented in the statement of financial position when, and only when:
| • | There is a legally enforceable right to set off the recognized amounts; and |
| • | There is an intention to settle on a net basis, or to realize the asset and settle the liability simultaneously. |
g.8) Financial guarantee contracts
Financial guarantee contracts, such as guarantees given by the Combined Group to third parties, are initially recognized at fair value, adjusting the transaction costs that are directly attributable to the issuance of the guarantee.
Subsequently to initial recognition, financial guarantee contracts are measured at the higher of:
| • | the amount determined under accounting policy describe in Note 3.l; and |
| • | the amount initially recognized less, if appropriate, any accumulated amortization. |
The fair value of an asset or liability is defined as the price that would be received from the sale of an asset or paid to transfer a liability in an orderly transaction between market participants at the measurement date.
Fair value measurement assumes that the transaction to sell an asset or transfer a liability occurs in the principal market, namely, the market with the greatest volume and level of activity for that asset or liability. In the absence of a principal market, it is assumed that the transaction is carried out in the most advantageous market available to the entity, namely, the market that maximizes the amount that would be received to sell the asset or minimizes the amount that would be paid to transfer the liability.
In estimating fair value, the Combined Group uses valuation techniques that are appropriate for the circumstances and for which there are sufficient data to conduct the measurement. The Combined Group maximizes the use of relevant observable data and minimizes the use of unobservable data.
Considering the hierarchy of the data used in these valuation techniques, the assets and liabilities measured at fair value can be classified into the following levels:
| Level 1: | Quoted prices (unadjusted) in active markets for identical assets or liabilities; |
| Level 2: | Inputs other than quoted prices included within Level 1 that are observable for the assets or liabilities, either directly (i.e. as prices) or indirectly (i.e. derived from prices). The methods and assumptions used to determine the fair values at Level 2 by type of financial asset or financial liability take into consideration estimated future cash flows discounted at zero coupon interest rate curves for each currency. All the valuations described are carried out using external tools, such as “Bloomberg”. |
| Level 3: | Inputs for assets or liabilities that are not based on observable market data (unobservable inputs). |
The Combined Group takes into account the characteristics of the asset or liability when measuring fair value, in particular:
| • | For non-financial assets, fair value measurement takes into account the ability of a market participant to generate economic benefits by using the asset in its highest and best use or by selling it to another market participant that would use the asset in its highest and best use; |
| • | For liabilities and equity instruments, the fair value measurement assumes that the liability would not be settled and an equity instrument would not be cancelled or otherwise extinguished on the |
F-151
Table of Contents
measurement date. The fair value of the liability reflects the effect of non-performance risk, namely, the risk that an entity will not fulfill the obligation, which includes, but is not limited to, the Combined Group’s own credit risk; |
| • | In the case of financial assets and financial liabilities with offsetting positions in market risks or counterparty credit risks, it is permitted to measure the fair value on a net basis. However, this must be consistent with the manner in which market participants would price the net risk exposure at the measurement date. |
i) Investments accounted for using the equity method
The Combined Group’s interests in joint ventures and associates are recognized using the equity method.
Under the equity method, an investment in an associate or joint venture is initially recognized at cost. As of the acquisition date, the investment is recognized in the statement of financial position based on the share of its equity that the Combined Group’s interest represents in its capital, adjusted for, if appropriate, the effect of transactions with Combined Group’s entities, plus any goodwill generated in acquiring the entity. If the resulting amount is negative, zero is recorded for that investment in the statement of financial position, unless the Combined Group has a present obligation (either legal or constructive) to support the investee’s negative equity situation, in which case a provision is recognized.
Goodwill from associates or joint ventures is included in the carrying amount of the investment. It is not amortized but is subject to impairment testing as part of the overall investment carrying amount when impairment indicators exist.
Dividends received from these investments are deducted from the carrying amount of the investment, and any profit or loss obtained from them to which the Combined Group is entitled based on its ownership interest is recognized under “Share of profit (loss) of associates accounted for using equity method.”
Appendix No. 3, “Enersis Chile Combined Group Associated Companies and Joint Ventures,” to these combined financial statements, provides information about the relationship of Enersis with each of these entities.
Inventories are measured at their weighted average acquisition cost or the net realizable value, whichever is lower.
k) Non-current assets held for sale
The Combined Group classifies property, plant and equipment; intangible assets; investments accounted for using the equity method, joint ventures, and disposal groups (a group of assets to be disposed of and the liabilities directly associated with those assets) as non-current assets held for sale, if, as of the date of the combined financial statements, the Combined Group has taken active measures for their sale and estimates that such a sale is highly probable.
Non-current assets held-for-sale or disposal groups are measured at the lower of their carrying amount and fair value less costs of disposal. Depreciation and amortization on these assets cease when they meet the criteria to be classified as non-current assets held for sale.
Assets that are no longer classified as held for sale, or are no longer part of a disposal group, are measured at the lower of their carrying amounts before being classified as held for sale less any depreciations, amortizations or revaluations that would have been recognized if they had not been classified as held for sale and their recoverable amount at the date of subsequent decision where would be reclassified as non-current assets.
Non-current assets held for sale and the components of the disposal groups classified as held for sale are presented in the combined statement of financial position as a single line item within assets called “Non-
F-152
Table of Contents
current assets or disposal groups classified as held for sale,” and the respective liabilities are presented as a single line item within liabilities called “Liabilities included in disposal groups classified as held for sale.”
The Combined Group classifies as discontinued operations those separate major lines of business that have been sold or disposed of, or are classified as held for sale, including other assets that are part of the same coordinated sales or disposal plan. Similarly, entities that have been acquired exclusively with a view to resale are also considered discontinued operations.
The components of profit or loss after taxes from discontinued operations are presented as a single line item in the combined comprehensive income statement as “Net income from discontinued operations”.
Provisions are recognized when the Combined Group has a present obligation (legal or constructive) as a result of a past event, it is probable that the Combined Group will be required to settle the obligation, and a reliable estimate can be made of the amount of the obligation. The amount recognized as a provision is the best estimate of the consideration required to settle the present obligation at the end of the reporting period, taking into account the risks and uncertainties surrounding the obligation. When a provision is measured using the cash flows estimated to settle the present obligation, its carrying amount is the present value of those cash flows (when the effect of the time value of money is material).
Provisions are measured using the best information available as of the date of issuance of the combined financial statements considering the consequences of the event causing the provision and are re-estimated at the end of each subsequent reporting period.
l.1) Provisions for post-employment benefits and similar obligations
Some of the combined entities have pension and similar obligations with their employees. These obligations, which can be defined benefits and defined contributions, are basically formalized through pension plans, except for certain non-monetary benefits, mainly electricity supply commitments, which, due to their nature, have not been externalized and are covered by the related in-house provisions.
For defined benefit plans, the cost of providing benefits is determined using the Projected Unit Credit Method, with actuarial valuations being carried out at the end of each reporting period. Past service costs relating to changes in benefits are recognized immediately.
The defined benefit plan obligations in the statement of financial position represent the present value of the accrued obligations, adjusted, once the fair value of the different plans’ assets has been deducted, if any.
For each of the defined benefit plans, any deficit between the actuarial liability and the plan assets (if any) is recognized under line item “Provisions for employee benefits” within current and non-current liabilities in the combined statement of financial position.
Actuarial gains and losses arising in remeasurement of both the plan liabilities and the plan assets (if any, and excluding interest) are recognized directly in other comprehensive income.
Contributions to defined contribution benefit plans are recognized as an expense in the combined statement of comprehensive income when the employees have rendered their services.
m) Translation of balances in foreign currency
Transactions carried out by each entity in a currency other than its functional currency are recognized using the exchange rates prevailing as of the date of the transactions. During the year, any differences that arise between the prevailing exchange rate at the date of the transaction and the exchange rate as of the date of collection or payment are recognized as “Foreign currency exchange differences” in the combined statement of comprehensive income.
F-153
Table of Contents
Likewise, at the end of each reporting period, receivable or payable balances denominated in a currency other than each entity’s functional currency are translated using the closing exchange rate. Any differences are recorded as “Foreign currency exchange differences” in the combined statement of comprehensive income.
The Combined Group has established a policy to hedge the portion of revenue from its combined entities that is directly linked to variations in the U.S. dollar, through obtaining financing in such currency. Exchange differences related to this debt, which is regarded as the hedging instrument in cash flow hedge transactions, are recognized, net of taxes, in other comprehensive income and are accumulated in an equity reserve and reclassified to profit or loss when the hedged cash flows impact profit or loss. This term has been estimated at five years.
n) Current/non-current classification
In these combined statements of financial position, assets and liabilities expected to be recovered or settled within twelve months are presented as current items, except for post-employment and other similar obligations. Those assets and liabilities expected to be recovered or settled in more than twelve months are presented as non-current items. Deferred income tax assets and liabilities are classified as non-current.
When the Combined Group have any obligations that mature in less than twelve months but can be refinanced over the long term at the Combined Group’s discretion, through unconditionally available credit agreements with long-term maturities, such obligations are classified as long-term liabilities.
Income tax expense for the period is determined as the sum of current taxes from the Combined Group’s different combined entities and results from applying the tax rate to the taxable income for the period, after permitted deductions have been made, plus any changes in deferred tax assets and liabilities and tax credits, both for tax losses and deductions. Differences between the carrying amount and tax basis of assets and liabilities generate deferred tax assets and liabilities, which are calculated using the tax rates expected to apply when the assets and liabilities are realized or settled, based on tax rates that have been enacted or substantively enacted by the end of the reporting period.
Deferred tax assets are recognized for all deductible temporary differences, tax losses and unused tax credits to the extent that it is probable that sufficient future taxable profits exist to recover the deductible temporary differences and make use of the tax credits. Such deferred tax asset is not recognized if the deductible temporary difference arises from the initial recognition of an asset or liability that:
| • | Did not arise from a business combination, and |
| • | At initial recognition affected neither accounting profit nor taxable profit (loss). |
With respect to deductible temporary differences associated with investments in combined entities, associates and joint arrangements, deferred tax assets are recognized only to the extent that it is probable that the temporary differences will reverse in the foreseeable future and taxable profits will be available against which the temporary differences can be utilized.
Deferred tax liabilities are recognized for all temporary differences, except those derived from the initial recognition of goodwill and those that arose from investments in combined entities, associates and joint ventures in which the Combined Group can control their reversal and where it is probable that they will not be reversed in the foreseeable future.
Current tax and changes in deferred tax assets or liabilities are recorded in profit or loss or in equity, depending on where the gains or losses that triggered these tax entries have been recognized.
Any tax deductions that can be applied to current tax liabilities are credited to earnings within the line item “Income tax expenses”, except when doubts exist about their tax realization, in which case they are not recognized until they are effectively realized, or when they correspond to specific tax incentives, in which case they are recorded as government grants.
F-154
Table of Contents
At the end of each reporting period, the Combined Group reviews the deferred taxes assets and liabilities recognized, and makes, if any, necessary corrections based on the results of this analysis.
Deferred tax assets and deferred tax liabilities are offset in the combined statement of financial position if has a legally enforceable right to set off current tax assets against current tax liabilities, and only when the deferred taxes relate to income taxes levied by the same taxation authority.
p) Revenue and expense recognition
Revenue is recognized when the gross inflow of economic benefits arising in the course of the Combined Group’s ordinary activities in the period occurs, provided that this inflow of economic benefits results in an increase in total equity other than increases relating to contributions from equity participants and such benefits can be measured reliably.
Revenues and expenses are recognized on an accrual basis and depending on the type of transaction; the following criteria for recognition are taken:
| • | Generation of electricity: Revenue is recognized based on physical delivery of energy and power, at prices established in the respective contracts, at prices stipulated in the electricity market by applicable regulations or at marginal cost determined on the spot market, as the case. This revenue includes an estimate of the service provided and not billed until the closing date (see Note 2.3). |
| • | Distribution of electricity: Revenue is recognized based on the amount of energy supplied to customers during the period, at prices established in the respective contracts or at prices stipulated in the electricity market by applicable regulations, as appropriate. This revenue includes an estimate of the energy supplied not yet read the meters customer (see Note 2.3). |
Revenue is recognized based on the economic substance of the transaction and are recognized when all and each of the following conditions are met:
| • | the entity has transferred to the buyer the significant risks and rewards of ownership of the goods; |
| • | the entity retains neither continuing managerial involvement to the degree usually associated with ownership nor effective control over the goods sold; |
| • | the amount of revenue can be measured reliably; |
| • | it is probable that the economic benefits associated with the transaction will flow to the entity; and |
| • | the costs incurred or to be incurred in respect of the transaction can be measured reliably. |
Revenue is measured at the fair value of the consideration received or receivable that gives rise to the revenue.
In arrangements under which the Combined Group will perform multiple revenue-generating activities (multiple-element arrangement), the recognition criteria are applied to the separately identifiable components of the transaction in order to reflect the substance of the transaction or to two or more transactions together when they are linked in such a way that the commercial effect cannot be understood without reference to the series of transactions as a whole.
Revenue from rendering of services is only recognized when it can be estimated reliably, by reference to the stage of completion of the service rendered at the date of the statement of financial position. When the outcome of a transaction involving the rendering of services cannot be estimated reliably, revenue is recognized only to the extent of the expenses recognized that are recoverable.
The Combined Group excludes from revenue those gross inflows of economic benefits it receives when it acts as an agent or commission agent on behalf of third parties, and only recognizes as revenue economic benefits received for its own activity.
When goods or services are exchanged or swapped for goods or services of a similar nature and value, the exchange is not regarded as a revenue-generating transaction.
F-155
Table of Contents
The Combined Group recognizes the net amount of non-financial asset purchases or sale contracts that are settled for a net amount of cash or through some other financial instruments. Contracts entered into and maintained for the purpose of receiving or delivering these non-financial assets are recognized on the basis of the contractual terms of the purchase, sale, or usage requirements expected by the entity.
Financial income (expense) is recognized using the effective interest rate applicable to the outstanding principal over the repayment period.
Expenses are recognized on an accruals basis, immediately in the event of expenditures that do not generate future economic benefits or when they do not meet the requirements for recording them as assets.
Article 79 of the Chilean Companies Act establishes that, unless unanimously agreed otherwise by the shareholders of all issued shares, listed corporations must distribute a cash dividend to shareholders on an annual basis, pro rata to the shares owned or the proportion established in the company’s by-laws if there are preferred shares, of at least 30% of net income for each year, except when accumulated losses from prior years must be absorbed.
As it is practically impossible to achieve a unanimous agreement not to approve the mandatory dividend, given Enersis’ highly fragmented share capital. At the end of each reporting period the amount of the minimum statutory dividend obligation to its shareholders is determined, net of interim dividends approved during the fiscal year, and then accounted for in “Trade and other current payables” and “Accounts payable to related companies,” as appropriate, and recognized in Equity.
Interim and final dividends are deducted from Equity when approved by the competent body, which in the first case is normally the Combined Group’s Board of Directors and in the second case is the shareholders as agreed at an Ordinary Shareholders’ Meeting.
Share issuance costs, only when represents incremental expenses directly attributable to the transaction, are recognized directly in equity as a deduction from “Allocated capital,” net of any applicable taxes. If the allocated capital account has a zero balance or if the costs described exceed the balance, they are recognized in “Other reserves.”
| 4. | SECTOR REGULATION AND ELECTRICITY SYSTEM OPERATIONS |
Chile
The electricity sector is regulated by the General Law of Electrical Services (Chilean Electricity Law), also known as DFL No. 1 of 1982, of the Ministry of Mining, whose compiled and coordinated text was established in DFL No. 4 issued in 2006 by the Ministry of Economy (the Electricity Law), as well as by an associated Regulation (D.S. No. 327 issued in 1998). Three government bodies are primarily responsible for enforcing this law: the National Energy Commission (CNE), which has the authority to propose regulated tariffs (node prices) and to draw up indicative plans for the construction of new generating units; the Superintendence of Electricity and Fuels (SEF), which supervises and oversees compliance with the laws, regulations, and technical standards that govern the generation, transmission, and distribution of electricity, as well as liquid fuels, and gas; and the Ministry of Energy, which is responsible for proposing and guiding public policies on energy matters. It also oversees the SEF, the CNE, and the Chilean Commission for Nuclear Energy (ChCNE), thus strengthening coordination and allowing for an integrated view of the energy sector. The Ministry of Energy also includes the Agency for Energy Efficiency and the Center for Renewable Energy, (Centro de Energías Renovables – CER), which in November 2014 was replaced by the National Center for Innovation and Development of Sustainable Energy (Centro Nacional para la Innovación y Fomento de las Energías Sustentables – CIFES). The Chilean Electricity Law has also
F-156
Table of Contents
established a Panel of Experts whose main task is to resolve potential discrepancies among the players in the electricity market, including electricity companies, system operators, regulators, etc.
From a physical viewpoint, the Chilean electrical sector is divided into four electrical grids: theSistema Interconectado Central (SIC), theSistema Interconectado del Norte Grande (SING), and two separate medium-size grids located in southern Chile, one in Aysén and the other in Magallanes. The SIC, the main electrical grid, runs 2,400 km longitudinally and connects the country from Taltal in the north to Quellon, on the island of Chiloe in the south. The SING covers the northern part of the country, from Arica down to Coloso, covering a length of some 700 km. A law was passed on January 8, 2014, which will allow the SIC to be connected to the SING.
The electricity industry is organized into three business segments: generation, transmission, and distribution, all operating in an interconnected and coordinated manner, and whose main purpose is to supply electrical energy to the market at minimum cost while maintaining the quality and safety service standards required by the electrical regulations. As essential services, the power transmission and distribution businesses are natural monopolies; these segments are regulated as such by the electricity law, which requires free access to networks and regulates rates.
Under the Chilean Electricity Law, companies engaged in generation and transmission on an interconnected electrical grid must coordinate their operations through a centralizing operating agent, theCentro de Despacho Económico de Carga (CDEC), in order to operate the system at minimum cost while maintaining a reliable service. For this reason, the CDEC plans and operates the system, including the calculation of the so-called “marginal cost,” which is the price assigned to energy transfers among power generating companies.
Therefore, a company’s decision to generate electricity is subject to the CDEC’s operation plan. On the other hand, each company is free to decide whether to sell its energy to regulated or unregulated customers. Any surplus or deficit between a company’s sales to its customers and its energy supply is sold to, or purchased from, other generators at the spot market price.
A power generating company may have the following types of customers:
(i)Distribution companies that supply power to regulated customers: This distribution is to residential and commercial consumers and small and medium-size businesses with a connected capacity equal to or less than 500 kW located in the concession area of a distribution company. Customers that consume from 500 kW to 2,000 kW1 may choose to be regulated or unregulated clients. Until 2009, the transfer prices between generators and distribution companies for supplying power to regulated customers were capped at a maximum value called the node price, which is regulated by the Ministry of Energy. Node prices are set every six months, in April and October, based on a report prepared by the CNE that takes into account projections of expected marginal costs in the system over the next 48 months for the SIC and 24 months for the SING. Beginning in 2010, and as the node price contracts begin to expire, the transfer prices between generators and distributors are being replaced by the results of regulated bidding processes, with a price cap set by the authority every six months.
(ii)Unregulated customers: Those customers, mainly industrial and mining companies, with a connected capacity of over 2,000 kW. These consumers can freely negotiate prices for electrical supply with generators and/or distributors. Customers with capacity between 500 and 2,000 kW (see footnote N° 1 above), as indicated in the preceding paragraph, have the option to contract energy at prices agreed upon with their suppliers or be subject to regulated prices, with a minimum term of at least four years under each pricing system.
(iii)Spot market: This represents energy and capacity transactions among generating companies that result from the CDEC’s coordination to keep the system running as economically as possible, where the surpluses (deficits) between a generator’s energy supply and the energy it needs to comply with business
| 1 | At the end of 2014, a legal amendment to the articles of the electricity law is going through Congress. One of the modifications involves raising the limit from 2,000 to 5,000 kW. |
F-157
Table of Contents
commitments are transferred through sales (purchases) to (from) other generators in the CDEC. In the case of energy, transfers are valued at the marginal cost, while node prices for capacity are set every semester by the regulators.
In Chile, the capacity that must be paid to each generator depends on an annual calculation performed by the CDEC to determine the firm capacity of each power plant, which is not the same as the dispatched capacity.
Beginning in 2010, with the enactment of Law 20,018, distribution companies must have sufficient supply permanently available to cover their entire demand projected for a period of three years; to do so, they must carry out long-term public bidding processes.
On May 15, 2014, the Minister of Energy presented the “Energy Agenda,” a document outlining general guidelines for the energy policy of the new government.
On September 29, 2014 a Tax Reform was approved which emphasizes the creation of so-called green tax to be levied on air emissions of particulate matter (PM), nitrogen oxides (NOx), sulfur dioxide (SO2) and carbon dioxide (CO2). The tax will be US$5/ton for CO2 emissions.
Non-Conventional Renewable Energy
In Chile,Law 20,257 was enacted in April of 2008 to encourage the use of Non-Conventional Renewable Energy (NCRE). The principal aspect of this law is that at least 5% of the energy sold by generation companies to their customers must come from renewable sources between years 2010 and 2014. This requirement progressively increases by 0.5% from year 2015 until 2024, when a 10% renewable energy requirement will be reached. This law was amended in 2013 by Law 20,698, dubbed the “20/25 law,” as it establishes that by 2025, 20% of power supplied will be generated by NCRE. It does not change the previous law’s plan for supplying power under agreements in effect in July 2013.
Limits on integration and concentration
In general, Chile has legislation in effect that defends free competition and, together with specific regulations that apply to the electricity market, defines criteria to avoid certain levels of economic concentration and/or abusive market practices.
In principle, the regulators allow the participation of companies in different activities (e.g. generation, distribution, and commercialization) as long as there is an adequate separation of each activity, for both accounting and company purposes. Nevertheless, most of the restrictions imposed involve the transmission sector mainly due to its nature and to the need to guarantee adequate access to all agents. In Chile there are specific restrictions if generation or distribution companies want to become majority shareholders in transmission companies.
Regarding concentration in a specific sector, while there are regulations on free competition, there are no specific quantitative limits on vertical or horizontal integration. However, the General Law on Electrical Services provides that companies that operate on or have ownership in the Trunk Transmission Systems cannot engage in, either directly or indirectly, activities that are in any way involved in the business of power generation or distribution.
Market for unregulated customers
In Chile, distributing companies can supply their customers under regulated or freely-agreed conditions. For clients purchasing more than 500kW and less than 2,000 Kw may choose between the regulated and unregulated markets. Clients purchasing more than 2,000 kW are required to be categorized as unregulated customers. Clients purchasing less than 500 kW are regulated customers and such threshold is applied if energy is purchased from renewable sources, for which the government provide incentives through a discount on tolls.
F-158
Table of Contents
General Aspects
In Chile selling prices charged to clients are based on the purchase price paid to generators plus a component associated with the value added in distribution. Regulators set this value periodically through reviews of distribution tariffs. As a result, distribution is essentially a regulated activity.
The Distribution Value Added (VAD) is established every four years. For this, the local regulator, (the CNE) classifies companies by typical areas that group together companies with similar distribution costs. A distribution company’s return on investment depends on the company’s performance compared to model company standards defined by the regulator. On April 2, 2013, the Energy Ministry published Tariff Decree No. 1T in the Official Gazette. This was made retroactive to November 4, 2012 and will remain in effect until November 3, 2016. The next tariff-setting process will take place in 2016 and will cover the period November 2016 to November 2020.
Decree No. 14, which established the subtransmission tolls for this segment for 2011-2014 was published in the Official Gazette on April 9, 2013. The Average Node Price Decrees transfer these tolls to final customers, as they are part of distribution company’s costs.
The Average Node Price Decrees, which include these new subtransmission tolls, were published between October and December 2014. During the first months of 2015, distribution companies should invoice final customers for these new tolls, as instructed by the Superintendence of Electricity and Fuels. Moreover, during 2014 there were delays in publishing the Short Term Price Node Decrees (PNCP), which is why the supply contracts were not indexed on the date these decrees came into operation, and accruals for these differences were recorded. Estimated amounts for these settlements were included under “Trade debtors” with respect to collection rights, and under “Trade and other accounts payable” for obligations to generators. Chilectra S.A. during the year 2014 has recognized provisions for sale and purchase from energy and capacity which generated a net profit for ThCh$75,313,324 (net loss for ThCh$ 3,356,862 in 2013), resulting from the non-application of the Average Node Price decrees (PNP).
| 5. | BUSINESS COMBINATION – ACQUISITION OF GASATACAMA |
On April 22, 2014, the Combined Group through its subsidiary Endesa Chile acquired the remaining 50% ownership interest in Inversiones GasAtacama Holding Limitada (hereinafter “GasAtacama”) that was owned by Southern Cross Latin America Private Equity Fund III L.P. (hereinafter “Southern Cross”) at that time.
Consequently, the Combined Group now holds 100% of control over GasAtacama which at the same time is the owner of (i) the Atacama Plant, a 780 MW capacity combined cycle thermal power plant fired by natural gas or diesel oil located in the north of Chile; (ii) the 940 km Atacama Pipeline that runs between Coronel Cornejo in Argentina and Mejillones in Chile; and (iii) the 223 km Taltal Pipeline between Mejillones and Paposo.
Upon obtaining control of GasAtacama, the Combined Group’s total generation capacity in Chile’s northern grid (theSistema Interconectado del Norte Grande, or SING) reached 1,000 MW, and it is expected to enable us to satisfy greater industrial, residential and mining demand through a competitively priced energy supply with a low environmental impact.
GasAtacama acquisition was recognized using the accounting criteria for business combinations achieved in stages as detailed in Note 2.6.1.
Since the date of acquisition, GasAtacama has contributed ThCh$113,074,006 in revenues and ThCh$33,443,547 in income before tax to the Combined Group’s results. Had the acquisition taken place on January 1, 2014, it is estimated that these amounts would have been ThCh$179,474,707 in revenues and ThCh$41,772,291 in income before tax for the year ended December 31, 2014.
F-159
Table of Contents
a) Consideration transferred
The following table summarizes the fair value of each type of consideration transferred in connection with the GasAtacama acquisition:
| ThCh$ | ||||
Total price paid | 174,028,622 | |||
Transaction recorded separately from the assets acquired and liabilities assumed (i) | (16,070,521 | ) | ||
|
| |||
Total consideration paid in cash (Note 7) | 157,958,101 | |||
|
| |||
| (i) | The total consideration transferred was ThCh$174,028,622 and included the cession of rights to collect an outstanding loan for ThCh$16,070,521 owed by Pacific Energy Sub Co. (a subsidiary of Southern Cross) to Atacama Finance Co. (a subsidiary of GasAtacama). |
b) Acquisition-related costs
Endesa Chile incurred costs for ThCh$23,543 in financial advisory fees related to the acquisition of Inversiones GasAtacama Holding Limitada. These costs have been recognized under the line item “Other expenses” in the combined statements of comprehensive income.
c) Identifiable assets acquired and liabilities assumed
The following table summarizes the fair values recognized for identifiable assets acquired and liabilities assumed in connection with the acquisition:
| Fair Value | ||||
Identifiable assets acquired, net | ThCh$ | |||
Cash and cash equivalents | 120,303,339 | |||
Trade and other current receivables | 34,465,552 | |||
Current accounts receivable from related companies | 5,692,257 | |||
Inventories | 15,009,265 | |||
Property, plant and equipment | 199,660,391 | |||
Deferred tax assets | 2,392,531 | |||
Other assets | 23,906,126 | |||
Trade and other current payables | (30,818,836 | ) | ||
Current accounts payable to related companies | (34,445,277 | ) | ||
Deferred tax liabilities | (28,923,167 | ) | ||
Other liabilities | (10,874,817 | ) | ||
|
| |||
Total | 296,367,364 | |||
|
| |||
No risk of default is expected for the gross amount of trade and other receivables.
Given the nature of GasAtacama’s business and assets, the fair value of the assets acquired and liabilities assumed was measured using the following valuation approaches:
i. The market approach using the comparison method, based on quoted market prices for identical or comparable items when available.
ii. The cost approach or depreciated replacement cost, which reflects adjustments for physical deterioration and functional and economic obsolescence.
iii. The income approach, which uses valuation techniques that convert future amounts (such as cash flows or income and expenses) into a single current amount (that is, discounted). The fair value measurement reflects current market expectations for those future amounts.
F-160
Table of Contents
Reconciliation of values
Finally, the fair values are reached from an assessment and reconciliation of the results obtained from the methods selected, based on the nature of each asset acquired and liability assumed.
If during a period of one year (measurement period) after the acquisition date new information is obtained about facts and circumstances that existed as of the acquisition date and result in the recognition of additional assets or liabilities, the accounting of the acquisition will be revised and the corresponding adjustment would be made, following the criteria described in Note 2.6.
d) Goodwill
| ThCh$ | ||||
Total consideration paid | 157,958,101 | |||
Fair value of pre-existing interest in the acquiree | 157,147,000 | |||
Fair value of identifiable net assets acquired | (296,367,364 | ) | ||
|
| |||
Goodwill (See Note 16) | 18,737,737 | |||
|
| |||
The goodwill is attributable primarily to the value of the synergies expected to be obtained by integrating GasAtacama into the Combined Group. These synergies include reduced administrative, research and structure costs, which could be absorbed by Endesa Chile.
e) Remeasurement of pre-existing interest and currency translation differences
The remeasurement of the fair value of Endesa Chile’s pre-existing 50% equity interest in GasAtacama resulted in a gain of ThCh$21,546,320. The gain recognized was the positive difference between the acquisition-date fair value of the pre-existing equity interest of ThCh$157,147,000, and the carrying amount of the investment accounted for using the equity method at the acquisition date of ThCh$135,600,682.
In addition, the exchange differences on translation of the pre-existing equity interest accumulated in the equity of the Combined Group at the acquisition date, were reclassified to profit or loss resulting in a gain of ThCh$21,006,456.
Both amounts have been recorded in the caption “Other gains (losses)” in the combined statement of comprehensive income (see Note 32).
| 6. | CAPITAL INCREASE |
During the first quarter of 2013, Enersis completed capital increase that was approved by the Extraordinary Shareholders’ Meeting held on December 20, 2012. All of the issued shares were subscribed (see Note 26.1.1).
The capital increase amounted to ThCh$2,845,858,393. A 60.62% of the shares were subscribed by Endesa, S.A., its parent company located in Spain, and paid for with its investments in Latin America valued at ThCh$1,724,400,000. The remaining shares were subscribed and paid for with non-controlling interests of Enersis via cash payments of ThCh$1,121,458,393, which included a share issuance premium of ThCh$1,460,503. This capital increase has been reflected in the combined statement of changes in equity in relation to the contributions in kind of additional interests of Endesa, S.A.’s in certain entities in Chile for ThCh$1,092,347,262.
F-161
Table of Contents
| 7. | CASH AND CASH EQUIVALENTS |
| a) | The detail of cash and cash equivalents as of December 31, 2014 and 2013 and January 1, 2013 is as follows: |
Cash and cash equivalents | Balance at | |||||||||||
| 12-31-2014 ThCh$ | 12-31-2013 ThCh$ | 1-1-2013 ThCh$ | ||||||||||
Cash balances | 634,059 | 162,345 | 137,261 | |||||||||
Bank balances | 17,765,485 | 11,933,898 | 8,725,791 | |||||||||
Time deposits | 83,326,061 | 131,877,605 | 32,557,275 | |||||||||
Other fixed-income instruments | 31,260,322 | 70,933,248 | 52,673,433 | |||||||||
|
|
|
|
|
| |||||||
Total | 132,985,927 | 214,907,097 | 94,093,760 | |||||||||
|
|
|
|
|
| |||||||
Time deposits have a maturity of three months or less from their date of acquisition and accrue the market interest for this type of short-term investment. Other fixed-income investments are mainly comprised of repurchase agreements with original maturities of less than or equal to 90 days. There are no restrictions for significant amounts of cash availability.
| b) | The detail of cash and cash equivalents by currency is as follows: |
Currency | Balance at | |||||||||||
| 12-31-2014 ThCh$ | 12-31-2013 ThCh$ | 1-1-2013 ThCh$ | ||||||||||
Chilean peso | 44,863,907 | 117,344,638 | 93,217,835 | |||||||||
Argentine peso | 4,206,734 | — | — | |||||||||
U.S. dollar | 83,915,286 | 97,562,458 | 875,924 | |||||||||
|
|
|
|
|
| |||||||
Total | 132,985,927 | 214,907,097 | 94,093,760 | |||||||||
|
|
|
|
|
| |||||||
| c) | The following table shows the amounts paid to obtain control of combined entities as of December 31, 2014 and 2013 and January 1, 2013: |
Acquisition of Subsidiaries | 12-31-2014 ThCh$ | 12-31-2013 ThCh$ | 1-1-2013 ThCh$ | |||||||||
Acquisitions paid in cash and cash equivalents | (157,958,101 | ) | (5,084,700 | ) | (7,140,000 | ) | ||||||
Cash and cash equivalents in entities acquired | 120,303,339 | — | — | |||||||||
|
|
|
|
|
| |||||||
Total, net (*) | (37,654,762 | ) | (5,084,700 | ) | (7,140,000 | ) | ||||||
|
|
|
|
|
| |||||||
| (*) | See Note 5. |
| d) | The following table shows a reconciliation of cash and cash equivalents presented in the statement of financial position with cash and cash equivalents in the cash flow statement at December 31, 2014, 2013 and January 1, 2013: |
| Balance at | ||||||||||||
| 12-31-2014 ThCh$ | 12-31-2013 ThCh$ | 1-1-2013 ThCh$ | ||||||||||
Cash and cash equivalents (statement of financial position) | 132,985,927 | 214,907,097 | 94,093,760 | |||||||||
Cash and cash equivalents attributable to assets held for sale (*) | 29,702 | — | — | |||||||||
|
|
|
|
|
| |||||||
Cash and cash equivalents (statement of cash flow) | 133,015,629 | 214,907,097 | 94,093,760 | |||||||||
|
|
|
|
|
| |||||||
| (*) | See Note 13. |
F-162
Table of Contents
| e) | The following table shows cash and cash equivalents that have been received from the sale of shares in combined entities: |
Loss of control at Subsidiaries | 12-31-2014 ThCh$ | 12-31-2013 ThCh$ | 1-1-2013 ThCh$ | |||||||||
Amounts received for the sale of Subsidiaries(*) | 57,173,142 | — | — | |||||||||
Amounts in cash and cash equivalents | (16,311,571 | ) | — | — | ||||||||
|
|
|
|
|
| |||||||
Total net | 40,861,571 | — | — | |||||||||
|
|
|
|
|
| |||||||
| (*) | See Note 2.4.1 and Note 32. |
| 8. | OTHER FINANCIAL ASSETS |
The detail of other financial assets as of December 31, 2014 and 2013 and January 1, 2013 is as follows:
Other Financial Assets | Current | Non-current | ||||||||||||||||||||||
| 12-31-2014 ThCh$ | 12-31-2013 ThCh$ | 1-1-2013 ThCh$ | 12-31-2014 ThCh$ | 12-31-2013 ThCh$ | 1-1-2013 ThCh$ | |||||||||||||||||||
Available-for-sale financial investments – unquoted equity securities or with limited liquidity | — | — | — | 2,670,665 | 2,753,413 | 2,685,780 | ||||||||||||||||||
Available-for-sale financial investments – quoted equity securities | — | — | 362,169 | 29,195 | 31,468 | |||||||||||||||||||
Financial assets held to maturity (*) | 948,789 | 954,230 | — | — | — | |||||||||||||||||||
Hedging derivatives (*) | 508,458 | 20,948,126 | — | 3,695,636 | — | 28,676,421 | ||||||||||||||||||
Non-hedging derivatives (*) | 33,882 | 361,595 | — | 22,002 | — | — | ||||||||||||||||||
Financial assets at fair value through profit or loss (*) | — | — | 3,864 | — | — | — | ||||||||||||||||||
Other | — | — | — | — | — | 181,863 | ||||||||||||||||||
|
|
|
|
|
|
|
|
|
|
|
| |||||||||||||
Total | 1,491,129 | 22,263,951 | 3,864 | 6,750,472 | 2,782,608 | 31,575,532 | ||||||||||||||||||
|
|
|
|
|
|
|
|
|
|
|
| |||||||||||||
| (*) | See Note 22.1.a |
The amounts included in “financial assets held to maturity” and “financial assets at fair value with change in profit or loss” correspond mainly to time deposits and other highly liquid investments that are readily convertible to cash and subject to a low risk of changes in value, but that do not fulfill the definition of cash equivalent as defined in Note 3.g.2 (e.g. with maturity over 90 days from time of investment).
| 9. | TRADE AND OTHER RECEIVABLES |
a) The detail of trade and other receivables as of December 31, 2014 and 2013 and January 1, 2013 is as follows:
Trade and Other Receivables, Gross | Balance at | |||||||||||||||||||||||
| 12-31-2014 | 12-31-2013 | 1-1-2013 | ||||||||||||||||||||||
| Current ThCh$ | Non-current ThCh$ | Current ThCh$ | Non-current ThCh$ | Current ThCh$ | Non-current ThCh$ | |||||||||||||||||||
Trade and other receivables, gross | 607,916,372 | 7,496,412 | 333,866,780 | 6,875,034 | 326,332,459 | 7,548,389 | ||||||||||||||||||
Trade receivables, gross | 490,553,898 | 3,318,126 | 299,153,206 | 2,864,459 | 234,068,138 | 3,343,742 | ||||||||||||||||||
Other receivables, gross | 117,362,474 | 4,178,286 | 34,713,574 | 4,010,575 | 92,264,321 | 4,204,647 | ||||||||||||||||||
F-163
Table of Contents
Trade and Other Receivables, Net | Balance at | |||||||||||||||||||||||
| 12-31-2014 | 12-31-2013 | 1-1-2013 | ||||||||||||||||||||||
| Current ThCh$ | Non-current ThCh$ | Current ThCh$ | Non-current ThCh$ | Current ThCh$ | Non-current ThCh$ | |||||||||||||||||||
Trade and other receivables, net | 578,081,205 | 7,496,412 | 302,980,633 | 6,875,034 | 302,204,856 | 7,548,389 | ||||||||||||||||||
Trade receivables, net | 466,647,454 | 3,318,126 | 276,692,065 | 2,864,459 | 214,225,210 | 3,343,742 | ||||||||||||||||||
Other receivables, net | 111,433,751 | 4,178,286 | 26,288,568 | 4,010,575 | 87,979,646 | 4,204,647 | ||||||||||||||||||
There are no significant trade and other receivables balances held by the Combined Group that are not available for its use.
The Combined Group does not have customers with sales representing 10% or more of its total combined revenues for years ended December 31, 2014 and 2013.
Refer to Note 10.1 for detailed information on amounts, terms and conditions associated with accounts receivable from related companies.
b) As of December 31, 2014 and 2013 and January 1, 2013, the balance of past due but not impaired trade receivables is as follows
Trade Receivables Past Due But Not Impaired | Balance at | |||||||||||
| 12-31-2014 | 12-31-2013 | 1-1-2013 | ||||||||||
| ThCh$ | ThCh$ | ThCh$ | ||||||||||
Less than three months | 39,058,318 | 38,794,147 | 28,857,798 | |||||||||
Between three and six months | 2,624,968 | 23,933,636 | 2,765,184 | |||||||||
Between six and twelve months | 3,693,880 | 3,193,765 | 12,948,994 | |||||||||
More than twelve months | 12,957,133 | 12,481,822 | 3,343,742 | |||||||||
|
|
|
|
|
| |||||||
Total | 58,334,299 | 78,403,370 | 47,915,718 | |||||||||
|
|
|
|
|
| |||||||
c) The reconciliation of changes in the allowance for impairment of trade receivables is as follows:
Trade Receivables Past Due and Impaired | Current and Non-current ThCh$ | |||
January 1, 2013 | 24,127,603 | |||
Increases (decreases) for the year (*) | 7,940,767 | |||
Amounts written off | (1,182,223 | ) | ||
Foreign currency translation differences | — | |||
|
| |||
Balance at December 31, 2013 | 30,886,147 | |||
Increases (decreases) for the year (*) | 655,600 | |||
Amounts written off | (1,706,580 | ) | ||
Foreign currency translation differences | — | |||
|
| |||
Balance at December 31, 2014 | 29,835,167 | |||
|
| |||
| (*) | See Note 30 for impairment of financial assets. |
Write-offs for past due receivables
Past due receivables are written off once all collection procedures and legal proceedings have been exhausted and the debtors’ insolvency has been demonstrated. In our power generation business, this process normally takes at least one year. In our distribution business the process takes at least twenty four months. Overall, the risk of writing off our trade receivables, is limited (see Notes 3.e and 21.5).
F-164
Table of Contents
| 10. | BALANCES AND TRANSACTIONS WITH RELATED COMPANIES |
Related party transactions are performed at current market conditions.
Transactions between the Combined Group and its combined entities and joint ventures have been eliminated on combination and are not itemized in this note.
As of the date of these financial statements, no guarantees have been given or received nor has any allowance for bad or doubtful accounts been recorded with respect to receivable balances for related party transactions.
The controlling shareholder of Enersis Chile is the Italian corporation Enel S.p.A.
10.1 Balances and transactions with related companies
The balances of accounts receivable and payable between the Combined Group and its non-combined related companies are as follows:
a) Receivables from related companies
| Balance at | ||||||||||||||||||||||||||||||||||||
| Current | Non-Current | |||||||||||||||||||||||||||||||||||
Taxpayer ID Number | Company | Country | Relationship | Description of transaction | Term of transaction | Currency | 12-31-2014 ThCh$ | 12-31-2013 ThCh$ | 01-01-2013 ThCh$ | 12-31-2014 ThCh$ | 12-31-2013 ThCh$ | 01-01-2013 ThCh$ | ||||||||||||||||||||||||
Foreign | Enel Latinoamérica S.A | Spain | Related to Immediate Parent | Other services | Less than 90 days | CH$ | 26,165 | 26,165 | 26,165 | — | — | — | ||||||||||||||||||||||||
Foreign | Enel Latinoamérica S.A | Spain | Related to Immediate Parent | Dividends | Less than 90 days | CH$ | — | 82,273 | — | — | — | — | ||||||||||||||||||||||||
Foreign | Endesa España | Spain | Common Immediate Parent | Other services | Less than 90 days | CH$ | 61,852 | 4,229 | 4,229 | — | — | — | ||||||||||||||||||||||||
96.524.140-K | Empresa Electrica Panguipulli S.A. | Chile | Common Immediate Parent | Energy sales | Less than 90 days | CH$ | 273,705 | 66,697 | 22,457 | — | — | — | ||||||||||||||||||||||||
96.880.800-1 | Empresa Electrica Puyehue S.A. | Chile | Common Immediate Parent | Energy sales | Less than 90 days | CH$ | 64 | 11,949 | 95,399 | — | — | — | ||||||||||||||||||||||||
Foreign | Enel Energy Europe | Spain | Common Immediate Parent | Other services | Less than 90 days | CH$ | — | 799,470 | — | — | — | — | ||||||||||||||||||||||||
Foreign | Generalima S.A. | Peru | Common Immediate Parent | Other services | Less than 90 days | CH$ | — | — | 23,890 | — | — | — | ||||||||||||||||||||||||
96.806.130-5 | Electrogas S.A. | Chile | Associate | Dividends | Less than 90 days | CH$ | 1,477,177 | 1,375,492 | — | — | — | — | ||||||||||||||||||||||||
76.788.080-4 | GNL Quintero S.A. | Chile | Associate | Energy sales | Less than 90 days | CH$ | 649,986 | 366,882 | 771,985 | — | — | — | ||||||||||||||||||||||||
76.418.940-k | GNL Chile S.A. | Chile | Associate | Advance natural gas purchase | Less than 90 days | US$ | 11,845,926 | 11,382,879 | — | — | — | — | ||||||||||||||||||||||||
76.418.940-k | GNL Chile S.A. | Chile | Associate | Other services | Less than 90 days | US$ | 1,644,650 | 1,717,013 | 546,833 | — | — | — | ||||||||||||||||||||||||
76.418.940-k | GNL Chile S.A. | Chile | Associate | Loans | Less than 90 days | US$ | 549,359 | 445,022 | 379,802 | — | — | — | ||||||||||||||||||||||||
76.014.570-K | Inversiones Gas Atacama Holding Ltda. (1) | Chile | Joint Venture | Other services | Less than 90 days | US$ | — | 544,015 | 213 | — | — | — | ||||||||||||||||||||||||
76.014.570-K | Inversiones Gas Atacama Holding Ltda. (1) | Chile | Joint Venture | Loans | Less than 90 days | US$ | — | 14,839,233 | 13,336,205 | — | — | — | ||||||||||||||||||||||||
76.014.570-K | Inversiones Gas Atacama Holding Ltda. | Chile | Joint Venture | Energy sales | Less than 90 days | US$ | — | — | 98,150 | — | — | — | ||||||||||||||||||||||||
Foreign | CCSA Endesa Costanera | Argentina | Common Immediate Parent | Other services | Less than 90 days | Ar$ | — | — | 5,000,998 | — | — | 5,712,830 | ||||||||||||||||||||||||
77.017.930-0 | Transmisora Eléctrica de Quillota Ltda. | Chile | Joint Venture | Other services | Less than 90 days | CH$ | — | — | 181,855 | — | — | — | ||||||||||||||||||||||||
Foreign | Endesa Generación | Spain | Common Immediate Parent | Commodity derivatives | Less than 90 days | CH$ | 99,662 | 129,780 | 784,741 | — | — | — | ||||||||||||||||||||||||
Foreign | Enel Ingegneria e Innovazione | Italy | Common Immediate Parent | Other services | Less than 90 days | CH$ | 10,299 | 25,908 | 36,340 | — | — | — | ||||||||||||||||||||||||
Foreign | PH Chucas Costa Rica | Costa Rica | Common Immediate Parent | Other services | Less than 90 days | CH$ | — | 147,234 | 42,019 | — | — | — | ||||||||||||||||||||||||
TBD | Enersis Americas | Chile | Common Immediate Parent | Other services | Less than 90 days | CH$ | 38,720 | 94,863 | 237,279 | — | — | — | ||||||||||||||||||||||||
TBD | Chilectra Américas | Chile | Common Immediate Parent | Other services | Less than 90 days | CH$ | 2,394 | 127,086 | 116,118 | — | — | — | ||||||||||||||||||||||||
TBD | Endesa Américas | Chile | Common Immediate Parent | Other services | Less than 90 days | CH$ | 57,775 | 33,834 | 4,432 | — | — | — | ||||||||||||||||||||||||
76.652.400-1 | Centrales Hidroeléctricas de Aysen S.A. | Chile | Joint Venture | Other services | Less than 90 days | CH$ | — | — | 292,518 | — | — | — | ||||||||||||||||||||||||
F-165
Table of Contents
| Balance at | ||||||||||||||||||||||||||||||||||||
| Current | Non-Current | |||||||||||||||||||||||||||||||||||
Taxpayer ID Number | Company | Country | Relationship | Description of transaction | Term of transaction | Currency | 12-31-2014 ThCh$ | 12-31-2013 ThCh$ | 01-01-2013 ThCh$ | 12-31-2014 ThCh$ | 12-31-2013 ThCh$ | 01-01-2013 ThCh$ | ||||||||||||||||||||||||
76.126.507-5 | Parque Eolico Talinay Oriente SA | Chile | Common Immediate Parent | Energy sales | Less than 90 days | CH$ | 21,647 | 20 | — | — | — | — | ||||||||||||||||||||||||
Foreign | Distrilec | Argentina | Common Immediate Parent | Other services | Less than 90 days | CH$ | 1,305 | — | — | — | — | — | ||||||||||||||||||||||||
Foreign | Endesa Brasil | Brazil | Common Immediate Parent | Other services | Less than 90 days | Real | — | 1,959,181 | 1,472,887 | — | — | — | ||||||||||||||||||||||||
Foreign | Emgesa S.A. E.S.P. | Colombia | Common Immediate Parent | Other services | Less than 90 days | CH$ | — | — | 23,797 | — | — | — | ||||||||||||||||||||||||
Foreign | Edegel S.A.A | Peru | Common Immediate Parent | Other services | Less than 90 days | CH$ | — | — | 85,146 | — | — | — | ||||||||||||||||||||||||
Foreign | Edelnor | Peru | Common Immediate Parent | Other services | Less than 90 days | Sol | — | — | 33,689 | — | — | — | ||||||||||||||||||||||||
Foreign | Empresa de Distribución Eléctrica de Lima Norte S.A.A | Peru | Common Immediate Parent | Other services | Less than 90 days | CH$ | 42,355 | 18,326 | — | — | — | — | ||||||||||||||||||||||||
99.573.910-0 | Chilectra Inversud S.A. | Chile | Common Immediate Parent | Other services | Less than 90 days | CH$ | 149,609 | 151,342 | 1,676,194 | — | — | — | ||||||||||||||||||||||||
Foreign | Codensa | Colombia | Common Immediate Parent | Other services | Less than 90 days | CP | — | — | 125,526 | — | — | — | ||||||||||||||||||||||||
|
|
|
|
|
|
|
|
|
|
|
| |||||||||||||||||||||||||
| Total | 16,952,650 | 34,348,893 | 25,418,867 | — | — | 5,712,830 | ||||||||||||||||||||||||||||||
|
|
|
|
|
|
|
|
|
|
|
| |||||||||||||||||||||||||
| (1) | See Notes 2.4.1, 5 and 14. |
b) Accounts payable to related companies
| Balance at | ||||||||||||||||||||||||||||||||||||||
| Current | Non-Current | |||||||||||||||||||||||||||||||||||||
Taxpayer | Company | Country | Relationship | Description of transaction | Term of transaction | Currency | 12-31-2014 ThCh$ | 12-31-2013 ThCh$ | 01-01-2013 ThCh$ | 12-31-2014 ThCh$ | 12-31-2013 ThCh$ | 01-01-2013 ThCh$ | ||||||||||||||||||||||||||
Foreign | Enel Latinoamérica S.A | Spain | Related to Immediate Parent | Dividends | Less than 90 days | CH$ | 24,842,818 | 27,763,950 | 29,321,732 | — | — | — | ||||||||||||||||||||||||||
96.524.140-K | Empresa Electrica Panguipulli S.A. | Chile | Common Immediate Parent | Energy purchases | Less than 90 days | CH$ | 1,708,804 | 684,882 | 216,029 | — | — | — | ||||||||||||||||||||||||||
96.880.800-1 | Empresa Electrica Puyehue S.A. | Chile | Common Immediate Parent | Energy purchases | Less than 90 days | CH$ | — | 2,865 | 15,896 | — | — | — | ||||||||||||||||||||||||||
96.806.130-5 | Electrogas S.A. | Chile | Associate | Other services | Less than 90 days | CH$ | 335,962 | 200,821 | 54,607 | — | — | — | ||||||||||||||||||||||||||
76.418.940-k | GNL Chile S.A. | Chile | Associate | Natural Gas purchases | Less than 90 days | US$ | 19,808,375 | 13,864,085 | 25,884,955 | — | — | — | ||||||||||||||||||||||||||
Foreign | Endesa Generación | Spain | Common Immediate Parent | Fuel purchases | Less than 90 days | CH$ | 2,881,032 | 4,947,081 | 4,556,926 | — | — | — | ||||||||||||||||||||||||||
Foreign | Endesa Generación | Spain | Common Immediate Parent | Commodity derivatives | Less than 90 days | CH$ | 1,102,253 | — | 32,200 | — | — | — | ||||||||||||||||||||||||||
Foreign | Enel Energy Europe | Spain | Common Immediate Parent | Other services | Less than 90 days | CH$ | — | 240,707 | 336,240 | — | — | — | ||||||||||||||||||||||||||
Foreign | Enel Iberoamérica S.R.L | Spain | Parent | Dividends | Less than 90 days | CH$ | 12,509,673 | — | — | — | — | — | ||||||||||||||||||||||||||
Foreign | Enel Iberoamérica S.R.L | Spain | Parent | Other services | Less than 90 days | CH$ | 382,893 | — | — | — | — | — | ||||||||||||||||||||||||||
Foreign | Enel Distribuzione | Italy | Common Immediate Parent | Other services | Less than 90 days | CH$ | 73,730 | 65,500 | — | — | — | — | ||||||||||||||||||||||||||
Foreign | Enel Produzione | Italy | Common Immediate Parent | Other services | Less than 90 days | CH$ | 99,837 | 80,928 | 80,928 | — | — | — | ||||||||||||||||||||||||||
Foreign | Enel Ingegneria e Innovazione | Italy | Common Immediate Parent | Other services | Less than 90 days | CH$ | 2,024,190 | 2,073,649 | — | — | — | — | ||||||||||||||||||||||||||
Foreign | Endesa Costanera | Argentina | Common Immediate Parent | Other services | Less than 90 days | Ar $ | — | — | 3,984,205 | — | — | — | ||||||||||||||||||||||||||
76.014.570-K | Inversiones Gas Atacama Holding Ltda. (1) | Chile | Joint Venture | Gas purchases | Less than 90 days | US$ | — | 4,846,992 | 1,629,774 | — | — | — | ||||||||||||||||||||||||||
76.014.570-K | Inversiones Gas Atacama Holding Ltda. (1) | Chile | Joint Venture | Other services | Less than 90 days | CH$ | — | — | 90,625 | — | — | — | ||||||||||||||||||||||||||
76.014.570-K | Inversiones Gas Atacama Holding Ltda. | Chile | Joint Venture | Energy purchases | Less than 90 days | CH$ | — | — | 371,729 | — | — | — | ||||||||||||||||||||||||||
77.017.930-0 | Transmisora Eléctrica de Quillota Ltda. | Chile | Joint Venture | Other services | Less than 90 days | CH$ | — | 219,866 | — | — | — | — | ||||||||||||||||||||||||||
77.017.930-0 | Transmisora Eléctrica de Quillota Ltda. | Chile | Joint Venture | Tolls | Less than 90 days | CH$ | — | — | 66,037 | — | — | — | ||||||||||||||||||||||||||
77.017.930-0 | Transmisora Eléctrica de Quillota Ltda. | Chile | Joint Venture | Other services | Less than 90 days | CH$ | 157,762 | — | 158,713 | — | — | — | ||||||||||||||||||||||||||
Foreign | Enel Green Power España SL | Spain | Common Immediate Parent | Other services | Less than 90 days | CH$ | 23,982 | — | — | — | — | — | ||||||||||||||||||||||||||
Foreign | Endesa España | Spain | Common Immediate Parent | Other services | Less than 90 days | CH$ | 129,492 | — | — | — | — | — | ||||||||||||||||||||||||||
Foreign | Endesa España | Spain | Common Immediate Parent | Dividends | Less than 90 days | CH$ | — | 13,979,167 | — | — | — | — | ||||||||||||||||||||||||||
76.126.507-5 | Parque Eolico Talinay Oriente SA | Chile | Common Immediate Parent | Energy purchases | Less than 90 days | CH$ | — | 400,585 | — | — | — | — | ||||||||||||||||||||||||||
F-166
Table of Contents
| Balance at | ||||||||||||||||||||||||||||||||||||||
| Current | Non-Current | |||||||||||||||||||||||||||||||||||||
Taxpayer | Company | Country | Relationship | Description of transaction | Term of transaction | Currency | 12-31-2014 ThCh$ | 12-31-2013 ThCh$ | 01-01-2013 ThCh$ | 12-31-2014 ThCh$ | 12-31-2013 ThCh$ | 01-01-2013 ThCh$ | ||||||||||||||||||||||||||
TBD | Enersis Americas | Chile | Common Immediate Parent | Loans | Less than 90 days | US$ | — | 262,982,628 | — | — | — | — | ||||||||||||||||||||||||||
TBD | Enersis Américas | Chile | Common Immediate Parent | Loans | Less than 90 days | CH$ | 60,858,956 | — | — | — | — | — | ||||||||||||||||||||||||||
TBD | Enersis Américas | Chile | Common Immediate Parent | Current Account | Less than 90 days | CH$ | 39,315,938 | — | — | — | — | — | ||||||||||||||||||||||||||
Foreign | Endesa Brasil | Brazil | Common Immediate Parent | Other services | Less than 90 days | CH$ | — | 92,999 | — | — | — | — | ||||||||||||||||||||||||||
Foreign | Endesa Cemsa S.A. | Argentina | Common Immediate Parent | Other services | Less than 90 days | CH$ | 58,720 | — | — | — | — | — | ||||||||||||||||||||||||||
99.573.910-0 | Chilectra Inversud S.A. | Chile | Common Immediate Parent | Current Account | Less than 90 days | CH$ | 20,775,085 | — | — | — | — | — | ||||||||||||||||||||||||||
99.573.910-0 | Chilectra Inversud S.A. | Chile | Common Immediate Parent | Other services | Less than 90 days | CH$ | — | 4,644,832 | — | — | — | — | ||||||||||||||||||||||||||
Foreign | Enel Brasil | Brazil | Common Immediate Parent | Other services | Less than 90 days | CH$ | 95,691 | — | — | — | — | — | ||||||||||||||||||||||||||
Foreign | Endesa Cemsa S.A. | Argentina | Common Immediate Parent | Other services | Less than 90 days | CH$ | — | 80,399 | — | — | — | — | ||||||||||||||||||||||||||
Foreign | Endesa Cemsa S.A. | Argentina | Common Immediate Parent | Fuel purchases | Less than 90 days | Ar $ | — | — | 91,068 | — | — | — | ||||||||||||||||||||||||||
| Total | 187,185,193 | 337,171,936 | 66,891,664 | — | — | — | ||||||||||||||||||||||||||||||||
| (2) | See Notes 2.4.1, 5 and 14. |
c) Significant transactions and effects on income/expenses:
Transactions with related companies that are not combined and their effects on profit or loss are as follows:
| For the years ended | ||||||||||||||||||||
Taxpayer ID | Company | Country | Relationship | Description of transaction | 12-31-2014 ThCh$ | 12-31-2013 ThCh$ | 12-31-2012 ThCh$ | |||||||||||||
Foreign | Endesa Energía S.A. | Spain | Common Immediate Parent | Gas sales | — | 21,397,171 | — | |||||||||||||
Foreign | Endesa Energía S.A. | Spain | Common Immediate Parent | Other operating income | — | 51,722 | — | |||||||||||||
Foreign | Endesa Generación | Spain | Common Immediate Parent | Fuel consumption | (30,318,202 | ) | (47,540,061 | ) | (41,522,504 | ) | ||||||||||
Foreign | Endesa Generación | Spain | Common Immediate Parent | Commodity derivatives | (2,521,138 | ) | — | — | ||||||||||||
Foreign | Endesa Trading | Spain | Common Immediate Parent | Fuel consumption | — | — | (705,859 | ) | ||||||||||||
Foreign | Generalima S.A. | Peru | Common Immediate Parent | Other services rendered | — | — | 23,890 | |||||||||||||
76.418.940-k | GNL Chile S.A. | Chile | Associate | Gas consumption | (114,115,041 | ) | (60,095,868 | ) | (168,238,842 | ) | ||||||||||
76.418.940-k | GNL Chile S.A. | Chile | Associate | Gas transportation | (39,638,398 | ) | (34,796,720 | ) | (34,209,731 | ) | ||||||||||
76.418.940-k | GNL Chile S.A. | Chile | Associate | Other services rendered | 56,042 | 769,402 | 220,493 | |||||||||||||
76.418.940-k | GNL Chile S.A. | Chile | Associate | Other financial income | 58,169 | 40,124 | 21,995 | |||||||||||||
76.788.080-4 | GNL Quintero S.A. | Chile | Associate | Energy sales | 2,671,120 | 2,808,698 | 638,187 | |||||||||||||
76.788.080-4 | GNL Quintero S.A. | Chile | Associate | Electricity tolls | 47,263 | — | — | |||||||||||||
76.788.080-4 | GNL Quintero S.A. | Chile | Associate | Other services rendered | 956,854 | 835,543 | 661,296 | |||||||||||||
96.976.600-0 | Gestión Social S.A. (*) | Chile | Related to Director | Other services rendered | — | — | 49,133 | |||||||||||||
78.488.290-k | Tironi y Asociados S.A. | Chile | Related to Director | Other services rendered | — | — | 2,475 | |||||||||||||
96.880.800-1 | Empresa Eléctrica Puyehue S.A. | Chile | Common Immediate Parent | Energy purchases | (1,407,349 | ) | (109,699 | ) | (1,988,042 | ) | ||||||||||
96.880.800-1 | Empresa Eléctrica Puyehue S.A. | Chile | Common Immediate Parent | Electricity tolls | (3,805 | ) | — | — | ||||||||||||
96.880.800-1 | Empresa Eléctrica Puyehue S.A. | Chile | Common Immediate Parent | Energy sales | (12,399 | ) | 227,765 | 99,120 | ||||||||||||
96.524.140-K | Empresa Eléctrica Panguipulli S.A. | Chile | Common Immediate Parent | Energy purchases | (10,113,496 | ) | (6,118,816 | ) | (789,477 | ) | ||||||||||
96.524.140-K | Empresa Eléctrica Panguipulli S.A. | Chile | Common Immediate Parent | Electricity tolls | (260,495 | ) | — | — | ||||||||||||
96.524.140-K | Empresa Eléctrica Panguipulli S.A. | Chile | Common Immediate Parent | Other services rendered | 197,812 | — | — | |||||||||||||
96.524.140-K | Empresa Eléctrica Panguipulli S.A. | Chile | Common Immediate Parent | Energy sales | 942,615 | 356,056 | 133,735 | |||||||||||||
Foreign | Enel Distribuzione | Italy | Parent | Other fixed operating expenses | — | — | (97,053 | ) | ||||||||||||
Foreign | Enel Energy Europe | Spain | Common Immediate Parent | Other fixed operating expenses | — | (826,603 | ) | (336,239 | ) | |||||||||||
Foreign | Enel Iberoamérica S.R.L | Spain | Parent | Other fixed operating expenses | (2,860,930 | ) | — | — | ||||||||||||
96.806.130-5 | Electrogas S.A. | Chile | Associate | Gas tolls | (3,409,581 | ) | (2,734,877 | ) | (2,175,039 | ) | ||||||||||
96.806.130-5 | Electrogas S.A. | Chile | Associate | Fuel consumption | (434,289 | ) | (428,555 | ) | (697,653 | ) | ||||||||||
Foreign | Carboex S.A. | Spain | Common Immediate Parent | Fuel consumption | — | — | (5,042,960 | ) | ||||||||||||
Foreign | PH Chucas Costa Rica | Costa Rica | Common Immediate Parent | Other services rendered | — | 236,173 | 481,177 | |||||||||||||
Foreign | Endesa Distribución Eléctrica | Spain | Common Immediate Parent | Other fixed operating expenses | — | — | (6,133 | ) | ||||||||||||
Foreign | Enel Ingegneria e Innovazione | Italy | Common Immediate Parent | Other services rendered | — | 32,569 | 30,536 | |||||||||||||
Foreign | Enel Ingegneria e Innovazione | Italy | Common Immediate Parent | Other fixed operating expenses | — | (479,542 | ) | — | ||||||||||||
76.652.400-1 | Centrales Hidroeléctricas De Aysén S.A. | Chile | Joint Venture | Other financial income | — | 46,444 | — | |||||||||||||
76.652.400-1 | Centrales Hidroeléctricas De Aysén S.A. | Chile | Joint Venture | Other services rendered | 23,891 | 10,281 | — | |||||||||||||
76.014.570-K | Inversiones GasAtacama Holding Ltda. (1) | Chile | Joint Venture | Energy purchases | — | (9,295,172 | ) | (6,589,964 | ) | |||||||||||
76.014.570-K | Inversiones GasAtacama Holding Ltda. (1) | Chile | Joint Venture | Gas transportation | — | (20,937,075 | ) | (20,131,152 | ) | |||||||||||
76.014.570-K | Inversiones GasAtacama Holding Ltda. (1) | Chile | Joint Venture | Energy sales | — | 95,845 | 64,914 | |||||||||||||
76.014.570-K | Inversiones GasAtacama Holding Ltda. (1) | Chile | Joint Venture | Other financial income | — | 489,864 | 765,504 | |||||||||||||
76.014.570-K | Inversiones GasAtacama Holding Ltda. (1) | Chile | Joint Venture | Other fixed operating expenses | — | (219,671 | ) | (417,892 | ) | |||||||||||
77.017.930-0 | Transmisora Eléctrica de Quillota Ltda. | Chile | Joint Venture | Electricity tolls | (1,378,743 | ) | (1,243,417 | ) | (1,219,958 | ) | ||||||||||
Foreign | Endesa España | Spain | Common Immediate Parent | Other operating income | 57,623 | — | — | |||||||||||||
Foreign | Enel Trade S.p.A | Italy | Common Immediate Parent | Other operating income | 3,222 | — | — | |||||||||||||
TBD | Endesa Américas | Chile | Common Immediate Parent | Other services rendered | — | 305,347 | 300,435 | |||||||||||||
TBD | Chilectra Américas | Chile | Common Immediate Parent | Other services rendered | — | 625,195 | 615,157 | |||||||||||||
TBD | Enersis Américas | Chile | Common Immediate Parent | Other services rendered | — | 290,779 | 264,472 | |||||||||||||
TBD | Enersis Américas | Chile | Common Immediate Parent | Other financial expenses | (15,437,257 | ) | (7,357,031 | ) | — | |||||||||||
Foreign | Codensa S.A. | Colombia | Common Immediate Parent | Other services rendered | — | 310,793 | 143,999 | |||||||||||||
Foreign | Codensa S.A. | Colombia | Common Immediate Parent | Other variable expenses | — | (27,445 | ) | — | ||||||||||||
Foreign | Endesa Brasil | Brazil | Common Immediate Parent | Other services rendered | — | 307,467 | 850,045 | |||||||||||||
Foreign | Emgesa S.A. | Colombia | Common Immediate Parent | Other services rendered | — | 30,000 | — | |||||||||||||
Foreign | Emgesa S.A. | Colombia | Common Immediate Parent | Other variable expenses | — | (2,640 | ) | — | ||||||||||||
Foreign | Empresa de Distribución Eléctrica de Lima Norte S.A.A | Peru | Common Immediate Parent | Other services rendered | — | 206,847 | 64,669 | |||||||||||||
99.573.910-0 | Chilectra Inversud S.A. | Chile | Common Immediate Parent | Other operating income | — | 16 | 126 | |||||||||||||
99.573.910-0 | Chilectra Inversud S.A. | Chile | Common Immediate Parent | Other financial income | — | 139,799 | — | |||||||||||||
99.573.910-0 | Chilectra Inversud S.A. | Chile | Common Immediate Parent | Other financial expenses | (645,276 | ) | (16,271 | ) | — | |||||||||||
Foreign | Endesa Cemsa S.A. | Argentina | Associate | Electricity tolls | — | — | (6,577 | ) | ||||||||||||
Foreign | Endesa Cemsa S.A. | Argentina | Associate | Other fixed operating expenses | — | (268,631 | ) | (253,900 | ) | |||||||||||
76.126.507-5 | Parque Eolico Talinay Oriente SA | Chile | Common Immediate Parent | Energy purchases | (5,141,912 | ) | (1,148,277 | ) | — | |||||||||||
|
|
|
|
|
| |||||||||||||||
| Total | (222,683,700 | ) | (164,032,471 | ) | (278,997,617 | ) | ||||||||||||||
|
|
|
|
|
| |||||||||||||||
F-167
Table of Contents
| (1) | See Notes 2.4.1, 5 and 14. |
Transfers of short-term funds between related companies are treated as current accounts changes, with variable interest rates based on market conditions used for the monthly balance. The resulting receivable or payable balances are usually at 30 days term, with automatic rollover for the same periods and amortization in line with cash flows.
10.2 Board of Directors and Key management personnel
Once Enersis Chile S.A. is formed, its Board of Directors will initially consist of seven members who will be elected for an interim term at an Extraordinary Shareholders’ Meeting (“ESM”) to be held on December 18, 2015 to hold office until the first Ordinary Shareholders’ Meeting (“OSM”) to be held in April 2016. At the 2016 OSM, the entire Board of Directors consisting of seven members will be elected to a three-year term. Following the end of their term, they may be re-elected or replaced. If a vacancy occurs in the interim, the Board of Directors will elect a temporary director to fill the vacancy until the next OSM, at which time the entire Board of Directors will be elected to new three-year terms. Its Executive Officers will be appointed by the Board of Directors and hold office at the discretion of the Board.
10.3 Compensation plans linked to share price
There are no compensation plans linked to share price.
| 11. | INVENTORIES |
The detail of inventories as of December 31, 2014 and 2013 and January 1, 2013, is as follows:
Classes of Inventories | Balance at | |||||||||||
| 12-31-2014 ThCh$ | 12-31-2013 ThCh$ | 1-1-2013 ThCh$ | ||||||||||
Supplies for Production | 22,295,599 | 10,561,168 | 23,746,835 | |||||||||
Gas | 1,407,284 | — | — | |||||||||
Oil | 3,734,834 | 1,630,489 | 3,993,634 | |||||||||
Coal | 17,153,480 | 8,930,679 | 19,753,201 | |||||||||
Other inventories (*) | 21,382,280 | 11,453,856 | 12,076,060 | |||||||||
|
|
|
|
|
| |||||||
Total | 43,677,878 | 22,015,024 | 35,822,895 | |||||||||
|
|
|
|
|
| |||||||
Detail of other inventories | ||||||||||||
(*) Other inventories | 21,382,280 | 11,453,856 | 12,076,060 | |||||||||
Supplies for projects and spare parts | 16,747,706 | 4,101,796 | 6,307,714 | |||||||||
Electrical materials | 4,634,574 | 7,352,060 | 5,768,346 | |||||||||
There are no inventories pledged as security for liabilities.
For the years ended December 31, 2014 and 2013 raw materials and consumables recognized as fuel expenses were ThCh$305,480,260 and ThCh$211,612,174. See Note 28.
As of December 31, 2014 and 2013 and January 1, 2013, no inventories have been written down due to obsolescence.
F-168
Table of Contents
| 12. | TAX RECEIVABLES AND PAYABLES |
The detail of current tax receivables as of December 31, 2014 and 2013 and January 1, 2013, is as follows:
Tax Receivables | Balance at | |||||||||||
| 12-31-2014 ThCh$ | 12-31-2013 ThCh$ | 1-1-2013 ThCh$ | ||||||||||
Monthly provisional tax payments | 14,510,732 | 50,601,027 | 39,436,319 | |||||||||
Tax credit for absorbed profits | 9,993,425 | 23,936,341 | 41,296,507 | |||||||||
Tax credit for training expenses | 240,800 | 241,998 | 183,498 | |||||||||
Tax credit for dividends abroad | 20,903,182 | 18,668,757 | — | |||||||||
VAT credit | — | 59,912,201 | 66,250,388 | |||||||||
Other | — | 23,174 | 1,007,463 | |||||||||
|
|
|
|
|
| |||||||
Total | 45,648,139 | 153,383,498 | 148,174,175 | |||||||||
|
|
|
|
|
| |||||||
The detail of current tax payables as of December 31, 2014 and 2013 and January 1, 2013, is as follows:
Tax Payables | Balance at | |||||||||||
| 12-31-2014 ThCh$ | 12-31-2013 ThCh$ | 1-1-2013 ThCh$ | ||||||||||
Income tax | 38,357,866 | 59,433,519 | 30,073,926 | |||||||||
|
|
|
|
|
| |||||||
Total | 38,357,866 | 59,433,519 | 30,073,926 | |||||||||
|
|
|
|
|
| |||||||
| 13. | NON-CURRENT ASSETS OR GROUPS OF ASSETS FOR DISPOSAL CLASSIFIED AS HELD FOR SALE |
In December 2014, Empresa Nacional de Electricidad S.A. and its subsidiary Compañía Eléctrica de Tarapacá SA signed a contract to sell all their shares in Sociedad Concesionaria Túnel El Melón S.A. to Temsa Private Investment Fund. Such contract established a number of conditions, which were not fulfilled at the end of 2014, preventing the closure of the sale. The sale was finalized on January 9, 2015.
Túnel El Melón S.A is a private corporation whose purpose is the construction, maintenance and operation of the public work called the El Melón Tunnel and the provision of ancillary services authorized by the Ministry of Public Works (MOP for its Spanish acronym).
El Melón Tunnel is an alternative route to the road that climbs the El Melon pass, which is located between 126 and 132 kilometers north of Santiago on Route 5. This is the main highway linking the country from Arica to Puerto Montt.
As described in Note 3.k), non-current assets and groups of assets held for sale have been recorded at the lower of their carrying amount and fair value less costs of disposal.
F-169
Table of Contents
The main items of assets, liabilities and cash flows held for sale as of December 31, 2014 are as follows:
| Balance 12/31/2014 | ||||
| ThCh$ | ||||
CURRENT ASSETS | ||||
Cash and cash equivalents | 29,702 | |||
Other current non-financial assets | 81,275 | |||
Trade and other current receivables | 758,645 | |||
Current tax assets | 1,400 | |||
|
| |||
TOTAL CURRENT ASSETS | 871,022 | |||
|
| |||
NON-CURRENT ASSETS | ||||
Intangible assets other than goodwill | 4,404,615 | |||
Property, plant and equipment | 81,432 | |||
Deferred tax assets | 2,621,894 | |||
|
| |||
TOTAL NON-CURRENT ASSETS | 7,107,941 | |||
|
| |||
TOTAL ASSETS | 7,978,963 | |||
|
| |||
CURRENT LIABILITIES | ||||
Other current financial liabilities | 3,072,179 | |||
Trade and other current payables | 495,235 | |||
Other current non-financial liabilities | 131,030 | |||
|
| |||
TOTAL CURRENT LIABILITIES | 3,698,444 | |||
|
| |||
NON-CURRENT LIABILITIES | ||||
Other non-current financial liabilities | 1,660,254 | |||
Non-current provisions for employee benefits | 102,423 | |||
Other non-current non-financial liabilities | 27,026 | |||
|
| |||
TOTAL NON-CURRENT LIABILITIES | 1,789,703 | |||
|
| |||
TOTAL LIABILITIES | 5,488,147 | |||
|
| |||
| Balance 12/31/2014 | ||||
| ThCh$ | ||||
Summary of net cash flow | ||||
Net cash flows from (used in) operating activities | 9,045,775 | |||
Net cash flows from (used in) investment activities | (5,604,740 | ) | ||
Net cash flows from (used in) financing activities | (3,450,774 | ) | ||
Net increase (decrease) in cash and cash equivalents before effect of exchange rate changes | (9,739 | ) | ||
Effect of exchange rate changes on cash and cash equivalents | — | |||
Net increase (decrease) in cash and cash equivalents | (9,739 | ) | ||
Cash and cash equivalents at beginning of period | 39,440 | |||
Cash and cash equivalents at end of period | 29,702 | |||
F-170
Table of Contents
| 14. | INVESTMENTS ACCOUNTED FOR USING THE EQUITY METHOD |
14.1. Investments accounted for using the equity method
| a. | The following tables present the changes in investments in combined associates and joint ventures accounted for using the equity method as of December 31, 2014 and 2013 and January 1, 2013: |
Taxpayer ID | Changes in Investments in | Relationship | Country | Currency | Ownership Interest | Balance at 01-01-2014 ThCh$ | Additions ThCh$ | Share of Profit (Loss) ThCh$ | Dividends Declared ThCh$ | Foreign Currency Translation ThCh$ | Other Comprehensive Income ThCh$ | Other Increase (Decrease) ThCh$ | Balance at 12-31-2014 ThCh$ | Negative Equity Provision ThCh$ | Balance at 12-31-2014 ThCh$ | |||||||||||||||||||||||||||||||||||||||
96.806.130-5 | Electrogas S.A. | Associate | Chile | U.S. dollar | 42.50 | % | 9,682,324 | — | 4,456,124 | (4,239,280 | ) | 847,016 | 31,475 | — | 10,777,659 | — | 10,777,659 | |||||||||||||||||||||||||||||||||||||
76.788.080-4 | GNL Quintero S.A. | Associate | Chile | U.S. dollar | 20.00 | % | 4,797,508 | — | 3,541,883 | (6,897,599 | ) | 311,747 | 13,445,396 | — | 15,198,935 | — | 15,198,935 | |||||||||||||||||||||||||||||||||||||
76.418.940-K | GNL Chile S.A. | Associate | Chile | U.S. dollar | 33.33 | % | 559,615 | — | 1,099,143 | — | 159,410 | — | — | 1,818,168 | — | 1,818,168 | ||||||||||||||||||||||||||||||||||||||
76.652.400-1 | Centrales Hidroeléctricas De Aysén S.A. (2) | Joint Venture | Chile | Chilean peso | 51.00 | % | 69,684,864 | 3,315,000 | (66,855,307 | ) | — | — | — | — | 6,144,557 | — | 6,144,557 | |||||||||||||||||||||||||||||||||||||
77.017.930-0 | Transmisora Eléctrica de Quillota Ltda. | Joint Venture | Chile | Chilean peso | 50.00 | % | 6,073,897 | — | 352,107 | — | — | — | — | 6,426,004 | — | 6,426,004 | ||||||||||||||||||||||||||||||||||||||
76.014.570-K | Inversiones GasAtacama Holding Ltda. (1) | Joint Venture | Chile | U.S. dollar | 50.00 | % | 123,627,968 | — | 3,053,468 | — | 8,919,246 | — | (135,600,682 | ) | — | — | — | |||||||||||||||||||||||||||||||||||||
|
|
|
|
|
|
|
|
|
|
|
|
|
|
|
|
|
|
|
| |||||||||||||||||||||||||||||||||||
| TOTAL | 214,426,176 | 3,315,000 | (54,352,582 | ) | (11,136,879 | ) | 10,237,419 | 13,476,871 | (135,600,682 | ) | 40,365,323 | — | 40,365,323 | |||||||||||||||||||||||||||||||||||||||||
|
|
|
|
|
|
|
|
|
|
|
|
|
|
|
|
|
|
|
| |||||||||||||||||||||||||||||||||||
Taxpayer ID | Changes in Investments in | Relationship | Country | Currency | Ownership Interest | Balance at 01-01-2013 ThCh$ | Additions ThCh$ | Share of Profit (Loss) ThCh$ | Dividends Declared ThCh$ | Foreign Currency Translation ThCh$ | Other Comprehensive Income ThCh$ | Other Increase (Decrease) ThCh$ | Balance at 12-31-2013 ThCh$ | Negative Equity Provision ThCh$ | Balance at 12-31-2013 ThCh$ | |||||||||||||||||||||||||||||||||||||||
96.806.130-5 | Electrogas S.A. | Associate | Chile | U.S. dollar | 42.50 | % | 9,030,441 | — | 4,186,294 | (5,080,897 | ) | 769,156 | 777,330 | — | 9,682,324 | — | 9,682,324 | |||||||||||||||||||||||||||||||||||||
76.788.080-4 | GNL Quintero S.A. | Associate | Chile | U.S. dollar | 20.00 | % | — | — | 4,914,871 | (3,088,495 | ) | 36,052 | 7,922,262 | — | 9,784,690 | (4,987,182 | ) | 4,797,508 | ||||||||||||||||||||||||||||||||||||
76.418.940-K | GNL Chile S.A. | Associate | Chile | U.S. dollar | 33.33 | % | 376,835 | — | 137,691 | — | 45,089 | — | — | 559,615 | — | 559,615 | ||||||||||||||||||||||||||||||||||||||
76.652.400-1 | Centrales Hidroeléctricas De Aysén S.A. | Joint Venture | Chile | Chilean peso | 51.00 | % | 66,894,760 | 5,084,699 | (2,294,595 | ) | — | — | — | — | 69,684,864 | — | 69,684,864 | |||||||||||||||||||||||||||||||||||||
77.017.930-0 | Transmisora Eléctrica de Quillota Ltda. | Joint Venture | Chile | Chilean peso | 50.00 | % | 5,710,960 | — | 362,937 | — | — | — | — | 6,073,897 | — | 6,073,897 | ||||||||||||||||||||||||||||||||||||||
76.014.570-K | Inversiones GasAtacama Holding Ltda. | Joint Venture | Chile | U.S. dollar | 50.00 | % | 96,207,755 | — | 17,002,146 | — | 10,418,067 | — | — | 123,627,968 | — | 123,627,968 | ||||||||||||||||||||||||||||||||||||||
|
|
|
|
|
|
|
|
|
|
|
|
|
|
|
|
|
|
|
| |||||||||||||||||||||||||||||||||||
| TOTAL | 178,220,751 | 5,084,699 | 24,309,344 | (8,169,392 | ) | 11,268,364 | 8,699,592 | — | 219,413,358 | (4,987,182 | ) | 214,426,176 | ||||||||||||||||||||||||||||||||||||||||||
|
|
|
|
|
|
|
|
|
|
|
|
|
|
|
|
|
|
|
| |||||||||||||||||||||||||||||||||||
| (1) | In April 2014, the company Inversiones GasAtacama Holding Ltda. became a subsidiary of the Combined Group (see Notes 2.4.1 and 5). |
| (2) | The loss recognized during 2014, includes an impairment loss of ThCh$69,066,857 as a result of uncertainty about the recoverability of this investment. |
| b. | Additional financial information on investments in associated companies and joint ventures |
14.2. Investments with significant influence
The following tables show financial information as of December 31, 2014 and 2013 from the financial statements of the investments in associates where the Combined Group has significant influence:
Investments with | 12-31-2014 | |||||||||||||||||||||||||||||||||||||||
| % Ownership Interest Direct / Indirect | Current Assets ThCh$ | Non-current Assets ThCh$ | Current Liabilities ThCh$ | Non-current Liabilities ThCh$ | Revenues ThCh$ | Expenses ThCh$ | Profit (Loss) ThCh$ | Other Comprehensive Income ThCh$ | Comprehensive Income ThCh$ | |||||||||||||||||||||||||||||||
GNL Chile S.A | 33.33 | % | 73,425,419 | 81,983 | 64,329,604 | 3,723,224 | 732,138,386 | (728,840,589 | ) | 3,297,797 | 478,277 | 3,776,074 | ||||||||||||||||||||||||||||
GNL Quintero S.A. | 20.00 | % | 98,325,654 | 597,812,711 | 20,036,542 | 600,107,009 | 117,435,890 | (99,726,467 | ) | 17,709,423 | 68,785,714 | 86,495,137 | ||||||||||||||||||||||||||||
Electrogas S.A. | 42.50 | % | 6,085,889 | 43,289,210 | 10,076,915 | 13,938,983 | 19,635,597 | (9,150,599 | ) | 10,484,998 | 2,067,038 | 12,552,036 | ||||||||||||||||||||||||||||
Investments with | 12-31-2013 | |||||||||||||||||||||||||||||||||||||||
| % Ownership Interest Direct / Indirect | Current Assets ThCh$ | Non-current assets ThCh$ | Current Liabilities ThCh$ | Non-current Liabilities ThCh$ | Revenues ThCh$ | Expenses ThCh$ | Profit (Loss) ThCh$ | Other Comprehensive Income ThCh$ | Comprehensive Income ThCh$ | |||||||||||||||||||||||||||||||
GNL Chile S.A. | 33.33 | % | 82,737,334 | 79,263 | 78,005,985 | 3,131,599 | 538,715,428 | (538,302,314 | ) | 413,114 | 135,281 | 548,395 | ||||||||||||||||||||||||||||
GNL Quintero S.A. | 20.00 | % | 88,131,062 | 566,951,431 | 34,063,764 | 597,031,096 | 100,431,648 | (75,857,214 | ) | 24,574,434 | 39,791,400 | 64,365,834 | ||||||||||||||||||||||||||||
Electrogas S.A. | 42.50 | % | 4,624,089 | 39,891,362 | 9,624,463 | 12,109,047 | 17,591,544 | (7,741,439 | ) | 9,850,105 | 3,638,791 | 13,488,896 | ||||||||||||||||||||||||||||
F-171
Table of Contents
Appendix 3 to these combined financial statements provides information on the main activities of our associates and the ownership interest that the Combined Group holds in them.
None of our associates have published price quotations.
14.3. Joint ventures
The following tables present information from the financial statements as of December 31, 2014 and 2013 and January 1, 2013 on the main joint ventures:
| Centrales Hidroeléctricas de Aysén S.A. | Transmisora Eléctrica de Quillota Ltda. | Inversiones Gas Atacama Holding Ltda. (*) | ||||||||||||||||||||||||||||||||||
% Ownership | 51.0% 12/31/2014 ThCh$ | 51.0% 12/31/2013 ThCh$ | 51.0% 1/1/2013 ThCh$ | 50.0% 12/31/2014 ThCh$ | 50.0% 12/31/2013 ThCh$ | 50.0% 1/1/2013 ThCh$ | 50.0% 12/31/2014 ThCh$ | 50.0% 12/31/2013 ThCh$ | 50.0% 1/1/2013 ThCh$ | |||||||||||||||||||||||||||
Total current assets | 485,966 | 9,596,488 | 10,081,574 | 4,426,445 | 3,950,498 | 3,273,653 | — | 176,292,080 | 111,109,274 | |||||||||||||||||||||||||||
Total non-current assets | 15,026,706 | 131,270,190 | 127,061,491 | 11,420,593 | 10,237,702 | 9,921,635 | — | 295,704,711 | 256,741,087 | |||||||||||||||||||||||||||
Total current liabilities | 3,419,214 | 4,049,634 | 5,728,373 | 1,159,095 | 670,215 | 503,949 | — | 63,483,879 | 49,340,104 | |||||||||||||||||||||||||||
Total non-current liabilities | 45,348 | 180,059 | 248,465 | 1,835,937 | 1,370,193 | 1,269,420 | — | 44,840,436 | 56,704,587 | |||||||||||||||||||||||||||
Cash and cash equivalents | 319,670 | 1,727,261 | 2,754,590 | 3,930,814 | 3,450,144 | 2,904,898 | — | 108,934,464 | 76,706,833 | |||||||||||||||||||||||||||
Other current financial liabilities | — | — | — | — | — | — | — | 14,865,354 | 9,732,430 | |||||||||||||||||||||||||||
Other non-current financial liabilities | — | — | — | — | — | — | — | — | — | |||||||||||||||||||||||||||
Revenues | — | — | — | 2,672,950 | 2,394,408 | 2,265,866 | — | 176,517,866 | 119,376,747 | |||||||||||||||||||||||||||
Depreciation and amortization expense | (52,978 | ) | (69,316 | ) | (92,533 | ) | (738,927 | ) | (680,519 | ) | (686,931 | ) | — | (11,145,909 | ) | (10,239,012 | ) | |||||||||||||||||||
Impairment losses | (126,657,707 | ) | — | — | — | — | — | — | — | — | ||||||||||||||||||||||||||
Interest income | 479,518 | 121,509 | 255,431 | 88,597 | 134,631 | 94,083 | — | 1,040,933 | 996,160 | |||||||||||||||||||||||||||
Interest expense | — | 78,059 | (62,115 | ) | — | — | — | — | (1,575,774 | ) | (1,713,723 | ) | ||||||||||||||||||||||||
Income tax expense | — | 1,333,808 | (6,222,845 | ) | (671,727 | ) | (124,757 | ) | (354,165 | ) | — | (9,908,686 | ) | (12,188,867 | ) | |||||||||||||||||||||
Profit (loss) | (131,088,876 | ) | (4,499,239 | ) | (1,140,074 | ) | 704,214 | 725,873 | 689,429 | — | 34,042,459 | 37,132,872 | ||||||||||||||||||||||||
Other comprehensive income | — | — | — | — | — | — | — | — | — | |||||||||||||||||||||||||||
Comprehensive income | (131,088,876 | ) | (4,499,239 | ) | (1,140,074 | ) | 704,214 | 725,873 | 689,429 | — | 34,042,459l | 37,132,872 | ||||||||||||||||||||||||
| (*) | See Notes 2.4.1 and 5. |
| c. | There are no significant commitments and contingencies, or restrictions on funds transfers to its owners in associates and joint ventures. |
| 15. | INTANGIBLE ASSETS OTHER THAN GOODWILL |
The following table presents intangible assets as of December 31, 2014 and 2013 and January 1, 2013:
Intangible Assets, Net | 12-31-2014 ThCh$ | 12-31-2013 ThCh$ | 1-1-2013 ThCh$ | |||||||||
Intangible Assets, Net | 36,525,522 | 37,570,805 | 37,962,229 | |||||||||
Easements and water rights | 14,692,984 | 14,517,212 | 14,523,007 | |||||||||
Concessions | — | 6,951,508 | 9,478,468 | |||||||||
Computer software | 21,651,862 | 15,991,138 | 13,845,449 | |||||||||
Other identifiable intangible assets | 180,676 | 110,947 | 115,305 | |||||||||
F-172
Table of Contents
Intangible Assets, Gross | 12-31-2014 ThCh$ | 12-31-2013 ThCh$ | 1-1-2013 ThCh$ | |||||||||
Intangible Assets, Gross | 82,119,207 | 111,173,564 | 105,860,908 | |||||||||
Easements and water rights | 17,106,353 | 16,930,581 | 16,932,126 | |||||||||
Concessions | — | 39,246,752 | 39,246,752 | |||||||||
Computer software | 58,579,846 | 48,684,070 | 43,369,870 | |||||||||
Other identifiable intangible assets | 6,433,008 | 6,312,161 | 6,312,160 | |||||||||
Intangible Assets, Amortization and Impairment | 12-31-2014 ThCh$ | 12-31-2013 ThCh$ | 1-1-2013 ThCh$ | |||||||||
Accumulated Amortization and Impairment, Total | (45,593,685 | ) | (73,602,759 | ) | (67,898,679 | ) | ||||||
Identifiable intangible assets | (45,593,685 | ) | (73,602,759 | ) | (67,898,679 | ) | ||||||
Easements and water rights | (2,413,369 | ) | (2,413,369 | ) | (2,409,119 | ) | ||||||
Concessions | — | (32,295,244 | ) | (29,768,284 | ) | |||||||
Computer software | (36,927,984 | ) | (32,692,932 | ) | (29,524,421 | ) | ||||||
Other identifiable intangible assets | (6,252,332 | ) | (6,201,214 | ) | (6,196,855 | ) | ||||||
The reconciliations of the carrying amounts of intangible assets during the years ended December 31, 2014 and 2013 are as follows:
Changes in Intangible Assets | Easements | Concessions | Computer Software | Other Identifiable Intangible Assets, Net | Intangibles Assets, Net | |||||||||||||||
| ThCh$ | �� | ThCh$ | ThCh$ | ThCh$ | ThCh$ | |||||||||||||||
Opening balance January 1, 2014 | 14,517,212 | 6,951,508 | 15,991,138 | 110,947 | 37,570,805 | |||||||||||||||
Changes in identifiable intangible assets | ||||||||||||||||||||
Increases (decreases) other than from business combinations | (19,567 | ) | — | 8,568,249 | — | 8,548,682 | ||||||||||||||
Increase (decrease) from exchange differences, net | — | — | 6,303 | 4,577 | 10,880 | |||||||||||||||
Amortization (1) | — | (2,546,894 | ) | (3,400,009 | ) | (7,207 | ) | (5,954,110 | ) | |||||||||||
Increases (decreases) from transfers and other changes | 195,339 | 1 | 489,030 | 72,359 | 756,729 | |||||||||||||||
Increases (decreases) from transfers | 195,339 | 1 | (195,339 | ) | (1 | ) | — | |||||||||||||
Increases (decreases) from other changes | — | — | 684,369 | 72,360 | 756,729 | |||||||||||||||
Disposals and removals from service | — | — | (2,849 | ) | — | (2,849 | ) | |||||||||||||
Disposals | — | — | — | — | ||||||||||||||||
Removals from service | — | — | (2,849 | ) | — | (2,849 | ) | |||||||||||||
Decreases classified as held for sale | — | — | — | — | — | |||||||||||||||
Other increases (decreases) | — | (4,404,615 | ) | — | — | (4,404,615 | ) | |||||||||||||
|
|
|
|
|
|
|
|
|
| |||||||||||
Total changes in identifiable intangible assets | 175,772 | (6,951,508 | ) | 5,660,724 | 69,729 | (1,045,283 | ) | |||||||||||||
|
|
|
|
|
|
|
|
|
| |||||||||||
Closing balance December 31, 2014 | 14,692,984 | — | 21,651,862 | 180,676 | 36,525,522 | |||||||||||||||
|
|
|
|
|
|
|
|
|
| |||||||||||
F-173
Table of Contents
Changes in Intangible Assets | Easements | Concessions | Computer Software | Other Identifiable Intangible Assets, Net | Activos Intangibles, Neto | |||||||||||||||
| ThCh$ | ThCh$ | ThCh$ | ThCh$ | ThCh$ | ||||||||||||||||
Opening balance January 1, 2013 | 14,523,007 | 9,478,468 | 13,845,449 | 115,305 | 37,962,229 | |||||||||||||||
Changes in identifiable intangible assets | ||||||||||||||||||||
Increases other than from business combinations | (1,547 | ) | — | 5,295,240 | — | 5,293,693 | ||||||||||||||
Acquisitions through business combinations | — | — | — | — | — | |||||||||||||||
Increase (decrease) from exchange differences, net | — | — | — | — | — | |||||||||||||||
Amortization (1) | (363 | ) | (2,526,959 | ) | (3,220,451 | ) | (3,269 | ) | (5,751,042 | ) | ||||||||||
Impairment losses recognized in profit or loss | — | — | — | — | — | |||||||||||||||
Increases (decreases) from transfers and other changes | (43,947 | ) | — | — | 43,947 | — | ||||||||||||||
Increases (decreases) from transfers | — | — | — | — | — | |||||||||||||||
Increases (decreases) from other changes | (43,947 | ) | — | — | 43,947 | — | ||||||||||||||
Disposals and removals from service | — | — | — | — | — | |||||||||||||||
Disposals | — | — | ||||||||||||||||||
Removals from service | — | — | — | — | — | |||||||||||||||
Decreases classified as held for sale | — | — | — | |||||||||||||||||
Other increases (decreases) | 40,062 | (1 | ) | 70,900 | (45,036 | ) | 65,925 | |||||||||||||
|
|
|
|
|
|
|
|
|
| |||||||||||
Total changes in identifiable intangible assets | (5,795 | ) | (2,526,960 | ) | 2,145,689 | (4,358 | ) | (391,424 | ) | |||||||||||
|
|
|
|
|
|
|
|
|
| |||||||||||
Closing balance December 31, 2013 | 14,517,212 | 6,951,508 | 15,991,138 | 110,947 | 37,570,805 | |||||||||||||||
|
|
|
|
|
|
|
|
|
| |||||||||||
| (1) | See Note 30. |
According to Enersis management’s estimates and projections, the expected future cash flows attributable to intangible assets allow the recovery of the carrying amount of these assets recorded as of December 31, 2014 (See Note 3.e).
| 16. | GOODWILL |
The following table shows goodwill by the Cash-Generating Unit or group of Cash-Generating Units to which it belongs and changes as of December 31, 2014 and 2013 and January 1, 2013:
Company | Cash Generating Unit | Opening Balance 1/1/2014 ThCh$ | Increases (decreases) | Foreign Currency Translation ThCh$ | Closing Balance 12/31/2014 ThCh$ | |||||||||||||
Empresa Eléctrica Colina Ltda. | Empresa Eléctrica Colina Ltda. | 2,240,478 | — | — | 2,240,478 | |||||||||||||
Compañía Eléctrica Tarapaca S.A. | Generación Chile | 4,656,105 | — | — | 4,656,105 | |||||||||||||
Chilectra S.A. | Chilectra S.A. | 128,374,362 | — | — | 128,374,362 | |||||||||||||
Empresa Nacional de Electricidad S.A | Generación Chile | 731,782,459 | — | — | 731,782,459 | |||||||||||||
Inversiones GasAtacama Holding Ltda. (2) | Inversiones GasAtacama Holding | — | 18,737,737 | 1,466,514 | 20,204,251 | |||||||||||||
|
|
|
|
|
|
|
| |||||||||||
Total | 867,053,404 | 18,737,737 | 1,466,514 | 887,257,655 | ||||||||||||||
|
|
|
|
|
|
|
| |||||||||||
Company | Cash Generating Unit | Opening Balance 1/1/2013 ThCh$ | Transfers from Mergers | Foreign Currency Translation ThCh$ | Closing Balance 12/31/2013 ThCh$ | |||||||||||||
Empresa Eléctrica Colina Ltda. | Empresa Eléctrica Colina Ltda. | 2,240,478 | — | — | 2,240,478 | |||||||||||||
Compañía Eléctrica San Isidro S.A. (1) | 4,656,105 | (4,656,105 | ) | — | — | |||||||||||||
Compañía Eléctrica Tarapacá S.A. (1) | Generación Chile | — | 4,656,105 | — | 4,656,105 | |||||||||||||
Chilectra S.A. | Chilectra S.A. | 128,374,362 | — | — | 128,374,362 | |||||||||||||
Empresa Nacional de Electricidad S.A | Generación Chile | 731,782,459 | — | — | 731,782,459 | |||||||||||||
|
|
|
|
|
|
|
| |||||||||||
Total | 867,053,404 | — | — | 867,053,404 | ||||||||||||||
|
|
|
|
|
|
|
| |||||||||||
| (1) | Empresa Eléctrica Pangue S.A. was merged with Compañía Eléctrica San Isidro S.A. on May 1, 2012; it is the latter company that legally continues to exist. Compañía Eléctrica San Isidro S.A. was merged with Endesa Eco S.A. on September 1, 2013; it is the latter company that legally continues to exist. Endesa Eco S.A. was merged with Compañía Eléctrica Tarapacá S.A. on November 1, 2013; it is the latter company that legally continues to exist. |
| (2) | See Notes 2.4.1 and 5. |
F-174
Table of Contents
According to the Combined Group management’s estimates and projections, the expected future cash flows projections attributable to the Cash-Generating Units or groups of Cash-Generating Units, to which the acquired goodwill has been allocated, allow recovery of its carrying value as of December 31, 2014 (See Note 3.e).
The origin of the goodwill is detailed below:
1.- Empresa Eléctrica de Colina Ltda.
On September 30, 1996, Chilectra S.A. acquired 100% of the company Empresa Eléctrica de Colina Ltda. from the investment company Saint Thomas S.A., which is neither directly nor indirectly related to Chilectra S.A.
2.- Empresa Eléctrica Pangue S.A.
On July 12, 2002, Endesa Chile acquired 2.51% of the shares of Empresa Eléctrica Pangue S.A. through a put option held by the minority shareholder Internacional Finance Corporation (IFC).
On May 2, 2012, Empresa Eléctrica Pangue S.A. merged with Compañía Eléctrica San Isidro S.A.; it is the latter company that legally continues to exist.
3.- Compañía Eléctrica San Isidro S.A.
On August 11, 2005, Endesa Chile bought the shares of the company Inversiones Lo Venecia Ltda., whose only asset was a 25% interest in the company San Isidro S.A. (minority shareholder purchase).
4.- Chilectra S.A.
In November 2000, Enersis S.A. purchased an additional 25.4% interest in Chilectra S.A. through a purchasing power of attorney in a public bidding process, reaching a 99.99% stake in the company.
5.- Empresa Nacional de Electricidad S.A.
On May 11, 1999, Enersis S.A. acquired an additional 35% in Endesa Chile in a public bidding process on the Santiago Stock Exchange and by buying shares in the U.S. (30% and 5%, respectively), reaching a 60% interest in the generation company.
6.- Inversiones GasAtacama Holding Limitada.
On April 22, 2014, Endesa Chile acquired the 50% interest in Inversiones GasAtacama Holding Limitada that was owned at that time by Southern Cross Latin America Private Equity Fund III L.P (see Notes 2.4.1 and 5).
F-175
Table of Contents
| 17. | PROPERTY, PLANT AND EQUIPMENT |
The following table shows property, plant and equipment as of December 31, 2014 and 2013 and January 1, 2013:
Classes of Property, Plant and Equipment, Net | 12-31-2014 ThCh$ | 12-31-2013 ThCh$ | 1-1-2013 ThCh$ | |||||||||
Property, Plant and Equipment, Net | 3,283,760,776 | 2,880,470,635 | 2,810,746,294 | |||||||||
Construction in progress | 526,367,579 | 425,836,637 | 306,937,371 | |||||||||
Land | 61,050,488 | 57,582,247 | 51,617,936 | |||||||||
Buildings | 10,149,650 | 9,971,705 | 10,139,645 | |||||||||
Plant and equipment | 2,626,471,522 | 2,348,545,639 | 2,403,461,358 | |||||||||
Fixtures and fittings | 38,649,831 | 16,608,442 | 15,809,761 | |||||||||
Other property, plant and equipment under financial lease | 21,071,706 | 21,925,965 | 22,780,223 | |||||||||
Classes of Property, Plant and Equipment, Gross | 12-31-2014 ThCh$ | 12-31-2013 ThCh$ | 1-1-2013 ThCh$ | |||||||||
Property, Plant and Equipment, Gross | 6,080,079,331 | 5,394,224,952 | 5,213,376,199 | |||||||||
Construction in progress | 526,367,579 | 425,836,637 | 306,937,371 | |||||||||
Land | 61,050,488 | 57,582,247 | 51,617,936 | |||||||||
Buildings | 20,219,104 | 19,559,422 | 19,492,672 | |||||||||
Plant and equipment | 5,362,568,353 | 4,813,576,765 | 4,757,182,529 | |||||||||
Fixtures and fittings | 81,113,776 | 48,909,849 | 49,385,660 | |||||||||
Other property, plant and equipment under financial lease | 28,760,031 | 28,760,032 | 28,760,031 | |||||||||
Classes of Accumulated Depreciation and Impairment in Property, | 12-31-2014 ThCh$ | 12-31-2013 ThCh$ | 1-1-2013 ThCh$ | |||||||||
Total Accumulated Depreciation and Impairment in Property, Plant and Equipment | (2,796,318,555 | ) | (2,513,754,317 | ) | (2,402,629,905 | ) | ||||||
Buildings | (10,069,454 | ) | (9,587,717 | ) | (9,353,027 | ) | ||||||
Plant and equipment | (2,736,096,831 | ) | (2,465,031,126 | ) | (2,353,721,171 | ) | ||||||
Fixtures and fittings | (42,463,945 | ) | (32,301,407 | ) | (33,575,899 | ) | ||||||
Other property, plant and equipment under financial lease | (7,688,325 | ) | (6,834,067 | ) | (5,979,808 | ) | ||||||
The detail and changes in property, plant, and equipment during the years ended December 31, 2014 and 2013 are as follows:
Changes in 2014 | Construction in Progress ThCh$ | Land ThCh$ | Buildings, Net ThCh$ | Plant and Equipment, Net ThCh$ | Fixtures and Fittings, Net ThCh$ | Other Property, Plant and Equipment under Finance Lease, Net ThCh$ | Property, Plant and Equipment, Net ThCh$ | |||||||||||||||||||||||
Opening balance January 1, 2014 | 425,836,637 | 57,582,247 | 9,971,705 | 2,348,545,639 | 16,608,442 | 21,925,965 | 2,880,470,635 | |||||||||||||||||||||||
| Increases other than from business combinations | 318,751,963 | — | — | 3,988 | 1,796,610 | — | 320,552,561 | ||||||||||||||||||||||
| Acquisitions through business combinations | 10,802,165 | 3,216,432 | — | 171,934,311 | 13,707,483 | — | 199,660,391 | |||||||||||||||||||||||
| Increases (decreases) from exchange differences, net | 1,690,772 | 466,822 | — | 33,352,192 | 1,553,738 | — | 37,063,524 | |||||||||||||||||||||||
| Depreciation (1) | — | — | (481,737 | ) | (118,822,062 | ) | (2,324,987 | ) | (854,258 | ) | (122,483,044 | ) | ||||||||||||||||||
| Impairment losses recognized in profit or loss (1) | — | — | — | (12,529,820 | ) | — | — | (12,529,820 | ) | |||||||||||||||||||||
| Increases (decreases) from transfers and other changes | (227,696,726 | ) | 74 | 659,682 | 224,759,203 | 2,277,767 | — | — | ||||||||||||||||||||||
Increases (decreases) from transfers | (227,696,726 | ) | 74 | 659,682 | 224,759,203 | 2,277,767 | — | — | ||||||||||||||||||||||
Increases (decreases) from transfers from constructions in progress | (227,696,726 | ) | 74 | 659,682 | 224,759,203 | 2,277,767 | — | — | ||||||||||||||||||||||
Increases (decreases) from other changes | — | |||||||||||||||||||||||||||||
| Disposals and removals from service | — | — | — | (392,778 | ) | (35,900 | ) | — | (428,678 | ) | ||||||||||||||||||||
Disposals | — | — | — | — | — | — | — | |||||||||||||||||||||||
Removals | — | — | — | (392,778 | ) | (35,900 | ) | — | (428,678 | ) | ||||||||||||||||||||
| Other increases (decreases) | (3,017,232 | ) | (215,087 | ) | — | (636,920 | ) | 5,066,678 | (1 | ) | 1,197,438 | |||||||||||||||||||
|
|
|
|
|
|
|
|
|
|
|
|
|
| |||||||||||||||||
| Total changes | 100,530,942 | 3,468,241 | 177,945 | 277,925,883 | 22,041,389 | (854,259 | ) | 403,290,141 | ||||||||||||||||||||||
|
|
|
|
|
|
|
|
|
|
|
|
|
| |||||||||||||||||
Closing balance December 31, 2014 | 526,367,579 | 61,050,488 | 10,149,650 | 2,626,471,522 | 38,649,832 | 21,071,706 | 3,283,760,776 | |||||||||||||||||||||||
|
|
|
|
|
|
|
|
|
|
|
|
|
| |||||||||||||||||
F-176
Table of Contents
Changes in 2013 | Construction in Progress ThCh$ | Land ThCh$ | Buildings, Net ThCh$ | Plant and Equipment, Net ThCh$ | Fixtures and Fittings, Net ThCh$ | Other Property, Plant and Equipment under Finance Lease, Net ThCh$ | Property, Plant and Equipment, Net ThCh$ | |||||||||||||||||||||||
Opening balance January 1, 2013 | 306,937,371 | 51,617,936 | 10,139,645 | 2,403,461,358 | 15,809,761 | 22,780,223 | 2,810,746,294 | |||||||||||||||||||||||
| Increases other than from business combinations | 187,120,080 | — | — | — | 1,314,925 | — | 188,435,005 | ||||||||||||||||||||||
| Acquisitions through business combinations | — | — | — | — | — | — | — | |||||||||||||||||||||||
| Increases (decreases) from exchange differences, net | — | — | — | — | — | — | — | |||||||||||||||||||||||
| Depreciation (1) | — | — | (601,563 | ) | (109,506,089 | ) | (2,794,166 | ) | (854,258 | ) | (113,756,076 | ) | ||||||||||||||||||
| Impairment losses recognized in profit or loss (1) | (272,181 | ) | — | — | — | — | — | (272,181 | ) | |||||||||||||||||||||
| Increases (decreases) from transfers and other changes | (66,461,341 | ) | (118,739 | ) | 507,728 | 68,359,995 | 2,712,357 | — | — | |||||||||||||||||||||
Increases (decreases) from transfers | (66,461,341 | ) | (118,739 | ) | 507,728 | 63,359,995 | 2,712,357 | — | — | |||||||||||||||||||||
Increases (decreases) from transfers from constructions in progress | (66,461,341 | ) | (118,739 | ) | 507,728 | 63,359,995 | 2,712,357 | — | — | |||||||||||||||||||||
Increases (decreases) from other changes | — | — | — | — | — | — | — | |||||||||||||||||||||||
| Disposals and removals from service | (1,459,819 | ) | (847,678 | ) | 338,148 | (3,581,803 | ) | (420,227 | ) | — | (5,971,379 | ) | ||||||||||||||||||
Disposals | — | — | — | — | — | — | — | |||||||||||||||||||||||
Removals | (1,459,819 | ) | (847,678 | ) | 338,148 | (3,581,803 | ) | (420,227 | ) | — | (5,971,379 | ) | ||||||||||||||||||
| Other increases (decreases) | (27,473 | ) | 6,930,728 | (412,253 | ) | 4,960,286 | (14,208 | ) | — | 11,437,080 | ||||||||||||||||||||
|
|
|
|
|
|
|
|
|
|
|
|
|
| |||||||||||||||||
| Total changes | 118,899,266 | 5,964,311 | (167,940 | ) | (54,915,719 | ) | 798,681 | (854,258 | ) | 69,724,341 | ||||||||||||||||||||
|
|
|
|
|
|
|
|
|
|
|
|
|
| |||||||||||||||||
Closing balance December 31, 2013 | 425,836,637 | 57,582,247 | 9,971,705 | 2,348,545,639 | 16,608,442 | 21,925,965 | 2,880,470,635 | |||||||||||||||||||||||
|
|
|
|
|
|
|
|
|
|
|
|
|
| |||||||||||||||||
| (1) | See Note 30. |
Additional information on property, plant and equipment, net
a) Main investments
Major additions to property, plant and equipment are investments in operating plants and new projects amounting to ThCh$320,552,561 and ThCh$188,435,005 for the years ended December 31, 2014 and 2013, respectively. In the generation business the main investments include maintenance to plants of ThCh$253,740,453 and ThCh$128,049,150 for the years ended December 31, 2014 and 2013, respectively. In the distribution business major investments are network extensions and investments to optimize their operation, in order to improve the efficiency and quality of service, amounting to ThCh$62,680,946 and ThCh$52,898,690 for the years ended December 31, 2014 and 2013, respectively.
b) Finance leases
As of December 31, 2014 and 2013 and January 1, 2013, property, plant and equipment includes ThCh$21,071,706, ThCh$21,925,965 and ThCh$22,780,223, respectively, in leased assets classified as finance leases.
The present value of future lease payments derived from these finance leases is as follows:
| 12-31-2014 | 12-31-2013 | 1-1-2013 | ||||||||||||||||||||||||||||||||||
| Gross ThCh$ | Interest ThCh$ | Present Value ThCh$ | Gross ThCh$ | Interest ThCh$ | Present Value ThCh$ | Gross ThCh$ | Interest ThCh$ | Present Value ThCh$ | ||||||||||||||||||||||||||||
Less than one year | 2,427,000 | 956,437 | 1,470,563 | 2,098,440 | 904,559 | 1,193,881 | 1,919,840 | 894,236 | 1,025,604 | |||||||||||||||||||||||||||
From one to five years | 9,708,000 | 2,270,534 | 7,437,466 | 8,393,760 | 2,790,113 | 5,603,647 | 7,679,360 | 2,265,107 | 5,414,253 | |||||||||||||||||||||||||||
More than five years | 11,601,579 | 1,386,142 | 10,215,437 | 12,129,434 | 1,198,490 | 10,930,944 | 13,016,927 | 2,211,594 | 10,805,333 | |||||||||||||||||||||||||||
|
|
|
|
|
|
|
|
|
|
|
|
|
|
|
|
|
| |||||||||||||||||||
Total | 23,736,579 | 4,613,112 | 19,123,467 | 22,621,634 | 4,893,162 | 17,728,472 | 22,616,127 | 5,370,937 | 17,245,190 | |||||||||||||||||||||||||||
|
|
|
|
|
|
|
|
|
|
|
|
|
|
|
|
|
| |||||||||||||||||||
Leased assets primarily relate to a lease agreement for Electric Transmission Lines and Installations (Ralco-Charrúa 2X220 KV) entered into between Endesa Chile and Abengoa Chile S.A. The lease agreement has a 20-year maturity and bears interest at an annual rate of 6.5%.
c) Operating leases
The combined statements of income for the years ended December 31, 2014 and 2013 include ThCh$6,734,776 and ThCh$8,043,094, respectively, corresponding to operating lease contracts for material assets in operation.
F-177
Table of Contents
As of December 31, 2014 and 2013 and January 1, 2013, the total future lease payments under those contracts are as follows:
| 12-31-2014 ThCh$ | 12-31-2013 ThCh$ | 1-1-2013 ThCh$ | ||||||||||
Less than one year | 8,566,303 | 13,045,665 | 10,000,006 | |||||||||
From one to five years | 16,634,394 | 19,887,638 | 10,459,805 | |||||||||
More than five years | 10,064,425 | 11,036,942 | 1,712,415 | |||||||||
|
|
|
|
|
| |||||||
Total | 35,265,122 | 43,970,245 | 22,172,226 | |||||||||
|
|
|
|
|
| |||||||
d) Other information
i) As of December 31, 2014 and 2013 and January 1, 2013, the Combined Group had contractual commitments for the acquisition of property, plant and equipment amounting to ThCh$170,911,479, ThCh$80,459,620 and ThCh$15,067,890, respectively.
ii) As of December 31, 2014 and 2013 and January 1, 2013, the Combined Group does not have any property, plant and equipment pledged as security for liabilities (see Note 36).
iii) The Combined Group and its combined entities have insurance policies for all risks, earthquake and machinery breakdown and damages for business interruption with a €1,000 million limit in the case of generating companies and a €50 million limit for distribution companies, including business interruption coverage. Additionally, the Combined Group has Civil Liability insurance to meet claims from third parties with a €500 million limit. The insurance premiums associated with these policies are presented proportionally for each company in the caption “Prepaid expenses”.
iv) The situation of certain assets of our subsidiary Endesa Chile has changed, primarily works and infrastructure for facilities built to support power generation in the SIC grid in 1998, due primarily to the installation in the SIC of new thermoelectric plants, the arrival of LNG, and new projects that will be starting up soon. This has resulted in a new supply configuration for the upcoming years, in which it is expected that these facilities will not need to be used. Accordingly, in 2009, the Combined Group recognized an impairment loss of ThCh$43,999,600 for these assets, which is still in effect.
v) On October 16, 2012, Endesa Chile began the collection process on all of the bank performance bonds guaranteeing compliance with the works and correct, timely execution of these works as specified in the agreement “Bocamina Thermal Plant Expansion Project”, contract ACP-003.06. This is a turnkey project for a 350 MW coal-fired thermal generation plant (“the contract”) signed on July 25, 2007 between Empresa Nacional de Electricidad S.A. (“the owner”) and the consortium consisting of (i) the Chilean company Ingeniería y Construcción Tecnimont Chile y Compañía Limitada; (ii) the Italian company Tecnimont SpA; (iii) the Brazilian company Tecnimont do Brasil Construcao e Administracao de Projetos Ltda; (iv) the Slovakian company Slovenske Energeticke Strojarne a.s. (“SES”); and (v) the Chilean company Ingeniería y Construcción SES Chile Limitada; (all referred to collectively as “the Contractor” or “the Consortium”).
These performance bonds amounted to US$74,795,164.44 and UF 796,594.29 (approximately US$38,200,000). As of January 1, 2013 it was collected US$93,992,554 of these bonds and currently it is still pending to collect US$18,940,295, equivalent to ThCh$11,492,024 in local currency (see Note 36.3.6).
Collection made on these bank performance bonds reduced the cost overruns incurred by the company due to breach of contract; they were capitalized into the Project.
Together collecting on the bonds, Endesa Chile has reserved all of the rights conferred upon it under the Contract and applicable national legislation to demand complete, timely compliance with the obligations agreed to by the Contractor.
On October 17, 2012, Endesa Chile filed an arbitration request with the International Chamber of Arbitration of Paris in order to enforce the rights conferred upon it under the Contract.
F-178
Table of Contents
vi) At the end of 2012, our subsidiary Compañía Eléctrica Tarapacá S.A. recognized an impairment loss for ThCh$12,578,098, to adjust the carrying amount of its Property, plant and equipment to their recoverable value (see Note 3.e).
vii) At the end of 2014, our subsidiary Endesa Chile recognized an impairment loss for ThCh$12,581,947 related to the Punta Alcalde project. This impairment loss arises because the current definition of the project is not fully aligned with the strategy that the Combined Group is reformulating, particularly with regard to technological leadership, and to community and environmental sustainability. Endesa Chile has decided to suspend the project as its profitability is still unclear (see Note 3.e).
| 18. | INVESTMENT PROPERTY |
The detail and changes in investment property during the years ended December 31, 2014 and 2013, are as follows:
| Investment Properties, Gross | Accumulated Depreciation, Amortization and Impairment | Investment Properties, Net | ||||||||||
Investment Properties | ThCh$ | ThCh$ | ThCh$ | |||||||||
Balance at January 1, 2013 | 51,003,011 | (4,080,041 | ) | 46,922,970 | ||||||||
Additions | 2,487,919 | — | 2,487,919 | |||||||||
Disposals (1) | (6,443,325 | ) | 2,127,925 | (4,315,400 | ) | |||||||
Depreciation expense | — | (59,078 | ) | (59,078 | ) | |||||||
Impairment losses recognized in profit or loss | — | (159,362 | ) | (159,362 | ) | |||||||
Balance at December 31, 2013 | 47,047,605 | (2,170,556 | ) | 44,877,049 | ||||||||
Additions | 1,463,242 | — | 1,463,242 | |||||||||
Land sales (1) | (1,806,675 | ) | — | (1,806,675 | ) | |||||||
Disposals related to the sale of combined entities (2) | (36,040,698 | ) | — | (36,040,698 | ) | |||||||
Depreciation expense | — | (30,483 | ) | (30,483 | ) | |||||||
Impairment losses reversed, recognized in profit or loss | — | 52,127 | 52,127 | |||||||||
Balance at December 31, 2014 | 10,663,474 | (2,148,912 | ) | 8,514,562 | ||||||||
| (1) | The sale prices of investment properties disposed of years 2014 and 2013 were ThCh$9,363,249 and ThCh$16,510,931, respectively. |
| (2) | See Note 32. |
-Fair value measurement and hierarchy
As of December 31, 2014, the fair value of the Combined Group’s investment properties was ThCh$12,272,521 which was determined using independent appraisals.
The fair value measurement for these investment properties was categorized as Level 2.
For the years ended December 31, 2014 and 2013, the detail of income and expenses from investment properties is as follows:
| For the years ended | ||||||||
| 12-31-2014 | 12-31-2013 | |||||||
Income and expense from investment properties | ThCh$ | ThCh$ | ||||||
Rental income from investment properties | 263,643 | 341,494 | ||||||
Income from the sale of investment properties (*) | 9,363,249 | 16,510,931 | ||||||
Direct operating expense from investment properties generating rental income | (328,590 | ) | (192,963 | ) | ||||
Direct operating expense from investment properties not generating rental income (*) | (1,806,675 | ) | (4,315,400 | ) | ||||
|
|
|
| |||||
Total | 7,491,627 | 12,344,062 | ||||||
|
|
|
| |||||
| (*) | See Note 32. |
F-179
Table of Contents
The Combined Group has no repair, maintenance, acquisition, construction or development agreements that represent future obligations for the Combined Group as of December 31, 2014 (ThCh$971,776 as of December 31, 2013 and ThCh$0 as of January 1, 2013).
The Combined Group has insurance policies to cover operational risks of its investment properties, as well as to cover legal claims against the Combined Group that could potentially arise from exercising its business activity. Management considers that the insurance policy coverage is sufficient against the risks involved.
| 19. | DEFERRED TAXES |
a. The origination and changes in deferred tax assets and liabilities as of December 31, 2014 and 2013 and January 1, 2013 are as follows:
Deferred Tax Assets | Deferred Tax Assets Relating to | Deferred Tax Assets | ||||||||||||||||||||||||||||
| Accumulated Depreciation | Provisions | Post-employment benefit obligations | Revaluation of financial instruments | Tax Loss Carryforwards | Other | |||||||||||||||||||||||||
Opening balance January 1, 2014 | 1,409,000 | 2,471,333 | — | — | 1,710,288 | 5,660,926 | 11,251,547 | |||||||||||||||||||||||
| Increase (decrease) in profit or loss | (1,110,934 | ) | 3,894,698 | (1,218,281 | ) | (1,716 | ) | 6,297,437 | 6,750,316 | 14,611,520 | |||||||||||||||||||
Increase (decrease) in other comprehensive income | — | — | 4,488,450 | 1,716 | — | (1,084 | ) | 4,489,082 | ||||||||||||||||||||||
Acquisitions through business combinations (1) | — | 879,716 | — | — | 537,932 | 974,883 | 2,392,531 | |||||||||||||||||||||||
Disinvestments through selling businesses (1) | (107,241 | ) | (34,403 | ) | — | — | (329,845 | ) | (5,816,292 | ) | (6,287,781 | ) | ||||||||||||||||||
Foreign currency translation | — | 361,135 | — | — | — | 155,705 | 516,840 | |||||||||||||||||||||||
Transfers to (from) Non-current assets and groups held for sale | — | (29,583 | ) | (1,761 | ) | — | (1,448,281 | ) | (1,142,270 | ) | (2,621,895 | ) | ||||||||||||||||||
| Other increase (decreases) | (2 | ) | (1,744,590 | ) | (3,106,043 | ) | — | (1,915,692 | ) | (4,620,422 | ) | (11,386,749 | ) | |||||||||||||||||
Closing balance December 31, 2014 | 190,823 | 5,798,306 | 162,365 | — | 4,851,839 | 1,961,762 | 12,965,095 | |||||||||||||||||||||||
Deferred Tax Assets | Deferred Tax Assets Relating to | Deferred Tax Assets | ||||||||||||||||||||||||||||
| Accumulated Depreciation | Provisions | Post-employment benefit obligations | Revaluation of financial instruments | Tax Loss Carryforwards | Other | |||||||||||||||||||||||||
Opening balance January 1, 2013 | 3,366,028 | 2,489,026 | (1 | ) | (1 | ) | 8,635,197 | 3,554,687 | 18,044,936 | |||||||||||||||||||||
| Increase (decrease) in profit or loss | (205,618 | ) | 1,678,133 | (358,834 | ) | — | (14,647,929 | ) | 2,506 | (13,531,742 | ) | ||||||||||||||||||
Increase (decrease) in other comprehensive income | — | — | 490,159 | — | 5,010,578 | — | 5,500,737 | |||||||||||||||||||||||
| Foreign currency translation | 2 | — | — | — | — | — | 2 | |||||||||||||||||||||||
| Other increases (decreases) | (1,751,412 | ) | (1,695,826 | ) | (131,324 | ) | 1 | 2,712,442 | 2,103,733 | 1,237,614 | ||||||||||||||||||||
Closing balance December 31, 2013 | 1,409,000 | 2,471,333 | — | — | 1,710,288 | 5,660,926 | 11,251,547 | |||||||||||||||||||||||
Deferred Tax Liabilities | Deferred Tax Liabilities Relating to | Deferred Tax Liabilities | ||||||||||||||||||||||||
| Accumulated depreciation | Provisions | Post-employment benefit obligations | Revaluation of financial instruments | Other | ||||||||||||||||||||||
Opening balance January 1, 2014 | 172,945,228 | — | 20,818 | 3,933,526 | 1,649 | 176,901,221 | ||||||||||||||||||||
| Increase (decrease) in profit or loss | 60,395,908 | 379 | (457,558 | ) | (4,490,773 | ) | 1,399,160 | 56,847,116 | |||||||||||||||||
| Increase (decrease) in other comprehensive income | — | — | (20,511 | ) | 557,247 | 378 | 537,114 | |||||||||||||||||||
| Acquisitions through business combinations | 27,088,856 | — | — | — | 1,834,311 | 28,923,167 | ||||||||||||||||||||
| Disinvestments through selling businesses | — | — | — | — | — | — | ||||||||||||||||||||
| Foreign currency translation | 3,324,089 | — | — | — | 77,065 | 3,401,154 | ||||||||||||||||||||
Transfers to (from) Non-current assets and groups held for sale | — | — | — | — | — | — | ||||||||||||||||||||
| Other increase (decreases) | (10,758,834 | ) | — | 473,749 | — | (1,102,021 | ) | (11,387,106 | ) | |||||||||||||||||
Closing balance December 31, 2014 | 252,995,247 | 379 | 16,498 | — | 2,210,542 | 255,222,666 | ||||||||||||||||||||
F-180
Table of Contents
Deferred Tax Liabilities | Deferred Tax Liabilities Relating to | Deferred Tax Liabilities | ||||||||||||||||||||||||
| Accumulated depreciation | Provisions | Post-employment benefit obligations | Revaluation of financial instruments | Other | ||||||||||||||||||||||
Opening balance January 1, 2013 | 179,912,972 | — | 17,080 | 5,224,632 | 2,157,060 | 187,311,744 | ||||||||||||||||||||
| Increase (decrease) in profit or loss | (8,772,530 | ) | — | 71,264 | 937,186 | (2,031,600 | ) | (9,795,680 | ) | ||||||||||||||||
| Increase (decrease) in other comprehensive income | (476 | ) | — | (161,890 | ) | (2,228,292 | ) | 22 | (2,390,636 | ) | ||||||||||||||||
| Acquisitions through business combinations | — | — | — | — | — | — | ||||||||||||||||||||
| Disinvestments through selling businesses | — | — | — | — | — | — | ||||||||||||||||||||
| Foreign currency translation | — | — | — | — | — | — | ||||||||||||||||||||
| Other increases (decreases) | 1,805,262 | — | 94,364 | — | (123,833 | ) | 1,775,793 | |||||||||||||||||||
Closing balance December 31, 2013 | 172,945,228 | — | 20,818 | 3,933,526 | 1,649 | 176,901,221 | ||||||||||||||||||||
| (1) | See Note 2.4.1 and 5. |
Recovery of deferred tax assets will depend on whether sufficient taxable profits will be obtain in the future. The Combined Group believes that the future profit projections for its combined entities will allow these assets to be recovered.
b. As of December 31, 2014 and 2013 and January 1, 2013, the Combined Group has unrecognized deferred tax assets related to tax loss carryforwards totaling ThCh$351,900, ThCh$611,400, and ThCh$1,691,200, respectively. See Note 3.o.
The Combined Group has unrecognized deferred tax liabilities for taxable temporary differences associated with investment in combined entities and joint ventures, as it is able to control the timing of the reversal of the temporary differences and considers that it is probable that such temporary differences will not reverse in the foreseeable future. As of December 31, 2014 and 2013 and January 1, 2013 , the aggregate amount of taxable temporary differences associated with investments in combined entities and joint ventures for which deferred tax liabilities have not been recognized totaled ThCh$426,167,022, ThCh$200,658,751 and ThCh$187,263,671, respectively.
Additionally, the Combined Group has not recognized deferred tax asset for deductible temporary differences which as of December 31, 2014 and 2013 and January 1, 2013 , totaled ThCh$966,314,793, ThCh$737,394,169 and ThCh$868,176,194, respectively, as it is not probable that sufficient future taxable profits exist to recover such temporary differences.
The Combined Group entities are potentially subject to income tax audits by the Chilean tax regulator and are limited to three tax years after which tax audits over those years can no longer be performed. Tax audits by nature are often complex and can require several years to complete. The tax years potentially subject to examination are 2012 through 2014.
Given the range of possible interpretations of tax standards, the results of any future inspections carried out by Chilean tax authority for the years subject to audit can give rise to tax liabilities that cannot currently be quantified objectively. Nevertheless, management estimates that the liabilities, if any, that may arise from such tax audits, would not significantly impact the Combined Group’s future results.
The effects of deferred tax on the components of other comprehensive income are as follows:
Effects of Deferred Tax on the Components of Other Comprehensive Income | Year ended December 31, 2014 | Year ended December 31, 2013 | ||||||||||||||||||||||
| Amount Before Tax ThCh$ | Income Tax Expense (Benefit) ThCh$ | Amount After Tax ThCh$ | Amount Before Tax | Income Tax Expense (Benefit) | Amount After Tax | |||||||||||||||||||
| ThCh$ | ThCh$ | ThCh$ | ||||||||||||||||||||||
Available-for-sale financial assets | 1,849 | (1,462 | ) | 387 | (2,273 | ) | 455 | (1,818 | ) | |||||||||||||||
Cash flow hedge | (131,355,881 | ) | 31,585,153 | (99,770,728 | ) | (70,928,723 | ) | 10,955,996 | (59,972,727 | ) | ||||||||||||||
Share of other comprehensive income from associates and joint ventures accounted for using the equity method | 13,476,871 | — | 13,476,871 | 8,699,592 | — | 8,699,592 | ||||||||||||||||||
Foreign currency translation | 12,473,950 | — | 12,473,950 | 12,286,748 | — | 12,286,748 | ||||||||||||||||||
Actuarial gains(losses) on defined-benefit pension plans | (12,692,856 | ) | 4,527,209 | (8,165,647 | ) | (3,260,244 | ) | 652,049 | (2,608,195 | ) | ||||||||||||||
Income tax related to components of other comprehensive income | (118,096,067 | ) | 36,110,900 | (81,985,167 | ) | (53,204,900 | ) | 11,608,500 | (41,596,400 | ) | ||||||||||||||
F-181
Table of Contents
c. In Chile, Law No. 20,780 was published in the Official Gazette on September 29, 2014. It changes the income tax system and other taxes, by replacing the current tax system in 2017 with two alternative tax systems: the attributed income system and partially integrated system.
This Law gradually increases the rate of income tax on corporate income. Thus, it will increase to 21% in 2014, to 22.5% in 2015 and to 24% in 2016. As from 2017 taxpayers choosing the attributed income system will be subject to a rate of 25%, while companies choosing the partially integrated system will be subject to a rate of 25.5% in 2017 and 27% in 2018.
Furthermore, this Law establishes that the partially integrated system will apply by default to open stock companies, unless a future Extraordinary Shareholders’ Meeting agrees to adopt the attributed income system.
The Combined Group assumes that, since an Extraordinary Shareholders’ Meeting has not agreed to adopt the alternative system, the partially integrated system applies by default. Therefore, changes in deferred tax assets and liabilities as a direct effect of the increase in the corporate income tax rate have been recognized in profit or loss. Specifically, as of December 31, 2014 the net charge against income was a loss of ThCh$66,669,816.
| 20. | OTHER FINANCIAL LIABILITIES |
The balances of other financial liabilities as of December 31, 2014 and 2013 and January 1, 2013 are as follows:
Other Financial Liabilities | 12-31-2014 | 12-31-2013 | 1-1-2013 | |||||||||||||||||||||
| Current ThCh$ | Non-current ThCh$ | Current ThCh$ | Non-current ThCh$ | Current ThCh$ | Non-current ThCh$ | |||||||||||||||||||
Interest-bearing borrowings | 143,170,408 | 743,672,174 | 123,125,951 | 574,924,355 | 217,822,784 | 646,439,270 | ||||||||||||||||||
Hedging derivatives (*) | 667,153 | 28,176,011 | 1,280,496 | — | 91,276 | 3,214,525 | ||||||||||||||||||
Non-hedging derivatives (**) | 2,526,798 | 6,286,982 | 164,983 | — | — | — | ||||||||||||||||||
Obligation for Túnel el Melón concession | — | — | 2,692,424 | 4,479,251 | 2,442,849 | 7,027,434 | ||||||||||||||||||
|
|
|
|
|
|
|
|
|
|
|
| |||||||||||||
Total | 146,364,359 | 778,135,167 | 127,263,854 | 579,403,606 | 220,356,909 | 656,681,229 | ||||||||||||||||||
|
|
|
|
|
|
|
|
|
|
|
| |||||||||||||
| (*) | See Note 22.2.a |
| (**) | See Note 22.2.b |
| 20.1 | Interest-bearing borrowings |
The detail of current and non-current interest-bearing borrowings as of December 31, 2014 and 2013 and January 1, 2013 is as follows:
Classes of Loans that Accrue | 12-31-2014 | 12-31-2013 | 1-1-2013 | |||||||||||||||||||||
| Current ThCh$ | Non-current ThCh$ | Current ThCh$ | Non-current ThCh$ | Current ThCh$ | Non-current ThCh$ | |||||||||||||||||||
Bank loans | 1,008,956 | — | 106,492,963 | 858,299 | 1,547,154 | 97,967,390 | ||||||||||||||||||
Unsecured obligations | 140,690,889 | 726,019,271 | 15,439,104 | 557,531,468 | 213,227,767 | 532,252,294 | ||||||||||||||||||
Secured obligations | — | — | — | — | — | — | ||||||||||||||||||
Financial leases | 1,470,563 | 17,652,903 | 1,193,884 | 16,534,588 | 1,025,604 | 16,219,586 | ||||||||||||||||||
Other obligations | — | — | — | — | 2,022,260 | — | ||||||||||||||||||
|
|
|
|
|
|
|
|
|
|
|
| |||||||||||||
Total | 143,170,408 | 743,672,174 | 123,125,951 | 574,924,355 | 217,822,785 | 646,439,270 | ||||||||||||||||||
|
|
|
|
|
|
|
|
|
|
|
| |||||||||||||
F-182
Table of Contents
Bank loans by currency and contractual maturity as of December 31, 2014 and 2013 and January 1, 2013, are as follows:
Summary of bank loans by currency and maturity
Country | Currency | Nominal Interest Rate | Secured/ Unsecured | Current | Non-current | |||||||||||||||||||||||||||||||||||||||||||
| Maturity | Total Current at 12/31/2014 | Maturity | Total Non- current at 12/31/2014 | |||||||||||||||||||||||||||||||||||||||||||||
| One to three months | Three to twelve months | One to two years | Two to three years | Three to four years | Four to five years | Over five years | ||||||||||||||||||||||||||||||||||||||||||
| ThCh$ | ThCh$ | ThCh$ | ThCh$ | ThCh$ | ThCh$ | ThCh$ | ThCh$ | ThCh$ | ||||||||||||||||||||||||||||||||||||||||
Chile | US$ | 5.98 | % | Unsecured | — | 1,007,362 | 1,007,362 | — | — | — | — | — | — | |||||||||||||||||||||||||||||||||||
Chile | Ch$ | 5.47 | % | Unsecured | 1,594 | — | 1,594 | — | — | — | — | — | — | |||||||||||||||||||||||||||||||||||
|
|
|
|
|
|
|
|
|
|
|
|
|
|
|
|
|
| |||||||||||||||||||||||||||||||
Total | 1,594 | 1,007,362 | 1,008,956 | — | — | — | — | — | — | |||||||||||||||||||||||||||||||||||||||
|
|
|
|
|
|
|
|
|
|
|
|
|
|
|
|
|
| |||||||||||||||||||||||||||||||
Country | Currency | Nominal Interest Rate | Secured/ Unsecured | Current | Non-current | |||||||||||||||||||||||||||||||||||||||||||
| Maturity | Total Current at 12/31/2013 ThCh$ | Maturity | Total Non- current at 12/31/2013 | |||||||||||||||||||||||||||||||||||||||||||||
| One to three months | Three to twelve months | One to two years | Two to three years | Three to four years | Four to five years | Over five years | ||||||||||||||||||||||||||||||||||||||||||
| ThCh$ | ThCh$ | ThCh$ | ThCh$ | ThCh$ | ThCh$ | ThCh$ | ThCh$ | |||||||||||||||||||||||||||||||||||||||||
Chile | US$ | 2.29 | % | Unsecured | 404,070 | 106,087,171 | 106,491,241 | 858,299 | — | — | — | — | 858,299 | |||||||||||||||||||||||||||||||||||
Chile | Ch$ | 5.91 | % | Unsecured | — | 199 | 199 | — | — | — | — | — | — | |||||||||||||||||||||||||||||||||||
Chile | Ch$ | 5.00 | % | Unsecured | 1,519 | — | 1,519 | — | — | — | — | — | — | |||||||||||||||||||||||||||||||||||
Chile | Ch$ | 5.67 | % | Unsecured | 4 | — | 4 | — | — | — | — | — | — | |||||||||||||||||||||||||||||||||||
|
|
|
|
|
|
|
|
|
|
|
|
|
|
|
|
|
| |||||||||||||||||||||||||||||||
Total | 405,593 | 106,087,370 | 106,492,963 | 858,299 | — | — | — | — | 858,299 | |||||||||||||||||||||||||||||||||||||||
|
|
|
|
|
|
|
|
|
|
|
|
|
|
|
|
|
| |||||||||||||||||||||||||||||||
Country | Currency | Nominal Interest Rate | Secured/ Unsecured | Current | Non-current | |||||||||||||||||||||||||||||||||||||||||||
| Maturity | Total Current at 1/1/2013 | Maturity | Total Non- current at 1/1/2013 | |||||||||||||||||||||||||||||||||||||||||||||
| One to three months | Three to twelve months | One to two years | Two to three years | Three to four years | Four to five years | Over five years | ||||||||||||||||||||||||||||||||||||||||||
| ThCh$ | ThCh$ | ThCh$ | ThCh$ | ThCh$ | ThCh$ | ThCh$ | ThCh$ | ThCh$ | ||||||||||||||||||||||||||||||||||||||||
Chile | US$ | 1.76 | % | Unsecured | 354,739 | 1,191,983 | 1,546,722 | 97,182,141 | 785,249 | — | — | — | 97,967,390 | |||||||||||||||||||||||||||||||||||
Chile | Ch$ | 4.90 | % | Unsecured | 432 | — | 432 | — | — | — | — | — | — | |||||||||||||||||||||||||||||||||||
|
|
|
|
|
|
|
|
|
|
|
|
|
|
|
|
|
| |||||||||||||||||||||||||||||||
Total | 355,171 | 1,191,983 | 1,547,154 | 97,182,141 | 785,249 | — | — | — | 97,967,390 | |||||||||||||||||||||||||||||||||||||||
|
|
|
|
|
|
|
|
|
|
|
|
|
|
|
|
|
| |||||||||||||||||||||||||||||||
Fair value measurement and hierarchy
The fair value of current and non-current bank borrowings as of December 31, 2014 and 2013 and January 1, 2013 totaled ThCh$1,027,794, ThCh$107,659,698, and ThCh$99,648,995, respectively. The fair value measurement of borrowings have been categorized as Level 2 (see Note 3.h).
F-183
Table of Contents
– Identification of bank borrowings by company
Taxpayer ID Number | Company | Country | Taxpayer ID Number | Financial Institution | Country | Currency | Effective Interest Rate | Nominal Interest Rate | Amortization | December 31, 2014 | ||||||||||||||||||||||||||||||||||||||||||||||||||||
| Current ThCh$ | Non-Current ThCh$ | |||||||||||||||||||||||||||||||||||||||||||||||||||||||||||||
| Less than 90 days | More than 90 days | Total Current | One to two years | Two to three years | Three to four years | Four to five years | More than five years | Total Non- Current | ||||||||||||||||||||||||||||||||||||||||||||||||||||||
96.800.570-7 | Chilectra S.A. | Chile | 0-E | Credit lines | Chile | Ch$ | 5.91 | % | 5.91 | % | Otra | 133 | — | 133 | — | — | — | — | — | — | ||||||||||||||||||||||||||||||||||||||||||
91.081.000-6 | Endesa Chile S.A. | Chile | Foreign | B.N.P. Paribas | E.E.U.U. | US$ | 6.32 | % | 5.98 | % | Semestral | — | 1,007,362 | 1,007,362 | — | — | — | — | — | — | ||||||||||||||||||||||||||||||||||||||||||
91.081.000-6 | Endesa Chile S.A. | Chile | 97.004.000-5 | Banco Santander | Chile | Ch$ | 6.00 | % | 6.00 | % | Mensual | 1,338 | — | 1,338 | — | — | — | — | — | — | ||||||||||||||||||||||||||||||||||||||||||
94.271.00-3 | Enersis S.A. | Chile | 97.004.000-5 | Banco Santander Chile | Chile | Ch$ | 4.50 | % | 4.50 | % | Al Vencimiento | 123 | — | 123 | — | — | — | — | — | — | ||||||||||||||||||||||||||||||||||||||||||
|
|
|
|
|
|
|
|
|
|
|
|
|
|
|
|
|
| |||||||||||||||||||||||||||||||||||||||||||||
| Total | 1,594 | 1,007,362 | 1,008,956 | — | — | — | — | — | — | |||||||||||||||||||||||||||||||||||||||||||||||||||||
|
|
|
|
|
|
|
|
|
|
|
|
|
|
|
|
|
| |||||||||||||||||||||||||||||||||||||||||||||
Taxpayer ID Number | Company | Country | Taxpayer ID Number | Financial Institution | Country | Currency | Effective Interest Rate | Nominal Interest Rate | Amortization | December 31, 2013 | ||||||||||||||||||||||||||||||||||||||||||||||||||||
| Current ThCh$ | Non-Current ThCh$ | |||||||||||||||||||||||||||||||||||||||||||||||||||||||||||||
| Less than 90 days | More than 90 days | Total Current | One to two years | Two to three years | Three to four years | Four to five years | More than five years | Total Non- Current | ||||||||||||||||||||||||||||||||||||||||||||||||||||||
96.800.570-7 | Chilectra S.A. | Chile | 0-E | Credit lines | Chile | Ch$ | 5.91 | % | 5.91 | % | Other | 198 | — | 198 | — | — | — | — | — | — | ||||||||||||||||||||||||||||||||||||||||||
91.081.000-6 | Endesa S.A. (Chile) | Chile | Foreign | B.N.P. Paribas | U.S.A | US$ | 6.32 | % | 5.98 | % | Semi-annually | — | 883,679 | 883,679 | 858,299 | — | — | — | — | 858,299 | ||||||||||||||||||||||||||||||||||||||||||
91.081.000-6 | Endesa S.A. (Chile) | Chile | Foreign | Banco Santander C.H. SA Chile | U.S.A | US$ | 1.69 | % | 1.01 | % | At maturity | — | 17,296,605 | 17,296,605 | — | — | — | — | — | — | ||||||||||||||||||||||||||||||||||||||||||
91.081.000-6 | Endesa S.A. (Chile) | Chile | 97.004.000-5 | Banco Santander Chile (Linea Crédito) | Chile | Ch$ | 6.00 | % | 6.00 | % | At maturity | — | 176 | 176 | — | — | — | — | — | — | ||||||||||||||||||||||||||||||||||||||||||
91.081.000-6 | Endesa S.A. (Chile) | Chile | Foreign | Export Development Corpotation Loan | U.S.A | US$ | 1.57 | % | 1.40 | % | Semi-annually | 380,556 | 375,606 | 756,162 | — | — | — | — | — | — | ||||||||||||||||||||||||||||||||||||||||||
91.081.000-6 | Endesa S.A. (Chile) | Chile | Foreign | The Bank of Tokyo-Mitsubishi, Ltd. | U.S.A | US$ | 1.68 | % | 1.00 | % | At maturity | — | 17,296,605 | 17,296,605 | — | — | — | — | — | — | ||||||||||||||||||||||||||||||||||||||||||
91.081.000-6 | Endesa S.A. (Chile) | Chile | Foreign | Scotiabank & Trust Cayman Ltd | Cayman Islands | US$ | 1.68 | % | 1.00 | % | At maturity | 23,316 | 26,206,977 | 26,230,293 | — | — | — | — | — | — | ||||||||||||||||||||||||||||||||||||||||||
91.081.000-6 | Endesa S.A. (Chile) | Chile | Foreign | Bank Of America | U.S.A | US$ | 1.66 | % | 1.03 | % | At maturity | — | — | — | — | — | — | — | — | — | ||||||||||||||||||||||||||||||||||||||||||
91.081.000-6 | Endesa S.A. (Chile) | Chile | Foreign | Mercantil Commercebank | U.S.A | US$ | 1.68 | % | 1.00 | % | At maturity | — | 10,482,791 | 10,482,791 | — | — | — | — | — | — | ||||||||||||||||||||||||||||||||||||||||||
91.081.000-6 | Endesa S.A. (Chile) | Chile | 97.030.000-7 | Banco del Estado de Chile | Chile | US$ | 1.69 | % | 1.01 | % | At maturity | — | 33,544,931 | 33,544,931 | — | — | — | — | — | — | ||||||||||||||||||||||||||||||||||||||||||
94.271.00-3 | Enersis S.A. | Chile | 97.004.000-5 | Banco Santander Chile | Chile | Ch$ | 5.00 | % | 5.00 | % | At maturity | 1,519 | — | 1,519 | — | — | — | — | — | — | ||||||||||||||||||||||||||||||||||||||||||
79.913.810-7 | Inmobiliaria Manso de Velasco Ltda. | Chile | 97.004.000-5 | Banco Santander Chile | Argentina | Ch$ | 6.00 | % | 6.00 | % | Monthly | 4 | — | 4 | — | — | — | — | — | — | ||||||||||||||||||||||||||||||||||||||||||
|
|
|
|
|
|
|
|
|
|
|
|
|
|
|
|
|
| |||||||||||||||||||||||||||||||||||||||||||||
| Total | 405,593 | 106,087,370 | 106,492,963 | 858,299 | — | — | — | — | 858,299 | |||||||||||||||||||||||||||||||||||||||||||||||||||||
|
|
|
|
|
|
|
|
|
|
|
|
|
|
|
|
|
| |||||||||||||||||||||||||||||||||||||||||||||
Taxpayer ID Number | Company | Country | Taxpayer ID Number | Financial Institution | Country | Currency | Effective Interest Rate | Nominal Interest Rate | Amortization | January 1, 2013 | ||||||||||||||||||||||||||||||||||||||||||||||||||||
| Current ThCh$ | Non-Current ThCh$ | |||||||||||||||||||||||||||||||||||||||||||||||||||||||||||||
| Less than 90 days | More than 90 days | Total Current | One to two years | Two to three years | Three to four years | Four to five years | More than five years | Total Non- Current | ||||||||||||||||||||||||||||||||||||||||||||||||||||||
96.800.570-7 | Chilectra S.A. | Chile | 0-E | Credit lines | Chile | Ch$ | 5.91 | % | 5.91 | % | Other | 46 | — | 46 | — | — | — | — | — | — | ||||||||||||||||||||||||||||||||||||||||||
91.081.000-6 | Endesa S.A. (Chile) | Chile | Foreign | B.N.P. Paribas | U.S.A | US$ | 6.32 | % | 5.98 | % | Semi-annually | — | 820,076 | 820,076 | 785,249 | 785,249 | — | — | — | 1,570,498 | ||||||||||||||||||||||||||||||||||||||||||
91.081.000-6 | Endesa S.A. (Chile) | Chile | Foreign | Banco Santander C.H. SA Chile | U.S.A | US$ | 1.69 | % | 1.01 | % | At maturity | — | — | — | 15,792,106 | — | — | — | — | 15,792,106 | ||||||||||||||||||||||||||||||||||||||||||
91.081.000-6 | Endesa S.A. (Chile) | Chile | 97.004.000-5 | Banco Santander Chile (Linea Crédito) | Chile | Ch$ | 6.00 | % | 6.00 | % | At maturity | 277 | — | 277 | — | — | — | — | — | — | ||||||||||||||||||||||||||||||||||||||||||
91.081.000-6 | Endesa S.A. (Chile) | Chile | Foreign | Export Development Corpotation Loan | U.S.A | US$ | 1.57 | % | 1.40 | % | Semi-annually | 354,739 | 343,643 | 698,382 | 687,160 | — | — | — | — | 687,160 | ||||||||||||||||||||||||||||||||||||||||||
91.081.000-6 | Endesa S.A. (Chile) | Chile | Foreign | The Bank of Tokyo-Mitsubishi, Ltd. | U.S.A | US$ | 1.68 | % | 1.00 | % | At maturity | — | — | — | 15,792,106 | — | — | — | — | 15,792,106 | ||||||||||||||||||||||||||||||||||||||||||
91.081.000-6 | Endesa S.A. (Chile) | Chile | Foreign | Scotiabank & Trust Cayman Ltd | Cayman Islands | US$ | 1.68 | % | 1.00 | % | At maturity | — | 28,264 | 28,264 | 23,927,433 | — | — | — | — | 23,927,433 | ||||||||||||||||||||||||||||||||||||||||||
91.081.000-6 | Endesa S.A. (Chile) | Chile | Foreign | Bank Of America | U.S.A | US$ | 1.66 | % | 1.03 | % | At maturity | — | — | — | 11,963,716 | — | — | — | — | 11,963,716 | ||||||||||||||||||||||||||||||||||||||||||
91.081.000-6 | Endesa S.A. (Chile) | Chile | Foreign | Mercantil Commercebank | U.S.A | US$ | 1.68 | % | 1.00 | % | At maturity | — | — | — | 9,570,973 | — | — | — | — | 9,570,973 | ||||||||||||||||||||||||||||||||||||||||||
91.081.000-6 | Endesa S.A. (Chile) | Chile | 97.030.000-7 | Banco del Estado de Chile | Chile | US$ | 1.69 | % | 1.01 | % | At maturity | — | — | — | 18,663,398 | — | — | — | — | 18,663,398 | ||||||||||||||||||||||||||||||||||||||||||
94.271.00-3 | Enersis S.A. | Chile | 97.004.000-5 | Banco Santander Chile | Chile | Ch$ | 5.00 | % | 5.00 | % | At maturity | 109 | 109 | — | — | — | — | — | — | |||||||||||||||||||||||||||||||||||||||||||
79.913.810-7 | Inmobiliaria Manso de Velasco Ltda. | Chile | 97.004.000-5 | Banco Santander Chile | Argentina | Ch$ | 6.00 | % | 6.00 | % | Monthly | — | — | — | — | — | — | — | — | — | ||||||||||||||||||||||||||||||||||||||||||
|
|
|
|
|
|
|
|
|
|
|
|
|
|
|
|
|
| |||||||||||||||||||||||||||||||||||||||||||||
| Total | 355,171 | 1,191,983 | 1,547,154 | 97,182,141 | 785,249 | — | — | — | 97,967,390 | |||||||||||||||||||||||||||||||||||||||||||||||||||||
|
|
|
|
|
|
|
|
|
|
|
|
|
|
|
|
|
| |||||||||||||||||||||||||||||||||||||||||||||
Appendix No.4, letter a), presents details of estimated future cash flows (undiscounted) that the Combined Group will have to disburse to settle the bank loans detailed above.
F-184
Table of Contents
20.2 Unsecured liabilities
The detail of Unsecured Liabilities by currency and maturity as of December 31, 2014 and 2013 and January 1, 2013, is as follows:
Summary of unsecured liabilities by currency and maturity
| Currency | Annual Nominal Rate | Secured/ Unsecured | Current | Non-current | ||||||||||||||||||||||||||||||||||||||||
| Maturity | Total Current at 12/31/2014 ThCh$ | Maturity | Total Non- current at 12/31/2014 ThCh$ | |||||||||||||||||||||||||||||||||||||||||
| One to three months ThCh$ | Three to twelve months ThCh$ | One to two years ThCh$ | Two to three years ThCh$ | Three to Four years ThCh$ | Four to five years ThCh$ | Over five years ThCh$ | ||||||||||||||||||||||||||||||||||||||
Country | ||||||||||||||||||||||||||||||||||||||||||||
Chile | US$ | 7.17 | % | Unsecured | 10,600,825 | 123,527,558 | 134,128,383 | — | — | — | — | 419,950,580 | 419,950,580 | |||||||||||||||||||||||||||||||
Chile | U.F. | 5.57 | % | Unsecured | — | 6,562,506 | 6,562,506 | 5,122,437 | 5,122,437 | 5,122,437 | 27,510,710 | 263,190,670 | 306,068,691 | |||||||||||||||||||||||||||||||
|
|
|
|
|
|
|
|
|
|
|
|
|
|
|
|
|
| |||||||||||||||||||||||||||
| Total | 10,600,825 | 130,090,065 | 140,690,889 | 5,122,437 | 5,122,437 | 5,122,437 | 27,510,710 | 683,141,250 | 726,019,271 | |||||||||||||||||||||||||||||||||||
|
|
|
|
|
|
|
|
|
|
|
|
|
|
|
|
|
| |||||||||||||||||||||||||||
| Currency | Annual Nominal Rate | Secured/ Unsecured | Current | Non-current | ||||||||||||||||||||||||||||||||||||||||||
| Maturity | Total Current at 12/31/2013 ThCh$ | Maturity | Total Non- current at 12/31/2013 ThCh$ | |||||||||||||||||||||||||||||||||||||||||||
| One to three months ThCh$ | Three to twelve months ThCh$ | One to two years ThCh$ | Two to three years ThCh$ | Three to four years ThCh$ | Four to five years ThCh$ | Over five years ThCh$ | ||||||||||||||||||||||||||||||||||||||||
Country | ||||||||||||||||||||||||||||||||||||||||||||||
Chile | US$ | 7.99 | % | Unsecured | 9,165,713 | — | 9,165,713 | 104,458,309 | — | — | — | 159,088,295 | 263,546,604 | |||||||||||||||||||||||||||||||||
Chile | U.F. | 5.48 | % | Unsecured | — | 6,273,391 | 6,273,391 | 4,848,388 | 4,848,388 | 4,848,388 | 4,848,388 | 274,591,312 | 293,984,864 | |||||||||||||||||||||||||||||||||
|
|
|
|
|
|
|
|
|
|
|
|
|
|
|
|
|
| |||||||||||||||||||||||||||||
| Total | 9,165,713 | 6,273,391 | 15,439,104 | 109,306,697 | 4,848,388 | 4,848,388 | 4,848,388 | 433,679,607 | 557,531,468 | |||||||||||||||||||||||||||||||||||||
|
|
|
|
|
|
|
|
|
|
|
|
|
|
|
|
|
| |||||||||||||||||||||||||||||
| Currency | Annual Nominal Rate | Secured/ Unsecured | Current | Non-current | ||||||||||||||||||||||||||||||||||||||||
| Maturity | Total Current at 1/1/2013 ThCh$ | Maturity | Total Non- current at 1/1/2013 ThCh$ | |||||||||||||||||||||||||||||||||||||||||
| One to three months ThCh$ | Three to twelve months ThCh$ | One to two years ThCh$ | Two to three years ThCh$ | Three to four years ThCh$ | Four to five years ThCh$ | Over five years ThCh$ | ||||||||||||||||||||||||||||||||||||||
Country | ||||||||||||||||||||||||||||||||||||||||||||
Chile | US$ | 8.06 | % | Unsecured | 15,065,057 | 191,984,000 | 207,049,057 | — | 94,914,421 | — | — | 144,892,812 | 239,807,233 | |||||||||||||||||||||||||||||||
Chile | U.F. | 5.48 | % | Unsecured | — | 6,178,710 | 6,178,710 | 4,750,876 | 4,750,876 | 4,750,876 | 4,750,876 | 273,441,557 | 292,445,061 | |||||||||||||||||||||||||||||||
|
|
|
|
|
|
|
|
|
|
|
|
|
|
|
|
|
| |||||||||||||||||||||||||||
| Total | 15,065,057 | 198,162,710 | 213,227,767 | 4,750,876 | 99,665,297 | 4,750,876 | 4,750,876 | 418,334,369 | 532,252,294 | |||||||||||||||||||||||||||||||||||
|
|
|
|
|
|
|
|
|
|
|
|
|
|
|
|
|
| |||||||||||||||||||||||||||
20.3 Secured liabilities
As of December 31, 2014 and 2013 and January 1, 2013, there were no secured liabilities.
Fair value measurement and hierarchy
The fair value of current and non-current unsecured liabilities as of December 31, 2014 and 2013 and January 1, 2013 totaled ThCh$1,088,491,056, ThCh$720,236,576, and ThCh$893,434,380, respectively. The fair value measurement of these liabilities have been categorized as Level 2 (see Note 3.h).
F-185
Table of Contents
- Secured and unsecured liabilities by company
Taxpayer ID | Company | Country | Taxpayer ID Number | Financial Institution | Country | Currency | Effective Interest Rate | Nominal Interest Rate | Secured | December 31, 2014 | ||||||||||||||||||||||||||||||||||||||||||||||||||
| Current ThCh$ | Non-Current ThCh$ | |||||||||||||||||||||||||||||||||||||||||||||||||||||||||||
| Less than 90 days | More than 90 days | Total Current | One to two years | Two to three years | Three to four years | Four to five years | More than five years | Total Non- Current | ||||||||||||||||||||||||||||||||||||||||||||||||||||
| 91.081.000-6 | Endesa Chile S.A. | Chile | Foreing | BNY Mellon – Primera Emisión S-1 | U.S.A | US$ | 7.96 | % | 7.88 | % | No | 4,098,882 | — | 4,098,882 | — | — | — | — | 123,713,346 | 123,713,346 | ||||||||||||||||||||||||||||||||||||||||
| 91.081.000-6 | Endesa Chile S.A. | Chile | Foreing | BNY Mellon – Primera Emisión S-2 | U.S.A | US$ | 7.40 | % | 7.33 | % | No | 1,310,741 | — | 1,310,741 | — | — | — | — | 42,390,409 | 42,390,409 | ||||||||||||||||||||||||||||||||||||||||
| 91.081.000-6 | Endesa Chile S.A. | Chile | Foreing | BNY Mellon – Primera Emisión S-3 | U.S.A | US$ | 8.26 | % | 8.13 | % | No | 830,186 | — | 830,186 | — | — | — | — | 18,905,448 | 18,905,448 | ||||||||||||||||||||||||||||||||||||||||
| 91.081.000-6 | Endesa Chile S.A. | Chile | Foreing | BNY Mellon – 144 – A | U.S.A | US$ | 8.83 | % | 8.63 | % | No | 4,361,016 | 121,350,000 | 125,711,016 | — | — | — | — | — | — | ||||||||||||||||||||||||||||||||||||||||
| 91.081.000-6 | Endesa Chile S.A. | Chile | Foreing | BNY Mellon – Unica 24296 | U.S.A | US$ | 5.30 | % | 4.25 | % | No | — | 2,177,558 | 2,177,558 | — | — | — | — | 234,941,377 | 234,941,377 | ||||||||||||||||||||||||||||||||||||||||
| 91.081.000-6 | Endesa Chile S.A. | Chile | 97.004.000-5 | Banco Santander -317 Serie-H | Chile | U.F. | 7.17 | % | 6.20 | % | No | — | 6,054,055 | 6,054,055 | 5,122,437 | 5,122,437 | 5,122,437 | 5,122,437 | 42,939,415 | 63,429,163 | ||||||||||||||||||||||||||||||||||||||||
| 91.081.000-6 | Endesa Chile S.A. | Chile | 97.004.000-5 | Banco Santander 522 Serie-M | Chile | U.F. | 4.82 | % | 4.75 | % | No | — | 508,451 | 508,451 | — | — | — | 22,388,273 | 220,251,255 | 242,639,528 | ||||||||||||||||||||||||||||||||||||||||
|
|
|
|
|
|
|
|
|
|
|
|
|
|
|
|
|
| |||||||||||||||||||||||||||||||||||||||||||
| Total Unsecured Bonds | 10,600,825 | 130,090,064 | 140,690,889 | 5,122,437 | 5,122,437 | 5,122,437 | 27,510,710 | 683,141,250 | 726,019,271 | |||||||||||||||||||||||||||||||||||||||||||||||||||
|
|
|
|
|
|
|
|
|
|
|
|
|
|
|
|
|
| |||||||||||||||||||||||||||||||||||||||||||
Taxpayer ID | Company | Country | ID No. Financial Institution | Financial Institution | Country | Currency | Effective Interest Rate | Nominal Interest Rate | Secured | December 31, 2013 | ||||||||||||||||||||||||||||||||||||||||||||||||||
| Current ThCh$ | Non-current ThCh$ | |||||||||||||||||||||||||||||||||||||||||||||||||||||||||||
| Less than 90 days | More than 90 days | Total Current | One to two years | Two to three years | Three to four years | Four to five years | Over five years | Total Non- current | ||||||||||||||||||||||||||||||||||||||||||||||||||||
| 91,081,000-6 | Endesa Chile S.A. | Chile | Foreign | The Bank of New York Mellon – First issue S-1 | USA | US$ | 7.96 | % | 7.88 | % | No | 3,543,987 | — | 3,543,987 | — | — | — | — | 106,741,471 | 106,741,471 | ||||||||||||||||||||||||||||||||||||||||
| 91,081,000-6 | Endesa Chile S.A. | Chile | Foreign | The Bank of New York Mellon – First issue S-2 | USA | US$ | 7.40 | % | 7.33 | % | No | 1,133,296 | — | 1,133,296 | — | — | — | — | 36,596,392 | 36,596,392 | ||||||||||||||||||||||||||||||||||||||||
| 91,081,000-6 | Endesa Chile S.A. | Chile | Foreign | The Bank of New York Mellon – First issue S-3 | USA | US$ | 8.26 | % | 8.13 | % | No | 717,798 | — | 717,798 | — | — | — | — | 15,750,432 | 15,750,432 | ||||||||||||||||||||||||||||||||||||||||
| 91,081,000-6 | Endesa Chile S.A. | Chile | Foreign | The Bank of New York Mellon – 144 – A | USA | US$ | 8.83 | % | 8.63 | % | No | 3,770,632 | — | 3,770,632 | 104,458,309 | — | — | — | — | 104,458,309 | ||||||||||||||||||||||||||||||||||||||||
| 91,081,000-6 | Endesa Chile S.A. | Chile | Foreign | The Bank of New York Mellon -Single Series 24296 | USA | US$ | 5.30 | % | 4.25 | % | No | — | — | — | — | — | — | — | — | — | ||||||||||||||||||||||||||||||||||||||||
| 91,081,000-6 | Endesa Chile S.A. | Chile | 97,004,000-5 | Banco Santander -317 Series-H | Chile | U.F. | 7.17 | % | 6.20 | % | No | — | 5,792,134 | 5,792,134 | 4,848,388 | 4,848,388 | 4,848,388 | 4,848,388 | 45,132,232 | 64,525,785 | ||||||||||||||||||||||||||||||||||||||||
| 91,081,000-6 | Endesa Chile S.A. | Chile | 97,004,000-5 | Banco Santander 522 Series-M | Chile | U.F. | 4.82 | % | 4.75 | % | No | — | 481,257 | 481,257 | — | — | — | — | 229,459,080 | 229,459,080 | ||||||||||||||||||||||||||||||||||||||||
|
|
|
|
|
|
|
|
|
|
|
|
|
|
|
|
|
| |||||||||||||||||||||||||||||||||||||||||||
| Total Unsecured Bonds | 9,165,713 | 6,273,391 | 15,439,104 | 109,306,697 | 4,848,388 | 4,848,388 | 4,848,388 | 433,679,607 | 557,531,469 | |||||||||||||||||||||||||||||||||||||||||||||||||||
|
|
|
|
|
|
|
|
|
|
|
|
|
|
|
|
|
| |||||||||||||||||||||||||||||||||||||||||||
Taxpayer ID | Company | Country | ID No. Financial Institution | Financial Institution | Country | Currency | Effective Interest Rate | Nominal Interest Rate | Secured | January 1, 2013 | ||||||||||||||||||||||||||||||||||||||||||||||||||
| Current ThCh$ | Non-current ThCh$ | |||||||||||||||||||||||||||||||||||||||||||||||||||||||||||
| Less than 90 days | More than 90 days | Total Current | One to two years | Two to three years | Three to four years | Four to five years | Over five years | Total Non- current | ||||||||||||||||||||||||||||||||||||||||||||||||||||
| 91,081,000-6 | Endesa Chile S.A. | Chile | 97.004.000-5 | Banco Santander Chile – 317 Serie-H | Chile | UF | 7.17 | % | 6.20 | % | No | — | 5,731,907 | 5,731,907 | 4,750,876 | 4,750,876 | 4,750,876 | 4,750,876 | 48,775,725 | 67,779,229 | ||||||||||||||||||||||||||||||||||||||||
| 91,081,000-6 | Endesa Chile S.A. | Chile | 97.004.000-5 | Banco Santander Chile – 522 Serie-M | Chile | UF | 4.82 | % | 4.75 | % | No | — | 446,803 | 446,803 | — | — | — | — | 224,665,832 | 224,665,832 | ||||||||||||||||||||||||||||||||||||||||
| 91,081,000-6 | Endesa Chile S.A. | Chile | Foreign | The Bank of New York Mellon – 144 – A | USA | US$ | 8.50 | % | 8.35 | % | No | 6,679,443 | 191,984,000 | 198,663,443 | — | — | — | — | — | — | ||||||||||||||||||||||||||||||||||||||||
| 91,081,000-6 | Endesa Chile S.A. | Chile | Foreign | The Bank of New York Mellon – 144 – A | USA | US$ | 8.83 | % | 8.63 | % | No | 3,449,713 | — | 3,449,713 | — | 94,914,421 | — | — | — | 94,914,421 | ||||||||||||||||||||||||||||||||||||||||
| 91,081,000-6 | Endesa Chile S.A. | Chile | Foreign | The Bank of New York Mellon – Primera Emisión S-1 | USA | US$ | 7.96 | % | 7.88 | % | No | 3,242,355 | — | 3,242,355 | — | — | — | — | 97,491,553 | 97,491,553 | ||||||||||||||||||||||||||||||||||||||||
| 91,081,000-6 | Endesa Chile S.A. | Chile | Foreign | The Bank of New York Mellon – Primera Emisión S-2 | USA | US$ | 7.40 | % | 7.33 | % | No | 1,036,841 | — | 1,036,841 | — | — | — | — | 33,456,554 | 33,456,554 | ||||||||||||||||||||||||||||||||||||||||
| 91,081,000-6 | Endesa Chile S.A. | Chile | Foreign | The Bank of New York Mellon – Primera Emisión S-3 | USA | US$ | 8.26 | % | 8.13 | % | No | 656,705 | — | 656,705 | — | — | — | — | 13,944,705 | 13,944,705 | ||||||||||||||||||||||||||||||||||||||||
|
|
|
|
|
|
|
|
|
|
|
|
|
|
|
|
|
| |||||||||||||||||||||||||||||||||||||||||||
| Total Unsecured Bonds | 15,065,057 | 198,162,710 | 213,227,767 | 4,750,876 | 99,665,297 | 4,750,876 | 4,750,876 | 418,334,369 | 532,252,294 | |||||||||||||||||||||||||||||||||||||||||||||||||||
|
|
|
|
|
|
|
|
|
|
|
|
|
|
|
|
|
| |||||||||||||||||||||||||||||||||||||||||||
Appendix No. 4, letter b) presents details of estimated future cash flows (undiscounted) that the Combined Group will have to disburse to settle the secured and unsecured liabilities detailed above.
F-186
Table of Contents
- Detail of finance lease obligations
Tax ID No. | Company | Country | ID No. Financial Institution | Financial Institution | Country | Currency | Nominal Interest Rate | December 31, 2014 | ||||||||||||||||||||||||||||||||||||||||||||||||||||||||
| Current ThCh$ | Non-current ThCh$ | |||||||||||||||||||||||||||||||||||||||||||||||||||||||||||||||
| Less than 90 days | More than 90 days | Total Current | One to two years | Two to three years | Three to four years | Four to five years | Over five years | Total Non- current | ||||||||||||||||||||||||||||||||||||||||||||||||||||||||
91,081,000-6 | Endesa Chile S.A. | Chile | 87,509,100-K | Abengoa Chile | Chile | US$ | 6.50 | % | — | 1,470,563 | 1,470,563 | 2,427,000 | 1,566,150 | 1,667,950 | 1,776,367 | 10,215,436 | 17,652,903 | |||||||||||||||||||||||||||||||||||||||||||||||
|
|
|
|
|
|
|
|
|
|
|
|
|
|
|
|
|
| |||||||||||||||||||||||||||||||||||||||||||||||
| Total | — | 1,470,563 | 1,470,563 | 2,427,000 | 1,566,150 | 1,667,950 | 1,776,367 | 10,215,436 | 17,652,903 | |||||||||||||||||||||||||||||||||||||||||||||||||||||||
|
|
|
|
|
|
|
|
|
|
|
|
|
|
|
|
|
| |||||||||||||||||||||||||||||||||||||||||||||||
Tax ID No. | Company | Country | ID No. Financial Institution | Financial Institution | Country | Currency | Nominal Interest Rate | December 31, 2013 | ||||||||||||||||||||||||||||||||||||||||||||||||||||||||
| Current ThCh$ | Non-current ThCh$ | |||||||||||||||||||||||||||||||||||||||||||||||||||||||||||||||
| Less than 90 days | More than 90 days | Total Current | One to two years | Two to three years | Three to four years | Four to five years | Over five years | Total Non- current | ||||||||||||||||||||||||||||||||||||||||||||||||||||||||
91,081,000-6 | Endesa Chile S.A. | Chile | 87,509,100-K | Abengoa Chile | Chile | US$ | 6.50 | % | — | 1,193,884 | 1,193,884 | 1,271,483 | 1,354,129 | 1,442,148 | 1,535,887 | 10,930,941 | 16,534,588 | |||||||||||||||||||||||||||||||||||||||||||||||
|
|
|
|
|
|
|
|
|
|
|
|
|
|
|
|
|
| |||||||||||||||||||||||||||||||||||||||||||||||
| Total | — | 1,193,884 | 1,193,884 | 1,271,483 | 1,354,129 | 1,442,148 | 1,535,887 | 10,930,941 | 16,534,588 | |||||||||||||||||||||||||||||||||||||||||||||||||||||||
|
|
|
|
|
|
|
|
|
|
|
|
|
|
|
|
|
| |||||||||||||||||||||||||||||||||||||||||||||||
Tax ID No. | Company | Country | ID No. Financial Institution | Financial Institution | Country | Currency | Nominal Interest Rate | January 1, 2013 | ||||||||||||||||||||||||||||||||||||||||||||||||||||||||
| Current ThCh$ | Non-current ThCh$ | |||||||||||||||||||||||||||||||||||||||||||||||||||||||||||||||
| Less than 90 days | More than 90 days | Total Current | One to two years | Two to three years | Three to four years | Four to five years | Over five years | Total Non- current | ||||||||||||||||||||||||||||||||||||||||||||||||||||||||
91,081,000-6 | Endesa Chile S.A. | Chile | 87,509,100-K | Abengoa Chile | Chile | US$ | 6.50 | % | — | 1,025,603 | 1,025,603 | 1,092,269 | 1,163,266 | 1,238,878 | 1,319,406 | 11,405,767 | 16,219,586 | |||||||||||||||||||||||||||||||||||||||||||||||
|
|
|
|
|
|
|
|
|
|
|
|
|
|
|
|
|
| |||||||||||||||||||||||||||||||||||||||||||||||
| Total | — | 1,025,603 | 1,025,603 | 1,092,269 | 1,163,266 | 1,238,878 | 1,319,406 | 11,405,767 | 16,219,586 | |||||||||||||||||||||||||||||||||||||||||||||||||||||||
|
|
|
|
|
|
|
|
|
|
|
|
|
|
|
|
|
| |||||||||||||||||||||||||||||||||||||||||||||||
Appendix No. 4 letter c) presents details of estimated future cash flows (undiscounted) that the Combined Group will have to disburse to settle the finance lease obligations detailed above.
- Detail of other obligations
There were no other obligations as of December 31, 2014 and 2013. The detail of other obligations as of January 1, 2013 is as follows:
Tax ID No. | Company | Country | ID No. Financial Institution | Financial Institution | Country | Currency | Nominal Interest Rate | January 1, 2013 | ||||||||||||||||||||||||||||||||||||||||||||||||||||||||
| Current ThCh$ | Non-current ThCh$ | |||||||||||||||||||||||||||||||||||||||||||||||||||||||||||||||
| Less than 90 days | More than 90 days | Total Current | One to two years | Two to three years | Three to four years | Four to five years | Over five years | Total Non- current | ||||||||||||||||||||||||||||||||||||||||||||||||||||||||
96,827,970-k | Endesa Eco S.A. | Chile | 96,601,250-1 | Inversiones Centinela S.A. | Chile | US$ | 6.10 | % | 2,022,260 | — | 2,022,260 | — | — | — | — | — | — | |||||||||||||||||||||||||||||||||||||||||||||||
|
|
|
|
|
|
|
|
|
|
|
|
|
|
|
|
|
| |||||||||||||||||||||||||||||||||||||||||||||||
| Total | 2,022,260 | — | 2,022,260 | — | — | — | — | — | — | |||||||||||||||||||||||||||||||||||||||||||||||||||||||
|
|
|
|
|
|
|
|
|
|
|
|
|
|
|
|
|
| |||||||||||||||||||||||||||||||||||||||||||||||
F-187
Table of Contents
20.4 Hedged debt
The U.S. dollar denominated debt of the Combined Group that is designated as cash flow hedge, as referenced in Note 3.m, was ThCh$608,113,125, ThCh$628,734,593, and ThCh$539,848,481 as of December 31, 2014 and 2013 and January 1, 2013 (See Note 3.m).
The following table details changes in “Reserve for cash flow hedges” as of December 31, 2014 and 2013 due to exchange differences of this debt:
| 12-31-2014 | 12-31-2013 | |||||||
Balance in hedging reserves (hedging income) at the beginning of the period, net | (217,636 | ) | 31,222,869 | |||||
Foreign currency exchange differences recorded in equity, net | (30,045,776 | ) | (22,075,469 | ) | ||||
Recognition of foreign currency exchange differences in profit and loss, net | (9,541,685 | ) | (9,365,036 | ) | ||||
Foreign currency translation differences | — | — | ||||||
Balance in hedging reserves (hedging income) at the end of the period, net | (39,805,097 | ) | (217,636 | ) | ||||
20.5 Other information
As of December 31, 2014 and 2013, and January 1, 2013, the Combined Group has undrawn borrowing Facilities available for use amounting to ThCh$238,502,592, ThCh$110,884,975, and ThCh$95,992,000, respectively.
| 21. | RISK MANAGEMENT POLICY |
The Combined Group entities are exposed to certain risks that are managed by systems that identify, measure, limit concentration of, and monitor these risks.
The main principles in the Combined Group’s risk management policy include the following:
| • | Compliance with good corporate governance standards. |
| • | Strict compliance with all the Combined Group’s internal policies. |
| • | Each business and corporate area determines: |
| I. | The markets in which it can operate based on its knowledge and ability to ensure effective risk management; |
| II. | Criteria regarding counterparts; |
| III. | Authorized operators. |
| • | Business and corporate areas establish their risk tolerance in a manner consistent with the defined strategy for each market in which they operate. |
| • | All of the operations of the businesses and corporate areas are conducted within the limits approved for each case. |
| • | Businesses, corporate areas, lines of business and companies design the risk management controls necessary to ensure that transactions in the markets are conducted in accordance with the Enersis Chile policies, standards, and procedures. |
21.1 Interest rate risk
Changes in interest rates affect the fair value of assets and liabilities bearing fixed interest rates, as well as the expected future cash flows of assets and liabilities subject to floating interest rates.
F-188
Table of Contents
The objective of managing interest rate risk exposure is to achieve a balance in the debt structure to minimize the cost of debt with reduced volatility in profit or loss.
In compliance with the current interest rate hedging policy, the proportion of fixed debt and/or hedged debt over the net total debt was 100% as of December 31, 2014.
Depending on the Combined Group’s estimates and on the objectives of the debt structure, hedging transactions are performed by entering into derivatives contracts that mitigate interest rate risk. Derivative instruments currently used to comply with the risk management policy are interest rate swaps to set floating rate at fixed rate.
The financial debt structure of the Combined Group detailed by the mostly strongly hedged fixed and floating interest rates on total net debt, net of hedging derivative instruments, is as follows:
Net position:
| 12-31-2014 % | 12-31-2013 % | 1-1-2013 % | ||||||||||
Fixed interest rate | 100 | % | 100 | % | 100 | % | ||||||
Floating interest rate | — | — | — | |||||||||
Total | 100 | % | 100 | % | 100 | % | ||||||
21.2 Exchange rate risk
Exchange rate risks involve basically the following transactions:
| • | Debt taken on by the Combined Group’s companies that is denominated in a currency other than that in which its cash flows are indexed. |
| • | Payments to be made for the acquisition of project-related materials and for corporate insurance policies in a currency other than that in which its cash flows are indexed. |
| • | Income in the Combined Group companies directly linked to changes in currencies other than that of its cash flows. |
In order to mitigate foreign currency risk, the Combined Group’s foreign currency risk management policy is based on cash flows and includes maintaining a balance between U.S. dollar flows and the levels of assets and liabilities denominated in this currency. The objective is to minimize the exposure to variability in cash flows that are attributable to foreign exchange risk.
The hedging instruments currently being used to comply with the policy are currency swaps and forward exchange contracts. In addition, the policy seeks to refinance debt in the functional currency of each of the Combined Group’s companies.
21.3 Commodities risk
The Combined Group has a risk exposure to price fluctuations in certain commodities, basically due to:
| • | Purchases of fuel used to generate electricity. |
| • | Energy purchase/sale transactions that take place in local markets. |
In order to reduce the risk in situations of extreme drought, the Combined Group has designed a commercial policy that defines the levels of sales commitments in line with the capacity of its generating power plants in a dry year. It also includes risk mitigation terms in certain contracts with unregulated customers and with regulated customers subject to long-term tender processes, establishing indexation polynomials that allow for reducing commodities exposure risk.
F-189
Table of Contents
Considering the operating conditions faced by the power generation market in Chile, with drought and highly volatile commodity prices on international markets, the Combined Group is constantly verifying the advisability of using hedging to lessen the impacts that these price swings have on its results. As of December 31, 2014, the Combined Group had swap hedges for 266,000 barrels of Brent oil for January 2015 and 350,000 MMBTU of Henry Hub gas for February 2015. As of December 31, 2013, the Combined Group had no derivative operations for commodities. As of January 1, 2013, the Combined Group had swap hedges for 462,000 barrels of Brent oil for January 2013 and 365,000 tons of coal for the period February – June 2013.
Depending on operating conditions, which are constantly being updated, these hedges may be modified or may cover other commodities.
21.4 Liquidity risk
The Combined Group maintains a liquidity risk management policy that consists of entering into long-term committed banking facilities and temporary financial investments for amounts that cover the projected needs over a period of time that is determined based on the situation and expectations for debt and capital markets.
The projected needs mentioned above include maturities of financial debt, net of financial derivatives. For further details regarding the features and conditions of financial obligations and financial derivatives, See Notes 20 and 22, and Appendix No. 4.
As of December 31, 2014 and 2013 and January 1, 2013, the Combined Group has cash and cash equivalent totaling ThCh$132,985,927, ThCh$214,907,097, and ThCh$94,093,760, respectively, and unconditionally available lines of long-term credit totaling ThCh$238,502,592, ThCh$110,884,975, and ThCh$95,992,000, respectively.
21.5 Credit risk
The Combined Group closely monitors its credit risk.
Trade receivables:
The credit risk for receivables from the Combined Group’s commercial activity has historically been very low, due to the short term period of collections from customers, resulting in non-significant cumulative receivables amounts. This situation applies to both the electricity generating and distribution lines of business.
In our electricity generating business, some countries’ regulations allow the suspension of energy service to customers with outstanding payments, and most contracts have termination clauses for payment default. The Combined Group monitors its credit risk on an ongoing basis and measures quantitatively its maximum exposure to payment default risk, which, as stated above, is very low.
In our electricity distribution companies, the suspension of energy service for customers in payment default is permitted in all cases, in accordance with current regulations in each country. This facilitates our credit risk management, which is also low in this line of business.
Financial assets:
Cash surpluses are invested in the highest-rated local and foreign financial entities (with risk rating equivalent to investment grade where possible) with thresholds established for each entity.
Banks that have received investment grade ratings from the three major international rating agencies (Moody’s, S&P, and Fitch) are selected for making investments.
F-190
Table of Contents
Investments may be backed with treasury bonds from the countries in which the Combined Group operates and/or with commercial papers issued by the highest rated banks; the latter are preferred, as they offer higher returns (always in line with current investment policies).
Derivative instruments are entered into with entities with solid creditworthiness; all derivative transactions are performed with entities with investment grade ratings.
21.6 Risk measurement
The Combined Group measures the Value at Risk (VaR) of its debt positions and financial derivatives in order to monitor the risk assumed by the Combined Group, thereby reducing volatility in the income statement.
The VaR determined represents the potential variation in value of the portfolio of positions described above in one quarter with a 95% confidence level. To determine the VaR, we take into account the volatility of the risk variables affecting the value of the portfolio of positions including:
| • | U.S. dollar Libor interest rate. |
| • | The exchange rates of the Chilean Peso and the Unidad de Fomento (U.F.) against the U.S. dollar. |
The calculation of VaR is based on generating possible future scenarios (at one quarter) of market values (both spot and term) for the risk variables based on the scenarios with observable inputs for a same period (quarter) during five years.
The one-quarter 95%-confidence VaR number is calculated as the 5% percentile of the potential variations in the fair value of the portfolio in one quarter.
Taking into account the assumptions described above, the one-quarter VaR was ThCh$18,177. This amount represents the potential increase of the Debt and Derivatives’ Portfolio, thus these Values at Risk are inherently related to the Portfolio’s value at end of each quarter.
| 22. | FINANCIAL INSTRUMENTS |
22.1 Financial instruments, classified by type and category
a) The detail of financial assets, classified by type and category, as of December 31, 2014 and 2013 and January 1, 2013 is as follows:
| December 31, 2014 | ||||||||||||||||||||||||
Financial assets held | Financial assets at fair value through profit or loss | Held-to- maturity investments | Loans and receivables | Available-for- sale financial assets | Financial derivatives for hedging | |||||||||||||||||||
| ThCh$ | ThCh$ | ThCh$ | ThCh$ | ThCh$ | ThCh$ | |||||||||||||||||||
Derivative instruments | 33,882 | — | — | — | — | 508,458 | ||||||||||||||||||
Other financial assets | — | — | 948,789 | 595,033,855 | — | — | ||||||||||||||||||
|
|
|
|
|
|
|
|
|
|
|
| |||||||||||||
Total Current | 33,882 | — | 948,789 | 595,033,855 | — | 508,458 | ||||||||||||||||||
|
|
|
|
|
|
|
|
|
|
|
| |||||||||||||
Equity instruments | — | — | — | — | 3,032,834 | — | ||||||||||||||||||
Derivative instruments | 22,002 | — | — | — | — | 3,695,636 | ||||||||||||||||||
Other financial assets | — | — | — | 7,496,412 | — | — | ||||||||||||||||||
|
|
|
|
|
|
|
|
|
|
|
| |||||||||||||
Total Non-Current | 22,002 | — | — | 7,496,412 | 3,032,834 | 3,695,636 | ||||||||||||||||||
|
|
|
|
|
|
|
|
|
|
|
| |||||||||||||
Total | 55,884 | — | 948,789 | 602,530,267 | 3,032,834 | 4,204,094 | ||||||||||||||||||
|
|
|
|
|
|
|
|
|
|
|
| |||||||||||||
F-191
Table of Contents
| December 31, 2103 | ||||||||||||||||||||||||
| Financial assets held for trading | Financial assets at fair value through profit or loss | Held-to- maturity investments | Loans and receivables | Available-for- sale financial assets | Financial derivatives for hedging | |||||||||||||||||||
| ThCh$ | ThCh$ | ThCh$ | ThCh$ | ThCh$ | ThCh$ | |||||||||||||||||||
Derivative instruments | 361,595 | — | — | — | — | 20,948,126 | ||||||||||||||||||
Other financial assets | — | — | 954,230 | 337,329,526 | — | — | ||||||||||||||||||
|
|
|
|
|
|
|
|
|
|
|
| |||||||||||||
Total Current | 361,595 | — | 954,230 | 337,329,526 | — | 20,948,126 | ||||||||||||||||||
|
|
|
|
|
|
|
|
|
|
|
| |||||||||||||
Equity instruments | — | — | — | — | 2,782,608 | — | ||||||||||||||||||
Other financial assets | — | — | — | 6,875,034 | — | — | ||||||||||||||||||
|
|
|
|
|
|
|
|
|
|
|
| |||||||||||||
Total Non-Current | — | — | — | 6,875,034 | 2,782,608 | — | ||||||||||||||||||
|
|
|
|
|
|
|
|
|
|
|
| |||||||||||||
Total | 361,595 | — | 954,230 | 344,204,560 | 2,782,608 | 20,948,126 | ||||||||||||||||||
|
|
|
|
|
|
|
|
|
|
|
| |||||||||||||
| January 1, 2013 | ||||||||||||||||||||||||
| Financial assets held for trading | Financial assets at fair value through profit or loss | Held-to- maturity investments | Loans and receivables | Available-for- sale financial assets | Financial derivatives for hedging | |||||||||||||||||||
| ThCh$ | ThCh$ | ThCh$ | ThCh$ | ThCh$ | ThCh$ | |||||||||||||||||||
Derivative instruments | — | — | — | — | — | — | ||||||||||||||||||
Other financial assets | — | 3,864 | — | 327,623,723 | — | — | ||||||||||||||||||
|
|
|
|
|
|
|
|
|
|
|
| |||||||||||||
Total Current | — | 3,864 | — | 327,623,723 | — | — | ||||||||||||||||||
|
|
|
|
|
|
|
|
|
|
|
| |||||||||||||
Equity instruments | — | — | — | — | 2,717,248 | — | ||||||||||||||||||
Derivative instruments | — | — | — | — | — | 28,676,421 | ||||||||||||||||||
Other financial assets | — | — | — | 13,443,082 | — | — | ||||||||||||||||||
|
|
|
|
|
|
|
|
|
|
|
| |||||||||||||
Total Non-Current | — | — | — | 13,443,082 | 2,717,248 | 28,676,421 | ||||||||||||||||||
|
|
|
|
|
|
|
|
|
|
|
| |||||||||||||
Total | — | 3,864 | — | 341,066,805 | 2,717,248 | 28,676,421 | ||||||||||||||||||
|
|
|
|
|
|
|
|
|
|
|
| |||||||||||||
b)The detail of financial liabilities, classified by type and category, as of December 31, 2014 and 2013 and January 1, 2013 is as follows:
| 12-31-2014 | ||||||||||||||||
| Financial liabilities held for trading ThCh$ | Financial liabilities at fair value through profit or loss ThCh$ | Loans and payables ThCh$ | Financial derivatives for hedging ThCh$ | |||||||||||||
Interest-bearing loans | — | — | 143,170,408 | — | ||||||||||||
Derivative instruments | 2,526,798 | — | — | 667,153 | ||||||||||||
Other financial liabilities | — | — | 682,546,548 | — | ||||||||||||
|
|
|
|
|
|
|
| |||||||||
Total Current | 2,526,798 | — | 825,716,956 | 667,153 | ||||||||||||
|
|
|
|
|
|
|
| |||||||||
Interest-bearing loans | — | — | 743,672,174 | — | ||||||||||||
Derivative instruments | 6,286,982 | — | — | 28,176,011 | ||||||||||||
Other financial liabilities | — | — | 3,711,078 | — | ||||||||||||
|
|
|
|
|
|
|
| |||||||||
Total Non-current | 6,286,982 | — | 747,383,252 | 28,176,011 | ||||||||||||
|
|
|
|
|
|
|
| |||||||||
Total | 8,813,780 | — | 1,573,100,208 | 28,843,164 | ||||||||||||
|
|
|
|
|
|
|
| |||||||||
F-192
Table of Contents
| 12-31-2013 | ||||||||||||||||
| Financial liabilities held for trading ThCh$ | Financial liabilities at fair value through profit or loss ThCh$ | Loans and payables ThCh$ | Financial derivatives for hedging ThCh$ | |||||||||||||
Interest-bearing loans | — | — | 125,818,375 | — | ||||||||||||
Derivative instruments | 164,983 | — | — | 1,280,496 | ||||||||||||
Other financial liabilities | — | — | 695,502,932 | — | ||||||||||||
|
|
|
|
|
|
|
| |||||||||
Total Current | 164,983 | — | 821,321,307 | 1,280,496 | ||||||||||||
|
|
|
|
|
|
|
| |||||||||
Interest-bearing loans | — | — | 579,403,606 | — | ||||||||||||
Derivative instruments | — | — | — | — | ||||||||||||
|
|
|
|
|
|
|
| |||||||||
Total Non-current | — | — | 579,403,606 | — | ||||||||||||
|
|
|
|
|
|
|
| |||||||||
Total | 164,983 | — | 1,400,724,913 | 1,280,496 | ||||||||||||
|
|
|
|
|
|
|
| |||||||||
| 1-1-2013 | ||||||||||||||||
| Financial liabilities held for trading ThCh$ | Financial liabilities at fair value through profit or loss ThCh$ | Loans and payables ThCh$ | Financial derivatives for hedging ThCh$ | |||||||||||||
Interest-bearing loans | — | 2,022,260 | 218,243,373 | — | ||||||||||||
Derivative instruments | — | — | — | 91,276 | ||||||||||||
Other financial liabilities | — | — | 341,250,795 | — | ||||||||||||
|
|
|
|
|
|
|
| |||||||||
Total Current | — | 2,022,260 | 559,494,168 | 91,276 | ||||||||||||
|
|
|
|
|
|
|
| |||||||||
Interest-bearing loans | — | — | 653,466,704 | — | ||||||||||||
Derivative instruments | — | — | — | 3,214,525 | ||||||||||||
|
|
|
|
|
|
|
| |||||||||
Total Non-current | — | — | 653,466,704 | 3,214,525 | ||||||||||||
|
|
|
|
|
|
|
| |||||||||
Total | — | 2,022,260 | 1,212,960,872 | 3,305,801 | ||||||||||||
|
|
|
|
|
|
|
| |||||||||
22.2 Derivative instruments
The risk management policy of the Combined Group uses primarily interest rate and foreign exchange rate derivatives to hedge its exposure to interest rate and foreign currency risks.
The Combined Group classifies its derivatives as follows:
| • | Derivatives designated for Cash flow hedges: Those that hedge the cash flows of the underlying hedged item. |
| • | Derivatives designated for Fair value hedges: Those that hedge the fair value of the underlying hedged item. |
| • | Non-hedge derivatives: Financial derivatives that do not meet the requirements established by IFRS to be designated as hedge instruments are recorded at fair value with changes in net income (assets held for trading). |
F-193
Table of Contents
a) Assets and liabilities for hedge derivative instruments
As of December 31, 2014 and 2013 and January 1, 2013, financial derivative transactions qualifying as hedge instruments resulted in recognition of the following assets and liabilities in the combined statement of financial position:
| December 31, 2014 | ||||||||||||||||
| Assets | Liabilities | |||||||||||||||
| Current ThCh$ | Non-current ThCh$ | Current ThCh$ | Non-current ThCh$ | |||||||||||||
Exchange rate hedge: | 508,458 | 3,695,636 | 667,153 | 28,176,011 | ||||||||||||
Cash flow hedge | 508,458 | 3,695,636 | 667,153 | 28,176,011 | ||||||||||||
|
|
|
|
|
|
|
| |||||||||
Total | 508,458 | 3,695,636 | 667,153 | 28,176,011 | ||||||||||||
|
|
|
|
|
|
|
| |||||||||
| December 31, 2013 | ||||||||||||||||
| Assets | Liabilities | |||||||||||||||
| Current ThCh$ | Non-current ThCh$ | Current ThCh$ | Non-current ThCh$ | |||||||||||||
Interest rate hedge: | — | — | 1,197,310 | — | ||||||||||||
Cash flow hedge | — | — | 1,197,310 | — | ||||||||||||
Exchange rate hedge: | 20,948,126 | — | 83,186 | — | ||||||||||||
Cash flow hedge | 20,948,126 | — | 83,186 | — | ||||||||||||
|
|
|
|
|
|
|
| |||||||||
Total | 20,948,126 | — | 1,280,496 | — | ||||||||||||
|
|
|
|
|
|
|
| |||||||||
| January 1, 2013 | ||||||||||||||||
| Assets | Liabilities | |||||||||||||||
| Current ThCh$ | Non-current ThCh$ | Current ThCh$ | Non-current ThCh$ | |||||||||||||
Interest rate hedge: | — | — | 49,225 | 3,214,525 | ||||||||||||
Cash flow hedge | — | — | 49,225 | 3,214,525 | ||||||||||||
Exchange rate hedge: | — | 28,676,421 | 42,051 | — | ||||||||||||
Cash flow hedge | — | 28,676,421 | 42,051 | — | ||||||||||||
|
|
|
|
|
|
|
| |||||||||
Total | — | 28,676,421 | 91,276 | 3,214,525 | ||||||||||||
|
|
|
|
|
|
|
| |||||||||
General information on hedge derivative instruments
Hedge derivative instruments and their corresponding hedged instruments are shown in the following table:
Detail of hedge instruments | Description of hedge instrument | Description of instrument hedged | Fair value of instruments hedged | Fair value of instruments hedged | Fair value of instruments hedged | |||||||||||
| 12-31-2014 ThCh$ | 12-31-2013 ThCh$ | 1-1-2013 ThCh$ | ||||||||||||||
Swap | Interest rate | Bank borrowings | — | (1,197,310 | ) | (3,263,750 | ) | |||||||||
Swap | Exchange rate | Unsecured obligations (bonds) | (24,639,070 | ) | 20,864,940 | 28,634,370 | ||||||||||
For the years ended December 31, 2014 and 2013, the Combined Group has not recognized significant gains or losses for ineffective cash flow hedges.
F-194
Table of Contents
b) Financial derivative instrument assets and liabilities at fair value through profit or loss
As of December 31, 2014 and 2013, financial derivative transactions recorded at fair value through profit or loss, resulted in the recognition of the following assets and liabilities in the statement of financial position:
| December 31, 2014 | ||||||||||||||||
| Current Assets ThCh$ | Current Liabilities ThCh$ | Non-current Assets ThCh$ | Non-current Liabilities ThCh$ | |||||||||||||
Non-hedging derivative instruments | 33,882 | 2,526,798 | 22,002 | 6,286,982 | ||||||||||||
| December 31, 2013 | ||||||||||||||||
| Current Assets ThCh$ | Current Liabilities ThCh$ | Non-current Assets ThCh$ | Non-current Liabilities ThCh$ | |||||||||||||
Non-hedging derivative instruments | 361,595 | 164,983 | — | — | ||||||||||||
As of January 1, 2013, there were no financial derivative transactions recorded at fair value through profit or loss.
c) Other information on derivatives
The following tables present the fair value of hedging and non-hedging derivatives entered into by the Combined Group as well as the remaining contractual maturities as of December 31, 2014 and 2013 and January 1, 2013:
| December 31, 2014 | ||||||||||||||||||||||||||||||||
| Fair value ThCh$ | Notional amount | |||||||||||||||||||||||||||||||
Financial derivatives | Less than one year ThCh$ | 1-2 years ThCh$ | 2-3 years ThCh$ | 3-4 years ThCh$ | 4-5 years ThCh$ | More than 5 yeras ThCh$ | Total ThCh$ | |||||||||||||||||||||||||
Exchange rate hedge: | (24,639,070 | ) | — | — | — | — | 260,451,370 | — | 260,451,370 | |||||||||||||||||||||||
Cash flow hedge | (24,639,070 | ) | — | — | — | — | 260,451,370 | — | 260,451,370 | |||||||||||||||||||||||
Derivatives not designated for hedge accounting | (8,757,896 | ) | 65,572,071 | 46,908,791 | 45,078,924 | 19,426,499 | — | — | 176,986,285 | |||||||||||||||||||||||
|
|
|
|
|
|
|
|
|
|
|
|
|
|
|
| |||||||||||||||||
Total | (33,396,066 | ) | 65,572,071 | 46,908,791 | 45,078,924 | 19,426,499 | 260,451,370 | — | 437,437,655 | |||||||||||||||||||||||
|
|
|
|
|
|
|
|
|
|
|
|
|
|
|
| |||||||||||||||||
| December 31, 2013 | ||||||||||||||||||||||||||||||||
| Notional amount | |||||||||||||||||||||||||||||||
Financial derivatives | Fair value ThCh$ | Less than one year ThCh$ | 1-2 years ThCh$ | 2-3 years ThCh$ | 3-4 years ThCh$ | 4-5 years ThCh$ | More than 5 yeras ThCh$ | Total ThCh$ | ||||||||||||||||||||||||
Interest rate hedge: | (1,197,310 | ) | 104,922,000 | — | — | — | — | — | 104,922,000 | |||||||||||||||||||||||
Cash flow hedge | (1,197,310 | ) | 104,922,000 | — | — | — | — | — | 104,922,000 | |||||||||||||||||||||||
Exchange rate hedge: | 20,864,940 | 207,559,921 | — | — | — | — | — | 207,559,921 | ||||||||||||||||||||||||
Cash flow hedge | 20,864,940 | 207,559,921 | — | — | — | — | — | 207,559,921 | ||||||||||||||||||||||||
Derivatives not designated for hedge accounting | 196,612 | 32,354,473 | — | — | — | — | — | 32,354,473 | ||||||||||||||||||||||||
|
|
|
|
|
|
|
|
|
|
|
|
|
|
|
| |||||||||||||||||
Total | 19,864,242 | 344,836,394 | — | — | — | — | — | 344,836,394 | ||||||||||||||||||||||||
|
|
|
|
|
|
|
|
|
|
|
|
|
|
|
| |||||||||||||||||
F-195
Table of Contents
| January 1, 2013 | ||||||||||||||||||||||||||||||||
| Notional amount | |||||||||||||||||||||||||||||||
Derivados financieros | Fair value ThCh$ | Less than one year ThCh$ | 1-2 years ThCh$ | 2-3 years ThCh$ | 3-4 years ThCh$ | 4-5 years ThCh$ | More than 5 yeras ThCh$ | Total ThCh$ | ||||||||||||||||||||||||
Interest rate hedge: | (3,263,750 | ) | — | 95,992,000 | — | — | — | — | 95,992,000 | |||||||||||||||||||||||
Cash flow hedge | (3,263,750 | ) | — | 95,992,000 | — | — | — | — | 95,992,000 | |||||||||||||||||||||||
Exchange rate hedge: | 28,634,370 | — | 189,894,321 | — | — | — | — | 189,894,321 | ||||||||||||||||||||||||
Cash flow hedge | 28,634,370 | — | 189,894,321 | — | — | — | — | 189,894,321 | ||||||||||||||||||||||||
Derivatives not designated for hedge accounting | — | — | — | — | — | — | — | — | ||||||||||||||||||||||||
|
|
|
|
|
|
|
|
|
|
|
|
|
|
|
| |||||||||||||||||
Total | 25,370,620 | — | 285,886,321 | — | — | — | — | 285,886,321 | ||||||||||||||||||||||||
|
|
|
|
|
|
|
|
|
|
|
|
|
|
|
| |||||||||||||||||
The hedging and non-hedging derivatives contractual maturities do not represent the Combined Group’s total risk exposure, as the amounts presented in the above tables have been drawn up based on undiscounted contractual cash inflows and outflows for their settlement.
22.3 Fair value hierarchy
Financial instruments recognized at fair value in the combined statement of financial position are classified based on the hierarchy described in Note 3h.
The following table presents financial assets and liabilities measured at fair value as of December 31, 2014 and 2013 and January 1, 2013:
Financial instruments measured at fair value | Fair value measured at end of reporting period using: | |||||||||||||||
| 12-31-2014 ThCh$ | Level 1 ThCh$ | Level 2 ThCh$ | Level 3 ThCh$ | |||||||||||||
Financial Assets | ||||||||||||||||
Financial derivatives designated as cash flow hedges | 4,204,094 | — | 4,204,094 | — | ||||||||||||
Financial derivatives not designated for hedge accounting | 55,884 | — | 55,884 | — | ||||||||||||
Available-for-sale financial assets, non-current | 362,169 | 362,169 | — | — | ||||||||||||
|
|
|
|
|
|
|
| |||||||||
Total | 4,622,147 | 362,169 | 4,259,978 | — | ||||||||||||
|
|
|
|
|
|
|
| |||||||||
Financial Liabilities | ||||||||||||||||
Financial derivatives designated as cash flow hedges | 28,843,164 | — | 28,843,164 | — | ||||||||||||
Financial derivatives not designated for hedge accounting | 8,813,780 | — | 8,813,780 | — | ||||||||||||
|
|
|
|
|
|
|
| |||||||||
Total | 37,656,944 | — | 37,656,944 | — | ||||||||||||
|
|
|
|
|
|
|
| |||||||||
Financial instruments measured at fair value | Fair value measured at end of reporting period using: | |||||||||||||||
| 12-31-2013 ThCh$ | Level 1 ThCh$ | Level 2 ThCh$ | Level 3 ThCh$ | |||||||||||||
Financial Assets | ||||||||||||||||
Financial derivatives designated as cash flow hedges | 20,948,126 | — | 20,948,126 | — | ||||||||||||
Financial derivatives not designated for hedge accounting | 361,595 | — | 361,595 | — | ||||||||||||
Commodity derivatives designted as cash flow hedges | 129,780 | — | 129,780 | — | ||||||||||||
Available-for-sale financial assets, non-current | 29,195 | 29,195 | — | — | ||||||||||||
|
|
|
|
|
|
|
| |||||||||
Total | 21,468,696 | 29,195 | 21,439,501 | — | ||||||||||||
|
|
|
|
|
|
|
| |||||||||
Financial Liabilities | ||||||||||||||||
Financial derivatives designated as cash flow hedges | 1,280,496 | — | 1,280,496 | — | ||||||||||||
Financial derivatives not designated for hedge accounting | 164,983 | 164,983 | — | |||||||||||||
|
|
|
|
|
|
|
| |||||||||
Total | 1,445,479 | — | 1,445,479 | — | ||||||||||||
|
|
|
|
|
|
|
| |||||||||
F-196
Table of Contents
Financial instruments measured at fair value | Fair value measured at end of reporting period using: | |||||||||||||||
| 1-1-2013 ThCh$ | Level 1 ThCh$ | Level 2 ThCh$ | Level 3 ThCh$ | |||||||||||||
Financial Assets | ||||||||||||||||
Financial derivatives designated as cash flow hedges | 28,676,421 | — | 28,676,421 | — | ||||||||||||
Commodity derivatives designted as cash flow hedges | 784,741 | — | 784,741 | — | ||||||||||||
Financial assets at fair value through profit or loss | 3,864 | 3,864 | — | — | ||||||||||||
Available-for-sale financial assets, non-current | 31,468 | 31,468 | — | — | ||||||||||||
|
|
|
|
|
|
|
| |||||||||
Total | 29,496,494 | 35,332 | 29,461,162 | — | ||||||||||||
|
|
|
|
|
|
|
| |||||||||
Financial Liabilities | ||||||||||||||||
Financial derivatives designated as cash flow hedges | 3,305,801 | — | 3,305,801 | — | ||||||||||||
Commodity derivatives designted as cash flow hedges | 32,200 | — | 32,200 | — | ||||||||||||
Other non-current financial liabilities | — | — | — | 2,022,260 | ||||||||||||
|
|
|
|
|
|
|
| |||||||||
Total | 3,338,001 | — | 3,338,001 | 2,022,260 | ||||||||||||
|
|
|
|
|
|
|
| |||||||||
| b) | The following is the reconciliation between opening and closing balances for financial instruments whose fair value is classified at Level 3: |
Non-current Interest-bearing Borrowings | ThCh$ | |||
Balance at January 1, 2013 | 2,022,260 | |||
Total profit recognized in financial profit or loss | (2,022,260 | ) | ||
Balance at December 31, 2013 | — | |||
Total profit recognized in financial profit or loss | — | |||
Balance at December 31, 2014 | — | |||
The fair value of Level 3 has been calculated by applying a traditional discounted cash flow method. These projected cash flows include assumptions from within the Combined Group that are primarily based on estimates for prices and levels of energy production and firm capacity, as well as the costs of operating and maintaining some of our plants.
None of the possible reasonable scenarios foreseeable in the assumptions mentioned in the above paragraph would result in a significant change in the fair value of the financial instruments included at this level.
| 23. | TRADE AND OTHER CURRENT PAYABLES |
The breakdown of Trade and Other Payables as of December 31, 2014 and 2013 is as follows:
| Current | Non-current | |||||||||||||||||||||||
Trade and Other Payables | 12-31-2014 ThCh$ | 12-31-2013 ThCh$ | 1-1-2013 ThCh$ | 12-31-2014 ThCh$ | 12-31-2013 ThCh$ | 1-1-2013 ThCh$ | ||||||||||||||||||
Trade payables | 141,406,478 | 110,858,208 | 126,353,801 | — | — | — | ||||||||||||||||||
Other payables | 353,954,877 | 247,472,788 | 148,005,330 | 3,711,078 | — | — | ||||||||||||||||||
|
|
|
|
|
|
|
|
|
|
|
| |||||||||||||
Total | 495,361,355 | 358,330,996 | 274,359,131 | 3,711,078 | — | — | ||||||||||||||||||
|
|
|
|
|
|
|
|
|
|
|
| |||||||||||||
F-197
Table of Contents
The detail of Trade and Other Current Payables as of December 31, 2014 and 2013 and 2013 is as follows:
| Current | Non-current | |||||||||||||||||||||||
Trade and Other Payables | 12-31-2014 ThCh$ | 12-31-2013 ThCh$ | 1-1-2013 ThCh$ | 12-31-2014 ThCh$ | 12-31-2013 ThCh$ | 1-1-2013 ThCh$ | ||||||||||||||||||
Energy suppliers | 117,406,230 | 101,048,199 | 110,594,771 | — | — | — | ||||||||||||||||||
Fuel and natural gas suppliers | 24,000,248 | 9,810,009 | 15,759,030 | — | — | — | ||||||||||||||||||
Payables for goods and services | 239,620,155 | 180,018,380 | 109,525,219 | — | — | — | ||||||||||||||||||
Dividends payable to non-controlling interests | 52,514,644 | 52,801,224 | 31,172,908 | — | — | — | ||||||||||||||||||
Payables to tax authorities other than Corporate Income Tax | 9,151,384 | — | 1,226,740 | 3,711,078 | — | — | ||||||||||||||||||
VAT debit | 13,615,918 | — | — | — | — | — | ||||||||||||||||||
Mitsubishi contract (LTSA) | 34,214,611 | 13,458,204 | 5,081,697 | — | — | — | ||||||||||||||||||
Other payables | 4,838,165 | 1,194,980 | 998,766 | — | — | — | ||||||||||||||||||
|
|
|
|
|
|
|
|
|
|
|
| |||||||||||||
Total | 495,361,355 | 358,330,996 | 274,359,131 | 3,711,078 | — | — | ||||||||||||||||||
|
|
|
|
|
|
|
|
|
|
|
| |||||||||||||
See Note 21.4 for the description of the liquidity risk management policy.
The detail of trade payables, both non-past due and past due as of December 31, 2014 and 2013 and January 1, 2013, are presented in Appendix 7.
| 24. | PROVISIONS |
| a) | The breakdown of provisions as of December 31, 2014 and 2013 and January 1, 2013 is as follows: |
Provisions | Current | Non-current | ||||||||||||||||||||||
| 12-31-2014 ThCh$ | 12-31-2013 ThCh$ | 1-1-2013 ThCh$ | 12-31-2014 ThCh$ | 12-31-2013 ThCh$ | 1-1-2013 ThCh$ | |||||||||||||||||||
Provision for legal proceedings | 5,113,728 | 7,072,256 | 3,038,316 | 2,397,507 | 6,292,648 | 8,392,536 | ||||||||||||||||||
Provision for decommissioning and restoration (1) | 25,572,428 | 17,691,003 | 16,693,529 | |||||||||||||||||||||
Other provisions | 6,509,786 | 37,566,816 | 35,614,471 | — | — | 197,707 | ||||||||||||||||||
|
|
|
|
|
|
|
|
|
|
|
| |||||||||||||
Total | 11,623,514 | 44,639,072 | 38,652,787 | 27,969,935 | 23,983,651 | 25,283,772 | ||||||||||||||||||
|
|
|
|
|
|
|
|
|
|
|
| |||||||||||||
| (1) | See Note 3a |
The expected timing and amount of any cash outflows related to the above provisions is uncertain and depends on the final resolution of the provisioned matters (See note 3.l)
The management of Enersis Chile considers that the provisions recorded in the combined financial statements are adequate to cover the risks resulting from litigation.
F-198
Table of Contents
| b) | Changes in provisions as of December 31, 2014 and 2013 and January 1, 2013 are as follows: |
| Legal Proceedings ThCh$ | Decommissioning or Restoration ThCh$ | Other Provisions ThCh$ | Total ThCh$ | |||||||||||||
Changes in Provisions | ||||||||||||||||
Balance at January 1, 2014 | 13,364,904 | 17,691,003 | 37,566,816 | 68,622,723 | ||||||||||||
Additional provisions | — | 6,815,580 | — | 6,815,580 | ||||||||||||
Increase (decrease) in existing provisions | (925,600 | ) | 15,850 | (31,043,430 | ) | (31,953,180 | ) | |||||||||
Provisions used | (4,928,069 | ) | — | (13,601 | ) | (4,941,670 | ) | |||||||||
Increase from adjustment to time value of money | — | 1,049,996 | — | 1,049,996 | ||||||||||||
Foreign currency translation | — | — | — | — | ||||||||||||
Other increase (decrease) | — | — | — | — | ||||||||||||
|
|
|
|
|
|
|
| |||||||||
Total changes in provisions | (5,853,669 | ) | 7,881,426 | (31,057,031 | ) | (29,029,274 | ) | |||||||||
|
|
|
|
|
|
|
| |||||||||
Balance at December 31, 2014 | 7,511,235 | 25,572,429 | 6,509,785 | 39,593,449 | ||||||||||||
|
|
|
|
|
|
|
| |||||||||
| Legal Proceedings ThCh$ | Decommissioning or Restoration ThCh$ | Other Provisions ThCh$ | Total ThCh$ | |||||||||||||
Changes in Provisions | ||||||||||||||||
Balance at January 1, 2013 | 11,430,852 | 16,693,529 | 35,812,178 | 63,936,559 | ||||||||||||
Additional provisions | — | — | — | — | ||||||||||||
Increase (decrease) in existing provisions | 2,795,206 | 14,952 | — | 2,810,158 | ||||||||||||
Provisions used | (232,518 | ) | — | (824,158 | ) | (1,056,676 | ) | |||||||||
Increase from adjustment to time value of money | — | 982,522 | 159,361 | 1,141,883 | ||||||||||||
Foreign currency translation | (168,021 | ) | — | — | (168,021 | ) | ||||||||||
Other increase (decrease) | (460,615 | ) | — | 2,419,435 | 1,958,820 | |||||||||||
|
|
|
|
|
|
|
| |||||||||
Total changes in provisions | 1,934,052 | 997,474 | 1,754,638 | 4,686,164 | ||||||||||||
|
|
|
|
|
|
|
| |||||||||
Balance at December 31, 2013 | 13,364,904 | 17,691,003 | 37,566,816 | 68,622,723 | ||||||||||||
|
|
|
|
|
|
|
| |||||||||
| 25. | EMPLOYEE BENEFIT OBLIGATIONS |
25.1 General information
The Combined Group provides various post-employment benefits for all or some of their active or retired employees. These benefits are calculated and recorded in the financial statements according to the criteria described in Note 3.l.1, and include primarily the following:
Defined benefit plans:
| • | Complementary pension: The beneficiary is entitled to receive a monthly amount that supplements the pension obtained from the respective social security system. |
| • | Employee severance indemnities: The beneficiary receives a certain number of contractual salaries upon retirement. Such benefit is subject to a vesting minimum service requirement period, which depending on the entity, varies within a range from 5 to 15 years. |
| • | Electricity: The beneficiary receives a monthly bonus to cover a portion of their billed residential electricity consumption. |
| • | Health benefit: The beneficiary receives health coverage in addition to that to which they are entitled to under applicable social security regime. |
F-199
Table of Contents
25.2 Details, changes and presentation in financial statements
| a) | The post-employment obligations associated with the defined benefits plan as of December 31, 2014 and 2013 and January 1, 2013 are as follows: |
General ledger accounts:
| 12-31-2014 ThCh$ | 12-31-2013 ThCh$ | 1-1-2013 ThCh$ | ||||||||||
Post-employment obligations | 53,937,842 | 41,495,612 | 38,842,337 | |||||||||
|
|
|
|
|
| |||||||
Total | 53,937,842 | 41,495,612 | 38,842,337 | |||||||||
|
|
|
|
|
| |||||||
Non-current portion | 53,937,842 | 41,495,612 | 38,842,337 | |||||||||
|
|
|
|
|
| |||||||
| b) | The following amounts were recognized in the combined statement of comprehensive income for the years ended December 31, 2014 and 2013: |
| 12-31-2014 ThCh$ | 12-31-2013 ThCh$ | |||||||
Expense Recognized in the Statement of Comprehensive Income | ||||||||
Current service cost for defined benefits plan | 1,642,846 | 1,476,129 | ||||||
Interest cost for defined benefits plan | 2,139,043 | 2,197,469 | ||||||
Past service costs | 667,153 | — | ||||||
Expenses recognized in the Statement of Income | 4,449,042 | 3,673,598 | ||||||
Gains (losses) from remeasurement of defined benefit plans | 12,692,856 | 3,260,244 | ||||||
|
|
|
| |||||
Total expense recognized in the Statement of Comprehensive Income | 17,141,898 | 6,933,842 | ||||||
|
|
|
| |||||
| c) | The balance and changes in post-employment defined benefit obligations as of December 31, 2014 and 2013 and January 1, 2013 are as follows: |
Net Actuarial Liabilities | ThCh$ | |||
Balance at January 1, 2013 | 38,842,337 | |||
Current service cost | 1,476,129 | |||
Net interest cost | 2,197,469 | |||
Actuarial (gains) losses from changes in financial assumptions | 1,969,177 | |||
Actuarial (gains) losses from changes in experience adjustments | 1,291,067 | |||
Benefits paid | (4,173,234 | ) | ||
Other | (107,331 | ) | ||
|
| |||
Balance at December 31, 2013 | 41,495,612 | |||
|
| |||
Current service cost | 1,642,846 | |||
Net interest cost | 2,139,043 | |||
Actuarial (gains) losses from changes in financial assumptions | 6,190,052 | |||
Actuarial (gains) losses from changes in experience adjustments | 6,502,804 | |||
Benefits paid | (5,007,250 | ) | ||
Foreign currency translation differences | (273,590 | ) | ||
Past service costs | 667,153 | |||
Defined benefit plan obligations from business combinations | 1,297,048 | |||
Transferred to held for sale | (102,423 | ) | ||
Other | (613,453 | ) | ||
|
| |||
Balance at December 31, 2014 | 53,937,842 | |||
|
| |||
The Combined Group companies make no contributions to funds for financing the payment of these benefits.
F-200
Table of Contents
Other disclosures:
| • | Actuarial assumptions: |
As of December 31, 2014 and 2013 and January 1, 2013, the following assumptions were used in the actuarial calculation of defined benefits:
| 12-31-2014 | 12-31-2013 | 1-1-2013 | ||||||||||
Discount rates used | 4.60 | % | 5.40 | % | 6.0 | % | ||||||
Expected rate of salary increases | 4.00 | % | 3.00 | % | 3.0 | % | ||||||
Mortality tables | RV—2009 | RV—2004 | RV—2004 | |||||||||
| • | Sensitivity |
As of December 31, 2014 and 2013 and January 1, 2013, the sensitivity value of the actuarial liability for post-employment benefits to variations of 100 basis points in the discount rate assumes a decrease of ThCh$3,886,938, ThCh$3,187,030, and ThCh$2,890,774, respectively, if the rate rises, and an increase of ThCh$4,559,332, ThCh$3,716,366, and ThCh$3,338,399 if the rate falls.
| • | Future disbursements |
The estimates available indicate that ThCh$7,615,896 (ThCh$5,344,740 for the year ended December 31, 2014) will be disbursed for defined benefit plans in the next year.
| • | Term of commitments |
The Combined Group’s obligations have a weighted average length of 7.55 years for the year ended December 31, 2014 (8.24 years in 2013), and the outflows for benefits for the next five years and more is expected to be as follows:
Years | ThCh$ | |||
1 | 7,615,896 | |||
2 | 5,206,831 | |||
3 | 4,457,526 | |||
4 | 4,253,947 | |||
5 | 4,982,185 | |||
Over 5 | 25,385,653 | |||
| 26. | EQUITY |
26.1 Net assets (Combined financial statements)
As stated in Note 2.1 “Basis of preparation” Enersis Chile was not a group for Consolidated Financial Statements reporting purposes in accordance with IFRS 10Consolidated Financial Statements and was presented on the basis of the aggregation of the net assets of the legal entities of Enersis group located in Chile. Since the combined group does not have any subscribed issued shares, a presentation of earning per share in accordance with IAS 33Earnings per Share, it is not applicable.
F-201
Table of Contents
26.2 Foreign currency translation reserves
The following table details currency translation adjustments attributable to the shareholders of Enersis, in the combined statement of financial position as of December 31, 2014 and 2013:
Reserves for Accumulated Currency Translation Differences | 12-31-2014 ThCh$ | 12-31-2013 ThCh$ | ||||||
Inversiones GasAtacama Holding Ltda. | 11,500,876 | 5,380,978 | ||||||
GNL Quinteros | (957,220 | ) | (1,683,614 | ) | ||||
GNL Chile | 119,434 | 23,820 | ||||||
Electrogas | 780,876 | (93,000 | ) | |||||
|
|
|
| |||||
TOTAL | 11,443,966 | 3,628,184 | ||||||
|
|
|
| |||||
26.3 Restrictions on combined entities transferring funds to the parent
Certain of the Group’s combined entities must comply with financial ratio covenants which require them to have a minimum level of equity or other requirements that restrict the transferring of assets to Enersis. The Combined Group’s restricted net assets as of December 31, 2014 from its subsidiary Endesa Chile totaled ThCh$471,161,296.
26.4 Other reserves
Other reserves within Equity attributable to Enersis Chile as of December 31, 2014 and 2013 are as follows:
| Balance at January 1, 2014 ThCh$ | 2014 Changes ThCh$ | Balance at December 31, 2014 ThCh$ | ||||||||||
Exchange differences on translation | 3,628,184 | 7,815,782 | 11,443,966 | |||||||||
Cash flow hedges | (6,258,379 | ) | (60,592,484 | ) | (66,850,863 | ) | ||||||
Available-for-sale financial assets | 11,811 | 2,235 | 14,046 | |||||||||
Other miscellaneous reserves | (877,246,493 | ) | 3,760,126 | (873,486,367 | ) | |||||||
|
|
|
|
|
| |||||||
TOTAL | (879,864,877 | ) | (49,014,341 | ) | (928,879,218 | ) | ||||||
|
|
|
|
|
| |||||||
| Balance at January 1, 2013 ThCh$ | 2013 Changes ThCh$ | Balance at December 31, 2013 ThCh$ | ||||||||||
Exchange differences on translation | (3,488,610 | ) | 7,116,794 | 3,628,184 | ||||||||
Cash flow hedges | 25,228,578 | (31,486,957 | ) | (6,258,379 | ) | |||||||
Available-for-sale financial assets | 13,647 | (1,836 | ) | 11,811 | ||||||||
Other miscellaneous reserves | 360,334,722 | (1,237,581,215 | ) | (877,246,493 | ) | |||||||
|
|
|
|
|
| |||||||
TOTAL | 382,088,337 | (1,261,953,214 | ) | (879,864,877 | ) | |||||||
|
|
|
|
|
| |||||||
| a) | Reserves for exchange differences on translation arise from: |
| • | Translation of the financial statements of our foreign operations from their functional currencies to our presentation currency (i.e. Chilean peso) (see Note 2.6.3); and |
| • | Translation of goodwill arising from the acquisition of foreign operations with a functional currency other than the Chilean peso (see Note 3.c). |
| b) | Cash flow hedging reserves:These reserves represent the cumulative effective portion of gains and losses recognized on cash flow hedges (see Note 3.g.5). |
F-202
Table of Contents
| c) | Other reserves |
The items included in the balance in “Other miscellaneous reserves” as of December 31, 2014 and 2013 are explained as follows:
i) In accordance with Official Bulletin No. 456 from the SVS (Superintendencia de Valores y Seguros de Chile), included in this line item is the price-level restatment corresponding to the accumulated paid-in capital from the date of our transition to IFRS, January 1, 2004, to December 31, 2008.
Please note that, while the Combined Group adopted the IFRS as its statutory accounting standards on January 1, 2013, the date of transition was the same as that used by its parent company, Endesa, S.A. located in Spain, January 1, 2004, applying the exemption for that purpose in IFRS 1, “First Time Adoption”.
ii) Foreign currency translation differences existing at the time of transition to IFRS (IFRS 1 exemption, First Time Adoption).
26.5 Non-controlling Interests
26.5.1 The detail of non-controlling interests
| Non-controlling Financial Interests | ||||||||||||||||||||||||
| 12-31-2014 | Equity | Profit (Loss) | ||||||||||||||||||||||
Companies | 12-31-2014 | 12-31-2013 | 1-1-2013 | 12-31-2014 | 12-31-2013 | |||||||||||||||||||
| % | ThCh$ | ThCh$ | ThCh$ | ThCh$ | ThCh$ | |||||||||||||||||||
Chilectra Chile | 0.91 | % | 6,096,609 | 5,056,793 | 4,961,366 | 1,134,243 | 1,038,575 | |||||||||||||||||
Endesa Chile | 40.02 | % | 590,523,470 | 578,601,677 | 551,018,023 | 22,360,050 | 69,291,895 | |||||||||||||||||
Empresa Eléctrica Pehuenche S.A. | 7.35 | % | 12,597,077 | 12,756,939 | 12,351,472 | 9,526,574 | 8,415,147 | |||||||||||||||||
Sociedad Agrícola de Cameros Ltda. | 42.50 | % | 2,483,339 | 2,532,644 | 2,584,716 | (49,305 | ) | (52,073 | ) | |||||||||||||||
Constructora y Proyectos Los Maitenes S.A. | 0.00 | % | — | 25,446,652 | 25,393,339 | 3,948,804 | 3,543,412 | |||||||||||||||||
Otras | 163,862 | 2,551,916 | 9,243,311 | 180,012 | 620,899 | |||||||||||||||||||
|
|
|
|
|
|
|
|
|
| |||||||||||||||
TOTAL | 611,864,357 | 626,946,621 | 605,552,277 | 37,100,378 | 82,857,855 | |||||||||||||||||||
|
|
|
|
|
|
|
|
|
| |||||||||||||||
F-203
Table of Contents
| 27. | REVENUE AND OTHER INCOME |
The detail of revenues presented in the statement of comprehensive income for the years ended December 31, 2014 and 2013 is as follows:
Revenues | For the years ended | |||||||
| 12-31-2014 ThCh$ | 12-31-2013 ThCh$ | |||||||
Energy sales | 1,886,300,883 | 1,516,877,306 | ||||||
Generation | 888,464,799 | 674,123,726 | ||||||
Regulated customers | 498,286,123 | 481,385,994 | ||||||
Non-regulated customers | 274,937,535 | 156,628,460 | ||||||
Spot market sales | 98,642,810 | 27,575,021 | ||||||
Other customers | 16,598,331 | 8,534,251 | ||||||
Distribution | 997,836,084 | 842,753,580 | ||||||
Residential | 335,917,449 | 283,881,233 | ||||||
Business | 281,978,818 | 238,298,115 | ||||||
Industrial | 196,219,296 | 165,823,406 | ||||||
Other consumers (1) | 183,720,521 | 154,750,826 | ||||||
Other sales | 26,677,747 | 37,365,915 | ||||||
Natural gas sales | 4,721,304 | 25,261,022 | ||||||
Sales of products and services | 21,956,443 | 12,104,893 | ||||||
Revenue from other services | 101,885,268 | 165,323,495 | ||||||
Tolls and transmission | 32,836,510 | 101,073,720 | ||||||
Metering equipment leases | 4,188,416 | 4,301,905 | ||||||
Public lighting | 9,558,413 | 5,945,226 | ||||||
Engineering and consulting services | 290,889 | 348,714 | ||||||
Other services (2) | 55,011,040 | 53,653,930 | ||||||
|
|
|
| |||||
Total operating revenue | 2,014,863,898 | 1,719,566,716 | ||||||
|
|
|
| |||||
Other Operating Income | 12-31-2014 ThCh$ | 12-31-2013 ThCh$ | ||||||
Mutual support | 1,136,352 | 2,753,665 | ||||||
Leases | 680,168 | 306,963 | ||||||
Other income (3) | 32,384,867 | 15,455,533 | ||||||
|
|
|
| |||||
Total other income | 34,201,387 | 18,516,161 | ||||||
|
|
|
| |||||
| (1) | For the year ended December 31, 2014, includes revenues from energy sales to municipalities for ThCh$68,818,164; government entities ThCh$33,329,550; hospitals and other related public health entities for ThCh$22,821,228; distribution companies for ThCh$43,305,906; agricultural sector entities for ThCh$8,079,571; and other for ThCh$7,366,103. For the year ended December 31, 2013, includes revenues from energy sales to municipalities for ThCh$47,688,673; government entities ThCh$22,974,154; hospitals and other related public health entities for ThCh$44,018,911; distribution companies for ThCh$28,780,840; agricultural sector entities for ThCh$5,575,971; and other for ThCh$5,712,278. |
| (2) | For the year ended December 31, 2014, includes services for construction of junctions for ThCh$14,189,316; tolls from concessions ThCh$10,531,493; works in specific facilities and networks for ThCh$20,399,104; and other services for ThCh$9,891,127. For the year ended December 31, 2013, includes services for construction of junctions for ThCh$14,273,568; tolls from concessions for ThCh$10,283,929; works in specific facilities and networks for ThCh$16,462,850; and other services for ThCh$12,633,583. |
F-204
Table of Contents
| (3) | Mainly related to indemnifications received from third-party for breach of contracts of ThCh$23,721,999 for the year ended December 31, 2014 (ThCh$12,943,564 for the year ended December 31, 2013) and revenues from trading commodity derivatives for ThCh$2,549,925 for the year ended December 31, 2014. |
| 28. | RAW MATERIALS AND CONSUMABLES USED |
The detail of raw materials and consumables used presented in profit or loss for the years ended December 31, 2014 and 2013 is as follows:
Raw Materials and Consumables Used | For the years ended | |||||||
| 12-31-2014 ThCh$ | 12-31-2013 ThCh$ | |||||||
Energy purchases | (788,420,653 | ) | (568,466,950 | ) | ||||
Fuel consumption | (305,480,260 | ) | (211,612,174 | ) | ||||
Transportation costs | (151,948,779 | ) | (182,821,321 | ) | ||||
Other raw materials and consumables | (63,552,591 | ) | (36,003,533 | ) | ||||
|
|
|
| |||||
Total | (1,309,402,283 | ) | (998,903,978 | ) | ||||
|
|
|
| |||||
| 29. | EMPLOYEE BENEFITS EXPENSE |
Employee expenses recognized in profit or loss for the years ended December 31, 2014 and 2013 are as follows:
Employee Benefits Expense | For the years ended | |||||||
| 12-31-2014 ThCh$ | 12-31-2013 ThCh$ | |||||||
Wages and salaries | (113,865,986 | ) | (108,318,816 | ) | ||||
Post-employment benefit obligations expense | (2,309,999 | ) | (1,476,129 | ) | ||||
Social security and other contributions | (10,165,378 | ) | (10,318,957 | ) | ||||
|
|
|
| |||||
Total | (126,341,363 | ) | (120,113,902 | ) | ||||
|
|
|
| |||||
| 30. | DEPRECIATION, AMORTIZATION AND IMPAIRMENT LOSSES |
The detail of depreciation, amortization and impairment losses recognized for the years ended December 31, 2014 and 2013 are as follows:
| For the years ended | ||||||||
| 12-31-2014 ThCh$ | 12-31-2013 ThCh$ | |||||||
Depreciation | (122,483,044 | ) | (113,756,076 | ) | ||||
Amortization | (5,954,110 | ) | (5,751,042 | ) | ||||
|
|
|
| |||||
Subtotal | (128,437,154 | ) | (119,507,118 | ) | ||||
|
|
|
| |||||
Impairment losses (*) | (13,185,420 | ) | (8,212,948 | ) | ||||
|
|
|
| |||||
Total | (141,622,574 | ) | (127,720,066 | ) | ||||
|
|
|
| |||||
(*) Impairment Losses | For the years ended | |||||||
| 12-31-2014 | 12-31-2013 | |||||||
| ThCh$ | ThCh$ | |||||||
Impairment losses of financial assets (See Note 9. c)) | (655,600 | ) | (7,940,767 | ) | ||||
Impairment losses of property, plant and equipment (See Note 17) | (12,529,820 | ) | (272,181 | ) | ||||
|
|
|
| |||||
Total | (13,185,420 | ) | (8,212,948 | ) | ||||
|
|
|
| |||||
F-205
Table of Contents
| 31. | OTHER EXPENSES |
Other miscellaneous operating expenses for the years ended December 31, 2014 and 2013 are as follows:
Other Expenses | For the years ended | |||||||
| 12-31-2014 ThCh$ | 12-31-2013 ThCh$ | |||||||
Other supplies and services | (15,630,380 | ) | (14,484,587 | ) | ||||
Professional, outsourced and other services | (44,418,344 | ) | (44,861,997 | ) | ||||
Repairs and maintenance | (11,867,380 | ) | (10,236,117 | ) | ||||
Indemnities and fines | (781,069 | ) | (5,908,646 | ) | ||||
Taxes and charges | (6,239,456 | ) | (10,442,697 | ) | ||||
Insurance premiums | (12,212,488 | ) | (9,851,988 | ) | ||||
Leases and rental costs | (6,734,776 | ) | (8,043,094 | ) | ||||
Marketing, public relations and advertising | (3,765,455 | ) | (3,869,225 | ) | ||||
Other supplies | (1,781,536 | ) | (1,121,835 | ) | ||||
Travel expenses | (4,153,233 | ) | (3,317,758 | ) | ||||
Environmental expenses | (2,870,098 | ) | (2,414,784 | ) | ||||
|
|
|
| |||||
Total | (110,454,215 | ) | (114,552,727 | ) | ||||
|
|
|
| |||||
| 32. | OTHER GAINS (LOSSES) |
Other gains (losses) for the years ended December 31, 2014 and 2013 are as follows:
Other Gains (Losses) | For the years ended | |||||||
| 12-31-2014 ThCh$ | 12-31-2013 ThCh$ | |||||||
Gain on sale of investment properties (1) | 7,556,574 | 12,195,531 | ||||||
Gain from remeasuring the pre-existing interest held in Inversiones GasAtacama Holding Ltda. (3) | 21,546,320 | — | ||||||
Recognition of translation difference on pre-existing interest held in Inversiones GasAtacama Holding Ltda. (3) | 21,006,456 | — | ||||||
Gain on sale of equity interest in Maitenes y Aguas Santiago Poniente (2) | 21,077,900 | — | ||||||
Gain on sale of Charrua transmission lines | — | 2,532,438 | ||||||
Other | (293,987 | ) | (200,232 | ) | ||||
|
|
|
| |||||
Total | 70,893,263 | 14,527,737 | ||||||
|
|
|
| |||||
| (1) | See Note 18 |
| (2) | See Note 2.4.1 |
| (3) | See Note 5.e |
| 33. | FINANCIAL RESULTS |
Financial income and costs for the years ended December 31, 2014 and 2013 are as follows:
Financial Income | For the years ended | |||||||
| 12-31-2014 ThCh$ | 12-31-2013 ThCh$ | |||||||
Income from deposits and other financial instruments | 2,813,132 | 2,738,938 | ||||||
Other financial income | 11,949,383 | 10,911,593 | ||||||
|
|
|
| |||||
Total | 14,762,515 | 13,650,531 | ||||||
|
|
|
| |||||
F-206
Table of Contents
Financial Costs | For the years ended | |||||||
| 12-31-2014 ThCh$ | 12-31-2013 ThCh$ | |||||||
Financial costs | (75,626,489 | ) | (69,768,634 | ) | ||||
Bank loans | (619,079 | ) | (1,220,055 | ) | ||||
Secured and unsecured obligations | (48,046,358 | ) | (46,713,612 | ) | ||||
Financial leasing | (989,288 | ) | (936,487 | ) | ||||
Valuation of financial derivatives | (2,634,032 | ) | (4,380,154 | ) | ||||
Financial provisions | (1,049,996 | ) | (1,141,883 | ) | ||||
Post-employment benefit obligations | (2,139,043 | ) | (2,197,469 | ) | ||||
Capitalized borrowing costs | 1,817,283 | 998,984 | ||||||
Other financial costs | (21,965,975 | ) | (14,177,958 | ) | ||||
Gains (losses) from indexed assets and liabilities (*) | 15,263,623 | 1,593,046 | ||||||
Foreign currency exchange differences (**) | (21,444,198 | ) | (1,838,329 | ) | ||||
|
|
|
| |||||
Total financial costs | (81,807,064 | ) | (70,013,917 | ) | ||||
|
|
|
| |||||
Total financial results | (67,044,549 | ) | (56,363,386 | ) | ||||
|
|
|
| |||||
The effects on financial results from exchange differences and the application of indexed assets and liabilities originated from the following:
Gains (losses) from Indexed Assets and Liabilities (*) | For the years ended | |||||||
| 12-31-2014 ThCh$ | 12-31-2013 ThCh$ | |||||||
Cash and cash equivalents | — | — | ||||||
Other financial assets | 23,240,913 | 4,732,150 | ||||||
Other non-financial assets | 115,593 | 13,669 | ||||||
Trade and other receivables | 185,459 | 273,757 | ||||||
Current tax assets and liabilities | 9,415,017 | 2,950,060 | ||||||
Other financial liabilities (financial debt and derivative instruments) | (17,623,602 | ) | (6,428,168 | ) | ||||
Trade and other payables | (3,757 | ) | 8,563 | |||||
Other provisions | (66,000 | ) | (12,564 | ) | ||||
Other non-financial liabilities | — | 55,579 | ||||||
|
|
|
| |||||
Total | 15,263,623 | 1,593,046 | ||||||
|
|
|
| |||||
Foreign Currency Exchange Differences (**) | For the years ended | |||||||
|
| |||||||
| 12-31-2014 ThCh$ | 12-31-2013 ThCh$ | |||||||
Cash and cash equivalents | 385,881 | 1,787,955 | ||||||
Other financial assets | (23,775,272 | ) | 150,051 | |||||
Other non-financial assets | 23,905 | 37,634 | ||||||
Trade and other receivables | 2,580,400 | (3,570,513 | ) | |||||
Current tax assets and liabilities | (1,076,322 | ) | (3,678 | ) | ||||
Other financial liabilities (financial debt and derivative instruments) | (2,694,805 | ) | (1,511,102 | ) | ||||
Trade and other payables | 3,841,715 | 1,537,678 | ||||||
Other non-financial liabilities | (729,700 | ) | (266,354 | ) | ||||
|
|
|
| |||||
Total | (21,444,198 | ) | (1,838,329 | ) | ||||
|
|
|
| |||||
F-207
Table of Contents
| 34. | INCOME TAXES |
The following table presents the components of the income tax expense/(benefit) for the years ended December 31, 2014 and 2013:
Current Income Tax and Adjustments to Current Income Tax for Previous Periods | For the years ended | |||||||
| 12-31-2014 ThCh$ | 12-31-2013 ThCh$ | |||||||
Current income tax | (75,830,800 | ) | (49,623,371 | ) | ||||
Tax benefit from tax losses, tax credits or temporary differences not previously recognized for the current period (current tax credits and/or benefits) | — | 1,698,566 | ||||||
Adjustments to current tax from the previous period | (7,073,017 | ) | (224,922 | ) | ||||
(Benefit) / expense for current income tax due to changes in tax rates or the introduction of new taxes | (4,245,607 | ) | ||||||
Other current tax benefit / (expense) | (3,302,113 | ) | (9,826,652 | ) | ||||
Current tax expense, net | (90,451,536 | ) | (57,976,379 | ) | ||||
(Benefit) / expense from deferred taxes for origination and reversal of temporary differences | 22,315,523 | (3,736,062 | ) | |||||
(Benefit) / expense from deferred taxes due to changes in tax rates or the introduction of new taxes (*) | (64,551,120 | ) | — | |||||
Other components of deferred tax (benefit) /expense | — | — | ||||||
|
|
|
| |||||
Total deferred tax benefit / (expense) | (42,235,597 | ) | (3,736,062 | ) | ||||
|
|
|
| |||||
Income tax expense, continuing operations | (132,687,133 | ) | (61,712,442 | ) | ||||
|
|
|
| |||||
| (*) | See Note 19 c), d) and e). |
The following table reconciles income taxes resulting from applying the local current tax rate to “Net income before taxes” and the actual income tax expense recorded in the accompanying combined statement of comprehensive income for the years ended December 31, 2014 and 2013:
Reconciliation of Tax Expense | Rate | 12-31-2014 ThCh$ | Rate | 12-31-2013 ThCh$ | ||||||||||||
ACCOUNTING INCOME BEFORE TAX | 332,246,550 | 374,096,957 | ||||||||||||||
Total tax income (expense) using statutory rate | (21.00 | %) | (69,771,775 | ) | (20.00 | %) | (74,819,391 | ) | ||||||||
Tax effect of non-taxable revenues | 4.43 | % | 14,714,272 | 3.50 | % | 13,092,926 | ||||||||||
Tax effect of non-tax-deductible expenses | (4.12 | %) | (13,691,638 | ) | (2.21 | %) | (8,256,436 | ) | ||||||||
Tax effect of changes in income tax rates (*) | (20.71 | %) | (68,796,727 | ) | — | — | ||||||||||
Tax effect of adjustments to taxes in previous periods | (2.13 | %) | (7,073,017 | ) | (0.06 | %) | (224,922 | ) | ||||||||
Price level restatement for tax purposes (investments and equity) | 3.59 | % | 11,931,752 | 2.27 | % | 8,495,382 | ||||||||||
Total adjustments to tax expense using statutory rate | (18.94 | %) | (62,915,358 | ) | 3.50 | % | 13,106,949 | |||||||||
Income tax benefit (expense), continuing operations | (39.94 | %) | (132,687,133 | ) | (16.50 | %) | (61,712,442 | ) | ||||||||
| (*) | The principal temporary differences are detailed in Note 19a. |
F-208
Table of Contents
| 35. | INFORMATION BY SEGMENT |
35.1 Basis of segmentation criteria
Since Enersis Chile has not yet been established as a legal entity, no chief operating decision maker exists for this Combined Group. Consequently, the Combined Group does not yet have any operating segments as the term is defined under IFRS 8 Operating Segments. Information provided in this note includes segments as they are supposed to be analyzed by the chief operating decision maker upon appointment of the latter.
The Combined Group’s activities are organized primarily around its core businesses: electric energy generation and distribution. On that basis, the Combined Group has established two major business lines.
Considering presents the differentiated information that is analyzed by the Combined Group’s chief operating decision maker, segment information has been organized by its core business.
Given that the Combined Group’s corporate organization basically matches its business organization and, therefore, the segments, the following information is based on the financial information of the companies forming each segment. The accounting policies used to determine the segment information are the same as those used in the preparation of the Combined Group’s combined financial statements.
F-209
Table of Contents
The following tables present details of this information by segment:
35.2 Generation, distribution and others
Line of Business | Generation | Distribution | Eliminations and Others | Total | ||||||||||||||||||||||||||||||||||||||||||||
| ASSETS | 12-31-2014 ThCh$ | 12-31-2013 ThCh$ | 1-1-2013 ThCh$ | 12-31-2014 ThCh$ | 12-31-2013 ThCh$ | 1-1-2013 ThCh$ | 12-31-2014 ThCh$ | 12-31-2013 ThCh$ | 1-1-2013 ThCh$ | 12-31-2014 ThCh$ | 12-31-2013 ThCh$ | 1-1-2013 ThCh$ | ||||||||||||||||||||||||||||||||||||
CURRENT ASSET | 514,223,177 | 428,962,509 | 352,513,040 | 283,754,811 | 166,075,023 | 156,993,644 | 44,885,510 | 159,680,654 | 104,755,778 | 842,863,498 | 754,718,186 | 614,262,462 | ||||||||||||||||||||||||||||||||||||
Cash and cash equivalents | 38,186,573 | 37,549,246 | 4,324,607 | 4,867,106 | 11,423,687 | 4,290,415 | 89,932,248 | 165,934,164 | 85,478,738 | 132,985,927 | 214,907,097 | 94,093,760 | ||||||||||||||||||||||||||||||||||||
Other current financial assets | 1,464,821 | 22,254,261 | — | 13,483 | — | — | 12,825 | 9,690 | 3,864 | 1,491,129 | 22,263,951 | 3,864 | ||||||||||||||||||||||||||||||||||||
Other current non-financial assets | 10,766,654 | 2,104,086 | 5,343,847 | 4,837,555 | 1,793,463 | 2,458,642 | 443,398 | 921,541 | 741,556 | 16,047,607 | 4,819,090 | 8,544,045 | ||||||||||||||||||||||||||||||||||||
Trade and other current receivables | 317,250,689 | 145,121,585 | 142,288,734 | 257,567,489 | 149,399,519 | 146,523,590 | 3,263,027 | 8,459,529 | 13,392,532 | 578,081,205 | 302,980,633 | 302,204,856 | ||||||||||||||||||||||||||||||||||||
Current accounts receivable from related companies | 54,976,444 | 54,808,305 | 23,222,928 | 12,867,310 | 935,683 | 2,227,669 | (50,891,104 | ) | (21,395,095 | ) | (31,730 | ) | 16,952,650 | 34,348,893 | 25,418,867 | |||||||||||||||||||||||||||||||||
Inventories | 36,871,184 | 14,662,965 | 30,054,548 | 3,542,452 | 2,516,897 | 1,452,915 | 3,264,242 | 4,835,162 | 4,315,432 | 43,677,878 | 22,015,024 | 35,822,895 | ||||||||||||||||||||||||||||||||||||
Current tax assets | 44,701,760 | 152,462,061 | 147,278,376 | 59,416 | 5,774 | 40,413 | 886,963 | 915,663 | 855,386 | 45,648,139 | 153,383,498 | 148,174,175 | ||||||||||||||||||||||||||||||||||||
Non-current assets classified as held for sale and discontinued operations | 10,005,052 | — | — | — | — | — | (2,026,089 | ) | — | — | 7,978,963 | |||||||||||||||||||||||||||||||||||||
NON-CURRENT ASSETS | 2,722,809,246 | 2,489,410,473 | 2,465,776,586 | 698,940,269 | 658,527,961 | 631,050,104 | 862,121,732 | 917,735,601 | 907,341,563 | 4,283,871,247 | 4,065,674,035 | 4,004,168,253 | ||||||||||||||||||||||||||||||||||||
Other non-current financial assets | 6,719,853 | 2,759,880 | 31,436,192 | 30,619 | 22,728 | 25,110 | — | — | 114,231 | 6,750,472 | 2,782,608 | 31,575,533 | ||||||||||||||||||||||||||||||||||||
Other non-current non-financial assets | 42,847 | 42,847 | 42,847 | 188,156 | 319,504 | 333,644 | 4,427 | 4,426 | 4,426 | 235,430 | 366,777 | 380,917 | ||||||||||||||||||||||||||||||||||||
Trade and other non-current receivables | — | — | — | 7,364,934 | 6,055,190 | 6,863,062 | 131,478 | 819,844 | 685,327 | 7,496,412 | 6,875,034 | 7,548,389 | ||||||||||||||||||||||||||||||||||||
Non-current accounts receivable from related companies | — | — | 5,712,830 | — | — | — | — | — | — | — | — | 5,712,830 | ||||||||||||||||||||||||||||||||||||
Investments accounted for using equity method | 40,365,323 | 214,426,175 | 178,127,840 | 53,525 | 1,014 | 13,824 | (53,525 | ) | (1,013 | ) | 79,087 | 40,365,323 | 214,426,176 | 178,220,751 | ||||||||||||||||||||||||||||||||||
Intangible assets other than goodwill | 18,851,913 | 14,551,065 | 12,617,054 | 14,613,951 | 13,175,169 | 13,233,744 | 3,059,658 | 9,844,571 | 12,111,431 | 36,525,522 | 37,570,805 | 37,962,229 | ||||||||||||||||||||||||||||||||||||
Goodwill | 24,860,356 | 4,656,105 | 4,656,105 | 2,240,478 | 2,240,478 | 2,240,478 | 860,156,821 | 860,156,821 | 860,156,821 | 887,257,655 | 867,053,404 | 867,053,404 | ||||||||||||||||||||||||||||||||||||
Property, plant and equipment | 2,621,113,892 | 2,249,838,283 | 2,209,465,780 | 674,156,508 | 636,528,765 | 608,238,796 | (11,509,624 | ) | (5,896,413 | ) | (6,958,282 | ) | 3,283,760,776 | 2,880,470,635 | 2,810,746,294 | |||||||||||||||||||||||||||||||||
Investment property | — | — | — | — | — | — | 8,514,562 | 44,877,049 | 46,922,970 | 8,514,562 | 44,877,049 | 46,922,970 | ||||||||||||||||||||||||||||||||||||
Deferred tax assets | 10,855,062 | 3,136,118 | 23,717,938 | 292,098 | 185,113 | 101,446 | 1,817,935 | 7,930,316 | (5,774,448 | ) | 12,965,095 | 11,251,547 | 18,044,936 | |||||||||||||||||||||||||||||||||||
|
|
|
|
|
|
|
|
|
|
|
|
|
|
|
|
|
|
|
|
|
|
|
| |||||||||||||||||||||||||
TOTAL ASSETS | 3,237,032,423 | 2,918,372,982 | 2,818,289,626 | 982,695,080 | 824,602,984 | 788,043,748 | 907,007,242 | 1,077,416,255 | 1,012,097,341 | 5,126,734,745 | 4,820,392,221 | 4,618,430,715 | ||||||||||||||||||||||||||||||||||||
|
|
|
|
|
|
|
|
|
|
|
|
|
|
|
|
|
|
|
|
|
|
|
| |||||||||||||||||||||||||
|
|
|
|
|
|
|
|
|
|
|
|
|
|
|
|
|
|
|
|
|
|
|
| |||||||||||||||||||||||||
Line of Busines | Generation | Distribution | Eliminations and others | Total | ||||||||||||||||||||||||||||||||||||||||||||
| LIABILITIES AND EQUITY | 31-12-2014 M$ | 31-12-2013 M$ | 31-12-2012 M$ | 31-12-2014 M$ | 31-12-2013 M$ | 31-12-2012 M$ | 31-12-2014 M$ | 31-12-2013 M$ | 31-12-2012 M$ | 31-12-2014 M$ | 31-12-2013 M$ | 31-12-2012 M$ | ||||||||||||||||||||||||||||||||||||
CURRENT LIABILITIES | 680,402,981 | 688,536,858 | 557,297,199 | 261,250,997 | 224,908,034 | 195,486,556 | (21,570,283 | ) | 14,685,579 | (119,861,378 | ) | 920,083,695 | 928,130,471 | 632,922,377 | ||||||||||||||||||||||||||||||||||
Other current financial liabilities | 146,364,103 | 124,569,707 | 217,913,907 | 133 | 198 | 47 | 123 | 2,693,949 | 2,442,955 | 146,364,359 | 127,263,854 | 220,356,909 | ||||||||||||||||||||||||||||||||||||
Trade and other current payables | 332,677,495 | 226,132,161 | 137,457,760 | 116,345,087 | 91,431,160 | 100,344,207 | 46,338,773 | 40,767,675 | 36,557,164 | 495,361,355 | 358,330,996 | 274,359,131 | ||||||||||||||||||||||||||||||||||||
Current account payables to related companies | 142,780,113 | 268,360,036 | 154,709,619 | 128,880,543 | 107,731,967 | 79,928,373 | (84,475,463 | ) | (38,920,067 | ) | (167,746,328 | ) | 187,185,193 | 337,171,936 | 66,891,664 | |||||||||||||||||||||||||||||||||
Other current provisions | 10,932,577 | 27,490,145 | 23,357,509 | 68,028 | 8,600,066 | 9,036,796 | 622,909 | 8,548,861 | 6,258,482 | 11,623,514 | 44,639,072 | 38,652,787 | ||||||||||||||||||||||||||||||||||||
Current tax liabilities | 31,480,257 | 41,456,080 | 23,323,179 | 4,501,006 | 16,608,698 | 4,660,597 | 2,376,603 | 1,368,741 | 2,090,150 | 38,357,866 | 59,433,519 | 30,073,926 | ||||||||||||||||||||||||||||||||||||
Current provisions for employee benefits | — | — | — | — | — | — | — | — | — | — | — | — | ||||||||||||||||||||||||||||||||||||
Other current non-financial liabilities | 16,168,436 | 528,729 | 535,225 | 11,456,200 | 535,945 | 1,516,536 | 8,078,625 | 226,420 | 536,199 | 35,703,261 | 1,291,094 | 2,587,960 | ||||||||||||||||||||||||||||||||||||
Liabilities associated with current assets classified as held for sale and discontinued operations | — | — | — | — | — | — | 5,488,147 | — | — | 5,488,147 | ||||||||||||||||||||||||||||||||||||||
NON-CURRENT LIABILITIES | 1,060,586,955 | 771,080,512 | 874,469,705 | 51,025,398 | 43,620,083 | 46,976,282 | 10,972,906 | 11,777,166 | 744,882 | 1,122,585,259 | 826,477,761 | 922,190,869 | ||||||||||||||||||||||||||||||||||||
Other non-current financial liabilities | 778,135,167 | 574,924,356 | 649,653,793 | — | — | — | — | 4,479,250 | 7,027,436 | 778,135,167 | 579,403,606 | 656,681,229 | ||||||||||||||||||||||||||||||||||||
Trade and other non-current payables | 3,711,078 | — | — | — | — | — | — | — | — | 3,711,078 | — | — | ||||||||||||||||||||||||||||||||||||
Non-current accounts payable to related companies | — | — | — | — | — | — | — | — | — | — | — | — | ||||||||||||||||||||||||||||||||||||
Other non-current provisions | 25,161,118 | 17,426,844 | 16,545,029 | 2,808,817 | 6,556,807 | 8,738,743 | — | — | — | 27,969,935 | 23,983,651 | 25,283,772 | ||||||||||||||||||||||||||||||||||||
Deferred tax liabilities | 232,085,097 | 159,982,265 | 183,460,069 | 23,069,096 | 16,824,414 | 16,134,512 | 68,473 | 94,542 | (12,282,837 | ) | 255,222,666 | 176,901,221 | 187,311,744 | |||||||||||||||||||||||||||||||||||
Non-current provisions for employee benefits | 18,537,036 | 15,072,071 | 14,234,207 | 24,497,162 | 19,266,073 | 18,670,336 | 10,903,644 | 7,157,468 | 5,937,794 | 53,937,842 | 41,495,612 | 38,842,337 | ||||||||||||||||||||||||||||||||||||
Other non-current non-financial liabilities | 2,957,459 | 3,674,976 | 10,576,607 | 650,323 | 972,789 | 3,432,691 | 789 | 45,906 | 62,489 | 3,608,571 | 4,693,671 | 14,071,787 | ||||||||||||||||||||||||||||||||||||
Equity | 1,496,042,487 | 1,458,755,612 | 1,386,522,722 | 670,418,685 | 556,074,867 | 545,580,910 | 917,604,619 | 1,050,953,510 | 1,131,213,837 | 3,084,065,791 | 3,065,783,989 | 3,063,317,469 | ||||||||||||||||||||||||||||||||||||
Equity attributable to Enersis Chile | 1,496,042,487 | 1,458,755,612 | 1,386,522,722 | 670,418,685 | 556,074,867 | 545,580,910 | 917,604,619 | 1,050,953,510 | 1,131,213,837 | 2,472,201,434 | 2,438,837,368 | 2,457,765,242 | ||||||||||||||||||||||||||||||||||||
Allocated capital | 619,260,333 | 619,260,333 | 619,260,333 | 230,492,200 | 230,492,200 | 230,492,200 | 1,379,356,442 | 1,388,416,735 | 296,069,473 | 2,229,108,975 | 2,238,169,268 | 1,145,822,006 | ||||||||||||||||||||||||||||||||||||
Retained earnings | 829,887,035 | 793,646,805 | 717,268,643 | 767,602,864 | 709,899,378 | 642,695,159 | (425,518,222 | ) | (423,013,206 | ) | (430,108,903 | ) | 1,171,971,677 | 1,080,532,977 | 929,854,899 | |||||||||||||||||||||||||||||||||
Other reserves | 46,895,119 | 45,848,474 | 49,993,746 | (327,676,379 | ) | (384,316,711 | ) | (327,606,449 | ) | (36,233,601 | ) | 85,549,981 | 1,265,253,267 | (928,879,218 | ) | (879,864,877 | ) | 382,088,337 | ||||||||||||||||||||||||||||||
Non-controlling interests | — | — | — | — | — | — | — | — | �� | — | 611,864,357 | 626,946,621 | 605,552,227 | |||||||||||||||||||||||||||||||||||
|
|
|
|
|
|
|
|
|
|
|
|
|
|
|
|
|
|
|
|
|
|
|
| |||||||||||||||||||||||||
Total Liabilities and Equity | 3,237,032,423 | 2,918,372,982 | 2,818,289,626 | 982,695,080 | 824,602,984 | 788,043,748 | 907,007,242 | 1,077,416,255 | 1,012,097,341 | 5,126,734,745 | 4,820,392,221 | 4,618,430,715 | ||||||||||||||||||||||||||||||||||||
|
|
|
|
|
|
|
|
|
|
|
|
|
|
|
|
|
|
|
|
|
|
|
| |||||||||||||||||||||||||
|
|
|
|
|
|
|
|
|
|
|
|
|
|
|
|
|
|
|
|
|
|
|
| |||||||||||||||||||||||||
The eliminations column corresponds to transactions between companies in different lines of business and country, primarily purchases and sales of energy and services.
F-210
Table of Contents
Line of Business | Generation | Distribution | Elimination and Others | Total | ||||||||||||||||||||||||||||
| STATEMENT OF COMPREHENSIVE INCOME | 12-31-2014 ThCh$ | 12-31-2013 ThCh$ | 12-31-2014 ThCh$ | 12-31-2013 ThCh$ | 12-31-2014 ThCh$ | 12-31-2013 ThCh$ | 12-31-2014 ThCh$ | 12-31-2013 ThCh$ | ||||||||||||||||||||||||
| REVENUES AND OTHER OPERATING INCOME | 1,220,566,158 | 959,786,924 | 1,127,892,544 | 975,023,631 | (299,393,417) | (196,727,678) | 2,049,065,285 | 1,738,082,877 | ||||||||||||||||||||||||
Revenues | 1,199,341,011 | 958,039,403 | 1,116,092,610 | 959,692,208 | (300,569,723 | ) | (198,164,895 | ) | 2,014,863,898 | 1,719,566,716 | ||||||||||||||||||||||
Energy sales | 1,155,805,379 | 860,581,278 | 997,836,084 | 842,753,580 | (267,340,580 | ) | (186,457,552 | ) | 1,886,300,883 | 1,516,877,306 | ||||||||||||||||||||||
Other sales | 11,062,697 | 25,273,582 | 7,396,980 | 7,963,873 | 8,218,070 | 4,128,460 | 26,677,747 | 37,365,915 | ||||||||||||||||||||||||
Other services rendered | 32,472,935 | 72,184,543 | 110,859,546 | 108,974,755 | (41,447,213 | ) | (15,835,803 | ) | 101,885,268 | 165,323,495 | ||||||||||||||||||||||
Other operating income | 21,225,147 | 1,747,521 | 11,799,934 | 15,331,423 | 1,176,306 | 1,437,217 | 34,201,387 | 18,516,161 | ||||||||||||||||||||||||
RAW MATERIALS AND CONSUMABLES USED | (750,212,920 | ) | (494,891,538 | ) | (855,757,752 | ) | (712,458,219 | ) | 296,568,389 | 208,445,779 | (1,309,402,283 | ) | (998,903,978 | ) | ||||||||||||||||||
Energy purchases | (288,442,686 | ) | (124,419,095 | ) | (766,324,946 | ) | (628,376,375 | ) | 266,346,979 | 184,328,520 | (788,420,653 | ) | (568,466,950 | ) | ||||||||||||||||||
Fuel consumption | (305,475,422 | ) | (211,607,778 | ) | — | — | (4,838 | ) | (4,396 | ) | (305,480,260 | ) | (211,612,174 | ) | ||||||||||||||||||
Transportation costs | (142,831,143 | ) | (149,447,930 | ) | (56,360,475 | ) | (57,958,728 | ) | 47,242,839 | 24,585,337 | (151,948,779 | ) | (182,821,321 | ) | ||||||||||||||||||
Other miscellaneous supplies and services | (13,463,669 | ) | (9,416,735 | ) | (33,072,331 | ) | (26,123,116 | ) | (17,016,591 | ) | (463,682 | ) | (63,552,591 | ) | (36,003,533 | ) | ||||||||||||||||
CONTRIBUTION MARGIN | 470,353,238 | 464,895,386 | 272,134,792 | 262,565,412 | (2,825,028 | ) | 11,718,101 | 739,663,002 | 739,178,899 | |||||||||||||||||||||||
Other work performed by the entity and capitalized | 16,466,172 | 10,625,755 | 5,039,396 | 4,205,303 | — | — | 21,505,568 | 14,831,058 | ||||||||||||||||||||||||
Employee benefit expenses | (64,466,875 | ) | (62,922,790 | ) | (31,386,273 | ) | (30,154,099 | ) | (30,488,215 | ) | (27,037,013 | ) | (126,341,363 | ) | (120,113,902 | ) | ||||||||||||||||
Other expenses | (65,464,992 | ) | (59,734,743 | ) | (63,527,130 | ) | (61,243,603 | ) | 18,537,907 | 6,425,619 | (110,454,215 | ) | (114,552,727 | ) | ||||||||||||||||||
GROSS OPERATING RESULT | 356,887,543 | 352,863,608 | 182,260,785 | 175,373,013 | (14,775,336 | ) | (8,893,293 | ) | 524,372,992 | 519,343,328 | ||||||||||||||||||||||
Depreciation and amortization expense | (98,700,534 | ) | (90,062,967 | ) | (27,377,925 | ) | (27,033,400 | ) | (2,358,695 | ) | (2,410,751 | ) | (128,437,154 | ) | (119,507,118 | ) | ||||||||||||||||
Impairment losses (reversals of impairment losses) recognized in profit or loss | (12,461,456 | ) | 64,138 | (776,091 | ) | (8,277,086 | ) | 52,127 | — | (13,185,420 | ) | (8,212,948 | ) | |||||||||||||||||||
OPERATING INCOME | 245,725,553 | 262,864,779 | 154,106,769 | 140,062,527 | (17,081,904 | ) | (11,304,044 | ) | 382,750,418 | 391,623,262 | ||||||||||||||||||||||
FINANCIAL RESULTS | (77,428,301 | ) | (73,737,083 | ) | 8,282,495 | 1,201,395 | 2,101,257 | 16,172,302 | (67,044,549 | ) | (56,363,386 | ) | ||||||||||||||||||||
Financial income | 1,576,923 | 3,146,530 | 11,638,248 | 8,348,785 | 1,547,344 | 2,155,216 | 14,762,515 | 13,650,531 | ||||||||||||||||||||||||
Financial costs | (72,106,182 | ) | (75,970,098 | ) | (4,109,576 | ) | (7,776,562 | ) | 589,269 | 13,978,026 | (75,626,489 | ) | (69,768,634 | ) | ||||||||||||||||||
Profit (loss) from indexed assets and liabilities | 14,341,214 | 1,220,366 | 632,973 | 558,758 | 289,436 | (186,078 | ) | 15,263,623 | 1,593,046 | |||||||||||||||||||||||
Foreign currency exchange differences | (21,240,256 | ) | (2,133,881 | ) | 120,850 | 70,414 | (324,792 | ) | 225,138 | (21,444,198 | ) | (1,838,329 | ) | |||||||||||||||||||
Positive | 17,473,317 | 6,200,002 | 194,226 | 73,179 | 1,966,549 | 1,113,874 | 19,634,092 | 7,387,055 | ||||||||||||||||||||||||
Negative | (38,713,573 | ) | (8,333,883 | ) | (73,376 | ) | (2,765 | ) | (2,291,341 | ) | (888,736 | ) | (41,078,290 | ) | (9,225,384 | ) | ||||||||||||||||
Share of profit of associates accounted for using the equity method | (54,352,582 | ) | 24,309,344 | — | — | — | — | (54,352,582 | ) | 24,309,344 | ||||||||||||||||||||||
Other gains (losses) | 42,651,567 | 2,513,923 | (392,778 | ) | (176,425 | ) | 28,634,474 | 12,190,239 | 70,893,263 | 14,527,737 | ||||||||||||||||||||||
Gains (losses) from other investments | 42,651,567 | 67,384 | — | — | 21,077,899 | — | 63,729,466 | 67,384 | ||||||||||||||||||||||||
Gains (losses) on sale of property, plant and equipment | — | 2,446,539 | (392,778 | ) | (176,425 | ) | 7,556,575 | 12,190,239 | 7,163,797 | 14,460,353 | ||||||||||||||||||||||
Income before tax | 156,596,237 | 215,950,963 | 161,996,486 | 141,087,497 | 13,653,827 | 17,058,497 | 332,246,550 | 374,096,957 | ||||||||||||||||||||||||
Income tax | (93,758,705 | ) | (36,937,826 | ) | (37,256,549 | ) | (26,867,652 | ) | (1,671,879 | ) | 2,093,036 | (132,687,133 | ) | (61,712,442 | ) | |||||||||||||||||
Net Income from continuing operations | 62,837,532 | 179,013,137 | 124,739,937 | 114,219,845 | 11,981,948 | 19,151,533 | 199,559,417 | 312,384,515 | ||||||||||||||||||||||||
Net income from discontinued operations | — | — | ||||||||||||||||||||||||||||||
NET INCOME | 62,837,532 | 179,013,137 | 124,739,937 | 114,219,845 | 11,981,948 | 19,151,533 | 199,559,417 | 312,384,515 | ||||||||||||||||||||||||
Net income attributable to: | 62,837,532 | 179,013,137 | 124,739,937 | 114,219,845 | 11,981,948 | 19,151,533 | 199,559,417 | 312,384,515 | ||||||||||||||||||||||||
Shareholders of Enersis | 162,459,039 | 229,526,660 | ||||||||||||||||||||||||||||||
Non-controlling interests | 37,100,378 | 82,857,855 | ||||||||||||||||||||||||||||||
Line of Business | Generation | Distribution | Elimination and Others | Total | ||||||||||||||||||||||||||||
| STATEMENT OF CASH FLOWS | 12-31-2014 ThCh$ | 12-31-2013 ThCh$ | 12-31-2014 ThCh$ | 12-31-2013 ThCh$ | 12-31-2014 ThCh$ | 12-31-2013 ThCh$ | 12-31-2014 ThCh$ | 12-31-2013 ThCh$ | ||||||||||||||||||||||||
Cash flows from (used in) operating activities | 239,770,586 | 303,203,744 | 37,181,550 | 137,848,565 | (12,005,255 | ) | 1,908,222 | 264,946,881 | 442,960,531 | |||||||||||||||||||||||
Cash flows from (used in) investing activities | (190,799,690 | ) | (66,993,838 | ) | (52,663,122 | ) | (57,340,634 | ) | 54,724,341 | 18,209,414 | (188,738,471 | ) | (106,125,058 | ) | ||||||||||||||||||
Cash flows from (used in) financing activities | (49,531,606 | ) | (202,875,463 | ) | 8,796,278 | (73,380,728 | ) | (118,409,153 | ) | 59,845,126 | (159,144,481 | ) | (216,411,065 | ) | ||||||||||||||||||
The eliminations column corresponds to transactions between companies in different lines of business and country, primarily purchases and sales of energy and services.
F-211
Table of Contents
| 36. | THIRD PARTY GUARANTEES, OTHER CONTINGENT ASSETS AND LIABILITIES, AND OTHER COMMITMENTS |
36.1 Direct guarantees
Creditor Of Guarantee | Debtor | Type of Guarantee | Assets Committed | Outstanding balance as of | Guarantees Released | |||||||||||||||||||||||||||||||||||||||||||||||||||
| Type | Currency | Carrying amount | ||||||||||||||||||||||||||||||||||||||||||||||||||||||
| Company | Relationship | Currency | Dec-14 | Dec-13 | Jan-13 | 2015 | Assets | 2016 | Assets | 2017 | Assets | |||||||||||||||||||||||||||||||||||||||||||||
Banco Santander (security agent) | G.N.L. Quintero | Associate | Pledge | Shares | ThCh$ | — | ThCh$ | — | 102,302,517 | 97,034,059 | — | — | — | — | — | — | ||||||||||||||||||||||||||||||||||||||||
Deutsche Bank /Santander Benelux | Enersis S.A. | Creditor | Deposit account | Deposit account | ThCh$ | 26,337,776 | ThCh$ | 50,509,024 | 56,138,756 | 60,774,330 | — | — | — | — | — | — | ||||||||||||||||||||||||||||||||||||||||
Citibank N.A. | Endesa Chile | Creidtor | Pledge | Deposit account | ThCh$ | 788,775 | ThCh$ | 702,470 | 796,448 | — | — | — | — | — | — | — | ||||||||||||||||||||||||||||||||||||||||
As of December 31, 2014 and 2013 and January 1, 2013, the Combined Group had future energy purchase commitments amounting to ThCh$9,578,942,757, ThCh$4,803,454,702, and ThCh$4,394,511,499, respectively.
36.2 Indirect guarantees
As of December 31, 2014 and 2013, and January 1, 2013, there are no indirect guarantees.
F-212
Table of Contents
36.3 Lawsuits and Arbitration Proceedings
As of the date of these Combined Financial Statements, the most relevant contingent liabilities, for which no provisions have been recognized, involving Enersis Chile and its combined entities are as follows:
1. Law 25,561 on Public Emergency and Reform to the Currency System, enacted on January 6, 2002 by the Argentine authorities, voided certain provisions of the concession agreement of Enersis Chile’s combined entity Edesur. Law 25,561 also required that utility concession agreements be renegotiated within a reasonable timeframe to adjust them to the new conditions. However, the failure to renegotiate Edesur’s concession agreement prompted Enersis S.A., Chilectra S.A., Endesa Chile and Elesur S.A. (now Chilectra S.A.) (collectively, the “Claimants”) to file an arbitration petition in 2003 under the Treaty for the Promotion and Protection of Chilean-Argentine Investments before the International Center for Settlement of Investment Disputes (ICSID). The statement of claim principally requested that the ICSID declare the investment expropriated for an amount of US$ 1,306,875,960 (approximately ThCh$ 792,946,989), and seeking for the damages caused to the investment due to lack of fair and equitable treatment, in the amount of US$ 318,780,600 (approximately ThCh$193,420,129). The Claimants also seek, with respect to both claims, compounded annual interest of 6.9% per annum. The Claimants also claimed the sums resulting from the damages caused as from July 1, 2004. Finally, the Claimants also demanded US$ 102,164,683 (approximately ThCh$61,988,421) for Elesur S.A. (now Chilectra S.A.) due to a lower price received on the sale of its shares. In 2005, the Argentine authorities and Edesur signed a Letter of Understanding, in which the terms and conditions are established for amendments and supplements to the Concession Agreement, forecasting tariff modifications, first during a transitional period and then under a Integral Tariff Review, in which the conditions for an ordinary tariff period of 5 years will be set. The arbitration has been suspended since March 2006 in accordance with the terms of the Letter of Understanding, and the appointment of one of the arbitrators, to replace an arbitrator who resigned in 2010 has been suspended. As of December 31, 2014, the parties informed ICSID of their agreement to extend the suspension of the arbitration procedure for 12 months starting on the same date, informing also that any of the parties can request the renewal of the arbitration procedure with 30 calendar days prior notice.
2. In 2005, three lawsuits were filed against Endesa Chile, the Chilean Treasury and the Chilean Water Authority (DGA, in its Spanish acronym), which are currently being treated as a single proceeding, requesting that DGA Resolution No. 134, which established non-consumptive water rights in favor of Endesa Chile to build the Neltume hydroelectric power plant project be declared null as a matter of public policy, with compensation for damages. Alternatively, the lawsuits request the compensation for damages for the losses allegedly sustained by the plaintiffs due to the loss of their status as riparian owners along Pirihueico Lake, as well as due to the devaluation of their properties. The defendants have rejected these allegations, contending that the DGA Resolution complies with all legal requirements, and that the exercise of this right does not cause any detriment to the plaintiffs, among other arguments. The sums involved in these suits are undetermined. This case was joined with two other cases: the first one is captioned “Arrieta v. the State and Others” in the 9th Civil Court, docket 15279-2005 and the second is captioned “Jordán v. the State and Others,” in the 10th Civil Court, docket 1608-2005. With regard to these cases, an injunction has been ordered against entering into any acts and contracts concerning Endesa Chile’s water rights related to the Neltume project. On September 25, 2014, the Court of Law issued an unfavorable ruling against Endesa Chile that in essence declared the right to use water established by DGA Resolution No. 134 illegal and orders its cancellation in the corresponding Water Rights Register of the correspondent Real Estate Registrar. Endesa Chile filed an appeal and cassation resources with the Santiago Court of Appeals, which are still pending.
3. During 2010, three lawsuits for damages were filed against Endesa Chile by plaintiffs who alleged they were affected by the flooding of the Bio-Bio River in Region VIII of Chile. The plaintiffs sued Endesa Chile for losses caused by its deficient operation of the Ralco hydroelectric power plant during the flood. These three cases were joined, and a first instance ruling has been issued which denies the claim filed in all its parts. The ruling was appealed and such appeal has not yet been reviewed by the court. The plaintiffs are required to produce legal evidence proving the causal link between the operation of the Ralco hydroelectric
F-213
Table of Contents
power plant during the floods and the damages that the plaintiffs claim they sustained as a result of deficient facility operation. On March 27, 2012, there was a first instance judgment filed, which rejected the claim filed in all its parts. The plaintiff filed an appeal on March 12, 2013, and the Court of Appeals ordered proceedings to supplement the judgment, since there were exceptions and defenses that were not resolved in the first instance judgment. On May 2, 2013, the first instance Court of Law filed a supplementary judgment, referring to the exceptions and defenses that were not resolved in the first initial judgment. On July 14, 2014, the Court of Appeals of Concepción rejected the appeal filed by the plaintiffs and confirmed the first ruling denying relief in the lawsuit. The plaintiffs filed an appeal with the Supreme Court, which is pending resolution. The amount involved in the three lawsuits currently pending against Endesa Chile is ThCh$14,610,043, which is covered by an insurance policy.
4. In July and September 2010, Ingeniería y Construcción Madrid S.A. and Transportes Silva y Silva Limitada, respectively, filed separate lawsuits against Endesa Chile and the DGA seeking to declare the annulment of DGA Resolution No. 134 that granted Endesa Chile’s water rights for the Neltume hydroelectric station. Similarly, Ingeniería y Construcción Madrid S.A. and Transportes Silva y Silva Limitada, respectively, each filed suits against DGA Resolution No. 732 that authorized the relocation of the collection point of such water rights, arguing its invalidity as a violation of public policy. Ultimately, the plaintiffs attempted to demand payment for their water rights located in the area of influence of the hydraulic works for the future Neltume hydroelectric station. Endesa Chile has rejected these claims, contending that the plaintiffs are engaging in wrongful prosecution to prevent the construction of the power plant in order to obtain monetary compensation. The evidentiary period of the complaint filed by Ingeniería y Construcción Madrid S.A. (Case No. 7036-2010) has expired, and the parties have been summoned to hear judgment. Regarding the other lawsuit (Case No. 6705-2010), requesting the annulment of DGA Resolution No. 732, on March 12, 2012 a ruling was issued that declared the proceeding as abandoned. On June 27, 2012, Ingeniería y Construcción Madrid, filed a similar claim before another Court of Law (Case C-15156-2012), in which the discussion period and the regular evidentiary period have ended, and only some expert testimony is pending. On November 26, 2014, the court considering the lack of agreement between the parties, designated an expert, who has not accepted the position to date.
With respect to the Transportes Silva y Silva Ltda lawsuit (Case No. 16025-2012), which contests DGA Resolution No. 134, the proceeding was declared abandoned. In another lawsuit (Case No. 17916-2010), a similar request was made for the action to be declared abandoned, however, this request was denied. The plaintiff filed an appeal against the ruling, which was decided on May 10, 2013, declaring the proceeding abandoned. The resolution is final and executed. The amount of this proceeding is undetermined.
5. On May 24, 2011, Endesa Chile was served with a lawsuit filed by 19 riparian owners along the Pirihueico Lake, seeking to nullify DGA Resolution No. 732, which authorized the relocation of water rights collection for the Neltume power plant, from the Pirihueico Lake drainage 900 meters downstream along Fui River. The plaintiffs seek to have this annulment annotated at the margin of the notarized instrument that memorialized DGA Resolution No. 732, which approved the transfer of the collection. The plaintiffs also seek to have the recording of the deed struck from the Water Rights Registry, if entered, and to require the Chilean Treasury, the DGA and Endesa Chile to pay damages to the plaintiffs as a result of the challenged DGA Resolution. The plaintiffs seek to reserve their right to indicate the type and amount of damages in a subsequent legal proceeding. The claim is for an undetermined amount because the plaintiffs have requested that damages be determined in another suit, once the DGA Resolution is nullified. The discussion period has ended and the evidence action has been issued, which when received by the parties was the object of a replacement appeal filed by the plaintiff and an annulment petition filed by Endesa Chile, both of which were denied. On August 20, 2013 a conciliation hearing was initiated, and is still pending to date.
Afterwards, hydraulic and appraisal expert analysis were carried out. The Santiago Court of Appeals’ resolution was also notified incorporating evidence, and Endesa Chile provided documentary evidence consisting of: (i) a law report drafted by Mr. Cristián Maturana M., (ii) a law report drafted by Mr. Luis S. Figueroa, (iii) an engineering report drafted by Mr. Guillermo Cabrera, and (iv) an update of a land
F-214
Table of Contents
appraisal report on the zone farms drafted by Mr. Armando Illanes; Finally, other documents relative to the Environmental Impact Study (EIA, in its Spanish acronym) were provided, and testimonial evidence was presented both by Endesa Chile and by the plaintiffs. The regular and special evidentiary period has ended.
6. The arbitration proceeding being heard by the International Chamber of Commerce (the Chamber), under the framework of the Bocamina Thermal Power Plant Extension Project contract for the turnkey supply of a coal thermal generation plant, located in Coronel, Region VIII of Chile, executed in July 2007 between Endesa Chile and a consortium comprised of: Ingeniería y Construcción Tecnimont Chile Compañía Limitada, Tecnimont SpA, Tecnimont do Brasil Construção e Administração de Projetos Ltda., Slovenské Energetické Strojárne a.s. (SES) and Ingeniería y Construcción SES Chile Limitada, (the “Consortium”).
As a result of material breaches of the Consortium, for not finishing the works according to the terms and conditions agreed and within the time period stipulated in the contract and its supplementary documents, on October 16, 2012, Endesa Chile proceeded, strictly complying with the conditions authorized in the contract for such purpose, to collect the performance bonds, and in particular, those issued by Banco Santander Chile for US$93,992,554 (approximately ThCh$57,029,982) and the one from Credit Agricole for US$18,940,295 (approximately ThCh$11,492,024). To date, Endesa Chile has only been able to collect the performance bonds issued by Banco Santander Chile. Upon collection of the aforementioned performance bonds, Endesa Chile filed before the Chamber (Case 19015/CA) a request for arbitration to compel compliance with the contract plus compensation for damages, and, as an alternate request, termination of the contract with compensation for damages. In both cases, Endesa Chile reserved the right to file litigation regarding the amount and sum of the damages at a later stage. Endesa Chile based its claim on the serious non-compliance of the Consortium, including, among other material breaches: (i) material breach of the contractual date of the end of the works, (ii) the lack of payment to subcontractors and suppliers, which has forced Endesa Chile to take on part of their commitments to avoid a situation of total work stoppage, (iii) material breach of the schedule of intermediate control stages agreed to, (iv) breach of the “Open Book” delivery time period of the works, and (v) lack of compliance with safety and environmental standards agreed to and the administrative standards proscribed for managing the contract.
In turn, SES filed legal actions before the Chamber (Case 1924/CA) requesting that the collection of the performance bonds by Endesa Chile be declared illegal.
On January 4, 2013, Endesa Chile notified the Consortium of the early termination of the contract due to material breach of its obligations according to the terms of it.
In January 2013, SES and Tecnimont separately contested the request for arbitration filed by Endesa Chile and sued Endesa Chile. Tecnimont sued for approximately US$1,294 million (approximately ThCh$785,134,500) and SES sued for US$15 million (approximately ThCh$9,101,250). On March 26, 2013, Endesa Chile responded to the counterclaims and petitioned for their dismissal. The proceeding filed by SES (Case 1924/CA) was consolidated with the arbitration proceeding described above.
On June 21, 2013, upon request of the arbitration court, the bases of the procedural proposals or simultaneous procedure were filed by each of the parties in a clear and precise manner as well as their respective proposed schedules. On July 2, 2013, the procedural order that established the procedural rules whereby the proceeding will be conducted was approved. On December 2, 2013 the parties exchanged legal briefs. Endesa Chile requested in its brief that the arbitrational court find (i) the defendants in breach of the contract, (ii) the defendants’ breach was attributable to serious fraud or negligence on their part and (iii) that the contract termination be recognized as occurring due to the defendant’s breach. On the grounds stated above, Endesa Chile has asserted that the performance bonds are consistent with the law and petitioned the court to order the defendants to pay fines and damages amounting to US$373,269,376 (approximately ThCh$226,481,193). Tecnimont requested an extension in order to object the documents, which was accepted by the arbitrational court.
The parties submitted documents, against which objections were filed. For the arbitration court, the parties resolved the objections raised by replacing the documents or performing complementation if necessary. On May 2, 2014, the parties submitted briefs, and rebuttal is expected to occur by January 15, 2015.
F-215
Table of Contents
7. On August 22, 2013, Endesa Chile, Pehuenche and San Isidro filed before the Santiago Court of Appeals a claim against the Chilean Superintendence of Electricity and Fuels (SEF). The claim asserts the illegality of Resolution ORD No. 7230, dated August 7, 2013, in which the SEF, relying on its interpretative and supervisory authority, decreed that consumption by distributing companies in excess of the contracted supply, with respect to electricity generators that are forced by means of a bid to supply electricity, must be covered by electricity surpluses generated by other companies. The distributors with surplus electricity can assign their surpluses to distributors with deficits, irrespective of the will of the respective generator. The claim asserts this is contrary to the law and exceeds SEF’s powers and authority, resulting in an illegal resolution.
An injunction was requested, which was denied in the San Isidro and Pehuenche suits but was granted in the Endesa Chile suit. As a result, the effects of the decree are suspended. The three claims were heard one after the other and the result were communicated to all the companies. On April 10, 2014, the claims were dismissed as having been filed outside of the period allowed by law. An appeal was filed against such resolution before the Chilean Supreme Court, which accepted the appeal on July 8, 2014 and found the claim was filed in a timely manner. The cases were remanded to the Santiago Court of Appeals to determine the validity of the claim, which are still pending of resolution.
8. In August 2013, the Chilean Superintendence of the Environment (SMA, in its Spanish acronym) filed charges against Endesa Chile alleging several violations of Exempt Resolution No. 206, dated August 2, 2007 and its supplementary and explanatory resolutions that environmentally certified the Bocamina Thermal Power Plant Extension Project. These alleged violations are related to the cooling system discharge channel, an inoperative Bocamina I desulphurizer, non-compliance with information delivery obligations, surpassing CO limits, failures in the acoustic perimeter fence of Bocamina I, excessive noise levels and having no technological barriers that prevent the massive entry of biomass in the intake of the central power plant. Endesa Chile submitted a compliance program that was not approved. On November 27, 2013, SMA added two additional violations to its charges. Endesa Chile presented its defense in December 2013, partially recognizing some of these violations (which could reduce the fine by 25% in case of recognition) and contesting the remainder. On August 11, 2014, SMA passed Resolution No. 421 that fined Endesa Chile 8,640.4 UTA for environmental non-compliances that are the subject matter of the sanctioning proceeding. Endesa Chile filed an illegality claim against the SMA before the Third Environmental Court of Valdivia that to date is pending resolution.
In December 2013, the fishermen’s and algae collector trade unions of Coronel, among others, filed two constitutional protection appeals against Endesa Chile before the Court of Appeals of Concepcion. The first appeal alleges Endesa Chile would be operating Unit II of the Bocamina thermal power plant without the proper environmental authorizations. The second appeal alleges that Endesa Chile would not have an operational desulphurizing plant for the operation of Unit I of the Bocamina thermal power plant. The first plaintiff obtained a temporary injunction that halted operation of Unit II of the Bocamina thermal power plant. Endesa Chile contested the injunction but was denied relief. Endesa Chile also presented its defense in both resources, providing the background for rejection. On May 29, 2014, the ruling was upheld that accepted the appeal and imposed a series of requirements designed to prevent the Bocamina thermal power plant from causing environmental damage. An appeal was filed against this judgment before the Chilean Supreme Court, with which on November 6, 2014 ruling was sentenced that although it confirms the appealed decision (i.e. it confirms the resolution that picked up the protection appeals it contains certain declarations that are favorable for the company). It recognizes that the Bocamina II thermal power plant has an Environmental Qualification Resolution (RCA), and the changes introduced in it must be approved through an Environmental Impact Study (EIA).
9. On May 12, 2014, Compañía Eléctrica Tarapacá S.A., (Celta) formally filed an arbitration claim against Compañía Minera Doña Inés de Collahuasi, requesting that the Arbitration Court of Law declare that through the contracts entered into in 1995 and 2001, the parties have established a long-term contractual relation, characterized by the economic balance that there must be in their reciprocal services supplied and that, due to the above, greater costs corresponding to the investment that must be made to comply with the
F-216
Table of Contents
emission standard contained in DS (Supreme Decree) (MMA) No. 13, 2011 must be shared by the parties. Based on this, the defendant should start paying up to the maturity of the contract, a fixed monthly charge that as of March 31, 2020 amounts to US$72,275,000 (approximately ThCh$43,852,856) for the proportional part of the investments that the defendant must pay due to the Supreme Decree mentioned above.
The claim was notified on July 3, 2014. On August 8, 2014 Collahuasi contested Celta’s claim and filed a counterclaim against Celta requesting that the Court declare that Celta has violated the prohibition to call on as precedent what was agreed to in the modifications of the 2009 supply contracts, reserving the right to discuss and prove the amount of damages. On August 26, 2014, Celta filed its response to the main claim and contested the counterclaim. On September 11, 2014, Collahuasi filed its rejoinder to the main claim and its response to the counterclaim. On October 1, 2014, Celta filed its response to the counterclaim. Additionally, the Arbitration Judge formulated a questionnaire with questions separately to each one of the parties and also with common questions for both.
Once these were responded, the arbitrator gave the parties a deadline of January 16, 2015 to contest or observe the answers provided and the documents attached specifying the contrary.
36.4 Financial restrictions
As of December 31, 2014, we had no debt obligations and are therefore not affected by any covenants or events of default. However, a number of the Combined Group’s entities’ loan agreements, include the obligation to comply with certain financial ratios, which is normal in contracts of this nature. There are also affirmative and negative covenants requiring the monitoring of these commitments. In addition, there are restrictions in the events-of-default clauses of the agreements which require compliance.
| 1. | Cross Default |
Some of the financial debt contracts of Endesa Chile contain cross default clauses. The credit line agreements governed by Chilean law, which Endesa Chile signed in February 2013, stipulate that cross default arises only in the event of non-compliance by the borrower itself, with no reference made to its subsidiaries. In order to accelerate payment of the debt in these credit lines due to cross default originating from other debt, the amount overdue of a debt must exceed US$50 million, or the equivalent in other currencies, and other additional conditions must be met such as the expiry of grace periods. Since being signed, these credit lines have not been disbursed. They mature in February 2016. Endesa Chile’s international credit line governed by New York State law, which was signed in July 2014 and expires in July 2019, also makes no reference to its subsidiaries, so cross default arises only in the event of non-compliance by the borrower itself. For the repayment of debt to be accelerated under this facility due to cross default on another debt, the amount in default should exceed US$50 million or its equivalent in other currencies. It must also meet other conditions, including the expiration of any grace periods, and a formal notice of intent to accelerate the debt repayment must have been served by creditors representing more than 50% of the amount owed or committed in the contract. This line of credit has not currently been utilized.
Regarding the bond issues of Endesa Chile registered with the United States Securities and Exchange Commission (the SEC), commonly called “Yankee bonds”, a cross default can be triggered by another debt of the same company or of any of their subsidiaries, for any amount overdue provided that the principal of the debt giving rise to the cross default exceeds US$30 million or its equivalent in other currencies. Debt acceleration due to cross default does not occur automatically but has to be demanded by the holders of at least 25% of the bonds of a certain series of Yankee bonds. The Endesa Yankee bonds mature in 2015, 2024, 2027, 2037 and 2097. For the specific Yankee Bond that was issued in April 2014 and matures in 2024, the threshold for triggering cross default increased to US$50 million or its equivalent in other currencies.
The Endesa Chile bonds issued in Chile state that cross default can be triggered only by the default of the issuer when the amount in default exceeds US$50 million or its equivalent in other currencies. Debt acceleration requires the agreement of at least 50% of the holders of the bonds of a certain series.
F-217
Table of Contents
| 2. | Financial covenants |
Financial covenants are contractual commitments with respect to minimum or maximum financial ratios that a company is obliged to meet at certain periods of time (quarterly, annually, etc.). Most of the financial covenants of the Combined Group limit the level of indebtedness and evaluate the ability to generate cash flows in order to service the companies’ debts. Various companies are also required to certify these covenants periodically. The types of covenants and their respective limits vary according to the type of debt.
The Endesa Chile bonds issued in Chile include the following financial covenants whose definitions and calculation formulas are established in the respective indentures based on Endesa Chile’s financial statements figures:
Series H
| • | Consolidated Debt Ratio: The consolidated debt ratio, which is Financial debt to Capitalization, must be no more than 0.64. Financial debt is the sum of interest-bearing loans, current; Interest-bearing loans, non-current; Other financial liabilities, current; Other financial liabilities, non-current; and Other obligations guaranteed by the issuer or its subsidiaries; while Capitalization is the sum of Financial liabilities, Equity attributable to the shareholders of Endesa Chile and Non-controlling interests. As of December 31, 2014, the ratio was 0.37. |
| • | Consolidated Equity: A minimum Equity of Ch$760,468 million must be maintained; this limit is adjusted at the end of each year as established in the indenture. Equity corresponds to Equity attributable to the shareholders of Endesa Chile. As of December 31, 2014, the equity of Endesa Chile was Ch$1,475,571 million. |
| • | Financial Expense Coverage: A financial expense coverage ratio of at least 1.85 must be maintained. Financial expense coverage is the quotient between i) the gross margin plus Financial income and dividends received from associated companies, and ii) Financial expenses; both items refer to the period of four consecutive quarters ending on the quarter being reported. For the period ended December 31, 2014, this ratio was 5.31. |
| • | Net Asset Position with Related Companies: A Net asset position must be maintained with related companies of no more than a hundred million dollars. The Net asset position with related companies is the difference between i) the sum of Accounts receivable from related entities, current, Accounts receivable from related entities, non-current, less transactions in the ordinary course of business at less than 180 days term, short-term transactions of associates of Endesa Chile in which Enersis Chile has no participation, and long-term transactions of associates of Endesa Chile in which Enersis Chile has no participation; and ii) the sum of Accounts payable to related entities, current; Accounts payable to related entities, non-current, less transactions in the ordinary course of business at less than 180 days term; short-term transactions of associates of Endesa Chile in which Enersis Chile has no participation; and long-term transactions of associates of Endesa Chile in which Enersis Chile has no participation. As of December 31, 2014, using the exchange rate prevailing on that date, the Net asset position with related companies was a negative US$168.45 million, indicating that Enersis Chile is a net creditor of Endesa Chile rather than a net debtor. |
Series M
| • | Consolidated Debt Ratio: The consolidated debt ratio, which is Financial debt to Capitalization, must be no more than 0.64. Financial debt is the sum of Interest-bearing loans, current; Interest-bearing loans, non-current; Other financial liabilities, current; and Other financial liabilities, non-current; while Capitalization is the sum of Financial liabilities, Equity attributable to the shareholders of Enersis and Non-controlling interests. As of As of December 31, 2014, the debt ratio was 0.37. |
| • | Consolidated Equity: Same as for Series H. |
| • | Financial Expense Coverage Ratio: Same as for Series H. |
F-218
Table of Contents
The rest of Endesa Chile’s debt and the undisbursed credit lines include other covenants such as leverage and debt coverage ratios (debt/EBITDA ratio), while the Yankee bonds are not subject to financial covenants.
The most restrictive financial covenant for Endesa Chile as of December 31, 2014 was the Debt Ratio requirement for the credit line under Chilean law, which expires in February 2016.
Lastly, in most of the contracts, debt acceleration for non-compliance with these covenants does not occur automatically but is subject to certain conditions, such as a cure period.
As of December 31, 2014 and 2013 and January 1, 2013, none of our combined entities were in default under their financial obligations summarized here or other financial obligations whose defaults might trigger the acceleration of their financial commitments.
36.5 Other Information
Centrales Hidroeléctricas de Aysén, S.A.
On July 9, 2014, the Ministers’ Committee issued (i) Exempt Resolution 569 resolving the invalidation process, and (ii) Exempt Resolution 570 resolving the claims filed by individuals, citizens’ organizations and the proponent of the Aysén Hydroelectric Project against Exempt Resolution 225/2011 issued by the Aysén del General Carlos Ibañez del Campo Region’s Assessment Committee, the project’s Environmental Qualification Resolution, or RCA.
Centrales Hidroeléctricas de Aysén S.A. was notified of these agreements and resolutions on July 14, 2014.
On January 28, 2015, Endesa Chile was informed that the request of water rights made by Centrales Hidroeléctricas de Aysén S.A. (hereinafter “HidroAysén”) in 2008, was partially denied. Endesa Chile expressed its intention to continue to defend the water rights and the environmental qualification granted to the project in the corresponding instances, by continuing legal actions already initiated or implementing new administrative or judicial actions for this purpose. Endesa Chile maintains the conviction that the hydraulic resources of Aysén region are important for the energy development of the country.
However, in the current situation, there is uncertainty about the recoverability of the investment made so far in HidroAysén, since it depends on both judicial decisions and definitions on matters that are in the energy agenda which cannot be foreseen at present. Consequently, the project is not part of the immediate projects of Endesa Chile’s portfolio. As a consequence, Endesa Chile decided to register an impairment of Ch$ 69,066 million (approximately US$ 121 million) for its participation in HydroAysén S.A., which affected the company’s 2014 year end net income (See Note 14.1.a). The financial and accounting effects for Enersis of this impairment registered by Endesa Chile resulted into a charge against the net results of Enersis of Ch$ 41,426 million (approximately US$ 73 million).
| 37. | SANCTIONS |
The following companies belonging to the Combined Group have received sanctions from the administrative authorities:
| a) | Subsidiaries |
1. – Endesa Chile
| • | Income for fiscal year 2011: the Chilean Internal Revenue Service (SII) issued a fine after investigating the use of a credit for taxes paid abroad on income earned in other countries. The investigation found discrepancies in the calculation of net income from foreign sources, and a tax credit for a lower amount should have been used for that foreign income than declared at the time on the fiscal year 2011 income tax return. A fine of Ch$82,923,124 was imposed.Closed and paid(May 2014). |
| • | During fiscal year 2011, the company was fined 1,380 UTA (Annual Tax Units) (approximately ThCh$683,315) by the Superintendence of Electricity and Fuels (SEF) for the blackout that occurred on March 14, 2010. Endesa Chile filed an appeal against the measure with the Santiago Court of |
F-219
Table of Contents
Appeals, which rejected the appeal on January 18, 2013 and upheld the fine. Endesa Chile then filed an appeal against this ruling with the Supreme Court who, on November 20, 2013, rejected the second appeal and once again upheld the fine, but reduced its amount to 1,246 UTA (approximately ThCh$616,964). |
Closed and paid.
| • | In the 2012 fiscal year, the Company received a fine, plus interest, totaling ThCh$13,151 from the SII for the excessive use of tax credits for the 2010 tax year. The amount was paid on March 28, 2013. |
Closed and paid.
| • | During the 2012 fiscal year, the Company was fined 1,200 UTA by the SEF for the blackout that occurred on September 24, 2011. Endesa Chile filed a request for reconsideration with the SEF; this was denied in Exempt Resolution 703 of March 25, 2013, which also upheld the fine. The company later filed appeal No. 2262-2013 challenging the ruling with the Santiago Court of Appeals. After studying the appeal, the Court of Appeals confirmed the fine imposed by the SEF but reduced it from 1,200 to 400 UTA. Endesa Chile filed another appeal against this ruling with the Supreme Court, which upheld the ruling and kept the fine at 400 UTA (approximately ThCh$203,059). |
Closed and paid.
| • | In January 2013, Endesa Chile was notified of SEF Exempt Resolution 2496 fining the company 10 UTA (approximately ThCh$4,952) for violating Article 123 of Decree Law (DFL) 4/20,018 of 2006 due to its failure to report to the SEF the commissioning of its electricity facilities by the deadline provided for in that law. To clear the charges, Endesa Chile paid the fine in full. |
Closed and paid.
| • | In the first quarter of 2013, Endesa Chile was notified of three resolutions issued by the Health SEREMI (Regional Ministerial Office) of the Maule Region, Resolutions 1057, 085, and 970, which ruled on health summary proceedings RIT Nos. 355/2011, 354/2011, and 256/2011, respectively, imposing a 20 UTM fine for each of the proceedings. The fines were imposed for the following violations: Resolution 1057 penalizes a health violation of Decree 594 of 1999, Regulations on Basic Health and Environmental Conditions in the Workplace, specifically, at the Cipreses Plant facilities; this fine has been paid in full. Resolution 085 penalizes a violation of Executive Decree 90/2011, which requires a statement of the emissions made in 2009 and 2010 by a 20.8-kW-capacity Siemens-Schukertwerke A6 power generator located at the Bocatoma Maule Isla facility. This resolution is currently being challenged. Resolution 970 penalizes a violation of Executive Decree 90/2011, which requires a statement of the emissions made in 2009 and 2010 by a 34 kW Conex generator located at the Bocatoma Maule Isla facility. This resolution is currently being challenged. Total: 60 UTA (approximately ThCh$2,592). |
| • | Endesa Chile received notification in September 2013 of ORD No. 603 issued by the Superintendence of the Environment (SMA) initiating sanction proceedings and filing charges against Endesa Chile as Holder of the Expansion Project for Unit Two of the Bocamina Plant for a number of violations against environmental regulations and the RCA environmental regulation instrument. The sanction proceedings are the result of inspections conducted by SMA personnel on February 13 and 14 and on March 19, 26, and 27, 2013, at the Bocamina thermoelectric facilities. The inspections found a number of violations of Exempt Resolution 206 of August 2, 2007 (RCA 206/2007), which was clarified by Exempt Resolutions 229 of August 21, 2007 (RCA 229/2007) and 285 of October 8, 2007 (RCA 285/2007) giving environmental approval to this expansion project. The infractions consist primarily of (i) not having a discharge channel for the cooling system that extends 30 meters into the ocean from the edge of the beach; (ii) not having the Bocamina I desulfurization unit in operation; (iii) not submitting the information requested by the SMA’s official on past records of on-line emissions reports (CEM reports) from the startup of operations until the present time; (iv) exceeding the CO limit for Bocamina I set in the RCA for Bocamina II in January 2013; (v) defects and gaps between panels in the Bocamina I perimeter acoustic enclosure; (vi) noise emissions that exceed regulatory limits; and (vii) not having technological barriers that prevent biomass from pouring into the plant’s intake. |
F-220
Table of Contents
Endesa Chile submitted a compliance schedule within the time frame allotted, that was rejected. On November 27, 2013, the SMA reformulated the charges filed, adding two new charges (failure to comply with RCA 206/2007, considered a grave violation, and failure to comply with the information requirement issued in Ord UIPS 603, which is also considered a grave violation).
On August 11, 2014, the SMA issued Resolution No. 421 which penalized Endesa Chile for these environmental breaches applying a fine of 8,640.4 UTA (approximately ThCh$4,478,976). Endesa Chile filed a counter-claim of illegality before the Third Environmental Court of Valdivia, which is currently pending.
| • | The Labor Directorate (Inspección del Trabajo) of the Bío Bío Region fined Endesa ThCh$2,523 for failure to fulfill its duties as the operating company after confirming, on June 12, 2014, an accident suffered by a worker employed by the contractor Metalcav at the Bocamina II worksite. Payment of the fine is in process at this time. |
Closed and paid.
| • | On May 20, 2014, the Valparaíso Court of Appeals confirmed the fine of ThCh$2,646 imposed by the Quintero Local Police Court (Juzgado de Policía Local) upholding CONAF’s claim that Endesa Chile cut trees without first having a forestry management plan approved by CONAF. The trees were cut in the Valle Alegre area in lot 22, site 3 in the municipality of Quintero in order to clear trees from the high voltage wires. The fine was paid through the appropriate court. |
Closed and paid.
| • | On June 23, 2014, the SISS (Sanitary Services Superintendence) fined Endesa Chile 13 UTA (approximately ThCh$6,599) for discharging liquid waste from the San Isidro II thermal plant during the cooling process in excess of the amount permitted under D.S. 90 on sulfate concentration. |
Closed and paid.
| • | In July 2014 the Coronel Labor Directorate fined Endesa Chile for labor legislation violations relating to staff serving at the Bocamina plant. The infringements are: i) exceeding the maximum of two hours overtime per day; ii) not allowing staff to rest on Sundays; iii) incorrectly recording attendance; iv) exceeding the maximum 10-hour working day. The fine imposed for these offenses totaled Ch$10,122,720, which the company has paid in full. |
Closed and paid.
2. – Pehuenche
| • | During the 2011 fiscal year, Empresa Eléctrica Pehuenche S.A. was fined 602 UTA , or approximately ThCh$298,084 by the SEF for the blackout that occurred on March 14, 2010. Pehuenche filed an appeal against the measure with the Santiago Court of Appeals, which rejected the appeal on January 18, 2013 and upheld the fine. Pehuenche filed an appeal against this ruling with the Supreme Court, which rejected the appeal on November 20, 2013, and upheld the fine but reduced the amount to 421 UTA, approximately ThCh$208,461. |
Closed and paid.
| • | On October 2, 2013, the Superintendence of Securities and Insurance (SVS) fined Empresa Eléctrica Pehuenche S.A. and its Chief Executive Officer for alleged violations of Article 54 of Law 18,046 “over the right of all shareholders to examine the annual report, balance sheet, inventory, minutes, ledgers, and external auditors’ reports during the 15 days prior to a company’s ordinary shareholders’ meeting.” It resolved the following: |
“To impose on Empresa Eléctrica Pehuenche S.A. and its Chief Executive Officer, Lucio Castro Márquez, a fine of 150 UF each for violation of Article 54 of Law 18,046 and Article 61 of the Regulations on Corporations in effect at the time the events penalized occurred.”
The fine was applied as a result of a claim made by Tricahue Inversiones S.A. against Pehuenche based on the fact that, on April 24, 2012, the Tricahue S.A. Chief Executive Officer went to Pehuenche’s
F-221
Table of Contents
offices to examine the minute book of the company’s Board of Directors and stated that he was first required to sign a statement of confidentiality and indemnity in Pehuenche’s favor, which he considered illegal and arbitrary.
On August 24, 2012, Tricahue Inversiones S.A. withdrew its complaint filed against Empresa Eléctrica Pehuenche S.A.
The company and its Chief Executive Officer, respectively, exercised the action provided for under Article 30 of Decree Law 3,538, within the conditions and time frame required, to file a claim against the SVS resolution with the ordinary courts of law to have the resolution revoked.
Finally, on May 20, 2014, the Court recognized the claim filed and revoked the sanction applied as groundless.
Closed.
3. – Chilectra
| • | Income for fiscal year 2012 (2011 business year): the SII fined Chilectra S.A. after an audit of the 2012 tax return which detected discrepancies in the determination of taxable net income, specifically in an amount deducted as a carryover loss. That entry had been adjusted as a result of audits of the entry corresponding to previous years, and it was lowered with respect to the amount declared at that time. Fine: Ch$114,291,807. |
Closed and paid(June 2014).
| • | During the fiscal year 2012, Chilectra was sanctioned by the SEF with 19 fines amounting to ThCh$1,050,663. |
| • | During the fiscal year 2013, Chilectra was sanctioned by the SEF with 7 fines amounting to ThCh$227,507. |
| • | During the fiscal year 2014, Chilectra was sanctioned by the SEF with 8 fines amounting to ThCh$459,453. |
b) Joint Ventures
1. – Transquillota
| • | During the 2012 fiscal year, Transquillota, in which Endesa Chile and Colbún each hold a 50% stake, was audited by the SII under an expense verification program, as the SII considers that certain entries such as depreciation of fixed assets were not properly handled. An administrative reconsideration for the Supervisory Review (RAF) was submitted explaining the differences. The SII accepted the company’s explanations and reduced the interest and fines payable to ThCh$19,208, which the company paid on March 27, 2013. Endesa Chile paid only 50% of the amount, or Thch$9,604. |
| • | Closed and paid. |
The Combined Group has not received any other fines from the SVS or from any other administrative authorities.
F-222
Table of Contents
| 38. | ENVIRONMENT |
Environmental expenses for the years ended December 31, 2014 and 2013 are as follows:
Company Incurring the Cost | Project | 12-31-2014 ThCh$ | 12-31-2013 ThCh$ | |||||||
Endesa Chile S.A. | Studies, monitoring, laboratory analysis, removal and final disposal of solid waste at hydroelectric power stations (HPS) and thermoelectric power stations. | 1,894,105 | 1,996,818 | |||||||
Chilectra | Santa Elena Substation noise modeling, environmental consulting on the new Lo Aguirre-Cerro Navia line project, Santa Elena Substation noise mitigation project, ISO 14001 environmental compliance at substations, SpaceCab and preliminary assembly. | 1,807,356 | 1,537,004 | |||||||
Chilectra | Hazardous waste management, pruning of trees and vegetation near high voltage, garden maintenance and weed removal at substations. | 793,447 | — | |||||||
|
|
|
| |||||||
Total | 4,494,908 | 3,533,822 | ||||||||
|
|
|
| |||||||
F-223
Table of Contents
| 39. | FINANCIAL INFORMATION ON SUBSIDIARIES, SUMMARIZED |
As of December 31, 2014 and 2013, summarized financial information of our principal combined entities prepared under IFRS and instructions from the SVS is as follows:
| 12-31-2014 | ||||||||||||||||||||||||||||||||||||||||||||||
| Type of Financial Statements | Current Assets ThCh$ | Non-current Assets ThCh$ | Total Assets ThCh$ | Current Liabilities ThCh$ | Non-current Liabilities ThCh$ | Total Liabilities ThCh$ | Revenues ThCh$ | Costs ThCh$ | Profit (Loss) ThCh$ | Other Comprehensive Income ThCh$ | Total Comprehensive Income ThCh$ | |||||||||||||||||||||||||||||||||||
Grupo Chilectra S.A. | Combined | 283,754,811 | 698,940,269 | 982,695,080 | 261,250,997 | 51,025,398 | 312,276,395 | 1,127,892,544 | (855,757,752 | ) | 124,727,499 | (4,520,678 | ) | 120,206,821 | ||||||||||||||||||||||||||||||||
Grupo Inmobiliaria Manso de Velasco Ltda. | Combined | 47,631,734 | 12,103,210 | 59,734,944 | 3,605,662 | 526,608 | 4,132,270 | 12,596,339 | (2,146,800 | ) | 24,014,775 | (39,600 | ) | 23,975,175 | ||||||||||||||||||||||||||||||||
ICT Servicios Informáticos Ltda. | Separate | 2,214,084 | 555,542 | 2,769,626 | 3,005,476 | 1,069,158 | 4,074,634 | 4,978,226 | — | (1,367,466 | ) | (162,551 | ) | (1,530,017 | ) | |||||||||||||||||||||||||||||||
Empresa Eléctrica Pehuenche S.A. | Separate | 75,414,557 | 209,069,274 | 284,483,831 | 59,142,217 | 53,952,811 | 113,095,028 | 227,886,302 | (34,362,209 | ) | 143,162,280 | (51,043 | ) | 143,111,237 | ||||||||||||||||||||||||||||||||
Compañía Eléctrica Tarapacá S.A. | Separate | 77,067,775 | 450,573,978 | 527,641,753 | 110,849,007 | 30,918,614 | 141,767,621 | 318,959,142 | (196,105,061 | ) | 89,900,366 | (604 | ) | 89,899,762 | ||||||||||||||||||||||||||||||||
Soc. Concesionaria Túnel El Melón S.A. | Separate | 19,183,735 | 7,107,942 | 26,291,677 | 3,709,123 | 1,789,703 | 5,498,826 | 10,484,435 | (3,751 | ) | 5,830,719 | (12,156 | ) | 5,818,563 | ||||||||||||||||||||||||||||||||
Grupo Endesa Chile | Combined | 512,188,512 | 2,722,809,245 | 3,234,997,757 | 667,580,516 | 1,060,586,957 | 1,728,167,473 | 1,230,985,755 | (750,216,671 | ) | 129,068,163 | (73,959,262 | ) | 55,108,901 | ||||||||||||||||||||||||||||||||
Grupo Inversiones GasAtacama Holding Ltda. | Combined | 197,276,197 | 216,893,717 | 414,169,914 | 29,892,670 | 48,748,663 | 78,641,333 | 179,474,707 | (99,313,387 | ) | 29,364,528 | 51,288,697 | 80,653,225 | |||||||||||||||||||||||||||||||||
| 12-31-2013 | ||||||||||||||||||||||||||||||||||||||||||||||
| Type of Financial Statements | Current Assets ThCh$ | Non-current Assets ThCh$ | Total Assets ThCh$ | Current Liabilities ThCh$ | Non-current Liabilities ThCh$ | Total Liabilities ThCh$ | Revenues ThCh$ | Costs ThCh$ | Profit (Loss) ThCh$ | Other Comprehensive Income ThCh$ | Total Comprehensive Income ThCh$ | |||||||||||||||||||||||||||||||||||
Grupo Chilectra S.A. | Combined | 166,075,023 | 658,527,962 | 824,602,985 | (224,908,035 | ) | (43,620,084 | ) | (268,528,120 | ) | 975,023,630 | (860,816,204 | ) | 114,207,426 | (536,651 | ) | 113,670,775 | |||||||||||||||||||||||||||||
Grupo Inmobiliaria Manso de Velasco Ltda. | Combiend | 28,152,699 | 38,156,192 | 66,308,891 | (3,943,277 | ) | (460,705 | ) | (4,403,982 | ) | 17,831,676 | (8,884,221 | ) | 8,947,455 | (12,609 | ) | 8,934,846 | |||||||||||||||||||||||||||||
ICT Servicios Informáticos Ltda. | Separate | 4,335,716 | 230,392 | 4,566,108 | (3,866,062 | ) | (598,655 | ) | (4,464,717 | ) | 5,445,388 | (6,687,243 | ) | (1,241,856 | ) | (39,029 | ) | (1,280,885 | ) | |||||||||||||||||||||||||||
Grupo Endesa Chile | Combined | 429,600,069 | 2,499,417,477 | 2,929,017,546 | (680,108,401 | ) | (775,680,337 | ) | (1,455,788,737 | ) | 970,047,909 | (784,881,857 | ) | 185,166,052 | (38,539,136 | ) | 146,626,916 | |||||||||||||||||||||||||||||
Endesa Eco S.A. | Separate | — | — | — | — | — | — | 48,938,968 | (24,522,864 | ) | 24,416,104 | (15,989 | ) | 24,400,115 | ||||||||||||||||||||||||||||||||
Empresa Eléctrica Pehuenche S.A. | Separate | 33,988,505 | 217,379,509 | 251,368,014 | (35,867,416 | ) | (41,936,800 | ) | (77,804,216 | ) | 192,839,780 | (78,347,987 | ) | 114,491,793 | (13,866 | ) | 114,477,927 | |||||||||||||||||||||||||||||
Compañía Eléctrica San Isidro S.A. | Separate | — | — | — | — | — | — | 211,140,517 | (157,918,033 | ) | 53,222,484 | — | 53,222,484 | |||||||||||||||||||||||||||||||||
Compañía Eléctrica Tarapacá S.A. | Separate | 74,282,837 | 428,366,270 | 502,649,107 | (173,508,052 | ) | (25,716,898 | ) | (199,224,950 | ) | 74,083,557 | (66,581,674 | ) | 7,501,883 | 5,793 | 7,507,676 | ||||||||||||||||||||||||||||||
Soc. Concesionaria Túnel El Melón S.A. | Separate | 12,248,481 | 10,007,003 | 22,255,484 | (3,182,462 | ) | (4,599,826 | ) | (7,782,288 | ) | 10,301,994 | (4,155,242 | ) | 6,146,752 | 9,435 | 6,156,187 | ||||||||||||||||||||||||||||||
| 40. | SUBSEQUENT EVENTS |
The accompanying combined financial statements reflect the combined operations of the Combined Group as it would have been incorporated following the spin-off, whose assumed date would have been January 1, 2013, and have been derived from historical financial information.
The combined financial statements reflect our evaluation of all events that have occurred subsequent to December 31, 2014 through November 30, 2015, which is the date that the combined financial statements are available to be issued.
F-224
Table of Contents
APPENDIX 1. ENERSIS CHILE COMBINED GROUP ENTITIES
This appendix is part of Note 2.4, “Combined entities.”
It presents the Combined Group’s percentage of control in each company.
Taxpayer ID Number | Company | Currency | Percentage of control at 12/31/2014 | Percentage of control at 12/31/2013 | Percentage of control at 1/1/2013 | Type of Relationship | Country | Activity | ||||||||||||||||||||||||||||||||||||||||||
| Direct | Indirect | Total | Direct | Indirect | Total | Direct | Indirect | Total | ||||||||||||||||||||||||||||||||||||||||||
96,773,290-7 | Aguas Santiago Poniente S.A. (3) | Chilean peso | 0.00 | % | 0.00 | % | 0.00 | % | 0.00 | % | 78.88 | % | 78.88 | % | 0.00 | % | 78.88 | % | 78.88 | % | Subsidiary | Chile | Sanitation services | |||||||||||||||||||||||||||
76,003,204-2 | Central Eólica Canela S.A. | Chilean peso | 0.00 | % | 75.00 | % | 75.00 | % | 0.00 | % | 75.00 | % | 75.00 | % | 0.00 | % | 75.00 | % | 75.00 | % | Subsidiary | Chile | Promotion and development of renewable energy projects | |||||||||||||||||||||||||||
99,573,910-0 | Chilectra Inversud S.A. | Chilean peso | 0.00 | % | 100.00 | % | 100.00 | % | 0.00 | % | 100.00 | % | 100.00 | % | 0.00 | % | 100.00 | % | 100.00 | % | Subsidiary | Chile | Portfolio company | |||||||||||||||||||||||||||
96,800,570-7 | Chilectra S.A. | Chilean peso | 99.08 | % | 0.01 | % | 99.09 | % | 99.08 | % | 0.01 | % | 99.09 | % | 99.08 | % | 0.01 | % | 99.09 | % | Subsidiary | Chile | Ownership interest in companies of any nature | |||||||||||||||||||||||||||
96,770,940-9 | Compañía Eléctrica Tarapacá S.A. | Chilean peso | 3.78 | % | 96.21 | % | 99.99 | % | 3.78 | % | 96.21 | % | 99.99 | % | 3.78 | % | 96.21 | % | 99.99 | % | Subsidiary | Chile | Complete electric energy cycle | |||||||||||||||||||||||||||
96,764,840-K | Constructora y Proyectos Los Maitenes S.A. (3) | Chilean peso | 0.00 | % | 0.00 | % | 0.00 | % | 0.00 | % | 55.00 | % | 55.00 | % | 0.00 | % | 55.00 | % | 55.00 | % | Subsidiary | Chile | Construction and facilities | |||||||||||||||||||||||||||
96,783,910-8 | Empresa Eléctrica de Colina Ltda. | Chilean peso | 0.00 | % | 100.00 | % | 100.00 | % | 0.00 | % | 100.00 | % | 100.00 | % | 0.00 | % | 100.00 | % | 100.00 | % | Subsidiary | Chile | Complete energy cycle and related supplies | |||||||||||||||||||||||||||
96,504,980-0 | Empresa Eléctrica Pehuenche S.A. | Chilean peso | 0.00 | % | 92.65 | % | 92.65 | % | 0.00 | % | 92.65 | % | 92.65 | % | 0.00 | % | 92.65 | % | 92.65 | % | Subsidiary | Chile | Complete electric energy cycle | |||||||||||||||||||||||||||
91,081,000-6 | Empresa Nacional de Electricidad S.A | Chilean peso | 59.98 | % | 0.00 | % | 59.98 | % | 59.98 | % | 0.00 | % | 59.98 | % | 59.98 | % | 0.00 | % | 59.98 | % | Subsidiary | Chile | Complete electric energy cycle | |||||||||||||||||||||||||||
76,014,570-K | Inversiones GasAtacama Holding Ltda. (1) | U.S. dollar | 0.00 | % | 100.00 | % | 100.00 | % | 0.00 | % | 50.00 | % | 50.00 | % | 0.00 | % | 50.00 | % | 50.00 | % | Subsidiary | Chile | Natural gas transportation | |||||||||||||||||||||||||||
96,830,980-3 | GasAtacama S.A. | U.S. dollar | 0.00 | % | 100.00 | % | 100.00 | % | 0.00 | % | 0.00 | % | 0.00 | % | 0.00 | % | 0.00 | % | 0.00 | % | Subsidiary | Chile | Exploitation, generation, transmission and distribution of electric energy and natural gas | |||||||||||||||||||||||||||
78,932,860-9 | GasAtacama Chile S.A. | U.S. dollar | 0.00 | % | 100.00 | % | 100.00 | % | 0.00 | % | 0.00 | % | 0.00 | % | 0.00 | % | 0.00 | % | 0.00 | % | Subsidiary | Chile | Company management | |||||||||||||||||||||||||||
77,032,280-4 | Gasoducto TalTal S.A. | Chilean peso | 0.00 | % | 100.00 | % | 100.00 | % | 0.00 | % | 0.00 | % | 0.00 | % | 0.00 | % | 0.00 | % | 0.00 | % | Subsidiary | Chile | Natural gas transportation, sale and distribution | |||||||||||||||||||||||||||
78,952,420-3 | Gasoducto Atacama Argentina S.A. | U.S. dollar | 0.00 | % | 100.00 | % | 100.00 | % | 0.00 | % | 0.00 | % | 0.00 | % | 0.00 | % | 0.00 | % | 0.00 | % | Subsidiary | Chile | Natural gas exploitation and transportation | |||||||||||||||||||||||||||
76,676,750-8 | GNL Norte S.A. | Chilean peso | 0.00 | % | 100.00 | % | 100.00 | % | 0.00 | % | 0.00 | % | 0.00 | % | 0.00 | % | 0.00 | % | 0.00 | % | Subsidiary | Chile | Energy and fuel production, transportation and distribution | |||||||||||||||||||||||||||
76,107,186-6 | Servicios Informáticos e Inmobiliarios Ltda. (2) | Chilean peso | 99.00 | % | 1.00 | % | 100.00 | % | 99.00 | % | 1.00 | % | 100.00 | % | 99.00 | % | 1.00 | % | 100.00 | % | Subsidiary | Chile | Information Technology services | |||||||||||||||||||||||||||
79,913,810-7 | Inmobiliaria Manso de Velasco Ltda. (2) | Chilean peso | 99.99 | % | 0.00 | % | 99.99 | % | 99.99 | % | 0.00 | % | 99.99 | % | 99.99 | % | 0.00 | % | 99.99 | % | Subsidiary | Chile | Construction and works | |||||||||||||||||||||||||||
96,800,460-3 | Luz Andes Ltda. | Chilean peso | 0.00 | % | 100.00 | % | 100.00 | % | 0.00 | % | 100.00 | % | 100.00 | % | 0.00 | % | 100.00 | % | 100.00 | % | Subsidiary | Chile | Energy and fuel transportation, distribution and sales | |||||||||||||||||||||||||||
96,905,700-K | Progas S.A. | Chilean peso | 0.00 | % | 100.00 | % | 100.00 | % | 0.00 | % | 0.00 | % | 0.00 | % | 0.00 | % | 0.00 | % | 0.00 | % | Subsidiary | Chile | Purchase, production, transportation and commercial distribution of natural gas | |||||||||||||||||||||||||||
77,047,280-6 | Sociedad Agrícola de Cameros Ltda. | Chilean peso | 0.00 | % | 57.50 | % | 57.50 | % | 0.00 | % | 57.50 | % | 57.50 | % | 0.00 | % | 57.50 | % | 57.50 | % | Subsidiary | Chile | Financial investments | |||||||||||||||||||||||||||
96,671,360-7 | Sociedad Concesionaria Túnel El Melón S.A. | Chilean peso | 0.00 | % | 100.00 | % | 100.00 | % | 0.00 | % | 100.00 | % | 100.00 | % | 0.00 | % | 100.00 | % | 100.00 | % | Subsidiary | Chile | Execution, construction and operation of the El Melón tunnel | |||||||||||||||||||||||||||
| (1) | On April 22, 2014, Endesa Chile acquired the remaining 50% equity interest in Inversiones GasAtacama Holding Limitada, (See Note 5). |
| (2) | On December 31, 2014, Inmobiliaria Manso de Velasco was merged with ICT, the latter being the legal successor company under the name of Servicios Informáticos e Inmobiliarios Ltda. |
| (3) | On 30 December 2014, the companies Aguas Santiago Poniente SA and Constructora y Proyectos los Maitenes SA were sold. |
F-225
Table of Contents
APPENDIX 2. CHANGES IN THE SCOPE OF COMBINATION
This appendix is part of Note 2.4.1 “Changes in the scope of combination”.
Incorporation into the scope of combination:
| Ownership Interest | ||||||||||||||||
Company | December 31, 2014 | |||||||||||||||
| Direct | Indirect | Total | Consolidation Method | |||||||||||||
Inversiones GasAtacama Holding Ltda | 0.00 | % | 100.00 | % | 100.00 | % | Full integration | |||||||||
Atacama Finance Co. (1) | 0.00 | % | 0.00 | % | 0.00 | % | Full integration | |||||||||
Energex Co. (1) | 0.00 | % | 0.00 | % | 0.00 | % | Full integration | |||||||||
GasAtacama S.A. | 0.00 | % | 100.00 | % | 100.00 | % | Full integration | |||||||||
GasAtacama Chile S.A. | 0.00 | % | 100.00 | % | 100.00 | % | Full integration | |||||||||
Gasoducto TalTal S.A. | 0.00 | % | 100.00 | % | 100.00 | % | Full integration | |||||||||
GNL Norte S.A. | 0.00 | % | 100.00 | % | 100.00 | % | Full integration | |||||||||
Progas S.A. | 0.00 | % | 100.00 | % | 100.00 | % | Full integration | |||||||||
See Note 2.4.1.
| (1) | On 17 September 2014 the companies Atacama Finance Co and Energex Co were dissolved. |
There were no incorporation of entites into the scope of combination as of December 31, 2013 and January 1, 2013.
Entities eliminated from the scope of combination:
| Ownership Interest | ||||||||||||||||
Company | December 31, 2014 | |||||||||||||||
| Direct | Indirect | Total | Consolidation Method | |||||||||||||
Aguas Santiago Poniente S.A. | 0.00 | % | 78.88 | % | 78.88 | % | Full integration | |||||||||
Constructora y Proyectos Los Maitenes S.A. | 0.00 | % | 55.00 | % | 55.00 | % | Full integration | |||||||||
There were no entities eliminated from the scope of combination as of December 31, 2013 and January 1, 2013.
F-226
Table of Contents
APPENDIX 3. ASSOCIATED COMPANIES AND JOINT VENTURES
This appendix is part of Note 3.i, “Investments accounted for using the equity method”.
Taxpayer ID | Company (in alphabetical | Currency | Ownership Interest at 12/31/2014 | Ownership Interest at 12/31/2013 | Ownership Interest at 1/1/2013 | Type of | Country | Activity | ||||||||||||||||||||||||||||||||||||||
| Direct | Indirect | Total | Direct | Indirect | Total | Direct | Indirect | Total | ||||||||||||||||||||||||||||||||||||||
96,806,130-5 | Electrogas S.A. | U.S. dollar | 0.00 | % | 42.50 | % | 42.50 | % | 0.00 | % | 42.50 | % | 42.50 | % | 0.00 | % | 42.50 | % | 42.50 | % | Associate | Chile | Portfolio company | |||||||||||||||||||||||
76,418,940-K | GNL Chile S.A. | Chilean peso | 0.00 | % | 33.33 | % | 33.33 | % | 0.00 | % | 33.33 | % | 33.33 | % | 0.00 | % | 33.33 | % | 33.33 | % | Associate | Chile | Promotion of liquefied natural gas supply project | |||||||||||||||||||||||
76,788,080-4 | GNL Quintero S.A. | U.S. dollar | 0.00 | % | 20.00 | % | 20.00 | % | 0.00 | % | 20.00 | % | 20.00 | % | 0.00 | % | 20.00 | % | 20.00 | % | Associate | Chile | Development, design and supply of liquid natural gas regasifying terminal | |||||||||||||||||||||||
76,652,400-1 | Centrales Hidroeléctricas De Aysén S.A. | Chilean peso | 0.00 | % | 51.00 | % | 51.00 | % | 0.00 | % | 51.00 | % | 51.00 | % | 0.00 | % | 51.00 | % | 51.00 | % | Joint venture | Chile | Development and operation of a hydroelectric plant | |||||||||||||||||||||||
76,041,891-9 | Aysén Transmisión S.A. | Chilean peso | 0.00 | % | 51.00 | % | 51.00 | % | 0.00 | % | 51.00 | % | 51.00 | % | 0.00 | % | 51.00 | % | 51.00 | % | Joint venture | Chile | Development and operation of a hydroelectric plant | |||||||||||||||||||||||
76,091,595-5 | Aysén Energía S.A. | Chilean peso | 0.00 | % | 51.00 | % | 51.00 | % | 0.00 | % | 51.00 | % | 51.00 | % | 0.00 | % | 51.00 | % | 51.00 | % | Joint venture | Chile | Development and operation of a hydroelectric plant | |||||||||||||||||||||||
76,014,570-K | Inversiones GasAtacama Holding Ltda. (1) | U.S. dollar | 0.00 | % | 0.00 | % | 0.00 | % | 0.00 | % | 50.00 | % | 50.00 | % | 0.00 | % | 50.00 | % | 50.00 | % | Joint venture | Chile | Natural gas transportation | |||||||||||||||||||||||
77,017,930-0 | Transmisora Eléctrica de Quillota Ltda. | Chilean peso | 0.00 | % | 50.00 | % | 50.00 | % | 0.00 | % | 50.00 | % | 50.00 | % | 0.00 | % | 50.00 | % | 50.00 | % | Joint venture | Chile | Electric energy transportation and distribution | |||||||||||||||||||||||
| (1) | On April 22, 2014, Endesa Chile acquired the remaining 50% equity interest in Inversiones GasAtacama Holding Limitada, (See Note 5). |
F-227
Table of Contents
APPENDIX 4. ADDITIONAL INFORMATION ON FINANCIAL DEBT
This appendix is part of Note 20, “Other financial liabilities.” The following tables present the contractual undiscounted cash flows by type of financial debt:
a) Bank borrowings
Summary of bank borrowings by currency and maturity
Country | Currency | Effective interest rate | Nominal interest rate | Current | Non-Current | |||||||||||||||||||||||||||||||||||||||||||
| Maturity | Total Current 12/31/2014 ThCh$ | Maturity | Total Non- Current 12/31/2014 ThCh$ | |||||||||||||||||||||||||||||||||||||||||||||
| One to three months ThCh$ | Three to Twelve months ThCh$ | One to two years ThCh$ | Two to three years ThCh$ | Three to four years ThCh$ | Four to five years ThCh$ | More than five years ThCh$ | ||||||||||||||||||||||||||||||||||||||||||
Chile | US$ | 6.32 | % | 5.98 | % | 20,269 | 1,020,576 | 1,040,845 | — | — | — | — | — | — | ||||||||||||||||||||||||||||||||||
Chile | Ch$ | 5.60 | % | 5.60 | % | 714 | — | 714 | — | — | — | — | — | — | ||||||||||||||||||||||||||||||||||
|
|
|
|
|
|
|
|
|
|
|
|
|
|
|
|
|
| |||||||||||||||||||||||||||||||
| 20,983 | 1,020,576 | 1,041,559 | — | — | — | — | — | — | ||||||||||||||||||||||||||||||||||||||||
|
|
|
|
|
|
|
|
|
|
|
|
|
|
|
|
|
| |||||||||||||||||||||||||||||||
Country | Currency | Effective interest rate | Nominal interest rate | Current | Non-Current | |||||||||||||||||||||||||||||||||||||||||||
| Maturity | Total Current 12/31/2013 ThCh$ | Maturity | Total Non- Current 12/31/2013 ThCh$ | |||||||||||||||||||||||||||||||||||||||||||||
| One to three months ThCh$ | Three to Twelve months ThCh$ | One to two years ThCh$ | Two to three years ThCh$ | Three to four years ThCh$ | Four to five years ThCh$ | More than five years ThCh$ | ||||||||||||||||||||||||||||||||||||||||||
Chile | US$ | 2.78 | % | 2.29 | % | 842,850 | 106,843,174 | 107,686,024 | 892,825 | — | — | — | — | 892,825 | ||||||||||||||||||||||||||||||||||
Chile | Ch$ | 5.67 | % | 5.67 | % | 119 | — | 119 | — | — | — | — | — | — | ||||||||||||||||||||||||||||||||||
|
|
|
|
|
|
|
|
|
|
|
|
|
|
|
|
|
| |||||||||||||||||||||||||||||||
| 842,969 | 106,843,174 | 107,686,143 | 892,825 | — | — | — | — | 892,825 | ||||||||||||||||||||||||||||||||||||||||
|
|
|
|
|
|
|
|
|
|
|
|
|
|
|
|
|
| |||||||||||||||||||||||||||||||
Country | Currency | Effective interest rate | Nominal interest rate | Current | Non-Current | |||||||||||||||||||||||||||||||||||||||||||
| Maturity | Total Current 1/1/2013 ThCh$ | Maturity | Total Non- Current 1/1/2013 ThCh$ | |||||||||||||||||||||||||||||||||||||||||||||
| One to three months ThCh$ | Three to Twelve months ThCh$ | One to two years ThCh$ | Two to three years ThCh$ | Three to four years ThCh$ | Four to five years ThCh$ | More than five years ThCh$ | ||||||||||||||||||||||||||||||||||||||||||
Chile | US$ | 2.39 | % | 1.76 | % | 818,386 | 2,531,449 | 3,349,835 | 98,174,784 | 807,675 | — | — | — | 98,982,459 | ||||||||||||||||||||||||||||||||||
Chile | Ch$ | 4.90 | % | 4.90 | % | 371 | — | 371 | — | — | — | — | — | — | ||||||||||||||||||||||||||||||||||
|
|
|
|
|
|
|
|
|
|
|
|
|
|
|
|
|
| |||||||||||||||||||||||||||||||
| 818,757 | 2,531,449 | 3,350,206 | 98,174,784 | 807,675 | — | — | — | 98,982,459 | ||||||||||||||||||||||||||||||||||||||||
|
|
|
|
|
|
|
|
|
|
|
|
|
|
|
|
|
| |||||||||||||||||||||||||||||||
F-228
Table of Contents
Identification of bank borrowings by company
Taxpayer | Company | Country | Financial Institution | Country | Currency | Effective Interest Rate | Nominal Interest Rate | December 31, 2014 | ||||||||||||||||||||||||||||||||||||||||||||||
| Maturity | Maturity | |||||||||||||||||||||||||||||||||||||||||||||||||||||
| Less than 90 days | More than 90 days | Total Current | One to two years | Two to three years | Three to four years | Four to five years | More than five years | Total Non- Current | ||||||||||||||||||||||||||||||||||||||||||||||
96.800.570-7 | Chilectra S.A. | Chile | Line of credit | Chile | Ch$ | 5.91 | % | 5.91 | % | 132 | — | 132 | — | — | — | — | — | — | ||||||||||||||||||||||||||||||||||||
91.081.000-6 | Endesa Chile S.A. | Chile | B.N.P. Paribas | U.S.A. | US$ | 6.32 | % | 5.98 | % | 20,269 | 1,020,576 | 1,040,845 | — | — | — | — | — | — | ||||||||||||||||||||||||||||||||||||
91.081.000-6 | Endesa Chile S.A. | Chile | Banco Santander | Chile | Ch$ | 6.00 | % | 6.00 | % | 582 | — | 582 | — | — | — | — | — | — | ||||||||||||||||||||||||||||||||||||
|
|
|
|
|
|
|
|
|
|
|
|
|
|
|
|
|
| |||||||||||||||||||||||||||||||||||||
| 20,983 | 1,020,576 | 1,041,559 | — | — | — | — | — | — | ||||||||||||||||||||||||||||||||||||||||||||||
|
|
|
|
|
|
|
|
|
|
|
|
|
|
|
|
|
| |||||||||||||||||||||||||||||||||||||
Taxpayer | Company | Country | Financial Institution | Country | Currency | Effective Interest Rate | Nominal Interest Rate | December 31, 2013 | ||||||||||||||||||||||||||||||||||||||||||||||
| Maturity | Maturity | |||||||||||||||||||||||||||||||||||||||||||||||||||||
| Less than 90 days | More than 90 days | Total Current | One to two years | Two to three years | Three to four years | Four to five years | More than five years | Total Non- Current | ||||||||||||||||||||||||||||||||||||||||||||||
96.800.570-7 | Chilectra S.A. | Chile | Line of credit | Chile | Ch$ | 5.91 | % | 5.91 | % | 104 | — | 104 | — | — | — | — | — | — | ||||||||||||||||||||||||||||||||||||
94.271.00-3 | Enersis S.A. | Chile | Banco Santander Chile | Chile | Ch$ | 4.50 | % | 4.50 | % | 4 | — | 4 | — | — | — | — | — | — | ||||||||||||||||||||||||||||||||||||
79.913.810-7 | Manso de Velasco Ltda. | Chile | Banco Santander Chile | Chile | Ch$ | 6.00 | % | 6.00 | % | 4 | — | 4 | — | — | — | — | — | — | ||||||||||||||||||||||||||||||||||||
91.081.000-6 | Endesa Chile S.A. | Chile | B.N.P. Paribas | U.S.A. | US$ | 6.32 | % | 5.98 | % | 28,293 | 921,118 | 949,411 | 892,825 | — | — | — | — | 892,825 | ||||||||||||||||||||||||||||||||||||
91.081.000-6 | Endesa Chile S.A. | Chile | Banco Santander | Chile | Ch$ | 6.00 | % | 6.00 | % | 7 | — | 7 | — | — | — | — | — | — | ||||||||||||||||||||||||||||||||||||
91.081.000-6 | Endesa Chile S.A. | Chile | EDC | U.S.A. | US$ | 1.42 | % | 1.34 | % | 378,291 | 378,290 | 756,581 | — | — | — | — | — | — | ||||||||||||||||||||||||||||||||||||
91.081.000-6 | Endesa Chile S.A. | Chile | BBVA S.A.NY | U.S.A. | US$ | 1.56 | % | 0.99 | % | 436,266 | 105,543,766 | 105,980,032 | — | — | — | — | — | — | ||||||||||||||||||||||||||||||||||||
|
|
|
|
|
|
|
|
|
|
|
|
|
|
|
|
|
| |||||||||||||||||||||||||||||||||||||
| 842,969 | 106,843,174 | 107,686,143 | 892,825 | — | — | — | — | 892,825 | ||||||||||||||||||||||||||||||||||||||||||||||
| �� |
|
|
|
|
|
|
|
|
|
|
|
|
|
|
|
|
|
| ||||||||||||||||||||||||||||||||||||
Taxpayer | Company | Country | Financial Institution | Country | Currency | Effective Interest Rate | Nominal Interest Rate | Janaury 1, 2013 | ||||||||||||||||||||||||||||||||||||||||||||||
| Maturity | Maturity | |||||||||||||||||||||||||||||||||||||||||||||||||||||
| Less than 90 days | More than 90 days | Total Current | One to two years | Two to three years | Three to four years | Four to five years | More than five years | Total Non- Current | ||||||||||||||||||||||||||||||||||||||||||||||
96.800.570-7 | Chilectra S.A. | Chile | Líneas de crédito bancarias | Chile | Ch$ | 6.60 | % | 6.60 | % | 46 | 46 | — | — | — | — | — | — | |||||||||||||||||||||||||||||||||||||
94.271.00-3 | Enersis S.A. | Chile | Banco Santander Chile | Chile | Ch$ | 2.10 | % | 2.10 | % | 53 | 53 | — | — | — | — | — | — | |||||||||||||||||||||||||||||||||||||
91.081.000-6 | Endesa Chile S.A. | Chile | B.N.P. Paribas | U.S.A. | US$ | 6.32 | % | 5.98 | % | 31,301 | 859,843 | 891,144 | 849,410 | 807,675 | — | — | — | 1,657,085 | ||||||||||||||||||||||||||||||||||||
91.081.000-6 | Endesa Chile S.A. | Chile | Export Development Corpotation Loan | U.S.A. | US$ | 1.82 | % | 1.73 | % | 347,952 | 354,206 | 702,158 | 689,651 | — | — | — | 689,651 | |||||||||||||||||||||||||||||||||||||
91.081.000-6 | Endesa Chile S.A. | Chile | Banco Bilbao Vizcaya Argentaria S.A.NY | U.S.A. | US$ | 1.72 | % | 1.12 | % | 439,133 | 1,317,400 | 1,756,533 | 96,635,723 | — | — | — | 96,635,723 | |||||||||||||||||||||||||||||||||||||
91.081.000-6 | Endesa Chile S.A. | Chile | Banco Santander Chile (Linea Crédito) | Chile | Ch$ | 6.00 | % | 6.00 | % | 272 | 272 | — | — | — | — | — | — | |||||||||||||||||||||||||||||||||||||
|
|
|
|
|
|
|
|
|
|
|
|
|
|
|
|
|
| |||||||||||||||||||||||||||||||||||||
| 818,757 | 2,531,449 | 3,350,206 | 98,174,784 | 807,675 | — | — | — | 98,982,459 | ||||||||||||||||||||||||||||||||||||||||||||||
|
|
|
|
|
|
|
|
|
|
|
|
|
|
|
|
|
| |||||||||||||||||||||||||||||||||||||
F-229
Table of Contents
b) Secured and unsecured liabilities
Summary of secured and unsecured liabilities by currency and maturity
Country | Currency | Effective interest rate | Nominal interest rate | Current | Non-Current | |||||||||||||||||||||||||||||||||||||||||
| Maturity | Total Current 12/31/2014 ThCh$ | Maturity | Total Non- Current 12/31/2014 ThCh$ | |||||||||||||||||||||||||||||||||||||||||||
| One to three months ThCh$ | Three to Twelve months ThCh$ | One to two years ThCh$ | Two to three years ThCh$ | Three to four years ThCh$ | Four to five years ThCh$ | More than five years ThCh$ | ||||||||||||||||||||||||||||||||||||||||
Chile | US$ | 7.61 | % | 7.17 | % | 9,028,616 | 144,138,509 | 153,167,125 | 25,547,239 | 25,547,239 | 25,547,239 | 25,547,239 | 733,419,902 | 835,608,858 | ||||||||||||||||||||||||||||||||
Chile | U.F. | 6.34 | % | 5.57 | % | 8,377,677 | 30,005,314 | 38,382,991 | 37,771,918 | 37,160,846 | 36,549,774 | 46,672,611 | 429,466,743 | 587,621,892 | ||||||||||||||||||||||||||||||||
|
|
|
|
|
|
|
|
|
|
|
|
|
|
|
|
|
| |||||||||||||||||||||||||||||
Total | 17,406,293 | 174,143,823 | 191,550,116 | 63,319,157 | 62,708,085 | 62,097,013 | 72,219,850 | 1,162,886,645 | 1,423,230,750 | |||||||||||||||||||||||||||||||||||||
|
|
|
|
|
|
|
|
|
|
|
|
|
|
|
|
|
| |||||||||||||||||||||||||||||
Country | Currency | Effective interest rate | Nominal interest rate | Non-Current | ||||||||||||||||||||||||||||||||||||||||||
| Maturity | Total Current 12/31/2013 ThCh$ | Maturity | Total Non- Current 12/31/2013 ThCh$ | |||||||||||||||||||||||||||||||||||||||||||
| One to three months ThCh$ | Three to Twelve months ThCh$ | One to two years ThCh$ | Two to three years ThCh$ | Three to four years ThCh$ | Four to five years ThCh$ | More than five years ThCh$ | ||||||||||||||||||||||||||||||||||||||||
Chile | US$ | 7.95 | % | 7.62 | % | 5,738,678 | 17,216,036 | 22,954,714 | 124,912,501 | 13,505,570 | 13,505,570 | 13,505,570 | 399,525,039 | 564,954,250 | ||||||||||||||||||||||||||||||||
Chile | U.F. | 6.34 | % | 5.57 | % | 5,444,098 | 21,021,997 | 26,466,095 | 26,064,679 | 25,663,264 | 25,261,847 | 24,860,433 | 394,573,848 | 496,424,071 | ||||||||||||||||||||||||||||||||
|
|
|
|
|
|
|
|
|
|
|
|
|
|
|
|
|
| |||||||||||||||||||||||||||||
Total | 11,182,776 | 38,238,033 | 49,420,809 | 150,977,180 | 39,168,834 | 38,767,417 | 38,366,003 | 794,098,887 | 1,061,378,321 | |||||||||||||||||||||||||||||||||||||
|
|
|
|
|
|
|
|
|
|
|
|
|
|
|
|
|
| |||||||||||||||||||||||||||||
Country | Currency | Effective interest rate | Nominal interest rate | Current | Non-Current | |||||||||||||||||||||||||||||||||||||||||
| Maturity | Total Current 1/1/2013 ThCh$ | Maturity | Total Non- Current 1/1/2013 ThCh$ | |||||||||||||||||||||||||||||||||||||||||||
| One to three months ThCh$ | Three to Twelve months ThCh$ | One to two years ThCh$ | Two to three years ThCh$ | Three to four years ThCh$ | Four to five years ThCh$ | More than five years ThCh$ | ||||||||||||||||||||||||||||||||||||||||
Chile | US$ | 8.02 | % | 7.71 | % | 9,265,672 | 213,808,862 | 223,074,534 | 20,553,482 | 113,476,689 | 12,050,729 | 12,050,730 | 396,990,182 | 555,121,812 | ||||||||||||||||||||||||||||||||
Chile | U.F. | 6.34 | % | 5.57 | % | 5,802,114 | 21,972,628 | 27,774,742 | 27,359,583 | 26,944,423 | 26,529,265 | 26,114,104 | 418,783,834 | 525,731,209 | ||||||||||||||||||||||||||||||||
|
|
|
|
|
|
|
|
|
|
|
|
|
|
|
|
|
| |||||||||||||||||||||||||||||
Total | 15,067,786 | 235,781,490 | 250,849,276 | 47,913,065 | 140,421,112 | 38,579,994 | 38,164,834 | 815,774,016 | 1,080,853,021 | |||||||||||||||||||||||||||||||||||||
|
|
|
|
|
|
|
|
|
|
|
|
|
|
|
|
|
| |||||||||||||||||||||||||||||
F-230
Table of Contents
Secured and unsecured liabilities by company
Taxpayer | Company | Country | Financial Institution | Country | Currency | Effective Interest Rate | Nominal Interest Rate | December 31, 2014 | ||||||||||||||||||||||||||||||||||||||||||||||||
| Maturity | Maturity | |||||||||||||||||||||||||||||||||||||||||||||||||||||||
| Less than 90 days | More than 90 days | Total Current | One to two years | Two to three years | Three to four years | Four to five years | More than five years | Total Non- Current | ||||||||||||||||||||||||||||||||||||||||||||||||
91.081.000-6 | Endesa Chile S.A. | Chile | BNY Mellon - Primera Emisión S-1 | U.S.A | US$ | 7.96 | % | 7.88 | % | 2,474,039 | 7,422,118 | 9,896,157 | 9,896,157 | 9,896,157 | 9,896,157 | 9,896,157 | 195,949,534 | 235,534,162 | ||||||||||||||||||||||||||||||||||||||
91.081.000-6 | Endesa Chile S.A. | Chile | BNY Mellon - Primera Emisión S-2 | U.S.A | US$ | 7.40 | % | 7.33 | % | 789,495 | 2,368,484 | 3,157,979 | 3,157,979 | 3,157,979 | 3,157,979 | 3,157,979 | 77,747,246 | 90,379,162 | ||||||||||||||||||||||||||||||||||||||
91.081.000-6 | Endesa Chile S.A. | Chile | BNY Mellon - Primera Emisión S-3 | U.S.A | US$ | 8.26 | % | 8.13 | % | 502,137 | 1,506,412 | 2,008,549 | 2,008,549 | 2,008,549 | 2,008,549 | 2,008,549 | 168,757,572 | 176,791,768 | ||||||||||||||||||||||||||||||||||||||
91.081.000-6 | Endesa Chile S.A. | Chile | BNY Mellon - 144 - A | U.S.A | US$ | 8.83 | % | 8.63 | % | 2,641,806 | 124,978,079 | 127,619,885 | — | — | — | — | — | — | ||||||||||||||||||||||||||||||||||||||
91.081.000-6 | Endesa Chile S.A. | Chile | BNY Mellon - Unica 24296 | U.S.A | US$ | 5.30 | % | 4.25 | % | 2,621,139 | 7,863,416 | 10,484,555 | 10,484,554 | 10,484,554 | 10,484,554 | 10,484,554 | 290,965,550 | 332,903,766 | ||||||||||||||||||||||||||||||||||||||
91.081.000-6 | Endesa Chile S.A. | Chile | Banco Santander - 317 Serie-H | Chile | U.F. | 7.17 | % | 6.20 | % | 2,174,007 | 11,394,304 | 13,568,311 | 12,957,238 | 12,346,166 | 11,735,094 | 11,124,022 | 73,777,578 | 121,940,098 | ||||||||||||||||||||||||||||||||||||||
91.081.000-6 | Endesa Chile S.A. | Chile | Banco Santander 522 Serie-M | Chile | U.F. | 4.82 | % | 4.75 | % | 6,203,670 | 18,611,010 | 24,814,680 | 24,814,680 | 24,814,680 | 24,814,680 | 35,548,589 | 355,689,165 | 465,681,794 | ||||||||||||||||||||||||||||||||||||||
|
|
|
|
|
|
|
|
|
|
|
|
|
|
|
|
|
| |||||||||||||||||||||||||||||||||||||||
| 17,406,293 | 174,143,823 | 191,550,116 | 63,319,157 | 62,708,085 | 62,097,013 | 72,219,850 | 1,162,886,645 | 1,423,230,750 | ||||||||||||||||||||||||||||||||||||||||||||||||
|
|
|
|
|
|
|
|
|
|
|
|
|
|
|
|
|
| |||||||||||||||||||||||||||||||||||||||
Taxpayer | Company | Country | Financial Institution | Country | Currency | Effective Interest Rate | Nominal Interest Rate | December 31, 2013 | ||||||||||||||||||||||||||||||||||||||||||||||||
| Maturity | Maturity | |||||||||||||||||||||||||||||||||||||||||||||||||||||||
| Less than 90 days | More than 90 days | Total Current | One to two years | Two to three years | Three to four years | Four to five years | More than five years | Total Non- Current | ||||||||||||||||||||||||||||||||||||||||||||||||
91.081.000-6 | Endesa Chile S.A. | Chile | BNY Mellon - Primera Emisión S-1 | U.S.A | US$ | 7.96 | % | 7.88 | % | 2,217,451 | 6,652,353 | 8,869,804 | 8,869,804 | 8,869,805 | 8,869,804 | 8,869,805 | 180,634,922 | 216,114,140 | ||||||||||||||||||||||||||||||||||||||
91.081.000-6 | Endesa Chile S.A. | Chile | BNY Mellon - Primera Emisión S-2 | U.S.A | US$ | 7.40 | % | 7.33 | % | 708,960 | 2,126,881 | 2,835,841 | 2,835,842 | 2,835,841 | 2,835,842 | 2,835,841 | 68,415,434 | 79,758,800 | ||||||||||||||||||||||||||||||||||||||
91.081.000-6 | Endesa Chile S.A. | Chile | BNY Mellon - Primera Emisión S-3 | U.S.A | US$ | 8.26 | % | 8.13 | % | 449,981 | 1,349,943 | 1,799,924 | 1,799,924 | 1,799,924 | 1,799,924 | 1,799,924 | 150,474,683 | 157,674,379 | ||||||||||||||||||||||||||||||||||||||
91.081.000-6 | Endesa Chile S.A. | Chile | BNY Mellon - 144 - A | U.S.A | US$ | 8.83 | % | 8.63 | % | 2,362,286 | 7,086,859 | 9,449,145 | 111,406,931 | — | — | — | — | 111,406,931 | ||||||||||||||||||||||||||||||||||||||
91.081.000-6 | Endesa Chile S.A. | Chile | BNY Mellon - Unica 24296 | U.S.A | US$ | 5.30 | % | 4.25 | % | — | — | — | — | — | — | — | — | — | ||||||||||||||||||||||||||||||||||||||
91.081.000-6 | Endesa Chile S.A. | Chile | Banco Santander -317 Serie-H | Chile | U.F. | 7.17 | % | 6.20 | % | 1,528,468 | 9,275,107 | 10,803,575 | 10,402,159 | 10,000,743 | 9,599,327 | 9,197,912 | 71,006,646 | 110,206,787 | ||||||||||||||||||||||||||||||||||||||
91.081.000-6 | Endesa Chile S.A. | Chile | Banco Santander 522 Serie-M | Chile | U.F. | 4.82 | % | 4.75 | % | 3,915,630 | 11,746,890 | 15,662,520 | 15,662,520 | 15,662,521 | 15,662,520 | 15,662,521 | 323,567,202 | 386,217,284 | ||||||||||||||||||||||||||||||||||||||
|
|
|
|
|
|
|
|
|
|
|
|
|
|
|
|
|
| |||||||||||||||||||||||||||||||||||||||
| 11,182,776 | 38,238,033 | 49,420,809 | 150,977,180 | 39,168,834 | 38,767,417 | 38,366,003 | 794,098,887 | 1,061,378,321 | ||||||||||||||||||||||||||||||||||||||||||||||||
|
|
|
|
|
|
|
|
|
|
|
|
|
|
|
|
|
| |||||||||||||||||||||||||||||||||||||||
Taxpayer | Company | Country | Financial Institution | Country | Currency | Effective Interest Rate | Nominal Interest Rate | January 1, 2013 | ||||||||||||||||||||||||||||||||||||||||||||||||
| Maturity | Maturity | |||||||||||||||||||||||||||||||||||||||||||||||||||||||
| Less than 90 days | More than 90 days | Total Current | One to two years | Two to three years | Three to four years | Four to five years | More than five years | Total Non- Current | ||||||||||||||||||||||||||||||||||||||||||||||||
91.081.000-6 | Endesa Chile S.A. | Chile | BNY Mellon - Primera Emisión S-1 | U.S.A | US$ | 7.96 | % | 7.88 | % | 1,975,290 | 5,925,870 | 7,901,160 | 7,901,160 | 7,901,161 | 7,901,160 | 7,901,161 | 171,658,937 | 203,263,579 | ||||||||||||||||||||||||||||||||||||||
91.081.000-6 | Endesa Chile S.A. | Chile | BNY Mellon - Primera Emisión S-2 | U.S.A | US$ | 7.40 | % | 7.33 | % | 630,588 | 1,891,764 | 2,522,352 | 2,522,351 | 2,522,352 | 2,522,351 | 2,522,352 | 78,366,028 | 88,455,434 | ||||||||||||||||||||||||||||||||||||||
91.081.000-6 | Endesa Chile S.A. | Chile | BNY Mellon - Primera Emisión S-3 | U.S.A | US$ | 8.26 | % | 8.13 | % | 406,804 | 1,220,413 | 1,627,217 | 1,627,218 | 1,627,217 | 1,627,218 | 1,627,217 | 146,965,217 | 153,474,087 | ||||||||||||||||||||||||||||||||||||||
91.081.000-6 | Endesa Chile S.A. | Chile | BNY Mellon - 144 - A | U.S.A | US$ | 8.50 | % | 8.35 | % | 4,127,302 | 198,393,750 | 202,521,052 | — | — | ||||||||||||||||||||||||||||||||||||||||||
91.081.000-6 | Endesa Chile S.A. | Chile | BNY Mellon - 144-A | U.S.A | US$ | 8.83 | % | 8.63 | % | 2,125,688 | 6,377,065 | 8,502,753 | 8,502,753 | 101,425,959 | — | 109,928,712 | ||||||||||||||||||||||||||||||||||||||||
91.081.000-6 | Endesa Chile S.A. | Chile | Banco Santander -317 Serie-H | Chile | U.F. | 7.17 | % | 6.20 | % | 1,684,588 | 9,620,049 | 11,304,637 | 10,889,478 | 10,474,319 | 10,059,160 | 9,644,000 | 79,761,211 | 120,828,168 | ||||||||||||||||||||||||||||||||||||||
91.081.000-6 | Endesa Chile S.A. | Chile | Banco Santander 522 Serie-M | Chile | U.F. | 4.82 | % | 4.75 | % | 4,117,526 | 12,352,579 | 16,470,105 | 16,470,105 | 16,470,104 | 16,470,105 | 16,470,104 | 339,022,623 | 404,903,041 | ||||||||||||||||||||||||||||||||||||||
|
|
|
|
|
|
|
|
|
|
|
|
|
|
|
|
|
| |||||||||||||||||||||||||||||||||||||||
| 15,067,786 | 235,781,490 | 250,849,276 | 47,913,065 | 140,421,112 | 38,579,994 | 38,164,834 | 815,774,016 | 1,080,853,021 | ||||||||||||||||||||||||||||||||||||||||||||||||
|
|
|
|
|
|
|
|
|
|
|
|
|
|
|
|
|
| |||||||||||||||||||||||||||||||||||||||
F-231
Table of Contents
c) Financial lease obligations
Financial lease obligations by company
Taxpayer | Company | Country | Financial | Country | Currency | Nominal Interest Rate | December 31, 2014 | |||||||||||||||||||||||||||||||||||||||||||||||
| Maturity | Maturity | |||||||||||||||||||||||||||||||||||||||||||||||||||||
| Less than 90 days | More than 90 days | Total Current | One to two years | Two to three years | Three to four years | Four to five years | More than five years | Total Non- Current | ||||||||||||||||||||||||||||||||||||||||||||||
91.081.000-6 | Endesa Chile S.A. | Chile | Abengoa Chile | Chile | US$ | 6.50 | % | 652,199 | 1,957,446 | 2,609,645 | 2,611,991 | 2,614,490 | 2,617,151 | 2,619,984 | 12,287,815 | 22,751,431 | ||||||||||||||||||||||||||||||||||||||
|
|
|
|
|
|
|
|
|
|
|
|
|
|
|
|
|
| |||||||||||||||||||||||||||||||||||||
| 652,199 | 1,957,446 | 2,609,645 | 2,611,991 | 2,614,490 | 2,617,151 | 2,619,984 | 12,287,815 | 22,751,431 | ||||||||||||||||||||||||||||||||||||||||||||||
|
|
|
|
|
|
|
|
|
|
|
|
|
|
|
|
|
| |||||||||||||||||||||||||||||||||||||
Taxpayer | Company | Country | Financial | Country | Currency | Nominal Interest Rate | December 31, 2013 | |||||||||||||||||||||||||||||||||||||||||||||||
| Maturity | Maturity | |||||||||||||||||||||||||||||||||||||||||||||||||||||
| Less than 90 days | More than 90 days | Total Current | One to two years | Two to three years | Three to four years | Four to five years | More than five years | Total Non- Current | ||||||||||||||||||||||||||||||||||||||||||||||
91.081.000-6 | Endesa Chile S.A. | Chile | Abengoa Chile | Chile | US$ | 6.50 | % | 581,073 | 1,742,183 | 2,323,256 | 2,320,387 | 2,317,331 | 2,314,078 | 2,310,611 | 13,024,032 | 22,286,439 | ||||||||||||||||||||||||||||||||||||||
|
|
|
|
|
|
|
|
|
|
|
|
|
|
|
|
|
| |||||||||||||||||||||||||||||||||||||
| 581,073 | 1,742,183 | 2,323,256 | 2,320,387 | 2,317,331 | 2,314,078 | 2,310,611 | 13,024,032 | 22,286,439 | ||||||||||||||||||||||||||||||||||||||||||||||
|
|
|
|
|
|
|
|
|
|
|
|
|
|
|
|
|
| |||||||||||||||||||||||||||||||||||||
Taxpayer | Company | Country | Financial | Country | Currency | Nominal Interest Rate | January 1, 2013 | |||||||||||||||||||||||||||||||||||||||||||||||
| Maturity | Maturity | |||||||||||||||||||||||||||||||||||||||||||||||||||||
| Less than 90 days | More than 90 days | Total Current | One to two years | Two to three years | Three to four years | Four to five years | More than five years | Total Non- Current | ||||||||||||||||||||||||||||||||||||||||||||||
91.081.000-6 | Endesa Chile S.A. | Chile | Abengoa Chile | Chile | US$ | 6.50 | % | 517,486 | 1,552,682 | 2,070,168 | 2,070,789 | 2,071,450 | 2,072,153 | 2,072,904 | 13,854,905 | 22,142,201 | ||||||||||||||||||||||||||||||||||||||
|
|
|
|
|
|
|
|
|
|
|
|
|
|
|
|
|
| |||||||||||||||||||||||||||||||||||||
| 517,486 | 1,552,682 | 2,070,168 | 2,070,789 | 2,071,450 | 2,072,153 | 2,072,904 | 13,854,905 | 22,142,201 | ||||||||||||||||||||||||||||||||||||||||||||||
|
|
|
|
|
|
|
|
|
|
|
|
|
|
|
|
|
| |||||||||||||||||||||||||||||||||||||
F-232
Table of Contents
d) Other obligations
Taxpayer ID | Company | Country | Financial | Country | Currency | Nominal Interest Rate | January 1, 2013 | |||||||||||||||||||||||||||||||||||||||||||||||
| Maturity | Maturity | |||||||||||||||||||||||||||||||||||||||||||||||||||||
| Less than 90 days | More than 90 days | Total Current | One to two years | Two to three years | Three to four years | Four to five years | More than five years | Total Non- Current | ||||||||||||||||||||||||||||||||||||||||||||||
96.827.970-K | Endesa Eco S.A. | Chile | Inversiones Centinela S.A. | Chile | US$ | 6.10 | % | 2,017,319 | — | 2,017,319 | — | — | — | — | — | — | ||||||||||||||||||||||||||||||||||||||
|
|
|
|
|
|
|
|
|
|
|
|
|
|
|
|
|
| |||||||||||||||||||||||||||||||||||||
| 2,017,319 | — | 2,017,319 | — | — | — | — | — | — | ||||||||||||||||||||||||||||||||||||||||||||||
|
|
|
|
|
|
|
|
|
|
|
|
|
|
|
|
|
| |||||||||||||||||||||||||||||||||||||
F-233
Table of Contents
APPENDIX 5. DETAILS OF ASSETS AND LIABILITIES IN FOREIGN CURRENCY
This appendix forms an integral part of the Enersis Chile’s financial statements.
The detail of assets and liabilities denominated in foreign currencies is the following:
ASSETS | Foreign Currency | Functional Currency | 12-31-2014 ThCh$ | 12-31-2013 ThCh$ | 1-1-2013 ThCh$ | |||||||||||
CURRENT ASSETS | ||||||||||||||||
Cash and cash equivalents | 91,039,422 | 97,562,458 | 875,924 | |||||||||||||
| U.S. dollar | Chilean peso | 80,722,128 | 97,562,458 | 875,924 | ||||||||||||
| Argentine peso | U.S. dollar | 6,110,560 | ||||||||||||||
| Chilean peso | U.S. dollar | 4,206,734 | — | — | ||||||||||||
Current accounts receivable from related companies | 14,039,935 | 28,384,147 | 13,434,569 | |||||||||||||
| U.S. dollar | Chilean peso | 14,039,935 | 28,384,147 | 13,434,569 | ||||||||||||
|
|
|
|
|
| |||||||||||
TOTAL CURRENT ASSETS | 105,079,357 | 125,946,605 | 14,310,493 | |||||||||||||
|
|
|
|
|
| |||||||||||
NON- CURRENT ASSETS | ||||||||||||||||
Investments accounted for using the equity method | 27,794,762 | 15,039,447 | 9,407,276 | |||||||||||||
| U.S. dollar | Chilean peso | 27,794,762 | 15,039,447 | 9,407,276 | ||||||||||||
|
|
|
|
|
| |||||||||||
TOTAL NON-CURRENT ASSETS | 27,794,762 | 15,039,447 | 9,407,276 | |||||||||||||
|
|
|
|
|
| |||||||||||
TOTAL ASSETS | 132,874,119 | 140,986,052 | 23,717,769 | |||||||||||||
|
|
|
|
|
| |||||||||||
F-234
Table of Contents
| Foreign Currency | Functional Currency | 12-31-2014 | ||||||||||||||||||||||||||||||||||||||
| Current Liabilities | Non-current Liabilities | |||||||||||||||||||||||||||||||||||||||
| 90 days or less | 91 days to 1 year | Total Current | One to two years | Two to three years | Three to four years | Four to five years | More than five years | Total Non-current | ||||||||||||||||||||||||||||||||
| ThCh$ | ThCh$ | ThCh$ | ThCh$ | ThCh$ | ThCh$ | ThCh$ | ||||||||||||||||||||||||||||||||||
LIABILITIES | ||||||||||||||||||||||||||||||||||||||||
Other current financial liabilities | U.S. dollar | Chilean peso | 9,701,084 | 147,116,531 | 156,817,615 | 28,159,230 | 28,161,729 | 28,164,390 | 28,167,223 | 745,707,717 | 858,360,289 | |||||||||||||||||||||||||||||
| 9,701,084 | 147,116,531 | 156,817,615 | 28,159,230 | 28,161,729 | 28,164,390 | 28,167,223 | 745,707,717 | 858,360,289 | ||||||||||||||||||||||||||||||||
|
|
|
|
|
|
|
|
|
|
|
|
|
|
|
|
|
| |||||||||||||||||||||||
TOTAL LIABILITIES | 9,701,084 | 147,116,531 | 156,817,615 | 28,159,230 | 28,161,729 | 28,164,390 | 28,167,223 | 745,707,717 | 858,360,289 | |||||||||||||||||||||||||||||||
|
|
|
|
|
|
|
|
|
|
|
|
|
|
|
|
|
| |||||||||||||||||||||||
| Foreign Currency | Functional Currency | 12-31-2013 | ||||||||||||||||||||||||||||||||||||||
| Current Liabilities | Non-current Liabilities | |||||||||||||||||||||||||||||||||||||||
| 90 days or less | 91 days to 1 year | Total Current | One to two years | Two to three years | Three to four years | Four to five years | More than five years | Total Non-current | ||||||||||||||||||||||||||||||||
| ThCh$ | ThCh$ | ThCh$ | ThCh$ | ThCh$ | ThCh$ | ThCh$ | ||||||||||||||||||||||||||||||||||
LIABILITIES | ||||||||||||||||||||||||||||||||||||||||
Other current financial liabilities | U.S. dollar | Chilean peso | 7,162,601 | 125,801,393 | 132,963,994 | 128,125,713 | 15,822,901 | 15,819,647 | 15,816,181 | 412,549,072 | 588,133,514 | |||||||||||||||||||||||||||||
| 7,162,601 | 125,801,393 | 132,963,994 | 128,125,713 | 15,822,901 | 15,819,647 | 15,816,181 | 412,549,072 | 588,133,514 | ||||||||||||||||||||||||||||||||
|
|
|
|
|
|
|
|
|
|
|
|
|
|
|
|
|
| |||||||||||||||||||||||
TOTAL LIABILITIES | 7,162,601 | 125,801,393 | 132,963,994 | 128,125,713 | 15,822,901 | 15,819,647 | 15,816,181 | 412,549,072 | 588,133,514 | |||||||||||||||||||||||||||||||
|
|
|
|
|
|
|
|
|
|
|
|
|
|
|
|
|
| |||||||||||||||||||||||
| Foreign Currency | Functional Currency | 1-1-2013 | ||||||||||||||||||||||||||||||||||||||
| Current Liabilities | Non-current Liabilities | |||||||||||||||||||||||||||||||||||||||
| 90 days or less | 91 days to 1 year | Total Current | One to two years | Two to three years | Three to four years | Four to five years | More than five years | Total Non-current | ||||||||||||||||||||||||||||||||
| ThCh$ | ThCh$ | ThCh$ | ThCh$ | ThCh$ | ThCh$ | ThCh$ | ||||||||||||||||||||||||||||||||||
LIABILITIES | ||||||||||||||||||||||||||||||||||||||||
Other current financial liabilities | U.S. dollar | Chilan peso | 12,618,863 | 217,892,993 | 230,511,856 | 120,799,054 | 116,355,813 | 14,122,883 | 14,123,633 | 410,845,086 | 676,246,469 | |||||||||||||||||||||||||||||
| 12,618,863 | 217,892,993 | 230,511,856 | 120,799,054 | 116,355,813 | 14,122,883 | 14,123,633 | 410,845,086 | 676,246,469 | ||||||||||||||||||||||||||||||||
|
|
|
|
|
|
|
|
|
|
|
|
|
|
|
|
|
| |||||||||||||||||||||||
TOTAL LIABILITIES | 12,618,863 | 217,892,993 | 230,511,856 | 120,799,054 | 116,355,813 | 14,122,883 | 14,123,633 | 410,845,086 | 676,246,469 | |||||||||||||||||||||||||||||||
|
|
|
|
|
|
|
|
|
|
|
|
|
|
|
|
|
| |||||||||||||||||||||||
F-235
Table of Contents
APPENDIX 6. ADDITIONAL INFORMATION TRADE AND OTHER RECEIVABLES
This appendix forms an integral part of the Enersis Chile’s financial statements.
a) Portfolio stratification
| • | Trade and other receivables by aging: |
Trade and other | Balance at | |||||||||||||||||||||||||||||||||||||||||||||||
| 12-31-2014 | ||||||||||||||||||||||||||||||||||||||||||||||||
| Current portfolio ThCh$ | 1-30 days ThCh$ | 31-60 days ThCh$ | 61-90 days ThCh$ | 91-120 days ThCh$ | 121-150 days ThCh$ | 151-180 days ThCh$ | 181-210 days ThCh$ | 211-250 days ThCh$ | More than 251 days ThCh$ | Total Current ThCh$ | Total Non- Current ThCh$ | |||||||||||||||||||||||||||||||||||||
Trade receivables, gross | 408,553,659 | 24,895,938 | 11,368,415 | 3,524,410 | 780,369 | 1,529,776 | 724,073 | 1,364,913 | 683,993 | 37,128,352 | 490,553,898 | 3,318,126 | ||||||||||||||||||||||||||||||||||||
Allowance for doubtful accounts | (240,504 | ) | (206,494 | ) | (284,757 | ) | (239,194 | ) | (169,479 | ) | (143,664 | ) | (96,107 | ) | (381,988 | ) | (113,699 | ) | (22,030,558 | ) | (23,906,444 | ) | — | |||||||||||||||||||||||||
Other receivables, gross | 117,362,474 | — | — | — | — | — | — | — | — | — | 117,362,474 | 4,178,286 | ||||||||||||||||||||||||||||||||||||
Allowance for doubtful accounts | (5,928,723 | ) | — | — | — | — | — | — | — | — | — | (5,928,723 | ) | — | ||||||||||||||||||||||||||||||||||
|
|
|
|
|
|
|
|
|
|
|
|
|
|
|
|
|
|
|
|
|
|
|
| |||||||||||||||||||||||||
Total | 519,746,906 | 24,689,444 | 11,083,658 | 3,285,216 | 610,890 | 1,386,112 | 627,966 | 982,925 | 570,294 | 15,097,794 | 578,081,205 | 7,496,412 | ||||||||||||||||||||||||||||||||||||
|
|
|
|
|
|
|
|
|
|
|
|
|
|
|
|
|
|
|
|
|
|
|
| |||||||||||||||||||||||||
Trade and other | Balance at | |||||||||||||||||||||||||||||||||||||||||||||||
| 12-31-2013 | ||||||||||||||||||||||||||||||||||||||||||||||||
| Current portfolio ThCh$ | 1-30 days ThCh$ | 31-60 days ThCh$ | 61-90 days ThCh$ | 91-120 days ThCh$ | 121-150 days ThCh$ | 151-180 days ThCh$ | 181-210 days ThCh$ | 211-250 days ThCh$ | More than 251 days ThCh$ | Total Current ThCh$ | Total Non- Current ThCh$ | |||||||||||||||||||||||||||||||||||||
Trade receivables, gross | 198,677,570 | 28,534,523 | 9,663,543 | 1,290,763 | 1,226,819 | 21,888,357 | 1,314,153 | 1,230,286 | 607,250 | 34,719,942 | 299,153,206 | 2,864,459 | ||||||||||||||||||||||||||||||||||||
Allowance for doubtful accounts | (388,875 | ) | (245,282 | ) | (292,237 | ) | (157,163 | ) | (178,308 | ) | (210,302 | ) | (107,083 | ) | (318,241 | ) | (103,035 | ) | (20,460,615 | ) | (22,461,141 | ) | — | |||||||||||||||||||||||||
Other receivables, gross | 34,713,574 | — | — | — | — | — | — | — | — | — | 34,713,574 | 4,010,575 | ||||||||||||||||||||||||||||||||||||
Allowance for doubtful accounts | (8,425,006 | ) | — | — | — | — | — | — | — | — | — | (8,425,006 | ) | — | ||||||||||||||||||||||||||||||||||
|
|
|
|
|
|
|
|
|
|
|
|
|
|
|
|
|
|
|
|
|
|
|
| |||||||||||||||||||||||||
Total | 224,577,263 | 28,289,241 | 9,371,306 | 1,133,600 | 1,048,511 | 21,678,055 | 1,207,070 | 912,045 | 504,215 | 14,259,327 | 302,980,633 | 6,875,034 | ||||||||||||||||||||||||||||||||||||
|
|
|
|
|
|
|
|
|
|
|
|
|
|
|
|
|
|
|
|
|
|
|
| |||||||||||||||||||||||||
F-236
Table of Contents
Trade and other | Balance at | |||||||||||||||||||||||||||||||||||||||||||||||
| 1-1-2013 | ||||||||||||||||||||||||||||||||||||||||||||||||
| Current portfolio ThCh$ | 1-30 days ThCh$ | 31-60 days ThCh$ | 61-90 days ThCh$ | 91-120 days ThCh$ | 121-150 days ThCh$ | 151-180 days ThCh$ | 181-210 days ThCh$ | 211-250 days ThCh$ | More than 251 days ThCh$ | Total Current ThCh$ | Total Non- Current ThCh$ | |||||||||||||||||||||||||||||||||||||
Trade receivables, gross | 166,636,732 | 20,586,674 | 6,781,074 | 2,042,335 | 1,020,396 | 1,691,470 | 432,151 | 1,367,349 | 255,818 | 33,254,139 | 234,068,138 | 3,343,742 | ||||||||||||||||||||||||||||||||||||
Allowance for doubtful accounts | (327,240 | ) | (175,329 | ) | (182,625 | ) | (194,331 | ) | (145,518 | ) | (138,186 | ) | (95,129 | ) | (300,849 | ) | (78,723 | ) | (18,204,998 | ) | (19,842,928 | ) | — | |||||||||||||||||||||||||
Other receivables, gross | 92,264,321 | — | — | — | — | — | — | — | — | — | 92,264,321 | 4,204,647 | ||||||||||||||||||||||||||||||||||||
Allowance for doubtful accounts | (4,284,675 | ) | — | (4,284,675 | ) | — | ||||||||||||||||||||||||||||||||||||||||||
|
|
|
|
|
|
|
|
|
|
|
|
|
|
|
|
|
|
|
|
|
|
|
| |||||||||||||||||||||||||
Total | 254,289,138 | 20,411,345 | 6,598,449 | 1,848,004 | 874,878 | 1,553,284 | 337,022 | 1,066,500 | 177,095 | 15,049,141 | 302,204,856 | 7,548,389 | ||||||||||||||||||||||||||||||||||||
|
|
|
|
|
|
|
|
|
|
|
|
|
|
|
|
|
|
|
|
|
|
|
| |||||||||||||||||||||||||
| • | By type of portfolio: |
Aging of balances | Balance at | |||||||||||||||||||||||
| 12-31-2014 | ||||||||||||||||||||||||
| Non-Renegotiated Portfolio | Renegotiated Portfolio | Total Gross Portfolio | ||||||||||||||||||||||
| Number of customers | Gross value | Number of customers | Gross value | Number of customers | Gross value | |||||||||||||||||||
| ThCh$ | ThCh$ | ThCh$ | ||||||||||||||||||||||
Current | 1,120,913 | 408,973,803 | 44,355 | 2,897,982 | 1,165,268 | 411,871,785 | ||||||||||||||||||
1 to 30 days | 394,849 | 22,455,423 | 20,378 | 2,440,515 | 415,227 | 24,895,938 | ||||||||||||||||||
31 to 60 days | 107,014 | 10,431,423 | 6,632 | 936,992 | 113,646 | 11,368,415 | ||||||||||||||||||
61 to 90 days | 16,019 | 3,237,896 | 1,335 | 286,514 | 17,354 | 3,524,410 | ||||||||||||||||||
91 to 120 days | 6,699 | 617,720 | 672 | 162,649 | 7,371 | 780,369 | ||||||||||||||||||
121 to 150 days | 5,401 | 1,403,115 | 468 | 126,661 | 5,869 | 1,529,776 | ||||||||||||||||||
151 to 180 days | 4,457 | 650,259 | 272 | 73,814 | 4,729 | 724,073 | ||||||||||||||||||
181 to 210 days | 5,433 | 1,299,677 | 183 | 65,236 | 5,616 | 1,364,913 | ||||||||||||||||||
211 to 250 days | 3,731 | 644,648 | 158 | 39,345 | 3,889 | 683,993 | ||||||||||||||||||
More than 251 days | 91,978 | 29,615,862 | 4,650 | 7,512,490 | 96,628 | 37,128,352 | ||||||||||||||||||
|
|
|
|
|
|
|
|
|
|
|
| |||||||||||||
Total | 1,756,494 | 479,329,826 | 79,103 | 14,542,198 | 1,835,597 | 493,872,024 | ||||||||||||||||||
|
|
|
|
|
|
|
|
|
|
|
| |||||||||||||
F-237
Table of Contents
Aging of balances | Balance at | |||||||||||||||||||||||
| 12-31-2013 | ||||||||||||||||||||||||
| Non-Renegotiated Portfolio | Renegotiated Portfolio | Total Gross Portfolio | ||||||||||||||||||||||
| Number of customers | Gross value | Number of customers | Gross value | Number of customers | Gross value | |||||||||||||||||||
| ThCh$ | ThCh$ | ThCh$ | ||||||||||||||||||||||
Current | 1,004,517 | 195,562,433 | 45,831 | 3,115,137 | 1,050,348 | 198,677,570 | ||||||||||||||||||
1 to 30 days | 472,375 | 25,802,726 | 21,903 | 2,731,797 | 494,278 | 28,534,523 | ||||||||||||||||||
31 to 60 days | 109,366 | 8,740,051 | 5,836 | 923,492 | 115,202 | 9,663,543 | ||||||||||||||||||
61 to 90 days | 12,702 | 1,069,871 | 979 | 220,892 | 13,681 | 1,290,763 | ||||||||||||||||||
91 to 120 days | 6,147 | 1,048,283 | 508 | 178,536 | 6,655 | 1,226,819 | ||||||||||||||||||
121 to 150 days | 4,831 | 21,751,217 | 371 | 137,140 | 5,202 | 21,888,357 | ||||||||||||||||||
151 to 180 days | 3,917 | 809,784 | 207 | 504,369 | 4,124 | 1,314,153 | ||||||||||||||||||
181 to 210 days | 5,109 | 1,133,610 | 150 | 96,676 | 5,259 | 1,230,286 | ||||||||||||||||||
211 to 250 days | 3,210 | 566,037 | 122 | 41,213 | 3,332 | 607,250 | ||||||||||||||||||
More than 251 days | 162,041 | 26,972,677 | 5,295 | 7,747,265 | 167,336 | 34,719,942 | ||||||||||||||||||
|
|
|
|
|
|
|
|
|
|
|
| |||||||||||||
Total | 1,784,215 | 283,456,689 | 81,202 | 15,696,517 | 1,865,417 | 299,153,206 | ||||||||||||||||||
|
|
|
|
|
|
|
|
|
|
|
| |||||||||||||
Aging of balances | Balance at | |||||||||||||||||||||||
| 1-1-2013 | ||||||||||||||||||||||||
| Non-Renegotiated Portfolio | Renegotiated Portfolio | Total Gross Portfolio | ||||||||||||||||||||||
| Number of customers | Gross value | Number of customers | Gross value | Number of customers | Gross value | |||||||||||||||||||
| ThCh$ | ThCh$ | ThCh$ | ||||||||||||||||||||||
Current | 10,265,582 | 159,257,844 | 333,154 | 7,378,888 | 10,598,736 | 166,636,732 | ||||||||||||||||||
1 to 30 days | 2,063,754 | 18,580,548 | 92,078 | 2,006,126 | 2,155,832 | 20,586,674 | ||||||||||||||||||
31 to 60 days | 371,586 | 6,157,877 | 36,119 | 623,197 | 407,705 | 6,781,074 | ||||||||||||||||||
61 to 90 days | 76,378 | 1,779,825 | 24,312 | 262,510 | 100,690 | 2,042,335 | ||||||||||||||||||
91 to 120 days | 54,860 | 819,186 | 15,077 | 201,210 | 69,937 | �� | 1,020,396 | |||||||||||||||||
121 to 150 days | 43,521 | 1,565,404 | 14,427 | 126,066 | 57,948 | 1,691,470 | ||||||||||||||||||
151 to 180 days | 34,882 | 366,974 | 9,840 | 65,177 | 44,722 | 432,151 | ||||||||||||||||||
181 to 210 days | 18,980 | 952,333 | 15,738 | 415,016 | 34,718 | 1,367,349 | ||||||||||||||||||
211 to 250 days | 17,673 | 221,968 | 10,848 | 33,850 | 28,521 | 255,818 | ||||||||||||||||||
More than 251 days | 312,567 | 26,832,198 | 22,929 | 6,421,941 | 335,496 | 33,254,139 | ||||||||||||||||||
|
|
|
|
|
|
|
|
|
|
|
| |||||||||||||
Total | 13,259,784 | 216,534,157 | 574,521 | 17,533,981 | 13,834,305 | 234,068,138 | ||||||||||||||||||
|
|
|
|
|
|
|
|
|
|
|
| |||||||||||||
b ) Portfolio in default and in legal collection process
Portfolio in Default and in Legal Collection | Balance at | Balance at | Balance at | |||||||||||||||||||||
| 12-31-2014 | 12-31-2013 | 1-1-2013 | ||||||||||||||||||||||
| Number of Clients | Amount ThCh$ | Number of Clients | Amount ThCh$ | Number of Clients | Amount ThCh$ | |||||||||||||||||||
Notes receivable in default | 2,039 | 269,934 | 2,095 | 275,052 | 2,240 | 270,358 | ||||||||||||||||||
Notes receivable in legal collection process (*) | 3,898 | 6,983,415 | 3,344 | 5,606,201 | 2,605 | 4,642,597 | ||||||||||||||||||
|
|
|
|
|
|
|
|
|
|
|
| |||||||||||||
Total | 5,937 | 7,253,349 | 5,439 | 5,881,253 | 4,845 | 4,912,955 | ||||||||||||||||||
|
|
|
|
|
|
|
|
|
|
|
| |||||||||||||
| (*) | Legal collections are included in the portfolio in arrears. |
F-238
Table of Contents
c ) Provisions and write-offs
Provisions and Write-offs | Balance at | |||||||||||
| 12-31-2014 | 12-31-2013 | 1-1-2013 | ||||||||||
| ThCh$ | ThCh$ | ThCh$ | ||||||||||
Provision for non-renegotiated portfolio | 663,184 | 6,720,527 | 6,760,845 | |||||||||
Provision for renegotiated portfolio | (7,584 | ) | 1,220,240 | (1,679,698 | ) | |||||||
Write-offs during the period | — | (1,182,223 | ) | (4,042,612 | ) | |||||||
Recoveries during the period | — | — | — | |||||||||
|
|
|
|
|
| |||||||
Total | 655,600 | 6,758,544 | 1,038,535 | |||||||||
|
|
|
|
|
| |||||||
d ) Number and value of operations
Number and Value of | Balance at | |||||||||||||||||||||||
| 12-31-2014 | 12-31-2013 | 1-1-2013 | ||||||||||||||||||||||
| Total detail by type of operation Last Quarter | Total detail by type of operation Annual Accumulation | Total detail by type of operation Last Quarter | Total detail by type of operation Annual Accumulation | Total detail by type of operation Last Quarter | Total detail by type of operation Annual Accumulation | |||||||||||||||||||
| ThCh$ | ThCh$ | ThCh$ | ThCh$ | ThCh$ | ThCh$ | |||||||||||||||||||
Impairment and recoveries | ||||||||||||||||||||||||
Number of operations | 1,811,109 | 1,811,109 | 1,850,913 | 1,838,395 | 1,678,934 | 1,678,934 | ||||||||||||||||||
Value of operations, in ThCh$ | 655,600 | 655,600 | 11,101,128 | 7,940,767 | 2,922,929 | 5,081,147 | ||||||||||||||||||
F-239
Table of Contents
APPENDIX 6.1. SUPPLEMENTARY INFORMATION ON TRADE RECEIVABLES
This appendix forms an integral part of the Enersis Chile’s financial statements.
a) Portfolio stratification
| • | Trade receivables by aging: |
Trade and other receivables | Balance at | |||||||||||||||||||||||||||||||||||||||||||||||
| 12-31-2014 | ||||||||||||||||||||||||||||||||||||||||||||||||
| Current portfolio ThCh$ | 1-30 days ThCh$ | 31-60 days ThCh$ | 61-90 days ThCh$ | 91-120 days ThCh$ | 121-150 days ThCh$ | 151-180 days ThCh$ | 181-210 days ThCh$ | 211-250 days ThCh$ | More than 251 days ThCh$ | Total Current ThCh$ | Total Non-Current ThCh$ | |||||||||||||||||||||||||||||||||||||
Generation receivables | 215,515,564 | 1,126,379 | 2,211,459 | 549,240 | 165,805 | 16,224 | 203,213 | 4,742 | 11,386 | 1,475,172 | 221,279,184 | — | ||||||||||||||||||||||||||||||||||||
-Large customers | 215,515,564 | 1,126,379 | 2,211,459 | 498,757 | 165,805 | 16,224 | 203,213 | 4,742 | 11,386 | 1,475,172 | 221,228,701 | — | ||||||||||||||||||||||||||||||||||||
-Institutional customers | — | — | — | — | — | — | — | — | — | — | — | — | ||||||||||||||||||||||||||||||||||||
-Other | — | — | — | 50,483 | — | — | — | — | — | — | 50,483 | — | ||||||||||||||||||||||||||||||||||||
Allowance for doubtful accoutns | — | — | — | — | — | — | — | — | — | (1,177,635 | ) | (1,177,635 | ) | — | ||||||||||||||||||||||||||||||||||
Unbilled services | 129,288,778 | — | — | — | — | — | — | — | — | — | 129,288,778 | — | ||||||||||||||||||||||||||||||||||||
Services billed | 86,226,786 | 1,126,379 | 2,211,459 | 549,240 | 165,805 | 16,224 | 203,213 | 4,742 | 11,386 | 1,475,172 | 91,990,406 | — | ||||||||||||||||||||||||||||||||||||
Distribution receivables | 193,038,095 | 23,769,559 | 9,156,956 | 2,975,170 | 614,564 | 1,513,552 | 520,860 | 1,360,171 | 672,607 | 35,653,180 | 269,274,714 | 3,318,126 | ||||||||||||||||||||||||||||||||||||
-Mass market customers | 148,429,749 | 16,970,890 | 6,872,321 | 1,012,684 | 474,373 | 337,101 | 258,211 | 486,833 | 154,843 | 17,153,968 | 192,150,973 | 2,358,478 | ||||||||||||||||||||||||||||||||||||
-Large customers | 39,530,019 | 6,327,489 | 1,561,755 | 1,708,259 | 6,617 | 357,959 | 231,579 | 662,941 | 217,543 | 8,790,763 | 59,394,924 | 550,439 | ||||||||||||||||||||||||||||||||||||
-Institutional customers | 5,078,327 | 471,180 | 722,880 | 254,227 | 133,574 | 818,492 | 31,070 | 210,397 | 300,221 | 9,708,449 | 17,728,817 | 409,209 | ||||||||||||||||||||||||||||||||||||
Allowance for doubtful accounts | (240,504 | ) | (206,494 | ) | (284,757 | ) | (239,194 | ) | (169,479 | ) | (143,664 | ) | (96,107 | ) | (381,988 | ) | (113,699 | ) | (20,852,923 | ) | (22,728,809 | ) | — | |||||||||||||||||||||||||
Unbilled services | 159,974,872 | — | — | — | — | — | — | — | — | — | 159,974,872 | — | ||||||||||||||||||||||||||||||||||||
Services billed | 33,063,222 | 23,769,559 | 9,156,956 | 2,975,170 | 614,564 | 1,513,552 | 520,860 | 1,360,171 | 672,607 | 35,653,180 | 109,299,841 | 3,318,126 | ||||||||||||||||||||||||||||||||||||
|
|
|
|
|
|
|
|
|
|
|
|
|
|
|
|
|
|
|
|
|
|
|
| |||||||||||||||||||||||||
Total Trade Receivables, Gross | 408,553,659 | 24,895,938 | 11,368,415 | 3,524,410 | 780,369 | 1,529,776 | 724,073 | 1,364,913 | 683,993 | 37,128,352 | 490,553,898 | 3,318,126 | ||||||||||||||||||||||||||||||||||||
|
|
|
|
|
|
|
|
|
|
|
|
|
|
|
|
|
|
|
|
|
|
|
| |||||||||||||||||||||||||
Total Allowance for doubtful accounts | (240,504 | ) | (206,494 | ) | (284,757 | ) | (239,194 | ) | (169,479 | ) | (143,664 | ) | (96,107 | ) | (381,988 | ) | (113,699 | ) | (22,030,558 | ) | (23,906,444 | ) | — | |||||||||||||||||||||||||
|
|
|
|
|
|
|
|
|
|
|
|
|
|
|
|
|
|
|
|
|
|
|
| |||||||||||||||||||||||||
Total Trade Receivables, Net | 408,313,155 | 24,689,444 | 11,083,658 | 3,285,216 | 610,890 | 1,386,112 | 627,966 | 982,925 | 570,294 | 15,097,794 | 466,647,454 | 3,318,126 | ||||||||||||||||||||||||||||||||||||
|
|
|
|
|
|
|
|
|
|
|
|
|
|
|
|
|
|
|
|
|
|
|
| |||||||||||||||||||||||||
F-240
Table of Contents
Trade and other receivables | Balance at | |||||||||||||||||||||||||||||||||||||||||||||||
| 12-31-2013 | ||||||||||||||||||||||||||||||||||||||||||||||||
| Current portfolio ThCh$ | 1-30 days ThCh$ | 31-60 days ThCh$ | 61-90 days ThCh$ | 91-120 days ThCh$ | 121-150 days ThCh$ | 151-180 days ThCh$ | 181-210 days ThCh$ | 211-250 days ThCh$ | More than 251 days ThCh$ | Total Current ThCh$ | Total Non-Current ThCh$ | |||||||||||||||||||||||||||||||||||||
Generation receivables | 112,047,882 | 198 | 97,813 | 7 | 1,646 | 20,713,740 | 1,050 | — | 2 | 2,528,299 | 135,390,637 | — | ||||||||||||||||||||||||||||||||||||
-Large customers | 111,494,204 | 198 | 97,813 | 7 | 1,646 | 20,713,740 | 1,050 | — | 2 | 2,528,299 | 134,836,959 | — | ||||||||||||||||||||||||||||||||||||
-Institutional customers | — | — | — | — | — | — | — | — | — | — | — | — | ||||||||||||||||||||||||||||||||||||
-Other | 553,678 | — | — | — | — | — | — | — | — | — | 553,678 | — | ||||||||||||||||||||||||||||||||||||
Allowance for doubtful accoutns | — | — | — | — | — | (55,494 | ) | — | — | — | (2,113,828 | ) | (2,169,322 | ) | — | |||||||||||||||||||||||||||||||||
Unbilled services | 82,283,697 | — | — | — | — | — | — | — | — | — | 82,283,697 | — | ||||||||||||||||||||||||||||||||||||
Services billed | 29,764,185 | 198 | 97,813 | 7 | 1,646 | 20,713,740 | 1,050 | — | 2 | 2,528,299 | 53,106,940 | — | ||||||||||||||||||||||||||||||||||||
Distribution receivables | 86,629,688 | 28,534,325 | 9,565,730 | 1,290,756 | 1,225,173 | 1,174,617 | 1,313,103 | 1,230,286 | 607,248 | 32,191,643 | 163,762,569 | 2,864,459 | ||||||||||||||||||||||||||||||||||||
-Mass market customers | 43,088,700 | 19,834,133 | 6,915,311 | 747,993 | 460,339 | 399,548 | 207,620 | 393,091 | 141,548 | 14,890,334 | 87,078,617 | 2,372,520 | ||||||||||||||||||||||||||||||||||||
-Large customers | 39,209,364 | 8,175,587 | 2,190,001 | 401,817 | 97,703 | 274,715 | 467,769 | 408,799 | 17,783 | 6,988,976 | 58,232,514 | 331,849 | ||||||||||||||||||||||||||||||||||||
-Institutional customers | 4,331,624 | 524,605 | 460,418 | 140,946 | 667,131 | 500,354 | 637,714 | 428,396 | 447,917 | 10,312,333 | 18,451,438 | 160,090 | ||||||||||||||||||||||||||||||||||||
Allowance for doubtful accounts | (388,875 | ) | (245,282 | ) | (292,237 | ) | (157,163 | ) | (178,308 | ) | (154,808 | ) | (107,083 | ) | (318,241 | ) | (103,035 | ) | (18,346,787 | ) | (20,291,819 | ) | — | |||||||||||||||||||||||||
Unbilled services | 54,543,307 | — | — | — | — | — | — | — | — | — | 54,543,307 | 699,393 | ||||||||||||||||||||||||||||||||||||
Services billed | 32,086,381 | 28,534,325 | 9,565,730 | 1,290,756 | 1,225,173 | 1,174,617 | 1,313,103 | 1,230,286 | 607,248 | 32,191,643 | 109,219,262 | 2,165,066 | ||||||||||||||||||||||||||||||||||||
|
|
|
|
|
|
|
|
|
|
|
|
|
|
|
|
|
|
|
|
|
|
|
| |||||||||||||||||||||||||
Total Trade Receivables, Gross | 198,677,570 | 28,534,523 | 9,663,543 | 1,290,763 | 1,226,819 | 21,888,357 | 1,314,153 | 1,230,286 | 607,250 | 34,719,942 | 299,153,206 | 2,864,459 | ||||||||||||||||||||||||||||||||||||
|
|
|
|
|
|
|
|
|
|
|
|
|
|
|
|
|
|
|
|
|
|
|
| |||||||||||||||||||||||||
Total Allowance for doubtful accounts | (388,875 | ) | (245,282 | ) | (292,237 | ) | (157,163 | ) | (178,308 | ) | (210,302 | ) | (107,083 | ) | (318,241 | ) | (103,035 | ) | (20,460,615 | ) | (22,461,141 | ) | — | |||||||||||||||||||||||||
|
|
|
|
|
|
|
|
|
|
|
|
|
|
|
|
|
|
|
|
|
|
|
| |||||||||||||||||||||||||
Total Trade Receivables, Net | 198,288,695 | 28,289,241 | 9,371,306 | 1,133,600 | 1,048,511 | 21,678,055 | 1,207,070 | 912,045 | 504,215 | 14,259,327 | 276,692,065 | 2,864,459 | ||||||||||||||||||||||||||||||||||||
|
|
|
|
|
|
|
|
|
|
|
|
|
|
|
|
|
|
|
|
|
|
|
| |||||||||||||||||||||||||
Trade and other receivables | Balance at | |||||||||||||||||||||||||||||||||||||||||||||||
| 1-1-2013 | ||||||||||||||||||||||||||||||||||||||||||||||||
| Current portfolio ThCh$ | 1-30 days ThCh$ | 31-60 days ThCh$ | 61-90 days ThCh$ | 91-120 days ThCh$ | 121-150 days ThCh$ | 151-180 days ThCh$ | 181-210 days ThCh$ | 211-250 days ThCh$ | More than 251 days ThCh$ | Total Current ThCh$ | Total Non-Current ThCh$ | |||||||||||||||||||||||||||||||||||||
Generation receivables | 66,688,744 | 690,657 | 47,160 | 55,509 | 225,950 | 1,854 | 4,577 | — | — | 3,977,224 | 71,691,675 | — | ||||||||||||||||||||||||||||||||||||
-Large customers | 64,579,710 | 77,435 | 95 | 2 | 404 | — | 2 | — | — | 3,975,563 | 68,633,211 | — | ||||||||||||||||||||||||||||||||||||
-Institutional customers | — | — | — | — | — | — | — | — | — | — | — | — | ||||||||||||||||||||||||||||||||||||
-Other | 2,109,034 | 613,222 | 47,065 | 55,507 | 225,546 | 1,854 | 4,575 | — | — | 1,661 | 3,058,464 | — | ||||||||||||||||||||||||||||||||||||
Allowance for doubtful accoutns | — | — | — | — | — | — | — | — | — | (2,615,893 | ) | (2,615,893 | ) | |||||||||||||||||||||||||||||||||||
Unbilled services | 41,575,275 | — | — | — | — | — | — | — | — | — | 41,575,275 | — | ||||||||||||||||||||||||||||||||||||
Services billed | 25,113,469 | 690,657 | 47,160 | 55,509 | 225,950 | 1,854 | 4,577 | — | — | 3,977,224 | 30,116,400 | — | ||||||||||||||||||||||||||||||||||||
Distribution receivables | 99,947,988 | 19,896,017 | 6,733,914 | 1,986,826 | 794,446 | 1,689,616 | 427,574 | 1,367,349 | 255,818 | 29,276,915 | 162,376,463 | 3,343,742 | ||||||||||||||||||||||||||||||||||||
-Mass market customers | 52,941,796 | 13,669,680 | 4,052,703 | 866,507 | 463,935 | 296,526 | 227,916 | 331,750 | 147,860 | 13,029,363 | 86,028,036 | 2,645,462 | ||||||||||||||||||||||||||||||||||||
-Large customers | 38,636,985 | 5,518,006 | 2,315,421 | 815,384 | 146,301 | 333,926 | 24,988 | 161,295 | 5,076 | 6,001,142 | 53,958,524 | 528,630 | ||||||||||||||||||||||||||||||||||||
-Institutional customers | 8,369,207 | 708,331 | 365,790 | 304,935 | 184,210 | 1,059,164 | 174,670 | 874,304 | 102,882 | 10,246,410 | 22,389,903 | 169,650 | ||||||||||||||||||||||||||||||||||||
Allowance for doubtful accounts | (327,240 | ) | (175,329 | ) | (182,625 | ) | (194,331 | ) | (145,518 | ) | (138,186 | ) | (95,129 | ) | (300,849 | ) | (78,723 | ) | (15,589,105 | ) | (17,227,035 | ) | ||||||||||||||||||||||||||
Unbilled services | 54,348,384 | — | — | — | — | — | — | — | — | — | 54,348,384 | 685,327 | ||||||||||||||||||||||||||||||||||||
Services billed | 45,599,606 | 19,896,017 | 6,733,914 | 1,986,826 | 794,446 | 1,689,616 | 427,574 | 1,367,349 | 255,818 | 29,276,915 | 108,028,081 | 2,658,416 | ||||||||||||||||||||||||||||||||||||
|
|
|
|
|
|
|
|
|
|
|
|
|
|
|
|
|
|
|
|
|
|
|
| |||||||||||||||||||||||||
Total Trade Receivables, Gross | 166,636,732 | 20,586,674 | 6,781,074 | 2,042,335 | 1,020,396 | 1,691,470 | 432,151 | 1,367,349 | 255,818 | 33,254,139 | 234,068,138 | 3,343,742 | ||||||||||||||||||||||||||||||||||||
|
|
|
|
|
|
|
|
|
|
|
|
|
|
|
|
|
|
|
|
|
|
|
| |||||||||||||||||||||||||
Total Allowance for doubtful accounts | (327,240 | ) | (175,329 | ) | (182,625 | ) | (194,331 | ) | (145,518 | ) | (138,186 | ) | (95,129 | ) | (300,849 | ) | (78,723 | ) | (18,204,998 | ) | (19,842,928 | ) | — | |||||||||||||||||||||||||
|
|
|
|
|
|
|
|
|
|
|
|
|
|
|
|
|
|
|
|
|
|
|
| |||||||||||||||||||||||||
Total Trade Receivables, Net | 166,309,492 | 20,411,345 | 6,598,449 | 1,848,004 | 874,878 | 1,553,284 | 337,022 | 1,066,500 | 177,095 | 15,049,141 | 214,225,210 | 3,343,742 | ||||||||||||||||||||||||||||||||||||
|
|
|
|
|
|
|
|
|
|
|
|
|
|
|
|
|
|
|
|
|
|
|
| |||||||||||||||||||||||||
Since not all of our commercial databases in our Group’s different combined entities distinguish whether the final electricity service consumer is a natural or legal person, the main management segmentation used by all the combined entities to monitor and follow up on trade receivables is the following:
| • | Large customers |
| • | Institutional customers |
| • | Mass-market customers |
F-241
Table of Contents
- By type of portfolio:
Portfolio Type | Balance at | |||||||||||||||||||||||||||||||||||||||||||
| 12-31-2014 | ||||||||||||||||||||||||||||||||||||||||||||
| Current portfolio ThCh$ | 1-30 days ThCh$ | 31-60 days ThCh$ | 61-90 days ThCh$ | 91-120 days ThCh$ | 121-150 days ThCh$ | 151-180 days ThCh$ | 181-210 days ThCh$ | 211-250 days ThCh$ | More than 251 days ThCh$ | Total Gross Portfolio ThCh$ | ||||||||||||||||||||||||||||||||||
GENERATION | ||||||||||||||||||||||||||||||||||||||||||||
Non-Renegotiated Portfolio | 215,515,564 | 1,126,379 | 2,211,459 | 549,240 | 165,805 | 16,224 | 203,213 | 4,742 | 11,386 | 1,475,172 | 221,279,184 | |||||||||||||||||||||||||||||||||
-Large customers | 215,515,564 | 1,126,379 | 2,211,459 | 498,757 | 165,805 | 16,224 | 203,213 | 4,742 | 11,386 | 1,475,172 | 221,228,701 | |||||||||||||||||||||||||||||||||
-Institutional customers | — | — | — | — | — | — | — | — | — | — | — | |||||||||||||||||||||||||||||||||
-Other | — | — | — | 50,483 | — | — | — | — | — | — | 50,483 | |||||||||||||||||||||||||||||||||
Renegotiated Portfolio | — | — | — | — | — | — | — | — | — | — | — | |||||||||||||||||||||||||||||||||
-Large customers | — | — | — | — | — | — | — | — | — | — | — | |||||||||||||||||||||||||||||||||
-Institutional customers | — | — | — | — | — | — | — | — | — | — | — | |||||||||||||||||||||||||||||||||
-Other | — | — | — | — | — | — | — | — | — | — | — | |||||||||||||||||||||||||||||||||
DISTRIBUTION | ||||||||||||||||||||||||||||||||||||||||||||
Non-Renegotiated Portfolio | 190,140,113 | 21,329,044 | 8,219,964 | 2,688,656 | 451,915 | 1,386,891 | 447,046 | 1,294,935 | 633,262 | 28,140,690 | 254,732,516 | |||||||||||||||||||||||||||||||||
-Mass market customers | 146,243,855 | 14,632,805 | 5,935,329 | 736,267 | 311,815 | 210,642 | 184,854 | 421,774 | 115,498 | 9,683,090 | 178,475,929 | |||||||||||||||||||||||||||||||||
-Large customers | 39,239,436 | 6,240,396 | 1,561,755 | 1,698,236 | 6,617 | 357,959 | 231,579 | 662,941 | 217,543 | 8,774,211 | 58,990,673 | |||||||||||||||||||||||||||||||||
-Institutional customers | 4,656,822 | 455,843 | 722,880 | 254,153 | 133,483 | 818,290 | 30,613 | 210,220 | 300,221 | 9,683,389 | 17,265,914 | |||||||||||||||||||||||||||||||||
Renegotiated Portfolio | 2,897,982 | 2,440,515 | 936,992 | 286,514 | 162,649 | 126,661 | 73,814 | 65,236 | 39,345 | 7,512,490 | 14,542,198 | |||||||||||||||||||||||||||||||||
-Mass market customers | 2,185,893 | 2,338,085 | 936,992 | 276,417 | 162,558 | 126,459 | 73,357 | 65,059 | 39,345 | 7,470,878 | 13,675,043 | |||||||||||||||||||||||||||||||||
-Large customers | 290,583 | 87,093 | — | 10,023 | — | — | — | — | — | 16,552 | 404,251 | |||||||||||||||||||||||||||||||||
-Institutional customers | 421,506 | 15,337 | — | 74 | 91 | 202 | 457 | 177 | — | 25,060 | 462,904 | |||||||||||||||||||||||||||||||||
|
|
|
|
|
|
|
|
|
|
|
|
|
|
|
|
|
|
|
|
|
| |||||||||||||||||||||||
Total gross portfolio | 408,553,659 | 24,895,938 | 11,368,415 | 3,524,410 | 780,369 | 1,529,776 | 724,073 | 1,364,913 | 683,993 | 37,128,352 | 490,553,898 | |||||||||||||||||||||||||||||||||
|
|
|
|
|
|
|
|
|
|
|
|
|
|
|
|
|
|
|
|
|
| |||||||||||||||||||||||
Portfolio Type | Balance at | |||||||||||||||||||||||||||||||||||||||||||
| 12-31-2013 | ||||||||||||||||||||||||||||||||||||||||||||
| Current portfolio ThCh$ | 1-30 days ThCh$ | 31-60 days ThCh$ | 61-90 days ThCh$ | 91-120 days ThCh$ | 121-150 days ThCh$ | 151-180 days ThCh$ | 181-210 days ThCh$ | 211-250 days ThCh$ | More than 251 days ThCh$ | Total Gross Portfolio ThCh$ | ||||||||||||||||||||||||||||||||||
GENERATION | ||||||||||||||||||||||||||||||||||||||||||||
Non-Renegotiated Portfolio | 112,047,882 | 198 | 97,813 | 7 | 1,646 | 20,713,740 | 1,050 | — | 2 | 2,528,299 | 135,390,637 | |||||||||||||||||||||||||||||||||
-Large customers | 111,494,204 | 198 | 97,813 | 7 | 1,646 | 20,713,740 | 1,050 | — | 2 | 2,528,299 | 134,836,959 | |||||||||||||||||||||||||||||||||
-Institutional customers | — | — | — | — | — | — | — | — | — | — | — | |||||||||||||||||||||||||||||||||
-Other | 553,678 | — | — | — | — | — | — | — | — | — | 553,678 | |||||||||||||||||||||||||||||||||
Renegotiated Portfolio | — | — | — | — | — | — | — | — | — | — | — | |||||||||||||||||||||||||||||||||
-Large customers | — | — | — | — | — | — | — | — | — | — | — | |||||||||||||||||||||||||||||||||
-Institutional customers | — | — | — | — | — | — | — | — | — | — | — | |||||||||||||||||||||||||||||||||
-Other | — | — | — | — | — | — | — | — | — | — | — | |||||||||||||||||||||||||||||||||
DISTRIBUTION | ||||||||||||||||||||||||||||||||||||||||||||
Non-Renegotiated Portfolio | 83,514,551 | 25,802,528 | 8,642,238 | 1,069,864 | 1,046,637 | 1,037,477 | 808,734 | 1,133,610 | 566,035 | 24,444,378 | 148,066,052 | |||||||||||||||||||||||||||||||||
-Mass market customers | 71,602,345 | 17,143,040 | 5,992,086 | 552,135 | 312,374 | 264,085 | 131,165 | 342,224 | 103,494 | 7,465,923 | 103,908,871 | |||||||||||||||||||||||||||||||||
-Large customers | 7,679,208 | 8,174,806 | 2,190,001 | 400,524 | 67,211 | 274,715 | 467,769 | 399,196 | 14,624 | 6,904,062 | 26,572,116 | |||||||||||||||||||||||||||||||||
-Institutional customers | 4,232,998 | 484,682 | 460,151 | 117,205 | 667,052 | 498,677 | 209,800 | 392,190 | 447,917 | 10,074,393 | 17,585,065 | |||||||||||||||||||||||||||||||||
Renegotiated Portfolio | 3,115,137 | 2,731,797 | 923,492 | 220,892 | 178,536 | 137,140 | 504,369 | 96,676 | 41,213 | 7,747,265 | 15,696,517 | |||||||||||||||||||||||||||||||||
-Mass market customers | 3,000,800 | 2,691,093 | 923,226 | 195,857 | 147,966 | 135,463 | 76,455 | 50,866 | 38,054 | 7,424,411 | 14,684,191 | |||||||||||||||||||||||||||||||||
-Large customers | 15,711 | 781 | — | 1,294 | 30,492 | — | — | 9,603 | 3,159 | 84,914 | 145,954 | |||||||||||||||||||||||||||||||||
-Institutional customers | 98,626 | 39,923 | 266 | 23,741 | 78 | 1,677 | 427,914 | 36,207 | — | 237,940 | 866,372 | |||||||||||||||||||||||||||||||||
|
|
|
|
|
|
|
|
|
|
|
|
|
|
|
|
|
|
|
|
|
| |||||||||||||||||||||||
Total gross portfolio | 198,677,570 | 28,534,523 | 9,663,543 | 1,290,763 | 1,226,819 | 21,888,357 | 1,314,153 | 1,230,286 | 607,250 | 34,719,942 | 299,153,206 | |||||||||||||||||||||||||||||||||
|
|
|
|
|
|
|
|
|
|
|
|
|
|
|
|
|
|
|
|
|
| |||||||||||||||||||||||
F-242
Table of Contents
Portfolio Type | Balance at | |||||||||||||||||||||||||||||||||||||||||||
| 1-1-2013 | ||||||||||||||||||||||||||||||||||||||||||||
| Current portfolio ThCh$ | 1-30 days ThCh$ | 31-60 days ThCh$ | 61-90 days ThCh$ | 91-120 days ThCh$ | 121-150 days ThCh$ | 151-180 days ThCh$ | 181-210 days ThCh$ | 211-250 days ThCh$ | More than 251 days ThCh$ | Total Gross Portfolio ThCh$ | ||||||||||||||||||||||||||||||||||
GENERATION | ||||||||||||||||||||||||||||||||||||||||||||
Non-Renegotiated Portfolio | 66,688,744 | 690,657 | 47,160 | 55,509 | 225,950 | 1,854 | 4,577 | — | — | 3,977,224 | 71,691,675 | |||||||||||||||||||||||||||||||||
-Large customers | 64,579,710 | 77,435 | 95 | 2 | 404 | — | 2 | — | — | 3,975,563 | 68,633,211 | |||||||||||||||||||||||||||||||||
-Institutional customers | — | — | — | — | — | — | — | — | — | — | — | |||||||||||||||||||||||||||||||||
-Other | 2,109,034 | 613,222 | 47,065 | 55,507 | 225,546 | 1,854 | 4,575 | — | — | 1,661 | 3,058,464 | |||||||||||||||||||||||||||||||||
Renegotiated Portfolio | — | — | — | — | — | — | — | — | — | — | — | |||||||||||||||||||||||||||||||||
-Large customers | — | — | — | — | — | — | — | — | — | — | — | |||||||||||||||||||||||||||||||||
-Institutional customers | — | — | — | — | — | — | — | — | — | — | — | |||||||||||||||||||||||||||||||||
-Other | — | — | — | — | — | — | — | — | — | — | — | |||||||||||||||||||||||||||||||||
DISTRIBUTION | ||||||||||||||||||||||||||||||||||||||||||||
Non-Renegotiated Portfolio | 92,569,100 | 17,889,891 | 6,110,717 | 1,724,316 | 593,236 | 1,563,550 | 362,397 | 952,333 | 221,968 | 22,854,974 | 144,842,482 | |||||||||||||||||||||||||||||||||
-Mass market customers | 46,823,731 | 11,744,808 | 3,437,068 | 644,271 | 307,599 | 198,344 | 163,068 | 284,314 | 117,169 | 6,748,419 | 70,468,791 | |||||||||||||||||||||||||||||||||
-Large customers | 38,425,833 | 5,454,674 | 2,315,421 | 787,328 | 101,536 | 333,926 | 24,988 | 151,693 | 1,917 | 5,931,605 | 53,528,921 | |||||||||||||||||||||||||||||||||
-Institutional customers | 7,319,536 | 690,409 | 358,228 | 292,717 | 184,101 | 1,031,280 | 174,341 | 516,326 | 102,882 | 10,174,950 | 20,844,770 | |||||||||||||||||||||||||||||||||
Renegotiated Portfolio | 7,378,888 | 2,006,126 | 623,197 | 262,510 | 201,210 | 126,066 | 65,177 | 415,016 | 33,850 | 6,421,941 | 17,533,981 | |||||||||||||||||||||||||||||||||
-Mass market customers | 6,118,065 | 1,924,871 | 615,635 | 222,235 | 156,335 | 98,182 | 64,848 | 47,435 | 30,691 | 6,280,943 | 15,559,240 | |||||||||||||||||||||||||||||||||
-Large customers | 211,152 | 63,333 | — | 28,056 | 44,766 | — | — | 9,603 | 3,159 | 69,537 | 429,606 | |||||||||||||||||||||||||||||||||
-Institutional customers | 1,049,671 | 17,922 | 7,562 | 12,219 | 109 | 27,884 | 329 | 357,978 | — | 71,461 | 1,545,135 | |||||||||||||||||||||||||||||||||
|
|
|
|
|
|
|
|
|
|
|
|
|
|
|
|
|
|
|
|
|
| |||||||||||||||||||||||
Total gross portfolio | 166,636,732 | 20,586,674 | 6,781,074 | 2,042,335 | 1,020,396 | 1,691,470 | 432,151 | 1,367,349 | 255,818 | 33,254,139 | 234,068,138 | |||||||||||||||||||||||||||||||||
|
|
|
|
|
|
|
|
|
|
|
|
|
|
|
|
|
|
|
|
|
| |||||||||||||||||||||||
F-243
Table of Contents
APPENDIX 6.2. ESTIMATED SALES AND PURCHASES OF ENERGY AND CAPACITY
This appendix forms an integral part of the Enersis Chile’s financial statements.
| CHILE | TOTAL | |||||||||||||||
| 12-31-2014 | 12-31-2014 | |||||||||||||||
BALANCE | Energy and Tolls | Capacity | Energy and Tolls | Capacity | ||||||||||||
Current accounts receivable from related companies | 212,000 | 109,588 | 212,000 | 109,588 | ||||||||||||
Trade and other current receivables | 245,764,182 | 14,741,243 | 245,764,182 | 14,741,243 | ||||||||||||
Total Estimated Assets | 245,976,182 | 14,850,831 | 245,976,182 | 14,850,831 | ||||||||||||
Current accounts payable to related companies | 1,547,416 | 71,570 | 1,547,416 | 71,570 | ||||||||||||
Trade and other current payables | 75,929,064 | 26,185,456 | 75,929,064 | 26,185,456 | ||||||||||||
Total Estimated Liabilities | 77,476,480 | 26,257,026 | 77,476,480 | 26,257,026 | ||||||||||||
INCOME STATEMENT | ||||||||||||||||
Energy Sales | 212,420,675 | 10,496,376 | 212,420,675 | 10,496,376 | ||||||||||||
Energy Purchases | 38,827,589 | 10,873,645 | 38,827,589 | 10,873,645 | ||||||||||||
F-244
Table of Contents
APPENDIX 7. DETAILS OF DUE DATES OF PAYMENTS TO SUPPLIERS
This appendix forms an integral part of the Enersis Chile’s financial statements.
| Balance at | ||||||||||||||||
| 12-31-2014 | ||||||||||||||||
| Goods | Services | Other | Total | |||||||||||||
Suppliers with Current Payments | ThCh$ | ThCh$ | ThCh$ | ThCh$ | ||||||||||||
Up to 30 days | — | 80,138,994 | 60,130,466 | 140,269,460 | ||||||||||||
From 31 to 60 days | — | — | — | — | ||||||||||||
From 61 to 90 days | — | — | — | — | ||||||||||||
From 91 to 120 days | — | — | — | — | ||||||||||||
From 121 to 365 days | — | — | — | — | ||||||||||||
More than 365 days | — | — | — | — | ||||||||||||
|
|
|
|
|
|
|
| |||||||||
Total | — | 80,138,994 | 60,130,466 | 140,269,460 | ||||||||||||
|
|
|
|
|
|
|
| |||||||||
| Balance at | ||||||||||||||||
| 12-31-2014 | ||||||||||||||||
| Goods | Services | Other | Total | |||||||||||||
Suppliers with Past-Due Payments | ThCh$ | ThCh$ | ThCh$ | ThCh$ | ||||||||||||
Up to 30 days | — | — | — | — | ||||||||||||
From 31 to 60 days | — | — | — | — | ||||||||||||
From 61 to 90 days | — | — | — | — | ||||||||||||
From 91 to 120 days | — | — | — | — | ||||||||||||
From 121 to 180 days | — | — | — | — | ||||||||||||
More than 180 days | — | 1,137,018 | — | 1,137,018 | ||||||||||||
|
|
|
|
|
|
|
| |||||||||
Total | — | 1,137,018 | — | 1,137,018 | ||||||||||||
|
|
|
|
|
|
|
| |||||||||
F-245