UNITED STATES
SECURITIES AND EXCHANGE COMMISSION
WASHINGTON, D.C. 20549
FORM 20-F
☐ | REGISTRATION STATEMENT PURSUANT TO SECTION 12(b) OR 12(g) OF THE SECURITIES EXCHANGE ACT OF 1934 |
OR
☒ | ANNUAL REPORT PURSUANT TO SECTION 13 OR 15(d) OF THE SECURITIES EXCHANGE ACT OF 1934 |
For the fiscal year ended December 31, 2017
OR
☐ | TRANSITION REPORT PURSUANT TO SECTION 13 OR 15(d) OF THE SECURITIES EXCHANGE ACT OF 1934 |
For the transition period from to
OR
☐ | SHELL COMPANY REPORT PURSUANT TO SECTION 13 OR 15(d) OF THE SECURITIES EXCHANGE ACT OF 1934 |
Date of event requiring this shell company report,
Commission file number: 001-37723
ENEL CHILE S.A.
(Exact name of Registrant as specified in its charter)
ENEL CHILE S.A.
(Translation of Registrant’s name into English)
CHILE
(Jurisdiction of incorporation or organization)
Santa Rosa 76, Santiago, Chile
(Address of principal executive offices)
Nicolás Billikopf, phone: (56-2) 2353-4628, nicolas.billikopf@enel.com, Santa Rosa 76, Piso 15, Santiago, Chile
(Name, Telephone, E-mail and/or Facsimile number and Address of Company Contact Person)
Securities registered or to be registered pursuant to Section 12(b) of the Act:
Title of Each Class | | Name of Each Exchange on Which Registered |
American Depositary Shares Representing Common Stock | | New York Stock Exchange |
Common Stock, no par value * | | |
* | Listed, not for trading, but only in connection with the registration of American Depositary Shares, pursuant to the requirements of the Securities and Exchange Commission. |
Securities registered or to be registered pursuant to Section 12(g) of the Act: None
Securities for which there is a reporting obligation pursuant to Section 15(d) of the Act: None
Indicate by check mark if the registrant is a well-known seasoned issuer, as defined in Rule 405 of the Securities Act. ☒ Yes ☐ No
If this report is an annual or transition report, indicate by check mark if the registrant is not required to file reports pursuant to Section 13 or 15(d) of the Securities Exchange Act of 1934. ☐ Yes ☒ No
Indicate by check mark whether the registrant (1) has filed all reports required to be filed by Section 13 or 15(d) of the Securities Exchange Act of 1934 during the preceding 12 months (or for such shorter period that the registrant was required to file such reports), and (2) has been subject to such filing requirements for the past 90 days. ☒ Yes ☐ No
Indicate by check mark whether the registrant has submitted electronically and posted on its corporate Web site, if any, every Interactive Data File required to be submitted and posted pursuant to Rule 405 of Regulation S-T during the preceding 12 months (or for such shorter period that the registrant was required to submit and post such files). ☐ Yes ☐ No
Indicate by check mark whether the registrant is a large accelerated filer, an accelerated filer, a non-accelerated filer, or an emerging growth company. See the definitions of “large accelerated filer,” “accelerated filer,” and “emerging growth company” in Rule 12b-2 of the Exchange Act.
Large accelerated filer ☒ | Accelerated filer ☐ | Non-accelerated filer ☐ Emerging growth company ☐ |
If an emerging growth company that prepares its financial statements in accordance with U.S. GAAP, indicate by check mark if the registrant has elected not to use the extended transition period for complying with any new or revised financial accounting standards † provided pursuant to Section 13(a) of the Exchange Act. ☐
† The term “new or revised financial accounting standard” refers to any update issued by the Financial Accounting Standards Board to its Accounting Standards Codification after April 5, 2012.
Indicate by check mark which basis of accounting the registrant has used to prepare the financial statements included in this filing:
U.S. GAAP ☐ | International Financial Reporting Standards as issued by the International Accounting Standards Board ☒ | Other ☐ |
If “Other” has been checked in response to the previous question, indicate by check mark which financial statement item the registrant has elected to follow.☐ Item 17 ☐ Item 18
If this is an annual report, indicate by check mark whether the registrant is a shell company (as defined in Rule 12b-2 of the Exchange Act).☐ Yes ☒ No
Indicate the number of outstanding shares of each of the issuer’s classes of capital or common stock as of the close of the period covered by the annual report
Shares of Common Stock: 49,092,772,762
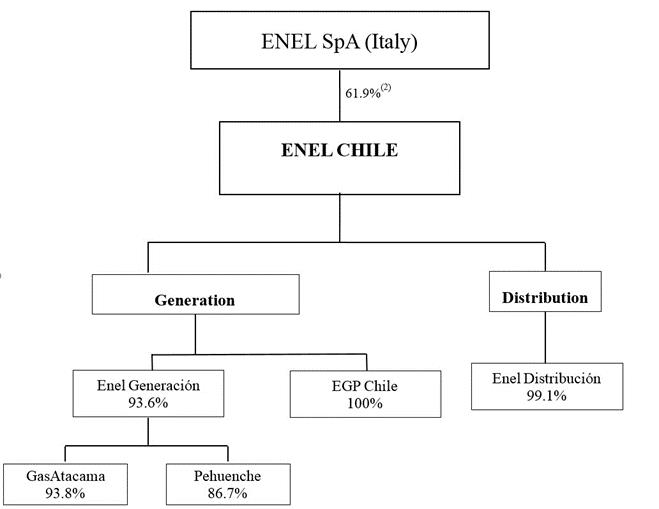
Enel Chile’s Organizational Structure(1)
As of December 31, 2017(2)

| (1) | Only principal operating consolidated entities are presented here. The percentage listed in the box for each of Enel Chile’s consolidated subsidiaries represents its economic interest in such consolidated subsidiary. |
| (2) | Reflects organizational structure prior to giving effect to the 2018 Reorganization, which was completed on April 2, 2018. |
Enel Chile’s Organizational Structure(1)
As of the date of this Report and after giving effect to the 2018 Reorganization
| (1) | Only principal operating consolidated entities are presented here. The percentage listed in the box for each of Enel Chile’s consolidated subsidiaries represents its economic interest in such consolidated subsidiary. |
| (2) | Enel owns 61.9% of our outstanding shares (excluding treasury stock which will be cancelled). |
TABLE OF CONTENTS
1
GLOSSARY
AFP | | Administradora de Fondos de Pensiones | | A legal entity that manages a Chilean pension fund. |
| | | | |
CDEC | | Centro de Despacho Económico de Carga | | The autonomous entity in charge of coordinating the efficient operation and dispatch of generation units to satisfy demand in the SIC and SING that was replaced by the CEN in November 2017. |
| | | | |
Celta | | Compañía Eléctrica Tarapacá S.A. | | Celta was a former Chilean generation subsidiary of Enel Generación that operated plants in the SING and the SIC. Celta merged into GasAtacama in November 2016. |
| | | | |
CEN | | Coordinador Eléctrico Nacional | | An autonomous entity in charge of coordinating the efficient operation of the SEN, dispatching generation units to satisfy demand and known as the National Electricity Coordinator. It replaced the CDEC for both the SIC and SING in November 2017. |
| | | | |
| | | | |
Chilean Stock Exchanges | | Chilean Stock Exchanges | | The three principal stock exchanges located in Chile: the Santiago Stock Exchange, the Electronic Stock Exchange and the Valparaíso Stock Exchange. |
| | | | |
Chilectra Américas | | Chilectra Américas S.A. | | A former electricity distribution company that held minority interests in non-Chilean generation companies. Chilectra Américas was created in the context of the reorganization carried out during 2016 and then merged into Enel Américas in December 2016. |
| | | | |
CMF | | Comisión para el Mercado Financiero | | Chilean Financial Market Commission, the governmental authority that supervises public companies, securities and the insurance business. Formerly the Chilean Superintendence of Securities and Insurance or SVS in its Spanish acronym. |
| | | | |
CNE | | Comisión Nacional de Energía | | Chilean National Energy Commission, governmental entity with responsibilities under the Chilean regulatory framework. |
| | | | |
DCV | | Depósito Central de Valores S.A. | | Chilean Central Securities Depositary. |
| | | | |
Enel | | Enel S.p.A. | | An Italian energy company with multinational operations in the power and gas markets. A 60.6% beneficial owner of us as of December 31, 2017 and 61.9% owner of our voting shares (excluding treasury stock which will be cancelled) as of the date of this Report and after giving effect to the 2018 Reorganization, and our ultimate parent company. |
| | | | |
Enel Américas | | Enel Américas S.A. | | An affiliated publicly held limited liability stock corporation incorporated under the laws of the Republic of Chile headquartered in Chile, with subsidiaries engaged primarily in the generation, transmission and distribution of electricity in Argentina, Brazil, Colombia, and Peru, and which is controlled by Enel. Formerly known on an interim basis as Enersis Américas S.A. and prior to that as Enersis S.A. |
2
| | | | |
Enel Chile | | Enel Chile S.A. | | Our company, a publicly held limited liability stock corporation incorporated under the laws of the Republic of Chile, with subsidiaries engaged primarily in the generation and distribution of electricity in Chile. Registrant of this Report. Formerly known on an interim basis as Enersis Chile S.A. |
| | | | |
Enel Distribución | | Enel Distribución Chile S.A. | | A publicly held limited liability stock corporation incorporated under the laws of the Republic of Chile and our electricity distribution subsidiary operating in the Santiago metropolitan area. Formerly known on an interim basis as Chilectra Chile S.A. and prior to that as Chilectra S.A. |
| | | | |
Enel Generación | | Enel Generación Chile S.A. | | A publicly held limited liability stock corporation incorporated under the laws of the Republic of Chile and our electricity generation subsidiary in Chile. Formerly known as Empresa Nacional de Electricidad S.A. or Endesa Chile. |
| | | | |
EGP Chile | | Enel Green Power Chile Ltda. | | A closely held stock corporation organized under the laws of the Republic of Chile, with non-conventional renewable electricity generation operations and since April 2, 2018, our consolidated subsidiary. |
| | | | |
EGPL | | Enel Green Power Latin América S.A. | | A closely held stock corporation organized under the laws of the Republic of Chile that merged with us on April 2, 2018. As a result, we now consolidate EGP Chile. |
| | | | |
GasAtacama | | GasAtacama Chile S.A. | | A company engaged in gas transportation and electricity generation in northern Chile. A subsidiary of Enel Generación. |
| | | | |
GasAtacama Holding | | Inversiones GasAtacama Holding Ltda. | | A holding company subsidiary of Enel Generación, which previously held GasAtacama. GasAtacama Holding merged into Celta during 2016, which later merged into GasAtacama. |
| | | | |
Gener | | AES Gener S.A. | | A Chilean generation company and one of our competitors in Chile. |
| | | | |
GNL Quintero | | GNL Quintero S.A. | | A company created to develop, build, finance, own and operate a LNG regasification facility at Quintero Bay at which LNG is unloaded, stored and regasified. Enel Generación sold its 20% stake in this company to Enagas Chile S.p.A., an unaffiliated company, in September 2016. |
| | | | |
HidroAysén | | Centrales Hidroeléctricas de Aysén S.A. | | A company created to develop a hydroelectric project in the Aysén region, southern Chile. Enel Generación owned 51% of HidroAysén and Colbún, an unaffiliated company, owned the remaining 49%. The company terminated its activities in 2017. |
| | | | |
IFRS | | International Financial Reporting Standards | | International Financial Reporting Standards as issued by the International Accounting Standards Board (IASB). |
| | | | |
LNG | | Liquefied Natural Gas. | | Liquefied natural gas. |
| | | | |
3
NCRE | | Non-Conventional Renewable Energy | | Energy sources which are continuously replenished by natural processes, such as wind, biomass, mini-hydro, geothermal, wave, solar or tidal energy. |
| | | | |
OSM | | Ordinary Shareholders’ Meeting | | Ordinary Shareholders’ Meeting. |
| | | | |
Pehuenche | | Empresa Eléctrica Pehuenche S.A. | | A publicly held limited liability Chilean electricity stock corporation, owner of three power stations in the Maule River basin and a subsidiary of Enel Generación. |
| | | | |
SEF | | Superintendencia de Electricidad y Combustible | | Chilean Superintendence of Electricity and Fuels, the governmental authority that supervises the Chilean electricity industry. |
| | | | |
SEN | | Sistema Eléctrico Nacional | | The National Electricity System is the Chilean national interconnected electricity system formed in November 2017 through the integration of the SIC and SING. |
| | | | |
SIC | | Sistema Interconectado Central | | Chilean central interconnected electricity system that was integrated with the SING in November 2017 to form a single interconnected system, the SEN. |
| | | | |
SING | | Sistema Interconectado del Norte Grande | | Chilean interconnected electric system operating in northern Chile that was integrated with the SIC in November 2017 to form a single interconnected system, the SEN. |
| | | | |
UF | | Unidad de Fomento | | Chilean inflation-indexed, Chilean peso-denominated monetary unit, equivalent to Ch$ 26,798.14 as of December 31, 2017. |
| | | | |
UTA | | Unidad Tributaria Anual | | Chilean annual tax unit. One UTA equals 12 Unidad Tributaria Mensual (“UTM”), a Chilean inflation-indexed monthly tax unit used to define fines, among other purposes. For December 2017, one UTM was equivalent to Ch$ 46,972 and one UTA was equivalent to Ch$ 563,664. |
| | | | |
VAD | | Valor Agregado de Distribución | | Value added from distribution of electricity. |
4
INTRODUCTION
As used in this Report on Form 20-F (“Report”), first person personal pronouns such as “we”, “us” or “our”, as well as “Enel Chile” or the “Company”, refer to Enel Chile S.A. and our consolidated subsidiaries unless the context indicates otherwise. Unless otherwise noted, our interest in our principal subsidiaries, and jointly-controlled companies and associates is expressed in terms of our economic interest as of December 31, 2017.
We are a Chilean company engaged in the electricity generation and distribution businesses in Chile through our subsidiaries and affiliates. As of the date of this Report and after giving effect to the 2018 Reorganization (described in “Item 4. Information on the Company ― A. History and Development of the Company ― the 2018 Reorganization”), we own 93.6% of Enel Generación Chile S.A. (“Enel Generación”), a Chilean electricity generation company holding electricity generation operations in Chile, and 99.1% of Enel Distribución Chile S.A. (“Enel Distribución”), a Chilean electricity distribution company with operation in the Santiago Metropolitan Area. On April 2, 2018, Enel Green Power Latin America S.A. (“EGPL”), a Chilean non-conventional electricity generation company holding non-conventional electricity generation operations in Chile, merged with us in connection with the 2018 Reorganization. As a result, we now wholly-own and consolidate Enel Green Power Chile Ltda. (“EGP Chile”).
5
PRESENTATION OF INFORMATION
Financial Information
In this Report, unless otherwise specified, references to “U.S. dollars” or “US$”, are to dollars of the United States of America (“United States”); references to “pesos” or “Ch$” are to Chilean pesos, the legal currency of Chile; and references to “UF” are to Unidades de Fomento. The UF is a Chilean inflation-indexed, peso-denominated monetary unit that is adjusted daily to reflect changes in the official Consumer Price Index (“CPI”) of the Chilean National Institute of Statistics (Instituto Nacional de Estadísticas or “INE”). The UF is adjusted in monthly cycles. Each day in the period beginning on the tenth day of the current month through the ninth day of the succeeding month, the nominal peso value of the UF is indexed in order to reflect a proportionate amount of the change in the Chilean CPI during the prior calendar month. As of December 31, 2017, one UF was equivalent to Ch$ 26,798.14. The U.S. dollar equivalent of one UF was US$ 43.59 as of December 31, 2017, using the Observed Exchange Rate reported by the Central Bank of Chile (Banco Central de Chile) as of December 31, 2017 of Ch$ 614.75 per US$ 1.00. The U.S. dollar observed exchange rate (dólar observado) (the “Observed Exchange Rate”), which is reported by the Central Bank of Chile and published daily on its webpage, is the weighted average exchange rate of the previous business day’s transactions in the Formal Exchange Market. Unless the context specifies otherwise, all amounts translated from Chilean pesos to U.S. dollars or vice versa, or from UF to Chilean pesos, have been carried out at the rates applicable as of December 31, 2017.
The Central Bank of Chile may intervene by buying or selling foreign currency on the Formal Exchange Market to maintain the Observed Exchange Rate within a desired range.
Our consolidated financial statements and, unless otherwise indicated, other financial information concerning us included in this Report are presented in Chilean pesos. We have prepared our consolidated financial statements in accordance with International Financial Reporting Standards (“IFRS”), as issued by the International Accounting Standards Board (“IASB”).
All of our subsidiaries are integrated and all their assets, liabilities, income, expenses and cash flows are included in the consolidated financial statements after making the adjustments and eliminations related to intra-group transactions. Investments in associated companies over which we exercise significant influence are included in our consolidated financial statements using the equity method. For detailed information regarding consolidated entities, jointly-controlled entities and associated companies, see Appendices 1, 2 and 3 to the consolidated financial statements.
Solely for the convenience of the reader, this Report contains translations of certain Chilean peso amounts into U.S. dollars at specified rates. Unless otherwise indicated, the U.S. dollar equivalent for information in Chilean pesos is based on the Observed Exchange Rate for December 31, 2017, as defined in “Item 3. Key Information — A. Selected Financial Data — Exchange Rates”. The Federal Reserve Bank of New York does not report a noon buying rate for Chilean pesos. No representation is made that the Chilean peso or U.S. dollar amounts shown in this Report could have been or could be converted into U.S. dollars or Chilean pesos, as the case may be, at such rate or at any other rate. See “Item 3. Key Information — A. Selected Financial Data — Exchange Rates”.
Technical Terms
References to “TW” are to terawatts (1012 watts or a trillion watts); references to “GW” and “GWh” are to gigawatts (109 watts or a billion watts) and gigawatt hours, respectively; references to “MW” and “MWh” are to megawatts (106 watts or a million watts) and megawatt hours, respectively; references to “kW” and “kWh” are to kilowatts (103 watts or a thousand watts) and kilowatt hours, respectively; references to “kV” are to kilovolts, and references to “MVA” are to megavolt amperes. References to “BTU” and “MBTU” are to British thermal unit and million British thermal units, respectively. A “BTU” is an energy unit equal to approximately 1,055 joules. References to “Hz” are to hertz; and references to “mtpa” are to metric tons per annum. Unless otherwise indicated, statistics provided in this Report with respect to the installed capacity of electricity generation facilities are expressed in MW. One TW equals 1,000 GW, one GW equals 1,000 MW and one MW equals 1,000 kW. The installed capacity we are presenting in this Report corresponds to the gross installed capacity, without considering the MW that each power plant consumes for its own operation.
Statistics relating to aggregate annual electricity production are expressed in GWh and based on a year of 8,760 hours, except for leap years, which are based on 8,784 hours. Statistics relating to installed capacity and production of the electricity industry do not include electricity of self-generators.
6
Energy losses experienced by generation companies during transmission are calculated by subtracting the number of GWh of energy sold from the number of GWh of energy generated (excluding their own energy consumption and losses on the part of the power plant), within a given period. Losses are expressed as a percentage of total energy generated.
Energy losses during distribution are calculated as the difference between total energy purchased (GWh of electricity demand, including own generation) and the energy sold excluding tolls and energy consumption not billed (also measured in GWh), within a given period. Distribution losses are expressed as a percentage of total energy purchased. Losses in distribution arise from illegally tapped energy as well as technical losses.
Calculation of Economic Interest
References are made in this Report to the “economic interest” of Enel Chile in its related companies. We could have direct and indirect interest is such companies. In circumstances where we do not directly own an interest in a related company, our economic interest in such ultimate related company is calculated by multiplying the percentage of economic interest in a directly held related company by the percentage of economic interest of any entity in the ownership chain of such related company. For example, if we directly own a 6% equity stake in an associate company and 40% is directly held by our 60%-owned subsidiary, our economic interest in such associate would be 60% times 40% plus 6%, equal to 30%.
Rounding
Certain figures included in this Report have been rounded for ease of presentation. Because of this rounding, it is possible that amounts in tables may not add up to exactly the same amounts as the sum of the entries.
7
FORWARD-LOOKING STATEMENTS
This Report contains statements that are or may constitute forward-looking statements within the meaning of Section 27A of the Securities Act of 1933, as amended, and Section 21E of the Securities Exchange Act of 1934, as amended (the “Exchange Act”). These statements appear throughout this Report and include statements regarding our intent, belief or current expectations, including but not limited to any statements concerning:
| • | our capital investment program; |
| • | trends affecting our financial condition or results from operations; |
| • | the future impact of competition and regulation; |
| • | political and economic conditions in the countries in which we or our related companies operate or may operate in the future; |
| • | any statements preceded by, followed by or that include the words “believes,” “expects,” “predicts,” “anticipates,” “intends,” “estimates,” “should,” “may” or similar expressions; and |
| • | other statements contained or incorporated by reference in this Report regarding matters that are not historical facts. |
Because such statements are subject to risks and uncertainties, actual results may differ materially from those expressed or implied by such forward-looking statements. Factors that could cause actual results to differ materially include, but are not limited to:
| • | demographic developments, political events, economic fluctuations and interventionist measures by authorities in Chile; |
| • | water supply, droughts, flooding and other weather conditions; |
| • | changes in Chilean environmental regulations and the regulatory framework of the electricity industry; |
| • | our ability to implement proposed capital expenditures, including our ability to arrange financing where required; |
| • | the nature and extent of future competition in our principal markets; |
| • | integration of EGPL may not be successful or we may not realize the business growth opportunities, revenue benefits or other benefits; and |
| • | the factors discussed below under “Risk Factors.” |
You should not place undue reliance on such statements, which speak only as of the date that they were made. Our independent registered public accounting firm has not examined or compiled the forward-looking statements and, accordingly, does not provide any assurance with respect to such statements. You should consider these cautionary statements together with any written or oral forward-looking statements that we may issue in the future. We do not undertake any obligation to release publicly any revisions to forward-looking statements contained in this Report to reflect later events or circumstances or to reflect the occurrence of unanticipated events.
For all these forward-looking statements, we claim the protection of the safe harbor for forward-looking statements contained in the Private Securities Litigation Reform Act of 1995.
8
RECENT DEVELOPMENTS
On April 2, 2018, we completed a corporate reorganization to consolidate Enel’s conventional and non-conventional renewable energy businesses in Chile under one company. The corporate reorganization involved a tender offer for all outstanding shares of common stock (including in the form of American Depositary Shares or “ADSs”) of Enel Generación other than shares owned by us (the “Tender Offer”), a capital increase, including a preemptive rights offering, and the merger of Enel Green Power Latin América S.A. (“EGPL”) with and into Enel Chile. For additional information on the corporate reorganization, see “Item 4. Information on the Company – A. History and Development of the Company – The 2018 Reorganization.”
9
PART I
Item 1.Identity of Directors, Senior Management and Advisers
Not applicable.
Item 2.Offer Statistics and Expected Timetable
Not applicable.
Item 3.Key Information
A. Selected Financial Data.
The following selected consolidated financial data should be read in conjunction with our consolidated financial statements included in this Report. The selected consolidated financial data as of December 31, 2017 and 2016 and for each of the years in the three-year period ended December 31, 2017 are derived from our audited consolidated financial statements included in this Report. The selected consolidated financial data as of December 31, 2015, 2014 and 2013, and for the year ended December 31, 2014 and 2013 is derived from our consolidated financial statements not included in this Report. Our consolidated financial statements were prepared in accordance with IFRS, as issued by the IASB.
Amounts in the tables are expressed in millions, except for ratios, operating data and data for shares and American Depositary Shares (“ADS”). For the convenience of the reader, all data presented in U.S. dollars in the following summary, as of and for the year ended December 31, 2017, has been converted at the U.S. dollar Observed Exchange Rate (dólar observado) for that date of Ch$ 614.75 per US$ 1.00. The Observed Exchange Rate, which is reported and published daily on the Central Bank of Chile’s web page, corresponds to the weighted average exchange rate of the previous business day’s transactions in the Formal Exchange Market. For more information concerning historical exchange rates, see “Item 3. Key Information — A. Selected Financial Data— Exchange Rates” below.
10
The following tables set forth our selected consolidated financial data and operating data for the years indicated:
| | As of and for the year ended December 31, | |
| | 2017 (1) | | | 2017 | | | 2016 | | | 2015 | | | 2014 | | | 2013 | |
| | (US$ millions) | | | (Ch$ millions) | |
Consolidated Statement of Comprehensive Income Data | | | | | | | | | | | | | | | | | | | | | | | | |
Revenues and other operating income | | | 4,114 | | | | 2,529,347 | | | | 2,541,567 | | | | 2,399,029 | | | | 2,049,065 | | | | 1,738,083 | |
Operating costs (2) | | | (3,173 | ) | | | (1,950,716 | ) | | | (1,973,778 | ) | | | (1,873,540 | ) | | | (1,666,315 | ) | | | (1,346,460 | ) |
Operating income | | | 941 | | | | 578,631 | | | | 567,789 | | | | 525,489 | | | | 382,750 | | | | 391,623 | |
Financial results (3) | | | (36 | ) | | | (22,415 | ) | | | (20,483 | ) | | | (97,869 | ) | | | (67,045 | ) | | | (56,363 | ) |
Other non-operating income | | | 184 | | | | 113,241 | | | | 121,490 | | | | 20,056 | | | | 70,893 | | | | 14,528 | |
Share of profit (loss) of associates and joint ventures accounted for using the equity method | | | (4 | ) | | | (2,697 | ) | | | 7,878 | | | | 8,905 | | | | (54,353 | ) | | | 24,309 | |
Income before income taxes | | | 1,085 | | | | 666,760 | | | | 676,674 | | | | 456,581 | | | | 332,245 | | | | 374,097 | |
Income tax expenses | | | (233 | ) | | | (143,342 | ) | | | (111,403 | ) | | | (109,613 | ) | | | (132,687 | ) | | | (61,712 | ) |
Net income | | | 851 | | | | 523,418 | | | | 565,271 | | | | 346,968 | | | | 199,558 | | | | 312,385 | |
Net income attributable to the parent Company | | | 568 | | | | 349,383 | | | | 384,160 | | | | 251,838 | | | | 162,459 | | | | 229,527 | |
Net income attributable to non-controlling interests | | | 283 | | | | 174,035 | | | | 181,111 | | | | 95,130 | | | | 37,099 | | | | 82,858 | |
Total basic and diluted earnings per average number of shares (Ch$/US$ per share) | | | 0.01 | | | | 7.12 | | | | 7.83 | | | | 5.13 | | | | 3.31 | | | | 5.08 | |
Total basic and diluted earnings per average number of ADSs (Ch$/US$ per ADS) | | | 0.58 | | | | 355.84 | | | | 391.26 | | | | 256.49 | | | | 165.46 | | | | 253.79 | |
Cash dividends per share (Ch$/US$ per share)(4) | | | 0.01 | | | | 3.23 | | | | 2.09 | | | | — | | | | — | | | | — | |
Cash dividends per ADS (Ch$/US$ per ADS)(4) | | | 0.26 | | | | 161.72 | | | | 104.65 | | | | — | | | | — | | | | — | |
Weighted average number of shares of common stock (millions) | | | | | | | 49,093 | | | | 49,093 | | | | 49,093 | | | | 49,093 | | | | 45,219 | |
| | | | | | | | | | | | | | | | | | | | | | | | |
Consolidated Statement of Financial Position Data | | | | | | | | | | | | | | | | | | | | | | | | |
Total assets | | | 9,264 | | | | 5,694,773 | | | | 5,398,711 | | | | 5,325,469 | | | | 5,126,735 | | | | 4,820,392 | |
Non-current liabilities | | | 1,775 | | | | 1,090,995 | | | | 1,178,471 | | | | 1,270,006 | | | | 1,122,585 | | | | 826,478 | |
Equity attributable to the parent company | | | 4,853 | | | | 2,983,384 | | | | 2,763,391 | | | | 2,592,682 | | | | 2,472,201 | | | | 2,438,837 | |
Equity attributable to non-controlling interests | | | 1,307 | | | | 803,578 | | | | 699,602 | | | | 609,219 | | | | 611,864 | | | | 626,947 | |
Total equity | | | 6,160 | | | | 3,786,962 | | | | 3,462,994 | | | | 3,201,901 | | | | 3,084,066 | | | | 3,065,784 | |
Capital stock | | | 3,626 | | | | 2,229,109 | | | | 2,229,109 | | | | 2,229,109 | | | | 2,229,109 | | | | 2,238,169 | |
| | | | | | | | | | | | | | | | | | | | | | | | |
Other Consolidated Financial Data | | | | | | | | | | | | | | | | | | | | | | | | |
Capital expenditures (CAPEX) (5) | | | 433 | | | | 266,030 | | | | 222,386 | | | | 309,503 | | | | 196,932 | | | | 128,239 | |
Depreciation, amortization and impairment losses (6) | | | 261 | | | | 160,622 | | | | 197,587 | | | | 150,147 | | | | 141,623 | | | | 127,720 | |
(1) | Solely for the convenience of the reader, Chilean peso amounts have been converted into U.S. dollars at the exchange rate of Ch$ 614.75 per U.S. dollar, as of December 31, 2017. |
(2) | Operating costs represent raw materials and supplies used, other work performed by the entity, employee benefits expenses, depreciation and amortization expenses, impairment losses recognized in the period’s profit or loss and other expenses. |
(3) | Financial results represent (+) financial income, (-) financial costs, (+/-) foreign currency exchange differences and net gains/losses from indexed assets and liabilities. |
(4) | For 2016, a payout ratio of 50% was used based on annual consolidated net income for our 2016’s annual consolidated net income filed with the CMF, based on 10 months of results starting as of our incorporation on March 1, 2016, and therefore differs from the twelve month net income included in this Report. |
(5) | CAPEX figures represent cash flows used for purchases of property, plant and equipment and intangible assets for each year. |
(6) | For further detail please refer to Note 28 of the Notes to our consolidated financial statements. |
11
| | As of and for the year ended December 31, | |
| | 2017 | | | 2016 | | | 2015 | | | 2014 | | | 2013 | |
OPERATING DATA OF SUBSIDIARIES | | | | | | | | | | | | | | | | | | | | |
| | | | | | | | | | | | | | | | | | | | |
Enel Distribución | | | | | | | | | | | | | | | | | | | | |
Electricity sold (GWh) | | | 16,438 | | | | 15,924 | | | | 15,893 | | | | 15,690 | | | | 15,140 | |
Number of customers (thousands) | | | 1,882 | | | | 1,826 | | | | 1,781 | | | | 1,737 | | | | 1,694 | |
Total energy losses (%) (1) | | | 5.1 | | | | 5.3 | | | | 5.3 | | | | 5.3 | | | | 5.3 | |
| | | | | | | | | | | | | | | | | | | | |
Enel Generación | | | | | | | | | | | | | | | | | | | | |
Installed capacity (MW) (2) | | | 6,351 | | | | 6,351 | | | | 6,351 | | | | 6,351 | | | | 5,571 | |
Generation (GWh) (2) | | | 17,073 | | | | 17,564 | | | | 18,294 | | | | 18,063 | | | | 19,438 | |
(1) | Energy losses in distribution arise from illegally tapped energy as well as technical losses. They are calculated as the difference between total energy generated and purchased and the energy sold, excluding tolls and energy consumption not billed (GWh), within a given period. Losses are expressed as a percentage of total energy purchased. |
(2) | The 2014 and 2015 data includes the capacity and generation of GasAtacama, as a result of its consolidation. Prior to 2014, our unconsolidated interest in GasAtacama was excluded. |
Exchange Rates
Fluctuations in the exchange rate between the Chilean peso and the U.S. dollar will affect the U.S. dollar equivalent of the peso price of our shares of common stock on the Santiago Stock Exchange (Bolsa de Comercio de Santiago), the Chilean Electronic Stock Exchange (Bolsa Electrónica de Chile) and the Valparaíso Stock Exchange (Bolsa de Corredores de Valparaíso). These exchange rate fluctuations affect the price of our American Depositary Shares (“ADSs”) and the conversion of cash dividends relating to the common shares represented by ADSs from Chilean pesos to U.S. dollars. In addition, to the extent that significant financial liabilities of the Company are denominated in foreign currencies, exchange rate fluctuations may have a significant impact on earnings.
In Chile, there are two currency markets, the Formal Exchange Market (Mercado Cambiario Formal) and the Informal Exchange Market (Mercado Cambiario Informal). The Formal Exchange Market is comprised of banks and other entities authorized by the Central Bank of Chile. The Informal Exchange Market is comprised of entities that are not expressly authorized to operate in the Formal Exchange Market, such as certain foreign currency exchange houses and travel agencies, among others. The Central Bank of Chile has the authority to require that certain purchases and sales of foreign currencies be carried out on the Formal Exchange Market. Both the Formal and Informal Exchange Markets are driven by free market forces. Current regulations require that the Central Bank of Chile be informed of certain transactions that must be carried out through the Formal Exchange Market.
The U.S. dollar Observed Exchange Rate, which is reported by the Central Bank of Chile and published daily on its web page, is the weighted average exchange rate of the previous business day’s transactions in the Formal Exchange Market. Nevertheless, the Central Bank of Chile may intervene by buying or selling foreign currency on the Formal Exchange Market to attempt to maintain the Observed Exchange Rate within a desired range.
The Informal Exchange Market reflects transactions carried out at an informal exchange rate (the “Informal Exchange Rate”). There are no limits imposed on the extent to which the rate of exchange in the Informal Exchange Market can fluctuate above or below the Observed Exchange Rate. Foreign currency for payments and distributions with respect to the ADSs may be purchased either in the Formal or the Informal Exchange Market, but such payments and distributions must be remitted through the Formal Exchange Market.
The Federal Reserve Bank of New York does not report a noon buying rate for Chilean pesos. As of December 31, 2017, the U.S. dollar Observed Exchange Rate was Ch$ 614.75 per US$ 1.00.
12
The following table sets forth the low, high, average and period-end Observed Exchange Rate for U.S. dollars for the periods set forth below, as reported by the Central Bank of Chile:
| | Daily Observed Exchange Rate (Ch$ per US$)(1) | |
| | Low(2) | | | High(2) | | | Average(3) | | | Period-end | |
Month ended | | | | | | | | | | | | | | | | |
March 2018 | | | 595.93 | | | | 609.58 | | | n.a. | | | | 603.39 | |
February 2018 | | | 588.28 | | | | 603.07 | | | n.a. | | | | 593.61 | |
January 2018 | | | 599.33 | | | | 609.49 | | | n.a. | | | | 603.25 | |
December 2017 | | | 614.75 | | | | 655.74 | | | n.a. | | | | 614.75 | |
November 2017 | | | 629.21 | | | | 645.32 | | | n.a. | | | | 645.32 | |
October 2017 | | | 619.68 | | | | 640.52 | | | n.a. | | | | 636.80 | |
Year ended December 31, | | | | | | | | | | | | | | | | |
2017 | | | 614.75 | | | | 679.05 | | | | 649.11 | | | | 614.75 | |
2016 | | | 645.22 | | | | 730.31 | | | | 676.67 | | | | 669.47 | |
2015 | | | 597.10 | | | | 715.66 | | | | 654.66 | | | | 710.16 | |
2014 | | | 527.53 | | | | 621.41 | | | | 570.34 | | | | 606.75 | |
2013 | | | 466.50 | | | | 533.95 | | | | 498.83 | | | | 524.61 | |
Source: Central Bank of Chile.
(2) | Exchange rates are the actual low and high, on a day-by-day basis for each period. |
(3) | The average of the exchange rates on the last day of each month during the period. |
As of April 24, 2018, the U.S. dollar Observed Exchange Rate was Ch$ 599.84 per US$ 1.00.
Calculation of the appreciation or devaluation of the Chilean peso against the U.S. dollar in any given period is made by determining the percent change between the reciprocals of the Chilean peso equivalent of US$ 1.00 at the end of the preceding period and the end of the period for which the calculation is being made. For example, to calculate the appreciation of the year-end Chilean peso in 2017, one determines the percentage of change between the reciprocal of Ch$ 669.47, the value of one U.S. dollar as of December 31, 2016, or 0.001494, and the reciprocal of Ch$ 614.75, the value of one U.S. dollar as of December 31, 2017, or 0.001627. In this example, the percentage change between the two periods is 8.9%, which represents the 2017 year-end appreciation of the Chilean peso against the 2016 year-end U.S. dollar. A positive percentage change means that the Chilean peso appreciated against the U.S. dollar, while a negative percentage change means that the Chilean peso devaluated against the U.S. dollar.
The following table sets forth the period-end rates for U.S. dollars for the years ended December 31, 2013 through December 31, 2017, based on information published by the Central Bank of Chile.
| | Ch$ per US$(1) | |
| | Period End | | | Appreciation (Devaluation) | |
| | (in Ch$) | | | (in %) | |
Year ended December 31, | | | | | | | | |
2017 | | | 614.8 | | | | 8.9 | |
2016 | | | 669.5 | | | | 6.1 | |
2015 | | | 710.2 | | | | (14.6 | ) |
2014 | | | 606.8 | | | | (13.5 | ) |
2013 | | | 524.6 | | | | (8.5 | ) |
Source: Central Bank of Chile.
(1) | Calculated based on the variation of period-end exchange rates. |
B. | Capitalization and Indebtedness. |
Not applicable.
13
C. | Reasons for the Offer and Use of Proceeds. |
Not applicable.
Chilean economic fluctuations as well as certain economic interventionist measures by governmental authorities may affect our results of operations and financial condition as well as the value of our securities.
All of our operations are located in Chile. Accordingly, our revenues are affected by the performance of the Chilean economy. If local, regional or worldwide economic trends adversely affect the Chilean economy, our financial condition and results from operations could be adversely affected. Moreover, insufficient cash flows for our subsidiaries could result in their inability to meet debt obligations and the need to seek waivers to comply with restrictive debt covenants and increasing costs for subsequent financings.
The Chilean government has exercised in the past, and continues to exercise, a substantial influence over many aspects of the private sector, which may result in changes to economic or other policies.
Future adverse developments in Chile or changes in policies regarding exchange controls, regulations and taxation may impair our ability to execute our strategic plans, which could adversely affect our results of operations and financial condition. Inflation, devaluation, social instability and other political, economic or diplomatic developments, could also reduce our profitability. In addition, Chilean financial and securities markets are influenced by economic and market conditions in other countries and may be affected by events in other countries, which could adversely affect the value of our securities.
Our businesses depend heavily on water supply, and the occurance of droughts, flooding, storms, oceanographic currents and other weather conditions and may adversely affect our operations and profitability.
Approximately 55% of our installed generation capacity in 2017 was hydroelectric. Accordingly, dry hydrological conditions could adversely affect our business, results of operations and financial condition. Our results have been adversely affected when hydrological conditions in Chile have been below their historical average.
While our subsidiary, Enel Generación, has entered into certain agreements with the Chilean government and local irrigators regarding the use of water for hydroelectric generation purposes, during periods of low water levels, if drought conditions persist or become worse, we may face increased pressure by the Chilean government or other third parties to further restrict our water use.
The below-average hydrological conditions not only reduce our ability to operate our hydroelectric plants at full capacity, but also may result in increased water transportation costs for the operation of the San Isidro thermal power plant (778 MW) for cooling purposes. In addition, thermal plant operating costs can be considerably higher than those of hydroelectric plants. Our operating expenses increase during these drought periods when thermal plants are used more frequently. We may need to buy electricity at higher spot prices in order to comply with our contractual supply obligations and the cost of these electricity purchases may exceed our contracted electricity sale prices, thus potentially producing losses from those contracts. For further information with respect to the effect of hydrology on our business and financial results, please refer to “Item 5. Operating and Financial Review and Prospects — A. Operating Results —1. Discussion of Main Factors Affecting Operating Results and Financial Condition of the Company —a. Generation Business.”
Droughts also indirectly affect the operation of our thermal plants, including our facilities that use natural gas, fuel oil or coal, in the following manner:
| • | Our thermal plants require water for cooling and droughts not only reduce the availability of water, but also increase the concentration of chemicals, such as sulfates in the water. The high concentration of chemicals in the water that we use for cooling increases the risk of damaging the equipment at our thermal plants as well as the risk of violating environmental regulations. As a result, we have had to purchase water from agricultural areas that are also experiencing water shortages. These water purchases may increase our operating costs and may require us to negotiate with the local communities. |
| • | Thermal power plants that burn natural gas generate emissions such as nitrogen oxide (NO), carbon dioxide (CO2) and carbon monoxide (CO) gases. When operating with diesel they release NO, sulfur dioxide (SO2) and particulate matter into the atmosphere. Coal fired plants generate emissions of SO2 and NO. Therefore, greater use of thermal plants during periods of drought generally increases the risk of producing a higher level of pollutants, which also would decrease our operating income due to the payment of so called “green taxes” (see “Environmental regulations may cause delays, impede the development of new projects, or increase the costs of operations and capital expenditures” below). |
14
It may take an extended period of time to fully recover from the drought that has been affecting the regions where most of our hydroelectric plants are located and new drought periods may recur in the future. A prolonged drought may exacerbate the risks described above and have a further adverse effect upon our business, results of operations and financial condition.
The distribution business is also affected by weather. Moderate temperatures, for instance, decrease heating in the winter months and air conditioning in the summer months, affecting energy consumption. On the other hand, with extreme temperatures, demand can increase significantly within a very short period of time, which in turn affects service and could result in service disruptions that are potentially subject to fines. Depending on weather conditions, results obtained by our distribution business can vary significantly from year to year. In addition, damage to one or more of our main electricity distribution installations or interruption to service caused by extreme weather events, earthquakes or other natural disasters could have a material adverse effect on our operations. For example, as a result of severe rainstorms in June 2017, with high wind gusts that brought down part of the electric network, 125,000 of our customers, or 7%, were affected adversely. In July 2017, a strong snowstorm that hit the Santiago Metropolitan Region, caused massive damage to the electrical infrastructure, and affected 342,000 of our customers, or 18%, and 17% of our feeders. This was the most damaging snowstorm in Santiago since 1970, and left parts of the capital without power for over a week. These events significantly increased our costs due to emergency responses including payments related to damage compensation, fines, line maintenance and tree trimming programs.
Governmental regulations may adversely affect our businesses.
Our businesses and the tariffs that we charge to our customers are subject to extensive regulation and these regulations may adversely affect our profitability. For example, governmental authorities might impose material rationing policies during droughts or prolonged failures of power facilities, which may adversely affect our business, results of operations and financial condition.
Governmental authorities may also delay the distribution tariff review process, or tariff adjustments may be insufficient to pass through all of our costs to customers. Similarly, electricity regulations issued by governmental authorities in Chile may affect the ability of our generation companies to collect revenues sufficient to cover their operating costs.
The inability of any company in our consolidated group to collect revenues sufficient to cover operating costs may affect the ability of that company to operate as a going concern and may otherwise have an adverse effect on our business, financial results and operations.
In 2014, the Chilean government implemented the Energy Agenda, with an emphasis on promoting non-conventional renewable energy (“NCRE”) sources aimed at diversifying conventional energy sources and reducing the cost of electricity. Solar and wind sources are the NCRE technologies most widely used. NCRE facilities dispatch energy at very low marginal costs, and substitute expensive sources, such as conventional thermal plants. However, wind and solar sources have higher intermittency since they can only generate electricity when the wind blows or the sun shines. Handling this intermittency requires integration and flexibility from the rest of the grid’s power plants. The National Electricity Coordinator (“CEN”) coordinates dispatch from all sources. The balance of production not supplied by hydro and NCRE plants comes from thermal plants, which are among the most expensive producers, and in some cases, are subject to operating restrictions. Authorities sometimes request that thermal generators reduce their “technical minimum power capacity,” the minimum capacity at which a power plant should be safely and permanently operated, and its “minimum operating time” as specified by the turbine manufacturer. A turbine that operates for less than the manufacturers’ recommended minimum time, or at less than the technical minimum power capacity, is subject to higher maintenance costs, which are not always recognized by the CEN. Generation below the technical minimum power capacity may also have adverse environmental effects. The CEN has the authority to audit power plant technical parameters, and impose fines or request injunctions.
Changes in the regulatory framework are often submitted to the legislators and administrative authorities and, some of these changes could have a material adverse impact on our business, results of operations and financial condition.
Regulatory authorities may impose fines on our subsidiaries due to operational failures or any breach of regulations.
Our electricity businesses are subject to regulatory fines for any breach of current regulations, including energy supply failures. Such fines may be imposed for a maximum of 10,000 Annual Tax Units (“UTA” in its Spanish acronym), or Ch$ 5.6 billion using the UTA as of December 31, 2017. Our electricity generation subsidiaries are supervised by local regulatory authorities and are subject to fines in cases where, in the opinion of the regulatory authority, operational failures affecting the regular energy supply to the system, including coordination issues, are the fault of the generator. Regulations establish a compensation fee to end customers when energy is interrupted more than the standard allowed time due to events or failures affecting transmission facilities. Compensation is a proportion of the energy not supplied with a minimum value between 20,000 UTA (Ch$ 11.3 billion) and the previous year's energy
15
sales revenues in the case of generators. Due to the consequences of electricity interruptions caused by extreme 2017 weather events, we paid Ch$ 2 billion in legal and Ch$ 3.4 billion in voluntary compensations to distribution customers without electricity for more than 24 hours, with a maximum of Ch$ 25,000 per customer, equivalent to customers’ average monthly consumption (240 kWh/month).
In 2015, the CDEC-SING audited GasAtacama’s thermal plant and reported its findings to the the Superintendence of Electricity and Fuels (“SEF”), which in August 2016 fined GasAtacama 10,000 UTA (Ch$ 5.6 billion as of December 31, 2017) for allegedly providing inaccurate information to the CDEC-SING. In 2017, Gener, a competitor, requested Enel Generación to pay US$ 65.8 million as compensation for their alleged overpayments to GasAtacama associated with the technical minimum power capacity reported by GasAtacama at 310 MW with a 30‑hour minimum operating time that was later estimated by the CEN at only 118 MW and just a 2‑hour minimum time. Further compensation claims from other market players may arise in the future and further fines to any of our plants could adversely affect our business, results of operations and financial condition.
In 2017, Enel Distribución was fined by the SEF for a total amount of 15,000 UTA (Ch$ 8.5 billion) due to various claims of infractions related to the extreme weather in June and July 2017. For further information on fines, please refer to Note 35 of the Notes to our consolidated financial statements.
We depend on payments from our subsidiaries to meet our payment obligations.
In order to pay our obligations, we rely on cash from dividends, loans, interest payments, capital reductions and other distributions from our subsidiaries. The ability of our subsidiaries to pay dividends, interest payments, loans and other distributions to us is subject to legal constraints such as dividend restrictions, fiduciary duties and limitations that may be imposed by local authorities, except for legal minimums.
Contractual Constraints. Distribution restrictions included in certain credit agreements of our subsidiaries may prevent dividends and other distributions to shareholders if they are not in compliance with certain financial ratios. Generally, our credit agreements prohibit any type of distribution if there is an ongoing default.
Operating Results of Our Subsidiaries. The ability of our subsidiaries to pay dividends or make loan payments or other distributions to us is limited by their operating results. To the extent that the cash requirements of any of our subsidiaries exceed their available cash, the subsidiary will not be able to make cash available to us.
Any of the situations described above could adversely affect our business, results of operations and financial condition.
We are involved in litigation proceedings.
We are involved in various litigation proceedings, which could result in unfavorable decisions or financial penalties against us. We will continue to be subject to future litigation proceedings, which could cause material adverse consequences to our business. Our financial condition or results of operations could be adversely affected if we are unsuccessful in defending lawsuits and proceedings against us. For further information on litigation proceedings, please see Note 33.3 of the Notes to our consolidated financial statements.
Environmental regulations may cause delays, impede the development of new projects, or increase the costs of operations and capital expenditures.
Our operating subsidiaries are subject to environmental regulations which, among other things, require us to perform environmental impact studies for future projects and obtain construction and operating permits from both local and national regulators. The approval of these environmental impact studies may be withheld by governmental authorities and therefore their processing time may be longer than expected.
Environmental regulations for existing and future generation capacity have become stricter and now require increased capital investments. For example, we performed improvements to our Tarapacá power plant for which the estimated total investment in reducing and monitoring emissions is Ch$ 68,240 million. Any delay in meeting the standards constitutes a violation of the regulations. Failure to certify the original implementation and ongoing emission standard requirements of such monitoring system may result in significant penalties and sanctions or legal claims for damages. We expect that even more restrictive emission limits will be established in the future. Between 2016 and 2017, Enel Generación paid fines amounting to Ch$ 4.9 billion for non-
16
compliance with environmental license requirements and failure to submit the monitoring reports for our Bocamina, Huasco and Diego de Almagro thermal plants in past years.
The 2014 tax reform law established an annual green tax on stationary power generators, such as thermal generators, based on their emission of pollutants in the previous year. This green tax is payable in 2018 and is applicable to all our thermal facilities. Our plants have reported their emissions during 2017, recognizing a tax liability as of December 31, 2017 in the amount of Ch$ 17.3 billion by Enel Generación, which was paid in April 2018. Tax expense may continue to increase in the future, and discourage thermal electricity generation.
Our power plants, both in operation and under development, may encounter significant opposition from different groups that may delay their development, increase costs, damage our reputation and potentially result in impairment of our goodwill with stakeholders.
Our reputation is the foundation of our relationship with key stakeholders. If we are unable to effectively manage real or perceived issues that could impact us negatively, our business, results of operations and financial condition could be adversely affected.
In 2015, Chilean governmental authorities established procedures that require all stakeholders to participate in the preliminary phase of the evaluation process. Plants built before the adoption of these rules that were not submitted to local consultation may face opposition from several stakeholders, such as ethnic groups, environmental groups, land owners, farmers, local communities and political parties, among others, any of whom may impact the sponsoring company’s reputation and goodwill. The projects that require consultation with local stakeholders in their evaluation process may be rejected or their development may be impeded or slowed down. Our stakeholders may also seek injunctive or other relief, which could negatively impact us if they are successful. Moreover, projects that do not require consultation with local stakeholders may be subject to intervention or suffer continuous resistance, delaying their approval process or development. In 2013‑2016, the Bocamina II power plant encountered substantial opposition from local fishermen’s unions that claimed that our facility negatively affected marine life and caused pollution, which resulted in the interruption of the operation of the power plant for over a year. In July 2015, the Bocamina II power plant resumed operations but then a second group of fishermen illegally occupied a high-voltage pylon which supports the transmission lines owned by Transelec S.A. and serve our power plants. As a consequence, both Bocamina I and II plants were temporarily shut down. The financial effects of this illegal occupation and electricity transmission interruption amounted to a Ch$ 2.8 billion reduction in operating income. Such groups may have the ability to block our power plants and directly affect our results.
The operation of our thermal power plants, especially coal power plants, may also affect our goodwill with stakeholders, due to greenhouse gas emissions, which could adversely affect the environment.
Damage to our reputation may exert considerable pressure on regulators, creditors, and other stakeholders and ultimately lead to projects and operations that may be abandoned, causing our share prices to drop and hindering our ability to attract and retain valuable employees, any of which could result in an impairment of our goodwill with stakeholders.
Power plant construction may encounter delays and significant cost over-runs.
Our power plant projects may be delayed in obtaining regulatory approvals, or may face shortages and increases in the price of equipment, materials or labor, and they may be subject to construction delays, strikes, adverse weather conditions, natural disasters, civil unrest, accidents, and human error. Any such event could adversely impact our results of operations and financial condition.
Market conditions at the time when the projects are initially approved may significantly differ from those that prevail when the projects are completed, which in some cases make such projects commercially unfeasible. This has been the case of many of our former projects, which were initially planned under completely different market conditions with higher energy prices prevailing in the market and less competition than currently exists, especially with the growth of NCRE sources. Deviations in these assumptions, including the estimation of the timing and expenditures related to these projects, may lead to cost over-runs and a completion time widely exceeding our initial estimates, which in turn may have a material adverse effect on our business, results of operation and financial condition. In 2016‑2017, we recorded over Ch$ 90 billion in impairment losses and write-offs due to the abandonment of such projects.
We are currently constructing the Los Cóndores project, a 150 MW run-of-the-river hydroelectric plant. We began the initial evaluation of Los Cóndores, which also includes a transmission line, in 1991, and we originally expected to begin operations in 2012. The project has been delayed for many reasons, including its redesign due to a technological construction change, which required a
17
new emviromental approval. Finally, construction began during 2014 and the project’s commercial start-up has now been deferred until 2020, with an estimated aggregate investment of US$ 940 million, significantly greater than the initial project, although the two are not completely comparable because of the different design and the higher standards employed today.
The locations where we may develop new projects are also sometimes highly challenging in terms of geographical topography, in some cases in mountain slopes with very limited access. These factors may also lead to significant delays and cost overruns.
Political events or financial or other crises in any region worldwide can have a significant impact in Chile, and consequently, may adversely affect our operations as well as our liquidity.
Chile is vulnerable to external shocks, including financial and political events, which could cause significant economic difficulties and affect growth. For example, the 2016 U.S. presidential election considerably increased the volatility of financial markets worldwide due to the uncertainty of political decisions. New policies adopted by the U.S. could affect world markets and global trade and result in renewed volatility, especially in commodity prices. Instability in the Middle East or in any other major oil producing region could also result in higher fuel prices worldwide, which in turn could increase the cost of fuel for our thermal generation plants and adversely affect our results of operations and financial condition. Even temporary or threatened U.S. government shut‑downs, such as those of early 2018, can have a very adverse effect on the timing, execution and increased expense associated with our major transactions and reorganizations.
An international financial crisis and its disruptive effects on the financial industry could adversely impact our ability to obtain new financings on the same historical terms and conditions that we have benefited from to date. Political events or financial or other crises could also diminish our ability to access the Chilean and international capital markets or increase the interest rates available to us. Reduced liquidity could, in turn, adversely affect our capital expenditures, our long term investments and acquisitions, our growth prospects and our dividend payout policy.
We may be unable to enter into suitable acquisitions or successfully integrate businesses that we acquire.
On an ongoing basis, we review acquisition prospects that may increase our market coverage or supplement our existing businesses, though there can be no assurance that we will be able to identify and consummate suitable acquisition transactions in the future. The acquisition and integration of independent companies that we do not control is generally a complex, costly and time-consuming process and requires significant efforts and expenditures. If we consummate an acquisition, it could result in the incurrence of substantial debt and assumption of unknown liabilities, the potential loss of key employees, amortization expenses related to tangible assets and the diversion of management’s attention from other business concerns. In addition, any delays or difficulties encountered in connection with acquisitions and the integration of multiple businesses could have a material adverse effect on our business, financial condition or results of operations.
For example, our integration with EGPL may be difficult and expensive. The merger with EGPL involves the integration of a mature business, as is the case of our conventional energy business, which we develop through Enel Generación, with EGPL’s non-conventional renewable energy business. Our goal in integrating the operations is to increase the revenues and earnings of the combined businesses and, as a combined company, to increase our ability to satisfy the demands of our customers. In so doing, we may encounter substantial difficulties in integrating our operations, and could incur substantial costs as a result of, among other things:
| • | inconsistencies in standards, controls, procedures and policies, business cultures and compensation structures between us and EGPL and the need to implement, integrate and harmonize various business-specific operating procedures and systems, as well as our financial, accounting, information and other systems and those of EGPL; |
| • | diversion of management’s attention from their other responsibilities as a result of the need to deal with integration issues; |
| • | failure to retain our customers and suppliers and those of EGPL; |
| • | difficulties in achieving full utilization of our assets and resources and those of EGPL; and |
| • | complications in retaining key employees (who may depart because of issues relating to the uncertainty and difficulty of integration or general discontent) or in efficiently managing the larger and broader organization. |
18
Under any of these circumstances, the business growth opportunities, revenue benefits and other benefits anticipated by us to result from the completion of the 2018 Reorganization may not be achieved as expected. To the extent that we incur higher integration costs or achieve lower revenue benefits than expected, our results of operations and financial condition may suffer. In addition, the diversion of management attention and any difficulties encountered from this merger could also increase costs or reduce our revenues, earnings and operating results. Any delays encountered in the integration process could have an adverse effect on our revenues, level of expenses, operating results and financial condition, which may adversely affect the value of our securities.
Our business and profitability could be adversely affected if water rights are denied or if water concessions are granted with limited duration.
We own water rights granted by the Chilean Water Authority (Dirección General de Aguas) for the supply of water from rivers and lakes near our production facilities. Under current law, these water rights are (i) for unlimited duration, (ii) absolute and unconditional property rights and (iii) not subject to further challenge. Chilean generation companies must pay an annual license fee for unused water rights. New hydroelectric facilities are required to obtain water rights, the conditions of which may impact design, timing or profitability of a project.
In addition, Chilean Congress has discussed amendments to the Water Code since 2014 in order to prioritize the use of water by defining its access as a basic human need that must be guaranteed by the State. The amendment will establish that water use for human consumption, domestic subsistence and sanitation will always take precedence, in both the granting and limiting the exercise of rights of exploitation. Under the proposal: (i) new water use concessions would be limited to 30 years, which would be extendable with respect to water rights actually used during the 30-year period, unless the Chilean Water Authority demonstrates the water rights have not been used effectively; (ii) new non-consumptive water rights would expire if the holder does not exercise the rights within eight years; (iii) existing non-consumptive water rights which have not been used would expire within eight years from the date of enactment of the new Water Code; and (iv) the preservation of water environmental flows to protect the ecosystem was added for both consumptive and non-consumptive water use and empowers the Chilean Water Authority to mandate an environmental flow requirement for existing water rights. Restrictions enacted to preserve environmental flows would reduce water availability for generation purposes.
Any limitations on our water rights, our need for additional water rights, or our unlimited duration of water concessions could have a material adverse effect on our hydroelectric development projects and our profitability.
Foreign exchange risks may adversely affect our results and the U.S. dollar value of dividends payable to ADS holders.
The Chilean peso has been subject to devaluations and appreciations against the U.S. dollar and may be subject to significant fluctuations in the future. Historically, a significant portion of our consolidated indebtedness has been denominated in U.S. dollars. Although a substantial portion of our operating cash flows is linked to U.S. dollars (primarily coming from the generation business), we generally have been and will continue to be exposed to fluctuations of the Chilean peso against the U.S. dollar because of time lags and other limitations to peg our tariffs to the U.S. dollar and the potential difficulty of obtaining loans in the same currency as our operating cash flow.
Because of this exposure, the U.S. dollar value of cash generated by our subsidiaries can decrease substantially due to peso devaluations against the U.S. dollar. Future volatility in the exchange rate of the currency in which we receive revenues or incur expenditures may adversely affect our business, results of operations and financial condition.
Our long-term electricity sale contracts are subject to fluctuations in the market prices of certain commodities, energy and other factors.
In our generation business, we have economic exposure to fluctuations in the market prices of certain commodities as a result of the long term electricity sales contracts into which we have entered, and the fact that currently 97% of our expected annual generation is sold under contracts with terms of at least five years. We have material obligations as selling parties under long term fixed-price electricity sales contracts. Prices in these contracts are indexed according to different commodities, exchange rates, inflation, and the market price of electricity. Adverse changes to these indices would reduce the rates we charge under our long term fixed-price electricity sales contracts, which could adversely affect our business, results of operations and financial condition.
In our distribution business, we are also exposed to fluctuations in electricity prices. Since 2016, some customers who had freely chosen to be subject to regulated tariffs have now been switching to the unregulated tariff regime instead due to the lower prices. These customers are tendering their electricity needs, either directly or in association with other customers, because regulated tariffs
19
are currently higher than unregulated prices, given that the former are based on contracts tendered in the past at higher prices. Lower market prices might reduce the number of customers that choose regulated tariffs, and customers may choose an alternative energy provider, reducing our number of customers, which could adversely affect our business, results of operations and financial condition.
Our controlling shareholder may exert influence over us and may have a different strategic view for our development than that of our minority shareholders.
Enel owns 61.9% of our voting shares as of the date of this Report and after giving effect to the 2018 Reorganization (and excluding treasury stock which will be cancelled). Enel, our controlling shareholder, has the power to determine the outcome of substantially all material matters that require shareholder votes in accordance with Chilean corporate law, such as the election of the majority of our board members and, subject to contractual and legal restrictions, the adoption of our dividend policy. Enel also exercises significant influence over our business strategy and operations. Its interests may, in some cases, differ from those of our minority shareholders. Certain conflicts of interest affecting Enel in these matters may be resolved in a manner that is different from interests of our company or our minority shareholders.
Our electricity business is subject to risks arising from natural disasters, catastrophic accidents and acts of terrorism, which could adversely affect our operations, earnings and cash flow.
Our primary facilities include power plants and distribution assets. Our facilities may be damaged by earthquakes, flooding, fires, and other catastrophic disasters arising from natural or accidental human causes, as well as acts of protest, vandalism, riot, and terrorism. A catastrophic event could cause disruptions in our business, significant decreases in revenues due to lower demand or significant additional costs to us not covered by our business interruption insurance. There may be lags between a major accident or catastrophic event and the final reimbursement from our insurance policies, which typically carry a deductible and are subject to per event policy maximum amounts.
We are subject to financing risks, such as those associated with funding our new projects and capital expenditures, and risks related to refinancing our maturing debt; we are also subject to debt covenant compliance, all of which could adversely affect our liquidity.
As of December 31, 2017, our consolidated interest-bearing debt totaled Ch$ 778 billion.
Our consolidated interest-bearing debt had the following maturity profile:
| • | Ch$ 15 billion in 2019-2020; |
| • | Ch$ 16 billion in 2021‑2022; and |
| • | Ch$ 730 billion thereafter. |
Some of our debt agreements are subject to (1) financial covenants, (2) affirmative and negative covenants, (3) events of default and (4) mandatory prepayments for contractual breaches, among other provisions. A significant portion of our subsidiaries’ financial indebtedness is subject to cross default provisions, which have varying definitions, criteria, materiality thresholds and applicability with respect to subsidiaries that could give rise to such a cross default. We incurred debt in connection with the 2018 Reorganization, primarily to finance the Tender Offer. As a result, we have recently entered into a debt agreement that is subject to cross default provisions.
In the event that we or our subsidiaries breach any of these contractual provisions, our debtholders may demand immediate repayment, and a significant portion of our indebtedness could become due and payable. We may be unable to refinance our indebtedness or obtain such refinancing on terms acceptable to us. In the absence of such refinancing, we could be forced to dispose of assets in order to make the payments due on our indebtedness under circumstances that might not be favorable to obtaining the best price for such assets. Furthermore, we may be unable to sell our assets quickly enough, or at sufficiently high prices, to enable us to make such payments.
We may also be unable to raise the necessary funds required to finish our projects under development or under construction. Market conditions prevailing at the moment we require these funds or other unforeseen project costs can compromise our ability to finance these projects and expenditures.
20
Our inability to finance new projects or capital expenditures or to refinance our existing debt could adversely affect our results of operation and financial condition.
We rely on electricity transmission facilities that we do not own or control. If these facilities do not provide us with an adequate transmission service, we may not be able to deliver the power we sell to our final customers.
We depend on transmission facilities owned and operated by other unaffiliated power companies to deliver the electricity we sell. This dependence exposes us to several risks. If transmission is disrupted, or transmission capacity is inadequate, we may be unable to sell and deliver our electricity. If a region’s power transmission infrastructure is inadequate, our recovery of sales costs and profits may be insufficient. If restrictive transmission price regulation is imposed, transmission companies upon whom we rely may not have sufficient incentives to invest in expansion of their transmission infrastructure, which could adversely affect our operations and financial results. The construction of new transmission lines may take longer than in the past, mainly because of social and environmental requirements that are creating uncertainty on the probability of completing the projects.
There have been blackout events in the past due to the failure of transmission lines, which exposed weaknesses in the transmission grid and its need for expansion and technological improvements to increase its reliability. Additional failures of transmission lines may occur in the future.
Any such disruption or failure of transmission facilities could interrupt our business, which could adversely affect our results of operations and financial condition.
Our business may experience adverse consequences if we are unable to reach satisfactory collective bargaining agreements with our unionized employees.
A large percentage of our employees are members of unions and have collective bargaining agreements that must be renewed on a regular basis. Our business, financial condition and results of operations could be adversely affected by a failure to reach agreement with any labor union representing such employees or by an agreement with a labor union that contains terms we view as unfavorable. Chilean law provides legal mechanisms for judicial authorities to impose a collective agreement if the parties are unable to come to an agreement, which may increase our costs beyond what we have budgeted.
In addition, we employ many highly-specialized employees, and certain actions such as strikes, walk-outs or work stoppages by these employees, could adversely impact our business, results of operations and financial condition as well as our reputation.
The relative illiquidity and volatility of the Chilean securities markets and its dependence on economic conditions in Latin America and other parts of the world could adversely affect the price of our common stock and ADS.
Chilean securities markets are substantially smaller and less liquid than the major securities markets in the United States or other developed countries. The low liquidity of the Chilean market may impair the ability of shareholders to sell shares, or holders of ADSs to sell shares of our common stock withdrawn from the ADS program, into the Chilean market in the amount and at the price and time they wish to do so. Also, the liquidity and the market for our shares or ADSs may be affected by a number of factors including variations in exchange and interest rates, the deterioration and volatility of the markets for similar securities and any changes in our liquidity, financial condition, creditworthiness, results and profitability.
In addition, Chilean securities markets may be affected to varying degrees by economic and market conditions and developments in Latin American countries, other emerging markets and elsewhere in the world. Although economic conditions in such countries may differ significantly from economic conditions in Chile, investors’ reactions to developments in any of these other countries may have an adverse effect on the market value and the liquidity of securities for Chilean issuers. An increase in the perceived risks associated with investing in South American countries and elsewhere in the world could lessen capital flows to Chile and adversely affect the Chilean economy in general, and the interest of investors in our shares or ADSs in particular.
The price or the liquidity of our shares or ADSs may be negatively affected by events in Latin American markets or the global economy in general.
21
Lawsuits against us brought outside Chile or complaints against us based on foreign legal concepts may be unsuccessful.
All of our investments are located outside of the United States. All of our directors and officers reside outside of the United States and most of their assets are located outside the United States as well. If any investor were to bring a lawsuit against our directors, officers or experts in the United States, it may be difficult for them to effect service of legal process within the United States upon these persons, or to enforce judgments obtained in United States courts based upon the civil liability provisions of the federal securities laws of the United States, against them in United States or Chilean courts. In addition, there is doubt as to whether an action could be brought successfully in Chile on the basis of liability based solely upon the civil liability provisions of the United States federal securities laws.
Interruption or failure of our information technology and communications systems or external attacks to or breaches of these systems could have an adverse effect on our operations and results.
We depend on information technology, communication and processing systems (“IT Systems”) to operate our businesses, the failure of which could adversely affect our business, results of operations and financial condition. In our generation business, IT systems are critical in monitoring our power plants’ operations, maintaining generation and network performance, adequately generating invoices to customers, achieve operating efficiencies and meeting our service targets and standards. Our distribution subsidiaries could be affected adversely because they rely heavily on IT Systems to monitor their grids (known as “smart grids” due to the higher digitalization of the market), billing processes for millions of customers and customer service platforms with over 100,000 smart meters in Santiago, which will allow bi-directional communication, digitized and interconnected networks. Temporary or long-lasting operational failures of any of these IT Systems, either intentional or not, could have a material adverse effect on our results of operations.
Cyber-attacks can have an adverse effect on our image and our relationship with the community. Over the last few years, global cyber-attacks on security systems, treasury operations, and IT Systems have intensified worldwide. We are exposed to cyber-attacks aimed at damaging our assets through computer networks, cyber spying involving strategic information that may be beneficial for third parties and cyber-theft of proprietary and confidential information, including customer information. We are also exposed to denial-of-service attacks that may affect the accessibility of our services to our users and attacks that may affect our domain name systems, preventing the use of certain useful web pages and applications.
Item 4.Information on the Company
| A. | History and Development of the Company. |
We are a publicly held limited liability stock corporation organized on March 1, 2016 under the laws of the Republic of Chile. Since April 2016, we have been registered in Santiago with the CMF (which replaced the SVS) under Registration No. 1139. We are also registered with the SEC under the commission file number 001-37723. We are legally referred to by our full name Enel Chile S.A. as well as by the abbreviated name “Enel Chile.”
Enel beneficially owned 60.6% of our Company as of December 31, 2017 and 61.9% of our voting shares (excluding treasury stock which will be cancelled) as of the date of this Report and after giving effect to the 2018 Reorganization. Our shares are listed and traded on the Chilean Stock Exchanges and our ADRs are listed and traded on the NYSE.
Our contact information in Chile is:
| |
| |
Contact Person: | Nicolás Billikopf |
Street Address: | Santa Rosa 76, Santiago, Código Postal 8330099, Chile |
email: | nicolas.billikopf@enel.com |
Telephone: | (56-2) 2353-4628 |
Web site: | www.enelchile.cl |
We are an electric utility company engaged, through our subsidiaries and affiliates, in the generation, transmission and distribution of electricity businesses in Chile. As of December 31, 2017, we had 6,351 MW of installed capacity and 1.9 million distribution customers. Our installed capacity is comprised of 28 generation facilities and a total 111 generation units, of which 55% consists of hydroelectric power plants. As of December 31, 2017, we had consolidated assets amounting to Ch$ 5,695 billion and operating revenues of Ch$ 2,529 billion.
22
We trace our origins to Compañía Chilena de Electricidad Ltda. (“CCE”), which was formed in 1921 as a result of the merger of Chilean Electric Tramway and Light Co., founded in 1889, and Compañía Nacional de Fuerza Eléctrica (“CONAFE”), with operations dating back to 1919. In 1970, the Chilean government nationalized CCE. During the 1980s, the sector was reorganized through the Chilean Electricity Law (referred to as DFL 1), CCE’s operations were divided into one generation company, a currently unrelated company, and two distribution companies, one with a concession in the Valparaíso Region, and the other, our predecessor company, with a concession in the Santiago Metropolitan Region. From 1982 to 1987, the Chilean electric utility sector went through a process of re-privatization. In August 1988, our predecessor company changed its name to Enersis S.A. (“Enersis” and currently known as Enel Américas S.A.) and became the new parent company of Distribuidora Chilectra Metropolitana S.A., later renamed Chilectra S.A (“Chilectra” and currently known as Enel Distribución Chile S.A). In the 1990s, Enersis diversified into electricity generation through increasing equity stakes in Endesa Chile S.A. (currently known as Enel Generación Chile S.A.).
During the last few years, our business stategy has focused on our core business. We have increased our shareholdings in subsidiaries related to electricity generation, divested certain non-strategic assets and reduced the number of our companies, simplifying our corporate structure, mainly through mergers.
We have conducted the following sales of non-core assets over the past few years:
| • | On January 9, 2015, we and our subsidiary Central Eléctrica de Tarapacá S.A. (“Celta”) sold 100% of the shares that were jointly held in Sociedad Concesionaria Túnel El Melón S.A. (“Túnel El Melón”) to Independencia S.A., a Chilean private equity fund. Túnel El Melón is a 2.5 kilometer two-lane highway tunnel, located between the provinces of Petorca and Quillota in the Valparaíso Region, Chile. |
| • | On September 14, 2016, we sold our 20% equity interest in GNL Quintero S.A. (“GNL Quintero”), to Enagás Chile S.p.A. We obtained this interest in GNL Quintero in 2007, as part of a consortium we formed along with ENAP, Metrogas and British Gas to build the LNG regasification facility in the Quintero Bay. Partial commercial operations of the facility began in September 2009 and full commercial operations began on January 1, 2011. |
| • | On December 16, 2016, we sold our 42.5% equity interest in Electrogas S.A. (“Electrogas”). Electrogas is a company dedicated to the transportation of natural gas and other fuels, which serves our San Isidro and Quintero power plants, among others. We received the proceeds of this sale, amounting to US$ 180 million (Ch$ 115 billion at that time), on February 7, 2017. |
In order to simplify our corporate structure, we have reduced the number of our companies over the last few years:
| • | On April 22, 2014, we acquired an additional 50% interest in Inversiones GasAtacama Holding Ltda. (“GasAtacama Holding”), which was the parent company of several subsidiaries, including GasAtacama Chile S.A. (“GasAtacama”), a 780 MW generation company located in northern Chile. We have consolidated GasAtacama since May 1, 2014 |
| • | During 2016, GasAtacama Holding merged into Celta, which later merged into GasAtacama, the surviving company on November 1, 2016. Celta was our investment vehicle through which we owned the San Isidro thermal plants, the Pangue hydroelectric plant and the Tarapacá thermal generation facility in addition to our interest in Central Éolica Canela S.A, that owned the Canela wind farms. |
| • | On November 9, 2017, GasAtacama purchased the 25% minority interest of Central Eólica Canela S.A, which was dissolved on December 22, 2017. Our economic interest in GasAtacama was 61% as of December 31, 2017. |
The 2016 Reorganization
During 2016, our shareholders carried out a reorganization process to separate the Chilean businesses from the non-Chilean businesses (the “2016 Reorganization”).
The first phase of the 2016 Reorganization involved the separation of the respective Chilean and non-Chilean electricity generation, transmission and distribution businesses of Endesa Chile, Chilectra and Enersis by means of a “demerger” under Chilean law and the subsequent distribution of the shares of the newly created entities to each company’s respective shareholders (collectively, the “Spin-Offs”). Following the approvals of the Spin-Offs by the shareholders of Enersis, Endesa Chile and Chilectra at their extraordinary shareholders’ meetings held on December 18, 2015, the “demerger” or separation of the businesses occurred on March 1, 2016 and the Spin-Offs were completed in April 2016, with the creation and public listing of the shares of the newly incorporated entities: Enersis Chile S.A. (“Enersis Chile”), Endesa Américas S.A. (“Endesa Américas”) and Chilectra Américas S.A. (“Chilectra Américas”). As a result of the Spin-Offs: (i) Endesa Chile spun-off Endesa Américas, which held the non-Chilean businesses of Endesa Chile, (ii) Chilectra spun-off Chilectra Américas, which held the non-Chilean businesses of Chilectra and (iii) Enersis spun-off Enersis Chile, which held the Chilean businesses of Enersis.
23
The second phase of the 2016 Reorganization involved the merger between the companies holding the non‑Chilean assets. On September 28, 2016, the respective shareholders of Enersis Américas S.A., Endesa Américas and Chilectra Américas approved the merger of Endesa Américas and Chilectra Américas with and into Enersis Américas S.A., with Enersis Américas S.A. continuing as the surviving company. The merger combined the non-Chilean generation, transmission and distribution businesses under a single holding company, with the aim of contributing to the simplification of the corporate structure of the group and providing benefits such as subsidiary cash leakage reduction, strategic interest alignment and increased decision-making and operational efficiencies. The merger became effective on December 1, 2016.
As part of this process, Enersis changed its name to Enersis Américas S.A. on March 1, 2016 and subsequently to Enel Américas S.A. on December 1, 2016. On October 18, 2016 (i) Endesa Chile changed its name to Enel Generación Chile S.A.; (ii) Chilectra changed its name to Enel Distribución Chile S.A.; and (iii) Enersis Chile S.A. changed its name to Enel Chile S.A.
The 2018 Reorganization
On August 25, 2017, we proposed a corporate reorganization (the “2018 Reorganization”) to consolidate Enel’s conventional and non-conventional renewable energy businesses in Chile under one company, Enel Chile, which will become Enel’s only vehicle to invest in Chile. The 2018 Reorganization involved the following transactions:
| • | a cash tender offer by Enel Chile of all outstanding shares of common stock (including American Depositary Shares or “ADSs”) of Enel Generación other than Enel Generación shares owned by us (the “Tender Offer”). The Tender Offer was subject to the condition that the tendering holders of Enel Generación shares and ADSs use Ch$236 of the Ch$590 tender offer consideration for each Enel Generación share and Ch$7,080 of the Ch$17,700 tender offer consideration for each Enel Generación ADS to subscribe for shares of our common stock at a subscription price of Ch$82 per Enel Chile share (or Ch$2,460 per Enel Chile ADS) (the "Enel Chile U.S. Share/ADS Subscription Condition”); | |
| • | a capital increase (the “Capital Increase”) to make available a sufficient number of shares of common stock of Enel Chile to deliver to tendering holders of Enel Generación shares and ADSs to satisfy the Enel Chile U.S. Share/ADS Subscription Condition and the Enel Chile Share Subscription Condition in the Tender Offer; and | |
| • | a merger pursuant to which Enel Green Power Latin América S.A. (“EGPL”) merged into Enel Chile (the “Merger”). EGPL is a closely held stock corporation organized under the laws of the Republic of Chile. Before the 2018 Reorganization, EGPL was a member of the Enel Green Power group of companies. Enel Green Power is a transnational company dedicated to electricity generation with renewable resources, which in turn is controlled by Enel. EGPL is a renewable energy generation holding company engaged, through its wholly owned subsidiary Enel Green Power Chile Ltda. (“EGP Chile”), in the electricity generation business in Chile. | |
Under Chilean Law, the 2018 Reorganization was deemed a related party transaction, subject to the statutory requirements and protections of the Title XVI of the Chilean Corporations Act. Therefore, the following additional key requirements were met:
| • | directors and executive officers who have an interest in the related party transaction disclosed such interest; |
| • | two-thirds of the outstanding voting shares at the ESM held on December 20, 2017 approved the related party transaction; and |
| • | the Board of Directors resolutions adopting the related party transaction were disclosed at the ESM held on December 20, 2017 along with the identification of the board members who approved said transaction. |
Additionally, the following requirements were also met:
| • | the Board of Directors appointed an independent evaluator to report on the conditions, effects and potential impact of the transaction on the company to shareholders; |
| • | the Directors’ Committee appointed an additional independent evaluator; |
| • | the opinions of the independent evaluators were made publicly available; and |
24
| • | each director made a publicly available statement as to whether the related party transaction is in the best interest of the company as well as disclosed any relationship with the counterparty or such director’s interest in the related party transaction. |
The different steps of the 2018 Reorganization were approved by the respective shareholders of Enel Chile, Enel Generación and EGPL at their extraordinary shareholders’ meetings held on December 20, 2017. The Tender Offer occurred between February 16, 2018 and March 22, 2018, the preemptive rights offering in connection with the Capital Increase took place between February 15, 2018 and March 16, 2018 and the 2018 Reorganization, in the aggregate, was completed and effective on April 2, 2018..
As a result of the consummation of the 2018 Reorganization, we increased our ownership of Enel Generación from 60% to a 93.6% economic interest. We continue to own 99.1% of Enel Distribución. Currently, we consolidate the Chilean conventional and renewable electricity generation business through Enel Generación, the Chilean electricity distribution business through Enel Distribución and the Chilean non-conventional renewable electricity generation business through EGP Chile. Enel remains as our parent company and our majority shareholder with 61.9% of our voting shares (excluding treasury stock which will be cancelled) after giving effect to the 2018 Reorganization.
Capital Investments, Capital Expenditures and Divestitures
We coordinate our overall financing strategy, including the terms and conditions of loans and intercompany advances entered into by our subsidiaries, in order to optimize debt and liquidity management. Generally, our operating subsidiaries independently plan capital expenditures financed by internally generated funds or direct financings. One of our goals is to focus on investments that will provide long-term benefits, such as the environmental optimization of the Bocamina II power plant and sustainability initiatives. On the other hand, to allow the connection of new customers and to provide turnkey projects, we have adopted the medium and high voltage network. Although we have considered how these investments will be financed as part of our budget process, we have not committed to any particular financing structure, and investments will depend on the prevailing market conditions at the time the cash flows are needed.
Our investment plan is flexible enough to adapt to changing circumstances by giving different priorities to each project in accordance with profitability and strategic fit. Investment priorities are currently focused on the distribution business, related to network reliability, capacity improvement and new technology developments such as smart meters.
For the 2018-2020 period, we expect to make capital expenditures of Ch$ 768 billion in our subsidiaries, related to investments currently in progress, maintenance of our distribution network, maintenance of existing generation plants and in the studies required to develop other potential generation and distribution projects. For further detail regarding these projects please see “Item 4. Information on the Company — D. Property, Plants and Equipment— Projects Under Development.”
The table below sets forth the expected capital expenditures for the 2018-2020 period and the capital expenditures incurred in 2017, 2016 and 2015:
| | Estimated 2018-2020 | | | 2017 | | | 2016 | | | 2015 | |
| | (in millions of Ch$) | |
Capital Expenditure(1) | | | 768,139 | | | | 266,030 | | | | 222,386 | | | | 309,503 | |
(1)Capex amounts represent effective payments for each year, except for future projections.
In the past, we reported a five‑year estimate of future capital expenses. However, while our planned investments go beyond the three years highlighted in this table, we are now reporting three years to be aligned with Enel’s three-year industrial plan that was disclosed in November 2016. For further information, please refer to “Item 4. Information on the Company — D. Property, Plants and Equipment. — Project Investments” and “Item 5. Operating and Financial Review and Prospects — F. Tabular Disclosure of Contractual Obligations.”
Capital Expenditures for 2017, 2016 and 2015
Our capital expenditures in the last three years were principally related to the optimization of the 350 MW Bocamina II power plant, improvements to the Tarapacá coal-fired power plant, the construction of the 150 MW Los Cóndores power plant and maintenance of our current power plants. Investments related to the Bocamina II and Tarapacá power plants focused on making
25
improvements to reduce environmental impact. These improvements were the consequence of environmental injunctions in the case of Bocamina II and new environmental regulations in the case of Tarapacá. We expect to complete the improvements to Bocamina II in 2018, while those of Tarapacá were completed in 2017.
In 2017, our investments in the distribution business were focused on connections of new customers, reinforcing feeders mainly to increase our service quality, increasing the capacity of our substations, public lighting relocation projects and automatization of our systems through the installation of control remote devices and smart meters for residential customers.
In our generation business, material plans in progress include Los Cóndores project, which began construction in 2014 with completion expected during the second half of 2020. For further detail of the Los Cóndores project, please see “Item 4. Information on the Company — D. Property, Plants and Equipment. — Projects Under Construction.”
A portion of our capital expenditures is reserved for maintenance, and for the assurance of quality and operational standards of our facilities.
In our distribution business, we plan to continue to expand our services and control energy losses in order to improve the efficiency of our facilities and profitability of our business. Our current distribution projects seek to increase our capacity to satisfy our growing number of customers and their increasing service quality demands..
Projects in progress will be financed with resources provided by external financing as well as internally generated funds.
We are a publicly held limited liability stock corporation that operates in Chile. Our core business is electricity, both generation and distribution. We conduct our business through Enel Generación and Enel Distribución, and their respective subsidiaries.
We also participate in other activities but that are not core businesses and represent less than 1% of our 2017 revenues. We do not report them as separate business segment in this Report nor in our consolidated financial statements.
The table below presents our revenues:
| | Year ended December 31, | |
Revenues | | 2017 | | | 2016 | | | 2015 | | | Change 2017 vs. 2016 | |
| | (in millions of Ch$) | | | (in %) | |
Generation | | | 1,634,937 | | | | 1,659,727 | | | | 1,543,812 | | | | (1.5 | ) |
Distribution | | | 1,333,027 | | | | 1,315,761 | | | | 1,257,732 | | | | 1.3 | |
Other businesses and intercompany transaction adjustments | | | (438,618 | ) | | | (433,921 | ) | | | (402,515 | ) | | | 1.1 | |
Total revenues | | | 2,529,347 | | | | 2,541,567 | | | | 2,399,029 | | | | (0.5 | ) |
For further financial information related to our revenues, see “Item 5. Operating and Financial Review and Prospects — A. Operating Results” and Note 32 of the Notes to our consolidated financial statements.
Electricity Generation Business Segment
We, through our subsidiary Enel Generación, in which we hold a 94% economic interest as of the date hereof, after giving effect to the 2018 Reorganization, are a generation operator in the SEN, representing 34.2% of the electricity market share in 2017.
As of December 31, 2017, we accounted for 27.8% of the SEN’s total generation capacity, measured by the installed capacity, according to figures published by the National Electricity Coordinator (“CEN” in its Spanish acronym). Hydroelectric, thermal and wind power represent 54.6%, 44.2% and 1.2% of our total installed capacity in Chile, respectively.
For additional detail on our historical capacity see “Item 4. Information on the Company — D. Property, Plants and Equipment.”
26
The following tables summarize the information relating to our capacity, electricity generation and energy sales:
ELECTRICITY DATA
| | Year ended December 31, | |
| | 2017 | | | 2016 | | | 2015 | |
Number of generating units(1) | | | 111 | | | | 111 | | | | 111 | |
Installed capacity (MW)(2) | | | 6,351 | | | | 6,351 | | | | 6,351 | |
Electricity generation (GWh) | | | 17,073 | | | | 17,564 | | | | 18,294 | |
Energy sales (GWh) | | | 23,356 | | | | 23,689 | | | | 23,558 | |
(1) | For details on generation facilities, see “Item 4. Information on the Company — D. Property, Plants and Equipment — Property, Plant and Equipment of Generation Companies.” |
(2) | Total installed capacity is defined as the maximum capacity (MW), under specific technical conditions and characteristics. In most cases, installed capacity is confirmed by satisfaction guarantee tests performed by equipment suppliers. Figures may differ from installed capacity declared to governmental authorities and customers, according to criteria defined by such authorities and relevant contracts. |
Our consolidated electricity generation sales in 2017 were 23,356 GWh and our production was 17,073 GWh, which represents a 1.4% and 2.8% decrease, when compared to 2016, respectively.
Dividing the electricity generation business into hydroelectric, thermoelectric and other generation is customary in the electricity industry, because each generation type has significantly different variable costs. Thermoelectric generation, for instance, requires the purchase of fuel, which generally leads to higher variable costs than hydroelectric generation from reservoirs or rivers that normally has minimal variable costs. Of our total consolidated generation in 2017, 56.5% was from hydroelectric sources, 42.7% was from thermal sources, and less than 1% was from wind energy, which is generated by the Canela I and Canela II wind farms, which are subsidiaries of GasAtacama.
The following table summarizes our consolidated generation by type of energy:
GENERATION BY TYPE OF ENERGY (GWh)
| | Year ended December 31, | |
| | 2017 | | | 2016 | | | 2015 | |
| | Generation | | | % | | | Generation | | | % | | | Generation | | | % | |
Hydroelectric | | | 9,652 | | | | 56.5 | | | | 9,078 | | | | 51.7 | | | | 11,842 | | | | 64.7 | |
Thermal | | | 7,292 | | | | 42.7 | | | | 8,379 | | | | 47.7 | | | | 6,314 | | | | 34.5 | |
Other generation(1) | | | 129 | | | | 0.8 | | | | 107 | | | | 0.6 | | | | 138 | | | | 0.8 | |
Total generation | | | 17,073 | | | | 100 | | | | 17,564 | | | | 100 | | | | 18,294 | | | | 100 | |
(1) | Other generation refers to the generation from the Canela I and Canela II wind farms. |
The following table contains information regarding our consolidated sales of electricity by type of customer for each of the periods indicated:
ELECTRICITY SALES BY CUSTOMER TYPE (GWh)
| | Year ended December 31, | |
| | 2017 | | | 2016 | | | 2015 | |
| | Sales | | | % of Sales Volume | | | Sales | | | % of Sales Volume | | | Sales | | | % of Sales Volume | |
Regulated customers | | | 17,029 | | | | 72.9 | | | | 18,516 | | | | 78.2 | | | | 17,622 | | | | 74.8 | |
Unregulated customers | | | 5,586 | | | | 23.9 | | | | 4,321 | | | | 18.2 | | | | 4,319 | | | | 18.3 | |
Total contracted sales(1) | | | 22,615 | | | | 96.8 | | | | 22,838 | | | | 96.4 | | | | 21,940 | | | | 93.1 | |
Electricity pool market sales | | | 742 | | | | 3.2 | | | | 852 | | | | 3.6 | | | | 1,618 | | | | 6.9 | |
Total electricity sales | | | 23,356 | | | | 100 | | | | 23,689 | | | | 100 | | | | 23,558 | | | | 100 | |
(1) | Includes sales to distribution companies not backed by contracts. |
27
Dividing sales by customer type in terms of regulated and unregulated customer is useful in managing and understanding the business. Our generation companies sell electricity to regulated customers through distribution companies, and to unregulated customers directly. The sales to distribution companies to supply the distributors’ regulated customers, that is, either residential, commercial or others, are classified as regulated sales and are subject to government regulated electricity tariffs. The sales of generation companies to distribution companies to supply the distributors’ unregulated customers are also classified as regulated sales and are also governed by contracts at a regulated electricity tariff. The sales of our generation companies directly to large commercial and industrial customers and other generators are classified as unregulated sales and are generally governed by contracts with freely negotiated prices and terms. Finally, pool market sales are the sales that take place when generation companies are dispatched by the CEN in excess of their contractual obligations and therefore must sell their surplus electricity in the pool market, or when the generators electricity dispatched is less than their contractual commitments with their customers and therefore must purchase the deficit in the pool market. These purchase and sale transactions among electricity companies are normally carried out in the pool market at the spot price, and do not require a contractual agreement.
The regulatory framework often requires that electricity distribution companies have contracts to support their commitments to small volume customers. Chilean regulations also determine which customers can purchase energy directly in the electricity pool market.
We attempt to minimize the risk of electricity generation deficits resulting from poor hydrological conditions in any given year by limiting our contractual sales requirements to a quantity that does not exceed our estimated electricity production in a dry year. We consider the available statistical information concerning rainfall, mountain snow and ice, and when they are expected to melt, hydrological levels, and the capacity of key reservoirs to determine our estimated production for a dry year. In addition to limiting contracted sales, we may adopt other strategies including installing temporary thermal capacity, negotiating lower consumption levels with unregulated customers, negotiating with other water users and including pass-through cost clauses in contracts with customers to cover the cost of spot market purchases.
In 2022, distribution company contracts awarded in the August 2016 auction will come into effect and therefore the tariffs of our regulated contracts will decrease by 6% as a consequence of the lower prices offered by NCRE providers in the energy auction for distribution companies. In 2024, contracts awarded in the November 2017 auction will come into effect with an average price of US$ 32.5 per MWh, which is 31.7% lower than the average price of the previous tender process. We routinely participate in energy bids and we have been awarded long term energy sale contracts that incorporate the expected variable costs considering changes to the most relevant variables. These contracts secure the sale of our current and expected new capacity and allow us to stabilize our income. Currently, 39.4% of our expected annual generation is sold under contracts with terms of at least ten years and 96.8% is sold under contracts with terms of at least five years.
In November 2017, the outcome of the latest bidding process was announced. This process tendered 2,200 GWh per year to be delivered between 2024 and 2043. The total amount of energy tendered was based on renewable energy offers, thus representing a milestone in the industry. We, through Enel Generación, were awarded 54% of the tender, corresponding to 1.2 TW at an average price of US$ 34.7 per MWh with a mix of wind, solar and geothermal generation.
In terms of expenses, the primary variable costs involved in the electricity generation business, in addition to the direct variable cost of generating hydroelectric or thermal electricity such as fuel costs, are energy purchases and transportation costs. During periods of relatively low hydrology, the amount of our thermal generation increases. This involves an increase in the amount of fuel required and the costs of its transportation to the thermal generation power plants. Under dry conditions, electricity that we have contractually agreed to provide may exceed the amount of electricity that we are able to generate. Therefore, to satisfy our contractual commitments, we may be required to purchase electricity in the pool at spot market prices. The cost of these purchases at spot prices may, under certain circumstances, exceed the price at which we sell electricity under contracts and, therefore, may result in a loss. We attempt to minimize the effect of poor hydrological conditions on our operations in any given year by limiting our contractual sales requirements to a quantity that does not exceed our estimated electricity production in a dry year. We consider the available statistical information concerning rainfall, mountain snow and ice which is expected to melt, hydrological levels, and the capacity of key reservoirs to determine our estimated production for a dry year. In addition to limiting contracted sales, we may adopt other strategies including installing temporary thermal capacity, negotiating lower consumption levels with unregulated customers, negotiating with other water users and including pass-through cost clauses in contracts with customers.
28
Seasonality
While our core business is subject to weather patterns, generally only extreme events such as prolonged droughts, which may adversely affect our generation capacity, rather than seasonal weather variations, materially affect our operating results and financial condition.
The generation business is affected by seasonal changes throughout the year. During normal hydrological years, snow melts typically occur during the warmer months of October through March. These snow melts increase the level of water in our reservoirs. The months with most precipitation are typically May through August.
When there is more precipitation, hydroelectric generating facilities can accumulate additional water to be used for generation. The increased level of our reservoirs allows us to generate more electricity with hydro power plants during months in which marginal electricity costs are lower.
In general, hydrological conditions such as droughts and insufficient rainfall adversely affect our generation capacity. For example, severe prolonged drought conditions or reduced rainfall levels in Chile caused by El Niño phenomenon reduces the amount of water that can be accumulated in reservoirs, thereby curtailing our hydroelectric generation capacity. In order to mitigate hydrological risk, hydroelectric generation may be substituted with thermal generation (natural gas, LNG, coal or diesel) and energy purchases on the spot market, both of which could result in higher costs, in order to meet our obligations under contracts with both regulated and unregulated customers.
Operations
We own and operate a total of 111 generation units in Chile both directly and through our subsidiaries, GasAtacama and Pehuenche. Of these generation units, 38 are hydroelectric, with a total installed capacity of 3,465 MW, representing 54.6% of our total installed capacity in Chile. There are 22 thermal generation units that operate with gas, coal or oil with a total installed capacity of 2,808 MW, representing 44.2% of our total installed capacity in Chile. There are 51 wind powered generation units with an aggregate installed capacity of 78 MW, representing 1.2 % of our total installed capacity in Chile. On November 21, 2017, the integration of the SIC and the SING into one interconnected system was completed and resulted in the creation of the SEN, a new national interconnected system that extends from Arica in the north to Chiloé in the south.
For information on the installed generation capacity for each of our subsidiaries, see “Item 4. Information on the Company — D. Property, Plants and Equipment.”
Our total gross electricity generation in Chile accounted for 23.8% of total gross electricity generation in Chile during 2017.
The following table sets forth the electricity generation by each of our generation companies:
ELECTRICITY GENERATION BY COMPANY (GWh)
| | Year ended December 31, | |
| | 2017 | | | 2016 | | | 2015 | |
Enel Generación | | | 10,976 | | | | 11,538 | | | | 10,450 | |
Pehuenche | | | 2,443 | | | | 2,369 | | | | 2,959 | |
Celta(1) | | | — | | | | — | | | | 3,614 | |
GasAtacama(1) | | | 3,654 | | | | 3,657 | | | | 1,270 | |
Total | | | 17,073 | | | | 17,564 | | | | 18,294 | |
(1) | In November 2016, Celta was merged into GasAtacama. |
In 2017, Chilean reservoirs reached 4,277 GWh of energy equivalent, a 1,228 GWh increase, or 40%, compared to 3,049 GWh in 2016. In 2015, the energy equivalent was 4,409 GWh.
29
The following table sets forth the electricity generation by type:
ELECTRICITY GENERATION BY TYPE (GWh)
| | Year ended December 31, | |
| | 2017 | | | 2016 | | | 2015 | |
| | Generation | | | % | | | Generation | | | % | | | Generation | | | % | |
Hydroelectric generation | | | 9,392 | | | | 55.0 | | | | 8,815 | | | | 50.2 | | | | 11,557 | | | | 63.2 | |
Thermal generation | | | 7,292 | | | | 42.7 | | | | 8,379 | | | | 47.7 | | | | 6,314 | | | | 34.5 | |
Wind generation – NCRE(1) | | | 129 | | | | 0.8 | | | | 107 | | | | 0.6 | | | | 138 | | | | 0.8 | |
Mini-hydro generation – NCRE(2) | | | 260 | | | | 1.5 | | | | 263 | | | | 1.5 | | | | 285 | | | | 1.6 | |
Total generation | | | 17,073 | | | | 100 | | | | 17,564 | | | | 100 | | | | 18,294 | | | | 100 | |
(1) | Electricity generated by the Canela I and Canela II wind farms. |
(2) | Electricity generated by the Palmucho and the Ojos de Agua mini-hydroelectric plants. |
Water Agreements
Water agreements refer to the right of a user to utilize water from a particular source, such as a river, stream, pond or groundwater. In times of good hydrological conditions, water agreements are generally not complicated or contentious. However, in times of poor hydrological conditions, water agreements protect our right to use water resources for hydroelectric generation.
Through our subsidiaries, we have three agreements in force with the purpose of utilizing water for both irrigation and hydroelectric generation more efficiently. Two of them are agreements between Enel Generación and the Chilean Water Works Authority (“DOH” in its Spanish acronym) and are related to the water consumption during the most intense irrigation period (normally from September to April) from Laja Lake and Maule Lagoon, both located in southern Chile. Enel Generación signed the first agreement with the DOH related to Laja Lake and Maule Lagoon on October 24, 1958 and September 9, 1947, respectively.
After four years of studies and dialogue with different sectors making use of water from the Laja Lake, on November 16, 2017, the Operation and Recovery of Laja Lake Agreement was signed, which complements the agreement signed with DOH in 1958. This agreement provides reasonable irrigation security to irrigators in the area, giving priority to extractions for irrigation when the reservoir is at low levels, which are also used by generation. It also contemplates the use of a certain volume of water to maintain the scenic beauty of Salto del Laja, a well-known tourist attraction in the area. It also significantly improves the flexibility in the use of water, eliminating most of the restrictions that existed in the form of water extraction, replacing it by annual volumes that will manage irrigation and generation according to their needs. Another agreement was signed in October 2017 between our subsidiary Pehuenche and the irrigators of the Maule Lagoon Monitoring Board to optimize the use of water during drought periods. These agreements allow us to use the water more efficiently and to avoid further litigation with the local community, especially with farmers.
Thermal Generation
Our thermal electricity generation facilities use mostly LNG, coal and to a lesser extent, diesel. This mix allows us to use other fuels if the price of LNG were to be relatively too high, if there were to be a shortage of supply, or another circumstance were to make LNG unavailable. To satisfy our natural gas and transportation requirements, we signed a long-term gas supply contract with suppliers that establishes maximum supply amounts and prices, as well as long-term gas transportation agreements with the pipeline companies. Gasoducto GasAndes S.A. and Electrogas S.A. are our current gas transportation providers. Since March 2008, all of our natural gas units can operate using either natural gas or diesel and since December 2009, San Isidro, San Isidro 2 and Quintero power plants operate using LNG.
The LNG contract is the largest supply contract and it is based on long-term agreements between Enel Generación with Quintero LNG Terminal (“GNLQ terminal”) for regasification services and British Gas for supply. Our LNG Sale and Purchase Agreement is in force through 2030 and is indexed to the Henry Hub/Brent commodity prices. We receive 29.7 TBtu of gas annually, and the contract provides the flexibility to purchase an additional amount between 23.6 TBtu and 24.6 TBtu. There are contingencies clauses in the contract that would allow cancellations (for a fee), and deviations, under certain conditions. We are not dependent on any one particular source of LNG, as long as the LNG meets the contracted specifications.
30
The Terminal Use Agreement, between Enel Generación and the GNLQ terminal, is the most relevant agreement regarding our LNG supply and covers our foreseeable needs. This contract runs through 2035, has a fixed pricing structure, providing a 10% return on assets plus a marketing fee and allows us, through GNL Chile, to access additional supply from the spot market, if needed.
These contracts allow us to secure its long-term LNG supply at competitive prices, with significant flexibility and the addition of new capacity sufficient for our current and potential needs.
Enel Generación also exercised a priority right to purchase additional regasification capacity as part of an expansion of the GNLQ terminal. This allowed us to increase our regasification capacity from 3.2 million cubic meters per day to 5.4 million cubic meters per day since first quarter of 2015. This additional capacity allows our San Isidro and Quintero facilities to provide additional thermal generation, to secure the regasification for future power plants, as well as develop new businesses, such as the lease agreement signed with Gener in 2017, which allowed us to generate energy utilizing our additional capacity of LNG in Gener’s Nueva Renca combined-cycle power plant.
In February 2017, we completed the sale of our 42.5% equity interest in Electrogas to Aerio Chile S.A., a subsidiary of the Portuguese REN-Redes Energeticas Nacionais. This agreement does not affect our gas and oil transportation agreements with Electrogas, allowing us to satisfy San Isidro CCGT units’ gas and oil requirements through Electrogas’ network.
In 2017, Enel Generación, along with ENAP and Metrogas, exported 277 million cubic meters of natural gas from the GNLQ terminal to Argentina during the winter through an existing transport infrastructure. Enel Generación contributed with 32% of the gas volume. This is the second year that we have exported natural gas to Argentina along with ENAP and Metrogas.
Since August 2014, Enel Generación has been delivering its gas sales through a LNG truck loading facility (“TLF”) in the GNLQ terminal. This facility has allowed us to reach both industrial customers and gas distributor companies in different cities within 700 km from Santiago. The largest satellite regasification facility for industrial supply built so far was put into operations during 2017 and supplied by Enel Generación, which strengthens our position in the LNG distribution business to industrial customers.
During 2017, Enel Generación signed a Terminal Use Agreement with GNL Mejillones, a port located in northern Chile, to unload LNG, which has allowed us to become one of the main suppliers in the region. This agreement has allowed us to renew gas purchase contracts with industrial customers and to supply our thermal generation plants located in northern electric grid.
Regarding LNG trading, during 2017 Enel Generación sold LNG to Enel Trade to be delivered at Isle of Grain, UK, which was the first LNG transaction with delivery outside Latin America.
With respect to coal-based power plant operations, during 2017, 924 kilotons of coal were consumed by Tarapacá and Bocamina power plants. This consumption was equivalent of 1.8 TWh of energy generated by Bocamina 2 and 0.6 TWh generated by Bocamina.
Generation from NCRE sources
Under Chilean law, electricity generation companies must derive a minimum amount of their energy sales from NCRE. This minimum amount depends on the date of execution of the sale contract and ranges from zero, for those signed prior to 2007, to 20% for those signed starting in July 2013. Currently, our Canela wind farms, Ojos de Agua mini-hydroelectric plant and 40% of the installed capacity of our Palmucho mini-hydroelectric plant qualify as NCRE facilities.
Electricity sales and generation
The SEN’s electricity sales increased 1.2% during 2017 compared to 2016, as set forth in the following table:
ELECTRICITY SALES PER SYSTEM (GWh)
| | Year ended December 31, | |
| | 2017(1) | | | 2016 | | | 2015 | |
Electricity sales in the SIC | | | - | | | | 50,516 | | | | 49,581 | |
Electricity sales in the SING | | | - | | | | 16,960 | | | | 16,887 | |
Total electricity sales (SEN) | | | 68,256 | | | | 67,476 | | | | 66,468 | |
| (1) | On November 21, 2017, the SIC and the SING were integrated into one interconnected system and resulted in the creation of SEN. |
31
Our electricity sales reached 23,356 GWh in 2017, 23,689 GWh in 2016 and 23,558 GWh in 2015, which represented a 34.2%, 35.1% and 35.4% market share, respectively. The percentage of the energy purchases to comply with our contractual obligations to third parties increased by 2.6% in 2017 when compared to 2016 primarily due to a decrease in electricity generation, partially offset by a slight decrease in our volume of sales to customers.
The following table sets forth our electricity generation and purchases:
ELECTRICITY GENERATION AND PURCHASES (GWh)
| | Year ended December 31, | |
| | 2017 | | | 2016 | | | 2015 | |
| | (GWh) | | | % of Volume | | | (GWh) | | | % of Volume | | | (GWh) | | | % of Volume | |
Electricity generation | | | 17,073 | | | | 73.1 | | | | 17,564 | | | | 74.1 | | | | 18,294 | | | | 77.7 | |
Electricity purchases | | | 6,283 | | | | 26.9 | | | | 6,125 | | | | 25.9 | | | | 5,264 | | | | 22.3 | |
Total | | | 23,356 | | | | 100 | | | | 23,689 | | | | 100 | | | | 23,558 | | | | 100 | |
We supply electricity to the major regulated electricity distribution companies, large unregulated industrial firms (primarily in the mining, pulp and steel sectors) and the pool market. Commercial relationships with our customers are usually governed by contracts. Supply contracts with distribution companies must be auctioned, and are generally standardized with an average term of ten years.
Supply contracts with unregulated customers (large industrial customers) are specific to the needs of each customer, and the conditions are agreed between both parties, reflecting competitive market conditions.
In 2017, 2016 and 2015, we had 152, 46 and 41 customers, respectively. This significant increase in 2017 is mainly due to a transfer of regulated clients to unregulated clients resulting from the advantage givin by the regulation by seeking lower prices when negotiating directly their contracts with the generators in a competitive market, and due to changes in our commercial strategy. In 2017, our customers included 25 distribution companies in the SEN and 127 unregulated customers.
The most significant supply contracts with regulated customers are with our subsidiary Enel Distribución and with Compañía General de Electricidad S.A. (“CGE”), an unaffiliated entity. These are the two largest electricity distribution companies in Chile in terms of sales.
Our generation contracts with unregulated customers are generally on a long-term basis and typically range from five to fifteen years. Such contracts are usually automatically extended at the end of the applicable term, unless terminated by either party upon prior notice. Some include a price adjustment mechanism in the case of high marginal costs, and therefore, reduces the hydrological risk. Contracts with unregulated customers may also include specifications regarding power sources and equipment, which may be provided at special rates, as well as provisions for technical assistance to the customer. We have not experienced any supply interruptions under our contracts. If we experienced a force majeure event, as defined in the contract, we are allowed to reject purchases and we have no obligation to supply electricity to our unregulated customers. Disputes are typically subject to binding arbitration between the parties, with limited exceptions.
For the year ended December 31, 2017, our principal distribution customers were (in alphabetical order): Enel Distribución. Grupo CGE, Grupo Chilquinta and Grupo Saesa.
Our principal unregulated customers were (in alphabetical order): Compañia Minera Doña Inés de Collahuasi SCM, Enel Distribución, Empresa CMPC S.A., Minera Valle Central S.A. and SCM Minera Lumina Copper Chile.
We compete in the SEN primarily with three generation companies, AES Gener, Colbún S.A. (“Colbún”) and Engie. According to the National Electricity Coordinator (“CEN” in its Spanish acronym) in 2017, AES Gener and its subsidiaries had an installed capacity of 4,048 MW, of which 93% was thermoelectric. Colbún had an installed capacity of 3,302 MW connected to the SEN, of which approximately 52% was thermoelectric. Engie had an installed capacity of 2,054 MW connected to the SEN, of which approximately 95% was thermoelectric In addition, there are a number of smaller entities with an aggregate installed capacity of 7,093 MW that generate electricity in the SEN.
32
Electricity generation companies compete largely on the basis of price, technical experience and reliability. In addition, because 54.6% of our installed capacity connected to the SEN is hydroelectric, we have lower marginal production costs than companies whose installed capacity is primarily thermal. Our installed thermal capacity benefits from access to gas from the GNLQ terminal. However, during periods of extended droughts, we may be forced to buy more expensive electricity from thermoelectric generators at spot prices in order to comply with our contractual obligations.
Electricity Distribution Business Segment
We, through our subsidiary Enel Distribución, in which we have a 99.1% economic interest, are one of the largest electricity distribution companies in Chile in terms of the number of regulated customers, distribution assets and energy sales.
We operate in a concession area of 2,105 square kilometers, under an indefinite concession granted by the Chilean government. We transmit and distribute electricity in 33 municipalities in the Santiago metropolitan region. Our service area is primarily defined as a densely populated area under the Chilean tariff regulations, which govern electricity distribution companies and includes all residential, commercial, industrial, governmental electricity customers, and toll customers. The Santiago metropolitan region, which includes the capital of Chile, is the country’s most densely populated area and has the highest concentration of industries, industrial parks and office facilities in the country. As of December 31, 2017, we distributed electricity to approximately 1.9 million customers. Energy losses were 5.1% in 2017 and 5.3% in 2016 and 2015.
For the year ended December 31, 2017, residential, commercial, industrial and other customers, who are primarily municipalities, represented 28%, 32% and 15% and 25%, respectively, of our total energy sales of 16,438 GWh, which is an increase of 3.2% in comparison with the same period in 2016.
The following table sets forth our principal operating data for each of the periods indicated:
| | Year ended December 31, | |
| | 2017 | | | 2016 | | | 2015 | |
Electricity sales (GWh) | | | 16,438 | | | | 15,924 | | | | 15,893 | |
Residential | | | 4,676 | | | | 4,442 | | | | 4,329 | |
Commercial | | | 5,271 | | | | 5,075 | | | | 5,157 | |
Industrial | | | 2,451 | | | | 2,536 | | | | 2,674 | |
Other customers(1) | | | 4,039 | | | | 3,871 | | | | 3,733 | |
Number of customers (thousands) | | | 1,882 | | | | 1,826 | | | | 1,781 | |
Residential | | | 1,686 | | | | 1,634 | | | | 1,593 | |
Commercial | | | 146 | | | | 142 | | | | 139 | |
Industrial | | | 13 | | | | 13 | | | | 12 | |
Other customers | | | 38 | | | | 37 | | | | 37 | |
Energy purchased (GWh)(2) | | | 17,373 | | | | 16,803 | | | | 16,772 | |
Total energy losses (%)(3) | | | 5.1 | | | | 5.3 | | | | 5.3 | |
(1) | The data for other customers includes tolls. |
(2) | During 2017, 2016, and 2015, Enel Distribución acquired from Enel Generación 39%, 38% and 35%, respectively, of its electricity purchases. |
(3) | Energy losses are calculated as the percent difference between energy purchased and energy sold excluding tolls and energy consumption not billed (GWh) within a given period Losses in distribution arise from illegally tapped lines as well as technical losses. |
Enel Distribución’s tariff review process, which set the tariffs for the 2016-2020 period, was finalized in August 2017. The new tariffs were applied retroactively as of November 2016 and the review did not have a significant effect on Enel Distribución’s tariffs.
For the year ended December 31, 2017, the collection rate was 99.6%, compared to 100.2% during the same period in 2016. The 2016 collection rate was more than 100% due to the collection of unpaid bills from previous years.
For the supply to regulated distribution customers, Enel Distribución has entered into contracts with the following generation companies: Enel Generación, our subsidiary, as well as the unaffiliated companies SCB II SpA, AES Gener S.A., Amunche Solar S.A., Colbún S.A., OPDE Chile SpA, Guacolda S.A., Camán Eólica SpA, Empresa Eléctrica Panguipulli S.A., Coihue Eólica SpA,
33
Empresa Eléctrica Carén S.A., Tchamma Eólica SpA, Empresa Eléctrica ERNC-1 S.A., Cerro Tigre Eólica SpA, Chungungo S.A., Ckani Eólica SpA, Polpaico S.A., Esperanza Eólica SpA, Energía Cerro el Morado S.A., Puelche Sur Eólica SpA, SPV P4 S.A., Parque Eólico Cabo Leones I S.A., San Juan S.A., Ibereólica Cabo Leones II S.A., Pelumpén S.A., Ibereólica Cabo Leones III S.A., Santiago Solar S.A., WPD Malleco SpA, Acciona Energía Chile Holdings S.A.,WPD Malleco II SpA, E-CL S.A., WPD Negrete SpA, Central El Campesino S.A., WPD Duqueco SpA, Norvind S.A., WPD Santa Fe SpA, Abengoa Generación Chile S.A., María Elena Solar S.A., Aela Generación S.A., Besalco Energía Renovable S.A., Abengoa Generación Chile Dos S.A., Cox Energy Chile SpA and Ibereólica Cabo Leones I.S.A.
In 2017, the distribution companies of the former SIC jointly submitted a 2,200 GWh/year bid for the period of 2024 through 2043. In November 2017, the following generation companies were awarded the most relevant amounts of the bid companies: Enel Generación, Energía Renovable Verano Tres SpA, Cox Energía SpA, Atacama Energy Holdings S.A. and Atacama Solar S.A.
For the supply to unregulated distribution customers, Enel Distribución has contracts with the following generation companies: Colbún S.A., Hidroeléctrica La Higuera S.A., Hidroeléctrica La Confluencia S.A., Guacolda S.A., Pacific Hydro Chacayes S.A., Enel Green Power, Orazul Energy Duqueco SpA (formerly Duke Energy Duqueco SpA) and KDM Energía S.A.
Seasonality
The distribution business is directly influenced by seasonal changes in energy demand. Although the price at which a distribution company purchases electricity can change seasonally and has an impact on the price at which it is sold to end users, it does not have an impact on our profitability since the cost of electricity purchased is passed to end users through tariffs that are set for multi-year periods. In general, moderate temperatures reduce the need for electric heating and air conditioning. During 2017, the effects of low temperatures (especially during winter) positively impacted our residential customers’ per capita consumption, which represented 28% of our electricity distribution during 2017.
ELECTRICITY INDUSTRY STRUCTURE AND REGULATORY FRAMEWORK
1. Overview and Industry Structure
The goal of the Chilean Electricity Law is to provide incentives to maximize efficiency and to provide a simplified regulatory scheme and tariff-setting process that limits the discretionary role of the government. This goal is acheived by establishing objective criteria for setting prices that provide a competitive rate of return on investment to stimulate private investment, while ensuring the availability of electricity in the system to all who request it.
The Chilean electricity sector is physically divided into three main networks, the SEN and two smaller isolated networks (Aysén and Magallanes). The SEN was created by of the integration of the SIC and the SING that took place in November 2017 and extends from Arica in the north to Chiloé in the south.
The operation of the SEN is coordinated by a centralized dispatch center, the CEN (National Electricity Coordinator). Until the interconnection of the SIC and SING in 2017, each system was coordinated by its respective dispatch center, the CDEC-SIC and the CDEC-SING.
The Chilean electricity market provides energy and capacity and several related services to regulated customers (49% of electricity sales in 2017) and non-regulated customers (51% of electricity sales in 2017). The SEN had a total 22,835 MW of installed capacity as of December 31, 2017 of which 29% was hydro, 58% was thermal, and 13% was from other sources including NCRE capacity.
The industry is divided into three business segments: generation, transmission and distribution. The electricity installations that carry out these activities must operate in an interconnected and coordinated manner to supply electricity at the minimum cost and within the standards of quality and security required by the industry’s rules and regulations.
Given the structural characteristics of the transmission and distribution segments, they are considered natural monopolies and are therefore subject to special industry regulations, including antitrust legislation. The electricity network is open access and tariffs of transmission and distribution are regulated. Electricity distribution requires a concession and a distributor has the obligation to supply electricity to regulated customers within a concession area. The generation segment, on the other hand, operates competitively and does not require a concession granted by the authority.
34
The following chart shows the relationships among the various participants in the Chilean electricity market:
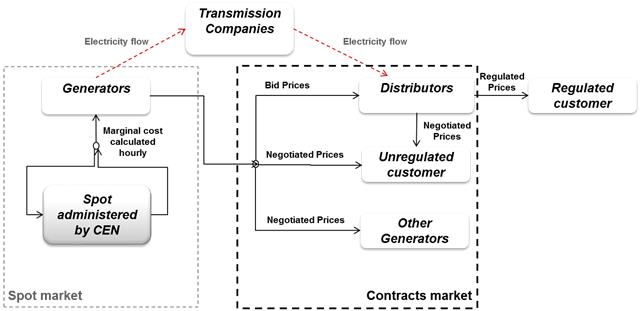
As presented in the chart above, generators supply electricity to end customers using the lines and substations that belong to transmission and distribution companies. They may sell their energy through contracts to unregulated customers, and other generation companies at freely negotiated prices, but their sales to distribution companies to supply regulated customers must be carried out through contracts governed by bids.
The operation of electricity generation companies is coordinated by the CEN, with an efficiency criterion in which the lowest cost producer available is usually required to satisfy demand at any moment in time and therefore differences between electricity production and contracted sales of generators are sold in the spot market at a price equal to the hourly marginal cost of the system.
Transmission companies own lines and substations with a voltage above 23 kV flowing from generators’ production points to the centers of consumption or distribution, charging a regulated toll for the use of their installations.
Distribution companies supply electricity to end customers using lines and substations with less than 23 kV. They have the obligation to provide electricity to the regulated customers within their concession area and at regulated prices. They may sell to unregulated customers through contracts at freely negotiated prices.
Customers are classified according to their demand as regulated or unregulated. Certain customers may choose to be either regulated or unregulated, and therefore subject to the respective price regime.
2. Electricity Law and Authorities
Since its inception, the Chilean electricity industry has been developed primarily by private sector companies. However, nationalization by the government was carried out between 1970 and 1973. During the 1980s, the sector was reorganized through the Chilean Electricity Law, known as Decreto con Fuerza de Ley DFL 1 (“DFL 1”), allowing for the renewed participation of the private sector.
The industry is currently governed by the electricity law Ley General de Servicios Eléctricos No. 20,018 and its modifications, under the Electricity Law, known as Decreto con Fuerza de Ley DFL 4 (“DFL 4”), the restated DFL 1, published in 2006 by the Ministry of Economy and its respective Regulations included in Decreto Supremo D.S. No. 327/1998.
The main authority in the energy industry is the Ministry of Energy that has existed since February 1, 2010. This government body is responsible for proposing and delivering comprehensive public policies as a coordinate effort. The Ministry of Energy also elaborates and coordinates plans, policies and standards for the proper operation of the sector and the development of the industry in Chile.
35
The National Energy Commission (“CNE”, in its Spanish acronym) and the Superintendence of Electricity and Fuel, “SEF,” are also relevant industry authorities. They report to the Ministry of Energy.
The CNE is the entity in charge of approving the annual transmission expansion plans, elaborating the indicative plan for the construction of new electricity generation facilities and proposing regulated tariffs to the Ministry of Energy for approval. The SEF inspects and oversees compliance with the law, rules regulations and technical norms applicable to electricity generation, transmission and distribution, liquid fuels and gas.
Other important entities related to the energy sector are: the Chilean Energy Efficiency Agency that is in charge of promoting energy efficiency, and the Center for Innovation and Promotion of Sustainable Energies (“CIFES”, in its Spanish acronym) in charge of strategic programs and projects with public financing for innovation and promotion of sustainable energies, which in 2014, replaced the Renewable Energies Center (“CER”, in its Spanish acronym).
Additionally, the law provides for a “Panel of Experts”, whose main responsibility is to acts as a court, issuing enforceable resolutions in disputes related to subjects referred to by DFL 4, and other electricity related laws. This panel is comprised of professional experts, all of whom are elected every six years by the antitrust government agency, Tribunal de la Libre Competencia (“TDLC” in its Spanish acronym).
According to DFL 4, the operation and coordination of the Chilean electricity system is to be carried out by CEN. The CEN is an independent entity in charge of coordinating the operation of the electricity system with the following objectives: i) maintain service security, ii) guarantee the efficient operation of the facilities connected to the system and iii) guarantee open access to all transmission networks. The main activities of the CEN include: coordination of electricity market operations, authorization of connections, ancillary services management, implementation of information systems available for the public and monitor competition and payments, among others. The CEN performs the calculation of market balances (energy injections and withdrawals), determines the transfers among generation companies and calculates the hourly marginal cost, which is the price at which energy transfers are carried out in the spot market. However, the CEN does not calculate the prices of generation capacity. Such prices are calculated by the CNE.
Limits on Integration and Concentration
The criteria regarding economic concentration and abusive market practices in Chile are provided by the antitrust legislation established in DFL 211, modified by Law No. 20,945 in 2016, and the regulations particularly applicable to the electricity industry stated in DFL 4 and Law No. 20,018, mentioned above.
Companies can participate in the different market segments (generation, distribution, transmission) to the extent that they are adequately separate, both from an accounting perspective and a corporate perspective according to the requirements established in DFL 4 and Law 20,018 and the antitrust law DL 211 referred to above, in addition to complying with the conditions established in Resolution No 667/2002, listed below.
The transmission sector is subject to the greatest restrictions, mainly because of its open access requirements. DFL 4 sets limits to the shareholdings of generation and distribution companies in companies that participate in the national transmission segment of the transmission system.
The owners of the National Transmission System (“STN” in its Spanish acronym) must be constituted as limited liability stock corporations.
Individual interests in the STN by companies operating in another electricity or unregulated customer segment cannot exceed, directly or indirectly, 8% of the total investment value of the STN. The aggregate interest of all such agents in the STN cannot exceed 40% of the total investment value.
According to the Electricity Law, there are no restrictions on market concentration for generation and distribution activities. However, Chilean antitrust authorities have imposed certain measures to increase transparency associated with us and our subsidiaries, Enel Generación and Enel Distribución through Resolution 667 issued by the TDLC.
Resolution 667 states that:
| • | electricity generation and distribution activities cannot be merged. For instance, Enel Chile must continue to keep both business segments separate and manage them as independent business units; and |
36
| • | all three companies must remain subject to the regulatory authority of the CMF and comply with the regulations applicable to publicly held stock corporations, even if they should lose such designation; |
•board members must be elected from different and independent groups;
•the external auditors of the companies must be different for local statutory purposes.
In addition, the Water Utility Services Law also sets restrictions on the overlapping of different utility concessions in the same area, setting restrictions on the ownership of the property for water and sewage service concessions and utilities that are natural monopolies, such as electricity distribution, gas or home telephone networks. By way of example, an electricity distribution company and a water utility company that belong to the same owner cannot operate in the same concession area.
3. Generation Segment
The generation segment is comprised of companies that own electricity generation power plants. They operate under market-driven conditions delivering their electricity to end customers through transmission and distribution networks. Generation companies freely determine whether to sell their energy and capacity to regulated or unregulated customers, but the operation of their power plants is determined by the CEN. The surplus or deficit between the generation company’s electricity sales and production is sold or purchased, as the case may be, to other generators at the spot market price.
Law No. 20,257 was issued in 2008 to promote the development of NCRE generation. In Chile, NCRE refers to power from wind, solar, geothermal, biomass, ocean (movement of tides, waves and currents, as well as the ocean’s thermal gradient) and mini-hydro plants under 20 MW.
Law No. 20,257 requires generators, between 2010 and 2014, to supply at least 5% of their total contracted sales with NCRE sources and progressively increases that percentage by 0.5% a year beginning in 2015 with the aim of reaching 10% by 2024. In 2013, Law 20,698, modified the previously defined NCRE minimum requirements, establishing a mandatory 20% share of NCRE as a percentage of total contracted energy sales by 2025, but allowing contracts signed between 2007 and 2013 to maintain the 10% target by 2024.
Dispatch, Customers and Pricing
Generation companies may sell to distribution companies, unregulated end customers or to other generation companies through contracts. Generation companies satisfy their contractual sales requirements with dispatched electricity, whether produced by them or purchased from other generation companies in the spot market. They balance their contractual obligations with their dispatch by trading deficit and surplus electricity at the spot market price, which is set hourly by the CEN based on the lowest cost of production of the last kWh dispatched.
The CEN operates the electricity system to minimize operating costs and also monitors the quality of the service provided by the generation and transmission companies. To minimize operating costs, it applies an efficiency criterion in which the lowest cost producer available is usually required to satisfy demand at any moment in time. As a result, at any specific level of demand, the appropriate supply will be provided at the lowest possible production cost available in the system. This marginal cost, on an hourly basis, is the price at which generators trade energy in the spot market, both their injections (sales) and their withdrawals (purchases) to balance their contracted customer sales to their production determined by the CEN.
The customers of generation companies are classified according to demand, in terms of the electricity capacity they require, as follows:
| i) | Unregulated customers: Customers who demand over 5,000 kW of capacity, mainly industrial and mining companies. These customers freely negotiate their electricity supply prices with generators and/or distributors. This customer category also includes those who demand between 500 and 5,000 kW of capacity that have the option to choose between the unregulated regime and the regulated regime and choose the unregulated regime. |
| ii) | Distribution companies: Distributors distinguishing between the energy they require to satisfy their regulated customers from the energy they require to satisfy their unregulated customers. The energy they require to supply their regulated customers is purchased from generation companies through an open bid process regulated by the CNE, while the supply for their unregulated customers is freely negotiated through bilateral contracts. |
37
| iii) | Generation companies trading on the spot or short term market: The energy and capacity transactions between generation companies arise from the difference between the electricity produced by a generator, as determined by the CEN, and the contractual obligations of that generator with its customers. The price of energy traded on the spot market is the hourly marginal cost of the system and the price of capacity traded on the spot market is the “node price” that is set by the CNE. |
Each generators’ capacity remuneration is calculated annually by the CEN based on what is called “capacidad de suficiencia” regarding the generation capacity of each power plant. This power plant capacity “capacidad de suficiencia” replaces the previous firm capacity concept. It continues to depend primarily on the availability of such facility, the type of power plant technology, and the resources used to generate. It is the maximum capacity a generator may supply to the system at certain peak hours, considering statistical information, accounting for maintenance time and extremely dry conditions for hydroelectric power plants, but differs from firm capacity because it does not consider the power plants’ contribution to the security of the entire system as firm capacity does.
Generation costs are passed on to distributors end consumers through the “average node price.” The average node price is adjusted in three instances: (1) every six months, in January and July of each year, based on local and international indexes; (2) upon the entry of a new supply contract with any distribution company; and (3) upon indexation of a supply contract in more than 10%.
Incentives and Penalties
If a rationing decree is enacted in response to prolonged periods of electricity shortages, strict penalties may be imposed on generation companies that contravene the decree. A severe drought is not considered a force majeure event under our service agreements.
Generation companies may also be required to pay fines to the regulatory authorities, as well as compensate electricity customers affected by shortages of electricity. The fines are related to system blackouts due to an electricity generator’s operational problems, including failures related to the coordination duties of all system agents. If generation companies cannot satisfy their contractual commitments to deliver electricity during periods when a rationing decree is in effect and there is no energy available to purchase in the system, the generation company must compensate the customers at a rate known as the “failure cost” determined by the authority in each node price setting. This failure cost, which is updated semiannually by the CNE, is a measurement of how much end customers would pay for one extra MWh under rationing conditions.
Water Rights
Companies in Chile must pay an annual fee for unused water rights. License fees already paid may be recovered through monthly tax credits commencing on the start-up date of the project associated with the water right. The maximum license fees that may be recovered are those paid during the eight years before the start-up date.
The Chilean Constitution considers water as a national public good in which real utilization rights are defined. It is similar to holding private property rights over water, as set forth in article 19, paragraph 24: “The rights of individuals over water, recognized or constituted in accordance with the law, grant their holders ownership over such rights.” Notwithstanding the foregoing, paragraph 24 also specifies legal limitations to those water rights.
The Chilean Congress is currently discussing amendments to the Water Code with the objective of making water use for human consumption, household subsistence and sanitation a high priority. On November 22, 2016, the Chilean House of Representatives approved an amendment which is being evaluated by the Water Resources, Desertification and Drought Commission of the Chilean Senate. The main aspects of the amendments are as follows:
| • | Granting of new water rights which would be limited to a maximum period of 30 years and extendable, unless the Water Authority proves the ineffective use of resources. The extension shall be effective only for used water rights. |
| • | The expiration of new non-consumptive water rights that were granted by law, if the holder does not exercise the right of use within eight years. |
| • | The expiration of new non-consumptive water rights already granted, if the user does not effectively use the rights within a period of eight years from the date of enactment of the new Water Code. The term can be extended for up to four years only in justified cases such as delays in obtaining permits or environmental approvals. |
38
In April 2017, the President modified this amendment to state that the preservation of environmental flows to protect the ecosystem only applies to future water rights for both consumptive and non-consumptive water use, which would reduce the water availability for generation purposes.
4. Transmission Segment
The transmission segment supplies electricity over lines or substations with a voltage or tension higher than 23 kV from generators’ production points to the centers of consumption or distribution. Transmission systems are comprised of the electricity lines and substations that are not considered part of the distribution network.
Given the structural characteristics of the transmission segments, it is considered a natural monopoly and it is therefore subject to special electricity industry regulation. Tariffs are regulated, and access must be open and guaranteed under nondiscriminatory conditions.
Law No. 20,936 published in July 2016 established a new regulatory framework for all electricity transmission systems in Chile, redefining the system into the following segments: National, Development Poles, Zonal, Dedicated, and International.
National and Zonal Transmission Systems planning is a centralized, regulated process carried out by the CEN that annually issues an expansion plan to be approved by the CNE.
The expansion of both systems is granted through an open tender process that distinguishes new installations from enlargement of existing installations. The tenders carried out for new installations grant the winner ownership of the installation to be built. The expansion of existing installations, on the other hand, belongs to the owner of the original installation, who is obliged to tender the construction of the required expansion.
The remuneration of existing national and zonal transmission installations is determined by a tariff setting process performed every four years. This process determines the Annual Transmission Value that considers efficient operation and maintenance costs and an annual valuation of investments that is based on a discount rate determined by the authority every four years (minimum 7% after tax) and the useful life of the installations.
The remuneration of expansions is the value resulting from the respective bid of such expansion for the first 20 years of operations. From year 21 on, such expansion is considered an existing installation and remunerated accordingly.
Regulation currently in force states that transmission remuneration is the sum of tariff revenue and the usage charge (“CUT”, in its Spanish acronym) revenue, received for use of the transmission system defined as $/kWh by the CNE every six months.
Transmission Tariffs
Law No. 20,936 introduced changes to the transmission tariff setting process. In transitioning to the implementation of the new law, the 2016-2019, zonal transmission tariff setting process is to continue as stated by transitory Article No. 20 of Law No. 20,936. The results obtained are to be used for the 2018-2019 tariffs. The 2020-2023 tariff setting process is also in progress. No new tariff decree has been published as of the date hereof.
5. Distribution Segment
The distribution segment is comprised of substations and electricity lines with a voltage lower than 23 kV to supply electricity to end customers. Electricity distribution is considered a natural monopoly and companies therefore operate under a public utility concession regime, with service obligations and regulated tariffs for supplying regulated customers. They may sell to unregulated customers at negotiated prices.
Customers are classified according to their demand as regulated or unregulated. Regulated customers are those whose connected capacity is below or equal to 5,000 kW and unregulated customers are those whose connected capacity is at least 5,000 kW. Customers with connected capacity between 500 kW and 5,000 kW may choose to be regulated or unregulated, subject to the respective price regime.
39
Customers subject to the unregulated price regime may negotiate their electricity supply with any generator or distributor, although they must pay a regulated toll for using the distribution network.
Distribution concessions are given by the Chilean Ministry of Energy for an undefined period of time and give the right to use public areas for building distribution lines. Distribution companies have the obligation to supply electricity to regulated customers that request service within their concession area, except for customers that have chosen the unregulated regime. A concession may be declared expired if the quality of service does not meet certain minimum standards.
Regarding the supply of electricity to regulated customers, DFL 4 establishes that distribution companies must permanently have electricity supply available. They must contract their energy supply through open, non-discriminatory and transparent public tenders. These bidding processes are managed by the CNE and are based on distribution companies’ projections of energy demand. They are carried out at least five years in advance from the expected effective date of the energy supply contract, which has a 20-year term. In case of unforeseen deviations in the projections of demand, the regulator has the authority to carry out short term tenders. There is also a regulated mechanism to remunerate supply not covered by a contract if this were to take place.
The latest tender was carried out in 2017. A total 2,200 GWh/year were awarded for the period from January 1, 2024 to December 31, 2043 at an average price of 32.5 US$/MWh, which must be completely sourced from NCRE. For further detail on the outcome of tenders, please see “Item 4.B Information on the Company – Business overview.”
Distribution Tariffs
The Chilean distribution tariff model is mature and has gone through nine tariff setting process since its privatization in the 1980s.
Tariffs charged by distribution companies to end regulated customers are set every four years and are determined by the sum of the cost of electricity purchased by the distribution company, a transmission charge and the Value Added from Distribution of electricity (“VAD”), which allows distribution companies to recover their investment and operating costs, including a return on investment, which is set by law. The transmission charge reflects the cost paid for electricity transmission and transformation.
The VAD is based on a so-called “efficient model company” within a Typical Distribution Area (“TDA”). It considers the cost of building and operating the company at the minimum cost, fulfilling quality and safety standards of a company within that TDA. Therefore, the CNE classifies all distribution companies according to their TDA, then selects one distribution company from each TDA and estimates its cost as an efficient model company. Distribution companies also carry out their own studies to determine the costs of such company as the efficient model company. Cost estimates include fixed costs, average energy and capacity losses, standard investment costs, and operation and maintenance costs. The annual investment costs are calculated considering the Replacement Cost (“VNR” in its Spanish acronym) of the installations, useful life and a 10% return on assets associated with electricity investments.
The VAD of each TDA is determined as a weighted average with one third of the value estimated by the study of the companies and two thirds by the CNE. Preliminary tariffs, with the resulting VAD, are tested to ensure that they provide an industry aggregate rate of return between 6% and 14%.
The real return on investment for a distribution company depends on its actual performance relative to the standards chosen by the CNE for the efficient model company. The tariff system allows for a greater return to distribution companies that are more efficient than the model company.
Electricity regulation establishes tariff equality mechanisms for electrical services. Law No. 20,928 states that the maximum tariff that distribution companies may charge residential customers must not exceed the average national tariff by more than 10%. The differences arising from the application of this mechanism will be progressively absorbed by the remaining customers subject to regulated prices that are under the mentioned average, except for those residential users whose monthly average consumption of energy in the prior calendar year is lower than or equal to 200 kWh.
Additionally, Chilean law provides that transitory subsidies can be granted if the residential customer tariff increases by 5% or more within a six-month period. This subsidy is conferred by the state, its application is a faculty of the government and the last one was granted in 2009.
The tariff setting process for 2016-2020 concluded in August 2017 and has been effective, retroactively, since November 4, 2016.
40
Distribution-Related Services
Distribution-related services are services identified by the TDLC as subject to regulation, such as meter rentals and meter verification, among others. The tariffs of these services are set every four years by the CNE along with the VAD calculation. On March 14, 2014, the Ministry of Energy published the prices for distribution-related services, which are currently still effective.
In 2015, the CNE began a new tariff setting process for electricity distribution-related services. The CNE communicated the terms for the “Electricity Distribution-Related Services Cost Study” as part of the 2016 – 2020 tariff setting process. These terms identify five new distribution-related services, of which the most significant are “Construction and installment of temporary junctions” and “Lease of temporary junctions”.
On April 27, 2017, the CNE published Exempt Resolution No. 213, approving the report regarding the formulas to calculate the tariffs of electricity distribution related services. As of the date of this Report, the decree setting new tariffs has not been issued.
Incentives and Penalties
Distribution companies may be required to compensate end customers in the case of electricity shortages that exceed the authorized standards. These compensatory payments are equal to double the amount of electricity the distribution company failed to provide, using a rate equal to the “failure cost.” In addition, distribution companies are subject to the provisions of the SEF, in particular to in its articles 15 and 16 of the Law No. 18,410.
6. Environmental Regulation
The Chilean constitution grants citizens the right to live in a pollution-free environment. It further provides that certain other constitutional rights may be limited to protect the environment. Chile has numerous laws, regulations, decrees and municipal ordinances that address environmental considerations. Among them are regulations relating to waste disposal (including the discharge of liquid industrial wastes), the establishment of industries in areas that may affect public health, and the protection of water for human consumption.
Environmental Law No. 19,300 was enacted in 1994 and has been amended by several regulations, including the Environmental Impact Assessment System Rule issued in 1997 and modified in 2001. This law requires companies to conduct an environmental impact study and a declaration of any future generation or transmission projects.
In January 2010, Law No. 19,300 was modified by Law No. 20,417, and introduced changes to the environmental assessment process and in the public institutions involved, principally creating the Chilean Ministry of Environment and the Superintendence of Environment. Environmental assessment processes are coordinated by this entity and by the Environmental Assessment Service.
In June 2011, the Ministry of Environment published Decree 13, which establishes emission standards for thermoelectric plants applicable to generation units of at least 50 MW. The objective of this regulation is to control atmospheric emissions of particulate matter (MP), nitrogen oxides (NOx), sulfur dioxide (SO2) and mercury (Hg), to prevent and protect the health of the population and protect the environment. Existing emission sources are required to meet emission limits as established in the regulation for MP emissions and for SO2 and NOx emissions by June 2015 in highly polluted areas and by June 2016 elsewhere.
In June 2012, Law No. 20,600 created the Environmental Courts, special jurisdictional courts subject to the control of the Chilean Supreme Court. Their primary function is to resolve environmental disputes within their jurisdiction and investigate other matters that are submitted for their attention under the law. The law created three such courts, all of which are in operation.
On December 28, 2012, the Superintendence of Environment was formally created and began to exercise its powers of enforcement and sanctions pursuant to Chilean environmental regulations.
On September 10, 2014, Law No. 20,780 was enacted and included charges for the emission of MP, NOx, SO2 and CO2 into the atmosphere. For CO2 emissions, the charge is US$ 5 per emitted ton (not applicable to renewable biomass generation). MP, NOx and SO2 emissions will be charged the equivalent of US$ 0.10 per emitted ton, multiplied by the result of a formula based on the population of the municipality where the generation plant is located and an additional fee of US$ 0.90 per ton of MP emitted, US$ 0.01 per ton of SO2 emitted and US$ 0.025 per ton of NOx emitted. This tax became effective in 2018, with the amount due calculated based on the previous year’s emissions.
41
In 2017, authorities published Exempt Resolution No. 659 related to the implementation of Article No. 8 of Law No. 20,780 regarding taxes on thermal electric power plant emissions as a result of the country’s latest tax reform.
All thermal plants of Enel Generación and its subsidiary GasAtacama have established methodologies to measure emissions and pay related taxes, in line with the requirements of the Environmental Superintendence of Chile.
Regarding biodiversity, on January 5, 2018, the Chilean Sustainable Development Board approved the 2017-2030 National Biodiversity Strategy. This strategy replaces the existing national strategy adopted in 2003. The new strategy identifies five objectives related to the sustainable use of biodiversity, and the development of the institutions and regulation required for the sustainable management of ecosystems.
7. Recent Regulatory Events
Law No. 20,928 (Tariff Equality Law). In January 2017, the Ministry of Energy, the CNE and the SEF announced that the cost of service interruption and reconnection due to non-payment would no longer be charged as a distribution-related service. The cost is to be included in the electricity distribution tariff for 2016 – 2020.
On October 6, 2017, the CNE issued a resolution stating the approval of the New Tariff Study by the CNE and the electricity distribution companies as required by electricity law. Within this context, the CNE requested distribution companies to provide information regarding their investment plans and costs necessary to comply with the electricity Distribution Systems Technical Service Quality Standards not recognized in the current electricity distribution tariffs|. On December 18, 2017, the CNE published a resolution which sets the Distribution System Technical Service Quality Standards, establishing higher technical and commercial standards.
On December 18, 2017, the CNE published Exempt Resolution No. 706 which sets forth the Distribution System Technical Service Quality Standards. The Distribution System Technical Service Quality Standards establish higher technical and commercial standards, including electricity supply reliability indicators, such as, the System Average Interruption Frequency Index (SAIFI) which measures the average number of times a customer’s supply is interrupted in a year; and the System Average Interruption Duration Index (SAIDI), which measures the total number of minutes, on average, that a customer is without electricity in a year, among others. This resolution also refers to product quality, metering, monitoring and controlling and commercial service quality. Regarding the transmission expansion plan, on December 29, 2017, the CNE published a resolution which identified the new installations and the expansions of existing installations of the 2017 annual transmission expansion plan.
8. Raw Materials
For information regarding our raw materials, please see “Item 11. Quantitative and Qualitative Disclosures About Market Risk — Commodity Price Risk.”
42
C. Organizational Structure.
Principal Subsidiaries and Affiliates
We are part of an electricity group controlled by Enel, our Italian ultimate controlling shareholder, which beneficially owned 60.6% of our shares as of December 31, 2017. As of April 2, 2018 and after giving effect to the 2018 Reorganization, Enel beneficially owned 61.9% of our voting shares (excluding treasury stock which will be cancelled). For additional information on the 2018 Reorganization, see “Item 4. Information on the Company – A. History and Development of the Company – The 2018 Reorganization.” Enel is an energy company with multinational operations in the power and gas markets, with a focus on Europe and Latin America. Enel operates in over 30 countries across four continents, produces energy through a net installed capacity of 83 GW and distributes electricity and gas through a network covering 2.1 million kilometers. With over 65 million users worldwide, Enel has the largest customer base among European competitors and figures among Europe’s leading power companies in terms of installed capacity and reported EBITDA. Enel shares trade on the Milan Stock Exchange.
43
Enel Chile’s Organizational Structure(1)
As of December 31, 2017(2)

| (1) | Only principal operating consolidated entities are presented here. The percentage listed in the box for each of Enel Chile’s consolidated subsidiaries represents its economic interest in such consolidated subsidiary. |
| (2) | Reflects organizational structure prior to giving effect to the 2018 Reorganization, which was completed on April 2, 2018. |
44
Enel Chile’s Organizational Structure(1)
As of the date of this Report and after giving effect to the 2018 Reorganization

| (1) | Only principal operating consolidated entities are presented here. The percentage listed in the box for each of Enel Chile’s consolidated subsidiaries represents its economic interest in such consolidated subsidiary. |
| (2) | Enel owns 61.9% of our outstanding shares (excluding treasury stock which will be cancelled). |
45
The companies listed in the following table were consolidated by us as of December 31, 2017. In the case of subsidiaries, economic interest is calculated by multiplying our percentage of economic interest in a directly held subsidiary by the percentage economic interest of any entity in the chain of ownership of such ultimate subsidiary.
Principal Subsidiaries | | % Ownership of Each Main Subsidiary by Enel Chile | | | Consolidated Assets of Each Main Consolidated Entity | | | Revenues and Other Operating Income of Each Main Subsidiary | |
| | (in %) | | | (in billions of Ch$) | | | | | |
Electricity Generation | | | | | | | | | | | | |
Enel Generación(1)(2) | | | 60.0 | % | | | 3,554 | | | | 1,635 | |
Electricity Distribution | | | | | | | | | | | | |
Enel Distribución | | | 99.1 | % | | | 1,155 | | | | 1,333 | |
| (1) | Enel Generación consolidates all our generation facilities in Chile. |
| (2) | As of the date of this Report and after giving effect to the 2018 Reorganization, we owned 94% of Enel Generación. |
Generation Business
Enel Generación
Enel Generación is a Chilean electricity generation company, which has a total installed capacity of 6,351 MW as of December 31, 2017, with 28 generation facilities. Of the total installed capacity, 55% is from hydroelectric power plants and includes, among others, Ralco with 690 MW, Pehuenche with 570 MW, El Toro with 450 MW, Rapel with 377 MW, and Antuco with 320 MW. Nearly 77% of its thermoelectric facilities are gas/fuel oil power plants, and the remaining are coal-fired steam power plants. Our economic interest in Enel Generación was 60.0% as of December 31, 2017 and 94% (excluding treasury stock that will be cancelled) as of the date of this Report and after giving effect to the 2018 Reorganization. For additional information on the corporate reorganization, see “Item 4. Information on the Company – A. History and Development of the Company – The 2018 Reorganization.”
GasAtacama
GasAtacama is a generation company located northern Chile, which owns and operate a four-unit combined-cycle power plant with a total installed capacity of 780 MW and a gas pipeline, which connects to Argentina. In April 2014, we acquired a 50% ownership interest in Inversiones GasAtacama Holding Ltda. (“GasAtacama Holding”) and as a result of it, we owned a controlling equity interest in GasAtacama Holding.
Since the second half of 2016, we have been carrying out a corporate simplification process, which mainly involved mergers. During 2016, GasAtacama Holding merged into Celta, which merged into GasAtacama, the surviving company, on November 1, 2016. On November 9, 2017, GasAtacama purchased the 25% minority interest of Central Éolica Canela S.A. On December 22, 2017, Central Éolica Canela S.A. was dissolved subsequent to the sale of its assets to GasAtacama on November 21, 2017.
As of December 31, 2017, GasAtacama owned the following power plants: Tarapacá, San Isidro, Pangue, Canela I and II and Ojos de Agua, which have an aggregate capacity of 1,115 MW.
As of December 31, 2017, we beneficially owned 61.0% of GasAtacama, with 58.4% from our indirect equity interest through Enel Generación, which owns 97.4% of GasAtacama, and the remaining 2.6% from our direct ownership.
Pehuenche
Pehuenche, a generation company connected to the SEN, owns three hydroelectric facilities located in the hydrological basin of the Maule River, south of Santiago, with a total installed capacity of 699 MW. The 570 MW Pehuenche plant began operations in 1991, the 89 MW Curillinque plant began operations in 1993, and the 40 MW Loma Alta plant began operations in 1997. Enel Generación holds 92.7% of the economic interest in Pehuenche. As of December 31, 2017, we beneficially owned a 55.6% economic interest in Pehuenche, through Enel Generación.
46
Distribution Business
Enel Distribución
Enel Distribución is one of the largest electricity distribution businesses in Chile as measured by the number of regulated customers, distribution assets and energy sales. Enel Distribución operates in a concession area of 2,105 square kilometers in the Santiago metropolitan area, serving approximately 1.9 million customers. As of December 31, 2017, our economic interest in Enel Distribución was 99.1%.
Selected Related and Jointly-Controlled Companies
HidroAysén
Centrales Hidroeléctricas de Aysén S.A. (“HidroAysén”) was incorporated in March 2007 to develop and exploit a hydroelectric project in the Aysén Region in southern Chile. As of December 31, 2017, Enel Generación owned 51% of HidroAysén, and Colbún, an unaffiliated entity, owns the remaining 49%. In the fourth quarter of 2014, we recorded an impairment loss of Ch$ 69,067 million, related to the uncertainty of recovering the investment carried out in HidroAysén mainly as a consequence of the long judicial process in order to obtain enviromental approvals.
On November 17, 2017, the Board of Directors of HidroAysén approved the termination of its activities and the waiver of the water rights related to the project. The termination of HidroAysén was approved by HydroAysén’s ESM on December 7, 2017. As of December 31, 2017, the book value of our investment in HidroAysén was Ch$ 4,205 million, which is expected to be recovered in the liquidation process. The liquidation process is expected to conclude in the first half of 2018.
For additional information on all of our subsidiaries and jointly-controlled companies, please refer to Appendix 1 of our consolidated financial statements.
D. | Property, Plants and Equipment. |
Our property, plant and equipment are concentrated on electricity generation and distribution assets in Chile.
We conduct our generation business through Enel Generación and its subsidiaries, Pehuenche and GasAtacama, which together own 28 generation power plants, all located in Chile, of which 16 are hydroelectric (3,465 MW installed capacity), ten are thermal (2,808 MW installed capacity) and two are wind farms (78 MW installed capacity). The description for our generation subsidiaries, and their businesses is included in this “Item 4. Information on the Company.”
A substantial portion of our generating subsidiaries’ cash flow and net income is derived from the sale of electricity produced by our electricity generation facilities. Significant damage to one or more of our main electricity generation facilities or interruption in the production of electricity, whether as a result of an earthquake, flood, volcanic activity, severe and extended droughts or any other such natural disasters, could have a material adverse effect on our operations.
The following table identifies the power plants that we own, all located in Chile, at the end of each year, by company and their basic characteristics:
47
Property, Plant and Equipment of Generation Companies
| | | | | | Installed Capacity(1) As of December 31, | |
Company | | Power Plant Name | | Power Plant Type(2) | | 2017 | | | 2016 | | | 2015 | |
| | | | | | (in MW) | |
Enel Generación | | Rapel | | Reservoir | | | 377 | | | | 377 | | | | 377 | |
| | Cipreses | | Reservoir | | | 106 | | | | 106 | | | | 106 | |
| | El Toro | | Reservoir | | | 450 | | | | 450 | | | | 450 | |
| | Los Molles | | Run-of-the-river | | | 18 | | | | 18 | | | | 18 | |
| | Sauzal | | Run-of-the-river | | | 77 | | | | 77 | | | | 77 | |
| | Sauzalito | | Run-of-the-river | | | 12 | | | | 12 | | | | 12 | |
| | Isla | | Run-of-the-river | | | 70 | | | | 70 | | | | 70 | |
| | Antuco | | Run-of-the-river | | | 320 | | | | 320 | | | | 320 | |
| | Abanico | | Run-of-the-river | | | 136 | | | | 136 | | | | 136 | |
| | Ralco | | Reservoir | | | 690 | | | | 690 | | | | 690 | |
| | Palmucho | | Run-of-the-river | | | 34 | | | | 34 | | | | 34 | |
| | Total hydroelectric | | | | | 2,290 | | | | 2,290 | | | | 2,290 | |
| | Bocamina | | Steam Turbine/Coal | | | 478 | | | | 478 | | | | 478 | |
| | Diego de Almagro | | Gas Turbine/ Diesel Oil | | | 24 | | | | 24 | | | | 24 | |
| | Huasco | | Gas Turbine | | | 64 | | | | 64 | | | | 64 | |
| | Taltal | | Gas Turbine/Natural Gas+Diesel Oil | | | 245 | | | | 245 | | | | 245 | |
| | San Isidro 2 | | Combined Cycle /Natural Gas+Diesel Oil | | | 399 | | | | 399 | | | | 399 | |
| | Quintero | | Gas Turbine/Natural Gas | | | 257 | | | | 257 | | | | 257 | |
| | Total thermal | | | | | 1,467 | | | | 1,467 | | | | 1,467 | |
| | Total | | | | | 3,757 | | | | 3,757 | | | | 3,757 | |
Pehuenche | | Pehuenche | | Reservoir | | | 570 | | | | 570 | | | | 570 | |
| | Curillinque | | Run-of-the-river | | | 89 | | | | 89 | | | | 89 | |
| | Loma Alta | | Run-of-the-river | | | 40 | | | | 40 | | | | 40 | |
| | Total | | | | | 699 | | | | 699 | | | | 699 | |
Celta(3) | | Tarapacá | | Steam Turbine/Coal | | | - | | | — | | | | 158 | |
| | Tarapacá | | Gas Turbine/Diesel Oil | | | - | | | — | | | | 24 | |
| | San Isidro | | Combined Cycle /Natural Gas+Diesel Oil | | | - | | | — | | | | 379 | |
| | Pangue | | Reservoir | | | - | | | — | | | | 467 | |
| | Canela I | | Wind Farm | | | - | | | — | | | | 18 | |
| | Canela II | | Wind Farm | | | - | | | — | | | | 60 | |
| | Ojos de Agua | | Run-of-the-river | | | - | | | — | | | | 9 | |
| | Total | | | | — | | | | - | | | | 1,115 | |
GasAtacama (4) | | Atacama | | Combined Cycle /Natural Gas+Diesel Oil | | | 781 | | | | 781 | | | | 781 | |
| | Tarapacá | | Steam Turbine/Coal | | | 158 | | | | 158 | | | — | |
| | Tarapacá | | Gas Turbine/Diesel Oil | | | 24 | | | | 24 | | | — | |
| | San Isidro | | Combined Cycle /Natural Gas+Diesel Oil | | | 379 | | | | 379 | | | — | |
| | Pangue | | Reservoir | | | 467 | | | | 467 | | | — | |
| | Canela I | | Wind Farm | | | 18 | | | | 18 | | | — | |
| | Canela II | | Wind Farm | | | 60 | | | | 60 | | | — | |
| | Ojos de Agua | | Run-of-the-river | | | 9 | | | | 9 | | | — | |
| | Total | | | | | 1,896 | | | | 1,896 | | | | 781 | |
Total capacity | | | | | | | 6,351 | | | | 6,351 | | | | 6,351 | |
48
(1) | The installed capacity corresponds to the gross installed capacity, without considering the MW that each power plant consumes for its own operation. |
(2) | “Reservoir” and “run-of-the-river” refer to hydroelectric plants that use the force of a dam or a river, respectively, to move the turbines which generate electricity. “Steam” refers to thermal power plants fueled with natural gas, coal, diesel or fuel oil to produce steam that moves the turbines. “Gas Turbine” or “Open Cycle” refer to thermal power that uses either diesel or natural gas to produce gas that moves the turbines. “Combined-Cycle” refers to a thermal power plant fueled with natural gas, diesel oil, or fuel oil to generate gas that first moves a turbine and then recovers the gas from that process to generate steam to move a second turbine. |
(3) | Celta merged into GasAtacama, the surviving company, on November 1, 2016. |
(4) | Since May 1, 2014, GasAtacama has been fully consolidated following Enel Generación’s purchase of an additional 50% interest in GasAtacama Holding. Previously, it was accounted for under the equity method and its installed capacity was not included in a portion of 2014. |
Property, Plant and Equipment of Distribution Companies
We conduct our distribution business through Enel Distribución and its subsidiaries, Empresa Eléctrica de Colina Ltda. and Luz Andes Ltda. The description of our distribution subsidiary and its business is included in this “Item 4. Information on the Company.”
A substantial portion of our distribution subsidiaries’ cash flow and net income is derived from the sale of electricity distributed through our distribution installations. Significant damage to one or more of our main electricity distribution installations or interruption in the distribution of electricity, whether as a result of an earthquake, flood, volcanic activity, severe snowstorms and wind storms or any other such natural disasters, could have a material adverse effect on our operations.
The table below describes our main electricity distribution equipment, such as, distribution networks, substations and transformers, and also transmission lines. They include the consolidate property, plant and equipment figures of our subsidiary Enel Distribución.
TABLE OF DISTRIBUTION FACILITIES
General Characteristics
| | | | | | Transmission Lines(1) As of December 31, | |
| | Concession Area | | | 2017 | | | 2016 | | | 2015 | |
| | (in km2) | | | (in kilometers) | |
Enel Distribución | | | 2,105 | | | | 367 | | | | 361 | | | | 361 | |
(1) | The transmission lines consist of circuits with voltages in the 35-220 kV range. |
Power and Interconnection Substations and Transformers (1)
| | As of December 31, 2017 | | | As of December 31, 2016 | | | As of December 31, 2015 | |
| | Number of Substations | | | Number of Transformers | | | Capacity (MVA) | | | Number of Substations | | | Number of Transformers | | | Capacity (MVA) | | | Number of Substations | | | Number of Transformers | | | Capacity (MVA) | |
Enel Distribución (2) | | | 56 | | | | 203 | | | | 8,386 | | | | 56 | | | | 204 | | | | 8,281 | | | | 56 | | | | 201 | | | | 8,146 | |
(1)Voltage of these transformers is in the range of 500 kV (in - high voltage) and 1 kV (out - medium voltage).
(2) | In 2017 a failure destroyed a transformer in the Quilicura SE, which caused its withdrawal from the system. |
Distribution Network - Medium and Low Voltage Lines (1)
| | As of December 31, 2017 | | | As of December 31, 2016 | | | As of December 31, 2015 | |
| | Medium Voltage | | | Low Voltage | | | Medium Voltage | | | Low Voltage | | | Medium Voltage | | | Low Voltage | |
| | | | | | | | | | (in Kilometers) | | | | | | | | | |
Enel Distribución | | | 5,298 | | | | 11,519 | | | | 5,251 | | | | 11,431 | | | | 5,215 | | | | 11,208 | |
(1) | Medium voltage lines: 1 kV - 34.5 kV; low voltage lines: 380-110 V. |
49
Transformers for Distribution(1)
| | As of December 31, 2017 | | | As of December 31, 2016 | | | As of December 31, 2015 | |
| | Number of Transformers | | | Capacity | | | Number of Transformers | | | Capacity | | | Number of Transformers | | | Capacity | |
| | | | | | (in MVA) | | | | | | | (in MVA) | | | | | | | (in MVA) | |
Enel Distribución | | | 21,838 | | | | 4,575 | | | | 21,876 | | | | 4,505 | | | | 22,177 | | | | 4,357 | |
(1) | Voltage of these transformers is in the range of 34.5 kV (in - medium voltage) and 1 kV (out - low voltage). |
Insurance
Both our electricity generation and distribution facilities are insured against damage caused by natural disasters such as earthquakes, fires, floods, other acts of god (but not for droughts, which are not considered force majeure risks, and are not covered by insurance) and from damage due to third-party actions, based on the appraised value of the facilities as determined from time to time by an independent appraiser. Based on geological, hydrological and engineering studies, management believes that the risk of the previously described events resulting in a material adverse effect on our facilities is remote. Claims under our subsidiaries’ insurance policies are subject to customary deductibles and other conditions. We also maintain business interruption insurance providing coverage for the failure of any of our facilities for a period of up to 24 months, including the deductible period. Insurance policies include liability clauses, which protect our companies from claims made by third parties. The insurance coverage taken for our property is approved by each company’s management, taking into account the quality of the insurance companies and the needs, conditions and risk evaluations of each facility, and is based on general corporate guidelines. All insurance policies are purchased from reputable international insurers. We continuously monitor and meet with the insurance companies in order to obtain what we believe is the most commercially reasonable insurance coverage.
Project Investments
We continuously analyze different growth opportunities in Chile. The study and profitability assessment of our project portfolio is an ongoing effort. Industry technology is allowing for smaller, less environmentally impactful power plants. These plants can be constructed more quickly, allow greater flexibility to activate or deactivate according to system needs, and are preferred by the community. When it comes to power plant investments, greater focus is also being placed on renewable energy technologies. In the thermal generation business, we seek new opportunities, either by building new greenfield projects or by modernizing existing brownfield assets and improving (operationally and/or environmentally) the performance of such assets. The expected start-up for each project is assessed and is defined based on the commercial opportunities and our financing capacity to fund these projects. Our most important projects are described below:
The total investment for each project described below was translated into Chilean pesos at the exchange rate of Ch$ 614.75 per U.S. dollar, the U.S. dollar Observed Exchange Rate as of December 31, 2017. Budgeted amounts include connecting lines that could be owned by third parties and paid as tolls, unless otherwise indicated.
| 1. | Generation Business Projects |
During 2017, Enel Generación and its subsidiaries, invested a total of Ch$ 137.6 billion in projects already under construction and projects in the pre-construction, developmental stage.
| A. | Projects completed during 2017 |
Tarapacá Environmental Retro-fitting Project
Tarapacá is a 158 MW coal-fired power plant located in the Tarapacá region in northern Chile. The Tarapacá environmental retro-fitting project seeks to comply with regulations for the emissions of thermal power plants, which required the reduction of SO2 and NOx emissions effective as of June 2016. The project involved installing desulfurizers and modifying the ash discharge site to improve the handling and disposal of waste resulting from the desulfurization process (DeSOx) and implementing measures to reduce emissions of NOx (DeNOx), such as installing low NOx burners, improving coal mills, installing an Over-Fire Air system, building lime storage silos, and implementing a seawater desalination system.
50
The power plant became commercially operational again in December 2016 and during 2017 the pending works were concluded and the principal contracts related to the project were completed. The estimated total investment is Ch$ 68,240 million, of which Ch$ 67,696 million was incurred as of December 31, 2017. This project is being financed primarily with internally generated funds.
| B. | Projects under Construction |
Los Cóndores Hydroelectric Project
The Los Cóndores project is located in the Maule region, in the San Clemente area. It consists of a 150 MW run-of-the-river hydroelectric power plant, with two Pelton vertical water turbine units, which will use water from the Maule Lagoon reservoir through a pressure tunnel. The power plant will be connected to the SEN at the Ancoa substation (220 kV) through an 87 km transmission line.
The basic engineering and the Environmental Impact Statement of the Los Cóndores optimized project concluded in early 2011. The Environmental Qualifications Resolution (“RCA” in its Spanish acronym) for the power plant was obtained in November 2011 and the RCA for the transmission line project was granted in May 2012. In November 2014, the General Water Authority approved the waterworks permit.
As of December 31, 2017, 61% of the project was completed and 60% of the transmission lines were completed and assembled.
Construction is expected to be completed during the second half of 2020. The estimated total investment is Ch$ 577,865 million, of which Ch$ 274,995 million was incurred as of December 31, 2017. This project is being financed primarily with internally generated funds.
Bocamina Optimization Project
Bocamina is 478 MW coal-fired power plant, located in Coronel in the Bíobío region in southern Chile consisting of two units, Bocamina I (128 MW) and Bocamina II (350 MW). Bocamina II started commercial operations in July 2013 but suspended operations in December 2013 due to environmental injunctions. We submitted a new environmental impact study including developing a new technical optimization plan of the plant, which was approved on March 16, 2015. On April 2, 2015, the Chilean Court approved the new RCA, and the plant resumed operations in July 2015 after we satisfied all necessary conditions established in the new RCA.
The technical optimization plan involves the following: (i) installation of Johnson filters in both units; (ii) installation of domes over the north and south coal fields; (iii) improvement of the ash dump in operation; (iv) studies of a new ash dump, and (v) construction of a water treatment plant. In 2016, the Johnson filters were installed in both units, and the improvements to zones 2 and 3 of the ash dump concluded. During 2017, the Municipal Works Department of Coronel approved the dome built over the north coal field, which became operational on July 17, and granted the construction permit of the dome over the south coal field, which is expected to conclude in 2018.
The estimated total investment is Ch$ 62,026 million, of which Ch$ 53,695 million was incurred as of December 31, 2017. This project is being financed primarily with internally generated funds.
| C. | Projects Under Development |
The following projects are in an evaluation stage and still under development. The final investment decision regarding whether to build a project or not will depend on, among others, the commercial opportunities foreseen in the upcoming years, and in particular, the prices in future tenders for supplying the energy requirements of the regulated market and/or negotiations with existing or new unregulated customers.
Vallecito Hydroelectric Project
The Vallecito hydroelectric project is located in the Maule region, in the upper part of the Maule river basin. It consists of a run-of-the-river hydroelectric plant with an installed capacity of 55 MW. The energy produced is expected to be delivered to the SEN through the transmission line of the Los Cóndores hydroelectric plant, which is currently under construction (see above).
51
The Vallecito project has been developed on the basis of a sustainable development plan, which consists of defining activities to be developed in the technical-economic, environmental and social scope of the project. We have established community-specific actions to be carried out with nine communities of the Pehuenche Route in order to incorporate, social aspirations, capacities and local projects in the hydro projet development plan.
During 2016, the technical feasibility studies of the project were carried out and a series of field studies (drilling, paving, geophysical prospecting, etc.) were completed. During 2017, complete basic design and environmental base line campaigns were developed, as well as the implementation of the sustainable development plan after several meetings with local communities aimed to codesign the best shared use for the hydro project and to obtain agreements with local communities that will be integrated in the Environmental Impact Study (“EIA” in its Spanish acronym).
The next steps are to finalize and prepare the EIA that will include collaborative agreements with communities directly related to the project. Based on current market conditions and future commercial options, decisions should be taken whether or not continuing with the development plan of this project. The current plan contemplates commencing construction during 2020 and commissioning to take place in 2023. The estimated total investment is Ch$ 127,357 million, of which Ch$ 5,824 million was incurred as of December 31, 2017. This project is being financed primarily with internally generated funds.
Quintero Combined-Cycle Project
The Quintero project is located in the Valparaíso region and consists of an energy efficiency project that takes advantage of the heat of the gases emitted by the existing turbines to produce steam. This is accomplished through the installation of a steam turbine and a generator, which allows converting the existing open cycle plant into a combined-cycle gas plant. Currently, the Quintero plant has two gas turbines with a total capacity of 257 MW. With the addition of a steam turbine unit of 130 MW capacity, the Quintero plant would reach a total capacity of 387 MW. The energy produced would be delivered to the SEN through the existing Quintero-San Luis line, a simple 220 kV circuit built to evacuate the energy of the combined-cycle power plant.
During 2017 the preparation of the environmental impact study and the implementation of the sustainability plan have continued.
The final investment decision of the project will depend, among other factors, on the commercial opportunities foreseen in the upcoming years, including the prices in future tenders for supplying the energy requirements of the regulated market and/or negotiations with existing or new unregulated customers. The estimated total investment is Ch$ 133,695 million, of which Ch$ 2,825 million was incurred as of December 31, 2017. This project is being financed primarily with internally generated funds.
Ttanti Combined-Cycle Project
The Ttanti project is located in the Antofagasta region, on land adjacent to the existing Atacama power plant that is located in the industrial zone of the city of Mejillones. The project consists of the construction of a natural gas combined-cycle power plant with an aggregate installed capacity of 1,290 MW, 430 MW for each of three units, and one unit would be able to use diesel oil as a backup in case of a shortage of natural gas. The power plant would be connected to the SEN through a 0.5 km 220 kV double circuit transmission line to the Atacama substation, which would be expanded for this purpose.
The project is in the environment assessment phase. On December 28, 2017, the Environmental Evaluation Commission of the Antofagasta region voted in favor of the power plant’s environmental approval and we are waiting for the issuance of the resolution to obtain the environmental permit. Any decision related to the construction of the project will depend, among others, on the commercial opportunities foreseen in the upcoming years, including prices in future tenders for supplying the energy requirements of the regulated market and/or negotiations with existing or new unregulated customers.
The estimated total investment for the first unit is Ch$ 231,937 million, of which Ch$ 1,163 million was incurred as of December 31, 2017. This project is being financed primarily with internally generated funds.
Taltal Combined-Cycle Project
The Taltal project consists of the construction of a steam turbine for converting the existing Taltal gas-fired open cycle plant to a combined-cycle plant by adding a turbine in the vapor phase, which would use the steam generated by the gas turbines’ heat emissions to produce energy, which will considerably improve its efficiency. The Taltal power plant is located in the Antofagasta Region. Currently, the existing Taltal power plant has two gas turbines with 120 MW installed capacity each. The steam turbine would add 130 MW and
52
therefore, the Taltal power plant would reach a total capacity of 370 MW. The energy produced will be supplied to the SEN through the existing 220 kV double circuit Diego de Almagro – Paposo transmission line.
The environmental permit, requested through an Environmental Impact Statement submitted in December 2013, was approved by the relevant authority in January 2017. Any decision related to the construction of the project will depend, among others, on the commercial opportunities foreseen in the upcoming years, e.g., prices in future tenders for supplying the energy requirements of the regulated market and/or negotiations with existing or new unregulated customers.
The estimated total investment is Ch$ 121,550 million, of which Ch$ 2,873 million was incurred as of December 31, 2017. This project is being financed primarily with internally generated funds.
Tarapacá Battery Energy Storage System
We are analyzing the installation of a battery energy storage system (BESS) in the Tarapacá power plant to provide ancillary services in upcoming years.
The project would consider the installation of a BESS with about 14 MW of installed capacity and 7 MWh of energy storage, connected to the 11.5 kV bar of the existing 23 MW turbine installed in the Tarapacá power plant.
On December 2017, the Environmental Evaluation Service (“SEA” in its Spanish acronym) of the Tarapacá Region issued the resolution waiving the obligation to submit the project to environmental assessment before its construction. Despite this fact, any decision related to the construction of the project will depend, among others, on the commercial opportunities foreseen in the upcoming years and, particularly, on the evolution of the regulatory framework for the provision and remuneration of the ancillary services.
The estimated total investment is about Ch$ 6,803 million. As of December 31, 2017, Ch$ 74 million was incurred. This project is being financed primarily with internally generated funds.
Smart Repowering Projects
Within the context of projects under development, we are analyzing the following three Smart Repowering projects to increase the installed capacity or electricity generation, or both, of power plants already in operations by either upgrading some components or improving the hydraulic potential of the plant, or both. This project is being financed primarily with internally generated funds.
Antuco Repowering
Antuco Repowering is a project to be implemented within the Antuco operating power plant, located in Biobío region in southern Chile. The project involves replacing one turbine installed in 1981 with an 88% load factor, with a new turbine with a target efficiency rate of 94%, obtaining 21 GWh of new energy. The estimated total investments is Ch$ 3,507 million, none of which has been incurred as of December 31, 2017, and is expected to begin operations in the second quarter of 2020. This project is being financed primarily with internally generated funds.
Sauzal Repowering
Sauzal Repowering is a project to be implemented within the Sauzal power plant, Región del Libertador General Bernando O’Higgins in central Chile. The project involves changing one turbine supplied by Charmilles in 1951 with an 88% load factor replacing it with a new one with target efficiency rate of 94%, obtaining up to 3MW of new capacity and 12 GWh coming from repowering. The estimated total investment is Ch$ 1,752 million, none of which has been incurred as of December 31, 2017, and is expected to begin operations in the fourth quarter of 2019. This project is being financed primarily with internally generated funds.
Estero Atravesado Repowering
Estero Atravesado Repowering is a project to be developed in Biobío Region, souther Chile, in the upper basin area of Laja River. This project involves increase the water flow use to generate by installing an additional adduction pipeline for the Antuco power plant. The project will increase electricity generation in 1,240 GWh. The estimated total investment is Ch$ 1,936 million and is expected to begin operations in the fourth quarter of 2019. The incurred investment as of December 31, 2017 was Ch$ 16.7 million. This project is being financed primarily with internally generated funds.
53
| D. | Projects Cancelled in 2017 |
Neltume Hydroelectric Project
The Neltume project was expected to be located in Los Ríos region, on the upper part of the Valdivia River basin. The project was officially abandoned and closing activities with communities and other environmental commitments are ongoing. The project would have consisted of a 490 MW installed capacity run-of -the-river hydro power plant to be connected to the SEN through a 42 kilometer 220 kV transmission line from Neltume to Pullinque.
Our indigenous community inquiry process, which was completed at the end of 2015, revealed that there were some significant social and environmental controversies in the land associated with the Neltume project. Therefore, the original 2010 EIA was likely to be rejected given the official announcements of various public service authorities issued in late 2015 as well as several meetings with the authorities and the concerns of residents living near Lake Neltume. We decided to study new design alternatives in order to redesign the discharge to the lake. As a consequence of this decision, we recorded a Ch$ 2.7 billion write-off in the fourth quarter of 2015, associated with some assets related to the 2010 EIA, which was withdrawn on December 29, 2015, and other studies directly related to the original design.
In the fourth quarter of 2016, we recorded a Ch$ 20.5 billion impairment loss related to the Neltume project because under the prevailing electricity market conditions, the expected returns would not cover the projected investment. In addition, considering our new focus on investing in more manageable projects with shorter construction periods and shorter paybacks, the project would have needed to be redesigned to become economically and technically feasible.
In 2017, an additional Ch$ 21,975 billion write-off was booked based on non-recoverable amounts due to the lower value of the asset, net of the impairments and write-offs mentioned above that were recorded before 2017.
Choshuenco Hydroelectric Project
The Choshuenco project was expected to be located in Los Ríos region, connected in series with the Neltume project. The project would have consisted of a 135 MW run-of-the-river hydroelectric plant using the water of the Llanquihue River and restoring water to the Panguipulli Lake. It was to be connected to the Loncoche substation through Neltume’s transmission line. A feasibility analysis determined results to be lower than expected.
In the fourth quarter of 2016, we recorded a Ch$ 3.7 billion impairment loss, related to the Choshuenco project. Even though the project offers positive environmental and social impacts, the expected profit of the project is lower than the expected investment.
In 2017, an additional Ch$ 3.1 billion write-off was recorded, mainly due to the relevance of the synergies with the construction and operation phase of the Neltume Project and based on the non-recoverable amounts due to the lower value of the asset, net of the impairments and write-offs mentioned above that were performed before 2017.
| 2. | Distribution Business Projects |
During 2017, our subsidiary Enel Distribución and its subsidiaries, Empresa Eléctrica de Colina and Luz Andes, invested a total Ch$ 91 billion in projects related to our customers’ natural growth rate, service quality requirements, safety and information system needs.
The most relevant investments in 2017 include the following:
| • | Ch$ 18 billion in the medium and low voltage network to allow for the connection of our new customers, including residential customers, large volume clients, and real estate projects. |
| • | Ch$ 10.7 billion to increase our distribution capacity, consisting of Ch$ 8 billion invested in the San Pablo, Chicureo, Club Hípico substations and Ch$2.7 billion for adding and reinforcing medium voltage feeders. |
| • | Ch$ 11 billion to reinforce feeders, specifically those determined by our service quality plan. Automation of the medium voltage network increased rapidly as a result of the installation of 320 new remote control devices, reaching a total 1,500 devices controlled by our Centralized Network Operations Center. |
54
| • | Ch$ 8.6 billion in network relocations due to new highways and requests from municipalities, which imply changing the electricity cables, including in some cases placing them below ground. |
| • | Ch$ 4 billion to buy and install 45,628 Smart Meters in 2017, reaching a total 100,865 Smart Meters throughout 11 districts in Santiago. Smart Meters allow us to remotely and automatically read electricity consumption, connect and disconnect electricity supply and also allow customers to install solar panels and inject their surplus energy into the distribution network without the need of any additional equipment. |
Major Encumbrances
As of December 31, 2017, we have full ownership of our assets and they are not subject to material encumbrances.
Environmental Issues and Focus on Renewable Energy
In recent years, Chile and the region have seen an increase in the development of regulations and other strategies to promote environmentally friendly NCRE. Our operating subsidiaries are subject to increasing environmental regulations. We are required to perform environmental impact studies for future projects and obtain permits from both local and national regulators. The approval of these environmental impact studies may be withheld by governmental authorities and therefore their processing time may be longer than expected. In addition, any deviation from the environmental license to operate could result in penalties or sanctions from authorities.
Environmental regulations have established stricter emission limits for existing and future generation capacity requiring increased capital investments. Any delay in meeting the standards constitutes a violation of the regulations which established emission limits effective June 23, 2015 or June 23, 2016 and may result in penalties and sanctions. All of our thermal plants made incremental investments focused on the new stricter regulations, such as installing abatement systems to control pollutant emissions. The Tarapacá Environmental Retro-fitting Project described above is an example of additional investments driven by stricter environmental regulatory requirements.
Enel, our ultimate controlling shareholder, is aiming for a complete de-carbonization of energy generation by 2050. The lost capacity resulting from the closure of existing coal power plants will be substituted with more environmentally friendly types of generation, focusing on NCRE. This announcement is aligned with the Energy Agenda released by the Chilean government in May 2014, which seeks to facilitate the incorporation of NCRE sources and promote the efficient use of energy, among other objectives.
NCRE plants provide energy with minimal environmental impact and without CO2 emissions. They are therefore considered technological options that strengthen sustainable energy development as they supplement the production of traditional generators.
The promotion of NCRE has driven Enel Distribución to invest in replacing traditional electricity meters with digital smart meters that allow a permanent and bidirectional connection with customers, increasing operational efficiency and enabling customers to inject their surplus solar energy into the distribution network.
Our NCRE generation facilities as of December 31, 2017 are: (i) Canela I wind farm with 18 MW of installed capacity and 11 self-generators, which has been in operation since 2007, (ii) Canela II wind farm with 60 MW of installed capacity and 40 self-generators, which has been in operation since 2009, and (iii) Ojos de Agua run-of-the-river mini-hydro power plant with 9 MW of installed capacity, which has been in operation since 2008, which as of December 31, 2017, totaled 1.4% of our installed capacity (including the Ojos de Agua power plant).
In addition, as described above, we are constructing Los Cóndores project, a run-of-the-river hydroelectric power plant, which is intended to displace thermal units connected to the SEN.
Finally, after the 2018 Reorganization, our participation in the renewable energy business will increase through the merger with EGPL, adding 1.2 GW of renewable generation capacity to reach 17% of our total installed capacity. For additional information on the 2018 Reorganization, see “Item 4. Information on the Company – A. History and Development of the Company – The 2018 Reorganization.”
Item 4A.Unresolved Staff Comments
None.
55
Item 5.Operating and Financial Review and Prospects
A. Operating Results.
General
The following discussion should be read in conjunction with our audited consolidated financial statements and the notes thereto, included in Item 18 in this Report, and “Selected Financial Data,” included in Item 3 herein. Our audited consolidated financial statements as of December 31, 2017 and 2016 and for each of the years in the three-year period ended December 31, 2017, have been prepared in accordance with IFRS, as issued by the IASB.
1. | Discussion of Main Factors Affecting Operating Results and Financial Condition of the Company |
We own and operate, through our subsidiaries, electricity generation and distribution companies in Chile. Our revenues, income and cash flows primarily come from the operations of our subsidiaries and associates in Chile.
Factors such as (i) hydrological conditions, (ii) fuel prices, (iii) regulatory developments, (iv) exceptional actions adopted by governmental authorities and (v) changes in economic conditions may materially affect our financial results. In addition, our results from operations and financial condition are affected by variations in the exchange rate between the Chilean peso and the U.S. dollar. We have certain critical accounting policies that affect our consolidated operating results. The impact of these factors on us, for the years covered by this Report, is discussed below.
A substantial part of our generation capacity is hydroelectric and depends on the prevailing hydrological conditions in Chile. Our installed capacity as of December 31, 2017, 2016 and 2015 was 6,351 MW, of which 55% was hydroelectric for the three years. See “Item 4. Information on the Company — D. Property, Plants and Equipment.”
Hydroelectric generation was 9,652 GWh, 9,078 GWh and 11,842 GWh in 2017, 2016 and 2015, respectively. Our 2017 hydroelectric generation was greater than 2016 mainly due to more humid hydrological conditions especially during the last quarter of 2017, even though some important reservoirs are still at low levels due to several years of drought, characterized by low rainfalls and a poor snowmelt, since 2010.
Hydrological conditions in Chile can range from very wet, as a result of several years of abundant rainfall and lakes at their peak capacity, to extremely dry, as a consequence of prolonged droughts lasting for several years, the partial or material depletion of water reservoirs and the significant reduction of snow and ice in the mountains, which in turn leads to materially lower levels of available water as a consequence of lower melts. In between these two extremes, there is a wide range of possible hydrological conditions. For instance, a new year of drought has very different impacts on our business, depending on whether it follows several years of drought or a period of abundant rainfall. On the other hand, a good hydrological year has less marginal impact if it comes after several wet years rather than after a prolonged drought. In Chile, the period of the year that typically has the most precipitation is from May through August, and the period with more snow and ice melt is from October through March, providing water flow to lakes, reservoirs and rivers, which supply our hydroelectric plants, most of them located in southern Chile. For purposes of discussing the impact of hydrological conditions on our business, we generally categorize our hydrological conditions as either dry or wet, although there are several other intermediate scenarios. Extreme hydrological conditions materially affect our operating results and financial condition. However, it is difficult to indicate the effects of hydrology on our operating income, without concurrently considering other factors, because our operating income can only be explained by looking at a combination of factors and not each one on a stand-alone basis.
Hydrological conditions affect electricity market prices, generation costs, spot prices, tariffs and the mix of hydroelectric, thermal and NCRE generation, which is constantly being determined by the CEN to minimize the operating costs of the entire system. According to the current regulatory framework, the price at which energy is traded on the spot market (known as spot price) is determined by the marginal cost of the system. The marginal cost is the cost of the most expensive power plant in operation given an efficiency-based dispatch. Regulation also considers capacity payments to generators, which remunerates each power plant’s installed capacity according to its availability and contribution to the system’ safety. This capacity payment is determined by the regulator every six months. Run-of-the-river hydroelectric and NCRE generation are almost always the least expensive generation technology and normally have a marginal cost close to zero. Water from reservoirs used to generate electricity, on the other hand, is assigned an opportunity cost for the use of water, which may lead to hydroelectric generation using water from reservoirs having a significant cost in extended drought conditions. The cost of thermal generation does not depend on hydrological conditions but instead on
56
international commodity prices for LNG, coal, diesel and fuel oil. Solar and wind sources are currently the NCRE technologies most widely used. NCRE facilities are able to dispatch energy to the system at very low marginal costs, but they depend on the blowing of the wind or the shining of the sun.
Spot prices primarily depend on hydrological conditions and commodity prices and, to a lesser extent, on NCRE availability. Under most circumstances, abundant hydrological conditions lower spot prices while dry conditions normally increase spot prices. Spot market prices affect our results because we must purchase electricity in the spot market when our contracted energy sales are greater than our generation, and we sell electricity in the spot market when we have electricity surpluses.
There are many other factors that may affect our operating income, including the level of contracted sales, purchases and sales in the spot market, commodity prices, energy demand and supply, technical and unforeseen problems that can affect the availability of our thermal plants, plant locations in relation to urban demand centers, and transmission system conditions, among others.
To illustrate the effects of hydrology on our operating results, the following table describes certain hydrological conditions, their expected effects on spot prices and generation, and the expected impact on our operating income, assuming that other factors remain unchanged. In all cases, hydrological conditions do not have an isolated effect but need to be evaluated along with other factors to better understand the impact on our operating results.
Hydrological
Conditions | | Expected effects on spot prices and generation | | Expected impact on our operating results |
| | | | |
Dry | | Higher spot prices | | Positive: if our generation is higher than our contracted energy sales, energy surpluses are sold in the spot market at higher prices. Negative: if our generation is lower than our contracted sales, we have an energy deficit and must purchase energy in the spot market at higher prices. |
| Reduced hydro generation | | Negative: less energy available to sell in the spot market. |
| Increased thermal generation | | Positive: increases our energy available for sale and either reduces purchases in the spot market or increases sales in the spot market at higer prices. |
| | | | |
Wet | | Lower spot prices | | Positive: if our generation is lower than contracted energy sales, the energy deficit is covered by purchases in the spot market at lower prices. Negative: if we have energy surpluses, they are sold in the spot market at lower prices. |
| | | |
| Increased hydroelectric generation | | Positive: more energy available to sell in the spot market at lower prices. |
| | | |
| Reduced thermal generation | | Negative: less energy available to sell in the spot market. |
If factors other than those described above apply, the expected impact of hydrological conditions on operating results will be different than those shown above. For instance, in a dry year with lower commodity prices, spot prices may decrease, or in a wet year if demand increases, or generation plants are not available for technical or other reasons, the spot price may increase, altering the impact of hydrological conditions discussed in the table above.
Our electricity distribution business is conducted through Enel Distribución in the Santiago metropolitan area, providing electricity to almost 1.9 million customers. Santiago is the country’s most densely populated area and has the highest concentration of industries, industrial parks and office facilities in the country.
For the year ended December 31, 2017, electricity sales amounted to 16,438 GWh, representing a 3.2% increase when compared to 2016. For the year ended December 31, 2016, our electricity distribution sales totaled 15,924 GWh representing, a slight increase of 0.2% compared to 2015.
Distribution revenues are mainly derived from the resale of electricity purchased from generators. Revenues associated with distribution include the recovery of the cost of electricity purchased and the resulting revenues from the “Value Added from Distribution,” or VAD, plus the physical energy losses permitted by the regulator. Other revenues derived from our distribution
57
business normally consist of transmission revenues, charges for new connections and the maintenance and rental of meters, among others. However, recently, it also includes revenues derived from public lighting, infrastructure projects mainly associated with real estate development and energy efficiency solutions, including air conditioning equipment, LED lights, etc., in all cases including customers outside of our concession area.
Although these other sources of revenue have increased, the core business continues to be the distribution of electricity at regulated prices. Therefore, the regulatory framework has a substantive impact on our distribution business results.
In particular, regulators set distribution tariffs taking into account the cost of electricity purchases paid by distribution companies (which distribution companies pass on to their customers) and the VAD, all of which are intended to reflect investment and operating costs incurred by distribution and generation companies and to allow them to earn a regulated level of return on their investments and guarantee service quality and reliability. Our earnings are determined to a large degree by government regulation, mainly through the tariff setting process. Our ability to buy electricity relies highly on generation availability, and on regulation to a lesser degree. The cost of electricity purchased is passed on to end users through tariffs that are set for multi-year periods. Therefore, variations in the price at which a distribution company purchases electricity do not have an impact on our profitability.
In the past, we focused on reducing physical losses, especially those due to illegally tapped energy. Our physical losses have generally been around 5% for the last 20 years, a level close to the distribution technical loss threshold for our concession. Reducing losses below this level requires additional investments to reduce illegal tapping and would not be expected to have an economically attractive return. Currently, we are working instead on improving our receivables turnover and our efficiency, especially through new technologies to automate our networks.
Enel Distribución’s tariff review process, which set the tariffs for the 2016-2020 period, was finalized in August 2017. The new tariffs were applied retroactively as of November 2016 and the review did not have a significant effect on Enel Distribución’s tariffs. Tariffs for residential, commercial and industrial customers changed, but the changes offset each other, and Enel Distribución's revenues remained stable. Tariff reviews seek to capture distribution efficiencies and economies of scale resulting from economic growth.
Macroeconomic conditions, such as changes in employment levels and inflation or deflation may have a significant effect on our operating results. Macroeconomic factors, such as the variation of the Chilean peso against the U.S. dollar, may impact our operating results, as well as our assets and liabilities, depending on the amounts denominated in U.S. dollars. For example, a devaluation of the Chilean peso against the U.S. dollar increases the cost of capital expenditure plans. For additional information, see “Item 3. Key Information — D. Risk Factors — Foreign exchange risks may adversely affect our results and the U.S. dollar value of dividends payable to ADS holders” and “Item 3. Key Information — D. Risk Factors — Chilean economic fluctuations as well as certain economic interventionist measures by governmental authorities may affect our results of operations and financial condition as well as the value of our securities.”
The following table sets forth the closing and average Chilean pesos per U.S. dollar exchange rates for the years indicated:
| | Local Currency U.S. Dollar Exchange Rates | |
| | 2017 | | | 2016 | | | 2015 | |
| | Average | | | Year End | | | Average | | | Year End | | | Average | | | Year End | |
Chilean pesos per U.S. dollar | | | 649.11 | | | | 614.75 | | | | 676.67 | | | | 669.47 | | | | 654.66 | | | | 710.16 | |
Source: Central Bank of Chile
d. | Critical Accounting Policies |
Critical accounting policies are defined as those that reflect significant judgments and uncertainties which would potentially result in materially different results under different assumptions and conditions. We believe that our most critical accounting policies with reference to the preparation of our consolidated financial statements under IFRS are those described below.
For further detail of the accounting policies and the methods used in the preparation of the consolidated financial statements, see Notes 2 and 3 of the Notes to our consolidated financial statements.
58
Impairment of Long-Lived Assets
From time to time, and principally at the end of any year, we evaluate whether there is any indication that an asset has been impaired. Should any such indication exist, we estimate the recoverable amount of that asset to determine, where appropriate, the amount of impairment. In the case of identifiable assets that do not generate cash flows independently, we estimate the recoverability of the cash generating unit to which the asset belongs, which is understood to be the smallest identifiable group of assets that generates independent cash inflows.
Notwithstanding the preceding paragraph, in the case of cash generating units to which goodwill or intangible assets with an indefinite useful life have been allocated, a recoverability analysis is performed routinely at each period end.
The recoverable amount is the greater of (i) the fair value less the cost needed to sell and (ii) the value in use, which is defined as the present value of the estimated future cash flows. In order to calculate the recoverable value of property, plant and equipment, goodwill and intangible assets that form part of a cash generating unit, we use “value in use” criteria in nearly all cases.
To estimate the value in use, we prepare future pre-tax cash flow projections based on the most recent budgets available. These budgets incorporate management’s best estimates of cash generating units, revenues and costs using sector projections, past experience and future expectations.
In general, these projections cover the next five years, estimating cash flows for future years and applying reasonable growth rates, which in no case are increasing nor exceed the average long term growth rates for the Chilean electricity sector. At the end of December 2017, projected cash flows were extrapolated using an annual growth rate of 3.1%.
These future cash flows are discounted at a given pre-tax rate to calculate their present value. This rate reflects the cost of capital of the business in Chile. The discount rate is calculated taking into account the current time value of money and the risk premiums generally used by market participants for the specific business activity.
The pre-tax nominal discount rates applied in 2017, 2016 and 2015 are as follows:
Year ended December 31, | |
2017 | | | 2016 | | | 2015 | |
Minimum | | | Maximum | | | Minimum | | Maximum | | | Minimum | | | Maximum | |
| 7.5 | % | | | 10.7 | % | | 8.1% | | | 12.2 | % | | | 8.1 | % | | | 12.7 | % |
If the recoverable amount is less than the net carrying amount of the cash generating unit, the corresponding impairment loss provision is recognized for the difference, and charged to “Reversal of impairment loss (impairment loss) recognized in profit or loss” in the consolidated statement of comprehensive income.
Impairment losses recognized for an asset other than goodwill in prior periods are reversed when its estimated recoverable amount changes, increasing the asset’s value with a credit to earnings, limited to the asset’s carrying amount if no adjustment had occurred. Impairment adjustments to goodwill are not reversible.
Litigation and Contingencies
We are currently involved in legal and tax proceedings. As discussed in Note 22 of the Notes to our consolidated financial statements as of December 31, 2017, we recognized provisions for legal and tax proceedings in an aggregate amount of Ch$ 17.4 billion as of December 31, 2017. This amount was based on consultations with our legal and tax advisors, who are carrying out our defense in these matters and an analysis of potential results, assuming a combination of litigation and settlement strategies.
Hedge Cash Revenues Directly Linked to the U.S. Dollar
We have established a policy to hedge the portion of our revenues directly linked to the U.S. dollar by obtaining financing in U.S. dollars. Exchange differences related to this debt, as they are cash flow hedge transactions, are charged net of taxes to an equity reserve account that forms part of “Other Comprehensive Income” and recorded as income during the period in which the hedged cash flows are realized. This term has been estimated at ten years.
59
This policy reflects a detailed analysis of our future U.S. dollar revenue streams. Such analysis may change in the future due to new electricity regulations limiting the amount of cash flows tied to the U.S. dollar.
Pension and Post-Employment Benefit Liabilities
We have various defined benefit plans for our employees. These plans pay benefits to employees at retirement and use formulas based on years of service and employee compensations. We also offer certain additional benefits for some specific retired employees.
The liabilities shown for the pensions and post-employment benefits reflect our best estimate of the future cost of meeting our obligations under these plans. The accounting applied to these defined benefit plans involves actuarial calculations which contain key assumptions that include employee turnover, life expectancy, retirement age, discount rates, the future level of employee compensations and benefits, the claims rate under medical plans and future medical costs. These assumptions change as economic and market conditions vary and any change in any of these assumptions could have a material effect on the reported results from operations.
The effect of an increase of 100 basis points in the discount rate used to determine the present value of the post-employment defined benefits would decrease the liability by Ch$ 4.3 billion and Ch$ 4.7 billion as of December 31, 2017 and 2016, respectively, and the effect of a decrease of 100 basis points in the rate used to determine the present value of the post-employment defined benefits would increase the liability by Ch$ 4.8 billion and Ch$ 5.2 billion as of December 31, 2017 and 2016, respectively.
Recent Accounting Pronouncements
Please see Note 2.2 of the Notes to our consolidated financial statements for additional information regarding recent accounting pronouncements.
2. | Analysis of Results of Operations for the Years Ended December 31, 2017 and 2016 |
Hydrological conditions in Chile have been below the historical average since 2010. However, in 2017, hydrological conditions were slightly more humid than in 2016, mainly during the fourth quarter of 2017. This allowed us to produce more electricity through hydroelectric generation rather than thermal generation that is more expensive. In addition, the commissioning of new NCRE plants reduced the impact of dry conditions. Therefore, the marginal cost of electricity generation decreased in 2017 when compared to 2016. As a result, we were able to cover our energy deficit in the spot market at lower prices. Our physical sales decreased when compared to 2016 and our customer mix changed because a portion of our regulated customers chose the unregulated tariff regime instead. Our selling and administrative expenses decreased considerably in 2017, mainly due to the impairments and write-offs we booked in 2016.
In the distribution business, although our physical sales and unregulated sales related to infrastructure projects and public lighting increased in 2017 when compared to 2016, in June and July 2017 we faced rain storms and the most damaging snow storm in Santiago since 1970, leaving parts of the capital without power for over one week. These situations significantly increased our costs due to emergency responses including payments related to damage compensation, fines, lines maintenance and tree trimming plans.
The combination of these factors, among others, contributed to an increase of operating income in 2017 when compared to 2016. For details, please refer to “Consolidated Operating Income” below.
60
Consolidated Revenues
The following table sets forth our revenues by reportable segment for the years ended December 31, 2017 and 2016:
| | Years ended December 31, | |
| | 2017 | | | 2016 | | | Change | | | Change | |
| | (in millions of Ch$) | | | (in %) | |
Generation Business | | | | | | | | | | | | | | | | |
Enel Generación and subsidiaries | | | 1,634,937 | | | | 1,659,727 | | | | (24,790 | ) | | | (1.5 | ) |
Distribution Business | | | | | | | | | | | | | | | | |
Enel Distribución and subsidiaries | | | 1,333,027 | | | | 1,315,761 | | | | 17,267 | | | | 1.3 | |
Non-electricity business and consolidation adjustments | | | (438,618 | ) | | | (433,921 | ) | | | (4,696 | ) | | | 1.1 | |
Total Revenues | | | 2,529,347 | | | | 2,541,567 | | | | (12,220 | ) | | | (0.5 | ) |
Generation Business: Revenues
Revenues from our generation business decreased in 2017 compared to 2016. The decrease was mainly due to Ch$59.0 billion lower revenues from energy sales, which was primarily attributable to (i) Ch$41.2 billion associated with the lower energy average sales price, (ii) lower physical sales of Ch$ 39.6 billion as a result of an 8% decrease in sales to regulated clients, and (iii) partially offset by Ch$ 21.9 billion of higher revenues as a result of settlements performed by the CEN associated with price and quantity adjustments. The decrease was partially offset by Ch$28.4 billion of higher natural gas sales.
Distribution Business: Revenues
Revenues from our distribution business increased in 2017 compared to 2016, primarily due to an increase in customer consumption of Ch$ 17.3 billion, mainly attributable to (i) greater sales of Ch$ 9.8 billion to residential customers, (ii) higher unregulated customer sales of Ch$ 4.3 billion, and (iii) greater revenues from non-electricity sales of Ch$ 3.8 billion, mainly sales of products and connections to telecommunications companies.
The number of customers rose by 56,875 in 2017 compared to 2016, totaling 1,882,394, mainly new residential customers.
Consolidated Operating Costs
Our operating costs are primarily energy purchases from third parties, fuel purchases, tolls paid to transmission companies, depreciation, amortization and impairment losses, maintenance costs, employee salaries and administrative and selling expenses.
The following table sets forth the principal items for consolidated operating cost for the years ended December 31, 2017 and 2016:
| | Years ended December 31, | |
| | 2017 | | | 2016 | | | Change | | | Change | |
| | (in millions of Ch$) | | | (in %) | |
Energy purchases | | | 902,435 | | | | 891,747 | | | | 10,688 | | | | 1.2 | |
Fuel consumption | | | 280,739 | | | | 295,149 | | | | (14,409 | ) | | | (4.9 | ) |
Other variable procurement and services | | | 182,102 | | | | 115,401 | | | | 66,701 | | | | 57.8 | |
Transportation costs | | | 155,879 | | | | 195,123 | | | | (39,244 | ) | | | (20.1 | ) |
Total consolidated operating costs | | | 1,521,156 | | | | 1,497,420 | | | | 23,736 | | | | 1.6 | |
61
The following table sets forth our consolidated operating costs (excluding selling and administrative expenses) by reportable segment for the years ended December 31, 2017 and 2016:
| | Years ended December 31, | |
| | 2017 | | | 2016 | | | Change | | | Change | |
| | (in millions of Ch$) | | | (in %) | |
Generation Business | | | | | | | | | | | | | | | | |
Enel Generación and subsidiaries | | | 903,978 | | | | 895,060 | | | | 8,918 | | | | 1.0 | |
Distribution Business | | | | | | | | | | | | | | | | |
Enel Distribución and subsidiaries | | | 1,062,077 | | | | 1,042,329 | | | | 19,747 | | | | 1.9 | |
Non-electricity business activities and consolidation adjustments | | | (444,899 | ) | | | (439,970 | ) | | | (4,929 | ) | | | 1.1 | |
Total consolidated operating costs (excluding selling and administrative expenses) | | | 1,521,156 | | | | 1,497,420 | | | | 23,736 | | | | 1.6 | |
Generation Business: Operating Costs
Operating costs of our generation business increased in 2017 compared to 2016, mainly due to Ch$ 51.7 billion higher other variable procurement and services costs, which in turn was mostly attributable to (i) Ch$ 29.5 billion higher costs in the gas commercialization business, (ii) Ch$17.3 billion higher thermal emissions taxes and (iii) Ch$ 7.6 billion higher commodity derivative costs and increased purchases of Ch$ 11.2 billion due to higher physical purchases to comply with our contractual sales obligations. Such increases were partially offset by Ch$ 39.6 billion lower transportation costs due to lower tolls and Ch$ 14.4 billion lower fuel consumption costs mainly due to better hydrology in southern Chile during the fourth quarter of 2017, which allowed us to reduce our thermal generation during such quarter.
Distribution Business: Operating Costs
Operating costs of our distribution business increased in 2017 compared to 2016, mainly due to (i) Ch$ 16.1 billion higher other variable procurement and service costs attributable to greater outages, reinstatement and emergency plan costs related to extraordinary climatic events in June and July 2017 amounting to Ch$ 15.5 billion (including provisions for fines amounting to Ch$ 8.4 billion, legal damage compensation payments for Ch$ 3.6 billion, the payment of voluntary compensations for Ch$ 3.4 billion), and (ii) increased transportation expenses for Ch$ 2.6 billion.
Consolidated Selling and Administrative Expenses
Our selling and administrative expenses are salaries, compensation, administrative expenses, depreciation, amortization and impairment losses, and office materials and supplies.
The following table sets forth the consolidated selling and administrative expenses by category for the years ended December 31, 2017 and 2016:
| | Years ended December 31, | |
| | 2017 | | | 2016 | | | Change | | | Change | |
| | (in millions of Ch$) | | | | | | | | | | | (in %) | |
Depreciation, amortization and impairment losses | | | 160,622 | | | | 197,587 | | | | (36,965 | ) | | | (18.7 | ) |
Other fixed costs | | | 161,824 | | | | 170,769 | | | | (8,945 | ) | | | (5.2 | ) |
Employee benefit expense and others | | | 107,115 | | | | 108,002 | | | | (887 | ) | | | (0.8 | ) |
Total consolidated selling and administrative expenses | | | 429,561 | | | | 476,358 | | | | (46,797 | ) | | | (9.8 | ) |
62
The following table sets forth our consolidated selling and administrative expenses by reportable segment for the years ended December 31, 2017 and 2016:
| | Years ended December 31, | |
| | 2017 | | | 2016 | | | Change | | | Change | |
| | (in millions of Ch$) | | | (in %) | |
Generation Business | | | | | | | | | | | | | | | | |
Enel Generación and subsidiaries | | | 267,099 | | | | 333,281 | | | | (66,182 | ) | | | (19.9 | ) |
Distribution Business | | | | | | | | | | | | | | | | |
Enel Distribución and subsidiaries | | | 138,441 | | | | 116,837 | | | | 21,603 | | | | 18.5 | |
Non-electricity business and consolidation adjustments | | | 24,021 | | | | 26,240 | | | | (2,219 | ) | | | (8.5 | ) |
Total consolidated selling and administrative expenses | | | 429,561 | | | | 476,358 | | | | (46,797 | ) | | | (9.8 | ) |
Consolidated selling and administrative expenses from continuing operations decreased in 2017 compared to 2016, mainly due to a reduction in the generation business. The reduction in the generation business is primarily due to (i) lower impairment losses of property, plant and equipment of Ch$ 30.8 billion due to the non-recurring impairment charges of Ch$ 24.2 billion booked in 2016 related to NCRE projects and the Neltume and Choshuenco projects (see “― 2. Analysis of Result of operations for the year ended December 31, 2016 and 2015 ― Consolidated Selling and Administrative Expenses”); (ii) lower other fixed costs of Ch$ 16.5 billion primarily attributable to the non-recurring impairment charges of Ch$ 35.4 billion related to the waiver of water rights of the Bardón, Chillán 1 and 2, Futaleufú, Huechún and Puelo hydroelectric projects recorded in 2016 compared with the Ch$ 25.1 billion loss recognized in 2017 in connection with Enel Generación’s decision to abandon the Neltume and Choshuenco projects for being economically unfeasible to reduce the net book value of the associated assets to zero; and (iii) lower depreciation and amortization of Ch$ 15.3 billon primarily due to the modification of the remaining useful life of fixed assets applied to property, plants, and equipment in 2017. Selling and administrative expenses in our distribution business increased in 2017 compared to 2016, primarily due to (i) Ch$ 9.8 billion higher other fixed costs, mainly attributable to an increase in emergency attention, line maintenance and a tree trimming plan of Ch$ 8.6 billion, (ii) Ch$ 9.1 billion higher depreciation and amortization and impairment losses due to an increase in depreciation related to construction works that became operational and (iii) a Ch$ 2.6 billion increase in employee expenses due to extraordinary non-recurrent employee bonuses related to the new collective bargaining process carried out with Enel Distribución’s unions in 2016.
Consolidated Operating Income
The following table sets forth our operating income by reportable segment for the years ended December 31, 2017 and 2016:
| | Years ended December 31, | |
| | 2017 | | | 2016 | | | Change | | | Change | |
| | (in millions of Ch$) | | | (in %) | |
Generation Business | | | | | | | | | | | | | | | | |
Enel Generación and subsidiaries | | | 463,860 | | | | 431,386 | | | | 32,474 | | | | 7.5 | |
Distribution Business | | | | | | | | | | | | | | | | |
Enel Distribución and subsidiaries | | | 132,510 | | | | 156,594 | | | | (24,084 | ) | | | (15.4 | ) |
Non-electricity business and consolidation adjustments | | | (17,740 | ) | | | (20,191 | ) | | | 2,452 | | | | (12.1 | ) |
Total consolidated operating income | | | 578,631 | | | | 567,789 | | | | 10,841 | | | | 1.9 | |
Operating margin(1) | | | 22.9 | % | | | 22.3 | % | | | — | | | | — | |
(1) | Operating margin, a measure of efficiency, represents income as a percentage of revenues. |
Our operating income and operating margin in 2017 increased slightly compared to 2016 primaily due to the decrease in consolidated selling and administrative expenses.
63
Consolidated Financial and Other Results
The following table sets forth our financial and other results for the years ended December 31, 2017 and 2016:
| | Years ended December 31, | |
| | 2017 | | | 2016 | | | Change | | | Change | |
| | (in millions of Ch$) | | | (in %) | |
Financial results | | | | | | | | | | | | | | | | |
Financial income | | | 21,663 | | | | 23,106 | | | | (1,443 | ) | | | (6.2 | ) |
Financial costs | | | (53,511 | ) | | | (58,199 | ) | | | 4,689 | | | | (8.1 | ) |
Gain from indexed assets and liabilities | | | 917 | | | | 1,632 | | | | (715 | ) | | | (43.8 | ) |
Foreign currency exchange differences | | | 8,517 | | | | 12,978 | | | | (4,462 | ) | | | (34.4 | ) |
Total financial results | | | (22,415 | ) | | | (20,483 | ) | | | (1,931 | ) | | | 9.4 | |
Other results | | | | | | | | | | | | | | | | |
Share of the profit (loss) of associates and joint ventures accounted for using the equity method | | | (2,697 | ) | | | 7,878 | | | | (10,575 | ) | | n.a. | |
Gain from sales of assets | | | 113,241 | | | | 121,490 | | | | (8,249 | ) | | | (6.8 | ) |
Total Other results | | | 110,544 | | | | 129,368 | | | | (18,824 | ) | | | (14.6 | ) |
Total Consolidated Financial and Other results | | | 88,130 | | | | 108,885 | | | | (20,755 | ) | | | (19.1 | ) |
Financial Results
We recorded a higher net financial expense for the year ended December 31, 2017 compared to 2016. This is primarily attributable to lower gains from foreign currency exchange differences, mainly as a result of the lower Chilean peso value of the U.S. dollar intercompany debt owed by Enel Generación to Enel Américas for Ch$ 10.1 billion that was offset by greater income on cash and cash equivalents in U.S. dollars for Ch$ 5.7 billion. These lower gains were offset by Ch$ 4.7 billion in lower financial costs, mainly due to lower interest expenses on bank loans and public bonds for Ch$ 4.7 billion. The reduction of our financial result was also the consequence of Ch$ 1.4 billion lower financial income due to a settlement agreement we entered into with YPF in 2016 for Ch$ 2.0 billion and lower customer refinancing income for Ch$ 1.9 billion in 2017, offset by higher income from temporary investments in fixed income securities for Ch$ 2.6 billion.
Other Results
Our share of the profit (loss) of associates and joint ventures accounted for using the equity method for the year ended December 31, 2017 decreased compared to 2016, primarily due to the sale of our former associate Electrogas in February 2017 and GNL Quintero in September 2016, accounting for a Ch$ 5.2 billion and Ch$ 2.8 billion decrease in equity investment profits, respectively. In addition, the loss registered in connection with HidroAysén increased by Ch$ 2.0 billion. For additional information on the termination and liquidation of HidroAysén, see “Item 4. Information on the Company – C. Organizational Strcuture – Selected Related and Jointly-Controleed Companies – HidroAysén.”
We also registered a lower gain from the sales of assets in 2017 when compared to 2016. In 2017 we recorded a Ch$ 105.3 billion gain from the sale of Electrogas and the sale of a land owned by GasAtacama for Ch$ 7.6 billion, while in 2016 we recognized a Ch$ 121.3 billion gain in 2016 from the sale of GNL Quintero.
Consolidated Income Tax Expenses
Consolidated income tax expenses totaled Ch$ 143.3 billion in 2017, an increase of Ch$ 31.9 billion, or 28.7%, when compared to 2016.
The increase in consolidated income tax expenses was primarily due to (i) a Ch$ 13.5 billion higher expense due to the reversal of the deferred income tax related to the dissolution of Central Canela S.A., (ii) Ch$ 13.1 billion greater income tax expenses related to lower exchange rate and price-level restatement losses (which increases the taxable income) and (iii) Ch$ 8.0 billion related to the increase of the statutory tax rate, from 24.0% to 25.5%. The increase in consolidated income tax expenses resulted in the increase of the effective income tax rate.
The effective tax rate was 21.5% in 2017 compared to 16.5% in 2016. For further details, please refer to Note 17 of the Notes to our consolidated financial statements.
64
Consolidated Net Income
The following table sets forth our consolidated net income before taxes, income tax expenses and net income for the years ended December 31, 2017 and 2016:
| | Years ended December 31, | |
| | 2017 | | | 2016 | | | Change | | | Change | |
| | (in millions of Ch$) | | | (in %) | |
Operating income | | | 578,631 | | | | 567,789 | | | | 10,841 | | | | 1.9 | |
Other results | | | 88,130 | | | | 108,885 | | | | (20,755 | ) | | | (19.1 | ) |
Net income before taxes | | | 666,760 | | | | 676,674 | | | | (9,914 | ) | | | (1.5 | ) |
Income tax expenses | | | (143,342 | ) | | | (111,403 | ) | | | (31,939 | ) | | | 28.7 | |
Consolidated Net income | | | 523,418 | | | | 565,271 | | | | (41,853 | ) | | | (7.4 | ) |
Net income attributable to the Parent Company | | | 349,383 | | | | 384,160 | | | | (34,777 | ) | | | (9.1 | ) |
Net income attributable to non-controlling interests | | | 174,035 | | | | 181,111 | | | | (7,076 | ) | | | (3.9 | ) |
The decrease in net income attributable to non-controlling interests in 2017 compared to 2016 is primarily due to the Ch$ 5.8 billion decrease of net income attributable to the non-controlling interests of Enel Generación for 2017, which in turn is mainly due to the decrease of the net income of Enel Generación by Ch$ 95.9 billion. The controlling and economic interest in Enel Generación was the same in both years.
3. Analysis of Results of Operations for the Years Ended December 31, 2016 and 2015
In 2016, hydrological conditions were slightly drier than in 2015 and adversely affected our hydroelectric generation. However, our Bocamina and San Isidro thermal plants generated during the full year 2016, compared to 2015 during which they only operated partially, which helped to offset our lower hydroelectric generation. In 2015, Bocamina operated for only five months due to legal issues and San Isidro generated at half of its capacity due to the lack of water needed to produce energy as a combined-cycle power plant. In 2016, despite the drought that especially affected southern Chile, where most of our plants are located, the marginal cost of electricity decreased mainly as a consequence of: (i) higher thermal generation, and a greater reliance on coal, with its lower marginal cost in relation to LNG; (ii) low international prices, and (iii) the commissioning of new NCRE plants into the system. As result, we were able to cover our energy deficit in the spot market at lower prices, partially offsetting our higher physical purchases, and to reduce our fuel consumption cost.
In the distribution business, physical sales in 2016 remained at practically the same level as in 2015, however our operating income increased due to regular indexed cost adjustment in the tariff as well as from higher margins in the non-regulated businesses, mainly infrastructure projects and other business outside of our concession area.
The combination of these factors, among others, contributed to increase our operating income in 2016 compared to 2015. Please refer to “Consolidated Operating Income” below.
Consolidated Revenues
The following table sets forth our revenues by reportable segment for the years ended December 31, 2016 and 2015:
| | Years ended December 31, | |
| | 2016 | | | 2015 | | | Change | | | Change | |
| | (in millions of Ch$) | | | (in %) | |
Generation Business | | | | | | | | | | | | | | | | |
Enel Generación and subsidiaries | | | 1,659,727 | | | | 1,543,812 | | | | 115,915 | | | | 7.5 | |
Distribution Business | | | | | | | | | | | | | | | | |
Enel Distribución and subsidiaries | | | 1,315,761 | | | | 1,257,732 | | | | 58,029 | | | | 4.6 | |
Non-electricity business activities and consolidation adjustments | | | (433,921 | ) | | | (402,515 | ) | | | (31,406 | ) | | | 7.8 | |
Total Revenues | | | 2,541,567 | | | | 2,399,029 | | | | 142,537 | | | | 5.9 | |
65
Generation Business: Revenues
Revenues from Enel Generación increased by Ch$ 115.9 billion, or 7.5%, in 2016 compared to 2015, primarily due to (i) Ch$ 53.1 billion as a result of a 3.6% increase in average energy sale prices, (ii) Ch$ 40.6 billion of higher natural gas sales, mainly related to exports to Argentina, (iii) Ch$ 15.9 billion increase in other income mainly related to better results in commodity hedges in Enel Generación (Ch$ 9.0 billion) and insurance indemnification for damage to the Tarapacá power plant (Ch$ 6.5 billion), and (iv) Ch$ 8.2 billion from increased physical sales of 131 GWh, an increase of 0.6%, mostly to regulated customers.
Distribution Business: Revenues
Revenues from Enel Distribución increased by Ch$ 58 billion, or 4.6%, in 2016 compared to 2015, primarily due to a Ch$ 49.7 billion increase due to Ch$ 4.2/kWh (5.0%) higher tariff to regulated customers because of regular indexed cost adjustment in the tariff and Ch$ 6.6 billion related to services rendered to non-regulated customers, such as street lighting outside of the concession area. The number of customers, mainly residential, rose by 44,739 in 2016 compared to 2015, totaling 1,825,519, and was mainly new residential customers.
Consolidated Operating Costs
Total operating costs consist primarily of energy purchases from third parties, fuel purchases, tolls paid to transmission companies, depreciation, amortization and impairment losses, maintenance costs, employee salaries and administrative and selling expenses.
The following table sets forth the principal items for our consolidated operating costs for the years ended December 31, 2016 and 2015:
| | Years ended December 31, | |
| | 2016 | | | 2015 | | | Change | | | Change | |
| | (in millions of Ch$) | | | (in %) | |
| | | | | | | | | | | | | | | | |
Energy purchases | | | 891,747 | | | | 860,203 | | | | 31,544 | | | | 3.7 | |
Fuel consumption | | | 295,149 | | | | 327,503 | | | | (32,354 | ) | | | (9.9 | ) |
Transportation costs | | | 195,123 | | | | 182,453 | | | | 12,670 | | | | 6.9 | |
Other variable procurement and services | | | 115,401 | | | | 111,826 | | | | 3,575 | | | | 3.2 | |
Total Consolidated Operating Costs | | | 1,497,420 | | | | 1,481,986 | | | | 15,435 | | | | 1.0 | |
The following table sets forth our consolidated operating costs (excluding selling and administrative expenses) by reportable segment for the years ended December 31, 2016 and 2015:
| | Years ended December 31, | |
| | 2016 | | | 2015 | | | Change | | | Change | |
| | (in millions of Ch$) | | | (in %) | |
Generation Business | | | | | | | | | | | | | | | | |
Enel Generación and subsidiaries | | | 895,060 | | | | 880,891 | | | | 14,169 | | | | 1.6 | |
Distribution Business | | | | | | | | | | | | | | | | |
Enel Distribución and subsidiaries | | | 1,042,329 | | | | 983,733 | | | | 58,596 | | | | 6.0 | |
Non-electricity business and consolidation adjustments | | | (439,970 | ) | | | (382,639 | ) | | | (57,331 | ) | | | 15.0 | |
Total Consolidated Operating Costs (excluding selling and administrative expenses) | | | 1,497,420 | | | | 1,481,985 | | | | 15,435 | | | | 1.0 | |
Generation Business: Operating Costs
Operating costs (excluding selling and administrative expenses) from continuing operations, increased by Ch$ 14.2 billion, or 1.6%, in 2016 compared to 2015, mainly due to (i) Ch$ 18.7 billion of higher other variable procurement and services costs mostly attributable to Ch$ 31.9 billion of higher costs in the gas commercialization business, (ii) increased purchases of energy of Ch$ 15.0 billion due to higher physical purchases of 861 GWh, an increase of 16.3%, mostly in the spot market, and (iii) Ch$ 12.8 billion of higher transportation costs due to higher tolls. This increase was partially offset by (i) Ch$ 32.4 billion of lower
66
fuel consumption costs mainly due to lower average prices, given the decrease of international commodity prices, which accounted for Ch$ 93.9 billion of the decrease, partially offset by Ch$ 69.3 billion related to higher thermal generation and by (ii) Ch$ 15.9 billion lower costs related to the lease agreement with Gener to use its Nueva Renca combined-cycle power plant, allowing us to use our available LNG, which directly compensates other variable procurement and services costs.
Distribution Business: Operating Costs
Operating costs of Enel Distribución increased by Ch$ 58.6 billion, or 6.0%, in 2016 compared to 2015, mainly due to Ch$ 55.4 billion greater energy purchases, primarily attributable to a higher average purchase price of Ch$ 3.8 /KWh (6.0%) as a result of regular indexed costs adjustment.
Consolidated Selling and Administrative Expenses
Selling and administrative expenses relate to salaries, compensation, administrative expenses, depreciation, amortization and impairment losses, and office materials and supplies.
The following table sets forth our consolidated selling and administrative expenses in Chilean pesos, and as a percentage of total consolidated selling and administrative expenses for the years ended December 31, 2016 and 2015:
| | Years ended December 31, | |
| | 2016 | | | 2015 | |
| | (in millions of Ch$) | | | (in %) | | | (in millions of Ch$) | | | (in %) | |
Depreciation, amortization and impairment losses | | | 197,587 | | | | 41.5 | | | | 150,147 | | | | 38.3 | |
Other fixed costs | | | 170,769 | | | | 35.8 | | | | 125,857 | | | | 32.1 | |
Employee benefit expense and others | | | 108,002 | | | | 22.7 | | | | 115,551 | | | | 29.5 | |
Total consolidated selling and administrative expenses | | | 476,358 | | | | 100 | | | | 391,555 | | | | 100 | |
The following table sets forth our consolidated selling and administrative expenses by reportable segment for the years ended December 31, 2016 and 2015:
| | Years ended December 31, | |
| | 2016 | | | 2015 | | | Change | | | Change | |
| | (in millions of Ch$) | | | (in %) | |
Generation Business | | | | | | | | | | | | | | | | |
Enel Generación and subsidiaries | | | 333,281 | | | | 261,088 | | | | 72,193 | | | | 27.7 | |
Distribution Business | | | | | | | | | | | | | | | | |
Enel Distribución and subsidiaries | | | 116,837 | | | | 124,706 | | | | (7,869 | ) | | | (6.3 | ) |
Non-electricity business and consolidation adjustments | | | 26,240 | | | | 5,761 | | | | 20,479 | | | n.a | |
Total consolidated selling and administrative expenses | | | 476,358 | | | | 391,555 | | | | 84,803 | | | | 21.7 | |
Selling and administrative expenses from continuing operations increased by Ch$ 84.8 billion, or 21.7%, in 2016 compared to 2015, mainly related to the generation business, which increased by Ch$ 72.2 billion. The increase in the generation business is mainly due to (i) higher impairment losses of property, plant and equipment of Ch$ 40.6 billion related to a recognition in 2016 of Ch$ 24.2 billion of impairment charges related to the Neltume (Ch$ 20.5 billion) and Choshuenco (Ch$ 3.7 billion) projects and an increase of Ch$ 4.1 billion impairment of capitalized investments in NCRE projects between 2016 and 2015, compared to income in 2015 of Ch$ 12.6 billion due to the reversal of impairment charges associated with the Tarapacá power plant; and (ii) higher other fixed costs of Ch$ 29.0 billion mostly attributable to the write-off of Ch$ 35.4 billion of property, plant and equipment related to the waiver of water rights associated with the Bardón, Chillán 1 and 2, Futaleufú, Hechún and Puelo hydroelectric projects, which was partially offset by Ch$ 4.1 billion in lower expenses of outsourced services, compared to 2015 in which we incurred higher costs related to the corporate reorganization.
Selling and administrative expenses in our distribution business decreased by Ch$ 7.9 billion, or 6.3%, mainly due to (i) Ch$ 4.4 billion reduction of third-party services expenses due to lower activity in customer inspections, and (ii) Ch$ 3.8 billion lower transmission rental expenses, as a result of the acquisition of transmission assets in August 2015. These decreases were partially offset by a Ch$ 2.5 billion increase in employee expenses due to salary increases.
67
Consolidated Operating Income
The following table sets forth our operating income by reportable segment for the years ended December 31, 2016 and 2015:
| | Years ended December 31, | |
| | 2016 | | | 2015 | | | Change | | | Change | |
| | (in millions of Ch$) | | | (in %) | |
Generation Business | | | | | | | | | | | | | | | | |
Enel Generación and subsidiaries | | | 431,386 | | | | 401,833 | | | | 29,553 | | | | 7.4 | |
Distribution Business | | | | | | | | | | | | | | | | |
Enel Distribución and subsidiaries | | | 156,594 | | | | 149,294 | | | | 7,300 | | | | 4.9 | |
Non-electricity business and consolidation adjustments | | | (20,191 | ) | | | (25,638 | ) | | | 5,447 | | | | (21.2 | ) |
Total consolidated operating income | | | 567,789 | | | | 525,489 | | | | 42,300 | | | | 8.0 | |
Operating margin from (1) | | | 22.3 | % | | | 21.9 | % | | | — | | | | — | |
(1) | Operating margin from continuing operations represents income as a percentage of revenues. |
The 5.9% increase in revenues offset a slight increase in operating costs of 1.0% and a 21.7% increase in selling and administrative expenses and contributed to a 8.0% increase in our operating income in 2016 compared to 2015, and a small increase in operating margin from 21.9% to 22.3%.
Consolidated Financial and Other Results
The following table sets forth our financial and other results for the years ended December 31, 2016 and 2015:
| | Years ended December 31, | |
| | 2016 | | | 2015 | | | Change | | | Change | |
| | (in millions of Ch$) | | | (in %) | |
Financial results | | | | | | | | | | | | | | | | |
Financial income | | | 23,106 | | | | 15,270 | | | | 7,836 | | | | 51.3 | |
Financial costs | | | (58,199 | ) | | | (66,701 | ) | | | 8,501 | | | | (12.7 | ) |
Profit for indexed assets and liabilities | | | 1,632 | | | | 4,839 | | | | (3,207 | ) | | | (66.3 | ) |
Foreign currency exchange differences | | | 12,978 | | | | (51,277 | ) | | | 64,256 | | | | (125.3 | ) |
Total | | | (20,483 | ) | | | (97,869 | ) | | | 77,386 | | | | (79.1 | ) |
Others | | | | | | | | | | | | | | | | |
Share of the profit (loss) of associates and joint ventures accounted for using the equity method | | | 7,878 | | | | 8,905 | | | | (1,027 | ) | | | (11.5 | ) |
Gain from sales of assets | | | 121,490 | | | | 20,056 | | | | 101,434 | | | n.a. | |
Total | | | 129,368 | | | | 28,961 | | | | 100,407 | | | n.a. | |
Total Consolidated Other Results | | | 108,885 | | | | (68,908 | ) | | | 177,793 | | | n.a. | |
Financial Results
The net financial results for the year ended December 31, 2016 was an expense of Ch$ 20.5 billion, or Ch$ 77.4 billion lower than the comparable net expenses in 2015. This better result is primarily due to a net reversal of charges for foreign currency exchange differences of Ch$ 64.3 billion, mainly as a result of the lower Chilean peso value of the U.S. dollar intercompany debt owed by Enel Generación to Enel Américas for Ch$ 48.0 billion, and the higher gain in forward contracts for Ch$ 14.4 billion.
Other Results
Our share of the profit (loss) of associates and joint ventures accounted under the equity method for the year ended December 31, 2016 was Ch$ 7.9 billion, a decrease of Ch$ 1.0 billion, or 11.5%, compared to 2015, primarily because we sold our former associate GNL Quintero in September 2016, while in 2015 we recognized a full year of operations of GNL Quintero.
Gain from the sales of assets was Ch$ 121.5 billion in 2016, an increase of Ch$ 101.4 billion as compared to 2015. This increase was primarily due to the gain of Ch$ 121.3 billion from the sale of our former associate GNL Quintero, when compared to
68
the gains recognized in 2015 of Ch$ 4.2 billion arising from the sale of our former associate Túnel El Melón in January 2015 and the sale of the land next to our Alonso de Córdova substation of Ch$ 14.6 billion during the fourth quarter of 2015.
Consolidated Income Tax Expenses
Total income tax expenses totaled Ch$ 111.4 billion in 2016, an increase of Ch$ 1.8 billion, or 1.6% compared to 2015.
The increase in total income tax expenses from continuing operations was mainly due to Ch$ 4.2 billion related to the increase of the statutory tax rate from 22.5% to 24% and Ch$ 52.9 billion higher income from continuing operations effect for the year ended December 31, 2016, including Ch$ 28.1 billion of higher taxes due to the effect generated by the sale of our former associate GNL Quintero. These increases were partially offset by Ch$ 18.8 billion of tax benefits gained as part of the corporate simplification process related to generating companies in Chile, Ch$ 14.4 billion of lower taxes on taxable price-level readjustment of investments, Ch$ 5.6 billion lower deferred taxes associated with the investments Enel Generación had in Peru and Ch$ 16.4 lower income taxes due to other different concepts of non-taxable revenues. These decreases resulted in the decrease of the effective income tax rate.
The effective tax rate was 16.5% in 2016 compared to 24% in 2015. For further details, please refer to Note 17 of the Notes to our consolidated financial statements.
Consolidated Net Income
The following table sets forth our consolidated net income before taxes, income tax expenses and net income for the years ended December 31, 2016 and 2015:
| | Years ended December 31, | |
| | 2016 | | | 2015 | | | Change | | | Change | |
| | (in millions of Ch$) | | | (in %) | |
Consolidated Operating income | | | 567,789 | | | | 525,489 | | | | 42,300 | | | | 8.0 | |
Consolidated Other results | | | 108,885 | | | | (68,908 | ) | | | 177,793 | | | | (258.0 | ) |
Consolidated Net income before taxes | | | 676,674 | | | | 456,581 | | | | 220,094 | | | | 48.2 | |
Income tax expenses | | | (111,403 | ) | | | (109,613 | ) | | | (1,791 | ) | | | 1.6 | |
Consolidated Net income | | | 565,271 | | | | 346,968 | | | | 218,303 | | | | 62.9 | |
Net income attributable to the Parent Company | | | 384,160 | | | | 251,838 | | | | 132,321 | | | | 52.5 | |
Net income attributable to non-controlling interests | | | 181,111 | | | | 95,130 | | | | 85,981 | | | | 90.4 | |
The increase in net income attributable to non-controlling interests of Ch$ 86.0 billion in 2016 compared to 2015, is primarily due to the Ch$ 87.2 billion increase of net income attributable to the non-controlling interests of Enel Generación for 2016, which in turn is mainly due to the increase in net income from continuing operations in Enel Generación by Ch$ 218 billion. The controlling and economic interest in Enel Generación is 60%, the same in both years.
B. | Liquidity and Capital Resources. |
Our main assets are our consolidated Chilean subsidiaries, Enel Generación and Enel Distribución. The following discussion of cash sources and uses reflects the key drivers of our cash flow.
We receive cash inflows from our subsidiaries and related companies. Our subsidiaries and associates’ cash flows may not always be available to satisfy our own liquidity needs because there may be a time lag before we have effective access to those funds through dividends or capital reductions. However, we believe that cash flow generated from our business operations, as well as cash balances, borrowings from commercial banks, short-term intercompany loans and ample access to the Chilean and international capital markets will be sufficient to satisfy all our needs for working capital, expected debt service, dividends and planned capital expenditures in the foreseeable future.
Set forth below is a summary of our consolidated cash flow information for the years ended December 31, 2017, 2016 and 2015:
69
| | Year ended December 31, | |
| | 2017 | | | 2016 | | | 2015 | |
| | (in billions of Ch$) | |
Net cash flows provided by operating activities | | | 636 | | | | 615 | | | | 577 | |
Net cash flows used in investing activities | | | (146 | ) | | | (63 | ) | | | (297 | ) |
Net cash flows used in financing activities | | | (318 | ) | | | (446 | ) | | | (273 | ) |
Net increase (decrease) in cash and cash equivalents before effect of exchange rates changes | | | 172 | | | | 105 | | | | 6 | |
Effects of exchange rate changes on cash and cash equivalents | | | 2 | | | | (4 | ) | | | 5 | |
Cash and cash equivalents at beginning of period | | | 246 | | | | 144 | | | | 133 | |
Cash and cash equivalents at end of period | | | 419 | | | | 246 | | | | 144 | |
For the year ended December 31, 2017, net cash flow provided by operating activities increased 3.4% compared to the same period in 2016. The increase was in part the result of:
| (i) | a Ch$ 102 billion decrease in other payments for operating activities of mainly attributable to Ch$ 132 billion of additional tax payments in 2016 generated in accordance with Peruvian tax law as a result of the spin-offs of the non-Chilean electricity businesses in 2016, paid in March 2016 by Enel Generación (Ch$ 116 billion) and Enel Distribución (Ch$ 16 billion), and partially offset by Ch$ 29 billion of higher VAT in 2017; |
| (ii) | a Ch$ 51 billion decrease in payments to suppliers of goods and services’ comprised mainly of Ch$ 41 billion from Enel Distribución, mostly as a consequence of lower energy purchases from third parties. |
| (iii) | a Ch$ 11 billion increase in other collections from operating activities, comprised mainly of tax refunds in the context of the 2016 Reorganization from Peru to Enel Generación corresponding to excess tax paid in 2016. |
This was partially offset by a Ch$ 88 million decrease in collections from the sale of goods and services, comprised mainly of:
| (i) | Ch$ 62 billion of lower collections from Enel Distribución, excluding intercompany transactions, due to lower energy billing during the 2017 compared to the same period in 2016, as a result of the non-application of the government’s price decree that establishes the “Average Node Price”, which were applied retroactively to November 2016; |
| (ii) | Ch$ 63 billion of lower collections from GasAtacama, excluding intercompany transactions, due to lower physical sales mainly in the spot market; and |
| (iii) | Ch$ 41 billion of higher collections from Enel Generación, on a stand-alone basis and excluding intercompany transactions, due to higher natural gas sales and higher collections from energy sales. |
Finally, the increase was also offset by an increase of Ch$ 57 billion in income tax paid during 2017 primarily due to the absence of the tax credit benefit corresponding to dividends received from Enel Generación’s former non-Chilean subsidiaries.
For further information regarding our operating results in 2017 and 2016, please see “— A. Operating Results. — 2. Analysis of Results of Operations for the Years Ended December 31, 2017 and 2016.”
For the year ended December 31, 2016, net cash flow provided by operating activities increased 6.6% compared to the same period in 2015, primarily as a result of a Ch$ 185 billion increase in collections on the sale of goods and services comprised mainly of:
| (i) | Ch$ 99 billion higher collections received from Enel Generación, excluding intercompany transactions, mainly due to an increase in physical sales to regulated customers and gas export to Argentina; and |
| (ii) | Ch$ 82 billion higher collections received from Enel Distribución excluding intercompany transactions, due to an increase in the regulated customers’ tariff in 2016. |
70
This increase was partially offset by:
| (i) | a Ch$ 49 billion increase in payments to suppliers of goods and services mainly paid by Enel Distribución, mostly as a consequence of higher energy purchases from third parties, primarily attributable to a higher average purchase price of Ch$ 3.8 /kWh (6.0%); |
| (ii) | an increase in other payments for operating activities of Ch$ 109 billion mainly attributable to Ch$ 132 billion of additional tax payments generated in accordance with Peruvian tax law as a result of the spin-offs of the non-Chilean electricity businesses in 2016, paid in March 2016 by Enel Generación (Ch$ 116 billion) and Enel Distribución (Ch$ 16 billion), partially offset by Ch$ 24 billion lower VAT and other payments due to higher purchases; and |
| (iii) | a Ch$ 7 billion decrease in other outflows. |
For further information regarding our operating results in 2016 and 2015, please see “— A. Operating Results. — 3. Analysis of Results of Operations for the Years Ended December 31, 2016 and 2015.”
For the year ended December 31, 2017, net cash flows used for investing activities increased 131% compared to the same period of 2016. The increase was mainly due to the acquisition of fixed assets for Ch$ 266 billion, primarily related to Los Cóndores project and extension of the electrical network, partially offset by other collections from the sale of equity or debt instruments belonging to other entities of Ch$ 116 billion related to the Electrogas sale and proceeds of Ch$ 4 billion received from the sale of land by GasAtacama.
For the year ended December 31, 2016, net cash flows used for investing activities decreased 79% compared to the same period of 2015. The change was mainly due to the acquisition of fixed assets of Ch$ 222 billion, which was partially offset by collections from time deposits with a maturity greater than 90 days of Ch$ 135 billion, proceeds received from the sale of land next to Enel Distribución’s Alonso de Córdova substation of Ch$ 15 billion, and dividends classified as investment cash flow of Ch$ 9 billion.
For further information regarding the acquisition of fixed assets in 2017 and 2016, please see “Item 4. Information on the Company — A. History and Development of the Company — Capital Investments, Capital Expenditures and Divestitures.”
For the year ended December 31, 2017, net cash flows used in financing activities decreased 29% compared to 2016 mainly due to lower dividend payments due in part to the payment of dividends by Enel Distribución and Enel Generación to Enel Américas prior to the spin-offs in 2016 and lower other cash outflows associated with cash allocations related to the 2016 Reorganization.
The aggregate cash outflows from financing activities in 2017 were primarily due to:
| • | Ch$ 261 billion in dividend payments, of which Ch$ 96 billion were paid to Enel, our controlling shareholder; |
| • | Ch$ 44 billion in interest expense, mainly paid by Enel Generación on a stand-alone basis; |
| • | Ch$ 6 billion in payments of loans and bonds paid by Enel Generación on a stand-alone basis; and |
| • | Ch$ 5 billion mainly of derivatives instrument payments executed by Enel Generación. |
For the year ended December 31, 2016, net cash flows used in financing activities increased 63% compared to 2015, mainly due to increase in dividends associated with the payment of dividends by Enel Distribución and Enel Generación to Enel Américas prior to the spin-offs in 2016 and higher other cash outflows, offset by a decrease in interest expense.
The aggregate cash outflows from financing activities in 2016 were primarily due to:
| • | Ch$ 138 billion in payments of loans and bonds for Enel Generación on a stand-alone basis. |
| • | Ch$ 322 billion in dividend payments (including Ch$ 165 billion paid by Enel Distribución and Enel Generación to Enel Américas during 2016 and before the spin-off was completed, Ch$ 103 billion paid by us, Ch$ 45 billion paid by Enel Generación, on a stand-alone basis, excluding dividends paid to us and Ch$ 8 billion paid by Pehuenche, among others); |
| • | Ch$ 48 billion in interest expense, mainly for Enel Generación on a stand-alone basis; |
| • | Ch$ 55 billion of other cash outflows, net; and |
| • | Ch$ 17 billion in loans to related parties, including Enel Generación and Enel Distribución. |
71
These outflows were partially offset by cash inflows primarily due to Ch$ 137 billion in loans from Enel Generación.
For a description of liquidity risks resulting from the inability of our subsidiaries to transfer funds, please see “Item 3. Key Information — D. Risk Factors — We depend on payments from our subsidiaries, jointly-controlled entities and associates to meet our payment obligations.”
We coordinate the overall financing strategy of our subsidiaries. However, our subsidiaries develop their capital expenditure plans and customarily finance their capital expansion programs through internally generated funds or direct financings. We, on a stand-alone basis, have no legal obligations or other commitments to financially support our subsidiaries. In some cases, our subsidiaries may be partially financed by us through intercompany loans. For information regarding our commitments for capital expenditures, see “Item 4. Information on the Company — A. History and Development of the Company — Capital Investments, Capital Expenditures and Divestitures” and our contractual obligations table set forth below under “Item 5. Operating and Financial Review and Prospects — F. Tabular Disclosure of Contractual Obligations.”
As of December 31, 2017, our consolidated interest-bearing debt totaled Ch$ 778 billion and had the following maturity profile:
| • | Ch$ 15 billion from 2019 to 2020; |
| • | Ch$ 16 billion from 2021 to 2022; and |
| • | Ch$ 730 billion thereafter. |
We have American Depositary Shares listed and that trade on the NYSE since April 26, 2016 and may in the future access the international equity capital markets (including SEC-registered ADS offerings) while our subsidiary Enel Generación has accessed the international equity capital markets, with an SEC-registered ADS offering on August 3, 1994. Enel Generación actively issued bonds in the United States (“Yankee Bonds”) in the past, and we may in the future issue Yankee Bonds depending on liquidity needs. Since 1996, Enel Generación and Pehuenche have issued a total of US$ 2.8 billion in Yankee Bonds.
The following table lists the Yankee Bonds issued by our subsidiary, Enel Generación, and the aggregate principal amount outstanding as of December 31, 2017. The weighted average annual coupon interest rate for such bonds is 5.8%, without giving effect to each bond’s duration, or put options.
| | | | | | | | | | Aggregate Principal Amount | |
Issuer | | Term | | Maturity | | Coupon | | | Issued | | | Outstanding | |
| | | | | | (%) | | | (in millions of US$) | |
Enel Generación | | 10 years | | April 2024 | | | 4.250 | | | | 400 | | | | 400 | |
Enel Generación (1) | | 30 years | | February 2027 | | | 7.875 | | | | 230 | | | | 206 | |
Enel Generación (2) | | 40 years | | February 2037 | | | 7.325 | | | | 220 | | | | 70.8 | |
Enel Generación (1) | | 100 years | | February 2097 | | | 8.125 | | | | 200 | | | | 40 | |
Total | | | | | | 5.813 (3) | | | | 1,050 | | | | 717 | |
(1) | Enel Generación repurchased some of these bonds in 2001. |
(2) | Holders of the Enel Generación 7.325% Yankee Bonds due 2037 exercised a put option on February 1, 2009 for a total amount of US$ 149.2 million. The remaining US$ 70.8 million principal amount of the Yankee Bonds mature in February 2037. |
(3) | Weighted-average coupon by outstanding amount. |
We also have access to the Chilean domestic capital markets. Our subsidiary, Enel Generación, has issued debt instruments including commercial paper and medium and long term bonds that are primarily sold to Chilean pension funds, life insurance companies and other institutional investors.
72
The following table lists UF-denominated Chilean bonds issued by Enel Generación that are outstanding as of December 31, 2017.
| | | | | | | | | | Aggregate Principal Amount | |
Issuer | | Term | | Maturity | | Coupon (inflation adjusted rate) | | | Issued | | | Outstanding | |
| | | | | | (%) | | | (in millions of UF) | | | (in millions of UF) | | | (in billions of Ch$) | |
Enel Generación Series H | | 25 years | | October 2028 | | | 6.20 | | | | 4.00 | | | | 2.3 | | | | 63 | |
Enel Generación Series M | | 21 years | | December 2029 | | | 4.75 | | | | 10.0 | | | | 10.0 | | | | 268 | |
Total | | | | | | 5.02 (1) | | | | 14.0 | | | | 12.3 | | | | 331 | |
| (1) | Weighted-average coupon by outstanding amount. |
For a full description of local bonds issued by Enel Generación, see “Unsecured liabilities detailed by currency and maturity” in Note 18.2 of the Notes to our consolidated financial statements.
We may also participate in the international commercial bank markets through syndicated or bilateral senior unsecured loans, including both fixed term and revolving credit facilities. The amounts outstanding or available under our syndicated revolving loan as of December 31, 2017 is set forth in the table below.
Borrower | | Type | | Maturity | | Facility Amount | | | Amount Drawn | |
| | | | | | (in millions of US$) | | | (in millions of US$) | |
Enel Generación | | Syndicated revolving loan | | February 2020 | | | 200 | | | | — | |
Total | | | | | | | 200 | | | | — | |
The undrawn revolving credit facility is governed by the laws of the State of New York and does not contain a condition precedent requirement regarding the non-occurrence of a “Material Adverse Effect” (or MAE, as defined contractually) prior to a disbursement, allowing us full flexibility to draw on up to US$ 200 million as of December 31, 2017 and US$ 200 million as of the date of this Report from such committed revolving facilities under any circumstances, including situations involving a MAE.
We also borrow from banks in Chile under fully committed facilities under which a potential MAE would not be an impediment to this source of liquidity. In 2016, Enel Generación entered into a 3-year bilateral revolving loan for an aggregate amount of UF 2.8 million (Ch$ 76 billion as of December 31, 2017) as set forth in the table below.
Borrower | | Type | | Maturity | | Facility Amount | | | Amount Drawn | |
| | | | | | (in millions of UF$) | | | (in millions of UF$) | |
Enel Generación | | Bilateral revolving loan | | March 2019 | | | 2.8 | | | | — | |
As a result of the foregoing, we have access to fully committed undrawn revolving loans, both international and domestic, for up to Ch$ 199 billion in the aggregate as of December 31, 2017.
On January 12, 2018, we entered into a senior unsecured term loan credit agreement. The credit agreement provides for an 18-month facility, originally comprised of a Ch$ 667.9 billion Term A Loan Commitment and a US$ 900 million Term B Loan Commitment and is governed by the laws of the State of New York. We entered into this credit agreement to fund the financial needs arising from the 2018 Reorganization, including (i) repurchase or acquisition of certain capital stock of Enel Chile and Enel Generación held by shareholders exercising their statutory withdrawal rights in connection with the Merger and the Tender Offer and (ii) the purchase of capital stock of Enel Generación validly tendered in the Tender Offer. Proceeds from the credit agreement may also be used to pay fees and expenses incurred in connection with the 2018 Reorganization and to repay indebtedness of EGP Chile. In March 2018, we drew down Ch$ 517.7 billion from the Term A Loan Commitment and US$ 697.5 million from the Term B loans Loan Commitment.
We and our subsidiaries also borrow routinely from uncommitted Chilean bank facilities with approved lines of credit for approximately Ch$ 59 billion in the aggregate, none of which are currently drawn. Unlike the committed lines described above, which are not subject to MAE conditions precedent prior to disbursements, these facilities are subject to greater risk of not being disbursed in the event of a MAE, and therefore could limit our liquidity under such circumstances.
73
We may also access the Chilean commercial paper market under programs that need to be registered with the CMF. Enel Generación has an outstanding program for up to US$ 200 million. In addition, in March 2018, we registered a 30-year local bond program with the CMF for UF 15 million (Ch$ 402 billion as of December 31, 2017). Finally, we can also access other types of financing, including supplier credits, leasing, among others.
As of December 31, 2017, we, on a stand-alone basis, had no debt obligations and was therefore not affected by any covenants or events of default. Enel Generación’s outstanding debt facilities, with the exception of their Yankee Bonds, include financial covenants. We are subject to the obligations incurred under the credit agreement executed in January 2018, without financial covenants. The types of financial covenants, and their respective limits, vary from one type of debt to another. As of December 31, 2017, the most restrictive financial covenant affecting Enel Generación was the leverage ratio in connection with the bilateral revolving loan facility that matures in March 2019, and the syndicated senior unsecured loan that matures in February 2020. Under such covenants, the maximum additional debt that could be incurred without a breach is Ch$ 2,006 billion. As of December 31, 2017 and as of the date of this Report, our subsidiaries are in compliance with the financial covenants contained in their debt instruments.
As is customary for certain credit and capital market debt facilities, a significant portion of our financial indebtedness is subject to cross default provisions. The revolving credit facilities described above, as well as all of Enel Generación’s Yankee Bonds, have cross default provisions with different definitions, criteria, materiality thresholds, and applicability as to the subsidiaries that could give rise to a cross default.
The cross default provision for our credit agreement executed in January 2018, governed by the laws of the State of New York, refers to defaults of the borrower, without reference to any subsidiary. Under such credit facility, only matured defaults of the borrower exceeding US$ 100 million qualify for a potential cross default when the principal exceeds US$ 100 million, or its equivalent in other currencies. In the case of a matured default above the materiality threshold, the revolving credit facility’s lenders would have the option to accelerate if lenders representing more than 50% of the aggregate debt of a particular outstanding facility choose to do so.
The cross default provisions for the Enel Generación revolving credit facility that is due in February 2020, governed by the laws of the State of New York, refers to defaults of the borrower, without reference to any subsidiary. Under such credit facility, only matured defaults of the borrower exceeding US$ 50 million qualify for a potential cross default when the principal exceeds US$ 50 million, or its equivalent in other currencies, although its subsidiaries do not have any financial obligation. In the case of a matured default above the materiality threshold, the revolving credit facility’s lenders would have the option to accelerate if lenders representing more than 50% of the aggregate debt of the outstanding facility choose to do so. All of Enel Generación’s Yankee Bonds are unsecured and not subject to any guarantees by any of its subsidiaries or parent companies.
The local facility of Enel Generación due in March 2019 does not have cross default provisions that affect debt other than the respective borrower’s own indebtedness.
Cross default provision of Enel Generación’s Yankee Bonds may be triggered by its subsidiaries’ debt. A matured default of Enel Generación or any of its subsidiaries could result in a cross default to Enel Generación’s Yankee Bonds if such matured default, on an individual basis, has a principal exceeding US$ 30 million, or its equivalent in other currencies, although Enel Generación’s subsidiaries do not currently have any financial obligation. In the specific case of the Enel Generación’s Yankee Bond, issued in April 2014, due in 2024, the threshold is US$ 50 million, or its equivalent in other currencies. In the case of a matured default above the materiality threshold, holders of Yankee Bonds would have the option to accelerate if either the trustee or bondholders representing at least 25% of the aggregate debt of a particular series then outstanding choose to do so. Enel Generación’s local bonds do not have cross default provisions arising from its subsidiaries.
Payment of dividends and distributions by our subsidiaries and affiliates represent an important source of funds for us. The payment of dividends and distributions by certain subsidiaries and affiliates are potentially subject to legal restrictions, such as legal reserve requirements, and capital and retained earnings criteria, and other contractual restrictions. We are currently in compliance with the legal restrictions, and therefore, they currently do not affect the payment of dividends or distributions to us. Certain credit facilities and investment agreements of our subsidiaries may restrict the payment of dividends or distributions in certain special circumstances. For instance, one of Enel Generación’s UF-denominated Chilean bonds restricts the amount of intercompany loans that Enel Generación and its subsidiaries are allowed to lend to related parties. The threshold for such aggregate restriction of intercompany loans is currently US$ 100 million, equal to approximately Ch$ 61 billion. For a description of liquidity risks resulting from our company status, please see “Item 3. Key Information — D. Risk Factors— We depend on payments from our subsidiaries, jointly-controlled entities and associates to meet our payment obligations.”
74
Our estimated capital expenditures for 2018 through 2020 amount to Ch$ 768 billion, of which Ch$ 745 billion are considered non-discretionary investments. Maintenance capital expenditures is considered non-discretionary because we need to maintain the quality and operation standards required for our facilities, but we do have some flexibility regarding the timing for these investments. We consider the investment in expansion projects under execution, such as those for Los Cóndores project, as well as water rights, as non-discretionary expenditures. We consider the remaining Ch$ 23 billion as discretionary capital expenditures. The latter includes expansion projects that are still under evaluation, in which case we would undertake them only if deemed profitable.
We do not currently anticipate liquidity shortfalls affecting our ability to satisfy the material obligations described in this Report. We expect to be able to refinance our consolidated indebtedness as it becomes due, fund our purchase obligations with internally generated cash and fund capital expenditures with a mixture of internally generated cash and borrowings.
C. | Research and Development, Patents and Licenses, etc. |
None.
Our subsidiaries are engaged in the generation and distribution of electricity in Chile, which is undergoing changes including more restrictive government regulations, the introduction of new technologies and business models, and more competition. Our businesses are subject to a wide range of conditions that may result in significant variability in our earnings and cash flows from year to year. We seek to establish a conservative and well-balanced commercial policy, which aims at controlling relevant variables, reducing risks and providing stability to our results of operations.
Our net income is principally the result of operating income from our generation and distribution businesses, and non-operating income, which consists primarily of income arising from related companies accounted for using the equity method, interest expense and tax expense.
Generation
Our operating income is impacted by the combined effect of several factors including our contracted electricity prices, prevailing hydrological conditions, the price of fuels used to generate thermal electricity, contracted obligations, generation mix, and the electricity prices prevailing in the spot market, among others. The combined effect of many of these factors impacts our operating income.
Sales prices and energy costs are among the main drivers of our results of operations of our electricity generation business. The quantity of electricity sold has been generally stable over time, with increases reflecting economic and demographic growth. Our profits from contracted sales are driven by the ability to generate or buy electricity at a cost lower than the contracted price. However, the applicable price for electricity sales and purchases in the spot market is much harder to predict because the spot generation price is influenced by many factors (mainly hydrology and fuel prices). Abundant hydrological conditions generally lower spot prices, while dry conditions increase them, although this effect on prices is mitigated with the incorporation of NCRE. We expect that the integration of the two electricity systems, the former SIC (central and southern area of the country) and SING (northern area), into one interconnected system, the SEN, that took place in November 2017, will help to better address the conditions of electricity generation especially for extreme situations and also improve investment and commercialization opportunities between both markets.
Our operating income might not be impacted adversely even when we are required to buy electricity at high prices in the spot market if our commercial policy is appropriately managed. Our goal is to have a conservative and well-balanced commercial policy that controls relevant variables, provides stability to profits, and mitigates our exposure to the volatility of the spot market by contracting a significant portion of our expected electricity generation through long term electricity supply contracts. The optimal level of electricity supply commitments is one that protects us against low marginal cost conditions, such as those existing during the rainy season, while still taking advantage of high marginal cost conditions, such as higher spot market prices, during dry years. In order to determine the optimal mix of long term contracts and sales in the spot market we: (i) project our aggregate generation taking into consideration our diversified generation mix (e.g., hydro, thermal and renewables), the incorporation of new projects under construction and a dry hydrology scenario, (ii) create demand estimates using standard economic theory, and (iii) forecast the system’s marginal cost using proprietary stochastic models.
75
Currently, our sales contracts to customers not subject to regulated prices are not standardized and the terms and conditions of these contracts are individually negotiated. When we negotiate these sale contracts, we typically try to set the price at a premium over future expected spot prices to mitigate the risk of increases in future spot prices. However, the premium can vary substantially depending on several conditions such as the node of supply, load profile or the term of the contract. Our contracted sales with regulated customers represent on average more than 70% of our sales, which allows us to maintain steady prices for longer periods, normally 10 to 20 years, which combined with our balanced commercial policy, generally provides for a stable profit. Most of our current regulated tariffs are indexed to the U.S. consumer price index and, to a lesser extent, to commodity prices. We expect regulated tariffs to remain fairly stable, without material changes, until 2020.
In 2022, distribution company contracts awarded by Enel Generación in the August 2016 auction will come into effect and therefore the tariffs of our regulated contracts will decrease by 6% as a consequence of the lower prices offered by NCRE providers in the energy auction for distribution companies. In 2024, contracts awarded in the November 2017 auction will come into effect with an average price of the total awarded energy of US$ 32.5 per MWh, which is 32% lower than the average price of the previous tender process. We regularly participate in energy bids and we have been awarded long term energy sale contracts that incorporate the expected variable costs considering changes to the most relevant variables. These contracts secure the sale of our current and expected new capacity and allow us to stabilize our income. Currently, 39% of our expected annual generation is sold under contracts with terms of at least ten years and 97% is sold under contracts with terms of at least five years.
In November 2017, the outcome of the latest bidding process was announced. This process tendered 2,200 GWh per year to be delivered between 2024 and 2043. The total amount of energy tendered was based on renewable energy offers, thus representing a milestone in the industry. We, through Enel Generación, were awarded 54% of the tender, corresponding to 1.2 TWh per year at an average US$ 34.7 per MWh with a mix of wind, solar and geothermal generation.
Spot prices could also be affected by international prices of fuel commodities such as fuel oil, coal and LNG, since Chile does not produce those fuels in any significant quantities. Fuel prices affect our results because commodity prices directly affect our thermal generation costs, which as of December 31, 2017 represented 44% of our installed capacity. Commodity prices, mainly oil, have significantly decreased from 2014 to their lowest level in the first quarter of 2016. Since then, fuel prices have increased, and the trend is expected to continue in 2018. Our costs depend on factors such as spot prices, generation mix, including NCRE generation, hydrology, and our contractual surpluses/deficits. As described above, our contracted sale prices are currently indexed to U.S. CPI, but also to commodities prices, including coal, Brent oil and Henry Hub gas prices, and therefore, sales prices are also affected by variations of these commodity prices. We estimate our exposure to commodity risk by considering the balance between our generation and the portion of our contracted sales that are indexed to commodity prices.
To mitigate the risk of fuel cost increases, we manage the respective commodity price risk using derivative contracts and we have entered into long term supply contracts (10-15 years) to cover part of the fuel needed to operate our thermal generation units, which use natural gas among other types of fuel. This allows us to use other fuels if the price of LNG is too high, if there is a shortage of its supply, or if this fuel is unavailable. In July 2013, we renegotiated a LNG sale and purchase agreement with British Gas through 2030, allowing us to secure our long term LNG supply at competitive prices, with significant flexibility and at capacities sufficient for our current and future needs. This enhances our position to manage fuel supply risks, especially when facing increasing fuel cost scenarios. This is becoming more important as there is an increasing trend to penalize fuel intensive technologies, such as coal and diesel, which have greater environmental impacts.
During 2016, Enel Generación entered into a Terminal Use Agreement with GNL Mejillones, a port located in northern Chile, to discharge LNG during 2017, becoming one of the main suppliers in the region. This agreement allowed us to renew gas purchase contracts with industrial customers and to supply our thermal plants located in the northern region of the SEN. During 2017, Enel Generación entered into a similar Terminal Use Agreement with GNL Mejillones to discharge LNG during 2018 and 2019.
During 2017, the average marginal costs in the SEN decreased by 4% compared to the previous year, a 41% cumulative decrease over the last two years, mainly due to better hydrology, especially by the end of the year, despite the drought that has affected southern Chile since 2010. This decrease could continue depending on the availability of water for generation and the effect of having only one major interconnected system, the SEN, since the integration of the SIC and SING, which allows covering deficits in one part of the country with energy from the other. The lower marginal cost partially offset our higher physical energy purchases in the spot market in 2017 compared to 2016. The combination of these factors had a positive effect on our operating income in the generation segment.
During the last few years, NCRE generation has shown a solid growth trend faster than expected, mainly as a consequence of the declining amount of capital required by competitive wind and solar technologies. This growth trend is boosted by several
76
initiatives that the government is promoting with the Energy Agenda Program. The main goal of these initiatives is that 70% of the country’s electricity generation be produced by NCRE by 2050. The government also established a regulated tender framework which allows the energy market to access this price reduction in the medium and long term, and has reduced the long term energy tariff 75% over the last 6 years.
Currently, NCRE installed capacity market share is 18%, according to the monthly CEN report as of February, 2018. As a result of NCRE’s consolidation, a slower growth rate is expected in the upcoming years, but is expected to grow at a rate that will satisfy the Energy Agenda Program and the country´s de-carbonization target.
Addressing environmental impacts potentially associated with climate change is one of the elements which guides Enel’s goal for a complete de-carbonization of our energy generation by 2050. Closures of existing coal power plants are scheduled to take place as they reach the end of their life cycles. The decommissioned capacity will most likely be substituted with NCRE generation. As of December 31, 2017, 1.4% of our installed capacity comes from NCRE sources (including the Ojos de Agua power plant). After the 2018 Reorganization, our participation in the renewable energy business will increase through the merger with EGPL adding 1.2 GW of renewable generation capacity to reach 17% of our total installed capacity. This merger will allow us to compete more efficiently by enabling us to offer electricity generated from a wide array of sources, and to use such sources individually or in a combined manner so as to better satisfy the needs and demands of the system and the market at any given time, as well as to reduce risks through an enhanced generation portfolio. We would also expect some synergies to arise from such a merger, including the immediate and focused access to a market that is growing much faster than conventional energy, and that has been identified by governmental authorities as being essential to the growth of the Chilean electricity sector in the future.
Currently, EGPL has a competitive pipeline of projects with short time-to-market, which is possible because of current commercial opportunities through PPA contracts. EGPL is expected to invest US$ 1 billion from 2018 to 2022 in developing the business, including new capacity, maintaining high environmental and operational efficiency standards. The most important projects under development through 2024 are expected to add 1,137 MW (comprised of 980 MW of solar power, 124 MW of wind power, and 33 MW of geothermal power), increasing EGPL’s installed capacity to 1.8 GW in 2022. EGPL’s production is also expected to increase more than 51% from 2017 to 2022 (from 3.4 TWh in 2017 to 5.2 TWh in 2022).
On July 20, 2016, the government enacted a new transmission law, which introduced the “Development Poles” concept to encourage the development of new projects in areas that might have high NCRE generation potential, using the same transmission system. A key aspect of this new regulatory framework was the interconnection project. The integration of the SIC and SING was possible due to the commissioning of a 600 km transmission line (2 × 500 kV). During 2018, a new line is expected to be added to complete the integration of the central and northern areas of Chile. This interconnection will support the consolidation of NCRE generation coming from new plants that shall cover the last two distributors’ tenders that awarded a total 12 TWh of energy per year beginning in 2022 and 2.2 TWh per year beginning in 2024.
With respect to the development of new projects to increase our installed capacity, smaller projects are becoming profitable although economies of scale have not been reached. These projects are facing fewer environmental restrictions and lesser opposition. In addition, they also have shorter construction periods, and therefore lower financing risks and have the additional advantage of being more flexible when it comes to addressing changes in demand and customers’ needs. For instance, in 2017, Enel Generación decided to abandon the Neltume and Choshuenco projects for being economically unfeasible and recognized a Ch$ 25.1 billion loss for reducing the net book value of the assets associated to the aforementioned projects to zero. The evaluation considered, among other variables, the high level of competition in the Chilean electricity market, the time associated with developing a new water discharge alternative, considering a term of no less than five years, given that it was necessary to request and obtain a new environmental impact study. The continuous addition of NCRE power plants to the grid will require further market flexibility and focus on operational efficiency to combine the different technologies while maintaining the security and attempting to maintain the system’s supply continuity, which is typically a NCRE weakness. Wind and solar sources, the NCRE most widely used, have higher intermittency than other non-NCRE facilities since they can only generate electricity when the wind blows or the sun shines. In addition, some customers are also expected to be able to generate their own energy based on NCRE higher availability. This will lead to greater commercialization of surpluses in the system, and therefore will require the grid operator and distribution companies to address these changes and adapt to these upcoming events as well as to the upcoming storage of energy, which development will lead to a new growth momentum. Battery energy solutions will likely play a key role in the next decade, providing a crucial solution for frequency control and grid stability in the context of significant wind and solar penetration.
77
Distribution
We expect that the regulator will continue to recognize investments, encourage efficiency, and establish prices that will allow for an appropriate return on our distribution investment. We also anticipate that our distribution company will maintain its profitability during the period between periodic tariff setting processes, according to the price cap tariff model, due to growth and economies of scale. After tariffs have been set, distribution companies can obtain higher returns by increasing efficiency during the period subsequent to each tariff setting process. Our physical losses are now at 5.1% and are therefore close to technical levels. Investments to reduce illegal tapping to lower losses beyond the technical level are not expected to have an economically reasonable return. Currently, we are working instead on improving our collection ratio and efficiency, especially through new automation technologies.
Although the price at which a distribution company purchases electricity has an impact on the price at which it is sold to end customers, it does not have an impact on our distribution profitability since the cost of electricity purchased is passed on to end customers through tariffs. Regulation dictates that purchase contracts must be made through long term contracts and are the result of a regulated tender.
Since 2016, some customers in the regulated category, who can choose between regulated and unregulated tariffs are switching to unregulated tariffs, thereby becoming direct generation company customers and paying tolls to distribution companies. These customers are tendering their energy needs, either directly or in association with other customers, because unregulated tariffs are currently lower than regulated tariffs that are based on contracts tendered in the past at higher prices. We expect this trend may continue in the future until lower cost contracts are recognized in the regulated tariffs.
We expect organic growth expansion in the distribution business. We are continuously seeking investments, especially in new technologies to automate our networks to achieve operational and economic efficiencies. For instance, we installed more than 100,000 smart meters in our concession area during the period from 2016 to 2017. These smart meters allow bi-directional communication, digitized and interconnected networks, and also enable our consumers to improve their energy efficiency. We expect to continue investing in this technology since it will allow us to reduce costs mainly in reading, disconnection and reconnection processes, as well as making some technical processes of preventive and corrective maintenance more efficient. We have also focused our marketing efforts ontargeting governmental entities, residential customers, industries and urban transportation. In the upcoming years, we expect to increase offering of turnkey projects for municipalities and various public and governmental entities, offer new technologies to residential customers such as air conditioning services, efficient solutions for water heating, photovoltaic systems, led lighting, projects related to energy efficiency, distributed generation, , and promote the development of urban and intercity electric mobility, charging infrastructure, as well as to promote electric public transportation offering integral solutions for transportation companies, in all cases including customers outside of our concession area.
For more detail on how factors impact the net income of our electricity generation and distribution businesses and 2017 results compared with those recorded in previous periods, see “Item 5. Operating and Financial Review and Prospects — A. Operating Results — 1. Discussion of Main Factors Affecting Operating Results and Financial Condition of the Company” and “Item 5. Operating and Financial Review and Prospects — A. Operating Results — 2. Analysis of Results of Operations for the Years Ended December 31, 2017 and 2016.” Investors should not look at our past performance as indicative of future performance.
We expect a reasonably stable operating performance during the coming years given the macroeconomic perspective for Chile. Despite current uncertainties concerning the global economy, there is favorable expectation for Chile’s growth during the next five years, including an expected 3.4% growth in GDP in 2018, based on Latin American Consensus Forecasts published by Consensus Economics Inc. on March 19, 2018, and an expected 3% growth in the annual electricity demand over the next five years.
E. | Off-balance Sheet Arrangements. |
We are not a party to any off-balance sheet arrangements.
78
F. | Tabular Disclosure of Contractual Obligations. |
The table below sets forth our cash payment obligations as of December 31, 2017:
| | Payments due by Period | |
Ch$ billion | | Total | | | 2018 | | | 2019-2020 | | | 2021-2022 | | | After 2022 | |
Purchase obligations(1) | | | 19,560 | | | | 1,197 | | | | 2,529 | | | | 2,456 | | | | 13,378 | |
Interest expense(2) | | | 411 | | | | 49 | | | | 95 | | | | 88 | | | | 179 | |
Yankee bonds | | | 441 | | | — | | | — | | | — | | | | 441 | |
Local bonds(3) | | | 327 | | | | 6 | | | | 56 | | | | 60 | | | | 205 | |
Pension and post-retirement obligations(4) | | | 57 | | | | 7 | | | | 8 | | | | 8 | | | | 34 | |
Financial leases | | | 17 | | | | 2 | | | | 5 | | | | 5 | | | | 5 | |
Total contractual obligations | | | 20,813 | | | | 1,261 | | | | 2,693 | | | | 2,617 | | | | 14,242 | |
| (1) | Includes generation and distribution business purchase obligations, which are comprised mainly of energy purchases, operating and maintenance contracts, and other services. Of the total contractual obligations of Ch$ 19,560 billion, 64.2% corresponds to energy purchased for distribution, 31.2% corresponds primarily to fuel supply, maintenance of medium and low voltage lines, supplies of cable and utility poles, and energy purchased for generation, and the remaining 4.6% corresponds to miscellaneous services, such as LNG regasification, fuel transportation and coal handling. |
(2) | Interest expense includes the interest payments for all outstanding financial obligations, calculated as principal multiplied by the interest rate, presented according to when the interest payment comes due. |
(3) | Hedging instruments included might substantially affect the outstanding amount of debt. |
(4) | We have funded and unfunded pension and post-retirement benefit plans. Our funded plans have contractual annual commitments for contributions, which do not change based on funding status. Cash flow estimates in the table are based on such annual contractual commitments including certain estimable variable factors such as interest. Cash flow estimates in the table relating to our unfunded plans are based on future discounted payments necessary to meet all of our pension and post-retirement obligations. |
The information contained in Items 5.E and 5.F contains statements that may constitute forward-looking statements. See “Forward-Looking Statements” in the “Introduction” of this information statement, for safe harbor provisions.
Item 6. Directors, Senior Management and Employees
A. | Directors and Senior Management. |
Directors
Our Board of Directors consists of seven members who are elected for a three-year term at an Ordinary Shareholders’ Meeting (“OSM”). Following the end of their term, they may be re-elected or replaced. If a vacancy occurs in the interim, the Board of Directors will elect a temporary director to fill the vacancy until the next OSM, at which time the entire Board of Directors will be elected to a new three-year term. Our Executive Officers are appointed and hold office at the discretion of the Board of Directors.
The members of our Board of Directors as of December 31, 2017 were as follows:
Directors | | Position (1) | | Current Position Held Since |
Herman Chadwick P. | | Chairman | | 2016 |
Salvatore Bernabei | | Director | | 2016 |
Pablo Cabrera G. | | Director | | 2016 |
Giulio Fazio | | Director | | 2016 |
Fernán Gazmuri P. | | Director | | 2016 |
Juan Gerardo Jofré M. | | Director | | 2016 |
Vicenzo Ranieri(2) | | Director | | 2016 |
(1) The elimination of the Vice Chairman position was approved at the ESM held on December 20, 2017.
(2) Mr. Ranieri resigned as a board member in February 2018 and has been replaced by Mr. Daniele Caprini on March 1, 2018.
79
Mr. Ranieri resigned as a director in February 2018. As required by the Chilean law, the full Board was up for election at the OSM held on April 25, 2018 for a new three‑year term. The members of the Board as of the date of this Report are:
| • | Herman Chadwick P. (Chairman) |
During the Board of Directors’ meeting held on April 25, 2018, our new Board appointed Mr. Chadwick P. as Chairman and agreed to appoint Mr. Gazmuri P., Mr. Cabrera G. and Mr. Jofré M. as members of the Directors’ Committee. Mr. Gazmuri P. was also appointed Financial Expert of the Directors’ Committee.
Set forth below are brief biographical descriptions of the members of our Board of Directors, of whom three reside in Chile and the rest in Europe.
Herman Chadwick P.
Chairman of the Board of Directors
Mr. Chadwick, is law partner at Chadwick & Cía. and serves as director of several companies unrelated to us, including Aguas Andinas, a Chilean water utility company, Inversiones Aguas Metropolitanas, an investment holding company, and Viña Santa Carolina, a Chilean winery company. Mr. Chadwick serves as an advisor and arbitrator at Centro de Arbitraje y Mediación de la Cámara de Comercio de Santiago, an association that provides arbitration services to resolve legal disputes. Mr. Chadwick holds a law degree from Pontificia Universidad Católica de Chile (Santiago, Chile).
Salvatore Bernabei
Director
Mr. Bernabei has served as the Head of Global Procurement of Enel since May 2017. From May 2016 to April 2017 has been Head of Renewable Energies Latin America of Enel Green Power. From January 2013 to April 2016, he was the Country Manager for Chile and the Andean Countries. From November 2011 to December 2012, Mr. Bernabei was the Head of Operations & Maintenance for Enel Green Power in Spain. From November 2010 to Octuber 2011, he worked as Engineering and Construction Resource Coordinator for Iberia and Latin America in Enel Green Power. Prior to that, Mr. Bernabei was Project Execution Manager at Enel Unión Fenosa and European Health Safety Environment Officer at Enel Green Power in Spain. Mr. Bernabei joined Enel in 1999 and held several managerial positions in Project Integration, Execution of Project, Inspection & Expediting and Logistics. Mr. Bernabei holds a Degree in Industrial Engineering from Università degli Studi di Roma “Tor Vergata” (Rome, Italy), an International Executive Education from INSEAD (Paris and Singapore) and an M.B.A from Politecnico di Milano (Milan, Italy).
Pablo Cabrera G.
Director and Member of the Directors’ Committee
Mr. Cabrera is a member of the Chilean Society of International Law. He is advisor to the Joint Chiefs of Staff of Chilean National Defense and to Pontificia Universidad Católica de Chile. Mr. Cabrera was a director of Academia Diplomática Andrés Bello, a Chilean institution engaged in the education of future Chilean diplomats, from 2010 to 2014, and also served as a professor at Universidad Diego Portales and at Academia Nacional de Estudios Políticos y Estratégicos, the higher education institution for the Chilean national defense. Mr. Cabrera served in several positions in public service, including as ambassador concurrently to the Holy See, Sovereign Military Order of Malta and Albania (2006‑2010), to the People’s Republic of China (2004‑2006), concurrently to the Russian Federation and Ukraine (2000‑2004), concurrently to the United Kingdom and Ireland (1999‑2000), as well as concurrently to the Deputy Secretary of the Navy in the Ministry of National Defense (1995‑1999), among others, since joining the Chilean foreign service in 1970. Mr. Cabrera holds a degree in law from Pontificia Universidad Católica de Chile and a degree from Academia Diplomática Andrés Bello (Santiago, Chile).
Giulio Fazio
Director
Mr. Fazio has served as the Head of Legal and Corporate Affairs of Enel since January 2016. Previously, he served in comparable positions in Italy since November 2014, and at Enel Green Power from October 2008 to November 2014. Since 2004, he has served as Head of Extraordinary Finance Operations and Antitrust in Enel’s Legal Department. In 2007, Mr. Fazio was Head of the Legal Department for Iberia and Latin America, a position he maintained until the acquisition of Endesa, S.A. (Spain) was
80
completed. Mr. Fazio started working for Enel as an attorney at Enel Distribution S.p.A. in 1996. Since 2003, Mr. Fazio has been the Chairman of the College of Accounting Reviewers of the Aeroclub of Rome. Mr. Fazio holds a degree in law and a Ph.D. in business law from Università degli Studi di Palermo (Palermo, Italy).
Fernán Gazmuri P.
Director, Chairman and Financial Expert of the Directors’ Committee
Mr. Gazmuri serves or has served as director of several Chilean companies unrelated to us, including Chairman of Citroën Chile S.A.C., Chairman of the Chilean Security Association, Vice Chairman of Invexans S.A., the Chilean parent company of the French cable producer Nexans, director of Sociedad de Fomento Fabril (SOFOFA), a non-profit trade association representing the views and interests of Chilean businessmen and the Asociación Nacional Automotriz de Chile, a car dealer association. In 2013‑2016, he was director of Empresa Nacional del Petróleo (ENAP), the Chilean state-owned oil company, and Vice-Chairman of the Chilean International Chamber of Commerce. In 2016, Mr. Gazmuri was distinguished with the Jorge Alessandri Rodríguez award by the Asociación de Industriales Metalúrgicos y Metalmecánicos, a metal-mechanic manufacturers’ association, due to his outstanding professional and business career. In 2014, Mr. Gazmuri was awarded the Ordre National du Mérite by the Republic of France. Mr. Gazmuri holds a degree in business administration from the Pontificia Universidad Católica de Chile (Santiago, Chile).
Gerardo Jofré M.
Director and Member of the Directors’ Committee
Mr. Jofré is currently director of Codelco, a Chilean state-owned mining company and LATAM Airlines Group S.A.. He is a member of the Real Estate Investment Council of Santander Asset Management S.A. and member of the Self-Regulatory Council of the Asociación de Aseguradores de Chile, the Chilean insurers association. In 2010‑2014 he was the Chairman of Codelco. In 2005‑2009, he served as a director of Enel Generación Chile, Viña San Pedro Tarapacá S.A., a Chilean winery, D&S S.A., a supermarket company, Construmart S.A., a Chilean hardware store chain, Inmobiliaria Titanium S.A., and Inmobiliaria Parque del Sendero S.A., real estate companies. Before that, he served in several in several managerial positions in Banco Santander (Chile) Mr. Jofré also served as CEO and Chairman of many companies related to Banco Santander. Mr. Jofré holds a degree in business administration from the Pontificia Universidad Católica de Chile (Santiago, Chile).
Vicenzo Ranieri
Director
Mr. Ranieri is Head of Planning and Control for Enel S.p.A. since September 2015. In 2014‑2015, Mr. Ranieri served as Head of Planning & Control of Infrastructure and Network. In 2011‑2014, he served as CFO of Slovenské Elektrárne, an Enel generation subsidiary in the Slovak Republic, and in 2009‑2011, as CFO of an Enel subsidiary in Romania. Mr. Ranieri served as Head of Planning & Control of the Italian Market Division in 2008‑2009, and before that as Head of Planning and Control of the Italian Market Commercial Operations in 2006‑2008 and for Enel Distribuzione from in 2004‑2006. Mr. Ranieri first joined Enel in 2000 as a member of the Strategic Planning Department. He holds a degree in business administration specialized in auditing and finance from Libera Università Internazionale degli Studi Sociali Guido Carli –LUISS (Rome, Italy).
81
Executive Officers
Set forth below are our Executive Officers as of December 31, 2017.
Executive Officers | | Position | | Current Position Held Since |
Nicola Cotugno | | Chief Executive Officer | | 2016 |
Antonio Barreda T.(1) | | Procurement Officer | | 2016 |
Raffaele Cutrignelli | | Internal Audit Officer | | 2016 |
Monica De Martino(2) | | Regulatory Affairs Officer | | 2017 |
Raffaele Grandi | | Chief Financial Officer | | 2016 |
José Miranda M. | | Communications Officer | | 2016 |
Antonella Pelegrini(2) | | Sustainability and Community Relations Officer | | 2017 |
Andres Pinto B.(2) | | Safety Officer | | 2017 |
Alain Rosolino(3) | | Human Resources Officer | | 2016 |
Francisco Silva B. (2) (4) | | Services Officer | | 2017 |
Bruno Stella(5) | | Planning and Control Officer | | 2017 |
Pedro Urzúa F. | | Institutional Affairs Officer | | 2016 |
Domingo Valdés P. | | General Counsel | | 2016 |
(1) | Mr. Barreda resigned as Procurement Officer in October 2017 and Mr. Juan José Bonilla A. assumed this position in January 2018. |
(2)These positions have been held since May 31, 2017.
(3)Ms. Liliana Schnaidt replaced Mr. Alain Rosolino as Human Resources Officer in February 2018.
(4)Mr. Silva held this position until March 2018.
(5)Mr. Stella has been Planning and Control Officer since January 23, 2017.
Set forth below are brief biographical descriptions of our Executive Officers, all of whom reside in Chile.
Nicola Cotugno, our CEO since August 2016, previously served as CEO of Slovenské Elektrárne, an Enel generation subsidiary in the Slovak Republic, where he was a member of the Board in 2008‑2017. In 2013‑2014, he served as Chief Operating Officer of Slovenské Elektrárne and in 2006‑2012, he was Head of the Energy Division. In 2005‑2006, he served as Head of the Spanish Market Division at Viesgo, an Enel generation and distribution subsidiary in Spain. In 2003‑2005, and in 1991‑2000, Mr. Cotugno served in several managerial positions at Enel Produzione, a generation subsidiary in Rome. In 2000‑2003, he served as Head of Energy Management of Interpower, a former Enel generation subsidiary. Mr. Cotugno holds a degree in mechanical engineering from Università degli Studi di Roma La Sapienza (Rome, Italy) and conducted executive studies at INSEAD and MIT (Massachusetts, USA).
Antonio Barreda T., our Procurement Officer since February 2016, has also been the Procurement Officer of Enel Américas since January 2015. In 2008‑2014, he served as Deputy Director of Works and Services Latin America. In 2001‑2008, he served as Deputy Director of both Supplier Business Relations and Corporate Service Purchases at Enel Américas. In 2000‑2001, Mr. Barreda served as Contracts Manager for CAM, a former subsidiary of Enel Américas. Mr. Barreda holds a degree in electrical engineering from Universidad de Santiago and an M.B.A. from Pontificia Universidad Católica de Chile (Santiago, Chile).
Raffaele Cutrignelli, our Internal Audit Officer since October 2016, also holds the same position at Enel Américas. In 2015‑2016, Mr. Cutrignelli served as Audit Officer for Codensa and Emgesa, Enel Américas’ subsidiaries in Colombia. In 2013‑2015, Mr. Cutrignelli served as Head of Latin America Audit for Enel Green Power in Brazil, and in 2011‑2012, in a comparable position for Enel Green Power in the United States. In 2008‑2010, Mr. Cutrignelli served as Internal Audit Manager at Enel OGK-5 in Moscow, Russia. Mr. Cutrignelli holds a degree in international business from Nottingham Trent University (Nottingham, United Kingdom), and a master’s degree in audit and internal controls from Universitá di Pisa (Pisa, Italy).
Mónica De Martino, our Regulatory Affairs Officer since May 2017, was previously Head of Regulatory Affairs Latin America Enel Green Power S.p.A from 2011 until being appointed to her current position at Enel Chile. She holds a degree in political science from the Libera Università Internazionale degli Studi Sociali Guido Carli in Rome, an M.B.A. from Columbia Business School in New York and a graduate degree from the London Business School (London, England).
82
Rafaelle Grandi, our CFO since April 2016, previously worked in the Administration, Finance and Control area of Enel Américas and was responsible for Chilean activities. In 2012‑2015, Mr. Grandi served as Accounting and Finance Officer for Enel in Peru and was director of Enel Peru Distribución. In 2010‑2012, Mr. Grandi served as Head of Structured and Subsidized Finance for Enel Green Power in Rome. In 2006‑2010, he was CFO of Enel Green Power in Brazil. Before joining us, he was CFO for Aguas de San Pedro, a Honduran water utility company (2004-2006), Head of Investor Relations at Manuli Rubber Industries, an Italian rubber/metal component producer (1999-2003) and consultant at Metis S.p.A, a consulting firm (1997-2000). Mr. Grandi holds a degree in economics from the Universitá di Genova (Genoa, Italy).
José Miranda M, our Communications Officer since February 2016, has also been the Communications Officer of Enel Américas since December 2014. Before joining the company, Mr. Miranda worked for 11 years at Televisión Nacional de Chile (TVN), a state-owned Chilean TV channel, as a producer of shows covering national and international events. In 2011‑2014, Mr. Miranda was General Producer of the Entertainment Area, and Executive Producer in charge of International and National Business Content. In 2008‑2010, he worked as General Producer of the Chilean news channel “Canal 24 Horas,” another TVN channel. Mr. Miranda is an audiovisual communicator with a degree from DUOC UC (Santiago, Chile) and a graduate degree in management from Universidad de Chile (Santiago, Chile).
Antonella Pellegrini, our Sustainability and Community Relations Officer since September 2016, was Business Development Planner at EGP Chile and Andean Countries until becoming the Sustainability Area Manager at Enel Green Power Peru in March, 2014. In May 2015 she was appointed Head of Sustainability at EGP Chile and Andean Countries until she assumed her current position at Enel Chile. Ms. Pellegrini has also been on the Board of Directors of Fundación San Ignacio de Huinay since June 2017. She holds a degree in marketing and communications from the Istituto Europeo di Design (Rome, Italy).
Andrés Pinto B., our Safety Officer since May 2017, previously served as Head of Project Planning and Cost Control Latam, within the Global Renewable Energies Department of Enel Generación. In 2015, he served as Head of Reporting and Post FID Project Control, of the Global Generation Department of Enel Generación, with a worldwide scope within Global Engineering and Construction. In 2010‑2015, he served as Head of Operations and Administration Management Latam of Endesa Chile S.A, currently Enel Generación. Mr. Pinto holds a degree in civil engineering and a minor in chemical engineering from the Pontificia Universidad Católica de Chile (Santiago, Chile).
Alain Rosolino was our Human Resources Officer between October 2016 and January 2018 and he held the analogous position for Enel Américas. Before that, he was our Internal Audit Officer as of February 2016 and Internal Audit Officer of Enel Américas as of December 2012. He joined Enel in 2003, and held several positions in the audit area at Enel, Enel Romania, Enel Green Power, Enel Latin America, and from 2011‑2012, at Enel Iberian Peninsula and Latin America. Mr. Rosolino holds a degree in business administration from Libera Università Internazionale degli Studi Sociali Guido Carli (Rome, Italy).
Francisco Silva B., was appointed Services Officer in 2014. He joined the Group over 30 years ago and held several positions over the years including Human Resources Officer and Deputy Director of Endesa Servicios in Madrid, Spain. Mr. Silva was the Regional Manager of General Services of Enersis S.A. from 2011‑2013. He was also a member of the Board of Directors of subsidiaries and companies outside the Group. Mr. Silva holds a degree in public administration from the Universidad de Chile and a graduate degree in management from the Escuela de Negocios Universidad Adolfo Ibáñez (Santiago, Chile).
Bruno Stella, our Planning and Control Officer since 2017, joined Enel in 1995 as part of the management, planning and control of energy team. He was in charge of planning and control of fuel and gas in the Energy Management Department from 2007 to 2012 and appointed Head of Planning and Control of Retail Customer Operations in 2012. From 2015 and until moving to Chile in 2016, he was Chief of Planning and Reporting in Global Trading. Mr. Stella holds a degree in business and economics from the Università degli Studi di Messina in Italy and attended an executive program at IESE in Spain and Bocconi University in Milan.
Pedro Urzúa F. our Institutional Affairs Officer since February 2016, has served before as Institutional Affairs Officer for Chile and the Andean Countries for Enel Green Power from 2012‑2016. Prior to joining Enel, he served as Director of Corporate Affairs of ENAP (2009‑2012), director of Fundación Acción RSE (2012), whose main purpose is to contribute to the development of Chile, Communications Director of ENAP Sipetrol (2009‑2012) and Chief of Staff of the Ministry of Mining (2002‑2006). Mr. Urzúa holds a degree in journalism from the Universidad de Artes y Ciencias de la Comunicación (Santiago, Chile).
Domingo Valdés P. our General Counsel since March 2016, has also been the General Counsel of Enel Américas since May 1999. Mr. Valdés further serves as Secretary of the Enel Chile and Enel Américas Boards of Directors and is a Professor of Economic and Antitrust Law at Universidad de Chile. He joined Enel Distribución in 1993 and Enel Américas in 1997. Mr. Valdés held an intern position in the New York City law firms of Milbank, Tweed, Hadley & McCloy LLP and Chadbourne & Parke LLP. Before joining us, Mr. Valdés was a lawyer for the Corporate Department of Chase Manhattan Bank, N.A. (Chile) and an associate at
83
Carey & Cía., a Santiago based law firm. Mr. Valdés holds a law degree from Universidad de Chile and a masters’ in law degree from University of Chicago (Illinois, USA).
To the best of our knowledge there is no relationship between the persons named above.
At the OSM held on April 26, 2017, our shareholders approved the compensation policy for our Board of Directors. Directors are paid an annual variable fee equivalent to 0.1% of our net earnings for the current year based on the consolidated financial statements. Directors are also paid a monthly fee, in advance, depending on their attendance at Board meetings and their participation as director of any of our subsidiaries. Director compensation consists of a monthly fixed compensation of UF 180 per month and an additional fee of UF 66 per meeting, up to a maximum of 15 sessions in total, including ordinary and extraordinary meetings, within the corresponding fiscal year. The monthly fees (fixed and variable) are considered as advances on the annual variable fee. In the case of the annual variable fee, the amounts received as advances must be deducted from the total, without requesting reimbursement if the variable remuneration is lower than the total amount of the advances. Once our net earnings are approved at the OSM of the following year, the difference between the accrued annual variable fee and the total fees paid in advance will be paid to directors, but only if the resulting amount is positive. The Chairman of the Board is entitled to double the compensation of other directors under this policy.
The members of our Directors’ Committee are paid a variable annual fee, equivalent to a percentage 0.11765 per thousand of our net earnings of the current year and a monthly fixed compensation of UF 60 per month and an additional fee of UF 22 per meeting, up to a maximum of 15 sessions in total, including ordinary and extraordinary meetings, within the corresponding fiscal year. The monthly fees (fixed and variable) are considered as advances on the annual variable fee. In the case of the annual variable fee, the amounts received as advances must be deducted from the total, without requesting reimbursement if the variable remuneration is lower than the total amount of the advances. Once our net earnings are approved at the OSM of the following year, the difference between the accrued annual variable fee and the total fees paid in advance will be paid to directors, but only if the resulting amount is positive.
If a director serves on one or more Boards of Directors of the subsidiaries and/or associate companies or serves as director of other companies or corporations in which the economic group holds an interest directly or indirectly, the director can only receive compensation from one of these Boards of Directors. Executive Officers of our Company and/or of our subsidiaries or associate companies will not receive compensation in the case that they serve as director of any subsidiary, associate company or are affiliated in any way to our Company.
In 2017, the total compensation paid to each of our directors, including fees for attending Directors’ Committee meetings was as follows:
Directors | | Fixed Compensation | | | Variable Compensation(1) | | | Directors' Committee | | | Total | |
| | (in thousand Ch$) | |
Herman Chadwick P. | | | 178,065 | | | | — | | | | — | | | | 178,065 | |
Giulio Fazio(2) | | | — | | | | — | | | | — | | | | — | |
Salvatore Bernabei(2) | | | — | | | | — | | | | — | | | | — | |
Pablo Cabrera G. | | | 89,032 | | | | — | | | | 28,504 | | | | 117,537 | |
Fernán Gazmuri P. | | | 89,032 | | | | — | | | | 28,504 | | | | 117,537 | |
Juan Gerardo Jofré M. | | | 89,032 | | | | — | | | | 28,504 | | | | 117,537 | |
Vicenzo Ranieri(2) | | | — | | | | — | | | | — | | | | — | |
Total | | | 445,162 | | | | — | | | | 85,513 | | | | 530,675 | |
(1) | Includes any positive balance to be used against the annual variable fee paid in advance. In 2017, the balance was negative and there was no additional variable compensation. |
(2) Messrs. Fazio, Bernabei and Ranieri waived their compensation for their position as director.
(3) | Mr. Ranieri resigned from his position as board member in February 2018 and therefore the entire Board of Directors was up for election at the OSM held on April 25, 2018. |
We do not disclose, to our shareholders or otherwise, any information about an individual Executive Officer’s compensation. For the year ended December 31, 2017, the aggregate gross compensation, paid or accrued, for all of our Executive Officers, attributable to fiscal year 2017, was Ch$ 2,959 million in fixed compensation and Ch$ 443 million in variable compensation.
84
Executive Officers are eligible for variable compensation under a bonus plan. The annual bonus plan is paid to our Executive Officers for achieving company-wide objectives and for their individual contribution to our results and objectives. The annual bonus plan provides for a range of bonus amounts according to seniority level and consists of a certain multiple of gross monthly salaries.
We entered into severance indemnity agreements with all of our Executive Officers, pursuant to which we will pay a severance indemnity in the event of voluntary resignation or termination by mutual agreement among the parties. The severance indemnity does not apply if the termination is due to willful misconduct, prohibited negotiations, unjustified absences or abandonment of duties, among other causes, as defined in Article 160 of the Chilean Labor Code. All of our employees are entitled to legal severance pay if terminated due to our needs, as defined in Article 161 of the Chilean Labor Code.
The total amounts accrued as of the end of 2017 to provide severance indemnity to our Executive Officers totaled Ch$ 641 million. There are no other amounts set aside or accrued to provide for pension, retirement or similar benefits for our Executive Officers.
C. Board Practices.
Our Board of Directors in office as of December 31, 2017 was elected at the OSM held on April 28, 2016, for a three-year term. However, a vacancy occurred in February 2018 and therefore, the entire Board of Directors was up for election at the OSM held on April 25, 2018, for a three-year term which ends in April 2021. For information about each of the directors and the year that they began their service on the Board of Directors, see “Item 6. Directors, Senior Management and Employees — A. Directors and Senior Management” above. Members of the Board of Directors do not have service contracts with us or with any of our subsidiaries that provide them benefits upon termination of their service.
Corporate Governance
We are managed by a Board of Directors in accordance with our bylaws, consisting of seven directors who are elected by our shareholders at an OSM. Each director serves for a three-year term. Following the end of their term, they may be re-elected or replaced. Directors can be re-elected indefinitely. Staggered terms are not permitted under Chilean law. If a vacancy occurs on the Board of Directors during the three-year term, the Board of Directors may appoint a temporary director to fill the vacancy. Any vacancy triggers an election for every seat on the Board of Directors at the next OSM.
Chilean corporate law provides that a company’s Board of Directors is responsible for the management and representation of a company in all matters concerning its corporate purpose, subject to the provisions of the company’s bylaws and the shareholders’ resolutions. In addition to the bylaws, our Board of Directors has adopted regulations and policies that guide our corporate governance principles.
Our corporate governance policies are included in the following policies or procedures: the Manual for the Management of Information of Interest to the Market (the “Manual”), the Human Rights Policy (Política de Derechos Humanos), the Code of Ethics and a Zero Tolerance Anti-Corruption Plan (the “ZTAC Plan”), the Penal Risk Prevention Model, the “Guidelines 231: Guidelines applicable to non-Italian subsidiaries in accordance with Legislative Decree 231 of June 8, 2001” (the “Guidelines 231”) and procedures issued in compliance with General Regulation 385 issued by the CMF.
In order to ensure compliance with Securities Market Law 18,045 and CMF regulations, our Board of Directors approved the Manual at the meeting held on February 29, 2016 and ratified such decision at its meeting held on March 23, 2016. This document addresses applicable standards regarding the information in connection with transactions of our securities and those of our affiliates, entered into by directors, management, principal executives, employees and other related parties, the existence of blackout periods for such transactions undertaken by directors, principal executives and other related parties, the existence of mechanisms for the continuous disclosure of information that is of interest to the market and mechanisms that provide protection for confidential information. The Manual was released to the public in 2016 and it is posted on our website at www.enelchile.cl. The provisions of this Manual apply to the members of our Board, as well as our executives and employees who have access to confidential information, and especially those who work in areas related to the securities markets.
Our Board of Directors approved a procedure for relationships between Politically Exposed People (Procedimiento Personas Políticamente Expuestas y Conexas) and our Company, which established a specific regulation for their commercial and contractual relationships.
85
The Human Rights Policy incorporates and adapts the United Nations’ general principles related to human rights into the corporate reality.
In order to supplement the aforementioned corporate governance regulations, our Board of Directors approved a Code of Ethics and a ZTAC Plan at its first meeting held on February 29, 2016 and ratified such decision at its meeting held on March 23, 2016. The Code of Ethics is based on general principles such as impartiality, honesty, integrity and other ethical standards of similar importance, all of which are expected from our employees. The ZTAC Plan reinforces the principles included in the Code of Ethics, but with special emphasis on avoiding corruption in the form of bribes, preferential treatment, prohibition of political donations under all circumstances and other similar matters.
In order to comply with Law 20,393 enacted on December 2, 2009, which imposes criminal responsibility on legal entities for the crimes of asset laundering, financing of terrorism and bribing of public officials, our Board of Directors approved the Penal Risk Prevention Model at its first meeting held on February 29, 2016 and ratified such decision at its meeting held on March 23, 2016. The law encourages companies to adopt this model, whose implementation involves compliance with managerial and supervision duties. The adoption of the Penal Risk Prevention Model mitigates, and in some cases relieves, the effects of criminal responsibility even when a crime is committed.
At its meeting held on October 27, 2016, our Board approved “The Global Compliance Program for Corporate Penal Liability”, which was incorporated into the Penal Risk Prevention Model to reflect current standards and appointed Mr. Rafael Cutrignelli as our Penal Risk Prevention and Global Compliance Program for Corporate Penal Liability Officer, as required by the Penal Risk Prevention Model. Mr. Cutrignelli also serves as Internal Audit Officer for both of Enel Américas and Enel Chile.
On February 29, 2016, our Board of Directors also approved the Guidelines 231 and ratified such decision at its meeting held on March 23, 2016. The Guidelines 231 is defined by Italian Legislative Decree 231, which was enacted on June 8, 2001. It establishes a compliance program that identifies the behaviors expected of related parties for the non-Italian subsidiaries of Enel. Given that our ultimate controlling shareholder, Enel, complies with Italian Legislative Decree 231, which establishes management responsibility for Italian companies as a consequence of certain crimes committed in Italy or abroad, in the name of or for the benefit of such entities, including those crimes described in Chilean Law 20,393, these guidelines set a group of measures, with standards of behavior expected from all employees, advisers, auditors, officials, directors as well as consultants, contractors, commercial partners, agents and suppliers. Legislative Decree 231 includes various activities of a preventive nature that are coherent with and integral to the requirements and compliance with Chilean Law 20,393, which deals with the criminal responsibility of legal entities. These guidelines are supplementary to the standards included in the Code of Ethics and the ZTAC Plan.
On November 29, 2012, the CMF issued General Regulation 341 which established regulations for the disclosure of information with respect to the standards of corporate governance compliance adopted by publicly held limited liability corporations and set the procedures, mechanisms and policies that are indicated in the Appendix to the regulation. The objective of this regulation is to provide credible information to investors with respect to good corporate governance policies and practices adopted by publicly held limited liability corporations, which include us, and permit entities like stock exchanges to produce their own analyses to help the various market participants to understand and evaluate the commitment of companies. General Regulation 341 was substituted by General Regulation 385, issued by the CMF on June 8, 2015. This regulation has similar objectives than the former General Regulation 341, but includes additional issues, by the way of separating each policy into several more detailed policies. Subjects such as non-discrimination, inclusion and sustainability are particularly important in this new regulation. The Appendix of General Regulation 385 is divided into the following four sections with respect to which companies must report the corporate practices that have been adopted: (i) the functioning and composition of the board, (ii) relations between the company, shareholders and the general public, (iii) risk management and control, and (iv) assessment by a third party. Publicly held limited liability corporations should send the information with respect to corporate governance practices to the CMF, no later than March 31 of each year, using the contents of the Appendix to this regulation as criteria. If none of them is adopted, the company must explain its reasons to the CMF. The information should refer to December 31 of the calendar year prior to its dispatch. At the same time, such information should also be at the public’s disposal on the company’s website and must be sent to the stock exchanges.
Compliance with the New York Stock Exchange Listing Standards on Corporate Governance
The following is a summary of the significant differences between our corporate governance practices and those applicable to U.S. domestic issuers under the corporate governance rules of the NYSE.
86
Independence and Functions of the Directors’ Committee (Audit Committee)
Chilean law requires that at least two thirds of the Directors’ Committee be independent directors. According to Article 50 bis of Law No.18,046, a member would not be considered independent if, at any time, within the last 18 months he: (i) maintained any relationship of a relevant nature and amount with the company, with other companies of the same group, with its controlling shareholder or with the principal officers of any of them or has been a director, manager, administrator or officer of any of them; (ii) maintained a family relationship with any of the members described in (i) above; (iii) has been a director, manager, administrator or principal officer of a non-profit organization that has received contributions from (i) above; (iv) has been a partner or a shareholder that has controlled, directly or indirectly, 10% or more of the capital stock or has been a director, manager, administrator or principal officer of an entity that has provided consulting or legal services for a relevant consideration or external audit services to the persons listed in (i) above; and (v) has been a partner or a shareholder that has controlled, directly or indirectly, 10% or more of the capital stock or has been a director, manager, administrator or principal officer of the principal competitors, suppliers or customers. In case there are not sufficient independent directors on the Board to serve on the Directors’ Committee, Chilean law determines that the independent director nominates the rest of the members of the Directors’ Committee among the remaining Board members that do not meet the Chilean law independence requirements. Chilean law also requires that all publicly held limited liability stock corporations that have a market capitalization of at least UF 1,500,000 (Ch$ 40.2 billion as of December 31, 2017) and at least 12.5% of its voting shares are held by shareholders that individually control or own less than 10% of such shares, must have at least one independent director and a Directors’ Committee.
Under the NYSE corporate governance rules, all members of the Audit Committee must be independent. The Audit Committee of a U.S. company must perform the functions detailed in, and otherwise comply with the requirements of NYSE Listed Company Manual Rules 303A.06 and 303A.07. As of July 31, 2005, non-U.S. companies have been required to comply with Rule 303A.06, but not with Rule 303A.07. We currently comply with the independence and the functional requirement of Rule 303A.06. Since our incorporation on March 1, 2016 we have complied with the independence and the functional requirement of Rule 303A.06.
Pursuant to our bylaws, all members of the Directors’ Committee must satisfy the requirements of independence, as stipulated by the NYSE. The Directors’ Committee is composed of three members of the Board and complies with Article 50 bis of Law No.18,046, as well as with the criteria and requirements of independence prescribed by the Sarbanes-Oxley Act (“SOX”), the SEC and the NYSE. As of the date of this Report, the Directors’ Committee complies with the conditions of the Audit Committee as required by the SOX, the SEC and the NYSE corporate governance rules. As a result, we have a single Committee, the Directors’ Committee, which includes among its functions the duties performed by an Audit Committee.
Our Directors’ Committee performs the following functions:
| • | review of financial statements and the reports of the external auditors prior to their submission for shareholders’ approval; |
| • | present proposals to the Board of Directors, which will make its own proposals to shareholders’ meetings, for the selection of external auditors and private rating agencies; |
| • | review of information related to our transactions with related parties and reports the opinion of the Directors’ Committee to the Board of Directors; |
| • | the examination of the compensation framework and plans for managers, executive officers and employees; |
| • | the preparation of an Annual Management Report, including its main recommendations to shareholders; |
| • | provide information to the Board of Directors about the convenience of recruiting external auditors to provide non-auditing services, when such services are not prohibited by law, depending on whether such services might affect the external auditors’ independence; |
| • | oversee the work of external auditors; |
| • | review and approval of the annual auditing plan by the external auditors; |
| • | evaluate the qualifications, independence and quality of the auditing services; |
| • | elaborate on policies regarding employment of former members of the external auditing firm; |
| • | review and discuss problems or disagreements between management and external auditors regarding the auditing process; |
| • | establish procedures for receiving and dealing with complaints regarding accounting, internal control and auditing matters; |
| • | any other function mandated to the Committee by the bylaws, our Board of Directors or our shareholders. |
Corporate Governance Guidelines
The NYSE’s corporate governance rules require U.S.-listed companies to adopt and disclose corporate governance guidelines. Chilean law provides for this practice through the disclosure of the procedures related to the General Resolution 385 and the Manual.
87
We have also adopted the Code of Ethics, and our bylaws include provisions that govern the creation, composition, attributions, functions and compensation of the Directors’ Committee described above, which includes among its functions the duties performed by an Audit Committee.
D. Employees.
The following table sets forth the total number of our personnel, permanent and temporary employees, in Enel Chile and in our subsidiaries as of December 31, 2017, 2016, and 2015, assuming that the Spin-Offs (for details on the Spin-Offs see “Item.4. History and Development of the Company – 2016 Reorganization”) had been completed as of December 31, 2015:
Company | | 2017 | | | 2016 | | | 2015 | |
Enel Generación | | | 753 | | | | 790 | | | | 919 | |
Pehuenche | | | 2 | | | | 2 | | | | 2 | |
Enel Chile | | | 431 | | | | 336 | | | | 391 | |
Enel Distribución (1) | | | 669 | | | | 688 | | | | 686 | |
Servicios Informáticos e Inmobiliarios Ltda. | | | 0 | | | | 103 | | | | 110 | |
GasAtacama(2) | | | 93 | | | | 91 | | | | 99 | |
Total personnel (3) | | | 1,948 | | | | 2,010 | | | | 2,207 | |
(1) | Includes Luz Andes S.A. and Empresa Eléctrica de Colina S.A. |
(2) | Includes GasAtacama Argentina S.A. |
(3) | The total number of temporary employees was not significant. |
All Chilean employees who are dismissed for reasons other than misconduct are entitled by law to severance payment. According to Chilean law, employees holding contracts of indefinite duration are entitled to a payment of one-month’s salary for each year (or a six-month portion thereof) worked, subject to a limit of a total payment of a maximum of 11 months’ pay for employees hired after August 14, 1981. Severance payments to employees hired prior to that date consist of one-month’s salary for each full year worked, not subject to any maximum limitation. Under our collective bargaining agreements, we are obligated to make severance payments to all covered employees in cases of voluntary resignation or death in specified amounts that increase according to seniority and may exceed the amounts required under Chilean law.
We have the following bargaining agreements:
| | In Force |
Company | | From | | To |
Enel Chile - Collective Bargaining Agreement 1 (1) | | July 2015 | | July 2019 |
Enel Chile - Collective Bargaining Agreement 2 (1) | | January 2016 | | December 2019 |
Enel Chile - Collective Bargaining Agreement 3 (2) | | January 2016 | | December 2019 |
Enel Generación - Collective Bargaining Agreement 1 | | January 2018 | | June 2020 |
Enel Generación - Collective Bargaining Agreement 2 | | January 2018 | | June 2020 |
Enel Generación - Collective Bargaining Agreement 3 | | January 2018 | | December 2020 |
Enel Generación - Collective Bargaining Agreement 4 | | July 2015 | | June 2019 |
Enel Generación - Collective Bargaining Agreement 5 | | January 2016 | | December 2019 |
Enel Generación - Collective Bargaining Agreement 6 | | July 2016 | | June 2020 |
Enel Distribución - Collective Bargaining Agreement 1 | | January 2017 | | December 2020 |
Enel Distribución - Collective Bargaining Agreement 2 | | January 2017 | | December 2020 |
Enel Distribución - Collective Bargaining Agreement 3 | | January 2017 | | December 2020 |
Empresa Eléctrica de Colina | | November 2015 | | October 2019 |
GasAtacama Chile | | January 2018 | | December 2020 |
| (1) | These collective bargaining agreements were transferred from Enel Américas S.A. in connection with the Spin-offs in the 2016 Reorganization. |
| (2) | This collective bargaining agreement was transferred from ICT Servicios Informáticos Ltda., a former subsidiary that merge into us. |
88
To the best of our knowledge, none of our directors or officers owns more than 0.1% of our shares or owns any stock options. It is not possible to confirm whether any of our directors or officers has a beneficial, rather than direct, interest in our shares. To the best of our knowledge, any share ownership by all of our directors and officers, in the aggregate, amounts to significantly less than 10% of our outstanding shares.
Item 7.Major Shareholders and Related Party Transactions
We have only one class of capital stock and Enel, our ultimate controlling shareholder, has no different voting rights than our other shareholders. As of April 24, 2018, 6,348 shareholders of record held our 70,133,928,163 shares of our common stock outstanding. Enel, our major shareholder, owned 42,832,058,392 shares of our total common stock. There were five record holders of our ADSs, as of such date. As of April 24, 2018, we held 967,519,298 shares as treasury stock that we reacquired in connection with the exercise of statuory merger dissenters’ withdrawal rights in the 2018 Reorganization, and such treasury stock will be cancelled following the approval of such cancellation by shareholders at a future ESM.
As of April 19, 2018, Enel beneficially owned 61.9% of our voting shares (excluding the treasury stock which will be cancelled), Chilean private pension funds (“AFPs”) in the aggregate owned 13.1% of our shares, Chilean stockbrokers, mutual funds, insurance companies, foreign equity funds, and other Chilean institutional investors collectively held 17.2% of our equity, ADS holders owned 5.5% of our equity and the remaining 2.4% of our equity was held by 6,204 minority shareholders.
It is not practicable for us to determine the number of our ADSs or our common shares beneficially owned in the United States as the depositary for our ADSs only has knowledge of the record holders, including the Depositary Trust Company and its nominees. As a result, we are not able to ascertain the domicile of the final beneficial holders represented by the five ADS record holders in the United States. Likewise, we cannot readily determine the domicile of any of our foreign shareholders who hold our common stock, either directly or indirectly.
On April 26, 2016, Enel Américas distributed our shares to all our shareholders as part of the spin-off of Enel Chile from Enel Américas. For further details related to the reorganization process, please refer to “Item 4. Information on the Company — A. History — The 2016 Reorganization.”
The following table sets forth certain information concerning ownership of our common stock as of April 19, 2018, with respect to each shareholder known by us to own more than 5% of our outstanding shares of common stock:
| | Number of Shares Owned | | | Percentage of Shares Outstanding | |
Enel S.p.A. (Italy) | | | 42,832,058,392 | | | | 61.9 | % |
Enel continues to be our ultimate controlling shareholder, with 61.9% of our voting shares (excluding the treasury stock which will be cancelled) as of the date of this Report and after giving effect to the 2018 Reorganization.
Enel is an energy company with multinational operations in the power and gas markets, with a focus on Europe and Latin America. Enel operates in over 30 countries across four continents, produces energy through a net installed capacity of 83 GW and distributes electricity and gas through a network covering 2.1 million kilometers. With over 65 million users worldwide, Enel has the largest customer base among European competitors and figures among Europe’s leading power companies in terms of installed capacity and reported EBITDA. Enel shares trade on the Milan Stock Exchange.
B. | Related Party Transactions. |
Article 146 of Law 18,046 (the “Chilean Corporations Act”) defines related-party transactions as all transactions involving a company and any entity belonging to the corporate group, its parent companies, controlling companies, subsidiaries or related companies, board members, managers, administrators, senior officers or company liquidators, including their spouses, some of their relatives and all entities controlled by them, in addition to individuals who may appoint at least one member of the company’s board of directors or who control 10% or more of voting capital, or companies in which a board member, manager, administrator, senior
89
officer or company liquidator has been serving in the same position within the last 18 months. The law establishes that in the event that these persons fulfill the requirements established by Article 146, such persons must immediately inform the Board of Directors of their related-party nature, or such other group as the Board may appoint for that purpose. As required by law, “related-party transactions” must comply with corporate interests, as well as prices, terms and conditions prevailing in the market at the time of their approval. They must also meet all legal requirements, including acknowledgement by the Directors’Committee and approval of the transaction by the Board of Directors (excluding the affected directors), by the ESM (in some cases, with requisite majority approval) and by any applicable regulatory procedures.
The aforementioned law, which also applies to our affiliates, also provides for some exceptions, stating that in certain cases, Board approval would suffice for “related-party transactions,” pursuant to certain related-party transaction thresholds and when such transactions are conducted in compliance with the related-party policies defined by the company’s board. The related-party transaction policy (política de habitualidad) was initially approved by the Board of Directors of Enel Américas at its session held on February 29, 2016, and subsequently ratified by our Board of Directors in its session held on March 23, 2016. This policy is available on our website at www.enelchile.cl.
If a transaction is not in compliance with Article 146 of the Chilean Corporations Act, this would not affect the transaction’s validity, but we or our shareholders may demand compensation from the individual associated with the infringement as provided under law, and compensation for damages.
Our internal procedure includes that all cash inflows and outflows of our Chilean subsidiaries be managed through our centralized cash management policy. It is a common practice in Chile to transfer surplus funds from one company to another affiliate that has a cash deficit. These transfers are carried out through either short-term transactions or through structured intercompany loans. Under Chilean laws and regulations, such transactions must be carried out on an arm’s-length basis. All of these transactions will be subject to the supervision of our Directors’ Committee. As of March 31, 2018, these transactions were priced at TIP (a Chilean variable interest rate) plus 0.05% per month.
We granted short-term intercompany loans to our subsidiaries Sociedad Agrícola Cameros Ltda. and Enel Distribución (through a structured loan). As of March 31, 2018, the outstanding balance of the loan with Sociedad Agrícola Cameros Ltda amounted Ch$ 1,154 million. As of March 31, 2018, the outstanding balance of the structured loan with Enel Distribución amounted Ch$ 1,121 million, at a fixed annual interest rate of 4.03%. Additionally, we received a loan from Enel Distribución and as of March 31, 2018, the outstanding balance of this loan amounted Ch$ 638 million.
Our subsidiary Enel Generación received short-term intercompany loans from our related parties in Chile. As of March 31, 2018, the outstanding balance of the intercompany loan received from GasAtacama was Ch$ 47,994 million. The outstanding balance of the loan received from Pehuenche was Ch$ 2,218 million.
Enel Distribución received short-term loans from its subsidiaries, Luz Andes Ltda., Empresa Eléctrica de Colina Ltda. and Empresa de Transmisión Chena S.A. As of March 31, 2018, the outstanding balance of these loans was Ch$ 3,575 million, Ch$ 1,089 million and Ch$ 347 million, respectively.
GasAtacama granted a short-term intercompany loan to its subsidiary, GasAtacama Argentina. As of March 31, 2018, the outstanding balance of the loan granted to GasAtacama Argentina was Ch$ 673 million.
All these abovementioned intercompanies loans have the purpose to meet the working capital needs.
As a result of the 2016 Reorganization, we entered into intercompany arrangements. Under Chilean law, Enel Américas remains jointly and severally liable for its former obligations that were assumed by us pursuant to the separation of the businesses completed on March 1, 2016. Such liability, however, will not extend to any obligation to a person or entity that has given its express consent relieving Enel Américas of such liability. For additional information on the corporate reorganization, see “Item 4. Information on the Company – A. History and Development of the Company – The 2016 Reorganization.”
There are various contractual relationships between Enel Américas, Enel Generación, Enel Distribución, and us to provide intercompany services. We entered into intercompany agreements under which we provide services directly and indirectly to Enel Generación and its subsidiaries, Enel Distribución and its subsidiaries. The services to be rendered by us include certain legal, finance, treasury, insurance services, capital markets, financial compliance, accounting, human resources, communications, security, relations with contractors, purchases, IT services, tax services, corporate affairs and other corporate support and administrative services. The services rendered varies depending on the company receiving the service. These services are provided and charged at market prices if there is a comparable service. If there are no comparable services in the market, they will be provided at cost plus a specified percentage. The intercompany services contracts are valid for five years with renewable terms since January 1, 2017.
90
The 2018 Reorganization consolidated Enel’s conventional and non-conventional renewable energy businesses in Chile under one company. Under Chilean Law, the 2018 Reorganization has been deemed a related party transaction, subject to the statutory requirements and protections of the Title XVI of the Chilean Corporations Act. For additional information on the 2018 Reorganization, see “Item 4. Information on the Company – A. History and Development of the Company – The 2018 Reorganization.”
As of the date of this Report, the abovementioned transactions have not experienced material changes. Finally, as of December 31, 2017, there were also some commercial transactions with related parties. For more information regarding transactions with related parties, refer to Note 9 of the Notes to our consolidated financial statements.
C. | Interests of Experts and Counsel. |
Not applicable.
Item 8.Financial Information
A. | Consolidated Statements and Other Financial Information. |
See “Item 18. Financial Statements.”
Legal Proceedings
We and our subsidiaries are parties to legal proceedings arising in the ordinary course of business. We believe it is unlikely that any loss associated with pending lawsuits will significantly affect the normal development of our business.
For detailed information as of December 31, 2017 on the status of the material pending lawsuits that have been filed against us and our subsidiaries, please refer to Note 33.3 of the Notes to our consolidated financial statements. Please note that since March 1, 2016, we appear as the defendant instead of Enel Américas for current legal proceedings or those that may arise from our former Chilean businesses.
In relation to the legal proceedings reported in the Notes to our consolidated financial statements, we use the criteria of disclosing lawsuits above a minimum threshold of US$ 10 million of potential impact to us, and, in some cases, qualitative criteria according to the materiality of the plausible impact in the conduct of our business. The lawsuit status includes a general description, the process status and the estimate of the amount involved in each lawsuit.
Dividend Policy
Our Board of Directors proposes annually to the OSM for approval a definitive dividend payable each year, which is accrued in the prior year and cannot be less than the legal minimum of 30% of annual net income and informs a dividend policy for the current fiscal year. Additionally, our Board of Directors generally establishes an interim dividend for the current fiscal year, to be paid in January of the following year and which is deducted from the definitive dividend to be paid in May of the following year. The interim dividend is established by the Board of Directors and it is not subject to any restrictions under the Chilean law.
For dividends corresponding to fiscal year 2016, the interim and definitive dividend were paid on January 27, 2017 and May 26, 2017, respectively. The interim dividend of Ch$ 0.75884 per share of common stock was paid as part of the definitive dividend and corresponded to 15% of consolidated net income as of September 30, 2016. At the OSM held on April 26, 2017, our shareholders approved the definitive dividend equivalent to Ch$ 3.23430 per share of common stock, but only Ch$ 2.47546 was effectively distributed since the interim dividend paid in January 2017 was deducted from it. The definitive dividend corresponded to a payout ratio of 50% based on annual consolidated net income for fiscal year 2016 based on 10 months of results starting as of our incorporation on March 1, 2016, and therefore differs from the twelve‑month net income included in this Report. The payment of dividends for fiscal year 2016 is based on net income filed with the CMF, which was marginally different from the net income based on IFRS.
For dividends corresponding to fiscal year 2017, on December 20, 2017, the Board of Directors agreed to distribute an interim dividend of Ch$ 0.75642, per share of common stock on January 26 , 2018, accrued in fiscal year 2017, corresponding to 15% of consolidated net income as of September 30, 2017. In the OSM held on April 25, 2018, our shareholders agreed to distribute a definitive dividend equivalent to Ch$ 192 billion, accrued in fiscal year 2017, but only Ch$ 155 billion will be effectively distributed
91
on May 18, 2018 since the interim dividend paid in January 2018 will be deducted from it. The definitive dividend corresponds to a payout ratio of 55% based on annual net income for fiscal year 2017.
For dividends corresponding to fiscal year 2018, our Board of Directors informed to the OSM held on April 25, 2018 the following Dividend Policy for Fiscal Year 2018:
| • | An interim dividend, accrued in fiscal year 2018 and corresponding to 15% of consolidated net income as of September 30, 2018, to be paid in January 2019. |
| • | A definitive dividend payout equal to 60% of the annual net income for fiscal year 2018, to be paid in May 2019. |
This dividend policy is conditional to net profits obtained in each period, as well as to expectations of future profit levels and other conditions that may exist at the time of such dividend declaration. The proposed dividend policy is subject to our Board of Director’s right to change the amount and timing of the dividends under the circumstances at the time of the payment. For fiscal year 2019, we expect to modify our dividend policy and return to payout equal to 65% of the annual net income.
The payment of dividends is potentially subject to legal restrictions, such as the requirement to pay dividends either from the net income or from retained earnings of the fiscal year. There may be also other contractual restrictions such as the non-default on credit agreements. However, these potential legal and contractual restrictions do not currently affect our ability or any of our subsidiaries’ ability to pay dividends. (See “Item 5. Operating and Financial Review and Prospects — B. Liquidity and Capital Resources” for further detail on our debt instruments).
Shareholders at each subsidiary and affiliate agree on the definitive dividend payments. Dividends are paid to shareholders of record as of midnight of the fifth business day prior to the payment date. Holders of ADS on the applicable record dates will be entitled to participate in dividends.
Dividends
The table below sets forth, the per-share dividend amounts distributed by us in Chilean pesos and the amount of dividends distributed per ADS (one ADS = 50 shares of common stock) in U.S. dollars for income attributable to 2017. See “Item 10. Additional Information — D. Exchange Controls.”
| | Dividends distributed (1) | |
Year | | Nominal Ch$ per Share | | | US$ per ADS (2) | |
2017 | | | 3.234 | | | | 0.26 | |
2016 | | | 2.093 | | | | 0.17 | |
(1) | This chart details dividends actually paid and not the dividends accrued. These amounts do not reflect reduction for any applicable Chilean withholding tax. |
(2) | The U.S. dollar per ADS amount has been calculated by applying the exchange rates as of December 31, 2017 and 2016, as applicable. One ADS = 50 shares of common stock. |
For a discussion of Chilean withholding taxes and access to the formal currency market in Chile in connection with the payment of dividends and sales of ADSs and the underlying common stock, see “Item 10. Additional Information — E. Taxation” and “Item 10. Additional Information — D. Exchange Controls.”
None.
92
Item 9. | The Offer and Listing |
A. | Offer and Listing Details. |
Market Price Information
The shares of our common stock and our ADSs are currently trading on Chilean exchanges and the NYSE, respectively.
The table below shows, for the periods indicated, high and low prices in Chilean pesos on the Santiago Stock Exchange, and high and low closing prices of the ADSs in U.S. dollars as reported by the NYSE. Our shares and ADS have traded in the Chilean exchanges since April 21, 2016 and on the NYSE since April 26, 2016.
| | Santiago Stock Exchange(1) | | | U.S. Stock Exchanges(2) | |
| | Ch$ per share | | | US$ per ADS | |
| | High | | | Low | | | High | | | Low | |
2018 | | | | | | | | | | | | | | | | |
April (up to April 24, 2017) | | | 79.80 | | | | 75.10 | | | | 6.56 | | | | 6.17 | |
March | | | 79.80 | | | | 72.50 | | | | 6.55 | | | | 5.99 | |
February | | | 78.50 | | | | 71.41 | | | | 6.50 | | | | 5.89 | |
January | | | 79.96 | | | | 71.00 | | | | 6.52 | | | | 5.75 | |
| | | | | | | | | | | | | | | | |
2017 | | | 79.50 | | | | 66.95 | | | | 6.28 | | | | 5.03 | |
December | | | 74.50 | | | | 66.95 | | | | 5.91 | | | | 5.03 | |
November | | | 74.45 | | | | 67.76 | | | | 5.87 | | | | 5.24 | |
4th Quarter | | | 79.50 | | | | 66.95 | | | | 6.28 | | | | 5.03 | |
3rd Quarter | | | 78.39 | | | | 69.00 | | | | 6.07 | | | | 5.37 | |
2nd Quarter | | | 76.50 | | | | 69.85 | | | | 5.72 | | | | 5.28 | |
1st Quarter | | | 73.25 | | | | 61.00 | | | | 5.53 | | | | 4.50 | |
| | | | | | | | | | | | | | | | |
2016 | | | 90.00 | | | | 58.65 | | | | 6.81 | | | | 4.25 | |
4th Quarter | | | 70.15 | | | | 58.65 | | | | 5.25 | | | | 4.25 | |
3rd Quarter | | | 79.00 | | | | 60.48 | | | | 6.08 | | | | 4.52 | |
2nd Quarter | | | 90.00 | | | | 73.94 | | | | 6.81 | | | | 5.22 | |
(1) | Source: Santiago Stock Exchange. |
(2) | Source: NYSE and over-the-counter trading. Our ADS composite figures include transactions in all U.S. stock exchanges. One ADS = 50 shares of common stock. |
On December 29, 2017, the last trading day in 2017, our common stock closed at Ch$ 72.81 per share on the Santiago Stock Exchange and our ADSs closed at US$ 5.68 per ADS on the NYSE.
Not applicable.
In Chile, our common stock is traded on three stock exchanges since April 21, 2016: the Santiago Stock Exchange, the Electronic Stock Exchange and the Valparaíso Stock Exchange. The Santiago Stock Exchange, the largest stock exchange in the country was established in 1893 as a private company. As of December 31, 2017, 212 companies had shares listed on the Santiago Stock Exchange. For 2017, the Santiago Stock Exchange accounted for 92.9% of our total equity traded in Chile and amounted to 8,868,671,150 shares. In addition, 7.1% of our equity trading was conducted on the Electronic Stock Exchange, an electronic trading market that was created by banks and non-member brokerage houses, and less than 0.1% was traded on the Valparaíso Stock Exchange.
Equities, closed-end funds, fixed-income securities, short-term and money market securities, gold and U.S. dollars are traded on the Santiago Stock Exchange. The Santiago Stock Exchange also trades U.S. dollar futures and stock index futures. Securities are
93
traded primarily through an open voice auction system; a firm offers system or the daily auction. Trading through the open voice system occurs on each business day from 9:30 a.m. to 4:00 p.m., during local standard time, and from 9:30 a.m. to 5:00 p.m. when daylight savings time is in place (usually from November to March), which may differ from New York City time by up to two hours, depending on the season. The Santiago Stock Exchange has an electronic trading system called Telepregón, which operates continuously from 9:30 a.m. to 4:00 p.m. during local standard time, and from 9:30 a.m. to 5:00 p.m. when daylight savings time in Chile is in place, on each business day. During local standard time, electronic auctions may be conducted at any of four times a day, at 10:30 a.m., 11:30 a.m., 1:30 p.m., and 3:30 p.m. During daylight savings time, there is an additional electronic auction at 4:30 p.m. More than 99% of the auctions and transactions take place electronically.
There are two main share price indexes on the Santiago Stock Exchange, the General Shares Price Index, or IGPA, and the Selected Shares Price Index, or IPSA. The IGPA is calculated using the prices of shares that are traded at least 5% of the trading days of a year, with total annual transactions exceeding UF 10,000 (approximately Ch$ 268 million as of December 31, 2017, equivalent to US$ 435,919) and a free float representing at least 5%. The IPSA is calculated using the prices of the 40 shares with highest trading volume on a quarterly basis, and with a market capitalization above US$ 200 million. The shares included in the IPSA and IGPA are weighted according to the weighted value of the shares traded. We have been included in the IPSA since April 21, 2016.
Our common stock trades in the United States in the form of ADSs on the NYSE by way of “when-issued” trading since April 21, 2016 under the ticker symbol “ENIC WI” and regular-way trading since April 27, 2016 under the ticker symbol “ENIC.” Each ADS represents 50 shares of common stock, with the ADSs in turn evidenced by American Depositary Receipts (“ADRs”). The ADRs were issued under a Deposit Agreement dated April 26, 2016, among us, Citibank, N.A. acting as Depositary (the “Depositary”), and the holders and beneficial owners from time to time of ADRs issued thereunder, which was amended on February 14, 2018 (the “Deposit Agreement”). Only persons in whose names ADRs are registered on the books of the Depositary are treated by the Depositary as owners of ADRs.
As of April 24, 2018, ADRs evidencing 75,628,354 ADSs (equivalent to 3,781,417,723 shares of common stock) were outstanding, representing 5.5% of the total number of outstanding shares. It is not practicable for us to determine the proportion of ADSs beneficially owned by U.S. final beneficial holders. Trading volume of our shares on the NYSE and other exchanges during 2017 amounted to 70.5 million ADSs, equivalent to US$ 396 million.
The NYSE is open for trading Monday through Friday from 9:30 am to 4:00 pm, with the exception of holidays declared by the NYSE in advance. On the trading floor, the NYSE trades in a continuous auction format, where traders can execute stock transactions on behalf of investors. Specialist brokers act as auctioneers in an open outcry auction market to bring buyers and sellers together and to manage the actual auction. Customers can also send orders for immediate electronic execution or route orders to the floor for trade in the auction market. The NYSE works with U.S. regulators like the SEC and the Commodity Futures Trading Commission to coordinate risk management measures in the electronic trading environment through the implementation of mechanisms like circuit breakers and liquidity replenishment points.
The following table contains information regarding the amount of total traded shares of common stock and the corresponding percentage traded per market during 2017:
| | Number of common shares traded | | | Percent | |
Market | | | | | | | | |
Chile(1) | | | 9,543,529,415 | | | | 72.5 | % |
United States (One ADS = 50 shares of common stock)(2) | | | 3,623,621,050 | | | | 27.5 | % |
Total | | | 13,167,150,465 | | | | 100 | % |
(1) | Includes Santiago Stock Exchange, Electronic Stock Exchange and Valparaíso Stock Exchange. |
(2) | Includes the New York Stock Exchange and over-the-counter trading. |
For further information see “Item 9. The Offer and Listing — A. Offer and Listing Details — Market Price Information.”
Not applicable.
94
Not applicable.
Not applicable.
Item 10.Additional Information
Not applicable.
B. | Memorandum and Articles of Association. |
Description of Share Capital
Set forth below is certain information concerning our share capital and a brief summary of certain significant provisions of Chilean law and our bylaws.
General
Shareholders’ rights in Chilean companies are governed by the company’s bylaws (estatutos), which have the same purpose as the articles or the certificate of incorporation and the bylaws of a company incorporated in the United States, and by the Chilean Corporations Act, Law 18,046. In addition, D.L. 3500, or the Pension Funds’ System Law, which permits the investment by Chilean pension funds in stock of qualified companies, indirectly affects corporate governance and prescribes certain rights of shareholders. In accordance with the Chilean Corporations Act, legal actions by shareholders to enforce their rights as shareholders of the company must be brought in Chile in arbitration proceedings or, at the option of the plaintiff, before Chilean courts. Members of the Board of Directors, managers, officers and principal executives of the company, or shareholders that individually own shares with a book value or stock value higher that UF 5,000 (Ch$ 134 million as of December 31, 2017) do not have the option to bring the procedure to the courts.
The Chilean securities markets are principally regulated by the CMF under Securities Market Law (Law 18,045) and the Chilean Corporations Act. These two laws state the disclosure requirements, restrictions on insider trading and price manipulation, and provide protection to minority shareholders. The Securities Market Law sets forth requirements for public offerings, stock exchanges and brokers, and outlines disclosure requirements for companies that issue publicly offered securities. The Chilean Corporations Act and the Securities Market Law, both as amended, state rules regarding takeovers, tender offers, transactions with related parties, qualified majorities, share repurchases, directors’ committees, independent directors, stock options and derivative actions.
Public Register
We are a publicly held stock corporation incorporated under the laws of Chile. We were incorporated by public deed issued on January 8, 2016 by the Santiago Notary Public, Mr. Ivan Torrealba A., and registered on January 19, 2016 in the Commercial Register (Registro de Comercio del Conservador de Bienes Raíces y Comercio de Santiago) on pages 4288 No. 2570. Our registry in the Securities Registry of the CMF was approved by the CMF on April 13, 2016, under the entry number 1139. We are also registered with the United States Securities and Exchange Commission under the commission file number 001-37723 on March 31, 2016.
95
Reporting Requirements Regarding Acquisition or Sale of Shares
Under Article 12 of the Securities Market Law and General Rule 269 of the CMF, certain information regarding transactions in shares of a publicly held stock corporation or in contracts or securities whose price or financial results depend on, or are conditioned in whole or in part on the price of such shares, must be reported to the CMF and the Chilean stock exchanges. Since ADSs are deemed to represent the shares of common stock underlying the ADRs, transactions in ADRs will be subject to these reporting requirements and those established in Circular 1375 of the CMF. Shareholders of publicly held stock corporations are required to report to the CMF and the Chilean stock exchanges:
| • | any direct or indirect acquisition or sale of shares made by a holder who owns, directly or indirectly, at least 10% of a publicly held stock corporation’s subscribed capital; |
| • | any direct or indirect acquisition or sale of contracts or securities whose price or financial results depend on or are conditioned in whole or in part on the price of shares made by a holder who owns, directly or indirectly, at least 10% of a publicly held stock corporation’s subscribed capital; |
| • | any direct or indirect acquisition or sale of shares made by a holder who, due to an acquisition of shares of such publicly held stock company, results in the holder acquiring, directly or indirectly, at least 10% of a publicly held stock company’s subscribed capital; and |
| • | any direct or indirect acquisition or sale of shares in any amount, made by a director, receiver, principal executive, general manager or manager of a publicly held stock corporation. |
In addition, majority shareholders of a publicly held stock corporation must inform the CMF and the Chilean stock exchanges if such transactions are entered into with the intention of acquiring control of the company or if they are making a passive financial investment instead.
Under Article 54 of the Securities Market Law and General Rule 104 enacted by the CMF, any person who directly or indirectly intends to take control of a publicly held stock corporation must disclose this intent to the market at least ten business days in advance of the proposed change of control and, in any event, as soon as the negotiations for the change of control have taken place or reserved information of the publicly held stock corporation has been provided.
Corporate Objectives and Purposes
Article 4 of our bylaws states that our corporate objectives and purposes are, among other things, to conduct the exploration, development, operation, generation, distribution, transformation, or sale of energy in any form, directly or through other companies, as well as to provide engineering-consulting services related to these objectives, to make loans to related companies, subsidiaries and affiliates and to participate in the telecommunications business.
Board of Directors
Our Board of Directors consists of seven members who are appointed by shareholders at an OSM and are elected for a three-year term, at the end of which they will be re-elected or replaced. The seven directors elected at the OSM are the seven individual nominees who receive the highest majority of the votes. Each shareholder may vote his shares in favor of one nominee or may apportion his shares among any number of nominees. The effect of these voting provisions is to ensure that a shareholder owning more than 12.5% of our shares is guaranteed to be able to elect a member of the Board.
The compensation of the directors is established annually at the OSM. See “Item 6. Directors, Senior Management and Employees —B. Compensation.”
Agreements entered into by us with related parties can only be executed when such agreements serve our interest, and their price, terms and conditions are consistent with prevailing market conditions at the time of their approval and comply with all the requirements and procedures indicated in Article 147 of the Chilean Corporations Act.
Certain Powers of the Board of Directors
Our bylaws provide that every agreement or contract that we enter into with our controlling shareholder, our directors or executives, or their related parties, must be previously approved by two-thirds of the Board of Directors and be included in the Board meetings, and must comply with the provisions of the Chilean Corporations Act.
96
Our bylaws do not contain provisions relating to:
| • | the directors’ power, in the absence of an independent quorum, to vote on compensation for themselves or any members of their body; |
| • | borrowing powers exercisable by the directors and how such borrowing powers can be changed; |
| • | retirement or non-retirement of directors under an age limit requirement; or |
| • | number of shares, if any, required for directors’ qualification. |
Certain Provisions Regarding Shareholder Rights
As of the date of the filing of this Report, our capital is comprised of only one class of shares, all of which are common shares and have the same rights.
Our bylaws do not contain any provisions relating to:
| • | liability for capital reductions by us. |
Under Chilean law, the rights of our shareholders may only be modified by an amendment to the bylaws that complies with the requirements explained below under “Item 10. Additional Information — B. Memorandum and Articles of Association. — Shareholders’ Meetings and Voting Rights.”
Capitalization
Under Chilean law, only the shareholders of a company acting at an ESM have the power to authorize a capital increase. When an investor subscribes shares, these are officially issued and registered under his name, and the subscriber is treated as a shareholder for all purposes, except receipt of dividends and for return of capital in the event that the shares have been subscribed but not paid for. The subscriber becomes eligible to receive dividends only for the shares that he has actually paid for or, if the subscriber has paid for only a portion of such shares, the pro rata portion of the dividends declared with respect to such shares unless the company’s bylaws provide otherwise. If a subscriber does not fully pay for shares for which the subscriber has subscribed on or prior to the date agreed upon for payment, notwithstanding the actions intended by the company to collect payment, the company is entitled to auction the shares on the stock exchange where such shares are traded, for the account and risk of the debtor, the number of shares held by the debtor necessary for the company to pay the outstanding balances and disposal expenses. However, until such shares are sold at auction, the subscriber continues to hold all the rights of a shareholder, except the right to receive dividends and return of capital. The Chief Executive Officer, or the person replacing him, will reduce in the shareholders’ register the number of shares in the name of the debtor shareholder to the number of shares that remain, deducting the shares sold by the company and settling the debt in the amount necessary to cover the result of such disposal after the corresponding expenses.
When there are authorized and issued shares for which full payment has not been made within the period fixed by shareholders at the same ESM at which the subscription was authorized (which in no case may exceed three years from the date of such meeting), these shall be reduced in the non-subscribed amount until that date. With respect to the shares subscribed and not paid following the term mentioned above, the Board must proceed to collect payment, unless the shareholders’ meeting authorizes (by two thirds of the voting shares) a reduction of the company’s capital to the amount effectively collected, in which case the capital shall be reduced by force of law to the amount effectively paid. Once collection actions have been exhausted, the Board should propose to the shareholders’ meeting the approval by simple majority of the write-off of the outstanding balance and the reduction of capital to the amount effectively recovered.
As of December 31, 2017, our subscribed and fully paid capital totaled Ch$ 2,229 billion and consisted of 49,092,772,762 shares. As of April 2, 2018, after giving effect to the 2018 Reorganization, our subscribed and fully paid capital totaled Ch$ 3,951 billion and consisted of 70,096,723,897 shares.
97
Preemptive Rights and Increases of Share Capital
The Chilean Corporations Act requires Chilean companies to grant shareholders preemptive rights to purchase a sufficient number of shares to maintain their existing ownership percentage of such company whenever such company issues new shares.
Under Chilean law, preemptive rights are exercisable or freely transferable by shareholders during a 30-day period. The options to subscribe for shares in capital increases of the company or of any other securities convertible into shares or that confer future rights over these shares, should be offered, at least once, to the shareholders pro rata to the shares held registered in their name at midnight on the fifth business day prior to the date of the start of the preemptive rights period. The preemptive rights offering and the start of the 30-day period for exercising them shall be communicated through the publication of a prominent notice, at least once, in the newspaper that should be used for notifications of shareholders’ meetings. During such 30-day period, and for an additional period of up to 30-days immediately following the initial 30-day period, publicly held stock corporations are not permitted to offer any unsubscribed shares to third parties on terms which are more favorable than those offered to their shareholders. At the end of the second 30-day period, a Chilean publicly held stock corporation is authorized to sell non-subscribed shares to third parties on any terms, provided they are sold on one of the Chilean stock exchanges.
Shareholders’ Meetings and Voting Rights
An OSM must be held within the first four months following the end of our fiscal year. Our last OSM was held on April 25, 2018. An ESM may be called by the Board of Directors when deemed appropriate, or when requested by shareholders representing at least 10% of the issued shares with voting rights, or by the CMF. Our last ESM was held on December 20, 2017. To convene an OSM or an ESM, notice must be given three times in a newspaper located in our corporate domicile. The newspaper designated by our shareholders is El Mercurio de Santiago. The first notice must be published not less than 15-days and no more than 20-days in advance of the scheduled meeting. Notice must also be mailed to each shareholder, to the CMF and to the Chilean stock exchanges.
The OSM shall be held on the day stated in the notice and should remain in session until having exhausted all the matters stated in the notice. However, once constituted, upon the proposal of the chairman or shareholders representing at least 10% of the shares with voting rights, the majority of the shareholders present may agree to suspend it and to continue it within the same day and place, with no new constitution of the meeting or qualification of powers being necessary, recorded in one set of minutes. Only those shareholders who were present or represented may attend the recommencement of the meeting with voting rights.
Under Chilean law, a quorum for a shareholders’ meeting is established by the presence, in person or by proxy, of shareholders representing at least a majority of the issued shares with voting rights of a company. If a quorum is not present at the first meeting, a reconvened meeting can take place at which the shareholders present are deemed to constitute a quorum regardless of the percentage of the shares represented. This second meeting must take place within 45-days following the scheduled date for the first meeting. Shareholders’ meetings adopt resolutions by the affirmative vote of a majority of those shares present or represented at the meeting. An ESM must be called to take the following actions:
| • | a transformation of the company into a form other than a publicly held stock corporation under the Chilean Corporations Act, a merger or split-up of the company; |
| • | an amendment to the term of duration or early dissolution of the company; |
| • | a change in the company’s domicile; |
| • | a decrease of corporate capital; |
| • | an approval of capital contributions in kind and non-monetary assessments; |
| • | a modification of the authority reserved to shareholders or limitations on the Board of Directors; |
| • | a reduction in the number of members of the Board of Directors; |
| • | a disposition of 50% or more of the assets of the company, whether it includes disposition of liabilities or not, as well as the approval or the amendment of the business plan which contemplates the disposition of assets in an amount greater that such percentage; |
| • | the disposition of 50% or more of the assets of a subsidiary, as long as such subsidiary represents at least 20% of the assets of the corporation, as well as any disposition of its shares that results in the parent company losing its position as controlling shareholder; |
98
| • | the form of distributing corporate benefits; |
| • | issue of guarantees for third-party liabilities which exceed 50% of the assets, except when the third party is a subsidiary of the company, in which case approval of the Board of Directors is deemed sufficient; |
| • | the purchase of the company’s own shares; |
| • | other actions established by the bylaws or the laws; |
| • | certain remedies for the nullification of the company’s bylaws; |
| • | inclusion in the bylaws of the right to purchase shares from minority shareholders, when the controlling shareholders reaches 95% of the company’s shares by means of a tender offer for all of the company’s shares, where at least 15% of the shares have been acquired from unrelated shareholders; and |
| • | approval or ratification of acts or contracts with related parties. |
Regardless of the quorum present, the vote required for any of the actions above is at least two-thirds of the outstanding shares with voting rights.
Bylaw amendments for the creation of a new class of shares, or an amendment to or an elimination of those classes of shares that already exist, must be approved by at least two-thirds of the outstanding shares of the affected series.
Chilean law does not require a publicly held stock corporation to provide its shareholders the same level and type of information required by the U.S. securities laws regarding the solicitation of proxies. However, shareholders are entitled to examine the financial statements and corporate books of a publicly held stock corporation within the 15-day period before its scheduled shareholders meetings. Under Chilean law, a notice of a shareholders meeting listing matters to be addressed at the meeting must be mailed at least 15 days prior to the date of such meeting, and, an indication of the way complete copies of the documents that support the matters submitted for voting can be obtained, which must also be made available to shareholders on our website. In the case of an OSM, our annual report of activities, which includes audited financial statements, must also be made available to shareholders and published on our website at: www.enelchile.cl.
The Chilean Corporations Act provides that, upon the request by the Directors’ Committee or by shareholders representing at least 10% of the issued shares with voting rights, a Chilean company’s annual report must include, in addition to the materials provided by the Board of Directors to shareholders, such shareholders’ comments and proposals in relation to the company’s affairs. In accordance with Article 136 of the Chilean Corporations Regulation (Reglamento de Sociedades Anónimas), the shareholder(s) holding or representing 10% or more of the shares issued with voting rights, may:
| • | make comments and proposals relating to the progress of the corporate businesses in the corresponding year, no shareholder being able to make individually or jointly more than one presentation. These observations should be presented in writing to the company concisely, responsibly and respectfully, and the respective shareholder(s) should state their willingness for these to be included as an appendix to the annual report. The board shall include in an appendix to the annual report of the year a faithful summary of the pertinent comments and proposals the interested parties had made, provided they are presented during the year or within 30-days after its ending; or |
| • | make comments and proposals on matters that the board submits for the knowledge or voting of the shareholders. The board shall include a faithful summary of those comments and proposals in all information it sends to shareholders, provided the shareholders’ proposal is received at the offices of the company at least 10-days prior to the date of dispatch of the information by the company. The shareholders should present their comments and proposals to the company, expressing their willingness for these to be included in the appendix to the respective annual report or in information sent to shareholders, as the case may be. The observations referred to in this Article may be made separately by each shareholder holding 10% or more of the shares issued with voting rights or shareholders who together hold that percentage, who should act as one. |
Similarly, the Chilean Corporations Act provides that whenever the Board of Directors of a publicly held stock corporation convenes an OSM and solicits proxies for the meeting, or circulates information supporting its decisions or other similar material, it is obligated to include the pertinent comments and proposals that may have been made by the Directors’ Committee or by shareholders owning 10% or more of the shares with voting rights who request that such comments and proposals be so included.
99
Only shareholders registered as such with us as of midnight on the fifth business day prior to the date of a meeting are entitled to attend and vote their shares. A shareholder may appoint another individual, who does not need to be a shareholder, as his proxy to attend the meeting and vote on his behalf. Proxies for such representation shall be given for all the shares held by the owner. The proxy may contain specific instructions to approve, reject, or abstain with respect to any of the matters submitted for voting at the meeting and which were included in the notice. Every shareholder entitled to attend and vote at a shareholders’ meeting shall have one vote for every share subscribed.
There are no limitations imposed by Chilean law or our bylaws on the right of nonresidents or foreigners to hold or vote shares of common stock. However, the registered holder of the shares of common stock represented by ADSs, and evidenced by outstanding ADSs, is the custodian of the Depositary, currently Banco Santander-Chile, or any successor thereto. Accordingly, holders of ADSs are not entitled to receive notice of meetings of shareholders directly or to vote the underlying shares of common stock represented by ADS directly. The Deposit Agreement contains provisions pursuant to which the Depositary has agreed to request instructions from registered holders of ADSs as to the exercise of the voting rights pertaining to the shares of common stock represented by the ADSs. Subject to compliance with the requirements of the Deposit Agreement and receipt of such instructions, the Depositary has agreed to endeavor, insofar as practicable and permitted under Chilean law and the provisions of the bylaws, to vote or cause to be voted (or grant a discretionary proxy to the Chairman of the Board of Directors or to a person designated by the Chairman of the Board of Directors to vote) the shares of common stock represented by the ADSs in accordance with any such instruction. The Depositary shall not itself exercise any voting discretion over any shares of common stock underlying ADSs. If no voting instructions are received by the Depositary from a holder of ADSs with respect to the shares of common stock represented by the ADSs, on or before the date established by the Depositary for such purpose, the shares of common stock represented by the ADS, may be voted in the manner directed by the Chairman of the Board, or by a person designated by the Chairman of the Board, subject to limitations set forth in the Deposit Agreement.
Dividends and Liquidation Rights
According to the Chilean Corporations Act, unless otherwise decided by unanimous vote of its issued shares eligible to vote, all companies must distribute a cash dividend in an amount equal to at least 30% of their consolidated net income, unless and except to the extent we have carried forward losses. The law provides that the Board of Directors must agree to the dividend policy and inform such policy to the shareholders at the OSM.
Any dividend in excess of 30% of net income may be paid, at the election of the shareholders, in cash, or in our shares, or in shares of publicly held corporations owned by us. Shareholders who do not expressly elect to receive a dividend other than in cash are legally presumed to have decided to receive the dividend in cash.
Dividends, which are declared but not paid within the appropriate time period set forth in the Chilean Corporations Act (as to minimum dividends, 30-days after declaration; as to additional dividends, the date set for payment at the time of declaration), are adjusted to reflect the change in the value of UF, from the date set for payment to the date such dividends are actually paid. Such dividends also accrue interest at the then-prevailing rate for UF-denominated deposits during such period. The right to receive a dividend lapses if it is not claimed within five years from the date such dividend is payable. Payments not collected in such period are transferred to the volunteer fire department.
In the event of our liquidation, the shareholders would participate in the assets available in proportion to the number of paid-in shares held by them, after payment to all creditors.
Approval of Financial Statements
The Board of Directors is required to submit our consolidated financial statements to the shareholders annually for their approval. If the shareholders by a vote of a majority of shares present (in person or by proxy) at the shareholders’ meeting reject the financial statements, the Board of Directors must submit new financial statements no later than 60-days from the date of such meeting. If the shareholders reject the new financial statements, the entire Board of Directors is deemed removed from office and a new board is elected at the same meeting. Directors who individually approved such financial statements are disqualified for reelection for the following period. Our shareholders have never rejected the financial statements presented by the Board of Directors.
Change of Control
The Capital Markets Law establishes a comprehensive regulation related to tender offers. The law defines a tender offer as the offer to purchase shares of companies which publicly offer their shares or securities convertibles into shares and which offer is made
100
to shareholders to purchase their shares under conditions which allow the bidder to reach a certain percentage of ownership of the company within a fixed period of time. These provisions apply to both voluntary and hostile tender offers.
Acquisition of Shares
No provision in our bylaws discriminates against any existing or prospective holder of shares as a result of such shareholder owning a substantial number of shares. However, no person may directly or indirectly own more than 65% of the outstanding shares of our stock. The foregoing restriction does not apply to the depositary as record owner of shares represented by ADRs, but it does apply to each beneficial ADS holder. Additionally, our bylaws prohibit any shareholder from exercising voting power with respect to more than 65% of the common stock owned by such shareholder or on behalf of others representing more than 65% of the outstanding issued shares with voting rights.
Right of Dissenting Shareholders to Tender Their Shares
The Chilean Corporations Act provides that upon the adoption of any of the resolutions enumerated below at a meeting of shareholders, dissenting shareholders acquire the right to withdraw from the company and to compel the company to repurchase their shares, subject to the fulfillment of certain terms and conditions. In order to exercise such withdrawal rights, holders of ADRs must first withdraw the shares represented by their ADRs pursuant to the terms of the Deposit Agreement.
“Dissenting” shareholders are defined as those who at a shareholders’ meeting vote against a resolution that results in the withdrawal right, or who if absent from such meeting, state in writing their opposition to the respective resolution, within the 30-days following the shareholders’ meeting. Shareholders present or represented at the meeting and who abstain in exercising their voting rights shall not be considered as dissenting. The right to withdraw should be exercised for all the shares that the dissenting shareholder had registered in their name on the date on which the right is determined to participate in the meeting at which the resolution is adopted that motivates the withdrawal and which remains on the date on which their intention to withdraw is communicated to the company.
The price paid to a dissenting shareholder of a publicly held stock corporation whose shares are quoted and actively traded on one of the Chilean stock exchanges is the weighted average of the sales prices for the shares as reported on the Chilean stock exchanges on which the shares are quoted for the two-month period between the ninetieth and the thirtieth day before the shareholders’ meeting giving rise to the withdrawal right. If, because of the volume, frequency, number and diversity of the buyers and sellers, the CMF determines that the shares are not actively traded on a stock exchange, the price paid to the dissenting shareholder shall be the book value. Book value for this purpose shall equal paid capital plus reserves and profits, less losses, divided by the total number of subscribed shares, whether entirely or partially paid. For the purpose of making this calculation, the last consolidated statements of financial position is used, as adjusted to reflect inflation up to the date of the shareholders’ meeting which gave rise to the withdrawal right.
Article 126 of the Chilean Corporations Act Regulations establishes that in cases where the right to withdraw arises, the company shall be obliged to inform the shareholders of this situation, the value per share that will be paid to shareholders exercising their right to withdraw and the term for exercising it. Such information should be given to shareholders at the same meeting at which the resolutions are adopted giving rise to the right of withdrawal, prior to its voting. A special communication should be given to the shareholders with rights, within two days following the date on which the rights to withdraw are born. In the case of publicly held companies, such information shall be communicated by a prominent notice in a newspaper with a wide national circulation and on its website, plus a written communication addressed to the shareholders with rights at the address they have registered with the company. The notice of the shareholders meeting that should pronounce on a matter that could originate withdrawal rights should mention this circumstance.
The resolutions that result in a shareholder’s right to withdraw include, among others, the following:
| • | the transformation of the company into an entity which is not a publicly held stock corporation governed by Chilean Corporations Act; |
| • | the merger of the company with another company; |
| • | disposition of 50% or more of the assets of the company, whether it includes disposition of liabilities or not, as well as the approval or the amendment of the business plan which contemplates the disposition of assets in an amount greater than such percentage; |
101
| • | the disposition of 50% or more of the assets of a subsidiary, as long as such subsidiary represents at least 20% of the assets of the company, as well as any disposition of its shares that results in the parent company losing its position of controlling shareholder; |
| • | issue of guarantees for third parties’ liabilities which exceed 50% of the assets (if the third party is a subsidiary of the company, the approval of the Board of Directors is sufficient); |
| • | the creation of preferential rights for a class of shares or an amendment to the existing ones. In this case the right to withdraw only accrues to the dissenting shareholders of the class or classes of shares adversely affected; |
| • | certain remedies for the nullification of the corporate bylaws; and |
| • | such other causes as may be established by the law or by the company’s bylaws. |
Investments by AFPs
The Pension Funds’ System Law permits AFPs to invest their funds in companies that are subject to Title XII and these companies are subject to greater restrictions than other companies. The determination of which stocks may be purchased by AFPs is made by the Risk Classification Committee. The Risk Classification Committee establishes investment guidelines and is empowered to approve or disapprove those companies that are eligible for AFP investments. We are and have been a Title XII company and are approved by the Risk Classification Committee.
Title XII companies are required to have bylaws that:
| • | limit the ownership of any shareholder to a specified maximum percentage, currently 65%; |
| • | require that certain actions be taken only at a meeting of the shareholders; and |
| • | give the shareholders the right to approve certain investment and financing policies. |
Registrations and Transfers
Shares issued by us are registered with an administrative agent, which is DCV Registros S.A. This entity is also responsible for our shareholders registry. In case of jointly-owned shares, an attorney-in-fact must be appointed to represent the joint owners in dealing with us.
None.
The Central Bank of Chile is responsible for, among other things, monetary policies and exchange controls in Chile. Currently applicable foreign exchange regulations are set forth in the Compendium of Foreign Exchange Regulations (the “Compendium”) approved by the Central Bank of Chile in 2002. Appropriate registration of a foreign investment in Chile permits the investor access to the Formal Exchange Market. Foreign investments can be registered with the Foreign Investment Committee under D.L. 600 of 1974 or can be registered with the Central Bank of Chile under the Central Bank Act, Law 18,840 of October 1989.
The following is a summary of certain provisions of Chapter XIV that are applicable to all existing shareholders (and ADS holders). This summary does not intend to be complete and is qualified in its entirety by reference to Chapter XIV. Chapter XIV regulates the following type of investments: credits, deposits, investments and equity contributions. A Chapter XIV investor may at any time repatriate an investment made in us upon sale of our shares, and the profits derived therefrom, with no monetary ceiling, subject to the then effective regulations, which must be reported to the Central Bank of Chile.
Except for compliance with tax regulations and some reporting requirements, currently there are no rules in Chile affecting repatriation rights, except that the remittance of foreign currency must be made through a Formal Exchange Market entity. However, the Central Bank of Chile has the authority to change such rules and impose exchange controls.
102
b) | The Compendium and International Bond Issuances |
Chilean issuers may offer bonds issued by the Central Bank of Chile internationally under Chapter XIV, as amended, of the Compendium.
E. Taxation.
Chilean Tax Considerations
The following discussion summarizes material Chilean income and withholding tax consequences to foreign holders arising from the ownership and disposition of shares and ADSs. The summary that follows does not purport to be a comprehensive description of all of the tax considerations that may be relevant to a decision to purchase, own or dispose of shares or ADSs, if any, and does not purport to deal with the tax consequences applicable to all categories of investors, some of which may be subject to special rules. Holders of shares and ADSs are advised to consult their own tax advisors concerning the Chilean and other tax consequences of the ownership of shares or ADSs.
The summary that follows is based on Chilean law, in effect on the date hereof, and is subject to any changes in these or other laws occurring after such date, possibly with retroactive effect. Under Chilean law, provisions contained in statutes such as tax rates applicable to foreign investors, the computation of taxable income for Chilean purposes and the manner in which Chilean taxes are imposed and collected may be amended only by another law. In addition, the Chilean tax authorities enact rulings and regulations of either general or specific application and interpret the provisions of the Chilean Income Tax Law. Chilean tax may not be assessed retroactively against taxpayers who act in good faith relying on such rulings, regulations and interpretations, but Chilean tax authorities may change their rulings, regulations and interpretations in the future. The discussion that follows is also based, in part, on representations of the depositary, and assumes that each obligation in the Deposit Agreement and any related agreements will be performed in accordance with its terms. As of this date, there is currently no applicable income tax treaty in effect between the United States and Chile. However, in 2010 the United States and Chile signed an income tax treaty that will enter into force once the treaty is ratified by both countries, which has not happened as of the date of this Report. There can be no assurance that the treaty will be ratified by either country. The following summary assumes that there is no applicable income tax treaty in effect between the United States and Chile.
As used in this Report, the term “foreign holder” means either:
| • | In the case of an individual holder, a person who is not a resident of Chile. For purposes of Chilean taxation, (a) an individual is a Chilean resident if he has resided in Chile for more than six months in one calendar year, or a total of more than six months in two consecutive fiscal years; or (b) an individual is domiciled in Chile if he resides in Chile and has the intention of remaining in Chile (such intention to be evidenced by circumstances such as the acceptance of employment in Chile or the relocation of the individual’s family to Chile), or | |
| • | in the case of a legal entity holder, an entity that is not organized under the laws of Chile, unless the shares or ADSs are assigned to a branch, agent, representative or permanent establishment of such entity in Chile. |
Taxation of Shares and ADSs
Taxation of Cash Dividends and Property Distributions
Cash dividends paid with respect to the shares or ADSs held by a Foreign Holder will be subject to Chilean withholding tax, which is withheld and paid by the company. The amount of the Chilean withholding tax is determined by applying a 35% rate to a “grossed-up” distribution amount (such amount equal to the sum of the actual distribution amount and the correlative Chilean corporate income tax (“CIT”), paid by the issuer), and then subtracting as a credit 65% of such Chilean CIT paid by the issuer, in case the residence country of the holder of shares or ADSs does not have a tax treaty with Chile. If there is a tax treaty between both countries (in force or signed prior to January 1, 2017) the Foreign Holder can apply 100% of the CIT as a credit. For 2017, the Chilean CIT applicable to us is a rate of 25.5%, and depending on the circumstances mentioned above, the Foreign Holder may apply 100% or 65% of the CIT as a credit.
There are two alternative mechanisms of shareholder-level income taxation in effect since January 1, 2017: a) accrued income basis (known as attributed-income system in Chile) shareholder taxation and b) cash basis (known as partially-integrated system in Chile) shareholder taxation.
103
Under the current Chilean Income Tax Law, publicly held limited liability stock companies, such as we, are subject to the latter regime.
Under the cash basis regime (or partially-integrated regime), a company pays CIT on its annual income tax result. Foreign and local individual shareholders will only pay in Chile the relevant tax on effective profit distributions and will be allowed to use the CIT paid by the distributing company as credit, with certain limitations. Only 65% of the CIT is creditable against the 35% shareholder-level tax (as opposed to 100% under the accrued income basis regime). However, if there is a tax treaty signed before January 1, 2017 between Chile and the jurisdiction of residence of the shareholder (even if not yet in effect), the CIT is fully creditable against the 35% withholding tax. This is the case of the tax treaty signed between Chile and the United States. In the case of treaties signed prior to January 1, 2017 that have not been enacted, a temporary sale allows applying 100% of the CIT as a credit until December 31, 2019 or if such treaty is enacted on or before December 31, 2019.
The example below illustrates the effective Chilean withholding tax burden on a cash dividend received by a Foreign Holder, assuming a Chilean withholding tax base rate of 35%, an effective Chilean CIT rate of 25.5% (the CIT rate for 2017 and later under the cash basis regime, which will increase to 27% in 2018 for companies that elected this regime) and a distribution of 50% of the net income of the company distributable after payment of the Chilean CIT:
Line | | Concept and calculation assumptions | | Amount Tax treaty resident | | | Amount Non-tax treaty resident | |
1 | | Company taxable income (based on Line 1 = 100) | | 100 | | | | 100.0 | |
2 | | Chilean corporate income tax : 25.5% x Line 1 | | 25.5 | | | | 25.5 | |
3 | | Net distributable income: Line 1—Line 2 | | 74.5 | | | | 74.5 | |
4 | | Dividend distributed (50% of net distributable income): 50% of Line 3 | | | 37.3 | | | | 37.3 | |
5 | | Withholding tax: (35% of (the sum of Line 4 and 50% of Line 2)) | | 17.5 | | | | 17.5 | |
6 | | Credit for 50% of Chilean corporate income tax : 50% of Line 2 | | | 12.8 | | | | 12.8 | |
7 | | CIT partial restitution (Line 6 x 35%)(1) | | | — | | | | 4.5 | |
8 | | Net withholding tax: Line 5 - Line 6 + Line 7 | | | 4.8 | | | | 9.2 | |
9 | | Net dividend received: Line 4 - Line 8 | | | 32.5 | | | | 28.0 | |
10 | | Effective dividend withholding rate : Line 8 / Line 4 | | | 12.8 | | | | 24.7 | |
(1) | Only applicable to non-tax treaty jurisdiction resident. From a practical standpoint the foregoing means that the CIT is only partially creditable (65%) against the withholding tax (i.e., CIT of 9.2%). | |
However, for purposes of the foregoing, the tax authority has not clarified whether the taxpayer residence will be the ADS holder’s address or the depository’s address.
Taxation on sale or exchange of ADSs, outside of Chile
Gains obtained by a foreign holder from the sale or exchange of ADSs outside Chile are not be subject to Chilean taxation.
Taxation on sale or exchange of Shares
The Chilean Income Tax Law includes a tax exemption on capital gains arising from the sale of shares of listed companies traded in stock markets. Although there are certain restrictions, in general terms, the law provides that in order to qualify for the capital gain exemption: (i) the shares must be of a publicly held stock corporation with a “sufficient stock market liquidity” status in the Chilean Stock Exchanges (the Santiago Stock Exchange, the Chilean Electronic Stock Exchange and the Valparaíso Stock Exchange); (ii) the sale must be carried out in a Chilean Stock Exchange authorized by the CMF, or in a tender offer subject to Chapter XXV of the Chilean Securities Market Law or as the consequence of a contribution to a fund as regulated in Section 109 of the Chilean Income Tax Law; (iii) the shares which are being sold must have been acquired on a Chilean Stock Exchange, or in a tender offer subject to Chapter XXV of the Chilean Securities Market Law, or in an initial public offering (due to the creation of a company or to a capital increase), or due to the exchange of convertible publicly offered securities, or due to the redemption of a fund’s quota as regulated in Section 109 of the Chilean Income Tax Law; and (iv) the shares must have been acquired after April 19,
104
2001. For purposes of considering the ADS’s as convertible publicly offered securities, they should be registered in the Chilean foreign securities registry (unless expressly excluded from such registry by the CMF).
Shares are considered to have a “high presence” in the Chilean Stock Exchanges when (i) they have been traded for a certain number of days at or beyond a volume threshold specified under Chilean law and regulations or (ii) in case the issuer has retained a market maker, in accordance with Chilean law and regulations. As of this date, our shares are considered to have a high presence in the Chilean Stock Exchanges and no market maker has been retained by us. Should our shares cease to have a “high presence” in the Chilean Stock Exchanges, a transfer of our shares may be subject to capital gains taxes from which holders of “high presence” securities are exempted, and which will apply at varying levels depending on the time of the transfer in relation to the date of loss of sufficient trading volume to qualify as a “high presence” security. If our shares regain a “high presence,” the tax exemptions will again be available to holders thereof.
If the shares do not qualify for the above exemption, capital gains on their sale or exchange of shares (as distinguished from sales or exchanges of ADSs representing such shares of common stock) could be subject to the general tax regime, with a 25.5% Chilean CIT, the rate applicable during 2017, and a 35% Chilean withholding tax, the former being creditable against the latter.
The date of acquisition of the ADSs is considered to be the date of acquisition of the shares for which the ADSs are exchanged.
Taxation of Share Rights and ADS Rights
For Chilean tax purposes and to the extent we issue any share rights or ADS rights, the receipt of share rights or ADS rights by a Foreign Holder of shares or ADSs pursuant to a rights offering is a nontaxable event. In addition, there are no Chilean income tax consequences to Foreign Holders upon the exercise or the expiration of the share rights or the ADS rights.
Any gain on the sale, exchange or transfer of any ADS rights by a Foreign Holder is not subject to taxes in Chile.
Any gain on the sale, exchange or transfer of the share rights by a Foreign Holder is subject to a 35% Chilean withholding tax.
Other Chilean Taxes
There is no gift, inheritance or succession tax applicable to the ownership, transfer or disposition of ADSs by foreign holders, but such taxes will generally apply to the transfer at death or by gift of the shares by a foreign holder. There is no Chilean stamp, issue, registration or similar taxes or duties payable by holders of shares or ADSs.
Material U.S. Federal Income Tax Considerations
This discussion is based on the U.S. Internal Revenue Code of 1986, as amended (the “Code”), administrative pronouncements, judicial decisions and final, temporary and proposed Treasury regulations, all as of the date of this Report. The discussion below does not address the effect of H.R. 1, originally known as the “Tax Cuts and Jobs Act,” which was signed into law on December 22, 2017 and significantly reformed the Code (the “2017 Tax Reform Act”). These authorities are subject to change, possibly with retroactive effect. This discussion assumes that the depositary’s activities are clearly and appropriately defined so as to ensure that the tax treatment of ADSs will be identical to the tax treatment of the underlying shares.
The following are the material U.S. federal income tax consequences to U.S. Holders (as defined herein) of receiving, owning, and disposing of shares or ADSs, but it does not purport to be a comprehensive description of all of the tax considerations that may be relevant to a particular person’s decision to hold such securities and is based on the assumption stated above under “Chilean Tax Considerations” that there is no applicable income tax treaty in effect between the United States and Chile. The discussion applies only if the beneficial owner holds shares or ADSs as capital assets for U.S. federal income tax purposes and it does not describe all of the tax consequences that may be relevant in light of the beneficial owner’s particular circumstances. For instance, it does not describe all the tax consequences that may be relevant to:
| • | certain financial institutions; |
| • | dealers and traders in securities who use a mark-to-market method of tax accounting; |
| • | persons holding shares or ADSs as part of a “straddle” integrated transaction or similar transaction; |
| • | persons whose functional currency for U.S. federal income tax purposes is not the U.S. dollar; |
| • | partnerships or other entities classified as partnerships for U.S. federal income tax purposes; |
105
| • | persons liable for the alternative minimum tax; |
| • | tax-exempt organizations; |
| • | persons holding shares or ADSs that own or are deemed to own ten percent or more of our stock; or |
| • | persons holding shares or ADSs in connection with a trade or business conducted outside of the United States. |
If an entity classified as a partnership for U.S. federal income tax purposes holds shares or ADSs, the U.S. federal income tax treatment of a partner will generally depend on the status of the partner and upon the activities of the partnership. Partnerships holding shares or ADSs and partners in such partnerships should consult their tax advisors as to the particular U.S. federal income tax consequences of holding and disposing of the shares or ADSs.
You will be a “U.S. Holder” for purposes of this discussion if you become a beneficial owner of our shares or ADSs and if you are, for U.S. federal income tax purposes:
| • | a citizen or individual resident of the United States; or |
| • | a corporation, or other entity taxable as a corporation, created or organized in or under the laws of the United States or any political subdivision thereof; or |
| • | an estate, the income of which is subject to U.S. federal income taxation regardless of its source; or |
| • | a trust (i) that validly elects to be treated as a U.S. person for U.S. federal income tax purposes or (ii) if (A) a court within the United States is able to exercise primary supervision over the administration of the trust and (B) one or more U.S. persons have the authority to control all substantial decisions of the trust. |
For U.S. federal income tax purposes, it is generally expected that a U.S. Holder of ADSs will be treated as the beneficial owner of the underlying shares represented by the ADSs. The remainder of this discussion assumes that a U.S. Holder of our ADSs will be treated in this manner for U.S. federal income tax purposes. Accordingly, deposits or withdrawals of shares for ADSs will generally not be subject to U.S. federal income tax. The U.S. Treasury has expressed concerns that parties to whom ADSs are released before shares are delivered to the depositary (pre-release) or intermediaries in the chain of ownership between beneficial owners and the issuer of the security underlying the ADSs may be taking actions that are inconsistent with the claiming of foreign tax credits for beneficial owners of depositary shares. Such actions would also be inconsistent with the claiming of the reduced tax rate, described below, applicable to dividends received by certain non-corporate beneficial owners. Accordingly, the analysis of the creditability of Chilean taxes, and the availability of the reduced tax rate for dividends received by certain non-corporate holders, each described below, could be affected by actions taken by such parties or intermediaries.
This discussion assumes that we will not be a passive foreign investment company, as described below. The discussion below does not address the effect of any U.S. state, local, estate or gift tax law or non-U.S. tax law or tax considerations that arise from rules of general application to all taxpayers on a U.S. Holder of the shares or ADSs, including the effects of the 2017 Tax Reform Act or of any future administrative guidance interpreting provisions thereof.
U.S. Holders should consult their tax advisors with respect to their particular tax consequences of owning or disposing of shares or ADSs, including the applicability and effect of state, local, non-U.S. and other tax laws and the possibility of changes in tax laws, including the effects of the 2017 Tax Reform Act or of any future administrative guidance interpreting provisions thereof.
Taxation of Distributions
The following discussion of cash dividends and other distributions is subject to the discussion below under “Passive Foreign Investment Company Rules.” Distributions received by a U.S. Holder on shares or ADSs, including the amount of any Chilean taxes withheld, other than certain pro rata distributions of shares to all shareholders, will constitute foreign-source income to the extent paid out of our current or accumulated earnings and profits (as determined for U.S. federal income tax purposes). Because we do not maintain calculations of our earnings and profits under U.S. federal income tax principles, it is expected that distributions generally will be reported to U.S. Holders as dividends. The amount of dividend income paid in Chilean pesos that a U.S. Holder will be required to include in income will equal the U.S. dollar value of the distributed Chilean peso, calculated by reference to the exchange rate in effect on the date the payment is received, regardless of whether the payment is converted into U.S. dollars on the date of receipt. If the dividend is converted into U.S. dollars on the date of receipt, a U.S. Holder will generally not be required to recognize foreign currency gain or loss in respect of the dividend income. A U.S. Holder may have foreign currency gain or loss if the dividend
106
is converted into U.S. dollars after the date of its receipt, which would be ordinary income or loss and would be treated as income from U.S. sources for foreign tax credit purposes. Dividends will be included in a U.S. Holder’s income on the date of the U.S. Holder’s, or in the case of ADSs, the depositary’s, receipt of the dividend. Corporate U.S. Holders will not be entitled to claim the dividends-received deduction with respect to dividends paid by us.
Subject to certain exceptions for short-term and hedged positions, the discussion above regarding concerns expressed by the U.S. Treasury and the discussion below regarding rules intended to be promulgated by the U.S. Treasury, the U.S. dollar amount of dividends received by a noncorporate U.S. Holder in respect of shares or ADSs) generally will be subject to taxation at preferential rates if the dividends are “qualified dividends.” Dividends paid on the ADSs generally will be treated as qualified dividends if (i) the ADSs are readily tradable on an established securities market in the United States (ii) we were not, in the year prior to the year in which the dividend was paid, and is not, in the year in which the dividend is paid, a passive foreign investment company (“PFIC”) and (iii) the holder thereof has satisfied certain holding period requirements. The ADSs are listed on the New York Stock Exchange and generally will qualify as readily tradable on an established securities market in the United States so long as they are so listed. We do not expect that we will be treated as having been a PFIC for U.S. federal income tax purposes with respect to our 2017 taxable year. In addition, based on our current expectations regarding the value and nature of our assets, the sources and nature of our income, and relevant market and shareholder data, we do not anticipate becoming a PFIC for our 2018 taxable year. However, because PFIC status depends upon the composition of a company’s income and assets and the market value of its assets from time to time, and because it is unclear whether certain types of our income constitute passive income for PFIC purposes, there can be no assurance that we will not be considered a PFIC for any current, prior or future taxable year.
Based on existing guidance, it is not entirely clear whether dividends received with respect to shares will be treated as qualified dividends, because the shares are not themselves listed on a U.S. exchange. In addition, the U.S. Treasury has announced its intention to promulgate rules pursuant to which holders of ADSs and intermediaries through whom such securities are held will be permitted to rely on certifications from issuers to establish that dividends are treated as qualified dividends. Because such procedures have not yet been issued, it is not clear whether we will be able to comply with them. A U.S. Holder should consult its tax advisors to determine whether the favorable rate will apply to dividends it receives and whether it is subject to any special rules that limit its ability to be taxed at this favorable rate.
The amount of a dividend generally will be treated as foreign-source dividend income to a U.S. Holder for foreign tax credit purposes. As discussed in more detail below under “—Foreign Tax Credits,” it is not free from doubt whether Chilean withholding taxes imposed on distributions on shares or ADSs will be treated as income taxes eligible for a foreign tax credit for U.S. federal income tax purposes. If a Chilean withholding tax is treated as an eligible foreign income tax, subject to generally applicable limitations, you may claim a credit against your U.S. federal income tax liability for the eligible Chilean taxes withheld from distributions on shares or ADSs. If the dividends are taxed as qualified dividend income (as discussed above), special rules will apply in determining the amount of the dividend taken into account for purposes of calculating the foreign tax credit limitation. The rules relating to foreign tax credits are complex. U.S. Holders are urged to consult their own tax advisors regarding the treatment of Chilean withholding taxes imposed on distributions on shares or ADSs.
Sale or Other Disposition of Shares or ADSs
If a beneficial owner is a U.S. Holder, for U.S. federal income tax purposes, the gain or loss a beneficial owner realizes on the sale or other disposition of shares or ADSs will be a capital gain or loss, and will be a long term capital gain or loss if the beneficial holder has held the shares or ADSs for more than one year. The amount of a beneficial owner’s gain or loss will equal the difference between the beneficial owner’s tax basis in the shares or ADSs disposed of and the amount realized on the disposition, in each case as determined in U.S. dollars. Such gain or loss will generally be U.S.-source gain or loss for foreign tax credit purposes. In addition, certain limitations exist on the deductibility of capital losses by both corporate and individual taxpayers.
In certain circumstances, Chilean taxes may be imposed upon the sale of shares (but not ADSs). See “Item 10. Additional Information — E. Taxation — Chilean Tax Considerations — Taxation of Shares and ADSs.” If a Chilean tax is imposed on the sale or disposition of shares, a beneficial owner that is a U.S. Holder may claim a credit against its U.S. federal income tax liability for the eligible Chilean taxes withheld pursuant to a sale or disposition of shares or ADSs as discussed in “― Foreign Tax Credits” below.
Foreign Tax Credits
Subject to applicable limitations that may vary depending upon a U.S. Holder’s circumstances and subject to the discussion above regarding concerns expressed by the U.S. Treasury, you may claim a credit against your U.S. tax liability for Chilean income taxes (or taxes imposed in lieu of an income tax) imposed in connection with distributions on and proceeds from the sale or other disposition of our shares or ADSs. Chilean dividend withholding taxes generally are expected to be income taxes eligible for the
107
foreign tax credit. The Chilean capital gains tax is likely to be treated as an income tax (or a tax paid in lieu of an income tax) and thus eligible for the foreign tax credit; however, you generally may claim a foreign tax credit only after taking into account any available opportunity to reduce the Chilean capital gains tax, such as the reduction for the credit for Chilean corporate income tax that is taken into account when calculating Chilean withholding tax. If a Chilean tax is imposed on the sale or disposition of our shares or ADSs, and a U.S. Holder does not receive significant foreign source income from other sources, such U.S. Holder may not be able to credit such Chilean tax against its U.S. federal income tax liability. If a Chilean tax is not treated as an income tax (or a tax paid in lieu of an income tax) for U.S. federal income tax purposes, a U.S. Holder would be unable to claim a foreign tax credit for any such Chilean tax withheld; however, a U.S. Holder may be able to deduct such tax in computing its U.S. federal income tax liability, subject to applicable limitations. In addition, instead of claiming a credit, a U.S. Holder may, at the U.S. Holder’s election, deduct such Chilean taxes in computing the U.S. Holder’s taxable income, subject to generally applicable limitations under U.S. law. An election to deduct foreign taxes instead of claiming foreign tax credits applies to all taxes paid or accrued in the taxable year to foreign countries and possessions of the U.S. The calculation of foreign tax credits and, in the case of a U.S. Holder that elects to deduct foreign income taxes, the availability of deductions, involves the application of complex rules that depend on its particular circumstances. U.S. Holders are urged to consult their tax advisors regarding the availability of foreign tax credits in their particular circumstances.
Passive Foreign Investment Company Rules
We were not a “passive foreign investment company”, or PFIC, for U.S. federal income tax purposes for our 2017 taxable year and we believe that we will not be a PFIC for the foreseeable future. However, because PFIC status depends upon the composition of a company’s income and assets and the market value of its assets from time to time, and because it is unclear whether certain types of our income constitute passive income for PFIC purposes, there can be no assurance that we will not be considered a PFIC for any current, prior or future taxable year. If we were to become a PFIC for any taxable year during which a beneficial owner held shares or ADSs, certain adverse consequences could apply to the U.S. Holder, including the imposition of higher amounts of tax than would otherwise apply, and additional filing requirements. In addition, if we were treated as a PFIC in a taxable year in which we pay a dividend or in the prior taxable year, the favorable dividend rates discussed above with respect to dividends paid to certain non-corporate U.S. Holders would not apply (see “— Taxation of Distributions” above). U.S. Holders should consult their tax advisors regarding the consequences to them if we were to become a PFIC, as well as the availability and advisability of making any election that might mitigate the adverse consequences of PFIC status.
Controlled Foreign Corporation Rules
A foreign corporation will be treated as a “controlled foreign corporation” (“CFC”) for U.S. federal income tax purposes if, on any day during the taxable year of such foreign corporation, more than 50% of the equity interests in such corporation, measured by reference to the combined voting power or value of the equity of the corporation, is owned directly or by application of the attribution and constructive ownership rules of Sections 958(a) and 958(b) of the Code by United States Shareholders. For this purpose, a “United States Shareholder” is any U.S. person that possesses directly, or by application of the attribution and constructive ownership rules of Sections 958(a) and 958(b) of the Code, 10% or more of the combined voting power of all classes of equity in such corporation or 10% or more of the combined value of all classes of equity in such corporation. If a foreign corporation is a CFC at any time during any taxable year, each United States Shareholder of the corporation who owns, directly or indirectly, shares in the corporation on the last day of the taxable year on which it is a CFC will be required to include in its gross income for U.S. federal income tax purposes its pro rata share of the CFC’s “Subpart F income” for such year, even if the Subpart F income is not distributed. Subpart F income generally includes passive income but also includes certain related party sales, manufacturing and services income. For tax years beginning after December 31, 2017, the 2017 Tax Reform Act also requires such United States Shareholders to include in their gross income for U.S. federal income tax purposes their pro rata share of certain global intangible low-tax income. The calculation of global intangible low-taxed income is complex, and involves calculations regarding other controlled foreign corporations in which a U.S. Holder is a United States Shareholder. Further, certain changes to the CFC constructive ownership rules under Section 958(b) of the Code introduced by the 2017 Tax Reform Act may cause one or more of our non-U.S. subsidiaries to be treated as CFCs, may also impact our CFC status, and may affect holders of our shares or ADSs that are United States Shareholders. U.S. Holders who might, directly, indirectly or constructively, acquire 10% or more of our shares (by vote or value), and therefore might be a United States Shareholder, should consider the possible application of the CFC rules, and are urged to consult a tax advisor with respect to such matter.
108
Required Disclosure with Respect to Foreign Financial Assets
Certain U.S. Holders are required to report information relating to an interest in our shares or ADSs, subject to certain exceptions (including an exception for our shares or ADSs held in accounts maintained by certain financial institutions), by attaching a completed IRS Form 8938, Statement of Specified Foreign Financial Assets, with their tax return for each year in which they hold an interest in our shares or ADSs. U.S. Holders are urged to consult their own U.S. tax advisors regarding information reporting requirements relating to their ownership of our shares or ADSs.
Information Reporting and Backup Withholding
Payments of dividends and sales proceeds that are made within the United States or through certain U.S.- related financial intermediaries generally are subject to information reporting and to backup withholding unless:
(i) the U.S. Holder is an exempt recipient or (ii) in the case of backup withholding, the beneficial owner provides a correct taxpayer identification number and certifies that the U.S. Holder is not subject to backup withholding.
The amount of any backup withholding from a payment to a beneficial owner will be allowed as a credit against the beneficial owner’s U.S. federal income tax liability and may entitle the U.S. Holder to a refund, provided that the required information is furnished in a timely fashion to the U.S. Internal Revenue Service.
Medicare Contribution Tax
Legislation enacted in 2010 generally imposes a tax of 3.8% on the “net investment income” of certain individuals, trusts and estates. Among other items, net investment income generally includes gross income from dividends and net gain attributable to the disposition of certain property, like the shares or ADSs, less certain deductions. A U.S. Holder should consult the holder’s own tax advisor regarding the possible application of this legislation in the beneficial owner’s particular circumstances.
U.S. Holders should consult their tax advisors with respect to the particular consequences to them of receiving, owning or disposing of shares or ADSs.
F. | Dividends and Paying Agents. |
Not applicable.
Not applicable.
We are subject to the information requirements of the Exchange Act, except that as a foreign issuer, we are not subject to SEC proxy rules (other than general anti-fraud rules) or the short-swing profit disclosure rules of the Exchange Act. In accordance with these statutory requirements, we file or furnish reports and other information with the SEC. Reports and other information filed or furnished with the SEC may be inspected and copied at the public reference facilities maintained by the SEC at Room 1024, 100 F Street, N.E., Washington, D.C. 20549. Copies of such material may also be inspected at the offices of the New York Stock Exchange, at 11 Wall Street, New York, New York 10005, on which our ADSs are listed. In addition, the SEC maintains a website that contains electronically filed information, which can be accessed at http://www.sec.gov.
I. | Subsidiary Information. |
Not applicable.
109
Item 11. Quantitative and Qualitative Disclosures About Market Risk
We are exposed to risks arising from changes in commodity prices, interest rates and foreign exchange rates that affect the generation and distribution businesses in Chile. These risks are monitored and managed by us in coordination with Enel Generación. Our Board of Directors approves risk management policies at all levels.
Commodity Price Risk
In our electricity generation business segment, we are exposed to market risks arising from the price volatility of electricity, natural gas, diesel oil, and coal. We seek to ensure our fuel supply by securing long-term contracts with our suppliers for periods that are expected to match the lifetime of our generation assets. These contracts generally have provisions that allow us to purchase natural gas with a pricing formula that combines Henry Hub natural gas and Brent diesel oil at market prices prevailing at the time the purchase occurs. As of December 31, 2017, we held contracts classified as derivative financial instruments related to natural gas (2.3 million MMBTU of Henry Hub). As of December 31, 2016 we held contracts classified as derivative financial instruments related to diesel oil (2.9 million barrels of Brent diesel oil) and natural gas (3.3 million MMBTU of Henry Hub).
In our thermal power plants, which use coal or petroleum-based liquid fuel, the dispatch or bidding mechanism allows these plants to cover their operating costs. However, under certain circumstances, fuel price fluctuations might affect marginal costs. In most cases, we transfer commodity prices variations to contracted sale prices according to indexing formulas. Due to the drought conditions in the past several years in Chile and the price volatility of coal, we hedged this risk with commodity instruments available in the international markets.
Additionally, through adequate commercial risk mitigation policies, and a hydro-thermal power plant mix, we seek to naturally protect our operating income from electricity price volatility. As of December 31, 2017 and 2016, we did not hold electricity price-sensitive instruments.
We are continually analyzing strategies to hedge commodity price risk, like transferring commodity price variations to the customers’ contract prices and/or permanently adjusting commodity indexed price formulas for new Power Purchase Agreements according to our exposure and/or analyzing ways to mitigate risk through hydrological insurance in dry years. In the future we may use price-sensitive instruments.
Interest Rate and Foreign Currency Risk
As of December 31, 2017, the carrying values according to maturity and the corresponding fair value of our interest bearing debt are detailed below. Values do not include derivatives.
| | Expected maturity date | |
For the year ended December 31, | | 2018 | | | 2019 | | | 2020 | | | 2021 | | | 2022 | | | Thereafter | | | Total | | | Fair Value(2) | |
| | (in millions of Ch$)(1) | |
Fixed Rate | | | | | | | | | | | | | | | | | | | | | | | | | | | | | | | | |
Ch$/UF | | | | | | | | | | | | | | | | | | | | | | | | | | | | | | | | |
Weighted average interest rate | | | | | | | | | | | | | | | | | | | | | | | | | | | | | | | | |
US$ | | | 1,800 | | | | 1,917 | | | | 2,041 | | | | 2,174 | | | | 2,315 | | | | 445,185 | | | | 455,432 | | | | — | |
Weighted average interest rate | | | 6.8 | % | | | 6.8 | % | | | 6.8 | % | | | 6.8 | % | | | 6.8 | % | | | 6.1 | % | | | 6.1 | % | | | | |
Total fixed rate | | | 1,800 | | | | 1,917 | | | | 2,041 | | | | 2,174 | | | | 2,315 | | | | 445,185 | | | | 455,432 | | | | — | |
Weighted average interest rate | | | 6.8 | % | | | 6.8 | % | | | 6.8 | % | | | 6.8 | % | | | 6.8 | % | | | 6.1 | % | | | 6.1 | % | | — | |
Variable Rate | | | | | | | | | | | | | | | | | | | | | | | | | | | | | | | | |
Ch$/UF | | | 5,574 | | | | 29,936 | | | | 29,936 | | | | 29,936 | | | | 29,936 | | | | 205,264 | | | | 330,582 | | | | — | |
Weighted average interest rate | | | 9.0 | % | | | 7.0 | % | | | 7.0 | % | | | 7.0 | % | | | 7.0 | % | | | 6.9 | % | | | 7.0 | % | | — | |
US$ | | — | | | — | | | — | | | — | | | — | | | — | | | — | | | — | |
Weighted average interest rate | | — | | | — | | | — | | | — | | | — | | | — | | | — | | | — | |
Total variable rate | | | 5,574 | | | | 29,936 | | | | 29,936 | | | | 29,936 | | | | 29,936 | | | | 205,264 | | | | 330,582 | | | | — | |
Weighted average interest rate | | | 9.0 | % | | | 7.0 | % | | | 7.0 | % | | | 7.0 | % | | | 7.0 | % | | | 6.9 | % | | | 7.0 | % | | — | |
Total | | | 7,374 | | | | 31,853 | | | | 31,977 | | | | 32,110 | | | | 32,251 | | | | 650,449 | | | | 786,014 | | | | — | |
110
(1) | Calculated based on the Observed Exchange Rate as of December 31, 2017, which was Ch$ 614.75 per US$ 1.00. |
(2) | As of December 31, 2017, fair value was calculated based on the discounted value of future cash flows expected to be paid (or received), considering current discount rates that reflect the different risks involved. |
As of December 31, 2016, the carrying values according to maturity and the corresponding fair value of our interest bearing debt are detailed below. Values do not include derivatives.
| | Expected maturity date | |
For the year ended December 31, | | 2017 | | | 2018 | | | 2019 | | | 2020 | | | 2021 | | | Thereafter | | | Total | | | Fair Value(2) | |
| | (in millions of Ch$)(1) | |
Fixed Rate | | | | | | | | | | | | | | | | | | | | | | | | | | | | | | | | |
Ch$/UF | | | — | | | | — | | | | — | | | | — | | | | — | | | | — | | | | — | | | | — | |
Weighted average interest rate | | | 0.0 | % | | — | | | — | | | — | | | — | | | — | | | | 0.0 | % | | — | |
US$ | | | 1,840 | | | | 1,960 | | | | 2,087 | | | | 2,223 | | | | 2,368 | | | | 487,333 | | | | 497,811 | | | | 596,452 | |
Weighted average interest rate | | | 0.0 | % | | | 0.0 | % | | | 0.0 | % | | | 0.0 | % | | | 0.0 | % | | | 0.0 | % | | | 0.0 | % | | | 0.0 | % |
Total Fixed Rate | | | 1,840 | | | | 1,960 | | | | 2,087 | | | | 2,223 | | | | 2,368 | | | | 487,333 | | | | 497,811 | | | | 596,452 | |
Weighted average interest rate | | | 6.5 | % | | | 6.5 | % | | | 6.5 | % | | | 6.5 | % | | | 6.5 | % | | | 6.1 | % | | | 6.1 | % | | — | |
Variable Rate | | | | | | | | | | | | | | | | | | | | | | | | | | | | | | | | |
Ch$/UF | | | 5,480 | | | | 5,480 | | | | 5,480 | | | | 5,480 | | | | 5,480 | | | | 5,480 | | | | 5,480 | | | | 5,480 | |
Weighted average interest rate | | | 9.1 | % | | | 9.1 | % | | | 7.8 | % | | | 7.8 | % | | | 7.8 | % | | | 7.8 | % | | | 7.8 | % | | — | |
US$ | | — | | | — | | | — | | | — | | | — | | | — | | | — | | | — | |
Weighted average interest rate | | — | | | — | | | — | | | — | | | — | | | — | | | — | | | — | |
Total Variable Rate | | | 5,480 | | | | 5,480 | | | | 5,480 | | | | 5,480 | | | | 5,480 | | | | 5,480 | | | | 5,480 | | | | 5,480 | |
Weighted average interest rate | | | 9.1 | % | | | 9.1 | % | | | 7.8 | % | | | 7.8 | % | | | 7.8 | % | | | 7.8 | % | | | 7.8 | % | | — | |
Total | | | 7,320 | | | | 7,320 | | | | 7,320 | | | | 7,320 | | | | 7,320 | | | | 7,320 | | | | 7,320 | | | | 7,320 | |
(1) | Calculated based on the Observed Exchange Rate as of December 31, 2016, which was Ch$ 669.47 per US$ 1.00. |
(2) | As of December 31, 2016, fair value was calculated based on the discounted value of future cash flows expected to be paid (or received), considering current discount rates that reflect the different risks involved. |
Interest Rate Risk
Our policy aims to minimize the average cost of debt and reduce the volatility of our financial results. Depending on our estimates and the debt structure, we sometimes manage interest rate risk through the use of interest rate derivatives.
At both December 31, 2017 and 2016, 92% of our total outstanding debt was denominated in fixed terms and 8% was subject to variable interest rates. Because the exposure to variable interest rate risk was so low, we did not engage in derivative hedging instruments.
Foreign Currency Risk
Our policy seeks to maintain a balance between the currency in which cash flows are indexed and the currency of the debt of each company. Most of our subsidiaries have access to funding in the same currency as their revenues, therefore reducing the exchange rate volatility impact. In some cases, we cannot fully benefit from this, and therefore, we try to manage the exposure with financial derivatives such as cross currency swaps or currency forwards, among others. However, this may not always be possible under reasonable terms due to market conditions.
As of December 31, 2017, the carrying values for financial accounting purposes and the corresponding fair value of the instruments that hedge the foreign exchange risk of our interest bearing debt were as follows:
111
| | Expected Maturity Date | |
For the year ended December 31, | | 2018 | | | 2019 | | | 2020 | | | 2021 | | | 2022 | | | Thereafter | | | Total | | | Fair Value(2) | |
| | (in millions of Ch$)(1) | |
UF to US$ | | | — | | | | 500,198 | | | | — | | | | — | | | | — | | | | — | | | | 500,198 | | | | — | |
US$ to Ch$/UF | | | — | | | | — | | | | — | | | | — | | | | — | | | | — | | | | — | | | | — | |
Ch$ to US$ | | | — | | | | — | | | | — | | | | — | | | | — | | | | — | | | | — | | | | — | |
Total | | | — | | | | 500,198 | | | | — | | | | — | | | | — | | | | — | | | | 500,198 | | | | — | |
(1) | Calculated based on the Observed Exchange Rate as of December 31, 2017, which was Ch$ 614.75 per US$ 1.00. |
(2) | Fair values were calculated based on the discounted value of future cash flows expected to be paid (or received), considering current discount rates that reflect the different risks involved. |
As of December 31, 2016, the carrying values for financial accounting purposes and the corresponding fair value of the instruments that hedge the foreign exchange risk of our interest bearing debt were as follows:
| | Expected Maturity Date | |
For the year ended December 31, | | 2017 | | | 2018 | | | 2019 | | | 2020 | | | 2021 | | | Thereafter | | | Total | | | Fair Value(2) | |
| | (in millions of Ch$)(1) | |
UF to US$ | | | — | | | | — | | | | 523,687 | | | | — | | | | — | | | | — | | | | 523,687 | | | | (23,641 | ) |
US$ to Ch$/UF | | | — | | | | — | | | | — | | | | — | | | | — | | | | — | | | | — | | | | — | |
Ch$ to US$ | | | — | | | | — | | | | — | | | | — | | | | — | | | | — | | | | — | | | | — | |
Total | | | — | | | | — | | | | 523,687 | | | | — | | | | — | | | | — | | | | 523,687 | | | | (23,641 | ) |
(1) | Calculated based on the Observed Exchange Rate as of December 31, 2016, which was Ch$ 669.47 per US$ 1.00. |
(2) | Fair values were calculated based on the discounted value of future cash flows expected to be paid (or received), considering current discount rates that reflect the different risks involved. |
For further detail please refer to Note 19 of the Notes to our consolidated financial statements.
(d) Safe Harbor
The information in this “Item 11. Quantitative and Qualitative Disclosures About Market Risk,” contains information that may constitute forward-looking statements. See “Forward-Looking Statements” in the Introduction of this Report for safe harbor provisions.
Item 12. Description of Securities Other Than Equity Securities
Not applicable.
Not applicable.
Not applicable.
D. | American Depositary Shares. |
Depositary Fees and Charges
112
Our ADS program’s depositary is Citibank, N.A. The Depositary collects fees for delivery and surrender of ADSs directly from investors depositing shares or surrendering ADSs for the purpose of withdrawal or from intermediaries acting for them. The Depositary fees payable for cash distributions are deducted from the cash being distributed. In the case of distributions other than cash, the Depositary will invoice the applicable ADS record date holders and such fees may be deducted from distributions. The Depositary may generally refuse to provide the requested services until its fees for those services are paid. Under the terms of the Deposit Agreement, an ADS holder may have to pay the following service fees to the Depositary:
Service Fees | | Fees |
| | |
(1) Issuance of ADS upon deposit of shares (i.e., an issuance upon a deposit of shares or upon a change in the ADS(s) to share(s) ratio), excluding issuances as a result of distributions described in paragraph (4) below. | | Up to US$5 per 100 ADSs (or fraction thereof) issued. |
| | |
(2) Delivery of deposited securities against surrender of ADS | | Up to US$5 per 100 ADSs (or fraction thereof) surrendered. |
| | |
(3) Distribution of cash dividends or other cash distributions (i.e., sale of rights and other entitlements) | | Up to US$5 per 100 ADSs (or fraction thereof) held. |
| | |
(4) Distribution of ADS pursuant to (i) stock dividends or other free stock distributions, or (ii) exercise of rights to purchase additional ADS | | Up to US$5 per 100 ADSs (or fraction thereof) held. |
| | |
(5) Distribution of securities other than ADS or rights to purchase additional ADS (i.e., spin-off of shares) | | Up to US$5 per 100 ADSs (or fraction thereof) held. |
| | |
(6) Depositary services | | Up to US$5 per 100 ADSs (or fraction thereof) held on the applicable record date(s) established by the Depositary. |
The Depositary collects fees for delivery and surrender of ADSs directly from investors depositing shares or surrendering ADSs for the purpose of withdrawal or from intermediaries acting for them. The Depositary fees payable for cash distributions are deducted from the cash being distributed. In the case of distributions other than cash, the Depositary will invoice the applicable ADS record date holders and such fees may be deducted from distributions.
Depositary Payments for Fiscal Year 2017
The Depositary has agreed to reimburse certain expenses incurred by us in connection with our ADS program. In 2017, the Depositary reimbursed expenses related primarily to investor relations’ activities for a total amount of US$ 1.0 million (after the deduction of applicable U.S. taxes).
113
PART II
Item 13.Defaults, Dividend Arrearages and Delinquencies
None.
Item 14.Material Modifications to the Rights of Security Holders and Use of Proceeds
None.
Item 15.Controls and Procedures
a) Disclosure Controls and Procedures
We carried out an evaluation under the supervision and with the participation of our senior management, including the Chief Executive Officer and Chief Financial Officer, of the effectiveness of the design and operation of our “disclosure controls and procedures” (as defined in Rules 13a-15(e) and 15d-15(e) under the Exchange Act) for the year ended December 31, 2017.
There are inherent limitations to the effectiveness of any system of disclosure controls and procedures, including the possibility of human error, and the circumvention or overriding of the controls and procedures. Accordingly, our disclosure controls and procedures are designed to provide reasonable assurance of achieving their control objectives.
Based upon our evaluation, the Chief Executive Officer and the Chief Financial Officer concluded that the disclosure controls and procedures are effective in providing reasonable assurance that information required to be disclosed in the reports we file and submit under the Exchange Act is recorded, processed, summarized and reported, within the time periods specified in the applicable rules and forms, and that it is gathered and communicated to our management, including the Chief Executive Officer and Chief Financial Officer, as appropriate, to allow timely decisions regarding required disclosure.
Our disclosure controls and procedures are designed to provide reasonable assurance of achieving their objectives, and our principal executive officer and principal financial officer have concluded that our disclosure controls and procedures are effective at that reasonable assurance level.
(b) Management’s Annual Report on Internal Control Over Financial Reporting
As required by Section 404 of the Sarbanes-Oxley Act of 2002, our management is responsible for establishing and maintaining “adequate internal control over financial reporting” (as defined in Rule13a-15(f) under the Exchange Act). Our internal control over financial reporting is designed to provide reasonable assurance regarding the reliability of financial reporting and the preparation of the financial statements for external purposes in accordance with IFRS, as issued by the IASB.
Because of its inherent limitations, internal control over financial reporting may not necessarily prevent or detect some misstatements. It can only provide reasonable assurance regarding financial statement preparation and presentation. Also, projections of any evaluation of effectiveness for future periods are subject to the risk that controls may become inadequate because of changes in conditions or because the degree of compliance with the policies or procedures may deteriorate over time.
Management assessed the effectiveness of its internal control over financial reporting for the year ended December 31, 2017. The assessment was based on criteria established in “Internal Control – Integrated Framework” issued by the Committee of Sponsoring Organizations of the Treadway Commission (“COSO 2013 framework”). Based on the assessment, our management has concluded that as of December 31, 2017, our internal control over financial reporting was effective.
(c) Attestation Report of the Public Accounting Firm
Our independent registered public accounting firm has audited the effectiveness of our internal control over financial reporting as of December 31, 2017. Their attestation report appears on page F-2.
114
(d) Changes in Internal Control over Financial Reporting
There were no changes in our internal control over financial reporting identified in connection with the evaluation required by Rules 13a-15(d) or 15d-15(d) under the Exchange Act that occurred during 2017 that have materially affected, or are reasonably likely to materially affect, our internal control over financial reporting model.
Item 16. Reserved
Item 16A.Audit Committee Financial Expert
As of December 31, 2017, the Directors’ Committee (which performs the functions of the Audit Committee) financial expert was Mr. Fernán Gazmuri P., as determined by the Board of Directors. Mr. Gazmuri is an independent member of the Directors’ Committee pursuant to the requirement of both Chilean law and NYSE corporate governance rules.
Item 16B.Code of Ethics
Our standards of ethical conduct are governed by means of the following five corporate rulings or policies: the Code of Ethics, the Zero Tolerance Anti-Corruption Plan (the “ZTAC Plan”), the Human Rights Policy, the Manual for the Management of Information of Interest to the Market (the “Manual”) and the Diversity Policy.
The Manual, adopted by our Board of Directors, addresses the following issues: applicable standards and blackout periods regarding the information in connection with transactions of our securities or those of our affiliates, entered into by directors, management, principal executives, employees and other related parties; the existence of mechanisms for the continuous disclosure of information that is of interest to the market; and mechanisms that provide protection for confidential information.
In addition to the corporate governance rules described above, our Board adopted the Code of Ethics, the ZTAC Plan and the Human Rights Policy. The Code of Ethics is based on general principles such as impartiality, honesty, integrity and other values of similar importance, which are translated into detailed behavioral criteria. The ZTAC Plan reinforces the principles included in the Code of Ethics, but with a special emphasis on avoiding corruption in the form of bribes, preferential treatment, and other similar matters. The Human Rights Policy incorporates and adapts the general human rights principles championed by the United Nations into a corporate reality.
The Diversity Policy was approved by the Board of Directors on August 30, 2016. This policy defines the key principles required to spread a culture that focuses on diversity and is based on the respect and promotion of the principles of preventing arbitrary discrimination and encouraging equal opportunities and inclusion, which are fundamental values in the development of the Company’s activities. By means of this policy, the Company seeks to improve the work environment and the quality of life at work. The Company is committed to creating an inclusive work environment where workers can develop their potential and maximize their contribution.
A copy of these documents is available on our webpage at www.enelchile.cl as well as upon request, free of charge, by writing or calling us at:
Enel Chile S.A.
Investor Relations Department
Santa Rosa 76, Piso 15
Santiago, Chile
(56-2) 2353-4682
During fiscal year 2017, there have been no amendments to any provisions of the documents described above. No waivers from any provisions of the Charter Governing Executives, the Code of Ethics, the ZTAC Plan or the Manual, were expressly or implicitly granted to the Chief Executive Officer, the Chief Financial Officer or any other senior financial officers of the Company in fiscal year 2017.
115
Item 16C.Principal Accountant Fees and Services
The following table provides information on the aggregate fees for approved services billed by our independent registered accounting firm, as well as the other member firms and their respective affiliates, by type of services for the periods indicated.
Services Rendered | | 2017 | | | 2016 | | |
| | (in millions of Ch$) | | |
Audit fees | | | 855 | | | | 928 | | |
Audit-related fees | | | 957 | | (1) | | 837 | | (2) |
Tax fees | | | — | | | | — | | |
All other fees | | | — | | | | — | | |
Total | | | 1,812 | | | | 1,765 | | |
(1) | Represents non-recurring audit services related to the 2018 Reorganization. |
(2) | Includes non-recurring audit services related to the 2016 Reorganization for Ch$ 753 million. |
All of the fees disclosed under audit-related fees and all other fees were pre-approved as required by the Directors’ Committee pre-approval policies and procedures.
The amounts included in the table above and the related footnotes have been classified in accordance with SEC guidance.
Directors’ Committee Pre-Approval Policies and Procedures
Our external auditors are appointed by our shareholders at the OSM. Similarly, the shareholders of our subsidiaries, appoint their own external auditors according to applicable law and regulation.
The Directors’ Committee (which performs the functions of the Audit Committee), reviews engagement letters with external auditors, ensures quality control in respect of the services provided, reviews and controls independence issues, and other related matters.
The Directors’ Committee has a pre-approval policy regarding the contracting of our external auditor, or any affiliate of the external auditor, for professional services. The professional services covered by such policy include audit and non-audit services provided to us.
Fees payable in connection with recurring audit services are pre-approved as part of our annual budget. Fees payable in connection with non-recurring audit services, once they have been analyzed by the CFO, are submitted to the Directors’ Committee for approval or rejection.
The pre-approval policy established by the Directors’ Committee for non-audit services and audit-related fees is as follows:
| • | The business unit that has requested the service and the audit firm expected to perform the service must request that the CFO review the nature of the service to be provided. |
| • | The CFO then analyzes the request and requires the selected audit firm to issue a certificate signed by the partner responsible for the audit of our consolidated financial statements confirming such audit firm’s independence. |
| • | Finally, the proposal is submitted to the Directors’ Committee for approval or denial. |
The Directors’ Committee has designed, approved, and implemented the necessary procedures to fulfill the new requirements described in SEC release number 34-53677, File No. PCAOB-2006-01 (Audit Committee Pre-Approval of Certain Tax Services).
Item 16D. Exemptions from the Listing Standards for Audit Committees
Not applicable.
Item 16E.Purchases of Equity Securities by the Issuer and Affiliated Purchasers
None.
116
Item 16F.Change in Registrant’s Certifying Accountant
None.
Item 16G.Corporate Governance
For a summary of the significant differences between our corporate governance practices and those applicable to domestic issuers under the corporate governance rules of the NYSE, see “Item 6. Directors, Senior Management and Employees — C. Board Practices.”
Item 16H.Mine Safety Disclosure
Not applicable.
117
PART III
Item 17.Financial Statements
Not Applicable.
Item 18.Financial Statements
Enel Chile
Index to the Consolidated Financial Statements
Report of Independent Registered Public Accounting Firm:
Report of EY Audit SpA — Enel Chile at December 31, 2017 and December 31, 2016 | | F-1 |
Report of EY Audit SpA — Enel Chile S.A. — Internal Control over Financial Reporting 2017 | | F-2 |
| | |
| | |
Consolidated Financial Statements: | | |
| | |
Consolidated Statements of Financial Position at December 31, 2017 and December 31, 2016 | | F-3 |
Consolidated Statements of Comprehensive Income for the years ended December 31, 2017, 2016 and 2015 | | F-5 |
Consolidated Statements of Changes in Equity for the years ended December 31, 2017, 2016 and 2015 | | F-7 |
Consolidated Statements of Cash Flows for the years ended December 31, 2017, 2016 and 2015 | | F-9 |
Notes to the Consolidated Financial Statements | | F-10 |
Ch$ | Chilean pesos | |
US$ | U.S. dollars | |
UF | The UF is a Chilean inflation-indexed, peso-denominated monetary unit that is set daily in advance based on the previous month’s inflation rate. | |
ThCh$ | Thousands of Chilean pesos | |
ThUS$ | Thousands of U.S. dollars | |
Item 19.Exhibits
We will furnish to the Securities and Exchange Commission, upon request, copies of any unfiled instruments that define the rights of stakeholders of Enel Chile.
118
SIGNATURES
The registrant hereby certifies that it meets all of the requirements for filing on Form 20-F and that it has duly caused and authorized the undersigned to sign this annual report on its behalf.
ENEL CHILE S.A. |
| |
By: | /s/ Nicola Cotugno |
Name: | Nicola Cotugno |
Title: | Chief Executive Officer |
Date: April 27, 2018
Enel Chile S.A. and its Subsidiaries
Consolidated Financial Statements as of December 31, 2017 and 2016
Index to the Audited Consolidated Financial Statements
Reports of Independent Registered Public Accounting Firms:
Report of EY Audit S.p.A. – Enel Chile S.A. at December 31, 2017 and December 31, 2016 | | F-1 |
Report of EY Audit S.p.A. – Enel Chile S.A. — Internal Control Over Financial Reporting 2017 | | F-2 |
| | |
Consolidated Financial Statements: | | |
| | |
Consolidated Statements of Financial Position at December 31, 2017 and December 31, 2016 | | F-3 |
Consolidated Statements of Comprehensive Income for the years ended December 31, 2017, 2016 and 2015 | | F-5 |
Consolidated Statements of Changes in Equity for the years ended December 31, 2017, 2016 and 2015 | | F-7 |
Consolidated Statements of Cash Flows for the years ended December 31, 2017, 2016 and 2015 | | F-9 |
Notes to the Consolidated Financial Statements | | F-10 |
Ch$ | | Chilean pesos |
US$ | | U.S. dollars |
UF | | The UF is a Chilean inflation-indexed, peso-denominated monetary unit that is set daily in advance based on the previous month’s inflation rate. |
ThCh$ | | Thousands of Chilean pesos |
ThUS$ | | Thousands of U.S. dollars |

| | | EY Audit SpA Avda. Presidente Riesco 5435, piso 4, Santiago | | | Tel: +56 (2) 2676 1000 www.eychile.cl | |
Report of Independent Registered Public Accounting Firm
To the Shareholders and the Board of Directors of Enel Chile S.A.
Opinion on the Financial Statements
We have audited the accompanying consolidated statements of financial position of Enel Chile S.A. and subsidiaries (the Company) as of December 31, 2017 and 2016, the related consolidated statements of comprehensive income, changes in equity and cash flows for each of the three years in the period ended December 31, 2017, and the related notes (collectively referred to as the “consolidated financial statements”). In our opinion, the consolidated financial statements present fairly, in all material respects, the financial position of the Company at December 31, 2017 and 2016, and the results of its operations and its cash flows for each of the three years in the period ended December 31, 2017, in conformity with International Financial Reporting Standards (IFRS) as issued by the International Accounting Standards Board.
We also have audited, in accordance with the standards of the Public Company Accounting Oversight Board (United States) (PCAOB), the Company's internal control over financial reporting as of December 31, 2017, based on criteria established in Internal Control-Integrated Framework issued by the Committee of Sponsoring Organizations of the Treadway Commission (2013 framework), and our report dated April 25, 2018 expressed an unqualified opinion thereon.
Basis for Opinion
These consolidated financial statements are the responsibility of the Company's management. Our responsibility is to express an opinion on the Company’s consolidated financial statements based on our audits. We are a public accounting firm registered with the PCAOB and are required to be independent with respect to the Company in accordance with the U.S. federal securities laws and the applicable rules and regulations of the Securities and Exchange Commission and the PCAOB.
We conducted our audits in accordance with the standards of the PCAOB. Those standards require that we plan and perform the audit to obtain reasonable assurance about whether the consolidated financial statements are free of material misstatement, whether due to error or fraud. Our audits included performing procedures to assess the risks of material misstatement of the consolidated financial statements, whether due to error or fraud, and performing procedures that respond to those risks. Such procedures included examining, on a test basis, evidence regarding the amounts and disclosures in the consolidated financial statements. Our audits also included evaluating the accounting principles used and significant estimates made by management, as well as evaluating the overall presentation of the financial statements. We believe that our audits provide a reasonable basis for our opinion.
|
/s/ EY Audit SpA. |
EY Audit SpA. |
|
We have served as the Company’s auditor since 2011. |
Santiago, Chile |
April 25, 2018
F-1
| | EY Audit SpA Avda. Presidente Riesco 5435, piso 4, Santiago | | | Tel: +56 (2) 2676 1000 www.eychile.cl | |
Report of Independent Registered Public Accounting Firm On Internal Control Over Financial Reporting
To Shareholders and the Board of Enel Chile S.A.
Opinion on Internal Control over Financial Reporting
|
We have audited Enel Chile S.A. and subsidiaries’ internal control over financial reporting as of December 31, 2017, based on criteria established in Internal Control— Integrated framework issued by the Committee of Sponsoring Organizations of the Treadway Commission (2013 framework) (the COSO criteria). In our opinion, Enel Chile S.A. and subsidiaries (the Company) maintained, in all material respects, effective internal control over financial reporting as of December 31, 2017, based on the COSO criteria.
We also have audited, in accordance with the standards of the Public Company Accounting Oversight Board (United States) (PCAOB), the consolidated statements of financial position of the Company as of December 31, 2017 and 2016, the related consolidated statements of comprehensive income, changes in equity and cash flows for each of the three years in the period ended December 31, 2017, and the related notes and our report dated April 25, 2018 expressed an unqualified opinion thereon.
Basis for Opinion
The Company’s management is responsible for maintaining effective internal control over financial reporting and for its assessment of the effectiveness of internal control over financial reporting included in the accompanying Management’s report on Internal Control over Financial Reporting. Our responsibility is to express an opinion on the Company’s internal control over financial reporting based on our audit. We are a public accounting firm registered with the PCAOB and are required to be independent with respect to the Company in accordance with the U.S. federal securities laws and the applicable rules and regulations of the Securities and Exchange Commission and the PCAOB.
We conducted our audit in accordance with the standards of the PCAOB. Those standards require that we plan and perform the audit to obtain reasonable assurance about whether effective internal control over financial reporting was maintained in all material respects. Our audit included obtaining an understanding of internal control over financial reporting, assessing the risk that a material weakness exists, testing and evaluating the design and operating effectiveness of internal control based on the assessed risk, and performing such other procedures as we considered necessary in the circumstances. We believe that our audit provides a reasonable basis for our opinion.
Definition and Limitations of Internal Control Over Financial Reporting
A company’s internal control over financial reporting is a process designed to provide reasonable assurance regarding the reliability of financial reporting and the preparation of financial statements for external purposes in accordance with generally accepted accounting principles. A company’s internal control over financial reporting includes those policies and procedures that (1) pertain to the maintenance of records that, in reasonable detail, accurately and fairly reflect the transactions and dispositions of the assets of the company; (2) provide reasonable assurance that transactions are recorded as necessary to permit preparation of financial statements in accordance with generally accepted accounting principles, and that receipts and expenditures of the company are being made only in accordance with authorizations of management and directors of the company; and (3) provide reasonable assurance regarding prevention or timely detection of unauthorized acquisition, use, or disposition of the company’s assets that could have a material effect on the financial Statements.
Because of its inherent limitations, internal control over financial reporting may not prevent or detect misstatements. Also, projections of any evaluation of effectiveness to future periods are subject to the risk that controls may become inadequate because of changes in conditions, or that the degree of compliance with the policies or procedures may deteriorate.
|
/s/ EY Audit SpA. |
EY Audit SpA. |
|
|
Santiago, Chile |
April 25, 2018 |
F-2
ENEL CHILE S.A.
Consolidated Statements of Financial Position
As of December 31, 2017 and 2016
(In thousands of Chilean pesos - ThCh)
| | | | 12-31-2017 | | | 12-31-2016 | |
ASSETS | | Note | | ThCh$ | | | ThCh$ | |
CURRENT ASSETS | | | | | | | | | | |
Cash and cash equivalents | | 6 | | | 419,456,026 | | | | 245,999,192 | |
Other current financial assets | | 7 | | | 20,627,062 | | | | 584,244 | |
Other current non-financial assets | | | | | 6,002,142 | | | | 15,831,486 | |
Trade and other current receivables | | 8 | | | 419,752,286 | | | | 445,071,856 | |
Current accounts receivable from related parties | | 9 | | | 71,856,046 | | | | 52,858,384 | |
Inventories | | 10 | | | 39,686,942 | | | | 37,539,596 | |
Current tax assets | | 11 | | | 77,756,048 | | | | 55,649,171 | |
Total current assets other than assets or disposal groups held for sale | | | | | 1,055,136,552 | | | | 853,533,929 | |
Non-current assets or disposal groups held for sale | | 5 | | | 4,205,233 | | | | 12,993,008 | |
TOTAL CURRENT ASSETS | | | | | 1,059,341,785 | | | | 866,526,937 | |
| | | | | | | | | | |
NON-CURRENT ASSETS | | | | | | | | | | |
Other non-current financial assets | | 7 | | | 33,418,204 | | | | 28,827,542 | |
Other non-current non-financial assets | | | | | 13,813,139 | | | | 13,336,152 | |
Trade and other non-current receivables | | 8 | | | 36,182,399 | | | | 33,500,105 | |
Investments accounted for using the equity method | | 12 | | | 12,707,221 | | | | 18,738,198 | |
Intangible assets other than goodwill | | 13 | | | 55,170,904 | | | | 44,470,750 | |
Goodwill | | 14 | | | 887,257,655 | | | | 887,257,655 | |
Property, plant and equipment | | 15 | | | 3,585,687,137 | | | | 3,476,128,634 | |
Investment property | | 16 | | | 8,356,772 | | | | 8,128,522 | |
Deferred tax assets | | 17 | | | 2,837,792 | | | | 21,796,517 | |
TOTAL NON-CURRENT ASSETS | | | | | 4,635,431,223 | | | | 4,532,184,075 | |
TOTAL ASSETS | | | | | 5,694,773,008 | | | | 5,398,711,012 | |
The accompanying notes are an integral part of these consolidated financial statements
F-3
ENEL CHILE S.A.
Consolidated Statements of Financial Position
As of December 31, 2017 and 2016
(In thousands of Chilean pesos - ThCh)
| | | | 12-31-2017 | | | 12-31-2016 | |
LIABILITIES AND EQUITY | | Note | | ThCh$ | | | ThCh$ | |
CURRENT LIABILITIES | | | | | | | | | | |
Other current financial liabilities | | 18 | | | 18,815,448 | | | | 25,696,166 | |
Trade and other current payables | | 21 | | | 594,498,606 | | | | 561,505,283 | |
Current accounts payable to related parties | | 9 | | | 119,612,972 | | | | 90,428,929 | |
Other current provisions | | 22 | | | 5,636,171 | | | | 6,493,532 | |
Current tax liabilities | | 11 | | | 67,027,507 | | | | 61,599,415 | |
Other current non-financial liabilities | | | | | 11,225,942 | | | | 11,523,322 | |
TOTAL CURRENT LIABILITIES | | | | | 816,816,646 | | | | 757,246,647 | |
| | | | | | | | | | |
NON-CURRENT LIABILITIES | | | | | | | | | | |
Other non-current financial liabilities | | 18 | | | 781,978,145 | | | | 854,016,751 | |
Trade and other non-current payables | | 21 | | | 659,824 | | | | 1,483,113 | |
Current accounts payable to related parties | | 9 | | | 318,518 | | | | 251,527 | |
Other long-term provisions | | 22 | | | 78,422,837 | | | | 63,106,908 | |
Deferred tax liabilities | | 17 | | | 172,223,681 | | | | 199,364,794 | |
Non-current provisions for employee benefits | | 23 | | | 57,081,924 | | | | 59,934,127 | |
Other non-current non-financial liabilities | | | | | 309,776 | | | | 313,503 | |
TOTAL NON-CURRENT LIABILITIES | | | | | 1,090,994,705 | | | | 1,178,470,723 | |
TOTAL LIABILITIES | | | | | 1,907,811,351 | | | | 1,935,717,370 | |
| | | | | | | | | | |
EQUITY | | | | | | | | | | |
Allocated capital | | | | | 2,229,108,975 | | | | 2,229,108,975 | |
Retained earnings | | | | | 1,751,605,583 | | | | 1,569,375,291 | |
Other reserves | | 24.5 | | | (997,330,548 | ) | | | (1,035,092,978 | ) |
Equity attributable to Enel Chile | | | | | 2,983,384,010 | | | | 2,763,391,288 | |
Non-controlling interests | | 24.6 | | | 803,577,647 | | | | 699,602,354 | |
TOTAL EQUITY | | | | | 3,786,961,657 | | | | 3,462,993,642 | |
TOTAL LIABILITIES AND EQUITY | | | | | 5,694,773,008 | | | | 5,398,711,012 | |
The accompanying notes are an integral part of these consolidated financial statements
F-4
ENEL CHILE S.A.
Consolidated Statements of Comprehensive Income, by Nature
For the years ended December 31, 2017, 2016 and 2015
(In thousands of Chilean pesos - ThCh)
| | | | | | | | | | | | | | |
CONSOLIDATED STATEMENTS OF COMPREHENSIVE INCOME | | | | 2017 | | | 2016 | | | 2015 | |
Profit (loss) | | Note | | ThCh$ | | | ThCh$ | | | ThCh$ | |
Revenues | | 25 | | | 2,490,470,178 | | | | 2,515,843,880 | | | | 2,384,293,189 | |
Other operating income | | 25 | | | 38,876,700 | | | | 25,722,939 | | | | 14,735,951 | |
Revenues and other operating income | | | | | 2,529,346,878 | | | | 2,541,566,819 | | | | 2,399,029,140 | |
Raw materials and consumables used | | 26 | | | (1,521,155,517 | ) | | | (1,497,419,580 | ) | | | (1,481,985,559 | ) |
Contribution Margin | | | | | 1,008,191,361 | | | | 1,044,147,239 | | | | 917,043,581 | |
| | | | | | | | | | | | | | |
Other work performed by the entity and capitalized | | 15.b.2 | | | 14,388,987 | | | | 16,096,852 | | | | 21,004,053 | |
Employee benefits expense | | 27 | | | (121,503,777 | ) | | | (124,098,428 | ) | | | (136,554,721 | ) |
Depreciation and amortization expense | | 28 | | | (152,684,106 | ) | | | (161,660,610 | ) | | | (153,201,662 | ) |
Impairment loss recognized in the period’s profit or loss | | 28 | | | (7,937,817 | ) | | | (35,926,710 | ) | | | 3,054,903 | |
Other expenses | | 29 | | | (161,824,074 | ) | | | (170,769,137 | ) | | | (125,857,397 | ) |
Operating Income | | | | | 578,630,574 | | | | 567,789,206 | | | | 525,488,757 | |
| | | | | | | | | | | | | | |
Other gains | | 30 | | | 113,241,196 | | | | 121,490,062 | | | | 20,055,745 | |
Financial income | | 31 | | | 21,662,688 | | | | 23,105,901 | | | | 15,270,169 | |
Financial costs | | 31 | | | (53,510,882 | ) | | | (58,199,382 | ) | | | (66,700,698 | ) |
Share of profit (loss) of associates and joint ventures accounted for using the equity method | | 12.1 | | | (2,696,904 | ) | | | 7,878,200 | | | | 8,905,045 | |
Foreign currency exchange differences | | 31 | | | 8,516,874 | | | | 12,978,471 | | | | (51,277,332 | ) |
Gains from indexed assets and liabilities | | 31 | | | 916,666 | | | | 1,631,840 | | | | 4,839,077 | |
Income before taxes | | | | | 666,760,212 | | | | 676,674,298 | | | | 456,580,763 | |
Income tax expense, continuing operations | | 17 | | | (143,342,301 | ) | | | (111,403,182 | ) | | | (109,612,599 | ) |
NET INCOME | | | | | 523,417,911 | | | | 565,271,116 | | | | 346,968,164 | |
| | | | | | | | | | | | | | |
Net income attributable to: | | | | | | | | | | | | | | |
Equity owners of Enel Chile | | | | | 349,382,642 | | | | 384,159,865 | | | | 251,838,410 | |
Non-controlling interests | | 24.6 | | | 174,035,269 | | | | 181,111,251 | | | | 95,129,754 | |
NET INCOME | | | | | 523,417,911 | | | | 565,271,116 | | | | 346,968,164 | |
| | | | | | | | | | | | | | |
Basic earnings per share | | | | | | | | | | | | | | |
Basic earnings continuing operations | | Ch$/Share | | | 7.12 | | | | 7.83 | | | | 5.13 | |
Basic earnings per share | | Ch$/Share | | | 7.12 | | | | 7.83 | | | | 5.13 | |
Weighted average number of shares of common stock | | | | | 49,092,772,762 | | | | 49,092,772,762 | | | | 49,092,772,762 | |
| | | | | | | | | | | | | | |
Diluted earnings per share | | | | | | | | | | | | | | |
Diluted earnings continuing operations | | Ch$/Share | | | 7.12 | | | | 7.83 | | | | 5.13 | |
Diluted earnings per share | | Ch$/Share | | | 7.12 | | | | 7.83 | | | | 5.13 | |
Weighted average number of shares of common stock | | | | | 49,092,772,762 | | | | 49,092,772,762 | | | | 49,092,772,762 | |
The accompanying notes are an integral part of these consolidated financial statements
F-5
ENEL CHILE S.A.
Consolidated Statements of Comprehensive Income, by Nature (continued)
For the years ended December 31, 2017, 2016 and 2015
(In thousands of Chilean pesos - ThCh)
| | | | | | | | | | | | | | |
CONSOLIDATED STATEMENTS OF COMPREHENSIVE INCOME | | | | 2017 | | | 2016 | | | 2015 | |
Other comprehensive income (loss) | | Note | | ThCh$ | | | ThCh$ | | | ThCh$ | |
Net Income | | | | | 523,417,911 | | | | 565,271,116 | | | | 346,968,164 | |
Components of other comprehensive income that will not be reclassified subsequently to profit or loss, before taxes | | | | | | | | | | | | | | |
Remeasurement losses from defined benefit plans | | 23.2.b | | | 1,716,875 | | | | (6,618,514 | ) | | | (5,645,532 | ) |
Other comprehensive loss that will not be reclassified subsequently to profit or loss | | | | | 1,716,875 | | | | (6,618,514 | ) | | | (5,645,532 | ) |
Components of other comprehensive income (loss) that will be reclassified subsequently to profit or loss, before taxes | | | | | | | | | | | | | | |
Foreign currency translation gains | | | | | (3,686,549 | ) | | | (3,532,410 | ) | | | 162,373 | |
Gains (losses) from available-for-sale financial assets | | | | | 1,840 | | | | (6,740 | ) | | | 1,077 | |
Share of other comprehensive income (loss) from associates and joint ventures accounted for using the equity method | | 12.1 | | | (1,490 | ) | | | (11,691,509 | ) | | | (577,862 | ) |
Gains (losses) from cash flow hedges | | | | | 73,333,487 | | | | 68,850,275 | | | | (137,733,945 | ) |
Adjustments from reclassification of cash flow hedges, transferred to profit or loss | | | | | 24,225,474 | | | | 20,218,082 | | | | 15,140,369 | |
Other comprehensive income (loss) that will be reclassified subsequently to profit or loss | | | | | 93,872,762 | | | | 73,837,698 | | | | (123,007,988 | ) |
Other comprehensive income (loss), before taxes | | | | | 95,589,637 | | | | 67,219,184 | | | | (128,653,520 | ) |
Income tax related to components of other comprehensive income that will not be reclassified subsequently to profit or loss | | | | | | | | | | | | | | |
Income tax related to defined benefit plans | | | | | (463,556 | ) | | | 1,786,999 | | | | 1,325,242 | |
Income tax related to components of other comprehensive income that will not be reclassified subsequently to profit or loss | | | | | (463,556 | ) | | | 1,786,999 | | | | 1,325,242 | |
Income tax related to components of other comprehensive income that will be reclassified subsequently to profit or loss | | | | | | | | | | | | | | |
Income tax related to cash flow hedge | | | | | (25,701,599 | ) | | | (21,116,232 | ) | | | 31,868,299 | |
Income tax related to available-for-sale financial assets | | | | | (497 | ) | | | 1,820 | | | | (290 | ) |
Income tax related to components of other comprehensive income that will be reclassified subsequently to profit or loss | | | | | (25,702,096 | ) | | | (21,114,412 | ) | | | 31,868,009 | |
| | | | | | | | | | | | | | |
Total Other Comprehensive Income (Loss) | | | | | 69,423,985 | | | | 47,891,771 | | | | (95,460,269 | ) |
TOTAL COMPREHENSIVE INCOME | | | | | 592,841,896 | | | | 613,162,887 | | | | 251,507,895 | |
| | | | | | | | | | | | | | |
Comprehensive income attributable to: | | | | | | | | | | | | | | |
Equity owners of Enel Chile | | | | | 391,680,966 | | | | 411,551,269 | | | | 193,709,073 | |
Non-controlling interests | | | | | 201,160,930 | | | | 201,611,618 | | | | 57,798,822 | |
TOTAL COMPREHENSIVE INCOME | | | | | 592,841,896 | | | | 613,162,887 | | | | 251,507,895 | |
The accompanying notes are an integral part of these consolidated financial statements
F-6
ENEL CHILE S.A.
Consolidated Statements of Changes in Equity
For the years ended December 31, 2017, 2016 and 2015
(In thousands of Chilean pesos - ThCh)
| | | | | | Changes in Other Reserves | | | | | | | | | | | | | | | | | |
| | Allocated Capital | | | Reserve for Exchange Differences in Translation | | | Reserve for Cash Flow Hedges | | | Reserve for Gains and Losses for Defined Benefit Plans | | | Reserve for Gains and Losses on Remeasuring Available-for- Sale Financial Assets | | | | | Amounts recognized in other comprehensive income and accumulated in equity related to non-current assets or groups of assets for disposal classified as held for sale | | | Other Miscellaneous Reserves | | | Other Reserves | | | Retained Earnings | | | Equity Attributable to Enel Chile | | | Non-controlling Interests | | | Total Equity | |
Statements of Changes in Equity | | ThCh$ | | | ThCh$ | | | ThCh$ | | | ThCh$ | | | ThCh$ | | | | | ThCh$ | | | ThCh$ | | | ThCh$ | | | ThCh$ | | | ThCh$ | | | ThCh$ | | | ThCh$ | |
Equity at beginning of period 1/1/2017 | | | 2,229,108,975 | | | | 9,222,933 | | | | (76,218,470 | ) | | | — | | | | 9,955 | | | | | | 1,632,724 | | | | (969,740,120 | ) | | | (1,035,092,978 | ) | | | 1,569,375,291 | | | | 2,763,391,288 | | | | 699,602,354 | | | | 3,462,993,642 | |
Changes in equity | | | | | | | | | | | | | | | | | | | | | | | | | | | | | | | | | | | | | | | | | | | | | | | | | | |
Comprehensive income | | | — | | | | — | | | | — | | | | — | | | | — | | | | | | — | | | | — | | | | — | | | | — | | | | — | | | | — | | | | — | |
Profit (loss) | | | — | | | | — | | | | — | | | | — | | | | — | | | | | | — | | | | — | | | | — | | | | 349,382,642 | | | | 349,382,642 | | | | 174,035,269 | | | | 523,417,911 | |
Other comprehensive income | | | — | | | | (2,246,550 | ) | | | 43,368,734 | | | | 1,174,811 | | | | 1,329 | | | | | | — | | | | — | | | | 42,298,324 | | | | — | | | | 42,298,324 | | | | 27,125,661 | | | | 69,423,985 | |
Comprehensive income | | | — | | | | — | | | | — | | | | — | | | | — | | | | | | — | | | | — | | | | — | | | | — | | | | 391,680,966 | | | | 201,160,930 | | | | 592,841,896 | |
Dividends | | | — | | | | — | | | | — | | | | — | | | | — | | | | | | — | | | | | | | | — | | | | (168,327,161 | ) | | | (168,327,161 | ) | | | (94,944,701 | ) | | | (263,271,862 | ) |
Increase (decrease) from other changes | | | — | | | | — | | | | — | | | | (1,174,811 | ) | | | — | | | | | | (1,632,724 | ) | | | (1,728,359 | ) | | | (4,535,894 | ) | | | 1,174,811 | | | | (3,361,083 | ) | | | (2,240,936 | ) | | | (5,602,019 | ) |
Total changes in equity | | | — | | | | (2,246,550 | ) | | | 43,368,734 | | | | — | | | | 1,329 | | | | | | (1,632,724 | ) | | | (1,728,359 | ) | | | 37,762,430 | | | | 182,230,292 | | | | 219,992,722 | | | | 103,975,293 | | | | 323,968,015 | |
| | | | | | | | | | | | | | | | | | | | | | | | | | | | | | | | | | | | | | | | | | | | | | | | | | |
Equity at end of period 12/31/2017 | | | 2,229,108,975 | | | | 6,976,383 | | | | (32,849,736 | ) | | | — | | | | 11,284 | | | | | | — | | | | (971,468,479 | ) | | | (997,330,548 | ) | | | 1,751,605,583 | | | | 2,983,384,010 | | | | 803,577,647 | | | | 3,786,961,657 | |
| | | | | | Changes in Other Reserves | | | | | | | | | | | | | | | | | |
| | Allocated Capital | | | Reserve for Exchange Differences in Translation | | | Reserve for Cash Flow Hedges | | | Reserve for Gains and Losses for Defined Benefit Plans | | | Reserve for Gains and Losses on Remeasuring Available-for- Sale Financial Assets | | | Amounts recognized in other comprehensive income and accumulated in equity related to non-current assets or groups of assets for disposal classified as held for sale | | | Other Miscellaneous Reserves | | | Other Reserves | | | Retained Earnings | | | Equity Attributable to Enel Chile | | | Non-controlling Interests | | | Total Equity | |
Statements of Changes in Equity | | ThCh$ | | | ThCh$ | | | ThCh$ | | | ThCh$ | | | ThCh$ | | | ThCh$ | | | ThCh$ | | | ThCh$ | | | ThCh$ | | | ThCh$ | | | ThCh$ | | | ThCh$ | |
Equity at beginning of period 1/1/2016 | | | 2,229,108,975 | | | | 12,423,692 | | | | (121,503,052 | ) | | | — | | | | 14,835 | | | | — | | | | (849,525,427 | ) | | | (958,589,952 | ) | | | 1,322,162,479 | | | | 2,592,681,502 | | | | 609,219,281 | | | | 3,201,900,783 | |
Changes in equity | | | | | | | | | | | | | | | | | | | | | | | | | | | | | | | | | | | | | | | | | | | | | | | | |
Comprehensive income | | | | | | | | | | | | | | | | | | | | | | | | | | | | | | | | | | | | | | | | | | | | | | | | |
Profit (loss) | | | — | | | | — | | | | — | | | | — | | | | — | | | | — | | | | — | | | | — | | | | 384,159,865 | | | | 384,159,865 | | | | 181,111,251 | | | | 565,271,116 | |
Other comprehensive income | | | — | | | | (2,137,753 | ) | | | 40,843,826 | | | | (4,297,479 | ) | | | (4,880 | ) | | | — | | | | (7,012,310 | ) | | | 27,391,404 | | | | — | | | | 27,391,404 | | | | 20,500,367 | | | | 47,891,771 | |
Comprehensive income | | | — | | | | — | | | | — | | | | — | | | | — | | | | — | | | | — | | | | — | | | | — | | | | 411,551,269 | | | | 201,611,618 | | | | 613,162,887 | |
Dividends | | | — | | | | — | | | | — | | | | — | | | | — | | | | — | | | | | | | | — | | | | (145,636,016 | ) | | | (145,636,016 | ) | | | (81,524,150 | ) | | | (227,160,166 | ) |
Increase (decrease) from other changes | | | — | | | | (1,063,006 | ) | | | 4,440,756 | | | | 4,297,479 | | | | — | | | | 1,632,724 | | | | (113,202,383 | ) | | | (103,894,430 | ) | | | 8,688,963 | | | | (95,205,467 | ) | | | (29,704,395 | ) | | | (124,909,862 | ) |
Total changes in equity | | | — | | | | (3,200,759 | ) | | | 45,284,582 | | | | — | | | | (4,880 | ) | | | 1,632,724 | | | | (120,214,693 | ) | | | (76,503,026 | ) | | | 247,212,812 | | | | 170,709,786 | | | | 90,383,073 | | | | 261,092,859 | |
| | | | | | | | | | | | | | | | | | | | | | | | | | | | | | | | | | | | | | | | | | | | | | | | |
Equity at end of period 12/31/2016 | | | 2,229,108,975 | | | | 9,222,933 | | | | (76,218,470 | ) | | | — | | | | 9,955 | | | | 1,632,724 | | | | (969,740,120 | ) | | | (1,035,092,978 | ) | | | 1,569,375,291 | | | | 2,763,391,288 | | | | 699,602,354 | | | | 3,462,993,642 | |
The accompanying notes are an integral part of these consolidated financial statements
F-7
| | | | | | Changes in Other Reserves | | | | | | | | | | | | | | | | | |
| | Allocated Capital | | | Reserve for Exchange Differences in Translation | | | Reserve for Cash Flow Hedges | | | Reserve for Gains and Losses for Defined Benefit Plans | | | Reserve for Gains and Losses on Remeasuring Available-for- Sale Financial Assets | | | Amounts recognized in other comprehensive income and accumulated in equity related to non-current assets or groups of assets for disposal classified as held for sale | | | Other Miscellaneous Reserves | | | Other Reserves | | | Retained Earnings | | | Equity Attributable to Enel Chile | | | Non-controlling Interests | | | Total Equity | |
Statements of Changes in Equity | | ThCh$ | | | ThCh$ | | | ThCh$ | | | ThCh$ | | | ThCh$ | | | ThCh$ | | | ThCh$ | | | ThCh$ | | | ThCh$ | | | ThCh$ | | | ThCh$ | | | ThCh$ | |
Equity at beginning of period 1/1/2015 | | | 2,229,108,975 | | | | 11,443,966 | | | | (66,850,863 | ) | | | — | | | | 14,046 | | | | — | | | | (873,486,367 | ) | | | (928,879,218 | ) | | | 1,171,971,677 | | | | 2,472,201,434 | | | | 611,864,357 | | | | 3,084,065,791 | |
Changes in equity | | | | | | | | | | | | | | | | | | | | | | | | | | | | | | | | | | | | | | | | | | | | | | | | |
Comprehensive income | | | | | | | | | | | | | | | | | | | | | | | | | | | | | | | | | | | | | | | | | | | | | | | | |
Profit (loss) | | | — | | | | — | | | | — | | | | — | | | | — | | | | — | | | | — | | | | — | | | | 251,838,410 | | | | 251,838,410 | | | | 95,129,754 | | | | 346,968,164 | |
Other comprehensive income | | | — | | | | 979,726 | | | | (54,652,189 | ) | | | (4,111,061 | ) | | | 789 | | | | — | | | | (346,602 | ) | | | (58,129,337 | ) | | | — | | | | (58,129,337 | ) | | | (37,330,932 | ) | | | (95,460,269 | ) |
Comprehensive income | | | | | | | | | | | | | | | | | | | | | | | — | | | | | | | | | | | | | | | | 193,709,073 | | | | 57,798,822 | | | | 251,507,895 | |
Dividends | | | — | | | | — | | | | — | | | | — | | | | — | | | | — | | | | — | | | | — | | | | (93,477,653 | ) | | | (93,477,653 | ) | | | (40,335,478 | ) | | | (133,813,131 | ) |
Increase (decrease) from other changes | | | — | | | | — | | | | — | | | | 4,111,061 | | | | — | | | | — | | | | 24,307,542 | | | | 28,418,603 | | | | (8,169,955 | ) | | | 20,248,648 | | | | (20,108,420 | ) | | | 140,228 | |
Total changes in equity | | | — | | | | 979,726 | | | | (54,652,189 | ) | | | — | | | | 789 | | | | — | | | | 23,960,940 | | | | (29,710,734 | ) | | | 150,190,802 | | | | 120,480,068 | | | | (2,645,076 | ) | | | 117,834,992 | |
| | | | | | | | | | | | | | | | | | | | | | | | | | | | | | | | | | | | | | | | | | | | | | | | |
Equity at end of period 12/31/2015 | | | 2,229,108,975 | | | | 12,423,692 | | | | (121,503,052 | ) | | | — | | | | 14,835 | | | | — | | | | (849,525,427 | ) | | | (958,589,952 | ) | | | 1,322,162,479 | | | | 2,592,681,502 | | | | 609,219,281 | | | | 3,201,900,783 | |
The accompanying notes are an integral part of these consolidated financial statements
F-8
ENEL CHILE S.A.
Consolidated Statements of Cash Flows, Direct
For the years ended December 31, 2017, 2016 and 2015
(In thousands of Chilean pesos- ThCh)
| | | | | | | | | | | | | | |
| | | | 2017 | | | 2016 | | | 2015 | |
Statements of Direct Cash Flows | | Note | | ThCh$ | | | ThCh$ | | | ThCh$ | |
Cash flows from (used in) operating activities | | | | | | | | | | | | | | |
| | | | | | | | | | | | | | |
Types of collection from operating activities | | | | | | | | | | | | | | |
Collections from the sale of goods and services | | | | | 3,147,019,752 | | | | 3,234,555,814 | | | | 3,049,501,263 | |
Collections from premiums and services, annual payments, and other obligations from policies held | | | | | 6,808,382 | | | | 3,941,414 | | | | 1,575,093 | |
Other collections from operating activities | | | | | 15,216,737 | | | | 3,764,294 | | | | 4,399,898 | |
Types of payment in cash from operating activities | | | | | | | | | | | | | | |
Payments to suppliers for goods and services | | | | | (2,068,346,327 | ) | | | (2,119,032,266 | ) | | | (2,069,604,155 | ) |
Payments to and on behalf of employees | | | | | (128,787,065 | ) | | | (128,828,942 | ) | | | (132,245,067 | ) |
Payments on premiums and services, annual payments, and other obligations from policies held | | | | | (15,466,609 | ) | | | (17,236,985 | ) | | | (7,547,854 | ) |
Other payments for operating activities | | | | | (130,403,003 | ) | | | (232,754,099 | ) | | | (123,833,216 | ) |
Cash flows from (used in operations) | | | | | | | | | | | | | | |
Income taxes paid | | | | | (183,022,750 | ) | | | (125,565,819 | ) | | | (134,275,698 | ) |
Other outflows of cash, net | | | | | (7,405,397 | ) | | | (4,158,555 | ) | | | (11,438,737 | ) |
Net cash flows from operating activities | | | | | 635,613,720 | | | | 614,684,856 | | | | 576,531,527 | |
| | | | | | | | | | | | | | |
Cash flows from (used in) investing activities | | | | | | | | | | | | | | |
Cash flows from the loss of control of subsidiaries or other businesses, net | | | | | — | | | | 3,003 | | | | 6,639,653 | |
Other collections from the sale of equity or debt instruments belonging to other entities | | | | | 115,582,806 | | | | 134,925,825 | | | | — | |
Other payments to acquire stakes in joint ventures | | | | | (1,943,100 | ) | | | (2,346,000 | ) | | | (2,550,000 | ) |
Loans to related companies | | | | | (161,363,897 | ) | | | (72,633,744 | ) | | | — | |
Proceeds from the sale of property, plant and equipment | | | | | 4,428,995 | | | | 15,272,996 | | | | 29,853 | |
Purchases of property, plant and equipment | | | | | (266,029,921 | ) | | | (222,385,600 | ) | | | (309,503,337 | ) |
Proceeds from the sale of the other long-term assets | | | | | — | | | | — | | | | 1,729,727 | |
Payments for future, forward, option and swap contracts | | | | | (7,808,837 | ) | | | (8,044,017 | ) | | | (6,143,222 | ) |
Collections from future, forward, option and swap contracts | | | | | 835,105 | | | | 3,744,080 | | | | 186,522 | |
Collections from related companies | | | | | 161,363,898 | | | | 72,855,009 | | | | — | |
Dividends received | | | | | 879,884 | | | | 8,682,136 | | | | 10,163,153 | |
Interest received | | | | | 7,589,290 | | | | 6,437,720 | | | | 2,706,304 | |
Net cash flows used in investing activities | | | | | (146,465,777 | ) | | | (63,488,592 | ) | | | (296,741,347 | ) |
| | | | | | | | | | | | | | |
Cash flows from (used in) financing activities | | | | | | | | | | | | | | |
Total Amounts from long-term loans | | | | | — | | | | 136,870,540 | | | | — | |
Proceeds from long-term loans | | | | | — | | | | 136,870,500 | | | | — | |
Proceeds from short-them loans | | | | | — | | | | 40 | | | | — | |
Loans from related companies | | | | | 150,000,000 | | | | 150,517,279 | | | | 672,906,691 | |
Payments of loans | | | | | (5,534,483 | ) | | | — | | | | — | |
Payments on borrowings and financial lease liabilities | | | | | (2,592,237 | ) | | | (139,596,278 | ) | | | (142,318,377 | ) |
Payment of loans to related companies | | | | | (150,000,000 | ) | | | (167,561,709 | ) | | | (633,103,315 | ) |
Dividends paid | | | | | (260,803,055 | ) | | | (322,805,225 | ) | | | (134,692,408 | ) |
Interest paid | | | | | (43,816,959 | ) | | | (48,344,510 | ) | | | (59,614,618 | ) |
Change in parent company investment | | | | | — | | | | — | | | | 28,596,303 | |
Other outflows of cash, net | | | | | (4,848,787 | ) | | | (54,947,069 | ) | | | (5,216,726 | ) |
Net cash flows used in financing activities | | | | | (317,595,521 | ) | | | (445,866,972 | ) | | | (273,442,450 | ) |
Net increase (decrease) in cash and cash equivalents before effect of exchange rate changes | | | | | 171,552,422 | | | | 105,329,292 | | | | 6,347,730 | |
Effect of exchange rate changes on cash and cash equivalents | | | | | | | | | | | | | | |
Effect of exchange rate changes on cash and cash equivalents | | | | | 1,904,412 | | | | (3,591,945 | ) | | | 4,898,486 | |
Net increase (decrease) in cash and cash equivalents | | | | | 173,456,834 | | | | 101,737,347 | | | | 11,246,216 | |
Cash and cash equivalents at beginning of year | | | | | 245,999,192 | | | | 144,261,845 | | | | 133,015,629 | |
Cash and cash equivalents at end of year | | | | | 419,456,026 | | | | 245,999,192 | | | | 144,261,845 | |
The accompanying notes are an integral part of these consolidated financial statements
F-9
ENEL CHILE S.A
NOTES TO THE CONSOLIDATED FINANCIAL STATEMENTS
Contents | Page |
1. BACKGROUND AND BUSINESS ACTIVITIES | F-11 |
2. BASIS OF PRESENTATION OF THE CONSOLIDATED FINANCIAL STATEMENTS. | F-14 |
2.1 Basis of preparation | F-14 |
2.2 New accounting pronouncements | F-17 |
2.3 Responsibility for the information, judgments and estimates provided | F-22 |
2.4 Subsidiaries | F-23 |
2.4.1 Changes in the scope of consolidation | F-24 |
2.4.2 Unconsolidated companies with an ownership interest of more than 50% | F-24 |
2.5 Investment in associates | F-24 |
2.6 Investment in joint arrangements | F-24 |
2.7 Basis of consolidation and business combinations | F-25 |
3. ACCOUNTING POLICIES APPLIED. | F-26 |
a) Property, plant and equipment | F-26 |
b) Investment property | F-27 |
c) Goodwill | F-27 |
d) Intangible assets other than goodwill | F-27 |
d.1) Research and development expenses | F-28 |
d.2) Other intangible assets | F-28 |
e) Impairment of non-financial assets | F-28 |
f) Leases | F-29 |
g) Financial instruments | F-29 |
g.1) Financial assets other than derivatives | F-29 |
g.2) Cash and cash equivalents | F-30 |
g.3) Impairment of financial assets | F-30 |
g.4) Financial liabilities other than derivatives | F-30 |
g.5) Derivative financial instruments and hedge accounting | F-30 |
g.6) Derecognition of financial assets and liabilities | F-31 |
g.7) Offsetting financial assets and liabilities. | F-31 |
g.8) Financial guarantee contracts | F-32 |
h) Measurement of fair value | F-32 |
i) Investments accounted for using the equity method | F-33 |
j) Non-current assets (or disposal group of assets) held for sale or held for distribution to owners and discontinued operations | F-33 |
k) Inventories | F-34 |
l) Provisions | F-34 |
l.1) Provisions for post-employment benefits and similar obligations | F-34 |
m) Translation of foreign currency balances | F-34 |
n) Current/non-current classification | F-35 |
o) Income taxes | F-35 |
p) Revenue and expense recognition | F-36 |
q) Earnings per share | F-36 |
r) Dividends | F-37 |
s) Statement of cash flows | F-37 |
4. SECTOR REGULATION AND ELECTRICITY SYSTEM OPERATIONS. | F-38 |
4.1 Regulatory framework: | F-38 |
4.1.1 Generation Segment | F-38 |
4.1.2. Transmission Segment | F-39 |
4.1.3 Distribution segment | F-39 |
4.2 Regulatory Developments in 2017 | F-40 |
4.3 Tariff Revisions: | F-41 |
4.3.1 Distribution Tariff Setting | F-41 |
4.3.2 Transmission Tariff Setting | F-42 |
4.3.3 Subtransmission Tariff Setting | F-43 |
4.3.4 Distribution Related Services Tariff Setting | F-43 |
4.3.5 Energy Tenders | F-44 |
5. NON-CURRENT ASSETS OR DISPOSAL GROUPS HELD FOR SALE. | F-45 |
6. CASH AND CASH EQUIVALENTS. | F-46 |
7. OTHER FINANCIAL ASSETS. | F-47 |
8. TRADE AND OTHER RECEIVABLES. | F-48 |
9. BALANCES AND TRANSACTIONS WITH RELATED PARTIES. | F-50 |
9.1 Balances and transactions with related parties | F-50 |
9.2 Board of Directors and Key management personnel | F-53 |
9.3 Compensation for key management personnel | F-54 |
9.4 Compensation plans linked to share price | F-55 |
10. INVENTORIES. | F-55 |
11. CURRENT TAX ASSETS AND LIABILITIES. | F-56 |
12. INVESTMENTS ACCOUNTED FOR USING THE EQUITY METHOD. | F-57 |
12.1. Investments accounted for using the equity method | F-57 |
12.2. Investments with significant influence | F-59 |
12.3. Joint ventures | F-60 |
13. INTANGIBLE ASSETS OTHER THAN GOODWILL. | F-60 |
14. GOODWILL. | F-61 |
15. PROPERTY, PLANT AND EQUIPMENT. | F-62 |
16. INVESTMENT PROPERTY. | F-67 |
17. INCOME TAXES. | F-68 |
18. OTHER FINANCIAL LIABILITIES. | F-72 |
18.1 Interest-bearing borrowings | F-72 |
18.2 Unsecured liabilities | F-74 |
18.3 Secured liabilities | F-75 |
18.4 Detail of finance lease obligations | F-76 |
18.5 Hedged debt | F-77 |
18.6 Other information | F-77 |
19. RISK MANAGEMENT POLICY. | F-78 |
19.1 Interest rate risk | F-78 |
19.2 Exchange rate risk | F-78 |
19.3 Commodities risk | F-79 |
19.4 Liquidity risk | F-79 |
19.5 Credit risk | F-79 |
19.6 Risk measurement | F-80 |
20. FINANCIAL INSTRUMENTS. | F-81 |
20.1 Financial instruments, classified by type and category | F-81 |
20.2 Derivative instruments | F-82 |
20.3 Fair value hierarchy | F-84 |
21. TRADE AND OTHER CURRENT PAYABLES. | F-85 |
22. PROVISIONS. | F-85 |
23. EMPLOYEE BENEFIT OBLIGATIONS. | F-87 |
23.1 General information: | F-87 |
23.2 Details, changes and presentation in financial statements: | F-87 |
24. EQUITY. | F-89 |
24.1 Equity attributable to the shareholders of Enel Chile | F-89 |
24.2 Dividends | F-89 |
24.3 Foreign currency translation reserves | F-89 |
28. DEPRECIATION, AMORTIZATION AND IMPAIRMENT LOSSES. | F-93 |
29. OTHER EXPENSES. | F-94 |
30. OTHER GAINS (LOSSES). | F-94 |
31. FINANCIAL RESULTS. | F-94 |
32. INFORMATION BY SEGMENT. | F-96 |
32.1 Basis of segmentation | F-96 |
32.2 Generation, distribution and others | F-97 |
33. THIRD PARTY GUARANTEES, OTHER CONTINGENT ASSETS AND LIABILITIES, AND OTHER COMMITMENTS. | F-99 |
33.1 Direct guarantees. | F-99 |
33.2 Indirect guarantees | F-99 |
33.3 Lawsuits and Arbitration Proceedings. | F-101 |
33.4 Financial restrictions. | F-102 |
33.5 Other Information | F-103 |
34. PERSONNEL FIGURES | F-104 |
35. SANCTIONS. | F-104 |
36. ENVIRONMENT. | F-106 |
37. SUMMARIZED FINANCIAL INFORMATION OF SUBSIDIARIES | F-109 |
38. SUBSEQUENT EVENTS | F-110 |
APPENDIX 1 ENEL CHILE GROUP SUBSIDIARIES | F-112 |
APPENDIX 2 CHANGES IN THE SCOPE OF CONSOLIDATION | F-113 |
APPENDIX 3 ASSOCIATES AND JOINT VENTURES | F-114 |
APPENDIX 4 ADDITIONAL INFORMATION ON FINANCIAL DEBT | F-115 |
APPENDIX 5 DETAILS OF ASSETS AND LIABILITIES IN FOREIGN CURRENCY | F-118 |
APPENDIX 6 ADDITIONAL INFORMATION OFICIO CIRCULAR (OFFICIAL BULLETIN) No. 715 OF FEBRUARY 3, 2012 | F-122 |
APPENDIX 6.1 SUPPLEMENTARY INFORMATION ON TRADE RECEIVABLES | F-125 |
APPENDIX 6.2 ESTIMATED SALES AND PURCHASES OF ENERGY AND CAPACITY | F-129 |
APPENDIX 7 DETAILS OF DUE DATES OF PAYMENTS TO SUPPLIERS | F-130 |
F-10
ENEL CHILE S.A. AND ITS SUBSIDIARIES
CONSOLIDATED FINANCIAL STATEMENTS AS OF DECEMBER 31, 2017 AND 2016
(In thousands of Chilean pesos - ThCh)
1. | BACKGROUND AND BUSINESS ACTIVITIES |
Enel Chile S.A. (hereinafter the “Parent Company” or the “Company”) and its subsidiaries comprise the Enel Chile Group (hereinafter the “Group”).
The Company is a publicly traded corporation with registered address and head office located at Avenida Santa Rosa, No. 76, in Santiago, Chile. Since April 13, 2016, he Company is registered in the securities register of the Financial Market Commission of Chile (“Comisión para el Mercado Financiero” or “CMF”, formerly the Chilean Superintendence of Securities and Insurance, “Superintendencia de Valores y Seguros” or “SVS”) and since March 31, 2016 is registered with the Securities and Exchange Commission of the United States of America. On April 21, 2016, the Company’s shares began trading on the Santiago Stock Exchange, the Electronic Stock Exchange and the Valparaíso Stock Exchange. In addition, the Company’s common stock began trading in the United States in the form of American Depositary Shares on the New York Stock Exchange by way of “when-issued” trading from April 21, 2016 to April 26, 2017 and “regular-way” trading since April 27, 2016.
Enel S.p.A. (hereinafter “Enel”), an Italian generation company, is the ultimate controlling shareholder of the Company.
The Company was initially incorporated by public deed dated January 22, 2016 and came into legal existence on March 1, 2016 under the name of Enersis Chile S.A. The Company changed its name to Enel Chile S.A. effective October 4, 2016, the date its by-laws were amended in connection with the corporate reorganization of the Group. For tax purposes, the Company operates under Chilean tax identification number 76.536.353-5.
As of December 31, 2017, the Group had 1,948 employees. During the fiscal year ended December 31, 2017, the Group averaged a total of 1,993 employees (see Note 34).
Enel Chile’s corporate purpose consists of exploring, developing, operating, generating, distributing, transporting, transforming and/or sale of energy in any of its forms or nature, directly or through other entities within Chile. Additionally, it is also engaged in investing and managing its investments in its subsidiaries and associates, whose activities include the generation, transmission, distribution or selling of electrical energy, or whose corporate purpose includes any of the following:
| i) | Energy of any kind or form, |
| ii) | Supplying public services, or services whose main component is energy, |
| iii) | Telecommunications and information technology services, and |
| iv) | Internet-based intermediation business. |
Corporate Reorganizations
| a) | Separation of businesses in Chile from its business in Argentina, Brazil, Colombia and Peru (the “Spin-Off”): |
In 2015, Enersis S.A. (“Enersis”), which was ultimately controlled and 60.6% beneficially owned by Enel, initiated a reorganization process to separate its electricity generation and distribution businesses and related assets and liabilities in Chile from its generation, transmission and distribution businesses in Argentina, Brazil, Colombia and Peru (the “Reorganization”).
The Reorganization began with the spin-offs by Enersis and its subsidiaries, Empresa Nacional de Electricidad S.A. (“Endesa Chile”) and Chilectra S.A. (“Chilectra”), following the approval of the spin-offs by the respective shareholders of Enersis, Endesa Chile and Chilectra at their extraordinary shareholders’ meetings held on December 18, 2015.
Endesa Chile conducted a “división” or “demerger” under Chilean corporate law to divide Endesa Chile into two separate companies. The new company, Endesa Américas S.A. (“Endesa Américas”), was assigned Endesa Chile's non-Chilean businesses and related assets and liabilities on March 1, 2016 (the “Separation”). Endesa Américas registered its shares with the Securities Registry of the SVS pursuant to Chilean law and with the U.S. Securities and Exchange Commission (the “SEC”) pursuant to applicable U.S. federal securities laws, and on April 21, 2016, Endesa Chile distributed shares of Endesa Américas to its shareholders in proportion to such shareholders’ share ownership in Endesa Chile based on a ratio of one share of Endesa
F-11
Américas for each outstanding share of Endesa Chile (the “Distribution,” and together with the Separation, the “Spin-Off”). Following the Spin-Off, Endesa Chile retained its Chilean businesses and related assets and liabilities.
Chilectra, a Chilean electricity distribution company and subsidiary of Enersis, also conducted a “división” or “demerger” and then distributed to its shareholders pro rata the shares of a new Chilean company, Chilectra Américas S.A. (“Chilectra Américas”), that holds the non-Chilean equity interests and related assets and liabilities, which consists exclusively of Chilectra’s ownership interests in shares of companies domiciled outside of Chile (the “Chilectra Spin-Off” and together with the Spin-Off, the “Endesa/Chilectra Spin-Offs”). Chilectra Américas registered its shares with the Securities Registry of the SVS pursuant to Chilean law and Chilectra continues to hold its Chilean businesses and related assets and liabilities.
In connection with the “demergers” of Endesa Chile and Chilectra, Enersis conducted a “división” or “demerger”. Following the Endesa/Chilectra Spin-Offs, Enersis distributed to its shareholders pro rata the shares of a new Chilean company, Enersis Chile S.A. (“Enersis Chile”), that was assigned the Chilean businesses and assets, including the equity interests in each of Endesa Chile and Chilectra, after giving effect to the “demergers” of Endesa Chile and Chilectra (the “Enersis Spin-Off”). On March 1, 2016, having satisfied all conditions precedent including the capital decrease and modifications to the by-laws, the Enersis Spin-Off became effective and Enersis S.A.’s corporate name was changed to Enersis Américas S.A. The new entity Enersis Chile was also incorporated on that date and allocated the equity interest and related assets and liabilities of Enersis' businesses in Chile. Enersis Chile registered its shares with the Securities Registry of the SVS pursuant to Chilean law and the SEC pursuant to applicable U.S. federal securities laws in connection with the Enersis Spin-Off, which was completed in April 2016.
As part of the Enersis Spin-Off, it was agreed that Enersis’ share capital would be reduced from Ch$5,804,447,986,000 divided into 49,092,772,762 registered common shares of a single series with no par value, to Ch$3,575,339,011,549 divided into 49,092,772,762 registered common shares of a single series with no par value. Additionally, it was agreed that (i) Enersis Chile’s share capital would be Ch$2,229,108,974,451, which corresponds to the amount by which the Enersis share capital would be decreased, divided into 49,092,772,762 registered common shares of a single series with no par value, and (ii) Enersis’ equity interest would be distributed between Enersis Américas and Enersis Chile by allocating assets and liabilities to Enersis Chile, as agreed at the extraordinary shareholders’ meeting held on December 18, 2015.
On October 4, 2016, the respective by-laws were amended and the corporate names of Enersis Chile, Endesa Chile and Chilectra were changed to Enel Chile S.A., Enel Generación Chile S.A. and Enel Distribución Chile S.A., respectively.
| 1.1 | Incorporation of Renewable Energy Assets in Chile: |
Considering the high priority of renewable energy in the Open Power strategy of Enel Chile and with the intention to strengthen this strategy, on August 25, 2017 Enel Chile proposed a corporate regonization (the “Renewable Assets Reorganization”) to consolidate Enel S.p.A.´s renewable Assets Reorganization is intended to incorporate the renewable energy assets in Chile held through Enel Green Power Latin America S.A. (“EGPL”) with Enel Chile, which in turn, holds conventional energy generation assets in Chile through Enel Generación Chile S.A. (“Enel Generación Chile”) and distribution assets in Chile through Enel Distribución Chile.
Enel Chile and Enel Generación Chile are both reporting companies under the regulation of the Chilean CMF and have American Depositary Receipts traded on the New York Stock Exchange, therefore are also subject to rules of the United States Securities and Exchange Commission (the “SEC”).
EGPL is a wholly owned subsidiary of Enel, held through Enel Green Power S.p.A. (“EGP”).
The Renewable Assets Reorganization involves the following transactions, each of which is conditional on the implementation of the other:
Enel Chile will make a public tender offer (the “Tender Offer”) for all of the shares (including American Depositary Shares or “ADSs”of its subsidiary Enel Generación Chile S.A. (“Enel Generación Chile”) held by non-controlling interests (equivalent to approximately 40% of the share capital). The Tender Offer consideration will be paid in cash, subject to the condition that tendering Enel Generación Chile shareholders agree to use Ch$236 of the Ch$590 cash tender offer consideration for each Enel Generación Chile share and Ch$$7,080 of the Ch$17,700 cash tender offer consideration for each Enel Generación Chile ADS to subscribe for shares American Depositary Shares (or “ADSs”) of Enel Chile at a subscription price of Ch$82 per Enel Chile share (or Ch$4,100 per Enel Chile ADS) the “Share/ADS Subscription Condition”.
F-12
The Tender Offer will be accounted for as the acquisition of the non-controlling interests in Enel Generación Chile. The transaction represents a change in Enel Chile’s ownership over Enel Generación Chile without resulting in a loss of control, reason for which it is accounted for as an equity transaction in accordance with IFRS as issued by the IASB.
Enel Chile will conduct a capital increase (the “Capital Increase”) in order to have a sufficient number of shares of common stock of Enel Chile available to deliver to tendering holders of Enel Generación Chile shares and ADSs to satisfy the Share/ADS Subscription Condition.
In connection with the Capital Increase, in accordance with Chilean law, Enel Chile will make a preemptive rights offering to existing shareholders of Enel Chile who have preemptive rights to subscribe for the additional shares of Enel Chile issued in the Capital Increase pro rata in proportions to their interest in Enel Chile at a subscription price of Ch$82 per Enel Chile share in cash.
Following the completion of the Tender Offer, EGPL will merge into Enel Chile (the “Merger”). Consequently, the renewable assets held by EGPL will be consolidated by Enel Chile.
Subject to the final share subscription price in the Tender Offer and the exchange ratio in the Merger, Enel is expected to hold, taken together, an ownership interest in Enel Chile similar to its current 60.6% ownership.
The Merger will be accounted for as a combination of entities under common control of Enel, similar to a pooling of interests, effected by Enel Chile through issuance of its shares to be delivered to EGP as consideration of the proposed merger of EGPL. As Enel Chile and EGPL are under common control of Enel, no purchase accounting is applied.
At the Extraordinary Shareholders’ Meeting of Enel Chile held on December 20, 2017, the Renewable Assets Reorganization was approved, subject to compliance with the conditions stipulated for the Tender Offer, Capital Increase and Merger. In addition, the Shareholders’ Meeting also approved the Capital Increase in Enel Chile of Ch$1,891,727,278,668 through issuance of 23,069,844,862 new registed common shares of a single series with no par value, at a share price and under the conditions approved at the Shareholders’ Meeting. Finally, it the amendments of the articles of incorporation of Enel Chile in order to reflect the Merger-related agreements, Capital Increase and expansion of the corporate purpose of Enel Chile were also approved, among other provisions. The Tender Offer occurred between February 16, 2018 and March 22, 2018, the preemptive right offering in connection with the Capital Increase took place between February 15, 2018 and March 16, 2018 and the Renewable Assets Reorganization (including the Merger) was completed and effective on April 2, 2018.
F-13
2.BASIS OF PRESENTATION OF THE CONSOLIDATED FINANCIAL STATEMENTS
2.1 Basis of preparation
The accompanying consolidated financial statements as of December 31, 2017 of Enel Chile approved by the Company’s Board of Directors at its meeting held on April 25, 2018, have been prepared in accordance with International Financial Reporting Standards (“IFRS”) as issued by the International Accounting Standards Board (“IASB”).
The consolidated financial statements for the periods prior to the Separation reflect the combined operations of the Group as it would have been incorporated following the Spin-Off, assuming date would have been January 1, 2013. The combined financial statements may not be indicative of the Group’s future performance and do not necessarily reflect what the results of operations, financial position and cash flows would have been had it operated, since January 1, 2013 as an independent combined group during the periods presented.
For the periods prior to the Separation, the Group does not represent a group for consolidated financial statement reporting purposes in accordance with IFRS 10 Consolidated Financial Statements.
Since IFRS does not provide any guidance for the preparation of combined financial statements, paragraph 12 of IAS 8 Accounting Policies, Changes in Accounting Estimates and Errors was used for the preparation of the combined financial statements. This paragraph requires that the latest pronouncements of other standard setters, other accounting literature and accepted industry practice should be considered. The combined financial statements of the Company were derived from the aggregation of the net assets of the Chilean business (currently Enel Américas S.A.). All intra-group balances, revenues, expenses and unrealized gains and losses arising from transactions between companies belonging to combined group were eliminated when preparing the combined financial statements. In addition, the investments of Enersis S.A. in the Group were eliminated against the equity of the respective combined entities. Transactions with Enel Américas group companies, which do not belong to the Group, have been disclosed as transactions with related parties.
Following the Separation, the consolidated financial statements include the financial statements of the Company and its subsidiaries, associates and joint ventures, and no longer include any allocations of expenses from Enersis S.A. to the Company. Accordingly:
| • | The consolidated statement of financial position as of December 31, 2017 and 2016, consists of the consolidated statement of financial position of the Group. |
| • | The consolidated statement of comprehensive income for the year ended December 31, 2017, consists of the consolidated statement of comprehensive income of the Group. The consolidated statement of comprehensive income for the year ended December 31, 2016, consists of the consolidated statement of comprehensive income of the Group for the ten month period ended December 31, 2016 and the combined statement of comprehensive income of the Company’s businesses aggregated as a combined group for the two month period ended March 1, 2016. The combined statements of comprehensive income for the year ended December 31, 2015, consist of the combined statements of comprehensive income of the Company’s businesses aggregated as a combined group. |
| • | The consolidated statement of changes in equity for the year ended December 31, 2017, consists of the consolidated statement of changes in equity of the Group. The consolidated statement of changes in equity for the year ended December 31, 2016, consists of the consolidated statement of changes in equity of the Group for the ten month period ended December 31, 2016 and the combined statement of changes in equity of the Company’s businesses aggregated as a combined group for the two month period ended March 1, 2016. The combined statements of changes in equity for the year ended December 31, 2015, consist of the combined statements of changes in equity of the Company’s businesses aggregated as a combined group. |
| • | The consolidated statement of cash flows for the year ended December 31, 2017, consists of the consolidated statement of cash flows of the Group. The consolidated statement of cash flows for the year ended December 31, 2016, consists of the consolidated statement of cash flows of the Group for the ten month period ended December 31, 2016 and the combined statement of cash flows of the Company’s businesses aggregated as a combined group for the two month period ended March 1, 2016. The combined statements of cash flows for the year ended December 31, 2015, consist of the combined statements of cash flows of the Company’s businesses aggregated as a combined group. |
These consolidated financial statements are presented in thousands of Chilean pesos (unless otherwise stated) which is the Company’s functional and presentation currency.
F-14
Principles applied in preparing the Combined Financial Statements
The following summarizes the accounting and other principles applied in preparing the combined financial statements. Management considers that the allocations described below were made on a reasonable basis, but are not necessarily indicative of the costs that would have been incurred if the Company aggregated as a combined group (hereinafter “the Combined Group”) had been a stand-alone entity.
Net assets of the Parent (equity)
Prior to the Separation, the Combined Group had not previously formed a separate legal group nor presented any stand-alone financial statements, and accordingly it was not conceivable to present share capital or an analysis of equity reserves. The net assets of the Combined Group were represented by capital invested in the Combined Group and were shown as “Equity” using the same captions as those used by Enersis. Issued capital, share premium and retained earnings of Enersis were allocated to Enersis Chile based on net assets value ratio assigned to it. Other reserves (which were primarily composed of the equity effects of past reorganizations, business combinations under common control, residual effects of first-time adoption of IFRS and the equity effects of the recent Spin-Off) were allocated considering the transaction and circumstances that led to creation of these reserves.
Cash and cash equivalents
Cash and cash equivalents of the foreign subsidiaries of Enersis were excluded from the combined financial statements.
In addition, the cash and cash equivalents balance of Enersis, on a stand-alone basis, was allocated using the following criteria:
(i) Cash and cash equivalents from the proceeds from the capital increase carried out in 2013 were excluded from the combined financial statements; and
(ii) Cash and cash equivalents remaining after excluding the 2013 capital increase proceeds, were allocated based on the exercise carried out by Enersis’ management, the ratios obtained for the division of the cash and cash equivalents, were as follows:
| | |
| | |
| Proportion of
Net Assets Market Value |
Entity | Chile | Américas |
Enersis | 42% | 58% |
Endesa S.A. | 66% | 34% |
Chilectra S.A. | 63% | 37% |
Intercompany balances and transactions with related companies
Intercompany balances with successors of Enersis were allocated by identifying the entity that provided/received the service as well as the nature of it. Intercompany balances with the Company were eliminated in full for the purpose of the combined financial statements. Intercompany balances with Enel Américas are included in the combined financial statements and disclosed as accounts with related companies.
Debt instruments and related interest expenses, exchange differences and effects of hedge accounting strategies
Financial debt and related interest expenses and exchange rate differences of the Chilean subsidiaries of Enersis were included in the combined financial statements. Financial debt and related interest expenses and exchange rate differences of Enersis stand-alone was 100% allocated to Enel Americas and were not included in the combined financial statements.
In relation to derivative instruments designated as hedging instruments for the Chilean subsidiaries of Enersis, these were included in the combined financial statements. Enersis’ management adopted as a criterion to keep the strategies of hedge accounting. Therefore, all effects on the statement of financial position, income and other comprehensive income were assigned to the specific companies to which the hedged items were assigned. In the case of Enersis on a stand-alone basis, the main items covered by the hedging strategies were related to debt (hedging exposure to foreign currency debt and variability in interest rates). Therefore, the main derivative instruments associated with such hedging strategies were assigned accordingly to Enel Américas, the entity that assumed 100% of the debt of Enersis stand-alone entity, or the Company, as applicable.
F-15
Personnel, salary expenses other employee benefits
For purposes of properly distributing the accounting effect of personnel from Enersis on a stand-alone basis between the Company and Enel Américas, the Enersis’ management defined as a criterion to identify those personnel whose main activities were related 100% to the operations based in Chile under Enersis. This group of employees was assigned to the Company. On the other hand, management also identified those employees whose main activities related 100% to foreign operations. This group of employees was assigned to Enel Américas.
All remaining personnel, who divide their main activities between the Chilean operations of Enersis and foreign operations, were assigned to the Company, meaning that from the date of the Spin-Off, those employees would identify the activities offered to foreign operations of Enersis and vice-versa. The existing contracts of inter-company provision of services between foreign and local businesses ensure reimbursement of the incurred costs of these employees that were allocated based on the time dedicated to activities offered to the Company’s entities from their total available time.
The table below sets forth the breakdown of employees allocated to the Company and Enel Américas:
| | |
| | |
| Employee
Allocation |
Entity | Chile | Américas |
Enersis | 391 | 87 |
Endesa S.A. | 925 | 7 |
Chilectra S.A. | 668 | 2 |
| | |
Total | 1,984 | 96 |
| | |
Once the allocation of personnel was determined Enersis management applied the following criterion to the division of all the personnel related accounts in the statements of financial position and comprehensive income that were associated with the costs directly related to the personnel, such as wages and salaries, post-employment benefit obligations expense and social security and other benefits, travel expenses, etc. In this regard their allocation was performed based on the specific assignment of the related personnel to the Combined Group, as described above.
Other share costs
The combined statements of income include expense allocations for certain corporate functions provided by Enersis, including, but not limited to, human resources administration, treasury, risk management, internal audit, accounting, tax, legal, insurance, medical services, information technology support, communication management, and other shared services. These expenses were allocated to the Company and Enel Américas based on a specific identification basis, and in other cases these expenses were allocated by Enersis based on a pro-rata basis of headcount or some other basis depending on the nature of the allocated cost. Management considers the basis on which the expenses were allocated to reasonably reflect the utilization of services provided to or the benefit received by the Company during the periods presented.
Dividends receivable and payable
The criterion defined by Enersis’ management to allocate to both the Company as well as to Enel Américas a portion of dividends receivable accounts from Enersis stand-alone as of the date of the Spin-Off, was based mainly on identifying the origin of each one of those dividends. If the dividends come directly from a Chilean subsidiary, these dividends were allocated 100% to the Company.
Income tax
The tax effect (income statement and income tax provision) related to the Chilean subsidiaries of Enersis was included in the combined financial statements and was calculated using the statutory corporate tax rates according to the jurisdiction where the pre-tax income was originated.
In addition, for the tax effect in the income statement of Enersis on a stand-alone basis it was allocated to the combined financial statements by determining a hypothetical taxable income as if the Company and Enel Américas had operated as separate taxpayers. However, and from a tax point of view, there is currently only one taxpaying company, which is Enersis’ successor Enel Américas. Accordingly, income tax payable by Enersis was allocated to the combined financial statements.
In relation to deferred tax assets and liabilities, these were assigned to the Company and Enel Américas, taking into account the underlying assets and liabilities, whose respective temporary differences have originated such deferred taxes.
Other working capital accounts
Working capital items such as accounts receivable, accounts payable and inventories that were directly attributable to the Chilean operations of the Combined Group were included in the combined financial statements.
F-16
| 2.2 | New accounting pronouncements |
| a) | Accounting pronouncements effective from January 1, 2017: |
| | | | | |
| | |
Amendments and Improvements | | Mandatory application for annual periods beginning on or after: |
Amendment to IAS 12: Recognition of Deferred Tax Assets for Unrealized Losses The purpose of the amendments to IAS 12 “Income Taxes” is to provide requirements on recognition of deferred tax assets for unrealized losses, and clarify how to account for deferred tax assets related to debt instruments measured at fair value. | | January 1, 2017 |
Amendment to IAS 7: Disclosure Initiative The amendments to IAS 7 “Statement of Cash Flows” are part of the IASB’s initiative aimed at improving presentation and disclosure of information in the financial statements. The amendments add additional disclosure requirements relating to financing activities in the statement of cash flows. See note 5.e for the disclosures required by this amendment. | | January 1, 2017 |
Annual Improvements to IFRS (2014 – 2016 Cycle) Annual improvements correspond to a series of limited scope amendments clarifying, correcting or eliminating redundancy in IFRS 12 “Disclosures of Interests in Other Entities”. | | January 1, 2017 |
The amendments and improvements to the standards, which came into effect on January 1, 2017, had no significant effect on the consolidated financial statements of the Company and its subsidiaries. The disclosures required by IAS 7 relating to financing activities are presented in Note 6 (e).
b) Accounting pronouncements effective from January 1, 2018 and subsequent periods:
As of the date of issue of these consolidated financial statements, the following accounting pronouncements had been issued by the IASB, but their application was not yet mandatory:
| | |
New Standards and Interpretations | | Mandatory application for annual periods beginning on or after: |
IFRS 9: Financial Instruments | | January 1, 2018 |
IFRS 15: Revenue from Contracts with Customers. | | January 1, 2018 |
IFRS 16: Leases | | January 1, 2019 |
IFRIC 22: Foreign Currency Transactions and Advance Consideration | | January 1, 2018 |
IFRIC 23: Uncertainty over Income Tax Treatments | | January 1, 2019 |
F-17
| • | IFRS 9 – Financial Instruments |
In July 2014, the IASB issued the final version of IFRS 9 that replaces IAS 39 Financial Instruments: Recognition, Measurement, and all previous versions of IFRS 9. IFRS 9 is effective for annual periods beginning on or after January 1, 2018, with early application permitted. The company will adopt the standard on the date of effective application without restating previous periods, recognizing the cumulative effect of its initial application as an adjustment to the opening balance of accumulated earnings (or another component of the estate, as appropriate).
IFRS 9 brings together all three phases of the IASB’s project on financial instruments: (i) classification and measurement, (ii) impairment and (iii) hedge accounting.
Enel Chile carried out a detailed evaluation of the three aspects of the standard and its impact on the Group's consolidated financial statements. This evaluation is based on the information currently available and, therefore, may be subject to changes arising from additional information available during the year 2018.
| (i) | Classification and measurement |
IFRS 9 introduces a new classification approach for financial assets, based on two concepts: the characteristics of the contractual cash flows of the financial assets and the business model of the entity. Under this new approach, the four classification categories of IAS 39 are replaced by the following three categories:
| - | Amortized cost, if the financial assets are held within a business model whose objective is to collect contractual cash flows; |
| - | Fair value through other comprehensive income, if the financial assets are held within a business model whose objective is achieved by both collecting contractual cash flows and selling financial assets; and |
| - | Fair value through profit or loss, a residual category that consists of financial instruments that are not held within any of the two business models previously discussed, including those held for trading and those designated at fair value on initial recognition. |
For financial liabilities, IFRS 9 retains largely the existing requirements in IAS 39, with certain specific modifications, under which most of the financial liabilities are measured at amortized cost, and allowing to designate a financial liability to be measure at fair value through profit or loss, if certain criteria are met.
However, IFRS 9 introduces new requirements for financial liabilities designated at fair value through profit or loss, which states that under certain circumstances, changes in fair value originated by the variation of an entity’s own credit risk will be recognized in other comprehensive income.
Based on the assessment made, the Group considers that the new classification requirements will not have a significant impact on the accounting of its financial assets. Loans and receivables are held to collect contractual cash flows that are solely payment of principal and interest, therefore, they meet the criteria to be measured at amortized cost under IFRS 9. Investments in equity instruments classified as available for sale will continue to be measured at fair value through other comprehensive income, except for those where the cost represents the best estimate of their fair value.
The new impairment model in IFRS 9 is based on expected credit losses, as opposed to the incurred loss model in IAS 39. Consequently, under IFRS 9 impairment losses will be recognized, generally, earlier than current practice.
The new impairment model will be applied to financial assets measured at amortized cost and those measured at fair value through other comprehensive income. The allowance for impairment losses will be measured based on:
| - | 12-month expected credit losses; or |
| - | Lifetime expected credit losses, if the credit risk of a financial asset at the reporting date has increased significantly since initial recognition. |
The standard allows the application of a simplified approach for trade receivables, contract assets and lease receivables so that the impairment is always recognized in reference to the lifetime expected credit losses for the asset. The Group has chosen to apply this policy for the designated financial assets.
F-18
Based on the new methodology for estimating expected credit losses, the Group estimates that the application of the impairment requirements of IFRS 9 do not have significant impact. For the year ended December 31, 2017 the quantification involves a higher net tax provision of approximately ThCh$4,000,000 .
IFRS 9 introduces a new model for hedge accounting in order to more closely align the accounting treatment with risk management activities of the entities and to establish a new principle-based approach. The new model will enable entities to better reflect risk management activities in the financial statements, and allow more items to be eligible as hedged items, such as non-financial risk component, net positions, and aggregated exposures (i.e., a combination of derivative and non-derivative exposure).
The most significant changes in relation to hedging instruments compared to hedge accounting methodology in IAS 39, is the possibility to defer in other comprehensive income the time value of options, forward points in forward contracts, and foreign currency basis spread, until the hedged item impacts profit or loss.
IFRS 9 also eliminates the current quantitative requirement for hedge effectiveness test, under which the results of the testing must be within a range of 80-125 percent. This will allow aligning hedge effectiveness with risk management by demonstrating the existence of an economic relationship between the hedging instrument and the hedged item
When initially applying IFRS 9, the Group may choose as its accounting policy to continue to apply the hedge accounting requirements of IAS 39 instead of the requirements in IFRS 9, until the time the new requirements on macro-hedging are published and adopted. The Group’s current plan is that it will elect to apply the new requirements of IFRS 9.
Implementing the new model included assessing the existing hedge relationships and the analysis of new strategies that may be applied under the new standard. The Group considers that all the existing hedge relationships at December 31, 2017, which have been designed as efficient hedges, will continue to be suitable for hedge accounting under IFRS 9. Similarly, non-accounting hedges will continue to be measured at fair value through profit or loss under the new standard.
| • | IFRS 15 – Revenue from Contracts with Customers |
In May 2014, the IASB published IFRS 15; the Standard is applicable to all contracts with customers, with certain exemptions. The new revenue standard supersedes all current revenue recognition standards:
| - | IAS 11 Construction Contracts; |
| - | IFRIC 13 Customer Loyalty Programs; |
| - | IFRIC 15 Agreements for the Construction of Real Estate; |
| - | IFRIC 18 Transfers of Assets from Customers; and |
| - | SIC-31 Revenue – Barter Transactions Involving Advertising Services. |
The standard shall be applied for annual periods beginning on or after January 1, 2018. Early adoption is permitted. The Group plans to adopt the new standard on the required effective date using the modified retrospective method. Consequently, the Group will apply IFRS 15 retrospectively only to those contracts effective on January 1, 2018, recognizing the cumulative effect of initially applying the standard as an adjustment to the opening balance of retained earnings (or another category of equity, if appropriate) of the annual reporting period that includes the date of initial application.
This new Standard introduces a general framework for recognition and measurement of revenue, based on the core principle that revenues are recognized for an amount that reflects the consideration to which the entity expects to be entitled in exchange for transferring promised goods or services to customers. This core principle shall be applied using a five-step approach to revenue recognition: (1) identify the contract with a customer; (2) identify the performance obligations in the contract; (3) determine the transaction price; (4) allocate the transaction price to the performance obligations in the contracts; and (5) recognize revenue when (or as) the entity satisfies a performance obligation.
IFRS 15 requires more detailed disclosures than the current requirements. The disclosure requirements represent a significant change as compared to current practice and increase significantly the volume of disclosures to be included in the Group’s financial statements.
F-19
In April 2016, the IASB issued amendments to IFRS 15 to clarify certain requirements and to provide additional practical expedients for transition. The amendments are mandatorily effective on the same date as the Standard, i.e., January 1, 2018.
The Group carried out an implementation project to identify and measure the potential impact of applying IFRS 15 on its consolidated financial statements. The project included the identification of all revenue streams of Enel Chile and its subsidiaries, use of our knowledge of the customary business practices, a comprehensive evaluation of each type of contract with clients and determining the methodology for recognizing revenue under current standards. The assessment was performed with an special focus on those contracts with key aspects under IFRS 15 and the specific characteristics of interest to the Group, such as: identifying contractual obligations; contracts with multiple deliverables and recognition timing; contracts with variable compensation; significant financing component; analysis of principal versus agent; existence of service guarantees; and recognition of costs of obtaining and fulfilling a contract.
The Enel Chile Group participates in the electrical energy generation, transmission and distribution businesses, and related activities. Based on the nature of the goods and services offered and the characteristics of its revenue streams, the Group does not expect that application of IFRS 15 will have a material impact on the consolidated financial statements of Enel Chile and subsidiaries.
| (3) | Sales and transportation of electricity: The main source of revenue of Enel Chile is from the sale of a series of goods and services whose control is transferred over time, since the customer simultaneously receives and consumes the benefits provided by the Group. In accordance with the criteria under IFRS 15, the Group will continue recognizing revenue over time, instead of at a point in time. |
| (4) | Construction contracts: Revenue from construction works in progress is recognized over time based on the stage of completion. The Group concluded under IFRS 15, that these contracts meet the criteri of performance obligations satisfied over time, since the customer controls the assets as the assets are created and enhanced. Therefore, the Standard will not change the timing or the amount of revenue recognized pursuant to these construction contracts. |
| (5) | Sale of other goods and services: Correspond mainly to the sale of supplementary electrical-related goods and services whose control is transferred to the customer at a point in time. Revenue is recognized when the control of the good or service has been transferred to the customer, i.e. when the customer obtains substantially all of the benefits from the asset and the ability to direct its use. Therefore, the Standard will not change the timing or the amount of revenue recognized pursuant to these contracts. |
The Group is assessing the necessary changes and improvements in the systems, internal controls, policies and procedures, in order to meet the new disclosure requirements of IFRS 15.
In January 2016, the IASB published IFRS 16, which establishes recognition, measurement, presentation and disclosure principles for lease agreements. IFRS 16 supersedes IAS 17, Leases, IFRIC 4, Determining whether an Arrangement contains a Lease, SIC-15, Operating Leases—Incentives, and SIC-27, Evaluating the Substance of Transactions Involving the Legal Form of a Lease.
The standard is effective for annual periods beginning on or after January 1, 2019. Early application is permitted for entities that apply IFRS 15 at or before the date of initial application of IFRS 16. The Group does not plan to adopt the Standard early.
Although IFRS 16 substantially retains the definition of a lease in IAS 17, the main change is the incorporation of the “control” concept within the new definition. In relation to the accounting treatment for a lessee and a lessor, the new Standard states the following:
| i) | Lessee accounting: IFRS 16 requires lessees to account for all leases under a single model, similar to accounting for finance leases under IAS 17. As a result, at the date of commencement of a lease, the lessee will recognize on the statement of financial position a right-to-use asset and a lease liability for the future payments. Subsequent to initial recognition, it will recognize in the statement of profit or loss the depreciation expense of the asset separately from the interest related to the liability. The standard provides two voluntary recognition exceptions for low-value leases and short-term leases. |
F-20
| ii) | Lessor accounting: Under IFRS 16 is substantially unchanged from current accounting under IAS 17. Lessors will continue to classify leases using the same classification principles as in IAS 17 as operating and finance leases. |
IFRS 16 provides a series of practical expedients for the transition, both for the definition of a lease and for retrospective application of the standard. The Group has not yet decided if it will use certain or all of the practical expedients.
The Group is currently carrying out an assessment of the potential impact of IFRS 16 on its consolidated financial statements. The quantitative effect will depend on, among others, the chosen transition method, the extent to which the Group uses the practical expedients and recognition exemptions, and any additional lease contract entered into by the Group in the future.
| • | IFRIC 22 – Foreign Currency Transactions and Advance Consideration |
This Interpretation clarifies the date of the transaction for the purpose of determining the exchange rate to use in foreign currency transactions when the consideration is paid or received before recognizing related revenues, expenses or assets. For this purposes, the date of the transaction is the date on which an entity initially recognizes the non-monetary asset or non-monetary liability arising from the payment or receipt of advance consideration.
The Interpretation is effective for annual periods beginning on or after January 1, 2018. Early application is permitted.
The Group expects that this new Interpretation will not have a material effect on the consolidated financial statements of Enel Chile and its subsidiaries.
| • | IFRIC 23 – Uncertainty over Income Tax Treatments |
In June 2017, the IASB issued IFRIC 23 to clarify the application of recognition and Measurement requirements in IAS 12, Income Taxes when there is uncertainty over income tax treatments. The Interpretation specifically addresses the following: whether an entity considers uncertain tax treatments separately; the assumptions an entity makes about the examination of tax treatments by taxation authorities; how an entity determines taxable profit (loss), tax bases, unused tax losses, unused tax credits and tax rates; and how an entity considers changes in facts and circumstances.
The Interpretation is effective for annual periods beginning on or after January 1, 2019. Early application is permitted.
The Group’s management is currently assessing the potential impact that IFRIC 23 will have on its consolidated financial statements on its initial application.
| | | | | |
Improvements and Amendments | | Mandatory
application for annual Periods beginning on or after: |
Annual Improvements to IFRS (Cycles 2014-2016) Annual improvements correspond to a series of minor amendments clarifying, correcting or eliminating redundancy in the following standards: IFRS 1 “First-time Adoption of IFRS and IAS 28 “Investments in Associates and Joint Ventures”. | | January 1, 2018 |
Amendment to IFRS 2: Classification and Measurement of Share-based Payment Transactions | | |
The amendments provide specific accounting requirements for: (i) the effects of vesting and non-vesting conditions on the measurement of cash-settled share-based payments; (ii) share-based payment transactions with a net settlement feature for withholding tax obligations; and (iii) a modification to the terms and conditions of a share-based payment that changes the classification of the transaction from cash-settled to equity-settled. | | January 1, 2018 |
Amendments to IAS 40: Transfers of investment property The IASB issued this amendment to clarify that a change in management’s intentions for the use of a property by itself does not constitute evidence of a change in use and not a sufficient reclassification criteria. | | January 1, 2018 |
F-21
| | | | | |
Amendments to IFRS 9: Prepayment features with negative compensation The amendments allow entities to measure prepayable financial assets with negative compensation at amortized cost or at fair value through other comprehensive income upon compliance of certain specific condition, instead of being measured at fair value through profit or loss. | | January 1, 2019 |
Amendments to IAS 28: Long-term interests in Associates and Joint Ventures The IASB issued these amendments to clarify that an entity that applies IFRS 9 to long-term interests in an associate or joint venture that form part of the net investment in the associate or joint venture but to which the equity method is not applied. | | January 1, 2019 |
Annual Improvements to IFRS (Cycle 2015-2017) Annual improvements correspond to a series of limited scope amendments that clarify the wording in an IFRS Standard or correct relatively minor oversights or conflicts between existing requirements of IFRS Standards: IFRS 3 “Business combination”, IFRS 11 “Joint arrangements”, IAS 12 “Income taxes” and IAS 23 “Borrowing costs”. | | January 1, 2019 |
Amendment to IFRS 10 and IAS 28: Sale or Contribution of Assets | | |
The amendment corrects an inconsistency between IFRS 10 “Consolidated Financial Statements” and IAS 28 “Investments in Associates and Joint Ventures” relating to the accounting treatment of the sale or contributions of assets between an Investor and its Associate or Joint Venture. The IASB decided to postpone the effective date of application of the amendment, until obtaining the results of its research Project on the equity method of accounting. | | Effective date deferred indefinitely. |
In Management’s opinion, the application of the foregoing amendments and annual improvements is not expected to have a significant effect on the consolidated financial statements of Enel Chile and its subsidiaries.
2.3 Responsibility for the information, judgments and estimates provided
Management is responsible for the information contained in these consolidated financial statements and expressly states that all IFRS principles and standards, as issued by the IASB, have been fully implemented.
In preparing the consolidated financial statements, certain judgments and estimates made by management have been used to quantify some of the assets, liabilities, income, expenses and commitments recorded in the statements.
The most important areas were critical judgment is required are:
•The identification of Cash Generating Units (CGU) for impairment testing (see Note 3.e).
• The hierarchy of information used to measure assets and liabilities at fair value (see Note 3.h)
The estimates refer basically to:
•The valuations performed to determine the existence of impairment losses among tangible and intangible assets and goodwill (see Note 3.e).
• The assumptions used to calculate the actuarial liabilities and obligations to employees, such as discount rates, mortality tables, salary raises, etc. (see Notes 3.l.1 and 23).
• The useful life of property, plant and equipment, and intangible assets (see Notes 3.a and 3.d).
• The assumptions used to calculate the fair value of financial instruments (see Notes 3.h and 20).
• Energy supplied to customers whose meter readings are pending.
• Certain assumptions inherent in the electricity system affecting transactions with other companies, such as production, customer billings, energy consumption, etc. that allow for estimating electricity system settlements that must occur on the corresponding final settlement dates, but that are pending as of the date of issuance of the consolidated financial statements and could affect the balances of assets, liabilities, income and expenses recorded in the statements (See Appendix 6.2).
F-22
•The probability that uncertain or contingent liabilities will be incurred and their related amounts (see Note 3.l).
• Future disbursements for the closure of facilities and restoration of land, as well as the discount rates to be used (see Note 3.a).
• The tax results of the various subsidiaries of the Group that will be reported to the respective tax authorities in the future, and that have served as the basis for recording different balances related to income taxes in these consolidated financial statements (see Note 3.o).
•The fair values of assets acquired and liabilities assumed, and any pre-existing interest in an entity acquired in a business combination.
Although these judgments and estimates have been based on the best information available on the issuance date of these consolidated financial statements, future events may occur that would require a change (increase or decrease) to these estimates in subsequent periods. This change would be made prospectively, recognizing the effects in the corresponding future consolidated financial statements.
2.3.1 Changes in accounting estimates
The Company carried out a new study on useful lives allocated to the Group’s main items of property, plant and equipment. The results of such study indicated that there is sufficient evidence to conclude that it is necessary to revise the remaining useful lives of certain assets, so as to better reflect the period over which these assets are expected to be available for use.
Based on above, beginning on January 1, 2017, the Company revised the remaining useful lives of certain items of its property, plant and equipment. This change in accounting estimate resulted in a lower depreciation expense of ThCh$11,023,983 for the year ended December 31, 2017.
2.4 Subsidiaries
Subsidiaries are defined as those entities controlled either, directly or indirectly, by the Company. Control is exercised if, and only if, the following conditions are met: the Company has i) power over the subsidiary; ii) exposure or rights to variable returns from these entities; and iii) the ability to use its power to influence the amount of these returns.
The Company has power over its subsidiaries when it holds the majority of the substantive voting rights or, should that not be the case, when it has rights granting the practical ability to direct the entities’ relevant activities, that is, the activities that significantly affect the subsidiary’s results.
The Company will reassess whether or not it controls a subsidiary if the facts and circumstances indicate that there are changes to one or more of the three elements of control listed above.
Subsidiaries are consolidated as described in note 2.7.
Appendix 1. “Enel Chile Group Subsidiaries” to these consolidated financial statements describes the relationship of the Company with each of its subsidiaries.
F-23
| 2.4.1 | Changes in the scope of consolidation |
On January 9, 2015, our subsidiary Enel Generación Chile S.A., sold all of the shares owned in Sociedad Concesionaria Túnel El Melón S.A. for ThCh$25,000,000.
The elimination of Sociedad Concesionaria Túnel El Melón S.A. from the Group’s scope of consolidation resulted in a decrease in the consolidated statement of financial position of ThCh$871,022 in current assets, ThCh$7,107,941 in non-current assets, ThCh$3,698,444 in current liabilities and ThCh$1,789,703 in non-current liabilities.
| 2.4.2 | Unconsolidated companies with an ownership interest of more than 50% |
Although the Group holds more than a 50% ownership interest in Centrales Hidroeléctricas de Aysén S.A., it is considered a “joint venture” since the Group, through contracts or agreements with shareholders, exercises joint control of the investee.
As of December 31, 2017, the investment that the Group has in Centrales Hidroeléctricas de Aysén S.A. has been classified as non-current assets held to distribute to the owners (See notes 3.j, 5 and 12).
2.5 Investment in associates
Associates are those entities in which the Group, either directly or indirectly, exercises significant influence.
Significant influence is the power to participate in the financial and operational policy decisions of the associate but is not control or joint control over those policies. In assessing significant influence, the Group takes into account the existence and effect of potential exercisable voting rights or convertible at the end of each reporting period, including potential voting rights held by the Company or by another Group entity. In general, significant influence is presumed to be those cases in which the Group has an ownership interest of more than 20%.
Associates are incorporated to the consolidated financial statements using the equity method, as described in Note 3.i.
Appendix 3. “Associates and Joint Ventures” to these consolidated financial statements describes the relationship of the Company and each of these companies.
2.6 Investment in joint arrangements
Joint arrangements are defined as those entities in which the Group exercises control under an agreement with other shareholders and jointly with them, in other words, when decisions on the entities’ relevant activities require the unanimous consent of the parties sharing control.
Depending on the rights and obligations of the parties, joint arrangements are classified as:
| - | Joint ventures: an agreement whereby the parties exercising joint control have rights to the entity’s net assets. Joint ventures are incorporated to the consolidated financial statements using the equity method, as described in note 3.h. |
| - | Joint operation: an agreement whereby the parties exercising joint control have rights to the assets and obligations with respect to the liabilities relating to the arrangement. Joint operations are incorporated to the consolidated financial statements recognizing the interest in the assets and liabilities held in the joint operation. |
In determining the type of joint arrangement in which it is involved, the management of the Group assesses its rights and obligations arising from the arrangement by considering the structure and legal form of the arrangement, the terms agreed by the parties in the contractual arrangement and, when relevant, other facts and circumstances. If facts and circumstances change, the Group reassesses whether the type of joint arrangement in which it is involved has changed.
Currently, the Company is not involved in any joint arrangement that qualifies as a joint operation.
Appendix 3. “Associates and Joint Ventures” to these consolidated financial statements describes the relationship of the Company and each of these companies
F-24
2.7 Basis of consolidation and business combinations
The subsidiaries are consolidated and all their assets, liabilities, income, expenses, and cash flows are included in the consolidated financial statements once the adjustments and eliminations from intragroup transactions have been made.
The comprehensive income of subsidiaries is included in the consolidated statement of comprehensive income from the date when the parent company obtains control of the subsidiary and until the date on which it loses control of the subsidiary.
The operations of the parent company and its subsidiaries have been consolidated under the following basic principles:
| 1. | At the date the parent obtains control, the subsidiary’s assets acquired and its liabilities assumed are recorded at fair value, except for certain assets and liabilities that are recorded using valuation principles established in other IFRS standards. If the fair value of the consideration transferred plus the fair value of any non-controlling interests exceeds the fair value of the net assets acquired, this difference is recorded as goodwill. In the case of a bargain purchase, the resulting gain is recognized in profit or loss for the period after reassessing whether all of the assets acquired and the liabilities assumed have been properly identified and following a review of the procedures used to measure the fair value of these amounts. |
For each business combination, the Group chooses whether to measure the non-controlling interests in the acquiree at fair value or at the proportional share of the net identifiable assets acquired.
If the fair value of all assets acquired and liabilities assumed at the acquisition date has not been completed, the Group reports the provisional values accounted for in the business combination. During the measurement period, which shall not exceed one year from the acquisition date, the provisional values recognized will be adjusted retrospectively as if the accounting for the business combination had been completed at the acquisition date, and also additional assets or liabilities will be recognized to reflect new information obtained on events and circumstances that existed on the acquisition date, but which were unknown to the management at that time. Comparative information for prior periods presented in the financial statements is revised as needed, including making any change in depreciation, amortization or other income effects recognized in completing the initial accounting.
For business combinations achieved in stages, the fair value of the equity interest previously held in the acquired company’s equity is measured on the date of acquisition and any gain or loss is recognized in the results for that period.
| 2. | Non-controlling interests in equity and in the comprehensive income of the consolidated subsidiaries are presented, respectively, under the line items “Total Equity: Non-controlling interests” in the consolidated statement of financial position and “Net Income attributable to non-controlling interests” and “Comprehensive income attributable to non-controlling interests” in the consolidated statement of comprehensive income. |
| 3. | The financial statements of entities with functional currencies other than the Chilean peso are translated as follows: |
| a. | For assets and liabilities, the prevailing exchange rate on the closing date of the financial statements is used. |
| b. | For items in the comprehensive income statement, the average exchange rate for the period is used (unless this average is not a reasonable approximation of the cumulative effect of the exchange rates in effect on the dates of the transactions, in which case the exchange rate in effect on the date of each transaction is used). |
| c. | Equity remains at the historical exchange rate from the date of acquisition or contribution, and retained earnings at the average exchange rate at the date of origination. |
| d. | Exchange differences arising in translation of financial statements are recognized in the item “Foreign currency translation gains (losses)” in Other comprehensive income. |
| 4. | Balances and transactions between consolidated entities were fully eliminated in the consolidation process. |
| 5. | Changes in interests in subsidiaries that do not result in obtaining or losing control are recognized as equity transactions, and the carrying amount of the controlling and non-controlling interests is adjusted to reflect the change in relative interest in the subsidiary. Any difference that may exist, between the value for which a non-controlling interest is adjusted and the fair value of a compensation paid or received, is recognized directly in Equity attributable to the shareholders of Enel Chile. |
| 6. | Business combinations under common control are recorded using, as a reference, the ‘pooling of interest’ method. Under this method, the assets and liabilities involved in the transaction remain reflected at the same carrying amount at which they were recorded in the ultimate controlling company, although subsequent accounting adjustments may need to be made to align the accounting policies of the companies involved. |
Any difference between the assets and liabilities contributed to the consolidation and the compensation given is recorded directly in Net equity as a debit or credit to Other reserves. The Group does not apply retrospective accounting recognition of business combinations under common control.
F-25
3. | ACCOUNTING POLICIES APPLIED. |
The main accounting policies used in preparing the accompanying consolidated financial statements are the following:
| a) | Property, plant and equipment |
Property, plant and equipment are measured at acquisition cost, net of accumulated depreciation and any impairment losses they may have experienced. In addition to the price paid to acquire each item, the cost also includes, where applicable, the following concepts:
| • | Financing expenses accrued during the construction period that are directly attributable to the acquisition, construction, or production of qualified assets, which require a substantial period of time before being ready for use such as, for example, electricity generation or distribution facilities. The Group defines “substantial period” as one that exceeds twelve months. The interest rate used is that of the specific financing or, if none exists, the weighted average financing rate of the company carrying out the investment. (See Note 15.b.1). |
| • | Employee expenses directly related to construction in progress. (See Note 15.b.2). |
| • | Future disbursements that the Group will have to incur to close its facilities are added to the value of the asset at fair value, recognizing the corresponding provision for dismantling or restoration. The Group reviews its estimate of these future disbursements on an annual basis, increasing or decreasing the value of the asset based on the results of this estimate (See Note 22). |
Items for construction work in progress are transferred to operating assets once the testing period has been completed and they are available for use, at which time depreciation begins.
Expansion, modernization or improvement costs that represent an increase in productivity, capacity or efficiency, or a longer useful life are capitalized as increasing the cost of the corresponding assets.
The replacement or overhaul of entire components that increase the asset’s useful life or economic capacity are recorded as an increase in cost for the respective assets, derecognizing the replaced or overhauled components.
Expenditures for periodic maintenance, conservation and repair are recognized directly as an expense for the year in which they are incurred.
Property, plant and equipment, net of its residual value, is depreciated by distributing the cost of the different items that comprise it on a straight-line basis over its estimated useful life, which is the period during which the Group expects to use the assets. Useful life estimates and residual values are reviewed on an annual basis and if appropriate adjusted prospectively.
The following table sets forth the main categories of property, plant and equipment with their respective estimated useful lives:
Categories of Property, plant and equipment | | Years of estimated useful lives |
Buildings | | 10 – 60 |
Plant and equipment | | 6 – 65 |
IT equipment | | 3 – 15 |
Fixtures and fittings | | 2 – 35 |
Motor vehicles | | 5 – 10 |
F-26
Additionally, the following table sets forth more details on the useful lives of plant and equipment items:
| | Years of estimated useful lives | |
Generating facilities: | | | | |
Hydroelectric plants | | | | |
Civil engineering works | | 10 – 65 | |
Electromechanical equipment | | 10 – 45 | |
Fuel oil/coal-fired power plants | | 25 – 40 | |
Combined cycle power plants | | 10 – 25 | |
Renewable energy power plants | | | 20 | |
Transmission and distribution facilities: | | | | |
High-voltage network | | 10 – 60 | |
Low- and medium-voltage network | | 10 – 50 | |
Measuring and remote control equipment | | 10 – 50 | |
Primary substations | | 6 – 25 | |
Natural gas transport facilities | | | | |
Pipelines | | | 20 | |
Land is not depreciated since it has an indefinite useful life.
Gains or losses that arise from the sale or disposal of items of Property, plant and equipment are recognized as “Other gains (losses)” in the comprehensive income statement and are calculated by deducting the net carrying amount of the asset and any sales expenses from the amount received in the sale.
Investment property includes land and buildings held for earning rentals and/or for capital appreciation.
Investment property is measured at acquisition cost less any accumulated depreciation and impairment losses that have been incurred. Investment property, excluding land, is depreciated on a straight-line basis over the useful lives of the related assets.
An investment property is derecognized upon disposal or when no future economic benefits are expected from its use or disposal.
Gains or losses on recognition of the investment property is calculated as the difference between the net disposal proceeds and the carrying amount of the asset.
The breakdown of the fair value of investment property is detailed in Note 16.
Goodwill arising from business combinations, and reflected upon consolidation, represents the excess value of the consideration paid plus the amount of any non-controlling interests over the Group’s share of the net value of the assets acquired and liabilities assumed, measured at fair value at the acquisition date. If the accounting for a business combination is completed within the following year after the acquisition date, and so is the goodwill determination, the entity recognizes the corresponding adjustments to the provisional amounts as if the accounting for the business combination had been completed at the acquisition date. During the measurement period of the business combination, the goodwill can be adjusted as a result of changes in the recognized provisional amounts of the assets acquired and liabilities assumed (See note 2.7.1).
Goodwill arising from acquisition of companies with functional currencies other than the Chilean peso is measured in the functional currency of the acquired company and translated to Chilean pesos using the exchange rate effective as of the date of the statement of financial position.
Goodwill is not amortized; instead, at the end of each reporting period or when there are indicators that an impairment might have occurred, the Group estimates whether any impairment loss has reduced its recoverable amount to an amount less than the carrying amount and, if so, an impairment loss is immediately recognized in profit or loss (See Note 3.e).
| d) | Intangible assets other than goodwill |
Intangible assets are initially recognized at their acquisition cost or production cost, and are subsequently measured at their cost, net of their accumulated amortization and impairment losses they may have experienced.
F-27
Intangible assets are amortized on a straight line basis during their useful lives, starting from the date when they are ready for use, except for those with an indefinite useful life, which are not amortized. As of December 31, 2017 and 2016, there are no significant intangible assets with an indefinite useful life.
An intangible asset is derecognized on disposal, or when no future economic benefits are expected from use or disposal.
Gains or losses arising from derecognition of an intangible asset, measured as the difference between the net disposal proceeds and the carrying amount of the asset are recognized in profit or loss when the asset is derecognized.
The criteria for recognizing these assets’ impairment losses and, if applicable, recovery of impairment losses recorded in previous periods are explained in Note 3.e below.
d.1) Research and development expenses
The Group recognizes the costs incurred in a project’s development phase as intangible assets in the statement of financial position as long as the project’s technical feasibility and future economic benefits have been demonstrated.
Research costs are recorded as an expense in the consolidated statement of comprehensive income in the period in which they are incurred.
d.2) Other intangible assets
Other intangible assets correspond to computer software, water rights, and easements. They are initially recognized at acquisition or production cost and are subsequently measured at cost less accumulated amortization and impairment losses, if any.
Computer software is amortized (on average) over four years. Certain easements and water rights have indefinite useful lives and, therefore, are not amortized.
| e) | Impairment of non-financial assets |
During the year, and principally at the end of each reporting period, the Group evaluates whether there is any indication that an asset has been impaired. If any such indication exist, the Group estimates the recoverable amount of that asset to determine the amount of the impairment loss. In the case of identifiable assets that do not generate cash flows independently, the Group estimates the recoverable amount of the Cash Generating Unit (CGU) to which the asset belongs, which is understood to be the smallest identifiable group of assets that generates independent cash inflows.
Notwithstanding the preceding paragraph, in the case of CGU’s to which goodwill or intangible assets with indefinite useful lives have been allocated, a recoverability analysis is performed routinely at each period end.
Recoverable amount is the higher of fair value less costs of disposal and value in use, which is defined as the present value of the estimated future cash flows. In order to calculate the recoverable amount of Property, plant, and equipment, as well as of goodwill, and intangible assets, the Group uses value in use criteria in practically all cases.
To estimate value in use, the Group prepares future pre-tax cash flow projections based on the most recent budgets available. These budgets incorporate management’s best estimates of a CGU’s revenue and costs using sector projections, past experience and future expectations.
In general, these projections cover the next five years, estimating cash flows for subsequent years by applying reasonable growth rates which, in no case, are increasing rates nor exceed the average long-term growth rates for the particular sector and country in which the Group operates. As of December 31, 2017, the growth rate used to extrapolate the projections was 3.1%.
Future cash flows are discounted to calculate their present value at a pre-tax rate that covers the cost of capital for the business activity and the geographic area in which it is being carried out. The time value of money and risk premiums generally used among analysts for the business activity and the geographic zone are taken into account to calculate the pre-tax rate.
The minimum and maximum pre-tax discount rates applied in the period ended December 31, 2017 expressed in nominal terms were 7.5% and 10.7%, respectively.
F-28
If the recoverable amount of the CGU is estimated to be less than the net carrying amount of the asset, the corresponding impairment loss is recognized for the difference, and charged to “Reversal of impairment loss (impairment loss)” recognized in profit or loss" in the consolidated statement of comprehensive income. The impairment is first allocated to reduce the carrying amount of any goodwill allocated to the CGU, and then to the other assets of the unit pro rata on the basis of the carrying amount of each asset in the unit. The carrying amount of an asset is not reduced below the highest of fair value less costs of disposal, its value in use; or zero.
Impairment losses recognized for an asset in prior periods are reversed when there are indications that the impairment loss no longer exists or may have decreased, thus increasing the asset’s carrying amount with a credit to earnings. The increase in the asset’s carrying amount shall not exceed that carrying amount that would have been determined had no impairment loss been recognized for the asset. Goodwill impairment losses are not reversed in subsequent periods.
In order to determine whether an arrangement is, or contains, a lease, the Group assesses the economic substance of the agreement, in order to determine whether fulfillment of the arrangement depends on the use of a specific asset and whether the agreement conveys the right to use an asset. If both conditions are met, at the inception of the arrangement the Group separates the payments and other considerations relating to the lease, at their fair values, from those corresponding to other components of the agreement.
Leases that substantially transfer all the risks and rewards of ownership to the Group are classified as finance leases. All others leases are classified as operating leases.
Finance leases in which the Group acts as a lessee are recognized at the inception of the arrangement. At that time, the Group records an asset based on the nature of the lease and a liability for the same amount, equal to the fair value of the leased asset or the present value of the minimum lease payments, if the latter is lower. Subsequently, the minimum lease payments are apportioned between finance expenses and reduction of the lease obligation. Finance expenses are recognized immediately in the income statement and allocated over the lease term, so as to achieve a constant interest rate on the remaining balance of the liability. Leased assets are depreciated on the same terms as other similar depreciable assets, as long as there is reasonable certainty that the lessee will acquire ownership of the asset at the end of the lease. If no such certainty exists, the leased assets are depreciated over the shorter of the useful lives of the assets and their lease term.
In the case of operating leases, payments are recognized as an expense in the case of the lessee and as income in the case of the lessor, both on a straight-line basis, over the term of the lease unless another type of systematic basis of distribution is deemed more representative.
Financial instruments are contracts that give rise to both a financial asset in one entity and a financial liability or equity instrument in another entity.
g.1) Financial assets other than derivatives
The Group classifies its financial assets other than derivatives, whether permanent or temporary, except for investments accounted for using equity method (See Notes 3.i and 12) and those held for sale, into four categories:
| • | Loans and account receivables: Trade and other receivables and accounts receivable from related companies are recognized at amortized cost, which is the initial fair value less principal repayments made, plus accrued and uncollected interest, calculated using the effective interest method. |
The effective interest method is used to calculate the amortized cost of a financial asset or liability (or group of financial assets or financial liabilities) and of allocating finance income or cost over the relevant period. The effective interest rate is the rate that exactly discounts estimated future cash flows to be received or paid over the expected life of the financial instrument or, when appropriate, a shorter period to the net carrying amount of the financial asset or financial liability.
| • | Held-to-maturity investments: Investments that the Group intends to hold and is capable of holding until their maturity are accounted for at amortized cost as defined in the preceding paragraph. |
| • | Financial assets at fair value with changes in net income: This category includes the trading portfolio and those financial assets that have been designated as such upon initial recognition and that are managed and evaluated on a fair value basis. They are measured in the consolidated statement of financial position at fair value, with changes in value recorded directly in income when they occur. |
| • | Available-for-sale financial assets: These are financial assets specifically designated as available-for-sale or are not classify within any of the three preceding categories. (See note 7) |
F-29
These investments are recognized in the consolidated statement of financial position at fair value when it can be reliably determined. For investments in equity instruments in unlisted companies or companies with lower levels of liquidity, normally the fair value cannot be reliably measured. When this occurs, those investments in equity instruments are measured at cost less impairment losses, if any.
Changes in fair value, net of taxes, are recognized in other comprehensive income, until the investments are disposed of, at which time the amount accumulated in other comprehensive income is reclassified to profit or loss.
If the fair value is lower than cost, and if there is objective evidence that the asset has been more than temporarily impaired, the difference is recognized directly in profit or loss.
Purchases and sales of financial assets are accounted for using their trade date.
g.2) Cash and cash equivalents
This item within the consolidated statement of financial position includes cash and bank balances, time deposits, and other highly liquid investments (with original maturity of less than or equal to 90 days) that are readily convertible to cash and are subject to insignificant risk of changes in value.
g.3) Impairment of financial assets
The following criteria are used to determine if a financial asset has been impaired:
| • | For trade receivables in the electricity generation, transmission and distribution segments, the Group’s policy is to recognize impairment losses when there is objective evidence that the balance will not be recoverable. In general terms, the Group’s entities has a defined policy to recognize an allowance for impairment losses based on the aging of past-due balances, except in those cases where a specific collective basis analysis is recommended, such as in the case of receivables from government-owned companies (See Note 8). |
| • | In the case of receivables of a financial nature, that are included in the “Loan and receivables” and “Investment held-to-maturity”, impairment is determined on case-by-case basis and is measured as the difference between the carrying amount and the present value of the future estimated cash flows discounted at the original effective interest rate (See Notes 7 and 20). |
| • | For financial investments available-for-sale, the criteria for impairment applied are described in Note 3.g.1. |
g.4) Financial liabilities other than derivatives
Financial liabilities are recognized based on cash received, net of any costs incurred in the transaction. In subsequent periods, these obligations are measured at their amortized cost using the effective interest rate method (see Note 3.g.1).
In the particular case that a liability is the hedged item in a fair value hedge, as an exception, such liability is measured at its fair value for the portion of the hedged risk.
In order to calculate the fair value of debt, both when it is recorded in the statement of financial position and for fair value disclosure purposes as shown in Note 20, debt has been divided into fixed interest rate debt (hereinafter “fixed-rate debt”) and variable interest rate debt (hereinafter “floating-rate debt”). Fixed-rate debt is that on which fixed-interest coupons established at the beginning of the transaction are paid explicitly or implicitly over its term. Floating-rate debt is that debt issued at a variable interest rate, i.e., each coupon is established at the beginning of each period based on the reference interest rate. All debt has been measured by discounting expected future cash flows with a market interest rate curve based on the payment currency.
g.5) Derivative financial instruments and hedge accounting
Derivatives held by the Group are transactions entered into to hedge interest and/or exchange rate risk, intended to eliminate or significantly reduce these risks in the underlying transactions being hedged.
Derivatives are recorded at fair value at the end of each reporting period as follows: if their fair value is positive, they are recorded within “Other financial assets”; and if their fair value is negative, they are recorded within “Other financial liabilities.” For derivatives on commodities, the positive fair value is recorded in “Trade and other receivables,” and negative fair values are recorded in “Trade and other liabilities.”
Changes in fair value are recorded directly in profit or loss, except when the derivative has been designated for hedge accounting purposes as a hedge instrument (in a cash flow hedge) and all of the conditions for applying hedge accounting are met, including that the hedge be highly effective. In this case, changes are recognized as follows:
| • | Fair value hedges: The underlying portion for which the risk is being hedged (hedged risk) and the hedge instrument are measured at fair value, and any changes in value of both items are recognized in the statement of comprehensive income by offsetting the effects in the same comprehensive income statement account. |
F-30
| • | Cash flow hedges: Changes in fair value of the effective portion of the hedged item and hedge instrument are recognized in other comprehensive income an accumulated in an equity reserve known as “Reserve for cash flow hedges.” The cumulative gain or loss in this reserve is reclassified to the statement of comprehensive income to the extent that the hedged item impacts the statement of comprehensive income offsetting the effect in the same comprehensive income statement account. Gains or losses from the ineffective portion of the hedging relationship are recorded directly in the statement of comprehensive income. |
A hedge relationship is considered highly effective when changes in fair value or in cash flows of the underlying item directly attributable to the hedged risk are offset by changes in fair value or cash flows of the hedging instrument, with an effectiveness ranging from 80% to 125%.
As a general rule, long-term commodity purchases or sales agreements are recognized in the statement of financial position at their fair value at the end of each reporting period, recognizing any differences in value directly in profit or loss, except for, when all of the following conditions are met:
| • | The sole purpose of the agreement is for the Group’s own use, which is understood as: (i) in the case of fuel purchase agreements its used to generate electricity; (ii) in the case of electrical energy purchased for sale, its sale to the end-customers; and, (i) in the case of electricity sales its sale to the end-customers. |
| • | The Group’s future projections evidence the existence of these agreements for its own use. |
| • | Past experience with agreements evidence that they have been utilized for the Group’s own use, except in certain isolated cases when for exceptional reasons or reasons associated with logistical issues have been used beyond the control and projection of the Group. |
| • | The agreement does not stipulate settlement by differences and the parties have not made it a practice to settle similar contracts with differences in the past. |
The long-term commodity purchase or sale agreements maintained by the Group, which are mainly for electricity, fuel, and other supplies, meet the conditions described above. Thus, the purpose of fuel purchase agreements is to use them to generate electricity, electricity purchase contracts are used to sell to end-customers, and electricity sale contracts are used to sell the Group’s own products.
The Group also evaluates the existence of derivatives embedded in contracts or financial instruments to determine if their characteristics and risk are closely related to the host contract, provided that when taken as a whole they are not being accounted for at fair value. If they are not closely related, they are recorded separately and changes in value are accounted for directly in profit or loss.
g.6) Derecognition of financial assets and liabilities
Financial assets are derecognized when:
| • | The contractual rights to receive cash flows from the financial asset expire or have been transferred or, if the contractual rights are retained, the Group has assumed a contractual obligation to pay these cash flows to one or more recipients. |
| • | The Group has substantially transferred all the risks and rewards of ownership of the financial asset, or, if it has neither transferred nor retained substantially all the risks and rewards, when it does not retain control of the financial asset. |
Transactions in which the Group retains substantially all the inherent risks and rewards of ownership of the transferred asset, it continues recognizing the transferred asset in its entirety and recognizes a financial liability for the consideration received. Transactions costs are recognized in profit and loss by using the effective interest method (See Note 3.g.1).
Financial liabilities are derecognized when they are extinguished, that is, when the obligation arising from the liability has been paid or cancelled, or has expired.
g.7) Offsetting financial assets and liabilities.
The Group offsets financial assets and liabilities and the net amount is presented in the statement of financial position when, and only when:
| • | There is a legally enforceable right to set off the recognized amounts; and |
| • | There is an intention to settle on a net basis, or to realize the asset and settle the liability simultaneously. |
These rights can only be legally enforceable within the normal course of business, or in case of default, insolvency or bankruptcy, of one or all of the counterparts.
F-31
g.8) Financial guarantee contracts
Financial guarantee contracts, such as guarantees given by the Group to third parties, are initially recognized at fair value, adjusting the transaction costs that are directly attributable to the issuance of the guarantee.
Subsequently to initial recognition, financial guarantee contracts are measured at the higher of:
| • | The amount determined under accounting policy describe in Note 3.l; and |
| • | The amount initially recognized less, when appropriate, any accumulated amortization. |
| • | Registered in accordance with the revenue recognition policy (see Note 3.p). |
| h) | Measurement of fair value |
The fair value of an asset or liability is defined as the price that would be received from the sale of an asset or paid to transfer a liability in an orderly transaction between market participants at the measurement date.
Fair value measurement assumes that the transaction to sell an asset or transfer a liability occurs in the principal market, namely, the market with the greatest volume and level of activity for that asset or liability. In the absence of a principal market, it is assumed that the transaction is carried out in the most advantageous market available to the entity, namely, the market that maximizes the amount that would be received to sell the asset or minimizes the amount that would be paid to transfer the liability.
In estimating fair value, the Group uses valuation techniques that are appropriate for the circumstances and for which there are sufficient data to conduct the measurement. The Group maximizes the use of relevant observable data and minimizes the use of unobservable data.
Considering the hierarchy of the data used in these valuation techniques, the assets and liabilities measured at fair value can be classified into the following levels:
| |
Level 1: | Quoted prices (unadjusted) in active markets for identical assets or liabilities; |
| |
Level 2: | Inputs other than quoted prices included within Level 1 that are observable for the assets or liabilities, either directly (i.e. as prices) or indirectly (i.e. derived from prices). The methods and assumptions used to determine the fair values at Level 2 by type of financial asset or financial liability take into consideration estimated future cash flows discounted at zero coupon interest rate curves for each currency. All the valuations described are carried out using external tools, such as “Bloomberg”. |
| |
Level 3: | Inputs for assets or liabilities that are not based on observable market data (unobservable inputs). |
The Group takes into account the characteristics of the asset or liability when measuring fair value, in particular:
| • | For non-financial assets, fair value measurement takes into account the ability of a market participant to generate economic benefits by using the asset in its highest and best use or by selling it to another market participant that would use the asset in its highest and best use; |
| • | For liabilities and equity instruments, the fair value measurement assumes that the liability would not be settled and an equity instrument would not be cancelled or otherwise extinguished on the measurement date. The fair value of the liability reflects the effect of non-performance risk, namely, the risk that an entity will not fulfill the obligation, which includes, but is not limited to, the Group’s own credit risk; |
| • | For derivatives not quoted in an organized market, the Group measures fair value by using the discounted cash flow method and generally accepted options valuation models, based on current and future market conditions as of year-end. This methodology also adjusts the value based on the Company’s own credit risk (Debt Valuation Adjustment, DVA), and the counterparty risk (Credit Valuation Adjustment, CVA). These CVA and DVA adjustments are measured on the basis of the potential future exposure of the instrument (creditor or borrower position) and the risk profile of both the counterparties and the Group itself. |
| • | In the case of financial assets and financial liabilities with offsetting positions in market risks or counterparty credit risks, it is permitted to measure the fair value on a net basis. However, this must be consistent with the manner in which market participants would price the net risk exposure at the measurement date. |
Financial assets and liabilities measured at fair value are disclosed in Note 20.3.
F-32
| i) | Investments accounted for using the equity method |
The Group’s interests in joint ventures and associates are recognized using the equity method.
Under the equity method, an investment in an associate or joint venture is initially recognized at cost. As of the acquisition date, the investment is recognized in the statement of financial position based on the share of its equity that the Group’s interest represents in its capital, adjusted for, if appropriate, the effect of transactions with Group’s entities, plus any goodwill generated in acquiring the entity. If the resulting amount is negative, zero is recorded for that investment in the statement of financial position, unless the Group has a present obligation (either legal or constructive) to support the investee’s negative equity situation, in which case a provision is recognized.
Goodwill from associates or joint ventures is included in the carrying amount of the investment. It is not amortized but is subject to impairment testing as part of the overall investment carrying amount when impairment indicators exist.
Dividends received from these investments are deducted from the carrying amount of the investment, and any profit or loss obtained from them to which the Group is entitled based on its ownership interest is recognized under “Share of profit (loss) of associates accounted for using equity method.”
Appendix 3. “Associates and Joint Ventures” to these consolidated financial statements describes the relationship of the Company and each of these companies.
j) Non-current assets (or disposal group of assets) held for sale or held for distribution to owners and discontinued operations.
Non-current assets, including property, plant and equipment; intangible assets; investments accounted for using the equity method, joint ventures, and disposal groups (a group of assets to be disposed of and the liabilities directly associated with those assets), are classified as:
| - | Held for sale, if their carrying amount will be recovered principally through a sale transaction rather than through continuing use |
| - | Held for distribution to owners, when the Company is committed to distribute the asset (or disposal group) to the owners. |
For the above classification, the assets must be available for immediate sale or distribution in their present condition and its sale or distribution is highly probable. For this transaction to be considered highly probable, management must be committed to the sale or distribution and actions to complete the transaction must have been initiated and should be expected to be completed within one year from the date of classification.
Actions required to complete the sale or distribution plan should indicate that it is unlikely that significant changes to the plan will be made or that the plan will be withdrawn. The probability of shareholders’ approval (if required in the jurisdiction) should be considered as part of the assessment of whether the sale or distribution is highly probable.
Non-current assets or disposal groups held-for-sale or held for distribution to owners are measured at the lower of their carrying amount and fair value less costs to sell or costs to distribute, as appropriate.
Depreciation and amortization on these assets cease when they meet the criteria to be classified as non-current assets held for sale or held for distribution to owners.
Assets that are no longer classified as held for sale or held for distribution to owners, or are no longer part of a disposal group, are measured at the lower of their carrying amounts before being classified as held for sale or held for distribution less any depreciations, amortizations or revaluations that would have been recognized if they had not been classified as held for sale or held for distribution to owners and their recoverable amount at the date of subsequent decision where would be reclassified as non-current assets.
Non-current assets held for sale and the components of the disposal groups classified as held for sale or held for distribution to owners are presented in the consolidated statement of financial position as a single line item within assets called “Non-current assets or disposal groups held for sale or for distribution to owners,” and the respective liabilities are presented as a single line item within liabilities called “Liabilities included in disposal groups held for sale or for distribution to owners.”
F-33
The Group classifies as discontinued operations those components of the Group that either have been disposed of, or are classified as held for sale, and:
(i)represents a separate major lines of business or geographical area of operations;
| (ii) | is a part of a single coordinated plan to dispose a separate major line of business or geographical area of operations; or |
| (iii) | is a subsidiary acquired exclusively with a view to resale. |
The components of profit or loss after taxes from discontinued operations and the post-tax gain or loss recognized on the measurement to fair value less costs to sell or on the disposal of the assets or groups constituting the discontinued operation are presented as a single line item in the consolidated comprehensive income statement as “Income after tax from discontinued operations”.
Inventories are measured at their weighted average acquisition cost or the net realizable value, whichever is lower.
The net realizable value is the estimated selling price in the ordinary course of business less the estimated costs necessary to make the sale.
Provisions are recognized when the Group has a present obligation (legal or constructive) as a result of a past event, it is probable that an outflow of economic benefits will be required to settle the obligation, and a reliable estimate can be made of the amount of the obligation.
The amount recognized as a provision is the best estimate of the consideration required to settle the present obligation at the end of the reporting period, taking into account the risks and uncertainties surrounding the obligation. When a provision is measured using the cash flows estimated to settle the present obligation, its carrying amount is the present value of those cash flows (when the effect of the time value of money is material). The unwinding of the discount is recognized as finance cost. Incremental legal cost expected to be incurred in resolving a legal claim is included in measuring of the provision.
Provisions are reviewed at the end of each reporting period and adjusted to reflect the current best estimate. If it is no longer probable that an outflow of resources embodying economic benefits will be required to settle the obligation, the provision is reversed.
A contingent liability does not result in the recognition of a provision. Legal costs expected to be incurred in defending a legal claim are expensed as they are incurred. Significant contingent liabilities are disclosed unless the likelihood of an outflow of resources embodying economic benefits is remote.
l.1) Provisions for post-employment benefits and similar obligations
Some of the Group’s subsidiaries have pension and similar obligations to their employees. Such obligations, which combine defined benefits and defined contributions, are basically formalized through pension plans, except for certain non-monetary benefits, mainly electricity supply commitments, which, due to their nature, have not been externalized and are covered by the related in-house provisions.
For defined benefit plans, the cost of providing benefits is determined using the Projected Unit Credit Method, with actuarial valuations being carried out at the end of each reporting period. Past service costs relating to changes in benefits are recognized immediately.
The defined benefit plan obligations in the statement of financial position represent the present value of the accrued obligations, adjusted, once the fair value of the different plans’ assets has been deducted, if any.
For each of the defined benefit plans, any deficit between the actuarial liability and the plan assets (if any) is recognized under line item “Provisions for employee benefits” within current and non-current liabilities in the statement of financial position.
Actuarial gains and losses arising in measurement of both the plan liabilities and the plan assets (if any, and excluding interest) are recognized directly in other comprehensive income.
Contributions to defined contribution benefit plans are recognized as an expense in the statement of comprehensive income when the employees have rendered their services.
| m) | Translation of foreign currency balances |
Transactions carried out by each entity in a currency other than its functional currency are recognized using the exchange rates prevailing as of the date of the transactions. During the year, any differences that arise between the prevailing exchange rate at the
F-34
date of the transaction and the exchange rate as of the date of collection or payment are recognized as “Foreign currency exchange differences” in the consolidated statement of comprehensive income.
Likewise, at the end of each reporting period, receivable or payable balances denominated in a currency other than each entity’s functional currency are translated using the closing exchange rate. Any differences are recorded as “Foreign currency exchange differences” in the consolidated statement of comprehensive income.
The Group has established a policy to hedge the portion of revenue from its consolidated entities that is directly linked to variations in the U.S. dollar, through obtaining financing in such currency. Exchange differences related to this debt, which is regarded as the hedging instrument in cash flow hedge transactions, are recognized, net of taxes, in other comprehensive income and are accumulated in an equity reserve and reclassified to profit or loss when the hedged cash flows affect profit or loss. This term has been estimated at ten years.
| n) | Current/non-current classification |
In these consolidated statements of financial position, assets and liabilities expected to be recovered or settled within twelve months are presented as current items, except for post-employment and other similar obligations. Those assets and liabilities expected to be recovered or settled in more than twelve months are presented as non-current items. Deferred income tax assets and liabilities are classified as non-current.
When the Group have any obligations that mature in less than twelve months but can be refinanced over the long term at the Group’s discretion, through unconditionally available credit agreements with long-term maturities, such obligations are classified as non-current liabilities.
Income tax expense for the period is determined as the sum of current taxes from the Group’s different entities and results from applying the tax rate to the taxable income for the period, after permitted deductions have been made, plus any changes in deferred tax assets and liabilities and tax credits, both for tax losses and deductions. Differences between the carrying amount and tax basis of assets and liabilities generate deferred tax assets and liabilities, which are calculated using the tax rates expected to apply when the assets and liabilities are realized or settled, based on tax rates that have been enacted or substantively enacted by the end of the reporting period.
Deferred tax assets are recognized for all deductible temporary differences, tax losses and unused tax credits to the extent that it is probable that sufficient future taxable profits exist to recover the deductible temporary differences and make use of the tax credits. Such deferred tax asset is not recognized if the deductible temporary difference arises from the initial recognition of an asset or liability that:
| • | Did not arise from a business combination, and |
| • | At initial recognition affected neither accounting profit nor taxable profit (loss). |
With respect to deductible temporary differences associated with investments in subsidiaries, associates and joint arrangements, deferred tax assets are recognized only to the extent that it is probable that the temporary differences will reverse in the foreseeable future and taxable profits will be available against which the temporary differences can be utilized.
Deferred tax liabilities are recognized for all temporary differences, except those derived from the initial recognition of goodwill and those that arose from investments in subsidiaries, associates and joint ventures in which the Group can control their reversal and where it is probable that they will not be reversed in the foreseeable future.
Current tax and changes in deferred tax assets or liabilities are recorded in profit or loss or in equity, depending on where the gains or losses that triggered these tax entries have been recognized.
Any tax deductions that can be applied to current tax liabilities are credited to earnings within the line item “Income tax expenses”, except when exists uncertainty about their tax realization, in which case they are not recognized until they are effectively realized, or when they correspond to specific tax incentives, in which case they are recorded as government grants.
At the end of each reporting period, the Group reviews the deferred taxes assets and liabilities recognized, and makes, if any, necessary corrections based on the results of this analysis.
Deferred tax assets and deferred tax liabilities are offset in the consolidated statement of financial position if has a legally enforceable right to set off current tax assets against current tax liabilities, and only when the deferred taxes relate to income taxes levied by the same taxation authority.
F-35
| p) | Revenue and expense recognition |
Revenue is recognized when the gross inflow of economic benefits arising in the course of the Group’s ordinary activities in the period occurs, provided that this inflow of economic benefits results in an increase in total equity other than increases relating to contributions from equity participants and such benefits can be measured reliably.
Revenues and expenses are recognized on an accrual basis and depending on the type of transaction; the following criteria for recognition are taken:
| • | Generation and transmission of electricity: Revenue is recognized based on physical delivery of energy and power, at prices established in the respective contracts, at prices stipulated in the electricity market by applicable regulations or at marginal cost determined on the spot market, as appropriate. This revenue includes an estimate of the service provided and not billed until the closing date (See Note 2.3 and 25). |
| • | Distribution of electricity: Revenue is recognized based on the amount of energy supplied to customers during the period, at prices established in the respective contracts or at prices stipulated in the electricity market by applicable regulations, as appropriate. This revenue includes an estimate of the energy supplied but not billed and for which the customers’ meters have not been read yet (See Note 2.3 and 25). |
Revenue from rendering of services is only recognized when it can be estimated reliably, by reference to the stage of completion of the service rendered at the date of the statement of financial position. When the outcome of a transaction involving the rendering of services cannot be estimated reliably, revenue is recognized only to the extent of the expenses recognized that are recoverable. (See Note 25)
Revenue from sales of goods is recognized based on the economic substance of the transaction and are recognized when all and each of the following conditions are met:
| • | the entity has transferred to the buyer the significant risks and rewards of ownership of the goods; |
| • | the entity retains neither continuing managerial involvement to the degree usually associated with ownership nor effective control over the goods sold; |
| • | the amount of revenue can be measured reliably; |
| • | it is probable that the economic benefits associated with the transaction will flow to the entity; and |
| • | the costs incurred or to be incurred in respect of the transaction can be measured reliably. |
Revenue is measured at the fair value of the consideration received or receivable that gives rise to the revenue.
In arrangements under which the Group will perform multiple revenue-generating activities (multiple-element arrangement), the recognition criteria are applied to the separately identifiable components of the transaction in order to reflect the substance of the transaction or to two or more transactions together when they are linked in such a way that the commercial effect cannot be understood without reference to the series of transactions as a whole.
The Group excludes from revenue those gross inflows of economic benefits it receives when it acts as an agent or commission agent on behalf of third parties, and only recognizes as revenue economic benefits received for its own activity.
When goods or services are exchanged or swapped for goods or services of a similar nature and value, the exchange is not regarded as a revenue-generating transaction.
The Group recognizes the net amount of non-financial asset purchase or sale contracts that are settled for a net amount of cash or through some other financial instruments. Contracts entered into and maintained for the purpose of receiving or delivering these non-financial assets are recognized on the basis of the contractual terms of the purchase, sale, or usage requirements expected by the entity.
Financial income (expense) is recognized using the effective interest rate applicable to the outstanding principal over the repayment period.
Expenses are recognized on an accruals basis, immediately in the event of expenditures that do not generate future economic benefits or when they do not meet the requirements for recognizing them as assets.
Basic earnings per share are calculated by dividing net income attributable to shareholders of the Parent Company by the weighted average number of ordinary shares outstanding during the period, excluding the average number of shares of the Parent Company held by other subsidiaries within the Group, if any.
Basic earnings per share for continuing and discontinued operations are calculated by dividing net income from continuing and discontinued operations attributable to shareholders of the Parent Company (the numerator) by the weighted average number of
F-36
ordinary shares outstanding (the denominator) during the year, excluding the average number of shares of the Parent Company held by other subsidiaries within the Group, if any.
Article No. 79 of the Chilean Corporations Act 18,046 establishes that, unless unanimously agreed otherwise by the shareholders of all issued shares, listed corporations must distribute a cash dividend to shareholders on an annual basis, pro rata to the shares owned or the proportion established in the company’s by-laws if there are preferred shares, of at least 30% of net income for each period, except when accumulated losses from prior years must be absorbed.
As it is practically impossible to achieve a unanimous agreement given the Company’s highly fragmented share capital, at the end of each reporting period the amount of the minimum statutory dividend obligation to its shareholders is determined, net of interim dividends approved during the fiscal year, and then accounted for in “Trade and other current payables” and “Accounts payable to related companies”, as appropriate, and recognized in equity.
Interim and final dividends are deducted from equity as soon as they are approved by the competent body, which in the first case is normally the Company’s Board of Directors and in the second case is the Ordinary Shareholders’ Meeting.
| s) | Statement of cash flows |
The statement of cash flows reflects changes in cash and cash equivalents that took place during the period, determined with the direct method. It uses the following expressions and corresponding meanings:
| - | Cash flows: inflows and outflows of cash or cash equivalents, which are defined as highly liquid investments maturing in less than three months with a low risk of changes in value. |
| - | Operating activities: the principal revenue-producing activities of the Group and other activities that cannot be considered investing or financing activities. |
| - | Investing activities: the acquisition and disposal of long-term assets and other investments not included in cash and cash equivalents. |
| - | Financing activities: activities that result in changes in the size and composition of the total equity and borrowings of the Group. |
F-37
4.SECTOR REGULATION AND ELECTRICITY SYSTEM OPERATIONS.
4.1 Regulatory framework:
The electricity sector is regulated by the General Law of Electrical Services N°20,018 (Chilean Electricity Law), also known as DFL No. 1 of 1982, of the Ministry of Mining, whose compiled and coordinated text was established in DFL No. 4 issued in 2006 by the Ministry of Economy (the Electricity Law), as well as by an associated Regulation (D.S. No. 327 issued in 1998).
Three government bodies are primarily responsible for enforcing this law: the National Energy Commission (CNE in its Spanish acronym), which has the authority to propose regulated tariffs (node prices) and to draw up indicative plans for the construction of new generating units; the Superintendency of Electricity and Fuels (SEF), which supervises and oversees compliance with the laws, regulations, and technical standards that govern the generation, transmission, and distribution of electricity, as well as liquid fuels, and gas; and the Ministry of Energy, which is responsible for proposing and guiding public policies on energy matters. It also oversees the SEF, the CNE, and the Chilean Commission for Nuclear Energy (CChEN in its Spanish acronym), thus strengthening coordination and allowing for an integrated view of the energy sector. The Ministry of Energy also includes the Agency for Energy Efficiency and the National Center for Innovation and Development of Sustainable Energy (Centro Nacional para la Innovación y Fomento de las Energías Sustentables – CIFES). The Chilean Electricity Law has also established a Panel of Experts whose main task is to resolve potential discrepancies among the participants in the electricity market, including electricity companies, system operators, regulators, etc.
From a physical point of view, the Chilean power sector is divided into three electrical grids: the Sistema Electrico Nacional (SEN) and two separate medium-size grids in southern Chile, one in Aysén and the other in Magallanes. The SEN was incoroporated in November 2017 through the interconnection of the Sistema Interconectado Central (SIC) and the Sistema Interconectado del Norte Grande (SING). Prior to the interconnection, the SIC was the main electrical grid, running 2,400 km. longitudinally and connecting the country from Taltal in the north, to Quellón on the island of Chiloé in the south. On the other hand, the SING covered the northern part of the country, from Arica down to Coloso, covering a length of about 700 km.
The electricity industry is organized into three business activities: generation, transmission, and distribution, all operating in an interconnected and coordinated manner, and whose main purpose is to supply electrical energy to the market at minimum cost while maintaining the quality and safety service standards required by the electrical regulations. As essential services, the power transmission and distribution businesses are natural monopolies; these segments are regulated as such by the Electricity Law, which requires free access to networks and regulates tariffs.
Under the Chilean Electricity Law, the electricity market coordinates their operations through a centralizing operating agent, the Coordinador Eléctrico Nacional (CISEN), in order to operate the system at minimum cost while maintaining reliable service, and the Sistema Eléctrico Nacional. The CISEN plans and operates the systems, including the calculation of the so-called “marginal cost,” which is the price assigned to energy transfers among power generating companies.
Limits on integration and concentration
Chile has legislation in effect that defends free competition and, together with specific regulations that apply to the electricity market, defines criteria to avoid certain levels of economic concentration and/or abusive market practices.
In principle, the regulator allows the participation of companies in different activities (e.g. generation, distribution, and commercialization) as long as there is an adequate separation of each activity, for both accounting and company purposes. Nevertheless, most of the restrictions imposed involve the transmission sector mainly due to its nature and to the need to guarantee adequate access to all agents.
The Chilean Electricity Law establishes limits for participation of generation or distribution companies in the Trunk Transmission Systems, and prohibits participation of Trunk Transmission Systems’ companies in the generation and distribution segment.
4.1.1 Generation Segment
Generation companies must comply with the operation plan of the CISEN. However, each generation company is free to decide whether to sell its energy to regulated or unregulated customers. Any surplus or deficit between a company’s sales to its customers and its energy supply is sold to, or purchased from, other generators at the spot market price.
A generation company may have the following types of customers:
| (i) | Unregulated customers: Those customers, mainly industrial and mining companies, with a connected capacity higher than 5,000 kW. These customers can freely negotiate prices for electrical supply with generators and/or distributors. Those customers with connected capacity between 500 and 5,000 kW have the option to contract energy at prices agreed upon with their suppliers or be subject to regulated prices, with a minimum term of at least four years under each pricing system. |
F-38
| (ii) | Distribution companies that supply power to regulated customers: Participation in public tenders regulated by the CNE for the supply to their free customers through bilateral contracts. |
| (iii) | Spot market: This represents energy and capacity transactions among generating companies that result from the CISEN’s coordination to keep the system running as economically as possible, where the surpluses (deficits) between a generator’s energy supply and the energy it needs to comply with business commitments are transferred through sales (purchases) to (from) other generators in the CISEN. In the case of energy, transfers are valued at the marginal cost, while node prices for capacity are set every semester by the regulators. |
In Chile, the capacity that must be paid to each generator depends on an annual calculation performed by the CISEN to determine the sufficiency capacity of each power plant, which is not the same as the dispatched capacity.
Non-Conventional Renewable Energy
Law No. 20,257 was enacted in April of 2008 to encourage the use of Non-Conventional Renewable Energy (NCRE). The principal aspect of this law is that at least 5% of the energy sold by generation companies to their customers must come from renewable sources between years 2010 and 2014. This requirement progressively increases by 0.5% from 2015 until 2024, when a 10% renewable energy requirement will be reached. This law was amended in 2013 by Law No. 20,698, dubbed the “20/25 law,” as it establishes that by 2025, 20% of energy supplied will be generated by NCRE. It does not change the previous law’s plan for supplying energy under agreements in effect in July 2013.
4.1.2. Transmission Segment
The transmission segment is comprised of a combination of lines, substations and equipment for the transmission of electricity from the production points (generators) to the centers of consumption or distribution, which do not correspond to distribution facilities. The transmission segment is divided into National Transmission System, Development Poles Transmission System, Zonal Transmission System and Dedicated Transmission System. The International Interconnection Systems, which are governed by special rules, are also part of the transmission segment.
The transmission system is open access, and transmission companies may impose rights of way over the available transmission capacity under non-discriminatory conditions. The fees of the existing facilities of the National and Zonal Transmission Systems is determined through a tariff setting process that is carried out every four years. In that process, the Annual Value of the Transmission is determined, which comprises efficient operation and maintenance costs and the annuity of the investment value, determined on the basis of a discount rate fixed by the authority on a quarterly basis (minimum 7% after tax) and the economic useful life of the facilities.
The planning of the National and Zonal Transmission Systems a regulated and centralized process, in which the CISEN annually issues an expansion plan, which must be approved by the CNE. The expansions of both systems are carried out through open tenders, distinguishing between new projects (with tenders open to any bidder) and expansion of existing facilities projects (participation in the expansion corresponds to the original facilities owners under modification). The bids correspond to the value resulting from the tender, which constitutes the revenues for the first 20 years from the start of operation. As of the year 21, the fees of such transmission facilities are determined as if they were existing facilities.
4.1.3 Distribution segment
The distribution segment is defined for regulatory purposes as all electricity supplied to end customers at a voltage no higher than 23 kV. Distribution companies operate under a distribution public utility concession regime, with service obligations and regulated tariffs for supplying regulated customers.
Customers are classified based on their demand as regulated and unregulated. Regulated customers are those with connected capacity of more than 5,000 kW. Customers with connected capacity between 500 kW and 5,000 kW can choose either a regulated or an unregulated regime.
Distribution companies can supply both regulated customers, under supply conditions regulated by the Law, and unregulated customers, whose supply conditions are freely negotiated and agreed in bilateral contracts with energy suppliers (generation or distribution companies).
Regarding price regulation, the Law establishes that distribution companies must permanently have available energy supply, on the basis of open, non-discriminatory and transparent public tenders. These bidding processes are managed by the CNE and are carried out at least five years in advance. The result of the process is a “pay as bid” contract, with an extension up to 20 years. In case of unforeseen deviations in the projections of demand, the regulator has the authority to carry out short-term tenders. In addition, a reimbursement mechanism exists allowing supply without contract and regulating corresponding tariffs.
The tariffs are set every four years in order to determine the distribution value added (“VAD”) as a result of model companies cost studies, composed of fixed costs, average energy and capacity losses and standard distribution costs. Both the CNE and the
F-39
distribution companies grouped by typical areas engage independent consultants for these studies. The VAD is obtained by weighting the results of the study received by the CNE and the companies with a ratio of 2:3 and 1:3, respectively. Based on this result, the CNE structures basic tariffs and verifies that the aggregate profitability of the industry is within the established range of 10% with a margin of ± 4%.
Additionally, every four years a review of services associated with the calculation of VAD is carried out, which do not represent energy supply and which the Free Competition Court qualifies as subject to tariff regulation.
The Chilean distribution tariff model is a consolidated model, which already had eight cycles of tariff settings since the privatization of the sector.
4.2 Regulatory Developments in 2017
Law No. 20,928 - Tariff Equality Law
On June 22, 2016, the Ministry of Energy published Law No. 20,928 in the Official Gazette, establishing tariff equality mechanisms for electrical services, amending the Electricity Law (DFL No. 4) of 2006. The law states that the maximum tariffs that distribution companies may charge to residential customers must not exceed the average national tariff by more than 10%. The differences arising from the application of this mechanism will be progressively absorbed by all the rest of the customers subject to regulated prices that are under the mentioned average, except for those residential users whose monthly average consumption of energy in the prior calendar year is lower than or equal to 200 kWh. In addition, the Law provides for a discount for consumers with installed capacity greater than 200 MW that are located in those cities with intensive energy generation.
Nonetheless, the law allows the regulator to incorporate within the VAD certain services unrelated to energy distribution.
In this context, in January 2017, the Ministry of Energy together with the CNE and SEF announced publicly the discontinuance of application of individual energy supply connection and disconnection service charge; also know as “cut-off and reconnection” charge. Prior to this announcement, the CNE requested distribution companies to discontinue the application of this charge, because this service charge will be incorporated in the tariff as part of the 2016 – 2020.
Distribution Law
On September 29, 2016, at the Seminar “The Future of Electric Power Distribution” the process to devise a new law on electric power distribution was launched.
This process is led by the Ministry of Energy with collaboration of the Pontifical Catholic University of Chile. In November and December 2016 and until January 2017, certain thematic workshops were carried out: “Development of the distribution network”; “Future financing of the network and tarification”; “Business model of distribution”; and “Future services of the network”. On April 13, 2017, the first stage of the process related to the distribution industry diagnosis, was completed. It is expected that the results of the work carried out during the year 2017, will be delivered to the authorities that make up the next government.
2017 CNE Regulatory Plan
On January 13, 2017, through Exempted Resolution No. 23 and pursuant Article 72-19 of the Chilean Electricity Law, the CNE published its Annual Work Plan aiming to draft and develop technical regulations for year 2017. The plan considers amendments to the Safety and Quality Service Technical Standard, new Technical Appendices and Technical Standards applicable to energy generation, distribution and transmission facilities.
Regulatory developments in 2017
In 2017, several regulations associated with Transmission Law No. 20,936 were published, among others: (i) Regulation on Long-Term Energy Planning; (ii) Regulation setting the requirements and the procedure applicable to requests of international exchange of electric services; (iii) Regulation for determination of preliminary bands for new works in the transmission systems; (iv) Regulation for determination and payment of compensations for interruption of energy supply; and (v) Regulation on establishing Technical Standards ruling technical requirements on safety, coordination, quality, information and economics about electric sector operation. Furthermore, in December the Supplementary Services Regulations were submitted to the General Comprollership of the Republic and they are expected to be published in early 2018.
Also, the regulations for the Transmission Law were published via Exempt Resolution No. 659: Technical provisions for implementing Article 8 of Law 20.870, which regulates payment of tax on emissions of the Steam-electric power plants as specified in the Tax Reform.
F-40
Technical Standard of the Quality of Service for Distribution Systems
On December 18, 2017, Exempted Resolution CNE 706 was published. It sets the Technical Standard of the Quality of Service for Distribution Systems. Preparation of this standard was considered in the CNE 2017 Regulatory Plan, for which a consulting committee was set up and the wording was submitted to public consultation.
The new standard incorporates greater technical and commercial demands for the electrical energy distribution segment. The following are among the main areas addressed by the new regulations: Continuity Indicators (it incorporated the indicators SAIDI, SAIFI, TIC and FIC); Quality of the Product; Measurement, Monitoring and Control; and Commercial Quality.
2017 Expansion Plan - Transmission
For the purposes of the expansion of the transmission segment, the Electricity Law considers a mandatory annual procedure on project planning for new facilities. In this context, the Ministry of Energy through Exempted Resolution CNE 770 issued on December 29, 2017 defined the new and expansion works of facilities within the planning process carried out in 2017. According to the milestones considered in the law, the stakeholders (duly registered in the citizen participation register) may make comments in that regard during the first days of January 2018.
Tariff Study under Article No. 187 of the Electricity Law
On October 6, 2017, CNE issued Exempted Resolution CNE 560, approving the unanimous agreement to perform a New Tariff Study in accordance with Article No. 187 of the Electricity Law, signed by CNE and the concessionaires of energy distribution service. In December, 2017, CNE requested to the distribution companies for their investment plans and necessary costs to comply with the Technical Standard on Quality of Service for Energy Distribution System (approved by Exempted Resolution CNE No. 706 issued on December 7, 2017) that had not been included in the current electricity supply tariffs (Decree No. 11T of the Ministry of Energy).
4.3 Tariff Revisions:
4.3.1 Distribution Tariff Setting
At the end of 2015, the CNE began the 2016 – 2020 tariff setting process through publishing Exempted Resolution No. 699 communicating the definition for Typical Areas, the terms for the “Distribution Value Added 2016 – 2020 Study”, and the terms for the “Services associated with Energy Distribution Supply Cost Study”.
The CNE defines six Typical Areas with separate tariff each, and Enel Distribución Chile was categorized within Typical Area No. 1, same as in prior tariff process, reflecting the higher density of its network and, therefore, lower costs as compared to other companies in the industry. The subsidiary Empresa Eléctrica de Colina and Luz Andes were categorized, same as in prior tariff process, within Typical Areas No. 4 and No. 2, respectively.
In February 2016, the CNE published in the Official Gazette, Exempted Resolution No. 83 containing the list of the qualified independent consultant entities to be eligible by the distribution companies to carry out the tariff studies. In April 2016, Enel Distribución Chile selected Consultor Systep Ingeniería y Diseños S.A. to carry out the Distribution Value Added 2016 – 2020 Study.
On September 5, 2016, Enel Distribución Chile submitted to the CNE the tariff study in compliance with the requirements indicated in the regulations.
The 2016-2020 tariff setting process was finalized by publishing in the Official Gazette Tariff Decree 11T, the distribution tariffs are retrospectively applicable to November 4, 2016.
The tariffs applied in 2016 and 2017 to end customers were determined based on the following decrees:
| i. | Decree No. 1T published in the Official Gazette on April 2, 2013, set the tariff formulas applicable to regulated customers. Tariffs were retroactively applied with a start date of November 4, 2012 until November 3, 2016. |
| ii. | Decree No. 11T published in the Official Gazette on August 24, 2017, set the tariff indexation formulas applicable to energy supplies subject to regulated prices. Tariffs were retroactively applied from November 4, 2016 until November 3, 2020. |
F-41
| iii. | Decree No. 14 published in the Official Gazette on April 9, 2013, set the tariffs and indexation formulas applicable to the subtransmission and additional transmission systems. Tariffs were retroactively applied with a start date of January 1, 2011 until December 31, 2015. Subsequently, Decree No. 7T extended the effective date until December 31, 2015. |
Node Average prices:
On January 4, 2016, the Ministry of Energy published in the Official Gazette, Decree No. 22T, setting the node prices for energy supply, retroactively applied from September 1, 2015.
On January 21, 2016, the Ministry of Energy published in the Official Gazette, Decree No. 24T, setting the node prices for energy supply, retroactively applied from November 1, 2015.
On March 4, 2016, the Ministry of Energy published in the Official Gazette, Decree No. 1T, setting the node prices for energy supply, retroactively applied from January 1, 2016.
On May 23, 2016, the Ministry of Energy published in the Official Gazette, Decree No. 4T, setting the node prices for energy supply, retroactively applied from March 1, 2016.
On June 17, 2016, the Ministry of Energy published in the Official Gazette, Decree No. 7T, setting the node prices for energy supply, retroactively applied from April 1, 2016.
On August 6, 2016, the Ministry of Energy published in the Official Gazette, Decree No. 8T, setting the node prices for energy supply, retroactively applied from May 1, 2016.
On September 1, 2016, the Ministry of Energy published in the Official Gazette, Decree No. 9T, setting the node prices for energy supply as part of Law No. 20,928 on Tariff Equality in relation to the Domestic Generation Acknowledgement, retroactively applied from August 1, 2016.
On October 10, 2017, the Ministry of Energy published in the Official Gazette, Decree No. 12T, setting the node prices for energy supply and the adjustments and surcharges from applying the Residential Rate Equality Mechanism, retroactively applied from January 1, 2017.
On October 10, 2017, the Ministry of Energy published in the Official Gazette Decree No. 3T, setting the node prices for energy supply and the adjustments and surcharges from applying the Residential Rate Equality Mechanism, retroactively applied from July 1, 2017.
Short-term node prices:
On July 2, 2016, the Ministry of Energy published in the Official Gazette, Decree No. 5T, setting the short-term node prices for energy supply, retroactively applied from May 1, 2016.
On August 26, 2017, the Ministry of Energy published in the Official Gazette, Decree No. 2T, setting short-term node prices for energy supply, retroactively applied from April 1, 2017.
4.3.2 Transmission Tariffs Setting
Tariffs Setting 2020-2023
On December 29, 2017, the CNE through Exempted Resolution CNE No. 771, as part of the Transmission Tariff Setting process, issued the preliminary technical report “Rating the Transmission System Facilities” for the period 2020-2023. The report defines which transmission facilities correspond to each segment (National, Zonal and Dedicated). Final rating of the facilities must be considered for the transmission system valuation study (ies) purposes. In accordance to the milestones established in the law, stakeholders may make comments to the preliminary report during the first days of January 2018.
F-42
Also, the law stipulates that, 24 months before the end of the effective period of the transmission systems’ rates, CNE must send the stakeholders (duly registered in the citizen participation register) the technical and administrative conditions for performing the transmission system valuation study or studies.
In this context, via Exempted Resolution No.769, the regulator issued the Preliminary Technical and Administrative Conditions for the Transmission System Valuation Study. In general terms, the document regulates the process of contracting the rate study and defines the rules for setting the rates for all the transmission, defining tenders for two studies – one for national installations and the other for Zonal and Dedicated Installations. According to the stages considered in the law, stakeholders may make observations to this report during the first days of January 2018.
4.3.3 Subtransmission Tariff Setting
On July 20, 2016, Law No. 20,936 was publish, setting the new regulatory framework for all electric energy transmission systems, making changes to the tariff process in all transmission sector. Also, the sector named “Subtransmission” was renamed to “Zonal Transmission”.
The Zonal Transmission tariffs are set every four years. However, before publishing Law No. 20.936, the tariff period for Substansmission had been extended, as follows:
| • | On January 29, 2015, Law No. 20,805 was published in the Official Gazette, which, among other matters, it entitles the Ministry of Energy to extend in one more year the effective date of Decree CNE No. 14 of 2012 (“Decree No.14”), which set the subtransmission tariffs for the 2011 – 2014 period (i.e., such decree would be effective for the 2011 – 2015 period), and also to extend in one more year the effective date of the tariff setting process for the period 2015 – 2018 (i.e., 2016 – 2019). |
| • | On April 22, 2015, the Ministry of Energy published in the Official Gazette, Decree No. 7T, extending the effective date of the subtransmission tariff decree and expressly stating that the tariffs will be applied beginning on January 1, 2016. |
Notwithstanding, in accordance with Article No. 11 of the transitory provisions of Law No. 20,936, the effective date for Decree No. 14 was extended to December 31, 2017.
In relation to the 2016 – 2017 tariff period, on December 29, 2016 it was published Exempted Resolution No. 940, which defined the necessary adjustments to Decree No. 14 to extend its effective date for the years 2016 and 2017. The main adjustment is related to exempt generating power plants from payment for using the Zonal Transmission systems. The 2016 – 2019 tariff setting process will continue is progress, and in accordance with Article No. 11 of the transitory provisions of Law No. 20,936, the results will be used for the tariffs to be applied to the 2018 – 2019 period.
On February 10, 2017, the CNE issued Exempted Resolution No. 83, which contained the “Preliminary Technical Report on Determination of the Annual Value of the Zonal Transmission and Dedicated Transmission Systems for the 2018-2019 period”. Enel Distribución, made comments to the report, and the final technical report was issued on March 28, 2017. Following the process steps, Enel Distribución communicated its discrepancies with the final technical report. On May 19, 2017, it was carried out a Public Hearing at which Enel Distribution and other interested parties presented their discrepancies to an Expert Panel.
At the reporting date of these interim consolidated financial statements, the tariff decree establishing the new tariffs has not been released.
4.3.4 Distribution-Related Services Tariff Setting
On March 14, 2014, the Ministry of Energy published in the Official Gazette, Decree No. 8T, setting the prices for distribution-related services, which are currently still effective.
At the end of 2015, the CNE through Exempted Resolution No. 699 communicated, among other matters, the terms for the “Services associated with Energy Distribution Supply Cost Study” as part of the 2016 – 2020 tariff setting process. The terms incorporate five new distribution-related services, of which the most significant are “Construction and installment of temporary junctions” and “Lease of temporary junctions”.
F-43
On January 20, 2017, it was published the final report on the “Energy Distribution Supply-Related Services Cost Study”. Following the steps of the process, Enel Distribución made comments to the report.
Subsequently, on April 27, 2017, the CNE through Exempted Resolution No. 213 approved the Technical Report on “Distribution-Related Services Tariff Setting”. Following the steps of the process, Enel Distribución communicated its discrepancies with the technical report.
At the reporting date of these consolidated financial statements, the decree setting new tariffs for distribution-related services has not been released.
4.3.5 Energy Tenders
Under the new law for energy tenders, three bidding processes have been carried out: Supply Bidding No. 2015/01, Supply Bidding No. 2015/02 and Supply Tender 2017/01
Supply Bidding No. 2015/01 was launched in May 2015 and finalized in July 2016. The final outcome of the process resulted in five energy blocks awarded for a total of 12,430 GWh to 84 companies at a weighted average price of US$ 47.6 per MWh. Enel Generación Chile was awarded with 5,918 GWh per year, which represented a 47.6% of the total energy awarded.
Supply Bidding No. 2015/02 was launched in June 2015 and finalized in October 2015. The final outcome of the process resulted in three energy blocks awarded for a total of 1,200 GWh per year at a weighted average price of US$ 79.3 per MWh, a 30% reduction as compared to the prices of prior bids, which indicates that the amendments to the Electricity Law have effectively reduced the prices through increased competition and a reduction in the risks for generators.
Supply Bidding No. 2017/01 was launched in January, 2017 and finalized in November 2017. The final outcome of the process resulted in five energy blocks awarded to five companies for a total of 2,200 GWh per year at a weighted average price of US$ 32.5 per MWh. Enel Generación Chile was awarded with 1.2 TWh per year, which represents 54% of the total energy awarded.
F-44
5. | NON-CURRENT ASSETS OR DISPOSAL GROUPS CLASSIFIED AS HELD FOR SALE. |
i.Centrales Hidroeléctricas de Aysén S.A.
Enel Generación Chile had a 51% interest in Centrales Hidroeléctricas de Aysén S.A. (hereinafter “Hidroaysén”), whose corporate purpose was to develop, finance, own and exploit a hydroelectric project in Region XI Aysén, Chile.
On November 17, 2017, the Board of Directors of Hidroaysén agreed to cease the company’s activities and terminate the Hidroaysén’s electrical project. The decision was made because the forecasted value of the investment in generation and transmission for the electrical project, its related costs and the long-term market prospects indicated that the project was not economically feasible in every possible valuation scenario. Also, the significance amount of the investment and its related risks, both legal and administrative, would add a second uncertainty factor that definitively precluded continuing with the project.
On December 7, 2017, at the Extraordinary Shareholders’ Meeting of Hidroysén it was agreed to terminate the company and the liquidation process of the company’s assets. The liquidation process considers the distribution of assets to the shareholders and it is expected to be completed in the first half of 2018.
On December 31, 2017, as a result of the above, the investment held by Enel Generación Chile in Hidroaysén comply with the criteria to be classified as a non-current assets or disposal groups classified as held for sale, therefore, as described in note 3.j), it has been recognized at the lower of its carrying amount and fair value less costs to sell. The following table shows the carrying amount of the investment:
Equity of Centrales Hidroeléctricas de Aysén S.A. | | | Ownership Interest | | | Carrying Amount of Centrales Hidroeléctricas de Aysén S.A. | |
ThCh$ | | | % | | | ThCh$ | |
| 8,245,555 | | | | 51 | % | | | 4,205,233 | |
It is important to note that in 2014, Enel Generación Chile recognized an impairment loss of ThCh$69,066,857 on its investment in Hydroaysén (See note 12.1 – Other information).
-Additional financial information on Hidroaysén:
Centrales Hidroeléctricas de Aysén S.A. | | 12/31/2017 |
| | ThCh$ |
Total Current Assets | | 355,835 |
Cash and cash equivalents | | 355,446 |
Total Non Current Assets | | 8,030,172 |
Land | | 8,030,172 |
Total Current Liabilities | | 139,182 |
Other fixed operating expenses | | (8,144,855) |
Interest income | | 24,829 |
Profit (loss) | | (8,193,671) |
F-45
ii.Electrogas S.A.
On December 16, 2016, our subsidiary Enel Generación Chile S.A. signed an agreement to sell all shares of its equity method investee Electrogas S.A., equivalent to a 42.5% ownership interest, to Aerio Chile SpA (“Aerio Chile”) which is an indirectly wholly-owned subsidiary of REN – Redes Energéticas Nacionais, S.G.P.S., S.A., under which Enel Generación Chile sold all its shares in Electrogas SA., representing 42.5% of the capital of said company. The total price was USD 180 million, which was paid on the closing date of the referred transaction. Finally, the amount collected was ThCh$115,582,806 and originated a pre-tax gain of ThCh $ 105,311,912 (see notes 6.d and 30, respectively).
Electrogas S.A. is a private corporation whose purpose is to provide services of transportation of natural gas and other fuels, on its own and on behalf of third parties. In order to provide its services, it can build, operate and maintain gas and oil pipelines, polyducts and supplementary facilities.
6. | CASH AND CASH EQUIVALENTS. |
| a) | The detail of cash and cash equivalents as of December 31, 2017 and 2016, is as follows: |
| | As of December 31, | |
| | 2017 | | | 2016 | |
Cash and Cash Equivalents | | ThCh$ | | | ThCh$ | |
Cash balances | | | 53,875 | | | | 48,002 | |
Bank balances | | | 35,208,300 | | | | 48,556,736 | |
Time deposits | | | 11,155,249 | | | | 17,325,478 | |
Other fixed-income instruments | | | 373,038,602 | | | | 180,068,976 | |
Total | | | 419,456,026 | | | | 245,999,192 | |
Time deposits have a maturity of three months or less from their date of acquisition and accrue the market interest for this type of short-term investment. Other fixed-income investments are mainly comprised of repurchase agreements with original maturities of less than or equal to 90 days.
| b) | The detail of cash and cash equivalents by currency is as follows: |
| | As of December 31, | |
| | 2017 | | | 2016 | |
Currency | | ThCh$ | | | ThCh$ | |
Chilean peso | | | 399,164,753 | | | | 235,993,647 | |
Argentine peso | | | 6,263,344 | | | | 4,807,406 | |
Euros | | | 11,594 | | | | — | |
U.S. dollar | | | 14,016,335 | | | | 5,198,139 | |
Total | | | 419,456,026 | | | | 245,999,192 | |
| c) | No payments have been made to obtain control of consolidated entities, as of December 31, 2017. |
| d) | The following tables sets forth cash and cash equivalents that have been received from the sale of shares of as of December 31, 2017, 2016 and 2015: |
| | As of December 31, |
| | 2017 | | 2016 | | 2015 (*) |
Loss of control at Subsidiaries | | ThCh$ | | ThCh$ | | ThCh$ |
Amounts received for the sale of subsidiaries | | — | | 3,003 | | 25,000,000 |
Amounts of cash and cash equivalents in entities sold | | — | | — | | (18,360,347) |
Total net | | — | | 3,003 | | 6,639,653 |
F-46
| | As of December 31, |
| | 2017 (*) | | 2016 (**) | | 2015 |
Loss of control at Associates | | ThCh$ | | ThCh$ | | ThCh$ |
Amounts received for the sale of Associates | | 115,582,806 | | 132,820,800 | | — |
Total | | 115,582,806 | | 132,820,800 | | — |
| e) | Reconciliation of liabilities arising from financing activities: |
Liabilities arising from financing activities | Balance as of 1/1/2017 (1) | | Financing Cash Flows | | Non-Cash Changes | | Balance as of 12/31/2017 (1) | |
| From | | Used | | Interest paid | | Total | | Changes in fair value | | Foreign exchange differences | | Financial costs (2) | | Other changes | | |
ThCh$ | | ThCh$ | | ThCh$ | | ThCh$ | | ThCh$ | | ThCh$ | | ThCh$ | | ThCh$ | | ThCh$ | | ThCh$ | |
Bank loans (Note 18.1) | | 4,274 | | | — | | | (4,156 | ) | | (12,581 | ) | | (16,737 | ) | | — | | | — | | | 12,585 | | | — | | | 122 | |
Unsecured obligations (Note 18.1) | | 802,306,161 | | | — | | | (5,530,327 | ) | | (43,514,578 | ) | | (49,044,905 | ) | | — | | | (33,226,098 | ) | | 43,544,427 | | | — | | | 763,579,585 | |
Finance leases (Note 18.1) | | 17,749,647 | | | — | | | (2,592,236 | ) | | — | | | (2,592,236 | ) | | — | | | (1,359,668 | ) | | 811,171 | | | — | | | 14,608,914 | |
Financial derivatives for hedging (Note 7 y 18) | | 23,640,892 | | | — | | | (3,543,399 | ) | | — | | | (3,543,399 | ) | | (25,059,561 | ) | | (23,488,917 | ) | | 3,473,938 | | | (4,501,595 | ) | | (29,478,642 | ) |
Loans to related parties | | — | | | 150,000,000 | | | (150,000,000 | ) | | (289,800 | ) | | (289,800 | ) | | — | | | — | | | 289,800 | | | — | | | — | |
Other obligations | | — | | | — | | | (1,305,389 | ) | | — | | | (1,305,389 | ) | | — | | | — | | | 1,305,389 | | | — | | | — | |
Total | | 843,700,974 | | | 150,000,000 | | | (162,975,507 | ) | | (43,816,959 | ) | | (56,792,466 | ) | | (25,059,561 | ) | | (58,074,683 | ) | | 49,437,310 | | | (4,501,595 | ) | | 748,709,979 | |
| (1) | Balance corresponds to current and non-current portion. |
| (2) | Other changes include interest accruals |
7. | OTHER FINANCIAL ASSETS. |
The detail of other financial assets as of December 31, 2017 and 2016, is as follows:
| | Current | | | Non-current | |
| | 12-31-2017 | | | 12-31-2016 | | | 12-31-2017 | | | 12-31-2016 | |
Other Financial Assets | | ThCh$ | | | ThCh$ | | | ThCh$ | | | ThCh$ | |
Available-for-sale financial investments – unquoted equity securities or with limited liquidity | | | — | | | | — | | | | 2,595,343 | | | | 2,616,239 | |
Available-for-sale financial investments – quoted equity Securities | | | — | | | | — | | | | 33,158 | | | | 25,381 | |
Financial assets held to maturity (*) | | | 185,913 | | | | 462,801 | | | | — | | | | 652,733 | |
Hedging derivatives | | | 20,038,433 | | | | 121,443 | | | | 30,789,703 | | | | 25,533,189 | |
Non-Hedging derivatives | | | 402,716 | | | | — | | | | — | | | | — | |
Total | | | 20,627,062 | | | | 584,244 | | | | 33,418,204 | | | | 28,827,542 | |
The amounts included in “financial assets held to maturity” correspond mainly to time deposits and other highly liquid investments that are readily convertible to cash and subject to a low risk of changes in value, but that do not fulfill the definition of cash equivalent as defined in Note 3.g.2 (e.g. with maturity over 90 days from time of investment).
F-47
| 8. | TRADE AND OTHER RECEIVABLES. |
| a) | The detail of trade and other receivables as of December 31, 2017 and 2016, is as follows: |
| | As of December 31, | |
| | 2017 | | | 2016 | |
| | Current | | | Non-current | | | Current | | | Non-current | |
Trade and Other Receivables, Gross | | ThCh$ | | | ThCh$ | | | ThCh$ | | | ThCh$ | |
Trade and other receivables, gross | | | 463,626,345 | | | | 36,182,399 | | | | 484,533,736 | | | | 33,500,105 | |
Trade receivables, gross (2) | | | 415,039,522 | | | | 1,917,828 | | | | 414,184,116 | | | | 8,369,878 | |
Other receivables, gross (1) | | | 48,586,823 | | | | 34,264,571 | | | | 70,349,620 | | | | 25,130,227 | |
| | | | | | | | | | | | | | | | |
| | As of December 31, | |
| | 2017 | | | 2016 | |
| | Current | | | Non-current | | | Current | | | Non-current | |
Trade and Other Receivables, Net | | ThCh$ | | | ThCh$ | | | ThCh$ | | | ThCh$ | |
Trade and other receivables, net | | | 419,752,286 | | | | 36,182,399 | | | | 445,071,856 | | | | 33,500,105 | |
Trade and other receivables, net (2) | | | 380,379,326 | | | | 1,917,828 | | | | 382,487,300 | | | | 8,369,878 | |
Other receivables, net (1) | | | 39,372,960 | | | | 34,264,571 | | | | 62,584,556 | | | | 25,130,227 | |
| (1) | As of December 31, 2017, it mainly includes accounts receivable related to loan and advances to employees for ThCh$9,709,051 (ThCh$11,167,266 as of December 31, 2016); recoverable taxes (VAT) for ThCh$18,318,007 (ThCh$18,658,849 as of December 31, 2016); recoverable taxes in Peru of ThCh$0 (ThCh$15,035,980 as of December 31, 2016); payments in advance to suppliers for ThCh$5,360,307 (ThCh$4,804,161 as of December 31, 2016); lease receivables for ThCh$34,550,131 (ThCh$23,296,966 as of December 31, 2016) and other miscellaneous receivables for ThCh$5,700,035 (ThCh$8,266,102 as of December 31, 2016) | |
| (2) | As of December 31, 2017, our subsidiary Enel Distribución Chile S.A. recognized unbilled revenue and trade and other accounts receivable for the difference between current and effective Average Node Prices and Short Term Node Prices for ThCh$4,117,611 (ThCh$8,581,761 as of December 31, 2016) to be billed and charge to regulated end-customers. |
There are no significant trade and other receivables balances held by the Group that are not available for its use.
The Group does not have customers with sales representing 10% or more of its total consolidated revenues for the years ended December 31, 2017, 2016 and 2015.
Refer to Note 9.1 for detailed information on amounts, terms and conditions associated with accounts receivable from related parties.
As of December 31, 2017 and 2016, the present value of minimum lease payments receivable is as follows:
| 12-31-2017 | | 12-31-2016 |
| Gross | Interest | Present Value | | Gross | Interest | Present Value |
| ThCh$ | ThCh$ | ThCh$ | | ThCh$ | ThCh$ | ThCh$ |
Less than one year | 4,380,499 | 944,578 | 3,435,921 | | 2,807,385 | 696,299 | 2,111,086 |
From one to five years | 17,521,998 | 3,617,167 | 13,904,831 | | 10,011,194 | 1,461,944 | 8,549,250 |
More than five years | 18,127,398 | 918,019 | 17,209,379 | | 15,021,707 | 2,385,077 | 12,636,630 |
Total | 40,029,895 | 5,479,764 | 34,550,131 | | 27,840,286 | 4,543,320 | 23,296,966 |
F-48
Lease arrangements are related to public lightning developments mainly to municipalities.
| c) | As of December 31, 2017 and 2016, the balance of past due but not impaired trade receivables is as follows |
Trade Receivables Past Due But Not Impaired (*) | As of December 31, | |
| 2017 | | 2016 | |
| ThCh$ | | ThCh$ | |
Less than three months | | 54,488,473 | | | 52,259,795 | |
Between three and six months | | 9,008,195 | | | 10,795,139 | |
Between six and twelve months | | 7,123,391 | | | 15,842,450 | |
More than twelve months | | 16,067,867 | | | 23,338,216 | |
Total | | 86,687,926 | | | 102,235,600 | |
(*) These balances correspond to non-impaired past due accounts and the portion does not affect the provision of other accounts due receivable.
| d) | The reconciliation of changes in the allowance for impairment of trade receivables is as follows: |
| | Current and | |
| | Non-current | |
Trade Receivables Past Due and Impaired | | ThCh$ | |
Balance at December 31, 2015 | | | 35,877,490 | |
Increases (decreases) for the year (*) | | | 5,141,179 | |
Amounts written off | | | (1,556,789 | ) |
Balance at December 31, 2016 | | | 39,461,880 | |
Increases (decreases) for the year (*) | | | 7,937,817 | |
Amounts written off | | | (3,525,638 | ) |
Balance at December 31, 2017 | | | 43,874,059 | |
| (*) | See Note 28 for impairment of financial assets. |
Write-offs for past due receivables
Past due receivables are written off once all collection procedures and legal proceedings have been exhausted and the debtors’ insolvency has been demonstrated. In our power generation business, this process normally takes at least one year. In our distribution business the process takes at least twenty four months. Overall, the risk of writing off our trade receivables is limited (See Notes 3.g.3, 19.5 and Appendices 6 and 6.1).
| e) | Additional information: |
| - | Additional statistical information required under Official Bulletin 715 of the CMF, of February 3, 2012 (XBRL Taxonomy). See Appendix 6. |
- | Supplementary information on trade receivables. See Appendix 6.1.
|
F-49
9. | BALANCES AND TRANSACTIONS WITH RELATED PARTIES. |
Related party transactions are performed at current market conditions.
Transactions between the Group and its subsidiaries, associates and joint ventures have been eliminated on consolidation and are not itemized in this note.
As of the date of these financial statements, no guarantees have been given or received nor has any allowance for bad or doubtful accounts been recorded with respect to receivable balances for related party transactions.
The controlling shareholder of the Company is the Italian corporation Enel S.p.A.
9.1 Balances and transactions with related parties
The balances of accounts receivable and payable between the Group and its non-consolidated related companies are as follows:
| a) | Receivables from related parties |
Taxpayer ID | | | | | | | | | | | | | | Current | | Non-current | |
Number | | Company | | Country | | Relationship | | Currency | | Description of transaction | | Term of transaction | | 12-31-2017 | | | 12-31-2016 | | 12-31-2017 | | | 12-31-2016 | |
| | | | | | | | | | | | | | ThCh$ | | | ThCh$ | | ThCh$ | | | ThCh$ | |
Foreign | | Endesa España | | Spain | | Common Immediate Parent | | CH$ | | Other services | | Less than 90 days | | | 70,371 | | | | 83,448 | | | — | | | | — | |
Foreign | | Endesa España | | Spain | | Common Immediate Parent | | Euros | | Other services | | Less than 90 days | | | 13,077 | | | | — | | | — | | | | — | |
96.524.140-K | | Empresa Electrica Panguipulli S.A. | | Chile | | Common Immediate Parent | | CH$ | | Energy sales | | Less than 90 days | | | 1,031,125 | | | | 129,755 | | | — | | | | — | |
96.524.140-K | | Empresa Electrica Panguipulli S.A. | | Chile | | Common Immediate Parent | | CH$ | | Tolls | | Less than 90 days | | | 79,217 | | | | 57,827 | | | — | | | | — | |
96.524.140-K | | Empresa Electrica Panguipulli S.A. | | Chile | | Common Immediate Parent | | CH$ | | Other services | | Less than 90 days | | | 86,089 | | | | — | | | — | | | | — | |
96.880.800-1 | | Empresa Electrica Puyehue S.A. | | Chile | | Common Immediate Parent | | CH$ | | Energy sales | | Less than 90 days | | | 0 | | | | 64 | | | — | | | | — | |
76.418.940-k | | GNL Chile S.A. | | Chile | | Associate | | CH$ | | Advance natural gas purchase | | Less than 90 days | | | 18,793,098 | | | | 16,780,275 | | | — | | | | — | |
Foreign | | Endesa Generación | | Spain | | Common Immediate Parent | | Euros | | Other services | | Less than 90 days | | | 36,067 | | | | 36,067 | | | — | | | | — | |
Foreign | | Endesa Generación | | Spain | | Common Immediate Parent | | US$ | | Commodity derivatives | | Less than 90 days | | | — | | | | 587,224 | | | — | | | | — | |
Foreign | | Enel Italia Servizi SRL | | Italy | | Common Immediate Parent | | CH$ | | Other services | | Less than 90 days | | | 8,144 | | | | 8,144 | | | — | | | | — | |
Foreign | | Enel Italia Servizi SRL | | Italy | | Common Immediate Parent | | Euros | | Other services | | Less than 90 days | | | 290,838 | | | | 278,834 | | | — | | | | — | |
Foreign | | Enel Trade S.p.A. | | Italy | | Common Immediate Parent | | Euros | | Other services | | Less than 90 days | | | 8,511 | | | | — | | | — | | | | — | |
Foreign | | Enel Trade S.p.A. | | Italy | | Common Immediate Parent | | Euros | | Other services | | Less than 90 days | | | 21,484,590 | | | | — | | | — | | | | — | |
Foreign | | Enel Trade S.p.A. | | Italy | | Common Immediate Parent | | Euros | | Commodity derivatives | | Less than 90 days | | | 20,751,714 | | | | 22,321,017 | | | — | | | | — | |
76.126.507-5 | | Parque Eolico Talinay Oriente SA | | Chile | | Common Immediate Parent | | CH$ | | Energy sales | | Less than 90 days | | | 16,994 | | | | 142,926 | | | — | | | | — | |
76.126.507-5 | | Parque Eolico Talinay Oriente SA | | Chile | | Common Immediate Parent | | CH$ | | Tolls | | Less than 90 days | | | 134 | | | | 8 | | | — | | | | — | |
76.126.507-5 | | Parque Eolico Talinay Oriente SA | | Chile | | Common Immediate Parent | | CH$ | | Other services | | Less than 90 days | | | 49,677 | | | | — | | | — | | | | — | |
76.321.458-3 | | Sociedad Almeyda Solar SpA | | Chile | | Common Immediate Parent | | CH$ | | Energy sales | | Less than 90 days | | | 50,594 | | | | 98,353 | | | — | | | | — | |
76.321.458-3 | | Sociedad Almeyda Solar SpA | | Chile | | Common Immediate Parent | | CH$ | | Tolls | | Less than 90 days | | | 35,572 | | | | 21,774 | | | — | | | | — | |
76.321.458-3 | | Sociedad Almeyda Solar SpA | | Chile | | Common Immediate Parent | | CH$ | | Other services | | Less than 90 days | | | 19,877 | | | | — | | | — | | | | — | |
76.179.024-2 | | Parque Eolico Tal Tal S.A. | | Chile | | Common Immediate Parent | | CH$ | | Energy sales | | Less than 90 days | | | 41,487 | | | | 243,946 | | | — | | | | — | |
76.179.024-2 | | Parque Eolico Tal Tal S.A. | | Chile | | Common Immediate Parent | | CH$ | | Tolls | | Less than 90 days | | | 425 | | | | — | | | — | | | | — | |
76.179.024-2 | | Parque Eolico Tal Tal S.A. | | Chile | | Common Immediate Parent | | CH$ | | Other services | | Less than 90 days | | | 54,638 | | | | — | | | — | | | | — | |
Foreign | | Enel SpA | | Italy | | Parent | | CH$ | | Other services | | Less than 90 days | | | 157,701 | | | | 194,879 | | | — | | | | — | |
Foreign | | Enel SpA | | Italy | | Parent | | Euros | | Other services | | Less than 90 days | | | 215,289 | | | | 145,858 | | | — | | | | — | |
76.052.206-6 | | Parque Eolico Valle de los Vientos S.A. | | Chile | | Common Immediate Parent | | CH$ | | Energy sales | | Less than 90 days | | | 75,956 | | | | 81,377 | | | — | | | | — | |
76.052.206-6 | | Parque Eolico Valle de los Vientos S.A. | | Chile | | Common Immediate Parent | | CH$ | | Other services | | Less than 90 days | | | 49,677 | | | | — | | | — | | | | — | |
76.412.562-2 | | Enel Green Power del Sur SpA | | Chile | | Common Immediate Parent | | CH$ | | Energy sales | | Less than 90 days | | | 28,835 | | | | 25,559 | | | — | | | | — | |
76.412.562-2 | | Enel Green Power del Sur SpA | | Chile | | Common Immediate Parent | | CH$ | | Tolls | | Less than 90 days | | | 3,443 | | | | — | | | — | | | | — | |
76.412.562-2 | | Enel Green Power del Sur SpA | | Chile | | Common Immediate Parent | | CH$ | | Other services | | Less than 90 days | | | 310,179 | | | | — | | | — | | | | — | |
96.210.110-10 | | Enel Green Power Chile S.A. | | Chile | | Common Immediate Parent | | CH$ | | Other services | | Less than 90 days | | | 162,594 | | | | 34,851 | | | — | | | | — | |
Foreign | | Enel Brasil S.A. | | Brazil | | Common Immediate Parent | | CH$ | | Other services | | Less than 90 days | | | 47,998 | | | | 2,121,609 | | | — | | | | — | |
Foreign | | Enel Brasil S.A. | | Brazil | | Common Immediate Parent | | Euros | | Other services | | Less than 90 days | | | 116,436 | | | | — | | | — | | | | — | |
Foreign | | Enel Brasil S.A. | | Brazil | | Common Immediate Parent | | US$ | | Other services | | Less than 90 days | | | 2,068,594 | | | | 36,276 | | | — | | | | — | |
76.532.379-7 | | Chilectra Inversud | | Chile | | Common Immediate Parent | | CH$ | | Other services | | Less than 90 days | | | — | | | | 150,246 | | | — | | | | — | |
Foreign | | PH Chucas Costa Rica | | Costa Rica | | Common Immediate Parent | | CH$ | | Other services | | Less than 90 days | | | — | | | | 1,614,168 | | | — | | | | — | |
Foreign | | PH Chucas Costa Rica | | Costa Rica | | Common Immediate Parent | | CH$ | | Other services | | Less than 90 days | | | 432,233 | | | | — | | | — | | | | — | |
Foreign | | Emgesa S.A. E.S.P. | | Colombia | | Common Immediate Parent | | CH$ | | Other services | | Less than 90 days | | | | | | | 29,989 | | | — | | | | — | |
Foreign | | Emgesa S.A. E.S.P. | | Colombia | | Common Immediate Parent | | CP$ | | Other services | | Less than 90 days | | | 13,746 | | | | — | | | — | | | | — | |
Foreign | | Emgesa S.A. E.S.P. | | Colombia | | Common Immediate Parent | | CP$ | | Other services | | Less than 90 days | | | — | | | | 13,327 | | | — | | | | — | |
Foreign | | Codensa S.A. | | Colombia | | Common Immediate Parent | | CH$ | | Other services | | Less than 90 days | | | 791,622 | | | | 423,462 | | | — | | | | — | |
Foreign | | Codensa S.A. | | Colombia | | Common Immediate Parent | | Euros | | Other services | | Less than 90 days | | | 29,221 | | | | — | | | — | | | | — | |
Foreign | | Enel Generación Perú S.A. | | Peru | | Common Immediate Parent | | CH$ | | Other services | | Less than 90 days | | | 15,192 | | | | 1,328,268 | | | — | | | | — | |
Foreign | | Enel Generación Perú S.A. | | Peru | | Common Immediate Parent | | US$ | | Other services | | Less than 90 days | | | 758,841 | | | | — | | | — | | | | — | |
Foreign | | Enel Generación Perú S.A. | | Peru | | Common Immediate Parent | | PS$ | | Other services | | Less than 90 days | | | — | | | | 15,192 | | | — | | | | — | |
94.271.000-3 | | Enel Américas S.A. | | Chile | | Common Immediate Parent | | CH$ | | Mercantile current account | | Less than 90 days | | | — | | | | 519,570 | | | — | | | | — | |
94.271.000-3 | | Enel Américas S.A. | | Chile | | Common Immediate Parent | | CH$ | | Other services | | Less than 90 days | | | 1,487,709 | | | | 2,356,523 | | | — | | | | — | |
94.271.000-3 | | Enel Américas S.A. | | Chile | | Common Immediate Parent | | CH$ | | Other services | | Less than 90 days | | | 54,949 | | | | — | | | — | | | | — | |
Foreign | | Enel Green Power Colombia SAS | | Colombia | | Common Immediate Parent | | CH$ | | Other services | | Less than 90 days | | | 46,557 | | | | — | | | — | | | | — | |
Foreign | | Enel Generación Piura S.A. | | Peru | | Common Immediate Parent | | CH$ | | Other services | | Less than 90 days | | | — | | | | 346,061 | | | — | | | | — | |
Foreign | | Enel Generación Piura S.A. | | Peru | | Common Immediate Parent | | US$ | | Other services | | Less than 90 days | | | 165,875 | | | | — | | | — | | | | — | |
Foreign | | Enel Perú S.A.C. | | Peru | | Common Immediate Parent | | CH$ | | Other services | | Less than 90 days | | | — | | | | 341,948 | | | — | | | | — | |
Foreign | | Compañía Energética Veracruz S.A.C. | | Peru | | Common Immediate Parent | | CH$ | | Other services | | Less than 90 days | | | | | | | 639,233 | | | — | | | | — | |
Foreign | | Chinango S.A.C. | | Peru | | Common Immediate Parent | | CH$ | | Other services | | Less than 90 days | | | 17,410 | | | | — | | | — | | | | — | |
Foreign | | Enel Green Power Italia | | Italy | | Common Immediate Parent | | CH$ | | Other services | | Less than 90 days | | | 262,694 | | | | — | | | — | | | | — | |
96.971.330-6 | | Geotérmica del Norte | | Chile | | Common Immediate Parent | | US$ | | Other services | | Less than 90 days | | | 82,830 | | | | — | | | — | | | | — | |
96.971.330-6 | | Geotérmica del Norte | | Chile | | Common Immediate Parent | | CH$ | | Energy sales | | Less than 90 days | | | 10,096 | | | | — | | | — | | | | — | |
Foreign | | Enel Distribución Perú S.A. | | Peru | | Common Immediate Parent | | CH$ | | Other services | | Less than 90 days | | | 354,283 | | | | 1,251,369 | | | — | | | | — | |
Foreign | | Enel Green Power Mexico | | Mexico | | Common Immediate Parent | | US$ | | Other services | | Less than 90 days | | | 152,495 | | | | — | | | — | | | | — | |
Foreign | | Enel Green Power Perú | | Peru | | Common Immediate Parent | | US$ | | Other services | | Less than 90 days | | | 177,478 | | | | — | | | — | | | | — | |
Foreign | | Enel Green Power Brasil | | Brazil | | Common Immediate Parent | | US$ | | Other services | | Less than 90 days | | | 37,936 | | | | — | | | — | | | | — | |
Foreign | | Enel Green Power Brasil Participacoes LTDA | | Brazil | | Common Immediate Parent | | US$ | | Other services | | Less than 90 days | | | 9,188 | | | | — | | | — | | | | — | |
Foreign | | Empresa Distribuidora del Sur S.A. | | Argentina | | Common Immediate Parent | | CH$ | | Other services | | Less than 90 days | | | 796,750 | | | | 398,957 | | | — | | | | — | |
| | | | | | | | | | | | Total | | | 71,856,046 | | | | 52,858,384 | | | — | | | | — | |
F-50
| b) | Accounts payable to related parties |
Taxpayer ID | | | | | | | | | | | | | | Current | | | Non-current | |
Number | | Company | | Country | | Relationship | | Currency | | Description of transaction | | Terms of transaction | | 12-31-2017 | | | 12-31-2016 | | | 12-31-2017 | | | 12-31-2016 | |
| | | | | | | | | | | | | | ThCh$ | | | ThCh$ | | | ThCh$ | | | ThCh$ | |
Foreign | | Endesa España | | Spain | | Common Immediate Parent | | CH$ | | Other services | | Less than 90 days | | | — | | | | 273,569 | | | | — | | | | — | |
Foreign | | Endesa España | | Spain | | Common Immediate Parent | | Euros | | Other services | | Less than 90 days | | | 277,868 | | | | — | | | | | | | | | |
Foreign | | Enel Brasil | | Brazil | | Common Immediate Parent | | US$ | | Other services | | Less than 90 days | | | 77,680 | | | | — | | | | — | | | | — | |
Foreign | | Enel Brasil | | Brazil | | Common Immediate Parent | | CH$ | | Other services | | Less than 90 days | | | — | | | | 85,864 | | | | — | | | | — | |
Foreign | | Enel Trading Argentina S.R.L. | | Argentina | | Common Immediate Parent | | US$ | | Other services | | Less than 90 days | | | — | | | | 63,992 | | | | — | | | | — | |
Foreign | | Enel Trading Argentina S.R.L. | | Argentina | | Common Immediate Parent | | AR$ | | Other services | | Less than 90 days | | | 74,740 | | | | — | | | | — | | | | — | |
Foreign | | Enel Trading Argentina S.R.L. | | Argentina | | Common Immediate Parent | | CH$ | | Other services | | Less than 90 days | | | — | | | | 13,574 | | | | — | | | | — | |
Foreign | | Emgesa S.A. E.S.P. | | Colombia | | Common Immediate Parent | | US$ | | Other services | | Less than 90 days | | | — | | | | 5,461 | | | | — | | | | — | |
Foreign | | Emgesa S.A. E.S.P. | | Colombia | | Common Immediate Parent | | CP$ | | Other services | | Less than 90 days | | | 4,551 | | | | — | | | | — | | | | — | |
94.271.000-2 | | Enel Américas | | Chile | | Common Immediate Parent | | CH$ | | Loan | | Less than 90 days | | | 4,650 | | | | 974,374 | | | | — | | | | — | |
94.271.000-2 | | Enel Américas | | Chile | | Common Immediate Parent | | US$ | | Other services | | Less than 90 days | | | 912,731 | | | | — | | | | — | | | | — | |
Foreign | | Enel Distribución Perú S.A. | | Peru | | Common Immediate Parent | | US$ | | Other services | | Less than 90 days | | | — | | | | 2,239 | | | | — | | | | — | |
Foreign | | Enel Distribución Perú S.A. | | Peru | | Common Immediate Parent | | PS$ | | Other services | | Less than 90 days | | | 2,110 | | | | — | | | | — | | | | — | |
96.524.140-K | | Empresa Electrica Panguipulli S.A. | | Chile | | Common Immediate Parent | | CH$ | | Energy purchase | | Less than 90 days | | | 3,175,956 | | | | 1,695,658 | | | | — | | | | — | |
96.524.140-K | | Empresa Electrica Panguipulli S.A. | | Chile | | Common Immediate Parent | | CH$ | | Tolls | | Less than 90 days | | | 71,648 | | | | 92,005 | | | | — | | | | — | |
96.806.130-5 | | Electrogas S.A. | | Chile | | Associate | | CH$ | | Tolls | | Less than 90 days | | | — | | | | 331,447 | | | | — | | | | — | |
76.418.940-k | | GNL Chile S.A. | | Chile | | Associate | | US$ | | Gas Purchase | | Less than 90 days | | | 8,100,426 | | | | 4,872,264 | | | | — | | | | — | |
Foreign | | Endesa Generación | | Spain | | Common Immediate Parent | | CH$ | | Coal Purchase | | Less than 90 days | | | — | | | | 486,180 | | | | — | | | | — | |
Foreign | | Endesa Generación | | Spain | | Common Immediate Parent | | CH$ | | Other services | | Less than 90 days | | | 22,257 | | | | 379,731 | | | | — | | | | — | |
Foreign | | Endesa Generación | | Spain | | Common Immediate Parent | | Euros | | Other services | | Less than 90 days | | | 214,667 | | | | — | | | | — | | | | — | |
Foreign | | Enel Iberoamérica S.R.L | | Spain | | Parent | | Euros | | Other services | | Less than 90 days | | | 749,834 | | | | 158,909 | | | | — | | | | — | |
Foreign | | Enel Iberoamérica S.R.L | | Spain | | Parent | | CH$ | | Dividends | | Less than 90 days | | | — | | | | 57,755,885 | | | | — | | | | — | |
Foreign | | Enel Iberoamérica S.R.L | | Spain | | Parent | | CH$ | | Other services | | Less than 90 days | | | 35 | | | | 867,838 | | | | — | | | | — | |
Foreign | | Enel Distribuzione | | Italy | | Common Immediate Parent | | Euros | | Other services | | Less than 90 days | | | 3,187,971 | | | | 705,730 | | | | — | | | | — | |
Foreign | | Enel Produzione | | Italy | | Common Immediate Parent | | Euros | | Other services | | Less than 90 days | | | 10,501,963 | | | | 118,261 | | | | 318,518 | | | | — | |
Foreign | | Enel Produzione | | Italy | | Common Immediate Parent | | CH$ | | Other services | | Less than 90 days | | | — | | | | 483,665 | | | | — | | | | — | |
Foreign | | Enel Ingegneria e Ricerca | | Italy | | Common Immediate Parent | | CH$ | | Other services | | Less than 90 days | | | — | | | | 6,343,845 | | | | — | | | | 251,527 | |
Foreign | | Enel Energía | | Italy | | Common Immediate Parent | | CH$ | | Other services | | Less than 90 days | | | 348,370 | | | | 163,911 | | | | — | | | | — | |
76.321.458-3 | | Sociedad Almeyda Solar Spa | | Chile | | Common Immediate Parent | | CH$ | | Energy purchase | | Less than 90 days | | | 371,339 | | | | 379,716 | | | | — | | | | — | |
76.321.458-3 | | Sociedad Almeyda Solar Spa | | Chile | | Common Immediate Parent | | CH$ | | Tolls | | Less than 90 days | | | 64,484 | | | | 45,153 | | | | — | | | | — | |
77.017.930-0 | | Transmisora Eléctrica de Quillota Ltda. | | Chile | | Joint Venture | | CH$ | | Tolls | | Less than 90 days | | | 72,965 | | | | 332,709 | | | | — | | | | — | |
77.017.930-0 | | Transmisora Eléctrica de Quillota Ltda. | | Chile | | Joint Venture | | CH$ | | Energy purchase | | Less than 90 days | | | 70,984 | | | | — | | | | — | | | | — | |
76.126.507-5 | | Parque Eólico Talinay Oriente SA | | Chile | | Common Immediate Parent | | CH$ | | Energy purchase | | Less than 90 days | | | 65,829 | | | | 48,434 | | | | — | | | | — | |
76.126.507-5 | | Parque Eólico Talinay Oriente SA | | Chile | | Common Immediate Parent | | CH$ | | Tolls | | Less than 90 days | | | 258 | | | | 301 | | | | — | | | | — | |
Foreign | | Enel Trade S.p.A. | | Italy | | Common Immediate Parent | | CH$ | | Other services | | Less than 90 days | | | — | | | | 589,896 | | | | — | | | | — | |
Foreign | | Enel Trade S.p.A. | | Italy | | Common Immediate Parent | | Euros | | Other services | | Less than 90 days | | | 924,051 | | | | — | | | | — | | | | — | |
Foreign | | Enel Trade S.p.A. | | Italy | | Common Immediate Parent | | Euros | | Commodity derivatives | | Less than 90 days | | | 4,184,469 | | | | — | | | | — | | | | — | |
Foreign | | Enel Trade S.p.A. | | Italy | | Common Immediate Parent | | CH$ | | Commodity derivatives | | Less than 90 days | | | — | | | | 1,103,206 | | | | — | | | | — | |
76.179.024-2 | | Parque Eólico Tal S.A. | | Chile | | Common Immediate Parent | | CH$ | | Energy purchase | | Less than 90 days | | | 2,105,042 | | | | 2,171,864 | | | | — | | | | — | |
76.179.024-2 | | Parque Eolico Tal Tal S.A. | | Chile | | Common Immediate Parent | | CH$ | | Tolls | | Less than 90 days | | | 484 | | | | 333 | | | | — | | | | — | |
76.412.562-2 | | Enel Green Power del Sur SpA | | Chile | | Common Immediate Parent | | CH$ | | Energy purchase | | Less than 90 days | | | 10,323,531 | | | | 7,406,880 | | | | — | | | | — | |
76.412.562-2 | | Enel Green Power del Sur SpA | | Chile | | Common Immediate Parent | | CH$ | | Other services | | Less than 90 days | | | — | | | | 87,448 | | | | — | | | | — | |
76.412.562-2 | | Enel Green Power del Sur SpA | | Chile | | Common Immediate Parent | | CH$ | | Tolls | | Less than 90 days | | | 853 | | | | 42,901 | | | | — | | | | — | |
96.920.110-0 | | Enel Green Power Chile Ltda. | | Chile | | Common Immediate Parent | | CH$ | | Other services | | Less than 90 days | | | 90,134 | | | | — | | | | — | | | | — | |
Foreign | | Enel S.p.A. | | Italy | | Parent | | CH$ | | Other services | | Less than 90 days | | | — | | | | 120,296 | | | | — | | | | — | |
Foreign | | Enel S.p.A. | | Italy | | Parent | | Euros | | Other services | | Less than 90 days | | | 77,415 | | | | — | | | | — | | | | — | |
Foreign | | Enel S.p.A. | | Italy | | Parent | | CH$ | | Dividends | | Less than 90 days | | | 63,543,371 | | | | — | | | | — | | | | — | |
Foreign | | Enel S.p.A. | | Italy | | Parent | | Euros | | Other services | | Less than 90 days | | | 1,583,058 | | | | 564,764 | | | | — | | | | — | |
76.052.206-6 | | Parque Eólico Valle de los Vientos S.A. | | Chile | | Common Immediate Parent | | CH$ | | Other services | | Less than 90 days | | | — | | | | 477 | | | | — | | | | — | |
76.052.206-6 | | Parque Eólico Valle de los Vientos S.A. | | Chile | | Common Immediate Parent | | CH$ | | Energy purchase | | Less than 90 days | | | 1,261,153 | | | | — | | | | — | | | | — | |
Foreign | | Enel Italia Servizi SRL | | Italy | | Common Immediate Parent | | CH$ | | Other services | | Less than 90 days | | | — | | | | 1,660,149 | | | | — | | | | — | |
Foreign | | Enel Italia Servizi SRL | | Italy | | Common Immediate Parent | | Euros | | Other services | | Less than 90 days | | | 4,591,580 | | | | — | | | | — | | | | — | |
Foreign | | Enel Italia | | Italy | | Common Immediate Parent | | Euros | | Other services | | Less than 90 days | | | 2,089,122 | | | | — | | | | — | | | | — | |
Foreign | | Codensa | | Colombia | | Common Immediate Parent | | US$ | | Other services | | Less than 90 days | | | 7,936 | | | | — | | | | — | | | | — | |
Foreign | | Enel Green Power Italia | | Italy | | Common Immediate Parent | | CH$ | | Other services | | Less than 90 days | | | 357,579 | | | | — | | | | — | | | | — | |
Foreign | | Enel Green Power Italia | | Italy | | Common Immediate Parent | | Euros | | Other services | | Less than 90 days | | | 99,878 | | | | — | | | | — | | | | — | |
| | | | | | | | | | | | Total | | | 119,612,972 | | | | 90,428,929 | | | | 318,518 | | | | 251,527 | |
F-51
| c) | Significant transactions and effects on income/expenses: |
Transactions with related companies that are not consolidated and their effects on profit or loss are as follows:
} | | | | | | | | | | For the years ended December 31, | |
Taxpayer ID Number | | Company | | Country | | Relationship | | Description of transaction | | 2017 | | | 2016 | | | 2015 | |
| | | | | | | | | | ThCh$ | | | ThCh$ | | | ThCh$ | |
Foreign | | Endesa Energía S.A. | | Spain | | Common Immediate Parent | | Other operating income | | | — | | | | — | | | | 232,867 | |
Foreign | | Endesa Energía S.A. | | Spain | | Common Immediate Parent | | Gas Sales | | | 10,394,146 | | | | 18,655,911 | | | | 14,604,841 | |
Foreign | | Endesa Energía S.A. | | Spain | | Common Immediate Parent | | Fuel consumption | | | — | | | | (134,393 | ) | | | (10,451,242 | ) |
Foreign | | Enel Latonoamérica | | Spain | | Common Immediate Parent | | Interests financial debt | | | — | | | | — | | | | (18,684 | ) |
Foreign | | Endesa Generación | | Spain | | Common Immediate Parent | | Fuel consumption | | | — | | | | (54,818,466 | ) | | | (15,030,911 | ) |
Foreign | | Endesa Generación | | Spain | | Common Immediate Parent | | Other fixed operating expenses | | | — | | | | — | | | | (23,329 | ) |
Foreign | | Endesa Generación | | Spain | | Common Immediate Parent | | Commodity derivatives | | | — | | | | — | | | | (2,144,063 | ) |
Foreign | | Generalima S.A.C. | | Peru | | Common Immediate Parent | | Other services rendered | | | — | | | | — | | | | — | |
Foreign | | Enel Perú S.A.C | | Peru | | Common Immediate Parent | | Other services rendered | | | 7,405 | | | | 68,066 | | | | — | |
Foreign | | Enel Perú S.A.C | | Peru | | Common Immediate Parent | | Financial expenses | | | (181 | ) | | | — | | | | — | |
94.271.000-3 | | Enel Américas | | Chile | | Common Immediate Parent | | Other financial expense | | | — | | | | — | | | | (4,709,312 | ) |
94.271.000-3 | | Enel Américas | | Chile | | Common Immediate Parent | | Financial expenses | | | (289,800 | ) | | | (1,933,040 | ) | | | — | |
94.271.000-3 | | Enel Américas | | Chile | | Common Immediate Parent | | Financial income | | | 144,404 | | | | 540,259 | | | | — | |
94.271.000-3 | | Enel Américas | | Chile | | Common Immediate Parent | | Other services rendered | | | 4,737,522 | | | | 4,822,344 | | | | — | |
94.271.000-3 | | Enel Américas | | Chile | | Common Immediate Parent | | Other variable expenses | | | — | | | | (352 | ) | | | — | |
94.271.000-3 | | Enel Américas | | Chile | | Common Immediate Parent | | Other operating income | | | — | | | | 182,091 | | | | — | |
94.271.000-3 | | Enel Américas | | Chile | | Common Immediate Parent | | Other fixed operating expenses | | | — | | | | (1,546,751 | ) | | | — | |
Foreign | | Codensa S.A. | | Colombia | | Common Immediate Parent | | Other operating income | | | — | | | | (709 | ) | | | — | |
Foreign | | Codensa S.A. | | Colombia | | Common Immediate Parent | | Other services rendered | | | 399,432 | | | | 141,664 | | | | — | |
Foreign | | Enel Brasil | | Brazil | | Common Immediate Parent | | Other fixed operating expenses | | | — | | | | (35,949 | ) | | | — | |
Foreign | | Enel Brasil | | Brazil | | Common Immediate Parent | | Other services rendered | | | — | | | | 2,044,935 | | | | — | |
76.418.940-k | | GNL Chile S.A. | | Chile | | Associate | | Gas consumption | | | (146,507,390 | ) | | | (102,686,858 | ) | | | (123,964,573 | ) |
76.418.940-k | | GNL Chile S.A. | | Chile | | Associate | | Gas transportation | | | (47,656,002 | ) | | | (40,494,275 | ) | | | (52,195,582 | ) |
76.418.940-k | | GNL Chile S.A. | | Chile | | Associate | | Other services rendered | | | 85,274 | | | | 82,762 | | | | 54,377 | |
76.418.940-k | | GNL Chile S.A. | | Chile | | Associate | | Other operating income | | | — | | | | (1,539 | ) | | | 81,749 | |
76.788.080-4 | | GNL Quintero S.A. | | Chile | | Associate | | Energy sales | | | — | | | | 1,912,448 | | | | 3,260,734 | |
76.788.080-4 | | GNL Quintero S.A. | | Chile | | Associate | | Electricity tolls | | | — | | | | 79,203 | | | | 151,088 | |
76.788.080-4 | | GNL Quintero S.A. | | Chile | | Associate | | Other services rendered | | | — | | | | 960,390 | | | | 650,390 | |
Foreign | | Endesa Cemsa S.A. | | Argentina | | Common Immediate Parent | | Other fixed operating expenses | | | — | | | | — | | | | (11,862 | ) |
96.524.140-K | | Empresa Eléctrica Panguipulli S.A. | | Chile | | Common Immediate Parent | | Energy purchases | | | (11,758,824 | ) | | | (8,803,274 | ) | | | (10,597,853 | ) |
96.524.140-K | | Empresa Eléctrica Panguipulli S.A. | | Chile | | Common Immediate Parent | | Electricity tolls | | | (254,065 | ) | | | (235,950 | ) | | | (294,910 | ) |
96.524.140-K | | Empresa Eléctrica Panguipulli S.A. | | Chile | | Common Immediate Parent | | Other services rendered | | | 415,162 | | | | 281,190 | | | | 392,168 | |
96.524.140-K | | Empresa Eléctrica Panguipulli S.A. | | Chile | | Common Immediate Parent | | Energy sales | | | 1,242,092 | | | | 116,726 | | | | 286,977 | |
Foreign | | Empresa Distribuidora del Sur S.A. | | Argentina | | Common Immediate Parent | | Other services rendered | | | 409,823 | | | | 398,957 | | | | — | |
Foreign | | Enel Distribución Perú S.A. | | Peru | | Common Immediate Parent | | Other services rendered | | | 176,867 | | | | 70,415 | | | | — | |
Foreign | | Enel Iberoamérica S.R.L | | Spain | | Parent | | Other fixed operating expenses | | | — | | | | — | | | | (402,833 | ) |
Foreign | | Enel Iberoamérica S.R.L | | Spain | | Parent | | Other fixed operating expenses | | | (6,085 | ) | | | — | | | | — | |
96.806.130-5 | | Electrogas S.A. | | Chile | | Associate | | Gas tolls | | | (251,099 | ) | | | (2,750,858 | ) | | | (3,296,951 | ) |
96.806.130-5 | | Electrogas S.A. | | Chile | | Associate | | Fuel consumption | | | (25,025 | ) | | | (717,599 | ) | | | (952,044 | ) |
Foreign | | Emgesa S.A.E.S.P | | Colombia | | Common Immediate Parent | | Other operating income | | | 1,866 | | | | (2,645 | ) | | | — | |
Foreign | | Enel Argentina S.A. | | Argentina | | Common Immediate Parent | | Other fixed operating expenses | | | — | | | | (970 | ) | | | — | |
Foreign | | Enel Generación Perú S.A. | | Peru | | Common Immediate Parent | | Other services rendered | | | — | | | | (96,109 | ) | | | — | |
Foreign | | Enel Generación Perú S.A. | | Peru | | Common Immediate Parent | | Other operating income | | | 745,818 | | | | — | | | | — | |
Foreign | | Enel Generación Perú S.A. | | Peru | | Common Immediate Parent | | Financial expenses | | | (349 | ) | | | — | | | | — | |
Foreign | | Enel Generación Perú S.A. | | Peru | | Common Immediate Parent | | Other operating income | | | — | | | | (9,253 | ) | | | — | |
Foreign | | Enel Generacion Piura S.A. | | Peru | | Common Immediate Parent | | Other services rendered | | | 98,421 | | | | 168,961 | | | | — | |
Foreign | | Enel Generacion Piura S.A. | | Peru | | Common Immediate Parent | | Financial expenses | | | (135 | ) | | | — | | | | — | |
77.017.930-0 | | Transmisora Eléctrica de Quillota Ltda. | | Chile | | Joint venture | | Electricity tolls | | | (1,383,710 | ) | | | (1,291,995 | ) | | | (1,473,974 | ) |
99.573.910-0 | | Chilectra Inversud S.A. | | Chile | | Common Immediate Parent | | Other operating income | | | — | | | | 637 | | | | — | |
76.532.379-7 | | Chilectra Américas S.A. (*) | | Chile | | Common Immediate Parent | | Other services rendered | | | — | | | | 289,994 | | | | 686,249 | |
76.532.379-7 | | Chilectra Américas S.A. (*) | | Chile | | Common Immediate Parent | | Other financial expense | | | | | | | — | | | | (375,037 | ) |
76.536.351-9 | | Endesa Américas S.A. (*) | | Chile | | Common Immediate Parent | | Other services rendered | | | — | | | | 1,260,448 | | | | 343,881 | |
Foreign | | PH Chucas Costa Rica | | Costa Rica | | Common Immediate Parent | | Other services rendered | | | 6,629 | | | | 425,604 | | | | 1,188,564 | |
Foreign | | PH Chucas Costa Rica | | Costa Rica | | Common Immediate Parent | | Financial expenses | | | (162,177 | ) | | | — | | | | — | |
Foreign | | Compañía Energética Veracruz S.A.C. | | Peru | | Common Immediate Parent | | Other services rendered | | | 283,346 | | | | 42,890 | | | | — | |
Foreign | | Enel Trade S.p.A | | Italy | | Common Immediate Parent | | Commodity derivatives | | | 19,941,617 | | | | — | | | | (833,366 | ) |
Foreign | | Enel Trade S.p.A | | Italy | | Common Immediate Parent | | Other fixed operating expenses | | | — | | | | — | | | | (216,437 | ) |
76.321.458-3 | | Sociedad Almeyda Solar Spa | | Chile | | Common Immediate Parent | | Energy purchases | | | (4,306,145 | ) | | | (3,674,821 | ) | | | (3,264,764 | ) |
76.321.458-3 | | Sociedad Almeyda Solar Spa | | Chile | | Common Immediate Parent | | Electricity tolls | | | (212,402 | ) | | | (188,859 | ) | | | (153,929 | ) |
76.321.458-3 | | Sociedad Almeyda Solar Spa | | Chile | | Common Immediate Parent | | Other services rendered | | | 40,643 | | | | 152,419 | | | | 109,891 | |
76.321.458-3 | | Sociedad Almeyda Solar Spa | | Chile | | Common Immediate Parent | | Energy sales | | | 344,090 | | | | 64,174 | | | | 87,062 | |
76.052.206-6 | | Parque Eólico Valle de los Vientos S.A. | | Chile | | Common Immediate Parent | | Energy purchases | | | (16,630,422 | ) | | | (11,992,799 | ) | | | (14,929,463 | ) |
76.052.206-6 | | Parque Eólico Valle de los Vientos S.A. | | Chile | | Common Immediate Parent | | Other services rendered | | | 101,595 | | | | — | | | | — | |
76.052.206-6 | | Parque Eólico Valle de los Vientos S.A. | | Chile | | Common Immediate Parent | | Energy sales | | | 144,589 | | | | 558,966 | | | | 670,035 | |
Foreign | | Enel SpA | | Italy | | Parent | | Other fixed operating expenses | | | (658,611 | ) | | | (34,700 | ) | | | — | |
Foreign | | Enel Italia Servizi | | Italy | | Common Immediate Parent | | Other fixed operating expenses | | | (2,230,668 | ) | | | (1,547,695 | ) | | | — | |
76.412.562-2 | | Enel Green Power del Sur S.p.A | | Chile | | Common Immediate Parent | | Energy purchases | | | (104,865,684 | ) | | | (34,952,571 | ) | | | — | |
76.412.562-2 | | Enel Green Power del Sur S.p.A | | Chile | | Common Immediate Parent | | Energy sales | | | 528,740 | | | | 48,322 | | | | — | |
76.412.562-2 | | Enel Green Power del Sur S.p.A | | Chile | | Common Immediate Parent | | Electricity tolls | | | 3,730 | | | | (2,323 | ) | | | — | |
76.412.562-2 | | Enel Green Power del Sur S.p.A | | Chile | | Common Immediate Parent | | Other services rendered | | | 634,361 | | | | 15 | | | | — | |
76.179.024-2 | | Parque Eolico Tal Tal S.A. | | Chile | | Common Immediate Parent | | Energy purchases | | | (25,959,608 | ) | | | (22,415,584 | ) | | | (26,456,188 | ) |
76.179.024-2 | | Parque Eolico Tal Tal S.A. | | Chile | | Common Immediate Parent | | Electricity tolls | | | 250 | | | | — | | | | — | |
76.179.024-2 | | Parque Eolico Tal Tal S.A. | | Chile | | Common Immediate Parent | | Other services rendered | | | 111,748 | | | | — | | | | — | |
76.179.024-2 | | Parque Eolico Tal Tal S.A. | | Chile | | Common Immediate Parent | | Energy sales | | | 109,643 | | | | 23,932 | | | | 217,448 | |
96.920.110-0 | | Enel Green Power Chile Ltda. | | Chile | | Common Immediate Parent | | Other services rendered | | | 162,848 | | | | 34,855 | | | | — | |
Foreign | | Enel Produzione | | Italy | | Common Immediate Parent | | Other fixed operating expenses | | | 94,045 | | | | — | | | | (206,912 | ) |
Foreign | | Enel Distribuzione | | Italy | | Common Immediate Parent | | Other fixed operating expenses | | | — | | | | (654,622 | ) | | | — | |
Foreign | | Enel Energy Europe | | Italy | | Common Immediate Parent | | Other services rendered | | | — | | | | — | | | | (69,202 | ) |
Foreign | | Enel Ingegneria e Innovazione | | Italy | | Common Immediate Parent | | Other services rendered | | | — | | | | 30,806 | | | | 35,773 | |
Foreign | | Enel Ingegneria e Innovazione | | Italy | | Common Immediate Parent | | Other fixed operating expenses | | | — | | | | (328,310 | ) | | | (1,354,650 | ) |
76.652.400-1 | | Centrales Hidroeléctricas de Aysén S.A. | | Chile | | Joint venture | | Other services rendered | | | — | | | | — | | | | 260,275 | |
Foreign | | Enel Global Trading S.p.A | | Italy | | Common Immediate Parent | | Other operating income | | | — | | | | 9,191,693 | | | | — | |
Foreign | | Enel Global Trading S.p.A | | Italy | | Common Immediate Parent | | Other variable expenses | | | — | | | | (2,120,323 | ) | | | — | |
Foreign | | Enel Trading Argentina S.r.L. | | Argentina | | Common Immediate Parent | | Other services rendered | | | 11,488 | | | | — | | | | — | |
Foreign | | Enel Green Power Italia | | Italy | | Common Immediate Parent | | Other fixed operating expenses | | | 262,694 | | | | — | | | | — | |
Foreign | | Enel Green Power Perù | | Peru | | Common Immediate Parent | | Other services rendered | | | 177,478 | | | | — | | | | — | |
Foreign | | Enel Green Power Brasil | | Brazil | | Common Immediate Parent | | Other services rendered | | | 37,936 | | | | — | | | | — | |
Foreign | | Enel Green Power Brasil Participacoes LTDA | | Brazil | | Common Immediate Parent | | Other services rendered | | | 9,188 | | | | — | | | | — | |
Foreign | | Enel Green Power Mexico | | Mexico | | Common Immediate Parent | | Other services rendered | | | 152,495 | | | | — | | | | — | |
96.971.330-6 | | Geotérmica del Norte | | Chile | | Common Immediate Parent | | Energy purchases | | | (456 | ) | | | — | | | | — | |
96.971.330-6 | | Geotérmica del Norte | | Chile | | Common Immediate Parent | | Energy sales | | | 10,552 | | | | — | | | | — | |
96.971.330-6 | | Geotérmica del Norte | | Chile | | Common Immediate Parent | | Other services rendered | | | 69,605 | | | | — | | | | — | |
Foreign | | Chinango S.A.C | | Peru | | Common Immediate Parent | | Other services rendered | | | 18,516 | | | | — | | | | — | |
Foreign | | Enel Green Power Colomboa SAS | | Colombia | | Common Immediate Parent | | Other services rendered | | | 46,557 | | | | — | | | | — | |
76.126.507-5 | | Parque Eólico Talinay Oriente S.A. | | Chile | | Common Immediate Parent | | Energy sales | | | 128,626 | | | | 89,710 | | | | 153,158 | |
76.126.507-5 | | Parque Eólico Talinay Oriente S.A. | | Chile | | Common Immediate Parent | | Electricity tolls | | | 144 | | | | — | | | | — | |
76.126.507-5 | | Parque Eólico Talinay Oriente S.A. | | Chile | | Common Immediate Parent | | Other services rendered | | | 101,595 | | | | — | | | | — | |
76.126.507-5 | | Parque Eólico Talinay Oriente S.A. | | Chile | | Common Immediate Parent | | Energy purchases | | | (539,646 | ) | | | (370,964 | ) | | | (505,404 | ) |
| | | | | | | | Total | | | (321,305,504 | ) | | | (251,103,769 | ) | | | (250,465,948 | ) |
| (*) | Entities merged with and into Enel Américas S.A. |
F-52
Transfers of short-term funds between related companies are treated as current accounts changes, with variable interest rates based on market conditions used for the monthly balance. The resulting receivable or payable balances are usually at 30 days term, with automatic rollover for the same periods and amortization in line with cash flows.
9.2 Board of Directors and Key management personnel
The Company is managed by a Board of Directors which consists of seven members. Each director serves for a three-year term after which they can be reelected.
The Board of Directors as of December 31, 2017, was elected at the Ordinary Shareholders Meeting held on April 28, 2016. At the Board of Directors Meeting held on April 29, 2016 the current Chairman and Vice Chairman were designated.
| a) | Account receivable and payable and other transactions |
| • | Accounts receivable and payable |
There are no outstanding amounts receivable or payable between the Company and the members or the Board of Directors and key management personnel.
No transactions other than the payment of compensation have taken place between the Company and the members of the Board of Directors and key management personnel and other than transactions in the normal course of business-electricity supply.
| b) | Compensation for directors |
In accordance with Article 33 of Law No. 18,046 governing shock corporations, the compensation of Directors is established each year at the Ordinary Shareholders Meeting of the Company.
The compensation consists of paying a variable annual compensation equal to one one-thousandth of the profit for the year (attributable to shareholders of Enel Chile). Also, each member of the Board will be paid a monthly compensation, one part a fixed monthly fee and another part dependent on meetings attended. The breakdown of this compensation is as follows:
-UF 180 as a fixed monthly fee; and
-UF 66 as per diem for each Board meeting attended, all with a maximum of fifteen sessions in total, be ordinary or extraordinary in the corresponding year.
The amounts paid for the monthly fee will be treated as payment in advance of the variable annual compensation described above. As stated in the by-laws, the compensation for the Chairman of the Board will be the double that of a Director.
Any advance payments received will be deducted from the annual variable compensation, with no reimbursement if the annual variable compensation is lower than the total amount paid in advances. The variable compensation will be paid, when appropriate, after the Ordinary Shareholders’ Meeting approves the Annual Report, Balance Sheet and Financial Statements, and the Independent Auditors’ Reports and Account Inspectors’ Reports for the year ended December 31, 2017.
If any Director of the Company is a member of more than one Board in any Chilean or foreign subsidiaries and/or associates, or holds the position of director or advisor in other Chilean or foreign companies or legal entities in which Enel Chile S.A. has a direct or indirect ownership interest, that Director can be compensated for his/her participation in only one of those Boards or Management Committees.
The Executive Officers of the Company and/or any of its Chilean or foreign subsidiaries or associates will not receive any compensation or per diem if they hold the position of director in any of the Chilean or foreign subsidiaries or associates of the Company. Nevertheless, the executives may receive such compensation or per diem, provided there is prior express authorization, as a payment in advance of the variable portion of their compensation received from the respective companies through which they are employed.
Directors’ Committee:
Each member of the Directors’ Committee will receive a variable compensation equal to 0.11765 thousandth of the profit for the year (attributable to shareholders of Enel Chile S.A.). Also each member will be paid a monthly compensation, one part in a fixed monthly fee and another part dependent on meetings attended.
This compensation is broken down as follows:
-UF 60.00 as a fixed monthly fee, and
-UF 22.00 as per diem for each Board meeting attended, all with a maximum of fifteen sessions in total, whether ordinary or extraordinary, in the corresponding year.
F-53
The amounts paid for the monthly fee will be treated as payment in advance of the variable annual compensation described above.
Any advance payments received will be deducted from the annual variable compensation, with no reimbursement if the annual variable compensation is lower than the total amount paid in advances. The variable compensation will be paid, when appropriate, after the Ordinary Shareholders’ Meeting approves the Annual Report, Balance Sheet and Financial Statements, and the Independent Auditors’ Reports and Account Inspectors’ Reports for the year ended December 31, 2017.
The following tables show details of the compensation paid to the members of the Board of Directors of the Company for the year ended December 31, 2017:
| | | | | | | | December 31, 2017 | |
| | | | | | | | Enel Chile Board | | | Board of subsidiaries | | | Directors' Committee | |
Taxpayer ID No. | | Name | | Position | | Period in position | | ThCh$ | | | ThCh$ | | | ThCh$ | |
4.975.992-4 | | Hermán Chadwick Piñera | | Chairman | | January - December 2017 | | | 178,065 | | | | — | | | | — | |
Foreigner | | Giulio Fazio | | Vice Chairman | | January - December 2017 | | | — | | | | — | | | | — | |
4.461.192-9 | | Fernán Gazmuri Plaza | | Director | | January - December 2017 | | | 89,032 | | | | — | | | | 28,504 | |
4.774.797-K | | Pedro Pablo Cabrera Gaete | | Director | | January - December 2017 | | | 89,032 | | | | — | | | | 28,504 | |
5.672.444-3 | | Juan Gerardo Jofré Miranda | | Director | | January - December 2017 | | | 89,032 | | | | — | | | | 28,504 | |
Foreigner | | Vicenzo Ranieri | | Director | | January - December 2017 | | | — | | | | — | | | | — | |
Foreigner | | Salvatore Bernabei | | Director | | January - December 2017 | | | — | | | | — | | | | — | |
| | | | | | Total | | | 445,161 | | | | — | | | | 85,512 | |
| | | | | | | | December 31, 2016 | |
| | | | | | | | Enel Chile Board | | | Board of subsidiaries | | | Directors' Committee | |
Taxpayer ID No. | | Name | | Position | | Period in position | | ThCh$ | | | ThCh$ | | | ThCh$ | |
4.975.992-4 | | Hermán Chadwick Piñera | | Chairman | | March - December 2016 | | | 129,578 | | | | — | | | | — | |
Foreigner | | Giulio Fazio | | Vice Chairman | | March - December 2016 | | | — | | | | — | | | | — | |
4.461.192-9 | | Fernán Gazmuri Plaza | | Director | | March - December 2016 | | | 80,864 | | | | — | | | | 25,250 | |
4.774.797-K | | Pedro Pablo Cabrera Gaete | | Director | | March - December 2016 | | | 80,864 | | | | — | | | | 25,250 | |
5.672.444-3 | | Juan Gerardo Jofré Miranda | | Director | | March - December 2016 | | | 80,864 | | | | — | | | | 25,250 | |
Foreigner | | Vicenzo Ranieri | | Director | | March - December 2016 | | | — | | | | — | | | | — | |
Foreigner | | Salvatore Bernabei | | Director | | March - December 2016 | | | — | | | | — | | | | — | |
| | | | | | Total | | | 372,170 | | | | — | | | | 75,750 | |
| c) | Guarantees given by the Company in favor of the directors |
No guarantees have been given in favor of the directors.
9.3 Compensation for key management personnel
| a) | Compensation received by key management personnel |
Key Management Personnel |
Taxpayer ID No. | | Name | | Position |
Foreigner | | Nicola Cotugno (1) | | Chief Executive Officer |
24.950.967-1 | | Raffaele Grandi | | Administration, Finance and Control Officer |
15.307.846-7 | | Jose Miranda Montecinos | | Communications Officer |
24.166.243-8 | | Alain Rosolino (2) | | Human Resources and Organization Officer |
6.973.465-0 | | Domingo Valdés Prieto | | General Counsel and Secretary to the Board |
Foreigner | | Raffael Cutrignelli (3) | | Internal Audit Officer |
11.625.161-2 | | Pedro Urzúa Frei | | Institutional Relations Officer |
Foreigner | | Bruno Stella (4) | | Planning and control Officer |
7.006.337-9 | | Francisco Silva Bafalluy | | Services Officer |
13.686.119-0 | | Andrés Pinto Bonta (5) | | Security Officer |
23.819.804-6 | | Antonella Pellegrini (5) | | Sustainability and community relations Officer |
25.629.782-5 | | Monica de Martino (5) | | Regulation Officer |
| (1) | On August 16, 2016, Mr. Nicola Cotugno became CEO replacing Mr. Luca D’Agnese who submitted his voluntarily resignation from the Company, and served until that date. |
| (2) | On October 1, 2016, Mr. Alain Rosolino became Human Resources and Organization Officer replacing Ms. Paola Visintini Vacarezza. |
| (3) | On October 1, 2016, Mr. Raffaele Cutrignelli became Internal Audit Officer replacing Mr. Alain Rosolino. |
| (4) | On January 23, 2017, Mr. Bruno Stella became Planning and Control Manager. |
| (5) | These position were assumed on May 31, 2017. |
F-54
Incentive plans for key management personnel
The Company has implemented an annual bonus plan for its executives based on meeting company-wide objectives and on the level of their individual contribution in achieving the overall goals of the Company. The plan provides for a range of bonus amounts according to seniority level. The bonuses paid to the executives consist of a certain number of monthly gross compensation.
Compensation received by key management personnel is the following:
| | December 31, 2017 | | | December 31, 2016 | |
| | ThCh$ | | | ThCh$ | |
Cash compensation | | | 2,959,467 | | | | 1,486,703 | |
Short-term benefits for employees | | | 557,122 | | | | 341,203 | |
Other long-term benefits | | | 183,453 | | | | 295,321 | |
Total | | | 3,700,042 | | | | 2,123,227 | |
| b) | Guarantees established by the Company in favor of key management personnel |
No guarantees have been given to key management personnel.
9.4 Compensation plans linked to share price
There are no payment plans granted to the Directors or key management personnel based on the share price of the Company.
The detail of inventories as of December 31, 2017 and 2016, is as follows:
| | As of December 31, | |
| | 2017 | | | 2016 | |
Classes of Inventories | | ThCh$ | | | ThCh$ | |
Supplies for Production | | | 16,879,260 | | | | 12,377,179 | |
Gas | | | 2,301,172 | | | | 2,159,901 | |
Oil | | | 2,593,806 | | | | 2,556,438 | |
Coal | | | 11,984,282 | | | | 7,660,840 | |
Other inventories (*) | | | 22,807,682 | | | | 25,162,417 | |
Total | | | 39,686,942 | | | | 37,539,596 | |
| | | | | | | | |
(*) Other inventories | | | 22,807,682 | | | | 25,162,417 | |
Supplies for projects and spare parts | | | 12,311,718 | | | | 17,076,698 | |
Electrical materials | | | 10,495,964 | | | | 8,085,719 | |
There are no inventories pledged as security for liabilities.
For the years ended December 31, 2017, 2016 and 2015, raw materials and consumables recognized as fuel expenses were ThCh$280,739,362, ThCh$295,148,838 and ThCh$327,502,996, respectively, See Note 26.
As of December 31, 2017, no inventories have been written down due to obsolescence.
F-55
11. | CURRENT TAX ASSETS AND LIABILITIES. |
The detail of current tax assets and liabilities as of December 31, 2017 and 2016, is as follows:
| | As of December 31, | |
| | 2017 | | | 2016 | |
Tax Receivables | | ThCh$ | | | ThCh$ | |
Monthly provisional tax payments | | | 63,942,847 | | | | 43,862,763 | |
Tax credit for absorbed profits | | | 13,433,962 | | | | 11,398,609 | |
Tax credit for training expenses | | | 261,000 | | | | 241,700 | |
Other | | | 118,239 | | | | 146,099 | |
Total | | | 77,756,048 | | | | 55,649,171 | |
| | As of December 31, | |
| | 2017 | | | 2016 | |
Tax Payables | | ThCh$ | | | ThCh$ | |
Income tax | | | 67,027,507 | | | | 61,599,415 | |
Total | | | 67,027,507 | | | | 61,599,415 | |
F-56
12. | INVESTMENTS ACCOUNTED FOR USING THE EQUITY METHOD. |
12.1. Investments accounted for using the equity method
| a. | The following tables present the changes in investments in associates and joint ventures accounted for using the equity method as of December 31, 2017 and 2016: |
| | | | | | | | | | | | Balance as of | | | | | | | Share of Profit | | | Dividends | | | Foreign Currency | | | Other Comprehensive | | | Other Increase | | | Balance as of | |
Taxpayer ID Number | | Associates and Joint Ventures | | Country | | Currency | | Ownership Interest | | | 01-01-2017 ThCh$ | | | Additions ThCh$ | | | (Loss) ThCh$ | | | Declared ThCh$ | | | Translation ThCh$ | | | Income ThCh$ | | | (Decrease) ThCh$ | | | 12-31-2017 ThCh$ | |
76.418.940-K | | GNL Chile S.A. | | Chile | | U.S. dollar | | | 33.33 | % | | | 3,982,934 | | | | — | | | | 841,957 | | | | (743,734 | ) | | | (297,841 | ) | | | — | | | | — | | | | 3,783,316 | |
76.652.400-1 | | Centrales Hidroeléctricas De Aysén S.A. (*) | | Chile | | Chilean peso | | | 51.00 | % | | | 6,441,166 | | | | 1,943,100 | | | | (4,179,033 | ) | | | — | | | | — | | | | — | | | | (4,205,233 | ) | | | — | |
77.017.930-0 | | Transmisora Eléctrica de Quillota Ltda. | | Chile | | Chilean peso | | | 50.00 | % | | | 8,222,763 | | | | — | | | | 595,996 | | | | — | | | | — | | | | — | | | | — | | | | 8,818,759 | |
Foreign | | Enel Argentina S.A. | | Argentina | | Argentine peso | | | 0.12 | % | | | 91,335 | | | | — | | | | 44,176 | | | | — | | | | (29,198 | ) | | | (1,490 | ) | | | 323 | | | | 105,146 | |
| | | | | | | | TOTAL | | | | 18,738,198 | | | | 1,943,100 | | | | (2,696,904 | ) | | | (743,734 | ) | | | (327,039 | ) | | | (1,490 | ) | | | (4,204,910 | ) | | | 12,707,221 | |
| | | | | | | | | | | | Balance as of | | | | | | | Share of Profit | | | Dividends | | | Foreign Currency | | | Other Comprehensive | | | Other Increase | | | Balance as of | |
Taxpayer ID Number | | Associates and Joint Ventures | | Country | | Currency | | Ownership Interest | | | 01-01-2016 ThCh$ | | | Additions ThCh$ | | | (Loss) ThCh$ | | | Declared ThCh$ | | | Translation ThCh$ | | | Income ThCh$ | | | (Decrease) ThCh$ | | | 12-31-2016 ThCh$ | |
96.806.130-5 | | Electrogas S.A. (*) | | Chile | | U.S. dollar | | | 42.50 | % | | | 12,042,873 | | | | — | | | | 5,166,226 | | | | (3,979,095 | ) | | | (844,372 | ) | | | 607,375 | | | | (12,993,007 | ) | | | — | |
76.788.080-4 | | GNL Quintero S.A. (**) | | Chile | | U.S. dollar | | | 20.00 | % | | | 17,137,023 | | | | — | | | | 2,750,075 | | | | (2,598,035 | ) | | | (816,094 | ) | | | (12,298,165 | ) | | | (4,174,804 | ) | | | — | |
76.418.940-K | | GNL Chile S.A. | | Chile | | U.S. dollar | | | 33.33 | % | | | 2,662,029 | | | | — | | | | 1,491,025 | | | | — | | | | (170,120 | ) | | | — | | | | — | | | | 3,982,934 | |
76.652.400-1 | | Centrales Hidroeléctricas De Aysén S.A. | | Chile | | Chilean peso | | | 51.00 | % | | | 6,280,293 | | | | 2,346,000 | | | | (2,185,127 | ) | | | — | | | | — | | | | — | | | | — | | | | 6,441,166 | |
77.017.930-0 | | Transmisora Eléctrica de Quillota Ltda. | | Chile | | Chilean peso | | | 50.00 | % | | | 7,594,153 | | | | — | | | | 628,610 | | | | — | | | | — | | | | — | | | | — | | | | 8,222,763 | |
Foreign | | Enel Argentina S.A. | | Argentina | | Argentine peso | | | 0.12 | % | | | — | | | | 235,090 | | | | 23,610 | | | | — | | | | (21,044 | ) | | | (656 | ) | | | (145,665 | ) | | | 91,335 | |
Foreign | | Southern Cone S.A. | | Argentina | | Argentine peso | | | 2.00 | % | | | — | | | | 3,326 | | | | 3,780 | | | | — | | | | (1,080 | ) | | | (63 | ) | | | (5,963 | ) | | | — | |
| | | | | | | | TOTAL | | | | 45,716,371 | | | | 2,584,416 | | | | 7,878,199 | | | | (6,577,130 | ) | | | (1,852,710 | ) | | | (11,691,509 | ) | | | (17,319,439 | ) | | | 18,738,198 | |
F-57
On June 9, 2016, the Company entered into a share purchase agreement with Enagás Chile S.p.A. (“Enagás Chile”), a wholly-owned subsidiary of Enagás S.A., under which Enagás Chile would acquire the entire 20% ownership interest held by the Company in the associated company GNL Quintero S.A.
The sale of this investment to Enagás Chile was subject to satisfaction of customary conditions precedent for this type of transaction, which included, among others, non-exercising by the other shareholders of GNL Quintero S.A. of the preferential acquisition rights, which they possess in accordance with the terms and conditions of the shareholders agreement.
On September 14, 2016, upon satisfaction of the conditions precedent, the Company transferred the shares it held in GNL Quintero S.A. to Enagás Chile. The total sale price was US$197,365,113.2 (ThCh$132,820,800). Cash received for GNL Quintero S.A. is included in “Other collections from the sale of equity or debt instruments belonging to other entities” in the Consolidated Statements of Cash Flows. Also see Note 30 for the net financial result of the transaction.
GNL Quintero S.A. operates a storage and regasification of Liquefied Natural Gas (LNG) plant and its related land-based Terminal for loading and unloading LNG, including facilities and network necessary to deliver LNG, through a LNG truck loading facility and delivery point’s pipelines.
Centrales Hidroeléctricas de Aysén S.A.
In May 2014, the Committee of Ministers revoked the Environmental Qualification Resolution (“RCA”) of the Centrales Hidroeléctricas de Aysén S.A. project, in which the Company participates by accepting some of the claims filed against this project. It is a public information that this decision was resorted before the Environmental Courts in Valdivia and Santiago. On January 28, 2015, it was made public that the water rights request made by Centrales Hidroeléctricas de Aysén S.A. has been partially rejected in 2008.
The Company has expressed its intention to promote at Centrales Hidroeléctricas de Aysén S.A. the defense for water rights and the environmental qualification granted to the project in the corresponding instances, continuing with the judicial actions already started or implementing new administrative or judicial actions that are necessary to this end, and it maintains the belief that hydric resources of the Aysén region are important for the energy development of the country.
Nevertheless, given the current situation, there is uncertainty on the recoverability of the investment made so far at Centrales Hidroeléctricas de Aysén S.A., since it depends both on judicial decisions and on definitions in the energy agenda which cannot be foreseen at present, consequently the investment is not included in the portfolio of the Company’s immediate projects. Consequently, at closing date of fiscal year 2014, the Company recognized an impairment of its participation in Centrales Hidroeléctricas de Aysén S.A. amounting to ThCh$ 69,066,857, which remains in effect as of December 31, 2017.
On December 7, 2017, an extraordinary shareholders’ meeting was held, in which the early dissolution of the Centrales Hidroeléctricas de Aysen S.A. aforementioned was agreed to, as well the company liquidation process of assets. The liquidation process contemplates a distribution of assets to shareholders and expected to be completed during the first half of 2018.
In accordance with the above, the investment that Enel Generación Chile has in Centrales Hidroeléctricas de Aysén S.A. has been classified as non-current assets or disposal groups classified as held for sale (See Note 5.1).
F-58
12.2. Investments with significant influence
The following tables show financial information as of December 31, 2017 and 2016, from the financial statements of the investments in associates where the Group has significant influence:
| | As of December 31, 2017 | |
| | % Ownership Interest Direct / | | Current Assets | | | Non-current Assets | | | Current Liabilities | | | Non-current Liabilities | | | Revenues | | | Expenses | | | Profit (Loss) | | | Other Comprehensive Income | | | Comprehensive Income | |
Investments with Significant Influence | | Indirect | | ThCh$ | | | ThCh$ | | | ThCh$ | | | ThCh$ | | | ThCh$ | | | ThCh$ | | | ThCh$ | | | ThCh$ | | | ThCh$ | |
GNL Chile S.A | | | 33.33 | % | | | | 71,254,956 | | | | 148,950 | | | | 60,052,823 | | | | — | | | | 687,399,254 | | | | (684,873,130 | ) | | | 2,526,124 | | | | (24,472 | ) | | | 2,501,652 | |
| | As of December 31, 2016 | |
| | % Ownership Interest Direct / | | Current Assets | | | Non-current Assets | | | Current Liabilities | | | Non-current Liabilities | | | Revenues | | | Expenses | | | Profit (Loss) | | | Other Comprehensive Income | | | Comprehensive Income | |
Investments with Significant Influence | | Indirect | | ThCh$ | | | ThCh$ | | | ThCh$ | | | ThCh$ | | | ThCh$ | | | ThCh$ | | | ThCh$ | | | ThCh$ | | | ThCh$ | |
GNL Chile S.A | | | 33.33 | % | | | | 90,283,944 | | | | 117,703 | | | | 78,452,153 | | | | — | | | | 615,229,994 | | | | (610,756,322 | ) | | | 4,473,672 | | | | (510,406 | ) | | | 3,963,266 | |
GNL Quintero S.A. | | | 20.00 | % | | | | — | | | | — | | | | — | | | | — | | | | 86,471,706 | | | | (72,752,059 | ) | | | 13,719,647 | | | | (65,571,292 | ) | | | (51,851,645 | ) |
Electrogas S.A. | | | 42.50 | % | | | | 9,318,456 | | | | 40,746,438 | | | | 5,683,680 | | | | 13,809,430 | | | | 24,126,070 | | | | (11,970,244 | ) | | | 12,155,826 | | | | (347,369 | ) | | | 11,808,457 | |
Appendix 3 to these consolidated financial statements provides information on the main activities of our associates and the ownership interest that the Group holds in them.
None of our associates have published price quotations
F-59
12.3. Joint ventures
The following tables present information from the financial statements as of December 31, 2017 and 2016, on the main joint ventures:
| | Centrales Hidroeléctricas | | | Transmisora Eléctrica | |
| | de Aysén S.A. | | | de Quillota Ltda. | |
| | | 51.0% | | | | 51.0% | | | | 50.0% | | | | 50.0% | |
| | 12-31-2017 | | | 12-31-2016 | | | 12-31-2017 | | | 12-31-2016 | |
Financial statement items | | ThCh$ | | | ThCh$ | | | ThCh$ | | | ThCh$ | |
Total current assets | | | 355,835 | | | | 863,962 | | | | 7,793,702 | | | | 6,366,378 | |
Total non-current assets | | | 8,030,172 | | | | 15,159,321 | | | | 12,036,201 | | | | 12,034,576 | |
Total current liabilities | | | 139,182 | | | | 3,324,706 | | | | 440,426 | | | | 245,025 | |
Total non-current liabilities | | | — | | | | 68,081 | | | | 1,751,963 | | | | 1,710,406 | |
Cash and cash equivalents | | | 355,446 | | | | 860,719 | | | | 7,310,296 | | | | 5,716,196 | |
Revenues | | | — | | | | — | | | | 2,813,493 | | | | 2,774,316 | |
Other fixed operating expenses | | | (8,144,855 | ) | | | (4,363,197 | ) | | | (525,471 | ) | | | — | |
Depreciation and amortization expense | | | — | | | | — | | | | (782,322 | ) | | | (773,093 | ) |
Interest income | | | 24,829 | | | | 42,046 | | | | — | | | | 134,995 | |
Income tax expense | | | — | | | | (7,070 | ) | | | (313,709 | ) | | | (225,008 | ) |
Profit (loss) | | | (8,193,671 | ) | | | (4,284,131 | ) | | | 1,191,991 | | | | 1,257,220 | |
Other comprehensive income | | | — | | | | — | | | | — | | | | — | |
Comprehensive income | | | (8,193,671 | ) | | | (4,284,131 | ) | | | 1,191,991 | | | | 1,257,220 | |
The profit and loss information corresponds to the 12-month year ended.
| d. | There are no significant commitments and contingencies, or restrictions on funds transfers to its owners in associates and joint ventures. |
13. | INTANGIBLE ASSETS OTHER THAN GOODWILL. |
The following table presents intangible assets as of December 31, 2017 and 2016:
| | As of December 31, | |
| | 2017 | | | 2016 | |
Intangible Assets, Net | | ThCh$ | | | ThCh$ | |
Intangible Assets, Net | | | 55,170,904 | | | | 44,470,750 | |
Easements and water rights | | | 12,608,950 | | | | 12,564,076 | |
Computer software | | | 38,254,793 | | | | 27,591,694 | |
Other identifiable intangible assets | | | 4,307,161 | | | | 4,314,980 | |
| | 2017 | | | 2016 | |
Intangible Assets, Gross | | ThCh$ | | | ThCh$ | |
Intangible Assets, Gross | | | 118,593,240 | | | | 101,092,918 | |
Easements and water rights | | | 14,598,701 | | | | 14,553,826 | |
Computer software | | | 93,260,355 | | | | 75,793,919 | |
Other identifiable intangible assets | | | 10,734,184 | | | | 10,745,173 | |
| | 2017 | | | 2016 | |
Intangible Assets, Amortization and Impairment | | ThCh$ | | | ThCh$ | |
Accumulated Amortization and Impairment, Total | | | (63,422,336 | ) | | | (56,622,168 | ) |
Easements and water rights | | | (1,989,751 | ) | | | (1,989,750 | ) |
Computer software | | | (55,005,562 | ) | | | (48,202,225 | ) |
Other identifiable intangible assets | | | (6,427,023 | ) | | | (6,430,193 | ) |
F-60
The reconciliations of the carrying amounts of intangible assets at December 31, 2017 and 2016 are as follows:
| | Easements | | | Computer Software | | | Other Identifiable Intangible Assets | | | Intangibles Assets, Net | |
Changes in Intangible Assets | | ThCh$ | | | ThCh$ | | | ThCh$ | | | ThCh$ | |
Opening balance January 1, 2017 | | | 12,564,076 | | | | 27,591,694 | | | | 4,314,980 | | | | 44,470,750 | |
Changes in identifiable intangible assets | | | | | | | | | | | | | | | | |
Increases (decreases) other than from business combinations | | | 295,588 | | | | 17,466,436 | | | | — | | | | 17,762,024 | |
Increase (decrease) from exchange differences, net | | | — | | | | — | | | | (115 | ) | | | (115 | ) |
Amortization (1) | | | — | | | | (6,803,337 | ) | | | (7,704 | ) | | | (6,811,041 | ) |
Increases (decreases) from transfers and other changes | | | (250,714 | ) | | | — | | | | — | | | | (250,714 | ) |
Increases (decreases) from transfers | | | (250,714 | ) | | | — | | | | — | | | | (250,714 | ) |
Total changes in identifiable intangible assets | | | 44,874 | | | | 10,663,099 | | | | (7,819 | ) | | | 10,700,154 | |
Closing balance December 31, 2017 | | | 12,608,950 | | | | 38,254,793 | | | | 4,307,161 | | | | 55,170,904 | |
| | Easements | | | Computer Software | | | Other Identifiable Intangible Assets | | | Intangibles Assets, Net | |
Changes in Intangible Assets | | ThCh$ | | | ThCh$ | | | ThCh$ | | | ThCh$ | |
Opening balance January 1, 2016 | | | 14,575,473 | | | | 27,824,092 | | | | 479,761 | | | | 42,879,326 | |
Changes in identifiable intangible assets | | | | | | | | | | | | | | | | |
Increases (decreases) other than from business combinations | | | 540,052 | | | | 5,690,091 | | | | 3,851,635 | | | | 10,081,778 | |
Increase (decrease) from exchange differences, net | | | — | | | | — | | | | 2,897 | | | | 2,897 | |
Amortization (1) | | | — | | | | (5,815,030 | ) | | | (18,961 | ) | | | (5,833,991 | ) |
Increases (decreases) from transfers and other changes | | | 352 | | | | — | | | | (352 | ) | | | — | |
Increases (decreases) from transfers | | | 352 | | | | — | | | | (352 | ) | | | — | |
Increases (decreases) from other changes | | | — | | | | — | | | | — | | | | — | |
Disposals and removals from service | | | (2,549,926 | ) | | | — | | | | — | | | | (2,549,926 | ) |
Disposals | | | (2,549,926 | ) | | | — | | | | — | | | | (2,549,926 | ) |
Removals from service | | | — | | | | — | | | | — | | | | — | |
Other increases (decreases) | | | (1,875 | ) | | | (107,459 | ) | | | — | | | | (109,334 | ) |
Total changes in identifiable intangible assets | | | (2,011,397 | ) | | | (232,398 | ) | | | 3,835,219 | | | | 1,591,424 | |
Closing balance December 31, 2016 | | | 12,564,076 | | | | 27,591,694 | | | | 4,314,980 | | | | 44,470,750 | |
(1) See Note 28.
(2) See Note 15.e).ix)
According to the Group management’s estimates and projections, the expected future cash flows attributable to intangible assets allow the recovery of the carrying amount of these assets recorded as of December 31, 2017 (See Note 3.e).
As of December 31, 2017 and 2016, there are no significant intangible assets with an indefinite useful life.
The following table shows goodwill by the Cash-Generating Unit or group of Cash-Generating Units to which it belongs and changes as of December 31, 2017 and 2016:
| | | | Opening Balance 01-01-2016 | | | Increase/ (Decrease) | | | Closing Balance 12/31/2016 | | | Increase/ (Decrease) | | | Closing Balance 12/31/2017 | |
Company | | Cash Generating Unit | | ThCh$ | | | ThCh$ | | | ThCh$ | | | ThCh$ | | | ThCh$ | |
Empresa Eléctrica de Colina Ltda. | | Empresa Eléctrica de Colina Ltda. | | | 2,240,478 | | | | — | | | | 2,240,478 | | | | — | | | | 2,240,478 | |
Compañía Eléctrica Tarapacá S.A. (1) | | Enel Generación Chile | | | 4,656,105 | | | | (4,656,105 | ) | | | — | | | | — | | | | — | |
Enel Distribución Chile S.A. | | Enel Distribución Chile | | | 128,374,362 | | | | — | | | | 128,374,362 | | | | — | | | | 128,374,362 | |
Enel Generación Chile S.A. | | Enel Generación Chile | | | 731,782,459 | | | | — | | | | 731,782,459 | | | | — | | | | 731,782,459 | |
GasAtacama Chile (1) | | Enel Generación Chile | | | 20,204,251 | | | | 4,656,105 | | | | 24,860,356 | | | | — | | | | 24,860,356 | |
| | Total | | | 887,257,655 | | | | — | | | | 887,257,655 | | | | — | | | | 887,257,655 | |
| (1) | On November 1, 2016, Compañía Eléctrica Tarapacá S.A. was merged with GasAtacama S.A., the latter being the surviving company. |
F-61
According to the Group management’s estimates and projections, the expected future cash flows projections attributable to the Cash-Generating Units or groups of Cash-Generating Units, to which the acquired goodwill has been allocated, allow recovery of its carrying amount as of December 31, 2017 and 2016 (See Note 3.e).
The origin of the goodwill is detailed below:
1.- Empresa Eléctrica de Colina Ltda.
On September 30, 1996, Enel Distribución Chile S.A. acquired 100% of Empresa Eléctrica de Colina Ltda. from the investment company Saint Thomas S.A., which is neither directly nor indirectly related to Enel Distribución Chile S.A.
2.- Enel Distribución Chile S.A.
In November 2000, Enel Américas S.A. acquired an additional 25,4% ownership interest in Enel Distribución Chile S.A. in a public bidding process, reaching a 99,99% ownership interest in the company.
3.- Enel Generación Chile S.A.
On May 11, 1999, Enel Américas S.A. acquired an additional 35% in Enel Generación Chile S.A. in a public bidding process on the Santiago Stock Exchange and by buying shares in the U.S. (30% and 5%, respectively), reaching a 60% ownership interest in the generation company.
4.- GasAtacama Chile S.A. (Formerly named Inversiones GasAtacama Holding Limitada)
On April 22, 2014, Enel Generación Chile S.A. acquired the remaining 50% equity interest in GasAtacama Chile S.A that was owned at that time by Southern Cross Latin America Private Equity Fund III L.P.
5.- Empresa Eléctrica Pangue S.A. (Currently named GasAtacama Chile S.A.)
On July 12, 2002, Enel Generación Chile S.A. acquired 2.51% of the shares of Empresa Eléctrica Pangue S.A. through a put option held by the minority shareholder International Finance Corporation (IFC).
On May 2, 2012, Empresa Eléctrica Pangue S.A. merged with Compañía Eléctrica San Isidro S.A.; with the latter company being the surviving entity.
6.- Compañía Eléctrica San Isidro S.A. (Currently named GasAtacama Chile S.A.)
On August 11, 2005, Enel Generación Chile S.A. acquired the shares of Inversiones Lo Venecia Ltda., whose only asset was a 25% interest in Compañía Eléctrica San Isidro S.A. (acquisition of non-controlling interests). On September 1, 2013, Compañía Eléctrica San Isidro S.A. was merged with Endesa Eco S.A., the latter being the surviving entity. On November 1, 2013, Endesa Eco S.A. was merged with Compañía Eléctrica Tarapacá, the latter being the surviving entity. Subsequently, on November 1, 2016, Compañía Eléctrica Tarapacá S.A. was merged with GasAtacama Chile S.A., the latter being the surviving company.
F-62
15. | PROPERTY, PLANT AND EQUIPMENT. |
The following table shows property, plant and equipment as of December 31, 2017 and 2016:
| | As of December 31, | |
| | 2017 | | | 2016 | |
Classes of Property, Plant and Equipment, Net | | ThCh$ | | | ThCh$ | |
Property, Plant and Equipment, Net | | | 3,585,687,137 | | | | 3,476,128,634 | |
Construction in progress | | | 666,590,543 | | | | 688,387,124 | |
Land | | | 67,485,380 | | | | 66,868,119 | |
Buildings | | | 12,793,641 | | | | 13,020,474 | |
Generation Plant and equipment | | | 2,080,903,064 | | | | 2,033,720,809 | |
Network infrastructure | | | 683,120,815 | | | | 613,443,219 | |
Fixtures and fittings | | | 56,284,762 | | | | 41,325,699 | |
Other property, plant and equipment under financial lease | | | 18,508,932 | | | | 19,363,190 | |
| | 2017 | | | 2016 | |
Classes of Property, Plant and Equipment, Gross | | ThCh$ | | | ThCh$ | |
Property, Plant and Equipment, Gross | | | 6,726,796,186 | | | | 6,471,364,618 | |
Construction in progress | | | 666,590,543 | | | | 688,387,124 | |
Land | | | 67,485,380 | | | | 66,868,119 | |
Buildings | | | 28,382,234 | | | | 27,891,216 | |
Generation Plant and equipment | | | 4,636,175,749 | | | | 4,481,701,141 | |
Network infrastructure | | | 1,151,951,280 | | | | 1,050,212,442 | |
Fixtures and fittings | | | 147,450,968 | | | | 127,544,544 | |
Other property, plant and equipment under financial lease | | | 28,760,032 | | | | 28,760,032 | |
Classes of Accumulated Depreciation and Impairment in Property, Plant | | 2017 | | | 2016 | |
and Equipment | | ThCh$ | | | ThCh$ | |
Total Accumulated Depreciation and Impairment in Property, Plant and Equipment | | | (3,141,109,049 | ) | | | (2,995,235,984 | ) |
Buildings | | | (15,588,593 | ) | | | (14,870,742 | ) |
Generation Plant and equipment | | | (2,555,272,685 | ) | | | (2,447,980,332 | ) |
Network infrastructure | | | (468,830,465 | ) | | | (436,769,223 | ) |
Fixtures and fittings | | | (91,166,206 | ) | | | (86,218,845 | ) |
Other property, plant and equipment under financial lease | | | (10,251,100 | ) | | | (9,396,842 | ) |
F-63
The detail and changes in property, plant, and equipment at December 31, 2017 and 2016, are as follows:
| | Construction in progress | | | Land | | | Buildings | | | Generation Plant and Equipment | | | Network infrastructure | | | Fixtures and Fittings | | | Other Property, Plant and Equipment under Financial Lease | | | Property, Plant and Equipment, Net | |
Changes in 2017 | | ThCh$ | | | ThCh$ | | | ThCh$ | | | ThCh$ | | | ThCh$ | | | ThCh$ | | | ThCh$ | | | ThCh$ | |
Opening balance January 1, 2017 | | | 688,387,124 | | | | 66,868,119 | | | | 13,020,474 | | | | 2,033,720,809 | | | | 613,443,219 | | | | 41,325,699 | | | | 19,363,190 | | | | 3,476,128,634 | |
Changes: | | | | | | | | | | | | | | | | | | | | | | | | | | | | | | | | |
Increases other than from business combinations | | | 281,007,995 | | | | — | | | | — | | | | — | | | | — | | | | 2,811,255 | | | | — | | | | 283,819,250 | |
Increases (decreases) from exchange differences, net | | | (101,444 | ) | | | (25,624 | ) | | | (44,699 | ) | | | (336,622 | ) | | | — | | | | (83,651 | ) | | | — | | | | (592,040 | ) |
Depreciation (1) (3) | | | — | | | | — | | | | (717,851 | ) | | | (107,292,353 | ) | | | (32,061,242 | ) | | | (4,947,361 | ) | | | (854,258 | ) | | | (145,873,065 | ) |
Increases (decreases) from transfers and other changes | | | (273,509,759 | ) | | | 776,933 | | | | 439,284 | | | | 155,711,630 | | | | 99,419,024 | | | | 17,162,888 | | | | — | | | | — | |
Increases (decreases) for transfers | | | (273,509,759 | ) | | | 776,933 | | | | 439,284 | | | | 155,711,630 | | | | 99,419,024 | | | | 17,162,888 | | | | — | | | | — | |
Disposals and removals from service | | | (30,255,180 | ) | | | (31,447 | ) | | | (154,623 | ) | | | (1,704,924 | ) | | | (1,023,777 | ) | | | 15,932 | | | | — | | | | (33,154,019 | ) |
Disposals | | | (5,099,800 | ) | | | (31,447 | ) | | | — | | | | (435,327 | ) | | | (18,555 | ) | | | 38,212 | | | | — | | | | (5,546,917 | ) |
Removals from service | | | (25,155,380 | ) | | | — | | | | (154,623 | ) | | | (1,269,597 | ) | | | (1,005,222 | ) | | | (22,280 | ) | | | — | | | | (27,607,102 | ) |
Other increases (decreases) | | | 1,061,807 | | | | (102,601 | ) | | | 251,056 | | | | 804,524 | | | | 3,343,591 | | | | — | | | | — | | | | 5,358,377 | |
Total changes | | | (21,796,581 | ) | | | 617,261 | | | | (226,833 | ) | | | 47,182,255 | | | | 69,677,596 | | | | 14,959,063 | | | | (854,258 | ) | | | 109,558,503 | |
Closing balance December 31, 2017 | | | 666,590,543 | | | | 67,485,380 | | | | 12,793,641 | | | | 2,080,903,064 | | | | 683,120,815 | | | | 56,284,762 | | | | 18,508,932 | | | | 3,585,687,137 | |
| | Construction in progress | | | Land | | | Buildings | | | Generation Plant and Equipment | | | Network infrastructure | | | Fixtures and Fittings | | | Other Property, Plant and Equipment under Financial Lease | | | Property, Plant and Equipment, Net | |
Changes in 2016 | | ThCh$ | | | ThCh$ | | | ThCh$ | | | ThCh$ | | | ThCh$ | | | ThCh$ | | | ThCh$ | | | ThCh$ | |
Opening balance January 1, 2016 | | | 636,148,748 | | | | 66,900,933 | | | | 13,481,093 | | | | 2,072,402,503 | | | | 589,334,703 | | | | 20,716,643 | | | | 20,075,072 | | | | 3,419,059,695 | |
Changes: | | | | | | | | | | | | | | | | | | | | | | | | | | | | | | | | |
Increases other than from business combinations | | | 244,473,325 | | | | — | | | | 24,934 | | | | — | | | | 1,443,508 | | | | 3,126,834 | | | | — | | | | 249,068,601 | |
Increases (decreases) from exchange differences, net | | | (37,543 | ) | | | (6,591 | ) | | | (11,711 | ) | | | (59,516 | ) | | | — | | | | (33,227 | ) | | | — | | | | (148,588 | ) |
Depreciation (1) | | | — | | | | — | | | | (620,865 | ) | | | (99,397,373 | ) | | | (25,187,344 | ) | | | (4,497,175 | ) | | | (711,882 | ) | | | (130,414,639 | ) |
Impairment losses recognized in profit or loss (2) | | | (30,785,531 | ) | | | — | | | | — | | | | — | | | | — | | | | — | | | | — | | | | (30,785,531 | ) |
Increases (decreases) from transfers and other changes | | | (128,045,183 | ) | | | 104,268 | | | | 147,023 | | | | 60,822,509 | | | | 48,308,750 | | | | 22,123,585 | | | | — | | | | 3,460,952 | |
Increases (decreases) for transfers | | | (127,694,878 | ) | | | 104,268 | | | | 147,023 | | | | 55,464,141 | | | | 48,308,750 | | | | 23,670,696 | | | | — | | | | — | |
Increases (decreases) from transfers from constructions in progress | | | (127,694,878 | ) | | | 104,268 | | | | 147,023 | | | | 55,464,141 | | | | 48,308,750 | | | | 23,670,696 | | | | — | | | | — | |
Increases (decreases) from other changes | | | (350,305 | ) | | | — | | | | — | | | | 5,358,368 | | | | — | | | | (1,547,111 | ) | | | — | | | | 3,460,952 | |
Disposals and removals from service | | | (33,366,692 | ) | | | (130,491 | ) | | | — | | | | (47,314 | ) | | | (456,398 | ) | | | (110,961 | ) | | | — | | | | (34,111,856 | ) |
Disposals | | | — | | | | — | | | | — | | | | — | | | | — | | | | — | | | | — | | | | — | |
Removals from service | | | (33,366,692 | ) | | | (130,491 | ) | | | — | | | | (47,314 | ) | | | (456,398 | ) | | | (110,961 | ) | | | — | | | | (34,111,856 | ) |
Other increases (decreases) | | | — | | | | — | | | | — | | | | 1,753,884 | | | | | | | | — | | | | — | | | | 3,416,059,695 | |
Total changes | | | 52,238,376 | | | | (32,814 | ) | | | (460,619 | ) | | | (38,681,694 | ) | | | 24,108,516 | | | | 20,609,056 | | | | (711,882 | ) | | | 57,068,939 | |
Closing balance December 31, 2016 | | | 688,387,124 | | | | 66,868,119 | | | | 13,020,474 | | | | 2,033,720,809 | | | | 613,443,219 | | | | 41,325,699 | | | | 19,363,190 | | | | 3,476,128,634 | |
| (2) | See Note 15.e).vii) and x). |
F-64
Additional information on property, plant and equipment, net
Major additions to property, plant and equipment are investments in operating plants and new projects amounting to ThCh$283,819,250 and ThCh$267,113,692 as of December 31, 2017 and 2016, respectively. In the generation business the main investments include maintenance to plants of ThCh$203,460,335 and ThCh$189,259,095 as of December 31, 2017 and 2016, respectively. In the distribution business, major investments are network extensions and investments to optimize their operation, in order to improve the efficiency and quality of service, amounting to ThCh$79,028,802 and ThCh$76,355,399 as of December 31, 2017 and 2016, respectively.
b.1) Borrowing costs
Capitalized borrowing costs were ThCh$4,078,463, ThCh$3,001,211 and ThCh$2,221,329 for the years ended December 31, 2017, 2016 and 2015 respectively (See Note 31). The weighted average borrowing rate was in a range of 7.12% and 7.95% as of December 31, 2017 (7.95% and 9% as of December 31, 2016 and 9% as of December 31, 2015).
b.2) Employee expenses capitalized
Employee expenses capitalized that are directly attributable to constructions in progress were ThCh$14,388,987, ThCh$16,096,852 and ThCh$21,004,053 during the years ended December 31, 2017, 2016 and 2015, respectively.
As of December 31, 2017 and 2016, property, plant and equipment includes ThCh$18,508,931 and ThCh$19,363,190, respectively, in leased assets classified as finance leases.
The present value of future lease payments derived from these finance leases is as follows:
| | As of December 31, | |
| | 2017 | | | 2016 | |
| | Gross | | | Interest | | | Present Value | | | Gross | | | Interest | | | Present Value | |
| | ThCh$ | | | ThCh$ | | | ThCh$ | | | ThCh$ | | | ThCh$ | | | ThCh$ | |
Less than one year | | | 2,459,000 | | | | 659,212 | | | | 1,799,788 | | | | 2,677,881 | | | | 837,514 | | | | 1,840,367 | |
From one to five years | | | 9,836,000 | | | | 1,244,808 | | | | 8,591,192 | | | | 10,711,519 | | | | 1,763,190 | | | | 8,948,329 | |
More than five years | | | 4,377,544 | | | | 159,610 | | | | 4,217,934 | | | | 7,445,079 | | | | 484,128 | | | | 6,960,951 | |
Total | | | 16,672,544 | | | | 2,063,630 | | | | 14,608,914 | | | | 20,834,479 | | | | 3,084,832 | | | | 17,749,647 | |
Leased assets primarily relate to a lease agreement for Electric Transmission Lines and Installations (Ralco-Charrúa 2X220 KV) entered into between Enel Generación Chile S.A. and Transelec S.A. The lease agreement has a 20-year maturity and bears interest at an annual rate of 6.5%.
The consolidated statements of income for the years ended December 31, 2017, 2016 and 2015 include ThCh$2,969,436, ThCh$3,250,503 and ThCh$10,098,166 respectively, corresponding to operating lease contracts for material assets in operation.
As of December 31, 2017 and 2016, the total future lease payments under those contracts are as follows:
| | As of December 31, | |
| | 2017 | | | 2016 | |
| | ThCh$ | | | ThCh$ | |
Less than one year | | | 4,622,605 | | | | 7,133,186 | |
From one to five years | | | 9,006,627 | | | | 11,998,147 | |
More than five years | | | 1,345,183 | | | | 9,015,356 | |
Total | | | 14,974,415 | | | | 28,146,689 | |
F-65
| (i) | As of December 31, 2017 and 2016, the Group had contractual commitments for the acquisition of property, plant and equipment amounting to ThCh$376,627,392 and ThCh$416,684,117, respectively. |
| (ii) | As of December 31, 2017 and 2016, the Group does not have property, plant and equipment pledged as security for liabilities. |
| (iii) | The Group and its consolidated entities have insurance policies for all risks, earthquake and machinery breakdown and damages for business interruption with a €1,000 million (ThCh$737,290,000) limit in the case of generating companies and a €50 million (ThCh$36,864,500) limit for distribution companies, including business interruption coverage. Additionally, the Group has Civil Liability insurance to meet claims from third parties with a €500 million (ThCh$368,645,000) limit. The insurance premiums associated with these policies are presented proportionally for each company in the caption “Prepaid expenses”. |
| (iv) | The condition of certain assets of our subsidiary Enel Generación Chile S.A. changed, primarily works and infrastructure for facilities built to support power generation in the SIC grid in 1998, due primarily to the installation in the SIC of new thermoelectric plants, the arrival of LNG, and new other projects. As such, a new supply configuration for the upcoming years, in which it is expected that these facilities will not be used. Therefore, in 2009, Enel Generación Chile S.A. recognized an impairment loss of ThCh$43,999,600 for these assets, which is still has not reversed. |
| (v) | At the end of 2014, the Group recognized an impairment loss of ThCh$12,581,947 related to the Punta Alcalde project. This impairment loss was triggered because the current definition of the project is not fully aligned with the strategy that the Company is reformulating; particularly, with regard to technological leadership, and to community and environmental sustainability. The Company has decided to suspend the project as its profitability is still unclear (see note 3.e). |
| (vi) | At the end of 2012, our subsidiary Compañía Eléctrica Tarapacá S.A. (“Celta”, a company merged with GasAtacama Chile on November 1, 2016), recognized an impairment loss of ThCh$12,578,098, to adjust the carrying amount of certain specific assets operating in the SING grid to its recoverable amount. |
At the closing of 2015, were approved certain regulatory developments to the Chilean energy industry, which after being evaluated by the Company, resulted in the identification of a new single CGU for all generation assets in Chile. The analysis took into account the fact that Enel Generación Chile S.A. performed an optimization and management of all its assets related to its generation business, it had a centralized trade policy, with sales contracts agreed at company level and not assigned to power plants. Therefore, generation of cash flows depends on all the assets as a whole.
Previously, the company identified a CGU for the assets operating in the SIC grid and another one for the assets operating in the SING, under the consideration that there were two separate markets. The new scheme, approved in 2015, posed by the interconnection of SIC and SING, unifies markets and considers a single determination of prices, which was illustrated by latest bids for energy supply to regulated customers.
Therefore, these new conditions indicated that the recognized impairment loss mentioned above has been reversed. This was based, inter alia, on the generation of additional value by the interconnection project between the SIC and SING which is expected to be operational in 2019, by improved utilization of reserves, by expanding the potential market for specific impaired assets and decreasing overall risk of the portfolio. The effects of the interconnection are considered in the five-year projections used by the company to perform impairment tests (see Note 3.e).
| (vii) | As of December 31, 2015, Enel Generación Chile recognized an impairment loss of ThCh$2,522,445 related to the wind project Waiwen. This loss was a result of new assessment of the feasibility of the project performed by the Company and a conclusion that, under existing conditions to date, its profitability is uncertain. |
| (viii) | In line with its sustainability strategy and in order to develop community relationships, Enel Generación Chile S.A. has decided to research new design alternatives for the Neltume project, in particular regarding the issue of the discharge of Lake Neltume, which has been raised by the communities in the various instances of dialogue. |
To start a new phase of research of an alternative project, which includes the discharge of water on the Fuy River in late December 2015, the Company withdrew the Environmental Impact Study. This decision applies only to the portion of the Neltume project related to the power plant and not to portion related to the transmission project, which continues its course on handling in the Environmental Assessment Service.
As a result of the above, as of December 31, 2015, Enel Generación Chile S.A. recognized a loss of ThCh$2,706,830, associated with the write down of certain assets related to Environmental Impact Study, which has been withdrawn and to other studies directly linked to the old design of assets.
Consequently, in line with the new sustainability strategy and as a result of sustained dialog with the communities, Enel Generación Chile’s projects in the territory, namely Neltume and Choshuenco, have good prospects from a social community
F-66
point of view. Nonetheless, given the current condition of the Chilean electricity market, expected profitability of the Neltume and Choshuenco projects is lower than the total capitalized investment in them. As a result, at the end of 2016, Enel Generación Chile recognized an impairment loss of ThCh$20,459,461 associated with the Neltume project and ThCh$3,748,124 associated with the Choshuenco project.
At the end of the fiscal year 2017, following an analysis during the last months, Enel Generación Chile determined to abandon the Neltume project; a decision justified mainly by the high-sustained competitiveness in the Chilean electricity market, which was ratified in November 2017 with the result of the last tender of Electric Distributors. Added to the above, there is the time associated with developing the alternative water discharge, considering a period of no less than 5 years, given the necessity to request and obtain a transfer of the current Water Right and commission a new study for environmental impact. The abandonment implied the recognition of a ThCh$21,975,641 loss, with the purpose of reducing to zero the net book value of the assets associated with the project.
Additionally, the Company also decided to abandon the Choshuenco project, mainly because the strong synergies considered with the Neltume hydroelectric project would not exist anymore and make it not viable. This decision involved recognizing a loss of ThCh$3,130,270, with the purpose of reducing the net book value of the assets associated with the project to zero.
| (ix) | On August 31, 2016, Enel Generación Chile decided to withdraw from the water rights associated with the hydroelectric projects Bardón, Chillan 1, Chillan 2, Futaleufú, Hechún and Puelo. This decision was made because of, among other evaluation aspects, the high annual maintenance cost of these unused water rights, lack of technical and economic feasibility and insufficient local communities support. As a result, the Group wrote off a total amount of ThCh$ 32,834,160 of property, plant and equipment and ThCh$ 2,549,926 of intangible assets, which represent 100% of the related costs previously capitalized (see Note 29). |
| (x) | As of December 31, 2016, Enel Generación Chile recognized an impairment loss of ThCh$ 6,577,946 associated with certain Non-Conventional Renewable Energy (“NCRE”) initiatives, such as wind, mini-hydro, biomass and solar projects. These initiatives deal with collection of natural resources data (wind speed, solar radiation, etc.) as well as engineering studies enabling the Company to perform and support technical and economical assessments in order to visualize their perspectives and decide on future steps. The results of the studies have not been entirely satisfactory, mainly due to the current conditions in the Chilean electricity market, as future viability of the NCRE projects is uncertain. As a result, Enel Generación Chile recognized an impairment loss for 100% of the capitalized investments to date in NCRE projects. |
On the other hand, Enel Generación Chile decided to write off 100% of capitalized investment in two thermal projects that until now were held in its portfolio. These are the Tames 2 and Totoralillo projects, which were being developed within the framework of the public land concessions bidden by the National Heritage Ministry in 2013. The amount of the write-off was ThCh$ 1,096,137 and arose as a result of the current conditions in the Chilean electricity market, lack of future viability of this type of technology (steam-coal) and high development costs, which make these projects unfeasible. In addition, Enel Generación Chile recognized a provision of ThCh$2,244,900 for the fines to be paid upon withdrawing from the concessions related to these projects. During fiscal year 2017, the Ministry of National Assets and Enel Generación Chile resolved to extinguish the onerous concessions by mutual agreement, and fines were not applied.
The detail and changes in investment property during the years ended December 31, 2017 and 2016, are as follows:
| | Investment Properties, Gross | | | Accumulated Depreciation, Amortization and Impairment | | | Investment Properties, Net | |
Investment Properties | | ThCh$ | | | ThCh$ | | | ThCh$ | |
Balance at January 1, 2016 | | | 8,938,662 | | | | (787,675 | ) | | | 8,150,987 | |
Depreciation expense | | | — | | | | (22,465 | ) | | | (22,465 | ) |
Balance at December 31, 2016 | | | 8,938,662 | | | | (810,140 | ) | | | 8,128,522 | |
Depreciation expense | | | — | | | | (22,465 | ) | | | (22,465 | ) |
Other increases (decreases) | | | 250,715 | | | | — | | | | 250,715 | |
Balance at December 31, 2017 | | | 9,189,377 | | | | (832,605 | ) | | | 8,356,772 | |
F-67
There were no investment properties disposed of during the periods ended December 31, 2017 and 2016.
Fair value measurement and hierarchy
As of December 31, 2017, the fair value of the Group’s investment properties was ThCh$9,758,782 (ThCh$11,567,758 as of December 31, 2016) which was determined using independent appraisals.
The fair value measurement for these investment properties was categorized as Level 3 within the fair value hierarchy.
For the years ended December 31, 2017, 2016 and 2015, the detail of income and expenses from investment properties is as follows:
| | For the years ended December 31, | |
| | 2017 | | | 2016 | | | 2015 | |
Income and expense from investment properties | | ThCh$ | | | ThCh$ | | | ThCh$ | |
Rental income from investment properties | | | 192,719 | | | | 167,429 | | | | 163,660 | |
Income from the sale of investment properties (*) | | | — | | | | — | | | | 1,800,933 | |
Direct operating expense from investment properties generating rental income | | | (78,367 | ) | | | (71,339 | ) | | | (163,767 | ) |
Direct operating expense from investment properties not generating rental income (*) | | | — | | | | — | | | | (337,770 | ) |
Total | | | 114,352 | | | | 96,090 | | | | 1,463,056 | |
The Group has no repair, maintenance, acquisition, construction or development agreements that represent future obligations for the Group as of December 31, 2017 and 2016.
The Group has insurance policies to cover operational risks of its investment properties, as well as to cover legal claims against the Group that could potentially arise from exercising its business activity. Management considers that the insurance policy coverage is sufficient against the risks involved.
The following table presents the components of the income tax expense / (benefit) for the years ended December 31, 2017, 2016 and 2015:
| | For the years ended December 31, | |
| | 2017 | | | 2016 | | | 2015 | |
Current Income Tax and Adjustments to Current Income Tax for Previous Periods | | ThCh$ | | | ThCh$ | | | ThCh$ | |
Current income tax | | | (162,820,181 | ) | | | (162,033,295 | ) | | | (84,003,064 | ) |
Adjustments to current tax from the previous period | | | (1,127,646 | ) | | | (710,740 | ) | | | (7,307,511 | ) |
Other current tax benefit / (expense) | | | 15,934,106 | | | | 21,380,071 | | | | (34,995,137 | ) |
Current tax expense, net | | | (148,013,721 | ) | | | (141,363,964 | ) | | | (126,305,712 | ) |
Benefit / (expense) from deferred taxes for origination and reversal of temporary differences | | | 4,671,420 | | | | 29,960,782 | | | | 16,693,113 | |
Total deferred tax benefit / (expense) | | | 4,671,420 | | | | 29,960,782 | | | | 16,693,113 | |
Income tax expense | | | (143,342,301 | ) | | | (111,403,182 | ) | | | (109,612,599 | ) |
F-68
The following table reconciles income taxes resulting from applying the local current tax rate to “Net income before taxes” and the actual income tax expense recorded in the accompanying Consolidated Statement of Comprehensive Income for the years ended December 31, 2017, 2016 and 2015:
| | | | | | 12-31-2017 | | | | | | | 12-31-2016 | | | | | | | 12-31-2015 | |
Reconciliation of Tax Expense | | Rate | | | ThCh$ | | | Rate | | | ThCh$ | | | Rate | | | ThCh$ | |
ACCOUNTING INCOME BEFORE TAX | | | | | | | 666,760,212 | | | | | | | | 676,674,298 | | | | | | | | 456,580,763 | |
Total tax income (expense) using statutory rate | | | (25.50 | %) | | | (170,023,854 | ) | | | (24.00 | %) | | | (162,401,830 | ) | | | (22.50 | %) | | | (102,730,671 | ) |
Tax effect of rates applied in other countries | | | 0.05 | % | | | 328,968 | | | | | | | | | | | | | | | | | |
Tax effect of non-taxable revenues | | | 5.67 | % | | | 37,774,743 | | | | 6.53 | % | | | 44,163,296 | | | | 2.12 | % | | | 9,674,087 | |
Tax effect of non-tax-deductible expenses | | | (3.11 | %) | | | (20,737,858 | ) | | | (2.13 | %) | | | (14,392,926 | ) | | | (4.61 | %) | | | (21,060,811 | ) |
Tax effect of adjustments to taxes in previous periods | | | (0.17 | %) | | | (1,127,646 | ) | | | (0.11 | %) | | | (710,740 | ) | | | (1.60 | %) | | | (7,307,511 | ) |
Price level restatement for tax purposes (investments and equity) | | | 1.57 | % | | | 10,443,346 | | | | 3.24 | % | | | 21,939,018 | | | | 2.58 | % | | | 11,812,307 | |
Total adjustments to tax expense using statutory rate | | | 4.00 | % | | | 26,681,553 | | | | 7.53 | % | | | 50,998,648 | | | | (1.51 | %) | | | (6,881,928 | ) |
Income tax benefit (expense) | | | (21.50 | %) | | | (143,342,301 | ) | | | (16.47 | %) | | | (111,403,182 | ) | | | (24.01 | %) | | | (109,612,599 | ) |
F-69
The origination and changes in deferred tax assets and liabilities as of December 31, 2017 and 2016, are as follows:
| | December 31, 2017 | | | December 31, 2016 | |
| | Assets | | | Liabilities | | | Assets | | | Liabilities | |
Deferred Tax Assets (Liabilities) | | ThCh$ | | | ThCh$ | | | ThCh$ | | | ThCh$ | |
Accumulated depreciation | | | 162,315 | | | | (263,847,598 | ) | | | 5,465,105 | | | | (246,373,416 | ) |
Provisions | | | 39,890,472 | | | | — | | | | 36,785,893 | | | | (342,283 | ) |
Post-employment benefit obligations | | | 6,336,920 | | | | (364,925 | ) | | | 6,795,806 | | | | (579,978 | ) |
Tax loss carryforwards | | | 9,536,102 | | | | — | | | | 11,911,396 | | | | — | |
Other | | | 49,635,500 | | | | (10,734,675 | ) | | | 21,979,742 | | | | (13,210,542 | ) |
Deferred Tax Assets/Liabilities before compensation | | | 105,561,309 | | | | (274,947,198 | ) | | | 82,937,942 | | | | (260,506,219 | ) |
Compensation of Assets (Liabilities) for deferred taxes | | | (102,723,517 | ) | | | 102,723,517 | | | | (61,141,425 | ) | | | 61,141,425 | |
Deferred Tax Assets (Liabilities) after compensation | | | 2,837,792 | | | | (172,223,681 | ) | | | 21,796,517 | | | | (199,364,794 | ) |
| | Opening balance January 1, 2017 | | | Changes 2017 | | | Closing balance December 31, 2017 | |
| | | | Increase (decrease) in profit or loss | | | Increase (decrease) in other comprehensive income | | | Recognized directly in equity | | | Foreign currency translation | | | Transfers to (from) Noncurrent Assets and Groups in Dispossession held for sale | | | Other increases (decreases) | | | |
Deferred Tax Assets (Liabilities) | | ThCh$ | | | ThCh$ | | | ThCh$ | | | ThCh$ | | | ThCh$ | | | ThCh$ | | | ThCh$ | | | ThCh$ | |
Accumulated depreciation | | | (240,908,311 | ) | | | (22,836,691 | ) | | | — | | | | — | | | | 61,222 | | | | — | | | | (1,503 | ) | | | (263,685,283 | ) |
Provisions | | | 36,443,610 | | | | 2,940,867 | | | | — | | | | — | | | | — | | | | — | | | | 505,995 | | | | 39,890,472 | |
Post-employment benefit obligations | | | 6,215,828 | | | | 976,808 | | | | (463,556 | ) | | | — | | | | — | | | | — | | | | (757,085 | ) | | | 5,971,995 | |
Tax loss carryforwards | | | 11,911,396 | | | | (2,375,294 | ) | | | — | | | | — | | | | — | | | | — | | | | — | | | | 9,536,102 | |
Other (1) | | | 8,769,200 | | | | 25,965,730 | | | | (497 | ) | | | — | | | | (28,356 | ) | | | — | | | | 4,194,748 | | | | 38,900,825 | |
Deferred Tax Assets (Liabilities) | | | (177,568,277 | ) | | | 4,671,420 | | | | (464,053 | ) | | | — | | | | 32,866 | | | | — | | | | 3,942,155 | | | | (169,385,889 | ) |
| | Opening balance January 1, 2016 | | | Changes 2016 | | | Closing balance December 31, 2016 | |
| | | | Increase (decrease) in profit or loss | | | Increase (decrease) in other comprehensive income | | | Recognized directly in equity | | | Foreign currency translation | | | Transfers to (from) Noncurrent Assets and Groups in Dispossession held for sale | | | Other increases (decreases) | | | |
Deferred Tax Assets (Liabilities) | | ThCh$ | | | ThCh$ | | | ThCh$ | | | ThCh$ | | | ThCh$ | | | ThCh$ | | | ThCh$ | | | ThCh$ | |
Accumulated depreciation | | | (265,258,085 | ) | | | 24,331,401 | | | | — | | | | — | | | | 15,488 | | | | — | | | | 2,885 | | | | (240,908,311 | ) |
Provisions | | | 33,240,241 | | | | 3,203,369 | | | | — | | | | — | | | | — | | | | (62,749 | ) | | | 62,749 | | | | 36,443,610 | |
Post-employment benefit obligations | | | 5,236,522 | | | | (807,693 | ) | | | 1,786,999 | | | | — | | | | — | | | | 21,853 | | | | (21,853 | ) | | | 6,215,828 | |
Tax loss carryforwards | | | 12,084,821 | | | | (173,368 | ) | | | — | | | | — | | | | — | | | | — | | | | (57 | ) | | | 11,911,396 | |
Other | | | 43,365,996 | | | | 756,651 | | | | 1,822 | | | | (30,829,099 | ) | | | 12,645 | | | | — | | | | (4,538,815 | ) | | | 8,769,200 | |
Deferred Tax Assets (Liabilities) | | | (171,330,505 | ) | | | 27,310,360 | | | | 1,788,821 | | | | (30,829,099 | ) | | | 28,133 | | | | (40,896 | ) | | | (4,495,091 | ) | | | (177,568,277 | ) |
| (1) | Deferred taxes recognized in increase (decrease) in profit and loss are mainly the related to recognition of tax on the investment in Hidroaysen, which has been classified as non-current assets held for distribution to the owners. |
Recovery of deferred tax assets will depend on whether sufficient tax profits will be obtained in the future. The Group believes that the future profit projections for its subsidiaries will allow these assets to be recovered.
| a. | As of December 31, 2017 and 2016, the Group does not have unrecognized deferred tax assets related to tax loss carryforwards. |
F-70
The Group has not recognized deferred tax liabilities for taxable temporary differences associated with investments in subsidiaries and joint ventures, as it is able to control the timing of the reversal of the temporary differences and considers that it is probable that such temporary differences will not reverse in the foreseeable future. As of December 31, 2017 and 2016, the aggregate of taxable temporary differences associated with investments in subsidiaries and joint ventures for which deferred tax liabilities have not been recognized totaled ThCh$1,143,608,396 and ThCh$1,145,437,791, respectively. Additionally, the Group has not recognized deferred tax asset for deductible temporary differences which as of December 31, 2017 and 2016, totaled ThCh$257,883,751 and ThCh$399,626,044, respectively, as it is not probable that sufficient future taxable profits exist to recover such temporary differences.
The Group entities are potentially subject to income tax audits by the Chilean tax regulator and are limited to three tax years after which tax audits over those years can no longer be performed. Tax audits by nature are often complex and can require several years to complete. The tax years potentially subject to examination are 2014 through 2016.
The Company came into legal existence on March 1, 2016, therefore, it does not have prior periods subject to income tax audits.
Given the range of possible interpretations of tax standards, the results of any future inspections carried out by Chilean tax authority for the years subject to audit can give rise to tax liabilities that cannot currently be quantified objectively. Nevertheless, management estimates that the liabilities, if any, that may arise from such tax audits, would not significantly impact the Group’s future results.
The effects of deferred tax on the components of other comprehensive income for the years ended December 31, 2017, 2016 and 2015, are as follows:
| | For the years ended December 31, | |
| | 2017 | | | 2016 | | | 2015 | |
Effects of Deferred Tax on the Components of | | Amount Before Tax | | | Income Tax Expense (Benefit) | | | Amount After Tax | | | Amount Before Tax | | | Income Tax Expense (Benefit) | | | Amount After Tax | | | Amount Before Tax | | | Income Tax Expense (Benefit) | | | Amount After Tax | |
Other Comprehensive Income | | ThCh$ | | | ThCh$ | | | ThCh$ | | | ThCh$ | | | ThCh$ | | | ThCh$ | | | ThCh$ | | | ThCh$ | | | ThCh$ | |
Available-for-sale financial assets | | | 1,840 | | | | (497 | ) | | | 1,343 | | | | (6,740 | ) | | | 1,820 | | | | (4,920 | ) | | | 1,077 | | | | (290 | ) | | | 787 | |
Cash flow hedge | | | 97,558,961 | | | | (25,701,599 | ) | | | 71,857,362 | | | | 89,068,357 | | | | (21,116,232 | ) | | | 67,952,125 | | | | (122,593,576 | ) | | | 31,868,299 | | | | (90,725,277 | ) |
Share of other comprehensive income from associates and joint ventures accounted for using the equity method | | | (1,490 | ) | | | — | | | | (1,490 | ) | | | (11,691,075 | ) | | | — | | | | (11,691,075 | ) | | | (577,862 | ) | | | — | | | | (577,862 | ) |
Foreign currency translation | | | (3,686,549 | ) | | | — | | | | (3,686,549 | ) | | | (3,532,844 | ) | | | — | | | | (3,532,844 | ) | | | 162,373 | | | | — | | | | 162,373 | |
Actuarial gains(losses) on defined-benefit pension plans | | | 1,716,875 | | | | (463,556 | ) | | | 1,253,319 | | | | (6,618,514 | ) | | | 1,786,999 | | | | (4,831,515 | ) | | | (5,645,532 | ) | | | 1,325,242 | | | | (4,320,290 | ) |
Income tax related to components of other comprehensive income | | | 95,589,637 | | | | (26,165,652 | ) | | | 69,423,985 | | | | 67,219,184 | | | | (19,327,413 | ) | | | 47,891,771 | | | | (128,653,520 | ) | | | 33,193,251 | | | | (95,460,269 | ) |
| b. | In Chile, Law No. 20,780 was published in the Official Gazette on September 29, 2014. It changes the income tax system and other taxes, by replacing the current tax system in 2017 with two alternative tax systems: the attributed income system and partially integrated system. |
This law gradually increases the rate of income tax on corporate income. Thus, it increased to 21% in 2014, to 22.5% in 2015 and to 24% in 2016. From 2017 taxpayers choosing the attributed income system are subject to a rate of 25%, while companies choosing the partially integrated system are subject to a rate of 25.5% in 2017 and 27% in 2018.
The law also states that corporations will automatically be subject to the partially integrated system unless a future Extraordinary Shareholders’ Meeting agrees to select the attributed income system.
Law No. 20,899 was published on February 8, 2016, simplifying the income tax system. This law among its main modifications imposed a partially integrated system as mandatory for corporations, cancelling the previously available attributed income system option.
The movements in deferred taxes for the components of other comprehensive income as of December 31, 2017, 2016 and 2015, are as follows:
| | For the years ended December 31, | |
| | 2017 | | | 2016 | | | 2015 | |
Reconciliation of changes in deferred taxes of components of other comprehensive income | | ThCh$ | | | ThCh$ | | | ThCh$ | |
Total increases (decreases) for deferred taxes of other comprehensive income from continuing operations | | | (497 | ) | | | 1,788,821 | | | | 1,724,427 | |
Income tax of changes in cash flow hedge transactions | | | (25,701,599 | ) | | | (21,116,234 | ) | | | 31,468,824 | |
Total income tax relating to components of other comprehensive income | | | (25,702,096 | ) | | | (19,327,413 | ) | | | 33,193,251 | |
F-71
18. | OTHER FINANCIAL LIABILITIES. |
The balances of other financial liabilities as of December 31, 2017 and 2016, are as follows:
| | As of December 31, | |
| | 2017 | | | 2016 | |
| | Current | | | Non-current | | | Current | | | Non-current | |
Other financial liabilities | | ThCh$ | | | ThCh$ | | | ThCh$ | | | ThCh$ | |
Interest –bearing borrowings | | | 17,255,692 | | | | 760,932,929 | | | | 18,013,114 | | | | 802,046,968 | |
Hedging derivatives (*) | | | 304,278 | | | | 21,045,216 | | | | 313,571 | | | | 48,981,953 | |
Non-hedging derivatives (**) | | | 1,255,478 | | | | — | | | | 7,369,481 | | | | 2,987,830 | |
Total | | | 18,815,448 | | | | 781,978,145 | | | | 25,696,166 | | | | 854,016,751 | |
18.1 Interest-bearing borrowings
The detail of current and non-current interest-bearing borrowings as of December 31, 2017 and 2016, is as follows:
| | As of December 31, | |
| | 2017 | | | 2016 | |
| | Current | | | Non-current | | | Current | | | Non-current | |
Classes of Interest-bearing borrowings | | ThCh$ | | | ThCh$ | | | ThCh$ | | | ThCh$ | |
Bank loans | | | 122 | | | | — | | | | 4,274 | | | | — | |
Unsecured obligations | | | 15,455,782 | | | | 748,123,803 | | | | 16,168,473 | | | | 786,137,688 | |
Financial leases | | | 1,799,788 | | | | 12,809,126 | | | | 1,840,367 | | | | 15,909,280 | |
Total | | | 17,255,692 | | | | 760,932,929 | | | | 18,013,114 | | | | 802,046,968 | |
Bank loans by currency and contractual maturity as of December 31, 2017 and 2016, are as follows:
Summary of bank loans by currency and maturity
| | | | | | | | | | | | | | Current | | | Non-current | |
| | | | | | | | | | | | | | Maturity | | | | | | | Maturity | | | | | |
| | | | Effective Interest | | | Nominal Interest | | | Secured/ | | One to three months | | | Three to twelve months | | | Total Current 12/31/2017 | | | One to two years | | | Two to three years | | | Three to four years | | | Four to five years | | | Over five years | | | Total Non-Current 12/31/2017 | |
Country | | Currency | | Rate | | | Rate | | | Unsecured | | ThCh$ | | | ThCh$ | | | ThCh$ | | | ThCh$ | | | ThCh$ | | | ThCh$ | | | ThCh$ | | | ThCh$ | | | ThCh$ | |
Chile | | Ch$ | | 6.00% | | | 6.00% | | | Unsecured | | | 122 | | | | — | | | | 122 | | | | — | | | | — | | | | — | | | | — | | | | — | | | | — | |
| | | | | | | | | | | | Total | | | 122 | | | | — | | | | 122 | | | | — | | | | — | | | | — | | | | — | | | | — | | | | — | |
| | | | | | | | | | | | | | | | | | | | | | | | | | | | | | | | | | | | | | | | | | | | | | | | |
| | | | | | | | | | | | | | Current | | | Non-current | |
| | | | | | | | | | | | | | Maturity | | | | | | | Maturity | | | | | |
| | | | Effective Interest | | | Nominal Interest | | | Secured/ | | One to three months | | | Three to twelve months | | | Total Current 12/31/2016 | | | One to two years | | | Two to three years | | | Three to four years | | | Four to five years | | | Over five years | | | Total Non-Current 12/31/2016 | |
Country | | Currency | | Rate | | | Rate | | | Unsecured | | ThCh$ | | | ThCh$ | | | ThCh$ | | | ThCh$ | | | ThCh$ | | | ThCh$ | | | ThCh$ | | | ThCh$ | | | ThCh$ | |
Chile | | Ch$ | | 6.00% | | | 6.00% | | | Unsecured | | | 4,274 | | | | — | | | | 4,274 | | | | — | | | | — | | | | — | | | | — | | | | — | | | | — | |
| | | | | | | | | | | | Total | | | 4,274 | | | | — | | | | 4,274 | | | | — | | | | — | | | | — | | | | — | | | | — | | | | — | |
Fair value measurement and hierarchy
The fair value of current and non-current bank borrowings as of December 31, 2017 and 2016 totaled ThCh$122 and ThCh$4.274, respectively . The fair value measurement of borrowings has been categorized as Level 2 (see Note 3.h).
F-72
Identification of bank borrowings by company
Appendix No.4, letter a), presents details of estimated future cash flows (undiscounted) that the Group will have to disburse to settle the bank loans detailed above.
| | | | | | | | | | | | | | | | | | | | | | | | December 31, 2017 | |
| | | | | | | | | | | | | | | | | | | | | | | | Current | | | Non-current | |
Taxpayer ID Number | | Company | | Country | | Taxpayer ID Number | | Financial Institution | | Country | | Currency | | Effective Interest Rate | | | Nominal Interest Rate | | | Amortization | | Less than 90 days ThCh$ | | | More than 90 days ThCh$ | | | Total Current ThCh$ | | | One to two years ThCh$ | | | Two to three years ThCh$ | | | Three to four years ThCh$ | | | Four to five years ThCh$ | | | More than five years ThCh$ | | | Total Non-Current ThCh$ | |
96.800.570-7 | | Enel Distribución Chile S.A. | | Chile | | 97.006.000-6 | | Banco de Crédito e Inversiones | | Chile | | Ch$ | | | 6.00% | | | | 6.00% | | | At maturity | | | 13 | | | | — | | | | 13 | | | | — | | | | — | | | | — | | | | — | | | | — | | | | — | |
91.081.000-6 | | Enel Generación Chile S.A. | | Chile | | 97.006.000-6 | | Banco de Crédito e Inversiones | | Chile | | Ch$ | | | 6.00% | | | | 6.00% | | | At maturity | | | 97 | | | | — | | | | 97 | | | | — | | | | — | | | | — | | | | — | | | | — | | | | — | |
91.081.000-6 | | Enel Generación Chile S.A. | | Chile | | 97.036.000-K | | Banco Santander | | Chile | | Ch$ | | | 6.00% | | | | 6.00% | | | At maturity | | | 12 | | | | — | | | | 12 | | | | — | | | | — | | | | — | | | | — | | | | — | | | | — | |
| | | | | | | | | | | | | | | | | | | | | | Total | | | 122 | | | | — | | | | 122 | | | | — | | | | — | | | | — | | | | — | | | | — | | | | — | |
| | | | | | | | | | | | | | | | | | | | | | | | | | | | | | | | | | | | | | | | | | | | | | | | | | | | | | | | | | |
| | | | | | | | | | | | | | | | | | | | | | | | December 31, 2016 | |
| | | | | | | | | | | | | | | | | | | | | | | | Current | | | Non-current | |
Taxpayer ID Number | | Company | | Country | | Taxpayer ID Number | | Financial Institution | | Country | | Currency | | Effective Interest Rate | | | Nominal Interest Rate | | | Amortization | | Less than 90 days ThCh$ | | | More than 90 days ThCh$ | | | Total Current ThCh$ | | | One to two years ThCh$ | | | Two to three years ThCh$ | | | Three to four years ThCh$ | | | Four to five years ThCh$ | | | More than five years ThCh$ | | | Total Non-Current ThCh$ | |
96.800.570-7 | | Enel Distribución Chile S.A. | | Chile | | 97.006.000-6 | | Banco de Crédito e Inversiones | | Chile | | Ch$ | | | 6.00% | | | | 6.00% | | | At maturity | | | 102 | | | | — | | | | 102 | | | | — | | | | — | | | | — | | | | — | | | | — | | | | — | |
91.081.000-6 | | Enel Generación Chile S.A. | | Chile | | 97.006.000-6 | | Banco de Crédito e Inversiones | | Chile | | Ch$ | | | 6.00% | | | | 6.00% | | | At maturity | | | 2,037 | | | | — | | | | 2,037 | | | | — | | | | — | | | | — | | | | — | | | | — | | | | — | |
91.081.000-6 | | Enel Generación Chile S.A. | | Chile | | 97.036.000-K | | Banco Santander | | Chile | | Ch$ | | 6.00% | | | 6.00% | | | At maturity | | | 2,135 | | | | — | | | | 2,135 | | | | — | | | | — | | | | — | | | | — | | | | — | | | | — | |
| | | | | | | | | | | | | | | | | | | | | | Total | | | 4,274 | | | | — | | | | 4,274 | | | | — | | | | — | | | | — | | | | — | | | | — | | | | — | |
F-73
18.2 Unsecured liabilities
The detail of Unsecured Liabilities by currency and maturity as of December 31, 2017 and 2016, is as follows:
Summary of unsecured liabilities by currency and maturity
| | | | | | | | | | | | | | Current | | | Non-Current | |
| | | | | | | | | | | | | | Maturity | | | | | | | Maturity | | | | | |
| | | | Effective Interest | | | Nominal Annual | | | Secured/ | | One to three months | | | Three to Twelve months | | | Total Current 12/31/2016 | | | One to two years | | | Two to three years | | | Three to four years | | | Four to five years | | | More than five years | | | Total Non-Current 12/31/2017 | |
Country | | Currency | | Rate | | | Rate | | | Unsecured | | ThCh$ | | | ThCh$ | | | ThCh$ | | | ThCh$ | | | ThCh$ | | | ThCh$ | | | ThCh$ | | | ThCh$ | | | ThCh$ | |
Chile | | US$ | | | 6.99% | | | | 6.90% | | | Unsecured | | | 6,322,081 | | | | 2,206,269 | | | | 8,528,350 | | | | — | | | | — | | | | — | | | | — | | | | 430,228,859 | | | | 430,228,859 | |
Chile | | U.F. | | | 6.00% | | | | 5.48% | | | Unsecured | | | — | | | | 6,927,432 | | | | 6,927,432 | | | | 5,574,013 | | | | 5,574,013 | | | | 5,574,013 | | | | 5,574,013 | | | | 295,598,892 | | | | 317,894,944 | |
| | | | | | | | | | | | Total | | | 6,322,081 | | | | 9,133,701 | | | | 15,455,782 | | | | 5,574,013 | | | | 5,574,013 | | | | 5,574,013 | | | | 5,574,013 | | | | 725,827,751 | | | | 748,123,803 | |
| | | | | | | | | | | | | | | | | | | | | | | | | | | | | | | | | | | | | | | | | | | | | | | | |
| | | | | | | | | | | | | | Current | | | Non-Current | |
| | | | | | | | | | | | | | Maturity | | | | | | | Maturity | | | | | |
| | | | Effective Interest | | | Nominal Annual | | | Secured/ | | One to three months | | | Three to Twelve months | | | Total Current 12/31/2015 | | | One to two years | | | Two to three years | | | Three to four years | | | Four to five years | | | More than five years | | | Total Non-Current 12/31/2016 | |
Country | | Currency | | Rate | | | Rate | | | Unsecured | | ThCh$ | | | ThCh$ | | | ThCh$ | | | ThCh$ | | | ThCh$ | | | ThCh$ | | | ThCh$ | | | ThCh$ | | | ThCh$ | |
Chile | | US$ | | 6.99% | | | 6.90% | | | Unsecured | | | 6,884,819 | | | | 2,402,653 | | | | 9,287,472 | | | | — | | | | — | | | | — | | | | — | | | | 468,578,474 | | | | 468,578,474 | |
Chile | | U.F. | | 6.00% | | | 5.48% | | | Unsecured | | | — | | | | 6,881,001 | | | | 6,881,001 | | | | 5,480,380 | | | | 5,480,380 | | | | 5,480,380 | | | | 5,480,380 | | | | 295,637,694 | | | | 317,559,214 | |
| | | | | | | | | | | | Total | | | 6,884,819 | | | | 9,283,654 | | | | 16,168,473 | | | | 5,480,380 | | | | 5,480,380 | | | | 5,480,380 | | | | 5,480,380 | | | | 764,216,168 | | | | 786,137,688 | |
F-74
Identification of unsecured liabilities by company
| | | | | | | | | | | | | | | | | | | | | | | | December 31, 2017 | |
| | | | | | | | | | | | | | | | | | | | | | | | Current | | | Non-Current | |
Taxpayer ID Number | | Company | | Country | | Taxpayer ID Number | | Financial Institution | | Country | | Currency | | Effective Interest Rate | | | Nominal Interest Rate | | | Secured | | Less than 90 days ThCh$ | | | More than 90 days ThCh$ | | | Total Current ThCh$ | | | One to two years ThCh$ | | | Two to three years ThCh$ | | | Three to four years ThCh$ | | | Four to five years ThCh$ | | | More than five years ThCh$ | | | Total Non-Current ThCh$ | |
91.081.000-6 | | Enel Generación Chile S.A. | | Chile | | Foreign | | BNY Mellon -Primera Emisión S-1 | | USA | | US$ | | | 7.96% | | | | 7.88% | | | No | | | 4,152,926 | | | | — | | | | 4,152,926 | | | | — | | | | — | | | | — | | | | — | | | | 125,566,611 | | | | 125,566,611 | |
91.081.000-6 | | Enel Generación Chile S.A. | | Chile | | Foreign | | BNY Mellon - Primera Emisión S-2 | | USA | | US$ | | | 7.40% | | | | 7.33% | | | No | | | 1,328,023 | | | | — | | | | 1,328,023 | | | | — | | | | — | | | | — | | | | — | | | | 42,902,198 | | | | 42,902,198 | |
91.081.000-6 | | Enel Generación Chile S.A. | | Chile | | Foreign | | BNY Mellon - Primera Emisión S-3 | | USA | | US$ | | | 8.26% | | | | 8.13% | | | No | | | 841,132 | | | | — | | | | 841,132 | | | | — | | | | — | | | | — | | | | — | | | | 19,398,499 | | | | 19,398,499 | |
91.081.000-6 | | Enel Generación Chile S.A. | | Chile | | Foreign | | BNY Mellon - Única 24296 | | USA | | US$ | | | 4.32% | | | | 4.25% | | | No | | | — | | | | 2,206,269 | | | | 2,206,269 | | | | — | | | | — | | | | — | | | | — | | | | 242,361,551 | | | | 242,361,551 | |
91.081.000-6 | | Enel Generación Chile S.A. | | Chile | | 97.004.000-5 | | Banco Santander -317 Serie-H | | Chile | | U.F. | | | 7.17% | | | | 6.20% | | | No | | | — | | | | 6,374,051 | | | | 6,374,051 | | | | 5,574,013 | | | | 5,574,013 | | | | 5,574,013 | | | | 5,574,013 | | | | 30,872,536 | | | | 53,168,588 | |
91.081.000-6 | | Enel Generación Chile S.A. | | Chile | | 97.004.000-5 | | Banco Santander 522 Serie-M | | Chile | | U.F. | | | 4.82% | | | | 4.75% | | | No | | | — | | | | 553,381 | | | | 553,381 | | | | — | | | | — | | | | — | | | | — | | | | 264,726,356 | | | | 264,726,356 | |
| | | | | | | | | | | | | | | | | | Total Unsecured Bonds | | | 6,322,081 | | | | 9,133,701 | | | | 15,455,782 | | | | 5,574,013 | | | | 5,574,013 | | | | 5,574,013 | | | | 5,574,013 | | | | 725,827,751 | | | | 748,123,803 | |
| | | | | | | | | | | | | | | | | | | | | | | | | | | | | | | | | | | | | | | | | | | | | | | | | | | | | | | | | | |
| | | | | | | | | | | | | | | | | | | | | | | | | | | | | | | | | | | | | | | | | | | | | | | | | | | | | | | | | | |
| | | | | | | | | | | | | | | | | | | | | | | | December 31, 2016 | |
| | | | | | | | | | | | | | | | | | | | | | | | Current | | | Non-Current | |
Taxpayer ID Number | | Company | | Country | | Taxpayer ID Number | | Financial Institution | | Country | | Currency | | Effective Interest Rate | | | Nominal Interest Rate | | | Secured | | Less than 90 days ThCh$ | | | More than 90 days ThCh$ | | | Total Current ThCh$ | | | One to two years ThCh$ | | | Two to three years ThCh$ | | | Three to four years ThCh$ | | | Four to five years ThCh$ | | | More than five years ThCh$ | | | Total Non-Current ThCh$ | |
91.081.000-6 | | Enel Generación Chile S.A. | | Chile | | Foreign | | BNY Mellon -Primera Emisión S-1 | | USA | | US$ | | | 7.96% | | | | 7.88% | | | No | | | 4,522,585 | | | | — | | | | 4,522,585 | | | | — | | | | — | | | | — | | | | — | | | | 136,759,395 | | | | 136,759,395 | |
91.081.000-6 | | Enel Generación Chile S.A. | | Chile | | Foreign | | BNY Mellon - Primera Emisión S-2 | | USA | | US$ | | | 7.40% | | | | 7.33% | | | No | | | 1,446,232 | | | | — | | | | 1,446,232 | | | | — | | | | — | | | | — | | | | — | | | | 46,792,429 | | | | 46,792,429 | |
91.081.000-6 | | Enel Generación Chile S.A. | | Chile | | Foreign | | BNY Mellon - Primera Emisión S-3 | | USA | | US$ | | | 8.26% | | | | 8.13% | | | No | | | 916,002 | | | | — | | | | 916,002 | | | | — | | | | — | | | | — | | | | — | | | | 21,608,757 | | | | 21,608,757 | |
91.081.000-6 | | Enel Generación Chile S.A. | | Chile | | Foreign | | BNY Mellon - Única 24296 | | USA | | US$ | | | 4.32% | | | | 4.25% | | | No | | | — | | | | 2,402,653 | | | | 2,402,653 | | | | — | | | | — | | | | — | | | | — | | | | 263,417,893 | | | | 263,417,893 | |
91.081.000-6 | | Enel Generación Chile S.A. | | Chile | | 97.004.000-5 | | Banco Santander -317 Serie-H | | Chile | | U.F. | | | 7.17% | | | | 6.20% | | | No | | | — | | | | 6,337,021 | | | | 6,337,021 | | | | 5,480,380 | | | | 5,480,380 | | | | 5,480,380 | | | | 5,480,380 | | | | 35,587,764 | | | | 57,509,284 | |
91.081.000-6 | | Enel Generación Chile S.A. | | Chile | | 97.004.000-5 | | Banco Santander 522 Serie-M (*) | | Chile | | U.F. | | | 4.82% | | | | 4.75% | | | No | | | — | | | | 543,980 | | | | 543,980 | | | | — | | | | — | | | | — | | | | — | | | | 260,049,930 | | | | 260,049,930 | |
| | | | | | | | | | | | | | | | | | Total Unsecured Bonds | | | 6,884,819 | | | | 9,283,654 | | | | 16,168,473 | | | | 5,480,380 | | | | 5,480,380 | | | | 5,480,380 | | | | 5,480,380 | | | | 764,216,168 | | | | 786,137,688 | |
18.3 Secured liabilities
As of December 31, 2017 and 2016, there were no secured liabilities.
Fair value measurement and hierarchy
The fair value of current and non-current unsecured liabilities as of December 31, 2017 and 2016 totaled ThCh$947,565,989 and ThCh$998,383,047, respectively. The fair value measurement of these liabilities has been categorized as Level 2 (See Note 3.h). It is important to note that these financial assets are measured at amortized cost (See Note 3.g.4).
F-75
18.4 Detail of finance lease obligations
Appendix No. 4 letter c) presents details of estimated future cash flows (undiscounted) that the Group will have to disburse to settle the finance lease obligations detailed above.
| | | | | | | | | | | | | | | | | | December 31, 2017 | |
| | | | | | | | | | | | | | | | | | Current | | | Non-Current ThCh$ | |
Taxpayer ID Number | | Company | | Country | | Taxpayer ID Number | | Financial Institution | | Country | | Currency | | Nominal Interest Rate | | | Less than 90 days ThCh$ | | | More than 90 days ThCh$ | | | Total Current ThCh$ | | | One to two years ThCh$ | | | Two to three years ThCh$ | | | Three to four years ThCh$ | | | Four to five years ThCh$ | | | More than five years ThCh$ | | | Total Non-Current ThCh$ | |
91.081.000-6 | | Enel Generación Chile S.A. | | Chile | | 76.555.400-4 | | Transelec S.A. | | Chile | | US$ | | | 6.50% | | | | 439,377 | | | | 1,360,411 | | | | 1,799,788 | | | | 2,459,000 | | | | 1,916,774 | | | | 2,041,364 | | | | 2,174,053 | | | | 4,217,935 | | | | 12,809,126 | |
| | | | | | | | | | | | | | Total Leasing | | | | 439,377 | | | | 1,360,411 | | | | 1,799,788 | | | | 2,459,000 | | | | 1,916,774 | | | | 2,041,364 | | | | 2,174,053 | | | | 4,217,935 | | | | 12,809,126 | |
| | | | | | | | | | | | | | | | | | | | | | | | | | | | | | | | | | | | | | | | | | | | | | | | | | | | |
| | | | | | | | | | | | | | | | | | December 31, 2016 | |
| | | | | | | | | | | | | | | | | | Current | | | Non-Current ThCh$ | |
Taxpayer ID Number | | Company | | Country | | Taxpayer ID Number | | Financial Institution | | Country | | Currency | | Nominal Interest Rate | | | Less than 90 days ThCh$ | | | More than 90 days ThCh$ | | | Total Current ThCh$ | | | One to two years ThCh$ | | | Two to three years ThCh$ | | | Three to four years ThCh$ | | | Four to five years ThCh$ | | | More than five years ThCh$ | | | Total Non-Current ThCh$ | |
91.081.000-6 | | Enel Generación Chile S.A. | | Chile | | 76.555.400-4 | | Transelec S.A. | | Chile | | US$ | | | 6.50% | | | | 449,283 | | | | 1,391,084 | | | | 1,840,367 | | | | 2,677,880 | | | | 2,677,880 | | | | 1,959,990 | | | | 2,087,390 | | | | 6,506,140 | | | | 15,909,280 | |
| | | | | | | | | | | | | | Total Leasing | | | | 449,283 | | | | 1,391,084 | | | | 1,840,367 | | | | 2,677,880 | | | | 2,677,880 | | | | 1,959,990 | | | | 2,087,390 | | | | 6,506,140 | | | | 15,909,280 | |
F-76
18.5 Hedged debt
The U.S. dollar denominated debt of the Group as of December 31, 2017 and 2016, that is designated as cash flow hedge to hedge the portion of revenue from its consolidated entities that is directly linked to variations in the U.S. dollar, as referenced in Note 3.m, was ThCh$440,823,086 and ThCh$480,061,539, respectively.
The following table details changes in “Reserve for cash flow hedges” as of December 31, 2017, 2016 and 2015, due to exchange differences of this debt:
| | For the years ended December 31, | |
| | 2017 | | | 2016 | | | 2015 | |
| | ThCh$ | | | ThCh$ | | | ThCh$ | |
Balance in hedging reserves (hedging income) at the beginning of the period, net | | | (52,747,646 | ) | | | (74,953,393 | ) | | | (39,805,098 | ) |
Foreign currency exchange differences recognized in equity, net | | | 17,321,594 | | | | 14,317,257 | | | | (38,579,730 | ) |
Foreign currency exchange differences recognized in profit and loss, net | | | 8,258,044 | | | | 7,888,490 | | | | 3,431,435 | |
Balance in hedging reserves (hedging income) at the end of the period, net | | | (27,168,008 | ) | | | (52,747,646 | ) | | | (74,953,393 | ) |
18.6 Other information
As of December 31, 2017 and 2016, the Group has undrawn line of credits available for use amounting to ThCh$199,271,103 and ThCh$342,827,047, respectively.
F-77
19. | RISK MANAGEMENT POLICY. |
The Group’s companies are exposed to certain risks that are managed by systems that identify, measure, limit concentration of, and monitor these risks.
The main principles in the Group’s risk management policy include the following:
| • | Compliance with good corporate governance standards. |
| • | Strict compliance with all the Group’s internal policies. |
| • | Each business and corporate area determines: |
| I. | The markets in which it can operate based on its knowledge and ability to ensure effective risk management; |
| II. | Criteria regarding counterparts; |
| III. | Authorized operators. |
| • | Business and corporate areas establish their risk tolerance in a manner consistent with the defined strategy for each market in which they operate. |
| • | All of the operations of the businesses and corporate areas are conducted within the limits approved for each case. |
| • | Businesses, corporate areas, lines of business and companies design the risk management controls necessary to ensure that transactions in the markets are conducted in accordance with the Enel Chile’s policies, standards, and procedures. |
19.1 Interest rate risk
Changes in interest rates affect the fair value of assets and liabilities bearing fixed interest rates, as well as the expected future cash flows of assets and liabilities subject to floating interest rates.
The objective of managing interest rate risk exposure is to achieve a balance in the debt structure to minimize the cost of debt with reduced volatility in profit or loss.
The comparative structure of the financial debt of the Enel Chile Group according to the fixed and / or protected interest rate on the gross debt, after derivatives contracted, is as follows:
Gross position:
| For the years ended December 31, | |
| 2017 | | | 2016 | |
| % | | | % | |
Fixed interest rate | 92% | | | 92% | |
Total | 92% | | | 92% | |
Depending on the Group’s estimates and on the objectives of the debt structure, hedging transactions are performed by entering into derivatives contracts that mitigate interest rate risk.
19.2 Exchange rate risk
Exchange rate risks involve basically the following transactions:
| • | Debt taken on by the Group’s companies that is denominated in a currency other than that in which its cash flows are indexed. |
| • | Payments to be made for the acquisition of project-related materials and for corporate insurance policies in a currency other than that in which its cash flows are indexed. |
| • | Revenues in the Group companies directly linked to changes in currencies other than that of its cash flows. |
F-78
In order to mitigate foreign currency risk, the Group’s foreign currency risk management policy is based on cash flows and includes maintaining a balance between U.S. dollar flows and the levels of assets and liabilities denominated in this currency. The objective is to minimize the exposure to variability in cash flows that are attributable to foreign exchange risk.
The hedging instruments currently being used to comply with the policy are currency swaps and forward exchange contracts. In addition, the policy seeks to refinance debt in the functional currency of each of the Group’s companies.
19.3 Commodities risk
The Group has a risk exposure to price fluctuations in certain commodities, basically due to:
| • | Purchases of fuel used to generate electricity. |
| • | Energy purchase/sale transactions that take place in local markets. |
In order to reduce the risk in situations of extreme drought, the Group has designed a commercial policy that defines the levels of sales commitments in line with the capacity of its generating power plants in a dry year. It also includes risk mitigation terms in certain contracts with unregulated customers and with regulated customers subject to long-term tender processes, establishing indexation polynomials that allow for reducing commodities exposure risk.
Considering the operating conditions faced by the power generation market in Chile, with drought and highly volatile commodity prices on international markets, the Group is constantly verifying the advisability of using hedging to lessen the impacts that these price swings have on its results.
As of December 31, 2017, the Group had swap hedges for 2.3 million MMBTU to be settled at January 2018.
As of December 31, 2016, the Group had swap hedges for 3 million barrels of Brent oil to be settle from January to November 2017 and 3.3 million MMTBU of Henry Hub gas swap to be settle from January to September 2017.
Depending on operating conditions, which are constantly being updated, these hedges may be modified or may cover other commodities..
19.4 Liquidity risk
The Group maintains a liquidity risk management policy that consists of entering into long-term committed banking facilities and temporary financial investments for amounts that cover the projected needs over a period of time that is determined based on the situation and expectations for debt and capital markets.
The projected needs mentioned above include maturities of financial debt, net of financial derivatives. For further details regarding the features and conditions of financial obligations and financial derivatives. See Notes 18 and 20, and Appendix No. 4.
As of December 31, 2017 and 2016, the Group has cash and cash equivalent totaling ThCh$419,456,026 and ThCh$245,999,192, respectively, and unconditionally available lines of long-term credit totaling ThCh$199,271,103 and ThCh$342,827,047, respectively.
19.5 Credit risk
The Group closely monitors its credit risk.
Trade receivables:
The credit risk for receivables from the Group’s commercial activity has historically been very low, due to the short term period of collections from customers, resulting in non-significant cumulative receivables amounts. This situation applies to both the electricity generation and distribution lines of business.
In the electricity generation and distribution lines of business, regulations allow the suspension of energy service to customers with outstanding payments, and the contracts have termination clauses for payment default. The Group monitors its credit risk on an ongoing basis and measures its maximum exposure to payment default risk, which, as stated above, is very limited.
In the case of our electricity distribution company, the suspension of energy service to customers, it is a power of the company in case of breaches by our clients, which is applied according to the current regulation, which facilitates the process of evaluation and control of credit risk, which by the way is limited.
F-79
Financial assets:
Cash surpluses are invested in the highest-rated local and foreign financial entities (with risk rating equivalent to investment grade where possible) with thresholds established for each entity.
In selecting banks to make investments, the Group considers those banks with investment grade ratings granted by main international rating agencies (Moody’s, S&P and Fitch).
Investments may be backed with treasury bonds from the countries in which the Group operates and/or with commercial papers issued by the highest rated banks; the latter are preferred, as they offer higher returns (always in line with current investment policies).
19.6 Risk measurement
The Group measures the Value at Risk (VaR) of its debt positions and financial derivatives in order to monitor the risk assumed by the Group, thereby reducing volatility in the income statement.
The portfolio of positions included for the purposes of the calculations of this value at risk include:
| • | Hedging derivatives for debt. |
The VaR determined represents the potential variation in value of the portfolio of positions described above in one quarter with a 95% confidence level. To determine the VaR, we take into account the volatility of the risk variables affecting the value of the portfolio of positions including:
| • | U.S. dollar Libor interest rate. |
| • | The exchange rates of the various currencies used in the calculation. |
The calculation of VaR is based on generating possible future scenarios (at one quarter) of market values (both spot and term) for the risk variables based on the scenarios with observable inputs for a same period (quarter) during five years. The one-quarter 95%-confidence VaR number is calculated as the 5% percentile of the potential variations in the fair value of the portfolio in one quarter. Taking into account the assumptions described above, the one-quarter VaR was ThCh$66,890,686. This amount represents the potential increase of the Debt and Derivatives’ Portfolio, thus these Values at Risk are inherently related, among other factors, to the Portfolio’s value at each quarter’ end.
F-80
20. | FINANCIAL INSTRUMENTS. |
20.1 Financial instruments, classified by type and category
| a) | The detail of financial assets, classified by type and category, as of December 31, 2017 and 2016, is as follows: |
| | | | | | December 31, 2017 | |
| | Financial assets held for trading (*) | | | Held-to-maturity investments (*) | | | Loans and receivables | | | Available-for-sale financial assets | | | Financial derivatives for hedging | |
| | ThCh$ | | | ThCh$ | | | ThCh$ | | | ThCh$ | | | ThCh$ | |
Derivative instruments | | | 402,716 | | | | — | | | | — | | | | — | | | | 20,038,433 | |
Other financial assets | | | — | | | | 185,913 | | | | 478,880,650 | | | | — | | | | — | |
Total Current | | | 402,716 | | | | 185,913 | | | | 478,880,650 | | | | — | | | | 20,038,433 | |
| | | | | | | | | | | | | | | | | | | | |
Equity instruments | | | — | | | | — | | | | — | | | | 2,628,501 | | | | — | |
Derivative instruments | | | — | | | | — | | | | — | | | | — | | | | 30,789,703 | |
Other financial assets | | | — | | | | — | | | | 36,182,399 | | | | — | | | | — | |
Total Non-current | | | — | | | | — | | | | 36,182,399 | | | | 2,628,501 | | | | 30,789,703 | |
| | | | | | | | | | | | | | | | | | | | |
Total | | | 402,716 | | | | 185,913 | | | | 515,063,049 | | | | 2,628,501 | | | | 50,828,136 | |
| | | | | | | | | | | | | | | | | | | | |
| | | | | | December 31, 2016 | |
| | Financial assets held for trading (*) | | | Held-to-maturity investments (*) | | | Loans and receivables | | | Available-for-sale financial assets | | | Financial derivatives for hedging | |
| | ThCh$ | | | ThCh$ | | | ThCh$ | | | ThCh$ | | | ThCh$ | |
Derivative instruments | | | — | | | | — | | | | — | | | | — | | | | 121,443 | |
Other financial assets | | | — | | | | 462,801 | | | | 464,235,411 | | | | — | | | | — | |
Total Current | | | — | | | | 462,801 | | | | 464,235,411 | | | | — | | | | 121,443 | |
| | | | | | | | | | | | | | | | | | | | |
Equity instruments | | | — | | | | — | | | | — | | | | 2,641,620 | | | | — | |
Derivative instruments | | | — | | | | — | | | | — | | | | — | | | | 25,533,189 | |
Other financial assets | | | — | | | | 652,733 | | | | 33,500,105 | | | | — | | | | — | |
Total Non-current | | | — | | | | 652,733 | | | | 33,500,105 | | | | 2,641,620 | | | | 25,533,189 | |
| | | | | | | | | | | | | | | | | | | | |
Total | | | — | | | | 1,115,534 | | | | 497,735,516 | | | | 2,641,620 | | | | 25,654,632 | |
(*) See note 7.
The book value of trade accounts receivable and payable approximates their fair value.
F-81
| b) | The detail of financial liabilities, classified by type and category, as of December 31, 2017 and 2016, is as follows: |
| | December 31, 2017 | |
| | Financial liabilities held for trading | | | Loans and payables | | | Financial derivatives for hedging | |
| | ThCh$ | | | ThCh$ | | | ThCh$ | |
Interest-bearing loans | | | — | | | | 17,255,692 | | | | — | |
Derivative instruments | | | 1,255,478 | | | | — | | | | 304,278 | |
Other financial liabilities | | | — | | | | 670,642,077 | | | | — | |
Total Current | | | 1,255,478 | | | | 687,897,769 | | | | 304,278 | |
| | | | | | | | | | | | |
Interest-bearing loans | | | — | | | | 760,932,929 | | | | — | |
Derivative instruments | | | — | | | | — | | | | 21,045,216 | |
Other financial liabilities | | | — | | | | 978,342 | | | | — | |
Total Non-current | | | — | | | | 761,911,271 | | | | 21,045,216 | |
| | | | | | | | | | | | |
Total | | | 1,255,478 | | | | 1,449,809,040 | | | | 21,349,494 | |
| | | | | | | | | | | | |
| | | | | | | | | | | | |
| | December 31, 2016 | |
| | Financial liabilities held for trading | | | Loans and payables | | | Financial derivatives for hedging | |
| | ThCh$ | | | ThCh$ | | | ThCh$ | |
Interest-bearing loans | | | — | | | | 18,013,114 | | | | — | |
Derivative instruments | | | 7,369,481 | | | | — | | | | 313,571 | |
Other financial liabilities | | | — | | | | 617,955,794 | | | | — | |
Total Current | | | 7,369,481 | | | | 635,968,908 | | | | 313,571 | |
| | | | | | | | | | | | |
Interest-bearing loans | | | — | | | | 802,046,968 | | | | — | |
Derivative instruments | | | 2,987,830 | | | | — | | | | 48,981,953 | |
Other financial liabilities | | | — | | | | 1,734,640 | | | | — | |
Total Non-current | | | 2,987,830 | | | | 803,781,608 | | | | 48,981,953 | |
| | | | | | | | | | | | |
Total | | | 10,357,311 | | | | 1,439,750,516 | | | | 49,295,524 | |
20.2 Derivative instruments
The risk management policy of the Group uses primarily interest rate and foreign exchange rate derivatives to hedge its exposure to interest rate and foreign currency risks.
The Group classifies its derivatives as follows:
| • | Cash flow hedges: Those that hedge the cash flows of the underlying hedged item. |
| • | Fair value hedges: Those that hedge the fair value of the underlying hedged item. |
| • | Non-hedge derivatives: Financial derivatives that do not meet the requirements established by IFRS to be designated as hedge instruments are recorded at fair value with changes in net income (assets held for trading). |
F-82
| a) | Assets and liabilities for hedge derivative instruments |
As of December 31, 2017 and 2016, financial derivative transactions qualifying as hedge instruments resulted in recognition of the following assets and liabilities in the consolidated statement of financial position:
| | December 31, 2017 | |
| | Assets | | | Liabilities | |
| | Current | | | Non-current | | | Current | | | Non-current | |
| | ThCh$ | | | ThCh$ | | | ThCh$ | | | ThCh$ | |
Exchange rate hedge: | | | 20,038,433 | | | | 30,789,703 | | | | 304,278 | | | | 21,045,216 | |
Cash flow hedge | | | 20,038,433 | | | | 30,789,703 | | | | 304,278 | | | | 21,045,216 | |
Total | | | 20,038,433 | | | | 30,789,703 | | | | 304,278 | | | | 21,045,216 | |
| | | | | | | | | | | | | | | | |
| | December 31, 2016 | |
| | Assets | | | Liabilities | |
| | Current | | | Non-current | | | Current | | | Non-current | |
| | ThCh$ | | | ThCh$ | | | ThCh$ | | | ThCh$ | |
Exchange rate hedge: | | | 121,443 | | | | 25,533,189 | | | | 313,571 | | | | 48,981,953 | |
Cash flow hedge | | | 121,443 | | | | 25,533,189 | | | | 313,571 | | | | 48,981,953 | |
Total | | | 121,443 | | | | 25,533,189 | | | | 313,571 | | | | 48,981,953 | |
General information on hedge derivative instruments
Hedge derivative instruments and their corresponding hedged instruments are shown in the following table:
Detail of hedging | | Description of hedging instrument | | Description of hedged item | | Fair value of hedged item | | | Fair value of hedged item | | | Type of risk hedged |
instrument | | | | 12-31-2017 | | | 12-31-2016 | | |
| | | ThCh$ | | | ThCh$ | | |
SWAP | | Exchange rate | | Unsecured obligations (bonds) (*) | | | 7,696,061 | | | | (23,640,892 | ) | | Cash Flow |
FORWARD | | Exchange rate | | Revenues | | | 21,782,581 | | | | — | | | Cash Flow |
(*) See note 18.2.
For the years ended December 31, 2017, 2016 and 2015, the Group did not recognize gains or losses for ineffective cash flow hedges.
The Group has not entered into any fair value hedges for any of the periods reported.
| b) | Financial derivative instrument assets and liabilities at fair value through profit or loss |
As of December 31, 2017 and 2016, financial derivative transactions recorded at fair value through profit or loss, resulted in the recognition of the following assets and liabilities in the statement of financial position:
| | December 31, 2017 | | | December 31, 2016 | |
| | Current Assets | | | Current Liabilities (*) | | | Non-Current Assets | | | Non-Current Liabilities (*) | | | Current Assets | | | Current Liabilities (*) | | | Non-Current Assets | | | Non-Current Liabilities (*) | |
| ThCh$ | | | ThCh$ | | | ThCh$ | | | ThCh$ | | | ThCh$ | | | ThCh$ | | | ThCh$ | | | ThCh$ | |
Non-hedging derivative instrument | | | 402,716 | | | | 1,255,478 | | | | — | | | | — | | | | — | | | | 7,369,481 | | | | — | | | | 2,987,830 | |
(*) See note 18.
These derivative instruments correspond to forward contracts entered into by the Group, whose purpose is to hedge the exchange rate risk related to future obligations arising from civil works contracts linked to the construction of the Los Cóndores Plant. Although these hedges have an economic substance, they do not qualify for hedge accounting because they do not strictly comply with the hedge accounting requirements established in IAS 39 Financial Instruments: Recognition and Measurement.
F-83
| c) | Other information on derivatives: |
The following tables present the fair value of hedging and non-hedging derivatives entered into by the Group as well as the remaining contractual maturities as of December 31, 2017 and 2016:
| | December 31, 2017 | |
| | | | | | Notional Amount | |
| | Fair value | | | Less than 1 year | | | 1-2 years | | | 2-3 years | | | 3-4 years | | | 4-5 years | | | Total | |
Financial derivatives | | ThCh$ | | | ThCh$ | | | ThCh$ | | | ThCh$ | | | ThCh$ | | | ThCh$ | | | ThCh$ | |
Interest rate hedge: | | | — | | | | — | | | | — | | | | — | | | | — | | | | — | | | | — | |
Cash flow hedge | | | — | | | | — | | | | — | | | | — | | | | — | | | | — | | | | — | |
Exchange rate hedge: | | | 29,478,642 | | | | 306,350,419 | | | | 525,812,635 | | | | — | | | | — | | | | — | | | | 832,163,054 | |
Cash flow hedge | | | 29,478,642 | | | | 306,350,419 | | | | 525,812,635 | | | | — | | | | — | | | | — | | | | 832,163,054 | |
Derivatives not designated for hedge accounting | | | (852,762 | ) | | | 19,682,638 | | | | — | | | | — | | | | — | | | | — | | | | 19,682,638 | |
Total | | | 28,625,880 | | | | 326,033,057 | | | | 525,812,635 | | | | — | | | | — | | | | — | | | | 851,845,692 | |
| | | | | | | | | | | | | | | | | | | | | | | | | | | | |
| | December 31, 2016 | |
| | | | | | Notional Amount | |
| | Fair value | | | Less than 1 year | | | 1-2 years | | | 2-3 years | | | 3-4 years | | | 4-5 years | | | Total | |
Financial derivatives | | ThCh$ | | | ThCh$ | | | ThCh$ | | | ThCh$ | | | ThCh$ | | | ThCh$ | | | ThCh$ | |
Interest rate hedge: | | | — | | | | — | | | | — | | | | — | | | | — | | | | — | | | | — | |
Cash flow hedge | | | — | | | | — | | | | — | | | | — | | | | — | | | | — | | | | — | |
Exchange rate hedge: | | | (23,640,892 | ) | | | — | | | | — | | | | 523,686,966 | | | | — | | | | — | | | | 523,686,966 | |
Cash flow hedge | | | (23,640,892 | ) | | | — | | | | — | | | | 523,686,966 | | | | — | | | | — | | | | 523,686,966 | |
Derivatives not designated for hedge accounting | | | (10,357,311 | ) | | | 49,738,751 | | | | 21,434,625 | | | | — | | | | — | | | | — | | | | 71,173,376 | |
Total | | | (33,998,203 | ) | | | 49,738,751 | | | | 21,434,625 | | | | 523,686,966 | | | | — | | | | — | | | | 594,860,342 | |
The hedging and non-hedging derivatives contractual maturities do not represent the Group’s total risk exposure, as the amounts presented in the above tables have been drawn up based on undiscounted contractual cash inflows and outflows for their settlement.
20.3 Fair value hierarchy
Financial instruments recognized at fair value in the consolidated statement of financial position are classified, based on the hierarchy described in Note 3.h.
The following table presents financial assets and liabilities measured at fair value as of December 31, 2017 and 2016:
| | | | | | Fair Value Measured at End of Reporting Period Using: | |
| | 12-31-2017 | | | Level 1 | | | Level 2 | | | Level 3 | |
Financial Instruments Measured at Fair Value | | ThCh$ | | | ThCh$ | | | ThCh$ | | | ThCh$ | |
Financial Assets: | | | | | | | | | | | | | | | | |
Financial derivatives designated as cash flow hedges | | | 50,828,136 | | | | — | | | | 50,828,136 | | | | — | |
Financial derivatives not designated for hedge accounting | | | 402,716 | | | | — | | | | 402,716 | | | | — | |
Commodity derivatives not designated as cash flow hedges | | | 9,940,955 | | | | — | | | | 9,940,955 | | | | — | |
Commodity derivatives designated as cash flow hedges | | | 5,742,633 | | | | — | | | | 5,742,633 | | | | | |
Available-for-sale financial assets, non-current | | | 33,158 | | | | 33,158 | | | | — | | | | — | |
Total | | | 66,947,598 | | | | 33,158 | | | | 66,914,440 | | | | — | |
Financial Liabilities: | | | | | | | | | | | | | | | | |
Financial derivatives designated as cash flow hedges | | | 21,349,494 | | | | — | | | | 21,349,494 | | | | — | |
Financial derivatives not designated for hedge accounting | | | 1,255,478 | | | | — | | | | 1,255,478 | | | | — | |
Commodity derivatives not designated for hedge accounting | | | — | | | | — | | | | — | | | | — | |
Commodity derivatives designated as cash flow hedges | | | 889,026 | | | | — | | | | 889,026 | | | | — | |
Total | | | 23,493,998 | | | | — | | | | 23,493,998 | | | | — | |
F-84
| | | | | | Fair Value Measured at End of Reporting Period Using: | |
| | 12-31-2016 | | | Level 1 | | | Level 2 | | | Level 3 | |
Financial Instruments Measured at Fair Value | | ThCh$ | | | ThCh$ | | | ThCh$ | | | ThCh$ | |
Financial Assets: | | | | | | | | | | | | | | | | |
Financial derivatives designated as cash flow hedges | | | 25,654,632 | | | | — | | | | 25,654,632 | | | | — | |
Commodity derivatives not designated for hedge accounting | | | 875,841 | | | | — | | | | 875,841 | | | | — | |
Commodity derivatives designated as cash flow hedges | | | 16,159,565 | | | | — | | | | 16,159,565 | | | | — | |
Available-for-sale financial assets, non-current | | | 25,381 | | | | 25,381 | | | | — | | | | — | |
Total | | | 42,715,419 | | | | 25,381 | | | | 42,690,038 | | | | — | |
Financial Liabilities: | | | | | | | | | | | | | | | | |
Financial derivatives designated as cash flow hedges | | | 49,295,524 | | | | — | | | | 49,295,524 | | | | — | |
Financial derivatives not designated for hedge accounting | | | 10,357,311 | | | | — | | | | 10,357,311 | | | | — | |
Commodity derivatives not designated for hedge accounting | | | 40,013 | | | | — | | | | 40,013 | | | | — | |
Commodity derivatives designated as cash flow hedges | | | 1,063,193 | | | | — | | | | 1,063,193 | | | | — | |
Total | | | 60,756,041 | | | | — | | | | 60,756,041 | | | | — | |
20.3.1 Financial instruments whose fair value measurement is classified as Level 3.
The Group does not have any financial instruments whose fair value measurement is classified as Level 3.
21. | TRADE AND OTHER CURRENT PAYABLES. |
The detail of Trade and Other Current Payables as of December 31, 2017 and 2016, is as follows:
| | Current | | | Non-current | |
| | 12-31-2017 | | | 12-31-2016 | | | 12-31-2017 | | | 12-31-2016 | |
Trade and other payables | | ThCh$ | | | ThCh$ | | | ThCh$ | | | ThCh$ | |
Energy suppliers (*) | | | 172,042,187 | | | | 140,739,018 | | | | — | | | | — | |
Fuel and gas suppliers | | | 13,300,051 | | | | 18,024,696 | | | | — | | | | — | |
Subtotal Trade Payables | | | 185,342,238 | | | | 158,763,714 | | | | — | | | | — | |
Other Payables | | | | | | | | | | | | | | | | |
Dividends payable to third parties | | | 95,150,149 | | | | 97,094,197 | | | | — | | | | — | |
Payables for goods and services | | | 170,859,517 | | | | 166,241,384 | | | | 4,485 | | | | 40,256 | |
Payable for assets acquisition | | | 71,248,286 | | | | 74,869,722 | | | | — | | | | — | |
Warranty deposits | | | 402,107 | | | | 378,562 | | | | — | | | | | |
Taxes payables other than income tax | | | 17,648,643 | | | | 11,581,921 | | | | — | | | | — | |
VAT debit | | | 25,766,224 | | | | 22,396,497 | | | | — | | | | — | |
Accounts payable to staff | | | 27,466,888 | | | | 28,952,388 | | | | — | | | | — | |
Other payables | | | 614,554 | | | | 1,226,898 | | | | 655,339 | | | | 1,442,857 | |
Subtotal Other Payables | | | 409,156,368 | | | | 402,741,569 | | | | 659,824 | | | | 1,483,113 | |
Total | | | 594,498,606 | | | | 561,505,283 | | | | 659,824 | | | | 1,483,113 | |
(*) As of December 31, 2017, Enel Distribución Chile S.A. has accrued ThCh$ 4,501,709 (ThCh$4,367,657 as of December 31, 2016) for payable expenses to generation companies due to delays in the publication of the decrees on Short-Term Node Prices and settlement of Average Node Prices.
See Note 19.4 for the description of the liquidity risk management policy.
The detail of trade payables, both non-past due and past due as of December 31, 2017 and 2016, are presented in Appendix 7.
| a) | The breakdown of provisions as of December 31, 2017 and 2016, is as follows: |
| | Current | | | Non-current | |
| | 12-31-2017 | | | 12-31-2016 | | | 12-31-2017 | | | 12-31-2016 | |
Provisions | | ThCh$ | | | ThCh$ | | | ThCh$ | | | ThCh$ | |
Provision for legal proceedings (1) | | | 3,497,786 | | | | 4,694,579 | | | | 13,936,190 | | | | 5,308,206 | |
Decommissioning or restoration (2) | | | — | | | | — | | | | 64,486,647 | | | | 57,798,702 | |
Other provisions | | | 2,138,385 | | | | 1,798,953 | | | | — | | | | — | |
Total | | | 5,636,171 | | | | 6,493,532 | | | | 78,422,837 | | | | 63,106,908 | |
F-85
| (1) | Provision for legal proceedings mainly consist of the contingencies related to lawsuits on administrative sanctions from our regulators. |
| (2) | Provision for decommissioning or restorations arises from the Bocamina II project and San Isidro Power Plant. |
The expected timing and amount of any cash outflows related to the above provisions is uncertain and depends on the final resolution of the provisioned matters.
| b) | Changes in provisions as of December 31, 2017 and 2016, are as follows: |
| | Legal Proceedings | | | Decommissioning or Restoration | | | Environment and Other Provisions | | | Total | |
Changes in Provisions | | ThCh$ | | | ThCh$ | | | ThCh$ | | | ThCh$ | |
Balance at January 1, 2017 | | | 10,002,785 | | | | 57,798,702 | | | | 1,798,953 | | | | 69,600,440 | |
Increase (decrease) in existing provisions (1) | | | 12,159,920 | | | | 4,340,858 | | | | 339,432 | | | | 16,840,210 | |
Provisions used | | | (2,995,017 | ) | | | — | | | | — | | | | (2,995,017 | ) |
Reversal of unused provision | | | (1,728,788 | ) | | | — | | | | — | | | | (1,728,788 | ) |
Increase from adjustment to time value of money (2) | | | — | | | | 2,347,087 | | | | — | | | | 2,347,087 | |
Foreign currency translation | | | (4,924 | ) | | | — | | | | — | | | | (4,924 | ) |
Total changes in provisions | | | 7,431,191 | | | | 6,687,945 | | | | 339,432 | | | | 14,458,568 | |
Balance at December 31, 2017 | | | 17,433,976 | | | | 64,486,647 | | | | 2,138,385 | | | | 84,059,008 | |
| | | | | | | | | | | | | | | | |
| | Legal Proceedings | | | Decommissioning or Restoration | | | Other Provisions | | | Total | |
Changes in Provisions | | ThCh$ | | | ThCh$ | | | ThCh$ | | | ThCh$ | |
Balance at January 1, 2016 | | | 14,829,364 | | | | 51,085,542 | | | | 6,530,429 | | | | 72,445,335 | |
Increase (decrease) in existing provisions | | | 111,723 | | | | 4,161,948 | | | | (4,731,476 | ) | | | (457,805 | ) |
Provisions used | | | (4,948,439 | ) | | | — | | | | — | | | | (4,948,439 | ) |
Increase from adjustment to time value of money | | | — | | | | 2,551,212 | | | | — | | | | 2,551,212 | |
Foreign currency translation | | | 10,137 | | | | — | | | | — | | | | 10,137 | |
Total changes in provisions | | | (4,826,579 | ) | | | 6,713,160 | | | | (4,731,476 | ) | | | (2,844,895 | ) |
Balance at December 31, 2016 | | | 10,002,785 | | | | 57,798,702 | | | | 1,798,953 | | | | 69,600,440 | |
(1) The increase in existing provisions in the year 2017 it is mainly due to sanctions taken by the Superintendency of Electricity and Fuels to Enel Distribución for an amount of ThCh $ 11,840,322. See note 35.
F-86
23. | EMPLOYEE BENEFIT OBLIGATIONS. |
23.1General information:
The Group provides various post-employment benefits for all or some of their active or retired employees. These benefits are calculated and recorded in the financial statements according to the criteria described in Note 3.l.1, and include primarily the following:
Defined benefit plans:
| • | Complementary pension: The beneficiary is entitled to receive a monthly amount that supplements the pension obtained from the respective social security system. |
| • | Employee severance indemnities: The beneficiary receives a certain number of contractual salaries upon retirement. Such benefit is subject to a minimum vesting service requirement period, which depending on the Group, varies within a range from 5 to 15 years. |
| • | Electricity: The beneficiary receives a monthly bonus to cover a portion of their billed residential electricity consumption. |
| • | Health benefit: The beneficiary receives health coverage in addition to that to which they are entitled to under applicable social security system. |
23.2 Details, changes and presentation in financial statements:
| a) | The post-employment obligations associated with the defined benefits plan as of December 31, 2017, 2016 and 2015, are as follows: |
General ledger accounts:
| | 12-31-2017 | | | 12-31-2016 | | | 12-31-2015 | |
| | ThCh$ | | | ThCh$ | | | ThCh$ | |
Post-employment obligations | | | 57,081,924 | | | | 59,934,127 | | | | 55,023,456 | |
Total | | | 57,081,924 | | | | 59,934,127 | | | | 55,023,456 | |
Total post-employment obligations, net | | | 57,081,924 | | | | 59,934,127 | | | | 55,023,456 | |
| b) | The following amounts were recognized in the consolidated statement of comprehensive income for the years ended December 31, 2017, 2016 and 2015: |
| | For the years ended December 31, | |
| | 2017 | | | 2016 | | | 2015 | |
Expense Recognized in the Statement of Comprehensive Income | | ThCh$ | | | ThCh$ | | | ThCh$ | |
Current service cost for defined benefits plan | | | 2,091,205 | | | | 1,899,660 | | | | 2,282,226 | |
Interest cost for defined benefits plan | | | 2,678,300 | | | | 2,517,406 | | | | 2,299,944 | |
Expenses recognized in the Statement of Income | | | 4,769,505 | | | | 4,417,066 | | | | 4,582,170 | |
Gains (losses) from remeasurement of defined benefit plans | | | (1,716,875 | ) | | | 6,618,514 | | | | 5,645,532 | |
Total expense recognized in the Statement of Comprehensive Income | | | 3,052,630 | | | | 11,035,580 | | | | 10,227,702 | |
F-87
| c) | The balance and changes in post-employment defined benefit obligations as of and for the years ended December 31, 2017, 2016 and 2015, are as follows: |
Actuarial Value of Post-employment Obligations | | ThCh$ | |
Balance at January 1, 2015 | | | 53,937,842 | |
Current service cost | | | 2,282,226 | |
Net Interest cost | | | 2,299,944 | |
Actuarial (gains) losses from changes in financial assumptions | | | 2,549,816 | |
Actuarial (gains) losses from changes in experience adjustments | | | 3,095,716 | |
Foreign currency translation | | | (697 | ) |
Benefits paid | | | (9,008,811 | ) |
Other | | | (132,580 | ) |
Balance at December 31, 2015 | | | 55,023,456 | |
Current service cost | | | 1,899,660 | |
Net Interest cost | | | 2,517,406 | |
Actuarial (gains) losses from changes in financial assumptions | | | 1,073,475 | |
Actuarial (gains) losses from changes in experience adjustments | | | 5,545,039 | |
Benefits paid | | | (7,771,781 | ) |
Transfers of employees | | | 1,337,621 | |
Other | | | 309,251 | |
Balance at December 31, 2016 | | | 59,934,127 | |
Current service cost | | | 2,091,205 | |
Net Interest cost | | | 2,678,300 | |
Actuarial (gains) losses from changes in financial assumptions | | | (1,414,201 | ) |
Actuarial (gains) losses from changes in experience adjustments | | | (302,674 | ) |
Benefits paid | | | (5,917,552 | ) |
Transfers of employees | | | 12,719 | |
Balance at December 31, 2017 | | | 57,081,924 | |
23.3 Other disclosures:
As of December 31, 2017, 2016 and 2015, the following assumptions were used in the actuarial calculation of defined benefits:
| | 12-31-2017 | | | 12-31-2016 | | | 12-31-2015 | |
Discount rates used | | 5.00% | | | 4.70% | | | 5.00% | |
Expected rate of salary increases | | | 4.00% | | | | 4.00% | | | | 4.00% | |
Turnover rate | | 4.57% | | | 4.72% | | | 4.89% | |
Mortality tables | | CB-H-2014 / RV-M-2014 | | | CB-H-2014 / RV-M-2014 | | | RV-2009 | |
As of December 31, 2017 and 2016, the sensitivity value of the actuarial liability for post-employment benefits to variations of 100 basis points in the discount rate assumes a decrease of ThCh$4,269,704 and ThCh$4,665,915, respectively, if the rate rises, and an increase of ThCh$4,773,942 and ThCh$5,241,395, respectively, if the rate falls.
The estimates available indicate that ThCh$5,558,032 will be disbursed for defined benefit plans in the next year.
F-88
The Group’s obligations have a weighted average length of 9.18 years, and the flow for benefits for the next five years and more is expected to be as follows:
Years | | ThCh$ | |
1 | | | 5,558,032 | |
2 | | | 4,970,959 | |
3 | | | 4,203,682 | |
4 | | | 5,105,974 | |
5 | | | 4,917,461 | |
Over 5 | | | 22,844,851 | |
24.1 Equity attributable to the shareholders of Enel Chile
The issued capital of the Company for the year ended December 31, 2017 is Ch$2,229,108,974,538 divided into 49,092,772,762 shares. The Company was initially incorporated on January 22, 2016 under the name of Enersis Chile S.A. and its shares began to be traded on the Santiago Stock Exchange, the Electronic Stock Exchange, the Valparaíso Stock Exchange, and the New York Stock Exchange, on April 21, 2016.
For more information on the general background of Enel Chile, See Note 1,
During the years ended December 31, 2017 and 2016, the Group did not engage in any transaction of any kind with potential dilutive effects leading to diluted earnings per share that could differ from basic earnings per share.
24.2 Dividends
Dividend No. | | Type of Dividend | | Payment Date | | Pesos per Share | | | Charged to |
1 | | Final | | 05-24-2016 | | | 2.09338 | | | 2015 |
2 | | Interim | | 01-27-2017 | | | 0.75884 | | | 2016 |
3 | | Final | | 05-26-2017 | | | 2.47546 | | | 2016 |
4 | | Interim | | 01-26-2018 | | | 0.75642 | | | 2017 |
24.3 Foreign currency translation reserves
The following table sets forth foreign currency translation adjustments attributable to the shareholders of the Company for the years ended December 31, 2017, 2016 and 2015:
| | For the years ended December 31, | |
| | 2017 | | | 2016 | | | 2015 | |
Reserves for Accumulated Currency Translation Differences | | ThCh$ | | | ThCh$ | | | ThCh$ | |
GasAtacama Chile S.A. (1) | | | 6,416,189 | | | | 8,484,094 | | | | 9,582,184 | |
Electrogas (2) | | | — | | | | — | | | | 1,875,303 | |
GNL Chile S.A. | | | 560,194 | | | | 738,839 | | | | 328,447 | |
GNL Quintero S.A. (3) | | | — | | | | — | | | | 637,758 | |
TOTAL | | | 6,976,383 | | | | 9,222,933 | | | | 12,423,692 | |
| (1) | From 1 January 2015, there was a change in the functional currency for this entity from the US dollar to the Chilean peso. |
F-89
24.4 Restrictions on consolidated subsidiaries transferring funds to the parent
Certain of the Group’s subsidiaries must comply with financial ratio covenants which require them to have a minimum level of equity or other requirements that restrict the transferring of assets to the Company. The Group’s restricted net assets as of December 31, 2017 and 2016 from its subsidiary Enel Generación Chile S.A. totaled ThCh$456,844,078 and ThCh$458,309,294, respectively.
24.5 Other reserves
Other reserves within Equity attributable to Enel Chile for the years ended December 31, 2017, 2016 and 2015 are as follows:
| | Balance at January 1, 2017 | | | 2017 Changes | | | Balance at December 31, 2017 | |
Other reserves | | ThCh$ | | | ThCh$ | | | ThCh$ | |
Exchange differences on translation (a) | | | 9,222,933 | | | | (2,246,550 | ) | | | 6,976,383 | |
Cash flow hedges (b) | | | (76,218,470 | ) | | | 43,368,734 | | | | (32,849,736 | ) |
Available-for-sale financial assets | | | 9,955 | | | | 1,329 | | | | 11,284 | |
Other miscellaneous reserves (c) | | | (969,740,120 | ) | | | (1,728,359 | ) | | | (971,468,479 | ) |
Other comprehensive income from non-current assets held for Sale (d) | | | 1,632,724 | | | | (1,632,724 | ) | | | — | |
TOTAL | | | (1,035,092,978 | ) | | | 37,762,430 | | | | (997,330,548 | ) |
| | | | | | | | | | | | |
| | Balance at January 1, 2016 | | | 2016 Changes | | | Balance at December 31, 2016 | |
Other reserves | | ThCh$ | | | ThCh$ | | | ThCh$ | |
Exchange differences on translation (a) | | | 12,423,692 | | | | (3,200,759 | ) | | | 9,222,933 | |
Cash flow hedges (b) | | | (121,503,052 | ) | | | 45,284,582 | | | | (76,218,470 | ) |
Available-for-sale financial assets | | | 14,835 | | | | (4,880 | ) | | | 9,955 | |
Other comprehensive income from non-current assets held for sale (d) | | | — | | | | 1,632,724 | | | | 1,632,724 | |
Other miscellaneous reserves (c) | | | (849,525,427 | ) | | | (120,214,693 | ) | | | (969,740,120 | ) |
TOTAL | | | (958,589,952 | ) | | | (76,503,026 | ) | | | (1,035,092,978 | ) |
| | | | | | | | | | | | |
| | Balance at January 1, 2015 | | | 2015 Changes | | | Balance at December 31, 2015 | |
Other reserves | | ThCh$ | | | ThCh$ | | | ThCh$ | |
Exchange differences on translation (a) | | | 11,443,966 | | | | 979,726 | | | | 12,423,692 | |
Cash flow hedges (b) | | | (66,850,863 | ) | | | (54,652,189 | ) | | | (121,503,052 | ) |
Available-for-sale financial assets | | | 14,046 | | | | 789 | | | | 14,835 | |
Other miscellaneous reserves (c) | | | (873,486,367 | ) | | | 23,960,940 | | | | (849,525,427 | ) |
TOTAL | | | (928,879,218 | ) | | | (29,710,734 | ) | | | (958,589,952 | ) |
| a) | Exchange differences on translation: These reserves arise primarily from exchange differences relating to: (i) Translation of the financial statements of our subsidiaries from their functional currencies to our presentation currency (i.e. Chilean peso) (see Note 2.7.3). |
| b) | Cash flow hedging reserves: These reserves represent the cumulative effective portion of gains and losses recognized in cash flow hedges (see Note 3.g.5 and 3.h). |
F-90
| c) | Other miscellaneous reserves |
The main items and their effects are the following:
| | For the years ended | |
| | 2017 | | | 2016 | | | 2015 | |
Other Miscellaneous Reserves | | ThCh$ | | | ThCh$ | | | ThCh$ | |
Reserve for corporate reorganization ("Spin-Off") (i) | | | (534,057,733 | ) | | | (532,330,290 | ) | | | (421,335,641 | ) |
Reserve for transition to IFRS (ii) | | | (457,221,836 | ) | | | (457,221,836 | ) | | | (457,221,836 | ) |
Reserve for subsidiaries transactions (iii) | | | 12,502,494 | | | | 12,502,494 | | | | 12,502,494 | |
Other Miscellaneous Reserves (iv) | | | 7,308,596 | | | | 7,309,512 | | | | 16,529,556 | |
TOTAL | | | (971,468,479 | ) | | | (969,740,120 | ) | | | (849,525,427 | ) |
| (i) | Reserve for corporate reorganization (“Spin-Off”): Corresponds to the effects from the corporate reorganization of the Company, as described in Note 1, and the separation of the foreign business in Enel Américas. This reserve includes the effect of the taxes that Enel Generación Chile (formerly named Endesa Chile) and Enel Distribución Chile (formerly named Chilectra Chile) paid in Peru for transferring their investments to Endesa Américas and Chilectra Américas. The tax payments made by Enel Generación Chile, in March 2016, and Enel Distribución Chile, in April 2016, were 577 million Soles (ThCh$100,978,571) and 74 million Soles (ThCh$15,193,186), respectively. The calculation basis for determining the tax corresponds to the difference between the market value of the investments, to the date of the transfer, and the cost of tax acquisition of the participations. The net economic effect on the opening equity was ThCh$90,274,727. |
It should be noted that, being directly linked to the split transaction, the accounting record of this tax has been made directly in equity, specifically in Other reserves, following the nature of the main transaction (transaction with shareholders), (See Notes 1 and 2).
| (ii) | Reserve for transition to IFRS: In accordance with Official Bulletin No. 456 from the CMF, included in this line item is the monetary correction corresponding to the accumulated paid-up capital from the date of our transition to IFRS, January 1, 2004, to December 31, 2008. |
| (iii) | Reserve for subsidiaries transactions: Corresponds to the effect of acquisition of equity interests in subsidiaries that were accounted for as transactions between entities under common control. |
| (iv) | Other miscellaneous reserves from transactions made in prior years. |
24.6 Non-controlling Interests
The detail of non-controlling interests is as follows:
| | | | | | Non-controlling Interests | |
| | | | | | Equity | | | Profit (Loss) | |
| | 12-31-2017 | | | 12-31-2017 | | | 12-31-2016 | | | 12-31-2015 | | | 12-31-2017 | | | 12-31-2016 | | | 12-31-2015 | |
Companies | | % | | | ThCh$ | | | ThCh$ | | | ThCh$ | | | ThCh$ | | | ThCh$ | | | ThCh$ | |
Enel Distribución Chile S.A. | | 0.91% | | | | 6,223,363 | | | | 6,441,611 | | | | 5,751,343 | | | | 961,490 | | | | 1,210,871 | | | | 1,294,111 | |
Enel Generación Chile S.A. | | 40.02% | | | | 784,999,394 | | | | 680,725,188 | | | | 590,091,089 | | | | 167,465,216 | | | | 173,299,349 | | | | 84,976,889 | |
Empresa Eléctrica Pehuenche S.A. | | 7.35% | | | | 9,963,472 | | | | 10,008,502 | | | | 10,900,863 | | | | 5,649,253 | | | | 6,512,893 | | | | 8,674,207 | |
Sociedad Agrícola de Cameros Ltda. | | 42.50% | | | | 2,596,764 | | | | 2,636,470 | | | | 2,675,177 | | | | (39,706 | ) | | | (38,707 | ) | | | 191,838 | |
Other | | | | | | | (205,346 | ) | | | (209,417 | ) | | | (199,191 | ) | | | (984 | ) | | | 126,845 | | | | (7,291 | ) |
TOTAL | | | | | | | 803,577,647 | | | | 699,602,354 | | | | 609,219,281 | | | | 174,035,269 | | | | 181,111,251 | | | | 95,129,754 | |
F-91
25. | REVENUE AND OTHER OPERATING INCOME. |
The detail of revenues for the years ended December 31, 2017, 2016 and 2015, is as follows:
| | For the years ended December 31, | |
| | 2017 | | | 2016 | | | 2015 | |
Revenues | | ThCh$ | | | ThCh$ | | | ThCh$ | |
Energy sales | | | 2,268,459,154 | | | | 2,312,643,619 | | | | 2,247,363,757 | |
Generation | | | 1,082,749,256 | | | | 1,141,725,803 | | | | 1,134,450,921 | |
Regulated customers | | | 726,166,640 | | | | 805,079,958 | | | | 726,264,558 | |
Non-regulated customers | | | 285,623,737 | | | | 234,641,908 | | | | 264,113,111 | |
Spot market sales | | | 70,958,879 | | | | 102,003,937 | | | | 140,339,722 | |
Other customers | | | — | | | | — | | | | 3,733,530 | |
Distribution | | | 1,185,709,898 | | | | 1,170,917,816 | | | | 1,112,912,836 | |
Residential | | | 442,137,827 | | | | 431,610,828 | | | | 407,435,626 | |
Business | | | 386,608,105 | | | | 379,037,776 | | | | 350,157,120 | |
Industrial | | | 225,736,231 | | | | 229,878,875 | | | | 230,416,697 | |
Other consumers (1) | | | 131,227,735 | | | | 130,390,337 | | | | 124,903,393 | |
Other sales | | | 107,362,797 | | | | 73,607,457 | | | | 32,057,524 | |
Natural gas sales | | | 91,652,707 | | | | 64,443,715 | | | | 12,582,771 | |
Sales of products and services | | | 15,710,090 | | | | 9,163,742 | | | | 19,474,753 | |
Revenue from other services | | | 114,648,227 | | | | 129,592,804 | | | | 104,871,908 | |
Tolls and transmission | | | 39,812,005 | | | | 51,014,073 | | | | 37,958,975 | |
Metering equipment leases | | | 4,945,609 | | | | 4,555,779 | | | | 4,415,191 | |
Public lighting | | | 13,449,852 | | | | 12,660,894 | | | | 10,859,012 | |
Engineering and consulting services | | | 3,414,472 | | | | 14,304,336 | | | | 1,817,284 | |
Other services (2) | | | 53,026,289 | | | | 47,057,722 | | | | 49,821,446 | |
Total Revenues | | | 2,490,470,178 | | | | 2,515,843,880 | | | | 2,384,293,189 | |
| | | | | | | | | | | | |
Other Operating Income | | ThCh$ | | | ThCh$ | | | ThCh$ | |
Mutual support | | | — | | | | — | | | | 14,563 | |
Commodity derivatives | | | 20,328,649 | | | | 10,794,682 | | | | 1,820,371 | |
Other income (3) | | | 18,548,051 | | | | 14,928,257 | | | | 12,901,017 | |
Total other income | | | 38,876,700 | | | | 25,722,939 | | | | 14,735,951 | |
| (1) | For the year ended December 31, 2017, it includes revenues from energy sales to municipalities of ThCh$36,165,698; government entities of ThCh$20,080,121 and agricultural sector entities of ThCh$5,811,319, and other of ThCh$ 69,170,597. For the year ended December 31, 2016, it includes revenues from energy sales to municipalities of ThCh$37,338,741; government entities of ThCh$18,333,375; agricultural sector entities of ThCh$5,377,993; and other of ThCh$69,340,228. For the year ended December 31, 2015, it includes revenues from energy sales to municipalities of ThCh$39,405,365; government entities of ThCh$18,631,045; agricultural sector entities of ThCh$5,356,396; and other of ThCh$61,510,586. |
| (2) | For the year ended December 31, 2017, it includes services for construction of junctions of ThCh$15,514,433; works in specific facilities and networks of ThCh$15,125,128; and other services of ThCh$22,386,728. For the year ended December 31, 2016, it includes services for construction of junctions of ThCh$14,359,194; works in specific facilities and networks of ThCh$21,397,176; and other services of ThCh$11,301,352. For the year ended December 31, 2015, it includes services for construction of junctions of ThCh$16,289,581; works in specific facilities and networks of ThCh$16,736,234; and other services of ThCh$11,741,987. |
| (3) | For the year ended December 31, 2017, it includes revenues from energy losses recoveries of ThCh$1,968,203; revenues from outdated collection of invoices of ThCh$1,299,470; and revenues from other services of ThCh$15,280,378. For the year ended December 31, 2016, it includes revenues from energy losses recoveries of ThCh$1,344,529; revenues from outdated collection of invoices of ThCh$1,540,348; and revenues from other services of ThCh$12,043,380. For the year ended December 31, 2015, it mainly related to revenues from water sales of ThCh$823,821; and revenues from other services for ThCh$4,877,987. |
F-92
26. | RAW MATERIALS AND CONSUMABLES USED. |
The detail of raw materials and consumables used for the years ended December 31, 2017, 2016 and 2015, is as follows:
| | For the years ended December 31, | |
| | 2017 | | | 2016 | | | 2015 | |
Raw materials and consumables used | | ThCh$ | | | ThCh$ | | | ThCh$ | |
Energy purchases | | | (902,434,871 | ) | | | (891,746,884 | ) | | | (860,203,181 | ) |
Fuel consumption | | | (280,739,362 | ) | | | (295,148,838 | ) | | | (327,502,996 | ) |
Transportation costs | | | (155,879,249 | ) | | | (195,123,118 | ) | | | (182,453,155 | ) |
Other raw materials and consumables | | | (182,102,035 | ) | | | (115,400,740 | ) | | | (111,826,227 | ) |
Total | | | (1,521,155,517 | ) | | | (1,497,419,580 | ) | | | (1,481,985,559 | ) |
27. | EMPLOYEE BENEFITS EXPENSE. |
Employee expenses for the years ended December 31, 2017, 2016 and 2015, are as follows:
| | For the years ended December 31, | |
| | 2017 | | | 2016 | | | 2015 | |
Employee Benefits Expense | | ThCh$ | | | ThCh$ | | | ThCh$ | |
Wages and salaries | | | (100,653,880 | ) | | | (100,938,761 | ) | | | (115,982,152 | ) |
Post-employment benefit obligations expense | | | (2,091,205 | ) | | | (1,899,660 | ) | | | (2,282,226 | ) |
Social security and other contributions | | | (18,758,692 | ) | | | (21,260,007 | ) | | | (18,290,343 | ) |
Total | | | (121,503,777 | ) | | | (124,098,428 | ) | | | (136,554,721 | ) |
28. | DEPRECIATION, AMORTIZATION AND IMPAIRMENT LOSSES. |
The detail of depreciation, amortization and impairment losses for the years ended December 31, 2017, 2016 and 2015, are as follows:
| | For the years ended December 31, | |
| | 2017 | | | 2016 | | | 2015 | |
| | ThCh$ | | | ThCh$ | | | ThCh$ | |
Depreciation | | | (145,873,065 | ) | | | (155,826,620 | ) | | | (148,421,514 | ) |
Amortization | | | (6,811,041 | ) | | | (5,833,990 | ) | | | (4,780,148 | ) |
Subtotal | | | (152,684,106 | ) | | | (161,660,610 | ) | | | (153,201,662 | ) |
Impairment (Losses) Reversals (*) | | | (7,937,817 | ) | | | (35,926,710 | ) | | | 3,054,903 | |
Total | | | (160,621,923 | ) | | | (197,587,320 | ) | | | (150,146,759 | ) |
| Balance as of | |
(*) Impairment Losses | Generation | | | Distribution | | | Total | |
| 2017 | | | 2016 | | | 2015 | | | 2017 | | | 2016 | | | 2015 | | | 2017 | | | 2016 | | | 2015 | |
| ThCh$ | | | ThCh$ | | | ThCh$ | | | ThCh$ | | | ThCh$ | | | ThCh$ | | | ThCh$ | | | ThCh$ | | | ThCh$ | |
Impairment losses of financial assets (See Note 8.d) | | 55,494 | | | | — | | | | (371,558 | ) | | | (7,993,311 | ) | | | (5,141,179 | ) | | | (6,738,750 | ) | | | (7,937,817 | ) | | | (5,141,179 | ) | | | (7,110,308 | ) |
Impairment losses of property, plant and equipment (See Note 15) | | — | | | | (30,785,531 | ) | | | 10,165,211 | | | | — | | | | — | | | | — | | | | — | | | | (30,785,531 | ) | | | 10,165,211 | |
Total | | 55,494 | | | | (30,785,531 | ) | | | 9,793,653 | | | | (7,993,311 | ) | | | (5,141,179 | ) | | | (6,738,750 | ) | | | (7,937,817 | ) | | | (35,926,710 | ) | | | 3,054,903 | |
F-93
Other miscellaneous operating expenses for the years ended December 31, 2017, 2016 and 2015, are as follows:
| | For the years ended December 31, | |
| | 2017 | | | 2016 | | | 2015 | |
Other Expenses | | ThCh$ | | | ThCh$ | | | ThCh$ | |
Other supplies and services | | | (17,064,008 | ) | | | (23,962,717 | ) | | | (16,365,050 | ) |
Professional, outsourced and other services | | | (58,622,123 | ) | | | (55,571,694 | ) | | | (43,006,875 | ) |
Repairs and maintenance | | | (13,999,283 | ) | | | (11,030,522 | ) | | | (14,034,924 | ) |
Indemnities and fines | | | (776,011 | ) | | | (3,046,557 | ) | | | (1,754,069 | ) |
Taxes and charges | | | (5,105,235 | ) | | | (4,972,995 | ) | | | (7,406,215 | ) |
Insurance premiums | | | (13,277,718 | ) | | | (17,148,278 | ) | | | (15,942,047 | ) |
Leases and rental costs | | | (2,969,436 | ) | | | (3,250,503 | ) | | | (10,098,166 | ) |
Marketing, public relations and advertising | | | (2,501,027 | ) | | | (3,736,414 | ) | | | (3,166,181 | ) |
Written-off Huechún and Chillán projects (*) | | | — | | | | (36,480,223 | ) | | | — | |
Written-off projects in progress (*) | | | (25,105,911 | ) | | | — | | | | — | |
Other supplies | | | (11,188,148 | ) | | | (6,132,681 | ) | | | (6,041,038 | ) |
Travel expenses | | | (3,445,944 | ) | | | (3,190,662 | ) | | | (4,103,471 | ) |
Environmental expenses | | | (7,769,230 | ) | | | (2,245,891 | ) | | | (3,939,361 | ) |
Total | | | (161,824,074 | ) | | | (170,769,137 | ) | | | (125,857,397 | ) |
Other gains (losses) for the years ended December 31, 2017, 2016 and 2015, are as follows:
| | For the years ended December 31, | |
| | 2017 | | | 2016 | | | 2015 | |
Other Gains (Losses) | | ThCh$ | | | ThCh$ | | | ThCh$ | |
Gain on sale of building (Alonso de Cordova) | | | — | | | | — | | | | 14,610,544 | |
Gain on sale of Tunel El Melón | | | — | | | | — | | | | 4,207,167 | |
Gain on sale of GNL Quintero S.A. (**) | | | — | | | | 121,325,018 | | | | — | |
Gain on sale of Electrogas (*) | | | 105,311,912 | | | | — | | | | — | |
Gain on sale of investment properties | | | — | | | | — | | | | 1,463,163 | |
Gain on sale of assets | | | 7,779,531 | | | | — | | | | — | |
Other | | | 149,753 | | | | 165,044 | | | | (225,129 | ) |
Total | | | 113,241,196 | | | | 121,490,062 | | | | 20,055,745 | |
Financial income and costs for the years ended December 31, 2017, 2016 and 2015, are as follows:
| | For the years ended December 31, | |
| | 2017 | | | 2016 | | | 2015 | |
Financial Income | | ThCh$ | | | ThCh$ | | | ThCh$ | |
Income from deposits and other financial instruments | | | 8,377,023 | | | | 5,733,428 | | | | 2,566,017 | |
Interests charged to customers in energy accounts and billing | | | 8,556,587 | | | | — | | | | — | |
Other financial income | | | 4,729,078 | | | | 17,372,473 | | | | 12,704,152 | |
Total Financial Income | | | 21,662,688 | | | | 23,105,901 | | | | 15,270,169 | |
F-94
| | For the years ended December 31, | |
| | 2017 | | | 2016 | | | 2015 | |
Financial Costs | | ThCh$ | | | ThCh$ | | | ThCh$ | |
Financial Costs | | | (53,510,882 | ) | | | (58,199,382 | ) | | | (66,700,698 | ) |
Bank loans | | | (12,585 | ) | | | (2,034,277 | ) | | | (131,502 | ) |
Secured and unsecured obligations | | | (42,708,253 | ) | | | (44,268,489 | ) | | | (51,697,708 | ) |
Financial leasing | | | (811,172 | ) | | | (780,953 | ) | | | (1,039,013 | ) |
Valuation of financial derivatives | | | (1,067,820 | ) | | | (824,922 | ) | | | (1,725,211 | ) |
Financial provisions (1) | | | (2,347,087 | ) | | | (2,551,211 | ) | | | (1,881,826 | ) |
Post-employment benefit obligations (2) | | | (2,678,300 | ) | | | (2,517,406 | ) | | | (2,299,944 | ) |
Debt formalization expenses and other associated expenses | | | (836,174 | ) | | | — | | | | — | |
Capitalized borrowing costs | | | 4,078,463 | | | | 3,001,211 | | | | 2,221,329 | |
Other financial costs | | | (7,127,954 | ) | | | (8,223,335 | ) | | | (10,146,823 | ) |
Loss from indexed assets and liabilities (*) | | | 916,666 | | | | 1,631,840 | | | | 4,839,077 | |
Foreign currency exchange differences (**) | | | 8,516,874 | | | | 12,978,471 | | | | (51,277,332 | ) |
Total Financial Costs | | | (44,077,342 | ) | | | (43,589,071 | ) | | | (113,138,953 | ) |
| | | | | | | | | | | | |
Total Financial Results | | | (22,414,654 | ) | | | (20,483,170 | ) | | | (97,868,784 | ) |
(*) and (**) The effects on financial results from exchange differences and the application of indexed assets and liabilities originated from the following:
| | For the years ended December 31, | |
| | 2017 | | | 2016 | | | 2015 | |
Profit (losses) from Indexed Assets and Liabilities (*) | | ThCh$ | | | ThCh$ | | | ThCh$ | |
Other financial assets | | | 4,659,933 | | | | 7,237,000 | | | | 10,153,342 | |
Other non-financial assets | | | — | | | | — | | | | 840,108 | |
Trade and other receivables | | | 155,158 | | | | 1,077,086 | | | | 745,270 | |
Current tax assets and liabilities | | | 1,654,538 | | | | 2,349,415 | | | | 6,052,524 | |
Other financial liabilities (financial debt and derivative instruments) | | | (5,551,163 | ) | | | (9,014,858 | ) | | | (12,864,959 | ) |
Trade and other payables | | | (1,800 | ) | | | (16,803 | ) | | | (73,133 | ) |
Other provisions | | | — | | | | — | | | | (14,075 | ) |
Total | | | 916,666 | | | | 1,631,840 | | | | 4,839,077 | |
| | | | | | | | | | | | |
| | For the years ended December 31, | |
| | 2017 | | | 2016 | | | 2015 | |
Foreign Currency Exchange Differences (**) | | ThCh$ | | | ThCh$ | | | ThCh$ | |
Cash and cash equivalents | | | 2,931,086 | | | | 240,451 | | | | 5,021,381 | |
Other financial assets | | | 10,895,862 | | | | 25,476,638 | | | | 10,637,768 | |
Trade and other receivables | | | 390,764 | | | | 2,595,997 | | | | 10,313,151 | |
Current tax assets and liabilities | | | (188,270 | ) | | | — | | | | — | |
Other financial liabilities (financial debt and derivative instruments) | | | (4,358,937 | ) | | | (18,538,354 | ) | | | (30,533,746 | ) |
Trade and other payables | | | (1,152,505 | ) | | | 3,203,739 | | | | (46,715,886 | ) |
Other non-financial liabilities | | | (1,126 | ) | | | — | | | | — | |
Total | | | 8,516,874 | | | | 12,978,471 | | | | (51,277,332 | ) |
F-95
32. | INFORMATION BY SEGMENT |
32.1 Basis of segmentation
The Group’s activities operate under a matrix management structure with dual and cross management responsibilities (based on businesses), and its subsidiaries are engaged in either the Generation Business or the Distribution Business.
The Group adopted a “bottom-up” approach to determine its reportable segments. The Generation and the Distribution reportable segments have been defined based on IFRS 8.9 and on the criteria described in IFRS 8.12.
Generation Business: The Generation Reportable Segment is comprised of a group of electricity companies that own electricity generating plants, whose energy is transmitted and distributed to end customers.
The Generation Business is conducted by our subsidiaries Enel Generación Chile S.A., Empresa Eléctrica Pehuenche S.A. and GasAtacama Chile S.A..
Distribution Business: The Distribution Reportable Segment is comprised of a group of electricity companies operating under a public utility concession, with service obligations and regulated tariffs for supplying regulated customers.
The Distribution Business is conducted by our subsidiary Enel Distribución Chile S.A. and its subsidiaries.
Each of the operating segments generates separate financial information, which is aggregated into one combined set of information for the Generation Business, and another set of combined information for the Distribution Business at the reportable segment level. In addition, in order to assist the decision maker process, the Planning & Control Department at the Parent Company level prepares internal reports containing combined information at the reportable segment level about the main key performance indicators (KPIs), such as: EBITDA, Gross Margin, Total Capex, Total Opex, Net income, Total Energy Generation, among others. The presentation of information under this business approach has been made taking into consideration that the KPIs are similar and comparable in all segments, in each of the following aspects:
| (a) | the nature of the activities: Generation on one hand, and Distribution on the other; |
| (b) | the nature of the production processes: the Generation Business deals with the generation of electricity, while the Distribution Business does not generate electricity, but distributes electricity to end customers; |
| (c) | the type or class of customer for their products and services: the Generation Business provides services mainly to unregulated customers, while the Distribution Business provides energy to regulated customers; |
| (d) | the methods used to distribute their products or provide their services: generators generally sell the energy through energy auctions, while distributors provide energy in their concession area; and |
| (e) | the nature of the regulatory environment (public utilities): the regulatory frameworks differs in the Generation Business and Distribution Business |
The Company’s chief operating decision maker (CODM) in conjunction with the Chile manager reviews on a monthly basis these internal reports and uses the KPI information to make decisions on the allocation of resources and the assessment of the performance of the operating segments for each reportable segment.
The information disclosed in the following tables is based on the financial information of the companies forming each segment. The accounting policies used to determine the segment information are the same as those used in the preparation of the Group’s consolidated financial statements.
F-96
The following tables present details of this information by segment:
32.2 Generation, distribution and others
Line of Business | | Generation | | | Distribution | | | Holdings, eliminations and others | | | Total | |
| | 12-31-2017 | | | 12-31-2016 | | | 12-31-2017 | | | 12-31-2016 | | | 12-31-2017 | | | 12-31-2016 | | | 12-31-2017 | | | 12-31-2016 | |
ASSETS | | ThCh$ | | | ThCh$ | | | ThCh$ | | | ThCh$ | | | ThCh$ | | | ThCh$ | | | ThCh$ | | | ThCh$ | |
CURRENT ASSETS | | | 662,804,360 | | | | 543,372,955 | | | | 261,378,069 | | | | 245,122,733 | | | | 135,159,356 | | | | 78,031,249 | | | | 1,059,341,785 | | | | 866,526,937 | |
Cash and cash equivalents | | | 211,027,141 | | | | 114,486,479 | | | | 42,594,390 | | | | 23,378,615 | | | | 165,834,495 | | | | 108,134,098 | | | | 419,456,026 | | | | 245,999,192 | |
Other current financial assets | | | 20,523,276 | | | | 487,106 | | | | 61,887 | | | | 47,517 | | | | 41,899 | | | | 49,621 | | | | 20,627,062 | | | | 584,244 | |
Other current non-financial assets | | | 2,167,272 | | | | 4,409,288 | | | | 3,434,462 | | | | 11,091,061 | | | | 400,408 | | | | 331,137 | | | | 6,002,142 | | | | 15,831,486 | |
Trade and other current receivables | | | 218,178,007 | | | | 260,440,086 | | | | 197,011,114 | | | | 180,290,279 | | | | 4,563,165 | | | | 4,341,491 | | | | 419,752,286 | | | | 445,071,856 | |
Current accounts receivable from related companies | | | 109,797,820 | | | | 82,727,781 | | | | 6,305,806 | | | | 8,895,440 | | | | (44,247,580 | ) | | | (38,764,837 | ) | | | 71,856,046 | | | | 52,858,384 | |
Inventories | | | 31,740,903 | | | | 33,390,799 | | | | 3,049,576 | | | | 1,878,072 | | | | 4,896,463 | | | | 2,270,725 | | | | 39,686,942 | | | | 37,539,596 | |
Current tax assets | | | 65,164,708 | | | | 34,438,408 | | | | 8,920,834 | | | | 19,541,749 | | | | 3,670,506 | | | | 1,669,014 | | | | 77,756,048 | | | | 55,649,171 | |
Non-current assets classified as held for sale | | | 4,205,233 | | | | 12,993,008 | | | | — | | | | — | | | | — | | | | — | | | | 4,205,233 | | | | 12,993,008 | |
| | | | | | | | | | | | | | | | | | | | | | | | | | | | | | | | |
NON-CURRENT ASSETS | | | 2,891,657,830 | | | | 2,856,309,537 | | | | 893,633,579 | | | | 829,203,115 | | | | 850,139,814 | | | | 846,671,423 | | | | 4,635,431,223 | | | | 4,532,184,075 | |
Other non-current financial assets | | | 33,391,398 | | | | 28,802,569 | | | | 26,806 | | | | 24,973 | | | | — | | | | — | | | | 33,418,204 | | | | 28,827,542 | |
Other non-current non-financial assets | | | 12,853,460 | | | | 12,318,444 | | | | 959,679 | | | | 1,019,050 | | | | — | | | | (1,342 | ) | | | 13,813,139 | | | | 13,336,152 | |
Trade and other non-current receivables | | | 1,032,922 | | | | 6,788,437 | | | | 34,272,234 | | | | 24,978,209 | | | | 877,243 | | | | 1,733,459 | | | | 36,182,399 | | | | 33,500,105 | |
Investments accounted for using the equity method | | | 12,707,221 | | | | 18,738,198 | | | | — | | | | 60,325 | | | | — | | | | (60,325 | ) | | | 12,707,221 | | | | 18,738,198 | |
Intangible assets other than goodwill | | | 18,607,972 | | | | 19,266,874 | | | | 34,236,891 | | | | 25,430,420 | | | | 2,326,041 | | | | (226,544 | ) | | | 55,170,904 | | | | 44,470,750 | |
Goodwill | | | 24,860,356 | | | | 24,860,356 | | | | 2,240,478 | | | | 2,240,478 | | | | 860,156,821 | | | | 860,156,821 | | | | 887,257,655 | | | | 887,257,655 | |
Property, plant and equipment | | | 2,788,204,501 | | | | 2,726,838,536 | | | | 821,234,672 | | | | 774,999,730 | | | | (23,752,036 | ) | | | (25,709,632 | ) | | | 3,585,687,137 | | | | 3,476,128,634 | |
Investment property | | | — | | | | — | | | | — | | | | — | | | | 8,356,772 | | | | 8,128,522 | | | | 8,356,772 | | | | 8,128,522 | |
Deferred tax assets | | | — | | | | 18,696,123 | | | | 662,819 | | | | 449,930 | | | | 2,174,973 | | | | 2,650,464 | | | | 2,837,792 | | | | 21,796,517 | |
| | | | | | | | | | | | | | | | | | | | | | | | | | | | | | | | |
TOTAL ASSETS | | | 3,554,462,190 | | | | 3,399,682,492 | | | | 1,155,011,648 | | | | 1,074,325,848 | | | | 985,299,170 | | | | 924,702,672 | | | | 5,694,773,008 | | | | 5,398,711,012 | |
Line of Business | | Generation | | | Distribution | | | Holdings, eliminations and others | | | Total | |
| | 12-31-2017 | | | 12-31-2016 | | | 12-31-2017 | | | 12-31-2016 | | | 12-31-2017 | | | 12-31-2016 | | | 12-31-2017 | | | 12-31-2016 | |
LIABILITIES AND EQUITY | | ThCh$ | | | ThCh$ | | | ThCh$ | | | ThCh$ | | | ThCh$ | | | ThCh$ | | | ThCh$ | | | ThCh$ | |
CURRENT LIABILITIES | | | 543,356,500 | | | | 555,777,465 | | | | 408,687,871 | | | | 259,684,837 | | | | (135,227,725 | ) | | | (58,215,655 | ) | | | 816,816,646 | | | | 757,246,647 | |
Other current financial liabilities | | | 18,815,434 | | | | 25,696,064 | | | | 14 | | | | 102 | | | | — | | | | — | | | | 18,815,448 | | | | 25,696,166 | |
Trade and other current payables | | | 329,448,226 | | | | 341,088,664 | | | | 189,458,076 | | | | 151,549,875 | | | | 75,592,304 | | | | 68,866,744 | | | | 594,498,606 | | | | 561,505,283 | |
Current accounts payable to related companies | | | 122,862,944 | | | | 121,018,039 | | | | 207,909,593 | | | | 96,520,909 | | | | (211,159,565 | ) | | | (127,110,019 | ) | | | 119,612,972 | | | | 90,428,929 | |
Other current provisions | | | 5,296,635 | | | | 6,493,428 | | | | — | | | | 104 | | | | 339,536 | | | | — | | | | 5,636,171 | | | | 6,493,532 | |
Current tax liabilities | | | 66,933,261 | | | | 61,457,940 | | | | 94,246 | | | | 113,855 | | | | — | | | | 27,620 | | | | 67,027,507 | | | | 61,599,415 | |
Other current non-financial liabilities | | | — | | | | 23,330 | | | | 11,225,942 | | | | 11,499,992 | | | | — | | | | — | | | | 11,225,942 | | | | 11,523,322 | |
| | | | | | | | | | | | | | | | | | | | | | | | | | | | | | | | |
NON-CURRENT LIABILITIES | | | 1,022,091,736 | | | | 1,114,144,775 | | | | 61,965,918 | | | | 106,283,505 | | | | 6,937,051 | | | | (41,957,557 | ) | | | 1,090,994,705 | | | | 1,178,470,723 | |
Other non-current financial liabilities | | | 781,978,145 | | | | 854,016,751 | | | | — | | | | — | | | | — | | | | — | | | | 781,978,145 | | | | 854,016,751 | |
Trade and other non-current payables | | | 632,642 | | | | 1,453,022 | | | | 27,182 | | | | 30,091 | | | | — | | | | — | | | | 659,824 | | | | 1,483,113 | |
Non-current accounts payable to related companies | | | 318,518 | | | | 251,527 | | | | — | | | | 50,000,180 | | | | — | | | | (50,000,180 | ) | | | 318,518 | | | | 251,527 | |
Other long-term provisions | | | 63,992,567 | | | | 57,325,914 | | | | 14,430,270 | | | | 5,780,994 | | | | — | | | | — | | | | 78,422,837 | | | | 63,106,908 | |
Deferred tax liabilities | | | 160,293,916 | | | | 185,277,004 | | | | 18,786,185 | | | | 20,502,853 | | | | (6,856,420 | ) | | | (6,415,063 | ) | | | 172,223,681 | | | | 199,364,794 | |
Non-current provisions for employee benefits | | | 14,875,948 | | | | 15,820,557 | | | | 28,412,505 | | | | 29,655,884 | | | | 13,793,471 | | | | 14,457,686 | | | | 57,081,924 | | | | 59,934,127 | |
Other non-current non-financial liabilities | | | — | | | | — | | | | 309,776 | | | | 313,503 | | | | — | | | | ��� | | | | 309,776 | | | | 313,503 | |
| | | | | | | | | | | | | | | | | | | | | | | | | | | | | | | | |
EQUITY | | | 1,989,013,954 | | | | 1,729,760,252 | | | | 684,357,859 | | | | 708,357,506 | | | | 1,113,589,844 | | | | 1,024,875,884 | | | | 3,786,961,657 | | | | 3,462,993,642 | |
Equity attributable to Enel Chile | | | 1,989,013,954 | | | | 1,729,760,252 | | | | 684,357,859 | | | | 708,357,506 | | | | 1,113,589,844 | | | | 1,024,875,884 | | | | 2,983,384,010 | | | | 2,763,391,288 | |
Issued capital | | | 552,777,321 | | | | 552,777,321 | | | | 230,137,980 | | | | 230,137,980 | | | | 1,446,193,674 | | | | 1,446,193,674 | | | | 2,229,108,975 | | | | 2,229,108,975 | |
Retained earnings | | | 1,398,018,156 | | | | 1,199,429,221 | | | | 769,928,443 | | | | 794,856,204 | | | | (416,341,016 | ) | | | (424,910,134 | ) | | | 1,751,605,583 | | | | 1,569,375,291 | |
Share Premium | | | 85,511,492 | | | | — | | | | 354,220 | | | | — | | | | (85,865,712 | ) | | | | | | | — | | | | — | |
Other reserves | | | (47,293,015 | ) | | | (22,446,290 | ) | | | (316,062,784 | ) | | | (316,636,678 | ) | | | 169,602,898 | | | | 3,592,344 | | | | (997,330,548 | ) | | | (1,035,092,978 | ) |
Non-controlling interests | | | — | | | | — | | | | — | | | | — | | | | — | | | | — | | | | 803,577,647 | | | | 699,602,354 | |
| | | | | | | | | | | | | | | | | | | | | | | | | | | | | | | | |
Total Liabilities and Equity | | | 3,554,462,190 | | | | 3,399,682,492 | | | | 1,155,011,648 | | | | 1,074,325,848 | | | | 985,299,170 | | | | 924,702,672 | | | | 5,694,773,008 | | | | 5,398,711,012 | |
The holdings, eliminations and others column corresponds to transactions between companies in different lines of business, primarily purchases and sales of energy and services.
Line of Business | | Generation | | | Distribution | | | Holdings, eliminations and others | | | Total | |
F-97
| | 12-31-2017 | | | 12-31-2016 | | | 12-31-2015 | | | 12-31-2017 | | | 12-31-2016 | | | 12-31-2015 | | | 12-31-2017 | | | 12-31-2016 | | | 12-31-2015 | | | 12-31-2017 | | | 12-31-2016 | | | 12-31-2015 | |
STATEMENT OF COMPREHENSIVE INCOME | | ThCh$ | | | ThCh$ | | | ThCh$ | | | ThCh$ | | | ThCh$ | | | ThCh$ | | | ThCh$ | | | ThCh$ | | | ThCh$ | | | ThCh$ | | | ThCh$ | | | ThCh$ | |
REVENUES AND OTHER OPERATING INCOME | | | 1,634,937,087 | | | | 1,659,727,329 | | | | 1,543,812,461 | | | | 1,333,027,456 | | | | 1,315,760,852 | | | | 1,257,732,165 | | | | (438,617,665 | ) | | | (433,921,362 | ) | | | (402,515,486 | ) | | | 2,529,346,878 | | | | 2,541,566,819 | | | | 2,399,029,140 | |
Revenues | | | 1,599,032,140 | | | | 1,639,959,816 | | | | 1,539,991,519 | | | | 1,328,791,205 | | | | 1,310,175,226 | | | | 1,247,900,614 | | | | (437,353,167 | ) | | | (434,291,162 | ) | | | (403,598,944 | ) | | | 2,490,470,178 | | | | 2,515,843,880 | | | | 2,384,293,189 | |
Energy sales | | | 1,457,671,722 | | | | 1,516,688,442 | | | | 1,474,818,366 | | | | 1,186,795,410 | | | | 1,172,700,558 | | | | 1,112,912,836 | | | | (376,007,978 | ) | | | (376,745,382 | ) | | | (340,367,445 | ) | | | 2,268,459,154 | | | | 2,312,643,618 | | | | 2,247,363,757 | |
Other sales | | | 94,452,287 | | | | 64,638,599 | | | | 24,293,133 | | | | 12,741,568 | | | | 8,968,859 | | | | 7,769,616 | | | | 168,942 | | | | — | | | | (5,225 | ) | | | 107,362,797 | | | | 73,607,458 | | | | 32,057,524 | |
Other services rendered | | | 46,908,131 | | | | 58,632,775 | | | | 40,880,020 | | | | 129,254,227 | | | | 128,505,809 | | | | 127,218,162 | | | | (61,514,131 | ) | | | (57,545,780 | ) | | | (63,226,274 | ) | | | 114,648,227 | | | | 129,592,804 | | | | 104,871,908 | |
Other operating income | | | 35,904,947 | | | | 19,767,513 | | | | 3,820,942 | | | | 4,236,251 | | | | 5,585,626 | | | | 9,831,551 | | | | (1,264,498 | ) | | | 369,800 | | | | 1,083,458 | | | | 38,876,700 | | | | 25,722,939 | | | | 14,735,951 | |
RAW MATERIALS AND CONSUMABLES USED | | | (903,978,006 | ) | | | (895,060,114 | ) | | | (880,891,222 | ) | | | (1,062,076,646 | ) | | | (1,042,329,385 | ) | | | (983,732,902 | ) | | | 444,899,135 | | | | 439,969,919 | | | | 382,638,565 | | | | (1,521,155,517 | ) | | | (1,497,419,580 | ) | | | (1,481,985,559 | ) |
Energy purchases | | | (346,954,692 | ) | | | (335,731,822 | ) | | | (320,731,795 | ) | | | (938,067,783 | ) | | | (936,965,119 | ) | | | (881,589,779 | ) | | | 382,587,604 | | | | 380,950,057 | | | | 342,118,393 | | | | (902,434,871 | ) | | | (891,746,884 | ) | | | (860,203,181 | ) |
Fuel consumption | | | (280,739,362 | ) | | | (295,148,838 | ) | | | (327,502,995 | ) | | | — | | | | — | | | | — | | | | — | | | | — | | | | — | | | | (280,739,362 | ) | | | (295,148,838 | ) | | | (327,502,995 | ) |
Transportation expenses | | | (152,869,838 | ) | | | (192,502,995 | ) | | | (179,691,471 | ) | | | (63,009,956 | ) | | | (60,454,433 | ) | | | (60,901,746 | ) | | | 60,000,545 | | | | 57,834,310 | | | | 58,140,062 | | | | (155,879,249 | ) | | | (195,123,118 | ) | | | (182,453,155 | ) |
Other miscellaneous supplies and services | | | (123,414,114 | ) | | | (71,676,459 | ) | | | (52,964,961 | ) | | | (60,998,907 | ) | | | (44,909,833 | ) | | | (41,241,377 | ) | | | 2,310,986 | | | | 1,185,552 | | | | (17,619,890 | ) | | | (182,102,035 | ) | | | (115,400,740 | ) | | | (111,826,228 | ) |
CONTRIBUTION MARGIN | | | 730,959,081 | | | | 764,667,215 | | | | 662,921,239 | | | | 270,950,810 | | | | 273,431,467 | | | | 273,999,263 | | | | 6,281,470 | | | | 6,048,557 | | | | (19,876,921 | ) | | | 1,008,191,361 | | | | 1,044,147,239 | | | | 917,043,581 | |
Other work performed by the entity and capitalized | | | 7,226,484 | | | | 9,758,304 | | | | 15,250,811 | | | | 6,630,130 | | | | 6,338,547 | | | | 5,753,242 | | | | 532,373 | | | | 1 | | | | — | | | | 14,388,987 | | | | 16,096,852 | | | | 21,004,053 | |
Employee benefits expense | | | (54,222,470 | ) | | | (60,350,072 | ) | | | (70,969,357 | ) | | | (38,449,551 | ) | | | (35,557,457 | ) | | | (32,454,962 | ) | | | (28,831,756 | ) | | | (28,190,899 | ) | | | (33,130,402 | ) | | | (121,503,777 | ) | | | (124,098,428 | ) | | | (136,554,721 | ) |
Other expenses | | | (102,821,020 | ) | | | (119,303,215 | ) | | | (90,327,960 | ) | | | (61,942,592 | ) | | | (52,077,948 | ) | | | (62,182,651 | ) | | | 2,939,538 | | | | 612,026 | | | | 26,653,214 | | | | (161,824,074 | ) | | | (170,769,137 | ) | | | (125,857,397 | ) |
GROSS OPERATING INCOME | | | 581,142,075 | | | | 594,772,232 | | | | 516,874,733 | | | | 177,188,797 | | | | 192,134,609 | | | | 185,114,892 | | | | (19,078,375 | ) | | | (21,530,315 | ) | | | (26,354,109 | ) | | | 739,252,497 | | | | 765,376,526 | | | | 675,635,516 | |
Depreciation and amortization expense | | | (117,337,553 | ) | | | (132,600,381 | ) | | | (124,835,559 | ) | | | (36,685,324 | ) | | | (30,399,304 | ) | | | (29,082,449 | ) | | | 1,338,771 | | | | 1,339,075 | | | | 716,346 | | | | (152,684,106 | ) | | | (161,660,610 | ) | | | (153,201,662 | ) |
Impairment losses (reversal of impairment losses) recognized in profit or loss | | | 55,494 | | | | (30,785,531 | ) | | | 9,793,653 | | | | (7,993,311 | ) | | | (5,141,179 | ) | | | (6,738,750 | ) | | | — | | | | — | | | | — | | | | (7,937,817 | ) | | | (35,926,710 | ) | | | 3,054,903 | |
OPERATING INCOME | | | 463,860,016 | | | | 431,386,320 | | | | 401,832,827 | | | | 132,510,162 | | | | 156,594,126 | | | | 149,293,693 | | | | (17,739,604 | ) | | | (20,191,240 | ) | | | (25,637,763 | ) | | | 578,630,574 | | | | 567,789,206 | | | | 525,488,757 | |
FINANCIAL RESULT | | | (36,610,248 | ) | | | (35,678,632 | ) | | | (114,252,182 | ) | | | 6,411,837 | | | | 8,579,316 | | | | 12,294,531 | | | | 7,783,757 | | | | 6,616,146 | | | | 4,088,867 | | | | (22,414,654 | ) | | | (20,483,170 | ) | | | (97,868,784 | ) |
Financial income | | | 5,273,672 | | | | 6,150,751 | | | | 234,822 | | | | 12,894,635 | | | | 14,289,185 | | | | 13,308,032 | | | | 3,494,381 | | | | 2,665,965 | | | | 1,727,315 | | | | 21,662,688 | | | | 23,105,901 | | | | 15,270,169 | |
Cash and cash equivalents | | | 3,077,708 | | | | 2,150,797 | | | | 152,518 | | | | 1,975,564 | | | | 1,680,365 | | | | 634,961 | | | | 3,323,751 | | | | — | | | | 1,778,538 | | | | 8,377,023 | | | | 3,831,162 | | | | 2,566,017 | |
Other financial income | | | 2,195,964 | | | | 3,999,954 | | | | 82,304 | | | | 10,919,071 | | | | 12,608,820 | | | | 12,673,071 | | | | 170,630 | | | | 2,665,965 | | | | (51,223 | ) | | | 13,285,665 | | | | 19,274,739 | | | | 12,704,152 | |
Financial costs | | | (50,851,829 | ) | | | (55,701,778 | ) | | | (64,206,719 | ) | | | (7,094,366 | ) | | | (6,488,659 | ) | | | (1,801,829 | ) | | | 4,435,313 | | | | 3,991,055 | | | | (692,150 | ) | | | (53,510,882 | ) | | | (58,199,382 | ) | | | (66,700,698 | ) |
Bank borrowings | | | (261 | ) | | | (2,033,835 | ) | | | (129,350 | ) | | | (12,299 | ) | | | (476 | ) | | | (1,659 | ) | | | (25 | ) | | | — | | | | (494 | ) | | | (12,585 | ) | | | (2,034,311 | ) | | | (131,503 | ) |
Secured and unsecured obligations | | | (42,708,253 | ) | | | (44,268,489 | ) | | | (51,697,708 | ) | | | — | | | | — | | | | — | | | | — | | | | — | | | | — | | | | (42,708,253 | ) | | | (44,268,489 | ) | | | (51,697,708 | ) |
Other | | | (8,143,315 | ) | | | (9,399,454 | ) | | | (12,379,661 | ) | | | (7,082,067 | ) | | | (6,488,183 | ) | | | (1,800,170 | ) | | | 4,435,338 | | | | 3,991,055 | | | | (691,656 | ) | | | (10,790,044 | ) | | | (11,896,582 | ) | | | (14,871,487 | ) |
Profit (loss) from indexed assets and liabilities | | | 145,608 | | | | 606,075 | | | | 3,600,187 | | | | 761,262 | | | | 974,891 | | | | 973,087 | | | | 9,796 | | | | 50,874 | | | | 265,803 | | | | 916,666 | | | | 1,631,840 | | | | 4,839,077 | |
Foreign currency exchange differences | | | 8,822,301 | | | | 13,266,320 | | | | (53,880,472 | ) | | | (149,694 | ) | | | (196,101 | ) | | | (184,759 | ) | | | (155,733 | ) | | | (91,748 | ) | | | 2,787,899 | | | | 8,516,874 | | | | 12,978,471 | | | | (51,277,332 | ) |
Positive | | | 19,563,838 | | | | 48,546,664 | | | | 26,738,738 | | | | 58,288 | | | | 609,359 | | | | (235,571 | ) | | | 134,942 | | | | 65,643 | | | | 3,930,935 | | | | 19,757,068 | | | | 49,221,666 | | | | 30,434,102 | |
Negative | | | (10,741,537 | ) | | | (35,280,344 | ) | | | (80,619,210 | ) | | | (207,982 | ) | | | (805,460 | ) | | | 50,812 | | | | (290,675 | ) | | | (157,391 | ) | | | (1,143,036 | ) | | | (11,240,194 | ) | | | (36,243,195 | ) | | | (81,711,434 | ) |
Share of profit of associates accounted for using the equity method | | | (2,696,904 | ) | | | 7,878,201 | | | | 8,905,045 | | | | — | | | | 1,818 | | | | 5,248 | | | | — | | | | (1,819 | ) | | | (5,248 | ) | | | (2,696,904 | ) | | | 7,878,200 | | | | 8,905,045 | |
Other gains (losses) | | | 113,088,869 | | | | 121,490,974 | | | | 4,015,401 | | | | 157,458 | | | | (831 | ) | | | 14,660,351 | | | | (5,131 | ) | | | (81 | ) | | | 1,379,993 | | | | 113,241,196 | | | | 121,490,062 | | | | 20,055,745 | |
Gain (loss) from other investments | | | 105,462,769 | | | | 121,457,430 | | | | 4,309,205 | | | | 4,026 | | | | (831 | ) | | | — | | | | (5,131 | ) | | | (81 | ) | | | (346 | ) | | | 105,461,664 | | | | 121,456,518 | | | | 4,308,859 | |
Gain (loss) from the sale of property, plant and equipment | | | 7,626,100 | | | | 33,544 | | | | (293,804 | ) | | | 153,432 | | | | — | | | | 14,660,351 | | | | — | | | | — | | | | 1,380,339 | | | | 7,779,532 | | | | 33,544 | | | | 15,746,886 | |
Income before tax | | | 537,641,733 | | | | 525,076,863 | | | | 300,501,091 | | | | 139,079,457 | | | | 165,174,429 | | | | 176,253,823 | | | | (9,960,978 | ) | | | (13,576,994 | ) | | | (20,174,151 | ) | | | 666,760,212 | | | | 676,674,298 | | | | 456,580,763 | |
Income tax | | | (112,099,519 | ) | | | (83,216,935 | ) | | | (76,655,819 | ) | | | (34,030,322 | ) | | | (32,589,362 | ) | | | (36,956,051 | ) | | | 2,787,540 | | | | 4,403,115 | | | | 3,999,271 | | | | (143,342,301 | ) | | | (111,403,182 | ) | | | (109,612,599 | ) |
Net income from continuing operations | | | 425,542,214 | | | | 441,859,928 | | | | 223,845,272 | | | | 105,049,135 | | | | 132,585,067 | | | | 139,297,772 | | | | (7,173,438 | ) | | | (9,173,879 | ) | | | (16,174,880 | ) | | | 523,417,911 | | | | 565,271,116 | | | | 346,968,164 | |
Net income from discontinued operations | | | — | | | | — | | | | — | | | | — | | | | — | | | | — | | | | — | | | | — | | | | — | | | | — | | | | — | | | | — | |
NET INCOME | | | 425,542,214 | | | | 441,859,928 | | | | 223,845,272 | | | | 105,049,135 | | | | 132,585,067 | | | | 139,297,772 | | | | (7,173,438 | ) | | | (9,173,879 | ) | | | (16,174,880 | ) | | | 523,417,911 | | | | 565,271,116 | | | | 346,968,164 | |
Net income attributable to: | | | 425,542,214 | | | | 441,859,928 | | | | 223,845,272 | | | | 105,049,135 | | | | 132,585,067 | | | | 139,297,772 | | | | (7,173,438 | ) | | | (9,173,879 | ) | | | (16,174,880 | ) | | | 523,417,911 | | | | 565,271,116 | | | | 346,968,164 | |
Shareholders of Enel Chile | | | — | | | | — | | | | — | | | | — | | | | — | | | | — | | | | — | | | | — | | | | — | | | | 349,382,642 | | | | 384,159,865 | | | | 251,838,410 | |
Non-controlling interests | | | — | | | | — | | | | — | | | | — | | | | — | | | | — | | | | — | | | | — | | | | — | | | | 174,035,269 | | | | 181,111,251 | | | | 95,129,754 | |
| | | | | | | | | | | | | | | | | | | | | | | | | | | | | | | | | | | | | | | | | | | | | | | | |
Line of Business | | Generation | | | Distribution | | | Holdings, eliminations and others | | | Total | |
| | 12-31-2017 | | | 12-31-2016 | | | 12-31-2015 | | | 12-31-2017 | | | 12-31-2016 | | | 12-31-2015 | | | 12-31-2017 | | | 12-31-2016 | | | 12-31-2015 | | | 12-31-2017 | | | 12-31-2016 | | | 12-31-2015 | |
STATEMENT OF CASH FLOWS | | ThCh$ | | | ThCh$ | | | ThCh$ | | | ThCh$ | | | ThCh$ | | | ThCh$ | | | ThCh$ | | | ThCh$ | | | ThCh$ | | | ThCh$ | | | ThCh$ | | | ThCh$ | |
Cash flows from (used in) operating activities | | | 488,157,362 | | | | 490,177,558 | | | | 428,211,622 | | | | 170,628,958 | | | | 148,354,968 | | | | 194,756,025 | | | | (23,182,620 | ) | | | (23,847,670 | ) | | | (46,436,120 | ) | | | 635,613,720 | | | | 614,684,856 | | | | 576,531,527 | |
Cash flows from (used in) investing activities | | | (91,867,647 | ) | | | (34,631,759 | ) | | | (255,251,615 | ) | | | (74,464,531 | ) | | | (55,007,620 | ) | | | (82,947,418 | ) | | | 19,886,401 | | | | 26,150,787 | | | | 41,457,686 | | | | (146,465,777 | ) | | | (63,488,592 | ) | | | (296,741,347 | ) |
Cash flows from (used in) financing activities | | | (301,835,211 | ) | | | (374,835,378 | ) | | | (175,094,207 | ) | | | (76,923,085 | ) | | | (88,519,047 | ) | | | (98,304,569 | ) | | | 61,162,775 | | | | 17,487,453 | | | | (43,674 | ) | | | (317,595,521 | ) | | | (445,866,972 | ) | | | (273,442,450 | ) |
The holdings, eliminations and others column corresponds to transactions between companies in different lines of business, primarily purchases and sales of energy and services
F-98
33. | THIRD PARTY GUARANTEES, OTHER CONTINGENT ASSETS AND LIABILITIES, AND OTHER COMMITMENTS. |
33.1 Direct guarantees.
As of December 31, 2017 and 2016, the Group had future energy purchase commitments amounting to ThCh$ 16,493,309,264 and ThCh$18,694,023,941, respectively.
33.2 Indirect guarantees
| | | | | | | | Debtor | | | | Outstanding balance as of | |
Type | | Contract | | Maturity | | Creditor of Guarantee | | Company | | Relationship | | Type of Guarantee | | Currency | | 12-31-2017 | | | 12-31-2016 | |
Secured | | Bonds Serie B | | October 2028 | | Bondholders of Enel Américas' Bonds | | Enel Américas S.A. | | Entities demerged from original debtor Enersis S.A. (codebtor Enel Chile S.A.) (1) | | Codebtor | | USD | | | 31,294 | | | | 33,449 | |
| | | | | | | | | | | | Total | | | 31,294 | | | | 33,449 | |
| (1) | As a result of the Enersis’ Spin-Off and in accordance with the bond indenture, all entities arising from the demerger are liable for the debt, regardless that the payment obligation remains in Enel Américas S.A. |
F-99
33.3 Lawsuits and Arbitration Proceedings.
As of the date of these consolidated financial statements, the most relevant litigation involving the Company and its subsidiaries are as follows:
1. | Enel Generación Chile S.A. |
| 1.1. | In 2005, three lawsuits were filed against Enel Generación Chile S.A., the Chilean Treasury and the Chilean Water Authority (DGA, in its Spanish acronym), which are currently being treated as a single proceeding, requesting that DGA Resolution No. 134, which established non-consumptive water rights in favor of Enel Generación Chile S.A. to build the Neltume hydroelectric power plant project be declared null as a matter of public policy, with compensation for damages. Alternatively, the lawsuits request the compensation for damages for the losses allegedly sustained by the plaintiffs due to the loss of their status as riparian owners along Pirihueico Lake, as well as due to the devaluation of their properties. The defendants have rejected these allegations, contending that the DGA Resolution complies with all legal requirements, and that the exercise of this right does not cause any detriment to the plaintiffs, among other arguments. The sums involved in these suits are undetermined. This case was joined with two other cases: the first one is captioned “Arrieta v. the State and Others” in the 9th Civil Court, docket 15279-2005 and the second is captioned “Jordán v. the State and Others,” in the 10th Civil Court, docket 1608-2005. With regard to these cases, an injunction has been ordered against entering into any acts and contracts concerning Enel Generación Chile S.A.’s water rights related to the Neltume project. On September 25, 2014, the Court of Law issued an unfavorable ruling against Enel Generación Chile S.A. that in essence declared the right to use water established by DGA Resolution No. 134 illegal and orders its cancellation in the corresponding Water Rights Register of the correspondent Real Estate Registrar. Enel Generación Chile S.A. filed an appeal and cassation resources with the Santiago Court of Appeals, which are still pending. In parallel, on June 9, 2017 the Court of Appeals issued a complementary ruling rejecting the claims for compensation for damages on the ground that there were no damages affecting the defendants, Enel Generación Chile S.A. filed an appeal, which is still pending resolution. Notwithstanding the foregoing, on January 29, 2018, the Board of Enel Generación Chile SA unanimously agreed to stop and abandon the development of the hydroelectric projects of Neltume and Choshuenco for not being economically viable, so this judicial contingency is over. The judicial plaintiffs had requested the declaration by a court that the water right is null. |
| 2.1. | On May 23, 2016 the Superintendency of Electricity and Fuels by means of ORD No. 5,705, filed charges against GasAtacama Chile S.A., for providing allegedly erroneous information to national centralizing operating agent CDEC-SING regarding the Minimum Technical (MT) and Average Time of Operation (TMO) parameters during the period from January 1, 2011 to October 29, 2015, GasAtacama Chile S.A. submitted its objections, which were rejected through notification by the Superintendency’s Resolution No. 014606 dated August 4, 2016, setting a fine for UTM 120,000. Disagreeing with the Superintendency’s resolution applying the fine in question, GasAtacama Chile S.A. filed an appeal for reinstatement filed before the Superintendency, which was rejected by the Superintendency through Resolution No. 15908, dated November 2, 2016, confirming the totality of the fine imposed. In opposition to the aforementioned resolution, GasAtacama Chile S.A. filed an illegality claim before the Court of Appeals of Santiago, recognizing a provision for 25% of the fine. To date, the claim of illegality is pending resolution by the Court of Appeals of Santiago. The loss contingency rating on this issue is probable because although the contingency was assessed on the basis that the fine imposed does not meet the legal requirement, nevertheless we had to make provisions for 50% of the fine, for the single fact of the application of the fine by the State Regulator. The basis for recognizing half of the risk lies in the fact that we have sued the Superintendence of Electricity and Fuels, before the Courts of Justice, requesting the annulment of the fine because it has no legal basis. |
3. | Enel Distribución Chile S.A. |
| 3.1. | The attorney, Ms. Nicole Vasseur Porcel, as legal representative of Ms. Camila Paz Castillo Abarca and her daughter Ms. Kimora Belén Fernández Castillo, and Ms. Graciela Rodríguez Mundaca, filed a lawsuit against Enel Distribución Chile for a total amount of ThCh$600,000 (ThCh$200,000 each) for alleged punitive damages due to death of her spouse, father and son, respectively, Mr. Javier Fernández Rodríguez, occurred on February 21, 2012 as a result of the injuries suffered by the fall of a street lighting pole on him after a truck passing through hooked the power lines attached to such a pole and caused it to fall. On February 24, 2016, Enel Distribución Chile requested the abandonment of the legal action and the reopening of the case. On March 2, 2016, the Court ruled to reopen the case, but the request for abandonment of the legal action was pending. On June 6, 2016, the case was reopened and the request for abandonment of the procedure was still pending resolution. |
F-100
| 3.2. | Ms. Evelyn del Carmen Molina González, on her behalf and on behalf or her under-age daughters Maite Alué Letelier Molina and Daniela Anaís Letelier Molina, filed a lawsuit against Chilectra S.A. (now Enel Distribución Chile S.A.) and its subcontractor Sociedad de Servicios Personales para el Área Eléctrica Limitada (“SSPAEL”)for a total amount of ThCh$2,000,000 for alleged punitive damages due to death of her spouse and father, respectively, Mr. David Letelier Rivera, which occurred on May 25, 2013 as a result of the injuries suffered by electrocution and falling from a street lightning pole while working. Chilectra S.A filed dilatory exceptions which are still pending resolution by the court, and it is waiting for the demand to be legally notified to the co-defendant SSPAEL, On July 4, 2016, Chilectra S.A requested the court to issue a resolution on the dilatory exceptions filed on November 16, 2014. On September 13, 2016, the defendants presented rejoinders. On October 25, 2016, the court summoned the parties to a conciliation hearing, which occurred on December 12, 2016, without reaching an agreement. On January 27, 2017, the case was received for trial. On June 27, 2017, after finalizing the evidence period, the court submitted the observations to the evidence. On September 12, 2017, the parties were summoned to hear sentence and the defendants filed an appeal against this ruling, which is still pending resolution. The sentence was delivered on November 7, 2017 and found SSPAEL and Enel Distribución Chile jointly liable to pay the sum of ThCh$ 90,000 for moral damages to the plaintiffs, plus readjustments and costs. On November 24, 2017 Chilectra S.A. filed an appeal against the ruling, raising the antecedents to the I.C.A. of Santiago on December 4, 2017. |
| 3.3. | Ms. Ximena Acevedo Herrera, Benjamín Jiménez Acevedo, Francisco Jiménez Acevedo, Nancy Garrido Muñoz, Juan Carlos Jiménez Rocuant, Carolina Jiménez Garrido and Natalia Jiménez Garrido filed a lawsuit against Ingeniería Eléctrica Azeta Ltda and Enel Distribución Chile S.A. for a total amount of ThCh$878,227 for alleged punitive damages due to the death of their spouse, father, son, and brother, Mr. Juan Pablo Jiménez Garrido, which occurred on February 22, 2013 as a result of a head trauma caused by a bullet. Enel Distribución Chile is a defendant in its capacity as contractor of Azeta. The discussion period has been finalized. On November 23, 2017, the court noticing an error, invalidated the conciliation hearing, therefore the citation to it is pending notification. On this ground the plaintiff filed an appeal for reconsideration with subsidiary appeal against this resolution, the latter being granted. |
| 3.4. | Mr. Víctor Hugo Coronado González; Ms. Francia Magali Bustos Uribe, both on their behalf and on behalf of the under-age daughter Nicolson Rocío Coronado Bustos, and Víctor Ignacio Coronado Bustos, filed a lawsuit against Enel Distribución Chile for a total amount of ThCh$704,860 for alleged punitive damages due to the accident that occurred on June 22, 2015 and affected Mr. Víctor Hugo Coronado González who received an electrical discharge and suffered severe injuries. On August 18, 2017, Enel Distribución ChileS.A. filed dilatory exceptions, with notice being given to the plaintiff on August 29. These were finally rejected, with Enel Distribución Chile S.A. appealing on October 30, 2017. On November 6, 2017, Enel Distribución Chile S.A. filed the plea for the defense. On December 22, 2017, the rebuttal was made. |
| 3.5. | A class action lawsuit sponsored by the National Consumer Board (SERNAC) for alleged breach of the collective, diffuse interest of the consumers as provided for in the Consumer Protection Law, for which they petitioned that Enel Distribución Chile S.A. should be fined for the breach of the above law, and also that it should be sentenced to paying compensation for damages caused to all of the consumers as a result of the interruption of the supply that affected a large part of the Metropolitan Region Distribution Center as a result of the inclement weather front, specifically a snowstorm, in July 2017. |
On November 13, 2017, Enel Distribución Chile filed the plea for the defense and the summons to the reconciliation hearing is pending.
| 3.6. | By means of Exempted Resolution 21,036 of November 3, 2017, the Superintendency of Electricity and Fuels confirmed the fine of 35,611 Monthly Tax Units imposed on Enel Distribución Chile S.A., when it ruled against the appeal for reconsideration of judgment filed on January 14, 2016, against Exempted Resolution 11,750 of December 29, 2015 because it considered that, in the period 2013-2014, Enel Distribución Chile had repeatedly exceeded the supply continuity indices stipulated in the law. Enel Distribución Chile filed a remedy of complaint against this ruling with the Santiago Court of Appeals. |
| 3.7. | By means of Exempted Resolution 21,129 of November 9, 2017, the Superintendency of Electricity and Fuels confirmed the fine of 2000 Monthly Tax Units imposed on Enel Distribución Chile S.A., when it ruled against the appeal for reconsideration of judgment filed on December 20, 2016 against Exempted Resolution 16,475 of December 7, 2016 because it considered that Enel Distribución Chile did not fulfill its obligation to keep its facilities in a good state of repair and in conditions that prevented any danger to people or things, with regard to the incident that occurred in the Lord Cochrane substation on April 17, 2016. Enel Distribución filed a remedy of complaint against this ruling with the Santiago Court of Appeals. |
The management of the Company considers that the provisions recorded in the consolidated financial statements are adequate to cover the risks resulting from litigation described in this Note. It does not consider there to be any additional liabilities other than those specified.
Given the characteristics of the risks covered by these provisions, it is not possible to determine a reasonable schedule of payment dates if there are any.
F-101
33.4 Financial restrictions.
As of December 31, 2017, the Company, on a stand-alone basis, had no debt obligations and was therefore not subject to any covenants or events of default. However, a number of the Group’s subsidiaries’ loan agreements, include the obligation to comply with certain financial ratios, which is normal in contracts of this nature. There are also affirmative and negative covenants requiring the monitoring of these commitments. In addition, there are restrictions in the events-of-default clauses of the agreements which require compliance.
Some of the financial debt contracts of Enel Generación Chile contain cross default clauses, The credit line agreement governed by Chilean law, which Enel Generación Chile signed in March 2016 for UF 2.8 million, stipulates that cross default is only triggered in the event of non-compliance by the borrower itself, i.e., Enel Generación Chile, with no reference made to its subsidiaries. In order to accelerate payment of the debt in this credit line due to cross default originated from other debt, the amount in default must exceed US$50 million, or the equivalent in other currencies, and other additional conditions must be met such as the expiration of any grace periods. Since being signed, this credit line has not been used. Enel Generación Chile’s international credit line governed by New York State law, which was signed in February 2016 expiring in February 2020, also makes no reference to its subsidiaries, thus, cross default is only triggered in the event of non-compliance by the borrower itself. For the repayment of debt to be accelerated under these credit lines due to cross default originated from other debt, the amount in default must exceed US$50 million or its equivalent in other currencies, and other additional conditions must be met, including the expiration of grace periods (if any), and a formal notice of intent to accelerate the debt repayment must have been served by creditors representing more than 50% of the amount owed or committed in the contract. As of December 31, 2017, these credit lines have not been drawn upon.
In relation to the bond issues of Enel Generación Chile registered with the SEC, commonly called “Yankee bonds”, a cross default can be triggered by another debt of the same company or of any of their subsidiaries, for any amount overdue provided that the principal of the debt giving rise to the cross default exceeds US$30 million or its equivalent in other currencies. Debt acceleration due to cross default does not occur automatically but has to be demanded by at least 25% of the bondholders of a certain series of Yankee bonds. The Yankee bonds of Enel Generación Chile mature in 2024, 2027, 2037 and 2097. For the specific Yankee bond that was issued in April 2014 with maturity in 2024, the threshold for triggering cross default increased to US$50 million or its equivalent in other currencies. As of December 31, 2017, the outstanding amount of the Yankee bonds was ThCh$ 438,757,209.
The Enel Generación Chile bonds issued in Chile state that cross default can be triggered only by the default of the issuer when the amount in default exceeds US$50 million or its equivalent in other currencies. Debt acceleration requires the agreement of at least 50% of the bondholders of a certain series. As of December 31, 2017, the outstanding amount of the local bonds was ThCh$324,822,376.
Financial covenants are contractual commitments with respect to minimum or maximum financial ratios that a company is obliged to meet at certain periods of time (quarterly, annually, etc.), and in certain cases upon compliance with certain conditions. Most of the financial covenants of the Group limit the level of indebtedness and evaluate the ability to generate cash flows in order to service the companies’ debts. Various companies are also required to certify these covenants periodically. The types of covenants and their respective limits vary based on debt and contract type.
The Enel Generación Chile bonds issued in Chile include the following financial covenants whose definitions and calculation formulas are established in the respective indentures:
Series H
| • | Consolidated Debt Ratio: The consolidated debt ratio, which is Financial Debt to Capitalization, must be no more than 0.64. Financial debt is the sum of Interest-bearing loans, current; Interest-bearing loans, non-current; Other financial liabilities, current; Other financial liabilities, non-current; and Other obligations guaranteed by the issuer or its subsidiaries; while Capitalization is the sum of Financial liabilities and Total Equity. As of December 31, 2017, the ratio was 0.28. |
| • | Consolidated Equity: A minimum Equity of Ch$761,661 million must be maintained; this limit is adjusted at the end of each year as established in the indenture. Equity corresponds to Equity attributable to the shareholders of Enel Generación Chile. As of December 31, 2017, the equity of Enel Generación Chile was Ch$1,961,517,727 million. |
| • | Financial Expense Coverage: A financial expense coverage ratio of at least 1.85 must be maintained. Financial expense coverage is the quotient between i) the gross margin plus financial income and dividends received from investments in |
F-102
| | associates, and ii) financial expenses; both items refer to the period of four consecutive quarters ending on the quarter being reported. For the year ended December 31, 2017, this ratio was 11.55. |
| • | Net Asset Position with Related Companies: A net asset position with related companies of no more than US$100 million must be maintained. The Net asset position with related companies is the difference between i) the sum of current accounts receivable from related parties, non-current accounts receivable from related parties, less transactions in the ordinary course of business at less than 180 days term, short-term transactions of associates of Enel Generación Chile in which Enel Américas has no participation, and long-term transactions of associates of Enel Generación Chile in which Enel Américas has no participation; and ii) the sum of current accounts payable to related parties; non-current accounts payable to related parties, less transactions in the ordinary course of business at less than 180 days term; short-term transactions of associates of Enel Generación Chile in which Enel Américas has no participation; and long-term transactions of associates of Enel Generación Chile in which Enel Américas has no participation. As of December 31, 2017, using the exchange rate prevailing on that date, the Net asset position with related companies was a negative US$83.39 million, indicating that Enel Américas is a net creditor of Enel Generación Chile rather than a net debtor. |
Series M
| • | Consolidated Debt Ratio: The consolidated debt ratio, which is Financial debt to Capitalization, must be no more than 0.64. Financial debt is the sum of Interest-bearing loans, current; Interest-bearing loans, non-current; Other financial liabilities, current; and Other financial liabilities, non-current; while Capitalization is the sum of Financial liabilities, Equity attributable to the shareholders of the Company and Non-controlling interests. As of December 31, 2017, the debt ratio was 0.28. |
| • | Consolidated Equity: Same as for Series H. |
| • | Financial Expense Coverage Ratio: Same as for Series H. |
Enel Generación Chile’s domestic (governed by Chilean law, maturity in April 2019) and international (governed by New York State law, maturity in July 2019 and February 2020) credit lines include the following covenants whose definitions and formulas, identical to each other, are established in the respective contracts:
| • | Debt Equity Ratio: The debt equity ratio, which is Financial debt to Net Equity, must be no more than 1.4. Financial debt is the sum of Interest-bearing loans, current; Interest-bearing loans, non-current; while Net Equity is the sum of the Equity attributable to the shareholders of Enel Generación Chile, and Non-controlling interests. As of December 31, 2017, the ratio was 0.39. |
| • | Debt Repayment Capacity (Debt/EBITDA Ratio): The ratio between Financial Debt and EBITDA must be no more than 6.5. Financial Debt is the sum of interest-bearing loans, current; and interest-bearing loans, non-current; while EBITDA is the operating income excluding depreciation and amortization expense and impairment losses / (reversal of impairment losses) for the four mobile quarters ended on the calculation date. As of December 31, 2017, the Debt/EBITDA ratio was 1.34. |
Yankee bonds are not subject to financial covenants.
As of December 31, 2017, the most restrictive financial covenant for Enel Generación Chile was the Debt Equity Ratio requirement for two credit lines.
The other Group companies not mentioned in this Note, are not subject to compliance with financial covenants.
Lastly, in most of the contracts, debt acceleration for non-compliance with these covenants does not occur automatically, but is subject to certain conditions, such as a cure period.
As of December 31, 2017 and 2016, neither the Company nor any company of the Group was in default under their financial obligations summarized herein or other financial obligations whose defaults might trigger the acceleration of their financial commitments.
33.5 Other Information
Enel Distribución Chile S.A.
| • | On June 16, 2017, severe weather, including heavy rain and wind, affected the Santiago Metropolitan Region. The weather system resulted in trees and branches, roofs and advertising signs falling on the electric lines, cutting power to our customers. |
As a result of effect caused by this severe weather, automatic compensations to customers were triggered as required by law when interruption of electricity supply is over 20 hours. The compensations were applied in the following or subsequent month according to the billing cycles.
In addition, Enel Distribución Chile granted an additional and extraordinary credit to those customers whose electric supply was interrupted for over 24 hours. The credit applied to customers in the billing was for up to Ch$25,000 per customer, which
F-103
is equivalent to the monthly average consumption per client (240kWh/monthly). The total amount for the additional credit was ThCh$590,796, which has been recognized as an expense in these interim consolidated financial statements.
On August 11, 2017, the Superintendency of Electricity and Fuels imposed a fine of 70,000 Monthly Tax Units (UTM) (ThCh$3,288,040) related to this severe weather event (See Note 35.3).
| • | On July 15, 2017, intense rain and a snowstorm hit the Santiago Metropolitan Region. This severe weather resulted in trees and branches falling on the electric lines causing significant damage to the electric network infrastructure, cutting power to our customers. |
As a result of effect caused by this severe weather, automatic compensations to customers were triggered as required by law when interruption of electricity supply is over 20 hours. The compensations were applied in the following or subsequent month according to the billing cycles.
Enel Distribución Chile granted an additional and extraordinary credit to those customers whose electric supply was interrupted for over 24 hours. The credit applied to customers in the billing will be for up to Ch$25,000 per customer. The estimate for the total amount related to the additional credit is ThCh$2,775,069, which has been recognized as an expense in these consolidated financial statements.
On December 29, 2017, the Superintendency of Electricity and Fuels imposed three fines for a total of 110,000 UTM (ThCh$5,166,920) related to this severe weather event (See Note 35.3).
The Company’s personnel as of December 31, 2017 and 2016, is distributed as follows:
| | December 31, 2017 | | | | | |
Country | | Managers and key executives | | | Professionals and Technicians | | | Staff and others | | | Total | | | Annual Average | |
Chile | | | 63 | | | | 1,747 | | | | 113 | | | | 1,923 | | | | 1,968 | |
Argentina | | | — | | | | 23 | | | | 2 | | | | 25 | | | | 25 | |
Total | | | 63 | | | | 1,770 | | | | 115 | | | | 1,948 | | | | 1,993 | |
| | | | | | | | | | | | | | | | | | | | |
| | | | | | | | | | | | | | | | | | | | |
| | December 31, 2016 | | | | | |
Country | | Managers and key executives | | | Professionals and Technicians | | | Staff and others | | | Total | | | Annual Average | |
Chile | | | 62 | | | | 1,709 | | | | 213 | | | | 1,984 | | | | 1,988 | |
Argentina | | | — | | | | 24 | | | | 2 | | | | 26 | | | | 27 | |
Total | | | 62 | | | | 1,733 | | | | 215 | | | | 2,010 | | | | 2,015 | |
The following Group’s subsidiaries have received sanctions from administrative authorities:
1. Enel Generación Chile S.A.
As of December 31, 2017, the illegal claims against Resolution No. 2658 of Bío Bío’s Health Secretary from the Health Ministry, that imposed a fine of 500 UTM (ThCh$23,347) for alleged infractions from Enel Generación Chile S.A. related to the asbestos removal approved by Health authority are still pending.
Additionally, at the same date, it is still pending the reposition filed in the sanitary summary procedure initiated by the inspection document No. 0788, coming from the Antofagasta’s Health Secretary, which imposed on the company a fine of 200 UTM (ThCh$9,339), which payment is still pending.
F-104
2. GasAtacama Chile S.A.
As of December 31, 2017, the Superintendency of Electricity and Fuels fined GasAtacama Chile S.A. for a total amount of 400UTM (ThCh$18,492). This amount has already been paid.
It is also pending the resolution of an illegality claim filed by GasAtacama Chile S.A. against Superintendency of Electricity and Fuels Resolution No. 15908 “CELTA”, dated November 2, 2016. This resolution imposed a fine of 120,000UTM (ThCh$5,541,960). This sanction is currently being appealed before the Santiago Court of Appeals.
Additionally, there are pending four non significants repositions claimed against the Tarapaca’s Health Secretary’s resolutions, through inspections records No. 3648742, 011599, 10066 and 766, that imposed fines on GasAtacama Chile S.A. for 500 UTM (ThCh$23,347) each.
3. Enel Distribución Chile S.A.
As of December 31, 2017, it is pending the resolution of four claims filed by Enel Distribución Chile against four resolutions issued by Superintendency of Electricity and Fuels. That resolutions imposed a fine of 180,000 UTM (ThCh$ 8,454,960) related to various infractions as a result of the severe weather occurred on July 16 and 17, 2017.
Also, it is still pending the resolution of an illegality claim filed by Enel Distribución Chile against Superintendency of Electricity and Fuels Resolution No. 13630 dated May 23, 2016. This resolution imposed a fine of 2,000 UTM (ThCh$93,944) for infractions related to improper maintenance of the facilities.
F-105
Environmental expenses for the years ended December 31, 2017, 2016 and 2015, are as follows:
| | | | | | | | | | | | | | | | | | | | | | | | | | |
| | | | 12-31-2017 | |
Company Incurring the Cost | Name | Project | | Project Status (Finished, In progress) | | Total Disbursements ThCh$ | | | Amounts Capitalized ThCh$ | | | Expenses ThCh$ | | | Disbursement amount in the future ThCh$ | | | Estimated future disbursement date ThCh$ | | Total Disbursements ThCh$ | |
Pehuenche | Hydroelectric Central Environmental Expenditures | Studies, monitoring, laboratory analysis, removal and final disposal of solid waste at hydroelectric power stations (HPS), thermoelectric power stations and combine cycle power stations. | | In progress | | | 6,786 | | | | - | | | | 6,786 | | | | - | | | | | | 6,787 | |
Enel Distribución Chile S.A. | Vegetation Control In Redesat | This activity contemplates the maintenance of the band of easement of high voltage lines between 34,5 y 500kv. | | In progress | | | 306,419 | | | | - | | | | 306,419 | | | | - | | | 31/12/2017 | | | 306,419 | |
Management Respel | Dangerous waste management | | Finished | | | 265 | | | | - | | | | 265 | | | | - | | | 30/09/2017 | | | 265 | |
Environmental management in Ssee | Tree maintenance of SSEE and removal of brush, debris and garbage, outer perimeter. | | In progress | | | 239,285 | | | | - | | | | 239,285 | | | | 18,644 | | | | | | 257,929 | |
| Consider all the environmental work that is done inside and outside of SSEE, as fumigation, placement and/or repair of rodent baits, irrigation system repair, waste removal, environmental inspections, garden | | Finished | | | 46,771 | | | | - | | | | 46,771 | | | | - | | | 31/12/2017 | | | 46,771 | |
Improvements in the Network M T/Bt | Traditional network replacement by protected, concentric, other | | Finished | | | 3,066,846 | | | | 3,066,846 | | | | - | | | | 1,957,246 | | | 30/09/2017 | | | 5,024,092 | |
Environmental Permits | Baseline for Environmental Impact Study, execution RCA and normative, preparation of reports and sectoral permits. | | In progress | | | 68,001 | | | | 68,001 | | | | - | | | | 34,811 | | | 31/03/2018 | | | 102,812 | |
Vegetation Control in Networks Mt/Bt | Pruning of trees near the media network and low voltage. | | In progress | | | 3,313,454 | | | | - | | | | 3,313,454 | | | | - | | | 31/12/2017 | | | 3,313,454 | |
Noise Control | Noise measurement and electromagnetic fields in substation, lines and other facilities. | | In progress | | | 786 | | | | - | | | | 786 | | | | - | | | 31/12/2017 | | | 786 | |
Asbestos Removal from Underground Cables | Removal of fireproof tape with asbestos from the underground network MT. | | In progress | | | 166,434 | | | | 166,434 | | | | - | | | | 37,290 | | | 31/12/2017 | | | 203,724 | |
Arborizations of Substations and Sat Line | Forest management plans, reforestations, construction and maintenance of tree-lined belts in substation. | | In progress | | | 251,740 | | | | 251,740 | | | | - | | | | 20,390 | | | 31/12/2017 | | | 272,130 | |
Gas Atacama Chile | Environmental monitoring | Environmental monitoring with SK Ecología operation and maintenance CEMS. | | In progress | | | 1,463,204 | | | | - | | | | 1,463,204 | | | | - | | | | | | 1,463,204 | |
Standardization Cems | Normalización bodegas, gestión ambiental. | | In progress | | | 1,021,630 | | | | 1,021,630 | | | | - | | | | - | | | | | | 1,021,630 | |
Eolica Canela | Environmental expenditures in power plants | Water quality analysis and monitoring and Higenization Canela | | In progress | | | 18,347 | | | | - | | | | 18,347 | | | | - | | | | | | 18,347 | |
Enel Generación Chile S.A. | Environmental costs in combined cycle plants | The main expenses incurred are: Bocamina U1-2: Operation and maintenance, monitoring stations air quality and meteorology, Environmental audit monitoring network 1 per year. Annual Validation CEMS, Protocol Service Biomasa Environmental Materials (magazine, books) Isokinetic Measurements. Jobs SGI (Objetive NC, inspections, audits and fizcalization) ISO 14001, certification OHSAS, Operation and Maintenance Service CEMS. | | In progress | | | 1,252,355 | | | | - | | | | 1,252,355 | | | | - | | | | | | 1,252,355 | |
Environmental costs in thermal plants | Studies, monitoring, laboratory analysis, retirement and final disposal of solid waste in thermoelectric plants (C.T.) | | In progress | | | 870,281 | | | | - | | | | 870,281 | | | | - | | | | | | 870,281 | |
Environmental costs in hydroelectric plants | Studies, monitoring, laboratory analysis, retirement and final disposal of solid waste in hydroelectric power plants (C.H.) | | In progress | | | 251,277 | | | | - | | | | 251,277 | | | | - | | | | | | 251,277 | |
Ralco Hydroelectric Plant | Reforestation according to the agreement with the Catholic University and Electrification of housing in Ayin Maipu. | | In progress | | | 5,075,137 | | | | 5,075,137 | | | | - | | | | - | | | | | | 5,075,137 | |
Tal Tal Thermal Plant | Dejection Nox TalTal: Engineering Civil Works and permits | | In progress | | | 1,290,133 | | | | 1,290,133 | | | | - | | | | - | | | | | | 1,290,133 | |
El Toro Hydroelectric Plant | Withdrawal Domestic and Industrial Waste | | In progress | | | - | | | | - | | | | - | | | | - | | | | | | - | |
| | Total | | | 18,709,151 | | | | 10,939,921 | | | | 7,769,230 | | | | 2,068,381 | | | | | | 20,777,533 | |
F-106
| | | | 12-31-2016 | |
Company Incurring the Cost | Name | Project | | Project Status (Finished, In progress) | | Total Disbursements ThCh$ | | | Amounts Capitalized ThCh$ | | | Expenses ThCh$ | | | Disbursement amount in the future ThCh$ | | | Estimated future disbursement date ThCh$ | | Total Disbursements ThCh$ | |
Pehuenche | Hydroelectric Central Environmental Expenditures | Studies, monitoring, laboratory analysis, removal and final disposal of solid waste at hydroelectric power stations (HPS). | | In progress | | | 6,515 | | | | - | | | | 6,515 | | | | - | | | | | | 6,515 | |
Gas Atacama Chile | Studies, monitoring and disposal of waste | Higenization, waste treatment, pest management and control system. | | Finished | | | 78,221 | | | | - | | | | 78,221 | | | | - | | | | | | 78,221 | |
Studies, monitoring and laboratory analysis | Withdrawal and final disposal of solid waste in Thermal Power Plants | | In progress | | | 169,743 | | | | - | | | | 169,743 | | | | - | | | | | | 169,743 | |
Plant ZLD (studies) | Plant ZLD (studies) | | Finished | | | 13,470 | | | | 13,470 | | | | - | | | | - | | | | | | 13,470 | |
Coal plants | Emission standard (Desox y Denox Tarapacá) | | In progress | | | 27,648,451 | | | | 27,648,451 | | | | - | | | | - | | | | | | 27,648,451 | |
Eolica Canela | Environmental expenditures in power plants | Water quality analysis and monitoring and Higenization Canela | | In progress | | | 94,770 | | | | - | | | | 94,770 | | | | - | | | | | | 94,770 | |
Enel Generación Chile S.A. | Environmental costs in combined cycle plants | The main expenses incurred are: Bocamina U1-2: Operation and maintenance, monitoring stations air quality and meteorology, Environmental audit monitoring network 1 per year. Annual Validation CEMS, Protocol Service Biomasa Environmental Materials (magazine, books) Isokinetic Measurements. Jobs SGI (Objetive NC, inspections, audits and fizcalization) ISO 14001, certification OHSAS, Operation and Maintenance Service CEMS. | | In progress | | | 567,616 | | | | - | | | | 567,616 | | | | - | | | | | | 567,616 | |
Environmental costs in thermal plants | Studies, monitoring, laboratory analysis, removal and final disposal of solid waste in thermoelectric plants (Thermal Power Plants) | | In progress | | | 243,264 | | | | - | | | | 243,264 | | | | - | | | | | | 243,264 | |
Environmental costs in hydroelectric plants | Studies, monitoring, laboratory analysis, removal and final disposal of solid waste in hydroelectric power plants (HPS) | | In progress | | | 181,644 | | | | - | | | | 181,644 | | | | - | | | | | | 181,644 | |
Ralco Hydroelectric Plant | Plan Ralco: Reforestation according to the Agreement with the Catholic University and Electrification of housing in Ayin Maipu. | | In progress | | | 4,497,330 | | | | 4,497,330 | | | | - | | | | - | | | | | | 4,497,330 | |
Tal Tal Thermal Plant | Dejection Nox TalTal: Engineering Civil Works and permits It consists of the pruning of branches until reaching the safety conditions to which the foliage must be left with respect to the drivers. | | In progress | | | 3,173,813 | | | | 3,173,813 | | | | - | | | | - | | | | | | 3,173,813 | |
Enel Distribución Chile S.A. | Vegetation Control In Redesat | | Finished | | | 38,475 | | | | - | | | | 38,475 | | | | - | | | | | | 38,475 | |
Management RESPEL | Consider the costs for the removal and treatment of Hazardous Waste (final destination) generated in maintenance activities AT Networks. | | Finished | | | 1,955 | | | | - | | | | 1,955 | | | | - | | | | | | 1,955 | |
Management RESSOL | This activity contemplates the clearing and pruning of the MT / BT distribution networks close to the distribution networks. | | Finished | | | 761,090 | | | | - | | | | 761,090 | | | | - | | | | | | 761,090 | |
Environmental management in SSEE | The service consists of the weeding and control of weeds in electric power substation enclosures in order to keep the enclosures free of weeds, ensuring a good operation of these facilities. | | Finished | | | 50,686 | | | | - | | | | 50,686 | | | | - | | | | | | 50,686 | |
Improvements in the Network M T/BT | Space CAB and Pre-assembled. | | Finished | | | 289,710 | | | | 289,710 | | | | - | | | | - | | | | | | 289,710 | |
Environmental permits | Payments will correspond to environmental commitments in the RCA that environmentally authorizes the project: Noise measurements and sectoral permits for the storage of waste | | Finished | | | 44,259 | | | | 44,259 | | | | - | | | | | | | | | | 44,259 | |
| Project day Potentiation Line 110 kv Los Almendros, El Salto, Tap Los Dominicos section. | | In progress | | | 8,856 | | | | 8,856 | | | | - | | | | 5,068 | | | 30-06-2017 | | | 13,924 | |
| DGA Studies project "Powering Line 110 kv, Ochagavia-Florida, Section TAP Santa Elena-TAP Macul" and DIA Ochagavia-Florida Section Tap Santa, Tap Macul. | | Finished | | | 6,150 | | | | 6,150 | | | | - | | | | - | | | | | | 6,150 | |
Improvements in the Network M T/BT | The service consists in the maintenance of green areas with replacement of species and turf in substation enclosures of Chilectra. | | Finished | | | 49,907 | | | | | | | | 49,907 | | | | | | | | | | 49,907 | |
Noise Control | This activity contemplates the maintenance of the easement strip of a high voltage line between 34.5 and 500 kv. | | Finished | | | 513 | | | | - | | | | 513 | | | | - | | | | | | 513 | |
| Measurement of noise in Sta Raquel, La Reina, Cisterna and Sta. Maria substations. | | In progress | | | 12,920 | | | | 12,920 | | | | - | | | | - | | | | | | 12,920 | |
Environmental Consulting | Environmental Consulting and Calibration of Sonometer. | | Finished | | | 1,492 | | | | - | | | | 1,492 | | | | - | | | | | | 1,492 | |
Environmental permits Lo Espejo- Ochagavia Line | Sectoral Environmental Permit Processing, Lo Espejo-Ochagavia Line, Tap Cisterna section | | Finished | | | 989 | | | | 989 | | | | - | | | | - | | | | | | 989 | |
| | Total | | | 37,941,840 | | | | 35,695,948 | | | | 2,245,891 | | | | 5,068 | | | | | | 37,946,908 | |
F-107
| | | | 12-31-2015 | |
Company Incurring the Cost | Name | Project | | Project Status (Finished, In progress) | | Total Disbursements ThCh$ | | | Amounts Capitalized ThCh$ | | | Expenses ThCh$ | | | Disbursement amount in the future ThCh$ | | | Estimated future disbursement date ThCh$ | | Total Disbursements ThCh$ | |
Pehuenche | Hydroelectric Central Environmental Expenditures | Studies, monitoring, laboratory analysis, removal and final disposal of solid waste at hydroelectric power stations (HPS), thermoelectric power stations and combine cycle power stations. | | In progress | | | 16,877 | | | | - | | | | 16,877 | | | | - | | | | | | 16,877 | |
Investments in Central Hydroelectric Plants | Regularization fuel facilities; Regularization water and sewer system; Regularization collection wells; Fabrication and installation cubits acid spill; Normalization fenced site archeology | | In process | | | 361,712 | | | | 361,712 | | | | - | | | | - | | | | | | 361,712 | |
Enel Distribución Chile S.A. | Vegetation Control In Redesat | This activity contemplates the maintenance of the band of easement of high voltage lines between 34,5 y 500kv. | | Finished | | | 79,956 | | | | - | | | | 79,956 | | | | 982,347 | | | 31/12/2015 | | | 1,062,303 | |
Management Respel | Dangerous waste management | | Finished | | | 3,377 | | | | - | | | | 3,377 | | | | - | | | | | | 3,377 | |
Environmental management in Ssee | Tree maintenance of SSEE and removal of brush, debris and garbage, outer perimeter. | | Finished | | | 112,437 | | | | - | | | | 112,437 | | | | - | | | | | | 112,437 | |
Improvements in the Network M T/Bt | Traditional network replacement by protected, concentric, other | | Finished | | | 1,841,766 | | | | 1,841,766 | | | | - | | | | - | | | | | | 1,841,766 | |
Vegetation Control in Networks Mt/Bt | Pruning of trees near the media network and low voltage. | | Finished | | | 930,940 | | | | - | | | | 930,940 | | | | - | | | | | | 930,940 | |
Noise Control | Noise measurement and electromagnetic fields in substation, lines and other facilities. | | Finished | | | 5,710 | | | | - | | | | 5,710 | | | | 223,482 | | | 31/12/2015 | | | 229,192 | |
Compañía Electrica Tarapacá S.A. | Waste | Studies, monitoring, laboratory analysis and waste disposal retirement | | Finished | | | 196,060 | | | | - | | | | 196,060 | | | | - | | | | | | 196,060 | |
Waste treatment | Removal of non-hazardous household and industrial waste | | Finished | | | 127,053 | | | | - | | | | 127,053 | | | | - | | | | | | 127,053 | |
Abatement Nox (LNF burners + OFA), desulfurizer and monitoring CEMS emissions | Abatement Nox (LNF burners + OFA), desulfurizer and monitoring CEMS emissions | | Finished | | | 9,624 | | | | 9,624 | | | | - | | | | | | | | | | 9,624 | |
Afforestation (RCA) Water Eyes | Afforestation (RCA) Water Eyes | | Finished | | | 27,032 | | | | 27,032 | | | | - | | | | | | | | | | 27,032 | |
Eolica Canela | Central Environmental expenses | Water quality analysis and monitoring and Higenization Canela | | In progress | | | 11,376 | | | | - | | | | 11,376 | | | | - | | | | | | 11,376 | |
Enel Generación Chile S.A. | Central Environmental Costs | Waste treatment, sanitation | | In progress | | | 2,455,575 | | | | - | | | | 2,455,575 | | | | - | | | | | | 2,455,575 | |
CT Bocamina | Emissions monitoring, CEMS project, NOX abatement | | In progress | | | 1,855 | | | | 1,855 | | | | - | | | | - | | | | | | 1,855 | |
Cems project | Cems C.T. Quintero project, C.T. San Isidro II project and C.T. Tal Tal project | | In progress | | | 61 | | | | 61 | | | | - | | | | - | | | | | | 61 | |
Regularizations C.H. | Regularizations C.H. | | In progress | | | 155,485 | | | | 155,485 | | | | - | | | | - | | | | | | 155,485 | |
Regularizations C.H. Ralco | Social Afforestation Program and Restorations Palmucho Chenqueco bypass road; Bridge reconstruction Lonquimay. | | In progress | | | 1,051,017 | | | | 1,051,017 | | | | - | | | | - | | | | | | 1,051,017 | |
| | Total | | | 7,387,913 | | | | 3,448,552 | | | | 3,939,361 | | | | 1,205,829 | | | | | | 8,593,742 | |
F-108
37. | SUMMARIZED FINANCIAL INFORMATION OF SUBSIDIARIES |
As of December 31, 2017 and 2016, summarized financial information of our principal subsidiaries is as follows:
| | December 31, 2017 |
| | Type of Financial Statements | | Current Assets | | Non-Current Assets | | Total Assets | | Current Liabilities | | Non-Current Liabilities | | Equity | | Total Equity and Liabilities | | Revenues | | Raw Materials and Consumables Used | | Contribution Margin | | Gross Operating Income | | Operating Income | | Financial Results | | Income before Taxes | | Income Taxes | | Profit (Loss) | | Other Comprehensive Income | | Total Comprehensive Income |
| | | | ThCh$ | | ThCh$ | | ThCh$ | | ThCh$ | | ThCh$ | | ThCh$ | | ThCh$ | | ThCh$ | | ThCh$ | | ThCh$ | | ThCh$ | | ThCh$ | | ThCh$ | | ThCh$ | | ThCh$ | | ThCh$ | | ThCh$ | | ThCh$ |
Grupo Enel Distribución Chile S.A. | | Consolidated | | 261,378,069 | | 893,633,580 | | 1,155,011,649 | | 408,687,866 | | 61,965,918 | | 684,357,865 | | 1,155,011,649 | | 1,333,027,456 | | (1,062,076,645) | | 270,950,811 | | 177,188,798 | | 132,510,164 | | 6,411,839 | | 139,079,732 | | (34,030,322) | | 105,049,408 | | 1,515,176 | | 106,564,584 |
Grupo Servicios Informaticos e Inmobiliarios Ltda. | | Consolidated | | - | | - | | - | | - | | - | | — | | - | | - | | - | | - | | (1) | | (1) | | - | | (1) | | - | | (1) | | - | | (1) |
Empresa Eléctrica Pehuenche S.A. | | Separate | | 35,369,243 | | 186,760,346 | | 222,129,589 | | 38,310,560 | | 48,261,590 | | 135,557,439 | | 222,129,589 | | 152,501,383 | | (36,289,330) | | 116,212,053 | | 110,957,039 | | 103,556,904 | | (395,231) | | 103,206,672 | | (26,346,081) | | 76,860,591 | | - | | 76,860,591 |
Grupo Enel Generación Chile S.A. | | Consolidated | | 662,804,359 | | 2,891,657,830 | | 3,554,462,189 | | 543,356,500 | | 1,022,091,737 | | 1,989,013,952 | | 3,554,462,189 | | 1,634,937,088 | | (903,978,007) | | 730,959,081 | | 581,142,074 | | 463,860,015 | | (36,610,248) | | 537,641,733 | | (112,099,519) | | 425,542,214 | | 67,663,516 | | 493,205,730 |
Grupo GasAtacama Chile S.A.. | | Consolidated | | 182,143,224 | | 611,319,090 | | 793,462,314 | | 75,370,131 | | 83,894,880 | | 634,197,303 | | 793,462,314 | | 307,272,380 | | (170,752,796) | | 136,519,583 | | 106,213,750 | | 70,509,184 | | 1,432,674 | | 80,142,531 | | (25,417,139) | | 54,725,392 | | (3,338,115) | | 51,387,277 |
| | | | | | | | | | | | | | | | | | | | | | | | | | | | | | | | | | | | | | |
| | December 31, 2016 |
| | Type of Financial Statements | | Current Assets | | Non-Current Assets | | Total Assets | | Current Liabilities | | Non-Current Liabilities | | Equity | | Total Equity and Liabilities | | Revenues | | Raw Materials and Consumables Used | | Contribution Margin | | Gross Operating Income | | Operating Income | | Financial Results | | Income before Taxes | | Income Taxes | | Profit (Loss) | | Other Comprehensive Income | | Total Comprehensive Income |
| | | | ThCh$ | | ThCh$ | | ThCh$ | | ThCh$ | | ThCh$ | | ThCh$ | | ThCh$ | | ThCh$ | | ThCh$ | | ThCh$ | | ThCh$ | | ThCh$ | | ThCh$ | | ThCh$ | | ThCh$ | | ThCh$ | | ThCh$ | | ThCh$ |
Grupo Enel Distribución Chile S.A. | | Consolidated | | 245,122,732 | | 829,203,115 | | 1,074,325,847 | | 259,684,836 | | 106,283,505 | | 708,357,506 | | 1,074,325,847 | | 1,315,760,851 | | (1,042,329,385) | | 273,431,466 | | 192,134,608 | | 156,594,125 | | 8,579,317 | | 165,174,429 | | (32,589,362) | | 132,585,067 | | (21,284,665) | | 111,300,402 |
Grupo Servicios Informaticos e Inmobiliarios Ltda. | | Consolidated | | 57,558,313 | | 11,654,352 | | 69,212,665 | | 6,711,190 | | 1,466,867 | | 61,034,608 | | 69,212,665 | | 10,983,012 | | — | | 10,983,012 | | (674,755) | | (736,519) | | 2,565,301 | | 1,828,782 | | (107,413) | | 1,721,370 | | — | | 1,721,370 |
Empresa Eléctrica Pehuenche S.A. | | Separate | | 35,730,340 | | 193,496,141 | | 229,226,481 | | 43,012,321 | | 50,044,060 | | 136,170,100 | | 229,226,481 | | 155,568,982 | | (23,529,448) | | 132,039,534 | | 125,454,246 | | 116,789,055 | | 24,333 | | 116,813,388 | | (28,202,602) | | 88,610,786 | | — | | 88,610,786 |
Compañĺa Eléctrica Tarapacá S.A. | | Separate | | — | | — | | — | | — | | — | | — | | — | | 219,980,554 | | (139,960,874) | | 80,019,680 | | 62,455,761 | | 36,937,980 | | (2,519,836) | | 51,585,349 | | 10,396,319 | | 61,981,668 | | (924,812) | | 61,056,856 |
Grupo Enel Generación Chile S.A. | | Consolidated | | 543,372,956 | | 2,856,309,537 | | 3,399,682,493 | | 555,777,465 | | 1,114,144,776 | | 1,729,760,252 | | 3,399,682,493 | | 1,659,727,329 | | (895,060,114) | | 764,667,215 | | 594,772,233 | | 431,386,321 | | (35,678,633) | | 525,076,864 | | (83,216,935) | | 441,859,929 | | (86,682,199) | | 355,177,730 |
Grupo GasAtacama Chile S.A.. | | Consolidated | | 194,264,349 | | 663,665,991 | | 857,930,340 | | 86,380,336 | | 89,573,088 | | 681,976,916 | | 857,930,340 | | 173,489,754 | | (87,098,923) | | 86,390,831 | | 67,795,883 | | 45,426,269 | | 6,453,677 | | 53,666,618 | | (10,337,536) | | 43,329,082 | | (1,779,413) | | 41,549,669 |
F-109
Enel Chile S.A.:
In relation to the Renewable Assets Reorganization discussed in Note 1.2), the following significant events have ocurred subsequent to December 31, 2017:
| 1. | On January 22, 2018, Enel Chile S.A. informed that the legal period for dissenting shareholders to exercise their withdrawal rights arising from the merger agreement of Enel Green Power Latin America S.A. into the Company (the “Merger”) approved at the Extraordinary Shareholders’ Meeting held on December 20, 2017 (the “ESM”) expired on January 19, 2018. |
During such period, and based on the information available as of this date, the shareholders that together represent a total of 1,024,251,979 common shares of the Company, or 2.09%, exercised their withdrawal rights. According to the relevant legal provisions and regulations and particularly Official Letter No 32,435 issued by the CMF dated November 7, 2017, the price of the shares of the shareholders that exercised their withdrawal rights will be paid by the Company as of the date the Merger is effective pursuant to the terms and conditions agreed upon by the ESM. The Company will inform on the aforementioned through a significant event.
Consequently, one of the conditions precedent to the Merger has been satisfied, i.e., that the Enel Chile shareholders that exercise their withdrawal rights do not represent more than 5% of the Company’s common shares with voting rights, and that as a result of the exercise of such withdrawal rights, as of the date of expiration of the dissenting shareholders’ withdrawal rights, no shareholder exceeds the 65% maximum shareholding concentration limit established by the Enel Chile bylaws. This percentage is to be calculated considering the number of shares into which the new equity of Enel Chile will be divided, which was approved as part of the Merger and the capital increase required to have sufficient shares to deliver to Enel Generación shareholders within the Enel Generación Tender Offer context.
| 2. | On February 8, 2018, Enel Chile S.A. commenced the preemptive rights subscription period, both in Chile and in the United States of America, of the 10,000,000,000 new common shares issuance associated with the $820,000,000,000 capital increase approved by the ESM, held on December 20, 2017. The notice of the preemptive rights to subscribe these shares, which sets the beginning of the preemptive rights subscription period was published in the El Mercurio de Santiago newspaper on the previously mentioned date. Pursuant to the ESM’s agreement and the terms and conditions of the Renewable Assets Reorganization, the shares that remain available once the preemptive rights subscription period ended were allocated to the shareholders of Enel Generación Chile S.A. (“Enel Generación”) that tendered their shares in the Enel Generación Tender Offer, as required by its terms and conditions. |
The effectiveness of this capital increase was subject to the conditions precedent approved by the ESM. In accordance with such approved conditions, the share subscription contract of the shareholders or third parties that decide to exercise their preemptive subscription rights during the preemptive rights subscription period will be conferred on the first business day of the month following the date in which the Company publishes the results notice declaring the Enel Generación Tender Offer successful as determined by article 212 of the Securities Market Law. The subscribers must pay for their shares on the respective contract subscription date, the same date in which the subscription contracts become effective and the shares are delivered to the subscriber.
| 3. | As part of the same event described in item 2, Enel Chile S.A. commenced the Enel Generación Tender Offer, both in Chile and in the United States of America, to purchase all Enel Generación Chile shares that are not owned by Enel Chile and that represent 40.02% of all shares that represent the equity of Enel Generacion Chile. As stated by law, the terms and conditions of the Enel Generación Tender Offer was detailed in the tender commencement notice and prospectus. The Enel Generación Tender Offer commencement notice was published in two local newspapers, both on February 15, 2018. The Enel Generación Tender Offer was conducted for a period that that began on February 16 and concluded on March 22, 2018. |
| 4. | On March 25, 2018, in relation to the Renewable Assets Reorganization process approved by the ESM held on December 20, 2017, Enel Chile S.A. states the following: |
| I. | In compliance with article 212 of Law No. 18,045 of the Securities Market, Enel Chile, on March 25, 2018, published in the newspapers "El Mercurio de Santiago" and "La Tercera" the corresponding notice of result for the Enel Generación Tender Offer declaring successful the aforementioned tender offer, according to its terms and conditions. |
Pursuant to the Enel Generación Tender Offer, Enel Chile acquired 2,753,096,167 shares of Enel Generación Chile (including those shares represented by the American Depositary Shares ("ADS"), by virtue of a public tender offer of carried out in Chile and the United States of America), equivalent to 33.6% of the shares issued by Enel Generación Chile. In this way, Enel Chile became the owner of a total of 7,672,584,961 shares issued by Enel Generación Chile (including those shares represented by the acquired ADSs). Consequently, the ownerships percentage held by Enel Chile corresponds to 93.55% of the outstanding capital of Enel Generación Chile.
F-110
Therefore, Enel Chile declared successful each and every one of the conditions and steps that make up the corporate reorganization approved by the ESM, for which it declared the resolution condition of the capital increase of Enel Chile approved at the ESM to be unsuccessful.
Thus, each of the steps that make up the Renewable Asset Reorganization will have its effects on the dates that, for each step, are indicated below:
| a) | Merger: The merger by incorporation of EGPL with Enel Chile (the "Merger"), will take effect on April 2, 2018, that is, the first business day of the month following the date on which Enel Chile has published the Notice of Result provided by article 212 of the Securities Market Law, declaring the Enel Generación Chile Tender Offer successful. On that date, Enel Chile will acquire all the assets and liabilities of EGPL and will succeed it in all its rights and obligations, combining in Enel Chile all the shareholders and equity of EGPL, which, as a consequence of the above, it will be dissolved as of right, without the need for its liquidation. |
| b) | Capital Increase of Enel Chile: The resolution condition applicable to the capital increase of Enel Chile approved at the ESM for, among other purposes, having sufficient shares to be delivered on the occasion of the Enel Generación Chile Tender Offer is declared unsuccessful. By virtue of the foregoing, as of April 2, 2018, the shareholders or third parties that exercised their pre-emptive subscription rights during the period pre-emptive rights offer ended on March 16, 2018, may subscribe for corresponding shares and proceed to the payment of the shares subscribed by them. |
| c) | Enel Generation Chile Tender Offer: In accordance with article 212 of Law No. 18,045 of the Securities Market, the date of acceptance of the Enel Generacion Chile Tender Offer by the shareholders of said company and of the closing of the sale of shares sold under the Enel Generación Chile Tender Offer was made on the date of publication of the Notice of Result. Notwithstanding the foregoing, the payment of the consideration of the Enel Generación Chile Tender Offer and subscription of shares of Enel Chile, will be made on April 2, 2018, in accordance with the terms and conditions described in the Enel Generación Chile Tender Offer prospectus. |
| d) | Modification of Bylaws of Enel Generación Chile: The modification of the bylaws of Enel Generación Chile approved by an extraordinary shareholders' meeting of said company held on December 20, 2017, became effective on March 25, 2018, the date on which the Notice of Result required by the article 212 of the Securities Market Law declaring the Enel Generation Chile Tender Offer successful was published. |
| II. | Finally, and in accordance with Ordinary Letter No. 32,435 issued by the CMF, dated November 7, 2017, the price of the shares of Enel Chile shareholders who exercised their statutory right to withdraw from Enel Chile as a consequence of the approval of the Merger will be paid by Enel Chile from the date on which the Merger takes effect in accordance with the terms and conditions agreed upon at the EMS, that is, on April 2, 2018 with its corresponding readjustments and interests. |
| 5. | On March 28, 2018, lenders, in favor of Enel Chile SA, had disbursed the amounts of ThCh$517,680,625,000 and ThUS$697,500,000 on March 27 and 28, 2018, respectively, pursuant to a "Senior Unsecured Term Loan Credit Agreement", for the purpose of financing the cash consideration for the Renewable Assets Reorganization. |
| 6. | On April 2, 2018, the following became effective and the Renewable Assets Reorganization was completed: |
| a) | The Merger became effective. |
| b) | Enel Chile shareholders and third parties who exercised their pre-emptive subscription rights may subscribe for and pay for the Enel Chile shares subscribed for. |
| c) | The payment of the consideration of the Enel Generación Chile Tender Offer, including the delivery of the Enel Chile shares subscribed for as a condition to the Enel Generación Tender Offer, was made. |
| d) | The payment of the statutory price payable to Enel Chile shareholders who exercised their statutory merger dissenters’ withdrawal rights commenced. |
There have been no other subsequent events between January 1, 2018 and the issuance date of these financial statements.
F-111
APPENDIX 1 ENEL CHILE GROUP SUBSIDIARIES:
This appendix is part of Note 2.4, “Subsidiaries”.
It discloses the Group’s percentage of control in each company.
| | | | | | Percentage of control at 12/31/2017 | | | Percentage of control at 12/31/2016 | | | | | | | |
Taxpayer ID No. | | Company | | Currency | | Direct | | | Indirect | | | Total | | | Direct | | | Indirect | | | Total | | | Type of Relationship | | Country | | Activity |
76.003.204-2 | | Central Eólica Canela S.A. | | Chilean peso | | - | | | - | | | - | | | | — | | | | 75.00 | % | | | 75.00 | % | | Subsidiary | | Chile | | Promotion and development of renewable energy projects |
96.800.570-7 | | Enel Distribución Chile S.A. | | Chilean peso | | | 99.09 | % | | - | | | | 99.09 | % | | | 99.08 | % | | | 0.01 | % | | | 99.09 | % | | Subsidiary | | Chile | | Ownership interest in companies of any nature |
96.783.910-8 | | Empresa Eléctrica de Colina Ltda. | | Chilean peso | | - | | | | 100.00 | % | | | 100.00 | % | | | — | | | | 100.00 | % | | | 100.00 | % | | Subsidiary | | Chile | | Complete energy cycle and related supplies |
96.504.980-0 | | Empresa Eléctrica Pehuenche S.A. | | Chilean peso | | - | | | | 92.65 | % | | | 92.65 | % | | | — | | | | 92.65 | % | | | 92.65 | % | | Subsidiary | | Chile | | Complete electric energy cycle |
91.081.000-6 | | Enel Generación Chile S.A. | | Chilean peso | | | 59.98 | % | | - | | | | 59.98 | % | | | 59.98 | % | | | — | | | | 59.98 | % | | Subsidiary | | Chile | | Complete electric energy cycle |
78.932.860-9 | | GasAtacama Chile S.A. (1) | | Chilean peso | | | 2.63 | % | | | 97.37 | % | | | 100.00 | % | | | 2.63 | % | | | 97.37 | % | | | 100.00 | % | | Subsidiary | | Chile | | Company management |
78.952.420-3 | | Gasoducto Atacama Argentina S.A. | | Chilean peso | | - | | | | 100.00 | % | | | 100.00 | % | | | — | | | | 100.00 | % | | | 100.00 | % | | Subsidiary | | Chile | | Natural gas exploitation and transportation |
76.107.186-6 | | Servicios Informáticos e Inmobiliarios Ltda. | | Chilean peso | | - | | | - | | | - | | | | 99.00 | % | | | 1.00 | % | | | 100.00 | % | | Subsidiary | | Chile | | Information Technology services |
96.800.460-3 | | Luz Andes Ltda. | | Chilean peso | | - | | | | 100.00 | % | | | 100.00 | % | | | — | | | | 100.00 | % | | | 100.00 | % | | Subsidiary | | Chile | | Energy and fuel transportation, distribution and sales |
76.722.488-5 | | Empresa de Transmisión Chena S.A | | Chilean peso | | - | | | | 100.00 | % | | | 100.00 | % | | | — | | | | — | | | | — | | | Subsidiary | | Chile | | Energy distribution |
77.047.280-6 | | Sociedad Agrícola de Cameros Ltda. | | Chilean peso | | | 57.50 | % | | - | | | | 57.50 | % | | | — | | | | 57.50 | % | | | 57.50 | % | | Subsidiary | | Chile | | Financial investments |
| (1) | On November 1, 2016, Compañia Eléctrica Tarapacá was merged in and with GasAtacama Chile S.A., being the latter the surviving company. |
F-112
APPENDIX 2 CHANGES IN THE SCOPE OF CONSOLIDATION:
This appendix is part of Note 2.4.1 “Changes in the scope of consolidation”.
The companies incorporated into the scope of consolidation, are as follows:
| Percentage of control at 12/31/2017 | | Percentage of control at 12/31/2016 | |
Company | Direct | | | Indirect | | | Total | | Direct | | | Indirect | | | Total | |
Empresa de Trasmisión Chena S.A. | | — | | | | 100.00 | % | | | 100.00 | % | | — | | | | — | | | | — | |
Companies eliminated from the scope of consolidation:
| | December 31, 2017 | | December 31, 2016 |
| | Ownership Interest | | Ownership Interest |
Company | | Direct | | | Indirect | | | Total | | | Consolidation Method | | Direct | | | Indirect | | | Total | | | Consolidation Method |
Gasoducto TalTal S.A. | | - | | | - | | | - | | | Full integration | | | — | | | 100.00% | | | 100.00% | | | Full integration |
GNL Norte S.A. | | - | | | - | | | - | | | Full integration | | | — | | | 100.00% | | | 100.00% | | | Full integration |
Progas S.A. | | - | | | - | | | - | | | Full integration | | | — | | | 100.00% | | | 100.00% | | | Full integration |
GNL Quintero S.A. | | - | | | - | | | - | | | Equity method | | | — | | | 20.00% | | | 20.00% | | | Equity method |
Compañía Eléctrica Tarapacá S.A. | | - | | | - | | | - | | | Full integration | | | 3.78 | % | | 96.21% | | | 99.99% | | | Full integration |
Inversiones GasAtacama Holding Ltda. | | - | | | - | | | - | | | Full integration | | | — | | | 100.00% | | | 100.00% | | | Full integration |
GasAtacama S.A. | | - | | | - | | | - | | | Full integration | | | — | | | 100.00% | | | 100.00% | | | Full integration |
Electrogas (1) | | - | | | 42.50% | | | 42.50% | | | Equity method | | | — | | | — | | | — | | | Equity method |
Servicios Informáticos e Inmobiliarios Ltda. (2) | | | 99.90 | % | | 0.10% | | | 100.00% | | | Full integration | | | — | | | — | | | — | | | Full integration |
Central Eólica Canela S.A. (3) | | - | | | 75.00% | | | 75.00% | | | Full integration | | | — | | | — | | | — | | | Full integration |
(1)See note 5.
(2)On September 1, 2017, this Company entity was merged with by Enel Chile, with the latter being the legal surviving entity.
(3)On December 22, 2017, this entity was liquidated and Company was wound up with its assets being were transferred to Gasatacama Chile.
F-113
APPENDIX 3 ASSOCIATES AND JOINT VENTURES:
This appendix is part of Note 3.i, “Investments accounted for using the Equity Method”.
| | | | | | Ownership Interest at 12/31/2017 | | | Ownership Interest at 12/31/2016 | | | | | | | |
Taxpayer ID No. | | Company | | Currency | | Direct | | | Indirect | | | Total | | | Direct | | | Indirect | | | Total | | | Type of Relationship | | Country | | Activity |
96.806.130-5 | | Electrogas S.A. (1) | | U.S. dollar | | | — | | | — | | | — | | | | — | | | 42.50% | | | 42.50% | | | Associate | | Chile | | Portfolio company |
76.418.940-K | | GNL Chile S.A. | | U.S. dollar | | | — | | | 33.33% | | | 33.33% | | | | — | | | 33.33% | | | 33.33% | | | Associate | | Chile | | Promotion of liquefied natural gas supply project |
76.652.400-1 | | Centrales Hidroeléctricas De Aysén S.A. | | Chilean peso | | | — | | | 51.00% | | | 51.00% | | | | — | | | 51.00% | | | 51.00% | | | Joint venture | | Chile | | Development and operation of a hydroelectric plant |
76.041.891-9 | | Aysén Transmisión S.A. | | Chilean peso | | | — | | | 51.00% | | | 51.00% | | | | — | | | 51.00% | | | 51.00% | | | Joint venture | | Chile | | Development and operation of a hydroelectric plant |
76.091.595-5 | | Aysén Energía S.A. | | Chilean peso | | | — | | | 51.00% | | | 51.00% | | | | — | | | 51.00% | | | 51.00% | | | Joint venture | | Chile | | Development and operation of a hydroelectric plant |
77.017.930-0 | | Transmisora Eléctrica de Quillota Ltda. | | Chilean peso | | | — | | | 50.00% | | | 50.00% | | | | — | | | 50.00% | | | 50.00% | | | Joint venture | | Chile | | Electric energy transportation and distribution |
F-114
APPENDIX 4 ADDITIONAL INFORMATION ON FINANCIAL DEBT:
This appendix is part of Note 18, “Other financial liabilities.” The following tables present the contractual undiscounted cash flows by type of financial debt:
1. Summary of bank borrowings by currency and maturity
| | | | | | Current | | Non-current | | Current | | Non-current |
| | | | | | Maturity | | | | Maturity | | | | Maturity | | | | Maturity | | |
Country | | Currency | | Nominal Interest Rate | | One to three months | | Three to twelve months | | Total Current at 12/31/2017 | | One to two years | | Two to three years | | Three to four years | | Four to five years | | More than five years | | Total Non- Current at 12/31/2017 | | One to three months | | Three to twelve months | | Total Current at 12/31/2016 | | One to two years | | Two to three years | | Three to four years | | Four to five years | | More than five years | | Total Non- Current at 12/31/2016 |
| | | | | | ThCh$ | | ThCh$ | | ThCh$ | | ThCh$ | | ThCh$ | | ThCh$ | | ThCh$ | | ThCh$ | | ThCh$ | | ThCh$ | | ThCh$ | | ThCh$ | | ThCh$ | | ThCh$ | | ThCh$ | | ThCh$ | | ThCh$ | | ThCh$ |
Chile | | Ch$ | | 6.00% | | 122 | | — | | 122 | | — | | — | | — | | — | | — | | — | | 4,283 | | — | | 4,283 | | — | | — | | — | | — | | — | | — |
| | | | Total | | 122 | | — | | 122 | | — | | — | | — | | — | | — | | — | | 4,283 | | — | | 4,283 | | — | | — | | — | | — | | — | | ��� |
2. Identification of bank borrowings by company
| | | | | | | | | | | | | | | | | | December 31, 2017 | |
| | | | | | | | | | | | | | | | | | Current | | | Non-current | |
Taxpayer ID No. | | Company | | Country | | Financial Institution | | Currency | | Effective Interest Rate | | | Nominal Interest Rate | | | Less than 90 days | | | More than 90 days | | | Total Current | | | One to two years | | | Two to three years | | | Three to four years | | | Four to five years | | | More than five years | | | Total Non-Current | |
| | | | | | | | | | | | | | | | | | ThCh$ | | | ThCh$ | | | ThCh$ | | | ThCh$ | | | ThCh$ | | | ThCh$ | | | ThCh$ | | | ThCh$ | | | ThCh$ | |
96.800.570-7 | | Enel Distribución Chile S.A. | | Chile | | Banco de Crédito e Inversiones | | Ch$ | | 6.00% | | | 6.00% | | | | 13 | | | | — | | | | 13 | | | | — | | | | — | | | | — | | | | — | | | | — | | | | — | |
91.081.000-6 | | Enel Generación Chile S.A. | | Chile | | Banco de Crédito e Inversiones | | US$ | | 6.00% | | | 6.00% | | | | 97 | | | | — | | | | 97 | | | | — | | | | — | | | | — | | | | — | | | | — | | | | — | |
91.081.000-6 | | Enel Generación Chile S.A. | | Chile | | Banco Santander | | Ch$ | | 6.00% | | | 6.00% | | | | 12 | | | | — | | | | 12 | | | | — | | | | — | | | | — | | | | — | | | | — | | | | — | |
| | | | | | Total | | | | 122 | | | | — | | | | 122 | | | | — | | | | — | | | | — | | | | — | | | | — | | | | — | |
| | | | | | | | | | | | | | | | | | | | | | | | | | | | | | | | | | | | | | | | | | | | | | | | | | | | |
| | | | | | | | | | | | | | | | | | | | | | | | | | | | | | | | | | | | | | | | | | | | | | | | | | | | |
| | | | | | | | | | | | | | | | | | December 31, 2016 | |
| | | | | | | | | | | | | | | | | | Current | | | Non-current | |
Taxpayer ID No. | | Company | | Country | | Financial Institution | | Currency | | Effective Interest Rate | | | Nominal Interest Rate | | | Less than 90 days | | | More than 90 days | | | Total Current | | | One to two years | | | Two to three years | | | Three to four years | | | Four to five years | | | More than five years | | | Total Non-Current | |
| | | | | | | | | | | | | | | | | | ThCh$ | | | ThCh$ | | | ThCh$ | | | ThCh$ | | | ThCh$ | | | ThCh$ | | | ThCh$ | | | ThCh$ | | | ThCh$ | |
96.800.570-7 | | Enel Distribución Chile S.A. | | Chile | | Banco de Crédito e Inversiones | | Ch$ | | 6.00% | | | 6.00% | | | | 102 | | | | — | | | | 102 | | | | — | | | | — | | | | — | | | | — | | | | — | | | | — | |
91.081.000-6 | | Enel Generación Chile S.A. | | Chile | | Banco de Crédito e Inversiones | | US$ | | 6.00% | | | 6.00% | | | | 2,048 | | | | — | | | | 2,048 | | | | — | | | | — | | | | — | | | | — | | | | — | | | | — | |
91.081.000-6 | | Enel Generación Chile S.A. | | Chile | | Banco Santander | | Ch$ | | 6.00% | | | 6.00% | | | | 2,133 | | | | — | | | | 2,133 | | | | — | | | | — | | | | — | | | | — | | | | — | | | | — | |
| | | | | | Total | | | | 4,283 | | | | — | | | | 4,283 | | | | — | | | | — | | | | — | | | | — | | | | — | | | | — | |
F-115
| b) | Secured and unsecured liabilities |
1. Summary of secured and unsecured liabilities by currency and maturity
| | | | | | Current | | Non-current | | Current | | Non-current |
| | | | | | Maturity | | | | Maturity | | | | Maturity | | | | Maturity | | |
Country | | Currency | | Nominal Interest Rate | | One to three months | | Three to twelve months | | Total Current at 12/31/2017 | | One to two years | | Two to three years | | Three to four years | | Four to five years | | More than five years | | Total Non-Current at 12/31/2017 | | One to three months | | Three to twelve months | | Total Current at 12/31/2016 | | One to two years | | Two to three years | | Three to four years | | Four to five years | | More than five years | | Total Non-Current at 12/31/2016 |
| | | | | | ThCh$ | | ThCh$ | | ThCh$ | | ThCh$ | | ThCh$ | | ThCh$ | | ThCh$ | | ThCh$ | | ThCh$ | | ThCh$ | | ThCh$ | | ThCh$ | | ThCh$ | | ThCh$ | | ThCh$ | | ThCh$ | | ThCh$ | | ThCh$ |
Chile | | US$ | | 6.90% | | 6,697,979 | | 20,093,935 | | 26,791,914 | | 26,791,913 | | 26,791,913 | | 26,791,913 | | 26,791,913 | | 568,727,913 | | 675,895,565 | | 7,264,786 | | 21,794,359 | | 29,059,145 | | 29,059,146 | | 29,059,146 | | 29,059,146 | | 29,059,146 | | 641,348,382 | | 757,584,966 |
Chile | | U.F. | | 5.48% | | 5,775,038 | | 22,689,438 | | 28,464,476 | | 51,927,014 | | 49,837,566 | | 47,748,117 | | 45,658,669 | | 256,892,562 | | 452,063,928 | | 6,466,160 | | 24,665,200 | | 31,131,360 | | 30,632,431 | | 53,611,843 | | 51,316,337 | | 49,020,830 | | 305,390,728 | | 489,972,169 |
| | | | Total | | 12,473,017 | | 42,783,373 | | 55,256,390 | | 78,718,927 | | 76,629,479 | | 74,540,030 | | 72,450,582 | | 825,620,475 | | 1,127,959,493 | | 13,730,946 | | 46,459,559 | | 60,190,505 | | 59,691,577 | | 82,670,989 | | 80,375,483 | | 78,079,976 | | 946,739,110 | | 1,247,557,135 |
2. Secured and unsecured liabilities by company
| | | | | | | | | | | | December 31, 2017 | |
| | | | | | | | | | | | Current | | Non-Current | |
Taxpayer ID No. | Company | Country | Financial Institution | Country | Currency | Effective Interest Rate | | Nominal Interest Rate | | Less than 90 days | | More than 90 days | | Total Current | | One to two years | | Two to three years | | Three to four years | | Four to five years | | More than five years | | Total Non-Current | |
| | | | | | | | | | | | ThCh$ | | ThCh$ | | ThCh$ | | ThCh$ | | ThCh$ | | ThCh$ | | ThCh$ | | ThCh$ | | ThCh$ | |
91.081.000-6 | Enel Generación Chile S.A. | Chile | BNY Mellon - Primera Emisión S-1 | U.S.A. | US$ | | 7.96% | | | 7.88% | | | 2,612,406 | | | 7,837,217 | | | 10,449,623 | | | 10,449,623 | | | 10,449,623 | | | 10,449,623 | | | 10,449,623 | | | 170,108,928 | | | 211,907,420 | |
91.081.000-6 | Enel Generación Chile S.A. | Chile | BNY Mellon - Primera Emisión S-2 | U.S.A. | US$ | | 7.40% | | | 7.33% | | | 833,743 | | | 2,501,229 | | | 3,334,972 | | | 3,334,972 | | | 3,334,972 | | | 3,334,972 | | | 3,334,972 | | | 86,312,007 | | | 99,651,895 | |
91.081.000-6 | Enel Generación Chile S.A. | Chile | BNY Mellon - Primera Emisión S-3 | U.S.A. | US$ | | 8.26% | | | 8.13% | | | 530,161 | | | 1,590,483 | | | 2,120,644 | | | 2,120,644 | | | 2,120,644 | | | 2,120,644 | | | 2,120,644 | | | 51,884,633 | | | 60,367,209 | |
91.081.000-6 | Enel Generación Chile S.A. | Chile | BNY Mellon - Unica 24296 | U.S.A. | US$ | | 4.32% | | | 4.25% | | | 2,721,669 | | | 8,165,006 | | | 10,886,675 | | | 10,886,674 | | | 10,886,674 | | | 10,886,674 | | | 10,886,674 | | | 260,422,345 | | | 303,969,041 | |
91.081.000-6 | Enel Generación Chile S.A. | Chile | Banco Santander -317 Serie-H | Chile | U.F. | | 7.17% | | | 6.20% | | | 1,414,018 | | | 9,606,378 | | | 11,020,396 | | | 10,516,773 | | | 10,013,150 | | | 9,509,527 | | | 9,005,904 | | | 44,726,323 | | | 83,771,677 | |
91.081.000-6 | Enel Generación Chile S.A. | Chile | Banco Santander 522 Serie-M | Chile | U.F. | | 4.82% | | | 4.75% | | | 4,361,020 | | | 13,083,060 | | | 17,444,080 | | | 41,410,241 | | | 39,824,416 | | | 38,238,590 | | | 36,652,765 | | | 212,166,239 | | | 368,292,251 | |
| | | | | | | | | Total | | | 12,473,017 | | | 42,783,373 | | | 55,256,390 | | | 78,718,927 | | | 76,629,479 | | | 74,540,030 | | | 72,450,582 | | | 825,620,475 | | | 1,127,959,493 | |
| | | | | | | | | | | | | | | | | | | | | | | | | | | | | | | | | | | | | | |
| | | | | | | | | | | | | | | | | | | | | | | | | | | | | | | | | | | | | | |
| | | | | | | | | | | | December 31, 2016 | |
| | | | | | | | | | | | Current | | Non-Current | |
Taxpayer ID No. | Company | Country | Financial Institution | Country | Currency | Effective Interest Rate | | Nominal Interest Rate | | Less than 90 days | | More than 90 days | | Total Current | | One to two years | | Two to three years | | Three to four years | | Four to five years | | More than five years | | Total Non-Current | |
| | | | | | | | | | | | ThCh$ | | ThCh$ | | ThCh$ | | ThCh$ | | ThCh$ | | ThCh$ | | ThCh$ | | ThCh$ | | ThCh$ | |
91.081.000-6 | Enel Generación Chile S.A. | Chile | BNY Mellon - Primera Emisión S-1 | U.S.A. | US$ | | 7.96% | | | 7.88% | | | 2,832,647 | | | 8,497,942 | | | 11,330,589 | | | 11,330,590 | | | 11,330,590 | | | 11,330,590 | | | 11,330,590 | | | 196,227,387 | | | 241,549,747 | |
91.081.000-6 | Enel Generación Chile S.A. | Chile | BNY Mellon - Primera EmisiónS-2 | U.S.A. | US$ | | 7.40% | | | 7.33% | | | 903,234 | | | 2,709,703 | | | 3,612,937 | | | 3,612,937 | | | 3,612,937 | | | 3,612,937 | | | 3,612,937 | | | 93,701,216 | | | 108,152,964 | |
91.081.000-6 | Enel Generación Chile S.A. | Chile | BNY Mellon - Primera Emisión S-3 | U.S.A. | US$ | | 8.26% | | | 8.13% | | | 574,765 | | | 1,724,294 | | | 2,299,059 | | | 2,299,059 | | | 2,299,059 | | | 2,299,059 | | | 2,299,059 | | | 56,341,806 | | | 65,538,042 | |
91.081.000-6 | Enel Generación Chile S.A. | Chile | BNY Mellon - Única 24296 | U.S.A. | US$ | | 4.32% | | | 4.25% | | | 2,954,140 | | | 8,862,420 | | | 11,816,560 | | | 11,816,560 | | | 11,816,560 | | | 11,816,560 | | | 11,816,560 | | | 295,077,973 | | | 342,344,213 | |
91.081.000-6 | Enel Generación Chile S.A. | Chile | Banco Santander -317 Serie-H | Chile | U.F. | | 7.17% | | | 6.20% | | | 1,525,571 | | | 9,843,433 | | | 11,369,004 | | | 10,870,075 | | | 10,371,146 | | | 9,872,218 | | | 9,373,289 | | | 52,887,199 | | | 93,373,927 | |
91.081.000-6 | Enel Generación Chile S.A. | Chile | Banco Santander 522 Serie-M | Chile | U.F. | | 4.82% | | | 4.75% | | | 4,940,589 | | | 14,821,767 | | | 19,762,356 | | | 19,762,356 | | | 43,240,697 | | | 41,444,119 | | | 39,647,541 | | | 252,503,529 | | | 396,598,242 | |
| | | | | | | | | Total | | | 13,730,946 | | | 46,459,559 | | | 60,190,505 | | | 59,691,577 | | | 82,670,989 | | | 80,375,483 | | | 78,079,976 | | | 946,739,110 | | | 1,247,557,135 | |
F-116
| c) | Financial lease obligations |
1. Financial lease obligations by company
| | | | | | | | | | | | | | | | | | December 31, 2017 | |
| | | | | | | | | | | | | | | | | | Current | | | Non-Current | |
Taxpayer ID No. | | Company | | Country | | Taxpayer ID No. | | Financial Institution | | Country | | Currency | | Nominal Interest Rate | | | Less than 90 days | | | More than 90 days | | | Total Current | | | One to two years | | | Two to three years | | | Three to four years | | | Four to five years | | | More than five years | | | Total Non-Current | |
| | | | | | | | | | | | | | | | | | ThCh$ | | | ThCh$ | | | ThCh$ | | | ThCh$ | | | ThCh$ | | | ThCh$ | | | ThCh$ | | | ThCh$ | | | ThCh$ | |
91.081.000-6 | | Enel Generación Chile S.A. | | Chile | | 76.556.400-4 | | Transelec S.A. | | Chile | | US$ | | | 6.50% | | | | 685,232 | | | | 2,052,448 | | | | 2,737,680 | | | | 2,728,693 | | | | 2,719,123 | | | | 2,708,931 | | | | 2,698,076 | | | | 4,473,883 | | | | 15,328,706 | |
| | | | | | | | | | | | | | Total | | | | 685,232 | | | | 2,052,448 | | | | 2,737,680 | | | | 2,728,693 | | | | 2,719,123 | | | | 2,708,931 | | | | 2,698,076 | | | | 4,473,883 | | | | 15,328,706 | |
| | | | | | | | | | | | | | | | | | | | | | | | | | | | | | | | | | | | | | | | | | | | | | | | | | | | |
| | | | | | | | | | | | | | | | | | | | | | | | | | | | | | | | | | | | | | | | | | | | | | | | | | | | |
| | | | | | | | | | | | | | | | | | December 31, 2016 | |
| | | | | | | | | | | | | | | | | | Current | | | Non-Current | |
Taxpayer ID No. | | Company | | Country | | Taxpayer ID No. | | Financial Institution | | Country | | Currency | | Nominal Interest Rate | | | Less than 90 days | | | More than 90 days | | | Total Current | | | One to two years | | | Two to three years | | | Three to four years | | | Four to five years | | | More than five years | | | Total Non-Current | |
| | | | | | | | | | | | | | | | | | ThCh$ | | | ThCh$ | | | ThCh$ | | | ThCh$ | | | ThCh$ | | | ThCh$ | | | ThCh$ | | | ThCh$ | | | ThCh$ | |
91.081.000-6 | | Enel Generación Chile S.A. | | Chile | | 76.556.400-4 | | Transelec S.A. | | Chile | | US$ | | | 6.50% | | | | 734,006 | | | | 2,200,827 | | | | 2,934,833 | | | | 2,931,533 | | | | 2,928,019 | | | | 2,924,276 | | | | 2,920,289 | | | | 7,777,314 | | | | 19,481,431 | |
| | | | | | | | | | | | | | Total | | | | 734,006 | | | | 2,200,827 | | | | 2,934,833 | | | | 2,931,533 | | | | 2,928,019 | | | | 2,924,276 | | | | 2,920,289 | | | | 7,777,314 | | | | 19,481,431 | |
F-117
APPENDIX 5 DETAILS OF ASSETS AND LIABILITIES IN FOREIGN CURRENCY:
This appendix forms an integral part of the Group’s consolidated financial statements.
The detail of assets and liabilities denominated in foreign currencies is the following:
| | | | 12-31-2017 | | | 12-31-2016 | |
ASSETS | | Foreign Currency | | ThCh$ | | | ThCh$ | |
Cash and cash equivalents | | | | | 419,456,026 | | | | 245,999,192 | |
| | U.S. dollar | | | 14,016,336 | | | | 5,198,139 | |
| | Euros | | | 11,594 | | | | — | |
| | Argentine peso | | | 6,263,345 | | | | 4,807,406 | |
| | Chilean peso non-adjustable | | | 399,164,751 | | | | 235,993,647 | |
Other current financial assets | | | | | 20,627,062 | | | | 584,244 | |
| | U.S. dollar | | | 20,441,150 | | | | 422,705 | |
| | Chilean peso non-adjustable | | | 185,912 | | | | 132,468 | |
| | U.F. | | | — | | | | 29,071 | |
Other current non- financial assets | | | | | 6,002,142 | | | | 15,831,486 | |
| | U.S. dollar | | | 902,026 | | | | 65,138 | |
| | Argentine peso | | | 32,621 | | | | 57,145 | |
| | Chilean peso non-adjustable | | | 5,067,495 | | | | 15,709,203 | |
Trade and other current receivables | | | | | 419,752,286 | | | | 445,071,856 | |
| | U.S. dollar | | | 5,273,104 | | | | — | |
| | Argentine peso | | | 1,073,072 | | | | 931,882 | |
| | Chilean peso non-adjustable | | | 412,267,621 | | | | 443,032,735 | |
| | U.F. | | | 1,138,489 | | | | 1,107,239 | |
Current accounts receivable from related companies | | | | | 71,856,046 | | | | 52,858,384 | |
| | U.S. dollar | | | 22,793,820 | | | | 16,780,275 | |
| | Euros | | | 42,663,049 | | | | 424,692 | |
| | Real | | | | | | | 36,276 | |
| | Colombian peso | | | | | | | 1,627,495 | |
| | Soles | | | | | | | 15,192 | |
| | Chilean peso non-adjustable | | | 6,399,177 | | | | 33,974,454 | |
Inventories | | | | | 39,686,942 | | | | 37,539,596 | |
| | Chilean peso non-adjustable | | | 39,686,942 | | | | 37,539,596 | |
Current tax assets | | | | | 77,756,048 | | | | 55,649,171 | |
| | Argentine peso | | | 146,525 | | | | 302,528 | |
| | Chilean peso non-adjustable | | | 77,609,523 | | | | 55,346,643 | |
Non- current assets or disposal group held for sale | | | | | — | | | | 12,993,008 | |
| | Chilean peso non-adjustable | | | — | | | | 12,993,008 | |
Non- current assets or disposal group held for distribution to owners | | | | | 4,205,233 | | | | — | |
| | Chilean peso non-adjustable | | | 4,205,233 | | | | — | |
TOTAL CURRENT ASSETS | | | | | 1,059,341,785 | | | | 866,526,937 | |
F-118
NON-CURRENT ASSETS | | Foreign Currency | | 12-31-2017 | | | 12-31-2016 | |
Other non-current financial assets | | | | | 33,418,204 | | | | 28,827,542 | |
| | U.S. dollar | | | 30,789,705 | | | | 26,185,923 | |
| | Chilean peso non-adjustable | | | 2,628,499 | | | | 2,641,619 | |
Other non-current non-financial assets | | | | | 13,813,139 | | | | 13,336,152 | |
| | U.S. dollar | | | 322,744 | | | | - | |
| | Argentine peso | | | 378,940 | | | | 303,837 | |
| | Chilean peso non-adjustable | | | 12,326,385 | | | | 12,241,662 | |
| | U.F. | | | 785,070 | | | | 790,653 | |
Trade and other non-current receivables | | | | | 36,182,399 | | | | 33,500,105 | |
| | Argentine peso | | | 62,563 | | | | 27,567 | |
| | Chilean peso non-adjustable | | | 25,228,146 | | | | 21,948,173 | |
| | U.F. | | | 10,891,690 | | | | 11,524,365 | |
Investments accounted for using the equity method | | | | | 12,707,221 | | | | 18,738,198 | |
| | U.S. dollar | | | 3,783,316 | | | | 3,982,934 | |
| | Argentine peso | | | 105,151 | | | | 91,335 | |
| | Chilean peso non-adjustable | | | 8,818,754 | | | | 14,663,929 | |
Intangible assets other than goodwill | | | | | 55,170,904 | | | | 44,470,750 | |
| | Argentine peso | | | 253,849 | | | | 194,529 | |
| | Chilean peso non-adjustable | | | 54,917,055 | | | | 44,276,221 | |
Goodwill | | | | | 887,257,655 | | | | 887,257,655 | |
| | Chilean peso non-adjustable | | | 887,257,655 | | | | 887,257,655 | |
Property, plant and equipment | | | | | 3,585,687,137 | | | | 3,476,128,634 | |
| | Argentine peso | | | 15,450,783 | | | | 16,039,114 | |
| | Chilean peso non-adjustable | | | 3,570,236,354 | | | | 3,460,089,520 | |
Investment property | | | | | 8,356,772 | | | | 8,128,522 | |
| | Chilean peso non-adjustable | | | 8,356,772 | | | | 8,128,522 | |
Deferred tax assets | | | | | 2,837,792 | | | | 21,796,517 | |
| | Chilean peso non-adjustable | | | 2,837,792 | | | | 21,796,517 | |
TOTAL NON-CURRENT ASSETS | | | | | 4,635,431,223 | | | | 4,532,184,075 | |
| | | | | | | | | | |
TOTAL ASSETS | | | | | 5,694,773,008 | | | | 5,398,711,012 | |
F-119
| | | | 12-31-2017 | | | 12-31-2016 | |
LIABILITIES | | | | Less than 90 days | | More than 90 days | | | Less than 90 days | | More than 90 days | |
| | Foreign Currency | | ThCh$ | | ThCh$ | | | ThCh$ | | ThCh$ | |
Other Current financial liabilities | | | | | 7,999,866 | | | 10,815,582 | | | | 15,021,428 | | | 10,674,738 | |
| | U.S. dollar | | | 7,999,743 | | | 3,888,150 | | | | 15,017,154 | | | 3,793,737 | |
| | Chilean peso non-adjustable | | | 123 | | | — | | | | 4,274 | | | — | |
| | U.F. | | | — | | | 6,927,432 | | | | — | | | 6,881,001 | |
Trade and other current payables | | | | | 590,848,682 | | | 3,649,924 | | | | 561,505,283 | | | — | |
| | U.S. dollar | | | 16,184,962 | | | — | | | | 9,463,287 | | | — | |
| | Euros | | | 3,174,586 | | | — | | | | 1,384,882 | | | — | |
| | Argentine peso | | | 732,777 | | | — | | | | 970,255 | | | — | |
| | Chilean peso non-adjustable | | | 570,756,357 | | | 3,649,924 | | | | 549,686,859 | | | — | |
Current accounts payable to related parties | | | | | 119,538,232 | | | — | | | | 90,428,929 | | | — | |
| | U.S. dollar | | | 9,090,837 | | | — | | | | 4,936,256 | | | — | |
| | Euros | | | 28,830,246 | | | — | | | | 841,934 | | | — | |
| | Colombian peso | | | 12,487 | | | — | | | | 5,461 | | | — | |
| | Soles | | | 2,110 | | | — | | | | 2,239 | | | — | |
| | Chilean peso non-adjustable | | | 81,602,552 | | | — | | | | 84,643,039 | | | — | |
Other current provisions | | | | | 384,955 | | | 5,251,216 | | | | 6,493,532 | | | — | |
| | Argentine peso | | | 45,419 | | | — | | | | 20,859 | | | — | |
| | Chilean peso non-adjustable | | | 339,536 | | | 5,251,216 | | | | 6,472,673 | | | — | |
Current tax liabilities | | | | | 904,248 | | | 66,123,259 | | | | 7,966,008 | | | 53,633,407 | |
| | Argentine peso | | | 146,769 | | | — | | | | — | | | — | |
| | Chilean peso non-adjustable | | | 757,479 | | | 66,123,259 | | | | 7,966,008 | | | 53,633,407 | |
Other current non-financial liabilities | | | | | — | | | 11,225,942 | | | | 23,330 | | | 11,499,992 | |
| | Chilean peso non-adjustable | | | — | | | 11,225,942 | | | | 23,330 | | | 11,499,992 | |
F-120
| | | | 12-31-2017 | | | 12-31-2016 | |
LIABILITIES | | Foreign Currency | | One to five years | | More than five years | | | One to five years | | More than five years | |
| | | | ThCh$ | | ThCh$ | | | ThCh$ | | ThCh$ | |
Other non-current financial liabilities | | | | | 51,932,458 | | | 730,045,687 | | | | 83,294,443 | | | 770,722,308 | |
| | U.S. dollar | | | 29,636,407 | | | 434,446,795 | | | | 61,372,923 | | | 475,084,614 | |
| | U.F. | | | 22,296,051 | | | 295,598,892 | | | | 21,921,520 | | | 295,637,694 | |
Trade and other non-current payables | | | | | 659,824 | | | - | | | | 1,483,113 | | | - | |
| | U.S. dollar | | | 947 | | | - | | | | - | | | - | |
| | Euro | | | - | | | - | | | | 29,952 | | | - | |
| | Argentine peso | | | 173,343 | | | - | | | | 887,668 | | | - | |
| | Chilean peso non-adjustable | | | 485,534 | | | - | | | | 565,493 | | | - | |
Current account payable to related parties | | | | | 318,518 | | | - | | | | 251,527 | | | - | |
| | Euros | | | 318,518 | | | - | | | | - | | | - | |
| | Chilean peso non-adjustable | | | - | | | - | | | | 251,527 | | | - | |
Other long-term provisions | | | | | 52,318 | | | 78,370,519 | | | | 17,912,846 | | | 45,194,062 | |
| | Chilean peso non-adjustable | | | 52,318 | | | 78,370,519 | | | | 17,912,846 | | | 45,194,062 | |
Deferred tax liabilities | | | | | 55,844,982 | | | 116,378,699 | | | | 66,412,315 | | | 132,952,479 | |
| | Argentine peso | | | 4,459,081 | | | - | | | | 3,751,112 | | | - | |
| | Chilean peso non-adjustable | | | 51,385,901 | | | 116,378,699 | | | | 62,661,203 | | | 132,952,479 | |
Non- current provisions for employee benefits | | | | | 3,434,185 | | | 53,647,739 | | | | 3,683,376 | | | 56,250,751 | |
| | Chilean peso non-adjustable | | | 3,434,185 | | | 53,647,739 | | | | 3,683,376 | | | 56,250,751 | |
Other non-current non financial liabilities | | | | | 309,776 | | | - | | | | 313,503 | | | - | |
| | Chilean peso non-adjustable | | | 309,776 | | | - | | | | 313,503 | | | - | |
TOTAL NON-CURRENT LIABILITIES | | | | | 112,552,061 | | | 978,442,644 | | | | 173,351,123 | | | 1,005,119,600 | |
| | | | | | | | | | | | | | | | |
TOTAL LIABILITIES | | | | | 832,302,784 | | | 1,075,508,567 | | | | 854,789,633 | | | 1,080,927,737 | |
F-121
APPENDIX 6 ADDITIONAL INFORMATION OFICIO CIRCULAR (OFFICIAL BULLETIN) No. 715 OF FEBRUARY 3, 2012:
This appendix forms an integral part of the Group’s consolidated financial statements.
| a) | Portfolio stratification |
| • | Trade and other receivables by aging: |
| | As of December 31, 2017 | |
| | Current Portfolio | | | 1-30 days | | | 31-60 days | | | 61-90 days | | | 91-120 days | | | 121-150 days | | | 151-180 days | | | 181-210 days | | | 211-250 days | | | More than 251 days | | | Total Current | | | Total Non-Current | |
Trade and Other Receivables | | ThCh$ | | | ThCh$ | | | ThCh$ | | | ThCh$ | | | ThCh$ | | | ThCh$ | | | ThCh$ | | | ThCh$ | | | ThCh$ | | | ThCh$ | | | ThCh$ | | | ThCh$ | |
Trade receivables, gross | | | 291,417,828 | | | | 33,630,393 | | | | 17,506,620 | | | | 3,996,144 | | | | 2,189,405 | | | | 4,565,337 | | | | 2,861,581 | | | | 2,470,973 | | | | 1,796,958 | | | | 54,604,283 | | | | 415,039,522 | | | | 1,917,828 | |
Allowance for doubtful accounts | | | (89,762 | ) | | | (231,131 | ) | | | (213,455 | ) | | | (200,097 | ) | | | (223,821 | ) | | | (176,789 | ) | | | (207,518 | ) | | | (914,480 | ) | | | (133,045 | ) | | | (32,270,098 | ) | | | (34,660,196 | ) | | | — | |
Other receivables, gross | | | 39,372,960 | | | | — | | | | — | | | | — | | | | — | | | | — | | | | — | | | | — | | | | — | | | | 9,213,863 | | | | 48,586,823 | | | | 34,264,571 | |
Allowance for doubtful accounts | | | — | | | | — | | | | — | | | | — | | | | — | | | | — | | | | — | | | | — | | | | — | | | | (9,213,863 | ) | | | (9,213,863 | ) | | | — | |
Total | | | 330,701,026 | | | | 33,399,262 | | | | 17,293,165 | | | | 3,796,047 | | | | 1,965,584 | | | | 4,388,548 | | | | 2,654,063 | | | | 1,556,493 | | | | 1,663,913 | | | | 22,334,185 | | | | 419,752,286 | | | | 36,182,399 | |
| | | | | | | | | | | | | | | | | | | | | | | | | | | | | | | | | | | | | | | | | | | | | | | | |
| | | | | | | | | | | | | | | | | | | | | | | | | | | | | | | | | | | | | | | | | | | | | | | | |
| | As of December 31, 2016 | |
| | Current Portfolio | | | 1-30 days | | | 31-60 days | | | 61-90 days | | | 91-120 days | | | 121-150 days | | | 151-180 days | | | 181-210 days | | | 211-250 days | | | More than 251 days | | | Total Current | | | Total Non-Current | |
Trade and Other Receivables | | ThCh$ | | | ThCh$ | | | ThCh$ | | | ThCh$ | | | ThCh$ | | | ThCh$ | | | ThCh$ | | | ThCh$ | | | ThCh$ | | | ThCh$ | | | ThCh$ | | | ThCh$ | |
Trade receivables, gross | | | 280,408,709 | | | | 34,119,100 | | | | 14,480,516 | | | | 4,262,852 | | | | 2,265,532 | | | | 5,983,874 | | | | 2,940,939 | | | | 2,126,283 | | | | 4,246,731 | | | | 63,349,580 | | | | 414,184,116 | | | | 8,369,878 | |
Allowance for doubtful accounts | | | (157,009 | ) | | | (221,810 | ) | | | (212,406 | ) | | | (168,457 | ) | | | (109,571 | ) | | | (110,910 | ) | | | (174,725 | ) | | | (766,217 | ) | | | (103,001 | ) | | | (29,672,710 | ) | | | (31,696,816 | ) | | | — | |
Other receivables, gross | | | 62,584,556 | | | | — | | | | — | | | | — | | | | — | | | | — | | | | — | | | | — | | | | — | | | | 7,765,064 | | | | 70,349,620 | | | | 25,130,227 | |
Allowance for doubtful accounts | | | — | | | | — | | | | — | | | | — | | | | — | | | | — | | | | — | | | | — | | | | — | | | | (7,765,064 | ) | | | (7,765,064 | ) | | | — | |
Total | | | 342,836,256 | | | | 33,897,290 | | | | 14,268,110 | | | | 4,094,395 | | | | 2,155,961 | | | | 5,872,964 | | | | 2,766,214 | | | | 1,360,066 | | | | 4,143,730 | | | | 33,676,870 | | | | 445,071,856 | | | | 33,500,105 | |
F-122
| | December 31, 2017 | | | December 31, 2016 | |
| | Non-renegotiated Portfolio | | | Renegotiated Portfolio | | | Total Gross Portfolio | | | Non-renegotiated Portfolio | | | Renegotiated Portfolio | | | Total Gross Portfolio | |
| | Number of Customers | | | Gross Amount | | | Number of Customers | | | Gross Amount | | | Number of Customers | | | Gross Amount | | | Number of Customers | | | Gross Amount | | | Number of Customers | | | Gross Amount | | | Number of Customers | | | Gross Amount | |
Aging of balances | | | | | | ThCh$ | | | | | | | ThCh$ | | | | | | | ThCh$ | | | | | | | ThCh$ | | | | | | | ThCh$ | | | | | | | ThCh$ | |
Current | | | 1,145,472 | | | | 288,681,858 | | | | 52,679 | | | | 4,653,798 | | | | 1,198,151 | | | | 293,335,656 | | | | 1,157,940 | | | | 281,705,071 | | | | 60,278 | | | | 5,850,339 | | | | 1,218,218 | | | | 287,555,410 | |
1 to 30 days | | | 451,929 | | | | 30,202,328 | | | | 22,869 | | | | 3,428,065 | | | | 474,798 | | | | 33,630,393 | | | | 414,617 | | | | 30,167,962 | | | | 22,459 | | | | 3,951,138 | | | | 437,076 | | | | 34,119,100 | |
31 to 60 days | | | 133,114 | | | | 15,573,493 | | | | 8,780 | | | | 1,933,127 | | | | 141,894 | | | | 17,506,620 | | | | 107,539 | | | | 12,724,070 | | | | 8,312 | | | | 1,756,446 | | | | 115,851 | | | | 14,480,516 | |
61 to 90 days | | | 22,305 | | | | 3,228,258 | | | | 2,795 | | | | 767,886 | | | | 25,100 | | | | 3,996,144 | | | | 18,344 | | | | 3,813,933 | | | | 2,128 | | | | 448,919 | | | | 20,472 | | | | 4,262,852 | |
91 to 120 days | | | 9,505 | | | | 1,817,086 | | | | 1,422 | | | | 372,319 | | | | 10,927 | | | | 2,189,405 | | | | 8,987 | | | | 1,978,892 | | | | 1,049 | | | | 286,640 | | | | 10,036 | | | | 2,265,532 | |
121 to 150 days | | | 7,118 | | | | 4,216,619 | | | | 1,093 | | | | 348,718 | | | | 8,211 | | | | 4,565,337 | | | | 5,866 | | | | 5,753,020 | | | | 656 | | | | 230,854 | | | | 6,522 | | | | 5,983,874 | |
151 to 180 days | | | 5,333 | | | | 2,526,954 | | | | 699 | | | | 334,627 | | | | 6,032 | | | | 2,861,581 | | | | 4,671 | | | | 2,415,755 | | | | 442 | | | | 525,184 | | | | 5,113 | | | | 2,940,939 | |
181 to 210 days | | | 10,103 | | | | 2,127,005 | | | | 446 | | | | 343,968 | | | | 10,549 | | | | 2,470,973 | | | | 20,001 | | | | 2,016,444 | | | | 275 | | | | 109,839 | | | | 20,276 | | | | 2,126,283 | |
211 to 250 days | | | 3,979 | | | | 1,599,571 | | | | 394 | | | | 197,387 | | | | 4,373 | | | | 1,796,958 | | | | 3,535 | | | | 4,163,062 | | | | 217 | | | | 83,669 | | | | 3,752 | | | | 4,246,731 | |
More than 251 days | | | 125,590 | | | | 48,307,224 | | | | 5,593 | | | | 6,297,059 | | | | 131,183 | | | | 54,604,283 | | | | 123,301 | | | | 60,447,048 | | | | 3,613 | | | | 4,125,709 | | | | 126,914 | | | | 64,572,757 | |
Total | | | 1,914,448 | | | | 398,280,396 | | | | 96,770 | | | | 18,676,954 | | | | 2,011,218 | | | | 416,957,350 | | | | 1,864,801 | | | | 405,185,257 | | | | 99,429 | | | | 17,368,737 | | | | 1,964,230 | | | | 422,553,994 | |
F-123
| b) | Portfolio in default and in legal collection process |
| | As of December 31, | |
| | 2017 | | | 2016 | |
| | Number of | | | Amount | | | Number of | | | Amount | |
Portfolio in Default and in Legal Collection Process | | Customers | | | ThCh$ | | | Customers | | | ThCh$ | |
Notes receivable in default | | | 1,902 | | | | 259,560 | | | | 1,949 | | | | 262,912 | |
Notes receivable in legal collection process (*) | | | 2,744 | | | | 6,041,670 | | | | 3,608 | | | | 7,049,869 | |
Total | | | 4,646 | | | | 6,301,230 | | | | 5,557 | | | | 7,312,781 | |
| (*) | Legal collections are included in the portfolio in arrears. |
| c) | Provisions and write-offs |
| | As of December 31, | |
| | 2017 | | | 2016 | |
Provisions and Write-offs | | ThCh$ | | | ThCh$ | |
Provision for non-renegotiated portfolio | | | 7,928,877 | | | | 4,919,244 | |
Provision for renegotiated portfolio | | | 8,940 | | | | (746,953 | ) |
Total | | | 7,937,817 | | | | 4,172,291 | |
| d) | Number and value of operations |
| | December 31, 2017 | | | December 31, 2016 | |
| | Total detail by type of operation | | | Total detail by type of operation | | | Total detail by type of operation | | | Total detail by type of operation | |
Number and Value of Operations | | Last Quarter | | | Year-to-date | | | Last Quarter | | | Year-to-date | |
Impairment provisions and recoveries: | | | | | | | | | | | | | | | | |
Number of operations | | | 5,376 | | | | 46,484 | | | | 11,092 | | | | 1,949,771 | |
Value of operations, in ThCh$ | | | 4,058,212 | | | | 7,937,817 | | | | 74,563 | | | | 4,172,291 | |
F-124
APPENDIX 6.1 SUPPLEMENTARY INFORMATION ON TRADE RECEIVABLES:
This appendix forms an integral part of the Group’s consolidated financial statements.
| a) | Portfolio stratification |
| • | Trade receivables by aging: |
| | December 31, 2017 | |
| | Current Portfolio | | | 1-30 days | | | 31-60 days | | | 61-90 days | | | 91-120 days | | | 121-150 days | | | 151-180 days | | | 181-210 days | | | 211-250 days | | | More than 251 days | | | More than 365 days | | | Total Current | | | Total Non- Current | |
Trade and other current receivables | | ThCh$ | | | ThCh$ | | | ThCh$ | | | ThCh$ | | | ThCh$ | | | ThCh$ | | | ThCh$ | | | ThCh$ | | | ThCh$ | | | ThCh$ | | | ThCh$ | | | ThCh$ | | | ThCh$ | |
Trade receivables, generation | | | 186,769,753 | | | | 3,057,994 | | | | 333,079 | | | | 279,100 | | | | 10,021 | | | | 42,015 | | | | 334,298 | | | | 399,552 | | | | 228,498 | | | | 1,596,976 | | | | 2,519,064 | | | | 195,570,350 | | | | 62,563 | |
- Large customers | | | 186,724,468 | | | | 3,057,994 | | | | 333,079 | | | | 279,100 | | | | 10,021 | | | | 42,015 | | | | 334,298 | | | | 399,552 | | | | 228,498 | | | | 1,596,976 | | | | 2,519,064 | | | | 195,525,065 | | | - | |
- Institutional customers | | - | | | | — | | | | — | | | | — | | | | — | | | - | | | - | | | - | | | - | | | - | | | - | | | - | | | - | |
- Others | | | 45,285 | | | | — | | | | — | | | | — | | | | — | | | - | | | - | | | - | | | - | | | - | | | - | | | | 45,285 | | | | 62,563 | |
Allowance for doubtful accounts | | - | | | | — | | | | — | | | | — | | | | — | | | - | | | - | | | - | | | - | | | | (1,103,086 | ) | | | (155,731 | ) | | | (1,258,817 | ) | | - | |
| | | | | | | | | | | | | | | | | | | | | | | | | | | | | | | | | | | | | | | | | | | | | | | | | | | | |
Unbilled services | | | 138,781,170 | | | | — | | | | — | | | | — | | | | — | | | | — | | | | — | | | | — | | | | — | | | | — | | | | — | | | | 138,781,170 | | | | — | |
Services billed | | | 47,988,583 | | | | 3,057,994 | | | | 333,079 | | | | 279,100 | | | | 10,021 | | | | 42,015 | | | | 334,298 | | | | 399,552 | | | | 228,498 | | | | 1,596,976 | | | | 2,519,064 | | | | 56,789,180 | | | | 62,563 | |
| | | | | | | | | | | | | | | | | | | | | | | | | | | | | | | | | | | | | | | | | | | | | | | | | | | | |
Trade receivables, distribution | | | 104,648,075 | | | | 30,572,399 | | | | 17,173,541 | | | | 3,717,044 | | | | 2,179,384 | | | | 4,523,322 | | | | 2,527,283 | | | | 2,071,421 | | | | 1,568,460 | | | | 4,286,717 | | | | 46,201,526 | | | | 219,469,172 | | | | 1,855,265 | |
- Mass-market customers | | | 84,591,816 | | | | 22,148,005 | | | | 10,699,951 | | | | 2,264,627 | | | | 1,657,978 | | | | 1,231,644 | | | | 918,357 | | | | 1,700,605 | | | | 567,152 | | | | 1,808,646 | | | | 25,341,852 | | | | 152,930,633 | | | | 1,781,421 | |
- Large customers | | | 17,771,942 | | | | 6,565,888 | | | | 4,987,871 | | | | 940,754 | | | | 168,838 | | | | 1,809,919 | | | | 357,379 | | | | 30,481 | | | | 7,237 | | | | 1,295,122 | | | | 12,333,224 | | | | 46,268,655 | | | | — | |
- Institutional customers | | | 2,284,317 | | | | 1,858,506 | | | | 1,485,719 | | | | 511,663 | | | | 352,568 | | | | 1,481,759 | | | | 1,251,547 | | | | 340,335 | | | | 994,071 | | | | 1,182,949 | | | | 8,526,450 | | | | 20,269,884 | | | | 73,844 | |
Allowance for doubtful accounts | | | (89,762 | ) | | | (231,131 | ) | | | (213,455 | ) | | | (200,097 | ) | | | (223,821 | ) | | | (176,789 | ) | | | (207,518 | ) | | | (914,480 | ) | | | (133,045 | ) | | | (877,621 | ) | | | (30,133,660 | ) | | | (33,401,379 | ) | | | — | |
| | | | | | | | | | | | | | | | | | | | | | | | | | | | | | | | | | | | | | | | | | | | | | | | | | | | |
Unbilled services | | | 77,733,438 | | | | — | | | | — | | | | — | | | | — | | | | — | | | | — | | | | — | | | | — | | | | — | | | | — | | | | 77,733,438 | | | | — | |
Services billed | | | 26,914,637 | | | | 30,572,399 | | | | 17,173,541 | | | | 3,717,044 | | | | 2,179,384 | | | | 4,523,322 | | | | 2,527,283 | | | | 2,071,421 | | | | 1,568,460 | | | | 4,286,717 | | | | 46,201,526 | | | | 141,735,734 | | | | 1,855,265 | |
| | | | | | | | | | | | | | | | | | | | | | | | | | | | | | | | | | | | | | | | | | | | | | | | | | | | |
Total Trade Receivables, Gross | | | 291,417,828 | | | | 33,630,393 | | | | 17,506,620 | | | | 3,996,144 | | | | 2,189,405 | | | | 4,565,337 | | | | 2,861,581 | | | | 2,470,973 | | | | 1,796,958 | | | | 5,883,693 | | | | 48,720,590 | | | | 415,039,522 | | | | 1,917,828 | |
Total Allowance for Doubtful Accounts | | | (89,762 | ) | | | (231,131 | ) | | | (213,455 | ) | | | (200,097 | ) | | | (223,821 | ) | | | (176,789 | ) | | | (207,518 | ) | | | (914,480 | ) | | | (133,045 | ) | | | (1,980,707 | ) | | | (30,289,391 | ) | | | (34,660,196 | ) | | | — | |
| | | | | | | | | | | | | | | | | | | | | | | | | | | | | | | | | | | | | | | | | | | | | | | | | | | | |
Total Trade Receivables, Net | | | 291,328,066 | | | | 33,399,262 | | | | 17,293,165 | | | | 3,796,047 | | | | 1,965,584 | | | | 4,388,548 | | | | 2,654,063 | | | | 1,556,493 | | | | 1,663,913 | | | | 3,902,986 | | | | 18,431,199 | | | | 380,379,326 | | | | 1,917,828 | |
F-125
| | December 31, 2016 | |
| | Current Portfolio | | | 1-30 days | | | 31-60 days | | | 61-90 days | | | 91-120 days | | | 121-150 days | | | 151-180 days | | | 181-210 days | | | 211-250 days | | | More than 251 days | | | More than 365 days | | | Total Current | | | Total Non- Current | |
Trade and other current receivables | | ThCh$ | | | ThCh$ | | | ThCh$ | | | ThCh$ | | | ThCh$ | | | ThCh$ | | | ThCh$ | | | ThCh$ | | | ThCh$ | | | ThCh$ | | | ThCh$ | | | ThCh$ | | | ThCh$ | |
Trade receivables, generation | | | 179,498,353 | | | | 2,770,582 | | | | 1,165,177 | | | | 773,502 | | | | 900,093 | | | | 5,101,117 | | | | 13,609 | | | | 553,986 | | | | 3,593,733 | | | | 9,600,268 | | | | 10,508,696 | | | | 214,479,116 | | | | 5,751,509 | |
- Large customers | | | 179,482,501 | | | | 2,770,582 | | | | 1,165,177 | | | | 773,502 | | | | 900,093 | | | | 5,101,117 | | | | 13,609 | | | | 553,986 | | | | 3,593,733 | | | | 9,600,268 | | | | 10,508,696 | | | | 214,463,264 | | | | 5,723,942 | |
- Institutional customers | | | — | | | | — | | | | — | | | | — | | | | — | | | | — | | | | — | | | | — | | | | — | | | | — | | | | — | | | | — | | | | — | |
- Others | | | 15,852 | | | | — | | | | — | | | | — | | | | — | | | | — | | | | — | | | | — | | | | — | | | | — | | | | — | | | | 15,852 | | | | 27,567 | |
Allowance for doubtful accounts | | | — | | | | — | | | | — | | | | — | | | | — | | | | — | | | | — | | | | — | | | | — | | | | (1,314,310 | ) | | | — | | | | (1,314,310 | ) | | | — | |
| | | | | | | | | | | | | | | | | | | | | | | | | | | | | | | | | | | | | | | | | | | | | | | | | | | | |
Unbilled services | | | 125,367,509 | | | | — | | | | — | | | | — | | | | — | | | | — | | | | — | | | | — | | | | — | | | | — | | | | — | | | | 125,367,509 | | | | 3,308,454 | |
Services billed | | | 54,130,844 | | | | 2,770,582 | | | | 1,165,177 | | | | 773,502 | | | | 900,093 | | | | 5,101,117 | | | | 13,609 | | | | 553,986 | | | | 3,593,733 | | | | 9,600,268 | | | | 10,508,696 | | | | 89,111,607 | | | | 2,443,055 | |
| | | | | | | | | | | | | | | | | | | | | | | | | | | | | | | | | | | | | | | | | | | | | | | | | | | | |
Trade receivables, distribution | | | 100,910,356 | | | | 31,348,518 | | | | 13,315,339 | | | | 3,489,350 | | | | 1,365,439 | | | | 882,757 | | | | 2,927,330 | | | | 1,572,297 | | | | 652,998 | | | | 2,667,650 | | | | 40,572,966 | | | | 199,705,000 | | | | 2,618,369 | |
- Mass-market customers | | | 74,735,718 | | | | 23,318,881 | | | | 9,558,288 | | | | 1,981,025 | | | | 862,071 | | | | 615,659 | | | | 534,796 | | | | 779,941 | | | | 347,398 | | | | 1,202,738 | | | | 23,490,230 | | | | 137,426,745 | | | | 2,164,930 | |
- Large customers | | | 23,586,354 | | | | 6,566,919 | | | | 2,148,243 | | | | 1,231,708 | | | | 209,825 | | | | 172,851 | | | | 1,174,012 | | | | 46,128 | | | | 2,424 | | | | 766,851 | | | | 10,154,924 | | | | 46,060,239 | | | | 34,602 | |
- Institutional customers | | | 2,588,284 | | | | 1,462,718 | | | | 1,608,808 | | | | 276,617 | | | | 293,543 | | | | 94,247 | | | | 1,218,522 | | | | 746,228 | | | | 303,176 | | | | 698,061 | | | | 6,927,812 | | | | 16,218,016 | | | | 418,837 | |
Allowance for doubtful accounts | | | (157,009 | ) | | | (221,810 | ) | | | (212,406 | ) | | | (168,457 | ) | | | (109,571 | ) | | | (110,910 | ) | | | (174,725 | ) | | | (766,217 | ) | | | (103,001 | ) | | | (614,954 | ) | | | (27,743,446 | ) | | | (30,382,506 | ) | | | — | |
| | | | | | | | | | | | | | | | | | | | | | | | | | | | | | | | | | | | | | | | | | | | | | | | | | | | |
Unbilled services | | | 61,742,593 | | | | — | | | | — | | | | — | | | | — | | | | — | | | | — | | | | — | | | | — | | | | — | | | | — | | | | 61,742,593 | | | | 149,508 | |
Services billed | | | 39,167,763 | | | | 31,348,518 | | | | 13,315,339 | | | | 3,489,350 | | | | 1,365,439 | | | | 882,757 | | | | 2,927,330 | | | | 1,572,297 | | | | 652,998 | | | | 2,667,650 | | | | 40,572,966 | | | | 137,962,407 | | | | 2,465,400 | |
| | | | | | | | | | | | | | | | | | | | | | | | | | | | | | | | | | | | | | | | | | | | | | | | | | | | |
Total Trade Receivables, Gross | | | 280,408,709 | | | | 34,119,100 | | | | 14,480,516 | | | | 4,262,852 | | | | 2,265,532 | | | | 5,983,874 | | | | 2,940,939 | | | | 2,126,283 | | | | 4,246,731 | | | | 12,267,918 | | | | 51,081,662 | | | | 414,184,116 | | | | 8,369,878 | |
Total Allowance for Doubtful Accounts | | | (157,009 | ) | | | (221,810 | ) | | | (212,406 | ) | | | (168,457 | ) | | | (109,571 | ) | | | (110,910 | ) | | | (174,725 | ) | | | (766,217 | ) | | | (103,001 | ) | | | (1,929,264 | ) | | | (27,743,446 | ) | | | (31,696,816 | ) | | | — | |
| | | | | | | | | | | | | | | | | | | | | | | | | | | | | | | | | | | | | | | | | | | | | | | | | | | | |
Total Trade Receivables, Net | | | 280,251,700 | | | | 33,897,290 | | | | 14,268,110 | | | | 4,094,395 | | | | 2,155,961 | | | | 5,872,964 | | | | 2,766,214 | | | | 1,360,066 | | | | 4,143,730 | | | | 10,338,654 | | | | 23,338,216 | | | | 382,487,300 | | | | 8,369,878 | |
Since not all of our commercial databases in our Group’s subsidiaries distinguish whether the final electricity service consumer is a natural or legal person, the main management segmentation used by all the consolidated entities to monitor and follow up on trade receivables is the following:
F-126
| | December 31, 2017 | |
| | Current Portfolio | | | 1-30 days | | | 31-60 days | | | 61-90 days | | | 91-120 days | | | 121-150 days | | | 151-180 days | | | 181-210 days | | | 211-250 days | | | More than 251 days | | | Total Current Gross Portfolio | | | Total Non-Current Gross Portfolio | |
Type of Portfolio | | ThCh$ | | | ThCh$ | | | ThCh$ | | | ThCh$ | | | ThCh$ | | | ThCh$ | | | ThCh$ | | | ThCh$ | | | ThCh$ | | | ThCh$ | | | ThCh$ | | | ThCh$ | |
GENERATION | | | | | | | | | | | | | | | | | | | | | | | | | | | | | | | | | | | | | | | | | | | | | | | | |
Non-renegotiated portfolio | | | 186,724,468 | | | | 3,057,994 | | | | 333,079 | | | | 279,100 | | | | 10,021 | | | | 42,015 | | | | 334,298 | | | | 399,552 | | | | 228,498 | | | | 4,116,040 | | | | 195,525,065 | | | | — | |
- Large customers | | | 186,724,468 | | | | 3,057,994 | | | | 333,079 | | | | 279,100 | | | | 10,021 | | | | 42,015 | | | | 334,298 | | | | 399,552 | | | | 228,498 | | | | 4,116,040 | | | | 195,525,065 | | | | — | |
- Institutional customers | | | — | | | | — | | | | — | | | | — | | | | — | | | | — | | | | — | | | | — | | | | — | | | | — | | | | — | | | | — | |
- Others | | | — | | | | — | | | | — | | | | — | | | | — | | | | — | | | | — | | | | — | | | | — | | | | — | | | | — | | | | — | |
Renegotiated portfolio | | | 45,285 | | | | — | | | | — | | | | — | | | | — | | | | — | | | | — | | | | — | | | | — | | | | — | | | | 45,285 | | | | 62,563 | |
- Large customers | | | — | | | | — | | | | — | | | | — | | | | — | | | | — | | | | — | | | | — | | | | — | | | | — | | | | — | | | | — | |
- Institutional customers | | | — | | | | — | | | | — | | | | — | | | | — | | | | — | | | | — | | | | — | | | | — | | | | — | | | | — | | | | — | |
- Others | | | 45,285 | | | | — | | | | — | | | | — | | | | — | | | | — | | | | — | | | | — | | | | — | | | | — | | | | 45,285 | | | | 62,563 | |
DISTRIBUTION | | | | | | | | | | | | | | | | | | | | | | | | | | | | | | | | | | | | | | | | | | | | | | | | |
Non-renegotiated portfolio | | | 101,580,927 | | | | 27,144,334 | | | | 15,240,414 | | | | 2,949,158 | | | | 1,807,065 | | | | 4,174,604 | | | | 2,192,656 | | | | 1,727,453 | | | | 1,371,073 | | | | 44,191,184 | | | | 202,378,868 | | | | 376,463 | |
- Mass-market customers | | | 81,786,896 | | | | 19,120,060 | | | | 9,323,291 | | | | 1,705,992 | | | | 1,285,659 | | | | 882,926 | | | | 671,894 | | | | 1,554,175 | | | | 423,730 | | | | 20,987,147 | | | | 137,741,770 | | | | 342,063 | |
- Large customers | | | 17,522,970 | | | | 6,565,888 | | | | 4,590,254 | | | | 940,754 | | | | 168,838 | | | | 1,809,919 | | | | 357,379 | | | | 30,481 | | | | 7,237 | | | | 13,521,914 | | | | 45,515,634 | | | | — | |
- Institutional customers | | | 2,271,061 | | | | 1,458,386 | | | | 1,326,869 | | | | 302,412 | | | | 352,568 | | | | 1,481,759 | | | | 1,163,383 | | | | 142,797 | | | | 940,106 | | | | 9,682,123 | | | | 19,121,464 | | | | 34,400 | |
Renegotiated portfolio | | | 3,067,148 | | | | 3,428,065 | | | | 1,933,127 | | | | 767,886 | | | | 372,319 | | | | 348,718 | | | | 334,627 | | | | 343,968 | | | | 197,387 | | | | 6,297,059 | | | | 17,090,304 | | | | 1,478,802 | |
- Mass-market customers | | | 2,804,920 | | | | 3,027,945 | | | | 1,376,659 | | | | 558,635 | | | | 372,319 | | | | 348,718 | | | | 246,463 | | | | 146,430 | | | | 143,422 | | | | 6,163,350 | | | | 15,188,861 | | | | 1,439,358 | |
- Large Customers | | | 248,972 | | | | — | | | | 397,617 | | | | — | | | | — | | | | — | | | | — | | | | — | | | | — | | | | 106,433 | | | | 753,022 | | | | — | |
- Institutional Customers | | | 13,256 | | | | 400,120 | | | | 158,851 | | | | 209,251 | | | | — | | | | — | | | | 88,164 | | | | 197,538 | | | | 53,965 | | | | 27,276 | | | | 1,148,421 | | | | 39,444 | |
| | | | | | | | | | | | | | | | | | | | | | | | | | | | | | | | | | | | | | | | | | | | | | | | |
Total Gross Portfolio | | | 291,372,543 | | | | 33,630,393 | | | | 17,506,620 | | | | 3,996,144 | | | | 2,189,405 | | | | 4,565,337 | | | | 2,861,581 | | | | 2,470,973 | | | | 1,796,958 | | | | 54,604,283 | | | | 415,039,522 | | | | 1,917,828 | |
F-127
| | December 31, 2016 | |
| | Current Portfolio | | | 1-30 days | | | 31-60 days | | | 61-90 days | | | 91-120 days | | | 121-150 days | | | 151-180 days | | | 181-210 days | | | 211-250 days | | | More than 251 days | | | Total Current Gross Portfolio | | | Total Non-Current Gross Portfolio | |
Type of Portfolio | | ThCh$ | | | ThCh$ | | | ThCh$ | | | ThCh$ | | | ThCh$ | | | ThCh$ | | | ThCh$ | | | ThCh$ | | | ThCh$ | | | ThCh$ | | | ThCh$ | | | ThCh$ | |
GENERATION | | | | | | | | | | | | | | | | | | | | | | | | | | | | | | | | | | | | | | | | | | | | | | | | |
Non-renegotiated portfolio | | | 179,498,353 | | | | 2,770,582 | | | | 1,165,177 | | | | 773,502 | | | | 900,093 | | | | 5,101,117 | | | | 13,609 | | | | 553,986 | | | | 3,593,733 | | | | 20,108,963 | | | | 214,479,115 | | | | 5,751,509 | |
- Large customers | | | 179,482,501 | | | | 2,770,582 | | | | 1,165,177 | | | | 773,502 | | | | 900,093 | | | | 5,101,117 | | | | 13,609 | | | | 553,986 | | | | 3,593,733 | | | | 20,108,963 | | | | 214,463,263 | | | | 5,723,942 | |
- Institutional customers | | | — | | | | — | | | | — | | | | — | | | | — | | | | — | | | | — | | | | — | | | | — | | | | — | | | | — | | | | — | |
- Others | | | 15,852 | | | | — | | | | — | | | | — | | | | — | | | | — | | | | — | | | | — | | | | — | | | | — | | | | 15,852 | | | | 27,567 | |
Renegotiated portfolio | | | — | | | | — | | | | — | | | | — | | | | — | | | | — | | | | — | | | | — | | | | — | | | | — | | | | — | | | | — | |
- Large customers | | | — | | | | — | | | | — | | | | — | | | | — | | | | — | | | | — | | | | — | | | | — | | | | — | | | | — | | | | — | |
- Institutional customers | | | — | | | | — | | | | — | | | | — | | | | — | | | | — | | | | — | | | | — | | | | — | | | | — | | | | — | | | | — | |
- Others | | | — | | | | — | | | | — | | | | — | | | | — | | | | — | | | | — | | | | — | | | | — | | | | — | | | | — | | | | — | |
DISTRIBUTION | | | | | | | | | | | | | | | | | | | | | | | | | | | | | | | | | | | | | | | | | | | | | | | | |
Non-renegotiated portfolio | | | 96,922,455 | | | | 27,397,380 | | | | 11,558,893 | | | | 3,040,431 | | | | 1,078,799 | | | | 651,903 | | | | 2,402,146 | | | | 1,462,458 | | | | 569,329 | | | | 39,114,907 | | | | 184,198,701 | | | | 755,931 | |
- Mass-market customers | | | 71,334,454 | | | | 20,155,266 | | | | 8,134,561 | | | | 1,532,106 | | | | 575,781 | | | | 410,789 | | | | 377,710 | | | | 670,102 | | | | 265,574 | | | | 20,582,480 | | | | 124,038,823 | | | | 721,329 | |
- Large customers | | | 23,376,286 | | | | 6,499,554 | | | | 2,148,243 | | | | 1,231,708 | | | | 209,825 | | | | 146,867 | | | | 1,174,012 | | | | 46,128 | | | | 2,424 | | | | 10,921,775 | | | | 45,756,822 | | | | 34,602 | |
- Institutional customers | | | 2,211,715 | | | | 742,560 | | | | 1,276,089 | | | | 276,617 | | | | 293,193 | | | | 94,247 | | | | 850,424 | | | | 746,228 | | | | 301,331 | | | | 7,610,652 | | | | 14,403,056 | | | | — | |
Renegotiated portfolio | | | 3,987,901 | | | | 3,951,138 | | | | 1,756,446 | | | | 448,919 | | | | 286,640 | | | | 230,854 | | | | 525,184 | | | | 109,839 | | | | 83,669 | | | | 4,125,709 | | | | 15,506,299 | | | | 1,862,438 | |
- Mass-market customers | | | 3,401,264 | | | | 3,163,614 | | | | 1,423,727 | | | | 448,919 | | | | 286,290 | | | | 204,870 | | | | 157,086 | | | | 109,839 | | | | 81,824 | | | | 4,110,488 | | | | 13,387,921 | | | | 1,443,601 | |
- Large Customers | | | 210,068 | | | | 67,366 | | | | — | | | | — | | | | — | | | | 25,984 | | | | — | | | | — | | | | — | | | | — | | | | 303,418 | | | | — | |
- Institutional Customers | | | 376,569 | | | | 720,158 | | | | 332,719 | | | | — | | | | 350 | | | | — | | | | 368,098 | | | | — | | | | 1,845 | | | | 15,221 | | | | 1,814,960 | | | | 418,837 | |
| | | | | | | | | | | | | | | | | | | | | | | | | | | | | | | | | | | | | | | | | | | | | | | | |
Total Gross Portfolio | | | 280,408,709 | | | | 34,119,100 | | | | 14,480,516 | | | | 4,262,852 | | | | 2,265,532 | | | | 5,983,874 | | | | 2,940,939 | | | | 2,126,283 | | | | 4,246,731 | | | | 63,349,579 | | | | 414,184,115 | | | | 8,369,878 | |
F-128
APPENDIX 6.2 ESTIMATED SALES AND PURCHASES OF ENERGY AND CAPACITY:
This appendix forms an integral part of the Group’s consolidated financial statements.
| | 12-31-2017 | | | 12-31-2016 | |
| | Energy and Tolls | | | Capacity | | | Energy and Tolls | | | Capacity | |
STATEMENT OF FINANCIAL POSITION | | ThCh$ | | | ThCh$ | | | ThCh$ | | | ThCh$ | |
Current accounts receivable from related companies | | | 5,518,711 | | | | 466,031 | | | | 590,636 | | | | 21,774 | |
Trade and other current receivables | | | 177,886,960 | | | | 48,122,678 | | | | 168,833,728 | | | | 23,276,222 | |
Total Estimated Assets | | | 183,405,671 | | | | 48,588,709 | | | | 169,424,364 | | | | 23,297,996 | |
Current accounts payable to related companies | | | 21,818,299 | | | | 177,839 | | | | 13,459,812 | | | | 191,936 | |
Trade and other current payables | | | 120,451,406 | | | | 47,893,119 | | | | 85,425,025 | | | | 42,571,883 | |
Total Estimated Liabilities | | | 142,269,705 | | | | 48,070,958 | | | | 98,884,837 | | | | 42,763,819 | |
| | 12-31-2017 | | | 12-31-2016 | | | 12-31-2015 | |
| | Energy and Tolls | | | Capacity | | | Energy and Tolls | | | Capacity | | | Energy and Tolls | | | Capacity | |
INCOME STATEMENT | | ThCh$ | | | ThCh$ | | | ThCh$ | | | ThCh$ | | | ThCh$ | | | ThCh$ | |
Energy Sales | | | 183,405,671 | | | | 48,588,709 | | | | 169,424,364 | | | | 23,297,996 | | | | 216,908,877 | | | | 34,686,488 | |
Energy Purchases | | | 142,269,706 | | | | 48,070,958 | | | | 98,884,837 | | | | 42,763,819 | | | | 101,922,626 | | | | 43,935,488 | |
F-129
APPENDIX 7 DETAILS OF DUE DATES OF PAYMENTS TO SUPPLIERS:
This appendix forms an integral part of the Group’s consolidated financial statements.
| | December 31, 2017 | | | December 31, 2016 | |
| | Goods | | | Services | | | Other | | | Total | | | Goods | | | Services | | | Other | | | Total | |
Suppliers with Current Payments | | ThCh$ | | | ThCh$ | | | ThCh$ | | | ThCh$ | | | ThCh$ | | | ThCh$ | | | ThCh$ | | | ThCh$ | |
Up to 30 days | | | — | | | | 94,132,902 | | | | 91,209,336 | | | | 185,342,238 | | | | — | | | | 90,386,018 | | | | 68,377,696 | | | | 158,763,714 | |
From 31 to 60 days | | | — | | | | — | | | | — | | | | — | | | | — | | | | — | | | | — | | | | — | |
From 61 to 90 days | | | — | | | | — | | | | — | | | | — | | | | — | | | | — | | | | — | | | | — | |
From 91 to 120 days | | | — | | | | — | | | | — | | | | — | | | | — | | | | — | | | | — | | | | — | |
From 121 to 365 days | | | — | | | | — | | | | — | | | | — | | | | — | | | | — | | | | — | | | | — | |
More than 365 days | | | — | | | | — | | | | — | | | | — | | | | — | | | | — | | | | — | | | | — | |
Total | | | — | | | | 94,132,902 | | | | 91,209,336 | | | | 185,342,238 | | | | — | | | | 90,386,018 | | | | 68,377,696 | | | | 158,763,714 | |
F-130