SECURITIES AND EXCHANGE COMMISSION
Washington, D.C. 20549
FORM 1-K
ANNUAL REPORT
ANNUAL REPORT PURSUANT TO REGULATION A OF THESECURITIES ACT OF 1933
For the fiscal year ended December 31, 2016
FUNDRISE EAST COAST OPPORTUNISTIC REIT, LLC
(Exact name of registrant as specified in its charter)
Commission File Number:024-10566
| Delaware | 30-0889118 | |
| (State or other jurisdiction of incorporation or organization) | (I.R.S. Employer Identification No.) | |
1601 Connecticut Ave., NW, Suite 300 Washington, DC | 20009
(Zip Code) |
(202) 584-0550
Registrant’s telephone number, including area code
Common Shares
(Title of each class of securities issued pursuant to Regulation A)
TABLE OF CONTENTS
| 2 |
Part II.
STATEMENTS REGARDING FORWARD-LOOKING INFORMATION
We make statements in this Annual Report on Form 1-K (“Annual Report”) that are forward-looking statements within the meaning of the federal securities laws. The words “believe,” “estimate,” “expect,” “anticipate,” “intend,” “plan,” “seek,” “may,” and similar expressions or statements regarding future periods are intended to identify forward-looking statements. These forward-looking statements involve known and unknown risks, uncertainties and other important factors that could cause our actual results, performance or achievements, or industry results, to differ materially from any predictions of future results, performance or achievements that we express or imply in this Annual Report or in the information incorporated by reference into this Annual Report.
The forward-looking statements included in this Annual Report are based upon our current expectations, plans, estimates, assumptions and beliefs that involve numerous risks and uncertainties. Assumptions relating to the foregoing involve judgments with respect to, among other things, future economic, competitive and market conditions and future business decisions, all of which are difficult or impossible to predict accurately and many of which are beyond our control. Although we believe that the expectations reflected in such forward-looking statements are based on reasonable assumptions, our actual results and performance could differ materially from those set forth in the forward-looking statements. Factors which could have a material adverse effect on our operations and future prospects include, but are not limited to:
| • | our ability to effectively deploy the proceeds raised in our initial public offering (the “Offering”); |
| • | our ability to attract and retain members to our sponsor’s online crowdfunding platform (the “Fundrise Platform”); |
| • | risks associated with breaches of our data security; |
| • | changes in economic conditions generally and the real estate and securities markets specifically; |
| • | limited ability to dispose of assets because of the relative illiquidity of real estate investments; |
| • | intense competition in the real estate market that may limit our ability to attract or retain tenants or re-lease space; |
| • | defaults on or non-renewal of leases by tenants; |
| • | increased interest rates and operating costs; |
| • | our failure to obtain necessary outside financing; |
| • | decreased rental rates or increased vacancy rates; |
| • | the risk associated with potential breach or expiration of a ground lease, if any; |
| • | difficulties in identifying properties to complete, and consummating, real estate acquisitions, developments, joint ventures and dispositions; |
| • | our failure to successfully operate acquired properties and operations; |
| • | exposure to liability relating to environmental and health and safety matters; |
| 3 |
| • | changes in real estate and zoning laws and increases in real property tax rates; |
| • | failure of acquisitions to yield anticipated results; |
| • | risks associated with breaches of our data security; |
| • | risks associated with derivatives or hedging activity; |
| • | our level of debt and the terms and limitations imposed on us by our debt agreements; |
| • | the need to invest additional equity in connection with debt refinancings as a result of reduced asset values; |
| • | our ability to retain our executive officers and other key personnel of our advisor, our property manager and their affiliates; | |
| • | expected rates of return provided to investors; |
| • | the ability of our sponsor and its affiliates to source, originate and service our loans and other assets, and the quality and performance of these assets; |
| • | our ability to retain and hire competent employees and appropriately staff our operations; |
| • | legislative or regulatory changes impacting our business or our assets (including changes to the laws governing the taxation of real estate investment trusts (“REITs”) and Securities and Exchange Commission (“SEC”) guidance related to Regulation A or the JOBS Act); |
| • | changes in business conditions and the market value of our assets, including changes in interest rates, prepayment risk, operator or borrower defaults or bankruptcy, and generally the increased risk of loss if our investments fail to perform as expected; |
| • | our ability to implement effective conflicts of interest policies and procedures among the various real estate investment opportunities sponsored by our sponsor; |
| • | our ability to access sources of liquidity when we have the need to fund redemptions of common shares in excess of the proceeds from the sales of our common shares in our continuous offering and the consequential risk that we may not have the resources to satisfy redemption requests; |
| • | our failure to maintain our status as a REIT; |
| • | our compliance with applicable local, state and federal laws, including the Investment Advisers Act of 1940, as amended (the “Advisers Act”), the Investment Company Act and other laws; and |
| • | changes to generally accepted accounting principles, or GAAP. |
| 4 |
Any of the assumptions underlying forward-looking statements could be inaccurate. You are cautioned not to place undue reliance on any forward-looking statements included in this Annual Report. All forward-looking statements are made as of the date of this Annual Report and the risk that actual results will differ materially from the expectations expressed in this Annual Report will increase with the passage of time. Except as otherwise required by the federal securities laws, we undertake no obligation to publicly update or revise any forward-looking statements after the date of this Annual Report, whether as a result of new information, future events, changed circumstances or any other reason. In light of the significant uncertainties inherent in the forward-looking statements included in this Annual Report, including, without limitation, the risks described under “Risk Factors,” the inclusion of such forward-looking statements should not be regarded as a representation by us or any other person that the objectives and plans set forth in this Annual Report will be achieved.
| 5 |

FUNDRISE EAST COAST OPPORTUNISTIC REIT, LLC
(the "East Coast eREITTM")
| Item 1. | Business |
The Company
Fundrise East Coast Opportunistic REIT, LLC is a Delaware limited liability company formed on November 19, 2015 to originate, invest in and manage a diversified portfolio primarily consisting of investments in multifamily rental properties and development projects located primarily in the states of Massachusetts, New York, New Jersey, North Carolina, South Carolina, Georgia and Florida, as well as the metropolitan statistical areas (“MSAs”) of Washington, DC and Philadelphia, PA, with such investments consisting of equity interests in such properties or debt, as well as commercial real estate debt securities and other select real estate-related assets, where the underlying assets primarily consist of such properties. We define development projects to include a range of activities from major renovation and lease-up of existing buildings to ground up construction. While we intend to primarily invest in multifamily rental properties and development projects located in the states of Massachusetts, New York, New Jersey, North Carolina, South Carolina, Georgia and Florida, as well as the MSAs of Washington, DC and Philadelphia, PA, we may invest in other asset classes as well as other locations, depending on the availability of suitable investment opportunities. We may also invest in commercial real estate-related debt securities (including commercial mortgage-backed securities, or CMBS, collateralized debt obligations, or CDOs, and REIT senior unsecured debt) and other real estate-related assets. We may make our investments through majority-owned subsidiaries, some of which may have rights to receive preferred economic returns. The use of the terms “Fundrise East Coast Opportunistic REIT”, the “Company”, “we”, “us” or “our” in this Annual Report refer to Fundrise East Coast Opportunistic REIT, LLC unless the context indicates otherwise.
We have elected to be taxed as a REIT under the Internal Revenue Code of 1986, as amended (“the Code”), commencing with our taxable year ending December 31, 2016. As of April 1, 2017 and December 31, 2016, our portfolio was comprised of approximately $19,152,000 and $12,689,000 worth of equity in controlled subsidiaries and other real estate holding entities, respectively, that in the opinion of our Manager, meets our investment objectives. SeeItem 2 “Management’s Discussion and Analysis of Financial Condition and Results of Operations - Recent Developments” for information concerning our investments since December 31, 2016. We will seek to create and maintain a portfolio of multifamily rental properties and development project investments that generate a low volatility income stream of attractive and consistent cash distributions. Our focus on investing in debt and equity instruments will emphasize the payment of current returns to investors and preservation of invested capital as our primary investment objectives, as well as emphasizing capital appreciation from our investments, as is typically the case with strategies focused exclusively on opportunistic or equity oriented investments.
Fundrise Advisors, LLC, our Manager, manages our day-to-day operations. Our Manager is an investment adviser registered with the SEC and a wholly-owned subsidiary of our sponsor. A team of real estate and debt finance professionals, acting through our Manager, makes all the decisions regarding the selection, negotiation, financing and disposition of our investments, subject to the limitations in our operating agreement. Our Manager also provides asset management, marketing, investor relations and other administrative services on our behalf with the goal of maximizing our operating cash flow and preserving our invested capital. Rise Companies Corp., our sponsor, is able to exercise significant control over our business.
We have offered, are offering, and will continue to offer up to $50,000,000 in our common shares, which represent limited liability company interests in our company (the “Offering”). See Item 2 “Management’s Discussion and Analysis of Financial Condition and Results of Operations – Overview” for more information concerning the current status of the Offering.
| 6 |
We expect to offer common shares in our Offering until we raise the maximum amount being offered, unless terminated by our Manager at an earlier time. Until December 31, 2017, the per share purchase price for our common shares will be $10.00 per share, an amount that was arbitrarily determined by our Manager. Thereafter, the per share purchase price will be adjusted every fiscal quarter and, as of January 1st, April 1st, July 1st and October 1st of each year (or as soon as commercially reasonable and announced by us thereafter), will equal the greater of (i) $10.00 per share or (ii) the sum of our net asset value, or NAV, divided by the number of our common shares outstanding as of the end of the prior fiscal quarter (NAV per share). Although we do not intend to list our common shares for trading on a stock exchange or other trading market, we have adopted a redemption plan designed to provide our shareholders with limited liquidity on a quarterly basis for their investment in our shares.
Investment Strategy
We originate, acquire, asset manage, operate, selectively leverage, syndicate and opportunistically sell multifamily rental properties and development projects through the acquisition of equity interests in such properties or debt (including senior mortgage loans, subordinated mortgage loans (also referred to as B Notes), mezzanine loans, and participations in such loans), as well as commercial real estate debt securities and other real estate-related assets, where the underlying assets primarily consist of such properties. Our management has extensive experience investing in numerous types of properties. While we focus our investments primarily in multifamily rental properties and development projects, in the event that appropriate investment opportunities are not available, we may acquire a wide variety of commercial properties, including office, industrial, retail, recreation and leisure, single-tenant residential and other real properties. These properties may be existing, income-producing properties, newly constructed properties or properties under development or construction and may include multifamily rental properties purchased for conversion into condominiums and single-tenant properties that may be converted for multifamily use. We focus on acquiring properties with significant possibilities for capital appreciation, such as those requiring development, redevelopment or repositioning, those located in markets with high growth potential and those available from sellers who are distressed or face time-sensitive deadlines. We also may invest in real estate-related securities, including securities issued by other real estate companies, either for investment or in change of control transactions completed on a negotiated basis or otherwise, and in bridge and mezzanine loans that may lead to an opportunity to purchase a real estate interest. In addition, to the extent that our Manager and its investment committee determines that it is advantageous, we also may make or invest in commercial mortgage-backed securities, mortgage loans and Code Section 1031 tenant-in-common interests. Our portfolio of debt investments is secured primarily by U.S. based collateral, primarily multifamily rental properties and development projects, and diversified by security type.
We seek to create and maintain a portfolio of multifamily rental properties and development project investments that generate a low volatility income stream of attractive and consistent cash distributions. Our focus on investing in debt and equity instruments emphasizes the payment of current returns to investors and preservation of invested capital as our primary investment objectives, as well as emphasizing capital appreciation from our investments, as is typically the case with strategies focused exclusively on opportunistic or equity-oriented investments.
| 7 |
For debt investments, our Manager directly structures, underwrites and originates many of the debt products in which we invest, as doing so provides for the best opportunity to control our borrower and partner relationships and optimize the terms of our investments. Our proven underwriting process, which our management team has successfully developed over their extensive real estate careers in a variety of market conditions and implemented at our sponsor, involves comprehensive financial, structural, operational and legal due diligence of our borrowers and partners in order to optimize pricing and structuring and mitigate risk. We feel the current and future market environment for multifamily rental properties and development projects (including any existing or future government-sponsored programs) provides a wide range of opportunities to generate compelling investments with strong risk-return profiles for our shareholders.
Investment Objectives
Our primary investment objectives are:
| · | to realize growth in the value of our investment within approximately five years of the termination of our Offering; |
| · | to grow net cash from operations so more cash is available for distributions to investors; |
| · | to pay attractive and consistent cash distributions; |
| · | to enable investors to realize a return on their investment by beginning the process of liquidating and distributing cash to investors within approximately five years of the termination of our Offering, or providing liquidity through alternative means such as in-kind distributions of our own securities or other assets; and |
| · | to preserve, protect and return shareholders’ capital contributions. |
We also seek to realize growth in the value of our investments by timing their sale to maximize value. There can be no assurance that we will be able to achieve these objectives.
Competition
Our net income depends, in large part, on our ability to source, acquire and manage investments with attractive risk-adjusted yields. We compete with many other entities engaged in real estate investment activities, including individuals, corporations, bank and insurance company investment accounts, other REITs, private real estate funds, and other entities engaged in real estate investment activities as well as online lending platforms that compete with the Fundrise Platform, many of which have greater financial resources and lower costs of capital available to them than we have. In addition, there are numerous REITs with asset acquisition objectives similar to ours, and others may be organized in the future, which may increase competition for the investments suitable for us. Competitive variables include market presence and visibility, amount of capital to be invested per project and underwriting standards. To the extent that a competitor is willing to risk larger amounts of capital in a particular transaction or to employ more liberal underwriting standards when evaluating potential investments than we are, our investment volume and profit margins for our investment portfolio could be impacted. Our competitors may also be willing to accept lower returns on their investments and may succeed in buying the assets that we have targeted for acquisition. Although we believe that we are well positioned to compete effectively in each facet of our business, there is enormous competition in our market sector and there can be no assurance that we will compete effectively or that we will not encounter increased competition in the future that could limit our ability to conduct our business effectively.
| 8 |
Risk Factors
We face risks and uncertainties that could affect us and our business as well as the real estate industry generally. These risks are outlined under the heading “Risk Factors” contained in our Offering Circular dated October 5, 2016, as supplemented, (the “Offering Circular”) which may be accessedhere, as the same may be updated from time to time by our future filings under Regulation A. In addition, new risks may emerge at any time and we cannot predict such risks or estimate the extent to which they may affect our financial performance. These risks could result in a decrease in the value of our common shares.
| 9 |
| Item 2. | Management’s Discussion and Analysis of Financial Condition and Results of Operations |
Overview
Fundrise East Coast Opportunistic REIT, LLC is a newly organized Delaware limited liability company formed to originate, invest in and manage a diversified portfolio primarily consisting of investments in multifamily rental properties and development projects located primarily in the states of Massachusetts, New York, New Jersey, North Carolina, South Carolina, Georgia and Florida, as well as the metropolitan statistical areas (“MSAs”) of Washington, DC and Philadelphia, PA, with such investments consisting of equity interests in such properties or debt, as well as commercial real estate debt securities and other select real estate-related assets, where the underlying assets primarily consist of such properties. We are externally managed by Fundrise Advisors, LLC, or our Manager, which is an investment adviser registered with the Securities and Exchange Commission, or SEC, and a wholly-owned subsidiary of our sponsor, Rise Companies Corp., the parent company of Fundrise, LLC, our affiliate. Fundrise, LLC owns and operates an online investment platform www.fundrise.com. On October 25, 2016, we commenced operations upon our satisfying the $1.0 million minimum offering requirement (not including the $100,000 received in the private placements to our sponsor and Fundrise, LP).
We have offered, are offering, and will continue to offer up to $50,000,000 in our common shares in our Offering. As of April 1, 2017 and December 31, 2016, we had raised total gross offering proceeds of approximately $11.35 million and $6.36 million, respectively, from settled subscriptions (including the $100,000 received in the private placements to our sponsor, Rise Companies Corp., and Fundrise, LP, an affiliate of our sponsor), and had settled subscriptions in our Offering and private placements for an aggregate of approximately 1,135,000 and 636,000 , respectively, of our common shares. Assuming the settlement for all subscriptions received as of April 1, 2017, approximately 3,865,000 of our common shares remained available for sale to the public under our Offering.
To mitigate the effect of our lack of assets, revenue and operating history, our Manager agreed, for a period until December 31, 2016 (the “fee waiver period”), to waive its asset management fee during the fee waiver period if the average annualized non-compounded return to investors is less than eight percent (8%). Following the conclusion of the fee waiver period, our Manager may, in its sole discretion, waive its asset management fee, in whole or in part. The Manager will forfeit any portion of the asset management fee that is waived. As of April 1, 2017, our Manager has not waived the asset management fee since the end of the fee waiver period. For more information regarding the fee waiver support of our common shares, please see “Description of Our Common Shares – Distributions” in our Offering Circular.
We have operated in a manner intended to qualify as a REIT for federal income tax purposes beginning with the year ended December 31, 2016.
Our Investments
During the year ended December 31, 2016, we entered into the following investments. See “Recent Developments”below for a description of investments we have made since December 31, 2016.
| Investment Type | Date | Description |
| Acquisitions of Controlled Subsidiaries | 11/21/16 | Directly acquired ownership of a “majority-owned subsidiary”, CEAI Sandtown Vista, LLC (the “Sandtown Controlled Subsidiary”), in which we have the right to receive a preferred economic return for a purchase price of $5,000,000, which is the initial stated value of our equity interest in the Sandtown Controlled Subsidiary. The Sandtown Controlled Subsidiary used the proceeds to acquire a stabilized, 350-unit garden-style multi-family property, Sandtown Vista, located at 1475 Sand Bay Drive, Atlanta, GA 30331. The Sandtown Controlled Subsidiary intends to |
| 10 |
| increase the value of the Sandtown Property by completing light renovations and is anticipating redeeming the Sandtown Controlled Subsidiary Investment via refinancing or sale by July 2022. More information on the Sandtown Controlled Subsidiary acquisition can be foundhere. | ||
| 11/30/16 | Directly acquired ownership of a “majority-owned subsidiary”, Enclave at Lake Ellenor JV, LLC (the “RSE REM Controlled Subsidiary”), for an initial purchase price of $7,650,000, which is the initial stated value of our equity interest in the RSE REM Controlled Subsidiary. The RSE REM Controlled Subsidiary used the proceeds to close on the acquisition of a single stabilized garden-style multi-family property totaling 296 units located at 2100 W Oak Ridge Road in Orlando, FL. The RSE REM Investment was funded with $650,000 in proceeds from our Offering and $7 million in proceeds from that certain Promissory Grid Note by and between us and our sponsor. More information on the RSE REM Controlled Subsidiary acquisition can be foundhere. |
Distributions
While we are under no obligation to do so, we have in the past and expect in the future to declare and pay distributions quarterly in arrears; however, our Manager may declare other periodic distributions as circumstances dictate. In order that investors may generally begin receiving distributions immediately upon our acceptance of their subscription, we expect to authorize and declare distributions based on daily record dates.
On January 12, 2017, we paid out our first distribution to shareholders of record as of the close of business on each day of the period commencing on November 1, 2016 and ending on December 31, 2016. Our Manager has declared daily distributions for shareholders of record as of the close of business on each day from November 1, 2016 through June 30, 2017, as shown in the table below:
| Distribution Period | Daily Distribution Amount/Common Share | Date of Declaration | Payment Date (1) | Annualized Yield (2) | ||||||||||
| 11/01/16 – 11/30/16 | 0.0008219178 | 10/26/16 | 1/12/17 | 3.00 | % | |||||||||
| 12/01/16 – 12/31/16 | 0.0013698630 | 11/30/16 | 1/12/17 | 5.00 | % | |||||||||
| 01/01/17 – 03/31/17 | 0.0022602740 | 12/31/16 | 4/21/17 | 8.25 | % | |||||||||
| 04/01/17 – 06/30/17 | 0.0023972603 | 03/21/17 | 7/21/17 | 8.75 | % | |||||||||
| Weighted Average (11/01/16 through 06/30/17) | 0.0020194158 | (3) | 7.37 | % | (4) | |||||||||
(1) Dates presented are the dates on which the distributions were, or are, scheduled to be distributed; actual distribution dates may vary.
(2) Annualized yield numbers represent the annualized yield amount of each distribution calculated on an annualized basis at the then current rate, assuming a $10.00 per share purchase price. While the Manager is under no obligation to do so, each annualized basis return assumes that the Manager would declare distributions in the future similar to the distributions for each period presented, and there can be no assurance that the Manager will declare such distributions in the future or, if declared, that such distributions would be of a similar amount.
(3) Weighted average daily distribution amount per common share is calculated as the average of the daily declared distribution amounts from November 1, 2016 through June 30, 2017.
| 11 |
(4) Weighted average annualized yield is calculated as the annualized yield of the average daily distribution amount for the periods presented, assuming a $10.00 per share purchase price.While the Manager is under no obligation to do so, the average annualized basis return assumes that the Manager would declare distributions in the future similar to the average distributions for the period from November 1, 2016 through June 30, 2017, and there can be no assurance that the Manager will declare such distributions in the future or, if declared, that such distributions would be of a similar amount.
Redemption Plan
We have adopted a redemption plan whereby, on a quarterly basis, a shareholder may obtain liquidity as described in detail in our Offering Circular, which may be accessedhere, Our Manager may in its sole discretion, amend, suspend, or terminate the redemption plan at any time, including to protect our operations and our non-redeemed shareholders, to prevent an undue burden on our liquidity, to preserve our status as a REIT, following any material decrease in our NAV, or for any other reason.
As of December 31, 2016, 15,100 common shares have been submitted for redemption through our redemption plan, and 100% of such redemption requests have been honored.
| 12 |
Sources of Operating Revenues and Cash Flows
We generate revenues from net interest income on our commercial real estate investments, as well as cash flow distributions and equity in earnings from our investments in unconsolidated joint ventures . Our income is primarily derived through the difference between revenue and the cost at which we are able to finance our investments. We may also seek to acquire investments which generate attractive returns without any leverage.
Outlook and Recent Trends
We believe that the near and intermediate-term market for investment in select East Coast commercial real estate properties, joint venture equity investments, and other real estate-related assets is compelling from a risk-return perspective, particularly with regard to multifamily rental units.
For purposes of this Annual Report, when discussing the East Coast, we are primarily referring to the states of Massachusetts, New York, New Jersey, North Carolina, South Carolina, Georgia and Florida, as well as the metropolitan statistical areas (“MSAs”) of Washington, DC and Philadelphia, PA. We favor a strategy weighted toward targeting mezzanine debt and joint venture equity with preferred economic returns that maximize current income, and equity investments with significant potential value creation but below the radar of institutional-sized investors.
We pursue a variety of tactics to search for pricing opportunistic dislocations in the East Coast multifamily market including: (i) acquiring value-add and lease-up properties; (ii) acquiring assets that require repositioning or redevelopment; (iii) investing in ground-up new development projects; and (iv) providing senior debt, mezzanine debt and recapitalization equity capital for existing transactions.
We believe that our investment strategy, combined with both our unique web-based origination platform and the experience and expertise of our Manager’s team, provides opportunities to originate investments with attractive current and accrued returns, long-term equity returns and strong structural features with local, joint venture real estate companies. This strategy expects to take advantage of changing market conditions to achieve favorable risk adjusted returns.
We believe that the East Coast multifamily rental market is benefitting from demographic changes, improved job growth, and strong economic dynamics.
Key statistics, as of December 2015, provided by the Bureau of Labor Statistics are set forth below:
| Key Statistics | Massachusetts | New York | New Jersey | North Carolina | South Carolina | Georgia | Florida | US | ||||||||||||||||||||||||
| Population | 6,794,422 | 19,795,791 | 8,958,013 | 10,042,802 | 4,896,146 | 10,214,860 | 20,271,272 | 318,900,000 | ||||||||||||||||||||||||
| Pop. Growth Since 2000 | 0.5 | % | 0.3 | % | 0.4 | % | 1.7 | % | 1.5 | % | 1.7 | % | 1.8 | % | 0.9 | % | ||||||||||||||||
| Number of Employed | 3,413,500 | 9,083,900 | 3,962,200 | 4,141,900 | 1,948,600 | 4,155,600 | 7,824,500 | 139,023,000 | ||||||||||||||||||||||||
| Unemployment Rate | 5.0 | % | 5.3 | % | 5.6 | % | 5.7 | % | 6.0 | % | 5.9 | % | 5.4 | % | 5.3 | % | ||||||||||||||||
| Job Growth (Y-O-Y) | 2.2 | % | 1.8 | % | 1.3 | % | 2.3 | % | 2.7 | % | 2.3 | % | 2.9 | % | 2.0 | % | ||||||||||||||||
| Three Yr. Avg. Employment Growth | 1.9 | % | 1.7 | % | 1.1 | % | 2.1 | % | 2.5 | % | 2.5 | % | 3.0 | % | 1.9 | % | ||||||||||||||||
| 13 |
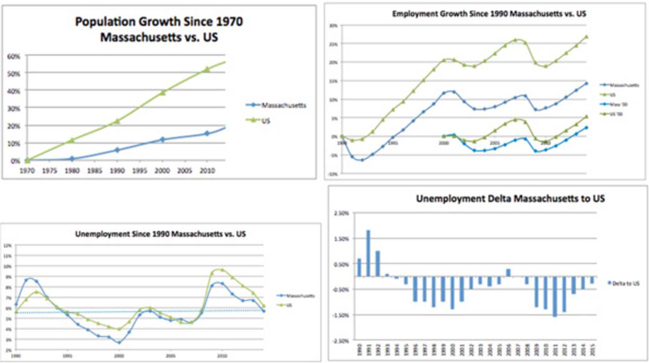
Massachusetts
Massachusetts is a slow growth, low risk, market that has low unemployment and has historically produced steady returns over the long run. As Marcus and Millichap reports in its 2016 Market Forecast, Boston-area tech and professional firms are projected to lead job growth this year, boosting apartment demand in the core and immediately surrounding areas. Tech companies expanding at Kendall Square include Google, which has grown its Cambridge Center campus. Those employed at nearby tech and bioscience firms seek residences close to work and the amenities that areas inside the Route 128 loop offer. While homeownership is an option for some residents, the cost remains out of reach for the majority of those employed in this area, generating additional need for apartments. Developers are responding to tenant demand with new luxury towers that are changing the local landscape in areas such as Cambridge, Fenway, the Seaport District and the South End. Strong demand for new rentals with the latest amenities should support further occupancy gains in core-based units. This absorption of apartments combined with a slowing construction pipeline is expected to result in lower overall vacancy in 2016 compared to 2015, allowing rents in the market to rise. Developers are projected to complete 4,500 new units in 2016, increasing local stock by 1 percent. This is a slowdown from the 7,500 rentals delivered in 2015.
| Nov ‘15 Nonfarm | % of | US % of | US 3 Yr Avg. | ||||||||||||||||||
| Massachusetts Employment Breakdown | Employment | Total | 3 Yr Avg. Increase | Total | Increase | ||||||||||||||||
| Trade, Transportation, and Utilities | $ | 571.8 | 16.2 | % | 0.5 | % | 18.9 | % | 1.8% | ||||||||||||
| Professional and Business Services | 549.1 | 15.5 | % | 3.3 | % | 14.0 | % | 3.3% | |||||||||||||
| Education and Health Services | 772.5 | 21.8 | % | 2.2 | % | 15.5 | % | 2.2% | |||||||||||||
| Government | 475.9 | 13.4 | % | 1.6 | % | 15. 3 | % | 0.1% | |||||||||||||
| Leisure and Hospitality | 342.8 | 9.7 | % | 2.7 | % | 10.8 | % | 3.4% | |||||||||||||
| Financial Activities | 212 | 6.0 | % | 0.8 | % | 5.7 | % | l.5% | |||||||||||||
| Manufacturing | 249:9 | 7.1 | % | -0 3 | % | 8.7 | % | 1.0% | |||||||||||||
| Other Services | 135.9 | 3.8 | % | 3.6 | % | 3.9 | % | 1.2% | |||||||||||||
| Information | 87.4 | 2.5 | % | 0.1 | % | 2.0 | % | 1.3% | |||||||||||||
| Mining, Logging and Construction | 142.4 | 4.0 | % | 6.0 | % | 5.2 | % | 3.4% | |||||||||||||
| Total Nonfarm | 3,540 | 1.9 | % | 1.9% | |||||||||||||||||
Numbers reported in 1,000’s
Source: BLS (not seasonally adjusted)
Source: BLS
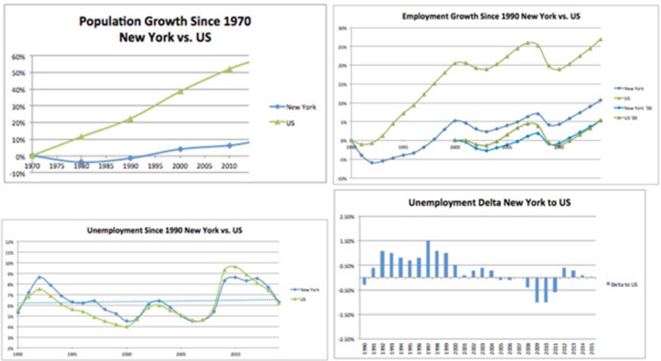
New York
| 14 |
With just over 9 million people, New York is a large state that is primarily driven by the 8.4 million people that live in New York City. Growth has lagged the US as a whole since 1970, but, as the below employment graph shows, employment growth has roughly matched the US as a whole since 2000. As Marcus and Millichap reports in its 2016 Market Forecast, New York City is providing investors with exciting opportunities as job creation at Google, Facebook and other large corporate employers continues to add new workers to the metro, fostering demand for rentals. The high cost of apartments, coupled with the income levels required for mortgages that are more than double the average salary, promote a vigorous multifamily market with vacancy levels near the lowest ever recorded. Developers have responded, and planned completions in 2016 are up dramatically from 2015 levels. Following the creation of 70,000 positions in 2015, New York city organizations are expected to add 80,000 staffers this year, a 1.9 percent growth rate led by professional and health services. With effective rents set to record a fifth straight year of growth, the market is expected to remain one of the brightest in the nation this year.
| Nov '15 Nonfarm | % of | US % of | US 3 Yr Avg. | ||||||||||||||||||
| New York Employment Breakdown | Employment | Total | 3 Yr Avg. Increase | Total | Increase | ||||||||||||||||
| Trade, Transportation, and Utilities | 1607.9 | 17.1 | % | 1.2 | % | 18.9 | % | 1.8 | % | ||||||||||||
| Professional and Business Services | 1272.9 | 13.5 | % | 2.4 | % | 14.0 | % | 3.3 | % | ||||||||||||
| Education and Health Services | 1982 | 21.1 | % | 3.0 | % | 15.5 | % | 2.2 | % | ||||||||||||
| Government | 1455.8 | 15.5 | % | -0.6 | % | 15.3 | % | 0.1 | % | ||||||||||||
| Leisure and Hospitality | 880.5 | 9.4 | % | 3.4 | % | 10.8 | % | 3.4 | % | ||||||||||||
| Financial Activities | 697.9 | 7.4 | % | 0.8 | % | 5.7 | % | 1.5 | % | ||||||||||||
| Manufacturing | 451.3 | 4.8 | % | -0 6 | % | 8.7 | % | 1.0 | % | ||||||||||||
| Other Services | 406.1 | 4.3 | % | 1.9 | % | 3.9 | % | 1.2 | % | ||||||||||||
| Information | 267 | 2.8 | % | 0.8 | % | 2.0 | % | 1.3 | % | ||||||||||||
| Mining, Logging and Construction | 384.9 | 4.1 | % | 5.7 | % | 5.2 | % | 3.4 | % | ||||||||||||
| Total Nonfarm | 9,406 | 1.7 | % | 1.9 | % | ||||||||||||||||
Numbers reported in 1,000’s
Source: BLS (not seasonally adjusted)
Source: BLS
New Jersey
New Jersey is the most densely populated state in the US, yet lacks a major central city. Its economy is cyclical, and although we expect to see opportunities within New Jersey, they will likely be either near New York
| 15 |
City or Philadelphia. Over the past three years the state has seen the steadiest growth in the Construction sector, which is a less reliable driver of growth as a result of its temporary demand. As Marcus and Millichap reports in its 2016 Northern New Jersey Market Forecast, an accelerating New York City economy is spilling over the Hudson, providing more affordable residential choices in Northern New Jersey. As more firms locate into Manhattan in order to expand their footprint, newly hired workers are picking up rentals in less expensive New Jersey locales such as Jersey City and Newark, where rents can be $2,000 per month below the New York equivalent. Development reached a cycle high in 2015 as builders focused on luxury towers along the waterfronts in Hudson County. The pace of completions is expected to slow this year, mostly a result of the timing of projects rather than a lack of sufficient demand. Activity is projected to remain concentrated along major transportation routes, providing quick commutes for prospective tenants. Overall, flourishing demand is expected to allow a mid-single-digit rise in effective rents this year, more than doubling the pace of inflation. In Northern New Jersey the dip in construction is anticipated to allow demand to catch up, trimming vacancy 20 basis points to 2.5%.
| Nov ‘15 Nonfarm | % of | US % of | US 3 Yr Avg. | |||||||||||||||||
| New Jersey Employment Breakdown | Employment | Total | 3 Yr Avg. Increase | Total | Increase | |||||||||||||||
| Trade, Transportation, and Utilities | 869.7 | 21.4 | % | 1.1 | % | 18.9 | % | 1.8 | % | |||||||||||
| Professional and Business Services | 639 7 | 15.7 | % | 0.8 | % | 14.0 | % | 3.3 | % | |||||||||||
| Education and Health Services | 659.1 | 16.2 | % | 1.8 | % | 15.5 | % | 2.2 | % | |||||||||||
| Government | 637.7 | 15.7 | % | 0.1 | % | 15.3 | % | 0.1 | % | |||||||||||
| Leisure and Hospitality | 354.9 | 8.7 | % | 2.1 | % | 10.8 | % | 3.4 | % | |||||||||||
| Financial Activities | 249 | 6.1 | % | -0.5 | % | 5.7 | % | 1.5 | % | |||||||||||
| Manufacturing | 247.6 | 6.1 | % | 0.1 | % | 8.7 | % | 1.0 | % | |||||||||||
| Other Services | 172.3 | 4.2 | % | 1.4 | % | 3.9 | % | 1.2 | % | |||||||||||
| Information | 75.3 | 1.9 | % | -0.5 | % | 2.0 | % | 1.3 | % | |||||||||||
| Mining, Logging and Construction | 161.6 | 4.0 | % | 5.5 | % | 5.2 | % | 3.4 | % | |||||||||||
| Total Nonfarm | 4,067 | 1.1 | % | 1.9 | % | |||||||||||||||
Numbers reported in 1,000’s
Source: BLS (not seasonally adjusted)

Source: BLS
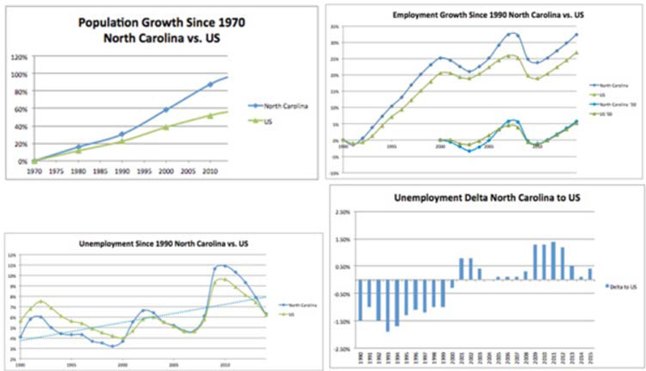
North Carolina
| 16 |
North Carolina is a high-growth market whose metrics look even stronger when considering only the major cities within the state. Employment growth is focused in high wage sectors, and its low cost of living has created an attractive place for people to move. As Marcus and Millichap reports in its 2016 Charlotte Market Forecast, a second consecutive year of robust job growth is expected to trigger new household formations in Charlotte and maintain a flow of residents into local apartment complexes. In response to surging demand, apartment developers continue to bring new complexes to the market. Overall, the market remains in the midst of a building boom that follows a brief respite in development in 2011 and 2012. A significant number of new units are projected to come online in the final months of 2016 and may not be sufficiently leased, however, to avert a slight uptick in the market wide vacancy rate at the end of the year. Higher yields than offered in other East Coast metros is expected to lead more apartment investors to Charlotte in 2016.
The Research Triangle, anchored by North Carolina State University, Duke University, University of North Carolina at Chapel Hill, and the cities of Raleigh and Durham, are comprised of approximately 2 million people and is expected to provide strong real estate opportunities because of demand growth, low construction costs and low cost of living.
| Nov’15 Nonfarm | % of | US % of | US 3 Yr Avg. | |||||||||||||||||
| North Carolina Employment Breakdown | Employment | Total | 3 Yr Avg. Increase | Total | Increase | |||||||||||||||
| Trade, Transportation, and Utilities | 810.6 | 18.8 | % | 2.1 | % | 18.9 | % | 1.8 | % | |||||||||||
| Professional and Business Services | 609.4 | 14.1 | % | 3.8 | % | 14.0 | % | 3.3 | % | |||||||||||
| Education and Health Services | 596 | 13.8 | % | 2.2 | % | 15.5 | % | 2.2 | % | |||||||||||
| Government | 736.8 | 17.0 | % | 0.2 | % | 15.3 | % | 0.1 | % | |||||||||||
| Leisure and Hospitality | 454.6 | 10.5 | % | 3.1 | % | 10.8 | % | 3.4 | % | |||||||||||
| Financial Activities | 221.7 | 5.1 | % | 3.2 | % | 5.7 | % | 1.5 | % | |||||||||||
| Manufacturing | 463 | 10.7 | % | 1.2 | % | 8.7 | % | 1.0 | % | |||||||||||
| Other Services | 157.2 | 3.6 | % | 2.7 | % | 3.9 | % | 1.2 | % | |||||||||||
| Information | 75.5 | 1.7 | % | 2.6 | % | 2.0 | % | 1.3 | % | |||||||||||
| Mining, Logging and Construction | 197.4 | 4.6 | % | 2.5 | % | 5.2 | % | 3.4 | % | |||||||||||
| Total Nonfarm | 4,322 | 2.1 | % | 1.9 | % | |||||||||||||||
Numbers reported in 1,000’s
Source: BLS (not seasonally adjusted)
Source: BLS
| 17 |
South Carolina
Beginning in 2013 South Carolina has seen 3 year average employment growth significantly higher than the US as a whole, which has been led by the high paying Professional and Business Services sector, which leads to positive real estate fundamentals. Although the unemployment rate has traditionally been above the US as a whole, it has fallen dramatically recently. As Colliers International reports in its Q4 2015 Multifamily Research and Forecast Report, Charleston, South Carolina’s multifamily market continues to strengthen and grow with record-high construction levels, increasing occupancy, and rising rental rates. Significant job creation and growing millennial and retiree populations are driving multifamily development. Demand for multifamily units is expected to continue through 2016 and beyond. The region’s growing tech industry and tourism industry is anticipated to attract millennials and retirees to the area. New development activity is expected to surge in the downtown, Summerville and Mount Pleasant submarkets in response to recent job announcements and projected strong future demand for rental units. Investment sales are projected to remain strong given tight market conditions, robust job creation, and low interest rates.
| Nov ‘15 Nonfarm | % of | US % of | US 3 Yr Avg. | |||||||||||||||||
| South Carolina Employment Breakdown | Employment | Total | 3 Yr Avg. Increase | Total | Increase | |||||||||||||||
| Trade, Transportation, and Utilities | 392.4 | 19.3 | % | 2.7 | % | 18.9 | % | 1.8 | % | |||||||||||
| Professional and Business Services | 276.9 | 13.6 | % | 4.7 | % | 14.0 | % | 3.3 | % | |||||||||||
| Education and Health Services | 241 | 11.8 | % | 3.4 | % | 15.5 | % | 2.2 | % | |||||||||||
| Government | 368.2 | 18.1 | % | 0.8 | % | 15.3 | % | 0.1 | % | |||||||||||
| Leisure and Hospitality | 237.2 | 11.7 | % | 3.4 | % | 10.8 | % | 3.4 | % | |||||||||||
| Financial Activities | 94.5 | 4.6 | % | 0.1 | % | 5.7 | % | 1.5 | % | |||||||||||
| Manufacturing | 231.5 | 11.4 | % | 1.3 | % | 8.7 | % | 1.0 | % | |||||||||||
| Other Services | 73.5 | 3.6 | % | 1.7 | % | 3.9 | % | 1.2 | % | |||||||||||
| Information | 26.5 | 1.3 | % | 0.0 | % | 2.0 | % | 1.3 | % | |||||||||||
| Mining, Logging and Construction | 92.9 | 4.6 | % | 4.5 | % | 5.2 | % | 3.4 | % | |||||||||||
| Total Nonfarm | 2,035 | 2.5 | % | 1.9 | % | |||||||||||||||
Numbers reported in 1,000’s
Source: BLS (not seasonally adjusted)

Source: BLS
Georgia
| 18 |
Atlanta is the financial hub of the south, and growth in the high paying Professional and Business Services sector has driven 3 year average employment growth in Georgia to levels significantly higher than the US as a whole. As Marcus and Millichap reports in its 2016 Atlanta Market Forecast, the Atlanta economy is expected to strengthen this year as corporations look to the metro as a premier market for expansion and relocation. An inflow of investor capital has supported broad-based development, with multiple billion-dollar projects currently underway. In addition to these large developments, corporate growth last year helped push the unemployment rate down to a post-recession low. Continued high-quality job opportunities are projected to put upward pressure on the pace of household formation, drawing highly skilled workers and young professionals to the metro. Developers have moved to capitalize on this strong demand and are expected to deliver a 13-year high in new units. Despite elevated levels of construction, the metro wide vacancy rate is expected to tighten to its lowest rate posted since late 2006.
| Nov ‘15 Nonfarm | % of | US % of | US 3 Yr Avg. | |||||||||||||||||
| Georgia Employment Breakdown | Employment | Total | 3 Yr Avg. Increase | Total | Increase | |||||||||||||||
| Trade, Transportation, and Utilities | 926.5 | 21.3 | % | 2.5 | % | 18.9 | % | 1.8 | % | |||||||||||
| Professional and Business Services | 659 | 15.2 | % | 4.8 | % | 14.0 | % | 3.3 | % | |||||||||||
| Education and Health Services | 550.8 | 12.7 | % | 3.0 | % | 15.5 | % | 2.2 | % | |||||||||||
| Government | 702.7 | 16.2 | % | 0.3 | % | 15.3 | % | 0.1 | % | |||||||||||
| Leisure and Hospitality | 454.9 | 10.5 | % | 4.4 | % | 10.8 | % | 3.4 | % | |||||||||||
| Financial Activities | 240.6 | 5.5 | % | 1.6 | % | 5.7 | % | 1.5 | % | |||||||||||
| Manufacturing | 377.3 | 8.7 | % | 1.8 | % | 8.7 | % | 1.0 | % | |||||||||||
| Other Services | 155.3 | 3.6 | % | 0.0 | % | 3.9 | % | 1.2 | % | |||||||||||
| Information | 107.4 | 2.5 | % | 1.6 | % | 2.0 | % | 1.3 | % | |||||||||||
| Mining, Logging and Construction | 173.7 | 4.0 | % | 4.5 | % | 5.2 | % | 3.4 | % | |||||||||||
| Total Nonfarm | 4,348 | 2.5 | % | 1.9 | % | |||||||||||||||
Numbers reported in 1,000’s
Source: BLS (not seasonally adjusted)

Source: BLS
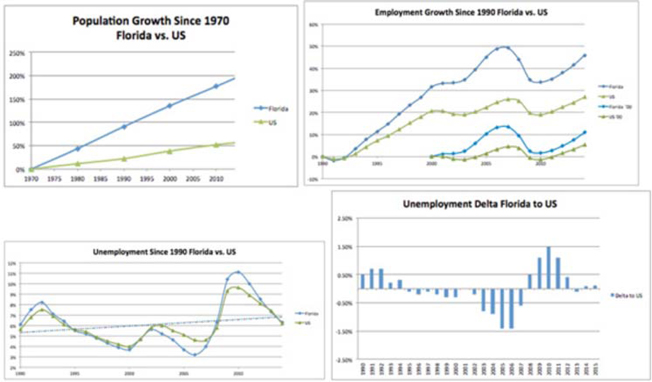
Florida
Florida has seen extremely strong fundamentals, with population and employment growth well outpacing the US as a whole. Although there is high and extremely steady population growth, largely due to retirees,
| 19 |
employment growth has been more cyclical in Florida than the rest of the country. Since 1970 employment growth has been higher than the US as a whole, but it has lost more jobs and recovered more than the US as a whole. As Marcus and Millichap reports in its 2016 Florida Market Forecasts, vacancy in Miami-Dade is projected to edge upward to a still-tight level in 2016 as employers maintain an elevated pace of hiring and developers wrap up projects and deliver thousands of new rentals. Continued growth in service-sector employment, the ongoing flow of new residents into Miami-Dade County and waning affordability of single-family homes in preferred neighborhoods would likely sustain a sizable renter population in the county.
The Jacksonville apartment market would be expected to tighten as rents rise, supported by a growing local economy that is generating new housing demand. Job creation over the past few years has pushed employment above the pre-recession peak and hiring is occurring in nearly every sector. As a result, apartment demand has grown, constricting vacancy by 600 basis points in the last five years. As companies fill new positions and bring residents to the market, apartment vacancy would be expected to retreat for the fifth consecutive year and rent growth should remain well above the previous five-year average.
Thousands of additional residents are expected to find jobs and form new rental households in Broward County (Fort Lauderdale) in 2016, keeping vacancy near 2015’s post-recession low and catapulting the average rent to a new high. Besides job growth’s principal role in expanding the pool of prospective renters, several other factors are aligned to maintain tight conditions in the apartment sector. Although some risk of overbuilding at the luxury end of the market is present, it has yet to materialize in the form of higher vacancy in new-vintage rentals.
In Orlando, completions are expected to slightly exceed tenant move-ins during 2016, pushing up the vacancy rate in Orlando from its lowest reading in 10 years. Several consecutive years of job growth, and additional hiring this year, are pumping new households into the renter pool. The spread of high-end complexes throughout the market has raised renters’ expectations, making many residents willing to pay up for modern features and enhanced curb appeal at new complexes and successfully repositioned older assets.
| Nov ‘15 Nonfarm | % of | US % of | US 3 Yr Avg. | |||||||||||||||||||
| Florida Employment Breakdown | Employment | Total | 3 Yr Avg. Increase | Total | Increase | |||||||||||||||||
| Trade, Transportation, and Utilities | 1716.4 | 20.8 | % | 2.8 | % | 18.9 | % | 1.8 | % | |||||||||||||
| Professional and Business Services | 1245.9 | 15.1 | % | 4.3 | % | 14.0 | % | 3.3 | % | |||||||||||||
| Education and Health Services | 1235.9 | 15.0 | % | 2.9 | % | 15.5 | % | 2.2 | % | |||||||||||||
| Government | 1094.5 | 13.3 | % | -0.3 | % | 15.3 | % | 0.1 | % | |||||||||||||
| Leisure and Hospitality | 1141.4 | 13.8 | % | 4.3 | % | 10.8 | % | 3.4 | % | |||||||||||||
| Financial Activities | 546 | 6.6 | % | 2.4 | % | 5.7 | % | l.5 | % | |||||||||||||
| Manufacturing | 339.7 | 4.1 | % | 2.1 | % | 8.7 | % | 1.0 | % | |||||||||||||
| Other Services | 342.9 | 4.2 | % | 3.9 | % | 3.9 | % | 1.2 | % | |||||||||||||
| Information | 135.1 | 1.6 | % | 0.2 | % | 2.0 | % | 1.3 | % | |||||||||||||
| Mining, Logging and Construction | 445.7 | 5.4 | % | 7.9 | % | 5.2 | % | 3.4 | % | |||||||||||||
| Total Nonfarm | 8,244 | 3.0 | % | 1.9 | % | |||||||||||||||||
Numbers reported in 1,000’s
Source: BLS (not seasonally adjusted)
| 20 |
Source: BLS
Washington, D.C. MSA
We define the Washington, DC MSA as the metropolitan area encompassing Washington, DC and its suburbs in Northern Virginia and Western Maryland. We believe that the Washington, DC MSA provides for a strong investment environment as a result of the following factors:
The Washington, DC MSA has been one of the most stable job markets in the country, showing consistently lower unemployment figures relative to the national average over the past 16 years.
The Washington, DC area unemployment has generally outperformed the national economy. According to the Bureau of Labor Statistics, as of June 2015, the national unemployment rate was 5.3%, while the Washington DC MSA (which is labeled “PMSA” in the chart below) had an unemployment rate was 4.8%.
| 21 |

Average household income in the Washington, DC MSA is materially higher than the national median.
According to Delta Associates, a leading real estate research firm, the average income in the Washington, DC MSA is $120,456, which is 61% higher than the U.S. average.
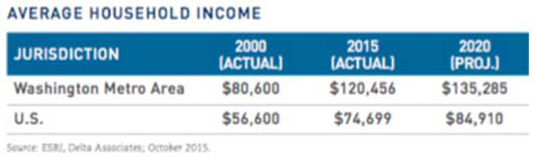
Delta Associates concluded in their Q3 2015 retail report that “[t]he average household income in the Washington metro area grew by 49% from 2000 to 2015, compared to just 32% nationally, and it currently exceeds the national average by 61%. By 2020, the Washington metro area’s average household income is projected to rise another 12%, compared to an increase of 14% nationally. The elevated household incomes in the Washington area yield greater discretionary spending and support demand for retail goods and space.”
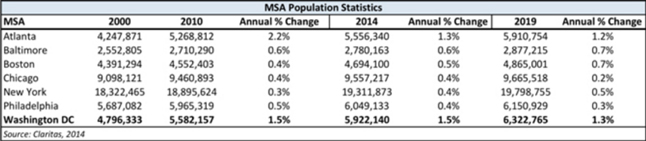
The Washington, DC Metropolitan Statistical Area (MSA) area has shown consistent demographic growth over the past decade and a half.
The Washington, DC MSA has shown steady population growth of 1.5% annually over the past 14 years with the strongest population growth occurring during the recent economic recession. According to Claritas, a demographic research firm, the population growth during this period was significantly higher than all of the competitive metropolitan areas (by relative distance and size to Washington, DC) with the exception of Atlanta. In a
| 22 |
period between 2009 and 2011, the population grew by 2.0% year over year, the strongest growth period over the last 10 years.
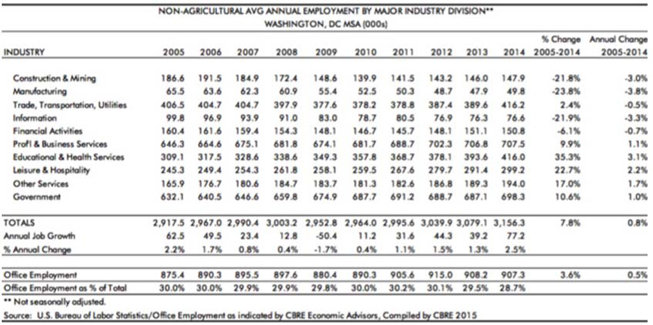
Federal, state, and local governments are major drivers of the jobs market in the Washington, DC MSA.
According to data provided by Claritas, Federal, state and local governments support a disproportionately larger share of the overall job market in the Washington, DC MSA. These sectors account for approximately 22% of local employment, above the national average of approximately 15%.
The dominant employment sectors in the Washington, DC MSA are government and services, which represent 79% of the region’s employment. Furthermore, many thousands of private sector jobs are either affiliated with, or dependent upon, the government, including government contractors to various federal agencies, law firms and lobbyists.
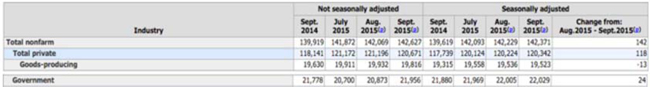
While the federal government continues to add to the region’s stable job market, small pullbacks in Federal employment between 2011 and 2013 have not measurably affected job growth in the Washington, DC MSA.
According to data provided by the U.S. Bureau of Labor Statistics/Office Employment, the Washington, DC MSA added 54,900 jobs in the 12-month period ending in June 2015 after adding 68,500 jobs in the 12-month period ending in June 2014. The June 12-month total represented the region’s highest figure since 2005.
| 23 |
The Washington, DC MSA is the country’s best-educated workforce.
As of the 2014, 49 percent of the greater Washington, DC MSA’s population have a bachelor’s degree or higher, according to a research report conducted by the Brookings Institute utilizing data provided by the U.S. Census Bureau. This is the highest of all major metropolitan areas and substantially higher than the national average, which is 31.2 percent. In 2014, the region employed 3.4 times the average U.S. share of legal professionals, 2.7 times the average share of computer and math workers, 2.2 times the average share of scientists and researchers, and 2 times the average share of business and financial professionals.

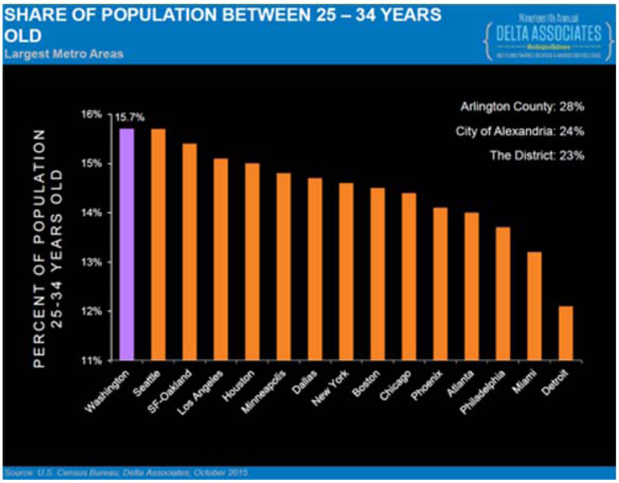
The Washington, DC MSA ranks at the top of the largest metro areas in terms of the share of its population that is between 25 and 34 years old.
| 24 |
According to a Washington Trendlines Market Research Report released by Delta Associates and Transwestern, “The [Washington, DC MSA] leads the nation in net in-migration of Millennials and remains the U.S. leader in the share of a region’s population with college degrees. These traits help to attract companies that are seeking to replace retiring Baby Boomers with young, well-educated additions to the work force.”
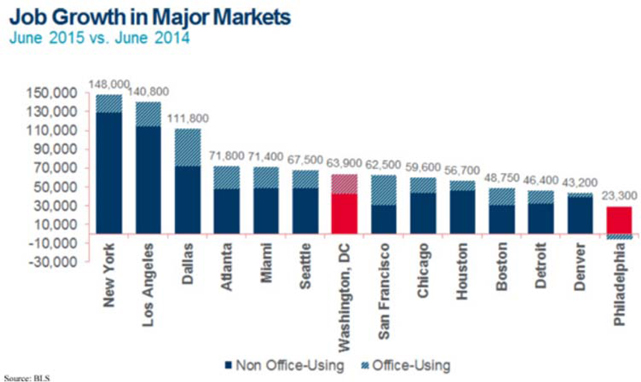
The Washington, DC MSA and Philadelphia MSA job markets have each been improving.
The Washington, DC MSA enjoys a large employment base with strong historic job growth with more than 37,000 jobs created annually over the last 19 years. The Washington, DC MSA hosts the headquarters of 15 2015 Fortune 500 companies, including Fannie Mae, Freddie Mac, Lockheed Martin, Northrop Grumman, General Dynamics, Capital One, and Booz Allen Hamilton. The nation’s 5th largest job market (3.1M payroll workers), the Washington, DC MSA enjoys a low unemployment rate of 4.3%, well below the national average of 5.4% (Delta Associates, Q2 2015). According to Delta Associates and the U.S. Census Bureau, in the twelve months ending April 2015, payroll employment in the Washington, DC MSA increased by 65,500 positions.
According to the federal Bureau of Labor Statistics, Philadelphia gained about 8,800 jobs in 2014, bringing total employment in the city to the highest level in more than a decade. Unemployment fell in 2014 to an annualized rate of 7.8 percent, the lowest since before the 2008 recession, and was trending even lower by the end of the year. But it remained substantially higher than the national rate of 6.2 percent. The education and medical sectors remained the bulwark of the city’s economy, accounting for more than 30 percent of all jobs. Of the 15 largest private employers in Philadelphia, 12 come from the fields of education and health care, and 11 are nonprofit organizations. The largest employers in Philadelphia are the federal and city governments, respectively. As shown in the chart below, job growth continued on a positive trajectory adding approximately 23,300 jobs by June 2015.
| 25 |
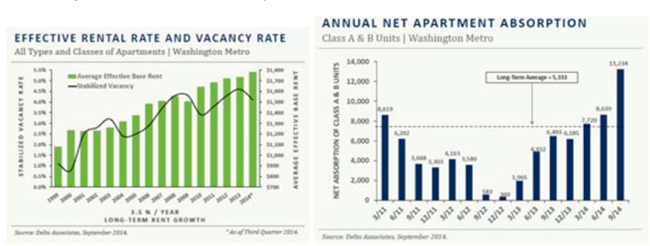
With strong job growth and record absorption, market dynamics in the Mid-Atlantic, driven by the Washington, DC MSA, reveal a favorable multifamily investment market.
The Washington DC MSA’s Class A apartment absorption was 10,663 units for the 12-month period ending September 2014, which represented a 77% increase over the 10-year average. This record-setting absorption also helped drive the strength in the Class B market. The major contributing absorption factors are apartment supply that is no longer constrained and an increase in jobs and household formations that tend to rent rather than own.
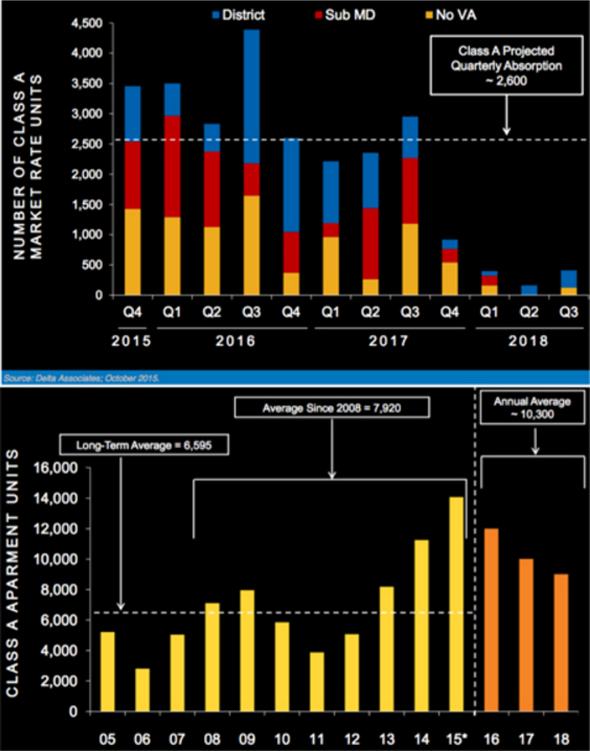
Absorption of Class A units in the Washington, DC MSA for the three-year period ended 2018 is projected by Delta Associates to be 10,300 units per year, which is significantly higher than the region’s long-term average of 6,595 units per year. This projection is predicated upon the de-nesting and un-coupling of potential renters currently living with parents or roommates, along with improved job growth and reduced uncertainty in the region over the intermediate term. As job growth continues in the Washington, DC MSA and household formation rises, this demographic is expected to enter the rental market continuing to drive demand for Class A apartments.
| 26 |
Philadelphia, in particular the City Center of Philadelphia, has seen a significant revival in population compared to the previous 60 years.
For the first time in 60 years, the 2010 Census recorded that Philadelphia’s population had grown, netting 8,456 new residents between 2000 and 2010. Since that time, downtown population growth has accelerated. According to Claritas, Philadelphia's population is projected to increase at a 0.5% annual rate from 2014 to 2019, equivalent to the addition of an average of 7,338 residents per year. Philadelphia's growth rate is expected to exceed that of Pennsylvania, which is projected to be 0.2%.
| 27 |
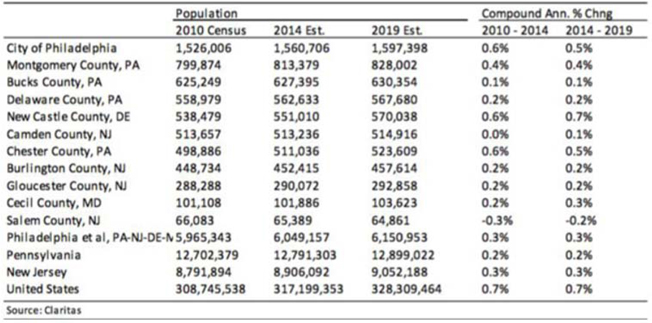
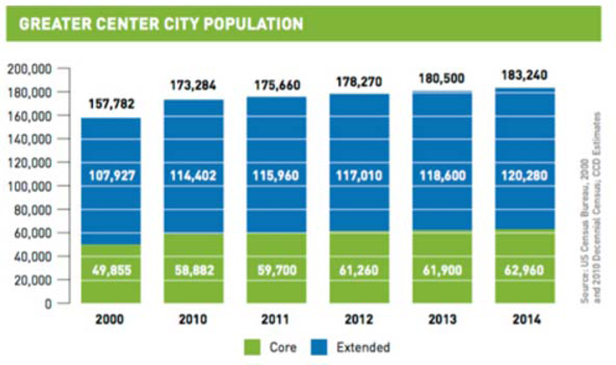
In addition to the recent growth of Philadelphia, the Center City area of Philadelphia has experienced some of the more significant population growth of any major Downtown City District.
According to the U.S. Census Bureau, since 2000, the population of Center City grew by 16% to 183,240 residents. According to the Center City District and Central Philadelphia Development Corporation, “Greater Center City now ranks second only to Midtown Manhattan in size of population among U.S. downtowns.”
The Philadelphia Economy is expected to continue to be positively affected by very strong job market in Center City. Within Center City, the Education and Medical industry drives job growth. These industries are
| 28 |
poised for future growth, making City Center the largest concentrated center of employment in the State of Pennsylvania.
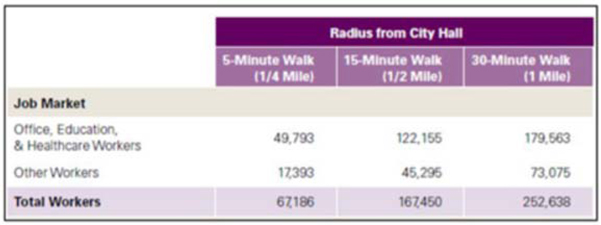
Center City Philadelphia is a major economic driver for the region. The primary employers in Center City include: finance, insurance, real estate, engineering and legal services. The following data was obtained from the Center City District and reflects a breakdown of workers within 1⁄4 mile, 1⁄2 mile and 1 mile radius from City Hall.
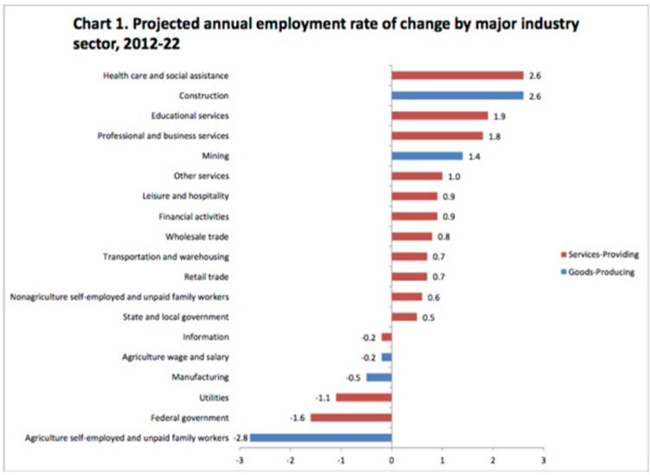
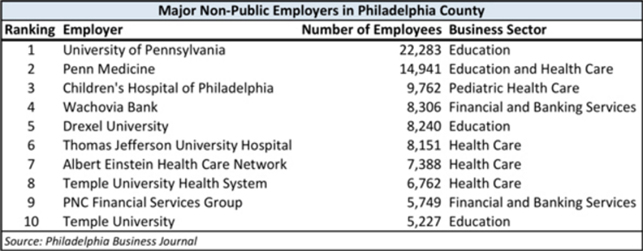
According to the chart below, using information provided by the Philadelphia Business Journal, the major non-public employers include a majority of Education, Health Care and Financial companies. These sectors are poised for future growth. According to the US Census Bureau, these sectors are within the top four categories for projected annual employment growth. See chart below, which was obtained from Census.gov:
| 29 |
In addition to future job growth in these sectors, the local government has enacted favorable tax treatment to retain these employment sectors. According to a 2014 employment study conducted by the Center City District & Central Philadelphia Development Corporation, favorable tax treatment cements the presence of these industries in Philadelphia:
“Healthcare and education are mature industries and stable employers, anchored by the fixed assets of tax-exempt real estate, classrooms, dormitories, medical and research equipment, and technology. Most are exempt as well from business taxes.”
| 30 |
Highly regarded education centers and their large student populations located within Philadelphia should continue to serve as a catalyst for future growth.
According to information provided by the Center City District, there are approximately 116,185 students in and adjacent to Center City (see chart below). According to a 2014 Campus Philly survey, 51% of non-natives who arrive in the city for higher education choose to remain in the Philadelphia region after graduation. These graduates who choose to stay in Philadelphia are expected to continue to add to future housing demand.

Current demographic trends are putting upward pressure on demand for multifamily units.
We believe that student debt will be a driving factor in pushing Millennials to rent rather than own. Research by Delta Associates reveals that average student loan balances for 25-year-olds has nearly doubled over the past decade. According to a study published by Delta Associates, Washington, DC, leads the nation in the net immigration of Millennials and percentage of residents with a college degree. We expect that this large and widely shared debt burden will delay saving for a down payment and likely lengthen the tenure of renters in this generation.
| 31 |

With demand stoked by demographic trends and supply constrained by economic forces, Mid-Atlantic multifamily rental units have displayed strong performance and are expected to be well positioned to see continued low vacancies and healthy rent growth moving forward. Additionally, the urban revival of many of the cities in the Mid-Atlantic, such as Washington, DC and Philadelphia, has created amenities and an urban lifestyle that appeal to recent college graduates.
General Market Considerations
For more information regarding general market considerations, please see “Investment Objectives and Strategy – Market Overview and Opportunity” in our Offering Circularhere.
| 32 |
Our Strategy
We may employ leverage to enhance total returns to our shareholders through a combination of senior financing on our real estate acquisitions, secured facilities, and capital markets financing transactions. Our target portfolio-wide leverage after we have acquired an initial substantial portfolio of diversified investments is between 50-85% of the greater of cost (before deducting depreciation or other non-cash reserves) or fair market value of our assets. As we acquire our initial portfolio, we employ greater leverage on individual assets (that will also result in greater leverage of the interim portfolio) in order to quickly build a diversified portfolio of multifamily rental properties and development project assets. We seek to secure conservatively structured leverage that is long-term, non-recourse, non-market-to-market financing to the extent obtainable on a cost effective basis. To the extent a higher level of leverage is employed it may come either in the form of government-sponsored programs or other long-term, non-recourse, non-market-to-market financing. Our Manager may from time to time modify our leverage policy in its discretion. However, other than during our initial period of operations, it is our policy to not borrow more than 85% of the greater of cost (before deducting depreciation or other non-cash reserves) or fair market value of our assets. We cannot exceed the leverage limit of our leverage policy unless any excess in borrowing over such level is approved by our Manager’s investment committee.
In executing on our business strategy, we believe that we benefit from our Manager’s affiliation with our sponsor given our sponsor’s strong track record and extensive experience and capabilities as an online real estate origination and funding platform. These competitive advantages include:
| · | our sponsor’s experience and reputation as a leading real estate investment manager, which historically has given it access to a large investment pipeline similar to our targeted assets and the key market data we use to underwrite and portfolio manage assets; |
| · | our sponsor’s direct and online origination capabilities, which are amplified by a proprietary crowdfunding technology platform, business process automation, and a large user base, of which a significant portion are seeking capital for real estate projects; |
| · | our sponsor’s relationships with financial institutions and other lenders that originate and distribute commercial real estate debt and other real estate-related products and that finance the types of assets we intend to acquire and originate; |
| · | our sponsor’s experienced portfolio management team which actively monitors each investment through an established regime of analysis, credit review and protocol; and |
| · | our sponsor’s management team, which has a successful track record of making commercial real estate investments in a variety of market conditions. |
| 33 |
Critical Accounting Policies
Our accounting policies have been established to conform with U.S. Generally Accepted Accounting Principles (“GAAP”). The preparation of financial statements in conformity with GAAP requires us to use judgment in the application of accounting policies, including making estimates and assumptions. These judgments affect the reported amounts of assets and liabilities and disclosure of contingent assets and liabilities at the dates of the financial statements and the reported amounts of revenue and expenses during the reporting periods. Management believes that we have made these estimates and assumptions in an appropriate manner and in a way that accurately reflects our financial condition. We continually test and evaluate these estimates and assumptions using our historical knowledge of the business, as well as other factors, to ensure that they are reasonable for reporting purposes. However, actual results may differ from these estimates and assumptions. If our judgment or interpretation of the facts and circumstances relating to various transactions had been different, it is possible that different accounting policies would have been applied, thus resulting in a different presentation of the financial statements.
We believe the following critical accounting policies govern the significant judgments and estimates used in the preparation of our financial statements. Please refer to Note 2 —Significant Accounting Policies, included in the financial statements contained in this reportbelow, for a more thorough discussion of our accounting policies and procedures. We consider our critical accounting policies to be the following:
Commercial Real Estate Debt Investments
Our commercial real estate debt investments are generally classified as held to maturity as we have both the intent and ability to hold these investments to maturity and, accordingly, are carried at cost, net of unamortized loan fees, premium, discount and unfunded commitments. We review our real estate debt investments on a quarterly basis, or more frequently when such an evaluation is warranted, to determine if an impairment exists. A real estate debt investment is impaired when, based on current information and events (including economic, industry and geographical factors), it is probable that we will be unable to collect all amounts due, both principal and interest, according to the contractual terms of the agreement. Commercial real estate debt investments that are deemed to be impaired are carried at amortized cost less a loan loss reserve, if deemed appropriate, which approximates fair value.
We have certain investments that are legally structured as equity investments with rights to receive preferred economic returns (seeInvestments in Unconsolidated Joint Venturesdiscussed above). We report these investments as real estate debt securities when the common equity holders have a contractual obligation to redeem our preferred equity interest at a specified date.
We have invested in one real estate debt investment as of December 31, 2016. SeeNote 2, Summary of Significant Accounting Policies,Real Estate Debt Investmentsin our financial statements for further detail. The following table describes our real estate debt investment activity as of December 31, 2016 (amounts in thousands):
| Investments in Real Estate Debt: | For the Year December 31, | For the Period December 31, | ||||||
| Beginning balance | $ | — | — | |||||
| Investments(1) | 5,000 | — | ||||||
| Principal repayments | — | — | ||||||
| Amortization of deferred fees, costs, and discounts/premiums | — | — | ||||||
| Ending balance | $ | 5,000 | — | |||||
(1) Investments include one preferred equity investment
| 34 |
Principles of Consolidation
Certain of our investments are considered “majority-owned subsidiaries” within the meaning of the Investment Company Act of 1940. Our ownership interest in an investee referred to as such does not necessarily exceed 50% of the capital of the investee, and the definition under the Investment Company Act differs from the considerations provided by GAAP for whether an investee should be consolidated. We analyze our investments to determine whether they should be consolidated using the voting interest and variable interest models provided by generally accepted accounting principles. See Note 2, Summary of Significant Accounting Policies,Principles of Consolidationin our financial statements for further detail.
Certain of our investments are considered to be “majority-owned subsidiaries” within the meaning of the Investment Company Act of 1940. This definition differs from the GAAP definition of the primary beneficiary of a variable interest entity.
As of December 31, 2016 and December 31, 2015, the Company does not consolidate any separate legal entities in which we own equity interests. We generally consolidate variable interest entities (“VIE”) where the Company is the primary beneficiary of a VIE in which we have a variable interest and voting interest entities where the Company is the majority owner or otherwise controls the voting interest entity.
As of December 31, 2016 and December 31, 2015, the Company did not hold any investments in entities which are considered to be variable interest entities based on the determination that we have substantive participating rights in all of the limited partnerships or similar legal entities which may have otherwise been considered variable interest entities.
Investments in Equity Method Investees
Non-controlling, unconsolidated ownership interests in an entity may be accounted for using the equity method, at fair value or the cost method. As of December 31, 2016 we accounted for our investments in Equity Method Investees under the equity method.
Under the equity method, the investment is adjusted each period for capital contributions and distributions and its share of the entity’s net income (loss). Capital contributions, distributions and net income (loss) of such entities are recorded in accordance with the terms of the governing documents. An allocation of net income (loss) may differ from the stated ownership percentage interest in such entity as a result of preferred returns and allocation formulas, if any, as described in such governing documents. Equity method investments are recognized using a cost accumulated model in which the investment is recognized based on the cost to the investor, which includes acquisition fees. Acquisition fees incurred directly in connection with the investments in a joint venture are capitalized and amortized using the straight-line method over the estimated useful life of the underlying joint venture assets. No amortization of acquisition fees is currently reflected on the financial statements.
Fair Value Disclosures
We are required to disclose an estimate of fair value of our financial instruments for which it is practicable to estimate the value. The fair value of a financial instrument is the amount at which such financial instrument could be exchanged in a current transaction between willing parties, other than in a forced sale or liquidation. For certain of our financial instruments, fair values are not readily available since there are no active trading markets as characterized by current exchanges by willing parties.
We determine the fair value of certain investments in accordance with the fair value hierarchy that requires an entity to maximize the use of observable inputs.
| 35 |
As of December 31, 2016, the Company’s financial instruments consist of cash, restricted cash, one debt investment, one equity investment, and accounts payable. The carrying values of cash and cash equivalents, restricted cash, receivables, note payable to a related party and accounts payable are reasonable estimates of their fair value. The aggregate fair value of our investments is based on unobservable Level 3 inputs which management has determined to be its best estimate of current market values. The methods utilized generally included a discounted cash flow method (an income approach) and recent investment method (a market approach). Significant inputs and assumptions include the market based interest or preferred return rate, loan to value ratios, and expected repayment and prepayment dates.
As a result of this assessment, as of December 31, 2016 and December 31, 2015, management estimated the fair value of our investments to be the carrying value of each investment. SeeNote 4, Fair Value of Financial Instruments in our statements.
Recent Accounting Pronouncements
The Financial Accounting Standards Board has released several Accounting Standards Updates (“ASU”) that may have an impact on our financial statements. SeeRecent Accounting Pronouncementsin Note 2, Summary of Significant Accounting Policies in our financial statements for discussion of the relevant ASUs. We are currently evaluating the impact of the various ASUs on our financial statements and determining our plan for adoption.
| 36 |
Results of Operations
Revenue
On October 25, 2016, we commenced operations upon our satisfying the $1 million minimum offering requirement (not including the $100,000 received in the private placements to our sponsor and Fundrise, LP). For the year ended December 31, 2016, we had total net income of approximately $9,000 primarily attributable to interest income and equity in earnings from our investments net of interest expense incurred to acquire our investments. For the period November 19, 2015 (Inception) through December 31, 2015, we incurred net income of approximately $0 due to no operations.
The Company had no investments as of December 31, 2015. Investments were added during Q4 2016. We expect cash flows from operating activities to increase in future periods as a result of adding more investments to our portfolio, in addition to operating for a full calendar year.
Interest Income
For the year ended December 31, 2016 and for the period November 19, 2015 (Inception) through December 31, 2015, we earned interest income of approximately $70,000 and $0 from our investments, respectively.
Expenses
General and Administrative
For the year ended December 31, 2016 and for the period November 19, 2015 (Inception) through December 31, 2015, we incurred general and administrative expenses of approximately $83,000 and $0, respectively, which includes auditing and professional fees, bank fees, organizational costs and other costs associated with operating our business.
Liquidity and Capital Resources
We require capital to fund our investment activities and operating expenses. Our capital sources may include net proceeds from our Offering, cash flow from operations, net proceeds from asset repayments and sales, borrowings under credit facilities, other term borrowings and securitization financing transactions.
We are dependent upon the net proceeds from our Offering to conduct our operations. We obtain the capital required to primarily originate, invest in and manage a diversified portfolio of commercial real estate investments and conduct our operations from the proceeds of our Offering and from secured or unsecured financings from banks and other lenders and from any undistributed funds from our operations. As of December 31, 2016, we had made two investments for approximately $12.7 million and had $1.4 million in cash. We had no future funding commitments related to our investments. We anticipate that proceeds from our Offering will provide sufficient liquidity to meet future funding commitments and costs of operations as of December 31, 2016.
As of December 31, 2016 and December 31, 2015 we had outstanding debt of approximately $7,680,000 and $0, respectively, that was drawn from our grid note with our Sponsor (SeeNote 6,Related Party Arrangements in our financial statements). Our targeted portfolio-wide leverage after we have acquired an initial substantial portfolio of diversified investments is between 50-85% of the greater of the cost (before deducting depreciation or other non-cash reserves) or fair market value of our assets. During the period when we are acquiring our initial portfolio, we may employ greater leverage on individual assets (that will also result in greater leverage of the interim portfolio) in order to quickly build a diversified portfolio of multifamily rental properties and development project assets. Our Manager may from time to time modify our leverage policy in its discretion in light of then-current economic conditions, relative costs of debt and equity capital, market values of our assets, general conditions in the market for debt and equity securities, growth and acquisition opportunities or other factors. However, other than
| 37 |
during our initial period of operations, it is our policy to not borrow more than 85% of the greater of cost (before deducting depreciation or other non-cash reserves) or fair market value of our assets. We cannot exceed the leverage limit of our leverage policy unless any excess in borrowing over such level is approved by our Manager’s investment committee.
If we are unable to fully raise $50,000,000 in common shares, we will make fewer investments resulting in less diversification in terms of the type, number and size of investments we make and the value of an investment in us will fluctuate with the performance of the specific assets we acquire. Further, we have certain direct and indirect operating expenses. Our inability to raise substantial funds would increase our fixed operating expenses as a percentage of gross income, reducing our net income and limiting our ability to make distributions.
In addition to making investments in accordance with our investment objectives, we use our capital resources to make certain payments to our Manager. During our organization and offering stage, these payments have and will continue to include payments for reimbursement of certain organization and offering expenses. As of December 31, 2016, organization and offering expenses have totaled approximately $468,000. We expect total offering costs to be less than 2% of our total offering. In addition, borrowers and real estate sponsors may make payments to our sponsor or its affiliates in connection with the selection and origination or purchase of investments. The amount of the asset management fee may vary from time to time, and we will publicly report any changes in the asset management fee. No asset management fees have paid or accrued to our Manager as of December 31, 2016.
We have elected to be taxed as a REIT and to operate as a REIT commencing with our taxable year ending December 31, 2016. To maintain our qualification as a REIT, we will be required to make aggregate annual distributions to our shareholders of at least 90% of our REIT taxable income (computed without regard to the dividends paid deduction and excluding net capital gain), and to avoid federal income and excise taxes on retained taxable income and gains we must distribute 100% of such income and gains annually. Our Manager may authorize distributions in excess of those required for us to maintain REIT status and/or avoid such taxes on retained taxable income and gains depending on our financial condition and such other factors as our Manager deems relevant. Provided we have sufficient available cash flow, we intend to authorize and declare distributions based on daily record dates and pay distributions on a quarterly or other periodic basis. We have not established a minimum distribution level.
Cash Flows
The following presents our statement of cash flows for the year ended December 31, 2016 and for the period November 19, 2015 (Inception) through December 31, 2015 (in thousands):
| Cash Flows | For the Year Ended December 31, 2016 | For the Period November 19, 2015 (Inception) Through December 31, 2015 | ||||||
| Operating activities: | $ | 58 | $ | 0 | ||||
| Investing activities: | (13,150 | ) | 0 | |||||
| Financing activities: | 14,438 | 5 | ||||||
| Net increase (decrease) in cash and cash equivalents | $ | 1,346 | $ | 5 | ||||
| Cash and cash equivalents, beginning of period | $ | 5 | $ | 0 | ||||
| Cash and cash equivalents, end of period | $ | 1,351 | $ | 5 | ||||
| 38 |
Off-Balance Sheet Arrangements
As of December 31, 2016 and December 31, 2015, we had no off-balance sheet arrangements.
Related Party Arrangements
For further information regarding “Related Party Arrangements,” please see “Item 5 - Interest of Management and Others in Certain Transactions”below.
| Event | Date | Description |
| Investments | ||
| 1. Acquisitions of Controlled Subsidiaries | 1/17/17 | Directly acquired ownership of a “majority-owned subsidiary”, Fundrise Insight Two, LLC (the “RSE Insight Controlled Subsidiary”), for an initial purchase price of $6,502,187, which is the initial stated value of our equity interest in the RSE Insight Controlled Subsidiary. The RSE Insight Controlled Subsidiary used the proceeds to acquire a single stabilized garden-style multifamily property totaling 118 units located at 751 S. Florida Street, Arlington, VA 22204. More information on the acquisition of the RSE Insight Controlled Subsidiary can be foundhere.
|
| 2. Issuance of Promissory Note | 1/17/17 | In connection with the acquisition of a “majority-owned subsidiary”, Fundrise Insight Two, LLC, we entered into a separate promissory note with Rise Companies Corp. in the principal amount of $2,310,000, at an interest rate of 2.5% per annum, calculated on a 30-day/360-day year basis. The maturity date of the promissory note is April 30, 2017. As of April 1, 2017, the entire balance had been repaid. More information on the acquisition of the Fundrise Insight Two Controlled Subsidiary can be foundhere. |
| Other | ||
| 1. Status of our Offering | As of April 1, 2017, we had raised total gross offering proceeds of approximately $11.35 million from settled subscriptions (including the $100,000 received in the private placements to our sponsor, Rise Companies Corp., and Fundrise, LP, an affiliate of our sponsor), and had settled subscriptions in our Offering and private placements for an aggregate of approximately 1,120,000 of our common shares. | |
| 2. Change of Principal Address | 1/3/17 | The Company moved its headquarters to 1601 Connecticut Ave., NW, Suite 300, Washington, DC 20009. |
| 3. Acceptance of IRA Investments | 1/31/17 | Announced that we would begin accepting subscriptions from investment retirement accounts (IRAs) maintained with certain custodians. |
| 4. Amended and Restated Promissory | 1/31/17 | Entered into an Amended and Restated Promissory Grid Note (the “Amended and Restated
|
| 39 |
| Grid Note | Promissory Grid Note”), as borrower, with Rise Companies Corp., as lender. The Amended and Restated Promissory Grid Note is an unsecured line of credit in the aggregate principal amount of $10 million that bears an interest rate of 3% per annum, calculated on a 30-day month/360-day year basis. All outstanding principal and interest on the Amended and Restated Promissory Grid Note is due and payable on April 30, 2017. | |
| 5. Declaration of Q2 2017 Dividends | 3/21/17 | On March 21, 2017, our Manager declared a daily distribution of $0.0023972603 per share for shareholders of record as of the close of business on each day of the period commencing on April 1, 2017 and ending on June 30, 2017. |
| 40 |
| Item 3. | Directors and Officers |
Our Manager
We operate under the direction of our Manager, which is responsible for directing the management of our business and affairs, managing our day-to-day affairs, and implementing our investment strategy. Our Manager has established an investment committee that makes decisions with respect to all acquisitions and dispositions. The Manager and its officers and directors are not required to devote all of their time to our business and are only required to devote such time to our affairs as their duties require.
We follow investment guidelines adopted by our Manager and the investment and borrowing policies set forth in our Offering Circular, which may be accessedhere, unless they are modified by our Manager. Our Manager may establish further written policies on investments and borrowings and will monitor our administrative procedures, investment operations and performance to ensure that the policies are fulfilled. Our Manager may change our investment objectives at any time without approval of our shareholders.
Our Manager performs its duties and responsibilities pursuant to our operating agreement. Our Manager maintains a contractual, as opposed to a fiduciary relationship, with us and our shareholders. Furthermore, we have agreed to limit the liability of our Manager and to indemnify our Manager against certain liabilities.
Executive Officers of Our Manager
As of the date of this Annual Report, the executive officers of our Manager and their positions and offices are as follows:
| Name | Age | Position | ||
| Benjamin S. Miller | 40 | Chief Executive Officer and Interim Chief Financial Officer and Treasurer | ||
| Brandon T. Jenkins | 31 | Chief Operating Officer | ||
| Bjorn J. Hall | 36 | General Counsel, Chief Compliance Officer and Secretary |
Benjamin S. Millercurrently serves as Chief Executive Officer of our Manager and has served as Chief Executive Officer and Director of our sponsor since its inception on March 14, 2012. As of February 9, 2016, Ben is also serving as Interim Chief Financial Officer and Treasurer of our Manager. Since June 2012, Ben has been Managing Partner of Rise Development LLC, a real estate company focused in the Mid-Atlantic. In December 2011, Ben started Popularise LLC, a real estate crowdsourcing website, which he currently manages. Prior to Rise Development, Ben had been a Managing Partner of the real estate company WestMill Capital Partners from October 2010 to June 2012, and before that, was President of Western Development Corporation from April 2006 to October 2010, after joining our Company in early 2003 as a board advisor and then as COO in 2005. Western Development Corp. is one of the largest retail, mixed-use real estate companies in Washington, DC, most notably known for developing Gallery Place, Washington Harbour, Georgetown Park, and Potomac Mills. While at Western Development, Ben led the development activities of over 1.5 million square feet of property, including more than $300.0 million of real estate acquisition and financing. Ben was an Associate and part of the founding team of Democracy Alliance, a progressive investment collaborative, from 2003 until he joined Western Development in 2005. From 1999 to 2001, Ben was an associate in business development at Lyte Inc., a retail technology start-up. Starting in 1997 until 1999, Ben worked as an analyst at a private equity real estate fund, Lubert-Adler, and for venture capital firm IL Management. Ben has a Bachelor of Arts from the University of Pennsylvania. Ben is on the Board of Trustees of the National Center for Children and Families.
| 41 |
Brandon T. Jenkinscurrently serves as Chief Operating Officer of our Manager and has served in such capacities with the sponsor since February of 2014, prior to which time he served as Head of Product Development and Director of Real Estate which he continues to do currently. Additionally, Brandon has served as Director of Real Estate for WestMill Capital Partners since March of 2011. Previously, Brandon spent two and a half years as an investment advisor and sales broker at Marcus & Millichap, the largest real estate investment sales brokerage in the country. Prior to his time in brokerage, Brandon also worked for Westfield Corporation, a leading shopping center owner. Brandon earned is BA in Public Policy and Economics from Duke University.
Bjorn J. Hallcurrently serves as the General Counsel, Chief Compliance Officer and Secretary of our Manager and has served in such capacities with our sponsor since February 2014. Prior to joining our sponsor in February 2014, Bjorn was a counsel at the law firm of O’Melveny & Myers LLP, where he was a member of the Corporate Finance and Securities Group. Bjorn has a Bachelor of Arts from the University of North Dakota and received a J.D. from Georgetown University Law Center.
Compensation of Executive Officers
We do not currently have any employees nor do we currently intend to hire any employees who will be compensated directly by us. Each of the executive officers of our sponsor also serves as an executive officer of our Manager. Each of these individuals receives compensation for his services, including services performed for us on behalf of our Manager, from our sponsor. As executive officers of our Manager, these individuals serve to manage our day-today affairs, oversee the review, selection and recommendation of investment opportunities, service acquired investments and monitor the performance of these investments to ensure that they are consistent with our investment objectives. Although we indirectly bear some of the costs of the compensation paid to these individuals, through fees and reimbursements we pay to our Manager, we do not pay any compensation directly to these individuals.
Compensation of our Manager
For information regarding the compensation of our Manager, please see “Management Compensation” in our Offering Circularhere.
| 42 |
| Item 4. | Security Ownership of Management and Certain Securityholders |
Principal Shareholders
The following table sets forth the beneficial ownership of our common shares as of March 31, 2017 for each person or group that holds more than 5% of our common shares, for each director and executive officer of our Manager and for the directors and executive officers of our Manager as a group. To our knowledge, each person that beneficially owns our common shares has sole voting and disposition power with regard to such shares.
Each person or entity has an address in care of our principal executive offices at 1601 Connecticut Ave., NW, Suite 300, Washington, DC 20009.
| Number of Shares | ||||||||
| Name of Beneficial Owner (1) | Beneficially Owned | Percent of All Shares | ||||||
| Benjamin S. Miller | 500 | * | ||||||
| Brandon T. Jenkins | 0 | * | ||||||
| Bjorn J. Hall | 0 | * | ||||||
| All directors and executive officers of our Manager as a group (3 persons) | 500 | * | ||||||
| * | Represents less than 1% of our outstanding common shares. |
| (1) | Under SEC rules, a person is deemed to be a “beneficial owner” of a security if that person has or shares “voting power,” which includes the power to dispose of or to direct the disposition of such security. A person also is deemed to be a beneficial owner of any securities which that person has a right to acquire within 60 days. Under these rules, more than one person may be deemed to be a beneficial owner of the same securities and a person may be deemed to be a beneficial owner of securities as to which he or she has no economic or pecuniary interest. |
| 43 |
| Item 5. | Interest of Management and Others in Certain Transactions |
For further details, please see “Related Party Arrangements” in Item 7 “Financial Statements”below.
| Item 6. | Other Information |
None.
| 44 |
INDEX TO FINANCIAL STATEMENTS OF
Fundrise East Coast Opportunistic REIT, LLC
| Independent Auditor’s Report | F-1 to F-2 |
| Balance Sheets | F-3 |
| Statements of Operations | F-4 |
| Statements of Members’ Equity | F-5 |
| Statements of Cash Flows | F-6 |
| Notes to Financial Statements | F-7 to F-22 |
| 45 |
To the Members Fundrise East Coast Opportunistic REIT, LLC Washington, D.C.
We have audited the accompanying financial statements ofFundrise East Coast Opportunistic REIT, LLC, which comprise the Balance Sheet as of December 31, 2016, and the related Statements of Operations, Members’ Equity, and Cash Flows for the year then ended, and the related notes to the financial statements.
Management’s Responsibility for the Financial Statements
Management is responsible for the preparation and fair presentation of these financial statements in accordance with accounting principles generally accepted in the United States of America; this includes the design, implementation, and maintenance of internal control relevant to the preparation and fair presentation of financial statements that are free from material misstatement, whether due to fraud or error.
Auditor’s Responsibility
Our responsibility is to express an opinion on these financial statements based on our audit. We conducted our audit in accordance with auditing standards generally accepted in the United States of America. Those standards require that we plan and perform the audit to obtain reasonable assurance about whether the financial statements are free from material misstatement.
An audit involves performing procedures to obtain audit evidence about the amounts and disclosures in the financial statements. The procedures selected depend on the auditor’s judgment, including the assessment of the risks of material misstatement of the financial statements, whether due to fraud or error. In making those risk assessments, the auditor considers internal control relevant to the entity’s preparation and fair presentation of the financial statements in order to design audit procedures that are appropriate in the circumstances, but not for the purpose of expressing an opinion on the effectiveness of the entity’s internal control. Accordingly, we express no such opinion. An audit also includes evaluating the appropriateness of accounting policies used and the reasonableness of significant accounting estimates made by management, as well as evaluating the overall presentation of the financial statements.
|

| F-1 |
Independent Auditor’s Report (continued)
We believe that the audit evidence we have obtained is sufficient and appropriate to provide a basis for our audit opinion .
Opinion
In our opinion, the 2016 financial statements referred to above present fairly, in all material respects, the financial position ofFundrise East Coast Opportunistic REIT, LLC as of December 31, 2016, and the results of its operations and its cash flows for the year then ended in accordance with accounting principles generally accepted in the United States of America.
Prior Period Financial Statements
The Balance Sheet ofFundrise East Coast Opportunistic REIT, LLC as of December 31 , 2015, was audited by other auditors whose report dated January 19, 2016, expressed an unmodified opinion on that Balance Sheet.
| /s/ Aronson LLC |
| Rockville, Maryland |
| March 16, 2017 |

| F-2 |
Fundrise East Coast Opportunistic REIT, LLC
Balance Sheets
As of December 31, 2016 and December 31, 2015
(Amounts in thousands, except share and per share data)
| 2016 | 2015 | |||||||
| ASSETS | ||||||||
| Cash and cash equivalents | $ | 1,351 | $ | 5 | ||||
| Interest receivable | — | — | ||||||
| Restricted cash | 500 | — | ||||||
| Other assets | 2 | — | ||||||
| Real estate debt investments | 5,000 | — | ||||||
| Investments in equity method investees | 7,689 | — | ||||||
| Deferred costs, net of accumulated amortization of $57 and $0, respectively | 388 | — | ||||||
| Total Assets | $ | 14,930 | $ | 5 | ||||
| LIABILITIES AND MEMBERS’ EQUITY | ||||||||
| Liabilities: | ||||||||
| Accounts payable and accrued expenses | $ | 49 | $ | — | ||||
| Due to related party | 429 | — | ||||||
| Note payable – related party | 7,697 | — | ||||||
| Settling subscriptions | 443 | — | ||||||
| Dividends payable | 166 | — | ||||||
| Redemptions payable | 150 | — | ||||||
| Total Liabilities | 8,934 | — | ||||||
| Members’ Equity: | ||||||||
| Fundrise East Coast Opportunistic REIT, LLC Members’ Equity: Common shares, $10 per share; unlimited shares authorized; 620,811 and 500 shares issued and outstanding as of December 31, 2016 and December 31, 2015, respectively, net of accumulated amortization of deferred offering costs | 6,153 | 5 | ||||||
| Retained Earnings (Accumulated deficit) | (157 | ) | — | |||||
| Total Members’ Equity | 5,996 | 5 | ||||||
| Total Liabilities and Members’ Equity | $ | 14,930 | $ | 5 | ||||
The accompanying notes are an integral part of these financial statements.
| F-3 |
Fundrise East Coast Opportunistic REIT, LLC
Statements of Operations
For the Year Ended December 31, 2016 and for the Period November 19, 2015 (Inception) through December 31, 2015
(Amounts in thousands, except share and per share data)
| 2016 | 2015 | |||||||
| Investment income | ||||||||
| Interest and preferred return income | $ | 70 | $ | — | ||||
| Equity in earnings | 39 | — | ||||||
| Interest expense – related party note | (17 | ) | — | |||||
| Net investment income | 92 | — | ||||||
| Expenses | ||||||||
| Asset management and other fees- related party | — | — | ||||||
| General and administrative expenses | 83 | — | ||||||
| Total expenses | 83 | — | ||||||
| Net income | $ | 9 | $ | — | ||||
| Net income per basic and diluted common share | $ | 0.02 | $ | — | ||||
| Weighted average number of common shares outstanding, basic and diluted | 462,564 | — | ||||||
The accompanying notes are an integral part of these financial statements.
| F-4 |
Fundrise East Coast Opportunistic REIT, LLC
Statements of Members’ Equity
For the Year Ended December 31, 2016 and for the Period November 19, 2015 (Inception) through December 31, 2015
(Amounts in thousands, except share data)
| Common Shares | ||||||||||||||||
| Shares | Amount | Retained Earnings (Accumulated Deficit) | Total Company’s Shareholders’ Equity | |||||||||||||
| November 19, 2015 (Inception) | — | $ | — | $ | — | $ | — | |||||||||
| Proceeds from issuance of common shares | 500 | 5 | — | 5 | ||||||||||||
| Accumulated amortization of deferred offering costs | — | — | — | — | ||||||||||||
| Distributions declared on common shares | — | — | — | — | ||||||||||||
| Redemptions of common shares | — | — | — | — | ||||||||||||
| Net income | — | — | — | — | ||||||||||||
| Balance as of December 31, 2015 | 500 | 5 | — | 5 | ||||||||||||
| Proceeds from issuance of common shares | 635,411 | 6,354 | — | 6,354 | ||||||||||||
| Accumulated amortization of deferred offering costs | — | (57 | ) | — | (57 | ) | ||||||||||
| Distributions declared on common shares | — | — | (166 | ) | (166 | ) | ||||||||||
| Redemptions of common shares | (15,100 | ) | (149 | ) | — | (149 | ) | |||||||||
| Net income | — | — | 9 | 9 | ||||||||||||
| Balance as of December 31, 2016 | 620,811 | $ | 6,153 | $ | (157 | ) | $ | 5,996 | ||||||||
The accompanying notes are an integral part of these financial statements.
| F-5 |
Fundrise East Coast Opportunistic REIT, LLC
Statements of Cash Flows
For the Year Ended December 31, 2016 and for the Period November 19, 2015 (Inception) through December 31, 2015
(Amounts in thousands)
| 2016 | 2015 | |||||||
| OPERATING ACTIVITIES: | ||||||||
| Net income (loss) | $ | 9 | $ | — | ||||
| Adjustments to reconcile net income to net cash provided by (used in) operating activities: | ||||||||
| Equity in earnings | (39 | ) | — | |||||
| Net increase in other assets | (2 | ) | — | |||||
| Net increase in accounts payable and accrued expenses | 49 | — | ||||||
| Increase in due to related party | 41 | — | ||||||
| Net cash provided by operating activities | 58 | — | ||||||
| INVESTING ACTIVITIES: | ||||||||
| Real estate deposits | (500 | ) | — | |||||
| Investment in real estate debt related investments | (5,000 | ) | — | |||||
| Investment in equity method investees | (7,650 | ) | — | |||||
| Net cash (used in) investing activities | (13,150 | ) | — | |||||
| FINANCING ACTIVITIES: | ||||||||
| Proceeds from issuance of common shares | 6,354 | 5 | ||||||
| Proceeds from note payable – related party | 7,680 | — | ||||||
| Proceeds from subscriptions not settled by prior period end | 443 | — | ||||||
| Deferred offering costs | (445 | ) | — | |||||
| Advances from related party | 445 | — | ||||||
| Repayments of advances from related party | (39 | ) | — | |||||
| Net cash provided by financing activities | 14,438 | 5 | ||||||
| Net increase in cash and cash equivalents | 1,346 | 5 | ||||||
| Cash and cash equivalents, beginning of period | 5 | — | ||||||
| Cash and cash equivalents, end of period | $ | 1,351 | $ | 5 | ||||
| SUPPLEMENTAL DISCLOSURE OF NON-CASH TRANSACTIONS: | ||||||||
| Amortization of deferred offering costs | $ | 57 | $ | — | ||||
| Dividends payable | $ | 166 | $ | — | ||||
| Redemptions payable | $ | 149 | $ | — | ||||
The accompanying notes are an integral part of these financial statements.
| F-6 |
Fundrise East Coast Opportunistic REIT, LLC
NOTES TO FINANCIAL STATEMENTS
For the Year Ended December 31, 2016 and for the Period November 19, 2015 (Inception) Through December 31, 2015
| 1. | Formation and Organization |
Fundrise East Coast Opportunistic REIT, LLC was formed on November 19, 2015, as a Delaware limited liability company to invest in a diversified portfolio of commercial real estate assets and securities. Operations commenced October 25, 2016. As used herein, the “Company,” “we,” “our,” and “us” refer to Fundrise East Coast Opportunistic REIT, LLC except where the context otherwise requires.
The Company was organized primarily to originate, invest in and manage a diversified portfolio of commercial real estate loans, commercial real estate, and may also invest in commercial real estate-related debt securities and other real estate-related assets. The Company may make its investments through majority-owned subsidiaries, some of which may have rights to receive preferred economic returns. Substantially all of the Company’s business is externally managed by Fundrise Advisors, LLC (the “Manager”), a Delaware limited liability company and an investment adviser registered with the Securities and Exchange Commission (the “SEC”).
The Company’s origination, investing and management activities related to commercial real estate are all considered a single reportable business segment for financial reporting purposes. All of the investments the Company has made to date have been in domestic commercial real estate assets with similar economic characteristics, and the Company evaluates the performance of all of its investments using similar criterion.
We believe we have operated in such a manner as to qualify as a real estate investment trust (“REIT”) for federal income tax purposes as of the year ended December 31, 2016. We hold substantially all of our assets directly, and as of the date of this filing have not established an operating partnership or any taxable REIT subsidiary (“TRS”) or qualified REIT subsidiary (“QRS”), though we may form such entities as required in the future to facilitate certain transactions that might otherwise have an adverse impact on our status as a REIT.
A maximum of $50 million in the Company’s common shares may be sold to the public in this Offering (as defined below). The Manager has the authority to issue an unlimited number of common shares. As of December 31, 2016 and December 31, 2015, the Company has issued 620,811 and 500, respectively, including shares to Rise Companies Corp. (the “Sponsor”), an indirect owner of the Manager, in an amount of 500 common shares for an aggregate purchase price of $5,000. In addition, as of December 31, 2016, Fundrise, L.P., an affiliate of the Sponsor, has purchased an aggregate of 9,500 common shares at $10.00 per share in a private placement for an aggregate purchase price of $95,000. At December 31, 2015, Fundrise, L.P. had committed to purchase but had not purchased any common shares.
Pursuant to the Form 1-A filed with the SEC with respect to our offering (the “Offering”) of up to $50 million in common shares, the purchase price for all shares was $10.00 per share as of December 31, 2016 and December 31, 2015. The Offering was declared qualified by the SEC on September 30, 2016.
| 2. | Summary of Significant Accounting Policies |
Basis of Presentation
The accompanying balance sheets, statements of operations and statements of cash flows and related notes to the financial statements of the Company are prepared on the accrual basis of accounting and conform to accounting principles generally accepted in the United States of America (“GAAP”) and Article 8 of Regulation S-X of the rules and regulations of the SEC.
| F-7 |
The Company adopted the calendar year as its basis of reporting.
Estimates
The preparation of the financial statements in conformity with accounting principles generally accepted in the United States of America requires management to make estimates and assumptions that affect reported amounts of assets and liabilities and the disclosures of contingent assets and liabilities at the date of the financial statements and the reported amounts of revenues and expenses during the reporting period. Actual results could materially differ from those estimates.
Cash and Cash Equivalents
Cash and cash equivalents consist of money market funds, demand deposits and highly liquid investments with original maturities of three months or less. Cash and cash equivalents are carried at cost which approximates fair value.
Restricted Cash
The Company has restricted cash primarily related to a certain escrow account required by the Company’s commitment to invest is an equity method investee.
Concentration of Credit Risk
Cash may at times exceed the Federal Deposit Insurance Corporation deposit insurance limit of $250,000 per institution. The Company mitigates credit risk by placing cash with major financial institutions. To date, the Company has not experienced any losses on cash.
Organizational, Offering and Related Costs
Organizational and offering costs of the Company are initially being paid by the Manager on behalf of the Company. These organizational and offering costs include all expenses to be paid by the Company in connection with the formation of the Company and the qualification of the Offering, and the marketing and distribution of shares, including, without limitation, expenses for printing, and amending offering statements or supplementing offering circulars, mailing and distributing costs, telephones, internet and other telecommunications costs, all advertising and marketing expenses, charges of experts and fees, expenses and taxes related to the filing, registration and qualification of the sale of shares under federal and state laws, including taxes and fees and accountants’ and attorneys’ fees. Pursuant to the Company’s amended and restated operating agreement (the “Operating Agreement”), the Company will be obligated to reimburse the Manager, or its affiliates, as applicable, for organization and offering costs paid by them on behalf of the Company, subject to a minimum offering raise, as described below.
The Sponsor intends to establish a number of programs as real estate investment trusts that will be similar in structure to ours. As the Company is one of the Sponsor’s initial such programs, it is anticipated that the legal fees and other formation and structuring expenses incurred by the Manager in qualifying this offering may be substantially higher than those of future similar programs. Accordingly, the Manager has agreed to allocate legal fees incurred in establishing the first ten such programs (including us) that exceed the estimated legal fees of $312,500 per program, to other programs sponsored by the Sponsor. As a result, we and each of the other nine programs will be required to reimburse the Manager for up to $312,500 in legal fees incurred in preparing such offerings. The Sponsor believes that this allocation of legal fees to future similar programs is the most equitable way to ensure that all of the first ten programs bear the burden of establishing a working framework for similar
| F-8 |
offerings under the newly revised rules of Regulation A. If the Sponsor is not successful in organizing an offering for each of the other nine programs, the Sponsor will bear the legal costs that exceed the portion allocated to us.
After the Company raised $1,000,000 in this offering (not including the $100,000 received or to be received in the private placements to the Sponsor and Fundrise, LP), beginning on the date that the Company started its operations, it started to reimburse the Manager, without interest, for these organization and offering costs incurred both before and after that date. Reimbursement payments are made in monthly installments; however, the aggregate monthly amount reimbursed can never exceed 0.50% of the aggregate gross offering proceeds from the Offering. If the sum of the total unreimbursed amount of such organization and offering costs, plus new costs incurred since the last reimbursement payment, exceeds the reimbursement limit described above for the applicable monthly installment, the excess is eligible for reimbursement in subsequent months (subject to the 0.50% limit), calculated on an accumulated basis, until the Manager has been reimbursed in full. As of December 31, 2016 and December 31, 2015 the Company had reimbursed the Manager $39,330 and $0, respectively.
As of December 31, 2016 and December 31, 2015, the Manager had incurred organizational and offering costs of approximately $468,000 and $53,000, respectively, on behalf of the Company. These costs are not recorded in the financial statements of the Company as of December 31, 2015 because such costs were not a liability of the Company until the Company had raised $1,000,000 in its offering, which occurred subsequent to December 31, 2015.
Organizational costs are expensed as incurred, and offering costs are amortized ratably as a reduction to members’ equity based on the proportion of gross proceeds raised to the total gross proceeds expected to be raised when the Offering is complete. As of December 31, 2016 and December 31, 2015, $28,615 and $0, respectively, of organizational expenses were included as an expense in the statements of operations, and $56,589 and $0, respectively, of offering costs had been amortized and were included in the statements of members’ equity.
Settling Subscriptions
Settling subscriptions presented on the balance sheet represent equity subscriptions for which funds have been received but common shares have not yet been issued. Under the terms of the Offering Circular for our common shares, subscriptions will be accepted or rejected within thirty days of receipt by us. Once a subscription agreement is accepted, settlement of the shares may occur up to fifteen days later, depending on the volume of subscriptions received; however, we generally issue shares the later of five business days from the date that an investor’s subscription is approved by our Manager or when funds settle in our bank account. We rely on our Automated Clearing House (ACH) provider to notify us that funds have settled for this purpose, which may differ from the time that cash is posted to our bank statement.
As of December 31, 2016 and December 31, 2015, the total amount of equity issued by the Company on a gross basis before considering amortization of offering costs was $6,359,110 and $5,000, respectively, and the total amount of settling subscriptions was $443,150 and $0, respectively. Both of these amounts were based on a $10 per share price.
Weighted Average Shares Outstanding and Net Income per Share Information
In order to more accurately reflect share ownership during the operating period reflected in these financial statements, the weighted average shares outstanding amount is computed beginning on October 25, 2016, the first day that shares were issued to the public. Prior to that date, the Company had not commenced any significant operations. There are not any convertible notes or common stock equivalents as of December 31, 2016 or December 31, 2015, so the net income per share on a fully diluted basis is equivalent to the basic net income per share.
| F-9 |
Principles of Consolidation
As of December 31, 2016 and December 31, 2015, the Company does not consolidate any separate legal entities in which we own equity interests. We generally consolidate variable interest entities (“VIE”) where the Company is the primary beneficiary of a VIE in which we have a variable interest and voting interest entities where the Company is the majority owner or otherwise controls the voting interest entity.
Variable Interest Entities
A variable interest entity is an entity that lacks one or more of the characteristics of a voting interest entity. A VIE is defined as an entity in which equity investors do not have the characteristics of a controlling financial interest or do not have sufficient equity at risk for the entity to finance its activities without additional subordinated financial support from other parties. The determination of whether an entity is a VIE includes consideration of various factors. These factors include review of the formation and design of the entity, its organizational structure including decision-making ability and relevant financial agreements, and analysis of the forecasted cash flows of the entity. The Company makes an initial determination upon acquisition of a VIE, and reassesses its initial evaluation of an entity as a VIE upon the occurrence of certain events.
A VIE must be consolidated only by its primary beneficiary, which is defined as the party who, along with its affiliates and agents has both the: (i) power to direct the activities that most significantly impact the VIE’s performance; and (ii) obligation to absorb the losses of the VIE or the right to receive the benefits from the VIE, which could be significant to the VIE. The Company determines whether it is the primary beneficiary of a VIE by considering various factors, including, but not limited to: which activities most significantly impact the VIE’s economic performance and which party controls such activities; the amount and characteristics of its investment; the obligation or likelihood for the Company or other interests to provide financial support; consideration of the VIE’s purpose and design, including the risks the VIE was designed to create and pass through to its variable interest holders and the similarity with and significance to the business activities of the Company and the other interests. The Company reassesses its determination of whether it is the primary beneficiary of a VIE each reporting period. Significant judgments related to these determinations include estimates about the future performance of investments held by VIEs and general market conditions. The maximum risk of loss related to our investments is limited to our recorded investment in such entities, if any.
As of December 31, 2016 and December 31, 2015, the Company did not hold any investments in entities which are considered to be variable interest entities based on the determination that we have substantive participating rights in all of the limited partnerships or similar legal entities which may have otherwise been considered variable interest entities.
Voting Interest Entities
A voting interest entity is an entity in which the total equity investment at risk is sufficient to enable it to finance its activities independently and the equity holders have the power to direct the activities of the entity that most significantly impact its economic performance, the obligation to absorb the losses of the entity and the right to receive the residual returns of the entity. The usual condition for a controlling financial interest in a voting interest entity is ownership of a majority voting interest. If the Company has a majority voting interest in a voting interest entity, the entity will generally be consolidated. For limited partnerships or similar legal entities, the usual condition for a controlling financial interest is control of kick-out rights through voting interests. The Company does not consolidate a voting interest entity if there are substantive participating rights by other parties or unilateral kick-out rights by a single party that, in our judgment, rise to the level of control of such entity. In our analysis of whether kick-out rights are substantive in nature, we also consider barriers to such rights that make them unlikely to be exercised. This analysis involves significant judgment on the part of management.
| F-10 |
Investments in Equity Method Investees
Non-controlling, unconsolidated ownership interests in an entity may be accounted for using the equity method, at fair value or the cost method.
Under the equity method, the investment is adjusted each period for capital contributions and distributions and its share of the entity’s net income (loss). Capital contributions, distributions and net income (loss) of such entities are recorded in accordance with the terms of the governing documents. An allocation of net income (loss) may differ from the stated ownership percentage interest in such entity as a result of preferred returns and allocation formulas, if any, as described in such governing documents. Equity method investments are recognized using a cost accumulated model in which the investment is recognized based on the cost to the investor, which includes acquisition fees. Acquisition fees incurred directly in connection with the investments in a joint venture are capitalized and amortized using the straight-line method over the estimated useful life of the underlying joint venture assets. No amortization of acquisition fees is currently reflected on the financial statements.
The Company may account for an investment in an unconsolidated entity at fair value by electing the fair value option. In general, if the fair value election is made, the Company’s share of changes in fair value from one period to another are recorded in the statement of operations. Any change in fair value attributable to market related assumptions is considered an unrealized gain or loss.
The Company may account for an investment that does not qualify for the equity method, or for which the fair value option has not been elected, by using the cost method. Under the cost method, equity in earnings is recorded as dividends are received to the extent they are not considered a return of capital, which is recorded as a reduction of cost of the investment.
The table below presents the activity of the Company's investments in equity method investees as of and for the periods presented (in thousands):
| For the Year Ended December 31, 2016 | For the Period November 19, 2015 (Inception) through December 31, 2015 | |||||||
| Beginning balance | $ | — | $ | — | ||||
| New investments in equity method investees | 7,650 | — | ||||||
| Distributions received | — | — | ||||||
| Equity in earnings | 39 | — | ||||||
| Ending balance | $ | 7,689 | $ | — | ||||
The Company evaluates its investment in equity method investees for impairment annually or whenever events or changes in circumstances indicate that there may be an other-than-temporary decline in value. To do so, the Company calculates the estimated fair value of the investment using various valuation techniques, including, but not limited to, discounted cash flow models, the Company’s intent and ability to retain its investment in the entity, the financial condition and long-term prospects of the entity, and the expected term of the investment. If the Company determined any decline in value is other-than-temporary, the Company would recognize an impairment charge to reduce the carrying value of its investment to fair value. No impairment losses were recorded related to equity method investees for the year ended December 31, 2016.
As of December 31, 2016 and December 31, 2015, respectively, the Company has not elected the fair value option with respect to any of its investments. The Company’s investments that are legally structured as
| F-11 |
preferred equity are treated as debt securities on these financial statements in accordance with GAAP. See further discussion under Note 2 – Real Estate Debt Investments.
Real Estate Debt Investments
Our debt related investments are considered to be classified as held to maturity, as we have both the intent and ability to hold these investments until maturity. Accordingly, these assets are carried at cost, net of unamortized loan origination costs and fees, discounts, repayments and unfunded commitments, if applicable, unless such loans or investments are deemed to be impaired.The Company’s real estate debt investments are subject to continual analysis for potential loan impairment.
A debt related investment is impaired when, based on current information and events (including economic, industry and geographical factors), it is probable that we will be unable to collect all amounts due, both principal and interest, according to the contractual terms of the agreement. When an investment is deemed impaired, the impairment is measured based on the expected future cash flows discounted at the investment’s effective interest rate. As a practical expedient, the Financial Accounting Standards Board (the “FASB”) issued ASC Topic 310,Receivables, which permits a creditor to measure an observable market price for the impaired debt related investment as an alternative to discounting expected future cash flows. Regardless of the measurement method, a creditor should measure impairment based on the fair value of the collateral when the creditor determines that foreclosure is probable. A debt related investment is also considered impaired if its terms are modified in a troubled debt restructuring (“TDR”). A TDR occurs when we grant a concession to a borrower in financial difficulty by modifying the original terms of the loan. Impairments on TDR loans are generally measured based on the present value of expected future cash flows discounted at the effective interest rate of the original loan.
We have certain investments that are legally structured as equity investments with rights to receive preferred economic returns (referred to throughout these Notes as “preferred equity” investments). We report these investments as real estate debt securities when the common equity holders have a contractual obligation to redeem our preferred equity interest at a specified date.
As of December 31, 2016 and December 31, 2015, our debt related investment is not considered impaired, and no impairment charges have been recorded in these financial statements. We have invested in one debt related investment as of the date of these financial statements. The following table describes our debt related investment activity for the year ended December 31, 2016 and for the period November 19, 2015 (Inception) through December 31, 2015 (amounts in thousands):
| Investments in Real Estate Debt: | For the Year Ended December 31, 2016 | For the Period November 19, 2015 (Inception) through December 31, 2015 | ||||||
| Beginning balance | $ | — | $ | — | ||||
| Investments(1) | 5,000 | — | ||||||
| Principal repayments | — | — | ||||||
| Amortization of deferred fees, costs, and discounts/premiums | — | — | ||||||
| Ending balance | $ | 5,000 | $ | — | ||||
| (1) | Investments include one preferred equity investment |
| F-12 |
Share Redemptions
The Company has adopted a redemption plan whereby on a quarterly basis, shareholders may request that the Company redeem at least 25% or more of their shares. Based on an assessment of the Company’s liquid resources and redemption requests, the Company’s Manager has the authority, in its sole discretion, to limit redemptions by each shareholder during any quarter, including if the Manager deems such action to be in the best interest of the shareholders as a whole.
Pursuant to the program, for the first eighty-nine (89) days following the settlement of the common shares subject to the redemption request (the “Introductory Period”), the per share redemption price will be equal to the purchase price of the shares being redeemed less any distributions received during that period. Shareholders that redeemed during the introductory period will not be allocated any dividends that were declared but unpaid during this period.
Beginning on the ninetieth day following the settlement of the common shares the Company may redeem shares with a per share redemption price calculated based on the most current Net Asset Value (“NAV”) per share. The redemption price is subject to the following discounts, depending upon when the shares are redeemed:
| Holding Period from Date of Purchase | Effective Redemption Price(1) (as percentage of per share redemption price) | |||
| Less than 90 days (Introductory Period) | 100 | % | ||
| 90 days until 3 years | 97 | % | ||
| 3 years to 4 years | 98 | % | ||
| 4 years to 5 years | 99 | % | ||
| More than 5 years | 100 | % | ||
(1)The Effective Redemption Price will be rounded down to the nearest $0.01.
In addition, the redemption price will be reduced by the aggregate sum of distributions, if any, declared on the shares subject to the redemption request with record dates during the period between the quarter-end redemption request date and the redemption date.
Because the Company’s NAV per share will be calculated at the end of each quarter beginning at the end of the fourth quarter of 2017, the redemption price may change between the date the Company receives the redemption request and the date on which redemption proceeds are paid. As a result, the redemption price that a shareholder will receive may be different from the redemption price on the day the redemption request is made.
The Manager may amend, suspend, or terminate the redemption plan at any time in its sole discretion, without notice, including if it believes that such action is in the best interest of the shareholders as a whole.
Income Taxes
The Company operates in a manner intended to qualify for treatment as a REIT under the Internal Revenue Code of 1986, commencing with the taxable year ending December 31, 2016. To qualify as a REIT, the Company must meet certain organizational and operational requirements, including a requirement to distribute at least 90% of the Company’s annual REIT taxable income to its shareholders (which is computed without regard to the dividends paid deduction or net capital gain and which does not necessarily equal net income as calculated in accordance with generally accepted accounting principles). As a REIT, the Company generally will not be subject to U.S. federal income tax to the extent it distributes qualifying dividends to its shareholders. Even if the Company qualifies for taxation as a REIT, it may be subject to certain state and local taxes on its income and property, and federal income and excise taxes on its undistributed income. No material provisions have been made for federal
| F-13 |
income taxes in the accompanying financial statements, and no gross deferred tax assets or liabilities have been recorded as of December 31, 2016 or December 31, 2015.
All tax periods since inception remain open to examination by the major taxing authorities in all jurisdictions where we are subject to taxation.
Distributions
Our distributions are characterized for federal income tax purposes as (i) ordinary income, (ii) non-taxable return of capital, or (iii) long-term capital gain. Distributions that exceed current or accumulated tax earnings and profits constitute a return of capital for tax purposes and reduce the shareholders’ basis in the common shares. To the extent that distributions exceed both current and accumulated earnings and profits and the shareholders’ basis in the common shares, they will generally be treated as a gain or loss upon the sale or exchange of our shareholders’ common shares. We will report the taxability of our distributions in information returns that will be provided to our shareholders and filed with the Internal Revenue Service in the year following the distributions. This information will be provided annually beginning with the year ended December 31, 2016.
The Company declared three distributions during the year ended December 31, 2016. These distributions were or will be calculated based on shareholders of record each day during these periods.
The table below outlines the Company’s total distributions declared to shareholders and dividends relating to the Sponsor and its affiliates for each of the period(all amounts are in thousands except per share data):
| Shareholders | Related Parties | |||||||||||||||
| Distributions for the Period: | Daily Distribution Per-Share Amount | Total Declared | Total Paid as of December 31, 2016 | Total Declared | ||||||||||||
| November 1, 2016 through November 30, 2016 | 0.0008219178 | $ | 10 | $ | — | $ | — | |||||||||
| December 1, 2016 through December 31, 2016 | 0.0013698630 | 24 | — | 1 | ||||||||||||
| January 1, 2017 through March 31, 2017 | 0.0022602740 | 132 | (1) | — | 2 | |||||||||||
| Total | $ | 166 | $ | — | $ | 3 | ||||||||||
(1) The liability for the first quarter 2017 dividend was estimated based on the daily distribution per-share amount multiplied by the number of shareholders as of the date of the preparation of the December 31, 2016 financial statements, and is scheduled to be paid within three weeks after the end of March 31, 2017.
Revenue Recognition
Interest income is recognized on an accrual basis and any related premium, discount, origination costs and fees are amortized over the life of the investment using the effective interest method. Interest income is recognized on senior debt investments classified as held to maturity securities, and investments in joint ventures that are accounted for using the cost method if the terms of the equity investment includes terms that are akin to interest on a debt instrument. As of December 31, 2016 and December 31, 2015, no amortization of premium, discount, origination costs or fees has been recognized.
| F-14 |
Recent Accounting Pronouncements
In January 2016, the FASB issued Accounting Standards Update 2016-01 (“ASU 2016-01”),Financial Instruments – Overall, which changes the accounting for equity investments, financial liabilities under the fair value option, and the presentation and disclosure requirements for financial instruments. The FASB also clarifies the guidance related to the valuation allowance assessment when recognizing deferred tax assets resulting from unrealized losses on available-for-sale debt securities. The guidance will be effective for annual reporting periods (including interim periods within those periods) beginning after December 15, 2017. The guidance should be applied prospectively from that date. Early adoption is permitted regarding the guidance on the presentation of the change in fair value of financial liabilities under the fair value option for financial statements that have not been issued. We do not anticipate the adoption will have a significant impact on the presentation of these financial statements.
In February 2016, the FASB issued Accounting Standards Update 2016-02 (“ASU 2016-02”),Leases, which changes the accounting for leases for both lessors and lessees. The guidance requires lessees to recognize right-of-use assets and lease liabilities for virtually all of their leases, including leases embedded in other contractual arrangements, among other changes. The guidance will be effective for annual reporting periods (including interim periods within those periods) beginning after December 15, 2018, with early adoption permitted. We are currently assessing the impact of this update on the presentation of these financial statements.
In March 2016, the FASB issued Accounting Standards Update 2016-07 (“ASU 2016-07”),Investments – Equity Method and Joint Ventures, which eliminates the requirement to retrospectively apply the equity method in previous periods when an investor initially obtains significant influence over an investee. The new guidance requires an investor to apply the equity method prospectively from the date the investment qualifies for the equity method. The guidance will be effective for annual reporting periods (including interim periods within those periods) beginning after December 15, 2016, with early adoption permitted. We do not anticipate the adoption will have a significant impact on the presentation of these financial statements.
In June 2016, the FASB issued Accounting Standards Update 2016-13 (“ASU 2016-13”),Financial Instruments-Credit Losses: Measurement of Credit Losses on Financial Instruments, which requires the measurement and recognition of expected credit losses for financial assets held at amortized cost. ASU 2016-13 replaces the existing incurred loss impairment model with an expected loss methodology, which will result in more timely recognition of credit losses. ASU 2016-13 is effective for annual reporting periods, and interim periods within those years beginning after December 15, 2019. We are currently in the process of evaluating the impact of the adoption of this standard on our financial statements.
In August 2016, the FASB issued Accounting Standards Updated 2016-1 (“ASU 2016-15”),Statement of Cash Flows: Classification of Certain Cash Receipts and Cash Payments, which provides guidance on the presentation and classification in the statement of cash flows for specific cash receipt and payment transactions, including debt prepayment or extinguishment costs, contingent consideration payments made after a business combination, proceeds from the settlement of insurance claims and corporate-owned life insurance policies, and distributions received from equity method investees. This standard is effective for fiscal years beginning after December 15, 2017, including interim periods within that reporting period. We are currently in the process of evaluating the impact of the adoption of this standard on our financial statements.
In November 2016, the FASB issued Accounting Standards Updated 2016-18 (“ASU 2016-18”)Statement of Cash Flows: Restricted Cash, which clarifies the presentation requirements of restricted cash within the statement of cash flows. The changes in restricted cash and restricted cash equivalents during the period should be included in the beginning and ending cash and cash equivalents balance reconciliation on the statement of cash flows. When cash, cash equivalents, restricted cash or restricted cash equivalents are presented in more than one line item within the statement of financial position, an entity shall calculate a total cash amount in a narrative or tabular format that agrees to the amount shown on the statement of cash flows. Details on the nature and amounts of restricted cash should also be disclosed. This standard is effective for fiscal years beginning after
| F-15 |
December 15, 2017, including interim periods within that reporting period. We are currently in the process of evaluating the impact of the adoption of this standard on our financial statements.
In January 2017, the FASB issued Accounting Standards Update 2017-01 (“ASU 2017-01”),Business Combinations, which clarifies the definition of a business, particularly when evaluating whether transactions should be accounted for as acquisitions or dispositions of assets or businesses. The first part of the guidance provides a screen to determine when a set is not a business; the second part of the guidance provides a framework to evaluate whether both an input and a substantive process are present. The guidance will be effective for annual reporting periods (including interim periods within those periods) beginning after December 15, 2017. Early adoption is permitted for transactions that have not been reported in issued financial statements. We are currently assessing the impact of this update on the presentation of these financial statements.
The Company evaluated subsequent events through March 16, 2017 which is the date the financial statements were available to be issued.
| 3. | Investments in Real Estate Related Assets |
The following table presents the Company’s investments in real estate related assets, as of December 31, 2016, all of which were acquired during this reporting period (dollars in thousands):
| Asset Type | Number | Principal Amount or Cost | Future Funding Commitments | Carrying Value | Allocation by Investment Type(1) | |||||||||||||||
| Real estate debt investments | 1 | $ | 5,000 | $ | — | $ | 5,000 | 39.27 | % | |||||||||||
| Investments in equity method investees | 1 | 7,650 | — | 7,689 | 60.73 | % | ||||||||||||||
Balance as of December 31, 2016 | 2 | $ | 12,650 | $ | — | $ | 12,689 | 100 | % | |||||||||||
| (1) | This allocation is based on the preferred equity investments at cost and initial equity contribution into an equity method investee plus equity in earnings. It does not include future funding commitments that are not yet drawn. |
The following table presents certain information about the Company’s investments in real estate related assets, as of December 31, 2016, by contractual maturity grouping(dollar amounts in thousands):
| Asset Type | Number | Amounts Maturing Within One Year | Amounts Maturing After One Year Through Five Years | Amounts Maturing After Five Years Through Ten Years | Amounts Maturing After Ten Years | |||||||||||||||
| Preferred equity | 1 | $ | — | $ | — | $ | 5,000 | $ | — | |||||||||||
Balance as of December 31, 2016 | 1 | $ | — | $ | — | $ | 5,000 | $ | — | |||||||||||
Credit Quality Monitoring
The Company’s debt investments and preferred equity investments that earn interest based on debt-like terms are typically secured by senior liens on real estate properties, mortgage payments, mortgage loans, or
| F-16 |
interests in entities that have interests in real estate similar to the interests just described. The Company evaluates its debt investments at least quarterly and differentiates the relative credit quality principally based on: (i) whether the borrower is currently paying contractual debt service or guaranteed preferred equity payments in accordance with its contractual terms; and (ii) whether the Company believes the borrower will be able to perform under its contractual terms in the future, as well as the Company’s expectations as to the ultimate recovery of principal at maturity. The Company considered investments for which it expects to receive full payment of contractual principal and interest payments as “performing.” As of December 31, 2016, all investments are considered to be performing. In the event that an investment is deemed other than performing, the Company will evaluate the instrument for any required impairment.
| 4. | Fair Value of Financial Instruments |
We are required to disclose an estimate of fair value of our financial instruments for which it is practicable to estimate the value. The fair value of a financial instrument is the amount at which such financial instrument could be exchanged in a current transaction between willing parties, other than in a forced sale or liquidation. For certain of our financial instruments, fair values are not readily available since there are no active trading markets as characterized by current exchanges by willing parties.
We determine the fair value of certain investments in accordance with the fair value hierarchy that requires an entity to maximize the use of observable inputs. The fair value hierarchy includes the following three levels based on the objectivity of the inputs, which were used for categorizing the assets or liabilities for which fair value is being measured and reported:
Level 1 – Quoted market prices in active markets for identical assets or liabilities.
Level 2 – Significant other observable inputs (e.g., quoted prices for similar items in active markets, quoted prices for identical or similar items in markets that are not active, inputs other than quoted prices that are observable such as interest rate and yield curves, and market-corroborated inputs).
Level 3 – Valuation generated from model-based techniques that use inputs that are significant and unobservable in the market. These unobservable assumptions reflect estimates of inputs that market participants would use in pricing the asset or liability. Valuation techniques include use of option pricing models, discounted cash flow methodologies or similar techniques, which incorporate management’s own estimates of assumptions that market participants would use in pricing the instrument or valuations that require significant management judgment or estimation.
The Company’s financial instruments consist of cash, restricted cash, one debt investment, one equity method investment, a note payable to a related party, and accounts payable. The carrying values of cash and cash equivalents, restricted cash, receivables, note payable to a related party, and accounts payable are reasonable estimates of their fair value. The aggregate fair value of our debt investment and investment in equity method investee is based on unobservable Level 3 inputs which management has determined to be its best estimate of current market values.
As a result of this assessment, as of December 31, 2016, management estimated the carrying value of the debt investment and investment in equity method investee are reasonable estimates of their fair value.
| 5. | Borrowings |
During the year ended December 31, 2016, the Company borrowed funds in the amount of $7,680,000 on its promissory grid note arrangement with a related party. As of December 31, 2016, principal and interest totaling $7,696,958 remained payable to our Sponsor. See Note 6 – Related Party Arrangements –Rise Companies Corp.
| F-17 |
| 6. | Related Party Arrangements |
Fundrise Advisors, LLC, Manager
Subject to certain restrictions and limitations, the Manager is responsible for managing the Company’s affairs on a day-to-day basis and for identifying and making acquisitions and investments on behalf of the Company.
The Manager and certain affiliates of the Manager receive fees and compensation in connection with the Company’s public offering, and the acquisition, management and sale of the Company’s real estate investments.
The Manager will be reimbursed for organizational and offering expenses incurred in conjunction with the Offering. The Company will reimburse the Manager, subject to the reimbursement limit previously described, for actual expenses incurred on behalf of the Company in connection with the selection, acquisition or origination of an investment, to the extent not reimbursed by the borrower, whether or not the Company ultimately acquires or originates the investment. The Company will reimburse the Manager for out-of-pocket expenses paid to third parties in connection with providing services to the Company. This does not include the Manager’s overhead, employee costs borne by the Manager, utilities or technology costs. Expense reimbursements payable to the Manager also may include expenses incurred by the Sponsor in the performance of services pursuant to a shared services agreement between the Manager and the Sponsor, including any increases in insurance attributable to the management or operation of the Company. See Note 2 – Summary of Significant Accounting Policies – Organizational, Offering and Related Costs.
The following table summarizes reimbursable costs incurred by the Company during the year ended December 31, 2016 and for the period November 19, 2015 (Inception) through December 31, 2015(amounts in thousands):
| Reimbursable Organizational and Offering Costs Due to Fundrise Advisors, LLC: | As of December 31, 2016 | For the Period November 19, 2015 (Inception) through December 31, 2015 | ||||||
| Organizational and other reimbursable costs | $ | 29 | $ | — | ||||
| Offering costs(1) | 439 | — | ||||||
| Reimbursements made | (39 | ) | — | |||||
| Balance as of December 31, 2016 | $ | 429 | $ | — | ||||
| (1) | As of December 31, 2016, $56,589 of offering costs were amortized against members’ equity, which represents the ratable portion of proceeds raised to date to the total amount of proceeds expected to be raised from the Offering. |
The Company will pay the Manager a quarterly asset management fee of one-fourth of 1.00%, which, until December 31, 2017, will be based on our net offering proceeds as of the end of each quarter, unless the Manager does not require reimbursement in any particular quarter, and thereafter will be based on our NAV at the end of each prior quarter.
The Company’s Manager has agreed, for a period until December 31, 2016 (the “fee waiver period”), to waive its asset management fee during the fee waiver period if the average annualized non-compounded return to investors is less than eight percent (8%). Following the conclusion of the fee waiver period, our Manager may, in its sole discretion, waive its asset management fee, in whole or in part. The Manager will forfeit any portion of the asset management fee that is waived. Accordingly, during the year ended December 31, 2016 and the period
| F-18 |
November 19, 2015 (Inception) through December 31, 2015, no asset management fees have been paid or accrued to the Manager.
The Company will also pay the Manager a special servicing fee for any non-performing asset at an annualized rate of 2.00%, which will be based on the original value of such non-performing asset. The Manager will determine, in its sole discretion, whether an asset is non-performing. As of December 31, 2016 and December 31, 2015, the Manager has not designated any asset as non-performing and no special servicing fees have been paid to the Manager.
The Company will also pay the Manager a disposition fee from the liquidation of any of our equity investments in real estate equal to 0.5% of the gross proceeds after repayment of any property level debt. As of December 31, 2016 and December 31, 2015, no equity investments had been acquired or disposed of, and accordingly no disposition fees were incurred.
Fundrise Servicing, LLC
Fundrise Servicing, LLC may receive a fee from 0.00% to 0.50% for the ongoing servicing and administration of certain loans and investments held by us. The fee is calculated as an annual percentage of the stated value of the loan and is deducted at the time that payments on the loan are made. The fee is deducted from payments in proportion to the split between current and accrued payments. Servicing fees may be waived at Fundrise Servicing, LLC’s sole discretion. As of December 31, 2016 and December 31, 2015, the Company had not paid any servicing fees nor had any servicing fees been accrued to Fundrise Servicing, LLC.
Fundrise Lending, LLC
As an alternative means of acquiring loans or other investments for which we do not yet have sufficient funds, and in order to comply with certain state lending requirements, Fundrise Lending, LLC or its affiliates may close and fund a loan or other investment prior to it being acquired by us. The ability to warehouse investments allows us the flexibility to deploy our offering proceeds as funds are raised. We then will acquire such investment at a price equal to the fair market value of the loan or other investment (including reimbursements for servicing fees and accrued interest, if any), so there is no mark-up (or mark-down) at the time of our acquisition.
For situations where our sponsor, Manager or their affiliates have a conflict of interest with us that is not otherwise covered by an existing policy we have adopted or a transaction is deemed to be a “principal transaction”, the Manager has appointed an independent representative (the “Independent Representative”) to protect the interests of the shareholders and review and approve such transactions. Any compensation payable to the Independent Representative for serving in such capacity on our behalf will be payable by us. Principal transactions are defined as transactions between our Sponsor, Manager or their affiliates, on the one hand, and us or one of our subsidiaries, on the other hand. Our Manager is only authorized to execute principal transactions with the prior approval of the Independent Representative and in accordance with applicable law. Such prior approval may include but not be limited to pricing methodology for the acquisition of assets and/or liabilities for which there are no readily observable market prices. During the year ended December 31, 2016 and the period November 19, 2015 (Inception) through December 31, 2015 fees of $4,000 and $0, respectively, were paid to the Independent Representative as compensation for those services.
Fundrise, L.P., Member
As an alternative means of acquiring loans or other investments for which we do not yet have sufficient funds, Fundrise L.P. may provide capital to Fundrise Lending, LLC for the purposes of acquiring investments where there would otherwise be insufficient capital. During the year ended December 31, 2016, Fundrise, L.P. did not provide capital to Fundrise Lending, LLC for the purposes of acquiring investments on behalf of the company.
| F-19 |
Fundrise, L.P. is a member of the Company and holds 9,500 shares as of December 31, 2016. Fundrise, L.P. did not hold any shares at December 31, 2015, but was committed to purchase 9,500 shares. One of our Sponsor’s wholly-owned subsidiaries is the general partner of Fundrise L.P.
Rise Companies Corp, Member and Sponsor
As a means to provide liquidity during capital raising periods, Rise Companies Corp. issued a promissory grid note to the Company and its affiliates in the amount of $10,000,000. The loan bears a 2.5% interest rate and expires on January 31, 2017. The total drawn between the five noteholders may not exceed $10,000,000. As of December 31, 2016, the Company has drawn against the promissory grid note in the amount of $7,680,000 and $16,958 of interest has been incurred and remains payable to Rise Companies Corp.
Rise Companies Corp is a member of the Company and holds 500 shares as of December 31, 2016 and as of December 31, 2015.
Executive Officers of Our Manager
As of the date of these financial statements, the executive officers of our Manager and their positions and offices are as follows:
| Name | Position | |
| Benjamin S. Miller | Chief Executive Officer and Interim Chief Financial Officer and Treasurer | |
| Brandon T. Jenkins | Chief Operating Officer | |
| Bjorn J. Hall | General Counsel, Chief Compliance Officer, and Secretary |
Benjamin S. Millercurrently serves asChief Executive Officer of our Manager and has served as Chief Executive Officer and Director of our Sponsor since its inception on March 14, 2012. As of February 9, 2016, Ben is also serving as Interim Chief Financial Officer and Treasurer of our Manager.
Brandon T. Jenkinscurrently serves as Chief Operating Officer of our Manager and has served in the same role for our Sponsor since February of 2014, prior to which time he served as Head of Product Development and Director of Real Estate.
Bjorn J. Hallcurrently serves as the General Counsel, Chief Compliance Officer and Secretary of our Manager and has served in such capacities with our Sponsor since February 2014.
| 7. | Economic Dependency |
Under various agreements, the Company has engaged or will engage Fundrise Advisors, LLC and its affiliates to provide certain services that are essential to the Company, including asset management services, asset acquisition and disposition decisions, the sale of the Company’s common shares available for issue, as well as other administrative responsibilities for the Company including accounting services and investor relations. As a result of these relationships, the Company is dependent upon Fundrise Advisors, LLC and its affiliates. In the event that these companies were unable to provide the Company with the respective services, the Company would be required to find alternative providers of these services.
| 8. | Commitments and Contingencies |
Legal Proceedings
As of the date of the financial statements we are not currently named as a defendant in any active or pending litigation. However, it is possible that the company could become involved in various litigation matters
| F-20 |
arising in the ordinary course of our business. Although we are unable to predict with certainty the eventual outcome of any litigation, management is not aware of any litigation likely to occur that we currently assess as being significant to us.
| 9. | Subsequent Events |
Offering
As of March 16, 2017, we had raised total gross offering proceeds of approximately $10,352,200 from settled subscriptions (including the $100,000 received in the private placements to our sponsor, Rise Companies Corp., and Fundrise, L.P., an affiliate of our sponsor), and had settled subscriptions in our Offering and private placements for a gross aggregate of approximately 1,035,220 of our common shares.
Organizational, Offering and Related Costs
As a result of the Offering raising in excess of the $1,000,000 threshold, the organizational, offering and related costs paid by the Manager or its affiliates on behalf of the Company are required to be reimbursed by the Company. As of March 16, 2017 $111,317 of reimbursement payments have been made.
New Investments
As of March 16, 2017, the Company has made additional investments in the amount of $6,501,503. Including the investments reported on the balance sheet as of December 31, 2016, the Company has now invested in $19,151,503 of commercial real estate assets with total capital commitments of $19,151,503. The economic terms of these investments are similar to the investments that had been made as of December 31, 2016.
Distributions
On October 26, 2016, the Manager of the Company ratified a daily distribution of $0.0008219178 per share (the “November 2016 Daily Distribution Amount”) for shareholders of record as of the close of business on each day of the period commencing on November 1, 2016 and ending on November 30, 2016 (the “November 2016 Distribution Period”). The distributions were payable to shareholders of record as of the close of business on each day of the November 2016 Distribution Period. On November 30, 2016, the Manager of the Company ratified a daily distribution of $0.0013698630 per share (the “December 2016 Daily Distribution Amount”) for shareholders of record as of the close of business on each day of the period commencing on December 1, 2016 and ending on December 31, 2016 (the “December 2016 Distribution Period”). The distributions were payable to shareholders of record as of the close of business on each day of the December 2016 Distribution Period. The November 2016 and December 2016 distributions were paid within the first three weeks of the end of the December 2016 Distribution Period. The aggregate amount of cash that was distributed relating to the November 2016 and December 2016 Distribution Periods was $33,993.
On December 31, 2016, the Manager of the Company ratified a daily distribution of $0.0022602740 per share (the “Q1 2017 Daily Distribution Amount”) for shareholders of record as of the close of business on each day of the period commencing on January 1, 2017 and ending on March 31, 2017 (the “Q1 2017 Distribution Period”). The distributions are payable to shareholders of record as of the close of business on each day of the Q1 2017 Distribution Period and the distributions are scheduled to be paid within the first three weeks of the end of the Q1 2017 Distribution Period. The aggregate estimated amount of cash to be distributed related to the Q1 2017 Distribution Period is approximately $132,000. We will begin processing Q1 2017 distributions prior to April 21, 2017.
| F-21 |
Settling Subscriptions
The entire amount of the $443,150 of settling subscriptions that existed as of December 31, 2016 were subsequently settled and common shares were issued by January 10, 2017.
Amended and Restated Promissory Grid Note
On October 25, 2016, the Company entered into an amended and restated promissory grid note, as borrower, with Rise Companies Corp, our Sponsor, as lender. The amended and restated note provides up to $10,000,000 in credit. On January 31, 2017, the expiration date was extended to April 30, 2017, and the interest rate increased to 3%. The Company did not pay any extension or other fees related to the amendment of this note. Additional draws and repayments of $2,320,000 and $700,000, respectively were made. As of March 16, 2017, the outstanding principal and interest balance on the promissory grid note was $9,371,909.
On January 17, 2017, the Company entered into an additional promissory note, as borrower, with Rise Companies Corp, our Sponsor, as lender. The note provided $2,310,000 in credit, which was drawn down on in its entirety. The loan bears a 2.5% interest rate and expires on April 30, 2017. As of March 16, 2017, the entire promissory note balance and all outstanding interest had been repaid.
| F-22 |
| Item 8. | Exhibits |
INDEX OF EXHIBITS
| Exhibit No. | Description | |
| 2.1** | Certificate of Formation (incorporated by reference to the copy thereof submitted as Exhibit 2.1 to the Company’s DOS/A filed as Exhibit 15.3 of Form 1-A) | |
| 2.2** | Certificate of Amendment (incorporated by reference to the copy thereof submitted as Exhibit 2.2 to the Company’s DOS/A filed as Exhibit 15.3 of Form 1-A) | |
| 2.3** | Amended and Restated Operating Agreement (incorporated by reference to the copy thereof submitted as Exhibit 2.3 to the Company’s DOS/A filed as Exhibit 15.3 of Form 1-A) | |
| 4.1** | Form of Subscription Package (incorporated by reference to the copy thereof submitted as Exhibit 4.1 of Form 1-A) | |
| 6.1** | Form of License Agreement between Fundrise East Coast Opportunistic REIT, LLC and Fundrise, LLC (incorporated by reference to the copy thereof submitted as Exhibit 6.1 to the Company’s DOS/A filed as Exhibit 15.3 of Form 1-A) | |
| 6.2** | Form of Fee Waiver Support Agreement between Fundrise East Coast Opportunistic REIT, LLC and Fundrise Advisors, LLC (incorporated by reference to the copy thereof submitted as Exhibit 6.2 to the Company’s DOS/A filed as Exhibit 15.3 of Form 1-A) | |
| 6.3** | Form of Shared Services Agreement between Rise Companies Corp. and Fundrise Advisors, LLC (incorporated by reference to the copy thereof submitted as Exhibit 6.3 to the Company’s DOS/A filed as Exhibit 15.3 of Form 1-A) | |
| 6.4** | Form of Servicing Agreement between Fundrise East Coast Opportunistic REIT, LLC and Fundrise Servicing, LLC (incorporated by reference to the copy thereof submitted as Exhibit 6.4 to the Company’s DOS/A filed as Exhibit 15.3 of Form 1-A) | |
| 11.1* | Consent of Aronson LLC | |
| 15.1** | Draft offering statement previously submitted pursuant to Rule 252(d) (incorporated by reference to the copy thereof previously made public pursuant to Rule 301 of Regulation S-T) | |
| 15.2** | Draft amended offering statement previously submitted pursuant to Rule 252(d) (incorporated by reference to the copy thereof previously made public pursuant to Rule 301 of Regulation S-T) | |
| 15.3** | Draft amended offering statement previously submitted pursuant to Rule 252(d) (incorporated by reference to the copy thereof previously made public pursuant to Rule 301 of Regulation S-T) | |
| 15.4** | Correspondence by or on behalf of the issuer previously submitted pursuant to Rule 252(d) (incorporated by reference to the copy thereof previously made public pursuant to Rule 301 of Regulation S-T) |
| * | Filed herewith |
| ** | Filed previously |
| 46 |
SIGNATURES
Pursuant to the requirements of Regulation A, the issuer has duly caused this Annual Report to be signed on its behalf by the undersigned, thereunto duly authorized, in Washington, D.C. on April 13, 2017.
| Fundrise East Coast Opportunistic REIT, LLC | ||
| By: | Fundrise Advisors, LLC, a Delaware limited liability company, its Manager | |
| By: | /s/ Benjamin S. Miller | ||
| Name: | Benjamin S. Miller | ||
| Title: | Chief Executive Officer | ||
Pursuant to the requirements of Regulation A, this report has been signed below by the following persons on behalf of the issuer in the capacities and on the dates indicated.
| Signature | Title | Date | ||
| /s/ Benjamin S. Miller | Chief Executive Officer, | April 13, 2017 | ||
| Benjamin S. Miller | Interim Chief Financial Officer | |||
| and Treasurer of | ||||
| Fundrise Advisors, LLC (Principal Executive Officer, Principal Financial Officer and Principal Accounting Officer) |
| 47 |