UNITED STATES
SECURITIES AND EXCHANGE COMMISSION
Washington, D.C. 20549
FORM N-CSR
Certified Shareholder Report of
Registered Management Investment Companies
Investment Company Act File Number: 811-23122
American Funds Emerging Markets Bond Fund
(Exact Name of Registrant as Specified in Charter)
6455 Irvine Center Drive
Irvine, California 92618
(Address of Principal Executive Offices)
Registrant's telephone number, including area code: (213) 486-9200
Date of fiscal year end: December 31
Date of reporting period: June 30, 2017
Steven I. Koszalka
American Funds Emerging Markets Bond Fund
333 South Hope Street
Los Angeles, California 90071
(Name and Address of Agent for Service)
ITEM 1 – Reports to Stockholders
 | American Funds Emerging
Markets Bond Fund®
Semi-annual report
for the six months ended
June 30, 2017 |

Find compelling
opportunities in
emerging markets
bonds with a flexible
approach.
American Funds Emerging Markets Bond Fund seeks to provide a high level of total return over the long term, of which current income is a large component.
This fund is one of more than 40 offered by one of the nation’s largest mutual fund families, American Funds, from Capital Group. For more than 85 years, Capital has invested with a long-term focus based on thorough research and attention to risk.
Fund results shown in this report, unless otherwise indicated, are for Class A shares at net asset value. If a sales charge (maximum 3.75%) had been deducted, the results would have been lower. Results are for past periods and are not predictive of results for future periods. Current and future results may be lower or higher than those shown. Share prices and returns will vary, so investors may lose money. Investing for short periods makes losses more likely. Investments are not FDIC-insured, nor are they deposits of or guaranteed by a bank or any other entity, so they may lose value. For current information and month-end results, visit americanfunds.com.
Here are the returns on a $1,000 investment with all distributions reinvested for the period ended June 30, 2017:
| | | Cumulative
total return | | Average annual
total return |
| Class A shares | | 1 year | | Lifetime (since 4/22/16) |
| | | | | |
| Reflecting 3.75% maximum sales charge | | 3.91% | | 5.49% |
The fund’s gross expense ratio for Class A shares is 1.16%, and the net expense ratio is 1.08% as of the prospectus dated April 7, 2017.
Investment results assume all distributions are reinvested and reflect applicable fees and expenses. The investment adviser is currently reimbursing a portion of other expenses. The reimbursement will be in effect through at least April 7, 2018. The adviser may elect to extend, modify or terminate the reimbursement at that time. The investment results shown reflect the reimbursement, without which the results would have been lower. Refer to the fund’s most recent prospectus for details.
The return of principal for bond funds and for funds with significant underlying bond holdings is not guaranteed. Fund shares are subject to the same interest rate, inflation and credit risks associated with the underlying bond holdings. The use of derivatives involves a variety of risks, which may be different from, or greater than, the risks associated with investing in traditional cash securities, such as stocks and bonds. Lower rated bonds are subject to greater fluctuations in value and risk of loss of income and principal than higher rated bonds. Investing outside the United States involves additional risks, such as currency fluctuations, periods of illiquidity and price volatility, as more fully described in the prospectus. These risks may be heightened in connection with investments in developing countries. Refer to the fund prospectus and the Risk Factors section of this report for more information on these and other risks associated with investing in the fund.
Fellow investors:
Emerging markets bonds rallied in the first half of American Funds Emerging Markets Bond Fund’s fiscal year. Bond yields (which move inversely to prices) declined in some markets as global economic conditions showed signs of modest improvement. A number of currencies appreciated against the U.S. dollar, providing a tailwind to market returns.
Over the six-month period ended June 30, 2017, the fund recorded a total return of 8.99%. Dividends were paid at each month-end between January and June, totaling 30 cents a share. Fund investors who reinvested their dividends earned an income return of 3.12%. For those taking their dividends in cash, the figure was 3.08%.
By way of comparison, the J.P. Morgan Emerging Markets Bond Index (EMBI) Global Diversified* recorded a return of 6.19% over the same period. This index measures broad returns across U.S. dollar-denominated emerging markets bonds. Because of the fund portfolio’s greater emphasis on local currency bonds, exposure to appreciating currencies such as the Russian ruble and Indian rupee helped fund results relative to the dollar bond market index. Domestic currency emerging markets bonds, as measured by the J.P. Morgan Government Bond Index-Emerging
Results at a glance
For periods ended June 30, 2017, with all distributions reinvested
| | | Cumulative
total returns | | Average annual
total returns |
| | | | | | | Lifetime |
| | | 6 months | | 1 year | | (since 4/22/16) |
| | | | | | | |
| American Funds Emerging Markets Bond Fund (Class A shares) | | | 8.99 | % | | | 8.01 | % | | | 8.94 | % |
| J.P. Morgan Emerging Markets Bond Index (EMBI) Global Diversified* | | | 6.19 | | | | 6.04 | | | | 8.12 | |
| J.P. Morgan Government Bond Index-Emerging Markets (GBI-EM) Global Diversified* | | | 10.36 | | | | 6.41 | | | | 7.00 | |
| Lipper Emerging Market Hard Currency Debt Funds Average† | | | 6.62 | | | | 7.77 | | | | 9.18 | |
| * | The index is unmanaged, and its results include reinvested dividends and/or distributions but do not reflect the effect of account fees, expenses or U.S. federal income taxes. Investors cannot invest directly in an index. This report, and any product, index or fund referred to herein, is not sponsored, endorsed or promoted in any way by J.P. Morgan or any of its affiliates who provide no warranties whatsoever, express or implied, and shall have no liability to any prospective investor, in connection with this report. J.P. Morgan disclaimer: http://www.jpmorgan.com/pages/jpmorgan/ib/girg. |
| † | Lipper averages reflect the current composition of all eligible mutual funds (all share classes) within a given category. Source: Thomson Reuters Lipper. Lipper categories are dynamic and averages may have few funds, especially over longer periods. To see the number of funds included in the Lipper category for each fund’s lifetime, please see the Quarterly Statistical Update, available on our website. |
| American Funds Emerging Markets Bond Fund | 1 |
Markets (GBI-EM) Global Diversified*, rose 10.36% in U.S. dollar terms. A 50%–50% blend of this local currency index and the dollar bond market index gained 8.26%.
Market overview
Neither mixed prices for commodities (key exports for developing economies) nor the U.S. Federal Reserve’s decision to raise interest rates in March and June curbed investor demand.
In Mexico, local currency and dollar-denominated bonds notched six-month gains of 8.0% and 22.0%, respectively. With hopes for an amicable renegotiation of the North American Free Trade Agreement growing, the peso strengthened 14% against the U.S. dollar. Brazilian dollar-denominated bonds gained 7.1%, and local issues rose 7.4% in dollar terms. The real depreciated 2% over the first half of 2017. Volatility struck late on as President Michel Temer was accused of bribery and indicted on charges of corruption.
In Russia, dollar-denominated bonds gained 3.5%, while local currency bonds rose 9.5% in U.S. dollar terms. Despite OPEC’s effort to support higher oil prices by extending production cuts, prices for crude oil (a major Russian export) declined. As of June 30 2017, crude oil was trading below $50 a barrel.
Inside the portfolio
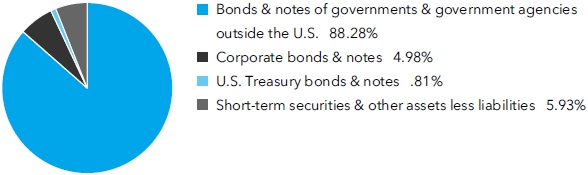
As of June 30, 2017, 88.3% of the fund’s portfolio was invested in government bonds issued in U.S. dollars and local currencies. Of the 42 countries represented in the portfolio, Mexico, Brazil, Turkey, India, South Africa, Poland and Indonesia figured prominently.
Though exposure to local currency Brazilian government bonds was significantly reduced, the country remains one of the fund’s larger currency and country exposures. Portfolio managers continue to monitor the political situation there. Conversely, portfolio managers increased investments in Mexican government bonds. The Mexican peso — one of the fund’s larger currency exposures — has continued to be modestly undervalued according to various measures of fair value. Attractive valuations in Africa and the Middle East prompted an increase in investments in government bonds from Egypt, Zambia and Turkey.
In Europe, fund holdings of Hungarian government bonds were reduced. Our research suggests inflation there could move higher, given the current policy of the Hungarian central bank. Elsewhere, portfolio managers added to investments in India. The central bank recently lowered its inflation forecast, bolstering the attractiveness of yields among local currency bonds.
| * | This report, and any product, index or fund referred to herein, is not sponsored, endorsed or promoted in any way by J.P. Morgan or any of its affiliates who provide no warranties whatsoever, express or implied, and shall have no liability to any prospective investor, in connection with this report. J.P. Morgan disclaimer: http://www.jpmorgan.com/pages/jpmorgan/ib/girg. |
| 2 | American Funds Emerging Markets Bond Fund |
Looking ahead
Today’s fundamental outlook includes some positives. Reform efforts offer grounds for guarded optimism. Likewise, the pickup in economic activity in developed economies should be supportive of prices for energy and industrial commodities over time. Also, investor confidence in emerging markets debt has shown resilience.
We’re mindful, however, that higher U.S. interest rates and changes to U.S. tax and trade policies could prompt volatility. A degree of caution, therefore, seems appropriate. Against this backdrop, our research is finding some reasonable relative value in certain local bond markets, thanks in part to an anticipated tailwind to total returns from currency. We are also finding opportunities to seek value in other ways — by favoring bonds of particular maturities, or emphasizing inflation-linked issues in certain markets.
The fund uses derivatives to manage its exposure to interest rates and currencies. Instruments such as interest rate swaps and forward currency contracts are used when cash bonds are unavailable or not attractively priced.
The fund has primarily used derivatives to manage the currency exposure of bonds denominated in emerging markets currencies (as of June 30, overall currency exposure via derivatives and local currency bonds in combination had a positive impact on the fund’s six-month result relative to the dollar bond market index).
Finally we’d like to take this opportunity to say thanks and farewell to fund portfolio manager Laurentius Harrer, who recently retired. We are grateful you have chosen to invest in American Funds Emerging Markets Bond Fund, and look forward to reporting to you again in six months’ time.
Cordially,

Robert H. Neithart
President
August 16, 2017
For current information about the fund, visit americanfunds.com.
The fund’s 30-day yield for Class A shares as of July 31, 2017, reflecting the 3.75% maximum sales charge and calculated in accordance with the U.S. Securities and Exchange Commission formula, was 5.78% (4.73% without the reimbursement).
| American Funds Emerging Markets Bond Fund | 3 |
| Summary investment portfolio June 30, 2017 | unaudited |
| Portfolio by type of security | Percent of net assets |
| Portfolio quality summary* | Percent of net assets | |
| U.S. Treasury and agency† | | | .81 | % |
| AA/Aa | | | 1.48 | |
| A/A | | | 20.78 | |
| BBB/Baa | | | 33.03 | |
| Below investment grade | | | 33.50 | |
| Unrated | | | 4.47 | |
| Short-term securities & other assets less liabilities | | | 5.93 | |
| * | Bond ratings, which typically range from AAA/Aaa (highest) to D (lowest), are assigned by credit rating agencies such as Standard & Poor’s, Moody’s and/or Fitch as an indication of an issuer’s creditworthiness. In assigning a credit rating to a security, the fund looks specifically to the ratings assigned to the issuer of the security by Standard & Poor’s, Moody’s and/or Fitch. If agency ratings differ, the security will be considered to have received the highest of those ratings, consistent with the fund’s investment policies. Securities in the “unrated” category (above) have not been rated by a rating agency; however, the investment adviser performs its own credit analysis and assigns comparable ratings that are used for compliance with the fund’s investment policies. |
| † | These securities are guaranteed by the full faith and credit of the U.S. government. |
| Bonds, notes & other debt instruments 94.07% | | Principal amount
(000) | | | Value
(000) | |
| Bonds & notes of governments & government agencies outside the U.S. 88.28% | | | | | | | | |
| Argentine Republic 6.875% 2021 | | $ | 1,400 | | | $ | 1,504 | |
| Argentine Republic 7.50% 2026 | | | 1,400 | | | | 1,509 | |
| Argentine Republic 2.50%–21.20% 2018–20261,2 | | ARS | 34,221 | | | | 2,020 | |
| Argentine Republic 0%–7.63% 2035–2046 | | $ | 1,325 | | | | 798 | |
| Armenia (Republic of) 7.15% 20253 | | | 1,400 | | | | 1,538 | |
| Brazil (Federative Republic of) 0% 2020 | | BRL | 19,900 | | | | 4,553 | |
| Brazil (Federative Republic of) 10.00% 2023 | | | 4,640 | | | | 1,387 | |
| Brazil (Federative Republic of) 10.00% 2025 | | | 7,925 | | | | 2,340 | |
| Brazil (Federative Republic of) 0%–10.00% 2017–20271 | | | 8,591 | | | | 2,554 | |
| Colombia (Republic of), Series UVL, 3.50% 20211 | | COP | 1,964,713 | | | | 696 | |
| Colombia (Republic of), Series B, 7.00% 2022 | | | 3,581,400 | | | | 1,234 | |
| Colombia (Republic of), Series B, 7.50% 2026 | | | 8,310,600 | | | | 2,927 | |
| Colombia (Republic of) 3.875% 2027 | | $ | 500 | | | | 505 | |
| Dominican Republic 5.50% 2025 | | | 1,430 | | | | 1,484 | |
| Dominican Republic 6.875% 20263 | | | 1,000 | | | | 1,121 | |
| 4 | American Funds Emerging Markets Bond Fund |
| | | Principal amount
(000) | | | Value
(000) | |
| Dominican Republic 5.95%–7.50% 2021–20453,4 | | $ | 1,400 | | | $ | 1,519 | |
| Egypt (Arab Republic of) 7.50% 20273 | | | 1,500 | | | | 1,596 | |
| Egypt (Arab Republic of) 5.88%–8.50% 2025–20473 | | | 800 | | | | 804 | |
| Ghana (Republic of) 19.00%–24.75% 2019–2026 | | GHS | 7,620 | | | | 1,903 | |
| Ghana (Republic of) 7.88%–8.13% 2023–20263,4 | | $ | 1,350 | | | | 1,381 | |
| Honduras (Republic of) 8.75% 2020 | | | 400 | | | | 456 | |
| Honduras (Republic of) 6.25% 20273 | | | 2,675 | | | | 2,775 | |
| Hungary 5.375% 2024 | | | 790 | | | | 891 | |
| Hungary 5.50%–7.50% 2020–2025 | | HUF | 185,800 | | | | 837 | |
| India (Republic of) 7.80% 2021 | | INR | 119,300 | | | | 1,920 | |
| India (Republic of) 8.60% 2028 | | | 170,300 | | | | 2,946 | |
| India (Republic of) 7.59% 2029 | | | 162,000 | | | | 2,624 | |
| India (Republic of) 7.61%–7.73% 2030–2034 | | | 60,350 | | | | 993 | |
| Indonesia (Republic of), Series 70, 8.375% 2024 | | IDR | 21,391,000 | | | | 1,746 | |
| Indonesia (Republic of), Series 59, 7.00% 2027 | | | 13,939,000 | | | | 1,059 | |
| Indonesia (Republic of), Series 72, 8.25% 2036 | | | 17,425,000 | | | | 1,405 | |
| Indonesia (Republic of) 7.00%–7.88% 2019–2022 | | | 17,150,000 | | | | 1,313 | |
| Indonesia (Republic of) 3.38%–4.88% 2021–20263 | | $ | 1,300 | | | | 1,364 | |
| Jordan (Hashemite Kingdom of) 5.75% 20273 | | | 1,100 | | | | 1,097 | |
| Kenya (Republic of) 6.875% 2024 | | | 2,225 | | | | 2,281 | |
| Malaysia (Federation of), Series 0215, 3.795% 2022 | | MYR | 9,100 | | | | 2,116 | |
| Malaysia (Federation of), Series 0316, 3.90% 2026 | | | 4,800 | | | | 1,113 | |
| Malaysia (Federation of), Series 0415, 4.254% 2035 | | | 5,800 | | | | 1,310 | |
| Malaysia (Federation of) 4.50%–4.79% 2030–2035 | | | 2,710 | | | | 644 | |
| Morocco (Kingdom of) 4.25% 2022 | | $ | 1,250 | | | | 1,312 | |
| Nigeria (Republic of) 14.20% 20245 | | NGN | 450,000 | | | | 1,150 | |
| Pakistan (Islamic Republic of) 5.50%–8.25% 2021–20253 | | $ | 1,550 | | | | 1,708 | |
| Panama (Republic of) 4.50% 20474 | | | 2,100 | | | | 2,129 | |
| Paraguay (Republic of) 5.00% 2026 | | | 1,000 | | | | 1,059 | |
| Paraguay (Republic of) 4.70%–5.00% 2026–20273 | | | 900 | | | | 947 | |
| Peru (Republic of) 5.70% 2024 | | PEN | 3,000 | | | | 963 | |
| Peru (Republic of) 6.35% 2028 | | | 7,100 | | | | 2,328 | |
| Peru (Republic of) 6.95% 2031 | | | 4,830 | | | | 1,651 | |
| Poland (Republic of), Series 0420, 1.50% 2020 | | PLN | 4,500 | | | | 1,196 | |
| Poland (Republic of), Series 0922, 5.75% 2022 | | | 15,860 | | | | 4,911 | |
| Poland (Republic of), Series 0726, 2.50% 2026 | | | 3,800 | | | | 971 | |
| Russian Federation 6.70% 2019 | | RUB | 100,000 | | | | 1,670 | |
| Russian Federation 7.50% 2021 | | | 52,300 | | | | 878 | |
| Russian Federation 7.00% 2023 | | | 129,600 | | | | 2,121 | |
| Russian Federation 8.50% 2031 | | | 60,000 | | | | 1,081 | |
| South Africa (Republic of), Series R-2023, 7.75% 2023 | | ZAR | 11,150 | | | | 836 | |
| South Africa (Republic of), Series R-186, 10.50% 2026 | | | 25,600 | | | | 2,172 | |
| South Africa (Republic of), Series R-214, 6.50% 2041 | | | 58,595 | | | | 3,130 | |
| South Africa (Republic of), Series R-2048, 8.75% 2048 | | | 28,100 | | | | 1,918 | |
| Sri Lanka (Democratic Socialist Republic of) 6.825% 2026 | | $ | 1,000 | | | | 1,056 | |
| Sri Lanka (Democratic Socialist Republic of) 6.00%–6.83% 2019–20273 | | | 2,150 | | | | 2,219 | |
| Thailand (Kingdom of) 2.55% 2020 | | THB | 52,500 | | | | 1,587 | |
| Thailand (Kingdom of) 2.125% 2026 | | | 2,400 | | | | 68 | |
| Turkey (Republic of) 9.20% 2021 | | TRY | 6,600 | | | | 1,798 | |
| Turkey (Republic of) 9.50% 2022 | | | 5,225 | | | | 1,435 | |
| Turkey (Republic of) 9.00% 2024 | | | 11,525 | | | | 3,086 | |
| Turkey (Republic of) 8.00% 2025 | | | 6,200 | | | | 1,556 | |
| American Funds Emerging Markets Bond Fund | 5 |
| Bonds, notes & other debt instruments (continued) | Principal amount
(000) | | | Value
(000) | |
| Bonds & notes of governments & government agencies outside the U.S. (continued) | | | | | | | | |
| Turkey (Republic of) 4.875% 2026 | | $ | 3,500 | | | $ | 3,459 | |
| Turkey (Republic of) 2.40%–11.00% 2020–20261 | | TRY | 6,613 | | | | 1,791 | |
| United Mexican States, Series M, 6.50% 2021 | | MXN | 88,700 | | | | 4,873 | |
| United Mexican States, Series M, 5.75% 2026 | | | 39,800 | | | | 2,049 | |
| United Mexican States 4.60% 2046 | | $ | 1,100 | | | | 1,078 | |
| United Mexican States Government Global, Series A, 5.75% 2110 | | | 1,350 | | | | 1,407 | |
| United Mexican States 2.00%–10.00% 2020–20461 | | MXN | 57,974 | | | | 3,671 | |
| United Mexican States 4.00%–4.15% 2023–2027 | | $ | 1,755 | | | | 1,830 | |
| Zambia (Republic of) 11.00% 2021–2022 | | ZMW | 10,175 | | | | 869 | |
| Zambia (Republic of) 5.38%–8.97% 2022–20274 | | $ | 1,200 | | | | 1,240 | |
| Other securities | | | | | | | 8,037 | |
| | | | | | | | 139,503 | |
| Corporate bonds & notes 4.98% | | | | | | | | |
| Energy 2.93% | | | | | | | | |
| Petrobras Global Finance Co. 4.38%–8.75% 2022–2115 | | | 2,645 | | | | 2,539 | |
| Petróleos Mexicanos 7.19% 2024 | | MXN | 8,370 | | | | 418 | |
| Petróleos Mexicanos 5.38%–6.88% 2021–20473 | | $ | 1,397 | | | | 1,439 | |
| Other securities | | | | | | | 226 | |
| | | | | | | | 4,622 | |
| Utilities 1.36% | | | | | | | | |
| State Grid Overseas Investment Ltd. 3.50% 20273 | | | 1,930 | | | | 1,935 | |
| Other securities | | | | | | | 217 | |
| | | | | | | | 2,152 | |
| Materials 0.44% | | | | | | | | |
| Other securities | | | | | | | 702 | |
| | | | | | | | | |
| Telecommunication services 0.25% | | | | | | | | |
| Other securities | | | | | | | 394 | |
| | | | | | | | | |
| Total corporate bonds & notes | | | | | | | 7,870 | |
| | | | | | | | | |
| U.S. Treasury bonds & notes 0.81% | | | | | | | | |
| | | | | | | | | |
| U.S. Treasury 0.81% | | | | | | | | |
| Other securities | | | | | | | 1,273 | |
| | | | | | | | | |
| Total bonds, notes & other debt instruments (cost: $144,931,000) | | | | | | | 148,646 | |
| | | | | | | | | |
| Short-term securities 3.83% | | | | | | | | |
| Egyptian Treasury Bills 15.77%–17.69% due 8/1/2017–2/20/2018 | | EGP | 70,550 | | | | 3,593 | |
| General Electric Co. 1.08% due 7/3/2017 | | $ | 1,200 | | | | 1,200 | |
| Nigerian Treasury Bills 17.71%–17.91% due 5/3/2018–6/21/20185 | | NGN | 551,735 | | | | 1,263 | |
| | | | | | | | | |
| Total short-term securities (cost: $6,134,000) | | | | | | | 6,056 | |
| Total investment securities 97.90% (cost: $151,065,000) | | | | | | | 154,702 | |
| Other assets less liabilities 2.10% | | | | | | | 3,314 | |
| | | | | | | | | |
| Net assets 100.00% | | | | | | $ | 158,016 | |
| 6 | American Funds Emerging Markets Bond Fund |
This summary investment portfolio is designed to streamline the report and help investors better focus on the fund’s principal holdings. See the inside back cover for details on how to obtain a complete schedule of portfolio holdings.
“Other securities” includes all issues that are not disclosed separately in the summary investment portfolio. “Other securities” also includes securities which were pledged as collateral. The total value of pledged collateral was $142,000, which represented .09% of the net assets of the fund.
Forward currency contracts
| Contract amount | | | | | | Unrealized
appreciation
(depreciation) | |
Purchases
(000) | | Sales
(000) | | Counterparty | | Settlement
date | | at 6/30/2017
(000) | |
| USD1,403 | | ZAR18,150 | | UBS AG | | 7/7/2017 | | | $18 | |
| USD1,007 | | ZAR13,050 | | UBS AG | | 7/7/2017 | | | 11 | |
| MXN4,838 | | USD263 | | Bank of America, N.A. | | 7/10/2017 | | | 3 | |
| USD2,096 | | INR135,500 | | JPMorgan Chase | | 7/10/2017 | | | 2 | |
| MXN5,375 | | USD293 | | Bank of America, N.A. | | 7/10/2017 | | | 2 | |
| USD1,054 | | MXN19,300 | | Bank of America, N.A. | | 7/10/2017 | | | (8 | ) |
| USD2,153 | | INR138,900 | | Citibank | | 7/13/2017 | | | 8 | |
| USD725 | | BRL2,400 | | Citibank | | 7/14/2017 | | | 3 | |
| MXN15,536 | | USD856 | | JPMorgan Chase | | 7/17/2017 | | | (2 | ) |
| USD287 | | ZAR3,700 | | JPMorgan Chase | | 7/19/2017 | | | 6 | |
| USD362 | | BRL1,200 | | HSBC Bank | | 7/20/2017 | | | 1 | |
| USD741 | | MYR3,200 | | JPMorgan Chase | | 7/24/2017 | | | (4 | ) |
| USD81 | | BRL305 | | Citibank | | 10/2/2017 | | | (9 | ) |
| | | | | | | | | | $31 | |
Swap contracts
Interest rate swaps
| Receive | | Pay | | Expiration
date | | Notional
(000) | | | Value at
6/30/2017
(000) | | | Upfront
payments/
receipts
(000) | | | Unrealized
appreciation
at 6/30/2017
(000) | |
| 7.505% | | 28-day MXN-TIIE | | 3/31/2027 | | MXN14,500 | | | | $ 20 | | | | $ — | | | | $ 20 | |
| 7.195% | | 28-day MXN-TIIE | | 6/9/2027 | | | 30,000 | | | | 2 | | | | — | | | | 2 | |
| 3-month USD-LIBOR | | 2.4775% | | 5/25/2047 | | | $1,500 | | | | 17 | | | | — | | | | 17 | |
| | | | | | | | | | | | | | | | $ — | | | | $ 39 | |
The following footnotes apply to either the individual securities noted or one or more of the securities aggregated and listed as a single line item.
| 1 | Index-linked bond whose principal amount moves with a government price index. |
| 2 | Coupon rate may change periodically. |
| 3 | Acquired in a transaction exempt from registration under Rule 144A of the Securities Act of 1933. May be resold in the U.S. in transactions exempt from registration, normally to qualified institutional buyers. The total value of all such securities was $18,911,000, which represented 11.97% of the net assets of the fund. |
| 4 | Principal payments may be made periodically. Therefore, the effective maturity date may be earlier than the stated maturity date. |
| 5 | Valued under fair value procedures adopted by authority of the board of trustees. The total value of all such securities was $2,413,000, which represented 1.53% of the net assets of the fund. |
| American Funds Emerging Markets Bond Fund | 7 |
Key to abbreviations and symbol
ARS = Argentine pesos
BRL = Brazilian reais
COP = Colombian pesos
EGP = Egyptian pounds
GHS = Ghanaian cedi
HUF = Hungarian forints
IDR = Indonesian rupiah
INR = Indian rupees
LIBOR = London Interbank Offered Rate
MXN = Mexican pesos
MYR = Malaysian ringgits
NGN = Nigerian naira
PEN = Peruvian nuevos soles
PLN = Polish zloty
RUB = Russian rubles
THB = Thai baht
TIIE = Equilibrium Interbank Interest Rate
TRY = Turkish lira
USD/$ = U.S. dollars
ZAR = South African rand
ZMW = Zambian kwacha
See Notes to Financial Statements
| 8 | American Funds Emerging Markets Bond Fund |
Financial statements
| Statement of assets and liabilities | | | unaudited | |
| at June 30, 2017 | | | (dollars in thousands) | |
| | | | | | | | | |
| Assets: | | | | | | | | |
| Investment securities in unaffiliated issuers, at value (cost: $151,065) | | | | | | $ | 154,702 | |
| Cash | | | | | | | 285 | |
| Cash denominated in currencies other than U.S. dollars (cost: $73) | | | | | | | 73 | |
| Unrealized appreciation on open forward currency contracts | | | | | | | 54 | |
| Receivables for: | | | | | | | | |
| Sales of investments | | $ | 1 | | | | | |
| Sales of fund’s shares | | | 1,913 | | | | | |
| Closed forward currency contracts | | | 23 | | | | | |
| Variation margin on swap contracts | | | 7 | | | | | |
| Interest | | | 2,893 | | | | | |
| Other | | | 117 | | | | 4,954 | |
| | | | | | | | 160,068 | |
| Liabilities: | | | | | | | | |
| Unrealized depreciation on open forward currency contracts | | | | | | | 23 | |
| Payables for: | | | | | | | | |
| Purchases of investments | | | 1,282 | | | | | |
| Repurchases of fund’s shares | | | 120 | | | | | |
| Dividends on fund’s shares | | | 264 | | | | | |
| Closed forward currency contracts | | | 52 | | | | | |
| Investment advisory services | | | 70 | | | | | |
| Services provided by related parties | | | 126 | | | | | |
| Trustees’ deferred compensation | | | — | * | | | | |
| Non-U.S. taxes | | | 42 | | | | | |
| Variation margin on swap contracts | | | 8 | | | | | |
| Other | | | 65 | | | | 2,029 | |
| Net assets at June 30, 2017 | | | | | | $ | 158,016 | |
| | | | | | | | | |
| Net assets consist of: | | | | | | | | |
| Capital paid in on shares of beneficial interest | | | | | | $ | 154,449 | |
| Distributions in excess of net investment income | | | | | | | (94 | ) |
| Undistributed net realized gain | | | | | | | 12 | |
| Net unrealized appreciation | | | | | | | 3,649 | |
| Net assets at June 30, 2017 | | | | | | $ | 158,016 | |
*Amount less than one thousand.
See Notes to Financial Statements
| American Funds Emerging Markets Bond Fund | 9 |
(dollars and shares in thousands, except per-share amounts)
Shares of beneficial interest issued and outstanding (no stated par value) —
unlimited shares authorized (15,276 total shares outstanding)
| | | Net assets | | | Shares
outstanding | | | Net asset
value per share | |
| Class A | | $ | 116,561 | | | | 11,269 | | | $ | 10.34 | |
| Class C | | | 3,610 | | | | 349 | | | | 10.34 | |
| Class T | | | 10 | | | | 1 | | | | 10.34 | |
| Class F-1 | | | 4,615 | | | | 446 | | | | 10.34 | |
| Class F-2 | | | 27,543 | | | | 2,663 | | | | 10.34 | |
| Class F-3 | | | 1,989 | | | | 192 | | | | 10.34 | |
| Class 529-A | | | 1,750 | | | | 169 | | | | 10.34 | |
| Class 529-C | | | 395 | | | | 38 | | | | 10.34 | |
| Class 529-E | | | 133 | | | | 13 | | | | 10.34 | |
| Class 529-T | | | 10 | | | | 1 | | | | 10.34 | |
| Class 529-F-1 | | | 480 | | | | 47 | | | | 10.34 | |
| Class R-1 | | | 94 | | | | 9 | | | | 10.34 | |
| Class R-2 | | | 388 | | | | 38 | | | | 10.34 | |
| Class R-2E | | | 25 | | | | 2 | | | | 10.34 | |
| Class R-3 | | | 181 | | | | 17 | | | | 10.34 | |
| Class R-4 | | | 80 | | | | 8 | | | | 10.34 | |
| Class R-5E | | | 25 | | | | 2 | | | | 10.34 | |
| Class R-5 | | | 44 | | | | 4 | | | | 10.34 | |
| Class R-6 | | | 83 | | | | 8 | | | | 10.34 | |
See Notes to Financial Statements
| 10 | American Funds Emerging Markets Bond Fund |
| Statement of operations | | unaudited | |
| for the six months ended June 30, 2017 | (dollars in thousands) | |
| | | | | | | | | |
| Investment income: | | | | | | | | |
| Income: | | | | | | | | |
| Interest (net of non-U.S. taxes of $64) | | | | | | $ | 3,772 | |
| Fees and expenses*: | | | | | | | | |
| Investment advisory services | | $ | 305 | | | | | |
| Distribution services | | | 140 | | | | | |
| Transfer agent services | | | 42 | | | | | |
| Administrative services | | | 10 | | | | | |
| Reports to shareholders | | | 21 | | | | | |
| Registration statement and prospectus | | | 106 | | | | | |
| Trustees’ compensation | | | — | † | | | | |
| Auditing and legal | | | 24 | | | | | |
| Custodian | | | 19 | | | | | |
| Other | | | 22 | | | | | |
| Total fees and expenses before reimbursements | | | 689 | | | | | |
| Less other reimbursements | | | 151 | | | | | |
| Total fees and expenses after reimbursements | | | | | | | 538 | |
| Net investment income | | | | | | | 3,234 | |
| | | | | | | | | |
| Net realized gain and unrealized appreciation: | | | | | | | | |
| Net realized (loss) gain on: | | | | | | | | |
| Investments in unaffiliated issuers (net of non-U.S. taxes of $2) | | | (13 | ) | | | | |
| Forward currency contracts | | | 55 | | | | | |
| Swap contracts | | | 56 | | | | | |
| Currency transactions | | | (80 | ) | | | 18 | |
| Net unrealized appreciation (depreciation) on: | | | | | | | | |
| Investments in unaffiliated issuers (net of non-U.S. taxes of $45) | | | 4,958 | | | | | |
| Forward currency contracts | | | 14 | | | | | |
| Swap contracts | | | (8 | ) | | | 4,964 | |
| Net realized gain and unrealized appreciation | | | | | | | 4,982 | |
| | | | | | | | | |
| Net increase in net assets resulting from operations | | | | | | $ | 8,216 | |
| * | Additional information related to class-specific fees and expenses is included in the Notes to Financial Statements. |
| † | Amount less than one thousand. |
See Notes to Financial Statements
| American Funds Emerging Markets Bond Fund | 11 |
Statements of changes in net assets
(dollars in thousands)
| | | Six months ended
June 30, 2017* | | For the period
April 22,
2016† to
December 31,
2016 |
| Operations: | | | | | | | | |
| Net investment income | | $ | 3,234 | | | $ | 2,172 | |
| Net realized gain (loss) | | | 18 | | | | (284 | ) |
| Net unrealized appreciation (depreciation) | | | 4,964 | | | | (1,315 | ) |
| Net increase in net assets resulting from operations | | | 8,216 | | | | 573 | |
| | | | | | | | | |
| Dividends and distributions paid or accrued and return of capital paid to shareholders: | | | | | | | | |
| Dividends from net investment income | | | (3,194 | ) | | | (2,027 | ) |
| Return of capital | | | — | | | | (110 | ) |
| Total dividends and distributions paid or accrued and return of capital paid to shareholders | | | (3,194 | ) | | | (2,137 | ) |
| | | | | | | | | |
| Net capital share transactions | | | 83,918 | | | | 70,640 | |
| | | | | | | | | |
| Total increase in net assets | | | 88,940 | | | | 69,076 | |
| | | | | | | | | |
| Net assets: | | | | | | | | |
| Beginning of period | | | 69,076 | | | | — | |
| End of period (including distributions in excess of net investment income: $(94) and $(134), respectively) | | $ | 158,016 | | | $ | 69,076 | |
| * | Unaudited. |
| † | Commencement of operations. |
See Notes to Financial Statements
| 12 | American Funds Emerging Markets Bond Fund |
| Notes to financial statements | unaudited |
1. Organization
American Funds Emerging Markets Bond Fund (the “fund”) is registered under the Investment Company Act of 1940 (the “1940 Act”), as an open-end, nondiversified management investment company. The fund seeks to provide a high level of total return over the long term, of which current income is a large component.
The fund has 19 share classes consisting of six retail share classes (Classes A, C, T, F-1, F-2 and F-3), five 529 college savings plan share classes (Classes 529-A, 529-C, 529-E, 529-T and 529-F-1) and eight retirement plan share classes (Classes R-1, R-2, R-2E, R-3, R-4, R-5E, R-5 and R-6). The 529 college savings plan share classes can be used to save for college education. The retirement plan share classes are generally offered only through eligible employer-sponsored retirement plans. The fund’s share classes are described further in the following table:
| | | | | Contingent deferred sales | | | |
| Share class | | Initial sales charge | | charge upon redemption | | Conversion feature | |
| Classes A and 529-A | | Up to 3.75% | | None (except 1% for certain | | None | |
| | | | | redemptions within one year | | | |
| | | | | of purchase without an initial | | | |
| | | | | sales charge) | | | |
| Class C | | None | | 1% for redemptions within one year of purchase | | Class C converts to Class F-1 after 10 years | |
| Class 529-C | | None | | 1% for redemptions within one year of purchase | | None | |
| Class 529-E | | None | | None | | None | |
| Classes T and 529-T* | | Up to 2.50% | | None | | None | |
| Classes F-1, F-2, | | None | | None | | None | |
| F-3 and 529-F-1 | | | | | | | |
| Classes R-1, R-2, R-2E, | | None | | None | | None | |
| R-3, R-4, R-5E, | | | | | | | |
| R-5 and R-6 | | | | | | | |
* Class T and 529-T shares are not available for purchase.
Holders of all share classes have equal pro rata rights to the assets, dividends and liquidation proceeds of the fund. Each share class has identical voting rights, except for the exclusive right to vote on matters affecting only its class. Share classes have different fees and expenses (“class-specific fees and expenses”), primarily due to different arrangements for distribution, transfer agent and administrative services. Differences in class-specific fees and expenses will result in differences in net investment income and, therefore, the payment of different per-share dividends by each share class.
2. Significant accounting policies
The fund is an investment company that applies the accounting and reporting guidance issued in Topic 946 by the U.S. Financial Accounting Standards Board. The fund’s financial statements have been prepared to comply with U.S. generally accepted accounting
| American Funds Emerging Markets Bond Fund | 13 |
principles (“U.S. GAAP”). These principles require the fund’s investment adviser to make estimates and assumptions that affect reported amounts and disclosures. Actual results could differ from those estimates. Subsequent events, if any, have been evaluated through the date of issuance in the preparation of the financial statements. The fund follows the significant accounting policies described in this section, as well as the valuation policies described in the next section on valuation.
Security transactions and related investment income — Security transactions are recorded by the fund as of the date the trades are executed with brokers. Realized gains and losses from security transactions are determined based on the specific identified cost of the securities. In the event a security is purchased with a delayed payment date, the fund will segregate liquid assets sufficient to meet its payment obligations. Interest income is recognized on an accrual basis. Market discounts, premiums and original issue discounts on fixed-income securities are amortized daily over the expected life of the security.
Class allocations — Income, fees and expenses (other than class-specific fees and expenses) are allocated daily among the various share classes based on the relative value of their settled shares. Realized and unrealized gains and losses are allocated daily among the various share classes based on their relative net assets. Class-specific fees and expenses, such as distribution, transfer agent and administrative services, are charged directly to the respective share class.
Dividends and distributions to shareholders — Dividends to shareholders are declared daily after the determination of the fund’s net investment income and are paid to shareholders monthly. Distributions to shareholders are recorded on the ex-dividend date.
Currency translation — Assets and liabilities, including investment securities, denominated in currencies other than U.S. dollars are translated into U.S. dollars at the exchange rates supplied by one or more pricing vendors on the valuation date. Purchases and sales of investment securities and income and expenses are translated into U.S. dollars at the exchange rates on the dates of such transactions. The effects of changes in exchange rates on investment securities are included with the net realized gain or loss and net unrealized appreciation or depreciation on investments in the fund’s statement of operations. The realized gain or loss and unrealized appreciation or depreciation resulting from all other transactions denominated in currencies other than U.S. dollars are disclosed separately.
3. Valuation
Capital Research and Management Company (“CRMC”), the fund’s investment adviser, values the fund’s investments at fair value as defined by U.S. GAAP. The net asset value of each share class of the fund is generally determined as of approximately 4:00 p.m. New York time each day the New York Stock Exchange is open.
| 14 | American Funds Emerging Markets Bond Fund |
Methods and inputs — The fund’s investment adviser uses the following methods and inputs to establish the fair value of the fund’s assets and liabilities. Use of particular methods and inputs may vary over time based on availability and relevance as market and economic conditions evolve.
Fixed-income securities, including short-term securities, are generally valued at prices obtained from one or more pricing vendors. Vendors value such securities based on one or more of the inputs described in the following table. The table provides examples of inputs that are commonly relevant for valuing particular classes of fixed-income securities in which the fund is authorized to invest. However, these classifications are not exclusive, and any of the inputs may be used to value any other class of fixed-income security.
| Fixed-income class | Examples of standard inputs |
| All | Benchmark yields, transactions, bids, offers, quotations from dealers and trading systems, new issues, spreads and other relationships observed in the markets among comparable securities; and proprietary pricing models such as yield measures calculated using factors such as cash flows, financial or collateral performance and other reference data (collectively referred to as “standard inputs”) |
| Corporate bonds & notes; convertible securities | Standard inputs and underlying equity of the issuer |
| Bonds & notes of governments & government agencies | Standard inputs and interest rate volatilities |
| Mortgage-backed; asset-backed obligations | Standard inputs and cash flows, prepayment information, default rates, delinquency and loss assumptions, collateral characteristics, credit enhancements and specific deal information |
| Municipal securities | Standard inputs and, for certain distressed securities, cash flows or liquidation values using a net present value calculation based on inputs that include, but are not limited to, financial statements and debt contracts |
When the fund’s investment adviser deems it appropriate to do so (such as when vendor prices are unavailable or deemed to be not representative), fixed-income securities will be valued in good faith at the mean quoted bid and ask prices that are reasonably and timely available (or bid prices, if ask prices are not available) or at prices for securities of comparable maturity, quality and type.
Forward currency contracts are valued at the mean of representative quoted bid and ask prices, generally based on prices supplied by one or more pricing vendors. Interest rate swaps are generally valued by pricing vendors based on market inputs that include the index and term of index, reset frequency, payer/receiver, currency and pay frequency.
Securities and other assets for which representative market quotations are not readily available or are considered unreliable by the fund’s investment adviser are fair valued as determined in good faith under fair valuation guidelines adopted by authority of the fund’s board of trustees as further described. The investment adviser follows fair valuation
| American Funds Emerging Markets Bond Fund | 15 |
guidelines, consistent with U.S. Securities and Exchange Commission rules and guidance, to consider relevant principles and factors when making fair value determinations. The investment adviser considers relevant indications of value that are reasonably and timely available to it in determining the fair value to be assigned to a particular security, such as the type and cost of the security; contractual or legal restrictions on resale of the security; relevant financial or business developments of the issuer; actively traded similar or related securities; conversion or exchange rights on the security; related corporate actions; significant events occurring after the close of trading in the security; and changes in overall market conditions. In addition, the closing prices of equity securities that trade in markets outside U.S. time zones may be adjusted to reflect significant events that occur after the close of local trading but before the net asset value of each share class of the fund is determined. Fair valuations and valuations of investments that are not actively trading involve judgment and may differ materially from valuations that would have been used had greater market activity occurred.
Processes and structure — The fund’s board of trustees has delegated authority to the fund’s investment adviser to make fair value determinations, subject to board oversight. The investment adviser has established a Joint Fair Valuation Committee (the “Fair Valuation Committee”) to administer, implement and oversee the fair valuation process, and to make fair value decisions. The Fair Valuation Committee regularly reviews its own fair value decisions, as well as decisions made under its standing instructions to the investment adviser’s valuation teams. The Fair Valuation Committee reviews changes in fair value measurements from period to period and may, as deemed appropriate, update the fair valuation guidelines to better reflect the results of back testing and address new or evolving issues. The Fair Valuation Committee reports any changes to the fair valuation guidelines to the board of trustees with supplemental information to support the changes. The fund’s board and audit committee also regularly review reports that describe fair value determinations and methods.
The fund’s investment adviser has also established a Fixed-Income Pricing Review Group to administer and oversee the fixed-income valuation process, including the use of fixed-income pricing vendors. This group regularly reviews pricing vendor information and market data. Pricing decisions, processes and controls over security valuation are also subject to additional internal reviews, including an annual control self-evaluation program facilitated by the investment adviser’s compliance group.
Classifications — The fund’s investment adviser classifies the fund’s assets and liabilities into three levels based on the inputs used to value the assets or liabilities. Level 1 values are based on quoted prices in active markets for identical securities. Level 2 values are based on significant observable market inputs, such as quoted prices for similar securities and quoted prices in inactive markets. Certain securities trading outside the U.S. may transfer between Level 1 and Level 2 due to valuation adjustments resulting from significant market movements following the close of local trading. Level 3 values are based on significant unobservable inputs that reflect the investment adviser’s determination of assumptions that market participants might reasonably use in valuing the securities. The valuation levels are not necessarily an indication of the risk or liquidity
| 16 | American Funds Emerging Markets Bond Fund |
associated with the underlying investment. For example, U.S. government securities are reflected as Level 2 because the inputs used to determine fair value may not always be quoted prices in an active market. At June 30, 2017, all of the fund’s investments were classified as Level 2.
4. Risk factors
Investing in the fund may involve certain risks including, but not limited to, those described below.
Market conditions — The prices of, and the income generated by, the securities held by the fund may decline — sometimes rapidly or unpredictably — due to various factors, including events or conditions affecting the general economy or particular industries; overall market changes; local, regional or global political, social or economic instability; governmental or governmental agency responses to economic conditions; and currency exchange rate, interest rate and commodity price fluctuations.
Issuer risks — The prices of, and the income generated by, securities held by the fund may decline in response to various factors directly related to the issuers of such securities, including reduced demand for an issuer’s goods or services, poor management performance and strategic initiatives such as mergers, acquisitions or dispositions and the market response to any such initiatives.
Investing in debt instruments — The prices of, and the income generated by, bonds and other debt securities held by the fund may be affected by changing interest rates and by changes in the effective maturities and credit ratings of these securities.
Rising interest rates will generally cause the prices of bonds and other debt securities to fall. Falling interest rates may cause an issuer to redeem, call or refinance a debt security before its stated maturity, which may result in the fund having to reinvest the proceeds in lower yielding securities. Longer maturity debt securities generally have greater sensitivity to changes in interest rates and may be subject to greater price fluctuations than shorter maturity debt securities.
Bonds and other debt securities are also subject to credit risk, which is the possibility that the credit strength of an issuer will weaken and/or an issuer of a debt security will fail to make timely payments of principal or interest and the security will go into default. Lower quality debt securities generally have higher rates of interest and may be subject to greater price fluctuations than higher quality debt securities. Credit risk is gauged, in part, by the credit ratings of the debt securities in which the fund invests. However, ratings are only the opinions of the rating agencies issuing them and are not guarantees as to credit quality or an evaluation of market risk. The fund’s investment adviser relies on its own credit analysts to research issuers and issues in seeking to mitigate various credit and default risks.
| American Funds Emerging Markets Bond Fund | 17 |
Investing in lower rated debt instruments — Lower rated bonds and other lower rated debt securities generally have higher rates of interest and involve greater risk of default or price declines due to changes in the issuer’s creditworthiness than those of higher quality debt securities. The market prices of these securities may fluctuate more than the prices of higher quality debt securities and may decline significantly in periods of general economic difficulty. These risks may be increased with respect to investments in junk bonds.
Investing in future delivery contracts — The fund may enter into contracts, such as to-be-announced contracts and mortgage dollar rolls, that involve the fund selling mortgage-related securities and simultaneously contracting to repurchase similar securities for delivery at a future date at a predetermined price. This can increase the fund’s market exposure, and the market price of the securities that the fund contracts to repurchase could drop below their purchase price. While the fund can preserve and generate capital through the use of such contracts by, for example, realizing the difference between the sale price and the future purchase price, the income generated by the fund may be reduced by engaging in such transactions. In addition, these transactions may increase the turnover rate of the fund.
Investing in derivatives — The use of derivatives involves a variety of risks, which may be different from, or greater than, the risks associated with investing in traditional cash securities, such as stocks and bonds. Changes in the value of a derivative may not correlate perfectly with, and may be more sensitive to market events than, the underlying asset, rate or index, and a derivative instrument may expose the fund to losses in excess of its initial investment. Derivatives may be difficult for the fund to buy or sell at an opportune time or price and may be difficult to terminate or otherwise offset. The fund’s use of derivatives may result in losses to the fund, and investing in derivatives may reduce the fund’s returns and increase the fund’s price volatility. The fund’s counterparty to a derivative transaction (including, if applicable, the fund’s clearing broker, the derivatives exchange or the clearinghouse) may be unable or unwilling to honor its financial obligations in respect of the transaction.
Liquidity risk — Certain fund holdings may be deemed to be less liquid or illiquid because they cannot be readily sold without significantly impacting the value of the holdings. Liquidity risk may result from the lack of an active market for a holding, legal or contractual restrictions on resale, or the reduced number and capacity of market participants to make a market in such holding. Market prices for less liquid or illiquid holdings may be volatile, and reduced liquidity may have an adverse impact on the market price of such holdings. Additionally, the sale of less liquid or illiquid holdings may involve substantial delays (including delays in settlement) and additional costs and the fund may be unable to sell such holdings when necessary to meet its liquidity needs.
Investing outside the U.S. — Securities of issuers domiciled outside the U.S., or with significant operations or revenues outside the U.S., may lose value because of adverse political, social, economic or market developments (including social instability, regional conflicts, terrorism and war) in the countries or regions in which the issuers operate or
| 18 | American Funds Emerging Markets Bond Fund |
generate revenue. These securities may also lose value due to changes in foreign currency exchange rates against the U.S. dollar and/or currencies of other countries. Issuers of these securities may be more susceptible to actions of foreign governments, such as the imposition of price controls or punitive taxes, that could adversely impact the value of these securities. Securities markets in certain countries may be more volatile and/or less liquid than those in the U.S. Investments outside the U.S. may also be subject to different accounting practices and different regulatory, legal and reporting standards and practices, and may be more difficult to value, than those in the U.S. In addition, the value of investments outside the U.S. may be reduced by foreign taxes, including foreign withholding taxes on interest and dividends. Further, there may be increased risks of delayed settlement of securities purchased or sold by the fund. The risks of investing outside the U.S. may be heightened in connection with investments in emerging markets.
Investing in emerging markets — Investing in emerging markets may involve risks in addition to and greater than those generally associated with investing in the securities markets of developed countries. For instance, developing countries may have less developed legal and accounting systems than those in developed countries. The governments of these countries may be less stable and more likely to impose capital controls, nationalize a company or industry, place restrictions on foreign ownership and on withdrawing sale proceeds of securities from the country, and/or impose punitive taxes that could adversely affect the prices of securities. In addition, the economies of these countries may be dependent on relatively few industries that are more susceptible to local and global changes. Securities markets in these countries can also be relatively small and have substantially lower trading volumes. As a result, securities issued in these countries may be more volatile and less liquid, and may be more difficult to value, than securities issued in countries with more developed economies and/or markets. Less certainty with respect to security valuations may lead to additional challenges and risks in calculating the fund’s net asset value. Additionally, there may be increased settlement risks for transactions in local securities.
Currency — The prices of, and the income generated by, many debt securities held by the fund may also be affected by changes in relative currency values. If the U.S. dollar appreciates against foreign currencies, the value in U.S. dollars of the fund’s securities denominated in such currencies would generally fall and vice versa. U.S. dollar-denominated securities of foreign issuers may also be affected by changes in relative currency values.
Nondiversification risk — As a nondiversified fund, the fund has the ability to invest a larger percentage of its assets in the securities of a smaller number of issuers than a diversified fund. Poor performance by a single large holding could adversely impact the fund’s investment results more than if the fund were invested in a larger number of issuers.
| American Funds Emerging Markets Bond Fund | 19 |
Management — The investment adviser to the fund actively manages the fund’s investments. Consequently, the fund is subject to the risk that the methods and analyses employed by the investment adviser in this process may not produce the desired results. This could cause the fund to lose value or its investment results to lag relevant benchmarks or other funds with similar objectives.
5. Certain investment techniques
Index-linked bonds — The fund has invested in index-linked bonds, which are fixed-income securities whose principal value is periodically adjusted to a government price index. Over the life of an index-linked bond, interest is paid on the adjusted principal value. Increases or decreases in the principal value of index-linked bonds are recorded as interest income in the fund’s statement of operations.
Forward currency contracts — The fund has entered into forward currency contracts, which represent agreements to exchange currencies on specific future dates at predetermined rates. The fund’s investment adviser uses forward currency contracts to manage the fund’s exposure to changes in exchange rates. Upon entering into these contracts, risks may arise from the potential inability of counterparties to meet the terms of their contracts and from possible movements in exchange rates.
On a daily basis, the fund’s investment adviser values forward currency contracts and records unrealized appreciation or depreciation for open forward currency contracts in the fund’s statement of assets and liabilities. Realized gains or losses are recorded at the time the forward currency contract is closed or offset by another contract with the same broker for the same settlement date and currency.
Closed forward currency contracts that have not reached their settlement date are included in the respective receivables or payables for closed forward currency contracts in the fund’s statement of assets and liabilities. Net realized gains or losses from closed forward currency contracts and net unrealized appreciation or depreciation from open forward currency contracts are recorded in the fund’s statement of operations. The average month-end notional amount of open forward currency contracts while held was $3,076,000.
Interest rate swaps — The fund has entered into interest rate swap contracts, which are agreements to exchange one stream of future interest payments for another based on a specified notional amount. Typically, interest rate swaps exchange a fixed interest rate for a payment that floats relative to a benchmark or vice versa. The fund’s investment adviser uses interest rate swaps to seek to manage the interest rate sensitivity of the fund by increasing or decreasing the duration of the fund or a portion of the fund’s portfolio. Risks may arise as a result of the fund’s investment adviser incorrectly anticipating changes in interest rates, increased volatility, reduced liquidity and the potential inability of counterparties to meet the terms of their agreements.
| 20 | American Funds Emerging Markets Bond Fund |
Upon entering into an interest rate swap contract, the fund is required to deposit cash, U.S. government securities or other liquid securities, which is known as “initial margin.” Generally, the initial margin required for a particular interest rate swap is set and held as collateral by the clearinghouse on which the contract is cleared. The amount of initial margin required may be significantly modified from time to time by the clearinghouse during the term of the contract.
On a daily basis, the fund’s investment adviser records daily interest accruals related to the exchange of future payments as a receivable and payable in the fund’s statement of assets and liabilities. The fund also pays or receives a “variation margin” based on the increase or decrease in the value of the interest rate swaps, including accrued interest, and records variation margin on interest rate swaps in the statement of assets and liabilities. The fund records realized gains and losses on both the net accrued interest and any gain or loss recognized at the time the interest rate swap is closed or expires. Net realized gains or losses, as well as any net unrealized appreciation or depreciation, from interest rate swaps are recorded in the fund’s statement of operations. The average month-end notional amount of interest rate swaps while held was $1,707,000.
The following tables present the financial statement impacts resulting from the fund’s use of forward currency contracts and interest rate swaps as of, or for the six months ended, June 30, 2017 (dollars in thousands):
| | | | | Assets | | Liabilities |
| | | | | Location on statement of | | | | Location on statement of | | |
| Contract | | Risk type | | assets and liabilities | | Value | | assets and liabilities | | Value |
| Forward currency | | Currency | | Unrealized appreciation on open forward currency contracts | | $ | 54 | | | Unrealized depreciation on open forward currency contracts | | $ | 23 | |
| Forward currency | | Currency | | Receivables for closed forward currency contracts | | | 23 | | | Payables for closed forward currency contracts | | | 52 | |
| Interest rate swaps | | Interest | | Net unrealized appreciation* | | | 39 | | | Net unrealized depreciation* | | | — | |
| | | | | | | $ | 116 | | | | | $ | 75 | |
| American Funds Emerging Markets Bond Fund | 21 |
| | | | | | | | | Net unrealized appreciation |
| | | | | Net realized gain | | (depreciation) |
| | | | | Location on statement of | | | | Location on statement of | | |
| Contract | | Risk type | | operations | | Value | | operations | | Value |
| Forward currency | | Currency | | Net realized gain on forward currency contracts | | $ | 55 | | | Net unrealized appreciation on forward currency contracts | | $ | 14 | |
| Interest rate swaps | | Interest | | Net realized gain on interest rate swaps | | | 56 | | | Net unrealized depreciation on interest rate swaps | | | (8 | ) |
| | | | | | | $ | 111 | | | | | $ | 6 | |
| * | Includes cumulative appreciation/depreciation on interest rate swaps as reported in the applicable table following the fund’s investment portfolio. Only current day’s variation margin is reported within the statement of assets and liabilities. |
Collateral — The fund participates in a collateral program due to its use of forward currency contracts and interest rate swaps. For forward currency contracts, the program calls for the fund to either receive or pledge highly liquid assets, such as cash or U.S. Treasury bills, as collateral based on the net gain or loss on unsettled forward currency contracts by counterparty. For interest rate swaps, the program calls for the fund to pledge highly liquid assets, such as cash or U.S. Treasury bills, as collateral for initial and variation margin by contract. The purpose of the collateral is to cover potential losses that could occur in the event that either party cannot meet its contractual obligations.
Rights of offset — The fund has entered into enforceable master netting agreements with certain counterparties for forward currency contracts, where on any date amounts payable by each party to the other (in the same currency with respect to the same transaction) may be closed or offset by each party’s payment obligation. If an early termination date occurs under these agreements following an event of default or termination event, all obligations of each party to its counterparty are settled net through a single payment in a single currency (“close-out netting”). For financial reporting purposes, the fund does not offset financial assets and financial liabilities that are subject to these master netting arrangements in the statement of assets and liabilities.
| 22 | American Funds Emerging Markets Bond Fund |
The following table presents the fund’s forward currency contracts by counterparty that are subject to master netting agreements but that are not offset in the fund’s statement of assets and liabilities. The net amount column shows the impact of offsetting on the fund’s statement of assets and liabilities as of June 30, 2017, if close-out netting was exercised (dollars in thousands):
| | | | | | Gross amounts not offset in the | | | | |
| | | Gross amounts | | | statement of assets and liabilities and | | | | |
| | | recognized in the | | | subject to a master netting agreement | | | | |
| | | statement of assets | | | Available | | | Non-cash | | | Cash | | | Net | |
| Counterparty | | and liabilities | | | to offset | | | collateral* | | | collateral | | | amount | |
| Assets: | | | | | | | | | | | | | | | | | | | | |
| Bank of America, N.A. | | $ | 5 | | | $ | (5 | ) | | $ | — | | | $ | — | | | $ | — | |
| Citibank | | | 35 | | | | (9 | ) | | | — | | | | — | | | | 26 | |
| HSBC Bank | | | 1 | | | | (1 | ) | | | — | | | | — | | | | — | |
| JPMorgan Chase | | | 8 | | | | (8 | ) | | | — | | | | — | | | | — | |
| UBS AG | | | 28 | | | | — | | | | — | | | | — | | | | 28 | |
| Total | | $ | 77 | | | $ | (23 | ) | | $ | — | | | $ | — | | | $ | 54 | |
| Liabilities: | | | | | | | | | | | | | | | | | | | | |
| Bank of America, N.A. | | $ | 15 | | | | (5 | ) | | | — | | | $ | — | | | $ | 10 | |
| Citibank | | | 9 | | | | (9 | ) | | | — | | | | — | | | | — | |
| HSBC Bank | | | 40 | | | | (1 | ) | | | — | | | | — | | | | 39 | |
| JPMorgan Chase | | | 11 | | | | (8 | ) | | | — | | | | — | | | | 3 | |
| Total | | $ | 75 | | | $ | (23 | ) | | $ | — | | | $ | — | | | $ | 52 | |
* Non-cash collateral is shown on a settlement basis.
6. Taxation and distributions
Federal income taxation — The fund complies with the requirements under Subchapter M of the Internal Revenue Code applicable to mutual funds and intends to distribute substantially all of its net taxable income and net capital gains each year. The fund is not subject to income taxes to the extent such distributions are made. Therefore, no federal income tax provision is required.
As of and during the period ended June 30, 2017, the fund did not have a liability for any unrecognized tax benefits. The fund recognizes interest and penalties, if any, related to unrecognized tax benefits as income tax expense in the statement of operations. During the period, the fund did not incur any interest or penalties.
The fund is not subject to examination by U.S. federal tax authorities, by state tax authorities and by tax authorities outside the U.S. for tax years before 2016, the year the fund commenced operations.
Non-U.S. taxation — Interest income is recorded net of non-U.S. taxes paid. The fund may file withholding tax reclaims in certain jurisdictions to recover a portion of amounts previously withheld. These reclaims are recorded when the amount is known and there are no significant uncertainties on collectability. Gains realized by the fund on the sale of
| American Funds Emerging Markets Bond Fund | 23 |
securities in certain countries, if any, may be subject to non-U.S. taxes. If applicable, the fund records an estimated deferred tax liability based on unrealized gains to provide for potential non-U.S. taxes payable upon the sale of these securities.
Distributions — Distributions paid to shareholders are based on net investment income and net realized gains determined on a tax basis, which may differ from net investment income and net realized gains for financial reporting purposes. These differences are due primarily to different treatment for items such as currency gains and losses; short-term capital gains and losses; capital losses related to sales of certain securities within 30 days of purchase; cost of investments sold and non-U.S. taxes on capital gains. The fiscal year in which amounts are distributed may differ from the year in which the net investment income and net realized gains are recorded by the fund for financial reporting purposes.
The components of distributable earnings on a tax basis are reported as of the fund’s most recent year-end. As of December 31, 2016, the components of distributable earnings on a tax basis were as follows (dollars in thousands):
| Undistributed ordinary income | | $ | 259 | |
| Late year ordinary loss deferral* | | | (137 | ) |
* This deferral is considered incurred in the subsequent year.
As of June 30, 2017, the tax basis unrealized appreciation (depreciation) and cost of investment securities were as follows (dollars in thousands):
| Gross unrealized appreciation on investment securities | | $ | 4,717 | |
| Gross unrealized depreciation on investment securities | | | (1,121 | ) |
| Net unrealized appreciation on investment securities | | | 3,596 | |
| Cost of investment securities | | | 151,106 | |
| 24 | American Funds Emerging Markets Bond Fund |
All or a portion of any income dividends or capital gain distributions paid during the current fiscal year may be classified as a return of capital. The actual amount of return of capital will be determined as of December 31, 2017.
The tax character of distributions paid or accrued to shareholders was as follows (dollars in thousands):
| | | | | | | | | For the period | |
| | | Six months ended June 30, 2017 | | | April 22, 20161 to December 31, 2016 | |
| Share class | | Ordinary
income | | | Total
dividends
paid
or accrued | | | Ordinary
income | | | Return of
capital | | | Total
dividends
paid
or accrued
and return
of capital | |
| Class A | | $ | 2,448 | | | $ | 2,448 | | | $ | 1,962 | | | $ | 97 | | | $ | 2,059 | |
| Class B2 | | | — | 3 | | | — | 3 | | | — | 3 | | | — | 3 | | | — | 3 |
| Class C4 | | | 49 | | | | 49 | | | | 5 | | | | 1 | | | | 6 | |
| Class T5 | | | — | 3 | | | — | 3 | | | | | | | | | | | | |
| Class F-14 | | | 79 | | | | 79 | | | | 6 | | | | 1 | | | | 7 | |
| Class F-24 | | | 533 | | | | 533 | | | | 32 | | | | 9 | | | | 41 | |
| Class F-36 | | | 14 | | | | 14 | | | | | | | | | | | | | |
| Class 529-A4 | | | 34 | | | | 34 | | | | 7 | | | | 1 | | | | 8 | |
| Class 529-B2 | | | — | 3 | | | — | 3 | | | — | 3 | | | — | 3 | | | — | 3 |
| Class 529-C4 | | | 7 | | | | 7 | | | | 1 | | | | — | 3 | | | 1 | |
| Class 529-E4 | | | 3 | | | | 3 | | | | 1 | | | | — | 3 | | | 1 | |
| Class 529-T5 | | | — | 3 | | | — | 3 | | | | | | | | | | | | |
| Class 529-F-14 | | | 6 | | | | 6 | | | | 1 | | | | — | 3 | | | 1 | |
| Class R-14 | | | 2 | | | | 2 | | | | 1 | | | | — | 3 | | | 1 | |
| Class R-24 | | | 9 | | | | 9 | | | | 5 | | | | 1 | | | | 6 | |
| Class R-2E4 | | | 1 | | | | 1 | | | | 1 | | | | — | 3 | | | 1 | |
| Class R-34 | | | 3 | | | | 3 | | | | 1 | | | | — | 3 | | | 1 | |
| Class R-44 | | | 2 | | | | 2 | | | | 1 | | | | — | 3 | | | 1 | |
| Class R-54 | | | 1 | | | | 1 | | | | 1 | | | | — | 3 | | | 1 | |
| Class R-5E4 | | | 1 | | | | 1 | | | | 1 | | | | — | 3 | | | 1 | |
| Class R-64 | | | 2 | | | | 2 | | | | 1 | | | | — | 3 | | | 1 | |
| Total | | $ | 3,194 | | | $ | 3,194 | | | $ | 2,027 | | | $ | 110 | | | $ | 2,137 | |
| 1 | Commencement of operations. |
| 2 | Class B and 529-B shares were fully liquidated on May 5, 2017. |
| 3 | Amount less than one thousand. |
| 4 | This share class began investment operations on July 29, 2016 |
| 5 | Class T and 529-T shares began investment operations on April 7, 2017. |
| 6 | Class F-3 shares began investment operations on January 27, 2017. |
| American Funds Emerging Markets Bond Fund | 25 |
7. Fees and transactions with related parties
CRMC, the fund’s investment adviser, is the parent company of American Funds Distributors,® Inc. (“AFD”), the principal underwriter of the fund’s shares, and American Funds Service Company® (“AFS”), the fund’s transfer agent. CRMC, AFD and AFS are considered related parties to the fund.
Investment advisory services — The fund has an investment advisory and service agreement with CRMC that provides for monthly fees accrued daily. These fees are based on an annual rate of 0.570% of average daily net assets. For the six months ended June 30, 2017, the investment advisory services fee was $305,000.
Miscellaneous fee reimbursements — CRMC has agreed to reimburse a portion of miscellaneous fees and expenses of the fund during its startup period. This reimbursement may be adjusted or discontinued by CRMC, subject to any restrictions in the fund’s prospectus. For the six months ended June 30, 2017, total fees and expenses reimbursed by CRMC were $151,000. Fees and expenses in the statement of operations are presented gross of any reimbursements from CRMC.
Class-specific fees and expenses — Expenses that are specific to individual share classes are accrued directly to the respective share class. The principal class-specific fees and expenses are further described below:
Distribution services — The fund has plans of distribution for all share classes, except Class F-2, F-3, R-5E, R-5 and R-6 shares. Under the plans, the board of trustees approves certain categories of expenses that are used to finance activities primarily intended to sell fund shares and service existing accounts. The plans provide for payments, based on an annualized percentage of average daily net assets, ranging from 0.30% to 1.00% as noted in this section. In some cases, the board of trustees has limited the amounts that may be paid to less than the maximum allowed by the plans. All share classes with a plan may use up to 0.25% of average daily net assets to pay service fees, or to compensate AFD for paying service fees, to firms that have entered into agreements with AFD to provide certain shareholder services. The remaining amounts available to be paid under each plan are paid to dealers to compensate them for their sales activities.
For Class A and 529-A shares, distribution-related expenses include the reimbursement of dealer and wholesaler commissions paid by AFD for certain shares sold without a sales charge. These share classes reimburse AFD for amounts
| 26 | American Funds Emerging Markets Bond Fund |
billed within the prior 15 months but only to the extent that the overall annual expense limit of 0.30% is not exceeded. As of June 30, 2017, there were no unreimbursed expenses subject to reimbursement for Class A or 529-A shares.
| | Share class | | Currently approved limits | | | Plan limits |
| | Class A | | 0.30 | % | | | 0.30 | % |
| | Class 529-A | | | 0.30 | | | | | 0.50 | |
| | Classes C, 529-C and R-1 | | | 1.00 | | | | | 1.00 | |
| | Class R-2 | | | 0.75 | | | | | 1.00 | |
| | Class R-2E | | | 0.60 | | | | | 0.85 | |
| | Classes 529-E and R-3 | | | 0.50 | | | | | 0.75 | |
| | Classes T, F-1, 529-T, 529-F-1 and R-4 | | | 0.25 | | | | | 0.50 | |
Transfer agent services — The fund has a shareholder services agreement with AFS under which the fund compensates AFS for providing transfer agent services to each of the fund’s share classes. These services include recordkeeping, shareholder communications and transaction processing. In addition, the fund reimburses AFS for amounts paid to third parties for performing transfer agent services on behalf of fund shareholders.
Administrative services — The fund has an administrative services agreement with CRMC under which the fund compensates CRMC for providing administrative services to Class A, C, T, F, 529 and R shares. These services include, but are not limited to, coordinating, monitoring, assisting and overseeing third parties that provide services to fund shareholders. Under the agreement, Class A shares pay an annual fee of 0.01% and Class C, T, F, 529 and R shares pay an annual fee of 0.05% of their respective average daily net assets.
529 plan services — Each 529 share class is subject to service fees to compensate the Virginia College Savings Plan (“Virginia529”) for its oversight and administration of the 529 college savings plan. The quarterly fee is based on a series of decreasing annual rates beginning with 0.10% on the first $20 billion of the net assets invested in the Class 529 shares of the American Funds and decreasing to 0.03% on such assets in excess of $100 billion. The fee for any given calendar quarter is accrued and calculated on the basis of the average net assets of Class 529 shares of the American Funds for the last month of the prior calendar quarter. The fee is included in other expenses in the fund’s statement of operations. Virginia529 is not considered a related party to the fund.
| American Funds Emerging Markets Bond Fund | 27 |
For the six months ended June 30, 2017, class-specific expenses under the agreements were as follows (dollars in thousands):
| | Share class | | | Distribution
services | | | | Transfer agent
services | | | | Administrative
services | | | 529 plan
services | |
| | Class A | | | $123 | | | | $ 25 | | | | $ 4 | | | Not applicable | |
| | Class B1 | | | — | 2 | | | — | 2 | | | Not applicable | | | Not applicable | |
| | Class C | | | 9 | | | | 1 | | | | 1 | | | Not applicable | |
| | Class T3 | | | — | | | | — | 2 | | | — | 2 | | Not applicable | |
| | Class F-1 | | | 4 | | | | 2 | | | | 1 | | | Not applicable | |
| | Class F-2 | | | Not applicable | | | | 14 | | | | 4 | | | Not applicable | |
| | Class F-34 | | | Not applicable | | | | — | 2 | | | — | 2 | | Not applicable | |
| | Class 529-A | | | 2 | | | | — | 2 | | | — | 2 | | $ 1 | |
| | Class 529-B1 | | | — | | | | — | | | | — | 2 | | — | 2 |
| | Class 529-C | | | 1 | | | | — | 2 | | | — | 2 | | — | 2 |
| | Class 529-E | | | — | 2 | | | — | 2 | | | — | 2 | | — | 2 |
| | Class 529-T3 | | | — | | | | — | 2 | | | — | 2 | | — | 2 |
| | Class 529-F-1 | | | — | | | | — | 2 | | | — | 2 | | — | 2 |
| | Class R-1 | | | — | 2 | | | — | 2 | | | — | 2 | | Not applicable | |
| | Class R-2 | | | 1 | | | | — | 2 | | | — | 2 | | Not applicable | |
| | Class R-2E | | | — | | | | — | 2 | | | — | 2 | | Not applicable | |
| | Class R-3 | | | — | 2 | | | — | 2 | | | — | 2 | | Not applicable | |
| | Class R-4 | | | — | 2 | | | — | 2 | | | — | 2 | | Not applicable | |
| | Class R-5E | | | Not applicable | | | | — | 2 | | | — | 2 | | Not applicable | |
| | Class R-5 | | | Not applicable | | | | — | 2 | | | — | 2 | | Not applicable | |
| | Class R-6 | | | Not applicable | | | | — | 2 | | | — | 2 | | Not applicable | |
| | Total class-specific expenses | | | $140 | | | | $ 42 | | | | $ 10 | | | $ 1 | |
| | 1 | Class B and 529-B shares were fully liquidated on May 5, 2017. |
| | 2 | Amount less than one thousand. |
| | 3 | Class T and 529-T shares began investment operations on April 7, 2017. |
| | 4 | Class F-3 shares began investment operations on January 27, 2017. |
Trustees’ deferred compensation — Trustees who are unaffiliated with CRMC may elect to defer the cash payment of part or all of their compensation. These deferred amounts, which remain as liabilities of the fund, are treated as if invested in shares of the fund or other American Funds. These amounts represent general, unsecured liabilities of the fund and vary according to the total returns of the selected funds. Trustees’ compensation in the fund’s statement of operations reflects the current fees (either paid in cash or deferred) and the net increase or decrease in the value of the deferred amounts.
Affiliated officers and trustees — Officers and certain trustees of the fund are or may be considered to be affiliated with CRMC, AFD and AFS. No affiliated officers or trustees received any compensation directly from the fund.
Security transactions with related funds — The fund may purchase from, or sell securities to, other funds managed by CRMC (or funds managed by certain affiliates of CRMC) under procedures adopted by the fund’s board of trustees. The funds involved in such transactions are considered related by virtue of having a common investment adviser (or affiliated investment advisers), common trustees and/or common officers. When such
| 28 | American Funds Emerging Markets Bond Fund |
transactions occur, each transaction is executed at the current market price of the security and no brokerage commissions or fees are paid in accordance with Rule 17a-7 of the 1940 Act.
Interfund lending — Pursuant to an exemptive order issued by the SEC, the fund, along with other CRMC-managed funds (or funds managed by certain affiliates of CRMC), may participate in an interfund lending program. The program provides an alternate credit facility that permits the funds to lend or borrow cash for temporary purposes directly to or from one another, subject to the conditions of the exemptive order. The fund did not lend or borrow cash through the interfund lending program at any time during the six months ended June 30, 2017.
8. Capital share transactions
Capital share transactions in the fund were as follows (dollars and shares in thousands):
| | | Sales1 | | | Reinvestments of
dividends | | | Repurchases1 | | | Net increase
(decrease) | |
| Share class | | Amount | | | Shares | | | Amount | | | Shares | | | Amount | | | Shares | | | Amount | | | Shares | |
| | | | | | | | | | | | | | | | | | | | | | | | | |
| Six months ended June 30, 2017 | | | | | | | | | | | | | | | | | | | | | | | | | | | |
| | | | | | | | | | | | | | | | | | | | | | | | | | | | | | | | | |
| Class A | | $ | 58,325 | | | | 5,696 | | | $ | 922 | | | | 90 | | | $ | (4,515 | ) | | | (441 | ) | | $ | 54,732 | | | | 5,345 | |
| Class B2 | | | — | 3 | | | — | 3 | | | — | | | | — | | | | (10 | ) | | | (1 | ) | | | (10 | ) | | | (1 | ) |
| Class C | | | 3,142 | | | | 307 | | | | 47 | | | | 4 | | | | (350 | ) | | | (34 | ) | | | 2,839 | | | | 277 | |
| Class T4 | | | 10 | | | | 1 | | | | — | | | | — | | | | — | | | | — | | | | 10 | | | | 1 | |
| Class F-1 | | | 3,542 | | | | 347 | | | | 78 | | | | 8 | | | | (224 | ) | | | (22 | ) | | | 3,396 | | | | 333 | |
| Class F-2 | | | 21,534 | | | | 2,114 | | | | 528 | | | | 52 | | | | (3,059 | ) | | | (299 | ) | | | 19,003 | | | | 1,867 | |
| Class F-35 | | | 2,023 | | | | 196 | | | | 14 | | | | 1 | | | | (51 | ) | | | (5 | ) | | | 1,986 | | | | 192 | |
| Class 529-A | | | 1,013 | | | | 99 | | | | 33 | | | | 3 | | | | (37 | ) | | | (3 | ) | | | 1,009 | | | | 99 | |
| Class 529-B2 | | | — | | | | — | | | | — | 3 | | | — | 3 | | | (11 | ) | | | (1 | ) | | | (11 | ) | | | (1 | ) |
| Class 529-C | | | 237 | | | | 23 | | | | 7 | | | | 1 | | | | (34 | ) | | | (4 | ) | | | 210 | | | | 20 | |
| Class 529-E | | | 34 | | | | 3 | | | | 3 | | | | — | 3 | | | (4 | ) | | | — | 3 | | | 33 | | | | 3 | |
| Class 529-T4 | | | 10 | | | | 1 | | | | — | 3 | | | — | 3 | | | — | | | | — | | | | 10 | | | | 1 | |
| Class 529-F-1 | | | 361 | | | | 35 | | | | 6 | | | | 1 | | | | — | | | | — | | | | 367 | | | | 36 | |
| Class R-1 | | | 14 | | | | 1 | | | | 2 | | | | — | 3 | | | — | | | | — | | | | 16 | | | | 1 | |
| Class R-2 | | | 68 | | | | 6 | | | | 9 | | | | 1 | | | | (5 | ) | | | — | 3 | | | 72 | | | | 7 | |
| Class R-2E | | | — | | | | — | | | | — | | | | — | | | | — | | | | — | | | | — | | | | — | |
| Class R-3 | | | 154 | | | | 15 | | | | 2 | | | | — | 3 | | | (22 | ) | | | (2 | ) | | | 134 | | | | 13 | |
| Class R-4 | | | 53 | | | | 6 | | | | 1 | | | | — | 3 | | | — | | | | — | | | | 54 | | | | 6 | |
| Class R-5E | | | — | | | | — | | | | — | | | | — | | | | — | | | | — | | | | — | | | | — | |
| Class R-5 | | | 19 | | | | 2 | | | | — | 3 | | | — | 3 | | | — | 3 | | | — | 3 | | | 19 | | | | 2 | |
| Class R-6 | | | 47 | | | | 5 | | | | 2 | | | | — | 3 | | | — | 3 | | | — | 3 | | | 49 | | | | 5 | |
| Total net increase (decrease) | | $ | 90,586 | | | | 8,857 | | | $ | 1,654 | | | | 161 | | | $ | (8,322 | ) | | | (812 | ) | | $ | 83,918 | | | | 8,206 | |
| American Funds Emerging Markets Bond Fund | 29 |
| | | Sales1 | | | Reinvestments of
dividends | | | Repurchases1 | | | Net increase
(decrease) | |
| Share class | | Amount | | | Shares | | | Amount | | | Shares | | | Amount | | | Shares | | | Amount | | | Shares | |
| | | | | | | | | | | | | | | | | | | | | | | | | |
| For the period April 22, 20166 to December 31, 2016 | | | | | | | | | | | | | | | | | | |
| | | | | | | | | | | | | | | | | | | | | | | | | | | | | | | | | |
| Class A | | $ | 60,467 | | | | 6,040 | | | $ | 110 | | | | 11 | | | $ | (1,282 | ) | | | (127) | | | $ | 59,295 | | | | 5,924 | |
| Class B7 | | | 10 | | | | 1 | | | | — | | | | — | | | | — | | | | — | | | | 10 | | | | 1 | |
| Class C7 | | | 761 | | | | 76 | | | | 5 | | | | 1 | | | | (46 | ) | | | (5 | ) | | | 720 | | | | 72 | |
| Class F-17 | | | 1,517 | | | | 153 | | | | 7 | | | | 1 | | | | (393 | ) | | | (41 | ) | | | 1,131 | | | | 113 | |
| Class F-27 | | | 7,889 | | | | 804 | | | | 40 | | | | 4 | | | | (117 | ) | | | (12 | ) | | | 7,812 | | | | 796 | |
| Class 529-A7 | | | 710 | | | | 69 | | | | 9 | | | | 1 | | | | (3 | ) | | | — | 3 | | | 716 | | | | 70 | |
| Class 529-B7 | | | 10 | | | | 1 | | | | — | 3 | | | — | 3 | | | — | | | | — | | | | 10 | | | | 1 | |
| Class 529-C7 | | | 175 | | | | 18 | | | | 2 | | | | — | 3 | | | — | | | | — | | | | 177 | | | | 18 | |
| Class 529-E7 | | | 97 | | | | 10 | | | | 2 | | | | — | 3 | | | — | | | | — | | | | 99 | | | | 10 | |
| Class 529-F-17 | | | 106 | | | | 11 | | | | 1 | | | | — | 3 | | | — | | | | — | | | | 107 | | | | 11 | |
| Class R-17 | | | 75 | | | | 8 | | | | — | 3 | | | — | 3 | | | — | | | | — | | | | 75 | | | | 8 | |
| Class R-27 | | | 308 | | | | 31 | | | | 4 | | | | — | 3 | | | — | | | | — | | | | 312 | | | | 31 | |
| Class R-2E7 | | | 25 | | | | 2 | | | | — | | | | — | | | | — | | | | — | | | | 25 | | | | 2 | |
| Class R-37 | | | 45 | | | | 4 | | | | — | 3 | | | — | 3 | | | — | | | | — | | | | 45 | | | | 4 | |
| Class R-47 | | | 25 | | | | 2 | | | | — | | | | — | | | | — | | | | — | | | | 25 | | | | 2 | |
| Class R-5E7 | | | 25 | | | | 2 | | | | — | | | | — | | | | — | | | | — | | | | 25 | | | | 2 | |
| Class R-57 | | | 25 | | | | 2 | | | | — | | | | — | | | | — | | | | — | | | | 25 | | | | 2 | |
| Class R-67 | | | 31 | | | | 3 | | | | — | 3 | | | — | 3 | | | — | 3 | | | — | 3 | | | 31 | | | | 3 | |
| Total net increase (decrease) | | $ | 72,301 | | | | 7,237 | | | $ | 180 | | | | 18 | | | $ | (1,841 | ) | | | (185 | ) | | $ | 70,640 | | | | 7,070 | |
| 1 | Includes exchanges between share classes of the fund. |
| 2 | Class B and 529-B shares were fully liquidated on May 5, 2017. |
| 3 | Amount less than one thousand. |
| 4 | Class T and 529-T shares began investment operations on April 7, 2017. |
| 5 | Class F-3 shares began investment operations on January 27, 2017. |
| 6 | Commencement of operations. |
| 7 | This share class began investment operations on July 29, 2016. |
| 30 | American Funds Emerging Markets Bond Fund |
9. Investment transactions
The fund made purchases and sales of investment securities, excluding short-term securities and U.S. government obligations, if any, of $98,559,000 and $20,911,000, respectively, during the six months ended June 30, 2017.
10. Ownership concentration
At June 30, 2017, CRMC held 33% of the fund’s outstanding shares. The ownership represents the seed money invested in the fund when it began operations on April 22, 2016.
| American Funds Emerging Markets Bond Fund | 31 |
Financial highlights
| | | | | Income (loss) from
investment operations1 |
| Period ended | | Net asset
value,
beginning
of period | | Net
investment
income | | Net gains
(losses) on
securities
(both
realized and
unrealized) | | Total from
investment
operations |
| Class A: | | | | | | | | | | | | | | | | |
| Six months ended 6/30/20174,5 | | $ | 9.77 | | | $ | .31 | | | $ | .56 | | | $ | .87 | |
| Period from 4/22/2016 to 12/31/20169 | | | 10.00 | | | | .40 | | | | (.24 | ) | | | .16 | |
| Class C: | | | | | | | | | | | | | | | | |
| Six months ended 6/30/20174,5 | | | 9.77 | | | | .27 | | | | .56 | | | | .83 | |
| Period from 7/29/2016 to 12/31/201610 | | | 10.19 | | | | .22 | | | | (.43 | ) | | | (.21 | ) |
| Class T: | | | | | | | | | | | | | | | | |
| Period from 4/7/2017 to 6/30/20174,5,11 | | | 10.22 | | | | .15 | | | | .12 | | | | .27 | |
| Class F-1: | | | | | | | | | | | | | | | | |
| Six months ended 6/30/20174,5 | | | 9.77 | | | | .30 | | | | .57 | | | | .87 | |
| Period from 7/29/2016 to 12/31/201610 | | | 10.19 | | | | .25 | | | | (.44 | ) | | | (.19 | ) |
| Class F-2: | | | | | | | | | | | | | | | | |
| Six months ended 6/30/20174,5 | | | 9.77 | | | | .31 | | | | .57 | | | | .88 | |
| Period from 7/29/2016 to 12/31/201610 | | | 10.19 | | | | .25 | | | | (.43 | ) | | | (.18 | ) |
| Class F-3: | | | | | | | | | | | | | | | | |
| Period from 1/27/2017 to 6/30/20174,5,12 | | | 9.91 | | | | .27 | | | | .43 | | | | .70 | |
| 32 | American Funds Emerging Markets Bond Fund |
| Dividends and return of capital | | | | | | | | | | | | |
Dividends
(from net
investment
income) | | Return of
capital | | Total
dividends
and
return of
capital | | Net asset
value, end
of period | | Total return2,3 | | Net assets,
end of period
(in thousands) | | Ratio of
expenses to
average net
assets before
reimburse-
ments | | Ratio of
expenses to
average net
assets after
reimburse-
ments2 | | Ratio of
net income
to average
net assets2 |
| $ | (.30 | ) | | $ | — | | | $ | (.30 | ) | | $ | 10.34 | | | | 8.99 | %6,7 | | $ | 116,561 | | | | 1.30 | %7,8 | | | 1.02 | %7,8 | | | 6.05 | %7,8 |
| | (.37 | ) | | | (.02 | ) | | | (.39 | ) | | | 9.77 | | | | 1.58 | 6,7 | | | 57,872 | | | | 1.00 | 7,8 | | | .93 | 7,8 | | | 5.74 | 7,8 |
| | (.26 | ) | | | — | | | | (.26 | ) | | | 10.34 | | | | 8.61 | 6 | | | 3,610 | | | | 2.02 | 8 | | | 1.75 | 8 | | | 5.28 | 8 |
| | (.20 | ) | | | (.01 | ) | | | (.21 | ) | | | 9.77 | | | | (2.09 | )6 | | | 703 | | | | .80 | 6 | | | .73 | 6 | | | 2.26 | 6 |
| | (.15 | ) | | | — | | | | (.15 | ) | | | 10.34 | | | | 2.64 | 6,7 | | | 10 | | | | .22 | 6,7 | | | .18 | 6,7 | | | 1.44 | 6,7 |
| | (.30 | ) | | | — | | | | (.30 | ) | | | 10.34 | | | | 8.97 | 6 | | | 4,615 | | | | 1.35 | 8 | | | 1.07 | 8 | | | 5.99 | 8 |
| | (.22 | ) | | | (.01 | ) | | | (.23 | ) | | | 9.77 | | | | (1.86 | )6 | | | 1,105 | | | | .55 | 6 | | | .46 | 6 | | | 2.54 | 6 |
| | (.31 | ) | | | — | | | | (.31 | ) | | | 10.34 | | | | 9.07 | 6 | | | 27,543 | | | | 1.13 | 8 | | | .85 | 8 | | | 6.18 | 8 |
| | (.23 | ) | | | (.01 | ) | | | (.24 | ) | | | 9.77 | | | | (1.81 | )6 | | | 7,778 | | | | .58 | 6 | | | .42 | 6 | | | 2.54 | 6 |
| | (.27 | ) | | | — | | | | (.27 | ) | | | 10.34 | | | | 7.13 | 6 | | | 1,989 | | | | .38 | 6 | | | .29 | 6 | | | 2.64 | 6 |
See page 39 for footnotes.
| American Funds Emerging Markets Bond Fund | 33 |
Financial highlights (continued)
| | | | | Income (loss) from
investment operations1 |
| Period ended | | Net asset
value,
beginning
of period | | Net
investment
income | | Net gains
(losses) on
securities
(both
realized and
unrealized) | | Total from
investment
operations |
| Class 529-A: | | | | | | | | | | | | | | | | |
| Six months ended 6/30/20174,5 | | $ | 9.77 | | | $ | .30 | | | $ | .57 | | | $ | .87 | |
| Period from 7/29/2016 to 12/31/201610 | | | 10.19 | | | | .25 | | | | (.44 | ) | | | (.19 | ) |
| Class 529-C: | | | | | | | | | | | | | | | | |
| Six months ended 6/30/20174,5 | | | 9.77 | | | | .27 | | | | .56 | | | | .83 | |
| Period from 7/29/2016 to 12/31/201610 | | | 10.19 | | | | .23 | | | | (.43 | ) | | | (.20 | ) |
| Class 529-E: | | | | | | | | | | | | | | | | |
| Six months ended 6/30/20174,5 | | | 9.77 | | | | .30 | | | | .56 | | | | .86 | |
| Period from 7/29/2016 to 12/31/201610 | | | 10.19 | | | | .24 | | | | (.43 | ) | | | (.19 | ) |
| Class 529-T: | | | | | | | | | | | | | | | | |
| Period from 4/7/2017 to 6/30/20174,5,11 | | | 10.22 | | | | .15 | | | | .12 | | | | .27 | |
| Class 529-F-1: | | | | | | | | | | | | | | | | |
| Six months ended 6/30/20174,5 | | | 9.77 | | | | .32 | | | | .56 | | | | .88 | |
| Period from 7/29/2016 to 12/31/201610 | | | 10.19 | | | | .25 | | | | (.43 | ) | | | (.18 | ) |
| Class R-1: | | | | | | | | | | | | | | | | |
| Six months ended 6/30/20174,5 | | | 9.77 | | | | .28 | | | | .57 | | | | .85 | |
| Period from 7/29/2016 to 12/31/201610 | | | 10.19 | | | | .25 | | | | (.43 | ) | | | (.18 | ) |
| 34 | American Funds Emerging Markets Bond Fund |
| Dividends and return of capital | | | | | | | | | | | | |
Dividends
(from net
investment
income) | | Return of
capital | | Total
dividends
and
return of
capital | | Net asset
value, end
of period | | Total return2,3 | | Net assets,
end of period
(in thousands) | | Ratio of
expenses to
average net
assets before
reimburse-
ments | | Ratio of
expenses to
average net
assets after
reimburse-
ments2 | | Ratio of
net income
to average
net assets2 |
| $ | (.30 | ) | | $ | — | | | $ | (.30 | ) | | $ | 10.34 | | | | 8.95 | %6 | | $ | 1,750 | | | | 1.40 | %8 | | | 1.13 | %8 | | | 5.95 | %8 |
| | (.22 | ) | | | (.01 | ) | | | (.23 | ) | | | 9.77 | | | | (1.88 | )6 | | | 688 | | | | .56 | 6 | | | .49 | 6 | | | 2.52 | 6 |
| | (.26 | ) | | | — | | | | (.26 | ) | | | 10.34 | | | | 8.61 | 6,7 | | | 395 | | | | 2.05 | 7,8 | | | 1.76 | 7,8 | | | 5.32 | 7,8 |
| | (.21 | ) | | | (.01 | ) | | | (.22 | ) | | | 9.77 | | | | (1.99 | )6,7 | | | 172 | | | | .72 | 6,7 | | | .64 | 6,7 | | | 2.31 | 6,7 |
| | (.29 | ) | | | — | | | | (.29 | ) | | | 10.34 | | | | 8.92 | 6,7 | | | 133 | | | | 1.45 | 7,8 | | | 1.16 | 7,8 | | | 5.93 | 7,8 |
| | (.22 | ) | | | (.01 | ) | | | (.23 | ) | | | 9.77 | | | | (1.89 | )6,7 | | | 93 | | | | .55 | 6,7 | | | .49 | 6,7 | | | 2.40 | 6,7 |
| | (.15 | ) | | | — | | | | (.15 | ) | | | 10.34 | | | | 2.62 | 6,7 | | | 10 | | | | .23 | 6,7 | | | .19 | 6,7 | | | 1.43 | 6,7 |
| | (.31 | ) | | | — | | | | (.31 | ) | | | 10.34 | | | | 9.10 | 6 | | | 480 | | | | 1.12 | 8 | | | .83 | 8 | | | 6.26 | 8 |
| | (.23 | ) | | | (.01 | ) | | | (.24 | ) | | | 9.77 | | | | (1.78 | )6 | | | 105 | | | | .47 | 6 | | | .37 | 6 | | | 2.55 | 6 |
| | (.28 | ) | | | — | | | | (.28 | ) | | | 10.34 | | | | 8.75 | 6,7 | | | 94 | | | | 1.78 | 7,8 | | | 1.49 | 7,8 | | | 5.60 | 7,8 |
| | (.23 | ) | | | (.01 | ) | | | (.24 | ) | | | 9.77 | | | | (1.77 | )6,7 | | | 74 | | | | .40 | 6,7 | | | .36 | 6,7 | | | 2.49 | 6,7 |
See page 39 for footnotes.
| American Funds Emerging Markets Bond Fund | 35 |
Financial highlights (continued)
| | | | | Income (loss) from
investment operations1 |
| Period ended | | Net asset
value,
beginning
of period | | Net
investment
income | | Net gains
(losses) on
securities
(both
realized and
unrealized) | | Total from
investment
operations |
| Class R-2: | | | | | | | | | | | | | | | | |
| Six months ended 6/30/20174,5 | | $ | 9.77 | | | $ | .29 | | | $ | .56 | | | $ | .85 | |
| Period from 7/29/2016 to 12/31/201610 | | | 10.19 | | | | .23 | | | | (.43 | ) | | | (.20 | ) |
| Class R-2E: | | | | | | | | | | | | | | | | |
| Six months ended 6/30/20174,5 | | | 9.77 | | | | .32 | | | | .57 | | | | .89 | |
| Period from 7/29/2016 to 12/31/201610 | | | 10.19 | | | | .25 | | | | (.43 | ) | | | (.18 | ) |
| Class R-3: | | | | | | | | | | | | | | | | |
| Six months ended 6/30/20174,5 | | | 9.77 | | | | .30 | | | | .57 | | | | .87 | |
| Period from 7/29/2016 to 12/31/201610 | | | 10.19 | | | | .25 | | | | (.43 | ) | | | (.18 | ) |
| Class R-4: | | | | | | | | | | | | | | | | |
| Six months ended 6/30/20174,5 | | | 9.77 | | | | .31 | | | | .57 | | | | .88 | |
| Period from 7/29/2016 to 12/31/201610 | | | 10.19 | | | | .25 | | | | (.43 | ) | | | (.18 | ) |
| Class R-5E: | | | | | | | | | | | | | | | | |
| Six months ended 6/30/20174,5 | | | 9.77 | | | | .32 | | | | .57 | | | | .89 | |
| Period from 7/29/2016 to 12/31/201610 | | | 10.19 | | | | .25 | | | | (.43 | ) | | | (.18 | ) |
| Class R-5: | | | | | | | | | | | | | | | | |
| Six months ended 6/30/20174,5 | | | 9.77 | | | | .32 | | | | .57 | | | | .89 | |
| Period from 7/29/2016 to 12/31/201610 | | | 10.19 | | | | .25 | | | | (.43 | ) | | | (.18 | ) |
| 36 | American Funds Emerging Markets Bond Fund |
| Dividends and return of capital | | | | | | | | | | | | |
Dividends
(from net
investment
income) | | Return of
capital | | Total
dividends
and
return of
capital | | Net asset
value, end
of period | | Total return2,3 | | Net assets,
end of period
(in thousands) | | Ratio of
expenses to
average net
assets before
reimburse-
ments | | Ratio of
expenses to
average net
assets after
reimburse-
ments2 | | Ratio of
net income
to average
net assets2 |
| $ | (.28 | ) | | $ | — | | | $ | (.28 | ) | | $ | 10.34 | | | | 8.77 | %6,7 | | $ | 388 | | | | 1.73 | %7,8 | | | 1.43 | %7,8 | | | 5.65 | %7,8 |
| | (.21 | ) | | | (.01 | ) | | | (.22 | ) | | | 9.77 | | | | (1.99 | )6,7 | | | 298 | | | | .68 | 6,7 | | | .62 | 6,7 | | | 2.34 | 6,7 |
| | (.32 | ) | | | — | | | | (.32 | ) | | | 10.34 | | | | 9.17 | 6,7 | | | 25 | | | | 1.09 | 7,8 | | | .70 | 7,8 | | | 6.39 | 7,8 |
| | (.23 | ) | | | (.01 | ) | | | (.24 | ) | | | 9.77 | | | | (1.77 | )6,7 | | | 24 | | | | .39 | 6,7 | | | .35 | 6,7 | | | 2.46 | 6,7 |
| | (.30 | ) | | | — | | | | (.30 | ) | | | 10.34 | | | | 8.93 | 6,7 | | | 181 | | | | 1.44 | 7,8 | | | 1.17 | 7,8 | | | 5.83 | 7,8 |
| | (.23 | ) | | | (.01 | ) | | | (.24 | ) | | | 9.77 | | | | (1.81 | )6,7 | | | 43 | | | | .46 | 6,7 | | | .41 | 6,7 | | | 2.47 | 6,7 |
| | (.31 | ) | | | — | | | | (.31 | ) | | | 10.34 | | | | 9.08 | 6,7 | | | 80 | | | | 1.19 | 7,8 | | | .89 | 7,8 | | | 6.17 | 7,8 |
| | (.23 | ) | | | (.01 | ) | | | (.24 | ) | | | 9.77 | | | | (1.76 | )6,7 | | | 24 | | | | .39 | 6,7 | | | .35 | 6,7 | | | 2.46 | 6,7 |
| | (.32 | ) | | | — | | | | (.32 | ) | | | 10.34 | | | | 9.17 | 6 | | | 25 | | | | 1.08 | 8 | | | .69 | 8 | | | 6.40 | 8 |
| | (.23 | ) | | | (.01 | ) | | | (.24 | ) | | | 9.77 | | | | (1.76 | )6 | | | 24 | | | | .39 | 6 | | | .35 | 6 | | | 2.46 | 6 |
| | (.32 | ) | | | — | | | | (.32 | ) | | | 10.34 | | | | 9.15 | 6 | | | 44 | | | | 1.06 | 8 | | | .73 | 8 | | | 6.28 | 8 |
| | (.23 | ) | | | (.01 | ) | | | (.24 | ) | | | 9.77 | | | | (1.76 | )6 | | | 24 | | | | .38 | 6 | | | .34 | 6 | | | 2.47 | 6 |
See page 39 for footnotes.
| American Funds Emerging Markets Bond Fund | 37 |
Financial highlights (continued)
| | | | | | | Income (loss) from
investment operations1 | |
| Period ended | | Net asset
value,
beginning
of period | | | Net
investment
income | | | Net gains
(losses) on
securities
(both
realized and
unrealized) | | | Total from
investment
operations | |
| Class R-6: | | | | | | | | | | | | | | | | |
| Six months ended 6/30/20174,5 | | $ | 9.77 | | | $ | .32 | | | $ | .56 | | | $ | .88 | |
| Period from 7/29/2016 to 12/31/201610 | | | 10.19 | | | | .25 | | | | (.43 | ) | | | (.18 | ) |
| | | Six months
ended
June 30,
20174,5,6 | | For the period
4/22/2016 to
12/31/20164,9 |
| Portfolio turnover rate for all share classes | | | 21 | % | | | 43 | % |
See Notes to Financial Statements
| 38 | American Funds Emerging Markets Bond Fund |
| Dividends and return of capital | | | | | | | | | | | | | | | | | | | | | | | | | |
Dividends
(from net
investment
income) | | Return of
capital | | Total
dividends
and
return of
capital | | Net asset
value, end
of period | | Total return2,3 | | Net assets,
end of period
(in thousands) | | Ratio of
expenses to
average net
assets before
reimburse-
ments | | Ratio of
expenses to
average net
assets after
reimburse-
ments2 | | Ratio of
net income
to average
net assets2 |
| $ | (.31 | ) | | $ | — | | | $ | (.31 | ) | | $ | 10.34 | | | | 9.10 | %6 | | $ | 83 | | | | 1.15 | %8 | | | .84 | %8 | | | 6.25 | %8 |
| | (.23 | ) | | | (.01 | ) | | | (.24 | ) | | | 9.77 | | | | (1.78 | )6 | | | 30 | | | | .41 | 6 | | | .37 | 6 | | | 2.48 | 6 |
| 1 | Based on average shares outstanding. |
| 2 | This column reflects the impact, if any, of certain reimbursements from CRMC. During the periods shown, CRMC reimbursed a portion of other fees and expenses. |
| 3 | Total returns exclude any applicable sales charges, including contingent deferred sales charges. |
| 4 | Based on operations for the period shown and, accordingly, is not representative of a full year. |
| 5 | Unaudited. |
| 6 | Not annualized. |
| 7 | All or a significant portion of assets in this class consisted of seed capital invested by CRMC and/or its affiliates. Fees for distribution services are not charged or accrued on these seed capital assets. If such fees were paid by the fund on seed capital assets, fund expenses would have been higher and net income and total return would have been lower. |
| 8 | Annualized. |
| 9 | For the period April 22, 2016, commencement of operations, through December 31, 2016. |
| 10 | This share class began investment operations on July 29, 2016. |
| 11 | Class T and 529-T shares began investment operations on April 7, 2017. |
| 12 | Class F-3 shares began investment operations on January 27, 2017. |
| American Funds Emerging Markets Bond Fund | 39 |
As a fund shareholder, you incur two types of costs: (1) transaction costs, such as initial sales charges on purchase payments and contingent deferred sales charges on redemptions (loads), and (2) ongoing costs, including management fees, distribution and service (12b-1) fees, and other expenses. This example is intended to help you understand your ongoing costs (in dollars) of investing in the fund so you can compare these costs with the ongoing costs of investing in other mutual funds. The example is based on an investment of $1,000 invested at the beginning of the period and held for the entire six-month period (January 1, 2017, through June 30, 2017).
Actual expenses:
The first line of each share class in the table on the following page provides information about actual account values and actual expenses. You may use the information in this line, together with the amount you invested, to estimate the expenses that you paid over the period. Simply divide your account value by $1,000 (for example, an $8,600 account value divided by $1,000 = 8.6), then multiply the result by the number in the first line under the heading titled “Expenses paid during period” to estimate the expenses you paid on your account during this period.
Hypothetical example for comparison purposes:
The second line of each share class in the table on the following page provides information about hypothetical account values and hypothetical expenses based on the actual expense ratio for the share class and an assumed rate of return of 5.00% per year before expenses, which is not the actual return of the share class. The hypothetical account values and expenses may not be used to estimate the actual ending account balance or expenses you paid for the period. You may use this information to compare the ongoing costs of investing in the fund and other funds. To do so, compare this 5.00% hypothetical example with the 5.00% hypothetical examples that appear in the shareholder reports of the other funds.
Notes:
Retirement plan participants may be subject to certain fees charged by the plan sponsor, and Class F-1, F-2, F-3 and 529-F-1 shareholders may be subject to fees charged by financial intermediaries, typically ranging from 0.75% to 1.50% of assets annually depending on services offered. You can estimate the impact of these fees by adding the amount of the fees to the total estimated expenses you paid on your account during the period as calculated above. In addition, your ending account value would be lower by the amount of these fees.
Note that the expenses shown in the table on the following page are meant to highlight your ongoing costs only and do not reflect any transactional costs, such as sales charges (loads). Therefore, the second line of each share class in the table is useful in comparing ongoing costs only and will not help you determine the relative total costs of owning different funds. In addition, if these transactional costs were included, your costs would have been higher.
| 40 | American Funds Emerging Markets Bond Fund |
| | | Beginning
account value
1/1/2017 | | | Ending
account value
6/30/2017 | | | Expenses paid
during period1 | | | Annualized
expense ratio | |
| Class A — actual return | | $ | 1,000.00 | | | $ | 1,089.95 | | | $ | 5.29 | | | | 1.02 | % |
| Class A — assumed 5% return | | | 1,000.00 | | | | 1,019.74 | | | | 5.11 | | | | 1.02 | |
| Class C — actual return | | | 1,000.00 | | | | 1,086.06 | | | | 9.05 | | | | 1.75 | |
| Class C — assumed 5% return | | | 1,000.00 | | | | 1,016.12 | | | | 8.75 | | | | 1.75 | |
| Class T — actual return2 | | | 1,000.00 | | | | 1,026.39 | | | | 1.77 | | | | .76 | |
| Class T — assumed 5% return2 | | | 1,000.00 | | | | 1,021.03 | | | | 3.81 | | | | .76 | |
| Class F-1 — actual return | | | 1,000.00 | | | | 1,089.67 | | | | 5.54 | | | | 1.07 | |
| Class F-1 — assumed 5% return | | | 1,000.00 | | | | 1,019.49 | | | | 5.36 | | | | 1.07 | |
| Class F-2 — actual return | | | 1,000.00 | | | | 1,090.74 | | | | 4.41 | | | | .85 | |
| Class F-2 — assumed 5% return | | | 1,000.00 | | | | 1,020.58 | | | | 4.26 | | | | .85 | |
| Class F-3 — actual return3 | | | 1,000.00 | | | | 1,071.33 | | | | 3.06 | | | | .70 | |
| Class F-3 — assumed 5% return3 | | | 1,000.00 | | | | 1,021.32 | | | | 3.51 | | | | .70 | |
| Class 529-A — actual return | | | 1,000.00 | | | | 1,089.45 | | | | 5.85 | | | | 1.13 | |
| Class 529-A — assumed 5% return | | | 1,000.00 | | | | 1,019.19 | | | | 5.66 | | | | 1.13 | |
| Class 529-C — actual return | | | 1,000.00 | | | | 1,086.05 | | | | 9.10 | | | | 1.76 | |
| Class 529-C — assumed 5% return | | | 1,000.00 | | | | 1,016.07 | | | | 8.80 | | | | 1.76 | |
| Class 529-E — actual return | | | 1,000.00 | | | | 1,089.21 | | | | 6.01 | | | | 1.16 | |
| Class 529-E — assumed 5% return | | | 1,000.00 | | | | 1,019.04 | | | | 5.81 | | | | 1.16 | |
| Class 529-T — actual return2 | | | 1,000.00 | | | | 1,026.23 | | | | 1.91 | | | | .82 | |
| Class 529-T — assumed 5% return2 | | | 1,000.00 | | | | 1,020.73 | | | | 4.11 | | | | .82 | |
| Class 529-F-1 — actual return | | | 1,000.00 | | | | 1,091.03 | | | | 4.30 | | | | .83 | |
| Class 529-F-1 — assumed 5% return | | | 1,000.00 | | | | 1,020.68 | | | | 4.16 | | | | .83 | |
| Class R-1 — actual return | | | 1,000.00 | | | | 1,087.47 | | | | 7.71 | | | | 1.49 | |
| Class R-1 — assumed 5% return | | | 1,000.00 | | | | 1,017.41 | | | | 7.45 | | | | 1.49 | |
| Class R-2 — actual return | | | 1,000.00 | | | | 1,087.73 | | | | 7.40 | | | | 1.43 | |
| Class R-2 — assumed 5% return | | | 1,000.00 | | | | 1,017.70 | | | | 7.15 | | | | 1.43 | |
| Class R-2E — actual return | | | 1,000.00 | | | | 1,091.72 | | | | 3.63 | | | | .70 | |
| Class R-2E — assumed 5% return | | | 1,000.00 | | | | 1,021.32 | | | | 3.51 | | | | .70 | |
| Class R-3 — actual return | | | 1,000.00 | | | | 1,089.31 | | | | 6.06 | | | | 1.17 | |
| Class R-3 — assumed 5% return | | | 1,000.00 | | | | 1,018.99 | | | | 5.86 | | | | 1.17 | |
| Class R-4 — actual return | | | 1,000.00 | | | | 1,090.81 | | | | 4.61 | | | | .89 | |
| Class R-4 — assumed 5% return | | | 1,000.00 | | | | 1,020.38 | | | | 4.46 | | | | .89 | |
| Class R-5E — actual return | | | 1,000.00 | | | | 1,091.74 | | | | 3.58 | | | | .69 | |
| Class R-5E — assumed 5% return | | | 1,000.00 | | | | 1,021.37 | | | | 3.46 | | | | .69 | |
| Class R-5 — actual return | | | 1,000.00 | | | | 1,091.53 | | | | 3.79 | | | | .73 | |
| Class R-5 — assumed 5% return | | | 1,000.00 | | | | 1,021.17 | | | | 3.66 | | | | .73 | |
| Class R-6 — actual return | | | 1,000.00 | | | | 1,090.97 | | | | 4.35 | | | | .84 | |
| Class R-6 — assumed 5% return | | | 1,000.00 | | | | 1,020.63 | | | | 4.21 | | | | .84 | |
See page 42 for footnotes.
| American Funds Emerging Markets Bond Fund | 41 |
| 1 | The “expenses paid during period” are equal to the “annualized expense ratio,” multiplied by the average account value over the period, multiplied by the number of days in the period, and divided by 365 (to reflect the one-half year period). |
| 2 | The period for the “annualized expense ratio” and “actual return” line is based on the number of days since the share class began investment operations on April 7, 2017. The “assumed 5% return” line is based on 181 days. |
| 3 | The period for the “annualized expense ratio” and “actual return” line is based on the number of days since the share class began investment operations on January 27, 2017. The “assumed 5% return” line is based on 181 days. |
| 42 | American Funds Emerging Markets Bond Fund |
Approval of Investment Advisory and Service Agreement
American Funds Emerging Markets Bond Fund’s board has approved the fund’s Investment Advisory and Service Agreement (the “agreement”) with Capital Research and Management Company (“CRMC”) for a one-year term through April 30, 2018. The board approved the agreement following the recommendation of the fund’s Contracts Committee (the “committee”), which is composed of all of the fund’s independent board members. The board and the committee determined that the fund’s advisory fee structure was fair and reasonable in relation to the services provided, and that approving the agreement was in the best interests of the fund and its shareholders.
In reaching this decision, the board and the committee took into account information furnished to them throughout the year and otherwise provided to them, as well as information prepared specifically in connection with their review of the agreement, and were advised by their independent counsel. They considered the following factors, among others, but did not identify any single issue or particular piece of information that, in isolation, was the controlling factor, and each board and committee member did not necessarily attribute the same weight to each factor.
1. Nature, extent and quality of services
The board and the committee considered the depth and quality of CRMC’s investment management process, including its global research capabilities; the experience, capability and integrity of its senior management and other personnel; the low turnover rates of its key personnel; the overall financial strength and stability of CRMC and the Capital Group organization; and the ongoing evolution of CRMC’s organizational structure designed to maintain and strengthen these qualities. The board and the committee also considered the nature, extent and quality of administrative, compliance and shareholder services provided by CRMC to the fund under the agreement and other agreements, as well as the benefits to fund shareholders from investing in a fund that is part of a large family of funds. The board and the committee concluded that the nature, extent and quality of the services provided by CRMC have benefited and should continue to benefit the fund and its shareholders.
2. Investment results
The board and the committee considered the investment results of the fund in light of its objective of providing, over the long term, a high level of total return, of which a large component is current income. They compared the fund’s investment results with those of other relevant funds (including funds that currently form the basis of the Lipper index for the category in which the fund is included), and data such as
| American Funds Emerging Markets Bond Fund | 43 |
relevant market and fund indexes, from the fund’s launch date of April 22, 2016, through October 31, 2016. This report, including the letter to shareholders and related disclosures, contains certain information about the fund’s investment results. The board and the committee reviewed the fund’s investment results measured against the Lipper Emerging Market Hard Currency Debt Funds Average, the J.P. Morgan EMBI Global Diversified Index, the J.P. Morgan GBI-EM Global Diversified Index, and a 50%/50% blend of the J.P. Morgan EMBI Global Diversified Index and the J.P. Morgan GBI-EM Global Diversified Index. They noted the brief operating period of the fund and the challenges of finding a comparable index given the fund’s investment parameters. They observed that for the period of its operation, the fund’s investment results were below the Lipper average and the J.P. Morgan EMBI Global Diversified Index, and above the results of the J.P. Morgan GBI-EM Global Diversified Index and a 50%/50% blend of the J.P. Morgan EMBI Global Diversified Index and the J.P. Morgan GBI-EM Global Diversified Index. The board and the committee concluded that the fund’s investment results have been satisfactory for renewal of the agreement, and that CRMC’s record in managing the fund indicated that its continued management should benefit the fund and its shareholders.
3. Advisory fees and total expenses
The board and the committee compared the advisory fees and total expense levels of the fund to those of other relevant funds. The board noted that CRMC was reimbursing expenses during the fund’s start-up period. They observed that the fund’s advisory fees and expenses were below the median of the other funds in the Lipper Emerging Market Hard Currency Debt Funds category. In addition, the board reviewed information regarding the effective advisory fees charged to non-mutual fund clients by CRMC and its affiliates. They noted that, to the extent there were differences between the advisory fees paid by the fund and the advisory fees paid by those clients, the differences appropriately reflected the investment, operational, regulatory and market differences between advising the fund and the other clients. The board and the committee concluded that the fund’s cost structure was fair and reasonable in relation to the services provided, and that the fund’s shareholders receive reasonable value in return for the advisory fees and other amounts paid to CRMC by the fund.
4. Ancillary benefits
The board and the committee considered a variety of other benefits that CRMC and its affiliates receive as a result of CRMC’s relationship with the fund and other American Funds, including fees for administrative services provided to certain share classes; fees paid to CRMC’s affiliated transfer agent; sales charges and distribution fees received
| 44 | American Funds Emerging Markets Bond Fund |
and retained by the fund’s principal underwriter, an affiliate of CRMC; and possible ancillary benefits to CRMC and its institutional management affiliates in managing other investment vehicles. The board and the committee reviewed CRMC’s portfolio trading practices, noting the benefits CRMC receives from the research obtained with commissions from portfolio transactions made on behalf of the fund. The board and the committee took these ancillary benefits into account in evaluating the reasonableness of the advisory fees and other amounts paid to CRMC by the fund.
5. Adviser financial information
The board and the committee reviewed information regarding CRMC’s costs of providing services to the American Funds, including personnel, systems and resources of investment, compliance, trading, accounting and other administrative operations. They considered CRMC’s costs and related cost allocation methodology as well as its willingness to invest in technology, infrastructure and staff to maintain and expand services and capabilities, respond to industry and regulatory developments, and attract and retain qualified personnel. They noted information regarding the compensation structure for CRMC’s investment professionals. The board and the committee also compared CRMC’s profitability and compensation data to the reported results and data of several large, publicly held investment management companies. The board and the committee noted the competitiveness and cyclicality of both the mutual fund industry and the capital markets, and the importance in that environment of CRMC’s long-term profitability for maintaining its independence, company culture and management continuity. They further considered the breakpoint discounts in the fund’s advisory fee structure. The board and the committee concluded that the fund’s advisory fee structure reflected a reasonable sharing of benefits between CRMC and the fund’s shareholders.
| American Funds Emerging Markets Bond Fund | 45 |
This page was intentionally left blank.
| 46 | American Funds Emerging Markets Bond Fund |
This page was intentionally left blank.
| American Funds Emerging Markets Bond Fund | 47 |
This page was intentionally left blank.
| 48 | American Funds Emerging Markets Bond Fund |
This page was intentionally left blank.
| American Funds Emerging Markets Bond Fund | 49 |
This page was intentionally left blank.
| 50 | American Funds Emerging Markets Bond Fund |
This page was intentionally left blank.
| American Funds Emerging Markets Bond Fund | 51 |
Office of the fund
6455 Irvine Center Drive
Irvine, CA 92618-4518
Investment adviser
Capital Research and Management Company
333 South Hope Street
Los Angeles, CA 90071-1406
6455 Irvine Center Drive
Irvine, CA 92618-4518
Transfer agent for shareholder accounts
American Funds Service Company
(Write to the address near you.)
P.O. Box 6007
Indianapolis, IN 46206-6007
P.O. Box 2280
Norfolk, VA 23501-2280
Custodian of assets
Bank of New York Mellon
One Wall Street
New York, NY 10286
Counsel
Morgan, Lewis & Bockius LLP
300 South Grand Avenue, 22nd Floor
Los Angeles, CA 90071-3132
Independent registered public accounting firm
Deloitte & Touche LLP
695 Town Center Drive
Suite 1200
Costa Mesa, CA 92626-7188
Principal underwriter
American Funds Distributors, Inc.
333 South Hope Street
Los Angeles, CA 90071-1406
| 52 | American Funds Emerging Markets Bond Fund |
Investors should carefully consider investment objectives, risks, charges and expenses. This and other important information is contained in the fund prospectus and summary prospectus, which can be obtained from your financial professional and should be read carefully before investing. You may also call American Funds Service Company (AFS) at (800) 421-4225 or visit the American Funds website at americanfunds.com. Securities offered through American Funds Distributors, Inc.
“American Funds Proxy Voting Procedures and Principles” — which describes how we vote proxies relating to portfolio securities — is available on the American Funds website or upon request by calling AFS. The fund files its proxy voting record with the U.S. Securities and Exchange Commission (SEC) for the 12 months ended June 30 by August 31. The proxy voting record is available free of charge on the SEC website at sec.gov and on the American Funds website.
A complete June 30, 2017, portfolio of American Funds Emerging Markets Bond Fund’s investments is available free of charge by calling AFS or visiting the SEC website (where it is part of Form N-CSR).
American Funds Emerging Markets Bond Fund files a complete list of its portfolio holdings with the SEC for the first and third quarters of each fiscal year on Form N-Q. This filing is available free of charge on the SEC website. You may also review or, for a fee, copy this filing at the SEC’s Public Reference Room in Washington, D.C. Additional information regarding the operation of the Public Reference Room may be obtained by calling the SEC’s Office of Investor Education and Advocacy at (800) SEC-0330. Additionally, the list of portfolio holdings is available by calling AFS.
This report is for the information of shareholders of American Funds Emerging Markets Bond Fund, but it also may be used as sales literature when preceded or accompanied by the current prospectus or summary prospectus, which gives details about charges, expenses, investment objectives and operating policies of the fund. If used as sales material after September 30, 2017, this report must be accompanied by an American Funds statistical update for the most recently completed calendar quarter.
American Funds from Capital Group
The Capital AdvantageSM
Since 1931, American Funds, part of Capital Group, has helped investors pursue long-term investment success. Our consistent approach — in combination with The Capital SystemSM — has resulted in a superior long-term track record.
Aligned with investor success
We base our decisions on a long-term perspective, which we believe aligns our goals with the interests of our clients. Our portfolio managers average 27 years of investment experience, including 21 years at our company, reflecting a career commitment to our long-term approach.1
The Capital System
The Capital System combines individual accountability with teamwork. Funds using The Capital System are divided into portions that are managed independently by investment professionals with diverse backgrounds, ages and investment approaches. An extensive global research effort is the backbone of our system.
American Funds’ superior long-term track record
Equity funds have beaten their Lipper peer indexes in 93% of 10-year periods and 98% of 20-year periods. Fixed income funds have beaten their Lipper indexes in 80% of 10-year periods and 80% of 20-year periods.2 Fund management fees have been among the lowest in the industry.3
| | 1 | Portfolio manager experience as of December 31, 2016. |
| | 2 | Based on Class F-2 share results for rolling periods through December 31, 2016. Periods covered are the shorter of the fund’s lifetime or since the comparable Lipper index inception date (except Capital Income Builder and SMALLCAP World Fund, for which the Lipper average was used). Expenses differ for each share class, so results will vary. Class F-2 shares were first offered on August 1, 2008. Class F-2 share results prior to the date of first sale are hypothetical based on Class A share results without a sales charge, adjusted for typical estimated expenses. Results for certain funds with an inception date after August 1, 2008, also include hypothetical returns because those funds’ Class F-2 shares sold after the funds’ date of first offering. Please see americanfunds.com for more information on specific expense adjustments and the actual dates of first sale. |
| | 3 | On average, our management fees were in the lowest quintile 73% of the time, based on the 20-year period ended December 31, 2016, versus comparable Lipper categories, excluding funds of funds. |

ITEM 2 – Code of Ethics
Not applicable for filing of semi-annual reports to shareholders.
ITEM 3 – Audit Committee Financial Expert
Not applicable for filing of semi-annual reports to shareholders.
ITEM 4 – Principal Accountant Fees and Services
Not applicable for filing of semi-annual reports to shareholders.
ITEM 5 – Audit Committee of Listed Registrants
Not applicable to this Registrant, insofar as the Registrant is not a listed issuer as defined in Rule 10A-3 under the Securities Exchange Act of 1934.
ITEM 6 – Schedule of Investments

American Funds Emerging Markets Bond Fund®
Investment portfolio
June 30, 2017
unaudited
Bonds, notes & other debt instruments94.07%
Bonds & notes of governments & government agencies outside the U.S.88.28% | Principal?amount
(000) | Value
(000) |
| Argentine Republic 21.20% 2018 | ARS4,360 | $265 |
| Argentine Republic 2.50% 20211 | 17,321 | 992 |
| Argentine Republic 6.875% 2021 | $1,400 | 1,504 |
| Argentine Republic 18.20% 2021 | ARS1,515 | 97 |
| Argentine Republic (Badlar Private Banks ARS Index + 2.00%) 21.063% 20222 | 8,900 | 523 |
| Argentine Republic 7.50% 2026 | $1,400 | 1,509 |
| Argentine Republic 15.50% 2026 | ARS2,125 | 143 |
| Argentine Republic 0% 2035 | $600 | 54 |
| Argentine Republic 7.625% 2046 | 725 | 744 |
| Armenia (Republic of) 7.15% 20253 | 1,400 | 1,538 |
| Belarus (Republic of) 6.875% 20233 | 1,020 | 1,044 |
| Brazil (Federative Republic of) 0% 2017 | BRL340 | 100 |
| Brazil (Federative Republic of) 0% 2018 | 1,700 | 492 |
| Brazil (Federative Republic of) 10.00% 2018 | 1,000 | 304 |
| Brazil (Federative Republic of) 0% 2020 | 19,900 | 4,553 |
| Brazil (Federative Republic of) 6.00% 20231 | 3,041 | 921 |
| Brazil (Federative Republic of) 10.00% 2023 | 4,640 | 1,387 |
| Brazil (Federative Republic of) 10.00% 2025 | 7,925 | 2,340 |
| Brazil (Federative Republic of) 10.00% 2027 | 2,510 | 737 |
| Chile (Banco Central de) 4.50% 2026 | CLP310,000 | 481 |
| Colombia (Republic of) 3.875% 2027 | $500 | 505 |
| Colombia (Republic of), Series UVL, 3.50% 20211 | COP1,964,713 | 696 |
| Colombia (Republic of), Series B, 7.00% 2022 | 3,581,400 | 1,234 |
| Colombia (Republic of), Series B, 7.50% 2026 | 8,310,600 | 2,927 |
| Cote d’Ivoire (Republic of) 5.375% 20243 | $300 | 293 |
| Cote d’Ivoire (Republic of) 5.75% 20324 | 290 | 279 |
| Cote d’Ivoire (Republic of) 6.125% 20333,4 | 1,000 | 964 |
| Dominican Republic 7.50% 20214 | 150 | 166 |
| Dominican Republic 5.50% 2025 | 1,430 | 1,484 |
| Dominican Republic 6.875% 20263 | 1,000 | 1,121 |
| Dominican Republic 6.875% 2026 | 500 | 561 |
| Dominican Republic 5.95% 20273 | 450 | 471 |
| Dominican Republic 6.85% 20453 | 300 | 321 |
| Egypt (Arab Republic of) 5.875% 2025 | 600 | 588 |
| Egypt (Arab Republic of) 7.50% 20273 | 1,500 | 1,596 |
| Egypt (Arab Republic of) 8.50% 20473 | 200 | 216 |
| Ethiopia (Federal Democratic Republic of) 6.625% 20243 | 550 | 547 |
| Ghana (Republic of) 21.00% 2019 | GHS400 | 93 |
| Ghana (Republic of) 24.00% 2019 | 105 | 26 |
| Ghana (Republic of) 24.75% 2019 | 500 | 123 |
| Ghana (Republic of) 21.00% 2020 | 590 | 141 |
| Ghana (Republic of) 24.75% 2021 | 2,795 | 750 |
| Ghana (Republic of) 7.875% 2023 | $650 | 665 |
| Ghana (Republic of) 19.75% 2024 | GHS1,100 | 266 |
| Ghana (Republic of) 8.125% 20263,4 | $700 | 716 |
| Ghana (Republic of) 19.00% 2026 | GHS2,130 | 504 |
| Honduras (Republic of) 8.75% 2020 | $400 | 456 |
American Funds Emerging Markets Bond Fund — Page 1 of 6
unaudited
Bonds, notes & other debt instruments
Bonds & notes of governments & government agencies outside the U.S. (continued) | Principal?amount
(000) | Value
(000) |
| Honduras (Republic of) 6.25% 20273 | $2,675 | $2,775 |
| Hungary 5.375% 2024 | 790 | 891 |
| Hungary, Series A, 7.50% 2020 | HUF154,900 | 700 |
| Hungary, Series B, 5.50% 2025 | 30,900 | 137 |
| India (Republic of) 7.80% 2021 | INR119,300 | 1,920 |
| India (Republic of) 8.60% 2028 | 170,300 | 2,946 |
| India (Republic of) 7.59% 2029 | 162,000 | 2,624 |
| India (Republic of) 7.61% 2030 | 49,350 | 811 |
| India (Republic of) 7.73% 2034 | 11,000 | 182 |
| Indonesia (Republic of) 4.875% 20213 | $200 | 215 |
| Indonesia (Republic of) 3.375% 2023 | 500 | 503 |
| Indonesia (Republic of) 4.75% 2026 | 600 | 646 |
| Indonesia (Republic of), Series 69, 7.875% 2019 | IDR7,150,000 | 551 |
| Indonesia (Republic of), Series 61, 7.00% 2022 | 10,000,000 | 762 |
| Indonesia (Republic of), Series 70, 8.375% 2024 | 21,391,000 | 1,746 |
| Indonesia (Republic of), Series 59, 7.00% 2027 | 13,939,000 | 1,059 |
| Indonesia (Republic of), Series 72, 8.25% 2036 | 17,425,000 | 1,405 |
| Iraq (Republic of) 5.80% 20284 | $250 | 223 |
| Israel (State of) 2.00% 2027 | ILS2,000 | 569 |
| Israel (State of) 5.50% 2042 | 300 | 120 |
| Jamaica 8.00% 20394 | $330 | 391 |
| Jordan (Hashemite Kingdom of) 6.125% 2026 | 200 | 205 |
| Jordan (Hashemite Kingdom of) 5.75% 20273 | 1,100 | 1,097 |
| Kazakhstan (Republic of) 5.125% 2025 | 300 | 326 |
| Kenya (Republic of) 6.875% 2024 | 2,225 | 2,281 |
| Kuwait (State of) 2.75% 20223 | 400 | 402 |
| Malaysia (Federation of), Series 0215, 3.795% 2022 | MYR9,100 | 2,116 |
| Malaysia (Federation of), Series 0316, 3.90% 2026 | 4,800 | 1,113 |
| Malaysia (Federation of), Series 0310, 4.498% 2030 | 285 | 67 |
| Malaysia (Federation of), Series 0415, 4.254% 2035 | 5,800 | 1,310 |
| Malaysia (Federation of), Series 0615, 4.786% 2035 | 2,425 | 577 |
| Morocco (Kingdom of) 4.25% 2022 | $1,250 | 1,312 |
| Nigeria (Republic of) 14.20% 20245 | NGN450,000 | 1,150 |
| Pakistan (Islamic Republic of) 5.50% 20213 | $700 | 731 |
| Pakistan (Islamic Republic of) 8.25% 2025 | 850 | 977 |
| Panama (Republic of) 4.50% 20474 | 2,100 | 2,129 |
| Paraguay (Republic of) 5.00% 2026 | 1,000 | 1,059 |
| Paraguay (Republic of) 5.00% 20263 | 700 | 741 |
| Paraguay (Republic of) 4.70% 20273 | 200 | 206 |
| Peru (Republic of) 5.70% 2024 | PEN3,000 | 963 |
| Peru (Republic of) 6.35% 2028 | 7,100 | 2,328 |
| Peru (Republic of) 6.95% 2031 | 4,830 | 1,651 |
| Philippines (Republic of the) 3.90% 2022 | PHP10,000 | 198 |
| Poland (Republic of), Series 0420, 1.50% 2020 | PLN4,500 | 1,196 |
| Poland (Republic of), Series 0922, 5.75% 2022 | 15,860 | 4,911 |
| Poland (Republic of), Series 0726, 2.50% 2026 | 3,800 | 971 |
| Portuguese Republic 5.125% 2024 | $500 | 511 |
| Russian Federation 6.70% 2019 | RUB100,000 | 1,670 |
| Russian Federation 7.50% 2021 | 52,300 | 878 |
| Russian Federation 7.00% 2023 | 129,600 | 2,121 |
| Russian Federation 8.50% 2031 | 60,000 | 1,081 |
| Saudi Arabia (Kingdom of) 3.25% 20263 | $200 | 199 |
| South Africa (Republic of), Series R-2023, 7.75% 2023 | ZAR11,150 | 836 |
| South Africa (Republic of), Series R-186, 10.50% 2026 | 25,600 | 2,172 |
| South Africa (Republic of), Series R-214, 6.50% 2041 | 58,595 | 3,130 |
American Funds Emerging Markets Bond Fund — Page 2 of 6
unaudited
Bonds, notes & other debt instruments
Bonds & notes of governments & government agencies outside the U.S. (continued) | Principal?amount
(000) | Value
(000) |
| South Africa (Republic of), Series R-2048, 8.75% 2048 | ZAR28,100 | $1,918 |
| Sri Lanka (Democratic Socialist Republic of) 6.00% 2019 | $400 | 415 |
| Sri Lanka (Democratic Socialist Republic of) 6.125% 2025 | 200 | 205 |
| Sri Lanka (Democratic Socialist Republic of) 6.825% 2026 | 1,000 | 1,056 |
| Sri Lanka (Democratic Socialist Republic of) 6.825% 20263 | 850 | 898 |
| Sri Lanka (Democratic Socialist Republic of) 6.20% 20273 | 700 | 701 |
| Thailand (Kingdom of) 2.55% 2020 | THB52,500 | 1,587 |
| Thailand (Kingdom of) 2.125% 2026 | 2,400 | 68 |
| Turkey (Republic of) 10.50% 2020 | TRY1,900 | 539 |
| Turkey (Republic of) 9.20% 2021 | 6,600 | 1,798 |
| Turkey (Republic of) 9.50% 2022 | 5,225 | 1,435 |
| Turkey (Republic of) 11.00% 2022 | 975 | 283 |
| Turkey (Republic of) 9.00% 2024 | 11,525 | 3,086 |
| Turkey (Republic of) 8.00% 2025 | 6,200 | 1,556 |
| Turkey (Republic of) 2.40% 20261 | 3,238 | 824 |
| Turkey (Republic of) 4.875% 2026 | $3,500 | 3,459 |
| Turkey (Republic of) 10.60% 2026 | TRY500 | 145 |
| United Mexican States 2.00% 20221 | MXN4,028 | 211 |
| United Mexican States 4.00% 2023 | $700 | 734 |
| United Mexican States 4.50% 20251 | MXN8,861 | 540 |
| United Mexican States 4.125% 2026 | $525 | 547 |
| United Mexican States 4.15% 2027 | 530 | 549 |
| United Mexican States 4.00% 20461 | MXN8,055 | 484 |
| United Mexican States 4.60% 2046 | $1,100 | 1,078 |
| United Mexican States, Series M, 8.00% 2020 | MXN10,000 | 572 |
| United Mexican States, Series M, 6.50% 2021 | 88,700 | 4,873 |
| United Mexican States, Series M20, 10.00% 2024 | 12,530 | 823 |
| United Mexican States, Series M, 5.75% 2026 | 39,800 | 2,049 |
| United Mexican States, Series M30, 10.00% 2036 | 14,500 | 1,041 |
| United Mexican States Government Global, Series A, 5.75% 2110 | $1,350 | 1,407 |
| Uruguay (Oriental Republic of) 9.875% 2022 | UYU18,300 | 663 |
| Uruguay (Republic of) 4.375% 20281,4 | 15,721 | 622 |
| Zambia (Republic of) 11.00% 2021 | ZMW4,340 | 374 |
| Zambia (Republic of) 11.00% 2021 | 305 | 26 |
| Zambia (Republic of) 5.375% 2022 | $200 | 188 |
| Zambia (Republic of) 11.00% 2022 | ZMW5,530 | 469 |
| Zambia (Republic of) 8.50% 2024 | $700 | 732 |
| Zambia (Republic of) 8.97% 20274 | 300 | 320 |
| | | 139,503 |
Corporate bonds & notes4.98%
Energy2.93% | | |
| Petrobras Global Finance Co. 6.125% 2022 | 715 | 740 |
| Petrobras Global Finance Co. 4.375% 2023 | 975 | 922 |
| Petrobras Global Finance Co. 6.25% 2024 | 25 | 26 |
| Petrobras Global Finance Co. 8.75% 2026 | 200 | 230 |
| Petrobras Global Finance Co. 5.625% 2043 | 525 | 439 |
| Petrobras Global Finance Co. 6.85% 2115 | 205 | 182 |
| Petróleos Mexicanos 6.375% 2021 | 150 | 163 |
| Petróleos Mexicanos 5.375% 20223 | 175 | 184 |
| Petróleos Mexicanos 7.19% 2024 | MXN8,370 | 418 |
| Petróleos Mexicanos 6.875% 2026 | $550 | 611 |
| Petróleos Mexicanos 5.50% 2044 | 16 | 14 |
| Petróleos Mexicanos 5.625% 2046 | 375 | 334 |
American Funds Emerging Markets Bond Fund — Page 3 of 6
unaudited
Bonds, notes & other debt instruments
Corporate bonds & notes (continued)
Energy (continued) | Principal?amount
(000) | Value
(000) |
| Petróleos Mexicanos 6.75% 2047 | $131 | $133 |
| YPF SA 8.50% 2025 | 200 | 226 |
| | | 4,622 |
| Utilities1.36% | | |
| Enersis Américas SA 4.00% 2026 | 215 | 217 |
| State Grid Overseas Investment Ltd. 3.50% 20273 | 1,930 | 1,935 |
| | | 2,152 |
| Materials0.44% | | |
| Vale Overseas Ltd. 6.25% 2026 | 400 | 433 |
| Vale Overseas Ltd. 6.875% 2036 | 95 | 102 |
| Vale Overseas Ltd. 6.875% 2039 | 155 | 167 |
| | | 702 |
| Telecommunication services0.25% | | |
| Digicel Group Ltd. 7.125% 2022 | 450 | 394 |
| Total corporate bonds & notes | | 7,870 |
U.S. Treasury bonds & notes0.81%
U.S. Treasury0.81% | | |
| U.S. Treasury 0.75% 20176 | 925 | 923 |
| U.S. Treasury 0.875% 2017 | 350 | 350 |
| Total U.S. Treasury bonds & notes | | 1,273 |
| Total bonds, notes & other debt instruments (cost: $144,931,000) | | 148,646 |
| Short-term securities3.83% | | |
| Egyptian Treasury Bills 15.77%–17.69% due 8/1/2017–2/20/2018 | EGP70,550 | 3,593 |
| General Electric Co. 1.08% due 7/3/2017 | $1,200 | 1,200 |
| Nigerian Treasury Bills 17.71%–17.91% due 5/3/2018–6/21/20185 | NGN551,735 | 1,263 |
| Total short-term securities (cost: $6,134,000) | | 6,056 |
| Total investment securities 97.90% (cost: $151,065,000) | | 154,702 |
| Other assets less liabilities 2.10% | | 3,314 |
| Net assets 100.00% | | $158,016 |
American Funds Emerging Markets Bond Fund — Page 4 of 6
unaudited
Forward currency contracts
| Contract amount | Counterparty | Settlement
date | Unrealized
appreciation
(depreciation)
at 6/30/2017
(000) |
Purchases
(000) | Sales
(000) |
| USD1,403 | ZAR18,150 | UBS AG | 7/7/2017 | $18 |
| USD1,007 | ZAR13,050 | UBS AG | 7/7/2017 | 11 |
| MXN4,838 | USD263 | Bank of America, N.A. | 7/10/2017 | 3 |
| USD2,096 | INR135,500 | JPMorgan Chase | 7/10/2017 | 2 |
| MXN5,375 | USD293 | Bank of America, N.A. | 7/10/2017 | 2 |
| USD1,054 | MXN19,300 | Bank of America, N.A. | 7/10/2017 | (8) |
| USD2,153 | INR138,900 | Citibank | 7/13/2017 | 8 |
| USD725 | BRL2,400 | Citibank | 7/14/2017 | 3 |
| MXN15,536 | USD856 | JPMorgan Chase | 7/17/2017 | (2) |
| USD287 | ZAR3,700 | JPMorgan Chase | 7/19/2017 | 6 |
| USD362 | BRL1,200 | HSBC Bank | 7/20/2017 | 1 |
| USD741 | MYR3,200 | JPMorgan Chase | 7/24/2017 | (4) |
| USD81 | BRL305 | Citibank | 10/2/2017 | (9) |
| | | | | $31 |
Swap contracts
Interest rate swaps
| Receive | Pay | Expiration
date | Notional
(000) | Value at
6/30/2017
(000) | Upfront
payments/
receipts
(000) | Unrealized
appreciation
at 6/30/2017
(000) |
| 7.505% | 28-day MXN-TIIE | 3/31/2027 | MXN14,500 | $20 | $— | $20 |
| 7.195% | 28-day MXN-TIIE | 6/9/2027 | 30,000 | 2 | — | 2 |
| 3-month USD-LIBOR | 2.4775% | 5/25/2047 | $1,500 | 17 | — | 17 |
| | | | | | $— | $39 |
The following footnotes apply to either the individual securities noted or one or more of the securities aggregated and listed as a single line item.
| 1 | Index-linked bond whose principal amount moves with a government price index. |
| 2 | Coupon rate may change periodically. |
| 3 | Acquired in a transaction exempt from registration under Rule 144A of the Securities Act of 1933. May be resold in the U.S. in transactions exempt from registration, normally to qualified institutional buyers. The total value of all such securities was $18,911,000, which represented 11.97% of the net assets of the fund. |
| 4 | Principal payments may be made periodically. Therefore, the effective maturity date may be earlier than the stated maturity date. |
| 5 | Valued under fair value procedures adopted by authority of the board of trustees. The total value of all such securities was $2,413,000, which represented 1.53% of the net assets of the fund. |
| 6 | A portion of this security was pledged as collateral. The total value of pledged collateral was $142,000, which represented .09% of the net assets of the fund. |
American Funds Emerging Markets Bond Fund — Page 5 of 6
unaudited
| Key to abbreviations and symbol | |
| ARS = Argentine pesos | NGN = Nigerian naira |
| BRL = Brazilian reais | PEN = Peruvian nuevos soles |
| CLP = Chilean pesos | PHP = Philippine pesos |
| COP = Colombian pesos | PLN = Polish zloty |
| GHS = Ghanaian cedi | RUB = Russian rubles |
| HUF = Hungarian forints | THB = Thai baht |
| IDR = Indonesian rupiah | TIIE = Equilibrium Interbank Interest Rate |
| ILS = Israeli shekels | TRY = Turkish lira |
| INR = Indian rupees | USD/$ = U.S. dollars |
| LIBOR = London Interbank Offered Rate | UYU = Uruguayan pesos |
| MXN = Mexican pesos | ZAR = South African rand |
| MYR = Malaysian ringgits | ZMW - Zambian kwacha |
Additional financial disclosures are included in the fund’s current shareholder report and should be read in conjunction with this report.
Investments are not FDIC-insured, nor are they deposits of or guaranteed by a bank or any other entity, so they may lose value.
Investors should carefully consider investment objectives, risks, charges and expenses. This and other important information is contained in the fund prospectus and summary prospectus, which can be obtained from your financial professional and should be read carefully before investing. You may also call American Funds Service Company (AFS) at (800) 421-4225 or visit the American Funds website at americanfunds.com. Securities offered through American Funds Distributors, Inc.
| MFGEFPX-114-0817O-S61900 | American Funds Emerging Markets Bond Fund — Page 6 of 6 |
ITEM 7 – Disclosure of Proxy Voting Policies and Procedures for Closed-End Management Investment Companies
Not applicable to this Registrant, insofar as the Registrant is not a closed-end management investment company.
ITEM 8 – Portfolio Managers of Closed-End Management Investment Companies
Not applicable to this Registrant, insofar as the Registrant is not a closed-end management investment company.
ITEM 9 – Purchases of Equity Securities by Closed-End Management Investment Company and Affiliated Purchasers
Not applicable to this Registrant, insofar as the Registrant is not a closed-end management investment company.
ITEM 10 – Submission of Matters to a Vote of Security Holders
There have been no material changes to the procedures by which shareholders may recommend nominees to the Registrant’s board of trustees since the Registrant last submitted a proxy statement to its shareholders. The procedures are as follows. The Registrant has a nominating and governance committee comprised solely of persons who are not considered ‘‘interested persons’’ of the Registrant within the meaning of the Investment Company Act of 1940, as amended. The committee periodically reviews such issues as the board’s composition, responsibilities, committees, compensation and other relevant issues, and recommends any appropriate changes to the full board of trustees. While the committee normally is able to identify from its own resources an ample number of qualified candidates, it will consider shareholder suggestions of persons to be considered as nominees to fill future vacancies on the board. Such suggestions must be sent in writing to the nominating and governance committee of the Registrant, c/o the Registrant’s Secretary, and must be accompanied by complete biographical and occupational data on the prospective nominee, along with a written consent of the prospective nominee for consideration of his or her name by the nominating and governance committee.
ITEM 11 – Controls and Procedures
| (a) | The Registrant’s Principal Executive Officer and Principal Financial Officer have concluded, based on their evaluation of the Registrant’s disclosure controls and procedures (as such term is defined in Rule 30a-3 under the Investment Company Act of 1940), that such controls and procedures are adequate and reasonably designed to achieve the purposes described in paragraph (c) of such rule. |
| | |
| (b) | There were no changes in the Registrant’s internal controls over financial reporting (as defined in Rule 30a-3(d) under the Investment Company Act of 1940) that occurred during the Registrant’s second fiscal quarter of the period covered by this report that has materially affected, or is reasonably likely to materially affect, the Registrant’s internal control over financial reporting. |
ITEM 12 – Exhibits
| (a)(1) | Not applicable for filing of semi-annual reports to shareholders. |
| | |
| (a)(2) | The certifications required by Rule 30a-2 of the Investment Company Act of 1940 and Sections 302 and 906 of the Sarbanes-Oxley Act of 2002 are attached as exhibits hereto. |
SIGNATURES
Pursuant to the requirements of the Securities Exchange Act of 1934 and the Investment Company Act of 1940, the Registrant has duly caused this report to be signed on its behalf by the undersigned, thereunto duly authorized.
| | AMERICAN FUNDS EMERGING MARKETS BOND FUND |
| | |
| | By /s/ Robert H. Neithart |
| | Robert H. Neithart, President and Principal Executive Officer |
| | |
| | Date: August 31, 2017 |
Pursuant to the requirements of the Securities Exchange Act of 1934 and the Investment Company Act of 1940, this report has been signed below by the following persons on behalf of the Registrant and in the capacities and on the dates indicated.
| By /s/ Robert H. Neithart |
Robert H. Neithart, President and Principal Executive Officer |
| |
| Date: August 31, 2017 |
| By /s/ Brian C. Janssen |
Brian C. Janssen, Treasurer and Principal Financial Officer |
| |
| Date: August 31, 2017 |