UNITED STATES
SECURITIES AND EXCHANGE COMMISSION
Washington, D.C. 20549
FORM N-CSR
Certified Shareholder Report of
Registered Management Investment Companies
Investment Company Act File Number: 811-23122
American Funds Emerging Markets Bond Fund
(Exact Name of Registrant as Specified in Charter)
6455 Irvine Center Drive
Irvine, California 92618
(Address of Principal Executive Offices)
Registrant's telephone number, including area code: (949) 975-5000
Date of fiscal year end: December 31
Date of reporting period: June 30, 2022
Brian C. Janssen
American Funds Emerging Markets Bond Fund
6455 Irvine Center Drive
Irvine, California 92618
(Name and Address of Agent for Service)
ITEM 1 – Reports to Stockholders
American Funds Emerging
Markets Bond Fund® |  |
| |
Semi-annual report
for the six months ended
June 30, 2022 |

Find compelling
opportunities in
emerging markets
bonds with a
flexible approach
American Funds Emerging Markets Bond Fund seeks to provide a high level of total return over the long term, of which current income is a large component.
This fund is one of more than 40 offered by Capital Group, home of American Funds, one of the nation’s largest mutual fund families. For over 90 years, Capital Group has invested with a long-term focus based on thorough research and attention to risk.
Fund results shown in this report, unless otherwise indicated, are for Class F-2 shares. Class A share results are shown at net asset value unless otherwise indicated. If a sales charge (maximum 3.75%) had been deducted, the results would have been lower. Results are for past periods and are not predictive of results for future periods. Current and future results may be lower or higher than those shown. Prices and returns will vary, so investors may lose money. Investing for short periods makes losses more likely. For current information and month-end results, visit capitalgroup.com.
Here are the returns on a $1,000 investment for the period ended June 30, 2022:
| | | Cumulative total return | | Average annual total returns |
| | | 1 year | | 5 years | | Lifetime (since 4/22/16) |
| | | | | | | |
| Class F-2 shares | | | –19.04 | % | | | –0.58 | % | | | 1.20 | % |
| Class A shares (reflecting 3.75% maximum sales charge) | | | –22.32 | | | | –1.59 | | | | 0.35 | |
The total annual fund operating expense ratios were 0.66% for Class F-2 shares and 0.97% for Class A shares as of the prospectus dated March 1, 2022 (as supplemented to date). The expense ratios are restated to reflect current fees.
Investment results assume all distributions are reinvested and reflect applicable fees and expenses. When applicable, investment results reflect fee waivers and/or expense reimbursements, without which results would have been lower. Visit capitalgroup.com for more information.
The fund’s 30-day yield as of June 30, 2022, was 8.57% for Class F-2 shares and 7.49% for Class A shares, calculated in accordance with the U.S. Securities and Exchange Commission formula. The Class A share value reflects the 3.75% maximum sales charge.
The return of principal for bond funds and for funds with significant underlying bond holdings is not guaranteed. Fund shares are subject to the same interest rate, inflation and credit risks associated with the underlying bond holdings. The use of derivatives involves a variety of risks, which may be different from, or greater than, the risks associated with investing in traditional cash securities, such as stocks and bonds. Lower rated bonds are subject to greater fluctuations in value and risk of loss of income and principal than higher rated bonds. Investing outside the United States involves additional risks, such as currency fluctuations, periods of illiquidity and price volatility, as more fully described in the prospectus. These risks may be heightened in connection with investments in developing countries. Refer to the fund prospectus and the Risk Factors section of this report for more information on these and other risks associated with investing in the fund.
Investments are not FDIC-insured, nor are they deposits of or guaranteed by a bank or any other entity, so they may lose value.
Fellow investors:
Results for American Funds Emerging Markets Bond Fund for the periods ended June 30, 2022, are shown in the table below, as well as results of the fund’s benchmark and peer group indexes.
For additional information about the fund, its investment results, holdings and portfolio managers, visit capitalgroup.com/individual/investments/fund/ebnfx. You can also access information about Capital Group’s American Funds and read our insights about the markets, retirement, saving for college, investing fundamentals and more at capitalgroup.com.
Contents
| 2 | | Investment portfolio |
| | | |
| 13 | | Financial statements |
| | | |
| 17 | | Notes to financial statements |
| | | |
| 31 | | Financial highlights |
Results at a glance
For periods ended June 30, 2022, with all distributions reinvested
| | | Cumulative
total returns | | Average annual total returns |
| | | 6 months | | 1 year | | 3 years | | 5 years | | Lifetime
(since 4/22/2016) |
| | | | | | | | | | | |
| American Funds Emerging Markets Bond Fund (Class F-2 shares) | | | –17.63 | % | | | –19.04 | % | | | –4.00 | % | | | –0.58 | % | | | 1.20 | % |
| American Funds Emerging Markets Bond Fund (Class A shares) | | | –17.75 | | | | –19.28 | | | | –4.29 | | | | –0.84 | | | | 0.97 | |
| J.P. Morgan Emerging Markets Bond Index (EMBI) Global Diversified* | | | –20.31 | | | | –21.22 | | | | –5.22 | | | | –1.19 | | | | 0.54 | |
| J.P. Morgan Government Bond Index-Emerging Markets (GBI-EM) Global Diversified* | | | –14.53 | | | | –19.28 | | | | –5.80 | | | | –2.31 | | | | –0.58 | |
| Lipper Emerging Markets Hard Currency Debt Funds Average† | | | –18.01 | | | | –20.13 | | | | –4.78 | | | | –1.39 | | | | 0.61 | |
| * | The J.P. Morgan Emerging Markets Bond Index (EMBI) Global Diversified is a uniquely weighted emerging market debt benchmark that tracks total returns for U.S. dollar-denominated bonds issued by emerging market sovereign and quasi-sovereign entities. The J.P. Morgan Government Bond Index–Emerging Markets (GBI-EM) Global Diversified covers the universe of regularly traded, liquid fixed-rate, domestic currency emerging market government bonds to which international investors can gain exposure. The indexes are unmanaged, and their results include reinvested dividends and/or distributions but do not reflect the effect of account fees, expenses or U.S. federal income taxes. Investors cannot invest directly in an index. This report, and any product, index or fund referred to herein, is not sponsored, endorsed or promoted in any way by J.P. Morgan or any of its affiliates who provide no warranties whatsoever, express or implied, and shall have no liability to any prospective investor, in connection with this report. J.P. Morgan disclaimer: https://www.jpmm.com/research/disclosures. |
| † | Lipper averages reflect the current composition of all eligible mutual funds (all share classes) within a given category. Source: Refinitiv Lipper. Lipper categories are dynamic and averages may have few funds, especially over longer periods. For the number of funds included in the Lipper category for each fund’s lifetime, please refer to the Quarterly Statistical Update, available on our website. |
| American Funds Emerging Markets Bond Fund | 1 |
| Investment portfolio June 30, 2022 | unaudited |
| | |
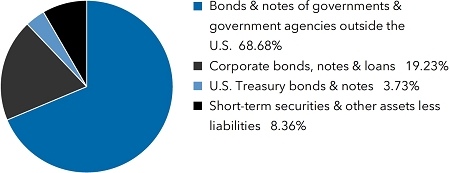
| Investment mix by security type | Percent of net assets |
| Portfolio quality summary* | | Percent of
net assets |
| U.S. Treasury and agency† | | | 3.73 | % |
| AA/Aa | | | 2.19 | |
| A/A | | | 12.92 | |
| BBB/Baa | | | 32.00 | |
| Below investment grade | | | 40.80 | |
| Short-term securities & other assets less liabilities | | | 8.36 | |
| * | Bond ratings, which typically range from AAA/Aaa (highest) to D (lowest), are assigned by credit rating agencies such as Standard & Poor’s, Moody’s and/or Fitch as an indication of an issuer’s creditworthiness. In assigning a credit rating to a security, the fund looks specifically to the ratings assigned to the issuer of the security by Standard & Poor’s, Moody’s and/or Fitch. If agency ratings differ, the security will be considered to have received the highest of those ratings, consistent with the fund’s investment policies. |
| † | These securities are guaranteed by the full faith and credit of the U.S. government. |
| Bonds, notes & other debt instruments 91.64% | | Principal amount
(000) | | | Value
(000) | |
| Bonds & notes of governments & government agencies outside the U.S. 68.68% | | | | |
| Abu Dhabi (Emirate of) 2.50% 20291 | | USD | 1,150 | | | $ | 1,058 | |
| Abu Dhabi (Emirate of) 3.125% 2049 | | | 2,900 | | | | 2,259 | |
| Angola (Republic of) 9.50% 2025 | | | 1,280 | | | | 1,178 | |
| Angola (Republic of) 8.25% 2028 | | | 1,380 | | | | 1,150 | |
| Angola (Republic of) 8.00% 20291 | | | 4,100 | | | | 3,257 | |
| Angola (Republic of) 8.00% 2029 | | | 1,710 | | | | 1,359 | |
| Angola (Republic of) 8.75% 20321 | | | 500 | | | | 402 | |
| Argentine Republic 0.50% 2029 | | EUR | 65 | | | | 16 | |
| Argentine Republic 1.00% 2029 | | USD | 1,290 | | | | 297 | |
| Argentine Republic 0.50% 2030 (0.75% on 7/9/2023)2 | | | 55,617 | | | | 13,191 | |
| Argentine Republic 0% 2035 | | | 600 | | | | 2 | |
| Argentine Republic 1.125% 2035 (1.50% on 7/9/2022)2 | | | 17,394 | | | | 3,768 | |
| Argentine Republic 0.125% 2038 (3.00% on 7/9/2022)2 | | EUR | 978 | | | | 239 | |
| Bahrain (Kingdom of) 6.125% 2022 | | USD | 3,800 | | | | 3,805 | |
| Bahrain (Kingdom of) 6.125% 2023 | | | 1,000 | | | | 1,007 | |
| Bahrain (Kingdom of) 6.75% 20291 | | | 520 | | | | 499 | |
| Belarus (Republic of) 5.875% 2026 | | | 5,776 | | | | 953 | |
| Brazil (Federative Republic of) 6.00% 20233 | | BRL | 16,352 | | | | 3,098 | |
| Brazil (Federative Republic of) 6.00% 20243 | | | 48,195 | | | | 9,172 | |
| Brazil (Federative Republic of) 0% 2025 | | | 48,849 | | | | 6,425 | |
| Brazil (Federative Republic of) 10.00% 2025 | | | 32,598 | | | | 5,873 | |
| Brazil (Federative Republic of) 6.00% 20263 | | | 54,217 | | | | 10,633 | |
| Brazil (Federative Republic of) 10.00% 2027 | | | 43,322 | | | | 7,523 | |
| Brazil (Federative Republic of) 10.00% 2029 | | | 55,481 | | | | 9,301 | |
| Brazil (Federative Republic of) 6.00% 20303 | | | 14,924 | | | | 2,904 | |
| Brazil (Federative Republic of) 10.00% 2031 | | | 6,000 | | | | 979 | |
| Chile (Republic of) 1.50% 20263 | | CLP | 2,717,439 | | | | 2,932 | |
| Chile (Republic of) 5.00% 2028 | | | 1,045,000 | | | | 1,053 | |
| Chile (Republic of) 1.90% 20303 | | | 3,115,113 | | | | 3,385 | |
| Chile (Republic of) 4.70% 2030 | | | 3,180,000 | | | | 3,102 | |
| Chile (Republic of) 3.50% 2034 | | USD | 1,130 | | | | 1,007 | |
| Chile (Republic of) 5.00% 2035 | | CLP | 345,000 | | | | 331 | |
| 2 | American Funds Emerging Markets Bond Fund |
| Bonds, notes & other debt instruments (continued) | | Principal amount
(000) | | | Value
(000) | |
| Bonds & notes of governments & government agencies outside the U.S. (continued) | | | | |
| Chile (Republic of) 3.10% 2041 | | USD | 2,150 | | | $ | 1,641 | |
| Chile (Republic of) 4.34% 2042 | | | 2,790 | | | | 2,489 | |
| Chile (Republic of) 4.00% 2052 | | | 200 | | | | 166 | |
| China (People’s Republic of), Series INBK, 2.80% 2029 | | CNY | 27,080 | | | | 4,042 | |
| China (People’s Republic of), Series INBK, 2.68% 2030 | | | 36,050 | | | | 5,304 | |
| China (People’s Republic of), Series 1910, 3.86% 2049 | | | 27,290 | | | | 4,432 | |
| China (People’s Republic of), Series INBK, 3.39% 2050 | | | 15,970 | | | | 2,392 | |
| China Development Bank Corp., Series 2009, 3.39% 2027 | | | 35,280 | | | | 5,388 | |
| China Development Bank Corp., Series 2004, 3.43% 2027 | | | 24,620 | | | | 3,760 | |
| China Development Bank Corp., Series 1905, 3.48% 2029 | | | 52,820 | | | | 8,088 | |
| Colombia (Republic of) 4.50% 2029 | | USD | 241 | | | | 209 | |
| Colombia (Republic of) 3.125% 2031 | | | 660 | | | | 488 | |
| Colombia (Republic of) 7.00% 2031 | | COP | 5,102,400 | | | | 934 | |
| Colombia (Republic of) 7.375% 2037 | | USD | 610 | | | | 566 | |
| Colombia (Republic of) 5.625% 2044 | | | 261 | | | | 188 | |
| Colombia (Republic of) 5.00% 2045 | | | 785 | | | | 528 | |
| Colombia (Republic of) 5.20% 2049 | | | 200 | | | | 136 | |
| Colombia (Republic of) 4.125% 2051 | | | 2,360 | | | | 1,419 | |
| Colombia (Republic of), Series UVR, 3.50% 20253 | | COP | 7,073,365 | | | | 1,999 | |
| Colombia (Republic of), Series B, 6.25% 2025 | | | 10,461,400 | | | | 2,214 | |
| Colombia (Republic of), Series B, 5.75% 2027 | | | 48,246,400 | | | | 9,205 | |
| Colombia (Republic of), Series UVR, 2.25% 20293 | | | 86,599 | | | | 5,528 | |
| Colombia (Republic of), Series B, 7.75% 2030 | | | 3,908,200 | | | | 766 | |
| Colombia (Republic of), Series B, 7.00% 2031 | | | 50,011,100 | | | | 9,156 | |
| Colombia (Republic of), Series B, 7.25% 2034 | | | 6,926,700 | | | | 1,208 | |
| Colombia (Republic of), Series B, 7.25% 2050 | | | 5,690,900 | | | | 869 | |
| Costa Rica (Republic of) 6.125% 2031 | | USD | 1,315 | | | | 1,231 | |
| Costa Rica (Republic of) 6.125% 20311 | | | 970 | | | | 908 | |
| Cote d’Ivoire (Republic of) 5.25% 2030 | | EUR | 1,380 | | | | 1,135 | |
| Cote d’Ivoire (Republic of) 5.875% 2031 | | | 2,875 | | | | 2,365 | |
| Cote d’Ivoire (Republic of) 4.875% 2032 | | | 970 | | | | 734 | |
| Czech Republic 0.45% 2023 | | CZK | 62,180 | | | | 2,435 | |
| Czech Republic 2.40% 2025 | | | 64,190 | | | | 2,465 | |
| Czech Republic 2.50% 2028 | | | 19,360 | | | | 712 | |
| Development Bank of Kazakhstan 10.95% 2026 | | KZT | 1,563,000 | | | | 2,628 | |
| Development Bank of Mongolia, LLC 7.25% 2023 | | USD | 700 | | | | 677 | |
| Dominican Republic 6.875% 2026 | | | 1,209 | | | | 1,236 | |
| Dominican Republic 6.875% 20261 | | | 984 | | | | 1,006 | |
| Dominican Republic 5.95% 20271 | | | 2,300 | | | | 2,201 | |
| Dominican Republic 5.95% 2027 | | | 1,700 | | | | 1,627 | |
| Dominican Republic 5.50% 20291 | | | 2,420 | | | | 2,113 | |
| Dominican Republic 4.50% 20301 | | | 6,188 | | | | 4,985 | |
| Dominican Republic 6.00% 20331 | | | 805 | | | | 673 | |
| Dominican Republic 5.30% 20411 | | | 887 | | | | 618 | |
| Dominican Republic 7.45% 2044 | | | 1,660 | | | | 1,423 | |
| Dominican Republic 6.85% 2045 | | | 800 | | | | 635 | |
| Dominican Republic 6.40% 2049 | | | 580 | | | | 435 | |
| Dominican Republic 5.875% 20601 | | | 2,170 | | | | 1,490 | |
| Dominican Republic 5.875% 2060 | | | 2,040 | | | | 1,401 | |
| Egypt (Arab Republic of) 14.051% 2022 | | EGP | 25,300 | | | | 1,348 | |
| Egypt (Arab Republic of) 5.75% 20241 | | USD | 640 | | | | 573 | |
| Egypt (Arab Republic of) 4.75% 2026 | | EUR | 6,650 | | | | 5,228 | |
| Egypt (Arab Republic of) 4.75% 2026 | | | 1,550 | | | | 1,218 | |
| Egypt (Arab Republic of) 6.588% 20281 | | USD | 4,900 | | | | 3,565 | |
| Egypt (Arab Republic of) 5.625% 2030 | | EUR | 1,719 | | | | 1,123 | |
| Egypt (Arab Republic of) 7.625% 20321 | | USD | 3,600 | | | | 2,368 | |
| Egypt (Arab Republic of) 7.625% 2032 | | | 1,800 | | | | 1,184 | |
| Egypt (Arab Republic of) 8.875% 2050 | | | 1,330 | | | | 812 | |
| Egypt (Arab Republic of) 8.75% 2051 | | | 2,742 | | | | 1,659 | |
| Egypt (Arab Republic of) 8.15% 20591 | | | 2,600 | | | | 1,512 | |
| Ethiopia (Federal Democratic Republic of) 6.625% 2024 | | | 5,675 | | | | 3,248 | |
| Export-Import Bank of India 3.25% 2030 | | | 2,180 | | | | 1,898 | |
| Gabonese Republic 6.95% 2025 | | | 1,048 | | | | 921 | |
| Gabonese Republic 6.625% 20311 | | | 400 | | | | 297 | |
| Gabonese Republic 7.00% 2031 | | | 1,710 | | | | 1,252 | |
| Gabonese Republic 7.00% 20311 | | | 1,470 | | | | 1,077 | |
| Georgia (Republic of) 2.75% 20261 | | | 1,975 | | | | 1,641 | |
| | |
| American Funds Emerging Markets Bond Fund | 3 |
| Bonds, notes & other debt instruments (continued) | | Principal amount
(000) | | | Value
(000) | |
| Bonds & notes of governments & government agencies outside the U.S. (continued) | | | | |
| Ghana (Republic of) 0% 2025 | | USD | 300 | | | $ | 171 | |
| Ghana (Republic of) 8.125% 2026 | | | 1,390 | | | | 1,006 | |
| Ghana (Republic of) 6.375% 2027 | | | 2,260 | | | | 1,302 | |
| Ghana (Republic of) 7.875% 2027 | | | 1,500 | | | | 876 | |
| Ghana (Republic of) 7.625% 2029 | | | 990 | | | | 488 | |
| Ghana (Republic of) 7.75% 20291 | | | 1,900 | | | | 954 | |
| Guatemala (Republic of) 6.125% 20501 | | | 1,060 | | | | 894 | |
| Honduras (Republic of) 6.25% 2027 | | | 8,010 | | | | 6,300 | |
| Honduras (Republic of) 6.25% 20271 | | | 263 | | | | 207 | |
| Honduras (Republic of) 5.625% 2030 | | | 3,806 | | | | 2,582 | |
| Honduras (Republic of) 5.625% 20301 | | | 2,285 | | | | 1,550 | |
| Hungary (Republic of), Series C, 1.50% 2023 | | HUF | 1,140,000 | | | | 2,823 | |
| Hungary (Republic of), Series A, 6.75% 2028 | | | 94,520 | | | | 232 | |
| Hungary (Republic of), Series A, 3.25% 2031 | | | 227,930 | | | | 420 | |
| Indonesia (Republic of), Series 63, 5.625% 2023 | | IDR | 15,500,000 | | | | 1,054 | |
| Indonesia (Republic of), Series 59, 7.00% 2027 | | | 95,278,000 | | | | 6,571 | |
| Indonesia (Republic of), Series 64, 6.125% 2028 | | | 76,302,000 | | | | 5,014 | |
| Indonesia (Republic of), Series 78, 8.25% 2029 | | | 73,568,000 | | | | 5,259 | |
| Indonesia (Republic of), Series 71, 9.00% 2029 | | | 49,743,000 | | | | 3,680 | |
| Indonesia (Republic of), Series 82, 7.00% 2030 | | | 76,605,000 | | | | 5,104 | |
| Indonesia (Republic of), Series 87, 6.50% 2031 | | | 34,751,000 | | | | 2,230 | |
| Indonesia (Republic of), Series 73, 8.75% 2031 | | | 42,235,000 | | | | 3,083 | |
| Indonesia (Republic of), Series 91, 6.375% 2032 | | | 28,257,000 | | | | 1,785 | |
| Indonesia (Republic of), Series 74, 7.50% 2032 | | | 65,399,000 | | | | 4,423 | |
| Indonesia (Republic of), Series 65, 6.625% 2033 | | | 26,000 | | | | 2 | |
| Indonesia (Republic of), Series 80, 7.50% 2035 | | | 9,075,000 | | | | 613 | |
| Indonesia (Republic of), Series 83, 7.50% 2040 | | | 3,711,000 | | | | 249 | |
| Israel (State of) 2.875% 2026 | | USD | 373 | | | | 364 | |
| Israel (State of) 2.00% 2027 | | ILS | 609 | | | | 171 | |
| Jordan (Hashemite Kingdom of) 5.75% 20271 | | USD | 665 | | | | 586 | |
| Kenya (Republic of) 6.875% 2024 | | | 775 | | | | 651 | |
| Kenya (Republic of) 7.25% 20281 | | | 1,725 | | | | 1,252 | |
| Kenya (Republic of) 10.90% 2031 | | KES | 70,000 | | | | 547 | |
| Kenya (Republic of) 6.30% 20341 | | USD | 1,830 | | | | 1,147 | |
| Malaysia (Federation of), Series 0513, 3.733% 2028 | | MYR | 1,870 | | | | 414 | |
| Malaysia (Federation of), Series 0219, 3.885% 2029 | | | 21,340 | | | | 4,728 | |
| Malaysia (Federation of), Series 0419, 3.828% 2034 | | | 42,730 | | | | 8,988 | |
| Malaysia (Federation of), Series 0415, 4.254% 2035 | | | 10,650 | | | | 2,319 | |
| Malaysia (Federation of), Series 0615, 4.786% 2035 | | | 5,925 | | | | 1,354 | |
| Malaysia (Federation of), Series 0418, 4.893% 2038 | | | 54,501 | | | | 12,492 | |
| Malaysia (Federation of), Series 0219, 4.467% 2039 | | | 2,000 | | | | 428 | |
| Malaysia (Federation of), Series 0519, 3.757% 2040 | | | 1,500 | | | | 297 | |
| Malaysia (Federation of), Series 0518, 4.921% 2048 | | | 3,438 | | | | 771 | |
| Mongolia (State of) 5.125% 2026 | | USD | 300 | | | | 271 | |
| Mozambique (Republic of) 5.00% 2031 (9.00% on 9/15/2023)2 | | | 5,265 | | | | 3,831 | |
| Namibia (Republic of) 5.25% 2025 | | | 2,000 | | | | 1,780 | |
| Nigeria (Republic of) 8.375% 20291 | | | 1,020 | | | | 779 | |
| Oman (Sultanate of) 5.375% 2027 | | | 421 | | | | 410 | |
| Oman (Sultanate of) 4.875% 20301 | | | 1,050 | | | | 1,020 | |
| Oman (Sultanate of) 6.25% 20311 | | | 3,568 | | | | 3,455 | |
| Pakistan (Islamic Republic of) 5.625% 2022 | | | 7,170 | | | | 6,740 | |
| Pakistan (Islamic Republic of) 8.25% 2025 | | | 850 | | | | 614 | |
| Pakistan (Islamic Republic of) 6.00% 20261 | | | 4,953 | | | | 3,367 | |
| Panama (Republic of) 7.125% 2026 | | | 710 | | | | 774 | |
| Panama (Republic of) 3.16% 2030 | | | 830 | | | | 739 | |
| Panama (Republic of) 4.50% 2047 | | | 1,350 | | | | 1,112 | |
| Panama (Republic of) 4.50% 2050 | | | 700 | | | | 571 | |
| Panama (Republic of) 4.30% 2053 | | | 820 | | | | 646 | |
| Panama (Republic of) 4.50% 2056 | | | 673 | | | | 536 | |
| Panama (Republic of) 3.87% 2060 | | | 410 | | | | 291 | |
| Panama (Republic of) 4.50% 2063 | | | 2,720 | | | | 2,100 | |
| Paraguay (Republic of) 5.00% 2026 | | | 200 | | | | 197 | |
| Paraguay (Republic of) 4.95% 2031 | | | 430 | | | | 399 | |
| Paraguay (Republic of) 5.60% 20481 | | | 2,432 | | | | 1,929 | |
| Peru (Republic of) 4.125% 2027 | | | 1,056 | | | | 1,037 | |
| Peru (Republic of) 6.95% 2031 | | PEN | 3,045 | | | | 756 | |
| Peru (Republic of) 6.15% 2032 | | | 5,402 | | | | 1,249 | |
| | |
| 4 | American Funds Emerging Markets Bond Fund |
| Bonds, notes & other debt instruments (continued) | | Principal amount
(000) | | | Value
(000) | |
| Bonds & notes of governments & government agencies outside the U.S. (continued) | | | | |
| Peru (Republic of) 3.00% 2034 | | USD | 840 | | | $ | 691 | |
| Peru (Republic of) 5.40% 2034 | | PEN | 15,139 | | | | 3,191 | |
| Peru (Republic of) 5.40% 2034 | | | 11,190 | | | | 2,359 | |
| Peru (Republic of) 6.85% 2042 | | | 2,519 | | | | 584 | |
| Peru (Republic of) 3.55% 2051 | | USD | 1,100 | | | | 825 | |
| Peru (Republic of) 2.78% 2060 | | | 1,615 | | | | 1,004 | |
| PETRONAS Capital, Ltd. 3.50% 20301 | | | 1,000 | | | | 942 | |
| PETRONAS Capital, Ltd. 3.50% 2030 | | | 300 | | | | 283 | |
| Philippines (Republic of) 3.95% 2040 | | | 550 | | | | 480 | |
| Philippines (Republic of) 3.70% 2042 | | | 1,000 | | | | 828 | |
| Philippines (Republic of) 2.95% 2045 | | | 1,687 | | | | 1,215 | |
| Poland (Republic of), Series 1024, 2.25% 2024 | | PLN | 16,400 | | | | 3,265 | |
| Poland (Republic of), Series 5Y, 3.75% 2027 | | | 16,586 | | | | 3,175 | |
| PT Indonesia Asahan Aluminium Tbk 4.75% 2025 | | USD | 2,000 | | | | 1,990 | |
| PT Indonesia Asahan Aluminium Tbk 6.53% 2028 | | | 264 | | | | 268 | |
| PT Indonesia Asahan Aluminium Tbk Pt 5.80% 2050 | | | 300 | | | | 242 | |
| Qatar (State of) 3.75% 20301 | | | 1,000 | | | | 994 | |
| Qatar (State of) 4.40% 20501 | | | 2,900 | | | | 2,775 | |
| Romania 3.65% 2025 | | RON | 6,200 | | | | 1,142 | |
| Romania 2.00% 2033 | | EUR | 1,760 | | | | 1,201 | |
| Romania 3.75% 2034 | | | 445 | | | | 352 | |
| Russian Federation 7.00% 2023 | | RUB | 270,652 | | | | 443 | |
| Russian Federation 7.15% 20254 | | | 230,100 | | | | 377 | |
| Russian Federation 8.15% 2027 | | | 967,215 | | | | 1,583 | |
| Russian Federation 2.50% 20283 | | | 807,108 | | | | 1,321 | |
| Russian Federation 4.375% 20291 | | USD | 2,400 | | | | 563 | |
| Russian Federation 4.375% 2029 | | | 600 | | | | 141 | |
| Russian Federation 7.65% 20304 | | RUB | 346,000 | | | | 566 | |
| Russian Federation 6.90% 2031 | | | 577,246 | | | | 945 | |
| Russian Federation 8.50% 20314 | | | 1,386,756 | | | | 2,269 | |
| Russian Federation 7.70% 20334 | | | 58,371 | | | | 96 | |
| Russian Federation 7.25% 20344 | | | 861,125 | | | | 1,409 | |
| Russian Federation 5.10% 2035 | | USD | 5,800 | | | | 1,380 | |
| Russian Federation 6.10% 2035 | | RUB | 636,503 | | | | 1,042 | |
| Russian Federation 7.70% 20394 | | | 38,467 | | | | 63 | |
| Russian Federation 5.25% 20474,5 | | USD | 5,600 | | | | 1,596 | |
| Saudi Arabia (Kingdom of) 4.625% 2047 | | | 2,400 | | | | 2,227 | |
| Senegal (Republic of) 4.75% 2028 | | EUR | 2,960 | | | | 2,528 | |
| Senegal (Republic of) 4.75% 2028 | | | 1,140 | | | | 974 | |
| Senegal (Republic of) 5.375% 2037 | | | 1,000 | | | | 660 | |
| South Africa (Republic of) 2.00% 20253 | | ZAR | 64,722 | | | | 3,966 | |
| South Africa (Republic of), Series R-2023, 7.75% 2023 | | | — | 6 | | | — | 6 |
| South Africa (Republic of), Series R-2030, 8.00% 2030 | | | 342,700 | | | | 18,308 | |
| South Africa (Republic of), Series R-213, 7.00% 2031 | | | 100,937 | | | | 4,884 | |
| South Africa (Republic of), Series R-2032, 8.25% 2032 | | | 42,744 | | | | 2,201 | |
| South Africa (Republic of), Series R-2035, 8.875% 2035 | | | 223,348 | | | | 11,514 | |
| South Africa (Republic of), Series R-2037, 8.50% 2037 | | | 72,130 | | | | 3,505 | |
| South Africa (Republic of), Series R-2040, 9.00% 2040 | | | 24,872 | | | | 1,233 | |
| South Africa (Republic of), Series R-214, 6.50% 2041 | | | 8,700 | | | | 328 | |
| South Africa (Republic of), Series R-2048, 8.75% 2048 | | | 89,514 | | | | 4,248 | |
| Sri Lanka (Democratic Socialist Republic of) 5.75% 20234 | | USD | 1,982 | | | | 643 | |
| Sri Lanka (Democratic Socialist Republic of) 6.125% 20254 | | | 3,100 | | | | 1,033 | |
| Sri Lanka (Democratic Socialist Republic of) 6.85% 20254 | | | 2,975 | | | | 981 | |
| Sri Lanka (Democratic Socialist Republic of) 6.825% 20261 | | | 1,350 | | | | 469 | |
| Sri Lanka (Democratic Socialist Republic of) 6.20% 20271,4 | | | 2,500 | | | | 813 | |
| Sri Lanka (Democratic Socialist Republic of) 6.20% 20274 | | | 300 | | | | 98 | |
| Sri Lanka (Democratic Socialist Republic of) 6.75% 20284 | | | 250 | | | | 81 | |
| Sri Lanka (Democratic Socialist Republic of) 7.85% 2029 | | | 604 | | | | 198 | |
| Sri Lanka (Democratic Socialist Republic of) 7.55% 2030 | | | 3,121 | | | | 1,011 | |
| Srpska (Republic of) 4.75% 2026 | | EUR | 959 | | | | 1,023 | |
| Thailand (Kingdom of) 3.85% 2025 | | THB | 110,000 | | | | 3,293 | |
| Thailand (Kingdom of) 2.875% 2028 | | | 53,950 | | | | 1,547 | |
| Thailand (Kingdom of) 2.00% 2031 | | | 63,400 | | | | 1,679 | |
| Thailand (Kingdom of) 2.00% 2042 | | | 78,770 | | | | 1,681 | |
| Tunisia (Republic of) 6.75% 2023 | | EUR | 13,970 | | | | 10,204 | |
| Tunisia (Republic of) 5.625% 2024 | | | 2,035 | | | | 1,256 | |
| Tunisia (Republic of) 5.75% 2025 | | USD | 465 | | | | 260 | |
| | |
| American Funds Emerging Markets Bond Fund | 5 |
| Bonds, notes & other debt instruments (continued) | | Principal amount
(000) | | | Value
(000) | |
| Bonds & notes of governments & government agencies outside the U.S. (continued) | | | | |
| Tunisia (Republic of) 6.375% 2026 | | EUR | 2,300 | | | $ | 1,312 | |
| Turkey (Republic of) 8.80% 2023 | | TRY | 9,000 | | | | 463 | |
| Turkey (Republic of) 3.20% 20243 | | | 13,303 | | | | 1,124 | |
| Turkey (Republic of) 4.10% 20243 | | | 19,198 | | | | 1,493 | |
| Turkey (Republic of) 6.375% 2025 | | USD | 1,035 | | | | 920 | |
| Turkey (Republic of) 8.00% 2025 | | TRY | 50 | | | | 2 | |
| Turkey (Republic of) 4.25% 2026 | | USD | 1,270 | | | | 1,024 | |
| Turkey (Republic of) 4.875% 2026 | | | 2,000 | | | | 1,608 | |
| Turkey (Republic of) 6.50% 2033 | | | 900 | | | | 647 | |
| Ukraine 7.75% 20225 | | | 1,600 | | | | 800 | |
| Ukraine 14.91% 2022 | | UAH | 34,797 | | | | 255 | |
| Ukraine 10.00% 2023 | | | 31,600 | | | | 232 | |
| Ukraine 11.67% 2023 | | | 5,804 | | | | 43 | |
| Ukraine 15.97% 2023 | | | 47,600 | | | | 349 | |
| Ukraine 8.994% 2024 | | USD | 5,523 | | | | 1,460 | |
| Ukraine 7.75% 2025 | | | 1,200 | | | | 304 | |
| Ukraine 15.84% 2025 | | UAH | 70,065 | | | | 514 | |
| Ukraine 6.75% 2026 | | EUR | 2,072 | | | | 570 | |
| Ukraine 6.876% 20291 | | USD | 1,800 | | | | 446 | |
| Ukraine 4.375% 2030 | | EUR | 700 | | | | 182 | |
| Ukraine 7.253% 2033 | | USD | 2,012 | | | | 506 | |
| Ukraine 7.253% 20331 | | | 1,700 | | | | 427 | |
| Ukraine 1.258% 20407 | | | 1,661 | | | | 421 | |
| United Mexican States 4.50% 20253 | | MXN | 203,458 | | | | 10,274 | |
| United Mexican States 3.25% 2030 | | USD | 890 | | | | 785 | |
| United Mexican States 4.75% 2032 | | | 359 | | | | 345 | |
| United Mexican States 3.50% 2034 | | | 1,250 | | | | 1,036 | |
| United Mexican States 4.50% 2050 | | | 1,017 | | | | 795 | |
| United Mexican States 4.40% 2052 | | | 883 | | | | 667 | |
| United Mexican States 3.75% 2071 | | | 1,590 | | | | 1,016 | |
| United Mexican States 5.75% 2110 | | | 1,684 | | | | 1,420 | |
| United Mexican States, Series M, 5.75% 2026 | | MXN | 166,000 | | | | 7,347 | |
| United Mexican States, Series M, 7.50% 2027 | | | 120,245 | | | | 5,592 | |
| United Mexican States, Series M20, 8.50% 2029 | | | 286,100 | | | | 13,821 | |
| United Mexican States, Series M, 7.75% 2031 | | | 146,521 | | | | 6,708 | |
| United Mexican States, Series M30, 10.00% 2036 | | | 23,500 | | | | 1,260 | |
| United Mexican States, Series M, 7.75% 2042 | | | 2,090 | | | | 91 | |
| United Mexican States, Series M, 8.00% 2047 | | | 30,663 | | | | 1,361 | |
| Uruguay (Oriental Republic of) 4.375% 20283 | | UYU | 49 | | | | 1 | |
| Uruguay (Oriental Republic of) 3.875% 20403 | | | 66,028 | | | | 1,742 | |
| Venezuela (Bolivarian Republic of) 7.00% 20184 | | USD | 155 | | | | 12 | |
| Venezuela (Bolivarian Republic of) 7.75% 20194 | | | 3,393 | | | | 263 | |
| Venezuela (Bolivarian Republic of) 6.00% 20204 | | | 2,293 | | | | 178 | |
| Venezuela (Bolivarian Republic of) 12.75% 20224 | | | 210 | | | | 18 | |
| Venezuela (Bolivarian Republic of) 9.00% 20234 | | | 3,335 | | | | 283 | |
| Venezuela (Bolivarian Republic of) 8.25% 20244 | | | 1,546 | | | | 131 | |
| Venezuela (Bolivarian Republic of) 7.65% 20254 | | | 450 | | | | 39 | |
| Venezuela (Bolivarian Republic of) 11.75% 20264 | | | 155 | | | | 14 | |
| Venezuela (Bolivarian Republic of) 9.25% 20274 | | | 2,100 | | | | 184 | |
| Venezuela (Bolivarian Republic of) 9.25% 20284 | | | 769 | | | | 67 | |
| Venezuela (Bolivarian Republic of) 11.95% 20314 | | | 267 | | | | 23 | |
| Venezuela (Bolivarian Republic of) 7.00% 20384 | | | 377 | | | | 33 | |
| | | | | | | | 566,368 | |
| | | | | | | | | |
| Corporate bonds, notes & loans 19.23% | | | | | | | | |
| Energy 5.39% | | | | | | | | |
| AI Candelaria (Spain), SLU 5.75% 20331 | | | 2,250 | | | | 1,651 | |
| Ecopetrol SA 5.875% 2045 | | | 457 | | | | 312 | |
| GeoPark, Ltd. 5.50% 2027 | | | 500 | | | | 420 | |
| Guara Norte SARL 5.198% 20341 | | | 2,629 | | | | 2,137 | |
| MV24 Capital BV 6.748% 20341 | | | 1,876 | | | | 1,684 | |
| MV24 Capital BV 6.748% 2034 | | | 1,333 | | | | 1,197 | |
| Odebrecht Drilling Norbe 6.72% PIK and 1.00% Cash 20268 | | | 8,247 | | | | 2,062 | |
| Oleoducto Central SA 4.00% 20271 | | | 2,850 | | | | 2,382 | |
| Petróleos Mexicanos 7.19% 2024 | | MXN | 46,570 | | | | 2,127 | |
| Petróleos Mexicanos 7.19% 2024 | | | 38,568 | | | | 1,761 | |
| Petróleos Mexicanos 6.875% 2025 | | USD | 730 | | | | 684 | |
| | |
| 6 | American Funds Emerging Markets Bond Fund |
| Bonds, notes & other debt instruments (continued) | | Principal amount
(000) | | | Value
(000) | |
| Corporate bonds, notes & loans (continued) | | | | | | |
| Energy (continued) | | | | | | | | |
| Petróleos Mexicanos 6.875% 2026 | | USD | 2,545 | | | $ | 2,298 | |
| Petróleos Mexicanos 7.47% 2026 | | MXN | 109,690 | | | | 4,762 | |
| Petróleos Mexicanos 6.49% 2027 | | USD | 460 | | | | 399 | |
| Petróleos Mexicanos 8.75% 20291 | | | 3,000 | | | | 2,722 | |
| Petróleos Mexicanos 6.70% 2032 | | | 4,418 | | | | 3,378 | |
| Petróleos Mexicanos 6.75% 2047 | | | 4,550 | | | | 2,825 | |
| Petróleos Mexicanos 7.69% 2050 | | | 6,950 | | | | 4,660 | |
| Petróleos Mexicanos 6.95% 2060 | | | 2,217 | | | | 1,372 | |
| Petron Corp. 4.60% perpetual bonds (5-year UST Yield Curve Rate T Note Constant Maturity + 4.769% on 7/19/2023)2 | | | 200 | | | | 193 | |
| Petrorio Luxembourg SARL 6.125% 20261 | | | 500 | | | | 461 | |
| PTT Exploration and Production PCL 2.587% 20271 | | | 278 | | | | 257 | |
| Qatar Petroleum 3.125% 20411 | | | 2,995 | | | | 2,356 | |
| Qatar Petroleum 3.30% 20511 | | | 2,710 | | | | 2,099 | |
| Sinopec Group Overseas Development (2018), Ltd. 2.30% 20311 | | | 250 | | | | 219 | |
| | | | | | | | 44,418 | |
| | | | | | | | | |
| Financials 3.22% | | | | | | | | |
| Banco de Crédito del Perú 3.25% 2031 (5-year UST Yield Curve Rate T Note Constant Maturity + 2.45% on 9/30/2026)1,2 | | | 2,955 | | | | 2,594 | |
| Bangkok Bank PCL 4.45% 20281 | | | 900 | | | | 908 | |
| Bangkok Bank PCL 9.025% 2029 | | | 348 | | | | 419 | |
| Bangkok Bank PCL 3.733% 2034 (5-year UST Yield Curve Rate T Note Constant Maturity + 1.90% on 9/25/2029)2 | | | 4,978 | | | | 4,369 | |
| China Construction Bank Corp. 2.85% 2032 (5-year UST Yield Curve Rate T Note Constant Maturity + 1.40% on 1/21/2027)2 | | | 1,340 | | | | 1,254 | |
| China Ping An Insurance Overseas (Holdings), Ltd. 2.85% 2031 | | | 272 | | | | 221 | |
| HDFC Bank, Ltd. 8.10% 2025 | | INR | 60,000 | | | | 755 | |
| Huarong Finance 2017 Co., Ltd. (3-month USD-LIBOR + 1.15%) 2.552% 20227 | | USD | 296 | | | | 293 | |
| Huarong Finance 2017 Co., Ltd. 4.75% 2027 | | | 800 | | | | 723 | |
| Huarong Finance 2019 Co., Ltd. (3-month USD-LIBOR + 1.125%) 2.631% 20237 | | | 2,579 | | | | 2,521 | |
| Huarong Finance 2019 Co., Ltd. 3.25% 2024 | | | 200 | | | | 188 | |
| Huarong Finance 2019 Co., Ltd. 3.75% 2024 | | | 200 | | | | 191 | |
| Huarong Finance 2019 Co., Ltd. (3-month USD-LIBOR + 1.25%) 2.756% 20257 | | | 204 | | | | 191 | |
| Huarong Finance 2019 Co., Ltd. 3.875% 2029 | | | 858 | | | | 685 | |
| Huarong Finance 2019 Co., Ltd. 4.50% 2029 | | | 200 | | | | 167 | |
| Huarong Finance II Co., Ltd. 5.00% 2025 | | | 200 | | | | 189 | |
| Huarong Finance II Co., Ltd. 5.50% 2025 | | | 500 | | | | 486 | |
| Huarong Finance II Co., Ltd. 4.625% 2026 | | | 2,106 | | | | 1,935 | |
| Huarong Finance II Co., Ltd. 4.875% 2026 | | | 200 | | | | 184 | |
| ICBCIL Finance Co., Ltd. 3.625% 2027 | | | 654 | | | | 636 | |
| Kasikornbank PCL HK 3.343% 2031 (5-year UST Yield Curve Rate T Note Constant Maturity + 1.70% on 10/2/2026)2 | | | 4,000 | | | | 3,604 | |
| Keb Hana Bank 3.25% 20271 | | | 1,265 | | | | 1,217 | |
| Power Financial Corp., Ltd. 3.90% 2029 | | | 500 | | | | 446 | |
| Power Financial Corp., Ltd. 3.95% 2030 | | | 200 | | | | 177 | |
| Shriram Transport Finance Co., Ltd. 4.40% 20241 | | | 1,146 | | | | 1,059 | |
| Vigorous Champion International, Ltd. 4.25% 2029 | | | 200 | | | | 186 | |
| Xiaomi Best Time International, Ltd. 2.875% 20311 | | | 215 | | | | 167 | |
| Xiaomi Best Time International, Ltd. 4.10% 20511 | | | 1,120 | | | | 754 | |
| | | | | | | | 26,519 | |
| | | | | | | | | |
| Utilities 2.69% | | | | | | | | |
| AES Panama Generation Holdings SRL 4.375% 20301 | | | 3,295 | | | | 2,824 | |
| Alfa Desarrollo SpA 4.55% 20511 | | | 1,117 | | | | 805 | |
| Azure Power Energy, Ltd. 3.575% 20261 | | | 385 | | | | 320 | |
| Empresas Publicas de Medellin ESP 8.375% 2027 | | COP | 10,000,000 | | | | 1,929 | |
| Empresas Publicas de Medellin ESP 8.375% 2027 | | | 3,744,000 | | | | 722 | |
| Empresas Publicas de Medellin ESP 4.25% 20291 | | USD | 1,602 | | | | 1,254 | |
| Empresas Publicas de Medellin ESP 4.375% 20311 | | | 960 | | | | 736 | |
| Enel Chile SA 4.875% 2028 | | | 1,701 | | | | 1,629 | |
| Enersis Américas SA 4.00% 2026 | | | 215 | | | | 208 | |
| Enfragen Energia Sur SA 5.375% 2030 | | | 1,800 | | | | 1,218 | |
| ENN Clean Energy International Investment, Ltd. 3.375% 20261 | | | 510 | | | | 464 | |
| ENN Energy Holdings, Ltd. 2.625% 20301 | | | 1,260 | | | | 1,074 | |
| Greenko Investment Co. 4.875% 20231 | | | 600 | | | | 581 | |
| Indian Renewable Energy Development Agency, Ltd. 7.125% 2022 | | INR | 120,000 | | | | 1,509 | |
| | |
| American Funds Emerging Markets Bond Fund | 7 |
| Bonds, notes & other debt instruments (continued) | | Principal amount
(000) | | | Value
(000) | |
| Corporate bonds, notes & loans (continued) | | | | | | |
| Utilities (continued) | | | | | | | | |
| Instituto Costarricense de Electricidad 6.75% 2031 | | USD | 2,295 | | | $ | 2,160 | |
| Investment Energy Resources, Ltd. 6.25% 20291 | | | 2,985 | | | | 2,528 | |
| Korea Electric Power Corp. 4.00% 20271 | | | 200 | | | | 200 | |
| Light Servicos de Eletricidade SA 4.375% 20261 | | | 2,000 | | | | 1,764 | |
| ReNew Power Private, Ltd. 5.875% 20271 | | | 300 | | | | 275 | |
| | | | | | | | 22,200 | |
| | | | | | | | | |
| Materials 2.27% | | | | | | | | |
| Alpek, SAB de CV, 3.25% 20311 | | | 2,175 | | | | 1,748 | |
| Bluestar Finance Holdings, Ltd. 3.10% junior subordinated perpetual bonds (3-year UST Yield Curve Rate T Note Constant Maturity + 5.634% on 7/12/2024)2 | | | 569 | | | | 555 | |
| Braskem Idesa SAPI 7.45% 20291 | | | 381 | | | | 327 | |
| Braskem Idesa SAPI 6.99% 20321 | | | 4,230 | | | | 3,278 | |
| Braskem Netherlands Finance BV 4.50% 2028 | | | 1,000 | | | | 910 | |
| CAP SA 3.90% 2031 | | | 200 | | | | 157 | |
| CSN Islands XI Corp. 6.75% 2028 | | | 500 | | | | 437 | |
| CSN Resources SA 5.875% 20321 | | | 1,610 | | | | 1,228 | |
| Fresnillo PLC 4.25% 20501 | | | 2,760 | | | | 2,031 | |
| GC Treasury Center Co., Ltd. 2.98% 20311 | | | 375 | | | | 312 | |
| GC Treasury Center Co., Ltd. 4.40% 20321 | | | 1,986 | | | | 1,826 | |
| Gran Colombia Gold Corp. 6.875% 20261 | | | 1,760 | | | | 1,380 | |
| Grupo Idesa, SA de CV, 2.969% PIK and 6.656% Cash 20262,8 | | | 400 | | | | 255 | |
| Industrias Peñoles, SAB de CV, 4.75% 20501 | | | 455 | | | | 362 | |
| Sasol Financing USA, LLC 4.375% 2026 | | | 4,410 | | | | 3,894 | |
| | | | | | | | 18,700 | |
| | | | | | | | | |
| Industrials 2.19% | | | | | | | | |
| Aeropuerto International de Tocume SA 4.00% 20411 | | | 700 | | | | 569 | |
| Aeropuerto International de Tocume SA 5.125% 20611 | | | 1,140 | | | | 905 | |
| Hidrovias International Finance SARL 4.95% 20311 | | | 4,347 | | | | 3,369 | |
| Hidrovias International Finance SARL 4.95% 2031 | | | 991 | | | | 768 | |
| Lima Metro Line 2 Finance, Ltd. 5.875% 20341 | | | 536 | | | | 529 | |
| Lima Metro Line 2 Finance, Ltd. 4.35% 20361 | | | 952 | | | | 857 | |
| Mexico City Airport Trust 4.25% 2026 | | | 1,800 | | | | 1,661 | |
| Mexico City Airport Trust 3.875% 2028 | | | 500 | | | | 430 | |
| Mexico City Airport Trust 5.50% 2046 | | | 1,609 | | | | 1,114 | |
| Mexico City Airport Trust 5.50% 2047 | | | 2,828 | | | | 1,948 | |
| MISC Capital Two (Labuan), Ltd. 3.75% 20271 | | | 4,135 | | | | 3,888 | |
| Rutas 2 and 7 Finance, Ltd. 0% 20361 | | | 2,726 | | | | 1,613 | |
| Simpar SA 5.20% 2031 | | | 200 | | | | 155 | |
| Summit Digitel Infrastructure Private, Ltd. 2.875% 20311 | | | 300 | | | | 232 | |
| | | | | | | | 18,038 | |
| | | | | | | | | |
| Consumer discretionary 1.17% | | | | | | | | |
| Arcos Dorados BV 6.125% 20291 | | | 1,100 | | | | 1,036 | |
| Meituan Dianping 3.05% 20301 | | | 3,150 | | | | 2,347 | |
| Melco International Development, Ltd. 4.875% 2025 | | | 400 | | | | 300 | |
| Melco International Development, Ltd. 5.375% 20291 | | | 2,250 | | | | 1,361 | |
| MercadoLibre, Inc. 3.125% 2031 | | | 1,345 | | | | 971 | |
| MGM China Holdings, Ltd. 5.375% 2024 | | | 300 | | | | 256 | |
| Sands China, Ltd. 2.55% 20271,2 | | | 2,300 | | | | 1,679 | |
| Wynn Macau, Ltd. 5.50% 20261 | | | 2,500 | | | | 1,735 | |
| | | | | | | | 9,685 | |
| | | | | | | | | |
| Consumer staples 1.00% | | | | | | | | |
| InRetail Consumer 3.25% 20281 | | | 2,730 | | | | 2,270 | |
| MARB BondCo PLC 3.95% 20311 | | | 1,500 | | | | 1,155 | |
| Minerva Luxembourg SA 4.375% 20311 | | | 400 | | | | 320 | |
| Natura Cosmeticos SA 4.125% 20281 | | | 1,520 | | | | 1,254 | |
| NBM US Holdings, Inc. 7.00% 20261 | | | 250 | | | | 254 | |
| PT Indofood CBP Sukses Makmur Tbk 3.398% 2031 | | | 3,374 | | | | 2,628 | |
| PT Indofood CBP Sukses Makmur Tbk 4.745% 2051 | | | 565 | | | | 380 | |
| | | | | | | | 8,261 | |
| | |
| 8 | American Funds Emerging Markets Bond Fund |
| Bonds, notes & other debt instruments (continued) | | Principal amount
(000) | | | Value
(000) | |
| Corporate bonds, notes & loans (continued) | | | | | | | | | |
| Communication services 0.70% | | | | | | | | | | | | |
| América Móvil, SAB de CV, 5.375% 20321 | | | | | | USD | 2,500 | | | $ | 2,224 | |
| Axiata SPV5 Labuan, Ltd. 3.064% 2050 | | | | | | | 1,053 | | | | 756 | |
| Globo Comunicação e Participações SA 4.875% 20301 | | | | | | | 2,000 | | | | 1,567 | |
| PLDT, Inc. 2.50% 2031 | | | | | | | 200 | | | | 168 | |
| Tencent Holdings, Ltd. 2.39% 2030 | | | | | | | 500 | | | | 419 | |
| Tencent Holdings, Ltd. 3.24% 20501 | | | | | | | 900 | | | | 622 | |
| | | | | | | | | | | | 5,756 | |
| | | | | | | | | | | | | |
| Health care 0.28% | | | | | | | | | | | | |
| Rede D’Or Finance SARL 4.95% 2028 | | | | | | | 205 | | | | 187 | |
| Rede D’Or Finance SARL 4.50% 2030 | | | | | | | 2,500 | | | | 2,115 | |
| | | | | | | | | | | | 2,302 | |
| | | | | | | | | | | | | |
| Real estate 0.26% | | | | | | | | | | | | |
| Corporacion Inmobiliaria Vesta, SAB de CV, 3.625% 20311 | | | | | | | 1,435 | | | | 1,142 | |
| FibraSOMA 4.375% 20311 | | | | | | | 1,430 | | | | 1,022 | |
| | | | | | | | | | | | 2,164 | |
| | | | | | | | | | | | | |
| Information technology 0.06% | | | | | | | | | | | | |
| SK hynix, Inc. 2.375% 20311 | | | | | | | 400 | | | | 316 | |
| TSMC Global, Ltd. 2.25% 20311 | | | | | | | 200 | | | | 169 | |
| | | | | | | | | | | | 485 | |
| | | | | | | | | | | | | |
| Total corporate bonds, notes & loans | | | | | | | | | | | 158,528 | |
| | | | | | | | | | | | | |
| U.S. Treasury bonds & notes 3.73% |
| U.S. Treasury inflation-protected securities 2.96% |
| U.S. Treasury Inflation-Protected Security 0.50% 20243 | | | | | | | 8,023 | | | | 8,138 | |
| U.S. Treasury Inflation-Protected Security 0.125% 20273 | | | | | | | 12,285 | | | | 12,089 | |
| U.S. Treasury Inflation-Protected Security 0.125% 20313,9 | | | | | | | 4,442 | | | | 4,215 | |
| | | | | | | | | | | | 24,442 | |
| | | | | | | | | | | | | |
| U.S. Treasury 0.77% | | | | | | | | | | | | |
| U.S. Treasury 2.875% 2032 | | | | | | | 3,300 | | | | 3,261 | |
| U.S. Treasury 2.00% 20519 | | | | | | | 4,000 | | | | 3,078 | |
| | | | | | | | | | | | 6,339 | |
| | | | | | | | | | | | | |
| Total U.S. Treasury bonds & notes | | | | | | | | | | | 30,781 | |
| | | | | | | | | | | | | |
| Total bonds, notes & other debt instruments (cost: $1,006,120,000) | | | | | | | | | | | 755,677 | |
| | | | | | | | | | | | | |
| Short-term securities 7.36% | | | | | | | Shares | | | | | |
| Money market investments 7.35% | | | | | | | | | | | | |
| Capital Group Central Cash Fund 1.38%10,11 | | | | | | | 605,825 | | | | 60,571 | |
| | | | | | | | | | | | | |
| | | Weighted
average yield
at acquisition | | | Principal amount
(000) | | | | | |
| Bills & notes of governments & government agencies outside the U.S. 0.01% | | | | | | | | | | | | |
| Egyptian Treasury 9/20/2022 | | | 14.048 | % | | EGP | 1,525 | | | | 78 | |
| Egyptian Treasury 12/27/2022 | | | 13.672 | | | | 500 | | | | 25 | |
| | | | | | | | | | | | 103 | |
| | | | | | | | | | | | | |
| Total short-term securities (cost: $60,668,000) | | | | | | | | | | | 60,674 | |
| Total investment securities 99.00% (cost: $1,066,788,000) | | | | | | | | | | | 816,351 | |
| Other assets less liabilities 1.00% | | | | | | | | | | | 8,280 | |
| | | | | | | | | | | | | |
| Net assets 100.00% | | | | | | | | | | $ | 824,631 | |
| | |
| American Funds Emerging Markets Bond Fund | 9 |
Futures contracts
| Contracts | | Type | | Number of
contracts | | Expiration | | Notional
amount
(000) | | | Value and
unrealized
appreciation
(depreciation)
at 6/30/2022
(000) | |
| 2 Year U.S. Treasury Note Futures | | Long | | 5 | | September 2022 | | USD | 1,050 | | | $ | 6 | |
| 5 Year U.S. Treasury Note Futures | | Short | | 316 | | September 2022 | | | (35,471 | ) | | | 278 | |
| 10 Year Euro-Bund Futures | | Short | | 58 | | September 2022 | | | (9,043 | ) | | | 164 | |
| 10 Year U.S. Treasury Note Futures | | Long | | 6 | | September 2022 | | | 711 | | | | 5 | |
| 10 Year Ultra U.S. Treasury Note Futures | | Short | | 15 | | September 2022 | | | (1,911 | ) | | | 29 | |
| 20 Year U.S. Treasury Bond Futures | | Long | | 3 | | September 2022 | | | 416 | | | | 11 | |
| 30 Year Ultra U.S. Treasury Bond Futures | | Long | | 68 | | September 2022 | | | 10,496 | | | | (222 | ) |
| | | | | | | | | | | | | $ | 271 | |
Forward currency contracts
| Contract amount | | | | | | Unrealized
appreciation
(depreciation) | |
Currency purchased
(000) | | Currency sold
(000) | | Counterparty | | Settlement
date | | at 6/30/2022
(000) | |
| USD | 7,275 | | EUR | 6,802 | | Standard Chartered Bank | | 7/11/2022 | | $ | 142 | |
| USD | 544 | | ZAR | 8,778 | | Morgan Stanley | | 7/11/2022 | | | 5 | |
| EUR | 1,363 | | USD | 1,436 | | BNP Paribas | | 7/11/2022 | | | (6 | ) |
| MXN | 16,164 | | USD | 819 | | Goldman Sachs | | 7/11/2022 | | | (17 | ) |
| ZAR | 10,522 | | USD | 682 | | Citibank | | 7/11/2022 | | | (35 | ) |
| EUR | 1,947 | | USD | 2,082 | | Standard Chartered Bank | | 7/11/2022 | | | (40 | ) |
| USD | 745 | | CLP | 617,987 | | Citibank | | 7/12/2022 | | | 73 | |
| MYR | 5,000 | | USD | 1,136 | | HSBC Bank | | 7/12/2022 | | | 1 | |
| USD | 1,136 | | MYR | 5,000 | | Bank of America | | 7/12/2022 | | | (1 | ) |
| COP | 1,431,708 | | USD | 377 | | Citibank | | 7/12/2022 | | | (33 | ) |
| BRL | 4,144 | | USD | 863 | | Citibank | | 7/12/2022 | | | (74 | ) |
| USD | 8,686 | | EUR | 8,135 | | Standard Chartered Bank | | 7/13/2022 | | | 154 | |
| USD | 1,776 | | CZK | 41,320 | | Citibank | | 7/13/2022 | | | 29 | |
| USD | 377 | | ZAR | 6,000 | | Standard Chartered Bank | | 7/13/2022 | | | 8 | |
| USD | 563 | | CZK | 13,290 | | HSBC Bank | | 7/13/2022 | | | 1 | |
| USD | 2,137 | | PLN | 9,600 | | JPMorgan Chase | | 7/13/2022 | | | (1 | ) |
| CZK | 46,130 | | USD | 1,982 | | Citibank | | 7/13/2022 | | | (32 | ) |
| EUR | 5,749 | | USD | 6,139 | | Standard Chartered Bank | | 7/13/2022 | | | (109 | ) |
| ZAR | 67,755 | | USD | 4,388 | | Goldman Sachs | | 7/13/2022 | | | (228 | ) |
| MXN | 259,213 | | USD | 13,145 | | BNP Paribas | | 7/13/2022 | | | (285 | ) |
| PLN | 48,960 | | USD | 11,301 | | Morgan Stanley | | 7/13/2022 | | | (396 | ) |
| USD | 3,192 | | MYR | 14,040 | | Standard Chartered Bank | | 7/15/2022 | | | — | 6 |
| USD | 245 | | MXN | 5,035 | | Goldman Sachs | | 7/15/2022 | | | (5 | ) |
| USD | 4,154 | | IDR | 60,360,040 | | Citibank | | 7/18/2022 | | | 119 | |
| IDR | 18,713,141 | | USD | 1,288 | | Citibank | | 7/18/2022 | | | (37 | ) |
| USD | 4,481 | | CNH | 30,300 | | Citibank | | 7/18/2022 | | | (45 | ) |
| IDR | 32,867,180 | | USD | 2,253 | | Standard Chartered Bank | | 7/18/2022 | | | (56 | ) |
| CLP | 1,658,843 | | USD | 1,916 | | Goldman Sachs | | 7/18/2022 | | | (115 | ) |
| PLN | 4,470 | | USD | 984 | | JPMorgan Chase | | 7/21/2022 | | | 10 | |
| USD | 1,567 | | BRL | 8,201 | | Citibank | | 7/21/2022 | | | 10 | |
| KRW | 2,300,000 | | USD | 1,779 | | Citibank | | 7/21/2022 | | | 5 | |
| USD | 349 | | BRL | 1,811 | | Citibank | | 7/21/2022 | | | 5 | |
| USD | 328 | | EUR | 310 | | Barclays Bank PLC | | 7/21/2022 | | | 3 | |
| BRL | 1,322 | | USD | 250 | | Morgan Stanley | | 7/21/2022 | | | 1 | |
| THB | 25,910 | | USD | 737 | | UBS AG | | 7/21/2022 | | | (2 | ) |
| USD | 1,569 | | CNH | 10,550 | | Bank of America | | 7/21/2022 | | | (7 | ) |
| USD | 30,761 | | EUR | 29,176 | | UBS AG | | 7/27/2022 | | | 130 | |
| THB | 459,200 | | USD | 12,957 | | Goldman Sachs | | 7/27/2022 | | | 68 | |
| USD | 2,083 | | ZAR | 33,357 | | JPMorgan Chase | | 7/27/2022 | | | 39 | |
| USD | 9,794 | | MXN | 197,303 | | Citibank | | 7/27/2022 | | | 32 | |
| CNH | 15,600 | | USD | 2,328 | | UBS AG | | 7/27/2022 | | | 2 | |
| USD | 1,646 | | PLN | 7,400 | | JPMorgan Chase | | 7/27/2022 | | | 1 | |
| EUR | 88 | | USD | 93 | | UBS AG | | 7/27/2022 | | | — | 6 |
| | |
| 10 | American Funds Emerging Markets Bond Fund |
Forward currency contracts (continued)
| Contract amount | | | | | | Unrealized
appreciation
(depreciation) | |
Currency purchased
(000) | | Currency sold
(000) | | Counterparty | | Settlement
date | | at 6/30/2022
(000) | |
| ZAR | 1,671 | | USD | 104 | | JPMorgan Chase | | 7/27/2022 | | $ | (2 | ) |
| EUR | 1,000 | | USD | 1,057 | | JPMorgan Chase | | 7/27/2022 | | | (7 | ) |
| CZK | 162,610 | | USD | 6,881 | | JPMorgan Chase | | 7/27/2022 | | | (21 | ) |
| USD | 735 | | COP | 2,988,544 | | Morgan Stanley | | 7/28/2022 | | | 19 | |
| USD | 168 | | CLP | 151,215 | | JPMorgan Chase | | 7/28/2022 | | | 4 | |
| COP | 203,885 | | USD | 51 | | Citibank | | 7/28/2022 | | | (2 | ) |
| USD | 260 | | PEN | 983 | | Citibank | | 8/4/2022 | | | 4 | |
| USD | 32 | | PEN | 120 | | JPMorgan Chase | | 8/4/2022 | | | 1 | |
| PLN | 14,000 | | USD | 3,132 | | Morgan Stanley | | 8/4/2022 | | | (25 | ) |
| KRW | 3,315,330 | | USD | 2,574 | | Citibank | | 8/5/2022 | | | — | 6 |
| CNH | 8,490 | | USD | 1,265 | | Standard Chartered Bank | | 8/22/2022 | | | 3 | |
| USD | 2,686 | | CNH | 18,200 | | BNP Paribas | | 8/22/2022 | | | (32 | ) |
| USD | 1,653 | | CNH | 11,200 | | Goldman Sachs | | 8/24/2022 | | | (20 | ) |
| USD | 839 | | PEN | 3,460 | | Morgan Stanley | | 8/26/2022 | | | (59 | ) |
| USD | 1,081 | | PEN | 4,480 | | Citibank | | 8/26/2022 | | | (82 | ) |
| ILS | 10,000 | | USD | 2,995 | | BNP Paribas | | 8/26/2022 | | | (120 | ) |
| USD | 1,086 | | IDR | 16,197,600 | | Citibank | | 9/27/2022 | | | 7 | |
| PLN | 7,710 | | USD | 1,893 | | BNP Paribas | | 11/9/2022 | | | (204 | ) |
| USD | 2,426 | | HUF | 930,100 | | Morgan Stanley | | 1/25/2023 | | | 56 | |
| USD | 2,185 | | PLN | 10,045 | | Goldman Sachs | | 1/25/2023 | | | 6 | |
| USD | 597 | | PLN | 2,835 | | Morgan Stanley | | 1/25/2023 | | | (18 | ) |
| HUF | 930,100 | | USD | 2,814 | | BNP Paribas | | 1/25/2023 | | | (443 | ) |
| PLN | 40,100 | | USD | 9,579 | | Goldman Sachs | | 1/25/2023 | | | (879 | ) |
| CZK | 100,000 | | USD | 4,320 | | BNP Paribas | | 2/3/2023 | | | (181 | ) |
| PLN | 21,000 | | USD | 5,123 | | BNP Paribas | | 2/3/2023 | | | (572 | ) |
| USD | 3,741 | | ZAR | 60,000 | | Goldman Sachs | | 2/7/2023 | | | 135 | |
| ZAR | 60,000 | | USD | 3,748 | | Citibank | | 2/7/2023 | | | (143 | ) |
| | | | | | | | | | | $ | (3,261 | ) |
Swap contracts
Interest rate swaps
Centrally cleared interest rate swaps
| Receive | | Pay | | | | Notional | | | Value at | | | Upfront
premium | | | Unrealized
depreciation | |
| Rate | | Payment
frequency | | Rate | | Payment
frequency | | Expiration
date | | amount
(000) | | | 6/30/2022
(000) | | | paid
(000) | | | at 6/30/2022
(000) | |
| 6.63% | | 28-day | | 28-day MXN-TIIE | | 28-day | | 6/23/2026 | | MXN | 115,400 | | | $ | (473 | ) | | $ | — | | | $ | (473 | ) |
| 6.44% | | 28-day | | 28-day MXN-TIIE | | 28-day | | 7/24/2026 | | | 20,650 | | | | (93 | ) | | | — | | | | (93 | ) |
| 7.28% | | 28-day | | 28-day MXN-TIIE | | 28-day | | 9/30/2026 | | | 13,000 | | | | (41 | ) | | | — | | | | (41 | ) |
| 7.24% | | 28-day | | 28-day MXN-TIIE | | 28-day | | 10/2/2026 | | | 13,000 | | | | (41 | ) | | | — | | | | (41 | ) |
| 7.18% | | 28-day | | 28-day MXN-TIIE | | 28-day | | 9/9/2031 | | | 122,990 | | | | (665 | ) | | | — | | | | (665 | ) |
| | | | | | | | | | | | | | | $ | (1,313 | ) | | $ | — | | | $ | (1,313 | ) |
Investments in affiliates11
| | | Value of
affiliate at
1/1/2022
(000) | | | Additions
(000) | | | Reductions
(000) | | | Net
realized
loss
(000) | | | Net
unrealized
depreciation
(000) | | | Value of
affiliate at
6/30/2022
(000) | | | Dividend
income
(000) | |
| Short-term securities 7.35% | | | | | | | | | | | | | | | | | | | | | | | | | | | | |
| Money market investments 7.35% | | | | | | | | | | | | | | | | | | | | | | | | | | | | |
| Capital Group Central Cash Fund 1.38%10 | | $ | 79,393 | | | $ | 426,631 | | | $ | 445,425 | | | $ | (27 | ) | | $ | (1 | ) | | $ | 60,571 | | | $ | 150 | |
| | |
| American Funds Emerging Markets Bond Fund | 11 |
| 1 | Acquired in a transaction exempt from registration under Rule 144A of the Securities Act of 1933. May be resold in the U.S. in transactions exempt from registration, normally to qualified institutional buyers. The total value of all such securities was $135,231,000, which represented 16.40% of the net assets of the fund. |
| 2 | Step bond; coupon rate may change at a later date. |
| 3 | Index-linked bond whose principal amount moves with a government price index. |
| 4 | Scheduled interest and/or principal payment was not received. |
| 5 | Valued under fair value procedures adopted by authority of the board of trustees. The total value of all such securities was $2,396,000, which represented .29% of the net assets of the fund. |
| 6 | Amount less than one thousand. |
| 7 | Coupon rate may change periodically. Reference rate and spread are as of the most recent information available. Some coupon rates are determined by the issuer or agent based on current market conditions; therefore, the reference rate and spread are not available. |
| 8 | Payment in kind; the issuer has the option of paying additional securities in lieu of cash. Payment methods and rates are as of the most recent payment when available. |
| 9 | All or a portion of this security was pledged as collateral. The total value of pledged collateral was $5,172,000, which represented .63% of the net assets of the fund. |
| 10 | Rate represents the seven-day yield at 6/30/2022. |
| 11 | Part of the same “group of investment companies” as the fund as defined under the Investment Company Act of 1940, as amended. |
Key to abbreviations
BRL = Brazilian reais
CLP = Chilean pesos
CNH = Chinese yuan renminbi
CNY = Chinese yuan
COP = Colombian pesos
CZK = Czech korunas
EGP = Egyptian pounds
EUR = Euros
HUF = Hungarian forints
IDR = Indonesian rupiah
ILS = Israeli shekels
INR = Indian rupees
KES = Kenyan shilling
KRW = South Korean won
KZT = Kazakhstani tenge
LIBOR = London Interbank Offered Rate
MXN = Mexican pesos
MYR = Malaysian ringgits
PEN = Peruvian nuevos soles
PLN = Polish zloty
RON = Romanian leu
RUB = Russian rubles
THB = Thai baht
TIIE = Equilibrium Interbank Interest Rate
TRY = Turkish lira
UAH = Ukrainian hryvnia
USD = U.S. dollars
UYU = Uruguayan pesos
ZAR = South African rand
Refer to the notes to financial statements.
| 12 | American Funds Emerging Markets Bond Fund |
Financial statements
| Statement of assets and liabilities | unaudited |
| at June 30, 2022 | (dollars in thousands) |
| Assets: | | | | | | | | |
| Investment securities, at value: | | | | | | | | |
| Unaffiliated issuers (cost: $1,006,224) | | $ | 755,780 | | | | | |
| Affiliated issuers (cost: $60,564) | | | 60,571 | | | $ | 816,351 | |
| Cash | | | | | | | 5 | |
| Cash denominated in currencies other than U.S. dollars (cost: $1,664) | | | | | | | 1,647 | |
| Unrealized appreciation on open forward currency contracts | | | | | | | 1,073 | |
| Receivables for: | | | | | | | | |
| Sales of investments | | | 10,706 | | | | | |
| Sales of fund’s shares | | | 1,552 | | | | | |
| Dividends and interest | | | 16,042 | | | | | |
| Closed forward currency contracts | | | 150 | | | | | |
| Variation margin on futures contracts | | | 170 | | | | | |
| Variation margin on centrally cleared swap contracts | | | 72 | | | | | |
| Other | | | 162 | | | | 28,854 | |
| | | | | | | | 847,930 | |
| Liabilities: | | | | | | | | |
| Unrealized depreciation on open forward currency contracts | | | | | | | 4,334 | |
| Payables for: | | | | | | | | |
| Purchases of investments | | | 13,339 | | | | | |
| Repurchases of fund’s shares | | | 3,687 | | | | | |
| Dividends on fund’s shares | | | 225 | | | | | |
| Investment advisory services | | | 372 | | | | | |
| Services provided by related parties | | | 206 | | | | | |
| Trustees’ deferred compensation | | | 8 | | | | | |
| Closed forward currency contracts | | | 108 | | | | | |
| Variation margin on futures contracts | | | 647 | | | | | |
| Variation margin on centrally cleared swap contracts | | | 27 | | | | | |
| Other | | | 346 | | | | 18,965 | |
| Net assets at June 30, 2022 | | | | | | $ | 824,631 | |
| | | | | | | | | |
| Net assets consist of: | | | | | | | | |
| Capital paid in on shares of beneficial interest | | | | | | $ | 1,174,834 | |
| Total accumulated loss | | | | | | | (350,203 | ) |
| Net assets at June 30, 2022 | | | | | | $ | 824,631 | |
Refer to the notes to financial statements.
| American Funds Emerging Markets Bond Fund | 13 |
Financial statements (continued)
| Statement of assets and liabilities | unaudited |
| at June 30, 2022 (continued) | (dollars and shares in thousands, except per-share amounts) |
Shares of beneficial interest issued and outstanding (no stated par value) —
unlimited shares authorized (111,608 total shares outstanding)
| | | Net assets | | | Shares
outstanding | | | Net asset
value per share | |
| Class A | | $ | 278,161 | | | | 37,647 | | | $ | 7.39 | |
| Class C | | | 16,674 | | | | 2,257 | | | | 7.39 | |
| Class T | | | 7 | | | | 1 | | | | 7.39 | |
| Class F-1 | | | 7,834 | | | | 1,060 | | | | 7.39 | |
| Class F-2 | | | 174,413 | | | | 23,606 | | | | 7.39 | |
| Class F-3 | | | 200,279 | | | | 27,106 | | | | 7.39 | |
| Class 529-A | | | 7,805 | | | | 1,056 | | | | 7.39 | |
| Class 529-C | | | 587 | | | | 80 | | | | 7.39 | |
| Class 529-E | | | 532 | | | | 72 | | | | 7.39 | |
| Class 529-T | | | 10 | | | | 1 | | | | 7.39 | |
| Class 529-F-1 | | | 8 | | | | 1 | | | | 7.39 | |
| Class 529-F-2 | | | 5,839 | | | | 790 | | | | 7.39 | |
| Class 529-F-3 | | | 9 | | | | 1 | | | | 7.39 | |
| Class R-1 | | | 144 | | | | 20 | | | | 7.39 | |
| Class R-2 | | | 1,485 | | | | 201 | | | | 7.39 | |
| Class R-2E | | | 100 | | | | 14 | | | | 7.39 | |
| Class R-3 | | | 1,510 | | | | 204 | | | | 7.39 | |
| Class R-4 | | | 855 | | | | 116 | | | | 7.39 | |
| Class R-5E | | | 635 | | | | 86 | | | | 7.39 | |
| Class R-5 | | | 863 | | | | 117 | | | | 7.39 | |
| Class R-6 | | | 126,881 | | | | 17,172 | | | | 7.39 | |
Refer to the notes to financial statements.
| 14 | American Funds Emerging Markets Bond Fund |
Financial statements (continued)
| Statement of operations | unaudited |
| for the six months ended June 30, 2022 | (dollars in thousands) |
| Investment income: | | | | | | | | |
| Income: | | | | | | | | |
| Interest from unaffiliated issuers (net of non-U.S. taxes of $213) | | $ | 44,780 | | | | | |
| Dividends from affiliated issuers | | | 150 | | | $ | 44,930 | |
| Fees and expenses*: | | | | | | | | |
| Investment advisory services | | | 3,307 | | | | | |
| Distribution services | | | 578 | | | | | |
| Transfer agent services | | | 564 | | | | | |
| Administrative services | | | 189 | | | | | |
| 529 plan services | | | 4 | | | | | |
| Reports to shareholders | | | 92 | | | | | |
| Registration statement and prospectus | | | 145 | | | | | |
| Trustees’ compensation | | | 2 | | | | | |
| Auditing and legal | | | 16 | | | | | |
| Custodian | | | 104 | | | | | |
| Other | | | 22 | | | | 5,023 | |
| Net investment income | | | | | | | 39,907 | |
| | | | | | | | | |
| Net realized loss and unrealized depreciation: | | | | | | | | |
| Net realized (loss) gain on: | | | | | | | | |
| Investments (net of non-U.S. taxes of $199): | | | | | | | | |
| Unaffiliated issuers | | | (83,119 | ) | | | | |
| Affiliated issuers | | | (27 | ) | | | | |
| Futures contracts | | | 1,423 | | | | | |
| Forward currency contracts | | | 3,009 | | | | | |
| Swap contracts | | | (32 | ) | | | | |
| Currency transactions | | | (2,229 | ) | | | (80,975 | ) |
| Net unrealized (depreciation) appreciation on: | | | | | | | | |
| Investments (net of non-U.S. taxes of $61): | | | | | | | | |
| Unaffiliated issuers | | | (207,465 | ) | | | | |
| Affiliated issuers | | | (1 | ) | | | | |
| Futures contracts | | | 101 | | | | | |
| Forward currency contracts | | | (3,045 | ) | | | | |
| Swap contracts | | | (900 | ) | | | | |
| Currency translations | | | 344 | | | | (210,966 | ) |
| Net realized loss and unrealized depreciation | | | | | | | (291,941 | ) |
| | | | | | | | | |
| Net decrease in net assets resulting from operations | | | | | | $ | (252,034 | ) |
| * | Additional information related to class-specific fees and expenses is included in the notes to financial statements. |
Refer to the notes to financial statements.
| American Funds Emerging Markets Bond Fund | 15 |
Financial statements (continued)
| Statements of changes in net assets | |
| | (dollars in thousands) |
| | | Six months ended
June 30, 2022* | | | Year ended
December 31, 2021 | |
| Operations: | | | | | | | | |
| Net investment income | | $ | 39,907 | | | $ | 69,150 | |
| Net realized loss | | | (80,975 | ) | | | (14,785 | ) |
| Net unrealized depreciation | | | (210,966 | ) | | | (106,528 | ) |
| Net decrease in net assets resulting from operations | | | (252,034 | ) | | | (52,163 | ) |
| | | | | | | | | |
| Distributions paid or accrued and return of capital paid to shareholders: | | | | | |
| Distributions | | | (43,739 | ) | | | (57,875 | ) |
| Return of capital | | | — | | | | (10,842 | ) |
| Total distributions paid or accrued and return of capital paid to shareholders | | | (43,739 | ) | | | (68,717 | ) |
| | | | | | | | | |
| Net capital share transactions | | | (350,129 | ) | | | 322,345 | |
| | | | | | | | | |
| Total (decrease) increase in net assets | | | (645,902 | ) | | | 201,465 | |
| | | | | | | | | |
| Net assets: | | | | | | | | |
| Beginning of period | | | 1,470,533 | | | | 1,269,068 | |
| End of period | | $ | 824,631 | | | $ | 1,470,533 | |
Refer to the notes to financial statements.
| 16 | American Funds Emerging Markets Bond Fund |
| Notes to financial statements | unaudited |
1. Organization
American Funds Emerging Markets Bond Fund (the “fund”) is registered under the Investment Company Act of 1940, as amended (the “1940 Act”), as an open-end, nondiversified management investment company. The fund seeks to provide a high level of total return over the long term, of which current income is a large component.
The fund has 21 share classes consisting of six retail share classes (Classes A, C, T, F-1, F-2 and F-3), seven 529 college savings plan share classes (Classes 529-A, 529-C, 529-E, 529-T, 529-F-1, 529-F-2 and 529-F-3) and eight retirement plan share classes (Classes R-1, R-2, R-2E, R-3, R-4, R-5E, R-5 and R-6). The 529 college savings plan share classes can be used to save for college education. The retirement plan share classes are generally offered only through eligible employer-sponsored retirement plans. The fund’s share classes are described further in the following table:
| Share class | | Initial sales
charge | | Contingent deferred sales
charge upon redemption | | Conversion feature |
| Classes A and 529-A | | Up to 3.75% for Class A; up to 3.50% for Class 529-A | | None (except 1.00% for certain redemptions within 18 months of purchase without an initial sales charge) | | None |
| Classes C and 529-C | | None | | 1.00% for redemptions within one year of purchase | | Class C converts to Class A after eight years and Class 529-C converts to Class 529-A after five years |
| Class 529-E | | None | | None | | None |
| Classes T and 529-T* | | Up to 2.50% | | None | | None |
| Classes F-1, F-2, F-3, 529-F-1, 529-F-2 and 529-F-3 | | None | | None | | None |
| Classes R-1, R-2, R-2E, R-3, R-4, R-5E, R-5 and R-6 | | None | | None | | None |
| * | Class T and 529-T shares are not available for purchase. |
Holders of all share classes have equal pro rata rights to the assets, dividends and liquidation proceeds of the fund. Each share class has identical voting rights, except for the exclusive right to vote on matters affecting only its class. Share classes have different fees and expenses (“class-specific fees and expenses”), primarily due to different arrangements for distribution, transfer agent and administrative services. Differences in class-specific fees and expenses will result in differences in net investment income and, therefore, the payment of different per-share dividends by each share class.
2. Significant accounting policies
The fund is an investment company that applies the accounting and reporting guidance issued in Topic 946 by the U.S. Financial Accounting Standards Board. The fund’s financial statements have been prepared to comply with U.S. generally accepted accounting principles (“U.S. GAAP”). These principles require the fund’s investment adviser to make estimates and assumptions that affect reported amounts and disclosures. Actual results could differ from those estimates. Subsequent events, if any, have been evaluated through the date of issuance in the preparation of the financial statements. The fund follows the significant accounting policies described in this section, as well as the valuation policies described in the next section on valuation.
Security transactions and related investment income — Security transactions are recorded by the fund as of the date the trades are executed with brokers. Realized gains and losses from security transactions are determined based on the specific identified cost of the securities. In the event a security is purchased with a delayed payment date, the fund will segregate liquid assets sufficient to meet its payment obligations. Dividend income is recognized on the ex-dividend date and interest income is recognized on an accrual basis. Market discounts, premiums and original issue discounts on fixed-income securities are amortized daily over the expected life of the security.
Class allocations — Income, fees and expenses (other than class-specific fees and expenses) are allocated daily among the various share classes based on the relative value of their settled shares. Realized gains and losses and unrealized appreciation and depreciation are allocated daily among the various share classes based on their relative net assets. Class-specific fees and expenses, such as distribution, transfer agent and administrative services, are charged directly to the respective share class.
Distributions paid or accrued to shareholders — Income dividends are declared daily after the determination of the fund’s net investment income and are paid to shareholders monthly. Capital gain distributions are recorded on the ex-dividend date.
| American Funds Emerging Markets Bond Fund | 17 |
Currency translation — Assets and liabilities, including investment securities, denominated in currencies other than U.S. dollars are translated into U.S. dollars at the exchange rates supplied by one or more pricing vendors on the valuation date. Purchases and sales of investment securities and income and expenses are translated into U.S. dollars at the exchange rates on the dates of such transactions. The effects of changes in exchange rates on investment securities are included with the net realized gain or loss and net unrealized appreciation or depreciation on investments in the fund’s statement of operations. The realized gain or loss and unrealized appreciation or depreciation resulting from all other transactions denominated in currencies other than U.S. dollars are disclosed separately.
3. Valuation
Capital Research and Management Company (“CRMC”), the fund’s investment adviser, values the fund’s investments at fair value as defined by U.S. GAAP. The net asset value per share is calculated once daily as of the close of regular trading on the New York Stock Exchange, normally 4 p.m. New York time, each day the New York Stock Exchange is open.
Methods and inputs — The fund’s investment adviser uses the following methods and inputs to establish the fair value of the fund’s assets and liabilities. Use of particular methods and inputs may vary over time based on availability and relevance as market and economic conditions evolve.
Fixed-income securities, including short-term securities, are generally valued at prices obtained from one or more pricing vendors. Vendors value such securities based on one or more of the inputs described in the following table. The table provides examples of inputs that are commonly relevant for valuing particular classes of fixed-income securities in which the fund is authorized to invest. However, these classifications are not exclusive, and any of the inputs may be used to value any other class of fixed-income security.
| Fixed-income class | | Examples of standard inputs |
| All | | Benchmark yields, transactions, bids, offers, quotations from dealers and trading systems, new issues, spreads and other relationships observed in the markets among comparable securities; and proprietary pricing models such as yield measures calculated using factors such as cash flows, financial or collateral performance and other reference data (collectively referred to as “standard inputs”) |
| Corporate bonds, notes & loans; convertible securities | | Standard inputs and underlying equity of the issuer |
| Bonds & notes of governments & government agencies | | Standard inputs and interest rate volatilities |
| Mortgage-backed; asset-backed obligations | | Standard inputs and cash flows, prepayment information, default rates, delinquency and loss assumptions, collateral characteristics, credit enhancements and specific deal information |
When the fund’s investment adviser deems it appropriate to do so (such as when vendor prices are unavailable or deemed to be not representative), fixed-income securities will be valued in good faith at the mean quoted bid and ask prices that are reasonably and timely available (or bid prices, if ask prices are not available) or at prices for securities of comparable maturity, quality and type. The Capital Group Central Cash Fund (“CCF”), a fund within the Capital Group Central Fund Series (“Central Funds”), is valued based upon a floating net asset value, which fluctuates with changes in the value of CCF’s portfolio securities. The underlying securities are valued based on the policies and procedures in CCF’s statement of additional information.
Exchange-traded futures are generally valued at the official settlement price of the exchange or market on which such instruments are traded, as of the close of business on the day the futures are being valued. Forward currency contracts are valued based on the spot and forward exchange rates obtained from one or more pricing vendors. Interest rate swaps and credit default swaps are generally valued by pricing vendors based on market inputs that include the index and term of index, reset frequency, payer/receiver, currency and pay frequency.
| 18 | American Funds Emerging Markets Bond Fund |
Securities and other assets for which representative market quotations are not readily available or are considered unreliable by the fund’s investment adviser are fair valued as determined in good faith under fair valuation guidelines adopted by authority of the fund’s board of trustees as further described. The investment adviser follows fair valuation guidelines, consistent with U.S. Securities and Exchange Commission rules and guidance, to consider relevant principles and factors when making fair value determinations. The investment adviser considers relevant indications of value that are reasonably and timely available to it in determining the fair value to be assigned to a particular security, such as the type and cost of the security; contractual or legal restrictions on resale of the security; relevant financial or business developments of the issuer; actively traded similar or related securities; conversion or exchange rights on the security; related corporate actions; significant events occurring after the close of trading in the security; and changes in overall market conditions. In addition, the closing prices of equity securities that trade in markets outside U.S. time zones may be adjusted to reflect significant events that occur after the close of local trading but before the net asset value of each share class of the fund is determined. Fair valuations and valuations of investments that are not actively trading involve judgment and may differ materially from valuations that would have been used had greater market activity occurred.
Processes and structure — The fund’s board of trustees has delegated authority to the fund’s investment adviser to make fair value determinations, subject to board oversight. The investment adviser has established a Joint Fair Valuation Committee (the “Fair Valuation Committee”) to administer, implement and oversee the fair valuation process, and to make fair value decisions. The Fair Valuation Committee regularly reviews its own fair value decisions, as well as decisions made under its standing instructions to the investment adviser’s valuation teams. The Fair Valuation Committee reviews changes in fair value measurements from period to period and may, as deemed appropriate, update the fair valuation guidelines to better reflect the results of back testing and address new or evolving issues. The Fair Valuation Committee reports any changes to the fair valuation guidelines to the board of trustees. The fund’s board and audit committee also regularly review reports that describe fair value determinations and methods.
The fund’s investment adviser has also established a Fixed-Income Pricing Review Group to administer and oversee the fixed-income valuation process, including the use of fixed-income pricing vendors. This group regularly reviews pricing vendor information and market data. Pricing decisions, processes and controls over security valuation are also subject to additional internal reviews facilitated by the investment adviser’s global risk management group.
Classifications — The fund’s investment adviser classifies the fund’s assets and liabilities into three levels based on the inputs used to value the assets or liabilities. Level 1 values are based on quoted prices in active markets for identical securities. Level 2 values are based on significant observable market inputs, such as quoted prices for similar securities and quoted prices in inactive markets. Certain securities trading outside the U.S. may transfer between Level 1 and Level 2 due to valuation adjustments resulting from significant market movements following the close of local trading. Level 3 values are based on significant unobservable inputs that reflect the investment adviser’s determination of assumptions that market participants might reasonably use in valuing the securities. The valuation levels are not necessarily an indication of the risk or liquidity associated with the underlying investment. For example, U.S. government securities are reflected as Level 2 because the inputs used to determine fair value may not always be quoted prices in an active market. The following tables present the fund’s valuation levels as of June 30, 2022 (dollars in thousands):
| | | Investment securities | |
| | | Level 1 | | | Level 2 | | | Level 3 | | | Total | |
| Assets: | | | | | | | | | | | | | | | | |
| Bonds, notes & other debt instruments: | | | | | | | | | | | | | | | | |
| Bonds & notes of governments & government agencies outside the U.S. | | $ | — | | | $ | 566,368 | | | $ | — | | | $ | 566,368 | |
| Corporate bonds, notes & loans | | | — | | | | 158,528 | | | | — | | | | 158,528 | |
| U.S. Treasury bonds & notes | | | — | | | | 30,781 | | | | — | | | | 30,781 | |
| Short-term securities | | | 60,571 | | | | 103 | | | | — | | | | 60,674 | |
| Total | | $ | 60,571 | | | $ | 755,780 | | | $ | — | | | $ | 816,351 | |
| American Funds Emerging Markets Bond Fund | 19 |
| | | Other investments* | |
| | | Level 1 | | | Level 2 | | | Level 3 | | | Total | |
| Assets: | | | | | | | | | | | | | | | | |
| Unrealized appreciation on futures contracts | | $ | 493 | | | $ | — | | | $ | — | | | $ | 493 | |
| Unrealized appreciation on open forward currency contracts | | | — | | | | 1,073 | | | | — | | | | 1,073 | |
| Liabilities: | | | | | | | | | | | | | | | | |
| Unrealized depreciation on futures contracts | | | (222 | ) | | | — | | | | — | | | | (222 | ) |
| Unrealized depreciation on open forward currency contracts | | | — | | | | (4,334 | ) | | | — | | | | (4,334 | ) |
| Unrealized depreciation on centrally cleared interest rate swaps | | | — | | | | (1,313 | ) | | | — | | | | (1,313 | ) |
| Total | | $ | 271 | | | $ | (4,574 | ) | | $ | — | | | $ | (4,303 | ) |
| * | Futures contracts, forward currency contracts and interest rate swaps are not included in the fund’s investment portfolio. |
4. Risk factors
Investing in the fund may involve certain risks including, but not limited to, those described below.
Market conditions — The prices of, and the income generated by, the securities held by the fund may decline — sometimes rapidly or unpredictably — due to various factors, including events or conditions affecting the general economy or particular industries; overall market changes; local, regional or global political, social or economic instability; governmental, governmental agency or central bank responses to economic conditions; and currency exchange rate, interest rate and commodity price fluctuations.
Economies and financial markets throughout the world are highly interconnected. Economic, financial or political events, trading and tariff arrangements, wars, terrorism, cybersecurity events, natural disasters, public health emergencies (such as the spread of infectious disease) and other circumstances in one country or region, including actions taken by governmental or quasi-governmental authorities in response to any of the foregoing, could have impacts on global economies or markets. As a result, whether or not the fund invests in securities of issuers located in or with significant exposure to the countries affected, the value and liquidity of the fund’s investments may be negatively affected by developments in other countries and regions.
Issuer risks — The prices of, and the income generated by, securities held by the fund may decline in response to various factors directly related to the issuers of such securities, including reduced demand for an issuer’s goods or services, poor management performance, major litigation, investigations or other controversies related to the issuer, changes in government regulations affecting the issuer or its competitive environment and strategic initiatives such as mergers, acquisitions or dispositions and the market response to any such initiatives.
Investing in debt instruments — The prices of, and the income generated by, bonds and other debt securities held by the fund may be affected by factors such as the interest rates, maturities and credit ratings of these securities.
Rising interest rates will generally cause the prices of bonds and other debt securities to fall. A general rise in interest rates may cause investors to sell debt securities on a large scale, which could also adversely affect the price and liquidity of debt securities and could also result in increased redemptions from the fund. Falling interest rates may cause an issuer to redeem, call or refinance a debt security before its stated maturity, which may result in the fund failing to recoup the full amount of its initial investment and having to reinvest the proceeds in lower yielding securities. Longer maturity debt securities generally have greater sensitivity to changes in interest rates and may be subject to greater price fluctuations than shorter maturity debt securities.
Bonds and other debt securities are also subject to credit risk, which is the possibility that the credit strength of an issuer or guarantor will weaken or be perceived to be weaker, and/or an issuer of a debt security will fail to make timely payments of principal or interest and the security will go into default. A downgrade or default affecting any of the fund’s securities could cause the value of the fund’s shares to decrease. Lower quality debt securities generally have higher rates of interest and may be subject to greater price fluctuations than higher quality debt securities. Credit risk is gauged, in part, by the credit ratings of the debt securities in which the fund invests. However, ratings are only the opinions of the rating agencies issuing them and are not guarantees as to credit quality or an evaluation of market risk. The fund’s investment adviser relies on its own credit analysts to research issuers and issues in seeking to assess credit and default risks.
| 20 | American Funds Emerging Markets Bond Fund |
Investing in lower rated debt instruments — Lower rated bonds and other lower rated debt securities generally have higher rates of interest and involve greater risk of default or price declines due to changes in the issuer’s creditworthiness than those of higher quality debt securities. The market prices of these securities may fluctuate more than the prices of higher quality debt securities and may decline significantly in periods of general economic difficulty. These risks may be increased with respect to investments in junk bonds.
Investing in derivatives — The use of derivatives involves a variety of risks, which may be different from, or greater than, the risks associated with investing in traditional securities, such as stocks and bonds. Changes in the value of a derivative may not correlate perfectly with, and may be more sensitive to market events than, the underlying asset, rate or index, and a derivative instrument may expose the fund to losses in excess of its initial investment. Derivatives may be difficult to value, difficult for the fund to buy or sell at an opportune time or price and difficult, or even impossible, to terminate or otherwise offset. The fund’s use of derivatives may result in losses to the fund, and investing in derivatives may reduce the fund’s returns and increase the fund’s price volatility. The fund’s counterparty to a derivative transaction (including, if applicable, the fund’s clearing broker, the derivatives exchange or the clearinghouse) may be unable or unwilling to honor its financial obligations in respect of the transaction. In certain cases, the fund may be hindered or delayed in exercising remedies against or closing out derivative instruments with a counterparty, which may result in additional losses.
Liquidity risk — Certain fund holdings may be or may become difficult or impossible to sell, particularly during times of market turmoil. Liquidity may be impacted by the lack of an active market for a holding, legal or contractual restrictions on resale, or the reduced number and capacity of market participants to make a market in such holding. Market prices for less liquid or illiquid holdings may be volatile, and reduced liquidity may have an adverse impact on the market price of such holdings. Additionally, the sale of less liquid or illiquid holdings may involve substantial delays (including delays in settlement) and additional costs and the fund may be unable to sell such holdings when necessary to meet its liquidity needs or may be forced to sell at a loss.
Investing outside the U.S. — Securities of issuers domiciled outside the U.S., or with significant operations or revenues outside the U.S., may lose value because of adverse political, social, economic or market developments (including social instability, regional conflicts, terrorism and war) in the countries or regions in which the issuers operate or generate revenue. These securities may also lose value due to changes in foreign currency exchange rates against the U.S. dollar and/or currencies of other countries. Issuers of these securities may be more susceptible to actions of foreign governments, such as nationalization, currency blockage or the imposition of price controls or punitive taxes, each of which could adversely impact the value of these securities. Securities markets in certain countries may be more volatile and/or less liquid than those in the U.S. Investments outside the U.S. may also be subject to different accounting and auditing practices and standards and different regulatory, legal and reporting requirements, and may be more difficult to value, than those in the U.S. In addition, the value of investments outside the U.S. may be reduced by foreign taxes, including foreign withholding taxes on interest and dividends. Further, there may be increased risks of delayed settlement of securities purchased or sold by the fund. The risks of investing outside the U.S. may be heightened in connection with investments in emerging markets.
Investing in emerging markets — Investing in emerging markets may involve risks in addition to and greater than those generally associated with investing in the securities markets of developed countries. For instance, emerging market countries tend to have less developed political, economic and legal systems and accounting and auditing practices and standards than those in developed countries. Accordingly, the governments of these countries may be less stable and more likely to intervene in the market economy, for example, by imposing capital controls, nationalizing a company or industry, placing restrictions on foreign ownership and on withdrawing sale proceeds of securities from the country, and/or imposing punitive taxes that could adversely affect the prices of securities. Information regarding issuers in emerging markets may be limited, incomplete or inaccurate, and there may be fewer rights and remedies available to the fund and its shareholders. In addition, the economies of these countries may be dependent on relatively few industries, may have limited access to capital and may be more susceptible to changes in local and global trade conditions and downturns in the world economy. Securities markets in these countries can also be relatively small and have substantially lower trading volumes. As a result, securities issued in these countries may be more volatile and less liquid, and may be more difficult to value, than securities issued in countries with more developed economies and/or markets. Less certainty with respect to security valuations may lead to additional challenges and risks in calculating the fund’s net asset value. Additionally, emerging markets are more likely to experience problems with the clearing and settling of trades and the holding of securities by banks, agents and depositories that are less established than those in developed countries.
Currency — The prices of, and the income generated by, many debt securities held by the fund may also be affected by changes in relative currency values. If the U.S. dollar appreciates against foreign currencies, the value in U.S. dollars of the fund’s securities denominated in such currencies would generally fall and vice versa.
Nondiversification risk — As a nondiversified fund, the fund has the ability to invest a larger percentage of its assets in the securities of a smaller number of issuers than a diversified fund. To the extent that the fund invests a larger percentage of its assets in securities of one or more issuers, poor performance by these securities could have a greater adverse impact on the fund’s investment results.
| American Funds Emerging Markets Bond Fund | 21 |
Management — The investment adviser to the fund actively manages the fund’s investments. Consequently, the fund is subject to the risk that the methods and analyses, including models, tools and data, employed by the investment adviser in this process may be flawed or incorrect and may not produce the desired results. This could cause the fund to lose value or its investment results to lag relevant benchmarks or other funds with similar objectives.
5. Certain investment techniques
Index-linked bonds — The fund has invested in index-linked bonds, which are fixed-income securities whose principal value is periodically adjusted to a government price index. Over the life of an index-linked bond, interest is paid on the adjusted principal value. Increases or decreases in the principal value of index-linked bonds are recorded as interest income in the fund’s statement of operations.
Futures contracts — The fund has entered into futures contracts, which provide for the future sale by one party and purchase by another party of a specified amount of a specific financial instrument for a specified price, date, time and place designated at the time the contract is made. Futures contracts are used to strategically manage the fund’s interest rate sensitivity by increasing or decreasing the duration of the fund or a portion of the fund’s portfolio.
Upon entering into futures contracts, and to maintain the fund’s open positions in futures contracts, the fund is required to deposit with a futures broker, known as a futures commission merchant (“FCM”), in a segregated account in the name of the FCM an amount of cash, U.S. government securities or other liquid securities, known as initial margin. The margin required for a particular futures contract is set by the exchange on which the contract is traded to serve as collateral, and may be significantly modified from time to time by the exchange during the term of the contract.
On a daily basis, the fund pays or receives variation margin based on the increase or decrease in the value of the futures contracts and records variation margin on futures contracts in the statement of assets and liabilities. Futures contracts may involve a risk of loss in excess of the variation margin shown on the fund’s statement of assets and liabilities. The fund records realized gains or losses at the time the futures contract is closed or expires. Net realized gains or losses and net unrealized appreciation or depreciation from futures contracts are recorded in the fund’s statement of operations. The average month-end notional amount of futures contracts while held was $85,377,000.
Forward currency contracts — The fund has entered into forward currency contracts, which represent agreements to exchange currencies on specific future dates at predetermined rates. The fund’s investment adviser uses forward currency contracts to manage the fund’s exposure to changes in exchange rates. Upon entering into these contracts, risks may arise from the potential inability of counterparties to meet the terms of their contracts and from possible movements in exchange rates.
On a daily basis, the fund’s investment adviser values forward currency contracts and records unrealized appreciation or depreciation for open forward currency contracts in the fund’s statement of assets and liabilities. Realized gains or losses are recorded at the time the forward currency contract is closed or offset by another contract with the same broker for the same settlement date and currency.
Closed forward currency contracts that have not reached their settlement date are included in the respective receivables or payables for closed forward currency contracts in the fund’s statement of assets and liabilities. Net realized gains or losses from closed forward currency contracts and net unrealized appreciation or depreciation from open forward currency contracts are recorded in the fund’s statement of operations. The average month-end notional amount of open forward currency contracts while held was $268,621,000.
Swap contracts — The fund has entered into swap agreements, which are two-party contracts entered into primarily by institutional investors for a specified time period. In a typical swap transaction, two parties agree to exchange the returns earned or realized from one or more underlying assets or rates of return. Swap agreements can be traded on a swap execution facility (SEF) and cleared through a central clearinghouse (cleared), traded over-the-counter (OTC) and cleared, or traded bilaterally and not cleared. Because clearing interposes a central clearinghouse as the ultimate counterparty to each participant’s swap, and margin is required to be exchanged under the rules of the clearinghouse, central clearing is intended to decrease (but not eliminate) counterparty risk relative to uncleared bilateral swaps. To the extent the fund enters into bilaterally negotiated swap transactions, the fund will enter into swap agreements only with counterparties that meet certain credit standards and subject to agreed collateralized procedures. The term of a swap can be days, months or years and certain swaps may be less liquid than others.
| 22 | American Funds Emerging Markets Bond Fund |
Upon entering into a centrally cleared swap contract, the fund is required to deposit cash, U.S. government securities or other liquid securities, which is known as initial margin. Generally, the initial margin required for a particular swap is set and held as collateral by the clearinghouse on which the contract is cleared. The amount of initial margin required may be significantly modified from time to time by the clearinghouse during the term of the contract.
On a daily basis, interest accruals related to the exchange of future payments are recorded as a receivable and payable in the fund’s statement of assets and liabilities for centrally cleared swaps and as unrealized appreciation or depreciation in the fund’s statement of assets and liabilities for bilateral swaps. For centrally cleared swaps, the fund also pays or receives a variation margin based on the increase or decrease in the value of the swaps, including accrued interest as applicable, and records variation margin in the statement of assets and liabilities. The fund records realized gains and losses on both the net accrued interest and any gain or loss recognized at the time the swap is closed or expires. Net realized gains or losses, as well as any net unrealized appreciation or depreciation, from swaps are recorded in the fund’s statement of operations.
Swap agreements can take different forms. The fund has entered into the following types of swap agreements:
Interest rate swaps — The fund has entered into interest rate swaps, which seek to manage the interest rate sensitivity of the fund by increasing or decreasing the duration of the fund or a portion of the fund’s portfolio. An interest rate swap is an agreement between two parties to exchange or swap payments based on changes in an interest rate or rates. Typically, one interest rate is fixed and the other is variable based on a designated short-term interest rate such as the Secured Overnight Financing Rate (SOFR), prime rate or other benchmark. In other types of interest rate swaps, known as basis swaps, the parties agree to swap variable interest rates based on different designated short-term interest rates. Interest rate swaps generally do not involve the delivery of securities or other principal amounts. Rather, cash payments are exchanged by the parties based on the application of the designated interest rates to a notional amount, which is the predetermined dollar principal of the trade upon which payment obligations are computed. Accordingly, the fund’s current obligation or right under the swap agreement is generally equal to the net amount to be paid or received under the swap agreement based on the relative value of the position held by each party. The average month-end notional amount of interest rate swaps while held was $20,150,000.
Credit default swap indices — The fund has entered into centrally cleared credit default swap indices, including CDX and iTraxx indices (collectively referred to as “CDSIs”), in order to assume exposure to a diversified portfolio of credits or to hedge against existing credit risks. A CDSI is based on a portfolio of credit default swaps with similar characteristics, such as credit default swaps on high-yield bonds. In a typical CDSI transaction, one party (the protection buyer) is obligated to pay the other party (the protection seller) a stream of periodic payments over the term of the contract. If a credit event, such as a default or restructuring, occurs with respect to any of the underlying reference obligations, the protection seller must pay the protection buyer the loss on those credits.
The fund may enter into a CDSI transaction as either protection buyer or protection seller. If the fund is a protection buyer, it would pay the counterparty a periodic stream of payments over the term of the contract and would not recover any of those payments if no credit events were to occur with respect to any of the underlying reference obligations. However, if a credit event did occur, the fund, as a protection buyer, would have the right to deliver the referenced debt obligations or a specified amount of cash, depending on the terms of the applicable agreement, and to receive the par value of such debt obligations from the counterparty protection seller. As a protection seller, the fund would receive fixed payments throughout the term of the contract if no credit events were to occur with respect to any of the underlying reference obligations. If a credit event were to occur, however, the value of any deliverable obligation received by the fund, coupled with the periodic payments previously received by the fund, may be less than the full notional value that the fund, as a protection seller, pays to the counterparty protection buyer, effectively resulting in a loss of value to the fund. Furthermore, as a protection seller, the fund would effectively add leverage to its portfolio because it would have investment exposure to the notional amount of the swap transaction. As of June 30, 2022, the fund did not have any credit default swaps. The average month-end notional amount of credit default swaps while held was $20,429,000.
| American Funds Emerging Markets Bond Fund | 23 |
The following tables identify the location and fair value amounts on the fund’s statement of assets and liabilities and the effect on the fund’s statement of operations resulting from the fund’s use of futures contracts, forward currency contracts, interest rate swaps and credit default swaps as of, or for the six months ended, June 30, 2022 (dollars in thousands):
| | | | | Assets | | | Liabilities | |
| Contracts | | Risk type | | Location on statement of
assets and liabilities | | Value | | | Location on statement of
assets and liabilities | | Value | |
| Futures | | Interest | | Unrealized appreciation* | | $ | 493 | | | Unrealized depreciation* | | $ | 222 | |
| Forward currency | | Currency | | Unrealized appreciation on open forward currency contracts | | | 1,073 | | | Unrealized depreciation on open forward currency contracts | | | 4,334 | |
| Forward currency | | Currency | | Receivables for closed forward currency contracts | | | 150 | | | Payables for closed forward currency contracts | | | 108 | |
| Swap (centrally cleared) | | Interest | | Unrealized appreciation* | | | — | | | Unrealized depreciation* | | | 1,313 | |
| | | | | | | $ | 1,716 | | | | | $ | 5,977 | |
| | | | | | | | | | | | | | | |
| | | | | Net realized gain (loss) | | | Net unrealized appreciation (depreciation) | |
| Contracts | | Risk type | | Location on statement of operations | | Value | | | Location on statement of operations | | Value | |
| Futures | | Interest | | Net realized gain on futures contracts | | $ | 1,423 | | | Net unrealized appreciation on futures contracts | | $ | 101 | |
| Forward currency | | Currency | | Net realized gain on forward currency contracts | | | 3,009 | | | Net unrealized depreciation on forward currency contracts | | | (3,045 | ) |
| Swap | | Interest | | Net realized gain on swap contracts | | | 346 | | | Net unrealized depreciation on swap contracts | | | (900 | ) |
| Swap | | Credit | | Net realized loss on swap contracts | | | (378 | ) | | Net unrealized appreciation on swap contracts | | | — | |
| | | | | | | $ | 4,400 | | | | | $ | (3,844 | ) |
| * | Includes cumulative appreciation/depreciation on futures contracts and centrally cleared interest rate swaps as reported in the applicable tables following the fund’s investment portfolio. Only current day’s variation margin is reported within the fund’s statement of assets and liabilities. |
Collateral — The fund receives or pledges highly liquid assets, such as cash or U.S. government securities, as collateral due to its use of futures contracts, forward currency contracts, interest rate swaps and credit default swaps. For futures contracts, centrally cleared interest rate swaps and centrally cleared credit default swaps, the fund pledges collateral for initial and variation margin by contract. For forward currency contracts, the fund either receives or pledges collateral based on the net gain or loss on unsettled contracts by counterparty. The purpose of the collateral is to cover potential losses that could occur in the event that either party cannot meet its contractual obligation. Non-cash collateral pledged by the fund, if any, is disclosed in the fund’s investment portfolio, and cash collateral pledged by the fund, if any, is held in a segregated account with the fund’s custodian, which is reflected as pledged cash collateral in the fund’s statement of assets and liabilities.
Rights of offset — The fund has entered into enforceable master netting agreements with certain counterparties for forward currency contracts, where on any date amounts payable by each party to the other (in the same currency with respect to the same transaction) may be closed or offset by each party’s payment obligation. If an early termination date occurs under these agreements following an event of default or termination event, all obligations of each party to its counterparty are settled net through a single payment in a single currency (“close-out netting”). For financial reporting purposes, the fund does not offset financial assets and financial liabilities that are subject to these master netting arrangements in the statement of assets and liabilities.
| 24 | American Funds Emerging Markets Bond Fund |
The following table presents the fund’s forward currency contracts by counterparty that are subject to master netting agreements but that are not offset in the fund’s statement of assets and liabilities. The net amount column shows the impact of offsetting on the fund’s statement of assets and liabilities as of June 30, 2022, if close-out netting was exercised (dollars in thousands):
| | | Gross amounts
recognized in the | | | Gross amounts not offset in the
statement of assets and liabilities and
subject to a master netting agreement | | | | |
| Counterparty | | statement of assets
and liabilities | | | Available
to offset | | | Non-cash
collateral* | | | Cash
collateral* | | | Net
amount | |
| Assets: | | | | | | | | | | | | | | | | | | | | |
| Barclays Bank PLC | | $ | 3 | | | $ | — | | | $ | — | | | $ | — | | | $ | 3 | |
| Citibank | | | 292 | | | | (292 | ) | | | — | | | | — | | | | — | |
| Goldman Sachs | | | 344 | | | | (344 | ) | | | — | | | | — | | | | — | |
| HSBC Bank | | | 2 | | | | — | | | | — | | | | — | | | | 2 | |
| JPMorgan Chase | | | 62 | | | | (31 | ) | | | — | | | | — | | | | 31 | |
| Morgan Stanley | | | 81 | | | | (81 | ) | | | — | | | | — | | | | — | |
| Standard Chartered Bank | | | 307 | | | | (212 | ) | | | — | | | | (95 | ) | | | — | |
| UBS AG | | | 132 | | | | (2 | ) | | | — | | | | — | | | | 130 | |
| Total | | $ | 1,223 | | | $ | (962 | ) | | $ | — | | | $ | (95 | ) | | $ | 166 | |
| Liabilities: | | | | | | | | | | | | | | | | | | | | |
| Bank of America | | $ | 8 | | | $ | — | | | $ | — | | | $ | — | | | $ | 8 | |
| BNP Paribas | | | 1,843 | | | | — | | | | (1,754 | ) | | | — | | | | 89 | |
| Citibank | | | 584 | | | | (292 | ) | | | (292 | ) | | | — | | | | — | |
| Goldman Sachs | | | 1,264 | | | | (344 | ) | | | (844 | ) | | | — | | | | 76 | |
| JPMorgan Chase | | | 31 | | | | (31 | ) | | | — | | | | — | | | | — | |
| Morgan Stanley | | | 498 | | | | (81 | ) | | | (250 | ) | | | — | | | | 167 | |
| Standard Chartered Bank | | | 212 | | | | (212 | ) | | | — | | | | — | | | | — | |
| UBS AG | | | 2 | | | | (2 | ) | | | — | | | | — | | | | — | |
| Total | | $ | 4,442 | | | $ | (962 | ) | | $ | (3,140 | ) | | $ | — | | | $ | 340 | |
| | |
| * | Collateral is shown on a settlement basis. |
6. Taxation and distributions
Federal income taxation — The fund complies with the requirements under Subchapter M of the Internal Revenue Code applicable to regulated investment companies and intends to distribute substantially all of its net taxable income and net capital gains each year. The fund is not subject to income taxes to the extent such distributions are made. Therefore, no federal income tax provision is required.
As of and during the period ended June 30, 2022, the fund did not have a liability for any unrecognized tax benefits. The fund recognizes interest and penalties, if any, related to unrecognized tax benefits as income tax expense in the statement of operations. During the period, the fund did not incur any significant interest or penalties.
The fund’s tax returns are generally not subject to examination by federal, state and, if applicable, non-U.S. tax authorities after the expiration of each jurisdiction’s statute of limitations, which is typically three years after the date of filing but can be extended in certain jurisdictions.
Non-U.S. taxation — Dividend and interest income are recorded net of non-U.S. taxes paid. The fund may file withholding tax reclaims in certain jurisdictions to recover a portion of amounts previously withheld. These reclaims are recorded when the amount is known and there are no significant uncertainties on collectability. Gains realized by the fund on the sale of securities in certain countries, if any, may be subject to non-U.S. taxes. If applicable, the fund records an estimated deferred tax liability based on unrealized gains to provide for potential non-U.S. taxes payable upon the sale of these securities.
| American Funds Emerging Markets Bond Fund | 25 |
Distributions — Distributions determined on a tax basis may differ from net investment income and net realized gains for financial reporting purposes. These differences are due primarily to different treatment for items such as currency gains and losses; short-term capital gains and losses; capital losses related to sales of certain securities within 30 days of purchase; cost of investments sold; net capital losses and income on certain investments. The fiscal year in which amounts are distributed may differ from the year in which the net investment income and net realized gains are recorded by the fund for financial reporting purposes.
The components of distributable earnings on a tax basis are reported as of the fund’s most recent year-end. As of December 31, 2021, the components of distributable earnings on a tax basis were as follows (dollars in thousands):
| Undistributed ordinary income | | $ | 149 | |
| Distributions in excess of ordinary income | | | 10,842 | |
| Late year ordinary loss deferral1 | | | (3,582 | ) |
| Capital loss carryforward2 | | | (5,402 | ) |
| | |
| 1 | This deferral is considered incurred in the subsequent year. |
| 2 | The capital loss carryforward will be used to offset any capital gains realized by the fund in the current year or in subsequent years. The fund will not make distributions from capital gains while a capital loss carryforward remains. |
As of June 30, 2022, the tax basis unrealized appreciation (depreciation) and cost of investments were as follows (dollars in thousands):
| Gross unrealized appreciation on investments | | $ | 6,200 | |
| Gross unrealized depreciation on investments | | | (263,799 | ) |
| Net unrealized depreciation on investments | | | (257,599 | ) |
| Cost of investments | | | 1,069,647 | |
Distributions paid or accrued were characterized for tax purposes as follows (dollars in thousands):
| | | Six months ended June 30, 2022 | | | Year ended December 31, 2021 | |
| Share class | | Ordinary
income3 | | | Long-term
capital gains | | | Total
distributions
paid or
accrued | | | Ordinary
income | | | Return of
capital | | | Total
distributions
paid or
accrued | |
| Class A | | $ | 10,924 | | | $ | — | | | $ | 10,924 | | | $ | 15,005 | | | $ | 2,811 | | | $ | 17,816 | |
| Class C | | | 594 | | | | — | | | | 594 | | | | 874 | | | | 164 | | | | 1,038 | |
| Class T | | | — | 4 | | | — | | | | — | 4 | | | — | 4 | | | — | 4 | | | — | 4 |
| Class F-1 | | | 327 | | | | — | | | | 327 | | | | 510 | | | | 95 | | | | 605 | |
| Class F-2 | | | 17,270 | | | | — | | | | 17,270 | | | | 24,116 | | | | 4,518 | | | | 28,634 | |
| Class F-3 | | | 8,302 | | | | — | | | | 8,302 | | | | 8,637 | | | | 1,618 | | | | 10,255 | |
| Class 529-A | | | 298 | | | | — | | | | 298 | | | | 402 | | | | 75 | | | | 477 | |
| Class 529-C | | | 20 | | | | — | | | | 20 | | | | 30 | | | | 6 | | | | 36 | |
| Class 529-E | | | 20 | | | | — | | | | 20 | | | | 28 | | | | 5 | | | | 33 | |
| Class 529-T | | | — | 4 | | | — | | | | — | 4 | | | 1 | | | | — | 4 | | | 1 | |
| Class 529-F-1 | | | — | 4 | | | — | | | | — | 4 | | | — | 4 | | | — | 4 | | | — | 4 |
| Class 529-F-2 | | | 214 | | | | — | | | | 214 | | | | 228 | | | | 43 | | | | 271 | |
| Class 529-F-3 | | | — | 4 | | | — | | | | — | 4 | | | 1 | | | | — | 4 | | | 1 | |
| Class R-1 | | | 4 | | | | — | | | | 4 | | | | 4 | | | | 1 | | | | 5 | |
| Class R-2 | | | 50 | | | | — | | | | 50 | | | | 63 | | | | 12 | | | | 75 | |
| Class R-2E | | | 3 | | | | — | | | | 3 | | | | 3 | | | | — | 4 | | | 3 | |
| Class R-3 | | | 55 | | | | — | | | | 55 | | | | 79 | | | | 15 | | | | 94 | |
| Class R-4 | | | 38 | | | | — | | | | 38 | | | | 47 | | | | 9 | | | | 56 | |
| Class R-5E | | | 22 | | | | — | | | | 22 | | | | 22 | | | | 4 | | | | 26 | |
| Class R-5 | | | 34 | | | | — | | | | 34 | | | | 43 | | | | 8 | | | | 51 | |
| Class R-6 | | | 5,564 | | | | — | | | | 5,564 | | | | 7,782 | | | | 1,458 | | | | 9,240 | |
| Total | | $ | 43,739 | | | $ | — | | | $ | 43,739 | | | $ | 57,875 | | | $ | 10,842 | | | $ | 68,717 | |
| | |
| 3 | All or a portion of these amounts may later be determined as return of capital; the determination will be made at December 31, 2022. |
| 4 | Amount less than one thousand. |
| | |
| 26 | American Funds Emerging Markets Bond Fund |
7. Fees and transactions with related parties
CRMC, the fund’s investment adviser, is the parent company of American Funds Distributors®, Inc. (“AFD”), the principal underwriter of the fund’s shares, and American Funds Service Company® (“AFS”), the fund’s transfer agent. CRMC, AFD and AFS are considered related parties to the fund.
Investment advisory services — The fund has an investment advisory and service agreement with CRMC that provides for monthly fees accrued daily. At the beginning of the year, these fees were based on a series of decreasing annual rates beginning with 0.553% on the first $1.5 billion of daily net assets and decreasing to 0.503% on such assets in excess of $1.5 billion. On March 9, 2022, the fund’s board of trustees approved an amended investment advisory and service agreement effective May 1, 2022, replacing the prior series of rates and breakpoints with a new series of decreasing annual rates beginning with 0.457% on the first $15.0 billion of daily net assets and decreasing to 0.428% on such assets in excess of $15.0 billion. For the six months ended June 30, 2022, the investment advisory services fees were $3,307,000, which were equivalent to an annualized rate of 0.525% of average daily net assets.
Class-specific fees and expenses — Expenses that are specific to individual share classes are accrued directly to the respective share class. The principal class-specific fees and expenses are further described below:
Distribution services — The fund has plans of distribution for all share classes, except Class F-2, F-3, 529-F-2, 529-F-3, R-5E, R-5 and R-6 shares. Under the plans, the board of trustees approves certain categories of expenses that are used to finance activities primarily intended to sell fund shares and service existing accounts. The plans provide for payments, based on an annualized percentage of average daily net assets, ranging from 0.30% to 1.00% as noted in this section. In some cases, the board of trustees has limited the amounts that may be paid to less than the maximum allowed by the plans. All share classes with a plan may use up to 0.25% of average daily net assets to pay service fees, or to compensate AFD for paying service fees, to firms that have entered into agreements with AFD to provide certain shareholder services. The remaining amounts available to be paid under each plan are paid to dealers to compensate them for their sales activities.
| | Share class | | Currently approved limits | | Plan limits |
| | Class A | | | 0.30 | % | | | 0.30 | % |
| | Class 529-A | | | 0.30 | | | | 0.50 | |
| | Classes C, 529-C and R-1 | | | 1.00 | | | | 1.00 | |
| | Class R-2 | | | 0.75 | | | | 1.00 | |
| | Class R-2E | | | 0.60 | | | | 0.85 | |
| | Classes 529-E and R-3 | | | 0.50 | | | | 0.75 | |
| | Classes T, F-1, 529-T, 529-F-1 and R-4 | | | 0.25 | | | | 0.50 | |
For Class A and 529-A shares, distribution-related expenses include the reimbursement of dealer and wholesaler commissions paid by AFD for certain shares sold without a sales charge. These share classes reimburse AFD for amounts billed within the prior 15 months but only to the extent that the overall annual expense limits are not exceeded. As of June 30, 2022, there were no unreimbursed expenses subject to reimbursement for Class A or 529-A shares.
Transfer agent services — The fund has a shareholder services agreement with AFS under which the fund compensates AFS for providing transfer agent services to each of the fund’s share classes. These services include recordkeeping, shareholder communications and transaction processing. In addition, the fund reimburses AFS for amounts paid to third parties for performing transfer agent services on behalf of fund shareholders.
Administrative services — The fund has an administrative services agreement with CRMC under which the fund compensates CRMC for providing administrative services to all share classes. Administrative services are provided by CRMC and its affiliates to help assist third parties providing non-distribution services to fund shareholders. These services include providing in-depth information on the fund and market developments that impact fund investments. Administrative services also include, but are not limited to, coordinating, monitoring and overseeing third parties that provide services to fund shareholders. The agreement provides the fund the ability to charge an administrative services fee at the annual rate of 0.05% of the average daily net assets attributable to each share class of the fund. Currently the fund pays CRMC an administrative services fee at the annual rate of 0.03% of the average daily net assets attributable to each share class of the fund for CRMC’s provision of administrative services.
| American Funds Emerging Markets Bond Fund | 27 |
529 plan services — Each 529 share class is subject to service fees to compensate the Virginia College Savings Plan (“Virginia529”) for its oversight and administration of the CollegeAmerica 529 college savings plan. The fees are based on the combined net assets invested in Class 529 and ABLE shares of the American Funds. Class ABLE shares are offered on other American Funds by Virginia529 through ABLEAmerica®, a tax-advantaged savings program for individuals with disabilities. Virginia529 is not considered a related party to the fund.
The quarterly fees are based on a series of decreasing annual rates beginning with 0.09% on the first $20 billion of the combined net assets invested in the American Funds and decreasing to 0.03% on such assets in excess of $75 billion. The fees for any given calendar quarter are accrued and calculated on the basis of the average net assets of Class 529 and ABLE shares of the American Funds for the last month of the prior calendar quarter. For the six months ended June 30, 2022, the 529 plan services fees were $4,000, which were equivalent to 0.056% of the average daily net assets of each 529 share class.
For the six months ended June 30, 2022, class-specific expenses under the agreements were as follows (dollars in thousands):
| | Share class | | Distribution
services | | Transfer agent
services | | Administrative
services | | 529 plan
services | |
| | Class A | | $440 | | $223 | | $48 | | Not applicable | |
| | Class C | | 99 | | 14 | | 3 | | Not applicable | |
| | Class T | | — | | — | * | — | * | Not applicable | |
| | Class F-1 | | 12 | | 7 | | 2 | | Not applicable | |
| | Class F-2 | | Not applicable | | 303 | | 75 | | Not applicable | |
| | Class F-3 | | Not applicable | | 3 | | 35 | | Not applicable | |
| | Class 529-A | | 10 | | 6 | | 1 | | $2 | |
| | Class 529-C | | 3 | | — | * | — | * | — | * |
| | Class 529-E | | 2 | | — | * | — | * | — | * |
| | Class 529-T | | — | | — | * | — | * | — | * |
| | Class 529-F-1 | | — | | — | * | — | * | — | * |
| | Class 529-F-2 | | Not applicable | | 2 | | 1 | | 2 | |
| | Class 529-F-3 | | Not applicable | | — | * | — | * | — | * |
| | Class R-1 | | 1 | | — | * | — | * | Not applicable | |
| | Class R-2 | | 6 | | 2 | | — | * | Not applicable | |
| | Class R-2E | | — | * | — | * | — | * | Not applicable | |
| | Class R-3 | | 4 | | 1 | | — | * | Not applicable | |
| | Class R-4 | | 1 | | 1 | | — | * | Not applicable | |
| | Class R-5E | | Not applicable | | — | | — | * | Not applicable | |
| | Class R-5 | | Not applicable | | — | * | — | * | Not applicable | |
| | Class R-6 | | Not applicable | | 2 | | 24 | | Not applicable | |
| | Total class-specific expenses | | $578 | | $564 | | $189 | | $4 | |
| | | |
| | * | Amount less than one thousand. |
Trustees’ deferred compensation — Trustees who are unaffiliated with CRMC may elect to defer the cash payment of part or all of their compensation. These deferred amounts, which remain as liabilities of the fund, are treated as if invested in shares of the fund or other American Funds. These amounts represent general, unsecured liabilities of the fund and vary according to the total returns of the selected funds. Trustees’ compensation of $2,000 in the fund’s statement of operations reflects $3,000 in current fees (either paid in cash or deferred) and a net decrease of $1,000 in the value of the deferred amounts.
Affiliated officers and trustees — Officers and certain trustees of the fund are or may be considered to be affiliated with CRMC, AFD and AFS. No affiliated officers or trustees received any compensation directly from the fund.
Investment in CCF — The fund holds shares of CCF, an institutional prime money market fund managed by CRMC. CCF invests in high-quality, short-term money market instruments. CCF is used as the primary investment vehicle for the fund’s short-term instruments. CCF shares are only available for purchase by CRMC, its affiliates, and other funds managed by CRMC or its affiliates, and are not available to the public. CRMC does not receive an investment advisory services fee from CCF.
Security transactions with related funds — The fund purchased investment securities from other funds managed by CRMC (or funds managed by certain affiliates of CRMC) under procedures adopted by the fund’s board of trustees. The funds involved in such transactions are considered related by virtue of having a common investment adviser (or affiliated investment advisers), common trustees and/or common officers. Each transaction was executed at the current market price of the security and no brokerage commissions or fees were paid in accordance with Rule 17a-7 of the 1940 Act. During the six months ended June 30, 2022, the fund engaged in such purchase transactions with related funds in the amount of $174,000.
| 28 | American Funds Emerging Markets Bond Fund |
Interfund lending — Pursuant to an exemptive order issued by the SEC, the fund, along with other CRMC-managed funds (or funds managed by certain affiliates of CRMC), may participate in an interfund lending program. The program provides an alternate credit facility that permits the funds to lend or borrow cash for temporary purposes directly to or from one another, subject to the conditions of the exemptive order. The fund did not lend or borrow cash through the interfund lending program at any time during the six months ended June 30, 2022.
8. Committed line of credit
The fund participates with other funds managed by CRMC (or funds managed by certain affiliates of CRMC) in a $1.5 billion credit facility (the “line of credit”) to be utilized for temporary purposes to support shareholder redemptions. The fund has agreed to pay commitment fees on its pro-rata portion of the line of credit, which are reflected in other expenses in the fund’s statement of operations. The fund did not borrow on this line of credit at any time during the six months ended June 30, 2022.
9. Indemnifications
The fund’s organizational documents provide board members and officers with indemnification against certain liabilities or expenses in connection with the performance of their duties to the fund. In the normal course of business, the fund may also enter into contracts that provide general indemnifications. The fund’s maximum exposure under these arrangements is unknown since it is dependent on future claims that may be made against the fund. The risk of material loss from such claims is considered remote. Insurance policies are also available to the fund’s board members and officers.
10. Capital share transactions
Capital share transactions in the fund were as follows (dollars and shares in thousands):
| | | Sales* | | | Reinvestments of
distributions | | | Repurchases* | | | Net (decrease)
increase | |
| Share class | | Amount | | | Shares | | | Amount | | | Shares | | | Amount | | | Shares | | | Amount | | | Shares | |
| | | | | | | | | | | | | | | | | | | | | | | | | | | | | | | | | |
| Six months ended June 30, 2022 | | | | | | | | | | | | | | | | | | | | | | | | | | | | | | | | |
| | | | | | | | | | | | | | | | | | | | | | | | | | | | | | | | | |
| Class A | | $ | 22,027 | | | | 2,650 | | | $ | 10,279 | | | | 1,269 | | | $ | (53,529 | ) | | | (6,556 | ) | | $ | (21,223 | ) | | | (2,637 | ) |
| Class C | | | 780 | | | | 92 | | | | 584 | | | | 72 | | | | (3,697 | ) | | | (444 | ) | | | (2,333 | ) | | | (280 | ) |
| Class T | | | — | | | | — | | | | — | | | | — | | | | — | | | | — | | | | — | | | | — | |
| Class F-1 | | | 1,196 | | | | 144 | | | | 324 | | | | 40 | | | | (3,323 | ) | | | (412 | ) | | | (1,803 | ) | | | (228 | ) |
| Class F-2 | | | 79,531 | | | | 9,506 | | | | 17,221 | | | | 2,110 | | | | (408,357 | ) | | | (52,995 | ) | | | (311,605 | ) | | | (41,379 | ) |
| Class F-3 | | | 103,946 | | | | 12,523 | | | | 7,883 | | | | 975 | | | | (95,499 | ) | | | (11,868 | ) | | | 16,330 | | | | 1,630 | |
| Class 529-A | | | 997 | | | | 119 | | | | 295 | | | | 36 | | | | (1,402 | ) | | | (170 | ) | | | (110 | ) | | | (15 | ) |
| Class 529-C | | | 54 | | | | 6 | | | | 20 | | | | 3 | | | | (128 | ) | | | (15 | ) | | | (54 | ) | | | (6 | ) |
| Class 529-E | | | 1 | | | | — | † | | | 20 | | | | 3 | | | | (38 | ) | | | (5 | ) | | | (17 | ) | | | (2 | ) |
| Class 529-T | | | — | | | | — | | | | — | † | | | — | † | | | — | | | | — | | | | — | † | | | — | † |
| Class 529-F-1 | | | — | | | | — | | | | — | † | | | — | † | | | — | | | | — | | | | — | † | | | — | † |
| Class 529-F-2 | | | 1,634 | | | | 191 | | | | 213 | | | | 26 | | | | (708 | ) | | | (84 | ) | | | 1,139 | | | | 133 | |
| Class 529-F-3 | | | — | | | | — | | | | — | † | | | — | † | | | — | | | | — | | | | — | † | | | — | † |
| Class R-1 | | | 29 | | | | 4 | | | | 4 | | | | 1 | | | | — | † | | | — | † | | | 33 | | | | 5 | |
| Class R-2 | | | 276 | | | | 33 | | | | 49 | | | | 6 | | | | (314 | ) | | | (37 | ) | | | 11 | | | | 2 | |
| Class R-2E | | | 11 | | | | 2 | | | | 3 | | | | — | † | | | — | † | | | — | † | | | 14 | | | | 2 | |
| Class R-3 | | | 300 | | | | 38 | | | | 54 | | | | 6 | | | | (461 | ) | | | (56 | ) | | | (107 | ) | | | (12 | ) |
| Class R-4 | | | 57 | | | | 7 | | | | 37 | | | | 5 | | | | (351 | ) | | | (44 | ) | | | (257 | ) | | | (32 | ) |
| Class R-5E | | | 222 | | | | 27 | | | | 21 | | | | 3 | | | | (58 | ) | | | (7 | ) | | | 185 | | | | 23 | |
| Class R-5 | | | 31 | | | | 4 | | | | 34 | | | | 4 | | | | (120 | ) | | | (13 | ) | | | (55 | ) | | | (5 | ) |
| Class R-6 | | | 751 | | | | 90 | | | | 5,563 | | | | 684 | | | | (36,591 | ) | | | (4,477 | ) | | | (30,277 | ) | | | (3,703 | ) |
| Total net increase (decrease) | | $ | 211,843 | | | | 25,436 | | | $ | 42,604 | | | | 5,243 | | | $ | (604,576 | ) | | | (77,183 | ) | | $ | (350,129 | ) | | | (46,504 | ) |
Refer to the end of the table for footnotes.
| American Funds Emerging Markets Bond Fund | 29 |
| | | Sales* | | | Reinvestments of
distributions | | | Repurchases* | | | Net increase
(decrease) | |
| Share class | | Amount | | | Shares | | | Amount | | | Shares | | | Amount | | | Shares | | | Amount | | | Shares | |
| | | | | | | | | | | | | | | | | | | | | | | | | | | | | | | | | |
| Year ended December 31, 2021 | | | | | | | | | | | | | | | | | | | | | | | | | | | | | | | | |
| | | | | | | | | | | | | | | | | | | | | | | | | | | | | | | | | |
| Class A | | $ | 86,203 | | | | 8,874 | | | $ | 16,831 | | | | 1,754 | | | $ | (66,831 | ) | | | (6,960 | ) | | $ | 36,203 | | | | 3,668 | |
| Class C | | | 5,320 | | | | 547 | | | | 1,019 | | | | 106 | | | | (8,770 | ) | | | (911 | ) | | | (2,431 | ) | | | (258 | ) |
| Class T | | | — | | | | — | | | | — | | | | — | | | | — | | | | — | | | | — | | | | — | |
| Class F-1 | | | 4,451 | | | | 456 | | | | 601 | | | | 63 | | | | (6,152 | ) | | | (632 | ) | | | (1,100 | ) | | | (113 | ) |
| Class F-2 | | | 234,369 | | | | 24,202 | | | | 28,514 | | | | 2,974 | | | | (122,138 | ) | | | (12,749 | ) | | | 140,745 | | | | 14,427 | |
| Class F-3 | | | 128,012 | | | | 13,201 | | | | 9,687 | | | | 1,012 | | | | (35,199 | ) | | | (3,697 | ) | | | 102,500 | | | | 10,516 | |
| Class 529-A | | | 4,077 | | | | 419 | | | | 473 | | | | 49 | | | | (3,169 | ) | | | (328 | ) | | | 1,381 | | | | 140 | |
| Class 529-C | | | 293 | | | | 31 | | | | 36 | | | | 4 | | | | (412 | ) | | | (43 | ) | | | (83 | ) | | | (8 | ) |
| Class 529-E | | | 73 | | | | 8 | | | | 33 | | | | 3 | | | | (194 | ) | | | (20 | ) | | | (88 | ) | | | (9 | ) |
| Class 529-T | | | — | | | | — | | | | 1 | | | | — | † | | | — | | | | — | | | | 1 | | | | — | † |
| Class 529-F-1 | | | — | | | | — | | | | 1 | | | | — | † | | | — | | | | — | | | | 1 | | | | — | † |
| Class 529-F-2 | | | 1,999 | | | | 209 | | | | 269 | | | | 29 | | | | (1,034 | ) | | | (108 | ) | | | 1,234 | | | | 130 | |
| Class 529-F-3 | | | — | | | | — | | | | 1 | | | | — | † | | | — | | | | — | | | | 1 | | | | — | † |
| Class R-1 | | | 41 | | | | 4 | | | | 4 | | | | — | † | | | (11 | ) | | | (1 | ) | | | 34 | | | | 3 | |
| Class R-2 | | | 711 | | | | 73 | | | | 74 | | | | 8 | | | | (535 | ) | | | (55 | ) | | | 250 | | | | 26 | |
| Class R-2E | | | 102 | | | | 11 | | | | 3 | | | | — | † | | | (14 | ) | | | (1 | ) | | | 91 | | | | 10 | |
| Class R-3 | | | 550 | | | | 57 | | | | 92 | | | | 10 | | | | (638 | ) | | | (67 | ) | | | 4 | | | | — | † |
| Class R-4 | | | 443 | | | | 47 | | | | 55 | | | | 6 | | | | (191 | ) | | | (20 | ) | | | 307 | | | | 33 | |
| Class R-5E | | | 292 | | | | 30 | | | | 24 | | | | 2 | | | | (203 | ) | | | (20 | ) | | | 113 | | | | 12 | |
| Class R-5 | | | 232 | | | | 24 | | | | 51 | | | | 5 | | | | (2 | ) | | | — | † | | | 281 | | | | 29 | |
| Class R-6 | | | 34,660 | | | | 3,570 | | | | 9,239 | | | | 964 | | | | (998 | ) | | | (103 | ) | | | 42,901 | | | | 4,431 | |
| Total net increase (decrease) | | $ | 501,828 | | | | 51,763 | | | $ | 67,008 | | | | 6,989 | | | $ | (246,491 | ) | | | (25,715 | ) | | $ | 322,345 | | | | 33,037 | |
| | |
| * | Includes exchanges between share classes of the fund. |
| † | Amount less than one thousand. |
11. Investment transactions
The fund engaged in purchases and sales of investment securities, excluding short-term securities and U.S. government obligations, if any, of $315,160,000 and $648,527,000, respectively, during the six months ended June 30, 2022.
| 30 | American Funds Emerging Markets Bond Fund |
Financial highlights
| | | | | | (Loss) income from
investment operations1 | | | Dividends, distributions and return of capital | | | | | | | | | | | | | | | | | | | |
| Year ended | | Net asset
value,
beginning
of year | | | Net
investment
income | | | Net (losses)
gains on
securities
(both
realized and
unrealized) | | | Total from
investment
operations | | | Dividends
(from net
investment
income) | | | Distributions
(from capital
gains) | | | Return of
capital | | | Total
dividends,
distributions
and return
of capital | | | Net assets
value, end
of year | | | Total return2,3 | | | Net assets,
end of year
(in millions) | | | Ratio of
expenses to
average net
assets before
waivers/
reimburse-
ments4 | | | Ratio of
expenses to
average net
assets after
waivers/
reimburse-
ments3,4 | | | Ratio of
net income
to average
net assets3 | |
| Class A: | | | | | | | | | | | | | | | | | | | | | | | | | | | | | | | | | | | | | | | | | | | | | | | | | | | | | | | | |
| 06/30/20225,6 | | $ | 9.30 | | | $ | .25 | | | $ | (1.88 | ) | | $ | (1.63 | ) | | $ | (.28 | ) | | $ | — | | | $ | — | | | $ | (.28 | ) | | $ | 7.39 | | | | (17.75 | )%7 | | $ | 278 | | | | 1.02 | %8 | | | 1.02 | %8 | | | 6.11 | %8 |
| 12/31/2021 | | | 10.15 | | | | .45 | | | | (.85 | ) | | | (.40 | ) | | | (.38 | ) | | | — | | | | (.07 | ) | | | (.45 | ) | | | 9.30 | | | | (3.98 | ) | | | 375 | | | | 1.06 | | | | 1.06 | | | | 4.70 | |
| 12/31/2020 | | | 9.94 | | | | .50 | | | | .21 | | | | .71 | | | | (.16 | ) | | | — | | | | (.34 | ) | | | (.50 | ) | | | 10.15 | | | | 7.62 | | | | 372 | | | | 1.09 | | | | 1.06 | | | | 5.24 | |
| 12/31/2019 | | | 9.35 | | | | .63 | | | | .62 | | | | 1.25 | | | | (.36 | ) | | | (.03 | ) | | | (.27 | ) | | | (.66 | ) | | | 9.94 | | | | 13.69 | | | | 387 | | | | 1.03 | | | | 1.00 | | | | 6.44 | |
| 12/31/2018 | | | 10.38 | | | | .61 | | | | (1.04 | ) | | | (.43 | ) | | | (.58 | ) | | | — | 9 | | | (.02 | ) | | | (.60 | ) | | | 9.35 | | | | (4.23 | ) | | | 285 | | | | 1.06 | | | | 1.01 | | | | 6.23 | |
| 12/31/2017 | | | 9.77 | | | | .62 | | | | .62 | | | | 1.24 | | | | (.61 | ) | | | (.02 | ) | | | — | | | | (.63 | ) | | | 10.38 | | | | 12.93 | | | | 203 | | | | 1.25 | | | | 1.01 | | | | 6.00 | |
| Class C: | | | | | | | | | | | | | | | | | | | | | | | | | | | | | | | | | | | | | | | | | | | | | | | | | | | | | | | | |
| 06/30/20225,6 | | | 9.30 | | | | .22 | | | | (1.88 | ) | | | (1.66 | ) | | | (.25 | ) | | | — | | | | — | | | | (.25 | ) | | | 7.39 | | | | (18.05 | )7 | | | 17 | | | | 1.76 | 8 | | | 1.76 | 8 | | | 5.38 | 8 |
| 12/31/2021 | | | 10.15 | | | | .38 | | | | (.85 | ) | | | (.47 | ) | | | (.32 | ) | | | — | | | | (.06 | ) | | | (.38 | ) | | | 9.30 | | | | (4.66 | ) | | | 24 | | | | 1.76 | | | | 1.76 | | | | 3.99 | |
| 12/31/2020 | | | 9.94 | | | | .43 | | | | .21 | | | | .64 | | | | (.14 | ) | | | — | | | | (.29 | ) | | | (.43 | ) | | | 10.15 | | | | 6.87 | | | | 28 | | | | 1.79 | | | | 1.77 | | | | 4.54 | |
| 12/31/2019 | | | 9.35 | | | | .56 | | | | .62 | | | | 1.18 | | | | (.32 | ) | | | (.03 | ) | | | (.24 | ) | | | (.59 | ) | | | 9.94 | | | �� | 12.82 | | | | 28 | | | | 1.79 | | | | 1.77 | | | | 5.67 | |
| 12/31/2018 | | | 10.38 | | | | .53 | | | | (1.04 | ) | | | (.51 | ) | | | (.50 | ) | | | — | 9 | | | (.02 | ) | | | (.52 | ) | | | 9.35 | | | | (4.98 | ) | | | 18 | | | | 1.85 | | | | 1.80 | | | | 5.43 | |
| 12/31/2017 | | | 9.77 | | | | .54 | | | | .62 | | | | 1.16 | | | | (.53 | ) | | | (.02 | ) | | | — | | | | (.55 | ) | | | 10.38 | | | | 12.08 | | | | 13 | | | | 2.04 | | | | 1.78 | | | | 5.19 | |
| Class T: | | | | | | | | | | | | | | | | | | | | | | | | | | | | | | | | | | | | | | | | | | | | | | | | | | | | | | | | |
| 06/30/20225,6 | | | 9.30 | | | | .26 | | | | (1.88 | ) | | | (1.62 | ) | | | (.29 | ) | | | — | | | | — | | | | (.29 | ) | | | 7.39 | | | | (17.64 | )7,10 | | | — | 11 | | | .75 | 8,10 | | | .75 | 8,10 | | | 6.37 | 8,10 |
| 12/31/2021 | | | 10.15 | | | | .48 | | | | (.85 | ) | | | (.37 | ) | | | (.40 | ) | | | — | | | | (.08 | ) | | | (.48 | ) | | | 9.30 | | | | (3.70 | )10 | | | — | 11 | | | .75 | 10 | | | .75 | 10 | | | 4.98 | 10 |
| 12/31/2020 | | | 9.94 | | | | .53 | | | | .21 | | | | .74 | | | | (.17 | ) | | | — | | | | (.36 | ) | | | (.53 | ) | | | 10.15 | | | | 7.95 | 10 | | | — | 11 | | | .79 | 10 | | | .77 | 10 | | | 5.57 | 10 |
| 12/31/2019 | | | 9.35 | | | | .65 | | | | .62 | | | | 1.27 | | | | (.37 | ) | | | (.03 | ) | | | (.28 | ) | | | (.68 | ) | | | 9.94 | | | | 13.96 | 10 | | | — | 11 | | | .80 | 10 | | | .78 | 10 | | | 6.67 | 10 |
| 12/31/2018 | | | 10.38 | | | | .63 | | | | (1.04 | ) | | | (.41 | ) | | | (.60 | ) | | | — | 9 | | | (.02 | ) | | | (.62 | ) | | | 9.35 | | | | (4.02 | )10 | | | — | 11 | | | .86 | 10 | | | .81 | 10 | | | 6.45 | 10 |
| 12/31/20175,12 | | | 10.22 | | | | .47 | | | | .18 | | | | .65 | | | | (.47 | ) | | | (.02 | ) | | | — | | | | (.49 | ) | | | 10.38 | | | | 6.45 | 7,10 | | | — | 11 | | | 1.04 | 8,10 | | | .79 | 8,10 | | | 6.20 | 8,10 |
| Class F-1: | | | | | | | | | | | | | | | | | | | | | | | | | | | | | | | | | | | | | | | | | | | | | | | | | | | | | | | | |
| 06/30/20225,6 | | | 9.30 | | | | .25 | | | | (1.88 | ) | | | (1.63 | ) | | | (.28 | ) | | | — | | | | — | | | | (.28 | ) | | | 7.39 | | | | (17.74 | )7 | | | 8 | | | | 1.01 | 8 | | | 1.01 | 8 | | | 6.11 | 8 |
| 12/31/2021 | | | 10.15 | | | | .45 | | | | (.85 | ) | | | (.40 | ) | | | (.38 | ) | | | — | | | | (.07 | ) | | | (.45 | ) | | | 9.30 | | | | (3.95 | ) | | | 12 | | | | 1.03 | | | | 1.03 | | | | 4.72 | |
| 12/31/2020 | | | 9.94 | | | | .50 | | | | .21 | | | | .71 | | | | (.16 | ) | | | — | | | | (.34 | ) | | | (.50 | ) | | | 10.15 | | | | 7.65 | | | | 14 | | | | 1.06 | | | | 1.04 | | | | 5.29 | |
| 12/31/2019 | | | 9.35 | | | | .63 | | | | .62 | | | | 1.25 | | | | (.36 | ) | | | (.03 | ) | | | (.27 | ) | | | (.66 | ) | | | 9.94 | | | | 13.64 | | | | 13 | | | | 1.07 | | | | 1.04 | | | | 6.41 | |
| 12/31/2018 | | | 10.38 | | | | .60 | | | | (1.04 | ) | | | (.44 | ) | | | (.57 | ) | | | — | 9 | | | (.02 | ) | | | (.59 | ) | | | 9.35 | | | | (4.29 | ) | | | 10 | | | | 1.13 | | | | 1.10 | | | | 5.99 | |
| 12/31/2017 | | | 9.77 | | | | .62 | | | | .62 | | | | 1.24 | | | | (.61 | ) | | | (.02 | ) | | | — | | | | (.63 | ) | | | 10.38 | | | | 12.87 | | | | 20 | | | | 1.35 | | | | 1.05 | | | | 5.98 | |
| Class F-2: | | | | | | | | | | | | | | | | | | | | | | | | | | | | | | | | | | | | | | | | | | | | | | | | | | | | | | | | |
| 06/30/20225,6 | | | 9.30 | | | | .27 | | | | (1.89 | ) | | | (1.62 | ) | | | (.29 | ) | | | — | | | | — | | | | (.29 | ) | | | 7.39 | | | | (17.63 | )7 | | | 174 | | | | .74 | 8 | | | .74 | 8 | | | 6.39 | 8 |
| 12/31/2021 | | | 10.15 | | | | .48 | | | | (.85 | ) | | | (.37 | ) | | | (.40 | ) | | | — | | | | (.08 | ) | | | (.48 | ) | | | 9.30 | | | | (3.69 | ) | | | 604 | | | | .75 | | | | .75 | | | | 5.01 | |
| 12/31/2020 | | | 9.94 | | | | .53 | | | | .21 | | | | .74 | | | | (.17 | ) | | | — | | | | (.36 | ) | | | (.53 | ) | | | 10.15 | | | | 7.95 | | | | 513 | | | | .77 | | | | .74 | | | | 5.35 | |
| 12/31/2019 | | | 9.35 | | | | .65 | | | | .62 | | | | 1.27 | | | | (.37 | ) | | | (.03 | ) | | | (.28 | ) | | | (.68 | ) | | | 9.94 | | | | 13.94 | | | | 214 | | | | .80 | | | | .78 | | | | 6.67 | |
| 12/31/2018 | | | 10.38 | | | | .63 | | | | (1.04 | ) | | | (.41 | ) | | | (.60 | ) | | | — | 9 | | | (.02 | ) | | | (.62 | ) | | | 9.35 | | | | (4.01 | ) | | | 164 | | | | .83 | | | | .78 | | | | 6.48 | |
| 12/31/2017 | | | 9.77 | | | | .64 | | | | .62 | | | | 1.26 | | | | (.63 | ) | | | (.02 | ) | | | — | | | | (.65 | ) | | | 10.38 | | | | 13.14 | | | | 67 | | | | 1.04 | | | | .79 | | | | 6.20 | |
| Class F-3: | | | | | | | | | | | | | | | | | | | | | | | | | | | | | | | | | | | | | | | | | | | | | | | | | | | | | | | | |
| 06/30/20225,6 | | | 9.30 | | | | .27 | | | | (1.88 | ) | | | (1.61 | ) | | | (.30 | ) | | | — | | | | — | | | | (.30 | ) | | | 7.39 | | | | (17.58 | )7 | | | 200 | | | | .62 | 8 | | | .62 | 8 | | | 6.54 | 8 |
| 12/31/2021 | | | 10.15 | | | | .49 | | | | (.85 | ) | | | (.36 | ) | | | (.41 | ) | | | — | | | | (.08 | ) | | | (.49 | ) | | | 9.30 | | | | (3.58 | ) | | | 237 | | | | .65 | | | | .65 | | | | 5.13 | |
| 12/31/2020 | | | 9.94 | | | | .53 | | | | .21 | | | | .74 | | | | (.17 | ) | | | — | | | | (.36 | ) | | | (.53 | ) | | | 10.15 | | | | 8.06 | | | | 152 | | | | .71 | | | | .66 | | | | 5.61 | |
| 12/31/2019 | | | 9.35 | | | | .66 | | | | .62 | | | | 1.28 | | | | (.38 | ) | | | (.03 | ) | | | (.28 | ) | | | (.69 | ) | | | 9.94 | | | | 14.05 | | | | 112 | | | | .74 | | | | .67 | | | | 6.76 | |
| 12/31/2018 | | | 10.38 | | | | .63 | | | | (1.04 | ) | | | (.41 | ) | | | (.60 | ) | | | — | 9 | | | (.02 | ) | | | (.62 | ) | | | 9.35 | | | | (4.00 | ) | | | 47 | | | | .82 | | | | .75 | | | | 6.53 | |
| 12/31/20175,13 | | | 9.91 | | | | .60 | | | | .48 | | | | 1.08 | | | | (.59 | ) | | | (.02 | ) | | | — | | | | (.61 | ) | | | 10.38 | | | | 11.13 | 7 | | | 23 | | | | 1.08 | 8 | | | .80 | 8 | | | 6.19 | 8 |
| Class 529-A: | | | | | | | | | | | | | | | | | | | | | | | | | | | | | | | | | | | | | | | | | | | | | | | | | | | | | | | | |
| 06/30/20225,6 | | | 9.30 | | | | .25 | | | | (1.88 | ) | | | (1.63 | ) | | | (.28 | ) | | | — | | | | — | | | | (.28 | ) | | | 7.39 | | | | (17.75 | )7 | | | 8 | | | | 1.02 | 8 | | | 1.02 | 8 | | | 6.12 | 8 |
| 12/31/2021 | | | 10.15 | | | | .45 | | | | (.85 | ) | | | (.40 | ) | | | (.38 | ) | | | — | | | | (.07 | ) | | | (.45 | ) | | | 9.30 | | | | (3.97 | ) | | | 10 | | | | 1.05 | | | | 1.05 | | | | 4.71 | |
| 12/31/2020 | | | 9.94 | | | | .50 | | | | .21 | | | | .71 | | | | (.16 | ) | | | — | | | | (.34 | ) | | | (.50 | ) | | | 10.15 | | | | 7.65 | | | | 9 | | | | 1.06 | | | | 1.04 | | | | 5.26 | |
| 12/31/2019 | | | 9.35 | | | | .63 | | | | .62 | | | | 1.25 | | | | (.36 | ) | | | (.03 | ) | | | (.27 | ) | | | (.66 | ) | | | 9.94 | | | | 13.63 | | | | 8 | | | | 1.08 | | | | 1.05 | | | | 6.39 | |
| 12/31/2018 | | | 10.38 | | | | .60 | | | | (1.04 | ) | | | (.44 | ) | | | (.57 | ) | | | — | 9 | | | (.02 | ) | | | (.59 | ) | | | 9.35 | | | | (4.28 | ) | | | 6 | | | | 1.11 | | | | 1.06 | | | | 6.19 | |
| 12/31/2017 | | | 9.77 | | | | .61 | | | | .62 | | | | 1.23 | | | | (.60 | ) | | | (.02 | ) | | | — | | | | (.62 | ) | | | 10.38 | | | | 12.79 | | | | 4 | | | | 1.39 | | | | 1.15 | | | | 5.87 | |
Refer to the end of the table for footnotes.
| American Funds Emerging Markets Bond Fund | 31 |
Financial highlights (continued)
| | | | | | (Loss) income from
investment operations1 | | | Dividends, distributions and return of capital | | | | | | | | | | | | | | | | | | | |
| Year ended | | Net asset
value,
beginning
of year | | | Net
investment
income | | | Net (losses)
gains on
securities
(both
realized and
unrealized) | | | Total from
investment
operations | | | Dividends
(from net
investment
income) | | | Distributions
(from capital
gains) | | | Return of
capital | | | Total
dividends,
distributions
and return
of capital | | | Net assets
value, end
of year | | | Total return2,3 | | | Net assets,
end of year
(in millions) | | | Ratio of
expenses to
average net
assets before
waivers/
reimburse-
ments4 | | | Ratio of
expenses to
average net
assets after
waivers/
reimburse-
ments3,4 | | | Ratio of
net income
to average
net assets3 | |
| Class 529-C: | | | | | | | | | | | | | | | | | | | | | | | | | | | | | | | | | | | | | | | | | | | | | | | | | | | | | | | | |
| 06/30/20225,6 | | $ | 9.30 | | | $ | .22 | | | $ | (1.88 | ) | | $ | (1.66 | ) | | $ | (.25 | ) | | $ | — | | | $ | — | | | $ | (.25 | ) | | $ | 7.39 | | | | (18.07 | )%7 | | $ | 1 | | | | 1.80 | %8 | | | 1.80 | %8 | | | 5.33 | %8 |
| 12/31/2021 | | | 10.15 | | | | .38 | | | | (.85 | ) | | | (.47 | ) | | | (.32 | ) | | | — | | | | (.06 | ) | | | (.38 | ) | | | 9.30 | | | | (4.70 | ) | | | 1 | | | | 1.80 | | | | 1.80 | | | | 3.94 | |
| 12/31/2020 | | | 9.94 | | | | .42 | | | | .22 | | | | .64 | | | | (.14 | ) | | | — | | | | (.29 | ) | | | (.43 | ) | | | 10.15 | | | | 6.82 | | | | 1 | | | | 1.84 | | | | 1.81 | | | | 4.57 | |
| 12/31/2019 | | | 9.35 | | | | .55 | | | | .62 | | | | 1.17 | | | | (.31 | ) | | | (.03 | ) | | | (.24 | ) | | | (.58 | ) | | | 9.94 | | | | 12.79 | | | | 1 | | | | 1.82 | | | | 1.80 | | | | 5.65 | |
| 12/31/2018 | | | 10.38 | | | | .53 | | | | (1.04 | ) | | | (.51 | ) | | | (.50 | ) | | | — | 9 | | | (.02 | ) | | | (.52 | ) | | | 9.35 | | | | (5.01 | ) | | | 1 | | | | 1.87 | | | | 1.82 | | | | 5.42 | |
| 12/31/2017 | | | 9.77 | | | | .54 | | | | .62 | | | | 1.16 | | | | (.53 | ) | | | (.02 | ) | | | — | | | | (.55 | ) | | | 10.38 | | | | 12.06 | 10 | | | 1 | | | | 2.03 | 10 | | | 1.80 | 10 | | | 5.21 | 10 |
| Class 529-E: | | | | | | | | | | | | | | | | | | | | | | | | | | | | | | | | | | | | | | | | | | | | | | | | | | | | | | | | |
| 06/30/20225,6 | | | 9.30 | | | | .24 | | | | (1.88 | ) | | | (1.64 | ) | | | (.27 | ) | | | — | | | | — | | | | (.27 | ) | | | 7.39 | | | | (17.83 | )7 | | | 1 | | | | 1.23 | 8 | | | 1.23 | 8 | | | 5.91 | 8 |
| 12/31/2021 | | | 10.15 | | | | .43 | | | | (.85 | ) | | | (.42 | ) | | | (.36 | ) | | | — | | | | (.07 | ) | | | (.43 | ) | | | 9.30 | | | | (4.17 | ) | | | 1 | | | | 1.25 | | | | 1.25 | | | | 4.50 | |
| 12/31/2020 | | | 9.94 | | | | .48 | | | | .20 | | | | .68 | | | | (.15 | ) | | | — | | | | (.32 | ) | | | (.47 | ) | | | 10.15 | | | | 7.41 | | | | 1 | | | | 1.29 | | | | 1.27 | | | | 5.09 | |
| 12/31/2019 | | | 9.35 | | | | .60 | | | | .62 | | | | 1.22 | | | | (.34 | ) | | | (.03 | ) | | | (.26 | ) | | | (.63 | ) | | | 9.94 | | | | 13.40 | | | | 1 | | | | 1.28 | | | | 1.26 | | | | 6.18 | |
| 12/31/2018 | | | 10.38 | | | | .58 | | | | (1.04 | ) | | | (.46 | ) | | | (.55 | ) | | | — | 9 | | | (.02 | ) | | | (.57 | ) | | | 9.35 | | | | (4.49 | ) | | | 1 | | | | 1.33 | | | | 1.26 | | | | 6.12 | |
| 12/31/2017 | | | 9.77 | | | | .60 | | | | .62 | | | | 1.22 | | | | (.59 | ) | | | (.02 | ) | | | — | | | | (.61 | ) | | | 10.38 | | | | 12.71 | | | | — | 11 | | | 1.47 | | | | 1.24 | | | | 5.76 | |
| Class 529-T: | | | | | | | | | | | | | | | | | | | | | | | | | | | | | | | | | | | | | | | | | | | | | | | | | | | | | | | | |
| 06/30/20225,6 | | | 9.30 | | | | .26 | | | | (1.88 | ) | | | (1.62 | ) | | | (.29 | ) | | | — | | | | — | | | | (.29 | ) | | | 7.39 | | | | (17.68 | )7,10 | | | — | 11 | | | .80 | 8,10 | | | .80 | 8,10 | | | 6.32 | 8,10 |
| 12/31/2021 | | | 10.15 | | | | .47 | | | | (.85 | ) | | | (.38 | ) | | | (.40 | ) | | | — | | | | (.07 | ) | | | (.47 | ) | | | 9.30 | | | | (3.75 | )10 | | | — | 11 | | | .81 | 10 | | | .81 | 10 | | | 4.92 | 10 |
| 12/31/2020 | | | 9.94 | | | | .52 | | | | .21 | | | | .73 | | | | (.17 | ) | | | — | | | | (.35 | ) | | | (.52 | ) | | | 10.15 | | | | 7.89 | 10 | | | — | 11 | | | .84 | 10 | | | .81 | 10 | | | 5.49 | 10 |
| 12/31/2019 | | | 9.35 | | | | .65 | | | | .62 | | | | 1.27 | | | | (.37 | ) | | | (.03 | ) | | | (.28 | ) | | | (.68 | ) | | | 9.94 | | | | 13.87 | 10 | | | — | 11 | | | .85 | 10 | | | .83 | 10 | | | 6.61 | 10 |
| 12/31/2018 | | | 10.38 | | | | .62 | | | | (1.04 | ) | | | (.42 | ) | | | (.59 | ) | | | — | 9 | | | (.02 | ) | | | (.61 | ) | | | 9.35 | | | | (4.08 | )10 | | | — | 11 | | | .92 | 10 | | | .87 | 10 | | | 6.36 | 10 |
| 12/31/20175,12 | | | 10.22 | | | | .47 | | | | .18 | | | | .65 | | | | (.47 | ) | | | (.02 | ) | | | — | | | | (.49 | ) | | | 10.38 | | | | 6.40 | 7,10 | | | — | 11 | | | 1.10 | 8,10 | | | .85 | 8,10 | | | 6.14 | 8,10 |
| Class 529-F-1: | | | | | | | | | | | | | | | | | | | | | | | | | | | | | | | | | | | | | | | | | | | | | | | | | | | | | | | | |
| 06/30/20225,6 | | | 9.30 | | | | .26 | | | | (1.88 | ) | | | (1.62 | ) | | | (.29 | ) | | | — | | | | — | | | | (.29 | ) | | | 7.39 | | | | (17.66 | )7,10 | | | — | 11 | | | .80 | 8,10 | | | .80 | 8,10 | | | 6.31 | 8,10 |
| 12/31/2021 | | | 10.15 | | | | .47 | | | | (.85 | ) | | | (.38 | ) | | | (.40 | ) | | | — | | | | (.07 | ) | | | (.47 | ) | | | 9.30 | | | | (3.78 | )10 | | | — | 11 | | | .84 | 10 | | | .84 | 10 | | | 4.89 | 10 |
| 12/31/2020 | | | 9.94 | | | | .52 | | | | .21 | | | | .73 | | | | (.17 | ) | | | — | | | | (.35 | ) | | | (.52 | ) | | | 10.15 | | | | 7.89 | 10 | | | — | 11 | | | .84 | 10 | | | .84 | 10 | | | 5.61 | 10 |
| 12/31/2019 | | | 9.35 | | | | .65 | | | | .62 | | | | 1.27 | | | | (.37 | ) | | | (.03 | ) | | | (.28 | ) | | | (.68 | ) | | | 9.94 | | | | 13.88 | | | | 4 | | | | .84 | | | | .82 | | | | 6.60 | |
| 12/31/2018 | | | 10.38 | | | | .62 | | | | (1.04 | ) | | | (.42 | ) | | | (.59 | ) | | | — | 9 | | | (.02 | ) | | | (.61 | ) | | | 9.35 | | | | (4.08 | ) | | | 1 | | | | .90 | | | | .84 | | | | 6.51 | |
| 12/31/2017 | | | 9.77 | | | | .63 | | | | .63 | | | | 1.26 | | | | (.63 | ) | | | (.02 | ) | | | — | | | | (.65 | ) | | | 10.38 | | | | 13.12 | | | | 1 | | | | 1.08 | | | | .85 | | | | 6.11 | |
| Class 529-F-2: | | | | | | | | | | | | | | | | | | | | | | | | | | | | | | | | | | | | | | | | | | | | | | | | | | | | | | | | |
| 06/30/20225,6 | | | 9.30 | | | | .26 | | | | (1.88 | ) | | | (1.62 | ) | | | (.29 | ) | | | — | | | | — | | | | (.29 | ) | | | 7.39 | | | | (17.62 | )7 | | | 6 | | | | .72 | 8 | | | .72 | 8 | | | 6.45 | 8 |
| 12/31/2021 | | | 10.15 | | | | .48 | | | | (.85 | ) | | | (.37 | ) | | | (.40 | ) | | | — | | | | (.08 | ) | | | (.48 | ) | | | 9.30 | | | | (3.71 | ) | | | 6 | | | | .77 | | | | .77 | | | | 4.99 | |
| 12/31/20205,14 | | | 9.39 | | | | .08 | | | | .76 | | | | .84 | | | | (.03 | ) | | | — | | | | (.05 | ) | | | (.08 | ) | | | 10.15 | | | | 8.95 | 7 | | | 5 | | | | .14 | 7 | | | .11 | 7 | | | .82 | 7 |
| Class 529-F-3: | | | | | | | | | | | | | | | | | | | | | | | | | | | | | | | | | | | | | | | | | | | | | | | | | | | | | | | | |
| 06/30/20225,6 | | | 9.30 | | | | .27 | | | | (1.89 | ) | | | (1.62 | ) | | | (.29 | ) | | | — | | | | — | | | | (.29 | ) | | | 7.39 | | | | (17.61 | )7 | | | — | 11 | | | .67 | 8 | | | .67 | 8 | | | 6.44 | 8 |
| 12/31/2021 | | | 10.15 | | | | .49 | | | | (.85 | ) | | | (.36 | ) | | | (.41 | ) | | | — | | | | (.08 | ) | | | (.49 | ) | | | 9.30 | | | | (3.66 | ) | | | — | 11 | | | .73 | | | | .71 | | | | 5.02 | |
| 12/31/20205,14 | | | 9.39 | | | | .08 | | | | .77 | | | | .85 | | | | (.03 | ) | | | — | | | | (.06 | ) | | | (.09 | ) | | | 10.15 | | | | 8.97 | 7 | | | — | 11 | | | .16 | 7 | | | .10 | 7 | | | .84 | 7 |
| Class R-1: | | | | | | | | | | | | | | | | | | | | | | | | | | | | | | | | | | | | | | | | | | | | | | | | | | | | | | | | |
| 06/30/20225,6 | | | 9.30 | | | | .23 | | | | (1.88 | ) | | | (1.65 | ) | | | (.26 | ) | | | — | | | | — | | | | (.26 | ) | | | 7.39 | | | | (17.97 | )7,10 | | | — | 11 | | | 1.57 | 8,10 | | | 1.57 | 8,10 | | | 5.63 | 8,10 |
| 12/31/2021 | | | 10.15 | | | | .40 | | | | (.85 | ) | | | (.45 | ) | | | (.34 | ) | | | — | | | | (.06 | ) | | | (.40 | ) | | | 9.30 | | | | (4.42 | )10 | | | — | 11 | | | 1.54 | 10 | | | 1.52 | 10 | | | 4.26 | 10 |
| 12/31/2020 | | | 9.94 | | | | .45 | | | | .20 | | | | .65 | | | | (.14 | ) | | | — | | | | (.30 | ) | | | (.44 | ) | | | 10.15 | | | | 7.08 | 10 | | | — | 11 | | | 1.62 | 10 | | | 1.57 | 10 | | | 4.73 | 10 |
| 12/31/2019 | | | 9.35 | | | | .58 | | | | .62 | | | | 1.20 | | | | (.33 | ) | | | (.03 | ) | | | (.25 | ) | | | (.61 | ) | | | 9.94 | | | | 13.11 | 10 | | | — | 11 | | | 1.56 | 10 | | | 1.52 | 10 | | | 5.94 | 10 |
| 12/31/2018 | | | 10.38 | | | | .56 | | | | (1.04 | ) | | | (.48 | ) | | | (.53 | ) | | | — | 9 | | | (.02 | ) | | | (.55 | ) | | | 9.35 | | | | (4.76 | )10 | | | — | 11 | | | 1.64 | 10 | | | 1.57 | 10 | | | 5.63 | 10 |
| 12/31/2017 | | | 9.77 | | | | .57 | | | | .62 | | | | 1.19 | | | | (.56 | ) | | | (.02 | ) | | | — | | | | (.58 | ) | | | 10.38 | | | | 12.37 | 10 | | | — | 11 | | | 1.73 | 10 | | | 1.52 | 10 | | | 5.51 | 10 |
Refer to the end of the table for footnotes.
| 32 | American Funds Emerging Markets Bond Fund |
Financial highlights (continued)
| | | | | | (Loss) income from
investment operations1 | | | Dividends, distributions and return of capital | | | | | | | | | | | | | | | | | | | |
| Year ended | | Net asset
value,
beginning
of year | | | Net
investment
income | | | Net (losses)
gains on
securities
(both
realized and
unrealized) | | | Total from
investment
operations | | | Dividends
(from net
investment
income) | | | Distributions
(from capital
gains) | | | Return of
capital | | | Total
dividends,
distributions
and return
of capital | | | Net assets
value, end
of year | | | Total return2,3 | | | Net assets,
end of year
(in millions) | | | Ratio of
expenses to
average net
assets before
waivers/
reimburse-
ments4 | | | Ratio of
expenses to
average net
assets after
waivers/
reimburse-
ments3,4 | | | Ratio of
net income
to average
net assets3 | |
| Class R-2: | | | | | | | | | | | | | | | | | | | | | | | | | | | | | | | | | | | | | | | | | | | | | | | | | | | | | | | | |
| 06/30/20225,6 | | $ | 9.30 | | | $ | .23 | | | $ | (1.88 | ) | | $ | (1.65 | ) | | $ | (.26 | ) | | $ | — | | | $ | — | | | $ | (.26 | ) | | $ | 7.39 | | | | (18.00 | )%7 | | $ | 1 | | | | 1.63 | %8 | | | 1.63 | %8 | | | 5.52 | %8 |
| 12/31/2021 | | | 10.15 | | | | .39 | | | | (.85 | ) | | | (.46 | ) | | | (.33 | ) | | | — | | | | (.06 | ) | | | (.39 | ) | | | 9.30 | | | | (4.55 | ) | | | 2 | | | | 1.65 | | | | 1.65 | | | | 4.11 | |
| 12/31/2020 | | | 9.94 | | | | .43 | | | | .22 | | | | .65 | | | | (.14 | ) | | | — | | | | (.30 | ) | | | (.44 | ) | | | 10.15 | | | | 6.93 | | | | 2 | | | | 1.73 | | | | 1.70 | | | | 4.54 | |
| 12/31/2019 | | | 9.35 | | | | .56 | | | | .62 | | | | 1.18 | | | | (.32 | ) | | | (.03 | ) | | | (.24 | ) | | | (.59 | ) | | | 9.94 | | | | 12.90 | | | | 1 | | | | 1.73 | | | | 1.70 | | | | 5.74 | |
| 12/31/2018 | | | 10.38 | | | | .55 | | | | (1.04 | ) | | | (.49 | ) | | | (.52 | ) | | | — | 9 | | | (.02 | ) | | | (.54 | ) | | | 9.35 | | | | (4.84 | ) | | | 1 | | | | 1.70 | | | | 1.64 | | | | 5.67 | |
| 12/31/2017 | | | 9.77 | | | | .57 | | | | .62 | | | | 1.19 | | | | (.56 | ) | | | (.02 | ) | | | — | | | | (.58 | ) | | | 10.38 | | | | 12.39 | 10 | | | — | 11 | | | 1.71 | 10 | | | 1.50 | 10 | | | 5.52 | 10 |
| Class R-2E: | | | | | | | | | | | | | | | | | | | | | | | | | | | | | | | | | | | | | | | | | | | | | | | | | | | | | | | | |
| 06/30/20225,6 | | | 9.30 | | | | .24 | | | | (1.88 | ) | | | (1.64 | ) | | | (.27 | ) | | | — | | | | — | | | | (.27 | ) | | | 7.39 | | | | (17.85 | )7,10 | | | — | 11 | | | 1.28 | 8,10 | | | 1.28 | 8,10 | | | 5.90 | 8,10 |
| 12/31/2021 | | | 10.15 | | | | .45 | | | | (.85 | ) | | | (.40 | ) | | | (.38 | ) | | | — | | | | (.07 | ) | | | (.45 | ) | | | 9.30 | | | | (4.01 | )10 | | | — | 11 | | | 1.21 | 10 | | | 1.20 | 10 | | | 4.62 | 10 |
| 12/31/2020 | | | 9.94 | | | | .49 | | | | .21 | | | | .70 | | | | (.16 | ) | | | — | | | | (.33 | ) | | | (.49 | ) | | | 10.15 | | | | 7.56 | 10 | | | — | 11 | | | 1.46 | 10 | | | 1.39 | 10 | | | 5.12 | 10 |
| 12/31/2019 | | | 9.35 | | | | .58 | | | | .62 | | | | 1.20 | | | | (.33 | ) | | | (.03 | ) | | | (.25 | ) | | | (.61 | ) | | | 9.94 | | | | 13.20 | | | | 1 | | | | 1.46 | | | | 1.43 | | | | 6.02 | |
| 12/31/2018 | | | 10.38 | | | | .58 | | | | (1.04 | ) | | | (.46 | ) | | | (.55 | ) | | | — | 9 | | | (.02 | ) | | | (.57 | ) | | | 9.35 | | | | (4.51 | ) | | | 1 | | | | 1.48 | | | | 1.42 | | | | 5.89 | |
| 12/31/2017 | | | 9.77 | | | | .65 | | | | .62 | | | | 1.27 | | | | (.64 | ) | | | (.02 | ) | | | — | | | | (.66 | ) | | | 10.38 | | | | 13.29 | 10 | | | — | 11 | | | 1.01 | 10 | | | .70 | 10 | | | 6.33 | 10 |
| Class R-3: | | | | | | | | | | | | | | | | | | | | | | | | | | | | | | | | | | | | | | | | | | | | | | | | | | | | | | | | |
| 06/30/20225,6 | | | 9.30 | | | | .24 | | | | (1.88 | ) | | | (1.64 | ) | | | (.27 | ) | | | — | | | | — | | | | (.27 | ) | | | 7.39 | | | | (17.85 | )7 | | | 1 | | | | 1.26 | 8 | | | 1.26 | 8 | | | 5.86 | 8 |
| 12/31/2021 | | | 10.15 | | | | .43 | | | | (.85 | ) | | | (.42 | ) | | | (.36 | ) | | | — | | | | (.07 | ) | | | (.43 | ) | | | 9.30 | | | | (4.19 | ) | | | 2 | | | | 1.28 | | | | 1.28 | | | | 4.47 | |
| 12/31/2020 | | | 9.94 | | | | .47 | | | | .21 | | | | .68 | | | | (.15 | ) | | | — | | | | (.32 | ) | | | (.47 | ) | | | 10.15 | | | | 7.38 | | | | 2 | | | | 1.31 | | | | 1.29 | | | | 5.02 | |
| 12/31/2019 | | | 9.35 | | | | .60 | | | | .62 | | | | 1.22 | | | | (.34 | ) | | | (.03 | ) | | | (.26 | ) | | | (.63 | ) | | | 9.94 | | | | 13.37 | | | | 2 | | | | 1.30 | | | | 1.28 | | | | 6.15 | |
| 12/31/2018 | | | 10.38 | | | | .58 | | | | (1.04 | ) | | | (.46 | ) | | | (.55 | ) | | | — | 9 | | | (.02 | ) | | | (.57 | ) | | | 9.35 | | | | (4.52 | ) | | | 1 | | | | 1.36 | | | | 1.31 | | | | 5.91 | |
| 12/31/2017 | | | 9.77 | | | | .59 | | | | .63 | | | | 1.22 | | | | (.59 | ) | | | (.02 | ) | | | — | | | | (.61 | ) | | | 10.38 | | | | 12.70 | | | | 1 | | | | 1.52 | | | | 1.27 | | | | 5.73 | |
| Class R-4: | | | | | | | | | | | | | | | | | | | | | | | | | | | | | | | | | | | | | | | | | | | | | | | | | | | | | | | | |
| 06/30/20225,6 | | | 9.30 | | | | .25 | | | | (1.88 | ) | | | (1.63 | ) | | | (.28 | ) | | | — | | | | — | | | | (.28 | ) | | | 7.39 | | | | (17.73 | )7 | | | 1 | | | | .97 | 8 | | | .97 | 8 | | | 6.15 | 8 |
| 12/31/2021 | | | 10.15 | | | | .46 | | | | (.85 | ) | | | (.39 | ) | | | (.39 | ) | | | — | | | | (.07 | ) | | | (.46 | ) | | | 9.30 | | | | (3.91 | ) | | | 1 | | | | .99 | | | | .99 | | | | 4.78 | |
| 12/31/2020 | | | 9.94 | | | | .50 | | | | .21 | | | | .71 | | | | (.16 | ) | | | — | | | | (.34 | ) | | | (.50 | ) | | | 10.15 | | | | 7.69 | | | | 1 | | | | 1.02 | | | | 1.00 | | | | 5.35 | |
| 12/31/2019 | | | 9.35 | | | | .63 | | | | .62 | | | | 1.25 | | | | (.36 | ) | | | (.03 | ) | | | (.27 | ) | | | (.66 | ) | | | 9.94 | | | | 13.67 | | | | 1 | | | | 1.04 | | | | 1.02 | | | | 6.44 | |
| 12/31/2018 | | | 10.38 | | | | .61 | | | | (1.04 | ) | | | (.43 | ) | | | (.58 | ) | | | — | 9 | | | (.02 | ) | | | (.60 | ) | | | 9.35 | | | | (4.26 | ) | | | 1 | | | | 1.09 | | | | 1.03 | | | | 6.24 | |
| 12/31/2017 | | | 9.77 | | | | .63 | | | | .62 | | | | 1.25 | | | | (.62 | ) | | | (.02 | ) | | | — | | | | (.64 | ) | | | 10.38 | | | | 13.03 | | | | — | 11 | | | 1.22 | | | | .96 | | | | 6.03 | |
| Class R-5E: | | | | | | | | | | | | | | | | | | | | | | | | | | | | | | | | | | | | | | | | | | | | | | | | | | | | | | | | |
| 06/30/20225,6 | | | 9.30 | | | | .27 | | | | (1.88 | ) | | | (1.61 | ) | | | (.30 | ) | | | — | | | | — | | | | (.30 | ) | | | 7.39 | | | | (17.58 | )7 | | | 1 | | | | .61 | 8 | | | .61 | 8 | | | 6.59 | 8 |
| 12/31/2021 | | | 10.15 | | | | .51 | | | | (.85 | ) | | | (.34 | ) | | | (.43 | ) | | | — | | | | (.08 | ) | | | (.51 | ) | | | 9.30 | | | | (3.40 | ) | | | 1 | | | | .44 | | | | .44 | | | | 5.32 | |
| 12/31/2020 | | | 9.94 | | | | .55 | | | | .21 | | | | .76 | | | | (.18 | ) | | | — | | | | (.37 | ) | | | (.55 | ) | | | 10.15 | | | | 8.23 | | | | 1 | | | | .49 | | | | .47 | | | | 5.82 | |
| 12/31/2019 | | | 9.35 | | | | .65 | | | | .62 | | | | 1.27 | | | | (.37 | ) | | | (.03 | ) | | | (.28 | ) | | | (.68 | ) | | | 9.94 | | | | 14.05 | | | | — | 11 | | | .77 | | | | .75 | | | | 6.81 | |
| 12/31/2018 | | | 10.38 | | | | .63 | | | | (1.04 | ) | | | (.41 | ) | | | (.60 | ) | | | — | 9 | | | (.02 | ) | | | (.62 | ) | | | 9.35 | | | | (4.03 | ) | | | — | 11 | | | .86 | | | | .76 | | | | 6.90 | |
| 12/31/2017 | | | 9.77 | | | | .65 | | | | .62 | | | | 1.27 | | | | (.64 | ) | | | (.02 | ) | | | — | | | | (.66 | ) | | | 10.38 | | | | 13.29 | | | | — | 11 | | | .99 | | | | .69 | | | | 6.33 | |
| Class R-5: | | | | | | | | | | | | | | | | | | | | | | | | | | | | | | | | | | | | | | | | | | | | | | | | | | | | | | | | |
| 06/30/20225,6 | | | 9.30 | | | | .27 | | | | (1.88 | ) | | | (1.61 | ) | | | (.30 | ) | | | — | | | | — | | | | (.30 | ) | | | 7.39 | | | | (17.59 | )7 | | | 1 | | | | .65 | 8 | | | .65 | 8 | | | 6.49 | 8 |
| 12/31/2021 | | | 10.15 | | | | .49 | | | | (.85 | ) | | | (.36 | ) | | | (.41 | ) | | | — | | | | (.08 | ) | | | (.49 | ) | | | 9.30 | | | | (3.61 | ) | | | 1 | | | | .67 | | | | .67 | | | | 5.09 | |
| 12/31/2020 | | | 9.94 | | | | .53 | | | | .21 | | | | .74 | | | | (.17 | ) | | | — | | | | (.36 | ) | | | (.53 | ) | | | 10.15 | | | | 8.01 | | | | 1 | | | | .73 | | | | .70 | | | | 5.59 | |
| 12/31/2019 | | | 9.35 | | | | .66 | | | | .62 | | | | 1.28 | | | | (.38 | ) | | | (.03 | ) | | | (.28 | ) | | | (.69 | ) | | | 9.94 | | | | 14.01 | | | | 1 | | | | .74 | | | | .71 | | | | 6.73 | |
| 12/31/2018 | | | 10.38 | | | | .63 | | | | (1.04 | ) | | | (.41 | ) | | | (.60 | ) | | | — | 9 | | | (.02 | ) | | | (.62 | ) | | | 9.35 | | | | (3.98 | ) | | | — | 11 | | | .80 | | | | .74 | | | | 6.54 | |
| 12/31/2017 | | | 9.77 | | | | .65 | | | | .62 | | | | 1.27 | | | | (.64 | ) | | | (.02 | ) | | | — | | | | (.66 | ) | | | 10.38 | | | | 13.23 | | | | — | 11 | | | 1.00 | | | | .74 | | | | 6.27 | |
| Class R-6: | | | | | | | | | | | | | | | | | | | | | | | | | | | | | | | | | | | | | | | | | | | | | | | | | | | | | | | | |
| 06/30/20225,6 | | | 9.30 | | | | .27 | | | | (1.88 | ) | | | (1.61 | ) | | | (.30 | ) | | | — | | | | — | | | | (.30 | ) | | | 7.39 | | | | (17.58 | )7 | | | 127 | | | | .62 | 8 | | | .62 | 8 | | | 6.50 | 8 |
| 12/31/2021 | | | 10.15 | | | | .49 | | | | (.85 | ) | | | (.36 | ) | | | (.41 | ) | | | — | | | | (.08 | ) | | | (.49 | ) | | | 9.30 | | | | (3.58 | ) | | | 194 | | | | .64 | | | | .64 | | | | 5.12 | |
| 12/31/2020 | | | 9.94 | | | | .54 | | | | .20 | | | | .74 | | | | (.17 | ) | | | — | | | | (.36 | ) | | | (.53 | ) | | | 10.15 | | | | 8.07 | | | | 167 | | | | .67 | | | | .65 | | | | 5.67 | |
| 12/31/2019 | | | 9.35 | | | | .66 | | | | .62 | | | | 1.28 | | | | (.38 | ) | | | (.03 | ) | | | (.28 | ) | | | (.69 | ) | | | 9.94 | | | | 14.07 | | | | 173 | | | | .68 | | | | .66 | | | | 6.80 | |
| 12/31/2018 | | | 10.38 | | | | .64 | | | | (1.04 | ) | | | (.40 | ) | | | (.61 | ) | | | — | 9 | | | (.02 | ) | | | (.63 | ) | | | 9.35 | | | | (3.95 | ) | | | 157 | | | | .72 | | | | .66 | | | | 6.69 | |
| 12/31/2017 | | | 9.77 | | | | .64 | | | | .62 | | | | 1.26 | | | | (.63 | ) | | | (.02 | ) | | | — | | | | (.65 | ) | | | 10.38 | | | | 13.17 | | | | — | 11 | | | 1.00 | | | | .79 | | | | 6.20 | |
Refer to the end of the table for footnotes.
| American Funds Emerging Markets Bond Fund | 33 |
Financial highlights (continued)
| | | Six months ended | | Year ended December 31, |
| | | June 30, 20225,6,7 | | 2021 | | 2020 | | 2019 | | 2018 | | 2017 |
| Portfolio turnover rate for all share classes15 | | 32% | | 52% | | 70% | | 54% | | 38% | | 35% |
| | |
| 1 | Based on average shares outstanding. |
| 2 | Total returns exclude any applicable sales charges, including contingent deferred sales charges. |
| 3 | This column reflects the impact, if any, of certain waivers/reimbursements from AFS and/or CRMC. During some of the years shown, AFS waived a portion of transfer agent services fees for Class F-3 shares. In addition, during some of the years shown, CRMC reimbursed a portion of transfer agent services fees for certain share classes and/or reimbursed a portion of miscellaneous fees and expenses. |
| 4 | Ratios do not include expenses of any Central Funds. The fund indirectly bears its proportionate share of the expenses of any Central Funds. |
| 5 | Based on operations for a period that is less than a full year. |
| 6 | Unaudited. |
| 7 | Not annualized. |
| 8 | Annualized. |
| 9 | Amount less than $.01. |
| 10 | All or a significant portion of assets in this class consisted of seed capital invested by CRMC and/or its affiliates. Fees for distribution services are not charged or accrued on these seed capital assets. If such fees were paid by the fund on seed capital assets, fund expenses would have been higher and net income and total return would have been lower. |
| 11 | Amount less than $1 million. |
| 12 | Class T and 529-T shares began investment operations on April 7, 2017. |
| 13 | Class F-3 shares began investment operations on January 27, 2017. |
| 14 | Class 529-F-2 and 529-F-3 shares began investment operations on October 30, 2020. |
| 15 | Rates do not include the fund’s portfolio activity with respect to any Central Funds. |
Refer to the notes to financial statements.
| 34 | American Funds Emerging Markets Bond Fund |
As a fund shareholder, you incur two types of costs: (1) transaction costs, such as initial sales charges on purchase payments and contingent deferred sales charges on redemptions (loads), and (2) ongoing costs, including management fees, distribution and service (12b-1) fees, and other expenses. This example is intended to help you understand your ongoing costs (in dollars) of investing in the fund so you can compare these costs with the ongoing costs of investing in other mutual funds. The example is based on an investment of $1,000 invested at the beginning of the period and held for the entire six-month period (January 1, 2022, through June 30, 2022).
Actual expenses:
The first line of each share class in the table on the following page provides information about actual account values and actual expenses. You may use the information in this line, together with the amount you invested, to estimate the expenses that you paid over the period. Simply divide your account value by $1,000 (for example, an $8,600 account value divided by $1,000 = 8.6), then multiply the result by the number in the first line under the heading titled “Expenses paid during period” to estimate the expenses you paid on your account during this period.
Hypothetical example for comparison purposes:
The second line of each share class in the table on the following page provides information about hypothetical account values and hypothetical expenses based on the actual expense ratio for the share class and an assumed rate of return of 5.00% per year before expenses, which is not the actual return of the share class. The hypothetical account values and expenses may not be used to estimate the actual ending account balance or expenses you paid for the period. You may use this information to compare the ongoing costs of investing in the fund and other funds. To do so, compare this 5.00% hypothetical example with the 5.00% hypothetical examples that appear in the shareholder reports of the other funds.
Notes:
Retirement plan participants may be subject to certain fees charged by the plan sponsor, and Class F-1, F-2, F-3, 529-F-1, 529-F-2 and 529-F-3 shareholders may be subject to fees charged by financial intermediaries, typically ranging from 0.75% to 1.50% of assets annually depending on services offered. You can estimate the impact of these fees by adding the amount of the fees to the total estimated expenses you paid on your account during the period as calculated above. In addition, your ending account value would be lower by the amount of these fees.
Note that the expenses shown in the table on the following page are meant to highlight your ongoing costs only and do not reflect any transactional costs, such as sales charges (loads). Therefore, the second line of each share class in the table is useful in comparing ongoing costs only and will not help you determine the relative total costs of owning different funds. In addition, if these transactional costs were included, your costs would have been higher.
| American Funds Emerging Markets Bond Fund | 35 |
Expense example (continued)
| | | Beginning
account value
1/1/2022 | | | Ending
account value
6/30/2022 | | | Expenses paid
during period* | | | Annualized
expense ratio | |
| Class A – actual return | | $ | 1,000.00 | | | $ | 822.52 | | | $ | 4.61 | | | | 1.02 | % |
| Class A – assumed 5% return | | | 1,000.00 | | | | 1,019.74 | | | | 5.11 | | | | 1.02 | |
| Class C – actual return | | | 1,000.00 | | | | 819.51 | | | | 7.94 | | | | 1.76 | |
| Class C – assumed 5% return | | | 1,000.00 | | | | 1,016.07 | | | | 8.80 | | | | 1.76 | |
| Class T – actual return | | | 1,000.00 | | | | 823.58 | | | | 3.39 | | | | .75 | |
| Class T – assumed 5% return | | | 1,000.00 | | | | 1,021.08 | | | | 3.76 | | | | .75 | |
| Class F-1 – actual return | | | 1,000.00 | | | | 822.57 | | | | 4.56 | | | | 1.01 | |
| Class F-1 – assumed 5% return | | | 1,000.00 | | | | 1,019.79 | | | | 5.06 | | | | 1.01 | |
| Class F-2 – actual return | | | 1,000.00 | | | | 823.71 | | | | 3.35 | | | | .74 | |
| Class F-2 – assumed 5% return | | | 1,000.00 | | | | 1,021.12 | | | | 3.71 | | | | .74 | |
| Class F-3 – actual return | | | 1,000.00 | | | | 824.21 | | | | 2.80 | | | | .62 | |
| Class F-3 – assumed 5% return | | | 1,000.00 | | | | 1,021.72 | | | | 3.11 | | | | .62 | |
| Class 529-A – actual return | | | 1,000.00 | | | | 822.51 | | | | 4.61 | | | | 1.02 | |
| Class 529-A – assumed 5% return | | | 1,000.00 | | | | 1,019.74 | | | | 5.11 | | | | 1.02 | |
| Class 529-C – actual return | | | 1,000.00 | | | | 819.32 | | | | 8.12 | | | | 1.80 | |
| Class 529-C – assumed 5% return | | | 1,000.00 | | | | 1,015.87 | | | | 9.00 | | | | 1.80 | |
| Class 529-E – actual return | | | 1,000.00 | | | | 821.66 | | | | 5.56 | | | | 1.23 | |
| Class 529-E – assumed 5% return | | | 1,000.00 | | | | 1,018.70 | | | | 6.16 | | | | 1.23 | |
| Class 529-T – actual return | | | 1,000.00 | | | | 823.25 | | | | 3.62 | | | | .80 | |
| Class 529-T – assumed 5% return | | | 1,000.00 | | | | 1,020.83 | | | | 4.01 | | | | .80 | |
| Class 529-F-1 – actual return | | | 1,000.00 | | | | 823.36 | | | | 3.62 | | | | .80 | |
| Class 529-F-1 – assumed 5% return | | 1,000.00 | | | | 1,020.83 | | | | 4.01 | | | | .80 | |
| Class 529-F-2 – actual return | | | 1,000.00 | | | | 823.78 | | | | 3.26 | | | | .72 | |
| Class 529-F-2 – assumed 5% return | | 1,000.00 | | | | 1,021.22 | | | | 3.61 | | | | .72 | |
| Class 529-F-3 – actual return | | | 1,000.00 | | | | 823.90 | | | | 3.03 | | | | .67 | |
| Class 529-F-3 – assumed 5% return | | 1,000.00 | | | | 1,021.47 | | | | 3.36 | | | | .67 | |
| Class R-1 – actual return | | | 1,000.00 | | | | 820.30 | | | | 7.09 | | | | 1.57 | |
| Class R-1 – assumed 5% return | | | 1,000.00 | | | | 1,017.01 | | | | 7.85 | | | | 1.57 | |
| Class R-2 – actual return | | | 1,000.00 | | | | 820.03 | | | | 7.36 | | | | 1.63 | |
| Class R-2 – assumed 5% return | | | 1,000.00 | | | | 1,016.71 | | | | 8.15 | | | | 1.63 | |
| Class R-2E – actual return | | | 1,000.00 | | | | 821.49 | | | | 5.78 | | | | 1.28 | |
| Class R-2E – assumed 5% return | | | 1,000.00 | | | | 1,018.45 | | | | 6.41 | | | | 1.28 | |
| Class R-3 – actual return | | | 1,000.00 | | | | 821.52 | | | | 5.69 | | | | 1.26 | |
| Class R-3 – assumed 5% return | | | 1,000.00 | | | | 1,018.55 | | | | 6.31 | | | | 1.26 | |
| Class R-4 – actual return | | | 1,000.00 | | | | 822.74 | | | | 4.38 | | | | .97 | |
| Class R-4 – assumed 5% return | | | 1,000.00 | | | | 1,019.98 | | | | 4.86 | | | | .97 | |
| Class R-5E – actual return | | | 1,000.00 | | | | 824.21 | | | | 2.76 | | | | .61 | |
| Class R-5E – assumed 5% return | | | 1,000.00 | | | | 1,021.77 | | | | 3.06 | | | | .61 | |
| Class R-5 – actual return | | | 1,000.00 | | | | 824.05 | | | | 2.94 | | | | .65 | |
| Class R-5 – assumed 5% return | | | 1,000.00 | | | | 1,021.57 | | | | 3.26 | | | | .65 | |
| Class R-6 – actual return | | | 1,000.00 | | | | 824.19 | | | | 2.80 | | | | .62 | |
| Class R-6 – assumed 5% return | | | 1,000.00 | | | | 1,021.72 | | | | 3.11 | | | | .62 | |
| | |
| * | The “expenses paid during period” are equal to the “annualized expense ratio,” multiplied by the average account value over the period, multiplied by the number of days in the period, and divided by 365 (to reflect the one-half year period). |
| | |
| 36 | American Funds Emerging Markets Bond Fund |
Approval of Investment Advisory and Service Agreement
The fund’s board has approved the continuation of the fund’s Investment Advisory and Service Agreement (the “agreement”) with Capital Research and Management Company (“CRMC”) for an additional one-year term through April 30, 2023. The agreement was amended to lower the current fee schedule resulting in an overall lower advisory fee. The board approved the agreement following the recommendation of the fund’s Contracts Committee (the “committee”), which is composed of all the fund’s independent board members. The board and the committee determined in the exercise of their business judgment that the fund’s advisory fee structure was fair and reasonable in relation to the services provided, and that approving the agreement was in the best interests of the fund and its shareholders.
In reaching this decision, the board and the committee took into account their interactions with CRMC as well as information furnished to them throughout the year and otherwise provided to them, as well as information prepared specifically in connection with their review of the agreement, and were advised by their independent counsel with respect to the matters considered. They considered the following factors, among others, but did not identify any single issue or particular piece of information that, in isolation, was the controlling factor, and each board and committee member did not necessarily attribute the same weight to each factor.
1. Nature, extent and quality of services
The board and the committee considered the depth and quality of CRMC’s investment management process, including its global research capabilities; the experience, capability and integrity of its senior management and other personnel; the low turnover rates of its key personnel; the overall financial strength and stability of CRMC and the Capital Group organization; the resources and systems CRMC devotes to investment management (the manner in which the fund’s assets are managed, including liquidity management), financial, investment operations, compliance, trading, proxy voting, shareholder communications, and other services; and the ongoing evolution of CRMC’s organizational structure designed to maintain and strengthen these qualities. The board and the committee also considered the nature, extent and quality of administrative and shareholder services provided by CRMC to the fund under the agreement and other agreements, as well as the benefits to fund shareholders from investing in a fund that is part of a large family of funds. The board and the committee considered the risks assumed by CRMC in providing services to the fund, including operational, business, financial, reputational, regulatory and litigation risks. The board and the committee concluded that the nature, extent and quality of the services provided by CRMC have benefited and should continue to benefit the fund and its shareholders.
2. Investment results
The board and the committee considered the investment results of the fund in light of its objective. They compared the fund’s investment results with those of other funds (including funds that currently form the basis of the Lipper index for the category in which the fund is included) and data such as relevant market and fund indexes over various periods (including the fund’s lifetime) through September 30, 2021. They generally placed greater emphasis on investment results over longer term periods. On the basis of this evaluation and the board’s and the committee’s ongoing review of investment results, and considering the relative market conditions during certain reporting periods, the board and the committee concluded that the fund’s investment results have been satisfactory for renewal of the agreement, and that CRMC’s record in managing the fund indicated that its continued management should benefit the fund and its shareholders.
3. Advisory fees and total expenses
The board and the committee compared the advisory fees and total expense levels of the fund to those of other relevant funds. They observed that the fund’s advisory fees and expenses generally compared favorably to those of other similar funds included in the comparable Lipper category. The board and the committee also considered the breakpoint discounts in the fund’s advisory fee structure that reduce the level of fees charged by CRMC to the fund as fund assets increase. The board also considered and approved the amended fee schedule to the agreement that lowered the current fee schedule and resulted in an overall lower advisory fee. The board noted that there would be no diminution in services provided as a result of the lower advisory fee.
| American Funds Emerging Markets Bond Fund | 37 |
In addition, the board and the committee reviewed information regarding the effective advisory fees charged to non-mutual fund clients by CRMC and its affiliates. They noted that, to the extent there were differences between the advisory fees paid by the fund and the advisory fees paid by those clients, the differences appropriately reflected the investment, operational, regulatory and market differences between advising the fund and the other clients. The board and the committee concluded that the fund’s cost structure was fair and reasonable in relation to the services provided, as well as in relation to the risks assumed by the adviser in sponsoring and managing the fund, and that the fund’s shareholders receive reasonable value in return for the advisory fees and other amounts paid to CRMC by the fund.
4. Ancillary benefits
The board and the committee considered a variety of other benefits that CRMC and its affiliates receive as a result of CRMC’s relationship with the fund and other American Funds, including fees for administrative services provided to certain share classes; fees paid to CRMC’s affiliated transfer agent; sales charges and distribution fees received and retained by the fund’s principal underwriter, an affiliate of CRMC; and possible ancillary benefits to CRMC and its institutional management affiliates in managing other investment vehicles. The board and the committee reviewed CRMC’s portfolio trading practices, noting that through December 31, 2018, CRMC benefited from research obtained with commissions from portfolio transactions made on behalf of each fund, and since that time has undertaken to bear the cost of obtaining such research. The board and the committee took these ancillary benefits into account in evaluating the reasonableness of the advisory fees and other amounts paid to CRMC by the fund.
5. Adviser financial information
The board and the committee reviewed information regarding CRMC’s costs of providing services to the American Funds, including personnel, systems and resources of investment, compliance, trading, accounting and other administrative operations. They considered CRMC’s costs and related cost allocation methodology as well as its track record of investing in technology, infrastructure and staff to maintain and expand services and capabilities, respond to industry and regulatory developments, and attract and retain qualified personnel. They noted information regarding the compensation structure for CRMC’s investment professionals. They reviewed information on the profitability of the investment adviser and its affiliates. The board and the committee also compared CRMC’s profitability and compensation data to the reported results and data of several large, publicly held investment management companies. The board and the committee noted the competitiveness and cyclicality of both the mutual fund industry and the capital markets, and the importance in that environment of CRMC’s long-term profitability for maintaining its independence, company culture and management continuity. They further considered the breakpoint discounts in the fund’s advisory fee structure and CRMC’s sharing of potential economies of scale, or efficiencies, through breakpoints and other fee reductions and costs voluntarily absorbed. The board and the committee concluded that the fund’s advisory fee structure reflected a reasonable sharing of benefits between CRMC and the fund’s shareholders.
| 38 | American Funds Emerging Markets Bond Fund |
This page intentionally left blank.
| American Funds Emerging Markets Bond Fund | 39 |
Office of the fund
6455 Irvine Center Drive
Irvine, CA 92618-4518
Investment adviser
Capital Research and Management Company
333 South Hope Street
Los Angeles, CA 90071-1406
Transfer agent for shareholder accounts
American Funds Service Company
(Write to the address nearest you.)
P.O. Box 6007
Indianapolis, IN 46206-6007
P.O. Box 2280
Norfolk, VA 23501-2280
Custodian of assets
JPMorgan Chase Bank
270 Park Avenue
New York, NY 10017-2070
Counsel
Morgan, Lewis & Bockius LLP
One Federal Street
Boston, MA 02110-1726
Independent registered public accounting firm
Deloitte & Touche LLP
695 Town Center Drive
Suite 1000
Costa Mesa, CA 92626-7188
Principal underwriter
American Funds Distributors, Inc.
333 South Hope Street
Los Angeles, CA 90071-1406
| 40 | American Funds Emerging Markets Bond Fund |
Investors should carefully consider investment objectives, risks, charges and expenses. This and other important information is contained in the fund prospectus and summary prospectus, which can be obtained from your financial professional and should be read carefully before investing. You may also call American Funds Service Company (AFS) at (800) 421-4225 or visit the Capital Group website at capitalgroup.com.
“American Funds Proxy Voting Procedures and Principles” — which describes how we vote proxies relating to portfolio securities — is available on our website or upon request by calling AFS. The fund files its proxy voting record with the U.S. Securities and Exchange Commission (SEC) for the 12 months ended June 30 by August 31. The proxy voting record is available free of charge on the SEC website at sec.gov and on our website.
American Funds Emerging Markets Bond Fund files a complete list of its portfolio holdings with the SEC for the first and third quarters of each fiscal year on Form NPORT-P. The list of portfolio holdings is available free of charge on the SEC website and on our website.
This report is for the information of shareholders of American Funds Emerging Markets Bond Fund, but it also may be used as sales literature when preceded or accompanied by the current prospectus or summary prospectus, which gives details about charges, expenses, investment objectives and operating policies of the fund. If used as sales material after September 30, 2022, this report must be accompanied by an American Funds statistical update for the most recently completed calendar quarter.
American Funds Distributors, Inc., member FINRA.
The Capital Advantage®
Since 1931, Capital Group, home of American Funds, has helped investors pursue long-term investment success. Our consistent approach — in combination with The Capital SystemSM — has resulted in superior outcomes.
Aligned with investor success
We base our decisions on a long-term perspective, which we believe aligns our goals with the interests of our clients. Our portfolio managers average 27 years of investment industry experience, including 21 years at our company, reflecting a career commitment to our long-term approach.1
The Capital System
The Capital System combines individual accountability with teamwork. Funds using The Capital System are divided into portions that are managed independently by investment professionals with diverse backgrounds, ages and investment approaches. An extensive global research effort is the backbone of our system.
American Funds’ superior outcomes
Equity funds have beaten their Lipper peer indexes in 90% of 10-year periods and 99% of 20-year periods.2 Fixed income funds have helped investors achieve diversification through attention to correlation between bonds and equities.3 Fund management fees have been among the lowest in the industry.4
| | 1 | Investment industry experience as of December 31, 2021. |
| | 2 | Based on Class F-2 share results for rolling calendar-year periods starting the first full calendar year after each fund’s inception through December 31, 2021. Periods covered are the shorter of the fund’s lifetime or since the comparable Lipper index inception date (except Capital Income Builder and SMALLCAP World Fund, for which the Lipper average was used). Expenses differ for each share class, so results will vary. |
| | 3 | Based on Class F-2 share results as of December 31, 2021. Thirteen of the 17 fixed income American Funds that have been in existence for the three-year period showed a three-year correlation below 0.3. S&P 500 Index was used as an equity market proxy. Correlation based on monthly total returns. Correlation is a statistical measure of how two securities move in relation to each other. A correlation ranges from –1 to 1. A positive correlation close to 1 implies that as one security moves, either up or down, the other security will move in “lockstep,” in the same direction. A negative correlation close to –1 indicates that the securities have moved in the opposite direction. |
| | 4 | On average, our management fees were in the lowest quintile 63% of the time, based on the 20-year period ended December 31, 2021, versus comparable Lipper categories, excluding funds of funds. |
Class F-2 shares were first offered on August 1, 2008. Class F-2 share results prior to the date of first sale are hypothetical based on the results of the original share class of the fund without a sales charge, adjusted for typical estimated expenses. Results for certain funds with an inception date after August 1, 2008, also include hypothetical returns because those funds’ Class F-2 shares sold after the funds’ date of first offering. Visit capitalgroup.com for more information on specific expense adjustments and the actual dates of first sale.
All Capital Group trademarks mentioned are owned by The Capital Group Companies, Inc., an affiliated company or fund. All other company and product names mentioned are the property of their respective companies.

ITEM 2 – Code of Ethics
Not applicable for filing of semi-annual reports to shareholders.
ITEM 3 – Audit Committee Financial Expert
Not applicable for filing of semi-annual reports to shareholders.
ITEM 4 – Principal Accountant Fees and Services
Not applicable for filing of semi-annual reports to shareholders.
ITEM 5 – Audit Committee of Listed Registrants
Not applicable to this Registrant, insofar as the Registrant is not a listed issuer as defined in Rule 10A-3 under the Securities Exchange Act of 1934.
ITEM 6 – Schedule of Investments
Not applicable, insofar as the schedule is included as part of the report to shareholders filed under Item 1 of this Form.
ITEM 7 – Disclosure of Proxy Voting Policies and Procedures for Closed-End Management Investment Companies.
Not applicable to this Registrant, insofar as the Registrant is not a closed-end management investment company.
ITEM 8 – Portfolio Managers of Closed-End Management Investment Companies
Not applicable to this Registrant, insofar as the Registrant is not a closed-end management investment company.
ITEM 9 – Purchases of Equity Securities by Closed-End Management Investment Company and Affiliated Purchasers
Not applicable to this Registrant, insofar as the Registrant is not a closed-end management investment company.
ITEM 10 – Submission of Matters to a Vote of Security Holders
There have been no material changes to the procedures by which shareholders may recommend nominees to the Registrant’s board of trustees since the Registrant last submitted a proxy statement to its shareholders. The procedures are as follows. The Registrant has a nominating and governance committee comprised solely of persons who are not considered ‘‘interested persons’’ of the Registrant within the meaning of the Investment Company Act of 1940, as amended. The committee periodically reviews such issues as the board’s composition, responsibilities, committees, compensation and other relevant issues, and recommends any appropriate changes to the full board of trustees. While the committee normally is able to identify from its own resources an ample number of qualified candidates, it will consider shareholder suggestions of persons to be considered as nominees to fill future vacancies on the board. Such suggestions must be sent in writing to the nominating and governance committee of the Registrant, c/o the Registrant’s Secretary, and must be accompanied by complete biographical and occupational data on the prospective nominee, along with a written consent of the prospective nominee for consideration of his or her name by the nominating and governance committee.
ITEM 11 – Controls and Procedures
| (a) | The Registrant’s Principal Executive Officer and Principal Financial Officer have concluded, based on their evaluation of the Registrant’s disclosure controls and procedures (as such term is defined in Rule 30a-3 under the Investment Company Act of 1940), that such controls and procedures are adequate and reasonably designed to achieve the purposes described in paragraph (c) of such rule. |
| | |
| (b) | There were no changes in the Registrant’s internal controls over financial reporting (as defined in Rule 30a-3(d) under the Investment Company Act of 1940) that occurred during the Registrant’s semi-annual period covered by this report that has materially affected, or is reasonably likely to materially affect, the Registrant’s internal control over financial reporting. |
ITEM 12 – Exhibits
| (a)(1) | Not applicable for filing of semi-annual reports to shareholders. |
| | |
| (a)(2) | The certifications required by Rule 30a-2 of the Investment Company Act of 1940 and Sections 302 and 906 of the Sarbanes-Oxley Act of 2002 are attached as exhibits hereto. |
SIGNATURES
Pursuant to the requirements of the Securities Exchange Act of 1934 and the Investment Company Act of 1940, the Registrant has duly caused this report to be signed on its behalf by the undersigned, thereunto duly authorized.
| | AMERICAN FUNDS EMERGING MARKETS BOND FUND |
| | |
| | By __/s/ Kristine M. Nishiyama____________________ |
| | Kristine M. Nishiyama, Principal Executive Officer |
| | |
| | Date: August 31, 2022 |
Pursuant to the requirements of the Securities Exchange Act of 1934 and the Investment Company Act of 1940, this report has been signed below by the following persons on behalf of the Registrant and in the capacities and on the dates indicated.
| By __/s/ Kristine M. Nishiyama_________________ |
Kristine M. Nishiyama, Principal Executive Officer |
| |
| Date: August 31, 2022 |
| By ___/s/ Brian C. Janssen __________ |
Brian C. Janssen, Treasurer and Principal Financial Officer |
| |
| Date: August 31, 2022 |